Engineering Science - Board of Studies NSW
73
1999 HSC Engineering Science Enhanced Examination Report
-
Upload
khangminh22 -
Category
Documents
-
view
0 -
download
0
Transcript of Engineering Science - Board of Studies NSW

1999 HSC
Engineering ScienceEnhanced Examination Report

Board of Studies 2000
Published byBoard of Studies NSWGPO Box 5300Sydney NSW 2001Australia
Tel: (02) 9367 8111Fax: (02) 9262 6270Internet: http://www.boardofstudies.nsw.edu.au
March 2000
Schools may reproduce all or part of this document for classroom use only. Anyone wishing toreproduce elements of this document for any other purpose must contact the Copyright Officer,Board of Studies NSW. Ph: (02 9367 8111; fax: (02) 9279 1482.
ISBN 0 7313 4450 2
2000113

ContentsIntroduction.....................................................................................................................................4
Procedures for HSC Marking ..................................................................................................... 42/3 Unit Common............................................................................................................................7
Section I ....................................................................................................................................7Section II ................................................................................................................................. 30
3 Unit (Additional) ........................................................................................................................ 48Section I .................................................................................................................................. 48Section II ................................................................................................................................. 57Section III ................................................................................................................................ 68

1999 HSC Engineering Science Enhanced Examination Report
4
1999 HIGHER SCHOOL CERTIFICATEENGINEERING SCIENCE
ENHANCED EXAMINATION REPORT
Introduction
The Enhanced Examination Report replaces the standard HSC examination report in selectedsubjects. It contains additional information, and, in this report, includes marking criteria, candidateresponses and detailed examiners comments on aspects of questions asked in both the 2/3 UnitCommon and 3 Unit Additional Engineering Science HSC Examinations. Some solutions bycandidates have been included to highlight points made by markers.
In 1999 approximately 1395 candidates sat for the 2/3 Unit Common Examination, and 163candidates sat for the 3 Unit Examination. This year, as in previous years, the top 2 Unit result wasachieved by a 3 Unit candidate.
The majority of candidates attempted all questions required. Some candidates displayed outstandingknowledge by their comprehensive and complete answers. This was a great encouragement to themarkers, to see candidates who were fully prepared for the examinations. The standard of thecandidates appears to be similar to previous years.
Procedures for HSC Marking
The Marking Process
The complete 2/3 Unit Common Engineering Science Examination is split into Sections I and II.Section I is marked in Newcastle and Section II, along with the 3 Unit paper, is marked in Sydney.The markers are carefully selected from experienced teachers and university lecturers and areappointed to mark a specific question which relates to their area of expertise.
The Examination Committee presents a set of answers to the Supervisor of Marking forconsideration. A meeting, between the Examination Committee, the Supervisor of Marking and theSenior Markers is held to discuss and confirm the best answer for each question. The HSC markersfurther develop the range of accepted responses and marking scales for each question by pilotmarking a range of scripts. The marking scales are examined and confirmed by the Supervisor ofMarking before the actual marking commences.
During the marking, questionable responses are analysed and discussed with the Senior Marker, andan appropriate mark is awarded. The Supervisor of Marking overviews the marking process toensure the scales are correctly used and that all candidates’ responses are marked fairly. Markingscales may include checklists and concept lists. As the marking proceeds, each marker keeps a tallyof the marks awarded for the question they are marking. These marker tallies are statisticallyexamined each day and are used as a check, along with systematic checkmarking by the SeniorMarker, to ensure the accuracy of the marking procedure. During the marking, control scripts arecirculated for marking to ensure the reliability of the marking to the agreed marking scales. Themarking is monitored to ensure that the first candidate response marked receives the sameconsideration as the last.
A correct solution for each question is contained in this report. It is impossible to provide a fullrange of answers for publication for any one question, as there are often many methods andcombinations possible in providing a solution. For example, candidates may commence with ananalytical solution, use a part graphical solution and revert to an analytical solution to calculate ananswer. Similarly, candidates may use auxiliary views, rebattment, or independent constructions to

1999 HSC Engineering Science Enhanced Examination Report
5
find true lengths of lines, all of which may provide the same solution. The marking scales aredesigned to provide flexibility, and to allow for alternative methods at arriving at a solution and tofairly discriminate between the Engineering Science candidates.
A report is also prepared with marker comments and marking scales for the information of theEngineering Science HSC Examination Committee. This is used by the Examination Committee toreview and refine setting of questions for the following year’s examination.
This enhanced report includes comments on the responses given by candidates made by Markersand Senior Markers and includes some part solutions given by candidates.
Allocation of Marks
Some general principles on the allocation of marks within each question are given below. They maybe helpful in understanding how the marking scales are determined.
General
– A N/A (Not Attempted) is awarded when there is no evidence (blank response) to any part ofthe question.
– A zero is awarded to an answer which is not blank and which deserves no marks in themarking scheme.
– Emphasis is placed on working when marks are allocated.
– Where possible marks are allocated on the basis of degree of difficulty and to reward eachcorrect response.
– Marks are attributed to correct and accurate use of terminology.
– Conflicting information given in an answer is penalised.
– Restating or rewording the information given in the question is not acceptable.
– Marks are awarded rather than subtracted (positive response).
– Candidates are expected to write sentences in response to questions that ask for definitions,descriptions or explanations. If the question asks the candidate to state, or list, then keywordsare rewarded and a sentence is not expected.
Materials
– When assessing diagrams, micro or macrostructures or graphs, it is expected that they shouldreasonably reflect accepted practice of drawing such diagrams.
– When labels are applied to drawings they should be concise and specifically related to thediagram.
– Emphasis is to be placed on concepts/methods used.
Engineering Mechanics
– Concept errors are not awarded marks, however, errors made in one part of the question, andcarried forward to the next part of the same question, are not penalised twice. In Mechanics,providing the error carried forward does not make the answer any easier, then no penalty isapplied.
– No marks are awarded for restating a formula given on the formulae sheet.
– Calculation errors are only applied once in a solution to a question.
– Correct answers where no working is found are given full marks.

1999 HSC Engineering Science Enhanced Examination Report
6
– An incorrect answer with no working is awarded no marks.
– g = 10 m/s2 or g = 9.8 m/s2 are both acceptable for gravity.
– Graphical solutions are acceptable in deriving solutions in mechanics.
– The use of measurements (angles and distances) from scaled drawings in questions isacceptable.
– When more than one solution is shown, and one is crossed out, the solution not crossed out ismarked.
– When one solution is given and crossed out, the solution is marked.
– When two solutions are given, one right and one wrong and an answer is not placed in thespace provided then marks awarded are at the discretion of the Senior Marker and Supervisorof Marking.
– It is acceptable for candidates to change the units on the paper, providing it conforms to SIstandards. For example, 1200N changed to 1.2 kN. Otherwise, units as indicated in the answerstatement must be given.
Graphics
– Projections in graphics questions should not be erased, as these often display the method usedin solving the problem. Marks are awarded for correct methods/concepts.
– Sectioning, linework and general standards related to Graphics are to conform to AS1100.
– Unless requested in the question, labels for plotted points are not required.
– Evidence of calculating true lengths in triangulation problems should be expected. Analyticalcalculations are acceptable, but not encouraged.
– In intersection problems, end points and change-over points should be clearly shown. Joiningpoints in correct order completes the ‘visibility’ of the view. Visibility is an importantcomponent of all orthogonal drawings.
– Evidence of recognised technical drawing construction methods is required for all solutions toGraphics problems.
Additional comments are included in the comments with each question.
Advice to Candidates:
Candidates will notice on reading the enhanced report that examiners and markers recommend thatmore time be spent in examining a range of components of the Prescribed Topics. It is obvious fromresponses that many candidates have not examined, in any depth, all aspects of these topics. Forexample, when studying the bicycle, as well as analysing the overall machine, examine componentparts such as spokes, handlebars, rims, brake components and centre bracket components.
Looking back over a number of past papers, components become the theme for many questions,particularly in Section II of the examination paper. Physical examination, sketching a shapedescription, sectioning to reveal threads and details, microstructural examination, formal drawing ofaspects of components, discussion on manufacture, properties, service properties, materials used,mechanical operation or requirements, will ensure a better prepared candidate.

1999 HSC Engineering Science Enhanced Examination Report
7
2/3 Unit Common
Section I
Question 1
This was a good question, testing a broad range of concepts and challenging most candidates. Themore able had little difficulty in obtaining full or near full marks.
A simple jib-crane truss is shown in the figure below. The crane assembly is connected to a verticalwall by a pin support at C and a roller support at A. The beam AB has a mass of 50 kg/m actingthrough the centre of the beam. Members AC and BC are relatively light, round cables and theirmass should be ignored.
(a) For one set of conditions, a vertical load of 30kN is applied to the beam AB at a point3 metres to the right of A.
(i) Determine the reactions at the supports A and CWeight of beam = 50 _ 10 _ 7
= 3500 N= 3.5 kN (at mid point)
(RA × 6) – (30 × 3) – (3.5 × 3.5) = 0∴ + ΣMC = 0
RA = 6
25.102 = 17 kN→
17
+ ↑Σv = 0 33.5 Rc = 22 )5.33()17( +
RA – 30 – 3.5 = 0 = 37.6 kN
∴ Rcv = 33.5 kN↑ θ = tan-1 17
5.33
+ → ΣH = 0 = 63o
θ

1999 HSC Engineering Science Enhanced Examination Report
8
17 – RCH = 17 kN←
Answer: Magnitude of Reaction at A 17 kN. Direction
Magnitude of Reaction at C 37.6 kN. Direction 63º
The most common error in this question was the omission of the weight force. Candidates had toread the question carefully to use the 50 kg/m data in calculating the weight force. In many casescandidates relied only on the diagram for data, and incorrectly simplified the problem.
The following solution is typical of this error.
Other common errors included:
The point of application of the weight force not being in the centre of the beam AB.
Considering the reaction of the wall only occurring at C, and therefore omitting the horizontalReaction at A.
Although taking moments about C is not incorrect, it often caused confusion later in the question.
Candidates should be encouraged to use a more systematic approach to the analytical solution ofthis type of question. Few (if any) candidates attempted a full or graphical solution.
(ii) Determine the magnitude and nature of the axial force in member BC.
+ ΣMc = 0
(FBC sin 40.6° _ 7) – (30 _ 3) − (3.5 _ 3.5) = 0
∴ FBC = 654
25102
.
. = 22.5 kN(T)
Answer: Axial force in member BC 22.5 kN
Nature of axial force in member BC tension

1999 HSC Engineering Science Enhanced Examination Report
9
This question was not well understood by the majority of candidates even though several methods(both graphical and analytical) could be used in its solution. The concept of an axial force was notwell understood by many candidates.
Incorrect responses were many and varied with most candidates obtaining part marks, such as in thefollowing example.
The nature of the force (tension), although answered correctly by the majority of candidates, givessome cause for concern, particularly when the question states that CB is a light round cable.
(b) The 30 kN force is moved to joint B. Select the most appropriate term: increase, decrease orremain the same, to complete the following sentences.
Answers: (i) The axial force in member BC would increase
(ii) The horizontal component of the reaction at A would increase
This question was generally well done by the majority of candidates, indicating they understood thebasic concept of ‘moments’. Candidates who gave an incorrect response might benefit from apractical approach, using spring balances and a string, to demonstrate the concept of moments.
(c) For another set of conditions, the maximum working axial force in the diagonal member BCis 53 kN. The steel used in the member has a yield stress of 300 MPa. Using a factor of safetyof 1.5, determine the minimum diameter of member BC.
FS =working
yield
σσ
1.5 =working
300
σ
σ working =51
300
.= 200 MPa

1999 HSC Engineering Science Enhanced Examination Report
10
σ =A
PA =
4d2π
200 =
53 10× 3
Ad2 =
4 265×π
∴ A = 265 mm2 ∴ d = 18.4 mm
Answer: Minimum diameter of BC 18.4 mm
The greatest single cause of errors in this question appeared to be due to poor setting out andorganisation of the answer, such as the example following:
A more systematic and organised approach would have benefited many candidates. Other commonerrors included:
– Poor or no understanding of the factor of safety. If the material has to be used safely, theworking stress has to be less than the yield stress of the material. The amount that it needs tobe lower is governed by the factor of safety.
– Use of incompatible units or direct substitution of given values into formula(stress = load/area).
– Incorrect manipulation of formulae and simple algebraic errors.
It is interesting to note that this question was similar in structure and concept to Question 1 in 1998.Obviously candidates who spend time revising past HSC examinations can obtain considerablebenefit.
Question 2
(a) A pumping system and water tank are shown below. (The dimensions of the water tank arealso given.) The pump draws water from the river and supplies the tank. The tank sits on aframe 15 m above the ground.

1999 HSC Engineering Science Enhanced Examination Report
11
(i) Determine the work done to pump the water from the river to half-fill the tank. (1 cubicmetre of water has a mass of 1000 kg.)
Volume of water = 16 × 10 × 4
= 640 m2
Mass of water = 640 × 103 kg
PE = mgh
= 640 × 103 × 10 × 27.5 h = 23.5 + 4
= 176 × 106 J = 27.5 m
Answer: Work done 176 MJ
This part of the question was well attempted by the majority of candidates. The most common andsuccessful approach involved using potential energy to calculate the work done. Other candidatesused the work formula to arrive at a solution. Candidates had to realise that the pump had to raisethe water 23.5 m + 4 m, and was independent of the redundant 15m and half-tank height.
Calculating and halving the volume of the tank to determine the correct mass of water to be liftedwas carried out effectively, using the data given.
Two good solutions are given below:

1999 HSC Engineering Science Enhanced Examination Report
12
Areas that caused difficulty were:
– Determining the correct height from the three dimensions given on the diagram.
– Failing to use a value for g in the equations.
– Converting the final answer from joules to mega joules
(ii) The tank is to be half-filled with water in 25 minutes. Determine the power required ofthe pumping system if it has an efficiency of 70%.
P =t
W
=176 10
1500
6×
= 117.3 kW
t = 25 min= 25 × 60 s= 1500 s
η =input
output
100
70=
input
117.3
∴ Input power =0.7
117.3= 167.6
Answer: Power required 167.6 kW
The majority of candidates were able to calculate the power required by transferring the previousanswer into the correct equation. Candidates who incorrectly answered part (a) and carried the datainto this part of the question, were not penalised in this part of the question.
A small number of candidates failed to convert time to seconds.
Calculating the efficiency was not handled as well, with many candidates confusing output withinput, or incorrectly multiplying the output by a factor of 1.3 (a misinterpretation of 70%efficiency). The conversion of units was generally well executed.
(b) Ball A is released from rest at a height of 12 metres from the ground. At the same time, asecond ball B is thrown vertically upwards from a height of 1 metre above the ground. Theballs pass one another at a height of 6 metres from the ground.
(i) Draw a free-body diagram representing the situation.

1999 HSC Engineering Science Enhanced Examination Report
13
Well answered. Most candidates were able to draw a clear free-body diagram that indicated correctunderstanding of the information given. A typical good response is given below:
(ii) Determine the velocity at which ball B is thrown upwards.
Time for A to travel 6 m
s = ut + 12
at2
6 = 0 + 12
10 × t2
∴t = 1.2 s
Velocity of B after 1.2 s and travelling 5 m
s = ut + 12
at2
5 = 1.2u + 12
(−10)(1.2)2
1.2u = 5 + 7.2
∴u =12 21 2
..
= 10.16 m/s
Answer: Velocity 10.2 m/s
This question was reasonably well done by candidates. The use of time to establish a relationshipbetween the two moving balls allowed candidates to select the appropriate equations to arrive at acorrect solution.

1999 HSC Engineering Science Enhanced Examination Report
14
Common errors included using a distance of 6 metres for ball B, using zero as a value for v(incorrectly assuming ball B comes to rest at a height of 6 metres) and not using a negative g valuefor ball B.
(b) A gi r l r uns al ong a whar f t o jum p ont o he r boat t hat has s t ar t e d to dr i f t . T he boat i s dr i f t i ngwi t h a v e l oc i t y of 1 m / s in t he s am e di r e c t i on t hat s he is r unni ng. T he boat has a m as s of 300 k g.
Determine the combined velocity of the girl and boat if the girl’s weight is 65 kg and hervelocity is 3.5 m/s when she jumps onto the boat.
m1u1 + m2u2 = (m1 + m2)v
(300 × 1) + (65 × 3.5) = 365v
∴ v =365
5.527 = 1.44 m/s
m1 = 300 kgu1 = 1 m/sm2 = 65 kgu2 = 3.5 m/sv = ?
Answer: Combined velocity 1.44 m/s
Very well answered by the majority of candidates. Candidates were able to demonstrate a soundunderstanding of conservation of momentum, using the correct formula to calculate the combinedvelocity.
Question 3
This question was a good test of process knowledge. Most candidates attempted this part of thequestion.
Responses varied from a poor understanding of manufacturing processes to a reasonable level ofunderstanding of correct processes.
(a) Four ceramic products are given in the table below. Complete the table by stating the mostsuitable forming process for each product.
Product Manufacturing process
Toilet bowl Answer: Slip cast
Glass bottle Answer: Blow moulding
Quality sheet glass Answer: Float process
Clay house-brick Answer: Extrusion
The majority of responses for the toilet bowl (slip casting process) were correct.
The majority of responses for the glass bottle (blow moulding or press and blow) were correct.
Many candidates had difficulty correctly identifying the most suitable process for forming qualitysheet glass (float process) and the clay house-brick (extrusion).
(b) (i) The following items are manufactured from various polymers.
- Plastic food wrap
- Bicycle brake block
- Inflatable inner tube

1999 HSC Engineering Science Enhanced Examination Report
15
Three polymeric structures are shown below. Write the name of the item below thediagram that best represents its polymeric structure.
Answers: Inflatable tube Plastic food wrap Bicycle brake block
This part was attempted by the majority of candidates with most responses showing a goodunderstanding of the polymeric structures, applications and uses. The plastic foodwrap wasthe best known response.
A number of candidates failed to relate the diagrams with the items provided, using labelssuch as thermosetting polymer or ebonite, indicating perhaps a failure to fully read thequestion. Many did not recognise the difference in the levels of cross-linking indicated in theremaining two structures.
(ii) Cross-linking is evident in one or more of the structures show above.
Name and describe a process used to achieve cross-linking.
Answer: Name Vulcanising
Description Addition of sulphur (up to 5%) to natural rubber then heated to asuitable temperature.
Most candidates who attempted this part of the question knew the correct name of the process(vulcanising), but quite often did not describe the process sufficiently well. They indicatedaddition of sulphur or metal oxides to rubber, but often failed to mention that heating andpressure of the mixture was required to vulcanise.
Some candidates confused the process with metal heat treatment processes, while othersanswered, incorrectly, ‘polymerisation’ as the name of the process. A typical good responsefollows:
Poor responses typically defined metal processes, as in the following example:

1999 HSC Engineering Science Enhanced Examination Report
16
(c) A cross-section through the wall of a structural component used in the marine and aircraftindustry is shown below.
(i) The panel is loaded as shown. State the surface area (A or B) that will require thegreater number of fibres.
Answer: B
Well answered by the majority of candidates showing a good understanding of simplysupported beam loadings. Some candidates did not indicate B (correct) or A (incorrect), butwrote other answers eg. ‘expanded foam’ (incorrect).
(ii) State ONE reason for the use of the foam.
Answer: Separation of the surfaces
Attempted by most candidates, but some had difficulty in expressing a valid reason for usingthe foam eg. insulation / rigidity, or were too general with their response eg. strength.
(iii) Name a suitable material for the expanded foam.
Answer: Polyurethane
Attempted by most candidates, with the majority able to correctly identify a suitable materialeg. polystyrene / polyurethane.
(iv) State the purpose of the fibre in the reinforced polymer.
Answer: Increase tensile strength
Attempted by most candidates with responses often being too general eg. ‘strength’ ratherthan ‘increased tensile strength’ / ‘improved impact strength’.
(v) Name a suitable material for the fibre in the reinforced polymer.
Answer: Glass fibre
Answered by the majority of candidates correctly, indicating a good knowledge of fibrereinforcing.
The most common responses were ‘glass’/ ‘carbon’. Others suitable include Kevlar, polyester,E-Glass, S-Glass.

1999 HSC Engineering Science Enhanced Examination Report
17
(d) Structural beams are often laminated, as shown below, rather than cut from solid timber.
State TWO structural advantages of using laminated beams for long spans in buildingstructures.
Advantage 1 Answer: Reduces the effects of defects in wood.
Advantage 2 Answer: Less shrinkage and improved stability.
Attempted by the majority of candidates, but many candidates failed to identifySTRUCTURAL advantages, answering in terms of physical, service or environmentaladvantages of laminated beams.
Candidates need to read questions carefully, identifying key indicators or words in thequestion.
The following example was a good response that received full marks:

1999 HSC Engineering Science Enhanced Examination Report
18
Question 4
(a) The phase diagram for a binary alloy system of metal A and metal B is given below. Fouralloy compositions are also indicated on the diagram.
(i) Match each of the microstructures shown below with the alloys 1, 2 ,3 or 4, shown inthe phase diagram. Assume that each alloy was cooled under equilibrium conditions.
Answer: Alloy 2 Alloy 4 Alloy 3 Alloy 1
This part was generally well answered.
An appropriate sequence for answering this part is:
1 Select the eutectic composition as Alloy 3.
2 Determine the alpha phase as the white grain because of the single phase Alloy 1
3 Alloy 2 must contain the white phase plus a eutectic matrix.
4 The remaining microstructure must be Alloy 4 by elimination or by determining thatthere is only one alloy with a beta phase
(ii) Determine the composition of the liquid at temperature T1 for a 20% A – 80% B alloyunder equilibrium conditions.
Answer: Composition of liquid 65% B, 35% A
This part was generally well answered.

1999 HSC Engineering Science Enhanced Examination Report
19
Many candidates forgot to include ‘B’ with their answer, ie. 65% B, 35% A.
In this case full marks were awarded if the candidate showed construction on the phasediagram. This is another indication why candidates must show all working and construction inexaminations.
(iii) Describe the changes to the microstructure of a 92% A – 8% B alloy as it cools fromtemperature T2 to T3, under equilibrium conditions. Draw and label the microstructureof the alloy at temperature T3.
Answer: B precipitates out of the solid solution (at T4) at the grain boundaries andwithin grains.
Average response to a typical question involving partial solid solubility, cooling through asolvus line.
Candidates often included steel phases in their answers, which is inappropriate.
Many candidates thought B or A or alpha + beta eutectic is precipitated, when the diagramclearly shows beta precipitates from alpha in the solid state, to produce a structure of alpha +beta phases. Some excellent responses were given:
Other responses missed the concept of cooling through the solvus line:

1999 HSC Engineering Science Enhanced Examination Report
20
(b) A portion of the iron-carbon phase diagram is given below. A cooling curve for a particularalloy is also given.
(i) Determine the composition of the alloy represented by the cooling curve shown above.
Answer: Composition 1.5 % carbon
This part was well answered with full marks allocated for answers between the range of 1.4%and 1.6% carbon without showing construction on the phase diagram.
Outside this tolerance, if candidates showed correct construction technique they were awardedfull marks.
Correct construction involved:
projecting horizontal lines from arrest points on the cooling curve to intersect phaseboundaries on the phase diagram, then a vertical line is drawn through these intersectionpoints and the composition is determined from the composition axis of the phase diagram.
(ii) Alloy 1 (0.4% carbon in iron) and alloy 2 (2.5% carbon in iron) are cooled, underequilibrium conditions, to room temperature. Draw and label the microstructure ofeach alloy.

1999 HSC Engineering Science Enhanced Examination Report
21
In answering this question, many candidates showed poor skills in sketching microstructures.
Two distinct phases had to be shown, with pearlite as a ‘striped’ grain and ferrite andcementite as white grains.
Drawing two similar microstructures with different grains shaded, incurred a penalty.
No elongated grains were accepted because the structures result from equilibrium cooling.
When a question requires candidates to ‘draw and label’, marks are allocated for the sketchand the labeling.
Slow cooling of the 2.5% carbon cast iron will form massive cementite in a matrix of pearlite.If there is not sufficient graphitising elements present (eg > 1.5% silicon), as in this case,graphite will not form.
(iii) Alloy 1 is relatively soft while alloy 2 is relatively hard. State ONE reason for thisdifference in mechanical properties.
Answer: Alloy 1 has more ferrite (soft and ductile)
A good response with candidates realising that a metal with more ferrite, which is soft andductile, will be softer than a metal with a high proportion of hard, brittle cementite.
In the iron–carbon phase diagram given, as carbon increases so the presence of cementiteincreases, until at 6.67% C, the structure becomes 100% cementite. It follows that as thecarbon content increases so does the amount of cementite; therefore less ferrite increasedhardness, decreased strength. The following modification of a ‘popular summary’ ofmechanical properties and structure indicates the relationship.
In industrial terms, the presence of graphitising impurities such as silicon (most powerfulelement), manganese, sulphur and phosphorus coupled with faster than equilibrium cooling

1999 HSC Engineering Science Enhanced Examination Report
22
rates causes the metastable cementite Fe3C to decompose to Fe and C (ferrite and graphite),producing a grey cast iron. In practical terms the main use for white cast iron is for theproduction of malleable iron products. White cast iron derives its name from the appearanceof its fracture surface (white). It is hard and brittle due to the presence of massive amounts ofcementite.
In this question, candidates were asked to relate the change in structure to the change inproperties, and as the phase diagram referred to was the iron-carbon (iron-iron carbide) thechanges to properties should have been in terms of the presence of ferrite and cementite, thetwo phases indicated on the diagram for the composition specified.
(iv) Determine which alloy, 1 or 2, has the lower casting temperature.
Answer: Alloy 2
Very well answered with candidates correctly reading melting temperatures off the liquidus phaseboundary on the phase diagram.

1999 HSC Engineering Science Enhanced Examination Report
23
Question 5
All of question 5 was generally poorly answered with 5(a) having better quality responses than 5(b).
(a) The top view and incomplete sectional front view of a cone inclined to the horizontal planeare shown below in third-angle projection.
The cone is cut by a vertical section plane as shown.
Complete the sectional front view.
The most popular solution is given below:
Answer:
Despite being the best answered of the two, in 5(a) candidates seemed to have a poor perception ofwhere the apex was located as a result of the cone being tilted. This led to incorrect insertion ofgenerators although many used what could be described as a random placement of generators.Despite this, in most cases, while the curve of intersection was located, many were inaccuratelyjoined.

1999 HSC Engineering Science Enhanced Examination Report
24
Projection of intersection points from top to front view also caused many problems for candidatesas they were frequently inaccurate. Location of the extremity points was generally well donealthough individual points were frequently not clearly indicated. Moreover, the extreme right-handcorner of the front view was frequently not omitted.
A significant number of candidates appeared to have little idea of conic sections generated fromcones, which are cut by planes of intersection.
Many candidates chose not to attempt this question despite it being easier than it first appeared.
(b) The top view and front view of a truncated square prism are given below in third-angleprojection.
Project a right-side view of the prism so that surface A is seen as the true shape. Show visibleand hidden outline.
This question was very poorly done with very few candidates achieving full marks.
Most candidates simply projected a right-side view with no true shape of ‘Surface A’ given. Ofthese solutions, many were not able to follow the solution through and indicate the sloping ‘SurfaceA’. There seemed to be a widespread lack of understanding of the basic principles of orthogonalprojection.
Other candidates projected up and out to the right perpendicular to ‘Surface A’ which provided thetrue shape without the complete auxiliary view. Very few candidates projected an accurate andcomplete auxiliary view. Rotating (tilting) the solid to obtain the ‘right side view’, which showed‘Surface A’ as true shape, was attempted by a small number of candidates.
Linework and accuracy generally tended to be of poor quality with the most common errors beinginaccurate projection, non-parallel projection lines, incorrect angles and inaccurate stepping off ofdistances. Also evident was a lack of knowledge of AS1100 in relation to line standards.
Many candidates displayed an incorrect perception of the difference between an invisible andhidden outline and the incorrect sectioning of true shapes. Hidden outline refers to the externaledges of a solid. Section planes that make imaginary cuts through solids to produce sectional viewshave the ‘cut’ surfaces shown with sectioning lines. The solid in this question has no section planeas such. It is a modified square prism, thus all projections of ‘Surface A’ should be shown just asany other face of the solid, without sectioning.

1999 HSC Engineering Science Enhanced Examination Report
25
An example is given below of a solution projected from the ‘Surface A’ to produce an auxiliaryview with the true shape of ‘Surface A’ shown. This is followed by two other solutions.

1999 HSC Engineering Science Enhanced Examination Report
26

1999 HSC Engineering Science Enhanced Examination Report
27

1999 HSC Engineering Science Enhanced Examination Report
28
Question 6
(a) The top view and front view of a transition piece are shown below in third-angle projection.Complete a pattern of the surface abcd 21. The starting position for the seam 1a is given.
Answer:
An intermediate point between ‘c’ and ‘d’ would have produced a more accurate curve betweenthese two points. A large number of candidates showed a straight line between ‘c’ and ‘d’ in theirsolution.
Note that ‘b1’ can be found by recognising that the angle ‘ab’ is a right angle or by using a TLdiagram.
Many candidates had problems recognising existing true lengths from front and top views.

1999 HSC Engineering Science Enhanced Examination Report
29
A considerable number of candidates used the given line for starting ‘a1’ instead of the true length.
‘a1’ and ‘12’ were frequently transferred incorrectly.
A clear distinction between outlines, fold lines and construction lines needs to be evident.
Many candidates had problems visualising the shape. A line on the development was oftenincorrectly shown between ‘a’ and ‘2’.
(b) The top view and incomplete front view of a cylinder intersecting with a square prism aregiven below in third-angle projection.
Complete the front view, showing only visible outline.
Answer:
The majority of candidates recognised that the lines of intersection were curved.
Plotting of the two centre points could have been produced more accurately by extending thevertical centre line in the top view, before projecting horizontally.
The preferred, more accurate solution for the lower left hand point, was to draw the base edge, inthe top view, until it contacted the cylinder.
Use of vertical section planes was not clearly understood by a majority of candidates.
Many candidates drew curves without plotting points, this solution scored zero marks.

1999 HSC Engineering Science Enhanced Examination Report
30
Section II
Question 7
The design of modern-day bicycles has developed over a short period of time, from a Tourer toBMX to a Mountain bike. (Please see exam paper for illustrations.)
(a) Complete the table below by filling in a statement next to each point.
Tourer BMX Mountain
Purpose of thedesign
• ‘on road’ design
• cheap transportto work
• for racing, jumpsand generalrugged ‘off road’use
• built for youngerage groups
Answer:
• For hilly/all terrain
• Hybrid- cross purposes
• Built for all ages
Features ofspeedmechanismdesign
• large wheels
• 3 speed hub,single cable
• small wheels
• had little or nodesign for speed
Answer:
• Medium, large wheels
• Large range of gearratios
Features offrame andcomponents
Answer:
• Mild/alloy/lowC./ steel frame
• Brazed lugconstruction
• Narrow tyres
• aluminium alloyframe
• small ruggedframe
• high-strengthwheels
• gussetconstruction forframe
• carbon fibre, alloy steeland aluminium
• large strong frame
• light weight
• hydraulic brakes andsuspension
This part of the question was well answered by candidates. The sample responses offered by theexaminers prompted candidates to model their responses along similar themes. As the samples werebasic ideas such as ‘cheap transport to work’ it was both anticipated and acceptable that candidateswould give answers of a similar type. Most candidates followed these examples when describingthe purpose of the mountain bike and correct answers referred to the purpose as an 'all terrain bike','built for all age groups', 'recreational use' or made a parallel statement from the given description ofthe tourer, 'cheap transport', to describe its purpose.
Candidates were asked to make six statements to answer this part of the question. Many candidateschose to give more than six and, in many instances, the extra answer contributed nothing of value tothe marks awarded by the examiners. While some of these extra answers were irrelevant, otherswere incorrect observations or, in some instances, contradicted correct answers that were also statedby the candidate. Candidates are reminded to respond to the question asked in the format required inorder to gain maximum marks.

1999 HSC Engineering Science Enhanced Examination Report
31
(b) Social values, events and materials development have played on important part in theevolution of bicycle design.
Write the number of each statement in the correct box on the time line.
1. Mass production techniques reduce costs, leading to greater demand for the bicycle.
2. Society sees the importance of fitness and a reduction in pollution.
3. Rover Safety with pneumatic tyres provides a safer, more comfortable ride.
4. The bicycle increased in popularity at this stage of its development, due to its use ascheap transport to work.
5. The Velocipede had a sprung frame, 2 cart wheels and a simple string-operated brake.
This question examined candidates’ knowledge of the parallel development of technology andsocietal influences. The format included five dates and five historical statements and candidates hadto place the five statements in correct time-line order.
Most candidates placed the Velocipede (Statements 5) with the first (left-hand) box and related it tothe 1861 date. Equally, most placed Statement 2 about society seeing the importance of fitness andreduction in pollution last, matching the 1975 date. Fewer candidates placed the development of theRover Safety bicycle with the 1885 date. Many candidates found difficulty in correctly placingStatement 1 with the 1910 date and Statement 4 with 1930. The correct sequence of statements is 5,3, 1, 4, 2.
(c) A variety of materials have been used as the friction components in the development of brakesystems, as shown in the diagrams below. Give TWO reasons for the use of each material.
.
Answer:
Reason Ease of production. Easily replaced. Adequate friction for slow vehicle.
1. Material common at the time / vulcanised rubber not available.
2. Replaceable shoe softer than metal type.

1999 HSC Engineering Science Enhanced Examination Report
32
Answer:
Reason
1. Vulcanised rubber now available. Suitable for light vehicles (bikes).
2. Better / good frictional properties. Compatible material with bike rims.
Answer:
Reason
1. Best combination of wear and frictional properties.
2. Dissipates heat energy well. Cermets are strong in compression.
When given a full line on which to supply a reason, candidates are encouraged to answer in asentence that incorporates the reason. A sentence allows the reason to be placed in context! This isnot always possible with single word answers. Words such as 'durable' or 'cheap' don’t reallyprovide a reason for the use of the material. Good responses included reasons describing the serviceproperties of each material or they made meaningful mention of the availability of the materialwithin the era in which the braking system was built. Poorer responses included references to thebraking system rather than to the material as required.
A correct response to this question should match the service properties to the action (and age) ofeach braking mechanism pictured in the question. Basic knowledge about mechanisms should becentral to any study of brakes. This part of the question was not answered well.
Question 8
(a) A bicycle and rider start from rest and roll down a slope of 1 : 2. The bicycle and rider have acombined mass of 105 kg. After a period of 12 seconds the bicycle and rider reach amaximum velocity of 30 km/h.

1999 HSC Engineering Science Enhanced Examination Report
33
(i) Determine the acceleration of the rider down the slope.
u = 0v = 30 km/h
= 8.33 m/s
v = u + at8.33 = 0 + 12aa = 0.69 m/s2
Answer: Acceleration 0.69 m/s2
Most candidates answered this part of the question correctly. Some candidates introducedirrelevant data and some used more complex equations than required. The most commonerrors occurred when candidates failed to convert km/h to m/s as this did not allow them tocalculate the time in seconds.
To assist in the analysis of this and other mechanics questions candidates should:
− underline key points in the question;
− list the data relevant to each solution;
− convert to common units;
− write appropriate formulae before substituting data.
These simple points would help many candidates produce solutions which better answer thequestion and better inform the markers.
(ii) Determine the resistance to motion when the rider is travelling at 30 km/h.
F = mgsinJ = R ∴ resistance to motion = mgsinJ
= 105 × 10 × sin26.56= 469.6 N
Answer: 469.6 N
This question was often incorrectly analysed with the majority of candidates not realising thatresistance to motion was equal to the force down the slope. Many candidates incorrectly usedF = ma and usually substituted in the mass from the previous answer. Some candidates incorrectlyidentified that the force down the slope was equal to N where the normal force was mgcos.
(iii) On the axes provided below, plot a velocity-time graph that represents the rider'sjourney for the first 20 seconds.
This question required candidates to plot velocity up to 12 seconds and then between 12 & 20seconds. Some candidates failed to plot a change in the the graph at 12 seconds. A commonresponse is shown below.
Some candidates failed to include the magnitude and units of the velocity on the axis of theirgraph while others failed to convert the velocities to m/s.
Candidates should be advised to draw and accurately label any graphs.
v 8.3 m/s at 12 sec
v 8.3 m/s at 20 sec
=
=

1999 HSC Engineering Science Enhanced Examination Report
34
(iv) On the axes provided below, sketch the displacement-time graph for the first 20seconds.
s = ut + _at 2
= 0 + _ _ 0.69 _ 122
= 49.7 m
s20sec = s0to12sec + s12to20sec
= 49.7 + 66.64
= 116.6
This question was poorly attempted as many candidates did not analyse the question correctly. Thisquestion required the candidates to SKETCH the graph and not to accurately plot data. Manycandidates determined displacement at 12 seconds and 20 seconds and plotted a proportionalrelationship between time and displacement for the whole period, while, in fact, there was animportant change at 12 seconds. Many candidates failed to correctly identify a curve from 0–12seconds, and straight line from 12–20 seconds, as the relationships in this answer.
(b) (i) For the same rider, now travelling on a level road at 25 km/h, the resistance to motionis 275 N. The rider must exert an average force of 350 N on the pedal to maintain thisspeed.
Determine the mechanical advantage of the system.
MA =E
L
=350
275
= 0.7857
Answer: Mechanical advantage 0.7857
This question was generally well answered. The most common mistake was reversing the load(output) and effort (input). Some candidates incorrectly identified effort as the total mass ofrider and bike (mg) rather than the effort stated in the question.
(ii) While travelling at a speed of 25 km/h the rider suddenly increases the average pedalforce to 500 N. The tractive force at the rear wheel increases in proportion to theincrease in pedal force.
Determine the acceleration of the bicycle and rider.
500 − 350 = 150 N
150 × 0.7857 = 117.85 N
117.85 = ma
117.85 = 105a
a = 1.12 m/s2
Answer: Acceleration 1.12 m/s2

1999 HSC Engineering Science Enhanced Examination Report
35
Only a few candidates answered this question correctly. Many candidates failed to usemechanical advantage when calculating the proportional increase in the load while othersincorrectly attempted to solve this question using only F = ma.
(c) For another set of conditions, the rider's velocity is 30 km/h. The brakes are then applied for6 seconds, reducing the velocity to 5 km/h. Determine the energy absorbed by the brakes.Assume that the energy lost is due to the application of the brakes only.
30 km/h = 8.3 m/s5 km/h = 1.39 m/s
KE = 12
m(u2 − v2)
= 12
× 105(8.332 − 1.392)
= 12
× 105 × 67.5
= 3541.6 J
or12
mu2 − 12
mv2
=12
× 105 × 8.332 − 12
× 105 × 1.392
= 3541.6 J
Answer: Energy absorbed 3541.6 J
The majority of candidates knew to apply the kinetic energy equation in this question to reach asolution. However, many failed to understand that the difference in kinetic energy at the twovelocities was the correct solution to the problem. Some candidates correctly transferred the kineticenergy equation from the data sheet and then failed to square the velocities in their solution.Candidates incorrectly attempted to simplify the problem by finding the difference between thevelocities and then using this figure in a kinetic energy equation.
Some candidates attempted to solve this question by finding distances and then acceleration andfinally applying the work equation. A small percentage of candidates used impulse and powerequations to derive the change in energy. Correct solutions were possible using both these methods.
Question 9
(a) Details of a handle used in a bicycle brake system are shown in the diagram.
(i) Determine the tension T in the cable if a load of 80 N is applied to the handle as shownin the diagram.
ΣMc = 0 = (T × 20) + (27.36 × 5) − (75.18 × 150)
T = 543.3 N
Answer: Tension T Graphically 500 N or Analytically 543.3 N

1999 HSC Engineering Science Enhanced Examination Report
36
This part of the question was generally well done by most candidates. However, it was surprisinghow many candidates still prefer to attempt the more difficult analytical solution. Of theseanalytical solutions, many omitted the horizontal component of the 80 N force in their momentsequation. Teachers are again reminded that measured distances from the diagrams are acceptableand often reduce a complicated analytical solution to a simple equation,
eg (T × 12) = (80 × 81)
(ii) Determine the resultant shear force acting on Pin C
Using cosine rule
a2 = 802 + 5432 − 2 × 80 × 543 × cos110˚
a = 575.3 N
Answer: Shear force 530 or 590 N
Candidates with incorrect answers for (i) were not penalised for using this answer to solve (ii).
Again the graphical solution was simpler than the analytical as the resultant is measured from thesame force diagram as the tension force T found in part (i). Some candidates had difficulty inunderstanding the ‘resultant shear force’ concept and tried to calculate a stress even though no pinsize was given in the question.
(b) Details of a centre-pull bicycle brake system, and a bicycle wheel are given in the diagrams.The wheel is held stationary by the brake system while a 250 N m torque is applied to thewheel. The coefficient of friction between the brake block and the wheel rim is 0.75.
(i) Determine the tangential friction force Q required to prevent the rotation of the wheel.
M = Fa × d
250 = FQ × 0.375
FQ = 666.6
Answer: Force Q 666.6 N
Most candidates scored well in this part of the question although some were unable to relatethe wheel on the right of the illustration to this part of the question. Of these many usedF = µN incorrectly. In this type of question it would be useful if teachers were able to spendtime in helping candidates understand and distinguish between ‘tangential friction force’ and‘normal’. This conceptual error cost many candidates marks.

1999 HSC Engineering Science Enhanced Examination Report
37
(ii) For a different set of conditions the tangential friction force is 800 N. Determine thetension T in the brake cable required to produce the 800 N force.
Fl = 800 ie. 400 on each side
N =µFl =
75.0
400= 533 N
N × d1 = TR × d2
533 × 34.64 = TR × 68.94
TR = 267.85
267 8550.
sin= TT
sin 80
TT = 344.34 N
Answer: Tension T 344.34 N
Candidates found this the most difficult part of the question and as a result it was answeredvery poorly. Candidates incorrectly used the 800 N force as the normal not the tangentialforce. Many failed to halve the normal (half force in each brake pad). Again the graphicalsolution is far easier than the analytical solution with this type of problem.
Candidates should be encouraged to:
− consider a graphical solution or at least sketch a diagram of the problem;
− look for a solution using measured distances obtainable from the diagram;
− attempt a complex analytical solution only if the graphical solution is not possible.
(iii) For a different set of conditions, the tension in the brake cable is 1·2 kN. The cable hasa gauge length of 300 mm and a diameter of 1·5 mm. The steel used in the cable has amodulus of elasticity of 210 MPA.
Determine the extension of the cable.
E = εσ
E = A
FL
E
e = EA
FL
= 1.2 10
1.54
3
2
× ×× × × ×−
0 3
10 210 106 6
.π
F = 1.2 × 10³
L = 0.3
A = πd2
4=
π14
2.5 10 6× −
E = 210 × 106

1999 HSC Engineering Science Enhanced Examination Report
38
= 0.36 10
1.767 210
3××
= 0.970 m
= 970 mm
Answer: Extension 970 mm
Most candidates scored very well in this part of the question. It was pleasing to see that mostcandidates understood the relationship between Young’s modulus, stress and strain.
Of those candidates who lost marks, a number were unable to derive E = FL/eA from theinformation on the formula sheet. Candidates often used incompatible units making it moredifficult for examiners to identify and award marks. The data in the question was such that theanswer was unrealistic. Only elastomers can extend three times their original length withoutfailure.
Question 10
(a) Lugs are used in the joining of a bicycle frame.
(i) 1 Name a method used to join the lug to the frame
Answer: Brazing / Hard Soldering.
Less than half of the candidates understood that lugs were brazed to the frame. Manycandidates incorrectly named a welding process such as MIG, TIG, oxy and resistancewelding.
2 List TWO reasons for the use of this lug joining method.
Answer: (I) Increased joint surface area.
(II) Minimal grain change in the heat affected area.
Many candidates displayed a poor understanding of the purpose of the lug. A lug is aphysical ‘connection’ between two frame parts used to increase the joint surface area.Brazing is used when a ductile joint is required that has both resistance to fatigue andgood strength properties. This occurs as the phase of the brazing rod cold-works withflexing and continues to increase the strength of the joint. As welding occurs at a muchhigher temperature, melting the parent metal and recrystalising the structure in the heataffected zone, it is not suitable for this application.
(ii) The following steel tube has been cold drawn to form butted ends by using acombination of cold-drawing processes.
1 What is the main advantage of butting the tube ends?
Answer: Increased bend or shear strength close to join/ Reduced overallweight.

1999 HSC Engineering Science Enhanced Examination Report
39
2 If 0.3%C seamless steel tube is used to form the butted tube, state a change inmechanical properties caused by this process.
Answer: Increased strength, stiffness / work hardening.
Around half of the candidates were unable to give satisfactory responses to these parts.General, unacceptable terms such as ‘strong’ and ‘hard’ were common. A qualifyingterm such as ‘increased’ or ‘greater’ should preface the mechanical or physical propertystated.
3 Draw the grain structure of the tube wall at the butted section.
Answer:
A number of candidates did not recognise that the grainflow occurs at the lower section onlywhere the deformation is greatest. Many incorrectly showed equiaxed grains indicating that ahot-working process had been used or the material had been recrystalised.
(b) The cowling of a lawn mower is produced by injection-moulding a 10% glass-filled nyloncomposite.
(i) If injection-moulding is used within glass fibre and a granulated form of nylon, giveTWO reasons for the use of injection moulding.
Answer: 1. High dimensional accuracy
2. Automated process / mass production
The majority of candidates gave at least one correct response but only 70% gave a secondcorrect response. Many candidates incorrectly stated that injection-moulding is a process usedto mix the nylon and glass fibre together.
(ii) At what stage is the glass fibre added to the composite in the manufacture of thecowling?
Answer: Glass fibre is mixed with the nylon in its liquid state.
Many candidates recognised that the nylon must be in a molten state to enable the glass fibreto be mixed. The majority, however, incorrectly believed that this took place in the heatingchamber around the torpedo within the injection-moulding machine.
(iii) Draw and label a macrostructure of 10% glass-filled nylon.

1999 HSC Engineering Science Enhanced Examination Report
40
Answer:
This section was generally well answered. Common errors occurred with candidates statingthat the glass fibres ‘crosslinked’ the nylon or that polymerisation occurred between the nylonchains. Candidates need to understand that the glass fibre is simply a filler that doesn’tchemically combine with the polymer.
(c) Brake drums are often made from grey cast iron.
(i) List THREE reasons for the use of cast iron in the brake drum.
Answer: 1 Compatibility
2 Suitable coefficient of friction
3 Good heat resistance
This was well answered by the majority of candidates who understood the need for heat to betaken away from the friction surface in order for the brakes to function efficiently.
(ii) Name the most appropriate type of casting used to make the brake drums.
Answer: Shell moulding / Sand casting
Around seventy percent of the candidates correctly selected sand casting or shell moulding.Other candidates often selected a casting process that was inappropriate such as die-castingand investment casting.
Question 11
A lawn mower assembly bolt is manufactured from cold-drawn 0.2% carbon steel. The head andthread are formed by cold-working processes.
(a) Both the cold-drawn stock and the finished bolt are to be tested to examine properties anddetect faults. Name and describe a different non-destructive test that could be used for eachsituation.
Answer: (i) Cold-drawn stock
Name of test Vicker’s Diamond Pyramid Test
Description of test A small diamond pyramid indentor is forced into thestock surface by a known load and the indentationmeasured to indicate hardness.
(ii) Finished bolt
Name of test Visual Inspection
Description of test Various parts of the bolt are examined using gaugesto satisfy prescribed tolerances (eg. head, shank andthread sizes).

1999 HSC Engineering Science Enhanced Examination Report
41
Many responses demonstrated a general knowledge of non-destructive testing but omitted specificdetails. Candidates are encouraged to answer the question fully where sufficient space is providedin the paper. Candidates should consider revising processes in a series of important points eachpertaining to the relevant stage in the testing process.
eg Dye Penetrant Test:
− apply fluorescent dye;
− wipe off excess dye;
− examine surface under ultra-violet light.
Many candidates did not distinguish between the stock and the finished bolt when namingappropriate tests for each. Some candidates answered in terms of the purpose of the test rather thana description. Some candidates also included destructive tests in their response. Candidates areencouraged to underline key words and phrases in the question to focus their attention.
A typical good response is given below:
(b) State TWO advantages that cold rolling of the thread has over machining of the thread.
Answer: Advantage 1 Increased strength and hardness.
Advantage 2 Increased production rates and reduced metal waste.
Candidates are encouraged to focus on the advantages in the properties of the finished bolt or in themanufacturing process. Suitable properties may be mechanical, such as improved toughness. Theymay also be physical, such as ‘grainflow follows thread profile’ or ‘reduced planes of weakness atthread’. Service properties, such as ‘improved wear resistance due to work-hardening at thread’ or‘increased tensile strength’, are also acceptable. Candidates are reminded that answers need to relateto engineering principles and that sketches can be used to explain written answers, as shown in thegood response below.
(c) Two samples of cold-drawn 0.2% carbon steel stock are to be prepared for microscopicexamination. One sample was process annealed. The second sample was normalised.
(i) With reference to the partial iron-carbon diagram, describe in detail the procedureused for each heat treatment process.

1999 HSC Engineering Science Enhanced Examination Report
42
Answer: 1 Process annealing
The 0.2% carbon steel is heated to below the lower criticaltemperature, soaked to allow ferrite to recrystallise and cooled toroom temperature.
2 Normalising
Heat the steel above the upper critical temperature, soak until allaustenite and then cool to room temperature in still air.
Many candidates did not clearly identify the correct heating temperature for process annealingand frequently omitted the soaking stage. Both these points are very important to the successof the process. Many other candidates described full annealing but did not show anunderstanding of the differences between this and process annealing. In some cases theresponse described the purpose of the treatment or its affect on grain structure but did notdescribe the actual process. It is essential that candidates concentrate their answer on thequestion being asked.
Some candidates were able to show a deeper understanding of the topic by describingcorrectly both the process and its effect on grain structure.
Candidates had a good general knowledge of normalising as a heat treatment process butoften did not provide enough specific detail about the heating temperatures required and thecooling rate. As with the process annealing, the soak stage was often overlooked. Soaking isnecessary to allow the whole mass to heat through and obtain a uniform temperature. Whenrevising, candidates are encouraged to summarise processes in stages using key points:
− heating details;
− soaking time;
− cooling rate.

1999 HSC Engineering Science Enhanced Examination Report
43
(ii) Draw and label the microstructure resulting from the normalising process.
This question showed an improvement from previous years in the quality of drawingsand labels, with most candidates giving more carefully drawn responses. Futurecandidates are reminded that carelessly drawn microstructures that appear to containvoids between the grains are not acceptable. Labels and leaders pointing to the relevantparts of the microstructure both need to be clear. Candidates are also reminded that theydo not need to fill in the entire space, if time is short, as it is far better to draw carefullyin part of the space so that the entire structure is adequately represented. A good studentresponse is given below:
(iii) Normalising and process annealing result in different mechanical properties. Statewhich heat treatment process results in:
1 higher strength
2 higher hardness.
Answer: 1 Normalising
2 Normalising
This question was not well answered as the properties associated with process annealing werenot well known to candidates. When revising, candidates are encouraged to summariseprocesses in table form as shown below.
Name ofProcess
Description ofProcess
Purpose ResultingStructure
Properties

1999 HSC Engineering Science Enhanced Examination Report
44
Question 12
Shape and size details of a brake-cable tensioning assembly for a bicycle are given below in theexploded pictorial drawing.
The head of the adjustment bolt is 5 mm from the caliper arm.
The centre cable of the Bowden cable should extend 1 mm beyond the end of the adjustment bolt.
The position of the left end of the adjustment bolt has been given.
Complete, using a scale of 5 : 1, a half-sectioned front view of the assembled parts when viewed inthe direction of the arrow.
This question examines aspects and disciplines in Engineering Drawing including: interpreting andreading pictorial representation of engineered components; assembly drawing; detail drawing;sectioning of components; and application of AS 1100 drawing standards.
The mean was slightly below half marks for this question, with very few candidates receiving fullmarks or zero.
The marking scale is designed to objectively and consistently recognise and reward all correctresponses made by candidates. In designing the marking scale, the correct solution is broken into anumber of components, or features, and these are then examined for: representation of the shapeconcept; size; relationship with other features; and representation according to the AS1100 drawingstandards.
As an example, the drill hole of 6 mm diameter and 4.5 mm length, in the question, would bebroken down into the following four responses for marking:
Drill hole outline, shape of the end of the drill hole, diameter 6 mm, length 4.5 mm, 60º angle forthe drill end.
All components are treated in this manner by allocating a tick to each aspect of the component. Thissystem follows every step which is taken by the student to complete the response to the question.
Once the ticks for each component are totalled, a conversion scale is used to convert the number ofticks obtained to a final mark. For example, a candidate who totals 34 correct responses would score

1999 HSC Engineering Science Enhanced Examination Report
45
a final mark of 9.5 for the question this year. The conversion process allows candidates to achievefull marks and marks in respect to the correctness of the solution. The marking detail is includedbelow.
Answer:

1999 HSC Engineering Science Enhanced Examination Report
46
The candidates' responses to this question indicated a reasonable knowledge of general assemblydrawing; however some aspects of the question were poorly answered. Many candidates failed todisplay an understanding of the practical manufacture, assembly and use of machined parts. Thiswas made evident by: failure to assemble the nut against the caliper; poor understanding of thedrilling and cutting of an external thread; and not sectioning the adjusting bolt as one complete solidpiece of metal. This could be redressed by examining a wide range of components/parts of theintegrated topic area, discussing their manufacture, measuring and sketching views, sectioning andassembly.
The concept of half-sectioning was poorly understood. Many candidates included full sections, andoften included hidden detail. This meant that features such as the parallel knurl were not shown, andtherefore marks could not be awarded.
Candidates' understanding of the drawing standards was generally poor.
Representation of an external thread. Appropriate thick and thin lines are required. In this case thethread on the adjusting bolt is external, thus the minor diameter of the thread is thin, because itshows the depth of thread. The major diameter is thick as it represents the outside of the bolt.
Representation of the drill end. This should have an included angle of 120º to represent the surfaceleft by the drill in a blind hole. The drawing below also shows the Ø2.5 mm hole meeting the Ø6mm hole and the correct location of the Ø5 swagged end when fully assembled.
Representation of commonly used machine features, eg. straight knurling.
Detail of knurl
Sectioned surfaces. Some candidates still include too many lines, too close together, wastingvaluable examination time. Many also failed to hatch the threaded area. Section lines are thin, darklines.

1999 HSC Engineering Science Enhanced Examination Report
47
Detail of sectioning
Candidates also generally failed to interpret correctly and therefore failed to represent thecontinuing Bowden cable through the adjusting bolt. Many candidates were also unable to representcorrectly the end of the cable with a standard break.
Drawing of end of cable
Areas where markers felt there has been a pleasing improvement in candidate responses include:overall shape and sizes of most features, including lengths and diameters; interpretation of thepictorial drawing; drawing the object to the stated Scale of 5:1; and the higher accuracy of thedrawings.
Advice to candidates for this type of question includes: take care with the size of the components sothat they are drawn accurately; learn AS1100 drawing standards for things like threads, knurls, flats,nuts, bolts and hatching; do not erase any construction lines; use two different clutch pencils fordrawing, eg. 0.25 and 0.5 so that variation in line thickness can be easily distinguished. For somecandidates 0.25 and 0.7 may be more suitable for their drawing 'hand'; and separate the examinationbooklets (Sections I and II) to make the drawing easier.
From a teaching point of view, candidates should be given a practical 'hands-on' approach so thatthey may better understand drilling, tapping of a hole and then cutting the piece in half to view theappearance before sketching or drawing the component. The candidates need to dismantle thecomponents of a bike, lawn mower and braking systems. It has been repeated a number of times inthis report that candidates need to examine as many real components of the topic areas as possible.It is obvious by candidates' responses through the paper that many candidates have not examined ordiscussed the components as would be expected.
The candidates also need to be familiar with the names and meaning of machining andmanufacturing such as drilling, tapping, parting off, knurling and swagging.

1999 HSC Engineering Science Enhanced Examination Report
48
3 Unit (Additional)
Section I
Question 1
(a) A small steel box girder is to be used as a footbridge, as shown in the diagram below. The girderis simply supported at A and C. The cross-section of the girder is also given. The steel used in thebox girder has a density of 7800 kg/m3. The bridge has a uniformly distributed load of 5 kN/mapplied.
(i) Determine the weight of the box girder
C.S.A. = 2 × 1000 × 25 + 2 × 400 × 10
= 58 000 mm2
Total V = 58 000 × 10 000 ÷ 10 9
= 0.58 m3
Mass = 0.58 × 7 800 = 4 524 kg
Weight = 5 524 × 9.8
Answer: Weight 44335 N
The first step in solving this problem is to find the volume of the composite shape. Weight canthen be found by multiplying the volume by density and g = 9.8 ms-2.. Candidates had difficulty incalculating the cross-sectional area. Mistakes converting mm to metres were common as well asthe incorrect length of the web as 450 rather than 400 mm. Another common error was failing tomultiply the cross-sectional area by the length of the beam (10 m) to find the volume. Generallythe conversion to weight force was done well.
Points that may prove useful in solving this type of question include:
– shading each part of the composite shape as they are included in the calculation;
– cross-sectional area must always be multiplied by a length to calculate volume;
– candidates should convert the answer to the units required in the answer space, in this case,Newtons (N).

1999 HSC Engineering Science Enhanced Examination Report
49
(ii) Determine the reactions at A and C
TotalAppliedLoad
= 5 × 10
= 50 kN
+ ΣMA = 0
0 = -94.335 × 5 + 8Rc
Rc = 58.96
+↑ΣV = 0
0 = RA − 94.335 + 58.96
RA = 35.37
Answer: Reaction at A 35.37 kN
Reaction at C 58.96 kN
The total load on the beam is equal to the combination of the applied load and self weight. For amoment calculation the self weight can be assumed to act at the centre of the 10 metre beam.Candidates then had to apportion the load to the supports.
This was a straight forward question but many candidates made elementary mistakes, such as notincluding the self weight of the girder and incorrectly summing moments by confusing distancesand signs.
In reaction calculations it is important to:
– draw a free body diagram to identify the forces acting at their correct position;
– keep consistent units throughout the calculation.
(iii) Draw the bending moment diagram for the bridge. Label the values at points B and C.
Answer:
Load / metre
= 10
335.94
= 9.4335 kN/m

1999 HSC Engineering Science Enhanced Examination Report
50
Values of the bending moments at points B and C can be found by taking sections and calculatingthe value at that section. For a given sign convention for bending moment, it must beremembered that the signs will be opposite for a left and right section. Any free end on a beamwill always have a bending moment equal to zero. Most candidates recognised that the positionof maximum bending moment (which was not required on this occasion) occurs where the shearforce is equal to zero. Few candidates, however, calculated the correct value of the bendingmoments at B and C and therefore failed to draw the correct curve for the diagram.
The following are useful points to consider when drawing a bending moment diagram.
– When calculating the bending moments along a beam, choose to work with a left or rightsection and not a combination.
– Check to see if there is a self weight that must be included.
– A uniformly distributed load can be taken as acting at the mid-point of a beam or sectionfor calculations.
– A uniformly distributed load will result in a curved bending moment shape
– When isolating a section for investigation, include all forces acting at their correct distancesand be sure to use a consistent sign direction.
(iv) The maximum bending stress (225 mm from the neutral axis) is limited to 150 MPa.Determine the maximum bending moment that can be applied to the girder.
I = 1000
12 12× − ×450 980 4003 3
= 91 125 10 62 72 109 9. .× − ×
12 12
= 2.367 × 109 mm4
σ = I
My
M = σ × I
y
M = 150 10
0.225
6× × × −2 367 10 3.
= 1578 × 103 Nm
Answer: Maximum bending moment 1578 kNm

1999 HSC Engineering Science Enhanced Examination Report
51
The second moment of area (Ixx) of a composite shape can be found using the equation for thebasic shape of a rectangle.
I beam = I total shape − I space between flanges
Generally candidates found it very difficult to manipulate and correctly substitute into the aboveequation. They performed better in the second part of the question.
Hints for teachers and candidates:
– Consistency of units is of utmost importance. Candidates are encouraged to choose asystem of units that they understand and then practise using this system in the bendingstress equation.
– Practice calculating Ixx for different composite shapes
(b) The pulley shown in the diagram below is used to raise a mass of 90 kg. The pulley has a momentof inertia of 14 kg m2.
Determine the energy required to accelerate the load from rest to a velocity of 6 m/s in a distanceof 10 m.
ϖ = r
v
= 0.25
6
= 24 rads/sec
∆E = ∆PE + ∆KELoad + ∆KEpulley
= mgh + _mv2 + _Iϖ2
= 90 × 9.8 × 10 + _ × 90 × 62 + _ × 14 × 242
= 8 820 + 1 620 + 4 032
= 14 472 J
= 14.472 × 10⁻³ MJ
Answer: Energy 14.472 × 10⁻³ MJ
The energy of the system, with the load accelerated upwards a distance of 10 m, is made up of theincrease in PE and the KE of the mass as well as the increase in the rotational KE of the pulley.
Candidates struggled to correctly identify the three separate energy components of this question. Somecandidates approached the solution by a force/torque method of finding the total work done through a

1999 HSC Engineering Science Enhanced Examination Report
52
rotational displacement of 40 radians. This method also involved the recognition of three separatecomponents of work done by the system.
Hints for teachers and candidates:
– Consistency of units is of utmost importance. Candidates are encouraged to express the logic oftheir solution in simple terms such as:
Energy = PE load + KE load + KE pulley
– Careful setting out and substitution into each formula should help to eliminate mistakes.
The following is an example of the combination of energy and work methods.

1999 HSC Engineering Science Enhanced Examination Report
53
Question 2
(a) To prevent corrosion of an underground iron pipe, a rod is connected to the pipe as shown in thediagram below.
(i) Using the standard electrode potentials, state the most suitable metal for the rod.
Electrode PotentialsAg+ + e– → Ag + 0.80 VCu2+ + 2e– → Cu + 0.35VMn2+ + 2e– → Mn – 1.05VFe2+ + 2e– → Fe – 0.41 VMg2+ + 2e– → Mg – 2.36V
Answer: Name of metal Magnesium (Mg)
This question was well answered with most candidates recognising that Mg had a lower electrodepotential than Fe although Engineering Science textbooks usually indicate electrode potentialwith the reverse sign. ie. Mg is usually shown as Mg = Mg2+ + 2e– (+2.36V). Candidates need tobe aware that electrode potential tables can be listed with either sign convention.
Some candidates reasoned that the rod was a means of supplying an impressed voltage, thereforethey chose copper as the most suitable metal as it is a good conductor. Impressed voltage wasthen given as their answer for part ii. These answers were accepted because the diagramillustrated the rod extending to the surface, which is not normally the case with sacrificial anodes.
(ii) Name and describe the process by which the rod aids in the prevention of corrosion.
Answer: Name Cathodic Protection (sacrificial anode)
Description By placing the iron pipe in contact with the magnesium pipewhich is above it in the galvanic series. The more activemagnesium becomes the anode.
Candidates who recognised the example as a sacrificial anode situation gave very goodresponses.

1999 HSC Engineering Science Enhanced Examination Report
54
(iii) Pure aluminium is another metal that could have been used for this purpose. In practice itis not recommended. State the reason.
Answer: Reason − Aluminium exhibits ‘passivity’ due to formation of a thin protectiveoxide film on the surface.
Generally well answered, although some candidates obviously had no knowledge of passivity andanswered in terms of other properties such as softness and ductility which are irrelevant in thiscase.
(iv) Name and describe TWO other preventative measures that could be used to reducecorrosion of the iron pipe.
Answer:
Method 1
Name Surface Coating: Paints etc.; metal coatings (hot dipping); oxidefilms; ceramic and plastic coatings.
Description Seal the iron pipe from contact with the surrounding environmentby means of protective coating.
Method 2
Name Impressed Voltage
Description Connection to DC power source, supplying the pipe with excesse– thereby preventing corrosion by making the pipe cathodic.
This was a straight-forward question which was well answered.
(b) (i) Explain the term intergranular corrosion.
Answer: Corrosion that occurs along the grain boundaries (a potential difference existsbetween the grain boundaries and the rest of the alloy).
Some candidates did not understand that intergranular corrosion is corrosion between the grainand the grain boundary.
(ii) List TWO causes for this type of corrosion.
Answer: 1 Precipitation of a phase occurs faster at grain boundaries; coring; changein composition across each grain.
2 Presence of impurities; Area of high energy; Potential difference at grainboundaries.
Presence of more than one phase in the metal.
Different grain orientations in pure metal.
Candidates need to understand that there are a number of possible causes of this type ofcorrosion.

1999 HSC Engineering Science Enhanced Examination Report
55
Teaching Hint
In studying corrosion, candidates need a knowledge of electrode potential, how to combine them andhow to distinguish, from an electrochemical table, which metal will be the anode and cathodedepending on their position in the table. Candidates need to understand the principles of sacrificialanodes (cathodic protection) by identifying which metals will be anodic and therefore protect metalswhich are cathodic. They also need to understand the common mechanisms of corrosion, eg anodescorrode by giving up electrons which flow to the cathodes. Candidates also need to understand thecommon types of corrosion, where they occur and suitable methods of prevention.
(c) Part of the iron-carbon equilibrium diagram is shown below. An alloy of 0.15% carbon is cooledunder equilibrium conditions from 1550° C to 1400° C.
(i) Name the phases present and determine the proportion of these phases for this alloy at1500° C.
Liquid
Solid
. %
. %
= × =
= × =
638
1001
15 8
3238
1001
84 2
Answer: Name of phase 1 Liquid Proportion 16 %
Name of phase 2 δ Iron (Solid) Proportion 84 %
Most candidates successfully understood and applied the lever rule to find the phase proportionsalthough the diagram not having a horizontal scale meant a greater tolerance of answers wasaccepted.

1999 HSC Engineering Science Enhanced Examination Report
56
(ii) In the space provided, draw and label the microstructure of the alloy at a temperature of1490° C.
This question was poorly answered with many candidates not recognising the phases present andhow to represent them in a microstructure. Many candidates incorrectly drew theirmicrostructures containing a eutectic (lamellar) structure.
(iii) Name and describe the reaction that occurs at 1492°C.
Answer: Name Peritectic Reaction
Description L + δ ⇔ ϒ
The remaining liquid solidifies and the alloy is single phase austenite instructure.
Generally well answered, but many descriptions did not show any understanding of the reactionbeyond stating the formula.

1999 HSC Engineering Science Enhanced Examination Report
57
Section II
Question 3
The seats on an amusement park ride, shown below, rotate in the vertical plane. The arm rotatesaround axle B with a constant angular velocity of 1 rad/s. The minor arm rotates around axle A with aconstant angular velocity of 2 rad/s.
(a) Determine the maximum centrifugal force that an 80 kg person will experience during the ride.
vtotal = ωB × rmax + ωA × rA
= 1 × 7 + 2 × 2.5
= 12 m/s
ar = r
v2
= 7
122
= 20.57 m/s2
F = mar = 80 × 20.57 = 1 646 N
Answer: Centrifugal force 1 646 N

1999 HSC Engineering Science Enhanced Examination Report
58
When the mass of 80kg lines up with the arm AB, it experiences a tangential velocity in the samedirection (perpendicular to the arms) from both rotations. The total linear velocity vt can be used tofind the value of the radial force. Whilst many candidates recognised the maximum force would occurhen the arms line up with a radius of 7 metres, few candidates realised they could add linear velocities.
Common errors were:
Adding angular velocities with different origins.
1 Fc = mω 2r
Fc = 80 × (1 + 2)2 × 7
Fc = 5 040 N
2 F = m(ωA
2 r + ωB
2rmax)
F = 80(22 × 2.5 + 12 × 4.5)
F = 1 360 N
3 F = m(ωA
2 r + ωB
2r)
F = 80(22 × 2.5 + 12 × 4.5)
F = 1 160 N
Candidates were not penalised for applying the incorrect formula supplied. The formulae sheet shouldhave read:
Fc = r
2mv = mω2r
When attempting this type of problem candidates should note:
– A free-body diagram identifying position of maximum force and the forces acting is essential inthese types of questions.
– A clear understanding of what can be added together in this question is essential, ie angularvelocities (ω) cannot be added as they have different origins, whereas linear velocities may beadded as they are specific to the object and are vectors in the same direction.
– State your answer in force units as required by the question — candidates often failed to useF = ma after finding their acceleration.

1999 HSC Engineering Science Enhanced Examination Report
59
(b) Determine the maximum linear velocity that the person will experience.
vmax = ϖB × rB + ϖA × rA
= 1 × 7 + 2 × 2.5
= 12 m/s
Answer: Linear velocity 12 m/s
The linear velocities from each rotation are added together, as in the previous part. For the instant thatthe mass lines up with the major arm, the radius for the larger rotation is taken as 7 metres.
This part was generally well answered. The most common error involved candidates in calculating alinear velocity at A of 4.5 m/s then adding this to a relative velocity for the person of 5 m/s.
When attempting this type of problem candidates should note:
– always use a free body diagram to clarify the problem;
– it may be wise to complete a question on its own merits rather than transferring, possiblyincorrect, data from a previous part.
(c) Determine the maximum g force experienced by the person during the ride.
Max g force occurs when the mass is in line with A and B and isdirectly below both.
Max ar = 20.57 + 9.8
= 30.37 m/s2
g force = 9.8
30.37 = 3.1
Answer: g force 3.1 g
For the instant that the mass lines up with the arm AB and is at the bottom position, the maximumacceleration experienced by the 80 kg person will be found by combining the radial acceleration andthe acceleration due to gravity. Comparing this calculated figure to the acceleration due to gravity gavethe solution to the problem.
rad/sec 2 rad/sec 1
A
B
4.5 + 2.5 = 7 m

1999 HSC Engineering Science Enhanced Examination Report
60
Few candidates were able to combine all the components of this question correctly. Some neglectedthe weight-force while others didn’t realise that the arms needed to be vertical. Many candidates wereconfused by the ‘g force’ term, not realising that this was simply a ratio that compared the accelerationof the person to the acceleration of gravity. Some candidates incorrectly calculated a force in Newtons.
When attempting this type of problem candidates should realise:
– a free-body diagram will easily show that the position where maximum ‘g force’ will beexperienced is in the vertically down position;
– ‘g force’, though called a force, has no units and is simply a ratio;
– a ‘g force’ is calculated by dividing an acceleration by an acceleration.
Question 4
An object is suspended from a beam by a non-elastic cable (AC) and a spring (AB), as shown in thediagram below. The unstretched length of spring AB is 660 mm. The spring stiffness is 475 N/m.
Determine the mass of the suspended object.
AB2 = 3502 + 6002
AB = 694.62Extension = 694.6 − 660
= 34.62 mm
= 0.0346 m
Force in the spring = kx= 475 × 0.0346
= 16.44 N
FAC 16.44
W

1999 HSC Engineering Science Enhanced Examination Report
61
Wsin 71.46
=16.44
sin 48.8
W =16.44 sin 71.46
sin 48.8×
= 20.71 N
m =9.8
20.71
W
48.8° FAC
71.45°
16.4459.7°
Answer: Mass 2.1 kg
The force in member AB can be calculated by finding the extension of the spring and multiplying it bythe spring constant. An equilibrium statement for forces acting at point A will yield a value for theweight force which can be divided by ‘g’ to give the mass. Very few candidates answered thisquestion. Many students, when attempting to find the force in AB, erroneously used the extendedlength of the spring, 694.62 mm rather than the extension of the spring, 694.62 – 660 = 34.62 mm. Asimple substitution into the equation F = kx gave the force in the member AB. Few candidatescompleted this simple manipulation.
When attempting this type of problem candidates should note:
– identify the three forces acting at A by sketching a free-body diagram;
– the force in the spring is found by multiplying the extension by the spring constant;
– the spring constant is given in N/m so the extension must be expressed in metres;
– clearly identify each angle calculated as candidates often confuse angles on diagrams;
– an equilibrium force diagram, with clear arrows, is an important aid;
– ensure that the answer given is in the units required.

1999 HSC Engineering Science Enhanced Examination Report
62
(b) A system of wedges and springs is used to support a load of 100 N, as shown in the diagram.
Determine the minimum spring constant for the springs used, necessary to prevent the load frommoving down.
Neglect the mass of the blocks. The coefficient of static friction for all surfaces is 0.18.
4.50sin
100=
Fsin 64.8
R
100 4.50sin
8.64sin= FR
= 117.42
N = 117.43 sin 25.2°= 50 N
→+ΣFH = 0= 117.43 cos 25.2° − 8.99 − Fspring
Fspring = 106.25 − 8.99 = 97.26FR = 0.18 × 50
= 8.99 N
Data does not allow for calculation of spring contraction.
Therefore spring constant cannot be determined.
Answer: Spring constant N/m

1999 HSC Engineering Science Enhanced Examination Report
63
An alternate solution using the angle of friction where you can identify the forces on the bottom wedgeis given below.
The force in the spring can only be determined if a free body-diagram of the sliding wedge isconsidered. The force between the wedges can be found by analysing the forces on the top wedge.Summing the horizontal forces in the sliding wedge will give the value of the force in the spring whichneeds to be divided by the contraction of the spring in order to find the spring constant. Unfortunatelythe data on spring contraction was not given in the question so those candidates who found the force inthe spring were awarded full marks.
Very few candidates attempted this question and many of those who did appeared to struggle with theconcept of friction and the angle of friction.
When preparing for this type problem it is important that candidates note:
– focus on an understanding of the forces acting on each wedge;
– don’t neglect friction when analysing the forces in the wedges as wedges depend on friction towork;
– gain a greater understanding of the concept of angle of friction;
– frictional force not only occurs between the wedges but also between the lower wedges on thehorizontal surface and the normal reaction at this surface is simply a reaction to the 100 Nexternal force.
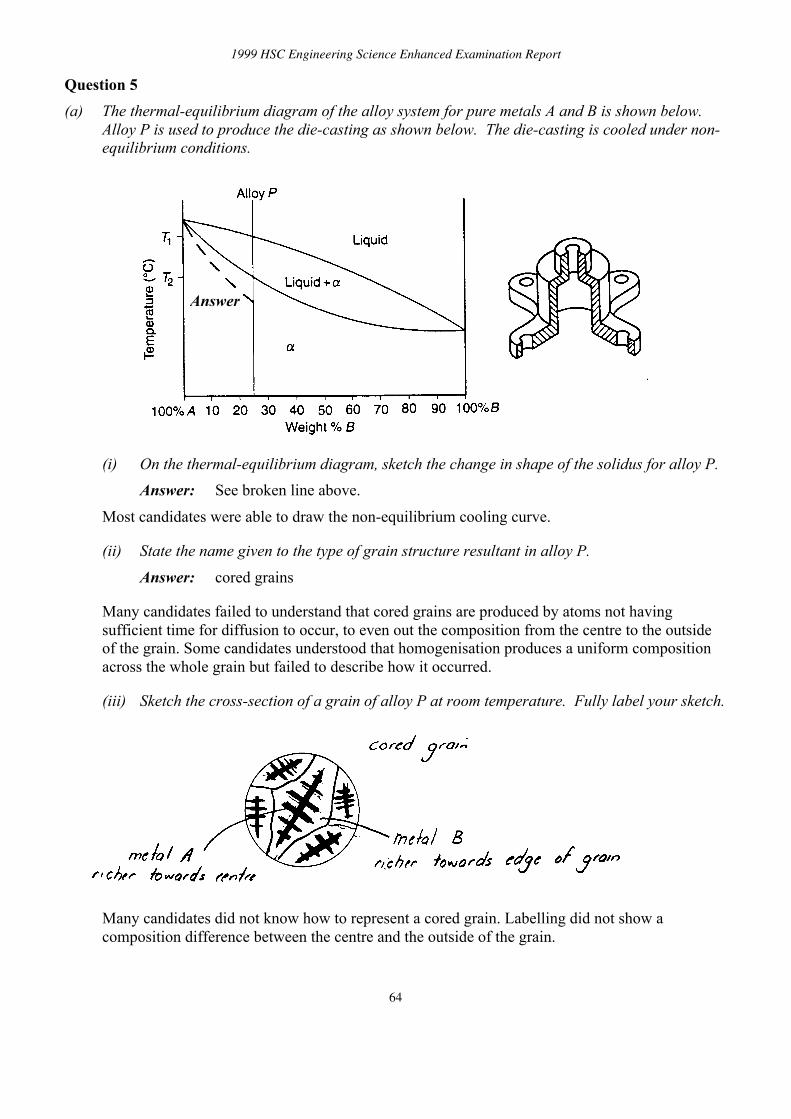
1999 HSC Engineering Science Enhanced Examination Report
64
Question 5
(a) The thermal-equilibrium diagram of the alloy system for pure metals A and B is shown below.Alloy P is used to produce the die-casting as shown below. The die-casting is cooled under non-equilibrium conditions.
(i) On the thermal-equilibrium diagram, sketch the change in shape of the solidus for alloy P.
Answer: See broken line above.
Most candidates were able to draw the non-equilibrium cooling curve.
(ii) State the name given to the type of grain structure resultant in alloy P.
Answer: cored grains
Many candidates failed to understand that cored grains are produced by atoms not havingsufficient time for diffusion to occur, to even out the composition from the centre to the outsideof the grain. Some candidates understood that homogenisation produces a uniform compositionacross the whole grain but failed to describe how it occurred.
(iii) Sketch the cross-section of a grain of alloy P at room temperature. Fully label your sketch.
Many candidates did not know how to represent a cored grain. Labelling did not show acomposition difference between the centre and the outside of the grain.
Answer

1999 HSC Engineering Science Enhanced Examination Report
65
(iv) The die-casting is homogenised to alter the grain structure. Describe the effect that thisprocess has at the atomic level of the grains.
Answer: Diffusion of the atoms of Metal A in B takes place giving a uniformcomposition across the grains ie. removes cored grains.
(b) A portion of the aluminium-copper phase diagram is shown below.
The process of age-hardening an alloy consists of two stages: solution treatment and ageing.
Describe each of these stages. Draw and fully label the microstructure of alloy A after each stage.
Answer:
Solution treatment
The alloy is heated to approximately 450oC so that the Cu Al2 is fully absorbed into the αsolution. It is then quenched so that the copper atoms are held in super saturated solid solutionwithin the aluminium.
Ageing
The alloy is held at room temperature for five to seven days (or artificially aged – reheated to120o C) to allow a very fine precipitation of the Cu Al2 throughout the matrix.
α of solution solid
solid solution of submicroscopic precipitate (CuAl )2
α

1999 HSC Engineering Science Enhanced Examination Report
66
Candidates generally understood that the question involved the process of age hardening, but did notshow understanding of the different steps involved. Many candidates could not draw and label themicrostructures correctly.
Question 6
(a) The unit cells of sodium chloride and caesium chloride are shown below:
(i) Name and describe the type of bond that exists between sodium and chlorine.
Answer: Name of bond Ionic bond
Description of bond Transfer of electrons forming +ve and –ve ions.These ions attract each other forming strong bonds.
This question was not well answered considering it was a very fundamental concept. Candidatesshould have a thorough knowledge of all the primary bonds (Ionic, Covalent and Metallic) andthe arrangement of electrons within each bond.
(ii) Determine the coordination numbers of the caesium chloride structure and the sodiumchloride structure.
Answer: Caesium chloride structure 8
Sodium chloride structure 6
Co-ordination numbers were correctly stated in most cases.
(iii) The coordination numbers of sodium chloride and caesium chloride differ. State a reasonfor this difference.
Answer:
Reason
NaCl – because of the ion size ratio, equal number of Na ions and Cl ions (6 of each) arearranged in a cubic lattice. This gives a coordination number of 6.
CaCl – exhibits a higher ion size ratio giving a BCC type structure that has a coordinationnumber of 8.
This proved to be a difficult concept for candidates to understand. The difference in co-ordinationnumbers resulted from the different lattice structures caused by the differing ionic radii ratios ofthe bonded elements.

1999 HSC Engineering Science Enhanced Examination Report
67
(b) (i) On the sketches below, draw the (112) plane and the (010) plane.
Answer:
The planes were generally well drawn and this question was well attempted.
(ii) State the Miller indices of the plane on which slip is more likely to occur in a body centredcubic structure. State a reason for your choice.
Answer: Miller indices (110)
Reason − plane of higher atomic density
Many candi dat es i ncorr ect ly stat ed t he Mi ll er indices, but gave t he corr ect r esponse for the r eason.
(c) The atomic radius of an iron atom is 0.124 nm. Iron crystallises as BCC. Calculate the latticeparameter of the unit cell.
r = 0.124
4r = 0.496
To find a, use Pythagoras’ Theorem
(4r)2= a2 + (
22a )2
(4r)2 = 3a2
3
(4r)2
= a2
(4r)3
2
= a
Answer: Lattice parameter 0.286 nm
A poorly answered question with many candidates having no idea of what a lattice parameter is or howto calculate it. Good candidates used a sketch as an aid in helping them calculate their answer. Somecandidates calculated the parameter for a FCC lattice.

1999 HSC Engineering Science Enhanced Examination Report
68
Section III
Question 7
The top view of the corners of the base of a regular square pyramid, A, B, C and D, is given below. Thefront view of the corners B and C of the same square pyramid is also given below.
The pyramid has been inclined to both the horizontal plane and vertical plane. The length of the axis is55 mm.
Complete the top view and the front view of the pyramid.

1999 HSC Engineering Science Enhanced Examination Report
69
Answer:
The majority of candidates did not attempt this question. Those who did, failed to understand the needfor an auxiliary view to find and use the ‘true length’ of the axis - projected to the top view. Candidateswho visualised and completed a square pyramid in both views were rewarded with marks. Somecandidates failed to realise that in a regular pyramid, the axis is perpendicular to the base. Overall,candidates were able to identify visible and hidden outline in both views.
Suggested steps to assist in the completion of a solution:
1. Join abcd in top view.
2. Recognise ad and bc as true lengths.
3. P roject an auxi li ar y vi ew perpendicul ar to t he top views of bc and ad to give an edge vi ew of base.
4. On the auxiliary view, draw the axis perpendicular to base and measure true length of 55 mm.
5. Project back to the top view and locate the apex position on the axis which is perpendicular to adand bc .
6. Project down from the top view and using distances from the auxiliary view plot the base andapex in the front view.
7. Firm in the outline and complete the hidden detail.

1999 HSC Engineering Science Enhanced Examination Report
70
Question 8
The coordinates of four points A, B, C and D are given in the table below.
X Y ZA 5 15 15B 50 50 25C 10 40 25D 50 20 45
Draw the top view and the front view of the two lines AB and CD on the axes given below.
Graphically determine the shortest distance between the two lines AB and CD.
Answer:
The majority of candidates attempting this question were able to locate the points and draw the lines inboth views. Some candidates confused the y and z directions. Most candidates realised that an auxiliaryplane was necessary and attempted to find the true length of one line. Candidates who rotated theapparent view could not find a solution.
Some candidates, on establishing a true length view could not proceed to the next step; that is, to placea plane perpendicular to the true length line and project a point view. The shortest distance is then theperpendicular measurement between the line and the point.
This question produced a wide range with a significant number achieving full marks.

1999 HSC Engineering Science Enhanced Examination Report
71
Candidates (and teachers) may find it beneficial to practise using co-ordinate geometry early in theirdrawing experience so that the correct coordinate standards are remembered.
Question 9
The top view and front view of a transition piece are shown below in a third-angle projection. Draw apattern for the surface abc21.
The starting position for the seam a1 is indicated below.
Answer:
The development of the transition piece was a variation on a commonly asked question. Marks wereawarded for recognising the need to triangulate the surface, establishing ‘true lengths’ for use intriangulation, plotting points and then making a suitable outline.

1999 HSC Engineering Science Enhanced Examination Report
72
Some common mistakes were:
– failure to divide the portion of ellipse between points 1 and 2 into smaller sections to ensureaccuracy.
– failure to recognise and draw curve bc which is given as a true shape in the original drawing.
– failure to accurately determine true lengths, particularly around the ellipse.
Suggested steps to assist in the completion of a solution:
1. Triangulate surface abc21 , dividing the section of ellipse 12 into at least three parts. Labellingthese points is not essential but will assist in completing an accurate drawing.
2. Calculate all true lengths using a suitable method. Remember that both the straight line andcurves need to be done. A true length diagram that combines ‘front view heights’ and ‘top viewlengths’ may help to avoid confusion. Again, labelling is helpful.
3. Transferring these true lengths with a pair of dividers or compasses will assist accuracy.
4. Using only true lengths, complete the development commencing with triangle 1ab. Curve bc isshown as a true shape on the given front view and can be drawn with a compass.
5. A thick black continuous outline is required.
Question 10
The top view, right-side view and incomplete front view of two intersecting triangular prisms are givenbelow in third-angle projection.
Complete the front view, showing both visible and hidden outline.
Answer:

1999 HSC Engineering Science Enhanced Examination Report
73
The solution to this problem fell into two parts:
– The correct location of eight points of intersection
– The visualisation of both visible and hidden outlines
Most candidates attempted this question, with the majority able to locate some points of intersectionand some visible lines. An objective marking scale was employed and a wide spread of marks resulted.
Common mistakes were:
– seeing the horizontal solid as a cylinder.
– missing crucial hidden detail, particularly on the lower portion.
Suggested steps to assist in the completion of a solution:
1. Letter all lines in both views: then identify, and number in cyclic order, all intersection points inthe top view. This doesn’t achieve marks but avoids confusion.
2. Project these points to the front view either directly or via the right side view.
3. Identify the visibility of the lines of intersection in the front view by looking through the verticalplane at the top view. Join the points accordingly using the appropriate lines.