Chinese Academy of Sciences Institutes of Science and ...
68
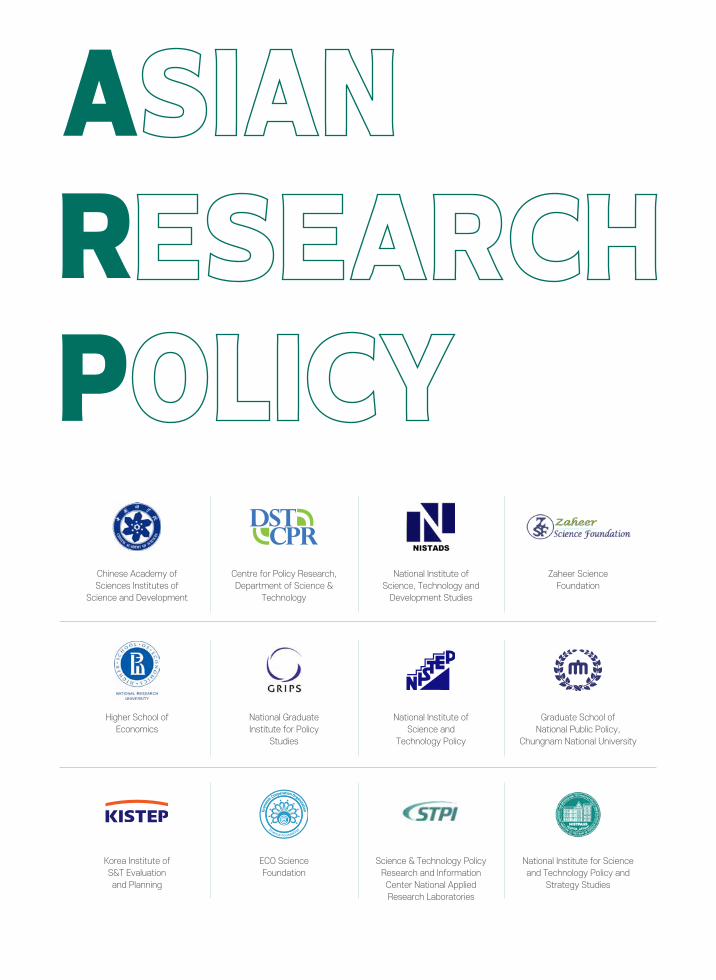
Chinese Academy of Sciences Institutes of Science and Development Higher School of Economics Korea Institute of S&T Evaluation and Planning Centre for Policy Research, Department of Science & Technology National Graduate Institute for Policy Studies ECO Science Foundation National Institute of Science, Technology and Development Studies National Institute of Science and Technology Policy Science & Technology Policy Research and Information Center National Applied Research Laboratories Zaheer Science Foundation Graduate School of National Public Policy, Chungnam National University National Institute for Science and Technology Policy and Strategy Studies
-
Upload
khangminh22 -
Category
Documents
-
view
1 -
download
0
Transcript of Chinese Academy of Sciences Institutes of Science and ...
Chinese Academy of Sciences Institutes of
Science and Development
Higher School of Economics
Korea Institute of S&T Evaluation and Planning
Centre for Policy Research, Department of Science &
Technology
National Graduate Institute for Policy
Studies
ECO Science Foundation
National Institute of Science, Technology and
Development Studies
National Institute of Science and
Technology Policy
Science & Technology Policy Research and Information Center National Applied Research Laboratories
Zaheer Science Foundation
Graduate School of National Public Policy,
Chungnam National University
National Institute for Science and Technology Policy and
Strategy Studies

LetterSince the joining of Asian STI Think Tank Network (ASTN) members to ARP Editorial Board, ARP was able to expand its focus from being a S&T policy-oriented journal to becoming the information platform for Asian STI institutes. Last year, we introduced two members—KISTEP and STPI— from the ARP Editorial board on renewed ARP, and this year, we are honored to introduce another leading STI institutes, ECO Science Foundation from Pakistan and CSIR-NIScPR from India. ECOSF and NISTADS have kept close cooperation with KISTEP, such as participating Asian Innovation Forum and ASTN Roundtable Meeting as ASTN members since 2015.
Through the forum and meetings, we, researchers, scholars and policymakers, learned that we needed a platform beyond the event where we could frequently circulate information on research projects and future plans for cooperation opportunities. We hope the last year’s renewed ARP served as the information platform and that this year’s publication provides more insight on the Asian STI Think Tanks and S&T policy issues in Asia.
This year, ‘ARP Honors Program’ was launched to encourage institutes and researchers to share their research work, and two articles were selected to introduce machine learning technology from STPI and regional innovation system from CSIR-NIScPR. We hope reading the articles will be the first step of finding collaboration opportunities amongst us.
The theme for ARP Vol. 12 S&T Trends is ‘carbon neutrality,’ as climate crisis is AND will be the main concern of international organizations and governments of many countries for the next half century. Korean government recently announced ‘Carbon Neutral 2050’ and ministries for environment, industry and trade, transport and land, science and technology, oceans and fisheries are all making efforts to achieve carbon neutral by 2050. We have invited experts from Malaysia, Vietnam, Indonesia, Japan, Pakistan and Singapore to share S&T policy, R&D management and trending technologies on achieving carbon neutral, and the articles will enhance our understanding on current issues and challenges for the subject.
We hope this year’s ARP expands your knowledge and views on Asian STI Think Tanks and global S&T issues.
Introduction of Asian STI Institutes 008 ECOSF
020 NIScPR
Articles030 FLUD: Expert-curated large-scale machine comprehension dataset with advanced reasoning strategies
Yi-Chih Huang et al.
038 Exploring regional innovation system pathways for startups in India
Avinash Kshitij and Kasturi Mandal
S&T Trends060 State-of-the-art innovation of renewable energy resources as
an alternative fuel source in Malaysia’s energy mix: policy implications
Marlia M. Hanafiah and Saleh Shadman
075 Vietnam's plans and strategies in accordance with Vietnam's commitment to achieve carbon neutrality
Nguyen Trinh Hoang Anh
089 Analysis the long-term impact of low carbon transport policy in Jakarta city
(case study: electrification of vehicles and biofuel program)
Sudarmanto B. Nugroho et al.
104 Trends of the zero carbon cities in Japan
Junko Ota and Junko Akagi
117 Decarbonizing road transport sector through electric mobility in Pakistan
Khalil Raza
125 Prospects for hydrogen in Asia Pacific
Craig Rogers et al.
Asian Research Policy
ASIAN RESEARCH
POLICY
007006
Introduction of Asian STI Institutes
Introduction of Asian STI
Institutes ECOSF
NIScPR
Since Asian STI Think tanks Network (ASTN) members
joined ARP Editorial Board, ARP has been introducing the ASTN
institutes to share information and find opportunities.
In the next pages, we present two institutes from ARP Editorial Board.
ASIAN RESEARCH
POLICY
009008
Introduction of Asian STI Institutes
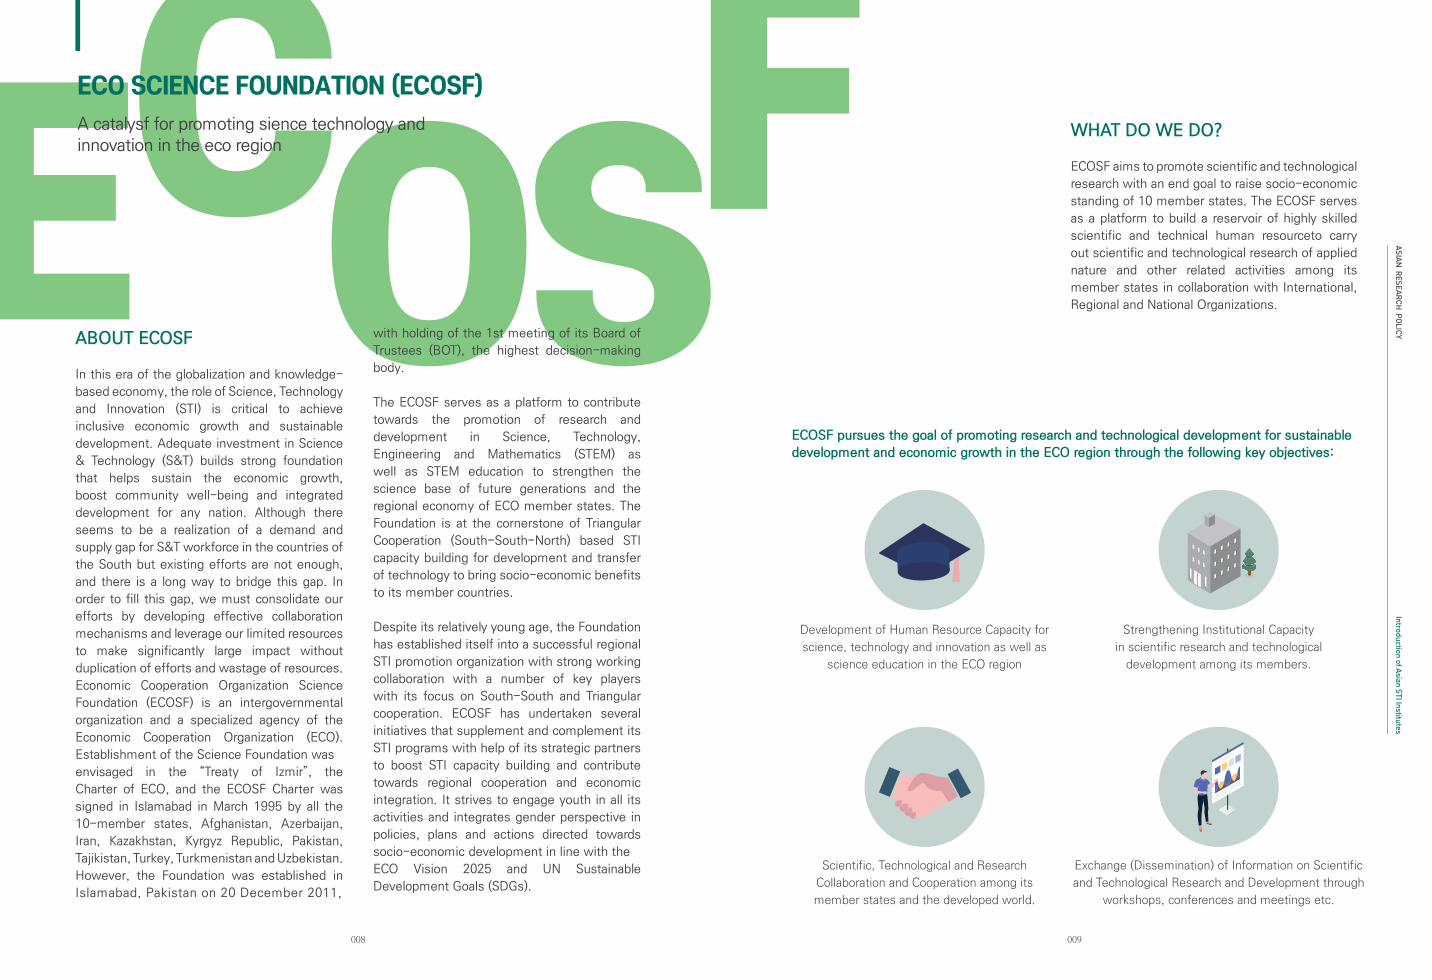
ECO SCIENCE FOUNDATION (ECOSF)A catalysf for promoting sience technology and innovation in the eco region
ABOUT ECOSF
In this era of the globalization and knowledge-
based economy, the role of Science, Technology
and Innovation (STI) is critical to achieve
inclusive economic growth and sustainable
development. Adequate investment in Science
& Technology (S&T) builds strong foundation
that helps sustain the economic growth,
boost community well-being and integrated
development for any nation. Although there
seems to be a realization of a demand and
supply gap for S&T workforce in the countries of
the South but existing efforts are not enough,
and there is a long way to bridge this gap. In
order to fill this gap, we must consolidate our
efforts by developing effective collaboration
mechanisms and leverage our limited resources
to make significantly large impact without
duplication of efforts and wastage of resources.
Economic Cooperation Organization Science
Foundation (ECOSF) is an intergovernmental
organization and a specialized agency of the
Economic Cooperation Organization (ECO).
Establishment of the Science Foundation was
envisaged in the “Treaty of Izmir”, the
Charter of ECO, and the ECOSF Charter was
signed in Islamabad in March 1995 by all the
10-member states, Afghanistan, Azerbaijan,
Iran, Kazakhstan, Kyrgyz Republic, Pakistan,
Tajikistan, Turkey, Turkmenistan and Uzbekistan.
However, the Foundation was established in
Islamabad, Pakistan on 20 December 2011,
with holding of the 1st meeting of its Board of
Trustees (BOT), the highest decision-making
body.
The ECOSF serves as a platform to contribute
towards the promotion of research and
development in Science, Technology,
Engineering and Mathematics (STEM) as
well as STEM education to strengthen the
science base of future generations and the
regional economy of ECO member states. The
Foundation is at the cornerstone of Triangular
Cooperation (South-South-North) based STI
capacity building for development and transfer
of technology to bring socio-economic benefits
to its member countries.
Despite its relatively young age, the Foundation
has established itself into a successful regional
STI promotion organization with strong working
collaboration with a number of key players
with its focus on South-South and Triangular
cooperation. ECOSF has undertaken several
initiatives that supplement and complement its
STI programs with help of its strategic partners
to boost STI capacity building and contribute
towards regional cooperation and economic
integration. It strives to engage youth in all its
activities and integrates gender perspective in
policies, plans and actions directed towards
socio-economic development in line with the
ECO Vision 2025 and UN Sustainable
Development Goals (SDGs).
WHAT DO WE DO?
ECOSF aims to promote scientific and technological
research with an end goal to raise socio-economic
standing of 10 member states. The ECOSF serves
as a platform to build a reservoir of highly skilled
scientific and technical human resourceto carry
out scientific and technological research of applied
nature and other related activities among its
member states in collaboration with International,
Regional and National Organizations.
ECOSF pursues the goal of promoting research and technological development for sustainable
development and economic growth in the ECO region through the following key objectives:
Development of Human Resource Capacity for
science, technology and innovation as well as
science education in the ECO region
Scientific, Technological and Research
Collaboration and Cooperation among its
member states and the developed world.
Strengthening Institutional Capacity
in scientific research and technological
development among its members.
Exchange (Dissemination) of Information on Scientific
and Technological Research and Development through
workshops, conferences and meetings etc.
ASIAN RESEARCH
POLICY
011010
Introduction of Asian STI Institutes
011
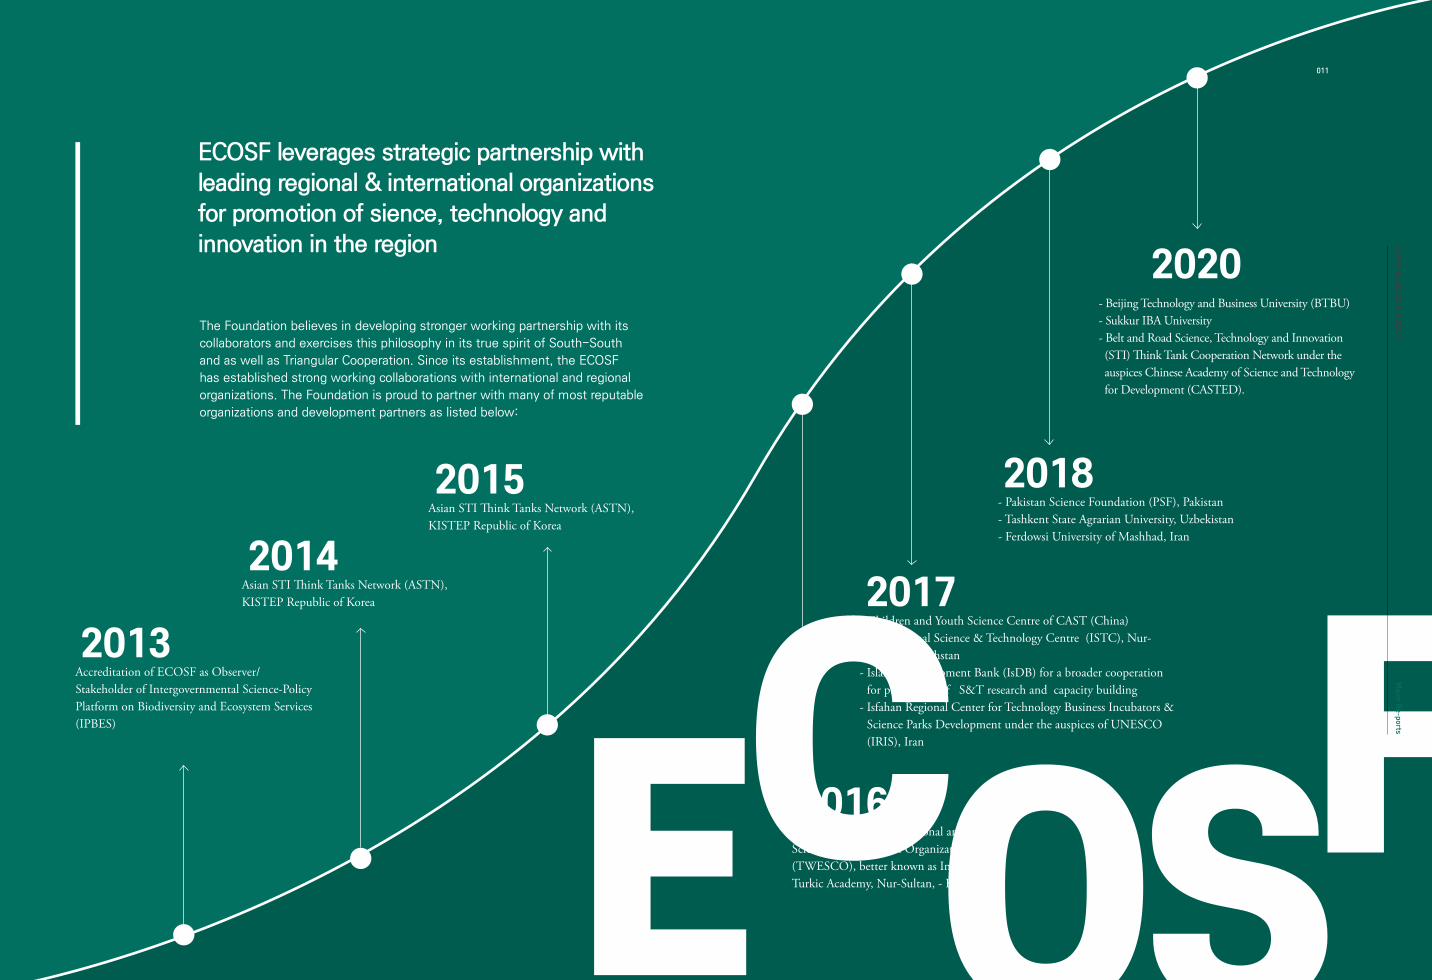
ECOSF leverages strategic partnership with
leading regional & international organizations
for promotion of sience, technology and
innovation in the region
The Foundation believes in developing stronger working partnership with its
collaborators and exercises this philosophy in its true spirit of South-South
and as well as Triangular Cooperation. Since its establishment, the ECOSF
has established strong working collaborations with international and regional
organizations. The Foundation is proud to partner with many of most reputable
organizations and development partners as listed below:
2013
2014
2015
2016
2017
2018
2020
Accreditation of ECOSF as Observer/Stakeholder of Intergovernmental Science-Policy Platform on Biodiversity and Ecosystem Services (IPBES)
Asian STI Think Tanks Network (ASTN), KISTEP Republic of Korea
Asian STI Think Tanks Network (ASTN), KISTEP Republic of Korea
The Turkic World Educational and Scientific Cooperation Organization (TWESCO), better known as International Turkic Academy, Nur-Sultan, - Kazakhstan
- Children and Youth Science Centre of CAST (China)- International Science & Technology Centre (ISTC), Nur-
Sultan, Kazakhstan- Islamic Development Bank (IsDB) for a broader cooperation
for promotion of S&T research and capacity building- Isfahan Regional Center for Technology Business Incubators &
Science Parks Development under the auspices of UNESCO (IRIS), Iran
- Pakistan Science Foundation (PSF), Pakistan- Tashkent State Agrarian University, Uzbekistan- Ferdowsi University of Mashhad, Iran
- Beijing Technology and Business University (BTBU)- Sukkur IBA University- Belt and Road Science, Technology and Innovation (STI) Think Tank Cooperation Network under the auspices Chinese Academy of Science and Technology for Development (CASTED).
ASIAN RESEARCH
POLICYM
ajor Re-ports
ASIAN RESEARCH
POLICY
013012
Introduction of Asian STI Institutes
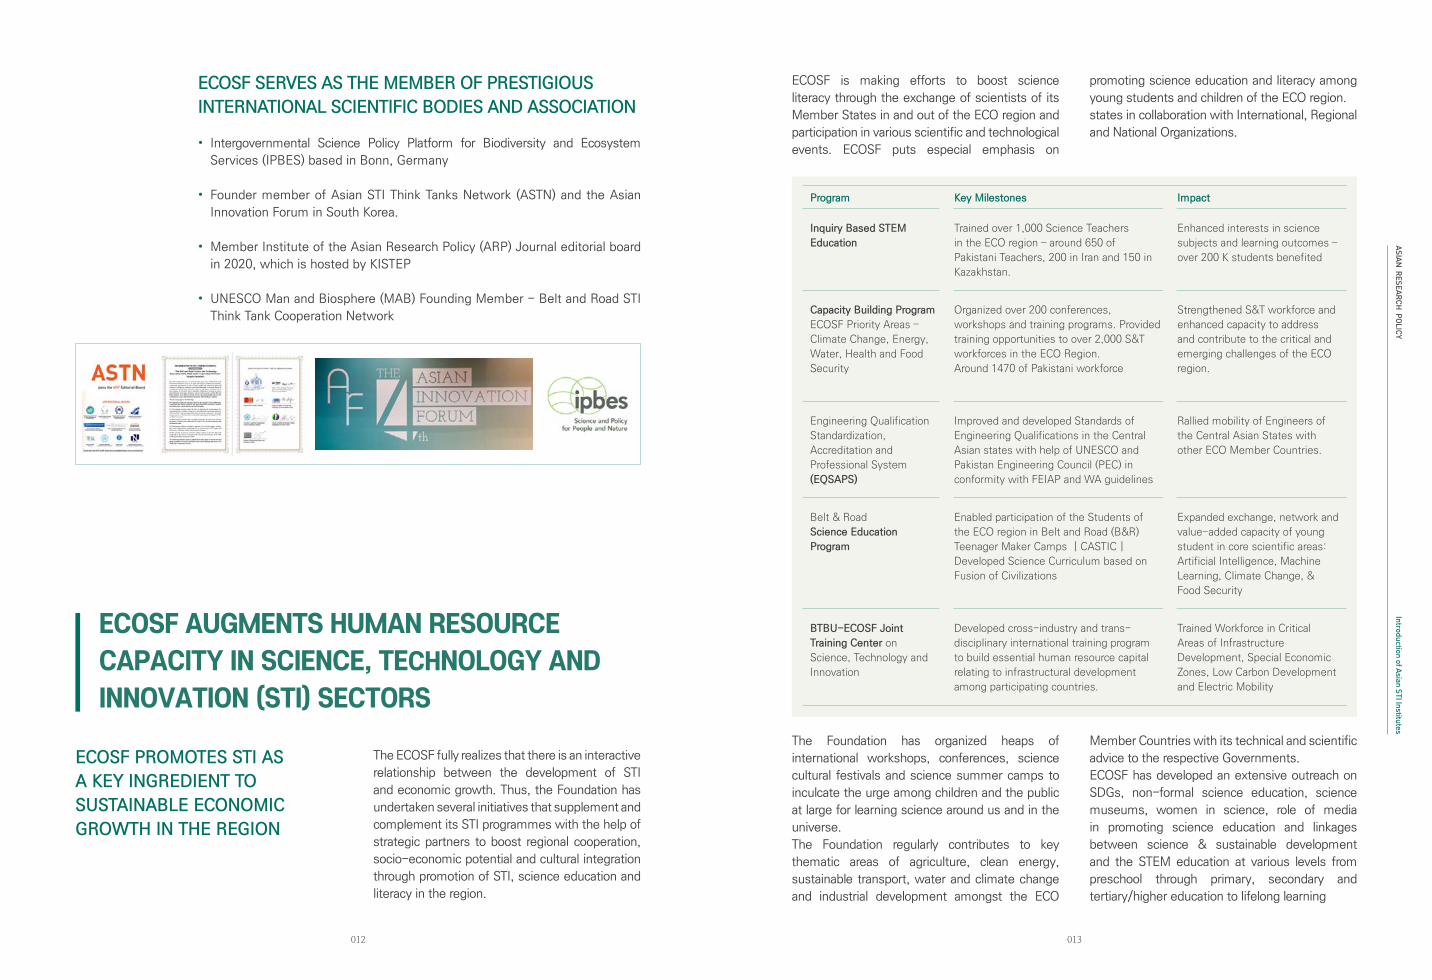
ECOSF SERVES AS THE MEMBER OF PRESTIGIOUS
INTERNATIONAL SCIENTIFIC BODIES AND ASSOCIATION
• Intergovernmental Science Policy Platform for Biodiversity and Ecosystem
Services (IPBES) based in Bonn, Germany
• Founder member of Asian STI Think Tanks Network (ASTN) and the Asian
Innovation Forum in South Korea.
• Member Institute of the Asian Research Policy (ARP) Journal editorial board
in 2020, which is hosted by KISTEP
• UNESCO Man and Biosphere (MAB) Founding Member - Belt and Road STI
Think Tank Cooperation Network
ECOSF PROMOTES STI AS
A KEY INGREDIENT TO
SUSTAINABLE ECONOMIC
GROWTH IN THE REGION
The ECOSF fully realizes that there is an interactive
relationship between the development of STI
and economic growth. Thus, the Foundation has
undertaken several initiatives that supplement and
complement its STI programmes with the help of
strategic partners to boost regional cooperation,
socio-economic potential and cultural integration
through promotion of STI, science education and
literacy in the region.
ECOSF AUGMENTS HUMAN RESOURCE CAPACITY IN SCIENCE, TECHNOLOGY AND INNOVATION (STI) SECTORS
ECOSF is making efforts to boost science
literacy through the exchange of scientists of its
Member States in and out of the ECO region and
participation in various scientific and technological
events. ECOSF puts especial emphasis on
promoting science education and literacy among
young students and children of the ECO region.
states in collaboration with International, Regional
and National Organizations.
The Foundation has organized heaps of
international workshops, conferences, science
cultural festivals and science summer camps to
inculcate the urge among children and the public
at large for learning science around us and in the
universe.
The Foundation regularly contributes to key
thematic areas of agriculture, clean energy,
sustainable transport, water and climate change
and industrial development amongst the ECO
Member Countries with its technical and scientific
advice to the respective Governments.
ECOSF has developed an extensive outreach on
SDGs, non-formal science education, science
museums, women in science, role of media
in promoting science education and linkages
between science & sustainable development
and the STEM education at various levels from
preschool through primary, secondary and
tertiary/higher education to lifelong learning
Program Key Milestones Impact
Inquiry Based STEM
Education
Trained over 1,000 Science Teachers
in the ECO region – around 650 of
Pakistani Teachers, 200 in Iran and 150 in
Kazakhstan.
Enhanced interests in science
subjects and learning outcomes –
over 200 K students benefited
Capacity Building Program
ECOSF Priority Areas –
Climate Change, Energy,
Water, Health and Food
Security
Organized over 200 conferences,
workshops and training programs. Provided
training opportunities to over 2,000 S&T
workforces in the ECO Region.
Around 1470 of Pakistani workforce
Strengthened S&T workforce and
enhanced capacity to address
and contribute to the critical and
emerging challenges of the ECO
region.
Engineering Qualification
Standardization,
Accreditation and
Professional System
(EQSAPS)
Improved and developed Standards of
Engineering Qualifications in the Central
Asian states with help of UNESCO and
Pakistan Engineering Council (PEC) in
conformity with FEIAP and WA guidelines
Rallied mobility of Engineers of
the Central Asian States with
other ECO Member Countries.
Belt & Road
Science Education
Program
Enabled participation of the Students of
the ECO region in Belt and Road (B&R)
Teenager Maker Camps | CASTIC |
Developed Science Curriculum based on
Fusion of Civilizations
Expanded exchange, network and
value-added capacity of young
student in core scientific areas:
Artificial Intelligence, Machine
Learning, Climate Change, &
Food Security
BTBU-ECOSF Joint
Training Center on
Science, Technology and
Innovation
Developed cross-industry and trans-
disciplinary international training program
to build essential human resource capital
relating to infrastructural development
among participating countries.
Trained Workforce in Critical
Areas of Infrastructure
Development, Special Economic
Zones, Low Carbon Development
and Electric Mobility
ASIAN RESEARCH
POLICY
015014
Introduction of Asian STI Institutes
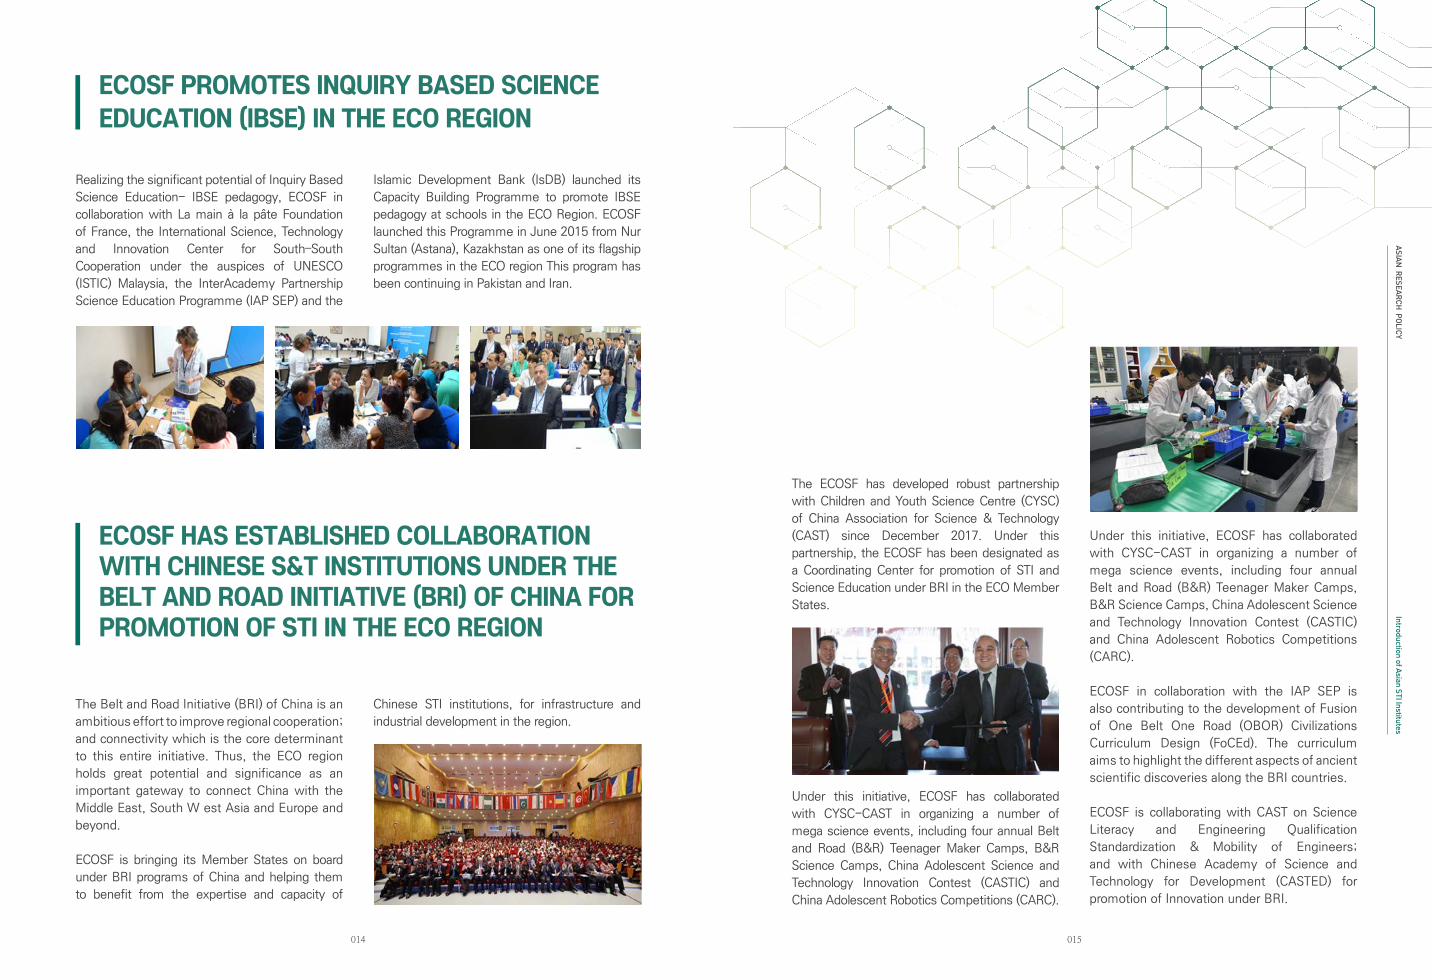
Realizing the significant potential of Inquiry Based
Science Education- IBSE pedagogy, ECOSF in
collaboration with La main à la pâte Foundation
of France, the International Science, Technology
and Innovation Center for South–South
Cooperation under the auspices of UNESCO
(ISTIC) Malaysia, the InterAcademy Partnership
Science Education Programme (IAP SEP) and the
Islamic Development Bank (IsDB) launched its
Capacity Building Programme to promote IBSE
pedagogy at schools in the ECO Region. ECOSF
launched this Programme in June 2015 from Nur
Sultan (Astana), Kazakhstan as one of its flagship
programmes in the ECO region This program has
been continuing in Pakistan and Iran.
The Belt and Road Initiative (BRI) of China is an
ambitious effort to improve regional cooperation;
and connectivity which is the core determinant
to this entire initiative. Thus, the ECO region
holds great potential and significance as an
important gateway to connect China with the
Middle East, South W est Asia and Europe and
beyond.
ECOSF is bringing its Member States on board
under BRI programs of China and helping them
to benefit from the expertise and capacity of
Chinese STI institutions, for infrastructure and
industrial development in the region.
ECOSF PROMOTES INQUIRY BASED SCIENCE EDUCATION (IBSE) IN THE ECO REGION
ECOSF HAS ESTABLISHED COLLABORATION WITH CHINESE S&T INSTITUTIONS UNDER THE BELT AND ROAD INITIATIVE (BRI) OF CHINA FOR PROMOTION OF STI IN THE ECO REGION
The ECOSF has developed robust partnership
with Children and Youth Science Centre (CYSC)
of China Association for Science & Technology
(CAST) since December 2017. Under this
partnership, the ECOSF has been designated as
a Coordinating Center for promotion of STI and
Science Education under BRI in the ECO Member
States.
Under this initiative, ECOSF has collaborated
with CYSC-CAST in organizing a number of
mega science events, including four annual Belt
and Road (B&R) Teenager Maker Camps, B&R
Science Camps, China Adolescent Science and
Technology Innovation Contest (CASTIC) and
China Adolescent Robotics Competitions (CARC).
Under this initiative, ECOSF has collaborated
with CYSC-CAST in organizing a number of
mega science events, including four annual
Belt and Road (B&R) Teenager Maker Camps,
B&R Science Camps, China Adolescent Science
and Technology Innovation Contest (CASTIC)
and China Adolescent Robotics Competitions
(CARC).
ECOSF in collaboration with the IAP SEP is
also contributing to the development of Fusion
of One Belt One Road (OBOR) Civilizations
Curriculum Design (FoCEd). The curriculum
aims to highlight the different aspects of ancient
scientific discoveries along the BRI countries.
ECOSF is collaborating with CAST on Science
Literacy and Engineering Qualification
Standardization & Mobility of Engineers;
and with Chinese Academy of Science and
Technology for Development (CASTED) for
promotion of Innovation under BRI.
ASIAN RESEARCH
POLICY
017016
Introduction of Asian STI Institutes
The Belt and Road Initiative (BRI) is a massive
global initiative aimed at connecting international
trading partners in the east and the west. The BRI
offers a tremendous potential to spur a new era
of trade, economic and industrial growth for the
countries in the Asia and beyond.
In order to maximize the benefits of BRI, the
participating countries require to develop adequate
technological workforce and engage in an alliance
for promotion of cross-border cooperation in the
Science, Technology and Innovation (STI) sectors.
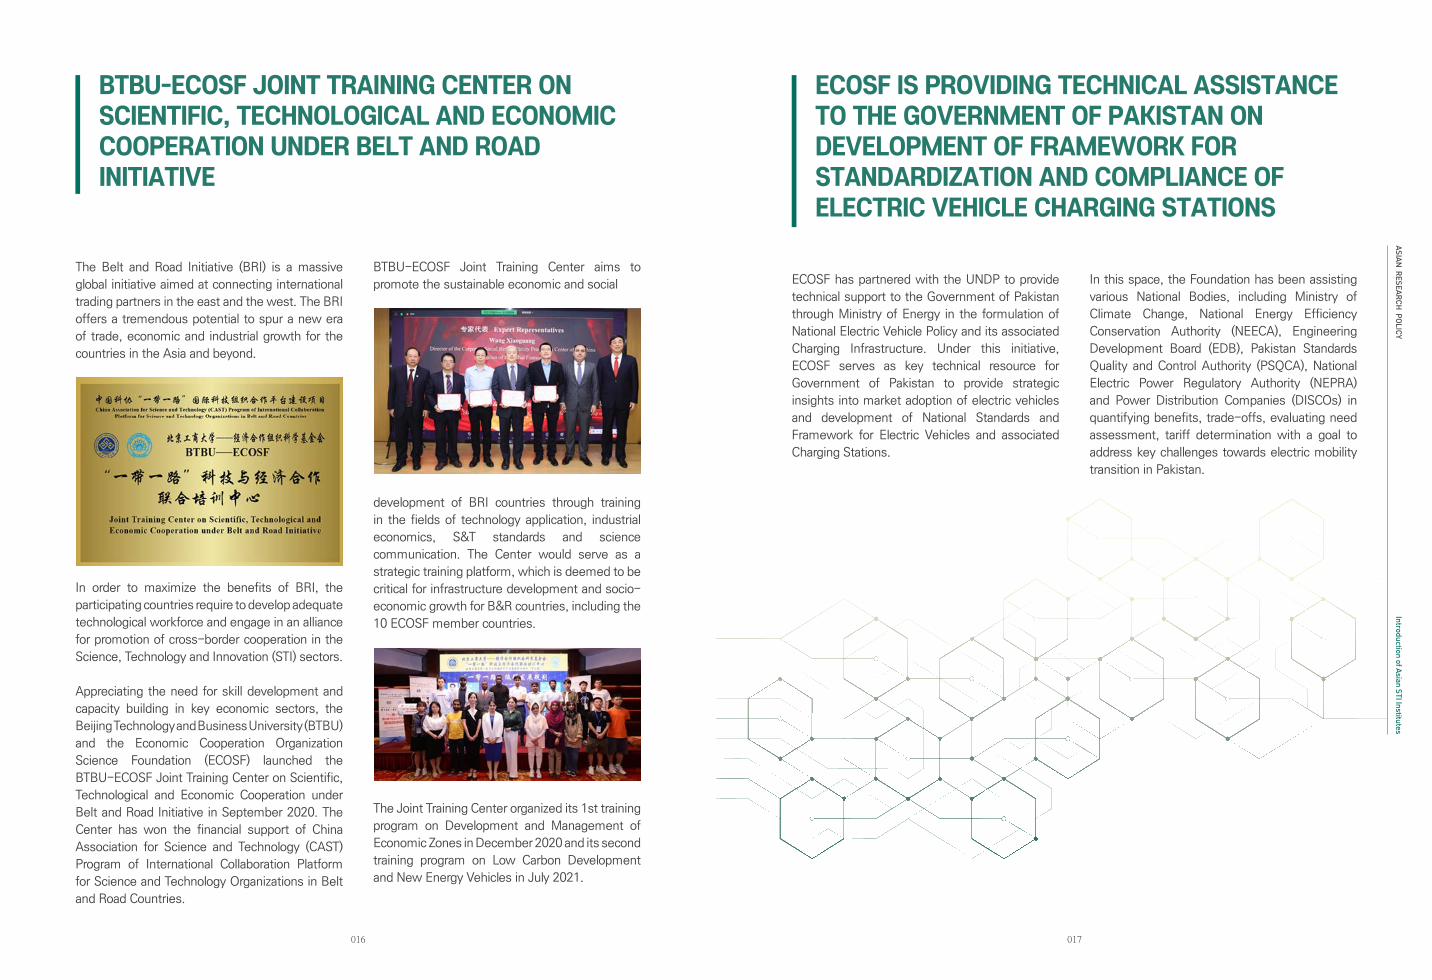
Appreciating the need for skill development and
capacity building in key economic sectors, the
Beijing Technology and Business University (BTBU)
and the Economic Cooperation Organization
Science Foundation (ECOSF) launched the
BTBU-ECOSF Joint Training Center on Scientific,
Technological and Economic Cooperation under
Belt and Road Initiative in September 2020. The
Center has won the financial support of China
Association for Science and Technology (CAST)
Program of International Collaboration Platform
for Science and Technology Organizations in Belt
and Road Countries.
BTBU-ECOSF Joint Training Center aims to
promote the sustainable economic and social
development of BRI countries through training
in the fields of technology application, industrial
economics, S&T standards and science
communication. The Center would serve as a
strategic training platform, which is deemed to be
critical for infrastructure development and socio-
economic growth for B&R countries, including the
10 ECOSF member countries.
The Joint Training Center organized its 1st training
program on Development and Management of
Economic Zones in December 2020 and its second
training program on Low Carbon Development
and New Energy Vehicles in July 2021.
ECOSF has partnered with the UNDP to provide
technical support to the Government of Pakistan
through Ministry of Energy in the formulation of
National Electric Vehicle Policy and its associated
Charging Infrastructure. Under this initiative,
ECOSF serves as key technical resource for
Government of Pakistan to provide strategic
insights into market adoption of electric vehicles
and development of National Standards and
Framework for Electric Vehicles and associated
Charging Stations.
In this space, the Foundation has been assisting
various National Bodies, including Ministry of
Climate Change, National Energy Efficiency
Conservation Authority (NEECA), Engineering
Development Board (EDB), Pakistan Standards
Quality and Control Authority (PSQCA), National
Electric Power Regulatory Authority (NEPRA)
and Power Distribution Companies (DISCOs) in
quantifying benefits, trade-offs, evaluating need
assessment, tariff determination with a goal to
address key challenges towards electric mobility
transition in Pakistan.
BTBU-ECOSF JOINT TRAINING CENTER ON SCIENTIFIC, TECHNOLOGICAL AND ECONOMIC COOPERATION UNDER BELT AND ROAD INITIATIVE
ECOSF IS PROVIDING TECHNICAL ASSISTANCE TO THE GOVERNMENT OF PAKISTAN ON DEVELOPMENT OF FRAMEWORK FOR STANDARDIZATION AND COMPLIANCE OF ELECTRIC VEHICLE CHARGING STATIONS
ASIAN RESEARCH
POLICY
019018
Introduction of Asian STI Institutes
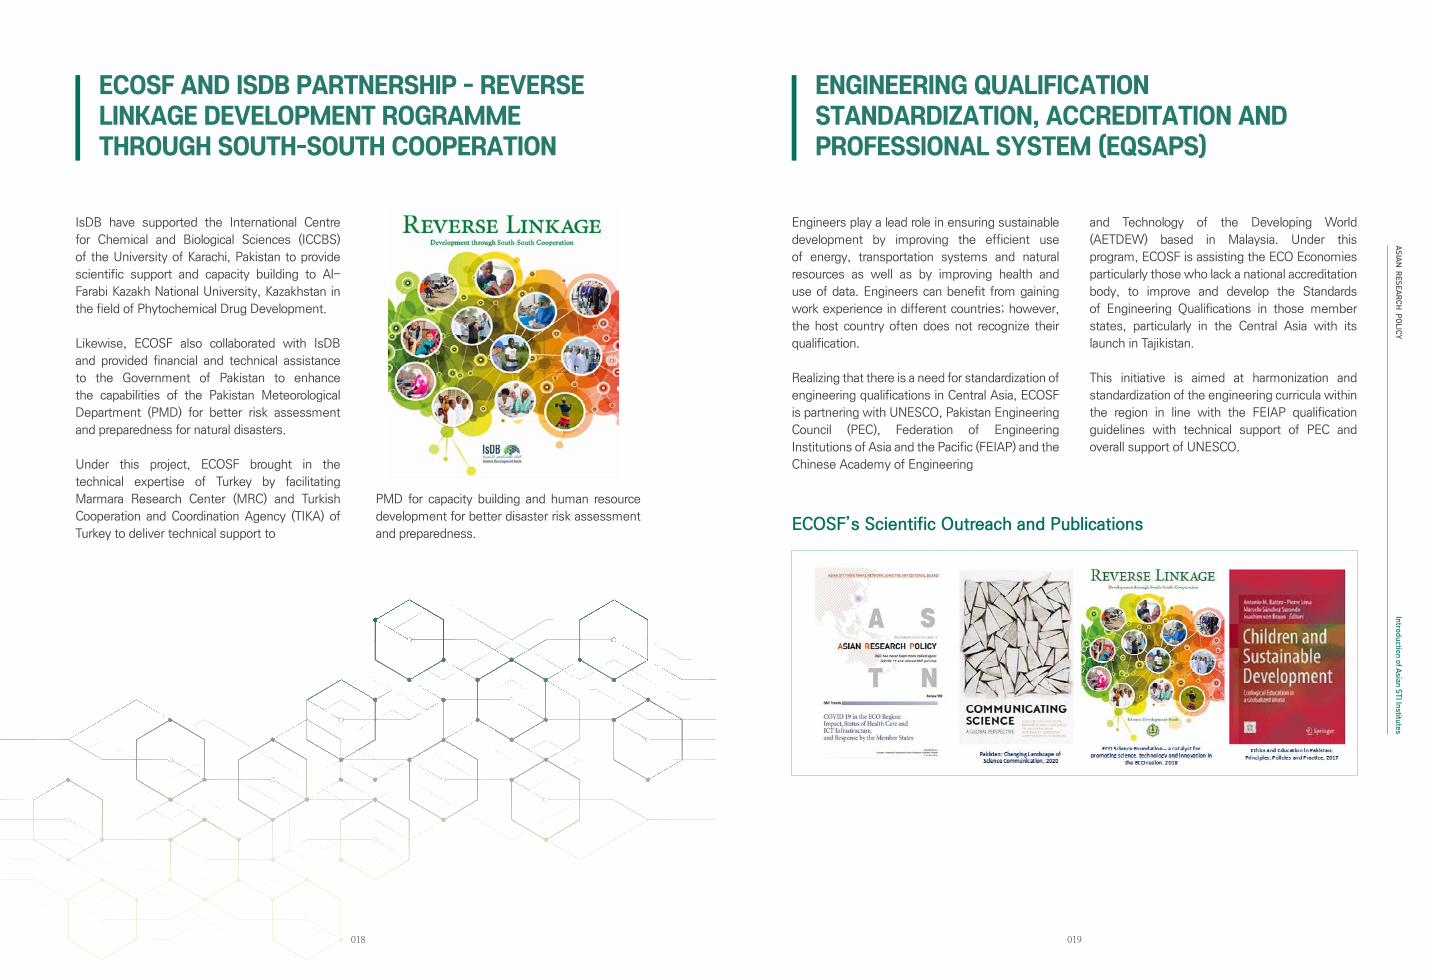
IsDB have supported the International Centre
for Chemical and Biological Sciences (ICCBS)
of the University of Karachi, Pakistan to provide
scientific support and capacity building to Al-
Farabi Kazakh National University, Kazakhstan in
the field of Phytochemical Drug Development.
Likewise, ECOSF also collaborated with IsDB
and provided financial and technical assistance
to the Government of Pakistan to enhance
the capabilities of the Pakistan Meteorological
Department (PMD) for better risk assessment
and preparedness for natural disasters.
Under this project, ECOSF brought in the
technical expertise of Turkey by facilitating
Marmara Research Center (MRC) and Turkish
Cooperation and Coordination Agency (TIKA) of
Turkey to deliver technical support to
ECOSF AND ISDB PARTNERSHIP - REVERSE LINKAGE DEVELOPMENT ROGRAMME THROUGH SOUTH-SOUTH COOPERATION
ENGINEERING QUALIFICATION STANDARDIZATION, ACCREDITATION AND PROFESSIONAL SYSTEM (EQSAPS)
PMD for capacity building and human resource
development for better disaster risk assessment
and preparedness.
Engineers play a lead role in ensuring sustainable
development by improving the efficient use
of energy, transportation systems and natural
resources as well as by improving health and
use of data. Engineers can benefit from gaining
work experience in different countries; however,
the host country often does not recognize their
qualification.
Realizing that there is a need for standardization of
engineering qualifications in Central Asia, ECOSF
is partnering with UNESCO, Pakistan Engineering
Council (PEC), Federation of Engineering
Institutions of Asia and the Pacific (FEIAP) and the
Chinese Academy of Engineering
and Technology of the Developing World
(AETDEW) based in Malaysia. Under this
program, ECOSF is assisting the ECO Economies
particularly those who lack a national accreditation
body, to improve and develop the Standards
of Engineering Qualifications in those member
states, particularly in the Central Asia with its
launch in Tajikistan.
This initiative is aimed at harmonization and
standardization of the engineering curricula within
the region in line with the FEIAP qualification
guidelines with technical support of PEC and
overall support of UNESCO.
ECOSF’s Scientific Outreach and Publications
ASIAN RESEARCH
POLICY
021020
Introduction of Asian STI Institutes
CSIR-National Institute of Science Communication and Policy Research (CSIR-NIScPR)has been established after the merger of two prestigious institutes of CSIR namely, CSIR-NISCAIR and CSIR-NISTADS working at the interface of S&T, Society; and Science Communication and Policy Research. CSIR-NISCAIR carries the legacy of pioneer in science communication and CSIR-NISTADS has legacy of leader in STI Policy Research.
The new institute is mandated to carry-out the research study for the following:
CSIR-NIScPR become a globally respected Think Tank and Resource Centre for
understanding Science, Technology & Innovation (STI)
Policy Research and Communication.
The activities of CSIR-NIScPR is distributed among the two verticals:
Broad area of undertaking policy research are:
Vision
Mission
To become a globally respected Think tank and resource center for
understanding Science, Technology & Innovation (ST&I)
Policy Research and Science Communication
To promote Science, Technology & Innovation (ST&I) policy studies
and science communication among diverse stakeholders and act
as a bridge at the interface of science, technology, industry and
society
• To provide evidence based policy advocacy on Techno-Socio-Economic issues
identified by CSIR/Government and other stakeholders
• To Identify ST&I needs for National missions and create road maps for Sustainable
Development
• To establish a repository of data, information, road-maps and policy documents
related to science, technology and innovation activities in India as well as the world
and create a digital Resource Centre for the Nation
• To provide linkages of communication among the scientific community in the form
of research journals in different areas of ST&I
A Science Communication
B Policy Research
• Innovation, Entrepreneurship & Diffusion Research
• Studies in Inclusive Health Research
• Studies in Science Communication (SC) Research
• Energy, Environment & Sustainability
• Agriculture & Sustainable Rural Development
• Traditional Knowledge (TK)
• Global Governance and Science Diplomacy Science Diplomacy
• To disseminate ST&I information to Society
• To harness information technology for science communication and publication
• To act as a facilitator in furthering the economic, social, industrial, scientific and
commercial development by providing timely access to relevant and accurate
information
• To collaborate with national and international Institutions and organizations having
objectives and goals similar to those of CSIR-NIScPR
ASIAN RESEARCH
POLICY
023022
Introduction of Asian STI Institutes
Major Achievements
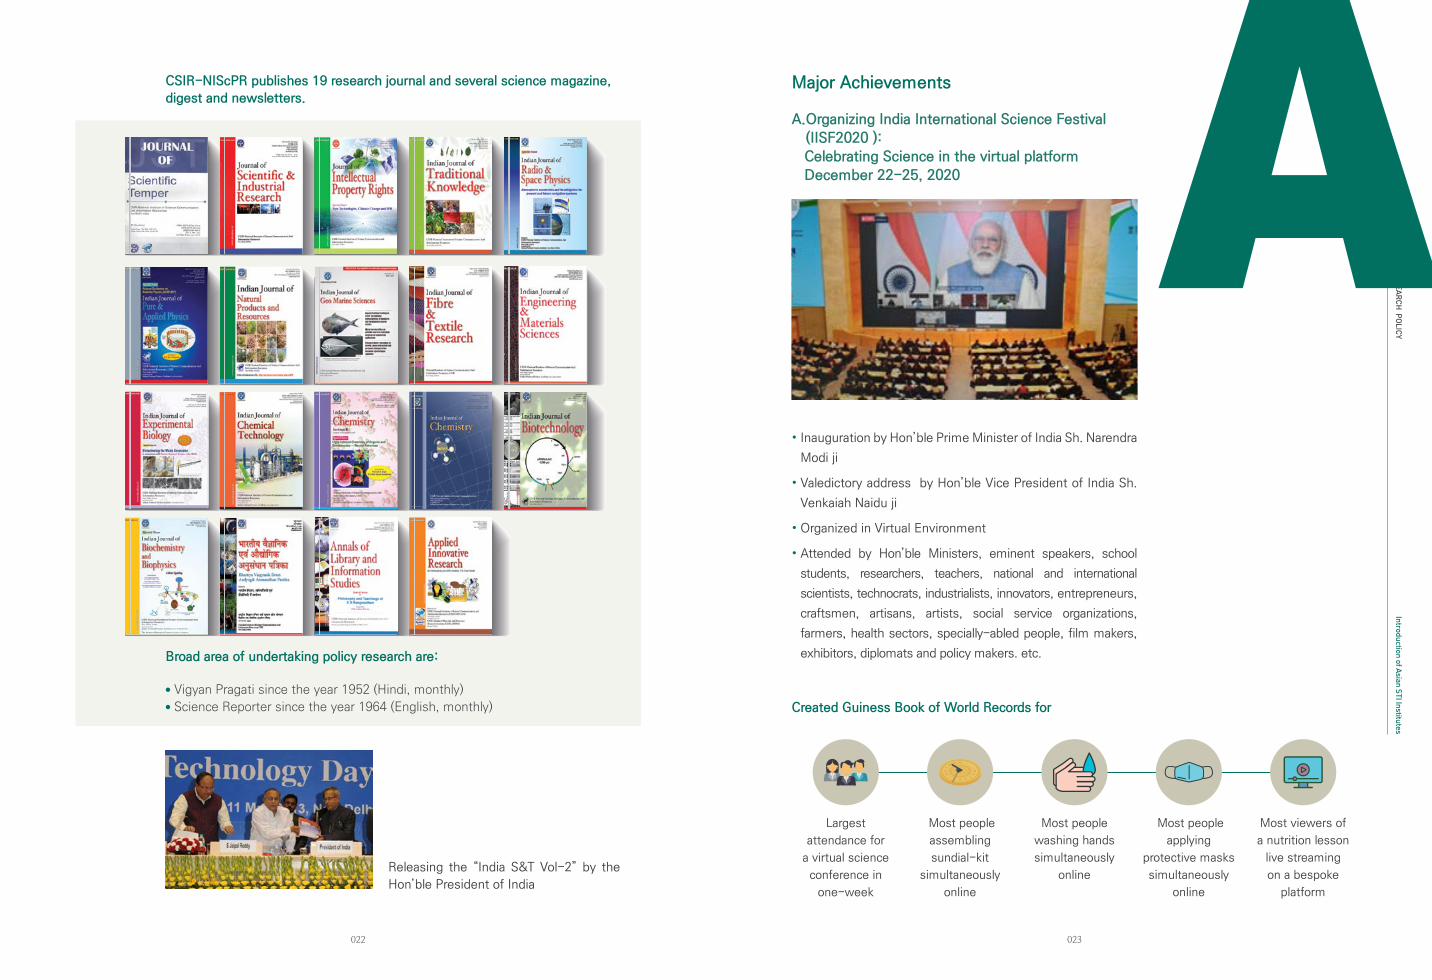
A. Organizing India International Science Festival
(IISF2020 ):
Celebrating Science in the virtual platform
December 22-25, 2020
• Inauguration by Hon’ble Prime Minister of India Sh. Narendra
Modi ji
• Valedictory address by Hon’ble Vice President of India Sh.
Venkaiah Naidu ji
• Organized in Virtual Environment
• Attended by Hon’ble Ministers, eminent speakers, school
students, researchers, teachers, national and international
scientists, technocrats, industrialists, innovators, entrepreneurs,
craftsmen, artisans, artists, social service organizations,
farmers, health sectors, specially-abled people, film makers,
exhibitors, diplomats and policy makers. etc.
Created Guiness Book of World Records for
ACSIR-NIScPR publishes 19 research journal and several science magazine,
digest and newsletters.
Broad area of undertaking policy research are:
● Vigyan Pragati since the year 1952 (Hindi, monthly) ● Science Reporter since the year 1964 (English, monthly)
Releasing the “India S&T Vol-2” by the
Hon’ble President of India
Largest
attendance for
a virtual science
conference in
one-week
Most people
assembling
sundial-kit
simultaneously
online
Most people
washing hands
simultaneously
online
Most people
applying
protective masks
simultaneously
online
Most viewers of
a nutrition lesson
live streaming
on a bespoke
platform
ASIAN RESEARCH
POLICY
025024
Introduction of Asian STI Institutes
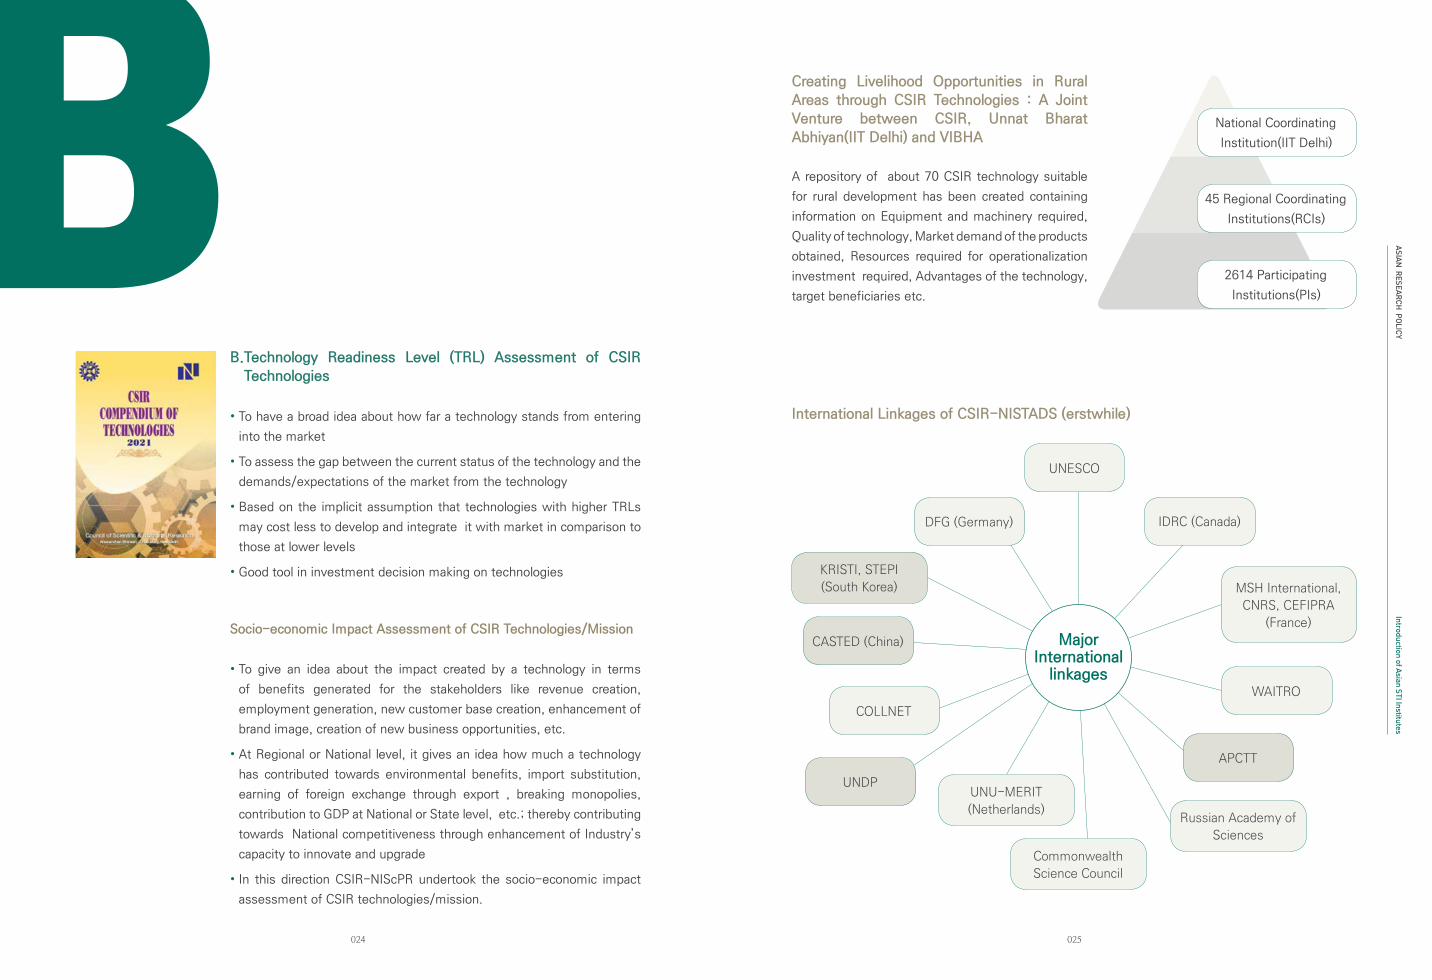
BB. Technology Readiness Level (TRL) Assessment of CSIR
Technologies
• To have a broad idea about how far a technology stands from entering
into the market
• To assess the gap between the current status of the technology and the
demands/expectations of the market from the technology
• Based on the implicit assumption that technologies with higher TRLs
may cost less to develop and integrate it with market in comparison to
those at lower levels
• Good tool in investment decision making on technologies
Socio-economic Impact Assessment of CSIR Technologies/Mission
• To give an idea about the impact created by a technology in terms
of benefits generated for the stakeholders like revenue creation,
employment generation, new customer base creation, enhancement of
brand image, creation of new business opportunities, etc.
• At Regional or National level, it gives an idea how much a technology
has contributed towards environmental benefits, import substitution,
earning of foreign exchange through export , breaking monopolies,
contribution to GDP at National or State level, etc.; thereby contributing
towards National competitiveness through enhancement of Industry’s
capacity to innovate and upgrade
• In this direction CSIR-NIScPR undertook the socio-economic impact
assessment of CSIR technologies/mission.
International Linkages of CSIR-NISTADS (erstwhile)
Creating Livelihood Opportunities in Rural
Areas through CSIR Technologies : A Joint
Venture between CSIR, Unnat Bharat
Abhiyan(IIT Delhi) and VIBHA
A repository of about 70 CSIR technology suitable
for rural development has been created containing
information on Equipment and machinery required,
Quality of technology, Market demand of the products
obtained, Resources required for operationalization
investment required, Advantages of the technology,
target beneficiaries etc.
National Coordinating
Institution(IIT Delhi)
45 Regional Coordinating
Institutions(RCIs)
2614 Participating
Institutions(PIs)
UNESCO
IDRC (Canada)
WAITRO
UNDP
COLLNET
CASTED (China)
APCTT
DFG (Germany)
MSH International,
CNRS, CEFIPRA
(France)
Russian Academy of
Sciences
KRISTI, STEPI
(South Korea)
Commonwealth
Science Council
UNU-MERIT
(Netherlands)
MajorInternational
linkages
ASIAN RESEARCH
POLICY
027026
Introduction of Asian STI Institutes
Reaching out to Society
• Bankura field station: STI based interventions for enhancing rural
capacity and traditional artisan industries of the district.
• Niche products, supply chain, enhancement of employment and
income.
• Development of institutionalised flower market in Delhi
• GIS based resource mapping & planning
• Proof of concept studies for air pollution monitoring, Ayurvatika,
carbon sequestration system
• Longitudinal studies on public engagement/understanding of
science
Communicating India’s Scientifically Validated Societal
Traditional Knowledge
Objective
Conserve Indian traditional knowledge and practices, inculcate
R&D temper of verifying tradition in a scientific manner and instil
confidence among the citizens regarding the scientific value of
Indian traditional knowledge/practices.
Knowledge and Awareness Mapping Platform “KAMP” is an International intellect
E-based assessment platform to evaluate cognizance of 21st century skills, awareness
and knowledge of Science, Technology & Humanities among students.
Objectives
• To help students identify their awareness and aptitude for Science, Technology and Humanities.
• To create awareness among students in emerging technologies
• To infuse a healthy competitive spirit through rewards, based on performance levels.
• Track student progress through a dynamic system.
• To create an performance index for all the participating schools/institutions.
Priority Areas
Mathematics, Astronomy, Architecture, Metallurgy, Water &
Sustainable Agriculture, Energy, Ecology & Environment, Indian
Medicine, Indian Commerce, and Indian Way of Education &
Philosophy
KISAN SABHA - Application for Supply Chain and Freight
Transportation Management System for Farmers
farmers directly to transporters, Service provider (for pesticides/
fertilizer/ dealers, cold store and warehouse owners, refrigerated
trucks, cold storage facilities, aqua farming and organic farming
options), Mandi dealers, customers (like big retail outlets, online
stores, institutional buyers) and other related entities.
Interference of middlemen is reduced, enhancing farmers’ margins.
CSIR-NIScPR
Policy
Advocacy
To provide actionable policy recommendations for
solving problems through S & T Interventions
Identify ST&I needs for National
missions by involving wide
variety of stakeholders
Promoting Linkages among
scientific community through
Research Journals in ST&I
Facilitate economic, social,
industrial, scientific and
commercial development by
providing timely access to
relevant & accurate information
through data repository and
publications
Developing linkages with reputed
global institutes, undertaking
comparative research studies to
learn from best practices
Popularizing Science among
masses through IT, Social
Media(Blogs, Twitter etc.)
Disseminate ST&I information to society and to develop
understanding about public perception of science
Creating repository of
information on ST&I research,
data, information, roadmaps,
policies, etc. (National Digital
resource center)
ST&I
Dissemination
ST&I
needs
roadmap
Create
ST&I
NDRC
ST&I
Research
Journals
Information
Access
Collaborate
Harness IT

ASIAN RESEARCH
POLICY
029028
ArticlesASIAN
RESEARCH POLICY
Articles
Articles
FLUD: Expert-curated large-scale machine comprehension dataset with advanced reasoning strategies
Yi-Chih Huang et al.
Exploring regional innovation system pathways for startups in India
Avinash Kshitij and Kasturi Mandal
ASIAN RESEARCH
POLICY
031030
Articles
Abstract
We introduce the Formosa Language Understanding Dataset (FLUD), a large open-domain Traditional Chinese machine reading comprehension dataset curated by professionals. FLUD contains more than 15,000 textual question-answer pairs and corresponding articles from Wikipedia, news, and elementary school textbooks. The questions are in the form of multichoice or short-answer problems, and the level of difficulty is evaluated by organizers of official language proficiency tests. In addition, we incorporate task-oriented multiround dialogue and record parts of the question-answer pairs spoken by humans to extend the breadth of this dataset. The aim is to design a more challenging dataset that requires advanced reasoning beyond straightforward span extraction techniques to answer the questions correctly. FLUD was used in two public machine-learning competitions, in which we conducted human evaluations on the difficulty of this corpus. Human evaluations on the accuracy of multichoice and short-answer problems amount to 89.6% and 62.7%, whereas the best machine performances are 53.7% and 40.8%, respectively. The public competitions energize the scientific and engineering community and the public to develop a sense of the possibilities and an urgent commitment to accelerate progress.
1 The Test of Chinese as a Foreign Language (TOCFL) is a set of standardized language proficiency tests developed for non-native speakers of Chinese.
1. Introduction
Language understanding technology is receiving considerable attention from the artificial intelligence (AI) and natural language processing (NLP) community and people in the general public. The application ranges from text classification to question answering (QA) and multiturn conversations. Furthermore, the machine needs to categorize documents, produce casual conversations, and respond to user questions regarding specific topics or tasks to be comprehensive. In order to boost development in this direction, we construct the Formosa Language Understanding Dataset (FLUD), of which the level
of difficulty is set to match “Band C” of the “Test of Chinese as a Foreign Language” (TOCFL) . This level roughly corresponds to “Advanced” in other language proficiency tests such as the Common European Framework of Reference for Languages. The corpus contains three different tasks: around 15,000 multiple-choice quizzes, more than 700 short-answer questions, and 20 task-oriented multiturn dialogues. The majority of this dataset contains audio recordings as well as accompanying textual content. Moreover, we design the questions with special attention to the linguistic and logical aspects of machine reading. The machine would require inference abilities beyond simple span extraction to answer the more advanced
2. Related Work
Many new large-scale reading comprehension datasets promote the rapid development of machine-learning models that can answer factual questions based on the provided information. This trend is pioneered by a notable breakthrough in the formulationof the Stanford Question Answering Dataset, or SQuAD (Rajpurkar et al., 2016). The innovation of this dataset lies in how the questions are composed; namely, each answer can be extracted in a reference article collected from Wikipedia. This dataset includes over 100,000 question-answer pairs along with their corresponding articles, which is much larger than previous work, e.g., MCTest (Richardson et al., (2013)). In addition, it is the first corpus that does not come in the form of multiple-choice questions, increasing the difficulty for a machine-learning model to guess the answer based on simple similarity measures between questions and choices. Another QA dataset published around the same time is the MS MARCO dataset (Nguyen et al. (2016)), which contains the same number of question-answer pairs, but with much more reference paragraphs (over 1 million). They are collected from user queries in the Bing search engine, and the answers have been composed by humans. TriviaQA (Joshi et al. 2017) studied this trend and made a few improvements. The 650,000 question-answer pairs and their corresponding document are collected from various trivia competition participants. Thus, they are created naturally, without reference documents. Then, the evidence articles are gathered from the Internet and Wikipedia. As a result, these questions are claimed to be more realistic and organic. The comprehension
and inference of various sources, such as news, encyclopedias, and social media, is required to answer the questions in TriviaQA correctly. Subsequently, more QA datasets emerge, (e.g., HotpotQA Yang et al. (2018), ReCoRD Zhang et al. (2018), Cosmos QA Huang et al. (2019), and TYDI QA Clark et al. (2020)).
Almost all existing large-scale QA datasets consist of English content, whereas two notable Chinese corpora have been proposed, i.e., DuReader (He et al. (2018)) and DRCD (Shao et al. (2018)). The former includes simplified Chinese QA and the latter Traditional Chinese. DuReader contains questions from search engines as well as online forums, and the answers are generated by humans. There are 200,000 questions, 420,000 answers, and one million reference documents. DRCD stands for Delta Reading Comprehension Dataset, as constructed by Delta Electronics, Inc. It is an open-domain QA dataset, including over 10,000 paragraphs, 2,000 documents from Wikipedia, and over 30,000 questions. Similar to SQuAD and other extractive QA, the answer to each question can be extracted entirely from the accompanying paragraph and ismanually created by humans. The newly constructed FLUD stands out from previous research in several aspects. First, multiple logical inference techniques or linguistic knowledge are required to answer a question correctly. The answer to a question often cannot be directly extracted from the document. Second, open-ended essay questions can also be answered using the accompanying document apart from questions with exact answers. In addition, many multiple-choice
FLUD: Expert-curated large-scale machine comprehension dataset with advanced reasoning strategiesYi-Chih Huang1,*, Yu-Lun Hsieh1, Yi-Yu Lin1, Teo Lin Hui1,
Hung-Ying Chu1, Wen-Lian Hsu1
1 Science & Technology Policy Research and Information Center,
National Applied Research Laboratories, Taipei 10636, Taiwan * Correspondence: [email protected]
questions correctly.
The main contributions of this work are as follows. (1) We introduce the novel FLUD, the first large-scale, open-domain machine reading comprehension dataset with TOCFL Band C level questions and accompanying audio recordings. (2) To the best of our knowledge, it is the first corpus that considers deeper language understanding techniques common in human language and communication. (3) For national technology policy, it is also the most extensive Taiwanese Mandarin speech QA corpus that can
enrich the development of accent-robust automatic speech recognition systems. (4) We conduct an extensive human evaluation of the quality and validity of the dataset’s content and compare results from machine-learning models, providing us with a general understanding of current AI technologies used to solve these types of tasks.
ASIAN RESEARCH
POLICY
033032
Articles
questions and task-oriented dialogue scripts are also included, further increasing the diversity of this dataset. Lastly, there are advanced questions where the answer covers multiple, noncontinuous spans of the
reference article. These characteristics greatly enhance the level of understanding required to respond correctly to the questions.
3. Methodology
In this section, we describe how this corpus is constructed, including the collection of documents from various sources and composing the questions. Notably, The primary aims of building this dataset are to boost the development of machine reading comprehension and to be able to release it to the general public. Therefore, special attention is paid to assert the copyright of this data and the difficulty of the questions.
3.1. Data Collection
There are three parts in FLUD, namely, multiple-choice QA, short-answer QA, and dialogues. In this section, we introduce in detail the construction of each part.
3.1.1. Multiple-choice Questions
The first section of FLUD contains multiple-choice questions and their corresponding articles. There are 1,000 Band C and approximately 14,000 Band B level questions in this portion, respectively. According to TOCFL, the Band C level is designed for the following types of learners:
1. Non-native Chinese speakers at the advanced level.2. Studied Chinese for over 960 hours in Taiwan or for
1,920 hours in non-Chinese-speaking regions.3. Familiar with about 8,000 Chinese vocabulary
terms.
Taking content diversity into consideration, we collect articles from the Science Development magazine and Chinese literary classics. The question domains include festivals, cuisines, traveling, music, sport, leisure, social and cultural topics in Taiwan, classical literature, Internet phenomenon, environment, and news in multichoice questions.
Nevertheless, collecting high-quality speech data that corresponds to the above content is time-consuming. In order to solve this problem, we inquire organizations such as radio stations to authorize us with the right to use their programs along with raw data from radio shows. For example, the Police Broadcasting Service (PBS) provideddaily news in 2018,and the National Education Radio contributed archived programs from 2012 to 2017. Moreover, we recruited more than 50 speakers to participate in the speech recording of the remaining questions. See Table 1for the sources, data type, and data for matfor this portion of the FLUD dataset.
After acquiring raw data, either in text or speech,we perform data cleaning for further use. We recruit annotators to carefully type and check every word while listening to the radio program. Then, they are asked to generate one to five questions from an article. Each question has four options and one answer. Answers to each question could be contained inthe article, while others may not. One example of a multiple-choice question set is listed in Table 2. Note that the exact wordsof the answer to this question are
Source Data type Format
National Education Radio (NER) text and speech Mono,16kHz, 16 bits PCM, *.wav
Police Broadcasting Service (PBS) text and speech Mono,16kHz, 16 bits PCM, *.wav
Science development (online
magazine)text and speech Mono,16kHz, 16 bits PCM, *.wav
Chinese literary classics text and speech Mono,16kHz, 16 bits PCM, *.wav
Paragraph
臺灣有水果王國之美稱,一年四季都可以嘗到不同的水果,因為有多變化的地形,而且氣候舒適。春季有梅子、李子、琵琶,吃在嘴裡甜在心裡;夏季出產消暑解渴的西瓜、芒果、荔枝等,趕走悶熱的夏天;秋天正好吃柚子過中秋;冬季可以吃柑橘類:金棗、柑橘、柳丁酸甜滋味好像戀愛的感覺;一年四季更有鳳梨、蓮霧、木瓜等水果可以品嚐,臺灣的水果真好吃,如果來台灣旅遊,一定要試試看當季的水果。
Taiwan is known as the Kingdom of Fruits. Different fruits can be tasted all year round because of the changing
terrain and the comfortable climate. In the spring, there are plums, apricots, and loquat, etc., which you could feel
the sweet in your heart when tasting. In summer, there are thirst-quenching watermelons, mangoes, lychees,
etc. to get rid of the sultry summer. In autumn, you can eat pomelo for mid-autumn festival. In winter, you can
eat citrus: kumquat, citrus, orange, etc., the sweet and sour taste makes people feel that they are in love. There
are pineapple, wax apple, papaya and other fruits that can be tasted throughout the year. Fruits in Taiwan are really
delicious. If you come to Taiwan, you must try fruits in season
Question
請問文中的當季是什麼意思? What does “in season” mean in the text?
Paragraph
1. 主要的季節 Main season
2. 符合生產的季節 Growing season
3. 豐富的水果種類 Rich variety
Paragraph
2. 符合生產的季節 Growing season
Table 1. Source and data types of multiple-choice questions Table 2. An example of multiple-choice QA, along with the reference article in FLUD, with English translations
not present in the reference article.
3.1.2. Short-Answer Questions
We also utilize multiple sources for the second part of FLUD when collecting the short-answer and essay questions. The first major source is the Traditional Chinese version of Wikipedia (shortened as WTC hereafter). We gathered over 1,000 articles from WTC dumped on Aug. 20, 2019. Another source is from all elementary school textbooks published by the Taiwanese government before 1980 since they are open to the public. Next, we collected news articles from online news sites. The last source is the archive of public announcements made by the Taiwanese government. After collecting and cleaning the raw textual data, the question-answer pairs are manually created by three curators. In order to ensure the quality and accuracy of the answer(s), they are cross-checked by all curators. In the end, we compiled a training set of 746 question-answer pairs and over 100 related documents. Each question is assigned 1
or 2 points according to its complexity and difficulty.
More specifically, we design these questions so that they can cover a wider range of NLP techniques than straightforward span extraction. In order to answer theshort-answer questions correctly, the human/machine requires multiple types of inference strategies. The eight categories includel exical definition, enumeration, temporal relation, spatial relation, quantity, entailment, causal relation, and essay questions. For the reader’s reference, the original Chinese termsare “字義, 列舉, 時間關係, 空間關係, 數量, 蘊含, 因果, 申論,” respectively. There are also combinatory questions that require more than one of these types of methods. Detailed descriptions and some examples are as follows.
• Lexical definition: Using synonymy, hyponymy, antonymy, and definition information to understand the question. For instance, the question “What is the lastname of the U.S. President?” requires the definition of “last name.”
ASIAN RESEARCH
POLICY
035034
Articles
Paragraph
國產毛豆去年外銷產值創下28年來的新高,外銷量3萬7520公噸,貿易額高達8118萬美元(約新台幣24.5億元),並促成7家冷凍食品公司於國內建新廠或擴廠,共投資計30億元,創造上千個就業機會,堪稱是「台灣綠金」!「毛豆」即未成熟且呈青綠色的食用大豆,全株的鮮莢80%達飽滿時,此時豆莢呈綠色帶有茸毛,故名為「毛豆」,又稱「菜用大豆」,日本稱為「枝豆」。一般豆類含有棉籽糖,容易引起脹氣。但毛豆的棉籽糖含量少,卻有豐富的鉀,可以改善因為缺乏鉀離子造成的倦怠和食欲下降,常做為開胃菜;它比一般豆類有更多優質蛋白質,被稱作植物肉,很適合素食者補充營養。農委會高雄區農業改良場長戴順發指出,近10年以來,臺灣的毛豆產業在周國隆先生和高、屏地區農民的通力合作下,除銷往日本占85.4%外,也銷往美國、加拿大等24個國家。戴順發說明,我國冷凍毛豆產品的產值,在日本市占率達到44.8%,分別是競爭對手泰國、中國的1.63、1.91倍,平均每公斤價格為250日圓,更較中國的189日圓31.9%。戴順發強調,高雄場領航品種研發,推出「高雄9號-綠晶」及「高雄11號香蜜茶豆」等高產毛豆品種授權產業界應用,同時為保護智慧財產權,除了申請國內品種權外,也向日本申請品種權,讓我國毛豆以創新研發勝出,跳脫市場削價競爭,也證明持續推動產業升級,是永續經營的方針。
The domestic export value of domestic edamame reached a new 28-year high, with an external sales
volume of 37,520metric tons and a trade volume of US$81.18 million (about NT$ 2.45 billion). It also helped 7
frozen food companies tobuild new plants or expand factories in Taiwan. With an investment of NT$ 3 billion and
thousands of job opportunities, itis called “Taiwan Green Gold”! “Edamame” is the immature and greenish-colored
edible soybean. When the fresh pods ofthe whole plant are 80% full, the pods are green with fuzz, so it is called
“edamame”, also known as “vegetable soybean”,and it is called “edamame bean” in Japan. Generally, beans
contain cottonseed sugar, which may cause flatulence.
Question
1. 毛豆是否為台灣的經濟作物? Is edamame a Taiwanese cash crop?
2. 有「台灣綠金」之稱的是哪一種植物? Which plant is called “Taiwan Green Gold”?
3. 毛豆從哪一年開始外銷的? From what year did the edamame export start?
4. 毛豆有哪些別名? What other names are there for edamame?
5. 吃了豆類造成脹氣的原因是哪一種成份? What is the cause of flatulence from eating beans?
6. 文本中指出毛豆有哪些營養成份? In the text, which nutrients are found in edamame?
7. 多吃毛豆是否有益健康? Is eating edamame healthy?
8. 台灣毛豆外銷至哪些地區? To which countries are Taiwanese edamame exported?
9. 台灣毛豆的產區集中於何處? Where is the production area of Taiwanese edamame concentrated?
10. 欲申請品種權專利的毛豆品種是哪兩項? What are the two varieties of edamame that have applied for
various patents?
11. 毛豆成為「台灣綠金」的優勢有哪些面向? What are the advantages of edamame as the “Taiwan Green
Gold”?
Table 3. An example article in FLUD, with English translations, as the question reference
4. Evaluation
In this section, we first depict the design and the results of the human evaluation of FLUD. Then, we provide the machine performances achieved in the open competitions in which this dataset was used.
4.1. Human Evaluation
A predefined test set is split from FLUD for the purpose of the competition. Therefore, we assess human performance on the test set as the bar for machine-learning models. The human evaluation is divided into three parts according to the question format (e.g., multiple-choice, short-answer, and chatbot). First, similar to the TOCFL online test, 10 participants are asked to complete an exam with 50 multichoice questions in the form of spoken content. The duration of the test is 70 minutes. When recruiting the participants, the minimum education level is set as college or graduate school. The result of the human performance evaluation on the test set with multiple-choice questions is 89.6% in terms of accuracy.
Second, we randomly selected 30 from 167 participants who volunteered to join the short-answer exam in our study. Those who want to join the exam should meet the criteria as follows:
• foreigners who passed TOCFL Band C, • or native speakers with a senior high school degree.
All of them are instructed to complete 50 short-answer questions individually, in the form of an online survey. The distribution of the question’s level of difficulty matches that of the competition for machines. In other words, the number of basic and advanced questions match those in the competition. In the end, the average score is 50.21 out of 80. Therefore, the accuracy is equal to 62.7%.
For the last part of the test, namely, task-oriented conversational agent, we recruit five participants to perform multiround dialogue. Notably, the competition organizerselects five as the final testing category out of the 20 provided training topics in FLUD, including travel recommendations, restaurant reservations, insurance, car rentals, and housing loans. Therefore, each of the five participants in this experiment corresponds to one of those categories. Meanwhile, the participants in this experiment must have at least one year of customer service experience. The human customer service score is evaluated by a committee of five judges identical to the machine competition. In the end, the human score is 18 out of 20, denoting an accuracy of 90%.
4.2. Performance of Machine-Learning Models
• Enumeration: The model must selectively extract multiple spans from the reference document. For example, we provide an article regarding COVID-19 and ask the question, “What are the symptoms of COVID-19?” The answers may be scattered over different parts of the reference article.
• Temporal relation: The model must know the meaning of, e.g., “next month,” “last year,” regarding the current or a specific day. For example, the reference article can be about the stock price of company X separated by year. We may ask: “What was the value of company X last year?”
• Spatial relation: The use of relations such as “on top of” and “within” to find the answer. For example, we can include a news article regarding an earthquake and the city’s name in which the center is located. We may ask: “In what province did the earthquake originate?”
• Quantity: The ability to count or compare quantity. For example, there is an article about the number of deaths and hospitalized people due to COVID-19 and SARS-related diseases. We can then ask: “How many people were affected?” or “Which disease is more lethal?”
• Entailment: Understanding the logical relations betweenevents or entities, such as “A contradicts with B” or “A entails B.” For instance, given the information “X is married to Y,” one can answer, “Is Y a family member of X?”
• Causal relation: Utilizing the cause-effect relations in the document. For example, given the sentence “The disease can spread to birds, pigs, and humans.” One can answer thequestion, “Can this disease affect multiple species?”
• Essay questions: the answer consists of a longer segment, often more than one sentence. It can be thought of as a form of summarization. There can be more than one correct response, as long as they correspond to the content ofthe reference article.
One example of a multiple-choice question set is shown in Table 3.
3.1.3. Task-oriented Dialogue
Lastly, FLUD also incorporates conversation scripts for 20 tasks. We compose 20 scripts, each targeting a specific task, as the training data of task-oriented conversational agents. They include train ticket reservations, purchasing home appliances, ordering drinks, travel recommendations, foreign exchange, savings account, restaurant reservations, sports game ticket reservations, and car rentals. We compose spreadsheets for each with important information that is required for their completion. Notably, there are situations where more than one client may contact the agent for some of these tasks, or the same client may call multiple times to change their previous request. We believe that these scenarios are more realistic and useful when training a task-oriented conversational machine.
ASIAN RESEARCH
POLICY
037036
Articles
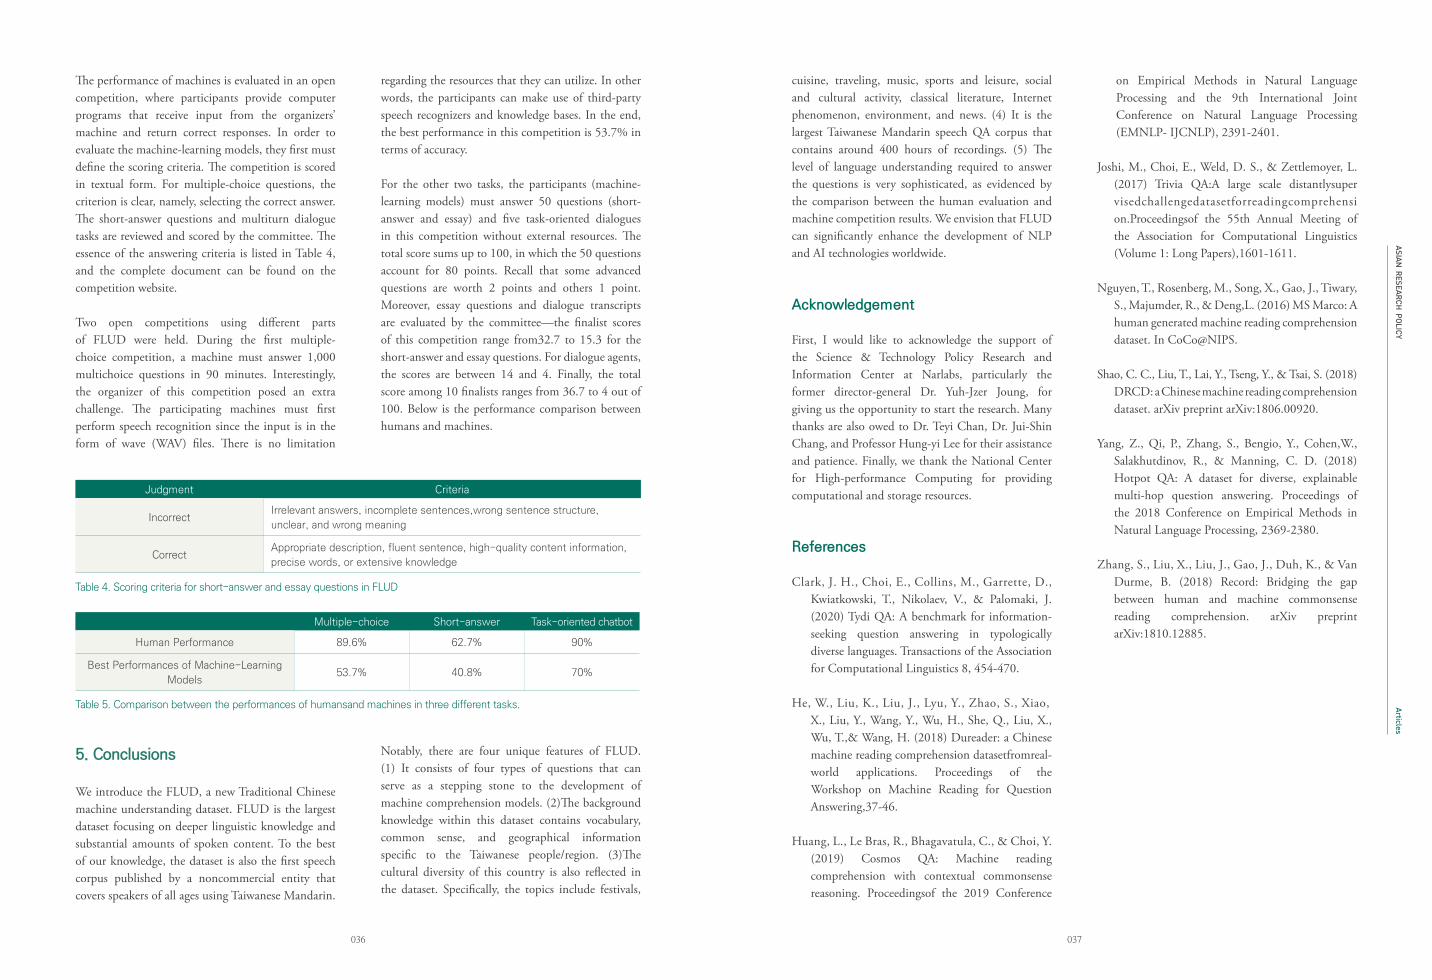
Judgment Criteria
IncorrectIrrelevant answers, incomplete sentences,wrong sentence structure,
unclear, and wrong meaning
CorrectAppropriate description, fluent sentence, high-quality content information,
precise words, or extensive knowledge
Table 4. Scoring criteria for short-answer and essay questions in FLUD
Multiple-choice Short-answer Task-oriented chatbot
Human Performance 89.6% 62.7% 90%
Best Performances of Machine-Learning
Models53.7% 40.8% 70%
Table 5. Comparison between the performances of humansand machines in three different tasks.
5. Conclusions
We introduce the FLUD, a new Traditional Chinese machine understanding dataset. FLUD is the largest dataset focusing on deeper linguistic knowledge and substantial amounts of spoken content. To the best of our knowledge, the dataset is also the first speech corpus published by a noncommercial entity that covers speakers of all ages using Taiwanese Mandarin.
Notably, there are four unique features of FLUD. (1) It consists of four types of questions that can serve as a stepping stone to the development of machine comprehension models. (2)The background knowledge within this dataset contains vocabulary, common sense, and geographical information specific to the Taiwanese people/region. (3)The cultural diversity of this country is also reflected in the dataset. Specifically, the topics include festivals,
The performance of machines is evaluated in an open competition, where participants provide computer programs that receive input from the organizers’ machine and return correct responses. In order to evaluate the machine-learning models, they first must define the scoring criteria. The competition is scored in textual form. For multiple-choice questions, the criterion is clear, namely, selecting the correct answer. The short-answer questions and multiturn dialogue tasks are reviewed and scored by the committee. The essence of the answering criteria is listed in Table 4, and the complete document can be found on the competition website.
Two open competitions using different parts of FLUD were held. During the first multiple-choice competition, a machine must answer 1,000 multichoice questions in 90 minutes. Interestingly, the organizer of this competition posed an extra challenge. The participating machines must first perform speech recognition since the input is in the form of wave (WAV) files. There is no limitation
regarding the resources that they can utilize. In other words, the participants can make use of third-party speech recognizers and knowledge bases. In the end, the best performance in this competition is 53.7% in terms of accuracy.
For the other two tasks, the participants (machine-learning models) must answer 50 questions (short-answer and essay) and five task-oriented dialogues in this competition without external resources. The total score sums up to 100, in which the 50 questions account for 80 points. Recall that some advanced questions are worth 2 points and others 1 point. Moreover, essay questions and dialogue transcripts are evaluated by the committee—the finalist scores of this competition range from32.7 to 15.3 for the short-answer and essay questions. For dialogue agents, the scores are between 14 and 4. Finally, the total score among 10 finalists ranges from 36.7 to 4 out of 100. Below is the performance comparison between humans and machines.
cuisine, traveling, music, sports and leisure, social and cultural activity, classical literature, Internet phenomenon, environment, and news. (4) It is the largest Taiwanese Mandarin speech QA corpus that contains around 400 hours of recordings. (5) The level of language understanding required to answer the questions is very sophisticated, as evidenced by the comparison between the human evaluation and machine competition results. We envision that FLUD can significantly enhance the development of NLP and AI technologies worldwide.
Acknowledgement
First, I would like to acknowledge the support of the Science & Technology Policy Research and Information Center at Narlabs, particularly the former director-general Dr. Yuh-Jzer Joung, for giving us the opportunity to start the research. Many thanks are also owed to Dr. Teyi Chan, Dr. Jui-Shin Chang, and Professor Hung-yi Lee for their assistance and patience. Finally, we thank the National Center for High-performance Computing for providing computational and storage resources.
References
Clark, J. H., Choi, E., Collins, M., Garrette, D., �Kwiatkowski, T., Nikolaev, V., & Palomaki, J. (2020) Tydi QA: A benchmark for information-seeking question answering in typologically diverse languages. Transactions of the Association for Computational Linguistics 8, 454-470.
He, W., Liu, K., Liu, J., Lyu, Y., Zhao, S., Xiao, X., Liu, Y., Wang, Y., Wu, H., She, Q., Liu, X., Wu, T.,& Wang, H. (2018) Dureader: a Chinese machine reading comprehension datasetfromreal-world applications. Proceedings of the Workshop on Machine Reading for Question Answering,37-46.
Huang, L., Le Bras, R., Bhagavatula, C., & Choi, Y. (2019) Cosmos QA: Machine reading
comprehension with contextual commonsense reasoning. Proceedingsof the 2019 Conference
on Empirical Methods in Natural Language Processing and the 9th International Joint Conference on Natural Language Processing (EMNLP- IJCNLP), 2391-2401.
Joshi, M., Choi, E., Weld, D. S., & Zettlemoyer, L. (2017) Trivia QA:A large scale distantlysupervisedchallengedatasetforreadingcomprehension.Proceedingsof the 55th Annual Meeting of the Association for Computational Linguistics (Volume 1: Long Papers),1601-1611.
Nguyen, T., Rosenberg, M., Song, X., Gao, J., Tiwary, S., Majumder, R., & Deng,L. (2016) MS Marco: A human generated machine reading comprehension dataset. In CoCo@NIPS.
Shao, C. C., Liu, T., Lai, Y., Tseng, Y., & Tsai, S. (2018) DRCD: a Chinese machine reading comprehension dataset. arXiv preprint arXiv:1806.00920.
Yang, Z., Qi, P., Zhang, S., Bengio, Y., Cohen,W., Salakhutdinov, R., & Manning, C. D. (2018) Hotpot QA: A dataset for diverse, explainable multi-hop question answering. Proceedings of the 2018 Conference on Empirical Methods in Natural Language Processing, 2369-2380.
Zhang, S., Liu, X., Liu, J., Gao, J., Duh, K., & Van Durme, B. (2018) Record: Bridging the gap between human and machine commonsense reading comprehension. arXiv preprint arXiv:1810.12885.
ASIAN RESEARCH
POLICY
039038
Articles
1. Introduction
The concept of regional science is an important part of the literature on innovation system as it explains how regional economic processes operate to produce agglomeration, urbanization, and industrialization. Economists have recently rediscovered the importance of this field and labeled it “new economic geography.” Traditionally, regional science and industrial innovation studies have focused on new rationalization strategies within enterprises. Sternberg and Muller (2005) highlighted that entrepreneurial activity is largely a regional event. They argued that local conditions are more significant if an individual decides to be an entrepreneur or an enterprise survives and grows. Industrial clusters and regional economic growth are correlated. Consistent with the literature on innovation systems, enterprises are neither atomistic nor do they interact with others based only on business considerations. Any business activity is embedded in a broader socio-institutional context; therefore, the economic dimensions or relationships cannot be separated from the socio-institutional ones. In this context, Regional Innovation System (RIS) explains the phenomenon well where business activity is embedded in a socio-institutional context where the relationship between that context, namely, the regional environment, and entrepreneurial activities is analyzed. According to Feldman and Martin (2005), enterprises’ success and regional economic growth are mutually dependent. Knowledge-based new enterprises positively influence RIS in various ways (Koschatzky, 2001). Malecki and Spigel (2013)
claimed that entrepreneurs have more to learn from their local environment and other actors within it (Zahra et al., 2006). In case of startups, entrepreneurs’ interregional connections enrich their socio-institutional capacity and increase their survival rate. A regional startup ecosystem is an effective method for endorsing regional innovation and developing the business environment, along with securing the growth of domestic product and employment in a country (Krajcik and Formanek, 2015). These associations between institutions linking knowledge-producing hubs, such as universities and public research labs within a region, and innovative enterprises leads to knowledge spill over among various organizations, thus increasing a region’s overall innovativeness (Cooke et al., 1997).
In this context, India is considered the next Asian wonder owing to its rising entrepreneurial success (Huang, 2008). The government's grip on the economy is limiting, and there are indicators that India is transitioning toward a market-oriented economy. India has also established a clear-cut policy and goal of becoming a premier business-friendly economy (World Bank, 2008). Startups and small businesses have played a critical role in India’s economy, with the world's third-largest startup population (ET, 2016b). India is likely to have more than 45 million small- and medium-sized enterprises (SMEs), accounting for more than 40% of the country's gross domestic product (GDP) (ET, 2016b).The State's domination over the economy is gradually declining and there are indications that the country is
Exploring regional innovation system pathways for startups in IndiaAvinash Kshitij1,*, Kasturi Mandal1
1 CSIR-National Institute of Science Communication and Policy Research (CSIR-NIScPR),
New Delhi 110012, India* Correspondence: [email protected]
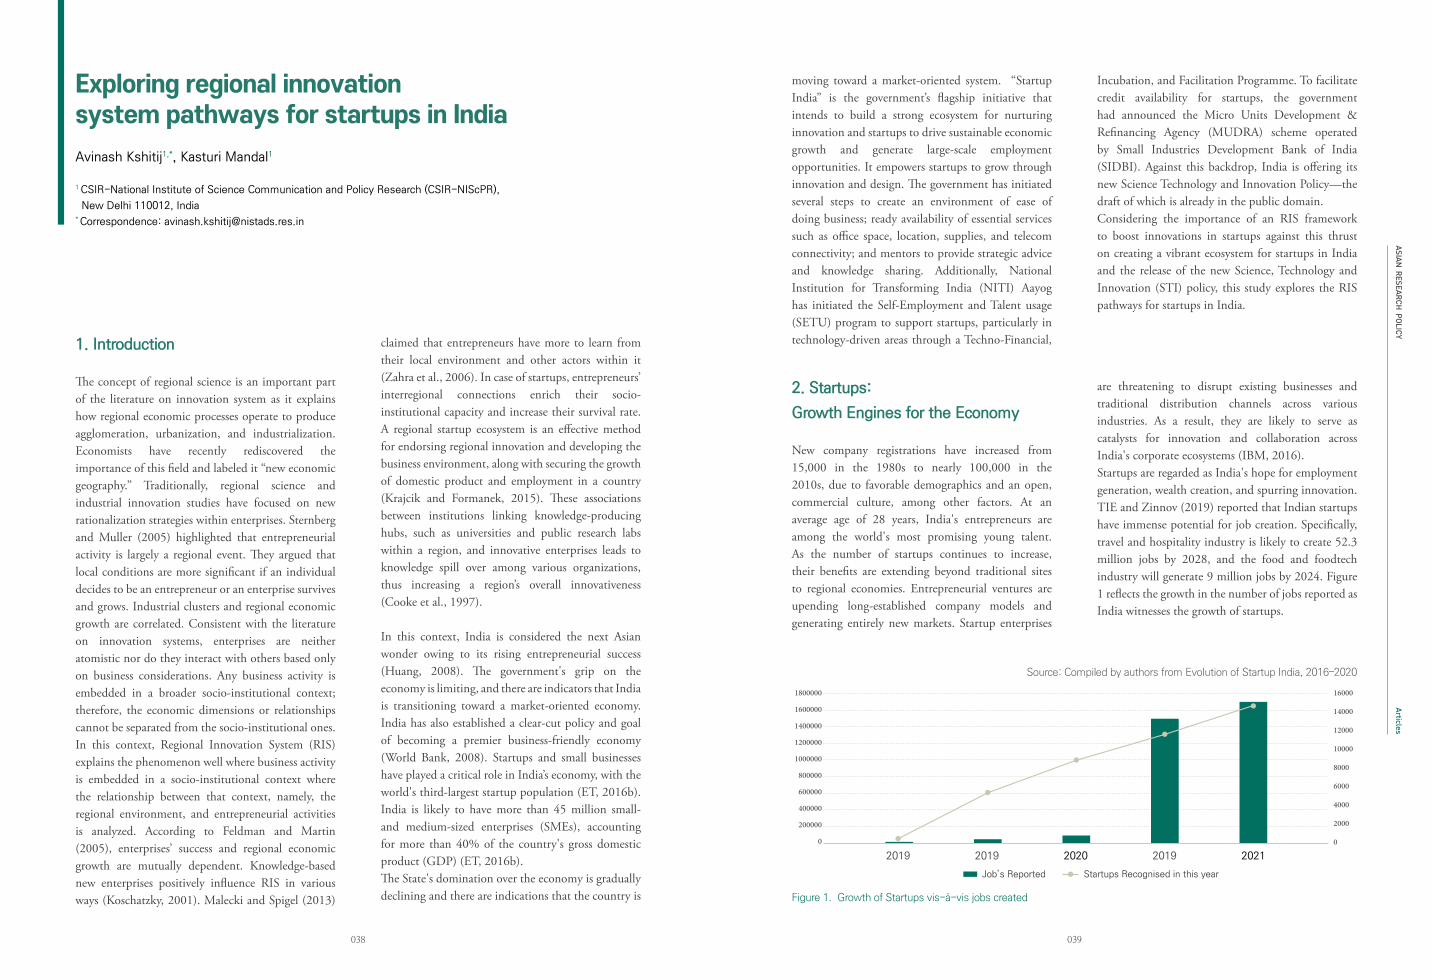
Figure 1. Growth of Startups vis-à-vis jobs created
1800000
1600000
1400000
1200000
1000000
800000
600000
400000
200000
0
16000
14000
12000
10000
8000
6000
4000
2000
0
2019 2019 20192020 2021
Job’s Reported Startups Recognised in this year
2. Startups:
Growth Engines for the Economy
New company registrations have increased from 15,000 in the 1980s to nearly 100,000 in the 2010s, due to favorable demographics and an open, commercial culture, among other factors. At an average age of 28 years, India's entrepreneurs are among the world's most promising young talent. As the number of startups continues to increase, their benefits are extending beyond traditional sites to regional economies. Entrepreneurial ventures are upending long-established company models and generating entirely new markets. Startup enterprises
are threatening to disrupt existing businesses and traditional distribution channels across various industries. As a result, they are likely to serve as catalysts for innovation and collaboration across India's corporate ecosystems (IBM, 2016).Startups are regarded as India's hope for employment generation, wealth creation, and spurring innovation. TIE and Zinnov (2019) reported that Indian startups have immense potential for job creation. Specifically, travel and hospitality industry is likely to create 52.3 million jobs by 2028, and the food and foodtech industry will generate 9 million jobs by 2024. Figure 1 reflects the growth in the number of jobs reported as India witnesses the growth of startups.
moving toward a market-oriented system. “Startup India” is the government’s flagship initiative that intends to build a strong ecosystem for nurturing innovation and startups to drive sustainable economic growth and generate large-scale employment opportunities. It empowers startups to grow through innovation and design. The government has initiated several steps to create an environment of ease of doing business; ready availability of essential services such as office space, location, supplies, and telecom connectivity; and mentors to provide strategic advice and knowledge sharing. Additionally, National Institution for Transforming India (NITI) Aayog has initiated the Self-Employment and Talent usage (SETU) program to support startups, particularly in technology-driven areas through a Techno-Financial,
Incubation, and Facilitation Programme. To facilitate credit availability for startups, the government had announced the Micro Units Development & Refinancing Agency (MUDRA) scheme operated by Small Industries Development Bank of India (SIDBI). Against this backdrop, India is offering its new Science Technology and Innovation Policy—the draft of which is already in the public domain.Considering the importance of an RIS framework to boost innovations in startups against this thrust on creating a vibrant ecosystem for startups in India and the release of the new Science, Technology and Innovation (STI) policy, this study explores the RIS pathways for startups in India.
Source: Compiled by authors from Evolution of Startup India, 2016–2020
ASIAN RESEARCH
POLICY
041040
Articles
India has more than 1500 traditional skill-based groups, covering a wide range of abilities from textile design, handicrafts, technology, paper manufacturing, coal, leather, and brass items to timber industries and everything between (Karma Bhutia, 2016) that can nurture prospective startups, which, in turn, can generate jobs, particularly in rural India. Moreover, with Industry 4.0, and technologies such as artificial intelligence, 3-D printing, and the Internet of things are no longer considered “next great things,” the digital technology revolution will significantly affect on every discipline, industry, and economy in every country. In this line, the growing number of startups in India can elevate the country from its status as a
hiring destination for low-cost IT services to that of a global leader in skilled work. The Indian startup ecosystem hosts nearly 167,540 startups, which can drive digital revolution in India and leverage the enormous opportunities to advance the economy. India is on the right route, as stated by the recent reports that the Indian venture capital business had invested $10 billion in 2019, which is 55% greater than the total investment in 2018. Startups can play a significant role in transforming India from world's information technology, services, and business process outsourcing hub to a key R&D center for international corporations.
3. Startup Ecosystem in India
Isenberg (2011) classified an ecosystem into six domains: policy, finance, culture, support, human capital, and markets. Aspects of the ecosystem's systemic conditions include networks of entrepreneurs, leadership, financial resources; human capital; knowledge; and support services. These factors, and their interactions, play a significant role in determining the success of an ecosystem. However, a diversified and talented pool of employees (referred
to as “talent” in certain cases, as in Lee et al., 2004) is possibly the most critical component of a successful entrepreneurial ecosystem. Entrepreneurship is determined by the factors that affect entrepreneurial performance (Ahmad and Hoffmann, 2008). Studies have shown that the various determinants of startups and entrepreneurship development can be divided into three categories: (1) regulatory framework, (2) values, culture, and skills, (3) access to finance, market, R&D, and technology (Kshetri, 2014).
4. Institutional structure and
governance for startups in India
Various government policy initiatives have enabled the growth of startups in India. Along with a strong policy shift toward innovation and entrepreneurship visible in different policy articulations, such as Make in India and Atamnirbhar Bharat (Self-Reliant India), specific policies has been developed for startups. “Startup India” is the government’s flagship initiative that intends to build a strong ecosystem for nurturing innovation and startups. The policy is directed toward sustainable economic growth and large-scale employment opportunities. It empowers startups to grow through innovation and design. The government has initiated several steps to create an environment of ease of doing business and provide entrepreneurial support. The core of the initiative was to build an ecosystem in which startups can innovate and excel.
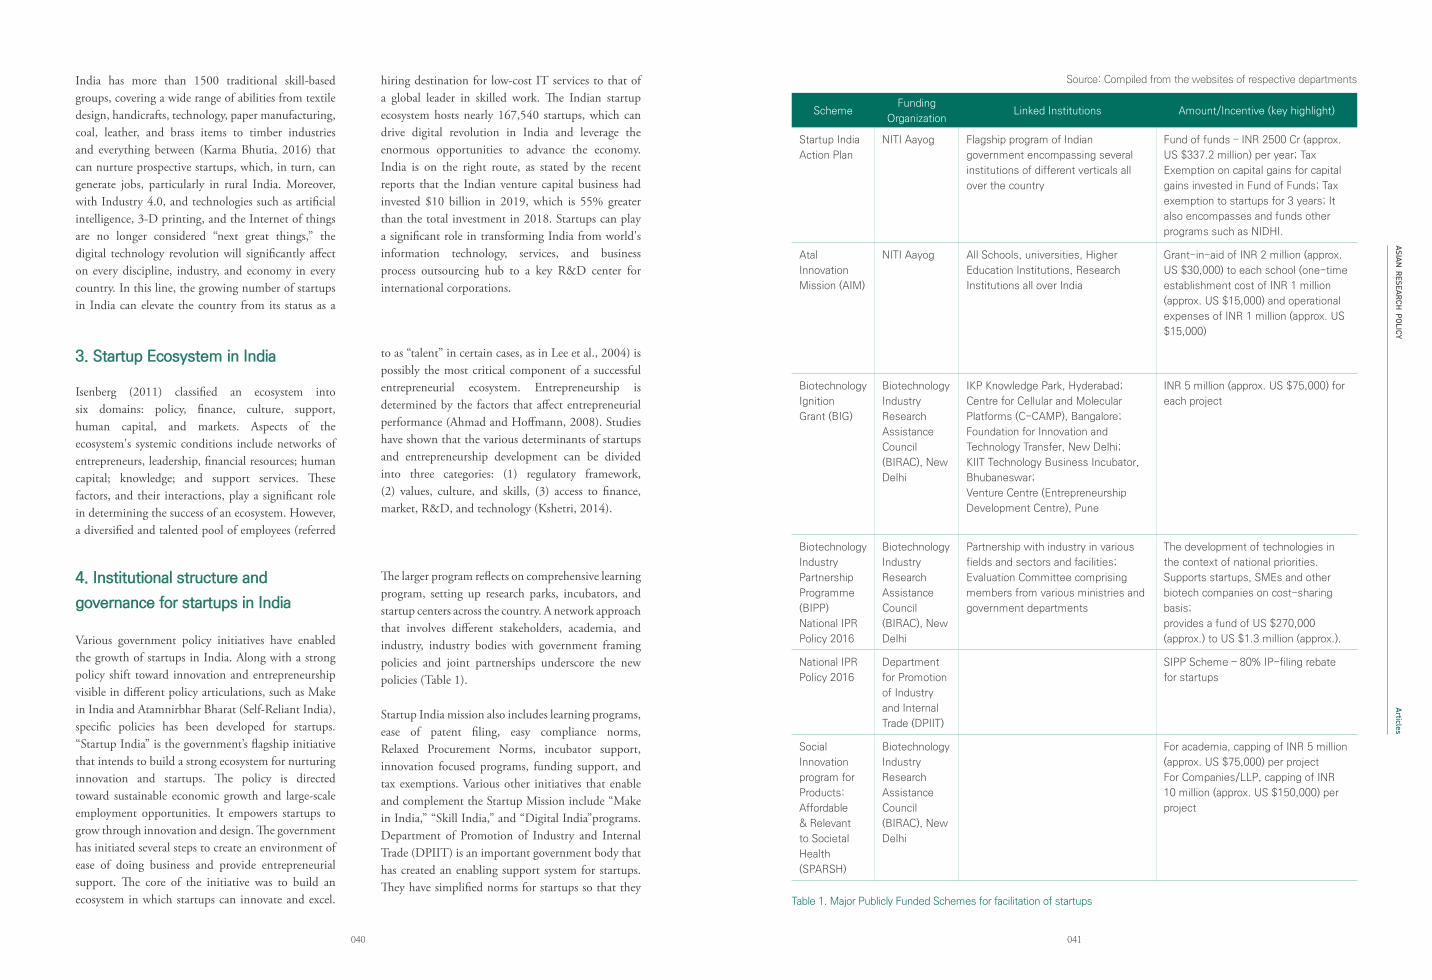
The larger program reflects on comprehensive learning program, setting up research parks, incubators, and startup centers across the country. A network approach that involves different stakeholders, academia, and industry, industry bodies with government framing policies and joint partnerships underscore the new policies (Table 1).
Startup India mission also includes learning programs, ease of patent filing, easy compliance norms, Relaxed Procurement Norms, incubator support, innovation focused programs, funding support, and tax exemptions. Various other initiatives that enable and complement the Startup Mission include “Make in India,” “Skill India,” and “Digital India”programs. Department of Promotion of Industry and Internal Trade (DPIIT) is an important government body that has created an enabling support system for startups. They have simplified norms for startups so that they
SchemeFunding
OrganizationLinked Institutions Amount/Incentive (key highlight)
Startup India
Action Plan
NITI Aayog Flagship program of Indian
government encompassing several
institutions of different verticals all
over the country
Fund of funds – INR 2500 Cr (approx.
US $337.2 million) per year; Tax
Exemption on capital gains for capital
gains invested in Fund of Funds; Tax
exemption to startups for 3 years; It
also encompasses and funds other
programs such as NIDHI.
Atal
Innovation
Mission (AIM)
NITI Aayog All Schools, universities, Higher
Education Institutions, Research
Institutions all over India
Grant-in-aid of INR 2 million (approx.
US $30,000) to each school (one-time
establishment cost of INR 1 million
(approx. US $15,000) and operational
expenses of INR 1 million (approx. US
$15,000)
Biotechnology
Ignition
Grant (BIG)
Biotechnology
Industry
Research
Assistance
Council
(BIRAC), New
Delhi
IKP Knowledge Park, Hyderabad;
Centre for Cellular and Molecular
Platforms (C-CAMP), Bangalore;
Foundation for Innovation and
Technology Transfer, New Delhi;
KIIT Technology Business Incubator,
Bhubaneswar;
Venture Centre (Entrepreneurship
Development Centre), Pune
INR 5 million (approx. US $75,000) for
each project
Biotechnology
Industry
Partnership
Programme
(BIPP)
National IPR
Policy 2016
Biotechnology
Industry
Research
Assistance
Council
(BIRAC), New
Delhi
Partnership with industry in various
fields and sectors and facilities;
Evaluation Committee comprising
members from various ministries and
government departments
The development of technologies in
the context of national priorities.
Supports startups, SMEs and other
biotech companies on cost-sharing
basis;
provides a fund of US $270,000
(approx.) to US $1.3 million (approx.).
National IPR
Policy 2016
Department
for Promotion
of Industry
and Internal
Trade (DPIIT)
SIPP Scheme – 80% IP-filing rebate
for startups
Social
Innovation
program for
Products:
Affordable
& Relevant
to Societal
Health
(SPARSH)
Biotechnology
Industry
Research
Assistance
Council
(BIRAC), New
Delhi
For academia, capping of INR 5 million
(approx. US $75,000) per project
For Companies/LLP, capping of INR
10 million (approx. US $150,000) per
project
Table 1. Major Publicly Funded Schemes for facilitation of startups
Source: Compiled from the websites of respective departments
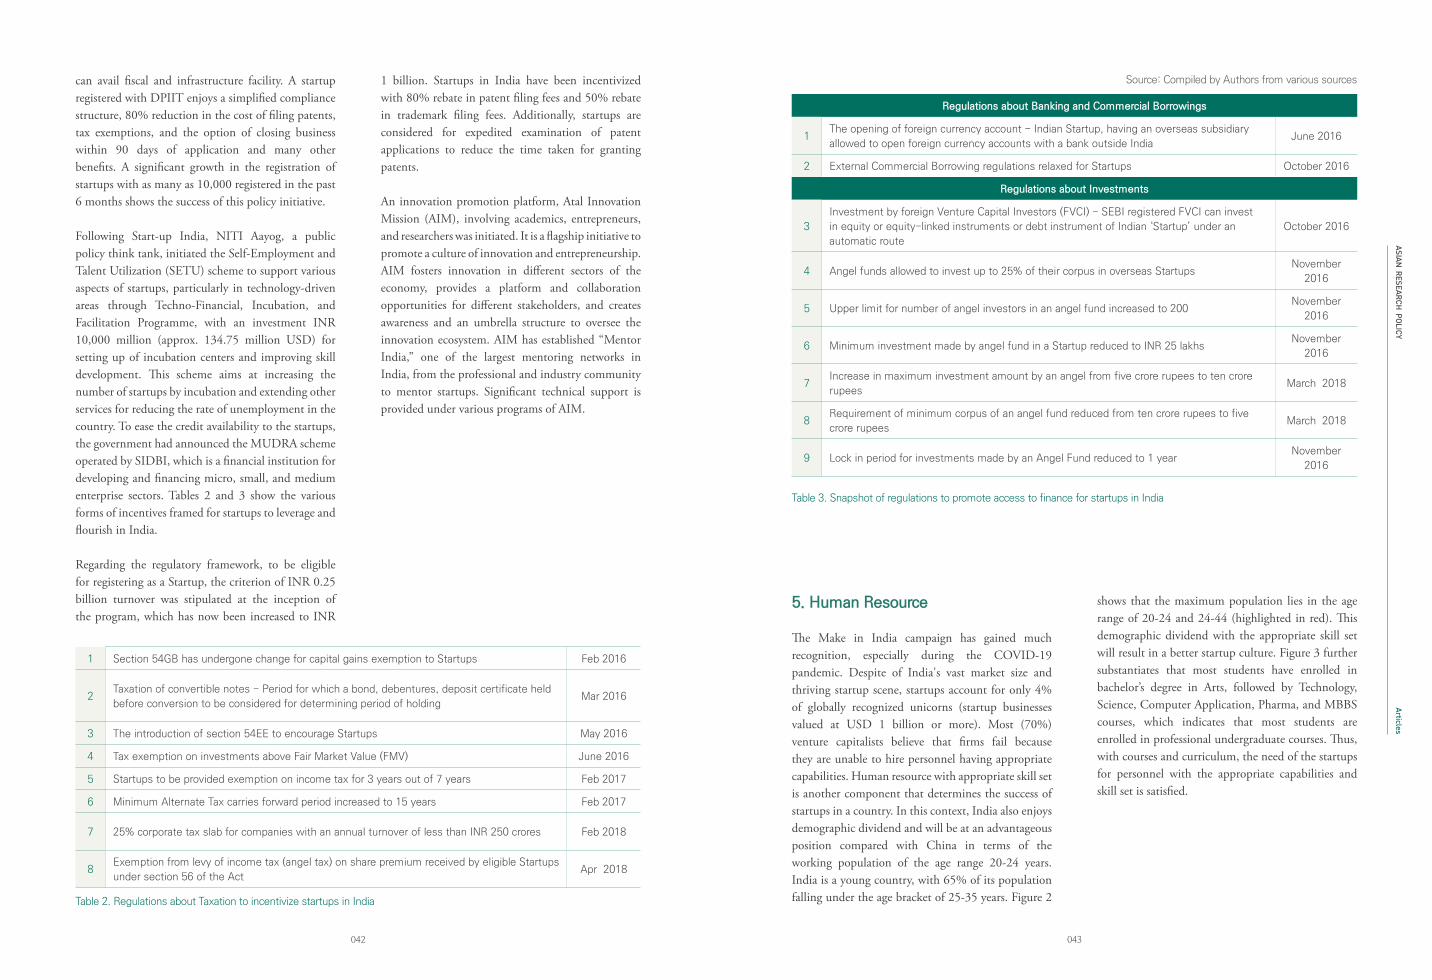
ASIAN RESEARCH
POLICY
043042
Articles
Table 2. Regulations about Taxation to incentivize startups in India
1 Section 54GB has undergone change for capital gains exemption to Startups Feb 2016
2Taxation of convertible notes - Period for which a bond, debentures, deposit certificate held
before conversion to be considered for determining period of holdingMar 2016
3 The introduction of section 54EE to encourage Startups May 2016
4 Tax exemption on investments above Fair Market Value (FMV) June 2016
5 Startups to be provided exemption on income tax for 3 years out of 7 years Feb 2017
6 Minimum Alternate Tax carries forward period increased to 15 years Feb 2017
7 25% corporate tax slab for companies with an annual turnover of less than INR 250 crores Feb 2018
8Exemption from levy of income tax (angel tax) on share premium received by eligible Startups
under section 56 of the ActApr 2018
can avail fiscal and infrastructure facility. A startup registered with DPIIT enjoys a simplified compliance structure, 80% reduction in the cost of filing patents, tax exemptions, and the option of closing business within 90 days of application and many other benefits. A significant growth in the registration of startups with as many as 10,000 registered in the past 6 months shows the success of this policy initiative.
Following Start-up India, NITI Aayog, a public policy think tank, initiated the Self-Employment and Talent Utilization (SETU) scheme to support various aspects of startups, particularly in technology-driven areas through Techno-Financial, Incubation, and Facilitation Programme, with an investment INR 10,000 million (approx. 134.75 million USD) for setting up of incubation centers and improving skill development. This scheme aims at increasing the number of startups by incubation and extending other services for reducing the rate of unemployment in the country. To ease the credit availability to the startups, the government had announced the MUDRA scheme operated by SIDBI, which is a financial institution for developing and financing micro, small, and medium enterprise sectors. Tables 2 and 3 show the various forms of incentives framed for startups to leverage and flourish in India.
Regarding the regulatory framework, to be eligible for registering as a Startup, the criterion of INR 0.25 billion turnover was stipulated at the inception of the program, which has now been increased to INR
1 billion. Startups in India have been incentivized with 80% rebate in patent filing fees and 50% rebate in trademark filing fees. Additionally, startups are considered for expedited examination of patent applications to reduce the time taken for granting patents.
An innovation promotion platform, Atal Innovation Mission (AIM), involving academics, entrepreneurs, and researchers was initiated. It is a flagship initiative to promote a culture of innovation and entrepreneurship. AIM fosters innovation in different sectors of the economy, provides a platform and collaboration opportunities for different stakeholders, and creates awareness and an umbrella structure to oversee the innovation ecosystem. AIM has established “Mentor India,” one of the largest mentoring networks in India, from the professional and industry community to mentor startups. Significant technical support is provided under various programs of AIM.
Table 3. Snapshot of regulations to promote access to finance for startups in India
Source: Compiled by Authors from various sources
5. Human Resource
The Make in India campaign has gained much recognition, especially during the COVID-19 pandemic. Despite of India's vast market size and thriving startup scene, startups account for only 4% of globally recognized unicorns (startup businesses valued at USD 1 billion or more). Most (70%) venture capitalists believe that firms fail because they are unable to hire personnel having appropriate capabilities. Human resource with appropriate skill set is another component that determines the success of startups in a country. In this context, India also enjoys demographic dividend and will be at an advantageous position compared with China in terms of the working population of the age range 20-24 years. India is a young country, with 65% of its population falling under the age bracket of 25-35 years. Figure 2
shows that the maximum population lies in the age range of 20-24 and 24-44 (highlighted in red). This demographic dividend with the appropriate skill set will result in a better startup culture. Figure 3 further substantiates that most students have enrolled in bachelor’s degree in Arts, followed by Technology, Science, Computer Application, Pharma, and MBBS courses, which indicates that most students are enrolled in professional undergraduate courses. Thus, with courses and curriculum, the need of the startups for personnel with the appropriate capabilities and skill set is satisfied.
Regulations about Banking and Commercial Borrowings
1The opening of foreign currency account - Indian Startup, having an overseas subsidiary
allowed to open foreign currency accounts with a bank outside IndiaJune 2016
2 External Commercial Borrowing regulations relaxed for Startups October 2016
Regulations about Investments
3
Investment by foreign Venture Capital Investors (FVCI) - SEBI registered FVCI can invest
in equity or equity-linked instruments or debt instrument of Indian ‘Startup’ under an
automatic route
October 2016
4 Angel funds allowed to invest up to 25% of their corpus in overseas StartupsNovember
2016
5 Upper limit for number of angel investors in an angel fund increased to 200November
2016
6 Minimum investment made by angel fund in a Startup reduced to INR 25 lakhsNovember
2016
7Increase in maximum investment amount by an angel from five crore rupees to ten crore
rupeesMarch 2018
8Requirement of minimum corpus of an angel fund reduced from ten crore rupees to five
crore rupeesMarch 2018
9 Lock in period for investments made by an Angel Fund reduced to 1 yearNovember
2016
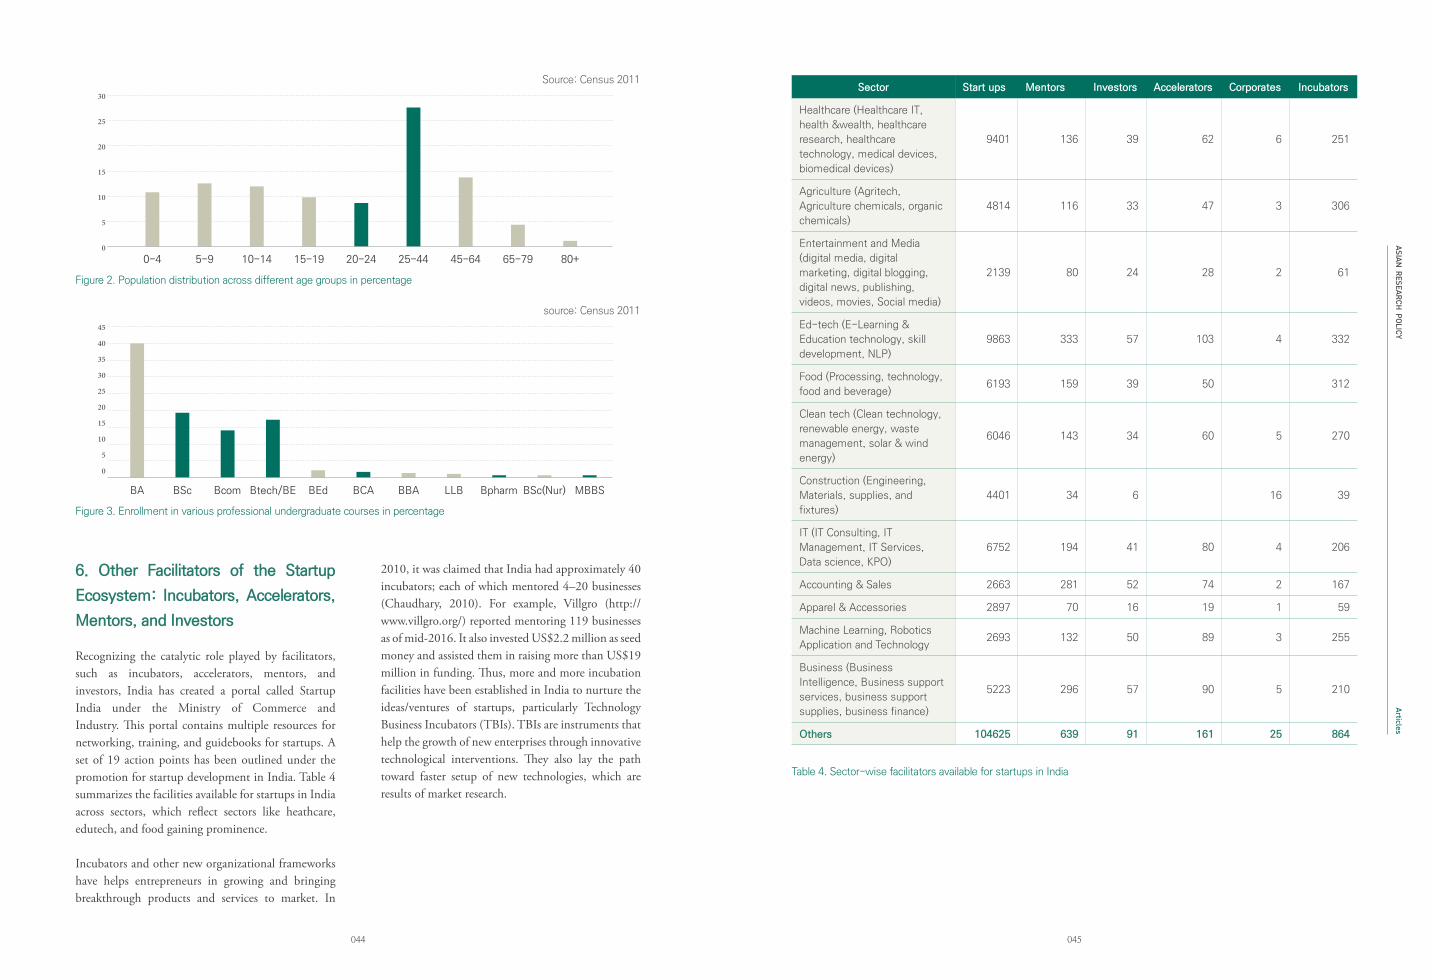
ASIAN RESEARCH
POLICY
045044
Articles
Figure 2. Population distribution across different age groups in percentage
Source: Census 2011
Figure 3. Enrollment in various professional undergraduate courses in percentage
30
25
20
15
10
5
00-4 5-9 25-44 45-6410-14 15-19 20-24 65-79 80+
45
40
35
30
25
20
15
10
5
0
BA BSc BCA BBA LLB Bpharm BSc(Nur) MBBSBcom Btech/BE BEd
6. Other Facilitators of the Startup
Ecosystem: Incubators, Accelerators,
Mentors, and Investors
Recognizing the catalytic role played by facilitators, such as incubators, accelerators, mentors, and investors, India has created a portal called Startup India under the Ministry of Commerce and Industry. This portal contains multiple resources for networking, training, and guidebooks for startups. A set of 19 action points has been outlined under the promotion for startup development in India. Table 4 summarizes the facilities available for startups in India across sectors, which reflect sectors like heathcare, edutech, and food gaining prominence.
Incubators and other new organizational frameworks have helps entrepreneurs in growing and bringing breakthrough products and services to market. In
2010, it was claimed that India had approximately 40 incubators; each of which mentored 4–20 businesses (Chaudhary, 2010). For example, Villgro (http://www.villgro.org/) reported mentoring 119 businesses as of mid-2016. It also invested US$2.2 million as seed money and assisted them in raising more than US$19 million in funding. Thus, more and more incubation facilities have been established in India to nurture the ideas/ventures of startups, particularly Technology Business Incubators (TBIs). TBIs are instruments that help the growth of new enterprises through innovative technological interventions. They also lay the path toward faster setup of new technologies, which are results of market research.
Table 4. Sector-wise facilitators available for startups in India
Sector Start ups Mentors Investors Accelerators Corporates Incubators
Healthcare (Healthcare IT,
health &wealth, healthcare
research, healthcare
technology, medical devices,
biomedical devices)
9401 136 39 62 6 251
Agriculture (Agritech,
Agriculture chemicals, organic
chemicals)
4814 116 33 47 3 306
Entertainment and Media
(digital media, digital
marketing, digital blogging,
digital news, publishing,
videos, movies, Social media)
2139 80 24 28 2 61
Ed-tech (E-Learning &
Education technology, skill
development, NLP)
9863 333 57 103 4 332
Food (Processing, technology,
food and beverage)6193 159 39 50 312
Clean tech (Clean technology,
renewable energy, waste
management, solar & wind
energy)
6046 143 34 60 5 270
Construction (Engineering,
Materials, supplies, and
fixtures)
4401 34 6 16 39
IT (IT Consulting, IT
Management, IT Services,
Data science, KPO)
6752 194 41 80 4 206
Accounting & Sales 2663 281 52 74 2 167
Apparel & Accessories 2897 70 16 19 1 59
Machine Learning, Robotics
Application and Technology2693 132 50 89 3 255
Business (Business
Intelligence, Business support
services, business support
supplies, business finance)
5223 296 57 90 5 210
Others 104625 639 91 161 25 864
source: Census 2011
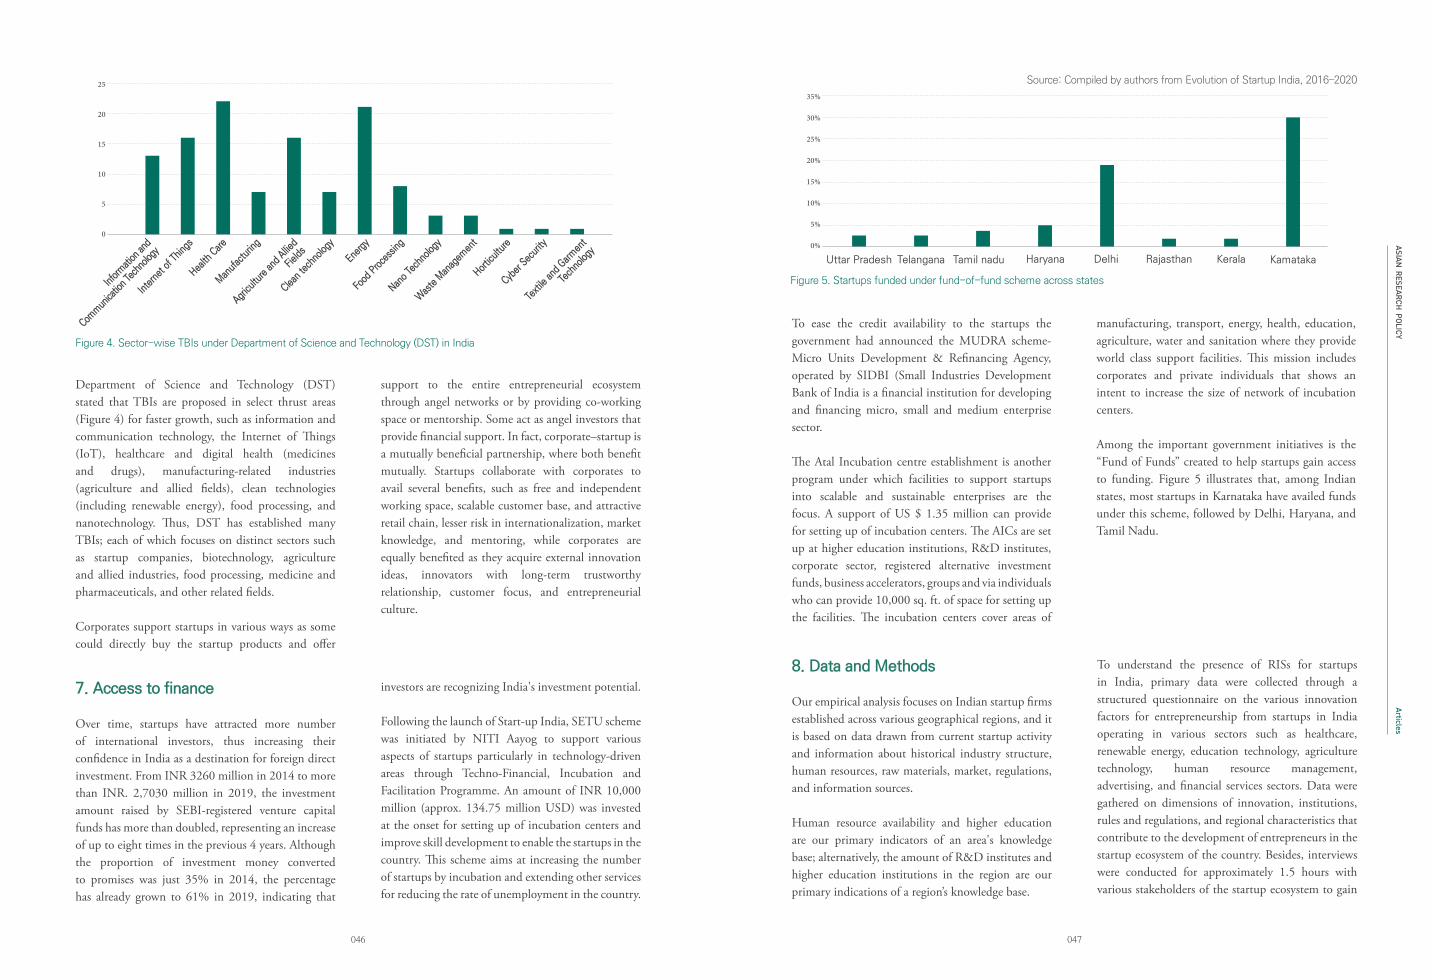
ASIAN RESEARCH
POLICY
047046
Articles
25
20
15
10
5
0
Infor
mati
on an
d
Comm
unica
tion T
echn
ology
Inte
rnet
of T
hings
Health
Care
Man
ufac
turin
g
Clean
tech
nolog
y
Ener
gy
Food
Pro
cess
ing
Nano
Tech
nolog
y
Was
te M
anag
emen
t
Hortic
ultur
e
Cyber
Sec
urity
Text
ile an
d Gar
men
t
Tech
nolog
y
Agricu
lture
and
Allied
Fields
Department of Science and Technology (DST) stated that TBIs are proposed in select thrust areas (Figure 4) for faster growth, such as information and communication technology, the Internet of Things (IoT), healthcare and digital health (medicines and drugs), manufacturing-related industries (agriculture and allied fields), clean technologies (including renewable energy), food processing, and nanotechnology. Thus, DST has established many TBIs; each of which focuses on distinct sectors such as startup companies, biotechnology, agriculture and allied industries, food processing, medicine and pharmaceuticals, and other related fields.
Corporates support startups in various ways as some could directly buy the startup products and offer
support to the entire entrepreneurial ecosystem through angel networks or by providing co-working space or mentorship. Some act as angel investors that provide financial support. In fact, corporate–startup is a mutually beneficial partnership, where both benefit mutually. Startups collaborate with corporates to avail several benefits, such as free and independent working space, scalable customer base, and attractive retail chain, lesser risk in internationalization, market knowledge, and mentoring, while corporates are equally benefited as they acquire external innovation ideas, innovators with long-term trustworthy relationship, customer focus, and entrepreneurial culture.
Figure 4. Sector-wise TBIs under Department of Science and Technology (DST) in India
7. Access to finance
Over time, startups have attracted more number of international investors, thus increasing their confidence in India as a destination for foreign direct investment. From INR 3260 million in 2014 to more than INR. 2,7030 million in 2019, the investment amount raised by SEBI-registered venture capital funds has more than doubled, representing an increase of up to eight times in the previous 4 years. Although the proportion of investment money converted to promises was just 35% in 2014, the percentage has already grown to 61% in 2019, indicating that
investors are recognizing India's investment potential.
Following the launch of Start-up India, SETU scheme was initiated by NITI Aayog to support various aspects of startups particularly in technology-driven areas through Techno-Financial, Incubation and Facilitation Programme. An amount of INR 10,000 million (approx. 134.75 million USD) was invested at the onset for setting up of incubation centers and improve skill development to enable the startups in the country. This scheme aims at increasing the number of startups by incubation and extending other services for reducing the rate of unemployment in the country.
8. Data and Methods
Our empirical analysis focuses on Indian startup firms established across various geographical regions, and it is based on data drawn from current startup activity and information about historical industry structure, human resources, raw materials, market, regulations, and information sources.
Human resource availability and higher education are our primary indicators of an area's knowledge base; alternatively, the amount of R&D institutes and higher education institutions in the region are our primary indications of a region’s knowledge base.
To understand the presence of RISs for startups in India, primary data were collected through a structured questionnaire on the various innovation factors for entrepreneurship from startups in India operating in various sectors such as healthcare, renewable energy, education technology, agriculture technology, human resource management, advertising, and financial services sectors. Data were gathered on dimensions of innovation, institutions, rules and regulations, and regional characteristics that contribute to the development of entrepreneurs in the startup ecosystem of the country. Besides, interviews were conducted for approximately 1.5 hours with various stakeholders of the startup ecosystem to gain
To ease the credit availability to the startups the government had announced the MUDRA scheme- Micro Units Development & Refinancing Agency, operated by SIDBI (Small Industries Development Bank of India is a financial institution for developing and financing micro, small and medium enterprise sector.
The Atal Incubation centre establishment is another program under which facilities to support startups into scalable and sustainable enterprises are the focus. A support of US $ 1.35 million can provide for setting up of incubation centers. The AICs are set up at higher education institutions, R&D institutes, corporate sector, registered alternative investment funds, business accelerators, groups and via individuals who can provide 10,000 sq. ft. of space for setting up the facilities. The incubation centers cover areas of
manufacturing, transport, energy, health, education, agriculture, water and sanitation where they provide world class support facilities. This mission includes corporates and private individuals that shows an intent to increase the size of network of incubation centers.
Among the important government initiatives is the “Fund of Funds” created to help startups gain access to funding. Figure 5 illustrates that, among Indian states, most startups in Karnataka have availed funds under this scheme, followed by Delhi, Haryana, and Tamil Nadu.
Figure 5. Startups funded under fund-of-fund scheme across states
35%
30%
25%
20%
15%
10%
5%
0%
Uttar Pradesh Telangana Tamil nadu Haryana Delhi Rajasthan Kerala Kamataka
Source: Compiled by authors from Evolution of Startup India, 2016–2020
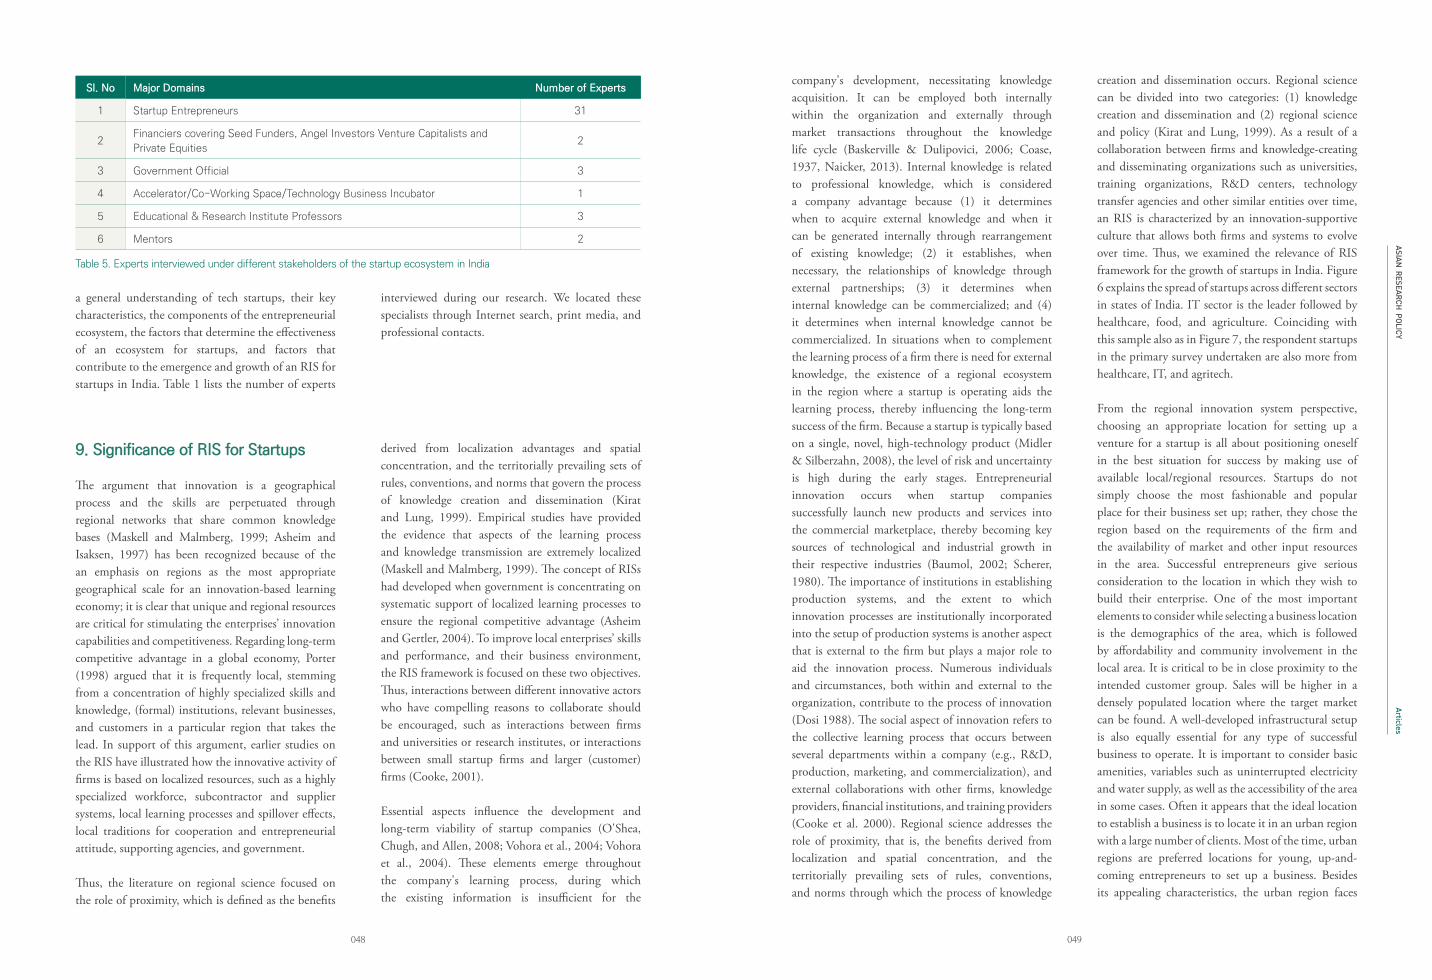
ASIAN RESEARCH
POLICY
049048
Articles
a general understanding of tech startups, their key characteristics, the components of the entrepreneurial ecosystem, the factors that determine the effectiveness of an ecosystem for startups, and factors that contribute to the emergence and growth of an RIS for startups in India. Table 1 lists the number of experts
interviewed during our research. We located these specialists through Internet search, print media, and professional contacts.
Sl. No Major Domains Number of Experts
1 Startup Entrepreneurs 31
2Financiers covering Seed Funders, Angel Investors Venture Capitalists and
Private Equities2
3 Government Official 3
4 Accelerator/Co-Working Space/Technology Business Incubator 1
5 Educational & Research Institute Professors 3
6 Mentors 2
Table 5. Experts interviewed under different stakeholders of the startup ecosystem in India
9. Significance of RIS for Startups
The argument that innovation is a geographical process and the skills are perpetuated through regional networks that share common knowledge bases (Maskell and Malmberg, 1999; Asheim and Isaksen, 1997) has been recognized because of the an emphasis on regions as the most appropriate geographical scale for an innovation-based learning economy; it is clear that unique and regional resources are critical for stimulating the enterprises’ innovation capabilities and competitiveness. Regarding long-term competitive advantage in a global economy, Porter (1998) argued that it is frequently local, stemming from a concentration of highly specialized skills and knowledge, (formal) institutions, relevant businesses, and customers in a particular region that takes the lead. In support of this argument, earlier studies on the RIS have illustrated how the innovative activity of firms is based on localized resources, such as a highly specialized workforce, subcontractor and supplier systems, local learning processes and spillover effects, local traditions for cooperation and entrepreneurial attitude, supporting agencies, and government.
Thus, the literature on regional science focused on the role of proximity, which is defined as the benefits
derived from localization advantages and spatial concentration, and the territorially prevailing sets of rules, conventions, and norms that govern the process of knowledge creation and dissemination (Kirat and Lung, 1999). Empirical studies have provided the evidence that aspects of the learning process and knowledge transmission are extremely localized (Maskell and Malmberg, 1999). The concept of RISs had developed when government is concentrating on systematic support of localized learning processes to ensure the regional competitive advantage (Asheim and Gertler, 2004). To improve local enterprises’ skills and performance, and their business environment, the RIS framework is focused on these two objectives. Thus, interactions between different innovative actors who have compelling reasons to collaborate should be encouraged, such as interactions between firms and universities or research institutes, or interactions between small startup firms and larger (customer) firms (Cooke, 2001).
Essential aspects influence the development and long-term viability of startup companies (O'Shea, Chugh, and Allen, 2008; Vohora et al., 2004; Vohora et al., 2004). These elements emerge throughout the company's learning process, during which the existing information is insufficient for the
company's development, necessitating knowledge acquisition. It can be employed both internally within the organization and externally through market transactions throughout the knowledge life cycle (Baskerville & Dulipovici, 2006; Coase, 1937, Naicker, 2013). Internal knowledge is related to professional knowledge, which is considered a company advantage because (1) it determines when to acquire external knowledge and when it can be generated internally through rearrangement of existing knowledge; (2) it establishes, when necessary, the relationships of knowledge through external partnerships; (3) it determines when internal knowledge can be commercialized; and (4) it determines when internal knowledge cannot be commercialized. In situations when to complement the learning process of a firm there is need for external knowledge, the existence of a regional ecosystem in the region where a startup is operating aids the learning process, thereby influencing the long-term success of the firm. Because a startup is typically based on a single, novel, high-technology product (Midler & Silberzahn, 2008), the level of risk and uncertainty is high during the early stages. Entrepreneurial innovation occurs when startup companies successfully launch new products and services into the commercial marketplace, thereby becoming key sources of technological and industrial growth in their respective industries (Baumol, 2002; Scherer, 1980). The importance of institutions in establishing production systems, and the extent to which innovation processes are institutionally incorporated into the setup of production systems is another aspect that is external to the firm but plays a major role to aid the innovation process. Numerous individuals and circumstances, both within and external to the organization, contribute to the process of innovation (Dosi 1988). The social aspect of innovation refers to the collective learning process that occurs between several departments within a company (e.g., R&D, production, marketing, and commercialization), and external collaborations with other firms, knowledge providers, financial institutions, and training providers (Cooke et al. 2000). Regional science addresses the role of proximity, that is, the benefits derived from localization and spatial concentration, and the territorially prevailing sets of rules, conventions, and norms through which the process of knowledge
creation and dissemination occurs. Regional science can be divided into two categories: (1) knowledge creation and dissemination and (2) regional science and policy (Kirat and Lung, 1999). As a result of a collaboration between firms and knowledge-creating and disseminating organizations such as universities, training organizations, R&D centers, technology transfer agencies and other similar entities over time, an RIS is characterized by an innovation-supportive culture that allows both firms and systems to evolve over time. Thus, we examined the relevance of RIS framework for the growth of startups in India. Figure 6 explains the spread of startups across different sectors in states of India. IT sector is the leader followed by healthcare, food, and agriculture. Coinciding with this sample also as in Figure 7, the respondent startups in the primary survey undertaken are also more from healthcare, IT, and agritech.
From the regional innovation system perspective, choosing an appropriate location for setting up a venture for a startup is all about positioning oneself in the best situation for success by making use of available local/regional resources. Startups do not simply choose the most fashionable and popular place for their business set up; rather, they chose the region based on the requirements of the firm and the availability of market and other input resources in the area. Successful entrepreneurs give serious consideration to the location in which they wish to build their enterprise. One of the most important elements to consider while selecting a business location is the demographics of the area, which is followed by affordability and community involvement in the local area. It is critical to be in close proximity to the intended customer group. Sales will be higher in a densely populated location where the target market can be found. A well-developed infrastructural setup is also equally essential for any type of successful business to operate. It is important to consider basic amenities, variables such as uninterrupted electricity and water supply, as well as the accessibility of the area in some cases. Often it appears that the ideal location to establish a business is to locate it in an urban region with a large number of clients. Most of the time, urban regions are preferred locations for young, up-and-coming entrepreneurs to set up a business. Besides its appealing characteristics, the urban region faces
ASIAN RESEARCH
POLICY
051050
Articles
3000
2500
2000
1500
1000
500
0
IT
HEALT
HCARE
REENER
GY
FOOD&BEV
NON-R
EENER
GY
AGRICULT
URE
MARKE
TING
EDUCAT
ION&SK
ILL
PROF.
&COM
M.S
ERV
TEXT
ILE&
APPARREL
CONS.
&ENG.
Delhi Maharastra Gujarat Haryana
Madhya Pradesh Tamil Nadu Uttar Pradesh West Bengal
Telangana Karnataka
IT services
Edu-Tech
Renewable Energy
Insurtech
Agri-Tech
Automation Technology
Recycling of Old Clothes
Staffing/manpow
Advertising Tech
Fin Tech
Healthcare
20%
17%
10%14%4%
20%
3%3%
3% 3%3%
Figure 6. Sector-wise registered startups across states of India
Source: Compiled by authors from Evolution of Startup India, 2016-2020
Figure 7. Sector-wise distribution of sample data According to our sample data,
Agritech businesses account for about 20% of all startups.
intense competition from other firms that are already established in the marketplace. In India, the situation is that startup entrepreneurs are increasingly choosing rural locations for their operations and production because rural areas have a lower population density than urban areas, which makes them more attractive to investors. In a rural region, there is a greater likelihood of reduced overhead expenses and lower costs, which translates into higher profits for businesses. Funds can be directed to other costs to increase the quality of your products and services. Because overhead costs
are significantly reduced, banks will allow for the acquisition of direct loans because lower expenses mean that they will not need to rely on third parties for approval. This is the reason that in our primary study it reflects metro areas account for around only 38 percent of startup-manufacturing units, with the remaining 34 percent located in other cities. The majority of startups are concentrated in urban areas, with only 14 percent based on rural areas (Figure 8).
Cities
Metro Cities
Sub-Urban Parts
Rural15%
33%38%
14%
Figure 8. Location of Production Units of startups Figure 9. Factors providing regional benefit to
the startups in India
The study also highlights that startups mostly prefer locally skilled human resources as a benefit from the geographic region of the location of their firm. 47% startups agree that local skilled labor is the major benefit from the region followed 21% of them has voted for the availability of raw materials in the region as a major benefit.. Climate condition gets 16% weight favoring their firm, followed by public infrastructure facilities by 11% (Figure 9). That the firms have experienced availability of local skilled labor as a greatest advantage of regionality is future substantiated in Figure 9, where we find a large pool of educated young population in the cities where the sample firms are located across several disciplines.Over 80% of the startups have rated that they are dependent for human resource, knowledge resources and tacit knowledge from the region that further adds to the argument on how regional resources are important in bringing innovation and hence the significance of regional innovation system is undoubtedly effective in building the startup ecosystem in India. Although only 25% startup firms have rated high on being directly dependent upon the natural resources in the region for their production, as for the rest of the firms production process is not dependent on the natural resources. Even in this scenario too almost 60% of firms give importance to the regional natural resources (Figure 11). Accordingly, only 11% of the firms get their raw materials from the local market, whereas 15% get it from nearby cities (Figure 12). Only 16% firms depend on the local market for their raw material, due to the sector like ICT, Advertisement, Edu-tech for which raw material as knowledge base is across the nation. The reason for
startups ranking high on the availability of knowledge resources as in Figure 13 is explained well in Fig, which reflects the presence of R&D institutes and universities in the cities from where the startups are located from whom data were collected.
ties like Bangalore, Hyderabad, Mumbai, Delhi and its NCR region are hubs for such knowledge producing organizations from which the startups are directly or indirectly gaining momentum in their areas of operation. Figure 14 shows the source of technology for the startups in the sample and reflects that the majority of them are developing them in house. It is followed by 18% of the firms using open source technologies for their day-to-day operation perhaps. About 9% of the firms are resorting to import of technologies and very less of them have developed technologies in collaboration with universities/R&D Institutes. This reflects that active collaboration with the knowledge producing organizations is missing in the region but at the same time the firms opine high on the availability of knowledge resources might be due to spillover effects.
Over 40% of the firms ranked the benefits derived from regional government as poor on provisioning of facilities for R&D, mentorship, input materials, market, and skilled human resources. Only 20% of the firms ranked such provisioning as high.
Local skilled manpower
Raw materials
Climatic conditions
Public Ingrastructural acilities
other47%
21%
16%
11%
5%
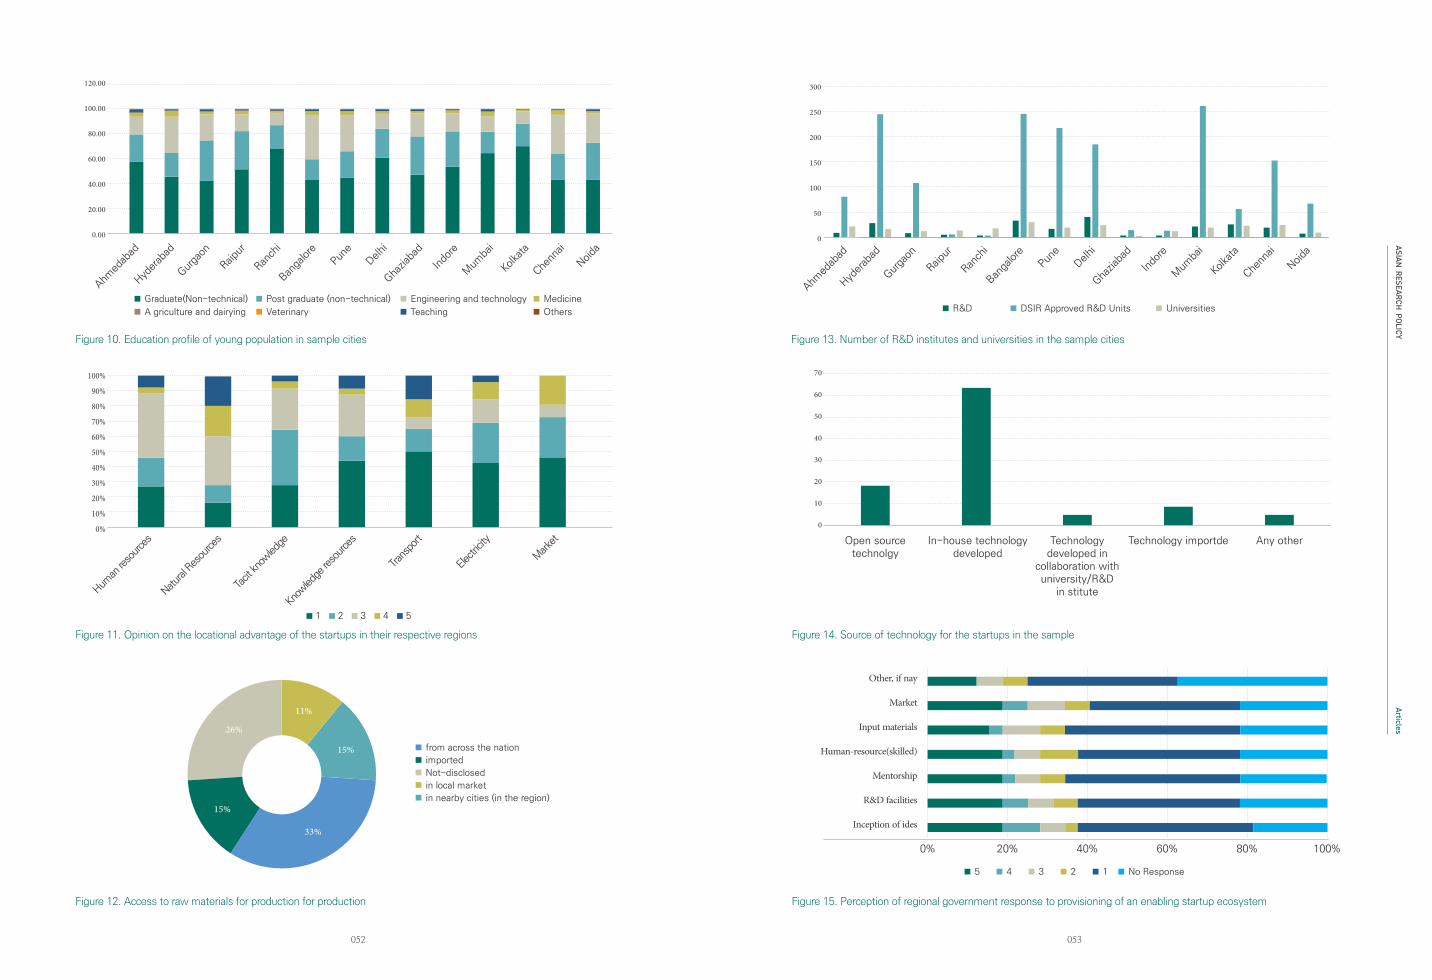
ASIAN RESEARCH
POLICY
053052
Articles
120.00
100.00
80.00
60.00
40.00
20.00
0.00
Ahmed
abad
Hyder
abad
Gurga
on
Raipur
Ranch
i
Banga
lore
Pune
Delhi
Ghazia
bad
Indo
re
Mum
bai
Kolka
ta
Chenn
ai
Noida
Graduate(Non-technical) Post graduate (non-technical) Engineering and technology Medicine
A griculture and dairying Veterinary Teaching Others
100%
90%
80%
70%
60%
50%
40%
30%
20%
10%
0%
Human
reso
urce
s
Natural
Reso
urce
s
Tacit
know
ledge
Know
ledge
reso
urce
s
Tran
sport
Electric
ity
Marke
t
1 2 3 4 5
Figure 10. Education profile of young population in sample cities
Figure 11. Opinion on the locational advantage of the startups in their respective regions
from across the nation
imported
Not-disclosed
in local market
in nearby cities (in the region)
15%
33%
15%
26%
11%
Figure 12. Access to raw materials for production for production
300
250
200
150
100
50
0
Ahmed
abad
Hyder
abad
Gurga
on
Raipur
Ranch
i
Banga
lore
Pune
Delhi
Ghazia
bad
Indo
re
Mum
bai
Kolka
ta
Chenn
ai
Noida
R&D DSIR Approved R&D Units Universities
Figure 13. Number of R&D institutes and universities in the sample cities
70
60
50
40
30
20
10
0
Open sourcetechnolgy
In-house technologydeveloped
Technologydeveloped in
collaboration withuniversity/R&D
in stitute
Technology importde Any other
Figure 14. Source of technology for the startups in the sample
0%
Other, if nay
Market
Input materials
Human-resource(skilled)
Mentorship
R&D facilities
Inception of ides
20% 40% 60% 80% 100%
5 4 3 2 1 No Response
Figure 15. Perception of regional government response to provisioning of an enabling startup ecosystem
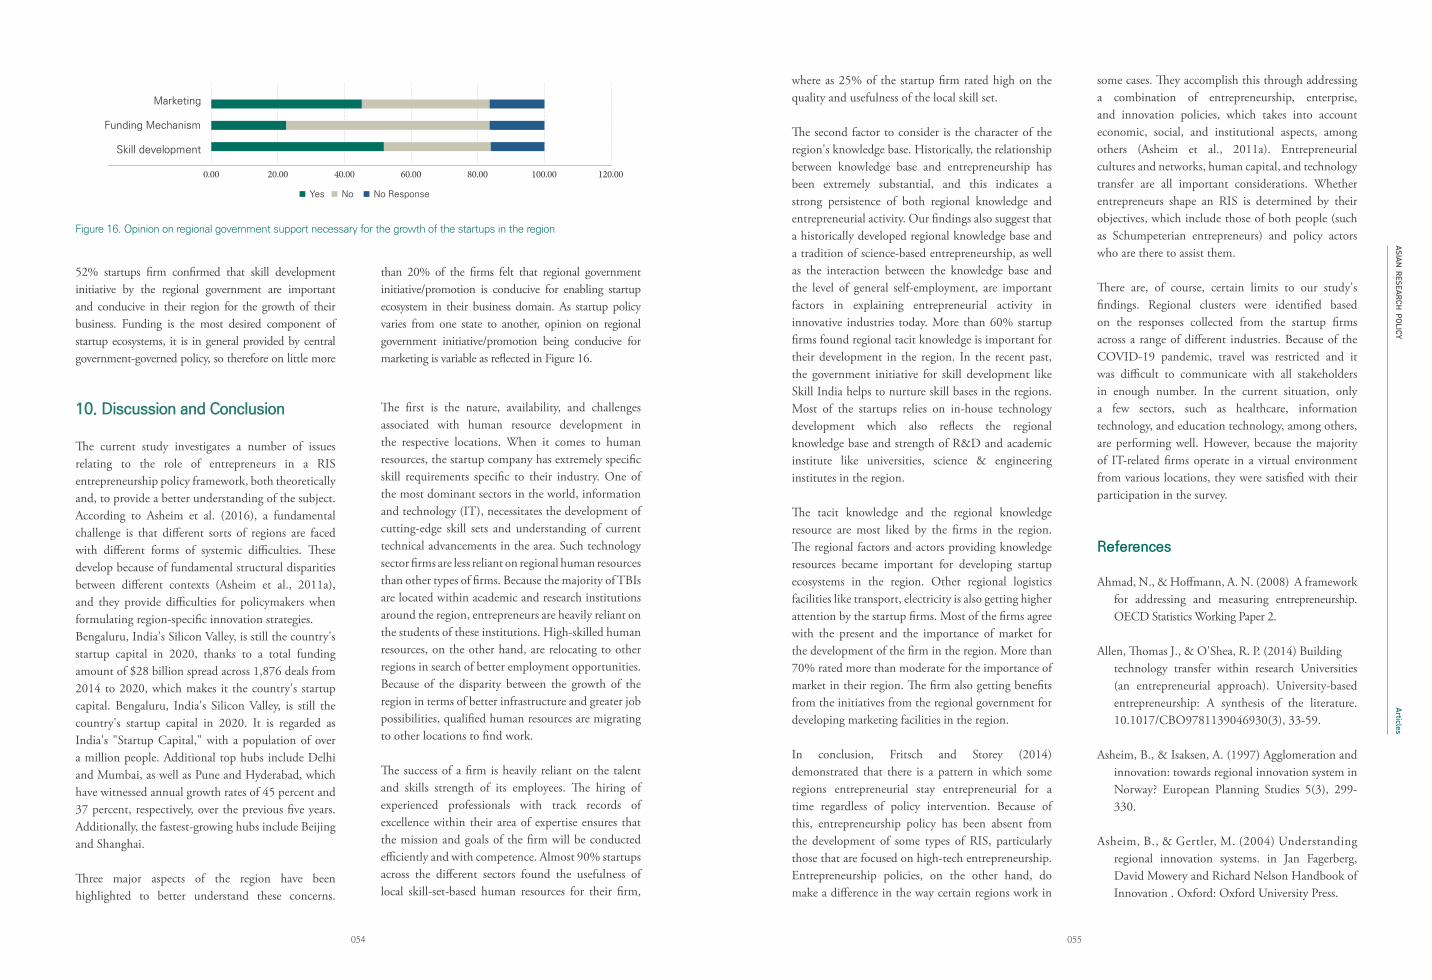
ASIAN RESEARCH
POLICY
055054
Articles
0.00
Marketing
Funding Mechanism
Skill development
40.0020.00 60.00 80.00 100.00 120.00
Yes No No Response
2019 2019 20192020 2021
Job’s Reported Startups Recognised in this year
Figure 16. Opinion on regional government support necessary for the growth of the startups in the region
52% startups firm confirmed that skill development initiative by the regional government are important and conducive in their region for the growth of their business. Funding is the most desired component of startup ecosystems, it is in general provided by central government-governed policy, so therefore on little more
than 20% of the firms felt that regional government initiative/promotion is conducive for enabling startup ecosystem in their business domain. As startup policy varies from one state to another, opinion on regional government initiative/promotion being conducive for marketing is variable as reflected in Figure 16.
10. Discussion and Conclusion
The current study investigates a number of issues relating to the role of entrepreneurs in a RIS entrepreneurship policy framework, both theoretically and, to provide a better understanding of the subject. According to Asheim et al. (2016), a fundamental challenge is that different sorts of regions are faced with different forms of systemic difficulties. These develop because of fundamental structural disparities between different contexts (Asheim et al., 2011a), and they provide difficulties for policymakers when formulating region-specific innovation strategies.Bengaluru, India's Silicon Valley, is still the country's startup capital in 2020, thanks to a total funding amount of $28 billion spread across 1,876 deals from 2014 to 2020, which makes it the country's startup capital. Bengaluru, India's Silicon Valley, is still the country's startup capital in 2020. It is regarded as India's "Startup Capital," with a population of over a million people. Additional top hubs include Delhi and Mumbai, as well as Pune and Hyderabad, which have witnessed annual growth rates of 45 percent and 37 percent, respectively, over the previous five years. Additionally, the fastest-growing hubs include Beijing and Shanghai.
Three major aspects of the region have been highlighted to better understand these concerns.
The first is the nature, availability, and challenges associated with human resource development in the respective locations. When it comes to human resources, the startup company has extremely specific skill requirements specific to their industry. One of the most dominant sectors in the world, information and technology (IT), necessitates the development of cutting-edge skill sets and understanding of current technical advancements in the area. Such technology sector firms are less reliant on regional human resources than other types of firms. Because the majority of TBIs are located within academic and research institutions around the region, entrepreneurs are heavily reliant on the students of these institutions. High-skilled human resources, on the other hand, are relocating to other regions in search of better employment opportunities. Because of the disparity between the growth of the region in terms of better infrastructure and greater job possibilities, qualified human resources are migrating to other locations to find work.
The success of a firm is heavily reliant on the talent and skills strength of its employees. The hiring of experienced professionals with track records of excellence within their area of expertise ensures that the mission and goals of the firm will be conducted efficiently and with competence. Almost 90% startups across the different sectors found the usefulness of local skill-set-based human resources for their firm,
where as 25% of the startup firm rated high on the quality and usefulness of the local skill set.
The second factor to consider is the character of the region's knowledge base. Historically, the relationship between knowledge base and entrepreneurship has been extremely substantial, and this indicates a strong persistence of both regional knowledge and entrepreneurial activity. Our findings also suggest that a historically developed regional knowledge base and a tradition of science-based entrepreneurship, as well as the interaction between the knowledge base and the level of general self-employment, are important factors in explaining entrepreneurial activity in innovative industries today. More than 60% startup firms found regional tacit knowledge is important for their development in the region. In the recent past, the government initiative for skill development like Skill India helps to nurture skill bases in the regions. Most of the startups relies on in-house technology development which also reflects the regional knowledge base and strength of R&D and academic institute like universities, science & engineering institutes in the region.
The tacit knowledge and the regional knowledge resource are most liked by the firms in the region. The regional factors and actors providing knowledge resources became important for developing startup ecosystems in the region. Other regional logistics facilities like transport, electricity is also getting higher attention by the startup firms. Most of the firms agree with the present and the importance of market for the development of the firm in the region. More than 70% rated more than moderate for the importance of market in their region. The firm also getting benefits from the initiatives from the regional government for developing marketing facilities in the region.
In conclusion, Fritsch and Storey (2014) demonstrated that there is a pattern in which some regions entrepreneurial stay entrepreneurial for a time regardless of policy intervention. Because of this, entrepreneurship policy has been absent from the development of some types of RIS, particularly those that are focused on high-tech entrepreneurship. Entrepreneurship policies, on the other hand, do make a difference in the way certain regions work in
some cases. They accomplish this through addressing a combination of entrepreneurship, enterprise, and innovation policies, which takes into account economic, social, and institutional aspects, among others (Asheim et al., 2011a). Entrepreneurial cultures and networks, human capital, and technology transfer are all important considerations. Whether entrepreneurs shape an RIS is determined by their objectives, which include those of both people (such as Schumpeterian entrepreneurs) and policy actors who are there to assist them.
There are, of course, certain limits to our study's findings. Regional clusters were identified based on the responses collected from the startup firms across a range of different industries. Because of the COVID-19 pandemic, travel was restricted and it was difficult to communicate with all stakeholders in enough number. In the current situation, only a few sectors, such as healthcare, information technology, and education technology, among others, are performing well. However, because the majority of IT-related firms operate in a virtual environment from various locations, they were satisfied with their participation in the survey.
References
Ahmad, N., & Hoffmann, A. N. (2008) A framework for addressing and measuring entrepreneurship. OECD Statistics Working Paper 2.
Allen, Thomas J., & O'Shea, R. P. (2014) Building technology transfer within research Universities (an entrepreneurial approach). University-based entrepreneurship: A synthesis of the literature. 10.1017/CBO9781139046930(3), 33-59.
Asheim, B., & Isaksen, A. (1997) Agglomeration and innovation: towards regional innovation system in Norway? European Planning Studies 5(3), 299-330.
Asheim, B., & Gertler, M. (2004) Understandingregional innovation systems. in Jan Fagerberg, David Mowery and Richard Nelson Handbook of Innovation . Oxford: Oxford University Press.
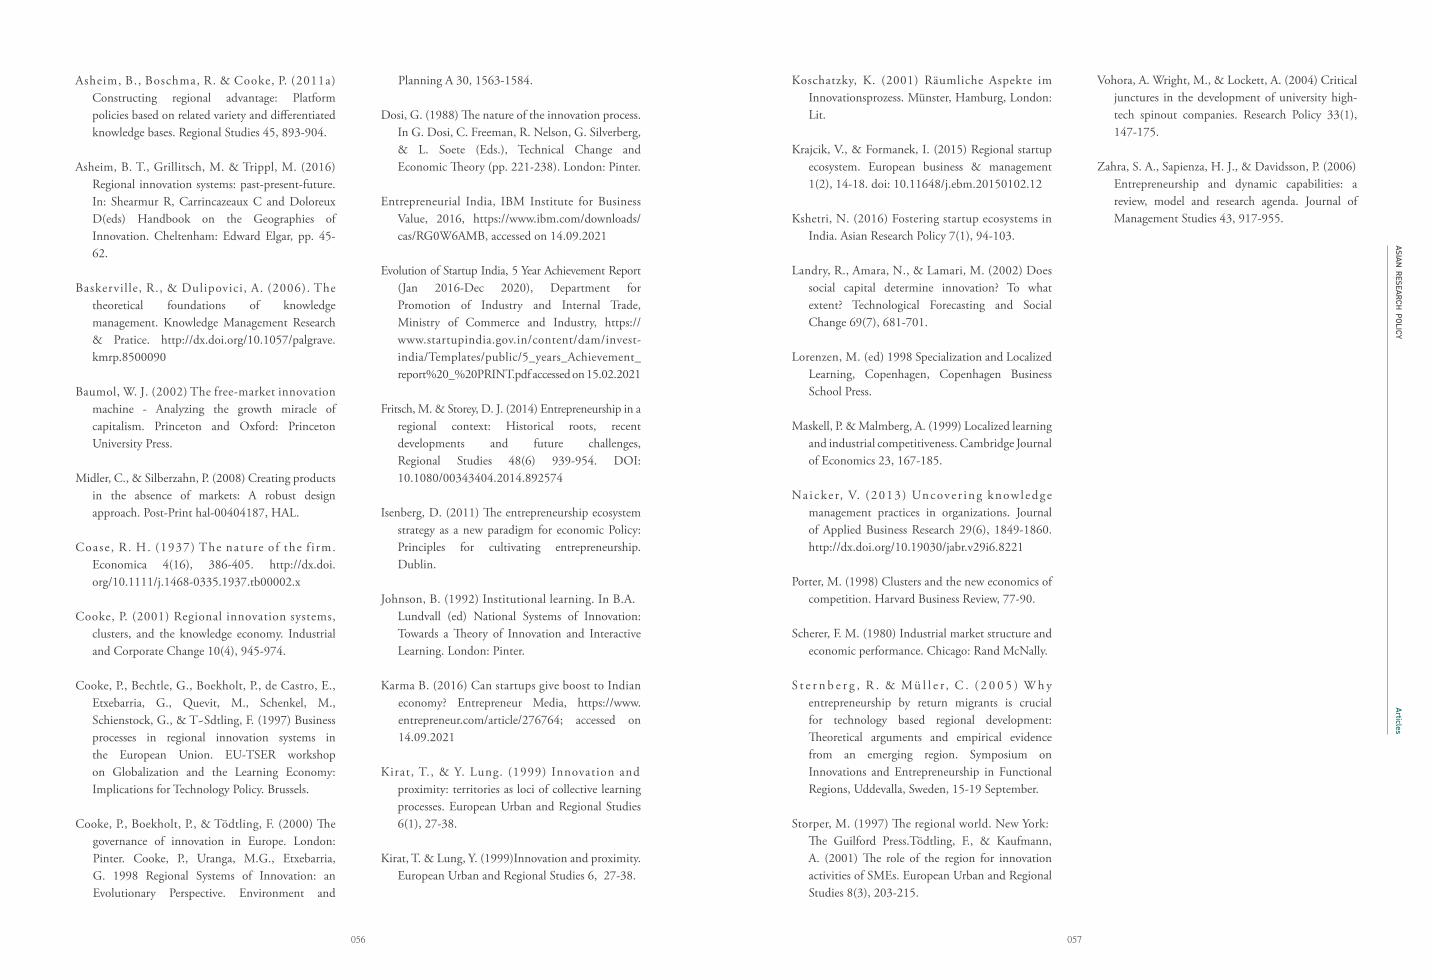
ASIAN RESEARCH
POLICY
057056
Articles
Asheim, B., Boschma, R. & Cooke, P. (2011a) Constructing regional advantage: Platform policies based on related variety and differentiated knowledge bases. Regional Studies 45, 893-904.
Asheim, B. T., Grillitsch, M. & Trippl, M. (2016)Regional innovation systems: past-present-future. In: Shearmur R, Carrincazeaux C and Doloreux D(eds) Handbook on the Geographies of Innovation. Cheltenham: Edward Elgar, pp. 45-62.
Baskerville, R., & Dulipovici, A. (2006). The theoretical foundations of knowledge management. Knowledge Management Research & Pratice. http://dx.doi.org/10.1057/palgrave.kmrp.8500090
Baumol, W. J. (2002) The free-market innovationmachine - Analyzing the growth miracle of capitalism. Princeton and Oxford: Princeton University Press.
Midler, C., & Silberzahn, P. (2008) Creating products in the absence of markets: A robust design approach. Post-Print hal-00404187, HAL.
Coase , R. H. (1937) The nature of the f i rm. Economica 4(16), 386-405. http://dx.doi.org/10.1111/j.1468-0335.1937.tb00002.x
Cooke, P. (2001) Regional innovation systems,clusters, and the knowledge economy. Industrial and Corporate Change 10(4), 945-974.
Cooke, P., Bechtle, G., Boekholt, P., de Castro, E., Etxebarria, G., Quevit, M., Schenkel, M., Schienstock, G., & T~Sdtling, F. (1997) Business processes in regional innovation systems in the European Union. EU-TSER workshop on Globalization and the Learning Economy: Implications for Technology Policy. Brussels.
Cooke, P., Boekholt, P., & Tödtling, F. (2000) The governance of innovation in Europe. London: Pinter. Cooke, P., Uranga, M.G., Etxebarria, G. 1998 Regional Systems of Innovation: an Evolutionary Perspective. Environment and
Planning A 30, 1563-1584.
Dosi, G. (1988) The nature of the innovation process. In G. Dosi, C. Freeman, R. Nelson, G. Silverberg, & L. Soete (Eds.), Technical Change and Economic Theory (pp. 221-238). London: Pinter.
Entrepreneurial India, IBM Institute for Business Value, 2016, https://www.ibm.com/downloads/cas/RG0W6AMB, accessed on 14.09.2021
Evolution of Startup India, 5 Year Achievement Report (Jan 2016-Dec 2020), Department for Promotion of Industry and Internal Trade, Ministry of Commerce and Industry, https://www.startupindia.gov.in/content/dam/invest-india/Templates/public/5_years_Achievement_report%20_%20PRINT.pdf accessed on 15.02.2021
Fritsch, M. & Storey, D. J. (2014) Entrepreneurship in a regional context: Historical roots, recent developments and future challenges, Regional Studies 48(6) 939-954. DOI: 10.1080/00343404.2014.892574
Isenberg, D. (2011) The entrepreneurship ecosystem strategy as a new paradigm for economic Policy: Principles for cultivating entrepreneurship. Dublin.
Johnson, B. (1992) Institutional learning. In B.A.Lundvall (ed) National Systems of Innovation: Towards a Theory of Innovation and Interactive Learning. London: Pinter.
Karma B. (2016) Can startups give boost to Indian economy? Entrepreneur Media, https://www.entrepreneur.com/article/276764; accessed on 14.09.2021
Kirat, T., & Y. Lung. (1999) Innovation andproximity: territories as loci of collective learning processes. European Urban and Regional Studies 6(1), 27-38.
Kirat, T. & Lung, Y. (1999)Innovation and proximity. European Urban and Regional Studies 6, 27-38.
Koschatzky, K. (2001) Räumliche Aspekte im Innovationsprozess. Münster, Hamburg, London: Lit.
Krajcik, V., & Formanek, I. (2015) Regional startup ecosystem. European business & management 1(2), 14-18. doi: 10.11648/j.ebm.20150102.12
Kshetri, N. (2016) Fostering startup ecosystems in India. Asian Research Policy 7(1), 94-103.
Landry, R., Amara, N., & Lamari, M. (2002) Does social capital determine innovation? To what extent? Technological Forecasting and Social Change 69(7), 681-701.
Lorenzen, M. (ed) 1998 Specialization and LocalizedLearning, Copenhagen, Copenhagen Business School Press.
Maskell, P. & Malmberg, A. (1999) Localized learning and industrial competitiveness. Cambridge Journal of Economics 23, 167-185.
Na i cke r, V. (2013) Uncove r ing knowledge management practices in organizations. Journal of Applied Business Research 29(6), 1849-1860. http://dx.doi.org/10.19030/jabr.v29i6.8221
Porter, M. (1998) Clusters and the new economics of competition. Harvard Business Review, 77-90.
Scherer, F. M. (1980) Industrial market structure and economic performance. Chicago: Rand McNally.
S t e r n b e r g , R . & Mü l l e r , C . ( 2 0 0 5 ) W h y entrepreneurship by return migrants is crucial for technology based regional development: Theoretical arguments and empirical evidence from an emerging region. Symposium on Innovations and Entrepreneurship in Functional Regions, Uddevalla, Sweden, 15-19 September.
Storper, M. (1997) The regional world. New York:The Guilford Press.Tödtling, F., & Kaufmann, A. (2001) The role of the region for innovation activities of SMEs. European Urban and Regional Studies 8(3), 203-215.
Vohora, A. Wright, M., & Lockett, A. (2004) Critical junctures in the development of university high-tech spinout companies. Research Policy 33(1), 147-175.
Zahra, S. A., Sapienza, H. J., & Davidsson, P. (2006)Entrepreneurship and dynamic capabilities: a review, model and research agenda. Journal of Management Studies 43, 917-955.

ASIAN RESEARCH
POLICY
059058
Introduction of Asian STI InstitutesASIAN
RESEARCH POLICY
S&T Trends
�Trends
S&TState-of-the-art innovation of renewable energy resources as an alternative fuel source in Malaysia’s energy mix: policy implications
Marlia M. Hanafiah and Saleh Shadman
Vietnam's plans and strategies in accordance with Vietnam's commitment to achieve carbon neutrality
Nguyen Trinh Hoang Anh
Analysis the long-term impact of low carbon transport policy in Jakarta city (case study: electrification of vehicles and biofuel program)
Sudarmanto B. Nugroho et al.
Trends of the zero carbon cities in Japan
Junko Ota and Junko Akagi
Decarbonizing road transport sector through electric mobility in Pakistan
Khalil Raza
Prospects for hydrogen in Asia Pacific
Craig Rogers et al.
ASIAN RESEARCH
POLICY
061060
S&T Trends
State-of-the-art innovation of renewable energy resources as an alternative fuel source in Malaysia’s energy mix: policy implicationsMarlia M. Hanafiah1,2,*, Saleh Shadman3
1 Department of Earth Sciences and Environment, Universiti Kebangsaan Malaysia, Bangi, Selangor, 43600, Malaysia2 Centre for Tropical Climate Change System, Universiti Kebangsaan Malaysia, Bangi, Selangor, 43600, Malaysia3 Department of Mechanical Materials and Manufacturing Engineering, University of Nottingham Malaysia, Jalan Broga,
43500 Semenyih, Selangor, Malaysia* Correspondence: [email protected]
This study establishes a consolidated body of knowledge on the potential of different renewable energy resources and the state-of-the-art technologies adapted to increase the renewable energy capacity in the energy mix of Malaysia. A systematic review of the current energy policies, renewable energy policies, and academic research is thoroughly performed. The secondary data collected and the primary data generated through the life cycle assessment method of biogas production provide a good understanding of the potential of agricultural wastes and palm oil mill effluent as biogas production sources. This is in line with the environmental and energy policy targets of increasing the renewable energy capacity to 31% by 2025 to take the burden off natural energy resources, reduce carbon emissions and footprint, and positively contribute to Malaysia’s environmental sustainability.
1. Introduction
The demand for energy almost proportionately increases with the increase in population and population growth rate (Masud et al., 2020). The global population growth rate has doubled over the last decade (Lee et al., 2016), leading to immense pressure on existing natural resources to fulfill the global energy demand. In 2000, roughly 86.1% of the worldwide energy demand was met by fossil fuels, which reduced to 84.3% in 2019. This reduction has seen the emergence of renewable energy sources, such as hydropower, solar power, wind, and biofuels, meeting the global energy demand with a share of 11.4%. The remaining 4.3% comes from nuclear power (Ritchie, 2019). The use of fossil fuels positively
contributes to the socio-economic development (Mohsin et al., 2019) of a nation because of its availability, accessibility, and affordability; however, it puts the environmental sustainability of that nation at stake. The release of greenhouse gases (GHG) is one of the primary causes of global warming and climate change worldwide (Vaka et al., 2020), (Mohsin et al., 2019) and (Gong et al., 2021).
One of the critical challenges that Malaysia is facing as regards tackling climate change issues is the lack of renewable energy resources and their contribution to mining fossil fuels, which have led to the depletion of their natural energy resources (Aziz et al., 2020). Energy Commission Malaysia (2020) has articulated that the current share of renewable resources in
Malaysia stands at 9% capacity in 2020, increasing by 3% over 2 years from 2018 (Miranville, 2019). However, this is far from the target of 31% share of renewable energy resources by 2025 (Energy Commission Malaysia, 2021). The increase in the share of renewable energy sources in Malaysia would eventually improve the nation’s long-term energy security (Shadman & Chin, 2021; Shadman et al., 2021).
Some of the recent studies on renewable energy worldwide, such as those of Toquica et al. (2021), Kaya et al. (2021), and Pupo-Roncallo et al. (2021), believe that renewable energy is a promising option for overcoming the threats of climate change if the challenge of intermittency and discontinuous supply can be solved. Thommessen et al. (2021) also stated that electricity generation from renewable energy sources is growing, creating jobs, and decreasing costs. This would eventually promote a circular economy around biomass waste to biogas conversion plants, solar power plants, hydropower plants, etc.
The key objective of this research is to identify the state-of-the-art technological innovations in renewable energy as an alternative source of fuel for Malaysia. The particular source of interest is how palm oil mill effluent (POME) and other agricultural waste can be used to the best of their potentials to create biogas as one of Malaysia’s forerunners of renewable energy sources. This objective is further analyzed
by evaluating the environmental impacts of biogas production based on the life cycle assessment (LCA) perspective. The Malaysian Palm Oil Board (MPOB) and SIRIM Berhad have primarily conducted LCA studies in Malaysia.
The overall economic impact of biogas as an alternative fuel, conversion of agricultural waste to biogas and its effects on the climate change challenges, mitigation strategies, and renewable energy policies of Malaysia have been studied in-depth. The output of fulfilling these research objectives would guide the use of biomass and biobased fuel to meet the future energy demand of Malaysia to some extent. This would reduce the pressure on natural resources, reduce dependency on fossil fuels, and positively contribute to Malaysia’s environmental sustainability.
The remainder of this paper is structured accordingly. Section 2 discusses the processes of the systematic literature review (SLR) and the LCA methods observed. Section 3 presents a systematic review of the existing literature classified as the secondary data for this study. This review is done to ensure that the current body of work is reflected herein to provide critical thinking and analysis of these secondary data. Section 4 discusses the overall findings of this study. Finally, Section 5 provides the conclusion, policy implications, and recommendations.
2. Methods
A project based on a literature review can be conducted in several ways. This study particularly aims to conduct an SLR of the existing literature in academic databases and the databases of the Ministry of Energy and Natural Resources, Energy Commission, and other statutory and regulatory bodies of Malaysia. The academic research data are from peer-reviewed, high-quality journals, ensuring robust and validated secondary data for this research. The data from ministry and regulatory bodies are provided in the public domain for data transparency. This study followed the methods mentioned by Okoli and Schabram (2010), Centobelli et al. (2017), and Xiao and Watson (2017) to perform the SLR.
Mohamed Shaffril et al. (2021) suggested a seven-step guide to an SLR comprising the following steps: (1) development and validation of the review protocol/publication standard/reporting standard/guidelines; (2) formulation of research questions; (3) systematic searching strategies; (4) quality appraisal; (5) data extraction; (6) data synthesis; and (7) data demonstration. Torres-Carrión et al. (2018) also suggested similar stages of SLR: 1) identification of the need for review; 2) development of a review protocol; and 3) conducting the review. Therefore, this study validates the method used herein to identify and analyze the most critical academic research papers. An overall combination of these studies and
Abstract
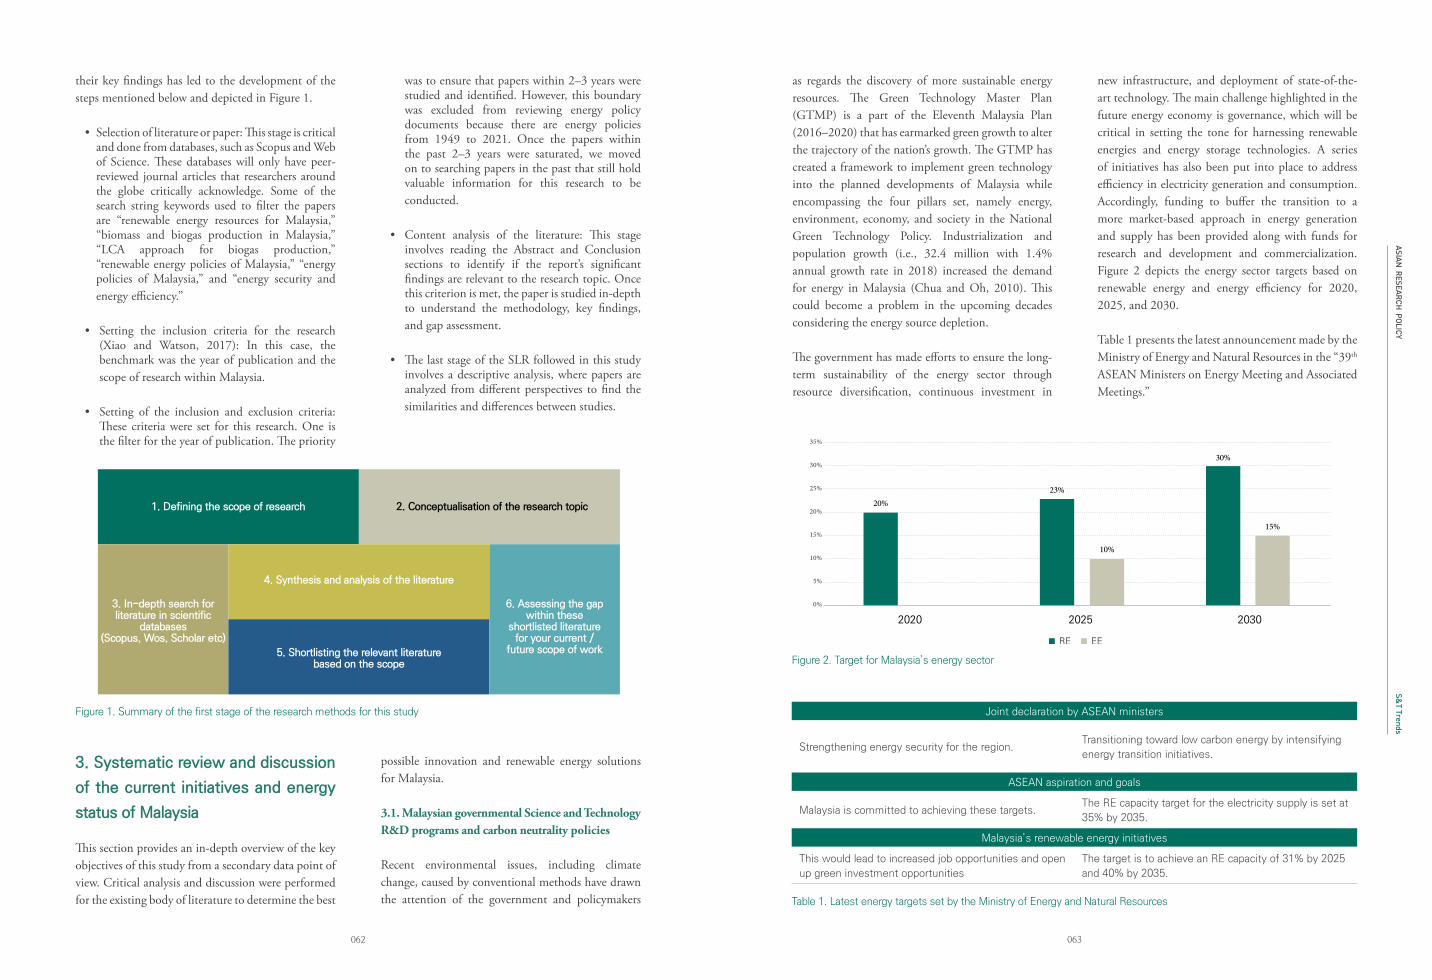
ASIAN RESEARCH
POLICY
063062
S&T Trends
their key findings has led to the development of the steps mentioned below and depicted in Figure 1.
• Selection of literature or paper: This stage is critical and done from databases, such as Scopus and Web of Science. These databases will only have peer-reviewed journal articles that researchers around the globe critically acknowledge. Some of the search string keywords used to filter the papers are “renewable energy resources for Malaysia,” “biomass and biogas production in Malaysia,” “LCA approach for biogas production,” “renewable energy policies of Malaysia,” “energy policies of Malaysia,” and “energy security and energy efficiency.”
• Setting the inclusion criteria for the research (Xiao and Watson, 2017): In this case, the benchmark was the year of publication and the scope of research within Malaysia.
• Setting of the inclusion and exclusion criteria: These criteria were set for this research. One is the filter for the year of publication. The priority
was to ensure that papers within 2–3 years were studied and identified. However, this boundary was excluded from reviewing energy policy documents because there are energy policies from 1949 to 2021. Once the papers within the past 2–3 years were saturated, we moved on to searching papers in the past that still hold valuable information for this research to be conducted.
• Content analysis of the literature: This stage involves reading the Abstract and Conclusion sections to identify if the report’s significant findings are relevant to the research topic. Once this criterion is met, the paper is studied in-depth to understand the methodology, key findings, and gap assessment.
• The last stage of the SLR followed in this study involves a descriptive analysis, where papers are analyzed from different perspectives to find the similarities and differences between studies.
1. Defining the scope of research
4. Synthesis and analysis of the literature
5. Shortlisting the relevant literaturebased on the scope
3. In-depth search forliterature in scientific
databases(Scopus, Wos, Scholar etc)
6. Assessing the gapwithin these
shortlisted literaturefor your current /
future scope of work
2. Conceptualisation of the research topic
Figure 1. Summary of the first stage of the research methods for this study
3. Systematic review and discussion
of the current initiatives and energy
status of Malaysia
This section provides an in-depth overview of the key objectives of this study from a secondary data point of view. Critical analysis and discussion were performed for the existing body of literature to determine the best
possible innovation and renewable energy solutions for Malaysia.
3.1. Malaysian governmental Science and Technology R&D programs and carbon neutrality policies
Recent environmental issues, including climate change, caused by conventional methods have drawn the attention of the government and policymakers
2020
20%23%
10%
30%
15%
2025 2030
35%
30%
25%
20%
15%
10%
5%
0%
RE EE
Figure 2. Target for Malaysia’s energy sector
as regards the discovery of more sustainable energy resources. The Green Technology Master Plan (GTMP) is a part of the Eleventh Malaysia Plan (2016–2020) that has earmarked green growth to alter the trajectory of the nation’s growth. The GTMP has created a framework to implement green technology into the planned developments of Malaysia while encompassing the four pillars set, namely energy, environment, economy, and society in the National Green Technology Policy. Industrialization and population growth (i.e., 32.4 million with 1.4% annual growth rate in 2018) increased the demand for energy in Malaysia (Chua and Oh, 2010). This could become a problem in the upcoming decades considering the energy source depletion.
The government has made efforts to ensure the long-term sustainability of the energy sector through resource diversification, continuous investment in
new infrastructure, and deployment of state-of-the-art technology. The main challenge highlighted in the future energy economy is governance, which will be critical in setting the tone for harnessing renewable energies and energy storage technologies. A series of initiatives has also been put into place to address efficiency in electricity generation and consumption. Accordingly, funding to buffer the transition to a more market-based approach in energy generation and supply has been provided along with funds for research and development and commercialization. Figure 2 depicts the energy sector targets based on renewable energy and energy efficiency for 2020, 2025, and 2030.
Table 1 presents the latest announcement made by the Ministry of Energy and Natural Resources in the “39th ASEAN Ministers on Energy Meeting and Associated Meetings.”
Joint declaration by ASEAN ministers
Strengthening energy security for the region. Transitioning toward low carbon energy by intensifying
energy transition initiatives.
ASEAN aspiration and goals
Malaysia is committed to achieving these targets.The RE capacity target for the electricity supply is set at
35% by 2035.
Malaysia’s renewable energy initiatives
This would lead to increased job opportunities and open
up green investment opportunities
The target is to achieve an RE capacity of 31% by 2025
and 40% by 2035.
Table 1. Latest energy targets set by the Ministry of Energy and Natural Resources
ASIAN RESEARCH
POLICY
065064
S&T Trends
The path-breaking Paris Agreement adopted in December 2015 marked a dramatic turn in the global efforts to mitigate climate change. The establishment of a new framework combining nationally determined contribution with new multilateral mechanisms aims to ensure transparency and accountability and promote a greater ambition over time. Malaysia pledged to reduce its GHG emission intensity of the GDP by 45% by 2030 relative to the emission intensity of the GDP in 2005. This is 35% on an unconditional basis, and a further 10% is conditional upon receipt of climate finance, technology transfer, and capacity building from developed countries.
3.2. Renewable energy policies of Malaysia
In their study, Shadman and Chin (2021) stated that Malaysia has never historically relied on renewable energy for electricity generation and as a fuel in the primary energy supply of the energy mix. The first-ever energy policy that involved any source of renewable energy was the Four-Fuel policy in 1981, which aimed to diversify fuel sources and mainly introduced hydropower. The Fifth-Fuel policy succeeded this policy in 2000, emphasizing the potential of biogas, biomass, mini-hydro, and solar power for electricity generation (Chua and Oh, 2010). The renewable energy policies in Malaysia failed to meet the targets set in the policy documents, leading to a poor implementation of the renewable resources in the energy mix (Chua and Oh, 2010; Ong et al., 2016).
Sovacool and Drupady (2011) mentioned that the ‘Small Renewable Energy Power (SREP) Program’ in 2001 only managed to fulfill 3% of its target by 2005 due to the lack of stakeholder intervention, lengthy approval process, lack of monitoring, and capacity caps. The SREP program was succeeded by the ‘National Renewable Energy Policy and Action Plan’ (NREPAP) after 8 years of implementation. The NREPAP aimed to ensure the best utilization of the indigenous renewable energy resources of Malaysia to contribute to socio-economic development and electricity generation (Cheng, 2020). Its primary objective was to ensure the sustainable management of natural resources and increase the share of renewable energy resources. The success of this program and policy did not just rely on government intervention,
but also required cooperation from private and third-party energy consumers in different economic sectors. This eventually led to an increase in job opportunities, better quality of life, and a circular economy around renewable energy plants.
By 2005, the 8th Malaysia plan aimed to generate 5% electricity equivalent to 600 MW. However, only a total capacity of 12 MW out of 600 MW was generated by the given timeline, indicating an unsuccessful policy implementation (Mustapa et al., 2010). Similarly, in the 9th Malaysia Plan (2006–2010), the government set a target of 300 MW electricity generation in Peninsular Malaysia and 50 MW in Sabah (Mustapa et al., 2010). By 2018, 2,057 MW of electricity generation capacity was established in Malaysia (Miranville, 2019). A target of 20% RE penetration with hydro projects smaller than 100 MW by 2025 was initially set in the 11th Malaysia plan. Out of which, 9% of the renewable energy capacity for electricity generation in 2020 had been established by 2020 (Energy Commission Malaysia, 2020).
Shadman and Chin (2021) also discussed the importance of the Renewable Energy Transition Roadmap (RETR) 2035 that SEDA is developing in collaboration with industry stakeholders to determine strategies that would be viable to ensure a successful implementation of the policies in place. The RETR 2035 aims to strike a balance between three key boundary conditions (Energy Commission, 2019):
1. to reduce GHG emissions and fulfill the 20% RE penetration by 2025;
2. to maintain the affordability of energy and economic benefits that the policies bring; and
3. to maintain system stability at the highest level.
Out of all projects, solar power plant projects, particularly large scale solar (LSS) projects and net energy metering (NEM), have been at the forefront of increasing the RE capacity for electricity in Malaysia. Four LSS projects have been sanctioned, with two projects fully functional, and the other two to be operational soon (Energy Commission, 2019). Accordingly, 27.81 MW of NEM had been approved as of the 31st of December 2018, and 9.01 MW total capacity had been commissioned (Miranville, 2019). Approximately 4.12 million buildings in
Peninsular Malaysia have been installed with rooftop solar plants, encouraging the future adoption of more NEM schemes (“Malaysia renewable energy 2025: private financing key to reaching target,” n.d.). Figure 3 depicts all the energy policies and programs that the Government of Malaysia has introduced since 1949 to utilize renewable energy resources to the best of their potential (Nair et al., 2021).
3.3. Malaysia’s efforts to reduce carbon footprint and carbon emissions
3.3.1. Existing plansSome of the existing initiatives taken by the Malaysian government to reduce carbon emissions in terms of electricity generation include the introduction of the NREPAP and the Feed-in Tariff. This plan aims to increase the RE contribution in the national power generation mix, facilitate the growth of the RE
industry, ensure reasonable RE generation costs, conserve the environment for future generations, and enhance awareness of the role and importance of RE. The Malaysian Biomass Industry Action Plan 2020 provides a biomass-to-wealth scenario, which will drive the development of national clusters in pellets, bioethanol, and biobased chemical industries and fulfil the national renewable energy target for converting biomass to energy while ensuring that sufficient nutrients are left for soil replenishment.The other existing initiatives of our government include the Malaysian Electricity Supply Industries Trust Account, Capacity Development and Training Programs, Incentive-Based Regulation, Efficiency in Power Generation, NEM, LSS plant, and a large hydropower plant. In terms of energy efficiency approaches, Home Energy Report, Minimum Energy Performance Standards, and National Energy Efficiency Action Plan were taken by the government.
· Energy policies and relevant inititives have been adopted in Malaysia since 1949, but they were executed actively only
after and up to 2000.
· 1974 and 1975 petroleum development act and policy were in place to monitor the utlisiation of the natural resources
for industrial development.
· 1980 depletion policy aimed at reducing the use of fossil fuels to prevent depletion.
· Third Outline Perspective Plan (OPP3) under Vision 2020.
· Eighth Malaysian Plan (8-MP)
· Introduced RE especially biomass as the fifth fuel into the existing energy sources so that 5.5% of the country’s electricity
derived from RE can be achieved by 2020
· Tenth Malaysian Plan (10-MP)
· Stronger incentives for investments in RE projects to boost the growth of green economy and sustainable energy supply
· ReACt 2011 established the FiT system to catalyse the generation of renewable energy.
· Ninth Malaysian Plan (9-MP)
· Strengthen the initiatives for energy efficiency (EE) and RE with a variety of fiscal and monetary incentives
· National Biofuel Policy of Malaysia 2006. The key focus was on the commercialisation, usage, research, technology, and
export of biodiesel.
· Malaysian Biofuel Industry Act 2007 was introduced to further regulate and promote biofuels.
· National REPolicy & Action Plan in 2009 to increase awareness on importance of renewable energy and Green Technology
Financing Scheme (GTFS) 2010.
· National Energy Efficiency Action Plan (NEEAP) in 2011 focused on energy efficiency plan. It included establishing a
sustainable funding mechanism to implement energy efficiency initiatives and promoting private sector investors.
· Emphasize “green growth” in society, which aims to reduce the environmental impact
· Conserve natural resources through the aspects of energy-efficient lifestyle and stressing more on 3Rs (i.e. Reduce,
Reuse and Recycle) in households and the industrial sector
· Improve the current educational systems
1949 - 2000
2001 - 2005
2011 - 2015
2006 - 2010
2016 - 2020
Figure 3. Summary of the renewable energy policies of Malaysia
ASIAN RESEARCH
POLICY
067066
S&T Trends
Oil palm
Rice
Forestry
Other
6%
77%
9%
8%
Figure 4. Malaysia’s agricultural residue
3.3.2. Way ForwardThe future approaches planned for generating electricity are the energy planning framework, planting up scenario, exploration of other resources, and reinvigoration of the co-generation policy. Long-term plans for the electricity tariff rate for higher renewable mix, introduction of new technologies, and enhancement of the cross-sectoral collaboration in R&D&C to develop localized technology are also being considered for the future of electricity production. Reinvigorating the demand side management in electricity thermal and transport, smart grid technology (incorporating digital grid, etc.), tailored communication strategy to a different target audience, and reinvigorating the National Energy Efficiency Action Plan are being considered to acquire more efficient energy.
3.4. Agricultural biomass waste
Malaysia is world-renowned for its abundant oil palm plantations, being the second largest palm oil-producing country in the world. Aside from oil palm, some of the agricultural crops include rubber, cocoa, and rice grown by both public and private sectors. Malaysia has a land area of 32.98 millihectare, with 31.2% of the land suitable for agriculture (Aminuddin, 1991). In the last three decades, Malaysia has become one of the most important poles of biofuel technology globally due to its abundant natural sources consisting of forests and agricultural fields covering 76% of its total land (Department of Statistics Malaysia Official Portal, 2018–2019). According to the MPOB statistics in 2017, the total oil palm planted area
in Peninsular Malaysia in 2017 was 2.70 million ha (46.6% of the total), followed by Sarawak with 1.56 million ha (26.8% of the total) and Sabah with 1.55 million ha (26.6% of the total). Consequently, many biomass wastes are being produced due to the accelerating growth in Malaysia’s agricultural sector.
The increase in the price of natural gas in the electricity sector increased coal-fired generation, which was a challenge in CO2 reduction. Thus, Malaysia faced problems in terms of sustaining the fossil fuel produced from natural gas and coal in electricity generation. This led to many financial incentives and policies promoting the use of renewables, such as the Five-Fuel Policy in 2001. The Five-Fuel Policy aims to utilize renewable energy from four renewable sources, namely biomass and MSW, biogas inclusive of landfill and sewage, solar photovoltaic (PV), and mini‐hydro, as additional fuel sources for electricity generation aside from conventional sources. According to Griffin et al. (2014), in Peninsular Malaysia, agriculture residue is estimated at 17 Mt. Accordingly, 77% of the total residues is from oil palm; 9.1% is from rice residues; 8.2% is from forestry residues; and 5.7% is from other residues like rubber, cocoa, and coconut (Figure 4).
Approximately 75% of the oil palm waste is composed of OPF and OPT, which are readily available in plantation sites. EFB, MF, PKS, and POME that account for the remaining 25% are usually available at mill sites during palm oil extraction from the fresh fruit bunch. The general oil palm yield for commodity trading includes crude palm oil (CPO), crude palm
kernel oil, and palm kernel cake (Hanafiah et al., 2018).Thermal treatment, which is a traditional treatment of biomass as a solid fuel, is used for cooking and heating agricultural wastes, such as fuelwood, wood chips, straw, sawdust, and logging residues. However, this type of biomass treatment significantly affects coal replacement in the electricity sector. The main advantage of biomass over coal is the availability of a carbon sequester, where the CO2 produced from combustion to generate power can be reused for photosynthesis, which will significantly reduce the air pollution from the sulfur oxide (SOX) and nitrogen oxide (NOX) released from combustion with coal (Hamzah et al., 2019). Unlike biomass, which is regularly available, fossil fuels require thousands or millions of years to reproduce. The annual biomass yield has pros and cons because it depends on the location, weather and climate condition, crop management, fertilization, and soil type. Agricultural residues have attracted biomass feedstock because low-cost by-products make an excellent economic value for solid fuel production. However, the thermochemical conversion for agriculture residues is more challenging than wood because the ash content in wood is usually less than many agricultural residues. The other technical challenges of biomass include low bulk, energy density, and calorific value, which require upgrade and densification that make the feedstock costly.
Moreover, biomass is more susceptible to moisture or hydrophilicity, which causes problems connected to fuel storage and handling. Most power station operators are concerned about logistics and boiler issues, such as fouling and corrosion of heat exchanger surfaces, slagging, ash deposition, and SOx and NOx emissions (Livingston, 2016; Rahman and Shamsuddin, 2013). Therefore, biomass pre-treatment is necessary for improving chemical and physical properties by increasing the energy content, grind ability, and hydrophobicity.
3.5. Palm oil mill effluent
POME is a type of greasy wastewater produced by the processing mills of palm oil. It contains various suspended materials, which when improperly discarded, are harmful to the environment due to
their high oxygen-depleting capability in aquatic systems. Improper wastewater disposal can result in contaminant leaching, which can pollute the groundwater and the soil and release methane gas into the atmosphere. The worldwide methane potential of POME is approximately 600 million m3 per annum. This gas has a GWP that is 25 times higher than that of carbon dioxide (Shakib and Rashid, 2019). After soy, palm oil is the second most traded vegetable oil crop worldwide. Over 90% of the world’s palm oil exports is produced in Malaysia and Indonesia. According to MPOB, in 2019, Malaysia is the second largest producer of oil palm (more than 20.3 million tons) in the world. The global palm oil production and trade have steeply and continuously risen from the 1970s onwards, with average growth rates achieved by oil palm substantially exceeding those of other oils and fats. The factors explaining the interest of the global marketplace in palm oil include: • high level of substitutability with other soft oils; • high melting point and low trans fatty acid content,
which is of special appeal to the food industry; and • reconfirmed health benefits (notably as a rich
source of carotenoids).According to the MPOB, in 2018, oil palm trees were planted in 5,849,330 ha of land in various states around Malaysia.
Palm oil production is abundant due to its high demand on a global scale; hence, the amount of waste it generates is also large. Accordingly, an efficient method of treating its waste must be developed. However, its waste can be reutilized as valuable renewable energy by generating biogas through anaerobic digestion (Aziz and Hanafiah, 2018; Hanafiah et al., 2017). Anaerobic digestion is a cost effective technique of treating POME and producing biogas that can be used to simultaneously generate power. Palm oil mill biomass mainly comprises 24%–65% cellulose, 21%–34% hemicellulose, and 14%–31% lignin (Palamae et al., 2017). The high cellulose content in POME makes it an ideal source for generating different biofuel types. Other than that, the high fatty acid content in POME serves as a suitable substrate in the fermentation process of hydrogen production (Mamimin et al., 2019). Figure 5 shows the biohydrogen production process from palm oil mill biomass (Aziz and Hanafiah, 2018).
ASIAN RESEARCH
POLICY
069068
S&T Trends
Figure 5. Biohydrogen production process from palm oil mill biomass
The BioGen Project is one of the earliest initiatives that the Government of Malaysia jointly funded with the United Nations Development Program, the Global Environment Facility, and the Malaysian private sector. Pusat Tenaga Malaysia is the implementing agency under the executing agency, which is the Ministry of Energy, Water and Communications. The broad objective of the BioGen Project is to reduce the growth rate of GHG emissions from fossil fuel-fired activities and the decomposition of unused biomass waste from palm oil mills. This is to be achieved by removing significant barriers to developing biomass-based combined heat and power projects to supplant part of Malaysia’s current fossil fuel electricity generation. The project explicitly aims to reduce the growth rate of GHG emissions from fossil-fired combustion processes by 3.8% by the end of 2008.
Malaysia has tons of biomass that can be utilized in a sustainable manner to produce bio-products for a circular green economy. At the 15th Conference of Parties in Copenhagen, Malaysia volunteered to reduce its gross domestic product emission intensity by up to 40% by 2020 from the 2005 level. Natural resources, forestry, and agricultural resources, such as POME, will contribute to the renewable energy production. Based on the processing capacity recorded for 2016, 1 ton of CPO production is associated with 9 tons of biomass generation. Figure 6 was adopted from the studies of Aziz et al. (2019) and Aziz and
Hanafiah (2020).
3.6. Life cycle assessment of POME
The LCA approach has long been practiced worldwide (Luo et al., 2018), but it is still new and under development in Malaysia. Hence, this study took a step further toward evaluating the environmental impacts of biogas production based on the LCA perspective. The MPOB and SIRIM Berhad primarily conducted LCA studies in Malaysia. The conversion of POME to renewable energy causes emissions along the process; thus, LCA would provide a more detailed statistics that will be useful in reducing the environmental impacts (Aziz et al., 2019; Aziz and Hanafiah, 2020; Izzah et al., 2017; Banch et al., 2020). Approximately 60% of GHG emissions comes from activities in crop plantations (e.g., irrigation, fertilization, and diesel used by vehicles for transportation) (Lam et al., 2009).Mohd Yusof et al. (2019) conducted a research to study the aspects of bioethanol production from oil palm using the LCA SimaPro 8 software. They found that fermentation and transportation are the main contributors to fossil fuel energy consumption, ranging from 52% to 97%. The outcome of the LCA analysis and the environmental performance of the biogas generation from POME have drawn the attention of decision makers in relation to the plantation phase (upstream stages) for achieving sustainability in the process (Aziz and Hanafiah, 2020; Ashraf and Mohd
Hanafiah, 2019; Aziz et al., 2020). Tan et al. (2010) also concluded that 506–971 kg CO2 eq. was emitted per ton of CPO with biogas capture produced. Figure 7 depicts the life cycle system of biogas production through the anaerobic digestion process.
Figure 7 depicts a simplified representation of the LCA of biogas production. Figure 8 shows a more detailed framework for biogas production from POME (Abdul Aziz et al., 2019).
Palm Oil Industry
Palm Oil millNursery
Sterilization
�reshing andstripping
Seedlingcultivation
Seedingtransplantation
Oil extractionSeedlings
Plantation
Oil palm planting
Harvesting
Fresh fruit bunch
E�uent
By-products
Crudepalm oil
Palmkernel oil
MidstreamUpstream Downstream
COmmercialProducts
Food products
Animal feeds
Personal care andcosmetics
Pharmaceuticals
Industrial
Biofuels and energy
Figure 6. Overview of the palm oil industry of Malaysia
LIFE CYCLESYSTEM
POME
AnaerobicDigestion
GasGenerator
NationalGrid
Palm OilMill
Figure 7. Life cycle system of biogas production
Biological process
· Dark Fermentarion· Light Fermentarion· Biophotolysis
Thermal & Thermochemical
· Pyrolysis· Gasification
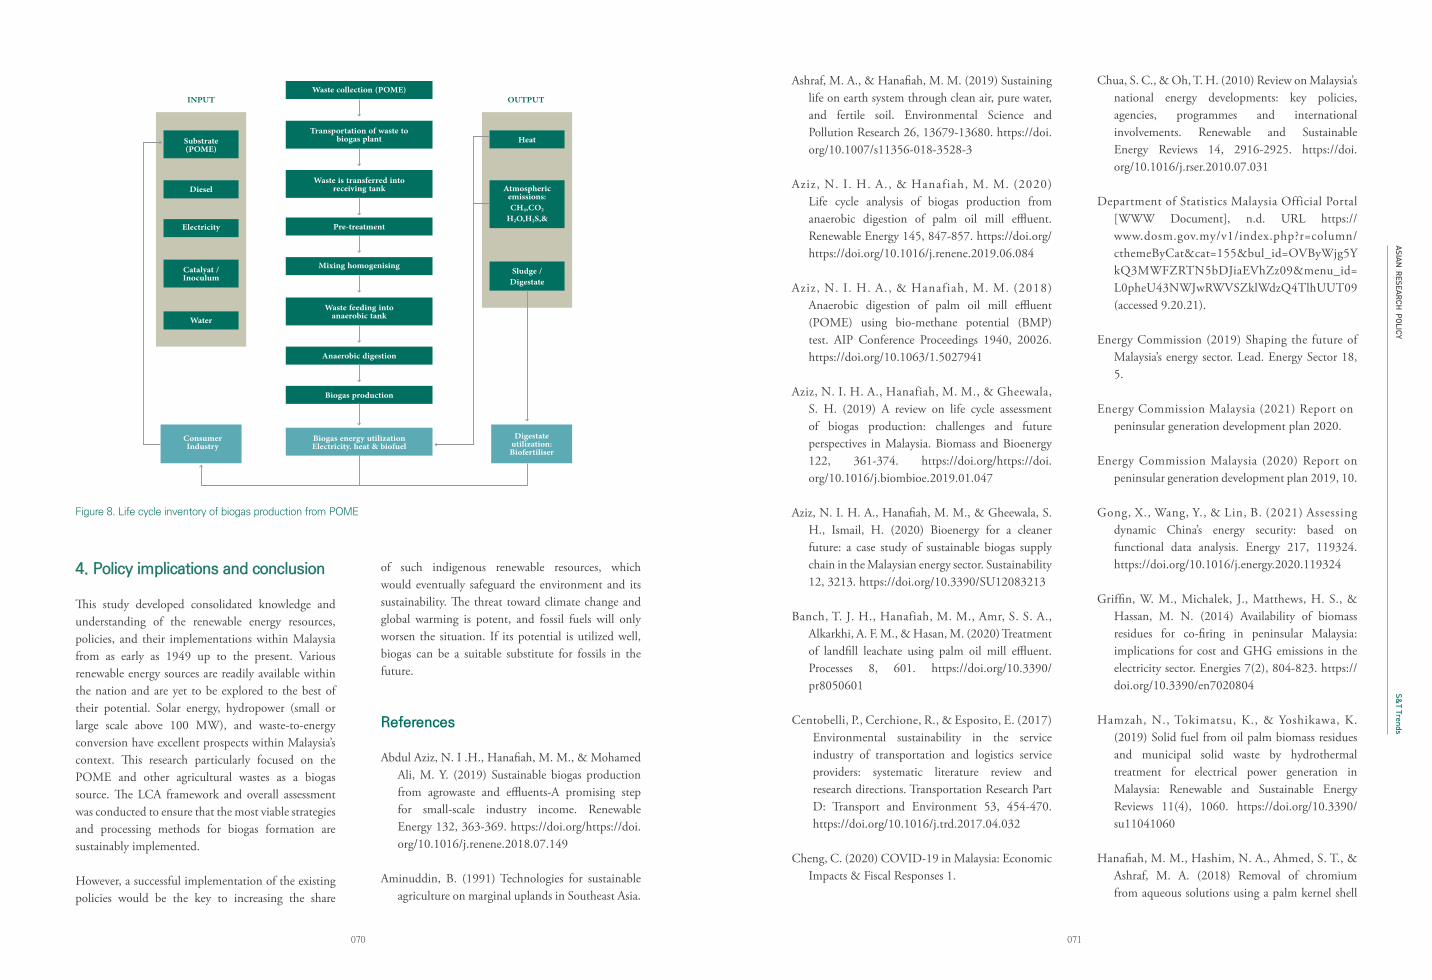
ASIAN RESEARCH
POLICY
071070
S&T Trends
Waste collection (POME)
Substrate(POME)
Diesel
Heat
Atmosphericemissions:CH4,CO2
H2O,H2S,&
Sludge /Digestate
Electricity
Catalyat /Inoculum
Water
INPUT OUTPUT
Pre-treatment
Mixing homogenising
Anaerobic digestion
Biogas production
Waste feeding intoanaerobic tank
Biogas energy utilizationElectricity. heat & biofuel
ConsumerIndustry
Digestateutilization:Biofertiliser
Transportation of waste tobiogas plant
Waste is transferred intoreceiving tank
Figure 8. Life cycle inventory of biogas production from POME
4. Policy implications and conclusion
This study developed consolidated knowledge and understanding of the renewable energy resources, policies, and their implementations within Malaysia from as early as 1949 up to the present. Various renewable energy sources are readily available within the nation and are yet to be explored to the best of their potential. Solar energy, hydropower (small or large scale above 100 MW), and waste-to-energy conversion have excellent prospects within Malaysia’s context. This research particularly focused on the POME and other agricultural wastes as a biogas source. The LCA framework and overall assessment was conducted to ensure that the most viable strategies and processing methods for biogas formation are sustainably implemented.
However, a successful implementation of the existing policies would be the key to increasing the share
of such indigenous renewable resources, which would eventually safeguard the environment and its sustainability. The threat toward climate change and global warming is potent, and fossil fuels will only worsen the situation. If its potential is utilized well, biogas can be a suitable substitute for fossils in the future.
References
Abdul Aziz, N. I .H., Hanafiah, M. M., & Mohamed Ali, M. Y. (2019) Sustainable biogas production from agrowaste and effluents-A promising step for small-scale industry income. Renewable Energy 132, 363-369. https://doi.org/https://doi.org/10.1016/j.renene.2018.07.149
Aminuddin, B. (1991) Technologies for sustainable agriculture on marginal uplands in Southeast Asia.
Ashraf, M. A., & Hanafiah, M. M. (2019) Sustaining life on earth system through clean air, pure water, and fertile soil. Environmental Science and Pollution Research 26, 13679-13680. https://doi.org/10.1007/s11356-018-3528-3
Aziz, N. I. H. A., & Hanafiah, M. M. (2020) Life cycle analysis of biogas production from anaerobic digestion of palm oil mill effluent. Renewable Energy 145, 847-857. https://doi.org/https://doi.org/10.1016/j.renene.2019.06.084
Aziz, N. I. H. A., & Hanafiah, M. M. (2018)Anaerobic digestion of palm oil mill effluent (POME) using bio-methane potential (BMP) test. AIP Conference Proceedings 1940, 20026. https://doi.org/10.1063/1.5027941
Aziz, N. I. H. A., Hanafiah, M. M., & Gheewala,S. H. (2019) A review on life cycle assessment of biogas production: challenges and future perspectives in Malaysia. Biomass and Bioenergy 122, 361-374. https://doi.org/https://doi.org/10.1016/j.biombioe.2019.01.047
Aziz, N. I. H. A., Hanafiah, M. M., & Gheewala, S. H., Ismail, H. (2020) Bioenergy for a cleaner future: a case study of sustainable biogas supply chain in the Malaysian energy sector. Sustainability 12, 3213. https://doi.org/10.3390/SU12083213
Banch, T. J. H., Hanafiah, M. M., Amr, S. S. A., Alkarkhi, A. F. M., & Hasan, M. (2020) Treatment of landfill leachate using palm oil mill effluent. Processes 8, 601. https://doi.org/10.3390/pr8050601
Centobelli, P., Cerchione, R., & Esposito, E. (2017)Environmental sustainability in the service industry of transportation and logistics service providers: systematic literature review and research directions. Transportation Research Part D: Transport and Environment 53, 454-470. https://doi.org/10.1016/j.trd.2017.04.032
Cheng, C. (2020) COVID-19 in Malaysia: Economic Impacts & Fiscal Responses 1.
Chua, S. C., & Oh, T. H. (2010) Review on Malaysia’s national energy developments: key policies, agencies, programmes and international involvements. Renewable and Sustainable Energy Reviews 14, 2916-2925. https://doi.org/10.1016/j.rser.2010.07.031
Department of Statistics Malaysia Official Portal[WWW Document], n.d. URL https://www.dosm.gov.my/v1/index.php?r=column/cthemeByCat&cat=155&bul_id=OVByWjg5YkQ3MWFZRTN5bDJiaEVhZz09&menu_id=L0pheU43NWJwRWVSZklWdzQ4TlhUUT09 (accessed 9.20.21).
Energy Commission (2019) Shaping the future of Malaysia’s energy sector. Lead. Energy Sector 18, 5.
Energy Commission Malaysia (2021) Report on peninsular generation development plan 2020.
Energy Commission Malaysia (2020) Report on peninsular generation development plan 2019, 10.
Gong, X., Wang, Y., & Lin, B. (2021) Assessingdynamic China’s energy security: based on functional data analysis. Energy 217, 119324. https://doi.org/10.1016/j.energy.2020.119324
Griffin, W. M., Michalek, J., Matthews, H. S., & Hassan, M. N. (2014) Availability of biomass residues for co-firing in peninsular Malaysia: implications for cost and GHG emissions in the electricity sector. Energies 7(2), 804-823. https://doi.org/10.3390/en7020804
Hamzah, N., Tokimatsu, K., & Yoshikawa, K. (2019) Solid fuel from oil palm biomass residues and municipal solid waste by hydrothermal treatment for electrical power generation in Malaysia: Renewable and Sustainable Energy Reviews 11(4), 1060. https://doi.org/10.3390/su11041060
Hanafiah, M. M., Hashim, N. A., Ahmed, S. T., &Ashraf, M. A. (2018) Removal of chromium from aqueous solutions using a palm kernel shell
ASIAN RESEARCH
POLICY
073072
S&T Trends
adsorbent. Desalination and Water Treatment 118, 172-180. https://doi.org/10.5004/dwt.2018.22639
Hanafiah, M. M., Mohamed Ali, M. Y., Abdul Aziz, N. I. H., Ashraf, M. A., Halim, A. A., Lee, K. E., & Idris, M. (2017) Biogas production from goat and chicken manure in Malaysia. Applied Ecology and Environmental Research 15, 529-535. https://doi.org/10.15666/aeer/1503_529535
Izzah, N., Aziz, H. A., & Hanafiah, M. M. (2017)The potential of palm oil mill effluent (POME) as a renewable energy. Acta Scientifica Malaysia 1, 9-11.
Kaya, F. , Şahin, G. , Alma, & M. H. (2021)Investigation effects of environmental and operating factors on PV panel efficiency using by multivariate linear regression. International Journal of Energy Research 45, 554-567. https://doi.org/10.1002/er.5717
Lam, M. K., Lee, K. T., & Mohamed, A. R. (2009)Life cycle assessment for the production of biodiesel: a case study in Malaysia for palm oil versus jatropha oil. Biofuels, Bioprod. Biorefining 3, 601-612. https://doi.org/https://doi.org/10.1002/bbb.182
Livingston, W. R. (2016) The status of large scalebiomass firing: the milling and combustion of biomass materials in large pulverised coal boilers, IEA Bioenergy Task 32: Biomass Combustion and co-firing.
Luo, L., Yang, L., & Hanafiah, M. M. (2018)Construction of renewable energy supply chain model based on LCA. Open Physics 16, 1118-1126. https://doi.org/10.1515/phys-2018-0132
Malaysia renewable energy 2025 private financingkey to reaching target [WWW Document], n.d. URL https://www.power-technology.com/comment/malaysia-needs-us8-billion-investment-to-achieve-20-renewable-energy-target-by-2025/ (accessed 6.30.20).
Mamimin, C. , Kongjan, P. , O-Thong, S . , &Prasertsan, P. (2019) Enhancement of biohythane production from solid waste by co-digestion with palm oil mill effluent in two-stage thermophilic fermentation. International Journal of Hydrogen Energy 44, 17224-17237. https://doi.org/https://doi.org/10.1016/j.ijhydene.2019.03.275
Masud, M. H., Nuruzzaman, M., Ahamed, R., nanno, A. A., & Tomal, A. N. M. A. (2020) Renewable energy in Bangladesh: current situation and future prospect. International Journal of Sustainable Energy 39, 132-175. https://doi.org/10.1080/14786451.2019.1659270
Miranville, A. (2019) Annual report 2018. AIMSMathematics 4, 166-169. https://doi.org/10.3934/Math.2019.1.166
Mohamed Shaffril, H. A., Samsuddin, S. F., & Abu Samah, A. (2021) The ABC of systematic literature review: the basic methodological guidance for beginners. Quality & Quantity 55, 1319-1346. https://doi.org/10.1007/s11135-020-01059-6
Mohd YUSOF, S. J., Roslan, A. M., Ibrahim, K. N., Syed ABDULLAH, S. S., Zakaria, M. R., Hassan, M. A., & Shirai, Y. (2019) Life Cycle Assessment for bioethanol production from oil palm frond Juice in an oil palm based biorefinery. Sustainability 11, 6928. https://doi.org/10.3390/su11246928
Mohsin, M., Rasheed, A. K., Sun, H., Zhang, J., Iram, R., Iqbal, N., & Abbas, Q. (2019) Developing low carbon economies: an aggregated composite index based on carbon emissions. Sustainable Energy Technologies and Assessments 35, 365-374. https://doi.org/https://doi.org/10.1016/j.seta.2019.08.003
Mustapa, S. I. , Peng, L. Y., & Hashim, A. H.(2010) Issues and challenges of renewable energy development: a Malaysian experience. Proceedings of the International Conference on Energy and Sustainable Development: Issues and Strategies (ESD 2010). https://doi.org/10.1109/esd.2010.5598779
Nair, K., Shadman, S., Chin, C. M. M., Sakundarini, N., Hwa Yap, E., & Koyande, A. (2021) Developing a system dynamics model to study the impact of renewable energy in the short- and long-term energy security. Materials Science for Energy Technologies 4, 391-397. https://doi.org/https://doi.org/10.1016/j.mset.2021.09.001
Okoli, C., & Schabram, K. (2010) A Guide to Conducting a Systematic Literature Review of Information Systems Research (May 5, 2010). http://dx.doi.org/10.2139/ssrn.1954824
Ong, P. Y., Chin, C. M. M., & Yap, E. H. (2016)Reviewing Malaysia’s renewable energy policies: a management framework perspective. Journal of Clean Energy Technology 4, 448-452. https://doi.org/10.18178/jocet.2016.4.6.330
Palamae, S., Dechatiwongse, P., Choorit, W., Chisti, Y., & Prasertsan, P. (2017) Cellulose and hemicellulose recovery from oil palm empty fruit bunch (EFB) fibers and production of sugars from the fibers. Carbohydrate Polymers 155, 491-497. https://doi.org/https://doi.org/10.1016/j.carbpol.2016.09.004
Pupo-Roncallo, O., Campillo, J., Ingham, D., Ma, L., & Pourkashanian, M. (2021) The role of energy storage and cross-border interconnections for increasing the flexibility of future power systems: the case of Colombia. Smart Energy 2, 100016. https://doi.org/10.1016/j.segy.2021.100016
Rahman, A. A., & Shamsuddin, A. H. (2013) Cofiring biomass with coal: Opportunities for Malaysia. IOP Conferences Series: Earth and Environmental Science 16, 012144. https://doi.org/101088/1755-1315/16/1/012144
Ritchie, H. (2019) Energy mix [WWW Document]. Our World Data.
Shadman, S., & Chin, C. M. M. (2021) The roleof current and future renewable energy policies in fortifying Malaysia’ s energy security : PESTLE and SWOT analysis through stakeholder engagement 16, 1-17.
Shadman, S., Chin, C. M. M., Sakundarini, N., Yap, E. H., & Velautham, S. (2021) Methodological review of Malaysia’s energy security measurement: a Systems approach using stakeholder engagement. IOP Conference Series: Materials Science and Engineering 1092, 012032. https://doi.org/10.1088/1757-899X/1092/1/012032
Shakib, N., & Rashid, M. (2019) Biogas production optimization from POME by using anaerobic digestion process. Journal of Applied Science & Process Engineering 6, 369-377. https://doi.org/10.33736/jaspe.1711.2019
Sovacool, B. K., & Drupady, I. M. (2011) Examining the small renewable energy power (SREP) program in Malaysia. Energy Policy 39, 7244-7256. https://doi.org/10.1016/j.enpol.2011.08.045
Ta n , Y. A . , Mu h a m m a d , H . , H a s h i m , Z . , ubramaniam, V., Wei, P. C., Let, C. C., Ngan, M. A., & May, C. Y. (2010) Life cycle assessment of refined palm oil production and fractionation (part 4). Journal of Oil Palm Research 22, 913-926.
Thommessen, C., Otto, M., Nigbur, F., & Roes, J.(2021) Storage pipeline ship offshore energy hub. Smart Energy 3, 100027. https://doi.org/10.1016/j.segy.2021.100027
Toquica, D., Agbossou, K., Henao, N., Malhamé,R., Kelouwani, S., & Amara, F. (2021) Prevision and planning for residential agents in a transactive energy environment. Smart Energy 2, 100019. https://doi.org/10.1016/j.segy.2021.100019
Torres-Carrión, P. V, González-González, C. S., Aciar, S., & Rodríguez-Morales, G. (2018) Methodology for systematic literature review applied to engineering and education, in: 2018 IEEE Global Engineering Education Conference (EDUCON). pp. 1364-1373. https://doi.org/10.1109/EDUCON.2018.8363388
Vaka, M., Walvekar, R. , Rasheed, A. K. , &Khalid, M. (2020) A review on Malaysia’s solar energy pathway towards carbon-neutral
ASIAN RESEARCH
POLICY
075074
S&T Trends
Malaysia beyond Covid-19 pandemic. Journal of Cleaner Production 273, 122834. https://doi.org/10.1016/j.jclepro.2020.122834
Xiao, Y., & Watson, M. (2017) Guidance on conducting a systematic literature review. Journal of Planning Education and Research 39, 93-112. https://doi.org/10.1177/0739456X17723971
1. INDC and the latest NDC of Vietnam
Vietnam’s emission per capita, regardless their remarkable growth in the last two decades, still remains far below the global average. However, Vietnam’s carbon intensity is still considerable, which has increased significantly in the last decade due to an increasing consumption of fossil fuels. In addition to that, Vietnam’s energy intensity has increased in the last decade and higher than China and other countries from ASEAN region.
A constructive engagement in the arena of international climate change mitigation is considered to contribute towards establishing a good international reputation for Vietnam as a ‘reliable partner’ in the region, which could then have positive spillovers to other policy arenas, such as trade negotiations or investment treaties. The most relevant example for this argument is that, on 12th February 2020, the EU-Vietnam free trade and investment protection deals have been approved by the Parliament of EU (European Parliament 2020). This remarkable
Vietnam's plans and strategies in accordance with Vietnam's commitment to achieve carbon neutrality Nguyen Trinh Hoang Anh1,2
1 Vietnam Initiative for Energy Transition (VIET SE), Hanoi, Vietnam2 Association of Vietnamese Scientists and Experts (AVSE Global), Paris 75008, France* Correspondence: [email protected]
With a young population of more than 96 million by 2019, Vietnam is one of the fastest-growing economies in Southeast Asia and the fourth largest GHG emitter the region. Since the early 2010s, Vietnam has been facing increasing pressure to control its emissions and shift to a low-carbon economy in decades to come. This pressure is from both international and domestic, reflecting Vietnam’s role in global/regional mitigation efforts, as well as the growing demand by citizens for better environmental conditions. In Vietnam’s nationally-determined contribution to the 2015 Paris Agreement on climate change, the country has not yet mentioned its carbon emissions peak but the country committed to reducing the emission from 8 to 25% as compared to the baseline by 2030. Given that the energy sector would play the most important role in the national NDCs’ implementation, the Politburo of Vietnam has recently issued Resolution 55 on the orientation on Vietnam’s national energy development strategy to 2030, with a vision to 2045, which presents the overall target of firmly ensuring national energy security as well as the high engagement of the country to achieve its NDCs’ targets through energy activities. This paper reviews some recent energy figures and climate targets for intensely understanding about the country’s climate mitigation efforts in the energy sector in decades to come.
JEL Classification: L94, O13, P28, P48, Q48Keywords: NDCs, energy, Vietnam, perspective, climate policy
Abstract
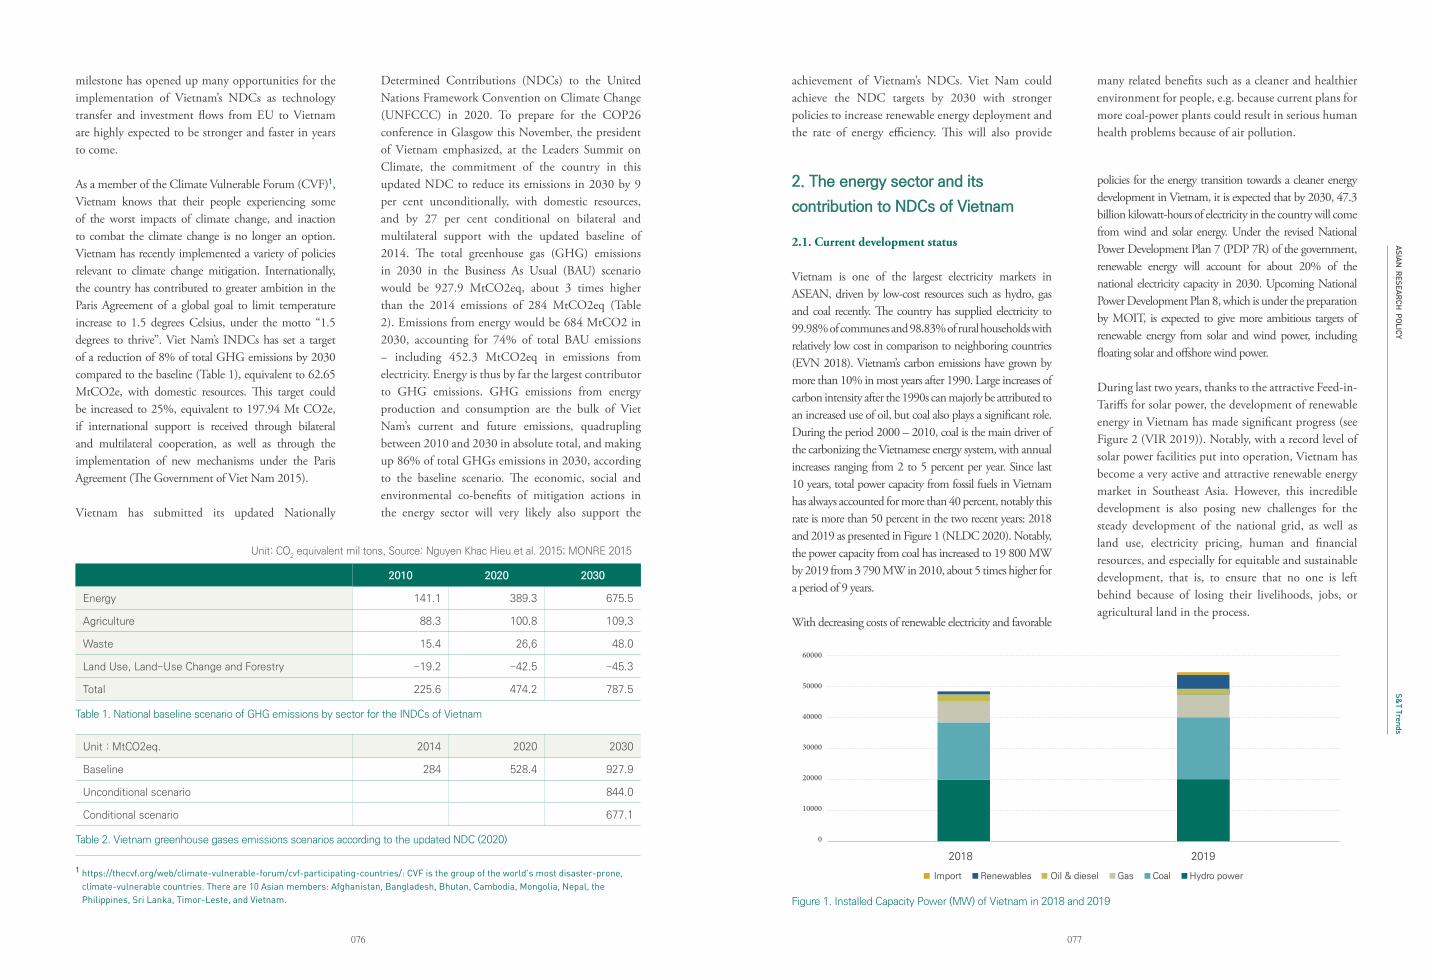
ASIAN RESEARCH
POLICY
077076
S&T Trends
1 https://thecvf.org/web/climate-vulnerable-forum/cvf-participating-countries/: CVF is the group of the world’s most disaster-prone, climate-vulnerable countries. There are 10 Asian members: Afghanistan, Bangladesh, Bhutan, Cambodia, Mongolia, Nepal, the Philippines, Sri Lanka, Timor-Leste, and Vietnam.
milestone has opened up many opportunities for the implementation of Vietnam’s NDCs as technology transfer and investment flows from EU to Vietnam are highly expected to be stronger and faster in years to come.
As a member of the Climate Vulnerable Forum (CVF)1, Vietnam knows that their people experiencing some of the worst impacts of climate change, and inaction to combat the climate change is no longer an option. Vietnam has recently implemented a variety of policies relevant to climate change mitigation. Internationally, the country has contributed to greater ambition in the Paris Agreement of a global goal to limit temperature increase to 1.5 degrees Celsius, under the motto “1.5 degrees to thrive”. Viet Nam’s INDCs has set a target of a reduction of 8% of total GHG emissions by 2030 compared to the baseline (Table 1), equivalent to 62.65 MtCO2e, with domestic resources. This target could be increased to 25%, equivalent to 197.94 Mt CO2e, if international support is received through bilateral and multilateral cooperation, as well as through the implementation of new mechanisms under the Paris Agreement (The Government of Viet Nam 2015).
Vietnam has submitted its updated Nationally
Determined Contributions (NDCs) to the United Nations Framework Convention on Climate Change (UNFCCC) in 2020. To prepare for the COP26 conference in Glasgow this November, the president of Vietnam emphasized, at the Leaders Summit on Climate, the commitment of the country in this updated NDC to reduce its emissions in 2030 by 9 per cent unconditionally, with domestic resources, and by 27 per cent conditional on bilateral and multilateral support with the updated baseline of 2014. The total greenhouse gas (GHG) emissions in 2030 in the Business As Usual (BAU) scenario would be 927.9 MtCO2eq, about 3 times higher than the 2014 emissions of 284 MtCO2eq (Table 2). Emissions from energy would be 684 MtCO2 in 2030, accounting for 74% of total BAU emissions – including 452.3 MtCO2eq in emissions from electricity. Energy is thus by far the largest contributor to GHG emissions. GHG emissions from energy production and consumption are the bulk of Viet Nam’s current and future emissions, quadrupling between 2010 and 2030 in absolute total, and making up 86% of total GHGs emissions in 2030, according to the baseline scenario. The economic, social and environmental co-benefits of mitigation actions in the energy sector will very likely also support the
2010 2020 2030
Energy 141.1 389.3 675.5
Agriculture 88.3 100.8 109,3
Waste 15.4 26,6 48.0
Land Use, Land-Use Change and Forestry -19.2 -42.5 -45.3
Total 225.6 474.2 787.5
Unit : MtCO2eq. 2014 2020 2030
Baseline 284 528.4 927.9
Unconditional scenario 844.0
Conditional scenario 677.1
Table 1. National baseline scenario of GHG emissions by sector for the INDCs of Vietnam
Table 2. Vietnam greenhouse gases emissions scenarios according to the updated NDC (2020)
2. The energy sector and its
contribution to NDCs of Vietnam
2.1. Current development status
Vietnam is one of the largest electricity markets in ASEAN, driven by low-cost resources such as hydro, gas and coal recently. The country has supplied electricity to 99.98% of communes and 98.83% of rural households with relatively low cost in comparison to neighboring countries (EVN 2018). Vietnam’s carbon emissions have grown by more than 10% in most years after 1990. Large increases of carbon intensity after the 1990s can majorly be attributed to an increased use of oil, but coal also plays a significant role. During the period 2000 – 2010, coal is the main driver of the carbonizing the Vietnamese energy system, with annual increases ranging from 2 to 5 percent per year. Since last 10 years, total power capacity from fossil fuels in Vietnam has always accounted for more than 40 percent, notably this rate is more than 50 percent in the two recent years: 2018 and 2019 as presented in Figure 1 (NLDC 2020). Notably, the power capacity from coal has increased to 19 800 MW by 2019 from 3 790 MW in 2010, about 5 times higher for a period of 9 years.
With decreasing costs of renewable electricity and favorable
policies for the energy transition towards a cleaner energy development in Vietnam, it is expected that by 2030, 47.3 billion kilowatt-hours of electricity in the country will come from wind and solar energy. Under the revised National Power Development Plan 7 (PDP 7R) of the government, renewable energy will account for about 20% of the national electricity capacity in 2030. Upcoming National Power Development Plan 8, which is under the preparation by MOIT, is expected to give more ambitious targets of renewable energy from solar and wind power, including floating solar and offshore wind power.
During last two years, thanks to the attractive Feed-in-Tariffs for solar power, the development of renewable energy in Vietnam has made significant progress (see Figure 2 (VIR 2019)). Notably, with a record level of solar power facilities put into operation, Vietnam has become a very active and attractive renewable energy market in Southeast Asia. However, this incredible development is also posing new challenges for the steady development of the national grid, as well as land use, electricity pricing, human and financial resources, and especially for equitable and sustainable development, that is, to ensure that no one is left behind because of losing their livelihoods, jobs, or agricultural land in the process.
60000
50000
40000
30000
20000
10000
0
Import Renewables Oil & diesel Gas Coal Hydro power
2018 2019
2019 2019 20192020 2021
Figure 1. Installed Capacity Power (MW) of Vietnam in 2018 and 2019
achievement of Vietnam’s NDCs. Viet Nam could achieve the NDC targets by 2030 with stronger policies to increase renewable energy deployment and the rate of energy efficiency. This will also provide
many related benefits such as a cleaner and healthier environment for people, e.g. because current plans for more coal-power plants could result in serious human health problems because of air pollution.
Unit: CO2 equivalent mil tons, Source: Nguyen Khac Hieu et al. 2015; MONRE 2015
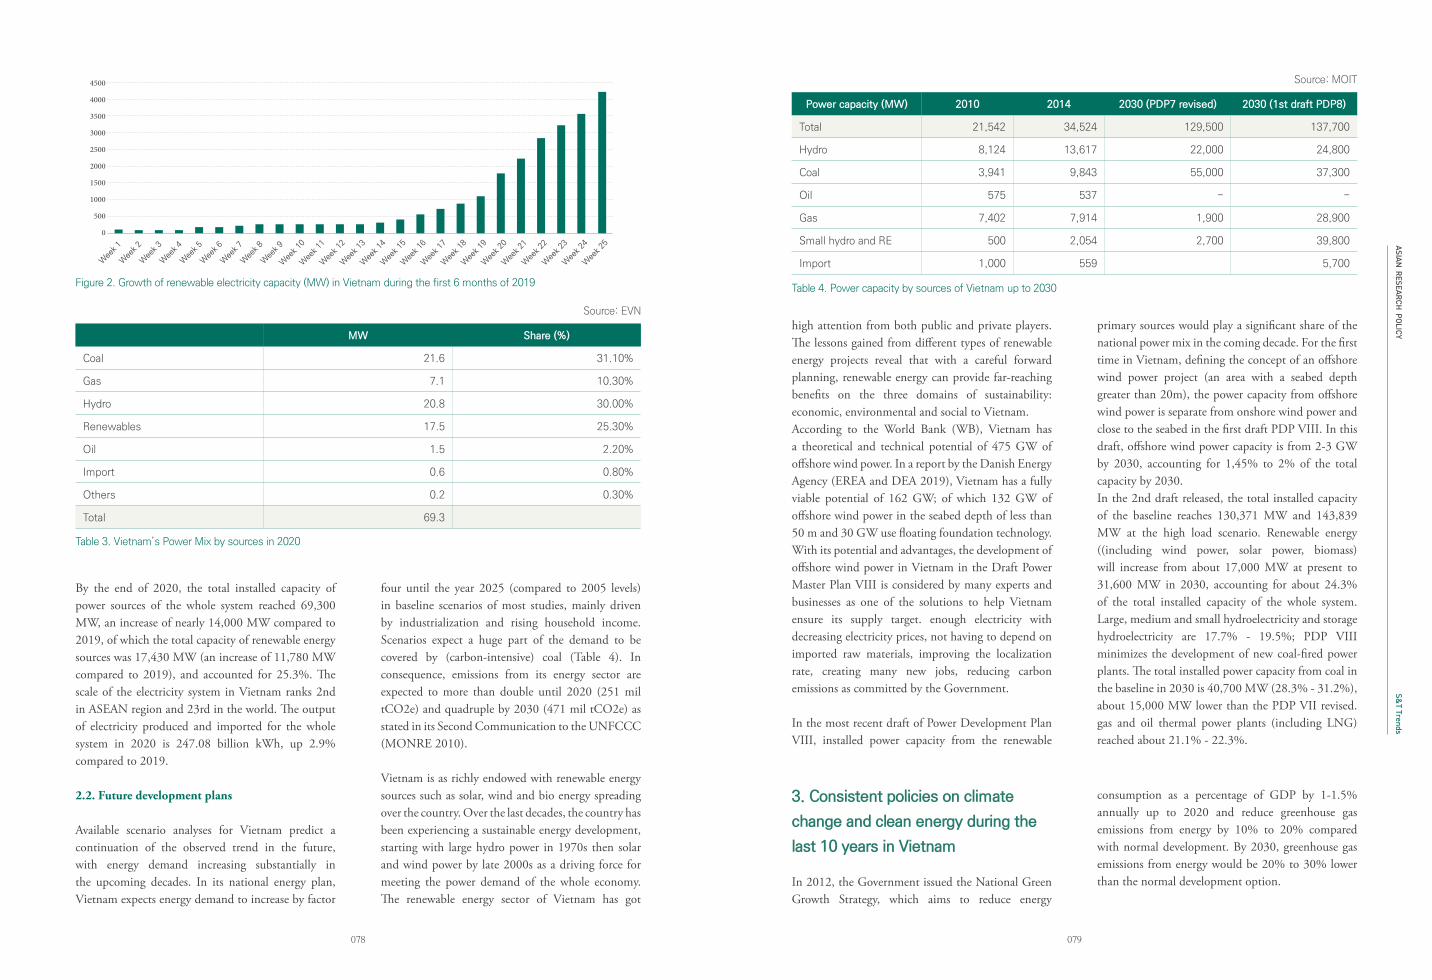
ASIAN RESEARCH
POLICY
079078
S&T Trends
By the end of 2020, the total installed capacity of power sources of the whole system reached 69,300 MW, an increase of nearly 14,000 MW compared to 2019, of which the total capacity of renewable energy sources was 17,430 MW (an increase of 11,780 MW compared to 2019), and accounted for 25.3%. The scale of the electricity system in Vietnam ranks 2nd in ASEAN region and 23rd in the world. The output of electricity produced and imported for the whole system in 2020 is 247.08 billion kWh, up 2.9% compared to 2019.
2.2. Future development plans
Available scenario analyses for Vietnam predict a continuation of the observed trend in the future, with energy demand increasing substantially in the upcoming decades. In its national energy plan, Vietnam expects energy demand to increase by factor
four until the year 2025 (compared to 2005 levels) in baseline scenarios of most studies, mainly driven by industrialization and rising household income. Scenarios expect a huge part of the demand to be covered by (carbon-intensive) coal (Table 4). In consequence, emissions from its energy sector are expected to more than double until 2020 (251 mil tCO2e) and quadruple by 2030 (471 mil tCO2e) as stated in its Second Communication to the UNFCCC (MONRE 2010).
Vietnam is as richly endowed with renewable energy sources such as solar, wind and bio energy spreading over the country. Over the last decades, the country has been experiencing a sustainable energy development, starting with large hydro power in 1970s then solar and wind power by late 2000s as a driving force for meeting the power demand of the whole economy. The renewable energy sector of Vietnam has got
4500
4000
3500
3000
2500
2000
1500
1000
500
0
Wee
k 1
Wee
k 2
Wee
k 3
Wee
k 4
Wee
k 5
Wee
k 6
Wee
k 7
Wee
k 8
Wee
k 9
Wee
k 10
Wee
k 11
Wee
k 12
Wee
k 13
Wee
k 14
Wee
k 15
Wee
k 16
Wee
k 17
Wee
k 18
Wee
k 19
Wee
k 20
Wee
k 21
Wee
k 22
Wee
k 23
Wee
k 24
Wee
k 25
Figure 2. Growth of renewable electricity capacity (MW) in Vietnam during the first 6 months of 2019
MW Share (%)
Coal 21.6 31.10%
Gas 7.1 10.30%
Hydro 20.8 30.00%
Renewables 17.5 25.30%
Oil 1.5 2.20%
Import 0.6 0.80%
Others 0.2 0.30%
Total 69.3
Table 3. Vietnam’s Power Mix by sources in 2020
Power capacity (MW) 2010 2014 2030 (PDP7 revised) 2030 (1st draft PDP8)
Total 21,542 34,524 129,500 137,700
Hydro 8,124 13,617 22,000 24,800
Coal 3,941 9,843 55,000 37,300
Oil 575 537 - -
Gas 7,402 7,914 1,900 28,900
Small hydro and RE 500 2,054 2,700 39,800
Import 1,000 559 5,700
Table 4. Power capacity by sources of Vietnam up to 2030
high attention from both public and private players. The lessons gained from different types of renewable energy projects reveal that with a careful forward planning, renewable energy can provide far-reaching benefits on the three domains of sustainability: economic, environmental and social to Vietnam. According to the World Bank (WB), Vietnam has a theoretical and technical potential of 475 GW of offshore wind power. In a report by the Danish Energy Agency (EREA and DEA 2019), Vietnam has a fully viable potential of 162 GW; of which 132 GW of offshore wind power in the seabed depth of less than 50 m and 30 GW use floating foundation technology. With its potential and advantages, the development of offshore wind power in Vietnam in the Draft Power Master Plan VIII is considered by many experts and businesses as one of the solutions to help Vietnam ensure its supply target. enough electricity with decreasing electricity prices, not having to depend on imported raw materials, improving the localization rate, creating many new jobs, reducing carbon emissions as committed by the Government.
In the most recent draft of Power Development Plan VIII, installed power capacity from the renewable
primary sources would play a significant share of the national power mix in the coming decade. For the first time in Vietnam, defining the concept of an offshore wind power project (an area with a seabed depth greater than 20m), the power capacity from offshore wind power is separate from onshore wind power and close to the seabed in the first draft PDP VIII. In this draft, offshore wind power capacity is from 2-3 GW by 2030, accounting for 1,45% to 2% of the total capacity by 2030. In the 2nd draft released, the total installed capacity of the baseline reaches 130,371 MW and 143,839 MW at the high load scenario. Renewable energy ((including wind power, solar power, biomass) will increase from about 17,000 MW at present to 31,600 MW in 2030, accounting for about 24.3% of the total installed capacity of the whole system. Large, medium and small hydroelectricity and storage hydroelectricity are 17.7% - 19.5%; PDP VIII minimizes the development of new coal-fired power plants. The total installed power capacity from coal in the baseline in 2030 is 40,700 MW (28.3% - 31.2%), about 15,000 MW lower than the PDP VII revised. gas and oil thermal power plants (including LNG) reached about 21.1% - 22.3%.
3. Consistent policies on climate
change and clean energy during the
last 10 years in Vietnam
In 2012, the Government issued the National Green Growth Strategy, which aims to reduce energy
consumption as a percentage of GDP by 1-1.5% annually up to 2020 and reduce greenhouse gas emissions from energy by 10% to 20% compared with normal development. By 2030, greenhouse gas emissions from energy would be 20% to 30% lower than the normal development option.
Source: EVN
Source: MOIT
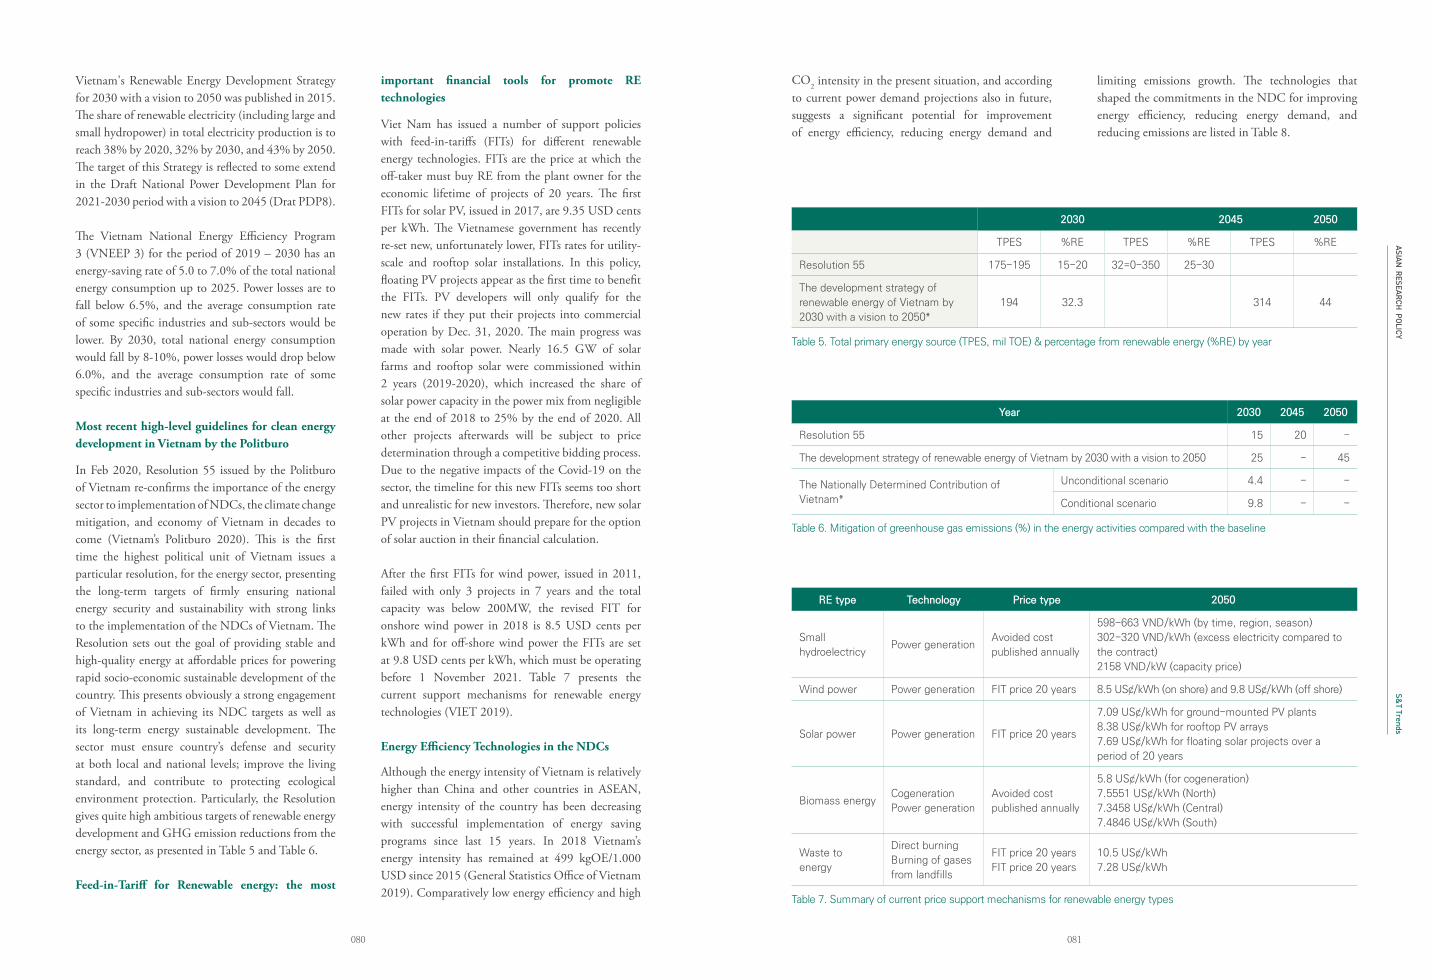
ASIAN RESEARCH
POLICY
081080
S&T Trends
2030 2045 2050
TPES %RE TPES %RE TPES %RE
Resolution 55 175-195 15-20 32=0-350 25-30
The development strategy of
renewable energy of Vietnam by
2030 with a vision to 2050*
194 32.3 314 44
Table 5. Total primary energy source (TPES, mil TOE) & percentage from renewable energy (%RE) by year
Year 2030 2045 2050
Resolution 55 15 20 -
The development strategy of renewable energy of Vietnam by 2030 with a vision to 2050 25 - 45
The Nationally Determined Contribution of
Vietnam*
Unconditional scenario 4.4 - -
Conditional scenario 9.8 - -
RE type Technology Price type 2050
Small
hydroelectricyPower generation
Avoided cost
published annually
598-663 VND/kWh (by time, region, season)
302-320 VND/kWh (excess electricity compared to
the contract)
2158 VND/kW (capacity price)
Wind power Power generation FIT price 20 years 8.5 US¢/kWh (on shore) and 9.8 US¢/kWh (off shore)
Solar power Power generation FIT price 20 years
7.09 US¢/kWh for ground-mounted PV plants
8.38 US¢/kWh for rooftop PV arrays
7.69 US¢/kWh for floating solar projects over a
period of 20 years
Biomass energyCogeneration
Power generation
Avoided cost
published annually
5.8 US¢/kWh (for cogeneration)
7.5551 US¢/kWh (North)
7.3458 US¢/kWh (Central)
7.4846 US¢/kWh (South)
Waste to
energy
Direct burning
Burning of gases
from landfills
FIT price 20 years
FIT price 20 years
10.5 US¢/kWh
7.28 US¢/kWh
Table 6. Mitigation of greenhouse gas emissions (%) in the energy activities compared with the baseline
Table 7. Summary of current price support mechanisms for renewable energy types
Vietnam's Renewable Energy Development Strategy for 2030 with a vision to 2050 was published in 2015. The share of renewable electricity (including large and small hydropower) in total electricity production is to reach 38% by 2020, 32% by 2030, and 43% by 2050. The target of this Strategy is reflected to some extend in the Draft National Power Development Plan for 2021-2030 period with a vision to 2045 (Drat PDP8).
The Vietnam National Energy Efficiency Program 3 (VNEEP 3) for the period of 2019 – 2030 has an energy-saving rate of 5.0 to 7.0% of the total national energy consumption up to 2025. Power losses are to fall below 6.5%, and the average consumption rate of some specific industries and sub-sectors would be lower. By 2030, total national energy consumption would fall by 8-10%, power losses would drop below 6.0%, and the average consumption rate of some specific industries and sub-sectors would fall.
Most recent high-level guidelines for clean energy development in Vietnam by the Politburo
In Feb 2020, Resolution 55 issued by the Politburo of Vietnam re-confirms the importance of the energy sector to implementation of NDCs, the climate change mitigation, and economy of Vietnam in decades to come (Vietnam’s Politburo 2020). This is the first time the highest political unit of Vietnam issues a particular resolution, for the energy sector, presenting the long-term targets of firmly ensuring national energy security and sustainability with strong links to the implementation of the NDCs of Vietnam. The Resolution sets out the goal of providing stable and high-quality energy at affordable prices for powering rapid socio-economic sustainable development of the country. This presents obviously a strong engagement of Vietnam in achieving its NDC targets as well as its long-term energy sustainable development. The sector must ensure country’s defense and security at both local and national levels; improve the living standard, and contribute to protecting ecological environment protection. Particularly, the Resolution gives quite high ambitious targets of renewable energy development and GHG emission reductions from the energy sector, as presented in Table 5 and Table 6.
Feed-in-Tariff for Renewable energy: the most
important financial tools for promote RE technologies
Viet Nam has issued a number of support policies with feed-in-tariffs (FITs) for different renewable energy technologies. FITs are the price at which the off-taker must buy RE from the plant owner for the economic lifetime of projects of 20 years. The first FITs for solar PV, issued in 2017, are 9.35 USD cents per kWh. The Vietnamese government has recently re-set new, unfortunately lower, FITs rates for utility-scale and rooftop solar installations. In this policy, floating PV projects appear as the first time to benefit the FITs. PV developers will only qualify for the new rates if they put their projects into commercial operation by Dec. 31, 2020. The main progress was made with solar power. Nearly 16.5 GW of solar farms and rooftop solar were commissioned within 2 years (2019-2020), which increased the share of solar power capacity in the power mix from negligible at the end of 2018 to 25% by the end of 2020. All other projects afterwards will be subject to price determination through a competitive bidding process. Due to the negative impacts of the Covid-19 on the sector, the timeline for this new FITs seems too short and unrealistic for new investors. Therefore, new solar PV projects in Vietnam should prepare for the option of solar auction in their financial calculation.
After the first FITs for wind power, issued in 2011, failed with only 3 projects in 7 years and the total capacity was below 200MW, the revised FIT for onshore wind power in 2018 is 8.5 USD cents per kWh and for off-shore wind power the FITs are set at 9.8 USD cents per kWh, which must be operating before 1 November 2021. Table 7 presents the current support mechanisms for renewable energy technologies (VIET 2019).
Energy Efficiency Technologies in the NDCs
Although the energy intensity of Vietnam is relatively higher than China and other countries in ASEAN, energy intensity of the country has been decreasing with successful implementation of energy saving programs since last 15 years. In 2018 Vietnam’s energy intensity has remained at 499 kgOE/1.000 USD since 2015 (General Statistics Office of Vietnam 2019). Comparatively low energy efficiency and high
CO2 intensity in the present situation, and according to current power demand projections also in future, suggests a significant potential for improvement of energy efficiency, reducing energy demand and
limiting emissions growth. The technologies that shaped the commitments in the NDC for improving energy efficiency, reducing energy demand, and reducing emissions are listed in Table 8.
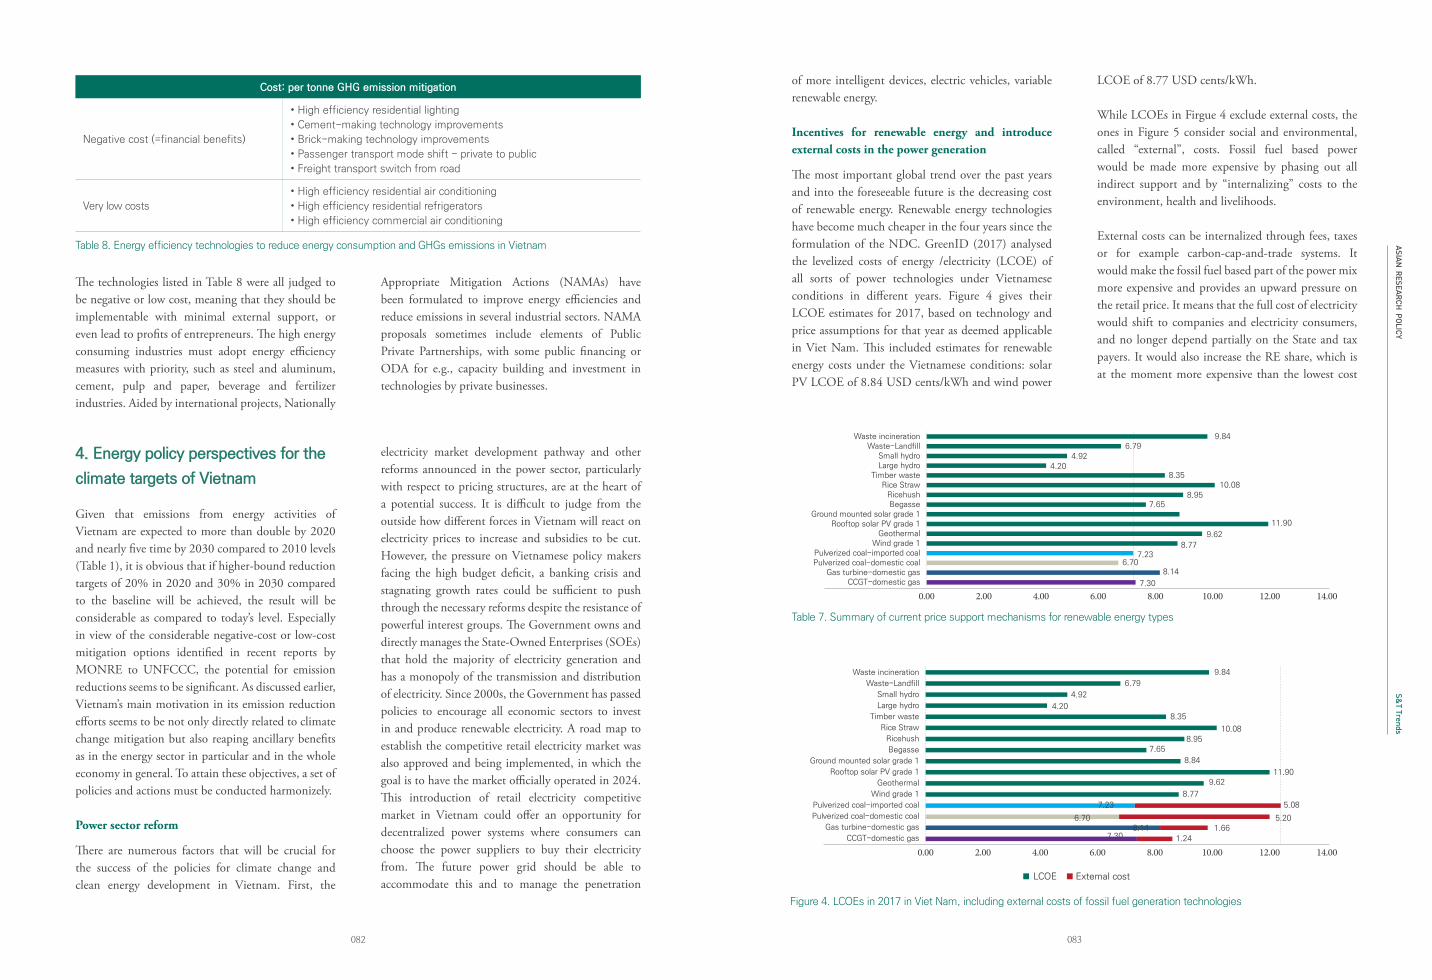
ASIAN RESEARCH
POLICY
083082
S&T Trends
Cost: per tonne GHG emission mitigation
Negative cost (=financial benefits)
• High efficiency residential lighting
• Cement-making technology improvements
• Brick-making technology improvements
• Passenger transport mode shift - private to public
• Freight transport switch from road
Very low costs
• High efficiency residential air conditioning
• High efficiency residential refrigerators
• High efficiency commercial air conditioning
Table 8. Energy efficiency technologies to reduce energy consumption and GHGs emissions in Vietnam
The technologies listed in Table 8 were all judged to be negative or low cost, meaning that they should be implementable with minimal external support, or even lead to profits of entrepreneurs. The high energy consuming industries must adopt energy efficiency measures with priority, such as steel and aluminum, cement, pulp and paper, beverage and fertilizer industries. Aided by international projects, Nationally
Appropriate Mitigation Actions (NAMAs) have been formulated to improve energy efficiencies and reduce emissions in several industrial sectors. NAMA proposals sometimes include elements of Public Private Partnerships, with some public financing or ODA for e.g., capacity building and investment in technologies by private businesses.
4. Energy policy perspectives for the
climate targets of Vietnam
Given that emissions from energy activities of Vietnam are expected to more than double by 2020 and nearly five time by 2030 compared to 2010 levels (Table 1), it is obvious that if higher-bound reduction targets of 20% in 2020 and 30% in 2030 compared to the baseline will be achieved, the result will be considerable as compared to today’s level. Especially in view of the considerable negative-cost or low-cost mitigation options identified in recent reports by MONRE to UNFCCC, the potential for emission reductions seems to be significant. As discussed earlier, Vietnam’s main motivation in its emission reduction efforts seems to be not only directly related to climate change mitigation but also reaping ancillary benefits as in the energy sector in particular and in the whole economy in general. To attain these objectives, a set of policies and actions must be conducted harmonizely.
Power sector reform
There are numerous factors that will be crucial for the success of the policies for climate change and clean energy development in Vietnam. First, the
electricity market development pathway and other reforms announced in the power sector, particularly with respect to pricing structures, are at the heart of a potential success. It is difficult to judge from the outside how different forces in Vietnam will react on electricity prices to increase and subsidies to be cut. However, the pressure on Vietnamese policy makers facing the high budget deficit, a banking crisis and stagnating growth rates could be sufficient to push through the necessary reforms despite the resistance of powerful interest groups. The Government owns and directly manages the State-Owned Enterprises (SOEs) that hold the majority of electricity generation and has a monopoly of the transmission and distribution of electricity. Since 2000s, the Government has passed policies to encourage all economic sectors to invest in and produce renewable electricity. A road map to establish the competitive retail electricity market was also approved and being implemented, in which the goal is to have the market officially operated in 2024. This introduction of retail electricity competitive market in Vietnam could offer an opportunity for decentralized power systems where consumers can choose the power suppliers to buy their electricity from. The future power grid should be able to accommodate this and to manage the penetration
of more intelligent devices, electric vehicles, variable renewable energy.
Incentives for renewable energy and introduce external costs in the power generation
The most important global trend over the past years and into the foreseeable future is the decreasing cost of renewable energy. Renewable energy technologies have become much cheaper in the four years since the formulation of the NDC. GreenID (2017) analysed the levelized costs of energy /electricity (LCOE) of all sorts of power technologies under Vietnamese conditions in different years. Figure 4 gives their LCOE estimates for 2017, based on technology and price assumptions for that year as deemed applicable in Viet Nam. This included estimates for renewable energy costs under the Vietnamese conditions: solar PV LCOE of 8.84 USD cents/kWh and wind power
LCOE of 8.77 USD cents/kWh.
While LCOEs in Firgue 4 exclude external costs, the ones in Figure 5 consider social and environmental, called “external”, costs. Fossil fuel based power would be made more expensive by phasing out all indirect support and by “internalizing” costs to the environment, health and livelihoods.
External costs can be internalized through fees, taxes or for example carbon-cap-and-trade systems. It would make the fossil fuel based part of the power mix more expensive and provides an upward pressure on the retail price. It means that the full cost of electricity would shift to companies and electricity consumers, and no longer depend partially on the State and tax payers. It would also increase the RE share, which is at the moment more expensive than the lowest cost
Table 7. Summary of current price support mechanisms for renewable energy types
0.00 2.00 4.00 6.00 8.00 10.00 12.00 14.00
Waste incinerationWaste-Landfill
Small hydroLarge hydro
Timber wasteRice Straw
RicehushBegasse
Ground mounted solar grade 1Rooftop solar PV grade 1
GeothermalWind grade 1
Pulverized coal-imported coalPulverized coal-domestic coal
Gas turbine-domestic gasCCGT-domestic gas
9.846.79
4.92
8.35
7.65
11.90
9.62
8.777.23
6.708.14
7.30
8.9510.08
4.20
0.00 2.00 4.00 6.00 8.00 10.00 12.00 14.00
Waste incineration
Waste-Landfill
Small hydro
Large hydro
Timber waste
Rice Straw
Ricehush
Begasse
Ground mounted solar grade 1
Rooftop solar PV grade 1
Geothermal
Wind grade 1
Pulverized coal-imported coal
Pulverized coal-domestic coal
Gas turbine-domestic gas
CCGT-domestic gas
9.84
6.79
4.92
4.208.35
10.088.95
7.65
8.84
11.909.62
8.77
LCOE Extemal cost
7.23 5.08
5.206.708.14
7.301.66
1.24
Figure 4. LCOEs in 2017 in Viet Nam, including external costs of fossil fuel generation technologies
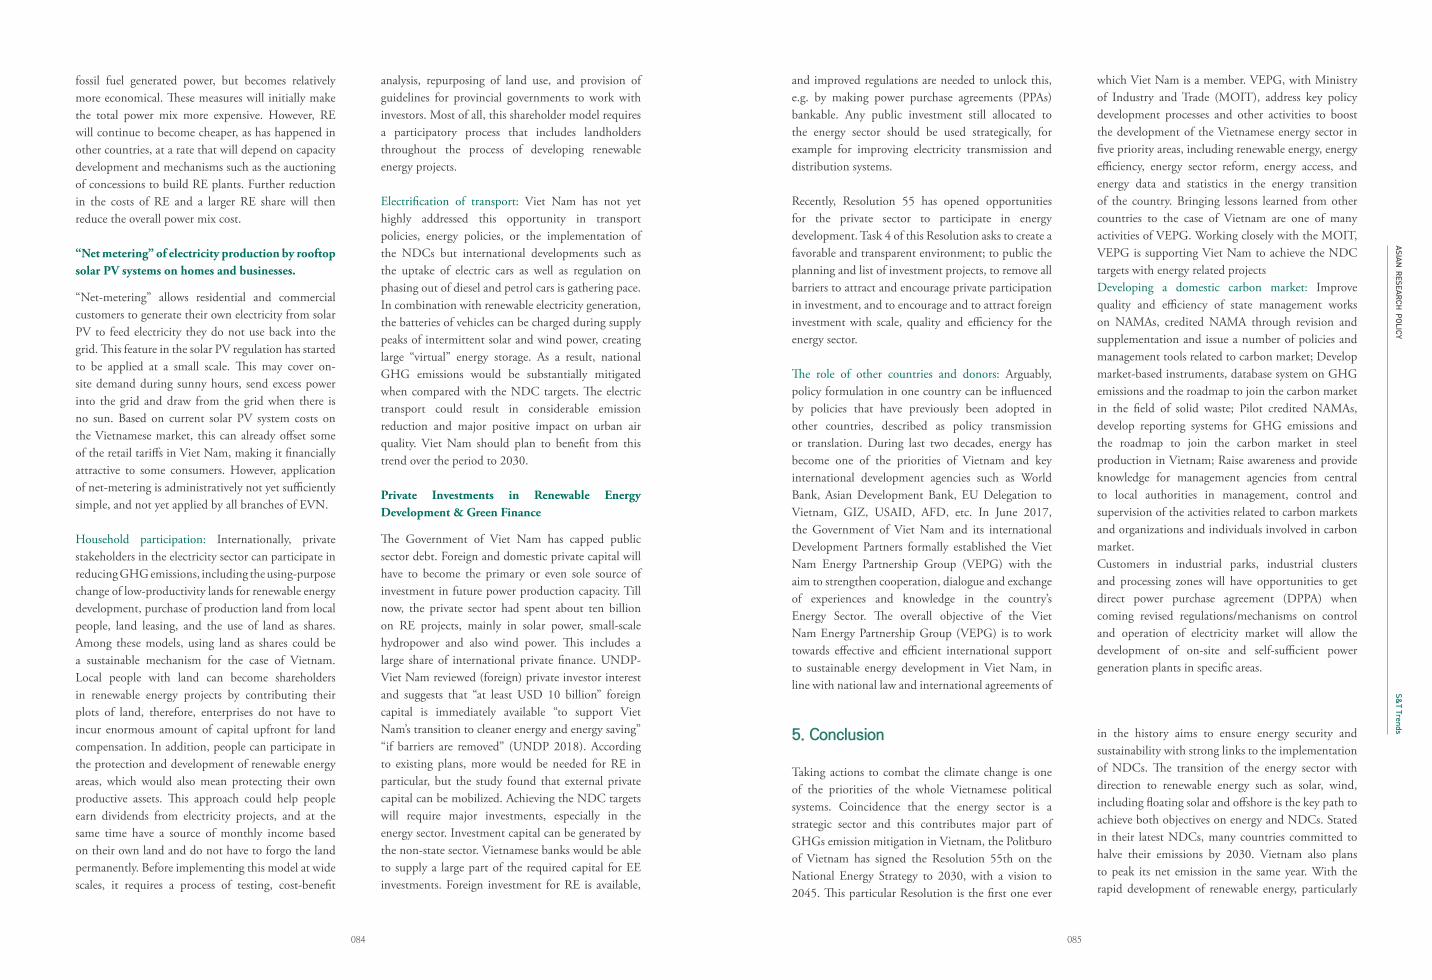
ASIAN RESEARCH
POLICY
085084
S&T Trends
fossil fuel generated power, but becomes relatively more economical. These measures will initially make the total power mix more expensive. However, RE will continue to become cheaper, as has happened in other countries, at a rate that will depend on capacity development and mechanisms such as the auctioning of concessions to build RE plants. Further reduction in the costs of RE and a larger RE share will then reduce the overall power mix cost.
“Net metering” of electricity production by rooftop solar PV systems on homes and businesses.
“Net-metering” allows residential and commercial customers to generate their own electricity from solar PV to feed electricity they do not use back into the grid. This feature in the solar PV regulation has started to be applied at a small scale. This may cover on-site demand during sunny hours, send excess power into the grid and draw from the grid when there is no sun. Based on current solar PV system costs on the Vietnamese market, this can already offset some of the retail tariffs in Viet Nam, making it financially attractive to some consumers. However, application of net-metering is administratively not yet sufficiently simple, and not yet applied by all branches of EVN.
Household participation: Internationally, private stakeholders in the electricity sector can participate in reducing GHG emissions, including the using-purpose change of low-productivity lands for renewable energy development, purchase of production land from local people, land leasing, and the use of land as shares. Among these models, using land as shares could be a sustainable mechanism for the case of Vietnam. Local people with land can become shareholders in renewable energy projects by contributing their plots of land, therefore, enterprises do not have to incur enormous amount of capital upfront for land compensation. In addition, people can participate in the protection and development of renewable energy areas, which would also mean protecting their own productive assets. This approach could help people earn dividends from electricity projects, and at the same time have a source of monthly income based on their own land and do not have to forgo the land permanently. Before implementing this model at wide scales, it requires a process of testing, cost-benefit
analysis, repurposing of land use, and provision of guidelines for provincial governments to work with investors. Most of all, this shareholder model requires a participatory process that includes landholders throughout the process of developing renewable energy projects.
Electrification of transport: Viet Nam has not yet highly addressed this opportunity in transport policies, energy policies, or the implementation of the NDCs but international developments such as the uptake of electric cars as well as regulation on phasing out of diesel and petrol cars is gathering pace. In combination with renewable electricity generation, the batteries of vehicles can be charged during supply peaks of intermittent solar and wind power, creating large “virtual” energy storage. As a result, national GHG emissions would be substantially mitigated when compared with the NDC targets. The electric transport could result in considerable emission reduction and major positive impact on urban air quality. Viet Nam should plan to benefit from this trend over the period to 2030.
Private Investments in Renewable Energy Development & Green Finance
The Government of Viet Nam has capped public sector debt. Foreign and domestic private capital will have to become the primary or even sole source of investment in future power production capacity. Till now, the private sector had spent about ten billion on RE projects, mainly in solar power, small-scale hydropower and also wind power. This includes a large share of international private finance. UNDP-Viet Nam reviewed (foreign) private investor interest and suggests that “at least USD 10 billion” foreign capital is immediately available “to support Viet Nam’s transition to cleaner energy and energy saving” “if barriers are removed” (UNDP 2018). According to existing plans, more would be needed for RE in particular, but the study found that external private capital can be mobilized. Achieving the NDC targets will require major investments, especially in the energy sector. Investment capital can be generated by the non-state sector. Vietnamese banks would be able to supply a large part of the required capital for EE investments. Foreign investment for RE is available,
and improved regulations are needed to unlock this, e.g. by making power purchase agreements (PPAs) bankable. Any public investment still allocated to the energy sector should be used strategically, for example for improving electricity transmission and distribution systems.
Recently, Resolution 55 has opened opportunities for the private sector to participate in energy development. Task 4 of this Resolution asks to create a favorable and transparent environment; to public the planning and list of investment projects, to remove all barriers to attract and encourage private participation in investment, and to encourage and to attract foreign investment with scale, quality and efficiency for the energy sector.
The role of other countries and donors: Arguably, policy formulation in one country can be influenced by policies that have previously been adopted in other countries, described as policy transmission or translation. During last two decades, energy has become one of the priorities of Vietnam and key international development agencies such as World Bank, Asian Development Bank, EU Delegation to Vietnam, GIZ, USAID, AFD, etc. In June 2017, the Government of Viet Nam and its international Development Partners formally established the Viet Nam Energy Partnership Group (VEPG) with the aim to strengthen cooperation, dialogue and exchange of experiences and knowledge in the country’s Energy Sector. The overall objective of the Viet Nam Energy Partnership Group (VEPG) is to work towards effective and efficient international support to sustainable energy development in Viet Nam, in line with national law and international agreements of
which Viet Nam is a member. VEPG, with Ministry of Industry and Trade (MOIT), address key policy development processes and other activities to boost the development of the Vietnamese energy sector in five priority areas, including renewable energy, energy efficiency, energy sector reform, energy access, and energy data and statistics in the energy transition of the country. Bringing lessons learned from other countries to the case of Vietnam are one of many activities of VEPG. Working closely with the MOIT, VEPG is supporting Viet Nam to achieve the NDC targets with energy related projectsDeveloping a domestic carbon market: Improve quality and efficiency of state management works on NAMAs, credited NAMA through revision and supplementation and issue a number of policies and management tools related to carbon market; Develop market-based instruments, database system on GHG emissions and the roadmap to join the carbon market in the field of solid waste; Pilot credited NAMAs, develop reporting systems for GHG emissions and the roadmap to join the carbon market in steel production in Vietnam; Raise awareness and provide knowledge for management agencies from central to local authorities in management, control and supervision of the activities related to carbon markets and organizations and individuals involved in carbon market.Customers in industrial parks, industrial clusters and processing zones will have opportunities to get direct power purchase agreement (DPPA) when coming revised regulations/mechanisms on control and operation of electricity market will allow the development of on-site and self-sufficient power generation plants in specific areas.
5. Conclusion
Taking actions to combat the climate change is one of the priorities of the whole Vietnamese political systems. Coincidence that the energy sector is a strategic sector and this contributes major part of GHGs emission mitigation in Vietnam, the Politburo of Vietnam has signed the Resolution 55th on the National Energy Strategy to 2030, with a vision to 2045. This particular Resolution is the first one ever
in the history aims to ensure energy security and sustainability with strong links to the implementation of NDCs. The transition of the energy sector with direction to renewable energy such as solar, wind, including floating solar and offshore is the key path to achieve both objectives on energy and NDCs. Stated in their latest NDCs, many countries committed to halve their emissions by 2030. Vietnam also plans to peak its net emission in the same year. With the rapid development of renewable energy, particularly
ASIAN RESEARCH
POLICY
087086
S&T Trends
solar and both onshore and offshore wind energy, in Vietnam recently, the country has huge opportunities to achieve its emission reduction target in next decades. Under the current policy scenarios and with domestic resources, Vietnam can achieve its climate targets. However, with international supports, Vietnam still hardly can reach the high ambitious target of zero emission by 2050. This target even has never been appeared in the official policy in the country.
References
EREA & DEA (2019) Vietnam energy outlook report 2019. https://ens.dk/en/our-responsibilities/global-cooperation/country-cooperation/vietnam.
European Pa r l i ament (2020 , December 2 )Parliament approves EU-Vietnam free trade and investment protection deals. European Parliament. https://www.europarl.europa.eu/news/en/press-room/20200206IPR72012/parliament-approves-eu-vietnam-free-trade-and-investment-protection-deals.
EVN (2018, April 24) Rural electrification: EVNaims at social welfare above corporate interests. h t tp s : / / en . e vn . com.vn /d6 /ne ws /Rur a l -electrification-EVN-sets-social-security-targets-above-corporate-interests-66-163-956.aspx
General Statistics Office of Vietnam (2019) StatisticsData 2019. https://www.gso.gov.vn/SLTK/Menu.aspx?rxid=8f161760-9ba0-4c6d-8898-fdef1a92c072&px_db=11.+Y+t%E1%BA%BF%2C+v%C4%83n+h%C3%B3a+v%C3%A0+%C4%91%E1%BB%9Di+s%E1%BB%91ng&px_type=PX&px_language=vi.
GreenID (2017) Analysis of Future Generation Capacity Scenarios for Vietnam. Green Innovation and Development Centre. http://en.greenidvietnam.org.vn/app/webroot/upload/admin/files/060618_GreenID_Study%20on%20future%20power%20sources.pdf.
MONRE (2010) Vietnam’s Second Nat ionalCommunication to the United Nations Framework Convention on Climate Change. http://unfccc.
int/resource/docs/natc/vnmnc02.pdf.
MONRE (2015) Intended Nationally Determined Contribution of Viet Nam (INDCs). National communication. Hanoi, Vietnam: The Ministry of Natural Resources and Environment of Vietnam. http://www4.unfccc.int/submissions/INDC/Published%20Documents/Viet%20Nam/1/VIETNAM'S%20INDC.pdf.
Nguyen K. H., Tran T., Pham V. T., Huynh T. L. H., Nguyen V. T., Dao M. T., Nguyen V. M., & Chu T. T. H. (2015) Vietnam’s INDC Technical Report. Ministry of Natural Resources and Environment.
NLDC (2020) Report of power system operation of Vietnam 2019. National Load Dispatch Center.
The Government of Viet Nam (2015) IntendedNationally Determined Contribution of Vietnam. http://www4.unfccc.int/submissions/INDC/Published%20Documents/Viet%20Nam/1/VIETNAM'S%20INDC.pdf.
UNDP (2018) Private funding opportunities forrenewable energy and energy efficiency investment in Vietnam. https://www.vn.undp.org/content/vietnam/en/home/library/environment_climate/private-funding-opportunities-for-renewable-energy-and-energy-ef.html.
VIET (2019) Database of Vietnam’s Energy Sector. Vietnam Initiative for Energy Transition. https://vietse.vn.
Vietnam’s Politburo (2020) Resolution 55-NQ/TW on the orientation of the national energy development strategy of Vietnam to 2030, vision to 2045.” Resolution of the Political Bureau. Central Executive Committee, Communist Party of Vietnam.
VIR (2019, December 2) Developing renewable energy in Vietnam through the lens of equality and sustainability. Vietnam Investment Review. https://www.vir.com.vn/developing-renewable-energy-in-vietnam-through-the-lens-of-equality-and-sustainability-72222.html.
Annex
Annex 1 Selected recent policies for environment protection and climate changes in Vietnam
- Decision No. 1183/QD-TTg dated August 30th, 2012 of the Prime Minister approving the National Target Program to respond to climate change in the period of 2012-2015 aims at reducing GHG emissions, developing a low carbon economy, participating in the international community to protect the Earth’s climate system. The program piloted GHG mitigation models in priority areas, namely agriculture, forestry, land use, water, energy, transportation, construction.
- Resolution No. 24-NQ/TW dated 03rd, June 2013 issued by the 11th Central Committee of the Party on actively response to climate change, improvement of natural resource management and environmental protection has identified climate change adaptation as an opportunity to promote growth pattern transformation towards sustainable development and simultaneously to conduct adaptation and mitigation actions.
- Law on Environment Protection No. 55/2014/QH13 (The 13th National Assembly, dated June 23rd, 2014) provides statutory provisions on response to climate change, including assessing climate change mitigation and adaptation measures, managing GHG emission and regulating the roadmap and modality for participation in reducing global GHG in conformity with socioeconomic conditions and commitments made in the international treaties to which the Socialist Republic of Viet Nam is a party.
- Decision No. 403/QD-TTg dated March 20th, 2014 of the Prime Minister approving the National Action Plan on Green Growth in Viet Nam for the period of 2014-2020, including: (1) Setting up institutions and formulating green growth action plans at the local level; (2) Reducing the intensity of GHG emissions and promoting the use of clean and renewable sources of energy; (3) Greening production; (4) Greening lifestyles and promoting sustainable consumption.
- Decision No. 2053/QD-TTg dated October 28th, 2016 of the Prime Minister approving the Action Plan for Implementation of the Paris Agreement on climate change for the period of 2016-2020 aims to: 1) review existing regulations and develop a Decree on the roadmap and modality for GHG emission mitigation; (2) develop a carbon
market within the country; piloting the system, policies and market tools for mitigation of GHG emissions in potential sectors; and (3) develop and implement GHG mitigation and green growth proposals in accordance with national conditions for implementation of NDC.
- Resolution No. 120/NQ-CP dated November 17th, 2017 of the Government of Viet Nam on sustainable development in the Mekong River Delta region with the vision to 2050. The Mekong Delta region will be on a more advanced development level compared to the country as a whole, with advanced social structure; with per capita income higher than the national average, and with people’s livelihood secured; the proportion of ecological agriculture and high-technology agriculture to be 80% and proportion of forest coverage to be increased to over 9% (compared to 4.3% now), along with efforts to preserve and develop important natural ecosystems.
Annex 2 Mitigation options in the Nationally Determined Contribution
- The energy sector consists of 17 options with the total mitigation potential of 65.93 MtCO2e.
- The agricultural sector consists of 15 options with a total mitigation potential of 45.78 MtCO2e.
- The LULUCF field consists of nine options with total GHG absorption potential of 66 MtCO2e.
- The waste sector consists of four options with a total mitigation potential of 20.23 MtCO2e.
In order to prepare for the global effort assessment in 2018 and to update the new policies related to climate change, Viet Nam is reviewing and updating the NDC, which is expected to be completed in 2019 with the following contents:
- To review policies related to energy, agriculture, waste and LULUCF;
- To update BAU and develop potential GHG mitigation options for energy, agriculture, waste and LULUCF for the period of 2020-2030;
- To analyze, compare and evaluate national efforts to achieve the mitigation target of 2030 in case of conditional contribution (25%) and unconditional contribution (8%) compared with BAU.
Energy Policies
- Decision No.37/2011/QD-TTg dated June 29th, 2011 of the Prime Minister on the provision of assistance in the development of wind power
ASIAN RESEARCH
POLICY
089088
S&T Trends
projects in Viet Nam.- Decision No. 24/2014/QD-TTg dated 24 March 2014 of the Prime Minister on support mechanism for development of biomass power projects in Viet Nam.
- Decision No. 31/2014/QD-TTg dated May 05th, 2014 of the Prime Minister on supporting mechanisms for development of power generation projects using solid waste in Viet Nam.
- Decision No. 2068/QD-TTg dated November 25th, 2015 of the Prime Minister approving the development strategy of renewable energy of Viet Nam by 2030 with a vision to 2050. One of the objectives of the strategy is to develop and utilize renewable energy sources in a way that contributes to fulfilling the objectives of sustainable environment and development of green economy
- Decision No. 428/QD-TTg dated March 18th, 2016 of the Prime Minister approving the Revised Master Plan of National Power Development for the period of 2011-2020 with the Vision to 2030 (Master Plan VII-revised), in which the proportion of renewable energy (namely small hydropower, wind power, solar power, biomass power) in total electricity output is projected to reach 6.5% by 2020, 6.9% by 2025 and 10.7% by 2030.
- Decision No. 13443/QD-BCT dated December 08th, 2015 of the Minister of Industry and Trade approving the Green Growth Action Plan for the industry and trade sector for the period of 2015-2020, which concretizes the key tasks in the industry and trade sector to implement the objectives and mandates of the National Green Growth Strategy and National Green Growth Action Plan for the period of 2014-2020.
- Decision No. 11/2017/QD-TTg dated April 11st, 2017 of the Prime Minister on mechanisms for encouragement of development of solar power in Viet Nam.
- Decision No. 13/2020/QD-TTg dated April 6th, 2020 of the Prime Minister on mechanisms for encouragement of development of solar power in Viet Nam.
Analysis the long-term impact of low carbon transport policy in Jakarta cityCase study: electrification of vehicles and biofuel program
Nugroho, S.B1,*; R.G. Dewi2, U.R. Siagiaan2, J Fujino1, T. Ishikawa1, I. Hendrawan2, G.N. Sevie2,
V.R. Sari3, A.Warih3, E.P. Fitratunisa3, S.Andraiani3
1 Institute for Global Environmental Strategies, Hayama 240-0115, Japan2 Institute of Technology Bandung, Bandung 40116, Indonesia3 Jakarta City Government, Indonesia* Correspondence: [email protected]
Abstract
Under the Paris Agreement, the Jakarta city government as non-state actor is preparing the Indonesia first long-term strategy at sub-national/province level through the Low Carbon Development Strategy (LCDS) to achieve Jakarta’s target 2050. The strategy was developed based on the existing masterplan and future development plan. The article aims to analyse the impact of strategy on public transport development, electrification of vehicles and biofuel program and its impact on GHG emission in Jakarta 2050. Two scenarios of business as usual associated GHG emissions without considering mitigation effort while countermeasures scenarios were developed to envision pathways to achieve low carbon city. We used a non-linear programming model ExSS GAMS v 23.3 to analyse the impact of transformative actions on transport sectors in Jakarta city. The use of alternative biofuel from the biodiesel for commercial trucks provide a large GHG emission reductions in the mid-term while the electrification of vehicles and improvement of fuel efficiency of public transport provide large GHG emission in the long-term. The massive developments of public transports supported by urban infrastructures such as pedestrian walkway encourages the modal shift from private vehicles, however, the impacts on GHG emission relatively small due to large share of travel demand by private vehicles. To maximising the impact of electrification of vehicles, upstream policy on renewable energy in necessary and combine with the downstream policies to increase diffusion of electric vehicles. A complimentary policies and strategies on travel demand managements is needed to increase the modal shift from private vehicles to public transport in Jakarta city. Keywords: Low carbon transport, Jakarta city, electric vehicle, biofuel, modal shift
1. Introduction
Under the Paris Agreement, the Indonesian government begins to prepare a long-term strategy (LTS) to achieve GHG emissions reduction target
in 2050. In order to contribute to GHG emissions reduction of 29% (unconditional target) and 41% (conditional target) below the baseline, the energy sector should reduce its GHG emissions level in 2030 by 314 Mton CO2e and 398 Mton CO2e (Indonesia

ASIAN RESEARCH
POLICY
091090
S&T Trends
NDC, 2016). To achieve this level, the GHG emissions is estimated become 5.63 ton CO2e per capita in 2030 or equal to almost three times compare to the emission per capita in 2010. In the long-term, Indonesia has the potential to deeply reduce GHG emissions from the energy sector to about 1.31 ton CO2e per capita in 2050, equal to 0.69 of the emission level per capita in 2010 (Siagian, 2017). The Indonesian government begins to prepare a long-term GHG emissions reduction target (2050) involving various stakeholders, state and non-state actors. Action and inactions by central, regional and local government will give significant impacts on climate mitigation actions at city level (Heidrich et al, 2016; Reckien et al, 2015). The government of Indonesia already developed roadmap implementation of Nationally Determined Contributions (INDC) in 2018 (Masripatin et al, 2018). Several local governments, as a non-state actor, are actively develop local action scenarios attempting to reduce their GHG emissions and contribute to the NDC.
The Jakarta city government as one key non-state actor is pioneering the Indonesia’s first long-term strategy at sub-national/province level through the Low Carbon Development Strategy (LCDS) to achieve Jakarta’s target 2050. The local government committed to implement GHG mitigation strategies through the governor regulation of DKI Jakarta no 131/2012 on local action plan on the GHG mitigations actions (RAD GRK) and set an ambitious climate change strategy reducing GHG emission by 30% by 2030 using a 2010 baseline (Dewi et al, 2016). Considering its emissions sources, geographical situation of urban coastal city and built environment conditions, the energy sector accounted for 89% of total GHG emission of Jakarta (Dewi et al, 2016). Thus, the Jakarta’s mitigation actions also explicitly heavily rely on energy sector about 35 Mtoe CO2 (Diyarni, 2018). While waste sector and agriculture forestry and other land use (AFOLU) expected to contribute about 8% and 2% respectively. The long-term strategy (LTS) of Jakarta city will still focus the attention on energy, power and waste sectors, while a few concern on AFOLU sectors. Within the energy sector, transportation sector account for about a quarter of energy-related CO2 emission globally (IPCC, 2018; International Energy Agency, 2020). In the Jakarta
case, transportation contribute about 19% of total GHG emissions in Jakarta city (Diyarni, 2018). Decarbonisation of Transport sector is key component on mitigation actions in heavily dense urban area as like as Jakarta city. At present, more than two-thirds of transportation emissions are from road travel (Sims R et al, 2014), but air travel has the highest emission intensity and is responsible for an increasingly large share. The strategies to reduce GHG emissions from transportation includes: avoid unnecessary travel, modal shift (shifting to lower-carbon option, like rail); improve vehicle efficiency and fuel substitution to alternative fuels and electrification (Sims R et al., 2014).
A low carbon scenario for the transport sector should ideally be a balanced and context appropriate combination of ‘Avoid- Shift-Improve’ (ASI) strategies that applicable uniformly across passenger and freight movement (Hidalgo and Huizenga, 2013). In the urban context such as Jakarta, the mitigation actions from the road transport sector, both passenger and freight, offer the largest magnitude of mitigation potential (Taptich, et al, 2016) and GHG emissions reduction may came from direct actions or indirect actions (Gomi, 2011). For example, transportation infrastructures can lock-in high emissions from urban area due to their very long lifespans and increasing the demands as impact of economic and demographic growth especially in the developing country context while on the contrary, compact city development may avoid (A) unnecessary trip (Romito, 2019). The intensive improvement of public transport infrastructures such as Mass Rapid Transit (MRT); Light Rail Transit (LRT), Bus Rapid Transit (BRT), non-motorized transit (NMT) may encourage the modal shift (S) from private vehicle to public transport which contribute to the reduction of GHG emissions. Those infrastructures development stand as the intersection between development goals, improve efficiency and competitiveness of city and climate change imperative. The other direct actions focusing on the improvement of vehicle performance and efficiency through a technology interventions such as fuel switching from fossil fuel to electric vehicles or biofuel (biodiesel) which is in line with national government programs in Indonesia may reduce fossil fuel consumption and GHG emissions
(Nugroho, 2020). This article aims to analysis those above initiatives as long-term strategies initiated by Jakarta’s government in collaboration or synergy with national government and other international cooperation initiatives and its contribution to achieve mid and long-term emission reduction target of Jakarta’s government. To do so, this research apply an integrated assessment model (IAM) non-linear programming model ExSS using GAMS v 23.3. The back casting approach applied through the developing sets of desirable goals/targets in the future and explore the way to achieve the target. The GHG emissions in 2010 was used as baseline to estimate future situations or conditions of the targeted the impacts in mid-term (2030) and long-term period (2050). Projection of future scenarios was calculate based on business as usual (BaU) and counter measures (CM) scenarios. The BaU scenario envisions future development paths on transport sectors and its GHG emissions without considering mitigation efforts. The mitigation scenarios developed to envisage various transformative actions and programs on transport sector to achieve low carbon city in Jakarta city. The transformative actions at the local level focusing on modal shift (S) from private vehicle due to intensive and massive development of public transport and non-motorized transport infrastructures provide a large opportunity
to reduce GHG emissions in the long-term period. The action the implementation of national program to improve combustion engine (I) based on mandatory of fuel switching to biofuel for freight (commercial trucks) gave larger opportunity to reduce GHG emission in a short and medium term on transport sector in Jakarta city. While the other improvement on technology initiated through electrification of vehicles (public transport and private vehicles) by local government may provide limited opportunity to reduce GHG emissions in the mid-term, but may significant in long-term. However the impacts could be maximising under the complimentary policy on renewable energy due to its dependency on the mix energy supply for the electricity which is still under responsibility and control by the national government.
The remainder of the article is divided into four sections. The next section reviews literature low carbon pathways and assessment. A third section describes the study location, actions plans and assumptions used in the assessment model. A fourth section presents key results. A final section concludes with a discussion of areas for future research.
2. Literature Review and Methodology
2.a. ASI approach for Decarbonizing Land Transport Sector
Global transport is the fourth largest source of GHG emissions in 2018, producing about 14% of total GHG emissions or about 23% of global energy-related CO2 emissions (International Energy Agency, 2020). Transport greenhouse gas emissions trends have increased fast over the last two decades, and since 2010, the sector’s trends have increased faster than for any other end-use sector, averaging +1.9% annual growth since 2000. The largest component of transport emissions and their main source is from the movement of passenger and freight in road transportation (6.2 Gt CO2eq, 73% of total). Urban transport is responsible for about 8% of global CO2emissions (3Gt CO2 yr-1) (IEA 2012, Creutzig, 2016). Land-based transport is a crucial component of
the urban mobility system, however decarbonization of land transport has been identified as key barrier because of its high cost of substituting energy-dense liquid fossil fuel (Kahn Ribeiro, S et al, 2012). This is because of the high energy density of fuels required for many types of vehicles, which constrains low-carbon alternatives, and because transport policies directly impact end-users and are thus more likely to be controversial. Low carbon technologies for land-based transport will be increasingly important to meet decarbonisation goals, as demand for these services will continue to grow in the future. The strategies can be categorized into avoid, shift and improve categories which constituting a simple analytical framework and well established in transport sector (Sims R et al, 2014). There have been also divergent developments for decarbonization efforts in transports sector focusing on the improvement (I) involving accelerating deployment of technologies
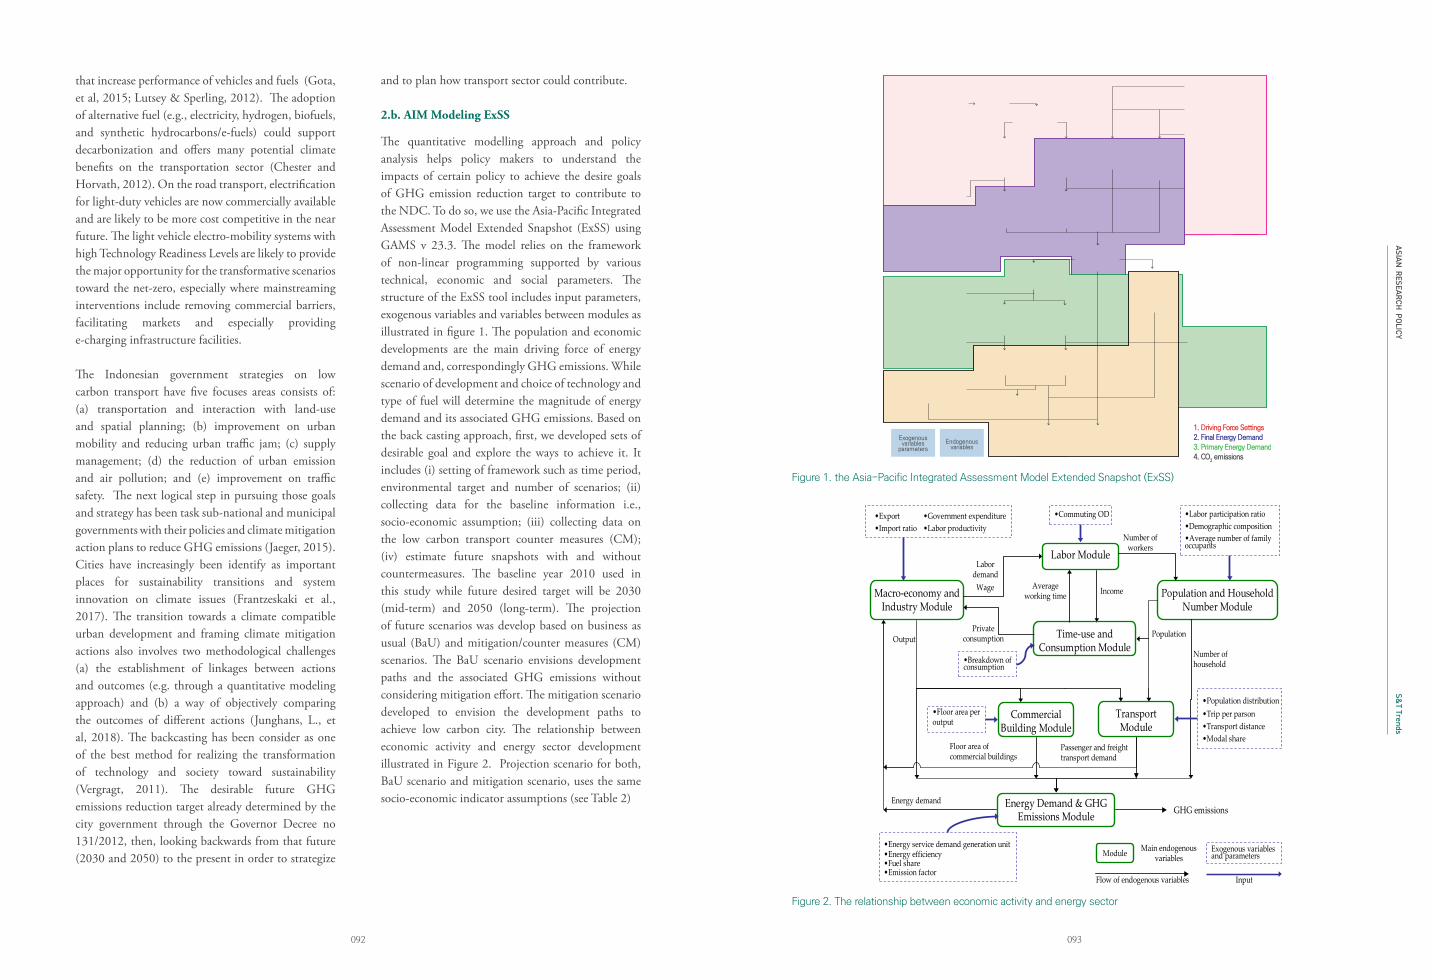
ASIAN RESEARCH
POLICY
093092
S&T Trends
that increase performance of vehicles and fuels (Gota, et al, 2015; Lutsey & Sperling, 2012). The adoption of alternative fuel (e.g., electricity, hydrogen, biofuels, and synthetic hydrocarbons/e-fuels) could support decarbonization and offers many potential climate benefits on the transportation sector (Chester and Horvath, 2012). On the road transport, electrification for light-duty vehicles are now commercially available and are likely to be more cost competitive in the near future. The light vehicle electro-mobility systems with high Technology Readiness Levels are likely to provide the major opportunity for the transformative scenarios toward the net-zero, especially where mainstreaming interventions include removing commercial barriers, facilitating markets and especially providing e-charging infrastructure facilities.
The Indonesian government strategies on low carbon transport have five focuses areas consists of: (a) transportation and interaction with land-use and spatial planning; (b) improvement on urban mobility and reducing urban traffic jam; (c) supply management; (d) the reduction of urban emission and air pollution; and (e) improvement on traffic safety. The next logical step in pursuing those goals and strategy has been task sub-national and municipal governments with their policies and climate mitigation action plans to reduce GHG emissions (Jaeger, 2015). Cities have increasingly been identify as important places for sustainability transitions and system innovation on climate issues (Frantzeskaki et al., 2017). The transition towards a climate compatible urban development and framing climate mitigation actions also involves two methodological challenges (a) the establishment of linkages between actions and outcomes (e.g. through a quantitative modeling approach) and (b) a way of objectively comparing the outcomes of different actions (Junghans, L., et al, 2018). The backcasting has been consider as one of the best method for realizing the transformation of technology and society toward sustainability (Vergragt, 2011). The desirable future GHG emissions reduction target already determined by the city government through the Governor Decree no 131/2012, then, looking backwards from that future (2030 and 2050) to the present in order to strategize
and to plan how transport sector could contribute.
2.b. AIM Modeling ExSS
The quantitative modelling approach and policy analysis helps policy makers to understand the impacts of certain policy to achieve the desire goals of GHG emission reduction target to contribute to the NDC. To do so, we use the Asia-Pacific Integrated Assessment Model Extended Snapshot (ExSS) using GAMS v 23.3. The model relies on the framework of non-linear programming supported by various technical, economic and social parameters. The structure of the ExSS tool includes input parameters, exogenous variables and variables between modules as illustrated in figure 1. The population and economic developments are the main driving force of energy demand and, correspondingly GHG emissions. While scenario of development and choice of technology and type of fuel will determine the magnitude of energy demand and its associated GHG emissions. Based on the back casting approach, first, we developed sets of desirable goal and explore the ways to achieve it. It includes (i) setting of framework such as time period, environmental target and number of scenarios; (ii) collecting data for the baseline information i.e., socio-economic assumption; (iii) collecting data on the low carbon transport counter measures (CM); (iv) estimate future snapshots with and without countermeasures. The baseline year 2010 used in this study while future desired target will be 2030 (mid-term) and 2050 (long-term). The projection of future scenarios was develop based on business as usual (BaU) and mitigation/counter measures (CM) scenarios. The BaU scenario envisions development paths and the associated GHG emissions without considering mitigation effort. The mitigation scenario developed to envision the development paths to achieve low carbon city. The relationship between economic activity and energy sector development illustrated in Figure 2. Projection scenario for both, BaU scenario and mitigation scenario, uses the same socio-economic indicator assumptions (see Table 2)
Private consumption
IOanalysis
Output byindustry
Output of commercial
industry
Commercial building floor
area
Electricity demand
Dispersed powergeneration (DPG)
Energy demand(DPG)
CO2 emission factor(electricity)
Energy demand(CPG)
Primary energydemand
CO2 emissions (by energy end-use factor)
1. Driving Force Settings2. Final Energy Demand3. Primary Energy Demand4. CO
2 emissions
Central power generation (CPG)
Energy demand(exc. electricity)
Final energydemand
Fright transport demand
Output of manufacturing
industry
Number of household
Passenger transport demand
Government expenditure
Fixed capital formation
Export
Input coefficient matrix
Import ratio
Floor area per output
Fuel share
Household size
Population
Trip per person
Trip distance
Modal share
Transport distance
Modal share
Fuel share (CFG)
Energy efficiency (CFG)
Own use (CFG)
Transmission loss (CFG)
Freight generation per output
Energy efficiency
Energy service demand per driving force
Fuel share
Energy efficiency (DPG)
Exogenousvariables
parametersEndogenous
variables
Own use (DPG)
CO2 emission factor(exc. electricity)
Figure 1. the Asia-Pacific Integrated Assessment Model Extended Snapshot (ExSS)
Figure 2. The relationship between economic activity and energy sector
Macro-economy and Industry Module
Labor Module
Population and Household Number Module
Time-use and Consumption Module
Transport Module
Commercial Building Module
Energy Demand & GHG Emissions Module GHG emissions
Labor demand
Wage
Number of workers
Average working time
PopulationPrivate consumption
Number of household
Output
Passenger and freight transport demand
Floor area of commercial buildings
Energy demand
Income
•Export•Import ratio
•Commuting OD •Labor participation ratio•Demographic composition•Average number of family occupants
•Breakdown of consumption
•Floor area per output
•Population distribution•Trip per parson•Transport distance•Modal share
•Energy service demand generation unit•Energy efficiency•Fuel share•Emission factor
•Government expenditure•Labor productivity
Exogenous variables and parameters
Main endogenous variablesModule
InputFlow of endogenous variables
ASIAN RESEARCH
POLICY
095094
S&T Trends
3. Study Location, Transport Action
Plans and Assumptions
3.a. Study Location
DKI Jakarta is the capital city of Indonesia with population more than 10.5 million in 2020 and has grown at 1.15% annual change since 2015 (World population review, 2021). It is the biggest city in the country and one of the most populous urban agglomeration in the world and largest city in Southeast Asian region. It is a metropolitan area with surrounding cities called as Jabodetabek stands for Jakarta, Bogor city, Depok city, Tangerang City and Bekasi. The metropolitan area of Jabodetabek has a population exceeds 30 million with a total land area of 4,384 square kilometres. While Jakarta city has 662 km2 of land area and 6,977 km2 of sea area. Jakarta and population density around 14,464 people per square kilometre.
Jakarta is an important alpha world city with major financial institutions, Indonesia Stock exchange, and corporate headquarters of numerous Indonesian companies and multinational companies. It is home for several Forbes Global 2000 companies, Fortune 500 Companies and other Union Companies significantly contributes to the country’s economy. The city’s GRP was about $483.4 billion USD and GDP around 396 trillion Rupiah (at constant price 2000) in 2010. The city accounts for 17% of national GDP. To support the urban mobility, the city heavily rely on private vehicles (cars and motorcycle). The share of public transport in Jakarta metropolitan area around 27% (ESCAP, 2017). The local government try to improve share of public transport through the various interventions by providing public transport infrastructures in collaboration with National Governments and others. The population growth, economic characteristics, and transportation condition has to lead climate change issues with GHG emissions level. The ambitions and commitment of the Jakarta’s government on emissions reduction target in 2030 declared in the local regulation, governor decree no 132/2012 about local mitigation actions to reduce GHG emissions in Jakarta city. This commitment has been monitored and reviewed in order to response to the latest development in the national as well
as regional level, particularly related to the GHG Emissions. The city government also enacted seven-point of Governor Instruction No 66/2019 on air quality control.
3.b. Transformative Actions on Low carbon transport in Jakarta city
Transport action plans in Greater Jakarta areas consists of several plans by National Governments and local governments. In the Jabodetabek region, the Greater Jakarta Transportation Masterplan (RITJ) 2018-2029 was approve through the presidential decree 55/2018. The transformative actions on low carbon transport currently being updated and revised to respond to the latest development in the national as well as regional level, particularly, which are related to the GHG Emissions. First, the city government are motivated to accelerate the implementation of air quality control to improve the better air quality. The detail actions were implemented through the seven-point of Governor instructions No. 66/2019. At this moment, the city heavily rely on private vehicles (cars and motorcycle) for urban mobility and the share of public transport in Jakarta metropolitan area around 27% (ESCAP, 2017). To improve the situations, the national government and local government developed various public transport infrastructure such as mass rapid transit, light rail transit and others (Table 1). The government also improve pedestrian and non-motorized transport facilities to encourage modal shift for walking and cycling within the city.
In summary, the decarbonization plan mainly consist of three main Avoid-Shift-Improve approaches. The detail of each approached as follows:
(a) Avoid: TOD, land-use planning and city developing planning especially along the corridor of new railway development (Mass Rapid Transit (MRT) and Light Rail Transit (LRT)) and its stations. One of TOD model project was located in Poris Plawad in Tangerang City, one of neighbor city of Jakarta nearby Jakarta Airport in the western part of the city (Selenia EP, 2018)
(b) Shifting to Public Transport and Non-Motorized To encourage modal shift, national and local government build public transport infrastructures aggressively. The first phase of Mass Rapid Transit
was built since 2013 and start to operate in March 2019.
(c) Improve (Shift to Electricity and Biofuel)Electrification of vehicles in Indonesia started by Low carbon emission program as the initial steps (Schroder, et al, 2021) and followed by President regulation to promote BEV (2019). The national policy aims to establish EVs hub; create the link of EVs and Battery Production (Schroder et al 2021). The government also aims to promote the local EV Manufacturing and export EVs to Australia and other ASEAN countries. The national policy also announced EV adoption target such as target EV market share (Li & Chang, 2019). The national government have set a target of EV market share about 20% of domestic vehicle sales by 2025 and 25% by 2030. In the long-term, it is expected to have BEV stock equal to 4.2 million vehicles & 10,000 units of charging stations by 2050 (Schroder, 2021). In response to the national policy of electrification of vehicles, the local government of Jakarta decided to play as an early adopters of the BEVs especially for the public transport fleets, Trans Jakarta. The transportation agency of Jakarta city released the decree no 120/2019 to assigned Trans Jakarta to conduct trial run of EV buses in Jakarta. The company also developed a roadmap for electrification of their fleets up to 2027. The ministry of energy and mineral resource (MEMR) released the policy on the provision of electricity charging infrastructure for batter-based electric motor vehicles aims to accelerate the programs. The international cooperation and technical assistant from international organization such as UNEP CTCN and C40 were implemented to support Jakarta’s transition to electromobility. A comprehensive study on electric vehicles by the ministry of Industry and ministry of research and higher education of Indonesia together with Toyota Indonesia and several universities show the key findings on fuel efficiency and CO2 reductions from EVs.
Due to the large potential for bioenergy, the Indonesian government set up a policy on the production and use of biofuels and, in particular, biodiesel produced from the refining palm oil. The biodiesel blending program was first introduced in 2015 through
MEMR Reg No. 12, which targeted 20% blending (B20) by 2016 for transportation and industrial consumption. In September 2018, the government expanded the subsidy scheme to non-Public Service Obligation (PSO) organizations through Presidential Regulation No.66/2018. The program is expended and also mandatory for other sectors such as mining, and other diesel-using industries. There is also an intention to further increase the target for blending for 30% biodiesel blending (B30) and 20% ethanol (E20) blending from 2025 onwards. The intention of increasing the blending mostly due to the oversupply of domestic market palm oil caused by the decreasing of the overseas market especially in the European region due to recent decision of the EU on biofuels (Suharsono et al, 2019). This exogenous shock reduces the overseas demand and the biofuel policy is therefore designed to provide an additional domestic market. The biofuel policy also aims to reduce diesel fuel imports (and thereby boost the trade balance) (Suharsono et al, 2019) and to reduce the fiscal cost of subsidizing diesel.
3.c. Basic assumption in the Assessment Model
The population of Jakarta city will continue to grow with an annual rate 1%. Total population in 2030 and 2050 are 1.17 times and 1.24 times compare to the reference in 2010 (Table 2). In parallel, number of household will also increase up to 1.17 times in 2030 and 1.3 times in 2050. In the long-term, increasing rate of household slightly higher due to the decreasing of family size in the household compare to the reference in 2010. On the socio-economic indicator, the GDP assumed to be increased on average 5.7% per year from 2010 to 2050. As result, the macro-economic indicators such GDP and Gross output will increase almost 3 times in 2030 and more than 9 times in 2050. The GDP per capita will also become double in 2030 and increase 9 times in 2050 compare to 2010. Looking at the economic sector, tertiary industry (commercial and services) will be dominant in the future. It will followed by secondary industry such as manufacturers and constructions industry and the rest will be primary industry.
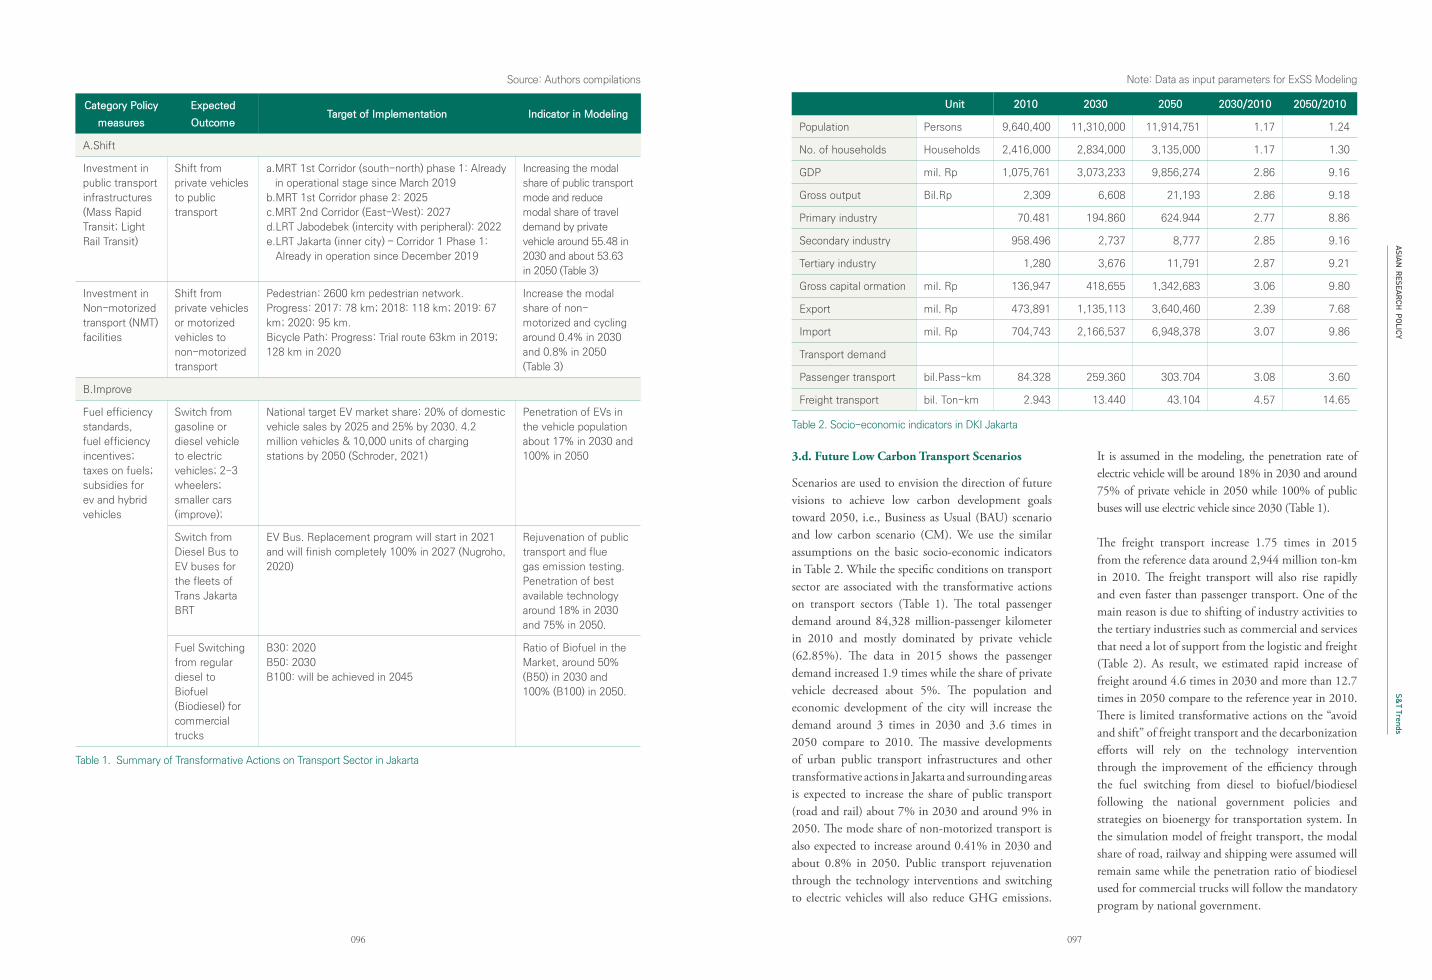
ASIAN RESEARCH
POLICY
097096
S&T Trends
Category Policy
measures
Expected
OutcomeTarget of Implementation Indicator in Modeling
A.Shift
Investment in
public transport
infrastructures
(Mass Rapid
Transit; Light
Rail Transit)
Shift from
private vehicles
to public
transport
a. MRT 1st Corridor (south-north) phase 1: Already
in operational stage since March 2019
b.MRT 1st Corridor phase 2: 2025
c.MRT 2nd Corridor (East-West): 2027
d. LRT Jabodebek (intercity with peripheral): 2022
e. LRT Jakarta (inner city) – Corridor 1 Phase 1:
Already in operation since December 2019
Increasing the modal
share of public transport
mode and reduce
modal share of travel
demand by private
vehicle around 55.48 in
2030 and about 53.63
in 2050 (Table 3)
Investment in
Non-motorized
transport (NMT)
facilities
Shift from
private vehicles
or motorized
vehicles to
non-motorized
transport
Pedestrian: 2600 km pedestrian network.
Progress: 2017: 78 km; 2018: 118 km; 2019: 67
km; 2020: 95 km.
Bicycle Path: Progress: Trial route 63km in 2019;
128 km in 2020
Increase the modal
share of non-
motorized and cycling
around 0.4% in 2030
and 0.8% in 2050
(Table 3)
B.Improve
Fuel efficiency
standards,
fuel efficiency
incentives;
taxes on fuels;
subsidies for
ev and hybrid
vehicles
Switch from
gasoline or
diesel vehicle
to electric
vehicles; 2-3
wheelers;
smaller cars
(improve);
National target EV market share: 20% of domestic
vehicle sales by 2025 and 25% by 2030. 4.2
million vehicles & 10,000 units of charging
stations by 2050 (Schroder, 2021)
Penetration of EVs in
the vehicle population
about 17% in 2030 and
100% in 2050
Switch from
Diesel Bus to
EV buses for
the fleets of
Trans Jakarta
BRT
EV Bus. Replacement program will start in 2021
and will finish completely 100% in 2027 (Nugroho,
2020)
Rejuvenation of public
transport and flue
gas emission testing.
Penetration of best
available technology
around 18% in 2030
and 75% in 2050.
Fuel Switching
from regular
diesel to
Biofuel
(Biodiesel) for
commercial
trucks
B30: 2020
B50: 2030
B100: will be achieved in 2045
Ratio of Biofuel in the
Market, around 50%
(B50) in 2030 and
100% (B100) in 2050.
Table 1. Summary of Transformative Actions on Transport Sector in Jakarta
Unit 2010 2030 2050 2030/2010 2050/2010
Population Persons 9,640,400 11,310,000 11,914,751 1.17 1.24
No. of households Households 2,416,000 2,834,000 3,135,000 1.17 1.30
GDP mil. Rp 1,075,761 3,073,233 9,856,274 2.86 9.16
Gross output Bil.Rp 2,309 6,608 21,193 2.86 9.18
Primary industry 70.481 194.860 624.944 2.77 8.86
Secondary industry 958.496 2,737 8,777 2.85 9.16
Tertiary industry 1,280 3,676 11,791 2.87 9.21
Gross capital ormation mil. Rp 136,947 418,655 1,342,683 3.06 9.80
Export mil. Rp 473,891 1,135,113 3,640,460 2.39 7.68
Import mil. Rp 704,743 2,166,537 6,948,378 3.07 9.86
Transport demand
Passenger transport bil.Pass-km 84.328 259.360 303.704 3.08 3.60
Freight transport bil. Ton-km 2.943 13.440 43.104 4.57 14.65
Table 2. Socio-economic indicators in DKI Jakarta
3.d. Future Low Carbon Transport Scenarios
Scenarios are used to envision the direction of future visions to achieve low carbon development goals toward 2050, i.e., Business as Usual (BAU) scenario and low carbon scenario (CM). We use the similar assumptions on the basic socio-economic indicators in Table 2. While the specific conditions on transport sector are associated with the transformative actions on transport sectors (Table 1). The total passenger demand around 84,328 million-passenger kilometer in 2010 and mostly dominated by private vehicle (62.85%). The data in 2015 shows the passenger demand increased 1.9 times while the share of private vehicle decreased about 5%. The population and economic development of the city will increase the demand around 3 times in 2030 and 3.6 times in 2050 compare to 2010. The massive developments of urban public transport infrastructures and other transformative actions in Jakarta and surrounding areas is expected to increase the share of public transport (road and rail) about 7% in 2030 and around 9% in 2050. The mode share of non-motorized transport is also expected to increase around 0.41% in 2030 and about 0.8% in 2050. Public transport rejuvenation through the technology interventions and switching to electric vehicles will also reduce GHG emissions.
It is assumed in the modeling, the penetration rate of electric vehicle will be around 18% in 2030 and around 75% of private vehicle in 2050 while 100% of public buses will use electric vehicle since 2030 (Table 1).
The freight transport increase 1.75 times in 2015 from the reference data around 2,944 million ton-km in 2010. The freight transport will also rise rapidly and even faster than passenger transport. One of the main reason is due to shifting of industry activities to the tertiary industries such as commercial and services that need a lot of support from the logistic and freight (Table 2). As result, we estimated rapid increase of freight around 4.6 times in 2030 and more than 12.7 times in 2050 compare to the reference year in 2010. There is limited transformative actions on the “avoid and shift” of freight transport and the decarbonization efforts will rely on the technology intervention through the improvement of the efficiency through the fuel switching from diesel to biofuel/biodiesel following the national government policies and strategies on bioenergy for transportation system. In the simulation model of freight transport, the modal share of road, railway and shipping were assumed will remain same while the penetration ratio of biodiesel used for commercial trucks will follow the mandatory program by national government.
Source: Authors compilations Note: Data as input parameters for ExSS Modeling
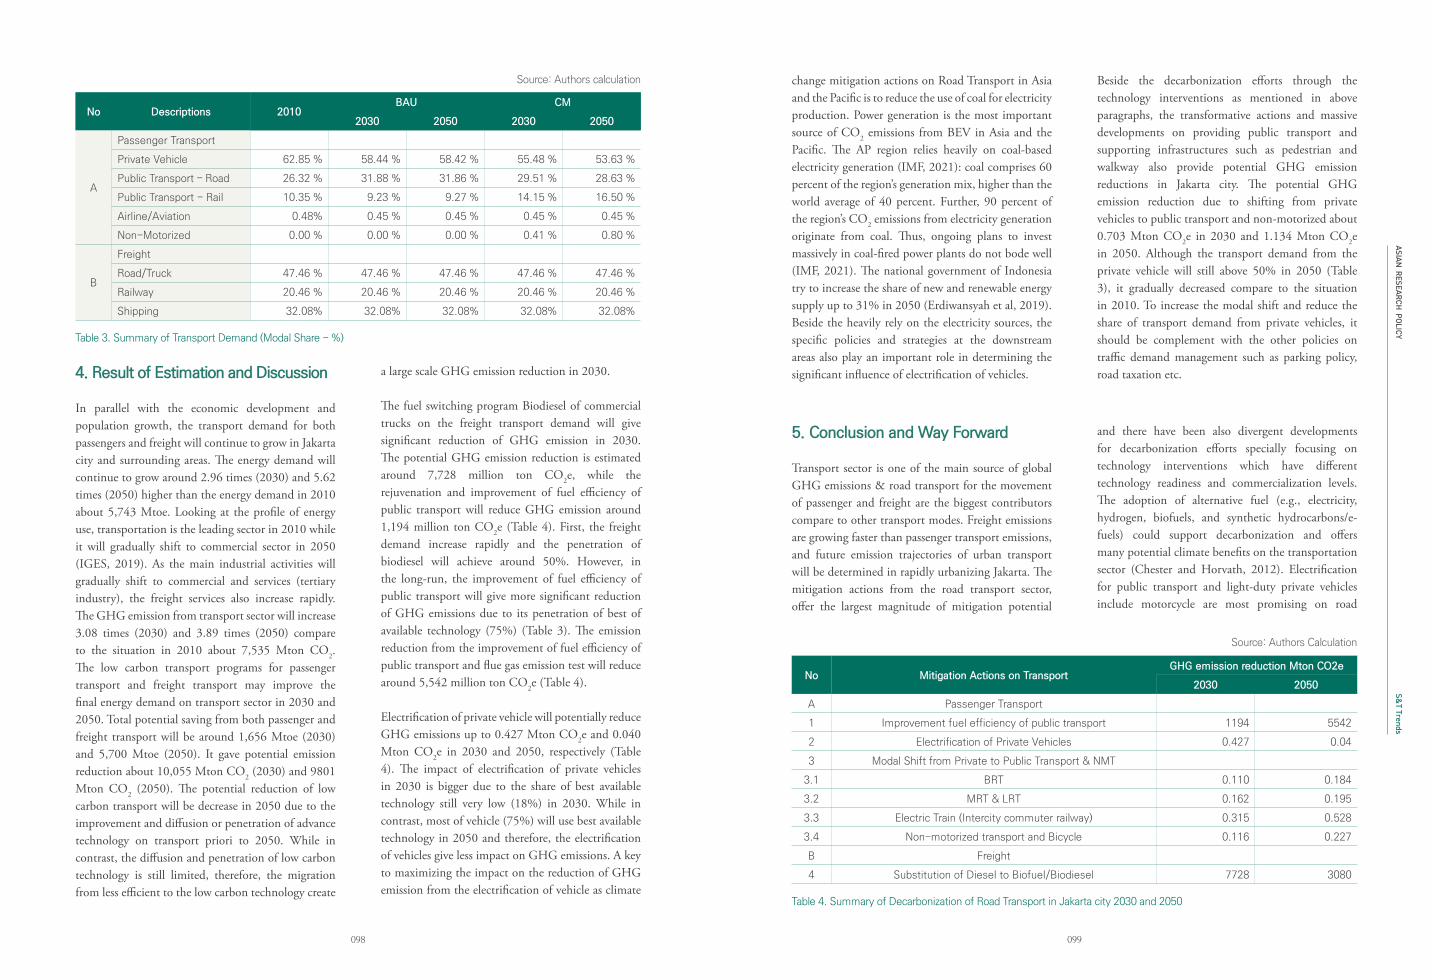
ASIAN RESEARCH
POLICY
099098
S&T Trends
No Descriptions 2010BAU CM
2030 2050 2030 2050
A
Passenger Transport
Private Vehicle 62.85 % 58.44 % 58.42 % 55.48 % 53.63 %
Public Transport – Road 26.32 % 31.88 % 31.86 % 29.51 % 28.63 %
Public Transport - Rail 10.35 % 9.23 % 9.27 % 14.15 % 16.50 %
Airline/Aviation 0.48% 0.45 % 0.45 % 0.45 % 0.45 %
Non-Motorized 0.00 % 0.00 % 0.00 % 0.41 % 0.80 %
B
Freight
Road/Truck 47.46 % 47.46 % 47.46 % 47.46 % 47.46 %
Railway 20.46 % 20.46 % 20.46 % 20.46 % 20.46 %
Shipping 32.08% 32.08% 32.08% 32.08% 32.08%
Table 3. Summary of Transport Demand (Modal Share - %)
4. Result of Estimation and Discussion
In parallel with the economic development and population growth, the transport demand for both passengers and freight will continue to grow in Jakarta city and surrounding areas. The energy demand will continue to grow around 2.96 times (2030) and 5.62 times (2050) higher than the energy demand in 2010 about 5,743 Mtoe. Looking at the profile of energy use, transportation is the leading sector in 2010 while it will gradually shift to commercial sector in 2050 (IGES, 2019). As the main industrial activities will gradually shift to commercial and services (tertiary industry), the freight services also increase rapidly. The GHG emission from transport sector will increase 3.08 times (2030) and 3.89 times (2050) compare to the situation in 2010 about 7,535 Mton CO2. The low carbon transport programs for passenger transport and freight transport may improve the final energy demand on transport sector in 2030 and 2050. Total potential saving from both passenger and freight transport will be around 1,656 Mtoe (2030) and 5,700 Mtoe (2050). It gave potential emission reduction about 10,055 Mton CO2 (2030) and 9801 Mton CO2 (2050). The potential reduction of low carbon transport will be decrease in 2050 due to the improvement and diffusion or penetration of advance technology on transport priori to 2050. While in contrast, the diffusion and penetration of low carbon technology is still limited, therefore, the migration from less efficient to the low carbon technology create
a large scale GHG emission reduction in 2030. The fuel switching program Biodiesel of commercial trucks on the freight transport demand will give significant reduction of GHG emission in 2030. The potential GHG emission reduction is estimated around 7,728 million ton CO2e, while the rejuvenation and improvement of fuel efficiency of public transport will reduce GHG emission around 1,194 million ton CO2e (Table 4). First, the freight demand increase rapidly and the penetration of biodiesel will achieve around 50%. However, in the long-run, the improvement of fuel efficiency of public transport will give more significant reduction of GHG emissions due to its penetration of best of available technology (75%) (Table 3). The emission reduction from the improvement of fuel efficiency of public transport and flue gas emission test will reduce around 5,542 million ton CO2e (Table 4).
Electrification of private vehicle will potentially reduce GHG emissions up to 0.427 Mton CO2e and 0.040 Mton CO2e in 2030 and 2050, respectively (Table 4). The impact of electrification of private vehicles in 2030 is bigger due to the share of best available technology still very low (18%) in 2030. While in contrast, most of vehicle (75%) will use best available technology in 2050 and therefore, the electrification of vehicles give less impact on GHG emissions. A key to maximizing the impact on the reduction of GHG emission from the electrification of vehicle as climate
change mitigation actions on Road Transport in Asia and the Pacific is to reduce the use of coal for electricity production. Power generation is the most important source of CO2 emissions from BEV in Asia and the Pacific. The AP region relies heavily on coal-based electricity generation (IMF, 2021): coal comprises 60 percent of the region’s generation mix, higher than the world average of 40 percent. Further, 90 percent of the region’s CO2 emissions from electricity generation originate from coal. Thus, ongoing plans to invest massively in coal-fired power plants do not bode well (IMF, 2021). The national government of Indonesia try to increase the share of new and renewable energy supply up to 31% in 2050 (Erdiwansyah et al, 2019). Beside the heavily rely on the electricity sources, the specific policies and strategies at the downstream areas also play an important role in determining the significant influence of electrification of vehicles.
Beside the decarbonization efforts through the technology interventions as mentioned in above paragraphs, the transformative actions and massive developments on providing public transport and supporting infrastructures such as pedestrian and walkway also provide potential GHG emission reductions in Jakarta city. The potential GHG emission reduction due to shifting from private vehicles to public transport and non-motorized about 0.703 Mton CO2e in 2030 and 1.134 Mton CO2e in 2050. Although the transport demand from the private vehicle will still above 50% in 2050 (Table 3), it gradually decreased compare to the situation in 2010. To increase the modal shift and reduce the share of transport demand from private vehicles, it should be complement with the other policies on traffic demand management such as parking policy, road taxation etc.
No Mitigation Actions on Transport GHG emission reduction Mton CO2e
2030 2050
A Passenger Transport
1 Improvement fuel efficiency of public transport 1194 5542
2 Electrification of Private Vehicles 0.427 0.04
3 Modal Shift from Private to Public Transport & NMT
3.1 BRT 0.110 0.184
3.2 MRT & LRT 0.162 0.195
3.3 Electric Train (Intercity commuter railway) 0.315 0.528
3.4 Non-motorized transport and Bicycle 0.116 0.227
B Freight
4 Substitution of Diesel to Biofuel/Biodiesel 7728 3080
Table 4. Summary of Decarbonization of Road Transport in Jakarta city 2030 and 2050
Source: Authors calculation
Source: Authors Calculation
5. Conclusion and Way Forward
Transport sector is one of the main source of global GHG emissions & road transport for the movement of passenger and freight are the biggest contributors compare to other transport modes. Freight emissions are growing faster than passenger transport emissions, and future emission trajectories of urban transport will be determined in rapidly urbanizing Jakarta. The mitigation actions from the road transport sector, offer the largest magnitude of mitigation potential
and there have been also divergent developments for decarbonization efforts specially focusing on technology interventions which have different technology readiness and commercialization levels. The adoption of alternative fuel (e.g., electricity, hydrogen, biofuels, and synthetic hydrocarbons/e-fuels) could support decarbonization and offers many potential climate benefits on the transportation sector (Chester and Horvath, 2012). Electrification for public transport and light-duty private vehicles include motorcycle are most promising on road
ASIAN RESEARCH
POLICY
101100
S&T Trends
transport because it is now commercially available and likely to be more cost competitive in the near future. Second, the adoption of biofuel from the biodiesel produced from palm oil due to its large potential sources for bioenergy and exogenous shocks from the overseas markets may improve fuel efficiency and reduce GHG emissions from transport sector.
The case study in Jakarta city shows the transformative actions on low carbon transport through various actions on providing public transport infrastructure to encourage modal shift from private vehicles and utilization of alternative fuels (electricity and biofuel) helps to reduce GHG emissions in the mid and long-term. The use of biofuel from commercial trucks provide immediate impacts on GHG emissions while the improvement of fuel efficiency and electrification of public transport may give more significant impact in the long-term. To maximizing the impact of electrification of vehicle, complementary program on renewable energy in the upstream and providing additional supports in the downstream such as charging facilities. The charging infrastructure was most strongly related to electric vehicle adoption (Sierzchula, et al, 2014; Yao, et, al, 2020). The policies focused on early adopters and niche markets such as public transport companies would create complementary system effects that will lead to increased PEV market penetration and realization of intended societal benefits (Green, H.E., 2014). Bringing on board the local authorities and stakeholders strengthen the diffusion process of EV (Gordon, et al, 2012; Kunle, 2020). The GHG emission reduction from the modal shift from private vehicles to public transport as the results of massive development of public transport infrastructures in Jakarta city shows a promising mitigation actions on transport sector too.
The integrated assessment model (IAM) non-linear programming model ExSS using GAMS v 23.3 could be used to assess the GHG emission reduction in the mid and long-term. The result of the bottom-up approaches at the city level provide opportunities to reduce GHG emissions in the mid and long-term future pathways on low carbon transport and GHG emission at the local level. The top-down approaches could be combined with the top-down that could
help to explore and identify more transformative and ambitious actions needed in order to achieve Net Zero target in 2050 on road transport sector in the Asia-Pacific Regions. Acknowledgement
This research is a part of the low carbon society (LCS) study in collaboration between Jakarta city government, Institute for Global Environmental Strategies-Japan, National Institute for Environmental Studies, Institute of Technology Bandung and the Asia-Pacific Integrated Assessment Model with funding from the Ministry of Environment Japan.
References
Chester, M., & Horvath, A. (2012). High-speedrail with emerging automobiles and aircraft can reduce environmental impacts in California’s future. Environmental Research Letters 7(3), 034012.
Creutzig, F. (2016) Evolving Narratives of Low-Carbon Futures in Transportation. Transport Reviews 36, 341-60.
Dewi R.G., Siagian U., Hendrawan I., Boer R., Anggraeni L., & Bakhtiar T. (2016) Low-Carbon City Scenarios for DKI Jakarta Towards 2030. In: Jupesta J., Wakiyama T. (eds) Low Carbon Urban Infrastructure Investment in Asian Cities. Cities and the Global Politics of the Environment. Palgrave Macmillan, London. https://doi.org/10.1057/978-1-137-59676-5_4
Diyarni, I. P. (2018) Low Carbon Development inDKI Jakarta. Seminar of city to city collaboration for low carbon city development in Asia. Tokyo, 30th January, 2018.
Erdiwansyah, Mamat, R., Sani, M. S. M. & Sudhakar, K. (2019) Renewable Energy in Southeast Asia: Policies and Recommendations. Science of the Total Environment 670, 1095-1102. https://doi.org/10.1016/j.scitotenv.2019.03.273 0
ESCAP (2017) Data collection report, SustainableUrban Transport Index (SUTI) for Asian Cities, Greater Jakarata Area (JABODABEK) Indonesia
Fisch-Romito, V., & Guivarch, C. (2019) Transportation infrastructures in a low carbon world: an evaluation of investment needs and their determinants. Transportation Research Part D: Transport and Environment 72, 203-219. https://doi.org/10.1016/j.trd.2019.04.014
Frantzeskaki, N., Coenen, L., Castan Broto, V., & Loorbach, D. (2017) Urban Sustainability Transition. London: Routledge.
Government of Indonesia (2016) First Nationally determined contribution Republic of Indonesia https://www4.unfccc.int/sites/ndcstaging/PublishedDocuments/Indonesia%20First/First%20NDC%20Indonesia_submitted%20to%20UNFCCC%20Set_November%20%202016.pdf
Gomi, K., Ochi, Y., & Matsuoka, Y. (2011) Asystematic quantitative backcasting on low-carbon society policy in case of Kyoto city. Technological Forecasting and Social Change 78, 852-871. doi:10.1016/j.techfore.2011.01.002
Gordon, D., Sperling, D., & Livingston, D. (2012) Policy priorities for advancing the U.S electric vehicle market. The Carnegie Papers, Energy and Climate, ITS UC Davis, September 2012.
Gota, S., Huizenga, C., Peet, K., & Kaar, G. (2015) Emission Reduction Potential in the Transport Sector by 2030. Retrieved from https://bit.ly/2pvZKwi
Green, H, E., Skerlos, S. J., & Winebrake, J. J.2014) Increasing electric vehicle policy efficiency and effectiveness by reducing mainstream market bias. Energy Policy 65, 562-566.
Heidrich, O., Reckien, D., Olazabal, M., Foley, A., Salvia, M., De Gregorio Hurtado, S., Orru, H. , Flacke, J., Geneletti, D., Pietrapertosa, F., Hamann, J. J. P., Tiwary, A., Feliu,E., & Dawason,
R. J. (2016) National climate policies across Europe and their impacts on cities strategies. Journal of Environmental Management 168, 36-45. https://doi.org/10.1016/j.jenvman.2015.11.043
Hidalgo, D., & Huizenga, C. (2013) Implementation of sustainable urban transport in Latin America. Research in Transportation Economics 40(1), 66-77.
Institute for Global Environmental Strategies (2019)Long-term strategy to achieve DKI Jakarta’s Low Carbon Society. Preliminary Study. https://www.iges.or.jp/en/publication_documents/pub/discussionpaper/en/10653/2020_LCS_DKI_RDG_r1.pdf
International Energy Agency (2012) http://www.p p m c - t r a n s p o r t . o r g / w p - c o n t e n t /uploads/2015/08/Analys i s -on-Nat iona l -Transport-Sector-Emissions-1990-2012.pdf
International Energy Agency. (2020). Global EVOutlook 2020. Global EV Outlook 2020. https://doi.org/10.1787/d394399e-en
International Monetary Fund Asia and PacificDepartment Fiscal Affairs Department (2021) Fiscal Policies to Address Climate Change in Asia and the Pacific.
IPCC. Global warming of 1.5 ◦C. An IPCC special report on the impacts of global warming of 1.5 ◦C above pre-industrial levels and related global greenhouse gas emission pathways, in the context of strengthening the global response to the threat of climate change, sustainable development, and efforts to eradicate poverty [V. Masson-Delmotte, P. Zhai, H. O. P¨ortner, D. Roberts, J. Skea, P.R. Shukla, A. Pirani, Y. Chen, S. Connors,M. Gomis, E. Lonnoy, J. B. R. Matthews, W. Moufouma-Okia, C. P´ean, R. Pidcock, N. Reay, M. Tignor, T. Waterfield, X. Zhou (eds.)]. 2018.
Jaeger A., Nugroho, S. B., Zusman, E., Nakano, R., & Daggy, R. (2015) Governing sustainable low-carbon transport in Indonesia: an assessment of provincial transport plans. Natural Resource Forum 39, 27-
ASIAN RESEARCH
POLICY
103102
S&T Trends
40. Doi:10.1111/1477-8947.12066
Junghans, L., Keft, S., & Welp, M. (2018) Inclusive visions for urban transitions: lesson from stakeholders dialogues in Asian medium sized cities. Sustainable Cities and Society 42, 512-520.
Kahn Ribeiro, S., Figueroa, M. J., Creutzig, F., Dubeux, C., Hupe, J., & Kobayashi, S. Chapter 9 - Energy End-Use: Transport. Global Energy Assessment - Toward a Sustainable Future. Cambridge University Press, Cambridge, UK and New York, NY, USA and the International Institute for Applied Systems Analysis, Laxenburg, Austria; 2012. pp. 575–648.
Kunle, E., & Minke. C. (2020) Macro-environmental comparative analysis of e-mobility adoption pathways in France, Germany and Norway. Transport Policy. https//doi.org/10.1016/j.tranpol.2020.08.019
Li, Y., & Chang, Y. (2019) Road transport electrificationand energy security in the Association of Southeast Asian Nations: quantitative analysis and policy implications. Energy Policy 129, 805-815. https://doi.org/10.1016/j.enpol.2019.02.048
Lutsey, N., & Sperling, D. (2012) Regulatory adaptation: accommodating electric vehicles in a petroleum world. Energy Policy 45, 308-316.
Masripatin, N., Rachmawaty, E., Suryanti, Y., Setyawan, H., Farid, M., & Iskandar, N. (2018) Implementation Strategy Nationally Determined Contribution. Directorate General Climate Change Control, Ministry of Environment and Forestry, Indonesia.
Nugroho, S. B. (2020) Analysis low carbon transport actions and projects in Indonesian Cities. Workshop on Deep Transition and Integration of Power and Transport System Supporting the Transition to Energy-efficient electric transport systems, Asia-Pacific Economic Cooperation, Washington DC, 14-15 January 2020. https://sd-strategies.com/wp-content/uploads/3_Nugroho_IGES_APEC_Indonesia.pdf
Reckien, D., Flacke, J., Olazabal, M., & Heidrich, O. (2015) The Influence of drivers and barriers on urban adaptation and mitigation plans-an empirical analysis of European cities. PLoS ONE 10, Article e0135597. https://doi.org/10.1371/journal.pone.0135597
Schroder, M., & Iwasaki, F. (2021) Current situation of Electric Vehicle in ASEAN, in Schroder, M., F. Iwasaki and H. Kobayashi (eds) Promotion of Electromobility in ASEAN: States, Carmakers, and International Production Networks. ERIA research project report FY2021 No 03, Jakarta: ERIA, pp. 1-32.
Se lenia E. P. (2018) Improvement of UrbanTransportation in Greater Jakarta (LRT and MRT Progress). Capacity Building Workshop on Sustainable Urban Transport Index, Dhaka, Bangladesh, September 12-13th, 2018
Siagian, U. W. R., Yuwono, B. B., Fujimori, S., &Masui, T. (2017) Low-carbon energy development in Indonesia in alignment with Intended Nationally Determined Contribution (INDC) by 2030. Energies 10, 52. Doi:10.3390/en10010052
Sierzchula, W., Bakker, S., Maat, K., & Van Wee, B. (2014) The influence of financial incentives and other socio-economic factors on electric vehicle adoption. Energy Policy 68, 183-194. https://doi.org/10.1016/j.enpol.2014.01.043
Sims R., Schaeffer, R., Creutzig, F., Cruz-Núñez, X., D’Agosto, M., Dimitriu, D., Figueroa Meza, M. J., Fulton, L., Kobayashi, S., Lah, O., McKinnon, A., Newman, P., Ouyang, M., Schauer, J. J., Sperling, D., & Tiwari, G. (2014) Transport. In: Climate Change 2014: Mitigation of Climate Change. Contribution of Working Group III to the Fifth Assessment Report of the Intergovernmental Panel on Climate Change [Edenhofer, O., R. Pichs-Madruga, Y. Sokona, E. Farahani, S. Kadner, K. Seyboth, A. Adler, I. Baum, S. Brunner, P. Eickemeier, B. Kriemann, J. Savolainen, S. Schlömer, C. von Stechow, T. Zwickel and J.C. Minx (eds.)]. Cambridge University Press,
Cambridge, United Kingdom and New York, NY, USA.
Suharsono, A., McCulloh, N., Mostafa, N., Bridle, R., Lontoh, L., & Gass, P. (2019) Getting to 23 Per Cent: Strategies to scale-up renewables in Indonesia. International Institute for Sustainable Development (IISD).
Taptich, M. N., Horvath, A., & Chester, M. V. (2016) Worldwide greenhouse gas reduction potentials in transportation by 2050. Journal of Industrial Ecology 20(2), 329-340. https://doi.org/10.1111/jiec.12391
Vergrart, P. J., & and Quist, J. (2011) Backcastingfor sustainability: introduction to the special issue. Technology Forecasting and Social Change 78, 747-755. https://worldpopulationreview.com/world-cities/jakarta-population (accessed on August 20,2021
Yao, J., Xiong, S., & Ma, X. (2020) Comparativeanalysis of national policies for electric vehicle uptake using econometric models. Energies, 13, 3604. Doi: 10.3390/en13143604
ASIAN RESEARCH
POLICY
105104
S&T Trends
1.1. International call for carbon neutrality
The Paris Agreement is an international treaty on climate change adopted by 196 nations at the 21st Conference of Parties (COP21) of the United Nations Framework Convention on Climate Change (UNFCCC) in 2015. It set a goal to limit global warming to well below 2 degree Celsius (°C), more ambitiously 1.5°C above the pre-industrial level. In 2018, the Intergovernmental Panel on Climate Change (IPCC)1 issued a special report entitled Global Warming of 1.5°C, which rang the alarm bell that an increase of 2°C in global temperature may cause higher and, in several cases, irreversible impacts and risks compared to 1.5°C (IPCC, 2018). From this
report onward, increasing number of countries, local governments, and private companies, among others, are supporting the 1.5°C target, which requires that global carbon dioxide (CO2) emissions should reach net zero by approximately 2050. Furthermore, the most recent IPCC report presented new projections that a global warming of 1.5°C may occur during the near term, that is, 2021–2040, which is earlier than expected (IPCC, 2021). This finding calls for further accelerated actions toward global carbon neutrality before 2050.According to the Race to Zero Campaign2 of the Climate Ambition Alliance by UNFCCC, 121 countries, 733 cities, 31 regions, 3,067 companies, 173 investors, and 661 organizations are registered as
1. Introduction
Trends of the Zero Carbon Cities in Japan
Junko Ota1,*, Junko Akagi1
1 Institute for Global Environmental Strategies, Kitakyushu 805-0062, Japan* Correspondence: [email protected]
The Paris Agreement sets the goal to limit the global warming to well below 2°C and preferably 1.5°C. The recent IPCC report warned that 1.5°C-warming may occur much earlier than expected. To meet the 1.5°C target, global emissions of greenhouse gases (GHGs) should be net zero by 2050 or earlier. Increasing number of countries, local governments, and private companies are committing for the 1.5°C target worldwide.In Japan, this zero carbon movement was initiate by several local governments in 2019, followed by the national government’s commitment in 2020. Now, over 400 local governments, representing nearly 90% of the national population in Japan, announced themselves as the “Zero Carbon City” under the national framework (as of July 30, 2021). This article illustrates the rapidly increasing trends of the Zero Carbon Cities with the overview of emission and energy status in Japan, and analyzes the triggering and supporting elements including the new development of national policies and strategies to ensure the implementation of zero carbon measures at local level as well as to create social and economic co-benefit to the local regions.
Abstract
1 IPCC is a body of the United Nations established in 1988 by the World Meteorological Organization (WMO) and the United Nations Environment Programme (UNEP) with the objective of providing scientific information related to climate change.
2 Race to Zero is a global campaign by UNFCCC to mobilize the coalition of leading net zero initiatives of various actors who pledge efforts to net zero CO2 emission by 2050.
3 10 special wards (Tokubetsu-ku in Japanese) are under the Tokyo Metropolitan Government (comprises 23 special wards).4 Net zero indicates achieving equilibrium between anthropogenic GHG emissions from sources and removal by sinks, such as forests.5 Yamanashi prefecture stated “CO2-zero Yamanashi” as a long-term vision toward 2050 in their Action Plan for Global Warming Countermeasures in 2009.6 In the speech, Prime Minister used a mixture of terms, such as GHGs, carbon-neutral, and de-carbonization.
actors who pledged net zero CO2 emission by 2050. The country itself as well as 91 local governments are participating in this campaign from Japan. The number of registered Japanese cities (91) is the second largest after Argentina (254), followed by the United States (75) and Denmark (64) (UNFCCC, 2021).
1.2. Rapid expansion of zero-carbon cities in Japan
In Japan, a total of 432 local governments (i.e., 40 prefectures, 256 cities, 10 special wards,3 106 towns, and 20 villages) have announced their commitment to achieving net zero4 CO2 emissions (in certain cases, greenhouse gases [GHGs]) by the year 2050. These local governments represent a population of approximately 111 million and cover nearly 88% of Japan’s national population. These announcements are registered in the national framework named zero-carbon city led by the Ministry of the Environment (MOE), Japan. MOE defines a zero-carbon city as “a local government in which head of the municipalities or the local government itself publicly announced a goal to achieve net zero CO2 emissions by 2050.” Figure 1 presents the number of local governments
that announced that the zero-carbon city has grown rapidly from four local governments in June 2019 to 432 local governments in the present (as of July 30, 2021) within the past two years.
Apart from the international influence, certain domestic factors promote the participation of zero-carbon cities. Such factors can be categorized into three stages. The first was initiated voluntarily by the four frontrunner local governments (Yamanashi Prefecture5, Kyoto City, Tokyo Metropolitan Government, and Yokohama City). This initiative then developed into the second stage after the inauguration of the Minister of the Environment Koizumi in September 2020, who vigorously called for participation in the zero-carbon city project. The initial number increased to over 160 before the national announcement on carbon neutrality in October 2020. The third stage was triggered by the national announcement to achieve net zero GHG emissions by 20506, which dramatically increased the number of zero-carbon cities to the current 432 (as of July 30, 2021).
500
450
400
350
300
250
200
150
100
50
0
May.
Jun.
Oct.
Nov.
Dec.
2019 2020 2021
Jan.
Fed.
Mar.
Apr.
May.
Jun.
Jul.
Jan.
Fed.
Mar.
Apr.
May.
Jun.
Jul.
Aug.
Sep.
Oct.
Nov.
Dec.
Figure 1. Number of Japanese local governments that announced net zero CO2 emissions by 2050
Source: MOE, 2021

ASIAN RESEARCH
POLICY
107106
S&T Trends
Prefecture City Town Village
900
800
700
600
500
400
300
200
100
0
90
80
70
60
50
40
30
20
10
0
Number of local governments by levels Zero Carbon Cities %
Figure 2. Ratio of Zero Carbon City announcement by levels of local governments
The total emissions from zero-carbon cities in Japan are approximately 940 MTCO2e (FY2017 8), which accounts for approximately 72% of national emissions for the same year despite zero-carbon cities (432 as of July 30, 2021) and represents only approximately one-fourth of the local governments in the country (MOE, 2021). The reason underlying this statistics is that many zero-carbon cities include large or industrial cities that fall under the so-called Pacific
Belt (an industry concentrated line from Kanto region to northeastern Kyushu). Approximately 35% of the national CO2 emissions are derived from the industry sector (FY2019). Figure 5 illustrates the geographical distribution and scale of GHG emissions of cities, towns, and villages that announced themselves as zero-carbon cities (prefectures are excluded to avoid duplication). The size and color of the dots reflect the amount of CO2 emissions of each zero-carbon city.
CO2 (Energy-related)
CO2 (not related to energy)
Methane (CH4)
Nitrous oxide (N2O)
F-gases (HFCs, PFCs, SF6, NF
3)
1.7%4.6%
84.9%
6.3%
2.5%
Figure 4. Japan’s national greenhouse gas emissions by gas (FY2019)
Figure 5. Distribution and size of GHG emissions (FY2017) of Cities, Towns, and Villages that announced their
commitment to achieve net zero CO2 emission by 20509
8 The figure is calculated based on the MOE data source for local government emissions (Jichitai-karte) for FY2017. To avoid duplication, if a prefecture has announced itself a zero-carbon city, then the emissions of the prefecture are counted (emissions from cities, towns, and villages within the prefecture are excluded). If the prefecture did not announce, then all cities, towns, and villages that announced themselves as zero-carbon cities are included.
9 The map is made by author with assistance of IGES intern, Mr. Fedor Myasoedov, using the MOEJ’s emission data of FY2017 for local government, Jichitai-Haishutsuryo-Karte.
7 Prefecture overlaps with cities (generally population above 50,000), towns (condition set by respective prefecture, generally population above around 5,000–8,000), and villages (smaller population than town) (Ministry of Internal Affairs and Communications, Japan, 2021).
In terms of number, zero-carbon cities (432) account for approximately 24% of the total local governments in Japan (1,765 local governments: 47 prefectures, 792 cities, 743 towns, and 183 villages7) (Ministry of Internal Affairs and Communications, 2021). Large units of local governments tend to display high percentage of zero-carbon cities: 85% of prefectures (40 out of 47), 32% of cities (256 out of 792), 14% of towns (106 out of 743), and 11% of villages (20 out of 183) (Figure 2).
1.3. Greenhouse gas emissions in Japan and zero-carbon cities
Japan’s national GHG emission reached 1,213 metric tons of carbon dioxide equivalent (MTCO2e) for fiscal year (FY) 2019, which translate to a decrease of 14% compared with emissions for FY2013 (base
year for Japan’s nationally determined contribution to the Paris Agreement). This statistics is lower than the emissions for FY1990, which was the original base year of the UNFCCC (MOE, 2021). Japan’s GHG emission reached its peak in FY2013 and has been declining ever since (Figure 3). However, Japan accounts for 3.2% of global emissions and ranks as the fifth largest emitter in the world.
The main factors for the decline in GHG emission in Japan are the decrease of energy consumption (e.g., energy savings) and reduction of CO2 emissions from electricity through the expansion of renewable energy and restarting of nuclear power plants. A total of 84.9% of Japan’s GHG emissions (FY2019) were energy-related CO2 (Figure 4; MOE, 2021). Therefore, energy-related policies and on-ground implementation at the local level are critical.
Source: MOE and Ministry of Internal Affairs and Communications, 2021
1990 2005 2006 2007 2008 2009 2010 2011 2012 2013 2014 2015 2016 2017 2018 2019
1,450
1400
1350
1300
1250
1200
1150
1100
Figure 3. Japan’s national greenhouse gas emissions (FY1990- FY2019)
Source: MOE, 2020
Data source: MOE, 2020
data source: MOE, 2017
ASIAN RESEARCH
POLICY
109108
S&T Trends
2. National policy framework in Japan
2.1. Carbon neutrality by 2050 is now legally binding
The Act on Promotion of Global Warming Countermeasures (Law No. 107 of 1998) plays a central role in Japan’s framework for its climate change policy, and the provisions have been amended through successive revisions based on domestic and international trends. In response to the declaration of Prime Minister Suga on carbon neutrality on October 2020, the latest revision was enacted on May 26, 2021, to position carbon neutrality as a basic principle in the law. Countries that stipulated carbon neutrality in their laws remain limited, such as the United Kingdom and France. Thus, this movement was widely recognized as the strong will and commitment of the Japanese government toward carbon neutrality.
Aligned with its long-term goal, Japan’s mid-term goal was announced in April 2021 (i.e., reduce GHG emissions by 46% by FY2030 from its FY2013 level and continue strenuous efforts in its challenge to meet the lofty goal of cutting its emission by 50%). Although this mid-term goal is not legally binding, this statement has further enhanced the predictability of Japan’s policy.Along this line, the GHG emission reduction target by sector has also been revised (Table 1). Although these figures remain tentative, a large increase in the rate of reduction is observed in all sectors, such as the residential and commercial sectors, which required a concerted national effort.
2.2. Development of carbon-neutral-related policies
The challenge of realizing a carbon-neutral society
10 The latest plan was endorsed by the cabinet on May 13, 2016.11 The latest plan was endorsed by the cabinet on July 3, 2018.12 The latest long-term strategy was endorsed by the cabinet on June 11, 2019.
Regional Decarbonization Roadmap – Overall picture of measures and policies Priority measures
2020 2025 2030 2050·······························
● Mobilize policies over the next five years to actively support human resources, technology, information, and finance
(1) Create at least 100 “model decarbonized regions” by FY 2030
(2) Implement priority measures nationwide (e.g., self-consumption solar power, energy-efficient housing, electric vehicles)
● Implement three fundamental measures: 1) continuous and comprehensive support, 2) lifestyle innovation, and 3) institutional reform
● Propagate the model nationwide and achieve decarbonization without waiting for 2050 (Decarbonization domino effect)
(1) Create at least 100 “model decarbonized regions” by FY 2030
(2) Implement priority measures nationwide
Decarb
oniz
ation d
om
ino e
ffect
nationw
ide
Realiz
ing d
ecarb
oniz
ed, re
sili
ent,
and v
ibra
nt
com
munitie
s
thro
ughout
Japan
Mobilize policiesover the next five years
★Fundamental measures
Prior to 2050
To be implemented in collaboration with policy programs such as “Strategy for Sustainable Food Systems”, “Green Challenge for
Land, Infrastructure, Transport and Tourism”, “Green Growth Strategy Through Achieving Carbon Neutrality in 2050”
(1)
(2)
(3)
(4)
(5)
(6)
(7)
(8)
Self-consumption solar power
generation, such as rooftop PV;
Renewable energy that coexist with
and benefit the local community;
Through energy saving, renewable
electricity procurement, and promotion
of ZEB for public facilities and other
commercial buildings upon renewal
and renovation;
Improving the energy-saving
performance of homes and buildings;
Zero carbon drive (renewable electricity
x EV/PHEV/FCV);
Transition to a circular economy
through the advancement of
resource recycling;
Decarbonized urban development
through, e.g., compact plus networks;
Balancing the improvement of
productivity and sustainability of food,
agriculture, forestry, and fisheries.
Figure 6. Outline of the roadmap for decarbonization of all local governments by 2050
by 2050 is currently positioned as the new growth strategy of Japan with a virtuous cycle of economic growth and environmental conservation. One of the four driving forces set by the Japanese government is the realization of a green society, which will be achieved through the promotion of private investment and innovation, the procurement of renewable energy as a main source of electricity, and the utilization of carbon pricing (Cabinet Office, 2021). This basic policy is reflected in the drafts of the Plan for Global Warming Countermeasures,10 Strategic Energy Plan,11 Japan's Long-term Strategy under the Paris Agreement,12 as well as other sectoral plans. The Roadmap for Decarbonization of All Local Governments by 2050 (Council for National and Local Decarbonization, 2021) presents the following approaches: (1) establishing more than 100 “model decarbonized regions,” where CO2 emission from commercial and residential electricity consumption should be reduced to net zero is a must, and (2) implementing priority measures throughout Japan by 2030 (Figure 6). The specifics of the requirement for the model decarbonization regions should be determined by the local governments with consideration of the local conditions. However, the roadmap calls for strong support from the national
government and for collaboration among local governments, businesses, and financial institutions for implementation, because the local governments cannot tackle this project on their own.Along this line, the GHG emission reduction target by sector has also been revised (Table 1). Although these figures remain tentative, a large increase in the rate of reduction is observed in all sectors, such as the residential and commercial sectors, which required a concerted national effort.
2.3. Roles and responsibilities of local governments
Under the Act on Promotion of Global Warming Countermeasures, the local governments are required to formulate and implement comprehensive and systematic measures to control GHG emissions according to the natural and social conditions of each area pursuant to the Plan for Global Warming Countermeasures. Action plans can be grouped into two categories, namely, action plans for administrative operations and action plans for area-wide policies (Table 2). The first focuses on the management of public facilities and operations, where all local governments should formulate the necessary policies. The second is obligated only for municipalities with
Emission
status in FY
2013
(Mt CO2eq.)
Under revisionBefore revision
(Reference)
Reduction target in
FY 2030 (%)
Reduction target in
FY 2030 (%)
Reduction target in
FY 2030 (%)
Total GHG emission 1,408 760 46% 26%
Carbon dioxide (CO2) 1,317 750 43% 24%
Energy-related CO2 1,235 680 45% 25%
Industry 463 290 37% 7%
Commercial and other 238 120 50% 40%
Residential 208 70 66% 39%
Transport 224 140 38% 28%
Energy transformation 106 60 43% 28%
CO2 not related to energy 82.3 70.0 15% 7%
Methane (CH4) 30.0 26.7 11% 12%
Nitrous oxide (N2O) 21.4 17.8 17% 6%
F-gases 39.1 21.8 44% 25%
Hydrofluorocarbons (HFCs) 32.1 14.5 55% 32%
Perfluorocarbons (PFCs) 3.3 4.2 +27% +27%
Sulfur hexafluoride (SF6) 2.1 2.7 +29% +23%
Nitrogen trifluoride (NF3) 1.6 0.5 69% 64%
Table 1. Japan’s GHG emission status in FY2013 and reduction target in FY2030
Source: Council for National and Local Decarbonization. Translated into English by authors.
ASIAN RESEARCH
POLICY
111110
S&T Trends
2.4 Carbon neutrality related policies in Kyushu
Kyushu region, which consists of seven prefectures, is located in the south-most part of the main lands of Japan and accounts for approximately 10% of the national population, 10% of the national GDP, and also 10% of GHG emissions of Japan, with a high potential for renewable energy (Ota and Akagi, 2021). Since Kumamoto Prefecture became the first municipality in Kyushu region to declare itself a zero-carbon city in December 2019, a number of other municipalities have followed suit. By the end of July 2021, this number reached more than 50. Although the majority of the declared cities are in the process of developing or revising their action plans, a few of the early movers, such as Kumamoto Prefecture, Ooki Town, and Kumamoto Cooperation Center Urban Area13, have released new plans. In any case, many municipalities are focusing on measures in the energy sector, such as renewable energy, energy saving, and transport sectors (Figure 7). Awareness-raising, which includes the promotion of life style change and capacity building initiatives, are also important, because collaboration
with local stakeholders is essential for implementing the action plans for an area-wide policy.
The private and academic sectors have also issued a series of expression of carbon neutrality commitment. For instance, the Kyushu Economic Federation, which is composed of approximately 1,000 organizations, expressed its commitment through the formulation of the Future Vision of Kyushu 2030 (Kyushu Economic Federation, 2021). Furthermore, three financial institutions have joined an international initiative called the Task Force on Climate-Related Financial Disclosure (Regional Banks Association of Japan, 2021).14 A total of 19 universities have joined a domestic initiative called the University Coalition for Achieving Carbon Neutrality (Ministry of Education, Culture, Sports, 2021). Moreover, the Kyuden group, the major electric power company in the region, developed the Carbon Neutral Vision 2050 (Kyushu Electric Power Co., 2021). The number of local energy companies that promote local economy revitalization through local production and local consumption of energy with local governments has increased five-
Table 2. Outline of action plans by local governments
* The above status is from the results of a FY 2019 survey by the Ministry of the Environment. The Survey was conducted targeting a
total of 3,349 organisations, including 1,788 prefectures and municipalities (including special wards) and 1,561 local public organisations
(including unions).
18
16
14
12
10
8
6
4
2
0Plan formulation Renewable
energyEnergy saving Transport Waste Nature
conservationAwareness
-raisingOther
Figure 7. Sectors covered by the overview of initiatives in each zero-carbon city in Kyushu
13 Kumamoto Cooperation Center Urban Area consists of the following 18 local governments: Kumamoto City, Kikuchi City, Uto City, Uki City, Aso City, Koshi City, Misato Town, Gyokutou Town, Ozu Town, Kikuyo Town, Takamori Town, Nishihara Village, Minamiaso Village, Mifune Town, Kashima Town, Mashiki Town, Kosa Town, Yamato Town. Net zero GHG emissions by 2050 was announced jointly in January 2020.
14 Fukuoka Financial Group (Fukuoka Bank, Juhachi-Shinwa Bank), Nishi-Nippon Financial Holdings (Nishi-Nihon City Bank), and Kyushu Financial Group (Higo Bank, Kagoshima Bank) have expressed their support for the recommendations of the TFCD.
Actual status for FY2019 Prospective target by 2030 (Japan’s Sixth Basic Energy Plan)
Renewable 18%
Hydro 7.4%
36–38%
Solar 7.4%
Biomass 2.7%
Wind 0.76%
Geothermal 0.24%
Hydrogen and Ammonia 0% 1%
Nuclear 6% 20–22%
Liquefied Natural Gas 37% 20%
Coal 32% 19%
Petroleum And Others 7% 2%
Plan Outline Target Formulation status
Action plan of
administrative
operations
A limited plan to promote the
reduction of GHG emissions
associated with office work and
operation of local governments.
All local governments are obliged
to formulate a plan (3,349
organisations).
63%
Action plan
of area-wide
policies
A comprehensive plan to promote
GHG emissions control according to
the natural and social conditions of
the area.
Measures include the promotion
of renewable energy, energy
conservation, convenience of public
transporttion for user, greening,
sound material-cycle society such as
reduction of waste generation, etc.
Prefectural governments, ordinance-
designated cities, and core cities
(Chukaku-shi: more than 200,000
population) are obliged to formulate a
plan (152 organisations)
Cities that are smaller than the core
city (Chukaku-shi), such as wards,
towns and villages are encouraged to
formulate a plan (no obligation).
100% of 152
organisations
26.6% of a
whole (1,788
organisations)
Table 3. Energy mix in Japan (actual status for FY2019 and prospective target by 2030)
a population of more than 200,000 given that its comprehensive nature targeting area is within the jurisdiction of the local government. For municipalities that aim to become zero-carbon cities, action plans for area-wide policies are essential. However, reading national policies into local conditions and planning for the year 2030 with a long-term vision up to 2050 is difficult for them in a situation of high uncertainty, where national policies are being formulated one after another, whereas discontinuous innovation is foreseen (Ota and Akagi, 2021). Other challenges exist, such as the lack of local data or the lack of expertise. With the objective of addressing these issues, the national government has been promoting the enhancement of local capacity by setting up a menu of support for the
formulation of local action plans (MOE, 2021).Furthermore, with the recent amendment to the law, the local governments are required to include targets for implementing measures in the action plan and to support projects that utilize renewable energy. By certifying projects that meet the conditions set by the local governments and providing support through the application of special exemptions, the introduction of renewable energies that benefit the region is expected to progress in a smooth manner.
Source: Ota and Akagi, 2021
Source: MOE , 2021
Note: Adapted for the Agency for Natural Resources and Energy and the Institute for Sustainable Energy Policies (2021)
ASIAN RESEARCH
POLICY
113112
S&T Trends
FY20
04
FY20
05
FY20
06
FY20
07
FY20
08
FY20
09
FY20
10
FY20
11
FY20
12
FY20
13
FY20
14
FY20
15
FY20
16
FY20
17
FY20
18
FY20
19
450
400
350
300
250
200
150
100
50
0
3,000
2,500
2,000
1,500
1,000
500
0
Amount of introduction of wind power generation (10,000kW) Number of wind turbines
Toho
ku
Kyus
hu
Hokka
ido
Kink
i
Chugo
ku
Shiko
ku
Hokur
iku
Kant
o
Chubu
Okin
awa
4,000,000
3,500,000
3,000,000
2,500,000
2,000,000
1,500,000
1,000,000
500,000
0
Introduction (under operation) Certificed amount (before operation)
Figure 8. Accumulated amount of wind power generation and number of wind turbines in Japan (FY2004 to 2019 )16
Figure 9. Introduced and certified amount of wind power
(sum of onshore and offshore) through the Feed-In-Tariff System by regions in Japan in the FY2019
Figure 10. Introduction target by 2030 and 2040 for offshore wind power in Japan
As the Japanese archipelago is surrounded by several bodies of water, it has the large potential for offshore wind power. However, certain natural conditions, such as the lack of shallow ocean beds and frequent incidences of typhoons, remain challenging for offshore wind power as well as the active fishing industry. In addition to onshore wind power, the Japanese government has been promoting offshore wind power in recent years. The Act on Promoting the Utilization of Sea Areas for the Development of Marine Renewable Energy Power Generation
Facilities, which was enacted in April 2019, designates promising sea areas, which render large-scale offshore wind farms more feasible for long-term operation. The first version for the Vision for Offshore Wind Power Industry was developed in December 2020 by the Public–Private Council on Enhancement of Industrial Competitiveness for Offshore Wind Power Generation.17 It set a new target to increase offshore wind power to 10 GW by 2030 and 40 to 25 GW by 2040, with the consideration of regional targets (Figure 10).
3.2. Decarbonized local models: Goto City and Kitakyushu City in Kyushu
The national government plans to create approximately 100 model decarbonized regions by 2030, which are expected to initiate the domino effect to all regions in Japan and to revitalize local societies at the same time. This section showcases promising and potential models from two zero-carbon cities in Kyushu, namely, Goto City (a remote island off Nagasaki Prefecture) and Kitakyushu City in Fukuoka Prefecture. In these cities, flagship offshore wind pilot projects were conducted, which are currently stepping up as large commercial operations.
<Case of Goto City>A pilot project of a floating-type wind turbine (2,000 kW) was conducted in Goto City from 2010 to 2015 through funding from the MOE (Figure 11). The project was verified as durable against typhoons and to bring local benefits. The foundation parts, which are made of concrete and steel anchors, were manufactured in Goto City and other parts of Nagasaki Prefecture, which, thus, created new local industries and employment. Furthermore, the project was found to be a sound environment for nesting micro marine organisms, which, therefore, attracted various species of fish (photo on the right; Figure 11).
17 A public–private council established in 2019 by the Ministry of Economy, Trade and Industry (METI), the Ministry of Land, Infrastructure, Transport and Tourism (MLIT), and the industry to advance the offshore wind power generation and competitiveness of industries.
fold after the deregulation of the electricity market (Ministry of Economy, Trade and Industry 2021).15
In this manner, the enabling environment for carbon neutrality is being developed. To embody projects that will benefit the local community and to promote a fair transition, the creation of a mechanism that enables local stakeholders to collaborate organically and to develop human resources who can act as local coordinators is urgent. Specifically, learning about specific examples of renewable energy projects that benefit local communities can drive local action.
3.1. Wind power in Japan
Among the various renewable sources, recent years has seen the special attention given to the possibility for wind power after the widespread use of solar power.
Wind power was introduced in Japan in the 1990s. Currently, 2,414 wind turbines (the sum of onshore and offshore units) generate approximately 3,920,000 kW as of 2019 (Figure 8). However, it accounts for less than 1% of the national energy (Table 3).
Furthermore, a great number of wind power projects are certified and waiting to be installed. Figure 9 indicates the regional amounts of introduction (under operation) and certification (pending operation) of wind power generation (the sum of onshore and offshore units) through the Feed-in-Tariff system. Tohoku has the largest introduction of wind power (1,467,000 kW) followed by Hokkaido (541,000 kW) and Kyushu (513,000 kW). For the certified amount, Kyushu (1,350,000 kW) ranks second after Tohoku (2,375,000 kW).
Source: Agency for Natural Resources and Energy, 2021
Source: Public-Private Council on Enhancement of Industrial Competitiveness for Offshore Wind Power Generation, 2020.
15 Out of the 75 regional energy companies partially owned by the local governments in Japan, 16 are based in Kyushu. When the liberalization of the electricity market began in April 2016, the region contained only three.
16 Figures until FY2016 are based on Japanese fiscal year (April to March), and figures after 2017 are calendar year (January to December)

ASIAN RESEARCH
POLICY
115114
S&T Trends
Figure 11
(left). Floating-type offshore wind turbine named “Haen-kaze” in Goto City / Source: Goto City
(right). Fish attracted to the offshore wind turbine foundation under water in Goto City / Source: Marine Renewable Energy and Fisheries
Figure 12. Imagery of functions of Green Energy Port Hibiki in Kitakyushu City
4. Conclusion
The zero-carbon movement has been spreading globally to meet the preferable 1.5 °C target of the Paris Agreement, which is grounded on the findings of IPCC. In Japan, zero-carbon movement was initiated using a bottom-up approach implemented by several local governments in 2019 followed by the vigorous call by the MOE, and, lastly, the national pledge in 2020. In only nearly two years, over 400 local governments joined the zero-carbon city initiative established by the MOE. In 2021, epoch-making legal foundations and policies were built and formulated, respectively, to realize all levels of commitment. The revision of the Act on Promotion of Global Warming Countermeasures afforded a legal status to the announcement of net zero GHG emissions by 2050 and created an assured environment for local government and private sectors to invest in long-term measures toward zero CO2 emission. The Regional Decarbonization Roadmap indicated a clear timeline toward 2050, that is, intensive mobilization of policies by 2025; creation of 100 model decarbonized regions by 2030; and promoting the domino effect to all regions by 2050. The Sixth Basic Energy Plan increased the renewable energy target to 36%–38% by 2030.
At the present, the legal framework, strategies, and plans are harmonized toward the common goal shared by the national government and numerous local governments and private actors. Thus, the next step entails the creation of a roadmap and concreate plans and actions by each actor as well as the fostering of human resources who can effectively manage and implement such plans and with certain knowledge of rapidly advancing technologies and information. Under the big slogan of a zero-carbon society, integrating other important issues, such as regional revitalization, aging and depopulation, circular economy, resilient society, adaptation, and digitalization, is crucial. Therefore, determining common values and avoiding tradeoffs among various issues and stakeholders is essential for building a sustainable zero-carbon society. Inevitably, industrial transformation will occur nationwide, which may exert negative impacts to certain industries and people. Thus, ensuring a just or fair transition is
important, especially from the local perspective.
Local regions hold a large potential for realizing the zero-carbon society, especially when multiple groups of people are engaged in determining the synergetic effects to other important issues in a region. To create a domino effect from 100 model decarbonized regions, learning from one another at the local and national levels is necessary for the carefully design of a foundation, where a model domino piece will knock down an adjacent domino piece. Research institutions, such as the Institute for Global Environmental Strategies (IGES), can provide assistance in bridging the national/international communities and local actors. IGES is eager to contribute by providing perspectives on how local actors can create synergetic effects in their region and continue the domino effect.
References
Agency for Natural Resources and Energy & Ministryof Economy (2021) Japan’s energy white paper 2021. https://www.meti.go.jp/english/press/2021/0604_006.html
Agency for Natural Resources and Energy (2021, July 21) Draft of the 6th Basic Energy Plan. https://www.meti.go.jp/
Cabinet Office (2021, August 24) Basic policy on economic and fiscal management and reform. https://www5.cao.go.jp/keizai-shimon/kaigi/cabinet/2021/decision0618.html
City of Kitakyushu (2021) Green energy port HIBIKI: A wind energy industry hub in Japan. http://www.kitaqport.or.jp/jap/pamphlet/download/panhu_green2021_eng.pdf
Council for National and Local Decarbonization(2021, August 24) Roadmap for decarbonization of all local governments by 2050. https://www.cas.go.jp/jp/seisaku/datsutanso/
Goto City (2014) Goto City Renewable Energy Basic Plan. Institute for Sustainable Energy Policies (2021, April 30) Ratio of natural energy 2020 (in Japanese). https://www.isep.or.jp/archives/library/13188
Renewable-related councils, study groups, and local energy companies have been actively established by local stakeholders, such as city administrations, the industry, academics, and civic organizations. Together with other renewables, such as solar, renewable energy reached 51% of the entire electricity consumption in Goto City (FY2019), which is outstandingly high compared with the national average of approximately 20%. Eight other offshore wind turbines are under construction via private consortium, with a total generation capacity of 16,800 kW (2100 kW × 8) and are expected to boost the renewable ratio in the city to 80%. Furthermore, Goto City sets the target of renewable supply at 132% by 2030 in its Basic Energy Plan (Goto City, 2014).
<Case of Kitakyushu City>Kitakyushu City, which is located in northeastern Kyushu and features a 200-km coastal line, implemented a pilot project for offshore wind turbines. Currently, it plans to build a large-scale offshore wind farm with a maximum of 44 offshore units. This prospect plan aims not only to install wind power but also to create an integrated base for a wind energy industry named Green Energy Port Hibiki (Figure 12). This port is expected to be the base for the following functions: (1) wind turbine shipping, (2) import and export, (3) operation and maintenance, and (4) wind turbine-related industries. The city aims to create new industries and employment along with related research and education.
Source: Green Energy Port HIBIKI: A Wind Energy Industry Hub in Japan, Kitakyushu City, 2021
ASIAN RESEARCH
POLICY
117116
S&T Trends
Intergovernmental Panel on Climate Change (2018) The special report on global warming of 1.5 Celsius.
Intergovernmental Panel on Climate Change (2021) The sixth assessment report, Climate Change 2021: The Physical Science Basis.
Japan Wind Power Association (JWPA) (2021, August 30) http://jwpa.cloud/
Kyushu Economic Federation (2021, August 24)Kyushu future vision 2030. https://www.kyuke i ren .o r. jp / commi t t e e / index .php?id=3353&committee_id=12
Kyushu Electric Power Co., I. (2021, August 24)Kyuden Group carbon neutral vision 2050- Kyuden Group will endeavor to achieve carbon neutrality by 2050. https://www.kyuden.co.jp/english_company_news_2021_h210428c-1.html
Marine Renewable Energy and Fisheries (2021,August 30) http://www.sdi-marine-energy.com/
Ministry of Economy, Trade and Industry (2021, June 11) Selection of offshore wind power generation operator in the coast of Goto City, Nagasaki Prefecture (in Japanese) https://www.meti.go.jp/press/2021/06/20210611004/20210611004.html
Ministry of Economy, Trade and Industry (2021)The 29th General Resources Energy Investigation Committee; Electricity and Gas Business Section; Electricity and Gas Basic Policy Subcommittee (in Japanese). https://www.meti.go.jp/shingikai/enecho/denryoku_gas/denryoku_gas/029.html
Ministry of Education, Culture, Sports, Science and Technology of Japan (2021, August 24). University coalition for achieving carbon neutrality (in Japanese). https://www.mext.go.jp/b_menu/houdou/mext_00678.html
Ministry of the Environment of Japan (2021) Survey on the enforcement of the law concerning the promotion of global warming countermeasures in local governments in 2020. https://www.env.go.jp/earth/dantai/index.html
Ministry of the Environment of Japan (2021, April12) Greenhouse gas emissions of FY2019. https://www.nies.go.jp/whatsnew/20210413/20210413-e.html
Ministry of the Environment of Japan (2021, August 24) Subcommittee Mid-long Term Climate Change Countermeasures Review Subcommittee/Industrial Structure Council; Industrial Technology and Environment Subcommittee; Global Environment
Ministry of the Environment of Japan (2021, August 30) Emission data of local governments (in Japanese). https://www.env.go.jp/policy/local_keikaku/tools/karte.html
Ministry of the Environment of Japan (2021, August 30) 2050 zero carbon cities in Japan. http://www.env.go.jp/en/earth/cc/2050_zero_carbon_cities_in_japan.html
Ministry of Internal Affairs and Communications of Japan (2021, August 30) Category of local municipalities. https://www.soumu.go.jp/main_sosiki/jichi_gyousei/bunken/chihou-koukyoudantai_kubun.html
Ota, J. & Akagi, J. (2021) Commitment to net zero carbon emissions by 2050 by local governments in the Kyushu region of Japan: background, current Situation, and challenges. IGES Issue Brief. https://www.iges.or.jp/en/pub/kyushu-zerocarbon-en/en
Regional Banks Association of Japan (2021, August 24) Environmental and climate change initiatives at regional Banks. https://www.chiginkyo.or.jp/app/story.php?story_id=1787
Subcommittee Global Warming CountermeasuresReview Working Group Joint Meeting. http://www.env.go.jp/council/06earth/y0620-8b.html
United Nations Framework Convention on Climate Change (2021, August 30) Who’s in race to zero? https://unfccc.int/climate-action/race-to-zero-campaign#eq-3
Decarbonizing Road Transport Sector through Electric Mobility in PakistanKhalil Raza1,*
1 ECO Science Foundation, Islamabad 44000, Pakistan* [email protected]
Electric vehicles (EVs) are anticipated to play an important role in meeting global goals on climate change. Electrification of road transport is one of the crucial pathways that can considerably mitigate the emissions in this sector that could limit warming to well-below 1.5◦C, which would be inline with the Paris Agreement’s targets (Logan et al., 2020).
Road transport sector in Pakistan relies heavily on fuel imports; hence it takes a heavy toll on Pakistan’s fuel import bill (Anwar, 2016). Pollution in major cities has reached alarming levels (Usman et al., 2019). Apparently, Pakistan currently faces a power surplus crisis. Increased EVs penetration could serve as a productive power demand to achieve adequate level of utilization of existing power capacity and bring down unit cost of electricity. Electrification of transportation is one of the effective means to reduce energy intensity in the road transport sector (Lee et al., 2021). Besides, EVs offer lower running and operational costs, as well as lower tailpipe emissions. All these factors put together make a strong case for EV adoption in Pakistan.
While recognizing the multiple economic, environmental and social benefits of electric mobility, Government of Pakistan (GoP) introduced its first ever National Electric Vehicle Policy (NEVP) in 2021, which outlines a number of fiscal and regulatory incentives to promote Electric Mobility (eMobility) in the country. The two major drivers behind the rollout of this NEVP are; to reduce Pakistan's heavy reliance on fuel imports to reduce energy intensity and Greenhouse Gas (GHG) emissions in the road transport sector.
Electric mobility is quite a new space in Pakistan and it is at the very initial stages of its development. Hence, the Economic Cooperation Organization Science Foundation (ECOSF) immediately recognized the need for capacity building of various state regulators, market players and grid planners towards accelerated adoption of EVs. This is a critical step to enable evidence and knowledge based policy decision making to help promote the accelerated transition towards eMobility in the country.
In this backdrop, the ECOSF in collaboration with United Nations Development Program (UNDP) provided strategic support to the Government of Pakistan through Ministry of Climate Change (MoCC) and National Energy Efficiency and Conservation Authority (NEECA), Ministry of Energy (MoE) to explore the potential development pathways of the eMobility market. This chapter provides some brief highlights of the work undertaken by the ECOSF on decarbonizing the road transport sector in Pakistan as part of its support program to the Government of Pakistan in meeting its climate goals. Through this effort, we assessed the climate benefits of accelerated adoption of eMobility in Pakistan in terms of lower demand for transport fuels, reduced GHG emissions and the need for grid expansion and strengthening of distribution network in Pakistan (Cornell, 2019).
Abstract
ASIAN RESEARCH
POLICY
119118
S&T Trends
One of the key outcomes of this work was computing the GHG emissions of road transport sector to assess climate mitigation potential of electric vehicles in Pakistan. The findings of this report served as the primary input to Pakistan’s revised Nationally Determined Contributions (NDCs) to the United Nations Framework Convention on Climate Change (UNFCCC) (Gyanchandani, 2016).
1. Electric Mobility to Enhance
Nationally Determined Contributions
(NDC) Ambitions and Climate Actions
of Pakistan
Nationally Determined Contributions (NDC) are non-binding national plans highlighting climate actions, including climate related targets for greenhouse gas emission reductions, policies and measures governments aim to implement in response to climate change and as a contribution to achieve the global targets set out in the Paris Agreement. Under the NDC Partnership program, which supports the revision of Pakistan’s Nationally Determined Contribution (NDC) at the MoCC, ECOSF and UNDP jointly contributed to developing a set of crucial guidelines for public and private stakeholders towards implementation of NEVP.
This chapter highlights the execution strategy of Pakistan’s NDC targets and vision for the transport sector. It does this by reviewing Pakistan’s NDC and the EV policy; exploring the transport sector and most effective policy options for increased adoption of EVs;
identifying a wide range of barriers and issues that are currently restricting adoption of EVs; and outlining key proposed actions and initiatives for overcoming these barriers.
This work primarily undertook a comparative assessment of Pakistan’s national EV policy and emerging EV markets in the US, EU, China, and India in the context of EV deployment targets, carbon emission regulations, fuel economy standards, phase-out plans for Internal Combustion Engine (ICE) vehicles and purchase incentives for EVs (ZImm, 2021).
In addition, this work provides insight into global EV market, highlights key drivers for global EV adoption, reviews national EV policy of Pakistan in comparison to other leading economies and underlines the global EV battery value chain.
Subsequently, the work also examines the key challenges and factors that will drive the EV adoption in Pakistan and concludes with some policy recommendations for accelerated adoption of electric mobility in Pakistan.
2. Measuring the potential climate,
technical and economic impact of
electric mobility in Pakistan
Projecting GHG Emission Mitigation Potential of EVs.
The GHG emission mitigation potential of EVs was measured in the form of reduced consumption for fuels with increasing number of EVs. Results show that EVs offer tremendous climate benefits in terms
of net emission reduction even after factoring in the grid emissions.
We measured the net GHG emission reduction potential based on total emissions avoided by switching to EVs minus the GHG emissions associated with electricity consumption for charging EVs. Figure 1 reflects that EVs offer tremendous environmental benefits in terms of net emission reduction after factoring in the grid emissions. It demonstrates that EV could achieve climate benefits within the range of over 100 MTCO2-eq in high EV penetration
High EV Penetration Medium EV Penetration Low EV Penetration
140
120
100
80
60
40
20
0
ICEV Emission Reduction Electricity Emission Net Emmission Reduction
2019 2019 20192020 2021
Job’s Reported Startups Recognised in this year
Figure 1. Net GHG emission mitigation potential of electric mobility in Pakistan
scenario to 30 MTCO2-eq GHG emission reduction in worst case scenario.
This analysis highlights that climate benefits of electric mobility in Pakistan would continue to increase with further decarbonization of the grid if we meet the target of 30% of renewables in total electricity generation as planned under the Alternative and Renewable Energy Policy 2019 (IEEFA, 2020).
Assessing impact on fuel demand with increased EV penetration: EVs were found to reduce fuel consumption, based on high, medium and low EV modeled scenarios. With the best-case scenario, high EV penetration in the market would offer a fuel reduction of over 18 Million Tonnes of Oil Equivalent (MTOE) during the period 2021-2030. Similarly, in a medium EV penetration case, potential reduction in fuel consumption is expected to be about 10 MTOE. While in the low growth scenario, fuel saving potential is estimated to be about 5 MTOE. This translates into fuel savings of over US$ 12 billion, US$ 7 billion and US$ 3.1 billion for high, medium and low EV penetration scenarios, respectively.
EVs Impact on Grid & Distribution Network: The result underlines that even in the high EV penetration case with cumulative addition of over 8.2 million EVs by 2030, our model demonstrated that it is unlikely to cause large increases in power demand through 2030; instead, it potentially adds about 2 percent to
the total and requires an extra about 1.7-2 gigawatts (GW) of generation capacity by 2030.
While the high market EV deployment is not likely to be a major challenge for electricity grid network in Pakistan; EVs are likely to reshape the electricity demand curve and might coincide with existing peak loads in the evening, if majority of EV owners decide to charge at home after work (Engel et al., 2019). To mitigate this impact, Time of Use (ToU) electricity tariff could be employed to influence charging behaviors and incentivize charging at off-peak periods to manage peak demand. This would require the distribution companies (DISCOs) to plan for system upgradation. This may require installing transformers, distribution lines and switch gears to mitigate the network impacts.
Projecting EV Penetration based on Total Cost of Ownership (TCO): We assessed the economic viability of EVs across different vehicle segments and various use cases using the TCO analysis. TCO is the sum of all costs involved in the purchase, operation and maintenance of a given asset during its lifetime (Hou et al., 2014).
Based on TCO analysis, we found that 2W - motorbikes and 3W - autorickshaws are already at TCO parity with their ICE equivalent models. Hence, these two segments are likely to shift to EVs much more rapidly. Whilst TCO equation is not yet
ASIAN RESEARCH
POLICY
121120
S&T Trends
3. Key challenges and barriers to mass
of adoption of EVs in Pakistan
Worldwide, major barriers to mass adoption of EVs are typically higher purchase cost, limited driving range of EVs, and lack of charging infrastructure. Although policy and fiscal incentives are in place in Pakistan, a range of barriers could restrict greater adoption of electric mobility – These barriers can be identified across four major areas, including; policy and governance, infrastructure, financing and resources and regulatory framework. Our analysis reveals that there are four critical factors that will drive the EV adoption in the country over the next decade – policy support, global battery costs, charging infrastructure and localization of supply chain.
I.Higher purchase costs act as major impediment to EV adoption
Higher purchase costs act as major impediment to EV adoption. While the policy incentives can create momentum for EV adoption, the eventual large-scale adoption will only happen when EVs make economic sense to the end-user. For Pakistan’s market, consumers are especially sensitive to the upfront cost. Thus, policy instruments can play predominant role in scaling up the uptake of electric vehicles. Currently, EVs are significantly more expensive than ICE vehicles in terms of the upfront cost (Kumar and Kanuri, 2020). Hence, the regulatory duty and tax concessions alone would not be able to drive the market for large scale adoption – that will happen only when upfront cost is significantly reduced, and economic parity is achieved in favor of EVs.
II. Additional policy support is needed to generate the required traction
Governments around the world have introduced ambitious policies with wide array of subsidies, purchase incentives for EVs and investments in public charging infrastructure to support the transition towards electric mobility. The policy support can be in form of long-term regulatory signals with targets for EV with specific timeframes, CO2 emissions regulations, fuel economy standards, the phase-out of internal combustion engine vehicles and financial support as demonstrated in Table 1 below. These incentives provide a strong signal both to manufacturers and consumers, which is essential to build the confidence at the early stage of market development (IEA, 2021).
Currently, the lack of purchase subsidy and other government incentives restrict the adoption of electric vehicles across various vehicular segments. Leading markets in this space demonstrate that policy incentives are extremely critical to help drive momentum for mass EV adoption.
III. Localization of EV Supply Chain
Localization of the supply chain is critical from the perspective of reducing the cost differential between EVs and ICE vehicles. A well-developed indigenous supply chain could help reduce the cost of electric vehicles. In short term, EV manufacturing in Pakistan would largely be contingent upon imported components. Currently, the scale of EV adoption is too small, which does not justify the localization of critical components. However, going forward, it would be important to develop a road map for scaling
Country
Zero Emission
Vehicle (ZEV)
Targets
Average vehicle
fleet emission
target
Fuel Economy
Standards
(Litres/100KM)
Phase-out
of Internal
Combustion
Engine Vehicle
EV Purchase
Incentives
China 30% of New Sales
of EV by 2030
117 gCO2/km for
2020
4.0 L/100km by
2025
- US$ 3,200 with
maximum price of
EV at US$ 42,400
USA 3.3 million EVs by
2025
93 gCO2/KM by
2025
4.25 L/100KM
by 2025 for
passenger
cars, and 5.985
L/100km for light
duty trucks by
2025
2050 Tax credit up to
US$ 7500
India 30% of New Sales
of EV by 2030
113 gCO2/km for
2021
4.77 L/100km
for sedan cars by
2022
Earlier adopted
this target for
2030 but later
withdrew
US$ 130/kWh -
US$ 400 for 2/3
wheels and US$
2000 for 4 wheels
Europe 30 million zero-
emission vehicles
on its roads by
2030
95 gCO2/km for
2020
4.1 L/100 km by
2021
Netherland,
Iceland, Ireland
and Denmark by
2030, France and
Spain by 2040,
Germany by 2050
US$ 2000-7000
depending on the
type of the vehicle
and capacity of
the battery
Pakistan 30% of New Sales
of EV by 2030
- - - -
Table 1. Incentives/Regulatory Signals and policy driven support for -Electric Vehicles in selected countries
(Compiled by the Author)
attractive for 4W passenger electric vehicles as of now due to higher upfront costs and lower daily mileage. However, it can economically be viable for 4W electric commercial fleets with high daily utilization rates. Whereas the electric buses have a very high upfront cost differential due to the large size of the battery. TCO parity can be achieved at the daily usage of over 250 km. However, we believe that the adoption in buses would be based on support from government driven demand in the form of additional purchase
subsidies and not on TCO parity.
The work also explored the capabilities of local vehicle manufacturers, how the market is currently positioned in terms of vehicle sales, who are the current leading market players and, most importantly, how the market is expected to change in future, based on TCO analysis.
up the EV market with vibrant domestic supply chain. Lithium-ion battery cells, which are the highest cost component in EVs, are also the most difficult to indigenize due to reliance on critical earth metals (Focus on Catalysts, 2020). Thus, Pakistan is likely to play a limited role in the electric vehicle Li-ion battery value chain. In medium term, the Pakistani EV battery industry is expected to remain limited to battery pack manufacturing wherein the cells may have to be imported.
Likewise, electric motor and controllers are also challenging to localize due to their reliance on rare earth magnets, which could become a bottleneck to domestic motor industry. However, for small motors for light electric vehicles should be easier to manufacture locally.
IV. Lack of fuel economy and emission standards
for automotive sector
Curbing vehicle population growth, reducing travel demand and improving vehicle fuel efficiency are three key elements to reducing overall energy intensity and GHG emissions in the road transport. Fuel economy standardization programs and emission targets have proven to be among the most cost-effective tools in suppressing fuel demand and GHG emissions from motor vehicles (Sen et al., 2017).
Despite the fact that road transport sector heavily relies on fuel imports, Pakistan has not yet established the national fuel economy standards for local automotive manufactures. The idea behind a fuel economy standard is to push automakers to produce vehicles that travel further on the same amount of fuel, thereby reducing the need for petrol or diesel and decreasing pollution. In the absence of these benchmarks,
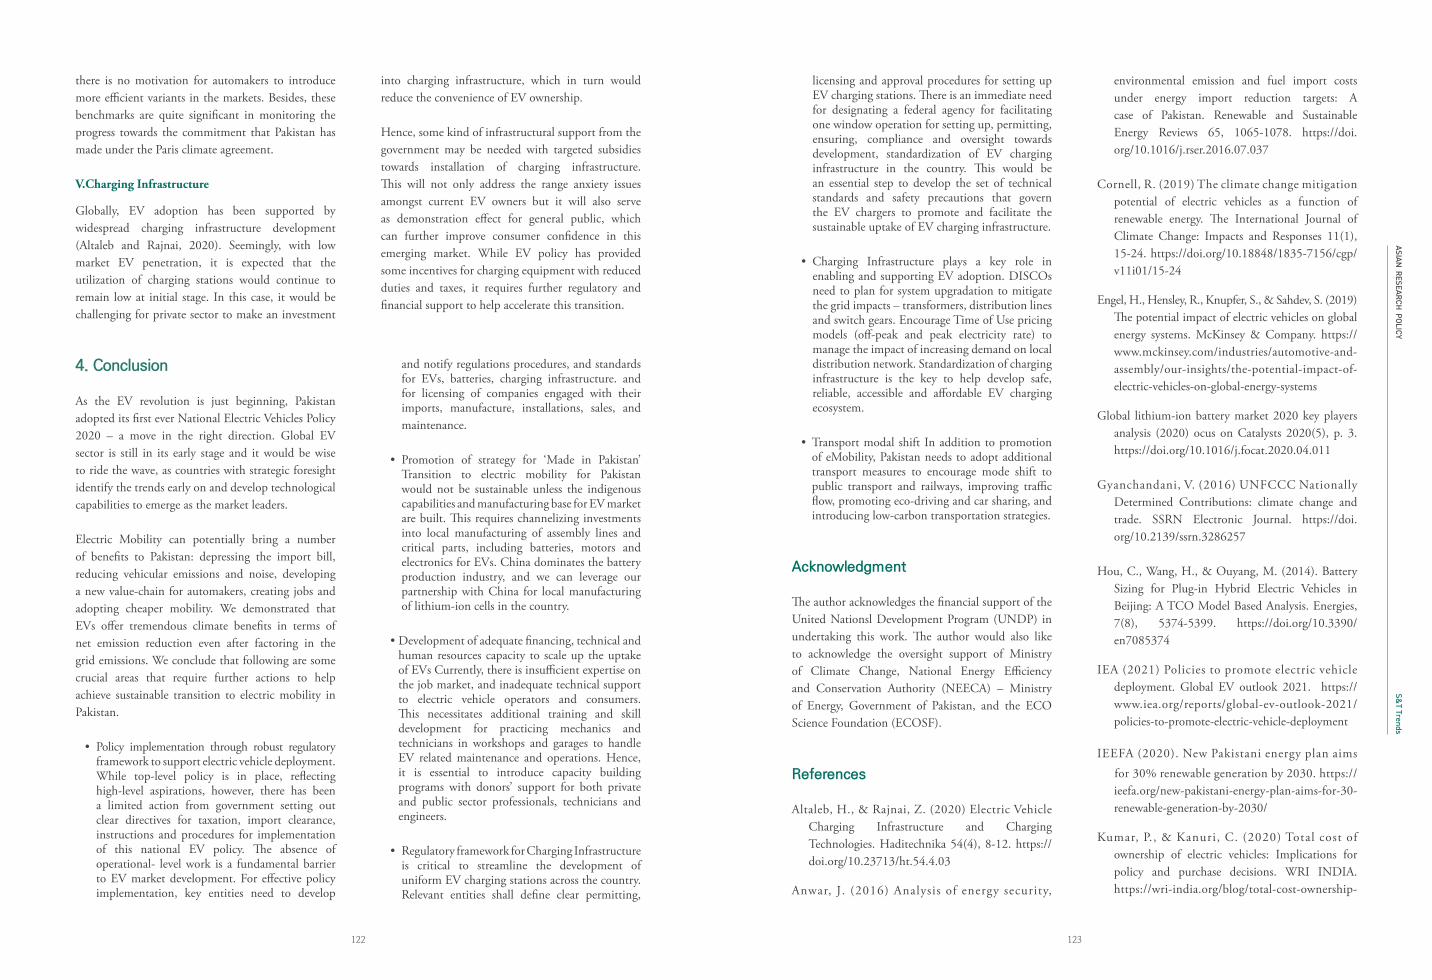
ASIAN RESEARCH
POLICY
123122
S&T Trends
4. Conclusion
As the EV revolution is just beginning, Pakistan adopted its first ever National Electric Vehicles Policy 2020 – a move in the right direction. Global EV sector is still in its early stage and it would be wise to ride the wave, as countries with strategic foresight identify the trends early on and develop technological capabilities to emerge as the market leaders.
Electric Mobility can potentially bring a number of benefits to Pakistan: depressing the import bill, reducing vehicular emissions and noise, developing a new value-chain for automakers, creating jobs and adopting cheaper mobility. We demonstrated that EVs offer tremendous climate benefits in terms of net emission reduction even after factoring in the grid emissions. We conclude that following are some crucial areas that require further actions to help achieve sustainable transition to electric mobility in Pakistan.
• Policy implementation through robust regulatory framework to support electric vehicle deployment. While top-level policy is in place, reflecting high-level aspirations, however, there has been a limited action from government setting out clear directives for taxation, import clearance, instructions and procedures for implementation of this national EV policy. The absence of operational- level work is a fundamental barrier to EV market development. For effective policy implementation, key entities need to develop
and notify regulations procedures, and standards for EVs, batteries, charging infrastructure. and for licensing of companies engaged with their imports, manufacture, installations, sales, and maintenance.
• Promotion of strategy for ‘Made in Pakistan’ Transition to electric mobility for Pakistan would not be sustainable unless the indigenous capabilities and manufacturing base for EV market are built. This requires channelizing investments into local manufacturing of assembly lines and critical parts, including batteries, motors and electronics for EVs. China dominates the battery production industry, and we can leverage our partnership with China for local manufacturing of lithium-ion cells in the country.
• Development of adequate financing, technical and human resources capacity to scale up the uptake of EVs Currently, there is insufficient expertise on the job market, and inadequate technical support to electric vehicle operators and consumers. This necessitates additional training and skill development for practicing mechanics and technicians in workshops and garages to handle EV related maintenance and operations. Hence, it is essential to introduce capacity building programs with donors’ support for both private and public sector professionals, technicians and engineers.
• Regulatory framework for Charging Infrastructure is critical to streamline the development of uniform EV charging stations across the country. Relevant entities shall define clear permitting,
licensing and approval procedures for setting up EV charging stations. There is an immediate need for designating a federal agency for facilitating one window operation for setting up, permitting, ensuring, compliance and oversight towards development, standardization of EV charging infrastructure in the country. This would be an essential step to develop the set of technical standards and safety precautions that govern the EV chargers to promote and facilitate the sustainable uptake of EV charging infrastructure.
• Charging Infrastructure plays a key role in enabling and supporting EV adoption. DISCOs need to plan for system upgradation to mitigate the grid impacts – transformers, distribution lines and switch gears. Encourage Time of Use pricing models (off-peak and peak electricity rate) to manage the impact of increasing demand on local distribution network. Standardization of charging infrastructure is the key to help develop safe, reliable, accessible and affordable EV charging ecosystem.
• Transport modal shift In addition to promotion of eMobility, Pakistan needs to adopt additional transport measures to encourage mode shift to public transport and railways, improving traffic flow, promoting eco-driving and car sharing, and introducing low-carbon transportation strategies.
Acknowledgment
The author acknowledges the financial support of the United Nationsl Development Program (UNDP) in undertaking this work. The author would also like to acknowledge the oversight support of Ministry of Climate Change, National Energy Efficiency and Conservation Authority (NEECA) – Ministry of Energy, Government of Pakistan, and the ECO Science Foundation (ECOSF).
References
Altaleb, H., & Rajnai, Z. (2020) Electric Vehicle Charging Infrastructure and Charging Technologies. Haditechnika 54(4), 8-12. https://doi.org/10.23713/ht.54.4.03
Anwar, J. (2016) Analysis of energy security,
environmental emission and fuel import costs under energy import reduction targets: A case of Pakistan. Renewable and Sustainable Energy Reviews 65, 1065-1078. https://doi.org/10.1016/j.rser.2016.07.037
Cornell, R. (2019) The climate change mitigation potential of electric vehicles as a function of renewable energy. The International Journal of Climate Change: Impacts and Responses 11(1), 15-24. https://doi.org/10.18848/1835-7156/cgp/v11i01/15-24
Engel, H., Hensley, R., Knupfer, S., & Sahdev, S. (2019)The potential impact of electric vehicles on global energy systems. McKinsey & Company. https://www.mckinsey.com/industries/automotive-and-assembly/our-insights/the-potential-impact-of-electric-vehicles-on-global-energy-systems
Global lithium-ion battery market 2020 key players analysis (2020) ocus on Catalysts 2020(5), p. 3. https://doi.org/10.1016/j.focat.2020.04.011
Gyanchandani, V. (2016) UNFCCC NationallyDetermined Contributions: climate change and trade. SSRN Electronic Journal. https://doi.org/10.2139/ssrn.3286257
Hou, C., Wang, H., & Ouyang, M. (2014). Battery Sizing for Plug-in Hybrid Electric Vehicles in Beijing: A TCO Model Based Analysis. Energies, 7(8), 5374-5399. https://doi.org/10.3390/en7085374
IEA (2021) Policies to promote electric vehicledeployment. Global EV outlook 2021. https://www.iea.org/reports/global-ev-outlook-2021/policies-to-promote-electric-vehicle-deployment
IEEFA (2020). New Pakistani energy plan aims for 30% renewable generation by 2030. https://ieefa.org/new-pakistani-energy-plan-aims-for-30-renewable-generation-by-2030/
Kumar, P., & Kanuri, C. (2020) Total cost of ownership of electric vehicles: Implications for policy and purchase decisions. WRI INDIA. https://wri-india.org/blog/total-cost-ownership-
there is no motivation for automakers to introduce more efficient variants in the markets. Besides, these benchmarks are quite significant in monitoring the progress towards the commitment that Pakistan has made under the Paris climate agreement.
V.Charging Infrastructure
Globally, EV adoption has been supported by widespread charging infrastructure development (Altaleb and Rajnai, 2020). Seemingly, with low market EV penetration, it is expected that the utilization of charging stations would continue to remain low at initial stage. In this case, it would be challenging for private sector to make an investment
into charging infrastructure, which in turn would reduce the convenience of EV ownership.
Hence, some kind of infrastructural support from the government may be needed with targeted subsidies towards installation of charging infrastructure. This will not only address the range anxiety issues amongst current EV owners but it will also serve as demonstration effect for general public, which can further improve consumer confidence in this emerging market. While EV policy has provided some incentives for charging equipment with reduced duties and taxes, it requires further regulatory and financial support to help accelerate this transition.
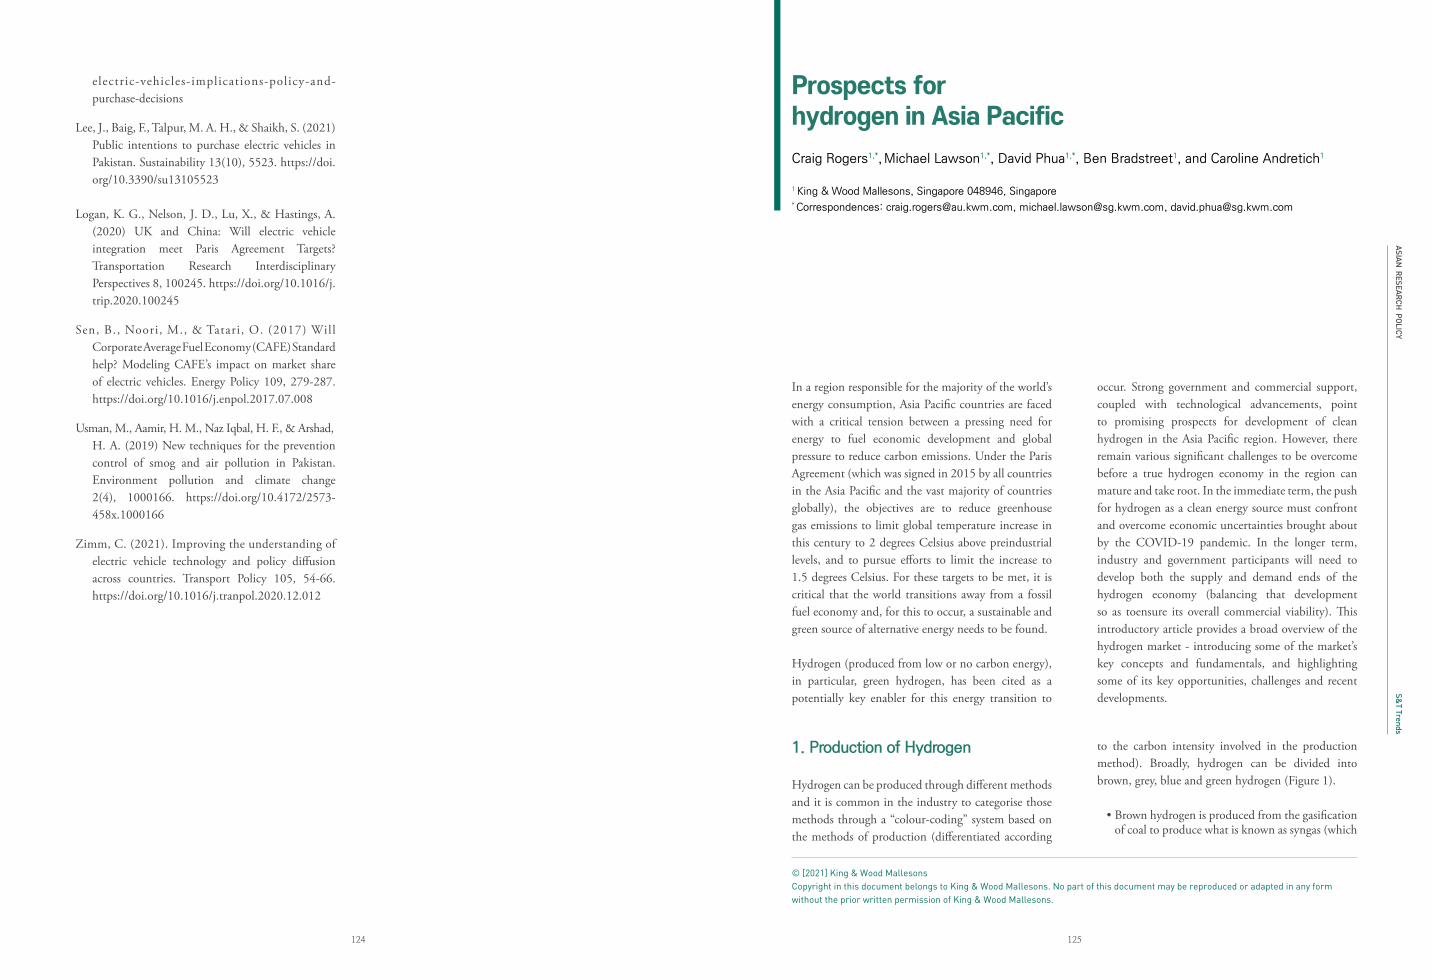
ASIAN RESEARCH
POLICY
125124
S&T Trends
electric-vehicles-implications-policy-and-purchase-decisions
Lee, J., Baig, F., Talpur, M. A. H., & Shaikh, S. (2021)Public intentions to purchase electric vehicles in Pakistan. Sustainability 13(10), 5523. https://doi.org/10.3390/su13105523
Logan, K. G., Nelson, J. D., Lu, X., & Hastings, A. (2020) UK and China: Will electric vehicle integration meet Paris Agreement Targets? Transportation Research Interdisciplinary Perspectives 8, 100245. https://doi.org/10.1016/j.trip.2020.100245
Sen, B., Noori, M., & Tatari, O. (2017) WillCorporate Average Fuel Economy (CAFE) Standard help? Modeling CAFE’s impact on market share of electric vehicles. Energy Policy 109, 279-287. https://doi.org/10.1016/j.enpol.2017.07.008
Usman, M., Aamir, H. M., Naz Iqbal, H. F., & Arshad,H. A. (2019) New techniques for the prevention control of smog and air pollution in Pakistan. Environment pollution and climate change 2(4), 1000166. https://doi.org/10.4172/2573-458x.1000166
Zimm, C. (2021). Improving the understanding of electric vehicle technology and policy diffusion across countries. Transport Policy 105, 54-66. https://doi.org/10.1016/j.tranpol.2020.12.012
1. Production of Hydrogen
Hydrogen can be produced through different methods and it is common in the industry to categorise those methods through a “colour-coding” system based on the methods of production (differentiated according
to the carbon intensity involved in the production method). Broadly, hydrogen can be divided into brown, grey, blue and green hydrogen (Figure 1).
• Brown hydrogen is produced from the gasification of coal to produce what is known as syngas (which
Prospects for hydrogen in Asia PacificCraig Rogers1,*, Michael Lawson1,*, David Phua1,*, Ben Bradstreet1, and Caroline Andretich1
1 King & Wood Mallesons, Singapore 048946, Singapore* Correspondences: [email protected], [email protected], [email protected]
In a region responsible for the majority of the world’s energy consumption, Asia Pacific countries are faced with a critical tension between a pressing need for energy to fuel economic development and global pressure to reduce carbon emissions. Under the Paris Agreement (which was signed in 2015 by all countries in the Asia Pacific and the vast majority of countries globally), the objectives are to reduce greenhouse gas emissions to limit global temperature increase in this century to 2 degrees Celsius above preindustrial levels, and to pursue efforts to limit the increase to 1.5 degrees Celsius. For these targets to be met, it is critical that the world transitions away from a fossil fuel economy and, for this to occur, a sustainable and green source of alternative energy needs to be found.
Hydrogen (produced from low or no carbon energy), in particular, green hydrogen, has been cited as a potentially key enabler for this energy transition to
occur. Strong government and commercial support, coupled with technological advancements, point to promising prospects for development of clean hydrogen in the Asia Pacific region. However, there remain various significant challenges to be overcome before a true hydrogen economy in the region can mature and take root. In the immediate term, the push for hydrogen as a clean energy source must confront and overcome economic uncertainties brought about by the COVID-19 pandemic. In the longer term, industry and government participants will need to develop both the supply and demand ends of the hydrogen economy (balancing that development so as toensure its overall commercial viability). This introductory article provides a broad overview of the hydrogen market - introducing some of the market’s key concepts and fundamentals, and highlighting some of its key opportunities, challenges and recent developments.
© [2021] King & Wood MallesonsCopyright in this document belongs to King & Wood Mallesons. No part of this document may be reproduced or adapted in any form without the prior written permission of King & Wood Mallesons.
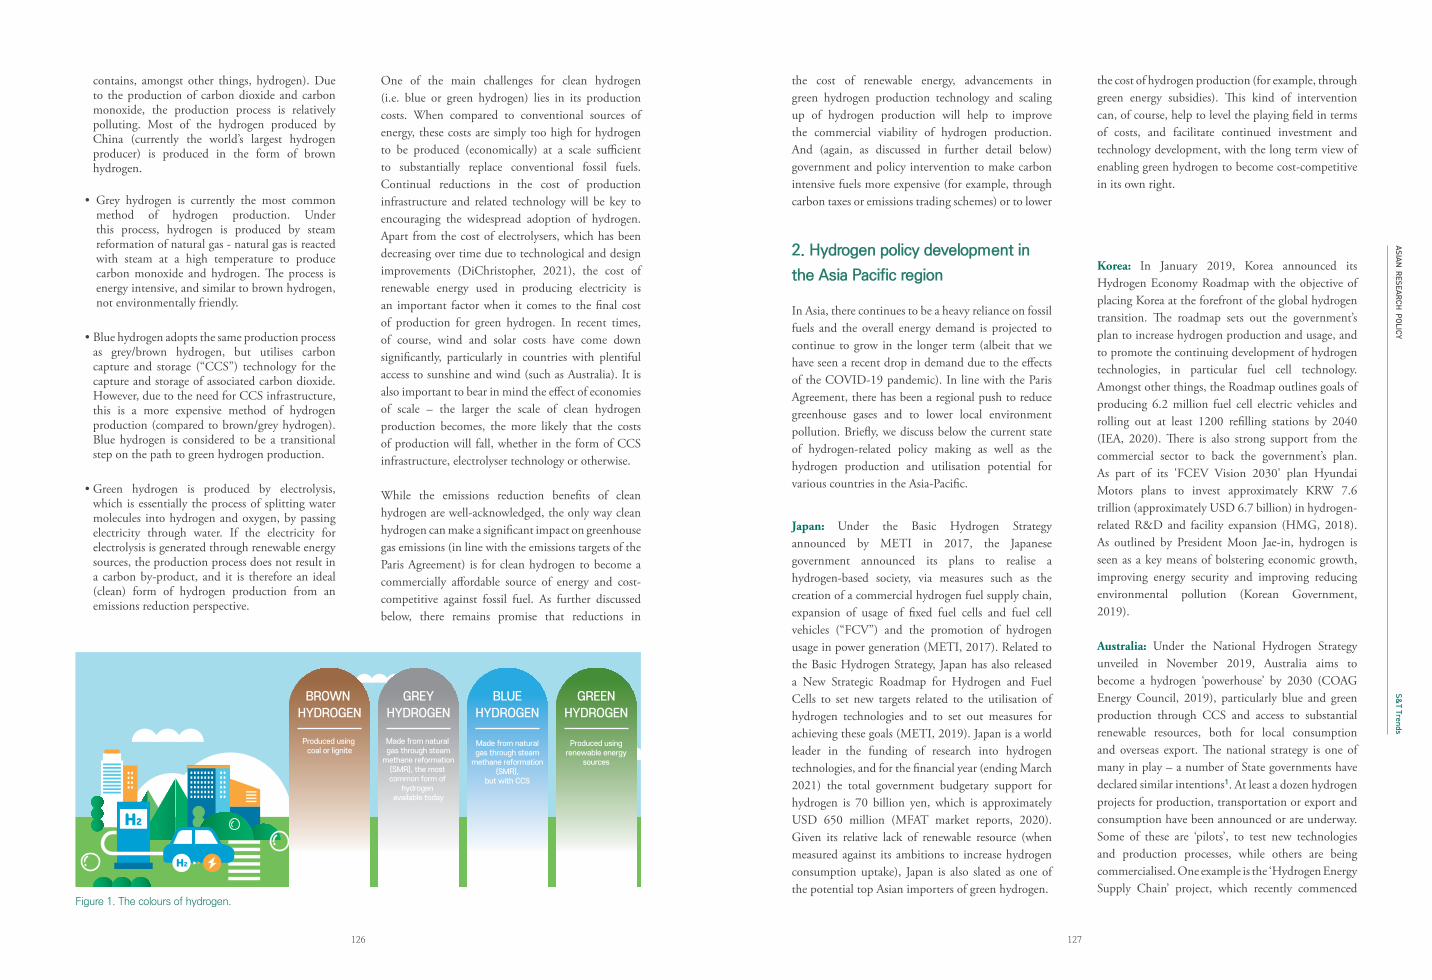
ASIAN RESEARCH
POLICY
127126
S&T Trends
��������������
���������� ����������������
��������������� �������� ���
������������������������������ �����������������
�������������������
�������������� �������� ���
�����������������������
��������� �
���������� ����������������
�����
������������
�����������
�������������
Figure 1. The colours of hydrogen.
2. Hydrogen policy development in
the Asia Pacific region
In Asia, there continues to be a heavy reliance on fossil fuels and the overall energy demand is projected to continue to grow in the longer term (albeit that we have seen a recent drop in demand due to the effects of the COVID-19 pandemic). In line with the Paris Agreement, there has been a regional push to reduce greenhouse gases and to lower local environment pollution. Briefly, we discuss below the current state of hydrogen-related policy making as well as the hydrogen production and utilisation potential for various countries in the Asia-Pacific.
Japan: Under the Basic Hydrogen Strategy announced by METI in 2017, the Japanese government announced its plans to realise a hydrogen-based society, via measures such as the creation of a commercial hydrogen fuel supply chain, expansion of usage of fixed fuel cells and fuel cell vehicles (“FCV”) and the promotion of hydrogen usage in power generation (METI, 2017). Related to the Basic Hydrogen Strategy, Japan has also released a New Strategic Roadmap for Hydrogen and Fuel Cells to set new targets related to the utilisation of hydrogen technologies and to set out measures for achieving these goals (METI, 2019). Japan is a world leader in the funding of research into hydrogen technologies, and for the financial year (ending March 2021) the total government budgetary support for hydrogen is 70 billion yen, which is approximately USD 650 million (MFAT market reports, 2020). Given its relative lack of renewable resource (when measured against its ambitions to increase hydrogen consumption uptake), Japan is also slated as one of the potential top Asian importers of green hydrogen.
Korea: In January 2019, Korea announced its Hydrogen Economy Roadmap with the objective of placing Korea at the forefront of the global hydrogen transition. The roadmap sets out the government’s plan to increase hydrogen production and usage, and to promote the continuing development of hydrogen technologies, in particular fuel cell technology. Amongst other things, the Roadmap outlines goals of producing 6.2 million fuel cell electric vehicles and rolling out at least 1200 refilling stations by 2040 (IEA, 2020). There is also strong support from the commercial sector to back the government’s plan. As part of its 'FCEV Vision 2030' plan Hyundai Motors plans to invest approximately KRW 7.6 trillion (approximately USD 6.7 billion) in hydrogen-related R&D and facility expansion (HMG, 2018). As outlined by President Moon Jae-in, hydrogen is seen as a key means of bolstering economic growth, improving energy security and improving reducing environmental pollution (Korean Government, 2019).
Australia: Under the National Hydrogen Strategy unveiled in November 2019, Australia aims to become a hydrogen ‘powerhouse’ by 2030 (COAG Energy Council, 2019), particularly blue and green production through CCS and access to substantial renewable resources, both for local consumption and overseas export. The national strategy is one of many in play – a number of State governments have declared similar intentions1. At least a dozen hydrogen projects for production, transportation or export and consumption have been announced or are underway. Some of these are ‘pilots’, to test new technologies and production processes, while others are being commercialised. One example is the ‘Hydrogen Energy Supply Chain’ project, which recently commenced
contains, amongst other things, hydrogen). Due to the production of carbon dioxide and carbon monoxide, the production process is relatively polluting. Most of the hydrogen produced by China (currently the world’s largest hydrogen producer) is produced in the form of brown hydrogen.
• Grey hydrogen is currently the most common method of hydrogen production. Under this process, hydrogen is produced by steam reformation of natural gas - natural gas is reacted with steam at a high temperature to produce carbon monoxide and hydrogen. The process is energy intensive, and similar to brown hydrogen, not environmentally friendly.
• Blue hydrogen adopts the same production process as grey/brown hydrogen, but utilises carbon capture and storage (“CCS”) technology for the capture and storage of associated carbon dioxide. However, due to the need for CCS infrastructure, this is a more expensive method of hydrogen production (compared to brown/grey hydrogen). Blue hydrogen is considered to be a transitional step on the path to green hydrogen production.
• Green hydrogen is produced by electrolysis, which is essentially the process of splitting water molecules into hydrogen and oxygen, by passing electricity through water. If the electricity for electrolysis is generated through renewable energy sources, the production process does not result in a carbon by-product, and it is therefore an ideal (clean) form of hydrogen production from an emissions reduction perspective.
One of the main challenges for clean hydrogen (i.e. blue or green hydrogen) lies in its production costs. When compared to conventional sources of energy, these costs are simply too high for hydrogen to be produced (economically) at a scale sufficient to substantially replace conventional fossil fuels. Continual reductions in the cost of production infrastructure and related technology will be key to encouraging the widespread adoption of hydrogen. Apart from the cost of electrolysers, which has been decreasing over time due to technological and design improvements (DiChristopher, 2021), the cost of renewable energy used in producing electricity is an important factor when it comes to the final cost of production for green hydrogen. In recent times, of course, wind and solar costs have come down significantly, particularly in countries with plentiful access to sunshine and wind (such as Australia). It is also important to bear in mind the effect of economies of scale – the larger the scale of clean hydrogen production becomes, the more likely that the costs of production will fall, whether in the form of CCS infrastructure, electrolyser technology or otherwise.
While the emissions reduction benefits of clean hydrogen are well-acknowledged, the only way clean hydrogen can make a significant impact on greenhouse gas emissions (in line with the emissions targets of the Paris Agreement) is for clean hydrogen to become a commercially affordable source of energy and cost-competitive against fossil fuel. As further discussed below, there remains promise that reductions in
the cost of renewable energy, advancements in green hydrogen production technology and scaling up of hydrogen production will help to improve the commercial viability of hydrogen production. And (again, as discussed in further detail below) government and policy intervention to make carbon intensive fuels more expensive (for example, through carbon taxes or emissions trading schemes) or to lower
the cost of hydrogen production (for example, through green energy subsidies). This kind of intervention can, of course, help to level the playing field in terms of costs, and facilitate continued investment and technology development, with the long term view of enabling green hydrogen to become cost-competitive in its own right.
ASIAN RESEARCH
POLICY
129128
S&T Trends
commercial-scale production, liquefaction and export in the world’s first LH2 carrier, the Suiso Frontier 2. Another project of note is the ‘Asian Renewable Energy Hub’ located in the Pilbara region of Western Australia, designated with ‘major project’ status by the Australian government in October 2020. It will use around 15 GW of wind and solar energy to produce green hydrogen for export to Asian consumer centres. By supporting industry, the Australian government is working towards a goal to produce clean hydrogen for under $2 per kilogram. With its political will, access to abundant renewable resources and close proximity to major Asian consumers, Australia is positioning itself as a prime candidate for future commercial exports of green hydrogen to Asian consumers.
China: At a virtual meeting of the UN General Assembly in September 2020, Chinese President Xi Jinping announced a commitment from China to achieve carbon neutrality before 2060. This will require a significant shift away from fossil fuels, and it is expected that clean hydrogen will have a major role to play in that transition. Already, China has stepped up investments in clean hydrogen and announced initiatives to promote the usage of hydrogen, particularly in the transportation sector – according to the New Energy Vehicle Industry Development Plan (2021-35) released by China’s State Council, China will focus on expanding the use of hydrogen in heavy transportation and developing infrastructure to support such expansion (Xin, 2021). Between 2016-2019, the number of hydrogen refuelling stations doubled every year and there are clear steps to roll out new subsidy policies to promote the usage of hydrogen fuel cell vehicles (Yuki, 2020; Jin and He, 2020). Issued last year, the new draft Energy Law of
the People’s Republic of China lists hydrogen as an energy source for the first time and, while there are few other details relating to hydrogen in the draft law, this is an important step towards hydrogen gaining recognition as a green fuel in the Chinese economy.
ASEAN: While still in its infancy for many countries in the ASEAN region, some initial steps have been taken to promote the development of the hydrogen industry. Increasingly, there is a growing recognition that hydrogen has significant potential to reduce the region’s dependence on fossil fuels. In 2020, the Singapore government announced a $49 million (approximately USD 36 million) Low Carbon Energy Research Funding Initiative, which will support the research and development of low carbon technologies such as hydrogen (Energy Market Authority, 2020). In the same year, a number of agreements were executed between Singaporean and Japanese companies to explore the importation and usage of hydrogen as a green energy source 3,4. In Brunei, preliminary steps have also been taken to explore the production and transportation of hydrogen - last year, as part of a hydrogen supply chain demonstration project, a total of 4.7 metric tonnes of hydrogen was shipped to Japan from Brunei Darussalam’s first pilot hydrogenation plant, which is operated by the Advanced Hydrogen Energy Chain Association for Technology Development (Kon, 2020).
1 Western Australia Renewable Hydrogen Strategy (July 2019); Victorian Hydrogen Investment Program (December 2018); ‘Hydrogen Roadmap for South Australia’ in 2017 followed by the South Australian Hydrogen Action Plan (September 2019); Queensland Hydrogen Industry Strategy (May 2019). A significant number of other State and Federal Government studies and roadmaps have been produced over the past few years, including the ‘H2 under 2’ initiative, which is the first economic target pursuant to the National Hydrogen Strategy.
2 See hydrogenenergysupplychain.com. The project is developed pursuant to intergovernmental and host government agreements between Japan, Australia, Victoria and the project’s sponsors.
3 Under a memorandum of understanding, PSA Corp. Ltd., Jurong Port Pte. Ltd., City Gas Pte. Ltd., Sembcorp Industries, Singapore LNG Corp. Pte. Ltd., Chiyoda Corp. and Mitsubishi Corp. will develop ways to utilize hydrogen as a green energy source. See https://www.
4 Keppel Data Centres and Mitsubishi Heavy Industries signed a memorandum of understanding to jointly explore the implementation of a hydrogen powered trigeneration plant concept for data centers in Singapore through the Steam Methane Reforming process. See https://www.kepcorp.com/en/media/media-releases-sgx-filings/keppel-and-mitsubishi-heavyindustries-to-jointly-explore-hydrogen-powered-tri-generation-plant-concept-for-data-centresin-singapore/
3. Potential for hydrogen usage and
production
Hydrogen has a wide array of uses, and it has been used in various applications for many decades. As of now, hydrogen is most commonly used in industrial applications (for example, in oil refining, as a reagent in industrial sectors such as chemical and fertiliser production, and as an ingredient in the production of plastics, fabrics and dyes). However, a key to realising hydrogen’s potential as a decarbonisation tool is encouraging its adoption as a fuel source in transportation and power generation and also as a means of energy storage. It remains early days but there are promising signs of a building momentum for the usage and deployment of hydrogen in these areas.
• Transportation has been identified as a leading area of hydrogen deployment (albeit still in its initial phases). In the Asia-Pacific, there is a broad range of commitment across the government and private sectors to support the usage of hydrogen in the transportation sector, being a major emissions contributor. In particular, while battery electric vehicles are presently the preferred choice as a low carbon solution for small vehicles travelling shorter distances, heavy vehicle transportation has been identified as a promising sub-sector for hydrogen FCVs and more vehicle manufacturers are seeking to invest in this area of hydrogen usage. Japan, China and South Korea all have an express objective to promote the usage of hydrogen FCVs. According to Japan’s Basic Hydrogen Strategy, the goal is to have 200,000 FCVs by 2025 and 800,000 FCVs by 2030, and also expand the number of hydrogen stations to 320 by 2025. Apart from road vehicular transportation, hydrogen is already used as a rocket fuel, and there is also potential for its use as a marine fuel (especially given the International Maritime Organization’s new bunker fuel regulations limiting sulphur content of marine fuels to 0.5% from 1 January 2020) as well as an aviation fuel.
• In the power and heating sector, there are also plans afoot to gradually replace natural gas with
hydrogen. Already pipeline hydrogen injection is part of the national hydrogen strategy for various countries including Australia, Japan and South Korea, and a key plank in the broader decarbonisation strategy. Initial plans are to blend hydrogen in a low concentration with natural gas for injection to avoid major modifications to pipeline networks (higher concentrations may require network modifications such as replacement of steel with polymer pipes or replacement of compressors). Certain newer and more advanced gas turbines are already able to accept fuel blends which may contain 50% or more hydrogen, and already major turbine manufacturers are developing gas turbines that could run on 100% hydrogen. While there is a long way to go before hydrogen might fully replace natural gas, the substitution of natural gas with hydrogen will be a very significant step away from fossil fuels and towards a low carbon economy.
• As a means of energy storage, hydrogen can work in tandem with renewable energy projects to address the drawbacks of reliance on renewable energy. By producing green hydrogen through electrolysers (powered by renewable energy), energy generated by wind or solar power projects can be stored and transported from regions with higher production and lower demand to areas with lower production and higher demand, or otherwise simply stored during low consumption periods until there is peak in energy demand. Naturally, production of hydrogen for energy storage purposes will carry some costs in financial terms and energy losses. However, the falling cost of renewable energy enhances the economic viability of hydrogen as a means of long term, seasonal and transportable green energy storage. At least in the early days the utilisation of hydrogen as a means of localised energy storage may be the most practical and promising usage, as a step towards long distance/cross-border transportation of hydrogen.
On the supply side, Asia Pacific holds the potential for clean hydrogen exports from regions with plentiful access to renewable resources to high demand centres in Asia. As noted, Australia stands
ASIAN RESEARCH
POLICY
131130
S&T Trends
4. Challenges
Despite the promising prospects for hydrogen, there are still some significant challenges in the path of its development as a clean fuel in widespread use. In this section, we briefly discuss some of these challenges, and how they might be overcome, in order for a successful transition to a hydrogen economy to occur.
• Production of blue or green hydrogen remains expensive compared to fossil fuels. Currently, the cost of production of green hydrogen is estimated to be USD 2.50-6.80 per kilogram, whereas the cost of production of blue hydrogen is estimated to be USD 1.40-2.40/kg (Collins, 2020). For green hydrogen to become cost-competitive with the fossil fuels, it has been said that the production cost needs to be lowered to USD 2 per kg (Lane, 2020). A key to reducing green hydrogen costs will be lowering the cost of renewable electricity and prices for electrolysis facilities. In recent years there has been a precipitous drop in solar and wind power costs5, and there are expectations
that this trend will continue. For blue hydrogen, the cost of CCS technology will also need to reduce to improve its cost-competitiveness, and already there are various CCS projects being developed to explore the use of CCS technology on a significant commercial scale6. For projects which need to source power (rather than self-produce), managing the electrolyser to meet downstream demand will generally require certainty of firm power purchase arrangements. If those arrangements are with a retailer, “firming” of the supply adds further cost (and “partial firming” can add complexity). Project proponents in this position will want to be in a position to optimise their cost base by dispatching power into the grid at higher electricity market prices (where this market option is available). For projects and markets with these characteristics, this may drive participation by those with a strong power portfolio (or access to one) rather than infrastructure investors without vertical integration and who are seeking more stable returns.Concurrently, there is also increasing government support for the uptake and usage of
out as a potential exporter of clean hydrogen, due to its geographic proximity, existing infrastructure and abundance of renewable resources. New Zealand has also demonstrated interest in exploiting its hydrogen export potential. Presently the majority of New Zealand’s power is generated from renewable energy sources and the government is keen to support the development of green hydrogen projects-one example is the development of a pilot geothermal-powered hydrogen production facility in New Zealand by a joint venture between the Tuaropaki Trust and Japan’s Obayashi’s Corporation. Apart from Australia and New Zealand, Brunei is exploring its ambitions to be a hydrogen exporter, having exported a maiden shipment of hydrogen to Japan (as mentioned above). Due to land constraints, Brunei’s hydrogen is more likely to be produced from gas rather than
wind or solar power, and the development of CCS infrastructure will be key to enabling its production of blue hydrogen.
Overall, while it remains to be seen whether hydrogen production and export can take off on a commercial scale, there are already several potential candidates in the Asia Pacific which could serve to supply green or blue hydrogen to users throughout the region.
5 From 2010 – 2019, the cost of energy production from solar photovoltaics fell by more than 80% and the cost of energy production from onshore wind fell by nearly 40%. See https://energypost.eu/5-charts-show-the-rapid-fall-in-costs-of-renewable-energy/#:~:text=Although%20all%20forms%20of%20renewable,Energy%20Agency%20(IRENA)%20says.
6 For instance, Australia’s CarbonNet Project seeking to integrate various CO2 capture projects and inject CO2 into underground storage sites in Victoria’s Gippsland region.
hydrogen. Government support works on both ends of the equation - in the form of financial subsidies and investment to make hydrogen production and usage more economical, and in the form of carbon taxes and emissions trading schemes, to increase the cost of fossil fuels. Various countries in Asia (e.g. Japan, South Korea and China) have already implemented emissions trading schemes in different forms, and in 2019 Singapore became the first country in Southeast Asia to introduce a carbon tax. Especially during the initial deployment phases, policy and financial support from the government for hydrogen technology and infrastructure will be critical to improving the commercial competitiveness of hydrogen versus fossil fuels. Hydrogen subsidy schemes should be coordinated with other environmental incentive schemes (for example, relating to carbon pricing or CCS) to ensure that desired policy outcomes are achieved in an efficient and targeted manner.
• Transportation of hydrogen (particularly over long-distances) can comprise a significant component of the final landed cost of hydrogen. For long distance transportation (for example, from Australia to Asian countries), the most realistic options will be for hydrogen to be liquefied or converted into ammonia prior to loading on specialised vessels. Both processes involve a degree of energy consumption and losses during the conversion and transportation process. For instance, during the ammonia conversion process, energy will be utilised to convert hydrogen and nitrogen to ammonia, and at the landed destination chemical processing is required to convert liquid ammonia back to gaseous ammonia. Being able to control and reduce transportation costs of hydrogen will be key in promoting the long-distance export of clean hydrogen.
• Widespread deployment of hydrogen will also require more investment in the distribution infrastructure. While certain existing natural gas pipeline networks can accept a limited concentration of hydrogen, existing pipeline infrastructure will generally need to be retrofitted
to accept the injection of more concentrated or pure hydrogen. Similarly, for refuelling infrastructure, the current infrastructure is inadequate to promote and support a significant increase in FCVs. Already FCVs cost considerably more than cars with normal combustion engines, and without the construction of hydrogen refuelling stations, it is unlikely that there will be a significant uptake in demand for hydrogen FCVs. Due to the commercial dynamics (i.e. parties may not invest in infrastructure unless there is demand but demand will not materialise without the infrastructure), there is a need for investors to take a long-term view and also a role for governments to provide financial and policy support for additional infrastructure investment.
• The development of a hydrogen economy will require the drafting and implementation of a clear and comprehensive regulatory framework. For instance, operational, environmental, safety and technical standards need to be implemented in order to ensure consistent standards for utilisation (for instance, blending with natural gas), transportation and storage of hydrogen. In particular, the cross-border transportation of hydrogen is still in its infancy, and the more consistent and clearer that such regulations pertaining to transportation can be, the more likely this will in turn promote the growth and development of hydrogen projects. Some countries have already rolled out initial laws pertaining to hydrogen usage and domestic safety standards (for example, in January 2020, the Korean National Assembly passed the Hydrogen Economy Promotion and Hydrogen Safety Management Law). However, substantial further work is still required to develop detailed rules and regulations, particularly in the sphere of international and cross-border regulation of hydrogen trade and transportation.
• In the longer term and for large scale hydrogen export projects to truly take off, there is a need for the development and integration of the full commercial, and operational value chain for hydrogen. This covers all of the factors described above, requiring each link in the value chain
ASIAN RESEARCH
POLICY
133132
S&T Trends
5. Conclusion
Despite the potential advantages offered by hydrogen in terms of energy decarbonization, there is still a long way to go before hydrogen can be deployed on a wide commercial scale. That said, the signs are promising given the falling cost of production, and strong, growing government and commercial support for hydrogen projects.
As a part of the world which holds both significant potential for clean hydrogen production and is home to potentially significant demand and consumption centres, there are strong prospects for countries in the region to lead in the transition to an international hydrogen economy. In these early days, broad-based government support and commercial commitment (taking a long-term view of hydrogen’s potential) will be critical to accelerating the trend towards widespread hydrogen usage. Over the long term, hydrogen
technology and commercial supply and production chains will also need to form a commercially viable and cost-competitive alternative to fossil fuels.
References
Collins, L. (2020, March 19) A wake-up call on green hydrogen: the amount of wind and solar needed is immense. Recharge. https://www.rechargenews.com/transit ion/a-wake-up-cal l -on-green-hydrogen-the-amountof-wind-and-solar-needed-is-immense/2-1-776481
COAG Energy Council (2019, November 22) Australia’snational hydrogen strategy. Australian Government. https://www.industry.gov.au/data-and-publications/australias-national-hydrogen-strategy
(production, storage, transportation, importation and downstream distribution) to be progressed in tandem (and at least in some cases as part of integrated projects). Due to the complexities and costs of the hydrogen value chain, the cross border export of hydrogen will also likely need to be underpinned by long term offtake agreements, which in turn will provide the capital and guaranteed cashflow for project development. The development of deep and liquid markets for the marketing, trading and transportation of hydrogen will also be fundamental to the long term success of the hydrogen economy. Features such as appropriate pricing mechanisms, conventions for measurement and determination of quality specifications, and consistent methodologies for the labelling and tracing of hydrogen (such as certifications for “green” or “blue” hydrogen) will all be important. Resilient, trustworthy and traceable certification of hydrogen as having been produced from clean energy sources will be key to accelerating hydrogen’s success in the global push to reduce carbons emissions. Already, there are several green hydrogen certification and guarantee of origin schemes proposed in different markets (for instance, in Europe and Australia). However,
these schemes are in their infancy - whether and how any of them is successfully developed, tested and adopted at any critical scale remains to be seen. In this regard, it is possible to look to the development of the LNG industry as providing something of a roadmap for hydrogen. Originally relatively localised and dependent on transport by physical pipeline, the gas industry transformed its product into a global commodity through liquefaction at source, regasification at destination and long distance ship-based transport connecting the two. The industry developed on the back of the project financing of extremely capital intensive infrastructure, supported by revenue under long term multi-billion dollar sale and purchase agreements. In terms of pricing, LNG has also developed certain pricing indices for its sale contracts (for instance, the Japanese Crude Cocktail (JCC) and more recently the Japan Korea Marker) and increasingly become a more liquid and flexible traded commodity over time. Indeed, the connections to LNG may not end with parallels of this nature - already we are seeing examples of planning for LNG terminals to have hydrogen capacity too.
DiChristopher, T. (2021, March 5) Experts explain why green hydrogen costs have fallen and will keep falling. S&P Gloal. https://www.spglobal.com/marketintelligence/en/news-insights/latest-news headlines/expertsexplain-why-green-hydrogen-costs-have-fallen-and-will-keep-falling-63037203
Energy Market Authority (2020, October 26) $49million research fund for low-carbon energy solutions. Government of Singapore. https://www.ema.gov.sg/media_release.aspx?news_sid=20201025eyksiX0dgcEH
HMG (2018, November 12) Hyundai Motor Group reveals ‘FCEV Vision 2030’. Hyundai Motor Group. https://www.hyundai.news/eu/brand/hyundai-motor-group-reveals-fcev-vision-2030/
IEA (2020, September 14) Korea hydrogen economy roadmap 2040. International Energy Agency. https://www.iea.org/policies/6566-korea-hydrogen-economy-roadmap-2040
Jin, L. and He, H. (2020, August 19) Ten cities, thousand fuel cell vehicles? China is sketching a roadmap for hydrogen vehicles. The international council on clean transportation. https://theicct.org/blog/staf f/china-sketching-roadmap-hydrogen-vehicles-aug2020
Kon, J. (2020, February 21) Brunei ships 4.7MT of hydrogen to Japan. Borneo Bulletin. https://borneobulletin.com.bn/brunei-ships-4-7mt-hydrogen-japan/
Korean Government (2019, January 17) Remarks by President Moon Jae-in at presentation for hydrogen economy roadmap and Ulsan’s future energy strategy. Korean Government. https://english1.president.go.kr/briefingspeeches/speeches/110
Lane. J. (2020, December 9) The green hydrogencatapult aims for $2/kg H2 and needs $110 billion, if you’ve any to spare. The Digest. https://www.biofuelsdigest.com/bdigest/2020/12/09/the-green-hydrogen-catapult-aims-for-2-kg-h2-and-needs-110-billion-if-youve-any-to-spare/
METI (2017, December 26) Basic hydrogen strategy determined. Ministry of Economy, Trade and Industry of Japan. https://www.meti.go.jp/english/press/2017/1226_003.html
METI (2019, March 12) Formulation of a newstrategic roadmap for hydrogen fuel cells. Ministry of Economy, Trade and Industry of Japan. https://www.meti.go.jp/english/press/2019/0312_002.html
MFAT market reports (2020, October 30) Japan:strategic hydrogen roadmap. New Zealand Foreign Affairs & Trade. https://www.mfat.govt.nz/br/trade/mfat-market-reports/market-reports-asia/japan-strategic-hydrogen-roadmap-30-october-2020/
Xin, Z. (2021, January 6) Hydrogen seen as greenway forward. China Daily. https://www.chinadailyhk.com/article/154211
Yuki (2020, February 19) China hydrogen market 2019review: fueling stations. Energy Iceberg. https://energyiceberg.com/hydrogen-fueling-2019/# :~ : t e x t=S ince%202016%2C%20the%20number%20of,or%20in%20the%20planning%20stage

ISSN: 2093-3509Published in December, 2021Published by KISTEP, 1339 Wonjung-ro, Eumseong-gun, Chungcheongbuk-do, ROK 27740Designed by Design it OnO Inc.Printed by Design it OnO Inc.
No part of this publication may be reproduced or distributed without the prior written consent of editorial office, including, but not limited to, in any network or other electronic storage or transmission, or broadcast for distance learning. Inquire at [email protected] or www.arpjournal.org.Asian Research Policy has been listed in Cabell’s Directories since 2011.Republic of Korea. Copyright ©2021 Korea Institute of S&T Evaluation and Planning. All rights reserved.
Asian Research PolicyEnhancing the knowledge on science and technology policy issues in Asia
Asian Research Policy (ARP) is an international multidisciplinary journal published annually by Korea Institute of S&T Evaluation and Planning (KISTEP).
ARP aims to enhance collective knowledge on research policy and innovation activities in Asia. With your input, ARP will continue to provide academic inspiration to researchers, practical policy practice to policymakers, and business intuition to industry experts.
We cordially invite you and your colleagues to submit an original article to the next issue or ARP. For more information, please visit http://arpjournal.org.
Topics of interest
●���������������R&D management and policy●���������������Science, technology & innovation management/policy/strategy●���������������Science & technology evaluation●���������������Core competence & dynamic capabilities●���������������Industrial clusters●���������������Creation, transfer, and exploitation of knowledge●���������������National/regional systems of innovation●���������������Organizational learning and experiment●���������������Product and process development
Submit your article today!
ARP Editorial Office
Korea Institute of S&T Evaluation and Planning (KISTP)1339 Wonjung-ro, Eumseong-gun. Chungcheongbuk-do 27740Republic of KoreaEmail: [email protected]://www.arpjournal.org
CALL FOR PAPERSVolume 13 (December 2022)
Editor-in-chiefSang-Seon Kim (KISTEP)
Managing EditorJinha Kim (KISTEP)[email protected]
Editorial OfficeCenter for International Cooperation Policy (KISTEP)
ARP Editorial Board CASISD (Chinese Academy of Sciences-Institutes of Science and Development)CNU GNPP (Graduate School of National Public Policy, Chungnam National University)DST CPR (Centre for Policy Research, Department of Science and Technology)ECOSF (ECO Science Foundation)GRIPS (National Graduate Institute for Policy Studies)HSE (Higher School of Economics)KISTEP (Korea Institute of S&T Evaluation and Planning)NIScPR (CSIR-National Institute of Science Communication and Policy Research)NISTEP (National Institute of Science and Technology Policy)NISTPASS (National Institute for Science and Technology Policy and Strategy Studies)STPI NARlabs (Science & Technology Policy Research and Information Center, National Applied Research Laboratories)