China Internal Market Development and Regulation
268
Report No. 12291 CHA China Internal MarketDevelopment and Regulation March 17, 1994 Country Operations Division China and Mongolia Department East Asiaand Pacific Regional Office FOR OFFICIAL USE ONLY I0 ,. . v ~- 5, c' ' 'N~~~~~~~~~~~~~~~~~~~~~~~~~~~~~~~~~~~~1 MI1CROGRAPHICS Report No: 12291 CIIA Type: SEC Document offheWoMW'anI~ This docuiient has" a ebictedIuinadmybeue ywm~ol iihe e1act pidaI- f. lb c'ntew. ''ay0't ot6 'e di~~cIo~ed w d&aCtb'w r.' '* .-. . '' .. . ~~~~~-~: .. .3 Public Disclosure Authorized Public Disclosure Authorized Public Disclosure Authorized Public Disclosure Authorized
-
Upload
khangminh22 -
Category
Documents
-
view
0 -
download
0
Transcript of China Internal Market Development and Regulation
Report No. 12291 CHA
ChinaInternal Market Development and Regulation
March 17, 1994
Country Operations DivisionChina and Mongolia DepartmentEast Asia and Pacific Regional Office
FOR OFFICIAL USE ONLY
I0
,. . v ~- 5, c' '
'N~~~~~~~~~~~~~~~~~~~~~~~~~~~~~~~~~~~~1
MI1CROGRAPHICS
Report No: 12291 CIIAType: SEC
Document offheWoMW'anI~
This docuiient has" a ebictedIuinadmybeue ywm~oliihe e1act pidaI- f. lb c'ntew. ''ay0't ot6 'e
di~~cIo~ed w d&aCtb'w r.' '*
.-. . ''
.. . ~~~~~-~: .. .3
Pub
lic D
iscl
osur
e A
utho
rized
Pub
lic D
iscl
osur
e A
utho
rized
Pub
lic D
iscl
osur
e A
utho
rized
Pub
lic D
iscl
osur
e A
utho
rized

CURRENCY EQUIVALENTS
Currency Unit: Yuan (Y)
(Nominal Official Period Average Rates)
Year Yuan (Y) per US$
1992 5.521991 5.321990 4.781989 3.771988 3.721987 3.7r1986 3.451985 2.941984 2.321983 1.981982 1.891981 1.701980 1.501979 1.561978 1.68
FLSCAL YEAR
January 1 - December 31
WEIGHTS AND MEASURES
Metric System

FOR OFFICIAL USE ONLY
ACRONYMS AND ABBREVIATIONS
ASEAN Association of South-East Asian NationsCASS Chinese Academy of Social SciencesCFSRRI China Economic Systems Reform Research InstituteCFA Communaut6 Financiere AfricaineCFMC Commodities Futures Management CommissionCFTC Commodities Futures Trading CommissionCNCC China National Coal CorporationCNFMGC China Non-FerrouG Metals General CorporationCOV CovarianceDRC Development Research CouncilEC European CommunityECU European Currency UnitETDZ Economic and Technical Development ZonesFEAC Foreign Exchange Adjustment CentersFIMBRA Financial Intermediaries', Managers' and Brokers' Regulatory AssociationFSU Former Soviet UnionFTC Foreign Trade CorporationGITIC Guangdong International Trust and Investment CenterGDP Gross Domestic ProductGNP Gross National ProductGPAIC Guangdong Province Administration of Industry and CommerceGVIO Gross Value of Industrial OutputGVO Gross Value of OutputLAUTRO Life Assurance and Unit Trust Regulatory OrganizationLME London Metal ExchangeMME Ministry of Materials and EquipmentMOC Ministry of CommerceMOFTEC Ministry of Foreign Trade and Economic CooperationNAFTA North American Free Trade AssociationNTHS National Trnmk Highway SystemOEC Office of Economic CooperationSAIC State Administration of Industry and CommerceSCETO State Council Economic and Trade OfficeSCRES State Commission for the Restructuring of the Economic SystemSEZ Special Economic ZoneSHME Shanghai Metals ExchangeSIB Securities and Investments BoardSME Shenzhen Metals ExchangeSOEs State Owned EnterprisesSPC State Planning CouncilSRO Self-Regulatory OrganizationsSTICERD Suntory-Toyota International Center for Economics and Related DisciplinesTVE Township and Village EnterprisesUK United KingdomUSA United States of America
Thds doment has a restricted distn1ution and may be used by recipient only in the perfom of thidrI official duties. Its contents may not otherise be disclosed without Wodd Bank authoion. l

CONTENTS
Executive Summary .................................... xi
Market Senatonand Market Developme .................. 1
A. Introduction 1Factors Affecting Internal Markets 4Objectives of this Report .5
B. The Potential Benefits of Internal Free Markets. 7Forms of Regional Integration. 7The Case for Regional Integration. 8
C. Market Strcture in China .12
Annex 1.1 Calculadtion of Regional Structural Difference Coefficients ...... 16
2 Rect Evolution of China's Internal Markets ........ ............. 20
A. The Impact of Price Reform .20Assessing Price Efficiency: Plan and Market Prices .22Assessing Price Efficiency: Regional Price Differentials 24
B. Interrgional Domestic Trade .26An Analysis of Domestic Trade Flows ...... .......... 29
C. Factor Mobility: Capital .32Factors Affecting nterprovincial Investment .32Profit Retention and Taxation .33Tax Concessions in 'Zones' Established by the Center .35Tax Concessions in 'Zones' Established by Localities .36Other Tax Concessions by Localities .37Regional Cooperation Zones .38Procedures and Practice .38Summary: Tax Policy and Regional Capital Flows .39An Analysis of Evidence .40The Banking System: Interbank Borrowing and Lending 43The Banking System: Payment Clearance and Settlement 45Capital Markets .47
D. Factor Mobility: Labor .47B. Foreign Exchange Mobility .53
Recent Changes .55F. Conclusions .55

- iv -
3 The Distribution System ..................................... 58
A. The Changing Role of the State in Distribution .58B. The Efficiency of the Present Distribution System .63
Evolution of the Materials Distribution System .63The System Today ........................... 67The Efficiency of the Present Materials Distribution System ... 70
C. Parlel Changes in Agriculture. 75Agrcultual Wholesale Markets .75
D. Transpoitation, Telecommunications and Services .76The Raflroad System .78Truck Transportation .78
E. Summay and Implications. 31
Annex 3.1 A Note on Producer Goods Distnbution Systems ................. 82Efficient Distribution Systems ...................... 82Altermative Cbannel Structures ...................... 82Chamel Functions ............................. 83The Evolution of Distnbution Channels for Producer's Goods . . 84Some Comments on Distributor Efficiency .... .......... 86'Best Practice' Tools and Techniques to Minimize Costs ...... 87
4 New Forms of Markes ...................................... 89
A. China's Distinctive Pattern of Development of Commodity Exchanges . 90B. Agricultural Markets .91C. The Metals Exchanges of Shanghai and Shenzhen .93
The Shenzhen Meta Exchange .96The Shanghai Meta Exchange .98
D. An Assessment of Trading on China's Two Metals Exchanges. 101The System of Trading on the Exchanges .101The Costs of Trading on the Exchanges .104The Nature of Trading Activity on the Exchanges .105
E. Policies and Regulations for Commodities and Futures Markets 109The Difficulty of Reconciling Free Markets andContimued Goverment Intervention .109
Financial Safeguards for Participants on the Exchanges 110. Framework of Regulation for Commodity Markets in Chinaand Oder Countries .111
F. Future Prospects for China's Commodity Exchanges ................... 114The Pressures for the Rationalization of the Number ofChinse Commodity Exchanges .................... 114
The Likely Development of Trading on the Exchanges .... ... 115G. Implications for Government Action ............................. 117
Annex 4.1 Commodity Market Trading: A Zero-Sum Game ................. 119

S Market Regaon . ........................................ 121
A. Regulation in a Market Economy .121B. Competition and a Competitive Enviromnent .122
Market Structure: Firm Size and Industrial Concentration 123Potental Changes in Market Structure: Mergers .125Potential Changes in Market Structure: Enterprise Groups 127Market Conduct Issues .134Legal Provisions on Competition .134
C. The Entry of New Firms .136The Role and Functions of the SAIC .136Other Agencies Concerned with Entry .139
D. Other Regulations Affecting Market Structre .140Consumer Protection Related Rules:
Advertizing and Fraudulent Practices .140Protection to Producers: Tridemarks, Patent and Copyright ... 142
E. Conclusions .144
6 Mbarkets ad Government: Future Perspectives ................... 146
A. General Themes - A Synthesis .146B. Policy, Regulation and Administration .149
Price and Quantity Controls .149Internal Trade .149Factor Mobifity. 10Market Reguation .152
C. Physical Constraints and the Management of Distribution .154Distribution Practices and Distribution Facilities .. 154Road Transportation .. 155Commodities and Futures Markets .155
D. The Future Role of the Govermment .156
References ......................................... 158

- vi -
Tables in Text
Table 1.1 Trends in the Branch Composition of China's Industrial Output .... ...... 13Table Al. 1 Comparison of Average Coefficients of Structural Difference .... ....... 19Table 2.1 Ratios of Market to State Prices for Main Materials ................. 23Table 2.2 Plan and Market Prices for Selected Materials (1985-1991) .... ........ 24Table 2.3 Coefficient of Regional Variation of Retail Prices of Major Commodities .... 25Table 2.4 Coefficients of Variation of Materials Prices by Province (1990-1992) ..... 25Table 2.5 China and Other Regional Trading Areas: Interregional Trade .... ....... 31Table 2.6 Interprovincial and Foreign Investment in Selected Provinces .... ....... 41Table 2.7 Mean and Coefficient
of Variation of Effective Tax Rates of 20 Provinces (1986-1990) .... ..... 43Table 3.1 Composition of Total Retail Sales Value by Ownership (1960-1991) ....... 61Table 3.2 Number and Share of Domestic Trade Units
by Ownership and Region (1985-1991) . 61Table 3.3 Retail Trade Services in China and Other Countries.63Table 3.4 China and Other Countries: Employment in Trade and Transport .... ..... 77Table 5.1 Industrial Concentration Ratios for Selected Industries ............... 124Table 5.2 Size Distribution of Industry by Alternative Indices (1991) ............. 125
Figues in Text
Figure 1.1 Reduction in Scope of Price Controls ........................... 2Figure 1.2 External and Domestic Trade Shares ........................... 3Figure 1.3 Coefficients of Structural Difference ........................... 15Figure 2.1 Free Market Prices Relative to State List Prices ........ ............ 23Figure 2.2 Domestic and Foreign Trade Ratios (1980-1992) .................... 30Figure 3.1 Material Supply by Government Contact ........................ 59Figure 3.2 Marketization of Agriculture ................................ 60
Annex Tables
Annex I Table Al. la European Community: Coefficients of Structural Differenceof Number of Firms, 1987 .................................... 168
Annex I Table Al. lb United States: Coefficients of Structural Differenceof Number of Firms, 1987 .................................... 169
Annex I Table AI. lc China: Coefficients of Structural Difference of Numberof Firms, 1991 ............................................ 170
Annex I Table AI.2a European Community: Coefficients of Structural Differenceof Number of Employees, 1987 ................................. 171
Annex I Table AI.2b United States: Coefficients of Structural Differenceof Number of Employees, 1987 ................................. 172
Annex I Table Al.2c China: Coefficients of Structural Differenceof Number of Employees, 1991 .................... ... 173
Annex I table AI.3a European Ccommunity: Coefficients of Structural Differenceof Output Value, 1987 ....................................... 174

- vii -
Annex I Table Al.3b United States: Coefficients of Structural Differenceof Output Value, 1987 . .. 175
Annex I Table Al.3c China: Ciefflcients of StructUral Differenceof Output Va;ue, 1991 .................. t . . . ... . 176
Annex I Table Al.4a EC, US and China: Coefficient of Variationof Average Employees Per Firm (Nos) ............. .. .............. 177
Annex I Table Al.4b EC, US and China: Coefficient of Variationof Average Output Per Firm (US$ million) ........... .. .............. 178
Appendx Tables
Appendix Table Al.l Per Capita National Income by Province (1983-1991) .... ..... 179Appernix Table A1.2 Per capita Investment in Fixed Assets by Provinces (1983-1991) 180Appendix Table A1.3 Per Capita Gross Value of Industrial Output
by Province (excluding village enterprises) (1985-1991) .................. 181Appendix Table A1.4 Per Capita Gross Value of Industrial Output
by Province (includiDg village enterprises) (1985-199i) .................. 182Appendix Table A1.5 Number and Gross Output Value of Industrial Enterpises
by Ownership (1985-1991) .................................... 183Appendix Table A1.6 Number of Enterprises, Gross Output Value (GOV),
and Number of Employees (1991) ................................ 184Appendix Table Al.7a Average Gross Output Value (GOV) Per Enterprise
by Province and Industry (1990) (Y million) ............. . ............ 187Appendix Table A1.7b Average Gross Output Value (GOV) Per Enterprise
by Province and Industry (1991) (Y million) ......................... 188Appendix Table Al.8a Average Number of Employees per Enterprise by Province: 1990 189Appendix Table A1.8b Average Number of Employees per Enterprise by Province (1991) 190
Appendix Table A2.1 Price Controls: Reduction in Scope (1978-1991) ...... ...... 191Appendix Table A2.2 Free Market Price Indices of Consumer Goods ....... ...... 192Appendix Table A2.3 Free Market Prices Relative to State List Prices (1983-1991) .... 193Appendix Table A2.4 Planned and Market Prices of Main Materials (Y/ton) ........ 194Appendix Table A2.5 Planned and Market Prices of Main Materials (1989-1991) ..... 195Appendix Table A2.6 Retail Prices of major Commodities
in 29 Provincial Capitals (1986) ................................ 197Appendix Table A2.7 Retail Prices of Major Commodities
in 29 Provincial Capitals (1989) ....... ........... ................ 198Appendix Table A2.8 Retail Prices of Major Commodities
in 29 Provincial Capitals (1991) ................ ....... 199Appendix Table A2.9 Average Price of Materials by Province (ecember 1990) ....... 200Appendix Table A2. 10 Average ?,dce of Materials by Province (December 1991) ...... 201Appendix Table A2. 11 Average Price of Materials by Province (June 1992) . .202Appendix Table A2.12 Imports of Commodities from Other Provinces (1985-1992) ...... 203Appendix Table A2.13 Exports of Commodities to Other Provinces (1985-1992) ...... 204Appendix Table A2.14 Total Domestic Sales within Province (1985-1992) .......... 205Appendix Tablc A2.15 Ratio of Interprovincial Exports
to Total Domestic Sales (1985-1992) .............. .. ............... 206
- viii -
Appendix Table A2.16 Ratio of Inter-provinical Importsto Total Domestic Sales (1985-1992) .............. .. ............... 207
Appendix Table A2.17 Ratio of Inter-provinical Tradeto Total Domestic Sales (1985-1992) ............. .. ............... 208
Appendix Table A2.18 Inter-provinical and Foreign Trade (RMB Y billion and %) .... 209Appendix Table A2.19 China and Other Regional Trading Areas: Interregional Trade ... 210Appendix Table A2.20 lnterprovincial and Fo.-eign Investment in Selected Provinces .... 211Appendix Table A2.21 Effective Tax Rates by Province (1986) ................. 213Appendix Table A2.22 Effec*ive Tax Rates by Province (1987) ................. 214Appendix Table A2.23 Effective Tax Rates by Province (1988) ................. 215Appendix Table A2.24 Effective T-x Rates by Province (1989) ................ 216Appendix Table A2.25 Effective Tax Rates by Province (1990) ................ 217
Appendix Table A3.1 Supply by Government Contacts (1981-1991) ............. 218Appendix Table A3.2 Production of Main Products (1981-1991) ........ ........ 219Appendix Table A3.3 Distribution of Retail Sales in Quantity and Value ........... 220Appendix Taole A3.4 Total Value of Retail Sales by Ownership (1960-1991) ........ 221Appendix Table A3.5 Composition of Total Retail Sales by Ownership (1960-1991) .... 222Appendix Table A3.6 Number of Domestic Trade Units
by Ownership and Region (1985-1991) ............. .. .............. 223Appendix Table A3.7 Composition of Dumestic Trade Units
by Ownership and Region (1985-1991) ............. .. .............. 224Appendix Table A3.8 Staff and Outlets of Materials Circulation System (1985-1991) ... 225Appendix Table A3.9 Number of Units and Persomel in Domestic Trade
by Ownership (1985-1991) .................. .................. 226Appendix Table A3.10 Sales of Machinery and Electrical Trading Companies
under MME (1991) .................... .................... 227Appendix Table A3.11 Sales of Metal Materials Trading Companies under MME (1991) 228Appendix Table A3.12 Sales of Fuel Trading Companies under MME (1991) .... .... 229Appendix Table A3.13 Sales of Comprehensive Trading Center ulder MME (1991) .... 230Appendix Table A3.14 Purchase, Sales and Inventory of CommercW Units (1962-1991) 231Appendix Table A3.15 Coal Industry: Inventory and Working Capital Requiremes
in Sample .............................................. 232Appendix Table A3.16 Cement Industry: Inventory and Working Capital Requirements
in Sample ..... ....................... 233Appendix Table A3.17 Steel Industry: Inventory an . 'orldng Capital Requiemens
in Sample .............................................. 234Appendix Table A3.18 Length of Transportation Routes by Province (1983-1991) .... 235Appendix Table A3.19 Per Capita Length of Transportation Routes
by Province (1983-1991) .................... .................. 236Appendix Table A3.20 Average Shiping Distance of Freight (1962-1991) .......... 237
Appendix Table A4.1 China's Foreign Trade in Non-Ferrous Metals ... ......... 238Appendix Table A4.2 Trading Volume on the Shenzhen Metal Exchange ........... 239Appendix Table A4.3 Trading Volume on the Shanghai Metal Exchange .... ....... 240
Appendix Table A5. la Size Distribution of Industry by Number ofEmployees and Number of Firms (1991) ............................ 241

- lx-
Appendix Table AS.lb Size Distribution of Industry by Number ofEmployees and Persons Employed (1991) ..... 242
Appendix Table AS. lc Size Distribution of Industry by Number ofEmployees and Gross Output Value (1991) .243
Appendix Table A5.2a Size Distribution of Industry by Gross Value ofIndustri Output and Number of Firms (1991) .244
Appendix Table AS.2b Size Distribution of Industry by Gross Value ofIndustrial Output and Number of Employees (1992) .245
Appendix Table A5.2c Size Distribution of Industry by Gross Value ofIndustrial Output and Output Value (1992) ........................... 246

CONTRIBUTORS
This report and its annexes are based on the findings of a preparatory visit to China in November 1992,followed by a full-fledged investigative study during March 1993 in China, jointly undertaken by the WorldBank, the Ministry of Materials and Equipment, and the State Administration of Industry and Commerce,Government of China. In addition to discussions in Beijing, the team visited Shenyang (Liaoning Province),Shanghai Municipality, Suzhou, Wuxi (Jiangsu Province) and Shenzhen (Guangdong Province). Excellentsupport was provided at each location visited by the local departments of the Ministry of Materials as wellas the State Administration of Industry and Commerce.
The World Bank team consisted of Anjali Kuniar (team manager and principal author of this report),Wang Yuan (task coordinator from the Beijing Office of the World Bank), Mark Dutz (competition policy),James Fry (commodities and futures markets), Lawrence Wortzel (distribution systems) and Jun Ma (capitalmobility, data base). Jun Ma also provided able research assistance in Washington and Cathy Song helpedwith document preparation. The Chinese team consisted of Wu Baozhong (task leader from the Ministryof Materials and Equipment), Zhao Jie, Wang Erliog, Li Chenghuai, Qi Xiaojie and Shi Chunling and XuSu (MME). Wang Baotong from the SAIC also accompanied the team on its field visits. Background papersfor this study were prepared by a team led by Tao Fei of the Chinese Academy of Social Scienc, s; by theMinistry of Materials and by the Development Research Council. The team extends its gratitude andappreciation to all the officials from the various govermment agencies, distribution companies and enterpriseswith whom it met.

Executive Summary
A. An Overview
i. China's commitment to the creation of a market economy received new emphasis in therecent 8th National People's Congress of March 1993. The congress ratified the decision taken at the14th Party Congress of October 1992, to develop a 'socialist market economy', shifting decisively awayfrom central planning. The Constitution of 1982 was amended to emphasize this shift.
ii. The development of the internal market was fostered by a series of mechanisms intendedto reduce the scope of state intervention:
(1) Progressive price decontrol was first introduced through three categories of prices(planned, guidance and market prices) and the gradual movement of goods from morereglated to less regulated categories. The 'dual track' pricing, introduced in 1985,permitted output above certain target levels to be sold on the free market. The proportionof goods in total domestic retail trade subject to planned prices fell dramatically between1978 and 1991, In favor of 'guidance prices' and free market prices. Goods subject toplanned prices have fallen considerably further, with recent announcements in early 1993of the relaxation of controls on prices of grain and edible oils.
(2) The allocation of goods moved progressively out of the mandatory plan. In 1980, 90percent of industrial goods and 837 production materials were allocated under the plansystem. By 1993, the proportion of industrial goods under the plan had declined to lessthan 10 percent and the number of production materials in this category was reduced to11. At the same time, consumer goods administered by the Ministry of Commercedeclined in number from 274 in 1978 to 14 in 1993.
(3) Distribution systems and chamcis gradually expanded. Formerly, the system of unifiedpurchase and sale of consumer manufactures, and the unified purchase of farm products,by designated government agencies, accounted for virtually all sales. Sales may now bemade to private purchasing agencies or directly to consumers. New 'comprehensive' and'specialized' cistribution agencies have sprung up. Sales undertaken by governmentagencies have also diversified in form and function, and state-owned distribution agenciesare providing new forms of services.
(4) Sophisticated forms of commodities markets, for many agricultural products andIndustrial raw materials have been established. Today there are 21 centrally sponsored

- xii -
commodities exchanges in China, many of which are equipped with advanced computertechnology and newly constructed modern trading facilities.
(5) In conjunction with these policy and real side adjustments, the government has drawn upa major program of legislative change for establishing a framework for a marketeconomy.
iii. Over the last decade, China has made remarkable strides towards the establishment of amarket economy. But the progress achieved so far has been uneven. This report evaluates the extentto which China, through the adoption of the measures described above, has been able to establish well-functioning markets. Well-functioning markets imply markets which transmit accurate signals to economicagents in terms of production decisions and factor allocation. The report distinguishes between theregional or spatial aspect of market functioning, and the movement from plan to market. Foliowing apolicy evaluation, the report analyzes the new systems for allocating and distributing goods that haveevolved in the aftermath of planning. The report also discusses present regulation of markets In thechanging environment.
B. Main Flndings
iv. There are large potential benefits in achieving well-functioning and regionally integiatedinternal markets and other countries have achieved greater market integration through systematic anddeliberate policies (Chapter 1, para 1.21 to 1.30). The report examines China's present Industrialstructure and demonstrates that the composition of output has remained remarkably staic despiteshifts In the ownership of industrial output (para 1.33). The cross-section structure of industi outputby region shows that each major industrial group is located in virually all provinces. Firm size is alsoremarkably similar across provinces.
V. To assess the extent to which China could gain from greater integration of its domesticmarket, the report compares China and other large regional markets. Subject to the caveats that applyto international comparisons with the EC and the US, the findings suggest that regional differences inChina appear relatively small, and there is little evidence of industrial specialization or a well-integratedstructure (para 1.37 and Annex 1.1). Relative to other countries, China Is far from realizing thebenefits of its potentially large internal market. As a consequence of its relatively 'cellular'economicstructure, many benefits, such as scale economies in plant size and the spreading of overheads inmanagement, technology and learning, communications and infrastructure, associated with thedevelopment of industrial 'clusters', have yet to be exploited.
vi. To promote regional trade and specialization, mechanisms for the redistribution ofbenefits among the various regions are needed. Today with the marked relative decline in theproportion of total revenue accruing to the central government, the scope for such redistributivemechanisms is limited. Options for such mechanisms are discussed (Chapter 1, para 1.27 and Chapter6, para 6.21).
vii. Using a series of measures of price behavior, an analysis shows that there has bee asignificant convergence between plan and market prices (Chapter 2, parn 2.8 to 2.10). Recent price
- xiii -
reforms in early 1993 have consolidated and extended the progress achieved with the dual track system.This shows that China has achieved notable success in replacing the allocative mechanisms of the planningregime with allocation through the market. The reduction in the proportion of goods allocated throughthe plan, as well as the increase in the proportion of goods subject to market prices, has been remarkable.
viii. Progress is less evident in the regional integration of China's markets. Despite the rapiddecline In the number and level of price controls, there are still persistent regional price differentialsamong both producer and consumer goods (para 2.12 to 2.16). Price convergence across regions hasbeen slower and more erratic than convergence between plan and market prices, for specific products.Some divergence in regional prices may have emerged as a consequence of the lifting of price controlsand the reflection of real costs of transport in prices. But eventual price convergence (with transport costadjusted differentials) would still be expected. The present differentials suggest spatial segmentation ofthe internal market.
ix. An analysis of domestic Interprovincial trade In goods indicates that the share of tradeflows across provinces, relative to total retail trade, have declined in many provinces, and on aggregatefor the country as a whole (para 2.17 to 2.29). These declines have occurred at th3 same time as theshares of external trade, and inflows of external investment, have increased In most provinces. From1985 to 1992, overseas exports and imports grew at 17 and 10 percent per year, respectively. Whiledomestic interprovincial trade also rose in absolute terms, its rate of growth at 4.8 percent per year waslow relative to foreign trade and also lower than the 9 percent annual rate of growth of total retail sales.The findings suggest that individual provinces are tending to behave like independent countries, with anincrease in external (overseas) trade and a relative decline in trade flows with each other.
x. A part of the relative decline in internal trade could be ascribed to the reduction in theforced movement of goods under planning. Another explanation is that the partial deregulation of theoutput and selling price of some goods led to incentives to evade public procurement, over 1985 to 1988,in the period of the interprovincial 'trade wars'. Provincial authorities responded with the erection ofexport embargoes. With further relaxations in price and quantity controls, as well as the decline in theshort-lived demand boom, export embargoes became less significant.
xi. The downward trend in interprovincial trade, continuing untl the present, cannot beexplained only by these considerations and requires other explanations. Some relative reduction may bedue to an increase in intraprovincial production as well as consumption, due to the rapid growth intownship and village enterprises. Problems of numerous fees and fines, extracd on the road, legal aswell as illegal are also an explanation. The absence of overarching regulations on iteprovincial tradeimplies that decisions which may limit trade made at the provincial, or lower levels, cannot be easilyovertned. Difficulties of transportation by road as well as by rail also hinder the domestic flow ofgoods. Transport facilities have not grown as fast as output. Mimisterial and jurisdictional barriers haveaggravated spatial segmentation. Difficulties encountered in interprovincial payments and settlementmechanisms have also segmented the internal market.
xii. Cross-provinical investment flows have declined in relative terms (compared to the shareof foreign investments, and relative to provincial GDP) over 1985 to 1992 (para 2.54 to 2.60). The fiscalsystem, and the incentives and authority given to provincial and local governments to raise revenues,provide partial explanations. The separation of profits and taxes was accompanied by the introduction ofprofit retention, as well as an increase in local authorities' taxation powers. It is therefore to theadvantage of local governments to retain enterprises within their jurisdictions. InAtivs for
- xiv -
Interprovincial investment are also confused by the large number of special investment zones, with nmnyauthorized or unauthorized tax concessions.
xiii. Some progress is observed in labor mobility in terms of increased flexibility in the hiringand dismissal of labor in state enterprises, and in determining wages and bonuses. There is less progressin the regional mobility of labor, despite the recent relaxation of urban grain rationing In several locations(para 2.74 to 2.88).
xiv. Foreign exchange had been constrained in its mobility across regions, as regionaldifferentials in swap markets indicated. Recent changes, introduced on January 1, 1994, indicateconsiderable imporvement in the flexibility of access to foreign exchange, as well as simpliflcation of thetrade and exchange control regime. How the new system will operate in practice can only be determinedafter it has been in place for some months. In conclusion, there has been considerable progress in thesubstitution of planned allocation by the price mechanism. Yet, markets for both goods and factorsof production still show signs of regional fragmentation.
xv. The withdrawal of the state from allocation and pricing decisions was not accompaniedby a parallel withdrawal of the state from distribution (Chapter 3, para 3.7 to 3.12). The share of thestate sector (excluding collectives) in distribution, as measured by both the value of retail trade and thenumber of distribution units increased in absolute terms over the last decade. While there was a relativedecline in the state's share over the early years of the reform (1978 to 1985), there was little perceptiblechange from 1985 to 1991.
xvi. Yet, in aggregate, retail trade grew and the level of retail trade services available nowput China above the former Soviet Union, though still below Western Europe (Table 3.3). Innovativechanges have also occurred in the distribution system, in response to other changes in marketmechanisms. They illustrate that the state sector has been able to respond to competitive stimuli and thatchanges in operation are being effected despite relatively gradual changes in ownership. The combinedrequirements of capital-intensive infrastructure and the need to build information networks across largeregions and many entities may make it more difficult for the non-state sector to enter the business ofdistribution, relative to production.
xvii. While the evolution of new forms of distribution in China has been in the right direction,there is scope for better management of distribution functions of existing warehouse facilities, improvedinventory management, delivery scheduling and the development of backchannels for the recycling ofused materials (Annex 3.1).
xviii. In terms of the organization of the distribution of producer goods, some enterprises underthe leadership of material and equipment bureaus and their sponsor, the former Ministry of Materials andEquipment (now a part of the Ministry of Internal Trade) are involved in a wide range of activities,including industry, real estate and construction. This diversification has been in part a response to poorprofitability from their main task of distribution, due to price controls and allocative obligations. Thetwelveenterprise structure of many materials bureaux results from the takeover of the marketng anddistriltion functions of some production bureaus, with agreements to maintain their structures intact.This 12-enterprise structure has developed variations in some areas and firther flexbility is encouragedto adapt to local industrial needs.

- xv -
xix. Some of the warehouses owned by tha materials bureaus are old, with inadequateprotection against the elements, leading to spoilage and damage in storage. The location of the newfacilities at the sites of existing storage centers is not optimal. Many warehouses today are located inurban areas where land is scarce and expensive in terms of its opportunity cost. The present level ofmechanization of materials handling and computerization of order placement and inventory managementis very limited. Due to a variety of causes, which may Include internal management and administrationas well as market conditions, the financial condition of some materials bureaus is reported to beprecarious and should be analyzed.
xx. Difficulties caused by trade barriers and distribution problems are compounded by realbottlenecks in transport (para 3.51 to 3.65). The demand for 200 million tons of freight (around 10percent of freight capacity) was estimated to be unsatisfied in 1989. China's rate of investment intransport, at around 1.3 percent of GNP, compares unfavorably with other developing country ratios, of2 to 3.8 percent of GNP (para 3.56). Producer goods depend largely on the railroad system, thatsuffered from underinvestment due to limited revenues resulting from low passenger and freight tariffs.Recent successive raises in tariffs are expected to improve the profitability of the system. The assignmentof freight quotas to specific producers or users also distorted the prices of commodities requiring railfreight.
xxi. On road transportation, the regulation and administration of the trucking business is anissue of concern. Although the entry of new operators of trucking services has grown easier, and pricinghas become more flexible since 1983, there is still overlap in the functions of the multiple agencies whosepermits are required for licensing and registration (the local Transportation Bureaux as well as the PublicSecurity Office). There are also constraints on the time period and permitted uses of 'own account'trucks. Deregulation of trucking tariffs has taken the form of 'decentralized regulation', with the transferof the authority for setting tariffs to the to local Departments of Communications. Consequently, thereare now wide regional variations in tariffs.
xxii. The development of trucking operations is constrained by the lack of freight forwardingand consolidation centers and the limited development of intermodal transportation systems. Such systemsrequire the development of containerized shipping, which China is now beginning to explore.
xxiii. A remarkable number of commodities exchanges have been established in the last twoto three years, in grain, non-ferrous metals, petrochemicals, and agricultural commodities such as rubberand sugar (Chapter 4). A new framework of supervision for the new exchanges was announced, on Nov.4, 1993. The registration of exchanges remains the responsibility of the State Administration of Industryand Commerce, but the responsibility for their supervision has been assigned to the State CouncilSecurities Commission. Day to day administration of such supervision will be entrusted to the ChinaSecurity Supervision and Administation Committee. After scrutiny by this body, all exchanges will bere-registered with the SAIC. There have been wide differences in the operating rules of the variousexchanges. Some regulations (concerning margin deposits and fees) have been at inappropriate levels.Essential elements of commodities market regulations (such as Pidelity funds) did not exist. It is hopedthat under the new framework these difficulties will be resolved.
xxiv. Continued intervention in activities related to the exchange of commodities, such as settingprice ceilings or floors (as in the case of the Zhengzhou grain center), warehousing (through the provisionof differential subsidies, in the metals trade) raises the risk of either undermining the price uncertaintyon which such exchanges depend, or raising the pressure to continually increase government subsidies,

- xvi -
as subsidies are transferred through arbitrage to all market participants. The recent operation of thecommodity exchanges emphasizes the possibility of 'proxy markets' arising in cases where continuedgovernment intervention persists.
xxv. The most striking example provided here of the effects of controls in one market on therest of the economy is the case of foreign exchange speculation through trade on the metals exchanges.If exporters and importers do not have free access to foreign currencies, and there are markets which dealin forward and futures contracts for internationally tradable commodities, these markets will reflectexpected movements in the foreign exchange rate. Hedging or speculative transactions in foreign exchangebecome part of the raison-detre of such exchanges. The large and growing volume of trade on theexchanges suggests that the foreign exchange market is more constrained today than apparent, and pricesignals are consequently distorted (para 4.44 to 4.49).
xxvi. A key issue which China must confront in its experiments with new market forms, andspeciflcally in the area of establishing commodities markets, is that the present large numbers of suchexchanges will probably diminish over time due to a number of factors; the improvement in internalcommunications, closer integration with the world economy and consequently closer links with exchangesoutside the country. Speculative activity will fall as the 'zero-sum' nature of such trade is betterunderstood. The establishment of independent markets, especially in foreign exchange, will hasten thisprocess. There is a likelihood of waste in the establishment of several new exchanges, especially in viewof the presently preferred capital-iatensive methods . f screen-trading which is an expensive option toadopt in the initial stages of an exchange.
xxvii. There is room to improve the efficiency and reduce the cost of trading practices (para4.33 to 4.40). The metals Exchange at Shanghai is a fully computerized screen based system, where theexistence of a trading floor is redundant. The Shenzhen exchange is a combination of an 'open outcry'system, with a large central screen recording bids and buys. In both cases, a simple open outcry ringdealing system may have been preferable on cost grounds. The computerized information entryrequirements slow the trading process and will become a hindrance as the pace of trading accelerates. Italso impedes the growth of trade by 'market makers', trading on their own account and providingessential liquidity to the system. While cultural reticence may be a factor against the adoption of 'openoutcry', its cost advantages for a newly-established should also be considered. In the future, onceexchanges are well-established, they could evolve towards more expensive screen-based trading.
xxviii. China is aware of the need to safeguard competition and develop regulations forcompetitive markets. A law on competition was approved in September 1993, and a new law on consumerprotection has also been adopted. Laws to safeguard market competition through the protection .f patentsand trademarks were approved earlier. The problem of monopoly in China is not pervasive, unlike manyother transforming socialist countries. Consequently, the emphasis should be on market 'conduct' issues,such as the the control of unfair trading practices rather than market 'structure' issues, such as enterprisesize, or mergers and acquisitions. China is today experimenting with the fostering of links betweenenterprises and the formation of enterprise groups and some of the experiments are likely to increaseoperational efficiency, and facilitate interregional investments (5.13 to 5.27).
xxix. Procedures for establishing new enterprises are still onerous (para 5.35 to 5.46). Manydifferent agencies' permits are required and a large discretionary role is given to some agencies, such asthe State Administration for Industry and Commerce (SAIC). Ihe role of the SAIC has expandedenormously over the last few years and it may be undertaking the work entrusted to several different
- xvii -
agencies in market economies (including licensing new establishments, safeguarding competition andregistering 'kew commodity exchanges).
xxx. A large agenda for legal reform is now under preparation as part of the Five-year planfor economic legislation. Many differen. agencies will tackle different aspects of reform, and the processcould be slow, especially In view of the need for drafting assistance required by some of the agenciesconcerned. The World Bank has offered assistance to the Chinese government in this process of legalreform through an Economic Law Reform Project which is currently under preparation.
C. Recommendattons
xxxi. Key recommendations to help China accelerate its movement towards the adoption ofwell-functioning internal markets and an integrated domestic economy are presented below. These aregrouped under four broad heads: (1) increased market integration through trade, price and factor mobility;(2) enhanced efficiency in distribution; (3) better functioning of new markets; and (4) a more appropriateregulatory framework.
Market Integration
xxxii. China's authorities should ift residual controls on prices. So far, they have emphasizedthe prices, or allocation, oa goods. They must now achieve further progress with the decontrol of theprices of both critical consumer goods and producer goods still subject to the Plan and then move towardsprice and quantity restraints on services and on factors of production.
xxxiii. Concerning regional trade policies and the Integration of regional markets:
(1) China must establish a general framework of legislation on interregional trade andprohibit trade barriers, such as internal 'export' embargoes or 'import' restraints;
(2) The myriad fees and fines levied on interstate (and intercounty) trade must be harmonizedacross provinces. A nationwide standardized list of genuine charges should be prepared.The transparency of the procedure followed in each local jurisdiction can be improvedthrough the collection and periodic publication of schedules of tariffs, taxes and othercharges, at a provincial or national level;
(3) Authorities should standardize the collection agencies for fees and publish details ofpersons or agencies responsible for collection; and
(4) Once a list of genuine fees is established, authorities must stop the collection of illegalcharges.
xxxiv. In the context of capital mobility and interprovincial investments, the government should:
(1) Condnue and extend the separation of profits and taxes;

- xviii -
(2) Reduce the Incentives to provincial or lower level authorities to restrict the transfer ofenterprises to other locations through the stricter enforcement of the rule of tax accrualto the home province. Establish an appropriate monitoring system for this; and
(3) Stop the legal and illegal circumventions of the interstate income tax regulation resultingfrom the establishment of special 'zones'. While many illicit zones have receinly beenremoved, the 200-odd which have been permitted to remain are still a non-negligiblenumber.
xxxv. To ensure the equitable distribution of the, benefits of the gaias from increased internaltrade and factor mobility, the Government should consider the establishment of an appropriateredistributive or compensation mechanism. Alternative mechanisms incluee the European Community'sStructural Funds, or the fund suggested in the Bank's recent Budgetary Expenditure study (see Chapter6).
xxxvi. Attention should be turned towards regulations which permit an increase in the regionalmobility of labor. One important reason for restricting labor mobility in the past was urban grainrationing. Some rations have been lifted in early 1993, and many price controls on consumer essentialssuch as grain and edible oils. This is an appropriate moment to begin to lift restraints on labor mobility.
xxxvii. In the context of the recently unified exchange rate, care should be taken to ensure freeaccess to foreign exchange by exporters and importers through the banking system. Besides the widerimplications for efficiency this should increase foreign exchange mobility and also permit the newcommodities markets to fulfil their primary function.
DMbutton Syste
xxxviii. While the evolution of new forms of distribution in China have been in the rightdirection, there are still shortfalls compared to best practice in market economies. A detailed study ofcurrent distribution practices should be undertaken, to investigate the scope for better management ofdistnrbution functions of existing warehouse facilities, through (i) the reduction of partly-loaded truckshipments; (ii) the reduction oe +he number of times goods are handled or moved; (iii) improved inventorymanagement through more reliable shipping from producers and timely information from users; (iv) betterphysical management of warehouse space by arranging goods on a computerized customer order in theorder in which they will be picked up from warehouse shelves; (v) the introduction of 'cross docking'practices to permit vehicles bringing in supplies to be transferred directly to delivery vehicles topurchasers, and (vi) the development of backcbannels for the recycling of used materials.
xxxix. Concerning the range of operations of the former MME and the organization of materialsbureaux, China should:
(1) Accord greater flexibility to the MME in their primary activities, in terms of theprocurement, pricing and distribution of the goods they carry, through the acceleratedlifting of price controls and allocation obligations on these activities;
(2) Discourage the branching out of materials bureaux into unrelated and speculativeactivities such as real estate purchase or construction;

-xix -
(3) Permit the present twelve-enterprise structure to be more flexible and better adapted tothe needs of local industry; and
(4) Encourage value-adding activities at the materials bureaux, to provide additional qualityor convenience for buyers. But research on products distributed may be better integratedwith production enterprises than with distribution enterprises.
xl. Actions to increase future competition through new entrants are also required. Localbureaus should be permitted and encouraged to expand into other localities, and entry into distributionby individuals and collectives could also be encouraged, for example by permitting them to leasewarehouse space from government bureaus.
xli. Detailed studies of the physical facilities of the distributionsystem are recommended. Thecosts and benefits of investing in improved facilities must be evaluated. The evaluation should examinethe potential loration of any proposed new facilities, as well as the relocation of existing urbanwarehouses to points outside major cities. The study should also appraise the costs and benefits of themechanization of materials handling and the computerization of order placement and inventorymanagement.
xlii. A study of the financial condition of the materials bureaus and an esdmation of the extentto which the decline in profitability of the materials bureaus is due to losses made on goods which remainunder planned allocation should be undertaken. The expected improvement in profitablity at materialsbureaus, with recent reductions in the number of goods under planned allocation or controlled prices,should then be calculated. The examination of the profitability of the materials distribution system shouldalso include an evaluation of cash-flow and inventory management, and should be launched as an exercisewhich combines marketing as well as financial expertise. Since the last major round of price decontrolshas just been concluded, this is an appropriate time to begin such an undertaking.
xliii. Detailed recommendations on transport are available in other reports. This report pointsto some key issues affecting distributional efficiency. Regarding railways, the government should:
(1) Undertake successive increases in railway tariffs, to their long run marginal cost levels,to improve profitability and ensure that decisions on industrial location are based on theright parameters; and
(2) Phase out the assignment of freight quotas to specific producers or users, to avoiddistortions in the prices of commodities requiring rail freight.
xliv. On the regulation and administration of the trucidng business, China should:
(1) Remove the overlap in some of the functions of the multiple agencies whose permits arerequired for licensing and registration (the local Transportation Bureaux as well as thePublic Security Office);
(2) Gradually remove constraints on the time period, and permitted uses, of 'own account'trucks;

-xx -
(3) Deregulate altogether the 'decentralized regulation', of trucking tariffs (which has led tothe transfer of the authority for setting tariffs to the to local Departments ofCommunications, and consequent wide regional variations in tariffs);
(4) Develop freight forwarding and cousolidation centers to encourage 'own account' truckersby serving as collection points for goods shipped in less-thaa-truckload quantities; ar4
(5) Further promote the development of containerized shipping to facilitiate intermodaltransportation systems.
New Marets
xlv. A first concern in this area is completion of the overal framework of supervision for thenew exchanges, to be adopted by the new CFMC. The new legislation should take into considerationalternative approaches to the regulation of commodities exchanges, presented in the report (pp 109).Second, once the umbrella legislation is in place, the task of reconciling the differences in operating rulesof different exchanges must be undertaken. Areas of the present legislation which require attention are:the nature of the supervisory Board, the regulations on participation, on transaction fees, and margindeposits. The establishment of provisions for a Fidelity Fund (for protection against default by brokers)is also recommended. Third, the role of the SAIC, as the body best suited to handle the registration ofnew exchanges, should be reevaluated. The SAIC is already considerably overextended and this is a taskrequiring specialized knowledge. In this context, the regulations, recendy adopted by the SAIC, fortraders and brokers on the exchanges, may restrict the number of participants on the new exchanges, andshould therefore be reviewed. It is more desirable to have a smaller munber of exchanges, but with arelatively large number of participants on each, than vice versa. Fourth, the likelihood of considerablewaste in the establishment of several new exchanges, especially in view of the presently preferred capital-intensive methods of trading, must be recognized and more exchanges should only be established if shownto be sustainable in the medium term.
xlvi. In terms of the physical organization of the new exchanges, the following improvementscan be pointed out. First, the adoption of a simple open outcry ring dealing system should be considered,as an alternative to the present computerized system, not only in all new exchanges, but also in theexisting ones, ast the time when the next increase in computer requirements is reviewed. Objections to'open outcry' based on their vulnerability to fraud, are exaggerated. However if this a majorconsideration, the 'Japanese Auction System' could be introduced, in which there is a single price for allbuying and selling orders for a given trading session.
xlvii. Meanwhile, trading costs can be reduced with the utilization of the facilities at a giventrading center by more than one exchange. Since most exchanges at present do not trade every day of theweek, or all hours of the day, this should be feasible.
Ma*et Regukaion
xlviii. FMrst, there is little evidence of monopoly, in the sense of industrial structure, in China.The regulatory emphasis should therefore be on market conduct issues. Care must be exercised to notsnuff out early experiments with enterprise groups, with unduly restrictive regulations on mergers.

-xxi -
xlix. Second, entry for new enterprises should be simplified. The administration of the processof entry and exit may sometimes be as important as the law. Third, the functions of the SAIC and otheragencies should be redefined to make them more transparent and reduce the discretionary element presenttoday in the granting of approvals. Fourth, some of the functions of the SAIC (such as the monitoringof unfair practices, monitoring cases of fraud in labelling and trademarks, and taking care of enterpriseentry requirements), should be delegated to more specialized agencies in the future. Finally, it shouldbe noted th.at a proliferation of new laws, sometimes conflicting in scope, or in terms of agenciesconcerned, could be counterproductive. Care must also be taken to counter any tendencies to permit theinterests of the agencies drafting the laws to dominate the new draft legislation.

1Market Segmentation and Market Development
A. Introduction
1.1 China's commitment to the creation of a market economy, which has been the centralplank of its program of economic reform, received new emphasis in the 8th National People's Congressof March 1993. The congress ratified the decision, already taken at the 14th Party Congress of October1992, to develop a 'socialist market economy', shifting decisively away from central planning. TheConstitution of 1982 was amended to emphasize this shift of policy towards the development of 'socialismwith Chinese characteristics'. These decisions reflect the culmination of a series of policy shifts whichbegan in December 1978, when the Third Plenum of the 11th Party Congress announced for the first timethat planning and markets could be compatible. Over the subsequent period, futher policypronouncements steadily moved China towards the goal of an increase in the role of its markets and adecline in central planning.'
1.2 Shifts in administrative responsibility had been introduced in parallel to the changes inpolicy direction. In 1982, internal distribution functions for consumer goods were consolidated underthe Ministry of Commerce, which merged the Ministry of Grains and the National Trading Corporationwith the former Ministry of Commerce. In 1988, the Ministry of Materials was established, by adecision of the State Council to gradually abolish the material supply and marketing organizations ofindividual ministries, and consolidate the supply and marketing responsibility of producer goods at thenational level though enterprises under the new Ministry. Finally, in 1993, at the 8th National People'sCongress, it was decided that the erstwhile Ministries of Commerce and Materials would be merged ina single new Ministry of Internal Trade.
1.3 The development of the internal market was fostered by a series of mechanisms intendedto reduce the scope of state intervention. A first key element of the strategy was progressive pricedecontrol, through the introduction of three categories of prices, planned prices, guidance prices andmarket prices and the gradual movement of goods from more regulated to less regulated categories,together with 'dual track' pricing, introduced in 1985, which permitted output above certain target levels
I Following the success of agncultural maiket reforms after 1979, the 12th Congress of the Party aimedto use nadcet regulation as a supplement to planning, and in October 1984 it called for a furtherreduction in the scope of madatory planning and its replacement by 'guidance planning'. The 13thCongress of 1987 adopted the goal of 'letting the state regulate tL3 market, and letting the market guidethe enterprises'. The evolution of the politics of market reform is taced in White (1993).

-2-
to be sold on the free market.2 The proportion of goods in total domestic retail trade subject to plannedprices fell dramatically between 1978 and 1991 (Figure 1.1), in favor of 'guidance prices' and freemarket prices. Goods subject to planned prices have fallen considerably aurther, with recentannouncements in early 1993 of the relaxation of controls on prices of grain and edible oils.
Figure 1.1 Ieduot1on In Scope of Price controls(Peroentage)(1978-1991)
L1 t1 t993
1 Iliad Ples 1 Gulded Priew UmI Fe" Pdie
1.4 Second, the allocation of goods was progressively moved out of the mandatory plan. In1980, 90 percent of industrial goods, and 837 production materials were allocated under the plan system.By early 1993, the proportion of industrial goods under the plan had declined to 12 percent and thenumber of production materials in this category has been reduced to 11. At the same time, consumergoods whose planned allocation was administered by the Ministry of Commerce declined in number from274 in 1978 to 14 in 1993. Third, a diversification of distribution systems and channels was graduallypermitted. Formerly, the system of unified purchase and sale of consumer manufactures, as well as theunified purchase of farm products, by designated government agencies, accounted for virtually all sales.3
Sales may now be made to private purchasing agencies, or directly to consumers. A variety of newforms of markets are evolving as a consequence, including sophisticated commodity exchanges andcomprehensive as well as specialized distribution centers.
2 Explored furtr in Chapter 2. Descriptions of the progress of price reform in China may be tracedthrough Byrd (1987), Wu and Zhao (1987) and World Bank (1990a&b). Sectodal details are given inWorld Bank (1992) 'China: The Achievements and Challenges of Price Reform', Albouy (1991) and acompanrtive pepective is offered in RIjaran (1991).
3 The Unified Purchase system dated from 1951, wben it was introduced with an Implementing Decisionof the State Council. Manufachtued consumer goods were classified under three categories, accordingto whether they were deemed to be essential goods, items of mass demand, or others. The purchaseand sale of goods in the first two categories were handled by the central government, while goods inthe third category were handled by local governments. Agrcultural goods were similarly grouped andgoods in the first two categories were subject to 'monopoly purchase' and 'designated purchase',respectively, at statedetermined prices. Goods in the third category were subject to purchase atnegotiated prices.

- 3 -
1.5 At the same time as these measures to improve the functioning of the internal market werebeing introduced, China also adopted an 'open door' policy towards foreign trade and investment. It Isclear that China has made rapid strides in the development of its external trade. In recent years, from1985 to 1992, exports and imports grew at 17 and 10 percent per year, respectively. While domesticinterprovincial trade also rose in absolute terms, its rate of growth at 4.8 percent per year was lowrelative to foreign trade, and also lower than the 9 percent annual rate of growth of total retail sales(Figure 1.2). As a consequence, while the share of external trade in GDP increased, the share ofinterprovincial trade in domestic retail sales declined.
Figure 1.2 External and Domestic Trade Shares
GBX 7~~~~~~~~ox.40o% . t%
50%307o .. 1- . 640% *- -
ZoSa *-** -11- 111|1-- -1 . 3 80% . -_lox. I
1985 1988 1990 1991 1992 1985 1988 1990 1991 1992
i hternal Trade / GDP I Dro= Trade/ReLSalee
fomwe Appendix Table P.10 nd WM Bank hti
1.6 Together with the finding of the relative decline in domestic trade, there are reports ofdifficulties encountered in the processes of internal trade, both in terms of the difficulties of establishingnew forms of markets, as well as obstacles created by authorities in some provinces, which restrict theinflow or outflow of goods and factors in their provinces. These difficulties are compounded by realbottlenecks in transport, storage and distribution. It has recently been estimated that the demand foraround 200 million tons of freight, or around 10 percent of freight capacity, remained unsatisfied in 1989.China's rate of investment in transport has averaged around 1.3 percent of GNP, while other developingnations' investments in transport ranged from 2 to 3.8 percent of GNP.4
1.7 The limited extent to which internal trade exists has sometimes been attributed to theuniquely 'cellular' structure of the economy.' Though geographically vast, it has been pointed out thatattempts at achieving the local self-sufficiency emphasized in the Maoist era led to a duplication ofindustrial pattern by province. The inefficient location of industry was compounded by dispersal resultingfrom the 'Third Front' policy, of moving industrial enterprises towards the interior. In later years, (aspointed out today by some government officials), with increasing dencentralization, local governmentofficials sometimes established 'repetitive and non-economic industries with a view to increasing local
4 World Bank (1992). Report No. 10592-CHA.
5 Commented on by Donnithome (1972), and later by Lyons (1987). Recent evidence, particularly in theprovinces around Shanghad, has been described by W. Huang (1992).

4-
fiscal revenues, or local employment, or even to "chase achievements" during their official careers. In1987, 80 factories in 21 provinces produced refrigerators, over a hundred factories in 26 provincesproduced televisions and 300 factories in 28 provinces could produce washing machines. The pattern wasreinforced by the nature of the planning mechanism and the decentralization of investment decisions inthe early 1980s at the provincial level. As a consequence, industrial plant is frequently undersized. Onereason why provincial and local authorities have sometimes limited the entry of goods from otherprovinces is to attempt to shelter these small and relatively inefficient enterprises. This protection resultsultimately in higher prices for consumers and inefficient production. While there are now some signsof change, impediments to regional trade flows still exist in a variety of forms. A major potentialeconomic advantage, the large internal market, is diminished as a consequence.
Factors Affecting Internal Markets
1.8 As the preceding paragraphs suggest, there is a wide range of factors which determinemarket structure and affect the functioning of markets, beginning, first, with a broad group of governmentpolicies. Most important among these are decisions regarding resource allocation and resourcedistribution systems, and price determination systems. Decisions to remove goods from the system ofcentrally-planned procurement, allocation and distribution implied by the unified purchase and salessystems represent major moves towards the creation of markets. The relaxation or removal of pricecontrols, which permits prices to be determined by the forces of market demand and supply, is also acritical element of market creating policies.
1.9 Another key factor in the creation of efficient markets is the spatial integration of marketswithin an economy. The geographical size of China's internal market offers huge potential benefits fromsuch integration, in terms of increased efficiency in industrial structure as well as in the deployment offactors and pricing of goods. The policies affecting the realization of market integration are those whichrelate to the mobility of goods and factors of production. The extent to which goods, or factors ofproduction such as labor and capital, are permitted to move freely within the country depends not onlyon the establishment of distribution systems, but also on both national and local level policy decisions tofacilitate, or at least allow, their movement. In international trade, such constraints on trade flows ingoods take the form of tariff or non-tariff barriers. In internal trade, tariff barriers in the form ofcodified specific or ad valorem levies on goods entering or leaving provinces are rare, within a country.6
In the case of China, there are no such formal tariffs, but there many accounts of ad hoc charges, feesand tolls on goods entering or leaving provinces, and in economic terms their equivalence to tariffs maybe established. Moreover the uncertainties created by the ad hoc nature of some of these charges and thedifficulties they add to interstate transactions constitute a form of non-tariff barrier to trade. Additionalnon-tariff barriers take the form of policies such as procurement guidelines, at the levels of provincialor lower level govermments, which may restrict imports or exports.
1.10 Both central and lower level government policies also affect factor mobility. The mobilityof capital refers to investment flows as well as credit flows, across provincial boundaries. Capitalmobility is essential for efficient resource allocation in a market economy, if investment is to flow intoits most productive uses, and in the most geographicaliy suitable areas. Labor mobility includes the
I In India, however, there is an interstate 'octroi', which takes the form of an ad valorem sales tax ongoods crossing state boundaries. bItersfrte sales tax registrion procedures are also cumbersome andact as a de facto constraint on intemal trade.

ability of both skilled and unskilled labor to seek jobs in alternative occupations and locations, alsopermitting industries to have access to the labor skills they require. Policies affecting the developmentand functioning of markets for capital and labor are therefore integral elements of the creation of anefficient internal market.
1.1' ~In additional to these policies, the functioning of the internal market will increasingly beaffected by the regulations of the government which monitor market behavior to safeguard competitionand guard against the abuse of market power. The issues alluded to here lead to the question of thefuture role of the government in the support of the market economy. As the government retracts fromits close involvement in market administration, its role in a more liberal market requires definition.While the government may no longer be setting prices, there may be a need for monitoring price settingin some contexts, for example, if there are possibilities of monopoly or oligopoly. This requires thecreation of a legal framework which permits this to be undertaken, as well as the setting up, oreinforcement, of appropriate agencies to perform these functions. The reduction in the role of state
planning also requires the proper functioning of contractual mechanisms, as well as the enactment andenforcement of mechanisms to protect consumers, for example against fraudulent trade or falseadvertising.
1.12 Finally, in parallel to these policies and regulations, the physical framework for transportand communication that permits the flow of goods and factors across the country will also criticallydetermine how well the market functions. At present China does not have sufficient capacity in itsransportation system to sustain its high rates of growth, and transportation is a particular impediment tothe development of an internal market, leading to production stoppages due to lack of inputs, the holdingof excessive inventory, and the spoilage of perishable goods, awaiting shipment.
Objectives of this Report
1.13 The everall objective of this report Is to evaluate the extent to which China, in its processof transition towards a market economy, has really been able to establish well-functioning and efficientmarkets which transmit accurate signals to economic agents in terms of production decisions and factorallocation, and permit the efficient exchange and distribution of goods. To this end, the report examinesthe present efficiency of markets and evaluates policies which affect market formation. Both the regionalor spatial aspect of market functioning, and the 'vertical' issue, of the movement from plan to market,are exaniined. Following a policy evaluation, the report analyzes 'real' aspects of market formation, interms of the new systems for allocating and distributing goods, which have evolved in the aftermath ofthe diminished role of planning. The present framework of regulation for the new markets is alsoexamined to evaluate its adequacy in the changing enviromnent.
1.14 In the following section, the report begins by pointing out the potential benefits of well-functioning and regionally integrated internal markets and shows how greater market integration has beenrealized in other countries. In this context, the report examines China's present industrial structure andshows that there is little evidence, so far, of a well-integrated structure, and that, relative to othercountries, China appears to be below its potential.
1 .1S Next, the report aims to analyze and evaluate policy measures which affect the functioningof the internal market (Chapter 2), including, first, policies relating to the price mechanism, and second,policies direcdy affecting the iterregional flows of goods and factors of production. The report showsthat, despite some success in the integration of plan and market pricing, regional integration, in terms
-6-
of the regional price convergence, has met with less success. Moreover, regional flow of goods, as wellas interregional investments and capital flows, appear to have declined, at least relative to the growth oftotal retail sales, or provincial GDP. Issues relating to regional mobility of labor are also examined,particularly in terms of recent developments, which suggest that there has been some progress in thisdirection, although further gains may be realized.'
1.16 Third, on the real side, the report evaluates changes in the distribution system and pointsout its present botdenecks (Chapter 3) It shows that the role of the state remains surprisingly large interms of distribution, despite Its withdrawal from planned allocation. However the state distributionmechanisms themselves have adapted to the new market environment While the evolution of new formsof distribution in China has been in the right direction, there a&e still constraints and limitations,compared to best practice in market economies, and areas in which Improvements may be achieved arepointed out. Constraints to distribution caused by transportation difficulties are also examined.
1.17 One striking development in Chinaes evolution towards a market economy are itsambitious recent experiments at setting up new forms of markets, in particular, the commoditiesexchanges, some of which engage in not only spot, but also forward and futures transactions. Aremarkable number of these new markets has been established in the last two to three years, notably ingrain, non-ferrous metals, petrochemicals, and agricultural commodities such as rubber and sugar. Thepresent report focuses particularly on the two non-ferrous metals exchanges as examples (Chapter 4).The report points out reasons why these markets are in many cases not functioning as intended. Areaswhere the efficiency and regulation of these markets could be strengthened are discussed. The report alsoprovides a demonstration of the links between markets for commodities and the market for services andforeign exchange. One of the difficulties faced by China, in its present situation of partly regulated andpardy liberated markets is that 'proxy markets' are beginning to evolve, where prices in liberated marketssometimes subsume the effects of price or quantity constraints in more controlled markets. Anotherdifficulty is the continued govermment intervention in different areas of price setting.
1.18 Finally, turning to market regulation, the report aims to provide a first assessment of theelements of the legal framework which are in place already, and to point out areas where extensions tothis would be required (Chapter 5). It also examines the institutions charged with the enforcement of thepresent system and evaluates their effectiveness, suggesting areas where reinforcement may be necessary.In the concluding chapter, the report pulls these different strands together to map out a feasible route forthe integration of the internal market, in terms of appropriate policy and regulatory instruments as wellas an adequate physical infrastructure. The report will discuss the specific 'real" and 'policy' variablesaffecing the mobility of goods and factors of production and will also describe the broader areas in thelegal and regulatory framework that require attention if internal competition is to be promoted.
7 Condrable attention has already been paid to this issue in a number of works, and therefore thetr_ant here is largely a summary of existing wor Evidence on the extent of labor mobility is_ummarized in World Bank (IM) Report No. 10266-CHA, and links between poverty levels and labormobility are discussed in World Bank (1992 October). Issues concerning the floating population ofurban labt and migrants are discussed in Banister (1989); Jefferson and Rawski (1992); Rutkowskd(1991); Solinger (1992 and 1992). New measures to enhance labor mobility are deAiled in Ody (1991).

-7-
B. The Potential Benefits of Internal Free Markets
1.19 The benefits of market determined prices and distribution systems are now wellrecognized in China. The case for allowing prices to be determined by demand and supply rests uponfirst, the long-run allocative efficiency that this will lead to, as resources flow towards their best uses,based upon price signals which reflect relative scarcities and needs; second, on the elimination of rent-seeking and parallel markets that arise, if prices are pegged at levels which do not reflect theirequilibrium values; third, a reduction in artificial losses (profits) in certain economic activities whereprices are set at levels below (above) their equilibrium values, and in addition, a reduction in direct orindirect subsidies that may be paid to loss-making economic agents, if these losses are due to policyconstrained prices. It is also accepted that greater flexibility in distribution systems which gives greaterflexibility to producers and consumers in procurement channels can reduce costs, cut inventoryrequirements and shorten delivery periods.
1.20 Economic gains from regional integration and its links to market efficiency are less wellunderstood and they are therefore the focus of this section. Regional economic integration, in its broadestsense, refers to the absence of economic discrimination and restrictions among economic agents of aregion." The process of integration requires the gradual elimination of economic frontiers and traderestricting instruments between territories within a region so that the mobility of goods, services andfactors is not constrained. This process of 'integration from below', can be reinforced by 'integrationfrom above', or the active promotion of economic cooperation between territories which may beencouraged through appropriate policies or institutions.9
Forms of Regional Integration
1.21 The core of most economic literature on regional integration refers to theories of customsunions. As a national unit, however, China is already a customs union, in the sense that it has a commonexternal tariff. The aim in the Chinese context is to go beyond the creation of a customs union, to theformation of a common market. The creation of a common market does not necessarily automaticallyfollow, within a customs union, as the example of Europe well illustrates. The customs union of the EECwas formed in 1957. However it was not till 1986 that the more ambitious goal of a 'market withoutfrontiers' was adopted, together with the wider goal of economic union in other areas. An economicunion, such as the EC aims to be, progresses beyond a customs union to monetary union and interlinkagesin internal (for example fiscal) economic policies. In China today, there is an anomalous situation wheremajor elements of economic union including a single currency and a common external tariff are combinedwith a lack of some basic features of a free trade area, such as the free movement of goods and factors.
8 In this chapter, thb analysis of regional integration is conducted at the level of intra-provincial tradeflow statistics. It would be interesting and valuable to examine intra-provincial trade flows as well,particularly in the larger provinces, to see whether similar patterns emerge. Lack of data haveprevented this from being included in the analysis.
4 Tinbergen (1965), discussed in the Chinese context in W. Huang (1992). Huang also refers tointegration from above and below as 'positive' and 'negative' regional itegraion, and discussesdistnctions between customs unions atnd common markets, based on Balassa (1961).

-8 -
1.22 Attempts at the regional Integration of markets elsewhere have taken many forms withvarying degrees of Implied integration. A free trade area, for example, such as the NAFTA, does notrequire the free movement of factors of production (abor and capital) or a common external tariff, unlikea customs union. Free trade areas may also be created for single commodities, or single sectors ofactivity, and combinations of partial common markets and coordinated investment plans are also possible.Recognizing these advantages, there have been many attempts world wide at regional trade integration,among both developed and developing countries.10
New Moves Tords Regional lntegraton In Developing Countries: Central Amerka
Recognizing the potentil inpact of the NAIPA for trade Salvadores private airline, TACO, has bought shares in fivebetween the US, Canada and Mexico, the six countries of other regional arlines since 1989 to face north AmericanCentrla America have recently launched new attempt at oompedtion. Banco Uno, a Guatemalan bank, has recentlycreating free markets among themselves, and discussed an begun to open branches in Honduras.'integration protocol' for economic union, in August 19. The proposed protocol sets out ambitious goals includingFour of these countries, Guatemala, El Salvador, Nicaagua monetary union and a single currency, but sets out noand Honduas have already begun to dismantle the baniers timetables, so far, for their achievement. A two-speed orto movement of goods, labor and money across their multi-speed process may be adopted to accommodatborders. Trade within Cental America has almost doubled individual countries. While Costa Rica has joined the other(to $1.8 bilion) rlative to its 1986 low point. By setting up countries in cutting extenal tariffs, it is more hesitant abouta low common extenal tariff, the group is also opening up the idea of a single market, given its relatively more stableto the rest of the world, unlike the previous attempt at a economy and lower current rates of unemployment. It maycommon market, set up in the 1960s. The four are now therefore opt out of some of these provisions for thenegotiating free trade agremen with Mexico, Columbia preent. Panama is similarly hesitant about the commonand Venezuela. etemal tariff. The importance of compromise and the need
Business interest in the integration proposal is evident. El to accommodate individual requirements is weU illustrated.
Sourc. Whm Econois. July 17 1993, p.63.
ITe Case for Regional Integration
1.23 The case for freer trade within a region rests upon a series of static and dynamic gains,to be achieved from production according to comparative advantage, increased competition, the benefitsof scale economies, and the diffusion of technical knowledge. Traditional theories of comparativeadvantage point out that production costs and selling prices for different products are likely to differbetween locations, due to differences in factor endowments (natural resources, skilled and unskilled labor,and capital), technical methods of production and regional differences in preferences and tastes." Dueto these differences in production costs and selling prices at different locations, there will be an overalleconomic gain to the region if locations are encouraged to engage in 'division of labor' and specializein the production of goods and services for which they are best suited.
10 Different forms of regional integration and their implications are described in Hufbauer and Schott(1992). Among developed countries the EC and recendy the proposed NAFTA are examples ofregional integration. Among developing countries, examples may be found in the ASEAN nations ofsouth east Asia and among north (Maghreb) and West (CFA franc zone) African countres. A recentsummary for developing counties is available in Langhammer and Hiemenz (1991).
hTe classic Heckscher-Ohlin-Samuelson model of international trade.

9-
1.24 The benefits of achieving scale economies in production are important in many capitalintensive industries where cost-savings may be effected though the better utilization of machinery withlonger production runs and fuller utilization of existing capacity. Joint management and the coordinateduse of joint resources also contribute to this. Mosc production processes face indivisibilities at somestages, for example, large-scale handling equipment, regional infrastructure, transportation and storagecosts. Scale economies are of particular significance in the group of manufactures referred to as 'processindustries' (for example, cement or fertilizers) which deal mostly with the conversion of bulk industrialraw materials. In these industries, the principle of non-linearity arises due to the fact that equipment costis a function of surface areas, whereas capacity is related to volume. In such industries, engineersestimate coefficients of the proportional increase in cost, per unit increase in volume, and the resultingcoefficients are well below 1, at around 0.6 according to some estimates.'2
1.25 Greater regional integration also permits an increase in the effective competition for allindustries producing in that area. An increase in the number of firms puts pressure on each individualunit to cut costs and improve technology. Over time, there will also be a tendency towards regional priceconvergence, as well as a reduction in the overall number of firms, as the least cost-effective producersare forced to lower costs, or leave the market. For example, in Italy, there were 50 washing machineproducers in 1960, and only 13 in 1974, as competition with other European producers increased. TheItalian industry's exports to France, Germany and the UK, which by then accounted for 30 percent ofits output, lowered unit costs by 8 percent." Another benefit of competition is greater productdiversification between producers, as different units specialize in different varieties of products.
1.26 Economic geographers also point out that there is a tendency for 'clusters' of productionto develop at certain locations, and that sometimes, given a critical mass of enterprises, growth in a givenregion will tend to accelerate. Links between such clusters an-d regional growth have long beenrecognized by development economists.'4 There is now a growing recognition of the interrelationbetween the factors cited above, and its impact on industrial structure and regional development. Theimportance of scale economies, combined with transport costs, imply that many national economiesdevelop 'cores' of manufacturing activities, combined with outlying agricultural peripheries.'5 The
12 Balassa (1961). Economic work relating plant size to cost efficiency, by industry, has calculated the'MEPS' or minimum economic plant size by industry for a number of industries. Examples cited, interms of minimum annual volumes of production, are 10,000 tons of soap, between 1 and 3 milliontons for steel, 160,000 units for bicycles, 90,000 units for tractors, 200,000 tons for cement, 1 millionunits for automobiles, and 800,000 units a year for refrigerators. See HMSO 1975, as cited in Huang(1992); Scherer and Ross (1990), as cited in Wu (1990).
3 Similar examples are cited for the European car and truck industries. The number of automobileproducers fell in Germany, Britain and France, between 1955 and 1970. Meanwhile the lowest-costtruck producer, Daimler-Benz of Germany, raised output by 7.5 percent through its increased exportsto a single country, France. Owen (1983), W. Huang (1992).
14 Hoover (1948) discussed the economics of agglomerations in the context of the US. Myrdal (1957)discussed the 'circular causation' of development and Hirschman (1958) discussed backward linkages inthe context of developing economies.
Is See particularly Krugman (199la,b&c). Murphy, St;leifer and Vishny (1989a&b) also discuss theimportance of scale economies, market size and market structure.

- 10-
demand for manufactures arises not only from consumers, but also from other geographically proximatemanufacturing industries. The importance of such clusters in the presence of 'growth enabling factors',such as foreign knowledge, learning, labor turnover and the diffusion of technical information is alsobeing pointed out, both in the general context and in the specific case of its application to some of thefaster-growing areas of China."'
1.27 Progressing towards a common market, however, requires the drawing up of a largeagenda of measures, to address both physical and technical issues impeding integration. Some of theseissues are multisectoral (such as border checkposts and 'customs' formalities, including delays imposedon road haulage, differences in product standards or technical regutations) while others must be examinedat the level of individual subsectors (for example, variations in charges for telecommunications or otherservices). An illustration of the process of moving towards a 'market without frontiers' Is provided bythe European Community, which demonstrates that progress may be spread over long periods of time,and must be meticulously mapped out.
1.28 Regional integration which permits the free movement of not only goods but also factorsof production may however have associated costs, for specific regions, in some circumstances. Whilethe arguments in favor of integration demonstrate that there are possibilities for improved total economicwelfare, the distribution of these gains among regional economies is also a consideration. Oneconsequence of the clusters and increased polarization that may occur with greater opportunities forspecialization is that, in the absence of appropriate distribution mechanisms for the total gains, someregions may be worse off with integration. The possibilities for greater polarization increase with greaterfactor mobility. While this is the implicit argument behind many forms of regional protection, it shouldbe recognized that there Is a potential for greater total gains, and also, that the existence of a credibleredistribution mechanism during the process of integration is critical for its acceptability and success.In the case of China, the decline in the central government's budgetary expenditure as a share of GNPfrom 31 percent in 1978 to 20 percent in 1991 (and a parallel decline in revenue shares from 31 to 17percent) reduces the redistributive capacity of the center. The concerns that this may justifiably arousein the context of promoting regional integration have to be taken into account.
1.29 The economic case for regional free trade blocs also raises the question of the extent towhich such a bloc creates trade, or diverts trade away from areas outside the bloc."' Even for theparticipants in the free trade area, the effects of tariff revenue losses from diverted trade may sometimesoutweigh the beneficial effects of price gains. Whether this occurs in any situation is empirical and willdepend on the relative attractiveness of domestic and external prices (including the effects of domesticand external tariffs or their equivalents and any premia that may be attached to export privileges) whichin turn depend on the relative demand and supply conditions in these markets. It remains, however, thatthe likelihood of internal gain increases if current internal obstacles to trade are high. Moreover, thelower the external tariffs, the less the likelihood of trade diversion.
16 Jacobs (1969), Romer (1986) and Porter (1989), as cited in Wang and Mody (1993) in the context ofexplanations for rapidly growing areas in China.
17 de Melo, et. al (1992), in an extension of the classic analysis by Viner (1950). What is also pointedout (based on Kemp and Wan 1976) is that it is always possible to design a welfare improving freetrade area.
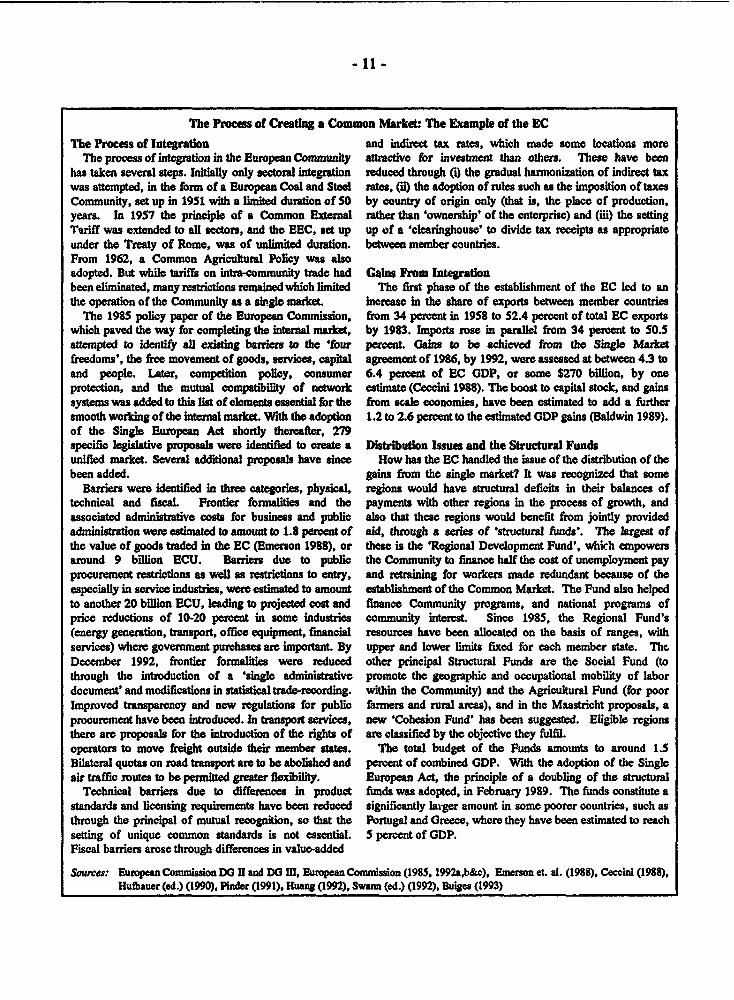
- 11-
The Process of Creating a Common Market The Example of the EC
The Process of Integration and indirect tax ates, which made some locations moreThe process of integration in the European Communuty attracdve for investment than others. These have been
has taken seal steps. Bitay only stoal integration reduced through (i) the gadual harmonizadon of indirect taxwas attempted, in the form of a European Coal and Steel rates, (u) the adoption of rules such as the imposition of taxesCommunity, set up in 1951 with a limited duration of 50 by country of origin only (that is, the place of production,years. In 1957 the principle of a Common Extemal rather thn 'ownership' of the entetprise) and (iii) the settingTariff was extended to al sectors, and the EEC, set up up of a 'clearinghouse' to divide tax receipts as appropriateunder the Treaty of Rome, was of unlimited duration. between member countries.From 1962, a Common Agricultural Policy was alsoadopted. But while taiffs on intra-community trade had Gains From Integrationbeen eliminated, many restictions ramained which limited The first phase of the establishment of the EC led to anthe operation of the Community as a single market. increase in the share of exports between member countries
The 1985 policy paper of the European Commission, from 34 percent in 1958 to 52.4 percent of total EC exportswhich paved the way for completing the internal market, by 1983. Import rose in paralle from 34 percent to 50.5attempted to identify all existing bariers to the 'four percent. Gains to bo achieved from the Single Marketfreedoms', the free movement of goods, services, capital agreement of 1986, by 1992, were assessed at between 4.3 toand people. Later, competition policy, consumer 6.4 percent of EC GDP, or some $270 billion, by oneprotection, and the mutual compatibility of network estimate (Ceccini 1988). The boost to capital stock, and gainssystems was added to this list of elements essential for the from scale economies, have been estimated to add a furthersmooth working of the internal market With the adoption 1.2 to 2.6 percent to the estimated GDP gains (Baldwin 1989).of the Single European Act shortly thereafter, 279specific legislative proposals were identified to create a Distribution Issues and the Structural Fundsunified market. Severd additional proposals have since How has the EC handled the issue of the distribution of thebeen added. gains from the single market? It was recognized that some
Barriers were identified in three categories, physical, regions would have structural deficits in their balances oftechnical and fiscaL Fronter formaLities and the payments with other regions in the prooess of growth, andassociated administrative costs for business and publio also that these regions would benefit from jointly providedadministration were esdmated to amount to 1.8 percent of aid, through a series of 'stcural funds'. The largest ofthe value of goods traded in the EC (Emerson 1988), or these is the 'Regional Development Fund', which empowersaround 9 billion ECU. Barriers due to public the Community to finance half the cost of unemployment payprocurement resticons as well as resictons to entry, and retraining for workers made redundant because of theespecially in service industries, were cstimated to amount establishment of the Common Market. The Fund also helpedto another 20 billion ECU, leading to projected cost and finane Community programs, and national programs ofprice reductions of 10-20 percent in some industries community interest. Since 1985, the Regional Fund's(energy generation, transport, office equipment, financial resources have been allocated on the basis of ranges, withservices) where government purchases are important By upper and lower limits fixed for each member state. TheDecember 1992, frontier formalities were reduced other principal Structural Funds are the Social Fund (tothrough the introduction of a 'sine administrative promote the geographic and occupational mobility of labordocument' and modifications in statistical trade-recording. within the Community) and the Agricultural Fund (for poorImproved tra ency and new regulations for public farmers and rumal areas), and in the Maastricht proposals, aprocurement have been introduced. In tansport services, new 'Cohesion Fund' has been suggested. Eligible regionsthere are proposals for the introduction of the rights of are classified by the objective they fulfil.operators to move freight outside their member states. The total budget of the Funds amounts to around 1.5Bilateral quotas on road transport are to be abolshed and percent of combined GDP. With the adoption of the Singleair traffic routes to be permitted greater flexibility. European Act, the principle of a doubling of the structural
Technical barriers due to differences in product funds was adopted, in February 1989. The funds constitute astandards and licensing requirements have been reduced significantly larger amount in some poorer countries, such asthrough the principal of mutual recognition, so that the Portugal and Greece, where they have been estmated to reachsetting of unique common standards is not essential. 5 percent of GDP.Fiscal barriers arose through differences in value-added
Sources: European Commission D 11 and DO m, Euopean Commision (1985, 1992a,b&c), Emerson et. al. (1988), Ceccini (1988),Hufbauer (ed.) (1990), Plnder (1991), Hualng (1992), Swami (ed.) (1992), Buips (1993)

- 12 -
1.30 In China, the rapid rise in external trade, together with the relative fall in internal tradeflows implies that trade diversion cannot be entirely ruled out. Trade expansion with the external marketmay well have been easier, for some provinces, than internal market penetration. However, recent movesin China to lower external tariffs make this less likely to occur. There may also have been dynamicsecondary effects of external trade in some areas, which may have led to increased domestic trade aswell, for example, the establishment of backward links with domestic suppliers, or increased sales toother provinces to achieve scale economies required to keep unit costs low. Estimating the real effectof this is difficult and the present report will only point out the relevant factors to be taken into account,and their behavior so far, based on available evidence.
C. Market Structure in China
1.31 It is necessary to examine the evidence of market fragmentation in China, and see howthis 'cellular' character affects overall industrial structure. The extent to which market fragmentation mayaffect China's growth potential as a consequence must be evaluated, and this in turn depends on howChina today compares, in this respect, with other large economies.
1.32 There is evidence which suggests that China has enjoyed some success in terms ofreducing interprovincial income inequalities. An analysis of regional distribution of per capita income,and shifts in this over time, indicates a decline in per capita income variation.' Between 1983 and1991, the coefficient of variation in regional income declined steadily from 0.77 to 0.59. There has beena similar decline in regional coefficients of variation in different measures of per capita industrial output(from 1.4 to 1.1, or 1.24 to 1.03,) and a somewhat more erratic decline in regional variations in percapita investment (0.84 to 0.75)."9 However, as explained above, greater income equality or inequalityneed not be associated with the structure of output. In the long run in China, the relative structuralhomogeneity in output may limit increases in total income for all provinces taken together.
1.33 Turning next to industrial structure and the structure of output, it is noticeable that, inChina as a whole, there have been remarkable shifts in the ownership of industrial output. Theproportion of gross output value accounted for by the state sector declined from 76 percent in 1980 to65 percent in 1985, and further to 53 percent by 1990. Both the number of firms and the outputcontribution of collective, individual, private and other enterprises (such as joint ventures), which makeup the non-state sector, have grown steadily during the last decade. Despite this, the structure of
I However, there is also evidence that points to increasng urban-rural income differentials over the pastdecade. (Khan, et. al., 1992, presents carefilly adjusted data from published statistics as well as asurvey).
9 Measured as the ratio of the standard deviation to the mean. The GINI coefficient of dispersion givesimilar results. For per capita income, these declined over the same period, from 0.300 to 0.264(Appendix Table Al. 1). There is a similar clear decline in the value of the GINI coefficients for percapita industdal output (0.5 or 0.47 to 0.43, using altemative measures, as shown in Appendix TablesA1.3 to A1.4) with a less marked decline in the GINI coefficient for per capita investment (0.36 to0.348; Appendix Table A1.2).
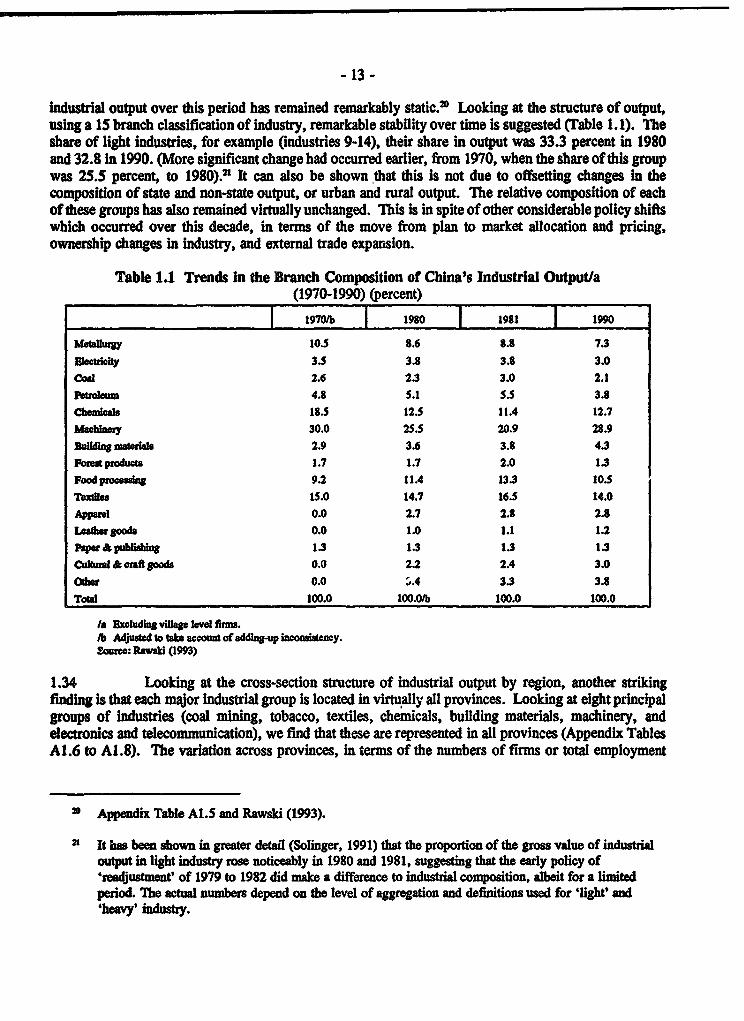
- 13 -
industrial output over this period has remained remarkably static.21 Looking at the structure of output,using a 15 branch classification of industry, remarkable stability over tme is suggested (Table 1.1). Tleshare of light industries, for example (industries 9-14), their share in output was 33.3 percent in 1980and 32.8 in 1990. (More significant change had occurred earlier, from 1970, when the share of this groupwas 25.5 percent, to 1980).21 It can also be shown that this is not due to offsetting changes in thecomposition of state and non-state output, or urban and rural output. The relative composition of eachof these groups has also remained virtually unchanged. This is in spite of other considerable policy shiftswhich occurred over this decade, in terms of the move from plan to market allocation and pricing,ownership changes in Industry, and extenal trade expansion.
Table 1.1 Trends in the Branch Composition of China's Industrial Output/a(1970-1990) (percent)
19701b 1980 1981 1990
M Bautg 10.3 8.6 8.8 73
Electuicity 3.5 3.8 3.8 3.0cod 2.6 2.3 3.0 2.1
Perolen 4.8 5.1 S5. 3.8
Chemical 18.5 12.5 11.4 12.7
Mac111MY 30.0 25.5 20.9 28.9
Buud b mates 2.9 3.6 3.8 4.3
Fatedtproducts 1.7 1.7 2.0 1.3
Food proces4s 9.2 11A 133 10.5
Texie 15.0 14.7 16.5 14.0
Apparel 0.0 2.7 2.8 2.8Leshr oods 0.0 1.0 1.1 1.2
Paper&publlsbi 1.3 1.3 1.3 1.3Cukl & caftpgaods 0.0 2.2 2.4 3.0
Other 0.0 ,.4 3.3 3.8
Total 100.0 100.0/b 100.0 100.0
Is ExcudinS vflago leve firms.lb Adjusted to t account of addlng-up inconsency.Source: Rawsld (1993)
1.34 Looking at the cross-section structure of industrial output by region, another strikingfinding is that each major industrial group is located in virtually all provinces. Looking at eight principalgroups of industries (coal mining, tobacco, textiles, chemicals, building materials, machinery, andelectronics and telecommunication), we find that these are represented in all provinces (Appendix TablesAl.6 to Al.8). TMe variation across provinces, in terms of the numbers of firms or total employment
a Appendix Table Al.5 and Rawskd (1993).
21 It has been shown in greater detail (Solinger, 1991) that the proportion of the gross value of industrialoutput in light industry rose noticeably in 1980 and 1981, suggesfing that the early policy of'readjustment' of 1979 to 1982 did make a difference to industrial composition, albeit for a limitedperiod. The actual numbers depend on the level of aggregation and definitions used for 'light' and'heagvy' industry.

- 14-
in each sector is low, compared to what might be expected, in view of the considerable diversity of theprovinces in terms of size and resource endowments. For five out of these eight sectors, the coefficientsof variation for these measures are below I in 1991O In terms of gross output value, the coefficientsof variation are below 1 in six sectors in both 1990 and 1991, and the values for 1991 are lower than for1990. 'he most pronounced similarity is for the average mnmber of persons employed per enterprise,where the coefficients of variation are less than 0.5 for 5 sectors and below 0.8 for the remaining three.Ilis suggests that firm size is also remarkably similar across provinces.
1.35 The significance of this structural similarity across provinces, especially in conjunctionwith a fairly static industrial structure over time, would suggest, in terms of the discussion of the orevioussection, that China so far has not benefited from the opportunities for regional specializadon that its largeiernal market would permit. To assess the extent ,- which China may potentially gain from this, acomparison of China and other large regional markets is undertaken here. The two comparators chosenare the European Community, and the United States. The selection of the US is obvious, as anotherlarge, federal nation state. Ihe presence of 'manufacturing belts', and sometimes highly concentratedindustries in a few specific towns, is notable. The choice of the EC is due to the fact that it is increasinglyapproximating a single market, in the same sense as the US. Although the regions of the EC areindividual countries, with huge differences between north and south, differences in size and also a highdegree of linguistic and culturl diversity, advantage has been taken of relative regional specializatimn.Thus most manufictures are located in countries such as Britain and Germany, many agricultural productsare grown mostly in Portugal and Spain, and France and Italy dominate the internal EC clothing industry.
1.36 The analysis measures the difference in the shares of individual industries between eachpair of regions within the three countries (e, for each pair of countries in the EC, and each group ofprovinces in China or states in the US), and then constructs an average of these differences for each ofthe three countries considered. The higher the value of this measure, the greater the relative regionaldifferences in industriat structure, and the bigher the degree of local specialization. Three differentindices of industrial structure have been used; the shares of individual industries in output, employmentand numbers of firms, in each region. Details of the analysis are provided in Annex 1.1. As shown inthe Figure 1.3, regional differences in China are relatively low, suggesting that there is little industrialspecialization or regional industrial concentration. The degree of differentiation is much higher in boththe EC and the US, particularly in terms of the first two measures S"
22 The coefficient of varation is the standard deviation of a distribution divided by its mean. Usingcoefficients of variation to measure dispersion enables 'normalized' comparisons of the dispersion ofdistributions, in tuations where where may be widely diffenng ranges and mean values.
2 As explained in Annex 1, the reason for fte less pronounced difference in terms of numbers of firms istdat this variable may be afrected by systematic variations in firm size, across the three countries orcountry groups. This is one of the caveats concerning the interpretation of results of cross-countryo ons. Admittedly, the use of the EC and the US as compartors is far ftom ideal, since thesecountries are at a more advanced level of indusraliation, and moreover have not undergone theprocess of transition from a planned to mret economy. However, data on better comparators are notavailable at present.

- 1S-
Figure 1.3 Coefficients of Structural DifferenceChia, USA and EC
0.91";v.IM
Sburaw S" Auae
i.37 To summaize the observations of this chapter, it is noted first of all that China has mademany moves towards the creation of a market economy over the last decade. There have beenpronounced reductions in the degree of central control over resource allocation and pricing. At the sametime, there has been a remarkable opening up of the economy towards the exterior, with a rapid growthin foreign trade. Yet, there are some disturbing imbalances in this movement towards a market economy.First of all, industri structure has remained remarkably constant over time, and moreover, the regionaldifferences in industri structure are very low relative to other counties or communities of comparablesize. This indicates that China has taken relatively little advantage of the opportunities for regionalspecialization according to comparative advantage, and the potential available to it in this direction maybe large. The additional finding that internal trade flows have been declining in relative terms reinforcesthe urgency of exploring means towards market integration, as part of the movement towards theestablishment of a market economy.

- 16-
ANNEX 1.1 Calculation of Regional Structural Difference CoeffldentsP
1. Methodology
1. The underlying assumption is that the integration of a market can permit, and willencourage, greater regional specialization. If constraints to internal trade or factor mobility exist, regionsare less likely to specialize and industrial structures across regions will tend to be more similar.
2. If the regions within a country have identical industrial structures, the shares of differentsubsectors of industry in the total for each region will be the same. These shares can be measured interms of variables such as the numbers of firms in a given subsector, the numbers of persons employedin that subsector, or its share in output value.
3. If y, represents the share (On terms of number of firms, number of persons employed,output value) of subsector i in region j, and yD represents the share of subsector i In region k, then theshares of subsector i in regions j and k may be defined as:
dij = ,& and dik nY+ , i = 1,2, ... ,n, j, kg = 1,2, ... m
Yij Y1- k
4. Tnen the difference in the shares of all subsectors i between regions j and k may bedefined as:
nDjk= Z Idij -dikl 0 s Djk s 2
2=1
5. Note that the number of subsectors i in each region j and k must be equal, to permit thecomparison. The upper limit of D , will be 2, because if the two regions have no industries in common,each pair of values will be counited twice. The lower limit of D,k will be 0, because if the structures ofthe two regions are identical, each difference will be zero. For an easier understanding of the coefficient,this can be normalized, giving us
Djk = Djk/2 o s Djk s 1 ........l (1)
21 This section draws upon and extends the methodology used in Krugman (1991b), 'Geography andTrade'. MIT Press, Cambridge, Massachusetts.

- 17-
6. The greater the strucural difference between these two regions, across all industries, thecloser the value of this measure is to 1. If a country had three regions, we can estimate the values of thiscoefficient for each pair of regions within the country, and the resulting array would be a matrix ofelements, such as:
Jl i2 i 3
i El.D 2 3 j, k = 1, 2, ... ,m
~~k 0
7. By extension, an index of the 'overall structural difference', or degree of regionalspecialization, of all the regions of a country may be estimated as an averaged value of the elements ofthis matrix. Therefore, for any country with m regions, we can define:
m m
D-ks1 D'1
8. D, by analogy with the above, has a lower limit of zero. The upper limit of D isdetermined by m, the number of regions, which is the upper limit of j and k. The limts of the measureare
ma O D s (m-j)
9. For example, if m is 3, the upper limit of the value is 3, as the matrix above shows(provided the elements below the diagonal are not counted). Dividing by this upper limit, we have a'normalized' value of D, which varies between zero and 1. Thus,
.6 D o D 1 ....... (2)m
)-1 (m-j)
10. The advantage of this measure is that it provides a summary of the overall degree ofspecialization of a country, and permits comparisons to be made with other countries. For suchcomparisons to be valid, the number of regional groupings in each of the countries considered must alsobe the same.

- 1°-
2. ApplicatIon to China and Comparison with Other Countries
11. Measures of the degree of regional specialization between different regions (D.) of Chinawere undertaken, and similar measures were also constructed for different regions within the UnitedStates (US), and the different member countries of the European Community (EC). Although China has29 provinces, and the United States has 50 states, the provinces of China and the states of the US weregrouped in 12 geographically contiguous and structurally similar units for this exercise. This wasundertaken primarily to construct measures of the overall regional structural difference (b) and thusenable comparisons of China and the US with each other, as well as with the EC, which has 12 membercountries. The grouping also eases the interpretation of the matrix of coefficients for each country byreducing the dimensions of the array. The regional groupings adopted, as well as the data sources, aregiven at the end of the tables of coefficients (bDk) for each country, in Annex, Tables Al. la to AI.3c.
12. Given the 12 regional groups for each of the three areas, the overall structural differenceindex would be:
- D - DD= -2 ,or D- 6 DS 112 ~~~~66
(12-j)
13. The industrial classifications of the three countries were similar but not identical. Acorrespondence was established between the classifications, to conform as closely as possible to theInternational Standard Industrial Classification, at the three digit level. All manufacturing industries wereincluded and the resulting classification has 17 groups of sectors at the three digit level.'
14. Three different measures have been used to estimate regional subsector shares, the numberof firms in a given subsector and region, the number of persons employed in that subsector, and the totalvalue of output. Of these three, the second and the third are likely to be more reliable, because thenumber of firms will be affected by differences in the distribution of average firm size in differentregions. This is particularly likely to affect cross-country comparisons.
15. The results of the estimations of regional diffcrence coefficients for regions within thethree countries/ areas (Di) are presented in Annex Tables Al. la-c (number of firms), AI.2a-c (numberof persons employed) and AI.3a-c (gross value of industrial output). An inspection of the matrices forthe three countries suggests first, that on any of the three measures of regional shares, the differences inindustrial structure across regions in China Is lower than in either the EC or in the US. For example,looking at the array of coefficients for regional differences in the number of persons employed in differentindustries (Tables AI.2a to Al.2c, across the three selected areas), we fid that in the EC, regional
2 The subsectors are: Food and Beverages [311/2/3]; Tobacco [314]; Textiles [321]; Wearing Apparel[322]; Leather and Products [323]; Wood Products and Furniture [33112J; Paper and Products t341];Printing, Publishing [342]; Industrial Chemicals [351]; Petroleum and Coal Products [353/4]; RubberProducts [3551; Glass and Non-metal Products [362/9]; Metal Industdes [371/2]; Metal Products [381];Machinery n.e.c [382]; Electrical Machiney [383]; and Transport Equipment [384]. Details of thecorrespondence established across countries is available if required.
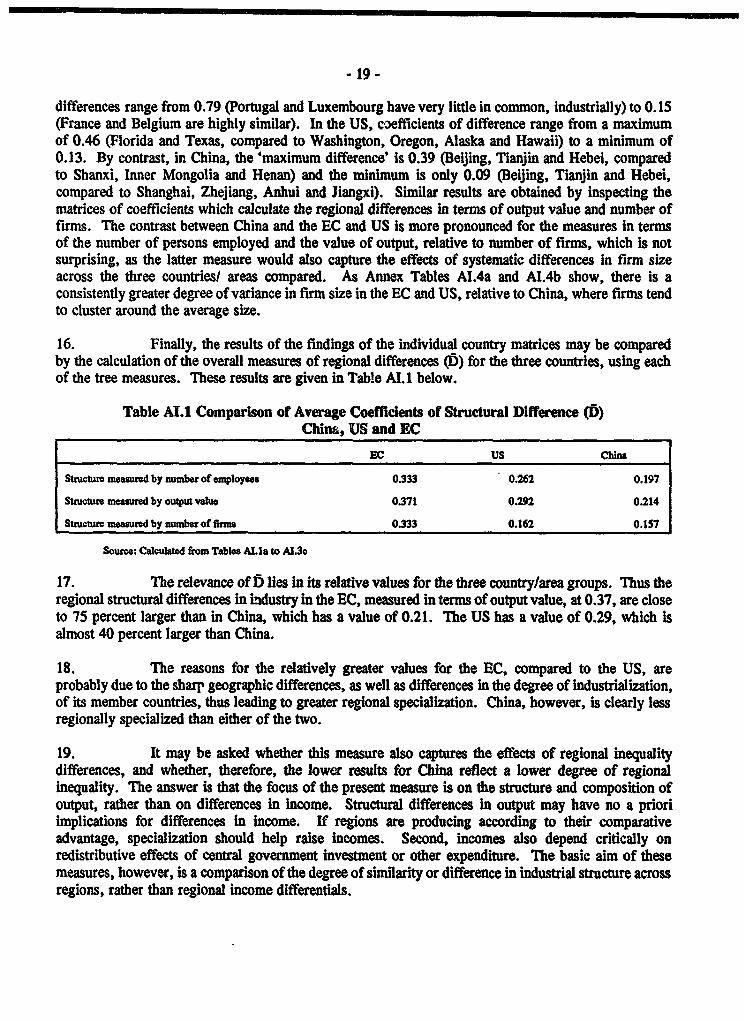
- 19 -
differences range from 0.79 (Portugal and Luxembourg have very little in common, industrially) to 0.15(France and Belgium are highly similar). In the US, coefficients of difference range from a maximumof 0.46 (Florida and Texas, compared to Washington, Oregon, Alaska and Hawaii) to a minimum of0.13. By contrast, in China, the 'maximum difference' is 0.39 (Beijing, Tianjin and Hebei, comparedto Shanxi, Inner Mongolia and Henan) and the minimum is only 0.09 (Beijing, Tianjin and Hebei,compared to Shanghai, Zhejiang, Anhui and Jiangxi). Similar results are obtained by inspecting thematrices of coefficients which calculate the regional differences in terms of output value and number offirms. The contrast between China and the EC and US is more pronounced for the measures in termsof the number of persons employed and the value of output, relative to number of firms, which is notsurprising, as the latter measure would also capture the effects of systematic differences in firm sizeacross the three countries/ areas compared. As Annex Tables AI.4a and AI.4b show, there is aconsistently greater degree of variance in firm size in the EC and US, relative to China, where firms tendto cluster around the average size.
16. Finally, the results of the findings of the individual country matrices may be comparedby the calculation of the overall measures of regional differences (b) for the three countries, using eachof the tree measures. These results are given in Table Al.1 below.
Table AI.1 Comparison of Average Coefficients of Structural Difference (i)China, US and EC
EC US China
Stntudro measured by number of employees 0333 0.262 0.197
Suuoture mead by output value 0371 0.292 0.214
Stucture measured by number of firms 0333 0.162 0.157
Source: Calculated fiom Tables AI.la to l.3c
17. The relevance of 13 lies in its relative values for the three country/area groups. Thus theregional structural differences in industry in the EC, measured in terms of output value, at 0.37, are closeto 75 percent larger than in China, which has a value of 0.21. The US has a value of 0.29, which isalmost 40 percent larger than China.
18. The reasons for the relatively greater values for the EC, compared to the US, areprobably due to the sharp geographic differences, as well as differences in the degree of industrialization,of its member countries, thus leading to greater regional specialization. China, however, is clearly lessregionally specialized than either of the two.
19. It may be asked whether this measure also captures the effects of regional inequalitydifferences, and whether, therefore, the lower results for China reflect a lower degree of regionalinequality. The answer is that the focus of the present measure is on the structure and composition ofoutput, rather than on differences in income. Structural differences in output may have no a prioriimplications for differences in income. If regions are producing according to their comparativeadvantage, specialization should help raise incomes. Second, incomes also depend critically onredistributive effects of central government investment or other expenditure. The basic aim of thesemeasures, however, is a comparison of the degree of similarity or difference in industrial structure acrossregions, rather than regional income differentials.

2Recent Evolution of China's Internal Markets
2.1 The objective of this chapter is to assess the recent evolution of Cbina towards a marketeconomy, in terms of key economic parameters. One important indicator of the extent to which marketsare functioning, as discussed in Chapter 1, is the behavior of prices. In a market economy, the price ofa good would normally be independent of the person or agent selling or buying the good, and prices indifferent markets would tend to equalize, subject to differentials in product quality and real costs oftransportation. The first section of this chapter therefore examines price behavior, to see whether recentmoves towards the lifting of price controls has brought about price convergence in different markets, bothin terms of 'plan' and 'market' prices and in terms of spatial price differentials.
2.2 The following sections examine the mobility of goods and the mobility of factors ofproduction, among alternative uses as well as in a geographic sense. Trade in goods is first analyzed, interms of interprovincial flows of goods, and changes in these over time. The regional mobility of goodsin China Is compared with other countries. Next, the mobility of capital and labor is evaluated, acrossregional boundaries as well as, in the case of labor, flexibility of deployment between within and betweenoccupations. Finally, since foreign exchange is also a critical scarce input in domestic production, themarket for foreign exchange is also evaluated.
A. The Impact of Price Reform
2.3 The objective of this chapter is to assess the recent evolution of China towards a marketeconomy, in terms of key economic parameters. A first extremely important indicator of the extent towhich markets are functioning, as discussed in Chapter 1, is the behavior of prices. China's efforts toderegulate prices have already been noted. More specific details of the proportions of retail sales andfarm produce subject to controlled, 'guidance' and free prices are available in Appendix Table A2.1.In 1978, 97 percent of domestic retail goods and 93 percent of farm produce was subject to fixed prices.During the first phase of reform, controls on prices had already diminished, particularly in agriculture.By 1985, retail goods and agricultural goods subject to fixed prices had fallen to 47 and 37 percent,respectively. After 1985, decontrol was more notable outside agriculture and by 1991, these ratios hadfallen further, to 21 and 22 percent.
2.4 Although the inflationary period of 1988 to 1989 put a brake on price reforms, and insome cases, controls were reimposed on goods whose prices had been freed, by 1991, for the most part,the effects of this reversal had been allayed and for most goods, price deregulation by 1991 had surpassedthe achievements of 1985. At this time, prices in agricultute were somewhat more regulated than in non-

-21 -
agriculture, (only 58 percent of agricultural goods were in the free price category, in contrast to 69percent for all retail trade), and the use of guidance mechanisms was also greater (20 percent of farmproduce, compared to 10 percent of retail goods).
2.5 From 1991, more radical advances in price deregulation have been made. The totalnumber of heavy industrial products and transport services subject to control was reduced from 737 atthe end of 1991 to 89 in 1992. These included most machinery and electrical products, some steel goodsand some petrochemicals. Many producer goods subject to central government price controls werederegulated, with new guidelines on material prices issued in July and August 1992. Of the 593production materials ona these lists, 571 were transferred to market pricing, and for another 22 goods, thecontrol over prices was transferred from the center to local governments. In addition, for products stillsubject to controlled prices, these prices were adjusted upwards, towards their market levels.
2.6 Rapid progress has recently been achieved with those goods whose price controls had ledto the need for heavy government subsidies; coal, transport, grain and edible oils.' For coal, where forseveral years only 5 percent of output was permitted to be sold at market prices, this ratio was raised to20 percent in 1992 and to 57 percent in early 1993.2 In the case of crude oil, selling price controls willbe lifted on 22 million tons of output per year, at three major oilfields.3 Price decontrols in 14 mediumto small oilfields were also announced in May 1993. Transport tariffs have been raised for rail and watertransport. Rail freight tariffs were raised in 1991, and then again in July 1992, from 2.85 to 3.85 fenper ton kilometer. A further 40 percent increase was announced on July 1 1993, to 5.35 fen, expectedto generate Y8 billion worth of revenues. Among consumer goods, urban ration prices of grain, whichhad been constant since 1957, had an increase in seller prices in 1992 to match purchasing prices. ByJanuary 1993, urban ration prices for grain were free in 844 cities and counties and in March and April,the major urban centers Shanghai and Tianjin, as well as the province of Jiangsu, announced the decontrolof grain as well as edible oil prices for consumers, and the withdrawal of the coupons for their subsidizeddistribution.' Surplus provinces are now entering into market contracts with major purchasing areas.5
I World Bank (1992) 'China: The Achievements and Challenge of Price Reform' details the controls andsubsidies for individual products.
2 In 1992, China National Coal Corporation, the state coal monopoly, reduced its losses by some 500million yuan as a consequence of the freeing of prices of 20 percent of output, as well as the layoffs of100,000 workers. In 1993, market prices were permitted for 190 million tons of the total 370 milliontons of state-allocated output, which was expected to further reduce operating losses by over 1 billionyuan. At the end of 1992, the CNCC, together with the Shanghai municipal govemment, put a coal'futures market' into opeuation i the city. Asian Wall Street Journal, January 4 1993.
3 Daqing, Liaohe and Shangli. The quantity of crude sold at market pnces will also be increased by 22million tons per year until 1995. Complete prioe decontrol will be introduced at the Jiln oilfield. From1993, China National Petroleum and Natural Oil Corporation will purchase oil at the international pricefrom these oilfields, and will then sell at fixed prices. Summary of World Broadcasts, BBC, 18February 1993.
4 However, in Jiangsu some compensatory cash subsidies were introduced; 6 yuan per worker and 4 yuanper student.

- 22 -
Prices of services are also beipg freed in some provinces such as Guangdong, where fees and chargeshave been lifted on 90 categories of services, and only 12 are still subject to controls.
2.7 Partly as a consequence of the accelerated lifting of price controls sInce 1992, the costof living index of the 35 largest cities increased by 17 percent in the first quarter of 1993, over the sameperiod last year.' To reduce the possibilities of escalating inflation, new price reforms will be suspendedin the second half of 1992, as part of an overall economic plan to curb overheating! This marks a haltin the latest phase of price deregulation.
Assessing Price Efficiency: Plan and Market Prices
2.8 How successful was the progressive decontrol of prices, in terms of the establishment of markets?If markets function efficiently, prices should accurately reflect relative scarcities, and the price of anygiven good should be the same regardless of the seller. For example, in the era of state controlled prices,parallel markets emerged for many scarce commodities where goods were sold at prices well above stateregulated levels. With the introduction of dual-track pricing, which implied that a part of (above target)output could legally be sold on the free market, the gap between this price and controlled prices shouldhave fallen, and the differential should be further reduced with progressive price decontrol. Thus onemeasure of the efficiency of markets is the extent of convergence between state regulated and marketprices. As shown in Appendix Table A2.2, for consumer goods as a whole, free market prices were 80percent above state prices in 1975. The gap declined to 48 percent by 1980, and further to 28 percentby 1985. By 1991, the differential was only 5 percent.
2.9 Disaggregating, to look at different categories of consumer goods (Figure 2.1), thegeneral trend towards price convergence is clear for all products. However, as discussed above, residualcontrols until recently were much more important for some agricultural products, such as grain andvegetable oils. As a consequence, the graph clearly illustrates, official and market price differentials weremuch larger for these products. The effect of the reimposition of controls is also illustrated; the trendtowards convergence was temporarily reversed between 1987 and 1989, notably for grain and meatproducts. However by 1991 the effects of this episode had been alleviated.
s At the national meoting for grain production and marketing in Febra 1993, Heilongjiang andShandong, which are major grain producers, entered itto an interregional grain sales contract withYunnan, Shanghai and Beijing, marking the inception of a nationwide grain marketing system.
Major macroeconomic factors are of course also involved, such as the credit expansion and high gowthof investment.
Sixteen point plan of the Central Committee of the Chinese Communist Party, announced in Juy 1993.

-23-
Figure 2.1 Free Market Prices Relative to State Ist Prioes
2.4
2.2 A_ ._. . ._
2 .
1.8 - ---
1.4
1.2 1 - --- -- - -- - --
188S 1984 1980 1986 1987 1088 1089 1990 1991
OveraU mUd Grain + -* Vg. On
*fehVO. most. to.
Meurc Appeu4l Table A"S
2.10 Trends for producer goods also indicate convergence, but the result is weaker, and thetemporary increase in the divergence of market and state controlled prices is more pronounced. In Table2.1, price divergence increases for all products, around 1989, but declines, thereafter, for all products.Eventually, market prices in 1991, relative to 1986, are closer to planned prices for four out of sixproducts; steel, cement, aluminum and timber. Market prices for copper are only marginally higher.The one significant exception is coal, although even in this case, prices do begin to converge after 1989.The reason for the slower convergence in coal prices is that controls on coal have remained moresignificant than for the other listed products, and the effect of this on market efficiency is well illustrated.
Table 2.1 Ratios of larket to State Prices for Min Mateials
Mabt/Sta Prds(ice(pecnt) 1986 1987 m988 1989 1990 1991
Steelptoducts 148 14S 146 136 122 111
Cemner 122 120 127 13S 119 111
Coal 14S 142 192 268 205 170
CONper III 109 182 l8S itS 113
Aluhimim 143 143 180 168 120 108
Lumber 145 153 169 169 161 140
Soute: Appenix Table A2.4
2.11 More evidence of price behavior for additional producer goods is given in Table 2.2.This table, like the preceding one, also shows that there has been price convergence over time in theproducer goods described here, if we look at the end points 1985 and 1991. In this table too, prices have
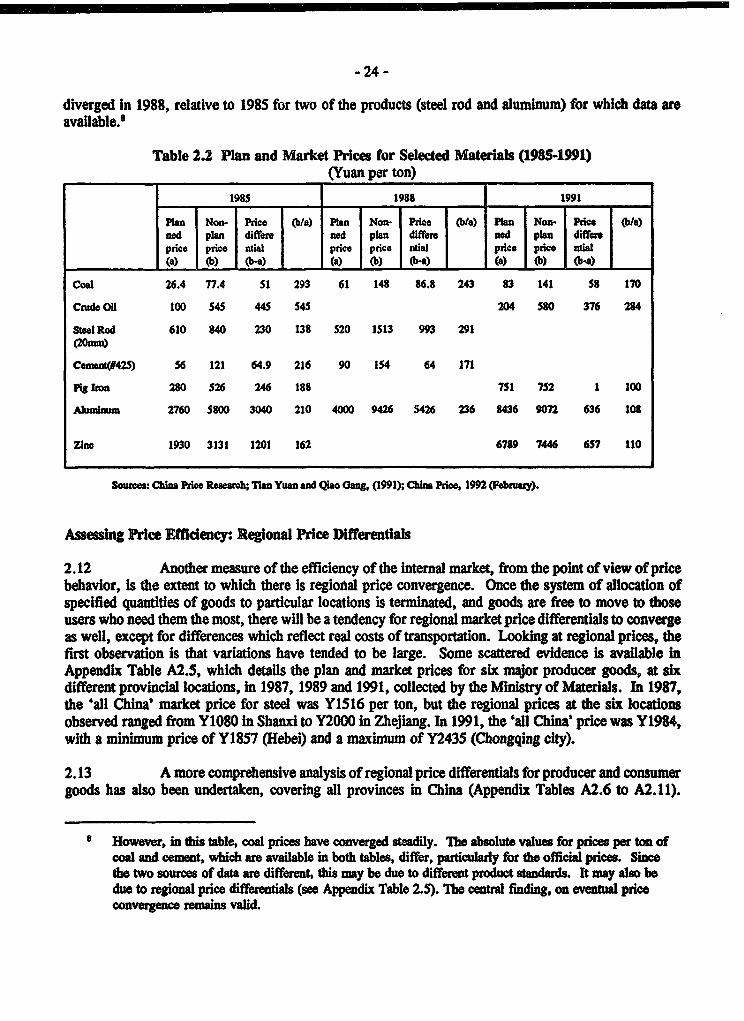
-24-
diverged in 1988, relative to 1985 for two of the products (steel rod and aluminum) for which data areavailable.'
Table 2.2 Plan and Market Prices tor Selected Materials (1985M1991)(Yuan per ton)
1985 1988 1991
pqan Non- wee bla) Pbn Non- hkce bla) Pln No- Pce (WO)ned pln differe ned plan differm ned plan differprice price ntial price prie ne lI price price ntial
_ (a) °) (b-a) (a) (b) (b-a) (a) (b) (b-a)
Coal 26.4 77.4 St 293 61 148 86.8 243 83 141 58 170
Cmde Oil 100 S45 445 545 204 580 376 284
Steel Rod 610 840 230 138 520 1513 993 291
Cement(425) 56 121 64.9 216 90 154 64 171
pis Ion 280 S26 246 188 751 752 1 100
Alunmun 2760 5800 3040 210 4000 9426 5426 236 8436 9072 636 108
zinc 1930 3131 1201 162 6789 7446 657 110
Sources: China Prie Research; Tian Yuan and Qiso Gang, (1991); China Pie, 1992 (Feb"uay).
Assessing Price Effidency: Regional Price Differentials
2.12 Another measure of the efficiency of the internal market, from the point of view of pricebehavior, is the extent to which there is regional price convergence. Once the system of allocation ofspecified quantities of goods to particular locations is terminated, and goods are free to move to thoseusers who need them the most, there will be a tendency for regional market price differentals to convergeas well, except for differences which reflect real costs of transportation. Looking at regional prices, thefirst observation is that variations have tended to be large. Some scattered evidence is available inAppendix Table A2.5, which details the plan and market prices for six major producer goods, at sixdifferent provincial locations, in 1987, 1989 and 1991, collected by the Ministry of Materials. In 1987,the 'all China' market price for steel was Y1516 per ton, but the regional prices at the six locationsobserved ranged from Y1080 in Shanxi to Y2000 in Zhejiang. In 1991, the 'all China' price was Y1984,with a minimum price of Y1857 (Hebei) and a maxinmum of Y2435 (Chongqing city).
2.13 A more comprehensive analysis of regional price differentials for producer and consumergoods has also been undertaken, covering all provinces in China (Appendix Tables A2.6 to A2.11).
8 However, in this table, coal prices have converged steadiy. The absolute values for pnces per ton ofcoal and cement, which are avaiable in both tables, differ, particularly for the official pries. Sincethe two sources of data ae different, this may be due to different product standards. It may also bedue to regional price differenils (see Appendix Table 2.5). Ibe central finding, on eventual priceconvergence reainum valid.

- 25 -
Looking first at seven broad categories of consumer goods from 1986 to 1091, it is observed that for allthe products, regional variations in prices increased after 1986 (summarized in Table 2.3). For six ofthese products, price variations declined after 1989, but the levels of variatio in 1991 were still higherthan in 1986. For one of the seven products (color TVs), there has been no decline.
Table 2.3 Coefficient of Regional Variation of Retail Price of Major Commodities(1986-1991)
1986 1989 1991
SD Man ICOV SD IMean ICOVI SD Mean COV
Flour (Y/kg) 0.05 0.50 0.10 0.16 055 0.28 0.16 0.74 0.22
Rice (Y/kg) 0.06 03S 0.18 0.21 0.48 0.44 0.16 0.55 028
Vegetable Oil 0.29 2.18 0.13 0.95 2.97 0.32 0.53 3.70 0.14(V/kg)
Apples (Y/kg) 0.29 1.92 0.15 0.69 3.34 0.21 0.75 4.21 0.18
White cotton cloth 0.14 1.18 0.12 0.49 2.2S 0.22 0.41 2.73 O.1S(Y71)
ColorTV (45 cm) S7.01 1383.55 0.04 233.05 2765.66 0.08 315.34 22S0.69 0.14(sn
Coal(resident use) 0.89 3.37 0.26 138 4.00 0.34 1.94 S.87 0.33(Y/100 kg)
Kerosene (Y/kg) 0.12 0.73 0.16 0.40 0.86 0.46 0.34 0.96 0.3S
Not: SD: Stwndard devatkon; COV: Coefficient of vaiation.Source: Calculated from data In China Prie Statistical Yeaeoook (various luau) (So. Appendix Tables A2.6-A2.8)
2.14 For producer goods, the time period for which information is available is much shorter;December 1990 to June 1992. Looking at the prices of five major producer goods in all provincialcapitals, from December 1990 to June 1992 (Appendix Tables A2.9-A2.11), we notice that the regionalvariations, for three out of five products, rose, but then decreased again. For two products, there wasa continuous decrease. Although the pattern is not as clear as in the case of consumer goods, and thetime periods are not comparable, the results generally suggest that regional price variations for manyproducts, and clearly for consumer goods, rose after 1986, until around 1989. In more recent years,regional variations have begun to decline, but the decline is not consistent. In some cases variationsappear to still be on the increase. And the recent declines in many cases are not sufficient, so far, tocompensate for the earlier increases in regional price differentials.
Table 2.4 Coefficients of Variation of Materials Prices by Province (1990-1992)
Location Stl Sheet Copper Coal Cement (#425) ` Timber(16-20mm) I I
COV December 1990 0.076S 0.08 03047 0.214S 0.24S6
COV December 1991 0.0591 0.0382 0.2265 0.183S 0.2302
COVJune 1942 0.0693 0.0211 0.3374 0.1312 0.226
Source: Calculations in Appeaix Tables A2.9 to A2.11

- 26 -
2.15 One possibility is that, with the relaxation of controls, there was first a tendency forprices to diverge, as different markets each attempted to find out what the real demand and supply facingtheir products was. This, as well as the reimposition of controls In 1988-89, can help explain the initialdivergences in market prices, by both sets of measures. However the failure of regional prices variationsto even attain their 1986 levels, in the case of many consumer goods, cannot be thus explained.
2.16 To summarize the findings of the preceding paragraphs, there was clearly an increase inthe efficiency of market price signalling, in terms of the movement from plan to market prices, at leastuntil 1991. For convenience, we shall refer to this as 'vertical integration' of markets. The move wasless pronounced in terms of producer goods than consumer goods. The data also indicate that this successis vulnerable to reversal when controls are reintroduced. The record in terms of 'regional marketintegration', as measured by regional price convergence, is not as encouraging. On balance it is clearthat regional price variations were still significant in 1991 and have not noticeably diminished since 1986.The analysis so far reinforces the findings of the previous chapter on regionally segmented markets andsuggests that this issue should now be the area of focus. However, one qualification to the above findingsis that the effects of recently introduced price decontrols of 1992 and early 1993 have not beenincorporated, for the most part, as data on these are not yet published. Ihe analysis will have to beextended to take these into account when data are available.
B. Interreonal Domestic Trade
2.17 One explanation for the findings above may be that the movement of goods betweenprovinces is relatively little, so that prices in each province are relatively protected from prices elsewhere.In an effort to protect local industry, many provinces in China have set up barriers to internal trade.There are several anecdotal accounts of difficulties encount; red in internal trade, due to a variety offactors, apart from transport associated botdenecks. Iltey: clude, first, restraint orders on exports orimports of certain goods. Physical restraints have someti. tes been imposed, in the form of roadsidebarriers or checkpoints. Second, fees and fines have been levied on truckers transporting goods from oneprovince to another. Procurement preferences given by local governments to producers in theirjurisdictions are also mentioned, though there are fewer accounts of this, possibly because it is notunexpected.

-27 -
Constraints on Domestic Trade:. Some Anecdotes
Export Embargoes: The Commodity 'Wars'During the latter 1980s, a number of agroprocessing became a tax collection point for 38 different taxes, for
factories in coastal provincoes suffered from severe which the Nanping n sunicipal tax bureau had cnlisted theunderutilization of capacity because of raw matenra help of 30 agencies in the past. Tax colectors wereshortages. Although China was a highly competitive commissioned in the baggag room, and the tax bueau setsupplier of both cotton and silk textiles, domestic capacity up a joint operation with thec freight office to colct taxesutilization in these industries declined year by year over the when goods were coUlected for shipment. Revenue collectionperiod 1985 to 1989. Raw materials from interior provinces more than tipled. In Nirgdo county, a truck load:d withwere either diverted by regional governments towards local live eels for export was confronted on its way to Fuzhouprocessors, or sold directly to overseas buyers. Embargoes airport with a demand for collection of a 3 percent specialor taxes wene imposed on interregional exports. 'Wars' product tax. The owner responded that in the p.st, thebroke out between neighboring provinces, with barricades, foreign trade bureau had claimed responsibility for all taxesroadblocks, and sometimes local militia, to enforce these. on exported eels and asked to discuss the mattw with the
Silk processors in Shanghai complained that Hunan foreign trade department. The truck was detained, the aelsrefused to provide them with silk, preferring to export perished, and eventualy the province suffered a loss ofdirecly to Hong Kong, while Shanghai in tum was forecd export earnings as well as a damaged reputation.to import silk from Hong Kong for processing. State owned Apart from legitimate fees and taxes, there are ilegalcotton processing enterprises only received 40 percent of trade barriers in the fous- of 'inspection stations' whichtheir cotton requirements from the state in 1990 and many demand arbitrary traffic fees. In Baihuting, suburbanmills operated at only 50 percent capacity utilization. While Fuzhou, vehicles carrying scrap iron were stopped and finesste enterprise output increased only 28 percent over 1984 were demanded, or else, the goods were confiscated for ato 1989, output in rural enterprises increased five fold. token sum. A bamboo dealer in Sanming country in
In the case of other commodities, local trade barriers led Zhejiang bought 1,524 yuan worth of bamnboo shoots toto market chaos, speculation and violence. At the same time truck to Shanghai. But by the time he had reachedas the fiber wars, a 'tea war' began, around 1985, Tongxiang county in Zhejiang, a total of 546 yuan had beencontinuing in some provinces until 1989. In May 1987, in paid en route, for 13 taxes and fees. With several hundredZhejiang province, peddlers and speculators forced up the kilometers to go, and no knowledge of how many moreprice of tea, while crude processing factories hoarded and inspection stations there would be, the dealer decided to sellspeculated, delibe-ately creating panic in the market. his cargo in Tongxiang and return.Collective and contracted fields of tea were plundered in Even in Guangdong province, reputed to be free tradeTishun county. In Shaoxing county, when tea was sold to oriented, a series of checkposts, barriers, local blockades,neighboring Shangyu county at a more favorable price, the including those set up by the Guangdong Provincevillage head led twenty people in tucks and vans to attack Administion of Industry and Commerce (GPAIC) and thethe supply and marketing cooperative undertaking the sales. public security bureau, as well as numerous fees and fines,
Grain embargoes continued into the 1990s. Hunan have been reported. In June 1992, orders were issued toprovince was approached by its neighbor, Guangdong, in close checkposts and the GPAIC reduced the checkposts1990, to import rice. Guangdong felt that the price quoted from S1 to S. Guangdong complains that its neighboringby Hunan provincial officials appeared high. Guangdong provinces of Jangxi, Pujian and Guangxi have made noofficials then approached Hunan farmers directly, offering a reciprocal attempts to reduce protection.price lower than this, but higher than the procurement priceoffered by Hunan province. Hunan put security guards on Import Restraints and Provnal Protectionthe borders to prevent the shipments and Guangdong Sichuan province says that it has Lifted governmentrealiated with its own forces. restrdtions and checkpoint on trade, since the beginning of
Export embargoes have not been restricted to agriculurl the 1990s. However, in terms of government purchases, allcommodities alone. Liaoning declared in 1992 that it would other things being equal, local suppliers would be preferred.not permit exports of fertilizers, except under the central Meanwhile Bejing, in 1992, resticted imports of hogs,plan, as it could not meet its own requirements. from HebeL Elsewhere, according to a CASS field survey,
a province in the southwest decided to protect 19 localTax Colecton, Fees and Fmes products in 1989 and resticted the imports of these goods
In mid 1990, the Nanping railroad station, a transport hub from other provinces. And an autonomous region in thefor the ten counties of the Minbei region of Fujian province, west expressly prohibited the entry of 48 outside products.
Smw'cau: Forser (1991), Agarwaa (1992), Finlmay et al (1992), Watson and Fmdlay (1992), Lyons (1992), Huang (l992),lh Economis, June 26, 1993.

- 28 -
2.18 It is possible to categorize these constraints and consider their likelihood of persistenceor recurrence. The export embargoes on raw materials which occurred in the latter half of the 1980s,forcing the underutilization of some processing capacity, arose first of all because of the end of theunifled purchasing system under mandatory plan, in 1985. Second, this was combined with a surge indemand. As free market prices rose above plan prices, there was a temptation to sellers to evade planprocurement and obtain the higher free market price. Local governments were forced to impose exportembargoes to control outflows which occurred before mandatory quotas were fulfilled. The activities ofhoarding and speculation vere essentially a by-product of the market segmentation introduced with thenew system. From 1989, there was a contraction in domestic demand, and a simultaneous reimposition,for some commodities, of the state procurement system. It may also be argued that by this time, a moreorderly secondary market had developed, so that domestic 'exports' could now take place in a moreorderly fashion, and the extent to which hoarding, speculation and disruptive market conduct could occur,might have diminished. The commodity 'wars' declined considerably for most products.' The moregradual reduction in government procurement quotas, as well as price controls, for these commoditiessince 1991 is likely to further reduce the likelihood of their recurrence.
2.19 Other factors which provoked the domestic export embargoes Include an increase in theauthority given to provincial and local officials to collect revenues, under the fiscal contracting system,and the export eamings retention system. Under the former, it was to the sdvantage of provincialauthorities to extract monopsonistic rents for purchases and sales though public channels, and as the caseof Hunan's grain exports illustrawes, this factor is likely to persist to the extent that public procurementis channeled though provincial or county officials. The authority to collect revenues has also affected theflow of goods not subject to public procurement. The story of the tax collection at Nanping railwaystation ilustrates the fact that transit points have sometimes proven convenient for the collection of anumber of legitimate fees and taxes that would otherwise have large collection costs. However inaddition, there are many instances of abuse of this authority, as well as cases of 5llegal checkposts andtaxes, imposed on the highway. This form of ad hoc fee and fine imposition is likely to be moreimportant, today, than the export embargoes of the commodity 'wars'
2.20 Another implication of the increased revenue collection authority given to provincialofficials was the diversion of raw materials away from processing units in other provinces, towardsprocessors in their own provinces, in an attempt to capture tax revenues from value-added. Importrestraints issued by provinces are also a consequence of attempts by provincial authorities to protect localenterprises, at the same time increasing revenues from the profits and taxes of local enterprises. Localprocurement preferences have the same effect, and are difficult to trace in the absence of formalizedprocurement guidelines. Finaily, the factor that led to the diversion of goods away from the domesticmarket and towards the export market was the export retention system. Provinces were permitted to retaina part of export proceedings, and with the overvalued exchange rate, as well as the differentials inretention rates across provinces, each province attempted to increase its holdings of the undervaluedresource, foreign exchange, by diverting sales away from the domestic market.
2.21 There are indications that such barriers may have loosened up in the 1990s. In November1990 the State Council issued a circular banning restrictions on interprovincial trade. This is echoed in
9 It is reported, for examle, that once grain rationing ended, grain began flowing fiom Hunan toGuangdong. Baokan Wenzhaf (Periodicals Digest), 26 May 1992, p 1.

-29 -
the new law against unfair competition of September 1993. Both major manufacturers and township andvillage enterprises in Shanghai and Guangzhou have established countrywide marketng networks for someof their products. This is particularly true of certain manufactured consumer goods such as wrist watchesor radios, where firms from the south are now reported to be making inroads in the markets of northernprovinces. Some larger products (for example, tractors), are less mobile, although a few heavy capitalgoods produced by a small number of state enterprises are also nationally distributed.
An Analysis of Domestic Trade Flows
2.22 The extent to which policy and real obstacles may have constrained internal trade maybe gauged from an analysis of internal trade flows (Appendix Tables A2.12-A2.17).?0 In aggregate, forall provinces taken together, both domestic imports and domestic exports grew over time, in absoluteterms. The annual average rate of growth of domestic interprovincial exports and imports, at 6.9 and4.8 percent per year, were however slower than the rate of growth of total retail sales, and as a result,the share of domestic trade in retail sales (defined as (domestic imports+exports)/{domestic retail sales))declined over time. The decline was pronounced between 1985 and 1990 (from 63 percent to 48percent), with some marginal recovery since, to 50.3 percent in 1992. These results are in markedcontrast to external trade. Over the last seven years, 1985 to 1992, international exports grew at 16.7percent per year, while imports grew by 9.7 percent, on average, measured in dollar terms. Measuredin domestic currency (for appropriate comparison with domestic trade), the rates are considerably higher,at 28 percent and 20 percent per year. These patterns imply that there has been a growing tendency forindividual provinces to behave as independent countries, increasing their links with the external world,and in relative terms, reducing trade links with other provinces within the country.
2.23 There are some interesting differences between provinces in terms of domestic tradebehavior. Looking first at export ratios alone, on average for all provinces, domestic interprovincialexports as a percentage of retail sales declined from 36.6 to 27.6 percent over 1985 to 1992. However,in some provinces, these ratios stayed virtually constant (Hebei) or increased over time (Liaoning,Jiangsu, Zhejiang, Fujian, Jiangxi, Guangdong, and Sichuan). With the exception of Sichuan, these areall relatively rapidly growing coastal provinces or their hinterlands. In terms of imports, Hebei, Oilin,Fujian, Jiangxi, Hubei, Guangdong and Guangxi were also able to raise domestic import ratios.'" Thissuggests that more rapidly growing coastal areas may also be able to develop stronger trade links, interms of domestic exports, with other interior areas. One significant implication is that 'trade diversion'does not appear to have occurred, as these areas simultaneously increased their domestic and externalexports.
2.24 It is also notable that the three major cities of Beijing, Tianjin and Shanghai were themost 'open' areas at the beginning of this period, with higher ratios of exports and imports than mostother provinces. However, in all three, both domestic export and import ratios have declined over time.This suggests that the municipalities direcdy under the central government may be growing somewhatmore autarkic over time, and also relative to other provinces.
10 The source of the data in these tables is the State Statistial Burau
1' Import ratios also rose in some of the remote provinces; Sichuan, Yunan and siai.
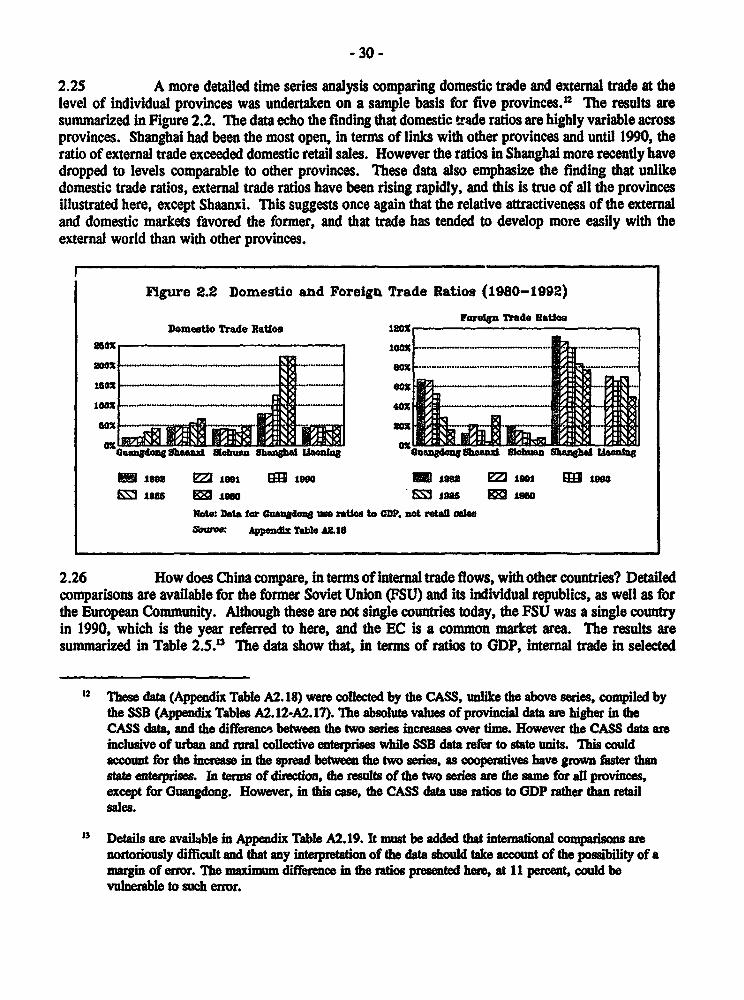
- 30 -
2.25 A more detailed time series analysis comparing domestic trade and external trade at thelevel of individual provinces was undertaken on a sample basis for five provinces.'2 Ihe results aresummarized In Figure 2.2. The data echo the finding that domestic trade ratios are highly variable acrossprovinces. Shanghai had been the most open, in terms of links with other provinces and until 1990, theratio of external trade exceeded domestic retail sales. However the ratios in Shanghai more recently havedropped to levels comparable to other provinces. These data also emphasize the finding that unlikedomestic trade ratios, external trade ratios have been rising rapidly, and this is true of all the provincesillustrated here, except Shaanxi. This suggests once again that the relative attractiveness of the externaland domestic markets favored the former, and that trade has tended to develop more easily with theexternal world than with other provinces.
Figure 2.2 Domestie and Foreigm Trade Ratios (1980-1992)Forig Trade Ratio
DomesUo TrAde Ratios 12o2002. 1002 --........ - .. .
200X . ._80X ._ _
200x sox.
0 2uugdn Ihnz lhs Shngai ican GuuduSenlowI. hnga am- 1992 ez 1991 - 1999 i " z 1992 00 1 990E; 1985 Bg 190 ' 198 Il $1960
N*: Ddta fr Guangda us rates to CDP. not reaelmOeww: AppsNz Tath AI lS
2.26 How does China compare, in terms of internal trade flows, with other countries? Detailedcomparisons are available for the former Soviet Union (FSU) and its individual republics, as well as forthe European Community. Although these are not single countries today, the FSU was a single countryin 1990, which is the year referred to here, and the EC is a common market area. The results aresummarized in Table 2.5.'3 The data show that, in terms of ratios to GDP, intermal trade in selected
12 These data (Appendix Table A2. 18) were collected by the CASS, unlike the above series, compiled bythe SSB (Appendix Tables A2.12-A2.17). The absolute values of provincial data are higher in theCASS data, and the difference betwe the two seies increases over time. However the CASS data areinclusive of urban and nual collcfive enteprs while SSB data refer to state units. This couldaccount for the increase in the spread between the two series, as cooperafives have grown faster thanstate eto Ises, n terms of diection, the results of the two series are the same for all provinces,except for Guangdong. However, in this case, the CASS data use ratios to GDP rather than retailsales.
13 Detils are avail4ble in Appendix Table A2.19. It must be added that internaional comparsons arenortoriously difficult and that any interpretation of the data should take account of the possibility of amagin of error. The maximm difference in the ratios presented here, at 11 percent, could bevulnerable to such enor.

- 31 -
provinces in China, at 22.1 percent, was lower than trade in the EC (28.3 percent), and also lower tatrade among the nations of the FSU, excluding Russia.1'4 This also suggests that there Is considerablepotential for expanding the internal market In China through increased internal trade.
Table 2.5 China and Other Regional Trading Areas: Interreglonal Trade
Id. Exports I Total GDPIa ImpuIP Exporn/ TodaI 'l'~I I I GDP % GDP % TW/GDP %China (M1981M91): (Y mllliou)IbSubtotal for 5 provinces/b 49085.8 36486.8 387878.0 12.7 9.4 22.1
E C (1989): (ECU milion)EC Total 624.S 624.S 4406.9 14.2 14.2 28.3
F S U (1990): (Ruble millon)
Subtotal (ExcludingRusda) 12S752 958S6 814602 15.4 11.8 27.2
Subtotal (all FSU countries 182335 182335 2103179 8.7 8.7 17.3
/a lbe Chiaes fgures for the GDP column are GNP./b Guangdong, Jianxi, Sichuan, Guizhou, Beijing. Various years between 1989 and 1991.Source: AppendixTable A2.19
2.27 The inferences drawn from these findings depend on the coverage of the data used. Datapublished in the Provincial statistical yearbooks cover only SOEs and rural cooperatives, which impliesthat private trade flows are not included. These are likely to have risen, over the recent reform years.At present no comprehensive data are available. Meanwhile, as data in Chapter 3 shows, the statecontinued to dominate the distribution system (see Appendix tables 3.4 and 3.5).
2.28 Taking this into account, how should China's relative decline in interna trade beassessed? First, some decline in the regional mobility of goods may be attributed to the decline incentralized allocation. At least a part of the centralized allocation was held to be inefficient, in terms ofspatial planning, and some goods were transported unnecessarily long distances. To this extent, thedecline in trade need not reflect a decline in efficiency. Second, the relative decline in Intea tradebetween provinces, compared to the growth in total retail trade, may also be due to the rapid growth oftownship and village enterprises, and a consequent increase in production as well as consumption withinprovincial frontiers." Third, some of the decline, in the years before 1989, may have been due to theadoption of the dual price system, and the embargoes on trade placed by some provincial authorities onthe export of specific goods. However, these were not the only factors behind the decline in internaltrade, and trade restraints were also a consequence of increased roadside tax collection by provincial andlower level authorities, as well as by unauthorized persons and the difficulties in arranging for financialflows (for payments) across regions. The increase In regional price divergence probably reflects some ofthese factors. If the decline in centralized allocation was the primary reason for the decline in internaltrade, the trend decline in regional trade would have been arrested, as in the case of early plan-market
14 The trade to GDP ratio for Russia was much lower than for other FSU counties, at 11.1 percent(Appendix Table A2.19). On account of its large weight in the sample, this brings do the nationalaggregate markedly, if included.
Is A comparable analysis of intrapvncial trade, especially within some of the lar provinces, isdesirable, but data are not available at present.

- 32 -
price divergence. The relatively low interprovincial trade in China, compared to the countries In Table2.5, may therefore suggest some neglect of opportunities to benefit from specialization and localcomparative advantages.
2.29 Some adverse effects of trade limitations are apparent. In the latter 1980s, theperformance of large processing industries, for example in cotton and wool textiles, typically in the statesector, in coastal provinces, suffered, due to a deprivation of raw materials from interior provinces. Thisis likely to have been inefficient for the economy as a whole. It is also possible that rural collectiveenterprises in some industries, though profitable due to protection and captive markets, also suffered fromthe lack of scale economies. Today, revenue collection though ad hoc fees and fines, as well asprotectionist import restraints, are probably more important than export embargoes. To the extent thatthe ievenue collection is legitimate, it reflects the need for consolidation of numerous fees and chargesin a more efficient way, and the devising of more efficient revenue collection methods. To the extentthat the revenues collected are illegal, there is an urgent need to investigate remaining constraints andeliminate them.
2.30 Finally, there is a need to provide more transparent guidelines on interregional trade, ata national level. There have been no specific laws for this in China."' Some large federal systems, suchas the USA, have constitutional clauses which specifically prohibit constraints against interstatecommerce.' Some umbrella provision at the national level, which will of course have to be appropriateto the Chinese legal and governmental system, is required. Equally important, the implications of thefiscal contracting system for interstate commerce require deeper investigation. The ability to increase theextraction of revenues has probably fostered the development of some inefficient rural industry, andrestraints against imports will have the same effect. Last of all, the drawing up of guidelines on the localpreferences in provincial level procurement codes, will also be required, as the more transparent formsof trade constraints are removed.
C. Factor Mobility: Capital
Factors Affecting Interprovincial Investment
2.31 Parallel to the mobility of goods is the issue of factor mobility, also an essential elementof an efficient internal market. Capital is usually considered the most mobile, among factors ofproduction. One form in which capital mobility occurs is through enterprise investment. At a simplifiedlevel, enterprises may choose locations outside their current area of operation if there are favorable
16 Although the State Council has periodically tried to address tbis tbrough other legislation, including,(1980), the Provisional Regulations relating to the Development and Protection of SocialistCompetition, and again in 1982, with a Notice relating to the Prohibition of Blockadets v . the Sale ofIndustrial Products. In 1990, a circular was issued banning restrictions on interprovincial trade. Mostrecently, the new law against unfair competion (September 1993) also has an article restrictingconstraints on intenegional trade.
17 Article 6 of the US Constitution, the 'Interstate CoMMere clause'.

- 33 -
locational factors (input prices, infrastructure, communications, input availability), or policy-determinedfactors (taxes, subsidies or incentives and other cross-provincial investment regulations) which reducecosts. Special business links or tie ups, with other producers, buyers or suppliers, may also be anincentive. Another form in which capital may be regionally mobile is through the banking system, ifthere are inter-provincial bank deposits or loans. Tbis requires that funds deposited at a given locationmay be loaned to investors in other locations, or alternatively that depositors may put their funds in banksoutside their region of residence. There is also a variety of additional forms of markets for capital, forexample, stock exchanges, which gradually evolve in market economies. This section first examines thevarious factors affecting regional investment flows and assesses the extent to which they have beenconducive to capital mobility or otherwise, and then evaluates the available empirical evidence on capitalmobility.
Profit Retention and Taxation
2.32 Arrangements between the central and local governments for the sharing of enterprisetaxes and profits tended to discourage capital mobility, in the form of enterprise investment, in the earlyyears of economic reform. More recent reforms in center-local fiscal arrangements over the past decadehave removed some but not all of these effects. In the early 1980s, under the profit retention system,enterprises' transfers to other locations would have implied a loss in profits accruing to the localgovernment."' At this time, the fiscal system was characterized by centralized revenue collection andcentralized fiscal transfers. The revenue-sharing system distinguished between centrally fixed, locallyfixed and shared revenues. Local revenues included the retained profits of enterprises owned by localgovernments, and consequently the system implied that local governments were reluctant to see theirenterprises transfer resources outside their jurisdictions.'9
2.33 In 1983/84 modifications to ;he revenue sharing system began, with the separation oftaxes and profits at the enterprise level. However, the retention of profits, which was now permitted,accrued to local industrial bureaux, compared to central ministries, prior to this. The change wasaccompanied by new incentives to generate these now retainable profits, by the lowering of plan targetsand permission to sell above plan output on the markets, together with fiurther decentralization of planformulation and implementation. A burst of investment resulted, but incentives to retain investmentswithin local jurisdictions were high under this regime. To retain funds at their own level, and reduce taxremittances to the center, a number of items were removed from the enterprises' accounts and transferredto extrabudgetary funds, which grew rapidly after 1985.
2.34 Shortly after, the system of revenue contracts, first applied in agriculture, was modifiedand extended to state enterprises, under the contract responsibility system, which fixed profit remittances,retention rates and investment targets, usually for a three year period. By 1988, over 90 percent of allstate enterprises were following this system. Parallel to the enterprise contracts, a system of fiscalcontracting between central and local levels of government was also introduced, specifying which taxeswere to be assigned to central and local governments respectively, and which were to be shared, and inwhat proportions. The income and adjustment taxes of locally-owned enterprises accrue to local
18 This has been described, for example, by Zhang (1992), in the context of the bicycle industry.
9 For fiurter details of the evolution of central and local revenuehariog arrngements, see World Bank(1990), Oksenberg and Tong (1990), Wong (1991) and Agarwala (1992) and Ma and Bell (1992).
- 34 -
governments, while certain other taxes, such as sales tax revenues from all enterprises, are sharedbetween the center and local governments.
2.35 Regulations concerning the taxation of interprovincial investment under this systemrequire that enterprises established wholly though investments from another region should pay turnovertaxes (including product tax, business tax and value added tax) in the host area but continue to remitincome taxes to the home jurisdiction. For a joint enterprise (set up with investments from outside aswell as from the host area), turnover taxes are paid in the host area, while income tax can be paid in oneof the following two methods. The first is to "first divide revenue then pay taxes," which means the twoparties involved divide revenue according to their contract and then each pays taxes in its home area.The second method is to "first pay taxes then divide profits," which means the 'joint-venture' enterprisepays taxes in the host area, and the two parties then divide after tax profits according to the contract.
2.36 If the second method is adopted, regulations require that if the host area offers a turnovertax concession that is not available in the home area, the portion of taxes exempted in the host areashould be submitted to the home area's tax or finance bureau. The method adopted in any given case issubject to negotiation between the two parties and the approval of the supervisory agencies and taxbureaus of both the host and the home area. In most cases, the home tax bureau objects to the secondmethod, which reduces its revenue collection. No matter which method is chosen, according to these rulesthere is no income tax benefit for the investor from the host area. Although an outside investor can enjoythe host area's concessions on turnover taxes, this plays a less important role since in many casesturnover taxes account for a small portion of total taxes. The attractiveness of turnover tax concessionsmust be weighed against the uncertainties they involve. First, the offers of concessions are usuallydiscretionary, and second, as soon as the fiscal contract of the host locality changes, its ability to offertax concessions also changes, and many localities' commitments to favorable tax treatments are notcredible. In sum, the present rules attempt to be neutral between location, at least to the extent thatindirect tax rate differences permit. There do not appear to be any problems of double taxation due toambiguities in the rules.
2.37 In practice these rules are not always adhered to and there is much regional variation intheir application. Usually, the second method is applied, but investors do take advantage of turnover taxconcessions offered by the host governments, without remitting the difference to their home provinces.Also, in practice, income tax frequently appears to be paid to the host government, contrary to therules.' Some of these concessions are applied through the establishment of a variety of legal and illegalinvestment 'zGnes' and Special Economic Zones, where investment incentives in the form of both incomeand indirect tax concessions are offered.21
20 Guangdong province responded in a survey that investors from other provinces had the choice ofpaying income taxes at either location (possibly in the hope of extracting some taxes which wouldnormally be remitted to the region of origin) 'avoiding unnecessary financial and administrativerestrictions in their place of origin'. Such arangements have been negotiated in practice, and have alsobeen undertaken by other provinces. Shaanxi province reports that its enteiprises investing elsewhereand enjoying special concessions are indeed obliged to send the differential back but in practice this isdifficult to enforce.
21 World Bank (1993) Report No.11568-CHA, Wall (1992, 1993a&b), and Ma and Li (1992) provideextensive addidonal details of the zones.
- 35 -
Tax Concessions In 'Zones' Established by the Center
2.38 Under the open door policy launched in 1979, the central government opened some areas,particularly coastal provinces, to foreign investors, offering them various tax incentives. Some of theseopen areas provide similar tax incentives to domestic investment as well. The concessions had a profoundimpact on external capital inflows. Investments betveen the coastal and the inland regions were alsoaffected to a modest extent. Five types of special regions were established; special economic zones(SEZs), 14 open coastal cities, Hainan, Pudong, and Inland province zones along the Yangtze Delta.
2.39 Enterprises with foreign investment at the SEZs enjoy a 15 percent rate of income tax.'Still lower rates apply to investments of US$5 million and above, and projects with advanced technology.This is even more favorable than the standard concessional rates for foreign joint ventures, applicable inother regions.' Tax holidays have also been offered in the SEZs. Income tax is exempted for the firstand second profit-making year and there is a 50 percent reduction for the third to the fifth years.Exemptions of import duties for production inputs and exemptions of income tax on profits forreinvestment are also offered. At many SEZs, the tax concessions for foreign investors have also beenoffered to domestic investors from other provinces, leading to capital outflows from many interiorprovinces to these zones.
2.40 Hainan, formerly one of the poorest regions in China, was granted the status of the fifthSEZ in 1988. According to the 1988 regulation outlining Hainan's special policies, the basic corporateincome tax and tax holidays in HIainan are the same as in other SEZs and the Economic andTechnological Development Zones (ETDZs) in fourteen coastal cities. The preferential tax policies fordomestic investment applied in the other SEZs were also used in Hainan. In addition, Hainian providesmore aggressive tax concessions in certain fields such as infrastructure and export processing.
2.41 The fourteen coastal cities' Economic and Technological Development Zones have alsobasically enjoyed the same preferential tax policy as the SEZs, since 1984X. An income tax rate of 15percent is offered to foreign investors within the ETDZ, and to technology intensive enterprises withforeign capital of US$30 million or more in other parts of the cities. Tax holidays similar to those in theSEZs were also applicable. In other parts of the cities, a flat income tax rate of 24 percent prevails. The10% profit remittance tax is exempt within the zone. However, there are no officially announcedincentives for domestic enterprises in these cities.
22 he regulations are detailed in Economic Research Center (1981). The four original SEZs wereShenzhen, Zhuhai, Shantou and Xiamen.
a Thirty three percent for equity joint-ventures and a progressive marginal rate scheme for contractualjoint venwres and wholly foreign-owned ventures in 'non-open' areas. Equity joint ventures (HeziJingying) are limited liability cotporations in which Chinese and foreign parners jointly invest in andoperate a corporation, sharing the profits, losses and risks. In contractual joint ventures (HezuoJingying) the foreign partner typically provides technology, and may also provide a capital share whichcould take the form of a loan. Foreign investors are repaid on the basis of a predetermined schedule.The Chinese partner usually provides land, materials, the work force, basic buildings, services, etc.Wholly foreign-owned ventures (Duzi Jingying) entetprises are wholly owned and operated by foreigninvestors.
24 China Investment Guide (1989).

- 36 -
2.42 Pudong, a relatively underdeveloped area in east Shanghai, was 'opened' in early 1990.The regulation outlining the preferential policy for Pudong provides for basic income tax rates and taxholidays for foreign investment enterprises similar to those applied in SEZs. The 15 percent income taxrate and tax holidays also apply to domestic enterprises from other provinces. As a result, both foreigninvestment and investments from other parts of China have poured in.25 In May 1992, the policy ofspecial zones was extended into the interior, to a series of cities along the Yangtze.
Tax Concessions In 'Zones' Established by Localities
2.43 The attractive investment incentives in coastal zones put inland areas at a considerabledisadvantage in terms of attracting external investment. In other parts of the country, foreign investorswith equity contributions pay income tax at the rate of 30 percent plus a local surtax, or a total of 33percent. 26These rates are much higher than those in open areas. Investment from domestic state-ownedenterprises or collective enterprises from other provinces is subject to the standard 55 percent nominalincome tax rate and collectively-owned enterprises are subject to the standard progressive rate.
2.44 As an attempt to equalize tax treatment with the centrally-approved special zones clusteredon the coast, all 30 provinces and thousands of counties and townships have launched their own 'zones.'This may be interpreted as the localities' natural reaction against the center's unequal tax policy. By early1993, there were 1,800 zones (including special economic zones, economic development zones, economicand technology development zones, high- and new-technology zones, special zones for Taiwaneseinvestors, border trade zones, etc.) at and above the county level.' These zones are approved by eitherState, provincial or county authorities. Most offer preferential tax policies similar to those which appliedin the SEZs. Some zones offer even more aggressive tax reliefs, such as a five year tax exemption andfurther five year reduction by 50 percent."'
2.45 In some provinces, or in some counties within provinces, these concessions are offeredto all incoming investment, whether foreign or domestic, while in numerous cases, domestic investorsare accorded the concessions on a discretionary basis. The special zone for Taiwanese investors in Lanxicounty, Zhejiang Province, for example, offers the same treatment to all domestic investment. Shaanxi
2' While there are many real investments made by various central line ministries and other provinces,many domestic entetprises in west Shanghai moved their headquarters to Pudong and re-registered asnew firms. Although all the production facilities stiU reside in west Shanghai, these enterprises nowenjoy the preferential tax rate offered to new firms in Pudong.
2 According to the foreign enterprise law of 1980. Income taxes levied on contractual joint ventures andwholly foreign-owned ventures were progressive, with the rates ranging from 20 percent to 40 percentaccording to total income. In July 1991 tax policy for foreign investment was unified across differenttypes of enterprises with foreign investment.
27 According to the Ministry of Finance. According to the People's Bank of China, 233 developmentzones at and above county level were proposed in Sichuan Province alone in the first half of 1992. Bythe end of 1992, Tai prefecture of Zhejiang Province had established 152 development zones, amongwhich 134 zones were below the county level.
2 The development zones in Jinin City in Inner Mongolia and Taiyuan City in Shangxi Provir- . areexamples.

- 37 -
province offers investors exemption from the business tax for a year, and from income tax for two tothree years. Sichuan reported the same exemptions, adding that there was some flexibility in theapplication of the rates. Township and village enterprises and enterprises from minority regions are givenlonger exemptions. Sichuan can also exempt other funds payable by enterprises, notably the Two Funds;for Energy and Communication Development, and for Budget Adjustment. If investors from otherprovinces invest in industries where Sichuan appears to have a comparative advantage, or to infrastructureindustries, bank loans are provided on a priority basis. Sichuan has now transferred the power to granttax remissions or exemptions to governments at the city or prefecture level, and these cities or prefectureshave introduced their own regulations on these issues. Liaoning, by contrast, maintains that it has nospecial incentives, except in its Economic and Technical Development Zones, where the 'two plus three'rule of corporate tax exemption applies?
2.46 Most of these tax exemptions and reductions are not approved by the central taxationauthority and are considered illegal by the center. In July 1993, the State General Bureau of Taxationissued a circular stating that the tax relief policies offered by these locally-approved zones should bestopped. The circular also required each province to 'clean' these unapproved zones. It added that allpromises made by the localities regarding tax concession could only be fulfilled using the localities' ownbudgetary funds. The circular appears to have had some effect, since many provinces have reported anumber of 'cleaned' zones to the center.
Other Tax Concessions by Loalities
2.47 In addition to 'zones,' many areas offer tax concessions under other forms, legal andillegal. The current center-province revenue sharing system stipulates that provinces can only offer taxexemption and reduction on 'local-fixed' revenues, or revenues assigned to local governments.?Exemptions or reductions on centrally assigned or center-local shared taxes are subject to approval bythe center, except for those to which special policies apply.31 These regulations are frequently abusedby localities for tax relief purpose. Most localities attempting to offer a tax concession can findregulations that are 'applicable.' In addition to using the centrally announced policies, many offer taxrelief under the guise of implementing local industrial policy, or as 'subsidies to enterprises indifficulties.' Many taxes belonging to the center-fixed or center-local shared categories have beenexempted without consulting the center.
20 The information refers to late 1992.
30 These include agrcultural and animal husbandry tax, urban maintenance and construction tax, propertytax, title trade tax, individual industrial and business tax, market tax, bonus tax, vehicle utilization tax,a special tax on fonesty and agricultural products, slaughter tax, personal income tax and salt tax.
31 For example, enterprises in priority sectors (eg, electronics, exports) meeting certain requirements canenjoy income tax holidays. Enterprises that export more than 70 percent of their output value areeligible for incame tax reduction. Newly established collectively-owned enterprises are pennitted taxexemption for the first two years. Enterprises established by educational units, certain massorganizations, and social welfare units can also benefit from exempted or reduced income tax.

- 38 -
Regional Cooperation Zones
2.48 Another question to be examined in this context Is the effect of the Regional CooperationAreas In the promotion of internal trade and investment. The concept of establishing such regional zonesbegan before the Cultural Revolution but the concrete introduction of six cooperative zones took shapewith the Ten Year Development Plan of 1976 to 1985.'2 Guangdong, for example, Is a member of theSouth China Region of Economic and Technological Coordination. The Shanghai zone, established at theend of 1982, originally embraced 9 other medium to large cities as well as 54 counties in Jiangsu andZhejiang provinces. It was later expanded to include Anhui, Jiangxi and Fujian provinces as well.
2.49 Although much larger and less specialized entities than most of the special economiczones, these zones of cooperation are essentially an older variant of the many special zones discussedabove, which did not carry any special incentives in the form of investment or tax concessions. ThePlanning Office of the zone was entrusted with the coordination and promotion of zonal cooperation.While there is some anecdotal evidence of resulting instances of cooperation, the general consensus is thatsuch zones of coordinationhave had little effect in promoting investments, and in some cases, particularlyin earlier years, had furither complicated center-local administrative issues by the presence of another,'area level' office between the center and the provinces.
Procedures and Practice
2.50 The procedures for setting up a new establishment for investors from other provincescould sometimes be discouraging. Taking a typical example, in Guangdong, individual enterprises fromother provinces must first apply for a change of registration, at the Guangdong province bureau of theAdministration of Industry and Commerce and then obtain approval from the local Office of EconomicCooperation, which undertakes a capital assessment and an examination of the certificate of real estate.33If investments are made as part of an enterprise group, the GPAIC is also required to examine 'relateddocuments' such as the agreement of joint operation, corporation by-laws, notarial documents andfinancial statements. Property transfer procedures are additionally required in the case of mergers.Guangdong province assures equal treatment in terms of access to energy, water supply, transport andlabor supply.3' Difficulties with equal treatment have been reported at Shanghai, where enterprises fromother provinces have complained that outsiders are charged higher rents for business space and they havedifficulty in obtaining registration and operating permits for their business cars. At Liaoning, in addition
32 Historcally the Six Cooperative Areas have their origin in the Six Administve Areas, established atthe birth of the People's Republic. Apart from economic cooperaion the concept waS also intended toplay a coordinaung and cooperative role between lower levels of adm nistraton. There were alsopolitical considerations such as the prosperity of local ethnic minoities. Huang (1992) has details, anda case study of the Shanghai zone.
33 On the whole the role of the provincial Administration of Industry and Commerce is more powerfulthan that of the Office of Economic Cooperation (OEC). The OECs were established in all provincesin the latter 1980s to facilitate exteral investment, but in practice their role has been limited and theyhave done little to facilitate interprovincial investment flows.
3' An asurace that suggests that in some cases (ossibly provinces other than Guangdong), equaltreatment is not accorded.

- 39-
to the permission of the Department of Economic and Technical Cooperation and the SAIC registration,a new enterprise must register its seal in the Public Security System, register in the tax department andopen a bank account in the local branch of the Industrial and Commercial Bank.
2.51 Much of the interprovincial investment which has occurred has been intended to facilitateand 'internalize' buyer-supplier links, for example, the timely delivery of raw materials, or the marketingof finished products. Investments have also occurred in the tertiary industries, such as hotels andcommerce, and in recent years, particularly in a few provinces, there have been large flows of investmentInto real estate, much of which has been speculative in nature. There have also been examples ofinvestment flows which are essentially a form of compensation trade, intended to circumvent price orquantity controls." However, on a more positive note, in a few rare cases, such investment has alsooccurred when enterprises have set up associated companies, producing goods with a common brandname and common quality control procedures.3'
Summary: Tax Policy and Regional Capital Flows
2.52 The broad conclusions of the preceding sections are that first, in the past, regional capitalmobility was discouraged, under the profit remittance system. Next, with the introduction of theseparation of profits and taxes, as well as permission to retain profits and the concomitant increase in thelocal authorities' taxation powers, incentives to retain new incentives within local jurisdictions remainedhigh. Third, the regulations goveming cross-provincial investments are fairly clear, at least for regionswhich do not belong to special zones. These regulations are neutral across locations in terms of incometax; enterprises do not benefit from relocation but are not subject to double taxation as a result.Enterprises can take advantage of indirect tax concessions offered by host governments. However, fourth,the picture is distorted by the large number of special investment zones in China. Many of these haveextended their offers of concessions to investors from other provinces, legally or illegally. Some of theseincentives may be discretionary and subject to uncerainty. Nominally the granting of some of theseconcessions is controlled by the center alone. However, under current central-local fiscal relations, theonly binding constraint that a locality actually faces is the fiscal contract with the level of governmentdirectly above. As long as the locality has fulfilled the revenue target specified in the contract, it tendsto use exemption as much as possible to keep the resource in the locality. Moreover, there are no real,implementable, punitive measures against localities' illegal tax concessions. Finally, there may bepractical and procedural difficulties in interprovincial investment flows which inhibit their growth.
2.53 The economic consequences of these findings for regional capital mobility are first, thatunder normal circumstances, regional capital mobility is likely to be limited. To the extent that it occurs,it is likely to be strongly influenced by the concessions offered by the large variety of special zones, beingattracted to regions where such concessions are high. The implication is that even if interregional capitalmobility does occur, it may not be efficiency enhancing for the economy as a whole, as it is based oncompeting regional tax differentials rather than on real differences in natural endowments or other costs.
t Guangdong Intemational Tnst and Investment Center (GMTIC) jointly invested in an aluminum fictorywith Gongxian county of Henan province in 1986, in which GMTlC provided a loan of Y 2 million, tobe repaid with aluminum, at the market prices prevailing in 1986. Given the limited supply ofaluminum at the time and its rising price, GMTIC benefitted considerably.
36 See the discussion on enterprise groups in Chapter 5.
- 40 -
2.54 The implications for policy adjustment are first, that disincentives to regional mobilitydue to local governments and local industry bureau interests in profit, revenue retention andextrabudgetary funds should be examined, with a view to their reduction. Such an investigation mustnecessarily form a part of a larger examination of the current system of fiscal contracting. Next, thereis a strong case for more equal treatment of investors in all regions ('zones' and normal areas), and fromall regions (domestic and foreign). Third, the current regulations on cross-provincial investments lackcredibility because of a lack of enforcement procedures, as well as a lack of sanctions in cases of theirviolation. The development of regulations and enforcement procedures for this is a major undertakingwhich must be embarked upon If future flows of interregional investments, at the enterprise level, are tobe facilitated.
An Analysis of Evidence
2.55 This section first examines the evidence on direct flows of interprovincial investment.Data are available for six provinces, Guangdong, Shaanxi, Sichuan, Beijing, Shanghai and Liaoning, overthe period 1985 to 1992. These six provinces represent a cross-section in terms of location, coastal aswell as interior, from the north as well as the south, and from developed as well as backward regions.'The total investment in these provinces accounted for around 30 percent of national investment, over theperiod, and the sample is therefore reasonably representative (fable 2.6)
2.56 The first observation is that interprovincial investment as a proportion of total investmenttoday is very low in most provinces. In five of the six provinces examined, the ratio in the most recentyear is less than 3 percent. The only exception is Shanghai, where interprovincial transfers account foralmost a third of total investment. Second, in three of the six provinces, this ratio has declined over time(Guangdong, Shaanxi and Beijing). Sichuan has remained virtually constant and Liaoning has a smallincrease. Shanghai is the only province with a significant increase, which probably reflects inflows dueto the Pudong investment zone. It also suggests that the declining internal trade ratio in Shanghai maybe partially offset, in term of links with other provinces, by its increasing internal investment ratio. Itis however clear that the case of Shanghai is exceptional.
2.57 It is also notable that domestic investment flows from other provinces are less significanthan external investment. Foreign investment as a proportion of total investment in recent years has beenas high as 10-13 percent in Shanghai, Liaoning and Beijing, and even higher in Guangdong (32 percent).In all these provinces, there has been an increase in this ratio over time. In the interior provinces,however (Sichuan and Shaanxi), external investment has been stagnant or declining. The high and risingexternal investment in Shanghai suggests that this is not 'crowding out' domestic interprovincialinvestment flows; rather, both have been able to significantly expand at the same time. It must also berecalled that the increasing fbreign investment ratio of Shanghai has coexisted with a high and risingforeign trade ratio.
I The data were collected as part of a background study for this report, undertaken bv the CASS. Dataare collected from provincial authorities and Departments of Cooperation.
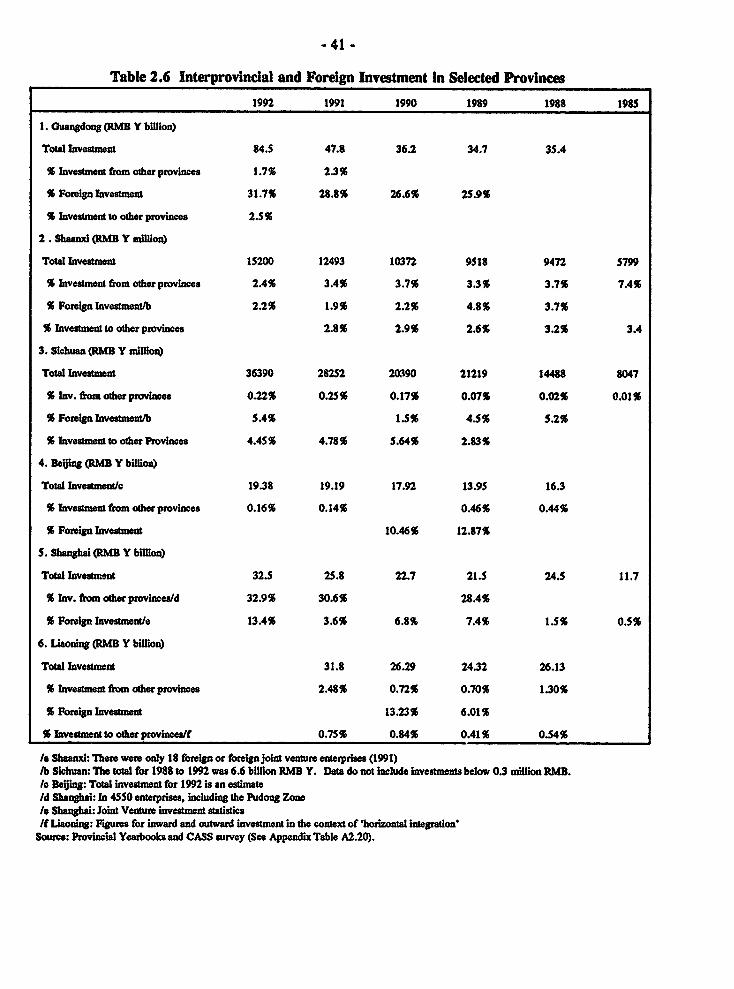
- 41 -
Table 2.6 Interprovincial and Foreign Investment In Selected Provinces
1992 1991 1990 1989 1988 1985
1. Guangdong (RMB Y bilion)
Total Investmant 84.5 47.8 36.2 34.7 35.4
% Investment fiom other provinces 1.7% 2.3%
% Foreagnlnvestent 31.7% 28.8% 26.6% 2S.9%
Investamet to other provinese 2.S%
2. Shaa=nx MB Y million)
Total Investmaent IS200 12493 10372 9518 9472 S799
% Investment from other provinces 2.4% 3.4% 3.7% 3.3% 3.7% 7.4%
% Foreign Investment/b 2.2% 1.9% 2.2% 4.8% 3.7%
% Investment to other provinces 2.8% 2.9% 2.6% 3.2% 3.4
3. Sichuan (1MB Y million)
Total Investment 36390 28252 20390 21219 14488 8047
X Inv. fim oterprovines 0.22% 0.2S% 0.17% 0.07% 0.02% 0.01%
X ForeignIavestment/b S.4% 1.5% 4.5% 5.2%
X Investmt to otherProvinces 4.45% 4.78% 5.64% 2.83%
4. Beijing aRMB Y billion)
Total Invesme/c 19.38 19.19 17.92 13.95 16.3
% Investment fiom orprovinces 0.16% 0.14% 0.46% 0.44%
% Foreign Investment 10.46% 12.87%
S. Shanghai (MB Y billion)
Total Invesnt 32.S 25.8 22.7 21.S 24.5 11.7
% Inv. fiom other provincestd 32.9% 30.6% 28.4%
% Foreign Investment/e 13.4% 3.6% 6.8% 7.4% 1.S% 0.5%
6. Liaoning (RMB Y illion)
Total Investment 31.8 26.29 24.32 26.13
X Invesament fmn other provinces 2.48% 0.72% 0.70% 1.30%
S Foreign Investment 13.23% 6.01%
% Investmaenttootherprovincesf 0.75% 0.84% 0.41% 0.54%
la Shaanxi: here were only 18 foreign or foreignjoint venture enterprises (1991)/b Sichuan: Tnh total for 1988 to 1992 was 6.6 billion RMB Y. Data do not include investments below 0.3 million RMB./c Beijing: Total investment for 1M is an estimateid Shanghai: In 45SO enterprises, including the Pudong Zone/e Shanghai: Joint Vere investment statistics/f Liaoning: Figures for inward and outward investamnt in the context of 'horizontal integratione
Source: Provincial Yearbooks and CASS survey (See Appendix Table A2.20).
-42 -
2.58 There are also some limited data from the same source (Appendix Table A2.20), thoughonly for Stee provinces, on the outward investment of these provinces. It suggests that outwardinvestments increase when investment flows inwards increase, and that the two may tend towards similarlevels. Thus in Liaoning and Sichuan, inward investment has had a modest gain, or remained constant,over the period for which data are available, and outward investment has increased as well. In Shaanxi,there has been a general decline in inward investment as well as constant or falling outward investmentin the most recent years. The inference is that provinces which are relatively more open tend to haveboth higher inflows as well as outflows. There are no cases of a successful 'beggar-my-neighbor' policyof high inward and low outward investments.
2.59 A second form in which the mobility of capital may be gauged empirically is through ananalysis of differentials in returns to capital across different uses. If these differentials reduce over time,it suggests that capital mobility has increased. There is some evidence to suggest that capital is relativelymore mobile than in the past, between different productive sectors. A study on sectoral profitdifferentials over 1980 to 1989 shows that these have declined over time.Y8 A decline in sectoral profitsugests that administrative barriers across sectors (the vertical barriers) have weakened.
2.60 However, this has no automatic implications for capital mobility in regional or spatialterms. To analyze this, data on regional differentials in profit rates as well as enterprise tax rates wereexamined, using time-series data on state and private enterprises (Appendix Tables A2.21 to A2.25). Thedat separate the average profit rates and tax rates, by province, for each of the five years 1986-1990.Further, the average profit rates are computed separately for profitable and loss-making enterprises. Taxrates are also separated in terms of the total effective rate, and the effective rate for commodity taxesalone. Coefficients of regional variation have been estimated for each year's data. The results aresummarized in Table 2.7.3
^ Naughton (1992).
30 Calculations are based on data from the CESSRI (China Economic Systems Reform Research Institute)data base, compiled by the SCRES on around 800 state and private enterprises, over six years,beginning in 1986. The data base is maintained at the STICERD, London School of Economics.

- 43 -
Table 2.7 Mean and CoeMfient of Variation of Effective Tax Rates of 20 ProvInces (1986-1990)
Total Effective Commwdity Tax _ _P__ fit__t
Tax RaI Rates Profit-maker Lo f mi e Average
1986 Mean (percent) 84.51 16.92 65.85 -70.29 64.25
COV 0.085 0.559 0.148 0.791 0.193
1987 Mean (percent) 84.41 1S.58 66.34 -71.67 65.00
coV 0.081 0.556 0.127 0.482 0.152
1988 Mean (percent) 85.14 15.05 68.27 -70.33 66.44
COV 0.099 0.546 0.144 0.238 0.176
1989 Mean (percent) 86.02 15.49 6S.92 -84.79 58.29
COV 0.100 0.543 0.164 0.247 0.343
1990 Mean (percent) 89.78 16.10 71.33 -79.48/a 48.14/a
COV 0.102 0.579 0.185 0.459/a 0.657/a
/a Adjutsed value for 1990 (See AppendixTable A2.25)Note: rouJ effecusi &a rate is defined as (commodity taxem + profit tax)/(commodity taxes + profit tax + retained profits);
Comunodiy tar m is defined as commodity taxes/sales revenue;PFojit uat rue is defined as profit taxes/(saes revenue - materW costs - depreciation).
Source: Calculated from data in AppendixTables A2.21 to A2.25
2.61 The results are an interesting contrast to the findings on sectoral profit rates. Lookingat profit rates for all finns, on average, or at profitable and loss-making firms separately. coefficients ofregional variation increased over time. In the case of taxes, the results are similar, for all enterprisetaxes taken together, as well as for commodity taxes alone. The overall finding is that there is noevidence to support a convergence of returns to capital across different provinces. Other things beingequal, this suggests that capital mobility has not increased noticeably since 1985.
The Banking System: Interbank Borrowing and Lending
2.62 Another form of capital mobility Is through the banking system and through financialmarkets. While there are a number of nascent forms of financial market in China, the interbank marketis the main channel of cross regional capital flows today.40 The interbank market, designed by thecentral bank as a short-term money market to meet the needs of banks which encounter a temporaryshortage of funds for interbank payment, was first organized in a number of major cities in 1986.Initially, branches of People's Bank of China (PBC) in these cities organized a regular meeting-usuallyweekly-at which local bank branches could negotiate interbank loans for periods ranging from a weekto several months. Currently, there are six visible markets, and interbank activities also take place
4 Other capital markets include markets in short-term negotiable paper, bonds and securities. Howevertheir scope so far is limited (see below). In addition, some cities, such as Shanghai, have been able todirectly attract bank deposits from persons outside the province, and these are now estimated to accountfor around 10% of Shanghai's total household savings accounts. However, cross-regional deposits arelimited on a nationwide scale.

- 44 -
directly and 'invisibly' between banks and other financial institutions.4' Over the past few years, theseinvisible markets dominated interbank activities by accruing more than 90 percent of total transactions.Interbank borrowings include transactions taking place within or outside the same city or region, andwithin or outside a given specialized banking system. It is estimated that of the Y 96 billion of interbanktransactions in Shanghai in 1992, about one third was across provinces.43
2.63 The country's interbank borrowing activity has shown an upward trend, but withsignificant pro-cyclical variations. Total borrowing activities amounted to Y 230 billion in 1987, whichgrew to Y 520 billion in 1988 when the economy was overheated. During the credit squeeze of the'rectification program,' interbank borrowing shrank to Y 290 billion in 1989, and further to Y 260 billionin 1990.4 From 1991, monetary policy began to loosen and interbank activities surged to a new record.In 1992, interbank borrowing was estimated to be about Y 800 billion.4
2.64 Although intended primarily for meeting short term liquidity requirements or placingshort-term assets, these activities contribute to the breaking of administrative barriers between regionsand sectors. The increasing interbank activities reflect that the current credit allocation mechanism is notefficient, and that the marginal productivity of funds differs across regions and sectors. According tosome research, the faster-growing developed areas usually offer higher rates than the less developedareas.' High rates have been concentrated in the developed and fast growing eastern region, especiallyShanghai, Jiangsu and Zhejiang. The study suggests that low rates prevailed in the western region andnorthern part of China, where capital productivity is relatively low.
2.65 The future growth of interbank market activities may be curbed by the policies of thegovernment on instruments of monetary control. At present, credit controls are a key instrument ofmonetary policy, and the credit ceiling assigned to each local bank branch restricts interbank borrowing.The People's Bank of China (PBC) stipulates that only those banks (branches) with unused creditallowance can borrow from the interbank markets. However, in many cases, banks that lack funds alsolack a credit allowance. The control over the nominal interest rate in the interbank market, which isrestricted by a ceiling set by PBC, is also an instrument of overall credit control, which depresses thesupply of the funds in the interbank market. Recently, an increasing volume of lending has been takingplace at parallel market rates, which are much higher than the nominal ceiling. In early 1993, the interest
41 Huadong (or East China, including Shanghai, Jiangsu, Zhejiang, Anhui, Shandong and Jiangxi), SouthMiddle (including Sichuan, Yunnan, Guangdong, Hman, Hunan, Hubei), South West (includingXinjiang, Gansu, Qinghai, Ningxia and Shaanxi), Huabei (or North China, including Beijing, Tianjin,Hebei, and Shanxi), and North East (including Heilongjiang, Liaoning and Jilin).
'2 Shanghai branch of the People's bank of China.
43 Figures are fiom Y. Huang (1992).
4O Interview estimate provide by the Fund Control Department of the People's Bank of China.
Is An examination of the weighted average interest rates in five major interbank mnarkets during 1987-90shows that in 1987, the reported weighted average rate in Huadong (East China) was 6.17 percent, therate in South Middle was 5.99 percent, the rate in South West was 5.79 percent, and the rate in Huabeiwas 5.58 percent. The next three years followed the same pattern. See Shi and Yan (1991), p.61 .

- 45 -
rate ceiling set by the PBC was about 8 percent, while the parallel market rates were close to 17 to 18percent in some regions.
2.66 At the same time, there has been some abuse of the initerbank matket by banks, and asa consequence, the government has begun to look askance at its growth. The lending term is currentlyrestricted to two months, as is appropriate for a short term liquidity managerAent instrument, andborrowing from the interbank market for long term investment is prohibited.1 TPwtly in response to thelack of adequate and flexible term lending institutions, at the time of the accelerated investment of 1992-1993, many banks tended to use the interbank borrowing for long term financing. In some cases this wasundertaken by diverting funds to the banks' subsidiary non-bank financial institutions. In March 1993,the central PBC declared that this was prohibited.
2.67 These considerations point on the one hand to the need for the government to diversifyits instruments of monetary policy away from credit and interest rate controls, which are still the primarymeans of monetary control. In the short term, within this framework, while it remains, there is a needto move away from regional and bank-specific credit ceilings, to enhance the efficiency of capital use.The PBC could consider the possibility of permitting the trading of credit allowances across regions andsectors. This will enhance the efficiency of the use of funds, although it will not substantially increasetotal outstanding credit while aggregate credit ceilings are in place. On the other hand, the supervisionof the activities on the interbank market also needs to be strengthened, so that the misuse of funds fromthis source does not occur.
The Banking System: Payment Clearance and Settlement4
2.68 One of the factors affecting both interregional trade as well as interregional factormobility is the degree of facility in interstate payments. If goods are bought or sold in other provinces,or if laborers are hired from outside their own province and wish to remit money to their home province,how easily can this be undertaken? This depends on the form of the interbank payment clearance andsettlement system an how effectively it functions. There are many accounts of delays in payments, whichindicates the merits of an examination of the payments mechanism.
2.69 A basic feature of China's interbank clearing system is that all non local interbankpayment must first be cleared and settled between specialized banks on a local basis through the localclearing agency and then cleared within the specialized banks across localities or regions via the intrabankclearing mechanism.' Local clearings are made through approximately 2,200 local city and county levelclearing houses throughout China. All local interbank and nrst local intrabank payments are exchangedand setded through the local clearing houses. All non local interbank payments are first exchanged andsettled between specialized banks through the local clearing houses before being processed acrossgeographic regions. After local clearings, non local items use intrabank clearing mechanism to effectpayment. There are four different intrabank payment systems, and each has three stages, which are the
l Te maximum term of interbank lending was six months before September 1989, when it was revisedto two months.
47 This section draws from The World Bank (January 31, 1992) and The World Bank (March 1993).
' Between branches of the same specialized bank.

- 46 -
physical exchange of payment instruments; the clearing of payment instruments and the settlement of theintrabank clearing. Instruments are physically exchanged by mail or telegraph, depending on the paymentinstrument used. This physical exchange is generally directly between the sending branch and thereceiving branch, irrespective of location. The clearing and settlement of the instrument is morecomplicated and takes place through different levels depending on the location of the sending andreceiving branches of the specialized banks.
2.70 The Chinese settlement system is extremely complex by western standards since itincludes separate settlements from local clearing, intra-county, intra-provincial and inter-provincialtransfers. In addition, settlement is not undertaken daily for each settling participant, but only occurswhen certain net balance thresholds are reached. These factors result in delays in the payment process.Payments made across regions also involve slow reconciliation since many specialized banks still usemanual checking. Under normal situations, a payment made within a city may take one to three days,depending on whether it is across specialized banks. A payment made across banks and across regionsmay take from three days to many weeks, depending on whether the receiving bank is located in a cityor in a remote county. As a consequence, branch banks have the incentive to keep accounts payable forlonger than necessary, to guard against temporary difficulties in payment.
2.71 The problem of payment delays and hinders the efficient movement of capital acrossregions. Currently, the reconciliation system is being computerized within major banks, largely toovercome the long delays. In addition, an electronic interbank system, which uses satellite transmissiontechniques, has been adopted to increase the speed of payment clearing. This system has connected 21branches and plan to cover some 200 branches nationwide. As the system spreads, disincentives toundertake interregional transactions will decrease. Meanwhile, the problem of post office cleaance ofIOUs also has to be addressed. It is estimated that by the end of 1992, money orders totalling 800 millionyuan ($137.9 million) had stil to be cashed in Sichuan province alone."O
2.72 In 1991, 320 millionpostal remittances were received, amountingto 101.78bilion yuan.The Miistry of Post and Telecommunications operates its remittances and accounts settlement with theIndustrial and Commercial Bank of China, and with the Agricultural Bank of China. It claims that theprocess of remittance allocation and transfers between these rural branches is much slower because ofweak computer links and the cash shortage which these banks suffer from. Many rural banks thereforefind it hard to obtain sufficient cash for money orders. As a solution, the government is reconsideringthe birth of a national postal savings bank to handle postal rremittances. It points out that postal depositsare already large. By the end of last year, more than 20,000 postal offices dealt with deposits. Postalsavings totalled 47.6 billion yuan.
2.73 Although a specialized postal bank may have its merits, on other grounds, theestablishment of such a bank is not likely to solve the problem of cross-regional payments, if settlementsstill operate through the existing commercial bank network. Setting up a parallel network is likely to beextremely expensive and there is no guarantee that this will function more efficiently. 'he answer seems
China Dai. 19 February 1993. According to the Ministry of Posts and Telecommunications, theproblem has grown mwe serious in the provinces of Sichuan, Hubei, Hunan, Jiangsu and Henan, whichprovide surplus nual labor. In Nanchong prefecture of Sichuan province, two tlhirds of the ural postoffices were aaked by angry famers before New Yea's Day.

-47 -
rather to lie in strengthening and streamlining the current payments system operating through the bankingsystem.
Capital Markets
2.74 Finally, interprovincial investments are also beginning to occur today through stock andbond issues. Some enterprises have begun to float these in numerous provinces. In the medium term,this may well develop into a promising vehicle for regional investment flows. Today however the scopeof such markets is limited. By the end of June, 1993,over 120 enterprises were quoted on the Shanghaiand Shenzhen stock exchanges, including enterprises from outside these municipalities. Another ninecompanies have ben approved for listing in Hong Kong this year, and one has already been listed in NewYork. Although there are a number of informal regional markets in shares, their operations tend to belocal or regional in character. A major obstacle to the development to this market today is their imperfectsupervision and regulation, which has led to well-publicized speculative activity well as fraud.' Theseproblems will have to be coirected before this avenue of capital mobility can expand significantly.
D. Factor Mobility: Labor
2.75 China's policy towards the mobilization and deployment of labor in the prereform periodwas based on the twin principles of minimizing or eliminating unemployment, as well as providinglifetime job security and stability. These aims were largely achieved, through a set of complementarymeasures. Urban labor force entrants were allocated by government authorities to permanent positionsin state enterprises, in predetermined quotas, and at the same time, rural urban migration was prohibited.This prohibition was effectively enforced by the household registration (hukou) system, and by urbangrain rationing, which severely discouraged movement. However, the system engendered manyunfavorable economic consequences. At the level of enterprises, udeir role in providing other services fortheir employees, such as housing or hospitals, combined with the lack of social security for unemployedpersons, greatly increased the burden of their responsibility as well as financial liabilities andconsequently increased the difficulties of dismissal of any staff.5' The segmentation of the rural andurban labor force restricted the supply of rural labor to meet growing industrial requirements, and createda differential in wages, causing urban labor to be overpriced.52 A further consequence, in combinationwith the underpricing and subsidization of capital, implicit in investment and interest rate subsidies
5 Notably the stampede outside the Shenzhen stock exchange in late 1992 when new share issues weremade. In terms of fraud, the Great Wall Company of Beijing has recently (eady 1993) defraudedthousands of would be investors by promising them rates of return of 24 percent on a bond issue.
L Limitations on labor mobility also arose from the 'inheritance' of jobs in state enterprises by theirfamilies or offspring, according to the dingti system. The practice had been in existence for a long timeand was formally permitted from 1978 (Christiansen, 1992). For a discussion of housing issues seeWodd Bank Report No. 9222-CHA (1991) and for social security issues see World Bank Report No,8074-CHA (1990),
52 Putterman (1992), Jefferson and Rawski (1993) and World Bank (1992) Report No 10266-CHA discussthese issues in greater detail.
- 48 -
prevalent at the time, was that enterprises had little incentive to use more labor-intensive techniques ofproduction, and indeed sometimes accepted new recruits only if capital grants were also included. Aparadoxical consequence was that urban job availability became constrained.1' Job security and wagerigidity in their turn implied that performance incentives and productivity were low, andunderemployment was high, even among salaried workers.'
2.76 With the onset of reforms there has been a growing recognition of the adverse effects ofthe former policies, and attempts have been made to increase the flexibility of the labor market. Lookingfirst at the supply side, the breakup of the commune system in the countryside in the late 1970s forcedthe massive disguised surplus rural labor force into evidence." Millions of peasants became redundantin a few short years. Rapid new construction in urban areas provided a market for such persons. Thetemporary migration of rural labor to urban areas was permitted in 1983, with a State Council ruling thatpermitted rural households, without changing their residence, to embark upon 'cooperative joint ventures'in market towns. Permanent migration was permitted in 1984, for peasants who were self-reliant in termsof cash, food supply and accommodation. Although intended primarily for smaller townships, this rulinghad the effect of legalizing the entry of large numbers of rural workers in all urban areas. From 1986,the sale of grain to urban migrants, at negotiated prices, was also legalized. Meanwhile, enterprises havealso expanded their use of rural workers by setting up rural subsidiaries or 'associate' companies, andpeasant entrepreneurs have also begun to employ rural labor.O Later, some provinces, such as Gansuand Sichuan, began to develop active unskilled labor export programs to labor deficit areas. In recentyears, new moves have been made by the government to simplify transfers of skilled labor, in particular,between occupations. University graduates are now permitted to take jobs in township and villageenterprises without losing their urban residence permits and their access to urban subsidies.5 Talentexchange centers have been established for highly specialized personnel.
Other factors also contributed to the slow growth of jobs; the general bias against the creation of newservice sector jobs in the early years of reform, the bias against agriculture implicit in grain pricecontrols and the 'policy hierarchy', which gave preferential treatment to state-owned, collectivelyowned and private enterprises, in that order (Jefferson and Rawski, 1993).
O' One survey shows that actual work time in industrial enterprises in Wuhan was 5.6 hours per day,instead of the statutory 7 to 8 hours (Jefferson and Xu, 1991).
5 Based largely on Solinger (1992 and 1993).
X The Wuxi Boiler Factory, for example, started an enterprise in Xinguang village in Wangzhuangtownship in May 1985, exclusively to produce boiler parts. The initial investment was based on thetransfer of machinery from Wuxi Boiler Factory, funded by an interest-free loan from the company.Initially the plant hired 205 workers from the village and in the mid 1980s, an additional 130 non-localpersons were added from other neighboring counties (Christiansen, 1992).
a In Wuxi, enterprise leaders talked of 'buying' graduates (daxuesheng) from technical universities for afixed sum of Y10,000 from other provinces or counties, to be employed as engineers or technical staff(Christansen, 1992). It should also be noted that in 1982 the State Commission of Science andTechnology had promulgated a 'temporary regulation on the hiring of science specialists on secondjobs'.

-49 -
2.77 At the same time, larger cities have begun to acquire a number of illegal entrants fromrural areas who contribute to a reserve pool of floating labor. This population differs from the migrantlabor described above, as it is only eligible for 'temporary' residence, at best, in the locale to which ithas moved.m It is estimated that in 1990 there were some 60 to 80 million persons in this category.'On average, according to public security statistics, at least a million or more persons 'floated' in eachof the 23 largest cities with populations of over a million. In most medium sized cities the transients areprovided by nearby areas. However in the largest cities of Shanghai and Guangdong floaters are drawnfrom much further afield. Estimates suggest that over two thirds of the transients stay on for half a yearor more. These floaters provide a large and docile labor force, who however are extremely vulnerableto exploitation on account of their lack of formal status. Enterprises and even government departmentshave hired such laborers to reduce costs and increase flexibility.
2.78 On the demand side, complementary instruments were introduced to increase theflexibility permitted to enterprises in the hiring of labor. As early as 1980, a State Council directivereplaced the state monopoly on labor allocation with a system in which the official promotion ofindividual and private businessmen, as well as the possibility of individual job search, was accepted. Ihestate also recognized the need for establishing special job promotion measures, in the form of 'laborservice companies' (LSCs) for job vacancy registration, job training and placement.6 ; The role of theLSCs gradually expanded to include the setting up and operation of new enterprises to create employmentfor surplus workers.a
2.79 At the level of the enterprise, greater latitude was granted in terms of hiring, andenterprises were permitted to hire temporary migrant workers in lieu of permanent labor. Not only werethese cheaper, but they also provided greater flexibility in terms of increasing or reducing numbers tomeet fluctuations in business activity. However the hiring of such labor still falls under the purview ofthe Ministry of Labor and local labor bureaux, who encourage the hiring of permanent staff to achieveaggregate employment and placement targets. More significant, a new flexibility has been introduced inthe definition of jobs and job expectations, through the labor contact system.'
S 'Temporary' residence is a legal category but it is estimated that probably only a third to a half ofpersons in this category are legally registered.
I Around two thirds of these are estimated to be peasants. The rest comprise tourists, or authorizedbusiness or individual travellers.
I However, due to the fact that such persons impose an additional burden for service on cities which arenot equipped to deal with them, there are periodic moves to 'evict' the migrants and send them back totheir villages. Beijing has recently announced that it wants to put tighter controls on unskilled transientswho have 'flooded' the city. China News Digest, July 13 1993.
a The new 'three-channels-in-one' system (san jie he) for job placement.
'2 The lawufuwu gongsi. These could be new urban collective or state-owned enterprises or theirsubsidiaries, set up by the labor bureau (Chrisiansen, 1992).
'1 The following two paragraphs on labor contracts and wages are based largely on World Bank (1992)Report No. 10266-CHA.
-50 -
2.80 Under the labor contract system, new entrants to an enterprise are required to sign acontract, which typically specifies the duration of the agreement, the responsibilities and benefits of bothparties (work requirements and performance standards on the one hand, and wages and benefits on theother) and terms for renewal or cancellation. The contracts greatly increased the flexibility provided toenterprises to reject unsuitable candidates, as well as to avoid the obligations of permanent recruitment,by not renewing contracts. The contract system covered only new recruits, and was first introduced onan experimental basis in 1983. It was formalized by a regulation of the State Council in 1986 and it isthe intention of the government that it will eventually cover all workers.
2.81 New mechanisms for the linking of wages to performance were also introduced, initiallythrough the bonus system, in 1978. Bonuses were allowed to cover 5 percent of the total wage billinitially and this was expanded to 12 percent shortly after. In 1985, a 'floating wage' system wasintroduced, permitting the linking of a portion of wages and bonuses to various performance indices. Theconcept was extended in 1988 to link wage funds to economic efficiency and meanwhile, the proportionof funds allocated to bonus and incentive funds was allowed to rise.O Within state enterprises, the shareof basic wages in the total wage bill decreased as a consequence, from 85 percent in 1978 to less than50 percent in 1990. The share of bonuses rose from 2.3 to 17 percent over the same period. In 1992, itwas estimated that over 100,000 state-owned enterprises, with 41 r 'on workers (over half the totalstate-owned enterprise workers) gave various forms of efficiency pe? ' gross wages.6"
2.82 New managerial incentives tco link rewards to performance were also introduced, in theform of both incentives and penalties.' First, considerably greater managerial autonomy was permittedunder the enterprise contract responsibility system, which gave managers the authority to set productiontargets and gave them greater authority in decisions concerning pricing and sales. The selection ofmanagers by competitive bidding was also introduced. The managerial role in risk-takdng was also mademore explicit. In a large number of enterprises, managers 'bidding' for a position offered to enter intoa personal 'management contract', stating what their expected achievements would be, and offering asecurity deposit to back their promised undertakings. Managerial and professional 'demotion' for failureto perform was also introduced.
2.83 In 1985-87, a new experiment was launched to stem the severity of underemployment instate enterprises, known as the Optimal Labor Reorganization program. The program allows for acomprehensive reorganization of the work unit, with the retraining and redeployment of labor with theaim of increasing overall worker productivity, particularly of permanent workers. The identification and
I The link of wages to economic efficiency, known as 'gongxiao guagou 'was an extension of thestructural wage system, which was an alternative to the floating wage system, based on a delinking ofthe wage systems of public agencies and enterprises, but in other respects closer to the former (revised)structural system.
I 'Bulletin on the development of labor and employment in 1992', issued by the Vice Minister for Laborin early 1993. Summary of World Broadcasts, BBC, June 2, 1993. Analyses of the effects of such wageincentives on economic efficiency of state enterprises have shown that the links are significant (Chetty,et. al., 1993).
"6 Discussed in Groves, et. al., (1992, March) and (1992, September).

- 51 -
elimination of excess workers within an enterprise was aimed at, as well as the placing of remainingworkers on contract.67
2.84 Achievements have also been made in the development of arrangements that mitigate thesocial dislocation associated with increased job turnover among urban workers.6' The creation of systemsfor the compensation, training or retraining of workers, and the placement or dismissal of redundantworkers, has begun. Contributory retirement programs for permanent, temporary and contract workershave been launched and some social welfare responsibilities formerly under the purview of the enterprise(such as medical care) are being transferred back to the state. Experiments with alternative means ofcommercializing the allocation of urban housing are growing widespread.
2.85 Partly as a consequence of these new cushions, from late 1991, the government beganto permit bolder actions in the shedding of surplus labor by enterprises, to break the 'three irons'; theiron salary (inflexible wages), the iron chair (or permanent jobs for officials) and the iron rice bowl (orlifetime jobs for ordinary laborers). In July 1992, the government announced a new set of 'Regulationson Transforming the Management Mechanisms of State-;wned Enterprises'Y. These rules providedenterprises with the right to 'make their own decisions about hiring', and the form of employment. Theright to terminate contracts and dismiss and fire workers and staff was also included, and the right todemote managers and workers, and to reduce as well as increase pay, was made explicit. Enterprises infinancial difficulties are expected to reduce wages and reduce or halt bonus payments, drawing on wagereserves to fulfil financial obligations. In the event of bankruptcy, firms may be disbanded.
2.86 The terms and conditions of layoffs and retrenchments were made more explicit throughthe 'Regulations on the Resettlement of Surplus Workers from State-Owned Enterprises%° Theregulations state explicitly that 'in case a layoff is necessitated by major changes to production andmanagement, enterprises may terminate the labor contracts of staff and workers employed under thesecontracts before the term of their contract expires, and after such a move has been discussed andapproved by the workers' congress'. However if the contracts do not provide for such early termination,compensation must be provided, with one-month standard wage for each year of service. There are alsoprovisions for the option of lump sum compensation with resignation. Options for resettlement willdepend largely on the enterprises' own programs, with society-assisted resettlement as a second choice.The livelihood of surplus staff and workers is to be ensured. Tertiary industry enterprises established bystate enterprises to resettle surplus workers are exempt from income taxes for the first two years and pay50 percent of taxes in the third year. The state enterprise is obliged to support labor service companies(LSCs) set up to provide employment for redundant workers, with funding, working space and materialsand equipment. Provisions also exist for job training.
7 Workers are encouraged to form labor groups to voluntarily contract for production. If an individualfails to be accepted, he may remain in the enteuprise, on a reduced wage, or be asked to leave, ifalternative employment opportunites are found for thea. Many enterprises, especially before 1991,have relied on natural attrition to reduce the numbers of redundant workers.
The paragraphs on new developments draw upon Jefferson and Rawski (1993).
" Also known as the 'New Operating Mechanisms' for State-Owned Enterprises.
7e Xinhua News Agency, domestic service, 27 April 1993, announced the text of these regulations.
- 52 -
2.87 The consequences of the new regulations are already apparent. During the first half of1992, the newly-created Economic and Trade Office of the State Council announced that 1.4 millionurban workers had lost their jobs (in contast to 0.7 million in the entire year of 1989). Major instancesof labor shedding were announced at large state enterprises. The China National Coal Corporation shed100,000 workers in 1992, and it plans further reductions of 400,000 of its remaining labor force of 2.8million over the period 1993 to 1995. Wuhan steel, one of the larger national steel plants, claims to haveshed 80,000 of its 120,000 workers, with the aim of raising output per capita from 40 tons of steeltowards higher international norms.71 Most of the staff shed are nt directly involved in production, butrather are from administrative or ancillary positions.' Meanwhile the Central government itself hasannounced its intention of laying off a fourth of its 34 million employees over the next three years. Areduction by a third in the staff of the State Council itself was proposed at the Eighth National People'sCongress (March 1993), though the dissolution or merger of certain production departnents under theCouncil.'
2.88 At present, the reforms are likely to find a natural limit as the ability of the enterprisesas well as the state to provide new jobs is approached. According to a recent survey of 200 large andmedium state enterprises in nine cities, around 17 million workers have been rendered redundant as aresult of the reform process. The state will be able to provide jobs for no more than 7.32 million andthe rest will be 'left to society'.
2.89 It has been pointed out that these new regulations do not completely abolish long-standinglabor market restrictions, as state fiSms remain constrained to recruit ordinary workers (as opposed tomanagers or technicians) in their home localities. The right of ordinary workers to resign from their postshas not been established in the regulations. Moreover, the enterprises' autonomy in undertaking actionsassociated with labor-shedding may be challenged by local governments and branches of ministries.Nevertheless the new framework could represent a major transformation in China's labor market, in termsof the establishment of a market largely governed by economic forces. In terms of furiter progress, thereis clearly some scope for furither increases in flexibility, again especially in terms of regional transfers.Now that some of the constraints on providing for new urban entrants, such as the controls on sales ofprice-regulated grain and edible oils have been removed, with the large-scale lifting of grain pricecontrols, and the ending of grain rationing in more than 400 counties and cities, the absorption of suchtransfers is easier than it was in the past.'7 Facilitation of the process of residence transfer could alsoinclude an examination of the legalization of 'illegal' migrants who, while providing a reservoir of cheap
' The UK produces around 12.1 million tons of steel with 40,000 workers, which amounts to around 300tons per capita. The Japanese norm is higher, at 800 tons per capita.
n In this respect the path being followed by China today mirrors the path already followed by steelcompanies the world over, including the UK, USA, Italy and Germany. This is being undertakendespite the present profitability of Wuhan steel, and indicates that the Chinese intenal masket isbecoming increasing aware of the standards of international production and markets.
3 Such as the Ministries of Textile Industry, Chemical Industry, Metallurgical Industry and LightIndustry. However in some cases it was proposed tat the ministries spun off would be 'converted tocompny entities', which makes the real diversion of labor ambiguous.
74 China Daily. September 28, 1992. But the permanent residence registration system remain a limitingfactor, which has not so far been resolved.
- 53 -
labor, are easy to exploit and contribute to the wage segmentation of the urban labor market.'" In thecase of skilled workers, obstacles still remain in terms of the need to transfer each individual's dossiersfrom one official agency to another. Finally, new moves to increase the flexibility of enterprises in termsof layoffs and retrenchments are valuable, however, China has to tread a fine line between the thecreation of a pool of unemployed persons without adequate security, and efficiency requirements ofenterprises. Although protest strickes have occurred in recent years (in 1989, 1992 and 1993), on thewhole, commendable parallel progress has been made on these fronts, and a maintenance of a balancedand synchronized approach in the future is to be hoped for.
E. Foreign Exchange Mcbility76
2.90 Given the limited availability of foreign exchange, an important criterion of marketperformance is its efficiency of allocation among alternative uses, so that it can flow towards those useswhere its marginal productivity is the highest. The extent to which foreign exchange can flow betweenalternative uses depends on the freedom of movement of foreign exchange among competing users andbetween competing regions. China traditionally combined an inconvertible currency with a rigid systemof exchange control, under which any would-be importer had to depend on the State PlanningCommission, which allocated all foreign exchange earnings via an annual import plan. Exporters turnedover all of their foreign exchange receipts to a specialized bank, the Bank of China, in exchange fordomestic currency. Exporters thus were left with no foreign exchange to finance their imports. With theonset of economic reforms, the govermment began to decentralize the administration of foreign exchangeearnings in 1979 by allowing local authorities, departments, and enterprises to retain the rights to buyback a certain proportion of their foreign exchange earnings.' On January 1, 1994, China made majorchanges in its foreign exchange regime, with the unification of its exchange rates. A market-basedmanaged float will be established. Other changes permitting greater flexibility in the foreign exchangemanagement system have also been introduced, as discussed further below.
2.91 Retention quotas under the former system were transacted at the administered exchangerate, but by 1988, all enterprises with foreign investment as well as domestic enterprises with retentionquotas were permitted to operate in the FEACs. Retention rates in 1984/85 were only 25 percent ofexport earnings. From 1988, specific priority sectors Oight industries, arts and crafts, clothing,machinery, and electrical products) were permitted to retain higher proportions (between 70 and 100percent) and higher retention rates were also allowed on foreign exchange earnings above planned targets,
n Migration into the tertiary sector and from rual areas is simpler than other forms of migration. Besides,the government now turns a blind eye to rural labor mobility, especially after the annual Spring Festival.
5 This section draws largely upon World Bank (June 1993) Report No 11568-CHA.
" Tbe full amount of the foreign exchange receipts was required to be surrendered to the state at theofficial rate by exporters. 'Retention quotas' for foreign exchange could be sold for renminbi atforeign exchange adjustment or 'swap' centers (FEACs), which were established in late 1986, or usedto purchase imports. Retention quotas could also be traded in the foreign exchange centers, or used foracquiring foreign exchange at the official rate to purchase approved imports.
- 54 -
during the period of mandatory export plans, until 1991. Some regions also enjoyed higher retention rates(provinces such as Guangdong and Fujian, several minority-dominated autonomous regions), and theSEZs, enjoyed retention rates of up to 100 percent. In general, retained foreign exchange was split evenlybetween the foreign trade corporation (FTC) handling the export transaction and the firm producing thegood.
2.92 Expanded foreign exchange retentio.i rights extended in 1991 were combined with easieraccess to foreign exchange markets. Quota controls on the utilization of retained foreign exchange, whichhad been imposed by the central government in 1985, were abolished, and the number of authorized localforeign exchange markets increased. Each province, autonomous region and centrally administered citywas authorized to establish at least one foreign exchange swap center within its territory.8 A nationalforeign currency swap center was also to be established in Beijing to facilitate currency transactionsbetween central government agencies and to facilitate transactions between local swap markets in differentadministrative jurisdictions. In addition, the swap markets were formally opened not only to enterpriseswith foreign investment, but also to state-owned and collectively owned enterprises.
2.93 Major modifications to this system were introduced in 1991, and again at the end of 1993.In 1991, a uniform retention rate of 80 percent was set throughout the country, of which 10 percentaccrues to the entprise, 10 percent to the local government and the remaining 60 percent to the foreigntrade corporation. However, special rates for certain sectors were retained and adjusted upwards. Formachinery and electronics products, the retention rate is now 100 percent of which 10 percent accruesto the producing enterprises and 90 percent to the foreign trade corporation. Moreover, the centralgovernment ensured access to foreign exchange sufficient to meet its own requirements by reserving theright to purchase, albeit at the prevailing FEAC rate, an additional 30 percent of the foreign exchangeinitially retained; 20 additional percent points from the foreign trade corportations and 10 from exportproducers. Since it appears that the center fully exercised this option in 1991, an effective 50 percent ofthe overatl foreign exchange earnings of the local authorities and enterprises was still appropriated by thecentral government, and producers of export goods were left with no reLined foreign exchange. Evenexporting firms which wanted to purchase imports outside the plan had to seek access to the FEACs:V
2.94 Under the former system, selling foreign exchange w2s considerably easier than buyingforeign exchange. Sales of foreign exchange at the swap rate were virtually unrestricted after December1991, when all domestic residents were allowed to start selling foreign exchange at the swap rate atdesignated branches of banks. These sales consisted of actual foreign exchange, sold mainly byenterprises with foreign investment, and of foreign exchange retention quotas by Chinese enterprises(since the actual foreign exchange was surrendered to the state).
2.95 By contrast, access to FEACs to purchase foreign exchange was subject to approval andwas restricted mainly to enterprises which needed foreign exchange either to service their foreigncurrency debt or to import goods consistent with the industrial policy of the state. Purchases of actual
t By end-December 1992, there were over 100 'swap centers' in operation.
The authonties have recey started expedmenting with a cash retention system on a limited scale inseveral centers around the countzy. In such a system, the enwterpnis would only be required tosunder a portion of their foreign exchange earnings to the state adminstraion of exchange controland would be allowed to keep a portion of its foreigp exchange earnings in resident bank accounts.

-55 -
foreign exchange were usually limited to enterprises with foreign investment, which could be used forpurposes approved by the Ministry of Foreign Trade and Economic Cooperation (MOFTEC) includingtheir own operating needs, debt repayment, and remittances. However, even domestic enterprises withpermission to import were only permitted to purchase retention quotas in the FEACs; the purchasedquotas had to be used within a six-month period to acquire foreign exchange from the state reserves, atthe prevailing official rate, for approved uses. The priority list reflected plan objectives regarding keycommodities, and it provideed for favorable treatment for exporting activity as well as for the acquisitionof advanced technology. Requests for foreign exchange to finance imports of consumer durables, luxurygoods or goods judged to be speculative in nature were not permitted.
Recent Changes
2.96 From January 1, 1994, the system of trading foreign exchange through the FEACs wasshifted to the trade of foreign exchange through the banking system, wiht the development of a nationalinterbank market in foreign exchange. The People's Bank of China (PBC) will publish renminbi buyingand selling rates within floating margins set by the PBC. All domestic enterprises will be required tosurrender their foreign exchange earnings to banks, and the retention system which prevailed until theend of 1993 will be abolished. However, 'cash' foreign exchange accounts can be held (in RMBequivalent) for foreign direct investment, proceedings of foreign borowings and individual foreigncurrency deposits. Retention quotas may continue to be used to purchase foreign exchange at the officialrate through the 1st quarter of 1994.
2.97 The advantages of the new system are flrst, that aU transactions will occurr at one rate.Second, if exporters or importers need foreign exchange, there is no need to be restricted by 'retentionquotas'; foreign exchange can be purchased at banks. Third, with the interbank market, a nationalforeign exchange market will be established, to replace the former 18 foreign exchange swap centers.A national electronic exchange will be established with its headquarters at Shanghai, opening on April1, 1994. Fourth, the system of the 'priority list' under the former system will be abolished.
2.98 Although it is too early to assess the new system, it cerany represents considerably moreflexibility, as well as more more uniform prices for foreign exchange, across different forms oftransactions. It represents a major improvement in the establishment of a unified market for foreignexchange. Its efficiency in practice, in terms of ease of access of different agents to foreign exchange,should be reviewed once the system is well established.
F. Conclusions
2.99 Drawing together the evidence of the preceding sections, a first general point whichemerges is that while China has clearly made progress in improving the functioning of the market on thewhole, and in substituting the former system of central guidance with a considerably increased relianceon market signals, there are still areas in which progress is required, particularly in the continuingsegmentation of regional markets, but also in terms of market access, and uniform treatment to differenteconomic agents. While detailed comments on the markets discussed above are discussed in each specificsection, the key findings are reiteraed below.

- 56 -
2.100 First of all, price behavior indicates that there has been a convergence in terms of planand market prices, and there has also been some convergence in regional price differentials, after 1990.However, regional price differential still appear to be larger for many goods today than they were in1986. The recent dramatic moves towards price liberalization of 1992 and 1993 however are notadequately captured in the information here and an assessment using these estimates should be undertakenwhen the data are available. It would be useful to establish an ongoing system for monitoring pricedifferentials and trends in convergence, as undertaken here, to assess the real progress and impact of pricedecontrol. It should also be noted here that the rapid recent escalation of transport costs for cargo mayhave the effect of raising regional price differentials for some commodities, reflecting the increased andreal cost of transport. To the extent that this is a factor, increased regional differentials are not harmful.Explicit treatment of the effects of transport costs will be necessary as their share in total cost risestowards significant levels.
2.101 The general conclusion on the mobility of both goods and factors is that such mobilityappears to be low, and may in some cases have declined relative to the growth of output. Links with theoverseas exterior appear to have been easier to develop than links with other provinces, both in terms ofthe mobility of goods and some factors, particularly capital investment. There has been some tendencyfor individual provinces to behave as separate countries, rather than as parts of a single large country.The continuous relative decline in internal trade is prima facie surprising and the reasons for this mustbe explored. First, some of this decline, in the early years of the reform, may have been the result ofthe introduction of the dual pricing system, in combination with output contracts and the increasedrevenue-collecting authority given to local officials, and this illustrates the difficulties of partial reform.Second, it may also be that with the rapid growth of township and village enterprises, intra-provincialconsumption and production rose, relative to interprovincial trade. Third, the decline in the plannedallocation and distribution of goods may itself have led to a decline in interprovincial trade flows. Butit may also be argued that the continuation of this trend, as well as China's low relative levels ofinterprovincial trade, indicate that local protection, as well as the local government's incentives to keeplocal enterprises profitable, may be significant factors. Once more comprehensive data are available, theextent to which they support this conclusion should be reexamined, together with an assessment of theextent to which this phenomenon persists in the future. It also suggests the existence of other constraintsto domestic trade, such as difficulties in interregional payments and in transportation. The rapidimplementation and spread of the computerised interregional clearance mechanism is to be hoped for, andshould be supplemented with an examination of procedural steps in intrabank and interbank paymentsystems.
2.102 The question which follows is, what form of regulation, or what changes in the structureof enforcement, could encourage increased mobility of goods and assist the breakdown of regionalbarriers. Experiments with unilateral freeing up of trade in some locations (Wuhan) met with noreciprocal response from other provinces and suggest that multilateral 'loosening up', guided by thecenter, may be more acceptable.' The adoption of regulations against constraints to domestic trade atthe level of the center is called for. Attention will also have to be paid to the present incentives, at thelevel of provincial governments, to protect local industry, which emanate from the fiscal contract systemand their assigned revenue bases.
" Cited in World Bank (1992) Report No 10479-CHA. However theoretically even a unilateral openingup of markets should lead to gains from trade. This illustrates the need to combine the politicallyacceptable with the economically rational.

-57 -
2.103 The present revenue sharing arrangements probably also account for the limited flows ofenterprise investment across provinces. It is also unfortunately likely that to the extent that capital flowsdo occur, they are motivated by the tax breaks offered, legally and illegally, in the multiple forms ofspecial 'zones'. This process has itself aggravated internal differentials as in general inland provinces havebenefitted less than coastal provinces. Although the government is now making a serious effort to removeillegal zones, a significant number of zones will remain and present indications are that regionaldifferentials in fiscal incentives may therefore persist." The examination of all such zones, with a viewto reducing unequal treatment across provinces and across different categories of investors is required.
2.104 Constraints on regional flows of credit through the interbank market are in part relatedto the government's use of credit ceilings as the primary form of control on monetary expansion. Theabuse of such controls by banks wishing to circumvent quotas, in the form of the misuse of interbanklending, has not assisted the development of this market. While a diversification in instruments ofmonetary policy in the medium term is required, this will need to be combined with closer monitoringof the interbank market, together with controls against its misuse.
2.105 In the field of labor mobility, there has been considerable progress over the last few yearsin terms of an increased capacity for both employers and employees to respond to performance basedincentives and flexibilities in staffing requirements, through both systems of reward and penalty, Recentlegislation on labor-shedding affords hitherto unprecedented opportunities to enterprises to adjust the sizesof their labor force. The issue here is how to find a balance, between the requirements of enterprises,and the requirements of society as a whole. China is making creditable progress so far in its recognitionof these factors, and is gradually developing improved social 'safety nets'. One area in which thedevelopment of a flexible labor market is still lagging noticeably is in the spatial mobility of labor.Although some progress has been achieved here, the difficulties of regional transfers are still great andthe rights of large numbers of illegal migrants are limited. Given the easing of rationing of urban grainand other essentials, this may be an opportune time to reexamine other constraints on regional mobility,such as the permanent residence registration requirement.
2.106 Finally, the market for foreign exchange has exhibited changes in behavior which in manyrespects parallel other markets, in terms of improving access and flexibility of use. In the case of thismarket, in 1993, there was an effort at eliminating regional differentials, in terms of retention rates, butin practice this did not work very well, and regional differentials in rates persisted, aggravated in periodssuch as mid-1993 when additional restraints on mobility were imposed by the central government. Therecent changes introduced in the foreign exchange control and management system from January 1, 1994,in particular the exchange rate unification and the establishment of an interbank market, with the abolitionof the retention system and the priority list, should considerably increase flexibility and reduce pricedistortions.
$ According to the Special Economic Zone Office, 1200 zones in 8 coastl provices have recently beenscrutinized, and all but 200 of these have been declared illegal, and will be closed down and retumedto agiculural land. UPI, August 12, 1993.

3The Distribution System
3.1 While the previous chapters examined the structure of the internal market and policiesconcerning factor pricing and factor mobility, the present chapter evaluates the real side of marketformation and product distribution. First, an assessment is undertaken at an aggregate level of the roleof the state in distribution and the changes in its functions, in qualitative and quantitative terms. Next,the chapter examines the characteristics of the present distnbution system to see whether it is successfullyadapting to its expected role in a market economy. The emphasis here is on the distribution of producergoods, where the state has traditionally been more important and the process of transition is thereforemore difficult. A review of the supporting infrastructure of the market, in terms of transportation andcommur.ication services, which critically affects the functioning of markets, supplements this examination.
A. The Changing Role of the State In Distribution
3.2 A fundamental part of the movement towards the establishment of a market economy hasbeen the decline in the role of the state in material allocation. The total number of goods subject tocentralized allocation through government procurement, and later contract, has declined from 837 to 19between 1980 and 1992, or from 90 percent to 12 percent by value. Consumer goods allocated throughthe plan declined from 274 in 1978 to 14 in 1992. The allocation of producer goods, until 1993, wasundertaken through the Material Supply bureaus of the former Ministry of Materials and Equipment(MME). Consumer goods were distributed through the Ministry of Commerce (MOC), through largestate-owned trading enterprises in cities, and through the network of All China Supply and MarketingCooperatives in rural areas. This segmentation of responsibilities for internal marketing ceased in 1993,with the merger of these two ministries, to form a single new Ministry of Internal Trade (MIT).1However, the separation of domestic and foreign trade continues, as virtually all foreign trade isconducted through foreign trade corporations (FTCs) under the Ministry of Foreign Trade and EconomicCooperation (MOFTEC).2 FICs do not have their own domestic distribution networks.'
The extent to which this will lead to a real merger of distribution facilites will however only be knownafter the new ministry presents its organiganm. Meanwhile the facilities continue to operate in a parllelfashion.
2 FTCs handle over 90 percent of China's import and at least 80 percent of exports. There are now anesfimated 3,600 FTCs in operation, which are all owned by cena or lower level govermnents.Enterprises with foreign investment, and a smal number of individual eatises (538, in mid-1992)also have the right to trade directly (World Bank 1993, Report No. 11568-CHA).
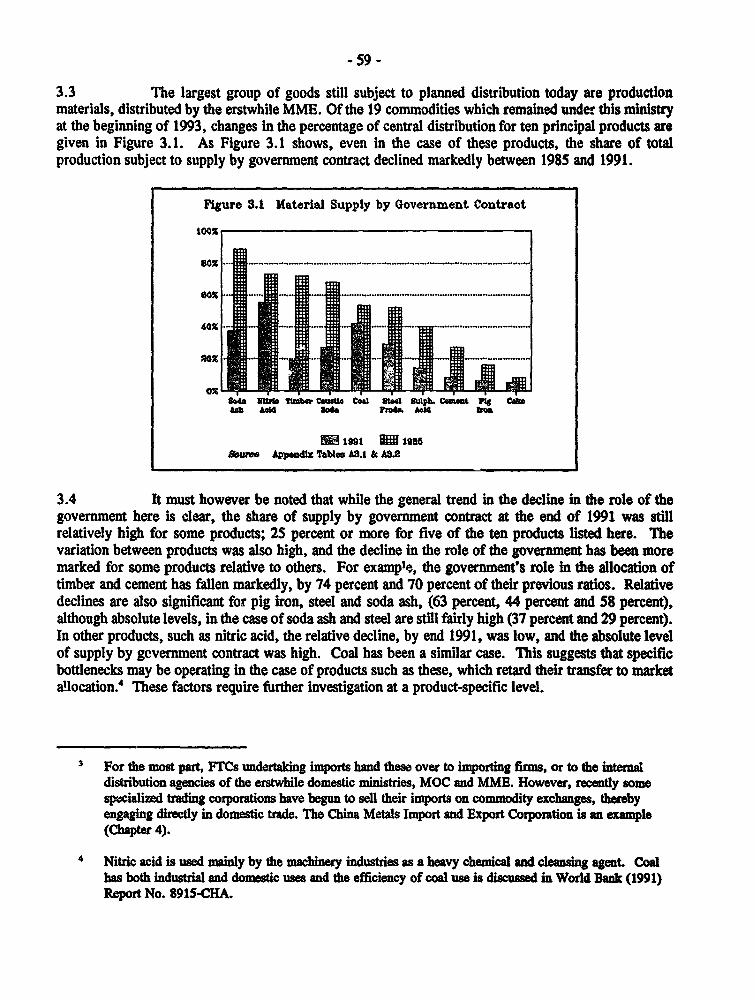
-59 -
3.3 The largest group of goods still subject to planned distribution today are productionmaterials, distributed by the erstwhile MME. Of the 19 commodities which remained under this ministryat the beginning of 1993, changes in the percentage of central distribution for ten principal products aregiven in Figure 3.1. As Figure 3.1 shows, even in the case of these products, the share of totalproduction subject to supply by government contract declined markedly between 1985 and 1991.
Figure Sl. Material Supply by Government Coutraot
to0%
80% .
4 SodAMWwo" A r h
&mre. AppefdJ Tables AI.1 & A3.2
3.4 It must however be noted that while the general trend in the decline in the role of thegovernment here is clear, the share of supply by government contract at the end of 1991 was stillrelatively high for some products; 25 percent or more for five of the ten products listed here. Thevariation between products was also high, and the decline in the role of the government has been moremarked for some products relative to others. For example, the government's role in the allocation oftimber and cement has fallen markedly, by 74 percent and 70 percent of their previous ratios. Relativedeclines are also significant for pig iron, steel and soda ash, (63 percent, 44 percent and 58 percent),although absolute levels, in the case of soda ash and steel are still fairly high (37 percent and 29 percent).In other products, such as nitric acid, the relative decline, by end 1991, was low, and the absolute levelof supply by government contract was high. Coal has been a similar case. This suggests that specificbottlenecks may be operating in the case of products such as these, which retard their transfer to marketallocation.' These factors require further investigation at a product-specific level.
s For the most pat, FTCs underldng imports hand these over to importing firms, or to the internadistribution agencies of the erstwhile domestic ministries, MOC and MME. However, recendy somespzciWizd trading coiporations have begun to sell their imports on commodity exchanges, therebyengaging direcdy in domestic trade. The China Metals Import and Export Corporation is an examle(Chapter 4).
4 Nitric acid is used mainly by the machinery industries as a heavy chemical and cleamng agent. Coalhas both industral and domestic uses and the efficiency of coal use is discussed in World Bank (1991)Report No. 8915-CHA.

- 60 -
3.5 In the case of agricultural consumer goods, it must first be noted that the rate ofmarketization of agricultural products has increased. Thus, the proportion of retail sales by agriculturalresidents, to persons outside agriculture (as opposed to consumption within the agricultural sector), hasincreased for all major agricultural products (Figure 3.2). This again reflects an increase in the role ofmarkets in the allocation of goods. While the absolute proportions sold outside agriculture are moresignificant for fruits and vegetables, the proportional increase in grain and vegetable oils has also beenhigh; fom 7.5 to 9.6 percent, and 8.6 to 15.9 percent, respectively.
Figure 3.2 MarketUzation of Agriculture
1985 1991
75* 7fX -
25x. 25x
Food Grain Veg. Vege Fruit Food Grain Veg. Vege Fruitolts tables oils tables
Sales M Cons. by Agr, Sales M CoDS. by Agr
Source: Appendix Table A3.3
3.6 The increased role of the market in terms of the allocation of goods, andcin terms of themarketization of produce, is clear. As discussed in the previous chapter, the role of the state in priceregulation has similarly diminished considerably. It might therefore be expected that the role of the statein distribution has declined in the same fash.on. However, as Table 3.1 indicates, this does not appearto have been the case. While the table shows that there has been a clear decline over time in theproportion of state-owned units in retail sales, most of this decline occurred in the period 1978 to 1985,when the share of the state in the ownership of retailing fell from over 53 percent to around 40 percent,in tenrns of the value of retail sales. Between 1985 and 1991, there is litfle perceptible change in thisproportion. 'Tis finding is unexpected, and parallels the findings of Chapters 1 and 2, of thesimultaneous observation of remarkable change in some aspects of the movements towards a marketeconomy, and virtually no change in other directions.

- 61 -
Table 3.1 Composition of Total Retail Sales Value by Ownership (1960-1991)(Y 100 Million and Percent)
Ya"r Retail Sales By Ownership Sae ofAgricultural to
I I I ~~~~~~~~~~~Non- AV.Total Value of State-Owned Collcftive | Jointly Owmned | Individual Riens Agt
Sales (Y tOOm) Units % Units % Units % Units %
1965 67.03 53.0 43.2 0.0 1.9 1.9
1978 158.97 53.5 42.4 0.1 2.0 2.0
198S 430.5 40.4 37.2 03 Is.: 6.8
1991 941.56 40.2 30.0 0.5 19.6 9.7
Source: Appendix Tables A3.4 and A3.S
3.7 One reason for this finding may be that although new distribution and retailing units havebeen established by the non-state sectors, their share in the total value of distribution remains smal,because of their relatively small size. This is partly correct, but is not a sufficient explanation. Asindicated in Appendix Tables A3.6 and A3.7, individual and collective units have dominated for years,in terms of numbers of units, on account of their small size. Thus in both 1985 and 1991, the share ofthe state sector in terms of numbers of units, was just over 5 percent. However, it remains true that theabsolute increase over this period in individual and collective units has been negligible. While the 6.2million individually owned units, accounting for 75.6 percent of domestic trade units in 1985, grew to7.8 million, and 79.8 percent of the total number of units by 1991, the absolute number and proportionalshare of collective units declined (from 1.6 to 1.4 million units, and 19.1 to 14.7 percent of the numbersof units). Looking at different provinces within China, the relative shares of state and non-state units are,on the whole, similar.
Table 3.2 Number and Share of Domestic Trade Units by Ownership and Region(1985-1991)
1985 1991
i Total Statc Collective Indvuay Total Colle¢tic individull
Uni Owned
Numbers of units 8250472 429424 1578953 6238600 9'97708 534145 1443617 7817454
Pera 100.0 S.2 19.1 7S.6 100.0 S5S 14.7 79.8
Source: Appendix Tables A3.6 and A3.7
3.8 Not only was there no change in the state's share in the value of retail trade, and arelatively constant state share in the total number of distribution units, there was also a steady absoluteincrease in the number of outlets unaer the Materials Circulation system, between 1985 and 1991(Appendix Table A3.8). In terms of numbers, the outlets of the material supply system grew from 32.5thousand in 1985 to 51.2 thousand in 1991; an annual average rate of growth of 7.9 percent. There wasalso a large increase in the numbers of persons employed (over 300,000, or an increase of 5.5 percentper year. In regional terms, increases appear smaller in relatively developed areas and larger in morebackward areas. Thus, the growth of persornel in Beijing, Shanghai and Guangdong, in terms ofpersonnel in the materials circulation system, much lower than the national average (at 1.1, 0.4 and 1.7

-62 -
percent per year on average). The growth of state-owned units in storage and transport (3.4 percent peryear) has also been faster than collectives or supply and marketing cooperatives for storage and transport(2.6 and 0.2 percent per year, respectively) (Appendix Table A3.9).
3.9 The data above show that while the role of the state in allocation has declined, it continuesto play a large role in distribution, growing in absolute terms and perhaps increasing its share relativeto the non-state sector. This finding is particularly surprising, in view of the overall sharp decline in theshare of state owned enterprises in output value (Chapter 1). It must be concluded that while the shareof the state in productive enterprises has declined sharply, the state has not withdrawn from its dominantrole in distribution.
3.10 How can the declining role of the state in allocation and price controls be reconciled withthe maintenance of the state in distribution? One explanation is that, despite the steady presence anddominance of the state in distribution, there may have been a change, in the orientation of state-ownedunits, towards more market-based functions and behavior. In the past, state owned stores were largelyintended to focus on the sales of state-allocated gjods. However, as the state withdrew from plannedallocation, the facilities for distribution remained, and state-owned stores continued to serve asdistribution centers, for enterprises wishing to sell their output on the free market. State enterpriseswithin the Materials Supply system have made strong efforts to become more competitive and moremarket-oriented. This is reflected in Appendix Table 3.9, wr!;'h shows that personnel employed at state-owned 'administrative units' grew relatively slowly, betwect- 1985 and 1991, from 1.35 to 1.5 million,or 1.9 percent per year. At the same time, personnel at state-owned 'business units' grew at 4.8 percentper year, and their numbers rose from 5 to 6.6 million. New forms of retail outlets appeared over thisperiod, for example, outlets owned by the state but run by collectives, and outlets leased and run byindividuals. By 1991, 522,000 persons were employed by such enterprises. The number of personsemployed in jointly owned enterprises grew faster than the other categories (5.3 percent per year in all,and 26 percent per year for Sino-foreign joint ventures), though absolute numbers are still small (50,000persons in all joint-venture distribution enterprises).
3.11 It should be mentioned here that whether or not the new enterprises belong to the statesector, the general trend towards an increase in the mumber of retail trade units is desirable. Mostplanned economies suffer from relatively limited retail trade services, and as such the rapid growth inthese stores in the early 1980s, and the continued, though slow, growth in more recent years has helpedto place China above the league of other formerly planned economies. As Table 3.3 shows, retail tradeservices per capita in China have been well above the former Soviet Union. In tems of numbers ofpersons employed in retail trade China is still well below West Europe, although in terms of numbers ofstores the figures are comparable.

- 63 -
Table 3.3 Retail Trade Services In China and Other Countries(per 10,000 of Population)
Number of stores Number employed 1
| 1978 | 198S 1991 | 1978 1985 | 1991
Soviet Union 20 177
United States 61 491
United Kingdom 61 412
Germany 66 383
France 86 335
Japan 135 527
Ialy 175 350
China 11 74 80 46 170 190
state ownerahip 1 2 3 10 27 34
coictive ownership 9 13 10 3S 63 58
individual ownershin I 58 67 1 79 98
Sources: China Statiscal Yeasbook (1992) and Woo (1993).
3.12 The conclusion of continued strong state presence, albeit with a rapidly caging face,is corroborated by the following sections of this chapter and the next, which describe the new measuresand experiments adopted by govermment marketing agencies to improve their systems of distribution.Tlis overview also emphasizes the importance of assessing the efficiency of the state-agencies' effortsin this direction.
B. The Emclency of the Present Distribution Systm
Evolution of the Materials Distribution System
3.13 Prior to the launching of economic reform, the distribution of production materials wasundertaken in conjunction with allocative plans of the State Council, which assigned the output of thesegoods to specific users. The function of distribution was conducted by individual ministries ordepartments which oversaw the production of these goods in conjunction with the State General Officeof Materials, for major production goods.S With the launching of economic reform, the decentralizationof the distribution function began and in 1979, 'production goods service companies', the precursors ofdistribution enterprises, were established. Also at this time, some producer goods were removed fromthe central plan allocation system, and the production service companies began to assist their salesthrough supporting the organization of large 'firs', where buyers and sellers would meet and examine
Distrbution durng the pro reform period also had its phases, whAich are not detailed here. However, tosynopsize, there was a Ministry of Mateials in the period prior to the Cultual Revolution, which wasdissolved in 1967. In 1975, the State Generl Office of Materidals was set up, and administraivedepartments for materials were partialy restored. By the end of 1978, many provinci and ministenalbureaux of materials had also been resored. (See MME Background Note 5 for details).

- 64 -
the goods available for sale outside the plan. It was believed at the time that markets for these goodswould emerge, more or less automatically, after their removal from central allocation. The state becameaware of the need for maintaining at least a supervisory role in the distribution of these goods, and inAugust 1981, the first directive on market regulation was issued by the state council; Regulation No. 120of 1981, the 'Temporary Provision on Regulating Markets for Industrial Production Goods'. Theprovision defines the industrial production goods which could be freely traded, as well as thequalifications and business scope of firms dealing with their distribution. This is still the only major legalregulation of markets for goods.
3.14 Shortly after, the State Bureau of Material Supply, which had until this time had no morethan a guidance function in the allocation of goods, was given increased importance. In 1982 the StateCouncil decided that the materials office could be made into a department of the State Council, and placedthis department below the State Economic Commission. The importance of the function of distributionwas given increasing recognition, and the State Council provided Y6 billion in the form of bank loansto material supply and marketing units, to augment their working capital. Half this sum went to theGeneral Office of Materials, of the State Bureau of Material Supply and half went to the supply andmarketing organs of the material departments. At the same time, materials enterprises were given somecontrol over price fixing, for certain goods, and the possibility of profit retention was also introduced.
3.15 The process of materials market reform accelerated over 1984 to 1986 as a consequenceof the introduction of production contracts and dual-track pricing. A given commodity could now be soldpartially under the plan, and partially outside the plan, witn a proportion subject to fixed prices, and thebalance under free prices. However, there was only a single distribution network in existence for the salesof all these categories of goods. As a result, the material supply bureaus began to establish facilities forproducers to sell their non-plan output at the same location on a commercial basis, through theestablishment of permanent 'on-site' trade fairs for a variety of goods. This led to the emergence of a newform of market, the 'comprehensive distribution center', set up initially to facilitate the sales of above-plan output of producer goods on a commercial basis.
3.16 Specialized material bureaus for individual products were also set up, as the State Councilgradually began to transfer the function of distribution from the production ministries or departmentsresponsible for these goods, to the Material Supply bureau. The organization of specialized markets forspecific products, in addition to the comprehensive trading centers also began. The establishment ofmarkets for steel products was approved in 1985 and in March 1987 steel markets were set up in 68cities, including Beijing and 20 provinces. An automobile trade center was approved in the same year."
3.17 Another significant experiment launched at this time was the introduction of sales on amargin or commission basis by the Material Supply bureaus, for producers outside the plan. The'Shijiazuang market' experiment, as it came to be known, as a consequence of its city of origin, initiallycame into being due to the fact that producers selling goods outside the plan had greater flexibility interms of meeting customer requirements in terms of quality and price. The Material Supply bureaus onthe other hand had the physical infrastructure for distribution, in the form of warehousing, and contacts
By the end of 1992, the Ministry of Materials and Equipment (MME) reported the existence of 3,000retail markets, as weU as some 500 'comprehensive tading centes', whose combined turover totalled45 billion RMB Yuan in 1991. By now, it has also created over 300 wholesale markets specializing inthe sale of steel products, whose tumnover exceeded 21 million tons of products in 1992.

- 65 -
with buyers. It was agreed that the Material Supply bureau would undertake to sell the non-plan goods,on the condition that it could sell these at the same price as the goods which it was obliged to sell underthe plan. The difference would then be returned to the producer. Later, the system grew more flexible,and the Material Supply bureau kept a part of the difference in price (10 percent) as its own fee. Althoughthis represented a form of price maintenance, the experiment was significant as it also represented theprovision of distributor services on a commercial basis by the Material Supply bureaus, and thusrepresents the beginning of the commercialization of the functions of these government agencies.
3.18 There was a considerable degree of regional diversity in the experiments launched at thistime. For example, in the province of Guangdong, the material offices were converted to GeneralCompanies of Materials and accorded considerable commercial freedom. In 18 provinces, distributionwas under the charge of the Material Bureau offices, advised by local economic and technicalcoordination offices. In other provinces however distribution plans were made by the provincial planningcouncil, and the only role of the materials offices was to supply the goods according to these plans.
3.19 Over this entire period, 1979 to 1987, the State General Office of Materials and localmaterial departments helped to develop product markets, but the various departments of production ofthese goods still retained their roles. In April 1988, at the first session of the 7th National People'sCongress, the State General Office of Materials was dissolved and the Ministry of Materials (MME), amore autonomous and powerful organization, was set up in its place. Twelve ministries signed contractswith the new MME on the transfer of their supply and marketing organs to the new ministry. The staff,working systems and channels, however, were to remain unchanged. A liaison department between theseproduction departments and the MME was established at the MME. In 1991, the MME issued provisionalrules on the Approval of Qualification for National Firms Trading Important Industrial Means ofProduction and their Trading Scopes; thus defining the activities of major marketing organizations. Moreradical changes in the distribution system began from this time, with the establishment of a series ofcommodities exchanges and 'futures markets'. The development of these is discussed in detail in thefollowing chapter (Chapter 4).
3.20 The importance of this history of institutional change is threefold. First, it illustrates thatthe process of deregulation, in terms of planned allocation or price decontrol, did not, in China,automatically lead to the creation of markets for these goods. Even when goods could have been sold byother means, producers continued to find efficiencies in using existing distribution systems. Second, thestate-owned distribution system, however, adapted to changing circumstances, with progressive newexperiments. Third, this process has taken considerable time, and is still far from resembling thedistribution network of a moderately developed market economy.

-66 -
Specialized Distribution Companies: Recent Developments In Fuel Distribution
Coal Distribution In Shanghai area by conveyor or other mechanical means.The Shanghai Fuel Genetral Corporation is one of the Iousehold Propane Gas DistributIon In Shenzhen
largest fuel distribution companies in China. Its 1992 The shenzhen Gas Company bottles and distributes cookingdistribution volume was 14.5 million tons of coal and 1.1 gas to households and restaurants. It maintains a fillingmillion tons of heavy oils, resulting in sales of Y2.2 facility, a fleet of over 80 delivery trucks, and 6 stores. Eachbillion. store maintains its own fleet of tricycles for local delivery to
Today it faces increased competition. Users can now households. The company owns a total of about 140 tricycles.buy coal direct from mining companies or middlemen. In Its sales are around Y100 million per year, with a profit of1991, the Corporation accounted for 94 percent of coal about Y2 milion on gas sales.sales in its trading area, but in 1992, this had dropped to The filing facility receives imported LPG (liquefied90 percent as some middlemen began to solicit business petroleum gas) and stores it in large tanks. The storage tanksactively. Most of the 30 or 40 middlemen represent are connected by hose to a canister-filling carousel, which istrading companies from other provinces. Lacking facilities located on a raised, covered concrete platfarm. The platformto warehouse coal, they must ship directly to their serves al the functions performed by the company. It is thecustomers. At present, this constrains their expansion. storage facility for both returned and filed canisters, and the
In response, the Shanghai Corporation is inmproving and loading dock for delivery trucks.adding value to its services, through coal blending for The operation works virtualy on a 'just-in-time' systempower use before sale, to reduce polution and evenly because there is litle storage space available. Five workersraise combustibility value. The Corporation's physical load 12 empty canisters on the carousel, where they aredistribution system is also improving. Coal delivery used automaticaly filed, in 40 seconds each. The canister's valvesto be the responsibility of a separate trucking company are ¢losed manually by the workers, who then place them inover which the Coal Corpoation had no control. With the the loading area where other workers load them onto waitingtakeover of the trucking company in 1992 the Corporation delivery trucks. When a truck is fully loaded with about 200has instituted regular delivery schedules, important for the canisters, it leaves almost immediately for one of the stores. Aseveal customers who lack spac to hold large inventory. store has room for a maximum of about 1000 canisters
There is scope for imprvemnent, however, in the (including empties), and the trucks go back and forth all day.handling of incoming coal. Much of Shanghai's coal There are about 300,000 canisters in circulation in Shenzhen.arrives by ship. Incoming coal is unloaded onto a dock, Most customers request the stores to transport gas to theirthen loaded again, into smaller boats, for tansportation to homes by tricycle delivery, which costs around Y2 perthe coalyard. At the coalyard it is once again unloaded canister.and stored until it is loaded onto trucks for delivery to The system is labor intensive. For example, a truck iscustomers/uers. loaded at the filling plant, then unloaded at the store. A
This system is inefficient as it involves more rounds of tricycle is then loaded at the store and then unloaded at thematerials handling than strictly necessary. It would be customer's apartment. The company is planning to reducepreferable to load coal directly into smaDler boats at the wage costs, through (1) the instalation of a new filling line atdocks. Today this is out of the Corporation's control, as a second location that wil fill containers much faster and willthe port is under separate management and dock space require only one worker to manage. (2) It has also received alimits a collier's time at dock to 10 hours, which is license to pipe gas dircy to the users in certainevidently not enough for direct loading into smaller boats. neighborhoods. The company would like to expand its use ofMoreover, arrival times for shipments in are not always pipeline distribution.predictable, and this, together with multiple storage sites Further improvements to be considered for the future areand slow handling, results in actual inventories of amund (1) the institution of scheduled regular deliveries direct to1.8 million tons; much larger than the desired inventory users' apartments, instead of the present ad hoc andlevel, of 1 million tons. unscheduled deliveries. Since most dwellings in Shenzhen are
If the Coal Corporation could control or contract with multi-family, and clustered, it might then be possiblc tothe warehouse company, large gains could be realized dliver to one location in trucldoad quantities, distributing tothrough better control of the timing and mode of inward each apartment directly from the delivery trucl. (2) As gasand outward shipments and mode of storage. Introducing usage increases, it might be feasible to pipe gas withincross-docking (loading coal directly from incoming ships buildings and feed gas to individual apartments from one largeinto trucks that transport it to customers) would also help canister centraly located somewhere in the building. It iseliminate much dock to coalyard shipping. Where this is considerably less expensive to pipe only the inside of adifficult, warehousing facilities at or newr the post should building than to pipe to each building from a central location.be added, so that coal can either be unloaded direcdy into And it is lss expensive to deliver one largegas canister to aa warchoue or tnsporWted to a holding building than a number of apartment sized ones.
Sources: Background Papers.
-67 -
The System Today
3.21 The structure of the distribution system in China today reflects its gradual evolution asit followed the process of economic reform. With the growth of the non-state sector, as well as the shiftin administrative systems of SOEs, a change in marketing system has been a natural corollary.7 Clearlythere has been considerable progress in the development of a producer goods market.8 The state'sdominance of distribution functions, particularly of producer goods, has continued, despite the declineof the state in planned allocation. Nevertheless the system today represents a hybrid which includes coreelements of distribution geared towards central planning, but with several modifications and adjustments,in response to the phased decline of planned allocation, and also in response to competitive forcesemerging in the economy. As with many other elements of economic reform, the new elements have beenintroduced gradually, on an experimental basis, and with wide regional variations.9 Examples of theadaptive ability, as well as of continuing inefficiencies and difficulties carried over from the formersystem, are illustrated in the descriptions provided of the distribution of coal and household fuels inShanghai and Shenzhen.3.22 At the apex, the major city of each region has a parent organization,which is a Materials Supply and Equipment bureau, which is delegated by the local government toorganize the distribution of producer goods. The Bureau reports to the MME interns of business policy.This parent organization supervises approximately a dozen distribution organizations. Most of thesespecialize in a particular commodity, such as coal or steel, or a range of goods, such as electricalequipment, which represent the goods currently or formerly allocated under the plan, and which wereformerly transferred to the MME from specialized ministerial departments.10 Although these goods mayno longer be subject to distribution under the plan at all, or the proportions subject to planned distributionmay be negligible, the material bureaus still dominate their distributihrn, as existing distribution facilitiesand networks are still the only ones still available on a large scale, to carry out the distribution function.This distribution function is in some cases undertaken on a purchase and sale, or on a commission basis.Ths, range of goods so far does not appear to be driven by specific customer needs; there appears to havebeen little change in the merchandise assortments carried by individual distribution organizations over thecourse of reform.
7 The reorientation of SOEs is referred to as 2huan Gui Bian XIng; or 'shifting rails and transformingfunctions', in China.
8 In the distribution field, the Chinese government launched experiments with ownership refonn severalyears ago, with the 'Three Various's' (various economic ownership, operational models anddistribution channels) and One 'Less'(reduction of distribution links and levels)'.
9 See in particular Solinger (1989), who describes the new form of hybridized relations of exchange.
10 Examples of these material distribution companies, for individual product lines, are given in AppendixTables A3. 10 to A3.12, for machinery and electrical equipment, metals and fuel. Each table list the 20largest product specific corporations in the country.

- 68 -
Material Supply Bureaus in China Today
The Wuxi Municipal Goods and MaterIals Bureau manufactuing). The reasons offered are that price decontrolThe materials bureau at Wuxi, one of the fastest has made trading too risky and profits are low and uncertain.
growing areas in China, consists of 12 companies, each Too many competitors are entering the field. Both largespecializing in a single commodity or a range of goods, manufacturers and construction firms are increasinglycovering the principal goods subject to state planning. bypassing the Bureau's distnbution firms and buying materialsVery few of its products are now distributed by plan; less they use in large or predictable quantities directly fromthan 2 percent in 1992, oompared with 85 percent in suppliers.1986. Individual distribution companies can shop formerchandise in any province. Moreover, this bureau can The Shenzheu Materials General Companyimport directly through its own import/export agency. The Shenzhen Materials General Company is the oldestThe Bureau sells at largely market determined prices. The State-owned company in Shenzhen, also the largest and mostBureau has competitors; it estimates t. are are some 4600 widely diversified. It is the largest of the national materialscompanies trading in one good or another in the Wuxi trading companies. It has thirteen subordinate companies andarea. Today the emphasis of the bureau is on providing owns interests in fifty-six joint ventures. Of the latter, 20 areplaces for trading activities to take place. with foreign firms and 36 are with inland Chinese firms.
The Bureau's distribution firms maintain a staff of In addition to the usual distribution companies, thesome 5000 salespeople who are responsible for Materials General Company also owns a taxi fleet, an autoprocurement as wel as sales. Salespeopletoday reoeive a repair business, assembly plants, and real estate. Thebasic salary plus incentive compensation based on their Company engages in compensation trade. It also engages involume of sales. bonded storage of imported raw materials and components. It
The distribution companies instiued customer delivery has opened foreign branches in Hong Kong and Thailand to doin 1991, and their latest initiative is a 'comprehensive trading.delivery center.- If customers require products handled The Company controls its enterprises very tightly by meansby different distribution companies the comprehensive of a "finaneial settlement center which functions as a bank.center provides a single central ordering poit, and All of the Company's entepises deposit their receipts in thisassembles and delivers the order. The customers, center daily. Tbe center then pays all of the enterprises' bills.however, will receive separate bills from each distribution This system, of course, gives the Company almost completecompany. control of its enterprises' cash. lt also minimizes the
The Bureau also processes certain materials. For Company's needs for working capital since all the enterprises'example, it owns sawmills and will cut timber to balances are available to offset any enterprise's needs forcustomers/users' orders. It wants to extend its processing disbursement. On the negative side, though, the individualactivities to other materials as well. enterprises are not free to take advantage of any opportunities
The Bureau maintains a building that houses a that require funds without the Company's express pernission.showroom, and offices that it rents to sales The Materials General Company is an independent legalrepresentatives of manufacturing firms that want to do entity with its own general manager and its own board ofbusiness in Wuxi. These firms may be located in any directors. All the stock in the company is now held by theprovince and may sell direct to customers in the Wuxi Shenzben Municipal Investment Management Corporation.area. They do not have to go through the distribution Plans are in place to reorganize as a joint stock company andcompany. Also included in the building is a materials to sell some of the stock to the public. The proposed stocktrading center. offering will raise, management believes, several hundred
million RMB Yuan, which the Company plans to use toThe Suzhou Material Bureau finance some ambitious expansion plans. It wants to expand its
This Bureau encompasses the usual 12 companies. One trading activities, storage and warehousing capacity, build aof the 12 is a real estate company, established in 1991. multi-function materials and equipment mall and producerThe real estate company is building offices and hotel goods wholesale market, an exhibition center, start a bus lineblocks. It also has enterprises attached to it, including a for passenger tansportation, expand its goods transportationknitting company. business and open more overseas offices. It also wants to
The Bureau would like to expand both horizontally develop more high technology manufacturing.(into more enterprise) and vertically, (into
Sources: Background Papers.

- 69 -
3.23 In addition, many materials bureaus also have a 'comprehensive trading center' as oneof their companies. By and large, delivery systems are still traditional and distributors deliver to theircustomers."1 The distribution companies have salespeople who call on customers. In some companies,the salespeople perform a procurement function also, acting as buyers for the goods the distributioncompany offers. These persons' functions strongly resemble those of the old factory purchasing agents(calgouyuan), who served enterprises whenever the plan proved inadequate.
3.24 In other respects, the system today has new features, which have developed in responseto the reforms in the allocation and distribution system. The first major tool that has been used is theintroduction of competition into the distribution system by broadening the geographic reach within whichdistribution enterprises can buy and sell. Second, purchases are now permitted from or sales to any entity.Distribution companies today can buy from producers in any province, and can sell to state, private orcollectively owned customers/users anywhere in China. Distribution companies can also sell toindependent (privately or collectively owned) distribution organizations. Third, new privately orcollectively owned distribution organizations are allowed to enter, and ,mpete with the State-owneddistributors, in most product categories. Fourth, at the level of the production enterprise, 'zero-levelchannels' are permitted, in which producers sell direct to users, bypassing the distributor.23.25 Fifth, a system of incentive compensation for managers and workers in the Statedistribution enterprises has been instituted. Managers and salesmen in distribution companies receiveincentive pay based on performance. A typical performance pay formula takes into account sales, grossmargins, capital employed and profits. The companies are now expected to show a profit. Sixth,innovations have been introduced in delivery systems. Some material bureaus have a separate deliveryorganization that takes orders that encompass goods sold by more than one of the distribution companies,and combines and assembles the goods into one order. Seventh, distribution centers are now undertakingsome value-adding functions such as the further processing of materials. 3
3.26 In addition to their distribution companies, the municipal materials bureaus have enteredother ventures, some related to distribution, some not. Typically, as the example of Suzhou illustrates,the materials bureau owns a hotel catering to businessmen, and has built or is building a large, high risestructure to house its offices, a commodities trading operation and offices and display space for producerswho want to sell direct to customers in the area. In Shenzhen, the municipal materials bureau hasdiversified into automobile repairs, and operates a taxicab fleet. It maintains a showroom which displaysa wide range of imported items such as plywood and bathroom faucets for use in goods manufactured inShenzhen for export. This bureau also participates in some forty-six joint ventures, many with foreignpartners. In addition, the Shenzhen bureau acts as banker for all its enterprises. All funds collected goto the municipal "bank" which then makes all disbursements on behalf of the enterprises, includingpayroll. The diversity in the functions of apex material supply bureaus is illustrated in the examplesprovided, of Wuxi, Suzhou and Shenzhen.
" Appendix Table A3.13.
12 See the annex to this chapter, Annex m. 1.
3 A new nationwide Outline Plan for Commodities Markets is under preparation, under the newly-formedMinistry of Internal Trade (MINT), which emerged from the merger of the former MOC and MME.The plan should be ready by March 1994.

-70 -
lhe Effidency of the Present Materials Distribution System
3.27 Strengthening the distribution system in the future requires changes that may be groupedinto two broad categories. First, those which are derived from the unique evolutionary origins of theChinese system, and which are therefore highly specific to China. The second set of recommendationsare derived from features of the Chinese system which are observed In other countries at a similar stageof evolution towards a market economy, and are therefore based essentially on China's stage ofdevelopment. Experience in other countries with more advanced industrWized economies indicates thatdistnrbution systems must continually improve and change as industrialization proceeds. Actions shouldhowever be taken to ensure that changes are made in the right direction. One method of gauging theefficiency of a given system is by comparing it to 'best practice' elsewhere. The annex to this chapter(Annex 3.1) details the key structural elements of a producer goods' distribution system in any marketeconomy, detailing the range of options and describing 'best practice' techniques that could be appliedto ChL ' today.
3.28 Looking at features specific to China, a first issue is the diversity of functions beingundertaken by the materials distribution bureaus today. Some bureaus are branching out into a varietyof activities beyond distribution." This can be detrimental to the building and maintenance of a strong,efflcient distrbution system. Some of these activities, such as investments in real estate, are speculative.In many cases the material bureaus have made use of their relative ease of access, through links with localadministrations, to prime real estate, to undertake these activities.
3.29 Materis bureaus have also taken on a variety of highly diverse industrial and commercialactivities. The ability to diversify into such a broad range of areas probably stems, originally, from thevery diverse products whose distribution they were entrusted with. However these activities go wellbeyond the processing or trading of production materials. In order to ensure that local materials bureausfocus their activities on distribution, consideration should be given to regulations on the breadth and scopeof the businesses these bureaus own or control. Expansion into real estate should be seriously questionedand diversification into manufacturng, or service businesses other than distnbution, merits examination.One disadvantage of this diversity is the potential for creation of a large, cumbersome bureaucracy.Another is the possibility of cross-subsidization that masks inefficient enterprises or leads to investmentsthat are not market justified. It is also not clear that the ownership of new industrial assets should be inthe hands of the local Materials Bureau. However, the restriction of other activities may not be necessaryif different activities can be separated, so that the performance of each is more transparent. A separategroup or groups should own and control manufacturing enterprises."
14 Some industrd enteipzses undertake their own distribution of producer goods and other industries haveentered the distribution network. The diversification of distnbution entepnse is partly a response tothis.
" At Shenhen, for example, the vastly different chawcte of the various businesses presently under thecontrol of the Corpotion require very different management skcils. Consideration should therefore begiven to breaing the conglomerate up ito smaller, separately contolied units. A possible strucmemight be to break the Matrials General Corporation into five units containing respectively: (1)distribution and trading, incluling import/export; (2) inf ct, including terminals and portfacilities; (3) service businesses, such as auto repair, trcking and txicabs; (4) domestically ownedmanufacturing and related businesses; and (5) joint ventures with foreign parters.
-71 -
3.30 An issue to be examined in this context is whether the diversification of materials bureausoccurring today may not be in part a response to the restrictions placed on the deepening of their tradingactivities. In a market economy, such bureaus may evolve towards general trading companies, whichintegrate external and domestic distribution functions.16 Restrictions against directly undertaking foreigntrade have already been mentioned. Even the right of approving the volumes of quotas for imports andexports, for products under the control of the MME, such as steel, has beer, transferred to the StatePlanning Commission. This restricts the functions of the MME in adjusting demand and supply.' InAugust 1992, following the promulgation of the New Operating Mechanism fot state enterprises, theMME formulated a set of implementing rules, regarding materials enterprises, where continuingrestrictions on the autonomy of these enterprises were pointed out. Apart from requesrtng import licensesfor large and medium-sized material bureaus, the MME also requested permission to make swaps orchanges in the varieties or specifications of materials still to be distributed under the mandatory plan, ifthe products did not meet with customer approval. Greater independence in price setting, for the productsthey are obliged to sell, and greater flexibility with labor management was requested. The MME alsoproposed that materials enterprise be allowed to set up of joint ventures, trans-departmental, and trans-regional undertakings, including cooperative arrangements and mergers, if required, with otherenterprises. Greater flexibility to undertake imports and make decisions on qiantities purchased and soldwould assist whichever agency is responsible for the distribution of these products, whether the MMEor any other private or public agency. These requests are therefore efficiency-enhancing and will helpthe present distribution companies to deepen rather than widen their activities.18 The essential pointconcernint scope of activities is that fewer controls at the operational level on such agencies' decisionswill permit them greater flexibility to achieve the efficient execution of their tasks.
3.31 Actions to increase future competition through new entrants in the distribution system arerequired as well. The present situation makes it more difficult than necessary for competitors to enterdistribution businesses presently controlled by bureaus. Producers from anywhere in China should beencouraged to set up sales offices and, where profitable, distribution facilities in the municipalities, andshould be allowed to sell directly to customers in those municipalities. Local distributors should beencouraged to expand into municipalities other than their own. Entry into distribution by privateindividuals and collectives should also be encouraged. The small organizatimns that may result can servesome business sectors and customers more efficiently than the large ministerial distribution organizations.
3.32 Another feature of the present distribution system which is specific to China and meritsreview is the core eleven to twelve company structure below the materials supply bureau which is stillfrequent today. This is the result of the transfer of former material supply organs of other ministriesunder the State Council to the MME. However, the maintenance of these intact in the future may bedetrimental to efficiency.1" Regions as diverse as the heavy industrial city of Shenyang and the light-
" For example, the sogo sosha of Japan (see World Bank 1993 Report No 11568-CHA for details).
1 MME Background Paper No. 5 (1992).
18 However, the MME also requested permission to launch new industrial undertakings, a proposition tobe treated with greater caution.
t9 Before this the MME already had more than 40 directly subordinate general companies, with their ownsubsidiares, or levels of subsidiaries.

-72 -
industry city of Suzhou have identical groups of compariles below the material supply bureau. The futurestructures should be given greater flexibility, to adapt better to the requirements of local industries andactivities. Greater flexibility may be aided by the emergence of a modern enterprise system permittinggreater executive independence. Elsehere in the world, a producers' goods distributor typically servesan application or an industry (or a cluster of industries with similar needs) because this is the mostefficient arrangement. Municipal distribution companies in China should start moving in this directionwhere clusters of industries or applications are emerging.
3.33 The delivery companies some municipalities have instituted recognize that somecustomers' needs transcend the goods assortments carried by indivieNal distribution companies. Thesedelivery companies may provide a basis for reorganizing the present companies. It is worth noting, inthis regard, that it is not necessarily inefficient if two or more distribution companies' goods assortmentsoverlaps. The goal is to maximize efficiency in merchandise handling and delivery, and small targetedcompanies may be more efficient than large institutions with very broad product lines.
3.34 Similarly, the 'comprehensive distributioncenters' which originally developed in responseto the liberalization of a portion of production from planned allocation for various producer goods, mayalso be grouped into industries which provide similar goods, or related goods, in the future. Some ofthese new groupings will emerge naturally, provided distribution centers are permitted the flexibility ofresponding to industries' needs.
3.35 Other specific difficulties faced by the distribution system today in China include theorganization and costs of the order-placing conferences; a tradition which continues today and is estimatedto cost YIOO-300 million each year. The scale of the conferences has grown, despite the decline inplanned allocation. This is partly because of the additional stalls for 'non-planned transactions', that havesprung up alongside the planned exchange of goods. Many production enterprises are urging distributiondepartments to hold another trade fair for such non-plan production. Some fairs are held more than oncea year and cb. time the locations differ.
3.36 Dealing with the trade fairs is problematic. Clearly they serve a purpose, in terms of thedissemination of information. The issue here is the extent to which such a system could be replaced byother more convenient and less costly methods of contact and exchange, such as catalogs, newsletters,and of course telephone and computer communications. One hindrance to the development of theseindirect methods of contact is that buyers and suppliers are no longer able to see the goods transacted.This calls for a high degree of standardization in product specification, to remove buyers and sellersconcerns.
3.37 Material distribution enterprises have expressed a desire to undertake more value-addingactivities, such as the processing of some of the materials they receive, as well as research on the qualitiesand properties of their materials. In market economies it is recognized that value-adding though sorting,packaging, grouping, blending, etc., is a part of the normal range- of functions that may be provided bya distribution channel, the functions of which extend well beyond the simple task of distribution (seeAnnex 3.1). These suggestions, if shown to be profitable, are to be encouraged. Primary research onmaterials is however not a normal function of distribution systems, although the institution of standardsand quality control systems is. A careful extension towards these additional functions is also desirable.
3.38 Materials enterprises have also pointed out the relatively poor condition of warel&ousingfacilities and the high capital costs for their replacement or extension. Around 90 percent of the l10

- 73 -
million square meters of goods yards in the country have floors of earth, gravel or stone, and wereconstructed mosdy in the 1950s or 1960s. MME bureaus claim that these are older than the warehousesof the ministries of commerce or foreign trade. The poor moisture proofing of these warehouses leadsto large losses due to corrosion and rot. Major actions must be taken to assess the capital investmentrequirements of the distribution system, and a program for progressive upgrading over time must belaunched.
3.39 Finally, a major issue to be examined in the context of China's distribution system is itsprofitability. According to the MME, profits on sales of materials enterprises have declined over time,from 2 percent in 1988 to 0.7 percent in 1990. Materials distribution enterprises attribute these to losseson sales of goods still subject to planned allocation as well as price regulation. High costs of carryinginventory, due to difficulties of transportation, also reduce profitability.
3.40 An examination of the extent to which the recent changes in the distribution system mayhave led to long term gains in efficiency was undertaken, by estimating the ratios of inventory to totalsales (Appendix Table A3.14). First, looking at a long time series of inventory to sales ratios incommercial units, it appears that there was indeed a decline in this ratio in the early years of the reform,between 1982/83, when the ratio was between 63 and 65 percent, and 1985-86, when the ratio droppedby 12 percent, to just over 51 percent. The extent to which there was a drop after this is appears to havebeen much lower. This suggests that efficiency gaiBs were the most pronounced in the earlier years.A more detailed examination of these effects was also undertaken, for 1986-1991, for three producergoods sectors, steel, cement and coal (Appendix Table A3.15 to A3.17). The data are based on smallsamples of production as well as distribution enterprises, looking at ratios of inventory to turnover as wellas working capital to turnover. No clear trend emerges from these. In the case of coal and steel, thereare some indications of reductions in inventory and working capital requirements around 1989, with arise again by 1991. However, this could well be the effect of cyclical movements. No such trend wasobserved for steel. Overall, there is no clear indication of a change in inventory management in thematerials distribution system after the mid-1980s.
3.41 An examination of the profitability, cash-flow management and inventory managementof the distribution system is clear!y called for. With the merger of the MME and MOC in mid-1993, aparallel examination of distributian systems for consumer goods should also be considered. This will bea major undertaking and should te taken up through a team of marketing as well as financial consultants.The exercise should attempt to separate the impact of policy-induced costs (such as costs associated withprice controls or essential distribution) from other operational or capital costs. Given that the last majorround of price decontrols and adjustments has just been concluded, this would be an appropriate time forsuch an exercise.
3.42 Regarding more general recommendations, at this stage in China's development, the keyactivities where the distribution system should be strengthening its performance are (1) product searchand procurement, (2) inventory holding and storage, (3) financing, (4) delivery, (5) personnel incentives
20 Interpretation of the data after 1986 is difficult as the definition of the series changes to include non-state retailing units. The data show a continued decline, but this may be due to lower holdings ofinventory among non-state firms. The decline may also have been due to the cyclical boom of the late1980s which would have had the effect of lowering inventory. Besides, by 1991, the ratio had risenagain, and stood only 5 percentage points below the value of 1986 (Appendix Table A3. 14).

- 74 -
and (6) making better use of backchanne!s and recycling. Promotion is a secondary consideration undermost circumstances. Further details of some of the necessary functions, and how they are generallyconducted in a market economy, are given in Annex 3.1
Produd Search
3.43 Product search and procurement are important because not all prospective sellers appearto be in touch with all potential customers. Similarly there are many prospective buyers who may nothave the experience or ability to search efficiently for sources of supply. The functions of the formercalgouyuans must now be now professionalized. In a rapidly industrializing economy, the variety ofgoods produced increases steadily, and manufacturing firms need a continually broadening assortment ofinputs and capital equipment.
Personnel Incentives
3.44 While the introduction of incentives for sales persons is a move in the right direction, thespecific factors used in determining incentive pay today may be encouraging behavior that iscounterproductive for the system. The typical incentive formula today takes into account sales, expenses,capital employed and profits. Factoring profits into the equation encourages managers to look towardraising prices as the easiest way of earning incentive compensation. They should instead be focusing onholding down expenses while serving as many customers as possible. An incentive system that rewardsmanagers for minimizing gross margins while maximizing sales may encourage behavior more specificallyfocused on efficiency.
Shment and delivery teciudques
3.45 Distribution companies should encourage producers to ship direct ('drop ship') tocustomers/users where such shipment is more efficient than shipping to the warehouse and thenreshipping. In such cases, the distribution company can act as the customer's agent and take a commissionon the sale. Comparing the size and frequency of customers' orders with the quantities a producer canefficiently ship (e.g. a truckload or a boxcar load) can also identify opportunities to obtain such savings.
Warehousing and Computerizaion
3.46 As wages increase, the distribution companies may have to replace warehouse labor withcapital and office personnel and paper with computers. The distribution companies should recognize theseneeds, and prepare plans for the timely introduction of mechanized materials handling and computers.The distribution companies should recognize that they may have to relocate some of their physicalfacilities as the configuration of customers' locations and local and long haul transportation systems maychange. They should be identifying such future needs and planning to take action in response.
Revene Distribution
3.47 In addition, the cities and provinces should begin at once to develop backchannels (alsoknown as a reverse distribution system) for recycling used materials, especially of plastics and metals.In other countries, scrap steel, rather than iron ore, has become the major feedstock for steel mills.Virtually all lead used in manufacturing automobile batteries comes from reprocessing the lead from deadbatteries. As China's automobile stock increases, so will its stock of scrap batteries and automobile

- 75 -
bodies. At present there seems to be no organized means for retrieving scrap and delivering it forreprocessing and reuse.2' Specialist organizations have emerged in such coufltries that pick ; p the usedmaterial and deliver it for reprocessing. These organizations have emerged because there are markets forthe scrap and facilities to transport it. China should encourage its smelters and mills to develop theability to use recycled material. Given free entry into the trucking business, a reverse distri' ition systemwill emerge. Wherever possible, reprecessing should be done locally so as to minimize the use of analready burdened transportation system.
C. Parallel Changes In Agriculture
3.48 It should be mentioned that while changes were taking place in the distribution ofproducer materials, new directions in the marketing of agricultural produce were also being explored.Markets for specific agricultural commodities have been studied more intensively elsewhere, however,an overview of the pattern of change in wholesale distribution is presented here, which illustrates theparallels in the development of the various segments of the distribution systim.Y In addition, and againin parallel to certain producer goods, new forms of commodity exchanges have been established forproducer goods. These are discussed in the following chapter (Chapter 4).
Agricultural Wholesale Markets
3.49 The reduction in the role of the state in the procurement and distribution of agriculturalproducts accelerated after the back-to-back good harvests of 1989 and 1990, which imposed a heavyburden on the state's resources devoted to the procurement and stockpiling of foodstuffis. Spending onprice supports for grain and edible oils rose from Y3.6 billion in 1978 to over Y40 billion by 1990,representing 14.5 percent of government revenues.' As a result, the government began to graduallywithdraw from the purchasing of grain, and more rapidly, from the rationing and controlled distributionof grain to urban consumers. In 1991, the State Council released a 'Communique on Further Revitalizingthe Distribution of Agricultural Goods, which authorized the establishment of agricultural markets and
21 In the indushialized countries, every place that sells automobile batteries is a recycling point. Battaydistributors pick up used batteris when they deliver new ones and consolidate them for pickup by alead smelter. Unserviceable automobiles are taken to scrap yards. In these yards, useable parts areremoved, and the car bodies cmshed and cut up for shipment to a steel mill.
22 See World Bank (1991) 'China: Options for Reform in the Grain Sector, and later, World Bank (1993)Report No 11671-CHA on grain distribution. More attention is being paid today to the mark.ang ofagroindustrial products as well, as discussed in Landell Mills Commodities Studies (1993), in the caseof rubber an' sugar.
23 in 1991, despite extensive flood damage, food production was reduced only 11 million tons from theprevious year, and stood at 435.3 million tons. This was still historically the second highest level ofoutput achieved, and illustrates tte new security in food supplies.
Id This section draws extensively upon Kobayashi (1992).

-76 -
provided incentives for the diversification of distribution routes, including the participation of individualsand village collective organizations in the distribution sector.
3.50 Smaller 'period-c agricultural markets', or general markets, that were traditionally thecenter of local agricultural produce are also growing rapidly in numbers and sophistication. In 1991,there were close to 75,000 such markets, which accounted for a fourth of all retail sales of theagricultural products traded in the market, countrywide. Thirty percent of the taxes from these regionalmarkets go to local govermnents, and the funds are used to build permanent markets and improve thehygiene and sanitary controls of existing ones.' Expenditure on the construction of these generalmarkets in 1991, at Y2.8 billion, was almost double that of 1990. Clusters of these smallet markets havedeveloped around larger centers; for ex,..iple in Henan province, where the Zhengzhou grain 'futures'market is located, almost 150 general markets grew up in the second half of 1991 alone and Y140 millionwas spent on the construction of new transaction facilities (1.63 million square meters).
3.51 Many of these small general markets are growing into larger and more establichedwholesale agricultural markets, serving growing areas. For example the private market established at theDazhong temple in Beijing's Haidian district in 1986, (now renamed the Dazhong Agricultural andSecondary Foods Wholesale Market) today supplies a quarter of the vegetables consumed in Beijing city,procured through out China, and brought to the market by a force of over a thousand seasonal orpermanent drivers. However their growth has been constrained by the difficulties faced by 'own-account'fainer drivers due to restrictions and difficulties with long-distance transportation. Due to the perishablenature of agricultural goods, such difficulties have been relatively more important in their case.
D. Transportation, Teleconununications and Services
3.52 The efficiency of a distribution system is necessarily dependent on the efficacy of theavailable infrastructure for the movement of goods, in the form of transport, primarily, and also oncommunications and services. At present, the level of transportation and services available in China (asmeasured by the combined share of employment in trade as well as transport), at around 15 percent oftotal employment, is roughly comparable with other large developing countries, such as Brazil and India,or even the former Soviet Union, but considerably below the level of advanced countries such asGermany (over 20 percent) or the US (over 25 percent) (Table 3.4).
3.53 The growth of transportation routes over the last decade has fallen considerably behindthe overall rate of economic growth (Appendix table A3.18). For railways, new routes grew by only0.43 percent per year over 1983 to 1992, and the rate of growth of waterways was lower still (0.09percent). The rate of growth of highways has been somewhat higher (1.63 percent per year), but is stilllow in absolute terms. In per capita terms, the rates of growth of railways and waterways has beennegative, and of highways only marginally positive (Appendix Table A3.19). Although there has beena gradual but steady increase in average shipping distance of freight over the last three decades, whichhas compensated for this to some extent, even these rates of growth are low (Appendix Table A3.20).
5 According to the 'Regulations on the Collection and Management of market Taxes from GenertMarkets' of January 1983.

-77 -
The average shipping distance by highway, for example, which is the most dynamic part of the market,has grown at only 3.1 percent per year, from 19 to 46 kilometers, between 1961 and 1991.
Table 3.4 China and Other Countries: Employment In Trade and Transport(0X0)
iTaftl Employmer in trade FVOWi mp
evloy Nuo*ct I Share(%) Nluniber !Share(%)China (19 9W)a 101087 9806 9.70 6400 6.33
hvdia (1988)1b 25712 421 1.64 3063 11.91
BaeU (1987)/a 57410 6656 11.59 2161 3.76
Germany (1989)/d 27742 4092 14.75 1545 5.57
USSR (1989)/e 127057 9877 7.77 10233 8.05
U.S. (19S99f 117342 24230 20.6S 6588 S.61
al Stas-owned and collectlvely-owned enterprises.hi employmen in 'propietdarsblismnts only.l Chil labor fo employed.
dl Civilian labor fbrce employed.e/ Employmein state-owned unt only.f Civilian lbor fo&e employed. Hote, are not included in trade.-Sourc: Sscal Yearbook 88/89, United Nations, 37th issue.
3.54 These issues have been the subject of detailed independent investigations.' This sectionrestricts itself to discussing the linkages between these issues, and the problems of distribution, discussedin the preceding section. An inability to get goods to where they are needed in a timely and predictablem er leads to difficult consequences for the manufacturing sector, particularly (i) production downtimedue to lack of input materials; (ii) the holding of excess inventiLy as a buffer against late shipments; and(ii) spoilage of perishable goods while in storage awaiting shipment or during shipment.
3.55 The discussion on transportation focuses on railroad and highway transportation, whichare the most Important in China, And also the most extensively used for the transportation of materis.However the development of inland waterways is becoming increasingly important and the use of arransportation for exports has increased. It is clear from existing studies that China does not at present
X World Bank (September 1992) 'China: Refotm and Role of the Plan in the 1990s' describes thecotbaints of transportation on overall economic growth. A cbapter in (World Bank 1990) 'China:Macroeconomic Stability and Indusrial Grwth under Decetnlized Social' discusses transportationissues fically in the context of regional trade. Two regional tra ortation studies have also beeundertaken; a three volume study on the Yangte Economic Zone (World Bank December 1990) andanother on Southern China (Haral, 1992). Railway investments and strategy are discussed in WorldBank (1992) Report No. 10375-CHA, and World Bank (1992) Report No. 10592-CHA. A study of thetrucking industry is under preparation. A recent study (World Bank 1992 Report no 9413-CHA) hasalso been undert on the telecommunication sector in China. It points out that China'stelecommunications system grew at over 16 percent per year in the late 1980s, and is now the 10thlargest in the world. Although service quality may be poor, and sophisticated business services areIackdng, over 70 percent of the population bas access to some telecommuication services, wel abovemost developing countnes. The role of communications developmnt and vertical and horizontal contactacaoss regions is also discussed in Liu (1991).

-78 -
have sufficient capacity in its transportation system to sustaini a high rate of economic growth. Chinatherefore faces the need to make considerable investments in transportation over the next several years,both in railroads and in roads and highways.
The RsJlroad System
3.56 Transportation needs for goc.is may be classified in three categories: (i) long haul, 1000km. or longer. For long hauls, railroad or water are usually the most economical shipping methods; (ii)medium haul, less than 1000 km. As the hauling distance becomes shorter, highway transportation, usingtrucks becomes more efficient; and (iii) local transportation. Road transportation is usually th mostefficient for local hauling. China's lack of capacity is most severe in its railroad system, and the majorimpact of this capacity shortage is therefore on long distance hauling.
3.57 It F- s recently been estimated that demand for about 200 million tons of freight remainedunsatisfied in D9 8 9 I This amounted to almost 10 percent of freight capacity. Bottleneck links on therailroad network occurring when traffic reached 95 percent of capacity rose from 7 percent of the networkin 1985 to 37 percent in 1989. The problem was identified to be undennvestment in facilities, and wasnot ascribed to poor management or org?nization. China has been mvesting in its transport at an averagerate of 1.3 percent of GNP over the last few decades, while other developing nations' investments wereat a rate of from 2.0 to 3.8 percent of GNP. To bring supply into balance with d ,mand by the year 2000,China must raise its rate of investment in railways to at least 2 percent of GNP. With an appropriateadjustment of tariffs to reflect costs, the railway system could enjoy a profit rate of 30 percent or more.In the long run, the railroad system will have to become more responsive to its customers needs as theeconomy becomes increasingly market dAiven. The railroad system will have to compete with other modesof transportation, especially for medium and shorter haul business.
3.58 One difficulty which has been observed in the utlization of railway capacity is thedistribution of quotas for the use of available freight space. For example, grain traded at certainwholesale centers may be eligible for a rail transportation 'quota', while at other locations, the quota maybe unavailable. As a result of its potential mobility, the price of grain purchased at the first locationrises, relative to the second, and this may occur even if this region enjoys a surplus. At the other region,which camnot offer freight quotas, demand and prices fall. In this example, the rail quota is implicitlyincluded in the price paid for grain, and the overall price represents a proxy element for the transportationquota in addition to the price for the grain itself. It is advisable to separate the two markets, making thefreight space available to all and raising tariffs to reflect availability. Proxy markets distort price andproduction signals and could lead to inefficient long term resource allocation.
Truck Trasportation
3.59 First of all, looking at the road network, it is clear that intercity road capacity is sevwrelystrained by recent economic development, and traffic congestion within cities and on major intercityroutes, is intense. There are plans in place for development of an extensive intercity highway network,the National Trunk Highway System (NTHS). While still in its infancy, many important links are underconstruction. Municipalities are also working to improve their street networks.
X World Bank 1992 ateport 10592-CHA) .

- 79 -
3.60 Next, looking at the vehicles used In highway transportation, a first observation is thatin contrast with the railroad system, trucking capacity is relatively less efficiently used. The reasons forthis are a combination of the fragmentation of ownership of the trucking fleet, as well as legal constraintsthat inhibit many truckers from maximizing the efficient use of the equipment. A series of reformsintroduced since 1983 have made entry into the trucking business easier and pricing of these servicesmore flexible. Licensing of for-hire vehicles is now open to state, collective as well as privately ownedenterprises. State trucking enterprises have more autonomy vis-a-vis their bureaus and ratesetting hasbeen progressively deregulated. Guidelines on a spread of tariff groups have been formulated acrossproducts and a 10 to 20 percent variation within the band is permitted.2" More recently, in 1992, thefuel allocation system was abolished, and the sector has now been opened to partial foreign Investment."As a result, the share of state enterprises in the sector has declined by 17.6 percent over 1986 to 1990.
3.61 However, barriers and constraints on entry remain. For example, business licenses arerequired for the provision of 'for hire' services and the criteria include not only vehicle and facilitiessafety and security, but also a minimum number of vehicles (10) to start an enterprise. Driver and vehiclelicensing and registration, which prior to 1984 was the responsibility of the local Transportation Bureau,is now undertaken partially by the Public Security (police) Service. There qppears to be some duplicationin the function of the two offices.Y0
3.62 'Own-account' trucks (those owned by say, a manufacturing or distribution firm) mustobtain a special license to use their trucks on a for-hire basis. These licenses are short-term and maycontain severe constraints on their use. Ihis means that a manufacturer's truck that makes intercity orinterprovince deliveries from its factory to, say, a distributor must return empty. To complicate theproblem, a manufacturer who wants to hire a trucking company or individual trucker to make suchdeliveries will find this difficult because of interprovince and perhaps even intercity licensing problems.Possibly as a consequence, there appear as yet to be few private sector trucking companies. There arestill municipal and provincial bureaus that maintain trucking fleets and there are some individual truckoperators, but there are no trucking fleets which are common in most other countries.
3.63 Given the constraint on highways and streets, and the high cost of trucks and trailers,good utilization of whatever capacity is available is critical, and regulations which restrict such use shouldbe revised. A first recommendation to improve capacity utilization is that firms with own-account trucksshould be allowed to operate for hire as well. If allowed to do so, these firms are likely to look forbusiness that will fill their empty and partially filled trucks. In the process, some may even become quasifreight forwarders. Second, individual ownership of trucks should be encouraged, because this will initself promote good truck care and efficient truck utilization. One of the factors which inhibits greater use
2 b Me authority for tariff-setting withi these guidelins has been vested in the local Departments ofCommunications, and in practice, there are known to be considerable regional variations in tariffs.
21 Up to 50 -eren. However in most productive sectors, a hundred percent foreign ownership isalowed. New joint venture trucking enteprises have begun in coastl provinces such as Guangdong.
30 Public Security bureaus look into drivers' licenses, vehicle registration and safety inspection, while theTransport bueaus look at the same vehicles from the point of view of 'economic inspection'.

-80 -
of private trucks may be the tolls, fees and fines on highways, described in the previous chapter. Theextent to which private truckers are more vulnerable to such exactions should be investigated.1
3.64 Another, more concrete way to further encourage the efficient use of individually ownedtrucks, would be to provide support services in the form of consolidation and forwarding terminals.Today, freight forwarding or consolidating terminals that could serve as collection points for goodsshipped in less-than-truckload quantities are lacking. It diff- 'ilt and inefficient to send and receive goodsin small quantities. Individual truck owners may be efficieut haulers, but may find it difficult to findsteady sources of goods to haul. Termials could provide marketing assistance for these individualtruckers. Once aware of its benefits, individual truckers might later group together to build and maintainsuch terminals.
3.65 The grol th of trucking companies that will specialize in intercity and interprovincialhauling should also be encouraged, by giving them the ability to participate in intermodal arrangementsand operate terminals. Provincial licensing requirements should be made uniform and the mutual andreciprocal recognition of individual provinces' (or municipalities') licenses should begin. In the mediumterm, however, if large trucking companies become a force in the market and gain a virtual monopolyposition, it may be necessary to accompany this growth with a regulation of shipping rates. In addition,municipalities particularly, should keep shipping needs (both shipping in and shipping out) firmly in mindwhen planning or approving manufacturing plant and distribution center sites. One of the best ways toship efficiently is to minimize road time by careful facilities placement.
3.66 Finally, and apart from recommendations specific to the railroad or road freight industriestoday, for the medium term, China should consider the introduction of intermodal systems. These areincreasingly being used for long hauls in industrialized countries. These systems require that freight beshipped in containers. Containers are then moved from truck to railroad (or barge) and back asefficiencies dictate.32 Eventually, China must look at its producers' goods distribution system as part ofa larger system that includes both producer/ sellers and customers/users." The long-term goal shouldbe a system that results in the delivery of finished goods to their final buyers at the lowest possible cost.In China, the long-distance transportation system is a major constraint towards this today.
31 A detailed account of how the 'three malpractices' (the extortion of unsctioned fees, the collection ofaritrary 'fines' and the apportionment of 'expenses') have operated in the case of the long-distancetransportation of agcultural goods is available in Kobayashi (1992). During an 800-km journey, aprivate truck loaded with garlic cloves was stopped 15 to 16 times, and was forced to pay a fine every45 to 50 km on average. No receipts were issued.
32 For example, in the U.S., containers of goods destined for New Yotk (on the East coast) might beunloaded from a slip in Los Angeles (on the West coast) onto trucks, carried by truck to a railroadfreight depot, carried by tail to somewhere near New York and again loaded on to trucks for finaldelivery
33 In the early 1980, certain transportation activities, required for trade in agriculture, were restrcted. InFebruary 1986, the State Council issued a communique allowing the use of powered transportation(trucks and boats), and also freeing long-distance transporters from certain restrictions on volume,administrative district and distance (Kobayashi 1992). However, in some quarters, 'long-distancetansportaion' continued to be viewed as speculative and 'capitalist' in ideology.
- 81 -
E. Summary and Implications
3.67 The first key finding of this chapter is that the state's withdrawal from the task ofdistribution occurred primarily prior to '985, over the first phase of reform. Since then, there has beenvirtually no ownership change in the undertaking of distribution. In the latter period, the state'swithdrawal from allocation has been far more noteworthy than its withdrawal from distribution. However,a second finding is that the nature of the ownership function has changed over the more recent period.There has been a rapid increase in distribution services availabla over the last five years, and now, thedistribution services available in China far exceed those available in other laige transforming economies,such as the former Soviet Union, although the level of these services is still well below the norms ofWestern Europe. It is alsi noteworthy that many innovations have been introduced by the state sectorin distribution. The overall position therefore is, a distribution system with continued strong statedominance, although with a rapidly changing face.
3.68 Third, the distribution system today is a hybrid, and some of its structures such as thecomprehensive distribution centers, reflect the partial transition of China towards a market economy.some features of the present system bear strong characteristics of the former period (such as the 12enterprise structure of most material bureaus). There are other features, at the same time, which are veryinnovative, such as the multiple agencies and branching out of operations at bureaus such as Shenzhen,and the value-adding processes adopted at many specialized distribution centers. It is desirable that, onthe one hand, greater flexibility is introduced into the frequently encountered 11 or 12-enterprisestructures, and on the otler hand, that the growth of the new style bureaus is orderly. Thus, speculativeactivities should be checked, value-adding functions should be encouraged, and constraints within thedistribution system, in the form of obligatory sales at controlled prices, should be reduced, to makegenuine distribution-related functions more attractive.
3.69 Fourth, there is much which is still to be done to improve distribution functions, throughbetter handling, delivery and warehousing procedures. A detailed set of recommendations on specificmeasures which can be introduced, which are considered 'best practice' elsewhere, is given in the annexto this chapter. Fifth, there is a need to review the physical warehousing facilities available. Preliminaryinvestigation suggests that new investment is desirable, to upgrade and relocate existing facilities. Sixth,there is also a need to undertake a detailed examination of the present financial situation of the materialsdistribution system. Again, preliminary observations suggest that profits are declining and it is essentialto find out why this is so. As with the physical appraisal of warehousing, such a financial appraisal is amajor ut.Jertaking which should be launched with specialized expertise.
3.70 Finally, the role of t-usportation in distribution is critical, and it is clear that there aredifficulties here. On railways, the )roblem has been prolonged underinvestment, in turn due toinsufficient funds, resulting from low tariffs. This situation has recently improved and it is hoped thatfresh investment will follow. In trucking and highway transportation, there are more issues relating toregulation; multiple regulatory authorities, the lack of synchronization of tariff schedules across regions,and problems of entry. An integrated approach to all these issues is required to achieve the successfulphysical development of markets.

-82 -
Annex 3.1 A Note on Producer Goods Distribution Systems
Efficent Distribution Systems
1. A distribution system is a lihk between producer and user, who, in most cases, areseparated geographically. The primary function of a distribution system is to get the right goods fromthe right producer to the right customer/user av efficiently as possible. In many cases, the mix of goodsneeded by a user do not match the output of any one producer. Given this situation, an importantfunction of distribution systems is to provide time, place, and assortment convenience based on thephysical movement and storage of goods. Distribution systems also help to match supply and demand,both by moving goods where they are most needed and by providing demand and supply information toproducers. Time and place convenience implies that goods are more easily and quickly available to usersthan if the user had to pick them up at their places of manufacture. Assortment convenience implies thatthe distributor can combine in one place and ship to a user the output of more than one producer.
2. An efficient distribution system is essential to an efficient economy because without agood distribution system manufacturers cannot plan their production efficiently, the country'stransportation system is not well utilized, and buyers end up paying too much for goods for v.hichdelivery is unpredictable. Efficiency in the distribution of producers' goods is, in fact, a virtual necessityfor a country that wants to avoid inflation at home or to compete In world markets. Such inefficienciesaffect the price of all finished goods because they add unnecessary costs to Inputs. Inefticiency inconsumer goods distribution may result in a penalty paid only by domestic consumers that may hold downdemand, but may also contribute significantly to inflation. Inefficiency in producers' goods distributionaffects also the price of finished goods that firms may want to export.
3. ihere is no particular structure that is most efficient in all circumstances. The structurethat will be most efficient depends on several factors including (but by no means limited to) the relativesize of sellers and buyers, their geographical location with respect to each other, and the services thebuyer requires from the seller. As described below, channel members typically perform additionalfunctions in addition to physical distribution. Channels of distribution are very dynamic; given theopportunity to do so steuctures and functions keep changing to accommodate to the ever changing needsof buyers and sellers.
Alternative Channel Structures
4. Channel structurehas two dimensions, length, and ownership. Channel length is describedin terms of levels. In a zero-level channel, goods go directly from their manufacturer to thecustomer-user. In a one-level channel, goods go from producer to a middleman, commonly referred toas a wholesaler or distributor, and then to the customer-user. A two-level channel has both a distributorand a sub-distributor between manufacturer and customer-user, and so on. While a producer might haveonly one manufacturing site in a given country, a one-level channel will typically have severaldistributors, each located to best serve a particular geographic area. A two-level channel will have alarger number of more localized distributors.
5. Channel structures are categorized as direct or indirect depending on who owns thechannel institutions. In a direct channel, the manufacturer owns all the distribution institutions.

- 83 -
Typically, direct channels are either zero- or one-level. In a one-level direct channel, the distributor issimply a branch owned and operated by the manufacturer. In an indirect channel, the manufacturer doesnot own the institutions at one or more of the distribution levels. Indirect channels can be, and often are,multi-level.
Channel Functions
6. The functions of a distribution system, extend well beyond just the physical distributionof goods. Distribution systems are also systems for information transmission, for the performance ofpromotional and related marketing activities, and for financing and funds flow. In some cases, they caneven become 'shoppers' for their users. Some of the major functions that distribution systems provideare:
o Product Search and Procurement: A channel member can act as its customers' purchasing agent,identifying the best sources for the products its customers need and then procuring those productsfor its customers.
e Consultative Advising: A channel member can be an authority on a particular manufacturingprocess or product category, recommending product specifications and manufacturing processesto its customers.
= Customer Prospecting: Finding potential customers for the manufacturer's products.
* Customer Selection: Choosing the particular customers the seller wants to serve.
* Promotion: Devising an( promulgating information designed to induce potential customers to buya particular mamnfacturer's products or to buy from a particular distributor. Promotionencompasses both advertising and personal selling.
o Inventory Holding and Storage: Keeping a supply of the manufacturer's goods at a place wherethey will be readily available to customers.
* Ordering: Placing orders with the manufacturer to ensure that stock will be available forcustomers.
• Delivery: Transporting or arranging for the transportation of goods to the customer-user. In azero-level channel, goods are transported only once. In a one-level channel, of course, goods aretypically transported twice, once from producer to distributor (ong haul), and once locally fromdistributor to customer/user.
o Allocating: For goods in short supply, deciding how to apportion them among customer-users.
e Negotiating: Coming to agreement with customers on matters such as costs and terms.
e Financing: Extending and receiving credit; collecting and transmitting payment for goods.
* Installing: For capital goods, putting the item in place at the customer/users site and readying itfor use by the customer.

- 84 -
o Servicing: Providing after-sales service and/or spare parts for equipment sold to customer-users.
e Information transmission: rollecting and disseminating information about market and economicconditions from customer-users to manufacturers and from manufacturers to customer-users.
* Recycling: Picking up scrap and used material and sending it to the appropriate place to bere-used in one form or another.
The Evolution of Distribution Channels for Producers' Goods
7. As economic development proceeds in countries in which market forces operate,distribution systems are in a continuous state of change. Indeed, channels continue to change even in amature economy in which market forces operate. The stimuli for change come primarily from thec;anging needs of customer/users that competing sellers vie to serve and trom a changing supply/demandsituation. There are four kinds of change that are of interest for analyzing the efficiency of a distributionsystem: (1) changes in the modal length of channels, (2) in the size of channel institutions, (3) in thecontroller of the channel, and (4) in the number and type of alternative sources of supply availableto a prospective buyer.
8. Studies of industrialization suggest some generalizations about the changes that are likelyto occur in distribution systems in market economies. (There are, however, many exceptions to thegeneralizations and they should be not be taken as completely representative). At very early stages of acountry's industrialization, channels are short, even zero-level, and the selling institutions are few andlarge. The major distribution institution is likely to be an importer, either an independent importer actingas agent for a foreign producer or a sales subsidiary of a foreign producer. Customers/users are likelyto be small, but despite their small size the importers may sell direct to their customers. At this earlystage, demand for many goods is likely to exceed supply.
9. As industrialization proceeds, domestic producers appear, supplanting some imports, butimports are still important, especially for more sophisticated products. Larger and larger customer/usersappear as the domestic manufacturing sector grows. Smaller firms may proliferate also, at both thebuying and selling end of the channel. Supply begins to catch up with demand, and for some easilyproduced products, supply may exceed demand.
10. Later, some longer channels using indirect distribution appear because of (1) a larger andmore diverse base of consumers, who require an increasingly diverse list of products and (2) theappearance of small, specialized sellers who cannot afford the expense of direct zero-level distribution.This lengthening occurs in part because the needs of particular customer/users encompass a wider breadthof products than any one producer can supply.
11. As some customers/users grow larger, the zero-level channel becomes more importantfor goods those large customers/users purchase in substantial quantities. Multi-level channels becomemore important in serving the needs of smaller customer/users and in serving the smaller quantitypurchases of larger customer/users. As independent distributors appear, they are likely to be small,rather than large, and to specialize in a narrow, rather than a broad range of products.

- 85 -
12. In virtually every economy channel alternatives proliferate as industrialization proceeds.Zero-level and one- or two-level channels exist side-by-side, dealing in the same goods, with eachspecializing in a particular kind or size of customer. Sellers may t smselves employ more that onemethod of distribution, using for example both a zero-level direct channel and a one-level indirectchannel, depending on the relative efficiency of different channels in different circumstances.
13. Channels that are one-level or longer are typically indirect, with middlemen that areowned independently of the producers they represent. There is a set of conditions that particularly favorsthe appearance of one-level (or higher) channels employing independent distributors. These conditionsare:
o Large num:lbers of potential customers.
• Standard and stockable items.
e Typically smnil quantities of sales.
* Requirements of fast delivery and/or service by customers.
14. As potential supply begins to exceed demand, control of the channel passes from produceror distributor to customers/users. Producers compete for good distributors and both distributors andproducers must compete for good customer/users. At this stage of industrialization, they are competingfor customers/users who have enough experience to shop intelligently, and can evaluate the offerings ofdifferent sellers.
15. In response to changed market conditions, the functions that channel members performchange in importance. At early stages of industrialization, product search, procurement and allocationare likely to be key functions, while customer prospecting and promotion are not. As industrializationproceeds, consulting advice may take on added importance as potental customer/users confrontopportunities to develop new products requiring inputs with which they may wot be familiar. Informationtransmission, both up and down the channel, increases in importance. Customer/buyers want moreinformation about the alternatives available to them. Sellers want to know more and more about thecustomers to whom they sell and want information that allows them to better forecast demnand so they canproduce more efficiently.
16. Producers' and distributors' competitive strategie become more diverse. For some, pricebecomes their key competitive weapon. These competitors strive simply to offer the lowest deliveredprices to their customer/users. Other channel members base their competitive strategies on offering quickdelivery, liberal credit terms, after-sales service or consulting advice. Regardless of the specificcompetitive strategy they may pursue, virtually all use promotion very heavily, especially personalselling. Wherever possible, producers try to differentiate their product offerings as well. Some try todifferentiate only by offering lower prices; others try to add more features to their products, raise theirquality, or build a brand image. Producers, too, use promotion very extensively.
17. The result of all these efforts is a marketplace characterized by an increasing proliferationof product alternatives and a wide diversity of distribution channels, all coexisting and competingstrongly for customers. They coexist because of the diversity in their customers' desires and are

-86-
successful when they can meet the needs and desires of a panicular customer group more effectively thancompetitors pursuing similar strategies.
18. Independent distributors, especially in industrialized countries often specialize, either inan application or product category or in a particular industry. For example, a distributor might specializein hydraulics, offering a complete line of equipment and supplies to a potential customer who has a needfor hydraulics. Alternatively, a distributor might specialize in supplying hospitals. Such a distributorwould endeavor to supply everything a hospital would need.
19. In an advanced market economy, where supply frequently exceeds demand, distributioninstitutions can come reasonably close to the economist's definition of perfect competition. This isespecially the case when a modicum of regulation allows free entry and restricts the use of predatorymarket power. For independent distributors, entry ard exit barriers are low, provided they can gainaccess to goods that are in demand. Neither large amounts of capital nor great expertise are required tobecome a successful distributor. In a market economy, distributors and distribution systems come and goas the needs and desires of customers/users dictate. In such economies, especially in industrializedcountries, many forms of distribution will coexist.
Some Comments on Distributor Eklclency
20. While some customers may not be purely interested in obtaining the lowest possible pricefrom a distributor, in a market economy every distributor must operate efficiently in order to survive.The gains from efficient operation, if not passed on to custumers In the form of lower prices, can supportpromotion, service, delivery or other elements of the distributor's competitive strategy. There are severalmajor elements of distributor operations that affect costs and, therefore, efficiency. They are:
X Inward Shipping: TMe cost of shipping goods from the producer to the distributor's warehouse.Using pardly loaded trucks or railroad cars, or slow-moving equipment can add to costs.
* Inventory Holding: Holding inventory ties up capital which could otherwise be invested.Inventory holding also increases costs because it increases the amount of space the distributorneeds to operate. Unreliable inward transportation means that distributors must carry higherlevels of inventory.
e Goods handling: The more times goods are handled or moved, within the distribution center, andthe greater the distance over which they are moved, the higher the cost.
• Order processing and billing: Pushing and processing paper costs money, and inevitably leads tomistakes in billing.
o Payload planning and delivery scheduling: Poorly scheduled vehicles, or only partily filledvehicles, can add substantially to costs even if delivery is local.
* Worker productivity: Regardless of the particular systems or techniques a distributor mayemploy, the efficiency with which workers perform their assigned tasks affects distribution costs.
o Labor costs: The cost of warehouse labor has been a major cost item in distribution. The trendin virtually every country is toward steadily increasing wages for labor, thus raising costs.

-87 -
o Physical location: Land costs for warehouses and offices obviously affect distibution, and hencethe location of many large warehouses outside urban centers. Location can also affect costsdepending on how efficiently a location fits into local and long haul transportation system.
'Best Practice' Tools and Techniques to Minlmze Costs
Inward Shipping
21. Inward shipping is the cost item that is least controllable by the distributor, and thereforethe most difficult to minimize. Where possible, distributors can take a variety of actions to minimizethese costs. One action is to locate directly on the line of the long haul carrier most accessible to thesupplier. This means locating, as appropriate, at a dock, on a railroad spur, or contiguous to a majorhighway. A related action is to choose suppliers, where possible, that are located in such a way that theywill minimize shipping costs. In some cases, this is not a matter of choosing the closest supplier, but isa matter of choosing a supplier with direct access to a connecting railroad, highway, or water system.Placing orders of a size that fits the shipping capacity of the transportation mode to be used also lowerscosts. A full load invariably costs less per unit to ship thaD a partial load. Placing orders well ahead ofneed or buying on a contractual basis can also lower costs because these actions allow suppliers to plantheir production more efficiently.
Inventory Holding
22. Minimizing inventory requires predictability in receiving incoming orders and in the sizeand timing of orders from customers/users. This requires not only reliable shipping but information fromcustomer/users as to the size and timing of their needs. Predictability allows for smaller buffer stocksand can also result in less handling of goods. Inventory minimizing systems are most beneficial whenproducer, distributor, and customers/user are all linked together with a common information system.TMese linkages are becoming more and more common in the industrialized world.
23. In a typical system, customers/users enter product use information into the system as theyuse the product in their manfacturing process. TIis allows the distributor to anticipate customer/users'needs, permitting the distributor to plan both inventory and customer/user delivery schedules. Ihedistributor then collates this information from all cusmer/use of the product and reports it to thesupplier of the product. The supplier can then plan both production and shipping more efficiently.
24. Any sophisticated system to minimize inventory requires computerization. This is notjust a matter of hating a micro-computer at each site. Ihe customerhuser's, distributor's and producer'scomputers must all be tied together. ITis means the systems each use must be compatible andelectronically linked. Typically, local linkages use telephone lines, while, in sopbisticated systems, moredistant linkages are by satellite.
25. The well-known Japanese 'just-in-time' system is designed to minimize inventory storedat the customer/user's site. In this system, a distribucor or producer delivers goods to the customer/useraccording to a preplanned schedule of when the goods will enter the customer/user's production process.In this system, the customer/user might receive several small deliveries each day. A by-product of thesystem is that it also allows the distributor or producer to minimize their inventory as well.

- 88 -
26. However, co.ntinuous change and adaptation is necessary. Japanese firms insittedjust-in-time systems in part because of the high cost of space In Japan. These high space costs, of course,make inventory expensive to bold. The system worked well because supplier firms located very closeto their customer/users and because both roads and trucks were in ample supply. But in the past fewyears, the efficiencies produced by the system have been questioned. As adoption of just-in-tmebroadened, the streets and roads have become clogged with delivery vehicles.
Goods Handling
27. Goods handling has become a capital intensive activlty, even in Industrializing countries.As wages go up, the only way to increase labor productivity is to replace hand trucks with fork lifts andconveyor belts, and introduce palette handling systems. Other tools and techniquee have also been adoptedto jrimize handling. Warehouses arrange their inventories so that goods frequently appearing on thesame order are stored close together to minimize order pick-up time and effort. Heavy and bulky itemsare stored near the loading and unloading dock for the same reasons.
28. Warehouse efficiency is also improved by the arrangement of the computerized printingof customer orders in the sequence in which goods are stocked in the warehouse. This technique alsominimizes pick-up time and effort, as an order can be picked and assembed with one orderly 'pass'through the warehouse. Cross-docking is another recent Innovation. It is a variant on the just-in-tmsystem. In a cross-docking system, the supplier's vehicle arrives as vehicles that will deliver goods tocustomer/users are preparing to leave. Incoming goods go straight from the incoming supplier's vehicleto the outgoing delivery vehicle without ever entering the warehouse.
Order Pneessing and Biln
29. Distributors are replacing manual procedures using people and paper with computerizedprocesses as quickly as they can. In a typical system, in more and more common use in the industraizedcountries, customers/buyers transmit their orders to distributors or producers via a computer link.

4New Forms of Markets
4.1 As the previous chapter described, the progressive withdrawal of the state from thefunctions of procurement and a-location of large numbers of goods accompanied the decontrol of theirprices. However the withdrawal of the state from distribution activities was more gradual, due first tothe need to develop entire chains of buyer-seller links as well as new distribution techniques, in additionto the need for the physical infrastructure for distribution. Second, the state's role in distribution itselfgrew more innovative over time. The majority of the newly-established centers cater purely for retailtrading, and constitute an adaptation of traditional retail markets. The next largest group of such marketsis represented by wholesale markets. New retailing techniques and new forms of wholesale markets forproducer goods were discussed in the previous chapter.
4.2 Third, in addition to the changes in wholesaling and retailing, more innovative forms ofnew markets have recently and rapidly been introduced for both agricultural and industrial commodities.These markets comprise highly automated Exchanges in which both forward and prompt trading occursin a comparatively narrow range of products.' In an effort to hasten the switch towards a marketeconomy, there has been a deliberate effort to establish formal exchanges in which commodity tradingis undertaken. Government agencies at every level, as well as national production and import-exportcorporations have come together to create commodity Exchanges. This chapter evaluates their functioning,drawing in detail on examples of the new metals Exchanges.2 The interlinlages between these marketsand other areas of the economy are pointed out and the future direction in which these markets mayevolve is discussed.
By early 1993, three independent Exchanges, trading metals, coal and agricltural inputs were alreadyin operation in Shanghai (the leader in this field), and two urtdier independent Exchanges, tadingpetroleum and agricultural products such as grains and vegetable oils, began trading during the year.Each of these Sbanghai Exchanges has its own geographicaly separate and distinct facilities, eventhough there can be no doubt dtat the benefits from sbaring telecommunications, computing, bankdng,training, regulatory supervision, settlement procedures, brokerago and trading facilities would be verysubstantial, and could be achieved (as is done in New York and London, for example) without forcingthe individual Exchanges to lose their identities.
2 These are the best established and most important exchanges today for industdal products.Examinations of the markets for agricultural products have been undertken earlier (see Chapter 3section C) and exchanges for agricultuaMl goods are examined below (in Chapter 4 Section B).

-90 -
A. China's Distinctive Pattern of Development of Commodity Exchanges
4.3 The rapid mushrooming of commodity marketing centers in China has no parallelanywhere else in the world, except the former Soviet Union. In all other countries, commodity marketshave been allowed to evolve at their own pace, and it is virtually unknown for a fully-fledged Exchange,complete with Exchange members, computer systems and detailed rules for the payment and delivery ofproducts, to exist without having spent some considerable time passing through much less sophisticatedpatterns of trade. For example, all of the world's main metal markets - in London, New York and Tokyo- have their origins in very old informal markets, in which metal trading occurred between dealers whoseoffices were all near one another, so that trading could be undertalren in person. The markets thenevolved towards a more formal framework, with traders meeting in one convenient centrallocation, andwith the standardization of contracts. For a long while, trading was purely on a spot basis, but eventuallyforward markets emerged - at first, purely informally, and later under formal rules - in which tradersagreed to buy or sell metals for physical delivery at some mutually acceptable date in the future.
4.4 The next stage of the development of Exchanges in world trading centers was thestandardization of forward contracts and the buying and selling of these contracts between traders in theperiod before the contracts matured. Only when forward trading was very well understood, and thebuying and selling of forward contracts in the period between the date of the opening of a forwardcontract and its expiry was common, did proper futures contracts come into existence. The distinctionbetween forward and futures markets lies in the degree of standardization of contracts.3 Whereaforward markets may permit buyers or sellers to stipulate one particular brand of a product or oneparticular point of delivery, futures market contracts are designed in one completely standard form, inwhich typically a number of brands and a number of delivery points are permitted completely freely andinterchangeably. Unlike with forward contracts, therefore, the buyer of a futures contract who takesdelivery of copper at the expiry of the contract merely knows that the seller will be allowed to deliverany one of the permitted range of brands, and that the delivery will take place in any one of a numberof permitted delivery points.
4.5 In China, several stages n the evolution of commodity markets are being compressed intoone single step. After only a few months of a fledgling free market, several commodity sectors aresuddenly being offered access to formal Commodity Exchanges, some of which are more complex andsophisticated in certain respects than their counterparts in the industrialized world. Before producers,traders and users of commodities have become accustomed to spot physical trading between themselves,they are being invited to trade on a forward or futures basis on a Commodity Exchange.
4.6 The proliferation of commodity marketing centers reflects some lack of understandingabout the nature and functions of Commodity Exchanges and futures markets. There is a misconceptionthat building a special trading room and installing computers programmed to record trades constitutes afutures market. Therefore, many "futures markets are now claimed to exist; but almost all of these arelittle more than an adaptation of existing formal or informal markets, in which products free from
3 Forward and futures contracts are typically used for different puposes. A forward purchaser usullyintends to take delivery of the product at a certain date, while a 'hedge' purchaser of a futures contractdoes not intend to take delivery at that date, but rther to cover his current position in the commoditvagainst its future price vanations.

- 91 -
government price controls and marketing quotas are traded on a spot basis, for Immediate payment anddelivery. Speculation has rapidly become the primary source of turnover, and therefore commissionincome. However, there Is also a small, but nonetheless significant, proportion of tradir.g wbich is basedupon conventional techniques of "hedging" against price uncertainties.4 The following sections describeand evaluate the functioning of specific new Exchanges, and then draw together common findings interms of their effectiveness.
B. Agricultural Markets
4.7 Following the accelerated reduction in the role of the state in the procurement anddistribution of foodstuffs, from 1991, large wholesale markets in agricultural products were set up at anumber of locations, dealing mainly in foodstuffs, such as grain (Zhengzhou in October 1990; Hubei,March 1991; Heilongjiang, October 1989), edible oils (Heilongjiang, October 1989), rice (Anhui, January1991), corn (Jmln, March 1991), poultry (Jiangsu Wuxi, June 1991) and sugar (Guangdong Yujian in June1991, Southern sugar at Guangzhou and Northern sugar at Tianjin, in January 1992).
4.8 Most of these were relatively large wholesale markets, under the control of the nationalor provincial governments, and at some of these centers, formal Exchanges have been established.Established on a no-profit basis, they operate on a membership or agency system. Most agricultralexchanges require the payment of deposits based on the contracted values of transactions and most havea system of 'insurance' against price fluctuations, which in practice is a form of government interventionthat limits the normal price variation that haracterizes a commodity exchange.' The experience of thefirst of the country's major agricultural commodity exchanges, the Zhengzhou Grain Wholesale Marketin Henan Province, which started trading in October 1990, has been one of only a slow move away fromspot trading. The market was established by the Ministry of Commerce in conjunction with the HenanProvincial Government. In March 1993, the Zhengzhou grain market was "officially turned into a futresmarket". Announcements about its price movements are made in the Chinese and foreign press. Nmeseparate Government agencies, Including the Ministries of Railways, Agriculture and Finance, and thePeople's Bank of China, were involved in the approval of the establishment of the Zhengzbou Market.
4 Annex 4.1 explains how gains and losses from forward and futures tr are distibuted betwoehodgers and speculato. It shows how trading on Commodity Excbanges is a 'zer-m game; theprofits made by thosd who are uccessfil in their tading are exactly balnced by the losses suffered by
ios who are unsuccessful. On average, a participant in tading on tho Exchamges should not expect tomake money consistenly from such ktading.
5 At the Zhengzhou grain market, if there are price fluctuations below 6 percent of the contated price,the buyer bears 40 percent and the seller 60 percent of the loss. However for fluctuations between 6and 10 percent, the state bears the loss. For variations over this level, an application may be made byone of he parties to cancel the contract and the secrity deposit is used to compensate the other party.These provisions are intended to be preliminary and in the futre all govment intervention is tocease.
6 Information provided by the Ministry of lItemal Trade in January 1994.

- 92 -
Special dispensations had to be obtained from the State Administration for Industry and Commerce toallow brokers trading on the regular Zhengzhou grain market to have their trading licenses amended topermit them to trade on the Exchange."
4.9 The Zhengzhou grain exchangs uses a sequential auction system of trade, in which anauctioneer oversees the trading of individual lots of grain one after another, with the prices displayed ona screen.8 The auctioneer announces prices verbally, and adjusts prices upwards, when competitivebidding is occurring, or downwards, when there is a lack of offers, until a single price is reached atwhich the lot of grain being auctioned is sold. The lots traded are far from uniform In terns of quality,location and delivery time. In practice, the majority of transactions are for spot sales; only 10 percentof all trades are estimated to be for forward delivery. In view of the highly specific nature of each lottraded in Zhengzhou, and the frequent problems associated with securing freight capacity to transportgrain, it is difficult to find secondary buyers wanting to purchase existing contracts from other buyers,with the result that there is minimal speculative interest in trading on the Zhengzhou Market.
4.10 Government intervention in the grain market is a serious barrier to the more active useof China's first formal Grain Market. The government-enforced price ceilings and quota prices for grainreduce, and often remove entirely, the incentive to use the Zhengzhou Market, since the nature of pricerisk is distorted by the government's actions. Moreover, the government's efforts to defend fixed priceceilings remove the attractions of storage and potential "cash and carry" business in the grain market.'
4.11 It is therefore not surprising that the volumes traded on the Zhengzhou Grain Market arelow. On many trading days, there are few, or none, transactions which are completed. To summarize,therefore, the failure of the grain sector to support an active commodity exchange can be attributed to(i) the lack of standardization of the lots being traded, (ii) the transport cost barriers to the existence ofa truly national grain market and (iii) the extent of government intervention. Nevertheless, the institions(notably the Shanghai Municipal Government and the Ministry of Commerce) behind the proposedShanghai Cereals and Oils Exchange have not been discouraged, and the Exchange opened for the tradingof wheat, rice and maize in July 1993. By January 1994, according to the new Ministry of InternalTrade, it had a healthy level of trade.
4.12 In other agricultural sectors, these problems should pose less of an obstacle to a thrivingmarket and active two-way trading. For example, the liberalization of the sugar and rubber markets overthe past two years has been very comprehensive, and in recent months the domestic prices for both ofthese products have moved closely in parallel witi world market movements. Neither sugar nor rubberare very perishable, and they can therefore be stored safely for relatively long periods. Recently, noserious transportation difficulties have been reported for these products. Further, there are large numbersof both sellers and buyers of these two commodities. Sugar and rubber prices are free to fluctuate, and
7 This was because 'speculation' is not permitted as a trading activity. Similar special dispensations wererequired for the Shanghai Metals Exchange (see below).
8 This system is much simpler, and less cosdy, than those adoptd on the two Metal Exchanges (seebelow).
9 The recent reducton in govemment pment, pnce cotol and intervention in grain tbade may gosome of the way towards reducing this obscle (see Chapter 2).

- 93 -
have often done so substantially over the past year. It therefore appears that the pre-conditions exist forthe establishment of a thriving commodity exchange, trading spot and forward contracts in each of thesecommodities.
4.13 The first large scale commodity exchange opened its doors for trading in these productsIn 1993. The South China Commodity Exchange in Guangzhou was to start trading natural rubber spotand forward contracts in May 1993 on a trading floor that is largely modelled upon the design of theShanghai Metal Exchange, established by the Guangdong Bureau of Land Reclamation and State Farms,in conjunction with the Guangdong Provincial Government and the Ministries of Agriculture andChemical Industry. At present, however, this is another example of an Exchange being imposed upon thesector from outside rather than evolving naturally from an existing actively traded market. Currently thereis only a very limited volume of even forward trading in the rubber sector. Companies involved in thephysical production or trading of natural rubber did not clamor for the establishment of the South ChinaExchange, which did not represent an obviously useful tool use for their day-t-day commercial business.
4.14 Unlike rubber, the sugar sector did not opt for the creation of large and wiosdy Exchanges.Instead, the sugar industry has seen the creation of two specialist wholesale markets, under the aegis ofthe Ministry of Commerce, in association with the Sugar, Wine and Tobacec Corporation (an enterpriseunder the control of the Ministry, and the former monopoly distributor of sugar within China). Onemarket is in Tianjin, for beet sugar, and the other is in Guangzhou, for cane sugar. It is reported that athird market will be opened soon in Zhanjiang, the largest sugar producing region of the country, lyingin South West Guangdong. However, at present, there is no trading in either Tianjin or Guangzhou. Themain explanation offered by users and traders is that they tend to trade directly with their customers orsuppliers, and do not see the need for an intermediary in the process. It is relatively simple to contacttraditional buyers or sellers and terms for the delivery of sugar to the desired location can then benegotiated, without involving third parties.
4.15 Within the direct buyer-seller trading system for sugar, there is very little forwardtrading, even though there has been substantial price volatility of sugar since 1991. Possible difficultieswith contract enforcement are mentioned as one reason, if one or other party felt that prices had movedexcessively in the period since the forward contract was signed. Another and possibly more importatbarrier to forward contracts appears to be the feeling that such contracts represent an unacceptable degreeof speculation.
4.16 Notwithstanding the reluctance on the part of people in the sugar sector to get involiedin forward trading, there is growing pressure in Guangdong to establish a sophisticated forward andfutures market for sugar, possibly in association with the South China Exchange. It is quite conceivable,therefore, that Guangzhou will soon be host to two commodity markets, trading agricultural forward andfutures contracts, yet without a clear indication of interest in these contracts on the part of the companiesinvolved in production, consumption and trade.
C. The Metals Exchanges of Shangha and Shbezhek
4.17 Looking at producer goods, two commodity Exchanges have been set up for the trade ofnon-ferrous metals, and in the summer of 1993, a petrochemicals Exchange was also established. This

-94 -
section focuses o. the experience of the metals exchanges, due to their relative stability and length ofexistence. The development of metals markets and exchanges in China has followed a different coursefrom that seen in the agricultural sector. In tFe metal market, spot and forward trading is facilitated byfour main factors, which distinguish the trade in metals from that in agricultura produce. First, metalstend to be relatively high unit value products, so that internal transport costs constitute only a modestbarrier to inter-regional trade. Second, metals are not perishable; therefore, delays in transporting metalsfrom one part of China to another do not create undue difficulties. Third, the Chinese government'sintervention in the determination of domestic prices is much weaker in the metal sector than it is inseveral major agricultural sectors, such as the grains market, and therefore, the metal sector behavesmuch more like a free market than the domestic agricultura sectors. Finally, the most successful contractsfor the trading of metals are those in copper and aluminum, and in both of these markets, China is a netimporter (where the volume of metal in unprocessed raw material is taken into account) (Appendix TableA4. l). Consequently, the domestic prices of copper and alumimnm follow the world market very closely;this is in marked contrast to some of the leading agricultural sectors, in which China may be self-sufficient, and where there is often in any case a very limited link between world market prices and thoseprevailing domestically.
4.18 The metal markets are undoubtedly moving rapidly through several stages of evolutionwhich took decades, or even centuries, in Europe and North America. Both the Shanghai and ShenzhenExchanges have moved from spot to forward markets, and are now not far from becoming fully-fledgedfutures markets, in which standardized contracts form the basis of trading.

- 95 -
The Shenzhen Metab Exchange: Strcture and Methods of Operation
Ownersh: Te Shenzhen Metals Exchange (SME) is a Sessions I and 4 are devoted to the trading of copper,pnvate company, which charges members for the Sessions 2 and 5 are devoted to aluminum trading and Sessionprovision of services, and hopes to be profitable. This is 3 is reserved for all of the other metals - lead, zinc, tin,unlike the Shanghai Metals Exchange (SHME), which is nickel, manganese and antimony. lhere is no Okexb tradinggovernment-owned, but which is not intended to be a outside the offwicil trading sessions.profit-making company. At present, the SME provides all 7)pes of Contracts: Trsding occurs in both spot andof the services required for the operation of the forward contracts for each metal, and also ocours in futuresExchange; however, the Guarantee Fund and Clearing for aluminum alone. A number of different btrds of metalHouse will be takens over and operated by the SME's are approved for each spot and forward oontmact, as well as amembers later in 1993. number of different delivery points. The aluminum futwes
Supervision: The Shenzhen Municipal Government contract specifies just three delivery points: two in Guangzhoupublshed and approved the regulations under which the and one in Shanghai, and also specifies that the metal must beSME operate. These have three main elements,the of an acceptable quality, and therefore delivery is restroed tocharter of the SME, the regulation of the managemeat of registered brands which meet the SME quality crieria Th lotthe exchange, and regulations goveniing trading. The size on the SME is 10 tons.Municipal government has established the supervision Natsre ef Traig: Trading is undertaken in a rading floorcommittee which oversees trading and has the ultimte in which members have access to telephones. Member. submitpower to enforce penalties in the event of breaches of their bids and offers to the representatives of the SME whoexchange rules. are seated by computer terminals. These bids and offers
Management and Adisnsion to Membership: The spcify the price, quantity, month of delivery, brand andadmission of new membaers is recommended by the location of the delhwy, and identify the member who isManagement Commitee of the SME, but aU applications making the bid or offer. All of this infonnation is then enteredhave to be approved by the Municipal govemnent The into the computer and is displayed anonymcusly (so as toManagemant Commitee includes representatives of the conceal the identity of the member) on a large computrshareholders, but over half the Committee is made up of screen which dominates the trading room. The screon listsmembers of the SMB. details of all of the bids and offers that have been made by
Funacil Condiions of Membership: Upon joining, taders in the metal that is being traded during that session.members of the exchange have to deposit 200,000 IMB When one of the members decides to accept th bids or offersin cash with the SME Guarantee Fund. In addition, they that are listed on the computer screen, it submits a note ofpay an annual fee, which was set at 20,000 RMB in the acceptance to the represnatv of the SME seated by theirfirst year, but which has been increased to 30,000 RMB computer terinal, and the Clerk announces that a deal hasin 1993. The members also pay a fee of 0.1 pern of been struck and reads the details of the deal into athe value of each contract to the SME; however, the SME microphone. The computer terminals list bids and ofibrs inthen pays 20 percent of its fee income into the Gunrantec chronological order, and ensures that if there are several bidsfund, which serves to augment the Fund as turnover or offer. at the same price, those bids or offers which wereincreascs. made first are the ones which are filled before any others. If
Margin Payments: There is an inital margin payment there are several acceptances submhted for the same offer atequal to 5 percent of the value of a contract, and daily the samentie, the tonnage on offer is divided equay betweenvariation margins are called if prices move against a the different mnbers acopding the offer.trader. Thus, if someone has sold a forward contract at Setmnt Pis: At the end of each day's tading,20,000 RMB/ton and the price ri esby 200 RMB the net sdtlement prices are deternined and pubhihed by theday, a variation margin of 200 RMB/ton is caled by the Setlement Commitee of the Exchange, which is composed ofSME Settemnent Department in order to ensure that there a repretative of the SME and five trading members.remaiz,; the cushion of 5 percent against the risk of a Pie Lbnltr There is a daily limit on price movements ofdefault by the trader. Thse margins are all held in bank 3 perent Thus prices in one day's trading are not allowed toaccounts in the name of the member, therefore, members move more than 3 percent, either upwards or downwards,receive the interet eamed on their margin payments from the previous day's settlemen pnces.during their commodity trading on the SME. Physicat Delivery: The physical delivery at the expiry of a
lading Session: Trading sessions are held between 9 contact occurs between the 21st and 25th of the month ofa.m. and 11 a.m. daily from Monday to Friday. The two expiry, and payment setlement is between the 26th and thehours are divided into five trading sessions of 20 minutes 30th of the month.each, with a break of five minutes between the sesions.
Sources: Background Papes.
-96 -
The Shenzhen Metal Exchange
4.19 The first fully-fledged metals exchange to be created in China was the Shenzhen MetalExchange (SME).10 The Exchange was formed in June 1991, and the formal opening of the exchangefor the trading of contracts was in January 1992. In total, 81 companies were trading on the Exchangeby March 1993.11 The SME was modelled primarily upon the London Metal Exchange (LME) Ring-dealing system, using "open outcry' methods of trading, but its trading methods have evolved towardsa system that now is a close approximation to the screen-based trading methods of the Shanghai MetalsExchange (SHME). The key features of the structure and methods of operation both exchanges areprovided below.
4.20 The structure of trading on the SME has evolved considerably since the exchange firstopened. Having started with a high percentage of spot trades and with a large proportion of forwardcontracts leading to eventual physical delivery of metals, the proportion of spot trades is now typicallybelow 10 percent of turnover, and the proportion of forward trades which result in physical delivery isalso below 10 percent. During 1992 as a whole, spot trades accounted for 18 percent of total turnover;forward trades for 75 percent; and futures trading for 7.2 percent. The total volume of turnover duringthe course of 1992 was 483,000 tons, with a value of 6.3 billion RMB (implying a fee income fromcommissions alone of 6.3 million RMB).
4.21 An indication of the expanding pace of trading volume is given in Appendix Table A4.2,describing trading during January 1993 (which was shortened by the Spring Festival holidays) andFebruary 1993. In January, trading exceeded 53,000 tons, with a value of 795 million RMB, and inFebruary, the volume was over 73,000 tons (implying a daily trading average of almost 3,700 tons) andthe value was 1,023 million RMB (equivalent to 51 million RMB per trading day). By mid-March, the
10 The local Bureau of the MME and the Municipal govemment in the Specid Econoniic Zone firstcreated a Trade Center, in which 52 producers, users and traders were able to trade and exhibit theirproducts, but by 1989, they had decided, in conjunction with the China Non-Ferrous Metal GeneralCorporation (CNFMGC), to move towards the establishment of a formal metals exchange. To this end,the Shenzhen branch of the CNFMGC formed a Hong Kong branch in 1989, from which to gaintrading expenence. After two years of this experience, the Corporation acted as the instigator in thecreation of the Shenzhen Metal Exchange Company. The CNFMGC was the majority shareholder inthe new company (with 60 percent of the equity), and the two minority shareholders were the ShenzlenNon-Ferrous Metal Corporation (with 25 percent of the equity) and the Shenien Materials GenealCompany (an enterprise of the MME, with a share of 15 pecent in the SME). The total investment inthe facilities of the SME totals 12 million RMB Yuan At present, the SMB owns and operates theExchange's Guarantee Fund and Clearing House, but it is planned that these will both be owned andoperated by SME members later in 1993.
The SME has been selective in accepting applicants for seats on the Exchange, and has so far tried toselect mainly produce and user companies. In March 1993, there were only seven members frombrokerage companies, but their numbers are expected to be increased in the next round of admissions ofnew members.

- 97 -
daily volume reached almost 8,000 tons.'2 For 1993 as a whole, it is forecast that total trading volumewill be of the order of 20 billion RMB.
4.22 Over time, the volume has become increasingly concentrated in just one or two activecontracts. In both metals exchanges, the active metals are copper and aluminum, with copper dominantin Shanghai and aluminum in Shenzhen. A second form of trading concentration, which can be interpretedas a healthy stage in the move towards fully fledged futures trading, is the growing proportion of tradein what are effectively standardized contracts. A growing proportion of forward trades specify LMEbrand metal (rather than particular individual brands, which are of a lower quality), and specify eitherShanghai or Guangzhou as delivery points). As much as 80 percent or more of all forward trading wouldbe eligible to qualify for delivery against an aluminum futures contract.
4.23 Today, hedge-buying and selling account for only a relatively small proportion (10 to 1Spercent)of trade. The primary interest of the participants was speculative, with a major proportion of thisspeculation linked to expectations about the unofficial swap exchange rate for the RMB Yuan against theUS dollar. Since aluminum and copper are both products in which China is a regular net importer(Appendix Table A4.1), China's domestic prices follow world prices closely, with a relatively stablerelationship between the world price (expressed in RMB yuan at the unofficial exchange rate) and thedomestic market price, quoted on the SME. Thus, the purchase or sale of a forward or futures contracton the SME can be used as a means of speculating on movements in either the world prices of these twometals or in the unofficial exchange rate.
4.24 The link between local and world prices for metals is highlighted by the practice of theSME of listing the latest world market quotations from the LME and Comex in the trading room and onboards outside the room, together with details of exchange rates, and of listing the conversion of theSME's settlement prices into dollars for comparison with the quotations on overseas markets. Onepossibility that is actively being considered is the denomination of all of the SME's contracts in USdollars, rather than RMB Yuan. Such a change would require the approval of the State Administrationfor Foreign Exchange Control.
4.2S The overriding interest in speculation has led to an almost total neglect of one majoraspect of commodity trading in other countries, namely the arbitrage between physical and forwardmarkets and the use of forward and futures conuracts as a means of reducing the cost of holding andmanaging inventories. It can be shown that the differentials between the prices for different forwardcontracts on the SME reflect apparent failures of arbitrage to bring these differentals into line with thecosts of storage.
4.26 There are several possible reasons for the failure of arbitrage to take effect in thedifferentials in the structure of forward prices. One is ignorance about the scope for such arbitrage;another is poor access to storage facilities; but the most important are undoubtedly the high costs ofmargin deposits for such arbitrage operations, and the perception that the scope for speculative profits
12 The tunover figures for both the SME and the SHME count one transaction, involving the combinationof a buying and selling order for, say, 100 tonnes as 200 tonnes of tumover. However the conventionadopted by Exchanges elsewhere is to count each transaction only once. Turnover on ChineseExchanges shoud therefore be balved for purposes of comparison with the quantities mentioned onExchanges in North America and Europe.

-98 -
from these operations is limited in relation to the potential gains from speculation in forward and futuresmarkets.
The Shanghai Metal Exchange
4.27 The Shanghai Metal Exchange (SHME) was formed as a joint enterprise of the ShanghaiMunicipal Government and the former Ministry of Materials and Equipment in Betjing.13 The investmentcosts of the new exchange were raised by the Shanghai Materials and Equipment bureau, through bankborrowings. The management of the SHME was entrusted to the Shanghai MME, which was alsoresponsible for drafting the regulations under which the exchange would operate. The MME secured theapproval of the Shanghai Municipal State Administration for Industry and Commerce for the amendmentsto government policy which were essential before the commodity exchange could operate. Trading beganin May 1992. The Exchange Company has five departments (Dealing, Delivery, Settlement, Informationand Administration) and employs some 60 people. The Settlement department acts as the Clearing Housefor the SHM2 and oversees the daily settlements of margins. Another two departments (Developmentand Engineering) have been added and the number of employees has consequently increased.
13 In 1979, when the govenment first started to encourage the operation of a market economy widtin asocialist framework, Shangbai was the first city to establish a spot commodity market, which opertedwithin the broad guidelines set down by the State Plan The commodities that were traded on this firstexchange were predomnantly geared towards the needs of heavy industry, and included wholesaleproducts such as cars, steel and electrical machinery. The sucoess of the first moves towerds thecreation of commodity markets encouraged the establismt of other such markets, and in 1984, theShanghai Municipal Materials and Equipment Bureau (Shanghai MME) established the ShanghaiMatials and Goods Trade Center in the Wu Mao Building in the city to promote spot trading inmetals and related industria products. The acceleratian of the adoption of a socialist market economyencouaged the Shanghai MME to examine the potential viability of a commodity exchange in whichforward and futures contacts could be traded. In April 1991, the Shanghai MME invitedrepresentatives of oversess metals markets to visit the Trade Center and lecture on the functions andoperations of futures markets, who presented the Shanghai MME with a proposal to open a full metalexchange in the Trade Center.
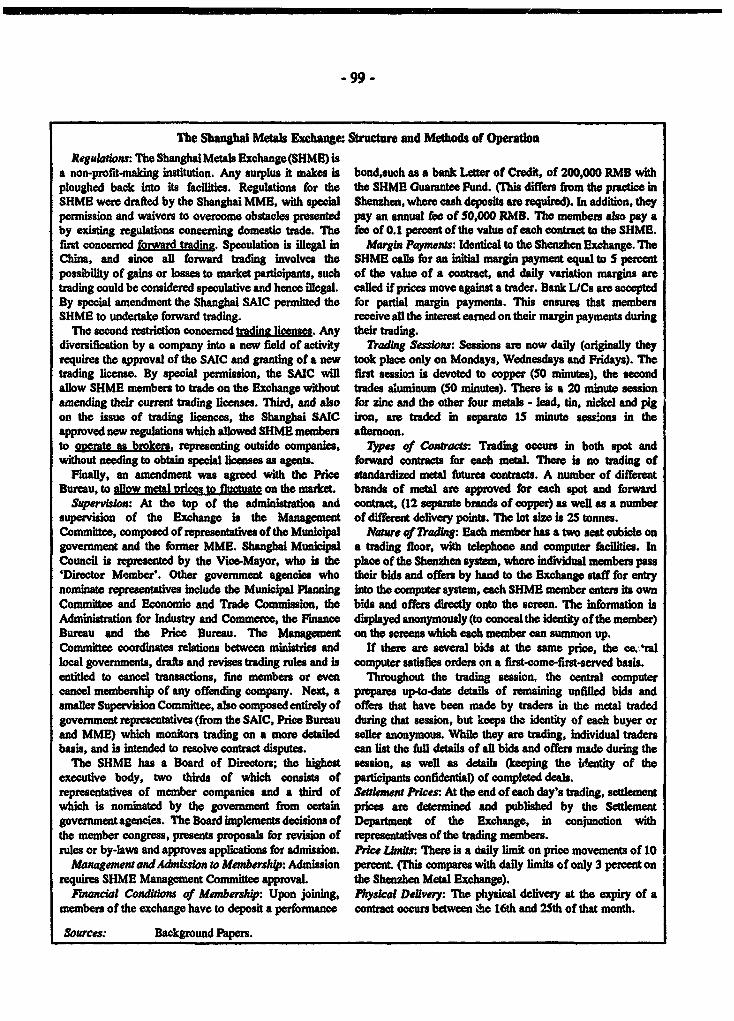
99 -
The Shanghai Meta Exchange: Structure and Methods of Operation
Reguladons: The Shanghai Metals Exchange (SHME) isa non-profit-maing institution. Any surplus it makes is bond,such as a bank Letter of Credit, of 200,000 RMB withploughed back into its facilities. Regubations for the the SHME Guarantee Fund. CThis diffes from the practic inSHME were drafted by the Shanghai MMB, with special Shenzhen, where cash deposits are required). In addition, theypemission and waivers to overcome obstacles presented pay an annual feo of 50,000 RMB. The manbers also pay aby existing regulations concening domestic trade. The fee of 0.1 percet of the value of each contract to the SHME.first conctned forward tmdin. Speculation is illegal in Margin Paynu: Idential to the Shenzhen Exchange. TheChina, and since all forward trading involves the SHME calls for an Initial margin payment equal to 5 pereentpossibility of gains or losses to market participants, such of the value of a contract, and daily varation margins aretrading could be considered speculative and hence illegal. called if pries move against a trader. Bank L/Cs are accptedBy special amendment the Shanghai SAIC permitted the for partial margin payments. This ensum that membestSHMB to undoeake forward trading. receive all the interest earned on their margin payments during
The second restiction concerned tadingi Honses. Any their trading.diversification by a company into a new field of activity Trading Sessions: Sessions are now daily (originally theyrequires the approval of the SAIC and granting of a new took place only on Mondays, Wednesdays and Fridays). Thetrading license. By special permission, the SAIC will first sessioa is devoted to copper (50 minutes), the secondallow SHME members to trade on the Exchange without trades aluminum (50 minutes). There is a 20 minute sessionamending their current trading licenses. Third, and also for zinc and the other four metsls - lead, tin, nickel and pigof the issue of trading licences, the Shanghai SAIC iron, are traded in seprate 15 minute sesPons in theapproved new regulations which allowed SHME members aRernoon.to oemte as brokr representing outside companies, 73pes of Contracts: Trading occus in both spot andwithout neoding to obtain spocial licenses as agents. forward contracts for each mtal There is no trading of
Fmally, an amendment was agreed with the Price standardized metal fures contracts. A number of differentBureau, to allow metal mice. to fluctuate on the maket. bmads of mel are approved for each spot and forward
Sapervsion: Al the top of the administration and contract, (12 separate brands of copper) as well as a numbersupervision of the Exchange is the Management of different delivery points. The lot size is 25 tonnes.Commitee, composed of representatives of the Municipal Nature of fulng: Each member has a two seat cubicle ongovernment and the former MMB. Shanghai Municipal a trading floor, with telephone and computer facilties. InCouncil is represented by the Vice-Mayor, who is the place of the Shenzhen system, where individual members pass'Director Member'. Other government agencies who their bids and offers by hand to the Exchange staff for entrynominate rersntatves include the Municipal Plannin into the computer system, each SHME member enters its ownCommittee and Economic and Trade Commission, the bids and offers direy onto the screen. The information IsAdministration for Industry and Commerce, the Fmance displayed anonymously (to conceal the identity of the member)Bureau and the Price Bureau. Th Management on the screens which each member can summon up.Committee coordinates relations between ministrie and If there are several bids at the same price, the ceralloal governments, drafts and revises trading ruls and is computer satisfies orders on a first-come-firt-served basis.enttled to cancel ansactions, fine members or even Throughout the trading session, the central computercancel membership of any offending company. Next, a prepares up-to-date details of remaining unfilld bids andsmaller Supervision Committee, also composed entirely of offers that have been made by traders in the metal tradedgovernment representatives (from the SAIC, Price Bureau during that session, but keeps the identity of each buyer orand MME) which monitors trading on a more deailed seller anonymous. Wh they are trading, individual tradersbasis, and is intended to resolve contract disputes. can list the full details of al bids and offers made during the
The SHME has a Board of Directors; the highest session, as wel as details (keeping the identity of theexecutive body, two thirds of which consists of participants confidential) of completeddeals.representatives of member companies and a third of Senmwnt Prices At the end of each day's trading, settlementwhich is nominated by the government from certain pries are detemned and published by the Settlementgovernmentagencies. TheBoardimplementsdecisionsof Department of the Exchange, in conjunction withthe member congress, presents proposals for revision of representatives of the trading members.rules or by-laws and approves applications for admission. Price Limits: There is a daily limit on prioe movements of 10
Maogement and Admssion to Membership: Admission percent (This compares with daily limits of only 3 percent onrequires SHME Management Committe approvaL the Shenzhen Metal Exchange).
Finncial Conditons of Membership: Upon joining, Physical Delvery: The physical delivery at the expiry of amembers of the exchange have to deposit a performance contract oCcuts between he 16th and 25th of that month.
Sources: Background Papers.
- 100-
4.28 The Exchange had 62 member companies by Janua ry 1994. The largest single groupof members is traders on the domestic market, who provide 31 members. The next largest &.oup consistsof 19 members which have interests in the production and processing of metals; these 19 include severalmajor companies which are end-users of copper, such as in the manufacture of wire and cables. Themembership of the exchange is completed by companies which are active in the import and export ofmetals and by financial institutions, such as brokerage companies. The SHME has been highly selectiveabout admitting companies to the Exchange, and has a large number of unsatisfied applications. As withthe Shenzhen Exchange, the SHME was modelled primarily upon the London Metal Exchange (LME)Ring-dealing system, but instead of the "open outcry" methods of trading used in London and on Comex,the SHME's trading is entirely screen-based.
4.29 Like the Shenzhen exchange, the SHME has made very rapid progress in its first fewmonths of operations. In the period of just over seven months from its opening until the end of 1992, ittraded 2.93 million tonnes of metals with a total value of 48.8 billion RMB.14 This implied that theSHME received 48.8 million RMB in 0.1 percent transactions fees alone, a figure which dwarfs the 2.4million RMB received as annual membership fees.' Over the next two months, from the start of 1993until March, turnover totalled 2.05 million tonnes, worth 39.8 billion RMB, even though this includedthe Spring Festival holidays, implying an average daily volume of the order of 100,000 tonnes, with avalue of close to 2.0 billion RMB (Appendix Table A4.3). During its first seven months of existence, theproportion of contracts that resulted in physical delivery was 26 percent. However, the proportion hasfallen steadily; it was 86 percent in the first month of trading, and was down to 17 percent by December.
4.30 The two forms of concentration that were discernible from the patterns of trading inShenzhen have been repeated in Shanghai. As in Shenzhen, volume has become increasingly focused uponjust two metals, copper and aluminum, with copper increasing Its turnover, and hence its share of overallvolume, at a faster rate than aluminum. In 1992, the two metals accounted for over 90 percent of totalvolume, of which aluminum contributed almost 35 percent; in the first two months of 1993, copper'sshare had increased to 60 percent, while aluminum's contribution to the total had slipped to 32 percent.
4.31 The other form of concentration of activity represents a major step in the evolutiontowards futures market trading. As volume has expanded on the Shanghai Exchange, so also has the shareof total business that takes place in grades of metal and locations of delivery which are more or lessstandardized in the way that one would expect on a futures market. By March 1993, nearly all tradingspecified Shanghai (where three warehouses have been registered with the SHME) as a delivery point,and it was estimated that in excess of 80 percent of trading volume was in LME-registered brands ofmetal.
4.32 Participation in trading on the SHME appears less heavily dependent upon speculationthan in Shenzhen. Leading traders here include importers of concentrates who use the SHME as a meansof hedging their price risk in the period between purchasing the concentrates and selling the refined metal
'4 It should be remembered that this means tdat there were 1.465 million tonnes of metals that wereactually sold on the Exchange. (The other 1.465 million tonnes represented the other (purchasing) sideof the same tranactions).
I At both exchanges, both buyer and seller pay the 0.1 percent commission fee. Fees at overseas futuesmarkets are much lower.

- 101 -
produced from the same concentrates to Chinese customers. Others obtain their initial futures marketprice hedges on their overseas purchases of metal through the LME. Later, once their LME hedges werein place, they gradually reduced their LME futures positions and moved their hedging protection to theSHME.' Among domestic producers of metals, there was a significant use of the SHME for physicalhedging up to three months forward, with the possibility of making physical deliveries at the expiry ofa contract if that appeared to be advantageous. Nevertheless, there can be no doubt that the dominantforce behind trading on the SHME is the same as that in Shenzhen, namely speculation about theunofficial exchange rate for the RMB Yuan, or hedging against future foreign exchange rate variations.17
With the new exchange rate system, it will be interesting to see whether this decreases. To the extentto which access to foreign exchange is free, it may well lead to a decline in trade.
D. An Assessment of Trading on China's Two Metal Exchanges
The System of Trading on the Exchanges
4.33 The developers of commodity exchanges in China clearly have a specific model in mindwhen they establish such exchanges. They profess a desire to incorporate the main features of the leadingexchanges, such as the Chicago Board of Trade and Comex in the US or the London Metal Exchangein England, but have chosen to adopt a computer-based trading system, rather than the open outcrymethods employed on almost all of the world's main commodity exchanges. This approach is both morecostly and technically more complex than those found on the world's leading commodity markets. Thechoice has been defended on the ground that the open outcry methods of trading in other countries havea long historical tradition and have evolved over many decades or centuries. They may be difficult tocreate from scratch in an economy that has not been governed by a market economy for a period of 40years. Moreover, even the exchanges that rely upon open outcry methods are becoming increasinglycomputer-based, while many of the newer forward and futures markets, such as those in foreign exchangeand interest rates, are using screen trading, rather than open outcry. Therefore, it was felt that Chinashould opt direcdy for the most modern methods of trading, rather than evolving slowly towards them.
4.34 Those exchanges which have adopted computer-based trading have often done so becausethe volume of trading has become too great, and the number of market participants too large (as with themarkets in financial instruments) to be handled by open outcry methods. Volumes of trading on theChinese exchanges are nowhere near the limits possible with open outcry. It may have been preferablefor China too to adopt an evolutionary approach with 'open outcry' to begin with, moving towardsscreen-based trading as volumes pick up and live contracts are assured for specific commodities. Choiceof technique should be determined in part by the technology available and the costs of the alternatives.
8 T.he dif*frential between the LME and Shanghai is said to be fairly stable in the region of US$250 perton (where the Shanghai quotations are transla into dollars at the swap market rate); consequently,there is not too much risk in the switching of hedged positions from the LME to the SHME.
" The key point is that the metals exchange serves as a proxy for a market in foreign exchange.

- 102-
Where wages are high, as in Europe and North America, there is a stronger economic incentive to holddown costs by substituting computers for employees than in China.
4.35 Establishers of exchanges in China argue that the less well regulated framework of openoutcry markets would lend itself to possible corruption and falsification of deals. By contrast, computer-based trading methods in which the identity of traders was kept confidential, were felt to be less proneto cheating. However, those exchanges which practise open outcry methods of trading have all establishedrules which permit other members of the exchanges or the regulatory authorities overseeing the exchangesto question the validity of the prices at which individual transactions occur. Where the exchanges keepsequential time records of the details of each trade, it is simple for outside authorities to evaluate thepattern of trades over time and detect if there are transactions whose prices are significantly out of linewith other trades. It may also be questioned whether the use of computers avoids problems of cheating.Besides, the most important forms of cheating are typically those wbich occur off the trading floor."'In early 1994, cases of 'computer fraud' were reported in the Shanghai stock exchange, whichdemonstrates the vulnerability of screen-based trading to fraud.
4.36 Since the investment on these two exchanges at least has been made, it may be too lateto reopen the debate about the form of trading in these, but the same principles should apply to otherexchanges being established. However, there are other factors that should be taken into consideration indetermining how to develop the current trading systems in future in these exchanges. The first is thesuitability of present computer systems for an expansion of trading volume. From observing the twoMetal Exchanges in operadon, it is doubtful whether the current systems can be said to be suitable tohandle much greater volumes of turnover.19 When the computer systems are working as intended, thespeed of response of the systems is inadequate. It takes traders several seconds to input a fairlycomplicated sequence of details (including brands of metal, delivery location, price, month of contractand quantities) onto the screen in the Shanghai Metal Exchange, and the task is not helped by the use oflong sequences of number codes, extending up to eight or so digits, to represent different brands orlocations. During trading, when traders want to view the details of bids and offers and of the strike pricesat which deals have been agreed during the session, the computer system is again somewhat slow. Insteadof the instant response that is needed, it often takes several seconds to go through the listing of bid andoffer prices. This suggests, at least, a need for reprogramming the software used.
4.37 A second issue that seems to have been inadequately appreciated during the design of theMetal Exchanges and of the other commodity eachanges established in China relates to the physical
For example, when a broker receives several different trading orders during a session, it may requiresophisticated methods of scrutiny to ensure that all of the customers of the broker receive equaly goodservice, and that the broker does not reservo the best prices durng the session for the most favoredcustomers and relegate the worst prces obtained dunng the session to the least favored customers. (Onemeans of avoiding the danger of cheating wowld be to adopt the Japanese system whereby one prico isdetennined each session, at which the tonnages of all bids and offers are exacdy matched. It isintereting to note that this is being adopted for the Guangzhou Rubber Exchange.)
In one of the two visits that were made to tading sessions on the exchanges the sat of trading had tobe delayed by half an hour because of computer failure.
X Some of these problems may be reduced if and when the markets move over to ftures trading withstadardized contracts, since less information is required for each trnsaction.

- 103 -
facilities and infrastructure that are needed for alternative forms of exchange. Trading floors are essentialwhen trading occurs through means, such as open outcry, in which all participants need to be able to seeone another and to respond to the waves and shouts of other traders. Trading floors become much lessnecessary, and may not be needed at all, if trading is entirely computer-based. The lack of contactbetween traders at the Shanghai Metal Exchange suggests that they have no need whatever to be locatednearby. In effect, there is no need for the trading floor, and all traders could be situated more cheaplyin their offices, linked to one another and the central computer of the Exchange via a computer telephonenetwork.
4.38 The situation in China's Metal Exchanges represents a hybrid, combining the physicalInfrastructure (and associated cost of a trading room) of an open outcry market with the computerinfrastructure (and the associated cost of the networked computer system) of a screen-based market. Oneof these expenditures is redundant: either the trading floor should be used more fully for open outcrytrading, and the computer system adapted to link individual traders with their offices, or the trading floorcasn Se eliminated or used for other purposes and the computer system altered so that the terminals arelocated in traders' own offices, rather than on the trading floor.
4.39 The time is already approaching when both existing Metal Exchanges have to considerexpanding their present computer systems. The Shanghai Metal Exchange is reviewing an investment of$1 million in new facilities for trading, in which added computer capacity will undoubtedly loom large.Before making these investments, the inconsistency between a trading floor suitable for open outcrymethods, on the one hand, and a computer-based trading system which does not require such a floor, onthe other, should be resolved. This provides an opportunity for a serious review of the present screen-based system as well as software presendy used. Although sunk costs may dictate that it is too late tochange the present system, these factors should be evaluated in any new exchanges to be set up in thefuture. To reduce the risk of cheating, if this is felt to be a major concern, serious consideration shouldbe given to modelling the trading system upon the Japanese auction method (see below) which is to beapplied to the Guangzhou Rubber Exchange.
4.40 It is sometimes argued that the benefit of computer trading is that trade is notmonopolized by traders in the geographic proximity of an exchange, and greater regional integration oftrade is encouraged. It should be pointed out that in an 'open outcry' system, distant participants can berepresented by traders or brokers. Eventually, however, if the voume of trade proves sufficient to justifythe costs of screen-based trading, this option should be considered, but Its selection at the outset is anexpensive choice.
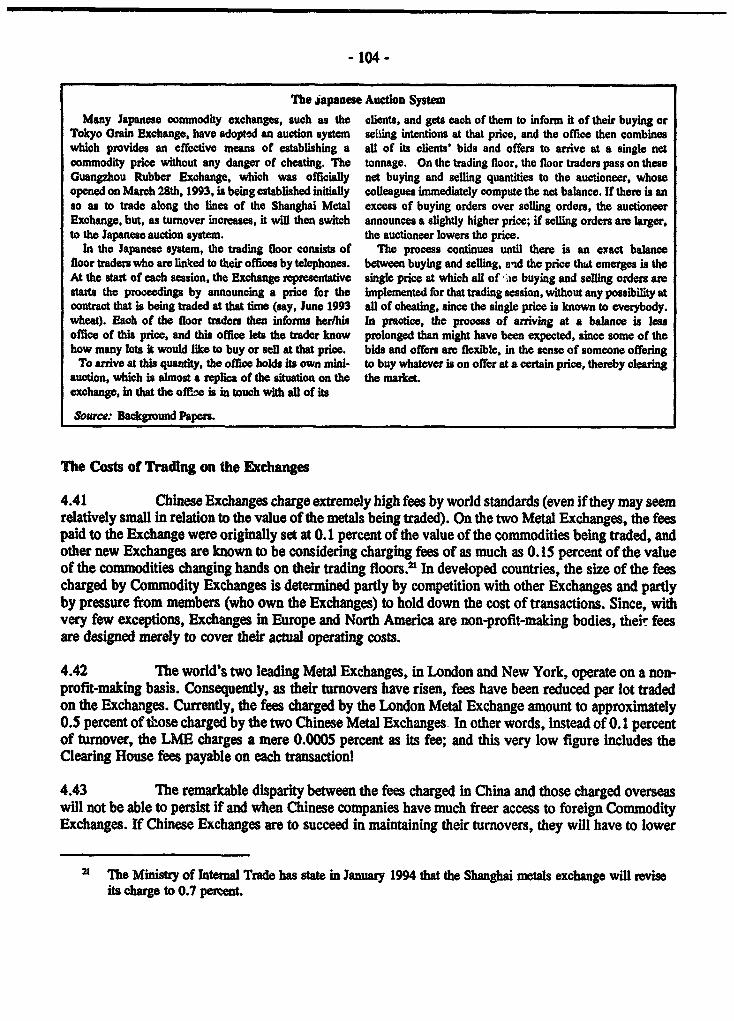
- 104-
The Japanese Auction SystemMany Japanese commodity exchanges, such as the clients, and gets each of them to infonn it of their buying or
Tokyo Grain Exchange. have adopted an auction system seliing intentions at that price, and the office then combineswhich provides an effeotive means of establishing a all of its clients' bids and offers to arrive at a single netcommodity price without any danger of cheating. The tonnage. On the trading floor, the floor traders pass on theseGuangzhou Rubber Exchange, which was officially net buying and selling quantities to the auctioneer, whoseopened on March 28th, 1993, is being established initiaDy colleagues immediately compute the net balance. If there is anso as to trade along the lines of the Shanghai Metal excess of buying orders over selling orders, the auctioneerExchange, but, as tumover increases, it will then switch announces a slightly higher price; if selling orders are larger,to the Japanese auction systen. the auctioneer lowers the price.
In the Japanese system, the trading floor consists of The process continues until there is an exact balanoefloor traders who are limked to their offices by telephones. between buying and selling, and the price that emerges is theAt the start of each session, the Exchange representative single price at which all of .ac buying and selling orders arestarts the proceedings by announcing a price for the implemented for that trading session, without any possibility atcontract that is being traded at that time (say, June 1993 all of cheating, since the single price is knowr to everybody.wheat). Each of the floor traders then infonms her/is In practice, the prcess of arriving at a balance is lesoffice of this price, and this office lets the trader know prolonged than might have been expeoted, since some of thehow many lots it would like to buy or seU at that prie. bids and offers are flexible, in the sense of someone offering
To arive at this quantity, the offoe holds its own mini- to buy whatever is on offer at a crtain price, thereby clearingauction, which is alnost a replica of the situaon on the tho market.exchange, in that the off£e is in touch with atl of its
Souce: Background Paper.
The Costs of Trading on Ute Exchanges
4.41 Chinese Exchanges charge extremely high fees by world standards (even if they may seemrelatively small in relation to the value of the metals being traded). On the two Metal Exchanges, the feespaid to the Exchange were originally set at 0.1 percent of the value of the commodities being traded, andother new Exchanges are known to be considering charging fees of as much as 0.15 percent of the valueof the commodities changing hands on their trading floors.O In developed countries, the size of the feescharged by Commodity Exchanges is determined partly by competition with other Exchanges and partlyby pressure from members (who own the Exchanges) to hold down the cost of transactions. Since, withvery few exceptions, Exchanges in Europe and North America are non-profit-making bodies, their feesare designed merely to cover their actual operating costs.
4.42 The world's two leading Metal Exchanges, in London and New York, operate on a non-profit-making basis. Consequently, as their turnovers have risen, fees have been reduced per lot tradedon the Exchanges. Currently, the fees charged by the London Metal Exchange amount to approximately0.5 percent of those charged by the two Chinese Metal Exchanges In other words, instead of 0.1 percentof turnover, the LME charges a mere 0.0005 percent as its fee; and this very low figure includes theClearing House fees payable on each transaction!
4.43 The remarkable disparity between the fees charged in China and those charged overseaswill not be able to persist if and when Chinese companies have much freer access to foreign CommodityExchanges. If Chinese Exchanges are to succeed in maintaining their turnovers, they will have to lower
21 TI Ministy of ntenal Trade has state in January 1994 that the Shanghai metals exchange will reviseits charge to 0.7 percelt.
- 105 -
their fees towards the levels charged by their major international competitors. When this happens, therewill be much greater pressure than there is at present for the Chinese Exchanges to reduce their coststowards international norms. It is to be expected that this may bring to a head the issue of theappropriateness or otherwise of the current computer-intensive trading methods employed in China.
The Nature of Trading Activity on the Exchanges
Speculaion
4.44 The importance of speculation as a source of trading volume on these exchanges hasalready been pointed out. Since the trading is in metals contracts, It is inevitable that the speculationappears at first sight to be centered upon metal prices; however, the contrast between the complete lackof trading interest in those metals in which China is self-sufficient and the active two-way forward tradingin those in which China is a regular net importer is powerful evidence of the extreme importance ofexchange rate speculation as the primary cause of speculative interest. Only for those metals in whichChina Is a consistent net importer are domestic prices linked closely to world market quotations. Whenworld prices of copper or aluminum increase, Chinese prices follow suit. The same is not true of lead,zinc or tin, for example, since China's self-sufficiency has led to a much weaker correlation between localprices and world market values.
4.45 Speculators who trade copper or aluminum forward contracts in Shanghai and Shenzhenare speculating on two prices: the world market quotations for these metals, expressed in US dollars, andthe unofficial exchange rate between the RMB Yuan and the dollar. Moreover, provided that thevariations in the world market quotations are uncorrelated with changes in the exchange rate (as is likely),it can be shown that the volatility of the Chinese domestic price of these two metals will be greater thanthe volatility of either the world metal price or the exchange rate.' Since price volatility is one of themain pre-conditions for active speculation, the enhancement of price volatility by the introduction ofexchange rate uncertainty adds to the attractions of speculating in copper and aluminum contracts. Whenthe price volatility of these two non-ferrous metals is low, then the forward contracts acquire anotherallure: as a proxy for a speculation in the value of the RMB Yuan. In the absence of a more directmethod of taking forward positions in the currency, these metals contracts become a major arena forforeign exchange speculative interest at times of heightened uncertainty about the international value ofthe Chinese currency.? With the growth in the number of participants on their own account or as
" In the absence of correlation, the volatility will vary with the sum of the variance of each price series;ie, with the sum of the squares of price movements in metals and in foreign exchange.
23 However, China is now mxjur, moves towards the establishment of foreign exchange futures markets.In late 1992, the government cracked down on several unauthorized foreign exchange companies, but inmid 1993, the Guangdong SAIC authorized the setting up of the Guangdong Wantong FuturesBrokerage, and further such brokerages are to be approved (Flemings Research, May 1993). On June9, 1993, the Central Bank approved provisional regulations on foreign exchange futures trading.According to these rules, the eligible traders are financial agencies, or traders and brokers cosponsoredby financial institutions, and approved by the State Administration of Foreign Exchange (EconomicDaily, June 27).

- 106-
brokers, the scope for further development of this speculative interest in trading on the two Exchangesis considerable.2Y
4.46 A general implication is that in a partially deregulated market, 'proxy markets' will form,in which trade in goods where prices and quantities are allowed to vary freely sometimes become'bundled' with other goods, where there are constraints on such flexibility. (The example of grain pricesreflecting freight availability for grain (Chapter 3) was another example of this phenomenon. Theseconsequences demonstrate some of the costs of partial deregulation.
Hedging
4.47 The use of the Exchanges for conventional hedging purposes and for price protection isstill relatively limited. It would appear that hedging accounts for a higher proportion of futures turnoverin Shanghai than in Shenzhen, but it is still doubtful whether hedging, defined broadly to include thosetransactions for which it is difficult to distinguish hedging motives from more spewulative trading,accounts for as much as 25 percent of the total volume of turnover in Shanghai.
4.48 The main origins of the current hedging business on the Exchanges are twofold. Oneimportant category of users of forward contracts consists of import/export trading corporations andprocessors, such as smelters and refineries. Both of these groups face operating margins which are verysensitive to fluctuations in commodity prices between the date when they purchase their raw materialsand the date when they sell their products to their customers.
4.49 The other major category of users of the Exchanges for hedging is producers who employthe Exchange as a means of "locking in" prices for forward delivery, in order to reduce the uncertaintyabout their future revenues. By the very nature of these transactions, it is difficult to know tue degree towhich forward trading 'epresents a form of speculation or whether it is part of a deliberate strategy ofcontrolling price uncertainties.
Physa Dedveds
4.50 In their early days, the majority of trading on both Exchanges was for prompt delivery,and a majority of total turnover led to the physical delivery of metals to buyers. Since then, theproportion of spot trading has fallen towards 10 percent of turnover, as has the proportion of tradingvolume which results in fnal delivery to buyers. The reduction in both proportions is a natural part ofthe evolution of trading towards one that is close to conventional futures trading, in which only a smallpercentage of turnover ever results in physical delivery. Nevertheless, the possibility of physical deliveryis still very important in generating interest in trading on the Exchanges, since it enables users to becomeaccustomed to viewing trading on the Exchanges as a valuable extension of their trading and marketing
2 At pmrsent, the method of trading on both Exchanges is cumbersome and is not designed to stimulatethe active partcipation of potential customers located outside the Exchange buildings. There are, as yet,no computer screens displaying either SHME or SME prices to participants away from the Exchangepremises. Indeed, apart from telephone contact with the -red jackets" (the floor traders) in theExchange trading rooms, there is no link between the outside world and trading on the Exchanges.Custome of the brokerage companies have to rely upon faxes transmitted to them by their brokerseach day for their information on the market.

- 107 -
of physical metals to customers. For example, producers who need to supply metal at short notice tocustomers in Shanghai can buy it from the Exchange, rather than having to arrange urgent shipments fromtheir refineries.
Inventory Management
4.51 One of the most important omissions by member companies in the present range oftrading interest in the two Exchanges is an active use of forward contracts as a medium for managinginventory financing.25 Until the time profile of forward prices reflects the costs of holding inventories,the markets cannot be considered to be functioning at their full efficiency. The causes of the failure offorward prices to reflect storage costs are both informational and institutional. They are informational inthat users of the Exchanges do not yet appear to be aware of the scope for using the forward and futuresmarkets as a tool for inventory management. This deficiency will presumably be overcome as tradingbecomes more sophisticated. The failure is also institutional in the sense that the methods of marginpayments on the Exchanges mean that, in relation to straightforward speculation or hedging in a singleforward contract, a comparatively large sum of money has to be tied up in margins when trading the"spreads" between forward prices (the differentials between forward prices for different contractmonths).2
4.52 This is in marked contrast with the situation on Exchanges in other countries. On theseExchanges, the Clearing Houses calculate the degree of price volatility and associated risk of fluctuationsin the magnitude of spreads. For example, in recent months, copper spreads have displayed greater pricevolatility than those for aluminum; therefore, the London Metal Exchange charges relatively higher initial
A An analysis of the sructure of forward pnces on the Shenzhen Metal Exchange dunng the week of 8thto 12th March, 1993 was umnertaken, which dem red that the structre of price differentialsbee the prces quoted for different contract months does not yet reflect the costs of financing andstoring inventories. The same is tme of the srctue of prices on the Shanghai Exchange.
26 When buying or selling a single forward contract at a prce of, say, 20,000 RMB per ton, for the June1993 contract, the initial margin deposit on both Exchanges is 5 percent of this value, i.e., 1,000 RMBper ton. If, however, a trader makes a 'spread' between the June 1993 contract and the September1993 contract by buying the June contract at 20,000 RMB at the same time as he sells the Septembercontract at 20,750 RMB, he has to make two initial margin deposits, one of 5 percent of 20,000 RMBand the other of 5 percent of 20,750 RMB, making an initial deposit of 2,037.5 RMB even though thespread which is being traded is one of only 750 RMB (20,750 minus 20,000). From the perspective ofa trader with limited access to working capital for the payment of margins on the Exchanges, a singleforward transaction ties up a mere 5 percent if the value of the contract that is being taded. However,the initial margin required to buy or sell a spread on China's two Metal Exchanges ties up over 270percent of the value of the spread itself The leverage that can be secured from 100,000 RMB ofmargin finance is therefore very much greater with sttaigntforward trading in a single forward positionthan in a 'spread' between two contracts.

- 108 -
margins on copper spreads than for aluminum.2 This limits the usefulness of the Chinese exchanges totheir participants.
Ihe Role of "Market Makers" or "Locals"
4.53 An important component of a successful Commodity Exchange in other countries is theexistence of a group of traders, known as 'market makers" or "locals", who trade actively on their ownaccount, often buying and selling many times during the trading session. These traders are vital inproviding the market with liquidity in the very short run. If someone appears on the Exchange floor witha large buy or sell order, it is these market makers who will adjust their prices slightly and take the otherside of the transaction, in the expectation that they will be able to make a small profit from disposing oftheir position in steps over the remainder of the trading sessien. In effect, they act as small wholesalers,who earn their living from the small profits that they hope to earn by providing very brief "storage" forcommodity futures contracts.
4.54 This group does not yet exist on any of China's Commodity Exchanges. One reason isthat the contracts that are currently being traded are forward (rather than futures) contracts, so thatpotential market makers run the unacceptable risk that they may find that they have bought contracts fordelivery of a certain brand in Beijing with the intention of a rapid resale, only to discover that prospectivebuyers either want delivery in Shanghai or specify a different brand of metal. This particular problem willbe overcome once the trading shifts to a standardized futures contract.
4.55 The other barrier to the emergence of a group of locals lies in the nature of the screentrading methods that have been selected for use on all local Exchanges. Despite the substantial tonnagesthat are recorded in turnover on each Metal Exchange every trading day, the actual mtnber of distincttransactions is surprisingly small. Appendix Table A4.2 reveals that the Shenzhen Exchange actuallyhandled an average of fewer than 20 transactions per trading day in January and February 1993. InShanghai the flow of transactions is significantly higher, but there are several longueurs when trading maybe very slack.
4.56 The present cumbersome screen-based trading is largely responsible. Even if someonewanted to trade actively within the course of a single session, the methods of trading employed in Chinawill impose a constraint upon the number of transactions that can be completed within the session. Thisruns the risk of violating one of the cardinal rules of many market makers, which is that they will neverend a day involuntarily as a net buyer or seller of contracts. Their intention is to profit from trading thatoccurs entirely within the session. The other problem with screen-based trading is that it lacks the senseof contact with other traders of the traditional trading pit. In such a pit, they can adjust their buying andselling prices instantly, as they see how the other traders are behaving. With a computer, they have to
27 In March 1993, the initial margins for each 25 ton lot of copper futures amounted to $2,500 (equivalentto approximately 4 percent of the value of the contract), and those for 25 ton lots of aluminum futuestotalled $1,250 (roughly 3 percent of the contract value). However, foe three months' fitures spreads,the initial margin stood at a mere $1,000 for copper (which contasts with the margin of $5,000, i.e.,twice $2,500, which would have been charged if the rules of China's two Metal Exchanges had beenapplied); and for aluminum, the initial margin on three months' futues spreads was only $150 (asagainst the $2,250, i.e., twice $1,250, which would have been applied in China).

-109-
wait until they can list the bids and offers of other traders, and lack the sense of immediate reactions tosudden changes in circumstances within the session.
E. Polides and Regulations for Commodities and Futures Markets
The DlfficuLy of Reconcling Free Marlets and Continued Government Intervention
4.57 'he rapid adoption of the socialist market economy has led to a situation in which someaspects of official policy, such as continuing forms of government intervention in commodity pricing,distribution or storage, are incompatible with most recently adopted policies, such as the developmentof thriving commodity exchanges. The development of 'proxy markets' in foreign exchange through themetals exchanges, or in scarce transport facilities through the grain exchanges, has already beendescribed. Any systematic form of government intervention in the pricing of commodities or in theirdistribution and storage runs the same risks; either of undermining the price uncertainty on which anyfutures market depends, thereby making it impossible to keep newly established commodity exchangesin estence, or, altemnatively, In the cases in which forward markets succeed in surviving, of generatingpotentily unsustnable upward pressure upon the financial costs of government intervention.
4.58 Another example of this is provided by storage subsidies. Futures (or forward) marketsare by their very nature concerned with inter-temporal price differences, and the physical counterpart ofthese markets is storage. On a commodity exchange, the premium of today's futures quotation for onepartcular calendar month (say, March 1994) over today's quotation for a less distant month (say, October1993) represents the market value placed upon storage between those two periods. In a truly free market,this storage value reflects (J) the physical costs of warehousing, (ii) the financial costs of stock financ3and OM expectations of relative scarcity of the commodity in question in the two months.?s
4.59 However, there are cases in which the structure of forward prices can be distorted bygovernment actions. In China at present, in several markets for major agricultural products, govermnentgencies provide cheap storage finance to enterprises under their control. At present, the Ministry of
Internal Trade (formerly Commerce) provides finance for the storage of certain commodities atpreferential interest rates. It does so, for example, for enterprises in the oilseed crushing and cottonginning sectors, and has done so in the recent past for sugar. The Ministry of Chemicals has intervenedin a similar manner in the natural rubber sector. It is to be presumed that the government's objective in
M Th first two items are straightfor nard they preet the actual financid costs incurred whencomnodities are stor The significance of price expectations can best be understood by consideringtie stuation which may arise if supplies of an agricultural product are seasonaly very tight in theimmediat fture (in October), but are then expected to eas when the new crop becomes avaiable (inOctober, for example). Under these circumstances, it is quite normal for the more distat (March 1994)price to stand at a discount to the neatby (October 1993) price, because this set of price differentialsgives a clear signal to any holdes of swplus stocks that they should sell tbn to the maket as soon aspossible, and help to ease the immediate scarcity of supplies, instead of holding on to them. Thepremium that is paid for nearby supplies in this example represents an illustration of the fonvardmarket providing valuable pnce signals to the holders of surplus stocks.

- 110 -
providing these storage subsidies is to ensure that the economy at large benefits through lower pricepremia for forward delivery than would otherwise be the case.
4.60 Provided (as may be expected) that SOEs pass on the benefits of their storage subsidiesIn the forward prices that they quote to their customers, private firms without access to these creditsubsidies will find it attractive to "arbitrage" the market by leaving the main responsibility for commoditystorage to the government sector, and shifting as much of their inventory as possible to these subsidizedSOEs. Under such circumstances, the futures market will lose a considerable proportion of its two-wayflow of trade, and will be turned into one in which pirticipants from the sector without access tosubsidized credit will tend to be consistent buyers of fut. es contracts (in order to save on their storagecosts), with subsidized SOEs acting as the major sellers of futures.
4.61 In this situation, a 'proxy' has been established through the futures market, which ensuresthat every enterprise, state-owned or otherwise, has access to the benefits of subsidized credit for storage.However, the government may find that it has to face a larger cost of storage subsidies than it hadanticipated. If it is unwilling to continue to underwrite subsidized storage and see stock-holdingincreasingly left to SOEs, it may impose a strict limit to the money spent on storage subsidies. In thisevent, the weight of futures or forward buying will provide a mechanism through which the effectivepremium for storage will be pushed up to the unsubsidized free market level. Under these circumstances,the government storage subsidies will have achieved nothing but a transfer of income (in the form of thesubsidized credit) to the SOEs, without any benefit in terms of reduced premia for forward prices for theeconomy at large.
4.62 Ihus, if forward/futures markets are allowed to opera in sectors in which governmentagencies are involved in the subsidized financing of storage, the arbitrage in the financing of storage willmean that the situation should tend towards one of two outcomes: either the companies without accessto subsidized credit witl shift as many as possible of their storage activities onto the government by sellingphysical metal and buying their stock requirements forward (thereby taking advantage of the subsidizedcredit embodied in the 'carry'); or the government wil give insufficient subsidized credit to the Ministryto allow it to defend the low, subsidized "carty", and the 'carry' in the forward market will reflect thecost of capital to the private sector, rather dtan the government's subsidized interest rate. In the lattercase, the subsidized credit acts as a direct transfer Cm effect, a gift) to the Ministry which receives it.
Financial Safeguards for Participants on the Exchanges
4.63 Financial safeguards which form an integral part of any Exchange's operations aretypically reflected in up to three different categories of payments. The first is the deposit by each memberof an Exchange of a significant sum of money, or some form of bank guarantee, such as a Letter ofCredit, to create a Guaratee Fund to provide reassurance for other members of the ability of the memberto meet any reasonable commitments.
4.64 The second is the payment of margins, both as initial and variation margins, which areadjusted daily to maintain a sizeable financial deterrent against a member defaulting on a commitment,and to provide a cushion (equal to the initial margin), which can be applied to prevent any other memberfrom being put at a disadvantage if a particular member does not meet its margin calls, and has itsposition closed out by the Exchange.

- III -
4.65 Both Metal Exchanges have somewhat similar regulations regarding the size oftheir Initialmargin payments and variation margins, and both require a payment of 200,000 RMB to the Exchange'sGuarantee Fund. The main distinetion of note is that Shenzhen requires a cash payment, while Shanghaiaccepts Letters of Credit.
4.66 The most important discretionary item in these two categories of payment is the size ofthe initial margin. At normal times, a 5 percent deposit should be more than ample to cover one day'sprice movement; but there are occasions when market prices can become very volatile, and the Exchangesreserve the right to make adjustments to the size of this deposit. Under ideal circumstances, changes inthe size of the margins, and special margin requirements for "spreads' betwevn two different forwardcontracts (which were highlighted in our earlier discussion of the obstacle that current marginrequirements pose to the use of the Exchanges for financing and hedging inventories), are issues thatshould be resolved in regular contacts between the Exchange's Management Committee and the proposedCommodities and Futures Management Commission (CFMC).
4.67 A third form of payment is made into what is commonly known as a Fidelity Fund. TIisdiffers from the Guarantee Fund and from margin payments in one crucial respect. The other twopayments apply solely to payments between members of the Exchange. Thus, the margin calls and theGuarantee Fund are intended to reassure members that other members' debts to them will be paid in fullwhen a forward trading position is settled. Yet, many members of Exchanges act as brokers for non-members. An active broker may be at one and the same time both a large buyer of contracts for someclients, and a large seller for other clients. In terms of the broker's commitments, such as margin calls,the quantities that are relevant are nMt the total grm numbers of contracts bought and sold by members,but are the n= numbers, after the buying orders are set against the selling orders.
4.68 The significance of this distinction between gross and net positions is that it means thatindividual clients of brokers do not necessarily receive any protection against a default by the broker. Theinterests of other members of the Exchange will be protected, but the Exchange's procedures do notprovide an unequivocal guarantee against possible default by an individual member in its dealings withbrokerage clients (other than the requirement that member companies demonstrate that they haveconsiderable financial backing before they are allowed to join). To avoid this risk, many Exchanges haveestablished a Fidelity Fund, which accumulates reserves to insure the clients of individual brokers againstprecisely this eventuality.
4.69 A major omission from all of China's current Committee Exchanges is a Fidelity Fund,to protect outside users of the Exchange from possible default by their brokers. The creation of suchFunds should, therefore, be given priority by the Department of the CFMC that is responsible for theRegulation of Futures Brokerage Companies.
A Framework of Regulation for Commodity Markets in China and Other Countries
4.70 A first observation on all the new commodities and futures exchanges which have recendyopened in China is that the speed with which these agencies have been opened has been far ahead of thenational government's ability to lay down clear rules for the operations of such exchanges. Consequently(and as illustrated by t!!e preceding examples) there is a disturbing absence of uniformity in the regulationand supervision of exchanges. Without a nationwide legal and regulatory framework, different exchangesare operating under quite different forms of regulatory control, depending upon which precise group of

- 112-
provincial and municipal governments or bureaus has been active in establishing the individual exchanges.
4.71 This doas not imply that there are no regulatory policies. On the contrary, mostExchanges appear to have two or three levels of regulatory supervision, but the selection of institutionsfor the membership of the various regulatory bodies is different in every case. Typically, the top levelof regulatory supervision - usually known as the Management Committee - comprises representatives ofthe provincial and national government agencies actively involved in the establishment of the Exchangein question, as well as representatives from those government agencies, such as the State Administrationfor Industry and Commerce, which have a broad responsibility for the control of trading activity.
4.72 Although there have been no scandals involving the operation of any of the major ChineseCommodity Exchanges (though some of the small local tradinl, centers have fallen victim to problems ofcontract defaults), the dangers of the current approach are self-evident. In the absence of a singlespecialized agency which can monitor all commodity forward and futures trading, the expertise neededto supervise complex trading systems is not developed properly. Further, with the present membershipof the Management Committees of each Exchange, there must be a risk that Ministries and provincialgovernments which have invested in the development of an Exchange will face a conflict of interest whenapplying controls over commodity trading.
4.73 There is a fine line to be drawn between permitting an excessively lax approach to issues,such as the supervision of the market power of individual participants (in order to monitor whether thatare acquiring an unhealthily large share of the contracts - the so-called 'open interest' - in a particularforward month, with the consequent risk that they may try to 'squeeze" the market in an artificialmnner), on the one hand, and an excessively restrictive approach, which may obstruct a free flow oftrading on the Exchanges. It is not wise to allow different standards to be applied to different Exchanges.If just one Exchange were to founder on a failure of supervision in its early years, the damage whichwould be done to the entire system of Commodity Exchanges would be tremendous, and could underminethe official support for the continued operation of such markets.

- 113-
Regulation of Commodities and Futures Markets: The UK and USA
All countries with large and successful Commodity sector. Different financial service companies wer allocated toExchanges have nominated one govermment agency to specific "authorizing bodies", the so-called Self-Reguladngoversee and regulate all such Exchanges. In the USA, the Organizations (SROs), which are owned and operated by theCommodities Futures Trading Commission (CFTC) is the companies under the regulatory control of the thse sameagency. In the UK, it used to be the Bank of England, bodies. For example, the Securities and Putures Authoritywhich is the Central Bank. However, the change to UK (SPA) is responsible for ensuring that customers and investorsfinancial legisation in 1986, when the Fmancial Services are protected in their trading on the Stock Exchange and in aAct took effect in advance of the 'Big Bang' wide variety of derivatives. A12 brokers who do business onliberalization of British financial markets, led to the the British commodity exchanges have to be registered withremoval of the Bank of England's regulatory control over the SFA, which has very strong powers to disciplinethe British commodity markets. Initially, the Department members. Other SROs cover sectors such as life insuranceof Trade and Industry assumed the major role in (under LAUTRO) or fuiancial service companies dealingregulating these markets, with the Treasury in a minor directly with the general public (under FIMBRA).role, but in 1992, the main responsibility for the Al of the SROs report to the Securities and Investentsupervision of commodity exchanges was transferred to Board (SIB), which in turn is diectly answerable to the UKthe Treasury, under the ultimate control of the Financial Treasury. Because commodity exchanges are in a rather
rmanent Sectay. specil legal position, since they exist to provide services andThe contrast between thct. system in the US, where a facilities for their members, and do not act as brokers or
sle Federal agency, the CFTC, oversees the traders in their own right, they do not fit neatly into one ofcommodity markets, and the UK system is far-ranging, the SROs, and therefore, they report directly to the SIB,and higights the scope for quite differet philosophies of which monitors their activities. However, at its heart, theregulation. In essence, the US method of supervision is system retains the key feature of the former method ofsaightforward and unambiguous; the CFC maindains a regulation undertaken by the Bank of England, in that it isclose eye on virtaly all aspects of trading, ranging from intended that the ultimate sanction of intervention by the SIBdaily analysis of open interest (which is divided into will not be required. Istead, the emphasis remains stronglycategories such as 'Trade Long Hedging" and upon self-regulation by the exchanges."Speculative Short Trading") to occasional detailed Regardless of the precise institution nominated to overseereviews of the computer records of second-by-second commodity markets, the agencies such as the CFrC in the UStrading during a market session, in order to determine or the SIB in the UK have to develop the sdlls needed towhher floor traders and brokers are executing ensure that three different aspects of commodit trading arecustomers' orders fairly. Thus, the CFTC covers the undertaken in a proper way. They ensure that the regulationsentire gamut of commodity market trading from the acual under which the Exchanges operate are appropriate, includingbehavior of traders on the trading floor to the actions of aspects such as the size of initial margins and of Guaranteef.nancial intermediaries, such as brokers. Funds; they have the power to monitor the daily variations in
Until the 1986 Act, the UK method of regulation was the positions of each member of the Exchanges (the number ofmuch less formalized. The Bank of England had contracts bought and sold by each individual member of themonitored the actions of the commodity ecchanges and of Exchanges in each forward month, so as to prevent unduecommodity traders, largely as a legacy of the foreign influence being exercised by a single member); and they alsoexchange control powers held by the Bank. Ultimately, have the power to oversee the details of trading that occursthe Bank had extreme draconian powers to implement its second-by-second on the Exchanges, in order to preventdecisions on aspects of commodity trading, but these members cheating their customers (for example, by makingpowers were not intended to be invoked, other than as a several sales of a particular forward contract at differentmeans of ensuring that the committees in charge of prices for different clients on the same trading day, and thenBritain's commodity markets took full notice of the "quiet allocating to prefened clients the sales that were made at thewords that the Bank of England's officers might have highest price, and to least favored clients the sales that werewith them when cerain aspects of commodity trading made at the lowest prices).caused concern among the regulators. These skills are potentially very complex, especially the
The situation was transformed after 1986. The monitoring of oomputer records of second-by-second trading.Financial Services Act was designed to emphasize the Therefore, it makes good economic, as well as regulatoryself-regulation of every segment of the financial service sense for one single body to be given this power.
Sources: Background Papers.

- 114-
4.74 Confronted with a lack of uniform methods of regulation in the securities market, thegovernment has created a National Securities Administration Committee to monitor and regulate stocktrading. A similar body, the China Securities Supervision and Administration Committee, has recentlybeen set up to administer and supervise futures trading. 'Interim Regulations on the Registration andManagement of Futures Brokerage Companies' were announced by the State Administrative Bureau forIndustry and Commerce (SAIC) in April 1993.29 It was also announced, in June 1993, that regulationsgoverning trading on the exchanges would soon be Issued.'
4.75 The creation of the China Securities Supervision and Administration Committee wasoverdue. It would have been much better to have had it in place before the proliferation of Exchangesgot under way. It should now, as a matter of urgency, ensure that all of the existing Exchanges adapttheir regulations to implement good regulatory practice and apply brakes to the creation of newExchanges, in order to limit the numbers in existence and prevent unviable ones from being established.In the case of the two Metals Exchanges, it appears that these represent a good basis for operating in theabsence of a single national administration; but the situation would be Improved by the establishment ofsuch a Committee.
F. Future Prospects for China's Commodity Exchanges
The Pressures for the Rationalization of the Number of Chinese Commodity Exchanges
4.76 There is no evidence from any other country in the world that China will, in the long run,require anywhere near as many exchanges as have been established since 1990. It is certain that, as theChinese domestic economy continues with the liberalization of markets, most of these exchanges willbecome redundant in terms of meeting either regional or national needs. There are two main pressuresthat will hasten the process of reducing the number of exchanges.
4.77 First, the improvement in communications within China, both in the standard of thetelecommunications links between different regions of the country and of the physical distribution ofcommodities within China, will reduce the differences in prices between different regions, and will makeit easier for traders in one center to have immediate telephone contact with their counterparts elsewhere.As a result, a single exchange will be able to serve institutions in many parts of China without forcingthe participants to suffer any appreciable loss in their ability to protect themselves against adverse pricemovements.
4.78 The second force tending to reduce the need for a large number of exchanges in Chinais that, with price and foreign trade liberalization, Chinese domestic commodity prices will moveincreasingly closely in parallel with world prices. In the absence of barriers (such as import licenses) to
2 Xinhua news agency domestic sevice, 28th April 1993. lTe regulations contain 17 articles providingspecific stipulations on the establishment, behavior and registration of futures brokerage companies.The SAIC is entruste with their interetation.
30 China News Dgest, June 10, 1993.
the importation of products, and in the absence of distortions in the exchange rate for RMB Yuan, theChinese local price for imported products should equal the f.o.b. price of imports pite freight costs plusChinese import tariffs. Provided the levels of tariffs and freight rates are stable, prospective users offutures markets in China will be able to hedge their price risk on imported commodities In overseasmarkets just as easily as they can in domestic markets. However, exchanges catering for worldwidecustomers have the special attraction that they are usually more active and offer more competitive pricesthan markets catering only for Chinese customers. Eventually, many domestic exchanges will lose tradingvolume to those markets that serve a global audience.
4.79 The combined impact of these two forces leading to a reduction in the attractions of localcommodity exchanges to domestic participants is demonstrated by the results of empirical analysis whichillustrates the correlation between the number of viable futures markets that trade major commodities andthe value of world trade in these commodities.3" Even a commodity as important as copper appears tohave only sufficient world trade volume to be able to support two viable and thriving futures marketsserving international customers. This implies that if one of the new Chinese exchanges is to succeed inestabliLhing itself as an economically viable institution in the global free market trading of copper, it willhave to supplant one of the two existing major exchanges in London or New York. This will not be easy,
The Likely Development of Trading on the Exchanges
4.80 The most important feature of the development of both Metal Exchanges over the nextyear or so will be the further expansion of turnover and an associated improvement in the liquidity oftrading, making it easier for buyers and sellers to have an immediate response to their buy/sell orders.An essential element in the increases in turnover will be the development of means for the promptdissemination of price trends within a trading session to interested potential customers located away fromthe Exchange premises.
4.81 Once such information is available Immediately, so that outsiders can follow the tradingthat occurs during the course of the session, it is to be expected that, as the hectic activity on thecountry's two Stock Exchanges illustrates, there will be much larger demand from institutions such asfinancial institutions and money management funds (most of which are operated from Hong Kong orTaiwan), which already use the Metal Exchanges to some extent. Even now, weeldy brokeragecommissions of over one million RMB per month have been reported by one of the largest brokeragecompanies on the Shanghai Metal Exchange; but once the full potential for outside trading interest istapped, the value of these commissions is likely to rise many times over.
4.82 There is no doubt whatever that, hand-in-hand with the expansion in trading volumes, itwill be only a short while before both Exchanges evolve towards conentional futures markets. Atpresent, there is only one futures contract that is traded (without very much success); the aluminumfutures contract on the Shenzhen Metals Exchange. Instead, both Exchanges are acting as forwardmarkets, but it is very significant that they are forward markets in which already the vast majority ofturnover consists of the trading of forward contracts between traders. In view of the degree ofstandardization that has already occurred in the contracts that are actually being traded, it will becomparatively simple to make the transition to futures contracts specifying certain acceptable brands fordelivery and just one or two permitted delivery locations. Such a transition would not constitute a great
31 Lndell Mills (1993), Annex 3: An Evaluation of the 'Critical Mass' in Futures Contracts.

- 116-
imposition upon users of the two markets, since they have already accepted the same restrictions for mostof the trading that they undertake at present.
4.83 The question that arises at this point is why the sole futures contract that is currentlyavailable on the two Exchanges - namely, the aluminum futures contract in Shenzhen - has fared sopoorly. The answer lies in the limited liquidity of the market. At present, forward contracts are attractingsufficient trading volume for users to be happy to continue to concentrate their trading volumes in theseforward contracts, in the knowledge that it is relatively straightforward to resell, or buy back, thesecontracts when the time comes to do so. By contrast, the Shenzhen aluminum futures contract continuesto languish with a very low trading volume, which does nothing to attract prospective users of thecontract, who may fear that they may find it difficult to extricate themselves from a futures position whenthey want to do so. In effect, given the choice between a successful forward contract and an illiquidfutures contract, they have opted for success and liquidity. There is not sufficient and distinct volume offorward and futures trading to generate a large volume of turnover in both kinds of contract.
4.84 Nevertheless, the expectation must be that the two Exchanges will soon move to a futures-dominated trading structure, and that, at that time, forward trading will rapidly decline In importance.This is because futures trading is technically much simpler than forward trading. Instead of having a largenumber of different details (of brands and of delivery points) confronting users of the computer screens,and creating artificial barriers to a smooth flow of trading when volume is heavy, it will be much easierto have all bids and offers expressed in terms of standard contract terms.
4.85 The timing of the switch-over from an emphasis upon forward trading to an emphasisupon futures trading is likely to be determined principally by these practical considerations. Once theExchange authorities decide that their existing computer systems are at the limits of their capacities, andonce members decide that they are no longer willing to work with a sluggish computer network, whichhas to display long lists of bids and offers, differing only in small degrees from one another in terms ofbrands and locations of delivery, then there will be strong support for the launching of futures contracts,which will offer much simpler methods of trading. Other changes that will materialize more slowly arelikely to include the gradual emergence of a group of market makers, who will provide a strong boostto liquidity within the course of individual trading sessions. As our earlier remarks imply, however, theemergence of this group is likely to be faster if open outcry methods of trading are adopted.
4.86 Another change that must be anticipated within a matter of a few years, at most, is thecreation of foreign exchange futures markets, which will, at a stroke, eliminate the basis for a great dealof current trading volume on both Metal Exchanges. In order to survive the traumas that this could cause,the Exchanges will have little choice but to facilitate the use of their contracts for the regular needs ofthe physical buyers and sellers of metals. Already the Exchanges provide a valuable service for standardhedging purposes. The avenue in which new initiatives are most urgently needed is in the use of theExchange as a means of financing inventories. The current set of registered warehouses for eachExchange provides a valuable basis for the encouragement of this more sophisticated use of MetalExchanges, but the Exchanges themselves can hasten this trend by reducing the margin requirements foraspreads' between two futures positions, so as to reduce the current excessive imbalance in the trade-offsbetween risk and margin requirements when contrasting a single futures purchase or sale with a spread.The earlier example revealed that, as against a margin-to-price ratio of only 5 percent for astraightforward purchase or sale of a forward contract, the ratio of the margin to the value of the spreadcan easily reach several hundred per cent.

- 117-
4.87 A further change that can be expected is that both exchanges will eventually decide todrop their unsuccessful contracts. Shenzhen currently trades eight metals, while Shanghai trades seven;yet, in practice, only two metals dominate their trading: copper and aluminum. Once a contract hasattracted a bad reputation for low turnover, it is almost impossible to revive it.
4.88 The final change which could be hastened by the proposed new CFMC Is a rationalizationin the physical facilities provided by the various Exchanges which have been created in China. Each ofthese Exchanges makes substantial investments in their own offices, trading floors, computer systems,and back-up administrative and financial infrastructure. These are all respects In which there Is greatscope for reducing costs by bringing different Exchanges under one roof. This does not imply the demiseof the individual Exchanges: in New York, Chicago and London, it is common to find quite differentmarkets and independent Exchanges trading alongside one another, without in any way losing theirindependence. It is to be hoped, for example, that the five different Exchanges shordy to be In operationin Shanghai, covering Metals, Coal, Petroleum, Agricultural Inputs, and Grains and Vegetable Oils, canbe persuaded to share their facilities, to mutual benefit.
G. Implications for Government Action
4.89 It is clear that China today has moved remarkably rapidly towards the adoption of someof the most sophisticated forms of market of an advanced market economy. Due to the limitedevolutionary experience with these marketing systems, there are many areas of the operation andeconomic consequences of such markets which today are not fully understood. The differential speed ofchange, in different areas of the economy, with only partial reform in price or quantity controlmechanisms in other areas of the economy, also has implications for the nature of trade in these markets.
4.90 Details of potential problem areas, and measures that may be taken to address them, arepresented in the preceding sections. Some of the key points which emerge, for the attention of policymakers, may however be summarized here. First, caution should be exercised in the setting up ofadditional such exchanges. It must be recognized that today a substantial part of trade on some of thesemarkets is speculative in origin, and in part is a proxy for trade in less freely tradable goods, notablyforeign exchange, and also that many of these exchanges are likely to die out, as China grows betterintegrated with world markets.
4.91 Second, and related to the preceding point, if exchanges function effectively, controls onprice or quantity (subsidies or quotas) assoicated with the traded products, for example, freight orstorage, are undesirable. First, differential application to different individuals (as in freight quotas, or asin storage subsidies for SOEs) will be arbitraged through the exchanges, and second, some of the realadvantages of forward trading, (such as trading forward in lieu of paying warehousing costs) areobscured.
4.92 Third, given the existence of a number of exchanges today, efforts should be made toadapt their trading systems to increase efficiency, reduce information requirements and reduce expenses,as the number of traders grows. Apart from a reexamination of the present screen-based trading system,this also calls for an evaluation of the possibilities of combining the facilities of different exchanges ina single location, to reduce overheads.
- 118-
4.93 Fourth, the overall framework of regulation on the exchanges has to be developed, andthe present differences in systems in different locations, or for different products, should be ironed out.The role of the supervisory agency (or agencies) will have to be defined, and adapted to other areas ofeconomic policy. Finally, a large part of this common framework of regulations must also includesafeguarding the interests of users, through the introduction of a Fidelity Fund. The need for reductionsin the cost of trading (for example through adjustments in margin deposit rates, an increase in theflexibility with which these rates are determined, and reductions in commission fees) should also beinvestigated.

-119 -
Annex 4.1 Commodity Market Trading - A Zero Sum Game
1. Trade on commodity futures markets occurs for two main reasons: either to speculate,or to avoid speculation (by hedge-selling or hedge-buying). Although these reasons are the exact oppositesof one another, both groups of participants find great value in the operations of futures markets.However, the ways in which these three groups use futures markets are quite different from one another.Hedge-sellers of futures are corsistent sellers of more distant futures contracts and are then, subsequently,purchasers of these same contracts when they approach their expiry dates. Hedge-buyers are underaikenexactly the opposite form of transaction. They are consistent buyers of distant futures contracts and, lateron, sell back these contracts when they approach their expiry dates. Speculators can be either buyers orsellers of any particular futures contract, according to whether they believe that prices are more likelyto rise or fail.
2. In theory, it is possible that the activities of hedge-sellers and hedge-buyers could exactlybalance one another, so that hedge-sellers were wanting to sell a particular futres contract at preciselythe same time that a hedge-buyer wanted to buy that contract. In practice, it is highly unlikely that thetwo operations will be so perfectly synchronised. Speculators play a vital role in providing the volumeof trading, sometimes on one side, and at other times on the other, which ensures that every hedge-selleror hedge-buyer can find someone to take the other side of their transactions, whenever they want tohedge-sell or hedge-buy futures.
3 . Since for every buyer there is a seller, it follows that, on balance, all trading in futuresmarkets is a true zero-swn game. All of the profits that are made by certain participants are exacdtycounter-balanced by the losses made by the other participants. This is explained briefly below. First,looking at contracts purchased over a certain period of time, tl, suppose altogether n lots of copperfutures contracts are bought at prices of p1t,, ... , p.t,. These same n lots are subsequently sold, at pricesof q,t2 ..., q=t2. Then the profits (or losses) on these purchases and subsequent sales are given by
n nI-p = pt -t q t2 , p ' 1,2, ... ,n; q - 1,2, ... ,n, ... (1)
4. Next, we look at contracts sold. When the origina fitures contacts were bought, therewere people on the other side of the market who had sold these same contracts at these same prices, q1t1,... , qt,. These same people will evenually buy back their contracts. The company which sold the firstcontract at the price of p1tl will not necessarily be the company which buys it back at a price of q1t2, butit will buy it back at a price of q%t2, where j lies in the range l,...n. To each of the original sellers offutures at specific prices PA there will be its own value, q1, of the price at which it buys back thesefutures. Therefore, the profits (or losses) on these contact sales and subsequent purchases are
n nIq5 %q1t1 - NPitP2 p = 1,2, .. ,n; q 1,2.., n ,.

* 120-
S. Adding together the two sides of the market, one can calculate the overall combinedprofits or losses that are made from futures trading. These equal:
A n a a
lip + Ilq ' EPtl - E 1t + 1 2t p 2 ,..
6. But since the contracts purchased in period 1 matched the contracts sold In period 1,n2 2n
P., t, = Eq t, . And similarly, since contracts sold in period 2 match contracts purchased in
12 2*
n n3
period 2, qE 1 t2 = P1 t 2 . Tus the profits on one side are exactly offset by the losses on the
other side, and Up + Uq - 0 . This demonstrates that futures trading is a zero-sum game. Over anyperiod, all of those people who make profits from futures trading are only able to do so because all othermarket participants are suffering losses on futures trading, where these losses are exacdy equa to theprofits made by the first group.

5Market Regulation
A. Regulation In a Market Economy
5.1 As the previous chapters have demonstrated, China's move from a command economytowards an economy regulated by a system of markets requires not only the dismantling of proceduresof control, but their replacement by new instruments which ensure and safeguard the functioning of themarket. This necessitates a new framework of regulation, and the previous chapters have alreadydiscussed the need for new regulation, or the modification of present regulations, in the areas of pricing,internal trade, distribution, and the creation of new forms of markets. The central theme linking theseseparate areas of regulation together is the creation of a competitive market environ ment, to enableenterprises of production or distribution to make the correct allocative decisions, based on accuratemarket signals. The creation of a competitive market has many aspects, and these include the existenceof a large number of buyers and sellers, free entry and exit of producers or distributors, trade in goodsand factors without physical or tariff barriers, and independent price setting decisions by all producers.From a theoretical standpoint, 'perfect' competition also has requirements such as constant returns toscale in production or full information, which are rarely obtained even in functioning market economies.The aim should however be to at least steer the economy towards a situation of greater rather than lessercompetition.
5.2 Translated to regulation, this requires the creation of a range of instruments, required toensure competitive behavior, which may affect the number of economic agents, or the behavior of theseagents, in terms of 'fair' competitive practices, freedom of entry to the market for new firms, and easeof exit or dissolution, in addition to issues pointed out in earlier chapters, such as the mobility of goodsand factors, and flexibility of prices. There is a range of regulatory instruments which safeguard themarket in these areas, which include laws on the number of agents and freedom of entry, such aslicensing and regulatory procedures, laws on competitive behavior, such as !egulations on monopolies,or on restrictive or unfair trade : - ices, or laws to maintain or safeguard competition, and laws on exit,such as bankruptcy law. Other regulations also safeguard or uphold the operation of enterprises in amarket economy; the system of contract law and contract enforcement, safeguards to producers (such aspatent or copyright) and safeguards to consumers (such as trademark or advertizing rules, or consumerprotection laws).
5.3 In China today, some pieces of this canvas of regulations exist already in some form, andrecent modifications to adapt these to the framework of a market economy have been introduced in manycases. In other areas, there was virtually no regulation until recently, and the process of creating this abinito is now under consideration. An initiative to accelerate the pace of economic legislation waslaunched in early 1993, by agreeing on a blueprint for the development of a legal framework for themarket economy, to be implemented over the next five years. The plan is being formulated by theStanding Committee of the National People's Congress, along with the Bureau of Legislative Affairs andthe State Commission for the Restructuring of the Economic System. The legislative plan of the State
- 122 -
Council for 1993 alone includes 89 elements, of which 12 are laws and 72 are administrative statutes.'These include (1) standardizing and maintaining market economic order (through laws on competition,contract, consumer protection, insurance, domestic trade and market regulation for comnodities,securities and futures markets); (2) laws for macroeconomic control and regulation (such as laws on thebudget, taxation, and central banking); (3) social security law (abor law, unemployment insurance); (4)laws to aid the process of opening up the economy to the outside world (aws on foreign trade, on foreignbanks and other financial institutions, arrangements for foreign enterprises oil exploration); and (5) lawsfor improving administrative organizations (such as regulations on civil servants).2
5.4 There are some features of the Chinese economy which are unique, even if compared toother transitional economies, or even other market economies, and it is essential to take this into accountwhen preparing the legislation to be introduced in these areas. The following sections selectively discusssome major areas concerning the creation of a competitive market in China, where there are issues ofspecial interest to China, and from an economic viewpoint. The current state of legislation in other areasaffecting competition has recently been reviewed elsewhere, and as far as possible, duplication of issueshas been avoided here.3
B. Competition and a Competitive Environment
5.5 Appropriately designed competition laws can play an important role, complementary toliberal trade policies, in maintaining well-functioning, competitive markets. In addition, such laws alsocan be instrumental in creating more competitive markets, through their impact on the existing and futurestructure of markets, and on the behavior of market participants. The drafting and widespreaddissemination of detailed and transparent guidelines can help to accelerate the otherwise protracteddevelopment of specific rules through precedent and would provide both consumers and producersincreased certainty regarding the rules themselves, and the mechanisms by which they will be enforced.
5.6 In formulating rules for competition, the economic environment in which these rules areto be applied is of critical importance. In many centrally planned economies undertaking a move towardsfree market systems, there are pervasive problems of monopoly, due to the typically large size of firmsset up under the planning period. The breakup of these large enterprises, or the introduction of safeguardsagainst the exercise of monopoly power stemming from high concentration ratios and the presence of'dominant firms' then become important issues in the formulation of new economic regulations.
5.7 In China, as the first chapter points out, the industrial structure today is far fromconcentrated, in a sectoral or spatial sense. The following sections provide further evidence on market
The program is described in a pres release of the State Council's Legiative Affairs Bureau, of 18May 1993. The text of the release is available in Summary of World Broadcasts, May 22, 1993.
2 BBC, Surve of World Broadcs, 22 May 1993.
3 An overview of the legal framework confronting enterprises in China today, which spans a broadspectrum of issues, is available in Lichtenstein (1993).

- 123 -
structure in China today, looking at sectoral concentration, and also discuss its likely future evolution.In view of this evidence, it appears that while there is indeed a need for market regulation to safeguardcompetition, the emphasis may have to lie on market conduct, rather than market structure related issues.
Market Structure: Firm Size and Industrial Concentration
5.8 In contrast to countries of the former Soviet Union, where specialization took place atthe countrywide level and often resulted in single monopoly enterprises producing specific goods,specialization in China historically has taken place at the provincial or even local level. The emphasis onlocal self-sufficiency in the Maoist era led to a duplication of industrial pattern by province, a pattern thatwas reinforced by the decentralization of investment decisions to the provincial level in the early 1980s.Looking first at anecdotal examples, a large part of the Chinese automotive sector is characterized byfragmentation and small scale, with 2531 enterprises producing motor vehicles or related parts andcomponents, with an average employment of only 620 employees. Shanghai Volkswagen, arguably themost important producer of passenger cars in China, produced about 17,000 Volkswagen Santana carsin 1990, and there are over 110 producers with less than 10,000 units. In contrast, the new Saturndivision of General Motors of the US is designed to produce at least 200,000 cars a year.' A verydiversified number of enterprises also characterizes the machine tool sector, with every province in China(except for Tibet) manufacturing machine tools. While the top 5 machine tool enterprises in Japan accountfor 42 percent of national production share and 69 percent in the USA, the corresponding figure forChina is 20 percent.'
5.9 Data on industrial size distribution (Appendix Tables A5.la to A5.3c) provides a morecomprehensive source of information on industrial concentration. Aggregates for all sectors of industryare given in the summary Table 5.1 below. Details for individual subsectors are available in the appendixtables. First, classifying firm size in terms of number of persons employed, the number of fims, thenumbers of persons employed and the value of output is measured, in each size category. Next, analternative measure of firm size is used; classification by value of output, at current 1991 prices. Thesame three measures of concentration are undertaken.
4 World Bank (1991) (Automotive Sector Report). However, there are also some larg automobileenterprses and enerprs groups in China, such as Second Auto Works.
' Strong efforts at restucturing the sector in terms of mergers, alliances, joint production and makdetingarrngements have been recommended for China to compete effectively in international markets. WoddBank (1992) Report No 10688 (Machine Tool Sector).

124 -
Table 5.1 Size Distribution of Industry by Alternative Indices (1991)
1. Firms Classified by Numbers of Employees: Total Above 3000 1000-3000 100-1000 Below 100
la. Number of Firms (%) 100.0 0.5 2.2 30.4 66.8
lb. Numbers of Persons Enployed (%) 100.0 23.9 18.5 4S.1 123S
Ic. Output Value (%) 100.0 28.4 21.8 40.4 9.4
H. Firms Classified by Value of Industial Output: Total Above Y30m YlOm-Y30m Ylm-YtOm Below Ylm
2a. Number of Firms (%) 100.0 2.7 5.8 31.9 S9.5
2b. Number of Persons Employed (S) 100.0 36.0 18.5 32.4 13.1
2c. Output Value (%) 100.0 58 18.3 19.6 3.6
Note: Data in the table are of independent accounting enterprises at and above the township level.Source: Appendix Tables AS.Ia to AS.2c
5.10 As the table shows, using any measures of size, the number of firms in the large sizecategories is very small, 0.5 percent in terms of number of employees and 2.7 percent in terms of outputvalue." Althcugh the large firms are important in terms of the proportion of persons they employ(around a quarter, on the first measure, or 36 percent, in terms of the second), firms in the mediumcategories dominate in all measures. Looking at the firms with over a hundred but below 3,000employees, they account for three quarters of total employment and over 60 percent of total output value.If classified by output value, firms with a turnover of over Ylm but below Y30m account for around halftotal employment and around two fifths of total output value. Looking at disaggregated figures, there areindeed sectoral size differences, with a relatively larger concentration of large firms in industries suchas ferrous metals, chemical fibers and tobacco processing and lower ratios in food, clothing andconstruction materials.
5.11 More evidence on industrial concentration is r ivided in Table 5.2, in which regionalconcentration indices are estimated, in terms of the share of the leading province, and the leading fourprovinces, in the value of output, by sector. Tne data are ranked in descending order of concentration.
5.12 As the data show, for all industries except railway coaches and power generatingequipment, the share of the leading province is typically below a third of total output. In most cases, eventhe top four provinces account for less than two thirds of total output. Taking the evidence from allsources together, it suggests that concentration, in the sense of size or geography does not appear to havebeen a serious issue in China so far.7 However, industrial structures evolve, and the question of theextent to which this may alter over time, in view of the process of economic reform, should also beexamined. Apart from the natural growth of existing firms, there are two processes which couldaccelerate industrial concentration; the growth of firms by merger and acquisition, and the growth ofassociations between firms, in the form of enterprise groups. Both these processes have gained momentum
6 Since the sample of firms includes only those with the relatively new independent accounting system, itis likely that a large number of very small firms are omitted already.
7 These results are however preliminary and more detailed analyses ar required, as well as more'yardsticks' from other countries to evaluate the implications of the findings.

- 125 -
in China over the last few years. The following sections evaluate, on the basis of qualitative evidence,the possible implieaions of these tendencies for industrial concentration.
Table 5.2 Industrial Concentration Ratios for Slected Industries(1986, 1987)
Share of Commodity Output ValueProduct I Leading ProducerProduct Top Province Top 4 Pmro vc _
Railway coaches 57 100 Hebei
Railway freight wagons 38 82 HldloaiianMotor Vehicles 24 62 LJaonin
Transforers 22 49 Ree
ectric Wire 22 53 Triaqi
Washing machine 16 SS Shanhai
Sulfuric acid 9 34 Llmoiu
Ammonia 9 33 Rebel
Incicide 25 57 Tianjin
Silicon 12 29 RebeJ
Cotton cloth iS 41 lia48su
Bicycles 16 SO riaatjinSewing machine" 33 66 Shanghai
Power generatn equipmnt 4S 70 Anhui
Machie tools 17 SO Zhejiang
k 1 8 8dum4rtors 21 84
Sores: Data for the firs eleven products ('Raiway coachee' to 'Colton cloth) are taken fromn 'Cbina's Lrge and Medi- ScaleIndustrl Enterdpses', Summary Volume, 1989. Data for the last fhve products (Bicycles' to 'Lrge/medimtactos')are from the China Statistical Yea*book. Calculations are prnted in Rawsl (1993).
Potential Changes in Market Strudure Mergers
5.13 Enterprise mergers were initally exclusively government-initiated. In February 1989,guidelines on mergers were issued which applied to the mergers of enterprises through purchase,including the principles of mergers, the identification of merged enterprises, the forms and proceduresfor undertaking mergers, the ownership of assets and their valuation, and issues concerning taxation andemployment.' Among the stated principles of this document are provisions that mergers must promoteeconomic benefits, prevent monopoly and promote competition. ITe document was addressed directlyto provincial authorities in charge of economic reform, and in response, local governments began to takeincreasing interest in mergers and by the end of 1989, 17 separate regional authorities (provinces,autonomous regions, municipalities and cities with independent planning powers) had specific provisions
February 19, 1989, by the State Commission for the Resrctring of the Economic System, the StatePlanning Commission, the Ministry of Finance and the Stae Assets n.

- 126 -
for the merger of enterprises, each with their own preferential policies.9 The increasing number ofmergers led to the organization of specific enterprise property rights markets to promote enterprisemergers. Twenty five such markets were established by the end of 1989.10 Gradually, the process ofvoluntary merger, or mergers initiated by the concerned enterprises, was also accepted.
5.14 In 1992, the policy of voluntary mergers was formalized in the 'Regulations onTransforming the Management Mechanisms of State-Owned Industrial Enterprises', where the right ofenterprises to merge operations with other units was explicitly recognized."1 The approval of a mergermay be witheld if the authorizing government department considers the merger to violate state laws andprevent competition. Merging enterprises must comply with registration regulations, to indicate theirchange in status.12 Some limited experimentation in these procedures is taking place. In Shanghai, forexample, line bureau approval has been required only from the supervisory authorities of the larger partysince the beginning of 1993.
5.15 In practice, enterprise mergers to date appear to have been used mainly as a government-driven vehicle to rehabilitate loss-making enterprises. There are comparatively fewer cases of voluntary,market-driven mergers to achieve economic efficiencies or increase market power. It is also less commonfor enterprises of different regions and different sectors to annex or be annexed, because the relationsbetween different supervisory departments become more complicated and the coordinating work moredifficult. In 1989, the number of enterprises that merged with enterprises of other provinces droppedrelative to earlier years Cn part in response to efforts by localities to promote intra-regional mergers).The number of mergers or takeovers of eiterprises of different areas within the same province was alsolow, at 84, and a decline relative to 131 in 1988. These represented barely 3.5 percent of all merged
For example, the city of Chengdu released a document in 1988 aUlowing debt-ridden entpe thatmerge with anotber anterpse to keep enjoying all former subsidies. The newly fonred company isexempted from income tax for a certin period of time and enjoys a reduction and exemption of othertaxes and overdue fines according to its financial condition. Banks arn prevented from classifying theannexed enterprise as part of the annexing enterprise so that the latter can continue to raise loans. Citedin 'New Progress Made in Ene Mergers During Economic Rectification', in Gao Shangquan andYe Sen (eds)(l990) pp. 54-61.
10 These local property rights madrets provide a common location for sharing information (where potentialannexing and annexed enterprises can be informed about possible partners) and for coordinatingmerger-related activities (where representatives of govement departments and organizions candiscuss feasibility suldies, asset evaluation, liabilities liquddation, personnel placement and otherregistation procedures). TMe development of these markets was reported to have been promoted by theState Administion of Industry and Commerce (SAIC).
I The 'New Operating Mechanisms' for state enterpises, of July 23, 1992. The regulations define hiesphere of enterprise autonomy, though the rights are not absolute.
12 Diswussed in greager detail in section C below. Approval by the original suWpvisor authorities of bothparies and 'other relevant documents and certificates' are required before any merger can take place(including government deprme in charge of land, real estate, tax, labor, banldng, and the StateProperty Management Agency).
- 127 -
enterprises within China in 1989. Mergers or takeovers across different industries are also low. In 1989,only 697 enterprises merged with partners in other industries, or roughly 27 percent of the total.1
5.16 Although the aggregate number of mergers has declined, the number of voluntarymergers, cross-industry (vertical and conglomerate) mergers and cross-regional mergers appears to haveincreased somewhat since 1989. However a number of obstacles still appear to constrain efficiency-enhancing mergers. There are separate fees for the transfer of land, the transfer of buildings, notarialfees, and auditing fees. These are burdensome payments. There is also insufficient local audit capabilityto value the assets of firms to be merged, especially the value of intangible assets. Perhaps mostimportant, government officials still have discretion to determine which enterprises should merge, andthis discretion is often exercised for non-commercial objectives. Even if approval for voluntary mergeris finally granted, it may take the annexing and annexed enterprises several months to get the approvalof the first administrative department in some areas, a requirement which is still only the first of many.Administrative, financial and fiscal hurdles must then be several times multiplied in magnitude for cross-industry, cross-regional transacdons. Only once some of the more significant of these constraints areremoved does there seem to be a case for competition law which emphasizes a review of mergers, toconsider the impact of future mergers on efficiency and market power.1'
Potential Changes In Market Structure: Enterprise Groups1"
Odgins and Growth
5.17 Another question which can be raised about potential changes in the competitive strucurein Chinese industry concerns the emergence, over the past decade, of a large number of 'enterprisegroups'. Do these new structures signify an increase in concentration? An answer to this first requiresan understanding of naure of the new enterprise groups. The stimulus for the formation of enterprisegroups in China arose from different sources.16 First, the reduction of mandatory planning lent impetusto large state enterprises to set up 'horizontal linkages' with other firms. Since the planning system hadpreviously assured inputs required to meet planned output, new linkages were developed, with the declineof planning, as a means of creating alternative channels, or consolidating existing links, with supplyingand purchasing enterprises. Such linkages were also established for efficiency-enhancing purposes, such
13 Gao Shangquan and Ye Sen (eds) (1990) pp. 54-61.
4 The new competition law of September 1993 does not concern itself with mergers, but the newCompany Law, or Eterris Law, of 1994, has articles which clearly provide for the process by whicha merger may be approved (Articles 182-184).
5 This section draws on Tidrick and Chen (1987) and Wu (1990).
6 The sources are not necessarly mutually exclusive. Some of the early informal horintal associationswere 'encouraged' to a greater or lesser degree by govenmet authorities.
- 128 -
as the better utilization of capacity, sharing of technical knowbow or trademarks, and more rarely, In theform of capital investments."7
5.18 Second, some enterprise groups have been initiated by ministries and local administrativeauthorities. Such groups include a number of administrative line bureaus, at the provincial and locallevels, that have essentially changed their name from 'line bureau' to 'enterprise group' and in the processhave taken control over companies that they previously supervised."8 Third, in some cases, individualpowerful enterprises, with the consent and sometimes support of local authorities, have 'taken over' otherenterprises, in many cases without their full understanding or consent. A final category includes thosegroups that have been voluntarily organized, through nongovernmental channels. This category is thesmallest nationwide, reported to include around a hundred groups by the end of 1992.
5.19 In the first phase of their establishment, which began in 1980, enterprise groups were'horizontally associated' in relatively loose structures. From 1986, these horizontal associations wereupgraded into more formal enterprise groups, and some large enterprise groups were accorded specialstatus in the state economic plan (ikened sometimes to the treatment of 'off budget' items) which allowedthem direct dialogue with the central government. Today there are 55 large enterprise groups whichbelong to this category. Of these 55 large groups, 16 have their core activities in machinebuilding/electronics, 7 in energy, 6 in defense, 4 each in steel, building materials, chemicals andpharmaceuticals, 3 in banking, and 2 each in forestry, transport and foreign trade. Prominent amongthese are the Nanjing Zhongshan Electronic Works, Great Wall Computers, and Second Auto Works.Exceptionally, the 55 large groups are permitted to establish their own financial companies. Otherpreferential policies granted to these groups include import/export rights, business promotion-relatedforeign travel rights, and rights of independent planning (unrestricted by line ministry or locality plans).With the new enterprise regulations at the end of 1988, which permitted the establishment of shareholdingcompanies and mutual share participation, a third phase in enterprise group formation began, in whichownership participation in group enterprises could be conceived of.
7 In the Chinese context, 'horizontal links' or hengxiang lkane refers to links between producers whichcould be either upstream or downsteam suppliers or buyers, or with other enterprises, in trademark ortechnology assowiations. The critical distinction is that the link cut across normal administativebarriers of jurisdiction and may be formed across regions, across supevisory bureaus and acrossownership categories. 'Vertical linkges' in oontrast, in the Chinese context, are between supervisoryline bureaus and supervised enterprises.
" This transformation of administrative line bureaus into enterprise groups, motivated by self-preservationgiven the expectation that many line bureaus will be abolished in the course of reforms, has strongparallels with a similar transformation of 'branch ministries' into 'concerns and associations' incountries of the former Soviet Union (FSU). Members of these otganizations in Russia typically 'ownsbares' of the concern, and portray themselves as industry associations of the type conmnon inindustrialized countries. Yet most of these national or regional concerns are almost exact replicas ofthe former branch ministries, and are headed by high officials of the FSU. The economic environmentin which these concerns operate is critical in determining whether the concerns play a limited'facilitating' role or whether they are perpetuating centalized planning.
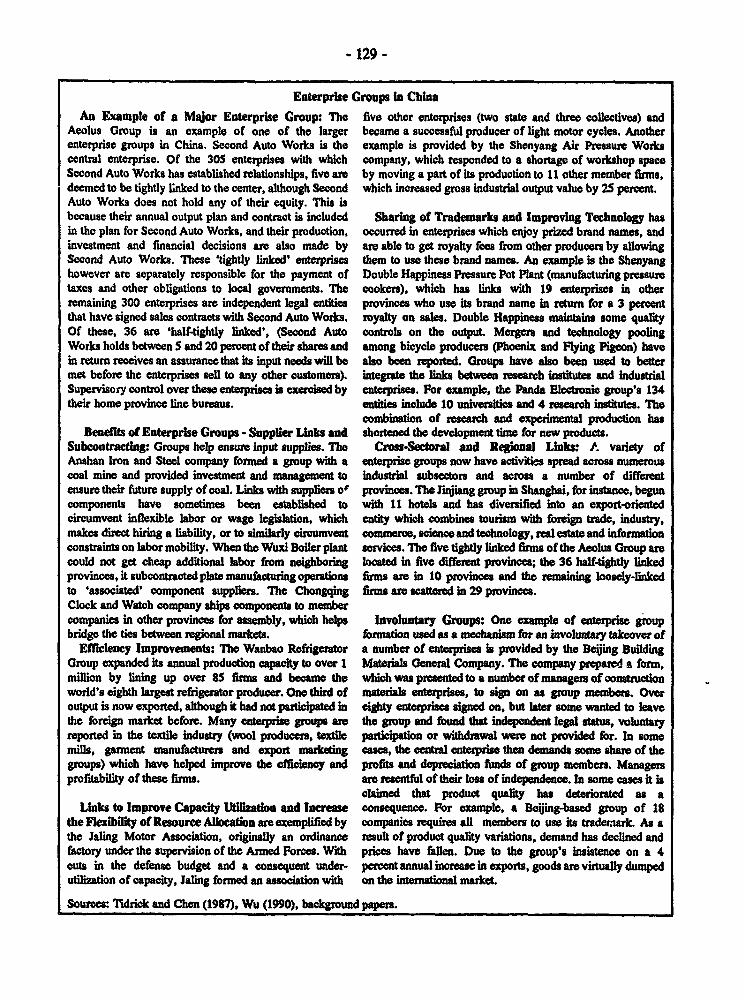
- 129 -
Enterprlse Groups In China
An Example of a Major Enterprise Group: The five other enterprises (two state and three collectives) andAeolus Group is an example of one of the larger became a successful producer of light motor cycles. Anotherenterprise groups in China. Second Auto Works is the example is provided by the Shenyang Air Pressure Workscentral enterprise. Of the 305 enterprises with which company, which responded to a shortage of workshop spaceSecond Auto Works has established reladonships, five are by moving a part of its production to 11 other member firms,deemed to be tightly linked to the center, although Second which increased gross industrial output value by 25 percent.Auto Works does not hold any of their equity. This isbecause their annual output plan and contraot is included Sharing of Trademarks and Improving Technolo hasin the plan for Second Auto Works, and their production, occurred in enterprises which enjoy pried brand nmes, andinvestment and financial decisions are also made by are able to get royalty fees from other producers by alowingSecond Auto Works. These 'tightly linked' enteupriscs them to use these band names. An example is the Shenyanghowever are separately responsible for the payment of Double Happiness Pressure Pot Plant (manufacturing pressuretaxes and other obligations to local governments. The cookers), which has links with 19 enterprises in otherremaining 300 enterprises are independent legal entities provinces who use its brand name in return for a 3 percentthat have signed sales contracts with Second Auto Wors, royalty on sales. Double Happiness maintins some qualityOf these, 36 are 'half-tightly linked', (Second Auto controls on the output. Mergers and technology poolingWorks holds between 5 and 20 percent of their shares and among bicycle producers (Phoenix and Flying Pigeon) havein return receives an assurance that its input needs will be alw been reported. Groups have also been used to bettermet before the enterprises sell to any other customers). integrate the links between research instiutes and industralSupervisory control over these enterprises is exercised by enterprises. For example, the Panda Elctoni group's 134their home province line bureaus. entities include 10 universities and 4 reearhb institutes. The
combination of resech and experimental production hasBenefds of Enterprie Groups - Suppr ins and shortened the development time for new products.
Subcontracting:Groups help ensure input supplies. The Cross-Sectoral and Regional Liks: t. variety ofAnshan Iron and Steel company formed a group with a enterprise groups now have acivities spread across numerouscoal mine and provided investment and management to industrial subsectors and across a number of differentensure their future supply of coal. Links with supplies o* provinces. The Jiaqiang group in Shanghai, for instance, beguncomponents have sometimes ben established to with 11 hotels and has diversified into an export-orentedcicumvent inflexible labor or wage legislation, which entity which combines tourism with foreign trade, industry,makes direct hiring a liability, or to simlarly circumvent commerce, science and technology, real estate and informationconstraints on labor mobility. When the Wuxi Boiler plant services. The five tightly linked firms of the Aeolus Group arecould not get cheap additional labor frm neighboring looated in five different provinces; the 36 half-tighly linkedprovinoes, it subcontracted plate manufacturing opeations firms are in 10 provinces and the remaining loosely-linkedto 'associated' component suppliers. The Chongqing firms arescatered in 29 prvins.Clock and Watch company ships components to membercompanies in other provinces for assembly, which helps Involuntary Groups: One example of enterprise groupbridge the ties between regional markets. fom-ation used as a mechanism for an involuntay takeover of
Efficiency Improvements: The Wanbao Refigerator a number of enterprises is provided by the Beging BuildingGroup expanded its annual production capacity to over 1 Materials General Company. The company prepared a forn,million by lining up over 85 firms and became the which was presented to a number of managers of constructionworld's eighth largest refrigerator producer. One third of matnials enterprises, to sign on as group members. Overoutput is now exported, although it had not paricipaed in eighty enterprises signed on, but later some wanted to leavethe foreign market before. Many enterprise groups are the group and found that independent lgal status, voluntayreported in the textile industry (wool producers, textile participation or withdrawal were not provided for. In somemils, garment manufacturers and export marketing cases, the eontal enterprise then demands sotme dare of thegroups) which have helped improve the efficiey and profits and deciation funds of group members. Managersprofitability of these firns. are resentful of their loss of independence. In some cases it is
clained that product quality has deteriorated as aLinks to Improve Capact Utilkation and Inrease consequence. For example, a Beijing-based group of 18
the Flexibility of Resource Alloation are exemplfied by companies requires all nmmbers to use its trademiark. As athe Jaling Motor Association, originally an ordinance result of product quality variations, demand has declined andfactory under the supervision of the Armed Forces. With prices have fallen. Due to the group's insistence on a 4cuts in the defense budget and a consequent under- percent annual increse in expotts, goods are virtually dumpeduttion of capacity, Jaling formed an association with on the inteaional market.
Sources: Tidrick and Chen (1987), Wu (1990), backgound papers.

- 130 -
5.20 Since the early 1990s, the number of enterprise groups has increased dramatically, withover a thousand 'national level' groups recorded by the end of 1991 and over 6,000 enterprise groupsat all levels by the end of 1992. The most rapid development occurred in the coastal provinces, with over47 percent of the national level groups in the regions of Guangdong, Shanghai, Jiangsu and Shandong.Over 65 percent of these groups have their core activities in electronics, light industry and textiles.
Stcture and Forms of Enterprise Groups
5.21 In termns of formal definition, enterprise groups were recognized by the government in1980, when the State Council issued a regulation explaining, probably for the first time, the basicprinciples and organizational issues relating to enterprise associations."' According to the regulation,economic associations must be based on voluntary and mutual benefits. Enterprises' associated entitiescould be established regardless of differences in locations, sectors, ownerships and administrative levels.In 1986, a second second fundamental regulation, on 'horizontal economic association', was issued,which, while confirming the bas ic principles of the 1980 regulation, promoted economic association asa reform strategy, to promote the rationalization of structure, separate administration from ownership andmanagement, and promote the markets for capital and technology. This regulation provides that largeor medium enterprises producing superior products are encouraged to be the backbone of economicassociations.2Y The voluntary principle is emphasized and administrations are prohibited from interferingwith the formation of economic associations. The change of administrative agencies to economicassociations is also prohibited.
5.22 The third, and so far latest, core piece of legisation on enterprise groups consists of theimplementing principles for the regulation of 1986, issued in 1987M Further definitions of enterprisegroups are offered, with the group described as a multi-tier organization, with a core tier, and less closelyassociated tiers. According to these, enterprise groups are allowed to choose the management systemsuitable to their needs, but requests that the system should combine centralized and decentralizedmanagement, for different categories of issues.
5.23 Pardy as a result of these regulations, many typologies of enterprise groups are insimultaneous use today. The classification adopted by the SAIC, defines 'regular enterprise groups'which are composed of a center (or 'mother') enterprise and three or more subsidiary enterprises (or'daughters') that are 'tightly linked' to the center. Firms 'tightly linked' to the center include whollyowned subsidiaries, majority owned subsidiaries, state enterprises whose rights and responsibilitiesconcerning resource use (including production, input purchase and sales decisions) have been transferredto central enterprises after consultation with the supervisory departments even though there is no formal
1 Interim Regulations on Promoting Economic Associations, issued by the Stat Council on July 1, 1980.
20 Regulations on Certain Issues Conceng Further Promoting Horizontal Economic Associations, issuedby the State Council on March 23, 1986.
21 This regulation introduced the distinctions between the 'closely associated', 'semi closely-associaed'and 'loosely-associated' eaterprise groups (see below) and also distinguished between equity andcontractual or other forms cf association.
2 Views on formation and development of Enterpnse Groups, of December 1987, issued jointly by theSCRES and the State Economic Commission.

- 131 -
ownership of shares, enterprises under a long term contract with the center, and enterprises or assetswhose management have been transferred to the center through the State Property ManagementBureau.' There are also 'half-tightly linked' subsidiaries (where the center is not a majorityshareholder), or 'loosely linked' subsidiaries (with stable, long-term contractual relationships with thecenter but no management links). It is reported that over 80 percent of enterprise groups in China are ofthe loosely linked type. Enterprise groups which were launched at the initiative of a central enterprise,in terms of the links described above, are referred to as 'mother first' groups. By contrast, those whichare established at the initiative of an organ of the government, such as a supervisory bureau whichtransforms itself into an 'enterprise group', are referred to as 'daughter first' groups.2 '
5.24 Other typologies of enterprise groups exist. Statistics published by the State StatisticalBureau (1989), on the 6,780 enterprise grours existing at the end of 1988, classify 7.9 percent of these(536 groups) as 'dominant firms with a ieader', 4.2 percent, or 285 groups, as the 'specialization type',24.4 percent (1,674 groups) of the 'vertical integration' type, 14.9 percent (1,008 groups) of the'horizontal integration' type, and finally, 40.6 percent (2,754 groups) as the conglomerate type?l
An Evaluation: Impiations of Enterpise Groups for Competion and Efflciency
5.25 Since over 80 percent of the enterprise groups in China are of the 'loosely linked' variety,their significance in terms of concentration of capital assets is limited. Cartel-like activities within themembers of a group are however possible, and these are market conduct issues (see below). Thedevelopment of large, multi-enterprise corporations of the 'tightly linked' variety is impeded today bya range of factors. First, the restrictive 'three no' principles of the government continue to apply to mostenterprise groups. According to these guidelines, there can be no changes in (1) affiliations withgovernment agencies; (2) ownership structure, and (3) the fiscal channels for taxes and profits. Groupsmay produce consolidated, or at least aggregated, financial accounts, and combined planning of output,and technology sharing, are possible. Some groups have unified planning and management systems (overissues such as personnel, finance, production, supplies and marketing). Nevertheless, each enterprise ina group typically continues to report to its own local industrial bureau and tax authority, and each firmcontinues to be an independent legal entity, individually responsible to the state for mandatory productionplans and for tax and profit remittances. Consolidated treatment for taxes and profits is not possible. Thegroup as a whole has no direct link to any government agency, but individual members may retain linksto several government organs.
5.26 The resulting structures typically suffer from a lack of clear governance mechanisms,continued state intervention, and the difficulties of multiple authorities to answer to. Moreover, theformation of enterprise groups, as in the case of mergers, may be prevented by the failure of line bureausin different subsectors or provinces, to give the necessary approvals. These approvals today are not basedon considerations of potential market power, but rather, rest upon considerations such as potential
a This final type was part of an experiment which began in 1992.
24 There has been much resentment over the formation of such 'fake enterpnse groups, expressed in thepress. The government has recently announced its intention of tightly controlling the authorization offurther such 'daughter first' groups.
2' The remaining 8 percent are defined as 'other' groups. Cited in Wu (1990).
- 132 -
conflicts with local authority revenue or tax sharing agreements. Provincial or municipal authorities mayalso sometimes introduce non-neutral requirements, for example, that the enterprise group conforms withthe region's industrial policy, or that it meets specific export thresholds.
5.27 Even if the formation of the enterprise group is approved, lack of financial consolidationimplies that the resulting group is of limited significance, especially if combined with a lack ofindependent planning rights. This prevents resource reallocation across enterprises in a group, tax offsetsor profit offsets. In some cases even the setting of prices of products is regulated by different linebureaus in separate provinces. Without its own financial company (and obtaining approval to set one upis alleged to be difficult), the transfer of funds between group enterprises is complex. For example, ifa group member producing industrial parts wishes to reallocate funds to an agriculture-related enterprisewithin the group, it must first transfer funds to the local Industrial and Commercial Bank, which in turntransfers funds to the other firm's local Agriculture Bank; a process costly in resources and time?6Even though enterprises decide to constitute an enterprise group, consolidated financial treatment isprohibited without the formation of an 'enterprise group financial company'. Setting up such a financialcompany requires the approval of the People's Bank of China (PBC), which is reputed to be hard toobtain. However, the 55 large groups are an exception to this framework, and many of them do havetheir own finance companies. Moreover, these groups are permitted to liaise directly with the centralgovernment, instead of a number of independent regional authorities.27
25 It must be recognized that financial consolidation also provides enterpises greater scope to cross-subsidize or trnsfer-price intemal transactions.
27 Eleven separte regulation documents for these 55 enterprise groups, authorzing them to experimentwith increased autonomy, are in the process of being drafted or already completed. These regulationsinclude rights of independent planning, for materials management, for labor and wage management, foraccounting, for the establishment of financial companies, for tegistration, for asset transfers, forimport/export rights, and for travel abroad/foreign visits.

- 133 -
Compettion Law In a Market Economy
A modern competition law is a legal code that is competition throughout administrtive bodies nationwide, anintended to create and maintain a competitive and emnphasis on reducing entry barriors (including lowering ofpredictable business environment, by addressing market policy-induced interrgional mobility barers), clear rulesfailures due to the exercise of 'market power'. A against cartel agreements, with stricter enforcement andcompetitive and predictable business environmnent, in turn, penalties against horizontal agreements and more lenientis desirable not as an end in itself but as a vehicle to treatment of vetiical agreements, and provisions regardingpromote economic efficiency and consumer welfare, so abuse of dominant position and mergers that are used onlythat consumers can enjoy the benefits of lower prices, sparingly at first and limited to instances of gross misconduct.increased product choice and improved product quality. The main agency responsible for administering theWhile some competition laws, such as the U.K. compedtion law also should play a role in the formulation ofRestrictive Trade Practies Act have traditionaly pursued government economic regulations. Although the agency shouldother public interest goals as well including regional be reactive toward anticompetitive business practices, it shouldemployment and export performanee, there has been a be ptoacive in seeking to remove government determinedgrowing consensus in international enforcment practice policies which limit competiton. Korea's Fair Tradeover the past years to focus on economic efficiency as the Commission, for example, lists 'reforn of anticompetitivesole objective of competiton law. Such a unique focus is government regulations' as the first item in its list of majordesirable because it reduces the likelihood that the activities over the past ten years. The Commission reviewscompetition enforcementauthorities will be deflected from draft regulations to prevent the introduction of restrictivetheir central purpose, since the pursuit of any other elements and every ministry which intends to issue regulationsobjective is more visible whenever there is deviation from must consult the Commission.a sinple rule. Explicit focus on clear and transparent There is widespread agreement in aU countries withobjectives also reduces business uncetainty regarding competidon laws that explicit horizontal, cartel-likeenforcement practices. agreements to fix prices, allocate customers or rig bids should
Competition law is typicaly a law of nadonwide be banned.Just as independence among competing supplies inapplication. In principle, competition law should apply to the same market is at the core of competition, prohibitionsal sectors of the economy and aU regions of the country. against cartel behavior are central to appropriate competitionAlthough there are specific sectors that are exempted law. The general approach for such practdecs where the harmunder most countries' competiton laws, ther has been a to competition is obvious is to make them per se illegal, thattrend reduction in these. Uilites, transpor, is, proving guilt requires only the demonstration that thetelecommunications and energy markets as weU as alleged conduct has occurred. To act as a strong deterrent andbanking and insurance are increasingly subjected to the convey a clear message that such practices are unacceptablesame rules of competition as other sectors. regardless of context, countries such as the U.S. and Korea
South Korea provides an example of a country hat have criminal sanctions against this. However other practices,adopted a competition law despite inial resistance. In the such as abuse of dominant position, or the implementation of1960s, governmnent intervention in the economy was merge, are genally reviewed according to civil rather thanwidespread and there was strong opposition in the criminal provisions. Rather than being outright ilegal, theybusiness community to the adoption of a competion law. require a balancing of probabilities or the 'rule of reason'However, once the economy became more open, it approach, where the harmful effects on competition arebecame clear that government allocations and controls balanced against possible beneficial effects on economiccould not allow a complex economy to adjust efficiently efficiency.to the oil price rises of the late 1970s. In addition, Rules on cartel agreements, abuse of dominant position andeconomic groups had accumulated large profits as a result mergers should be used sparingly at first and limited toof goverment protection, at the expense of consumers instances of gross misconduct. To limit the abuse ofand smaller firms. Bot. these developments were administrative power, it may be desirable to restrict the scopeinstrumental in leading to widespread support for a of activity of the competition authorities in the control ofcompetition law. In response to public pressure, the 'dominant enterprises' by having a 'safe harbor' clause, soKorean Fair Trade Act was enacted in 1980. that enterprises with less than a specified percentage of market
For economies characterized by a legacy of mandatory share would explicitly lie outside the purview of those rules.planning and an initial low level of competition law In the control of mergers, it may be desirable to start with arelated skills and enforcement resources, gradual high prenotification thrcsholds, so that only mergers beyond ainstitution-building is desirable, with an initial focus on a large size would be reviewed. Such thresholds could then belimited number of tasks. Key priorities include a general lowered over time, if necessary, as administrative capacitycompetition advocacy role, promoting the role of increases.
Source. Background Papers for this study.

-134 -
5.28 The discussion suggests that the concentration of economic power by the formation oflarge, multi-plant or even multi-enterprise corporations is not a major issue, at present. Indeed, thebenefits of the formation of multi-plant enterprises are often difficult to reap, because of the difficultiesconfronting enterprises which wish to expand through the setting up of new subsidiaries, or the formationof affiliated companies. In some areas, greater flexibility to permit such group formation is desirable, forexample, the possibility of answering to a single profit or tax authority, and permitting consolidatedfinancial and tax treatment, at least for majority owned subsidiaries. For the 55 large corporations,however, which are more 'tightly linked' today, it may be advisable to set up some process of monitoringtheir further growth in size, and their market behavior. This will have to be reviewed in the context ofan examination of the overall need for legal safeguards for competition. At the same time, it must berecognized that the formation of 'fake' enterprise groups, from former line bureaus, is not likely to beeconomically beneficial. The formation of groups through coercive processes ('hostile takeovers') needsto be more carefully defined, In terms of the conditions and the processes under which this can bepermitted to occur, and the formation of groups through fraudulent means has to be guarded against.
Market Conduct lssues
5.29 There appears to be a substantial incidence of agreements between enterprises in the samemarket (within or outside enterprise groups) regarding price and output decisions, as part of practicesinherited from the era of planning, when such decisions were required to be made collectively. Suchagreements take place, for example, within subsectoral producer groups. While these practices appear toleave scope for competition (through spreads between maximum and minimum prices agreed duringanmnal 'price meetings', as well as a lack of effective enforcement mechanisms to monitor pricing),continued close communication between enterprises in the same industrial subsector could lead to morecartel-like output restriction over the longer term. In early 1993, five top commercial outlets for electricalappliances in Beijing formed an association to add ten percent to the price of washing machines at theiroutlets. These five enterprises account for around a third of the capital's washing machine market. In May1993, eight large commercial firms in Nanjing, capital of Jiangsu province, established an association tojointly reduce the price of airconditioners. They were undercutting a small firm which had previouslybeaten their prices and had taken their business.23
Legal Provisions on Competition.
5.30 Ihe preceding sections suggest that while there are issues concerning competition inChina, they are related not so much to market structure as to market conduct and behavior. The casesof price collusion and predatory pricing behavior above illustrate the requirement for legal protectionagainst such behavior. Until recently there was no comprehensive competition law in China. A somewhatobscure 1980 regulation on the promotion and protection of competition was never invoked or
2 China Daily. June 23 1993. lTe five washing machine sales outlets of Beijing are the Xidan andBeijing Department Stores, the Dong'an and Chang'an Markets and the Longfu Emporum.

- 135 -
Implemented in practice.2 Through the 1983 State Enterprise regulations, the state safeguarded lawfulcompetition and prohibited inappropriate methods of competition (such as fraud, price collusion, briberyand illegal competition). The 1988 State Enterprise legislation did not continue these provisions. Morerecently, there were provisions under the 'Standards for Limited Share Companies' of 1992, whichempowered authorized government departments to withhold share company merger approval if the merger'violates state laws and regulations and policies prohibiting monopoly and unfair competition'?'However, this provision lacked force.
5.31 In 1993, three significant pieces of legislation affecting competition policy in China werepassed. The first (February 1993) was the Product Liability Law. Second, a Consumer Protection Lawwas adopted in November 1993. Third, an Anti Unfair Competition Law was enacted by the StandingCommittee of the National People's Congress in September 1993 and was declared effective on January1, 1994. On December 31, 1993, the Congress also passed a new Enterprise Law which has implicationsfor competition.
5.32 Legal provisions regarding holding companies or enterprise groups are less developed thanprovisions for mergers. Comprehensive legal definitions of rights and liabilities for concerned parties forboth holding companies and enterprise groups are still lacking. According to the 1988 enterpriseregistration regulations, enterprise groups and subsidiary/branch companies of national corporationsrequire official examination and approval. In practice, however, it appears that formal registration ofenerprise groups only began following the issuance of the specific 1992 registration rules for enterprisegroups; only since that time does SAIC have authority to intervene through administrative me'ans ifenterprise groups are not registered, requesting that they do not do business as a group.'
5.33 From the point of view of maintaining market competition, the new law on unfairpractices is timely. Its purpose is fourfold: to ensure healthy development of the socialist economy, toencourage and protect fair competition, to stop unfair competition and to protect the lawful rights ofbusiness operators and consumers. The focus of improper competition in the new law is on deceptivetrademark and advertizing, practices injurious to reputation and violation of trade secrets (although theprovisions here are not reconciled with existing legislation on these issues). There is a specific provisionagainst interregionally restrictive trade practices. While collusive pricing practives are outlawed in thecontext of submitting tenders, there is no allusion to the legality of cartel issues or oligopolistic pricecoordination in general - a key element of competition legislation in other countries. It is noteworthy thatthe new legislation includes in its scope both domestic and foreign enterprises and its general provisions
2 According to the 'Provisional Regulations on the Promotion and Protection of Socialist Competition'(approved by the State Council, October 17, 1980), 'Except for products which are under the specialmanagement of the departments concerned and units appointed by the State, no one is allowed toexercise a monopoly on the remaining products or act as the sole operator of a business'. According toone source (aCina Daily, June 23, 1993) these ries were put into effect in 1987, but have had littleeffect.
10 Article 90 of the 'Views on Standards for Limited Share Companies'. SCR'S (May 15, 1992).
31 In May 1992, regulations on the 'Temporay Method for Formation of Enterprise Groups' were jointlyissued by SCETO, SRC, SPC and SAIC. The new Enterprise Law of January 1994 does not make anyreference to enterprise groups.

- 136 -
apply to private and public companies alike. The new law certainly represents an important step forward,although its links to existing legislation need clarification, and its coverage needs to be strengthened.
5.34 Provisions on enterprise groups or holdings, when drafted, will have to find a careful balancebetween promoting the potential efficiencies to be gained through such groups, which so far have beendifficult to achieve in China, and the Implications of such groups for future market power. Market powerthrough such groups today is not, for the most part, a size-related issue. Provisions on forming enterprisegroups will also have to look at the mechanisms of group formation to provide adequate safeguards intocoercive or fraudulent behavior. Finally, the economic merits of encouraging the formation of enterprisegroups from ministries or industrial bureaus should be scrutinized before they are permitted.
C. The Entry of New Firms
5.35 Maintaining ease of entry of new suppliers, domestic or foreign, provides a highlyeffective source of competition in a market economy. Entry has many dimensions, and some aspects ofthis, concerning the regional mobility of goods and factors, have been discussed in previous chapters. Thefollowing section examines a specific, and immediate aspect of entry, the registration of new firms. Since1980, this process has been dominated by a single government agency, the State Administration ofIndustry and Commerce. Requirements for entry and the administration of the entry process are reviewedbelow.
Mme Role and Functions of the SAIC.
5.36 The State Administraion for Industry and Commerce (SAIC), set up in 1980, is aministeri-level government department directly under the State Council, and at the apex of Bureaus ofIndustry and Commerce throughout the country. The SAIC and its bureaus are entrusted with theresponsibility for the supervision and regulation of the economy and with administrative power to enforcelaws affecting economic markets." Established with the onset of reform, the original function of SAICwas largely limited to the supervision of the distribution of goods by private proprietorships and theadministration of local consumer goods markets, for daily necessities such as agricultural produce,clothing and small industrial products. In this context, the SAIC administered local trading facilitiesthroughout the country where individual sellers could come to sell their produce. The SAIC was allegedlyresponsible both for providing market-related facilities and services, as well as for protecting the interestsof consumers. Over time, with the rapid growth of private and collective enterprises, and the increasedmarket orientation of the economy, the role and functions of the SAIC have increased rapidly, to covera large spectrum of market regulated activities. Indeed, with the reforms to build a 'socialist market
3 During the Cultural Revolution, a department was established under the Ministry of Comm- ce with theenforcement of prohibitions against private sellers as its main task. Preparatory work for theestablishment of a specialized agency to regulate markets began following the third plenary session ofthe XIth Central Committee of the Communist Patty, in 1978.

- 137 -
economy', the Bureaus of Industry and Commerce have gained suthority and business scope, even as theeconomic ministries lose authority to control the planned economy.'
5.37 The principal functions of the SAIC today consist of (1) entetprise licensing andregistration; (2) market organization and administration, including rural and urban markets, consumergoods markets and the market for the means of production and production components (as well asstimulating the establishment of new markets such as futures markets); and (3) market supervision (forinvestigating and providing redress for violations of economic laws and regulations). This includes themonitoring of unfair trading practices, cases of fraud, false advertizing, violation of patents andtrademarks, as well as out-of-court dispute resolution. The central priority within the SAIC today is toprotect the legitimate interests of consumers in order to create an environment of fair competition. Inaddition to separate departments responsible for enterprise registration, market administration andsupervision, there are also functional departments at the central SAIC and at all local Bureaus of Industryand Commerce, responsible for advertisements, trademarks, economic contracts, the private economy,and the development and review of laws and regulations. The total staff employed by all SAIC branchesmust number in at least in the tens of thousands, since the Shenyang city SAIC bureau alone employsroughly 4,000 people while the Shenzhen city SAIC bureau employs over 1,000 people.
5.38 Enterprise registration in China is intended to ensure compliance with existing legalrequirements governing new enterprise entry (registration for starting operations), entry of existingenterprises into new markets (alteration in scope of operations), enterprise expansion (alteration inregistered capital) and other changes in enterprise status.3' All enterprises must register with theappropriate central or local SAIC to acquire legal status prior to undertaking any economic activity.Enterprises applying for 'legal entity' registration must have at least eight full-time employees andregistered capital above minimum thresholds; those not qualifying as legal entities must apply for'business' registration, in which case the investors, in an individual capacity, shoulder civilresponsibilities for the enterprise. Upon fulfillment of all registration requirements, enterprises receivea business license; they can then open bank accounts and carry out operations within the approvedbusiness scope. Business licenses are only valid for one year, after which a mandatory annual inspectionis required for renewal.'
3 Manion (1993) analyzes the structure and operations of the SAIC in depth, from the point of view ofprocess and insulation from conruption. From an econonuc standpoint the growth in power and statureof this agency provides an excellent example of the shift in extemal authority from one group ofagencies (the planners) to another (the regulators) in a process of economic transformation.
34 Registation rules for industrial and commercial enterprises are contained in the 'Regulations of thePeople's Republic of China On the Management of Registration of Enterprise Legal Persons',promulgated by the State Council on June 3, 1988 (effective July 1, 1988). Administrative guidelinesare contained in the 'Detailed Rules for the Implementation of the Regulations of the People's Republicof China concerning Registration Administration of Legal Entities', Aonouncement No. 1 of the SAIC,November 3, 1988 (effective December 1, 1988).
3 An annual examination report and financial statements must be submitted. As part of the annualinspection, checks are conducted by the relevant SAIC on the major items that constitute the enterpriselegal person registration.

- 138 -
5.39 According to the present requirements for enterprise registration, which date from 1988,all enterprises, state-owned, collectiva or private, applying to begin operations as legal entities, requirea series of documents. These Include (1) a certificate for eligibility as a 'legal person', (2) a certificateof creditworthiness, (3) documents 'from the department in charge or responsible for examination andapproval', and 'other relevant documents and papers', which consist in the main of (4) an application tothe SAIC, (5) the organization charter, and (6) certificates for the use of residence and locations ofoperation.36 The distinction in registration regulations for state versus collective or local enterprise liesIn the nature of documents required within these categories, and by whom they are approved. Forexample, the certificate of creditworthiness is issued by the State Property Administration Bureau for stateenterprises but by an accounting or auditing firm for private enterprises. Documents required 'from thedepartment in charge' usually include approvals from the supervisory administrative line bureau underwhich the economic activity was expected to take place, the Planning Commission (so that the project isincluded in the local plan), the Economic Commission (that deals with construction and factory buildings,among others), and the Environmental Protection Bureau. For enterprises from outside the locality,investment flows are monitored by the local Cooperation Office as well, and their approval is required.
5.40 In addition to the principal regulations on enterprise registration, there are allegedly over130 other rules affecting enterprise licensing, which specify the various documents required to accompanythe application, in the form of permits (xke zheng) from various government departments. In someinstances up to 100 or even 200 permits may be required. Apart from the standard documents, anenormous number of enterprise-specific special requirements may be invoked in individual cases.
5.41 According to the 1988 registration regulations, enterprises are oniy permitted to engagein economic activities in accordance with their initially approved business scope, operational methods andamount of registered capital. If the enterprise wants to enter a new market by producing or sellingsomething else, expand or contract its operations (increase or decrease its registered capital by more than20 percent) or change the location of operations, it must apply for an alteration in registration. For allsuch alterations, requirements include a letter of application to SAIC, approval by the original controllingauthorities, as well as the usual 'other relevant documents and certificates'. The key point of significancehere is the measure of flexibility accorded to officials in granting a license. Bureau officials have effectivecontrol over the time it takes to process an application, through the degree of flexibility or strictnessapplied to the evaluation of acceptability of an application." As a consequence, there is considerablescope for corruption. In 1990, a campaign to combat corruption in the SAIC was launched. However,penalties for abuse have not always been serious.'
3' Regulation On the Management of Registration (1988), Article 15.
3 Manion (1993). For example, a strict application of rues may allow an enterprise to produce onespecified type of computer software; a more flexible application may not require specification of thetype of software, and a truly flexible application may allow an applicant to specify production ofcomputer accessories as its main economic activity. Licensing authorities may also approve activitieswhich are clearly inappropriate in scope, such as 'scientific and technological exchange', in oneinstance.
3' Officials in one district in Beijing were reported to have refused 93 invitations to dinner, 29 bribesamounting to over Y1,000 in cash and YS,000 in gifts in a period of a few months, following thecampaign (Manion, 1993).

- 139 -
5.42 In terms of process, the apex SAIC does not dictate or prescribe operating procedures oflower level Bureaus of Industry and Commerce, and variations have arisen in different parts of China.in a typical process, however, licensing is sequential and requires the successful completion of four tasks:(1) the receipt of application materials (shouli); (2) investigation and verification of materials (shencha);(3) approval of a license (hezhun) and (4) issue of a license (fazhao). Once the formidable process ofapplication is complete, the task of investigation and verification begins, by administrative departmentsunder the Bureaus of Industry and Commerce, separate from the licensing departments.
5.43 Entry-related fees must be paid to the relevant SAIC, and these include charges for initialregistration, for all alteration of registrations, and for the annual examination. Penalties for opening abusiness without approval and registration include immediate halting of operations, confiscation of illegalproceeds, and on additional fine of up to Y20,000. Fines are also levied for failure to register alterationsor to comply with the annual license renewal process, together with confiscation of illegal proceeds andan order to rectify the violation as appropriate.
5.44 Though new central instructions on registration have not been issued since 1988, anattempt to simplify the enterprise registration procedure was launched in 1992.3 In May 1992 the SAICconvened a national meeting on the management of private and household enterprises, following whichan internal circular was issued, calling for fewer steps in investigation and approval procedures and arevision of the requirements for permits from other departments. Many regulations issued by governmentdepartments as well as by provincial Bureaus of Industry and Commerce were invalidated as aconsequence.40 For commercial enterprises, for example, the minimal thresholds for initial registeredcapital have been lowered, the minimal premises/facilities size requirement for wholesale trading has beenlifted, and the legal person eligibility requirement for state enterprises no longer requires nomination bythe relevant line bureau. Line bureau approval requirements in the registration process have beeneliminated completely in Shenzhen in 1985, and for selected subsectors in Guangdong in 1992. InShanghai, supervisory agencies' approval requirements for changes in business scope also have beeneliminated in 1992, though the relevant SAIC must still be notified of all changes.
Other Agencies Concemed with Entry
5.45 It is difficult to gauge whether the problems of entry and licensing are to be attributedsolely to the operations of the SAIC, or whether the other departments concerned also play a major role.In practice, it appears that the influence of line ministries and other administrative bodies on resourceallocation remains extensive in many subsectors. In the automotive sector, for example, the ChinaNational Automotive Industry Corporation (CNAIC), the focal point of Chinese government authority,is active in sectoral planning and has a strong say in national regulatory decisions affecting the sector.In early 1989, CNAIC was strengthened and has gained renewed authority over investment decisions.'lFor key enterprises in the machine tool sector, there is also a strong influence of the line ministry
39 Following Deng Xiao Ping's Spring Speech earlier that year which signalled a new politicalenvironment for public and private enteipnse.
" Circlar of 20 June, 1992. The simplification applied to enteqpises in all ownership categories.
41 World Bank (1991) (Automotive Sector Study).

-140-
regarding allocation of resources, product development and production orientation.4 As recently as1990, in electronics, the responsible line ministry was planning to use industrial licensing for largeprojects to prevent what it views as 'excessive entry' in critical areas.4' And in the fertilizer sector, themarketing system was remonopolized in 1991, with the China Agricultural Means of Production Company(CNAMPC) given the sole right for wholesale fertilizer distribution, while the China National ChemicalsImport and Export Corporation (SINOCHEM) remains the only corporation with the right to importfertilizers. SINOCHEM tends to favor the better-off coastal provinces which have easier access to importlicenses and foreign exchange.' As the economy relies more on market-based mechanisms, lessrestrictive entry and expansion rules would encourage more competition and banks should increasinglyperform most of the screening functions currently undertaken by administrative authorities.
5.46 Enterprise registration requirements, including the mandatory annual inspection, imposea burden on the scarce entrepreneurial resources of new entrants. They divert scarce resources fromproducers when they should be focusing their time and attention to the requirements of successful entry.There clearly appears to be scope for a great deal of procedural simplification. In many respects themultiple and discretionary requirements of the licensing process resemble the myriad taxes, tolls and feeslevied on goods in transit from one jurisdiction to another. Both illustrate the need for greatertransparency, simplification, and reduction of the scope for discretion in application. Although thesedeterrents have not prevented new firms from entering the market, they may well have restricted theirscope or form, and have likely extracted a tax in the process. Easing these procedures would certainlyassist the growth of market competition.
D. Other Regulations Affecting Market Structure
5.47 In addition, a number of regulations exist that affect both the structure of economicmarkets and the conduct of enterprises within those markets, ranging from rules on smuggling, deception,advertising, trademarks, contract and dispute settlement. There is currently a 'fair trade law' underpreparation by the central SAIC, which is said to include both competition law elements (such asprovisions on cartel-like agreements, abuse of dominant position, and mergers) and consumer protectionelements (such as fraudulent sales practices and false advertising). SAIC expects that this law will beenacted before the end of calendar year 1993. In addition, new laws are under preparation, andamendments to existing regulations have recently been enacted, in a number of areas affecting marketconduct and competition. Recent developments in this area are reviewed below.
Consu.ner Protection Related Rules: Advertising and Fraudulent Practices
5.48 There are over 70 separate rules and regulations governing illegal economic activities,including prohibitions on fake products and pornography, on smuggling and traffic in smuggled goods,
42 World Bank (1992) Report No 10688-CHA. pp 12-13.
43 World Bank (1990) Report No. 7962-CHA. p. 22.
4 World Bank (February 1993). Mimeo.

- 141 -
on speculation, and on deception and swindling. There are also separate laws on advertising, trademarks,and contract dispute settlement and arbitration. The 1987 advertising regulations replace the former 1982rules, and offer some degree of progress towards a market economy by allowing individuals (soleproprietors) to engage in the advertising industry, allowing advertisers to set their own fee scales, andextending the scope of judicial review to SAIC decisions.4' The 1987 regulations also address consumerprotection and competition law concerns. For example, advertisements are prohibited from deceivingconsumers, and consumers are empowered to lodge complaints with their local SAIC. Advertisers arealso prohibited from denigrating other similar products. 'Monopolization or unfair competition are alsoprohibited, though the law provides no details regarding the enforcement of this provision. Regional lawson the same topic also exist such as the 'Fujian Consumers' Lawful Interests Protection Regulations',which allow consumer redress for misleading advertising.
5.49 The local SAIC enforcement authorities are closely involved with the combatting of illegaleconomic activities. Interviews suggest that the most frequent complaints and interventions occur in theproduction and distribution of fake products and fake trademarks, followed by smuggling, deceptiveadvertizing and fraud, in addition to registration-related infractions.
5.50 In 1992, the nationwide 'antifake' campaign against counterfeit production and marketingresulted in the uncovering of over 116,000 cases, accounting for 62 percent of the country's totaleconomic crime. Defective goods handled by SAIC were valued at 366 million yuan, with finesamounting to roughly one third of that total value (114 million yuan). Over the year, 1,300 'fake-productcenters' have been discovered and eliminated, and more than 2,200 law-breakers were arrested. As anexample of illegal private activities and their links with state-run oversight, two apprehended individualshad been producing tons of useless fertilizer over a period of four years, labelled with fake trademarksof SOE factories. Without a production permit, business license, necessary technology and equipment,the individuals had carried on their illegal production under the protection of the local town government,which received sizeable side-payments for its complicity. In October 1993, a new law on ConsumerProtection was adopted by the Standing Committee of the National People's Congress, which for the firsttime represents a unified umbrella of legislation on consumer protection issues. This represents a majorstep forward In the area of competition policy.
a Administation of Advetsing Regulations, promulgated by the State Council and nnounced onNovember 10, 1987, followed by Administration of Adverdsing Reguations Implementing Rules,promulgatd by SAIC on, and effective from, January 9, 1988.

- 142 -
Consumer Protection Law
Consumer protection laws fonn a pad of the legislation The first piority in this area for a transitional economy iswhich defines a framework for retail trade. Reta io have a transparent set of rules governing the rights andtransactions inmaret economies ae undepinned by laws responsibilities of buyer and sellers in market-basedthat dfine the rights and responsibilites for buyers and trnusactions. Wth such a nationwide legal infastructure insellers. Additional laws prohibit fraudulent sales place, more competitiv markets should help solve manypractices, false or misleading advertising, and other informaion-rlated problems. For example, high warrantyharmful pracoties that cannot be efficiently addressed claims in an environment whero unmet claims Can bethrough market-based remedies. challenged oan become a relatively low-cost market signal of
Consumer protection policis are l 1otivated by a quality, since producers of detective products will be drivenconcern that enterpries operating in a market economy out of the market through competiive forces. The consumermay exploit informational disadvantages faced by their protection agency should play a market-supportive role tocustomers and thereby expose them to loss or harm. Such encourage madCets to supply accurate informadon on theirpolicies seek to address two main sources of market own, for example by establshing recognizable metrics tofailure in terms of consumer information. First, markets measure product characterstis for certain classes of goodsdo not always provide sufficient incentives for producers (such as the lumens scale for light bulb brightness and R-to reveal the true characteristics of their products and values for insultion). Sellers who score well on these metricsservices (referred to as 'asymmetric informadon' wilt adopt them on their own and promote themselves withoutproblems), and second, markets do not have adequate administrative enforcenent. More interventionist rules areinentives for individual consumers to assert their rights desirable in the protection of health and safety, including theafer transactions (referred to as 'public goods and regulation of foods, drugs and consumer products.coordinaton' problems). An important issue to consider, in the context of
The genea approach of consumer protecton policies tforcement of consumer protection-related laws, is whetherin most madcet economies is first to adopt market- or not to ombine the consumer protecdon authorities with thesupporive measures that promote the supply of accurate competition authorities. Though the competiton laws ofiformation by market partcipants, and only to adopt various countries include specific consumer protecton-elatedregulatory remedis for those specific problems where provisions, other countries have chosen to separte themarket4based remedies are not sufficiat. Competive enforcement of both sets of legal provisions. Consumermarkets and their accompanying legal infrastructure, if protection often involves a very large number of smallfunctdoning properly, help solve many information-related transactions, and it would be undesirable for the competitionproblems so that detailed specific legislation is generally authorities to be overwhelmed and fail to address other issues.inappoprit. Experience from other countries has shown On the other hand, for a country that is adoptig newthat arbitrary restictions on the number of entrants, such measures in both areas, there may be sizeable synergis fromas guaranteesensuring secure markets toone'responsible' having both offices at last located nearby, since economicenteprise while presutning that all potential rivals are staff adept at analyzing competition-related issues may also;irresponsible', are one of the most ineffective and have useful insights ir. o consumer protection issues.counterproductive ways to protect consumers.
Soure: Background Papers for this study.
Protection to Producers: Trademarks, Patent and Copyright4
5.51 The 1982 trademark law is another example of a law that addresses consumer protectionconcerns, as well as the rights of producers.4 ' Consequently, the law recognizes and protectstrademarks as an exclusive right, while imposing certain liabilities on trademark owners. It requires that
4' This Section draws on a series of articles in Development Business, on March 31 and April 16, 1993.
47 Te Trademaik Law of the People's Republic of China was adopted by the National People's CongressStandig Committe on August 23, 1982, and entered into fore on March 1, 1983. The ImplementingRegultons under the Trademark Law of tie People's Republic of China, promulgated by SAIC onJanuary 13, 1988 replace the earlier implementing regulations of March 1983.

- 143 -
(a) any changes on a registered mark must be approved by the Trademark Office; (b) a trademark ownermust be responsible for the quality of the goods; (c) a trademark applicant must be a lawfully registeredlegal entity or self-employed business person; (d) the trademark cannot be used for goods which exceedthe approved scope of the business, and (e) compulsory trademark registration is required forpharmaceuticals and tobacco products.
5.52 Registered trademarks are valid for ten years, after which they must be renewed. The lawempowers the SAIC to be the authority responsible for the registration and administrative control oftrademarks throughout the country, to supervise the quality of goods and stop any practices that deceiveconsumers. Foreign enterprises dealing with matters concerning a trademark in China must entrust anorganization designated by the SAIC to act on their behalf. According to the law, if a registeredtrademark is used for goods whose superior quality has been replaced by inferior quality so thatconsumers are deceived, the SAIC can order rectification, together with a notice of criticism, a fine, orcancellation of the trademark. If anyone infringes the exclusive right to use a registered trademark, SAICis empowered, at the request of any person, to order cessation and compensatory damages to be paid tothe infringed party; alternatively, the infringed party can institute proceedings directly with the people'scourt.48
5.53 In February 1993, nine amendments to the law were promulgated, and entered into forceon 1 July. The major improvement introduced was the extension of exclusive trademark rights toservices; previously only products could be covered. The significance of this is that service industries,such as advertising, insurance, banking or transportation, can now register their trademarks. The law alsoopens up the possibility of 'multi-class' filings, for different categories of goods. The new law is alsomore specific about requiring prosecution of infringers, in cases where the violation falls under criminallaw. Meanwhile criminal law penalties for counterfeiting have been raised, from three to seven years.Some experts are however concerned that the new law does not go as far as expected in certain areas,for example, the rights of any company to obtain any trademark provided it files first, in China, amongother requesting foreign or domestic companies. This is clearly of concern to foreign companies.Protection against certain types of infringement have been alleged to be weakened.
5.54 A second area of recent reform concerns patent law. China's first patent law was put onthe books in April 1985. While the law was generally considered 'satisfactory' by critics, and comparableto similar legislation in third World countries, gaps were considered to exist in coverage, for keyindustries. One industry where the US had repeatedly pointed out difficulties was the pharmaceuticalindustry, and in January 1993, the patent law was revised to include new provisions in this area. In theamended version, additionally, the duration of protection for invention patents is now 20 years (relativeto 15 in the past) and 10 years for utility designs (relative to eight in the past). Patent protection can beextended directly to drugs made by protected processes, and not only to the processes themselves.Production methods used for making animal or plant varieties can also be protected now. Licensingrequirements for patented products have been tightened and penalties for fraudulent representation ofpatented products have been raised.
5.55 Copyright law was promulgated on September 7, 1990 and became effective on June 1,1991. The law extends protection to works of Chinese citizens legal persons, as well as non-legal persons
4 Accession to GAIT will have unplications for stricter enforcement of tradmak regulation, especialyabuses by Chinese entewrpses regarding use of foreign tademarks.

- 144-
in China, as well as foreign persons, under international treaties or bilateral agreements. Unlikeprovisions in the Trademark Law and the Patent Law, the Copyright Law does not impose criminalpenalties for serious infringements. China has also promulgated computer software protection regulations,in 1991, which provide protection for 25 years. Copyright owners of software may also pursue civilremedies.
5.56 China has also taken a tougher stand on intellectual property laws, as copyrightinfringement allegations escalated. Since the beginning of 1992, a series of measures have been adoptedin rapid succession. In January 1992 China entered into an agreement with the United States to upgradeintellectual property protection, and shortly after (October 1992), China acceded to international copyrightconventions.49
E. Condusions
5.57 China today is making enormous efforts towards the establisbment of a framework ofregulations appropriate for a market economy. In the last year, at least three landmark pieces oflegislation in this area have been adopted - a law against unfair trading practices, a law on consumerprotection and a Product Liability Law. These laws suggest that the thrust of the new framework atpresent is broadly speaking the protection of consumers against fraudulent marketing practices.Preoccupations against size, cartel formation or me-rgers are not predominant. This may well reflect thecurrent economic issues facing the development of the market economy in China today. The remainingproposed agenda of new legislation and regulations is large and complex, and the comments offered hererefer to the areas selectively discussed in the preceding sections. However, an examination of theeconomic implications of all other areas of proposed legislation Is clearly desirable, as well as a reviewof the implementation experience of recently issued or adjusted regulations. This is a major undertakingwhich should be launched in the short to medium term.
5.58 With regard to the issues raised in the preceding sections, concerning the need forregulation to enforce competition, there is clearly a need to carefully assess the need to adapt anyproposed legislation to the structure of China's economy. The problem in China today is not firm size,per se, or asset concentration, but rather, market conduct. In terms of structure, China has the oppositeproblem, of difficulties of growth in enterprise size, in terms of difficulties in growth through mergersor enterprise groups, even when this may be economically desirable. At present there appears to bescope for efficiency gains from encouraging such formations, in some circumstances. New regulationsmust be careful to permit their orderly growth and distinguish between cases when such formations maybe economically desirable from cases where they would not be.
5.59 There are difficulties in granting a blanket permit to the development of some enterprisegroups, such as the 'fake' groups set up through the transformation of administrative bureaus, or groupsformed through coercion or 'hostile takeovers' or other fraudulent means. There is also an unusual degreeof difference in the treatment granted to the 55 large enterprise groups, relative to other groups. The basisfor differences in treatment, and the means of distinguishing between different forms of groups, require
4' The Bome convention in July and the Univesal Copynght Convention in October, of 1992.
- 145 -
clarification. Meanwhile, the present focus on market conduct, as opposed to size, as indicated by the'anti-unfair competition' law currently under review appears appropriate. However, the draft law has notbeen reviewed and detailed comments on this must await such a review.
5.60 Next, regarding the process of entry, it is clear that the present process is (1) complex,and (2) has a large discretionary element. Both issues need to be addressed. The two recent drives,against corruption In implementation, and in favor of a procedural simplification are both to bewelcomed. The problems in this area bear a strong resemblance in their nature to the myriad fees, fines,taxes and tolls levied on interprovincial trade, and as such may be symptomatic of a generic issue in thepresent forms of market regulation. In this instance too, it is desirable to have greater homogeneity inapplication and procedure across the various regional Bureaus of Industry and Commerce, and to makethe requirements and processes more transparent.
5.61 Regarding the SAIC itself, its rapid growth is likely to continue, as the need for marketregulation increases, if there are no interventions. It would be desirable, as this organization continuesto expand, to consider alternative means of separating its very diverse spectrum of activities. Forexample, the functions of competition enforcement, enterprise licensing, consumer protection and theregulation of commodities and futures markets usually lie with different authorities, in a moderatelyadvanced market economy. Although the limited age and experience of the organization, in the contextof China's rapid evolution towards a market economic systen, account for and explain Its presentstructure, there is a case for beginning now to examine alternatives for its future structure.
5.62 With regard to other legislation, it can only be said that rapid changes have beenintroduced, many of which appear to be in the right direction. China has clearly begun to develop a moresophisticated system of producer protection, in the form of patents, trademark, and copyright laws, frompredatory market behavior. It is hoped that consumer protection against fraudulent and fake products willalso be reinforced. Ultimately, however, it must be recognized, that the passage of laws alone is notenough. In some cases laws are passed without adequate prior review, and there may also be cases wherereulations reflect to some degree the self interest of the departments which prepare the draft legislation.And finally, the process of administration of the laws cannot be separated from the legal framework itself,and will require a detailed simultaneous examination.

6Markets and Government: Future Perspectives
A. General Themes - A Synthesis
6.1 It is clear from the discussion of the preceding chapters that China has made remarkablestrides, over the last decade, towards the establishment of a market economy. Particularly notable, inthis regard, is its progress in replacing the allocative mechanisms of the former planning regime withallocation through the market, based on signals through the price system. The reducuLon in the proportionof goods allocated though the plan, as well as the increase in the proportion of goods subject to marketprices, has been remarkable. As the analysis here shows, there has been a significant consequentreduction in the disparities in prices in different markets. Recent price reforms in early 1993 haveconsolidated and extended the progress achieved since the introduction of the dual track system in the mid1980s. China has also taken bold steps towards exploring the establishment of new forms of marketsusually found in mature market economies, as a part of its program of structural change.
6.2 However, as the report shows, the progress achieved so far has been uneven. In someareas of its transition towards a market economy, China is still well below its potential. The foremostamong these concerns the spatial or regional fragmentation of its markets. China has not taken advantageof the benefits of specialization of other large countries and its economic structure still tends to berelatively 'cellular', with a striking similarity of industrial pattern by region, and relatively little changein this structure over time. As a consequence, many benefits, such as scale economies in plant size, andthe spreading of overheads in management, technology and learning, communications and infrastructureassociated with the development of industrial 'clusters', have yet to be exploited. Moreover, despite therapid decline in the number and level of price controls, there are still persistent regional price differentialsamong both producer and consumer goods.
6.3 Data presently available on trends in the development of interregional trade, as well ascross-provincial investment, suggest that individual provinces are tending to behave like independentcountries, with an increase in external trade and a relative decline in trade flows with each other. Whiledata coverage issues require caution in interpreting the final results, Another explanation for the declinein trade, the sustained downward trend, continuing until the present, is still difficult to explain. A partof this decline may be ascribed to the reduction in the forced movement of goods under the plan system,over 1985 to 1988, in the period of the interprovincial 'trade wars'. The partial deregulation of the outputand selling price of some goods led to incentives to evade public procurement, in favor of free marketprices. These attempts at evasion, in turn, were countered by provincial authorities by the erection ofexport embargoes. The absence of any overarching regulations on interprovincial trade leaves the countryvulnerable to such whims at the provincial level. However, with further relaxations in price and quantitycontrols, as well as the decline in the short-lived demand boom of that period, such export embargoesbecame much less significant. Other possible reasons for the continuing decline include the problems of
- 147 -
numerous fees and fines, extracted on the road, legal as well as illegal, and also, the difficulties oftransportation, especially by rail.
6.4 The role of the fiscal system, and the incentives and authority given to provincial andlocal governments to raise revenues in contributing to the relative increase in provincial autarky, fromthe point of view of investment, is clearly significant. The separation of profits and taxes wasaccompanied by the introduction of profit retention, as well as an increase in local authorities' taxationpowers. It is therefore to the advantage of local governments to retain enterprises within theirjurisdictions. Besides, incentives for interprovincial investment are confused by the large number ofspecial zones, with their various authorized or unauthorized tax rebates or deductions.
6.5 If regional trade and specialization are to be promoted, there should be crediblemechanisms in place for the redistribution of benefits among the various regions. Today, with the markedrelative decline in the proportion of total revenue accruing to the central government, the scope for suchredistributive mechanisms is more constrained. The reforms in the fiscal system introduced in January1994 should help to alleviate the situation.
6.6 China's transition experience shows that the withdrawal of the state from allocation, andeven pricing decisions, need not lead automatically towards the withdrawal of the state from distribution.It may argued that the state In China was reluctant to abandon its former role in this area, but it appearsmore likely that it was more difficult for the state to withdraw, whether or not it wished to. Markets, itappears on the basis of the evidence presented here, do not emerge automatically. The innovative changesin the distribution system, which is still state-dominated, in response to other changes in marketmechanisms, do not suggest a conservative attitude. Moreover, they illustrate that the state sector hasbeen able to respond to competitive stimuli, and that changes in operation are being effected despiterelatively gradual changes in ownership. The combined requirements of capital-intentsive infrastructureand the need to build information networks across large regions and many entities may well make it moredifficult for the non-state sector to enter the business of distribution, relative to production. There ishowever scope for greater encouragement from the state in diversifying the ownership base and range ofservices of distribution.
6.7 Continuing state intervention in distribution has also taken the form of intervention in theprices (or quantities) of distribution services, for example, freight and storage. As the examples of thepreceding chapters clearly illustrate, it is not possible to Isolate these controls, and the effects of controlsin these spheres will spill over into the prices of goods which are allowed to vary. Two cases whichprovided examples were the effects of controls on freight availability, which are reflected in grain prices,and the effects of differential storage subsidies, for state and non-state enterprises, which are arbitragedthrough forward prices on metals contracts. If markets function, such transmissions of price controlsthrough the creation of 'proxy' markets are normal, and reinforce the case for proceeding with the liftingof residual controls on prices and quantities.
6.8 The most striking example provided here of the effects of controls in one market, on therest of the economy, is the story of foreign exchange speculation through trade on the metals exchanges.If there are markets which deal in forward and futures contracts, and engage in the exchange ofinterhiationally tradable commodities, these markets will inevitably also reflect movements in the foreignexchange rate, if foreign exchange is a non-tradable. In the absence of free tradability of foreignexchange, a large part of the ralson-d'etre of such exchanges will be speculative. The considerable andrapidly growing volume of trade on the exchanges already, and the large part of this which iz speculative,
- 148 -
suggests that the foreign exchange market is more constrained today than is, at first, apparent. Theconsequences for the rest of the economy, in terms of distortions in price signals elsewhere (ie, in themetals exchanges) are also obvious. With the removal of the dual exchange rate system, and theintroduction of an interbank market in foreign exchange, this situation should improve, provided thereis free access to foreign exchange for all traders.
6.9 The uneven pace of China's movement towards a market economy is nowhere felt asstrongly as in the realm of regulation. It is clear that in many areas, China has plunged ahead, in termsboth with the elimination of controls, as well as with experiments with major innovations in marketforms, without providing the necessary framework of consistent regulation for the new system. This doesnot necessarily imply an absence of regulation, on the contrary the difficulty sometimes is the presenceof a large variety of mutually inconsistent regulations. This is clearly illustrated in the case of the newcommodities and futures markets, where today a bewildering array of regulations exist, in the differentexchanges, depending on by whom they were established. There are wide mutual differences in terms offinancial conditions of membership, restrictions on price variation, the treatment of profits and the roleof supervisory agencies. There are also some considerable differences between these exchanges today,and standard regulation in more mature economies, for example, in cor ission fees charged. Recentmoves towards the establishment of common oversight bodies are to be *med. It is to be hoped thatthese will be established before the proliferation of commodities exchanges proceeds much further. Themore detailed tasks of harmonizing the legislation of individual exchanges must soon follow.
6.10 The need for adapting existing regulations or devising new regulations is also apparentin several other areas, particularly those laws which affect the degree of competition in the economy.Until 1993, there was no single competition law in China. In September 1993, the 'Anti-UnfairCompetition' law was adopted, which has a heavy emphasis on unfair trading practices such as falsetrademarks or false advertizing, as well as the violation of trade secrets. Although the new law does notemphasize the control of monopolistic practices, referring back to China's fragmented and cellularindustrial structure, the need for this so far has not clearly emerged. Any new law must be adapted tothe structural conditions of the economy, which in this instance implies not an emphasis on size, per se,but rather, the exercise of market power in terms of behavior. The new legislation has some provisionsfor this, which may in the future require fortification.
6.11 A new law on contracts, as well as a new version of the company law, were presentedto the State Council at the same time as the 'anti-unfair competition' law. The company law was finallyadopted on January 1, 1994. Another new law relating to market conduct, the Consumer Protection law,was adopted in November 1993. There are other pieces of legislation affecting various areas ofcompetition. For example, entry for new enterprises or units is largely, though not entirely, governedby laws relating to the activities of the State Administration of Industry and Commerce. This agency isalready overburdened and it is not clear that in the future it will be able to discharge these multipleresponsibilities efficiently. Laws on exit until recently were governed by the Bankruptcy law of December1986. Since then, considerable flexibility has been introduced in the context of enterprise downscalingby amendments in labor laws, which eased the conditions for partial or complete exit. The new companylaw includes detailed provisions for the implementation of bankruptcy procedures. Laws on patents andon copyright protection have been introduced, and the law on trademarks was modified in 1993, partlyas a result of China's efforts to accede to the GAT.
6.12 Based upon these general themes, which have emerged from the preceding analysis, thefollowing sections explore a set of actions which could follow, to fortify and strengthen the present
- 149 -
functioning of the market economy. A first set of actions discussed here refer to policy variables affectingthe functioning of the markets, and here it must be understood that since policy recommendations mayrequire trade-offs, only broad directions for change are prescribed. In the following section, however,which deals with the less ambiguous area of the functioning of 'real' markets, (such as improvements Inthe distribution system, or modifications to the trading mechanisms in the new commodity markets), moredetailed recommendations are possible.
B. Policy, Regulation and Administration
Price and Quantity Controls
6.13 A first area to examine, In terms of policy, is China's control over decisions on pricesand quantities, or resource allocation. Over the reform period these have been the key areas of focus ofpolicy makers, and a principal tool towards the movement towards a market economy. These instrumentshave been extensively used and have had a demonstrated effect already, in terms of price convergenceand market unification. A question which therefore arises today is, has their use been exhausted?
6.14 The present report suggests that this is not the case; there is still scope for adjustment inprices and in quantitative controls. It is recommended that residual controls on prices continue to belifted. So far, the emphasis has been on the prices, or allocation, of goods. In the next stage, theemphasis must move towards residual price and quantity restraints on services and on factors ofproduction. One finding here, which underscores the need for such firther action, is the fact that thereare 'leaks' from residual controls, which affect and distort the pricing of goods whose prices are notcontrolled. In the service area, these prices included freight quotas and subsidies, and storage subsidies.In fictor markets, foreign exchange is a prominent example. The argument many also be extended to thepricing of labor (where much progress has been achieved in the past few years) and the pricing of capital,although this has not been demonstrated in the present report. Establishing functioning markets in theseareas has been a slower process, so far, than in the case of goods.
Internal Trade
6.15 A second broad policy area to be examined is the issue of regional trade and theintegration of regional markets. Looking first at trade in goods, China relative to most other largecountries today suffers from the disadvantage of a lack of a general framework of legislation oninterregional trade, which would prohibit certain kinds of trade barriers, including export embargoes orimport restraints. First, the drawing up of an overall framework of regulation on domestic trade Isnecessary, whether as a constitutional clause (as in the US, and India, for example), or in the form ofother national level legislation. Second, the myriad fees and fines, legal and otherwise, levied onInterprovincial (or even lntercounty) trade today must be clarified. Ideally, If provincial approval Ispossible, a nationwide standardized list of genuine charges should be prepared. Third, if a commonlist cannot be agreed upon, the transparency of the procedure followed In each local jurisdiction canbe improved through the colection and periodic publication of schedules of tariffs, taxes and othercharges, at a provincial or national level. Then if a specific Item was not on the 'masterlist', it wouldbe know to be suspect. Fourth, the collection agencdes for each of these fees should also be

- 150 -
standardized, or once again, the details of persons or agencies responsible for collection should bemade evident and readily available.
6.16 Internal trade is also affected by regulations on transportation. Although detaledrecommendations on transport are available in other reports, some key issues affecting distributionalefficiency are pointed out or reiterated here. Producer goods have been particularly dependent on therailroad system, which has suffered over a prolonged period from severe underinvestment. One reasonfor this was the lack of adequate revenues from railways, due to the low passenger and freight tariffs.Recent successive raises in tariffs are expected to Improve the profitability of the system. In parallel, theassignment of freight quotas to specific producers or users must also be examined. This practice has ledto distortions in the prices of commodities requiring rail freight. The removal of subsidies to railwayfreight users should be combined with the removal of the practice of assigning freight quotas tospecific individuals or agencies.
6.17 Another policy issue of concern in this context is the regulation and administration of thetrucking business. Although the entry and pricing of trucking services has become more flexible since1983, the overlap in some of the functions the multiple agencies whose perndts are required forHeensing and registration (the local Transportation Bureaux as weU as the Public Security Office)should be removed. There are also severe constraints on the time period, and permitted uses, of'own account' trucks, which should be relaxed to permit greater flexibility. The deregulation oftrucking tariffs has taken the form of 'decentralized regulation', with the transfer of the authority forsetting tariffs to the local Departments of Communications. As a result, there are now considerableregional variations in tariffs. The need for such decentralized regulation is questionable and some of thesetariffs could probably be deregulated altogether, which would remove some tariff disparities. To thextent that truck tariffs could be deregulated, this should be undertaken; If tariff regulation Is stili
considered imperative In some areas, large regional variations In these tariffs should be reduced,through a harmonization of regional rates.
6.18 Another factor affecting the movement of goods, which is likely to become more evidentas the more obvious barriers are dealt with, is the question of government procurement. At present thereare no transparent regulations for this at lower levels of governments. It is considered normal today togive preferences to local suppliers. This is unusual in other federal countries and also in larger economictrading areas, such as the European Community. Government purchases should focus on obtaining thebest value and should not grant more than limited and transparent local preferences, at best. Thisrequires that the procedure for bidding for local govermment financed contracts should be madetransparent, and as far as possible uniried across regional governments at the same level. It shouldalso be assured that there is no discrimination between suppliers of different regions. Once thequestion is raised more frequently, these issues will follow.
Factor Mobility
6.19 Even more major issues arise in the context of capital mobility and interprovincialinvestments. It is clear today that the present fiscal system has inbuilt disincentives for permitting themobility of enterprises to other jurisdictions, if this implies a loss of both income and corporate taxes.It is necessary to reexamine the assignment of taxes, from this perspective. Although income taxes wouldnot be lost if guidelines are followed on the transfer of such taxes to the originating province, it is clearthat there are both legal and illegal circumventions of this regulation in various jurisdictions, as a resultof the establishment of special 'zones'. While many Illicit zones have recently been removed, the 200-
- 1S1 -
odd which have been permitted to remain are still a non-negligible number. The undesirableconsequences for the economy as a whole, despite short term local advantages, have to be recognizedand acted upon.
6.20 Many other issues arise on the subject of capital mobility, which could not be treated indepth in the present work, as they are too large to be explored in adequate detail. However, to enumerate,these include issues on interstate flows of deposits or loans through the banking system, as well as new,alternative markets for capital. Today, these have been developed little, and these questions are likely toloom larger in later years. It is not too early for China to begin devising appropriate regulation, whichwould also help develop these new markets into major alternative channels for interregional capital flows.
6.21 Additionally, government contributions to capital investments, which today are muchlower than in the past, have to be considered in this context. One positiv role played by these in the pastwas as a vehicle for some form of regional redistribution. Although the withdrawal of the state fromdirect support for industrial investment is normal in a market economy, the redistributive role of thesecontributions should not be forgotten. The need for setting up alternative new structures such as theEuropean Community's Structural Funds, to undertake these functions, should be explored.'
6.22 Concerning the labor market, it is true that the flexibility in the deployment of labor hasincreased considerably over the last few years, and so has de facto wage flexibility. There has been lessprogress however in increasing the regional mobility of labor, which is still strictly regulated. Oneimportant reason for restricting labor mobility in the past was urban grain rationing. However, sincemany of these rations have been lifted in early 1993, this is an appropriate moment to reconsiderthe need for maintaining the present restraints on lbor mobility under the permanent residenceregistration system. While the shortage of urban residences and the very limited market in housing isstill a constraint, an increase in regional mobility, over the present levels, could certainly be effected.
6.23 Under the 'swap center' system, constraints on the moblity of forelgn exchangeclearly existed, as demonstrated by the volume of speculative activity on the metals exchanges.2 Atpresent, the system is in transition, and in principle, with the interbank foreign exchange marketand the unification of the exchange rate, direct access to foreign exchange could be gredlyimproved. This will have to be carefuly monitored especily in its nital stages to ensure that themarket fulfils this expectation, so that the new commodities markets can fulfil their primaryfunction.
This is explored in the rt report on China's budgetary policy and inrvnm fiscal relations;(World Bank 11094-CHA, July 1993). Ihis report also points out Ihe erosion of the redistributivecapacity of the central govemment (pam 3.98) and recommends the setting up of a closed-end,interprovincial equalization fund (pam. 3.114), filled with a cetain percentage of taxes sbated betweencentral and local governments, admiistered by a body with both local and central representatives.
World Bank (1993), Report No. 11568-CHA, discusses the foreign exchange market in detail; thepresent recommedations are focused on the links between this and other markets, and therepeusons of the method of regulating mobilty in foreign exchange an the rest of the economy.
- 152 -
Market Regulation
6.24 China's rapid moves towards experiments with sophisticated instruments of a marketeconomy are bold steps, and care must be taken to ensure that these experiments do not founder becauof a lack of adequate definition of a framework of regulation. The predominant concern In this areso far has been the lack of an overall framework of supervision for the new exchanges. At present,the task of registering exchanges has been entrusted to the State Administration of Industry andCommerce, and the responsibility for their supervision has very recently been assigned to a new body,the China Securities Supervision and Administration Committee. Regulations for the latter are underpreparation, and this report presents different options for the approach towards the supervision of suchagencies, In terms of their scope and method of functioning. The early adoption of a standardframework of regulations is necessary today. Once the overall umbrella is in place, the task ofreconciling the differences in operating rules of different exchanges must also be undertaken.Finally, a critical element of the legislation on these exchanges, which so far has been neglected, is toput In place appropriate financial safeguards for participants on the exchanges, through theestablishment of a Fidefity Fund.
6.25 It is not clear that the SAIC is the body best suited to handle the process of registeringor approving new exchanges. Although this appears to be a natural extension of its present duties, ofregistering other new enterprises, the approval of commodities exchanges requires far morespecialized knowledge of trading systems and would be better handled by a separate department ofthe new China Seurities Committee. While the SAIC is now expected to re-register the exchangesafter their scrutiny by the Securities Committee, the role of the SAIC in this process should be limitedand not discretionary. Another issue here concerns the regulations, recently adopted by the SAIC, fortraders and brokers on the exchanges, which may restrict the number of participants on the newexchanges. It Is more desirable to have a smaller number of exchanges, but with a relatively brgenumber of participants on each, than vice versa.
6.26 ITe recent history of the operation of the commodity exchanges also emphasizes a pointraised earlier, in the context of 'proxy markets' and price controls; the difficulty of reconciling continuedgovernment intervention in some areas of these markets, with the concept of commodity exchanges. Asillustrated here, continued government intervention in activities related to the exchange of commodities,such as setting price ceilings or floors (as in the case of the Zhengzhou grain center), or warehousing(through the provision of differential subsidies, in the metals trade) runs the risk of either underminingthe price uncertainty on which such exchanges depend, or raising the pressure to continually increasegovernment subsidies, as these are transferred through arbitrage to all participants on the market. Onceagain the mesage Is that market economies are made up of a single price 'system', and that residualad hoc controls today would generate 'nterference' in other price signals. The early removal of suchconstraints is required to permit the new markets to function effectively.
6.27 A key issue which China must confront in its experiments with new market forms, andspecifically in the area of establishing commodities markets, is the fact that the present large numbers ofsuch exchanges will probably diminish over time due to a number of factors; the improvement in internalcommunications, closer integration with the world economy and consequently closer links with exchangesoutside the country. The reduction in speculative activity as the 'zero-sum' nature of such trade is betterunderstood, and the establishment of independent markets, most importantly in foreign exchange, willhasten this process. The likelihood of considerable waste in the establishment of several new

- 153 -
exchanges, especially In view of the presently preferred capital-Intensive methods of trading, mustbe recognized and more exchanges should only be established If expected to be sustainable In themedium term.
6.28 China is already aware of its need to develop regulation appropriate to the functioningof competitive markets, and has made considerable progress in this direction in 1993, through the lawsavainst unfair competition, the law on consumer protection, and the product liability law. Laws tosafeguard market competition through the protection of patents and trademarks have already beenapproved. It must be recognized, in this context, that the problem of monopoly in China is not pervasive,unlike many other transforming socialist countries, and consequently, the emphasis should be on thepromotion of competition, and the control of unfair trading practices, rather than safeguardsagainst, or dismantling of, large enterprises or groups of enterprises. The new competition law adoptsthis focus. The law has relatively little detail on more traditional areas of competition policy such asprice maintenance or cartels. These aspects may have to be reinforced in the future.
6.29 China is today experimenting with the fostering of links between enterprises and theformation of enterprise groups and some of the experiments are likely to increase operational efficiency,and facilitate interregional investments, given the backdrop of the cellular structure of the economy. Caremust be exercised to not snuff out these experiments with unduly restrictive regulations on mergers orenterprise groups.
6.30 It mus. also be remembered that competition law is far from being the only, or even theprincipal, vehicle of regulation for establishing a competitive economic environment. Laws on entry, orexit are at least equally important. The administration of the process of entry and exit, moreover, maysometimes be as important as the law. In this regard, the present study suggests that the procedures forestablishing new enterprises are still relatively onerous. Many different agencies' permits are required,and the discretionary role given to some of these, especially, today, the SAIC, is large. The role of theSAIC has expanded enormously over the last few years, as the market economy has developed, and itis undertaking the work entrusted to several different agencies in market economies (including thelicensing of establishments, the safeguarding of competition and the approval of new commodityexchanges). It is recommended that the functions of the SAIC and other agencies should be redefinedto make them more transparent and reduce the discretionary element. It Is also recommended thatsome of the SAIC's functions (such as, monitoring unfair practices, monitoring cases of fraud inlabelling and trademarks, and taking care of enterprise entry requirements), be delegated to morespecialized agencies in the future.
6.31 The agenda for legal reform appropriate to a market economy which is now beinglaunched, as part of the Five-year plan for economic legislation is ambitious in scope. A number ofdifferent agencies will tackle different aspects of reform, and the process could be slow, especially inview of the need for drafting assistance required by some of the agencies concerned. Care must be takento temper the universal enthusiasm and determination for setting up the legal framework for amarket economy, with the recognition that a proliferation of new laws, sometimes conflicting Inscope, or In terms of agencies concerned, could be counterproductive. Care must also be taken tocounter any tendencies to permit the interests of the agencies drafting the laws to dominate the new draftlegislation. The World Bank has indicated willingness to assist the Chinese government in this processof legal reform through an Economic Law Reform Project, which is currently under preparation.
- 154 -
C. Physical Constraints and the Management of Distribution
Distribution Practices and Distribution Facilities
6.32 Prescriptions for solutions to the physical difficulties of establishing markets, as well asthe minutiae of the management of marketing systems are less controversial, but equally necessary, toensure that the 'real' side of markets develops in tandem with the new policy environment. Looking firstat the process of materials distribution, the slowness of the state to detach itself from this sphere ofactivities requires that the state bears a significant responsibility for the continued streamlining andimprovement of the marketing and distribution process. It is first necessary to carefully examine thewide range of activities with which the MME Is involved, In some of Its bureaus, Incuding industry,real estate and construction. It may be advisable to limit the scope of some activities, a part of whichare speculative in nature, such as the real estate dealings. However, it is also essential to perceive therationale for its involvement in these activities. One possible explanation may be that some of thedistributional activities in which a normal distribution agency In a market economy may be Involved(for example, warehousing or transportation) are not attractive to the MME bureaus, because ofprice regulation or other curbs. Such constraints should be removed, so that the expansion of thematerials distribution bureaus into activities related to their maln business will be more likely.
6.33 Action to increase future competition through new entrants is also required. Leclbureaus should be permitted to, and encouraged to, expand into other localities, and entry intodistribution by individuals and collectives should also be facilitated, for example by permitting themto lease warehouse space from government bureaus.
6.34 One direction of diversification undertaken by some materias bureaux is the adding ofvalue to their products, through processing, blending or packaging. Such vWalue-adding activities, whichprovide additional quality or convenience for buyers should be encouraged. Quality control andtesting facilities are also desirable. However some materias bureaus talk about the undertaking ofresearch on the materials they distribute. Such industry facilities may be better integrated with productionenterprises than with distribution enterprises.
6.35 Another issue on the organization of the materials bureaus concerns their typical twelve-enterprise structure, below the central materials bureau of each location. This structure is the result ofthe takeover of the marketing and distribution fiuntions of some production bureaus, with agreements tomaintain their structures intact. As a result, the present material bureau 12-etprise structures lackthe flexibility to adapt to local needs. t would be desirable to permit the materals bureaus fuUflexibility to rationalize (expand, mge, separate or even dose down) these Individual materialsenterprises.
6.36 Similarly, the comprehensive distribution centers (which had emerged as a consequenceof partially deregulating the output of some goods, and the need to create marketing opportunities andoutiets for the portions of output sold outside the plan) may also require, or naturally undergo, structurarationalization. In the future, goods which are similar, or related, In terms of customer requirements,should be sold at a single center, or store.
6.37 More detailed attention must be paid to the physical facilities of the distributionsystem. Many of the warehouses owned by the materials bureaus are old, in some cases with inadequate

- 155 -
protection against the elements, leading to spoilage and damage in storage. However this demands adetailed review of existing facilities and appraisal of the costs of any proposed additions. Ile locationof the new facilities at the sites of existing storage centers may not be optimal. Many warehouses todayare located In urban areas, and their relocation to points outside major cities, but wel connectedby road or rail, should be considered. In the future, the mechanization of materials handling and thecomputerization of order placement and Inventory management will require Introduction.
6.38 There is scope for better management of distribution functions of existing warehousefacilities. For example, the reduction of partly-loaded truck shipments, the reduction of the numberof times goods are handled or moved and improved inventory management through more reliableshipping from producers as well as more infnrmation from users. Better physical management ofwarehouse space by arranging goods on a computerized customer order in the order in which they willbe picked up from warehouse shelves will reduce pick-up time and effort. The introduction of 'crossdocking' practices to permit vehicles bringing in supplies to be transferred directly to delivery vehiclesto purchasers, will also reduce materials handling and increase distributional efficiency. The developmentof backchannels for the recycling of used materials should also be introduced.
6.39 There is also a need to examine the financial condition of the materials bureaus. Theextent to which the decline in profitability of the materials bureaus may indeed be attributed to lossesmade on goods which remain under planned allocation will have to be ascertained. Given the recentconsiderable reduction in these goods, the profit rates of the materials bureaus should improve as aconsequence. The materials bureaus have also ascribed poor profitability to transportation difficulties. Theextent to which profitability coud improve as a result of the adoption of more efficient distributionpractices must also be considered. A detailed examinatlon of the profitability, cash-flow and inventorymanagement of the mateials distribution system should be launched as an exercise which combinesmarketing as well as financial expertise Since the last major round of price decontrols has just beenconcluded, this is an appropriate time to begin such an undertklng.
Road Transportation
6.40 Transportationby road is important for many raw materials, and agricultural goods. Apartfrom the policy issues affecting entry, and tariff structure, which have been raised above, there are issueshere too concerning the efficiency of management of trucking operations. For example, one practice thatwould aid the growth of private 'own account' truckers is the development of freight forwarding andconsoldation centers, to serve as collection points for goods shipped in lessthan-truckloadquantities. In the medium term, the growth of intercity and interprovincial trucking would be facilitatedby the development of Intermodal transportation systems, which enable goods to be moved from railto truck, or to barge or back, as efficencies dictate. Such systems require the development ofcontainerized shipping, which China is now beginning to explore.
Commodities and Futures Markets
6.41 Scope for improvements in the operational and cost efficiency of the many new exchangesin China can be pointed out, and can be effected independendy of the policy issues concerning theseexchanges given above. A first issue here concerns the nure of trading practices. The Metals Exchangeat Shanghai is a fully computerized screen based system, where, as has been pointed out, the existenceof a trading floor is redundant. The Shenzhen exchange is a combination of an 'open outcr' system, witha large central screen recording bids and buys. In both cases, a simple open outcry ring deaing system

- 156 -
would not only have suMced, but may have been preferable, and considerably cheaper. Thecomputerized information entry requirements slow the trading process and vvill become a hindranceas the pace of trading accelerates. The growth of trade by 'market makers', trading on their ownaccount and providing essential liquidity to the system, is also impeded by the present systems.Although It may arguably be late to change the present system in these exchanges, these are importantconsiderations for the many new exchanges in the process of being approved. Objections to 'open outcry'based on its vulnerability to fraud, are exaggerated. However if this is a major consideration, the'Japanese Auction System' could be introduced, in which there Is a single price for all buying and sellingorders for a given trading session.
6.42 Even at the existing exchanges, there will soon be a need for a major extension ofcomputer facilities. This may be an opportune moment to reconsider the adoption of a cheaper and moreeffective trading system. Meanwhile, trading costs could be reduced with the utilization of thefacilities at a given trading center by more than one exchange. Since most exchanges at present donot trade every day of the week, or all hours of the day, this should certainly be feasible.
6.43 To encourage the continued growth of the use of these exchanges, it will be advisableto reduce the costs of trading extracted at the exchanges, In the form of fee. Fees in China today(at least at the metals exchanges) are unusually high, at 0.1 percent per transaction, compared for exampleto the average 0.0005 percent at the London Metal Exchange. Some of the exchanges are set up asprofit-maing entities, in contrast to exchanges in market economies, which are typlcally operatedthrough a break-even membership basis. There are similar questions concerning the margin depositrequirements, which are also extremely high, and discourage the use of commodities exchanges asa medium for managing inventory financing.
D. The Future Role of the Government
6.44 In a market economy, the role of the government in the realm of economic activity is thatof indirect intervention, to create an enabling environment for economic agents. The economy is thenregulated through market signals, which determine prices and resource allocation. Ihe economic functionsof the government are therefore very different from the dirigiste role required in a centrally plannedeconomy, where decisions on resource allocation and price levels are determined to a greater or lesserdegree by the government.
6.45 China today is confronted by the task of transforming the economic role of its governmentfrom that required in a system of central planning, to a role more appropriate for a market economy.While China has made huge, and successful, efforts to disengage the State from the role bestowed uponit under the period of pianning, it has been less clear about the role of the government in a decentralizedmarket economy. A first issue here is that in some areas of economic activity, controls have been relaxed,but there are no regulations to replace these controls. Second, in some instances, the difficulty is not theabsence of new regulations, but rather, a proliferation of regulations, put forward by a variety of agents.Not surprisingly, there are sometimes contradictions between these independent regulations. Third, insome cases, the new regulations reflect the interests of the agencies who have drafted them to a greateldegree than they safeguard the interests of the affected individuals. China's emerging new commoditiesmarkets, to take an examle, illustrate all these difficulties. First, there is an absence of umbrella

- 157 -
legislation for all commodities and futures markets. To the extent that regulations exist at the individualexchanges, there are wide differences between them, in terms of supervisory responsibility. Moreover,in many areas the regulations are not in the best interests of users (the profit-seeking basis on which theyare established, the high commissions per transaction, and the lack of financial safeguards for users).These are the broad areas to which the government will have to pay increased attention, in its future roleas regulator, rather than controller, of economic activity.
6.46 One style of deregulation which has frequently been adopted in the context of China'seconomic reform program is the decentralization of regulatory authority, to lower levels of governments.This is true not only of some areas of prices (procurement prices for agricultural products, tariffs fortransport), but also in terms of licensing requirements for transport operators, and a multitude of fees andcharges levied on persons trading or transporting goods in any given province. This form of 'decontrol'can be misleading. Decentralized regulation can have the effect of creating large differences in economicregulations between local jurisdictional levels and consequent problems of differences in economicbehavior. The preceding analysis has shown that the spatial integration of China's markets represents amajor issue in its move towards a market economy and the difficuldes already present here couldsometimes be exacerbated by this form of decentralization of the authority to regulate. It is clearlynecessary to demarcate and distinguish botween economic functions where such decentralization isdesirable, from others where this is less clearly so.
6.47 In the medium term, China may wish to seriously consider the possibility of anenumeration of all internal barriers on trade and factor movements, in the same fashion as was undertakenin the European Community, in its White Paper of 1985, and prepare an agenda for dismantling these.China's version of such a document would look very different from that of the EC, where many barrierstook the form of technical specifications, or capital mobility constraints due to the independent financialsystems of member countries. These are not issues in China today. However, China will have its ownlist, which will include fees and fines on the movement of goods, tax regimes and factor mobility, andunique problems in the sphere of labor mobility. There will also be many issues, (both including and inaddition to those in the five year legal reform program) concening the drawing up of umbrella legislationon market management, as well as the harmonization of existing legislation, in different parts of China.
6.48 Finally, the government at all levels would have to pay more attention to the enforcementof Uts new regulatory framework. If direct intervention is to be limited, indirect itervention can only becredible if it can be successfully enforced. In this regard there are many instances today of ad hocism inthe application of regulations, with wide discretionary margins at all levels of authority. If this situationpersists, it will undermine the plausibility of 'market regulation', and lead instead to a situation wheredecontrol is replaced by anarchy, rather than monitored indirect regulation. The many tax 'zones' andexemptions provide one example; the equally numerous fines, fees and levies on interstate transport andfreight, by authorized and unauthorized personnel, provide another. The issue of enforcement must beconfronted as part of China's transformation towards indirect regulation and the establishment of a marketeconomy.

- 158 -
REERNCES
Agarwala, Raingopal (1992) China: Reforming Intergovernmental Fiscal Relations. World BankDiscussion Papers No. 178. China and Mongolia Department.
Albouy, Yves (1991) 'Coal Pricing in China'. World Bank Discussion Papers, China and MongoliaDepartment Series, No. 138. Washington D.C.
Altrogge, Phyllis, and Pitman, Russel (1992) 'Some Principles for an Effective Competition Policy inDeveloping and Transforming Economies'. US Government, Federal Trade Commission andDepartment of Justice. Mimeo.
Balassa, Bela (1961) The Theory of Economic Integration. R.D Irwin. Homewood, Illinois.
Baldwin, Richard (1989) 'The Growth Effects of 1992'. Economic Policy. pp. 277-99. October.
Banister, Judith (1989) 'The Migration of Surplus Laborers in China'. Mimeo, IUS Bureau of the Census.
Berglof, Erik and Perotti. Enrico (1992) 'The Governance StrucL re of the Japanese Financial Keiretsu'.ECARE (European Center for Advanced Research in Economics), Free University of Brussesand the London School of Economics. Muneo. November.
Boner, Roger and Krueger, Reinald (1991) 'lhe Basics of Antitrust Policy: A Review of Ten Nationsand the EEC'. Industry Series paper No. 43. World Bank. February.
Buiges, P. and Sheehy, J. (1993) 'Recent Developments and Trends of European Integration'.Commission of the European Communes. Mimeo, March.
Byrd, William A. (1987) 'The Impact of the Two rier Plan/Market System in Chinese Industry. Journalof Comparative Economic. Vol. 11, No. 3 pp. 309-18. September.
Ceccini, Paolo (1988) The European Challenge 1992. The Benefits of a Single Market. TheCommission of the European Communities and Gower, UK.
Chetty, V.K., Ratha, D., and Singh, IJ. (1993) 'Wage Incentives, Labor Productvity and EconomicReforms'. Mimeo, Policy Research Department, World Bank.
China Investment Guide (1989) (4th dition). 'Regulation Concerning Preferetal Tax Policy in the SEZsand 14 Coassal Cities'. CmC Publishing House.
Chinese Academy of Social Sciences (CASS) (1992) 'The Current State of Inter-Provincial Trade inChina and its Development Strategy'. Mimeo, November.

-159 -
Chinese Academy of Social Sciences (CASS) (1992) 'Background Data on the Chinese ConsumerCommodity Circulation Channel'. Mimeo, November.
Chinese Academy of Social Sciences (CASS) (1992) 'The Evolution and Change of the Purchasing andMarketing System for Consumer Goods in China'. Mimeo, November.
Chinese Academy of Social Sciences (CASS) (1992) 'A Study on the Consumer Goods CirculationSystem in China'. Mimeo, November.
Chinese Academy of Social Sciences (CASS) (1992) 'Background Data for Research of China's PriceManagement System of Consumer Goods'. Mimeo, November.
Christiansen, Flemming (1992) '"Market Transition" in China: The Case of the Jiangsu Labor Market,1978-1990'. Modern Odna. vol. 18, No. 1, pp. 72-93. January.
de Melo, Jaime, Panagariya, Arvind and Rodrik, Dani (1992) 'The New Regionalism: A CountryPcrspective. World Bank and CEPR conference on New Dimensions in Regional Integration.Washington DC. April.
Development Research Center, Government of China (1992) 'The Principles of Economic Zoning ofChina'. Mimeo, November
Development Research Center, Goverament of China (1992) 'Marketzaion in China: Progress in thepast Decade'. Mimeo, November
Dongsheng, Chen (1990) 'The Regional Economy', in P. Nolan and D. Fureng (eds.) lhe ChneseEconomny and Its Future. Polity Press, Cambridge, UK. pp. 259-267
Donnithorne, Audrey (1972) 'China's Cellular Economy: Some Trends since the Cultural Revolution.'China Quarterly. No. 52, pp. 605-19. October-Decei-ber.
Economic Research Center, State Council of the People's Republic of China (1981) 'Regulations onSpecial Ec ,nomic Zones in Guangdong Province' in the Almanac of China's Economy, 1981.
Emerson, M. et. al. (1988) Tle Economics of 1992. Oxford University Press, Oxfrod.
Eu;opean Commission (1985) 'Completing the Internal Market'. White Paper from the commission tothe Council. Luxembourg.
European Commission (1992a) 'Completing the Internal Market. Current Status 1 January 1992'. Paperfrom the Commission to the Council. 5 volumes. Luxembourg.
European Commission (1992b) Seventh Report of the Commission to the Council and the EuropeanParliament concerning the Implementation of the White Paper on the Completion of the IntnalMarket. Luxembourg.
Findlay, C., Martin, A., Watson, A. (1992)

- 160-
'Policy Reform, Economic Growth and China's Agriculture' University of Adelaide and theWorld Bank. Mimeo.
Forster, Keith (1991)'China's Tea War'. Chinese Economy Research Unit, The University of Adelaide. Mimeo.
Gao Shangquan and Ye Sen (eds.) (1990, 1991) China Economic Systems Reform Yearbooks. ChinaReforn Publishing lIouse. Beijing.
Groves, Theodore, Hong, Yongmiao, McMiIlan, John and Naughton, Barry (1992) 'Autonomy andIncentives in Cbinese State Enterprises'. University of California at San Diego. Mimeo, March.
Groves, Theodore, Hong, Yongmiao, McMillan, John and Naughton, Barry (1992) 'China's EvolvingManagerial Labor Market'. University of California San Cliego. Discussion Paper 92-36.September.
Halpern, Nina P. (1993) 'Changing State Functions: The 1988 Reorganization of the State EconomicBureaucracy'. Department of Political Science, Stanford University. Mimeo.
Harral, Clell G. (ed.) (1992) Transport Development in Soutien; China. World Bank Discussion PaperNo. 151, China and Mongolia Department Series.
HMSO Stationery Office (1975)'A Review of Monopolies and Mergers Policy'. London.
Huang, Yinfei (1992) 'Basic Situation of China's Financial Markets'. F7nancial Research (JinrongYanjiu), February.
Huang, Weixin (1992) Economic Integration as a Development Device. The Case of the EC and China.Nijmegen Studies in Development and Cultural Change. Vol 9. Verlag Breitenbach, SaarbrUckenand Fort Lauderdale.
Hufbauer, Gary C. (ed.) (1990) Europe 1992: An American Perspective. Brookings Institute.Washington DC.
Hufbauer, Gary C., and Schott, Jeffrey 1. (1992) North American Free Trade: Issues andRecommendations. Institute for International Economics, Washington DC.
Jacobs, Jane (1968) 'The Economy of Cities'. Vintage Books, New York.
Jefferson, Gary, Rawski, Thomas G., and Zheng, Yuxin (1992) 'Growth, Efficiency and Convergencein China's State and Collective Industry'. Economic Development and Cdutural Change. No.40, pp. 239-66. January.
Jefferson, Gary and Rawski, Thomas G. (1992) 'Unemployment, Underemployment and EmploymentPolicies in China's Cities'. Modern Odna. vol. 18, No. 1, pp. 42-71. January.

- 161 -
Jefferson, Gary and Wenyi Xu (1991) 'The Impact of Reform on Socialist Enterprises in Transition:Structure, Conduct and Performance in Chinese Industry'. Joumal of Comparative Economics.vol. 15, No. 1, pp. 45-64.
Jefferson, Gary and Rawski, Thomas G. (1993) 'Labor Markets as a Constraint on Reform In China'sUrban Economy' Mimeo, Universities of Brandeis and Pittsburgh.
Keidel, Albert (1993) The Third Japan US Symposium on China: Foreign Economic Relations. The JohnsHopkins University. Mimeo, July.
Khan, A.R., Griffin, Keith, Riskin, Carl, amd Zhao Renwei (1992) 'Household Income and itsDistribution in China'. China Quarterfly. (U.K.) No 132, December. pp 1029-61.
Kobayashi, Hironao (1992) 'Rural Economy and DistributionProblems in China'. Caina Newsletter. No.98, pp. 13-20. May-June. Jetro, Tokyo.
Krugman, Paul (199la) 'Increasing Returns and Economic Geography'. Journal of Politcal Eonomny.Vol. 99, No. 3, pp. 483-99. June.
Krugman, Paul (1991b) Geograpy and Trade. The MIT Press, Cambridge, Massachusetts USA andLondon England.
Krugman, Paul (1991c) 'History and Industrial Locaton: The Case of the ManuIacturing Belt.Amnetican Econondc Revkw, papers and proceedings. pp. 80-3. May.
Landell Mills Commodities (1993) Ile System of Commodity Exchanges in China. Mimeo, Oxford,U.K.
Langenfeld, James and Blitzer, Marsha W. (1991) 'Is Competition Policy the Last Thing Central avdEastern Europe Need?'. The American Journal of International Law and Policy. Vo. 6, No. 3,pp. 347-398. Spring.
Langhammer, Rolf J. and Hiemenz, Ulrich (1991) 'Regional Integration Among Developing Countries'.UNDP-World Bank Trade Expansion Program Occasional Paper 7. Washington D.C.
Lardy, Nicholas (1978) Economic Growth and Distribution in China. Cambridge University Press, NewYork.
Lardy, Nicholas (1983) Agriculture in China's Modern Economic Development. Cambridge UniversityPress, New York.
Lichtenstein, Natalie G. (1993) 'Enterprise Rebrm in China: The Evolving Legal Framework'. Annex4 in 'China: Enterprise Reform Strategy'. World Bank, Washington D.C. Draft. August.
Liu, Alan P. (1991) 'Communications and Development in Post-Mao Mainland China'. Issues andStudies. Vol. 27, No. 12, pp. 73-99. Decemer.

- 162 -
Liu, Yuelin (1993) Public Policy and Competition Amongst Foreign Investment Projects: a case studyof the Daya Bay Economic Development Zone in South China. Public Administration andDevelopment. Vol. 13, pp 65-800.
Lou Jiwei (19921) 'On Division of Economic Power between Central and Local Levels', in ChineseEconomic Studies, (eds.) Christine Wong and Dai Yuanchen. Vol. 25, Fall 1991-Summer 1992.
Lyons, Thomas P. (1987) Economic Integration and Planning in Maoist China. Columbia UniversityPress, New York.
Lyons, Thomas P. (1990) 'Planning and Interprovincial Cordination in Maoist China'. China QuarterlyNo. 121, pp. 36-60. March.
Lyons, Thomas P. (1991) 'Interprovincial Disparities in China: Output and Consumption: 1952-1987'.Economic Development and Qdtural Change. Vol. 39, No. 3, pp. 471-506. April.
Lyons, Thomas P. (1992) 'Grain in Fujian: Intra-Provincial Patterns of Production and Trade, 1952-1988. The China Quarterly. Vol. 129, pp. 184-215. March.
Lyons, Thomas P. (1992) 'Market-Oriented Reform in China: Cautionary Tales'. Department ofEconomics, Cornell University, Mimeo. Noi mber.
Ma, Jun and Li, Yong (1992) 'China's Regional Economic Policy: Effects and Altematives'. Mimeo.Georgetown University, Washington D.C. and Shandong Economics Research Center.September.
Ma, Jun (1992) 'China's Regional Policy and Its Macroeconomic Implications'. Mimeo, IMF.
Manion, Melanie (1993) 'Corruption by Design: An Institutional Study of Political corruption in thePeople's Republic of China. Case 1: Enterprise Licensing in a period of Market Reform'.Department of Political Science. University of Rochester, NY. Mimeo.
Michalopoulos, Constantine and Tarr, David (1992) 'Trade and Payments Arrangements for the Statesof Former USSR. Studies of Economies in Transition Paper No. 2. World Bank. WashingtonD.C.
McMillan, John and Naughton, Barry (1992) 'How to Reform a Planned Economy: Lessons fromChina'. Oxford ReWiew of Economic Policy. Vol. 8, No. 1, pp. 130-143. Spring.
Ministry of Materials and Equipment, Government of China (1992) 'Reforms of the Materials andEquipment Planning System'. Background Paper 1. November
Ministry of Mlaterials and Equipment, Government of China (1992) 'Reforms of Prices for Materials andEquipment'. Background Paper 2. November
Ministry of Materials and Equipment, Government of China (1992) 'Developemnt of Materials andEquipment Market'. Background Paper 3. November

- 163 -
Ministry of Materials and Equipment, Government of China (1992) 'Reform of Materials Enterprises'.Background Paper 4. November
Ministry of Materials and Equipment, Government of China (1992) 'Reform of the AdministrativeDepartments for Materials Circulation'. Background Paper 5. November
Ministry of Materials and Equipment, Government of China (1992) 'Introduction to Materis andEquipment Circulation Facilities, P.R.C'. Background Paper 6. November
Murphy, Kevin M., Schleifer, Andrei and Vishny, Robert W. (1989a) 'Income Distnbution, Market Sizeand ldustrialization'. Quarterly Journal of Economics, Vol. 104, pp. 537-564. August.
Murphy, Kevin M., Schleifer, Andrei and Vishmy, Robert W. (1989b) 'Industrialization and the BigPush' Journal of Political Economy Vol, 97 pp. 1003-26. October.
Naughton, Barry (1992) 'Implications of the State Monopoly Over Industry and its Relawion'. ModernCOna. Vol. 18, No. 1 pp. 1441. January.
Ody, Anthony (1991) China: Rural Enterprise, Rural Industry. World Bank, Washington DC.
OECD (Organization for Economic Cooperation and Development) (1991) Competition and EconomicDevelopment. Paris.
Oksenberg, Michael and Tong, James (1991) 'Me Evolution of Central-Provincial fiscal Relations inChina, 1971-1984: The Formal System. lhe Odna Quarterly. No. 25. March
Owen, Nicholas (1983) Economies of Scale, Competitiveness and Trade Patterns within the EuropeanCommunity. Oxford University Press. Oxford, New York.
Peck, M.J. (1989) 'Industrial Organization and the Gains from Europe 1992'. Brookings Papers onEconomic Actvi*y. Vol 2, pp. 277-99
Perotti, Enrico (1992) 'Financial Intermediation, Agency Theory and the Allocation of Control: AnInternational Comparison'. Mimeo, Boston University School of Economics.
Pieters, Hans Jilrgen (1992) Service. The New Focus in International Manufacturing and Trade. WorldBank, Policy Research Worldng Papers WPS 950. August.
Pinder, John (1991) European Community: The Building of a Union. Oxford University Press. Oxford,New York.
Porter, Michael E. (1990) The Competitive Advantage of Nations. Basic Books. New York.
Putterman, Louis (1992) 'Instittional Boundaries, Strucural Change and Economic Reform in China'.Modern China. Vol. 18, No. 1 pp. 3-13. January.
Qian, Yingyi and Stiglitz, Joseph (1993) 'A Report on the China Trip for the World Bank Project 'PublicPolicy and the Asian Miracle". Department of Economics, Stanformd University. Mimeo.

-164-
Rajaram, Anand (1991) 'Reforming Prices. The Experience of China, Hungary and Poland'. WorldBank Discussion Papers, China and Mongolia Department Series, No. 144. Washington D.C.
Rawski, Thomas G (1993) 'An Overvies of Chinese Industry in w-e 1980s'. Department of Economics,University of Pittsburgh. Mimeo. February.
Romer, Paul M. (1986) 'Increasing Returns and Long Run Growth.' Journal of Political Economy. Vol.94, pp. 1002-1037.
Rutkowski, Mark (1991) 'China's Floating Population and the Labor Market Reforms'. World Bank,Draft.
Shen Liren and Dai Yuanchen (1992) 'Formation of Dukedom Economies and Their Causes and Defects',in Chinese Economic Stdles, (eds.) Christine Wong and Dai Yuanchen. Vol. 25, Fall 1991-Summer 1992.
Solinger, Dorothy J. (1989a) 'Urban Reform and Relational contracting in Post-Mao China: AnInterpretation of the Transition from Plan to Market'. Studies in Comparative Communism, Vol.XX5 No 2/3. pp. 171-185. Summer/Autumn.
Solinger, Dorothy J. (1989b) 'City, Province and Region. The Case of Wuhan', in Bruce L. Reynoldsand Ilpyong J. Kim (eds.) 'Chinese Economic Policy. Economic Reform at Midstream'. ParagonHouse, New York.
Solinger, Dorothy J. (1991) From Lathes to Looms: China's Industrial Policy in ComparativePerspective, 1979-1982. Stanford University Press, California.
Solinger, Dorothy J. (1992) 'The Floating Population in the Cities: Chances for Assimilation?' Paperpresented at the conference on 'City Living, City Lives: The Potential for Community andAutonomy in Post-Mao China' Woodrow Wilson Center, Washington DC. May.
Solinger, Dorothy 1. (1993) 'China's Transients and the State: A Form of Civil Society?'. Politics andSoclity. Vol. 21, No. 1, March.
State Commission for the Restructring of the Economic System (SCRES), Government of China. (1990)'New Progress Made in Enterprise Mergers During Economic Rectification'. China EconomicSystems Reform Yearbook. pp 54-61.
Swann, Dennis (ed.) (1992) The Single European Market and Beyond. A Study of the WiderImplications of the Single European Act. Routdedge, London and New York.
Swann, Dennis (1983) Competition and Industrial Policy in the European Community. Methuen,London.
f'idrick, Gene and Chen, Jiyuan (eds.) (1987) China's Industrial Reform. Oxford University Press forthe World Bank. Washington D.C.
rian Yuan and Qiao Gang (1991) 'China Price Reform Study'. Electronic Industry Press, Beijing.

- 165 -
Tinbergen, Jan (1965) 'International Economic Integration' 2nd revised edition. Elsevier PublishingCompany. The Netherlands.
United States Government (1990) Staff Report No. 12: Highlights of Activity in the Property MotorCarrier Industry. Office of Transportation Analysis, Interstate Commerce Commission. January.
United States Government (1992) US Industrial Oudoook. Transportation Services: pp 40-5. Departmentof Commerce. January.
United States Goverunent (1992) The US Motor Carrier Industry Long After Deregulation. InterstateCommerce Commission. March
United States Goverrnent (1991) Overview of Consumer Protection Law in the United States. Mimeoprepared for officials in the Soviet Union, Federal Trade Commission.
Wall, David (1992) *Special Economic Zones and Industrialization In China' in C. Kirkpatrick (ed) IheImpact of Policy Reform on Trade and Industrial Performance in Developing Countries.Manchester University Press. pp. 198-212.
Wall, David (1993) 'Special Economic Zones in China: The Administrative and Regulatory Framework'.The Jownal of Eas Asian Affais, Vol. VII, No. 1, Winter/Spring. pp. 226-261.
Wall, David (1993) 'China's Reform and Opening Up Process: The Role of the Special EconomicZones'. Development Policy Revew. September.
White, Gordon (1993) Riding the Tiger. The Politics of Economic Reform in Post-Mao China. TheMacmillan Press, UK and Hong Kong.
Wiemer, Calla (1992) 'Price Reform and Structr Change: Distributional Impediments to AllocativeGains'. Modern China. Vol 18, No. 2, pp. 171-196. April.
Wang, Fang Yi and Mody, Ashoka (1993) 'Industrial Growl in Coastal China: Economic Reforms andWhat Else?'. Mimeo, World Bank, Washington DC. April.
Watson, Andrew, and Findlay, Christopher (1992) 'The 'Wool War' in China' in Christopher findlay(ed.) Challenges of Economic Reform and Industrial Growth: China's Wool War. Allen andUnwin. Australia.
Winters, Alan L. and Venables, Anthony J. (1990) European Integration: Trade and Industry.Cambridge University Press.
Wong, Christine (1992) 'Fiscal Reform and Local Industrialization'. Modern China. Vol 18, No. 2, pp.197-227. April.
Woo, Wing Thye (1993) 'The Art of Reforming Centrally-Planned Economies: comparing China, Polandand Russia'. Mimeo, University of California, Davis. May.
-166 -
World Bank (1990a) China: Macroeconomic Stability and Industrial Growth under DecentralizedSocialism. Washington DC. July.
World Bank (1990b) China: Country Economic Memorandum. Between Plan and Market. Report No.8440-CHA. Washington DC. May
World Bank (1990c) China: Electronics Sector Report. Report No. 7962-CHA. June
World Bank (1990d) China: Reforming Social Security in a Socialist Economy. Report No. 8074-CHA.June
World Bank (1991) China: Government of Australia and People's Republic of China (1990e) YangtzeEconomic Zone Study. Draft. December.
World Bank (1991) China: Industrial Organization and Efficiency Case Study: The Automotive Sector.Draft. June.
World Bank (1991) China: Urban Housing Reforms: Issues and Implementation Options. Report No.9222-CHA. June.
World Bank (1991) China: Efficiency and Environmental Impact of Coal Use. Two Vols. Report No.8915-CHA. Washington DC. March.
World Bank (1992) Payment Systems Project. Stocktaking Report. 31 January. Industry and EnergyDivision. Mumeo.
World Bank (1992) Telecomunicatlons Sector Sttdy. Report No. 9413-CHA. February.
World Bank (1992) China: Railway Investment Study. Report No. 10375-CHA. (3 volumes). February.
World Bank (1992) China's Railway Strategy. Report No. 10592. June.
World Bank (1992) China: Machine Tools Subsector Report. Report No. 10688. June.
World Bank (1992) China: Reforming the Urban Employment and Wage System. Report No. 10266-CHA. June.
World Bank (1992) Industrial Restucturing: A Tale of Three Cities. Report No 10479-CHA. July
World Bank (1992) China: Reform and the Role of the Plan in the 1990s. Washington D.C. September
World Bank (1992) China: Strategy for Reducing Poverty in the 1990s. October.
World Bank (1992) China: Budgetary Policy and Intergovernmental Relations. Report No. 11094-CHA.Draft. October.
World Bank (1992) China: Strategy for Road Freight Service. Initiating Memorandum. Draft.

- 167 -
World Bank (1992) China: The Achievements and Challenge of Price Reform. Country Study.
World Bank (1993) China: Strategies for the Reform and Restructuring of the Fertilizer Industry.February. Mimeo.
World Bank (1993) China: Financial Sector Reform Strategy. Industry and Energy Division. Mimeo,March.
World Bank (1993) China: Foreign Trade Reform: Meeting the Challenge of the 1990s. Report No.11568-CHA.
Wu, Changqi (1990) 'Enterprise Groups in China's Industry'. Asia Paciic Joumnal ofManagement. Vol.7 No. 2. pp. 123-136. October.
Wu Jinglian and Zhao Renwei (1987) 'The Dual Pricing System in CI"'a's Industry'. Jouwnal ofComparatiw Economis. Vol. 11, No. 3 pp. 295-308. Septembe.
Zhang Xiaohe, Weiguo, Lu, Keliang, Sun, Findlay, Christopher, and Watson, Andrew (1991) The 'WoolWar' and 'Cotton Chaos'. Fibre Marketing in China. Chinese Economic Research Unit,University of Adelaide. No. 91/14.
Zhang, Xun-Hai (1992) Enterprise Reforms in a Centrally Planned Economy: The Case of the ChineseBicycle Indusry. Macmillans, U.K., and St. Martins Press, U.S.A.
Zou, Gang and Ma, Jun (1991-92) 'Promoting Overall Cooperatior. Between Chinese Coastal Areas andthe East Asian Economies.' COinese Economic Studies. Vol. 25, No. 2, pp. 67-83. Winter.
Zweig, David (1993) 'Trade and Investment on the China Coast: Understanding a 'Developmentcommunity' in rural China%. Fletcher School of Law and Diplomacy, Tufts University. Mimeo.

Annex I Table Al. la European Community: Coefficients of Structural Difference of Number of Firms, 1987
Belgium Denmauk France Germany Ganece Ineand Ily Luxembourg Nethelands Portugal Spain U.K.
Begim 0.000 0.242 0.273 0.266 0.132 0.513 0.404 0.235 0.343 0.207 0.321
Denmark 0.000 ... 0.130 0.312 0.164 0.401 0.323 0.175 0.497 0.296 0.154
France 0.000 ... ... ... ... ... ... ... ... ...
Geimany 0.000 0.307 0.144 0.329 0.284 0.262 0.500 0.315 0.164
Oreece 0.000 0.234 0.354 0.481 0.318 0.370 0.350 0.370
Ireland 0.000 0.437 0.299 0.158 0.415 0.256 0.249
Itly 0.000 0.513 0.509 0.428 0.568 0.333
Luxembourg 0.000 0.497 OA16 0.556 0.345
Netdhrands 0.000 0.460 0.280 0.209
Portugai 0.000 0.281 0.531
Spain 0.000 0.375
U.K. 0.00000
Note: Data of number of finms are not available for France.Source: Caculaed fiom data in Industrl Statstcal Yearbook (United Nacios), 1991 and 1989.

Annex I Table Al. lb United States: Coefficients of Structural Difference of Number of Finrs, 1987Region Region 2 Region 3 Region 4 Region S Region 6 Region 7 Region 8 Region 9 Region 10 Region II Region 12
Region 1 0.000 0.116 0.112 0.123 0.198 0.185 0.145 0.126 0.228 0.120 0.247 0.084Region2 0.000 0.187 0.155 0.179 0.177 0.186 0.119 0.226 0.137 0.276 0.094Region 3 0.000 0.148 0.252 0.231 0.159 0.151 0.257 0.160 0.277 0.149Region 4 0.000 0.208 0.197 0.086 0.089 0.136 0.068 0.232 0.133Region 5 0.000 0.072 0.194 0.158 0.113 0.185 0.142 0.190Region 6 0.000 0.184 0.150 0.132 0.177 0.122 0.184Region 7 0.000 0.091 0.152 0.106 0.201 0.148Region 8
0.000 0.152 0.063 0.221 0.103Region 9
0.000 0.130 0.131 0.229Region 10
0.000 0.223 0.113Region 11
0.000 0.248Region 12
0.000Note: Tbe defiition of regions are as folows:
Region 1: Maine, New Hampshire, Vermont, MassacusettsRhode Ilan, Connecicut; Region 2: New York, New Jersey, Pennsylvania;Region 3: Ohio, Indiana, Mlinois, Michigan, WiLsconsin; Region 4: Minnesot, Iowa, Missouri North Dakota, South Dakota, Nebraska, Kansas;Region S: Delaware, Maiyland, Virginia, West Virginia, North Carolina,South Carolina, Georgia; Region 6:Kentucky, Tennsee, Alabama, Mississippi;Region 7: Louisiana, Oklahoma; Region 8: Florida, Texas;Region 9: Montana, Idaho, Wyoming, Colomdo; Region 10: New Mexico, Arizona, Utah, Nevada;Region I 1:Washington, Oregon, Alaska, Hawaii; Region 12: California.
Source: Calated from data United States' Census of Manfacrs for 1987 (Geogrphic Area Seris), various issues.

Annex I Table AI.lc China: Coefficients of Structural Difference of Number of Firms, 1991Region 1 Region 2 Region 3 Region4 RegbnS Region 6 Region 7 Region 8 Region 9 Region 10 Region II Region 12
Region 1 0.000 0.155 0.125 0.131 0.109 0.159 0.149 0.219 0.225 0.216 0.169 0.232
Region2 0.000 0.130 0.157 0.118 0.052 0.184 0.148 0.159 0.157 0.060 0.127
Region 3 0.000 0.128 0.121 0.118 0.160 0.186 0.159 0.193 0.100 0.166
Region 4 0.000 0.110 0.146 0.158 0.216 0.228 0.193 0.162 0.216
Region S 0.000 0.129 0.181 0.220 0.238 0.204 0.136 0.205
Region 6 0.000 0.161 0.157 0.151 0.149 0.048 0.112
Region 7 0.000 0.247 0.218 0.214 0.167 0.178
Region 8 0.000 0.120 0.138 0.144 0.140
Region 9 0.000 0.119 0.132 0.127
Region 10 0.000 0.158 0.157
Region 11 0.000 0.082
Region 12 0.000
Note: The dntion of regions are as folows:Region 1: Beijing. Tianjin, HebeL ; Region 2: Shanxi, Inner Mongolia, Hesan;Region 3: Liaoning, JiHn. Heilongjiang; Region 4: Shanghai. Zhejiang. Anbui, Jin;Region 5: Jangsu, Shandong; Region 6: Hubei, Hunan;Region 7: Guangdong, Fujian; Region 8: Sichu;Region 9: Guizbou. Yunna Region 10: Tibet, Xlnjiang, Qiughai;Region 11: Shaanxi, Ganm, Nngxia; Region 12: Guangxi, Hainan.
Sourme: Calculat from data n China Industrial Satsia Yeatbook 1992.
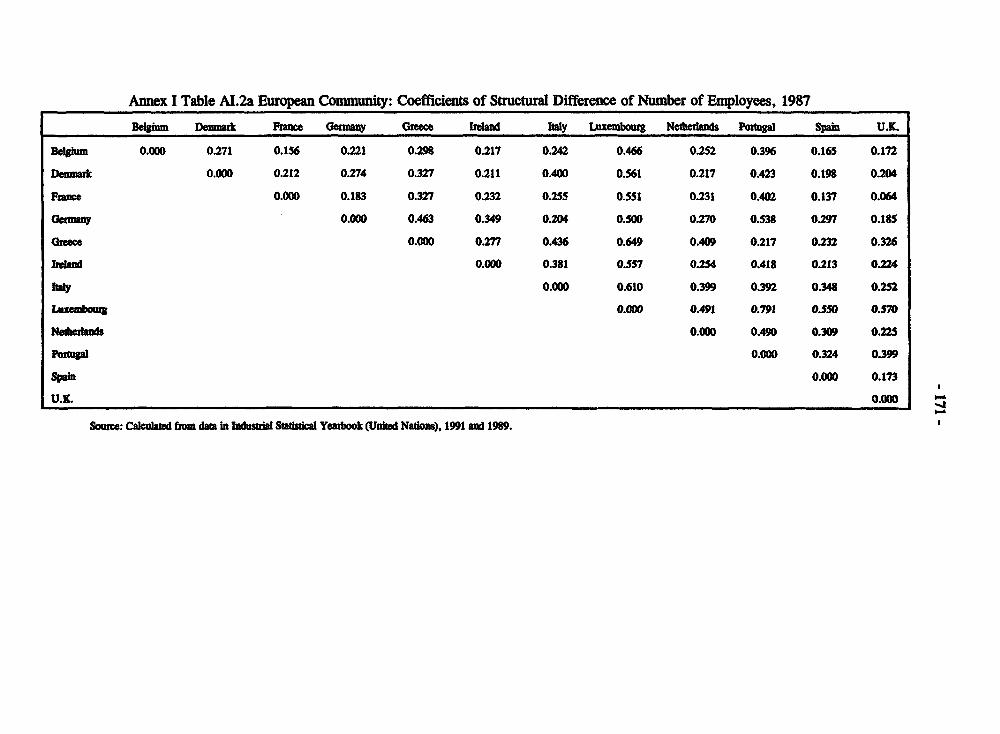
Annex I Table AI.2a European Comnity: Coefficients of Structural Difference of Number of Employees, 1987Begi Denmark Franmce Germay Grece hlelnd llaly Laxembourg Netberln Portugid Span U.K.
Begi 0.000 0.271 0.156 0.221 0.298 0.217 0.242 0.466 0.252 0.396 0.165 0.172
Denark 0.000 0.212 0.274 0.327 0.211 0.400 0.561 0.217 0.423 0.198 0.204
P"ce Q0.000 0.183 0.327 0.232 0.255 0.551 0.231 0.402 0.137 0.064
Grmany 0.000 0.463 0.349 0204 O.S0 0.270 0.538 0.297 0.185
areace 0.000 0.277 0.436 0.649 0.409 0217 0.232 0.326
bland 0.000 0.381 0.557 0254 0.418 0.213 0224
tal 0.000 0.610 0.399 0.392 0.348 0252
Lumbg O.OQO 0.491 0.791 0.550 O.S70
Neblands 0.000 0.490 0.309 0.2
Potua 0.000 0.324 0.399
Spain 0.000 0.173
SouWce: Caculated from daa in dustral Stistcal Yeabook (United Nadons), 1991 and 1989.

Annex I Table Al.2b United States: Coefficients of Structural Difference of Number of Employees, 1987Resion I Region 2 Region 3 Region 4 Region 5 Region 6 Region 7 Region 8 Region 9 Region 10 Region 1 I Region 12
Region I 0.000 0.176 0.164 0.171 0.302 0.263 0.225 0.378 0.261 0.270 0.322 0.157Region 2 0.000 0.200 0.179 0.186 0.192 0.215 0.316 0.229 0.299 0.269 0.19Region 3 0.000 0.131 0.310 0.285 0.177 0.404 0.251 0.269 0.296 0.144Region 4 0.000 0.308 0.308 0.174 0.316 0.152 0.18S 0.257 0.155Region S 0.000 0.208 0.277 0.421 0.306 0.413 0.275 0.276Region 6 0.000 0.279 0.369 0.315 0.420 0.229 0.268Region 7 0.000 0.308 0.258 0.248 0.304 0.149Region 8 0.000 0.360 0.260 0.460 0.316Region 9 0.000 0.249 0.209 0.222Region 10 0.000 0.363 0.170Region 11 0.000 0.305Region 12 0.000
Note: The defiition of regions are as foDows:Region 1: Main, New Hampsire, Vernon Massachusetts,Rhode Island, Connectict; Region 2: New Yotk, New Jersey, Pennaylvana;Region 3: Ohio, Indiana, Minois, Michigan, Wsconsin; Region 4: AMnesota, Iowa, Misuri, Noth Dakota, South Dakota,
Nebraska, Kansas;Region S: Delaware, Maryland. Virgia, West Virginia, North Carolina,
South Carolina, Georgia; Region 6:Kenftky, Tenmessee, Alabam, Misssippi;Region 7: Louisiana, Oklahoma; Region 8: Florida, Texas;Region 9: Monaca, Idaho, Wyoming, Colorado; Region 10: New Mexico, Arizon, Utah, Nevada;Region I :Washington, Orgon. Alaska, Hawaii; Region 12: Califlrnia.
Sousce: Cakulad frotm data United States' Census of Manufaere for 1987 (Geogaphic Area Series), varous issues.

Annex I Table AI.2c China: Coefficients of S luctura Difference of Number of Employees, 1991RegionI Rqgon2 Region3 Regin4 Region5 Region6 Reglon7 Region8 Region9 RegionlO Regionll 2Rego1
Region 0.000 0.161 0.145 0988 0.106 0.138 Q098 0.106 0.187 0.235 0.105 0.232
Reglon2 0.000 0.118 0.184 0.188 0.107 0 391 0.104 0.147 0.183 0.195 0.181
Region3 0.000 0.200 0.218 0.141 0.364 0.124 0.126 0.229 0.165 0205
Region 4 0.000 0.110 0.146 0.158 0.216 0.228 0.193 0.162 0.216
RegionS 0.000 0.144 0.306 0.155 0.238 0 0.153 0.235
Regin 6 0.000 0.385 0.110 0.146 0.156 0.16D 0.168
Region 7 0.000 0.351 0.372 0.425 0.285 0.3S
Region 8 0.000 0.116 0.179 0.120 0.167
Region 9 0.000 0.191 0.181 0.171
Region 10 0.000 0.260 0.239
Region 11 0.000 0.219
Region 12 0.000
Note: Mem defnition of regions are as folowa:Region 1: Be§ig, lianjin. Hebei; Region 2: Swan. In Mongol4a HenanRegion 3: aoning. filin, Hellonuin; Region 4: Shangi Zheg. Anul, hlangi;Region S: Jiangsu, Shandong; Region 6: Hubei, Hun..Region 7: Cuangdong, Fu*ji. Region 8: Sichuan-Region 9: Guizhou, Yuan; Region 10: Tet. Xljang. Qblgai;Region 11: ShanxL, Oansu, Ningl; Region 12: Guangxi. HaiEn.
Source, Ctalctd iom data in C1n dubstil Staiel Yeaibook 1992.

Annex I Table AI.3a European Community: Coefficients of Struchtral Difference of Output Value, t987Belgium Dnmitn Frane Ger Gnme ieland lly Luxembxur Nededands Potuga Spain U.KI
Belgium 0.000 0.370 0.43S 0.517 0.346 0.394 0.373 0.534 0.324 0.371 0.320 0.429Denauk 0.000 0.249 0.348 0.357 0.180 0.45 0.639 0.270 0.386 0.287 0.237Prae 0.000 0.177 0307 0.341 0.266 0.599 0.293 0.3S7 0.175 0.069Gem 0.000 0.439 0.315 0265 0.546 0.328 0.431 0291 0.152Gleece 0.000 0.427 0.422 0.650 0.396 0.216 02m 0.357Ireand 0.000 0.396 0.628 0265 0.432 0.371 0308baly 0.000 0.580 0356 0.317 0.350 0252LUxemo 0.000 0.596 0.749 0.619 0.589Netdelbnds 0.000 0.322 0.299 0.283Porga 0.000 0302 0.360Spain 0.000 0207U.L_ 0.000
Source: Caluated fim daa in Jisra St al Yearbook (Unid NatIcs), 1991 nd 199.

Annex I Table AI.3b United States: Coefficients of Stuucr Difference of Output Value, 19871Region 1 Reglon2 Region3 Region4 RegionS Region6 Region7 Regong Region9 Region 10 Region II Region 12
Region I 0.000 0.249 0.272 0.283 0.o 0.212 0.411 0.413 0.335 0.199 0.398 0.2CRegion 2 0.000 02S8 0.279 0.177 0.161 0.340 0.268 0.286 0.241 0.331 0.234Region 3 0.000 0.221 0.331 0.223 0.421 0.364 0.344 0.218 0.399 0208Region 4 0.000 0.327 0.284 0.41S 0.363 0.204 0.167 0.373 0.185RegionS 6.(0 0.157 0.347 0.28 0.323 0.303 0.337 0.287Region 6 0.000 0.365 0.295 0.308 0.254 0.319 0.225Region 7 0.000 0.252 0.447 0.404 0.433 0.374Region 8 0.000 0.285 0.343 0284 0279Region 9 0.000 0.240 0.251 0.213Region 10 0.000 0.353 0.103Region 11 0.000 0.324Region 12 0.000
Note: The ddbinon of regions ae as folows:Region 1: Mne, New Hampshire. Vermont, Massachuset4.Rhode blan, Connec_tt; Region 2: Neo York, New Jersey, Pennsylvania;Region 3: Ohio, liiaa Iinois, Michigan, Wrsconsin; Region 4: Mnnesota, Iowa, Misouri. North Dakota South Dakota. Nebrak, Kansas;Region S: Delwaw, Maiylnd. Virginia, West Virginia. North Carolina,
South Carolina, Geora Region 6:Kenby, Tennese, Alabama, Mississipp;Region 7: LoIsana, Oklhoma; Region 8: Plorida, Tems;Region 9: Monta, Id, Wyoming, Colomado; Region 10: New Mexico. Arin, Utah. Nevada;Region 1 1:WashWgion, Oregon, Alaska Hawaii; Region 12: Californa.
Somce: Cculad from data Uned Sates' Census of Manuac for 1987 (Geogrphic Area Series), varous issues.

Annex I Table AI.3c China: Coefficients of Strucural Difference of Output Value, 1991Region 1 Region 2 Region 3 Regbon4 RegionS Region 6 Region7 Region 8 Region 9 Region 10 Region II Region 12
Region 1 0.000 0.137 0.106 0.115 0.165 0.098 0.239 0.125 0.343 0.243 0.113 0.276
Region2 0.000 0.169 0.164 0.172 0.127 0.230 0.096 0.304 0.240 0.116 0.209
Region 3 0.000 0.197 0.227 0.150 0.273 0.135 0.321 0.271 0.165 0267
Region 4 0.000 0.110 0.146 0.158 0.216 0.228 0.193 0.162 0.216
RegionS 0.000 0.204 0.222 0.215 0.376 0.186 0.144 0.281
Region 6 0.000 0.227 0.i50 0.293 0.245 0.109 0.222
Region7 0.000 0.244 0.385 0.28t 0.218 028
Region8 0.000 0.308 0.25S 0.142 0.199
Region 9 0.000 0.390 0.31' 0.294
Region 10 0.000 0.245 0.293
Region 11 0.000 0.219
Region 12 0.000
Note: The definition of regions are as follows:Region 1: Beijing, lavjin, Hebei; Region 2: Shani, bnnr Mongolia. Henn;Region 3: laongng, Umin, Hellonilng; Rgion 4: Sbanh, Zhejiang, An, Jiangpd;Region 5: Jiangm, Sandong; Region 6: Hubei, Hunan;Region 7: Ouangdotg, Fujan; Region 8: SirhuanRegn 9: Gaizbou, Yunnan; Region 10: Tbet, Xnjhiag, QinghaiRegion II: Shaanxi, Gansu, Ningxia; Region 12: Guanglx EHnan
Source: Calculated from data n Ch Industrial Stistica Yearbook 1992.
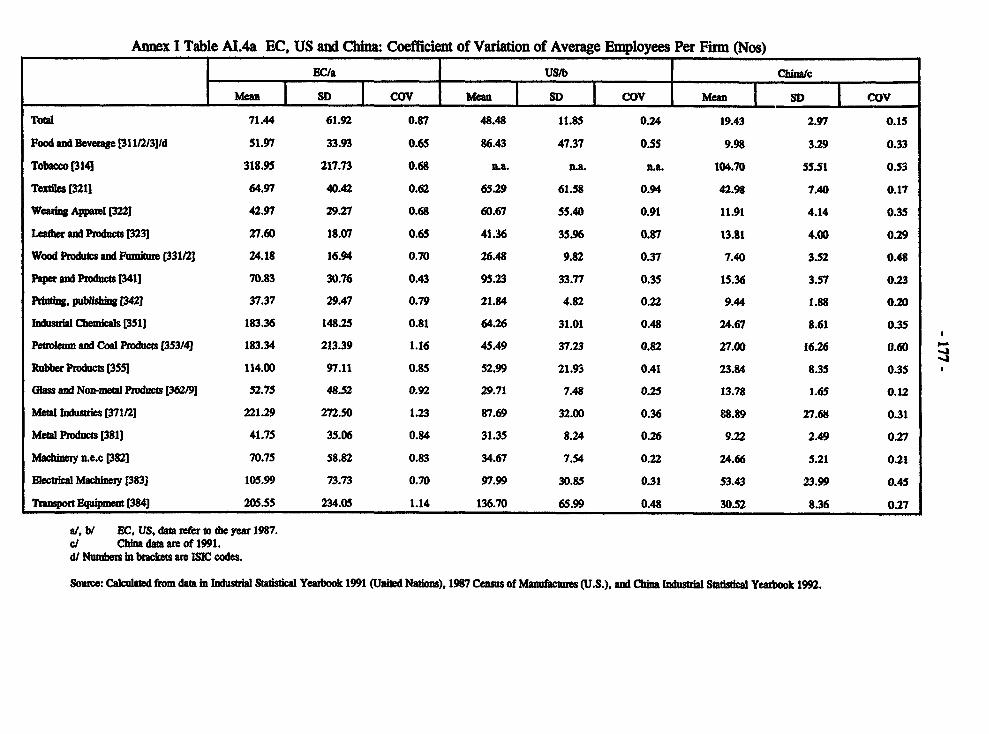
Annex I Table AI.4a EC, US and China: Coefficient of Variation of Average Employees Per Firm (Nos)
E9C/a US/b Chinac
Ma SD COy me SD COV Mea SD COV
TotW 71.44 61.92 0.87 48.48 11.85 0.24 19.43 2.97 0.15
Food and Bverge [31112/3]/d 51.97 33.93 0.65 86.43 47.37 0.55 9.98 3.29 0.33
Tobacco (314] 318.95 217.73 0.68 TLa. ILa. na. 104.70 55.51 O.S3
Textles 1321] 64.97 40.42 0.62 65.29 61.58 0.94 42.98 7.40 0.17
Weaing Appard [3221 42.97 29.27 0.68 60.67 55.40 0.91 11.91 4.14 0.35
Leather and Pducs 323] 27.60 18.07 0.65 41.36 35.96 0.87 13.81 4.00 0.29
Wood Produtrs and Funitue [331/2] 24.18 16.94 0.70 26.48 9.82 0.37 7.40 3.52 0.48
aper and Poducts [341] 70.83 30.76 0.43 95.23 33.77 0.35 15.36 3.57 0.23
Pritig, publshing t342] 37.37 29.47 0.79 21.84 4.82 0.22 9.44 1.88 0.20
Indusa Chemicas [3511 183.36 148.25 0.81 64.26 31.01 0.48 24.67 8.61 0.35
Pemtoleum and Coad Products [353/4] 183.34 213.39 1.16 45.49 37.23 0.82 27.00 16.26 0.60 2Rubber Products [3551 114.00 97.11 0.85 52.99 21.93 0.41 23.84 8.35 0.35
Glass and Non-meal Prnduts [362/9] 52.75 48.52 0.92 29.71 7.48 0.25 13.78 1.65 0.12
Metai Industies [371/2] 221.29 272.50 1.23 87.69 32.00 0.36 88.89 27.68 0.31
Metd Products [3811 41.75 35.06 0.84 31.35 8.24 0.26 9.22 2.49 0.27
MacWhiery n.e.c [3821 70.75 58.82 0.83 34.67 7.54 0.22 24.66 5.21 0.21
Eectrical Machiney [383] 105.99 73.73 0.70 97.99 30.85 0.31 53.43 23.99 0.45
Transort Equipmn [384] 205.55 234.05 1.14 136.70 65.99 0.48 30.52 8.36 0.27
a/, b/ EC, US, dataotr to die year 1987.cJ Chim nada are of 1991.d/ Numbers in btackets are ISIC codes.
Source: Cakulaed from data in Industrl Statisid Yeatbook 1991 (United NatIos), 1987 Census of Manufactues (U.S.), and China ndustrl Suisticd Yeabook 1992.

Annex I Table AI.4b EC, US and China: Coefficient of Variation of Average Output Per Firm (US$ million)13Cta US | Chinatc
Mean SD 9 oSD | cov mean SD rcovTotal 7413 6548 0.88 6522 1769 0.27 372.38 86.80 0.23
Food and Beveage (31112/31]d 9755 8812 0.90 14S62 4598 0.32 300.6" 122.43 0.41
Tobac [314] 81747 110877 1.36 na. na. n.a. 14033.10 9759.63 0.70
Textiles 1321] 4556 3377 0.74 5609 5579 0.99 776.26 123.08 0.16
Wearig Apparel (322] 1910 1609 0.84 2532 1561 0.62 180.24 104.02 0.58
Leatder an Produs [323] 2500 2017 0.81 2741 2305 0.84 217.35 115.96 0.53Wood Poca and Furnue [33112] 1704 1603 0.94 2709 1554 0.57 80.48 39.67 0.49
Paper and Producs (341] 8342 5912 0.71 18532 10467 0.56 281.92 89.01 0.32
Prntg. pubishing [342] 2762 2169 0.79 1880 634 0.34 151.23 64.62 0.43
ndusta Chemicals [351] 31834 27136 0.85 18184 11795 0.65 586.96 136.52 0.23
Peolum and Coal Poducts 35341 180538 190037 1.05 56763 S8656 1.03 2142.09 1 ..62 0.82
Rubber Prdut [3551 10681 12440 1.16 5794 3141 0.54 624.23 259.72 0.42
Gla ald Nonmetal Products 3629 6085 6186 1.02 3430 819 0.24 162.17 59.53 0.37
Mea dustries 37121 22217 26749 1.20 14813 6721 0.45 3107.04 1631.74 0.53
Metal Poducts [3811 4185 3718 0.89 2933 834 0.28 145.69 65.71 0.45
Mahiney n.e.c t3821 5211 4386 0.84 4108 1075 0.26 368.76 65.15 0.18
Blectrical Machity [383] 7852 6581 0.84 11188 4981 0.45 426.84 129.32 0.30
TtansportEqulpment 3841 21171 28234 1.33 22628 14352 0.63 628.10 183.34 0.29
a/, b/ EC, US, data rer to tbe year 1987.ct Cbina dat arm of 1991.dl Numbers in bracket are ISIC codes.
Soure: Calculated from data in Indu Statisdscal Yeatbook 1991 (United Nations), 1987 Consus of Maufct (U.S.), and Chia Industrial Saistcal Yearbook 1992.

- 179 -
Appendix Table Al.l Per Capita National Income by Province (1983-1991)(Yuan)
1983 1984 1985 1986 1987 1988 1989 1990 1991
ADiChina 489 575 688 765 878 1075 1184 1248 1391
BEijing 1420 1661 2026 2113 2214 2785 3248 3379 3705
Tianjin 1354 1523 1868 2026 2234 2623 2738 2897 3098
Hebei 436 514 614 669 785 963 1074 1140 1274
Shauxi 474 585 656 678 I96 847 999 1090 1135
Inner Mongoda 408 485 590 627 697 953 992 1079 1206
Liaoning 811 969 1155 1292 1500 1818 1989 1976 2180
Jimn 556 645 738 820 1015 1236 1268 1357 1424
Hefongjiang 707 804 851 994 1117 1286 1439 I192 1728
Shanugi 2470 2832 3367 3450 3789 4151 4599 4616 5201
Jiqgsu 615 756 931 1059 1243 ISO1 1615 1682 1825
ZhejiaNg 549 693 908 1037 123S 1532 1660 1743 2037
Aului 358 433 527 S95 675 819 910 915 879
Fujian 406 481 607 668 806 1081 1243 1280 1493
Jilagxi 366 414 500 540 615 747 835 929 1011
Shndong 519 62f 718 766 924 1135 1294 1347 157S
Henan 356 400 484 537 637 746 836 1412 954
Hubei 489 602 727 800 908 1067 1147 1079 1281
Hunan 398 446 535 60W 692 840 899 965 1049
Guangdong 559 644 804 1034 1092 1509 1718 1784 2144
Unangsi 315 337 398 446 516 616 723 789 888
Hainan 989 1130 1161 1301
Sishuang 343 399 482 512 598 755 809 900 977
Guidzhou 272 322 363 403 458 S73 625 649 723
Yunnan 317 365 408 450 521 668 771 945 1009
T t 269 462 632 545 $90 739 777 845 1148
Shaanxi 341 410 488 528 607 764 858 914 1021
GCksu 358 412 499 566 627 758 856 919 988
Qingh*i 41S 48. 604 693 752 9S8 1048 1103 1165
Nlgxia 384 450 538 610 657 836 970 1007 1081
Xhijang 484 553 657 734 844 1083 1232 1340 1623
SD 447 509 611 630 682 752 832 831 934
Mean 5 680 816 889 1002 1213 1343 1428 1571
COV 0.77 0.75 0.75 0.71 0.68 0.62 0.62 0.58 0.59
amN! 0.300 0294 0.295 0.291 0285 0.272 0.271 0.255 0.264
Note: SD: Sandaid dsvilon COV: co_ficit of vaan;a GIN: Gini coeffician

- 180-
Appendix Table A1.2 Per capita Investment in Fixed Assets by Provinces (1983-1991)
1983 1984 1985 1986 1987 1988 1989 1990 1991
AlD China 133.57 177.13 243.29 285.62 336.89 410.22 372.13 389.15 475.62
Beftng 542.61 726.82 984.58 1078.67 1313.50 1504.16 1410.22 1757.00 1861.52
T1anjin 502.15 609.01 828.47 879.61 935.62 1051.60 996.14 1000.90 1426.07
Hebei 117.84 157.32 203.88 238.61 312.54 413.01 364.38 295.70 396.62
Shanxi 174.03 257.50 337.11 357.06 385.02 383.99 377.16 41S.49 494.05
humer Mongolia 147.11 203.93 255.11 227.94 250.00 281.23 262.44 300.37 415.38
Liaonlng 200.99 263.12 377.16 476.95 579.77 699.63 647.65 656.31 790.40
Jiin 132.86 184.33 273.72 273.95 334.70 393.30 334.21 376.60 454.32
Hei4ongian 209.68 257.75 333.80 369.54 409.75 452.11 448.92 459.78 530.63
Shanghai 636.60 767.72 975.84 1145.78 1482.24 1935.68 1913.71 1698.50 1927.61
Jiangsu 170.29 209.38 241.38 376.83 498.87 585.82 496.63 533.62 658.08
Zhejipg 110.98 162.51 261.64 319.85 450.50 551.99 505.51 618.76 773.37
Anhui 90.96 121.34 156.17 192.26 221.21 252.65 203.62 220.62 234.49
Fjian 99.51 128.61 202.69 218.30 278.10 322.92 303.45 357.39 430.30
JiaDxi 85.67 104.41 126.39 148.13 164.84 220.45 198.32 185.49 235.65
Siandong 124.39 182.36 251.36 286.87 374.16 458.78 412.55 394.20 513.56
ena 79.92 113.69 164.53 200.45 204.13 254.76 228.02 388.97 292.61
Hubei 117.41 153.10 206.12 204.95 263.61 300.50 234.15 232.54 280.93
Hunan 88.46 105.79 143.69 165.68 205.28 241.14 185.95 196.39 251.88
(uangdong 155.95 221.83 314.39 365.73 429.95 679.49 633.99 640.89 786.78
Gluand 59.17 74.01 108.62 139.96 160.10 189.38 160.83 160.92 207.33
Hairn 337.42 453.25 591.40 656.82
Sclug 67.66 92.92 141.98 150.22 184.68 216.60 207.08 205.70 267.49
Guizhou 59.26 78.41 111.62 103.13 111.32 158.49 122.58 141.13 158.07
Yuman 68.8' 98.66 141.98 169.36 168.17 210.68 193.15 221.20 282.87
Tibet 104.66 253.81 356.28 225.12 331.25 366.51 325.16 431.98 651.33
Shbanid 100.61 133.24 189.67 206.15 252.99 284,82 293.11 305.07 352.78
Gau 88.53 117.61 159.77 180.59 209.74 252.35 212.50 249.40 285.16
Qingbd 263.36 318.66 396.31 427.43 502.57 612.90 460.04 480.36 527.31
Ningxha 136.43 200.25 301.45 374.06 425.75 408.09 379.89 437.45 531.25
Xihl 206.30 251.04 327.33 373.84 388.83 507.99 540.73 574.7' 705.66
NRS
SD 142.37 174.69 228.23 256.48 315.33 383.87 375.96 380.41 432.39
Mean 170.42 22S.83 305.97 340.59 407.90 484.28 450.18 484.30 579.34
COV 0.84 0.77 0.75 0.75 0.77 0.79 0.84 0.79 0.75
GINm 0.360 0.342 0.330 0.333 0.341 0.346 0.364 0.352 0.348
Note SD: Sandard deviin; COV: codficient of variation; GMI: Gin! codffiinSoume: China Stistc Yeaeoook (vanous is).

- 181 -
Appendix Table A1.3 Per Capita Gross Value of Industrial Output by Province(not including village enterprises) (1981-1991) (Y million)
tORI 19R 194&4 IORs ti 197 l08t 1029 1959
Al China 519.7 601.4 679.4 793.5 931.6 1094.5 1330.7 1571.S 1634.6
Beiing 2401.4 2683.1 2974.9 3277.8 3540.6 3740.3 4585.1 5811.6 5763.4
Tlrumi 2614.5 2904.9 3147.6 3537.1 3896.5 4321.3 5114.4 5766.1 5933.6
Hebei 414.1 466.2 529.0 601.0 704.5 833.9 996.4 1200.3 1225.8
Shanxl 472.9 590.5 657.8 724.7 820.5 936.4 1145.6 1396.8 1462.4
bnner Mongona 313.6 385.4 413.8 473.5 601.2 699.2 837.7 1035.0 1069.9
Liaoning 1276.8 1423.6 1580.5 1802.5 2124.1 2419.8 2828.0 3295.4 3281.3
Jimn 600.2 727.2 820.8 936.3 1149.0 1399.4 1679.0 1910.3 1926.1
Heiongang 773.7 872.7 959.6 1062.0 1362.4 1576.1 1807.0 2080.7 2199.6
Shanghai 5233.9 5683.2 6177.3 6838.7 7370.0 8071.0 8669.1 10763.9 11047.4
Jiangsu 774.9 928.2 1102.1 1389.9 1607.5 1987.0 2494.2 2894.6 3046.1
Zhjiamg 552.0 676.5 836.1 1101.6 1311.0 1604.1 2040A 2361.0 2514.1
4nbui 262.2 317.8 362.6 430.4 542.6 631.7 771.8 920.7 931.5
Fujian 319.9 362.9 432A 518.9 613.9 757.7 1040.5 1268.9 1296.2
Jbulpd 277.5 313.8 354.3 435.3 540.7 647.4 808.8 908.8 900.6
Shandong 464.7 536.2 597.4 701.7 839.2 1038.2 1331.5 1680.4 1786.0
Henan 275.2 311.7 350.3 416.8 488.1 568.4 683.1 813.9 824.5
Hubei 520.2 646.7 736.9 858.6 987.2 1158A 1340.2 1535.4 1529.3
Hunan 328.8 373.7 412.6 468.9 586.7 689.5 825.2 947.1 957.4
Ouangdong 425.5 503.6 595.0 737.3 902.1 1184.2 1626.0 1999.5 2174.6
Ouangxi 225.9 254.2 273.8 319.3 390.7 471.6 566.7 674.0 701.5
Reman 391.4 494.1 544.3
Sichuang 277A 337.4 386.7 445.8 524.7 617.6 743.6 873.0 907.6
Guiou 155.0 214.5 250.2 281.7 328.0 374.4 458.0 346.7 583.1
YUMnan 219.9 268.6 312.2 354.1 406.8 488.7 601.9 742.8 825A
Ibet 61.3 67A 68.0 69.8 75.9 84.6 47.2 112.9 118.5
Shaanxi 367.5 441.7 487A 564.2 629.2 719.5 889.6 1052.7 1084A
ansu 383.5 443.2 486.1 560.8 668.0 716.8 862.5 1030.2 1100.5
Qinghwa 309.4 363.1 403.5 476.2 624.8 704.9 917.3 1149.4 1141.5
Ninxia 323.0 405.0 452.2 526.3 637.3 726.9 908.3 1141.2 1210.0
Xbng 315.9 405.8 445.5 S35.9 686A 788.8 860.7 1057.2 1139.6
SD 1029.70 1118.14 1215.07 1343.06 1441.62 1S68.11 1719.05 2100.19 2141.32
Mean 722.10 824.45 917.46 1049.91 1205.50 1377.85 1595.71 1915.48 1974.20
COV 1.43 1.36 1.32 1.28 1.20 1.14 1.08 1.10 1.08
GINI 0.508 0.492 0.486 0.478 0.458 0.445 0.433 0.433 0.430
Note: SD: Sandard deviio; COV: coeffient of varn; JNLG li coefflciemaSource: China Stisal Yeatbook (vaious issues).

- 182 -
Appendix Table A1.4 Per Capita Gross Value of Industrial Output by Province(including village enterprises) (1985-1991)
1985 .986 1987 1988 1989 1990 1991
All China 885.4 10S8.8 1278.1 1662.6 1980.1 2092.S 2438.9
Being 3504.6 3812.9 4095.4 2488.1 6836.7 6765.0 8051.!
Tibjin 3867.1 4287.3 4879.8 6214.2 7420.8 7691.5 8409.2
Hebei 740.3 901.2 1122.0 1451.5 1744.7 1820.5 2141A
Shanxi 875.5 986.1 1119.9 1268.4 1746.0 1857.2 2044.4
inher Mongolia 489.4 622.5 731.8 1106.2 1139.1 1199.6 1373.2
lnoning 1949.2 2341.6 2764.7 3415.8 3989.8 4050.7 4663.1
Jiin 992.8 1220.2 1532.2 1033.5 2207.1 2224.7 2448.7
VISeonxjiaug 1098.1 1406.3 1S46.8 1979.3 2292.8 2437.2 2751.7
Shaunghai 7146.8 7729.0 8533.8 9514.5 11875.8 12213.5 14531.2
Jlaullsn 1667.2 1970.0 250!.5 3344.1 3836.3 4084.7 4617.7
Zheiaug 1359.5 1655.0 2063.8 2736.3 3169.9 3437.0 4287.0
Anhui 492.4 621.7 745.2 963.7 1147.8 1181.2 1329.5
Pujian 609.4 743.9 946.9 1366.8 1688.4 1750.0 2139.9
Jiaqgsi 485.3 609.1 727.8 956.9 1099.2 1117.5 1288.3
Shaudong 804.3 1005.4 1297.9 1805.3 2354.1 2592.1 3032.9
Hean 476.3 612.3 746.2 963.6 1158.5 1198.7 1395.3
Hubei 928.0 1074.2 1287.5 1610.4 1857.6 1888.3 2061.0
Hunan 515.8 647.6 785A 987.9 1131.8 1163.0 1294.4
Guangdong 828.3 1022.3 1390.3 2224.9 2734.0 2997.5 3920.0
Guanp 337.3 417.6 515.7 664.9 787.7 829.5 974.7
Haiman 497.6 609.3 668.5 841.1
Skug 484.5 580.0 693.6 911.6 1071.6 1131.9 1316.1
Gulahou 302.5 3s9.0 412.5 533.5 635.6 675.2 744.4
Yunna 367.9 426.0 514.3 680.7 835.7 925A 1040.8
Tibet 74.9 83.7 95.2 59.0 132.7 138.3 150.A
Shaauxi 625.2 720.5 836.6 1058.2 1274.4 1334.7 1513.0
Oansu 580.3 695.3 755.6 943.1 1143.1 1231A 1375.8
Qinghai 497.1 650.2 731.3 979.5 1230.2 1233.0 1332.8
NiWda 551.1 669.1 767A 988.8 1285.5 1377.7 1522.9
XLnjM 549.8 705.9 814.5 1045.5 1288.8 1438.4 1804A
SD 1416.34 1526.75 1685.29 1851.74 2411.62 2466.02 2898.02
Mean 1144.86 1330.22 1553.78 1793.11 2324.17 2421.79 2813.21
coV 1.24 1.15 1.08 1.03 1.04 1.02 1.03
oINI 0.474 0.451 0.440 0.412 0.430 0.425 0.430
Note: SD: Stnda devion; COV: coefficiet of variation; GIN Gini coefficieSource: Chimn Satstcal Yearbook (varios issues).

- 183 -
Appendix Table Al.S Number and Gross Output Value of Industial Enterpises by Ownership(1985-1991)
Tot Sta Stue M iprs Iolebctives bdividua
No. of CUDV/a Avg clOY No. of ChDV/a Avg GOV INo. of flrrns100Vla Avg No. of IOOV/a Avg clOYlinus Y lofO Y 10,0I 0 frrs Y 1Gom Y I0.000 O l,O Ot)n bOY jrma IYIOOmJY 10.00010,000 10 000 Y 10,000 110,0
1985 518.5 9716.5 18.7 9.4 6302.1 672.6 174.2 3117.2 17.9 334.8 179.8 0.5
1987 747.4 13388.7 17.9 9.8 7996.7 819.3 181.9 4634.8 25.5 555.3 487.0 0.9
1988 810.6 15425.0 19.0 9.9 8761.0 884.1 183.3 5575.4 30.1 614.8 669.0 1.1
1989 798.1 16741.9 21.0 10.2 9385.6 917.5 174.7 5975.3 34.2 612.4 804.3 1.3
1990 795.8 18041.1 22.7 10.4 9851.2 943.6 166.9 6426.9 38.5 617.6 973.0 1.6
1991 808.0 20660.7 25.6 10.5 10937.8 1044.7 157.7 7376.0 46.8 638.7 1176.9 1.8
la Gross Output Value ((G0) deflated io 1985 coustat pies.The numbens of te dtuee ownersips do not add up to the sUm became of 'odthr ownethalp.*Source: China Stustica Yearbook 1992.

- 184 -
Appendix Table Ai.6 Number of Enterprises, Gross Output Value (G0v),and Number of Employees (1991)
Coal Tobacco_ Textiles
| No. of CDOV No. of No. COhV No. of No.of | (#V No. ofirms YIOOm persons of Yl0Oni perons frinnu YlOOni persoIL
10,000 firns 1 O000 10000
Al China 9610 518.86 617.29 329 547.45 31.04 24596 2533.27 958.35
Beijig 51 3.68 6.65 2 4.43 0.16 300 46.52 13.74
Tlajin 1 4.47 OAI 373 53.28 20.96
Hebei 320 29.62 40.56 3 15.12 0.82 1474 130.27 48.64
Shanxi 1719 111.03 80.01 3 2.69 0.24 359 26.25 14.91
inn"r Mongoha 362 17.66 22.77 2 4.88 0.27 231 22.61 9.95
lsoning 255 37.79 43.50 5 4.99 0.61 * 860 91.91 47.46
Jii 226 13.09 23.73 7 9.75 0.68 331 22.60 14.36
Heilonjiang 323 54.63 53.10 19 11.39 1.11 532 35.75 24.18
Shanghai 0 0.00 0.00 2 26.60 0.59 1011 219.40 60.78
Jbunsu 67 19.09 19.55 5 12.31 0.68 3898 482.73 151.76
Zhpjlang 69 2.26 2.54 4 14.13 0.54 4275 317.79 92.31
Anhin 138 22.87 27.88 11 i9.55 1.56 977 72.44 36.15
Pujian 134 3.95 4.60 18 15.28 0.60 442 26.96 11.79
11o341 402 12.10 20.08 4 5.57 0.40 501 28.35 17.19
Snandong 338 46.71 51.51 15 30.43 2.05 2051 274.37 92.06
Henan 320 41.51 51.56 32 39.81 3.50 989 85.35 44.94
Hubsd 362 3.46 6.47 20 31.00 2.42 1262 124.32 62.74
Hunan 812 16.49 27.40 17 44.66 2.47 574 40.03 26.16
Guangdong 145 S.52 7.74 39 35.66 1.31 1'01 172.39 40.74
Guang 104 4.82 6.92 16 14.97 1.12 263 25.19 11.52
Hainan 1 0.05 0.06 1 1.71 0.10 25 1.78 0.81
Sichun 1905 30.04 55.21 23 24.68 2.17 1112 101.53 57.74
kuizhou 432 7.80 12.52 16 33.84 2.14 97 5.89 4.17
Yunnan 257 6.15 8.57 20 101.87 2.68 113 12.72 6.11
Tbet 4 0.05 0.04 0 0.00 0.00 3 0.14 0.11
Shaanxi 380 9.68 18.68 16 19.75 1.84 459 53.75 22.59
Gansu 218 5.86 9.39 12 4.66 0.37 197 11.92 7.08
Qinbd 33 0.95 2.54 1 0.30 0.04 38 3.25 2.24
Nigxis 60 6.23 6.65 1 0.74 0.06 66 2.73 1.75
Xhwjing 245 5.76 6.86 14 2.21 0.13 282 41.02 13.35
SD 438 22.99 20.65 9.76 20.22 0.94 1008 108.57 33.56
Mean 334 17.89 21.28 11.34 18.88 1.07 848 87.35 33.05
cOy 1.31 1.29 0.97 0.86 1.07 0.87 1.19 1.24 1.02
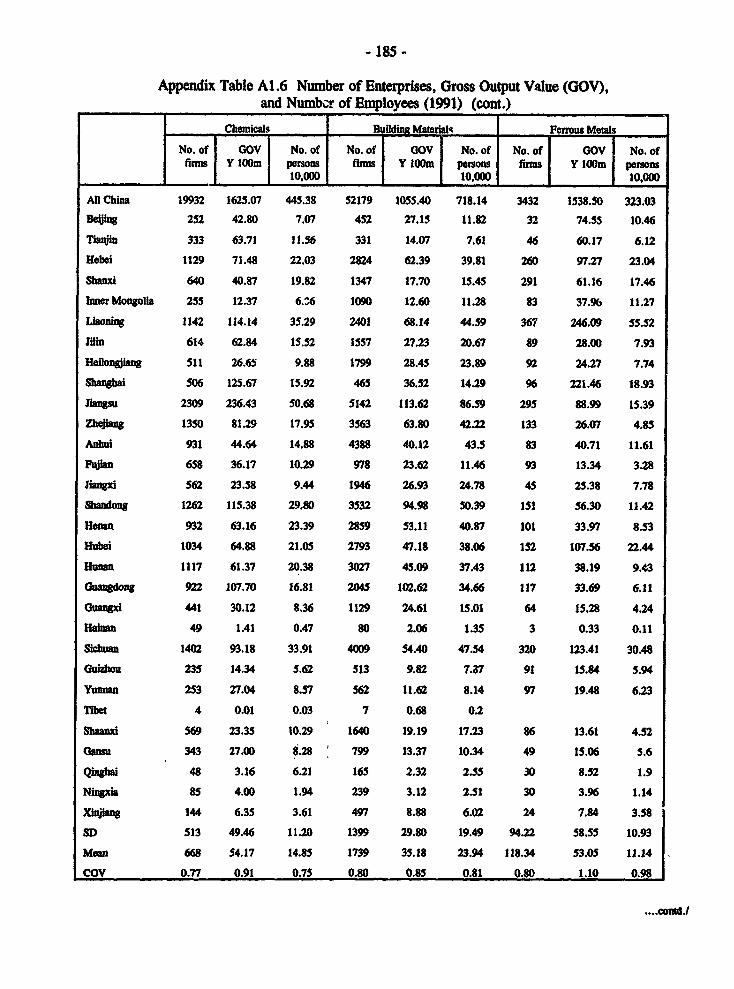
- 185 -
Appendix Table A1.6 Number of Enterprises, Gross Output Value (GOV),and Numbcr of Employees (1991) (cont.)
Chemicalws Bidin Mateull q Fermus Mewsls
No. of GOV No. of No. of GOV No. of No. of GOV No. offinms Y lOOm petsons fims Y lOOm pers firms y lOOm persons
10,000 10,000 10,00o
All China 19932 1625.07 445.38 52179 1055.40 718.14 3432 1538.50 323.03
Beng 252 42.80 7.07 452 27.15 11.82 32 74.5S 10.46
710in 333 63.71 11.56 331 14.07 7.61 46 60.17 6.12
Hebei 1129 71.48 22.03 2824 62.39 39.81 260 97.27 23.04
Sbanxi 640 40.87 19.82 1347 17.70 15.45 291 61.16 17.46
Inner Mongola 255 12.37 6.36 1090 12.60 11.28 83 37.96 11.27
Liaonig 1142 114.14 35.29 2401 68.14 44.59 367 246.09 55.52
hin 614 62.84 15.52 1557 27.23 20.67 89 28.00 7.93
Heiloniang 511 26.65 9.88 1799 28.45 23.89 92 24.27 7.74
Shanqai 506 125.67 15.92 465 36.52 14.29 96 221.46 18.93
rmssu 2309 236.43 50.68 5142 113.62 86.59 295 88.99 15.39
Zhejiang 1350 81.29 17.95 3563 63.80 42.22 133 26.07 4.85
AnImi 931 44.64 14.88 4388 40.12 43.5 83 40.71 11.61
Pujian 658 36.17 10.29 978 23.62 11.46 93 13.34 328
JIadni 562 23.58 9.44 1946 26.93 24.78 45 25.38 7.78
Shandoss 1262 115.38 29.80 3532 94.98 50.39 151 56.30 11.42
Henan 932 63.16 23.39 2859 53.11 40.87 101 33.97 8.53
Hubei 1034 64.88 21.05 2793 47.18 38.06 152 107.56 22.44
Hunan 1117 61.37 20.38 3027 45.09 37.43 112 38.19 9.43
Gangdon 922 107.70 16.81 2045 102.62 34.66 117 33.69 6.11
(uangai 441 30.12 8.36 1129 24.61 15.01 64 15.28 4.24
Halnn 49 1.41 0.47 80 2.06 1.35 3 0.33 0.11
Schuan 1402 93.18 33.91 4009 54.40 47.54 320 123.41 30.48
Guihou 235 14.34 5.62 513 9.82 7.87 91 15.84 5.94
Yumnan 253 27.04 8.57 562 11.62 8.14 97 19.48 6.23
TIbet 4 0.01 0.03 7 0.68 0.2
Shaanxi 569 23.35 10.29 1640 19.19 17.23 86 13.61 4.52
GM=su 343 27.00 8.28 799 13.37 10.34 49 15.06 5.6
Qiughal 48 3.16 6.21 165 2.32 2.55 30 8.52 1.9
Nllxia 85 4.00 1.94 239 3.12 2.51 30 3.96 1.14
Xinjiang 144 6.35 3.61 497 8.88 6.02 24 7.84 3.58
SD 513 49.46 11.20 1399 29.80 19.49 94.22 58.55 10.93
Mean 668 54.17 14.85 1739 3S.18 23.94 118.34 53.05 11.14
COV 0.77 0.91 0.75 0.80 0.85 0.81 0.80 1.10 0.98
....conul(.

- 186 -
Appendix Table A1.6 Number of Enterprises, Gross Output Value (GOV),and Number of Emloyees (1991)
aine Buih ! elcutiand Tl .muicaiomNo. of fnmu GOV Y lOOna |No. of peron No. of fims | CHV Y lOO0a No. of persn
I X ~~~~ ~ ~~10,"000 10,000
Al China 42496 1995.40 990.96 4919 764.69 175.35
Beijing 684 68.52 25.60 162 45.69 8.86
roi4in 750 56.90 25.10 133 28.97 6.53
Hebei 2245 80.37 44.41 127 9.51 3.11
Shanwi 1143 41.70 30.96 53 2.61 2.13
bnner Mongolia 564 21.10 14.81 31 4.05 OM.3
l 48:".g 3499 154.91 100.53 252 25.92 10.43
Jilin 1186 35.06 24.95 74 6.05 2.84
He1onagiaun 1497 63.19 45.61 64 4.05 1.88
Shanghai 1623 205.87 65.84 333 82.73 15.31
Jiangsu 4604 261.67 107.86 864 126.89 29.25
Zheiang 5351 119.54 51.10 692 33.45 10.03
Asunhi 1558 44.82 24.72 82 10.80 2.76
FuIan 916 27.55 13.01 236 37.57 4.49
Jiangi 1197 29.07 20.77 72 10.10 3.80
Shandong 2314 160.91 65.06 161 23.68 5.61
Hewn 1760 96.02 S3.57 70 9.08 3.05
Hubei 1689 66.60 43.79 121 12.25 5.58
Hunan 1757 56.37 36.58 151 8.83 4.13
ouangdong 1762 117.00 32.47 868 174.51 27.78
(huagxi 636 29.23 12.45 42 4.98 1.87
Hainan 54 0.96 0.91 13 2.41 0.42
Sikhuma 2971 129.50 70.79 158 39.94 11.70
Guizhou 289 17.56 10.26 30 5.25 2.64
YUnanM 330 21.38 12.25 19 3.80 0.65
Tibet 12 0.02 0.02 0 0.00 0.0'0
Shaxlwn 1224 46.56 32.16 84 44.29 7.33
ansau 400 18.97 12.5Si 16 5.74 1.74
Qlnghti 119 5.61 3.74 3 0.28 0.19
Nnxl a 134 8.79 4.16 4 0.16 0.14
Xinjia 228 9.63 5.00 4 1.11 0.18
SD 1281 63.08 27.31 230 38.71 7.14
Mean 1417 66.51 33.03 170 26.37 6.05
CoV 0.90 0.95 0.83 1.36 1.47 1.18
Sowuce: China bndustrl Sisidcal Yesabook 1992.
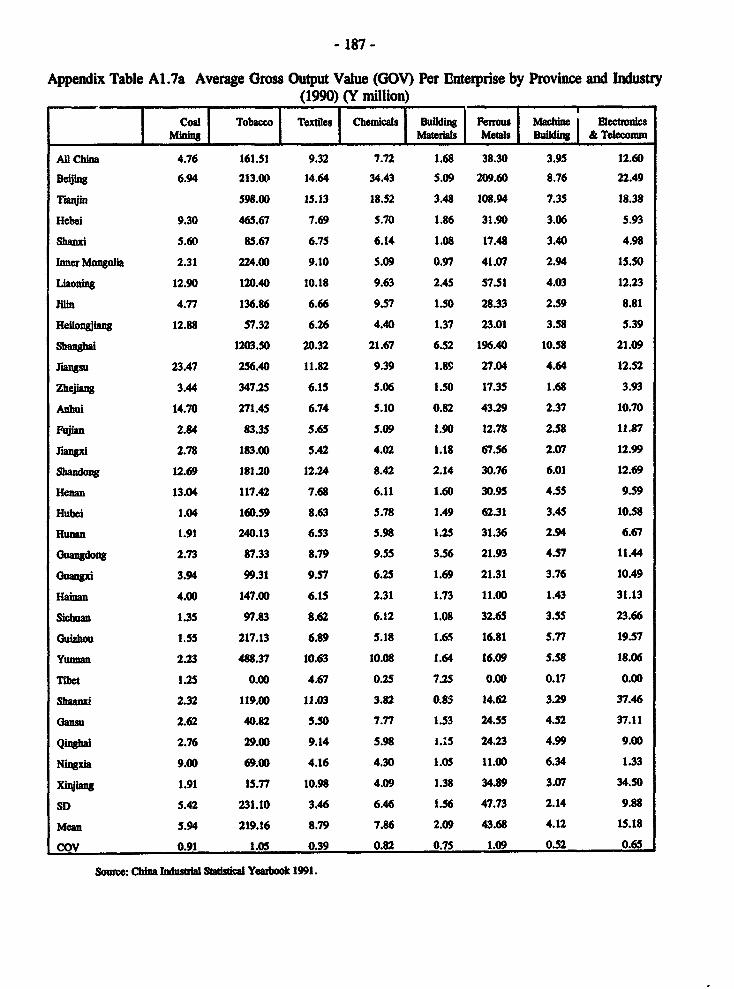
- 187-
Appendix Table Al.7a Average Gross Output Value (GOV) Per Enterprise by Province and Industry(1990) (Y million)
Coal Tobaco |T Ixts Cheoicals Building Fferous machine Elemonics| wm Mh*I M || ials Meals Bulding & TelCoxIm
AUR China 4.76 161.S1 9.32 7.72 1.68 38.30 3.95 12.60
Beiing 6.94 213.00 14.64 34.43 5.09 209.60 8.76 22.49
Tilanjin 598.00 15.13 18.52 3.48 108.94 7.35 18.38
Hebei 9.30 465.67 7.69 5.70 1.86 31.90 3.06 5.93
Shanxi 5.60 85.67 6.75 6.14 1.08 17.48 3.40 4.98
Inner Mongolia 2.31 224.00 9.10 5.09 0.97 41.07 2.94 15.50
Liaoning 12.90 120.40 10.18 9.63 2.45 57.51 4.03 12.23
Jiin 4.77 136.86 6.66 9.57 1.50 28.33 2.59 8.81
Heftong&ang 12.88 57.32 6.26 4.40 1.37 23.01 3.58 5.39
Shanghai 1203.50 20.32 21.67 6.52 196.40 10.58 21.09
Jiangsu 23.47 256.40 11.82 9.39 1.89 27.04 4.64 12.52
Zhejiang 3.44 347.25 6.15 5.06 1.50 17.35 1.68 3.93
Anhui 14.70 271.45 6.74 5.10 0.82 43.29 2.37 10.70
Fujian 2.84 83.35 5.65 5.09 1.90 12.78 2.S8 11.87
Jiangp 2.78 183.00 5.42 4.02 1.18 67.56 2.07 12.99
Shandong 12.69 181.20 12.24 8.42 2.14 30.76 6.01 12.69
Henan 13.04 117.42 7.68 6.11 1.60 30.95 4.55 9.59
Hubei 1.04 160.59 8.63 5.78 1.49 62.31 3.45 10.58
Hunan 1.91 240.13 6.53 5.98 1.25 31.36 2.94 6.67
Gluangdong 2.73 87.33 8.79 9.55 3.56 21.93 4.S7 11.44
uwangxi 3.94 99.31 9.57 6.25 1.69 21.31 3.76 10.49
Hainan 4.00 147.00 6.15 2.31 1.73 11.00 1.43 31.13
Sichuan 1.35 97.83 8.62 6.12 1.08 32.65 3.55 23.66
Guizhou 1.55 217.13 6.89 5.18 1.65 16.81 5.77 19.57
Yunnan 2.23 488.37 10.63 10.08 1.64 16.09 5.S8 18.06
Tlbet 1.25 0.00 4.67 0.25 7.25 0.00 0.17 0.00
Shaanxi 2.32 119.00 11.03 3.82 0.85 14.62 3.29 37.46
Garsu 2.62 40.82 5.50 7.77 1.53 24.55 4.52 37.11
Qighad 2.76 29.00 9.14 5.98 1.15 24.23 4.99 9.00
Ningxia 9.00 69.00 4.16 4.30 1.05 11.00 6.34 1.33
Xinjiang 1.91 15.77 10.98 4.09 1.38 34.89 3.07 34.50
SD 5.42 231.10 3.46 6.46 1.56 47.73 2.14 9.88
Mean 5.94 219.16 8.79 7.86 2.09 43.68 4.12 15.18
COV 0.91 1.05 0.39 0.82 0.75 1.09 0.52 0.65
Source: Cbina sdus AlSta stical Yeatbook 1991.

- 188 -
Appendix Table A1.7b Average Gross Output Value (GOV) Per Enterprise by Province and Industry(1991) (Ymillion)
Coal Tobacco Textiles Chemicals Building Fenous I Macbi ElectronicsMinig Mawnwls Metlls Buiding & Telecomm
Al China 5.40 166.40 10.30 8.15 2.02 44.83 4.70 15.55
Beijing 7.22 221.50 15.51 16.98 6.01 232.97 10.02 28.20
Tianjin 447.00 14.28 19.13 4.25 130.80 7.59 21.78
Hebei 9.26 504.00 8.84 6.33 2.21 37.41 3.58 7.49
Shanxi 6.46 89.67 7.31 6.39 1 31 21.02 3.65 4.92
mer Mongolia 4.88 244.00 9.79 4.85 1.16 45.73 3.74 13.06
Liaoning 14.82 99.80 10.69 9.99 2.84 67.05 4.43 10.29
Jlin 5.79 139.29 6.83 10.23 1.75 31.46 2.96 8.18
Heilongiang 16.91 59.95 6.72 5.22 1.58 26.38 4.22 6.33
ShanghaI 24.84 7.85 230.69 12.68 24.84
Jiangsu 28.49 246.20 12.38 10.24 2.21 30.17 5.68 14.69
Zhejiang 3.28 353.25 7.43 6.02 1.79 19.60 2.23 4.83
Anhu" 16.57 268.64 7.41 4.79 0.91 49.05 2.88 13.17
Fujian 2.95 84.89 6.10 5.50 2.42 14.34 3.01 15.92
ingi 3.01 139.25 5.66 4.20 1.38 56.40 2.43 14.03
Shandong 13.82 202.87 13.38 9.14 2.69 37.28 6.95 14.71
Henan 1.08 124.41 8.63 6.78 1.86 33.63 5.46 12.97
Hubei 4.56 155.00 9.85 6.27 1.69 70.76 3.94 10.12
Hunan 0.68 262.71 6.97 5.49 1.49 34.10 3.21 5.85
Guangdong 3.32 91.44 11.49 11.68 5.02 28.79 6.64 20.10
Guangxi 4.63 93.56 9.58 6.83 2.18 23.88 4.60 11.86
Haian 5.00 171.00 7.12 2.88 2.58 11.00 1.78 18.54
Sichuan 1.58 107.30 9.13 6.65 1.36 38.S7 4.36 25.28
Guizhou 1.81 211.50 6.07 6.10 1.91 17.41 6.08 17.50
Yumnan 2.39 509.35 11.26 10.69 2.07 20.08 6.48 20.00
Tibet 1.25 4.67 0.25 9.71 0.17
Shaanxi 1.54 123.44 11.71 4.10 1.17 15.83 3.80 52.73
Gansu 0.44 38.83 6.05 7.87 1.67 30.73 4.74 35.88
Qingba 18.88 30.00 8.55 6.58 1.41 28.40 4.71 9.33
Ningxia 9.60 74.00 4.14 4.71 1.31 13.20 6.56 4.00
Xiajing 0.00 15.79 14.55 4.41 1.79 32.67 4.22 27.75
SD 6.81 132.37 2.99 4.92 2.01 54.77 2.42 10.42
Mean 6.56 176.16 8.74 7.84 2.59 47.65 4.76 16.36
COV 1.04 0.75 0.34 0.63 0.78 1.15 0.51 0.64
Sourc: China 1dusti Statistical Yearbook 1992.
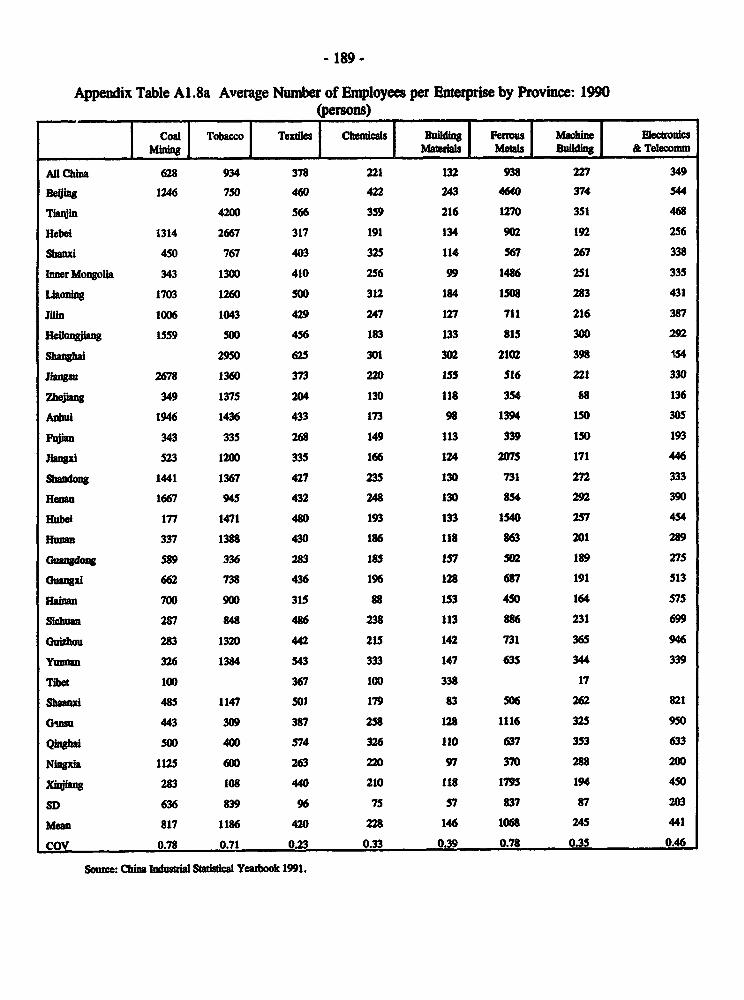
- 189 -
Appendix Table Al.8a Average Number of Employees per Enterprise by Province: 1990(perons)
- ~~~~~~~m mI ---- I --- 1Coa 1 Tobaccoj Te 1 Chendlcalsl Edfn imu Mahn TEleommnk
IMIni nh8 _cde _ MXis Mts Eifn es
AUl China 628 934 378 221 132 938 227 349
Deftg 1246 750 460 422 243 4640 374 544
Tiu41n 4200 566 359 216 1270 351 468
Hebei 1314 2667 317 191 134 902 192 256
Shanx* 450 767 403 325 114 567 267 338
Inner Mongola 343 1300 410 256 99 1486 251 335
liaoning 1703 1260 S00 312 184 1508 283 431
iifn 1006 1043 429 247 127 711 216 387
Heilornimg 1559 S00 456 183 133 815 300 292
Shan"h 2950 625 301 302 2102 398 154
Iiagmz 2678 1360 373 220 155 516 221 330
Zhejiang 349 1375 204 130 118 354 so 136
Anbld 1946 1436 433 173 98 1394 150 305
Fujan 343 335 268 149 113 339 150 193
Jiiypd 523 1200 335 166 124 2075 171 446
Shandong 1441 1367 427 235 130 731 272 333
Henan 1667 945 432 248 130 854 292 390
Hubei 177 1471 480 193 133 1540 257 454
Humn 337 1388 430 186 118 863 201 289
Guangdo_ g 589 336 283 185 157 502 189 275
Gusanpg 662 738 436 196 128 687 191 513
Hainak 700 900 315 88 153 450 164 575
Sichun 287 848 486 238 113 886 231 699
Ghfriou 283 1320 442 215 142 731 365 946
Yunnan 326 1384 543 333 147 635 344 339
Tibet 100 367 100 338 17
Sbhasxi 485 1147 501 179 83 506 262 821
Gknsu 443 309 387 258 128 1116 325 950
Qlaghal S0 400 574 326 110 637 353 633
Nigxia 1125 600 263 220 97 370 288 200
xhGjibag 283 108 440 210 118 1795 194 450
SD 636 839 96 75 57 837 87 203
Mean 817 1186 420 228 146 1068 245 441
CoV 0.78 0.71 0.23 0.33 0.39 0.78 0.35 0.46
Source: China Industrid Sistdcal Yearbook 1991.
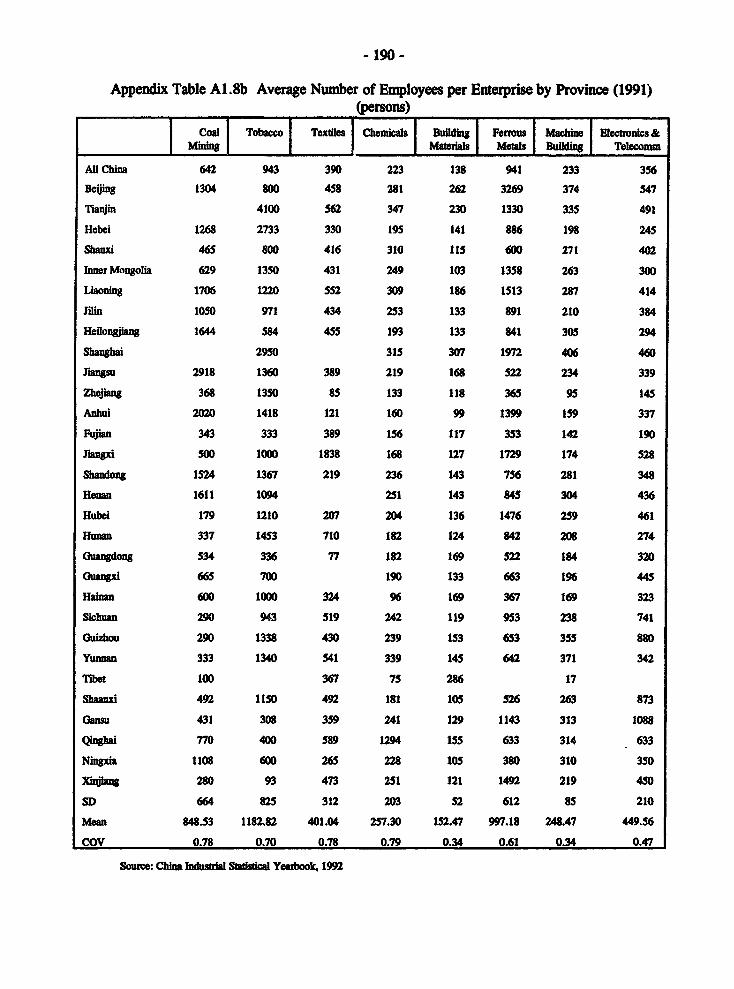
- 190 -
Appendix Table A1.8b Average Number of Employees per Enterprise by Province (1991)(persons)
Coal Tobacco Textiles Chemicals Building Ferrous Macbie Electronics &Ming Matedals Metals Building Telecomm
Al China 642 943 390 223 138 941 233 3S6
Beijing 1304 800 458 281 262 3269 374 S47
Tianjin 4100 562 347 230 1330 335 491
Hebei 1268 2733 330 195 141 886 198 245
Shanxd 465 800 416 310 115 600 271 402
Inner Mnngolia 629 1350 431 249 103 1358 263 300
Ilaoning 1706 1220 552 309 186 1513 287 414
JliIn 1050 971 434 253 133 891 210 384
Heilongpang 1644 584 455 193 133 841 305 294
Shanghai 2950 315 307 1972 406 460
Jiangsu 2918 1360 389 219 168 522 234 339
Zhejiang 368 1350 85 133 118 365 95 145
Anhui 2020 1418 121 160 99 1399 159 337
Fujian 343 333 389 156 117 353 142 190
Jiangxi 50 1000 1838 168 127 1729 174 528
Shandong 1524 1367 219 236 143 756 281 348
Henan 1611 1094 251 143 845 304 436
Hubei 179 1210 207 204 136 1476 259 461
Hunan 337 1453 710 182 124 842 208 274
Uwmngdong 534 336 77 182 169 522 184 320
(luangxi 665 700 190 133 663 196 445
Hainan 600 1000 324 96 169 367 169 323
Sichuan 290 943 519 242 119 953 238 741
Uuizhou 290 1338 430 239 153 653 355 880
Yumian 333 1340 541 339 145 642 371 342
Tibet 100 367 75 286 17
Shaanxi 492 11S0 492 181 105 526 263 873
Gansu 431 308 359 241 129 1143 313 1088
QinC 770 400 589 1294 I55 633 314 633
Ningxia 1108 600 265 228 105 380 310 350
XiWpjag 280 93 473 251 121 1492 219 450
SD 664 825 312 203 52 612 85 210
Mean 848.53 1182.82 401.04 257.30 152.47 997.18 248.47 449.56
COV 0.78 0.70 0.78 0.79 0.34 0.61 0.34 0.47
Source: China Iustal Satsicl Yeasbook, 1992

- 191 -
Appendix Table A2.1 Price ControS: Reductio in Scope (1978-1991)
Yea Domestic Reti Goods Farm PmdueA Soid by Patnerd2..3AA ~ ~ Iam S iw I
Fixed (kd% Fre Fixed Guided FreeI plicefi ! ri pimfi ! M% p*C(% M p(%, M pim M
1978 97.0 0.0 3.0 92.6 1.8 5.6
195 47.0 19.0 34.0 37.0 23.0 40.0
1986 35.0 25.0 40.0 35.3 21.0 43.7
1987 33.7 28.0 38.3 29.4 16.8 53.8
1988 28.9 21.8 49.3 24.0 19.0 57.0
1989 31.3 23.2 45.5 35.3 24.3 40.4
1990 30.0 25.0 45.0 31.0 27.0 42.0
1991 20.9 10.3 68.8 22.2 20.0 57.8
Source: Data compied by the CASS

- 192-
Appendix Table A2.2 Free Market Price Indices of Consumer Goods
Free maiket Free market Free narket Free marketIndex Ibdex Index Reldive to Stat(19S0=100) (1979=100) (1984-100) Lit
1962 354.8 151.0 130.5 270.0
1965 192.3 81.9 70.8 140.0
1970 197.7 84.2 72.7 142.0
1975 259.5 110.5 95.5 184.0
1978 246.0 104.7 90.5 169.0
1979 234.9 100.0 86.4 157.0
1980 239.6 102.0 88.2 148.0
1981 253.5 107.9 93.3 149.0
1982 261.9 111.5 96.4 148.0
1983 272.9 116.2 100.4 148.0
1984 271.8 IIS.7 100.0 143.0
1985 318.5 135.6 117.2 128.0
1986 344.3 146.6 126.7 117.0
1987 400.4 170.S 147.3 117.0
1988 521.7 222.1 191.9 117.0
1989 578.0 246.1 212.7 112.0
1990 545.1 232.1 200.6 107.7
1991 540.2 230.0 198.7 10S.2
Source: Chma StMistid Yearbook (varous ismUS).
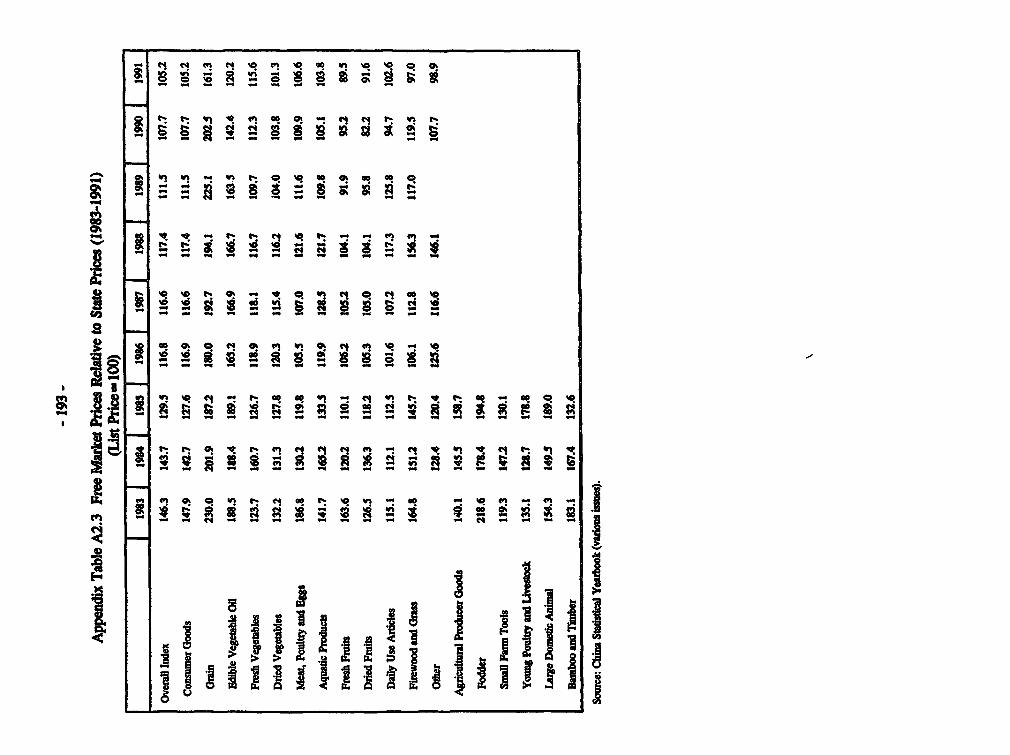
_
Q t-but^Z>
i - :g ; E"Eo
9 i ; RR a w : ss if f if3
i cjcsqi ^t ggr " q YB g? ai
X~i w.X } LiiMlj2X
iXi J 1*1*] ilUiflg ]

- 194 -
Appendix Table A2.4 Planned and Market Prices of Main MatialsCl/ton)
1986 1987 1988 1989 1990 1991
Stel produc
Conrrolled price (a) 1017 1047 1302 1616 1719 1780
Market price (b) 1501 1516 1900 2197 2092 1984
bla (penxt) 148 14S 146 136 122 111
Cement
Comroledprice (a) 107 111 127 157 154 175
Mart prike (b) 131 133 161 212 184 194
bla(percent) 122 120 127 135 119 111
Coal
Contolled prike (a) 44 45 52 65 75 83
MarDAprice (b) 64 64 100 174 154 141
b/a (percent) 145 142 192 268 205 170
Copper
Cntrolle price (a) 6051 6381 7824 10467 14825 14664
Moarkt price (b) 6689 6944 14226 19653 17553 16582
bla (percent) 111 109 182 188 118 113
Conroled Prie (a) 3780 4483 6051 9014 9037 8436
Madkt prie (b) 5389 6433 10912 15117 10831 9072
bla (poeet) 143 143 180 168 120 108
Lumber
Controlled prke (a) 247 310 378 418 430 441
Marketpd ce(b) 358 475 638 707 693 618
bla peenX) 145 153 169 169 161 140
Not.: Uni for Lumber. Yuan per cdbc mer.
&,uAce: Miistry of Matials and EiP*pmentL

Appendix Table A2.5 Planned and Market Prtces of Main Materals (1989-1991)(Yuan per ton)
1987 1989 1991
|Plamed Arket bha Planned Markt 7 b/a Plaed Maketk bhaprice (a) price (b) (percent) p!ice (a) price (b) (percent prie (a) pitc (b) (perce)
All China
Steel 1047 1516 145 1618 2197 136 1780 1984 11(produtws
Copper 6381 694 109 10467 19653 188 14664 16582 113
Aluminaum 4483 6433 143 9014 15117 168 8436 9072 108
Cenmen 111 133 120 157 212 135 175 194 111
Lunber 310 475 153 418 707 169 441 616 140
Coal 45 64 142 65 174 268 83 141 170
Chongqing City
Sted 1142 1471 129 1633 2326 142 188S 2435 129
Copper 6707 6700 100 10339 18914 183 16000 16563 104
Alumiinum 4826 5600 116 8219 13907 169 8000 8750 109
Cement 102 129 126 111 176 159 142 143 101
Lumber 320 483 151 383 650 172 470 579 123
Coal
Guangdong Prwvie
Sted 1071 1456 136 1485 2057 139 1767 1958 111product
Copper 6004 8671 144 12023 14066 117 15346 16007 104
Auinhiuhm 4850 6759 139 9589 10671 111 8427 9001 107
Cement 145 190 131 216 223 103 213 234 110
Lumber .85 857 690
Coal 71 85 120 114 178 156 144 167 116
Jiangsu ProviLce
Stee 800 1500 188 950 2000 211 1704 2058 121pwducts
Copper S650 7100 126 7700 19300 251 11275 16966 150
Aluminium 4000 6200 ISS 4800 14500 302 7758 9348 120
Cement 75 145 193 110 230 209 185 195 105
Lumber 195 410 210 300 700 233 517 741 143
Coal 70 100 143 95 220 232 113 147 130
.... coudJI

- 196-
198 1989 1991
Planned | M t b/a Pl_ud Maket b/a Plmud Mar blaprice (a) price (b) ppe(a) pricedb) O ( ) pdce (a) puce (b) )
Zbejmn Prvic
Sted 1050 2000 190 1245 2260 182 1710 1930 113products
Copper 5800 15700 271 85O 20400 240 12400 16500 133
AlumnIbum 2750 12000 436 6400 13000 203 8100 8990 111
Cemntn 130 195 150 165 250 152 170 220 129
Lumber
Coal 70 140 200 85 240 282 120 IS0 125
Shanxi Province
Sted 760 1080 142 1463 1978 135 1768 2006 113
CoppWr 7300 13010 178 16485 17904 109 14013 175S0 125
Alumininm 4500 8800 196 8O2 12139 139 8508 8738 103
Cement 48 85 177 149 168 113 164 171 104
Lanber 280 460 164 453 748 165 439 563 128
Coal 35 5D 143 56 76 136 85 107 126
Hebel Provne
Sted 1079.3 1447.85 134 1516.53 2103.43 139 1718.45 1857.07 108product
COPper 6335.84 6680.02 105 10595.13 17774.29 168 14814.53 15924.7 107
Aluminum 5223.13 6284.69 120 7665.78 13627.91 178 8239.27 10076.55 122
Cement 108.57 134.47 124 146.09 183.29 125 163.57 179.51 110
Lumber 320.37 418.13 131 514.84 718.42 140 431.23 555.47 129
Coal 35.72 40.82 114 62.49 96.73 155 61.98 87.33 141
Note: Unit for Lumber is you per squaw meor.Souce: te Miihsty of Matei and Equime

- 197 -
Appendix Table A2.6 Retail Prices of major Commodities in 29 Provincial Capitals1986
Fo'ur Rice Vegetabe AWes W Whe ColorWTV Col Kerosene(Y/kg) (Y/kg) On (Y/kg) Cotton cloth 45 cm (reident (YIkAW
(YAkg) (Y/M) | (Y) us)I I(Y/Iooks)
boi*g 0.50 0.31 2.36 1.86 1.08 1330 3.10 0.73
Tianjin 0.50 0.30 2.21 1.89 1.11 1330 3.40 0.67
Shijiauang(Hebei) 0.50 0.40 2.29 1.78 1.18 1340 2.90 0.68
Tal*uan(Shanxd) 0.51 0.38 2.27 1.90 1.08 1382 2.80
HuhebaotInnerMongolia) 0.40 2.07 2.07 1.11 1463 3.23 0.66
Shenyang(Lbaoing) 0.55 1.68 1.52 1.38 1380 3.83 0.66
Chfangchnn(Jiin) 0.54 241 1.12 1380 3.00 0.66
HaebinbWeieongjiag) 0.52 0.43 1.90 1.44 1380 3.50 0.66
Shanghai 0.44 0.30 2.43 2.36 1.4S 1330 5.20 0.66
Na&*ingJiaagsu) 0.40 03.U 2.28 1.77 1.20 1360 4.60 0.66
llHypduangz ejlang) 0.48 0.33 2.03 2.07 1.41 1330 4.20 0.66
HEfiWAshui) 0.44 0.31 1.78 1.90 1.02 1377 3.20
Fuzhow(Pu3jbn 0.54 0.33 2.29 1.98 1.07 1330 3.40 0.70
Nanchang(hbangi) 0.48 0.29 2.48 2.04 1.08 1370 3.40 0.70
| JiinaShandong) 0.50 0.28 1.38 1.05 1390 3.20
Z;sebouz(Henan) 0.50 0.34 2.50 1.77 1.24 1370 3.28 0.69
WjwuhanHbel) 0.40 0.32 1.97 2.27 1.27 1390 3.70 0.70
I Chbrngabo(Hunan) 0.46 0.31 2.52 2.04 1.05 1383 3.40 0.72
Ouanugzou(Guangdon 0.64 0.34 2.65 1.28 1621 4.20 1.03
Nannin(Guangz) 0.50 0.32 2.04 1.83 1.29 1452 4.00 0.75
Chxongqpng(Slchn) Q0.32 2.05 2.06 1.05 1377 3.33 0.76
Chmdu(Sichunag) 0.46 0.29 2.00 2.34 1.20 1459 1.60 1.12
Guiyang(Guizbou) 0.50 0.36 1.65 2.07 1.50 1330
KIuumnin gY1nry ) 0.51 1.76 1.75 1.13 1373 1.29 0.80
Xian(Sbaanxi) 0.47 0.35 2.46 1.67 1.10 1360 3.90 0.68
Lanzhou(Gansu) 0.52 0.48 2.29 1.59 0.93 1390 4.10 0.85
Xinin(Qingha) 0.45 1.90 1.70 1.02 1390 4.00 0.68
Yinchuang(Nirgda) 0.50 2.68 1.43 1.23 1370 1.18 0.70
Yuhrmunqi(Xinji 0.56 0.54 2.63 1.60 1.23 1386 0.58
SD 0.05 0.06 0.29 0.29 0.14 57.01 0.89 .0.12
mmean 0.0 0.35 2.18 1.92 1.18 1384 3.37 0.73
Coy 0.10 0.18 0.13 0.15 0.12 0.04 0.26 0.16
Solune: China PFice Staiasi Yearbook 1987.
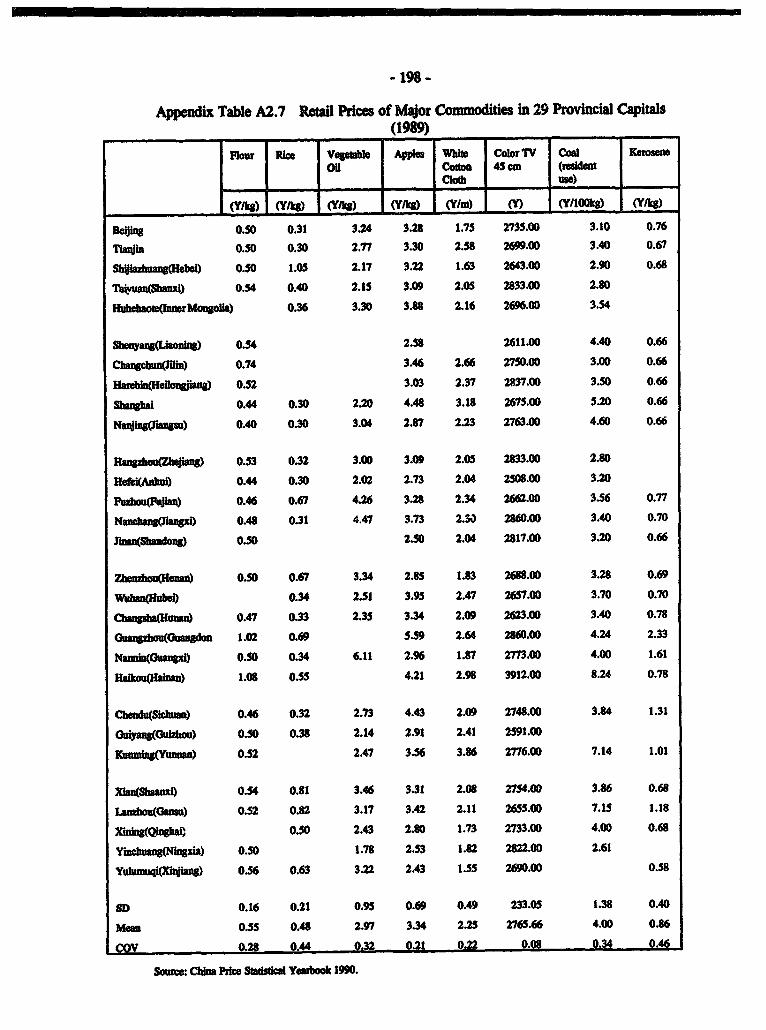
- 198-
Appndix Table A2.7 Retil Pices of Major Commodities in 29 Provincial Capitals(1989)
C)D CiMton 45 cmn (reddWI
(Y/kg) (Y/W8 (yaw8 (Yikg (Y/m) ll (YIl0OO}E (YIke
DEdjig 0.50 0.31 3.24 3.28 1.75 2735.00 3.10 0.76
Tauin 0.50 0.30 2.77 3.30 2.58 2699.00 3.40 0.67
Shbjlazhuang(Hebli) 0.50 1.05 2.17 3.22 1.63 2643.00 2.90 0.68
Tldyuan(Shani 0.54 0.40 2.15 3.09 2.05 2833.00 2.80
EHi:ehaote(IansbMongolla) 0.36 3.30 3.8 2.16 2696.00 3.54
Shenyang(Lzxialn) Q0.54 2.58 2611.00 4.40 0.66
Chan gchun(Jili) 0.74 3.46 2.66 2750.00 3.00 0.66
Hmbin(Heilongjiarn x 0.52 3.03 2.37 2837.00 3.50 0.66
Shan"hai 0.44 0.30 2.20 4.48 3.18 2675.00 5.20 0.66
Nanjing(fagu) 0.40 0.30 3.04 2.87 2.23 2763.00 4.60 0.66
0.53 0.32 3.00 3.09 2.05 2833.00 2.80
HM(Anhul) 0.44 0.30 2.02 2.73 2.04 2508.00 3.20
Pzhou(an) 0.46 0.67 4.26 3.28 2.34 2662.00 3.56 0.77
3 Nanchaag(Jlan) 0.48 0.31 4.47 3.73 2.30 2860.00 3.40 0.70
ih.n(San0g) f0.50 2.50 2.04 2817.00 3.20 0.66
Z _lndicu(Honan) 0.50 0.67 3.34 2.85 1.83 2688.00 3.28 0.69
Wzha(Hne 0.34 2.51 3.95 2.47 2657.00 3.70 0.70
)^_9 0.47 0.33 2.35 3.34 2.09 2623.00 3.40 0.78
Ouangzhcu(Guangdon 1.02 0.69 5.59 2.64 2860.00 4.24 2.33
NannWl(Gua) 0.50 0.34 6.11 2.96 1.87 2773.00 4.00 1.61
Halkouglainan) 1.08 0.55 4.21 2.98 3912.00 8.24 0.78
Chsnd(Slchxun) 0.46 0.32 2.73 4.43 2.09 2748.00 3.84 1.31
Guyang(Uuiwios) 0.50 0.38 2.14 2.91 2.41 2591.00
Kunming(Yuanan) 0.52 2.47 3.56 3.86 2776.00 7.14 1.01
Xlan(Shaanxl) 0.54 0.81 3.46 3.31 2.08 2754.00 3.86 0.68
Lanzhou(Ganau) 0.52 0.82 3.17 3.42 2.11 2655.00 7.15 1.18
Xlning(Qinghai) 0.50 2.43 2.80 1.73 2733.00 4.00 0.68
Yiclmag(NtiW) 0.50 1.78 2.53 1.82 2822.00 2.61
YONMOMOa* 0.56 0.63 3.22 2.43 1.55 2690.00 0.58
SD 0.16 0.21 0.95 0.69 0.49 233.05 1.38 0.40
Man 0.55 0.48 2.97 3.34 2.25 2765.66 4.00 0.86
COV 0.28 0.44 0.32 0.21 0.22 0.08 0.34 0.46
Souwce: Chlna Pmce Sfiads Ycabook 1990.

- 199-
Appendix Table A2.8 Retail Prices of Major Commodities in 29 Provincial Capitals(1991)
}lout Nice Vegetible Apples Whte Color Coal Kexroene(YA/g) (YAkg) oil (Y/kg) coon TV 4O (uWsiMet (Y/kg)
(Y/Wq Clodh crn use)_ . (Y) Yo ,r)
efint 0.67 0.47 3.99 4.13 2.50 2145 1.35
Tia*Ij 0.67 0.45 4.36 4.21 2.95 99Q2 0.76
Shbilmzhuag(Hebei) 0.67 0.62 2.81 3.86 2.46 2918
Ta=n(MMSbanxi) 0.61 0.48 3.45 4.14 2.20 2317 4.24
Mulehnot(ImmerMongolia) 0.47 3.79 4.70 2.45 2150 5.04
ShenyangLiaoning) 0.75 3.20 2.44 2140 4.78 0.66
Chancbun(llno) 0.86 4.83 3.37 2063 4.77 0.76
HrebHilongJ ) 0.72 4.26 3.08 3185 5.57
Shang1ai 0.62 0.43 3.18 5.78 3.19 2208 0.95
Na=i*g(Jiingsu) 0.60 0.51 3.50 3.84 2.88 2279
Ilaagzhoo(Zhejls3n 0.76 0.47 4.07 4.54 2.79 2300 0.66
Hefi("Anhul 0.61 0.45 2.89 3.38 2.66 2316 6.60
Fuzh=uFujibn) 1.13 0.87 4.48 3.99 2.47 2147 1.12
Nanchwg(nu) 0.67 0.48 4.54 4.36 2.36 2092 0.83
iagnSbandong) 0.67 0.31 4.16 3.19 2.18 2435 0.66
Z kenzhou(Henan) 0.66 0.47 3.33 4.21 2.60 2043 4.53 C.79
Wuhsn(Oue) 0.45 3.93 4.64 3.04 2303 0.75
Changeha(Hunan) 0.70 0.48 4.19 4.07 2.47 2252 5.20
Guangu(GuangdO 1.12 0.91 6.59 2.70 1932 1.42
Nain(Guangxi) 0.69 0.53 4.07 2.88 2374 1.84
Haikou(1ainan) 1.22 0.92 4.82 3.68 30S0 0.88
Chendu(Sichan) 0.65 0.42 3.71 4.95 2.59 2096 6.04 1.57
Guiyang(Guizhou) 0.70 0.54 3.42 3.21 2.52 1836
hinmlng(Yunnan) 0.69 04S 3.86 3.86 3.91 2049 5.77 1.24
Xian(SlIanzd) 0.69 0.6S 3.89 4.04 2.37 2001 6.64 0.79
Lasnzon(ansu) 0.68 0.74 3.92 4.73 2.35 1925 9.95 0.96
XinWgQthai) 0.57 3.23 3.64 2.88 2475 4.25 0.69
yiumg(Nwgxia) 0.63 2.50 3.52 2.34 2109 10.75
Yulumuql(Xinjiang) 0.72 0.66 3.98 3.27 2.85 2108 3.90 0.61
SD 0.16 0.16 0.53 0.75 0.41 315.34 1.94 0.34
mean 0.74 0.55 3.70 4.21 2.73 2251 5.87 0.96
COV 0.22 0.28 0.14 0.18 0.15 0.14 0.33 0.35
Sonse: China Prioe Stisda Yearbook 1992.
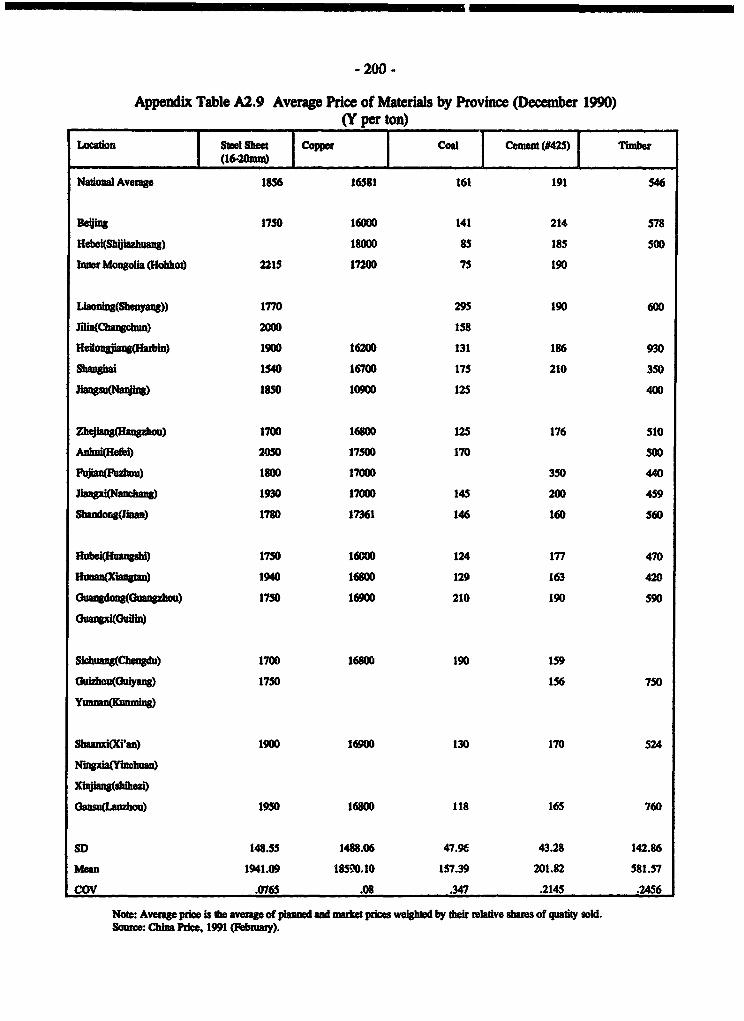
I I I , _ . I__ , I _ _ _. , I _IM
- 200 -
Appedix Table A2.9 Average Price of Materials by Province (December 1990)(Y per ton)
I cSted Coal Ceenst(1425) | T r, I (16-20mm) I
Nationa Aveage 1856 16581 161 191 546
Reafti 1750 160U0 141 214 578
Hebe4SbtUldaang) 18000 85 18S 500
Inner Mongolia (lohhot) 2215 17200 75 190
LlaoningShenyang)) 1770 295 190 600
JiinCbangcbun) 2000 158
HelcrnJing0(Habin) 1900 16200 131 186 930
Shang" 1540 16700 175 210 350
JbmgSu(Naqil4D 1850 10900 125 400
Zhejiang(llangzhou) 1700 16800 125 176 S10
Admhl(Heifh 2050 17500 170 S00
Puian(PFzhou) 1800 17000 350 440
Jlangxi(Nanehang) 1930 17000 145 200 459
Shtandoag(inan) 1780 17361 146 160 560
Hubei(Husngds) 1750 16C00 124 177 470
I HunanS>iOlG004 1940 16800 129 163 420
(buagdong(Guangahou) 1750 16900 210 190 590
Slchuang(Chengdu) 1700 16800 190 159
GuizhoCu(Gulban 1750 156 750
ShaanxiXI'an) 1900 16900 130 170 524
NhgxdibiYncan)
xwinm(fhiua)
oas(kLanzhou) 1950 16800 118 165 760
SD 148.55 1488.06 47.96 43.28 142.86
mean 1941.09 18590.10 157.39 201.82 581.57
COV .0765 .08 .347 .2145 .2456
Note: Average pnce b ite avmage of plannd and marke prces wetighed by tediratve shaeus of quatity sold.Souroe: China Prie, 1991 (Fbnxuay).

- 201 -
Appendix Table A2.10 Average Price of Materials by Province (Dember 1991)(Y per ton)
Location Steel Sheet | CoPper Coal Cement (#425) | TimberI (16-20mm) I I I I
Natdonal Average 1842 16558 154 211 588
Beijkq SOOShi(Traiya) 1750
Heelx(Shbiiazuang)
Inner MongoHa (Hobhot)
Laoning(Shenyang)) 1838 14253 143 530
I i:. Jrgchun) 16650 158 850
Heilo:ag(Harlt) 1950 16400 134 205 940
Shanghai 1750 16600 170 220 500
JiansgsnNanjing 1920 16800 180 561
Zhejian(Hangzhou) 1900 16700 185 185 530
Anfmi(lHefii) 1780 16000 142 550
Fujan(Fuzhou) 1820 17000 147 290 436
hiangxi(Nanchang) 2100 17100 140 275 495
Sbado ina) 1811 16750 172 178 510
H ee) ~~~~ ~ ~~1800 16800 81
Hubei(Huangshi) 1750 16700 204 207 530
Hun ol(a[gtta)
GiuangdongZhanjiar.g) 1820 16700 210 240 580
ouanupG(uffn)
Sikhuang(CheMndu) 1651 16600 165
Ohizhou(Guiyang) 16500 160 770
Shaawi(Xi'an) 1850 16790 100 210 570
Nigxia(Yinchuan) 1850 16800 55 180 837
xh1jiwwd1ff=En
SD 101.93 632.49 33.78 39.20 139.42
Mean 1725.88 16537.82 149.12 213.60 605.56
COV .0591 .0382 .2265 .1835 .2302
Note: Average prce is the aveage of planned and manrkt paces weighted by their rladve dsar sold.Source: China Price, 1992 (February).

- 202 -
Appendix Table A2. 11 Average Price of Materials by Province (June 1992)(Y per ton)
Lcation Sat Shet Copper Coal Ceeo t (1425) lmnber(16-20mm) II
National Average 1985 16721 151 212 565
Beijing
ShanxiCralyuan) 1780 57 375
Inner Mongolia (Hobot)
liaoning(Shenyang) 1900 16547 165 410
Jilln(Cbangchun) 2000 17000 148
Hbeflongjhung({arbin IS80 18000 147 205 950
ShanghWi 1980 16700 176 205 530
Jplagsu(Naqjing) 2100 16800 190 228 550
2kYdioNpIlaqg2bwu 2200 16600 195 548
Anhduidi) 1820 58
Pujlan(Fuzhou) 2150 17000 207 258 460
Jlngi(Nanchag)!
S _andong(Jlnan) 2090 16750 174
1900 16750 80 476
3 9bei(Huangshl) 2000 16500 220 670
Hunan(Changsba) 1909 16555 120 180 550
Ouangzi(Oullin) 2100 16700 185 380
Sichnang(Chengdu) 1850 16500 140 225
Guirhi(Ouimasn)
YunnanuwiIng) 1950 16500
Smaanti(Xlan) 1860 16450 441
2000 16400 116.9
Qinghai(XlnIng) 1930 16500 160 427
Ninxia(Yinchman) 1980.00 16800.00 56.25 200.00 791.00
Xiiang(Uuimq) 2000.00 245.00
SD 135.57 353.60 47.53 27.56 153.42
Mean 1956.14 16725.11 140.87 210.09 542.87
COV .0693 .0211 .3374 .1312 .2826
Note: Average price is the average of planed and matket prices weighted by thr r ve shares of quatidy sold.Source: Cbhina Price, 1992 (August).
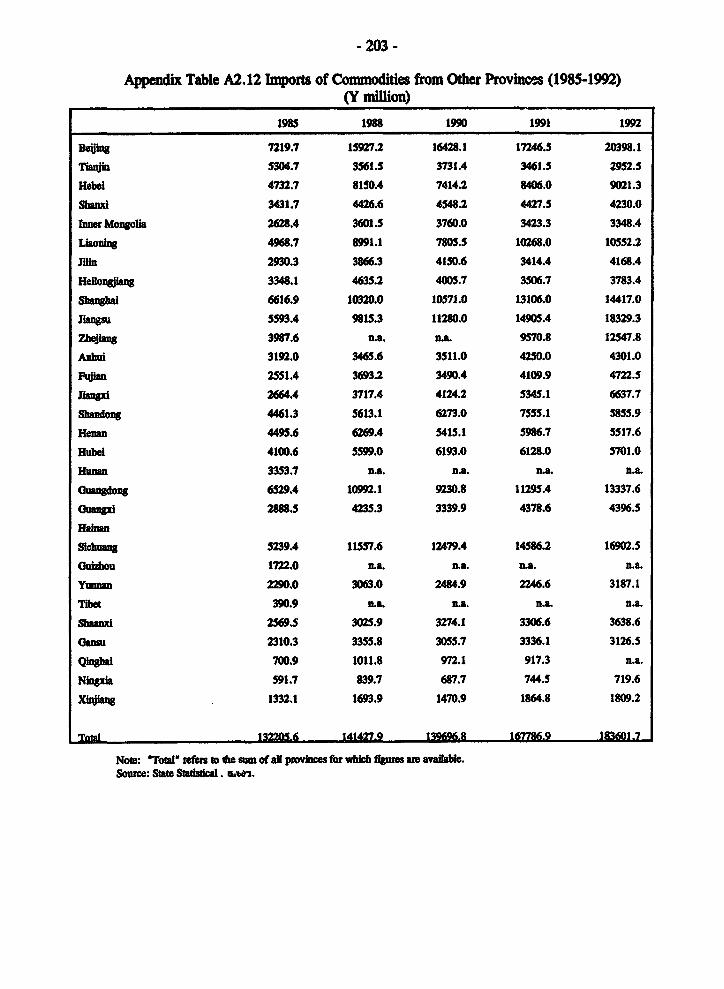
- 203 -
Appndix Table A2.12 Imports of Commodities from Other Provincss (1985-1992)(Y million)
198S 1988 1990 1991 1992
BeUsig 7219.7 159272 16428.1 17246.5 20398.1
IT&n 5304.7 3561.5 3731.4 3461.5 2952.5
Hebei 4732.7 8150.4 7414.2 8406.0 9021.3
Shanxi 3431.7 4426.6 4S48.2 4427.5 4230.0
imer Mongolia 2628.4 3601.5 3760.0 3423.3 3348.4
Lisong 4968.7 8991.1 7805.5 10268.0 10552.2
Jfn 2930.3 3866.3 4150.6 3414.4 4168.4
Hellongiang 3348.1 4635.2 4005.7 3506.7 3783.4
Shanghi 6616.9 10320.0 10571.0 13106.0 14417.0
Jengsu 5593.4 9815.3 11280.0 14905.4 18329.3
Zh*ejng 3987.6 n.a. na. 9570.8 12547.8
Auhui 3192.0 3465.6 3511.0 4250.0 4301.0
Fujien 2551.4 3693.2 3490.4 4109.9 4722.5
Jiangil 2664.4 3717.4 4124.2 5345.1 6637.7
Shandong 4461.3 5613.1 6273.0 7555.1 5855.9
Henn 4495.6 6269.4 5415.1 5986.7 5517.6
Hubei 4100.6 5599.0 6193.0 6128.0 5701.0
HUR 3353.7 n an. na. na.
O angdons 6529.4 1099Q.1 9230.8 11295.4 13337.6
Guangil 2888.5 4235.3 3339.9 4378.6 4396.5
S;hug 5239.4 11557.6 12479.4 14586.2 16902.5
*uizhou 1722.0 n.e na. na. na.
Yunnan 2290.0 3063.0 2484.9 2246.6 3187.1
Tibet 390.9 n.a. na. n.a. n.a.
shiena 2569.5 3025.9 3274.1 3306.6 3638.6
Oans= 2310.3 3355.8 3055.7 3336.1 3126.5
Qn4bd 700.9 1011.8 972.1 917.3 n.a.
Nngixa 591.7 839.7 687.7 744.5 719.6
Xhiag 1332.1 1693.9 1470.9 1864.8 1809.2
Tolal 132245.6 141427.9 13f8 167786.9 11360H7
Note: Tota1' refrs to doe sum of aU provinces br wvich fgue m anilable.Source: Sate Saidcl. u

- 204 -
Appendix Table A2.13 Exports of Commodities to Other Provinces (1985-1992)(Y million)
1985 1988 1990 1991 1992
BEbiing 4646.7 6885.8 6938.6 7737.1 9082.1
Tiaiin 10347.6 S037.8 4060.6 3943.5 2872.4
Hebel 1985.9 4320.3 3989.7 5024.7 5934.2
Shanxi 1019.5 1694.5 1693.9 1664.7 1729.0
knmer Mongola 963.4 IS77.9 1674.2 2124.7 1769.0
Laoning 5144.3 7465.1 6261.7 7899.5 7153.9
jail 1399.3 3107.0 2539.0 4674.5 4104.5
Heiongiang 4870.4 5214.4 5453.5 3218.9 4414.7
Shanglha 16356.0 16234.0 15276.0 15330.0 16097.0
Jiangsu 5883.8 10962.3 14774.6 8535.6 9686.1
Zhejiang 2795.1 na. n.a. 4825.6 6115.3
Anhuf 2555.8 3709.8 3881.0 2731.0 329.2
F}dian 1612.4 1896.8 2707.4 2969.5 3236.3
Jlauqgi 1299.1 2227.8 3628.2 4696.2 6129.5
Shandong 3018.8 6779.8 5613.4 6733.7 6513.8
Henan 5036.9 5783.9 5298.3 5983.3 5495.7
Hubeli 2784.6 4799.0 4906.0 5712.0 85'9.0I
Hunan 2300.7 n.a. n.a. na. na.
Ch3ungdong 8512.1 15209.7 1S292.1 16646.8 18129.0
3uangxi 1494.6 3403.8 3720.0 4107.3 3782.J
Hainan
Sichuang 3919.4 11787.7 6336.6 8052.7 8833.8
Guizhou 811.4 n.a. na. nLa. n.a.
Yunnan 1723.0 5B9.0 8488.3 9562.9 12581.7
Tibe 58.4 na. n.a. n.a. na.
Sbhanxi 1221.6 1603.6 1825.0 2197.5 2658.2
G3anma 1928.4 2627.5 2285.2 2690.2 2551.0
Qnghai 149.0 428.8 213.5 346.5 356.3
Ninxia 234.7 377.4 345.2 427.5 391.5
Xinjilang 791.0 1607.2 2021.9 2587.3 2978.6
TotnI 95063.8 129850.8 129223.9 140445.2 151514.2
Note: Total' nrfins toD t sum of aU provins for which figures are available.Source: Stt SWAsd Burean.

- 205 -
Appendix Table A2.14 Total Domestic Sales within Province (1985-1992)(Y million)
1985 1988 1990 1991 1992
1eIjing 12922.1 25568.8 30947.4 3S548.1 42461.7
Tlanjin 8828.6 7723.4 8010.8 8889.6 9539.6
Hebel 17084.5 24996.2 26273.0 29m.0 33139.9
shami 8815.3 13705.6 15963.6 14295.4 16S28.0
IneMogolia 7075.0 11509.7 12604.2 11956.0 13261.3
Llacing 19906.1 34143.5 22461.4 32231.6 38777.2
irm 9789.2 12566.9 14224.6 16381.2 17458.4
Helonaiag 14382.6 18032.5 22274.6 20181.5 22262.2
Shalnai 21872.7 39820.0 44550.0 43771.8 na.
hlaga 28660.9 43011.2 50289.6 56443.7 70654.1
ZD*ag 17560.1 26248.9 29198.3 33038.0 41938.0
Anhtui 12870.9 16132.0 17296.3 19033.0 21226.2
Pujian 806.9 13222.4 13780.5 11970.4 13386.1
hiangul 7869.7 12574.5 13611.7 12140.4 13430.7
Swmong 24100.2 45443.2 50409.1 S0251.2 790.8
Henna 18867.3 29864.9 33522.4 30741.2 32541.9
Hubei 18100.1 28094.0 30271.0 31022.0 31860.0
Hunam 15070.6 na. n.a. La. n.UA
Guangdoug 28844.1 54461.2 54127.8 46386.3 52430.8
Guasu 7702.6 14304.3 14796.9 14026.6 17275.8
HaUan
Sichuang 24389.1 39074.8 41520.5 36559.8 40732.9
Guizhou 5227.5 Ia. n.ea n.a. n.a.
Y _nna 89444 15172.9 15873.1 17041.2 19121.9
Tibet 634.7 L.a. n.a n.a. La.
S baaml 8103.1 12857.5 15116.7 12771.7 13765.4
4896.3 8327.6 9035.5 8S35.3 9384.1
Qinghal 1721.6 2S51.0 2771.8 2402.2 n.a.
Ninla 1338.5 1839.9 2110.1 2353.3 2572.8
XWMbag 5725.0 9500.3 11167.4 31213.2 34938.5
Tota 360923.6 524909.0 562113.4 589062.0 665978.0
Note: Fi are of suae-own commeal mills anld Mal coopeAtiv.OToa rfes to the sum of aU pvines for which figutes are avaiable.Soutce: Ste SdsJ B ure
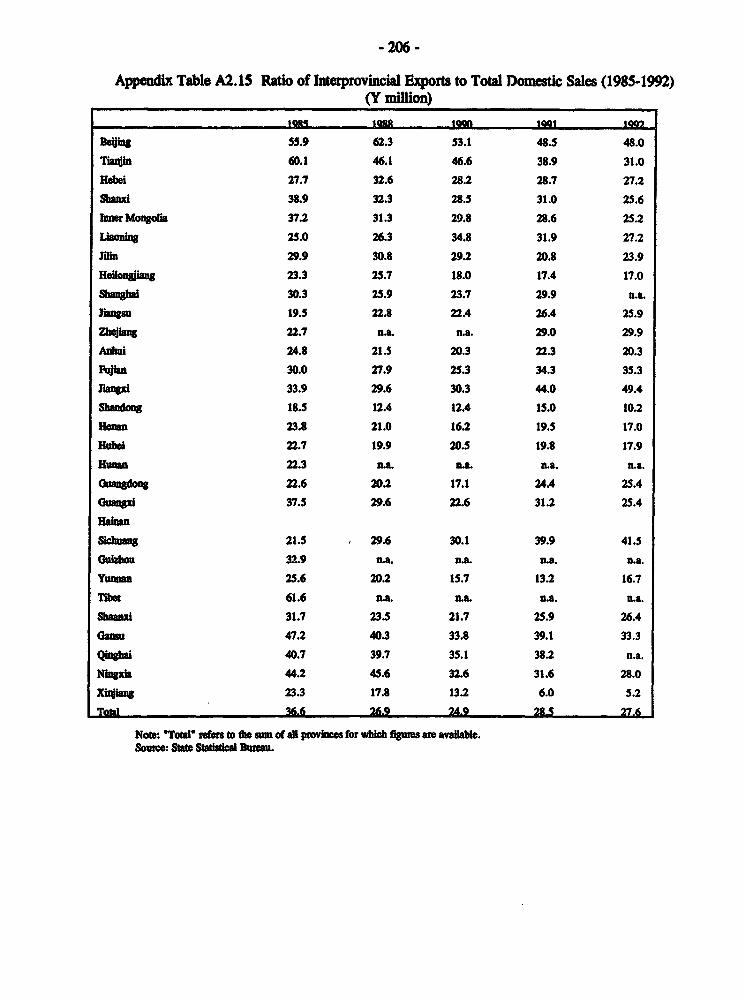
- 206 -
Appendix Table A2.15 Ratio of bntetprovincial Exports to Total Domestic Sales (1985-1992)(Y million)
10RZ 11iIas saon sacs tow
Beuijng 55.9 62.3 53.1 48.5 48.0
Th41n 60.1 46.1 46.6 38.9 31.0
Hebei 27.7 32.6 28.2 28.7 27.2
Shni 38.9 32.3 28.5 31.0 25.6
bnnerMongolia 37.2 31.3 29.8 28.6 25.2
1lsoning 25.0 26.3 34.8 31.9 27.2
Julin 29.9 30.8 29.2 20.8 23.9
Hilosiiang 23.3 25.7 18.0 17.4 17.0
Shaba 30.3 25.9 23.7 29.9 n.a.
Jialngu 19.5 22.8 22.4 26.4 25.9
Zbelg 22.7 nua n.a. 29.0 29.9
Anbui 24.8 21.5 20.3 22.3 20.3
Fujian 30.0 27.9 25.3 34.3 35.3
Jianpi 33.9 29.6 30.3 44.0 49.4
Shagdong 18.5 12.4 12.4 15.0 10.2
Henow 23.8 21.0 16.2 19.5 17.0
Hubei 22.7 19.9 20.5 19.8 17.9
H_n 22.3 na. na na. na.
(uangdong 22.6 20.2 17.1 24.4 25.4
Guanpl 37.5 29.6 22.6 31.2 25.4
Hae n
Siumg 21.5 29.6 30.1 39.9 41.5
G0ibon 32.9 U.L na. nua. n.a.
YU_M 25.6 20.2 15.7 13.2 16.7
iTh 61.6 u.n. na. n.a. na.
Shaanxi 31.7 23.5 21.7 25.9 26.4
tlasu 47.2 40.3 33.8 39.1 33.3
QW*i 40.7 39.7 35.1 38.2 U.n.
Ninglsf 44.2 45.6 32.6 31.6 28.0
Xb*ng 23.3 17.8 13.2 6.0 5.2
Tom! 3i.6 26.9 24.9 285 27.6
Note: Toa rfr to the sum of aU provincos for wbich figures are aviab*.Source: Ste Swcel Blrn.

- 207 -
Appendix Table A2.16 Ratio of Iner-provinical Imports to Total Domestic Sales (1985-1992)(Y million)
1985 1988 1990 1991 1992
Deftg 36.0 26.9 22.4 21.8 21.4
Tiain 119.5 65.2 50.7 44.4 30.1
H*eb 11.6 17.3 15.2 17.2 17.9
Shauxi 11.6 12.4 10.6 11.6 10.5
Ibe Mongolia 13.6 13.7 13.3 17.8 13.3
laning 25.8 21.9 27.9 24.5 18.4
fun 14.3 24.7 17.8 28.5 23.5
H _ionng 33.9 28.9 24.5 15.9 19.8
Shanghai 74.8 40.8 34.3 35.0 n.a.
JiaDgsu 20.5 25.5 29.4 15.1 13.7
Zhtejiba 15.9 n.a. n.a. 14.6 14.6
A.bui 19.9 23.0 22.4 14.3 1.6
Fujian 19.0 14.3 19.6 24.8 24.2
Jiagi 16.5 17.7 26.7 38.7 45.6
Sadons 12.5 14.9 11.1 13.4 11.4
Henan 26.7 19.4 15.8 19.5 16.9
He 15.4 17.1 16.2 18.4 27.0
Hunan 15.3 na. n.a. na nLa.
Guangdong 29.5 27.9 28.3 35.9 34.6
Guanoi 19.4 23.8 25.1 29.3 21.9
Haimn
Skhung 16.1 30.2 15.3 22.0 21.7
uihonu 15.5 n.a. n.a. na. n.a.
Yunnan 19.3 33.5 53.5 56.1 65.8
Tibet 9.2 na. nLa. n.a. n.a.
Shaanxi 15.1 12.5 12.1 17.2 19.3
aso 39.4 31.6 25.3 31.S 27.2
Qinbi 8.7 16.8 7.7 14.4 na.
Ningxia 17.5 20.5 16.4 18.2 15.2
Xiag 13.8 16.9 18.1 8.3 8.5
Total 26.3 24.7 23.0 23.8 22.8
Note: 1Tota refto t the sum of a,l provinces for which figures are available.Source: Sta Stdsdcal Bureau.

- 208 -
Appenix Table A2.17 Ratio of Inter-provincial Trade to Domestic Sales (198541992)(Y million)
- I lass ! .- 1 t !la to, ! - t
Beijing 91.8 89.2 75.5 70.3 69.4
Tanjn 179.6 111.3 97.3 83.3 61.1
Hbeb 39.3 49.9 43.4 4S.9 45.1
Shanxi 50.5 44.7 39.1 42.6 36.1
Inr Mon8gola 50.8 45.0 43.1 46.4 38.6
Llonig 50.8 48.2 62.6 56.4 45.7
1HI 44.2 55.5 47.0 49.4 47.4
HeUonitag S7.1 54.6 42.5 33.3 36.8
Shanghi 105.0 66.7 58.0 65.0 n.a.
Ihagsn 40.0 48.3 51.8 41.5 39.7
Zhejang 38.6 n.a. na. 43.6 44.5
Anhul 44.7 44.5 42.7 36.7 21.8
F}ian 48.9 42.3 45.0 59.1 59.5
ringd 50.4 47.3 57.0 82.7 95.1
Shandong 31.0 27.3 23.6 28.4 21.6
Henan 50.5 40.4 32.0 38.9 33.8
Hubei 38.0 37.0 36.7 38.2 44.9
Hunan 37.5 na. na. n.a. n.a.
Ouangdong 52.1 48.1 45.3 60.2 60.0
Ouanx 56.9 53.4 47.7 60.5 47.3
Hainan
Sihmang 37.6 59.7 45.3 61.9 63.2
3uizhou 48.5 n.a. n.a. na. La.
Yunmn 44.9 53.7 69.1 69.3 82.5
Mebet 70.8 La. na. nLa. na.
Sbaanxi 46.8 36.0 33.7 43.1 45.7
man=s 86.6 71.8 59.1 70.6 60.5
Qinabal 49.4 56.5 42.8 52.6 n.a.
Nugxila 61.7 66.2 49.0 49.8 43.2
Xluangw 37.1 34.7 31.3 14.3 13.7
Tota 63.0 51.7 47.8 52.3 503
Note: anderprvicIl tute- refs to Impo from otker provinces and expors tooder prvince. *Toal rer to te sm of all provic figmues the are avabe.
Source: State Slats Bureau (Calcul in Appendix Tables A2.12 to A2. *6)

- 209 -
Appendix Table A2.18 Interprovincial and Foreign Trade (RMB Y billion and %)
e1i Tota foreign Foreign tade _tpowvnica InteprovlncianSales, ODP/a Tvade Ratiofa TrlAe Trade Rato/a
1992 221.18 149.11 67.4% 40.68 18A%
1991 178.056 117.26 65.9% 33.76 19.0%
1990 147.184 77.624 52.7% 29.62 20.1%
198S 55.385 15.489 28.0% 18.19 32.8%
1980 24.571 3.86S 15.7% 10.18 41.4%
2. Shaanxi
1992 23.727 6.17 12.2% 10.70 45.1%
1991 20.337 4.33 21.3% 9.67 47.5%
1990 18.443 2.76 15.0% 8.42 4S.6%
198S 9.19 0.31 3.3% 5.16 56.1%
1980 5.125 0.01 0.3% 3.40 66.4%
3. Slchua
1992 71.93 13.78 19.2% 29.71 41.3%
1991 62.18 9.12 14.7% 26.62 42.8%
1990 54.53 6.52 12.0% 21.78 39.9%
1985 27.43 1.42 5.2% 9.15 33.4%
1980 15.19 1.20 7.9% 7.04 46.3%
4. Shnghi
1992 47.9 53.5 111.7%
1991 40.2 42.8 106.5% 31.1 77.4%
1990 35.3 35.5 100.7% 28.2 79.9%
1985 18.3 15.18 83.0% 22.9 12S.1%
1980 8.8 6.8 76.8% 19.5 221.6%
5. Iianui
1992 S8.9 26.6 45.2%
1991 51.1 36.2 70.8% 24.6 48.1%
1990 46.0 30.1 65.5% 20.6 44.8%
1985 23.2 16.2 69.6% 8.2 35.3%
1980 12.0 5.9 49.6% 6 50.0%
/a Ratio to ret ale excep for Guadong, whee dth ratio to GDP is gmn.Source: CASS Surwy

- 210 -
Appendix Table A2.19 China and Other Regional Trading Areas: Interregional Trade
IMP"nd E)qVOn (DP/a I nFrNS &WprW TOWdIGDP % GDP % Trade/GDP%
Guarngdong(1991) 11295.4 16646.8 1780S6.0 6.3 9.3 15.7
liangx(1989) 4244.7 2930.3 36347.0 11.7 8.1 19.7
Sichuan(1989) 14594.7 7531.1 99849.0 14.6 7.5 22.2
Guizhou(1989) 2522.8 2440.1 23554.0 10.7 IO.4 21.1
Boibng(1990) 16428.1 6938.6 50072.0 32.8 13.9 46.7
Subtotal 49085.8 36486.8 387878.0 12.7 9.4 22.1
Economic Communiy (1989): (ECU miion)
BElgium/luxemnburg 64.1 71.1 145A 44.1 48.9 93.0
Demnark 12.9 13.2 95.1 13.6 13.9 27.5
Germany 130.6 165.3 1079.9 12.1 15.3 27.4
Graece 9.1 5.1 49.2 18.6 10.4 29.0
Spain 35.0 25.7 345.2 10.1 7.4 17.6
France 118.9 100.0 870.3 13.7 11.5 25.1
Indand 11.0 13.5 30.8 35.6 43.7 79.3
Itay 78.8 71.4 786.5 10.0 9.1 19.1
Nethedands 61.1 84.9 203.2 30.1 41.8 71.9
Porhtuga 11.6 8.4 41.1 28.3 20.4 48.7
United Kingdom 91.3 65.9 760.3 12.0 8.7 20.7
EC Totd 624.5 624.5 4406.9 14.2 14.2 28.3
Former Sovie Union (1990): (Ruble mdilion)
Russia 56583 86449 1288577 4.4 6.7 11.1
Ukrine 42468 35968 329563 12.9 10.9 23.8
BeLdrus 17259 16043 81224 21.2 19.8 41.0
Uzbekistan 10993 6889 70125 15.7 9.8 25.5
Kazaksbsmn 14S70 8450 110673 13.2 7.6 20.8
Georgia 4464 2852 29500 15.1 9.7 24.8
AinaaiWjan 4308 4576 29812 14.5 15.3 29.8
Lithuanih 7169 4155 27755 25.8 15.0 40.8
Moldova 4947 2704 26474 18.7 10.2 28.9
Latvia 4873 3939 24011 20.3 16.4 36.7
Kyr*qnghtan 2910 1954 17560 16.6 11.1 27.7
Tadjfiksan 3082 1643 15242 20.2 10.8 31.0
Armenia 3155 1989 20094 15.7 9.9 25.6
Tukmenistan 2438 2773 15791 15.4 17.6 33.0
Estonia 3116 1951 16778 18.6 11.6 30.2
Subtotl (Excluding Russia) 125752 95886 814602 15.4 11.8 27.2
Subtta (al FSU counMes) 182335 182335 2103179 8.7 8.7 17.3
/a The Chinese fipures for the GDP column GONP.Sources: Basic Sttitis of the Community, 1990.28th edinn (gdonS Sttisdt Yearbook 1989 and 1991, riangxi StaisicdYearbook 1999 and 1990, Sicuan SEtatic Yearbook 1990. Guizhou SWaiPstc Yeabook 1990and 1991, China Sttiseia Yearbook1991, Michualpoulos and Taf (1992).
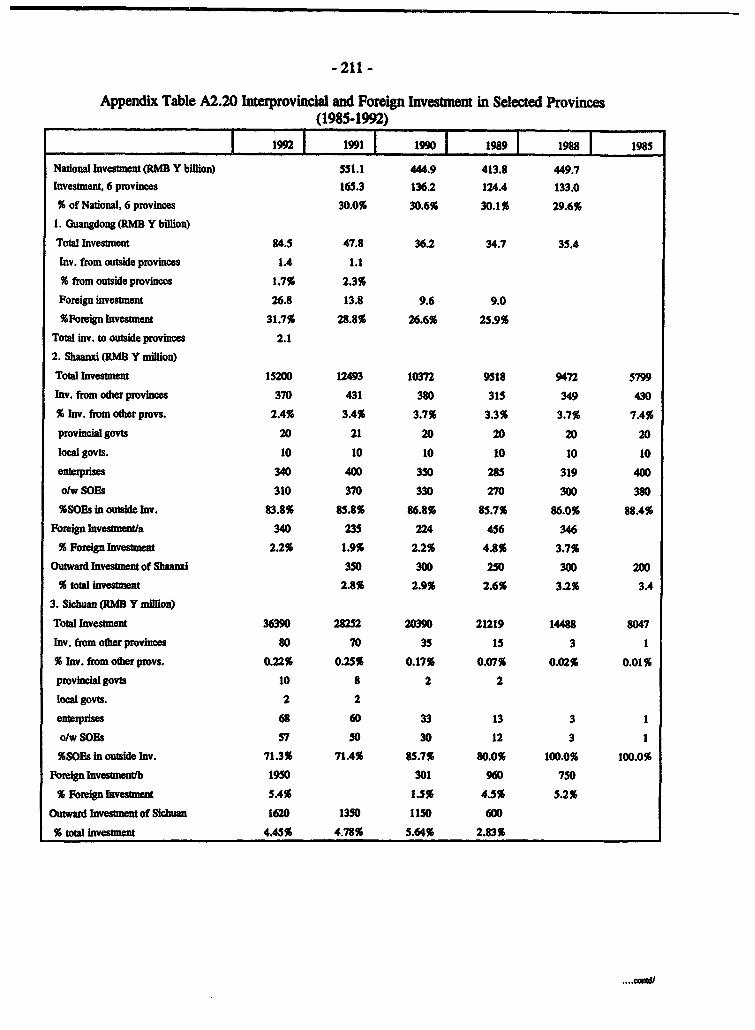
-211 -
Appendix Table A2.20 Interprovincial and Foreign Invesftent in Selected Provinces(1985-1992)
1992 1991 1990 1989 1988 1985
National Investment (RMB Y blion) 551.1 444.9 413.8 449.7
Investment, 6 provinces 165.3 136.2 124.4 133.0
% of National, 6 provinces 30.0% 30.6% 30.1% 29.6%
1. Guangdong (RMB Y bilion)
Total Invesment 84.5 47.8 36.2 34.7 35.4
Inv. fom outside provinces 1.4 1.1
% from outside provinces 1.7% 2.3%
Foreign invesument 26.8 13.8 9.6 9.0
%Foreign Ilvestment 31.7% 28.8% 26.6% 25.9%
Total inv. to outside provinces 2.1
2. Shaanxi (RMB Y million)
Total Invesment IS20 12493 10372 9518 9472 5799
Inv. from odter provinces 370 431 380 315 349 430
% Inv. from other provs. 2.4% 3.4% 3.7% 3.3% 3.7% 7.4%
provincial govts 20 21 20 20 20 20
local govts. 10 10 10 10 10 10
eneprises 340 400 350 285 319 400
olw SOEs 310 370 330 270 300 380
%SOEs in outside Inv. 83.8% 85.8% 86.8% 85.7% 86.0% 88.4%
Foreign Investmena 340 235 224 456 346
% Forign Inveslment 2.2% 1.9% 2.2% 4.8% 3.7%
Otward n estmnt of S aanu 350 300 250 300 200
% total investment 2.8% 2.9% 2.6% 3.2% 3.4
3. Sican (RM Y miion)
Total Invesment 36390 28252 20390 21219 14488 8047
Inv. from other pmvinces 80 70 35 15 3 1
% }v. from otherprovs. 0.22% 0.25% 0.17% 0.07% 0.02% 0.01%
provhl govts 10 8 2 2
local govts. 2 2
enterprises 68 60 33 13 3 1
o/w SOEs 57 50 30 12 3 1
%SOEs in outside Inv. 71.3% 71.4% 85.7% 80.0% 100.0% 100.0%
Foreign lvestment/b 1950 301 960 750
% Foreig Invesment 5.4% 1.3% 4.5% 5.2%
Outward Invesment of Sichuan 1620 1350 1150 600
% total invesument 4.45% 4.78% 5.64% 2.83%
.... CB

- 212 -
_ 1992 991 1990 1989 1988 1985
4. 1eing (RMB Y billion)
Total Investalme/c 19.38 19.19 17.92 13.95 16.3
Inv. from other provinces 0.031 0.027 0.064 0.071 0.05
% Inv. from otherprovs. 0.16% 0.14% 0.46% 0.44%
Foreign Investment 1.88 1.80
% Foreign Investment 10.46% 12.87%
S. Sanghai M Y bllion)
Total Investment 32.5 25.8 22.7 21.5 24.5 11.7
Inv. from other provinces/d 10.69 7.9 6.1
% Iv. from other provs. 32.9% 20.6% 28.4%
Foreign lavesutente 4.35 0.93 1.54 1.59 0.364 0.062
% Foreign Investment 13.4% 3.6% 6.8% 7.4% 1.5% 0.5%
6. Laonig (RMB Y billion)
Total Investment 31.8 26.29 24.32 26.13
Imv. from other pvnes/f 0.79 0.19 0.17 0.34
% Inv. from otherprovs. 2.48% 0.72% 0.70% 1.30%
Foreign Investen 3.48 1.46 0.388
% Foreign Ivestment 13.23% 6.01%
Outward Ivestment of Laonnglf 0.24 0.22 0.1 0.14
% total invesament 0.75% 0.84% 0.41% 0.54%
/a Shaanxi: There were only 18 foreig or foren joint venue entprises(1991)/b Sichuam The total for 1988 to 1992 was 6.6 bMion RMB Y/c Befting: Total investment for 1992 is an estim/d Shanghai In 4550 enerrises, including the Pudong Zone/e Shanghai: Joint Vemue invesment satis/f Liaonig: Fgures for iward and outward invesmentin the conext of orizal tnegon'
Source: Prviia Yeabooks, provincial Departmes of Cooperation and CASS survey.
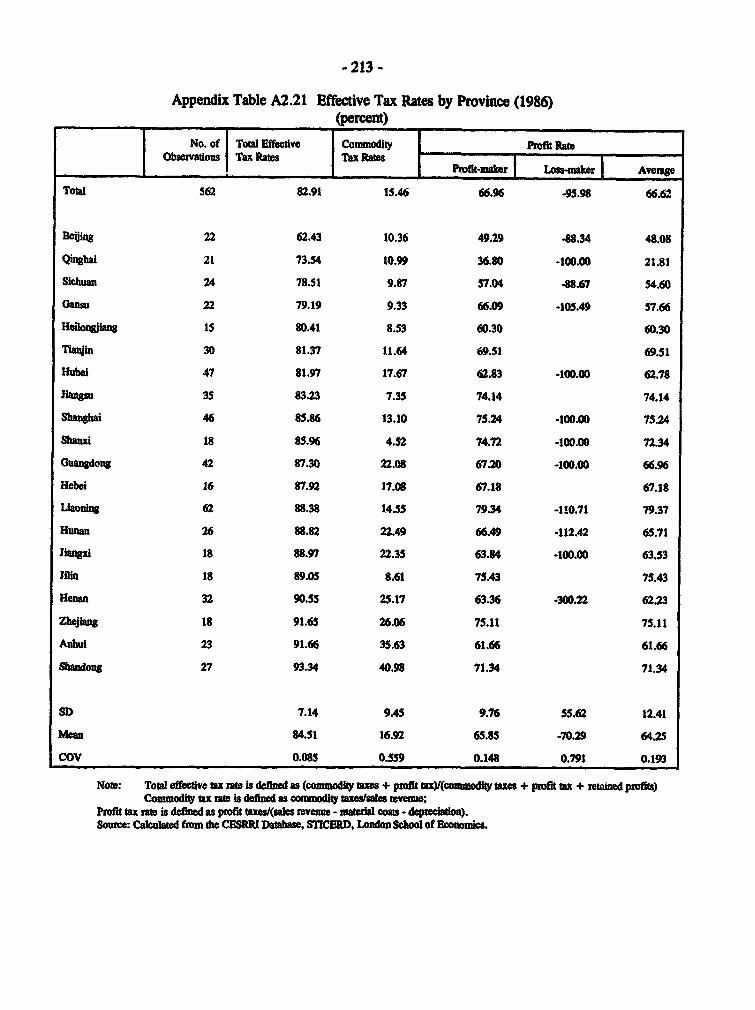
- 213 -
Appendix Table A2.21 Effective Tax Rates by Province (1986)(percent)
No. of R To Effective | Commodity Prfit R_aObswvads Tax Rale Tax Rafts tf-nb LomtAvw
_ ~ ~ ~ ~ ~ Profit-maker j Loss-maker! Aeremge
Total 562 82.91 1S.46 66.96 -95.98 66.62
Beiing 22 62.43 10.36 49.29 48.34 48.08
Qinghai 21 73.54 10.99 36.80 -100.00 21.81
Sicka 24 78.51 9.87 57.04 -88.67 54.60
G-au 22 79.19 9.33 66.09 -105.49 S7.66
Helongjiag 15 80.41 8.53 60.30 60.30
Tiabqjl 30 81.37 11.64 69.51 69.51
Hubd 47 81.97 17.67 62.83 -100.00 62.78
Jiangsu 35 83.23 7.35 74.14 74.14
Shangbi 46 85.86 13.10 75.24 -100.00 75.24
Shanxi 18 85.96 4.52 74.72 -100.00 72.34
Guangdong 42 87.30 22.08 67.20 -100.00 66.96
Hebei 16 87.92 17.08 67.18 67.18
Liaoing 62 88.38 14.55 79.34 -110.71 79.37
Hunan 26 88.82 22.49 66.49 -112.42 65.71
Tianxsi 18 88.97 22.35 63.84 -100.00 63.53
Jiin 18 89.0S 8.61 75.43 75.43
Hlenan 32 90.55 25.17 63.36 -300.22 62.23
Zhejiang 18 91.65 26.06 75.11 75.11
A"hui 23 91.66 35.63 61.66 61.66
Sbandong 27 93.34 40.98 71.34 71.34
SD 7.14 9.45 9.76 55.62 12.41
Mma 84.51 16.92 65.85 -70.29 64.2S
COV 0.085 0.559 0.148 0.791 0.193
Note: Total ffecive tax rmte is defined as (commodity xes + profit taxY(conodt taxes pwf t + p retained pwfit)Commodtty ta rat s defind as comodt taxesales :
Profit tax rate is ddined as profit tsu(sdes revnue - maer costs -depteciatimo).Source: Caculd firm the CESRRI Database, STICERD, London School of Econw_ is.
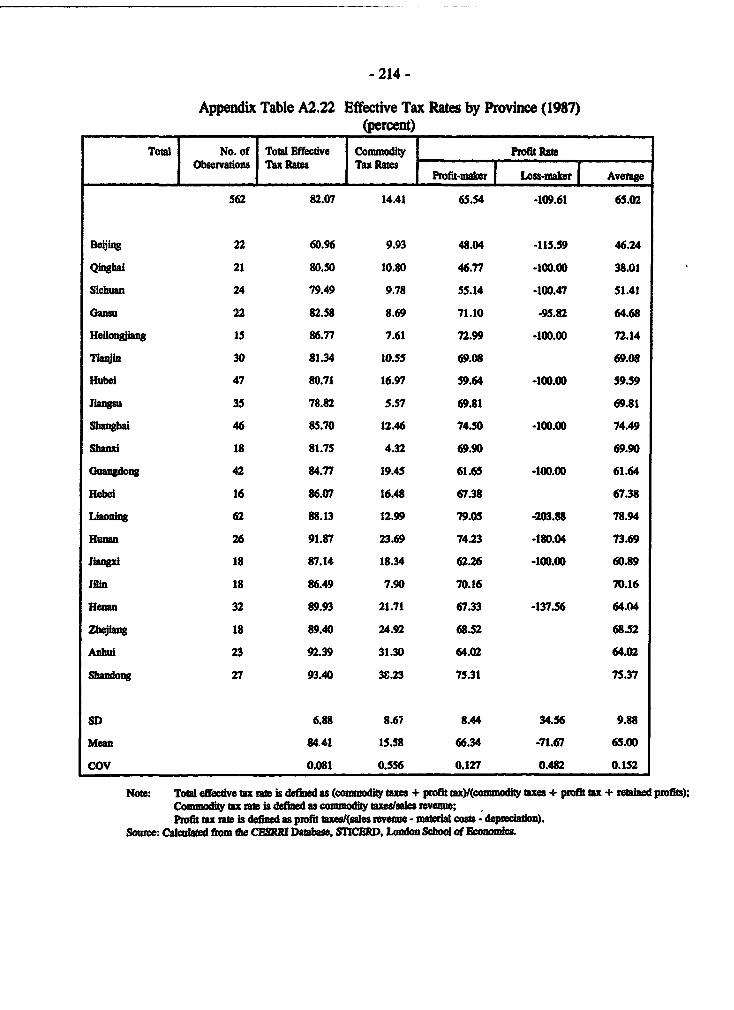
- 214 -
Appendix Table A2.22 Effective Tax Rates by Province (1987)(percent)
Total No. of Totl Effectve Commodity Prfit RaObsevatons Tax Rates Tax Rates _ 1 _ I
_ ~~~~~~~~~Pmofit-maker Losmaker Average
562 82.07 14.41 65.54 -109.61 65.02
Beojing 22 60.96 9.93 48.04 -115.59 46.24
Qinghai 21 80.50 10.80 46.77 -100.00 38.01
Slchuan 24 79.49 9.78 55.14 -100.47 51.41
Oansu 22 82.58 8.69 71.10 -95.82 64.68
Heilonijiag 15 86.77 7.61 72.99 -100.00 72.14
Tajin 30 81.34 10.55 69.08 69.08
Hubei 47 80.71 16.97 59.64 -100.00 59.59
Jianghm 35 78.82 S.57 69.81 69.81
Shanghai 46 85.70 12.46 74.50 -100.00 74.49
Shanxi 18 81.75 4.32 69.90 69.90
Guangdong 42 84.77 19.45 61.65 -100.00 61.64
Hebel 16 86.07 16.48 67.38 67.38
Lloning 62 88.13 12.99 79.05 -203.88 78.94
Hunan 26 91.87 23.69 74.23 -180.04 73.69
iianpi 18 87.14 18.34 62.26 -100.00 60.89
Win 18 86.49 7.90 70.16 70.16
Henan 32 89.93 21.71 67.33 -137.56 64.04
Zbejiang 18 89.40 24.92 68.52 68.52
Anhui 23 92.39 31.30 64.02 64.02
Sba dong 27 93.40 3S.23 75.31 75.37
SD 6.88 8.67 8.44 34.56 9.88
Men 84 41 15.58 66.34 -71.67 65.00
COV 0.081 O.SS6 0.127 0.482 0.152
Note: Totld effecdve tax rate is ddined as (commdity taxes + profit tax)(commo taxes + profit taX + rained profts);Commodity tax rate ia defined as commodi tyaxesla menue;Pwfit tax rate is defind as profit taxes/(sales revnue - matedal costs - da.
Sowue. Calculaed from dte CESRRI Database, STICEID, London School of Economics.

- 215 -
Appendix Table A2.23 Effective Tax Rates by Province (1988))PCM
No. of Toal Effeeive Commodity Tax Pofit RateObservationm Tax Pon RPtes P Los-Mar Avea
Total 562 81.87 14.08 63.79 -107.45 63.03
leijing 22 S7.24 9.30 43.52 -113.18 41.21
Qinhai 21 83.30 11.44 55.63 -109.62 46.92
Sichuan 24 75.78 10.11 49.18 -100.55 43.73
Gansu 22 v 79.83 8.47 66.13 -101.96 52A1
Heiongiians 1S 88.22 7.38 77.00 -100.00 76.23
TiaWin 30 88.31 10.57 78.85 -100.00 78.81
Hubei 47 78.94 17.23 55.74 -100.00 55.68
Jisngsu 35 77.28 5.03 65.86 65.86
Shanghai 46 84.96 11.82 72.04 -100.00 72.02
Shawxi 18 82.31 3.90 71.85 71.85
Guangdong 42 90.39 20.07 71.24 71.24
Hebei 16 87.91 15.03 71.38 71.38
Lisoning 62 89.31 12.79 79.77 -118.95 79.66
Humn 26 91.05 24.64 69.89 -162.27 69.24
Jiangxd 18 89.72 16.92 69.70 -100.00 69.44
ruin 18 85.S8 8.14 67.32 67.32
Henmn 32 90.24 16.96 70.72 -100.00 66.30
Zhejiang 18 91.43 26.13 71.30 71.30
Anhui 23 95.90 31.10 78.37 78.37
Shadong 27 95.06 33.98 79.81 -100.00 79.75
SD 8.41 i.21 9.81 16.72 11.70
Mean 85.14 15.05 68.27 -70.33 66.44
COV 0.099 0.S46 0.144 0.238 0.176
Note: Totl effcve tax aue is defined as (cmmot tes + ptofit tax)Y(commodtye + poft tax + retained pwrf);Commodity tax re s defined as commodit taxesWsWs rvenue;Profit tax re is defied as profit taxes/(sals revenue - mateial costs - deprecatn).
Source: Caculatd frm the CESRIW Databe, STICERD. London School of EcoWomirs.

- 216 -
Appendix Table A2.24 Effective Tax Rates by Province (1989)(percent)
No. of Toal Effective Commodit PmfitRaeObrations Tax Rates I Tax RalesIIObsi va Tax RgTU Itas Pmfit-ma Lo. mar Averae
Total 562 81.71 14.42 59.04 -105.52 56.8S
Beiing 22 55.90 11.37 38.68 -112.15 35.81
QiDghai 21 85.75 1151 56.27 -169.75 41.68
Sidnun 24 75.22 10.59 50.01 -100.00 32.63
Os= 22 86.26 8.77 72.75 -400.00 47.19
Heionaiang 15 89.07 7.63 74.93 -78.87 74.68
hqjln 30 90.46 10.72 80.90 -133.33 80.83
snei 47 78.52 16.93 51.49 -100.00 51.32
Jiangsu 35 82.96 4.19 73.64 73.64
ShA11ghi 46 86.31 11.61 70.07 -100.00 70.03
Shani 18 80.70 3.77 67.42 -103.06 -2.22
Guangdong 42 91.88 22.99 68.99 68.99
Hebei 16 87.98 16.13 67.75 -100.00 66.32
Lioning 62 93.24 12.70 83.12 -112.67 81.35
Hunan 26 89.03 29.13 58.47 -112.49 S7.01
Jianli 18 92.89 18.59 70.97 -73.40 70.90
Jfin 18 88.29 8.31 69.93 -100.00 69.54
Hena 32 86.07 16.05 61.17 -100.00 44.98
Zheiang 18 88.89 25.03 56.45 56.45
Anhui 23 96.77 34.06 72.70 72.70
Shadonag 27 94.26 29.62 72.68 -100.00 71.94
SD 8.63 8.41 10.81 20.96 19.99
Mean 86.02 15.49 65.92 -84.79 58.29
COV 0.100 0.4V3 0.164 0.247 0.343
Note: Tota efecdive tax rat is defined as (commodiq taxes + profit tax)I(commodity te + profit tax + reid pwfits);Commodity tax e is defined as commodity taxes/sales revenue;Pwfit tax rae defimned as profit taxes/(sales revenue - material cot - depteciaton).
Source: Calculd fom te CESRR Datba, STICERD. London. School of Economis.

- 217 -
Appendix Table A2.25 Effective Tax Rates by Province (1990)
(percent)
No. of Observadons Total CommodityTax Promfit ateEffecdve Tax Rates _Rates Profit-mar Loss-maler Avetage/a
Total 562 82.73 14.64 56.67 -99.75 51.58
Beijing 22 55.88 11.88 35.35 -100.07 30.46
Qinghai 21 90.67 13.30 54.61 -107.5OlOa -441.86
Sichuan 24 79.62 10.42 57.77 -100.14 3.28
Gansu 22 97.86 8.51 95.06 -100.00/0a -212.30
Heavonajiang IS 90.12 6.80 75.06 -97.84 50.47
Tianjin 30 90.47 10.69 77.22 77.22
Hubei 47 79.17 16.72 50.61 -100.00 48.50
Jiangsu 35 88.22 3.87 77.90 -100.00 77.76
Shanthai 46 87.60 11.80 66.02 -111.88 64.49
Sbanxi 18 90.61 3.40 83.78 -100.00 79.94
Guangdong 42 94.39 27.87 73.04 -89.90 70.70
Hebei 16 92.36 16.16 76.92 -100.00 75.62
Lixoning 62 93.93 12.31 81.34 -96.90 80.13
Hunan 26 93.03 29.86 64.24 -100.00 60.73
iiangxi 18 94.62 19.73 69.69 -92.88 9.05
Jil 18 94.53 7.91 80.31 -100.00 74.05
Hemnan 32 93.50 16.18 81.30 -100.00 9.38
Zhejiang 18 94.87 27.07 72.47 -100.00 70.37
Anuli 23 98.67 35.82 72.28 -100.00/0a -146.02
Shandong 27 95.45 31.74 81.53 -100.00 80.63
SD 9.20 9.32 13.23 4.38136.4Sa 127.80/31.61a
Mean 89.78 16.10 71.33 -94.861-79.48/a 8.13/48.14a
COV 0.102 0.579 0.18S 0.040.459/4 15.719/0.657a
/a Due to the high averge negative values for Qigha, Gas and Anulmi n this year, the sandar devation is also veyhigh. Adjusdtngfordtis by puing the averagesfor these three pwvinces eqa tzero, we obain the second set of values.
Note: Total effective tax rte is defined as (commodity xes + profit tax,V(commodky axes + profit tax + rained pmfits);Commodity tax rate is defined as commodity taxes/sales revenue;Profit tax nrte is defined as profit taxes/(sales revne - matedrll costs - depreciaton).
Source: Calculated fiom the CESRRI Database, STICERD, Lonn Schol of Economics.

- 218 -
Appendix Table A3. 1 Supply by Government Conracts (1981-1991)(10 thousand ton)
1983 1984 1985 1986 1987 1988 1989 1990 1991
Coal 365.31 383.07 400.25 405.85 402.58 407.98 426.66 4SS.19 456.6
Coke 3.56 4.2 3.9 4.02 3.94 3.65 3.41 4 3.61
Pig Iron 5.82 6.75 6.43 6.24 5.75 4.96 3.94 3.94 4.22
Steel Products 17.85 18.85 18.81 19.41 18.96 0.74 16.56 15.8 16.31
Caustic Soda 1.4 1.42 1.41 1.37 1.39 1.33 1.03 1.01 0.98
Soda Ash 1.56 1.54 1.53 1.52 0.93 1.32 1.28 1.62 1.44
Sulphuric Acid 3.11 3.03 2.61 2.39 2.91 2.81 2.16 1.85 1.86
Cocenbmed Nitrc Acid 0.21 0.22 0.21 0.18 0.21 0Q19 0.16 0.16 0.17
Cement 23.83 25.27 24.2 24.1 23.56 2.38 21.22 21.25 20.04
Timber 35.12 39.73 18.81 18.53 16.5 13.74 14.34 14.25 11.28
Source: China Sisal Yearbook (varou issues).

-219 -
Appendix Table A3.2 Production of Main Products (1981-1991)(10 thousand ton)
1983 1984 1985 1986 1987 1988 1989 1990 1991
Coal 714.53 789.23 872.28 894.04 928.08 979.88 1034.14 1079.88 1087AI
Coko 42.2 45.57 48.02 52.76 S7.95 61.08 66.24 73.28 73.52
Pig Iron 37.38 40.01 43.84 50.64 55.03 57.04 58.2 62.38 67.65
Steel Products 30.72 33.72 36.93 40.58 43.86 46.89 48.59 51.53 56.38
Caustic Soda 2.12 2.22 2.35 2.52 2.74 3.01 3.21 3.35 3.54
Soda Ash 1.79 1.88 2.01 2.15 2.36 2.61 3.04 3.8 3.94
Sulphuric Acid 8.7 8.17 6.76 7.63 9.83 11.11 11.53 11.97 13.33
Concentrate Nitrc Acid 0.26 0.26 0.27 0.28 0.29 0.3 0.33 0.32 0.34
Cement 108.25 123.03 145.95 166.06 186.25 210.14 210.29 209.71 252.61
Timber 52.32 63.85 63.23 65.02 64.08 62.18 58.02 51.09 58.07
Source: China Saistia Yeasbook (vanous ies).

Appendix Table A3.3 Distribution of Retail Sales in Quantity and Value(1985-1991) (Y 100 million)
Totak Reail Sas Retail Sales by Agriclturd to Non Agricultald Residens
I98S 1991 1985 1991
Quaty Vaue Quant Ty Valhe Qutity Value QuaMiy ValueTotad 3801.40 8245.70 291.00 909.80Food 2003.54 4537.48 269.00 866.94
radinlOooOtn) 9011.60 372.81 9242.60 603.41 550.00 28.08 710.10 58.23Veg. oil(1000 349.10 83.78 467.20 188.27 22.50 7.24 62.40 29.75
tn))
Hogs(10000 15324.60 M.17 21035.20 687.51 3631.00 65.10 5864.10 202.68
Bee cankZtOt b 376.20 12.39 666.90 35.93 175.00 4.14 353.30 19.97bad)
Sheep(IOth 2664.80 8.84 3602.60 22.82 1280.00 4.24 2041.00 13.28headt)
FowlS(10 th) 59430.00 25.85 89025.30 82.35 39980.00 14.99 63049.00 63.68Eggs(10 th tn)) 192.70 52.51 336.90 143.31 90.00 26.82 161.50 84.56Fish (10 lb to) 268.40 70.81 427.70 249.10 119.00 38.08 220.20 129.25Drid fesh veg.(l0 0 mi1 Y) 109.40 222.50 0.00 46.50 163.36Drixe fresh fruiL(lOO nil Y) 59.40 139.83 0.00 22.00 95.97Appls10 d Im) 81.00 7.94 130.60 24.96Clums and oragus(10 di mn) 45.00 5.67 106.30 25.09Tea(lO thm ) 25.30 25.85 31.80 56.29 1.00 1.10 2.70 4.24Honey(10 lb in) 0.20 0.06 0.50 0.25Sugar cane(lOl din) 50.00 0.80 57.80 2.22
Soorce: China Staistic Yearbook 1992.

-221 -
Appendix Table A3.4 Total Value of Retail Sales by Ownership (1960-1991)(Y 100 million)
Retai Sales By Ownersip
Year Total Vahle of Staw-owned Collective Jo intly I Indiuafy Saes of AVr. tosales Units Owned Unis tOwed Uis Owned Unibs Non-Agriwcua
1960 67.45 58.50 6.70 1.45 0.80
1965 67.03 35.55 28.93 1.25 1.30
1975 127.11 70.83 53.60 0.18 2.50
1978 158.97 85.10 61.44 0.21 3.11 3.11
1980 214.00 110.07 95.49 0.04 1.50 6.90
1983 284.94 133.88 118.95 0.36 18.45 13.30
1985 430.50 174.00 160.03 1.27 66.10 29.10
1986 495.00 195.10 180.40 1.52 80.48 37.50
1987 582.00 224.90 207.96 1.88 101.16 46.10
1988 744.00 293.S9 255.79 2.72 132.40 59.50
1989 810.14 316.78 268.97 3.63 150.96 69.80
1990 830.01 328.59 263.10 4.03 156.96 77.33
1991 941.56 3,8,37 282.62 5.15 184.44 90.98
Source: Chin Satstc Yeabook (various issues).

- 222 -
Appendix Table A3.5 Composition of Total Retail Sales Value by Ownership (1960-1991)(Y 100 Mllion and Percent)
Year RUtal Sals By OwCneiaip Sals ofAgriculna toNon- Agr.
Total Value of State-owned Collective loiliy Owned I xldividusiSales (Y lOOm) Units % Units% _ Unit % Units %
1960 67.45 86.7 9.9 0.0 2.1 1.2
1965 67.03 53.0 43.2 0.0 1.9 1.9
1975 127.11 55.7 42.2 0.0 0.1 2.0
1978 158.97 53.5 42.4 0.1 2.0 2.0
1980 214 51.4 44.6 0.0 0.7 3.2
1983 284.94 47.0 41.7 0.1 6.5 4.7
1985 430.5 40.4 37.2 0.3 15.4 6.8
1986 495 39.4 36.4 0.3 16.3 7.6
1987 582 38.6 35.7 0.3 17A 7.9
1988 744 39.5 34.4 0.4 17.8 8.0
1989 810.14 39.1 33.2 0.4 18.6 8.6
1990 830.01 39.6 31.7 0.5 18.9 9.3
1991 941.56 40.2 30.0 0.5 19.6 9.7
Souce: China Stuiicad Yearbook, vanous _sse

- 223 -
Appedix Table A3.6 Number of Domestic Trade Units by Ownership and Region (1985-1991)
1985 1991
Total . Collectve Inivdv idually Total Sta colecve IndividualyOwned Units Ownd Owned Units OwnedUnits units units UnIs
All China 8250472 429424 1378953 6238600 9797708 53414S 1443617 7817454
BeOig 53228 7023 11934 34238 91254 W') 12338 70794
Tianjin 62313 4355 7630 50316 74717 5459 10173 59035
Hebei 456142 16416 64938 374697 512356 18338 52400 441598
Shanxi 193394 12077 44799 136350 210699 13257 39515 157922
Inner 137050 8927 26415 101694 148699 11004 29789 107906Mongola
Liaoning 288492 15107 41250 232124 378816 18100 43692 317005
Jilin 185872 9740 30438 145647 212764 10814 28690 173256
Helonjiang 215901 12637 38032 165232 249522 13789 37062 198667
Shanghai 7466S 9320 20922 44324 92306 10472 24249 56939
Jiangsu 541287 24702 117483 399050 592401 23090 111292 457981
Zhejiang 398058 13309 71691 312973 580679 16606 63936 500086
A"ind 383423 19952 71540 291579 407930 22828 70672 314265
FUjian 223208 12738 50807 159292 276733 14766 42041 219656
JiAMuR 195910 11581 41448 142806 282051 17233 42799 221985
Shandong 611274 18650 118231 474216 8530 27094 96542 726862
eonan 534490 27069 139890 367431 524490 32028 90122 402339
Hubei 432829 25480 83552 323735 413634 37915 73275 302443
Hunan 474618 21301 93139 360102 505321 26958 74844 403514
Guangdong 605389 37816 94815 47175S 809962 47471 99459 662188
Guangxd 327006 13058 38325 275552 409806 16228 37436 356102
Hainan 79713 4460 7324 67894
Sichuang 930661 44577 215736 670205 1076726 5S9778 211694 805220
Gulhdou 188027 12173 29964 145890 206684 15315 22214 169137
Yunnan 261043 16706 34630 209649 247310 19887 34601 192821
Tibet 22827 419 954 21375 23786 1595 947 21237
Shawrud 192386 12401 47955 131797 215442 1S032 42634 157679
3ansu 107936 8625 19197 80063 137472 11060 22212 104200
QnhaiW 26270 2103 3099 21068 29622 2528 3021 24065
Ningpa 21823 1782 3891 16145 31860 2497 3859 25504
Xlnjang 104714 9380 16212 79095 124423 10483 14776 99054
Note: The surof stte-, cooet-and indWdkuda-ownedn _ lessdhanthetotlbecausedthetotallo inludesjoint-owneduits.
Source: Chin Saisticd Yeadxok. 1986 an 1992.

- 224 -
Appendix Table A3.7 Composition of Domestic Trade Units by Ownership and Region (1985-1991)(Percent)
1985 1991 DiffeiIn percena_ 1985-91
sat Collect. Individ. Ste Collect. Individual S Colcdve dividualunits units units units Units Unis units units
All China 5.2 19.1 75.6 5.5 14.7 79.8 0.2 -4.4 4.2
Beouing 13.2 22.4 64.3 8.8 13.5 77.6 -4.4 -8.9 13.3
TIai$in 7.0 12.2 80.7 7.3 13.6 79.0 0.3 1.4 -1.7
Hebei 3.6 14.2 82.1 3.6 10.2 86.2 0.0 -4.0 4.0
Sbanxi 6.2 23.2 70.5 6.3 18.8 75.0 0.0 -4.4 4.4
Inkmr Mongolia 6.5 19.3 74.2 7.4 20.0 72.6 0.9 0.8 -1.6
Liaoning 5.2 14.3 80.5 4.8 11.5 83.7 -0.5 -2.8 3.2
him 5.2 16.4 78.4 5.1 13.5 81.4 -0.2 -2.9 3.1
Helongiiang 5.9 17.6 76.5 5.5 14.9 79.6 -0.3 -2.8 3.1
Shaghi 12.5 28.0 59.4 11.3 26.3 61.7 -1.1 -1.8 2.3
Jiangsu 4.6 21.7 73.7 3.9 18.8 77.3 -0.7 -2.9 3.6
Zbejiang 3.3 18.0 78.6 2.9 11.0 86.1 -0.5 -7.0 7.5
Anhui 5.2 18.7 76.) 5.6 17.3 77.0 0.4 -1.3 1.0
Pujian 5.7 22.8 71.4 5.3 15.2 79.4 -0.4 -7.6 8.0
jianpi 5.9 21.2 72.9 6.1 15.2 78.7 0.2 .6.0 5.8
Mandong 3.1 19.3 77.6 3.2 11.4 85.5 0.1 -8.0 7.9
Henan 5.1 26.2 68.7 6.1 17.2 76.7 1.0 -9.0 8.0
Hubei 5.9 19.3 74.8 9.2 17.7 73.1 3.3 -'.j -1.7
Hunan 4.5 19.6 75.9 5.3 14.8 79.9 0.8 -4.8 4.0
ouagdong 6.2 15.7 77.9 5.9 12.3 81.8 -0.4 -3.4 3.8
Guangxi 4.0 11.7 84.3 4.0 9.1 86.9 0.0 -2.6 2.6
Hainan 5.6 9.2 85.2 5.6 9.2 85.2
Sichuan 4.8 23.2 72.0 5.6 19.7 74.8 0.8 -3.5 2.8
Guizhou 6.5 15.9 77.6 7.4 10.7 81.8 0.9 -5.2 4.2
Yunman 6.4 13.3 80.3 8.0 14.0 78.0 1.6 0.7 -2.3
lSet 1.8 4.2 93.6 6.7 4.0 89.3 4.9 40.2 -4.4
Shaanxi 6.4 24.9 68.5 7.0 19.8 73.2 0.5 -5.1 4.7
Oansu 8.0 17.8 74.2 8.0 16.2 75.8 0.1 -1.6 1.6
Qlnghai 8.0 11.8 80.2 8.5 10.2 81.2 0.5 -1.6 1.0
Nhi&a 8.2 17.8 74.0 7.8 12.1 80.1 -0.3 -5.7 6.1
XnXblib 9.0 15.5 75.5 8.4 11.9 79.6 -0.5 -3.6 4.1
Note: The sum of state-, collecve- and indhvidual-owned unts is less than Iw tota because de l also incldes jointowned units.
Source: China Sisical Yeatbook. 1986 ad 1992.

- 225 -
Appendix Table A3.8 Staff and Outlets of Mteris Circulaidon System (1985-1991)
STff and Wo* (IW00) OU-
1 1985 _1989 1990 1991 1985 1989 1990 1991
Nahonl Total 843.3 1049.7 1105.4 1160.9 32466 41564 44297 51165
Local MMB 814.5 1004.3 1059.7 1115.5 32370 41468 44201 49138
Beijing 14.7 16.0 15.7 15.7 213 40 433 454
Tianjn 32.9 29.8 29.7 29.2 647 731 678 715
Hebei 43.9 58.6 61.2 65.4 1890 2807 2909 3141
Shanlxi 17.4 19.2 25.5 28.4 914 995 1167 1264
Iner Mongolia 21.8 34.0 35.7 37.8 907 1091 1239 1489
liaoning 92.4 103.4 106.3 111.1 2593 3167 3380 3398
Ililn 41.7 51.2 53.2 54.9 1091 1569 1617 1760
Heiang 67.0 83.7 87.3 91.3 2128 2453 2563 2662
Shangh 34.5 35.3 35.4 35.3 2140 2167 2156 2177
Jiagsu 83.8 100.3 102.8 107.0 3807 3890 4060 4260
ZhMg 28.5 38.5 45.9 49.4 1455 2131 2013 2439
Anbui 20.8 30.2 34.1 37.0 1202 1470 1624 1911
FPjian 10.5 11.1 12.2 12.7 439 529 590 609
1lnp 9.6 13.5 14.3 15.8 407 606 645 825
Shandong 49.3 71.4 75.7 81.6 3008 3562 3989 4395
Henan 53.0 724 77.9 82.3 1285 2626 2715 3052
Hubei 37.7 49.9 52.3 54.8 1616 1644 1932 2185
Hunan 19.4 25.6 26.9 28.6 731 1171 1314 1606
Gouagdog 32.9 33.2 34.4 36.4 1292 1592 171S 1877
Guagi 11.2 11.4 13.0 11.0 558 691 768 1120
Haa 3.0 3.1 3.2 213 204 193
Sichban 27.3 34.7 36.2 38.4 13S7 1941 2225 2797
Guizhou 7.1 10.0 11.1 10.9 386 665 708 845
Yuanm 9.0 10.3 10.6 11.5 494 538 588 646
Wet 0.8 0.8 0.9 0.9 20 20
Shaanxi 24.5 30.2 30.4 32.9 847 1032 1437 1671
asu9, 10.4 11.7 12.6 15.6 444 812 787 837
Qinghai 3.6 4.2 4.3 4.4 80 100 105 134
Ninsia 3.2 3.7 4.0 4.3 1U0 207 231 257
XliEadg 5.6 7.0 7.0 7.7 289 391 369 399
Agencies undsr MME 28.8 45.4 45.7 45.4 96 96 96 2027
Soui: China Swista Yeabook (vfis mm).

- 226 -
Appenx Table A3.9 Number of UJnits and Penonnel in Domestic Trade by Ownership (1985-1991)(10,000)
1985 1991 Amual Aveage GrowthRate (1985-91)
Unis PCrsonUol Units f POmrol Units I Peronnel
Natlona Tota 82S.1 2398.4 979.8 2944.9 2.9 3.5
AdministaeUnits 11.2 222.4 13.3 245.1 2.9 1.6
Sotawneship 5.2 135.5 6.4 151.5 3.5 1.9
Coelecdve owneRip 7.5 95.5 9.1 107.1 3.3 1.9
Suply and Makf Coopaaves 4.5 78.3 4.7 80.1 0.7 0.4
Business Unis 611.7 2113.6 936.9 2624.8 2.4 3.7
(1) Soae ownership 36.3 499.9 45.5 663.7 3.7 4.8
Purhasig hm and seline p s 9.6 118.3 10.2 139.8 1.0 2.8
Wholesale industial produs 2.8 70.5 4.6 102.2 8.6 6.3
Retil oulets 22.9 290.7 29.0 388.3 4.0 4.9
owned by state, run by colecve 2.7 42.1
leased and mun by idIvduas 0.9 10.3
Odter Unts 1.2 20.3 1.8 33.6 7.0 8.8
(2) Collective ownesIp 151.0 767.9 136.4 816.3 -1.7 1.0
Supply and Madrkt coope te 59.0 276.6 63.0 325.4 1.1 2.7
Purchasing farm and lnpdu 6.6 41.0 6.3 45.7 * 0.8 1.8
Whobsale industri pducs 2.3 19.2 3.9 35.6 9.2 10.8
Retal oulet 46.7 191.6 48.6 213.6 0.7 1.8
Odter unIs 3A 24.8 4.2 30.5 3.6 3.5
Other coltve ownesip units 92.0 491.3 73.4 490.8 -3.7 0.0
Retail Ouets 89.5 473.8 68.9 488.9 -4.3 0.6
Trnsformed fom ste to coletiveownd 0.1 1.9
Prchase and s_a agents in _aras 28.3 34.7 14.6 18.2 -10.4 -10.2
(3) Joint ownerbsip 0.3 3.6 0.3 4.9 0.0 5.3
Joint Cna-Poeigpcutry ownerip 0.0 0.3 0.0 1.2 20.1 26.0
Rea sales Unt 0.3 2.9 0.2 3.6 -6.5 3.7
Licensed Individual Merat 623.9 842.2 781.7 1139.8 3.8 5.2
Soage and transport units 2.2 62.4 2.6 74.9 2.8 3.1
Ste ownehip 1.2 51.1 1.5 62.4 3.8 3.4
Collective ownerhip 1.1 13A 1.2 15.6 1.5 2.6
Supply and Marketing Coopea 0.9 9.2 1.0 9.3 1.8 0.2
Source: China Stastical Yeaok, varena issues
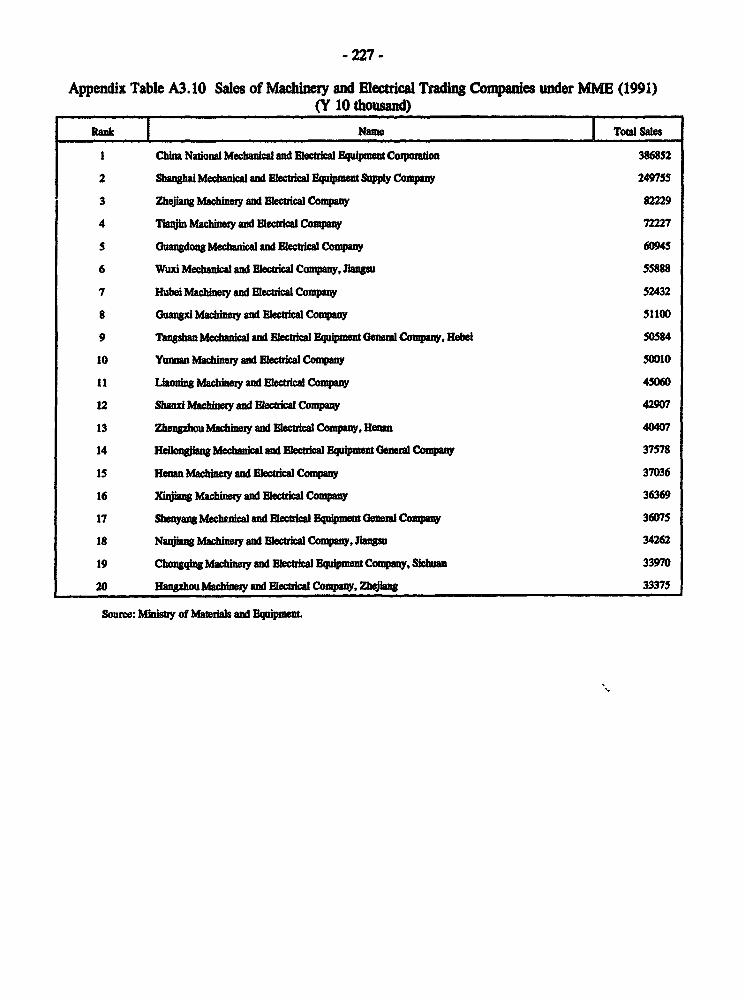
- 227 -
Appendix Table A3. 10 Sales of Machinery and Electuical Taing Companies under M[ME (1991)(Y 10 thousand)
-ank -Name Totl Sale.
I China Nadonal Mechia and Electrcal Equm Corpoato 386852
2 Shanghai Mechanical and Elecal Eqpment Supply Compwy 24975S
3 Zhejiag Machinety and Electial Compay 82229
4 Thl n Macnemy arnd Elecial CompaW 72227
5 Guangdong Mecbanic and Electrical Company 60945
6 Wuxi Mechancal d Ectrical Company, Jangsu 55888
7 Hubei Mah ey and Electcal Company 52432
8 Guangxi Machinery and Electical Compy 51100
9 Tangshan Mechanical and Eectrica Equipmen Geneal Company, Heb 50584
10 Yuman Machiny and Eleci Compaw 50010
11 Uaoning Madiney andlecial Company 45060
12 Shanl M n and Bectical Company 42907
13 Zhegzhou Macinry and Bectical Company, Hwe 40407
14 HeloniJa Mednical and Blec Euipment General Compa 37578
IS HMean Mac y and ElecC ompany 37036
16 Xjan Macinery and Elcical Compay 36369
17 Sbheyang Meanical ad Elcal Equpmen Genal Compay 36075
18 Nauasg Maciy and Electical Company, JlasU 34262
19 Chongqlng Machiy and ecical Equipmet Company, Sicwn 33970
20 Hanplhmr Machiney and Electrca Company. ZheJWau 33375
Source: Minisbty of Materas and Equpme_
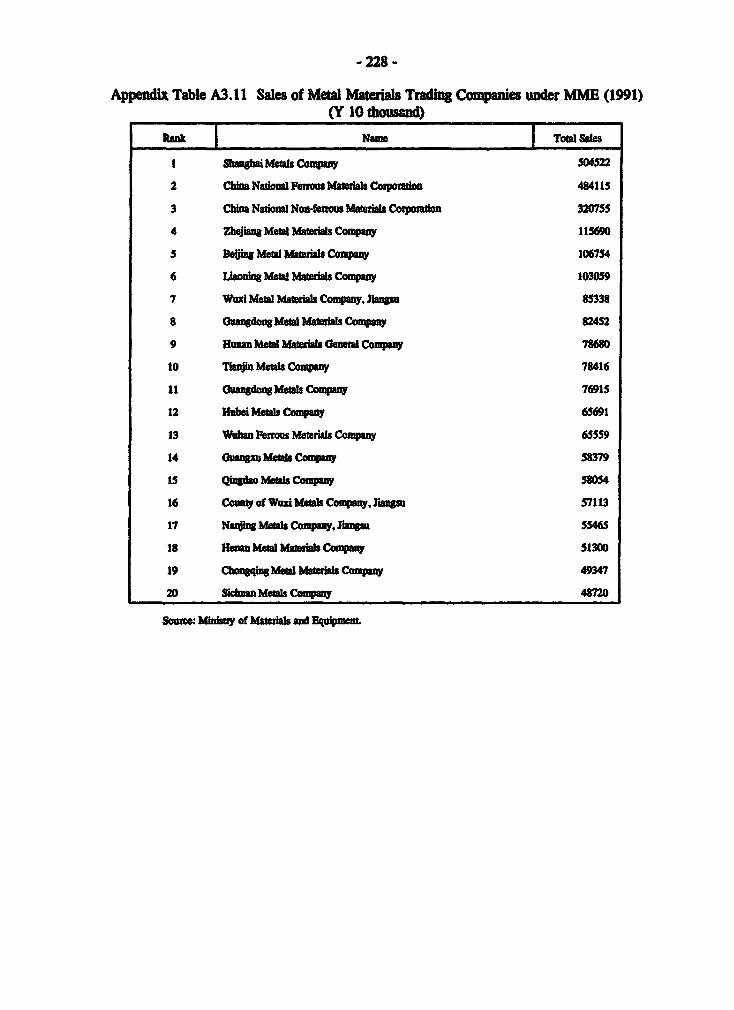
- 228 -
Appendix Table A3.11 Sales of Metal Materls Tradn Companies under MME (1991)(Y 10 dtsa)
Ra Name T TOWa Sales
I Sbanghaimetals Compwa 504522
2 China National Fom Matas Corpoon 484115
3 Chia Nadonl Non-ferous Mateials Copordon 320755
4 ZhbanJ Meta Materbb Compny 115690
5 Deft metal Mars Compa 106754
6 loning Mald Mara Company 103059
7 Whi Meta Matee als Compny, Jiasu 85338
8 OuagdomMng4d MaMbatis Corpany 82452
9 Hunan Meta Mmaialds General Company 78680
10 Tbajin Metas Conpany 78416
11 Guangdong Metas ComQpany 76915
12 Hubei Metas Company 65691
13 Wuhan FerrousMatneia Company 65559
14 Guawgn Metals Company 58379
15 Qingdao Metas Company S8054
16 County of Wuui Metals Company. r s 57113
17 Nailgl Metas Company, nM 55463
18 Henan Met Matials Company 51300
19 Caonqingl Metal Matials Company 49347
20 Sichuan Maetais Company 48720
soue: M btsy of Mateis and E _pmen
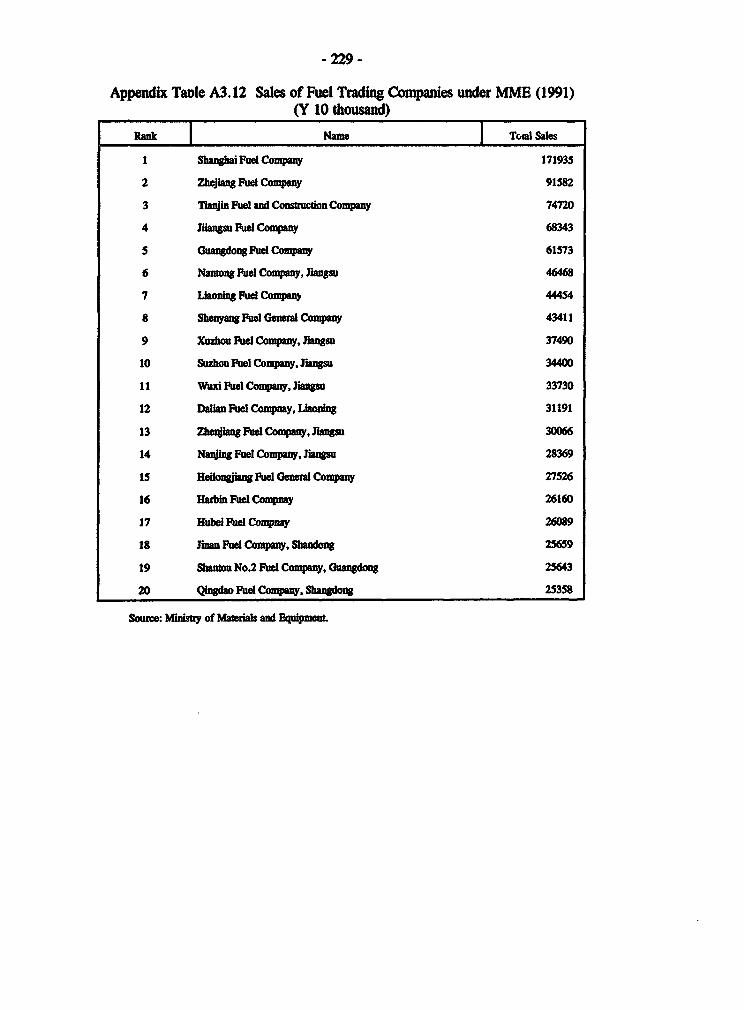
- 229 -
Appendix Taole A3.12 Sales of Fuel Trading Companies under MME (1991)(Y 10 thousand)
Rank Name ToMI Sales
I Sh2ahai Fuel Compa 171935
2 Zhejiang Fuel Company 91582
3 Tianjin Fuel and Consauction Company 74720
4 Jiiangsu Fu Company 68343
S angdongFud Company 61573
6 Namna Fuel Company, JIangau 46468
7 Long Fwue CompaUY 444S4
8 Seyang Fuel Genea Compny 43411
9 Xuzhou Fuel Company, Jlangs 37490
10 suzhou Fuel company. Jiman 34400
11 Wuxi Fue CoMpany, Jiang 33730
12 Dalian Fuel Compnay, Liaoning 31191
13 Zhenjiang Fue Company, Jibanu 30066
14 NaUMng Fuel Company, rianaS 28369
is Heidonamag Fuel Genaonl Company 27S26
16 Hatbin Fuel Company 26160
17 Hubei Flud Comnpnay 26089
18 Jman Fuel Company, Shandong 25659
19 Shantou No.2 Fuel Company, (luangdong 25643
20 Qingdao Fuel Company. Sbangdoeg 25358
Source: Ministry of Mateials and EqpakmentL
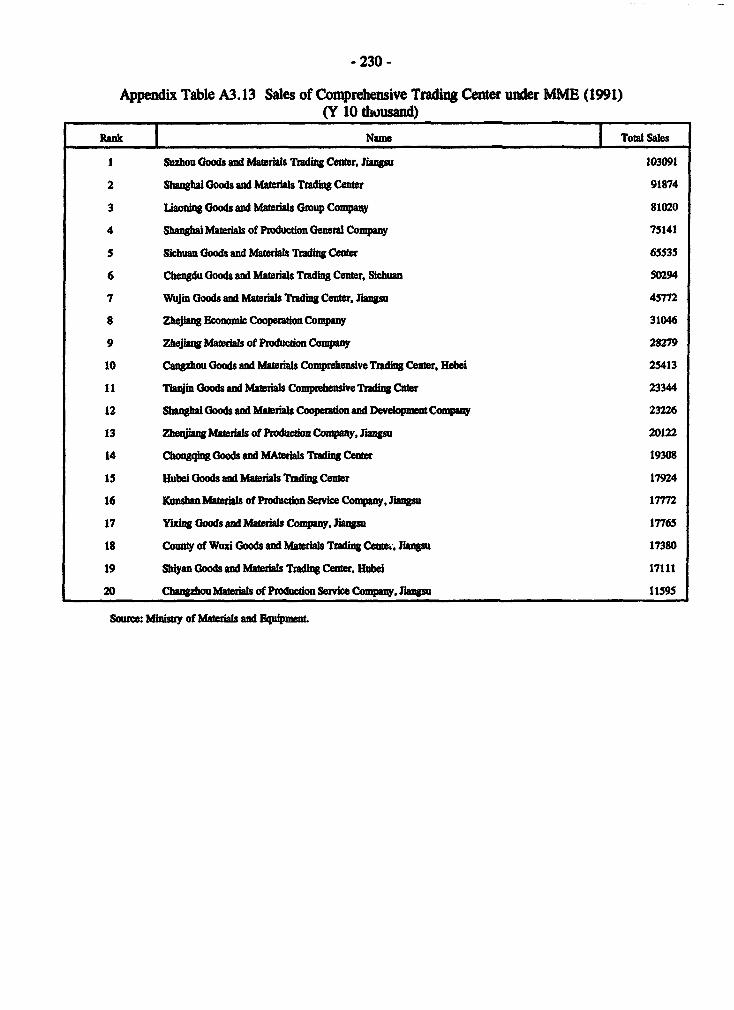
- 230 -
Appendix Table A3.13 Sales of Comprehensive Trading Center under MME (1991)(Y 10 thousand)
Rank Name Total Sales
I Suzhou Goods and Mates Tbding Center, lgsngu 103091
2 Shnghai Goods and Materials Tading Center 91874
3 Liaoning Goods and Mateials Group Company 81020
4 Shakngai Materials of Poduction Genea Company 75141
S Sichuan Goods and Matedals hrding Center 65535
6 Chengdu Goods and Mabrials Trdig Cenr, Sidwan 50294
7 Wuim Goods and Maerdals Tradig Ceter, Jiaungs 45M2
8 Zhjiang Bconomic Coopen0 Company 31046
9 Zhejiang Matedals of Pwduction Company 28279
10 Cangzou Goods and M als Comprehensive Tading Center, Hebei 25413
11 TISji Goods and Materials Comehev ve Trading Cnter 23344
12 Shsnghai Goods and Maerials Coopeation and Develpment Company 23226
13 ZheiagMaterials of Production Company, Jaung 20122
14 Chongq Goods and MAteris lTading Center 19308
15 Hubei Goods and Materials Trading Center 17924
16 Kunsbn Materils of Production Sevice Company, iau 17772
17 Yxisg Goods and Matris Company, Jiangsu 17765
18 County of Wuxi Goods and Materials Trding Cet.ranSe 17380
19 Shian Goods and Materials Tradng Center, Hubd 17111
20 Chaupghou Maeials of Producdon Service Company, Jangsu 1195
Souree: Ministry of Matris and Equipment.

- 231 -
Appendix Table A3.14 Purchase, Sales and Inventory of Commercial Units (1962-1991)(Y 100 million)
Year Total rchse Tol Sal Total Inventoty Invenloy/Sales (%)
1962 49.72 63.76 38.36 60.16
1963 53.59 64.81 41.81 64.51
1964 62.71 72.78 42.60 58.53
1965 71.05 79.01 45.83 58.01
1966 81.15 86.40 51.82 59.98
1967 76.90 87.30 50.20 57.50
1968 72.70 85.00 54.20 63.76
1969 82.10 90.50 56.20 62.10
1970 93.30 99.70 63.20 63.39
1971 95.79 110.26 70.57 64.00
1972 104.70 121.33 73.08 60.23
1973 122.35 131.34 83.44 63.53
1974 124.51 138.09 88.05 63.76
1975 139.74 150.56 94.88 63.02
1976 137.86 157.02 93.20 59.36
1977 156.63 170.54 104.56 61.31
1978 173.97 187.22 118.31 63.19
1979 199.24 208.93 132.06 63.21
1980 226.30 235.10 144.17 61.32
1981 246.90 250.14 159.68 63.84
1982 2622 266.15 172.44 64.79
1983 287.57 288.35 181.16 62.83
1984 310.33 324.69 178.90 55.10
1985 353.25 369.21 189.24 51.26
1986 403.34 408.05 208.84 51.18
1987 530.52 562.68 170.92 30.38
1988 686.13 734.28 319.82 43.56
1989 760.60 813.62 367.40 45.16
1990 822.12 835.81 408.76 48.91
1991 934.79 919.40 423.79 46.09
Note: 1952-1986 figures indude to sawned units and supply amd maketig coop es only.Source: China Sstcal Yearbook (vadous iues).
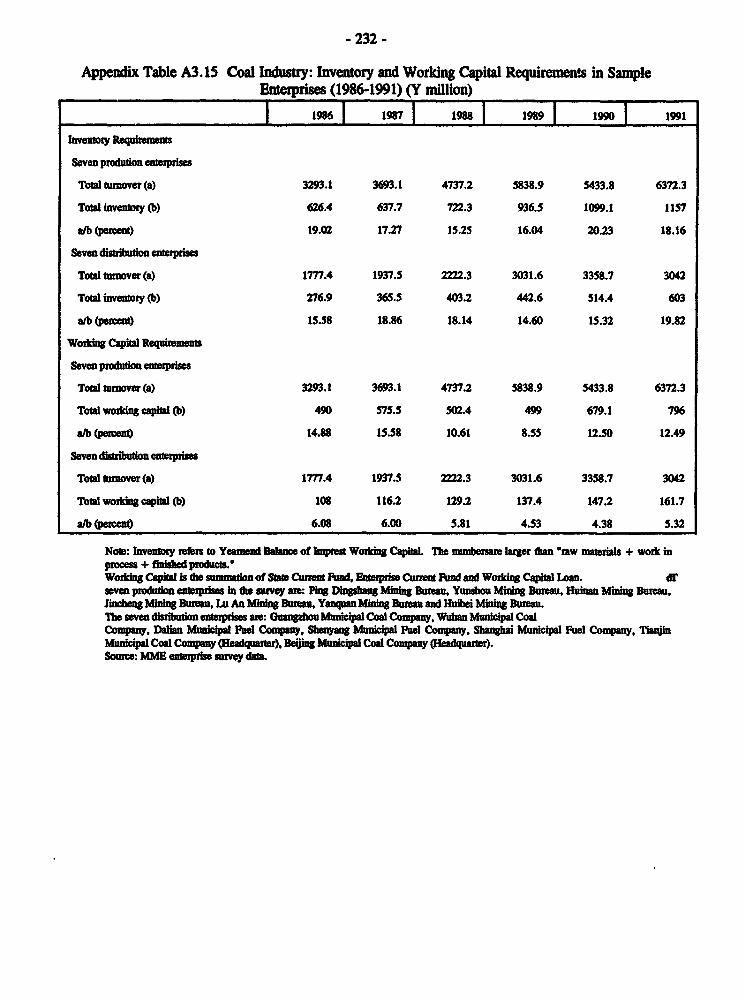
- 232 -
Appendix Table A3.15 Coal Industry: Inventory and Working Capital Requirmews in SampleEnrprises (1986-1991) (Y million)
- 1~ | l98516 1987 1988 1989 1990 1991
nventoy Reqremens
Seven produtin enterpriuse
Total umover (a) 3293.1 3693.1 4737.2 5838.9 5433.8 6372.3
Total Inveltory (b) 626A 637.7 722.3 936.5 1099.1 1157
a/b (pecent) 19.02 17.27 15.25 16.04 20.23 18.16
Sven distuo entises
To tumover (a) 1777.4 1937.5 2222.3 3031.6 33S8.7 3042
Total inventory (b) 276.9 36S.5 403.2 442.6 514A 603
a1b (percent) 15.58 18.86 18.14 14.60 15.32 19.82
WodftCkitgCRaq_ru
Seven ptodution ntpridses
Total mover(a) 3293.1 3693.1 4737.2 S838.9 S433.8 6372.3
Total woang caphl (b) 490 57S.5 502.4 499 679.1 796
atb (percent) 14.88 1558 10.61 8.SS 12.50 12.49
Saven drbuton enteises
Totsmnover(a) 1777.4 1937.5 22.3 3031.6 33S8.7 3042
Total woing capitl (b) 108 116.2 129.2 137.4 147.2 161.7
a/b (percent) 6.08 6.00 5.81 4.S3 4.38 5.32
Note: Inventry rers to Yeatnend Boal of hnpt Working Captal. The _nbersare larger than raw matras + work inprocess + finied products.'Workig Captal is die smmtion of Sae Currm Fumd, Etprise Current und and Workig Capis Loan. drsven pdtion etpiss in the surv ae: Ping Digang Minig Bua, Yunsou Ming Bureau, Human Mibi Burea,Jindheng Mhining Buu Lu An Minn Ba Yanquan Minig Bureau and uibe Miing Bureau.The seven dnl entps are: h MucW Coal Compy, Wban m CoalCompany. Dalan Muna Fuel Company, Sheyang Muicipal Fud Company. Shanghai Municipal Fuel Company, TianjinMuncipa Coal Company (Hequarte), Beijing Municipal Coal Company (eadquarter).Source: MM enterpr suney dat

- 233 -
Appendix Table A3. 16 Cement Industry: Inventory and Working Capital Requirements in SampleEnterprises (1986-1991) (Y million)
1986 1987 1988 1989 1990 1991
Invenoy Requment
Seven produdon eterprises
Total tnover (a) 476.1 S47.7 613.1 762.7 895.4
Totd inventory (b) 98.9 93.9 182.9 192.1 192
a/b (percet) 20.77 17.14 29.83 25.19 21.44
Seven user enkprises
Total unover (a) 223.38 240.99 267.44 274.13 292.51 312.3
Total invenoty (b) 67.33 78.26 81.3 121.42 110.51 125.13
a/b (percent) 30.14 32.47 30.40 44.29 37.78 40.07
Workn Capta Requirmn
Seven produdt en tises
Tod tumnover (a) 476.1 547.7 613.1 762.7 895.4
Average wordkng capitl (b) 125.8 190.6 202.6 275.3 374,2
a/b (percnt) 26.42 34.80 33.05 36.10 41.79
See user eneprises
ToW tunover (a) 223.38 240.99 267.44 274.13 292.51 312.3
Average wo*ing capital (b) 66.85 71.26 77.99 96.05 128.5 172.91
a/b (petcent) 29.93 29.57 29.16 35.04 43.93 55.37
Note: Inventory refers to Yeamend Balnce of Impresa Workng Capitd. Tbe numbets are larger than aw materias + work mproems + finishedptoducts."Aversge Balance of Wodrng Capital refets to the average of year- begining and yea-nd workng captal average. s
seven produdon enises in the survey are: Jidong Cement Factory. Taiyuan Cement Factory, Mudarjiang Cement Factory,Shanghai Cement Factory. Nigno Cemen Factory, Luoyang Cement Factory and Lluzhou Cement Factory.-he seven user entetprises are fatories under the Ministry of Railway.Soutce: ME enterprise smuvey data.

- 234 -
Appendix Table A3.17 Steel Industry: Inventory and Working Capital Requrements in SampleEnterprises (1986-1991) (Y million)
1986 1987 1988 1989 1990 991
hNentwy Requirements
Seven prodon eneprIe
Toad tunover (a) 12294.2 15303.1 18478 21379.1 24627.2 33298.9
Tota inventory (b) 3801.4 3934.7 17096.2 5935.3 7637.7 8188.4
albjpoermc) 30.92 25.71 92.52 27.76 31.01 24.59
Seven disorbution enterpris
Tota turnover (a) 6610.4 7682.9 8794.8 10740.9 10005.5 10586.2
Totd iventy (b) 1323.1 1592.2 1947.5 2460.1 2295.2 1986.6
a/b (prtent) 20.02 20.72 22.14 22.90 22.94 18.77
Seven user entrises
Tota unover (a) 268.1 288.7 387.3 383.6 351.5 435.9
Totd inventoy (b) 167.2 183.7 228.4 273.3 284.8 352.7
a/b (peet) 62.36 63.63 58.97 71.25 81.02 80.91
Worig Capital Requiem
Sve produdon enteprises
Toaltu er (a) 12294.2 15303.1 18478 21379.1 24627.2 33298.9
Total workiv4 capal (b) 4013.9 4302.4 4827.4 6385.3 8580.7 9954.4
a/b (percet) 32.65 28.11 26.13 29.87 34.84 29.89
Seven diidonenteres
Total tumover (a) 6610.4 7682.9 8794.8 10740.9 10005.5 10586.2
Total inventoy (b) 1326.7 1679 2233.7 2723 3037.4 2432.9
a/b (per) 20.07 21.85 25.40 25.35 30.36 22.98
Seven user entprises
Totl tunover (a) 268.1 288.7 387.3 383.6 351.5 435.9
Total worig capial (b) 148.2 160.5 184.8 214.4 273.3 326
a/b (percent) 55.28 55.59 47.71 55.89 77.75 74.79
Note: Inetr refs to Yearnend Balace of Imprest Working Capial. The ndmber are larger than "raw materals + work mproce + fined ptoductsa.Avee Balance of Woing Captal refrs to the averae of year- begiing and year-end working capita average. dlsven produdon enteprs in the swrey are: Ansdang Stel and Ibon Company, Capital Sdeel and Iron Company, Shangbai BaoshanSteel and Ion Company (eaqater), Qngdao Steel and ron Company (Headqurter).Jinm Stee and Iron Company (Headquarter),Tauan Seel and Iron Company, and Dalhn Sted Factory.The sevendistribution enterpries are: ShanghaiMet Materl Company (Headquarte). Liaoning Province Met Material Company,Zhejing Mel Mat Company, Hubei Povnce Me Mateial CompaVny, GuangdongProvice MeA Mate Company, lkijingMuicipal Met Matedal Company, and Tinjin Municipal Met Matrl Company.The swven user entepises arc: Jinan Bearig Factoty, Qingdao Tractor Factory. ah fi Faory. Hanghou Fork TiuckFactoy, Najin Steam Turbine Factoy, Shanghai Jinan Agricultural Mahinery Fact, and Shenyang No.3 Machine ToolFactory.Source: MME entrrise survey data.

- 235 -
Appendix Table A3.18 Length of Transportation Rrutes by Province (i983-1991)(kilometer)
1983 1991 Amual Growth Rate 1983-91 (%)
Railways Water- | Highways Railways I Water- Highways Railways Water- Highwaysways ' ways- ways
AUl China 51603.9 108904 915079 53414.8 109703 1041136 0.43 0.09 1.63
Beiing 859.9 8058 1011.4 10259 2.05 3.06
Tianjin 398.3 458 3722 470.4 89 4068 2.10 -18.52 1.12
Hebei 2589.8 48 40187 2977.2 75 45464 1.76 5.74 1.55
Shanxi 2176.7 170 27887 2332 170 31040 0.87 0.00 1.35
Inner Mongolia 4796.8 602 36727 5081.5 602 43396 0.72 0.00 2.11
Liaoning 3533.4 508 29878 3562.6 508 40195 0.10 0.00 3.78
iSn 3480.9 737 24114 3472.7 1114 27110 -0.03 5.30 1.47
Heilongjiang 5088.2 45295 4997.2 47188 -0.23 0.51
Shanghai 244.7 2474 2109 259 2100 3156 0.71 -2.03 5.17
Jiangsu 713.4 23528 21313 748.4 23670 24929 0.60 0.08 1.98
2hejiang 830.9 10620 21399 871.3 10617 29218 0.60 0.00 3.97
Anhui 1543.0 5490 25934 1544.5 5528 30448 0.01 0.09 2.03
Fujian 1027.6 3875 34445 1015.2 3888 41745 -0.15 0.04 2.43
Jiangxi 1433.1 4937 30687 1581.6 4937 33222 1.24 0.00 1.00
Shandong 1671.8 1859 35722 2042.1 1861 41937 2.53 0.01 2.03
Henan 1973.2 1110 37196 2084.9 1110 44199 0.69 0.00 2.18
Hubei 1597.2 7859 44985 1690.1 7907 47661 0.71 0.08 0.72
Hunan 2300.5 10164 55483 2271.3 10110 57693 -0.16 -0.07 0.49
Guangdong 846.0 11090 63360 684.4 10857 55307 -2.61 -0.27 -1.68
Guangid 1659.9 4519 32529 1665.8 4521 36660 0.04 0.01 1.51
Hainan 219 264 12922
Sichuang 2875.6 8192 84624 2876.6 7904 98122 0.00 -0.45 1.87
CGwzhou 1395.8 1661 27675 1419.4 1773 31588 0.21 0.82 1.67
Yunnan 1620.5 1010 46230 1625.2 1130 58123 0.04 1.41 2.90
Tibet 21551 21842 0.17
Shaanxi 1857.2 688 36832 1826,1 843 38193 -0.21 2.57 0.45
Gansu 2221.5 121 32365 2219.4 219 34776 -0.01 7.70 0.90
Qinghai 1097.5 15692 1094.7 16769 -0.03 0.83
Nmgxia 428.4 6867 428.5 397 8200 0.00 2.24
Xinjiang 1342.1 22213 1342.5 25697 0.00 1.84
Non-regional Specific 7509
Some: China Ssical Yearbook (various issues).

- 236 -
Appendix Table A3.19 Per Capita Length of Transportation Routes by Province (1983-1991)(kilometer)
1983 1991 Annual Growth Rate 1983-91 (%)
Railways Wator- Highways Railways Water- Highways Railways Water- Highwaysways ways ways
AUl China 50.3 106.3 892.8 46.1 94.7 898.9 -1.09 -1.43 0.09
Beijing 92.1 0.0 862.7 92.4 0.0 937.8 0.05 1.05
7ia4jin 50.5 58.0 471.7 51.7 9.8 447.5 0.31 -19.95 40.66
Hebei 47.8 0.9 741.5 47.9 1.2 730.9 0.02 3.93 .0.18
Shanxi 84.6 6.6 1084.3 79.3 5.8 1055.1 40.82 -1.67 4.34
Inner Mongolia 245.4 30.8 1878.6 232.7 27.6 1987.0 40.66 -1.38 0.70
Liaoring 97.4 14.0 823.3 89.3 12.7 1007.4 -1.08 -1.18 2.55
JiUn 153.3 32.5 1062.3 138.4 44A 1080.5 -1.27 3.99 0.21
HeilorJiang 153.9 0.0 1370.1 139.8 0.0 1319.9 -1.20 40.46
Shanghai 20.5 207.2 176.6 19.3 156.7 235.5 -0.73 -3.43 3.66
Jiaogsu 11.6 383.5 347.4 10.9 345.9 364.2 -0.77 -1.28 0.59
Zhejiang 21.0 268.0 540.0 20.7 252.7 695.3 -0.14 -0.73 3.21
Anbui 30.5 108.6 512.9 26.8 96.0 528.5 -1.61 -1.53 0.37
Fujian 38.9 146.8 1304.7 33.0 126.3 1355.8 -2.05 -1.86 0.48
Jiaugxi 42.3 145.9 906.8 40.9 127.7 859.6 -0.43 -1.65 -0.67
shandong 22.1 24.6 472.3 23.8 21.7 489.3 0.94 -1.54 0.45
Henan 26.0 14.6 490.0 23.8 12.7 504.4 -1.10 -1.78 0.36
Hubei 33.0 162.5 930.4 30.7 143.5 864.7 -0.93 -1.55 -0.91
Hunan 41.8 184.5 1007.1 36.6 162.8 929.2 -1.64 -1.55 -1.00
CGangriong 13.9 182.6 1043.0 10.6 168.6 858.9 -3.32 -0.99 -2.40
GCuangd 44.5 121.1 871.4 38.5 104.6 847.8 -1.78 -1.81 -0.34
Haina 32.5 39.2 1917.2
Sichuang 28.5 81.3 839.9 26.4 72.5 900.4 -0.97 -1.42 0.87
Chdzbou 48.1 57.3 954.0 42.8 53.5 952.9 -1.45 -0.85 -0.01
Yumnan 48.8 30.4 1392.9 43.0 29.9 1536.8 -1.58 40.23 1.24
TIbet 0.0 0.0 11166.3 0.0 0.0 9664.6 -1.79
ShaanXi 63.4 23.S 1256.6 54.3 25.1 1135.7 -1.91 0.82 -1.26
Gansu 111.7 6.1 1628.0 97.1 9.6 1521.9 -1.74 5.84 -0.84
Qinghai 279.3 0.0 3992.9 241.1 0.0 3693.6 -1.82 -0.97
Nnguia 107.6 0.0 1725.4 89.3 82.7 1708.3 -2.31 -0.12
Xinjian 101.8 0.0 1685.4 86.3 0.0 1652.5 -2.04 -0.25
SD 64.48 93.53 1935.13 57.18 81.64 1644.04 -1.49 -1.69 -2.02
Mean 72.78 82.67 1463.15 64.87 74.25 1422.75 -1.43 -1.33 -0.35
COV 0.89 1.13 1.32 0.88 1.10 1.16 40.06 -0.36 -1.67
Source: Cina Saist Yeatbook (various issues).

- 237 -
Appendix Table A3.20 Average Shiping Distance of Freight (1962-1991)(kilometer)
Year Railways Highways Waterways civilAviation
1962 488 19 259 836
1965 549 19 291 924
1970 513 24 366 954
1976 478 28 736 1292
1978 485 32 873 1521
1979 500 20 1056 1539
1980 514 20 1184 1573
1981 530 21 1241 1809
1982 539 25 1236 1961
1983 559 19 1285 1983
1984 584 22 1351 2074
1985 636 31 1216 2128
1986 646 34 1042 2143
1987 673 37 1174 2183
1988 681 44 1128 2226
1989 686 46 1281 2226
1990 705 46 1447 2218
1991 718 46 1554 2234
Growth Rate/a 1.34 3.10 6.37 3.45
/a Anmual average percentage, 1962-1971.Source: China Statistical Yearbook (various isses).

- 238 -
Appendix Table A4.1 China's Foreign Trade in Non-Ferrous Metals (000 tonnes)1988 1989 1990 1991 1992
Copperhunports
CoGncenates 173 178 242 310 340
Meta 84.3 70 42 114 379
Exports
deta 93 28 43 42 55
importsAlumina 159.5 298 582 686 800
Neta 75.4 175.5 71.7 43.7 230
ExporsBauxite 364 575 680 542 860
Meta 159 20 83 96 88
Ledimports
.eta! N/A N/A N/A N/A |
Exports
mewa N/A N/A N/A N/A NIA
hnports
metal N/A N/A N/A N/A NIA
Exportsmewl 14 20 17 6 85
ImportsMeta N/A N/A N/A N/A NIA
Exports
meta 11 10 10 15 30
Nic
bmportsmeta N/A N/A N/A N/A N/A
Exports
Metal N/A N/A N/A N/A NIA
Ir
ImportsOre 10540 12592 14342 18549 25220
mewa 870 690 1310 360 150
Exports
mewa 2330 530 380 680 620
Note: N/A means that the data were not available from the Ministry of Materils and Equipnen.Source: Ministry of Materials and Equipment. Beijing

- 239 -
Appendix Table A4.2 Trading Volume on the Shenzhen Metal ExchangeA. lst - 20th January, 1993
Contract Average Price Volume Value of Turnover Number of(RMB/ton) (tons) (Mn RMB) Transactions
Copper 21,369 12,940 276.51 66Aluminum 12,318 39,900 491.49 150
Lead 0 0 0.00 0Zinc 7,650 200 1.53 1Tin 45,000 60 2.70 1Nickel 56,012 400 22.40 7
Manganese 18,700 40 0.75 1Antimony 0 0 0.00 0OTAL 79538 226
B. Ist - 28th February, 1993Confrct Average Price Volume Value of Turnover Number of
(RM/ton) (tons) (Mn RMB) TransactionsCopper 21,193 10,300 218.29 51
Aluminum 12,542 62,400 782.62 271d 0 0 0.00 0
inc 8,300 200 1.66 1Tin 48,142 140 6.74 3Nickel 56,591 240 13.58 5Mganese 0 0 0.00 0lAntimony 0 0 0.00 0
OTAL 1,022.89 331
Source: Shenzhen Metal Exchange

- 240 -
Appendix Table A4.3 Trading Volume on the Shanghai Metal Exchange10th March 1993
ContaCt Average Price Volume (tonnes) Value of Turnover(RMB/ton) (Million RMB)
o. 1 Copper 20,590 70,920 1,460.24
Odier Copper 0 0 0.00
High Grade Aluminum 12,010 37,300 447.97
Other Aluminum 11,600 200 2.32
No. 1 Zinc 0 0 0.00
er Zinic 0 0 0.00
o. 1 Tin 49,500 20 0.99
Other Tin 0 0 0.00
Lead 0 0 0.00
Nickd 55,560 1,700 94.45
Pig ron 0 0 0.00
SotALe: hmgh Exchange2,005.97
Source: Shanghai Meta Exchange

Appendix Table A5. la Size Distribution of Industry by Number of Employees and Number of Finns (1991)
Number of Fms (Nos) Percentage of Frms
Total Above 5000 3000 - 500 100 50 10 bel Total Above 1000- 100 Blow10000 - - 3000 - - 10 3000 3000 - 100
10000 5000 1000 500 100 50 1000
TotW 418,869 356 697 1.144 9,186 16,675 110,795 76,113 161,488 42,406 100.0 0.5 2.2 30.4 66.8
Trimber Processing 10,782 3 12 23 68 129 1,318 1,300 5,680 2,249 100.0 0.4 0.6 13.4 85.6
Food 39,319 0 3 24 306 704 7,397 6,422 16,796 7,667 100.0 0.1 0.8 20.6 78.5
Tobacoo 329 0 2 IS 91 64 81 32 42 2 100.0 5.2 27.7 44.1 23.1
Tentie 24,596 IS 163 254 1,699 2,503 9,S46 4,370 5,379 667 100.0 1.8 6.9 49.0 42.3
Clofting 17.499 0 3 10 152 603 5,897 3,673 5,900 2,261 100.0 0.1 0.9 37.1 67.6
LaWther 8,308 0 1 5 80 301 2,459 1,664 3,262 536 100.0 0.1 1.0 33.2 65.7
Buiding Maerias 52,179 5 18 48 705 1,548 16,965 10,736 19,060 3,094 100.0 0.1 1.4 35.5 63.0
PaperMaking 10,875 0 11 23 165 428 3,021 2,578 4,151 498 100.0 0.3 1.5 31.7 66.5
Chemical Industry 19,932 15 29 78 645 1,482 4,730 3,441 8,136 1,376 100.0 0.6 3.2 31.2 65.0
harmaceuticals 3,305 0 5 15 133 310 1,457 610 657 119 100.0 0.6 4.0 53.5 41.9
Cemical Fibres 616 4 10 12 71 96 196 76 137 14 100.0 4.2 11.5 47.4 36.9
Rubber 3,818 0 8 1S 188 223 1,211 738 1,268 167 100.0 0.6 4.9 37.6 56.9
Pastic 14,554 0 2 6 89 305 3,514 3,032 6,585 1,021 100.0 0.1 0.6 26.2 73.1
Ferrous Metas 1,449 7 9 8 59 49 252 131 356 578 100.0 1.7 4.1 20.8 73.5
Machine Bl a 42,496 29 122 190 1,493 2,225 12,845 7.430 14,398 0 100.0 0.8 3.5 35.5 SI.4
Transport Equipment 11,203 27 59 64 385 579 3,008 2,219 4,216 646 100.0 1.3 3.4 32.0 63.2
Eectric MacWiety 14,763 4 23 34 397 725 4.398 2,820 5,503 859 100.0 0.4 2.7 34.7 62.2
Electronics&Telecom 4,919 5 16 35 327 513 1,881 852 1,127 163 100.0 1.1 6.6 48.7 43.5
/a Percentag data do not add up to 100 for this sector.Note: Data in the table ae of idepmdent accountg entepises at and above township level.Source: China Industrial Staticl Yearbook 1992.

Appendix Table AS. lb Size Distribution of Industry by Number of Employees and Persons Employed (1991)
Number of Persons Employed (in 10 ousand) Percentage of Persons Employed
Total Above 500 3000- 1000 | S00 100 50 10- Below Total Above 1000- 100- Below10000 5000 30S0 1 - 50 to 3000 3000 1000 100
IOC00 10IO0 S00 IC0
TotaW 7,798 961 476 428 1,442 1,144 2,374 536 413 24 100.0 23.9 18.5 45.1 12.5
7imber Processing 88 4 8 8 11 9 25 9 13 1 100.0 22.5 12.3 38.8 26.3
Food 342 0 2 8 47 48 148 45 40 4 100.0 2.9 13.7 57.1 26.2
Tobacoo 30 0 1 6 16 5 2 0 0 0 100.0 22.7 53.7 22.4 1.2
Texdle 938 19 111 95 268 174 224 31 15 0 100.0 24.0 28.5 42.5 5.0
Clotig 236 0 2 4 22 39 127 26 16 1 100.0 2.3 9.2 70.4 18.1
Leatier 107 1 2 12 20 53 12 9 0 88 100.0 13.3 18.7 59.8 90.5
Builing Mats 717 7 12 18 109 106 340 76 48 2 100.0 5.1 15.2 62.1 17.7
PaperMaking 164 0 8 8 24 29 65 18 12 0 100.0 9.8 14.7 57.1 18.4
Chemical ndustly 433 31 20 28 97 103 108 24 21 1 100.0 18.5 22.5 48.5 10.5
Pharmaceuls 93 0 4 5 21 22 35 4 2 0 100.0 10.2 22.3 60.6 6.9
ChemicalPibres 45 11 6 4 11 6 5 1 0 0 100.0 47.2 25.2 25.4 2.1
Rubber 93 0 5 5 31 16 27 5 3 0 100.0 11.0 33.6 46.0 9.4
Plastic 148 0 1 2 12 20 73 21 17 1 100.0 2.4 8.3 62.8 26.5
Ferrous Metals 317 185 21 20 37 18 29 5 2 0 100.0 71.2 11.7 15.0 2.2
Machine Buiding 973 45 85 72 239 154 286 53 37 0 100.0 20.7 24.6 45.2 9.3
Trnsort Equipment 315 54 40 25 63 40 66 16 11 0 100.0 37.7 20.0 33.6 8.7
Electric Macdey 276 5 15 13 62 49 97 20 14 1 100.0 12.0 22.4 53.1 12.6
Electronks&Telecom 173 6 11 13 52 36 45 6 3 0 100.0 17.5 30.1 47.0 5.4
Note: Data in th table are of independent accondu engerprises at and above township level.Source: China Industri Stacisal Yearbook 1992.

Appendix Table AS. Ic Size Distribution of Industry by Number of Employees and Gross Output Value (1991)
Tota Output Value (100 million Y) ToWa Output Vakle (m percenag)
Tota Alxwe 5000- 3000- 1000- 50-0- 100- 50- 10- delow Totd AIbove 1000- 100- Below10000 10000 5000 3000 1000 500 100 50 10 3000 3000 1000 100
Totd 22,089 3,206 1.562 1.504 4.822 3.238 5,676 1,146 823 112 100.0 28.4 21.8 40.4 9.4
Timber Processing 122 1 3 7 17 17 41 13 20 3 100.0 8.9 14.0 47.4 29.7
Food 1,473 0 7 38 216 201 695 174 130 12 100.0 3.1 14.7 60.8 21.5
Tobacoo 547 0 44 168 275 41 17 2 0 0 100.0 38.7 50.3 10.6 0.3
Textie 2,533 40 282 242 733 446 651 94 41 3 100.0 22.3 28.9 43.3 5.5
Clothing 523 0 3 13 66 111 260 42 24 3 100.0 3.1 12.6 71.0 13.3
Leahder 253 0 1 4 32 53 126 21 15 1 100.0 2.1 12.7 70.7 14.6
BlldingMaterials 1.055 13 23 35 213 188 430 85 65 4 100.0 6.8 20.2 58.5 14.6
aperM ading 423 0 35 27 73 86 148 34 20 1 100.0 14.6 17.3 55.1 13.0
Cbemlcal bdlstry 1,625 163 81 136 380 353 366 78 59 3 100.0 23.3 23.4 44.3 8.6
P13s snccrims 454 0 25 23 109 124 149 17 6 1 100.0 10.7 24.1 60.0 5.1
CernicalFlbrs 325 101 39 20 76 56 29 3 2 0 100.0 49.0 23.4 26.1 1.5
Rubber 317 0 37 29 127 49 60 9 6 0 100.0 20.7 40.1 34.4 4.8
Plastic 439 0 0 4 37 79 222 56 39 3 100.0 1.1 8.3 68.4 22.2
Fermos Metads 1,539 961 114 89 172 74 107 16 7 0 100.0 75.6 11.2 11.7 1.5
MachineBildling 1.995 107 213 157 522 307 528 92 64 0 100.0 23.9 26.2 41.8 7.8
Tansport Bqipmen 976 219 140 75 257 104 133 27 19 1 100.0 44.5 26.3 24.3 4.9
Electic Machiny 917 18 46 46 281 178 264 50 33 2 100.0 12.0 30.6 48.1 9.2
Electruncs&Talecom 765 28 77 98 264 127 140 21 10 1 100.0 26.5 34.5 34.9 4.1
Note: Daa In tbe table are of inependentccog entpises at and above townip levl.Source: China lidustal Stsical Yearbook 1992.

Appendix Table A5.2a Size Distribution of Industry by Gross Value of Industrial Output and Number of Firms (1991)
?Numhea of Firms (Nos) N4umber of Firms (im percentag)
Total Above YSOm Y30m YlOm YSm Ylm YO.Sm YSOO,000 Below Total Above Y10 Ylm BelowY100 100,000 Y30m m - - Ylmm YIOO YSOm Y3Om YiOm YSm Ylm Y100.000 Y30 Y10
m m m
Total 418,869 2,648 3,526 5,187 24,308 27,064 106,7S0 62,577 124,225 62,S84 100.0 2.7 5.8 31.9 9.5
Timber Procesig 10,782 6 24 26 126 235 1,482 1,467 4,530 2,886 100.0 O.S 1.2 1S.9 82.4
Food 39,319 94 284 503 2,609 2,791 9,333 5,271 11,025 7,409 100.0 2.2 6.6 30.8 60.3
Tobacoo 329 110 36 IS 3S 27 44 25 31 6 100.0 48.9 10.6 21.6 18.8
Texlile 24,596 446 S98 872 601 3,100 7,695 2,R48 3,925 I,51I 100.0 7.8 2.4 43.9 33.7
Clothig 17,499 20 67 144 977 1.234 4,825 2,597 5,058 2,557 100.0 1.3 5.6 34.7 58.4
Leather 8,308 8 45 82 470 519 2,226 1,292 2,722 944 100.0 1.6 5.7 33.0 59.7
Building Materials 52,179 S9 117 242 1,545 2,189 12,519 10,563 18,224 6,721 100.0 0.8 3.0 28.2 68.1
Paper Makiig 10,875 38 62 132 631 740 3,297 1,901 3,00S 1,069 100.0 2.1 5.8 37.1 54.9
Chemical Indty 19,932 233 298 474 2,132 1,770 5,493 2,757 4,879 1,896 100.0 5.0 10.7 36.4 47.8
Pha1maceutcals 3,306 64 140 174 581 524 992 288 388 155 100.0 11.4 17.6 45.9 25.1
Chemical Fibres 616 70 67 40 101 71 136 45 70 16 100.0 28.7 16.4 33.6 21.3
Rubber 3,818 5S 83 75 316 299 1,163 559 956 316 100.0 5.5 8.3 38.3 48.0
Plastic 14,554 17 76 132 744 958 4,146 2,337 4,492 1,652 100.0 1.5 5.1 35.1 58.3
Ferraos Metals 3,432 186 104 137 497 420 1,178 342 390 178 100.0 12.4 14.5 46.6 26.5
Machine Bufiding 42,496 239 338 549 2,774 3,302 12,660 6,350 11,148 5,136 100.0 2.6 6.5 37.6 53.3
Transport Equipment 11,203 128 152 169 710 690 3,128 1,882 3,289 1,053 100.0 4.0 6.3 34.1 55.6
Electric Machinery 14,763 137 192 244 1,090 1,272 4,621 2,181 3,798 1,228 100.0 3.9 7.4 39.9 48.8
Ebctronics&Telecom 4,919 134 131 171 584 563 1,565 632 873 266 100.0 8.9 11.9 43.3 36.0
Note: Data in the table are of independemaccounting enerprise at and above township level.Source: China Industtial Stical Yearbook 1992.

Appendit Table A5.2b Size Distribution of Industry by Gross Value of Industrial Output and Number of Employees (1992)
Nmnber of Employees (in 10 housand) Number of Employees (an percnage)
Tot Above Y50m Y30m YlOm YSm YIm YO.Sm Y100.000 Below Total Above YIO Ylm BelowYlOOm - 100,000 Y30m m- - Ylm
Yl1OOm YSOm Y30m Y1O YSm Ylm YSOO,000 Y30 YIOm m m
Total 7,798 1,605 625 576 1,442 893 1,635 448 461 112 100.0 36.0 18.5 32.4 13.1
Tiber Pmcessing 88 2 4 6 16 11 24 9 13 4 100.0 13.0 17.5 39.6 29.8
Food 342 19 27 30 78 47 82 23 27 8 100.0 22.4 22.7 37.8 17.1
Tobacoo 30 22 3 1 2 1 1 0 0 0 100.0 87.7 5.1 6.0 1.2
Textile 938 188 115 101 233 11S 139 24 20 5 100.0 43.0 24.9 27.1 5.1
Clob g 236 6 7 11 47 37 78 22 23 5 100.0 10.1 19.9 49.0 21.0
Lather 107 2 5 5 22 16 34 9 11 2 100.0 11.9 20.3 47.1 20.6
Builfinglats 717 26 23 33 112 89 235 100 85 13 100.0 11.4 15.6 45.3 27.7
Paper Maig 164 14 9 13 35 23 44 12 12 2 100.0 21.7 21.5 '1.0 15.8
tcakd lldsy 433 87 44 42 119 48 60 14 14 4 100.0 39.9 27.5 25.0 7.6
P _amuccudcals 93 15 15 12 24 12 12 2 1 0 100.0 45.1 25.8 25.3 3.8
ChenicalPR=s 45 27 7 3 4 2 2 0 0 0 100.0 82.8 9.0 7.1 1.1
Rubber 93 16 13 8 20 10 18 4 3 1 100.0 40.2 21.6 29.7 8.5
Plastic 148 2 6 9 27 24 48 14 15 3 100.0 11.9 18.0 48.9 21.3
FenusMmais 317 230 16 16 25 11 IS 2 2 1 100.0 82.5 7.8 8.2 1.5
MachinoBuiling 973 134 89 88 211 134 215 45 39 7 100.0 32.0 21.7 3S.9 9.4
Tqanso Eque=t 315 97 35 25 54 28 50 13 12 2 100.0 49.8 17.0 24.7 8.4
8ectuic Mcbiey 276 39 27 22 59 37 64 14 13 2 100.0 31.6 21.4 36.4 10.5
ElTeuonics&Telcom 173 35 19 16 37 22 32 6 4 1 100.0 40.8 21.5 31.7 6.1
Note: Data in he table are of id pent'*^-xmftg e_tprss at and above towndi bvd.Somce: China stul Satsticl Yeaubook 1992.

Appendix Table A5.2c Size Distribution of Industry by Gross Value of Industrial Output and Output Value (1992)Total Oup Valw (100 million Y) Total Output Value (in peretage)
Total above YSOm Y30m YIOM YSm Ylm YO.Sm Y100,000 Below Total Above YIO Ylm BelowYlOOm . . 100,000 Y30m m - Ylm
YI0 YSOm Y3Cm YiOm Y5D1 n Ylm Y500,000 Y OMm Y30
Total 22,089 8,530 2,418 1,981 4,040 1,897 2,426 444 324 29 100.0 58.5 18.3 19.6 3.6
Tlmbe processing 122 8 IS 10 19 16 31 10 11 1 100.0 27.0 15.8 38.8 18.4
Food 1,473 163 193 193 439 197 220 37 28 3 100.0 37.3 29.8 28.3 4.7
Tobacoo 547 508 24 6 6 2 1 0 0 0 100.0 98.2 1.2 0.6 0.0
Texble 2.533 733 410 335 613 221 190 21 11 1 - 100.0 S8.3 24.2 16.2 1.3
Clodng 523 34 45 54 159 88 110 19 14 1 100.0 25.4 30.5 37.8 6.3
Lamm 253 11 31 31 77 36 S1 9 7 0 100.0 28.7 30.4 34.4 6.5
BuigMmuls 1,055 97 78 91 248 153 262 75 49 3 100.0 25.1 23.5 39.3 12.1
PaperMakng 423 78 44 50 105 51 74 14 8 0 100.0 40A 24.7 29.6 5.3
Chemical Industy 1.625 S93 202 179 363 126 128 20 13 1 100.0 59.9 22.3 IS.7 2.1
tharmacendeals 454 12A 99 67 97 38 25 2 1 0 100.0 64.0 21.4 13.9 0.7
Chemical ibres 325 235 47 16 19 5 3 0 0 0 100.0 91.5 5.8 2.6 0.2
Rubber 317 121 57 30 55 21 26 4 3 0 100.0 65.7 17.3 14.9 2.1
Platc 439 26 51 51 120 67 95 17 12 1 100.0 29.0 27.3 37.0 6.7
Ferrous Metis 1,539 1,267 70 53 85 29 31 2 1 0 100.0 90.3 5.5 3.9 0.2
Machine Bldi;n 1,995 508 232 209 449 229 291 45 30 2 100.0 47.6 22.5 26.1 3.9
Transport Equpt 976 542 107 65 120 48 70 13 9 1 100.0 73.2 12.3 12.1 2.3
Elec icMachiney 917 288 134 92 181 90 106 15 10 1 100.0 56.1 19.8 21.3 2.9
ectn _cs&Telecom 765 423 91 66 99 40 39 S 2 0 100.0 75.8 12.9 10.3 0.9
Not: Datl inth table ar of depedtaccounting enpris at and above ewnsip lvel.Soure.: Chi bdust St tca Yearbook 1992.