Child Care the Impact of Recent Legislation Nov 28 2014
21
A review of the impact of legislative changes over the last five years on childcare and early learning in Australia. Richard Wilson, November 28, 2014 Abstract Current educational philosophy surrounding class size is identified as the most critical factor in the cost blowout although it is not the only factor. This paper identifies this and other key determinants of cost using the latest US and Australian data from a variety of highly respected 1
-
Upload
independent -
Category
Documents
-
view
4 -
download
0
Transcript of Child Care the Impact of Recent Legislation Nov 28 2014
A review of the impact of legislative changes over the last five years on childcare and early learning in Australia.
Richard Wilson, November 28, 2014
AbstractCurrent educational philosophy surrounding class size is identified as the most critical factor in the cost blowout although it is not the only factor. This paper identifies this and other key determinants of cost usingthe latest US and Australian data from a variety of highly respected
1
researchers in the area of early learning and education in general. It addresses these recent developments and offers a direction for childcare practitioners as well as federal and state governments in relation to the actions necessary to bring costs under control.
2

Introduction
The Productivity Commission’s draft report on childcare subsidies1 released on July 21, 2014 makes forty recommendations which it maintains will alleviate cost burden on families to a small degree unless costs continue to escalate further. At a time of focussed austerity on the part of both state and federal governments, a further blowout in costs may well leave childcare and early learning in the same position as K-12 post-Gonski.
Within Statement 6 of this year’s Federal Budget Paper 1, is a table which shows that childcare fee subsidies are one of the fastest growing direct cash payments by the federal government. During the next four years, the Commonwealth proposes to invest more than $16.1 billion in early childhood education and child care. According to Centre for Independent Studies researcher Trisha Jha ( 2014)2, while the government is reducing family benefits, childcare subsidies have increased 9.9% since the 2013 budget andby the end of the forward estimates period 2017-18 assistance to parents will have almost doubled. The Commission of Audit did not overlook this butfailed to propose actions that might lead to positive savings. Notwithstanding this apparent preservation of childcare payments, parents using childcare have been warned that their fees could jump as much as $35 per week and smaller providers put out of business as a result of government tightening of eligibility criteria from 2015 (i.e. NQF) according to a recent report in the Age newspaper.3 It is argued in this paper that recent national regulations regarding class size maximums and increased proportions of graduate teachers as opposed to diploma trained teachers are major contributors to the increase in childcare costs at a rate well above official inflation.
The Coalition government appears to have recognised the potential unintended consequences of the many hundreds of additional pages of regulation enacted since 2008, not only from comments made by the new federal Minister for Education, but also in the remarks made by the Prime Minister when he launched his first “Red Tape Removal Day” in the Federal Parliament earlier this year. Prime Minster Abbott noted that Australia ranked 128th in the world in terms of ease of navigation of regulations, between Romania and Angola and he singled out childcare services as a primeexample asking:
“Why should a long day-care centre with 15 staff and 75 places have to do paper work said to cost on average, $140,000 per year which is $2000 per child or $10,000 per staff member?”
1 http://pc.gov.au/__data/assets/pdf_file/0008/138383/childcare-draft.pdf2 Jha Trisha, “The looming task of childcare”, Ideas@TheCentre, Centre for Independent Studies, 16 May, 2014,www.cis.org.au/ideasthecentre/article/5181-the-centre3 “Fees-rise fear for family day care”, Matt Wade & Sherrill Nixon reporters, The Age, May 19,2014. www.theage.com.au/federal-politics/political-news/feesrise-fears-for-family-day-care-20140518-38i14.html
3
According to a report in the Australian newspaper on October 15, 20144, the Prime Minister’s figures were provided by the national childcare regulator ACEQA. There are approximately 15,000 childcare centres in Australia and ifthis figure were to apply as an average then the cost of the National Quality Framework to government, childcare centres and ultimately parents, could be as high as $2.1 billion.
In November 2010 after childcare’s largest provider, ABC Learning had entered voluntary liquidation; the Council of Australian Government (COAG) met and endorsed a new National Partnership Agreement on Early Childhood Education. Under this agreement, all state and territory governments committed to ensuring that by 2013, all children in the year before formal schooling will have access to a high quality education program delivered bydegree qualified early childhood teachers for 15 hours per week, 40 weeks of the year. At the same meeting, a new National Quality Standard (NQS) wasagreed to be introduced by January 1, 2014. Under the NQS, an early childhood teacher would need to be in attendance all of the time when long day care and pre-school services are being provided to 25 children or more and at least some of the time when the number is less than 25 children. Within each long day care centre or pre-school half of all staff will need to have (or be actively working towards) a diploma-level early childhood education qualification or above. Jha (2014) questions this decision describing these new policy settings as ‘laughably optimistic’. She suggests that “there needs to be significant changes to the underlying policies. Everything from first principles, to the purpose of government subsidies, to subsidy design needs to be up for debate.”
The Draft Productivity Commission Report also addresses the problem highlighted by Jha (2014) recommending a “minimum standard” rather than mandate a “philosophical ideal” in order to alleviate the pressure on childcare practitioners to be able to realistically deliver. However, the report does not address cost savings measures which must necessarily be part and parcel of any solution if it were to be adopted.
Early childhood education and child care funding has more than doubled in the last five years to approximately $4.4bn in 2012-13.5 Recent figures released by the Federal Assistant Minister for Education shows an increase of more than 50% in NSW children enrolled in childcare in NSW in the last seven years but those families are using fewer hours of childcare on average per week than Victoria Queensland ACT and NT6.
During the September quarter 2013, 773,070 families used approved child care services for their 1,111,100 children. In terms of affordability, morethan 90 per cent of these families are estimated to have received Child
4 The Australian, October 15, 2014 “Red tape hampers childcare standards”, Patricia Karvelas.5 Office of Childhood Education, “State of Childcare in Australia”, Dept. of Education, Employment and Workplace Relations, April 2010.6 http://www.abs.gov.au/ausstats/[email protected]/mediareleasesbyCatalogue/BBFFAEB8C564175BCA257CD20025F9D9?Opendocument
4
Care Rebate (CCR), with 50 per cent of their out-of-pocket costs covered bythe Australian Government.
In terms of availability, in the September quarter 2013, there were 15,907 services providing approved child care services across Australia with more than one third (5,403 or 34.0 per cent) of these located in New South Wales. The number of families in NSW using long day care (LDC) services was177,170 which is 69% of all approved child care services in this state, up 6.5% from September 2012. LDC costs have risen an average of 7% per annum over the last seven years.7
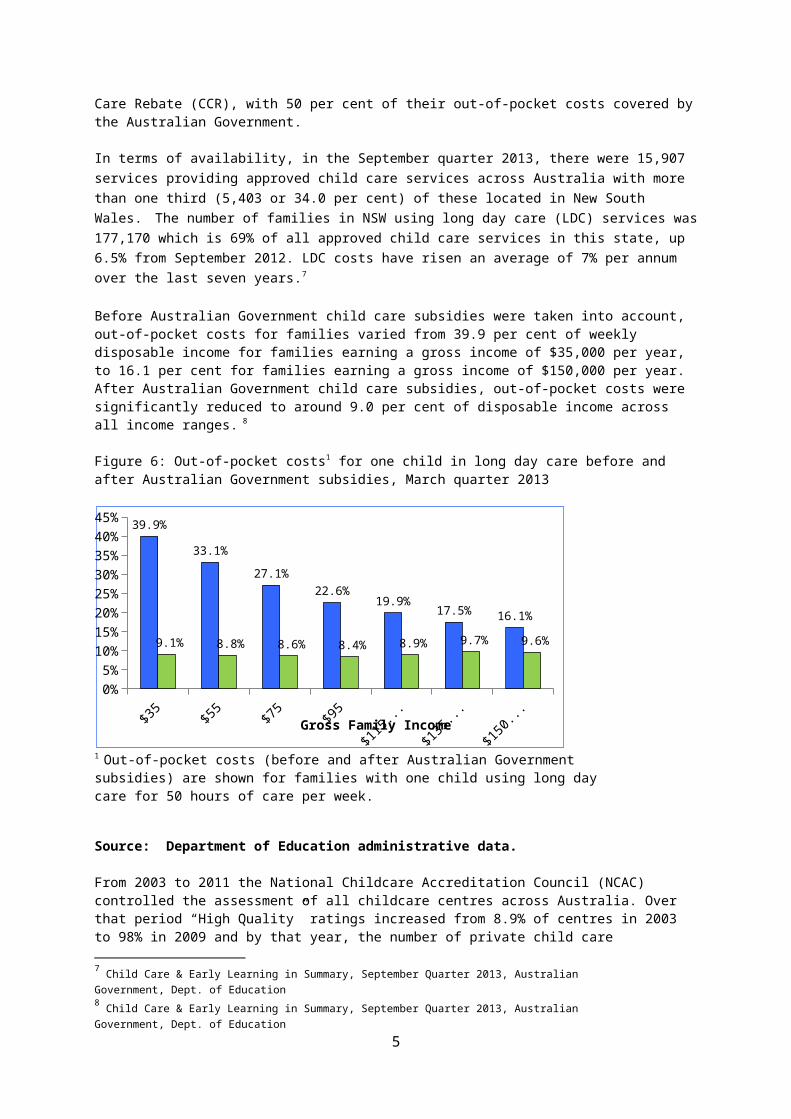
Before Australian Government child care subsidies were taken into account, out-of-pocket costs for families varied from 39.9 per cent of weekly disposable income for families earning a gross income of $35,000 per year, to 16.1 per cent for families earning a gross income of $150,000 per year.After Australian Government child care subsidies, out-of-pocket costs were significantly reduced to around 9.0 per cent of disposable income across all income ranges. 8
Figure 6: Out-of-pocket costs1 for one child in long day care before and after Australian Government subsidies, March quarter 2013
$35
$55
$75
$95
$115...
$135...
$150...
0%5%10%15%20%25%30%35%40%45% 39.9%
33.1%27.1%
22.6%19.9% 17.5% 16.1%
9.1% 8.8% 8.6% 8.4% 8.9% 9.7% 9.6%
Gross Family Income
1 Out-of-pocket costs (before and after Australian Government subsidies) are shown for families with one child using long daycare for 50 hours of care per week.
Source: Department of Education administrative data.
From 2003 to 2011 the National Childcare Accreditation Council (NCAC) controlled the assessment of all childcare centres across Australia. Over that period “High Quality” ratings increased from 8.9% of centres in 2003 to 98% in 2009 and by that year, the number of private child care
7 Child Care & Early Learning in Summary, September Quarter 2013, Australian Government, Dept. of Education8 Child Care & Early Learning in Summary, September Quarter 2013, Australian Government, Dept. of Education
5
establishments had increased to 75% of all providers (of which approximately one third were large corporates). With the demise of ABC Learning in 2010, this percentage fell to 66% when a number of not-for-profit community groups combined to take over more than 600 former ABC Learning centres.
Discussion
The first decade of the 21st century has been a time of change not least forchildcare providers and early learning practitioners. With the collapse of ABC Learning, a public corporation and largest provider of childcare and early learning in Australia the other providers found themselves under greater scrutiny by government and educational bodies. The “High Quality” performance percentage slipped from 98% in 2009 to 87% in 2010 and lower still more recently with NQF. This is still a massive lift from 2003 scores. Rush’s (2006) study for the Australia Institute based on a stratified sample of childcare centres across Australia showed that according to each centre’s own employee ratings, corporate controlled chains were doing considerably less well than either the small privately owned centres or not for profit community centres. In a sense, these findings foreshadowed the demise of the ABC Learning experiment and problems with the corporate approach to child care. Rush suggested that therapid increase in the size of the corporate controlled segment may have been an attempt to achieve economies of scale which when coupled with cost cutting would achieve the profit targets shareholders demanded, even if “atthe expense of humanist concerns”.9
It is possible that state governments and/or their education departments saw the events surrounding the collapse of ABC Learning as an opportunity to bring childcare in its many manifestations more directly under the control of government and in doing so introduce what they believed would bea far more rigorous performance standard as recommended in the “Vinson Report” (2002) .10 It would appear that state educationists may have relied too heavily on recommendations from Vinson’s Independent Inquiry into Public Education in NSW as the impetus for change, in addition to noting Rush’s “humanist” concerns. Report Chairman Vinson singled out the STAR study of Tennessee schooling11 as the “gold standard” in research studies on9 Rush E. (2006) “Child Care Quality in Australia”, Discussion paper Number 84, Australia Institute, April 2006.10 Inquiry into the provision of public education in NSW : First report May 2002, Chairman of panellists: Tony Vinson, NSW Teachers Federation and Federation of P&C Associations of NSW, 2002 11 The Tennessee class size project was a three-phase study designed to determine the effect of smaller class size in the earliest grades on short-term and long-term pupil performance. The first phase of this project, termed Project STAR (for Student-Teacher Achievement Ratio), was begun in 1985, when Lamar Alexander was governor of Tennessee. Governor Alexander, who later served as secretary of education in the cabinet of President George Bush, had made education a top priority for his second term. The legislature and the educational community ofTennessee were mindful of a promising study of the benefits of small class size carried out innearby Indiana, but were also aware of the costs associated with additional classrooms and teachers. Wishing to obtain data on the effectiveness of reduced class size before committing
6
class size effects to justify government action. With the benefit of hindsight and 13 years of follow up research, this appears to have been a mistake. In an effort to reign in corporate control of early learning, the proscribed legislation may have severely hamstrung an entire industry. State education heads, media commentators and some politicians seized upon Vinson’s recommendations regarding class sizes to trigger an avalanche of new regulations and requirements for the industry despite warnings to proceed cautiously by Centre for Independent Studies researcher Jennifer Buckingham (2003) who in response to Vinson, pointed out that the NSW Education Department chose to focus on some of the weakest associations in the “Vinson Report” report as a result of the undue influence of NSW teacher and P&C submissions over independent research. Buckingham argued that both of these groups had funded the project and arguably had a vested interest in bringing down class sizes to increase employment levels in the teaching profession inter alia.12
Despite these warnings, “Sizers” began pushing lawmakers even harder for class size reductions at what would be a massive additional cost to state and federal education budgets, while elsewhere in the Western world researchers are seriously questioning whether class size reductions were really worth the effort and perhaps recruiting more capable teachers would be a far more cost efficient solution.
Over the last twenty years, US researchers in particular have begun to seriously question the skyrocketing costs attached to the class-size dictums as well as the ability to generalise the results of the STAR project. Chingos and Whitehurst (2011)13 when looking at the impact of classsize on the educational outcomes noted:
additional funds, the Tennessee legislature authorized this four-year study in which results obtained in kindergarten, first, second, and third grade classrooms of 13 to 17 pupils were compared with those obtained in classrooms of 22 to 25 pupils and in class- rooms of this larger size where the teacher was assisted by a paid aide. Both standardized and curriculum-based tests were used to assess and compare the performance of some 6,500 pupils in about 330 classrooms at approximately 80 schools in the areas of reading, mathematics, and basic study skills. After four years, it was clear that smaller classes did produce substantial improvement in early learning and cognitive studies and that the effect of small class size onthe achievement of minority children was initially about double that observed for majority children, but in later years, it was about the same. The second phase of the project, called the Lasting Benefits Study, was begun in 1989 to determine whether these perceived benefits persisted. Observations made as a part of this phase confirmed that the children who were originally enrolled in smaller classes continued to perform better than their grade-mates (whose school experience had begun in larger classes) when they were returned to regular-sizedclasses in later grades. Under the third phase, Project Challenge, the 17 economically poorestschool districts were given small classes in kindergarten, first, second, and third grades. These districts improved their end-of-year standing in rank among the 139 districts from well below average to above average in reading and mathematics. According to Frederick Mosteller, Ph.D., is a professor emeritus of mathematical statistics at the departments of Statistics andof Health Policy and Management at Harvard University, this controlled experiment was one of the most important educational investigations ever carried out and illustrates the kind and magnitude of research needed in the field of education to strengthen schools. 12Buckingham J, (2003) “The Missing Links: Class Size, Discipline, Inclusion and Teacher Quality: A Response to the Vinson Report on Public Education in New South Wales” Issue Analysis, No 29, Feb 2003.13
7
“Despite there being a large literature on class size effect on achievement, only a few studies are of high enough quality and sufficiently relevant to the given credence for legislative action. Class size reduction (CSR) rests on the Student Teacher Achievement Ratio or STAR study conducted in Tennessee in the late 1980’s and the only study that has ever produced very significant effects. In this study students and teachers were randomly assigned to a small class (average 15 students) or a regular class (average 22 students). This 32% reduction in class size was found to increase student achievement by an amount equivalent to about three months of schooling four years later.Studies in Texas and Israel found benefits in smaller class sizes but not to anywhere near the magnitude of the Tennessee STAR study.”
Jepsen & Rivkin (2009) found positive effects for class size reduction albeit at about half the size of the Tennessee study but these effects wereclearly outweighed by the unintended consequences of increasing the number of teachers to manage smaller classes. Those recruited were not always fully certified or as experienced with the result that any positive benefitassociated with smaller class sizes was completely over-ridden by poorer teaching standards. 14
Although not direct at preschool age children, Woessman & West (2006) foundthat for 7th and 8th grades, within-school class size effects on performance on international exams in eleven countries varied markedly. For poorer countries, there appeared to be a small positive effect related to class size. However in all but one other, the result was either nil effect or a non-significant effect. That “other” was Singapore which was the top performer. Average class size for the Singapore data set was significantly higher (33) than in the western nations (approximately 26) tested despite their focus on class size reduction in recent years. 15 Hoxby (2000) found asimilar lack of association at the end of the 20th century when reviewing class size and exam results in Connecticut 1st and 2nd grade classes.16
In studies scientifically rigorous enough to satisfy Chingos and Whitehurst(2011)17, they report that results on the effects of class size have been mixed. This included ‘no effects’ and ‘variable effects’ in California, Florida and Connecticut; although it was acknowledged that class size reduction was more likely to have some influence when introduced in the earliest grades for students from disadvantaged backgrounds or situations. Notwithstanding the benefits of one-on-one teaching for disadvantaged children or children with a disability, when viewed across the board, the relationship could not be generalised to the population of pre-schoolers asa whole.
14 Jepson C & Rivkin S “Class Size Reduction and Student Achievement: The Potential Trade-off between Teacher Quality and Class Size”. Journal Human Resources, 44(1) 223-250 (2009)15 Woessman L & West M, (2006) “Class size Effects in School Systems Around the World: Evidencefrom Between Grade Variation in TIMMS” European Economic Review 50(3):695-736 (2006)16 Hoxby CM (2000). “The Effects of Class Size on Student Achievement: New Evidence from Population Variation” Quarterly Journal of Economics, 115(4) 1239-1285 , 200017Chingos MM & Whitehurst GJ (2011), “Class Size: What Research Says and What Research Says and What it Means for State Policy” Brookings Paper, May 11, 2011. http://www.brookings.edu/research/papers/2011/05/11-class-size-whitehurst-chingos
8
What can be said from more recent evaluations is that in 1986, class size had an effect on academic outcomes in Tennessee which happens to be one of the poorest states in the US and arguably, one of the most disadvantaged and we know these factors are related to positive CSR outcomes.18 The authors concluded that:
“Class size reduction has been shown to work for some students in some grades in some states (US)and countries but its impact has been found to be mixed or not discernible in other settings and circumstances that seem similar. It is very expensive. The costs and benefits of class size reduction mandates need to be carefully weighed against all of the alternatives when difficult decisions must be made.”
Support for Chingos and Whitehurst comes from a long term follow up of the STAR participants into adulthood by Ray et al (2010). Utilising IRS tax records they found that students assigned to small classes at the beginningof elementary school, were about 2% more likely to be enrolled in college at age 20 but the authors found no impact on incomes by age 27.19 Rivkin, Hanushek & Kain (2005) had found in a follow up to the mid 1990’s Texas study based on 500,000 Texan students that there were some positive effectson reading and maths attached to smaller classes for 4th grade but the result for 5th graders was far less clear. Results in the Texas study initially were found to be around half the magnitude of those reported in the STAR study so this follow up has not made the case for CSR any strongerin Texas.
The Denver Post20 in 2011 summed up the American case against class size as follows:
“Other systems make their key priority high teacher quality not low class size. The evidence is clear,CSR with its staggering cost has been the most damaging and counter-productive reform in 40 years as US education slips further and further down the Global Top 100. As pointed out in ‘Stretching the School Dollar’ 21, if policy makers had maintained the same overall teacher-to-student ratio since the 1970’s we would need one million fewer teachers, training could be focussed on a smaller and more able population and average teacher pay would be close to $75,000 per year. Total cost of the extra million teachers $60bn/year.”
Degree qualifications per se do not guarantee superior outcomes.
Providing further challenge to the new Australian regulations agreed by COAG ministers in 2008, based on a review of work in the USA by Tout,
18 http://www.act.org/newsroom/data/2010/states.html19 Ray C, Friedman JN, Hilger N, Saez E, Whitmore Schanzenbach & Yagan (2010), “How does Your Kindergarten Classroom Affect Your Earnings?” Evidence from Project STAR, NBER Working Paper No 16281, Sept 2010.20William Maloney, “Guest Commentary: A smart answer to K-12 cuts? Hike class sizes.” Denver Post, 02/20/2011.21 Hess FM & Osberg E, Eds (2010) Stretching the School Dollar: How Schools and Districts CanSave Money While Serving Students Best, Harvard Education Press, Cambridge Ma.
9
Zaslow and Berry (2005)22 and Early et al (2007)23 and (2006)24, Australian researchers Warren and Haisken-DeNew (2013)25 noted that:
“There is no conclusive evidence that a teacher with a Bachelor degree or any other specific level of qualification will ensure a high quality pre-school classroom or better cognitive outcomes.”
Bogard, Traylor and Takanishi (2008)26 supported this observation and concluded that:
“Recent studies do not find consistent relationships between teacher degree, degree major, certification and PK (pre-Kindergarten) outcomes” raising questions about the impact of the degrees and certifications of PK teachers on children’s learning. Bogard et al noted that these findings did not support the conclusion that teacher education does not matter for children’s learning but failed to provide specific directions for policymakers who decide on the minimum requirements for teacher qualifications in PK programs.” The researchers further remarked that “these findings raise issues for researchers and policymakers about whether PK is part of a K-12 educational continuum, how teachers are prepared to teach, how research is designed to inform policy, and the importance of developmental science in policy-relevant education research.” They suggested that professional PK education combined with extensive classroom experience was the desirable course of action in the PK education environment.
Rivkin, Hanushek & Kain (2005), were able to look at teacher effectiveness with data that enabled them to relate individual students to individual teachers. This process produced perhaps the most important finding of that project i.e. that teacher qualifications explained very little of the variance in teacher effectiveness.27 This finding would have come as no surprise to Australian researcher Leigh (2014) who found similar results ina recent large Australian study reported elsewhere in this paper.
Whitehurst (2014), a Brookings scholar, and arguably foremost spokesperson on early childhood education in the US in his recent testimony to the US Congress House Committee on Education and the Workforce made his position very clear:
22 Tout K, Zaslow M, Berry D (2005) Quality and Qualifications: Links between professional development and quality in early care and educational settings. In M. Zaslow, I Martinez-Bek (Eds), Critical issues in early childhood professional development, 77-110, Baltimore: BrookesPublishing.23 Early, D. M., Maxwell, K. L., Burchinal, M., Bender, R. H., Ebanks, C., Henry, G. T., et al.(2007). Teachers’ education, classroom quality, and young children’s academic skills: Results from seven studies of preschool programs., Child Development, 78 (2) 558-58024 Early, D.M., Bryant, D. M., Pianta, R. C., Clifford, R. M., Burchinal, M. R., Ritchie, S., et al. (2006). Are teachers’ education, major, and credentials related to classroom quality and children’s academic gains in pre-kindergarten?Early Childhood Research Quarterly - 21,174–19525Warren D & Haisken-DeNew J P, “Early Bird Catches the Worm: The Causal Impact of Pre-school Participation and Teacher Qualifications on Year 3 National NAPLAN Cognitive Tests”, 2013, Melbourne Institute Working Paper Series, Working paper No.34/13,26 Bogard K, Traylor F, Takanishi R (2008) Teacher education and PK outcomes: Are we asking theright questions?, Early Childhood Quarterly 23, 1-6.27 Rivkin SG, Hanushek EA & Kain JF (2005) “Teachers, Schools and Academic Achievement, Econometrica 73 (2) 417-458, 2005.
10
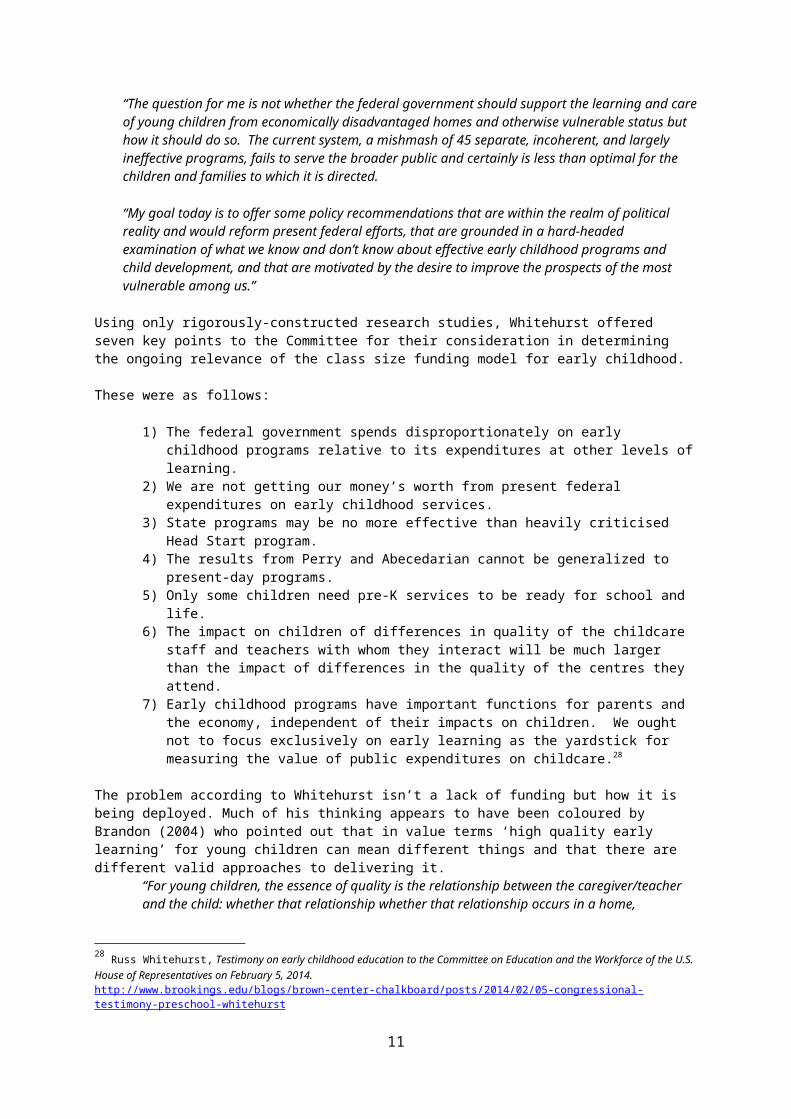
“The question for me is not whether the federal government should support the learning and careof young children from economically disadvantaged homes and otherwise vulnerable status but how it should do so. The current system, a mishmash of 45 separate, incoherent, and largely ineffective programs, fails to serve the broader public and certainly is less than optimal for the children and families to which it is directed.
“My goal today is to offer some policy recommendations that are within the realm of political reality and would reform present federal efforts, that are grounded in a hard-headed examination of what we know and don’t know about effective early childhood programs and child development, and that are motivated by the desire to improve the prospects of the most vulnerable among us.”
Using only rigorously-constructed research studies, Whitehurst offered seven key points to the Committee for their consideration in determining the ongoing relevance of the class size funding model for early childhood.
These were as follows:
1) The federal government spends disproportionately on early childhood programs relative to its expenditures at other levels oflearning.
2) We are not getting our money’s worth from present federal expenditures on early childhood services.
3) State programs may be no more effective than heavily criticised Head Start program.
4) The results from Perry and Abecedarian cannot be generalized to present-day programs.
5) Only some children need pre-K services to be ready for school and life.
6) The impact on children of differences in quality of the childcare staff and teachers with whom they interact will be much larger than the impact of differences in the quality of the centres they attend.
7) Early childhood programs have important functions for parents and the economy, independent of their impacts on children. We ought not to focus exclusively on early learning as the yardstick for measuring the value of public expenditures on childcare.28
The problem according to Whitehurst isn’t a lack of funding but how it is being deployed. Much of his thinking appears to have been coloured by Brandon (2004) who pointed out that in value terms ‘high quality early learning’ for young children can mean different things and that there are different valid approaches to delivering it.
“For young children, the essence of quality is the relationship between the caregiver/teacher and the child: whether that relationship whether that relationship occurs in a home,
28 Russ Whitehurst, Testimony on early childhood education to the Committee on Education and the Workforce of the U.S. House of Representatives on February 5, 2014. http://www.brookings.edu/blogs/brown-center-chalkboard/posts/2014/02/05-congressional-testimony-preschool-whitehurst
11
community based center or school environment is less important…The key issue for this paperregarding financing is what the different potential approaches imply for costs”.
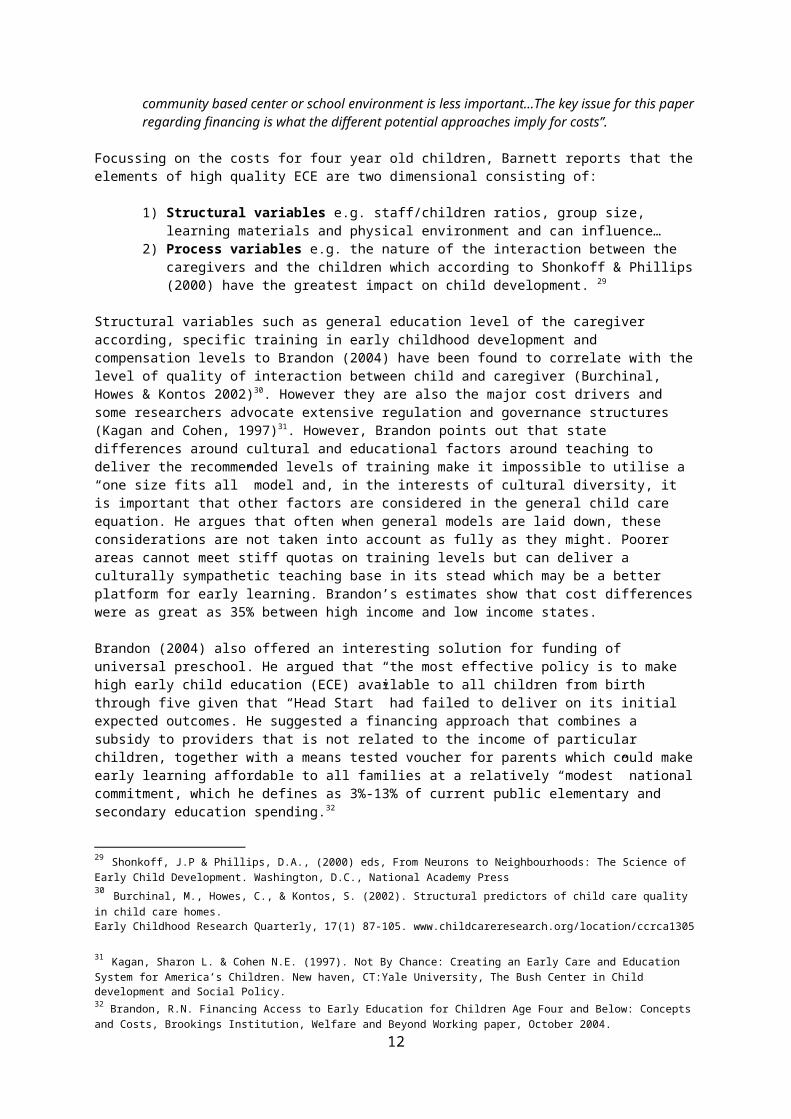
Focussing on the costs for four year old children, Barnett reports that theelements of high quality ECE are two dimensional consisting of:
1) Structural variables e.g. staff/children ratios, group size, learning materials and physical environment and can influence…
2) Process variables e.g. the nature of the interaction between the caregivers and the children which according to Shonkoff & Phillips(2000) have the greatest impact on child development. 29
Structural variables such as general education level of the caregiver according, specific training in early childhood development and compensation levels to Brandon (2004) have been found to correlate with thelevel of quality of interaction between child and caregiver (Burchinal, Howes & Kontos 2002)30. However they are also the major cost drivers and some researchers advocate extensive regulation and governance structures (Kagan and Cohen, 1997)31. However, Brandon points out that state differences around cultural and educational factors around teaching to deliver the recommended levels of training make it impossible to utilise a “one size fits all” model and, in the interests of cultural diversity, it is important that other factors are considered in the general child care equation. He argues that often when general models are laid down, these considerations are not taken into account as fully as they might. Poorer areas cannot meet stiff quotas on training levels but can deliver a culturally sympathetic teaching base in its stead which may be a better platform for early learning. Brandon’s estimates show that cost differenceswere as great as 35% between high income and low income states.
Brandon (2004) also offered an interesting solution for funding of universal preschool. He argued that “the most effective policy is to make high early child education (ECE) available to all children from birth through five given that “Head Start” had failed to deliver on its initial expected outcomes. He suggested a financing approach that combines a subsidy to providers that is not related to the income of particular children, together with a means tested voucher for parents which could makeearly learning affordable to all families at a relatively “modest” nationalcommitment, which he defines as 3%-13% of current public elementary and secondary education spending.32
29 Shonkoff, J.P & Phillips, D.A., (2000) eds, From Neurons to Neighbourhoods: The Science of Early Child Development. Washington, D.C., National Academy Press30 Burchinal, M., Howes, C., & Kontos, S. (2002). Structural predictors of child care quality in child care homes. Early Childhood Research Quarterly, 17(1) 87-105. www.childcareresearch.org/location/ccrca1305
31 Kagan, Sharon L. & Cohen N.E. (1997). Not By Chance: Creating an Early Care and Education System for America’s Children. New haven, CT:Yale University, The Bush Center in Child development and Social Policy.32 Brandon, R.N. Financing Access to Early Education for Children Age Four and Below: Concepts and Costs, Brookings Institution, Welfare and Beyond Working paper, October 2004.
12
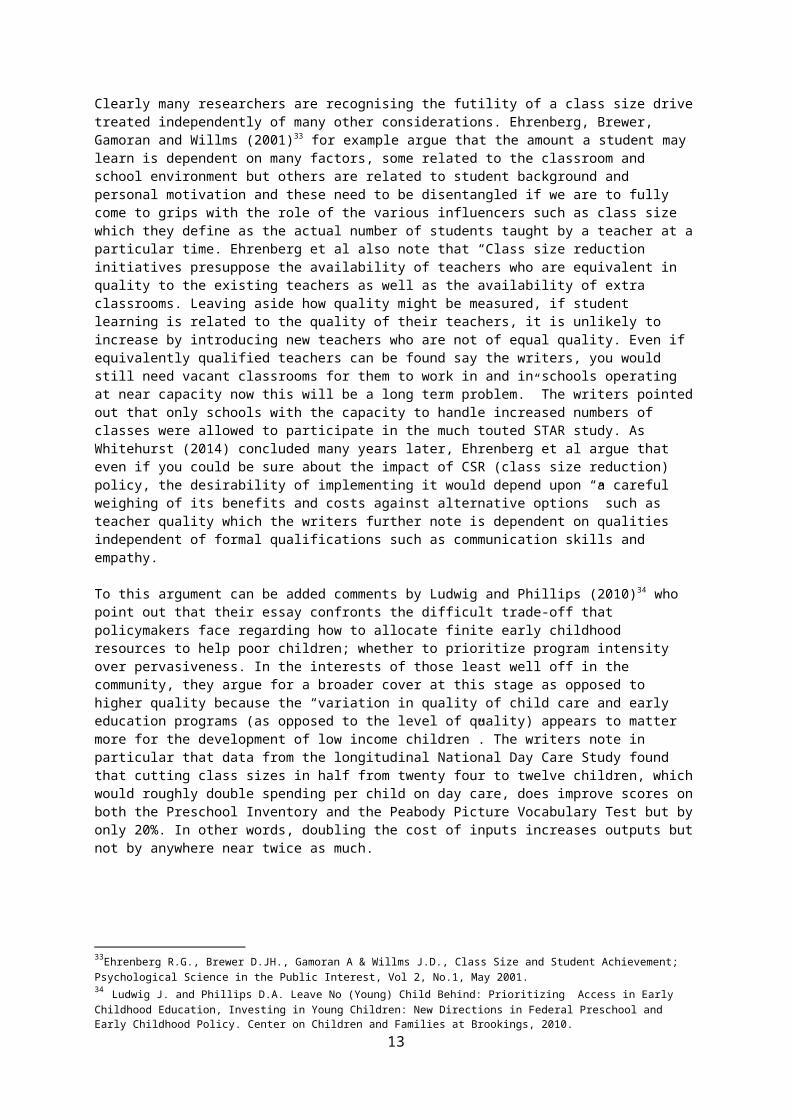
Clearly many researchers are recognising the futility of a class size drivetreated independently of many other considerations. Ehrenberg, Brewer, Gamoran and Willms (2001)33 for example argue that the amount a student may learn is dependent on many factors, some related to the classroom and school environment but others are related to student background and personal motivation and these need to be disentangled if we are to fully come to grips with the role of the various influencers such as class size which they define as the actual number of students taught by a teacher at aparticular time. Ehrenberg et al also note that “Class size reduction initiatives presuppose the availability of teachers who are equivalent in quality to the existing teachers as well as the availability of extra classrooms. Leaving aside how quality might be measured, if student learning is related to the quality of their teachers, it is unlikely to increase by introducing new teachers who are not of equal quality. Even if equivalently qualified teachers can be found say the writers, you would still need vacant classrooms for them to work in and in schools operating at near capacity now this will be a long term problem.” The writers pointedout that only schools with the capacity to handle increased numbers of classes were allowed to participate in the much touted STAR study. As Whitehurst (2014) concluded many years later, Ehrenberg et al argue that even if you could be sure about the impact of CSR (class size reduction) policy, the desirability of implementing it would depend upon “a careful weighing of its benefits and costs against alternative options” such as teacher quality which the writers further note is dependent on qualities independent of formal qualifications such as communication skills and empathy.
To this argument can be added comments by Ludwig and Phillips (2010)34 who point out that their essay confronts the difficult trade-off that policymakers face regarding how to allocate finite early childhood resources to help poor children; whether to prioritize program intensity over pervasiveness. In the interests of those least well off in the community, they argue for a broader cover at this stage as opposed to higher quality because the “variation in quality of child care and early education programs (as opposed to the level of quality) appears to matter more for the development of low income children”. The writers note in particular that data from the longitudinal National Day Care Study found that cutting class sizes in half from twenty four to twelve children, whichwould roughly double spending per child on day care, does improve scores onboth the Preschool Inventory and the Peabody Picture Vocabulary Test but byonly 20%. In other words, doubling the cost of inputs increases outputs butnot by anywhere near twice as much.
33Ehrenberg R.G., Brewer D.JH., Gamoran A & Willms J.D., Class Size and Student Achievement; Psychological Science in the Public Interest, Vol 2, No.1, May 2001.34 Ludwig J. and Phillips D.A. Leave No (Young) Child Behind: Prioritizing Access in Early Childhood Education, Investing in Young Children: New Directions in Federal Preschool and Early Childhood Policy. Center on Children and Families at Brookings, 2010.
13

Mashburn, Pianta et al (2008)35 concluded that the quality of interactions i.e. emotional supportive teachers (rather than academic content of interactions) in pre-kindergarten programs for four year olds plays a key role in accounting for gains in children’s development when compared to typical quality indicators such as teachers education, class size and child-to-teacher ratio. In other words those non-academic attributes raisedby Ehrenberg et al (2001) and Brandon (2004).
Barnett, Schulman and Shore (2004)36 noted that although much had been written about class size, there were still a large number of critical questions which must be addressed before a definitive program can be set inplace; notwithstanding that these writers promote class size as an important factor in successful early learning and development i.e.
1) Are there threshold levels at which lowering class size has a particularly large effect or at which the effect has little impact?
2) What are the costs of reducing class size from specific high levels to lower levels?
3) What types of training help teachers take full advantage of smaller classes and resultant increased opportunities for interaction with their students?
4) Are there important interdependencies – for example are gains fromincreasing teacher quality much larger with small classes?
5) When it is not feasible to reduce class sizes to desired level (e.g. no ability to expand the pre-school) are there any other steps that can be taken to compensate?
6) Do class size effects differ depending upon age of pre-schoolers, private or state run kindergarten or any other aspect of preschoolchild care?
This paper suggests that these issues have yet to be addressed definitivelyin Australia as well, notwithstanding the dogma building around class size and teacher quality.
Class Size Ratio Research in Australia
It should first be pointed out that class size ratios are not staff to student ratios and that this difference needs to be taken into account whenlooking at the data presented. Class size refers to the number of children in a class being taught at a given time whereas staff student ratios refer to the number of staff involved with the teaching of a particular class.
Clearly many international researchers are now recognising the futility of an “all or nothing” class size crusade. Nevertheless, for the past ten
35 Mashburn, AJ, Pianta, RC, Hamre, BK, and Downer, JT (University of Virginia), Barbarin, OA, Bryant, D, Birchinal, M, and Early, DM (University of North Carolina) and Howes, C. (UCLA). Measures of Classroom Quality in Pre-Kindergarten and Children’s Development of Academic, Language and Social Skills; Child Development, Vol 79, Issue 3 (May/June 2008)36 Barnett W. Steven, Schulman Karen & Shore Rima, Class Size: What’s the Best Fit? Preschool Policy Matter, Issue 9/December 2004 , National Institute for Early Education Research (NIEE)
14
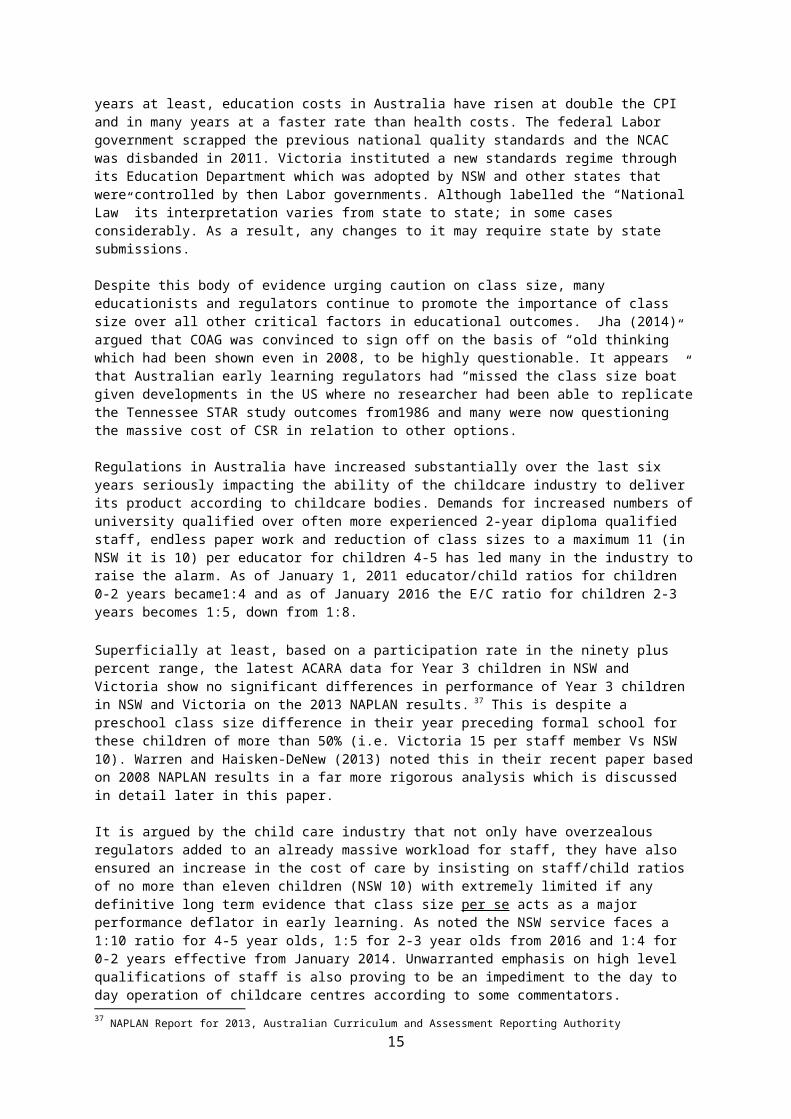
years at least, education costs in Australia have risen at double the CPI and in many years at a faster rate than health costs. The federal Labor government scrapped the previous national quality standards and the NCAC was disbanded in 2011. Victoria instituted a new standards regime through its Education Department which was adopted by NSW and other states that were controlled by then Labor governments. Although labelled the “National Law” its interpretation varies from state to state; in some cases considerably. As a result, any changes to it may require state by state submissions.
Despite this body of evidence urging caution on class size, many educationists and regulators continue to promote the importance of class size over all other critical factors in educational outcomes. Jha (2014) argued that COAG was convinced to sign off on the basis of “old thinking” which had been shown even in 2008, to be highly questionable. It appears that Australian early learning regulators had “missed the class size boat” given developments in the US where no researcher had been able to replicatethe Tennessee STAR study outcomes from1986 and many were now questioning the massive cost of CSR in relation to other options.
Regulations in Australia have increased substantially over the last six years seriously impacting the ability of the childcare industry to deliver its product according to childcare bodies. Demands for increased numbers ofuniversity qualified over often more experienced 2-year diploma qualified staff, endless paper work and reduction of class sizes to a maximum 11 (in NSW it is 10) per educator for children 4-5 has led many in the industry toraise the alarm. As of January 1, 2011 educator/child ratios for children 0-2 years became1:4 and as of January 2016 the E/C ratio for children 2-3 years becomes 1:5, down from 1:8. Superficially at least, based on a participation rate in the ninety plus percent range, the latest ACARA data for Year 3 children in NSW and Victoria show no significant differences in performance of Year 3 children in NSW and Victoria on the 2013 NAPLAN results. 37 This is despite a preschool class size difference in their year preceding formal school for these children of more than 50% (i.e. Victoria 15 per staff member Vs NSW 10). Warren and Haisken-DeNew (2013) noted this in their recent paper basedon 2008 NAPLAN results in a far more rigorous analysis which is discussed in detail later in this paper.
It is argued by the child care industry that not only have overzealous regulators added to an already massive workload for staff, they have also ensured an increase in the cost of care by insisting on staff/child ratios of no more than eleven children (NSW 10) with extremely limited if any definitive long term evidence that class size per se acts as a major performance deflator in early learning. As noted the NSW service faces a 1:10 ratio for 4-5 year olds, 1:5 for 2-3 year olds from 2016 and 1:4 for 0-2 years effective from January 2014. Unwarranted emphasis on high level qualifications of staff is also proving to be an impediment to the day to day operation of childcare centres according to some commentators. 37 NAPLAN Report for 2013, Australian Curriculum and Assessment Reporting Authority
15
Hundreds of pages of New Regulations and Guidelines Introduced
The new “National Law” and its accompanying enforcement regime some argue has left many early childhood practitioners unclear as to what is required,how it might be achieved and whether in fact it is even do-able. The incoming federal coalition government appears to have recognised the potential unintended consequences of the many hundreds of additional pages of regulation enacted since 2008, not only from comments made by the new federal Minister for Education, but also in the remarks made by the Prime Minister when he launched his first “Red Tape Removal Day” in the Federal Parliament earlier this year. Prime Minster Abbott noted that Australia ranked 128th in the world in terms of ease of navigation of regulations, right there between Romania and Angola and singled out childcare services as a prime example asking:
“Why should a long day-care centre with 15 staff and 75 places have to do paper work said to cost on average, $140,000 per year which is $2000 per child or $10,000 per staff member?”
Based on this and other examples, the Prime Minister indicated that he was “not surprised” that Australia’s competitiveness ranking had slipped six places in the last four years.
Latest Australian Research on Early Learning and Class Size.
It would therefore appear that absent strong supportive evidence together with a changing world view, Australian regulators may have burdened local childcare and early learning practitioners unnecessarily with a substantialincrease in costs which will need to be passed onto families at a time whenthey are suffering massive cost of living pressure. Immediately prior to the 2013 federal election, our research arm Australian Opinion Research38, conducted a major political and social survey based on a national sample of5,360 voters. That survey identified cost of living pressures as the numberone election issue singling out energy costs as one of the major culprits. Health and education are clearly the others. The Australian newspaper on April 23, 2014 carried a page one article by Economics Editor David Uren pointing out that new data from Canberra University’s National Institute for Social and Economic Modelling shows wages have been falling well behindcosts for a while in particular structural costs such as energy, health andeducation;39 and work by The Institute for 21st Century Problem Solving (2013) indicates that it is families who are usually hardest hit by these effects.40
More research is now emerging in Australia which supports the original caseby Buckingham (2003) urging caution with regard to the class size mantra and this data is challenging the assumptions behind that present highly regulated and heavily policed approach.38 www.australianopinionresearch.info39 The Australian, “Aussies doing it hard as prices outstrip pay” p1, April 23, 2014, Uren D.40 “Gonski Futures -…” http://www.checkmateanalytics.com/institute-for-21st-century-problem-solving/
16
A ground-breaking study by two researchers at the Melbourne Institute (partof the faculty of Business and Economics at Melbourne University)41 was recently released based on solid longitudinal survey data together with a comprehensive review of the more rigorous research that has been undertakenin the last twenty years. The strength of this study unlike Leigh (2014) isthat it has been able to control for most if not all of the external effects suggested by Leigh for which he was unable to test for due to lack of available ancillary data. Warren and Haisken-DeNew (2013) using data from the Growing up in Australia longitudinal research project were able to provide strong evidence for the following conclusions:
1) Children who attended a child care facility in the year prior to kindergarten (formal schooling), performed significantly better than those who do not on Year 3 NAPLAN tests.
2) Trained teachers delivered better results than untrained or minimallytrained teachers on that same benchmark.
3) Teachers trained specifically in child care subject material achievedbetter outcomes than formally trained teachers without that specific training.
4) Degree trained teachers performed no better and in some subjects significantly less well than diploma trained teachers when both had been trained specifically in child care.
These findings are strong evidence that the average 3-4 year PK degree trained teacher is not delivering superior outcomes to a 2 year PK diploma trained teacher in relation to Year 3 NAPLAN scores. It should also kept inmind that cost of training is likely to be appreciably different between a two year diploma course practitioner and a four year degree practitioner which is likely to be of interest to all stakeholders.
The fourth point above is in agreement with Leigh’s (2014) revisitation ofhis earlier writings on teaching effectiveness (2008). His paper is basedon 10,000 Queensland primary school teachers and 90,000 children in years3, 5 and 7 and subsequent test results i.e. that teacher experience ispositively correlated with teacher effectiveness, but Leigh found nopositive effect for teacher qualifications on test scores.Unfortunately, most of the differences between teachers according to Leighare the result of factors not captured in the payroll database he had athis disposal. This was not a problem in the Melbourne Institute project.42
41 Warren D & Haisken-DeNew J P, “Early Bird Catches the Worm: The Causal Impact of Pre-school Participation and Teacher Qualifications on Year 3 National NAPLAN Cognitive Tests”, 2013, Melbourne Institute Working Paper Series, Working paper No.34/13, see http://melbourneinstitute.com/downloads/conferences/LEW2013/LEW2013_papers/WarrenDiana_LEW2013.pdf
42 Leigh A, “Estimating Teacher Effectiveness from Two Changes in Students Test Scores”, Forthcoming Economics of Education Review 2014. http://andrewleigh.org/pdf/TQPanel.pdf &
17
The Melbourne Institute Study of Warren and Haisken-DeNew (2013) relied on data from the Longitudinal Study of Australian Children (LSAC)43 conducted in 2004 and 2008 respectively and matching the details of more than 2,229 children across Australia from all walks of life and across most if not allareas of advantage and disadvantage. This is particularly important becausemany previous studies (local and international) related to specific cohortsand as such the value of early learning could not be generalised confidently to all children. Even the supposed gold standard STAR study wasconfined to the state of Tennessee, one of the poorest and least core competent in the USA according to recent data.
Warren and Haisken-DeNew based their study on children who turned 4 or 5 and were not at school in 2004 but in 2008 had completed all five NAPLAN tests at which time NCAC rated 98% of Australian child care centres as HighQuality based on varying ratios of 1:10 in NSW, 1:11 in Queensland and 1:15in Victoria. No breakdowns were available as to whether any differences in class size impacted the 98% result but class size was not demonstrated as having any significant impact on outcomes.
From an initial nationally representative cross section of approximately 5,000 children targeted, full pre and post data sets were achieved for 2,229 of them. Although slightly less than half of the original sample pool, the sample is sufficiently large for the researchers to make a numberof significant determinations, after accounting for potential confounding effects. The study goes to great lengths to control for intervening variables that could be offered as alternative explanations for the outcomes achieved. In our view, the researchers appeared to leave “no stoneunturned” in the desire to address all possible areas of contention.
Leigh, A., & Ryan, C. (2008). How and Why has Teacher Quality Changed in Australia? AustralianEconomic Review, (2), 141-159. 43http://www.aifs.gov.au/growingup/
18
Conclusion
Despite a growing body of evidence that class size is by no means the most efficient method of delivering improved educational outcomes and that degree graduates have no better results than two-year diploma qualified graduates, educational authorities have thus far continued to mandate lowerclass ratios and higher quotas of degree-qualified teachers within child care centres commensurate with their size.
Historically degree graduates have chosen not to work in early learning butrecently have joined an estimated 56,000 unemployed teachers in NSW and Queensland waiting for a job with the Education Department. In NSW, for many years, there remains a shortage of early-learning degree graduates which has been reported to be of the order of 400 or more. The result of this apparent shortage of graduates to take up additional positions in childcare as mandated by new regulation is to leave employers in a positionwhere they cannot fulfil mandated requirements because they have no applicants to fulfil them. This is an untenable situation.
The final word is left to Brookings scholar and Brown Centre on Education Policy, Russ Whitehurst (2014) in a recent blog entitled “More Dubious Pre-K Science. In it he points out that the US President’s pronouncements on the Georgia program were incorrect and that no statistically significant relationship between class size and academic achievement had been demonstrated in either of the two studies conducted. Whitehurst says:
“Both these studies are careful econometric analyses, but their methods fall far short of providing the confidence in causal conclusions that could be expected from a well-designed and implemented randomised trial.“The problem of non-equivalent groups in Regression Discontinuity Design studies is exacerbated in the Georgia Study by wildly differing parental consent rates” recorded as 77% in the control group and 30% in the treatment group.44
It would appear that in 2008, state leaders had signed off on a decades-oldAmerican initiative which according to a number of researchers cited in this paper may be effective for disadvantaged children and children with disabilities but has failed to demonstrate to any significant degree changed outcomes in the general classroom except for a dramatic increase incosts.
With evidence mounting that class size has at best a tenuous relationship with academic outcomes in the general population and the massive pressure being placed on the industry to increase the quota of degree- qualified as opposed to diploma- qualified educators, future independent research is required to provide a way forward for childcare practitioners, in order to advise and inform regulators governments and parents as to latest evidence
44 Whitehurst GJ “More Dubious Pre-K Science, The Brown Center Chalkboard, April 2, 2014. http://www.brookings.edu/blogs/brown-center-chalkboard/posts/2014/04/02-dubious-prek-science-whitehurst
19
in the production of an optimum model for management and regulation of the early learning industry. The approach taken must realistically reflect the general consensus among educational researchers based on action which worksto the benefit of parents and children, as well as meeting the needs of practitioners and government in terms of cost savings and educational outcomes. Further work around the Warren & Haisken-DeNew analysis of the “Growing up in Australia” longitudinal dataset may be a very useful starting point and it is likely that the information required will reside in it somewhere. This we see as a most useful starting point for the next level of inquiry into this important issue.
It might also be argued that high quality diploma trained childcare practitioners with substantial experience could lose out to recent inexperienced university graduates (without any direct early learning training) merely in order that childcare centres meet 2014 NQF mandates; anunintended consequence about which no legislator or educationist would feelcomfortable.
Background on Richard Wilson
Richard Wilson is a social psychologist with 30 years’ experience in marketing, communications and social and political research. Wilson pioneered lifestyle research and market segmentation in Australia. During the 1980’s he launched Australia’s first farmer research panel providing ongoing statistics on all aspects of agriculture from the primary producer’s perspective. In the 90’s he created the MLI system linking media, social opinion and markets in a way that had not previously been done in Australia. This was the first major single source survey in Australia
In more recent years however, Richard Wilson has focussed on the not for profit sector and is involved in exploring opportunities for communities, educational institutions, health care organisations and local businesses towork efficiently for the benefit of their constituencies.
His interest in education stems from a belief that although the education sector knows how to teach they are not quite as good at promoting the education message (needs and goals) to the wider community as well as to key decision makers and stakeholders.
20

Two young children moving though the school system has given Rick a strong interest in where teaching and learning are headed and given the direction of education in much of the Western world centred on straight line thinkingand simplistic notions of educational success, he is anxious to ensure thatAustralia does not follow the same disastrous paths as other nations. The challenges of the century are vast and without a population capable of critical thinking who is able to hold its elected representatives and thoseso-called “experts and advisors” behind modern educational policy to account, we are destined for a second class existence in two generations.
Rick’s voluntary work extends across education, professional associations and local community representative bodies dealing with business and government at all levels. In recent years as well as being involved in his children’s school P&F bodies, Rick has been a member of the executive committee for the NSW Parents Council, the peak body representing parents of children at NSW independent schools, Vice President of NSW Parents Council and NSW Representative on the Australian Parents Council. He has also been a member of the Sydney Branch Executive of the Australian Psychological Society. Insofar as local government matters are concerned Rick has been a member of the Maroubra Precinct Committee as well as Secretary of that resident body. He has also sat on the Combined Randwick Precinct Committee which liaised with Randwick Council and the State Government on matters related to roads, development and community services.
A consultant and advisor to political leaders, educational bodies and not for profits as well as mainstream corporations, Rick continues to offer hisunique perspective on the nature of human action in the 21st century. His vision remains for a world where organisations through a sharper understanding of people, politics and media deliver a vastly superior levelof “social good” thereby ensuring success beyond their wildest imagination.
Rick also continues to be a dedicated member of The Australian Psychological Society, ESOMAR, the Australian Market and Social Research Society and the Society of Australasian Social Psychologists and other voluntary bodies.
21