Chemsearch Journal Volume 4 Number 1, June, 2013
11
CSJ 9(1): June, 2018 ISSN: 2276 – 707X Shaibu and Audu 65 Physico-chemical and Metal Impurity Assessment of Some Brands of Ciprofloxacin Hydrochloride Tablets Marketed in Kano Metropolis, Nigeria ⃰ Shaibu, A. N. and Audu, A. A. Department of Pure and Industrial Chemistry, Bayero University, P. M. B. 3011, Kano, Nigeria Email: [email protected] ABSTRACT This research was carried out to assess the quality and compare the physico-chemical equivalence of twenty samples of ciprofloxacin hydrochloride tablets marketed in Kano metropolis using standard analytical methods. The physico-chemical and chemical equivalence were assessed through the evaluation of uniformity of weight, disintegration test, friability test, assay for percentage concentration, metal impurities, pH and ionic strength. The product assay was carried out using UV/Visible spectrophotometric method while atomic absorption spectrophotometer was used to determine the possible metal impurities. All the samples complied with the official specifications for uniformity of weight, friability test while one sample failed the disintegration test of 15mins. Eighteen samples conformed to specifications 90% - 110% w/w of stated amount, one sample was above the limit, 111.66+0.57% w/w, while another sample was below the limit, 87.65+0.70 w/w. Eighteen of the samples evaluated in this study could be regarded as being physico-chemically and chemically equivalent while two samples could be regarded as substandard and fake product. All the samples have the metal impurities within official specifications except for one which has high concentration of lead. Keywords: Ciprofloxacin tablet, counterfeit, fake drug, physic-chemical and UV Spectrophotometer INTRODUCTION The World Health Organization (WHO) at the International Conference of Primary Health Care, Alma Ata 1973, identified the supply of good quality essential drugs as one of the basic pre- requisites for the delivery of health care and thus promulgated the WHO certification scheme on the quality of pharmaceutical products in international commerce. Some 128 countries participated in the WHO certification scheme, yet fake, adulterated and sub-standard drugs are exported from manufacturing countries into the non- manufacturing developing countries because of the conditions of sales. It was in view of this fact that World Health Organization (WHO) issued guidelines for global standard and requirements for the registration, assessment, marketing authorization, and quality control of generic pharmaceutical products (WHO, 1996, 2005). The quality of these drugs and the threat of counterfeit pharmaceuticals have been largely ignored (Shakoor et al., 1997). There is mounting evidence that counterfeit pharmaceuticals pose a serious threat to public health, especially in developing countries (Pecoul et al., 199). Pharmaceutical counterfeiting is a pervasive problem, impacting nations of every description (Aluba 1994, Graviela, 2001). There are many reports of the availability of counterfeited medicines, not only in developing countries but also in Europe and USA (Shakoor et al., 1997).Indication shows that there are substandard drugs circulating in the market in different developing countries, widely reported in Africa, Asia and Latin America (Shakoor et al., 1997).Antibiotics are the most frequently used, misused, abused and counterfeited class of drugs worldwide (Global Forum, 2002). The presence of substandard antibiotics in various parts of Nigeria as reported by some authors includes tetracycline capsules and ampicillin oral suspension (Aluba, 1994). This contributed to the problem of increasing resistance among previously sensitive bacterial species to common antimicrobial agents in Nigeria (Philip et al., 2005). The most common and widely spread dangers associated with the use of substandard antibiotics are waste of resources, microbial resistance and the complication of diseases (Oliphant and Green, 2002). Ciprofloxacin developed by Bayer in 1981, is the first oral antimicrobial drug with broad spectrum activity for treating severe infections caused by both gram-negative and gram-positive bacteria including pseudomonas spp. and staphylococcus spp. (Nayaz et al., 2013). It is one of the 4- quinolone carboxylic acid derivatives as drug for its chemical activity. It is relatively non- toxic, well tolerated and has proven especially ChemSearch Journal 9(1): 65 – 75, June, 2018 Publication of Chemical Society of Nigeria, Kano Chapter Received: 07/03/2018 Accepted: 25/05/2018 C.S.N C H E M I C A L S O C I E T Y O F N I G E R I A
-
Upload
khangminh22 -
Category
Documents
-
view
3 -
download
0
Transcript of Chemsearch Journal Volume 4 Number 1, June, 2013

CSJ 9(1): June, 2018 ISSN: 2276 – 707X Shaibu and Audu
65
Physico-chemical and Metal Impurity Assessment of Some Brands of
Ciprofloxacin Hydrochloride Tablets Marketed in Kano Metropolis,
Nigeria
Shaibu, A. N. and Audu, A. A. Department of Pure and Industrial Chemistry, Bayero University, P. M. B. 3011, Kano, Nigeria
Email: [email protected]
ABSTRACT This research was carried out to assess the quality and compare the physico-chemical equivalence of twenty
samples of ciprofloxacin hydrochloride tablets marketed in Kano metropolis using standard analytical methods.
The physico-chemical and chemical equivalence were assessed through the evaluation of uniformity of weight,
disintegration test, friability test, assay for percentage concentration, metal impurities, pH and ionic strength.
The product assay was carried out using UV/Visible spectrophotometric method while atomic absorption
spectrophotometer was used to determine the possible metal impurities. All the samples complied with the
official specifications for uniformity of weight, friability test while one sample failed the disintegration test of
15mins. Eighteen samples conformed to specifications 90% - 110% w/w of stated amount, one sample was
above the limit, 111.66+0.57% w/w, while another sample was below the limit, 87.65+0.70 w/w. Eighteen of
the samples evaluated in this study could be regarded as being physico-chemically and chemically equivalent
while two samples could be regarded as substandard and fake product. All the samples have the metal impurities
within official specifications except for one which has high concentration of lead.
Keywords: Ciprofloxacin tablet, counterfeit, fake drug, physic-chemical and UV Spectrophotometer
INTRODUCTION
The World Health Organization (WHO) at
the International Conference of Primary Health
Care, Alma Ata 1973, identified the supply of good
quality essential drugs as one of the basic pre-
requisites for the delivery of health care and thus
promulgated the WHO certification scheme on the
quality of pharmaceutical products in international
commerce. Some 128 countries participated in the
WHO certification scheme, yet fake, adulterated
and sub-standard drugs are exported from
manufacturing countries into the non-
manufacturing developing countries because of the
conditions of sales. It was in view of this fact that
World Health Organization (WHO) issued
guidelines for global standard and requirements for
the registration, assessment, marketing
authorization, and quality control of generic
pharmaceutical products (WHO, 1996, 2005). The
quality of these drugs and the threat of counterfeit
pharmaceuticals have been largely ignored
(Shakoor et al., 1997). There is mounting evidence
that counterfeit pharmaceuticals pose a serious
threat to public health, especially in developing
countries (Pecoul et al., 199).
Pharmaceutical counterfeiting is a
pervasive problem, impacting nations of every
description (Aluba 1994, Graviela, 2001). There
are many reports of the availability of counterfeited
medicines, not only in developing countries but
also in Europe and USA (Shakoor et al.,
1997).Indication shows that there are substandard
drugs circulating in the market in different
developing countries, widely reported in Africa,
Asia and Latin America (Shakoor et al.,
1997).Antibiotics are the most frequently used,
misused, abused and counterfeited class of drugs
worldwide (Global Forum, 2002). The presence of
substandard antibiotics in various parts of Nigeria
as reported by some authors includes tetracycline
capsules and ampicillin oral suspension (Aluba,
1994). This contributed to the problem of
increasing resistance among previously sensitive
bacterial species to common antimicrobial agents
in Nigeria (Philip et al., 2005). The most common
and widely spread dangers associated with the use
of substandard antibiotics are waste of resources,
microbial resistance and the complication of
diseases (Oliphant and Green, 2002).
Ciprofloxacin developed by Bayer in
1981, is the first oral antimicrobial drug with broad
spectrum activity for treating severe infections
caused by both gram-negative and gram-positive
bacteria including pseudomonas spp. and
staphylococcus spp. (Nayaz et al., 2013). It is one
of the 4- quinolone carboxylic acid derivatives as
drug for its chemical activity. It is relatively non-
toxic, well tolerated and has proven especially
ChemSearch Journal 9(1): 65 – 75, June, 2018 Publication of Chemical Society of Nigeria, Kano Chapter
Received: 07/03/2018 Accepted: 25/05/2018
C.S.N
CH
EM
IC
AL SOCIETY OF N
IGE
RIA

CSJ 9(1): June, 2018 ISSN: 2276 – 707X Shaibu and Audu
66
useful for oral therapy of chronic gram-negative
infections such as osteomyelitis and recurrent
cholangitis, and for acute exacerbations of
pseudomonas infection in cystic fibrosis (Shahnaz
et al., 2014). It is soluble in water, slightly soluble
in methanol, very slightly soluble in ethanol,
practically insoluble in acetone, ethyl acetate and
methylene chloride (Susmita et al., 2009). There
has been a proliferation of different brands of these
antibiotics in Nigeria, many of which are incredibly
cheap compared with ciprofloxacin by Bayer
pharmaceutical limited, hence the need for the
assessment of their quality (Philip et al., 2005).
In parts of the world, the evaluation and
assessment of different brands of Ciprofloxacin
tablet marketed were reported, (Mai, 2015, Jaman
et al., 2015, Kholoud, 2009). A good number of
assessment and evaluation of the quality of
ciprofloxacin marketed in some Africa countries
have been reported, (Getu, 2010, Mus’ab et al.,
2010, Tadesse and Shibesi, 2015). Different
authors have also undertaken various studies in the
ciprofloxacin available in the Nigerian
environment, (Ngozi et al., 2007, Bagbi et al.,
2014).
Nigeria imports a large proportion of its
pharmaceutical requirements from various regions of
the world. This has led to indiscriminate dumping of
fake, adulterated and counterfeit medicines in the
Nigerian drug market. The problems of fake,
substandard and counterfeited drugs threaten the
survival and effective functioning of the society.
Pharmaceutical tablets are composed of
number of different materials, each of which is
designed to improve performance at the targeted site.
Metallic particles (mostly heavy metals) are common
contaminants in the pharmaceutical manufacturing
process, a problem that should be addressed before
the product is released to market (Mary and Kent,
2010).
Kano drug market has about five thousand
registered pharmaceutical shops, some in Sabon –
Gari market while others are located outside the
market (NAFDAC, 2005). Drugs are distributed
from the manufacturing companies through the
medical representatives to the distributors, to the
retailers and finally to the consumers.
The aim of the research is to assess the
quality of the various brands of Ciprofloxacin
tablets sold in Kano metropolis to ascertaining their
effectiveness and establishing baseline information
on the level of substandard ciprofloxacin
hydrochloride tablets in Kano drug market.
MATERIALS AND METHODS
Cleaning of Materials
All glass wares and plastics containers
used in this work were washed with detergent,
soaked in potassium dichromate solution then
washed with tap water and finally rinsed with de
ionized water and dried in an oven at
105OC.Wooden spatula was used throughout the
work. All the salt chemicals used are of analar
grade and the nitric acid from sigma Aldrich
(specific gravity-1.42, percentage concentration-
70%).
Sample Collection
The samples selected were from three
drug producing regions of the world; Africa, Asia
and Europe. Ciprofloxacin hydrochloride tablets
were purchased from retail outlets mainly from
private pharmaceutical and drug stores in Kano.
The drug samples were obtained in their original
package as supplied by the manufacturers and
protected from direct sunlight.
Weight Uniformity
Twenty tablets of each sample were
individually weighed using an electronic analytical
balance (model APX – 100 Denver Instrument,
England). The mean tablet weight and standard
deviation were calculated.
Friability Test
The weight of 20 tablets of all the samples
was taken individually using electronic analytical
balance, model APX – 100 Denver Instrument,
England. The tablets were placed in the drum of
Erweka type TA friability testing machine. The
machine was switched on and operated at a speed
of 25 revolutions per minute for four minutes. The
tablets were dusted and their weight taken again to
ascertain the percentage friability,
Disintegration Time Test
To determine disingration time, 900cm3
distilled water was poured into a 1000cm3 capacity
beaker and then placed in the disintegration
machine, (IP STD. Tablet Disintegration Machine,
Lab Sales Cooperation, New Delhi, India). The
temperature of the machine was maintained at
37oC+0.5oC with thermostatic heater.
Six tablets of each sample were placed
into the basket rack assembly and placed into the
beaker containing the disintegration medium and
hung on the metal holder. The machine was placed
in position and the basket oscillated in an upward
and downward manner until the tablets fragmented.
The time taken for each tablet to break into
fragments was recorded and the average time
calculated.
Determination of Wavelength of Maximum
Absorption (λmax) For determination of λmax, 4.0cm3 of
5µgcm-3 solution of the ciprofloxacin
hydrochloride standard solution was taken into a
1cm quartz cell and placed in the sample
compartment of the UV/Visible spectrophotometer
(model UV 757 GRT B – BRAW Scientific
Instrument Company, England). The solution was
scanned between 200nm – 500nm wavelength to
obtain the absorption spectrum.

CSJ 9(1): June, 2018 ISSN: 2276 – 707X Shaibu and Audu
67
Preparation of Calibration curve
A 4.0cm3 standard solution of
Ciprofloxacin hydrochloride of various
concentrations were taken in quartz cell and placed
in the sample compartment of UV/Vis
spectrophotometer and the machine was set at the
obtained λmax (wavelength) of 276nm. The
absorbance of each solution (i.e.
1,2,3,4,5,6,7,8,9,10) µgcm-3 were taken in triplicate
and recorded. The average value of the absorbance
was taken and a calibration curve was plotted. A
regression equation was obtained from the plot.
The calibration curve regression equation was used
to calculate the percentage concentration of each
test sample solution.
Assay for Ciprofloxacin Hydrochloride tablet
The weight of twenty (20) tablets of each
sample was taken and average weight noted. The
weighed tablets were crushed into fine powder
using pestle and mortar.
A 0.006g of the powder was weighed and
transferred into a 1000cm3 volumetric flask. 50cm3
of water was added and shaken for 30 minutes
mechanically to attain complete dissolution. The
volume was made up to 1000cm3 mark in
volumetric flask with distilled water. The solution
was filtered and the absorbance taken at
wavelength of 276nm using UV spectrophotometer
(Adepoju, 2010).
Sample Digestion
To digest the sample, 2.00g of the
powdered ciprofloxacin hydrochloride tablet of
each sample was weighed and transferred into a
round-bottom flask. The beaker used in weighing
the powder was rinsed with 20cm3 of 5M
trioxonitrate V acid and poured into the flask.
Additional 30cm3 of the acid was transferred into
the content of the round bottom flask and refluxed
at 80oC for one hour on a thermostatically
controlled heating mantle. The solution was
allowed to cool to room temperature and made up
to 100cm3 mark with deionized water. This was
filtered with no. 42 Whatman filter paper and
stored in a clean dry plastic sample bottle. The
digested sample was aspirated into the atomic
absorption spectrophotometer (AAS, Bulk
scientific model 216VGP) at the individual metal
wavelength and the absorbance values were
recorded against a blank. Calibration curves for the
different metals were plotted from metal standard
solutions and from the result the concentrations of
metals were calculated (Alsante et al., 2004).
RESULTS AND DISCUSSION The results of the physicochemical
properties with respect to the sample weights,
disintegration time, friability and percentage
concentration for the various brands of
ciprofloxacin hydrochloride tablets analysed are
presented in Table 1.0
Table 1.0: The Physicochemical and quantitative results obtained for twenty samples of
Ciprofloxacin hydrochloride tablets. Sample Average Weight
of Tablet in
Gram + SD
Disintegration
Time (minutes) +
SD
% Friability +
SD
%Concentration+
SD
A 0.6061+0.01 5.70 + 0.01 0.23+0.00 100.93+0.01
B 0.7663+0.00 4.55 + 0.05 0.09+0.01 99.07+ 0.09
C 0.6902+0.01 16.0. + 0.55 0.30+0.00 91.84+ 0.47
D 0.9645+0.01 5.00 + 0.03 0.10 +0.01 105.59+0.24
E 0.8445+0.00 6.42 + 0.05 0.40 +0.00 111.66+0.57
F 0.7750+0.00 4.17 + 0.07 0.25+ 0.01 . 106.53+0.30
G 0.7842+0.00 3.37+ 0.11 0.22+ 0.00 102.56 +0.11
H 0.7771+0.00 1.72 + 0.20 0.01 +0.01 106.76+ 0.31
I 1.0566+0.01 2.50+ 0.16 0.05+ 0.01 103.96+0.16
J 0.6920+0.01 3.67 + 0.10 0.72+ 0.02 102.33+0.10
K 0.9392+0.01 13.12 +0.40 0.21+ 0.00 99.53 +.0.07
L 0.6599+0.01 4..25+ 0.07 0.09+ 0.01 87.65+ 0.70
M 0.9900+0.01 2.33 + 0.17 0.60+ 0.01 108.39+0.39
N 0.7840+0.00 2.08+ 0.18 0.35 +0.00 109.09+0.44
O 0.9465+0.01 5.17+ 0.02 0.38+ 0.01 98.32 + 0.13
P 0.6994+0.01 4.67+ 0.04 0.03 +0.01 99.16 + 0.09
Q 0.8996+0.00 4.37+ 0.06 0.14 +0.00 97.90 + 0.20
R 0.8718+0.00 6.92+ 0.08 0.29 +0.00 98.18 + 0.14
S 0.7814+0.00 7.78+ 0.12 0.72 +0.02 98.18 + 0.14
T 0.7985+0.00 6.00 + 0.03 0.11 + 0.01
90.44 + 0.55
BP
Limit
15.00 1.00 90.00-110.00
CSJ 9(1): June, 2018 ISSN: 2276 – 707X Shaibu and Audu
68
The wavelength of maximum absorption
(ʎmax) exhibited by the ciprofloxacin
hydrochloride standard, Fig.1.0, was an indication
that the ciprofloxacin standard was 99.80% pure,
(Adepoju, 2010). The linear plot of the calibration
curve, (Fig.2.0) indicated that ciprofloxacin obeys
Beer-Lambert law.
The uniformity of weight determination for
all the samples showed compliance with the official
specifications (BP, 2005) as none of the samples
deviated by up to 5% from their mean (Table 1.0).
This indicated that the weights of the tablets in
each batch within each sample are within the
expected official specifications.
Similarly, all the samples gave less than
1.0% w/w loss in weight with the friability test
determination and within the official limit of 1.0%
(Fig. 3.0, Table 1.0), (BP, 2005, USP, 2004). High
value of friability could result to loss of tablet
weight there by lowering the concentration of the
active ingredient (BP, 2005, USP, 2004).

CSJ 9(1): June, 2018 ISSN: 2276 – 707X Shaibu and Audu
69
Fig. 3.0: Bar Chart of Mean Friability of Samples
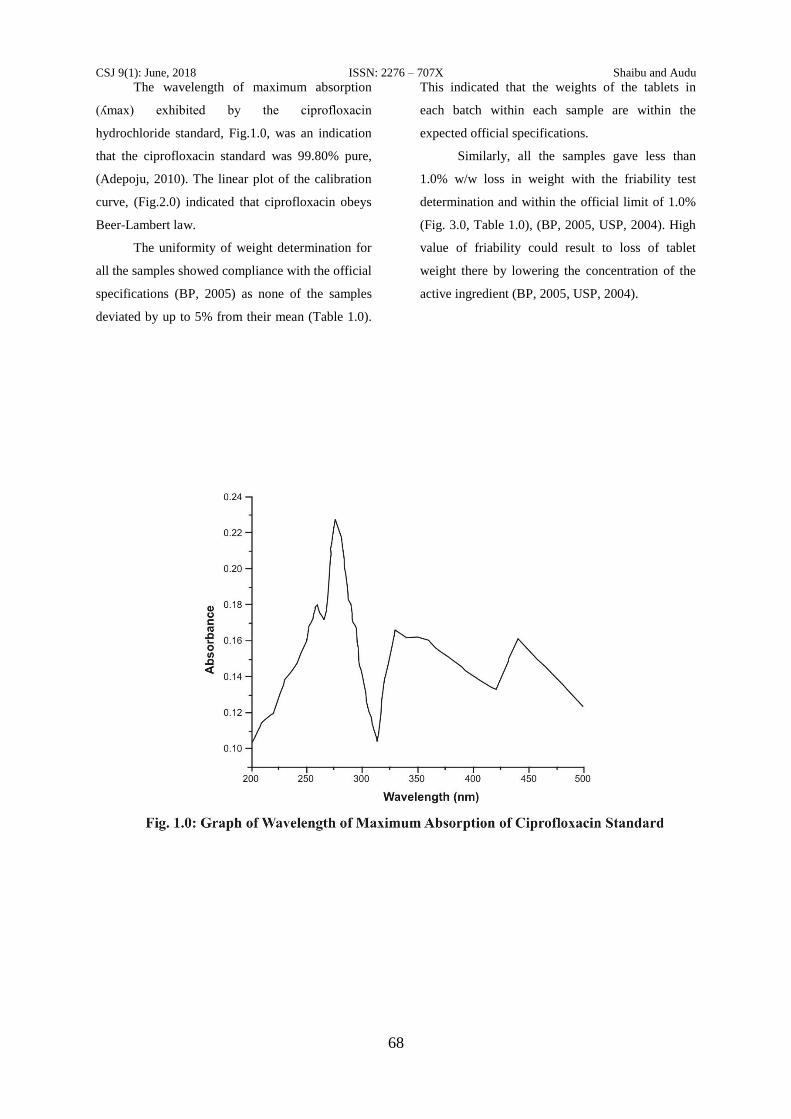
All the samples passed the disintegration
time test except sample C (Fig. 4.0) which fall
outside the official limit of 15 minutes. This may
be due to excess binder and pressure applied to the
tablet during compressing that delayed its
dissolution and would result in delaying its
absorption when taken (BP, 2005).
The assay of ciprofloxacin hydrochloride
indicated that eighteen samples gave values that
conform to the USP (2010) specification of 90 –
110% w/w while sample E was above the limit
with the value 111.66+0.53%w/w, sample L was
below the limit with the value 87.65+0.698% w/w,
(Table 1.0). These indicated that samples E and L
can be regarded as substandard and fake
respectively, since neither can provide the required
concentration needed for effective pharmacological
activities. The reasons for high and low result seen
in samples E and L respectively may be due to
excess of 1% of active ingredient added to take
care of loses and improper mixing of the wet
granules during processing (Susmita et al., 2009).
The calcium level in all the samples ranged
between 0.006mg/g – 0.016mg/g, (Table 2.0) and
falls within the specification of 3mg/g for the drug.
The level of calcium in the product results from the
nature of the excipient used which is usually
calcium phosphate.
0
0.1
0.2
0.3
0.4
0.5
0.6
0.7
0.8
0.9
1
A B C D E F G H I J K L M N O P Q R S T
BP
20
05
Fria
bili
ty (
%)
Samples
CSJ 9(1): June, 2018 ISSN: 2276 – 707X Shaibu and Audu
70
The sodium level in all the samples ranged
between 0.012mg/g – 1.975mg/g (Table 2.0) and
falls within the specification of 23.4mg/g, Webiner
(2010) which must have been incorporated as a
result of sodium methyl hydroxybenzoate, sodium
propyl hydroxybenzoate and sodium benzoate used
as preservatives, (Onlinelibrary, 2011).
Copper levels were found to be within
specification 0.25mg/g (Table 2.0) and must have
been sourced mostly from the water and processing
vessels, (Webiner 2010). Iron and zinc levels were
also found to be within specification and that the
only major source being the processing equipment,
(FDA, 2002; BP, 2005),
The potassium level in all the samples was
within the limit specified by the official standard,
3.6mg/g (table 2.0) with the major source coming
from the commonly used preservative, potassium
sorbate (Onlinelibrary, 2011). The level of
potassium in some of the samples ranged between
0.071 – 0.214mg/g while in samples B, J and Q the
potassium concentration was below the detection
limit.
Manganese concentration was found to be within
the official limits in some samples, 0.25mg/g
(Table 2.0), (IAPT, 1997) though in 14 of the
samples the manganese concentration was below
the detection limit. The manganese contents could
come as impurities in the raw materials and the
processing equipment.
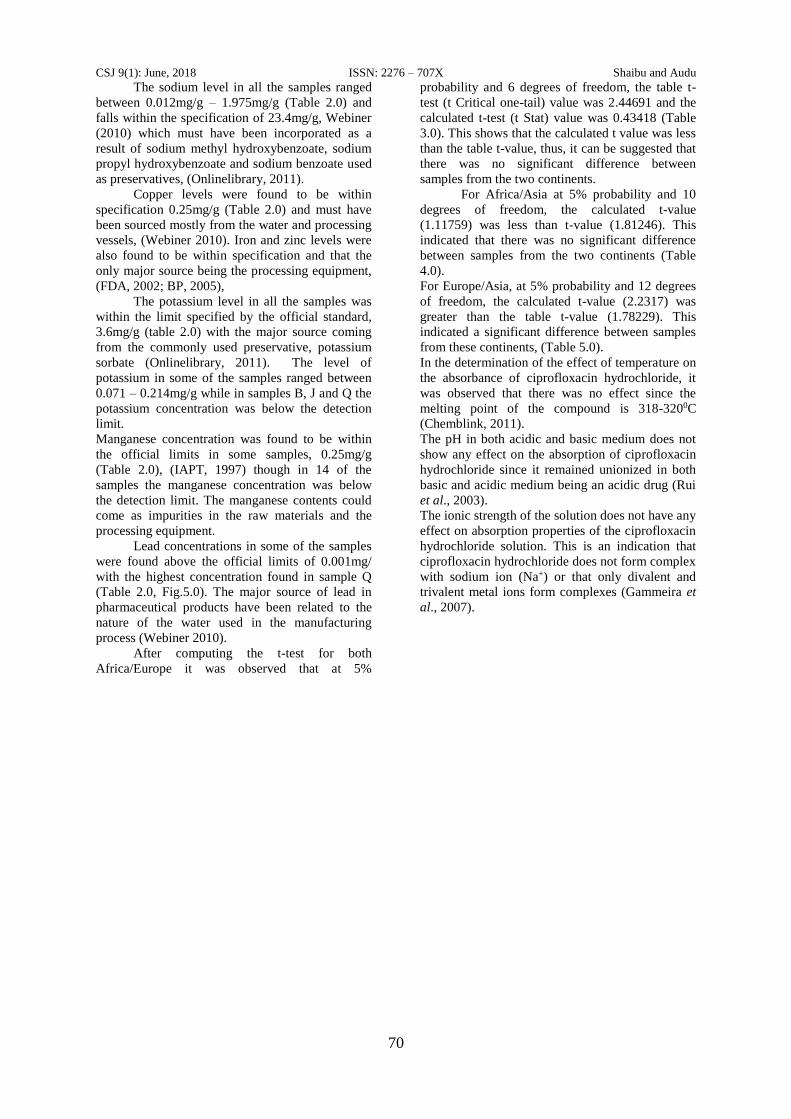
Lead concentrations in some of the samples
were found above the official limits of 0.001mg/
with the highest concentration found in sample Q
(Table 2.0, Fig.5.0). The major source of lead in
pharmaceutical products have been related to the
nature of the water used in the manufacturing
process (Webiner 2010).
After computing the t-test for both
Africa/Europe it was observed that at 5%
probability and 6 degrees of freedom, the table t-
test (t Critical one-tail) value was 2.44691 and the
calculated t-test (t Stat) value was 0.43418 (Table
3.0). This shows that the calculated t value was less
than the table t-value, thus, it can be suggested that
there was no significant difference between
samples from the two continents.
For Africa/Asia at 5% probability and 10
degrees of freedom, the calculated t-value
(1.11759) was less than t-value (1.81246). This
indicated that there was no significant difference
between samples from the two continents (Table
4.0).
For Europe/Asia, at 5% probability and 12 degrees
of freedom, the calculated t-value (2.2317) was
greater than the table t-value (1.78229). This
indicated a significant difference between samples
from these continents, (Table 5.0).
In the determination of the effect of temperature on
the absorbance of ciprofloxacin hydrochloride, it
was observed that there was no effect since the
melting point of the compound is 318-3200C
(Chemblink, 2011).
The pH in both acidic and basic medium does not
show any effect on the absorption of ciprofloxacin
hydrochloride since it remained unionized in both
basic and acidic medium being an acidic drug (Rui
et al., 2003).
The ionic strength of the solution does not have any
effect on absorption properties of the ciprofloxacin
hydrochloride solution. This is an indication that
ciprofloxacin hydrochloride does not form complex
with sodium ion (Na+) or that only divalent and
trivalent metal ions form complexes (Gammeira et
al., 2007).

CSJ 9(1): June, 2018 ISSN: 2276 – 707X Shaibu and Audu
71
Table 2.0: Concentration of Elemental Impurities (mg/g) in Ciprofloxacin
Hydrochloride Tablets
Sample Elements Concentration in mg/g
Ca Na Cu Fe K Mn Pb Zn
A 0.010 0.012 0.001
0.026 0.071 ND ND 0.007
B 0.006 0.302 0.001
0.028 ND 0.013 0.001 0.007
C 0.049 0.652 0.001
0.030 0.071 0.013 0.001 0.004
D 0.010 0.411 0.001
0.024 0.071 0.013 ND 0.002
E 0.013 0.409 0.001
0.015 0.213 ND ND 0.004
F 0.010 0.471 0.001
0.026 0.143 ND ND 0.002
G 0.016 1.975 0.001
0.019 0.214 ND ND 0.007
H 0.013 0.691 0.001
0.056 0.214 ND ND 0.007
I 0.100 0.504 0.001
0.002 0.071 ND ND 0.004
J 0.016 0.385 0.001
0.013 ND ND ND 0.002
K 0.010 0.572 0.001
0.017 0.071 0.001 ND 0.004
L 0.010 0.481 ND
0.011 0.142 ND ND 0.002
M 0.010 0.385 0.001
0.030 0.071 ND ND 0.004
N 0.006 0.403 0.001
0.026 0.071 ND 0.001 0.002
O 0.013 0.739 0.001
0.050 0.071 ND ND 0.002
P 0.006 0.802 0.001
0.013 0.143 0.001 ND 0.002
Q 0.006 0.554 0.001
0.048 ND 0.013 0.009 0.002
R 0.009 0.676 0.001
0.028 0.143 ND ND 0.004
S 0.006 0.802 ND
0.013 0.071 ND ND 0.002
T 0.006 0.700 0.001
0.030 0.071 ND ND 0.004
Standard 0.000 0.000 0.000 0.000 0.000 0.000 0.000 0.000

CSJ 9(1): June, 2018 ISSN: 2276 – 707X Shaibu and Audu
72
Table: 3.0. t-test for samples from Europe and Africa
t-Test: Two-Sample Assuming Unequal Variances
Europe Africa
Mean 103.903 102.603
Variance 4.14789 47.4992
Observations 4 6
Hypothesized Mean Difference 0 Df 6 t Stat 0.43418 P(T<=t) one-tail 0.33967 t Critical one-tail 1.94318 P(T<=t) two-tail 0.67934 t Critical two-tail 2.44691
Table: 4.0. t-test for samples from Africa and Asia
t-Test: Two-Sample Assuming Unequal Variances
Africa Asia
Mean 102.603 98.684
Variance 47.4992 43.8224
Observations 6 10
Hypothesized Mean Difference 0 Df 10 t Stat 1.11759 P(T<=t) one-tail 0.14494 t Critical one-tail 1.81246 P(T<=t) two-tail 0.28987 t Critical two-tail 2.22814
Table: 5.0. t-test for samples from Europe and Asia
t-Test: Two-Sample Assuming Unequal Variances
Europe Asia
Mean 103.903 98.684
Variance 4.14789 43.8224
Observations 4 10
Hypothesized Mean Difference 0 Df 12 t Stat 2.2417 P(T<=t) one-tail 0.02233 t Critical one-tail 1.78229 P(T<=t) two-tail 0.04466 t Critical two-tail 2.17881
CSJ 9(1): June, 2018 ISSN: 2276 – 707X Shaibu and Audu
73
Fig.4.0: Bar Chart of Mean Disintegration time of Samples
Fig. 5.0: Mean Concentration of Lead in Ciprofloxacin Hydrochloride Tablet RECOMMENDATION
Further work should be carried out using
high performance liquid chromatography (HPLC)
or gas chromatography mass spectrophotometer
(GC-MS) and compare the result with that of the
UV/VIS spectrophotometer so as to see the level of
accuracy.
REFERENCES:
Adepoju, A.A., Ayoola, G.A, Cooker, A.A.B,
(2010). Analysis of Fifteen Brands of
Ciprofloxacin Hydrochloride Tablets.
Nigeria Journal of Pharm. 43: 40-46
Alsante K.M, Boutres P., and Harwood J.W.
(2004). Pharmaceutical Impurity
Identification: A case study using a multi-
disciplinary approach.Jour. Pharm. Sci.; 9: 22
96.www.ijperoline.com/july-sep-2010/301.
Aluba, S.O. (1994). Death for Sale: A study of
drug poisoning and deaths in Nigeria. Socl Sci
Medi J.; 38: 97 – 103.
Bagbi BM, Omotoso AE, Chiagozie O. (2014).
Comparative Assessment of Quality Brands
of Atorvastatin Tablets Marketed in Southern
Nigeria. J Pharm Biomed Sci.; 04 (03):318-
326.
British Pharmacopoeia (2005). Medicinal and
Pharmaceutical Substances, Department of
Health. Her Majesty’s Stationary Office and
Queen’s Printer of Acts of Parliament. 5th
editon, Vol I, p369.
Chemblink (2011). Melting point of ciprofloxacin
hydrochloride. http://www.chemblunk.com
accessed on 21/7/2011.
FDA (2002). United State Department of Health
and Human Services, Centre for Evaluation
0
2
4
6
8
10
12
14
16
A B C D E F G H I J K L M N O P Q R S T
BP
20
05
Tim
e (M
inu
tes)
Samples
0
0.001
0.002
0.003
0.004
0.005
0.006
0.007
0.008
0.009
A B C D E F G H I J K L M N O P Q R S T
BP
20
05
Co
nce
ntr
atio
n (
mg/
g)
Samples

CSJ 9(1): June, 2018 ISSN: 2276 – 707X Shaibu and Audu
74
and Research.
http//www.fda.gov/CDER/GUIDANCE/3618
FNL.PDF
Gammeira, P., Catarina Rodrigues, Teresa
Baptista, Isobel Sousa and Baltzar de Castro
(2007). Metal – Ciprofloxacin Complex
formation.Int. J. Pharm.; 34: 129 – 136.
Getu K, Awot GE. (2010). Quality Assessment of
the Commonly Prescribed Antimicrobial
Drug, Ciprofloxacin Tablets, Marketed in
Tigray, Ethiopia. CNCS.; 2 (1): 93-107.
Global Forum (2002). Counterfeit trend in Asia. A
paper presented at the global forum on
pharmaceutical anti-counterfeiting.
http://www.gloalforum.com, accessed on
08/05/2012
Graviela, I.R. (2001). Argentina to Crack Down on
Pharmaceutical Black Market. The Lancet
Journal.; 47: 358.
IAPT (1997). Excipients in Pharmaceutical
Formulations. Regulatory Scientific
Requirements. IATP (International
Association for Pharmaceutical Technology
Presentation). http://www.iatp/pdf.
Accessed on 20/07/2012
IPEC (1998). Excipients in Pharmaceutical Dosage
forms. 1998. The challenge of the 21st
century; (International Pharmaceuical
Excipients Council).
Kholoud T. Abu Shaaban (2009). Quality Control
Study on Some Essential Drugs Available on
the Palestinian Drug Market. A Thesis
Submitted in Partial Fulfillment of the
Requirements for the Degree of Master of
Pharmaceutical Sciences. College of
Pharmacy Al-Azhar University; 1-134.
M. Jaman M, Chowdhury AA, Rana AA, Masum
SM, Ferdous T, Rashid MA, Karim MM.
(2015). In vitro evaluation of Ciprofloxacin
Hydrochloride. J. Sci. Ind. Res.; 50(4), 251-
256.
Mai Maher Ibrahim (2015). Post Marketing
Bioequivalence Study of Six Brands of
Ciprofloxacin Hydrochloride and Their
Evaluation in Treating Periodontal Pocket.
For Full Master Degree of Pharmaceutical
Science (Pharmaceutics): Department of
Pharmaceutics and Industrial Pharmacy
Faculty of Pharmacy Cairo University. 1-21.
Mary Stellmark and Kent Rhodes (2010).
Handbook on Metal Contamination in
Biopharmaceutical drugs.
http://www.aapspharmscitech.org accessed
on 30/09/2010.
Mus'ab M. K, Hiyam A Al-Taii, Imad A-J T.
(2010). Comparative evaluation of different
marketed products of Ciprofloxacin tablets in
vitro. Irq J Pharm.; 9(1): 9-15.
NAFDAC. (2005). National Agency for Food,
Drug Administration and Control. Fake Drugs
Identified by NAFDAC. Retrieved April
23rd,
2007.http://www.nafdacnigeria.org/identified.
htm
Nayaz A, Thakur RS, Koushik Y. (2013).
Formulation and Evaluation of Solubility
Enhanced Ciprofloxacin. Int J Pharm Sci
Nanotech.; 6 (3): 2131- 2136.
Ngozi N, Ikem U, Edwin O. O. (2007). Quality
Control Assessment and the Possibility of
Interchangeability between
MultisourcedNorfloxacin tablets Marketed in
Nigeria. Scientific Research and Essay; 2 (8):
348-352.
Oliphant, C.M. and Green, G.M. (2002).
“Quinolones, A Comprehensive Review.”
American Family Physician..
http://www,aafp.org/afp/200202021/45.html.
Onlinelibrary (2011). Elemental impurities
(potassium) in Drugs..
Onlinelibrarywiley.com/doi/10.1002/jps,
22376/full-similar.
Pecoul, B., Chirai, P., Trouiller, P. and Pinel J.
(1999). Access to Essential Drugs in Poor
Countries. A lost battle.Amer J of MediAsso.;
281: 361 – 367.
Philip F. Builders, Ayo Eyeriyeh, Peters Oladosu,
Olubay Kunle. (2005). Quality Assessment
of some brands of Ciprofloxacin Tablets on
sales in Abuja, Nigeria. J of Pharm and
Bioresources.; 2: 49 – 54.
Rui Yang, Yan Fu, Long Di Li and Jia Ming Lu.
(2005). Medium and pH effect on the
absorption spectra of ciprofloxacin
hydrochloride. Dept of chem. University of
Tsingua, Beijing, China.
Lib.bioinfo.pl/paper.14499832 of 2/8/11.
Shahnaz Usman, Aftab Alam, Rahma Suleiman,
Khawla Awad, and Isra Abudeek (2014).
Evaluation of Dissolution Testing for
Ciprofloxacin (500mg) Tablets: Post Market
Surveillance of Different Brands Available in
Ras Al khaimah (uae). Int J of Biopharma.;
5(1): 65-72.
Shakoor, O., Taylor, R.B. and Benhens, R.H.
(1997). Assessment of the Incidence of
Substandard Drugs in Developing Countries.
Tropical Medical International Health; 2: 839
– 845.
Susmita L, Tasnuva H, Mesbah Md. U. T, Ishtiaq
A, Muhammad R. I, Habibur R. (2009).
Development of GlycerylMonostearate Based
Ciprofloxacin Hydrochloride Sustained
Release Matrix Tablet: an In vitro Study.; J.
Pharm. Sci. 8(1): 81-88.
Tadesse HF, Shibesi BT. (2015). In vitro quality
assessment and bioequivalence studies on
four brands of Ciprofloxacin tablets,
marketed in Ambo, Ethiopia. Int J Pharma
Sci., 5(2): 1007-1012.
United States Pharmacopoeia (2004). 27th
edition, the USP convention Inc, 2278- 2396.
United State Pharmacopoeia (2010). The USP
Convention Inc. 417-420.

CSJ 9(1): June, 2018 ISSN: 2276 – 707X Shaibu and Audu
75
Webiner (2010) Analysis of metal impurities in
Pharmaceutical Ingredients..
www.chem.agilent.com/Atomic-portifolio-
usp-232-233-pharma-webinar.pdf. Accessed
20/8/2010.
WHO (1996). Technical Report Series No. 863
Committee on Specifications for
Pharmaceutical Preparations 34th Report
World Health Organization, Geneva.
WHO, (2005). Regional strategy for Improving
Access to Essential Medicines in the Western
Pacific Region, 2005 – 2010. World Health
Organization, Geneva.