
2016 Volume 48 / Number 2
174
BULGARIAN CHEMICAL COMMUNICATIONS Journal of the Chemical Institutes of the Bulgarian Academy of Sciences and of the Union of Chemists in Bulgaria 2016 Volume 48 / Number 2
-
Upload
khangminh22 -
Category
Documents
-
view
1 -
download
0
Transcript of 2016 Volume 48 / Number 2

BULGARIAN CHEMICAL
COMMUNICATIONS
Journal of the Chemical Institutes
of the Bulgarian Academy of Sciences
and of the Union of Chemists in Bulgaria
2016 Volume 48 / Number 2


Bulgarian Chemical Communications, Volume 48, Number 2
181
Book Review
Chr. Boyadjiev, M. Doichinova, B. Boyadjiev, P.
Popova-Krumova,
“Modeling of Column Apparatus Processes”,
Springer-Verlag, Berlin Heidelberg, 2016.
http://www.springer.com/gp/book/9783319282572
In the book is presented a new physically
motivated approach for the modeling of column
apparatus processes in industrial conditions, using
the mechanics of continua. In the Introduction is
presented the contemporary, physically motivated,
mass transfer theory.The proposed analysis shows
that the presented mass transfer theory is not
applicable for the modeling of column apparatus
processes in industrial conditions, because the
velocities in each phase and the phase surfaces in
columns are unknown and practically cannot be
determined.
The modeling of column apparatus processes
in industrial conditions is made, using new type
models as convection-diffusion models (for
qualitative analysis) and average concentration
models (for quantitative analysis), where as an
innovation is the process mechanism identification
on the base of the Guhman’s generalized model
analysis (model analysis in generalized variables).In
the book are presented convection-diffusion and
average concentration models of one, two and three
phase processes.
In the first part of the book are presented the
convection-diffusion models and qualitative analysis
of the chemical, absorption, adsorption and catalytic
processes.
The one-phase processes in column chemical
reactors are analized in the cases of complex
chemical reaction kinetics, two components
chemical reactions and pseudo-first-order reactions.
It is shown the influence of the velocity radial non-
uniformity on the conversion degree. As an
innovation is a new explanation of the “back
mixing” effect as a reducing of the average residence
time of the flow in the column.
The two-phase processes in column
apparatuses are analized in the cases of absorption
processes (physical and chemical absorption),
adsorption processes (physical and chemical
adsorption), catalytic processes (physical and
chemical adsorption mechanism).
The absorption processes are presented in co-
current and counter-current gas-liquid flows. As
innovations are the presentation of the interphase
mass transfer as a volume reaction and the
distribution of the interphase mass resistances
between the gas and liquid phases.
The adsorption processes are presented in the
cases of nonstationary process in the solid phase and
quasi stationary process in the gas (liquid) phase. As
innovation is the presentation of the adsorption
process as a volume reaction.
The catalytic processes are presented as
stationary processes in gas-solid systems, where the
adsorption of the first reagent is physically or
chemically. As innovation is the presentation of the
catalytic reaction as a volume reaction.
In the srcond part of the book are presented
the average concentration models and quantitative
analysis of the chemical, absorption, adsorption and
catalytic processes. The innovations in this part are:
1. The presented theoretical (averaging)
procedure.
2. The ability to be used the average concentration
models for modeling of the processes at an
unknown velocity distribution in the column,
which is introduced in the model by two
parameters, which can be determined from
experimental data.

Bulgarian Chemical Communications, Volume 48, Number 2
182
3. The explanation of the conversion degree
decrease as a result of the radial non-uniformity
of the velocity distribution.
4. The experimental data, obtained in a short
column with real diameter, are useful for the
model parameters identification.
In the third part of the book are presented
calculation algorithms as innovations.
In many cases the computer modeling of the
processes in column apparatuses, made on the base
the convection–diffusion and average concentration
models, does not allow a direct use of the MATLAB
program. In these cases it is necessary to create
combinations of appropriate algorithms.
Practically, the new type models are
characterized by the presence of small parameters at
the highest derivates. As a result, the use of the
conventional software for solving the model
differential equations is difficult. This difficulty may
be eliminated by an appropriate combination of
MATLAB and perturbations method.
In the cases of counter-current gas-liquid or
liquid-liquid processes the mass transfer process
models are presented in two-coordinate systems,
because in a one-coordinate system one of the
equations has no solution by reason of the negative
value in the equation Laplacian. Thus, a combination
of an iterative algorithm and MATLAB has to be
used for solving the equations set in different
coordinate systems.
In the practical cases of non-stationary
adsorption in gas-solid systems, the presence of
mobile (gas) and immobile (solid) phases in the
conditions of lengthy (long-term) processes leads to
a non-stationary process in the immobile phase and
a stationary process in the mobile phase. As a result
different coordinate systems must be used for the gas
and solid phase models. A combination of a multi-
step algorithm and MATLAB has to be used for the
solutions of the equations set in different coordinate
systems.
Practically, the waste gases purification in the
thermal power plants uses absorption methods. The
SO2 absorption intensification needs a quantitative
description of the process using a suitable
mathematical model, which has to be created on the
basis of a qualitative analysis of the process
mechanism. The new convection-diffusion and
average concentration models lead to the creation of
three patents as innovations.
In the cases of comparable interphase mass
transfer resistances in the gas and liquid phases, an
intensification of the mass transfer should be
realized in two phases. In these conditions a new
patent is proposed, where the process optimization is
realized in a two-zone column, where the upper zone
the process is physical absorption in a gas-liquid
drops system (intensification of the gas phase mass
transfer), while in the lower zone it is a physical
absorption in liquid-gas bubbles system
(intensification of the liquid phase mass transfer) and
the chemical reaction takes place in the column tank.
The waste gases purification from SO2 is
solved in a new patent, using a two-step process –
physical absorption of SO2 by water and adsorption
of SO2 from the water solution by synthetic anionite
particles. The adsorbent regeneration is made by
NH4OH solution. The obtained (NH4)2SO3
(NH4HSO3) is used (after reaction with HNO3) for
production of concentrated solutions of SO2 and
NH4NO3.
The decrease of the column diameter is
realized in a new patent, where a co-current SO2
absorption is used.
The created methods for modeling of column
apparatus processes are a base for solution of many
industrial problems.

183
Bulgarian Chemical Communications, Volume 48, Number 2 (pp. 183 – 186) 2016
Circadian misalignment and alcohol intake change the oxidative status of rat blood
plasma
M. G. Varadinova1, *, M. L. Valcheva-Traykova2
1 Department of Pharmacology and Toxicology, Medical Faculty, Medical University - Sofia, Bulgaria 2 Department of Medical Physics and Biophysics, Medical Faculty, Medical University - Sofia, Bulgaria
Received September 16, 2015, Revised October 25, 2015
Circadian misalignment and chronic alcohol intake often occur together and are known to result in decreased
endogenous antioxidant resistance and oxidative stress in human and animal models. This is associated with a myriad of
chronic health consequences and thus may have a large-scale financial burden on society and healthcare system. There
is evidence for the antioxidant activity of ethanol in model solutions. However, some data suggest that ethanol can
display pro-oxidative properties in vivo.
The aim of this study was to investigate the effect of in vitro ethanol supplementation on the oxidative status of rat
blood plasma in models of circadian rhythm disruption (CRD) and chronic alcohol consumption (A). Our results
demonstrated that ethanol exhibited pro-oxidative activity in blood plasma. The plasma oxidant status was impaired in
both models. Moreover, the combination of CRD and A increased malondialdehyde (MDA) levels nearly twice.
Our data suggest that the combined influence of CRD and A can exacerbate the single adverse effects of each factor on
the plasma oxidative status. The explanation of these observations needs further investigation on mechanisms of
association between circadian misalignment and chronic alcohol consumption.
Key words: chronic alcohol intake; circadian rhythm disruption; malondialdehyde; oxidative stress.
INTRODUCTION
Epidemiological data reveal that disruption of
circadian rhythm due to shift work, jet-lag, sleep
disorders, and other modern life style choices and
work practices is now very common in our society.
Circadian misalignment is associated with a wide
variety of adverse health consequences including
cancer, metabolic disorders, cardiovascular
dysfunction, immune dysregulation, impaired
reproduction and neuropsychiatric conditions [1, 2,
3].
Recent studies have reported that
disrupted circadian rhythms and increased alcohol
consumption are often related [4, 5, 6]. Moreover, it
has been suggested that the link is bidirectional [7].
Circadian misalignment and excessive alcohol
intake may have considerable harmful effects on
molecular and organismal levels [7, 8]. It has been
proposed that circadian and redox regulatory
systems are tightly interconnected [9].
Experimental evidence demonstrates that circadian
misalignment may cause substantial alterations on
the redox balance and may enhance susceptibility to
lipid peroxidation [10, 11, 12]. In addition, chronic
and acute models of alcohol exposure are reported
to produce increased oxidative stress [8, 13, 14].
In the literature, there is a controversy about the
pro-oxidative/antioxidative properties of alcohol in
vitro [15, 16, 17]. Interestingly, the effect of the
combination of circadian misalignment and chronic
alcohol intake on plasma antioxidant resistance still
remains unexplored.
The aim of this study was to investigate the
effect of in vitro ethanol supplementation on the
oxidative status of rat blood plasma in models of
circadian rhythm disruption and chronic alcohol
consumption. Endogenous lipid peroxidation was
assessed by measuring the levels of
malondialdehyde (MDA) in blood plasma.
MATERIALS AND METHODS
Chemicals
All chemicals used in the investigation were
SIGMA and of finest grade (p.a.). The water was
distilled and degassed by sonification, if necessary.
The 10% ethanol solution was prepared using 99%
ethanol.
Animals
Male Wistar rats (220-240) were housed 1 per
standard polypropylene cage and maintained in a
temperature (20±0.5°C) and humidity (65±1%)
controlled room for 6 weeks. The animals had free
access to food (standard rodent chow) and tap water
* To whom all correspondence should be sent:
E-mail: [email protected]
2016 Bulgarian Academy of Sciences, Union of Chemists in Bulgaria

M. G. Varadinova, M. L. Valcheva-Traykova: Circadian misalignment and alcohol intake change the oxidative status of rat...
184
or 10% ethanol solution. 2-3 days before the
experiment the animals were handled and then
randomly assigned to four groups (n=5).
Group 1 – Control – normal light/dark cycle +
tap water ad libitum;
Group 2 – Circadian rhythm disruption (CRD) –
exposed to light-at-night + tap water ad libitum;
Group 3 – Alcohol (A) - normal light/dark cycle
+ 10% ethanol solution ad libitum;
Group 4 – Circadian rhythm disruption +
alcohol (CRD+A) - exposed to light-at-night + 10%
ethanol solution ad libitum.
The experiments were carried out in accordance
with the Bulgarian regulations on animal welfare
and in conformance with the European
Communities Council Directive of 24 November
1986 (86/609/EEC).
The blood was collected in EDTA washed test
tubes, and the plasma was separated by
centrifugation at 2000XG (4C) for 30 min. The
protein content of the samples was determined
using the Biuret method [18]. A 552 UV-VIS
spectrophotometer “Perkin-Elmer” with 2 ml quartz
cuvettes was used for the spectrophotometric
measurements. The in vitro ethanol treatment was
performed at the following conditions: 50 μl of
blood plasma, 300 μl ethanol (10-3 M) and 1600 μl
PBS were incubated at 37°C for 15 min. The same
amount of blood plasma was incubated at the same
temperature in 1900 μl PBS. Then the MDA was
measured in all samples.
MDA assay
The MDA formation was assessed as described
in [19]. The characteristic absorbance of MDA at
=245 nm was monitored for 5 minutes at 25°C, in
presence (sample) and in absence (blank) of
supernatant. One ml of the cuvette contained 0.01
ml supernatant, 0.01 ml FeCl2/EDTA (3 mM FeCl2
and 0.2 mM EDTA in distilled water), BPS (pH
7.4) and 0.01 ml 0.003M H2O2. Molar extinction
coefficient of 13700 M-1 cm-1 was used to calculate
the MDA and after removing blank from sample
measurements, the MDA formation was presented
in pmoles/mg protein.
MDA levels determination in the absence
of alcohol in the sample: 50 μl of blood plasma and
1900 μl PBS were incubated at 20°C for 15 min. 50
μl FeCl2 and 10 μl H2O2 were added.
MDA levels determination in the presence
of alcohol in the sample: 50 μl of blood plasma,
300 μl ethanol (10-3 M) and 1600 μl PBS were
incubated at 20°C for 15 min. 50 μl FeCl2 and 10 μl
H2O2 were added. For the blank measurement only
FeCl2 and H2O2 were added to PBS.
Data presentation
For a better understanding, MDA was presented
by its Activity Index (AI), as a percentage of the
corresponding marker for the Control group (e.g.,
AI=Markerstress*100/Markercontrol). The AI for MDA
formation are shown in Figures 1 and 2.
Statistical analysis
Each OS marker was determined three times for
each animal. Thus, an oxidative marker of a group
was estimated using nine parallel measurements.
After elimination of the gross errors via the
Romanowski test [20], the mean values and
standard deviations were calculated. The statistical
significance of the differences between the mean
data was estimated by the INSTAT program
package (Bartlett test for significance of differences
among the standard deviations followed by
ANOVA and Bonferoni post-test).
RESULTS
There were no statistically significant
differences between the MDA levels in the blood
samples of all animals, exposed to light at night or
receiving ethanol, or both, compared to the control
group (Fig.1). The absolute values of our data were
in agreement with these described in the literature
for a different model of ethanol intake [21]. Figure
2 illustrates that elevated MDA levels were
registered in all experimental groups compared to
the same groups in the absence of alcohol. The
combined effects of circadian disruption and
alcohol caused the highest relative increase of
MDA in the “CRD+A” group.
Fig. 1. MDA levels in the blood plasma without
alcohol in the sample.
DISCUSSION
The present results demonstrated that, within our
model of systemic ethanol intake, there were no
significant differences in MDA levels (Fig. 1). The
data in Figure 2 show that ethanol in vitro
supplementation caused increased levels of MDA
in all experimental groups compared to the same
groups in the absence of alcohol. The increased
MDA level indicated more profound lipid

M. G. Varadinova, M. L. Valcheva-Traykova: Circadian misalignment and alcohol intake change the oxidative status of rat...
185
peroxidation due to inefficient antioxidant defense.
The lowest relative increase of the MDA level was
in the Control group. In agreement with [8] this
may be related with the metabolic transformation of
ethyl alcohol in the blood plasma of the control
animals in conditions of undisturbed antioxidant
defense. Disrupted circadian rhythm and chronic
ethanol intake, alone and in combination, resulted
in a significantly increased level of MDA in rat
blood plasma. This may be because of increased
free radicals formation, and/or diminished
antioxidant defense. Our data also suggest that the
combined influence of circadian rhythm disruption
and chronic alcohol can exacerbate the single
adverse effects of each factor on the plasma
oxidative status.
Fig. 2. MDA levels in the blood plasma in the
presence of alcohol in the sample.
*P=0.0063; **P<0.0001 vs the same group in the
absence of alcohol.
Our previous results showed that light at night
and chronic alcohol consumption induced
significant oxidative stress in the brains of the
experimental animals. Furthermore, our data
proposed that the combination of circadian
misalignment and chronic alcohol might result in
significantly higher MDA levels in the rat brain,
than any of these models alone [22]. In this
investigation, similar effects in rat blood plasma
were observed. It may be assumed that the
combination of circadian misalignment and chronic
ethanol intake compromise the antioxidant defense
and result in a massive lipid peroxidation within the
entire organism of the model animals.
It is believed that oxidative stress plays a major
role in the pathogenesis of a variety of adverse
health conditions. In addition, lots of disorders have
been found to have strong oxidative stress and
circadian rhythm connections, including physical
and psychiatric dysfunctions. Reactive oxygen
species (ROS) and reactive nitrogen species (RNS)
are important regulators of cellular metabolism,
signal transduction, and gene expression and they
are implicated in the regulation of physiological
processes [9]. The exposure to light at night
increases the lipid peroxidation in tissues and
decreases both the total antioxidant activity and
superoxide dismutase activity [12]. It is proposed
that impairment of redox regulation
and circadian rhythms may lead to a number of
adverse effects on human health [23].
One causative pathway between excessive
alcohol consumption and disease may be the
circadian misalignment because they are often
related [5, 24]. Furthermore, high ethanol
consumption significantly enhances endogenous
lipid peroxidation resulting in significantly elevated
MDA and increased oxidative stress [10, 25]. In
addition, exposure of cells to excessive ethanol
result in a significant increase in the ROS
production [16].
On the other hand, there is evidence for the
antioxidant activity of ethanol in experimental
models. For instance, Trevithick et al. [26]
demonstrated antioxidant properties of ethanol in
vivo, associated with anti-atherosclerotic effects.
Also, ethanol protected LDL from oxidation
initiated by superoxide and hydroxyl radicals in
vitro [15]. Additionally, Tyulina et al. [17] reported
that ethanol caused a decrease in erythrocyte
reactive oxygen species levels and displayed
protective activity on erythrocytes in vitro.
These controversial data gave us a reason to
investigate the effects of supplementation of
ethanol to plasma in our experimental models. It is
known that in pathological conditions the
antioxidant system may be overwhelmed. Oxidative
stress occurs when ROS outweigh the antioxidant
defense. In our experiment ethanol exhibited pro-
oxidative activity in blood plasma in vitro. In
agreement with the abovementioned data and our
results, we can speculate that in our models there
was increased lipid peroxidation and decreased
antioxidant resistance in the blood plasma.
Compelling evidence from experimental and
clinical studies links circadian misalignment and
chronic alcohol abuse to disruptions in the
neuroendocrine, immune and oxidative stress
systems. Assessment of various related mechanisms
is still a limited and novel field, but may be of
considerable clinical relevance, having in mind the
increasing number of affected individuals. Our
results suggest an interconnection between
circadian disruption, alcohol intake and imbalanced
oxidative status, due to enhanced lipid peroxidation
and/or reduced antioxidant resistance. The
explanation of these observations needs further
investigation and may contribute to the
development of more efficacious preventive and
therapeutic approaches for endangered patients.
M. G. Varadinova, M. L. Valcheva-Traykova: Circadian misalignment and alcohol intake change the oxidative status of rat...
186
REFERENCES
1. K. G. Baron, K. J. Reid, Int. Rev. Psychiatry, 26, 139
(2014).
2. J. A. Evans, A. J. Davidson, Prog. Mol. Biol. Transl.
Sci., 119, 283 (2013).
3. A. Knutsson, Occupat. Med., 53, 103 (2003).
4. A. N. Filiano, T. Millender-Swain, R. Johnson Jr, M.
E. Young, K. L. Gamble KL, S. M. Bailey., PLoS One,
8, e71684 (2013).
5. B. P. Hasler, D. B. Clark, Alcohol Clin. Exp. Res., 37,
558 (2013).
6. H. L. Rogers, S. M. Reilly, AAOHN J., 50, 449
(2002).
7. R. M. Voigt, C. B. Forsyth, A. Keshavarzian, Alcohol
Res. 2013; 35(1):87-96.
8. M. Comporti, C. Signorini, S. Leoncini, C. Gardi, L.
Ciccoli, A. Giardini, D. Vecchio, B. Arezzini, Genes
Nutr., 5, 101 (2010).
9. M. P. Antoch, R. V. Kondratov, Circ. Res., 106, 68
(2010).
10. E. B. Kalaz, B. Evran, S. Develi, G. Ö. Erata, M.
Uysal, N. Koçak-Toker, Pathophysiology, 19, 49 (2012).
11. N. Krishnan, K. Rakshit, E. S. Chow, J. S. Wentzell,
D. Kretzschmar, J. M. Giebultowicz, Neurobiol. Dis., 45,
1129 (2002).
12. I. A. Vinogradova IA, V. N. Anisimov, A. V.
Bukalev, V. A. Ilyukha, E. A. Khizhkin, T. A.
Lotosh, A. V. Semenchenko, M. A. Zabezhinski, Aging
(Albany NY), 2, 82 (2010).
13. A. Dolganiuc, G. Szabo, World J. Gastroenterol., 15,
1168 (2009).
14. A. Kahraman, H. Çakar, T. Köken, Mol. Biol. Rep.,
39, 2789 (2012).
15. D. Bonnefont-Rousselot, A. Rouscilles, C. Bizard, J.
Delattre, D. Jore, M. Gardès-Albert. Radiat. Res., 155,
279 (2001).
16. K.-M. Lee, H.-S. Kang, C.-H. Yun and H.-S. Kwak,
Biomol. Ther. (Seoul), 20, 492 (2012).
17. O. V. Tyulina, V. D. Prokopieva, R. D. Dodd, J. R.
Hawkins, S. W. Clay, D. O. Wilson, A. A. Boldyrev, P.
Johnson, Alcohol Alcohol., 37, 179 (2002).
18. K.C. Bohnstedt, in “Determination of biomarkers for
Lipid Peroxidation and Oxidative Stress – development
of Catalytical techniques and methods”, PhD Thesis, SU,
Stockholm, 2005.
19. E. Layne, Methods Enzymol.,10, 447 (1957).
20. I. Glushtenko. Basics of scientific research (in
Russian), Vissha Shkola, Kiev, 1983, p.103.
21. T. Traykov, M. Traykova, L. Astasidi, N.
Boyadjieva, Trakia J. Sci., 10, 326 (2012).
22. M. Varadinova, M. Traykova, N. Boyadjieva, Am. J.
Ther., (2015), in press.
23. M. Wilking, M. Ndiaye, H. Mukhtar, N. Ahmad,
Antioxid. Redox. Signal., 19, 192 (2013).
24. S. B. Hammer, C. L. Ruby, A. J. Brager, R. A.
Prosser, J. D. Glass, Alcohol. Clin. Exp. Res. 34, 1651
(2010).
25. S. Vasdev, V. Gill, P. K. Singal, Vasc. Health Risk
Manag., 2, 263 (2006).
26. C. C. Trevithick, J. A. Vinson, J. Caulfeild, F.
Rahman, T. Derksen, L. Bocksch, S. Hong, A. Stefan, K.
Teufel, N. Wu, M. Hirst, J. R., Redox Rep., 4, 89 (1999).
НАРУШЕНИЯТ ЦИРКАДЕН РИТЪМ И АЛКОХОЛНИЯТ ПРИЕМ ПРОМЕНЯТ
ОКСИДАТИВНИЯ СТАТУС НА КРЪВНА ПЛАЗМА НА ПЛЪХ
М. Г. Варадинова1, М. Л. Вълчева-Трайкова
1 Катедра по фармакология и токсикология, Медицински факултет, Медицински Университет – София,
България 2 Катедра по медицинскафизика и биофизика, Медицински факултет, Медицински Университет – София,
България
Постъпила на 16 септември, 2015 г. коригирана на 26 октомври, 2015 г.
(Резюме)
Нарушеният циркаден ритъм и хроничният алкохолен прием често се съчетават и водят до понижена
антиоксидантна защита и оксидативен стрес при човешки и животински опитни постановки. Това се асоциира с
редица хронични здравни проблеми, които от своя страна имат сериозни финансови последствия върху
обществото и системата на здравеопазване.
Съществуват доказателства за антиоксидантна роля на етанол в експериментални модели. Същевременно,
редица данни демонстрират про-оксидативни свойства на алкохол в in vivo условия.
Цел на настоящето изследване бе да проучи ефекта на етанол in vitro върху оксидативния статус на кръвна
плазма от плъх при модели на нарушен циркаден ритъм (НЦР) и хроничен алкохолен прием (А). Получените
резултати показаха про-оксидативна активност на етанол в кръвна плазма. Оксидативният статус на плазмата
бе нарушен и при двата модела. В допълнение, при комбинацията от НЦР и А нивата на малондиалдехид бяха
увеличени близо два пъти.
Нашите данни демонстрират, че съчетанието от нарушен циркаден ритъм и хроничен алкохолен прием
могат да отежнят самостоятелния отрицателен ефект на всеки от факторите върху оксидативния баланс на
кръвна плазма. Обяснението на тези наблюдения изисква по-нататъшни изследвания на механизмите на
взаимовръзка между НЦР и продължителен алкохолен прием.
http://www.ncbi.nlm.nih.gov/pubmed/?term=Dolganiuc%20A%5BAuthor%5D&cauthor=true&cauthor_uid=19291816
http://www.ncbi.nlm.nih.gov/pubmed/?term=Dolganiuc%20A%5BAuthor%5D&cauthor=true&cauthor_uid=19291816
http://www.ncbi.nlm.nih.gov/pubmed/?term=Boldyrev%20AA%5BAuthor%5D&cauthor=true&cauthor_uid=11912075

187
Bulgarian Chemical Communications, Volume 48, Number 2 (pp. 187 – 193) 2016
A convenient green protocol for one-pot three-component synthesis of 2-amino-4H-
chromene derivatives catalyzed by ilmenite (FeTiO3) as an efficient and reusable
catalyst in water
B. Ebadzadeh1, A. Ramazani1*, V. Azizkhani2, H. Aghahosseini1, S. W. Joo3*
1Department of Chemistry, University of Zanjan, P O Box 45195-313, Zanjan, Iran 2Department of Chemistry, Payame Noor University, P.O. Box 19395-3697, Tehran, Iran
3School of Mechanical Engineering, Yeungnam University, Gyeongsan 712-749, Republic of Korea
Received July 24, 2014, Revised March 28, 2016
A highly efficient and simple procedure for the synthesis of 2-amino-4H-chromene derivatives via one-pot, three-
component reaction from various aldehydes, malononitrile, and α- or β-naphthol in the presence of a catalytic amount of
ilmenite (FeTiO3) is described. The advantages of this novel protocol include good yield, short reaction time, simple
work-up, low toxicity and environmentally friendly catalyst. According to our results, FeTiO3 (10 mol %) can be used
as a catalyst for the synthesis of 2-amino-4H-chromene derivatives in water solvent under reflux conditions.
Key words: FeTiO3, ilmenite, three-component reaction, 2-amino-4H-chromene derivatives, malononitrile, aldehydes.
INTRODUCTION
Multicomponent coupling reactions (MCRs) are
emerging as useful tools for the carbon–carbon and
carbon–heteroatom bond-forming reactions and for
the synthesis of small drug-like molecules with
several degrees of structural diversity [1]. One-pot
multicomponent reactions provide the possibility of
directly synthesizing a complex molecule without
needing to isolate the intermediates, which has
aroused researchers to design such reactions using
different catalysts [2,3].
Ilmenite (FeTiO3) is one of the most common
minerals in the earth crust. FeTiO3 is an interesting
wide bandgap (2.58–2.9 eV) antiferromagnetic
semiconductor with potential applications in
spintronics, optoelectronics, high temperature
integrated circuits, chemical catalysts, photo
catalysts, etc. [4].
Aminochromenes and their derivatives are of
considerable interest as they possess a wide range
of biological properties [5], such as spasmolytic,
diuretic, anticoagulant, anticancer and
antianaphylactic activities [6]. In addition, they can
be used as cognitive enhancers for the treatment of
neurodegenerative diseases, including Alzheimer’s
disease, amyotrophic lateral sclerosis, Huntington’s
disease, Parkinson’s disease, AIDS associated
dementia and Down’s syndrome, as well as for the
treatment of schizophrenia and myoclonus [7].
Aminochromenes have been prepared by
heating a mixture of malononitrile, aldehydes and
activated phenols or naphthols in refluxing DMF or
acetonitrile in the presence of hazardous organic
bases such as piperidine and triethylamine [8, 9]. In
the literature, a lot of synthetic methods for the
synthesis of 2 amino-4H-chromene derivatives
have been reported so far [10-26], Most of these
methods are associated with shortcomings like the
use of costly, harmful and non-reusable catalysts,
tedious separation procedures, long reaction time,
tedious work up and use of toxic organic solvents.
To the best of our knowledge, the use of water
as a clean solvent in the presence of ilmenite as a
reusable catalyst for the synthesis of 2-amino-4H-
chromene derivatives has not been reported.
In light of the above reports, and in continuation
of our ongoing efforts to develop new methods in
organic synthesis [27-38], herein we report our
results for the synthesis of 2-amino-4H-chromene
derivatives via a one-pot three-component reaction
of various aldehydes (2), malononitrile (3) and α-,
or β-naphthol (1) in the presence of FeTiO3 as an
efficient and reusable catalyst in water under reflux
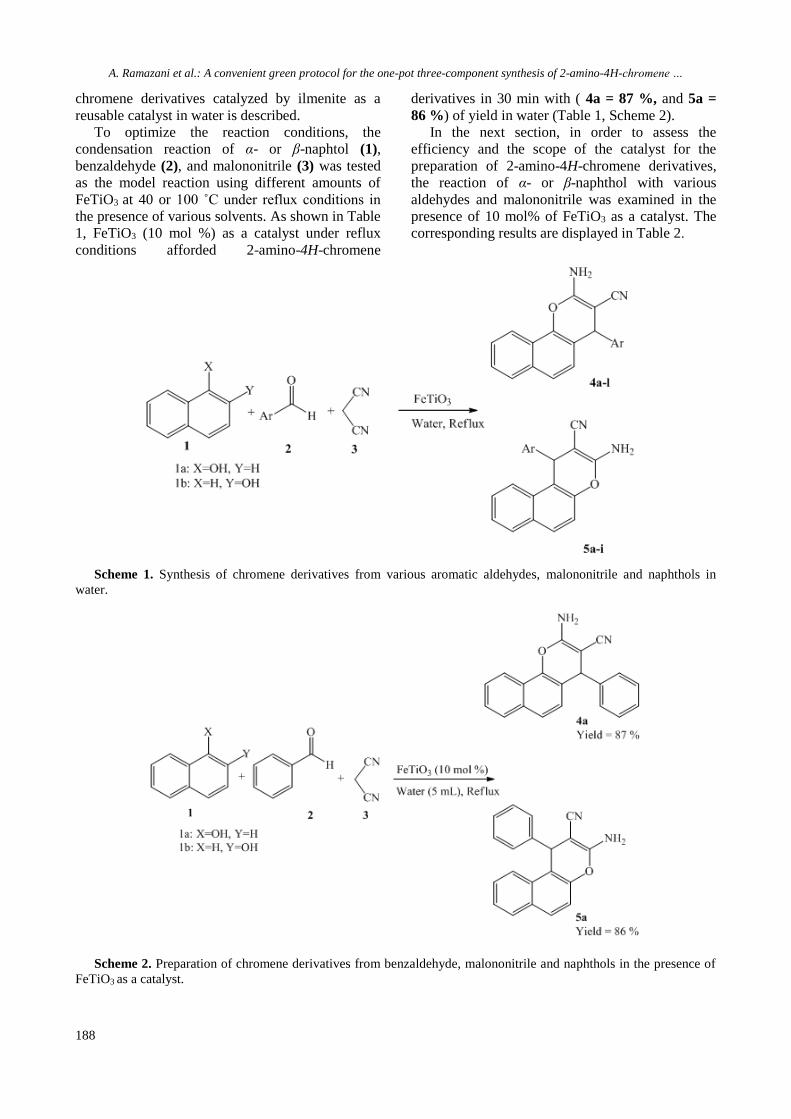
conditions (Scheme 1).
RESULTS AND DISCUSSION
As a part of a continuing effort in our laboratory
towards the development of new methods in
organic synthesis [27-38], in the present paper, a
convenient and green protocol for the one-pot
three-component synthesis of 2-amino-4H-* To whom all correspondence should be sent:
E-mail: [email protected] ; [email protected]
2016 Bulgarian Academy of Sciences, Union of Chemists in Bulgaria
A. Ramazani et al.: A convenient green protocol for the one-pot three-component synthesis of 2-amino-4H-chromene …
188
chromene derivatives catalyzed by ilmenite as a
reusable catalyst in water is described.
To optimize the reaction conditions, the
condensation reaction of α- or β-naphtol (1),
benzaldehyde (2), and malononitrile (3) was tested
as the model reaction using different amounts of
FeTiO3 at 40 or 100 ˚C under reflux conditions in
the presence of various solvents. As shown in Table
1, FeTiO3 (10 mol %) as a catalyst under reflux
conditions afforded 2-amino-4H-chromene
derivatives in 30 min with ( 4a = 87 %, and 5a =
86 %) of yield in water (Table 1, Scheme 2).
In the next section, in order to assess the
efficiency and the scope of the catalyst for the
preparation of 2-amino-4H-chromene derivatives,
the reaction of α- or β-naphthol with various
aldehydes and malononitrile was examined in the
presence of 10 mol% of FeTiO3 as a catalyst. The
corresponding results are displayed in Table 2.
Scheme 1. Synthesis of chromene derivatives from various aromatic aldehydes, malononitrile and naphthols in
water.
Scheme 2. Preparation of chromene derivatives from benzaldehyde, malononitrile and naphthols in the presence of
FeTiO3 as a catalyst.

A. Ramazani et al.: A convenient green protocol for the one-pot three-component synthesis of 2-amino-4H-chromene …
189
Table 1. Optimization of conditions for the synthesis of 2-amino-4H-chromene derivatives from 4-
chlorobenzaldehyde, malononitrile, and α- or β-naphthol in the presence of different amounts of FeTiO3 as a catalyst at
different temperatures.
Entry Solvent Catalyst (mol %) T ( ˚C) Time (min) Yield (%) a,b
4a 5a
1 Ethanol 10 60 35 75 73
2 Methanol 10 60 30 82 81
3 Dichloromethane 10 40 60 52 50
4 Acetonitrile 10 60 40 82 81
5 Water 15
Reflux
90
80
30
85
79
67
84
78
63
6 Water 10
Reflux
90
80
30
87
81
70
86
80
67
7 Water 5
Reflux
90
80
30
72
64
52
67
62
45
8 Water Catalyst-free Reflux 6 h 40 36
9 Solvent-free 10 100 60 72 70
aReaction conditions: α-naphthol (1 mmol), or β-naphthol (1 mmol), benzaldehyde (1 mmol), malononitrile (1
mmol) and solvent (5 mL) in the presence of FeTiO3 as a catalyst. b Isolated yield
Scheme 3 A proposed mechanism for the preparation of 2-amino-4H-chromene derivatives from various aldehydes,
malononitrile and α-naphthol.

A. Ramazani et al.: A convenient and green protocol for the one-pot three-component synthesis of 2-amino-4H-chromene …
190
Table 2. Synthesis of 2-amino-4H-chromene derivatives using ilmenite as a catalyst a
Entry Ar Phenol Product Time/min Yield /%b Mp/C Lit c Mp/C
1 C6H5 α- Naphthol 4a 30 87 209-211 210-211 [39]
2 4-ClC6H4 α- Naphthol 4b 35 91 231-232 231-232 [42]
3 2-ClC6H4 α- Naphthol 4c 35 90 237-238 236-237 [11]
4 2,4-Cl2C6H3 α- Naphthol 4d 35 91 220-222 222-224 [46]
5 4-NO2C6H4 α- Naphthol 4e 37 91 230-232 231-234 [18]
6 3-NO2C6H4 α- Naphthol 4f 40 89 208-210 208-211 [24]
7 4-FC6H4 α- Naphthol 4g 40 90 228-230 229-231 [42]
8 4-MeOC6H4 α- Naphthol 4h 30 85 194-195 195-196 [10]
9 3-OHC6H4 α- Naphthol 4i 35 83 230-232 228-232 [46]
10 4-BrC6H4 α- Naphthol 4j 30 90 243-244 241-243 [41]
11 4-MeC6H4 α- Naphthol 4k 30 84 205-206 205-206 [39]
12 4-HOC6H4 α- Naphthol 4l 35 85 244-246 245-247 [43]
13 C6H5 β- Naphthol 5a 30 86 279-280 278-280 [42]
14 4-ClC6H4 β- Naphthol 5b 35 90 209-210 208-210 [42]
15 2-ClC6H4 β- Naphthol 5c 35 91 237-238 274-276 [11]
16 2,4-Cl2C6H3 β- Naphthol 5d 35 90 220-222 219-222 [47]
17 4-NO2C6H4 β- Naphthol 5e 40 91 230-232 188-189 [42]
18 3-NO2C6H4 β- Naphthol 5f 50 94 211-213 210-212 [41]
19 4-FC6H4 β- Naphthol 5g 55 94 231-232 232-233 [45]
20 4-MeOC6H4 β- Naphthol 5h 30 83 190-192 191-193 [42]
21 4-MeC6H4 β- Naphthol 5i 35 82 205-206 270-272 [40]
a Reaction conditions: α- or β-naphthol (1 mmol), aldehyde (1 mmol), malononitrile (1 mmol) and water (5 mL) in the
presence of FeTiO3 as a catalyst under reflux conditions; b Isolated yield; c All known compounds were characterized by
comparing their spectral (FT-IR) and physical data with those reported.
As shown in Table 2, the presence of electron-
donating groups on the aromatic aldehydes resulted
in low yields of the corresponding products and the
reaction was sluggish. The presence of electron-
withdrawing groups, however, resulted in shorter
reaction times and higher yields. Using α-naphthol
or β-naphthol had no effect on the reaction time or
yield of the corresponding products.
The proposed mechanism for the preparation of
2-amino-3-cyano-4-phenyl-4H-benzo[h]chromene
from benzaldehyde, malononitrile, and α-naphthol
in the presence of FeTiO3 as a catalyst is depicted
in Scheme 3. According to the literature [10-19],
benzylidene malononitrile, containing an electron-
poor C=C double bond, is formed quantitatively by
Knoevenagel addition of malononitrile to the
aromatic aldehyde in the presence of FeTiO3 as a
catalyst. Ortho C-alkylation of the electrophilic
C=C double bond by α-naphthol gives the
intermediate (I). The latter converts via
tautomerization to intermediate (II) which is then
cyclized by nucleophilic attack of an OH group on
the cyano (CN) moiety to give intermediate (III).
Subsequent tautomerization produced the 2-amino-
3-cyano-4-phenyl-4H-benzo[h]chromene (4a).

A. Ramazani et al.: A convenient green protocol for the one-pot three-component synthesis of 2-amino-4H-chromene …
191
Reusability is one of the important properties of
this catalyst. In order to check the reusability of the
catalyst, the reaction of benzaldehyde,
malononitrile and α-naphtol was studied under
similar conditions in the presence of 10 mol% of
FeTiO3 (Table 2, Entry 1). After the completion of
the reaction, the catalyst was separated by an
external magnet, and after several washings with
acetone and distilled water the activated catalyst
was reused to assess its efficiency in subsequent
reaction cycles without any appreciable loss of its
activity.
Fig. 1. Recycling of FeTiO3 as a catalyst investigated
for the synthesis of 2-amino-4H-chromene derivatives by
the reaction of benzaldehyde, malononitrile and α-
naphthol as a model reaction.
CONCLUSIONS
To summarize, herein, an efficient and eco-
compatible method for the synthesis of 2-amino-
4H-chromene derivatives via a one-pot three-
component reaction of α- or β-naphthol with
malononitrile and aromatic aldehydes in the
presence of FeTiO3 as a catalyst was developed.
The operational simplicity, easy work-up, short
reaction time, together with the use of non-toxic
and commercially available catalyst are the
remarkable features of the procedure.
EXPERIMENTAL
Starting materials and solvents were obtained
from Merck (Germany) and Fluka (Switzerland)
and were used without further purification. Melting
points were measured on an Electrothermal 9100
apparatus and are uncorrected. IR spectra were
measured on a Jasco FT-IR 6300 spectrometer. All
obtained products are known compounds and were
identified by comparing their physical and spectral
data (FT-IR) with those reported in the literature.
The progress of reactions was monitored by thin
layer chromatography (TLC).
Synthesis of 2-amino-4H-chromene derivatives
catalyzed by FeTiO3. General procedure: A
mixture of aldehyde (1 mmol), malononitrile (1
mmol), α- or β-naphthol (1 mmol) and FeTiO3 (10
mol %) was added to a test tube and was heated in
an oil bath under reflux conditions in water (5 mL)
for the appropriate time (Table 2). After the
completion of the reaction (monitored by TLC), the
mixture was allowed to cool and the catalyst was
removed by an external magnet. Then, the solvent
was evaporated and the solid residue was
recrystallized from ethanol (95%) to afford the pure
2-amino-4H-chromene derivatives.
Acknowledgments: This work is funded by the
grant NRF-2015-002423 of the National Research
Foundation of Korea.
REFERENCES
1. J. Montgomery, Acc. Chem. Res., 33, 467 (2000).
2. L. Chen, X.-J. Huang, Y.-Q. Li, W.-J. Zheng,
Monatsh. Chem. 140, 45 (2009).
3. S.J. Mohr, M.A. Chirigos, F.S. Fuhrman, J.W. Pryor,
Cancer Res. 35, 3750 (1975).
4. A.T. Raghavender, N. H. Hong, K. J. Lee, M.-H.
Jung, Z. Skoko, M. Vasilevskiy, M. F. Cerqueira, A. P.
Samantilleke, J. Magn. Magn. Mater. 331, 129 (2013).
5. G. R. Green, J. M. Evans, A. K. Vong, in:
Comprehensive Heterocyclic Chemistry II, A. R.
Katritzky, C. W. Ress, E. F. V. Scriven, (Eds), vol. 5,
Pergamon Press: Oxford, UK, 1995, p. 469.
6. (a) W. O. Foye, Principi Di Chemico Farmaceutic;
Piccin: Padova, Italy, 1991; p 416. (b) E. C. Witte, P.
Neubert Roesch, A. Ger, D.E. Offen, Chem. Abstr., 104,
224915f (1986).
7. C. S. Konkoy, D. B. Fisck Cai, S. X. Lan, N. C.
Keana, Chem. Abstr., 134, 29313a (2001).
8. G. A. Elagamay, F. M. A. A. El-Taweel, Indian J.
Chem., Sect. B, 29, 885 (1990).
9. M. M. Heravi, B. Baghernejad, H. A. Oskooie, J.
Chin. Chem. Soc., 55, 659 (2008).
10. M. M. Heravi, K. Bakhtiari, V. Zadsirjan, F. F.
Bamoharram, O. M. Heravi, Bioorg. Med. Chem. Lett.,
17, 4262 (2007).
11. R. Ballini, G. Bosica, M. L. Conforti, R. Maggi, A.
Mazzacani, P. Righi, G. Sartori, Tetrahedron, 57, 1395
(2001).
12. L. Chen, X.-J. Huang, Y.-Q. Li, M.-Y. Zhou, W.-J.
Zheng, Monatsh. Chem., 140, 45 (2009).
13. J. Albadi, A. Mansournezhad, M. Darvishi-Paduk,
Chin. Chem. Lett., 24, 208 (2013).
14. M. Kidwai, S. Saxena, M. K. R. Khan, S. S. Thukral,
Bioorg. Med. Chem. Lett., 15, 4295 (2005).
15. H. M. Al-Matar, K. D. Khalil, H. Meier, H.
Kolshorn, M. H. Elnagdi, Arkivoc, xvi, 288 (2008).
16. B. S. Kumar, N. Srinivasulu, R. H. Udupi, B.
Rajitha, Y. T. Reddy, P. N. Reddy, P. S. Kumar, Russ. J.
Org. Chem., 42, 1813 (2006).
17. S. R. Kolla, Y. R. Lee, Tetrahedron, 67, 8271 (2011).
A. Ramazani et al.: A convenient green protocol for the one-pot three-component synthesis of 2-amino-4H-chromene …
192
18. D. Kumar, V. B. Reddy, B. G. Mishra, R. K. Rana,
M. N. Nadagoudac, R. S. Varma, Tetrahedron, 63, 3093
(2007).
19. B. Datta, M. A. Pasha, Ultrason. Sonochem., 19, 725
(2012).
20. S. Makarem, A. A. Mohammadi, A. R. Fakhari,
Tetrahedron Lett., 49, 7194 (2008).
21. R. A. Mekheimer, K. U. Sadek, Chin. Chem. Lett.,
20, 271 (2009).
22. S. Khaksar, A. Rouhollahpour, S. M. Talesh, J.
Fluorine Chem., 141, 11 (2012).
23. M. P. Surpur, S. Kshirsagar, S. D. Samant,
Tetrahedron Lett., 50, 719 (2009).
24. D. S. Raghuvanshi, K. N. Singh, Arkivoc, x, 305
(2010).
25. J. M. Khurana, B. Nand, P. Saluja, Tetrahedron, 66,
5637 (2010).
26. A.V. Borhade, B. K. Uphade, D. R. Tope, J. Chem.
Sci., 125, 583 (2013).
27. (a) H. Ahankar, A. Ramazani, K. Ślepokura, T. Lis
and S. W. Joo, Green Chem., 18, DOI:
10.1039/C6GC00157B (2016). (b) A. Souldozi, A.
Ramazani, N. Bouslimani, R. Welter, Tetrahedron Lett.
48, 2617 (2007).
28. M. R. Ganjali, S. Aghabalazadeh, M. khoobi, A.
Ramazani, A. R. Foroumadi, A. Shafiee, P. Norouzi, Int.
J. Electrochem. Sci., 6, 52 (2011).
29. (a) A. Ramazani, A. R. Kazemizadeh, Curr. Org.
Chem., 15, 3986 (2011). (b) A. Ramazani, M. Khoobi,
A. Torkaman, F. Zeinali Nasrabadi, H. Forootanfar, M.
Shakibaie, M. Jafari, A. Ameri, S. Emami, M. A.
Faramarzi, A. R. Foroumadi, A. Shafiee, Eur. J. Med.
Chem., 78, 151 (2014). (c) A. R. Kazemizadeh, A.
Ramazani, Curr. Org. Chem. 16, 418 (2012). (d) A.
Ramazani, M. Rouhani, E. Mirhadi, M. Sheikhi, K.
Ślepokura, T. Lis, Nano. Chem. Res. 1, 87 (2016). (e) A.
Ramazani, A. Bodaghi, Phosphorus. Sulfur, Silicon
Relat. Elem., 179, 1615 (2004). (f) A. Ramazani, M.
Rahimifard, Phosphorus, Sulfur, Silicon Relat. Elem.,
181, 2675 (2006). (g) A. Ramazani, A. Souldozi,
Phosphorus, Sulfur, Silicon Relat. Elem., 180, 2801
(2005). (h) A. Ramazani, A. Souldozi, Phosphorus
Sulfur, Silicon Relat. Elem., 178, 1325 (2003). (i) A.
Ramazani, H. Ahankar, Phosphorus, Sulfur, Silicon
Relat. Elem., 170, 181 (2001). (j) I. Yavari, A.
Ramazani, Synth. Commun., 27, 1385 (1997). (k) F. Z.
Nasrabadi, A. Ramazani, Y. Ahmadi, Mol. Divers., 15,
791 (2011). (l) A. Ramazani, A. Souldozi, Phosphorus,
Sulfur, Silicon Relat. Elem., 179, 529 (2004). (m) A.
Ramazani, A. Souldozi, Phosphorus, Sulfur, Silicon
Relat. Elem., 178, 1329 (2003). (n) M. Khoobi, S.
Emami, G. Dehghan, A. R. Foroumadi, A. Ramazani, A.
Shafiee, Arch. Pharm., 344, 588 (2011). (o) M. Khoobi,
A. Foroumadi, S. Emami, M. Safavi, G. Dehghan, B.
Heidary Alizadeh, A. Ramazani, S. A. Ardestani A.
Shafiee, Chem. Biol. Drug. Des., 78, 580 (2011). (p) A.
Ramazani, A. Souldozi, Phosphorus, Sulfur, Silicon
Relat. Elem., 178, 2663 (2003). (q) M. H. Gonbari, A.
Ramazani, A. Souldozi, Phosphorus, Sulfur, Silicon
Relat. Elem., 184, 309 (2009). (r) R. Arabian, A.
Ramazani, B. Mohtat, A. Azizkhani, S. W. Joo, M.
Rouhani, J. Energ. Mater., 32, 300 (2014). (s) S.
Shokrollahi, A. Ramazani, S. J. Tabatabaei Rezaei, A.
Mashhadi Malekzadeh, P. Azimzadeh Asiabi, S. W. Joo,
Iran. J. Cat., 6, 65 (2016).
30. (a) A. Ramazani, M. Rouhani and S. W. Joo,
Ultrason. Sonochem., 28, 393 (2016); (b) M. Rouhani,
A. Ramazani and S. W. Joo, Ultrason. Sonochem., 22,
391 (2015); (c) M. Rouhani, A. Ramazani and S. W. Joo,
Ultrason. Sonochem., 21, 262 (2014); (d) R. Moosavi, A.
R. Abbasi, M. Yousefi, A. Ramazani and A. Morsali,
Ultrason. Sonochem., 19, 1221 (2012); (e) A. R. Abbasi,
H. Kalantary, M. Yousefi, A. Ramazani and A. Morsali,
Ultrason. Sonochem., 19, 853 (2012); (f) M. Rouhani, A.
Ramazani, S. W. Joo and Younes Hanifehpour, Bull.
Korean Chem. Soc., 33, 4127 (2012); (g) A. Ramazani,
M. Rouhani, F. Zeinali Nasrabadi, F. Gouranlou,
Phosphorus, Sulfur, Silicon Relat. Elem., 190, 20 (2015).
31. H. Karami, A. Yaghoobi, A. Ramazani, Int. J.
Electrochem. Sci., 5, 1046 (2010).
32. A. Ramazani, Sh. Hamidi, A. Morsali, J. Mol. Liq.,
157, 73 (2010).
33. H. Ahankar, A. Ramazani, I. Amini, Y. Ahmadi, A.
Souldozi, Heteroat. Chem., 22, 612 (2011).
34. A. Ramazani, A. Farshadi, A. Mahyari, K. Ślepokura,
T. Lis, M. Rouhani, J. Chem. Crystallogr., 41, 1376
(2011).
35. A. Ramazani, V. Azizkhani, F. Gouranlou,
Phosphorus, Sulfur, Silicon Relat. Elem., 185, 719
(2010).
36. A. Ramazani, K. Dastanra, F. Zeinali Nasrabadi, Z.
Karimi, M. Rouhani, M. Hosseini, Turk. J. Chem., 36,
467 (2012).
37. A. Ramazani, A. Mahyari, Helv. Chim. Acta, 93,
2203 (2010).
38. A. Ramazani, A. Mahyari, H. Lashgari, K.
Slepokura, T. Lis, Helv. Chim. Acta., 94, 611 (2011).
39. T. S. Jin, J. C. Xiao, S. J. Wang, T. S. Li, X. R. Song,
Synlett., 13, 2001 (2003).
40. T. S. Jin, J. C. Xiao, S. J. Wang, T. S. Li, Ultrason.
Sonochem,. 11, 393 (2004).
41. R. Maggi, R. Ballini, G. Sartori, R. Sartorio,
Tetrahedron Lett., 45, 2297 (2004).
42. K. Gong, H. L. Wang, D. Fang, Z. L. Liu, Catal.
Commun., 9, 650 (2008).
43. Y. -M. Ren, C. Cai, Catal. Commun. 9, 1017 (2008).
44. S. Kumar, N. Srinivasulu, R. H. Udupi, Russ. J. Org.
Chem., 42, 1813 (2006).
45. Q. Shi, Z. Zhang, S. J. Tu, Chin. J. Org. Chem., 23,
809 (2003).
46. S. Balalaie, S. Ramezanpour, M. Bararjanian, J. H.
Gross, Synth. Commun., 38, 1078 (2008).
47. X. S. Wang, G. S. Yanga, G. Zhao, Tetrahedron, 19,
709 (2008).

A. Ramazani et al.: A convenient green protocol for the one-pot three-component synthesis of 2-amino-4H-chromene …
193
УДОБЕН ЗЕЛЕН ПРОТОКОЛ ЗА ЕДНО-СТАДИЙНА ТРИ-КОМПОНЕНТНА СИНТЕЗА
НА 2-АМИНО-4H-ХРОМЕНОВИ ПРОИЗВОДНИ, КАТАЛИЗИРАНИ ОТ
ИЛМЕНИТ(FeTiO3) КАТО ЕФЕКТИВЕН И МНОГОКРАТНО УПОТРЕБЯВАН
КАТАЛИЗАТОР ВЪВ ВОДНА СРЕДА
В. Евадзаде1, А. Рамазани1*, В. Азизхани2, Х. Агахосеини1, С. В. Джу3*
1Департамент по химия, Университет Занджан, 45195-313 Занджан, Иран 2Департамент по химия, Университет Паяме Нур, 19395-3697 Техеран, Иран
3Училище по механично инженерство, Университет Юнгнам, Гьонгсан 712-749, Република Корея
Постъпила на 24 юли, 2014 г.; Приета на 28 март, 2016 г.
(Резюме)
Описана е високо-ефективна и проста процедура за синтезата на 2-амино-4H-хроменови производни чрез
едностадийна трикомпонентна реакция от различни алдехиди, малононитрил и α- или β-нафтол в присъствие на
катализатор от илменит (FeTiO3). Предимствата на новия протокол включват добър добив, кратко време,
просто изпълнение, ниска токсичност и екологично съобразен катализатор. Според нашите резултати FeTiO3
(10 % мол.) може да се използва за тази синтеза във водна среда с рефлукс.
194
Bulgarian Chemical Communications, Volume 48, Number 2 (pp. 194 – 202) 2016
* To whom all correspondence should be sent:
E-mail: [email protected]
2016 Bulgarian Academy of Sciences, Union of Chemists in Bulgaria
Theoretical research of inulin’s pharmacological activity by combining DFT with
concept DFT methods
W. Long*, Y.K. Li , J.X. Ma, Y.B. Wang
School of Chemistry and Chemical Engineering, University of South China, Hengyang Hunan, 421001 P.R. China.
Received October 16, 2014; Revised May 20, 2015.
The molecular parameters of glucose, pyran-fructose, furfuran-fructose and inulin molecules were investigated by
the density functional theory B3LYP method on the 6-311+g(d, p) basis set level. The calculated results indicate that the
molecular stability order is: furfuran-fructose>pyran-fructose>glucose>inulin. Using the concept DFT method we found
that inulin has the maximum chemical potential, the minimum chemical hardness and the maximum electrophilic index.
The Fukui function scanning shows that the C2 atom of the inulin molecule has strong electron-losing ability, so it is the
active site of the inulin molecule. The EBDE calculations show that O2-H is the easiest position which could be broken
off because the bond energy is only 94.65 kcal•mol-1, which is far less than the adiabatic ionization potential value. A
reasonable theoretical model was established for the pharmacological activity of inulin.
Keywords: Pharmacological Activity, Inulin, DFT and DRFT, FuKui Function.
INTRODUCTION
There is currently a considerable interest to
inulin due to its pharmacological activities [1-6].
Jerusalem artichoke, which is abound of inulin, is a
large-area plant in China. Many kinds of fungi also
contain inulin. We found that the plant containing
inulin is wild reproductive and highly adaptable, so
inulin shows the unique advantage of high
resistance to pest invasion. It is easy to reach
bumper harvest without manual weeding and
fertilization, which attracted many scientists’
attention. Jerusalem artichoke tubers contain
glucose and a large amount of inulin, which has
better resist pest invasion owing to the magical
ingredient. There are many experiments [7-10]
about inulin in order to research its magical
function, but no theoretical research about inulin
has been reported so far.
The clinical pharmacology of non-toxic inulin
includes blood detoxificating, diuretic, detumescent,
antibacterial and antiphlogistic function, so it is
widely used in the cure of diseases such as fever,
diarrhea and many others [11,12]. It has a magical
two-way regulating blood pressure function: when
hypertensive patients are cured by inulin, it
effectively reduces blood sugar concentration;
when hypotensive patients are cured by inulin, it
distinctly raises blood glucose concentration [13].
Stevioside (CAS number 57817-89-7) is a
macromolecular system with the formula C38H60O18
shown in Figure 1(a). Inulin can be obtained by
hydrolysis of stevioside. Chi [14] found that inulin
has good oxidation resistance and it can play
selective catalytic function superior to that of free
radicals as (•OH) and super oxide anion free radical
as (O2-•) in the human body, but the real process is
not clear. Nieto-Nieto [15] found that a small
amount of inulin can greatly increase (from 13.93
to 22.98 kPa) the compressive stress of the gels
prepared at pH 7 in order to increase the apparent
protein concentration. Aidoo [16] pointed out that
inulin and polydextrose mixtures could be used for
sugar-free chocolate manufacture with satisfactory
physicochemical properties when sweetened with
stevia or thaumatin extracts. Hu [17] also made the
important conclusion that inulin has good
antioxidant activities against hydroxyl radicals
(•OH), super oxide radicals (O2•) and DPPH
radicals (DPPH•). In short, there are a lot of
experimental reports about inulin, and it is very
essential to do some theoretical chemical research
in order to explain its magical pharmacological
activity.
Predicting drug activity by the theory of
chemical simulation calculation have been widely
reported [18,19]. We chose D-marigold sugar (CAS
number 87-81-0, formula C6H12O6) to research its
pharmacological activity, which can be contrasted
to glucose, pyran-fructose, fructose, and
furfuran-fructose. We compared the differences in
their pharmacological activity by the concept DFT
activity index [20-21]. The charge scanning of the
inulin molecule was done by the Fukui function
[22], which can predict the active position and
W. Long et al.: Theoretical research of inulin’s pharmacological activity by combining DFT with concept DFT methods
195
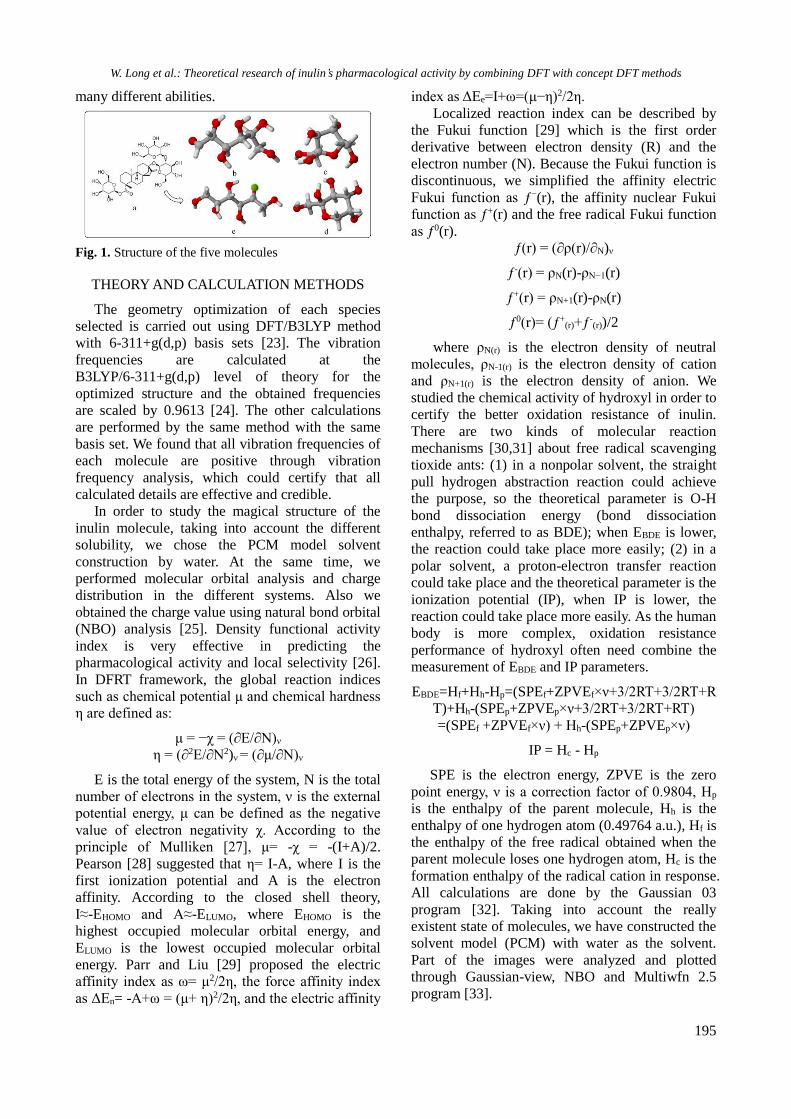
many different abilities.
Fig. 1. Structure of the five molecules
THEORY AND CALCULATION METHODS
The geometry optimization of each species
selected is carried out using DFT/B3LYP method
with 6-311+g(d,p) basis sets [23]. The vibration
frequencies are calculated at the
B3LYP/6-311+g(d,p) level of theory for the
optimized structure and the obtained frequencies
are scaled by 0.9613 [24]. The other calculations
are performed by the same method with the same
basis set. We found that all vibration frequencies of
each molecule are positive through vibration
frequency analysis, which could certify that all
calculated details are effective and credible.
In order to study the magical structure of the
inulin molecule, taking into account the different
solubility, we chose the PCM model solvent
construction by water. At the same time, we
performed molecular orbital analysis and charge
distribution in the different systems. Also we
obtained the charge value using natural bond orbital
(NBO) analysis [25]. Density functional activity
index is very effective in predicting the
pharmacological activity and local selectivity [26].
In DFRT framework, the global reaction indices
such as chemical potential μ and chemical hardness
η are defined as:
μ = −χ = (∂E/∂N)ν
η = (∂2E/∂N2)ν = (∂μ/∂N)ν
E is the total energy of the system, N is the total
number of electrons in the system, ν is the external
potential energy, μ can be defined as the negative
value of electron negativity χ. According to the
principle of Mulliken [27], μ= -χ = -(I+A)/2.
Pearson [28] suggested that η= I-A, where I is the
first ionization potential and A is the electron
affinity. According to the closed shell theory,
I≈-EHOMO and A≈-ELUMO, where EHOMO is the
highest occupied molecular orbital energy, and
ELUMO is the lowest occupied molecular orbital
energy. Parr and Liu [29] proposed the electric
affinity index as ω= μ2/2η, the force affinity index
as ΔEn= -A+ω = (μ+ η)2/2η, and the electric affinity
index as ΔEe=I+ω=(μ−η)2/2η.
Localized reaction index can be described by
the Fukui function [29] which is the first order
derivative between electron density (R) and the
electron number (N). Because the Fukui function is
discontinuous, we simplified the affinity electric
Fukui function as ƒ−(r), the affinity nuclear Fukui
function as ƒ+(r) and the free radical Fukui function
as ƒ0(r).
ƒ(r) = (∂ρ(r)/∂N)ν
ƒ-(r) = ρN(r)-ρN−1(r)
ƒ+(r) = ρN+1(r)-ρN(r)
ƒ0(r)= (ƒ+(r)+ƒ-
(r))/2
where ρN(r) is the electron density of neutral
molecules, ρN-1(r) is the electron density of cation
and ρN+1(r) is the electron density of anion. We
studied the chemical activity of hydroxyl in order to
certify the better oxidation resistance of inulin.
There are two kinds of molecular reaction
mechanisms [30,31] about free radical scavenging
tioxide ants: (1) in a nonpolar solvent, the straight
pull hydrogen abstraction reaction could achieve
the purpose, so the theoretical parameter is O-H
bond dissociation energy (bond dissociation
enthalpy, referred to as BDE); when EBDE is lower,
the reaction could take place more easily; (2) in a
polar solvent, a proton-electron transfer reaction
could take place and the theoretical parameter is the
ionization potential (IP), when IP is lower, the
reaction could take place more easily. As the human
body is more complex, oxidation resistance
performance of hydroxyl often need combine the
measurement of EBDE and IP parameters.
EBDE=Hf+Hh-Hp=(SPEf+ZPVEf×ν+3/2RT+3/2RT+R
T)+Hh-(SPEp+ZPVEp×ν+3/2RT+3/2RT+RT)
=(SPEf +ZPVEf×ν) + Hh-(SPEp+ZPVEp×ν)
IP = Hc - Hp
SPE is the electron energy, ZPVE is the zero
point energy, ν is a correction factor of 0.9804, Hp
is the enthalpy of the parent molecule, Hh is the
enthalpy of one hydrogen atom (0.49764 a.u.), Hf is
the enthalpy of the free radical obtained when the
parent molecule loses one hydrogen atom, Hc is the
formation enthalpy of the radical cation in response.
All calculations are done by the Gaussian 03
program [32]. Taking into account the really
existent state of molecules, we have constructed the
solvent model (PCM) with water as the solvent.
Part of the images were analyzed and plotted
through Gaussian-view, NBO and Multiwfn 2.5
program [33].

W. Long et al.: Theoretical research of inulin’s pharmacological activity by combining DFT with concept DFT methods
196
RESULTS AND DISCUSSION
Geometry Optimization
As shown in Figure 1, a is a stevioside molecule,
e is a D-Marigold-inulin molecule obtained by
hydrolysis from a, b is a glucose molecule, c is a
pyran-fructose molecule, and d is a
furfuran-fructose molecule. They all have hydroxyl
groups, the molecular formula is C6H12O6, and all
of them can be dissolved in water and be absorbed
into the cell. A carbon atom ring is involved in the c
and d molecules, a carbonyl radical (C=O) in the e
molecule, and an aldehyde radical (-CHO) in the b
molecule. In order to compare the different
molecular structures, we chose the
B3LYP/6-311+g(d,p) method combined with the
PCM solvent model (solvent is water) to optimize
the molecular geometrical structure. We also
analyzed the harmonic frequency vibration after the
stable structure has been found. All results are
positive which indicates that the molecular
structure is stable.
As shown in Table 1 (the carbon atom number is
shown in Fig.2), we found that the bond lengths in
the four isomeric molecules are almost equal, the
molecules are stable, and the C-C bond lengths in
furan-fructose and pyran-fructose are the same as in
the chain molecule, but the molecular intra angle is
110°. This is close to the straight chain molecule’s
angle of 119°, which leads to molecular stability. It
is shown that the covalent radius of the carbon atom
is 0.077 nm and the covalent radius of the oxygen
atom is 0.066 nm [35], so the bond length of C=O
should be less than 0.143 nm. We found that the
bond length of C1=O is 0.1200 nm in the b
molecule, the bond length of C2=O is 0.1220 nm in
the e molecule, both are less than 0.143 nm because
of the different aldehyde radical effects. The bond
angle data differing from 120° near the C2 are due
to the group electron attraction of the oxygen atom
in the e molecule. As there are experimental results
[36,37] for these molecules, we found that the error
between calculated data and experimental data [35]
is very small, so our calculations are credible and
reasonable.
Infrared Spectroscopy
After single frequency analysis of the four
molecules by the Gaussian 03 program [32], we
found that all vibration frequencies are positive.
The simple harmonic vibrations are attached by the
Gauss-View program, we drew the infrared spectra
of the four molecules as shown in Figure 3, and the
results are reasonable. Molecular vibration
fingerprint peaks appeared between 400 and 1300
cm-1 due to the vibration of the total molecule. The
absorption peaks between 1000 and 1400 cm-1 are
due to the stretching vibration of the C-O bond in
the molecules (including primary alcohol,
secondary alcohol and tertiary alcohol). A strong
absorption peak is observed at 1100 cm-1 in the c or
d molecules due to the asymmetric stretching
vibration of C-O-C bonds. A similar picture is
observed for the b molecule. There is one strong
absorption peak at 1700 cm-1 in the e molecule due
to the vibration of the carbonyl C=O bond, and
several strong absorption peaks appeared at 2900
cm-1 in the b molecule due to the vibration of C-H
bonds. There are some uncorrected results at a
frequency about 2820 cm-1. There are two areas of
many small absorption peaks after 3000 cm-1,
which are mainly due to the expansion of C-H bond
and the stretching of O-H bond.
NBO Analysis
In order to compare the atomic contribution in
the four molecules, we performed atom charged
scanning by the NBO program. The distribution of
natural charges belonging to an atom is shown in
Table 2. It is seen that both the C1 atom in the b
molecule and the C2 atom in the e molecule show a
strong positive charge owing to the strongly
electronegative attraction of the oxygen atom in the
C=O bond. The atomic charge of the carbon atom is
accounted for by the connected number of oxygen
atoms and hydrogen atoms. The atomic charge of
the C5 atom is 0.5616e and 0.5492e in the c and d
molecule, respectively, which is due to the lack of a
hydrogen atom contributing a positive charge. The
carbon atoms of the primary alcohol generally show
more negative charges because of the steric effect,
such as the C6 atom in the b molecule and the C1
atom in the e molecule. The oxygen atom shows a
negative charge in all molecules. The maximum
value of the negative charge has the oxygen atom
attached to C6 in the b molecule but not the oxygen
atom in C=O, which is affected by the contribution
of the electron cloud and the steric hindrance. The
oxygen atom in C-O-C at both c and d molecules
shows -0.6114e and -0.5560e respectively, which
indicate that the connection tension between the
ring atoms is suitable. The charge distribution may
not explain the overall stability, and we have to
judge by the natural orbit and the two-order
perturbation stabilization energy, the related data
are listed in Table 3.

W. Long et al.: Theoretical research of inulin’s pharmacological activity by combining DFT with concept DFT methods
197
Fig. 2. The carbon atom number in the molecule.
Fig. 3. Infrared spectra of the four molecules.
Table 1. Partial bond lengths (nm) and bond angle (°) data.
Length C1-C2 C2-C3 C3-C4 C4-C5 C5-C6 C1-O C2-O C3-O C4-O C5-O C6-O
b 0.1520 0.1550 0.1540 0.1550 0.1530 0.1200 0.1410 0.1430 0.1430 0.1430 0.1430
c 0.1530 0.1530 0.1540 0.1560 0.1530 0.1420 0.1450 0.1430 0.1410 0.1420 0.1430
d 0.1530 0.1530 0.1530 0.1550 0.1540 0.1430 0.1420 0.1420 0.1440 0.1430 0.1410
e 0.1520 0.1530 0.1550 0.1540 0.1530 0.1400 0.1220 0.1430 0.1410 0.1430 0.1420
Angle ∠ (O-
C1-C2)
∠ (C1-
C2-O)
∠ (C1-
C2-C3)
∠ (C2-
C3-O)
∠ (C2-
C3-C4)
∠ (C3-
C4-O)
∠ (C3-
C4-C5)
∠ (C4-
C5-O)
∠ (C4-
C5-C6)
∠ (C5-
C6-O)
∠ (C5-
C6-O)*
b 124.9 110.2 109.1 104.8 112.8 109.7 114.4 108.0 114.7 106.4 106.3
c 110.5 108.4 115.1 107.4 103.1 109.8 103.2 110.1 114.3 106.8 106.7
d 112.7 109.3 109.3 107.7 110.6 105.4 111.3 108.7 112.9 111.6 112.1
e 109.3 122.2 117.5 113.1 109.0 108.7 111.2 112.7 113.1 110.2 110.3
* from the experimental data in [34].

W. Long et al.: Theoretical research of inulin’s pharmacological activity by combining DFT with concept DFT methods
198
Table 2. Natural charge of atoms in the four molecules.
Molecule C1 C2 C3 C4 C5 C6
b 0.3936 – 0.0168 0.0635 0.0390 0.0351 – 0.1281
c – 0.1043 0.0635 0.0462 0.0176 0.5616 – 0.1252
d – 0.1199 0.0195 0.0474 – 0.0063 0.5492 – 0.1131
e – 0.1581 0.4679 – 0.0238 0.0426 0.0423 – 0.0981
Molecule C1-O C2-O C3-O C4-O C5-O C6-O
b – 0.5089 – 0.7565 – 0.7546 – 0.7751 – 0.7685 – 0.7768
c – 0.7547 – 0.6114 – 0.7589 – 0.7381 – 0.7478 – 0.7737
d – 0.5560 – 0.7737 – 0.7703 – 0.7491 – 0.7416 – 0.7372
e – 0.7223 – 0.4818 – 0.7246 – 0.7440 – 0.7688 – 0.7637
Table 3. Partial results by NBO analysis and the second-order perturbation energy.
Molecule Donor NBO(i) Acceptor NBO(j) Stabilization energy E(2)
cal•mol-1
B LP(C1-O) BD*C1-C2 21.88
LP(C1-O) BD*C1-H 21.39
C LP(C2-O) BD*C5-O 12.95
D LP(C3-O) BD*(C2-O)-H 21.16
LP(C1-O) BD*C5-O 12.69
E
LP(C2-O) BD*C1-C2 12.28
LP(C2-O) BD*C2-C3 11.26
BD(C1-H) BD*(C3-O)-H 10.22
If the two-order perturbation stabilization energy
(E(2)) is sourced from an isolated electron pair, this
could indicate that the other repel force of bonds is
small, so the molecular stability is high. The
maximum value of E(2) is followed as Donor
NBO(i)→Acceptor NBO(j). It is found that E(2)
between the lone pair of electrons of the oxygen
atom and the antibonding orbital has the maximum
value in the b, c, d molecules which indicate that
the three molecules are stable. E(2) value between
the C1-H bond and BD* of C3-O-H in the e
molecule is as large as 10.22 cal•mol-1 and cannot
be neglected. So the formation of molecular intra
hydrogen bond on C1-H in the e molecule may
proceed under the effect of the oxygen atom
attached to the C3 atom. This influence may bring
the inulin molecule in a stable state.
Molecular Energy and Frontier Orbit
In order to assess the different stability of the
four molecules, we calculated the energy data at 0K
which are listed in Table 4. We found that E0 of the
furan-fructose molecule has the lowest value, which
is because the ring built of six atoms could better
accommodate many electrons. The molecular
energy data indicate that the furan-fructose
molecule is the most stable one, the relative
isomerism energy of the glucose molecule is
50.6721kJ•mol-1, and the relative isomerism energy
of the inulin molecule is 43.3208 kJ•mol-1. The
reason for this phenomenon is that the linear
molecule could cause molecular volume expansion,
and the scope expansion of the electronic motion
leads to an energy increase. In order to assess the
electronic transitions and chemical energy, we
calculated the energy level of the frontier molecular
orbital, which is shown in Figure 4. HOMO is the
highest molecular orbital, and LUMO is the lowest
unoccupied molecular orbital. The HOMO-LUMO
gap is used as a direct indicator of kinetic stability.
A large HOMO-LUMO gap implies high kinetic
stability and low chemical activity because it is
energetically unfavorable to add electrons to a
high-lying LUMO orbit [38] or to extract electrons
from a low-lying HOMO orbit [39]. ΔE is the value
of the HOMO-LUMO gap, and for lower ΔE the
electron transition is easier and the molecule is
more unstable.
It is shown that the inulin molecule is more
unstable than the other ones because its ΔE=3.75eV
which is the lowest value in Figure 4, and one
electron could easily transit from the primary
alcohols at the end of the molecule to the carbonyl
bond (C=O), so the atom of the right hydroxy
radical is the best active site which could easily lose
one electron. The activity of the molecule is mainly
controlled by the aldehyde radical which has a large
contribution to the HOMO orbit and LUMO orbit.
It is shown that the electronic transition of
pyran-fructose is very difficult because its ΔE=7.51
eV is the maximum energy gap among the others.
The track comparison of LUMO orbit is dispersed,
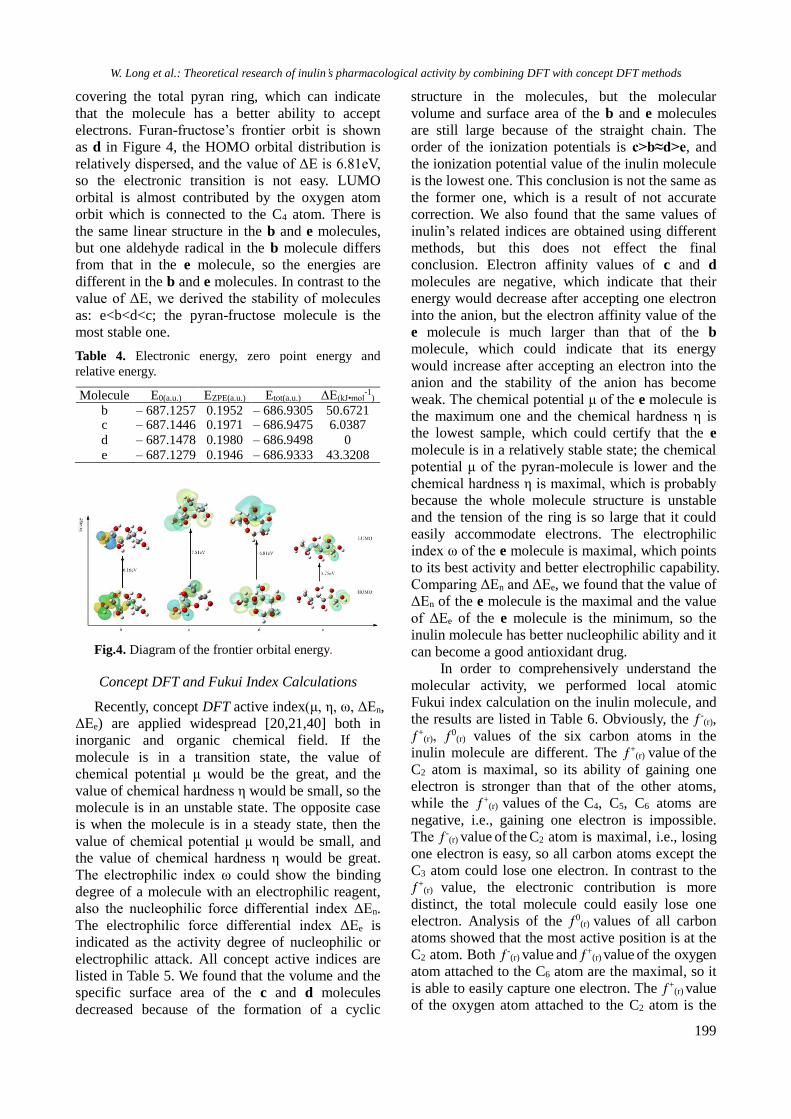
W. Long et al.: Theoretical research of inulin’s pharmacological activity by combining DFT with concept DFT methods
199
covering the total pyran ring, which can indicate
that the molecule has a better ability to accept
electrons. Furan-fructose’s frontier orbit is shown
as d in Figure 4, the HOMO orbital distribution is
relatively dispersed, and the value of ΔE is 6.81eV,
so the electronic transition is not easy. LUMO
orbital is almost contributed by the oxygen atom
orbit which is connected to the C4 atom. There is
the same linear structure in the b and e molecules,
but one aldehyde radical in the b molecule differs
from that in the e molecule, so the energies are
different in the b and e molecules. In contrast to the
value of ΔE, we derived the stability of molecules
as: e<b<d<c; the pyran-fructose molecule is the
most stable one.
Table 4. Electronic energy, zero point energy and
relative energy.
Molecule E0(a.u.) EZPE(a.u.) Etot(a.u.) ΔE(kJ•mol-1
)
b – 687.1257 0.1952 – 686.9305 50.6721 c – 687.1446 0.1971 – 686.9475 6.0387
d – 687.1478 0.1980 – 686.9498 0 e – 687.1279 0.1946 – 686.9333 43.3208
Fig.4. Diagram of the frontier orbital energy.
Concept DFT and Fukui Index Calculations
Recently, concept DFT active index(μ, η, ω, ΔEn,
ΔEe) are applied widespread [20,21,40] both in
inorganic and organic chemical field. If the
molecule is in a transition state, the value of
chemical potential μ would be the great, and the
value of chemical hardness η would be small, so the
molecule is in an unstable state. The opposite case
is when the molecule is in a steady state, then the
value of chemical potential μ would be small, and
the value of chemical hardness η would be great.
The electrophilic index ω could show the binding
degree of a molecule with an electrophilic reagent,
also the nucleophilic force differential index ΔEn.
The electrophilic force differential index ΔEe is
indicated as the activity degree of nucleophilic or
electrophilic attack. All concept active indices are
listed in Table 5. We found that the volume and the
specific surface area of the c and d molecules
decreased because of the formation of a cyclic
structure in the molecules, but the molecular
volume and surface area of the b and e molecules
are still large because of the straight chain. The
order of the ionization potentials is c>b≈d>e, and
the ionization potential value of the inulin molecule
is the lowest one. This conclusion is not the same as
the former one, which is a result of not accurate
correction. We also found that the same values of
inulin’s related indices are obtained using different
methods, but this does not effect the final
conclusion. Electron affinity values of c and d
molecules are negative, which indicate that their
energy would decrease after accepting one electron
into the anion, but the electron affinity value of the
e molecule is much larger than that of the b
molecule, which could indicate that its energy
would increase after accepting an electron into the
anion and the stability of the anion has become
weak. The chemical potential μ of the e molecule is
the maximum one and the chemical hardness η is
the lowest sample, which could certify that the e
molecule is in a relatively stable state; the chemical
potential μ of the pyran-molecule is lower and the
chemical hardness η is maximal, which is probably
because the whole molecule structure is unstable
and the tension of the ring is so large that it could
easily accommodate electrons. The electrophilic
index ω of the e molecule is maximal, which points
to its best activity and better electrophilic capability.
Comparing ΔEn and ΔEe, we found that the value of
ΔEn of the e molecule is the maximal and the value
of ΔEe of the e molecule is the minimum, so the
inulin molecule has better nucleophilic ability and it
can become a good antioxidant drug.
In order to comprehensively understand the
molecular activity, we performed local atomic
Fukui index calculation on the inulin molecule, and
the results are listed in Table 6. Obviously, the ƒ-(r),
ƒ+(r), ƒ0
(r) values of the six carbon atoms in the
inulin molecule are different. The ƒ+(r) value of the
C2 atom is maximal, so its ability of gaining one
electron is stronger than that of the other atoms,
while the ƒ+(r) values of the C4, C5, C6 atoms are
negative, i.e., gaining one electron is impossible.
The ƒ-(r) value of the C2 atom is maximal, i.e., losing
one electron is easy, so all carbon atoms except the
C3 atom could lose one electron. In contrast to the
ƒ+(r) value, the electronic contribution is more
distinct, the total molecule could easily lose one
electron. Analysis of the ƒ0(r) values of all carbon
atoms showed that the most active position is at the
C2 atom. Both ƒ-(r) value and ƒ+
(r) value of the oxygen
atom attached to the C6 atom are the maximal, so it
is able to easily capture one electron. The ƒ+(r) value
of the oxygen atom attached to the C2 atom is the
W. Long et al.: Theoretical research of inulin’s pharmacological activity by combining DFT with concept DFT methods
200
Table 5. Concept DFT indices of the four molecules.
Molecule V
Bohr3
SA
Bohr2
I
eV
A
eV
μ
eV
η
eV
ω
eV
ΔEn
eV
ΔEe
eV
b 1358.18 707.21 6.52 0.36 3.44 6.16 0.96 7.48 0.60
c 1287.23 669.13 6.72 − 0.77 3.48 7.49 0.81 8.03 1.07
d 1313.91 666.31 6.50 − 0.29 3.11 6.79 0.71 7.22 1.00
e 1329.88 708.32 6.45 2.71 4.58 3.74 2.80 9.25 0.09
Table 6. Fukui function analysis of key atoms in the inulin molecule.
Atom ρN(r) ρN-1(r) ρN+1(r) ƒ−(r) ƒ+(r) ƒ0(r)
C1 0.1581 0.1698 0.1448 0.0117 0.0133 0.0125
C2 0.4679 0.5677 0.1925 0.0998 0.2754 0.1876
C3 0.0238 0.0023 0.0088 – 0.0215 0.0150 – 0.0033
C4 0.0426 0.0731 0.0701 0.0305 – 0.0275 0.0015
C5 0.0423 0.0457 0.0490 0.0034 – 0.0067 – 0.0017
C6 0.0981 0.1264 0.1081 0.0283 – 0.0100 0.0092
C1-O 0.7223 0.7123 0.7316 – 0.0100 – 0.0093 – 0.0097
C2-O 0.4818 0.3757 0.7650 – 0.1061 – 0.2832 – 0.1947
C3-O 0.7246 0.7175 0.7908 – 0.0071 – 0.0662 – 0.0367
C4-O 0.7440 0.6914 0.8052 – 0.0526 – 0.0612 – 0.0569
C5-O 0.7688 0.7348 0.7926 – 0.0340 – 0.0238 – 0.0289
C6-O 0.7637 0.5236 0.7756 – 0.2401 – 0.0119 – 0.1260
Table 7. EBDE energy of the different hydrogen atoms
SPEf (a.u.) ZPVp (kJ•mol-1) O―H EBDE/(kJ•mol-1)
Molecule – 687.127937 511.068278 ―
1–H – 686.459871 470.287437 407.471927
2–H – 686.465734 474.290536 396.003258
3–H – 686.454712 473.926642 424.585545
4–H – 686.459414 473.009817 411.340801
5–H – 686.456683 471.023627 416.563519
lowest one so that it is difficult for the C2 atom to
accept one electron but it could lose one electron,
which makes the inulin’s real molecular structure
magical.
Evaluation of the Antioxidant Ability
In pharmacological aspect, the inulin molecule
shows very good antioxidant properties [41,42]. It
is known that inulin could exert pesticide effect by
reacting with the hydroxyl free radical (•OH) or the
super oxide anion free radical (O2-•). The reaction
mechanism of disposal of free radicals mainly
depends on the role of hydroxyl dehydrogenation,
which could be assessed by the EBDE and IP
parameters. Therefore, we calculated the EBDE
value of the different hydrogen atoms on the basis
of the molecular stable structure which has been
optimized by the B3LYP method. Every hydrogen
atom in the inulin molecule is numbered as shown
in Figure 5, and the EBDE values of the different
hydrogen atoms are listed in Table 7.
It is shown that the EBDE values of hydrogen
atoms at different positions are different. When the
EBDE value is lower, this position can more easily
provide a hydrogen atom, so the antioxidant ability
is stronger. We found that 2-H is most easily broken
because its EBDE value is the lowest one, which is
due to the strong electronic contribution of carbonyl
(C=O). But the EBDE value of the 3-H atom is by
approximately 28.5800 kJ•mol-1 higher than that of
the 2-H atom. We calculated the vertical ionization
energy and the adiabatic ionization energy of the
inulin molecule by the same method, the values are
196.5600 kcal• mol-1 and 183.1500 kcal•mol-1,
respectively. Both ionization energies are very high,
so the EBDE value is reasonable to explain the
antioxidant activity.

W. Long et al.: Theoretical research of inulin’s pharmacological activity by combining DFT with concept DFT methods
201
Fig.5. Hydrogen atom numbers in the inulin
molecule.
CONCLUSIONS
We found that the stability order is
furan-fructose>pyran-fructose>glucose>inulin
through geometrical structure optimization,
frequency analysis, infrared spectroscopy, atom
charge population, NBO analysis, and frontier
orbital energy calculation by the DFT method. On
this basis, we chose the concept DFT activity index
method to analyze the various parameters of inulin
molecule. The chemical potential and the
electrophilic index of the inulin molecule are great,
but the chemical hardness is small. The C2 atom is
the active center of the whole molecule because it is
the easiest position for losing one electron through
the Fukui index scanning. Calculations of EBDE
showed that 2-H is the most easily broken off
position because the value is far less than the
adiabatic ionization potential. All these can form a
reasonable theoretical model to explain the magical
pharmacological activity of the inulin molecule.
REFERENCES
1. H.Y. Zhang, L.F. Wang, Y.M. Sun, Bioorganic &
Medicinal Chemistry Letters, 13, 909 (2003).
2. J.H. Roe, J.H. Epstein, N.P. Goldstein, J. Biol. Chem.,
178, 839 (1949).
3. Y. Zhang, T.H. Chen, J.T. Sun, Chemistry Bulletin,
65, 12 (1998).
4. G.R. Gibson, E.R. Beatty, X. Wang,
Gastroenterology, 108, 975 (1995).
5. R.A.A. Muzzarelli, J. Boudrant, D. Meyer,
Carbohydrate Polymers, 87, 995 (2012).
6. S. Stoyanova, J. Geuns, E. Hideg, Int. J. Food Sci. &
nutr., 62, 207 (2011).
7. P. Andrewes, J.L.H.C. Busch, T. Joode, J. Agric.&
Food Chem., 51,1415 (2003).
8. K. Seki, K. Haraguchi, M. Kishimoto, S. Koboyashi
and K. Kainuma, Agric. Biol. Chem., 53, 2089 (1989).
9. Y.J. Zhang, Anal. Chem., 5, 167 (1977).
10. Y.M. Sun, H.Y. Zhang, D.Z. Chen, Org. Letters, 4,
2909 (2002).
11. J. Luo, S.W. Rizkalla, C. Alamowitch, Am. J. Clin.
Nutr., 96, 939 (1996).
12. M.L. Jose, T. Elad, P. Raymond, D.M. Glahn, Food
Chem., 109, 122 (2008).
13. K.G. Jackson, G.R. Taylor, A.M. Clohessy, Brit. J.
Nutrition, 82, 23 (1999).
14. Z.M. Chi, T. Zhang, T.S. Cao, Biol. Tech., 102, 4295
(2011).
15. T.V. Nieto-Nieto, Y.X. Wang, L. Ozimek, L.Y. Chen.
Food Hydrocolloids, 50, 116 (2015).
16. R.P. Aidoo, E.O. Afoakwa, K. Dewettinck.
LWT-Food Science and Technology, 62, 592 (2015).
17. Y.X. Hu, J. Zhang, C.W. Yu, Q. Li, F. Dong, G.
Wang, Z.Y. Guo. International Journal of Biological
Macromolecules, 70, 44 (2014).
18. L.J. Pauling, J. Am. Chem. Soc., 62, 2643 (1940).
19. M. Azenha, P. Kathirvel, P. Nogueira,
Biosens.&Bioelectron., 23, 1843 (2008).
20. A.D. Becke, J. Chem. Phys., 97, 9173(1992).
21. R.G. Parr, W. Yang, J. Am. Chem. Soc., 106, 4049
(1984).
22. K. Fukui, J. Phys. Chem., 74, 4161 (1970).
23. M.P. Andersson, P. Uvdal, J. Phys. Chem. A., 109,
2937 (2005).
24. A.P. Scott, L. Random, J. Phys. Chem., 100, 16502
(1996).
25. M. Szafram, A. Komasa, E.B. Adamska, J. Mol.
Struct., 827, 101 (2007).
26. B. Miehlich, B., A. Savin, A., H. Stoll, H. Preuss,
Chem. Phys. Letters, 157, 200 (1989).
27. Y. Li and J.N.S. Evans, J. Am. Chem. Soc., 117, 7756
(1995).
28. R.G. Pearson, Springer-Verlag: Berlin, 22, 101
(1993).
29. S.B. Liu, Acta Phys.-Chim. Sin., 25, 590 (2009).
30. G.T. Head, G.M. Head, M.J. Frisch, J. Am. Chem.
Soc., 113, 5989 (1991).
31. R.B. Ammar, W. Bhouri, M.B. Sghaier, Food Chem.,
116, 258 (2009).
32. M.J. Frisch, G.W. Trucks, H.B. Schlegel, Gaussian
03, Revision D.02; Gaussian Inc.: Pittsburgh, PA,
2003.
33. T. Lu, F.W. Chen, J. Comp. Chem., 33,580 (2012).
34. 34.M.Z. Saavedra-Leos, C. Leyva-Porras, E.
Martínez-Guerra, S.A. Pérez-García, J.A.
Aguilar-Martínez, C. Álvarez-Salas. Carbohydrate
Polymers, 105,10 (2014).
35. J.A. Dean Ed. Lang’s Handbook of Chemistry,
Thirteenth Edition. McGraw-Hill Book Company,
1985.
36. L. Santiago-Rodríguez, M. M. Lafontaine, C. Castro,
J. Méndez Vega, M. Latorre-Esteves, E. J. Juan, C.
Rinaldi, J. Mater. Chem. B, 22, 2807 (2013).
37. K.D.O. Vigier, A. Benguerba, A. Barrault, J. Green
Chem., 14, 285 (2012).
38. F. Russo, C. Clemente, M. Linsalata, M. Chiloiro, A.
Orlando, E. Marconi, Europ. J. Nutr., 50, 271 (2011).
39. R.M. Yosadara, J. Phys. Chem., A., 106, 11283
(2002).
40. P. Geerlings, F. Deproft, W. Langenaeker, Chem.
Rev., 103,1793 (2003).
41. E.M. Dewulf, P.D. Cani, A.M. Neyrinck, J. Nutr.
Biol.& Chem., 22.712 (2011).
42. 42. B.S. Reddy, R. Hamid, C.V. Rao, Carcinogenesis.
18, 1371(1997).

202
ТЕОРЕТИЧНО ИЗСЛЕДВАНЕ НА ФАРМАКОЛОГИНАТА АКТИВНОСТ НА ИНУЛИН
ЧРЕЗ КОМБИНАЦИЯ НА DFT С КОНЦЕПТУАЛНИ DFT-МЕТОДИ
В. Лонг*, И.И. Ли , Дж.С. Ма, И.Б. Ванг
Училище по химия и химично инженерство, Южнокитайски университет, Хенгянг, Юнан, 421001 Китай
Постъпила на 16 октомври, 2014 г.; Коригирана на 20 май, 2015 г.
(Резюме)
Молекулните параметри на глюкозата, пирано-фруктозата, фурфуран-фруктозата и на инулина са изследвани
с помощта на DFT –теорията по метода B3LYP на базата на 6-311+g(d, p)–ниво. Изчислителните резултати
показват, че редът на молекулна стабилност е: фурфуран-фруктоза>пиран-фруктоза>глюкоза>инулин. С
помощта на концептуален DFT-метод намерихме, че инулинът има максимален химичен потенциал, минимална
химическа устойчивост и максимален електрофилен индекс. Сканирането чрез функция на Fukui показа, че
C2-атомът в инулиновата молекула има силна склонност към отдаване на електрони и затова е активната й част.
EBDE –изчисленията показват, че връзката O2-H е най-лесна за разкъсване понеже енергията й е само 94.65
kcal•mol-1, което е много по-малко от потенциала за адиабатична йонизация. Съставен е подходящ теоретичен
модел за фармакологичната активност на инулина.

203
Bulgarian Chemical Communications, Volume 48, Number 2 (pp. 203 – 208) 2016
Suffering water of Pakistan: arsenic – A major threat
M. Parvez1, M. Akram2*
1Department of Chemistry, Govt. Degree College for Women Lodhran, Pakistan 2Deparment of Environmental Sciences, COMSATS Institute of Information Technology, Vehari Pakistan
Received December 11, 2014, Revised December 22, 2015
Arsenic which is known as ‘Sinkhia’ in Pakistan is notorious as a king of poisons. It is commonly found in water,
mostly originating from geological sources and pollutes the environment. It is the 12th most common element in nature.
It can be found in the earths’ crust, atmosphere, rocks, soil, organisms and natural water. Studies show that 60% of the
arsenic is introduced into the atmosphere by anthropogenic activities. It can combine with other elements to form
inorganic and organic arsenic compounds. The important inorganic species are arsenate (As V) and arsenite (As III).
Inorganic arsenic compounds may include oxygen, sodium, copper, potassium, chlorine, sulphur and iron, while arsenic
combines with carbon and hydrogen to form organic arsenic in plants and animals. The three basic pathways of arsenic
or sources of ingested arsenic include, water, food (fish, sea food, cereals and algae) and air (smelting, coal-fired power
generation). Out of these sources long term exposure to arsenic in drinking water is the greatest threat to human health.
Because of daily and widespread consumption, the presence of arsenic in drinking water has been documented as a
major public health concern in many parts of the world in recent years. The worst health effects due to arsenic are
directly related to the dose and duration of exposure. Dermatological effects are the characteristics of chronic or severe
exposure to arsenic. The dermatological effects include Melanosis (pigmentation) and Keratosis (rough, dry skin
lesions) which may be spotted or diffuse. Arsenic’s chronic exposure may result in neurological, reproductive,
cardiovascular, haematological, respiratory and diabetic effects in humans. Like other parts of the world in Pakistan too,
people are exposed to arsenic by different ways like by the intake of contaminated water or food, by the use of arsenic
containing medicinal preparations, by inhalation or by homicidal or suicidal ingestion of arsenic compounds. Data
regarding arsenic contamination in drinking water is lacking in Pakistan. It is essential that strategies are made available
to tackle the health hazards caused by arsenic contaminated water. This review is an attempt to cover the available data
concerning arsenic contamination, particularly in Punjab and Sindh and generally in Pakistan.
Key words: Arsenic hazards, contaminated drinking water, Arsenic in Pakistan
ARSENIC – THE HISTORY
Arsenic has been derived from the Greek word
“Arsenikon” which means ‘Yellow Orpiment’ [1].
It was first discovered by Albertus Magnus in 1250.
Arsenic is a metalloid existing in more than 200
different forms whereby 60% are arsenates, 20%
sulphosalts, sulphides and arsenite, oxides,
arsenide, silicates and elemental arsenic
constituting the remaining 20%, which exhibit
different grades of toxicity [2]. Arsenic which is
known as ‘Sinkhia’ in Pakistan is notorious as a
king of poisons. It is commonly found in water,
mostly originating from geological sources and
pollutes the environment [3]. It is the 12th most
common element in nature. It can be found in the
earth crust, atmosphere, rocks, soils, organisms and
natural water. Studies show that 60% of arsenic is
introduced into atmosphere by anthropogenic
activities. It can combine with other elements to
form inorganic and organic arsenic compounds [4].
The important inorganic species are arsenate (As V)
and arsenite (As III) [1]. Inorganic arsenic
compounds may include oxygen, sodium, copper,
potassium, chlorine, sulphur and iron, while arsenic
combines with carbon and hydrogen to form
organic arsenic in plants and animals. Organic
arsenic present in foods is harmless and easily
removed from the body but inorganic arsenic is
very toxic and can result in acute, sub-acute or
chronic affects. Due to long term exposure it can be
deposited in the body and once concentrated it can
cause long term damage [2].
SOURCES OF ARSENIC
The three basic pathways of arsenic or sources
of ingested As include:
1. Water
2. Food (fish, sea food, cereals and algae)
3. Air (smelting, coal-fired power generation)
[5].
Out of these sources long term exposure of
arsenic in drinking water is the greatest threat to * To whom all correspondence should be sent:
E-mail: [email protected] 2016 Bulgarian Academy of Sciences, Union of Chemists in Bulgaria

M. Parvez, M. Akram: Suffering water of Pakistan: arsenic – A major threat
204
human health. Because of daily and widespread
consumption, presence of arsenic in drinking water
has been documented as a major public health
concern in many parts of world in recent years [6].
Similarly Bangladesh, in recent years, witnessed a
mass poisoning of population because of arsenic
contaminated ground water [7]. The average
concentration of arsenic in sea water may be as
high as 2.6 µg/L and in fresh water is nearly 0.4
µg/L [8]. An extreme level of up to 225mg/L, as in
the case of drinking well water in Bangladesh can
also be reached [9].
ARSENIC – A USEFUL ELEMENT
The initial use of arsenic as a medicine was for
curing breathing problems and dates back to around
2500 years ago. Arsenic trioxide (As2O3), one of
the common forms of arsenic is used in agriculture
and for medical purposes such as the treatment of
promyelocytic leukemia. During 1970 arsenic was
mainly used as an insecticide to kill insects [2].
ARSENIC – A TOXIC, HAZARDOUS
CHEMICAL
The worst health effects of arsenic are directly
related to the dose and duration of exposure. The
dermatological effects are characteristic of chronic
or severe exposure to arsenic. The dermatological
effects include Melanosis (pigmentation) and
Keratosis (rough, dry skin lesions) which may be
spotted or diffuse. Chronic exposure to arsenic may
result in neurological, reproductive, cardiovascular,
haematological, respiratory and diabetic effects in
humans [10]. As arsenic is colorless, odorless and
tasteless so its exposure is mostly un-noticed
especially in drinking water. The International
Agency of Research on Cancer (IARC) has
classified arsenic as a class I human cancerogen.
The skin and many types of intestinal causes like
bladder, liver, kidney, prostate and lungs are also
linked to arsenic ingestion [5]. A variety of
substances coming from different sources can be
added to the soil, water, air and the food chain. It
can easily accumulate in biological samples such as
nails, hair, skin, urine and blood [11]. The nails and
hair are considered as the most acceptable
biomarkers as arsenic can persist in these
biosamples for longer periods of time [12].
DRINKING WATER CRITERIA FOR ARSENIC
The arsenic (As) in drinking water can affect
human health and is considered as one of the most
important environmental causes of cancer in the
world. Thus, it is essential to record the levels of As
in the drinking water, its chemical composition and
to establish the regulatory standards and guiding
principles [13]. According to FAO (Food and
Agriculture Organization) the health limit for As in
groundwater is 50 µg/L, but in view of recent
incidences of As poisoning in the Indian
subcontinent, a decrease to 5–10 µg/L is being
considered by a number of regulatory bodies
throughout the world. The temporary World Health
Organization (WHO) guideline for As in drinking
water is also 10 µg/L. This is based on the skin
cancer risk, which is much higher than the factor
usually used to protect human health. However, the
WHO states that the health-based drinking water
guideline for As should in reality be 0.17 µg/L [14].
Nevertheless, the current drinking water
guideline for As adopted by both the WHO and the
US EPA is 10 µg/L. This is higher than the
proposed Canadian and Australian maximum
permissible concentrations of 5 and 7 µg As/L,
respectively.
ARSENIC IN PAKISTAN – THE CURRENT
SCENARIO
Though a significant proportion of ground water
in South Asia is contaminated with arsenic,
Pakistan has low levels of arsenic in the ground
water as compared to Bangladesh, India and China
[15]. The expected increase of population in
Pakistan is from 180 million to 221 million by
2025. This represents a threat for the available fresh
water supply which is drops from 5600 m3 to 1000
m3 per capita. The quality of the water supply in
different cities in Pakistan is also deteriorating fast
[16]. In Pakistan the screening of water for arsenic
contamination started relatively late in the year
2000. It is essential that strategies are built to tackle
the health hazards caused by arsenic contaminated
water. A record of the data with the arsenic
contamination levels in different areas of Pakistan
would be helpful to address further contamination
[2].
Like other parts of the world in Pakistan too,
people are exposed to arsenic by different ways
such as by the intake of contaminated water or
food, by the use of arsenic containing medications,
by inhalation or by homicidal or suicidal ingestion
of arsenic compounds. But the arsenic present in
the water or food does not evaporate into air [15].
In the Southern part of Sindh, Pakistan 61-73%
of the population is facing chronic arsenic toxicity.
Almost the same situation prevails in the Punjab
province. With a huge outbreak of arsenic
contamination in different villages of the Kasur
district. The results of the study show that the water
M. Parvez, M. Akram: Suffering water of Pakistan: arsenic – A major threat
205
supply schemes of Kasur fail to fulfill the water
quality standards and due to the high concentration
of arsenic and the people of Kasur face the threat of
various diseases like skin cancer, skin irritation and
chronic inflammation of the kidneys [16].
Ground water is the main source of drinking
water in Pakistan which is pumped out by electric
pumps or hand pumps [2]. Another important
aspect was revealed in a study which showed, that
geographically, more arsenic containing ground
water and associated diseases are found along the
coastline, suggesting a strong link between arsenic
contamination of the ground water and presence of
the Arabian Sea. It was found that for the coastal
population, the toxicity of arsenic varies with the
health of the people, their meal composition, their
diet as well as the location of their drinking water
storage tanks, overhead or underground. As arsenic
is cumulative, its level can be easily determined in
hair, urine, nails or skin through which it slowly
leaves the body and these studies showed an
increasing risk from arsenic in Pakistan [15].
Matiari a district of Sindh, Pakistan is also
witnessing the presence of arsenic in the drinking
water. As in other parts of Pakistan, here too the
ground water is the main source of drinking water
that can be extracted by motor pump or hand pump.
In this area the presence of arsenic in the ground
water can be related to three theories or facts:
1. Use of phosphatic fertilizer that may
release arsenic due to phosphorus.
2. Oxidation of pyrite
3. Due to a reductive dissolution of metal
oxy-hydroxide desorption of arsenic.
In this area phosphate fertilizers are extensively
used on cotton and sugar cane crops which can be a
reason for the elevated concentration of arsenic as
found in many studies [17]. The emerging health
problems of arsenic contaminated water are more
prominent in Southern Punjab. The most affected
areas are located near the Indus River like Rajan
Pur, Rasul Pur in the district Rahim Yar Khan. In
some rural villages the ‘Curse of God’ name is
given to “Arsenicosis”, indicating the physical pain
and sufferings. Again, the main cause of the arsenic
contamination of the ground water is the extensive
use of fertilizers as Rahim Yar Khan is an
important agriculture production land [18]. Initially
only eight districts out of 34 in Punjab were
screened for arsenic contamination by the PCRWR
(Pakistan Council of Research in Water Resources)
and the UNICEF (United Nations Children's Fund)
and then in 2004-05 all the remaining districts were
also covered. It was found that six districts namely
Bahwalpur, Layyah. Multan, Muzzafar Garh, Okara
and Sahiwal are at high risk. The water samples
collected from these districts had the alarming
arsenic level of 250-500µg/L (Fig. 1) while samples
from 60% of the area of Punjab had an arsenic level
of less than 10µg/L i.e. within safe limits.
Safe area
Bahawalpur
Layyah
Multan
Muzzafar Garh
Okara
Sahiwal
Fig.1. Districts at high risk of the arsenic level in
Punjab Pakistan.
ARSENIC IN NEIGHBORING COUNTRIES
The arsenic contamination scenario has changed
remarkably in Asian countries in the near past.
Before the year 2000, only five major incidents of
arsenic contamination of ground water were
reported in Bangladesh, West Bengal, India and
China among Asian countries. During 2000-2005
new sites were reported having ground water
contaminated with arsenic in Mongolia, Cambodia,
Myanmar, Nepal, Pakistan and Afghanistan [19].
Here the main focus is on Afghanistan, India and
Bangladesh. According to the World Health
Organization (WHO) in Bangladesh 42 districts
have ground water contaminated with arsenic,
greater than the permissible limits of 50 µg/L. Nail,
hair and urine samples of the people living in the
arsenic contaminated villages were analyzed and
the people were found to suffer from arsenical skin
lesions. The study revealed that adults can be
afflicted by arsenical skin lesions if the water
contained arsenic above 300µg/L; the average
water intake for adults is 4L/day. Interestingly, if
the nutrition status is poor then even low arsenic
levels can cause arsenical skin lesions, while if the
nutrition status is good even 400µg/L cannot
generate the disease [20].
In Afghanistan, the Water and Sanitation group
(WSG) of Afghanistan did the screening of the
rural water supply schemes for arsenic in different
villages with the help of UNICEF. Under this
program they tested 647 wells out of which 565
were found to be arsenic free, 74 wells contained
arsenic and 56 had arsenic ranging from 10-
500µg/L. The predictable number of people at risk
was about 500,000 [10].
In India, the Lower Ganga plain of West Bengal
was initially found to be severely affected by

M. Parvez, M. Akram: Suffering water of Pakistan: arsenic – A major threat
206
arsenic contamination, but later Bhojpur District,
Bihar which is in the Middle Ganga plain was also
found to be contaminated with arsenic. In a study
conducted in these areas, water from 206 tube wells
was analyzed for arsenic content and it showed that
56.8% had an arsenic concentration exceeding
50µg/L to 300µg/L. In the same study 390 adults
and 160 children were medically examined and
showed that 13% of the adults and 6.3% of the
children had skin lesions, especially the children
were more affected, which can be linked to
malnutrition [21].
LESSONS LEARNT
There is a lot which can be learnt from the
neighboring countries as they fight arsenic
contamination. The public and private sector in
Pakistan can both play a very effective role in this
together so that they could educate and train the
natives of affected areas in taking preventive
measures against arsenic contamination.
An inspiring success story, in this regard, comes
from West Bengal, India. There the Public Health
Engineering (PHE) Department, with the
collaboration of the UNICEF and local NGOs set
up arsenic testing labs. The lab employees and
trainee female members of the local population not
only educate their communities about Arsenic
contamination but also regularly collect samples
from tube wells which are the common source of
drinking and domestic-usage of water for the local
people. If samples from a tube well give positive
results for Arsenic, the PHE teams (trained local
women) inform the local population about it and
encourage them to collectively buy Activated
Alumina Arsenic Filters for the affected tube well.
In addition to employing local women as awareness
and sampling resources, the PHE has also trained
around 300 local women to work as tube well
mechanics. These lady mechanics act on a self-help
basis to repair tube wells and install and replace As
Filters whenever needed. This makes it very cost
effective for the local communities and affordable
to maintain the arsenic free tube wells. This
strategy has really helped the PHE in fighting
Arsenic contamination on a war footing [22].
In Bangladesh, through the conducted survey of
the rural communities the level of awareness was
gauged and prevailed amongst the local community
members as regards arsenic contamination through
the water and soil. Throughout the survey it was
ensured that native members of rural community
were kept on board, educated and consulted to
promote arsenic awareness. Gatherings amongst the
village residents were organized to talk about the
As hazards and public networks such as radio and
TV were engaged to disseminate information
regarding the adverse long term effects of Arsenic
contamination. These activities drastically
improved the household perceptions about the
health impacts of arsenic contamination.
Furthermore, different methods and technologies
were identified for fighting arsenic contamination.
Rural residents were not only educated about these
methodologies but were also informed about the
merits and demerits of each. This infused interest
into the community members and encouraged their
positive involvement [23].
The methods and technologies identified to fight
back Arsenic were:
1. Three Kolshi (Pitcher) Method
2. Dugwell
3. Activated Alumina Method
4. Deep Tubewell
Similar strategies and models can be adopted in the
affected rural areas of Pakistan and with the support
of public-private partnerships.
Apart from Pakistan’s neighboring countries,
lessons can be learnt from other nations which have
been successfully fighting this menace too. In
Cambodia private philanthropists have taken it
upon themselves to discover new ways of
understanding and combating arsenic effectively.
To improve the lives of the local rural community
in this regard, these researchers test all the existing
wells for arsenic contamination. If the test comes
negative, they install another tube well in the
vicinity and hand it over to the local community for
domestic use. In case the test results show positive
signs of Arsenic, the team finances the local
community to buy a locally made rainwater-
harvesting unit. Thus, not only helping them meet
their domestic water needs but also providing them
with a water resource free of arsenic [19].
ENDING NOTE
Keeping in view of the whole scenario, the
following practices should be adopted:
1. Screening of the ground water / tube wells
should be undertaken on a regular basis to keep an
eye on the rise of arsenic contamination.
2. Provision of low cost testing facilities or
apparatus.
3. Areas which are at a high risk like the
Southern Punjab and also some sites in Sindh must
be monitored and the arsenic removal systems
should be made using locally available materials
such as water filtering mediums.
4. Social awareness is a must. It can be done
through print and electronic media. Besides that
M. Parvez, M. Akram: Suffering water of Pakistan: arsenic – A major threat
207
volunteers should be employed to educate the
masses in the affected villages about the harmful
affects. More importantly the sources/ tube wells/
wells that have been screened and found
contaminated should be marked or painted as ‘Red’
indicating the use of water as risky and those not
contaminated by arsenic should be painted as
‘Green’ indicating ‘safe’ for drinking.
5. As the ground water is more contaminated,
alternative water supply options should be
introduced.
6. To determine the health risks associated
with and caused by arsenic, the Government Health
department should take steps so that the
Epidemiological survey in various areas can be
carried out as early as possible.
7. The health hazards caused by arsenic like
‘Arsenicosis’ and all the related study materials
should be included in the curricula of the medical
institutes.
REFERENCES
1. S. Akhtar, A. Shoiab, J. Animal and Plant Sci., 22(3),
659 (2012).
2. K. T. Lim, M. Y. Shukor, H. Wasoh, BioMed
Research International, Volume 2014, Article ID
503784, doi 10.1155/2014/503784, (2014).
3. M. Siepak, P. Niedzielski, K. Bierla, Polish J. Env.
Studies 13(6), 709 (2004).
4. I. A. Toor, N. A. Tahir, Polish J. Env. Studies 18(5),
907 (2009).
5. V. D. Martinez, E. A. Vucic, D. D. Becker-Santos, L.
Gil, W. L. Lam, Journal of Toxicology, Volume 2011,
Article ID 431287, doi 10.1155/2011/431287 (2011).
6. D. N. G. Mazumder, WHO, Geneva, Switzerland,
2000, p. 655.
7. A.H. Smith, M. Goycolea, R. Haque, M. L. Biggs,
American J. Epidemiology, 147(7), 660 (1998).
8. W. R. Cullen, K. J. Reimer, Chem. Rev. 89(4), 713
(1989).
9. M. Kato, M. Y. Kumasaka, S. Ohnuma, A. Furuta, Y.
Kato, H. U. Shekhar, M. Kojima, Y. Koike, N. D.
Thang, N. Ohgami, T. B. Ly, X. Jia, H. Yetti, H.
Naito, G. Ichihara, I. Yajima, PLOS ONE, 8, 1 (2013).
10. A. Mukherjee, M.K. Sengupta, M. A. Hossain, S.
Ahamed, B. Das, B. Nayak, D. Lodh, M. M. Rahman,
D. Chakraborti. J. Health, Population and Nutrit.
24(2), 142 (2006).
11. http://www.sciencedirect.com/science/article/pii/S00
39914002000942.
12. S. H. Frisbie, R. Ortega, D. M. Maynard, B. Sarkar,
Env. Health Perspect., 110(11), 1147 (2002).
13. A. H. Welch, D. B. Westjohn, D. R. Helsel, R. B.
Wanty, Ground Water , 38(4), 589 (2000).
14. US EPA. US EPA Drinking Water Regulations and
Health Advisories; EPA 822-B- 96-002, Washington,
DC, 1996.
15. S. S. Ali, N. Karim, A. B. Munshi, I. Siddique, F. A.
Khan, J. water resource and protection, 5, 1235
(2013).
16. S. A. Ahmad, A. Gulzar, H. Rehman, Z. A. Soomro,
M. Hussain, M. U. Rehman, M. A. Qadir, World
Applied Sci., 24, 634 (2013).
17. A. A. Uqaili, A. H. Mughal, B. K. Maheshwari, Int.
J. Chemical and Env. Engineering, 3(4), 1 (2012).
18. I. ul Haq, W. Hanif, G. Hasnain, S. Durez,
Sustainable Agriculture Research, 1(2), 100 (2012).
19. http://www.sciencedaily.com/releases/2009/03/09032
5091830.htm.
20. U. K. Chowdhury, B. K. Biswas, T. R. Chowdhury,
G. Samanta, B. K. Mandal, G. C. Basu, C. R. Chanda,
D. Lodh, K. C. Saha, S. K. Mukherjee, S. Roy, S.
Kabir, Q. Quamruzzaman, D. Chakraborti, Env. Health
Perspect., 108, 393 (2000).
21. D. Chakraborti, S.C. Mukherjee, S. Pati, M. K.
Sengupta, M. Rahman, U. K. Chowdhury, D. Lodh, C.
R. Chandra, A. K. Chakraborti, G. K. Basu. Env.
Health Perspect., 111, 1194 (2003).
22. http://www.wunrn.com/news/2008/12_08/12_01_08/
120108_india.htm.
23. .http://www.wsp.org/sites/wsp.org/files/publications/
51200762900_Fighting_Arsenic,_Listening_to_Rural_
Communities,_Dec._2002.pdf.
M. Parvez, M. Akram: Suffering water of Pakistan: arsenic – A major threat
208
ВОДНИЯТ ПРОБЛЕМ НА ПАКИСТАН: АРСЕНЪТ КАТО ГЛАВНА ЗАПЛАХА
М. Парвез1, М. Акрам2*
1Департамент по химия, Дамски правителствен колеж, Лодхран, Пакистан 2 Департамент по екологични науки, Институт по информационни технологии COMSATS,Вехари, Пакистан
Постъпила на 11 декември, 2014 г., коригирана на 22 декември, 2015 г.
(Резюме)
Арсенът (известен като ‘Sinkhia’ в Пакистан) се определя като най-опасната отрова. Обикновено той се
среща във водите, главно от геологически източници или от замърсявания на околната среда. Като химичен
елемент той е на 12-то място по разпространение в природата. Намира се в земната кора, атмосферата, скалите,
живите организми и в природните води. Изследванията показват, че наличието му в атмосферата е с
антропогенен произход. Арсенът образува неорганични и арсен-органични съединения. Най-важните
неорганични вещества са арсенатите (AsV+) и арсенитите (AsIII+). Неорганичните арсенови съединения могат да
включват кислород, натрий, мед, калий, сяра и желязо, а органичните се образуват при взаимодействието му с
въглерод и водород в органичните на растенията и животните. Известни са три основни пътища за приемане на
арсена: чрез водата, храната (риба, морски храни, житни култури и водорасли) и въздуха (дишане, емисии от
изгаряне на въглища). Освен тях най-сериозна заплаха за човешкото здраве представлява дългосрочното
наличие на арсен в питейните води. В последните години това се смята за най-голямата заплаха в много части
по света. Най-лошите въздействия се дължат на дозите и продължителността на въздействието. Те се проявяват
дерматологични смущения при хронично или краткотрайно излагане на въздействието на арсен.
Дерматологичните ефекти включват меланози (пигментация) и кератози (втвърдяване, загрубяване на места от
кожата) като петна или дифузно разпространени. Хроничното излагане на въздействие може да причини
неврологични, репродуктивни, сърдечно-съдови, хематологични, дихателни и диабетични ефекти върху хората.
Както и в други места по света и в Пакистан хората са изложени на въздействието на арсена по различни
начини: чрез приемане на храна, медицински препарати, вдишване и пр. В Пакистан няма достатъчно данни по
отношение замърсяването с арсен на питейните води. Те са необходими за изработването на стратегия за
решаване на здравните проблеми, причинени от водите, замърсени с арсен. Този обзор е опит за да се разгледат
достъпните данни относно замърсяването с арсен в Пунджаб и Синдх и изобщо в Пакистан.

209
Bulgarian Chemical Communications, Volume 48, Number 2 (pp. 209 – 218) 2016
Nano-structure zinc and cadmium azide and thiocyanate complexes: Synthesis,
characterization, thermal, antimicrobial and DNA interaction
S. A. Musavi1, M. Montazerozohori1*, M. Nasr-Esfahani1, R. Naghiha2, M. Montazer Zohour3
1Department of Chemistry, Yasouj University, Yasouj 75918-74831, Iran. 2Department of Animal Sciences, Faculty of Agriculture, Yasouj University, Yasouj, Iran.
3Genetics of Non-Communicable Disease Research Center, Zahedan University of Medical Sciences, Zahedan, Iran
Received January 2, 2015, Revised July 3, 2015
Three nano-structure azide and thiocyanate zinc and cadmium complexes of a Schiff base ligand were prepared and
characterized by conductivity measurements, elemental analysis, IR, UV–Visible, 1H and 13C NMR Spectroscopy and
thermo-gravimetric studies. Detectable changes in the spectral data suggested coordination of ligand to zinc and
cadmium ions. The proposed formula structure of the complexes was found to be MLX2. Nano-size structure of the
complexes was confirmed by transmission electron microscopy (TEM). The average particle sizes of the complexes
were found to be in the range of 25.32 - 85.11 nm. Thermal analyses of the complexes was carried out. The thermal
curves showed that zinc thiocyanate was decomposed via six thermal steps while cadmium azide and thiocyanate
complexes were thermally degraded via three steps. Moreover some activation thermodynamic parameters such as the
activation energy, enthalpy, entropy and Gibbs-free energy of activation and the Arrhenius constant were calculated
based on TG/DTG curves. The antimicrobial behavior with respect to bacteria of Escherichia coli, Pseudomonas
aereuguinosa, Staphylococcus aureus, Bacillus subtillis and a fungus (Candida albicans) was investigated. ZnL(NCS)2
was found to have more antifungal activity against Candida albicans than others. Finally, the interaction of the
complexes with DNA (pMalC2X DNA of Escherichia coli) was checked to investigate their cleavage potential.
Keywords: Schiff base, antimicrobial, thermal, transmission electron microscopy, nano-structure.
INTRODUCTION
Metal complexes including a central metal atom
or ion is surrounded by a series of ligands and play
an important role from an inorganic chemistry point
of view especially for elements of the d-block.
Recently various organic ligands containing N, O
and S donor atoms have been used for preparation
of metal complexes. Schiff base ligands have an
important role in the development of the field of
coordination chemistry [1-7]. Such ligands and
their complexes are of interest due to their catalytic
activity in some reactions such as epoxidation,
carbonylation, oxidation and carbon–carbon
coupling reactions. The other reason of importance
of these types of compounds is their biological
activity in containing anti-inflammatory activity,
antibiotic activity, antimicrobial activity and
antitumor activity. The DNA binding or cleavage
interaction of Schiff base complexes is the other
major application of these compounds in the field
of biochemistry [8-19]. Nowadays the synthesis of
nanostructure coordination compounds is of interest
for many researchers. This interest may be due to
specific properties as compared with bulk
compounds. The notable characteristics of nano-
structure compounds originate from their large
surface area with respect to bulk materials. Various
methods are used for the preparation of nano-
structure compounds and synthesis under ultrasonic
conditions is one of the common techniques.
As part of our continued work in the synthesis of
metal complexes of Schiff base ligands [20-23],
herein we report on the synthesis and
characterization of three nano structure zinc and
cadmium azide and thiocyanate complexes of a
Schiff base ligand (L) with the general formula
MLX2 whereas X= SCN‾ and N3‾. These
compounds have been characterized by physical
and spectral data including elemental analysis,
conductance data, FT-IR, UV-Vis, 1H and 13C-
NMR spectroscopy. TEM images were used to
confirm the nano-size structure of all complexes.
Furthermore, the DNA interaction, antimicrobial
activities and thermal behavior of the complexes
were investigated.
EXPERIMENTAL
MATERIALS AND METHODS
All solvents used in the synthesis and analysis of
N'-(2-Amino-ethyl)-ethane-1,2-diamineand 4-nitro-
benzaldehyde were purchased from Aldrich and
Merck and used without any further purification. In
biological tests, Nutrient agar (Merck, Germany) * To whom all correspondence should be sent:
E-mail: [email protected] 2016 Bulgarian Academy of Sciences, Union of Chemists in Bulgaria
M. Montazerozohori et al.: Nano-structure zinc and cadmium azide and thiocyanate complexes: Synthesis, characterization…
210
was used to prepare nutrient plates while Mueller
Hinton broth (Scharlab) was used for the liquid
culture media. The Escherichia coli(ATCC 25922),
Pseudomonas aereuguinosa (ATCC 9027),
Staphylococcus aureus (ATCC 6538) and Bacillus
subtillis (ATCC 6633) were used for antibacterial
and Candidalbicans for the antifungal
investigations. The FT-IR spectra were recorded on
the JASCO-680 model in the range of 400-4000
cm-1 using KBr discs. Elemental analyses data (C,
H and N) were obtained by a CHNS-932(leco)
elemental analyzer. UV-Visible spectra were
recorded using a JASCO-V570 spectrometer of
DMF solution in the 200-800 nm range. 1H and 13C
NMR spectra were recorded using a Brucker DPX
FT-NMR spectrometer at 400 MHz in DMSO-d6
using TMS as the internal standard. Molar
conductance data of the ligand and their metal
complexes were measured in DMF (1.0×10⁻³ M) at
room temperature using a SelectaLab ECW 312
microprocessor conductivity meter. The ultrasonic
instrument used in the synthesis process was an
ultrasonic bath (Tecno-Gasz SPA, Parma, Italy)
with a frequency of 40 kHz and 130 W. The
melting points (ºC) of the complexes were recorded
on a Kruss instrument. The TG/DTG curves were
obtained from a Diamond TGA PerkinElmer 60 Hz.
The transmission electron microscopy (TEM)
images were recorded on a Zeiss EM900
transmission electron microscope with an
accelerating voltage of 80 kV.
Synthesis of Schiff base ligand
The Schiff base of (E)-N-(4-nitrobenzylidene)-
2-(2-(4-nitrophenyl)imidazolidine-1-yl)
ethanamine(L) was synthesized by a condensation
reaction between 2 mmol of 4-nitro-benzaldehyde
and 1 mmol of N'-(2-Amino-ethyl)-ethane-1,2-
diamine in 30 mL methanolic solution according to
our previous report23. After 2h, the ligand was
filtered as cream precipitate and washed twice with
cooled methanol and then dried on the vacuum
apparatus. The characteristic data of IR, UV-
Visible, 1HNMR and 13CNMR have been tabulated
as table 1, 2 and 3.
Preparation of nano-structure MLX2 complexes
(M= Zn(II) and Cd(II)and X= SCN‾ and N3‾)
At first, ethanolic solution of zinc and cadmium
thiocyanate or azide were prepared by a reaction
between zinc or cadmium nitrate (1 mmol) and
potassium thiocyante or sodium azide (2 mmol) in
20 mL ethanol and then filtration. For preparation
of the nano-structure complexes, 15 mL of fresh
ethanolic solution of MX2 was placed in an
ultrasonic condition at a temperature of 60 ˚C. Into
this solution, 15 mL of a methanolic solution of the
Schiff base ligand was added drop wise in a 1:1
molar ratio. After 1 h, the precipitate was filtered
off, washed with cooled ethanol and then dried in
the vacuum apparatus.
Antimicrobial activity assay procedure
To investigate the activity of the titled
compounds as antibacterial and antifungal agents in
vitro four bacteria and a fungus species were
selected. The disk diffusion technique was
employed for biological studies on Escherichia coli
and Pseudomonas aeruginosa as Gram negative;
Staphylococcus aureus and Bacillus subtillis as
Gram positive and Candid albicans as a fungus.
The stock solution of each compound was prepared
in DMSO solvent (500 µg/mL). Muller Hinton
broth was used for preparation of the basal media
for the organisms. For preparation of solid media
by the disk diffusion method, 15 mL of sterilized
nutrient agar (NA) and Sabouraub dextrose agar
(SDA) for antibacterial and antifungal studies
respectively were poured and solidified into each
petri plate. The suspension of the test
microorganisms (0.1 mL) was swabbed by a sterile
glass spreader on to individual media plates. A
sterile paper disk (6mm in diameter) was saturated
with a solution of the test compound and placed
over the media surface and the petri dishes were
incubated at 37◦C. The diameter of the inhibition
zone was measured after incubation for 24 h. The
minimum inhibitory concentration (MIC) values of
the ligand and its complexes were also determined.
The MIC value is defined as the lowest
concentration of compound that prevents the visible
growth of bacteria after the incubation period. In
the MIC method, test solutions of each compound
in DMSO were prepared by serially diluting the
stock solution (500 μg/mL). A set of tubes
containing Mueller–Hinton broth medium, different
concentration of compounds and inoculums of the
microorganism (18h old culture) were incubated at
37 ˚C for 24 hours to determine the MIC values.
DNA cleavage experiments
Investigation of the DNA cleavage activity of
the ligand and its complexes were performed by
agarose gel electrophoresis using plasmid DNA of
supercoiled pMalC2X of E. Coli. Plasmid DNA was
extracted using the DNA Mini Prep Extraction Kit
(BIONEER, Korea) according to the manufacturer's
instructions and the plasmid were kept at -40°C for
the following tests. For the extraction of plasmid
DNA, the LB protocol [Pepton water: 10 g/L; Yeast

M. Montazerozohori et al.: Nano-structure zinc and cadmium azide and thiocyanate complexes: Synthesis, characterization…
211
extract: 5 g/L; NaCl: 10 g/L and/or Agar: 1.5%]
were used for culturing TG1 strain of E. coli
(carried pMalC2X DNA). 30 mL of LB broth
medium was prepared and autoclaved for 20 min. at
121˚C under a pressure of 15 lb. After cooling, 50
µL of Ampiciline (100ug/ul for 1 liter) and TG1
strain were inoculated and incubated at 37˚C for 24
h. After cooling, the seed culture, 50 µL of
Ampiciline was added and incubated for 24 h at 37
˚C. The fresh bacterial culture was centrifuged to
obtain the Pellet. The agarose gel for
electrophoresis was prepared by dissolving 500 mg
of agarose in 50 mL of TAE buffer (40mM Tris
base, pH 8.0; 40mM Acetic acid; 1mM EDTA)
under a boiling condition. When the temperature of
the solution reached 55 ˚C, 10 µL of ethidium
bromide was added and poured into the gel cassette,
fitted with a comb and allowed to solidify. After
solidification, the comb was carefully removed.
The solid gel was placed in the electrophoresis
chamber flooded with a TBE buffer. The gel
electrophoresis experiment was performed by
incubation of the samples containing 4 µL of 5 mg
per mL of each compound in DMSO and 4 µL of
plasmid DNA for 2 h at 37 ˚C. After incubation, the
samples were mixed with bromophenol blue dye
and along with Plasmid DNA alone, the mixture of
DNA and H2O2 and a DNA ladder were carefully
loaded into wells of the instrument. Electrophoresis
was performed at a constant 100 V of electricity for
about 30 min. The resulting bands of
electrophoresis were visualized by UV light and
then photographed.
RESULTS AND DISCUSSION
The nano-structure complexes with the general
formula of [MLX2] were synthesized by reaction
between the Schiff base ligand (E)-N-(4-
nitrobenzylidene)-2-(2-(4-
nitrophenyl)imidazolidin-1-yl) ethanamine (L) and
thiocyanate and azid salts of zinc and cadmium
metals under ultrasonic conditions. The Ligand and
its complexes were obtained as stable powders at
room temperature. The titled compounds were
characterized by physical (elemental analysis,
molar conductance values) and spectral (FT-IR, 1H
and 13C NMR and UV–Visible) data. The molar
conductivity values of the complexes were obtained
in 10-3 M DMF solutions. Low molar conductivities
of them in the range 5.22-13.97 cm2 Ω-1M-1 indicate
that the complexes are non-electrolytes and stable
against dissociation in DMF (Table 1) [24]. The
decomposition temperatures of the titled complexes
are in the range of 143-185˚C. Figure 1 illustrates
the suggested structures of the free ligand and its
complexes. The experimental data are in good
agreement with the suggested structures for them.
The TEM images of the complexes (Figure 2) well
approve their nano- structure character. TEM
images analyses suggested average particle sizes of
85.11, 25.32 and 39.78 nm for zinc thiocyante, zinc
azide and cadmium thiocyante complexes
respectively.
Fig. 1. Proposed structure for the azide and
thiocyanate complexes with the general formula of
MLX2 wherein M= zinc(II), cadmium(II) and X= SCN‾
and N3‾.
Fig. 2.1H NMR (A) and 13C NMR (B) of ZnL(NCS)2
respectively.
Infrared and UV–Visible spectra
The characteristic IR spectral data of the
complexes as compared with the ligands have been
listed in Table 2. The IR spectrum of the Schiff
base ligand exhibited a sharp peak at 1645 cm-1
assigned to the vibration frequency of the
azomethine group [25]. Appearance of the C=N
vibration frequency and absence of the absorption
bands of the starting materials including aldehyde

M. Montazerozohori et al.: Nano-structure zinc and cadmium azide and thiocyanate complexes: Synthesis, characterization…
212
and amine at 1703 and 3100–3300 cm-1 provides
evidence to successfully synthesis of the Schiff
base ligand. The azomethine signal in the infrared
spectra of all complexes shifted to the lower
frequencies by 6-9 cm-1 toward lower energies [26-
28]. The red shift of the azomethine peak indicates
that the imine nitrogen atom is well bound to the
central metal ions. This red shift may be due to π-
back bonding of metal to ligand orbitals after
coordination that reduces the bond order of the
iminic bond leading to vibration at lower energies.
The ligand spectrum shows a stretching vibration
frequency of N-H at 3210 cm-1 as a broad peak due
to widely internal hydrogen bonding which is
observed in the complexes spectra at 3216-3268
cm-1 as a medium intensity band. This change in the
shape and intensity of the vibration frequency of
the N-H peak in the spectra is considered as
confirmation of the coordination of ligand to metal
ions [29]. The absorption peaks at (3101 and 3071),
(2941 and 2886) and 2848 cm-1 are assigned to the
stretching frequencies of aromatic, aliphatic and
iminic CH bonds respectively. After coordination,
these peaks shifted to the higher of the lower wave
numbers. The stretching vibration bands of
asymmetric (νasym) and symmetric (νsym) –NO2
groups were observed at 1518 and 1346 cm-1 [30]
respectively. These strong peaks shifted to another
position after coordination. In the spectra of
ZnL(SCN)2 and ZnL(N3)2, the absorption peaks at
2077 and (2088 and 2063) were assigned to the
coordination of SCN ‾(N-coordination) and N3‾ to
zinc ions [30-34]. In the IR spectra of the cadmium
thiocyanate complex, the appearance of two
absorption peaks at 2089 and 2066 cm-1 for
coordinated thiocyanate may be assigned to
coordinated thiocyante in [CdL(NCS)2]. Finally, the
appearance of some weak absorption peaks in the
range 482-495 cm-1 in the complexes spectra were
assigned to the M-N bond that is considered as
another evidence for the synthesis of the complexes
[35-37].
Electronic spectra of the ligand and its
complexes were recorded in DMF at room
temperature and their spectral data including the
λmax values are listed in Table 2. A band at 278 nm
attributed to the π- π* transition (iminic and
benzene ring) is observed in the electronic spectra
of the ligand and after formation of the complexes,
this band shows a blue shift to a lower value of
wavelength at 267 nm suggesting the coordination
of the iminic nitrogen to the metal ions [19-23].
Other possible transitions such as the d-d transition
and the metal to ligand charge transfers (MLCT) or
ligand to metal charge transfers (LMCT) were not
observed probably due to its overlap with the π-π*
transitions of the ligand.
1H and 13C NMR spectra
1H and 13C NMR spectra were recorded at 400
MHz, using DMSO-d6 solvent for the complexes
and CDCl3 solvent for the ligand. The signal
positions observed in the complexes spectra as
compared with the ligand are given in Table 3. The 1H and 13CNMR of the ligand and ZnL(NCS)2 as
typical spectra are exhibited in Figure 3. The
assignments of 1H and 13C NMR spectral data based
on Figure 1, confirm the structures of the ligand
and its complexes. In the 1H NMR spectrum of the
ligand, the resonance of Hm appeared at 4.40 ppm
shifted to 4.37-4.38 ppm in the complexes spectra.
In the 13CNMR spectrum of the ligand, the signal at
82.37 ppm is attributed to the C10 of the
imidazolidine ring [38] that is blue shifted to 81.24-
81.38 ppm in the azide and thiocyanate complexes
spectra proving the coordination of the ligand with
a retained structure.
Table 1. Analytical and physical data of the Schiff base ligand (L) and its azide and thiocyanate complexes.
Compound Color
Melting
point
(dec.)
Yield
(%)
Found (Calcd.) (%) ΛM
(cm2 Ω-
1M-1) Run C N H
1 Ligand cream 108 65 58.3 (58.53) 18.8 (18.96) 5.1 (5.18) 5.22
2 ZnL(NCS)2 cream 185 78 43.5 (43.60) 17.7 (17.85) 3.40 (3.56) 13.80
3 ZnL(N3)2 cream 143 72 41.5 (41.67) 29.6 (29.70) 3.8 (3.69) 6.20
4 CdL(NCS)2 cream 153 80 40.2 (40.17) 16.6 (16.40) 3.4(3.20) 13.97
Table 2.Vibrational (cm-1) and electronic (nm) spectral data of the Schiff base (L) and its complexes.
Compound νNH νCHarom. νCHaliph νCHimin νC=N Ν
(-NO2)
Ν
(-SCN) ν(-N3)
νM–
N λmax
ZnL(NCS)2 3259 3108,
3070
2929,
2881 2854 1638
1523,
1346 2077 - 482 267
ZnL(N3)2 3216 3108,
3062 2918 2879 1639
1525,
1342 -
2088,
2063 495 267
CdL(NCS)2 3268 30104,
3064 2929 2871 1636
1528,
1344
2089,
2066 - 484 267

M. Montazerozohori et al.: Nano-structure zinc and cadmium azide and thiocyanate complexes: Synthesis, characterization…
213
In the 1H NMR spectrum of the ligand, the
azomethine proton (Hc) is affected by complexation
so that it shifts to the weaker fields from 8.33 to
8.42-8.43 ppm as a singlet indicating coordination
of azomethine nitrogen to metal ions. The signals of
aromatic hydrogens of free ligand were observed in
the 7.69-8.30 ppm that they were found at 7.68-
8.31 ppm in the azide and thiocyanate complexes
spectra.
Ha, a' protons were found as a doublet signal at
8.30 ppm due to coupling with Hb, b' appearing at
7.88 ppm as doublet signals. In the complexes
spectra, these signals appeared as doublets at
similar chemical shifts or at up/downfield positions.
Ho, o' protons were observed as a doublet peak at
8.18 ppm due to coupling with Hn, n' and appeared at
7.69 ppm. Shifts of these signals to up or downfield
regions are another evidence for the coordination of
the ligand. Also, the signals of ethylenic hydrogens
were seen in the 2.61-3.76 ppm range as eight
individual multiple peaks due to the formation of a
imidazolidine ring in the structure of the free ligand
while these signals are shown as several multiple
signals in the range of 2.53-3.78 ppm in the
complexes. The signal of HNH appeared as a
multiple in the range of 2.6-2.78 ppm in the
spectrum of the ligand that shifts to 2.99-3.02 ppm
in the complexes spectra. In the 13CNMR spectrum
of the ligand, the iminic carbon resonance was
observed at 159.59 ppm shifts to 159.98-160.02
ppm in the complexes spectra. This difference in
the location of carbon resonance for the complexes
with respect to the free ligand suggests good
ligation to the central metal. The resonances of the
aromatic carbons appeared at 148.56 for C1 and
C14, 141.44 ppm for C4 and 11, 129.98 for C12,
129.81 ppm for C12', 128.70 ppm for C3 and 3',
123.98 for C2 and 2' and 123.72 ppm for C13 and
13'.
Fig. 3. TEM Images of (A) ZnL(NCS)2, (B)
ZnL(N3)2 and (C) CdL(NCS)2.
Table 3.1H NMR and 13C NMR chemical shifts of ligand and its zinc(II), cadmium(II) complexes in ppm.
Compounds Proposed assignment of the protons and carbons
ZnL(NCS)2
1H-NMR
8.42(s, 1H), 8.31(d, 2H, J= 8.80 Hz), 8.11(d, 2H, J= 8.80 Hz), 7.94(d, 2H, J=
8.80 Hz), 7.68(d, 2H, J= 8.80 Hz), 4.37(s, 1H), 3.77(m, 2H), 3.63(m, 1H),
3.29(m, 1H), 3.02(m, 2H), 2.79(m, 1H), 2.65(m, 1H), 2.54(m, 1H). 13C-
NMR
160.02, 149.18, 148.44, 147.14, 141.59, 134.86, 129.19, 129.10, 128.77,
123.87, 123.09, 81.24, 59.88, 53.09, 52.70, 44.76.
ZnL(N3)2
1H-NMR
8.43(s, 1H), 8.30(d, 2H, J= 8.80 Hz), 8.11(d, 2H, J= 8.80 Hz), 7.95(d, 2H, J=
8.80 Hz), 7.68(d, 2H, J= 8.40 Hz), 4.38(s, 1H), 3.78(m, 2H), 3.64(m, 1H),
3.26(m, 1H), 3.00(t, 2H), 2.80(m, 1H), 2.66(m, 1H), 2.53(m, 1H). 13C-
NMR
160.01, 149.87, 148.44, 147.02, 141.60, 129.28, 129.09, 128.78, 123.88,
123.06, 81.32, 59.99, 53.28, 52.94, 44.73.
CdL(NCS)2
1H-NMR
8.43(s, 1H), 8.31(d, 2H, J= 8.80 Hz), 8.10(d, 2H, J= 8.80 Hz), 7.94(d, 2H, J=
9.20 Hz), 7.68(d, 2H, J= 8.40 Hz), 4.38(s, 1H), 3.76(m, 2H), 3.64(m, 1H),
3.24(m, 1H), 2.99(t, 2H), 2.80(m, 1H), 2.66(m, 1H), 2.53(m, 1H). 13C-
NMR
159.98, 150.34, 148.44, 146.94, 141.60, 132.47, 129.04, 128.85, 128.77,
123.88, 123.03, 81.38, 60.05, 53.39, 53.09, 44.73.

M. Montazerozohori et al.: Nano-structure zinc and cadmium azide and thiocyanate complexes: Synthesis, characterization…
214
After formation of complexes, these signals are
shifted to down or up fields and exhibited at 149-
18-150.34(C1), 148.44(C14), 146.94-147.14(C4),
141.59-141.60(C11), 129.04-129.28(C12), 128.85-
129.10(C12'), 128.77-128.78(C3 and 3'), 123.87-
123.88(C2 and 2') and 123.03-123.09(C13 and 13').
The ligand spectrum showed four individual peaks
for C8, C6, C9 and C7 as aliphatic carbons at
61.10, 53.51, 53.46 and 45.30 ppm respectively.
The coordination of the ligand with the metal ions
leads to changes in their chemical shifts so that they
appeared at 57.60-60.05 ppm for C8, 53.09-53.28
ppm for C6, 52.70-53.09 ppm for C9 and 44.60-
44.73 ppm for C7 in the spectra of all complexes.
In the spectrum of ZnL(NCS)2 and [CdL(SCN)2],
the signal of the carbon resonance of –SCN anions
appeared at 134.86 and 132.47 ppm respectively
[19-23]. Finally it is obvious that the resultant data
obtained from the 1H and 13CNMR spectra well
confirms the suggested structure of the complexes
as shown in Figure 1.
Thermal analysis
Thermogravimetric and differential
thermogravimetric analysis (TG/DTG) of the
complexes were studied under an N2 atmosphere
from room temperature to 900 ºC (Fig. 4). Thermal
studies of the solid complexes were performed to
show more insight into the structure of the reported
complexes. The thermal analyses of the data
including the temperature range, the mass loss (%)
and the thermodynamic activation parameters of the
decomposition steps of the complexes are listed in
Table 4. The decomposition of ZnL(NCS)2
occurred in six successive thermal steps and in the
final step, the percentage of mass lose was 69.78%.
It seems that the thiocyanate groups and the organic
segment are eliminated respectively. A limited
amount of zinc-organic compound is left at the final
step. Major mass lose of ZnL(NCS)2 occurred at
510-680 ˚C with a weight loss of 41.93%. The TG
plots of ZnL(N3)2 and CdL(NCS)2 showed three
successive thermal degradation steps and the total
mass loss(%) at the end of the thermal
decomposition was 82.03% and 61.47% and the
major decomposition occurred at the third thermal
step 390-900 ˚C and 430-600 ˚C respectively.
Likewise in these complexes, azide and thiocyanate
as well as organic parts are the major lost segments
such that zinc and cadmium metals are major
residuals at the final step. The thermodynamic
activation parameters of the decomposition
processes of the complexes including the Arrhenius
constant (A), the activation energy (E*), enthalpy
(ΔH*), entropy (ΔS*) and Gibbs free energy of
decomposition (ΔG*) were evaluated based on
plots using the Coats– Redfern relation [39-41].
The Coats-Redfern equation for the first order
process is in the form:
log[log{Wf/(Wf −W)}/T2]=log [ AR/ӨE∗(1−
2RT/E∗)]−(E∗/2.303RT) (Eq. 1)
Where Wf is the mass loss at the completion of
the reaction, W is the mass loss up to temperature T;
(Wr=Wf-W), R is the gas constant, E* is the
activation energy in J mol-1, Ө is the heating rate.
Since 1-2RT/E*1, a plot vs. 1/T was drawn and E*
was calculated from the slope and the A (Arrhenius
constant) was found from the intercept. Fig. 5
shows the plots of three steps of decomposition for
CdL(NCS)2.
Fig. 4. TG diagrams of the ZnL(SCN)2 complex(A),
ZnL(N3)2 complex(B) and CdL(NCS)2complex (C).

M. Montazerozohori et al.: Nano-structure zinc and cadmium azide and thiocyanate complexes: Synthesis, characterization…
215
Fig. 5.Coats-Redfern plots of the three
decomposition steps of CdL(NCS)2 complex.
The equations used to calculate the activation
entropy ΔS٭, the activation enthalpy ΔH and the ٭
free energy of activation ΔG٭are:
∆S∗ = 2.303[log(Ah/kT)R] (Eq. 2)
∆H∗ = E∗ -RT (Eq.3)
∆G∗ = ∆H∗ − T∆S∗ (Eq.4)
where k and h are the Boltzmann and Planck
constants respectively.
The resultant data listed in table 4 is found in the
range 20.64-422.96 k J mol-1 for energies (E٭) at
different steps of thermal decomposition indicating
relative thermal stability for the complexes. Except
for two steps, the entropy of activation (ΔS٭) is
negative and the value of ΔS٭ is recorded in the
range -271-509 kJ mol-1. As reported in the
literature, the negative values suggest an associated
mechanism at the rate determining step of thermal
degradation. On the other hand the negative values
may be due to a lower rate of thermal
decomposition than the normal decomposition
process [39, 40]. The values of ΔH٭ and ΔG٭are
evaluated in the range 16.055 - 418.591 kJ.mol−1
and 138 - 330 kJ.mol−1 respectively. The positive
values for ΔH٭ and ΔG٭ at all steps indicate the
endothermic character of thermal decomposition for
these compounds.
Antibacterial and antifungal activity
The biological activities of the complexes as
compared with the ligand were investigated by two
methods containing disk diffusion and minimum
inhibitory concentration (MIC) techniques against
Escherichia coli and Pseudomonas aeruginosa as
Gram negative; Staphylococcus aureus and Bacillus
subtillis as Gram positive and Candid albicans as a
fungus. The experimental results have been
tabulated as Table 5. All tested compounds showed
a notable antimicrobial activity. Comparing the
biological activity of the Schiff base ligand with
respect to its complexes showed that metal
complexes potentially have more antibacterial and
anti-fungal activity against the microorganisms as
mentioned above. In general, the metal complexes
are more active than the ligands because metal
complexes may serve as a vehicle for activation of
the ligand as the principle cytotoxic species [42].
According to Overtone's concept and Tweedy's
chelation theory [43, 44], the overlap of the ligand
orbitals and metal ion valence orbitals leads to π-
electron delocalization in the ligand and
considerably reduces the polarity of the metal ion
and therefore increases the lipophilic character of
the compound that causes more diffusion into the
cell membranes. In this way, the growth of bacteria
and/or fungi can be disturbed by blocking the metal
coordination sites of the bacteria and/or fungi
enzymes.The MIC method was also carried out for
all the compounds using 15.63, 31.25, 62.50, 125,
250, 500 µg/mL concentrations. The MIC value of
the ligand for all bacteria is 500 µg/mL. After
coordination of the ligand to metal ions, the most
efficient value was found for CdL(NCS)2(125
µg/mL) with respect to Staphylococcus aureus as
Gram positive bacteria. In the disk diffusion
method, the diameter zone of the inhibitory effect
was recorded in millimeters. For all complexes
against all microorganisms, this value was more
than the parent Schiff base ligand.

M. Montazerozohori et al.: Nano-structure zinc and cadmium azide and thiocyanate complexes: Synthesis, characterization…
216
Table 4. Thermal analysis data including the temperature range, mass loss(%) and thermodynamic activation
parameters of the decomposition steps of the complexes
Compound Temperature
step(˚C)
~Mass
loss(%)
Total Mass
massloss(%) E*(kJmol−1) A(s−1) ΔS*(kJmol−1) ΔH*(kJmol−1) ΔG*(kJmol−1)
ZnL(NCS)2
230-275 2.92
69.78
422.96 3.96×1039 5.09×10² 418.591 1.51×10²
275-315 3.47 102.265 1.07×10⁷ -1.16×10² 97.577 1.63×10²
315-430 7.47 46.413 1.25×101 -2.30×10² 41.368 1.81×10²
430-510 3.87 89.532 6.33×10³ -1.80×10² 83.214 2.20×10²
510-680 41.93 167.729 2.00×10⁷ -1.14×10² 160.318 2.62×10²
680-900 10.12 228.425 2.01×10⁸ -9.72×101 218.921 3.30×10²
ZnL(N3)2
120-270 27.07
82.03
60.477 7.61×10³ -1.75×10² 56.520 1.39×10²
270-385 13.85 20.641 1.03×10⁻¹ -2.69×10² 16.055 1.64×10²
390-900 41.11 226.319 4.06×10¹² -1.03×101 220.748 2.28×10²
CdL(NCS)2
120-260 15.87
61.47
56.139 2.14×10³ -1.85×10² 52.192 1.40×10²
260-430 14.77 20.641 8.49×10⁻² -2.71×10² 16.055 1.65×10²
430-600 30.19 160.300 5.40×10⁷ -1.04×10² 154.728 2.24×10²
Table 5.Antibacterial and antifungal activities of 25 µg/disks of the Schiff based ligand and its complexes based on
the zone of inhibition, the growth of microorganisms(mm) and MIC(µg/mL).
As seen in Table 5, all compounds have the
lowest inhibition effect with respect to
Pseudomonas aereuguinosa among tested bacteria.
The bioassay data for ligands showed maximum
and minimum efficiency with respect to Bacillus
subtillis with inhibition zone of 14.46 mm and
Pseudomonas aereuguinosa with inhibition zone of
6.80 mm respectively. A comparable investigation
between all the complexes indicated that the growth
of bacteria is more inhibited by ZnL(NCS)2 for
Escherichia coli and Bacillus subtillis. CdL(NCS)2
efficiently stopped the growth of Pseudomonas
aereuguinosa and Staphylococcus aureus. The
growth inhibition effects of the ligand and its
complexes with respect to Candida albicansas, as a
fungus, were studied and ZnL(NCS)2 with
inhibition zone of 24.80 mm was selected as an
efficient antifungal as compared with the free
ligand.
DNA cleavage efficiency
The DNA cleavage ability of the complexes as
compared with the free ligand was monitored by
the agarose gel electrophoresis method with respect
to pMalC2X DNA of E. Coli. Three forms of DNA
containing a supercoiled form (Form I), open
circular (nicked) form (Form II) and the linear form
(Form III) were separated based on the difference
in the rate of migration by electrophoresis. When
the original supercoiled form (Form I) of plasmid
DNA is nicked, an open circular relaxed form
(Form II) will be exist in the system and the linear
form (Form III) can be found upon further
cleavage. The compact Form I migrates relatively
faster while the nicked Form II migrates slowly,
and the linearized form (Form III) migrates
between Forms I and II. The nuclease activity of
the complexes as compared with the free ligand
have been assessed by their ability to convert
supercoiled pMalC2X DNA from Form I to Form II
and Form III. All the metal complexes and free
ligands were able to convert supercoiled DNA into
an open circular and linear form of DNA. These
changes were illustrated in gel electrophoresis by
the intensity of the bands. The results of DNA
cleavage are given in Figure 5. In this figure L, X
and C are attributed to the ladder, mixture of DNA ,
H2O2 and control DNA respectively. The lanes 1 to
4 are attributed to mixtures of DNA with a ligand,
Compound
Gram negative bactria Gram positive bacteria Candida
albicans Escherichia coli Pseudomonas
aereuguinosa Bacillus subtillis
Staphylococcus
aureus
MIC
(µg/mL)
zone
(mm)
MIC
(µg/mL)
zone
(mm)
MIC
(µg/mL)
zone
(mm)
MIC
(µg/mL)
zone
(mm)
zone
(mm)
Ligand 500 11.50 500 6.80 500 14.46 500 10.00 17.40
ZnL(NCS)2 250 15.50 500 8.44 250 17.00 250 12.00 24.80
ZnL(N3)2 500 12.20 500 7.90 500 15.00 500 11.50 21.80
CdL(NCS)2 250 15.20 500 8.60 500 14.80 125 16.20 18.50

M. Montazerozohori et al.: Nano-structure zinc and cadmium azide and thiocyanate complexes: Synthesis, characterization…
217
ZnL(NCS)2, ZnL(N3)2 and CdL(NCS)2
respectively.
The effect of the compounds in cleavage of the
suppercoiled DNA to the form II and III is
determined by diminishing in intensity of the band
of the suppercoiled pMalC2X DNA. It seems that
ZnL(NCS)2 and CdL(NCS)2 are more efficient for
the cleavage of the supper coiled form to the linear
form of DNA as compared with the other tested
compounds. The DNA cleavage ability of the
complexes may depend on the binding of the DNA
molecule to the metal complexes. However, the
nature of the reactive intermediates involved in the
DNA cleavage by the complexes is not clear.
According to the experimental data from the DNA
cleavage studies, it may be correct to say that the
cleavage of genome is responsible for the death of
some of the studied microorganisms [45].
Fig. 6. Gel electrophoresis diagram for DNA
cleavage activity of ligand and its complexes. lane L:
ladder, lane X: DNA + H2O2; lane C: control DNA, lanes
1 to 4: ligand, ZnL(NCS)2, ZnL(N3)2 and CdL(NCS)2
respectively.
CONCLUSION
In this research three new azide and thiocyanate
complexes of an imidazolidine Schiff base ligand
were synthesized and characterized by spectral (IR,
UV–Visible, 1H and 13C NMR) and physical
techniques. The observable changes in IR and
NMR spectra in the complexes with respect to the
free ligand well suggest the formation of the
mentioned complexes. IR peaks appeared for azide
and thiocyanate well confirm the coordination of
these anions to metal centers in the inner
coordination sphere. The spectral data suggest the
formula structure of MLX2 for the complexes. The
nano-size character of the synthesized complexes
was confirmed by the TEM images. Moreover the
thermal behavior of the complexes was studied by
their thermal analysis and then some activation
thermodynamic parameters such as A, E*, ΔH*,
ΔS* and ΔG* were calculated based on the thermal
analysis plots of TG/DTG. The antimicrobial
behaviors of the complexes against the Escherichia
coli, Pseudomonas aereuguinosa, Staphylococcus
aureus and Bacillus subtillis and a fungus entitled
as Candida albicans were investigated. Finally, the
DNA interaction of the compounds with pMalC2X
DNA of Escherichia coli was investigated and it
was revealed that ZnL(NCS)2 and CdL(NCS)2 are
more successful for the cleavage of DNA that other
compounds.
Acknowledgement: This work was partially
supported by Yasouj University.
REFERENCES:
1. A.K. Sharma, S. Chandra, Spectrochim.Acta A,78,
337 (2011).
2. P.M. Vimal Kumar, P.K. Radhakrishnan,
Inorg.Chim.Acta, 375, 84 (2011).
3. 3.M. Sutradhar, T.R. Barman, M.G.B. Drew, E.
Rentschler, J.Mol.Struct., 1041, 44 (2013).
4. B. Gao, M. Wan, J. Men, Y. Zhang, Appl.Catal. A:
General, 10,156 (2012).
5. M. H. Habibi, E. Shojaee, G. S. Nichol, Spectrochim.
Acta A, 98, 396 (2012).
6. B. P. Baranwal, K Tripathi, A. K. Singh, S. Tripathi,
Spectrochim. Acta A, 91, 365 (2012).
7. S. Ershad, L. Sagathforoush, G. Karim-nezhad, S.
Kangari, Int. J. Electrochem. Sci., 4, 846 (2009).
8. G. Grivani, G. Bruno, H.A. Rudbari, A.D. Khalaji,
PegahPourteimouri, Inorg. Chem. Commun., 18, 15
(2012).
9. J. Li, J. Hu, Y. Gu, F. Mei, T. Li, G. Li, J. Mol.
Catal. A: Chem., 340, 53 (2011).
10. W. Zeng, J. Li, S. Qin, Inorg.Chem.Commun., 9, 10
(2006).
11. M. M. Tamizh, R. Karvembu, Inorg. Chem.
Commun., 25, 30 (2012).
12. D. Arish, M. Sivasankaran Nair, Spectrochim.Acta A,
82, 191 (2011).
13. G. Hu, G. Wang, N. Duan, X. Wen, T. Cao, S. Xie,
W. Huang, ActaPharma.Sin.B, 2, 312 (2012).
14. S. Sathiyaraj, K. Sampath, R.J. Butcher, R.
Pallepogu, C. Jayabalakrishnan, Eur. J. Med. Chem.,
64, 81 (2013).
15. S. Akine, T. Taniguchi, W. Dong, S. Masubuchi, T.
Nabeshima, J. Org. Chem., 70, 1704 (2005).
16. W. K. Dong, Y. X. Sun, Y. P. Zhang, L. Li, X. N.
He, X. L. Tong, Inorg.Chim.Acta, 362, 117 (2009).
17. M. F. Summers, L.G. Marzilli, N. Bresciani-Pahor,
L. Randaccio, J. Am. Chem. Soc., 106, 4478 (1984).
18. A. K. Singh, O. P. Pandey, S. K. Sengupta,
Spectrochim. Acta A, 85, 1 (2012).
19. M. Daszkiewicz, CrystEngComm, 15, 10427 (2013).
20. M. Montazerozohori, S. Zahedi, A. Naghiha, M.
Montazer Zohour, Mater. Sci. Eng. C, 35, 195 (2014).
21. M. Montazerozohori, S. Zahedi, M. Nasr-Esfahani,
A. Naghiha, J. Ind. Eng. Chem., 20, 2463 (2014).
22. M. Montazerozohori, S.A. Musavi, A. Naghiha, M.
Montazer Zohour, Spectrochim. Acta A, 129, 382
(2014).

M. Montazerozohori et al.: Nano-structure zinc and cadmium azide and thiocyanate complexes: Synthesis, characterization…
218
23. M. Montazerozohori, S.A. Musavi, A. Naghiha, S.
Veyseh, J. Chem. Sci., 126, 227(2014).
24. Y. Harinath, D. H. K. Reddy, B. N. Kumar, Ch.
Apparao, K. Seshaiah, Spectrochim. Acta A, 101, 264
(2013).
25. A. DehnoKhalaji, G. Grivani, M. Seyyedi, K.
Fejfarovac, M. Dusek, Polyhedron, 49, 19 (2013).
26. M. Shebl, Spectrochim.Acta A, 73, 313 (2009).
27. A. DehnoKhalaji, G. Grivani, M. Rezaei, K.
Fejfarovac, M. Dusek, Polyhedron, 30, 2790 (2011).
28. S. Chandra, S. Bargujar, R. Nirwal, N. Yadav,
Spectrochim.Acta A, 106, 91 (2013).
29. B. Dede, F. Karipcin, M. Cengiz, J. Hazard. Mater.,
163, 1148 (2009).
30. M. Montazerozohori, S.A. Musavi, J. Coord. Chem.,
61, 3934 (2008).
31. B. Samanta, J. Chakraborty, C.R. Choudhury, S.K.
Dey, D.K. Dey, S.R. Batten, P. Jensen, G.P.A. Yap, S.
Mitra. Struct.Chem., 18, 33 (2007).
32. C. Zhang, G. Tian, B. Liu. Transition Met. Chem.,
25, 377 (2000).
33. S. Sen, P. Talukder, G. Rosair, S. Mitra.
Struct.Chem., 16, 605 (2005).
34. N.A. Illan-Cabeza, F. Hueso-Urena, M.N. Moreno-
Carretero, J.M. Martınez-Martos, M.J. Ramırez-
Exposito, J. Inorg. Biochem., 102, 647 (2008).
35. L.P. Nitha a, R. Aswathy a, Niecy Elsa Mathews a,
B. Sindhukumari b, K. Mohanan, Spectrochim.Acta A,
118, 154 (2014).
36. G. Grivani, V. Tahmasebi, K. Eskandari, A.
DehnoKhalaji, G. Bruno, H. AmiriRudbari, J. Mol.
Struct., 100,1054 (2013).
37. Y. Harinath, D. H. K. Reddy, B. N. Kumar, Ch.
Apparao, K. Seshaiah, Spectrochim. Acta A, 101, 264
(2013).
38. F. Yue, L. Gang, T. Xiu-Mei, W. Ji-De, W. Wei,
Chin. J. Struct. Chem., 27, 455 (2008).
39. A. A. Soliman, J. Therm. Anal.Calorim., 63, 221
(2001).
40. R.R. Zaky, T.A. Yousef, K.M. Ibrahim, Spectrochim.
Acta A, 97, 683 (2012).
41. S. Sen, P. Talukder, G. Rosair, S. Mitra, Struct
Chem., 16, 605 (2005).
42. D.H. Petering, H. Sigel, Metal Ions in Biological
Systems, vol. 2, Marcel Dekker, New York,1973, p.
167.
43. B.G. Tweedy, Phytopathalogy, 55, 910 (1964).
44. J.W. Searl, R.C. Smith, S.J. Wyard, Proc. Phys. Soc.,
78, 1174 (1961).
45. A. Kulkarni, S.A. Patil, P.S. Badami, Eur. J. Med.
Chem., 44, 2904 (2009).
НАНО-СТРУКТУРИРАНИ ЦИНКОВ И КАДМИЕВ АЗИД И ТИОЦИАНАТНИ
КОМПЛЕКСИ: СИНТЕЗА, ХАРАКТЕРИЗИРАНЕ, ТЕРМИЧНИ, АНТИМИКРОБНИ И ДНК-
ВЗАИМОДЕЙСТВИЯ
С. А. Мусави1,М. Монтазерозохори1*, М. Наср-Есфахани1, Р. Нагиха2, М.Монтазер Зохоур3
1Департамент по химия, Университет Ясудж, Ясудж 75918-74831, Иран 2Департамент по зоология, Земеделски факултет, Университет Ясудж, Ясудж, Иран.
3Изследователски център по генетика на неинфекциозните заболявания, Медицински университет в Захедан,
Иран
Постъпила на 2 януари, 2015 г.; приета на 3 юли, 2015 г.
(Резюме)
Приготвени са три нано-структурирани азиди и тиоцианати на цинка и кадмия и техни комплекси с бази на
Schiff като лиганди, Те са охарактеризирани чрез измервания на проводимостта, елементен анализ, IR, UV–
Visible, 1H и 13C ЯМР-спектроскопия и термо-гравиметрични изследвания. Забележимите промени в
спектралните данни предполагат координиране на лигандите към цинковия и кадмиевия атом. Предлага се
следната емпирична формула на комплексите: MLX2. Нано-размерната структура на комплеските се
потвърждава чрез трансмисионна електронна микроскопия (TEM). Средният размер на комплексите е
определен в интервала на 25.32 - 85.11 nm. Резултатите от термичния анализ показват, че цинковият изоцианат
се разпада на шест последователни стъпки, докато кадмиевите комплекси се разлагат на три етапа. От
термогравиметричните криви и от диференциално-термогравиметричния анализ са определени
термодинамични параметри, като активиращата енергия, енталпията, ентропията, свободната енергия на
активация по Гибс, както и константата на Арениус. Изследвана е антимикробната активност спрямо
бактериите Escherichia coli, Pseudomonas aereuguinosa, Staphylococcus aureus, Bacillus subtillis и гъбичките
Candida albicans. ZnL(NCS)2 има най-висока анти-гъбична активност спрямо Candida albicans сравнение с
останалите комплекси. Накрая е изпитано взаимодействието на комплексите с ДНК (pMalC2X DNA от
Escherichia coli) за да се изследва потенциала на разкъсване.

219
Bulgarian Chemical Communications, Volume 48, Number 2 (pp. 219 – 224) 2016
The study on D-aminoacylase gene synthesis via chemical and enzymatic combined
method
X. Hou1, J. Li1, Z. Nuo1, Y. Ren1, C. Gao1,2,3*
1 Schools of Life Science, Jilin University, Changchun, Jinlin Province, People’s Republic of China;
2 National Engineering Laboratory for AIDS Vaccine, School of Life Science, Jilin University, Changchun, Jinlin
Province, People’s Republic of China;
3 Key Laboratory for Molecular Enzymology and Engineering, the Ministry of Education, School of Life Science,
Jilin University, Changchun, Jinlin Province, People’s Republic of China
Received July 8, 2015, Revised October 6, 2015
According to the amino acid sequence, the codons of D-aminoacylase gene from Alcaligenes A-6 were super-
seded by the most abundant codon in E. coli. The method is performed to avoid the rare codons and the lower
abund+ance which can affect the expression of heterologous proteins. The total length of the synthesized gene is
1479 bp. 52 oligonucleotides were designed and synthesized by the phosphoramidite four-step chemical method. A
three-stage assembling method was applied to assemble the whole DNA fragment. The reduction of the template
complexity in the reaction system had a significant effect on reducing the number of byproducts to quickly obtain
the synthetic gene. The synthesized DNA was connected to pET32a, and then put into E.coli BL21 (DE3) for ex-
pression. After induction by IPTG, the codon optimized D-aminoacylase gene can be expressed more efficiently in E.
coli BL21 (DE3), accounting for 78% of total bacterial protein compared to 56% of codon unoptimized gene. The
N-acetyl-D-valine amidohydrolase activity was assayed by measuring the D-valine formed using the fermentation
bacterial cell to catalyze the N-acetyl-D,L-valine, the fermentation activity of strain E. coli BL21 (DE3) harboring
pET-dan, which reaches 98 U/ml.
Keywords D-aminoacylase; Alcaligenes A-6; Gene synthesis; Expression.
INTRODUCTION
D-amino acids are involved in the synthesis of
antibiotics, pesticides, and other products
including food and agrochemical industries [1].
D-amino acids occur naturally in bacterial cell
walls, some microbial metabolites including
peptide toxins and antibiotics, plants, peptides
from frogs and molluscs, several insects,
earthworms and other animals [2]. But the
D-enantiomers of amino acids are far less
abundant in nature than the corresponding
L-enantiomers, which are the predominant form
occurring in biological molecules [3]. Since
fermentation is not an efficient method of
producing D-amino acids, the D-amino acids are
produced in two ways, by direct organic
asymmetric synthesis and by enzymatic
resolution of racemates. In recent years, much
attention has been paid to using N-acyl-D-amino
acid amidohydrolase for the production of
D-amino acids [4]. N-acyl-D-amino acid
amidohydrolase (3.5.1.81) catalyzes the hydrolysis
of N-acyl derivatives of various D-amino acids to
D-amino acids and fatty acids, and is used for the
optical resolution of DL-amino acids [5, 6].
N-acyl-D-amino acid amidohydrolase
(D-aminoacylase) that acts on N-acyl derivatives
of various neutral D-amino acids has been
reported from Alcaligenes, Pseudomonas,
Streptomyces, Sebekia, Variovorax.
D-aminoacylase from Alcaligenes xylosoxydans
subsp. xylosoxydans A-6 (Alcaligenes A-6) has
been produced and sold by Amano Enzyme Co. as
a commercial enzyme (D-aminoacylase “Amano”)
for the manufacture of neutral D-amino acids [6].
But the D-aminoacylase gene from Alcaligenes
A-6 using to construct engineering bacteria E.
coli, has some rare codons of host bacteria, which
can affect the expression of heterologous proteins.
Therefore, improving the expression of
D-aminoacylase is a main goal which needs to be
addressed.
The original purpose of this study was to syn-
thesize an Escherichia coli codon optimized
D-aminoacylase gene. After induction by IPTG,
the codon optimized D-aminoacylase gene can be
expressed more efficiently in E. coli BL21 (DE3),
accounting for 78% of total bacterial protein and
contrasted with 56% of codon unoptimized gene.
The N-acetyl-D-valine amidohydrolase activity
was assayed by measuring the D-valine formed * To whom all correspondence should be sent:
E-mail: [email protected] 2016 Bulgarian Academy of Sciences, Union of Chemists in Bulgaria
X. Hou et al.: The study on D-aminoacylase gene synthesis via chemical and enzymatic combined method
220
using the fermentation bacterial cell to catalyze
the N-acetyl-D,L-valine, the fermentation activity
of strain E. coli BL21 (DE3) harboring pET-dan
which can reach 98U/ml.
MATERIALS AND METHODS
Materials
E.coli BL21(DE3)、E.coli JM109、pUC18、
pET-32a were obtained from ATCC. EcoR I, Xba
I, BamH I, Bgl II, Xho I, dNTP, T4 DNA ligase,
pfu DNA polymerase, DNA marker were
purchased from Fermentas, USA.
Gene and Oligonucleotide Design
The synthesis of D-aminoacylase gene was
designed according to the literature [3,6] and
retrieved database [7] information.
Chemical synthesis of oligonucleotides
The phosphoramidite four-step method was
applied for chemical synthesis of oligonucleotides,
which uses the reaction of acid-activated
deoxynucleoside phosphoramidites with
solid-phase tethered deoxynucleoside. The
oligonucleotides were synthesized using the
Biolytic Oligo Synthesizers Dr. Oligo-192 by
BGI-Shenzhen at the 20 nmol scale, and PAGE
method was used for purification.
Enzymatic assembly of oligonucleotides
In each DA-PCR reaction, a mixed solution of 5
μL was used in 50 μL of reaction solution; thus, the
final concentration of each inner oligonucleotide in
the PCR reaction mixture was 40 nmol/L, and the
outer oligonucleotide was 0.2 μmol/L. DA-PCR
reaction was carried out in 25 cycles of denaturing
at 94℃ for 30 s, annealing at 53℃ for 30 s, and
extension at 72℃ for 90 s. In each OE-PCR
reaction, the final concentration of the template
block or fragment in the PCR reaction mixture was
40 nmol/L The two outermost oligonucleotides as
amplification primers, were used at a final
concentration of 0.2 μmol/L. OE-PCR reaction was
carried out in 25 cycles of denaturing at 94℃ for 1
min, annealing at 58℃ for 1 min, and extension at
72℃ for 3 min [7-9]. All PCR reactions were
performed on a PTC-200. PCR products were
purified using an agarose gel extraction kit.
Cloning and sequencing
The whole DNA fragment purified by agarose
gel electrophoresis was connected into pUC18,
constructed the pUC-dan recombinant plasmids
and then transformed into E.coli JM109. After
identification, the positive clones were sequenced
by Sangon Biotech (Shanghai) Co., Ltd. Using
other synthesized amplification primers with Nde
I and Bgl II restriction sites, the D-aminoacylase
gene was amplified from pUC-dan. Amplification
fragments were purified and cloned into Nde I
and BamH I sites of pET32a. After identification,
the plasmids pET-dan were put into E.coli BL21
(DE3) for enzyme expression.
Induced expression and activity assay
Strain of E. coli BL21 (DE3) harboring
pET-dan, was inoculated into 4 ml LB medium
containing 100 mg ampicillin/L (LB/Amp) and
were incubated at 37℃ for 12 h. The inoculum
(1%, v/v) was added to 100 ml LB/Amp and
cultured at 37℃ to an OD600 of 0.6, after which
protein production was induced by adding 0.1
mM IPTG and incubating at 37 ℃ for 3 h.
N-acyl-D-amino acid amidohydrolase activity was
assayed by measuring D-amino acids formed from
the hydrolysis of N-acetyl-D-amino acids as
previously described [3-4]. One unit of enzyme
activity was defined as the amount of enzyme that
catalyzed the formation of 1 μmol D-amino acid per
min.
RESULTS AND DISCUSSION
Gene and oligonucleotide design
D-aminoacylase gene (dan) from Alcaligenes
A-6 has been reported by M. Moriguchi in 1993
[10]. The whole sequence can be found in
GenBank using accession number D45918,
containing 1455 nucleotides, which can be
encoded as 484 amino acids.
To synthesize an Escherichia coli codon
optimized D-aminoacylase gene, the codons were
chosen to have either 1/3 or 2/3 GC content to
ensure that the resulting GC content of the
optimized DNA was between 40% and 60%. The
codons encoding each amino acid were superseded
by the most abundant codon in Escherichia
coli[11] to avoid the rare codons which can affect
the expression of heterologous proteins [12].
Adding the EcoR I and Xba I restriction
endonuclease sites in the 5’ and 3’ end, the whole
DNA fragment was 1479 bp in length. The design
of the synthetically assembled oligonucleotides
was that the length of each oligonucleotide was 50
bases and the overlapping region was 18 bases,
therefore, 14 nt gaps between overlapping regions,
52 oligonucleotides were designed using
Genedesign.

X. Hou et al.: The study on D-aminoacylase gene synthesis via chemical and enzymatic combined method
221
Oligonucleotide assembly
Chemically synthesized oligonucleotides were
assembled by DNA polymerase based on
polymerase chain reaction. Taq polymerase lacks
3′-5′ exonuclease activity and is known to be
error-prone, and therefore, the pfu polymerase is
used in this assembly process. Using a three-stage
assembling method the 52 oligonucleotides were
assembled into a full-length gene. The first stage
used DA-PCR, and the second and the third stage
used OE-PCR. The schematic diagram is shown in
Fig.1.
In the first stage, six single-stranded
oligonucleotides as a group were assembled into
an intermediate fragment forming a block. The
1-48 oligonucleotides were assembled into block
1-8, the last four oligonucleotides 49-52 were
assembled into block 9. In the second stage, three
double-stranded block DNA as a group were
assembled into a longer intermediate fragment
forming a fragment. The 1-9 blocks were
assembled into fragment 1-3. In the third stage,
three double-stranded DNA fragments were
assembled into the whole D-aminoacylase gene
(Fig.2).
Cloning and sequencing
The whole DNA fragment purified by agarose
gel electrophoresis was connected into pUC18,
constructed the pUC-dan recombinant plasmids
and then was transformed into E.coli JM109. After
identification, five positive clones were sequenced
by Sangon Biotech (Shanghai) Co., Ltd. The
sequencing results showed that two of them were
confirmed to be the correct products which have
the accurate sequence with the design.
Unfortunately, one of the five positive clones has
the major bands error after the final amplication
step appeared to be the correct size. There were
total 5 base errors in the sequence of two clones
which have no major bands error. It contained two
base deletions, one single base insertion and two
single point mutations. The average error rate
determined by sequencing was approximately
0.68‰.
Induced expression
The strain of E. coli BL21 (DE3) harboring
pET-dan, and the strain of E. coli BL21 (DE3)
harboring pET-dan-N (D-aminoacylase gene
amplified from Alcaligenes A-6, codons not
optimized) were induced by 1 mM IPTG in
LB/Amp medium and incubated at 37℃. The
expressed codon optimized and unoptimized
D-aminoacylase genes were detected by 10%
SDS-PAGE (Fig.3).
The codon unoptimized D-aminoacylase gene
efficiently expressed in E. coli BL21 (DE3),
accounted for 56% of total bacterial protein.
Correspondingly, the codon optimized
D-aminoacylase gene synthesized in this paper,
expressed more efficiently in E. coli BL21 (DE3),
accounted for 78% of total bacterial protein (Tab.
1). Another better way is to directly express the
D-aminoacylase gene in E. coli Rosetta 2 which
harbors pRARE2 providing all the rare codon
tRNAs for E. coli. The codon unoptimized
D-aminoacylase gene can be efficiently expressed
in E. coli Rosetta 2, accounting for 64% of total
bacterial protein (Tab. 1). This shows that rare
codon and codon abundance in the host affect the
exogenous gene expression.
Activity assay
D-aminoacylase from Alcaligenes A-6 acts
preferentially on N-acyl derivatives of d-Met,
d-Phe, and d-Leu, and less effectively on those of
d-Trp, d-Ala, and d-Val. We are using N-acetyl-D,
L-valine as the substrate to assess the recombinant
enzyme catalytic activity of the fermenting
bacterial cell. The N-acetyl-D-valine
amidohydrolase activity was assayed by
measuring D-valine formed from the hydrolysis of
N-acetyl-D-valine. The fermentation activity of
the strain of E. coli BL21 (DE3) harboring
pET-dan can reach 98 U/ml, higher than the wild
type strain Alcaligenes A-6 (Tab. 2). The codon
unoptimized D-aminoacylase gene can be
expressed efficiently in E. coli Rosetta 2, ac-
counting for 83 U/ml (Tab. 2).
Table 1. The expression of D-ANase synthetic
D-aminoacylase gene in E. coli BL21 (DE3).
Number
(% of ) 1 2 3 4 5
Average
value
Codon
unoptimized 59 51 54 58 58 56
Codon
optimized 63 68 65 61 63 64
Rosetta
Express 78 84 72 76 80 78
Table 2. Fermentation enzyme activity of
D-ANase.
Number (U/ml) 1 2 3 4 5 Average value
Codon unoptimized 68 59 66 74 78 70
Codon optimized 95 101 102 97 95 98
Rosetta Express 80 82 84 86 83 83

X. Hou et al.: The study on D-aminoacylase gene synthesis via chemical and enzymatic combined method
222
Fig. 1. Schematic diagram of the three-stage
assembling method.
Fig. 2. Oligonucleotide assembly results. (A)
three-stage assembling method. Lane 1: 100bp DNA
marker, lane 2-3: synthesized D-aminoacylase gene;
(B) two-stage assembling method. Lane 4:1000bp DNA
marker, lane 5-6: synthesized D-aminoacylase gene.
Fig. 3. SDS-PAGE analysis of the codon optimized
and unoptimized D-aminoacylase gene expression.
Lane 1: protein marker; lane 2-4: pET-dan-N induced
by IPTG for 0, 1.5 and 3 h; lane 5-7: pET-dan induced
by IPTG for 0, 1.5 and 3h.
D-aminoacylase chromatographic purification
process
The 100 ml induced expression of E.coli
BL21/pET-dan fermentation broth was centrifuged
at 4000 rpm and 4oC for 10 min. After collecting
the precipitated bacteria and weighing (wet
weight), 20 mmol / L PBS buffer (pH 5.0) was
added according to the proportion of 1g:10 mL.
After mixing in an ice bath for ultrasound break-
ing (breaking conditions: output power 300W,
breaking time 5 s, interval of 5 s times, 200 times),
the supernatant was collected at 10000 rpm and
4oC for 10 min. After the supernatant was filtered
through a 0.45 µm filter, the buffer solution was
used to replace the buffer solution in the 8000 Da.
Non fusion expression of D-ANase was purified
by DEAE-FF anion exchange chromatography,
CM-52 cation exchange chromatography and

X. Hou et al.: The study on D-aminoacylase gene synthesis via chemical and enzymatic combined method
223
Table 3. Separation and purification of non-fusion D-ANase.
Purification steps
Protein
content
(mg)
Total ac-
tivity
(U)
Specific
activity
(U/mg)
Recovery
rate
(%)
Total
yield
(%)
Purification
rate
1. Before breaking 1564.3 6897.5 4.41
2. Crude enzyme
liquid 946.7 8254.3 8.72 120 120
3.DEAE-FF 216.8 2137.8 9.86 26 31 1.13
4. CM-52 63.2 1769.1 27.99 83 26 2.84
6. Superdex-200 1.3 1489.6 1145.85 84 22 40.93
.
superdex200 AKTA-FPLC gel filtration
chromatography. D-ANase was purified through
multiple steps of chromatography, the final
product recovery rate was 84% and the specific
activity for 1145.85 (U/mg), purification rate was
40.93 times. The results of the chromatographic
purification and detection of the various stages are
shown in Table 3. The purity of D-ANase protein
obtained by SDS-PAGE was higher, and the
molecular weight of the protein was about 52 kDa
(Fig.3).
CONCLUSIONS
The three-stage assembling method used in this
paper includes a phase DA-PCR and two-stage
OE-PCR [13]. Irrespectively of the stage, the
heating step causes DNA melting of the DNA
template by disrupting the hydrogen bonds
between complementary bases, yielding
single-stranded DNA molecules. Then the reaction
solution became a complex system of
single-stranded DNA molecules, including the
chemically synthesized oligonucleotides, the
longer single-stranded fragments being assembled
by DNA polymerase. The cooling step causes the
primers or the overlapping segments containing
sequences complementary to the target region by
the stable DNA-DNA hydrogen bonds to form a
local double-stranded DNA molecule. The an-
nealing method yielded 3’-3’overlap,
3’-5’overlap and 5’-5’overlap. The DNA poly-
merase bound to the 3’-3’overlap and
3’-5’overlap double-stranded, synthesized a new
DNA strand complementary to the DNA template
strand by adding dNTPs that are complementary
to the template in 5' to 3' direction, condensing
the 5'-phosphate group of the dNTPs with the
3'-hydroxyl group at the end of the nascent (ex-
tending) DNA strand. The oligonucleotides
alternate between sense and antisense directions,
and the overlapping segments determine the order
of the PCR fragments, thereby selectively
producing the final long DNA product.
Considering the length of overlapping region of
only 18 bases in average, the annealing of long
single-stranded DNA molecules may easily
produce a mismatch, so that assembling into
full-length genes containing too many byproduct
bands can be connected into a plasmid. Using the
three-stage assembling method, the nine-block
assembly by OE-PCR splits into two phases, re-
ducing the complexity of the template in the
reaction system, yielding single product bands,
and reducing the workload of screening, by
quickly producing the synthetic genes.
Acknowledgements: This work was supported
by the Specialized Research Fund for the Doc-
toral Program of Higher Education of China
(20100061120076); the Fundamental Research
Funds for the Central Universities and the Spe-
cial Fund Project for the Scientific Research of
the Forest Public Welfare Industry (201204614).
REFERENCES
1. D. L. Zhang, F. U. Zhu, W. H. Fan, R. Sh. Tao, H.
Yu, Y. L. Yang, W. H. Jiang, Sh. Yang, Appl. Micro-
biol. Biotechnol., 90(4), 1361 (2011).
2. H. Lindner, S. Hopfner, M. Tafler-Naumann, M.
Miko, Konrad L.,Rohm K. H., Biochimie, 82(2),
129.(2000)
3. V. Vranova, H. Zahradnickova, D. Janous, K. R.
Skene, A. S. Matharu, K. Rejsek, P. Formanek,
Plant and Soil, 354(1), 21 (2012).
4. M. Moriguchi, K. Sakai, Y. Katsuno, T.i Maki, M.
Wakayama, Biosci., Biotechnol., Biochem., 57(7),

X. Hou et al.: The study on D-aminoacylase gene synthesis via chemical and enzymatic combined method
224
1145 (1993).
5. Yoshimune K., Ninomiya Y., Wakayama
M.,Moriguchi M., J. Ind, Microbiol. Biotechnol.,
31(9), 421 (2004).
6. R. Nandakumar, K. Yoshimune, M. Wakayama, M
M.origuchi, J. Mol. Catal. B-Enzym., 23(2-6), 87
(2003).
7. C. H. Gao, X. Y. Shi, X. T. Hou, Q. F. Meng, Y. J.
Zhang, L.R. Teng, Chem. Res. Chinese U, 24(4),
487 (2008).
8. D. An, X. H. Zhao, M. Zhou, Z. W. Ye, Chemical
Journal of Chinese Universities, 35(2), 275 (2014).
9. Young L.Dong Q. H., Nucleic Acids Res., 32(7)
e59, DOI: 10.1093/nar/gnh058 (2004).
10. M. Wakayama, Y. Katsuno, S. Hayashi, Miyamoto
Y., K. Sakai, M. Moriguchi, Bioscience, Biotech-
nology and Biochemistry, 59(11), 2115. (1995).
11. S. L. Shi, Y. R. Jiang, Y. Q. Liu, R. X. Xia, L. Qin,
Virus genes, 46(1), 10 (2013).
12. X. Y. G. C. H. Zhao, L. Jin, X. Wang, Q. F. Meng
L.R. Teng, Chemical Journal of Chinese Universi-
ties, 29(10), 1995 (2008).
13. K. Yoshimune, Y. Ninomiya, M. Wakayama, M.
Moriguchi, J. Ind. Microbiol. Biotechnol., 31(9),
421 (2004).
СИНТЕЗА НА ГЕН ЗА D-АМИНОАЦИЛАЗА ПО ХИМИЧЕН И КОМБИНИРАН
ЕНЗИМЕН МЕТОД
Кс. Хоу1, Дж. Ли1, Жай Нуо1, И. Рен1, К. Гао1,2,3*
1 Училищв по науки за живота, Университет Жилин, Чангчун, Провинция Жилин, Китайска НР 2 Национална лаборатория за СПИН-ваксини, Училищв по науки за живота, Университет Жилин, Чангчун,
Провинция Жилин, Китайска НР 3 Ключова лаборатория по молекулярна ензимология и инженерство, Министерство на образованието,
Училищв по науки за живота, Университет Жилин, Чангчун, Провинция Жилин, Китайска НР
Постъпила на 8 юли, 2015 г.; коригирана на 6 октомври, 2015 г.
(Резюме)
Според секвенцията на аминокиселините кодонът на гена за D-аминоацилаза в в щама Alcaligenes A-6 се
замества от по-разпространения кодон в E. coli. Представеният метод позволява да се избегнат редки кодони и
слабото разпространение, които могат да повлияят на експресията на хетероложни протеини. Общата дължина
на синтезирания ген е 1479 bp. Петдесет и два олигонуклеотида са конструирани и синтезирани чрез чети-
ри-степенен химичен метод с фосфорамидит. Три-степенен метод е проложен за асемблирането на целия
ДНК-фрагмент. Намаляването на сложността на темплейта в реакционната система има значителен ефект за
намаляването броя на страничните продукти за бързото получаване на синтетичния ген.
Синтезираната ДНК е свързана с pET32a, след което е вкарана в E.coli BL21 (DE3) за експресия. След ин-
дукция с IPTG кодон-оптимизираният ген за D-аминоацилаза може да бъде експресиран по-ефективно в E.coli
BL21 (DE3) с 78% общ бактериален протеин, при 56% при кодон-неоптимизиран ген. Определена е активност-
та на N-ацетил-D-валин амидохидролазата чрез измерване на D-валина, образуван при хидролизата на
N-acetyl-D,L-valine от щама E. coli BL21 (DE3) harboring pET-dan. Концентрацията на D-валина достига 98
U/ml.

225
Bulgarian Chemical Communications, Volume 48, Number 2 (pp. 225 – 231) 2016
Room temperature acetone vapor - sensing properties of a mesoporous zinc stannate
layer
I. E. Kononova1,2, D. M. Vorobiev1, D. Tz. Dimitrov3*, A. Ts. Georgieva4, V. A. Moshnikov1,5
1 Department of Micro- and Nanoelectronics, Saint-Petersburg State Electrotechnical University, Saint-Petersburg
197376, Russia 2 Department of Machines and Metal Forming Technology, Saint-Petersburg State Polytechnical University, Saint-
Petersburg 195251, Russia 3 Laboratory of Nanoparticle Science and Technology, Department of General and Inorganic Chemistry, Faculty of
Chemistry and Pharmacy, University of Sofia, Sofia 1164, Bulgaria 4 Particle Engineering Research Center, Materials Science & Engineering Department, University of Florida,
Gainesville, FL 32611, USA 5 Department of Integrated Electronics, Saint-Petersburg State Polytechnical University, Saint-Petersburg 195251,
Russia
Received January 13, 2015, Revised August 18, 2015
Zinc stannate porous nanostructured compositions of nanoparticles are produced in the form of thin films by means
of the chemical vapor deposition method. The phase, composition and surface condition of the layers as formed by the
above route are investigated. Under the application of an alternating electric field the electrical properties of the layer
change under acetone vapor exposure at room temperature. As a result of this interaction the radius of the semi-circle on
the Nyquist diagram is reduced and the centre of the semi-circle on the plot is shifted to the higher frequency. To
describe the resistance-capacitance properties of the samples the characteristic time of charge accumulation at the
atmosphere and under acetone vapor exposure is estimated. The values of the gas sensitivity in the frequency range
from 1 Hz to 50 KHz is calculated in two ways based on the real and imaginary components of the complex impedance.
Keywords: nanostructures; thin films; impedance spectroscopy; surface properties.
INTRODUCTION
The gas sensors, intended for the detection of
acetone in the air, are widely applied for
environmental monitoring, in criminology, in
military affairs, in mechanical engineering and for
medical non-invasive diagnosis for the analysis of
exhaled breath of patients suffering from diabetes.
Now-a-days, there is still a need for the creation of
nanomaterials for acetone gas sensors, operating at
room temperature.
Most sensor materials show acetone vapor
detection properties at elevated temperatures in the
range 150–450°С [1–6]. There are only a few
publications in the world literature at present,
devoted to research aimed at the creation of
nanomaterials that study the gas sensitive properties
of acetone vapor at room temperature. These are
ZnO nanorods doped with Ni, the sensitivity of
which is enhanced by UV activation [7], CuO
nanocrystalline thick films [8] and TiO2 nanotubes
with a certain deviation in stoichiometry [9]. To the
best of our knowledge, up to now in the scientific
journals there does not exist any information
concerning the measurement of the complex
resistivity (conductivity) of a Zinc Stannate Layer
in the atmosphere under acetone vapor exposure at
room temperature.
Impedance spectroscopy is a favorite tool for
materials characterization, useful in gathering both,
the kinetic and mechanistic information. A review
of the recent progress in evaluating the gas
concentration by the impedance change and the
establishment of state of the art of impedance-based
gas sensors is presented in [10]. Despite the well-
known fact that the interaction of the material with
a gaseous medium depends on the microstructure
and the surface states of the sensing material, to the
best our knowledge, alternating current (AC)
measurement has been used for detection of gases
only for a few metal oxides. The most important
advantage of the alternating current (AC)
measurements is that they can distinguish the
individual contributions to the electrical conduction
or polarization arising from different sources like
the bulk and the grain boundaries, the intergranular
contact regions, and the electrode-sample interface
regions whereas direct current (DC) measurements
show only the overall effect of all these
contributions [10, 11]. It is worth mentioning that
the impedance spectroscopy investigation of: * To whom all correspondence should be sent:
E-mail: [email protected] 2016 Bulgarian Academy of Sciences, Union of Chemists in Bulgaria

I. E. Kononova et al.: Room temperature acetone vapor - sensing properties of mesoporous zinc stannate layer
226
undoped titanium dioxide (TiO2) polycrystalline
thin films as a function of temperature and the
surrounding atmosphere are presented in [13],
zirconia gas sensors [14], zeolite hydrocarbon
sensors with a chromium oxide as the intermediate
layer [15], room temperature gas sensing of
ultrathin SnO2 sensors prepared by the Langmuir
Blodgett technique [16], WO3 sensors sensitivity
versus time and working temperature [17], SmFeO3
thin-film sensor [18] and a sensing device based on
vanadium oxide (V2O5)/porous Si /Si structure [19].
An improvement of the gas-sensitive properties
can be achieved by using multi-component metal
oxides as the sensor material [20–24]. Increasing
the gas sensitivity is possible in principle in the
case of the cooperative effect as a result of the
separation of the functional properties of adsorption
and complete oxidation of the reducing gases at
different surface centers of the multicomponent
systems. During the last few years there is a
growing interest in investigations of the properties
of nanostructured ZnO – SnO2 materials, which are
crystallized into perovskite (ZnSnO3) [25] and
spineli (Zn2SnO4) structures [26, 27]. The
formation of such mixed oxides leads to the
modification of the electronic band structure of the
Zn–Sn–O system. This includes changes in the bulk
and surface properties. The surface properties are
expected to be influenced by new boundaries
between the grains of different chemical
compositions. These could be stoichiometric
ZnSnO3 and Zn2SnO4 compounds or composites. It
is anticipated that all these phenomena will
contribute advantageously to the gas sensing
mechanism [28].
Thin films of ZnSnO3 structures are very
promising in the creation of new lead free
ferroelectric materials [29]. Other notable
applications of these nanostructured compounds are
their utilization in lithium ion batteries [30],
piezoelectric transformers [31], transparent
conductive coatings and thin film transistors [32–
34], electro-luminescence devices for power
independent memory cells. Among the above
applications, the number of investigations dealing
with the formation of zinc stannate layers that have
a highly sensing performance is increasing
remarkably [35–42]. For such new generation
sensing structures it is necessary to develop and
evaluate the advanced technological aspects for the
formation of nanostructure and nanocomposite
layers, including various nanocomposits, modified
nanowires, nanorods, nanospheres, nanotubes as
well as nanomaterials with hierarchical porous
nanostructures [43–55].
The development of three-dimensional (3D)
face-centered-cubic ZnSnO3 into two-dimensional
(2D) orthorhombic ZnSnO3 nanosheets has been
observed recently [56]. The synthesis from 3D of
2D nanostructures is realized by the dual-
hydrolysis-assisted liquid precipitation reaction and
subsequent hydrothermal treatment. The 2D
ZnSnO3 nanosheets should exhibit excellent gas
sensing properties of acetone vapor, especially
through their ultra-fast response and recovery. The
authors [56] show, that the 2D ZnSnO3 nanosheets
consist of smaller sized nanoflakes. This further
increases the special specific surface area and
facilitates their application in gas sensing.
Never-the-less, in the literature there is a
hitherto unreported study devoted to the sensitivity
of the ZnSnO3 layer to acetone vapor at room
temperature under the application of an alternating
electric field. Thus, the main goal of the presented
work is the formation and investigation of the
surface morphology, the electrical and acetone gas
sensing properties under the application of an
alternative electric field at room temperature
formed by a chemical vapor deposition nanosized
ZnSnO3 thin film.
EXPERIMENTAL
The metal oxides layers investigated in the
current work are formed in a laboratory installation
by means of the chemical vapor deposition (CVD)
method. There are two zones inside the quartz
reactor, in both of which there were boats with
inorganic metal salts of tin chloride (SnCl2·2H2O)
and zinc nitrate (Zn(NO3)2·6H2O) while the third
zone is the area of location of the holder with the
substrates. The temperature required for the process
is maintained in the three areas by using
independent heaters. The components of the salts
obtained were transferred to the deposition area in
the reactor. This is done by the transfer of the
vapors of volatile compounds from the areas of the
tin chloride and zinc nitrate boats to the area of the
holder with the substrates.
The sensing layer structures are formed by using
three subsequent processes:
- Decomposition of tin chloride (SnCl2·2H2O)
and zinc nitrate (Zn(NO3)2·6H2O) at the
temperature of 150 °С under an air flow within the
quartz reactor;
- After decomposition within the quartz reactor
the reaction products are transferred to the
substrates;
- The formation of the ZnSnO3 layer at the
temperature of 500 °С from the transferred to the
substrate reaction products;

I. E. Kononova et al.: Room temperature acetone vapor - sensing properties of mesoporous zinc stannate layer
227
Thermally oxidized silicon was used as a
substrate. The thickness of the oxide layer was
about 500 nm. Before application the substrates
were treated in acetone and isopropyl alcohol in an
ultrasonic bath. The thickness of the ZnSnO3 layers,
deposited on the substrates is about 500 nm,
estimated by means of ellipsometry measurements.
The investigations of the phase composition of
layers formed by the above route are done on a low
angle registration electron-diffraction apparatus
(SELMI, Ukraine). Electron diffraction [57, 58] is a
local (small extinction length) an express (high
intensity particle flux) method of structural
analysis. The method of electron diffraction is
indispensable in the study of near-surface regions,
thin films and other nano-objects. The investigation
is evaluated by comparison of the diffraction
patterns of nonelastically scattered electrons in
refraction geometry.
The conductive substrate necessitates the
determination of its phase composition by means of
a low-angle registering electronograph. Because of
this electron diffraction experiments were
performed on ZnSnO3 layers deposited on a non-
oxidized silicon substrate. However, to investigate
the gas-sensing properties of the ZnSnO3 layers it
was necessary to deposit these on an oxidized
silicon substrate. Silicon oxide is an insulating
dielectric layer between the silicon and the
semiconductor layer of zinc stannate. It was used to
avoid the conductive silicon and contributes to the
gas sensing properties of zinc stannate.
The investigation of the surface condition of the
nanostructured film formed by oxidation of a
silicon dielectric layer is done on a nanolaboratory
instrument Ntegra Terma (NT-MDT, Zelenograd).
It was performed by means of a “semi-contact”
vibrational AFM mode. Probe type sensors with
cantilevers series NSG 01 in the form of a
rectangular cross-section rafter were used in the
investigation. This has a resonance frequency of
150 кHz and was purchased from the NT-MDT
Company.
The electrical properties of ZnSnO3
nanostructures are studied by means of impedance
spectroscopy measurments. It is well know that this
method is widely used to investigate the electrical
properties of the grain boundary under the
application of an electrical field with an alternative
frequency. Measuring the frequency dependences
of the complex resistivity modulus and
determination of the phase shift angle between the
current and voltage in the capacitance circuit were
carried out in the frequency range between 1 Hz to
500 kHz with an amplitude of the alternating
voltage equal to 30 mV. On our experimental setup
[59] we were able to measure the electrical
properties of the nanostructure at the atmosphere
and under exposure to acetone vapor in the air. The
concentration of acetone was 100, 200 and 300 ppm
and at a relative humidity of 80 %.
RESULTS OF THE INVESTIGATION OF THE
STRUCTURAL PROPERTIES OF
MESOPOROUS ZnSnO3 LAYERS AND THEIR
SENSING PERFORMANCE UNDER THE
APPLICATION OF AN ALTERNATING
ELECTRIC FIELD
The result of electron diffraction for the zinc
stannate layer, deposited on an oxide free silicon
wafer is shown on Fig.1. It presents the typical
dependence of the signal intensity on the
photoelectron multiplier as a function of the
interplanar distance d. The latter is calculated based
on the value of the distance from the central spot.
The diffraction peaks for nonelastic scattered
electrons, corresponding to the crystallized in
perovkside structure nanosructured phase of
ZnSnO3 are marked by solid dots. It is clear, that
under the applied technological conditions of
chemical vapor deposition, the corresponding
ZnSnO3 crystal phase exhibits only reflections. An
electron diffraction image for the same sample is
presented in Fig.2.
Fig. 1. Cross-section of electron diffraction pattern at
radius from the central spot toward the interplanar
distance d for the based on ZnSnO3 layer.
Fig. 2. Electron-diffraction image for the based on
ZnSnO3 layer.
In the current work the AFM images were in the
form of a square matrix with the size 256256 of
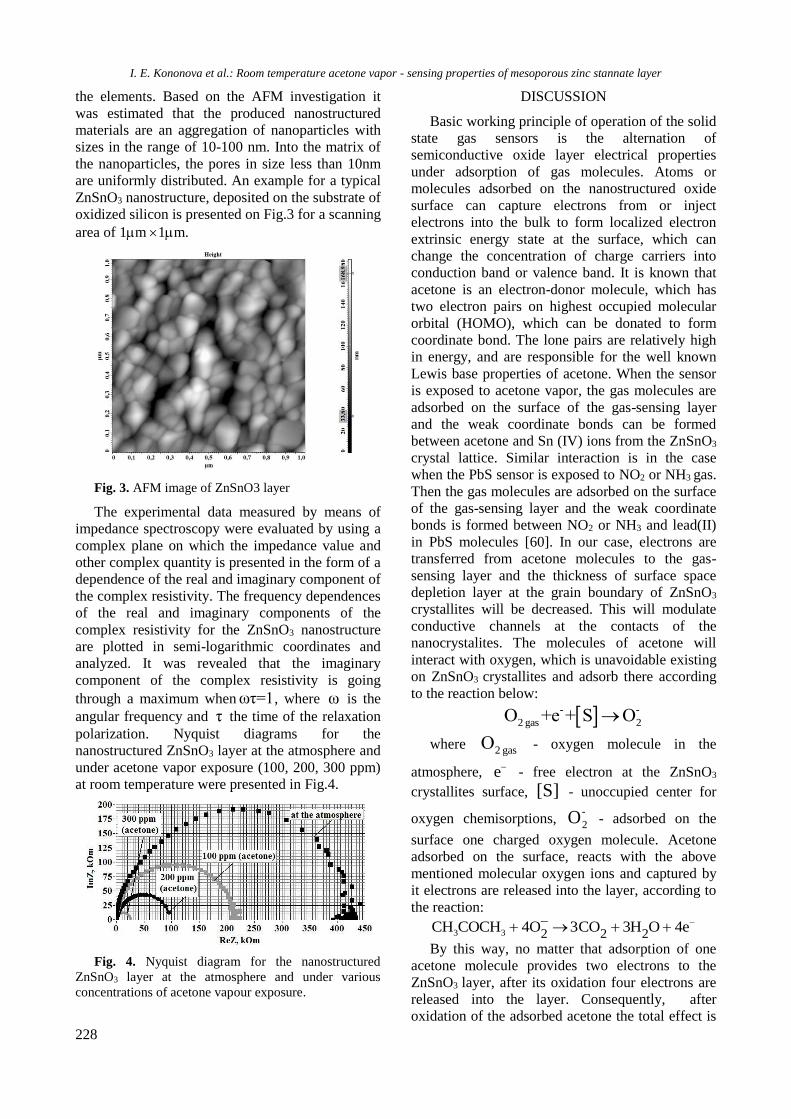
I. E. Kononova et al.: Room temperature acetone vapor - sensing properties of mesoporous zinc stannate layer
228
the elements. Based on the AFM investigation it
was estimated that the produced nanostructured
materials are an aggregation of nanoparticles with
sizes in the range of 10-100 nm. Into the matrix of
the nanoparticles, the pores in size less than 10nm
are uniformly distributed. An example for a typical
ZnSnO3 nanostructure, deposited on the substrate of
oxidized silicon is presented on Fig.3 for a scanning
area of 1m 1m.
Fig. 3. AFM image of ZnSnO3 layer
The experimental data measured by means of
impedance spectroscopy were evaluated by using a
complex plane on which the impedance value and
other complex quantity is presented in the form of a
dependence of the real and imaginary component of
the complex resistivity. The frequency dependences
of the real and imaginary components of the
complex resistivity for the ZnSnO3 nanostructure
are plotted in semi-logarithmic coordinates and
analyzed. It was revealed that the imaginary
component of the complex resistivity is going
through a maximum whenωτ=1, where ω is the
angular frequency and τ the time of the relaxation
polarization. Nyquist diagrams for the
nanostructured ZnSnO3 layer at the atmosphere and
under acetone vapor exposure (100, 200, 300 ppm)
at room temperature were presented in Fig.4.
Fig. 4. Nyquist diagram for the nanostructured
ZnSnO3 layer at the atmosphere and under various
concentrations of acetone vapour exposure.
DISCUSSION
Basic working principle of operation of the solid
state gas sensors is the alternation of
semiconductive oxide layer electrical properties
under adsorption of gas molecules. Atoms or
molecules adsorbed on the nanostructured oxide
surface can capture electrons from or inject
electrons into the bulk to form localized electron
extrinsic energy state at the surface, which can
change the concentration of charge carriers into
conduction band or valence band. It is known that
acetone is an electron-donor molecule, which has
two electron pairs on highest occupied molecular
orbital (HOMO), which can be donated to form
coordinate bond. The lone pairs are relatively high
in energy, and are responsible for the well known
Lewis base properties of acetone. When the sensor
is exposed to acetone vapor, the gas molecules are
adsorbed on the surface of the gas-sensing layer
and the weak coordinate bonds can be formed
between acetone and Sn (IV) ions from the ZnSnO3
crystal lattice. Similar interaction is in the case
when the PbS sensor is exposed to NO2 or NH3 gas.
Then the gas molecules are adsorbed on the surface
of the gas-sensing layer and the weak coordinate
bonds is formed between NO2 or NH3 and lead(II)
in PbS molecules [60]. In our case, electrons are
transferred from acetone molecules to the gas-
sensing layer and the thickness of surface space
depletion layer at the grain boundary of ZnSnO3
crystallites will be decreased. This will modulate
conductive channels at the contacts of the
nanocrystalites. The molecules of acetone will
interact with oxygen, which is unavoidable existing
on ZnSnO3 crystallites and adsorb there according
to the reaction below:
- -
2 gas 2О +e + S O
where 2 gasО - oxygen molecule in the
atmosphere, e - free electron at the ZnSnO3
crystallites surface, [S] - unoccupied center for
oxygen chemisorptions, -
2O - adsorbed on the
surface one charged oxygen molecule. Acetone
adsorbed on the surface, reacts with the above
mentioned molecular oxygen ions and captured by
it electrons are released into the layer, according to
the reaction:
3 3 2 2 2CH COCH 4O 3CO 3H O 4e
By this way, no matter that adsorption of one
acetone molecule provides two electrons to the
ZnSnO3 layer, after its oxidation four electrons are
released into the layer. Consequently, after
oxidation of the adsorbed acetone the total effect is

I. E. Kononova et al.: Room temperature acetone vapor - sensing properties of mesoporous zinc stannate layer
229
increasing the conductivity of the layer. Under
acetone vapor exposure the radius of the semi-circle
on the Nyquist diagram is reduced (Fig. 4) and the
centre of semi-circle on the plot is shifted to the
higher frequency. The reason for this effect is the
relaxation maximum shift of the imaginary
component of complex resistivity to the area of
higher frequencies.
The equivalent electric scheme is used for
interpretation of observed capacitance-resistance
properties of nanostructured ZnSnO3 layer. A
constant phase element, widely used for modeling
impedance of many electrical systems was
employed. This scheme describes well the
exponential dependence of parameters of chemical-
physics processes, related to overcoming energy
threshold during the charge transfer and impedance
behavior. Also, the scheme is connected to the
appearing of fractal properties of investigated
structures in particular frequency range. Impedance
of the element with constant phase is described by
equation: njAZ ω1 , where A - proportionality
factor, j - the imaginary unit, n- exponent index,
giving the information about the phase shift,
11 n . Frequency independent factor has
physical meaning and dimension of capacitance.
The plotted on Fig.4 impedance hodographs are
evaluated for the circuit, constructed of connected
in parallel resistance R and the constant phase
component. This circuitry can be characterized by
resistance and constant phase component of the
grain boundary of ZnSnO3 crystallites. The
hodographs consist of semi-circles with center
below the horizontal axis. The characteristic time of
charge accumulation for the circuit, constructed
from connected in parallel resistance R and the
constant phase component is expressed by equation
1
τ R A 1 ωn
, where ω is angular frequency
at the point where imaginary component of
complex resistivity having maximum value (at the
point of relaxation maximum on impedance
hodograph).
Let’s consider the impedance hodographs in air
and in the presence of acetone vapor with
concentration of 100 ppm. Values of resistivity R,
frequency independent fore-exponential factor A,
exponent index n, relaxation maximum frequency
fmax and time of relaxation polarization τ at the
atmosphere and under acetone vapor exposure are
calculated. It was revealed that under acetone vapor
exposure value of resistivity R is reduced by factor
of 1.99; value of frequency independent fore-
exponential factor A is reduced by factor of 1.39;
value of relaxation maximum frequency fmax is
increases by factor of 2.89. It was found that under
acetone vapor exposure value of exponent index n
is not changed and is 0.94; value of time of
relaxation polarization is 184 μsec in the
atmosphere and 64 μsec under acetone vapor
exposure.
Based on the above investigations, the value of
gas-sensitivity is evaluated in two ways: (i) by the
real component of the complex resistivity as
ReS ReZ ReZair gas , where ReZair is the real
component of the complex resistivity at the
atmosphere, ReZgas is the real component of the
complex resistivity under acetone vapor exposure;
(ii) by the imaginary component of the complex
resistivity as ImS ImZ ImZair gas , where
ImZair is the imaginary component of complex
resistivity at the atmosphere, ImZair – is the
imaginary component of the complex resistivity
under acetone vapor exposure. The estimated value
of sensitivity is 2.0, calculated by real component
and is 4.2 while calculated by imaginary
component. It was revealed that in both cases the
maximum of the sensitivity toward acetone vapor is
at frequency low than 140 Hz.
Because in the World wide literature to the best
of our knowledge does not exist any results of
investigation of complex resistivity (conductivity)
of Zinc Stannate Layer at the atmosphere and under
acetone vapor exposure at room temperature we
cannot compare the functional properties of the
produced in this work films with similar films of
the scientific periodic. At the available literature
existing only done at direct current (DC)
measurements of gas-sensitive properties of Zinc
Stannate Layers [37, 38, 40, 41, 56].
CONCLUSIONS
In this work is presented the procedure of
producing zinc stannate based porous
nanostructured composition by chemical vapor
deposition method. The produced layers are
composed from aggregations of nanoparticles 10-
100 nm in size. Into the nanoparticles matrix pores
are regularly distributed. Under application of
alternative electric field the electrical properties of
the layer change under acetone vapor exposure at
room temperature. Under acetone vapor exposure
the radius of the semi-circle on the Nyquist diagram
is reduced and the centre of semi-circle on the plot
is shifted to the higher frequency. The reason for
this effect is the relaxation maximum shift of the

I. E. Kononova et al.: Room temperature acetone vapor - sensing properties of mesoporous zinc stannate layer
230
imaginary component of complex resistivity to the
area of higher frequencies.
Acknowledgments: D. Dimitrov is thankful for
financial support to the Beyond Everest project
FP7-REGPOT-2011-1. The Russian researchers
are thankful to the grant of Russian Scientific Fund
(project №14-15-00324). The authors are grateful
to both Dr. Kamilu Gazinyrovich Gareev for help in
investigation the phase composition of the
nanostructures by electron diffraction
measurements.
REFFERENCES
1. L. Wang, A. Teleki, S. Pratsinis, P. Gouma, Chem.
Mater., 20, 4794 (2008).
2. K.W. Kao, M.-Ch. Hsu, Yu.-H. Chang, Sh. Gwo, J.
A. Yeh, Sens., 12, 7157 (2012).
3. P. Yu, J. Wang, H.-Yi Du, P.-J. Yao, Y. Hao, X.-G.
Li, J. Nanomater., 2013, 1 (2013).
4. H. Shan, Ch. Liu, L. Liu, Sh. Li, L. Wanga, X.
Zhang, X. Bo, X. Chi, Sens. Actuators B, 184, 243
(2013).
5. Yi. Zhang, W. He, H. Zhao, P. Li, Vacuum, 95, 30
(2013).
6. X. B. Li, S. Y. Ma, F. M. Li, Y. Chen, Q. Q. Zhang,
X. H. Yang, C. Y. Wang, J. Zhu, Mater. Lett., 100,
119 (2013).
7. H. Ahn, Y. Wang, S. H. Jee, M. Park, Y. S. Yoon,
D.-J. Kim, Chem. Phys. Lett., 511, 331 (2011).
8. I. Singh, R. K. Bedi, AIP Conf. Proc., 1536, 1175
(2013).
9. B. Bhowmik, A. Hazra, K. Dutta, P. Bhattacharyya,
Device and Materials Reliability, IEEE Transact. PP
99, 1 (2014).
10. J. M. Rheaume, A. P. Pisano, Ionics, 17, 99 (2011).
11. J. R. Macdonald, Ann. Biomed. Eng., 20, 289 (1992).
12. O. K. Varghese, L. K. Malhotra, J. Appl. Phys., 87,
7457 (2000).
13. M. A. Ponce, R. Parra, R. Savu, E. Joanni, P. R.
Bueno, M. Cilense, J. A. Varela, M. S. Castro, Sens.
Actuators B, 139, 447 (2009).
14. S. Zhuiykov, Electrochemistry of Zirconia Gas
Sensors, Taylor Francis Group, USA, 2007.
15. G. Hagen, A. Schulz, M. Knörr, R. Moos, Sensors
(Basel, 7, 2681 (2007).
16. C. A. Betty, S. Choudhury, K. G. Girija, Sens.
Actuators B, 173 781 (2012).
17. A. Abidi, C. Jacolin, M. Bendahan, A. Abdelghani, J.
Guerin, K. Aguir, M. Maaref, Sens. Actuators B, 106,
713 (2005).
18. T. Tasaki, S. Takase, Y. Shimizu, J. Sens. Tech., 2,
75 (2012).
19. K. Chebout, A. Iratni, A. Bouremana, K.
M’hammedi, H. Menari, A. Keffous, N. Gabouze, The
Third International Conference on Sensor Device
Technologies and Applications, SENSORDEVICES
2012, Rome, Italy, 2012, p.42.
20. E. H. Espinosa, R. Ionescu, B. Chambon, G. Bedis,
E. Sotter, C. Bittencourt, A. Felten, J.-J. Pireaux, X.
Correig, E. Llobet, Sens. Actuators B, 127, 137 (2007).
21. G. Lu, J. Xu, J. Sun, Y. Yu, Y. Zhang, F. Liu, Sens.
Actuators B , 162, 82 (2012).
22. Y. Gui, S. Li, J. Xu, C. Li, J. Microelectr., 39, 1120
(2008).
23. D. R. Patil, L. A. Patil, P. P. Patil, Sens. Actuators B,
126, 368 (2007).
24. G. Korotcenkov, Handbook of Gas Sensor Materials:
Properties, Advantages and Shortcomings for
Applications Volume 1: Conventional Approaches,
Springer, 2013.
25. B. Geng, C. Fang, F. Zhan, N. Yu, Small, 4, 1337
(2008).
26. Z. Li, Y. Zhou, C. Bao, G. Xue, J. Zhang, J. Liu, T.
Yu, Z. Zou, Nanoscale, 4, 3490 (2012).
27. S. Baruah, J. Dutta, Sci. Technol. Adv. Mater., 12,
01300410 (2011).
28. K. Zakrzewska, Thin Solid Films, 391, 229 (2001).
29. J. Y. Son, G. Lee, M.-H. Jo, H. Kim, H. M. Jang, Y.-
H. Shin, J. Am. Chem. Soc., 131, 8386 (2009).
30. Z. Y. Yuan, F. Huang, J. T. Sun, Y. H. Zhou, Chem. Lett.,
31, 408 (2002).
31. J. M. Wu, C. Xu, Y. Zhang, Z. L. Wang, ACS Nano,
6, 4335 (2012).
32. Y.-J. Chang, D.-H. Lee, G. S. Herman, C.-H.
Chang, Electrochem. Solid-State Lett., 10, H135
(2007).
33. C.-G. Lee, A. Dodabalapur, Appl. Phys. Lett., 96,
2435011 (2010).
34. S.-J. Seo, C. G. Choi, Y. H. Hwang, B.-S. Bae, J.
Phys. D, 42, 0351061 (2009).
35. S. An, C. Jin, H. Kim, S. Lee, B. Jeong, C.
Lee, Nano, 7, 12500131 (2012).
36. A. Sivapunniyam, N. Wiromrat, M. T. Z. Myint, J.
Dutta, Sens. Actuators B, 157, 232 (2011).
37. B. C. Yadav, R. Singh, S. Singh, P. K. Dwivedi,
Intern. J. Green Nanotechn., 4, 37 (2012) .
38. J. Huang, X. Xu, C. Gu, W. Wang, B. Geng, Y. Sun,
J. Liu, Sens. Actuators B, 171–172, 572 (2012).
39. H. Fan, Y. Zeng, X. Xu, N. Lv, T. Zhang, Sens.
Actuators B, 153, 170 (2011).
40. P. Song, Q. Wang, Z. Yang, Sens Actuators B, 156,
983 (2011).
41. Y. Zeng, K. Zhang, X. Wang, Y. Sui, B. Zou, W.
Zheng, G, Zou, Sens. Actuators B, 159, 245 (2011).
42. W. Zeng, T. Liu, Z. Wang, Mater. Transact., 51,
1326 (2010).
43. W. Zhang, C. Zeng, M. Kong, Y. Pan, Z. Yang, Sens.
Actuators B, 162, 292 (2012).
44. H. Men, P. Gao, B. Zhou Y. Chen, C. Zhu, G. Xiao,
L. Wanga, M. Zhang, Chem. Commun., 46, 7581
(2010).
45. J. Chen, L. Lu, W. Wang, J. Phys. Chem. C, 116,
10841 (2012).
46. R. Acharya, Y. Q. Zhang, X. A. Cao, Thin Solid
Films, 520, 6130 (2012).
47. K. Saravanakumar, K. Ravichandran, R.
Chandramohan, S. Gobalakrishnanc, M. Chavalic,
Superlatt. Microstr., 52, 528 (2012).

I. E. Kononova et al.: Room temperature acetone vapor - sensing properties of mesoporous zinc stannate layer
231
48. V. A. Moshnikov, I. E. Gracheva, V. V. Kuznezov,
A. I. Maximov, S. S. Karpova, A. A. Ponomareva, J.
Non-Cryst. Solids, 356, 2020 (2010) .
49. I. E. Gracheva, V. A. Moshnikov, S. S. Karpova, E.
V. Maraeva, J. Phys. Conf. Ser., 291, 0120171 (2011).
50. I. E. Gracheva, Y. M. Spivak, V. A. Moshnikov,
AFM techniques for nanostructures materials used in
optoelectronic and gas sensors, IEEE Eurocon-2009,
Saint-Petersburg, 2009, p.1250.
51. I. E. Gracheva, V. A. Moshnikov, E. V. Maraeva, S.
S. Karpova, O. A. Alexsandrova, N. I. Alekseyev, V.
V. Kuznetsov, G. Olchowik, K. N. Semenov, A. V.
Startseva, A. V. Sitnikov, J. M. Olchowik, J. Non-
Cryst. Solids, 358, 433 (2012) .
52. V. A. Moshnikov, I. E. Gracheva, M. G. An'chkov,
Glass Phys. Chem. , 37, 485 (2011).
53. A. A. Ponomareva, V. A. Moshnikov, G. Suchaneck,
Mater. Sci. Eng., 30 , 0120031 (2012).
54. V. A. Moshnikov, I. E. Gracheva, A. S. Lenshin, Y.
M. Spivak, M. G. Anchkov, V. V. Kuznetsov, J. M.
Olchowik, J. Non-Cryst. Solids, 358, 590 (2012).
55. N. V. Kaneva, D. T. Dimitrov, C. D. Dushkin, Appl.
Surf. Sci., 257, 8113 (2011).
56. Y. Chen, L. Yu, Q. Li, Y. Wu, Q. Li, T. Wang,
Nanotech. , 23, 415501 (2012).
57. L. H. Germer, Phys. Rev., 56, 58 (1939).
58. A. K. Srivastava, R. Kishore, S. A. Agnihotry, Indian
J. Eng. Mater. Sci., 11, 315 (2004).
59. I. E. Gracheva, V. A. Moshnikov, M. G. An’chkov,
Instrum. Exper. Tech., 56, 209 (2013).
60. T. Fu, Sens. Actuators B, 140, 116 (2009).
ОПРЕДЕЛЯНЕ ПРИ СТАЙНА ТЕМПЕРАТУРА НА СЕНЗОРНИТЕ СВОЙСТВА НА
МЕЗОПОРЕСТ СЛОЙ ОТ ЦИНКОВ СТАНАТ ПО ОТНОШЕНИЕ НА ИЗПАРЕНИЯ НА
АЦЕТОН
И. Е. Кононова 1,2, Д. М. Воробьов1, Д. Ц. Димитров3*, А. Ц. Георгиева4, В. А. Мошников1,5
1 Катедра по Микро- и Наноелектроника, Санкт-Петербургски държавен електротехнически университет,
Санкт-Петербург 197376, Русия 2 Катедра по Машини и технологии за формиране на метални детайли, Санкт-Петербургски държавен
политехнически университет, Санкт Петербург 195251, Русия 3 Лаборатория за Наука и технология на наночастици, Катедра по Обща и неорганична химия, Факултет
по Химия и фармация, Софийски университет, София 1164, България 4 Инженерен изследователски центъра за изследване на свойствата на елементарните частици, Катедра по
Материалознание и инженерни науки, Университет на Флорида, Гейнсвил, Флорида 32611, САЩ 5Катедра по Интегрална електроника, Санкт-Петербургски държавен политехнически университет, Санкт
Петербург 195251, Русия
Получена на 13 януари 2015, Преработена на 18 август 2015
(Резюме)
Цинк станатни порьозни наноструктурирани композиции от наночастици са получени под формата на
тънки слоеве посредством метода химическо отлагане от изпарения. На формираните по гореспоменатия
начин слоеве са изследвани фазовия състав и състоянието на повърхността. При прилагане на променливо
електрическо поле електрическите характеристики на слоя се измененят под въздействие на изпарения от
ацетон при стайна температура. Като резултат на това взаимодействие радиуса на полукръга на диаграмата
Найкуист се намалява и центъра на полукръга на графиката се измества към по-висока честота. При описване
на резистивно-емкостните свойства на пробите се оценява характерното време на акумулиране на заряд на
въздушна атмосфера и при излагане на ацетонови изпарения. Стойностите на чувствителността към
изпарения на ацетон в честотния обхват от 1 Hz до 50KHz са изчислени по два начина на базата на реални и
имагинерни компоненти на комплексния импеданс.
232
Bulgarian Chemical Communications, Volume 48, Number 2 (pp. 232 – 237) 2016
Concentration of flavonoids in ethanolic extracts from tobacco leaves through
nanofiltration
I. Tsibranska1*, V. Karabojikova 2a, J. Jeliazkov2
1 Institute of Chemical Engineering, Bulgarian Academy of Sciences, 1113 Sofia, Bulgaria
2Departement of Chemical Engineering, University of Chemical Technology and Metallurgy, bul. ”Kl.Ohridski” 8,
1756 Sofia, Bulgaria
Received November 20, 2014, Revised February 2, 2016
Bioactive compounds (BAC) such as soluble polyphenols and flavonoids, extracted from plant materials, are
successfully treated by membrane operations, in view of their separation or concentration. In the present study
nanofiltration of ethanolic extracts from tobacco leaves is performed, focusing on concentrating the content of
polyphenols and flavonoids (mainly rutin). Membranes DuramemTM 300 and Starmem 240 with molecular weight cut
off (MWCO) 300 and 400Da have been used. The obtained rejections with both membranes are about 88%, close to the
measured value for the model system rutin-ethanol (92%), and tend slightly to decrease during operation. Observed
average flux for real extracts are close to the values for the model system rutin-ethanol: 4.5 – 5.5 vs. 5.3 L/(m2.h) for
Duramem 300 and somewhat lower for Starmem 240 membrane. The flux vs time evolution for both membranes shows
a similar initial decrease and tends to stabilize during longer operation time. The results prove that the two membranes
are suitable for concentrating (volume concentration factor 2.5-3.5) extracts from tobacco leaves in terms of flavonoids.
Keywords: nanofiltration, solid-liquid extraction, rutin, tobacco leaves.
INTRODUCTION
Bioactive compounds (BAC) as polyphenols and
flavonoids in plant materials, extracted by
appropriate solvent and further treated by
membrane operations, are promising and
intensively investigated area of scientific research
in view of BAC separation or concentration. A
large number of potential applications are focused
on organic solvent nanofiltration (OSN) coupled
with solid-liquid extraction of valuable compounds
from plant material [1].
The leaves of Nicotiana tabacum are not only
the most important row material for the tobacco
industry, but also an interesting source of bioactive
natural compounds, among which the group of
flavonoids is increasingly studied [2-5]. Rutin
(C27H30O16, quercetin-3-rutinoside) is one of the
major polyphenol components of tobacco leaves
with a number of pharmacological activities [6].
Rutin is a low solubility compound (0.125mg/ml in
water [6, 7]), which further motivates the search of
an optimum extraction method regarding yield and
reasonable cost.
A comprehensive overview of the methods
applied for rutin extraction from plant materials is
shown in [6, 8, 9]. Either a HPLC component
analysis, or total phenolics (TP) and total
flavonoids (TF) characterization is used. In the
latter case TP are usually referred to the
concentration of chlorogenic acid, being highest
among the polyphenol compounds in tobacco
leaves. Different solvents are reported: water and
organic solvents such as methanol, ethanol,
acetone, N,N-dimethylformamide etc [10], higher
content of polyphenols being obtained with
increase in polarity of the solvent. The addition of
water (EtOH-H2O, MeOH-H2O etc.) usually results
in higher polyphenols content than in the pure
solvent [10]. Largely varying liquid-solid ratios
(10:1 to 90:1) and contact times (most often less
than 1h) are reported. Some of the literature data
about rutin extraction from tobacco leaves and
waste are summarized in Table 1.
Concerning membrane techniques application,
concentration of the extract from tobacco leaves has
been realized by electrodialysis in combination
with filtration through membrane with MWCO of
500 Da, as well as by ion-exchange membranes
such as AM-2 and AM-4 [15] (especially for
chlorogenic acid, scopoletin and rutin).
Concentration or separation of the valuable
bioactive components by nanofiltration has not
been studied, though OSN has been increasingly
investigated in view of treating plant extracts,
including separation/concentration of polyphenols
* To whom all correspondence should be sent:
E-mail: [email protected] a Actual address Institute of Physical Chemistry, Bulgarian
Academy of Sciences, 1113 Sofia, Bulgaria
2016 Bulgarian Academy of Sciences, Union of Chemists in Bulgaria

I. Tsibranska et al.: Concentration of flavonoids in ethanolic extracts from tobacco leaves through nanofiltration
233
Table. 1. Details of the extraction of flavonoids from milled tobacco leaves/ wastes.
Time
[min]
Extracting
solvent
Analysis of the
chemical composition
Liquid to
solid ratio Extraction mode
Ref. and raw
material
15 С2Н5OH-Н2О
8:2 (v/v)
TP**: UV-vis, Folin–
Ciocaulteu, ref.
compound:. chlorogenic
acid
10:1 ultrasound
assisted
[11] tobacco
leaves
- СН3OH-Н2О
7:3 (v/v)
Apigenin, quercetin,
rutin :UV-vis, NMR,
HPLC
- conventional
[2] waste
tobacco
leaves
1
(CH3)2CO-
Н2О, (v/v)
0:1; 3:7; 4:6
Chlorogenic acid
UV-vis 40:1
microwaves
assisted
[12] tobacco
leaves and
waste
90 (25)*
120(60)*
Н2О
C2H5OH
(96%)
Total yield, weight
analysis. 15:1 -40:1 conventional
[13, 14]
tobacco
leaves
30
EtOAc-
CH3OH 1:1;
CH3OH
HPLC 10:1 to
50:1
ultrasound
assisted
[5] tobacco
leaves and
waste
60 C2H5OH (85%
in water)
UV-vis: TP (Folin–
Ciocaulteu , gallic
acid), TF** (AlCl3)
10:1 heat reflux [4] tobacco
leaves
10-90
(30*) CH3OH HPLC
15:1 to
90:1
(45:1)
ultrasound
assisted
[7]
cigarettes
tobacco * to reach the plateau of the kinetic curve
** TP- total polyphenols; TF – total flavonoids
and flavonoids [16-26]. The method has advantages
for multicomponent systems, containing sensitive
to elevated temperatures components and allows for
the regeneration of the solvent. The technology is
especially promising when dealing with extracts
from cheap and widely available materials,
containing bioactive components that can be
concentrated by nanofiltration. The content of some
valuable flavonoids (such as rutin) in the tobacco
waste in low concentrations makes them a suitable
object for concentration by this process.
This study concerns the recovery of rutin from
tobacco leaves and waste by solid-liquid extraction
and subsequent concentration of the extract by
nanofiltration. The molecular weight of most of the
important polyphenols components in the extract
from tobacco leaves [5] is over 300 Da -
chlorogenic acid (C16H18O9, 354 Da) and its
isomers neochlorogenicacid (5-O-caffeoylquinic
acid) and 4-O-caffeoylquinic acid, and highest for
the flavonoids rutin (quercetin-3-O-rutinoside, MW
610 Da) and kaempferol-3-rutinoside (MW 594). It
is expected that nanofiltration using organic solvent
resistant (OSR) membranes with MWCO 300 Da
will allow the successful concentration of the
extract in terms of flavonoids. In the present study
two OSR membranes were used - DuramemTM
(modified polyimide) and Starmem 240 (polyimide)
with MWCO 300 and 400 Da respectively.
EXPERIMENTAL
ᵒ Extraction
The plant material for extraction was provided
by Bulgartabac Sofia - tobacco leaves with defined
origin (the region of Petrich) and moisture content
11%. All samples were grounded to powder and
then subjected to extraction with ethanol. After
batch extraction in a stirred vessel at room
temperature 20±1 ◦C and intensive mixing (stirring
speed 300 rpm) the extract was filtered and
analyzed. If not additionally treated, the ethanolic
extract from tobacco leaves has slightly acidic pH.
In our study pH of the extract was 5.93, obtained
with liquid/solid ratio 10:1 and 70% ethanol (where
highest content of polyphenols is observed), the
deviation from neutral being less pronounced for
the extracts, obtained with 96% ethanol. The latter
were further used in the membrane separation runs
with two organic solvent resistant membranes.
The extraction kinetics with 96% ethanol was
followed during 12h; the obtained results indicate a
contact time of 3h as needed to reach the plateau of
the kinetic curve. The recovered amount of
flavonoids was 0.8 mg/(g solids) at liquid to solid
ratio 10:1. Increasing the latter up to 30:1 allowed
evaluating the maximum extractable flavonoids
concentration as 1.108 mg/g solid. Further increase
of the liquid volume has practically negligible
effect on the amount of the extracted target
component.

I. Tsibranska et al.: Concentration of flavonoids in ethanolic extracts from tobacco leaves through nanofiltration
234
ᵒ Spectrophotometric analysis
For the spectrophotometric determination of
total flavonoids concentration a color reaction with
aluminum trichloride was used. According to
Ordonez [27] 0.5 ml of the sample was added to 0.5
ml AlCl3 (2% solution in ethanol). After 1 hour in
the dark the absorbance was measured at a
wavelength of 425 nm. Three measurements were
performed for each sample. The concentrations in
the extract (Cf), retentate (Cr) and permeate (Cp)
were calculated as rutin equivalent, according eq.
(1):
Abs= 10.953 C (R2=0.997) (1)
where C [mg/ml] is the concentration of total
flavonoids (up to 0.07 mg/ml) and Abs is the
measured absorbance. The calibration curve was
obtained with model solution of rutin-hidrate in
ethanol. Ethanol (96%) was supplied by Valerus
(Bulgaria); Aluminium chloride anhydrous and
rutin (as rutin hydrate 94%) was supplied by
Sigma-Aldrich.
ᵒ Nanofiltration
Batch nanofiltration in dead-end mode was
performed on a laboratory cell (METcell, Evonic
MET LTD, UK) with effective surface area of 54
cm2 at transmembrane pressure of 20 bar and
working volume up-to 200 ml. During
nanofiltration flow and rejection evolution over the
time of filtration was measured. The concentration
of equivalent rutin was determined after each 20 ml
permeate.
RESULTS AND DISCUSSION
The permeate flux and rejection evolution
during nanofiltration with Duramem 300 (MWCO
300Da) and Starmem 240 (MWCO 400Da) are
illustrated in Figs.1 and 2 for similar feed
concentrations of rutin (0.022, 0.025 mg/ml
respectively, see Fig.2). An initial pronounced flux
decrease within the first 3 hours is observed with
both membranes. The flux vs time data tend to
stabilize within longer operation time (6h), the final
flux being in the range of 2 - 3 l/(m2.h).
Fig. 1. Measured flux versus time of filtration
A similar tendency is observed in the time
evolution of observed rejections, shown in Fig.2.
An initial increase is better observed with
Duramem 300, corresponding to the more
pronounced flux decrease in this period and
associated with an increasing membrane resistance.
After that the rejection values tend to stabilize and
even a slight tendency to decrease can be observed.
The two membranes show similar rejections values.
Fig. 2. Measured rejections versus time of filtration
The additional membrane resistance is usually
attributed to fouling and related with different
phenomena such as concentration polarization, cake
layer formation, adsorption of solute molecules
inside the pores or pore blocking when the pore size
is similar to the molecular dimensions [28].
The four kinetic models commonly used for
systems showing flux decline are given in Table 2
together with the calculation results for the first 6
hours of filtration. As can be seen from Table 2, the
cake layer formation model gives best correlation,
but a statistically good description of the flux
decline is also obtained with the rest of the tested
models, which rather suggests that fouling
phenomenon is not very pronounced under the
working conditions (range of feed concentrations in
term of flavonoids 0.012 to 0.042 mg/ml).
Similar observations were already reported with
nanofiltration of natural extracts containing
polyphenols and flavonoids [29, 30], based on the
original model, proposed by Hermia to describe the
permeate flux decline during constant-pressure
filtration [31].
The flux dependence on feed concentration is
shown in Fig.3. These results concern average flux
values, obtained with Duramem 300 during the
initial 3h of filtration, where the flux decline is
most pronounced. The volume ratio permeate to
feed was kept in the range of 0.6 to 0.7, which
defines the limits of the achieved degree of
concentration. The feed concentration affects the
measured flux, but the latter remains close to the
measured value for the model system rutin-ethanol:
4.5 – 5.5 vs. 5.3 L/m2.h (model system, R2=0.998).
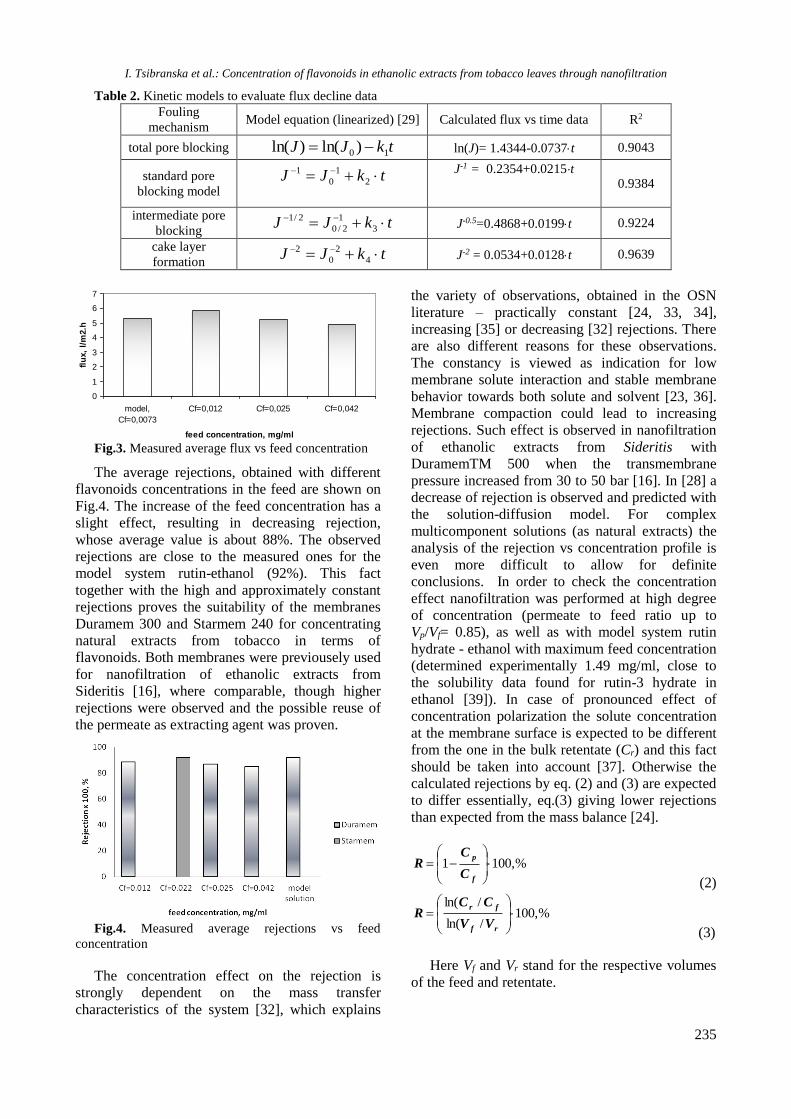
I. Tsibranska et al.: Concentration of flavonoids in ethanolic extracts from tobacco leaves through nanofiltration
235
Table 2. Kinetic models to evaluate flux decline data
Fouling
mechanism Model equation (linearized) [29] Calculated flux vs time data R2
total pore blocking tkJJ 10 )ln()ln(
ln(J)= 1.4344-0.0737t 0.9043
standard pore
blocking model tkJJ
2
1
0
1
J-1 = 0.2354+0.0215t
0.9384
intermediate pore
blocking tkJJ
3
1
2/0
2/1
J-0.5=0.4868+0.0199t 0.9224
cake layer
formation tkJJ
4
2
0
2
J-2 = 0.0534+0.0128t 0.9639
0
1
2
3
4
5
6
7
model,
Cf=0,0073
Cf=0,012 Cf=0,025 Cf=0,042
feed concentration, mg/ml
flu
x,
l/m
2.h
Fig.3. Measured average flux vs feed concentration
The average rejections, obtained with different
flavonoids concentrations in the feed are shown on
Fig.4. The increase of the feed concentration has a
slight effect, resulting in decreasing rejection,
whose average value is about 88%. The observed
rejections are close to the measured ones for the
model system rutin-ethanol (92%). This fact
together with the high and approximately constant
rejections proves the suitability of the membranes
Duramem 300 and Starmem 240 for concentrating
natural extracts from tobacco in terms of
flavonoids. Both membranes were previousely used
for nanofiltration of ethanolic extracts from
Sideritis [16], where comparable, though higher
rejections were observed and the possible reuse of
the permeate as extracting agent was proven.
Fig.4. Measured average rejections vs feed
concentration
The concentration effect on the rejection is
strongly dependent on the mass transfer
characteristics of the system [32], which explains
the variety of observations, obtained in the OSN
literature – practically constant [24, 33, 34],
increasing [35] or decreasing [32] rejections. There
are also different reasons for these observations.
The constancy is viewed as indication for low
membrane solute interaction and stable membrane
behavior towards both solute and solvent [23, 36].
Membrane compaction could lead to increasing
rejections. Such effect is observed in nanofiltration
of ethanolic extracts from Sideritis with
DuramemTM 500 when the transmembrane
pressure increased from 30 to 50 bar [16]. In [28] a
decrease of rejection is observed and predicted with
the solution-diffusion model. For complex
multicomponent solutions (as natural extracts) the
analysis of the rejection vs concentration profile is
even more difficult to allow for definite
conclusions. In order to check the concentration
effect nanofiltration was performed at high degree
of concentration (permeate to feed ratio up to
Vp/Vf= 0.85), as well as with model system rutin
hydrate - ethanol with maximum feed concentration
(determined experimentally 1.49 mg/ml, close to
the solubility data found for rutin-3 hydrate in
ethanol [39]). In case of pronounced effect of
concentration polarization the solute concentration
at the membrane surface is expected to be different
from the one in the bulk retentate (Cr) and this fact
should be taken into account [37]. Otherwise the
calculated rejections by eq. (2) and (3) are expected
to differ essentially, eq.(3) giving lower rejections
than expected from the mass balance [24].
,%1001
f
p
C
CR
(2)
,%100/ln(
/ln(
rf
fr
VV
CCR
(3)
Here Vf and Vr stand for the respective volumes
of the feed and retentate.
I. Tsibranska et al.: Concentration of flavonoids in ethanolic extracts from tobacco leaves through nanofiltration
236
Calculations according to eq. (2) and (3) showed
comparable rejections close to 80% (77.8% and
79.8% respectively), which supports the absence of
an essential concentration effect at the membrane
surface. For higher feed concentrations the
solubility limit was exceeded in the retentate, the
fact being already pointed out in the literature for
rutin extraction [38].
CONCLUSION
Extraction with ethanol of tobacco leaves at
room temperature shows total flavonoids content
1.1 mg/(g solid) rutin equivalent. About 90% of the
flavonoids are extracted during the first 3h, so this
time can be considered as sufficient for practical
applications.
The nanofiltration of the extracts was studied
with OSR membranes Duramem 300 and Starmem
240. Average rejections show small variation with
concentration, difficult to separate from the
experimental error during the measurements, in
view of the solution (natural extract,
multicomponent) and the accuracy of the chemical
analysis (group analysis, spectrophotometric). The concentration effect is better seen from the
rejection vs time plot. Both membranes show
rejections about 88% and tendency to decrease with
increasing degree of concentration. This
corresponds to observed and predicted rejections in
the OSN literature [31].
Permeate flow decreases with increasing
concentration, the effect being important in the
beginning (the first 3h of operation). Then the flux
decline is much less pronounced, tending to
stabilize at flux values between 2 and 3 l/m2.h.
Flux and rejections with real extracts are close to
the measured with the model system. The results
prove that the two membranes are suitable for
concentrating extracts from tobacco leaves in terms
of flavonoids.
REFERENCES
1. I.Tsibranska, B.Tylkowski, in “Integrated membrane
operations in the food production”, Ed. A. Cassano.
E. Drioli, chapter 11, p.269-294, De Gruyter, 2014
2. F. Fathiazad, Ab. Delazar, R. Amiri, S.D. Sarker,
Iranian Journal of Pharmaceutical Research 3, 222
(2006).
3. J. Chen, H. Leng, Y. Duan, W. Zhao, G. Yang, Y.
Guo, Y. Chen, Q. Hu, Phytochemistry Letters 6,
144 (2013).
4. Q.-M. Ru, L.-J. Wang, W.-M. Li, J.-L. Wang and
Y.-T. Ding, Molecules, 17, 11281 (2012).
5. M. Docheva, S. Dagnon, St. Statkova-Abeghe,
Natural Product Research, Taylor & Francis,
http://dx.doi.org/10.1080/14786419.2014.902947
(2014).
6. L.S. Chua, Journal of Ethnopharmacology, 150, 805
(2013).
7. Y. Sun, W. Li, J. Wang, J. Bi, Sh. Su, Molecules,
17, 3751 (2012).
8. M. Naczk, F. Shahidi, Journal of Pharmaceutical
and Biomedical Analysis, 41, 1523 (2006).
9. I. Ignat, I. Volf, V.I. Popa, Food Chemistry, 126,
1821 (2011).
10. P.Duangsri, K. Juntarapun, C. Satirapipathkul, In
Proceedings of the RMUTP International
Conference: Textiles & Fashion (2012).
11. H. Wang, M. Zhao, B. Yang, Y. Jiang, G. Rao,
Food Chemistry, 107, 1399 (2008).
12. Zh. Li, D. Huang, Zh. Tang, Ch. Deng, X. Zhang,
Talanta, 82, 1181 (2010).
13. E. Simeonov, I. Tsibranska, A. Minchev,
Chem.Eng.Journal, 73, 255 (1999).
14. E. Simeonov, Ch. Chilev, Journal of Chemical Technology and Metallurgy, 50(5), 597
(2015). 15. M. Aider, D. de Halleux, L. Bazinet, Trends in
Food Science & Technology, 19, 351 (2008).
16. B. Tylkowski, I. Tsibranska, R. Kochanov, G.
Peev, M. Giamberini, Food and Bioproducts
Processing, 89(4), 307 (2011).
17. G. Peev, P. Penchev, D. Peshev, G. Angelov,
Chemical Engineering Research and Design,
89(11), 2236 (2011).
18. B. Tylkowski, B. Trusheva, V. Bankova, M.
Giamberini, G. Peev, A. Nikolova, Journal of
Membrane Science, 348(1–2), 124 (2010).
19. M.T. Machado, B.C. Mello, M.D. Hubinger,
Journal of Food Engineering, 117(4), 450 (2013).
20. P.C. Pinto, M.I. Mota, J.M. Loureiro, A.E.
Rodrigues, Separation and Purification
Technology, 132, 234 (2014).
21. D. Peshev, L.G. Peeva, G. Peev, I.I. Baptista, A.T.
Boam, Chemical Engineering Research and
Design, 89(3), 318 (2011).
22. B.C. Mello, J.C. Petrus, M.D. Hubinger, Journal of
Food Engineering, 96(4), 533 (2010).
23. A.P. Prudêncio, E.S. Prudêncio, R.D. Amboni,
A.N. Murakami, M. Maraschin, J.C. Petrus, P.J.
Ogliari, R.S. Leite, Food and Bioproducts
Processing, 90(3), 399 (2012).
24. I. Tsibranska, B. Tylkowski, Food and
Bioproducts Processing, 91(2), 169 (2013).
25. A.N. Murakami, R.D. Amboni, E.S. Prudêncio,
E.R. Amante, C.B. Fritzen-Freire, B.C. Boaventura,
I.B. Muñoz, C.S. Branco, M. Salvador, M.
Maraschin, Food Chemistry, 141(11), 60 (2013).
26. B. Díaz-Reinoso, A. Moure, H. Domínguez, J.C.
Parajó, Chemical Engineering Journal, 175, 95
(2011).
27. G.J. Ordonez, M.A. Vattuone, M.I. Isla, Food
Chemistry, 97, 452 (2006).
28. C. M. Salgado, L. Palacio, P. Prádanos,
A.Hernández, C. González-Huerta, S. Pérez-

V. L. Strashilov et al.: Gas adsorption in ZnO nanowires as studied by surface acoustic wave resonators
237
Magariño, Food and Bioproducts Processing, 94,
610 (2015).
29. B. C. B. S. Mello, J.C. C. Petrus2, M.D. Hubinger,
Studies in Chemical Process
Technology (SCPT) 1(4), 55 (2013).
30. M.T.C. Machado, B. C.B.S. Mello, M.D. Hubinger,
Food and Bioproducts Processing, 95, 304 (2015).
31. J. Hermia, Chemical Engineering Research and
Design, 60, 183 (1982).
32. P. Silva, A.G. Livingston, Journal of Membrane
Science, 280, 889 (2006).
33. D. Shi, Y. Kong, J. Yu, Y. Wang, J. Yang,
Desalination, 191, 309 (2006).
34. B. Su, Zh. Wang, J. Wang, Sh. Wang, Journal of
Membrane Science, 251, 189 (2005).
35. J.A. Whu, B.C. Baltzis, K.K. Sirkar, Journal of
Membrane Science, 170, 159 (2000).
36. H.J. Zwijnenberg, A.M. Krosse, K. Ebert, K-V.
Peinemann, F.P. Cuperus, JAOCS, 76, 83 (1999).
37. D.A. Patterson, L.Y. Lau, Ch. Roengpithya, E.J.
Gibbins, A.G. Livingston, Desalination, 218, 248
(2008).
38. E. Miniati, L. Montanari, Italian Journal of Food
Science, 10(4), 339 (1998).
39. www.pvp.com.br/EN_rutin_dab_10_technical_data.h
tm
КОНЦЕНТРИРАНЕ НА ФЛАВОНОИДИ В ЕТАНОЛОВ ЕКСТРАКТ ОТ
ТЮТЮНЕВИ ЛИСТА ЧРЕЗ НАНОФИЛТРУВАНЕ
И. Х. Цибранска1, В. И. Карабожикова2, Ж. Желязков2
1 Институт по инженерна химия, Българска Академия на науките, 1113 София, България 2Катедра по инженерна химия, Химико-Технологичен и Meталургичен Университет, 1756 София, България
Постъпила на 20 ноември, 2014 г. коригирана на 2 февруари, 2015 г.
(Резюме)
Мембранни процеси на разделяне се прилагат успешно към биоактивни вещества като разтворими
полифеноли и флавоноиди, извлечени от растителни материали, с оглед на тяхното концентриране или
разделяне. В настоящото изследване е проведено нанофилтруване на етанолови екстракти от тютюневи листа с
цел концентриране на съдържанието на полифеноли и флавоноиди (главно рутин). Използвани са мембрани
DuramemTM 300 и Starmem 240 с праг на разделяне съответно 300 и 400Da. Наблюдавано е 88% задържане по
общи флавоноиди, близко до измерената стойност за моделна система рутин-етанол (92%), и с тенденция за
леко намаляване във времето. Наблюдаваните средни стойности за потока пермеат при реални екстракти са
близки до тези за моделната система рутин-етанол: 4.5-5.5 vs. 5.3 L / (m2.h) за Duramem 300 и малко по-ниска за
Starmem 240. Развитието на потока във времето за двете мембрани показва подобен ход: първоначално
намаляване с тенденция към стабилизиране при по-големи времена на филтруване. Резултатите доказват, че
двете мембрани са подходящи за концентриране на флавоноиди от екстракти на тютюневи листа в изследваните
обемни съотношения захранване спрямо ретентат (2.5-3.5).

238
Bulgarian Chemical Communications, Volume 48, Number 2 (pp. 238 – 243) 2016
Nickel doping effect on the photocatalytic activity of TiO2/SiO2 nanocomposite
B. Khodadadi
Department of Chemistry, University of Qom, Qom, Iran
Received January 24, 2015, Revised July 31, 2015
TiO2/SiO2 and TiO2/SiO2/Ni nanocomposite powders were prepared by a sol-gel technique. Moreover, different
concentrations of dopant were added to investigate the effect of the metal doping effect. Structures were characterized
by IR spectroscopy, Scanning Electron Microscopy (SEM), Energy Dispersive Analytical X-Ray (EDAX) and X-Ray
Diffraction (XRD) methods. Moreover, the absorption coefficients of the samples were analyzed by Tauc's approach
and the direct band gaps also were calculated. The photocatalytic activity of all the samples was investigated under UV
irradiation in an aqueous medium. The results revealed that metal doping plays an important role in decreasing the
particle size. Furthermore, photocatalytic activity improves in the presence of a dopant.
Keywords: Sol-Gel, Nanocomposite, Photocatalytic activity, TiO2/SiO2/Ni
INTRODUCTION
Photocatalytic and self-cleaning properties have
already become a very interesting subject for
researchers and can be used for practical
applications regarding environmental
decontamination. These properties depend on the
relationship between photocatalysis and
hydrophilicity, which causes more effective
cleaning over the surfaces and is useful for
decomposition of organic contaminants. TiO2 is one
of the best materials for self-cleaning purposes due
to its thermostability and photocatalytic properties
[1,2].
Recently, many researchers have reported
replacing TiO2 by the TiO2/SiO2 catalyst, which is
an advanced material for self-cleaning and
photocatalytic properties, since TiO2/SiO2 exhibits
different surface chemical and photochemical
properties compared to TiO2 [3, 4]. In order to
improve the efficiency of the photocatalytic
activity, the TiO2/SiO2 catalyst can be modified by
the addition of various modifiers, such as metals or
metallic oxides by various methods [5-8].
The metal doping process can be performed by the
sol–gel method or restricted to the surface by metal
deposition. Proportional abundance and low-cost
properties are reasons for choosing Nickel in this
process [8-11]. The photocatalytic properties are
related to the surface structure of the
nanocomposite powder [12]. On the other hand,
organic polymers are used to prevent agglomeration
of TiO2 powder and modify its photocatalytic
activity [13, 14].
Consequently, in this work, we have synthesized
TiO2/SiO2 nanocomposites, doped with Ni.
Moreover, we have investigated the effects of the
molar ratio of the dopant on the particle size,
structure and photocatalytic activity.
EXPERIMENTAL
Materials and Equipment
Titanium tetra isopropoxide (TTIP) (AR
analytical grade, Merck Chemical Company) was
used as the titanium source for the preparation of
the TiO2 photocatalysts. Nickel (II). 6 H2O,
Hydroxypropyl cellulose (HPC), HNO3, SiO2
colloid solution, absolute ethanol were purchased
from the Merck Chemical Company. XRD
measurements were performed using a Philips X'
Pert PRO MPD diffractometer with CuKα radiation
from 10 to 80 (2θ) at room temperature. The
morphology and microanalysis of the samples were
observed by a scanning electron microscope (SEM,
SEM-4100, Jeol). Ultraviolet-visible (UV-Vis)
absorption spectra were obtained by means of a
Varian Carry 300. FT-IR spectra were obtained via
KBr pellets in the range 500 to 4000 cm-1 using a
Thermo Nicolet 870 FT-IR Nexus
spectrophotometer.
Preparation of the Samples
All samples were prepared by the Sol-Gel
technique using the following procedure:
Preparation of sample 1 (TiO2/SiO2
nanocomposite)
A: Preparation of solution I: 0.2 g of (HPC) was
added to absolute ethanol and stirred until complete
dissolution was achieved. Then, TTIP was * To whom all correspondence should be sent:
E-mail: [email protected]; [email protected]
2016 Bulgarian Academy of Sciences, Union of Chemists in Bulgaria

nanocomposite 2/SiO2Khodadadi: Nickel doping effect on the photocatalytic activity of TiO. B
239
dissolved in this solution (with a molar ratio
TTIP/ethanol = 1/75).
B: Preparation of solution II: HNO3, deionized
water and SiO2 were dissolved in absolute ethanol
(with a molar ratio ethanol /HNO3/H2O/SiO2 =
43/0.2/1/30).
C: Preparation of the TiO2/SiO2 nanocomposite:
Solution II was added dropwise into solution I and
vigorously stirred for 30 min at room temperature.
The obtained transparent colloidal suspension was
sonicated for 30 min. and aged for 48 h to form a
gel. The sample was dried in an oven at 50◦C and
ultimately calcinated at 500◦C for 4 hours.
Preparation of samples 2, 3, 4, and 5 (TiO2/SiO2/Ni
nanocomposite)
A: Preparation of solution I: Solution A was
prepared exactly as sample 1.
B: Preparation of solution II: HNO3, deionized
water and SiO2 were dissolved in absolute ethanol
(with a molar ratio ethanol /HNO3/H2O/SiO2 =
43/0.2/1/30) and then several concentrations of Ni
(NO3)2 (0.1, 0.3, 0.6) and 1% W/W Ni (NO3)2/ SiO2
were added to solution II.
C: Preparation of TiO2/SiO2/Ni nanocomposite:
Solution II was added dropwise into solution I and
vigorously stirred for 30 min at room temperature.
The obtained transparent colloidal suspension was
sonicated for 30 min. and aged for 48 h to form a
gel. The sample was dried in an oven at 50◦C and
ultimately calcinated at 500◦C for 4 hours.
All the above steps have been summarized in a
chart in Fig. 1.
Fig. 1. Sample preparation chart
RESULTS AND DISCUSSION
FT-IR spectroscopy
Fig. 2 presents the FT-IR spectra of the samples
investigated. According to these results, in all
samples, wide absorption bands were observed
around 3100-3700 cm-1, which can be attributed to
the OH stretching vibration of the surface hydroxyl
group. Hydroxyl bands (3100-3700 cm-1) appeared
due to a great amount of propanol present during
the hydrolysis of TTIP [15-20]. Moreover, because
of the physically adsorbed water and hydroxyl
group, absorption bands were observed around
1635 cm-1 [19,20].
Fig. 2. FT-IR spectra of the sample sols. (a)Sample 1,
(b)Sample 2, (c)Sample 3, (d)Sample 4 and (e) sample 5.
The bands at 1117 cm-1 in the samples
correspond to an asymmetric stretching vibration of
the Ti-O bands [17-21] and the ones at 1073 cm-1
are due to the symmetrical vibration of the Si-O-Si
bands [20-22]. The FT-IR spectra show silicate
absorptions at 789, 467 and 464 cm-1, which can be
assigned to Si–O–Si bending and stretching
vibrations [22-24]. The peak at 602 cm-1 can be
assigned to a symmetric stretching vibration of the
Ti–O–Ti group [22-25]. Furthermore, a band was
observed at 2366 cm-1, which can be assigned to
Ni–TiO2–SiO2 [5, 7]. Exhibited broad peaks in the
range of 400–1000 cm-1 have contributions from
the anatase phase [21-24].

nanocomposite 2/SiO2Khodadadi: Nickel doping effect on the photocatalytic activity of TiO. B
240
XRD analysis
X-ray diffraction (XRD) analysis was employed
to determine the crystallite phase and crystallinity
of the samples and the results have been shown in
Fig. 3.
Fig. 3. XRD patterns of sol-gel synthesized
TiO2/SiO2. (a) Sample 1, (b) Sample 2, (c)Sample 3,
(d) Sample 4 and (e) Sample 5.
According to the XRD evaluation, the
diffraction patterns of each sample are well in
agreement with the anatase phase (the base peak in
the range of 20<2θ<30 is evidence of an anatase
phase). Sample 1, without Nickel shows less of an
anatase structure than other samples. The XRD
results reveal that the samples show an anatase
phase more than sample 1 after Ni doping and this
leads one to conclude that metal doping is effective
on anatase phase formation. Additionally, there is
no notable shift of all diffraction peaks between the
samples, confirming the successful doping of Ni
into the lattice. However, the intensity of the
diffraction peaks becomes higher with increasing
Ni concentration.
Scanning Electron Microscopy (SEM) and EDAX
analysis
All samples were identified by Scanning
Electron Microscopy (SEM) analysis and their
images are presented in Fig. 4. According to the
images, in all samples, the nanoparticles are
relatively uniform, global and slightly
agglomerated. It is remarkable that the particle size
decreases and becomes monotonous and particle
distribution becomes narrow with the increase in
Ni2+ doping concentration. This clearly reveals that
the Nickel ion decreases the grain size. EDAX
analysis has revealed that TiO2, SiO2 and Ni are
present in all the samples.
Fig. 4. SEM images for the sample powders. (a)
Sample 1, (b) Sample 2, (c) Sample 3, (d) Sample 4 and
(e) Sample 5.
UV–Visible spectra and Band gap calculation
UV–Vis diffuse reflectance spectroscopy was
carried out to investigate the optical properties of
the samples and the results are shown in Fig. 5. It
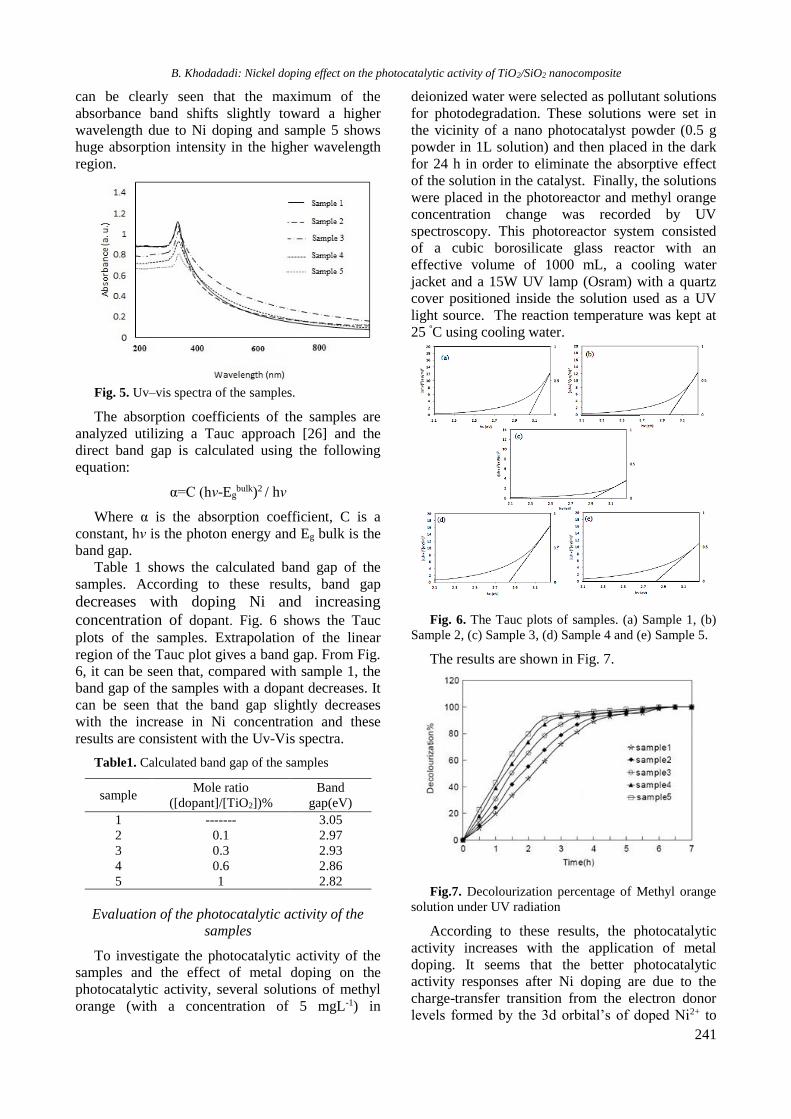
nanocomposite 2/SiO2Khodadadi: Nickel doping effect on the photocatalytic activity of TiO. B
241
can be clearly seen that the maximum of the
absorbance band shifts slightly toward a higher
wavelength due to Ni doping and sample 5 shows
huge absorption intensity in the higher wavelength
region.
Fig. 5. Uv–vis spectra of the samples.
The absorption coefficients of the samples are
analyzed utilizing a Tauc approach [26] and the
direct band gap is calculated using the following
equation:
α=C (hν-Egbulk)2 / hν
Where α is the absorption coefficient, C is a
constant, hν is the photon energy and Eg bulk is the
band gap.
Table 1 shows the calculated band gap of the
samples. According to these results, band gap decreases with doping Ni and increasing
concentration of dopant. Fig. 6 shows the Tauc
plots of the samples. Extrapolation of the linear
region of the Tauc plot gives a band gap. From Fig.
6, it can be seen that, compared with sample 1, the
band gap of the samples with a dopant decreases. It
can be seen that the band gap slightly decreases
with the increase in Ni concentration and these
results are consistent with the Uv-Vis spectra.
Table1. Calculated band gap of the samples
Band
gap(eV)
Mole ratio
])%2([dopant]/[TiO sample
3.05 ------- 1
2.97 0.1 2
2.93 0.3 3
2.86 0.6 4
2.82 1 5
Evaluation of the photocatalytic activity of the
samples
To investigate the photocatalytic activity of the
samples and the effect of metal doping on the
photocatalytic activity, several solutions of methyl
orange (with a concentration of 5 mgL-1) in
deionized water were selected as pollutant solutions
for photodegradation. These solutions were set in
the vicinity of a nano photocatalyst powder (0.5 g
powder in 1L solution) and then placed in the dark
for 24 h in order to eliminate the absorptive effect
of the solution in the catalyst. Finally, the solutions
were placed in the photoreactor and methyl orange
concentration change was recorded by UV
spectroscopy. This photoreactor system consisted
of a cubic borosilicate glass reactor with an
effective volume of 1000 mL, a cooling water
jacket and a 15W UV lamp (Osram) with a quartz
cover positioned inside the solution used as a UV
light source. The reaction temperature was kept at
25 ºC using cooling water.
Fig. 6. The Tauc plots of samples. (a) Sample 1, (b)
Sample 2, (c) Sample 3, (d) Sample 4 and (e) Sample 5.
The results are shown in Fig. 7.
Fig.7. Decolourization percentage of Methyl orange
solution under UV radiation
According to these results, the photocatalytic
activity increases with the application of metal
doping. It seems that the better photocatalytic
activity responses after Ni doping are due to the
charge-transfer transition from the electron donor
levels formed by the 3d orbital’s of doped Ni2+ to

nanocomposite 2/SiO2Khodadadi: Nickel doping effect on the photocatalytic activity of TiO. B
242
the conduction bands of the host materials [27].
Sample 5 (containing 1% Ni) has the highest
activity in comparison with other samples.
Therefore, the good photocatalytic ability of this
sample can be attributed to the smaller particle size,
porosity and less agglomerated nanostructure.
CONCLUSION
This research has verified that the photocatalytic
activity of TiO2/SiO2 nanocompsite powder can be
improved using metal doping. All samples have
been prepared by the sol–gel method and HPC has
been used as a modifier. SEM pictures have
revealed that the particle size of the nanocomposite
powder with 1% Ni was smaller than that of the
other samples. Furthermore, the XRD pattern
confirmed that the formation of the anatase
structure in this sample is better than in other
samples. UV–Vis diffuse reflectance spectroscopy
showed a red shift with doping and 1% Ni was
more effective than other concentrations. Moreover,
the absorption coefficients of the samples were
analyzed by the Tauc approach and the calculations
confirmed that the application of dopands and
dopant concentrations affect the band gap. The
photocatalytic activity of the samples was
examined for degradation of methyl orange in water
under UV irradiation in a batch reactor. The results
revealed that the photocatalytic activity of the
nanocomposites increased in the presence of Nickel
and according to other results; the sample with 1%
Ni exhibited the best photocatalytic activity.
REFERENCES
1. C. Euvananont; C. Junin; K. Inpor; P. Limthongkul,
C. Thanachayanont, Ceram. Int., 34, 1067 (2008).
2. S.Neatu; V.I. Parvulescu; G. Epure; N. Petera; V.
Somoghi; G. Ricchiardi; S. Bordiga, A. Zecchina, J.
Appl. Catal. B., 91, 546 (2009).
3. B. Braconnier; C.A. Paez; S. Lambert; C. Alie; C.
Henrist; D. Poelman; J. Pirard; R. Cloots, B.
Heinrichs, Microporous Mesoporous Mater., 122, 247
(2009).
4. Z. Liu; X. Zhang; T. Murakami, A. Fujishima, Sol.
Energy Mater. Sol. Cells., 92, 1434 (2008).
5. T. A. Egerton, I. R. Tooley J. Phy. Chem. B., 108.
5066 (2004).
6. A. Fujishima; T. Rao, D. Tryk. J. Photochem.
Photobiol. C. Photochem. Rev., 1, 1 (2000).
7. X. Fu; L. A. Clark; Q. Yang, M. A. Anderson, J.
Environ. Sci. Tech., 30, 647 (1996).
8. X. Deng; Y. Yue, Z. Gao, J. Appl. Catal. B., 39, 135
(2002).
9. H. Hayashi, K. Torii, J. Mater. Sci., 12, 3671 (2002).
10. Y. Li; N. H. Lee; D. S. Lee; D. S. Hwang; J. S. Song;
E. G. Lee, S. J. Kim, J. Langmuir, 20, 10838 (2004).
11. R. Rodriguez; S. J. Sandoval; M. Estevez, S. Vargas,
J. Non-Cryst. Solids, 351, 167 (2005).
12. H. Imai, H. Hirashima, J. Am. Ceram. Soc., 82, 2301
(1999).
13. S. Liu; N. Jaffrezic, C. Guillard, J. Appl. Surf. Sci.,
255, 2704 (2008).
14. M.M. Mohamed; T.M. Salama, T. Yamaguchi, J.
Colloids Surf., 207, 25 (2002).
15. K. Guan, J. Surf. Coat. Tech., 191, 155 (2005).
16. M. Houmard; D. Riassetto; F. Roussel; A. Bourgeois;
G. Berthome; J.C. Joud, M. Langlet, J. Appl. Surf. Sci.,
254, 1405 (2007).
17. J. Ovenstone, J. Mater. Sci., 36, 1325 (2001).
18. M.P. Zheng; M. Gu; Y. Jin and G. Jin, J. Mater. Sci.
Eng. B., 77, 55 (2000).
19. G. Zhao; Q. Tian; Q. Liu, G. Han, J. Surf. Coat.
Tech., 198, 55 (2005).
20. K.M. Parida, N. Sahu, J. Mol. Catal. A: Chem., 287,
151 (2008).
21. M.P. Zheng; M.Y. Gu; Y.P. Jin; H.H. Wang,; P.F.
Zu; P. Tao, J.B. He, J. Mater. Sci. Eng. B., 87, 197
(2001).
22. J. Jiao; Q. Xu, L. Li, J. Colloid Interface Sci., 316 ,
596 (2007).
23. M. Houmard; D. Riassetto; F. Roussel; A. Bourgeois;
G. Berthome; J.C.Joud, M. Langlet, J. Surf. Sci., 602,
3364 (2008).
24. P. Aberomand Azar; S.Moradi Dehaghi; S. Samadi;
S. Kamyar, M. Saber Tehrani, Asian J. Chem., 22,
1619 (2010).
25. B. Khodadadi; M. Sabeti; S. Moradi; P. Aberomand
Azar, S. Raies Farshid, J. Appl. Chem. Res., 20, 36
(2012).
26. H. Fu; C. Pan; W. Yao, Y. Zhu, J. Phys. Chem., B.
109, 22432 (2005).
27. R. Niishiro; H. Kato, A. Kudo, J. Phys. Chem.
Chem. Phys.,7, 2241 (2005).

243
ЕФЕКТ НА ДОТИРАНЕ С НИКЕЛ ВЪРХУ ФОТОКАТАЛИТИЧНАТА АКТИВНОСТ НА
НАНОКОМПОЗИТИ ОТ TiO2/SiO2
Б. Ходадади
Департамент по химия, Университет в Кум, Кум, Иран
Постъпила на 24 януари, 2015 г.; коригирана на 31 юли, 2015 г.
(Резюме)
Приготвени са прахови нанокомпозити от TiO2/SiO2 и TiO2/SiO2/Ni по зол-гел метода. Освен това са
добавени различни концентрации на примеси са да се изследва дотиращия ефект на металите. Структурите са
установени с ИЧ-спектроскопия, сканираща електронна микроскопия (SEM), дисперсионна аналитична
рентгенова дифракция (EDAX) и рентгенова дифракция (XRD). Абсорбционните коефициенти на пробите са
анализирани по подхода на Tauc и са изчислени директно забранените зони. Изследвана е фотокаталитичната
активност на всички образци под ултравиолетово облъчване във водна среда. Резултатите показват, че
дотирането с метали играе важна роля за намаляване размерите на частиците. Фотокаталитичният ефект се
подобрява при дотиране.
244
Bulgarian Chemical Communications, Volume 48, Number 2 (pp. 244 – 249) 2016
Kinetic investigation of tetrahydrobenzo[b]pyran synthesis in the presence of fructose
as a catalyst via a three-component reaction: an experimental study
H. Yaghoubian, S.M. Habibi-Khorassani*, A. Ebrahimi
Department of Chemistry, Faculty of Science, University of Sistan and Baluchestan, P. O. Box 98135-674, Zahedan,
Iran
Received January 23, 2015, Revised October 13, 2015
The synthesis reaction of tetrahydrobenzo[b]pyran from the reaction between 4-chlorobenzaldehyde, malononitrile
with dimedone in the presence of fructose as a catalyst were subjected to a kinetic and mechanistic study by a UV
spectrophotometric technique. The effects of various parameters such as the concentration, temperature, solvent
composition and various catalysts on the reaction rate were examined. Experimental data fully matched the second
order fits. The resultant rate constants obeyed the Arrhenius and Eyring equations. The relevant activation
parameters(Ea, ∆H‡, ∆S‡ and ∆G‡) were determined from these. In a solvent with a lower dielectric constant the rate of
reaction decreased. In accordance with the experimental observations and steady state approximation, the first step of
the proposed mechanism was recognized as a rate-determining step.
Keywords: Kinetics, Catalyst, Mechanism, Tetrahydrobenzo[b]pyran
INTRODUCTION
Benzopyrans and their derivatives, as a useful
class of heterocyclic compounds, show biological
and pharmacological properties, such as diuretic,
anticancer, spasmolytic, anticoagulant and
antianaphylactin activities [1]. They can also be
employed as cognitive enhancers for the treatment
of some neurodegenerative diseases, including
Parkinson, Alzheimer, Huntington, AIDS
associated dementia, Down’s syndrome and also for
the treatment of schizophrenia and myoclonus [2].
Furthermore, these compounds can be applied as
potential biodegradable agrochemicals, pigments
and photoactive materials [3-6]. In recent years,
many studies on the synthesis of
tetrahydrobenzo[b]pyrans have been reported[7-
11]. Multi component reactions (MCRs) occur in
one-pot and so these reactions are easier to perform
than multistep syntheses reactions [12]. The
considerable benefits due to MCR sconta in low
expenses, avoiding of time-consuming purification
processes and complex synthetic pathways, shorter
times of reaction, high yields and saving the energy
[13]. Three-component reactions have appeared as
a beneficial approach among the multi-component
reactions since the combination of three compounds
to obtain related products in a single step is quite
economical [14-17]. Therefore, an effective and
suitable synthesis of tetrahydrobenzo[b]pyrans can
usually be performed via a three-component
reaction of an aromatic aldehyde, an acting
methylene compound and dimedone in the presence
of an appropriate catalyst [18]. In addition to
synthesis, very valuable information about these
compounds is the mechanism and rate of the
reactions, the effect of various parameters can be
obtained from the kinetic studies [19]. In previous
works we have investigated the kinetics of the
synthesis of new organics such as phosphorus
ylides, phosphonate esters and others, both
experimental and theoretical studies [20-24]. In this
work we examine the experimental kinetics and
mechanism of the reaction between 4-
chlorobenzaldehyde 1, malononitrile 2, and
dimedone 3 in the presence of fructose as a catalyst
to attain tetrahydrobenzo[b]pyran 4 (Scheme1).
Fructose is a popular, commensurate, stable, cheap
and clean catalyst, dissolvable in water synthesized
by an environmentally desirable procedure.
Scheme1. Synthesis reaction of tetrahydrobenzo
[b]pyran, 4-chlorobenzaldehyde, malononitrile, and
dimedone in the presence of fructose as a catalyst.
* To whom all correspondence should be sent:
E-mail: [email protected]
2016 Bulgarian Academy of Sciences, Union of Chemists in Bulgaria

H. Yaghoubian et al.: Kinetic investigation of tetrahydrobenzo[b]pyran synthesis in the presence of fructose as a catalyst …
245
EXPERIMENTAL SECTION
4-chlorobenzaldehyde 1, malononitrile 2,
dimedone 3, fructose and ethanol were obtained
from Merck (Darmstadt, Germany) and Fluka
(Buchs, Switzerland), these were used without any
purification. All of the experiments were
accomplished by a carry UV-Vis spectrophotometer
as follow:
General procedure
At first, 10-2 M solution of each compound (1, 2,
3 and catalyst) was prepared in a mixture of 2:1
water: ethanol as a solvent. Then, the spectrum of
each compound was recorded in the wavelength
range 200-800 nm. In the second experiment, 0.2
mL of the solution of the catalyst and each reactant
2 and 3 were added into the cell, respectively (as
there is no reaction between them).Then, 0.2 mL of
reactant 1 was added to the mixture and the
progress of the reaction was monitored at the
ambient temperature (Fig.1).
Fig. 1. The UV/Vis spectra of the reaction between
4-chlorobenzaldehyde 1 (10-2M), malononitrile 2(10-2M)
and dimedone 3 (10-2M) in the presence of the fructose
catalyst (10-2M) and in a mixture of water: ethanol (2:1),
the upward arrow showing the progress of the reaction
Thereupon, the suitable wavelength at which
reactants 1, 2, 3 and the catalyst have relatively no
absorbance was found to be 380 nm. The full
kinetics and mechanism of the reaction can be
investigated at this wavelength. Herein, in all the
experiments, the UV-Vis spectrum of the product
was measured over the concentration range (10-3 M
< M product <10-2 M) to corroborate a linear
relation between the absorbance and concentrations
values. In the third experiment under the same
conditions just as the previous experiment, the
absorbance curve was recorded versus the time at
40℃ and 380 nm (Fig.2). Zero, first or second
curve fittings can be drawn using the software
associated with the UV-Vis instrument; also, the
relevant rate constant can be calculated
automatically [25]. As can be seen in Fig. 2, the
experimental absorbance data (dotted line)
accurately fits the second order curve (solid line).
Thus, the overall order of the reaction according to
the rate law expressed in equation (1), can be
written as: α+β+γ = 2
Rate= kovr [1] α [2] β [3] γ [cat], (1)
Fig. 2. Second order fit curve (solid line)
accompanied by the original experimental curve (dotted
line) for the reaction between compounds 1 (10-2M), 2
(10-2M) and 3 (10-2M) in the presence of fructose (10-
2M) in a mixture of water: ethanol (2:1) at 380nm
RESULTS AND DISCUSSIONS
The Effect of Concentration
In order to determine the partial order with
respect to each component three experiments were
carried out in which the concentration of one of the
components 1, 2 or 3 was selected much less (5×10-
3) than the others (10-2), separately. In other words,
pseudo-order conditions were set for these
reactions. The absorbance curves are shown in
Figures (3-5).
Fig. 3. The first pseudo order fit curve (solid line)
along with the original experimental curve (dotted line)
in relation to 4-chlorobenzaldehyde 1, for the reaction
between 1(5×10⁻³ M), 2 (10-3 M) and 3 (10-3 M) in the
presence of fructose and a mixture of water: ethanol
(2:1) at 380nm

H. Yaghoubian et al.: Kinetic investigation of tetrahydrobenzo[b]pyran synthesis in the presence of fructose as a catalyst …
246
Fig. 4. First pseudo order fit curve (solid line) along
with the original experimental curve (dotted line) in
relation to malononitrile 1, for the reaction between 1(10-
3 M), 2 (5×10⁻³ M) and 3 (10-3 M) in the presence of
fructose and a mixture of water: ethanol (2:1) at 380nm
Fig. 5. Second pseudo order fit curve (solid line)
accompanied by the original experimental curve (dotted
line) for the reaction between compounds 1 (10-2M), 2
(10-2M) and 3 (5×10⁻³M) in the presence of fructose (10-
2M) in a mixture of water: ethanol (2:1) at 380nm
It is obvious that under pseudo-order conditions,
the partial order of the reaction with respect to
compounds 1 and 2 is one (Figs. 3, 4). In the other
hands, α=β=1. Also by matching the experimental
data with a second order fit (Fig. 5) given the
similarity of the calculated rate constants. From this
plot of the rate constants calculated from the graph
of Fig. 2, we thus say by changing the
concentration of compound 3, rate constants have
not changed substantially. So we can rewrite
equation 1 as follow:
Rate= kovr[1][2][cat] , kobs=kovr[cat] , (2)
Rate= kobs[1][2] , (3)
The Effect of Solvent and Temperature
Several experiments were performed for various
temperatures and solvents under the same
concentration of each component (10-2M). The
relevant rate constants obtained from the software
are given in Table 1. The dependency of the rate
constants (lnk and lnk/T) on the reciprocal
temperature showed adaptability with the Arrhenius
and Eyring equations. Furthermore, the linearized
form of the Eyring equations was investigated to
compare these methods [13] (Figs. 6, 7). The
activation parameters are given in Table2.
Table 1. Values of observed rate constants for the reaction between 1, 2 and 3 in the presence of the fructose
catalyst at 380nm and various temperatures.
kobs(M.min-1)
(nm) Solvent (a) 45.0
ºC
(a) 40.0
ºC
(a) 35.0
ºC
(a) 30.0
ºC
(a) 25.0
ºC
(a) 20.0
ºC
(b)
40.0ºC
380
380
Water: ethanol
(2:1)
ethanol
8.18
4.36
6.12
3.14
4.33
1.09
3.33
0. 42
2.40
0.110
1.75
0.078
6.18
3.13
a: 1 (10-2 M), 2 (10-2 M),3 (10-2 M), catalyst (10-2M)
b: 1 (10-2 M), 2 (10-2 M),3 (5×10⁻³M), catalyst (10-2M)
Table 2. Activation parameters for the reaction between 1, 2 and 3 in the presence of the fructose catalyst at 380nm.
a: according to the Eyring equation,
b: according to the linearizied form of the Eyring equation
solvent ∆H‡(kJ.mol-1) ∆S‡(J.mol-1.K-1) ∆G‡(kJ.mol-1) Ea(kJ.mol-1)
Water: ethanol(2:1) (a) 45.31 (b) 45.54
(a) -85.64 (b) -84.80
(a) 70.84 (b) 70.82
47.86
H. Yaghoubian et al.: Kinetic investigation of tetrahydrobenzo[b]pyran synthesis in the presence of fructose as a catalyst …
247
Fig. 6. Eyring plots for the reaction between 1, 2, 3
and fructose in a mixture of water: ethanol (2:1) at
380nm.
Fig. 7. An Arrhenius plot for the reaction between 1,
2, 3 and fructose in a mixture of water: ethanol (2:1) at
380nm.
According to the data in Table1, it can be seen
that the reaction rate increases with increasing
temperature. Moreover, in a solvent with a lower
dielectric constant (ethanol) in comparison with a
higher dielectric constant (mixture 2:1 water:
ethanol) the reaction rate decreased. That can be
attributed to the change in stability of the reactants
and activated complexes in these environments.
Furthermore, the positive value of ∆H‡(Table2)
indicates that the reaction is needed to obtain a high
value of the activation energy endothermic and a
large negative value of ∆S‡ determines a transition
state that is more strongly ordered than the
reactants.
Effect of the catalyst
The reaction between 1, 2 and 3 was repeated in
the presence of agar, sucrose and 1,4-
diazabicyclo[2.2.2]octane(DABCO) as a catalyst in
a mixture of water:ethanol (2:1). The reaction rate
was increased in the presence of agar, sucrose and
DABCO in comparison with the fructose (Table 3).
Agar and DABCO have a poor interaction with a
polar solvent compared to fructose, such that, it has
more freedom to carry out its catalytic role. Also,
due to sucrose it can establish hydrogen bonding
with an oxygen atom in the 4-chlorobenzaldehyde
more than fructose and was more active for the
nucleophilic attack of the malononitrile compound.
Table 3. Effect of Various catalysts on the reaction
between 1, 2 and 3 at 45ºC and 380nm.
solvent catalyst kobs(M.min-1)
Water:
ethanol(2:1)
Fructose 8.18
Agar 10.01
Sucrose 8.84
DABCO 9.36
Mechanism
By using the above results, the proposed
reaction mechanism as a possible comment is
shown in Figure 8:
Scheme 2. The proposed mechanism for the reaction
between 1, 2 and 3 in the presence of fructose in a
mixture of water: ethanol (2:1).

H. Yaghoubian et al.: Kinetic investigation of tetrahydrobenzo[b]pyran synthesis in the presence of fructose as a catalyst …
248
To determine which step of the proposed
mechanism is the rate-determining step, the rate
law was written for the final step of the reaction as:
Rate=k4 [I3], (4)
By using the steady state approximation to
obtain the concentration of all intermediates (I1, I2
and I3), the rate equation becomes:
, (5)
This equation is independent of the rate
constants for the third and fourth steps. Thus, these
steps have no chance to be rate determining steps; if
<< ; then, we can conclude:
, (6)
Hence, from the comparison between both
equations (6) and (2) and the experimental data
, (7)
According to this equation, the order of the
reaction with respect to compounds (1, 2and 3) is
1, 1 and zero, respectively and the overall order of
the reaction is two, which was previously
confirmed by the experimental data.
The presence of k1 in the rate law (equation (6))
indicates that the first step is a rate-determining
step and step 2 should be a fast step. In this case,
the transition state (Scheme 2, step 1) carries a
dispersed charge; hereupon, the solvent with a
higher dielectric constant can be more effective on
this dispersed charge in comparison with reactants
1 and 2, that do not have any charge. Thus, the
solvent stabilizes the species at the transition state
more than the reactants. Therefore, Ea would be
lower and accelerate the reaction rate.
CONCLUSION
The reaction rate was accelerated by the increase
in temperature and was in compatibility with the
Eyring and Arrhenius equations. It also followed
the second-order kinetics and partial order with
respect to compounds 1, 2, and 3 was 1, 1 and 0,
respectively. The first step of the proposed
mechanism was identified as a rate-determining
step and this was affirmed by the steady-state
approximation. Furthermore, in a solvent with a
higher dielectric constant, the rate of the reaction
increased. This pertains to different stabilizing
effects of the solvent on the reactants and activated
complex.
Acknowledgments: The authors sincerely thank
the University of Sistan and Baluchestan for providing
the financial support for this work.
REFERENCES
1. S. Balalaie, M. Sh.-Ahmadi, M. Bararjanian, Catal.
Commun.,8, 1724 (2007).
2. D.-I. MaGee, P. Salehi, M. Dabiri, M. Bahramnejad,
Synth. Commun., 43, 486 (2013).
3. L. Fotouhi, M. M. Heravi, A. Fatehi, Kh. Bakhtiari,
Tetrahedron Lett., 48, 5379 (2007).
4. Zh. Yuan, F. Liang, Curr. Org. Chem, 18, 2016
(2014).
5. D. Klostermeyer, L. Knops, T. Sindlinger, K.
Polborn, W. Steglich, Eur. J. Org. Chem., 2000, 603
(2000).
6. A. A. Birkbeck, Z. Brkic, Robin-G.-F.-Giles,
Tetrahedron Lett., 45, 6147 (2004).
7. S. Gurumurthi, V. Sundari, R. Valliappan, E-J.
Chem., 6(S1), S466 (2009).
8. N. M. Abd El-Rahman, R. M. Borik, World Appl.
Sci. J., 31(1), 01 (2014).
9. G. Sabitha, K. Arundhathi, K. Sudhakar, B. S. Sastry,
J. S. Yadav. Synth. Commun., 39, 433 (2009)
10. P. P. Salvi , A. M. Mandhare, A. S. Sartape, D. K.
Pawar, S. H. Han, S.S. Kolekar. C. R. Chimie., 14, 878
(2011).
11. A.-V. Borhade, B.-K. Uphade, D.R Tope, J. Chem.
Sci., 125(3), 583 (2013).
12. I. Devi, P. J. Bhuyan. Tetrahedron Lett., 45, 8625
(2004).
13. N. Hazeri, M.T. Maghsoodlou, F. Mir, M. Kangani,
H. Saravani, E. Molashahi, Chin. J. Catal., 35, 391
(2014).
14. M. Syamala. Org. Prep. Proced. Int., 41, 1 (2009).
15. J. S. J. McCahill, G. C. Welch, D. W. Stephan,
Angew. Chem. Int. Ed., 46, 4968 (2007).
16. Z. Yuan, Gu.-Ch. Kuang, R. J. Clark, L. Zhu, Org.
Lett., 14, 2590 (2012).
17. B. List, J. Am. Chem. Soc., 122, 9336 (2000).
18. Y.Lei Wang, Zh. Li, J. Luoa, Z.L. Liu., J. Chin.
Chem. Soc., 60, 1431 (2013).
19. M. Dehdab, S. M. Habibi-Khorassani, M. Shahraki,
Catal. Lett., 144, 1790 (2014).
20. M. Shahraki, S.M. Habibi-Khorassani, A. Ebrahimi,
M.T. Maghsoodlou , A. Paknahad, Prog. React. Kinet.
Mech., 37, 321 (2012).
21. S. Sh. Pourpanah, S.M. Habibi-Khorassani, M.
Shahraki, Chin. J. Catal., 36, 757 (2015).
22. S.M. Habibi-Khorassani, M.T. Maghsoodlou, E.
Aghdaei, M. Shahraki, Prog. React. Kinet. Mech., 37,
301 (2012).
23. M. Shahraki, S.M. Habibi-Khorassani, J. Phys. Org.
Chem., 28(6), 396 (2015).
24. M. Shahraki, S.M. Habibi-Khorassani, M. Dehdab,
RSC Adv., 5(65), 52508 (2015).
25. L.M. Schwartz, R. I. Gelb,Anal. Che., 50, 1592
(1978).

H. Yaghoubian et al.: Kinetic investigation of tetrahydrobenzo[b]pyran synthesis in the presence of fructose as a catalyst …
249
КИНЕТИЧНО ИЗСЛЕДВАНЕ НА СИНТЕЗАТА НА ТЕТРАХИДРОБЕНЗО[b]ПИРАН В
ПРИСЪСТВИЕ НА ФРУКТОЗА КАТО КАТАЛИЗАТОР ЧРЕЗ ТРИКОМПОНЕНТНА
РЕАКЦИЯ: ЕКСПЕРИМЕНТАЛНО ИЗСЛЕДВАНЕ
Х. Ягубиан, С.М. Хабиби-Хорасани*, А. Ебрахими
Департамент по химия, Научен факултет, Университет в Систан и Белучестан, П.К. 98135-674, Захедан,
Постъпила на 23 януари, 2015 г.; коригирана на 13 октомври, 2015 г.
(Резюме)
Синтезата на тетрахидробензо[b]пиран при реакцията между 4-хлоробензалдехид, малононитрил и димедон
в присъствие на фруктоза като катализатор. Извършено е кинетично и механистично изследване чрез
ултравиолетова спектроскопия. Изследван е ефектът на различни параметри, като концентрации, температура,
състав на разтворителя и различни катализатори върху скоростта на реакцията. Експерименталните данни
напълно съответстват на реакции от втори порядък. Резултантните скоростни константи се подчиняват на
уравненията на Arrhenius и Eyring. Съществените параметри за активацията (Ea, ∆H‡, ∆S‡ и ∆G‡) са определени
от тези уравнения. Скоростите на реакциите се понижават в разтворители с по-ниска диелектрична константа. В
съответствие с експерименталните наблюдения и стационарно приближение е прието, че първият етап на
предложения механизъм е скоросто-определящ за общата реакция.

250
Bulgarian Chemical Communications, Volume 48, Number 2 (pp. 250 – 255) 2016
Solventless synthesis of triazoles and bistriazoles through Copper-catalyzed alkyne-
azide cycloaddition
M. Pateraki,1 G. K. Morales-Ortiz,1 A. López-Guzmán,1 A. Fuentes-Benites2 , E. Cuevas-Yañez1*
1Centro Conjunto de Investigación en Química Sustentable UAEM-UNAM. Carretera Toluca-Atlacomulco Km 14.5,
Toluca, Estado de México, 50200, México. 2Departamento de Química Orgánica, Facultad de Química, Universidad Autónoma del Estado de México, Paseo
Colón esq. Paseo Tollocan, Toluca, Estado de Mexico 50120, Mexico.
Received March 4, 2015, Revised October 6, 2015
A library of 1,2,3-triazoles, including a series of triazolyl styrenes which have a structural relationship with
resveratrol, was synthesized through a novel solventless method that involves the straightforward treatment by grinding
of several azides and alkynes in the presence of catalytic amounts of copper iodide and N,N-diisopropylethylamine. On
the other hand, when sodium hydroxide was used as the base, a mixture of bistriazoles and triazoles was formed where
1,2,3-triazoles were the major products. This new solvent-free synthesis protocol is carried out under mild conditions
for short times, affording the 1,4-regioisomers in high yields.
Keywords: Triazole, Bistriazole, Alkyne, Azide, Solventless.
INTRODUCTION
Copper-Catalyzed Alkyne-Azide
Cycloaddition (CuAAC) is the best known example
of an ideal reaction for Click Chemistry and one of
the most important methods for molecular assembly
[1], as well as a significant source of potentially
active compounds [2-4]. Therefore, the
development of new procedures for this reaction is
highly desirable. Although several groups have
thoroughly studied this reaction, designing catalysts
and optimizing conditions, the research of this topic
is far from complete.
One of the challenges of this reaction,
sustainable by itself, is the exploration of the
reaction conditions close to the principles of Green
Chemistry, avoiding as far as possible, the
generation of dangerous products. In this context,
the development of solvent-free chemical processes
is important and many examples of solventless
chemical reactions are reported in the literature
[5,6].
These reasons inspired us to start an
investigation with the aim of exploring the
possibility to obtain 1,2,3-triazoles and bistriazoles
in high yields through CuAAC using solvent free
conditions. This work summarizes our recent
successful efforts in this area.
EXPERIMENTAL
Instrument and chemical materials
The starting materials were purchased from
Aldrich Chemical Co. and were used without
further purification. The solvents were distilled
before use. Silica plates of 0.20 mm thickness were
used for thin layer chromatography. The melting
points were determined with a Fisher-Johns melting
point apparatus and they are not corrected. 1H and 13C NMR spectra were recorded using a Bruker
Advance 300; the chemical shifts (δ) are given in
ppm relative to TMS as an internal standard (0.00).
For analytical purposes the mass spectra were
recorded on a Shimadzu GCMS-QP2010 Plus in the
EI mode, 70 eV, 200 °C via a direct inlet probe.
Only the molecular and parent ions (m/z) are
reported. The IR spectra were recorded on a Bruker
Tensor 27 equipment. * To whom all correspondence should be sent:
E-mail: [email protected]
2016 Bulgarian Academy of Sciences, Union of Chemists in Bulgaria

M. Pateraki et. al.: Solventless synthesis of triazoles and bistriazoles through Copper-catalyzed alkyne-azide cycloaddition
251
Solventless copper-catalyzed cycloaddition of
alkynes and azides.
Typical procedure. Successively added in a
mortar were the corresponding alkyne (1 mmol),
azide (1 mmol), DIPEA (0.01 mL, 0.1 mmol) and
CuI (0.0095 g, 0.05 mmol). The mixture was
homogenized in a mortar during 5 minutes using a
pestle. The mixture was collected and the final
product was purified by crystallization.
1-Benzyl-4-phenyl-1,2,3-triazole (3). White
solid; mp 130°C (lit. 130-130.9ºC) [7] ; IR (ATR):
v = 3128, 2927, 1461, 1269 cm-1; 1H NMR (CDCl3,
300 MHz) δ 7.67-7.60 (m, 2H), 7.55 (dd, J= 5.7,
3.3 Hz, 1H), 7.50 (s, 1H), 7.28-7.21 (m, 4H), 7.19-
7.13 (m, 3H), 5.43 (s, 2H); 13C NMR (CDCl3, 75
MHz)δ 147.7 (C), 134.3 (C), 132.0 (C), 130.4
(CH), 130.1 (C), 128.7 (CH), 128.4 (CH), 127.7
(CH), 127.6 (CH), 125.3 (CH), 119.0 (CH), 53.8
(CH2); MS [EI+] m/z (%)235 [M]+ (20), 206 [M-
HN2]+ (50), 116 [M – C6H5N3]+ (90), 91
[C6H5CH2]+ (100).
1,4-diphenyl-1,2,3-triazole (4). Yellow solid;
mp 65.0 ºC; IR (ATR): v= 2958, 1598, 1462, 1272; 1H NMR (CDCl3, 300 MHz) δ 8.22 (s, 1H), 7.95-
7.90 (m, 2H), 7.70 (dd, J= 5.9, 3.8 Hz, 1H), 7.63-
7.59 (m, 1H), 7.50-7.45 (m, 5H), 7.41-7.33 (m,
1H); 13C NMR (CDCl3, 75 MHz) δ145.8 (CH),
130.6 (C), 128.9 (CH), 128.3 (CH), 127.9 (C),
126.7 (CH), 126.5 (CH), 126.1 (CH), 125.9 (CH),
119.7 (CH) ); MS [EI+] m/z (%) 221 [M]+ (35), 116
[M – C6H5N2]+ (100), 104 [M – C7H5N2]+ (50), 77
[C6H5]+ (90).
1-benzyl-4-[(4-bromophenoxy)methyl]-1,2,3-
triazole (5). White solid; mp 111.0 ºC; IR (ATR):
v= 3138, 2873, 1687, 1581, 1486; 1H NMR
(CDCl3, 300 MHz) δ7.51 (s, 1H), 7.37 (dt, J=5.7,
2.9 Hz), 7.28 (d, J= 3.3 Hz), 6.85 (d, J= 8.9 Hz),
5.53 (s, 2H), 5.15 (s, 2H); 13C NMR (CDCl3, 75
MHz) δ156.24 (C), 143.14 (C), 133.33 (C), 131.28
(CH), 128.11 (CH) 127.81(CH), 127.06 (CH),
121.54 (CH), 115.61 (CH), 112.45 (C), 61.22
(CH2), 53.23 (CH2); MS [EI+] m/z (%)343 [M]+
(35), 314 [M-HN2]+ (3), 226 [M – C8H8N]+ (3), 184
[C7H6BrO] +(4), 91 [C6H5CH2]+ (100), 77 [C6H5]+
(35).
4-[(4-bromophenoxy)methyl]-1-phenyl-1,2,3-
triazole (6). White solid; mp 60.0 °C; IR (ATR): v=
3138, 2955, 1584, 1485; 1H NMR (CDCl3, 300
MHz) δ8.05 (s, 1H), 7.68-7.31 (m, 5H), 7.40 (d, J=
8.9 Hz, 2H), 6.92 (d, J= 8.9 Hz, 2H), 5.29 (s, 2H); 13C NMR (CDCl3, 75 MHz) δ156.4 (C), 142.7 (C),
133.9 (C), 130.0 (CH), 129.9 (CH), 128.9 (CH),
127.7 (C), 127.1 (CH) 126.9 (CH), 119.7 (CH),
61.3 (CH2); MS [EI+] m/z (%) 329 [M]+ (10), 164
[C9H9BrN3O]+ (100). Elemental analysis calculated:
C, 54.56; H, 3.66; N, 12.73, found: C, 55.01; H,
3.75; N, 12.80.
4-[(4-bromophenoxy)methyl]-1-p-tolyl-1,2,3-
triazole (7). White solid; mp 98.0 °C; IR (ATR): v=
3139, 2958, 1589, 1518; 1H NMR (CDCl3, 300
MHz) δ8.00 (s, 1H), 7.60 (d, J= 8.4 Hz, 2H), 7.40
(d, J= 9.0 Hz, 2H), 7.32 (d, J= 8.5 Hz, 2H), 6.91 (d,
J= 9.0, 2H), 5.27 (s, 2H), 2.42 (s, 3H); 13C NMR
(CDCl3, 75 MHz) δ156.1 (C), 142.1 (C), 137.9 (C),
133.4 (C), 131.2 (CH), 129.0 (CH), 119.7 (CH),
119.3 (CH), 115.4 (CH), 112.3 (C), 61.0 (CH2),
19.8 (CH3); MS [EI+] m/z (%) 343 [M]+ (40), 314
[M-HN2]+ (10), 211 [M – C7H7N3]+ (100), 172 [M
– C6H4BrO]+ (70). Elemental analysis calculated:
C, 55.83; H, 4.10; N, 12.21, found: C, 56.13; H,
4.50; N, 12.30.
4-phenyl-1-p-tolyl-1H-1,2,3-triazole (8). White
solid; mp 121.0 °C; IR (ATR): v= 3124, 2956,
1605, 1482; 1H NMR (CDCl3, 300 MHz) δ 8.16 (s,
1H), 7.67 (d, J= 8.4 Hz, 2H), 7.60-7.42 (m, 5H),
7.34 (d, J= 8.4 Hz, 2H), 2.44 (s, 3H); 13C NMR
(CDCl3, 75 MHz) δ148.1 (C), 138.9 (C), 134.6 (C),
132.4 (C), 130.85 (CH), 130.2 (CH), 128.9 (CH),
128.3 (CH), 125.9 (CH), 120.1 (CH), 22.6 (CH3);
MS [EI+] m/z (%) 235 [M]+ (20), 130 [M-C7H7N]+
(20), 91 [C6H5CH2]+ (100).
[1-(4-methoxyphenoxy)-1,2,3-triazole-4-
yl]methanol (9). Yellow solid; 80 °C; IR (ATR): v=
2956, 2855, 1594, 1485; 1H NMR (CDCl3, 300
MHz) δ8.03 (s, 1H), 7.40 (d, J= 9.0 Hz, 2H), 6.91
(d, J= 8.9 Hz, 2H), 5.27 (s, 2H), 4.89 (s, 1H), 3.87
(s, 3H); 13C NMR (CDCl3, 75 MHz) δ157.40 (C),
154.70 (C), 142.36 (C), 119.77 (CH), 118.11 (CH),
113.98 (CH), 54.30 (CH3), 53.31 (CH2); MS [EI+]
m/z (%)205 [M]+ (20), 149 [M – C3H4O]+ (95), 57
[M – C8H8N2O]+ (100). Elemental analysis
calculated: C, 53.35; H, 3.92; N, 11.67, found: C,
53.85; H, 4.10; N, 12.02.
4-[(4-bromophenoxy)methyl]-1-(4-
methoxyphenyl)-1H-1,2,3-triazole (10). White
solid; mp 109 °C; IR (ATR): v= 2958, 2854, 1590,
1485; 1H NMR (CDCl3, 300 MHz) δδ 7.96 (s, 1H),
7.63 (d, J= 9.0 Hz, 2H), 7.40 (d, J= 9.0 Hz), 7.02
(d, J= 9.0 Hz, 2H), 6.91 (d, J= 9.0 Hz, 2H), 5.26 (s,
2H), 3.87 (s, 3H); 13C NMR (CDCl3, 75 MHz)
δ158.7 (C), 156.1 (C), 143.0 (C), 131.2 (CH), 129.1
(C), 121.0 (CH), 119.9 (CH), 115.4 (CH), 113.6
(CH), 112.3 (C), 61.0 (CH2), 54.4 (CH3); MS [EI+]
m/z (%)359 [M]+ (5), 280 [M – Br]+ (100).
4-[(4-bromophenoxy)methyl]-1p-tolyl-1,2,3-
triazole (11). White solid; mp 155°C; IR (ATR): v=
3123, 2921, 1608, 1460; 1H NMR (CDCl3, 300
MHz) δ8.11 (s, 1H), 7.94-7.86 (m, 2 H), 7.69 (d, J=
9.0 Hz, 2H), 7.52-7.31 (m, 5H), 7.05 (d, J= 9.0 Hz,
2 H), 3.89 (s, 3H); 13C NMR (CDCl3, 75 MHz)

M. Pateraki et. al.: Solventless synthesis of triazoles and bistriazoles through Copper-catalyzed alkyne-azide cycloaddition
252
δ157.40 (C), 154.70 (C), 142.36 (C), 119.58 (CH),
114.19 (CH), 54.39 (CH3), 53.23 (CH2); MS [EI+]
m/z (%) 251 [M]+ (10), 149 [M – C8H6]+ (80), 116
[M – C7H7N2O]+ (35), 102 [M – C7H7N3O]+ (15),
77 [C6H5]+ (100).
[1-(4-methoxyphenyl)-1,2,3-triazole-4-
yl]methyl butylcarbamate (12). White solid; mp
100 °C; IR (ATR): v= 3153, 2928, 1580, 1484; 1H
NMR (CDCl3, 300 MHz) δ7.99 (s, 1H), 7.62 (d, J=
8.9 Hz, 2H), 7.02 (d, J= 9.0 Hz, 2H), 5.26 (s, 2H),
3.87 (s, 3H), 3.19 (m, 2H), 1.53-1.43 (m, 2H), 1.37-
1.29 (m, 2H), 0.91 (t, J= 7.1 Hz, 3H); 13C NMR
(CDCl3, 75 MHz) δ159.87 (C), 156.25 (C), 144.06
(C), 130.38 (C), 125.00 (C), 122.20 (CH), 114.76
(CH), 57.57 (CH2) , 55.61 (CH3), 40.82 (CH2),
31.94 (CH2), 19.85 (CH2), 13.68 (CH3); ); MS [EI+]
m/z (%) 304 [M]+ (20), 266 (100). Elemental
analysis calculated: C, 59.20; H, 6.62; N, 18.41,
found: C, 60.05; H, 6.87; N, 18.10.
4-[(4-bromophenoxy)methyl]-1-(4-
bromophenyl)-1,2,3-triazole (13). White solid; mp
127 °C; IR (ATR): v= 3123, 2921, 1516, 1460; 1H
NMR (CDCl3, 300 MHz) δ8.02 (s, 1H), 7.71-7.60
(m, 4H), 7.40 (d, J= 8.9 Hz, 2H), 6.91 (d, J= 8.9
Hz), 5.27 (s, 2H); 13C NMR (CDCl3, 75 MHz)
δ157.0 (C), 144.7 (C), 135.73(C), 132.8 (CH),
132.3 (CH), 122.5 (C), 121.8 (CH), 120.6 (CH),
116.4 (CH), 113.5 (C), 61.9 (CH2); MS [EI+] m/z
(%) 406 [M]+ (10), 239 [M – C6H4BrN]+ (4), 211
[M – C6H4BrN3]+ (100), 156 [C6H4Br]+ (40), 184
[C7H6BrO]+ (80). Elemental analysis calculated: C,
44.04; H, 2.71; N, 10.27, found: C, 43.90; H, 2.81;
N, 10.90.
Ethyl 3-(4-chlorophenyl)-2-[4-phenyl-1,2,3-
triazole-1-yl]acrylate (14). White solid; mp 127 0C;
IR (ATR): v= 3137, 2925, 1725, 1645; 1H NMR
(CDCl3, 300 MHz) δ7.98 (s, 1H), 7.93-7.88 (m,
3H), 7.84 (s, 1H), 7.48-7.33 (m, 4H), 6.87-6.82 (m,
2H), 4.34 (q, J= 7.1 Hz, 2H), 1.32 (t, J= 7.1 Hz,
3H); 13C NMR (CDCl3, 75 MHz) δ162.7 (C), 148.2
(C), 137.7 (C), 131.5 (CH), 130.8 (C), 130.0 (C),
129.4 (CH), 129.3 (C), 128.9 (CH), 128.8 (CH),
128.5 (CH), 125.8 (CH), 125.6 (C), 121.2 (CH),
62.5 (CH2), 14.1 (CH3); MS [EI+] m/z (%) 354
[M+1]+ (2), 324 [M –HN2]+ (30), 251 [M-C8H6]+
(40), 102 [M-C11H10ClN3O2]+ (80). Elemental
analysis calculated: C, 64.50; H, 4.56;N, 11.88,
found: C, 64.00; H, 4.86; N, 10.90.
Ethyl (2-[4-((4-bromophenoxy)methyl)-1,2,3-
triazole-1-yl]-3-(4-chlorophenyl) acrylate (15).
White solid; mp 99 0C; IR (ATR): v= 3144, 1722,
1644, 1590; 1H NMR (CDCl3, 300 MHz) δ7.94 (s,
1H), 7.64 (s, 1H), 7.39 (d, J= 9.0 Hz, 2H), 7.16 (d,
J= 8.5 Hz, 2H), 6.88 (d, J= 8.9 Hz, 2H,), 6.70 (d, J=
8.5 Hz, 2H), 5.30 (s, 2H), 4.30 (q, J= 7.1 Hz, 2H),
1.29 (t, J= 7.1 Hz, 3H); 13C NMR (CDCl3, 75
MHz) δ162.6 (C), 157.0 (C), 144.4 (C), 139.2
(CH), 137.7 (C), 132.3 (CH), 131.3 (CH), 129.3
(CH), 129.1 (C), 125.4 (C), 124.6 (CH), 116.8
(CH), 113.6 (C), 62.5 (CH2), 62.0 (CH2), 14.1
(CH3); MS [EI+] m/z (%) 461 [M]+ (5), 251 [M –
C11H10ClO2]+ (4), 154 [M –C14H13ClN3O3]+
(100).Elemental analysis calculated: C, 51.91; H,
3.70; N, 9.08, found: C, 52.19; H, 3.79; N, 9.90.
Ethyl 3-(4-chlorophenyl)-2-[4-((4-
methoxyphenoxy)methyl)-1,2,3-triazole-1-yl]
acrylate (16). Yellow oil; IR (ATR): v= 2957, 2121,
1721, 823; 1H NMR (CDCl3, 300 MHz) δ7.94 (s,
1H), 7.63 (s, 1H), 7.16 (d, J= 8.5 Hz, 2H), 6.93 (d,
J= 9.1 Hz, 2H), 6.83 (d, J= 9.2 Hz, 2H), 6.69 (d, J=
8.5 Hz, 2H), 5.28 (s, 2H), 4.31 (q, J= 7.1 Hz, 2H),
3.78 (s, 3H), 0.92 (t, J= 7.1 Hz, 2H); 13C NMR
(CDCl3, 75 MHz) δ162.7 (C), 154.3 (C), 151.9 (C),
145.2 (C), 139.1 (CH), 137.6 (C), 131.4 (CH),
130.8 (C), 129.3 (CH), 129.1 (C), 124.4 (CH),
116.1 (CH), 114.6 (CH), 62.6 (CH2), 62.5 (CH2),
55.8 (CH3), 14.1 (CH3); MS [EI+] m/z (%) 413 [M]+
(10), 123 [M –C14H13ClN3O2]+ (100). Elemental
analysis calculated: C, 60.95; H, 4.87; N, 10.15,
found: C, 60.98; H, 4.84; N, 10.80.
Ethyl 2-[4-(2-(butylcarbamoyloxy)ethyl)-1,2,3-
triazole-1-yl)-3-(4-chlorophenyl] acrylate (17).
Yellow solid; mp 129 0C; IR (ATR): v= 3156,
1642, 1581, 1487, 1197; 1H NMR (CDCl3, 300
MHz) δ7.95 (s, 1H), 7.68 (s, 1H), 7.23 (d, J= 8.6
Hz, 2H), 6.75 (d, J= 8.5 Hz, 2H), 5.27 (s, 2H), 4.76
(s, 1H), 4.32 (q, J= 7.1 Hz, 2H), 3.17 (m, 2H), 1.37-
1.21 (m, 6H), 0.91 (t, J= 7.1 Hz, 3H); 13C NMR
(CDCl3, 75 MHz) δ162.7 (C), 156.0 (C), 144.1 (C),
139.1 (CH), 137.6 (C), 135.2 (CH), 131.4 (CH),
130.8 (C), 129.3 (CH), 128.8 (C), 62.5 (CH28), 57.6
(CH2), 32.1 (CH2), 26.3 (CH2), 23.4 (CH2), 14.1
(CH3), 13.6 (CH3); MS [EI+] m/z (%) 405 [M-1]+
(4), 363 [M-C3H7]+ (4), 349 [M-C4H9]+ (3), 250 [M
–C7H11N2O2]+ (35), 154 [M –C14H13ClN3O3]+ (50),
57 [M –C15H14ClN4O4]+ (100). Elemental analysis
calculated: C, 56.09; H, 5.70; N, 13.77, found: C,
56.80; H, 5.32; N, 14.01.
Solventless copper-catalyzed cycloaddition of
alkynes and azides with NaOH.
Typical procedure. Successively added in a
mortar were the corresponding alkyne (1 mmol),
the azide (1 mmol), NaOH (0.40 g, 10.0 mmol) and
CuI (0.0095 g, 0.05 mmol). The mixture was
homogenized in a mortar for 5 minutes using a
pestle. The mixture was collected and the final
products were purified by column chromatography
(SiO2, hexane/AcOEt 8:2).

M. Pateraki et. al.: Solventless synthesis of triazoles and bistriazoles through Copper-catalyzed alkyne-azide cycloaddition
253
3,3'-dibenzyl-5, 5'-diphenyl -[4,4'] bi [(1,2,3)-
triazolyl (Table 4, Entry 1). White solid; mp 65 0C;
IR (ATR): v= 2953, 2852, 1602, 1456; 1H NMR
(CDCl3, 300 MHz) δ7.45 (m, 4H), 7.28-7.20 (m,
6H), 7.14 (m, 2H), 7.09 (m, 4H), 6.81 (d, 4H, J =
8.0 Hz), 5.57 (s, 2H,), 5.26 (s, 2H); 13C NMR
(CDCl3, 75 MHz) δ147.52 (C), 132.57 (C), 128.93
(C), 128.66 (CH), 128.52 (CH), 128.47 (CH),
128.41 (CH), 127.87 (CH), 125.49 (CH), 119.59
(C), 52.37 (CH2); MS [EI+] m/z (%) 468 [M]+ (40),
349 [M - C7H7N2]+ (35), 321 [M - C7H7N4]+ (35),
91 [C6H5CH2]+ (100).
3,5,3',5'-tetraphenyl-[4,4']bi[(1,2,3)-triazolyl]
(Table 4, Entry 2). White solid; mp 68 0C; IR
(ATR): v= 2957, 2855, 1514, 1461; 1H NMR
(CDCl3, 300 MHz) δ8.27 (d, J= 7.2 Hz, 3H), 7.76
(d, J=8.3 Hz, 4H), 7.55-7.42 (m, 11H), 2.47 (s, 6H); 13C NMR (CDCl3, 75 MHz) δ139.12 (C), 133.73
(C), 131.01 (CH), 130.40 (C), 129.82 (CH), 129.34
(CH), 129.12 (CH), 128.25 (CH -35), 123.21 (CH),
121.14 (C), 20.56 (CH3); MS [EI+] m/z (%) 468
[M]+ (40), 349 [M - C7H7N2]+ (35), 321 [M -
C7H7N4]+ (35), 91 [C6H5CH2]+ (100).
3,3'-dibenzyl-5,5'-bis[(4-
bromophenoxy)methyl]-4,4'-bi[(1,2,3)-triazolyl]
(Table 4, Entry 3). White solid; mp 179 0C; IR
(ATR): v= 3063, 2921, 1581, 1484; 1H NMR
(CDCl3, 300 MHz) δ 7.23-7.33 (m, 10H), 6.87-6.89
(d, 4H), 6.44- 6.47 (d, 4H), 5.01 (s, 2H), 4.96 (s,
2H), 4.47 (s, 4H); 13C NMR (CDCl3, 75 MHz)
δ156.6, 145.5, 133.6, 132.3, 129.1, 129.0, 128.1,
122.1, 116.1, 113.7, 61.1, 52.6; MS [EI+] m/z (%)
686 [M]+ (2), 92 [C6H5CH3]+ (100).
RESULTS AND DISCUSSION
The first studies were carried out using
phenylacetylene (1) and benzyl azide (2) as starting
materials (scheme 1). Among many plausible co-
reactants to carry out CuAAC under solventless
conditions, we decided to use CuI-DIPEA as a
catalyst system which represents one of the
simplest protocols when this reaction is performed
in the presence of a solvent [8].
Scheme 1. Solventless cycloaddition between azide 2
and alkyne 1.
Moreover, we determined to place the alkyne,
the azide, the copper salt and the base on a mortar
and the resulting reaction mixture was
homogenized by grinding with a pestle for a certain
time. This procedure was essentially the same
during the course of the experiments in solvent-free
conditions, and for this case, the direct reaction
between alkyne 1 and azide 2 yielded 1-benzyl-4-
phenyl-1,2,3-triazole (3) as the only reaction
product. The effect of the concentration of both
CuI and DIPEA was studied, and the results in table
1 show that the reaction is efficient with
concentrations of 5 % mol CuI and 10% mol
DIPEA.
Table 1. Effect of the concentration of CuI and
DIPEA in the synthesis of triazole 3 under solventless
conditions.
Entry
CuI (mmol/
mmol
alkyne)
DIPEA
(mmol/
mmol
alkyne)
Reactio
n Time
(min)
Yield
(%)
1 0.1 1 2 95
2 0.05 1 2 95
3 0.025 1 2 88
4 0.0125 1 2 83
5 0.1 1 5 98
6 0.05 1 5 98
7 0.025 1 5 86
8 0.0125 1 5 82
9 0.1 0.1 5 98
10 0.05 0.1 5 98
11 0.025 0.1 5 85
12 0.0125 0.1 5 84
In addition, other bases were tested and the
results are presented in table 2. Although triazole 3
was obtained in all cases, the use of DIPEA as a
base afforded the best yields.
Scheme 2. Solventless cycloaddition between azide 2
and alkyne 1 in the presence of a base.
Table 2. Effect of the base in the synthesis of triazole
3 under solventless conditions.
Entry Base Yield (%)
1 DIPEA 98
2 Et3N 88
3 Pyridine 70
4 K2CO3 62
5 Na2CO3 52
6 NaHCO3 53
In order to explore the reaction scope, we
performed solventless CuAAC reactions with
diverse alkynes and azides and the results in table 3
demonstrate that this procedure is broad in scope
affording the corresponding 1,2,3-triazoles in high
yields which were fully characterized by the
conventional spectroscopic techniques.

M. Pateraki et. al.: Solventless synthesis of triazoles and bistriazoles through Copper-catalyzed alkyne-azide cycloaddition
254
CO2Et
N3
Cl
CO2Et
N3
Cl
CO2Et
N3
Cl
CO2Et
N3
Cl
Table 3. Synthesis of 1,2,3-triazoles under solventless conditions.
Compound R1 R2 Yield (%)
3 Ph PhCH2 98
4 Ph Ph 95
5 4-BrC6H4OCH2 PhCH2 57
6 4-BrC6H4OCH2 Ph 61
7 4-BrC6H4OCH2 4-CH3C6H4 75
8 Ph 4-CH3C6H4 92
9 CH2OH 4-CH3OC6H4 87
10 4-BrC6H4OCH2 4-CH3OC6H4 71
11 Ph 4-CH3OC6H4 88
12 nBuNHCO2CH2 4-CH3OC6H4 91
13 4-BrC6H4OCH2 4-BrC6H4 72
14
Ph
87
15
4-BrC6H4OCH2
75
16
4-CH3C6H4OCH2
82
17
nBuNHCO2CH2
80
Table 4. Synthesis of triazoles and bistriazoles using solventless conditions.
Entry R1 R2 % Triazole % Bistriazole
1 Ph PhCH2 30 15
2 Ph 4-CH3C6H4 35 20
3 4-BrC6H4OCH2 PhCH2 27 10
In these examples, triazoles 14-17 derived from
ethyl 2-azido-3-(4-chlorophenyl)acrylate are similar
to other heterocyclic analogs like resveratrol and
have an important activity against lung and colon
cancer cells.
Scheme 3. Synthesis of 1,2,3-triazoles under
solventless conditions.
Other outstanding characteristic of the process is
that the reaction times are short, and in the best of
the cases these do not exceed 5 minutes. In
addition, the purification of the final products is
simple, in accordance with the essence of Click
Chemistry.
On the other hand, we examined the use of
sodium hydroxide in solventless CuAAC reactions.
Previous reports described the formation of
bistriazoles in the presence of inorganic bases [9],
in particular, through the use of a high
concentration of sodium hydroxide at low
temperatures [10]. Thus, the solventless treatment
of some alkynes and azides with excess sodium
hydroxide and catalytic CuI yielded a mixture of
triazoles and bistriazoles (scheme 4). In these
processes, the yields of bistriazoles did not exceed
20% and in most cases the triazoles were obtained
as only reaction products in low yields (table 4).
Scheme 4. Solventless synthesis of 1,2,3-triazoles
and bistriazoles.

255
Despite these results, this method offers an
alternative, direct and rapid protocol for the
synthesis of these kinds of compounds with
promising applications and the possibility of
obtaining bistriazoles as major products of these
processes that represent a great motivation to
continue the studies in this area.
CONCLUSION
In summary, appropriately constituted alkynes
and azides are easily converted to the
corresponding 1,2,3-triazoles through a novel
method that does not require the use of solvents in
the presence of catalytic amounts of both CuI and
DIPEA. This process combines short reaction times
and high efficiency. In addition, when NaOH is
used as the base, bistriazoles could be obtained
through a solvent-free process. All the triazoles and
bistriazoles described have biological potential
activities and promise a broad application.
Acknowledgments: Financial support via the
CONACYT (Project No. 135053) is gratefully
acknowledged. The authors would like to thank
Signa S.A. de C. V. and N. Zavala, A. Nuñez, L.
Triana, for the technical support.
REFERENCES
1. M. Meldal, C.W. Tornoe, Chem. Rev., 108, 2952
(2008).
2. S.G. Agalave, S.R. Maujan, V.P. Pore, Chem. Asian
J., 6, 2696 (2011).
3. H.C. Kolb, K.B. Sharpless, Drug Discov. Today, 8,
1128 (2003).
4. Hein, C. D.; Liu, X. M.; Wang, D. Pharm. Res. 2008,
25, 2216.
5. H. Wang, K. Wen, L. Wang, Y.;Xiang, X. Xu, Y.
Shen, Z. Sun, Molecules, 17, 4533 (2012).
6. G.T. Tigineh, Y.S. Wen, L.K. Liu, Tetrahedron, 71,
170 (2015).
7. H. Gallardo, G. Conte, F. Bryk, M.C.S. Lourenço,
M.S. Costac, V.F. Ferreira, J. Braz. Chem. Soc., 18,
1285 (2007).
8. C.W. Tornoe, C. Christensen, M. Meldal, J. Org.
Chem. , 67, 3057 (2002).
9. Y. Angell, K. Burgess, Angew. Chem. Int. Ed. , 46,
3649 (2007).
10. J. González, V. M. Pérez, D. O. Jiménez, G. Lopez-
Valdez, D. Corona, E. Cuevas-Yañez, Tetrahedron
Lett., 52, 3514 (2011).
СИНТЕЗА БЕЗ РАЗТВОРИТЕЛ НА ТРИАЗОЛИ И БИС-ТРИАЗОЛИ ЧРЕЗ АЛКИН-
АЗИД‘ОВО ЦИКЛО-ПРИТЪКМЯВАНЕ, КАТАЛИЗИРАНО ОТ МЕД
М. Патераки1, Г.К. Моралес-Ортиз1, А. Лопес-Гусман1, А. Фуентес-Бенитес2, Е. Куевас-Янес1*
1Обединен изследователски център по устойчива химия UAEM-UNAM, Толука, Щат Мвксико, 50200 Мексико и
Автономен университет на щата Мексико, Толука, Щат Мексико, 50120 Мексико.
Постъпила на 4 март, 2015 г.; приета на 6 октомври, 2015 г.
(Резюме)
Синтезирани са 1,2,3-триазоли, включително серия от триазол-стирени, които имат структурна връзка с
ресвератрол чрез нов метод без използване на разтворител. Методът включва пряко третиране чрез смилане на
няколко азини и алкини в присъствие на катализатор от меден йодид и N,N-ди-изопропил-етиламин. От друга
страна, когато се използва натриева основа като алкален агент се получава смес от бис-триазоли и триазоли,
при която 1,2,3-триазолите са главният продукт. Този нов протокол на синтезата се извършва при меки условия
за кратко време, допускащ 1,4-позиционни изомери с високи добиви.

256
Bulgarian Chemical Communications, Volume 48, Number 2 (pp. 256 – 260) 2016
Effects of some hormone applications on germination and morphological characters
of endangered plant species Lilium artvinense L. Onion scales
H. Sevik1, M. Cetin2*
1Kastamonu University, Faculty of Engineering and Architecture, Environmental Engineering Department, Kuzeykent,
Kastamonu/Turkey 2*Kastamonu University, Faculty of Engineering and Architecture, Landscape Architecture Department, Kuzeykent,
Kastamonu/Turkey
Received April 2, 2015, Revised September 18, 2015
Lilies are economically important plants because of their large and attractive flowers. Thus, many wild species of
lilies have been cultivated to produce lilium bulbs or flowers. However, some non-cultivated species are still found in
nature, picked and sold, which damages the natural populations of the species. The easiest and most effective way of
preventing them from being nature picked is the identification of easy and cheap methods of producing them. This study
attempts to determine the ways of producing Lilium artvinense by the use of bulb flakes. 4 hormones (Indole-3-acetic
acid (IAA), Indole-3-butyric acid (IBA), Naphthaleneacetic acid (NAA), and Gibberellic acid (GA3) were used, and 12
hormone applications were made. 3 doses (1000 ppm, 3000 ppm, and 5000 ppm) were used from each hormone. In
addition, a control group was used. Each application was made to the basal, middle, and apical parts of the bulb flakes.
In this way, 39 applications were made in total. The applications to the bulb flakes were compared in terms of 6
characters (i.e. rooting percentage, the number of roots, root height, the number of scions, scion width and height).
Hormone applications can increase the likelihood of success at least two-fold, thus the species can be produced easily
and cheaply.
Keywords: Danger of extinction; Auxins; Gibberellins; Likelihood; Rooting; Sustainable plant.
INTRODUCTION
Lilium belongs to the group Lilieae of Liliaceae
and contains about 120 species [1]. Lilies are
economically important plants because of their
large and attractive flowers [2]. Thus, many wild
species of lilies have been cultivated to produce
lilium bulbs or flowers. Almost all horticulturalists
of lilies are used to flower cutting. Especially
Asiatic and oriental hybrids receive a great deal of
attention at the international market [3].
However, picking especially rare and endemic
species from their natural habitats in some countries
damage the populations of the species in their
natural environment. The easiest and the most
effective way of picking these species from their
natural habitats is the identification of methods of
producing the species in nursery conditions. If such
methods are cheap and practical, they can be put
into practice more effectively. Production with
seeds is of vital importance so as not to damage the
natural populations of endangered species.
“IUCN Red Data BOOK” and “National List of
European Threatened Plants List” contain 3 lilium
species from Europe. Lilium artvinense is one of
them [4]. Only found in a limited area, the Lilium
artvinense draws attention with its yellow flowers.
Its natural population is severely damaged when its
bulbs are picked from their natural habitats. To
protect the natural population of the species, easy
and cheap means of producing this species should
be taught to the locals, thereby preventing them
from picking the species from their natural
environment.
Previous research has mostly attempted to
determine the microculture techniques of producing
lilies. However, these techniques are difficult,
expensive, and impractical for the locals. This study
examines the production of Lilium artvinense by
the use of bulb flakes.
MATERIALS AND METHODS
The bulbs belonging to Lilium artvinense used
in the study were picked from Artvin. The bulbs
picked on the 10th and 11th of July were kept by
moistening them in a germination substrate.
Applications were made on the bulbs brought to the
laboratory on the 13th of July. * To whom all correspondence should be sent:
E-mail: [email protected]
2016 Bulgarian Academy of Sciences, Union of Chemists in Bulgaria
H. Sevik, M. Cetin: Effects of some hormone applications on germination and morphological characters of endangered…
257
Polyethylene tubes of 3x3x15 cm were prepared
in the laboratory by filling 2/3 of them with a
Klasmann sterile germination substrate. Then the
bulb flakes were cut out of the basal parts via a
sterile lancet. Each of the obtained nail-like bulbs
was divided into 3 parts in such a way that the
apical, middle and basal parts would be equal.
These 3 different parts taken from the nail-like
flakes were separately subjected to the solutions of
four different hormones Indole-3-acetic acid (IAA),
Indole-3-butyric acid (IBA), Naphthalene acetic
acid (NAA) and Gibberellic acid (GA3) in 3
different doses (1000 ppm, 3000 ppm, and 5000
ppm). In this way, 13 application groups
(3x4=12+1 [control] =13) were formed in total. The
applications were made by sinking the samples in
the hormones for 3 to 5 seconds. The same
application was made 3 times in such a way that
each time included 15 samples (i.e. 15 apical
samples, 15 basal samples, and 15 middle samples
included). 15 parts were put in each one of the
prepared tubes in a way that prevented them from
touching one another, covered with a germination
substrate of almost 2 cm and moistened
immediately.
The prepared tubes were placed in perforated
boxes that did not receive direct sunlight at a room
temperature of 20 to 25°C. They were irrigated
every other day for 120 days. The substrates
reached the saturation point during irrigation. No
water accumulation occurred in the tubes because
both the tubes and the boxes in which they were
placed were perforated, which made the excess
water flow away. Measurements were carried out
on the 10th of November (i.e. the 120th day). In the
meanwhile, the substrates in the tubes were
discharged onto the bench. The roots were cleaned
carefully. The number of roots was determined
first. Then the average root height was measured
via a digital micro-compass. After that, each sample
was cleaned with water; the number of scions was
determined and scion heights and widths were
measured. All measurements were conducted
through a digital micro-compass with a precision of
0.01 mm. The obtained results were entered in the
table. In this way, the effects of 13 applications on
the rooting percentage (RP), root height (RH), the
number of scions (CCN), scion height (CCH), and
scion width (CW) were evaluated.
These data were subjected to analysis of
variance via SPSS 17.0. Duncan’s test was carried
out for those characters and found to contain a
statistical difference at the minimum 95%
confidence level. In this way, homogenous groups
were created.
The effects of the hormone application on the
rooting percentage, the number of nascent, the
scions, the number of roots, root length, scion
height, scion width and root height were analyzed
via SPSS. The average values, analysis of variance
results, and Duncan’s test results concerning the
characters are given in Table 1.
The values in the table indicate that the hormone
applications had effects on all characters at a 99.9%
confidence level. The highest rooting percentage,
the highest root, the biggest number of scions, the
highest scion, and the widest scion were obtained
from IAA hormone applications. The largest
number of roots were obtained from IBA hormone
applications. Each hormone dose application was
treated as a separate application in order to
determine the effects of the hormone x dose
interaction on the rooting percentage and the
morphological characters of nascent individuals.
The obtained data were analyzed. The analysis
results are given in Table 2.
As seen in table 2, no rooting occurred in the
1000 ppm GA3 application and no scion emerged
in the 1000 ppm NAA application. Rooting took
place in all other hormone applications and the
control group. The statistical analysis results
indicated significant differences at a 99.9%
confidence level between the applications in terms
of all characters. Table 2 demonstrates that the
highest roots emerged at the 1000 ppm IBA
application and the highest roots were obtained at
the 3000 ppm GA3 application. The highest values
were obtained for IAA applications. The highest
rooting percentage (80.22%) was obtained from the
3000 ppm IAA application; the largest number of
scions (0.92) were obtained from the 1000 ppm
IAA application and the highest (6.55 mm) and
widest (4.3 mm) scions were obtained from the
5000 ppm IAA application. The obtained values
indicate that IAA hormone application can increase
the rooting percentage two times more than the
control group. In other morphological characters,
hormone applications can yield 4 to 5 times higher
values compared to the control group.
The apical, middle, and basal parts were taken
from the bulb flakes through division of these nail-
like flakes on the metamorphic underground stem
into three equal parts in order to reveal the
meristematic ability of these parts. These parts’
rates of forming new individuals and the
morphological characters of such individuals were
determined. The average values of the obtained
data, F value obtained through analysis of variance,
and groups formed as a result of Duncan’s test are
given in Table 3.

H. Sevik, M. Cetin: Effects of some hormone applications on germination and morphological characters of endangered…
258
The values in table 3 indicate that the apical,
middle, and basal parts have statistically significant
effects on all characters of the nascent individuals
including rooting percentage at the 99.9%
confidence level. Duncan’s test yielded two
homogenous groups in terms of the rooting
percentage, scion height, scion width and three
homogenous groups in terms of other characters.
Individuals consisting of sections taken from the
basal part of the teeth were included in the first
homogenous group in terms of all characters. That
shows that the basal parts obtained from the nail
have quite high rooting percentages, and the
individuals emerging in these parts are more
developed than the individuals emerging in other
parts in terms of morphological characters.
It was seen in the present study that each one of
the apical, middle, or basal parts obtained through
the division of the nail-like flakes on the stem into
3 equal parts has potential meristematic
proliferation ability. Thus, it was found out that the
potential ability of each lilium bulb to form a scion
may correspond to at least 3-folds of the number of
nail-like flakes in the bulb. The values in the table
show that while the sections obtained from the
basal part have the highest values in all characters,
those obtained from the apical section have the
lowest values. That indicates that the meristematic
proliferation ability decreases from the basal area to
the apical area.
RESULTS AND DISCUSSIONS
Many studies have been conducted on the
production of lilies so far. However, these studies
focus on the production of lilies through
microculture techniques. In these studies, IBA and
NAA [5] have been used in Lilium davidii var.
unicolor [6] and Lilium longiflorum; IAA, IBA, and
NAA [7,8] have been used in Lilium davidii var.
unicolor [9], Lilium oritential, and Lilium
longifolorum; IAA and IBA [2] have been used in
Lilium longiflorum; and BA and GA3 [10] have
been used in Lilium japonicum. However, it is not
reasonable to compare the results of these studies
with those of the present study because of the use
of different methods in them.
Table 1. The effects of the hormone applications on the rooting percentage and morphological characters.
Hormone RP RN RH CCN CCH CW
IAA 70,45 d 1,84 b 73,92 D 0,87 c 5,44 c 3,43 d
IBA 54,78 c 2,20 b 69,67 C
d 0,66 bc 2,86 b 1,54 bc
GA3 17,44 a 1,00 a 53,95 Bc 0,53 b 3,26 b 2,09 c
NAA 51,82 c 1,79 b 50,51 A
b 0,26 a 1,12 a 0,60 A
Control 28,57 b 1,14 a 34,71 A 0,43 ab 1,53 a 0,97 Ab
F Value 40,627
***
9,076**
*
7,075**
*
15,800*
**
30,924**
*
35,532*
**
Table 2. The effects of hormone x dose interaction on the rooting percentage and morphological characters.
HOR DOSE RP RN RH CCN CCH CW
IAA 5000 56,64 ef 2,36 e 84,16 fg 0,82 cd 6,55 f 4,3 G
IBA 5000 56,64 ef 2,18 de 85,2 fg 0,91 d 3,41 cde 2,08 cde
GA3 5000 27,47 c 1,29 bc 47,23 cd 0,57 bcd 4,06 de 2,76 ef
NAA 5000 36,36 cd 1,27 bc 78,77 efg 0,27 ab 1,94 bc 0,99 ab
IAA 3000 80,22 h 1,5 bcd 74,65 efg 0,86 cd 4,82 e 3,24 f
IBA 3000 64,1 fg 2 cde 64,69 def 0,56 bcd 2,68 bcd 1,38 bcd
GA3 3000 13,85 b 1,2 b 95,72 g 0,8 cd 4,1 de 2,4 def
NAA 3000 45,06 de 2,21 de 56,32 cde 0,5 bc 1,52 ab 0,86 ab
IAA 1000 71,6 gh 1,77 bcde 64,47 def 0,92 d 5,16 ef 2,89 ef
IBA 1000 39,1 cd 2,50 e 62,92 def 0,58 bcd 2,63 bcd 1,3 bc
GA3 1000 0 a 0 a 0 a 0 a 0 a 0 a
NAA 1000 72,19 gh 1,77 bcde 20,36 ab 0 a 0 a 0 a
Cont. 0 28,57 c 1,14 b 34,71 bc 0,43 b 1,53 ab 0,97 ab
F Value 25,564*** 5,837*** 9,265*** 8,591*** 13,512*** 15,872***
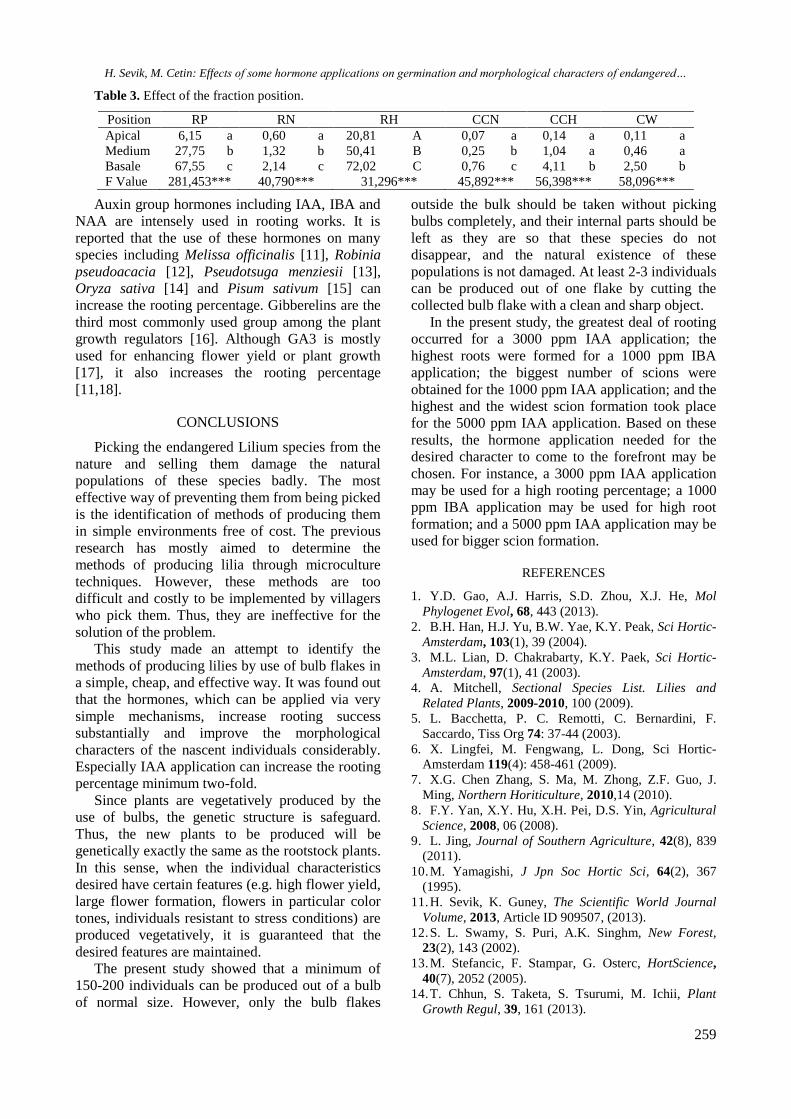
H. Sevik, M. Cetin: Effects of some hormone applications on germination and morphological characters of endangered…
259
Table 3. Effect of the fraction position.
Position RP RN RH CCN CCH CW
Apical 6,15 a 0,60 a 20,81 A 0,07 a 0,14 a 0,11 a
Medium 27,75 b 1,32 b 50,41 B 0,25 b 1,04 a 0,46 a
Basale 67,55 c 2,14 c 72,02 C 0,76 c 4,11 b 2,50 b
F Value 281,453*** 40,790*** 31,296*** 45,892*** 56,398*** 58,096***
Auxin group hormones including IAA, IBA and
NAA are intensely used in rooting works. It is
reported that the use of these hormones on many
species including Melissa officinalis [11], Robinia
pseudoacacia [12], Pseudotsuga menziesii [13],
Oryza sativa [14] and Pisum sativum [15] can
increase the rooting percentage. Gibberelins are the
third most commonly used group among the plant
growth regulators [16]. Although GA3 is mostly
used for enhancing flower yield or plant growth
[17], it also increases the rooting percentage
[11,18].
CONCLUSIONS
Picking the endangered Lilium species from the
nature and selling them damage the natural
populations of these species badly. The most
effective way of preventing them from being picked
is the identification of methods of producing them
in simple environments free of cost. The previous
research has mostly aimed to determine the
methods of producing lilia through microculture
techniques. However, these methods are too
difficult and costly to be implemented by villagers
who pick them. Thus, they are ineffective for the
solution of the problem.
This study made an attempt to identify the
methods of producing lilies by use of bulb flakes in
a simple, cheap, and effective way. It was found out
that the hormones, which can be applied via very
simple mechanisms, increase rooting success
substantially and improve the morphological
characters of the nascent individuals considerably.
Especially IAA application can increase the rooting
percentage minimum two-fold.
Since plants are vegetatively produced by the
use of bulbs, the genetic structure is safeguard.
Thus, the new plants to be produced will be
genetically exactly the same as the rootstock plants.
In this sense, when the individual characteristics
desired have certain features (e.g. high flower yield,
large flower formation, flowers in particular color
tones, individuals resistant to stress conditions) are
produced vegetatively, it is guaranteed that the
desired features are maintained.
The present study showed that a minimum of
150-200 individuals can be produced out of a bulb
of normal size. However, only the bulb flakes
outside the bulk should be taken without picking
bulbs completely, and their internal parts should be
left as they are so that these species do not
disappear, and the natural existence of these
populations is not damaged. At least 2-3 individuals
can be produced out of one flake by cutting the
collected bulb flake with a clean and sharp object.
In the present study, the greatest deal of rooting
occurred for a 3000 ppm IAA application; the
highest roots were formed for a 1000 ppm IBA
application; the biggest number of scions were
obtained for the 1000 ppm IAA application; and the
highest and the widest scion formation took place
for the 5000 ppm IAA application. Based on these
results, the hormone application needed for the
desired character to come to the forefront may be
chosen. For instance, a 3000 ppm IAA application
may be used for a high rooting percentage; a 1000
ppm IBA application may be used for high root
formation; and a 5000 ppm IAA application may be
used for bigger scion formation.
REFERENCES
1. Y.D. Gao, A.J. Harris, S.D. Zhou, X.J. He, Mol
Phylogenet Evol, 68, 443 (2013).
2. B.H. Han, H.J. Yu, B.W. Yae, K.Y. Peak, Sci Hortic-
Amsterdam, 103(1), 39 (2004).
3. M.L. Lian, D. Chakrabarty, K.Y. Paek, Sci Hortic-
Amsterdam, 97(1), 41 (2003).
4. A. Mitchell, Sectional Species List. Lilies and
Related Plants, 2009-2010, 100 (2009).
5. L. Bacchetta, P. C. Remotti, C. Bernardini, F.
Saccardo, Tiss Org 74: 37-44 (2003).
6. X. Lingfei, M. Fengwang, L. Dong, Sci Hortic-
Amsterdam 119(4): 458-461 (2009).
7. X.G. Chen Zhang, S. Ma, M. Zhong, Z.F. Guo, J.
Ming, Northern Horiticulture, 2010,14 (2010).
8. F.Y. Yan, X.Y. Hu, X.H. Pei, D.S. Yin, Agricultural
Science, 2008, 06 (2008).
9. L. Jing, Journal of Southern Agriculture, 42(8), 839
(2011).
10. M. Yamagishi, J Jpn Soc Hortic Sci, 64(2), 367
(1995).
11. H. Sevik, K. Guney, The Scientific World Journal
Volume, 2013, Article ID 909507, (2013).
12. S. L. Swamy, S. Puri, A.K. Singhm, New Forest,
23(2), 143 (2002).
13. M. Stefancic, F. Stampar, G. Osterc, HortScience,
40(7), 2052 (2005).
14. T. Chhun, S. Taketa, S. Tsurumi, M. Ichii, Plant
Growth Regul, 39, 161 (2013).

H. Sevik, M. Cetin: Effects of some hormone applications on germination and morphological characters of endangered…
260
15. A.C. Nordstrom, F.A. Jacobs, L. Eliasson, Plant
Physiol, 96, 856 (1991).
16. H. Sevik, K. Guney, Soil-Water Journal, 2(2), 1647
(2013).
17. A.M. Kumlay, T. Eryigit, Journal Science and
Technology, 1(2), 47 (2011).
18. B. Cosge, B. Gurbuz, D. Soyler, N. Sekeropglu,
Journal of Crop Research, 2, 29 (2005).
ЕФЕКТИ НА НЯКОИ ХОРМОНИ ВЪРХУ ЗРЕЕНЕТО И МОРФОЛОГИЧНИТЕ
ХАРАКТЕРИСТИКИ НА ЗАСТРАШЕНИЯ РАСТИТЕЛЕН ВИД Lilium artvinense L.
ЛУКОВИЧНИ ЛЮСПИ
Х. Севик1, М. Джетин2*
1Университет Кастамону, Факултет по инженерство и архитектура, Катедра по екологично инженерство,
Кузейкент, Кастамону, Турция 2Университет Кастамону, Факултет по инженерство и архитектура, Катедра по ландшафтна
архитектура, Кузейкент, Кастамону, Турция
Постъпила на 2 април, 2015 г.; приета на 15 септември, 2015 г.
(Резюме)
Лилиите са икономически важни растения поради техните големи и привлекателни цветове. При това много
диви видове от лилиите се култивират за производството на луковици и цветя. Но има и диво-растящи лилии,
които се берат и продават, като с това се нарушават естествените им популации. Най-лесният и ефективен
начин това да се предотврати е идентификацията на лесен и евтин начин за производството им. В тази работа се
прави опит да се намери начин за производството на Lilium artvinense използвайки луковични люспи.
Използвани са четири хормона (индол-3-оцетна киселина (IAA), индол-3-маслена киселина (IBA), нафтален-
оцетна киселина (NAA) и гибелеринова киселина (GA3) и са приложени 12 пъти. Използвани са по три дози
(1000 ppm, 3000 ppm, и 5000 ppm) от всеки хормон. Отделно е изпитана и контролна група. Всяко прилагане се
прави на основната, средната и апикалната част на луковичните люспи. По този начин са направени общо 39
наблюдения. , In addition, a control group was used. Резултатите с луковични люспи са сравнени по шест
показателя (процент на корени, брой на корените, височина на корените, брой на калемите, тяхната широчина и
височина). Прилагането на хормони може да повиши успешните опити поне двойно, като при това растението
се произвежда лесно и евтино.
261
Bulgarian Chemical Communications, Volume 48, Number 2 (pp. 261 – 268) 2016
BSA adsorption onto commercial activated carbon modified by microwave assisted
chemical activation
M. B. Taşkın1, S. Özbek2, E. Demirhan1*, B. Özbek1
1Yıldız Technical University, Chemical Engineering Department, Davutpasa Campus, Esenler, Istanbul, Turkey 2Gedik University, Metallurgy and Materials Engineering Department, Kartal Campus, Kartal, Istanbul, Turkey
Received April 15, 2015, Revised October 10, 2015
In the study, effects of pH and temperature on the equilibrium and the kinetics of bovine serum albumin (BSA)
adsorption onto commercial and modified activated carbon were investigated. Activated carbon was modified firstly by
treatment with Na2CO3, secondly thermally treated by microwave technique, and finally subjected to treatment with
HCl. The modified activated carbon samples were characterized by Fourier Transform Infrared (FTIR) and BET
analyses. The results indicated that it was possible to increase the surface area of the commercial activated carbon
(CAC) after the modification process (MAC) with an enhancement percentage of 59%, compared to initial untreated
CAC sample. The adsorption capacities decreased at pH values lower and higher than the isoelectric point value; and
increased with increasing temperature for both activated carbon samples. Moreover, adsorption isotherm and kinetic
data were well explained by the Langmuir isotherm and pseudo-second order kinetic models, respectively.
Keywords: Bovine serum albumin, activated carbon, microwave treatment, modification, adsorption, isotherm models,
kinetics.
INTRODUCTION
The adsorption of proteins from solution onto
solid surfaces is a vital and very active research
field because of its application in protein
purification, drug delivery systems, biosensors,
design of food processing equipment and artificial
implants. This process is complicated and involves
various interactions. Most proteins are known as
amphipathic molecules and this property makes
them surface-active molecules. Hence, different
results are obtained from the adsorption process
because of the characteristic features of surfaces
such as hydrophobicity and hydrophilicity. The
adsorption process results in a change in
physicochemical properties. The affinity of a
protein for an interface is affected by the structural
stability of the protein, the ionic strength and pH of
the solution, and the surface properties of the
sorbent [1-4].
Bovine serum albumin (BSA) is a globular
blood plasma protein. It has a high conformational
adaptability and is often used as a reference protein
for adsorption experiments. Sustainability of the
osmotic pressure and pH of blood, and transport of
various compounds are the most important
physiological functions of serum albumin. The
isoelectric point of BSA is about pH 4.5-5.0 [5-8].
Activated carbons (AC) are widely used as an
effective adsorbent for the removal of organic
pollutants such as dyes and heavy metals from
aqueous solutions due to their large porous surface
area, controllable pore structure, thermo stability
and low acid/base reactivity. The physical and
chemical properties of AC depend on their internal
pore structure and surface functional groups. The
commercial activated carbons are generally
produced from wood and coconut shells. However,
recently, other lignocellulosic materials, which are
generally considered as a waste, have been used as
precursors in the synthesis of this adsorbent for
specific applications. The utilization of
lignocellulosic biomass like rice hulls, bran,
sawdust and fibers is very important for the
economy, and simultaneously brings a solution to
the waste problem [9-11].
In literature, the protein adsorption has been a
subject of interest for various scientists and many
studies have evaluated the adsorption of proteins on
various adsorbents. In the present study, modified
and non-modified activated carbons were used as
adsorbents. For evaluation of the protein adsorption
ability of the activated carbon samples, bovine
serum albumin (BSA) was chosen as the target
protein. The aims of this study were: i) to modify
the surface properties of commercially available
activated carbon; ii) to investigate the effect of pH
and temperature on the adsorption of BSA from
* To whom all correspondence should be sent:
E-mail: [email protected]
2016 Bulgarian Academy of Sciences, Union of Chemists in Bulgaria

M. B. Taşkın et al.: BSA adsorption onto commercial activated carbon modified by microwave assisted chemical activation
262
aqueous solution; iii) to perform modelling studies
to represent the adsorption isotherms and kinetics.
MATERIALS AND METHODS
Materials
Commercial activated carbon was obtained from
Altek A.Ş., Istanbul. Bovine serum albumin and
other chemicals of analytical grade were purchased
from Sigma Aldrich.
Modification of activated carbon
Commercially available activated carbon
Acticarbone-CPW (produced from marine pine
wood by chemical activation with phosphoric acid)
was used in this study. Commercial activated
carbon (CAC) was modified using the method
described by Jiang et al. [10] with some
modifications. Firstly, CAC was impregnated with
a solution of 10% Na2CO3 at a ratio of 5:1 (weight
of impregnation reagent/weight of activated carbon)
and kept at room temperature for 24 h. Afterwards,
the mixture was subjected to microwave treatment
for 7 min at 540 W of microwave output power.
The mixture was cooled to room temperature and
then was boiled with 10% HCl solution for 30 min.
After the boiling procedure, the mixture was
washed several times with distilled water; and was
dried at 100°C for 24 h. The modified activated
carbon sample obtained from this treatment was
named MAC.
Characterization of the modified activated carbon
In order to determine the physical and chemical
changes of activated carbon after the modification
treatment, the modified activated carbon (MAC)
was characterized by Fourier Transform Infrared
(FTIR) and BET analyses. Pore size distribution of
CAC and MAC samples was analysed by the BJH
desorption method. While FTIR was used to
identify the chemical structure, surface structure
was examined by BET analysis. FTIR spectra of the
samples were collected using a Perkin Elmer Pyris1
FT-IR spectrometer. The KBr pellets were prepared
containing 1/2 g of the activated carbon sample.
Protein adsorption studies
Adsorption experiments were carried out to
evaluate the adsorption capacities and isotherms of
activated carbon samples at different pH (4-7) and
temperature (25-40°C) values. The experiment was
initiated by the addition of adsorbent to 50 mL of
BSA solution at the desired pH and temperature.
Buffer solutions were used to keep the pH value
steady. The mixture was shaken for 60 min at 100
rpm in a shaking incubator. During the processing
time of 60 min, the samples were taken from the
mixture at timed intervals and centrifuged to
remove the particles. The protein concentration in
the supernatant was determined by the Lowry
method [12]. The amount of protein adsorbed on
the adsorbent was calculated by the mass balance
before and after adsorption. For each sample, the
assay was carried out in triplicate and the average
was taken. In this study, all experiments were
carried out at least in duplicate and the
reproducibility between trials was within ±5%.
Adsorption capacities were calculated by using the
following equation:
m
VCCq ee
)( 0
where qe is the equilibrium adsorbed concentration
(mg/g), C0 and Ce are the initial and equilibrium
protein concentrations (mg/L), respectively. V is
the volume of the solutions and m is the weight of
adsorbent (g).
Adsorption isotherm models
Langmuir, Freundlich and Temkin isotherm
models were used to evaluate the data obtained
from the BSA adsorption experiments:
Langmuir model:
QCbQq ee
1
**
11
where qe is the equilibrium adsorbed concentration
(mg g-1), Ce is the equilibrium protein concentration
(mg L-1), Q is the maximum sorption capacity (mg
g-1) and b is the adsorption equilibrium constant.
Freundlich model:
eFe Cn
Kq ln1
lnln
where KF is the Freundlich affinity coefficient, n is
the Freundlich exponential coefficient.
Temkin model:
e
T
T
T
e Cb
RTA
b
RTq lnln
where AT and bT are the Temkin coefficients.
Adsorption kinetics of protein
Several methods are available to study the
adsorption mechanism. In this study, in order to
determine the adsorption kinetics, the data obtained
from the BSA adsorption process were analysed
with the pseudo-first order, pseudo-second order,
Elovich and intra particle diffusion models.

M. B. Taşkın et al.: BSA adsorption onto commercial activated carbon modified by microwave assisted chemical activation
263
Pseudo-first order model:
303.2log 1tk
q
e
te
where qe is the adsorbed amount at equilibrium (mg
g-1); qt is the adsorbed amount at time t (mg/g); k1 is
the pseudo-first order adsorption kinetic parameter
(min-1)
Pseudo-second order model:
eet q
t
qkq
t
22
1
where k2 is the pseudo-second order adsorption
kinetic parameter (g mg-1 min-1).
Elovich model:
The Elovich equation is valid for chemisorption
kinetics and systems in which the surface is
heterogenous.
tqt ln1
)ln(1
where α is the initial adsorption rate (mg g-1 min); β
is a constant related to the extent of surface
coverage and activation energy consumption (g mg-
1)
Intra particle diffusion model:
iit Ctkq 5.0
where ki is the intra particle diffusion kinetic
parameter (mg g-1 min-2); Ci is a constant related to
layer thickness (mg g-1).
RESULTS AND DISCUSSION
Characterization of the modified activated carbon
The FTIR results of CAC and MAC are shown
in Fig. 1 (a-b). As can be seen from these figures,
there is no significant difference between the FTIR
spectra of these two activated carbon samples. This
could be explained with the neutralizing effect
between Na2CO3 and HCl used for modification of
the activated carbon. According to literature, the
peaks observed around 3400 cm-1 were stretches
arisen from –OH groups [11, 13-15]. When two
spectra of activated carbon were compared, it was
observed that the –OH stretching intensity of MAC
sample slightly decreased due to the treatment with
Na2CO3.
On the other hand, in both spectra, peaks were
present around 1155 cm-1, which pointed to C-O
stretching [15]. Moreover, it was considered that
the observed peaks around 1565 cm-1 contained
multi groups and these groups were referred to as
C=C and –COOH groups, as stated in the literature
[11, 15-17].
The results of surface structure analyses of CAC
and MAC are given in Table 1. Pore size
distribution of CAC and MAC samples analysed by
the BJH desorption method is presented in Figure 2
(a,b). Generally, the surface areas of these two
activated carbon samples were high because of
numerous micropores on the surface structure. The
findings showed that the surface area of modified
AC increased up to 2492 m2/g compared to the
initial untreated AC sample surface area of 1572
m2/g. On the other hand, it was found that the
mesoporous surface area increased from 1014 to
1653 m2/g with an enhancement rate of 1.63.
a)
b)
Fig. 1. FT-IR spectra of a) CAC b) MAC.
Table 1 BET surface analysis results of CAC and MAC samples
Sample SBET
(m2/g)
Smes
(m2/g)
Vtot
(cm3/g)
V mic
(cm3/g)
V mes
(cm3/g)
Ravg
(nm)
CAC 1572 1014 1.608 0.256 1551 2.026
MAC 2492 1653 2.427 0.402 2296 1.948

M. B. Taşkın et al.: BSA adsorption onto commercial activated carbon modified by microwave assisted chemical activation
264
a)
b)
Fig. 2. Pore size distribution in a) CAC b) MAC.
Moreover, as a result of micropore intensity
increase in the MAC sample, it was observed that
the average pore diameter decreased from 2.026 nm
to 1.948 nm. According to the literature, pores with
a diameter of 2<r<50 nm are defined as mesopores.
The increase in the average pore diameter of MAC
samples (mesopores) was similar to that of CAC
samples. This obviously showed that although
diameters of mesopores were r>2 nm, these values
were very small to increase the pore diameter. In
other words, the diameter of the obtained
mesopores was similar to that of micropores.
Adsorption of BSA on the commercial (CAC) and
modified (MAC) activated carbon
Effect of pH on BSA adsorption
pH is one of the critical and most important
parameters for determining the adsorbent's surface
characteristics and the adsorption equilibrium in the
adsorption process. It affects the chemical
speciation of ions and the ionization of active
functional sites on the sorbent surface. The effect of
pH on the adsorption of BSA onto commercial
(CAC) and modified (MAC) activated carbon
samples was assessed in the pH range from 4 to 7
and the pH dependence of BSA adsorption is
presented in Figure 3. As can be seen from this
figure, maximum adsorption capacities are
observed at pH 5 for both activated carbon samples,
which is near to the isoelectric point of BSA. The
adsorbed amount of BSA decreased at pH values
lower and higher than the isoelectric point value.
This decrease could be explained by the bilateral
electrostatic repulsion of protein molecules since
they are with the same electric charge. Protein
molecules at the pI are natural, and the repulsion
force between BSA molecules becomes almost zero
[2,18,19]. Therefore, according to these results, the
optimum pH value was found as 5.0 for BSA
adsorption.
Fig. 3. Effect of pH on the BSA adsorption capacity
of activated carbon samples (● CAC; ◊ MAC).
Effect of temperature on BSA adsorption
In order to investigate the effect of temperature
on the adsorption of BSA onto CAC and MAC
samples, the experiments were performed in the
temperature range from 25 to 40°C. The BSA
adsorption capacity of CAC and MAC in respect to
temperature is presented in Fig. 4. The results
showed that the temperature of solution extremely
influenced the BSA adsorption. The adsorption
capacity of all samples increased with increasing
temperature. This increase might be due to the
increase of the diffusion on adsorbent surfaces with
increasing protein activity. The same result was
stated in the studies of BSA adsorption o on TiO2
[5], BSA adsorption on SBA-15 [20] and BSA
adsorption on monodispersed hollow silica
nanospheres [18].

M. B. Taşkın et al.: BSA adsorption onto commercial activated carbon modified by microwave assisted chemical activation
265
Fig. 4. Effect of temperature on the BSA adsorption
capacity of activated carbon samples (● CAC; ◊ MAC)
Adsorption isotherm modelling
Three classic adsorption models (Langmuir,
Freundlich and Temkin isotherm models) were
used to describe the equilibrium adsorption data of
the BSA onto activated carbon samples. Among
these isotherm models, Langmuir isotherm model
was determined as the most appropriate one for the
BSA adsorption data with high values of the
correlation coefficient (R2) and low values of the
standard error (σ). This result indicates that BSA
adsorption occurs as a monolayer onto the
homogenous adsorbent surface. The estimated
parameters of these models are presented in Table
2.
As can be seen in Table 2, the maximum
adsorption capacity of CAC and MAC for BSA
adsorption was found as 134.77 mg/g and 136
mg/g, respectively, at 40°C and pH 5. It was
observed that the adsorption capacity decreased at
pH 7 and pH 8. This showed that the maximum
adsorption occurred at pH 5 near its isoelectric
point, where it is neutral. This could be explained
with the hydrophobic interactions between BSA
and activated carbon. Furthermore, it was known
that BSA was negatively charged at pH 7.5. So,
above this pH value, the adsorption was limited
because of the electrostatic repulsions between the
negatively charged activated carbon and BSA
molecules [21].
On the other hand, the maximum adsorption
capacity values of MAC were slightly higher than
those of the CAC samples. This slight increase was
explained with the large molecular size of BSA to
enter the micropores. As explained in the previous
section, the mesopore diameter of the MAC sample
was similar to that of the micropores. So, these
mesopores were not sufficient to increase the
adsorption capacity of the MAC sample. The same
behaviour was observed in the adsorption of BSA
onto materials with different pore size in the
literature [22-23].
Additionally, the mineral residue remaining on
the surface of the activated carbon increased the
hydrophilicity of the MAC sample, which could
prevent the increase of the adsorption capacity [24].
Table 2. Estimated parameters and statistical values of isotherm models for BSA adsorption onto CAC and MAC
samples (pH= 5.0, T= 40°C).
CAC Sample
Langmuir Isotherm
Q (mg/g) b (L/mg) σ R2
134.77 0.02703 0.00077 0.9359 Freundlich Isotherm
KF (mg1-1/nL1/ng-1) n σ R2 41.99 5.7060 0.07896 0.9172
Temkin Isotherm
AT (L/g) bT (J/mol) σ R2 1.1737 131.9671 10.8043 0.8842
MAC Sample
Langmuir Isotherm
Q (mg/g) b (L/mg) σ R2
136.00 0.01884 0.00057 0.9433
Freundlich Isotherm
KF (mg1-1/nL1/ng-1) n σ R2
36.50 5.1647 0.06207 0.9437
Temkin Isotherm
AT (L/g) bT (J/mol) σ R2
0.6562 123.2266 8.1491 0.9213

M. B. Taşkın et al.: BSA adsorption onto commercial activated carbon modified by microwave assisted chemical activation
266
Adsorption kinetics modelling
Evaluation of the adsorption kinetics and
adsorption equilibrium is very important to plan
and control the adsorption process. In order to
describe the adsorption kinetics, the pseudo-first
order, the pseudo-second order, Elovich and the
intra particle diffusion models were used for the
evaluation of kinetic data obtained from the
adsorption experiments. The adsorption kinetics
experiments were carried out at different
temperature and pH values. The estimated
parameters and statistical data of these models are
presented in Tables 3 and 4.
As can be seen from the tables, among these
models, the second order kinetic model was found
as the most appropriate one for all experimental
data with high values of the coefficient of
determination and low standard error values.
Therefore, because of the fact that the pseudo-
second order kinetic model suggests that the
adsorption process incorporates chemisorption
mechanism, it may be concluded that adsorption of
BSA molecules onto activated carbon samples
consists of chemical adsorption. The result obtained
was in agreement with the studies published in the
literature, and several authors have stated that the
pseudo-second order kinetic model was better for
BSA adsorption onto monodispersed hollow silica
nanospheres [18] and Fe3O4 magnetic nanoparticles
[19].
A summary of the BSA adsorption capacity of
several adsorbents studied by several authors is
given in Table 5. The adsorption capacities of CAC
and MAC were higher than the results proposed in
the literature for BSA adsorption except for silica
gel, sepiolite and activated carbon.
Table 3. Statistical values of adsorption models for BSA adsorption onto CAC and MAC samples for various
temperature values (pH= 5.0).
CAC Sample
Pseudo-first order Pseudo-second order Elovich Intraparticle
T
(°C) R2 σ R2 σ R2 σ R2 σ
25 0.9662 5.9986 0.9937 0.0287 0.9280 8.6661 0.8432 12.3238
30 0.9716 5.0766 0.9927 0.0318 0.9215 8.3377 0.8887 9.8437
35 0.9856 4.1337 0.9978 0.0150 0.9749 5.4351 0.8450 13.0579
40 0.9837 4.5692 0.9976 0.0148 0.9621 6.9312 0.8732 12.3885
MAC Sample
Pseudo-first order Pseudo-second order Elovich Intraparticle
T
(°C) R2 σ R2 σ R2 σ R2 σ
25 0.9757 4.5804 0.9975 0.0186 0.9638 5.5739 0.8685 10.3576
30 0.9739 4.9770 0.9941 0.0278 0.9373 7.6453 0.8769 10.5424
35 0.9797 5.0747 0.9974 0.0157 0.9542 7.5709 0.8794 12.0425
40 0.9810 5.0075 0.9980 0.0135 0.9653 6.7349 0.8737 12.5541
Table 4. Statistical values of adsorption models for BSA adsorption onto CAC and MAC samples for various pH
values (T= 40°C).
CAC Sample
Pseudo-first order Pseudo-second order Elovich Intraparticle
pH R2 σ R2 σ R2 σ R2 σ
4 0.9522 5.5917 0.9787 0.0684 0.8556 9.4456 0.8976 8.0669
5 0.9837 4.5692 0.9976 0.0148 0.9621 6.9312 0.8732 12.3885
7 0.9378 4.8705 0.9671 0.1236 0.8562 7.2486 0.8067 8.2916
8 0.9357 3.9330 0.9829 0.0929 0.9071 4.6951 0.8939 4.9982
MAC Sample
Pseudo-first order Pseudo-second order Elovich Intraparticle
pH R2 σ R2 σ R2 σ R2 σ
4 0.9861 2.7174 0.9973 0.0254 0.9767 3.5281 0.8132 9.5382
5 0.9810 5.0075 0.9980 0.0135 0.9653 6.7349 0.8737 12.5541
7 0.8638 8.6977 0.9409 0.1297 0.7757 10.8938 0.8233 9.7983
8 0.9410 3.0856 0.9836 0.1190 0.9073 3.8342 0.8512 4.7872

M. B. Taşkın et al.: BSA adsorption onto commercial activated carbon modified by microwave assisted chemical activation
267
Table 5. Adsorption capacities of various adsorbents compared with the present study.
Adsorbents
Experimental Conditions Adsorption
capacity
(mg/g)
Ref.
pH Temp.
(°C)
Sepiolite 7.0 25 219.4 [1]
Kaolinite 7.0 25 29.1 [1]
Expanded perlite 7.0 25 2.3 [1]
Unexpanded perlite 7.0 25 1.1 [1]
Activated carbon 7.0 23 13.4 [9]
Silica coated MnFe2O4 3.8 25 100 [14]
Activated carbon 7.0 40 3.2 [26]
Activated carbon 5.7 25 312 [27]
Activated carbon 5.3 25 27.3 [28]
Silk fibroin microspheres 7.4 37 16 [29]
TiO2 5.0 40 82 [30]
Silica gel 7.0 25 228 [31]
Hydroxyapatite 6.8 30 49 [32]
Commercial activated carbon 5.0 40 134.8 Present study
Modified activated carbon 5.0 40 136 Present study
CONCLUSIONS
Commercially available AC powder was
modified by treating with chemical activation
agents such as Na2CO3 and HCl, followed by heat
treatment applying microwave technique. After the
modification process, the surface area of the
modified AC increased up to 2492 m2/g compared
to the initial untreated AC sample surface area of
1572 m2/g.
Adsorption experiments were carried out using
adsorption equilibrium and kinetics to investigate
the adsorption ability of the commercial and
modified activated carbon samples.
The maximum adsorption capacities for CAC
and MAC samples were obtained at pH 5, near to pI
of the protein where the repulsion force between
adsorbed proteins is minimal. The amount of
adsorbed BSA increased with increasing
temperature for CAC and MAC samples, which
indicates that the adsorption of BSA on activated
carbon samples is an endothermic process. The
isotherm data for BSA adsorption on activated
carbon fitted well the Langmuir isotherm model.
The maximum adsorption capacity of CAC and
MAC for BSA adsorption was found as 134.77
mg/g and 136 mg/g, respectively, at 40°C and pH 5.
Furthermore, kinetic data fitted the pseudo-second
order kinetic model. Hence, it can be concluded
that activated carbon samples can be employed as
effective adsorbents for adsorption of proteins.
Acknowledgements: This research has been
supported by Yıldız Technical University Scientific
Research Projects Coordination Department.
Project Number: 2011-07-01-KAP02.
REFERENCES
1. M. Alkan, Ö. Demirbas, M. Doğan, O. Arslan,
Micropor. Mesopor. Mat., 96, 331 (2006).
2. W. Li, S. Li, Colloid Surface A., 294, 159 (2007).
3. L. Song, K. Yang, W. Jiang, P. Du, B. Xing, Colloid
Surface. B., 94, 341 (2012).
4. K. Nakanishi, T. Sakiyama, K. Imamura, J. Biosci.
Bioeng., 91(3), 233 (2001).
5. T. Kopac, K. Bozgeyik, J. Yener, Colloid Surface A.,
322, 19 (2008).
6. F. Sezões, L.R. Carrott, P.A. Mourão, P.J. Carrot,
Adsorpt. Sci. Technol., 28, 777 (2010).
7. E. Mavropoulos, M.L.F.M. Kede, N.C.C. da Rocha,
A. Machado Costa, A. Tosi, M.H. Prado da Silva,
A.M. Rossi1, Bioceramic Develop. Appl., 1, D101115,
(2011).
8. E. Edri, O. Regev, Anal. Chem., 80, 4049 (2008).
9. N. Dizge, B. Tansel, J. Hazard. Mater., 185, 996
(2011).
10. L. Jiang, F. Ma, G. Liang, Abv. Manage. Sci., 3, 320
(2010).
11. Z. Liu, L. Li, L. Tang, R. Shi, Q. Gu, X. Liang, X.
Yao, J. Environ. Chem. Eng., 1, 131 (2013).
12. O.H. Lowry, J.N. Rosebrough, A.L. Farr, R.J.
Randall, J. Biol. Chem., 193, 265 (1951).
13. F.J. Lopez-Garzon, M. Domingo-Garcia, M. Perez-
Mendoza, P.M. Alvarez, V. Gomez-Serrano,
Langmuir, 19, 2838 (2003).
M. B. Taşkın et al.: BSA adsorption onto commercial activated carbon modified by microwave assisted chemical activation
268
14. H.F. Liang, Z.C. Wang, Mater. Chem. Phys., 124,
964 (2010).
15. P. Ramachandran, R. Vairamuthu, S. Ponnusamy, J.
Eng. Appl. Sci., 6(11), 15 (2011).
16. A.M. Puziy, O.I. Poddubnaya, A. Martinez-Alonso,
F. Suarez-Garcia and J.M.D Tascon, Carbon, 40, 1493
(2002).
17. Y. Guo and R.M. Bustin, Int. J. Coal Geol., 37, 29
(1998).
18. M.J. Hwang, O.H. Kim, W.G. Shim, H. Moon,
Micropor. Mesopor. Mat., 182, 81 (2013).
19. S. Kamran, M. Asadi, G. Absalan, Microchim. Acta,
180, 41 (2013).
20. T.P.B. Nguyen, J.W. Lee, W.G. Shim, H. Moon,
Micropor. Mesopor. Mat., 110, 560 (2008).
21. W. Shen, Z. Li, Y. Liu, Recent Pat. Chem. Eng., 1,
27 (2008).
22. F. Sezões, L.R. Carrott, P.A. Mourão, P.J. Carrot,
Adsorp. Sci. Technol., 28, 777 (2010).
23. D.P. Xu, S.H. Yoon, I. Mochida, W.M. Qiao, Y.G.
Wang, L.C. Ling, Micropor. Mesopor. Mat., 115, 461
(2008).
24. H. Marsh, F. Rodriguez-Reinoso, Activated Carbon.
Elsevier (2005).
25. S.Z. Qiao, H. Zhang, X. Zhou, S. Budihartono, G.Q.
Lu, Stud. Surf. Sci. Catal., 165, 425 (2007).
26. G. Sekaran, M., Mariappan, K.V. Raghavan,
Bioprocess Eng., 15, 165 (1996).
27. V.L. Sigal, P.V. Osadchii, Pharm. Chem. J., 21, 647
(1987).
28. R.Y.A. Wu, PhD Thesis, Purdue University, West
Lafayette, 1982.
29. Y. Srisuwan, P. Srihanam, Y. Baimark, J. Macromol.
Sci., 46, 521 (2009).
30. C.E. Giacomelli, M.J. Avena, C.P. De Puli, J.
Colloid Interface Sci., 188, 387 (1997).
31. C.E. Giacomelli, W. Norde, J. Colloid Interface Sci.,
233, 234 (2001).
32. G. Yin, Z. Liu, J. Zhan, F. Ding, N. Yuan, Chem.
Eng. J., 87, 181 (2002).
АДСОРБЦИЯ НА АЛБУМИН ОТ ГОВЕЖДИ СЕРУМ (BSA) ВЪРХУ ТЪРГОВСКИ
АКТИВЕН ВЪГЛЕН И МОДИФИЦИРАН С ХИМИЧНО АКТИВИРАНЕ С
МИКРОВЪЛНОВО ВЪЗДЕЙСТВИЕ
М.В. Ташкън1, С. Йозбек2, Е. Демирхан1*, Б. Йозбек1
1Технически университет Йълдъз, Департамент по химично инженерство, Есенлер, Истанбул, Турция 2Университет Гедик, Департамент по металургия и материалознание, Картал, Истанбул, Турция
Постъпила на 15 април, 2015 г., приета на 10 октомври, 2015 г.
(Резюме)
В настоящата работа са изследвани ефектите на pH и температурата върху равновесието и кинетиката на
адсорбция на албумин от говежди серум (BSA) върху търговски и модифициран активен въглен. Активният
въглен беше модифициран с микровълнова техника със следващо третиране със солна киселина.
Модифицираният активен въглен беше охарактеризиран с Фуриерова ИЧ-спектрометрия (FTIR) и БЕТ анализи.
Резултатите показват, че по този начин е възможно да се повиши повърхността на търговския активен въглен
(CAC) след модификацията до (MAC) с 59%, в сравнение с контролната проба (CAC). Адсорбционният
капацитет намалява при ниски pH, но е по-висок отколкото в изо-електричната точка. Той нараства с
температурата са двата изследвани въглена. Освен това, адсорбционната изотерма и кинетичните данни се
обясняват добре с изотермата на Langmuir и кинетично уравнение от псевдо-втори порядък.

269
Bulgarian Chemical Communications, Volume 48, Number 2 (pp. 269 – 271) 2016
EPR study of gamma - irradiated homeopathic medicines
K. I. Aleksieva*, N. D. Yordanov
Molecular catalysis with centre of EPR spectroscopy, Institute of Catalysis, Bulgarian Academy of Sciences, 1113,
Sofia, Bulgaria
Received April 22, 2015, Revised October 26, 2015
The EPR studies of homeopathic medicines from plant (aconite, arnica, belladonna, bryony, dulcamara, symphytum
and eupatorium) and animal (cuttle) origin before and after gamma-irradiation are reported. Before irradiation all
samples are EPR silent. After gamma-sterilization however they all exhibit a specific “sugar-like” EPR spectrum due
most probably to sucrose used as an excipient. These stable free radicals can be used to identify radiation processing a
long time after irradiation.
Keywords: homeopathic pills; gamma – irradiation; EPR.
INTRODUCTION
Gamma rays have been intensively used to
sterilize drugs, medical devices and foodstuffs [1].
One of the main advantages of the process is the
opportunity for sterilization of the products even in
their final packages [2]. This process however must
be under control. Electron Paramagnetic Resonance
(EPR) spectroscopy is an unambiguous technique
for determining the origin and stability of the
radiation induced free radicals in the solid state.
Thus, it has been accepted by the European Union
as a standard procedure for identification of
irradiated foods [3; 4; 5]. As for foodstuffs, it could
be interesting to be able to prove whether or not a
drug has been irradiated [6]. In view of this a wide
variety of gamma-irradiated antibiotics were
studied by EPR [7]. The character and stability of
radicals in drugs following ionizing radiation varies
depending on their structure and the propensity of
the solid matrix to free radical trapping. The decay
rates of gamma-induced free radicals in drugs that
have a wide application in anticancer [8] and anti-
asthmatic therapy [9] have been investigated. The
EPR spectroscopic properties were determined and
suggestions concerning the possible structure of
gamma induced radicals for anti-emetic [10] and
antipyretic drugs [11] have been made. In these
samples however there is only one substance – an
active pharmaceutical ingredient (API). Most of the
other pills are a mixture of an API which varies
from 2 -10% of the weight of the pill and the
remaining 98 – 90% are excipients [12]. This case
is similar to the homeopathic pill case in which the
API is extremely low and thus the identification of
the radiation sterilization is possible only from the
EPR spectra of the excipients. Therefore, previous
research [12, 13] on the stability of the induced
radicals by irradiation and mechanical treatment in
some excipients will be very useful.
In the present communication we report the EPR
spectra obtained before and after gamma irradiation
of some homeopathic medicines in order to prove
the samples have been irradiated or not. Also, the
stability of the radiation induced free radicals is
determined.
EXPERIMENTAL
Materials
Homeopathic pills from different plant (aconite,
arnica, belladonna, bryony, dulcamara, symphytum
and eupatorium) and animal origin (cuttle) were
purchased from a local pharmacy and were divided
in two portions. The first batch was passed for
irradiation, the second was separated as control
samples. After gamma-irradiation the samples were
kept under normal environmental conditions
(temperature 19–22 oC, humidity 70–80%),
available in the laboratory.
Irradiation
Homeopathic pills were simultaneously gamma-
irradiated by the “Gamma 1300” irradiator with a
single dose of 10 kGy. The irradiation was
performed at room temperature and in the air. All
further manipulations of the irradiated samples
were performed at least 72 h after irradiation in
order to avoid any interference by the radiation
induced short living paramagnetic species.
* To whom all correspondence should be sent:
E-mail: [email protected]
2016 Bulgarian Academy of Sciences, Union of Chemists in Bulgaria

K. I. Aleksieva, N. D. Yordanov: EPR study on gamma - irradiated homeopathic medicines
270
Instrumentation
EPR measurements were performed at room
temperature on a JEOL JES-FA 100 spectrometer
operated in the X-band. Standard cylindrical cavity
operating in the ТЕ011 mode was used. All samples
were accommodated in quartz EPR sample tubes
(i.d./o.d. 4/5 mm). The parameters used to record a
single scan EPR spectrum of each sample were:
microwave power 1 mW; modulation frequency
100 kHz and amplitude 0,25 mT; sweep width 10
mT, sweep time 2 min. and time constant 1 sec.
RESULTS AND DISCUSSION
EPR spectra
Before irradiation all studied pills do not show
EPR spectra.
After irradiation all homeopathic medicines
exhibit a typical EPR spectrum (Figure 1). It is
worth to note that the same EPR spectrum was
recorded from sucrose, white and brown sugar [14].
This feature, as well as its independence of the
origin of the sugar [15] is very important from a
dosimetric point of view because EPR can be used
also for emergency radiation monitoring. The
previous ENDOR [16] and high-frequency EPR
studies [17] of irradiated sucrose show that the
spectrum shown in Figure 1 is complex. At least
three separate EPR spectra due to different
paramagnetic species are superimposed on it [17].
In homeopathic pills sucrose is most probably used
as an excipient. This is in accordance with the well-
known fact that to reach the homeopathic
concentrations, a preparation selected starting
substance or compound is serially diluted in water
or ethyl alcohol. Thus we cannot record any EPR
spectrum from an active ingredient.
Fig. 1. EPR spectrum of homeopathic medicines after
gamma-irradiation.
Study of the stability of radiation induced free
radicals
The fading kinetics of the radiation induced EPR
signal is an important characteristic of the materials
because after irradiation it limits the time interval in
which the identification of radiation processing is
unambiguous. Since typically, for the given
excipient this period strongly depends on the
structure of the material under study, its storage
conditions before and after irradiation, the
humidity, exposure to air, light and temperature. In
order to find the stability of radiation-induced EPR
signals in homeopathic pills their kinetics were
studied for a period of 200 days after irradiation.
The studies show that radiation induced radicals in
sucrose remain stable (Figure 2). Each point of
Figure 2 is an average of at least three
measurements. This result is imported in direction
of emergency purpose because it is known that
sucrose is found to be a very promising radiation
sensitive material for gamma-irradiation with
respect to both retrospective and reference solid
state EPR dosimetry [18].
Fig. 2. Kinetics of the stability of a radiation induced
signal in homeopathic medicines.
CONCLUSION
The results of EPR studies on homeopathic pills
from: aconite, arnica, belladonna, bryony,
dulcamara, symphytum, eupatorium and cuttle
show that gamma-irradiation induce free radicals of
sucrose, which is used as an excipient. No EPR
spectra from active substances were record most
probably due to their low concentration. Thus, the
gamma-induced free radicals in sucrose present as
excipient can be used for identification of radiation
processing a long time after irradiation.

K. I. Aleksieva, N. D. Yordanov: EPR study on gamma - irradiated homeopathic medicines
271
REFERENCES
1. D. Petrisor, G. Damian, S. Simon, Radiat. Phys.
Chem., 77, 463 (2008)
2. H. Delincee, Food Sci. Techn., 9, 73 (1998).
3. EN 1786, European Committee for Standardization,
Brussels (1996).
4. EN 1787, European Committee for Standardization,
Brussels (2000).
5. EN 13708, European Committee for
Standardization, Brussels (2001).
6. J. Raffi, S. Gelly, P. Picerelle, P. Prinderre, A.P.
Chamayou, M. Baron, Radiat. Phys. Chem., 63, 705
(2002).
7. M. Gibella, A-S. Crucq, B. Tilquin, P. Stocker, G.
Lesgards, J. Raffi, Radiat. Phys. Chem., 58, 69 (2000).
8. H. B. Ambroz, E. M. Kornacka, B. Marciniec, G.
Przybytniak, J. Radioanal. Nucl. Chem., 254, 293
(2002).
9. J. P. Basly, J. L. Duroux, M. Bernard, Int. J.
Pharmac. 142, 125 (1996).
10. G. Damian, Talanta, 60, 923 (2003).
11. M. Polat, M. Korkmaz, Radiat. Eff. Def. Solids, 161,
51 (2006).
12. K. Aleksieva, N. D. Yordanov, Radiat. Eff. Def.
Solids, 167, 685 (2012).
13. J. Raffi, S. Gelly, L. Barral, F. Burger, P. Picerelle, P.
Prinderre, M. Baron, A. Chamayou, Spectrochim. Acta
58, 1313 (2002).
14. N. D. Yordanov, V. Gancheva, E. Georgieva, Radiat.
Phys. Chem., 65, 269 (2002).
15. T. Nakajima, T. Otsuki, Appl. Radiat. Isot. 41, 359
(1990).
16. G. Vanhaelewyn, J. Sadlo, F. Callens, W.
Mondelaers, D. DeFrenne, P. A Matthys, Appl. Radiat.
Isot. 52, 1221 (2000).
17. E. Georgieva, L. Pardi, G. Jeschke, X. Gatteschki, L.
Sorace, N. D. Yordanov, Free Radical Res., 40, 553
(2006).
18. 18. Y. Karakirova, E. Lund, N. D. Yordanov, Radiat.
Meas., 43, 1337 (2008).
ЕПР ИЗСЛЕДВАНЕ НА ГАМА-ОБЛЪЧЕНИ ХОМЕОПАТИЧНИ ЛЕКАРСТВА
К. И. Алексиева*, Н. Д. Йорданов
Молекулен катализ с център по ЕПР спектроскопия, Институт по катализ, Българска академия на науките,
ул. „Акад. Г. Бончев“ бл. 11, София 1113, България
Постъпила на 22 април 2015 г., приета на 26 октомври 2015 г.
(Резюме)
Представени са резултати от ЕПР изследване на хомеопатични лекарства от растителен (самакитка, арника,
беладона, дива тиква, червено кучешко грозде, черен оман и еупаториум) и животински произход (сепия) преди
и след гама-облъчване. Преди облъчване не се регистрира ЕПР спектър. След гама-стерилизация при всички
проби се детектира специфичният т. нар. „захароподобен“ ЕПР спектър, който най-вероятно се дължи на
захароза, използвана като пълнител. Тези стабилни радикали може да се използват за идентифициране на
радиационната обработка дълго време след облъчването.
272
Bulgarian Chemical Communications, Volume 48, Number 2 (pp. 272 – 278) 2016
Anticancer evaluation of novel quinazolines carrying a biologically active
pyrimidine, triazine, benzo[d][1,3]dioxol, morpholinophenyl, quinoline, sulfonamide
moieties
M. M. Ghorab1,2*, M. S. Alsaid1
1 Department of Pharmacognosy, College of Pharmacy, King Saud University, P.O. Box 2457, Riyadh 11451, Saudi
Arabia 2Department of Drug Radiation Research, National Center for Radiation Research and Technology, Atomic Energy
Authority, Nasr City, Cairo, Egypt
Received April 25, 2015, Revised June 5, 2015
A novel series of quinazolines incorporating a biologically active 4, 6-dimethylpyrimidine, 1, 2, 4-triazine,
benzo[d][1,3]dioxol, morpholinophenyl, quinoline, sulfonamide and thioureamoieties9-14, 15,16,19, 20 and 2-
hydrazinylquinazoline derivative 22were designed and synthesized using methyl 2-isothiocyanato derivative2 as
strategic starting material. The structure of the newlysynthesized compounds was confirmed by elemental analyses and
spectral data. All the prepared compounds were evaluated for their invitro anticancer activity against breast cancer cell
lines. It was found that quinazoline carrying free amino group at 3-position with sulfa-phenazolegroup at 2-position20
and thioureido derivative bearing sulfa-phenazole16 with IC50values (2.64 and 4.60 µg/mL) showed better activity
thandoxorubicin as positive control. In addition compounds 14, 12 and 15 are nearly as active as doxorubicin as
reference drug, while compounds 9, 13, 11 and 19 exhibited a moderate activity. On the other hand, compounds 10 and
22 showed no activity.
Keywords:Synthesis, DihydroquinazolineDerivatives,Anti-breast Cancer Activity.
INTRODUCTION
Natural and synthetic quinazolinone derivatives
constitute an important class of fused heterocycles,
which influence numerous cellular processes. These
scaffolds as a core unit have been extensively
studied in a number of biologically active
compounds because of their broad range of
biological medicinal, physiological and
pharmacological applications [1-8]. In recent years,
quinazolines, as an important pharmacophore, have
emerged as a versatile template for inhibition of a
diverse range of receptor tyrosine kinases [9-13].
The most widely studied of these is the epidermal
growth factor receptor (EGFR), with the small-
molecule inhibitor gefitinib being the first agent
from this class to be approved for the treatment of
Non-Small Cell Lung Cancer [14-18]. Subsequent
research aimed at further exploration of the SAR of
this novel template has led to the discovery of
highly selective compounds that target EGFR such
as Erlotinib, Lapatinib and Vandetanib [19-21]
(Fig. 1). These compounds act via competing with
ATP for binding at the catalytic domain of tyrosine
kinase. Later on, a great structural variety of
compounds of structurally diverse classes have
proved to be highly potent and selective ATP-
competitive inhibitors [22-25].
N
N
HN
O
O
O
O
N
N
NH
N
N
HN Cl
O N
O
Cl
O
F
O
SO
O
F
O
N
N
HN F
O N
NH
Cl
O
O
Erlotinib(Tarceva) Lapatinib
Gef itinib(Iressa)
Caneratib(CI 1033)
Fig. 1. EGFR-tyrosine kinase inhibitors.
Based on the good performance of quinazoline
derivatives in anticancer application, the
development of novel quinazoline derivatives as
anticancer drugs is a promising field. Varied
biological activities have been attributed to
sulfonamide compounds, including carbonic
anhydrase inhibition, antitumoral, antimalarial and
antimicrobial activities [26-28]. In the design of
new drugs, the development of hybrid molecules
through the combination of different
pharmacophores may lead to compounds with
interesting biological profiles [29]. In view of the
above mentioned knowledge based facts of
different pharmacophores and in continuation of

M. M. Ghorab, M. S. Alsaid: Anticancer evaluation of novel quinazolines carrying a biologically active pyrimidine…
273
our research programme [30-40], we have
synthesized quinazoline carrying a biologically
active 4, 6-dimethypyrimidine, 1, 2, 4-triazine,
benzo[d][1,3]dioxol, morpholino-phenyl, quinoline,
sulfonamide moieties to evaluate their anti-breast
cancer activity.
MATERIALS AND METHODS
Melting points (uncorrected) were determined in
open capillary on a Gallen Kamp melting point
apparatus (Sanyo Gallen Kamp, UK). Precoated
silica gel plates (Kieselgel 0.25 mm, 60 F254,
Merck, Germany) were used for thin layer
chromatography. A developing solvent system of
chloroform/methanol (8:2) was used and the spots
were detected by ultraviolet light. IR spectra (KBr
disc) were recorded using an FT-IR
spectrophotometer (Perkin Elmer, USA). 1H-NMR
spectra were scanned on a NMR spectrophotometer
(Bruker AXS Inc., Switzerland), operating at 500
MHz for 1H- and 125.76 MHz for 13C. Chemical
shifts are expressed in -values (ppm) relative to
TMS as an internal standard, using DMSO-d6 as a
solvent. Elemental analyses were done on a model
2400 CHNSO analyser (Perkin Elmer, USA). All
the values were within ± 0.4 % of the theoretical
values. All reagents used were of AR grads.
CHEMISTRY
Synthesis of quinazoline derivatives 9-14.
General procedure
A mixture of methyl-2-isothiocyanatobenzoate
2(1.93g, 0.01mol) and aromatic amines (0.012mol)
in dry dimethylformamide(10mL) containing 3
drops of triethylamine was refluxed for 12h., then
left to cool. The solid product formed upon pouring
onto ice/water was collected by filtration and
recrystallized from dioxane to give 9-14,
respectively.
4-(2-Phenylquinazolin-4-
ylamino)benzenesulfonamide (9)
Yield, 84%; m.p. 172.5 0C. IR: 3381 (NH), 3081
(arom.), 2971, 2828 (aliph.), 1691 (CO),1610 (CN),
1281 (CS).1H-NMR: 2.2 [s, 6H, 2CH3], 6.5 [s, 1H,
CH pyrimidine], 7.0-8.2 [m, 4H, Ar-H], 8.6
[s,1H,NH]. 13C-NMR: 26.7 (2), 112.6, 114.6, 118.7,
122.8, 125.4, 130.6, 136.9, 161.2, 164.8 (2), 167.1,
173.6. Anal. Calcd. For C14H12N4OS (284.34): C,
59.14; H, 4.25; N, 19.70. Found: C, 59.46; H, 4.55;
N, 19.39.
3-(5, 6-Dimethyl-1,2,4-triazin-3-yl)-2-thioxo-2,3-
dihydroquinazolin-4(1H)-one (10)
Yield, 88%; m.p. 95.90C. IR: 3411 (NH), 3056
(arom.), 2917, 2837 (aliph.), 1686 (CO), 1621
(CN), 1272 (CS). 1H-NMR: 2.4, 2.8 [2s, 6H, 2CH3],
6.9-8.2 [m, 4H, Ar-H], 8.5 [s,1H,NH]. 13C-NMR:
16.3, 18.7, 113.6, 118.0, 125.4, 126.1, 130.8, 140.3,
146.2, 161.3, 162.6, 168.5, 175.7. Anal.Calcd.For
C13H11N5OS (285.32): C, 54.72; H, 3.89; N, 24.55.
Found: C, 54.98; H, 4.13; N, 24.22.
3-(Benzo[d][1,3]dioxol-5-ylmethyl)-2-thioxo-2, 3-
dihydroquinazolin-4(1H)-one(11)
Method A:
A mixture of 2 (1.93g, 0.01 mole) and
benzo[d][1,3]dioxol-5-ylmethanamine (1.51g, 0.01
mole) in dry dimethylformamide (15 mL )
containing 3 drops of triethylamine was refluxed
for 3 h. The obtained solid while hot was separated
and recrystllized from dioxane to give 11.
Method B:
A mixture of 2 (1.93g, 0.01 mole) and benzo[d]
[1,3]dioxol-5-ylmethanamine (1.51g, 0.01 mole) in
dry dimethylformamide (15 mL) was stirred at
room temperature for 2 h. The obtained material
recrystllized from dioxane to give 11 (m.p and
mixed m.p).
Yield, 79%; m.p. 281.50C. IR: 3261 (NH), 3100
(arom.), 2928, 2844 (aliph.), 1691 (CO), 1263 (CS). 1H-NMR: 5.5 [s, 2H, CH2], 5.9 [s, 2H, CH2
pipronyl], 6.8-7.9 [m, 7H, Ar-H], 12.9 [s, 1H,
NH].13C-NMR: 48.3, 100.8, 107.9, 108.2, 115.6,
120.9, 124.5 (2), 127.2, 130.3, 135.5, 139.0, 146.1,
146.9, 159.3, 175.7. Anal.Calcd.For C16H12N2O3S
(312.34): C, 61.53; H, 3.87; N, 8.97. Found: C,
61.81; H, 4.09; N, 8.62.
3-(4-Morpholinophenyl)-2-thioxo-2,3-
dihydroquinazolin-4(1H)-one(12)
Yield, 93%; m.p. 392.4 0C. IR: 3261 (NH), 3081
(arom.), 2966, 2881 (aliph.), 1679 (CO), 1260
(CS).1H-NMR: 2.7- 3.3 [m, 8H, 4CH2], 6.8-7.8 [m,
8H, Ar-H], 8.0 [s, 1H, NH]. 13C-NMR: 51.2 (2),
62.6 (2), 112.6 (2), 116.7, 120.1, 121.7, 123.8 (2),
125.1, 128.2, 133.0, 141.2, 144.3, 162.2, 173.6.
Anal.Calcd. For C18H17N3O2S (339.41): C, 63.70;
H, 5.05; N, 12.38. Found: C, 63.40; H, 5.31; N,
12.05.
3-(Quinolin-3-yl) -2-thioxo-2,3-dihydroquinazolin-
4(1H)-one(13)
Yield, 72%; m.p. 341.80C. IR: 3167 (NH), 3062
(arom.), 1699 (CO), 1620 (CN), 1265 (CS).1 H-
NMR: 7.0- 8.1 [m, 10H, Ar-H], 8.3 [s, 1H,NH].13C-
NMR:114.6, 117.0, 126.7 (2), 127.3, 127.4, 127.8,
128.4, 128.7, 130.3, 135.5, 137.4, 139.0, 141.8,

M. M. Ghorab, M. S. Alsaid: Anticancer evaluation of novel quinazolines carrying a biologically active pyrimidine…
274
163.6, 176.3. Anal.Calcd. For C17H11N3OS
(305.35): C, 66.87; H, 3.63; N, 13.76. Found: C,
66.52; H, 3.95; N, 13.47.
N-(5, 6-Dimethoxypyrimidin-4-yl)-4-(4-oxo-2-
thioxo-1, 2-dihydroquinazolin-3(4H)-
yl)benzenesulfonamide(14)
Yield, 77%; m.p. 178.40C. IR: 3246 (NH), 3100
(arom.), 2943, 2861 (aliph.), 1670 (CO), 1618
(CN), 1338, 1199 (SO2).1H-NMR: 3.8, 3.9 [2s, 6H,
2OCH3], 7.0-8.3 [m, 9H, Ar-H], 8.7 [s,1H,
NH],11.0 [s,1H, SO2NH]. 13C-NMR: 54.1, 55.6,
113.2, 118.7, 119.6, 120.1, 121.3, 125.8, 127.3 (2),
129.1, 130.3, 133.4, 134.1, 140.8, 152.6, 153.1,
162.3, 164.6, 174.8. Anal.Calcd. For C20H17N5O5S2
(471.51): C, 50.95; H, 3.63; N, 14.85. Found: C,
51.19; H, 3.37; N, 14.58.
Methyl-2-(3-(4-
morpholinophenyl)thioureido)benzoate (15) and
methyl-2-(3-(4-(N-(1-phenyl-1H-pyrazol-5-yl)-
sulfonyl)phenyl)thioureido)benzoate(16)
A mixture of compound 2 (1.93g, 0.01 mole)
and 4-morpholinoaniline and/ or sulfa-phenazole
(0.01 mole) in dry dimethylformamide (15 mL) was
stirred at room temperature for 2 h. The obtained
solid upon pouring into ice water recrystallized
from ethanol to give compounds 15 and 16,
respectively.
15: Yield, 69%; m.p. 381.3 0C. IR: 3261, 3189
(NH), 3057 (arom.), 2981, 2861 (aliph.), 1678(CO),
1246 (CS). 1H-NMR: 2.7-3.7 [m, 8H, 4CH2], 4.1 [s,
3H, OCH3], 6.8-8.0 [m, 8H, Ar-H],13.0 [s, 2H,
2NH]. 13C-NMR: 48.4 (2), 52.3, 66.0 (2), 114.9 (2),
121.2, 123.6, 125.5, 126.7 (2), 130.0, 132.6 (2),
141.0, 144.6, 162.2, 173.2. Anal.Calcd.For
C19H21N3O3S (371.45): C, 61.44; H, 5.70; N, 11.31.
Found: C, 61.14; H, 5.44; N, 11.65.
16: Yield, 82%; m.p. 187.30C. IR: 3312, 3277
(NH), 3086 (arom.), 2976, 2831 (aliph.), 1682
(CO), 1618 (CN), 1371,1156 (CS).1H-NMR: 3.7 [s,
3H,OCH3], 6.6-8.2 [m, 15H, Ar-H], 11.0
[s,1H,SO2NH], 11.9 [s, 2H, 2NH].13C-NMR: 52.6,
103.7, 118.1, 120.7 (2), 122.0 (2), 124.4, 124.8,
125.1, 127.6 (2), 128.1 (2), 129.3, 130.8, 133.6,
134.7, 138.1, 139.5, 140.2, 142.9, 166.0, 176.3.
Anal.Calcd. For C24H21N5O4S2 (507.58): C, 56.79;
H, 4.17; N, 13.80. Found: C, 56.48; H, 4.50; N,
14.07.
3-Amino-2-(4-morpholinophenylamino) quinazolin-
4(3H)-one(19) and 4-(3-amino-4-oxo-3, 4-
dihydroquinazolin-2-ylamino)-N-(1-phenyl-1H-
phenyl-1H-pyrazol-5-yl) benzenesulfonamide(20)
A mixture of compounds 15 or 16 (0.01 mole)
and hydrazine hydrate (0.012 mole) in absolute
ethanol (20 mL) was refluxed for 15 h (after
evolution of all H2S). The reaction mixture was
poured on to ice water and the obtained solid
recrystallized from dioxane to give compounds 19
and 20, respectively.
19: Yield, 86%;m.p. 184.60C. IR: 3408, 3366,
3219 (NH, NH2), 3088 (arom.), 2937, 2843 (aliph.),
1688 (CO), 1622 (CN).1H-NMR: 3.1- 3.7 [m, 8H,
4CH2], 5.6 [s, 2H, NH], 6.2-8.3 [m, 8H, Ar-H],
9.1[s,1H,NH].13C-NMR: 48.8 (2), 66.2 (2), 116.4
(2), 117.5 (2), 121.5, 124.8, 126.8, 127.2, 130.6,
133.9, 134.0, 148.5, 160.9, 161.0. Anal.Calcd. For
C18H19N5O2 (337.37): C, 64.08; H, 5.68;N, 20.76.
Found: C, 64.33; H, 5.39; N, 20.48.
20: Yield, 85%; m.p. 331.30C. IR: 3448, 3275,
3205 (NH, NH2), 3100 (arom.), 1666 (CO), 1620
(CN), 1346,1172 (SO2).1H-NMR: 5.8 [s, 2H, NH2],
6.2-8.4 [m, 15H, Ar-H], 9.2 [s, 1H,NH], 11.2 [s,1H,
SO2NH]. 13C-NMR: 103.6, 112.0 (2), 117.6, 120.8
(2), 124.1, 124.8, 125.2, 126.3, 128.6 (2), 129.0,
129.6 (2), 131.4, 134.0, 137.1, 140.7, 145.9, 146.0,
161.2, 167.1. Anal.Calcd. For C23H19N7O3S
(473.51): C, 58.34; H, 4.04; N, 20.71. Found: C,
58.05; H, 4.30; N, 20.98.
3-(Benzo[d][1,3]dioxol-5-ylmethyl)-2-
hydrazinylquinazolin-4(3H)-one(22)
A mixture of compound 11 (3.12g, 0.01 mole)
and hydrazine hydrate (1g, 0.02 mole) was refluxed
for 24 h (lead acetate paper). The obtained solid
while hot was recrystallized from ethanol-
dimethylformamide to give compound 22.
Yield, 89%; m.p. 154.60C. IR: 3376, 3261 (NH,
NH2), 3059 (arom.), 2951,2873 (aliph.), 1688 (CO),
1617 (CN).1H-NMR: 5.1 [s, 2H, N-CH2], 5.9 [s,
2H, O-CH2-O], 6.8-8.0 [m, 7H, Ar-H], 8.9
[s,1H,NH], 9.5 [s, 1H,NH2]. 13C-NMR: 42.3, 101.0,
107.8, 108.5, 120.6, 121.7, 124.4, 127.0, 127.1,
133.6, 134.2, 147.7, 148.6, 151.7, 161.3, 162.0.
Anal.Calcd.For C16H14N4O3 (310.30): C, 61.93; H,
4.55; N, 18.06. Found: C, 61.64; H, 4.23; N, 17.88.
IN-VITRO ANTICANCER EVALUATION
The cytotoxic activity was measured in vitro for
the newly synthesized compounds using the
SulfoRhodamine-B stain (SRB) assay [41]. The in
vitro anticancer screening was done at the
Pharmacology Unit, the National Cancer Institute,
Cairo University. Cells were plated in 96- multi-
well plates (104 cells per well) for 24 h before
treatment with the compound, to allow attachment
of cells to the wall of the plate. Test compounds
were dissolved in DMSO and diluted with saline to
the appropriate concentration. Different
concentrations of the compound under test (10, 25,
50 and 100 µg/ml) were added to the cell

M. M. Ghorab, M. S. Alsaid: Anticancer evaluation of novel quinazolines carrying a biologically active pyrimidine…
275
monolayer. Triplicate wells were prepared for each
individual dose. Monolayer cells were incubated
with the compound(s) for 48 h at 37 oC and in an
atmosphere of 5% CO2. After 48h cells were fixed,
washed, and stained for 30 min with 0.4% (m/V)
with SRB dissolved in 1 % acetic acid. Excess
unbound dye was removed by four washes with 1
% of acetic acid and attached stain was recovered
with a Tris-EDTA buffer. Color intensity was
measured in an enzyme-linked immunosorbent
assay ELISA reader. The relation between the
surviving fraction and drug concentration is plotted
to get the survival curve for the breast tumor cell
line after the specified time. The molar
concentration required for 50 % inhibition of cell
viability (IC50) was calculated and the results are
given in (Table 1).
RESULTS AND DISCUSSION
Chemistry
The aim of this work was to design and
synthesize novel quinazoline incorporating a
biologically active 4, 6-dimethylpyrimidine 9, 5,6-
dimethyl-1,2,4-triazine 10, benzo[d][1,3]dioxol-5-
ylmethan 11, 4-morpholinophenyl12, quinolone 13
and benzenesulfonamide14, thioureido derivatives
15 and 16, 3-aminoquinazoline derivatives 19, 20
and 2-hydrazinylquinazoline derivative 22 to
evaluate their anti-breast cancer activity. Thus,
interaction of methyl-2-isothiocyanatobenzoate 2
with 2-amino-4, 6-dimethylpyrimidine, 2-amino-
5,6-dimethyl-1,2,4-triazine, benzo[d][1,3]dioxol-5-
ylmethanamine, 4-morpholinoaniline, 3-
aminoquinoline and sulfadoxinein dry N,N-
dimethylformamide containing triethylamine as
catalyst affordedthe corresponding quinazoline
derivatives is presented in 9-14(Scheme 1).
The IR of compound 15 showed the absence of a
N=C=S group and the presence of the characteristic
bands at 3261, 3189 cm-1 (NH), 3057 cm-1
(aromatic) 1678 cm-1 (CO), 1246 cm-1 (CS). The 1H-NMR of compound 15 exhibited signals at 4.1
ppm assigned to the OCH3 group, 13.0 ppm due to
2NH groups. The IR of compound 16 revealed the
absence of the N=C=S group and the presence of
characteristic bands at 3312, 3277cm-1 (NH), 1682
cm-1 (CO), 1618cm-1 (CN), 1371, 1156 cm-1 (SO2),
1256 cm-1 (CS). The 1H-NMR of compound 16
revealed signals at 3.7 ppm attributed to the OCH3
group, 11.0 ppm assigned to the SO2NH group,
11.9 ppm corresponding to 2NH groups. In addition
the interaction of compound 15 and 16 with
hydrazine hydrate in refluxing ethanol furnished the
corresponding 3-aminoquinazoline derivatives 19
and 20. Compounds 19 and 20 were obtained
through the formation of the intermediated 17 and
18.
O
O
NH2
CSCl2 O
O
N C S
(1) (2)
RNH2DMFTEA
O
NH
O
S
N R
H
-MeOH
NH
N
S
R
O
(3-8)(9-14)
9; R =
N
N
10; R =
11; R =
N O12; R =
13; R =
14; R =
N
S
O
O
NH
N
N
O
O
Scheme 1: Formation of quinazoline derivatives 9-14
O
O
N
N
N
The structures of the obtained compounds were
established on the basis of elemental analyses and
spectral data. The IR spectra of compounds 9-14
showed the absence of N=C=S group and the
presence of absorption bands for (NH), (aromatic),
(aliphatic), (CO), (CN), (CS) and (SO2) in
compound 14. 1H - NMR exhibited singlets
assigned to the NH group which were exchanged
upon deuteration. Also, the interaction of
compound 2 with 4-morpholinoaniline and/or sulfa-
phenazolein dimethylformamideat at room
temperature furnished the corresponding thioureido
derivatives 15 and 16, respectively. The structure of
compounds 15 and 16 was elucidated on the basis
of microanalysis, IR, 1H-NMR and 13C-NMR
(Scheme 2).
The reaction was proceeding via the elimination
of 1 mole of H2S. The structure of compound 19
and 20 was confirmed on the basis of elemental
analyses, IR, 1H-NMR, and 13C-NMR. The IR of
compound 19 revealed the absence of a OCH3
group and the presence of the characteristic bands
at 3408, 3366, 3219 cm-1(NH, NH2), 1688cm-1
(CO), 1622 cm-1 (CN). The 1H-NMR of compound
19 exhibited signals at 5.6 ppm assigned to the NH2
group, 9.1 ppm attributed to the NH group. The IR
of 20 showed characteristic bands at 3448, 3275,
3205 cm-1 (NH, NH2), 1666 cm-1(CO), 1620cm-1
(CN), 1346,1172cm-1(SO2). 1H-NMR of 20
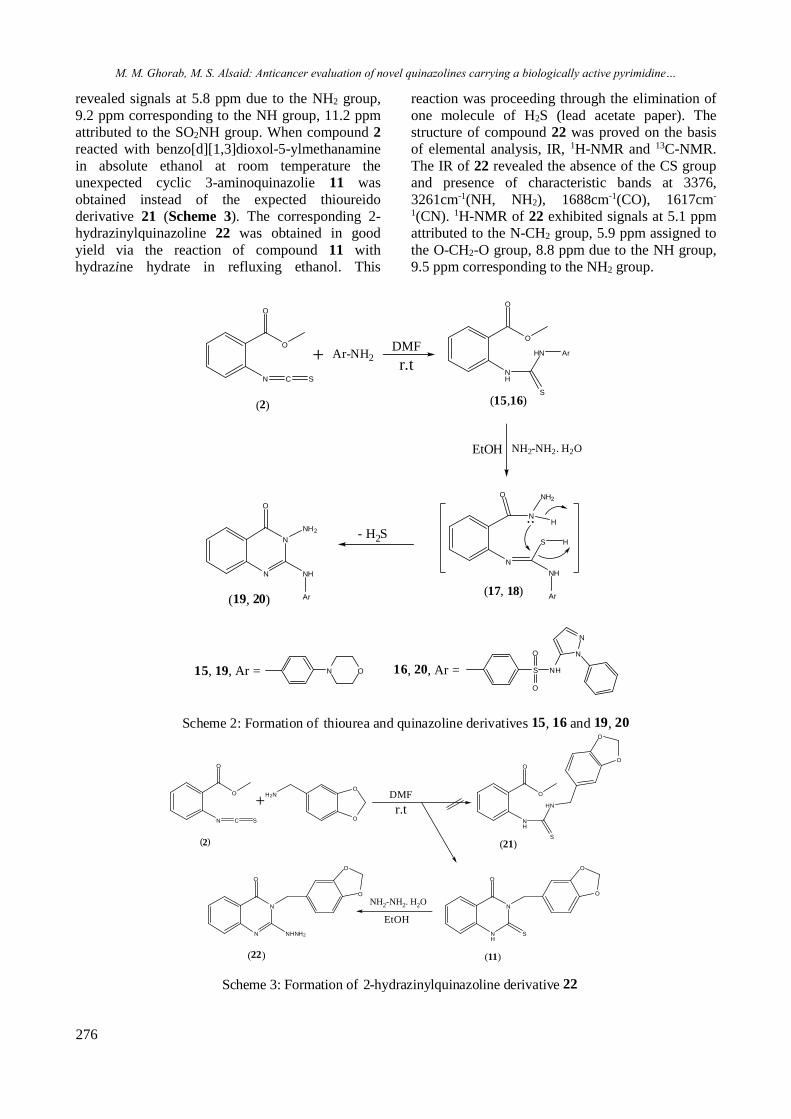
M. M. Ghorab, M. S. Alsaid: Anticancer evaluation of novel quinazolines carrying a biologically active pyrimidine…
276
revealed signals at 5.8 ppm due to the NH2 group,
9.2 ppm corresponding to the NH group, 11.2 ppm
attributed to the SO2NH group. When compound 2
reacted with benzo[d][1,3]dioxol-5-ylmethanamine
in absolute ethanol at room temperature the
unexpected cyclic 3-aminoquinazolie 11 was
obtained instead of the expected thioureido
derivative 21 (Scheme 3). The corresponding 2-
hydrazinylquinazoline 22 was obtained in good
yield via the reaction of compound 11 with
hydrazine hydrate in refluxing ethanol. This
reaction was proceeding through the elimination of
one molecule of H2S (lead acetate paper). The
structure of compound 22 was proved on the basis
of elemental analysis, IR, 1H-NMR and 13C-NMR.
The IR of 22 revealed the absence of the CS group
and presence of characteristic bands at 3376,
3261cm-1(NH, NH2), 1688cm-1(CO), 1617cm-
1(CN). 1H-NMR of 22 exhibited signals at 5.1 ppm
attributed to the N-CH2 group, 5.9 ppm assigned to
the O-CH2-O group, 8.8 ppm due to the NH group,
9.5 ppm corresponding to the NH2 group.
O
O
N C S
(2)
N
N
NH
NH2
O
(15,16)
N O
Scheme 2: Formation of thiourea and quinazoline derivatives 15, 16 and 19, 20
+ Ar-NH2DMF
r.t
O
O
NH
S
HN Ar
NH2-NH2. H2OEtOH
N
N
O NH2
H
S H
NH
Ar
- H2S
Ar
S
O
O
NH
N
N
(17, 18)(19, 20)
15, 19, Ar = 16, 20, Ar =
O
O
N C S
(2)
N
N
NHNH2
O
(21)
Scheme 3: Formation of 2-hydrazinylquinazoline derivative 22
+DMF
r.t
O
O
NH
S
HN
NH2-NH2. H2O
EtOH
(22)
O
OH2N
NH
N
S
O
O
O
(11)
O
O
O
O

277
IN-VITRO ANTICANCER EVALUATION
The newly synthesized compounds were
evaluated for their in vitro anticancer activity
versus the human breast cancer cell line (MCF7).
Doxorubicin was used as the reference drug in this
study. Table 1 shows the in vitro cytotoxic activity
of the newly synthesized compounds. Some of the
tested compounds exhibited significant activity
compared to doxorubicin. It was found that
quinazoline carrying the free amino group at the 3-
position with a biologically active sulfa-phenazole
at 2-position 20 and thioureido having a
biologically sulfa-phenazole 16 (with IC50 values of
2.64, 4.60 µg/ml) exhibited higher anti-breast
cancer activity than the reference drug (with IC50
value of 5.40 µg/ ml). Further, quinazoline bearing
the biologically active sulfa-doxine at the 3-
position with the thione group at 2-position 14,
quinazoline incorporating morpholinophenyl at 3-
position with the thione group at 2-position 12 and
thioureido carrying morpholinophenyl moiety 15
(with IC50 values 5.68, 8.62, and 9.66 µg/ml) are
nearly as active as doxorubicin. On the other hand,
compounds 9, 11, 13 and 19 revealed slightly lower
activity than that of doxorubicin. It is clear from the
present data that the comparison of the cytotoxicity
of the quinazoline derivatives against the breast
cancer cell line (MCF7) (Table 1) has showed that
the cell killing potency follows the order
20>16>Doxorubicin >14>12>15>9>13>1>19with
IC50 values (2.64, 4.64, 5.40, 5.68, 8.62, 9.66,
16.63, 19.06, 24.20, 24.31 µg/ml). The biological
screening of the tested compounds could offer an
encouraging framework in this field which may
lead to the discovery of potent anti-breast cancer
agents.
Table 1. In vitro anti-breast cancer (MCF-7) activity
of newly synthesized compounds
Compound. No. IC50 (µg / mL)a
MCF-7
Doxorubicin 5.40
9 16.63
10 NA
11 24.20
12 8.62
13 19.06
14 5.68
15 9.66
16 4.60
19 24.31
20 2.64
22 NA aIC50 value: Concentration causing 50% inhibition of cell
viability.
NA: No activity.
CONCLUSION
In this work, novel quinazolines having a
biologically active 2,3-dihydroquinazoline, 1,2-
dihydroquinazoline, quinazoline-4(3H)-one and
3,4-dihydroquinazoline derivatives were
synthesized and their in-vitro anti-breast cancer
activity was evaluated among the tested
compounds, two candidates (20 and 16) showed
effectiveness on the breast cancer cell line, the
active compounds could be considered as useful
templates for further development to obtain more
potent anti-breast cancer agent(s). Also, compounds
14, 12 and 15 are nearly as active as doxorubicin as
a reference drug. In addition, compounds 9, 11, 13
and 19 exhibited a moderate activity. Compounds
10 and 22 showed no activity.
Acknowledgment: The authors would like to
extend their sincere appreciation to the Deanship of
Scientific Research at King Saud University for its
funding of this research through the Research
Group Project no. RGP- 302.
REFERENCES
1. G. Bonola, E. Sianesi, J. Med. Chem.,13, 329 (1970).
2. R. J. Alaimo, H. E. Russell, J. Med. Chem.,15, 335
(1972).
3. E. M. Bermanand, L. M. Werbel, J. Med. Chem.,34,
479 (1991).
4. O. I. El-Sabbagh, S.M. Ibrahim, M. M. Baraka, H.
Kothayer, Arch. Pharm.,343, 274 (2010).
5. J. I. Levin, P. S. ChanBailey, A. S. Katocs, A. M.
Venkatesan, Bioorg. Med. Chem. Lett.,4, 1141 (1994).
6. R. P. Maskey, M. Shaaban, I. Grun-Wollny, H.
Laatsch, J. Nat. Prod., 67, 1131 (2004).
7. D. J. Connolly, D. Cusack, T. P. O`Sullivan, P. J.
Guiry, Tetrahedron.,61, 10153 (2005).
8. Y. S. Sadanandam, K. R. M. Reddy, A. BhaskarRao,
Eur. J. Med. Chem.,22, 169 (1987).
9. S.K. Srivastava, V. Kumar, S.K. Agarwal, R.
Mukherjee, A.C. Burman, Anticancer Agents Med
Chem., 9, 246 (2009).
10. O. Cruz-López, A. Conejo-García, M.C. Núñez, M.
Kimatrai, M.E. García-Rubiño, F. Morales, V. Gómez-
Pérez, J.M. Campos, Curr. Med. Chem.,18, 943
(2011).
11. A. Garofalo, L. Goossens, P. Six, A. Lemoine, S.
Ravez, A. Farce, P. Depreux, Bioorg. Med. Chem.
Lett., 21, 2106 (2011).
12. B.Lüth, W. Löwe, Eur. J. Med. Chem., 43, 1478
(2008).
13. Y.S. Lee, S.H. Seo, B.S. Yang, J.Y. Lee, Arch.
Pharm. (Weinheim).,338, 502 (2005).
14. G. Cui, M. Cui, Y. Li, Y. Liang, W. Li, H. Guo, S.
Zha, Med. Oncol., 32, 570 (2015).
15. M.P. Mathew, E. Tan, C.T. Saeui, P. Bovonratwet, L.
Liu, R. Bhattacharya, K.J. Yarema, Bioorg. Med.
Chem. Lett., 25, 1223 (2015).

M. M. Ghorab, M. S. Alsaid: Anticancer evaluation of novel quinazolines carrying a biologically active pyrimidine…
278
16. A. Bellizzi, M.R. Greco, R. Rubino, A. Paradiso, S.
Forciniti, K. Zeeberg, R.A. Cardone, S.J. Reshkin, Int.
J. Oncol., 46, 1214 (2015).
17. D.M. Jackman, L.A. Cioffredi, L. Sharmeen, L.K.
Morse, J. Lucca, S.R. Plotkin, P.J. Marcoux, M.S.
Rabin, T.J. Lynch, B.E. Johnson, S. Kesari,
Oncotarget., 6, 4527 (2015).
18. M. Nakao, H. Muramatsu, K. Sone, S. Aoki, H.
Akiko, Y. Kagawa, H. Sato, T. Kunieda, Mol. Clin.
Oncol.,3,403 (2015).
19. T. Koizumi, S. Sasaki, A. Sakamoto, T.
Kobayashi,Ann.Palliat. Med., 2, 111 (2013).
20. M. Nolting, T. Schneider-Merck, M. Trepel, Cancer
Res., 201, 125 (2014).
21. M. Brassard, G.Rondeau, Biologics.,6,59(2012).
22. A. Levitzki, Eur. J. Cancer., 38, 511 (2002).
23. S. Harakeh, M.D. Assef, M. El-Sabban, M.
Haddadin, H.G. Muhatasib, Chemico-Biol.
Interactions., 148, 101 (2004).
24. A. Levitzki, Pharmacol.Ther., 82, 231 (1999).
25. M.A. Bogoyevitch, D.P. Fairlie, Drug.
Discovery.Today.,12, 622 (2007).
26. J. Drews, Science., 287, 1960 (2000).
27. C.T. Supuran , A. Casini , A. Mastrolorenzoand A.
Scozzafava, Mini-Rev. Med. Chem., 4, 625 (2004).
28. F. Abbate, A. Casini, T. Owa, A. Scozzafava, C.T.
Supuran, Bioorg. Med. Chem. Lett., 14, 217 (2004).
29. V.R. Solomon, C. Hu, H. Lee, Bioorg. Med. Chem.,
17, 7585 (2009).
30. M. M. Ghorab, F.A. Ragab, H.I. Heiba, M.G. El-
Gazzar, S.S. Zahran,Synthesis, anticancer and
radiosensitizing evaluation of some novel sulfonamide
derivatives. Eur. J. Med. Chem., 92, 682, (2015).
31. M.M. Ghorab, M.S. Alsaid, M. Ceruso, Y.M. Nissan,
C.T. Supuran, Bioorg. Med. Chem., 14, 3684 (2014).
32. M. M. Ghorab, M. Ceruso, M. S. Alsaid, Y. M.
Nissan, R. K. Arafa, C. T. Supuran, Eur. J. Med.
Chem., 87, 186 (2014).
33. M.S. Al-Dosari, M.M. Ghorab, M.S. Alsaid, Y.M.
Nissan, A.B. Ahmed, Eur. J. Med. Chem., 69, 373
(2013).
34. M.M. Ghorab, F.A. Ragab, H.I.Heiba, R.M. El-
Hazek, Eur. J. Med. Chem., 46, 5120 (2011).
35. M.S. Alsaid, M.M. Ghorab, M.S. Al-Dosari, M.M.
Hamed, Eur. J. Med. Chem., 46, 201 (2011).
36. M.M. Ghorab, F.A. Ragab, H.I. Heiba, H.A. Youssef,
M.G El-Gazzar, Bioorg. Med. Chem. Lett., 20, 6316
(2010).
37. M.S. Alsaid, M.M. Ghorab, S.I. Alqasoumi, E.M. El-
Hossary, E. Noaman, Eur. J. Med. Chem., 45, 3011
(2011).
38. S.I. Alqasoumi, A.M.Al-Taweel, A.M. Alafeefy,
M.M. Ghorab, E.Noaman, Eur. J. Med. Chem., 45,
1849 (2010).
39. S.I. Alqasoumi, A.M. Al-Taweel, A.M. Alafeefy, E.
Noaman, M.M. Ghorab, Eur. J. Med. Chem., 45, 738
(2010) .
40. M.M. Ghorab, F.A. Ragab, M.M. Hamed, Eur. J.
Med. Chem., 44, 4211 (2009).
41. P. Skehan, R. Storeng, D. Scudiero, A. Monks, J.
McMahon, D. Vistica, J.T. Warren, H. Bokesch, S.
Kenney, M.R. Boyd, J. Nat. Cancer Inst., 82,
1107(1990).
ОЦЕНКА НА ПРОТИВОТУМОРНАТА АКТИВНОСТ НА НОВИ ХИНАЗОЛИНИ,
СЪДЪРЖАЩИ БИОЛОГИЧНО АКТИВНИ ПИРИМИДИН, ТРИАЗИН, БЕНЗО [d][1,3]
ДИОКСОЛ, МОРФОЛИНОФЕНИЛ, ХИНОЛИН И СУЛФОНАМИДИ
М.М. Гораб1,2*, М.С. Алсаид1
1 Департамент по фармакогнозия, Колеж по фармация, Университет „Крал Сауд“, Риад 11451,
Саудитска Арабия 2Департамент по радиологични изследвания на лекарствата, Национален център за радиологичниизследвания
и технологии, Служба по атомна енергетика, Наср Сити, Кайро, Египет
Получена на 25 април, 2015 г., Коригирана на 5 юни, 2015 г.
(Резюме)
Нова серия хиназолини, включващи биологично активни 4,6-диметилпиридин, 1,2,4-триазин,
бензо[d][1,3]диоксол, морфолинофенил, хинолин, сулфонамид и тиокарбамидни съставки 9-14, 15,16,19, 20 и 2-
хидразинил-хиназолиново производно 22 са конструирани с използването на метил 2-изоцианато- производно 2
като стратегически основно вещество. Структурата на ново-синтезираните съединения бе потвърдена с
елементен анализ и спектрални данни. Всички приготвени съединения са оценени за тяхната in vitro противо-
ракова активност срещу клетъчни линии за рак на гърдата. Намерено е, че хиназолинът със свободна
аминогрупа на 3-то място с сулфа-феназолова група на 2-ро място (20) и тиокарбамидовите производни,
носещи сулфа-феназол 16 с IC50 - стойности (2.64 и 4.60 µg/mL) показват по-добра активност от доксорубицина
като положителен контрол. Допълнително съединенията 14, 12 и 15 са близки по активност до доксорубицина
като сравнително лекарство, докато съединенията 9, 13, 11 и 19 показват умерена активност. От друга страна
съединенията 10 и 22 не показват активност.

279
Bulgarian Chemical Communications, Volume 48, Number 2 (pp. 279 – 284) 2016
Comparison of the components of the volatile oils from leaves of Ziziphus jujuba
extracted by changing the solvent system and the separation methods
Z. Aghajani*, A.A. Engashte-Vahed
Department of Chemistry, Qom Branch, Islamic Azad University, Qom, Iran
Received April 12, 2015, Revised November 3, 2015
Quantity and quality of the components of volatile oils are highly dependent on the conditions of extraction. In this
study, the volatile components of the leaves of Ziziphus jujuba in the flowering period were investigated by changing
the extraction solvent and the method of extraction. At first, the volatile components were extracted by changing the
type of the extraction solvent in the simultaneous distillation-extraction (SDE) method. Then, the effects of the
extraction method on the quality and quantity of the extracted compounds were studied using the hexane solvent via
two methods of SDE and percolation. The extracted volatile oils were separated and identified using GC/MS and
GC/FID. The extraction method itself, proved to have the most effect on the number and type of the compounds of the
volatile oils. Also the mean of molecular weight and solubility of the compounds of the extracted volatile oils in water,
were so different from one another.
Keywords: Ziziphus jujuba; Separation method; Volatile oil; Simultaneous distillation-extraction; Cold percolation
method
INTRODUCTION
Aromatic plants have been known for a very
long time and the use of them in the food and
perfume industries have a long history [1].
Ziziphus is a genus of the family Rhamnaceae
which consists of about 40 species and is a small
spiny shrub, distributed in warm-temperate
zones and subtropical regions throughout the world
[2].
In Iran, Ziziphus is mostly found in the central
regions and Khorasan and Golestan provinces.
The drupe and the flesh of Ziziphus contain its
most medicinal properties, also the leaves have
shown healing properties. The infusion of the
leaves is usually gargled to treat sore throat,
bleeding gums and joint pain [3-5].
Kurihara et al. [6] extracted the saponin,
ziziphin, from the dried leaves of Z. jujuba. Leaves
of Z. jujuba due to the existence of the active
substance of ziziphin, can suppress the sweet taste
sensation in flies (Pharma regina), rats and
hamsters [6].
In a study conducted by Shirdel and
Mirbadalzadeh [7] it was determined that the
ethanolic extract of leaves of Z. jujuba has a
hypoglycemic effect in diabetes mellitus patients
and its effect is similar to that of glibenclamide [7].
The anti-allergic activity of the water extract of
leaves of Z. jujuba was studied by measuring its
inhibitory effect on the activation of hyaluronidase
(bovine testes) in vitro; and Z. jujuba proved to
have strong anti-allergic activity [7].
El Husseiny and El Kholy [8] evaluated
insecticidal properties of different extracts of the
leaves of Z. jujuba. They showed that Petroleum
ether extract of the leaves of Z. jujuba is able to
reduce the population dynamics of Culex pipiens;
either directly through larval kill, or indirectly
through its latent effects expressed in reduction of
egg hatchability, inhibition of adult emergence,
interruption of life stages and the effect that it has
on sex ratio [8].
Due to the fact that plant extracts usually are a
combination of various types of bioactive
compounds, their separation, identification and
characterization of those bioactive compounds still
remain a big challenge in the way of the processes
[9].
In the traditional methods of extracting natural
compounds from plants such as water or steam
distillation and extraction with organic solvents
such as soaking, there are some disadvantages such
as loss of volatile components, degradation of
compounds and remaining toxic solvents [10, 11].
Due to the increasing usage of natural compounds
in the recent years, the effects of different
extraction methods and types of solvent on the
quality and quantity of volatile compounds,
extracted from the leaves of Z. jujuba during the
flowering season were studied.
* To whom all correspondence should be sent:
E-mail: [email protected] 2016 Bulgarian Academy of Sciences, Union of Chemists in Bulgaria
Z. Aghajani, A. A . Engashte-Vahed: Comparison of the components of the volatile oils from leaves of Ziziphus jujuba by
280
MATERIALS AND METHODS
Materials
Leaves of Z. jujuba were collected from one of
the central provinces of Iran (Qom province) during
the flowering period in 2014. The plant materials
were authenticated by the Department of Botany of
Islamic Azad University, Qom Branch.
Samples were dried and subsequently ground in
a blender to obtain fine powder. All reagents and
chemicals used in this study were from Merck or
Sigma Companies.
Extraction methods
Extraction by SDE method
The volatile oils of Z. jujuba were extracted
from dried leaves samples via hydro-distillation,
using the simultaneous distillation-extraction (SDE)
method [12]. Also the organic solvents of n-hexane
and ethyl acetate were used in the extraction
process. The extraction process took 2 h. Then the
solvent was removed and the solution was dried
over anhydrous sodium sulfate. The extracted oils
were stored at 4°C in a sealed vial until analyzed.
Extraction by cold percolation method
The plant extracts were prepared by the cold
percolation method. Ten grams of dried powder
were added to 300 ml of solvent in a conical flask
and the mixture was kept for 48 hours with
intermittent shaking. After that, the extract was
filtered through Whatman No. 1 filter paper; then
the solvent was removed using a rotary evaporator
and subsequently dried, until a constant weight of
each extract was obtained. The residues were stored
at 4°C for further use [13].
Gas chromatography analysis
Analytical gas chromatography of the volatile
oils was carried out using a Hewlett-Packard 5975B
series gas chromatograph with Agilent HP-5
capillary column (30 m×0.25 mm, f.t 0.25 µm);
carrier gas He; split ratio 1:10 and using a flame
ionization detector. The column temperature was
adjusted at 50°C which was unchanging for 10 min
and was programmed to rise up to 240°C at a rate
of 4°C/min and then stay constant at that
temperature for 15 min. GC/MS was performed on
an HP 5975B with a Hewlett–Packard 5973
quadrupole detector, on capillary column HP-5 (30
m×0.25 mm; f.t 0.25 µm).
The MS was operated at 70 eV ionization
energy. Retention indices were calculated using
retention times of n-alkanes that were injected after
the volatile oil at the same chromatographic
conditions. Quantitative data were obtained from
the electronic integration of the FID peak areas.
The components of the oils were identified by
comparing their mass spectra and kovats indexes
with Wiley library and published books, data bases
available and credible websites [14].
RESULTS AND DISCUSSION
In this study, qualitative and quantitative
characteristics of the components of the volatile oil
of the leaves of Z. jujuba in the flowering season
were evaluated after changing certain parameters
such as the extraction solvent and the extraction
method.
At first the components of the volatile oils were
extracted by changing the type of extraction solvent
in the SDE method. Ethyl acetate and hexane as the
polar and aprotic solvents, with different dipole
moments were used (D Hexane =0.08, D Ethyl acetate
=1.88).
In the second segment, by using the hexane
solvent but changing the extraction method from
SDE to cold percolation, the effects of the
extraction method on the quality and quantity of the
extracted compounds were studied.
Other important matters to take into
consideration are the type and number of the
extracted compounds. The compounds separated
using the hexane solvent and the SDE method have
a noticeable difference compared to the compounds
separated by the percolation method; that is to say
Eugenol, trans-β-Ionone, α-Farnesene and 2-
Hexenal are some of the main compounds in the
SDE method which were not separated in the
percolation method. Likewise α- Pinene, Linoleic
acid and Diisooctyl adipate were some of the
separated constituents of the percolation method
which were not obtained in the SDE method.
Some compounds such as palmitic acid and
phytol, exist in both of the separation methods but
their percentages are different. From the SDE
method while using the hexane solvent, 34
compounds were obtained; but this number for the
ethyl acetate solvent with the same method is 30
(Tables 1 & 2). When the SDE method and the
hexane solvent were used, 34 volatile compounds
were extracted while only 11 volatile compounds
were obtained from the percolation method with the
same solvent. As it can be seen, in separation of
compounds by the SDE method, there is only a
little difference in the number of extracted
compounds after changing the solvent but, when
the separation method is changed, this difference is
much greater.

Z. Aghajani, A. A . Engashte-Vahed: Comparison of the components of the volatile oils from leaves of Ziziphus jujuba by
281
It was previously reported that volatile oil
content of medicinal plants is influenced by the
extraction method. Gavahian and his colleague
demonstrated that essential oils obtained by
hydrodistillation and steam distillation, were
almost similar in their physical properties and
chemical compositions [15] but Xie et al. showed
that among the three extraction methods, the
solvent extraction method could extract compounds
with low volatility and high molecular weight.
They proved that both of the methods of headspace
solid-phase microextraction and steam distillation,
could extract volatile components [16].
In order to study the extracted compounds,
parameters such as solubility in water and the
boiling point were used. According to the results
demonstrated in Table 3, the mean of solubility
values of the extracted compounds in water (in
20°C) by the SDE method when using the ethyl
acetate solvent, was 2414.01 ppm; while this value
for the hexane solvent was 882.22 ppm.
Table 1. Chemical composition of the volatile oils of the leaves of Z .jujuba extracted by the SDE method
No Components extracted solvent:
Ethyl acetate a (%)
extracted solvent:
Hexane b (%) RIc
1 Octane - 9.10 ≤ 800
2 n-Hexanal 2.45 - 800
3 (E)-2-Hexenal 26.31 11.26 852
4 Xylene 1.38 - 870
5 6-Methyl-5-hepten-2-one - 1.80 991
6 α-Toluenol 0.96 - 1044
7 cis-Linalool oxide - 1.04 1092
8 trans-Linalool oxide 0.67 - 1093
9 Terpinolene - 2.26 1104
10 (3E)-6-Methyl-3,5-heptadien-
2-one - 0.61 1110
11 Naphthalene 14.21 - 1191
12 Fenchol - 0.95 1197
13 α-Terpineol 1.40 - 1198
14 Dodecane 1.70 - 1200
15 Tridecane 1.34 - 1300
16 Eugenol - 9.58 1367
17 Cyclohexane - 5.00 1396
18 Tetradecane 2.01 - 1401
19 Dihydropseudoionone - 1.67 1456
20 trans-β-Ionone 2.83 5.55 1493
21 Pentadecane 2.26 - 1501
22 α-Farnesene - 6.13 1511
23 δ-Cadinene - 6.31 1528
24 Dihydroactinolide 1.88 1.27 1540
25 E-Nerolidol 1.27 2.85 1569
26 (E)-3-Eicosene 1.05 - 1593
27 Hexadecane 2.17 - 1601
28 Benzophenone 1.86 - 1639
29 Benzyl benzoate 3.60 - 1776
30 Hexahydrofarnesyl acetone 1.33 - 1849
31 1-Butyl 2-isobutyl phthalate - 0.56 1968
32 Diisobutyl phthalate 2.20 0.92 1877
33 Dibutyl phthalate 2.74 - 1972
34 Palmitic acid 3.28 2.55 1980
35 Phytol 9.57 16.63 2118
36 Diisooctyl adipate 1.23 - 2400
Total
89.70 86.04
aCompounds extracted with hexane by the SDE method; bCompounds extracted with hexane by the percolation method cRI: Relative retention indices to C8–C24 n-alkanes on HP-5 MS column

Z. Aghajani, A. A . Engashte-Vahed: Comparison of the components of the volatile oils from leaves of Ziziphus jujuba by…
282
Table 2. Chemical composition of the hexane extract of the volatile oils of the leaves of Z .jujuba extracted by the
SDE and Percolation methods
No Components (%)aSDE method (%)bPercolation method RIc
1 Octane 9.10 - ≤ 800
2 (E)-2-Hexenal 11.26 - 852
3 6-Methyl-5-hepten-2-one 1.80 - 991
4 cis-Linalool oxide 1.04 - 1092
5 Terpinolene 2.26 - 1104
6 (3E)-6-Methyl-3,5-heptadien-2-one 0.61 - 1110
7 Fenchol 0.95
1197
8 Eugenol 9.58 - 1367
9 Cyclohexane 5.00 - 1396
10 Dihydropseudoionone 1.67 - 1456
11 trans-β-Ionone 5.55 - 1493
12 α-Farnesene 6.13 - 1511
13 δ-Cadinene 6.31 - 1528
14 Dihydroactinolide 1.27 2.08 1540
15 E-Nerolidol 2.85 - 1569
16 α-Pinene - 7.90 1841
17 Z-11-Tetradecenoic acid - 1.47 1848
18 1-Butyl 2-isobutyl phthalate 0.56 - 1968
19 Diisobutyl phthalate 0.92 - 1877
20 Dibutyl phthalate - 3.63 1972
21 Palmitic acid 2.55 18.42 1980
22 Phytol 16.63 31.70 2118
23 Linoleic acid - 13.54 2154
24 Diisooctyl adipate - 8.03 2400
25 Pentacosane - 3.68 2495
Total
86.04 90.45
aCompounds extracted with hexane by the SDE method; bCompounds extracted with hexane by the percolation method; cRI: Relative
retention indices to C8–C24 n-alkanes on HP-5 MS column
Fig. 1. The category of the compounds extracted from the volatile oils of the leaves of Z .jujuba by the SDE and
Percolation methods
A: Compounds extracted with Ethyl acetate by SDE method
B: Compounds extracted with Hexane by SDE method
C: Volatile compounds extracted with Hexane by percolation method

Z. Aghajani, A. A . Engashte-Vahed: Comparison of the components of the volatile oils from leaves of Ziziphus jujuba by…
283
Table 3. Comparison of the compounds extracted
from the volatile oils from the leaves of Z .jujuba by the
SDE and percolation methods using three measured
parameters
Parameter measured A B C
Average molecular
weight 203.15 188.61 265.94
Average solubility in
water (In 25 oC , ppm) 2414.01 882.22 68.63
Average boiling point
(In 760 mm Hg ) 260.86 237.23 284.11
A: Compounds extracted with ethyl acetate by SDE method;
B: Compounds extracted with hexane by SDE method;
C: Volatile compounds extracted with hexane by percolation
method.
The mean of the boiling points of the extracted
compounds for the ethyl acetate was 260.86°C and
the mean of the boiling points of the extracted
compounds for the hexane solvent was 237.23°C.
The results showed that the boiling point and
solubility of the extracted molecules in water have
a direct relationship with the dipole moment of the
extraction solvent. It can be concluded that the
ethyl acetate solvent in comparison with the hexane
solvent, has extracted compounds with higher
dipole moment values. This result is compatible
with the existing difference between the numbers of
extracted oxygenated compounds (Figure 1).
The second segment of this study investigated
the extraction methods by which the volatile
components were extracted by the hexane solvent
using the two methods of SDE and percolation and
then, the results of these methods were compared to
each other.
According to Table 3, the mean solubility of the
extracted compounds in water (in 20°C) using the
percolation method was 68.63 ppm; while this
value for the SDE method was 882.22 ppm. Also,
the mean molecular weight of the compounds
extracted by the percolation method was 265.94 u
and for the SDE method it was 188.61 u. These
results clearly confirm the ability of the SDE
method in separating compounds with higher dipole
moments and lesser molecular weight compared to
the percolation method.
CONCLUSIONS
Due to the fact that volatile oils are used in
different industries, finding the best extraction
methods in order to improve their quality and also,
to obtain the most suitable chemical compounds for
any particular application is crucial. According to
the changes in quality and quantity of the volatile
oils that can be observed in tables 1-3 and figure 1,
it can be concluded that the SDE method can
separate compounds with higher dipole moment but
lesser molecular weight in comparison with the
percolation method. Also as it was expected, these
results reveal this fact that the compounds separated
by the ethyl acetate solvent are more polar than the
compounds separated by the hexane solvent.
Acknowledgements: Authors acknowledge the
kind financial supports of the Research Council of
Qom Branch, Islamic Azad University, Qom, Iran"
REFERENCES:
1. N. Mezzomo, B.R. Mileo, M.T. Friedrich, J.
Martinez, S.R. Ferreira, Bioresour. Technol. 101 (14),
5622 (2010).
2. N. Kathleen, E. D. Brenzel, Sunset Western Garden
Book. Sunset Publishing Corporation. 1995, p. 606.
3. G.R. Amin, Traditional medicinal plants of Iran.
Research Deputy Publications of Hygiene Ministry.
Islamic Republic of Iran, [in Persian] 1997, p. 230.
4. R. Omid Beigi, Approach the Production and
Processing Plants. Tarahan Publisher, Tehran, Iran,
1997, p. 109.
5. G. Usher, A dictionary of plants used by man. CBS
Publishers and distributors, Delhi, India, 1974.
6. Y. Kurihara, K. Oohubo, H. Tasaki, H. Kodama, Y.
Akiyama, A. Yagi, B. Halperm, Tetrahedron, 44: 61
(1988).
7. Z.Shirdel, R.Mirbadalzadeh, Elixir Hor. & Sig. 31:
1957 (2011).
8. I.M. El Husseiny, S.E. El Kholy J. Adv. Biol. 6(2):
1066 (2015).
9. G. Brusottia, I. Cesari, A. Dentamaro, G.
Caccialanza, G. Massolinia. J. Pharm. Biomed. Anal.
87: 218 (2014).
10. A. Ruiz-Rodriguez, G. Reglero, E. Ibanez, J. Pharm.
Biomed. Anal. 51, 305 (2010).
11. I.T. Agar, C. Sarmiento, R. Garces, N. Kaska, S.
Kafkas, B.E. Ak, Acta Hortic, 419: 405 (1995).
12. H. Ebrahimabadi, A. Mazoochi, F. Jookar Kashi, Z.
jafari-Bidgoli, H. Batooli, Food Chem. Toxicol., 48:
1371 (2010).
13. S.D. Sarker, L.Nahar, Methods Mol Biol. 864: 301
(2012).
14. R.P.Adams, J. Chromatogr. A. 985: 137 (1995).
15. M. Gavahian, R. Farhoosh, A. Farahnaky, K.
Javidnia, F. Shahidi. Int. Food Res.J. 22 (1): 277 (2015).
16. Z.S. Xie, X.J. Xu, C.Y. Xie, J.Y. Huang, M. Yang,
D.P. Yang. J. Pharm. Anal. 3(3): 215 (2013).
Z. Aghajani, A. A . Engashte-Vahed: Comparison of the components of the volatile oils from leaves of Ziziphus jujuba by
284
СРАВНЯВАНЕ НА КОМПОНЕНТИТЕ НА ЛЕТЛИВИ МАСЛА ОТ ЛИСТАТА НА
Ziziphus jujuba ЧРЕЗ ПРОМЯНА НА РАЗТВОРИТЕЛЯ И МЕТОДА НА РАЗДЕЛЯНЕ
З. Агаяни *, А. А. Енгаще-Вахед
Департамент по химия, Ислямски университет „Азад“, Клон в Кум, Кум, Иран
Постъпила на 12 април, 2015 г., Коригирана на 3 ноември, 2015 г.
(Резюме)
Количествата и качествата на компонентите на летливите масла силно зависят от условията на екстракция. В
настоящата работа ние изследвахме летливите компоненти в листата на Ziziphus jujuba в периода на цъфтеж,
променяйки екстрагента и метода на екстракция. Най-напред, ние екстрахирахме летливите компоненти чрез
промяна на разтворителя чрез едновременна дестилация и екстракция (SDE); във втората част, използвайки
хексан като разтворител по два метода (SDE и перколация), ние изследвахме ефекта на метода на екстракция
върху количеството и качеството на екстрахираните съединения. Екстрахираните масла бяха разделени и
идентифицирани чрез GC/MS и GC/FID. Най-голяма разлика се наблюдава, когато методът на екстракция бе
променен по начин, при който броят и типът на съединенията драстично се променя. Също така средната
молекулна маса и средната разтворимост на компонентите на екстрахираните летливи масла са различни.

285
Bulgarian Chemical Communications, Volume 48, Number 2 (pp. 285 – 289) 2016
Physicochemical and electrochemical study of lead acid battery positive active mass
(PAM) modified by the addition of bismuth
N.Chahmana*1, M.Matrakova2, L.Zerroual1
1Laboratoire d’Energétique et Electrochimie du Solide (LEES), Université Sétif, Sétif, Algeria. 2Institute of Electrochemistry and Energy Systems”Akad.Evgeni Budevski”- Bulgarian Academy of Sciences, Sofia,
Bulgaria.
Received May 15, 2015, Revised October 8, 2015
This study attempts to discuss the influence of Bi alone and its combination with Sb and Sn on the electrochemical
performance of the PAM of lead acid batteries. The different additives were added in the electrolyte as cations. PAMs
were prepared by electro formation of cured battery plates in the presence and absence of a dopant (non-doped sample
ND). The results from different analyses showed that bismuth alone gives a remarkable improvement of the capacity.
The highest performance of PAM is obtained when bismuth is mixed with tin together as dopants.
The incorporation of bismuth and tin cations leads to an increase of the quantity of structural water in PAM. This
increases the hydrated and amorphous zones within the PbO2 particles and leads to an improvement of the
electrochemical capacity.
Key words: Lead acid battery, Positive active mass, Bismuth, Tin, Antimony, Capacity.
INTRODUCTION
The active mass of the positive plate of the lead-
acid battery is a gel-crystal system that conducts
electricity by electrons and protons in hydrated
areas of the gel zones [1]. The properties of the
active material were modified by the introduction
of dopants, but few reports in the literature deal
with these investigations [2-7]. The effect of the
addition of ions of the elements of group V
(Arsenic, Antimony and Bismuth) introduced in the
spin alloy or in the solution during the rebuilding
process of the active material structure and the
PbO2 powder density were investigated. The results
showed that these dopants decrease the value of the
critical density [8]. H.Y. Chen et al. [9] found that
bismuth improves the capacity and cycle life. In our
previous works, we studied the effect of the doping
of lead dioxide with some metallic ions on the
composition of PAM gel zones and its relationship
to battery performance. The results showed that the
quantity of water present in the gel zones and PAM
discharge capacity are mainly dependent on the
nature of the dopant [10, 11].
The aim of this work is the study of the
physicochemical properties of the lead acid battery
positive active mass, modified by adding Bi alone
and combined with Sb and Sn at different
concentrations and their electrochemical
performances. The study was based on chemical
analysis, X-ray diffraction (XRD),
thermogravimetry (TG) and scanning electronic
microscopy (SEM). The capacity of the different
PAMs is determined by galvanostatic discharge.
EXPERIMENTAL
Plate preparation
In order to investigate the effect of bismuth on
the positive active mass, four kinds of positive
electrodes were prepared. Lead dioxide was
prepared by electroformation of industrial cured
battery plates (with grids cast from a Pb-5wt. % Sb
alloy) in acidic solution according to the method
described by Voss and Freundlich [12]. The cured
plates were soaked in 1.40s.g. H2SO4 solution for
18h and then formed in 1.05s.g. H2SO4 solution.
The dopants were dissolved in the electrolyte as
Bi2O3, Sb2O3 and SnCl2. Table 1 shows the
concentrations of dopants.
Table 1. Concentrations of the different dopants
added to the PAM.
Dopant Concentration, ppm
Bi 25
Bi-Sb 25-50
Bi-Sn 25-100
The formed plates were washed in running water
for several hours to remove the excess of sulfuric
acid. Then they were dried overnight at 110°C. Part
of the active mass was removed from the grids,
* To whom all correspondence should be sent:
E-mail: [email protected] 2016 Bulgarian Academy of Sciences, Union of Chemists in Bulgaria
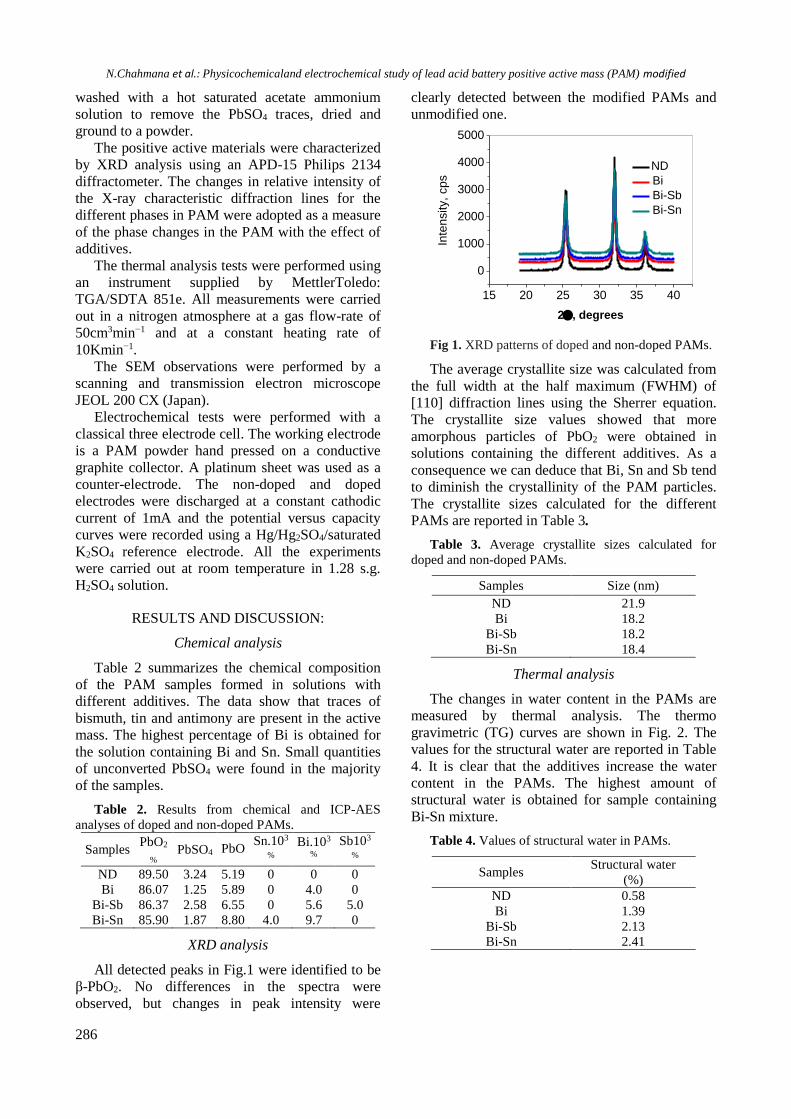
N.Chahmana et al.: Physicochemicaland electrochemical study of lead acid battery positive active mass (PAM) modified
286
washed with a hot saturated acetate ammonium
solution to remove the PbSO4 traces, dried and
ground to a powder.
The positive active materials were characterized
by XRD analysis using an APD-15 Philips 2134
diffractometer. The changes in relative intensity of
the X-ray characteristic diffraction lines for the
different phases in PAM were adopted as a measure
of the phase changes in the PAM with the effect of
additives.
The thermal analysis tests were performed using
an instrument supplied by MettlerToledo:
TGA/SDTA 851e. All measurements were carried
out in a nitrogen atmosphere at a gas flow-rate of
50cm3min−1 and at a constant heating rate of
10Kmin−1.
The SEM observations were performed by a
scanning and transmission electron microscope
JEOL 200 CX (Japan).
Electrochemical tests were performed with a
classical three electrode cell. The working electrode
is a PAM powder hand pressed on a conductive
graphite collector. A platinum sheet was used as a
counter-electrode. The non-doped and doped
electrodes were discharged at a constant cathodic
current of 1mA and the potential versus capacity
curves were recorded using a Hg/Hg2SO4/saturated
K2SO4 reference electrode. All the experiments
were carried out at room temperature in 1.28 s.g.
H2SO4 solution.
RESULTS AND DISCUSSION:
Chemical analysis
Table 2 summarizes the chemical composition
of the PAM samples formed in solutions with
different additives. The data show that traces of
bismuth, tin and antimony are present in the active
mass. The highest percentage of Bi is obtained for
the solution containing Bi and Sn. Small quantities
of unconverted PbSO4 were found in the majority
of the samples.
Table 2. Results from chemical and ICP-AES
analyses of doped and non-doped PAMs.
Samples PbO2
% PbSO4 PbO
Sn.103
%
Bi.103
%
Sb103
%
ND 89.50 3.24 5.19 0 0 0
Bi 86.07 1.25 5.89 0 4.0 0
Bi-Sb 86.37 2.58 6.55 0 5.6 5.0
Bi-Sn 85.90 1.87 8.80 4.0 9.7 0
XRD analysis
All detected peaks in Fig.1 were identified to be
β-PbO2. No differences in the spectra were
observed, but changes in peak intensity were
clearly detected between the modified PAMs and
unmodified one.
15 20 25 30 35 40
0
1000
2000
3000
4000
5000
Inte
nsity,
cp
s
2, degrees
ND
Bi
Bi-Sb
Bi-Sn
Fig 1. XRD patterns of doped and non-doped PAMs.
The average crystallite size was calculated from
the full width at the half maximum (FWHM) of
[110] diffraction lines using the Sherrer equation.
The crystallite size values showed that more
amorphous particles of PbO2 were obtained in
solutions containing the different additives. As a
consequence we can deduce that Bi, Sn and Sb tend
to diminish the crystallinity of the PAM particles.
The crystallite sizes calculated for the different
PAMs are reported in Table 3.
Table 3. Average crystallite sizes calculated for
doped and non-doped PAMs.
Samples Size (nm)
ND 21.9
Bi 18.2
Bi-Sb 18.2
Bi-Sn 18.4
Thermal analysis
The changes in water content in the PAMs are
measured by thermal analysis. The thermo
gravimetric (TG) curves are shown in Fig. 2. The
values for the structural water are reported in Table
4. It is clear that the additives increase the water
content in the PAMs. The highest amount of
structural water is obtained for sample containing
Bi-Sn mixture.
Table 4. Values of structural water in PAMs.
Samples Structural water
(%)
ND 0.58
Bi 1.39
Bi-Sb 2.13
Bi-Sn 2.41
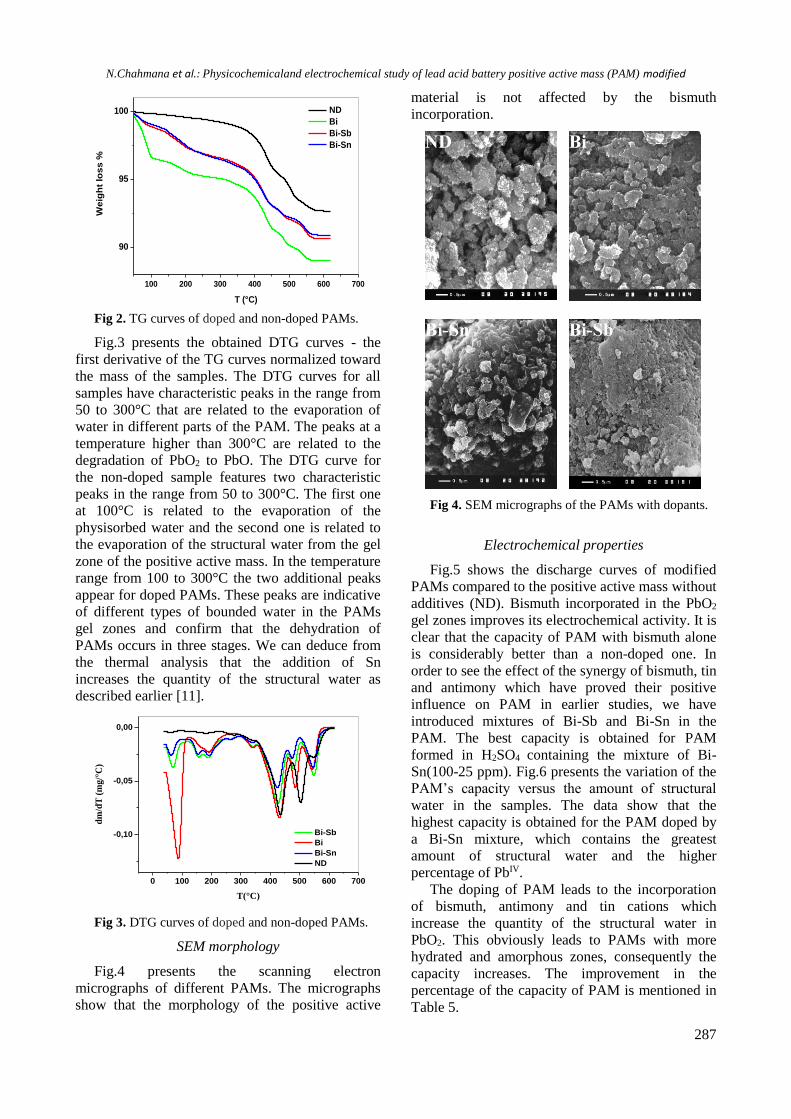
N.Chahmana et al.: Physicochemicaland electrochemical study of lead acid battery positive active mass (PAM) modified
287
100 200 300 400 500 600 700
90
95
100
We
igh
t lo
ss
%
T (°C)
ND
Bi
Bi-Sb
Bi-Sn
Fig 2. TG curves of doped and non-doped PAMs.
Fig.3 presents the obtained DTG curves - the
first derivative of the TG curves normalized toward
the mass of the samples. The DTG curves for all
samples have characteristic peaks in the range from
50 to 300°C that are related to the evaporation of
water in different parts of the PAM. The peaks at a
temperature higher than 300°C are related to the
degradation of PbO2 to PbO. The DTG curve for
the non-doped sample features two characteristic
peaks in the range from 50 to 300°C. The first one
at 100°C is related to the evaporation of the
physisorbed water and the second one is related to
the evaporation of the structural water from the gel
zone of the positive active mass. In the temperature
range from 100 to 300°C the two additional peaks
appear for doped PAMs. These peaks are indicative
of different types of bounded water in the PAMs
gel zones and confirm that the dehydration of
PAMs occurs in three stages. We can deduce from
the thermal analysis that the addition of Sn
increases the quantity of the structural water as
described earlier [11].
0 100 200 300 400 500 600 700
-0,10
-0,05
0,00
dm
/dT
(m
g/°
C)
T(°C)
Bi-Sb
Bi
Bi-Sn
ND
Fig 3. DTG curves of doped and non-doped PAMs.
SEM morphology
Fig.4 presents the scanning electron
micrographs of different PAMs. The micrographs
show that the morphology of the positive active
material is not affected by the bismuth
incorporation.
Fig 4. SEM micrographs of the PAMs with dopants.
Electrochemical properties
Fig.5 shows the discharge curves of modified
PAMs compared to the positive active mass without
additives (ND). Bismuth incorporated in the PbO2
gel zones improves its electrochemical activity. It is
clear that the capacity of PAM with bismuth alone
is considerably better than a non-doped one. In
order to see the effect of the synergy of bismuth, tin
and antimony which have proved their positive
influence on PAM in earlier studies, we have
introduced mixtures of Bi-Sb and Bi-Sn in the
PAM. The best capacity is obtained for PAM
formed in H2SO4 containing the mixture of Bi-
Sn(100-25 ppm). Fig.6 presents the variation of the
PAM’s capacity versus the amount of structural
water in the samples. The data show that the
highest capacity is obtained for the PAM doped by
a Bi-Sn mixture, which contains the greatest
amount of structural water and the higher
percentage of PbIV.
The doping of PAM leads to the incorporation
of bismuth, antimony and tin cations which
increase the quantity of the structural water in
PbO2. This obviously leads to PAMs with more
hydrated and amorphous zones, consequently the
capacity increases. The improvement in the
percentage of the capacity of PAM is mentioned in
Table 5.

N.Chahmana et al.: Physicochemicaland electrochemical study of lead acid battery positive active mass (PAM) modified
288
0 20 40 60 80 100
0,0
0,3
0,6
0,9
1,2E
(V)/
Hg
/Hg
2S
O4
C (mAh/g)
NDBi
Bi-Sb
Bi-Sn
Fig 5. Comparison of the electrochemical behavior of
non-doped PAM (ND) and ones with Bi alone and
mixtures of Bi-Sb and Bi-Sn.
Table 5. Capacity (%) of different PAMs.
Bi Bi - Sb Bi - Sn
Capacity
(%) 14.16 19.46 25.57
75 80 85 90 95
0,5
1,0
1,5
2,0
2,5
Wa
ter
los
s %
C ( mAh/ g)
ND
Bi
Bi-Sb
Bi-Sn
Fig 6. Evolution of the discharge capacity of
different PAMs with the loss of structural water.
CONCLUSIONS
The objective of this work was the development
of a battery with improved properties. The different
results have shown that bismuth yields a
remarkable increase in capacity. Better
performance for PAM is obtained when Bi and Sn
are added together in the electrolyte. This can be
explained by the fact that a mixture of Bi and Sn
modifies the hydrated and the gel parts of PAM
leading to more amorphous and small sized
hydrated particles. Hence the capacity increases and
a synergy is obtained when the positive active mass
is doped by a mixture of Bi and Sn. The
incorporation of the different metallic cations leads
to an increase in the quantity of a structural water
which improves the electrochemical activity of
PAM. These results should be applied in the
process of lead acid battery technology.
REFERENCES
1. D. Pavlov, E. Bashtavelova, V. Manev, A.
Nasalevska, Journal of Power Sources, 19, 15 (1987).
2. A.Boggio, M.Maja, N. Pennazi, Journal of Power
Sources,9, 221 (1983).
3. I.H.Yao, D.C.Johnson, J. Eletrochem. Soc., 134,
1973 (1987).
4. S. Hattori, M. Yamaura, M. Kino, M. Yamane, H.
Nakashima, J. Yamashita, J. Nakayama, ILZRO
Project No.LE-276, Rep.No.5, International Lead Zinc
Research Organization, Riverside, CA, USA, 1980.
5. M.T. Frost, J.A. Hamilton, K. Harowfield, R.J. Hill,
J.F. Moresby, D.A.J. Rand, ILZRO Project No. LE
290, Prog. Rep. No. 3, International Lead Zinc
Research Organization, Riverside, CA, USA, 1980.
6. T. G. Chang, J. A. Brown, Evaluation of battery
oxides, ILZRO Project No. LE 272, International Lead
Zinc Research Organization, Riverside, CA, USA.,
1979.
7. D. Pavlov, A. Dakhouche, T. Rogachev, Journal of
Power Sources, 30, 117 (1990).
8. D. Pavlov, Journal of Power Sources, 33, 221
(1991).
9. H.Y. Chen, L. Wu, C. Rena, Q.Z. Luo , Z. H. Xiea,
X. Jiang, S.P. Zhu, Y.K. Xia, Y.R. Luo, Journal of
Power Sources, 95, 108 (2001).
10. N. Chahmana, L. Zerroual, M. Matrakova, Journal of
Power Sources, 191, 144 (2009).
11. N. Chahmana, M. Matrakova, L. Zerroual, D. Pavlov,
Journal of Power Sources, 191, 51 (2009).
12. E.Voss, J. Freundlich, D.H. Collins (ed.), Batteries,
287, 73 (1963).

N.Chahmana et al.: Physicochemicaland electrochemical study of lead acid battery positive active mass (PAM) modified
289
ФИЗИКОХИМИЧНО И ЕЛЕКТРОХИМИЧНО ИЗСЛЕДВАНЕ НА
ПОЛОЖИТЕЛНАТА АКТИВНА МАСА В ОЛОВЕН АКУМУЛАТОР,
МОДИФИЦИРАН ЧРЕЗ ДОБАВЯНЕ НА БИСМУТ
Н. Чахмана*1, М. Матракова2, Л. Зеруал1
1Лаборатория по енергетика и електрохимия на твърдото тяло, Университет в Сетиф, Сетиф, Алжир 2Институт по електрохимия и енергийни системи „Акад. Евгени Будевски, Българска академия на науките,
София, България.
(Резюме)
Изследва се влиянието на бисмут, както и неговите комбинации с антимон и калай, върху електрохимичните
свойства на положителната активна маса в оловния акумулатор. Различните добавки са направени в
електролита и са под формата на катйони. Положителните активни маси са получени след формиране на зрели
плочи в присъствие или отсъствие на добавки. Резултатите от различни анализи показват, че бисмутът като
самостоятелна добавка значително увеличава капацитета на клетката. Характеристиките на положителната
активна маса са най-добри, когато добавката е комбинация от бисмут и калай.
Присъствието на йоните на Bi и Sn спомага за повишаване количеството на структурна водав
положителната активна маса. Така се увеличават зоните с хидратираните аморфни частици PbO2, което води до
увеличаване на капацитета.

290
Bulgarian Chemical Communications, Volume 48, Number 2 (pp. 290 – 296) 2016
Kinetic studies on the NaBH4/H2O hydrogen storage system with CoCl2 as a catalyst
A. Kaur*, D. Gangacharyulu, P.K. Bajpai
Department of Chemical Engineering, Thapar University, Patiala, India
Received April 28, 2015, Revised September 26, 2015
Hydrogen energy is considered at worldwide scale as a substitute to replace fossil fuels and to establish clean and
secure energy future. Hydride based hydrogen storage, for instance sodium borohydride (NaBH4), has acknowledged
substantial concern as a potential hydrogen source for portable fuel cell applications. The present paper highlights the
kinetic studies of the NaBH4/CoCl2/H2O system and the factors affecting the hydrogen generation rate (HGR) - NaBH4
concentration, NaOH concentration and temperature. It also reports the results on addition of alumina nanoparticles to
the NaBH4/CoCl2/H2O system, for accelerating the hydrogen generation rate, owing to better reactivity of the
nanoparticles. Cobalt chloride is extensively used as a catalyst, being a reactive and cost-effective non-noble metal that
expedites NaBH4 hydrolysis reaction. Kinetic studies show that the hydrolysis reaction of NaBH4 is of first order. The
rate increases with respect to sodium borohydride and decreases with respect to sodium hydroxide. It is also observed
that the rate increases with the increase in temperature. Characterization of residue is performed by SEM, EDS and
XRD analysis that confirmed that the particles agglomerate together. Boron, sodium, cobalt, chlorine and oxygen are
present with weight percentages of 78.46%, 3.41%, 0.05%, 0.07% and 18.01%, respectively. The diffraction peak at
2θ = 45o predicted from XRD analysis shows the presence of Co2B in the residue.
Keywords: Hydrogen energy; Sodium borohydride; Cobalt chloride; Alumina, Nanoparticles
INTRODUCTION
Inquisitiveness in hydrogen as a fuel has grown
and numerous advances in hydrogen production
and utilization have been made. Technologies for
hydrogen storage ought to be significantly
advanced if a hydrogen based energy system,
particularly in the transportation sector, is to be
acknowledged [1]. Storing hydrogen is relatively
difficult because of its low density and critical
temperature. Presently, there are three ways to store
hydrogen: (a) as a compressed gas, (b) as cryogenic
liquid hydrogen (LH2) and (c) solid-state hydrogen
storage [2, 3]. The main drawback of compressed
gas and cryogenic liquid hydrogen storage is the
low volumetric density of the system. Solid-state
hydrogen storage involves storage of hydrogen in
complex chemical hydrides. These hydrides have
high hydrogen content and hydrogen can be
released through several chemical pathways.
Hydrolysis of chemical hydrides takes place at
comparatively low temperatures and gives
promising theoretical hydrogen storage efficiencies
[4, 5].
Among diverse chemical hydrides, sodium
borohydride (NaBH4) has been considered as the
most attractive hydrogen storage material. It is a
safe practical means of producing hydrogen and has
high hydrogen content (10.7 wt %) [6, 7].
Hydrolysis of sodium borohydride is a heat
releasing reaction. No side reactions or volatile
byproducts are formed and the generated hydrogen
is of high purity (no traces of CO and S) and
humidified (heat generates some water vapor).
Additionally, sodium borohydride is the least
expensive metal hydride commercially available.
Furthermore, it is safe to use, handle and store.
Eqn. 1 gives the hydrolysis reaction of NaBH4.
NaBH4 + 2H2O → NaBO2 + 4H2 (1)
Rate kinetics of the above reaction is slow
without a catalyst that affects the hydrogen release.
Therefore, for the fast kinetics of the hydrolysis
reaction of NaBH4, a highly reactive catalyst is
obligatory. Many catalysts like RuCl3, RhCl3,
CoCl2, H2PtCl2, FeCl2, and PdCl2 are used for
NaBH4 hydrolysis. In terms of reactivity and cost,
CoCl2 is the most favored one [8]. As compared
with other non-noble metal catalysts like nickel,
maximum hydrogen generation is reported with
cobalt based catalysts [9]. Catalytic potential of
cobalt (II) and (III) salts has been studied in the
literature and CoCl2 showed the preeminent
performance as a catalyst for hydrolysis reaction of
NaBH4 [10-13]. It is also found that the catalytic
active phase of CoCl2 as a catalyst in NaBH4
hydrolysis is cobalt boride that could be formed as
CoxY or CoxBy [14]. Heat of hydrolysis of sodium
borohydride is lower when compared with other
chemical hydrides as shown in Table 1 [15]. * To whom all correspondence should be sent:
E-mail: [email protected]
2016 Bulgarian Academy of Sciences, Union of Chemists in Bulgaria

291
Hydrogen storage as high pressurized gas or
liquid cannot fulfill future storage goals.
Chemically or physically combined storage of
hydrogen in other materials has various advantages
over other storage methods. Intensive kinetic
studies have been done on complex hydrides for
progression of hydrogen generation (HG) properties
[4].
Efficiency of hydride based hydrogen storage
systems can be improved if the particle size is
reduced to the low nanometer range. Hydrogen
desorption rate increases due to the high surface-to-
volume ratio of the nanoparticles, which further
reduces the external energy required for hydrogen
desorption [16]. Studies are also carried out on
hydrogen generation with a combination of
nanoparticles of alumina with NaBH4 due to a
mutual promoting mechanism that exists between
hydrolysis of NaBH4 and Al2O3/H2O reactions [17,
18]. The constituted dual fuel system exhibited
complementary attributes, such as eminent
hydrogen density, reduced material cost and
adequate controllability of the reactions at moderate
temperatures, making it promising for mobile and
portable hydrogen source applications [17].
The present kinetic study reports on the
reactivity of the NaBH4-CoCl2 system and the
effect of Al2O3 nanoparticles on the hydrogen
generation rate for the NaBH4-CoCl2 system.
MATERIALS AND METHODS
The chemicals used in the investigation were
sodium borohydride powder (purity 97%), cobalt
chloride salt powder in hexa-hydrate form (purity
of 98%) procured from Loba Chemie Ltd., and
sodium hydroxide pellets (purity 97%) procured
from CDH Laboratory and Al2O3 nanoparticles (20
nm, 99% purity) from Sigma Aldrich.
The schematic experimental setup used for the
study is shown in Fig.1. It consists mainly of a
three-port reactor, the left-hand port of which is
equipped with a thermowell for placing a
thermometer; the middle port is connected to a
dropping funnel and the right-hand port guides the
generated hydrogen gas to a water-replacement
system. The water-replacement system consists of a
measuring cylinder filled with water and a water
container to submerge the cylinder. The volume of
the hydrogen generated is measured using the
measuring cylinder. To adjust the reaction
temperature in the reactor, thermostatically
controlled water bath is used.
Fig.1. Schematic diagram of the experimental
setup.
Dried NaBH4 and CoCl2 are put in the reaction
flask. Then 10 mL solution of NaOH and water is
added with a pressure-equalizing funnel and guided
to the reactor. Hydrogen gas is collected in the
measuring cylinder by downward displacement of
water and the volume of hydrogen produced is
monitored with time.
The residue left after hydrolysis reaction of
NaBH4 is kept in an incubator at 60-70oC overnight
for drying. The black solid obtained after drying is
characterized by SEM (scanning electron
microscopy), EDS (energy dispersive X-ray
spectroscopy) and XRD (X-ray diffraction)
analysis.
Table 1. Comparison of chemical hydrides with heat of hydrolysis reaction [5]
Sample Hydride Heat of hydrolysis
reaction
(kJ/mole H2) No. Name % H2 by weight % H2 in stoichiometric mixture
1. LiBH4 18 8.5 -90
2. LiH 13 8 -145
3. NaBH4 10.5 7.5 -80
4. LiAlH4 10.5 7.5 -150
5. AlH3 10 7 -158
6. MgH2 7.5 6.4 -161
7. NaAlH2 7.2 6 -140
8. CaH2 4.9 5.1 -140
9. NaH 4.9 4 -150
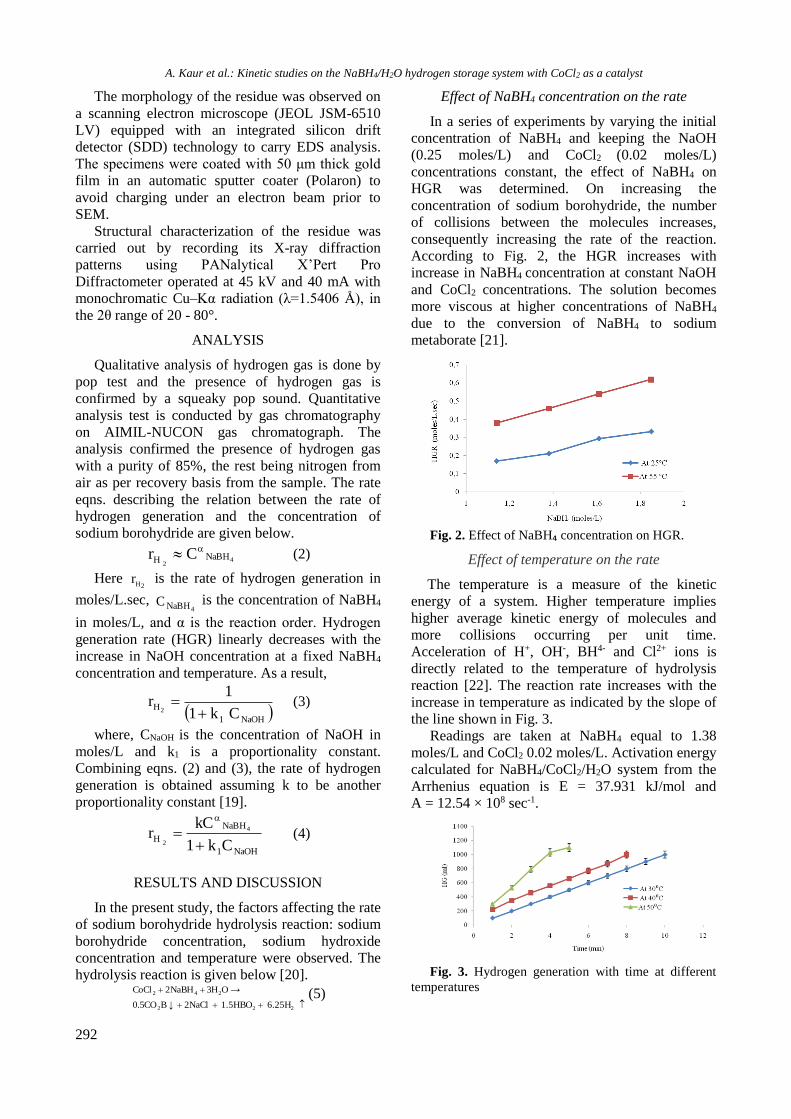
A. Kaur et al.: Kinetic studies on the NaBH4/H2O hydrogen storage system with CoCl2 as a catalyst
292
The morphology of the residue was observed on
a scanning electron microscope (JEOL JSM-6510
LV) equipped with an integrated silicon drift
detector (SDD) technology to carry EDS analysis.
The specimens were coated with 50 μm thick gold
film in an automatic sputter coater (Polaron) to
avoid charging under an electron beam prior to
SEM.
Structural characterization of the residue was
carried out by recording its X-ray diffraction
patterns using PANalytical X’Pert Pro
Diffractometer operated at 45 kV and 40 mA with
monochromatic Cu–Kα radiation (λ=1.5406 Å), in
the 2θ range of 20 - 80°.
ANALYSIS
Qualitative analysis of hydrogen gas is done by
pop test and the presence of hydrogen gas is
confirmed by a squeaky pop sound. Quantitative
analysis test is conducted by gas chromatography
on AIMIL-NUCON gas chromatograph. The
analysis confirmed the presence of hydrogen gas
with a purity of 85%, the rest being nitrogen from
air as per recovery basis from the sample. The rate
eqns. describing the relation between the rate of
hydrogen generation and the concentration of
sodium borohydride are given below.
42
NaBHH Cr (2)
Here 2H
r is the rate of hydrogen generation in
moles/L.sec, 4NaBHC is the concentration of NaBH4
in moles/L, and α is the reaction order. Hydrogen
generation rate (HGR) linearly decreases with the
increase in NaOH concentration at a fixed NaBH4
concentration and temperature. As a result,
NaOH1
HCk1
1r
2 (3)
where, CNaOH is the concentration of NaOH in
moles/L and k1 is a proportionality constant.
Combining eqns. (2) and (3), the rate of hydrogen
generation is obtained assuming k to be another
proportionality constant [19].
NaOH1
NaBH
HCk1
kCr 4
2
(4)
RESULTS AND DISCUSSION
In the present study, the factors affecting the rate
of sodium borohydride hydrolysis reaction: sodium
borohydride concentration, sodium hydroxide
concentration and temperature were observed. The
hydrolysis reaction is given below [20].
222
242
6.25H 1.5HBO 2NaCl ↓BCO5.0
→OH3NaBH2CoCl (5)
Effect of NaBH4 concentration on the rate
In a series of experiments by varying the initial
concentration of NaBH4 and keeping the NaOH
(0.25 moles/L) and CoCl2 (0.02 moles/L)
concentrations constant, the effect of NaBH4 on
HGR was determined. On increasing the
concentration of sodium borohydride, the number
of collisions between the molecules increases,
consequently increasing the rate of the reaction.
According to Fig. 2, the HGR increases with
increase in NaBH4 concentration at constant NaOH
and CoCl2 concentrations. The solution becomes
more viscous at higher concentrations of NaBH4
due to the conversion of NaBH4 to sodium
metaborate [21].
Fig. 2. Effect of NaBH₄ concentration on HGR.
Effect of temperature on the rate
The temperature is a measure of the kinetic
energy of a system. Higher temperature implies
higher average kinetic energy of molecules and
more collisions occurring per unit time.
Acceleration of H+, OH-, BH4- and Cl2+ ions is
directly related to the temperature of hydrolysis
reaction [22]. The reaction rate increases with the
increase in temperature as indicated by the slope of
the line shown in Fig. 3.
Readings are taken at NaBH4 equal to 1.38
moles/L and CoCl2 0.02 moles/L. Activation energy
calculated for NaBH4/CoCl2/H2O system from the
Arrhenius equation is E = 37.931 kJ/mol and
A = 12.54 × 10⁸ sec-1.
Fig. 3. Hydrogen generation with time at different
temperatures

A. Kaur et al.: Kinetic studies on the NaBH4/H2O hydrogen storage system with CoCl2 as a catalyst
293
Effect of sodium hydroxide (NaOH) concentration
on the rate
To increase the shelf life of NaBH4 solutions
and to suppress its self-hydrolysis, NaBH4 solutions
were maintained at alkaline conditions by adding
NaOH. According to Fig. 4 (a, b), HGR initially
increases with the increase in NaOH but decreases
beyond 0.25 moles/L. These experiments were
conducted at 1.14 and 1.38 moles/L NaBH4 and
constant CoCl2 (0.02 moles/L) concentration at
45⁰C.
Fig. 4(a). Variation of HGR with NaOH
concentration at 1.14 moles/L NaBH4.
Fig. 4(b). Variation of HGR with NaOH
concentration at 1.38 moles/L NaBH4.
These observations were made at relatively low
concentrations of NaOH and it was observed that at
higher concentrations of NaOH, HGR decreases
due to high alkalinity of the solution.
REGRESSION ANALYSIS
It is assumed that the maximum hydrogen
generation rate is the initial value of hydrogen
generation. The parameters (k/(1 + k1CNaOH)) and α
in Eqn. (4) can then be determined by regression
analysis and are given in Table 2. To determine the
rate constants k and k1, Eqn. (4) was modified to
Eqn. (6).
4
4
2
111
NaBH
NaOHNaBH
H C
C
k
kC
kr
, (6)
Table 2. Kinetic parameters at different temperatures.
The order of the reaction with respect to NaBH4
concentration α equals to 1 with an experimental
error of ± 0.2 (Table 2). Plot of inverse of
hydrogen generation rate (2Hr/1 ) versus the ratio of
NaOH and sodium borohydride concentration
( NaOHC /4NaBHC ) gives a straight line, as shown in
Fig. 5. The intercept on the y axis gives
(1/k4NaBHC ) and the slope gives (k1/k), from which
both k and k1 may be determined as shown in Table
3.
0.0 0.3 0.6
0.0
0.6
1.2
1/r
(L
/mole
s)
CNaOH
(moles/L)/CNaBH4
(moles/L)
Fig. 5. Effect of NaOH/ NaBH4 ratio on the rate.
Table 3. Rate constants k and k1
Sample
No.
Temperature
(°C)
NaOH
(moles/L)
k/(1 +
k1CNaOH)
(mL2/mol.sec)
α
1. 25 0 0.165 1.28
2. 35 0 0.270 1
3. 45 0 0.324 1.3
4. 25 0.25 0.246 1.03
5. 35 0.25 0.343 1.17
6. 45 0.25 0.527 1.04
7. 25 0.70 0.29 1.3
8. 35 0.70 0.3 1.27
9. 45 0.70 0.479 1.2
Sample
No. NaBH₄
(moles/L)
Temperature
(°C)
k k1
1. 1.14 25 0.604 3.03
2. 1.14 45 2.009 5.843
3. 1.14 65 3.02 5.88
4. 1.38 25 0.875 2.85
5. 1.38 45 2.09 3.76
6. 1.38 65 3.81 8.11
7. 1.61 25 0.76 1.13
8. 1.61 45 1.94 2.96
9. 1.61 65 4.31 6.20
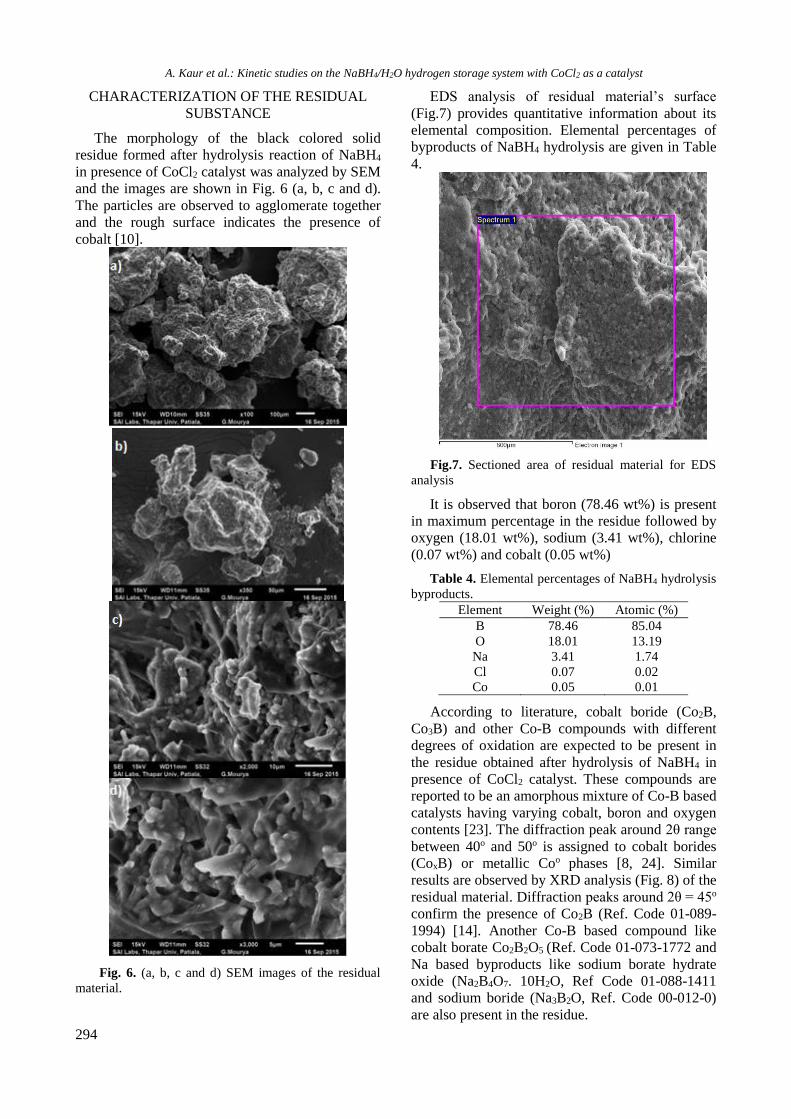
A. Kaur et al.: Kinetic studies on the NaBH4/H2O hydrogen storage system with CoCl2 as a catalyst
294
CHARACTERIZATION OF THE RESIDUAL
SUBSTANCE
The morphology of the black colored solid
residue formed after hydrolysis reaction of NaBH4
in presence of CoCl2 catalyst was analyzed by SEM
and the images are shown in Fig. 6 (a, b, c and d).
The particles are observed to agglomerate together
and the rough surface indicates the presence of
cobalt [10].
Fig. 6. (a, b, c and d) SEM images of the residual
material.
EDS analysis of residual material’s surface
(Fig.7) provides quantitative information about its
elemental composition. Elemental percentages of
byproducts of NaBH4 hydrolysis are given in Table
4.
Fig.7. Sectioned area of residual material for EDS
analysis
It is observed that boron (78.46 wt%) is present
in maximum percentage in the residue followed by
oxygen (18.01 wt%), sodium (3.41 wt%), chlorine
(0.07 wt%) and cobalt (0.05 wt%)
Table 4. Elemental percentages of NaBH4 hydrolysis
byproducts.
Element Weight (%) Atomic (%)
B 78.46 85.04
O 18.01 13.19
Na 3.41 1.74
Cl 0.07 0.02
Co 0.05 0.01
According to literature, cobalt boride (Co2B,
Co3B) and other Co-B compounds with different
degrees of oxidation are expected to be present in
the residue obtained after hydrolysis of NaBH4 in
presence of CoCl2 catalyst. These compounds are
reported to be an amorphous mixture of Co-B based
catalysts having varying cobalt, boron and oxygen
contents [23]. The diffraction peak around 2θ range
between 40o and 50o is assigned to cobalt borides
(CoxB) or metallic Coo phases [8, 24]. Similar
results are observed by XRD analysis (Fig. 8) of the
residual material. Diffraction peaks around 2θ = 45o
confirm the presence of Co2B (Ref. Code 01-089-
1994) [14]. Another Co-B based compound like
cobalt borate Co2B2O5 (Ref. Code 01-073-1772 and
Na based byproducts like sodium borate hydrate
oxide (Na2B4O7. 10H2O, Ref Code 01-088-1411
and sodium boride (Na3B2O, Ref. Code 00-012-0)
are also present in the residue.
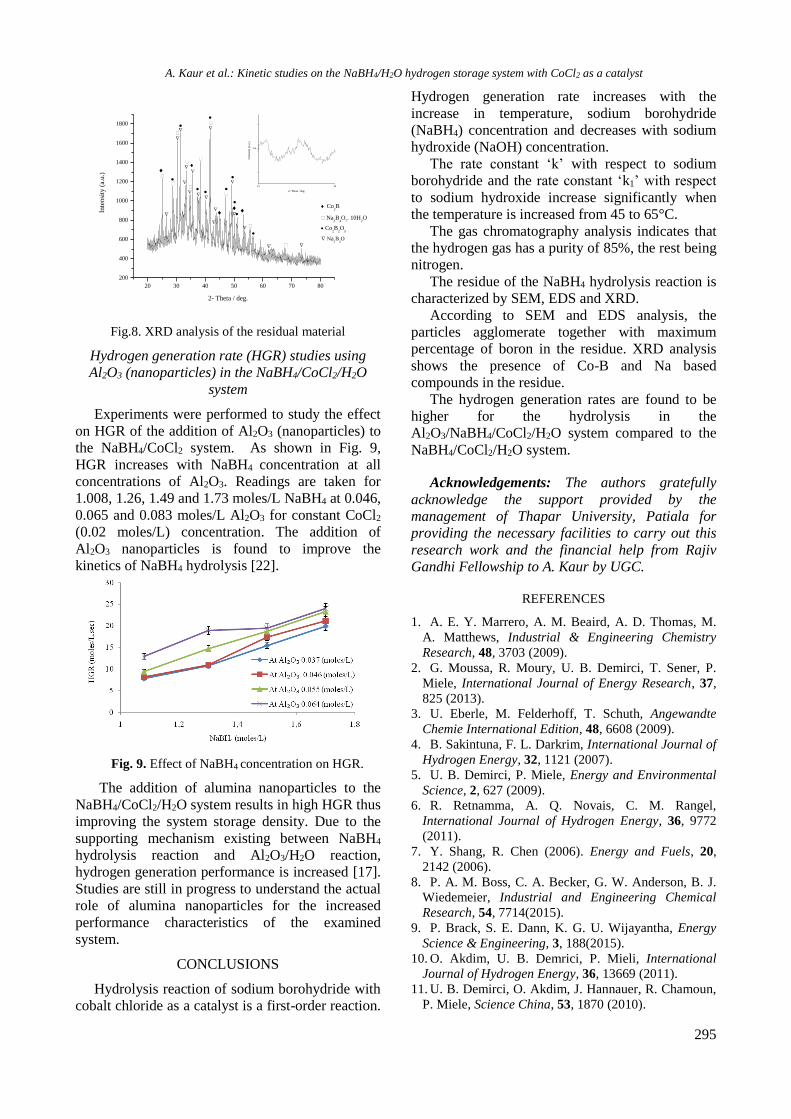
A. Kaur et al.: Kinetic studies on the NaBH4/H2O hydrogen storage system with CoCl2 as a catalyst
295
20 30 40 50 60 70 80
200
400
600
800
1000
1200
1400
1600
1800
Inte
nsi
ty (
a.u
.)
2- Theta / deg.
Co2B
Co2B
2O
5
Na2B
4O
7. 10H
2O
a
44 46
700
Inte
nsi
ty (
a.u
.)
2- Theta / deg.
Fig.8. XRD analysis of the residual material
Hydrogen generation rate (HGR) studies using
Al2O3 (nanoparticles) in the NaBH4/CoCl2/H2O
system
Experiments were performed to study the effect
on HGR of the addition of Al2O3 (nanoparticles) to
the NaBH4/CoCl2 system. As shown in Fig. 9,
HGR increases with NaBH4 concentration at all
concentrations of Al2O3. Readings are taken for
1.008, 1.26, 1.49 and 1.73 moles/L NaBH4 at 0.046,
0.065 and 0.083 moles/L Al2O3 for constant CoCl2
(0.02 moles/L) concentration. The addition of
Al2O3 nanoparticles is found to improve the
kinetics of NaBH4 hydrolysis [22].
Fig. 9. Effect of NaBH4 concentration on HGR.
The addition of alumina nanoparticles to the
NaBH4/CoCl2/H2O system results in high HGR thus
improving the system storage density. Due to the
supporting mechanism existing between NaBH4
hydrolysis reaction and Al2O3/H2O reaction,
hydrogen generation performance is increased [17].
Studies are still in progress to understand the actual
role of alumina nanoparticles for the increased
performance characteristics of the examined
system.
CONCLUSIONS
Hydrolysis reaction of sodium borohydride with
cobalt chloride as a catalyst is a first-order reaction.
Hydrogen generation rate increases with the
increase in temperature, sodium borohydride
(NaBH4) concentration and decreases with sodium
hydroxide (NaOH) concentration.
The rate constant ‘k’ with respect to sodium
borohydride and the rate constant ‘k1’ with respect
to sodium hydroxide increase significantly when
the temperature is increased from 45 to 65°C.
The gas chromatography analysis indicates that
the hydrogen gas has a purity of 85%, the rest being
nitrogen.
The residue of the NaBH4 hydrolysis reaction is
characterized by SEM, EDS and XRD.
According to SEM and EDS analysis, the
particles agglomerate together with maximum
percentage of boron in the residue. XRD analysis
shows the presence of Co-B and Na based
compounds in the residue.
The hydrogen generation rates are found to be
higher for the hydrolysis in the
Al2O3/NaBH4/CoCl2/H2O system compared to the
NaBH4/CoCl2/H2O system.
Acknowledgements: The authors gratefully
acknowledge the support provided by the
management of Thapar University, Patiala for
providing the necessary facilities to carry out this
research work and the financial help from Rajiv
Gandhi Fellowship to A. Kaur by UGC.
REFERENCES
1. A. E. Y. Marrero, A. M. Beaird, A. D. Thomas, M.
A. Matthews, Industrial & Engineering Chemistry
Research, 48, 3703 (2009).
2. G. Moussa, R. Moury, U. B. Demirci, T. Sener, P.
Miele, International Journal of Energy Research, 37,
825 (2013).
3. U. Eberle, M. Felderhoff, T. Schuth, Angewandte
Chemie International Edition, 48, 6608 (2009).
4. B. Sakintuna, F. L. Darkrim, International Journal of
Hydrogen Energy, 32, 1121 (2007).
5. U. B. Demirci, P. Miele, Energy and Environmental
Science, 2, 627 (2009).
6. R. Retnamma, A. Q. Novais, C. M. Rangel,
International Journal of Hydrogen Energy, 36, 9772
(2011).
7. Y. Shang, R. Chen (2006). Energy and Fuels, 20,
2142 (2006).
8. P. A. M. Boss, C. A. Becker, G. W. Anderson, B. J.
Wiedemeier, Industrial and Engineering Chemical
Research, 54, 7714(2015).
9. P. Brack, S. E. Dann, K. G. U. Wijayantha, Energy
Science & Engineering, 3, 188(2015).
10. O. Akdim, U. B. Demrici, P. Mieli, International
Journal of Hydrogen Energy, 36, 13669 (2011).
11. U. B. Demirci, O. Akdim, J. Hannauer, R. Chamoun,
P. Miele, Science China, 53, 1870 (2010).

A. Kaur et al.: Kinetic studies on the NaBH4/H2O hydrogen storage system with CoCl2 as a catalyst
296
12. J. C. Walter, A. Zurawski, D. Montgomery, M.
Thornburg, M. Revankar, Journal of Power Sources,
179, 335(2008).
13. O. Akdim, U. B. Demirci, D. Muller, P. Miele,
International Journal of Hydrogen Energy, 34, 2631
(2009).
14. U. B. Demirci, P. Miele, Physical Chemistry
Chemical Physics, 16, 6885 (2014).
15. Y. Wu, Presentation at the GCEP-Stanford
University, (2003)
16. G. D. Snow US Patent 6 589 312 (2003).
17. H. B. Dai, G. L. Ma, H. J. Xia, P. Wang, Fuel Cells,
11, 424 (2011).
18. D. W. Zhuanga, Q. Kang, S.S Muir, X. Yaoc , H. B.
Dai, G. L. Maa, P. Wanga, Journal of Power Sources,
224, 304 (2013).
19. H. S. Fogler, Elements of Chemical Reaction
Engineering, 3rd edition. Englewood Cliffs, NJ:
Prentice Hall, 2000.
20. S. U. Jeong, R. K. Kim, E. A. Cho, H. J. Kim, H. M.
Nam, Journal of Power Sources, 44, 129 (2005).
21. O. Metin, S. Ozkar, Energy and Fuels, 23, 3517
(2009).
22. Y. Wang, L. T. Zhou, H. Yuan, W. H. Shen, R.
Tang, M. Q. Fan, K. Y. Shu, International Journal of
Electrochemical Science, 8, 9764 (2013).
23. G. M. Arzac, T. C. Rojas, A. Fernandez,
ChemCatChem, 3, 1313 (2011).
24. G. N. Glavee, K. J. Klabunde, C. M. Sorensen, G. C.
Hadjapanayis, Langmuir, 8, 773 (1992).
КИНЕТИЧНИ ИЗСЛЕДВАНИЯ ВЪРХУ СИСТЕМАТА ЗА СЪХРАНЕНИЕ НА ВОДОРОД
NaBH4/H2O С CoCl2 КАТО КАТАЛИЗАТОР
А. Каур*, Д. Гангачарюлу, П.К. Баджпаи
Департамент по химично инженерство, Университет Тапар, Патиала, Индия
Получена на 28 април, 2015 г., коригирана на 26 септември, 2015 г.
(Резюме)
Водородът се приема в световен мащаб като заместител на изкопаемите горива и да установи чисто и
сигурно енергийно бъдеще. Съхранението на водорода като хидриди (например натриев борохидрид (NaBH4) е
срещнало сериозна загриженост като потенциален източник на водород за портативни устройства. Настоящата
работа засяга кинетични изследвания върху системата NaBH4/CoCl2/H2O и факторите, влияещи на скоростта на
генериране на водород (HGR): концентрацията на NaBH4, на NaOH и температурата. В нея също се съобщава за
резултатите за добавянето нано-частици от диалуминиев триоксид към системата NaBH4/CoCl2/H2O, за
ускоряването на скоростта на генериране на водород, дължащи се на по-добрата реактивоспособност на нано-
частиците. Кобалтовият хлорид е широко използван като изгоден катализатор с неблагороден метал, който
ускорява хидролизата на NaBH4. Кинетичните изследвания показват, че хидролизата на NaBH4 се описва от
уравнение от първи порядък. Скоростта нараства с натриевия борохидрид и намалява с натриевата основа.
Освен това е наблюдавано че скоростта на реакцията нараства с температурата. Охарактеризирането на
остатъка е извършено чрез SEM, EDS и XRD, при което се установява, че частиците се агломерират. В
остатъка се съдържат бор, натрий, кобалт, хлор и кислород в тегловни проценти съответно 78.46%, 3.41%,
0.05%, 0.07% и 18.01%. Дифракционният пик при 2θ = 45o, установен от рентгеноструктурния анализ показва
наличието на Co2B в остатъка.

297
Bulgarian Chemical Communications, Volume 48, Number 2 (pp. 297 – 302) 2016
Studying the effect of doping metal ions onto a crystalline hematite-based humidity
sensor for environmental control
A. S. Afify1*, M. Ataalla2, A. Hussain1, M. Hassan1, A. Mohammed3, M. Milanova4, J.M. Tulliani1
1 Politecnico di Torino, Department of Applied Science and Technology, 10129 Torino, Italy
2 University of Chemical Technology and Metallurgy, Department of Materials Science, 1756 Sofia, Bulgaria
3 Chemistry Department, Deanery of Academic Services, Taibah University, Al-Madinah Al-Munawwarah, Saudi
Arabia. On vacation from the Higher Institute of Optics Technology, Heliopolis, Cairo, Egypt 4 Institute of General and Inorganic Chemistry, BAS, Acad. G. Bonchev Str. bld. 11, 1113 Sofia, Bulgaria
Received March 24, 2015, Revised October 26, 2015
Humidity sensors have several applications in both industrial processing and environmental control. Pure and
doped hematite has proved to exhibit remarkable humidity sensing properties. The aim of this investigation is to study
the effect of doping of some metal ions (Li+,Mg+2, Ba+2, Sr+2, and Na+) onto the crystalline hematite and to determine
their sensitivity towards relative humidity (RH). The obtained crystalline samples were characterized by X-Ray
Diffraction (XRD) combined with Field Emission Scanning Electron Microscopy (FESEM). The doped sodium metal
ions (Na+) hematite sample showed a significant response towards relative humidity at room temperature.
Keywords: Doping, Hematite, Humidity sensors.
INTRODUCTION
Measurements and/or control of humidity are
important not only for human comfort but also for a
broad spectrum of industries and technologies.
Humidity sensors have several applications in
industrial processing, domestic applications and
environmental control [1-4].
Adding metal ions to humidity sensing materials
have been widely reported in literature due to their
abundance in nature hence, efforts were made to
denote their effects [5]. Doping of metal ions
affects the microstructure and creates surface
defects or oxygen vacancies of the sensing material
[6-8].
Ferric oxide has a wide range of applications as
a magnetic material [9]. In addition it is very
sensitive to humidity and can be used as a humidity
sensor [10]. α-Fe2O3 is an n-type semiconductor, it
is the most stable iron oxide under ambient
conditions, nontoxic, corrosion-resistant, low cost
and abundant. These features render it suitable for
numerous promising applications, such as
catalysts/photocatalysts [11-13], contrast
reagents/drug delivery [14] and gas sensors [15].
Nanocomposite materials containing α-Fe2O3
doped with noble metals (e.g., Pd, Pt, and Au) can
lead to a synergetic effect depending on the
preparation conditions, chemical composition,
sintering temperature, sintering time and doping
with various additives [16]. Different techniques
were used for producing hematite films on the
solid substrate like sputtering [17], laser
ablation[18], electrodeposition [19], spray pyrolysis
(SP) [20, 21], ion beam induced chemical vapor
deposition (IBICVD) [22], plasma enhanced
chemical vapor deposition (PECVD) [23] and
aerosol- assisted chemical vapor deposition
(AACVD) [24]. The aim of this study is to
investigate the doping effect of some metal ions
(Mg+2, Ba+2, Sr+2, Li+, and Na+) onto a crystalline
hematite and to determine their sensitivity to
humidity. The sensors studied were prepared by a
screen printing technique.
EXPERIMENTAL
Powder synthesis
All reagents were ACS grade from Sigma-
Aldrich. 1 mole of α-Fe2O3 powder (Aldrich >99%,
particle size distribution lower than 2 µm) was
dispersed in distilled water, then a dispersing agent
was added (Daraven 2 wt% of the used powder).
The solution was then ultrasonicated for 2 h. The
prepared dispersed solution was mixed stepwise
with 1.0 L aqueous solution of the salts (for
precipitation of metal hydroxide as the pH was
adjusted with NaOH): Li2CO3, MgCO3, Ba(NO3)2,
Sr(No3)2 and Na2CO3.
The dispersed solution was ultrasonicated again
for 1 h, the solid content in solution was diluted to
4 wt% by adding distilled water. Finally, the
dispersion was dried at 115°C overnight. * To whom all correspondence should be sent:
E-mail: [email protected] 2016 Bulgarian Academy of Sciences, Union of Chemists in Bulgaria
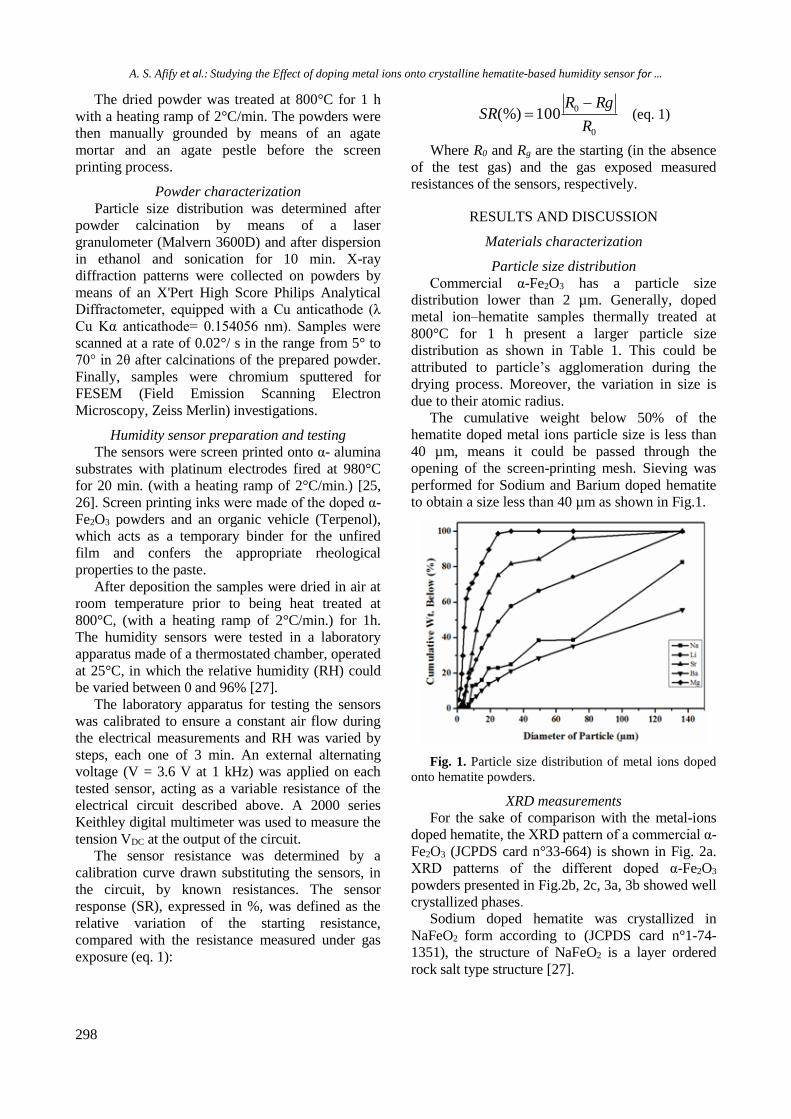
A. S. Afify et al.: Studying the Effect of doping metal ions onto crystalline hematite-based humidity sensor for …
298
The dried powder was treated at 800°C for 1 h
with a heating ramp of 2°C/min. The powders were
then manually grounded by means of an agate
mortar and an agate pestle before the screen
printing process.
Powder characterization
Particle size distribution was determined after
powder calcination by means of a laser
granulometer (Malvern 3600D) and after dispersion
in ethanol and sonication for 10 min. X-ray
diffraction patterns were collected on powders by
means of an X'Pert High Score Philips Analytical
Diffractometer, equipped with a Cu anticathode (λ
Cu Kα anticathode= 0.154056 nm). Samples were
scanned at a rate of 0.02°/ s in the range from 5° to
70° in 2θ after calcinations of the prepared powder.
Finally, samples were chromium sputtered for
FESEM (Field Emission Scanning Electron
Microscopy, Zeiss Merlin) investigations.
Humidity sensor preparation and testing
The sensors were screen printed onto α- alumina
substrates with platinum electrodes fired at 980°C
for 20 min. (with a heating ramp of 2°C/min.) [25,
26]. Screen printing inks were made of the doped α-
Fe2O3 powders and an organic vehicle (Terpenol),
which acts as a temporary binder for the unfired
film and confers the appropriate rheological
properties to the paste.
After deposition the samples were dried in air at
room temperature prior to being heat treated at
800°C, (with a heating ramp of 2°C/min.) for 1h.
The humidity sensors were tested in a laboratory
apparatus made of a thermostated chamber, operated
at 25°C, in which the relative humidity (RH) could
be varied between 0 and 96% [27].
The laboratory apparatus for testing the sensors
was calibrated to ensure a constant air flow during
the electrical measurements and RH was varied by
steps, each one of 3 min. An external alternating
voltage (V = 3.6 V at 1 kHz) was applied on each
tested sensor, acting as a variable resistance of the
electrical circuit described above. A 2000 series
Keithley digital multimeter was used to measure the
tension VDC at the output of the circuit.
The sensor resistance was determined by a
calibration curve drawn substituting the sensors, in
the circuit, by known resistances. The sensor
response (SR), expressed in %, was defined as the
relative variation of the starting resistance,
compared with the resistance measured under gas
exposure (eq. 1):
0
0100(%)R
RgRSR
(eq. 1)
Where R0 and Rg are the starting (in the absence
of the test gas) and the gas exposed measured
resistances of the sensors, respectively.
RESULTS AND DISCUSSION
Materials characterization
Particle size distribution
Commercial α-Fe2O3 has a particle size
distribution lower than 2 µm. Generally, doped
metal ion–hematite samples thermally treated at
800°C for 1 h present a larger particle size
distribution as shown in Table 1. This could be
attributed to particle’s agglomeration during the
drying process. Moreover, the variation in size is
due to their atomic radius.
The cumulative weight below 50% of the
hematite doped metal ions particle size is less than
40 µm, means it could be passed through the
opening of the screen-printing mesh. Sieving was
performed for Sodium and Barium doped hematite
to obtain a size less than 40 µm as shown in Fig.1.
Fig. 1. Particle size distribution of metal ions doped
onto hematite powders.
XRD measurements
For the sake of comparison with the metal-ions
doped hematite, the XRD pattern of a commercial α-
Fe2O3 (JCPDS card n°33-664) is shown in Fig. 2a.
XRD patterns of the different doped α-Fe2O3
powders presented in Fig.2b, 2c, 3a, 3b showed well
crystallized phases.
Sodium doped hematite was crystallized in
NaFeO2 form according to (JCPDS card n°1-74-
1351), the structure of NaFeO2 is a layer ordered
rock salt type structure [27].

A. S. Afify et al.: Studying the Effect of doping metal ions onto crystalline hematite-based humidity sensor for …
299
Table 1. Diameter of the doped metal ions hematite powders (µm)
Cumulative
wt%
Na+
(α-Fe2O3)
[µm]
Li+
(α-Fe2O3)
[µm]
Sr2+
(α-Fe2O3)
[µm]
Ba2+
(α-Fe2O3)
[µm]
Mg2+
(α-Fe2O3)
[µm]
10% 7.03 5.58 5.61 14.55 1.92
50% 91.13 25.36 13.19 122.62 4.7
90% 149.2 85.33 65.88 220.72 19.19
Fig. 2. XRD pattern of a) α-Fe2O3, b) sodium-doped
hematite and c) lithium-doped hematite
LiFe5O8 (JCPDS card n°17-115) with a cubic
spinel structure derived from lithium-doped
hematite [28].
The Sr4Fe6O13 phase obtained according to
(JCPDS card n° 1-78-2403) from a strontium doped
hematite sample, the phase formed when the powder
calcined above 775°C which matches the thermally
treated powder at 800°C [29].
Ba10Fe10O28 (JCPDS cards n°54-966) and
Fe1.9Mg0.16O3 (JCPDS cards n°1-70-2674) are
detected in barium and magnesium doped hematite,
respectively.
FE-SEM observation and microanalysis
FESEM micrographs of unfired, fired at 800°C
commercial hematite as well as Na+ doped hematite
heat treated at 800° are shown in Figs.4a, 4b and 4c
respectively in order to distinguish the
morphological difference between all of them.
According to the FESEM analysis, unfired
hematite appears denser with less porosity than
fired hematite (see Figs 4a, and 4b). Fired Na+
doped hematite powder has the biggest grains size
in comparison with the particles size of the fired
and unfired hematite (see Figs 4a, 4b and 4c). This
could be attributed to the diffusion of sodium ions
into the crystalline hematite.
Fig.3. XRD pattern of a) barium-doped hematite, b)
magnesium-doped hematite and c) strontium-doped
hematite
FESEM data also showed that the fired sodium
doped hematite film is characterized by well
distributed porosity, which makes this material
appropriate as a gas sensor. Energy dispersive x-ray
(EDX) analysis of sodium doped hematite showed
that Na+ and Fe+2 were well distributed in all the
samples (see Table 2. and Fig. 5) which is in a good
agreement with the XRD data for the NaFeO2
phase.
Table 2. EDX of the fired Na-doped hematite sample
at 800°C.
Metals At% Wt%
Na 8.42±1.2 3.65
Fe 91.58±3.2 96.35
Sensitivity towards relative humidity
Fig. 6 illustrates the sensors’ response to RH.
Among the different investigated samples, Na+
doped hematite showed a significant response to
RH at room temperature starting from 32% RH.

A. S. Afify et al.: Studying the Effect of doping metal ions onto crystalline hematite-based humidity sensor for …
300
(a)
(b)
(c)
Fig. 4. FESEM micrographs of a) unfired hematite
powder, b) hematite powder heat treated at 800°C for 1 h
and c) Na+ doped hematite heat treated at 800°C for 1 h.
Fig. 5. EDX maps of fired sodium -doped hematite at
800°C
Fig. 6. Sensors response to relative humidity
changes.
While the other metal ions doped hematite
samples show a poor sensitivity to RH. Fig.7 shows
the change in VDC as a function of time for Na+
doped hematite sensors. The response times (the
time taken by a sensor to achieve 90% of the total
resistance change in the case of gas adsorption) and
the recovery times (the time necessary to reach
90% of the total resistance changes in the case of
gas desorption) are reported in Table 3. These
response and recovery times are quite fast.
Fig. 7. Changes in VDC as a function of RH changes
at room temperature for Na+ doped hematite sensor.
Table 3. Response and recovery time of the Na+
doped hematite based sensor
Humidity
change
0-55%
RH
0-75%
RH
0-85%
RH
Response
time (min.) 2.5 2.1 1.2
Humidity
change
55-0%
RH
75-0%
RH
85-0%
RH
Recovery
time (min.) 1.0 2.5 2.5
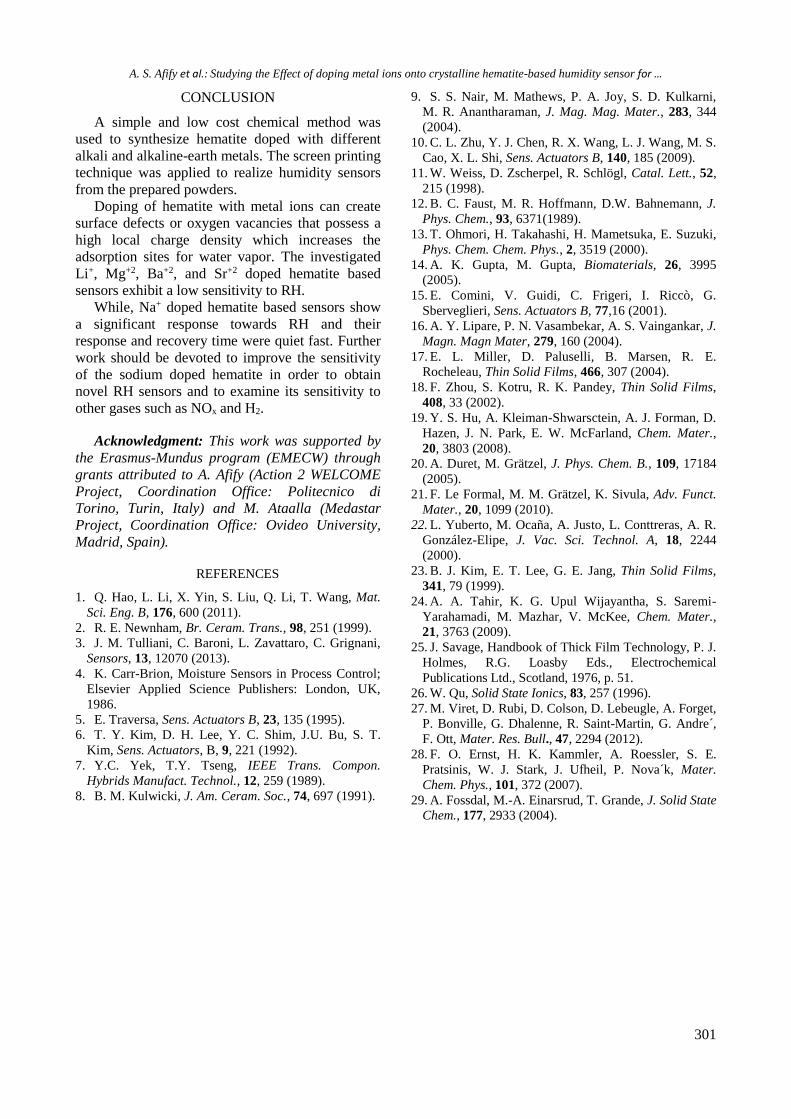
A. S. Afify et al.: Studying the Effect of doping metal ions onto crystalline hematite-based humidity sensor for …
301
CONCLUSION
A simple and low cost chemical method was
used to synthesize hematite doped with different
alkali and alkaline-earth metals. The screen printing
technique was applied to realize humidity sensors
from the prepared powders.
Doping of hematite with metal ions can create
surface defects or oxygen vacancies that possess a
high local charge density which increases the
adsorption sites for water vapor. The investigated
Li+, Mg+2, Ba+2, and Sr+2 doped hematite based
sensors exhibit a low sensitivity to RH.
While, Na+ doped hematite based sensors show
a significant response towards RH and their
response and recovery time were quiet fast. Further
work should be devoted to improve the sensitivity
of the sodium doped hematite in order to obtain
novel RH sensors and to examine its sensitivity to
other gases such as NOx and H2.
Acknowledgment: This work was supported by
the Erasmus-Mundus program (EMECW) through
grants attributed to A. Afify (Action 2 WELCOME
Project, Coordination Office: Politecnico di
Torino, Turin, Italy) and M. Ataalla (Medastar
Project, Coordination Office: Ovideo University,
Madrid, Spain).
REFERENCES
1. Q. Hao, L. Li, X. Yin, S. Liu, Q. Li, T. Wang, Mat.
Sci. Eng. B, 176, 600 (2011).
2. R. E. Newnham, Br. Ceram. Trans., 98, 251 (1999).
3. J. M. Tulliani, C. Baroni, L. Zavattaro, C. Grignani,
Sensors, 13, 12070 (2013).
4. K. Carr-Brion, Moisture Sensors in Process Control;
Elsevier Applied Science Publishers: London, UK,
1986.
5. E. Traversa, Sens. Actuators B, 23, 135 (1995).
6. T. Y. Kim, D. H. Lee, Y. C. Shim, J.U. Bu, S. T.
Kim, Sens. Actuators, B, 9, 221 (1992).
7. Y.C. Yek, T.Y. Tseng, IEEE Trans. Compon.
Hybrids Manufact. Technol., 12, 259 (1989).
8. B. M. Kulwicki, J. Am. Ceram. Soc., 74, 697 (1991).
9. S. S. Nair, M. Mathews, P. A. Joy, S. D. Kulkarni,
M. R. Anantharaman, J. Mag. Mag. Mater., 283, 344
(2004).
10. C. L. Zhu, Y. J. Chen, R. X. Wang, L. J. Wang, M. S.
Cao, X. L. Shi, Sens. Actuators B, 140, 185 (2009).
11. W. Weiss, D. Zscherpel, R. Schlögl, Catal. Lett., 52,
215 (1998).
12. B. C. Faust, M. R. Hoffmann, D.W. Bahnemann, J.
Phys. Chem., 93, 6371(1989).
13. T. Ohmori, H. Takahashi, H. Mametsuka, E. Suzuki,
Phys. Chem. Chem. Phys., 2, 3519 (2000).
14. A. K. Gupta, M. Gupta, Biomaterials, 26, 3995
(2005).
15. E. Comini, V. Guidi, C. Frigeri, I. Riccò, G.
Sberveglieri, Sens. Actuators B, 77,16 (2001).
16. A. Y. Lipare, P. N. Vasambekar, A. S. Vaingankar, J.
Magn. Magn Mater, 279, 160 (2004).
17. E. L. Miller, D. Paluselli, B. Marsen, R. E.
Rocheleau, Thin Solid Films, 466, 307 (2004).
18. F. Zhou, S. Kotru, R. K. Pandey, Thin Solid Films,
408, 33 (2002).
19. Y. S. Hu, A. Kleiman-Shwarsctein, A. J. Forman, D.
Hazen, J. N. Park, E. W. McFarland, Chem. Mater.,
20, 3803 (2008).
20. A. Duret, M. Grätzel, J. Phys. Chem. B., 109, 17184
(2005).
21. F. Le Formal, M. M. Grätzel, K. Sivula, Adv. Funct.
Mater., 20, 1099 (2010).
22. L. Yuberto, M. Ocaña, A. Justo, L. Conttreras, A. R.
González-Elipe, J. Vac. Sci. Technol. A, 18, 2244
(2000).
23. B. J. Kim, E. T. Lee, G. E. Jang, Thin Solid Films,
341, 79 (1999).
24. A. A. Tahir, K. G. Upul Wijayantha, S. Saremi-
Yarahamadi, M. Mazhar, V. McKee, Chem. Mater.,
21, 3763 (2009).
25. J. Savage, Handbook of Thick Film Technology, P. J.
Holmes, R.G. Loasby Eds., Electrochemical
Publications Ltd., Scotland, 1976, p. 51.
26. W. Qu, Solid State Ionics, 83, 257 (1996).
27. M. Viret, D. Rubi, D. Colson, D. Lebeugle, A. Forget,
P. Bonville, G. Dhalenne, R. Saint-Martin, G. Andre´,
F. Ott, Mater. Res. Bull., 47, 2294 (2012).
28. F. O. Ernst, H. K. Kammler, A. Roessler, S. E.
Pratsinis, W. J. Stark, J. Ufheil, P. Nova´k, Mater.
Chem. Phys., 101, 372 (2007).
29. A. Fossdal, M.-A. Einarsrud, T. Grande, J. Solid State
Chem., 177, 2933 (2004).

A. S. Afify et al.: Studying the Effect of doping metal ions onto crystalline hematite-based humidity sensor for …
302
ИЗСЛЕДВАНЕ НА ЕФЕКТА НА ДОТИРАНЕ С МЕТАЛНИ ЙОНИ НА КРИСТАЛНИ
ВЛАГОВИ СЕНЗОРИ НА ОСНОВАТА НА ХЕМАТИТ
А. Афифи1, М. Атаалла2, А. Хюсейн1, М. Хасан1, А. Мохамед3, М. Миланова4, Ж.М. Тюлиани1
1Политехнически университет, Факултет по наука и технологии, 10129 Торино, Италия 2 Химикотехнологичен и металургичен университет, Факултет по материалознание 1758 София, България
3 Институт по оптични технологии, Хелиополис, Кайро, Египет 4 Институт по обща и неорганична химия, БАН
Постъпила на 24 март, 2015 г. коригирана на 26 октомври, 2015 г.
(Резюме)
Влаговите сензори намират широко приложение, както в индустриалното производство, така и за контрол на
околната среда. Доказано е, че хематитът (α-Fe2O3), както недотиран, така и дотиран с различни метални йони
показва забележителни свойства като влагов сензор. Целта на настоящето изследване е да се изучи ефекта на
дотиране с метални йони (Li+, Mg+2, Ba+2, Sr+2 и Na+) на кристални влагови сензори на основата на хематит.
Получените материали са охарактеризирани чрез рентенофазов анализ и сканираща електронна мискроскопия.
Установено е, че Na+-дотиран хематит показва показва висока чувствителност спрямо относителната влажност
на въздуха при стайна температура.

303
Bulgarian Chemical Communications, Volume 48, Number 2 (pp. 303 – 305) 2016
Anti-influenza A activity of C-geranyl flavonoids isolated from Paulownia tomentosa and Maclura pomifera
H. I. Moon1,*, Y. B. Kim2, S. K. Kim3 1Department of Medicinal Biotechnology, Dong-A University, Busan 604-714, Republic of Korea. 2Department of Bioindustrial Technologies, Konkuk University, Seoul 143-701, Republic of Korea
3Department of Animal Science and Technology, Konkuk University, Seoul 143-701, Republic of Korea
Received September 16, 2015, Revised December 16, 2015
C-Geranyl flavonoids have received considerable attention as a simple flavanone with antioxidant, anti-carcinogenic, and anti-inflammatory effects. Influenza virus infection causes thousands of deaths and millions of hospitalizations worldwide every year and the emergence of resistance to anti-influenza drugs has prompted scientists to seek for new natural antiviral materials. In this study, we screened six natural flavonoids from different sources to identify the most potent antiviral flavonoid A/PR/8/34 (H1N1) against human influenza. The two methoxy group flavonoids including 3′-O-methyl-5′-O-methyldiplacone showed potent anti-influenza activity. Therefore, 3′-O-methyl-5′-O-methyldiplacone may be of value as a virus-protector to healthy tissue surrounding influenza A during chemotherapy to obtain better antiviral control with a significant dose.
Key words: C-Geranyl flavonoids, anti-influenza, influenza A, virus-protector.
INTRODUCTION
Influenza viruses affiliated to the Orthomyxoviridae family have caused significant morbidity and mortality in humans through epidemic or pandemic diseases [1]. Influenza virus infection remains an important health problem, particularly for babies, young and elderly people, and imposes significant social-economic costs [2]. The main strategies for dealing with influenza involve vaccination and antiviral drugs. Even though annual vaccination is the core preventive strategy for influenza infections, natural antiviral drugs development is necessary to provide additional preventive and therapeutic benefits [3]. Paulownia tomentosa (Thunb.) Siebold&Zucc. ex Steud. belongs to the family Scrophulariaceae in deciduous trees distributed throughout Korea, China, and Japan. Previous publications have reported polyphenolic compounds, such as iridoids, phenolic glycosides, flavonoids, and phenylethanoids in the MeOH and EtOH extracts of P. tomentosa. Iridoids, lignans and flavonoids have been reported as bioactive compounds of P. tomentosa [4,5]. Among them, geranylated flavonoids are known as the main bioactive constituents. In fact, most of the substances that have been isolated so far are polar, usually glycosides [6]. Diplacone (6-C-geranyl-eriodictyol), is a prenylated flavonoid, a simple flavanone, among four geranyl falvonoids that have
been known for inhibitory effects on inflammations and/or cancer. Furthermore, we reported that the hydroxylation patterns of the flavonoid B ring play a critical role in the cellular function of the C-geranyl flavonoids group [7]. Maclura pomifera commonly called osage orange in deciduous trees including cudrania and other genera of Moraceae and flavonoids has been reported as a bioactive compound of Maclura pomifera. Among them, prenylated isoflavones are known as the main bioactive constituents. Previous publications have reported polyphenolic compounds, such as osajin and pomiferin in the MeOH and EtOH extracts of Maclura pomifera [8]. In this study, we tested the efficacy of the flavonoid B ring of C-geranyl flavonoids against the influenza A virus.
EXPERIMENTS AND EQUIPMENT
Preparation of the C-geranyl flavonoids
Diplacone analogues (PT1~PT4) were kindly provided by Professor Karel Šmejkal of the University of Veterinary and Pharmaceutical Sciences Brno as standards for isolation from Paulownia tomentosa [6]. Osajin (PT5) and pomiferin (PT6) were recrystallized from the methanolic solution after preconcentration under vacuum from Maclura pomifera [9]. PT1~PT6 were diplacone, 3′-O-methyl-5′-hydroxydiplacone, 3′-O-methyl-5′-O-methyldiplacone, 3′-O-methyl diplacol, osajin and pomiferin. A 50 mM stock solution of PT1~PT6 was made in absolute ethanol, and working dilutions were prepared directly with * To whom all correspondence should be sent:
E-mail: [email protected] 2016 Bulgarian Academy of Sciences, Union of Chemists in Bulgaria
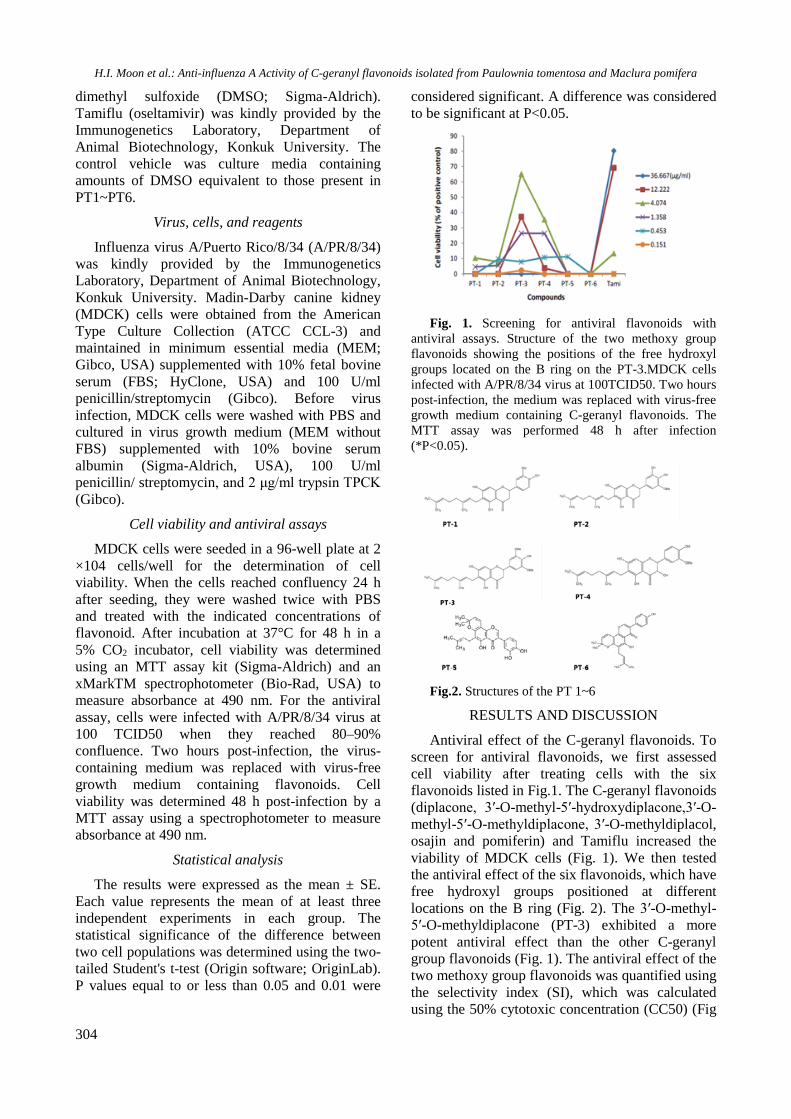
H.I. Moon et al.: Anti-influenza A Activity of C-geranyl flavonoids isolated from Paulownia tomentosa and Maclura pomifera
304
dimethyl sulfoxide (DMSO; Sigma-Aldrich). Tamiflu (oseltamivir) was kindly provided by the Immunogenetics Laboratory, Department of Animal Biotechnology, Konkuk University. The control vehicle was culture media containing amounts of DMSO equivalent to those present in PT1~PT6.
Virus, cells, and reagents
Influenza virus A/Puerto Rico/8/34 (A/PR/8/34) was kindly provided by the Immunogenetics Laboratory, Department of Animal Biotechnology, Konkuk University. Madin-Darby canine kidney (MDCK) cells were obtained from the American Type Culture Collection (ATCC CCL-3) and maintained in minimum essential media (MEM; Gibco, USA) supplemented with 10% fetal bovine serum (FBS; HyClone, USA) and 100 U/ml penicillin/streptomycin (Gibco). Before virus infection, MDCK cells were washed with PBS and cultured in virus growth medium (MEM without FBS) supplemented with 10% bovine serum albumin (Sigma-Aldrich, USA), 100 U/ml penicillin/ streptomycin, and 2 μg/ml trypsin TPCK (Gibco).
Cell viability and antiviral assays
MDCK cells were seeded in a 96-well plate at 2 ×10⁴ cells/well for the determination of cell viability. When the cells reached confluency 24 h after seeding, they were washed twice with PBS and treated with the indicated concentrations of flavonoid. After incubation at 37°C for 48 h in a 5% CO2 incubator, cell viability was determined using an MTT assay kit (Sigma-Aldrich) and an xMarkTM spectrophotometer (Bio-Rad, USA) to measure absorbance at 490 nm. For the antiviral assay, cells were infected with A/PR/8/34 virus at 100 TCID50 when they reached 80–90% confluence. Two hours post-infection, the virus-containing medium was replaced with virus-free growth medium containing flavonoids. Cell viability was determined 48 h post-infection by a MTT assay using a spectrophotometer to measure absorbance at 490 nm.
Statistical analysis
The results were expressed as the mean ± SE. Each value represents the mean of at least three independent experiments in each group. The statistical significance of the difference between two cell populations was determined using the two-tailed Student's t-test (Origin software; OriginLab). P values equal to or less than 0.05 and 0.01 were
considered significant. A difference was considered to be significant at P<0.05.
Fig. 1. Screening for antiviral flavonoids with
antiviral assays. Structure of the two methoxy group flavonoids showing the positions of the free hydroxyl groups located on the B ring on the PT-3.MDCK cells infected with A/PR/8/34 virus at 100TCID50. Two hours post-infection, the medium was replaced with virus-free growth medium containing C-geranyl flavonoids. The MTT assay was performed 48 h after infection (*P<0.05).
Fig.2. Structures of the PT 1~6
RESULTS AND DISCUSSION
Antiviral effect of the C-geranyl flavonoids. To screen for antiviral flavonoids, we first assessed cell viability after treating cells with the six flavonoids listed in Fig.1. The C-geranyl flavonoids (diplacone, 3′-O-methyl-5′-hydroxydiplacone,3′-O-methyl-5′-O-methyldiplacone, 3′-O-methyldiplacol, osajin and pomiferin) and Tamiflu increased the viability of MDCK cells (Fig. 1). We then tested the antiviral effect of the six flavonoids, which have free hydroxyl groups positioned at different locations on the B ring (Fig. 2). The 3′-O-methyl-5′-O-methyldiplacone (PT-3) exhibited a more potent antiviral effect than the other C-geranyl group flavonoids (Fig. 1). The antiviral effect of the two methoxy group flavonoids was quantified using the selectivity index (SI), which was calculated using the 50% cytotoxic concentration (CC50) (Fig

H.I. Moon et al.: Anti-influenza A Activity of C-geranyl flavonoids isolated from Paulownia tomentosa and Maclura pomifera
305
1). The results indicate that the two methoxy group 3′-O-methyl-5′-O-methyldiplacone, PT-3 may be an effective natural antiviral compound.
Acknowledgments: This work was carried out with the support of "Cooperative Research Program for Agriculture Science & Technology Development (Project title: Construction of safety establishment techniques on supplementary feed probiotics and fermented feeds, Project No. PJ010906)" Rural Development Administration, Republic of Korea.
REFERENCES
1. P. Palese, Nature Med., 10, S82 (2004). 2. G. K. Neumann, Y. Fujii, Kino, Y. Kawaoka, Proc.
Natl. Acad. Sci. U S A, 102, 16825 ( 2005).
3. F. G. Hayden, Curr. Opin. Infect. Dis., 19, 169 (2006).
4. S. Damtoft, S. R. Jensen, Phytochemistry, 35, 1187 (1994).
5. A.M. Toshihiro, S. Toshihiro, K. Akihito, F. Takashi, T. Makoto, S. Harukuni, K. Yumiko, Chemistry & Biodiversity, 9, 318 (2012).
6. Š.G. Karel, M. Lenka, L. Radek, J. Filip, F. Dagmar, V. Ján, S Hana, J. Nat. Prod., 70, 1244 (2007).
7. E.R. Lee,G.H. Kang, S.G. Cho, Recent Pat. Biotechnol., 1, 139 (2007).
8. R.H. Yang, J. Hanwell, R. Zhang, K.A. Meckling, J Agric. Food Chem., 59, 13328 (2011).
9. D. Giuliano, R.S. Monache, V. Alberto, B. Bruno, M. Barbara, P. Gabriella, P. Cleofe, C. Enrico, Phytochemistry, 37, 893 (1994).
АНТИ-ГРИПНА A-АКТИВНОСТ НА C-ГЕРАНИЛОВИ ФЛАВОНОИДИ, ИЗОЛИРАНИ ОТ Paulownia tomentosa И Maclura pomifera
Х. И. Мун1*, И. Б. Ким2, С. К. Ким3 1Департамент по медицинска биотехнология, Университет Донг-А, Бусан 604-714, Република Корея 2Департамент по биопромишлени технологии, Университет Конкук, Сеул 143-701, Република Корея
3Департамент по зоология и технология, Университет Конкук, Сеул 143-701, Република Корея
Получена на 16 септември, 2015 г., коригирана на 16 декември, 2015 г.
(Резюме) C-геранил-флавоноидите са заслужили значително внимание като прости флаванони с антиоксидантна,
анти-карциногенна и противовъзпалително действие. Грипните вирусни инфекции причиняват всяка година хиляди смъртни случаи и милиони хоспитализации по света. Необходимостта от противо-грипни лекарства е накарала учените на търсят нови природни противо-вирусни вещества. В тази работа ние подбрахме шест естествени флавоноиди от различни източници и идентифицирахме най-мощния антивирусен флавоноид A/PR/8/34 (H1N1) срещу грипа при хора. Два флавоноида с метокси-групи в молекулите си, включително 3′-O-метил-5′-O-метилдиплакон показва висока анти-грипна активност. Затова 3′-O-метил-5′-O-метилдиплаконътможе да бъде полезен като вирус-протектор на здравите тъкани срещу вирусите от грип А по време на хемотерапията за по-добър противо-вирусен контрол при значителна доза.
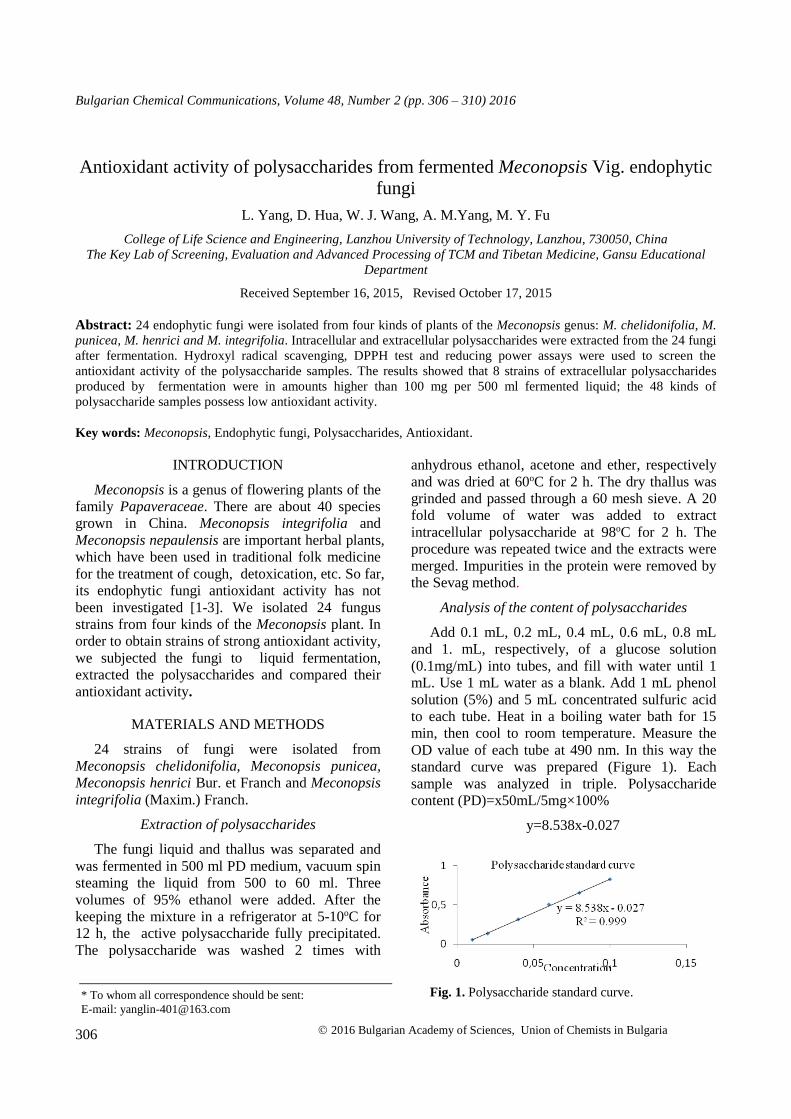
306
Bulgarian Chemical Communications, Volume 48, Number 2 (pp. 306 – 310) 2016
Antioxidant activity of polysaccharides from fermented Meconopsis Vig. endophytic
fungi
L. Yang, D. Hua, W. J. Wang, A. M.Yang, M. Y. Fu
College of Life Science and Engineering, Lanzhou University of Technology, Lanzhou, 730050, China
The Key Lab of Screening, Evaluation and Advanced Processing of TCM and Tibetan Medicine, Gansu Educational
Department
Received September 16, 2015, Revised October 17, 2015
Abstract: 24 endophytic fungi were isolated from four kinds of plants of the Meconopsis genus: M. chelidonifolia, M.
punicea, M. henrici and M. integrifolia. Intracellular and extracellular polysaccharides were extracted from the 24 fungi
after fermentation. Hydroxyl radical scavenging, DPPH test and reducing power assays were used to screen the
antioxidant activity of the polysaccharide samples. The results showed that 8 strains of extracellular polysaccharides
produced by fermentation were in amounts higher than 100 mg per 500 ml fermented liquid; the 48 kinds of
polysaccharide samples possess low antioxidant activity.
Key words: Meconopsis, Endophytic fungi, Polysaccharides, Antioxidant.
INTRODUCTION
Meconopsis is a genus of flowering plants of the
family Papaveraceae. There are about 40 species
grown in China. Meconopsis integrifolia and
Meconopsis nepaulensis are important herbal plants,
which have been used in traditional folk medicine
for the treatment of cough, detoxication, etc. So far,
its endophytic fungi antioxidant activity has not
been investigated [1-3]. We isolated 24 fungus
strains from four kinds of the Meconopsis plant. In
order to obtain strains of strong antioxidant activity,
we subjected the fungi to liquid fermentation,
extracted the polysaccharides and compared their
antioxidant activity.
MATERIALS AND METHODS
24 strains of fungi were isolated from
Meconopsis chelidonifolia, Meconopsis punicea,
Meconopsis henrici Bur. et Franch and Meconopsis
integrifolia (Maxim.) Franch.
Extraction of polysaccharides
The fungi liquid and thallus was separated and
was fermented in 500 ml PD medium, vacuum spin
steaming the liquid from 500 to 60 ml. Three
volumes of 95% ethanol were added. After the
keeping the mixture in a refrigerator at 5-10oC for
12 h, the active polysaccharide fully precipitated.
The polysaccharide was washed 2 times with
anhydrous ethanol, acetone and ether, respectively
and was dried at 60oC for 2 h. The dry thallus was
grinded and passed through a 60 mesh sieve. A 20
fold volume of water was added to extract
intracellular polysaccharide at 98oC for 2 h. The
procedure was repeated twice and the extracts were
merged. Impurities in the protein were removed by
the Sevag method.
Analysis of the content of polysaccharides
Add 0.1 mL, 0.2 mL, 0.4 mL, 0.6 mL, 0.8 mL
and 1. mL, respectively, of a glucose solution
(0.1mg/mL) into tubes, and fill with water until 1
mL. Use 1 mL water as a blank. Add 1 mL phenol
solution (5%) and 5 mL concentrated sulfuric acid
to each tube. Heat in a boiling water bath for 15
min, then cool to room temperature. Measure the
OD value of each tube at 490 nm. In this way the
standard curve was prepared (Figure 1). Each
sample was analyzed in triple. Polysaccharide
content (PD)=x50mL/5mg×100%
y=8.538x-0.027
Fig. 1. Polysaccharide standard curve.
* To whom all correspondence should be sent:
E-mail: [email protected]
2016 Bulgarian Academy of Sciences, Union of Chemists in Bulgaria

L. Yang et al.: Antioxidant activity of polysaccharide from fermentation in MeconopsisVig.endophytic fungi
307
Fig. 2. Vc standard curve.
Screening for antioxidant activity.
Determination of hydroxyl radical scavenging
activity
To a polysaccharide sample (1 mg/L) in a test
tube add 1 mL FeSO4 solution (6mmol/L), 1 mL
salicylic acid-ethanol solution (6mmol/L), 1 mL
sample solution, 1mL 0.1% H2O2 and 4 mL
distilled water, shake well in a 37oC water bath for
30 min. Cool to room temperature and measure the
absorbance value of each tube at 51 nm.
Clearance (%)=[1-(Asample- Acontrast)/ Ablank]×100%.
DPPH (1,1-diphenyl-2-picrylhydrazyl) free
radical scavenging activity
To a polysaccharide sample (1mg/L), in a test
tube add 2 ml of 0.025 mg/L ethanol solution of
DPPH, shake well at room temperature for 30 min.
Measure the absorbance value of each tube at 517
nm [4].
Inhibition of DPPH radical (%)=[1-(Asample-
Acontrast)/ Ablank]×100%.
Table 1. Results of endophytic fungi polysaccharide content determination
Sample QMP(mg)
))) Ā PC(%) QP(mg) Sample QMP(mg) Ā PC(%) QP(mg)
YL101
E 96.6 0.82
6 99.99 96.6 QL204
E 121.3 0.38
1 47.80 58.0
YL101 I 12.0 0.82
3 99.56 12.0 QL204
I 4.2 0.57
1 70.10 2.9
YL201
E 347.2 0.78
6 95.34 331.0 QL205
E 136.2 0.81
2 98.28 133.9
YL201 I 10.7 0.78
7 95.35 10.2 QL205
I 0.010.6 0.08
3 12.90 0.0014
YL202
E 390.5 0.13
3 18.75 73.2 QS102
E 0.296.4 0.70
9 86.21 0.26
YL202 I 12.3 0.12
9 18.28 2.2 QS102 I 0.103.6 0.68
2 83.05 0.086
YL203
E 436.5 0.19
2 25.66 112.0 BS101
E 423.2 0.25
8 33.39 141.3
YL203 I 13.7 0.78
7 95.35 13.1 BS101 I 15.9 0.11
7 16.88 2.7
YL204
E 16.5 0.19
3 25.78 4.3 BS102
E 54.5 0.41
8 52.13 28.4
YL204 I 25.4 0.61
9 75.67 19.2 BS102 I 18.0 0.22
8 29.88 5.4
YL205
E 35.1 0.03
9 7.74 2.7 RL201
E 196.7 0.53
3 65.60 129.0
YL205 I 27.1 0.11
7 16.88 4.6 RL201 I 16.7 0.43
4 54.06 9.0
YL1 E 36.1 0.25
5 33.04 11.9 RL202
E 29.4 0.45
6 56.58 16.6
YL1 I 7.0 0.14
2 19.81 1.4 RL202 I 16.6 0.42
3 52.72 8.8
YL2 E 34.7 0.42
6 53.07 18.4 RL203
E 30.8 0.82
6 99.99 30.8
YL2 I 26.0 0.30
9 39.36 10.2 RL203 I 28.4 0.82
5 99.80 28.4
YS101 E 887.4 0.82
5 99.80 885.6 RL204
E 574.6 0.12
5 17.81 102.3
YS101 I 12.2 0.79
6 96.40 11.8 RL204 I 15.7 0.03
7 7.51 1.2
YR202
E 44.5 0.13
0 18.40 8.2 RS202
E 55.4 0.62
3 76.14 42.3
YR202I 31.1 0.09
6 14.41 4.5 RS202 I 13.4 0.41
5 51.83 6.9
QL201
E 212.9 0.16
4 22.38 47.6 RS203
E 14.7 0.69
2 84.22 12.4
QL201 I 26.0 0.05
7 9.85 2.6 RS203 I 16.5 0.72
3 87.85 14.5
QL202
E 68.4 0.33
1 41.94 28.7 RS302
E 2302 0.40
3 50.37 116.0
QL202 I 17.6 0.19
7 26.25 4.6 RS302 I 34.3 0.68
4 83.29 28.6
Notes: I intracellular polysaccharide, E extracellular polysaccharide; MP quantity of mixture polysaccharide; PC
polysaccharide concentration; QP quantity of polysaccharide; Ā average absorbance of three parallel sets.

L. Yang et al.: Antioxidant activity of polysaccharides from fermented Meconopsis Vig. endophytic fungi
308
Table 2. Results of the determination of hydroxyl radical scavenging activity.
Sample Asample Acontrast Ablank Clearance(%) Sample Asample Acontrast Ablank Clearance(%)
YL101 E 0.431 0.001
0.622
30.86 QL204 E 0.1213 0.381
0.622
20.58
YL101 I 0.564 0.023 13.02 QL204 I 0.0042 0.571 19.29
YL201 E 0.578 0.000 7.07 QL205 E 0.1362 0.812 19.29
YL201 I 0.570 0.012 10.13 QL205 I 0.0106 0.083 7.56
YL202 E 0.538 0.001 13.67 QS102 E 0.2964 0.709 19.13
YL202 I 0.600 0.009 4.98 QS102 I 0.1036 0.682 6.59
YL203 E 0.597 0.004 4.66 BS101 E 0.4232 0.258 11.25
YL203 I 0.534 0.023 17.85 BS101 I 0.0159 0.117 12.22
YL204 E 0.307 0.013 52.73 BS102 E 0.0545 0.418 36.82
YL204 I 0.555 0.016 13.34 BS102 I 0.0180 0.228 14.31
YL205 E 0.433 0.017 33.12 RL201 E 0.1967 0.533 11.58
YL205 I 0.512 0.004 18.33 RL201 I 0.0167 0.434 3.54
YL1 E 0.543 0.006 13.17 RL202 E 0.0294 0.456 30.55
YL1 I 0.527 0.016 17.88 RL202 I 0.0166 0.423 8.68
YL2 E 0.547 0.007 22.19 RL203 E 0.0308 0.826 46.30
YL2 I 0.534 0.022 8.20 RL203 I 0.0284 0.825 9.81
YS101 E 0.455 0.007 27.97 RL204 E 0.5746 0.125 7.88
YS101 I 0.575 0.021 10.93 RL204 I 0.0157 0.037 -
YR202 E 0.506 0.012 20.58 RS202 E 0.0554 0.623 -
YR202I 0.520 0.000 16.40 RS202 I 0.0134 0.415 -
QL201 E 0.447 0.013 30.23 RS203 E 0.0147 0.692 7.23
QL201 I 0.530 0.019 17.85 RS203 I 0.0165 0.723 -
QL202 E 0.354 0.004 43.73 RS302 E 0.2302 0.403 26.37
QL202 I 0.568 0.013 10.77 RS302 I 0.0343 0.684 10.61
Note:- no hydroxyl radical scavenging activity
Reducing power assay
Different extracts and a standard (1 mg/mL) in 1
mL of distilled water were mixed with phosphate
buffer (2.5 mL, 0.2 mol/L, pH 6.6) and potassium
ferricyanide (2.5 mL, 1% w/v) was added to the
mixture, which was then centrifuged for 10 min at
3000 r/min. The upper layer of the solution (2.5 mL)
was mixed with distilled water (2.5 mL) and FeCl3
(0.5 mL, 0.1% w/v) and the absorbance was
measured at 700 nm on a spectrophotometer [5].
High absorbance value of the reaction mixture
indicates a high reductive potential. Draw the
standards of different concentration of vitamin C
curve. (Figure 2.)
RESULTS AND DISCUSSION
10 kinds of polysaccharide contents are below
20% of the samples. The polysaccharide samples
still contain a lot of impurities which should be
removed before application. Polysaccharide
contents are shown in Table1.
The experimental results showed that the
polysaccharide from the fermented liquid of YL204
has the highest activity of hydroxyl radical
scavenging (52.73%). Thallus polysaccharide in
RL204,RS202 and RS203 has no activity of
hydroxyl radical scavenging. Results are shown in
Table 2.
The results showed that thallus polysaccharide
and polysaccharide from fermented liquid in
YL202 have higher DPPH (1,1-diphenyl-2-
picrylhydrazyl) free radical scavenging activity
(45.50% and 42.78%, respectively). 12 samples
displayed no activity (Table 3).
The results showed that all 48 samples have
ability of reducing power. YL202 and YL2 have
stronger ability equivalent Vc (0.0210 mg/ml and
0.0216 mg/ml, respectively). Results are shown in
Table 4.

L. Yang et al.: Antioxidant activity of polysaccharides from fermented Meconopsis Vig. endophytic fungi
309
Table 3. Results of DPPH (1,1-diphenyl-2-picrylhydrazyl) free radical scavenging activity
Sample Asample Acontrast Ablank Clearance(%) Sample Asample Acontrast Ablank Clearance(%)
YL101 E 0.315 0.017
0.367
18.80 QL204 E 0.308 0.062
0.367
32.97
YL101 I 0.473 0.084 - QL204 I 0.370 0.019 4.36
YL201 E 0.356 0.037 13.08 QL205 E 0.304 0.016 21.53
YL201 I 0.288 0.018 26.43 QL205 I 0.701 0.285 -
YL202 E 0.208 0.008 45.50 QS102 E 0.397 0.103 19.89
YL202 I 0.306 0.096 42.78 QS102 I 0.489 0.113 -
YL203 E 0.292 0.005 21.80 BS101 E 0.302 0.002 18.26
YL203 I 0.287 0.049 35.15 BS101 I 0.449 0.160 21.25
YL204 E 0.458 0.025 - BS102 E 0.284 0.017 27.25
YL204 I 0.381 0.031 4.63 BS102 I 0.257 0.025 36.78
YL205 E 0.480 0.052 - RL201 E 0.280 0.010 26.43
YL205 I 0.350 0.017 9.26 RL201 I 0.380 0.015 0.54
YL1 E 0.299 0,029 26.43 RL202 E 0.433 0.160 25.61
YL1 I 0.352 0.026 11.17 RL202 I 0.367 0.017 4.63
YL2 E 0.417 0.067 4.63 RL203 E 0.286 0.006 23.71
YL2 I 0.496 0.103 - RL203 I 0.346 0.022 11.72
YS101 E 0.631 0.152 - RL204 E 0.303 0.006 19.07
YS101 I 0.366 0.042 11.71 RL204 I 0.401 0.027 -
YR202 E 0.531 0.051 - RS202 E 0.554 0.177 -
YR202I 0.431 0.038 - RS202 I 0.664 0.241 -
QL201 E 0.336 0.019 13.62 RS203 E 0.342 0.010 9.54
QL201 I 0.331 0.037 19.89 RS203 I 0.330 0.011 13.08
QL202 E 0.346 0.049 19.07 RS302 E 0.483 0.197 22.71
QL202 I 0.278 0.014 28.07 RS302 I 0.296 0.040 30.25
Notes: - no DPPH free radical scavenging activity
Table 4. Results of reducing power assay.
Sample Asample Equivalent Vc(mg/ml)
Samples Asample Equivalent
Vc(mg/ml) Sample Asample
Equivalent
Vc(mg/ml)
YL101 E 0.158 0.0140 YS101 E 0.139 0.0115 BS102 E 0.150 0.0129
YL101 I 0.147 0.0125 YS101 I 0.130 0.0103 BS102 I 0.175 0.0162
YL201 E 0.114 0.0082 YR202E 0.142 0.0119 RL201 E 0.191 0.0183
YL201 I 0.129 0.0102 YR202I 0.117 0.0086 RL201 I 0.158 0.0139
YL202 E 0.125 0.0097 QL201 E 0.180 0.0169 RL202 E 0.184 0.0174
YL202 I 0.212 0.0210 QL201 I 0.149 0.0128 RL202 I 0.151 0.0131
YL203 E 0.172 0.0158 QL202 E 0.177 0.0165 RL203 E 0.153 0.0133
YL203 I 0.148 0.0126 QL202 I 0.133 0.0107 RL203 I 0.149 0.0128
YL204 E 0.165 0.0149 QL204 E 0.157 0.0138 RL204 E 0.156 0.0137
YL204 I 0.140 0.0116 QL204 I 0.133 0.0107 RL204 I 0.140 0.0116
YL205 E 0.173 0.0159 QL205 E 0.149 0.0128 RS202 E 0.125 0.0096
YL205 I 0.172 0.0158 QL205 I 0.141 0.0117 RS202 I 0.129 0.0102
YL1 E 0.144 0.0121 QS102 E 0.165 0.0148 RS203 E 0.174 0.0161
YL1 I 0.132 0.0106 QS102 I 0.158 0.0139 RS203 I 0.162 0.0145
YL2 E 0.216 0.0216 BS101 E 0.137 0.0112 RS302 E 0.185 0.0175
YL2 I 0.135 0.0110 BS101 I 0.131 0.0104 RS302 I 0.143 0.0120
L. Yang et al.: Antioxidant activity of polysaccharides from fermented Meconopsis Vig. endophytic fungi
310
From the three different assays used, we got
some previous information of endophytic fungi in
the Meconopsis plant. Especially the endophytic
fungi in Meconopsis chelidonifolia displayed high
quality of polysaccharides and excellent antioxidant
potential. Intracellular and extracellular
polysaccharides in YL202 fungus possess the
highest antioxidant capacity in DPPH free radical
scavenging activity. This method is considered as
the most accurate method used to assess the
antioxidant activity of samples and the widely used
assay. Different samples showed inconformable
antioxidant capacity in the different assays. Besides,
we found that samples’ hydroxyl radical
scavenging activity is due to more than 30% to
extracellular polysaccharide. The results of this
study showed that Meconopsis endophytic fungi
may become a potential source of natural
antioxidants. This first report study provides
information and basic work on the bioactivity and
compounds of Meconopsis endophytes.
REFERENCES
1. Z.Q. Guo, Q. Guo, S.Y. Zhang, C. Li, X.Y. Chai, P.F.
Tu, Biochemical Systematics and Ecology, 55, 329
(2014).
2. J. Liu, H. Wu, F. Zheng, W. Liu, F. Feng, N. Xie, J.
Sep. Sci., 37,2513 (2014).
3. J.S. He, B. Huang, Journal of Ethnopharmacology,
141, 104 (2012).
4. A. Gao, B. Zhao, China Journal of Chinese Materia
Medica, 38, 284 (2013).
5. M. Yadav, A. Yadav, J.P.Yadav, Asian Pac. J. Trop.
Med., 7, 256 (2014).
АНТИОКСИДАНТНА АКТИВНОСТ НА ПОЛИЗАХАРИДИ ОТ ФЕРМЕНТИРАНИ
Meconopsis Vig. ЕНДОФИТНИ ФУНГИ
Л. Янг, Д. Хуа, У.Дж. Уанг, А.М. Янг, М.И. Фу
Колеж за науки за живота и инженерство, Технологичен университет в Ланжоу, Ланжоу 730050, Китай
Ключова лаборатория по скрийнинг, оценка и нови процеси по TCM и тибетска медицина, Департамент по
образование Гансу
Получена на 16 септември, 2015 г., коригирана на 17 октомври, 2015 г.
(Резюме)
Двадесет и четири ендофитни гъбички (фунги) бяха изолирани от 4 вида растения от рода Meconopsis: M.
chelidonifolia, M. punicea, M. henrici и M. integrifolia. От гъбичките са извлечени вътре-клетъчни и
извънклетъчни полизахариди след 24-часова ферментация. Анализи по отстраняване на хидроксилните
радикали, DPPH-тест и намалена мощност са използвани за скрийнинг на антиоксидантната активност на
образците от полизахаридите. Резултатите показват, че при 8 щама екстрацелуларните полизахариди, получени
при ферментация са повече от 100 mg за 500 ml ферментационна среда; 48 вида полизахариди притежават ниска
антиоксидантна активност.

311
Bulgarian Chemical Communications, Volume 48, Number 2 (pp. 311 – 316) 2016
CdSe nanometerials: kinetics, thermodynamics, antioxidant activity and application
to Denim fabric
Ö. Altun*, N. Becenen
Trakya University, Department of Chemistry, 22030 Edirne/TURKEY
Received August 8, 2015, Revised September 10, 2015
For the first time in this study, the kinetics and thermodynamics of the CdSe nanomaterials were determined by
spectral measurements. In addition, as a contrubution to the literature, antioxidant activity, application to denim fabric
and testing of finished fabric for antimicrobial activities of CdSe nanomaterials were investigated. According to
absorbance measurements, the activation energy (Ea) and other activation thermodynamic parameters (ΔS, ΔH and ΔG)
were determined. The study showed that the process was endothermic and was a nonspontaneous process during
activation. The presence of nanoparticles on denim fabric surfaces was confirmed by Scanning Electron Microscope
(SEM).The nano CdSe impregnated denim fabric (100% cotton) showed excellent antibacterial activity against
Staphylococcus aureus and Escherichia coli. Additionally, the CdSe nanomaterials demonstrated significant antioxidant
activity.
Keywords: CdSe Nanomaterials, Kinetics, Thermodynamics, Antioxidant Activity, Antibacterial Activity
INTRODUCTION
Nanotechnology is regarded as a key technology
which will not only influence technological
development in the near future, but will also have
economic, social and ecological implications. The
technology can be used in engineering desired
textile attributes, such as fabric softness, durability,
breathability, water repellency, fire retardancy and
antimicrobial resistance [1]. With the advent of
nanotechnology, a new area has developed in the
realm of textile finishing. Nano coating on the
surface of textiles and clothing enhances the UV
blocking, antimicrobial and self clening properties
of the material [2].
The inherent properties of textile fibers provide
room for the growth of micro-organisms. Besides,
the substrate structures and chemical processes may
induce growth of bacteria. Infestation by bacteria
causes cross infection by pathogens and
development of odor where the fabric is worn next
to skin. With the use of nano sized particles, the
number of particles per unit area is increased, and
thus antibacterial effects can be maximized [3].
Nanomaterials are tiny particles with particle
size mainly below 20 nm, as the optimum size
quantity can be attained below this range. It is
reported that optimum size variation in CdSe
nanocrystals due to quantum confinement is from 1
to 11 nm, which means it contain 10-10.000 atoms.
As the size decreases, number of atoms on the
surface may result in loss of optical properties and
shift in absorption frequency to the red region of
the visible spectrum due to increase in particles [4-
6].
CdSe has attracted great interest due to its high
photosensitivity, its attractive application to photo
conducting cells and the dependence of its
properties on size [7]. Traditionally, CdSe
nanomaterials have been prepared through a solid-
state reaction between elemental cadmium and
selenium at relatively high temperatures [8, 9].
Various chemical methods have been introduced to
synthesize CdSe nanomaterials, such as
solvothermal synthesis [10],laser ablation[11] and
hard template [12].
In the previous studies, the effect of CdSe
nanomaterials on humans are reported, such as
cytotoxic [13], toxic [14], genotoxic [15]. For
example, in the study by Young and colleagues
[15], the genotoxic effect of CdSe/ZnS
nanomaterials is measured in human cancer cells by
comet and micronucleus assays. Treatment with
CdSe/ZnS nanomaterials resulted in the most
severe extent of cell death.
The main of this research study is kinetics,
antioxidant activity, application to denim fabric and
testing of finished fabric for antimicrobial activities
of CdSe nanomaterials. In addition, as a
contrubution to the literature, for the first time in
this study, the kinetics and thermodynamics of the
CdSe nanomaterials are determined by spectral
measurements. * To whom all correspondence should be sent:
E-mail: [email protected], [email protected]
2016 Bulgarian Academy of Sciences, Union of Chemists in Bulgaria

Ö. Altun, N. Becenen: CdSe nanometerials: kinetics, thermodynamics, antioxidant activity and application to Denim fabric
312
EXPERIMENTAL
Material and measurements
All reagents were purchased from commercial
sources and used as supplied. UV/Vis spectra were
measured with a Shimadzu UV-1700 Pharma
spectrophotometer in the 200-800 nm range. Bruker
X Flash XRD-6110 and Shimadzu XRD-6000 were
employed for the XRD analyses. For the SEM
analysis, nano finished samples were mounted on a
specimen stub with double sided adhesive tape
coated with gold in a sputter coater and examined
with a Scanning Electron Microscope (SEM) model
ZEIS LEVO LS 10.
Synthesis of the CdSe nanomaterials [16]
30 mg Se and 5 mL of 1-octadecene were mixed
and 0.4 mL of trioctylphosphine was added. The
solution was stirred. It was warmed as necessary to
speed up the dissolution of Se. The stock solution
was storred at room temperature. Then, 17.4 mg
cadmium acetate and 0.6 mL oleic acid were added
in 10 mL octadecene and heated. When the
temperature reached 225 °C, 1 mL of selenium
solution at the room temperature was transferred
into the cadmium solution. The orange- red-brown
reaction mixture was cooled to room temperature
followed by addition of 10 mL of toluene and and
was stirred at room temperature for half on hour.
The reaction mixture was then centrifuged and
washed with the same solvent to obtain orange or
brown povder.
Yield (%): 88, UV-Vis (λ/nm): 431 and 458, IR
(cm−1/KBr): 2923(sym –CH2), 2854 (asym –CH2),
1450 (δas–CH3–), 1600 (=CH), 1700-1720 (C=O),
TGA (°C, a rate of 10 °C / min under nitrogen
atmosphere): 250-330 (organic capping), 800
(CdSe), XRD (2θ): 23.89473, 25.39343, 41.98555,
45.80425 and 49.67800.
Kinetics and thermodynamics procedure
There is no paper in the literature on the kinetics
of the synthesis reaction of CdSe nanomaterials
[17-21]. Rate formulas are derived from the
experimental data. The rate formula is [22],
ln C / C0 = - k t , (1)
where t is the time, C is the concentration at the
time t, C0 is the concentration t = 0, and k is the rate
constant.
According to the Beer-Lambert law [23],
because absorbance is proportional to the
concentration, equation 1 can be rearranged as
follows,
ln A / A0 = - k t , (2)
where A is the absorbance at time t, A0 is the
absorbance at t = 0.
The activation energy can be determined by the
Arrhenius equation [22]:
k = A e-Ea / RT , (3)
where k is rate constant, A is the frequency factor
or the Arrhenius Arrhenius constant, Ea is the
activation energy, R is the universal gas constant
(8.314 JK-1mol-1) and T is absolute temperature.
According to transition state theory,
thermodynamic parameters are assigned an
activated complex as follows [24]:
A = RT / Nh eΔS / R , (4)
ΔH = Ea – RT , (5)
ΔG = ΔH – TΔS , (6)
where N is the Avogadro constant (6.022 x 10²³
mol-1), h is the Planck constant (6.626 x 10⁻³⁴ Js),
ΔS is the activation entropy, ΔH is the activation
enthalpy, and ΔG is the activation energy or the
Gibbs energy of activation.
Antioxidant activity procedure
The antioxidant activity [25-28] of the CdSe
nanomaterials was determined in vitro as described
with slight modifications as follows: The
compounds were serially diluted in DMSO to
obtain a concentration range of 1.25–20 mM on a
96 well plate. The reaction mixture consisted of
100 μL of 0.5 mM 2,2-diphenyl-1-picrylhydrazyl
radical (DPPH), and 100 μL of each concentration
of the test compounds using DMSO as the solvent.
For positive control, 2,6-di-tert-butyl-4-
methylphenol (BHT) was used at a concentration
range of 0.0625–2 mM in methanol. The solvents,
DMSO and methanol, were used as blanks.
Duplicate experiments were performed. The plates
were covered with aluminum foil and kept in the
dark for 20 minutes after which the absorbance was
read on a Tecan-PC infinite M 200 Pro Plate reader
at the absorbance wavelength of 517 nm. The
percent antioxidant activity was calculated as
follows:
Antioxidant (%) : 100 x (A0 – A1 / A0) , (7)
where A0 is the absorbance of the blank and A1 is
the absorbance in the presence of the sample or
positive control.
General procedure for application to denim fabric
The denim fabric used in the experiments was
100 % cotton, weight was 247 g/m2, the warp was
dyed blue and the weft yarn wasn’t dyed. CdSe
nanomaterials were sprayed on denim fabric by
using a spray gun [29, 30].
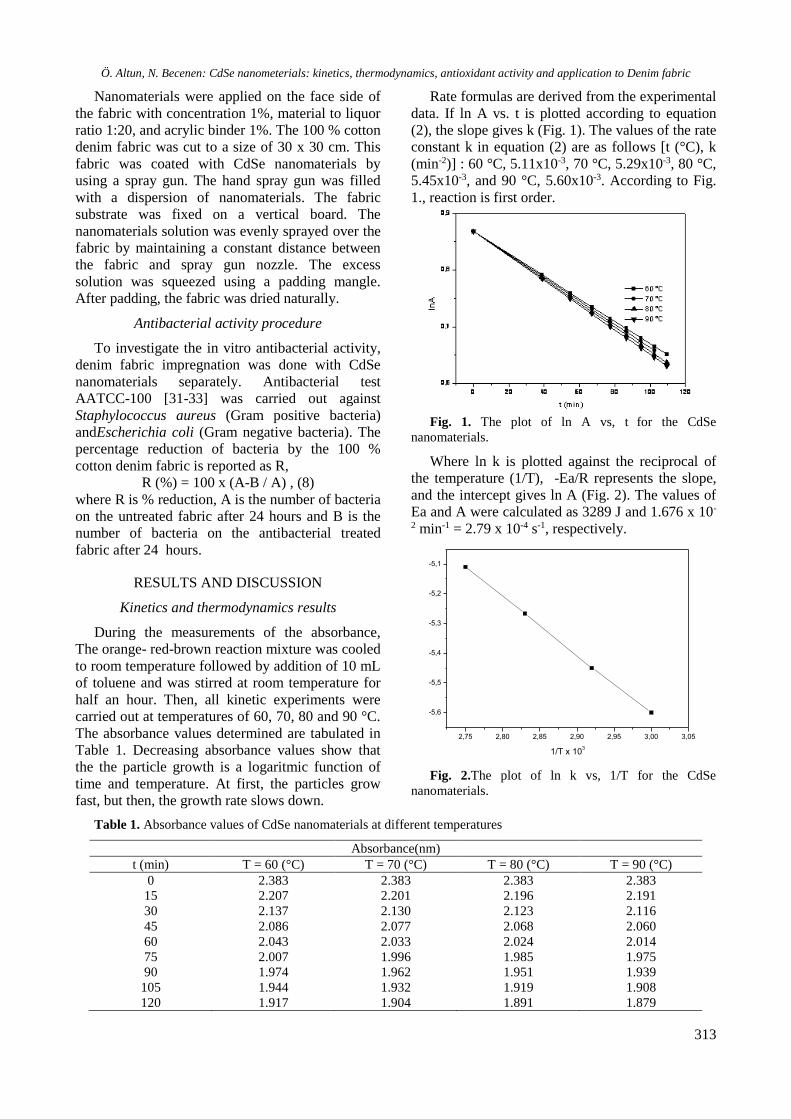
Ö. Altun, N. Becenen: CdSe nanometerials: kinetics, thermodynamics, antioxidant activity and application to Denim fabric
313
Nanomaterials were applied on the face side of
the fabric with concentration 1%, material to liquor
ratio 1:20, and acrylic binder 1%. The 100 % cotton
denim fabric was cut to a size of 30 x 30 cm. This
fabric was coated with CdSe nanomaterials by
using a spray gun. The hand spray gun was filled
with a dispersion of nanomaterials. The fabric
substrate was fixed on a vertical board. The
nanomaterials solution was evenly sprayed over the
fabric by maintaining a constant distance between
the fabric and spray gun nozzle. The excess
solution was squeezed using a padding mangle.
After padding, the fabric was dried naturally.
Antibacterial activity procedure
To investigate the in vitro antibacterial activity,
denim fabric impregnation was done with CdSe
nanomaterials separately. Antibacterial test
AATCC-100 [31-33] was carried out against
Staphylococcus aureus (Gram positive bacteria)
andEscherichia coli (Gram negative bacteria). The
percentage reduction of bacteria by the 100 %
cotton denim fabric is reported as R,
R (%) = 100 x (A-B / A) , (8)
where R is % reduction, A is the number of bacteria
on the untreated fabric after 24 hours and B is the
number of bacteria on the antibacterial treated
fabric after 24 hours.
RESULTS AND DISCUSSION
Kinetics and thermodynamics results
During the measurements of the absorbance,
The orange- red-brown reaction mixture was cooled
to room temperature followed by addition of 10 mL
of toluene and was stirred at room temperature for
half an hour. Then, all kinetic experiments were
carried out at temperatures of 60, 70, 80 and 90 °C.
The absorbance values determined are tabulated in
Table 1. Decreasing absorbance values show that
the the particle growth is a logaritmic function of
time and temperature. At first, the particles grow
fast, but then, the growth rate slows down.
Rate formulas are derived from the experimental
data. If ln A vs. t is plotted according to equation
(2), the slope gives k (Fig. 1). The values of the rate
constant k in equation (2) are as follows [t (°C), k
(min-2)] : 60 °C, 5.11x10⁻³, 70 °C, 5.29x10⁻³, 80 °C,
5.45x10⁻³, and 90 °C, 5.60x10⁻³. According to Fig.
1., reaction is first order.
Fig. 1. The plot of ln A vs, t for the CdSe
nanomaterials.
Where ln k is plotted against the reciprocal of
the temperature (1/T), -Ea/R represents the slope,
and the intercept gives ln A (Fig. 2). The values of
Ea and A were calculated as 3289 J and 1.676 x 10-
2 min-1 = 2.79 x 10⁻⁴ s-1, respectively.
2,75 2,80 2,85 2,90 2,95 3,00 3,05
-5,6
-5,5
-5,4
-5,3
-5,2
-5,1
lnk
1/T x 103
Fig. 2.The plot of ln k vs, 1/T for the CdSe
nanomaterials.
Table 1. Absorbance values of CdSe nanomaterials at different temperatures
Absorbance(nm)
t (min) T = 60 (°C) T = 70 (°C) T = 80 (°C) T = 90 (°C)
0 2.383 2.383 2.383 2.383
15 2.207 2.201 2.196 2.191
30 2.137 2.130 2.123 2.116
45 2.086 2.077 2.068 2.060
60 2.043 2.033 2.024 2.014
75 2.007 1.996 1.985 1.975
90 1.974 1.962 1.951 1.939
105 1.944 1.932 1.919 1.908
120 1.917 1.904 1.891 1.879
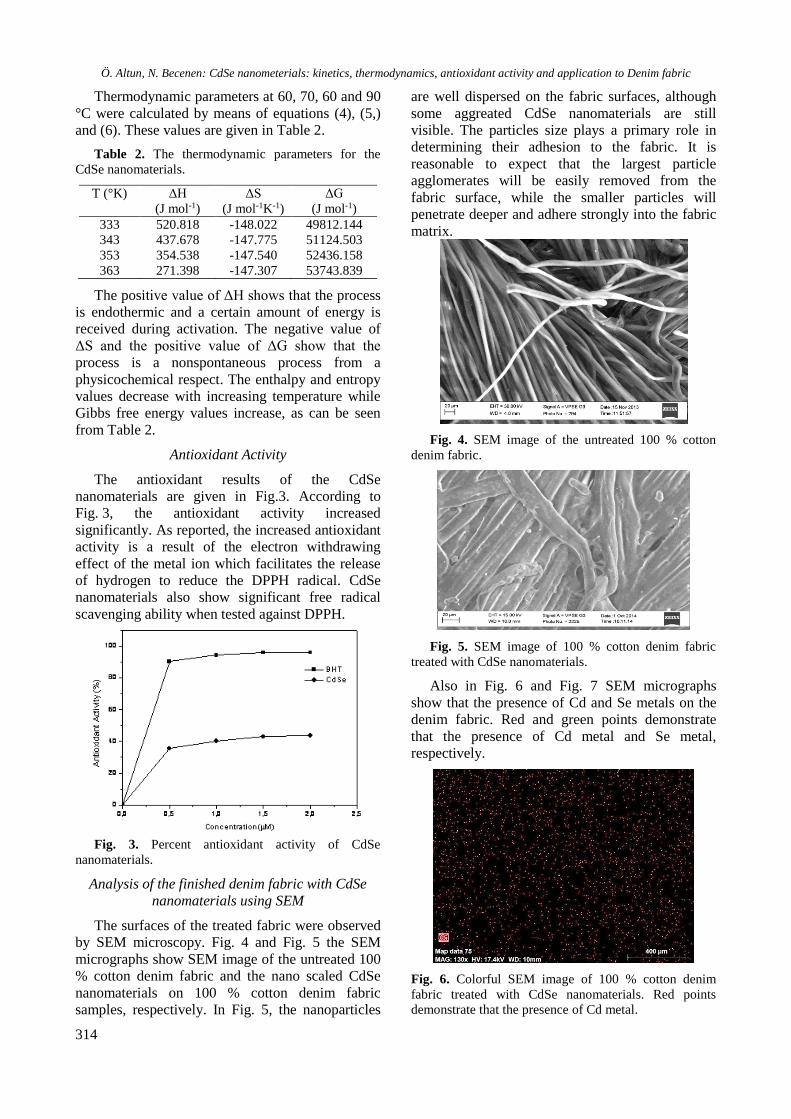
Ö. Altun, N. Becenen: CdSe nanometerials: kinetics, thermodynamics, antioxidant activity and application to Denim fabric
314
Thermodynamic parameters at 60, 70, 60 and 90
°C were calculated by means of equations (4), (5,)
and (6). These values are given in Table 2.
Table 2. The thermodynamic parameters for the
CdSe nanomaterials.
T (°K) ΔH
(J mol-1)
ΔS
(J mol-1K-1)
ΔG
(J mol-1)
333 520.818 -148.022 49812.144
343 437.678 -147.775 51124.503
353 354.538 -147.540 52436.158
363 271.398 -147.307 53743.839
The positive value of ΔH shows that the process
is endothermic and a certain amount of energy is
received during activation. The negative value of
ΔS and the positive value of ΔG show that the
process is a nonspontaneous process from a
physicochemical respect. The enthalpy and entropy
values decrease with increasing temperature while
Gibbs free energy values increase, as can be seen
from Table 2.
Antioxidant Activity
The antioxidant results of the CdSe
nanomaterials are given in Fig.3. According to
Fig. 3, the antioxidant activity increased
significantly. As reported, the increased antioxidant
activity is a result of the electron withdrawing
effect of the metal ion which facilitates the release
of hydrogen to reduce the DPPH radical. CdSe
nanomaterials also show significant free radical
scavenging ability when tested against DPPH.
Fig. 3. Percent antioxidant activity of CdSe
nanomaterials.
Analysis of the finished denim fabric with CdSe
nanomaterials using SEM
The surfaces of the treated fabric were observed
by SEM microscopy. Fig. 4 and Fig. 5 the SEM
micrographs show SEM image of the untreated 100
% cotton denim fabric and the nano scaled CdSe
nanomaterials on 100 % cotton denim fabric
samples, respectively. In Fig. 5, the nanoparticles
are well dispersed on the fabric surfaces, although
some aggreated CdSe nanomaterials are still
visible. The particles size plays a primary role in
determining their adhesion to the fabric. It is
reasonable to expect that the largest particle
agglomerates will be easily removed from the
fabric surface, while the smaller particles will
penetrate deeper and adhere strongly into the fabric
matrix.
Fig. 4. SEM image of the untreated 100 % cotton
denim fabric.
Fig. 5. SEM image of 100 % cotton denim fabric
treated with CdSe nanomaterials.
Also in Fig. 6 and Fig. 7 SEM micrographs
show that the presence of Cd and Se metals on the
denim fabric. Red and green points demonstrate
that the presence of Cd metal and Se metal,
respectively.
Fig. 6. Colorful SEM image of 100 % cotton denim
fabric treated with CdSe nanomaterials. Red points
demonstrate that the presence of Cd metal.

Ö. Altun, N. Becenen: CdSe nanometerials: kinetics, thermodynamics, antioxidant activity and application to Denim fabric
315
Fig. 7. Colorful SEM image of 100 % cotton denim
fabric treated with CdSe nanomaterials. Green points
demonstrate that the presence of Se metal
Antibacterial Activity
The results for the AATCC-100susceptibility
tests recorded in Table 2 show that the CdSe
nanoparticles have significant antibacterial activity
against Staphylococcus aureus and show moderate
activity against Escherichia coli. As a result, CdSe
nanomaterials are preferable to other inorganic
forms of cadmium because of its higher efficiency
in preventing infection.
Table 3. Antibacterial activity of CdSe nanomaterials
treated denim fabric.
Fabric
sample
Staphlococcus
aureus
Escherichia
coli
Untreated No reduction No reduction
Denim fabric 80.20 % 20 %
CONCLUSION
In the present study, the kinetic and
thermodynamic parameters such as the activation
energy (Ea), the activation entropy (ΔS), the
activation enthalpy (ΔH), and the Gibbs energy
(ΔG) of CdSe nanomaterials was determined by
spectral measurements. The activation energy is
found to be approximately 3289 J. The rate
constant does not depend on temperature due to the
lower activation energy. That is, lower activation
energy signifies that the rate constant does not
change rapidly with temperature. Finally, the
reaction is entropy controlled and the enthalpy
contribution changes slightly with change in
temperature.
It was shown that the nano-CdSe impregnated
on denim fabric showed excellent antibacterial
activity against two representative bacteria
Staphlococcus aureus and Escherichia coli. This
work provides a simple method for CdSe nano
composites and their application onto denim fabric
to impart antibacterial function. Additionally, the
nano CdSe demonstrates significant antioxidant
activity.
Acknowledgement: We thank to the Trakya
University TUBAP-2010/43 for the financial
support and dietician Figen ESEN from Osman
Gazi University, Faculty of Medicine,
Eskişehir/TURKEY for her help.
REFERENCES
1. Y.W.H.C. Wong, W.M. Yuen, M.Y.S. Leung, S.K.A.
Ku, AUTEX Res.J., 6, 1(2006).
2. J. L.Hoon, Text. Res. J., 75(7), 551 (2005).
3. 3.J.L. Xin, S.Y. Yeo, H.J. Lee, S.H. Jeong, J. Mater.
Sci., 38(10), 2143 (2003).
4. B.K.H. Yen, N.E. Stott, K.F. Jensen, M.G. Bawendi,
Adv. Mater., 15, 1858 (2003).
5. S.J. Rosenthal, J. McBride, S.J. Pennycook, L.C.
Feldman, Surf. Sci. Rep., 62, 111 (2007).
6. V.L. Colvin, M.C. Schlamp, A.V. Alivisatos, Nature,
370, 354 (1994).
7. P.Alivisatos, Science, 271, 933 (1996).
8. C.B. Murray, D.J. Norris, M.G. Bawendi, J. Am.
Chem. Soc. (ACS), 124, 8706 (1993).
9. Z.A. Peng, X.G. Peng, J. Am. Chem. Soc. (ACS), 124,
3343 (2002).
10. Y. Xie, W.Z. Wang, Y.T. Qian, X.M. Liu, J. Solid
State Chem.,147, 82 (1999).
11. C.M. Rouleau, D.H. Lowndes, App. Surf. Sci., 418,
127 (1998).
12. Q. Yang, K. Tang, C. Wong, Y. Qian, Mater. Lett.,
57, 3508 (2003).
13. C. Kirchner, T. Liedl, S. Kudera, T. Pellegrino, A.M.
Javier, H.E. Gaub, S. Sto1lzle, N. Fertig, W.J. Parak,
Nano Lett., 5(2), 332 (2005).
14. L. Wang, D.K. Nagesha, S. Selvarasah, M.R.
Dokmeci, R.L. Carrier, J. Nanobiotechnol., 6, 11
(2008).
15. Y.J. Choi, Y.J. Kim, J.W. Lee, Y. Lee, Y. Lim, H.W.
Chung, J. Nanosci Nanotechnol., 12 (3), 2160 (2012).
16. E.M. Boatman, G.C. Lisensky, J. Chem. Edu.,
82(11), 1697 (2005).
17. K.B. Gavazov, M. Türkyılmaz, Ö. Altun, Bulg.
Chem. Commun., 40(1), 65 (2008).
18. O. Altun, E. Dolen, M. Pekin, H. Aboul-Enein, Ins.
Sci. Technol., 31(1), 15 (2003).
19. O. Altun, H. Akbaş, E. Dolen, Spectrochim. Acta
Part A, 66(2), 499 (2007).
20. O. Altun, S. Bilcen, Spectrochim. Acta Part A,
75(2),789 (2010).
21. O. Altun, C. Küçüktepe, O. Yörük, A.F eyizoğlu,
Synt React. Inorg.Metal-Org. Nano-Metal Chem.,
43(3), 221 (2013).
22. K.J. Laidler, Chemical Kinetics, Harper & Row
Publishers, New York, 1987.
23. H.W. Dudley, I. Fleming, Spectroscopic Methods in
Organic Chemistry, Mc Graw-Hill Book Co Ltd,
London, 1987.
Ö. Altun, N. Becenen: CdSe nanometerials: kinetics, thermodynamics, antioxidant activity and application to Denim fabric
316
24. J.W. Moore, R.G. Pearson, Kinetic and Mechanism,
John Wiley&Sons, New York, 1981.
25. H. Lignert, K. Vallentin, C.Eriksson, J. Food
Process. Preserv., 3, 87 (1979).
26. K. Shimada, K. Fujikawa, K. Yahara, T. Nakaura, J.
Agric. Food Chem., 40, 945 (1992).
27. B. Tanti, A.K. Buragohain, L. Guring, D. Kakati,
A.K. Das, S.P. Borad, IJNPR, 1(1), 17 (2010).
28. A. Choudhary, R. Sharma, M. Nagar, M. Mohsin,
H.S. Meena, J. Chil. Chem. Soc., 56(4), 911 (2011).
29. K.L. Edwards, Mater. Des., 19(1), 1 (1998).
30. N. Gokarneshan, P.P. Gopalakrishnan, B. Jeyanthi,
Int. J. Basic Appl. Chem. Sci., 2(2), 8 (2012).
31. D.T.W. Chun, G.R. Gamble, J. Cotton Sci.,11, 154
(2007).
32. R. Rajendran, C. Balakumar, J. Kalaivani, R.
Sivakumar, J. Text. Apparel Technol. Manage, 7(2), 1
(2011).
33. S. Agnihotri, S. Mukherji, RSC Adv., 4, 3974 (2014).
НАНОМАТЕРИАЛИ ОТ CdSe: КИНЕТИКА, ТЕРМОДИНАМИКА, АНТИОКСИДАНТНА
АКТИВНОСТ И ПРИЛОЖЕНИЕ В DENIM-ТЪКАНИТЕ
Й. Алтун*, Н. Бедженен
Тракийски университет, Департамент по химия, 22030 Одрин, Турция
Постъпила на 8 август, 2015 г.; коригирана на 10 септември, 2015г.
(Резюме)
За пръв път са изследвани кинетиката и термодинамиката на наноматериали от CdSe с помощта на
спектрални методи. Допълнително са изследвани антиоксидантната и антимикробната активност на CdSe –
наноматериалите нанесени върху denim-текстил. Определени са активиращата енергия (Ea) и дрги
термодинамични параметри (ΔS, ΔH и ΔG) с помощта на измервания на абсорбционни спектри. Изследванията
показват, че процесът е ендотермичен и не е спонтанен по време на активирането. Наличието на наночастици
върху denim-тъканитее потвърдено със сканираща електронна микроскопия (SEM). Импрегнираните с
наночастици от CdSe denim-тъкани (100% памук) показват отлична антибактериална активност спрямо
бактериите Staphylococcus.

317
Bulgarian Chemical Communications, Volume 48, Number 2 (pp. 317 – 322) 2016
Effect of 6-hydroxy-7,4’-dimethoxyflavone on antidiabetic effects in normal and
streptozotocin-induced diabetic rats
H. I. Moon1,*, D. W. Kim2, S. K. Kim3, S. H. Seo1
1Department of Medicinal Biotechnology, Dong-A University, Busan 604-714, Republic of Korea. 2National Institute of Animal Science, RDA, Wanjugun 565-851, Republic of Korea
3Department of Animal Science and Technology, Konkuk University, Seoul 143-701, Republic of Korea
Received September 4, 2015; Revised October 25, 2015
Kaempferia parviflora is a famous endemic Thailand species of the family Zingiberaceae. MeOH extract of
Kaempferia parviflora was consecutively partitioned with organic solvents such as CHCl3 EtOAc and BuOH. CHCl3
fractions were diluted with distilled water and extracted with n-hexane and CH2Cl2. Five methoxyflavone compounds
were isolated from the CH2Cl2 fractions with column chromatography. The structures of the isolated compounds were
identified as 3,5,7,3’,4’-pentamethoxyflavone (KP1), 5,7-dimethoxyflavone (KP2), 5,7,4’-trimethoxyflavone (KP3),
3,5-dihydroxy-3’-methoxyflavone (KP4) and 6-hydroxy-7,4’-dimethoxyflavone (KP5) by 1D H-NMR spectral analysis
and comparison of spectral data with literature values. KP5 showed significant hypoglycemic activity in streptozotocin-
induced diabetic rats for 28 days. It significantly decreased the serum glucose and triglycerides while it increased the
serum insulin in diabetic rats but not in normal rats (p < 0.05; at doses of 50, 100 and 150mg/kg for 28 days). It had no
effect on C-peptide (ECLIA). Further structure-activity relationships of position 6 in the aromatic ring B will be
reported in due course.
Keywords: Kaempferia parviflora, α-glucosidase inhibitory activity, streptozotocin-induced diabetic rats,
methoxyflavone
INTRODUCTION
Kaempferia parviflora (KP) is a species of the
genus Kaempferia which involves 35 species and
belongs to the family of Zingiberaceae. There are
indigenes in Thailand which are spread in Loei,
Pitsanulok and Phetchabun. They are called kra-
chai-dum or Thai black ginger [1]. KP is a plant
that grows relatively low to the ground. It is a
understory plant which has short fleshy rhizomes
dark purple in colour, tuberous roots, straight and
curved leave ends and white with violet small
blooms under the leaves [2]. KP extracts in ethanol
or methanol are effective to visceral fat
accumulation, hyperinsulinemia, glucose
intolerance, hypertension, diabetes, antiobesity,
peripheral neuropathy, anti-gastric ulcer and
Alzheimer's disease [3]. 5,7,4’-Trimethoxyflavone
and 5,7,3’4’-tetramethoxyflavone display
antiplasmodial activity; 3,5,7,4’-methoxyflavone
has antifungal and low-level antimycobacterial
activity [4]; 5,7-dimethoxyflavone affects
multidrug resistance associated proteins (MRP) -
mediated transport in A549 cells [5]. Among the
structures, the 5,7-methoxy groups lead to
significant inhibitory activity while the 5-hydroxy
group decreases the inhibitory activity. Non-
insulin-dependent diabetes mellitus (NIDDM) is
one of the main adult diseases [6]. Type 1 leads to
destruction of the pancreatic langerhans β-cells
producing insulin. Type 2 is a secretory decrease in
insulin from pancreatic langerhans β-cells or
lowering of insulin resistance due to excess glucose
absorption [7]. Hyperglycemia and hyperlipidemia
are involved in the development of microvascular
and macrovascular complications of diabetes,
which are the major causes of morbidity and
mortality due to diabetes [8]. The current study
describes the isolation of five methoxyflavones
from Kaempferia parviflora. In the context of our
natural product chemistry program dealing with the
development of new potent antidiabetic agents, we
examined the 6-hydroxy-7,4’-dimethoxyflavone as
a lead for novel antidiabetic agents.
MATERIALS AND METHODS
General experimental procedures
1H NMR spectra were recorded with an Agilent
MR 400 DD2 400MHz spectrometer in CDCl3 and
DMSO-d6 solution and chemical shifts (δ) are
reported as parts per million (ppm). Coupling
constant (J) is reported in hertz (Hz). Melting points
were measured using a Fisher‑Johns melting point * To whom all correspondence should be sent:
E-mail: [email protected]
2016 Bulgarian Academy of Sciences, Union of Chemists in Bulgaria

H.I. Moon et al.: Effect of 6-hydroxy-7,4’-dimethoxyflavone on antidiabetic effects in normal and …
318
apparatus and are uncorrected. Column
chromatography was conducted using silica gel 60
(40‑63 and 63‑200 μm particle size, Merck) and
RP‑18 (40‑63 μm particle size, Merck)
Plant Material
Kaempferia parviflora rhizomes were kindly
provided by Professor Kim Soo-Ki from the
Animal Sciences Department of Konkuk
University. The rhizomes of Kaempferia parviflora
were identified by Prof. Hyung-In Moon. A
voucher specimen (No.2012-0405) has been
deposited in the Herbarium of the Dong-A
University (Busan, South Korea).
Extraction and fractionation
The rhizomes of Kaempferia parviflora (5 kg)
were sliced. Reflux extraction was performed with
9 L of MeOH, three times at 5℃. The MeOH
extracts (198 g) were combined and concentrated in
vacuo at 40℃. The MeOH extract was diluted with
distilled water (0.9 L) and then partitioned with
CHCl3 (0.6 L×3). CHCl3-soluble part was
evaporated (84.3 g) and diluted with distilled water
(1L). CHCl3-soluble part, diluted with distilled
wáter, was partitioned with n-hexane (0.9 L×3),
CH2Cl2 (0.7 L×3), EtOAc (0.8 L×3) and BuOH (0.8
L). The CH2Cl2 extract (49 g) was separated by
silica gel column chromatography. A mobile
gradient (from 30:1 to 0:1 v/v) was used and 12
fractions were obtained (K1-K12). The mobile
phase for K1 to K8 was CHCl3:MeOH (30:1 v/v).
For K9 CHCl3:MeOH (10:1 v/v) was used. For K10
and K11 CHCl3:MeOH (5:1 v/v) was used. For K12
CHCl3:MeOH (1:1 v/v) was used. All fractions
were recrystallized at -20℃ from MeOH. Each
recrystallized fraction was separated by filtering.
The recrystallized compounds were dried at room
temperature and the MeOH-soluble fractions were
evaporated at 40℃. KP1 (5.6 g) was recrystallized
from the K5 fraction. KP2 (3 g) was recrystallized
from the K6 fraction. KP3 (2.7g) was recrystallized
from the K4 fraction. K2 crystal fraction was
separated by silica gel column chromatography.
KP4 (2.16 g) was isolated from the K2 crystal
fraction (6 g) with silica gel column
chromatography using CHCl3 as mobile phase. K8
crystal fraction (288 mg) was separated by
Sephadex-LH20 column chromatography using
100% MeOH as mobile phase. KP5 was obtained
from the K8 crystal fraction.
KP1: Bright yellow powder, 1H-NMR (CDCl3,
300MHz) δ: 7.82 (1H, d, 5’-H), 6.99(1H, d, 6’-H),
6.62 (1H ,s , 2’-H), 6.56 (1H, s, 6-H), 6.37 (1H, s,
8-H), 3.95 (3H, s, OCH3), 3.91 (3H, s, OCH3), 3.88
(3H, s, OCH3), 3.77 (3H, s, OCH3), 3.49 (3H, s,
OCH3)
KP2: Bright yellow powder, 1H-NMR (CDCl3,
300MHz) δ: 7.84 (2H, d, 2’ and 6’-H), 7.51 (2H, t,
4’-H), 7.00 (2H, t, 3’ and 5’-H), 6.70 (H, s, 3-H),
6.57 (H, s, 6-H), 6.39 (H, s, 8-H), 3.96 (3H, s,
OCH3), 3.92 (3H, s, OCH3)
KP3: Bright yellow powder, 1H-NMR (CDCl3,
300MHz) δ: 7.71 (2H, d, 2’ and 6’-H), 6.98 (2H, d,
3’ and 5’-H), 6.77 (1H, s, 3-H), 6.51 (1H, s, 6-H),
6.35 (1H, s, 8-H), 3.96 (3H, s, OCH3), 3.91 (3H, s,
OCH3), 3.88 (3H, s, OCH3)
KP4: Yellow powder, 1H-NMR (CDCl3,
300MHz) δ: 12.75 (1H, s, OH), 12.60 (1H, s, OH),
8.09 (1H, t, 5’-H) 7.92, (1H, d, 6’-H), 7.57 (1H, s,
2’-H), 7.54 (1H, d, 4’-H), 6.53 (1H, d, 8-H), 6.48
(1H, d, 6-H), 6.40 (1H, t, 7-H), 3.90(3H, s, OCH3)
KP5: Yellow powder, 1H-NMR (CDCl3,
300MHz) δ: 10.20 (1H, s, OH), 7.88 (2H, d, 2’ and
6’-H), 6.90 (2H, d, 3’ and 5’-H), 6.83 (1H, s, 3-H),
6.58 (1H, s, 5-H), 6.50 (1H, s, 8-H), 3.89 (3H, s,
OCH3), 3.82 (3H, s, OCH3)
α-Glucosidase inhibitory activity assay
The α-glucosidase inhibitory activity of
compounds KP 1~5 was measured. The inhibitory
assay was done by the chromogenic method with a
slight modification. α-Glucosidase from
saccharomyces cerevisiae (10 µg/ml, 14 U/mg,
sigma) was dissolved in 100 mM phosphate buffer
(PB, pH 7.0) containing 0.2% BSA and 0.02%
NaN3 and was used as an enzyme solution. 4-
Nitrophenyl-α-D-glucopyranoside (Sigma, 5 mM)
in the same buffer (pH 7.0) was used as a substrate
solution. The enzyme solution (90 µl) contained
concentrations of 0, 20, 40, 80, 100 µM of KP
compounds, respectively, (18 µl) of the tested
materials was mixed in a well of a microtiter plate
and measured for titer (415 nm) at zero min with a
microplate reader. After incubation for 5 min, the
substrate solution (90 µl) was added and the
reaction was carried out at room temperature for 5
min. The increase in absorbance from zero time
was measured.
Animals
Adult male Wistar rats with body weights of
200-250 g were purchased from the Korea
SAMTAKO CO., LTD (Kyunggido, South Korea),
housed in specific pathogen-free facilities and
provided with autoclaved water and standard food.
The animals were housed at a controlled
temperature (20-22ºC) and relative humidity (55%-

H.I. Moon et al.: Effect of 6-hydroxy-7,4’-dimethoxyflavone on antidiabetic effects in normal and …
319
59%), with a normal 12-hour light-and-dark cycle.
All experiments conducted on mice were in
accordance with the guidelines for the care and use
of laboratory animals approved by Dong-A
University.
Experimental induction of diabetes in rats
Male adult Wistar rats were injected with
streptozotocin (STZ). Streptozotocin was dissolved
in saline immediately before use and injected
intraperitoneally (i.p.) in a single dose of 250 mg/
kg. Five days after injection, rats with fasting blood
glucose higher than 180 mg/dL were used for the
experiments. Ten rats were used in each
experiment. Each animal was used once. The food
was removed from the cages 12 hours before
testing. Streptozotocin (purity 99%) was purchased
from Sigma Co. The volume of the above three
doses was kept constant at 1 mL.
Drug administration
KP1~5 were suspended in acacia gum with
saline and administered orally through orogastric
tubes at doses of 50, 100 and 150 mg/kg body wt.
The volume of the above three doses was kept
constant at 1 mL.
Experimental design
In the experiment, a total of 60 rats (50 diabetic
rats, 10 normal rats) were used. Diabetes was
induced in rats 5 days before starting the treatment.
The rats were divided into nine groups, each group
involving six rats.
Group I: Normal control rats administered i.p.1
mL acacia gum with saline daily, for 28 days using
an intragastric tube.
Group II: Control drug rats administered i.p. 1
mL acacia gum with Metformin (250 mg/kg) daily,
for 28 days using an intragastric tube.
Group III: Diabetic control rats administered i.p.
1 mL acacia gum with STZ (250 mg/kg), for 28
days using an intragastric tube.
Group IV: Diabetic control rats administered
i.p. KP5 (50 mg/kg bw) in 1 mL acacia gum with
saline daily, for 28 days using an intragastric tube.
Group V: Diabetic rats administered i.p. KP5
(100 mg mg/kg bw) in 1 mL acacia gum with saline
daily, for 28 days using an intragastric tube.
Group VI: Diabetic rats administered i.p. KP5
(150 mg mg/kg bw) in 1 mL acacia gum with saline
daily, for 28 days using an intragastric tube.
Biochemical assays
Biochemical assays of male adult Wistar rats
were performed using a modified method of Eidi
[9]. After 28 days of treatment, blood samples were
drawn from the heart. Serum glucose, insulin,
triglycerides and C-peptide levels were determined.
The serum insulin was estimated by using a
radioimmunoassay kit (Diasorin, Italy) and the
triglycerides by the method of Rifai [10].
Statistical analysis
All data were expressed as mean ± SEM. Statistical
analysis was carried out using one way ANOVA
followed by the Tukey post hoc test. The criterion
for statistical significance was p < 0.05.
RESULTS AND DISCUSSION
The current study describes the isolation of five
methoxyflavones from Kaempferia parviflora.
Molecular structures were determined through a
combination of spectroscopic analyses, including 1H nnuclear magnetic resonance (NMR), mass
spectrometry (MS) data, and literature data. The
effects of the isolated compounds (0-100 μM) on
the inhibition of the α-glucosidase based assay are
reported here. Compound KP1 was obtained as a
bright yellowish amorphous powder. It was
detected as a bright yellow color on TLC when
visualized with 5% sulfuric acid spray reagent. In
the 1H NMR (CDCl3) spectra of KP1, typical
aromatic ring signals were observed, as well as five
methoxy singlet signals of the 3,5,7,3’,4’ position
methoxy groups. The five singlet signals at δ 3.49
to δ 3.95 indicated methoxy groups. Compound
KP2 was obtained as a yellow amorphous powder.
It was detected as a bright yellow color on TLC
when visualized with 5% sulfuric acid spray
reagent. In the 1H NMR (CDCl3) spectra of KP2
aromatic ring signals and two methoxy signals were
observed. Two methoxy signals were indicated at δ
3.92 and δ 3.96. Compound KP3 was obtained as a
yellow-white amorphous powder. It was detected as
a bright yellow color on TLC when visualized with
5% sulfuric acid spray reagent. 1H NMR (CDCl3)
spectra of KP3 indicated the presence of 5,7,4’
substituted methoxy group protons at δ 3.88, δ 3.91
and δ 3.96 signals and typical aromatic ring signals
were observed at δ 8.1 to δ 6.3. Compound KP4
was obtained as a bright yellow amorphous powder.
It was detected as a yellow color on TLC when
visualized with 5% sulfuric acid spray reagent. 1H
NMR (CDCl3) spectra of KP4 indicated aromatic
ring signals, two hydroxyl and one methoxy signal.
Two hydroxy signals and one methoxy signal were
indicated at δ 12.60, δ 12.75 and δ 3.90. Two
hydroxy groups were indicated at 3,5 position and
one methoxy group at 3’ position. Compound KP5
was obtained as a white amorphous powder. It was
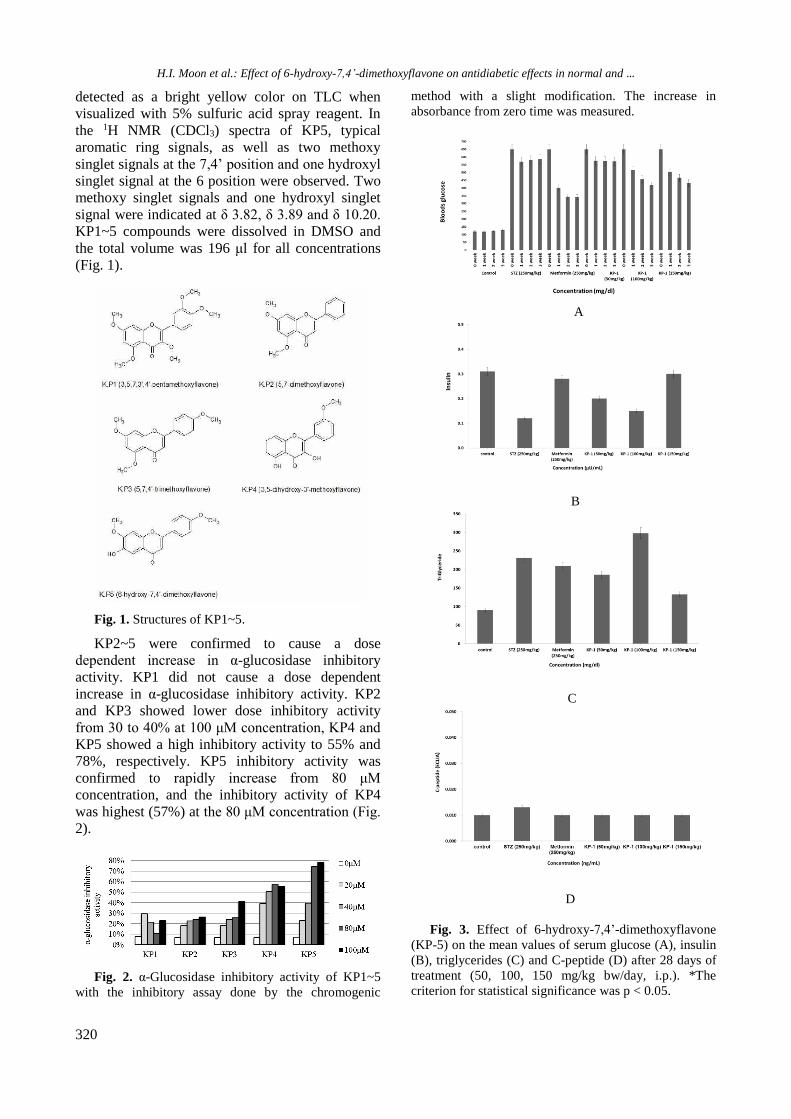
H.I. Moon et al.: Effect of 6-hydroxy-7,4’-dimethoxyflavone on antidiabetic effects in normal and …
320
detected as a bright yellow color on TLC when
visualized with 5% sulfuric acid spray reagent. In
the 1H NMR (CDCl3) spectra of KP5, typical
aromatic ring signals, as well as two methoxy
singlet signals at the 7,4’ position and one hydroxyl
singlet signal at the 6 position were observed. Two
methoxy singlet signals and one hydroxyl singlet
signal were indicated at δ 3.82, δ 3.89 and δ 10.20.
KP1~5 compounds were dissolved in DMSO and
the total volume was 196 μl for all concentrations
(Fig. 1).
Fig. 1. Structures of KP1~5.
KP2~5 were confirmed to cause a dose
dependent increase in α-glucosidase inhibitory
activity. KP1 did not cause a dose dependent
increase in α-glucosidase inhibitory activity. KP2
and KP3 showed lower dose inhibitory activity
from 30 to 40% at 100 μM concentration, KP4 and
KP5 showed a high inhibitory activity to 55% and
78%, respectively. KP5 inhibitory activity was
confirmed to rapidly increase from 80 μM
concentration, and the inhibitory activity of KP4
was highest (57%) at the 80 μM concentration (Fig.
2).
Fig. 2. α-Glucosidase inhibitory activity of KP1~5
with the inhibitory assay done by the chromogenic
method with a slight modification. The increase in
absorbance from zero time was measured.
A
B
C
D
Fig. 3. Effect of 6-hydroxy-7,4’-dimethoxyflavone
(KP-5) on the mean values of serum glucose (A), insulin
(B), triglycerides (C) and C-peptide (D) after 28 days of
treatment (50, 100, 150 mg/kg bw/day, i.p.). *The
criterion for statistical significance was p < 0.05.
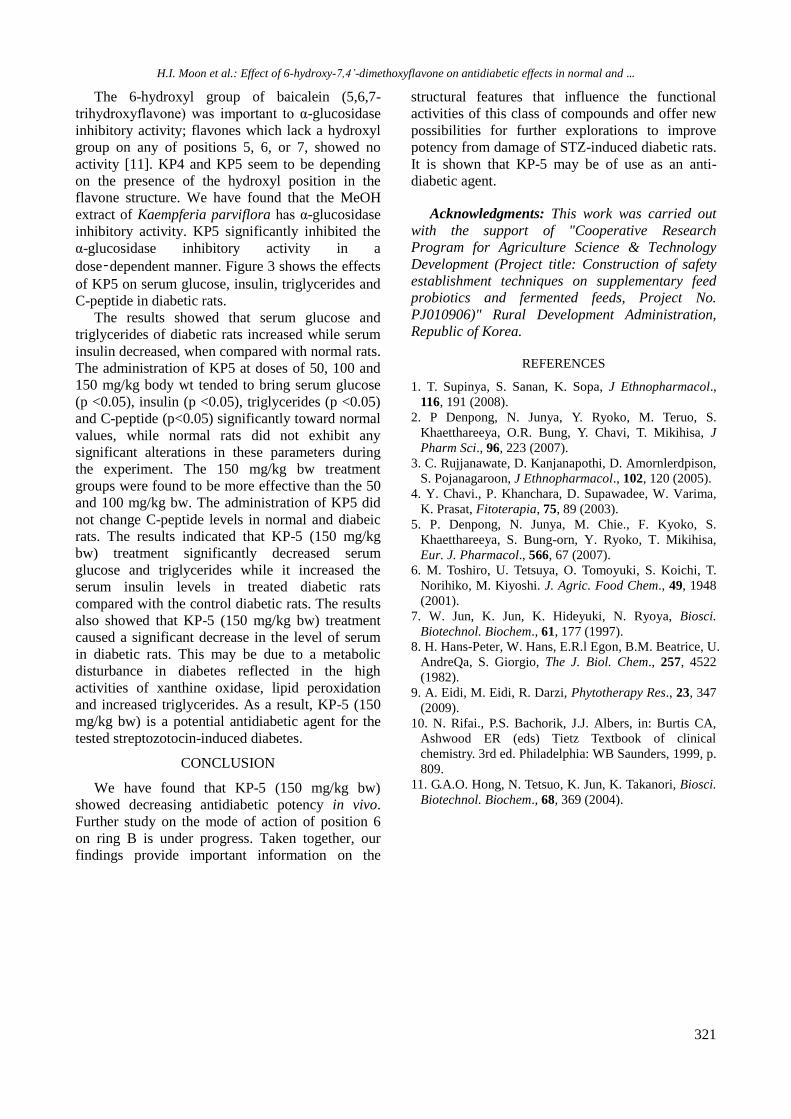
H.I. Moon et al.: Effect of 6-hydroxy-7,4’-dimethoxyflavone on antidiabetic effects in normal and …
321
The 6-hydroxyl group of baicalein (5,6,7-
trihydroxyflavone) was important to α-glucosidase
inhibitory activity; flavones which lack a hydroxyl
group on any of positions 5, 6, or 7, showed no
activity [11]. KP4 and KP5 seem to be depending
on the presence of the hydroxyl position in the
flavone structure. We have found that the MeOH
extract of Kaempferia parviflora has α-glucosidase
inhibitory activity. KP5 significantly inhibited the
α-glucosidase inhibitory activity in a
dose‑dependent manner. Figure 3 shows the effects
of KP5 on serum glucose, insulin, triglycerides and
C-peptide in diabetic rats.
The results showed that serum glucose and
triglycerides of diabetic rats increased while serum
insulin decreased, when compared with normal rats.
The administration of KP5 at doses of 50, 100 and
150 mg/kg body wt tended to bring serum glucose
(p <0.05), insulin (p <0.05), triglycerides (p <0.05)
and C-peptide (p<0.05) significantly toward normal
values, while normal rats did not exhibit any
significant alterations in these parameters during
the experiment. The 150 mg/kg bw treatment
groups were found to be more effective than the 50
and 100 mg/kg bw. The administration of KP5 did
not change C-peptide levels in normal and diabeic
rats. The results indicated that KP-5 (150 mg/kg
bw) treatment significantly decreased serum
glucose and triglycerides while it increased the
serum insulin levels in treated diabetic rats
compared with the control diabetic rats. The results
also showed that KP-5 (150 mg/kg bw) treatment
caused a significant decrease in the level of serum
in diabetic rats. This may be due to a metabolic
disturbance in diabetes reflected in the high
activities of xanthine oxidase, lipid peroxidation
and increased triglycerides. As a result, KP-5 (150
mg/kg bw) is a potential antidiabetic agent for the
tested streptozotocin-induced diabetes.
CONCLUSION
We have found that KP-5 (150 mg/kg bw)
showed decreasing antidiabetic potency in vivo.
Further study on the mode of action of position 6
on ring B is under progress. Taken together, our
findings provide important information on the
structural features that influence the functional
activities of this class of compounds and offer new
possibilities for further explorations to improve
potency from damage of STZ-induced diabetic rats.
It is shown that KP-5 may be of use as an anti-
diabetic agent.
Acknowledgments: This work was carried out
with the support of "Cooperative Research
Program for Agriculture Science & Technology
Development (Project title: Construction of safety
establishment techniques on supplementary feed
probiotics and fermented feeds, Project No.
PJ010906)" Rural Development Administration,
Republic of Korea.
REFERENCES
1. T. Supinya, S. Sanan, K. Sopa, J Ethnopharmacol.,
116, 191 (2008).
2. P Denpong, N. Junya, Y. Ryoko, M. Teruo, S.
Khaetthareeya, O.R. Bung, Y. Chavi, T. Mikihisa, J
Pharm Sci., 96, 223 (2007).
3. C. Rujjanawate, D. Kanjanapothi, D. Amornlerdpison,
S. Pojanagaroon, J Ethnopharmacol., 102, 120 (2005).
4. Y. Chavi., P. Khanchara, D. Supawadee, W. Varima,
K. Prasat, Fitoterapia, 75, 89 (2003).
5. P. Denpong, N. Junya, M. Chie., F. Kyoko, S.
Khaetthareeya, S. Bung-orn, Y. Ryoko, T. Mikihisa,
Eur. J. Pharmacol., 566, 67 (2007).
6. M. Toshiro, U. Tetsuya, O. Tomoyuki, S. Koichi, T.
Norihiko, M. Kiyoshi. J. Agric. Food Chem., 49, 1948
(2001).
7. W. Jun, K. Jun, K. Hideyuki, N. Ryoya, Biosci.
Biotechnol. Biochem., 61, 177 (1997).
8. H. Hans-Peter, W. Hans, E.R.l Egon, B.M. Beatrice, U.
AndreQa, S. Giorgio, The J. Biol. Chem., 257, 4522
(1982).
9. A. Eidi, M. Eidi, R. Darzi, Phytotherapy Res., 23, 347
(2009).
10. N. Rifai., P.S. Bachorik, J.J. Albers, in: Burtis CA,
Ashwood ER (eds) Tietz Textbook of clinical
chemistry. 3rd ed. Philadelphia: WB Saunders, 1999, p.
809.
11. G.A.O. Hong, N. Tetsuo, K. Jun, K. Takanori, Biosci.
Biotechnol. Biochem., 68, 369 (2004).

322
H.I. Moon et al.: Effect of 6-hydroxy-7,4’-dimethoxyflavone on antidiabetic effects in normal and …
ЕФЕКТ НА 6-ХИДРОКСИ-7,4’-ДИМЕТОКСИФЛАВОН ВЪРХУ АНТИДИАБЕТИЧНИТЕ
ПРОЯВИ ПРИ НОРМАЛНИ ПЛЪХОВЕ И ТАКИВА С СТРЕПТОЗОТОЦИН-ИНДУЦИРАН
ДИАБЕТ
Х. И. Мун1*, Д. В. Ким2, С. К. Ким3, С. Х. Сео1
1 Департамент по медицинска биотехнология, Университет Донг-А, Бусан 604-714, Република Корея 2 Национален институт по зоологически науки, Ванджугун 565-851, Република Корея
3 Департамент по животновъдни науки и технологии, Университет Конкук, Сеул 143-701, Република Корея
Получена на 4 септември, 2015 г.; коригирана на 25 октомври, 2015 г.
(Резюме)
Kaempferia parviflora е известно ендемично тайландско растение от семейство Zingiberaceae. Неговите
метанолови екстракти последователно се разделят с органични разтворители, като CHCl3 EtOAc и BuOH.
Хлороформените фракции се разреждат с дестилирана вода и се екстрахират с n-хексан и метиленхлорид. От
фракцията с метилен хлорид са изолирани пет метоксифлавонови съединения с помощта на колонна
хроматография. Структурите на изолираните съединения са идентифицирани като 3,5,7,3’,4’-
пентаметоксифлавон (KP1), 5,7-диметоксифлавон (KP2), 5,7,4’-триметоксифлавон (KP3), 3,5-дихидрокси-3‘-
метоксифлавон (KP4) и 6-хидроксиy-7,4’-диметоксифлавон (KP5) чрез 1D H-ЯМР спектрален анализ и
сравнение с литературни данни.
KP5 проявява значителна хипогликемична активност при плъхове със стрептозотоцин-индуциран
диабет в продължение на 28 дни. Той намалява значително серумната глюкоза и триглицеридите, докато
повишава серумния инсулин при диабетичните плъхове, но не и при нормалните плъхове (p < 0.05, при дози от
50, 100 и 150mg/kg за 28 дни). Препаратът няма ефект върху C-пептидите (ECLIA). Следващата зависимост
между структура и активност на позиция 6 в ароматния пръстен B ще бъде съобщен в близко време.

323
Bulgarian Chemical Communications, Volume 48, Number 2 (pp. 323– 331) 2016
Fluorocarbon nanostructures (PFOB-NEP) as camel milk lactoferrin and its anti-cancer effects on human breast cancer cell line MCF7
H. R. I. Keykanlu1, S. Zibaei 2*, M. Ardjmand3, A. A. Safekordi 4
1Department of Chemical Engineering, Science and Research Branch, Islamic Azad University, Tehran, Iran 2Razi Institute, Ministry of Jahad-e-Keshavarzi, Mashhad, Iran
3Department of Chemical Engineering, South Tehran Branch, Islamic Azad University, Tehran, Iran 4Department of Chemical Engineering, Sharif University of Technology, Tehran, Iran
Received January 5, 2016, Accepted January 14, 2016
Given the prevalence of cancer in the world, it is important to find new drugs for its treatment. Despite great
advances in cancer treatment, a significant tendency for new anticancer agents due to the increased resistance of cancer
cells to anticancer drugs is currently being expanded.
In this research the biological properties of lactoferrin (LF) from camel milk were studied and attempt was made to
provide a way for preserving the three-dimensional structure of LF and increasing LF life resulting in preventing its
denaturation by proteolysis via loading it on perfluorooctyl bromide nanoemulsion particles (PFOB-NEP). LF was
extracted from camel milk by ion-exchange chromatography (carboxymethyl Sephadex C-50 resin) and its purity was
confirmed by SDS-PAGE. Due to the biologically inert, chemically stable, non-biodegradable, nontoxic and nonvolatile
properties of perfluorocarbon, PFOB-NEP was prepared using an oil-in-water emulsion method (O/W). LF was loaded
onto the NEPs, then its characteristics and anti-cancer effects on human breast cancer cell line MCF7 were evaluated.
According to the results, LF accession to NEPs was proved by circular dichroism and tryptophan fluorescence
spectroscopy methods. The entrapment efficiency of LF into NEPs was about 91%. The mean diameter of the NEPs did
not change after accession of LF (~ 100 nm) and the zeta potential of the NEPs was increased from –18.43 mV (without
LF) to 21.61 mV (110.68µg/mL LF).
Keywords: Lactoferrin, Perfluorooctyl bromide (PFOB), Nanoemulsion Particles (NEP), Oil-in-water Emulsion,
Camel Milk, Circular Dichroism (CD).
INTRODUCTION
Camel milk and cow milk are different in
chemical composition, but in general camel milk
contains all essential micronutrients that are found
in cow milk including whey proteins such as LF
and immunoglobulin [1]. Camel milk generally has
white and opaque color, it has a sweet and sharp
taste, but sometimes, depending on the eaten plant
in the desert by the camel, it may be prone to
salinity [2]. Because of the higher salt and lactose
content of camel milk, its freezing point is lower
than that of cow milk (between -0.57˚C and -
0.61˚C). Camel milk is slightly higher in lactose
content than cow milk. However, levels of
potassium, magnesium, iron, copper, manganese,
sodium and zinc are higher than in cow milk.
Camel milk has anti-cancer, anti-diabetic,
antimicrobial and hypoallergic properties for which
LF, immunoglobulins, lysozyme or vitamin C play
a major role among its compounds [3]. LF, also
named lactotransferrin, is a glycoprotein of the
transferrin family with a molecular weight of about
80 kDa [4]; the molecular weight of LF purified
from camel milk was determined as 79.5 kDa and
75.3 kDa.
The concentration of camel milk LF (0.22
mg/mL) is about 2.44 times that of cow milk LF,
and the concentration of camel milk colostrum LF
was reported about 5.1 mg/mL on the second day
after parturition, while its content in cow milk
colostrum is about 0.5 mg/mL [4].
Camel milk LF concentration in the first week
after parturition varied from 1.422 to 0.586 mg/mL
[5,6].
This protein consists of a single polypeptide
chain containing 703 amino acids that are folded
into two globular lobes. These lobes, also called C
– (carboxy) and N – (amino) terminal regions, are
connected with an α-helix. Each lobe consists of
two domains known as C1, C2, N1, and N2. The
domains create one iron binding site on each lobe
(Fig. 1) [7,8]. LF has the ability to combat bacteria
(Gram+ and Gram−), yeast, fungi, viruses, and
parasites [9]. Due to the wide distribution of LF in
various tissues and the positive charge on its * To whom all correspondence should be sent:
E-mail: [email protected]
2016 Bulgarian Academy of Sciences, Union of Chemists in Bulgaria

H. R. I. Keykanlu et al.: Fluorocarbon nanostructures (PFOB-NEP) as camel milk lactoferrin and its anti-cancer effects on …
324
network, this protein is a multi-functional protein
[10,11].
LF has been identified in blood, tears, saliva,
vaginal fluids, semen, nasal and bronchial
secretions, bile, gastrointestinal fluids, urine,
mucous secretions, secretions from exocrine glands
and in specific granules of neutrophils [7,12,13]. A
high amount of LF is present in milk and colostrum
(7 g/L) [14,15]. LF is also found in fish and egg
yolks [16].
LF is used in feed, food and pharmaceuticals. It
exhibits anti-inflammatory and anticarcinogenic
activities and has several enzymatic functions
[17,18]. At higher concentrations of LF, it was
found to act as a pro-oxidant [18].
Antibacterial activity [19] of LF is effected by
two mechanisms: (1) LF at the site of infection
keeps out of reach iron which is a nutrient for the
organism, thus LF shows a bacteriostatic effect; (2)
direct interaction of LF with infectious
microorganisms [20]. The peptide lactoferricin
(LFcin) released from LF by pepsin proteolysis
under acidic conditions exhibits higher
antimicrobial activity than LF [21]. LFcinB
displays in vitro cytotoxic activity versus various
types of mouse and human cancer cell lines,
including leukemia cells, fibrosarcoma cells,
various carcinomas, and neuroblastoma cells
[22,23]. LF is the only transferrin, which is able to
maintain iron in a wide range of pH even if pH is
too acidic. It is also resistant to proteolysis [17]. LF
is able to stop the growth of cancer cells through
the inhibition of cell proliferation by altering the
expression or activity of regulatory proteins, and
through activation of natural killer cells. It inhibits
tumor growth through the activation of apoptosis
(programmed cell death) [7,24]. LF can be used to
increase the anti-cancer effect of anti-cancer drugs
such as apotransferrin. Kishore Golla et al.
evaluated the effect of doxorubicin loaded
apotransferrin and LF nanoparticles (apodoxonano
or lactodoxonano) in the drug orally for
hepatocellular carcinoma treatment (HCC) in rats.
Apodoxonano and lactodoxonano in comparison to
doxo showed improved efficacy, bioavailability and
safety [25]. LF is an iron-binding glycoprotein with
antihypertensive properties [26]. It is available as a
commercial extract from bovine milk and offers
potential as a therapeutic intervention for preterm
infants modulating infections and intestinal
pathologies [27].
According to the research done about the effect
of human, bovine, sheep and camel milk LF on the
C hepatitis virus it was found that camel milk LF
had the highest effect [28].
LF extracted from milk can be marketed as a
food supplement. In addition, it has a great
potential in the field of biomedicine. The structure
of this protein as of other proteins is fragile, so a
small change in the structure may reduce its
activity. Lipid-based carriers which are produced
by self-assembly have become favorite for a broad
scientific and commercial usage as carriers for the
delivery of peptides and proteins during the past
few years [10,29]. A way to avoid denaturation by
proteolysis and dilution effect is to trap proteins or
peptides in nanopores (or coating) until this action
causes a reduction in water activity and thus helps
to their stability in storage [30]. Nanoliposomes
may be fit for oral administration of LF and could
be a useful approach for LF availability to tumor
cells [31]. Its three-dimensional structure has been
attempted via nanoencapsulation within lipid
nanovesicles, integrating a multiple water-in-oil-in-
water emulsion [10]. The production of
biocompatible nanoemulsions can also help to it.
Since perfluorocarbons (PFCs) are biologically
inert, chemically stable, nonbiodegradable,
nontoxic and nonvolatile, they can produce
biocompatible nanoemulsions. Specifically,
perfluorooctyl bromide (PFOB) is mostly used due
to its low vapor pressure helping to reduce
pulmonary emphysema [32-34]. PFOB is used as
an ultrasound contrast agent [35]. The biological
half-lives were estimated to be 12 days (PFOB)
[36]. In vivo sensitivity for inflammation imaging
was assessed using the ear clip injury model. The
result of this test for PFOB provided 37%. In the
present study, perfluorocarbon NEPs were
formulated for LF loading, and the optimum
nanostructure characteristics were found. The
nanostructure particle size was analyzed and the
particle size distribution, charge, as well as the
surface morphology were determined. The obtained
results showed the proper incorporation of LF into
NEP.
MATERIALS AND METHOD
Bioactive protein: camel milk was obtained
from Torkaman Sahra located in the northeast parts
of Iran and stored at -20˚C until needed. The
bioactive LF (purity: >85%) from bovine whey was
purchased from Sigma-Aldrich (USA). Chemicals
and biochemicals: perfluorooctyl bromide (PFOB)
99%, carboxymethyl Sephadex C-50 resin, soybean
phosphatidylcholine (lecithin), dipalmitoyl-sn-
glycero-3-phosphoethanolamine (DPPE, assay:
>99%) were purchased from Sigma-Aldrich (USA).
Other chemicals and biochemicals including protein
marker 26612 were purchased from Thermo
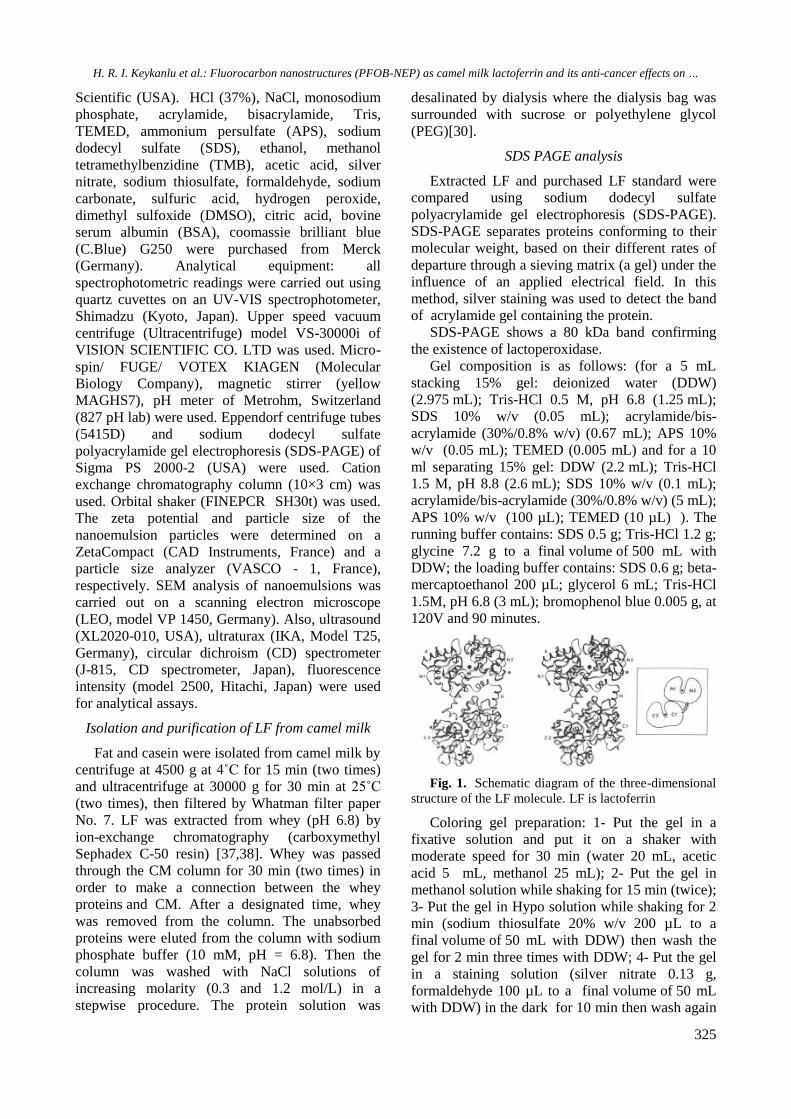
H. R. I. Keykanlu et al.: Fluorocarbon nanostructures (PFOB-NEP) as camel milk lactoferrin and its anti-cancer effects on …
325
Scientific (USA). HCl (37%), NaCl, monosodium
phosphate, acrylamide, bisacrylamide, Tris,
TEMED, ammonium persulfate (APS), sodium
dodecyl sulfate (SDS), ethanol, methanol
tetramethylbenzidine (TMB), acetic acid, silver
nitrate, sodium thiosulfate, formaldehyde, sodium
carbonate, sulfuric acid, hydrogen peroxide,
dimethyl sulfoxide (DMSO), citric acid, bovine
serum albumin (BSA), coomassie brilliant blue
(C.Blue) G250 were purchased from Merck
(Germany). Analytical equipment: all
spectrophotometric readings were carried out using
quartz cuvettes on an UV-VIS spectrophotometer,
Shimadzu (Kyoto, Japan). Upper speed vacuum
centrifuge (Ultracentrifuge) model VS-30000i of
VISION SCIENTIFIC CO. LTD was used. Micro-
spin/ FUGE/ VOTEX KIAGEN (Molecular
Biology Company), magnetic stirrer (yellow
MAGHS7), pH meter of Metrohm, Switzerland
(827 pH lab) were used. Eppendorf centrifuge tubes
(5415D) and sodium dodecyl sulfate
polyacrylamide gel electrophoresis (SDS-PAGE) of
Sigma PS 2000-2 (USA) were used. Cation
exchange chromatography column (10×3 cm) was
used. Orbital shaker (FINEPCR SH30t) was used.
The zeta potential and particle size of the
nanoemulsion particles were determined on a
ZetaCompact (CAD Instruments, France) and a
particle size analyzer (VASCO - 1, France),
respectively. SEM analysis of nanoemulsions was
carried out on a scanning electron microscope
(LEO, model VP 1450, Germany). Also, ultrasound
(XL2020-010, USA), ultraturax (IKA, Model T25,
Germany), circular dichroism (CD) spectrometer
(J-815, CD spectrometer, Japan), fluorescence
intensity (model 2500, Hitachi, Japan) were used
for analytical assays.
Isolation and purification of LF from camel milk
Fat and casein were isolated from camel milk by
centrifuge at 4500 g at 4˚C for 15 min (two times)
and ultracentrifuge at 30000 g for 30 min at 25˚C
(two times), then filtered by Whatman filter paper
No. 7. LF was extracted from whey (pH 6.8) by
ion-exchange chromatography (carboxymethyl
Sephadex C-50 resin) [37,38]. Whey was passed
through the CM column for 30 min (two times) in
order to make a connection between the whey
proteins and CM. After a designated time, whey
was removed from the column. The unabsorbed
proteins were eluted from the column with sodium
phosphate buffer (10 mM, pH = 6.8). Then the
column was washed with NaCl solutions of
increasing molarity (0.3 and 1.2 mol/L) in a
stepwise procedure. The protein solution was
desalinated by dialysis where the dialysis bag was
surrounded with sucrose or polyethylene glycol
(PEG)[30].
SDS PAGE analysis
Extracted LF and purchased LF standard were
compared using sodium dodecyl sulfate
polyacrylamide gel electrophoresis (SDS-PAGE).
SDS-PAGE separates proteins conforming to their
molecular weight, based on their different rates of
departure through a sieving matrix (a gel) under the
influence of an applied electrical field. In this
method, silver staining was used to detect the band
of acrylamide gel containing the protein.
SDS-PAGE shows a 80 kDa band confirming
the existence of lactoperoxidase.
Gel composition is as follows: (for a 5 mL
stacking 15% gel: deionized water (DDW)
(2.975 mL); Tris-HCl 0.5 M, pH 6.8 (1.25 mL);
SDS 10% w/v (0.05 mL); acrylamide/bis-
acrylamide (30%/0.8% w/v) (0.67 mL); APS 10%
w/v (0.05 mL); TEMED (0.005 mL) and for a 10
ml separating 15% gel: DDW (2.2 mL); Tris-HCl
1.5 M, pH 8.8 (2.6 mL); SDS 10% w/v (0.1 mL);
acrylamide/bis-acrylamide (30%/0.8% w/v) (5 mL);
APS 10% w/v (100 µL); TEMED (10 µL) ). The
running buffer contains: SDS 0.5 g; Tris-HCl 1.2 g;
glycine 7.2 g to a final volume of 500 mL with
DDW; the loading buffer contains: SDS 0.6 g; beta-
mercaptoethanol 200 µL; glycerol 6 mL; Tris-HCl
1.5M, pH 6.8 (3 mL); bromophenol blue 0.005 g, at
120V and 90 minutes.
Fig. 1. Schematic diagram of the three-dimensional
structure of the LF molecule. LF is lactoferrin
Coloring gel preparation: 1- Put the gel in a
fixative solution and put it on a shaker with
moderate speed for 30 min (water 20 mL, acetic
acid 5 mL, methanol 25 mL); 2- Put the gel in
methanol solution while shaking for 15 min (twice);
3- Put the gel in Hypo solution while shaking for 2
min (sodium thiosulfate 20% w/v 200 µL to a
final volume of 50 mL with DDW) then wash the
gel for 2 min three times with DDW; 4- Put the gel
in a staining solution (silver nitrate 0.13 g,
formaldehyde 100 µL to a final volume of 50 mL
with DDW) in the dark for 10 min then wash again

H. R. I. Keykanlu et al.: Fluorocarbon nanostructures (PFOB-NEP) as camel milk lactoferrin and its anti-cancer effects on …
326
the gel for 2 min three times with DDW; 5- Put the
gel in a developing solution (sodium carbonate 3.4
g, formaldehyde 1400 µL, sodium thiosulfate 20%
w/v 800 µL to a final volume of 50 mL with DDW)
until the appearance of a protein band, drain it and
put the gel in the fixative solution.
For the detection of lactoperoxidase the TMB
(3, 5, 3′, 5′ - tetramethylbenzidine) color reaction
was used in the presence of hydrogen peroxide and
the purity of LF was confirmed. Briefly: 1- Prepare
a solution of TMB (dissolve 5 mg of TMB powder
in 1 ml DMSO in a water bath at 45°C and add 300
µL of it to 700 µL of sodium phosphate buffer (pH
= 6)). Add 2-100 µL of the sample to 100 µL of
TMB solution and 10 µL hydrogen peroxide 30%
and incubate at 37˚C for 5 min, then read the
absorbance at 450 nm using a spectrophotometer.
LF concentration was determined by coomassie dye
binding or Bradford assay [39]. In summary, 50 µL
of sample was added to 2.5 ml of Bradford solution
(100 mg C. blue G250 dissolved in 50 mL ethanol
96%, then 100 ml of 85% phosphoric acid was
added and the volume was brought to 1 L with
DDW). Using BSA standard solution and
measuring absorbance at 595 nm, the absorption
curve was drawn with Excel 2013 and the
concentration of LF was found.
100 mg Blue Kumasi LF was lyophilized and
stored at -20˚C in the dark until needed.
Preparation of NEP stabilized emulsions
Pre-emulsions were prepared as follows : 2% W
/ V surfactant (including 98% mol egg lecithin and
2% mol DPPE) and 20% V/V PFOB in DDW
were stirred by a magnetic stirrer [40] for 10 min at
5000 rpm. Homogenization was carried out using
an Ultra-Turex stirrer for 10 min at 12000 rpm
within water-ice solution. To obtain nano-sized
particles and uniform emulsions duplicate stirring
in an ultrasonic stirrer for 10 min followed. The
formulations prepared with each of these lipids
showed a milky and uniform appearance [41].
Addition of LF to NEPs
After the preparation of NEPs, LF (selected
amounts in saline phosphate buffer of 110, 55, 27.5
µg/mL, respectively) was added to the preformed
NEPs, and the residual free (unbound) LF was
washed out by centrifugation at 1000 rpm for 10
min. The amount of unbound LF was determined
by measuring the tryptophan fluorescence and
Bradford method [39]. Control NEPs (without LF)
were stored for 52 days under the same conditions
[22].
Fig. 2. SDS PAGE analysis of LF on a 15% gel with
120V and 90 min of fractions obtained in ultrafiltrated
(purified) whey by ion-exchange column using saline
gradient. Lane 1, 2, and 3 represent protein markers,
elution peak with 0.7 mol/L NaCl and LF standard,
respectively.
Entrapment efficiency (EE):
The loading efficiency was determined by
centrifugation of NEPs. Following the addition of
LF to NEPs, the residual free (unbound) LF was
washed out by centrifugation at 1000 rpm for 10
min. The protein content of the supernatant was
measured by tryptophan fluorescence and Bradford
method [39] and the total amount of LF was
determined spectrophotometrically.
Entrapment efficiency (in percentage) was
calculated using Eq.1.
(1)
where is the amount of free LF and is the
total amount of LF present in 500 μL of NEPs [31].
Scanning electron microscopy analyses
The scanning electron microscopy (SEM)
produces a variety of signals at the solid samples
surface by using a focused beam of high-energy
electrons. The signals which are obtained by the
interaction of electrons with the solid sample give
information on the morphology, chemical
composition, crystalline structure and orientation of
the solid sample. Coating of samples is required to
enable or improve the imaging of samples. Samples
of NEPs were coated with a thin layer of
conducting material (gold/palladium (Au/Pd)).
Magnifications of NEPs before and after the
accession of LF are shown in Fig. 3, where the
shape structure of the particles is spherical. The
scanning electron microphotographs of the exposed

H. R. I. Keykanlu et al.: Fluorocarbon nanostructures (PFOB-NEP) as camel milk lactoferrin and its anti-cancer effects on …
327
surface of LF binding to nanoemulsions (see Fig. 3a
and 3b) show the matrix structure developed during
the manufacturing process and the highly
homogeneous distribution of nanoemulsions
diameters.
(a)
(b)
Fig. 3. Scanning electron microscopy analysis of the
PFOB-NEP using 100 000 magnification (a) and inserted
LF into PFOB-NEP using 50 000 magnification (b).
PFOB-NEP are perfluorooctyl bromide nanoemulsion
particles.
Determination of particle size
Particle size analysis is a part of particle science
and it is a patented innovative technology. Particle
size distribution is an important physical property
for determining the behavior and nature of
particles. The principles of measurement are based
on dynamic light scattering (DLS) of backscattered
light. DLS (also known as photon correlation
spectroscopy or quasi-elastic light scattering) is a
technique in physics that performs measurements in
dark which can be used to characterize the size
distribution profile of small particles in suspension
or emulsion or of polymers which exist in the
solution [42]. This method is also used to check the
behavior of complex fluids such as concentrated
polymer solutions. A laser is used as
monochromatic light source that is shot through a
polarizer into the sample. The scattered light then
goes through a second polarizer where it is
collected by a photomultiplier and the resulting
image is projected onto a screen [43].
Determination of zeta potential
Zeta potential shows the surface charge of
particles in emulsions and suspensions so that the
measurement of zeta potential serves for predicting
formulation stability and interactions between
particles. Optimization processing is an important
and easy way to control quality. Zeta potential is
the electric potential that dominates in the incision
plan of a particle, which is at a tiny distance from
its level, as a consequence of the measuring of the
mobility distribution of a scissoring of charged
particles that are under an electric field [44]. The
mobility is the speed of a particle per unit electric
field. In another definition, zeta potential is the
potential difference between the dispersion medium
and the stationary layer of fluid attached to the
dispersed particle. Methods of measuring a
particle’s zeta potential are dependent on the nature
of both the particle and the suspension or emulsion
formulation.
Circular dichroism (CD) spectroscopy
Circular dichroism (CD) is dichroism involving
circularly polarized light, i.e., differential
absorption of left- and right-handed light. CD
spectroscopy is an important technique in structural
biology for examining the folding, conformational
changes, and especially the secondary structures of
proteins. Herein, CD was used to confirm the
incorporation of LF in the nanoemulsions. This
interaction produces a CD signal at the plasmon
resonance frequency of the chiral protein−NEP
complex.
Fluorescence spectroscopy
For the analysis of sample fluorescence,
fluorescence spectroscopy (also known as
fluorometry or spectrofluorometry) is used which is
a type of electromagnetic spectroscopy. An
emission map is measured by recording the
emission spectra resulting from a range of
excitation wavelengths and combining them all
together. The intrinsic tryptophan fluorescence
(TRP19) in LF (excitation, 280 nm; emission, 355
nm) was used to study the nature of the LF
interaction with the lipid monolayer of
perfluorocarbon NEPs. Fluorescence emission
spectra show the quenching of endogenous
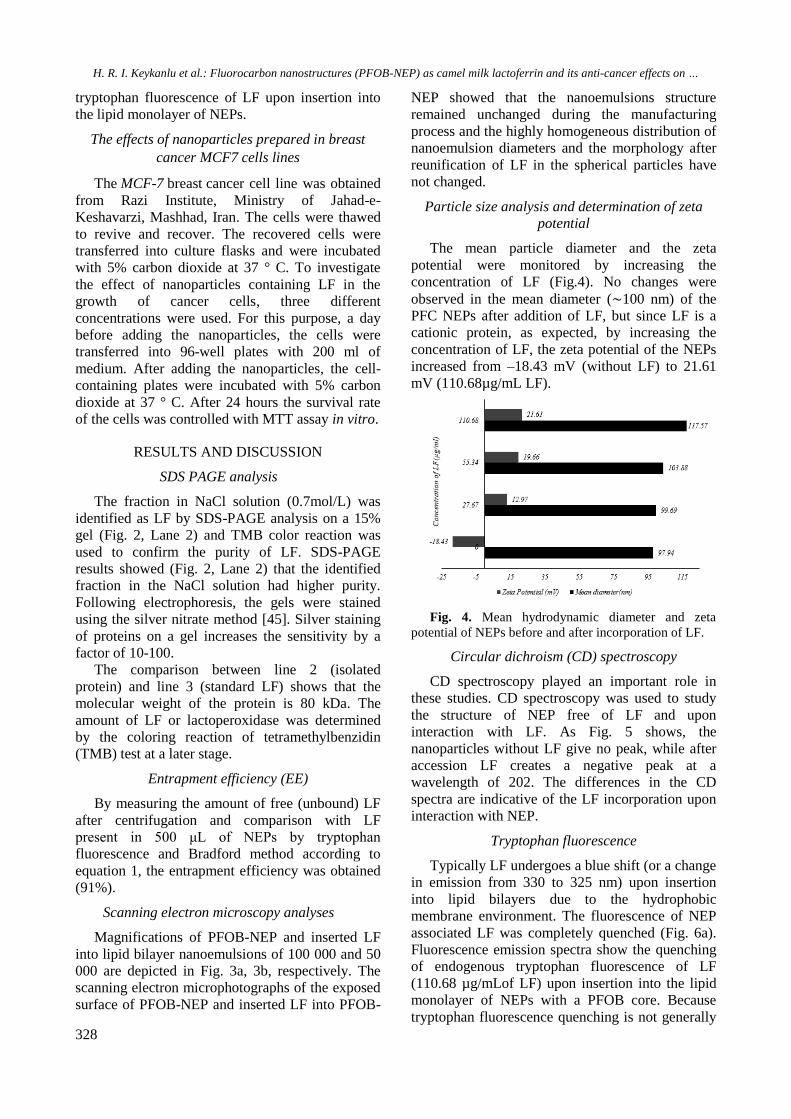
H. R. I. Keykanlu et al.: Fluorocarbon nanostructures (PFOB-NEP) as camel milk lactoferrin and its anti-cancer effects on …
328
tryptophan fluorescence of LF upon insertion into
the lipid monolayer of NEPs.
The effects of nanoparticles prepared in breast
cancer MCF7 cells lines
The MCF-7 breast cancer cell line was obtained
from Razi Institute, Ministry of Jahad-e-
Keshavarzi, Mashhad, Iran. The cells were thawed
to revive and recover. The recovered cells were
transferred into culture flasks and were incubated
with 5% carbon dioxide at 37 ° C. To investigate
the effect of nanoparticles containing LF in the
growth of cancer cells, three different
concentrations were used. For this purpose, a day
before adding the nanoparticles, the cells were
transferred into 96-well plates with 200 ml of
medium. After adding the nanoparticles, the cell-
containing plates were incubated with 5% carbon
dioxide at 37 ° C. After 24 hours the survival rate
of the cells was controlled with MTT assay in vitro.
RESULTS AND DISCUSSION
SDS PAGE analysis
The fraction in NaCl solution (0.7mol/L) was
identified as LF by SDS-PAGE analysis on a 15%
gel (Fig. 2, Lane 2) and TMB color reaction was
used to confirm the purity of LF. SDS-PAGE
results showed (Fig. 2, Lane 2) that the identified
fraction in the NaCl solution had higher purity.
Following electrophoresis, the gels were stained
using the silver nitrate method [45]. Silver staining
of proteins on a gel increases the sensitivity by a
factor of 10-100.
The comparison between line 2 (isolated
protein) and line 3 (standard LF) shows that the
molecular weight of the protein is 80 kDa. The
amount of LF or lactoperoxidase was determined
by the coloring reaction of tetramethylbenzidin
(TMB) test at a later stage.
Entrapment efficiency (EE)
By measuring the amount of free (unbound) LF
after centrifugation and comparison with LF
present in 500 μL of NEPs by tryptophan
fluorescence and Bradford method according to
equation 1, the entrapment efficiency was obtained
(91%).
Scanning electron microscopy analyses
Magnifications of PFOB-NEP and inserted LF
into lipid bilayer nanoemulsions of 100 000 and 50
000 are depicted in Fig. 3a, 3b, respectively. The
scanning electron microphotographs of the exposed
surface of PFOB-NEP and inserted LF into PFOB-
NEP showed that the nanoemulsions structure
remained unchanged during the manufacturing
process and the highly homogeneous distribution of
nanoemulsion diameters and the morphology after
reunification of LF in the spherical particles have
not changed.
Particle size analysis and determination of zeta
potential
The mean particle diameter and the zeta
potential were monitored by increasing the
concentration of LF (Fig.4). No changes were
observed in the mean diameter (∼100 nm) of the
PFC NEPs after addition of LF, but since LF is a
cationic protein, as expected, by increasing the
concentration of LF, the zeta potential of the NEPs
increased from –18.43 mV (without LF) to 21.61
mV (110.68µg/mL LF).
Fig. 4. Mean hydrodynamic diameter and zeta
potential of NEPs before and after incorporation of LF.
Circular dichroism (CD) spectroscopy
CD spectroscopy played an important role in
these studies. CD spectroscopy was used to study
the structure of NEP free of LF and upon
interaction with LF. As Fig. 5 shows, the
nanoparticles without LF give no peak, while after
accession LF creates a negative peak at a
wavelength of 202. The differences in the CD
spectra are indicative of the LF incorporation upon
interaction with NEP.
Tryptophan fluorescence
Typically LF undergoes a blue shift (or a change
in emission from 330 to 325 nm) upon insertion
into lipid bilayers due to the hydrophobic
membrane environment. The fluorescence of NEP
associated LF was completely quenched (Fig. 6a).
Fluorescence emission spectra show the quenching
of endogenous tryptophan fluorescence of LF
(110.68 µg/mLof LF) upon insertion into the lipid
monolayer of NEPs with a PFOB core. Because
tryptophan fluorescence quenching is not generally

H. R. I. Keykanlu et al.: Fluorocarbon nanostructures (PFOB-NEP) as camel milk lactoferrin and its anti-cancer effects on …
329
a feature of peptide interaction with membranes,
the special role of the PFOB core was tested as a
mechanism for the observed fluorescence
quenching upon integration into NEPs. Fig. 6b
shows the percentage quenching of tryptophan
fluorescence by free LF and LF with
perfluorocarbon cores.
Fig. 5. Far-UV CD spectra of NEPs and LF in
monolayered PFOB NEPs at 25˚C. CD is circular
dichroism
(a)
(b)
Fig. 6. Interaction of LF tryptophan with PFC NEPs
(a) Percentage quenching of tryptophan fluorescence
with free LF and LF with perfluorocarbon cores; (b) PFC
in perfluorocarbons.
MTT test results in breast cancer MCF7 cell lines
Cell viability was determined as a ratio of
absorbance (A570 nm) in treated cells relative to
absorbance in control cells (DMSO) (A570 nm). The
IC50 was defined as the concentration of sample
needed to reduce 50% of absorbance relative to the
vehicle (DMSO)-treated control (Fig. 7).
Fig. 7. Cell death % with concentration of LF in
PFOB NEPs.
CONCLUSIONS
Due to the unique properties of LFs such as
antimicrobial activity, immunomodulatory, and
even antineoplastic properties, LF seems to have
great potential in practical medicine. A lot of
research has been done on it of late. Nevertheless,
more research still needs to be carried out in order
to obtain a better understanding of its activity and
interactions and to enable the full and safe
utilization of this glycoprotein. As already
mentioned, due to the sensitivity of LF to
proteolysis, a lot of research has been done on the
use of alginate and carrageenan nanoparticles as
carriers.
The purpose of this research was to design,
formulate, characterize, and assess the advantage of
PFOB particles as nanovehicles for LF delivery in
pharmaceutical applications, e.g., the use of this
combination on breast cancer cells. In this study LF
was isolated from camel milk using ion-exchange
chromatography.
Although LF is resistant to pH changes, to avoid
breaking LF and to retain its biological activity
against factors such as sonication, stirring and heat,
LF was added after the formation of NEPs.
Effective connection between the NEPs and LF
is mediated by electrostatic interactions between
the negatively charged lipid monolayer of NEPs
and the positively charged LF surface. These
interactions were proved by CD and tryptophan
fluorescence.
SEM analysis (Fig. 3a and 3b) of PFOB NEPs
illustrates that their structural integrity is preserved
even after addition of LF. The very high surface
tension of PFOB NEPs, as well as the hydrophobic
and lipophobic perfluorocarbon core prevent

H. R. I. Keykanlu et al.: Fluorocarbon nanostructures (PFOB-NEP) as camel milk lactoferrin and its anti-cancer effects on …
330
disintegration of the NEP after LF insertion and
may actually contribute to the stability and
controlled release of LF from PFOB NEPs. The
results showed that perfluorocarbon NEPs can be
used to deliver cytolytic peptides and proteins.
The results of MTT assay showed that LF
loaded on PFOB NEPs causes the death of cancer
cells and with increasing LF concentration, the
percentage of dead cells increased.
REFERENCES
1. A. A. Al-Alawi, L.C. Laleye, Characterization of
Camel Milk Protein Isolates as Nutraceutical and
Functional Ingredients. Collaborative Research Project
SQU/UAEU, 2008
2. HA. Al Kanhal, International Dairy Journal, 20(12),
811 (2010).
3. Y.W. Park, Bioactive components in milk and dairy
products, John Wiley & Sons, 2009
4. P. Masson, J. Heremans, E.Schonne, The Journal of
Experimental Medicine, 130(3), 643 (1969).
5. G. Konuspayeva, B. Faye, G. Loiseau, D. Levieux,
Journal of Dairy Science, 90(1), 38 (2007).
6. G Konuspayeva, B Faye, G. Loiseau, Journal of
Food Composition and Analysis, 22(2), 95 (2009).
7. L. Adlerova, A. Bartoskova, M. Faldyna.
Veterinarni Medicina, 53(9), 457 (2008).
8. S. Sharma, M. Sinha, S. Kaushik, P. Kaur, T.P.
Singh, Biochemistry Research International,
Volume 2013, Article ID 271641, doi
10.1155/2013/271641 (2013).
9. P. Masson, J. Heremans, Comparative Biochemistry
and Physiology part B: Comparative Biochemistry.
39(1), 119 (1971).
10. V. M. Balcão, C. I. Costa, C. M. Matos, C. G.
Moutinho, M. Amorim, M. E. Pintado, A. P. Gomes,
M.M. Vila, J. A. Teixeira, Food Hydrocolloids, 32(2),
425 (2013).
11. A.M. Al-Majali, Z.B. Ismail, Y. Al-Hami, A.Y.
Nour, International Journal of Applied Research in
Veterinary Medicine, 5(3), 120 (2007).
12. A. Pierce, D. Legrand, J. Mazurier, Medicine
Sciences: M/S, 25(4), 361 (2009).
13. B. Van der Strate, L. Beljaars, G. Molema, M.
Harmsen, D. Meijer, Antiviral Research, 52(3), 225
(2001).
14. D. Rodriguez-Franco, L. Vazquez-Moreno, G.
Ramos, Rev. Latinoam. Microbiol., 47(3), 102 (2005).
15. S.A. González-Chávez, S. Arévalo-Gallegos, Q.
Rascón-Cruz, International Journal of Antimicrobial
Agents, 33(4), 301 (2009).
16. J.M. Torres, J.L. Concepción, J.R. Vielma, E.T. La
Mucuy, LdE.de Parásitos, Mundo Pecuario, 2(3), 57
(2006).
17. I.A. García-Montoya, T.S. Cendón, S. Arévalo-
Gallegos, Q. Rascón-Cruz, Biochimica et Biophysica
Acta (BBA)-General Subjects, 1820(3), 226 (2012).
18. E.D. Weinberg, Current Pharmaceutical Design,
13(8), 801 (2007).
19. F. Moradian, R. Sharbafi, A. Rafiei, Journal of
Medical and Bioengineering, 3(3), 203, (2014).
20. F. Berlutti, F. Pantanella, T. Natalizi, A. Frioni, R.
Paesano, A. Polimeni, P.Valenti, Molecules, 16(8),
6992 (2011).
21. L.H. Vorland, H. Ulvatne, J. Andersen, H. H.
Haukland, Ø. Rekdal, J.S. Svendsen, T. J. Gutteberg,
Scandinavian Journal of Infectious Diseases, 30(5),
513 (1998).
22. J.S. Mader, J. Salsman, D.M. Conrad, D.W. Hoskin,
Molecular Cancer Therapeutics, 4(4), 612 (2005).
23. L.H.Vorland, Anticancer Research, 22, 2703 (2002).
24. K-i. Fujita, E. Matsuda, K. Sekine, M. Iigo, H.
Tsuda, Carcinogenesis, 25(10), 1961 (2004).
25. K Golla, C. Bhaskar, F. Ahmed, A.K.Kondapi,
Journal of Cancer, 4(8), 644 (2013).
26. L. Safaeian, H. Zabolian, ISRN pharmacology,
Volume 2014, Article ID 943523, doi
10.1155/2014/943523 (2014).
27. N.D. Embleton, J.E. Berrington, W. McGuire,
C.J.Stewart, S.P. Cummings, Lactoferrin:
Antimicrobial activity and therapeutic potential. Paper
presented at: Seminars in Fetal and Neonatal
Medicine, 2013,
28. E.M. EL-Fakharany, L, Sánchez, H.A. Al-Mehdar,
E.M. Redwan, Virology Journal, 10(1), 199 (2013).
29. E. Acosta, Current Opinion in Colloid & Interface
Science, 14(1), 3 (2009).
30. G.R.M. Raei, S. Zibaei, S.M. Jafari, A.M. Sani,
International Journal of Biological Macromolecules,
28, 5 (2015).
31. R. Guan, J. Ma, Y. Wu, F. Lu, C-G Xiao, H. Jiang, T.
Kang., Nanoscale Research Letters, 7(1):679, (2012).
32. S-J. Lee, B. Olsen, P.H. Schlesinger, N.A. Baker.
The Journal of Physical Chemistry B, 114(31), 10086
(2010).
33. S-J. Lee, P.H. Schlesinger, S.A. Wickline, G.M.
Lanza, N.A. Baker, The Journal of Physical Chemistry
B, 115(51), 15271 (2011).
34. M. Chenoune, L. De Rochefort, P. Bruneval, F.
Lidouren, M. Kohlhauer, A. Seemann, B. Ghaleh, M.
Korn, R.-M. Dubuisson, A. B. Yahmed, X. Maître, D.
Isabey, J.-D. Ricard, R. E. Kerber, L. Darrasse, A.
Berdeaux, R. Tissier, BMC Pharmacology and
Toxicology, 15(1), 53 (2014).
35. T. Nelson, R. Mattrey, Investigative Radiology,
25(9), 983 (1990).
36. C. Jacoby, S. Temme, F. Mayenfels, N.Benoit, M. P.
Krafft, R.Schubert, J. Schrader, U. Flögel, NMR in
Biomedicine. 27(3), 261 (2014).
37. Y. Liang, X. Wang, M. Wu, W. Zhu, International
Journal of Environmental Research and Public
Health, 8(9), 3764 (2011).
38. M. Wu, R. Wang, X. Wang, Z. Zhang, . Isolation and
Purification of Bioactive Proteins from Bovine
Colostrum: INTECH, Open Access Publisher; Rijeka,
Croatia 2011.
39. N.J. Kruger, in: Basic Protein and Peptide Protocols
(Methods in Molecular Biology, vol. 32), Humana
Press, Totowa, NJ, p. 9, 1994.
H. R. I. Keykanlu et al.: Fluorocarbon nanostructures (PFOB-NEP) as camel milk lactoferrin and its anti-cancer effects on …
331
40. N.R. Soman, G.M. Lanza, J.M. Heuser, P.H.
Schlesinger, S.A. Wickline, Nano Letters., 8(4), 1131
(2008).
41. S. Abbas, K. Hayat, E. Karangwa, M. Bashari, X.
Zhang, Food Engineering Reviews, 5(3), 139 (2013).
42. B.J. Berne, R. Pecora, Dynamic light scattering: with
applications to chemistry, biology, and physics: Dover
Publications, Inc., Mineola, N. Y., 2000,
43. J.W. Goodman, JOSA, 66(11), 1145 (1976).
44. A. Wiącek, E. Chibowski, Colloids and Surfaces A:
Physicochemical and Engineering Aspects. 159(2),
253 (1999).
45. J.H.Morrissey, Analytical Biochemistry, 117(2), 307
(1981).
46. E.N. Baker, B.F. Anderson, H.M. Baker, C.L. Day,
M.Haridas, G.E. Norris, S.V. Rumball, C.A. Smith,
D.H. Thomas, in: Lactoferrin (Advances in
Experimental Medicine and Biology, vol. 357),
Springer US, 1994.
ФЛУОРОВЪГЛЕРОДНИ НАНО-СТРУКТУРИ (PFOB-NEP) КЪМ ЛАКТОФЕРИН ОТ КАМИЛСКО МЛЯКО И НЕГОВИЯТ ПРОТИВО-ТУМОРЕН ЕФЕКТ ВЪРХУ КЛЕТЪЧНА
ЛИНИЯ MCF7 НА РАК НА ГЪРДАТА
Х. Р. И. Кейканлу1, С. Зибаеи 2*, М. Арджманд3, А .А. Сафекорди4
1Департамент по химично инженерство, наука, Изследователски клон, Ислямски университет “Азад“,
Техеран, Иран 2Институт „Рази“, Министерство Джахад-е-Кешаварзи, Машхад, Иран
3Департамент по химично инженерство, Клон Южен Техеран,Ислямски университет „Азад“, Техеран, Иран 4Департамент по химично инженерство Технологичен университет „Шариф“, Техеран, Игах
Получена на 5 януари, 2016 г., приета на 14 януари, 2015 г.
(Резюме)
Поради разпространението на рака в световен мащаб е важно да се търсят нови лекарства за неговото
лечение. Въпреки големия напредък, разширеното разработване на нови лекарства се обуславя от
резистентността на раковите клетки към известните противоракови средства.
В настоящото изследване са изследвани биологичните свойства на лактоферин (LF) от камилско мляко и е
направен опит да се запази неговата тримерна структура и да се повиши живота на LF, като се предотврати
денатурирането му от протеолиза. Това се постига чрез добавяне на нано-емулсия с частици от перфлуоро-
октил бромид (PFOB-NEP). LF се извлича от камилско мляко чрез йонообменна хроматография
(карбоксиметилова Sephadex C-50 смола), а неговата чистота бе потвърдена чрез SDS-PAGE.
Перфлуоровъглеродът е биологически инертен, химически стабилен, нетоксичен и нелетлив, PFOB-NEP се
приготвят от емулсия масло/вода (O/W). LF се натоварва върху нано-частиците, а след това се определят
неговите характеристики и противо-туморния ефект върху клетъчна линия MCF7 на рак на гърдата. Достъпът
на LF до нано=частиците се доказва чрез кръгов дихроизъм и флуоресцентно спектроскопски методи.
Ефективността на включване на LF в наночастиците беше около 91%. Средният диаметър на нано-частиците не
се променя след включването на (~ 100 nm) а -потенциалът на нано-частиците нараства от –18.43 mV (без LF)
до 21.61 mV (110.68µg/mL LF).

332
Bulgarian Chemical Communications, Volume 48, Number 2 (pp. 332 – 337) 2016
On counting polynomials of certain polyomino chains
M. Imran1*, S. Hayat2
1Department of Mathematics, School of Natural Sciences (SNS), National University of Sciences and
Technology (NUST), Sector H-12, Islamabad, Pakistan 2School of Mathematical Sciences, University of Science and Technology of China (USTC), Hefei, Anhui,
China
Received April 24, 2015, Revised October 20, 2015
A counting polynomial ),( xGC is a sequence description of a topological property so that the exponents express
the extent of its partitions while the coefficients are related to the occurrence of these partitions. Omega, Sadhana and
Padmakar-Ivan polynomials are extensive examples of counting polynomials which play an important role in
topological description of bipartite structures as well as counts equidistance and non-equidistance edges in graphs.
These polynomials count the quasi orthogonal cut )(qoc strips in graphs generated from bipartite chemical structures.
A qoc strip defined with respect to any edge in a graph ),( EVG , represents the smallest subset of edges closed
under taking opposite edges on faces.
In this article, we focus on counting polynomials of polyomino chains of different possible shapes. We derive the
exact formulas of omega, Sadhana and PI polynomials for 2-parametric 4-polyomino system k
nP for 13, nk . An
open problem is proposed for further research in this direction.
2010 Mathematics Subject Classification: 05C12, 05C90
Keywords: Counting polynomial, omega polynomial, Sadhana polynomial, PI polynomial, Polyomino chains, k -
polyomino system
INTRODUCTION AND PRELIMINARY
RESULTS
A k -polyomino system is a finite 2 -connected
plane graph such that each interior face (also called
cell) is surrounded by a regular k4 -cycle of length
one. In other words, it is an edge-connected union
of cells [12].
Counting polynomials are those polynomials
having at exponent the extent of a property partition
and coefficients the multiplicity/occurrence of the
corresponding partition. A counting polynomial is
defined as: c
c
xcGmxGC ),(=),( , (1)
Where the coefficient ),( cGm are calculable by
various methods, techniques and algorithms. The
expression (1) was found independently by Sachs,
Harary, Mili c , Spialter, Hosoya, etc [5]. The
corresponding topological index )(GP is defined
in this way:
ccGmxGCGCc
x ),(=|),(=)( 1=
A moleculer/chemical graph is a simple finite
graph in which vertices denote the atoms and edges
denote the chemical bonds in underlying chemical
structure. This is more important to say that the
hydrogen atoms are often omitted in any molecular
graph. A graph can be represented by a matrix, a
sequence, a polynomial and a numeric number
(often called a topological index) which represents
the whole graph and these representations are
aimed to be uniquely defined for that graph.
Two edges uve = and xyf = in )(GE are
said to be codistant, usually denoted by e co f , if
),(=),( vyduxd
and
1),(=1),(=),(=),( vyduxduydvxd The relation “ co " is reflexive as e co e is true
for all edges in G , also symmetric as if e co f
then f co e for all )(, GEfe but the relation
“ co " is not necessarily transitive. Consider
}:)({=)( ecofGEfeC
If the relation is transitive on )(eC also, then
)(eC is called an orthogonal cut “ co " of the graph
* To whom all correspondence should be sent:
E-mail: [email protected]; [email protected]
2016 Bulgarian Academy of Sciences, Union of Chemists in Bulgaria

M. Imran, S. Hayat: On counting polynomials of certain polyomino chains
333
G . Let uve = and xyf = be two edges of a
graph G , which are opposite or topological
parallel, and this relation is denoted by fope . A
set of opposite edges, within the same face or ring,
eventually forming a strip of adjacent faces/rings, is
called an opposite edge strip ops, which is a quasi-
orthogonal cut qoc (i.e. the transitivity relation is
not necessarily obeyed). Note that “ co " relation is
defined in the whole graph while “ op " is defined
only in a face/ring.
In this article, G is considered to be simple
connected graph with vertex set )(GV and edge set
)(GE , ),( cGm be the number of ops of length c ,
|)(=| GEe is the edge set cardinality of G .
The omega polynomial was introduced by Diudea
et al. in 2006 on the ground of op strips. The
omega polynomial is proposed to describe cycle-
containing molecular structures, particularly those
associated with nanostructures.
Definition 1.1. [1] Let G be a graph, then its
omega polynomial denoted by ),( xG in x is
defined as c
c
xcGmxG ),(=),(
The derivative of omega polynomial at 1=x
for any bipartite graph is equal to its edge set
cardinality.
The Sadhana polynomial is defined based on
counting opposite edge strips in any graph. This
polynomial counts equidistant edges in G .
Definition 1.2. [6] Let G be a graph, then
Sadhana polynomial denoted by ),( xGSd is
defined as ce
c
xcGmxGSd ),(=),(
The PI polynomial is defined based on counting
opposite edge strips in any graph [10]. This
polynomial counts non-equidistant edges in G .
Definition 1.3. [11] Let G be a graph, then PI
polynomial denoted by ),( xGPI is defined as
ce
c
xccGmxGPI ),(=),(
Ashrafi et al. computed Sadhana polynomial of V-
phenylenic nanotube and nanotori.
Theorem 1.1. [2] Let G be the graph of V-
phenylenic nanotube, then Sadhana polynomial of
G is,
},{2)|(|2)|(|1},{
1=
1)|2(|4=),( nmMinGEiGEnmMax
i
xmnxxGSd
nGEmGEmGE xnxmnx )|(|2)|(|2)|(| 1)(1)(
All nanotubes are allotropes of carbon and are a
type of fullerene. Imran et al. [9] computed omega
and Sadhana polynomials of H-Naphtalenic
nanotube.
Theorem 1.2. [9] The omega polynomial of H-
Naphtalenic nanotube ],[ nmNPHX , Nnm,
is:
2>,1)2(24
2,1)22(4
=)],,[(
221
1=
42
12
1=
nmxnmx
nmxmnx
xnmNPHX
nin
i
mi
n
i
where mnm xnmxnx 223 1)(= .
The Sadhana polynomial of ],[ nmNPHX ,
Nnm, is.
2>,1)2(24
2,1)22(4
=)],,[(
221522151
1=
6152215
12
1=
nmxnmx
nmxmnx
xnmNPHXSd
nmmnimmnn
i
mmnimmn
n
i
where mmnnmmnmmn xnmxnx 4152215515 1)(= .
The preceding results are used to compute their
corresponding topological indices which provides a
good model correlating the certain physico-
chemical properties of these carbon allotropes.
RESULTS AND DISCUSSION
In this paper, we compute omega, Sadhana and
PI polynomials of polyomino chain system k
nP for
61,2,3,...,=k . By using these results, we present
our main results of counting polynomials for
polyomino chain system k
nP for 13, nk .
Imran et al. [8] studied some degree based
topological indices of the polyomino chains. For
further study of these polynomials their topological
indices and various nanotubes, consult [3, 4, 9, 13,
14, 15]. These polynomials are used to predict
various physico-chemical properties of certain
chemical compounds.
Polyomino chains
A polyomino system is a finite 2-connected
plane graph such that each interior face (or say a
cell) is surrounded by a regular square of length
one. In other words, it is an edge-connected union
of cells in the planar square lattice. This polyomino
system divides the plane into one infinite external
region and a number of finite internal regions
where all internal regions must be squares. A
polyomino chain is a polyomino system, in which

M. Imran, S. Hayat: On counting polynomials of certain polyomino chains
334
the joining of the centers of its adjacent cells
(regular squares) forms a path nccc ,...,, 21, where
ic is the center of the i -th square. Such a
polyomino chain is denoted as nB . A square of a
polyomino chain has either one or two neighboring
squares. If a square has one neighboring square, it
is called terminal, if it has two neighboring squares
having no vertex of degree 2, it is called medial,
and if it has two neighboring squares such that it
has a vertex of degree 2, it is called kink. Every
polyomino chain of dimension n has a unit such
that it contains n number of units [16].
Fig. 1. A 2-polyomino system which is a zig-zag
chain of 8-cycles.
Theorem 2.1.1. [7] Consider the graph of 2-
polyomino system depicted in Figure 1. Then:
Ω(x) = (4n − 1) x3 + (8n + 2) x2 and Sd(x) = (4n −
1) x28n – 2 + (8n + 2) x28n – 1.
We denote the polyomino chain system by k
nP ,
and tmkk = , where k is the number of
kinks, m is the number of medials and t is the
number of terminals in a unit of polyomino chain.
Figure 2 depicts the different polyomino chains
with their units as dotted part. We call nl ,
nz , nc ,
nk , nr and
nh the polyomino chains k
nP for
1,2,3,4,5=k and 6 respectively. Now we
compute omega polynomial of these chemical
graphs which count equidistance edges in these
graphs.
Theorem 2.1.2. The omega polynomial of k
nP
for 61,2,3,4,5,=k is equal to: 21=),( nxxxl n
n
32 1)(22=),( xnxxzn
432 1)(1)(1)(=),( xnxnxnxcn
5432 1)(1)(2=),( xnxnxxnxkn 6532 1)(1)(3=),( xnxnxxnxrn
7632 1)(1)(4=),( xnxnxxnxhn
Proof. Fornl
The polyomino chain nl is a linear chain of
squares as shown in Figure 2. The number of edges
in this chain graph is 13 n . There are two types of
ops in nl , there are n qoc strips of length 2 and
one strip of length 1n . Since c
c
xcGmxG ),(=),(
12=),( n
n xnxxl
Fornz :
The chemical graph nz is a zig-zag chain of
squares as shown in Figure 2. The number of edges
in this chain graph is 16 n . There are also two
types of ops in nz , there are 2 qoc strips of length 2
and 12 n strips of length 3. Since c
c
xcGmxG ),(=),(
32 1)(22=),( xnxxzn
Fornc :
The polyomino chain nc is a polyomino chain
k
nP with 3=k shown in Figure 2. The number of
edges in this chain graph is 19 n . This chain of
dimension n has three types of qoc strips in nc ,
there are 1n strips of length 2, 1n strips of
length 3 and 1n strips of length 4. Now c
c
xcGmxG ),(=),(
432 1)(1)(1)(=),( xnxnxnxcn
Fornk :
The number of edges in this chain graph is
112 n . This chain of dimension n has four types
of qoc strips in nk , there are 12 n strips of length
2, n strips of length 3, one strip of length 4 and
1n strips of length 5. Now c
c
xcGmxG ),(=),(
5432 1)(1)(2=),( xnxnxxnxkn
Fornr :
In polyomino chain nr , there are 115 n edges
and four types of strips. There are 13 n strips of
length 2, n strips of length 3, one strip of length 5
and 1n strips of length 6. We know c
c
xcGmxG ),(=),(

M. Imran, S. Hayat: On counting polynomials of certain polyomino chains
335
6532 1)(1)(3=),( xnxnxxnxrn
Fornh :
The polyomino chain nh contains 118 n
edges and four types of strips. There are 14 n
strips of length 2, n strips of length 3, one strip of
length 6 and 1n strips of length 7. We know c
c
xcGmxG ),(=),(
7632 1)(1)(4=),( xnxnxxnxhn
Fig. 2. Different polyomino chains.
In the following theorem, the Sadhana
polynomial of k
nP for 1,2,3,4,5=k and 6 is
computed.
Theorem 2.1.3. The Sadhana polynomial of k
nP
for 1,2,3,4,5=k and 6 is as follows:
nn
n xnxxlSd 213=),(
2616 1)(22=),( nn
n xnxxzSd
392919 1)(1)(1)(=),( nnn
n xnxnxnxcSd412312212112 1)(1)(2=),( nnnn
n xnxnxxnxkSd
515415215115 1)(1)(3=),( nnnn
n xnxnxxnxrSd618518218118 1)(1)(4=),( nnnn
n xnxnxxnxhSd
The proof of this theorem is on the same lines as
in case of omega polynomial, so we skip this proof.
Now we compute PI polynomial of k
nP for
61,2,3,4,5,=k .
Theorem 2.1.4. Consider the polyomino system k
nP for 1,2,3,4,5=k and 6. Then their PI
polynomials are: nn
n xnnxxlPI 213 1)(2=),(
2616 3)(64=),( nn
n xnxxzPI 392919 4)(43)(32)(2=),( nnn
n xnxnxnxcPI412312212112 5)(5432)(4=),( nnnn
n xnxnxxnxkPI515415215115 6)(6532)(6=),( nnnn
n xnxnxxnxrPI618518218118 7)(7634)(8=),( nnnn
n xnxnxxnxhPI The proof of this result is also skipped due to
similarity with proof of omega polynomial.
Polyomino chain system k
nP
In this section, we deal with polyomino chain
system k
nP with two defining parameters k and
n , where k is the sum of the number of kinks and
number of terminals in a unit of any particular
polyomino chain and n is the defining parameter
of the chain i.e. dimension. Figure 3 shows the
polyomino chain system k
nP , with arbitrary
defining parameters. The number of edges in k
nP is
13 kn .
Fig. 3. General representation of k
nP .
Table 1. Number of quasi-orthogonal strips in k
nP
for 3k , 1n .
Types of
qoc’s
Types of
edges
Number of
co-distant
edges
No of qoc
C1
e1 2 (kn-2n+1)
C2
e2 3 n
C3
e3 k 1
C4
e4 k n-1
There are four types of qoc strips in k
nP shown
in Table. In the following theorem, the omega

M. Imran, S. Hayat: On counting polynomials of certain polyomino chains
336
polynomial of k
nP is computed.
Theorem 2.2.1. The omega polynomial of k
nP
with 3k , 1n , is as follows:
132 1)(1)2(=),( kkk
n xnxnxxnknxP
Proof. Let G be the graph of polyomino chain
system k
nP with 3k , 1n . Table 1 shows the
number of co-distant edges and number of qoc in
G . The quasi-orthogonal cuts and starting edges of
strips are depicted in Fig 2. By using Table 1 , the
proof is mechanical. Now we apply formula and do
some calculation to get our result. c
c
xcGmxG ),(=),(
132 1)(1)2(=),( kk xnxnxxnknxG
Now we compute Sadhana polynomial of k
nP
for 3k , 1n . Following theorem shows the
Sadhana polynomial for this family of polyomino
chains.
Theorem 2.2.2. Consider the graph of k
nP with
3k , 1n . Then its Sadhana polynomial is as
follows:
kknkknknknk
n xnxnxxnknxPSd 3132313 1)(1)2(=),(
Proof. Consider the graph of k
nP with 3k ,
1n . We prove it by using Table 1 . We know that ce
c
xcGmxGSd ),(=),(
kknkknknknk
n xnxnxxnknxPSd 3132313 1)(1)2(=),(
Next we compute PI polynomial of this
polyomino chain system. Following theorem
explains the PI polynomial of this family of
polyomino chains.
Theorem 2.2.3 Consider the graph of k
nP with
3k , 1n . Then its PI polynomial is as follows:
kknnkknknknk
n xnxnxxnknxPPI 312313 1)(31)22(=),(
Proof. Let G be the graph of k
nP with 3k ,
1n . We prove it by using data given in Table 1 .
We know that ce
c
xccGmxGPI ),(=),(
kknnkknknknk
n xnxnxxnknxPPI 312313 1)(31)22(=),(
Open Problem
Investigate ),( xGC for 3-parametric 4-
polyomino system )(nPk
r, where tmkk = ,
and r is the number of squares between kinks
inclusively in a unit and n is the dimension.
CONCLUSION AND GENERAL REMARKS
In this paper, three important counting
polynomials called omega, Sadhana and PI are
studied. These polynomials are useful in
determining omega, Sadhana and PI topological
indices which play an important role in
QSAR/QSPR study. These counting polynomials
play an important role in topological description of
bipartite structures as well as counts equidistance
and non-equidistance edges in graphs. In this paper,
we studied these polynomials for polyomino chains
or conducted the counting of qoc strips in these
bipartite chemical graphs alternatively. An open
problem is proposed for study of polyomino chains
and k -polyomino system.
Acknowledgements: The authors would like to
thank the referee for his/her careful reading,
corrections and criticism which resulted as an
improved version of this paper. This research of
first author is supported by the grant of Higher
Education Commission of Pakistan Ref. No. 20-
367/NRPU/R&D/HEC/12/831. The second author
is supported by CAS-TWAS president’s fellowship
at USTC China.
REFERENCES
1. M. V. Diudea, Carpath. J. Math., 22, 43 (2006).
2. A.R. Ashrafi, M. Ghorbani, M. Jalali, Indian J.
Chem., 47A, 535 (2008).
3. A.Bahrami, J. Yazdani, Dig. J. Nanomater.
Biostruc., 3, 265 (2008).
4. K. C. Das, F. M. Bhatti, S. G. Lee, I. Gutman,
MATCH Commun. Math. Comput. Chem.,65, 753
(2011).
5. M. V. Diudea, I. Gutman, J. Lorentz, Molecular
Topology, Nova, Huntington, 2001.
6. M. V. Diudea, S. Cigher, P. E. John, MATCH
Commun. Math. Comput. Chem., 60, 237 (2008).
7. M. Ghorbani, M. Ghazi, Dig. J. Nanomater.
Biostruc., 5 (4), 843 (2010).
8. M. Imran, S. Hayat, M. K. Shafiq, Optoelectron.
Adv. Mater. Rapid Commun., 8, 948 (2014).
9. M. Imran, S. Hayat, M.K. Shafiq, Optoelectron.
Adv. Mater. Rapid Commun., 8, 1218 (2014).
10. P. V. Khadikar, Nat. Acad. Sci. letters, 23, 113
(2000).

M. Imran, S. Hayat: On counting polynomials of certain polyomino chains
337
11. P. V. Khadikar, S. Karmarkar, V. K. Agrawal, J.
Chem. Inf. Comput. Sci., 41, 931 (2001).
12. D. A. Klarner, Polyominoes, In: J. E. Goodman,
J. O’Rourke, (eds.), Handbook of Discrete and
Computational Geometry, CRC Press, Boca
Raton, 1997, p.225.
13. A. Rajan, A. William, C. Grigorious, S. Stephen,
J. Comp. Math. Sci., 5, 30 (2012).
14. S. Hayat, M. Imran, J. Comput. Theor. Nanosci.,
12, 7 (2015).
15. I. Tomescu, S. Kanwal, MATCH Commun.
Math. Comput. Chem., 69, 535 (2013).
16. Z. Yarahmadi, A. R. Ashrafi, S. Moradi, App.
Math. Lett., 25, 166 (2012).
17. I. Yazdani, A. Bahrami, Dig. J. Nanomater.
Biostruc., 4, 507 (2009).
18. M. Alaeiyan, A. Gilani, R. Mojarad, Kuwait J.
Sci., 41 (1), 85 (2014).
ВЪРХУ БРОЙНИ ПОЛИНОМИ НА НЯКОИ ПОЛИМИНО ВЕРИГИ
М. Имран1, С. Хаят2*
1 Департамент по математика, Училище по природни науки, Национален университет по наука и
техника, сектор H-12, Исламабад, Пакистан
2 Училище по математически науки, Университет по наука и техника на Китай, Хефей, Анхуй, Китай
Получена на 24 април 2015 г.;преработена на 20 октомври 2015 г.
Бройният полином ),( xGC е поредица, описваща топологично свойство, така че степенните показатели
изразяват размерите на неговите дялове, докато коефициентите са свързани с честотата на тези дялове.
Полиномите Ω, на Sadhana и Padmakar-Ivan са разширени примери на бройни полиноми, които играят важна
роля в топологичното писание на двуделни структури, както и в преброяването на еквидистантни и не
еквидистантни ребра на графи. Тези полиноми преброяват квазиортогоналните отрезни (КОО) ленти в графи,
генерирани от двуделни химически структури. КОО лента, дефинирана по отношение на кое и да е ребро на
графа ),( EVG , представлява най-малката подгрупа от ребра, затворени при вземане на противоположни ребра
върху лицата.
В тази статия, ние се фокусираме върху бройните полиноми на полимино вериги от различни възможни
форми. Ние извеждаме точните формули на полиномите оmega, на Sadhana и PI за 2-параметрична 4-полимино
система k
nP за 13, nk . Предложена е отворена задача за по-нататъшни изследвания в тази посока.

338
Bulgarian Chemical Communications, Volume 48, Number 2 (pp. 338 -– 348) 2016
Evaluation of ERIC-PCR for fingerprinting Methicillin-resistant Staphylococcus
aureus strains
S.Lin1, L. Li1, B. Li1, X. Zhao2*, C.Lin4, Y. Deng1, Z. Xu1, 3*
1College of Light Industry and Food Sciences, South China University of Technology, Guangzhou 510640, China 2 Key Laboratory for Green Chemical Process of Ministry of Education, School of Chemical Engineering and
Pharmacy, Wuhan Institute of Technology, Wuhan 430073, Hubei, China 3 Department of Microbial Pathogenesis, School of Dentistry, University of Maryland, Baltimore, Maryland, USA
4 Institute of Biomedical Engineering, National Taiwan University, Taipei 10617, Taiwan
Received September 16, 2015, Revised October 17, 2015
Staphylococcus aureus (S. aureus) has been long recognized as a common food-born pathogen in food safety. To
study their individuality and drug resistance, a total of 179 Staphylococci strains were subject to the investigation. S.
aureus was further confirmed with the detection of specific 16S rRNA and femA genes by multiplex-PCR. The
molecular method was also used for amplification of mecA and orfX elements to identify Methicillin-resistant S. aureus
(MRSA). Then fingerprinting for all strains was performed using ERIC-PCR. In this experiment, 179 staphylococci
were isolated, and all of these strains were MRSA. In addition, 179 MRSA strains can be typed into 10 genotypes which
have significant diversities, based on the results of ERIC-PCR. Through the above studies, a new protocol was brought
out for rapid identification of MRSA using multiplex-PCR and MRSA typing using fingerprinting, which have a broad
application prospect in food safety and epidemiology.
Key words: MRSA, Multiplex-PCR, ERIC-PCR, Fingerprinting
INTRODUCTION
Staphylococci are a group of gram-positive,
facultative aerobic and usually unencapsulated
organisms, which are responsible for various tissues
infection and a multitude of diseases.
Staphylococcus aureus are typical foodborne
microorganisms, which can cause food poisoning
and toxic shock, bringing serious public health
burden. About 14 million people are infected due to
foodborne microorganisms per year [1]. Among
these public health events, food poisoning caused
by Staphylococcus aureus accounts for a
large proportion, which has become an advanced
project in food safety [2-4]. Since the first
methicillin-resistance Staphylococcus aureus
(MRSA) was found in Britain in 1961, it has been
spreading among the world at an alerting rate. With
the wide identification of MRSA in animal
husbandry and food industry, a concept was put
forward that MRSA strains are a potential risk
factor, not only for food itself, but for those who
engage in food production and processing [5~8].
Instead of restricting the resistance, invasion and
propagation of MRSA into clinical fields, these
events should be expanded into food safety [9]. It
has been recognized that the infection caused by
MRSA has high morbidity and mortality.
According to the statistics published by CDC in
2003, hundreds of thousands of patients were
hospitalized due to infection of MRSA, and the
separation rate of MRSA might reach high up to
80%. The multi-drug resistance of MRSA increases
the complicacy and difficulty in therapy as well as
in the rapid growth of antibiotic and healthcare
budget. Reducing the infection rate of MRSA has
been a major challenge in clinical medicine, which
decides that rapid identification and efficient typing
method of MRSA are particularly crucial [10].
Increasing awareness of the risk of MRSA
strains and demands for tests capable of early, cost-
effective, timely, and sensitive detection of
staphylococci with associated antibiotic resistance
determinants has made these tests an urgent
demand. This study used multiplex-PCR assay for
identification of MRSA by detecting
Staphylococcus-specific regions of the 16S rRNA
gene, S. aureus specific femA gene and MRSA key
drug-resistance gene mecA. Furthermore, in order
to genotype MRSA strains, ERIC-PCR assay is
used for fingerprinting. MRSA can be rapidly
identified and genotyped using methods above.
* To whom all correspondence should be sent:
E-mail: [email protected]; [email protected]
2016 Bulgarian Academy of Sciences, Union of Chemists in Bulgaria
S. Lin et al.: Evaluation of ERIC-PCR for fingerprinting Methicillin-resistant Staphylococcus aureus strains
339
MATERIALS AND METHODS
Bacterial strains
Four reference strains, including MRSA 12513
and 10864 (with mecA, femA, 16S rRNA and orfX
positive), MSSA 10501 (with femA, 16S rRNA and
orfX positive, and mecA negative), MRCNS
A110146 (with mecA, 16S rRNA and orfX
positive, and femA negative), MSCNS 110830
(with 16S rRNA positive, and mecA, femA, orfX
negative) were subjected to evaluation and
optimization of multiplex-PCR assay. Application
of the multiplex-PCR and RAPD assays were
further performed on a total of 179 Staphylococcus
isolates, which were isolated from The First
Affiliated Hospital of Jinan University (FAHJU).
Culturing condition and template DNA preparation
Genomic DNA from S. aureus strains used as
template for PCR amplification was prepared from
overnight Tryptic soy broth (TSB) cultures at 37 °C
with shaking. Culture was performed according to
the instruction of kits (Dongsheng Biotech,
Guangzhou). Harvest 0.5-2.0ml culture in a sterile
1.5ml micro centrifuge tube by centrifuging for
1min at 12,000rpm, discard supernatant. Resuspend
pellet in 200μl DS Buffer. Mix the mixture
thoroughly with tip. Add 20μl Proteinase K and
220μl MS lysis buffer, mix thoroughly. Incubate at
65℃ for 10min. Add 220μl EtOH, mix the mixture
thoroughly with tip. Transfer the supernatant and
floc to a new purify tube, centrifuging for 1 min at
12,000rpm, discard filtrate. Add 500μl PS Buffer,
centrifuging for 1min at 12,000rpm, discard filtrate.
Add 500μl PE Buffer, centrifuging for 1min at
12,000rpm, discard filtrate. Add 500μl PE Buffer,
centrifuging for 1min at 12,000rpm, discard filtrate.
Centrifuge the tube for 3 min at 12,000rpm, and
transfer the spin column to a sterile 1.5ml
centrifuge tube. Add 100μl TE Buffer, incubate at
room temperature for 2min. At last, Centrifuge the
tube for 2 min at 12,000rpm. Remove spin column,
the buffer in the micro centrifuge tube contains the
highly purified DNA. Stored at -20℃.
Primer design
Three targets were selected to differentiate
MRSA、MSSA、MRCNS、MSCNS and non-
Staphylococci strains. The protocol was designed to
(i) detect any staphylococcal species to the
exclusion of other bacterial pathogens using as an
internal control, with primers corresponding to
Staphylococcus-specific regions of the 16S rRNA
genes (C1: 5’-GATGAGTGCTAAGTGTTAGG -3’
and C2: 5’-TCTACGATTACTAGCGATTC-3’ ,
with an expected 542 bp amplicon); (ii) distinguish
between S. aureus and CNS strains based on
amplification of the S. aureus specific femA gene
(F1: 5’-AAAGCTTGCTGAAGGTTATG-3’ and
F2: 5’-TTCTTCTTGTAGACGTTTAC-3’, with an
expected 823 bp amplicon) and (iii) provide an
indication of the likelihood that the staphylococci
present in the specimen are resistant to methicillin
based on the amplification of the mecA gene (M1:
5’-GGCATCGTTCCAAAGAATGT-3’ and M2:
5’-CCATCTTCATGTTGGAGCTTT-3’, with an
expected 374 bp amplicon). (iv) detect an open
reading frame existing on both sides of SCCmec in
order to identify MRSA strain (with mecA+) based
on the amplification of the orfX gene (O1: 5’-
ACCACAATCMACAGTCAT-3’ and O2:5’-
CCCGCATCATTTGATGTG-3’). Besides, primer
ERIC2 (5’-AAGTAAGTGACTGGGGTGAGCG-
3’) is used for ERIC-PCR assay.All primers
mentioned above are listed in Tab.1.
Establishment of multiplex-PCR assay
Four reference strains were used to evaluate the
multiplex-PCR assay, which was carried out in a
total of 25 μL reaction mixture. Components for
multiplex-PCR are listed in Tab.2. Primers are
stored at -20℃. The stock solution of primers is
100pmol/μL. Work solution of primers is
10pmol/μL. Multiplex-PCR amplification was
carried out using the thermal profile as follows:
94°C for 5 min, followed by 30 cycles of 94°C for
30 sec, annealing temperature for 30 sec, and 72°C
for 1.5 min and a final extension cycle at 72°C for 7
min. Annealing temperature is presented in Tab.1.
The amplified products (7μL/well) were analyzed
by gel electrophoresis in 1.5% agarose gels and
stained with ethidium bromide for 10 min. A
negative control was performed using sterile water
instead of DNA template.
Application of the multiplex-PCR assay on clinical
strains
179 clinical staphylococci isolates, were
subjected to detection by the established multiplex-
PCR assay with primers pairs F1 with F2, C1 with
C2, O1 with O2, and M1 with M2, and PCR
amplicons were evaluated by electrophoresis as
aforementioned. These experiments were replicated
to ensure reproducibility.
Fingerprinting analysis by ERIC-PCR on
clinical strains
179 isolated strains were genotyped using the
ERIC-PCR assay, which was carried out in a total
of 50 μL reaction mixture. Components for ERIC-
PCR are listed in Tab.3. Primer ERIC-2 is stored at
-20℃. The stock solution of primers is 100pmol/μL,
while work solution is 10pmol/μL.

S. Lin et al.: Evaluation of ERIC-PCR for fingerprinting Methicillin-resistant Staphylococcus aureus strains
340
Table 1. Description of the primers used for amplification
Primer Sequence(5’-3’) Target Tm(℃) Amplification(bp)
C1 GGACTGTTATATGGCCTTTT
16S rRNA
50
542
C2 GAGCCGTTCTTATGGACCT
M1 GGCATCGTTCCAAAGAATGT
mecA 374 M2 CCATCTTCATGTTGGAGCTTT
F1 AAAGCTTGCTGAAGGTTATG
femA 823
F2 TTCTTCTTGTAGACGTTTAC
O1 ACCACAATCMACAGTCAT
orfX 212 O2 CCCGCATCATTTGATGTG
ERIC2 AAGTAAGTGACTGGGGTGAGCG RAPD 25 —
Table 2. Reaction system of multiplex PCR
amplification
Component Volume (μL)
2×UTaq PCR Master Mix 12.5
Primer M1, M2; C1, C2 (each) 1
Primer F1, F2; O1, O2(each) 1.5
DNA template 1.5
ddH2O 1
Table 3. ERIC-PCR amplification of insert DNA
Component Volume (μL)
2×Uaq PCR Master Mix 25
Primer ERIC-2 3
DNA template 1
ddH2O 21
ERIC-PCR amplification was carried out using
the thermal profile as follows: 94°C for 4 min,
followed by 35 cycles of 94°C for 1 min, annealing
temperature for 2 min, and 72°C for 2 min and a
final extension cycle at 72°C for 7 min [11].
Annealing temperature is presented in Tab.1. The
amplified products (7μL/well) were analyzed by gel
electrophoresis in 1.5% agarose gels and stained
with ethidium bromide for 10 min. A negative
control was performed using sterile water instead of
DNA template
RESULTS AND DISCUSSION
Evaluation of the multiplex-PCR
The specific amplification generated 4 bands on
agarose gel (Fig.1), with sizes 823 bp for femA, 542
bp for 16S rRNA, 374 bp for mecA and 212bp for
orfX (Tab.1), respectively. Marker DS2000 (track
1) was used for control. MRSA strain 12513 (track
1) and strain 10864 (track 2) showed specific
amplification for mecA, femA, 16S rRNA and
orfX, MSSA strain 10501 (track 3) showed positive
result for femA, 16S rRNA and orfX, MRCNS
110146 (track 4) was detected to carry mecA ,16S
rRNA and orfX, MSCNS 110830 (track 5) had
been found to be 16S rRNA positive, while ddH2O
(track 6) cannot amplified any band.
Fig. 1. Amplification results of multiplex-PCR
According to the amplification results
mentioned above, the multiplex-PCR assay has fine
resolution, not only to MRSA, but other
Staphylococci such as MRCNS, MSCNS, and

S. Lin et al.: Evaluation of ERIC-PCR for fingerprinting Methicillin-resistant Staphylococcus aureus strains
341
MSSA etc. Besides, characters showed by
multiplex-PCR, rapid identification and high
specificity, for instance, may significantly increase
efficiency both in clinical medicine and microbial
safety in food industry.
Application of multiplex-PCR on 179 clinical
strains
One hundred and seventy-nine clinical
Staphylococci strains had been subjected to the
application of the multiplex-PCR detection using
primers F1 with F2, C1 with C2, O1 with O2, and
M1 with M2 together. Multiplex-PCR and
subsequent detection by electrophoresis were
performed as described previously. All 179 MRSA
strains yielded three bands as 374 bp, 572 bp and
823 bp amplicon, corresponding to mecA, 16S
rRNA and femA. No false positive amplification
was observed, indicating the high specificity of the
established multiplex-PCR assay (Fig.2).
Fig.2. Part of amplification results of 179 clinical
strains
Fig. 3. The PCR amplification of part Staphylococcus aureus in primer AP1in primer ERIC2 (continues on the next
page)
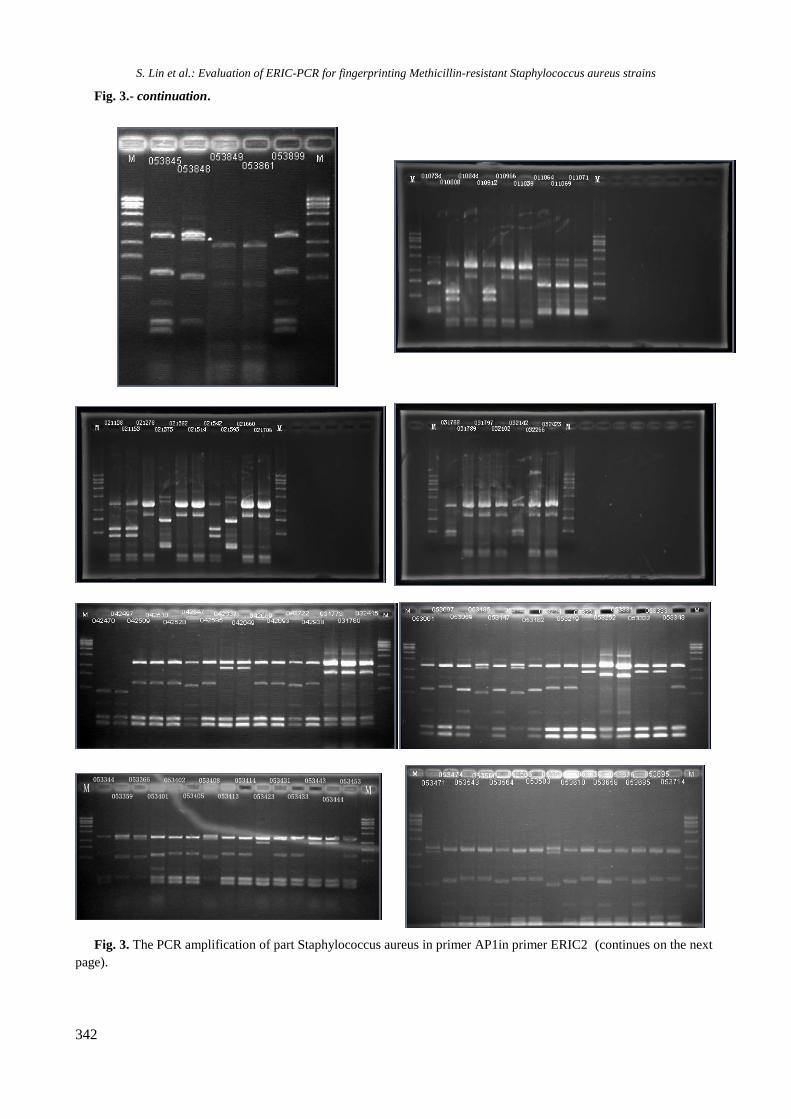
S. Lin et al.: Evaluation of ERIC-PCR for fingerprinting Methicillin-resistant Staphylococcus aureus strains
342
Fig. 3.- continuation.
Fig. 3. The PCR amplification of part Staphylococcus aureus in primer AP1in primer ERIC2 (continues on the next
page).

S. Lin et al.: Evaluation of ERIC-PCR for fingerprinting Methicillin-resistant Staphylococcus aureus strains
343
Fig. 3.- continuation.
Fig. 3. The PCR amplification of part Staphylococcus aureus in primer AP1in primer ERIC2
Application of Fingerprinting on 179 clinical
strains
One hundred and seventy-nine clinical MRSA
strains which were rapidly identified by multiplex-
PCR previously, had been subjected to the
application of the ERIC-PCR detection with primer
ERIC2 in order to genotyping in fingerprinting.
ERIC-PCR and subsequent detection by
electrophoresis were performed as described
previously.
Based on the results of gel electrophoresis of
ERIC-PCR, complex banding patterns were
amplified in 2-5 bands, ranging from 400bp-
5000bp. All 179 clinical MRSA strains were
successfully genotyped with ERIC-PCR assay into
10 genotypes A-J (Fig.4). These clinical MRSA
strains were isolated in separate ward and different
organs of patients. All 179 clinical MRSA strains
were listed in Tab.4. Fingerprinting results were
recorded, then with the usage of Quantity One, the
similarity between 179 MRSA strains was
evaluated. The DNA relatedness between 179
MRSA strains was analyzed based on the
unweighted pair group method using arithmetic
averages (UPGMA).
Fig. 4. Dendrogram analysis by ERIC-PCR of DNA
fingerprinting results.
CONCLUSION
MRSA are currently widespread pathogens
throughout the world and have prompted a
heightened interest and concern for the rapid
detection [12] and accurate categorization of these
pathogens. Thus, rapid and accurate detection and
genotyping approaches are needed to reduce risk in
nosocomial infection and food industry caused by
MRSA strains.
This study was aimed to use rapid identification
methods based on multiplex-PCR assays for
differentiation of MRSA, MSSA, MRCNS,
MSCNS even non-staphylococci strains.

S. Lin et al.: Evaluation of ERIC-PCR for fingerprinting Methicillin-resistant Staphylococcus aureus strains
344
Table 4. Summary of typing result of 179 MRSA strains using ERIC-PCR.
Year Source Ward Amount Genotype
2001
Blood
Orthopedics 1 C
General 1 B
Skin and parenchyma
Internal medicine 4 A
Surgery 1 C
Respiratory
Infection 1 A
Orthopedics 1 B
Neurology
1 A
1 B
1 C
Other
Orthopedics
1 A
1 C
Neurology 1 C
General 1 D
Surgery 1 A
Internal medicine 2 D
Urethra Surgery 1 C
2002
Skin and parenchyma
Internal medicine
5 A
5 D
Surgery
1 C
1 D
Blood Orthopedics 1 C
Urethra
Neurology 1 B
Surgery 1 C
Internal medicine 1 D
Respiratory Surgery
1 A
1 C
Other Surgery
1 A
1 C
2003 Skin and parenchyma Internal medicine
1 A
2 B
5 D
1 E
1 F

S. Lin et al.: Evaluation of ERIC-PCR for fingerprinting Methicillin-resistant Staphylococcus aureus strains
345
Table 4. Summary of typing result of 179 MRSA strains using ERIC-PCR. (Continuation).
Surgery
1 D
1 E
Blood Internal medicine 2 B
Other Surgery 1 A
2004
Skin and parenchyma
Internal medicine
1 A
5 D
4 G
1 H
3 I
2 J
Gynecology and obstetrics
1 D
1 G
Infection 1 A
General 1 G
Urethra
Internal medicine 1 A
General 1 A
Blood
Pediatric 1 G
Internal medicine 1 G
Other
Orthopedics 1 H
Internal medicine
1 A
2 D
1 G
1 H
2 I
Respiratory
Gynecology and obstetrics 1 I
Pediatric 1 I
2005
Skin and parenchyma
Internal medicine
2 G
3 H
3 I
4 J
General 1 I
Blood Internal medicine
1 I
1 J
1 H

S. Lin et al.: Evaluation of ERIC-PCR for fingerprinting Methicillin-resistant Staphylococcus aureus strains
346
Table 4. Summary of typing result of 179 MRSA strains using ERIC-PCR. (Continuation).
Respiratory
Infection 2 G
Pediatric
1 D
1 H
1 I
1 J
Neurology
2 G
2 H
3 I
General 2 G
Surgery
1 D
1 G
2 I
Orthopedics
3 G
1 H
Internal medicine
1 H
1 G
Gynecology and obstetrics 1 I
Urethra Internal medicine
6 G
1 H
1 I
2006
Skin and parenchyma
Internal medicine
5 G
5 H
1 J
Gynecology and obstetrics
1 G
2 H
1 J
Infection 1 I
Orthopedics
1 J
1 G
Pediatric 1 H
Blood Internal medicine
1 I
1 J
Respiratory Pediatric
1 G
1 I
S. Lin et al.: Evaluation of ERIC-PCR for fingerprinting Methicillin-resistant Staphylococcus aureus strains
347
Table 4. Summary of typing result of 179 MRSA strains using ERIC-PCR. (Continuation).
1 J
Infection 2 H
Surgery
1 G
2 H
Neurology
1 G
2 H
1 J
Gynecology and obstetrics 1 J
Urethra
Internal medicine
1 G
3 H
1 J
Orthopedics 1 J
Then apply fingerprinting to genotyping 179
clinical MRSA strains with ERIC-PCR assay. The
experiment results indicated that both multiplex-
PCR and ERIC-PCR showed strength in rapid
identification and superior sensitivity.
In conclusion, the multiplex-PCR assay proved
to be an efficient and accurate tool to identify and
separate staphylococci, such as MRSA, MSSA,
MRCNS, MSCNS, even non-staphylococci (Fig.1).
All of the 179 clinical strains were identified as
MRSA (Fig.2). On the other side, fingerprinting
using ERIC-PCR also showed excellent resolution
to 179 clinical MRSA strains (Fig.3). Each DNA of
the 179 clinical strains was amplified into 2-5
bands, ranging from 400bp- 5000bp. Based on this
result, the 179 clinical MRSA strains were
successfully genotyped into 10 genotypes A-J
(Fig.4).
Dendrogram analysis shows the similarity
between 10 types MRSA strains. Among 10 types,
type I and A, J and H, E and D had a relatively high
affinity while type G and F was rather low. The
results showed that the 179 clinical MRSA strains
resolute by ERIC-2 system did not have close
affinity, which could be considered to be evolved
isolated. Resulted from the resolution, the ERIC-
PCR assay in this study provided a sensitive
method in the classification of 179 clinical MRSA
strains while traditional genotyping means may not
possess such high sensitivity and accuracy.
In the long term, the fingerprinting approach can
be applied on rapid genotyping, genetic similarity
analysis [9], genetic tracking [13] and
epidemiology research [14]. Based on the character
of simple, rapid and accurate, DNA fingerprinting
are supposed to be listed in the common tools for
genotyping.
Acknowledgements: This work was supported
by the National 973-Plan of China
(2012CB720800), International Science &
Technology Cooperation Program of Guangdong
Province (2013B051000014), National Natural
Science Foundation of China (31201362 &
31101278), the National Science and Technology
Support Program (2012BAD37B01), National
Outstanding Doctoral Dissertation Funding (Dr.
Zhenbo Xu), Guangdong Outstanding Doctoral
Dissertation Funding (K3140030) , the
Fundamental Research Funds for the Central
Universities (2012ZM0060) and Hubei Provincial
Education Of Department Scientific Research
Program (Q20151508).
REFERENCES
1. L. Zhang; L. Wang; W. Zhang; Z. .Chinese Journal
of Food Hygiene, 16(1), 35 (2004).
2. L. Chen, M. Li, Y. Wang, Y. Jin, W. Guo, Chinese
Journal of Food Hygiene, 20(5), 431 (2008).
3. Y.-D. Xiang, X.-A. Xu, H.-W. Xiao,. Occupation
and Health., 21(2), 215 (2005).
4. B. Alarcon, B. Vicedo, R. Aznar, J Appl Microbiol,
100, 352 (2006).
5. O. Andreoletti, H. Budka, S.Buncic, P. Colin, J. D.
Collins, A. De Koeijer, J. Griffin, A. Havelaar, J.
Hope, G. Klein, H. Kruse, S. Magnino, A. M. López,
J. McLauchlin, C. Nguyen-Thé, K. Noeckler, B.
Noerrung, M. P. Maradona, T. Roberts, I. Vagsholm,
E. Vanopdenbosch , EFSA J, , 765, 2 (2008).

S. Lin et al.: Evaluation of ERIC-PCR for fingerprinting Methicillin-resistant Staphylococcus aureus strains
348
6. E. De Boer, Int J Food Microbiol, 134, 52 (2009).
7. J. Kluytmans, W. van Leeuwen, W. Goessens, R.
Hollis, S. Messer, L. Herwaldt, H. Bruining, M. Heck,
J. Rost, N. van Leeuwen, A. van Belkum, H.
Verbrugh,. J Clin Microbiol, 33, 1121 (1995).
8. N. H. Kwon K. T. Park, J. S. Moon, W. K. Jung , S.
H. Kim, J. M. Kim, S. K. Hong, H. C. Koo, Y. S. Joo,
Y. H. Park, J Antimicrobial Chemotherapy, 56, 624
(2005).
9. Z. Xu, Study on the mechanism of the biofilm
behavior and drug resistance of Staphylococcus in the
sugar biosecurity [D].Guangzhou: South China
University of Technology, 2011.
10. Z. Xu, L. Lin, L. Shi, Chinese Journal of Laboratory
Medicine, 31(11), 1270 (2008).
11. A. van Belkim, J. Kluytmans, W. van Leeuwen, R.
Bax, W. Quint, E. Peters, A. Fluit, C. van den
Broucke-Grauls, A. van den Brule, H. Koeleman, W.
Melchers, J. Meis, A. Elaichouni, M. Vaneechoutte, F.
Moonens, N. Maes, M. Struelens, F. Tenover, H.
Verbrugh , J Clin Microbiol, 33, 1537 (1995).
12. Z. Xu, L. Li, X. Zhao, J. Chu, B. Li, L. Shi, J. Su,
M.E. Shirtliff, Afr. J. Microbiol. Res. 5(14), 1869
(2011).
13. Z. Chunhui, Molecular epidemiological study of
Staphylococcus aureus [D].Tianjin: Tianjin Medical
University, 2010.
1. W. Jun., L. Xi. Clinical Medical Journal of China,
12(6), 1018 (2005)
ОЦЕНЯВАНЕ НА МЕТОДА ERIC-PCR ЗА ОПРЕДЕЛЯНЕ НА ПРЪСТОВИТЕ
ОТПЕЧАТЪЦИ НА МЕТИЦИЛИН-РЕЗИСТЕНТЕН ЩАМОВЕ ОТ ВИДА
Staphylococcus aureus
С. Лин1, Л. Ли1, Б. Ли1, С. Жао2*, С. Лин4, Я. Денг1, Ж. Ксу1, 3
1Колеж по лека промишленост и науки за храненето, Южнокитайски технологичен университет, Гуанчжоу
510640, Китай 2 Ключова лабоатория по зелени химични процеси при Министерството на образованието, Училище по
химично инженерство и фармация, Технологичен университет в Ухан, Ухан 430073, Хубей, Китай 3Департамент по микробиална патогенеза, Училище по стоматология, Университет в Мериленд, Балтимор,
Мериленд, САЩ 4 Институт по биомедицинско инженерство, Национален университет в Тайван, Тайпе 10617, Тайван
Постъпила на 16 септември, 2015 г.; Приета на 17 октомври, 2015 г.
(Резюме)
Бактериите от вида Staphylococcus aureus (S. aureus) дълго са били признавани като обикновени патогени в
храните. За да се изследва тяхната индивидуалност и резистентност спрямо лекарства в настоящата работа 179
стафилококови щама са подложени на изследване. S. aureus са потвърдени с откриването на специфични гени
16S rRNA и femA чрез мултиплексен PCR. Използван е също така молекулен метод за усилването на
елементите mecA и orfX за идентифицирането на метицилин-резистентен щам S. aureus (MRSA). След това са
представени пръстовите отпечатъци за всички щамове при използването на техниката ERIC-PCR. В този
експеримент са изолирани 179 стафилококови щамове, като всички те са MRSA. Допълнително, на основание
ERIC-PCR-техниката тези 179 MRSA-щама могат да се разпределят в 10 генотипа с значимо разнообразие. Чрез
тези резултати е съставен нов протокол за бърза идентификация на MRSA чрез пръстови отпечатъци. Тези
щамове имат широко приложение за безопасността на храните и епидемиологията.

Bulgarian Chemical Communications, Volume 48, Number 2, 2016
349
BULGARIAN CHEMICAL COMMUNICATIONS
Instructions about Preparation of Manuscripts
General remarks: Manuscripts are submitted in
English by e-mail or by mail (in duplicate). The text
must be typed double-spaced, on A4 format paper
using Times New Roman font size 12, normal
character spacing. The manuscript should not
exceed 15 pages (about 3500 words), including
photographs, tables, drawings, formulae, etc.
Authors are requested to use margins of 3 cm on all
sides. For mail submission hard copies, made by a
clearly legible duplication process, are requested.
Manuscripts should be subdivided into labelled
sections, e.g. Introduction, Experimental, Results
and Discussion, etc.
The title page comprises headline, author’s
names and affiliations, abstract and key words.
Attention is drawn to the following:
a) The title of the manuscript should reflect
concisely the purpose and findings of the work.
Abbreviations, symbols, chemical formulas, refer-
ences and footnotes should be avoided. If indis-
pensable, abbreviations and formulas should be given
in parentheses immediately after the respective full
form.
b) The author’s first and middle name initials,
and family name in full should be given, followed
by the address (or addresses) of the contributing
laboratory (laboratories). The affiliation of the author(s)
should be listed in detail (no abbreviations!). The
author to whom correspondence and/or inquiries
should be sent should be indicated by asterisk (*).
The abstract should be self-explanatory and
intelligible without any references to the text and
containing not more than 250 words. It should be
followed by key words (not more than six).
References should be numbered sequentially in
the order, in which they are cited in the text. The
numbers in the text should be enclosed in brackets
[2], [5, 6], [912], etc., set on the text line. Refer-
ences, typed with double spacing, are to be listed in
numerical order on a separate sheet. All references
are to be given in Latin letters. The names of the
authors are given without inversion. Titles of
journals must be abbreviated according to Chemical
Abstracts and given in italics, the volume is typed in
bold, the initial page is given and the year in
parentheses. Attention is drawn to the following
conventions:
a) The names of all authors of a certain
publications should be given. The use of “et al.” in
the list of references is not acceptable.
b) Only the initials of the first and middle names
should be given.
In the manuscripts, the reference to author(s) of
cited works should be made without giving initials,
e.g. “Bush and Smith [7] pioneered...”. If the refer-
ence carries the names of three or more authors it
should be quoted as “Bush et al. [7]”, if Bush is the
first author, or as “Bush and co-workers [7]”, if
Bush is the senior author.
Footnotes should be reduced to a minimum.
Each footnote should be typed double-spaced at the
bottom of the page, on which its subject is first
mentioned.
Tables are numbered with Arabic numerals on
the left-hand top. Each table should be referred to in
the text. Column headings should be as short as
possible but they must define units unambiguously.
The units are to be separated from the preceding
symbols by a comma or brackets.
Note: The following format should be used when
figures, equations, etc. are referred to the text
(followed by the respective numbers): Fig., Eqns.,
Table, Scheme.
Schemes and figures. Each manuscript (hard
copy) should contain or be accompanied by the
respective illustrative material as well as by the
respective figure captions in a separate file (sheet).
As far as presentation of units is concerned, SI units
are to be used. However, some non-SI units are also
acceptable, such as °C, ml, l, etc.
The author(s) name(s), the title of the
manuscript, the number of drawings, photographs,
diagrams, etc., should be written in black pencil on
the back of the illustrative material (hard copies) in
accordance with the list enclosed. Avoid using more
than 6 (12 for reviews, respectively) figures in the
manuscript. Since most of the illustrative materials
are to be presented as 8-cm wide pictures, attention
should be paid that all axis titles, numerals,
legend(s) and texts are legible.
The authors are asked to submit the final text
(after the manuscript has been accepted for
publication) in electronic form either by e-mail or
mail on a 3.5’’ diskette (CD) using a PC Word-
processor. The main text, list of references, tables
and figure captions should be saved in separate files
(as *.rtf or *.doc) with clearly identifiable file
names. It is essential that the name and version of
Bulgarian Chemical Communications, Volume 48, Number 2, 2016
350
the word-processing program and the format of the
text files is clearly indicated. It is recommended that
the pictures are presented in *.tif, *.jpg, *.cdr or
*.bmp format, the equations are written using
“Equation Editor” and chemical reaction schemes
are written using ISIS Draw or ChemDraw
programme.
The authors are required to submit the final text
with a list of three individuals and their e-mail
addresses that can be considered by the Editors as
potential reviewers. Please, note that the
reviewers should be outside the authors’ own
institution or organization. The Editorial Board of
the journal is not obliged to accept these proposals.
EXAMPLES FOR PRESENTATION OF REFERENCES
REFERENCES
1. D. S. Newsome, Catal. Rev.–Sci. Eng., 21, 275 (1980).
2. C.-H. Lin, C.-Y. Hsu, J. Chem. Soc. Chem. Commun., 1479 (1992).
3. R. G. Parr, W. Yang, Density Functional Theory of Atoms and Molecules, Oxford Univ. Press, New York, 1989.
4. V. Ponec, G. C. Bond, Catalysis by Metals and Alloys (Stud. Surf. Sci. Catal., vol. 95), Elsevier, Amsterdam, 1995.
5. G. Kadinov, S. Todorova, A. Palazov, in: New Frontiers in Catalysis (Proc. 10th Int. Congr. Catal., Budapest,
1992), L. Guczi, F. Solymosi, P. Tetenyi (eds.), Akademiai Kiado, Budapest, 1993, Part C, p. 2817.
6. G. L. C. Maire, F. Garin, in: Catalysis. Science and Technology, J. R. Anderson, M. Boudart (eds), vol. 6, Springer-
Verlag, Berlin, 1984, p. 161.
7. D. Pocknell, GB Patent 2 207 355 (1949).
8. G. Angelov, PhD Thesis, UCTM, Sofia, 2001.
9. JCPDS International Center for Diffraction Data, Power Diffraction File, Swarthmore, PA, 1991.
10. CA 127, 184 762q (1998).
11. P. Hou, H. Wise, J. Catal., in press.
12. M. Sinev, private communication.
13. http://www.chemweb.com/alchem/articles/1051611477211.html.
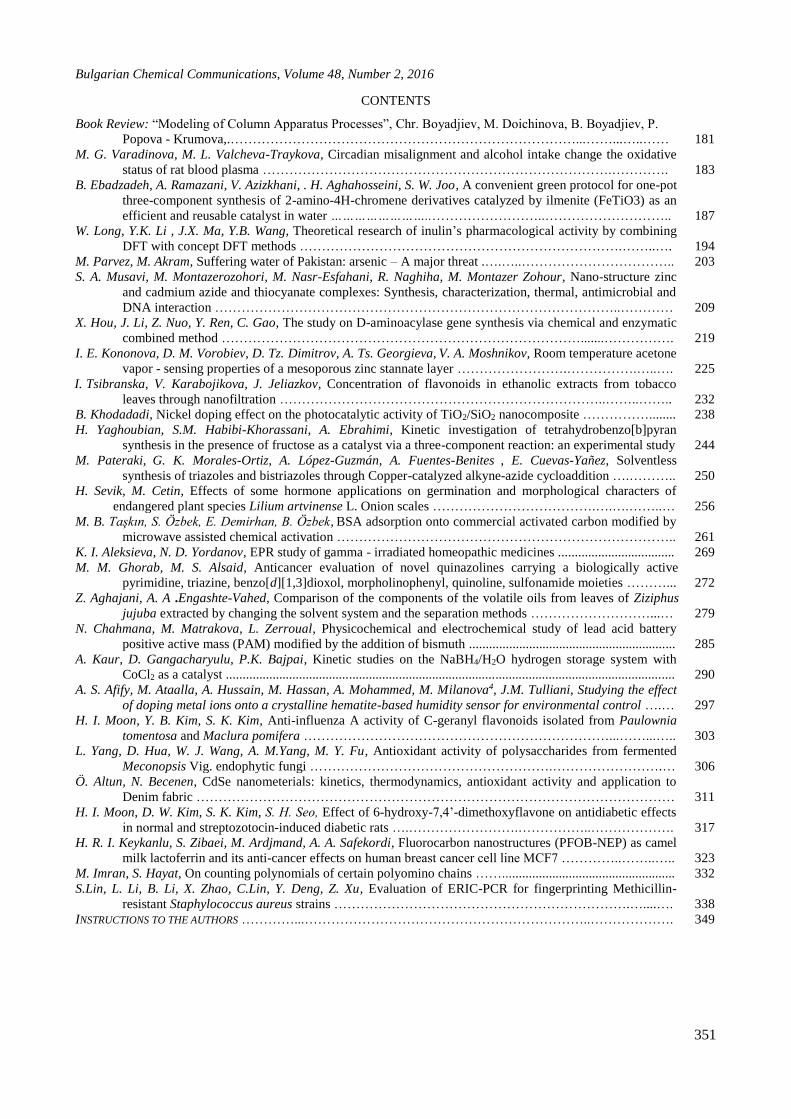
Bulgarian Chemical Communications, Volume 48, Number 2, 2016
351
CONTENTS
Book Review: “Modeling of Column Apparatus Processes”, Chr. Boyadjiev, M. Doichinova, B. Boyadjiev, P.
Popova - Krumova,.……………………………………………………………………...……...…..…… 181
M. G. Varadinova, M. L. Valcheva-Traykova, Circadian misalignment and alcohol intake change the oxidative
status of rat blood plasma …………………………………………………………………….…………. 183
B. Ebadzadeh, A. Ramazani, V. Azizkhani, . H. Aghahosseini, S. W. Joo, A convenient green protocol for one-pot
three-component synthesis of 2-amino-4H-chromene derivatives catalyzed by ilmenite (FeTiO3) as an
efficient and reusable catalyst in water ……………………..……………………..……………………….. 187
W. Long, Y.K. Li , J.X. Ma, Y.B. Wang, Theoretical research of inulin’s pharmacological activity by combining
DFT with concept DFT methods ……………………………………………………………….……..…. 194
M. Parvez, M. Akram, Suffering water of Pakistan: arsenic – A major threat .….…..…………………………….. 203
S. A. Musavi, M. Montazerozohori, M. Nasr-Esfahani, R. Naghiha, M. Montazer Zohour, Nano-structure zinc
and cadmium azide and thiocyanate complexes: Synthesis, characterization, thermal, antimicrobial and
DNA interaction ………………………………………………………………………………..………… 209
X. Hou, J. Li, Z. Nuo, Y. Ren, C. Gao, The study on D-aminoacylase gene synthesis via chemical and enzymatic
combined method ……………………………………………………………………….......……………. 219
I. E. Kononova, D. M. Vorobiev, D. Tz. Dimitrov, A. Ts. Georgieva, V. A. Moshnikov, Room temperature acetone
vapor - sensing properties of a mesoporous zinc stannate layer …………………….…………….…..…. 225
I. Tsibranska, V. Karabojikova, J. Jeliazkov, Concentration of flavonoids in ethanolic extracts from tobacco
leaves through nanofiltration ………………………………………………………………..……..…….. 232
B. Khodadadi, Nickel doping effect on the photocatalytic activity of TiO2/SiO2 nanocomposite ……………........ 238
H. Yaghoubian, S.M. Habibi-Khorassani, A. Ebrahimi, Kinetic investigation of tetrahydrobenzo[b]pyran
synthesis in the presence of fructose as a catalyst via a three-component reaction: an experimental study 244
M. Pateraki, G. K. Morales-Ortiz, A. López-Guzmán, A. Fuentes-Benites , E. Cuevas-Yañez, Solventless
synthesis of triazoles and bistriazoles through Copper-catalyzed alkyne-azide cycloaddition ….……….. 250
H. Sevik, M. Cetin, Effects of some hormone applications on germination and morphological characters of
endangered plant species Lilium artvinense L. Onion scales ……………………………….….….……..… 256
M. B. Taşkın, S. Özbek, E. Demirhan, B. Özbek, BSA adsorption onto commercial activated carbon modified by
microwave assisted chemical activation ………………………………………………………………….. 261
K. I. Aleksieva, N. D. Yordanov, EPR study of gamma - irradiated homeopathic medicines ................................... 269
M. M. Ghorab, M. S. Alsaid, Anticancer evaluation of novel quinazolines carrying a biologically active
pyrimidine, triazine, benzo[d][1,3]dioxol, morpholinophenyl, quinoline, sulfonamide moieties ………... 272
Z. Aghajani, A. A . Engashte-Vahed, Comparison of the components of the volatile oils from leaves of Ziziphus
jujuba extracted by changing the solvent system and the separation methods ………………………...… 279
N. Chahmana, M. Matrakova, L. Zerroual, Physicochemical and electrochemical study of lead acid battery
positive active mass (PAM) modified by the addition of bismuth .............................................................. 285
A. Kaur, D. Gangacharyulu, P.K. Bajpai, Kinetic studies on the NaBH4/H2O hydrogen storage system with
CoCl2 as a catalyst ....................................................................................................................................... 290
A. S. Afify, M. Ataalla, A. Hussain, M. Hassan, A. Mohammed, M. Milanova4, J.M. Tulliani, Studying the effect
of doping metal ions onto a crystalline hematite-based humidity sensor for environmental control ….… 297
H. I. Moon, Y. B. Kim, S. K. Kim, Anti-influenza A activity of C-geranyl flavonoids isolated from Paulownia
tomentosa and Maclura pomifera ……………………………………………………………...……...….. 303
L. Yang, D. Hua, W. J. Wang, A. M.Yang, M. Y. Fu, Antioxidant activity of polysaccharides from fermented
Meconopsis Vig. endophytic fungi ……………………………………………….…………………….… 306
Ö. Altun, N. Becenen, CdSe nanometerials: kinetics, thermodynamics, antioxidant activity and application to
Denim fabric ……………………………………………………………………………………………… 311
H. I. Moon, D. W. Kim, S. K. Kim, S. H. Seo, Effect of 6-hydroxy-7,4’-dimethoxyflavone on antidiabetic effects
in normal and streptozotocin-induced diabetic rats ….…………………….……………..………………. 317
H. R. I. Keykanlu, S. Zibaei, M. Ardjmand, A. A. Safekordi, Fluorocarbon nanostructures (PFOB-NEP) as camel
milk lactoferrin and its anti-cancer effects on human breast cancer cell line MCF7 …………..……..….. 323
M. Imran, S. Hayat, On counting polynomials of certain polyomino chains …….................................................... 332
S.Lin, L. Li, B. Li, X. Zhao, C.Lin, Y. Deng, Z. Xu, Evaluation of ERIC-PCR for fingerprinting Methicillin-
resistant Staphylococcus aureus strains ………………………………………………………….…....…. 338
INSTRUCTIONS TO THE AUTHORS …………...………………………………………………………..………………. 349
Bulgarian Chemical Communications, Volume 48, Number 1, 2016
352
СЪДЪРЖАНИЕ
М. Г. Варадинова, М. Л. Вълчева-Трайкова, Нарушеният циркаден ритъм и алкохолният прием променят
оксидативния статус на кръвна плазма на плъх ………………………………………………………. 186
В. Евадзаде, А. Рамазани, В. Азизхани, Х. Агахосеини, С. В. Джу, Удобен зелен протокол за едно-
стадийна три-компонентна синтеза на 2-амино-4h-хроменови производни, катализирани от
илменит(FeTiO3) като ефективен и многократно употребяван катализатор във водна среда ….….. 193
В. Лонг, И. И. Ли , Дж. С. Ма, И. Б. Ванг, Теоретично изследване на фармакологината активност на
инулин чрез комбинация на dft с концептуални dft-методи ….……………………….……………… 202
М. Парвез, М. Акрам, Водният проблем на Пакистан: арсенът като главна заплаха ……………...…………. 208
С. А. Мусави, М. Монтазерозохори, М. Наср-Есфахани, Р. Нагиха, М. Монтазер Зохоур, Нано-
структурирани цинков и кадмиев азид и тиоцианатни комплекси: синтеза, характеризиране,
термични, антимикробни и ДНК-взаимодействия.………...……………………………..…………… 218
Кс. Хоу, Дж. Ли, Жай Нуо, И. Рен, К. Гао, СинтеЗА на ген за D-аминоацилаза по химичен и комбиниран
ензимен метод …………………………………………………………………………………………… 224
И. Е. Кононова, Д. М. Воробьов, Д. Ц. Димитров, А. Ц. Георгиева, В. А. Мошников, Определяне при
стайна температура на сензорните свойства на мезопорест слой от цинков станат по отношение
на изпарения на ацетон ……………………………………………………...…………………….....…. 231
И. Х. Цибранска, В. И. Карабожикова, Ж. Желязков, Концентриране на флавоноиди в етанолов екстракт
от тютюневи листа чрез нанофилтруване ….…………………………………………….……….…… 237
Б. Ходадади, Ефект на дотиране с никел върху фотокаталитичната активност на нанокомпозити от
TiO2/SiO2 ……………………………………..…………………………………………………………... 243
Х. Ягубиан, С.М. Хабиби-Хорасани, А. Ебрахими, Кинетично изследване на синтезата на
тетрахидробензо[b]пиран в присъствие на фруктоза като катализатор чрез трикомпонентна
реакция: експериментално изследване …………………………………………..……………............. 249
М. Патераки, Г.К. Моралес-Ортиз, А. Лопес-Гусман, А. Фуентес-Бенитес, Е. Куевас-Янес, Синтеза без
разтворител на триазоли и бис-триазоли чрез алкин-азид‘ово цикло-притъкмяване, катализирано
от мед …………………………………………...………………………………..……………...……….. 255
Х. Севик, М. Джетин, Ефекти на някои хормони върху зреенето и морфологичните характеристики на
застрашения растителен вид Lilium artvinense L. луковични люспи………………………………..... 260
М.В. Ташкън, С. Йозбек, Е. Демирхан, Б. Йозбек, Адсорбция на албумин от говежди серум (BSA) върху
търговски активен въглен и модифициран с химично активиране с микровълново въздействие .... 268
К. И. Алексиева, Н. Д. Йорданов, ЕПР изследване на гама-облъчени хомеопатични лекарства ……………. 271
М.М. Гораб, М.С. Алсаид, Оценка на противотуморната активност на нови хиназолини, съдържащи
биологично активни пиримидин, триазин, бензо [d][1,3] диоксол, морфолинофенил, хинолин и
сулфонамиди …………………………………………………………….…………..…………………….. 278
З. Агаяни , А. А. Енгаще-Вахед, Сравняване на компонентите на летливи масла от листата на Ziziphus
jujuba чрез промяна на разтворителя и метода на разделяне ………………………………………… 284
Н. Чахмана, М. Матракова, Л. Зеруал, Физикохимично и електрохимично изследване на положителната
активна маса в оловен акумулатор, модифициран чрез добавяне на бисмут ……………………….. 289
А. Каур, Д. Гангачарюлу, П. К. Баджпаи, Кинетични изследвания върху системата за съхранение на
водород NaBH4/H2O с CoCl2 като катализатор ………………………………………………………... 296
А. Афифи, М. Атаалла, А. Хюсейн, М. Хасан, А. Мохамед, М. Миланова, Ж.М. Тюлиани, Изследване на
ефекта на дотиране с метални йони на кристални влагови сензори на основата на хематит …..…..
302
Х. И. Мун, И. Б. Ким, С. К. Ким, Анти-грипна A-активност на C-геранилови флавоноиди, изолирани от
Paulownia tomentosa и Maclura pomifera ………………..……………………….………………..…… 305
Л. Янг, Д. Хуа, У.Дж. Уанг, А.М. Янг, М.И. Фу, Антиоксидантна активност на полизахариди от
ферментирани Meconopsis Vig. ендофитни фунги …………...………………………………..……… 310
Й. Алтун, Н. Бедженен, Наноматериали от CdSe: кинетика, термодинамика, антиоксидантна активност и
приложение в denım-тъканите ………………………………………………………………………….. 316
Х. И. Мун, Д. В. Ким, С. К. Ким, С. Х. Сео, Ефект на 6-хидрокси-7,4’-диметоксифлавон върху антидиабети- чните прояви при нормални плъхове и такива с стрептозотоцин-индуциран диабет ......................... 322
Х. Р. И. Кейканлу, С. Зибаеи, М. Арджманд, А. А. Сафекорди, Флуоровъглеродни нано-структури (PFOB-
NEP) към лактоферин от камилско мляко и неговият противо-туморен ефект върху клетъчна
линия MCF7 на рак на гърдата ……...…………………………………………………….…………..... 331
М. Имран, С. Хаят, Върху бройни полиноми на някои полимино вериги.…...…………………………... 337
С. Лин, Л. Ли, Б. Ли, С. Жао, С. Лин, Я. Денг, Ж. Ксу, Оценяване на метода ERIC-PCR за определяне на
пръстовите отпечатъци на метицилин-резистентен щамове от вида Staphylococcus aureus……….... 348
ИНСТРУКЦИЯ ЗА АВТОРИТЕ ………………………………………………………………………………………… 349