Chemotherapy effects on brain glucose metabolism at rest
60
1 CHEMOTHERAPY EFFECTS ON BRAIN GLUCOSE METABOLISM AT REST NIPGI § § NIPGI (Nuclear Imaging, Psychological, Genetic Investigation) Study Group, composed by: Bruno Baudino 1* , Federico D’Agata 2,4* , Giancarlo Castellano 1 , Paola Caroppo 2 , Simona Cauda 1 , Antonella Parente 1 , Matteo Manfredi 1 , Elisabetta Geda 4 , Laura Orsi 2 , Franco Cauda 4 , Lorys Castelli 3,4 , Katiuscia Sacco 4 , Alberto Censon 1 , Pierpaola Fenoglio 2 , Roberto Passera 1 , Antonella Varetto 3 , Rita Ardito 4 , Lorenzo Pinessi 2 , Salvatore Gallone 2 , Paolo Mortara 2 , Giuliano Carlo Geminiani 4 , Riccardo Torta 3 , Gianni Bisi 1 1 Nuclear Medicine, AOU San Giovanni Battista, Turin, Italy; 2 Department of Neuroscience, AOU San Giovanni Battista, Turin, Italy; 3 Department of Psychooncology, AOU San Giovanni Battista, Turin, Italy; 4 Department of Psychology, University of Turin, Italy * Bruno Baudino and Federico D’Agata contributed equally to this work E-mail: [email protected] ; [email protected] Abstract: 254 words. Paper: 3839 words, 4 figures, 3 tables, 1 supplementary material. Keywords: Cancer; chemotherapy; neuropsychological functions; brain glucose metabolism; resting state.
-
Upload
independent -
Category
Documents
-
view
0 -
download
0
Transcript of Chemotherapy effects on brain glucose metabolism at rest

1
CHEMOTHERAPY EFFECTS ON BRAIN GLUCOSE METABOLISM AT REST
NIPGI§
§ NIPGI (Nuclear Imaging, Psychological, Genetic Investigation) Study Group, composed by:
Bruno Baudino1*
, Federico D’Agata2,4*
, Giancarlo Castellano1, Paola Caroppo
2,
Simona Cauda1, Antonella Parente
1, Matteo Manfredi
1, Elisabetta Geda
4,
Laura Orsi2, Franco Cauda
4, Lorys Castelli
3,4, Katiuscia Sacco
4,
Alberto Censon1, Pierpaola Fenoglio
2, Roberto Passera
1, Antonella Varetto
3,
Rita Ardito4, Lorenzo Pinessi
2, Salvatore Gallone
2, Paolo Mortara
2,
Giuliano Carlo Geminiani4, Riccardo Torta
3, Gianni Bisi
1
1Nuclear Medicine, AOU San Giovanni Battista, Turin, Italy;
2Department of Neuroscience, AOU San Giovanni Battista, Turin, Italy;
3Department of Psychooncology, AOU San Giovanni Battista, Turin, Italy;
4Department of Psychology, University of Turin, Italy
* Bruno Baudino and Federico D’Agata contributed equally to this work
E-mail: [email protected]; [email protected]
Abstract: 254 words.
Paper: 3839 words, 4 figures, 3 tables, 1 supplementary material.
Keywords: Cancer; chemotherapy; neuropsychological functions; brain glucose metabolism; resting
state.

2
ABSTRACT
Background: A growing number of studies reports that chemotherapy may impair brain functions
inducing cognitive changes which can persist in a subset of cancer survivors.
Aims: To investigate the neural basis of the chemotherapy-induced neurobehavioral changes by
means of metabolic imaging and voxel-based statistical parametric mapping analyses.
Methods: We studied the resting brain [18]FDG-PET/CT images of 43 adult cancer patients with
solid (n=12, 28%) or hematologic malignancies (n=31, 72%); 12 patients were studied prior the
chemotherapy (No chemotherapy) while treated patients were divided in two matched subgroups:
Early High (<9 months after chemotherapy, >6 chemotherapy cycles, n=10), and Late Low (>9
months after chemotherapy, <6 chemotherapy cycles, n=21).
Findings: Compared to No chemotherapy, the Early High subgroup showed a significant bilateral
(p<0.05) lower regional cerebral metabolic rate of glucose metabolism in both the prefrontal
cortices and white matter, cerebellum, posterior medial cortices and limbic regions. A similar
pattern emerged in the Early High versus Low Late comparison, while no significant result was
obtained in the Low Late versus No chemotherapy comparison. The number of cycles and the post-
chemotherapy time were negatively and positively correlated, respectively, with a set of these same
brain regions.
Interpretation: The present study shows that chemotherapy induces significant transient changes in
the glucose metabolism of multiple cerebral cortical and white matter regions with a prevailing
involvement of the prefrontal cortex. The severity of these changes are significantly related with the
number of chemotherapy cycles and a subset of brain regions seems to present longer lasting, but
more subtle, metabolic changes.

3
INTRODUCTION
Background
Cognitive changes in cancer patients after adjuvant chemotherapy (CHT) treatments have been
reported since the mid 1970s, with systematic research starting in the early 1990s. Since then most,
but not all [12, 22, 28], neuropsychological studies on cancer survivors having received adjuvant
CHT have reported cognitive impairments in multiple domains such as executive functions,
learning, memory (especially working memory, while the retrieval of remote memories seems to be
spared), attention, verbal fluency and speed of information processing [3, 4, 17, 36, 42, 49, 52].
Both prior meta-analyses [14, 21] and, more recently, longitudinal studies [9, 20, 41, 50] have
consistently shown that the CHT-induced cognitive impairments are small to moderate, involving
mostly the cognitive functions subserved by the frontal lobes.
Data are however less consistent regarding to the evolution in time of these changes and to the
possible dependency on CHT dose. Findings emerging from controlled longitudinal studies [9, 15,
50, 51] indicate that the cognitive changes tend to fully resolve over time while cross-sectional
studies suggest that they may persist for many years following completion of treatment at least in a
significant subset of patients [2, 8]. The CHT dose-effects relationships among cancer survivors has
been mostly investigated by comparing the neurobehavioral performance among breast cancer
patients receiving high or standard dose adjuvant CHT. High-dose therapy was found to elevate the
risk of cognitive dysfunctions in some [41, 49] but not in all studies [43]. In a study performed on a
mixed population of long-term breast cancer and lymphoma survivors [2] a significant, but low,
negative correlation was found between the number of cycles and the cognitive performance,
indicating that more cycles of CHT was associated with a greater cognitive disturbance.
Recent structural Magnetic Resonance Imaging studies have provided consistent evidence that CHT
can induce both gray and white matter changes which can however be, at least partially, reversible.
A CHT-related reduction in the gray matter volume [19] of structures significantly correlated with

4
indices of attention/concentration and/or visual memory (such as the prefrontal, cingulate and
parahippocampal cortex), and a loss of white matter integrity [6, 11, 16, 19, 47] has been shown by
comparing CHT treated with untreated cancer patients. The reversibility, at least partial, of these
changes was suggested by longitudinal examination of cancer patients finding a significant increase
in white matter volume from 6 months to 1 year after CHT [7] and no more gray and white matter
volume difference 3 years after completion of CHT [19]. Two neuroimaging studies suggest,
however, that CHT can induce long lasting adverse effects on the brain functions. Using [15]O
water PET in an activation short-term recall task, modulation of cerebral blood flow in specific
regions of frontal cortex and cerebellum was significantly altered, compared to a control sample, in
breast cancer women investigated 5-10 years after receiving CHT [45]. An fMRI memory task
performed on a sample of breast cancer women recruited 3-5 years after completion of CHT [24]
showed a lower prefrontal cortex activation and an altered cerebellar recruitment compared to
controls.
In sum, neither behavioural nor neuroimaging data are conclusive about the relationships between
CHT dosage/number of cycles and cognitive impairments, as well as about the reversibility of the
effects. Besides, little is known about the mechanisms leading these changes and how the brain tries
to adaptively react. The recruitment of compensatory mechanisms aimed at overcoming the CHT-
induced structural and/or functional impairments has been suggested by a fMRI in pairs of 60-year-
old identical twins discordant for breast cancer [16]. While performing an identical working
memory task with increasing levels of difficulty, the CHT-treated twin showed, compared to the
other, a greater spatial extent of activation in the fronto-parietal dorsal attentional network.
The mechanisms for CHT-induced cognitive changes are largely unknown; however, several
candidate mechanisms have been proposed, including blood brain barrier alterations, cytokines and
hormonal deregulation, as well as a direct neurotoxicity of chemotherapic agents [1].

5
Aim of the Study
The present study used brain resting state [18]FDG-PET, combined with neuropsycological tests to
assess relations between regional cerebral metabolic glucose rate (rCMRglc), cognitive
performances and oncologic/therapeutic variables.
6
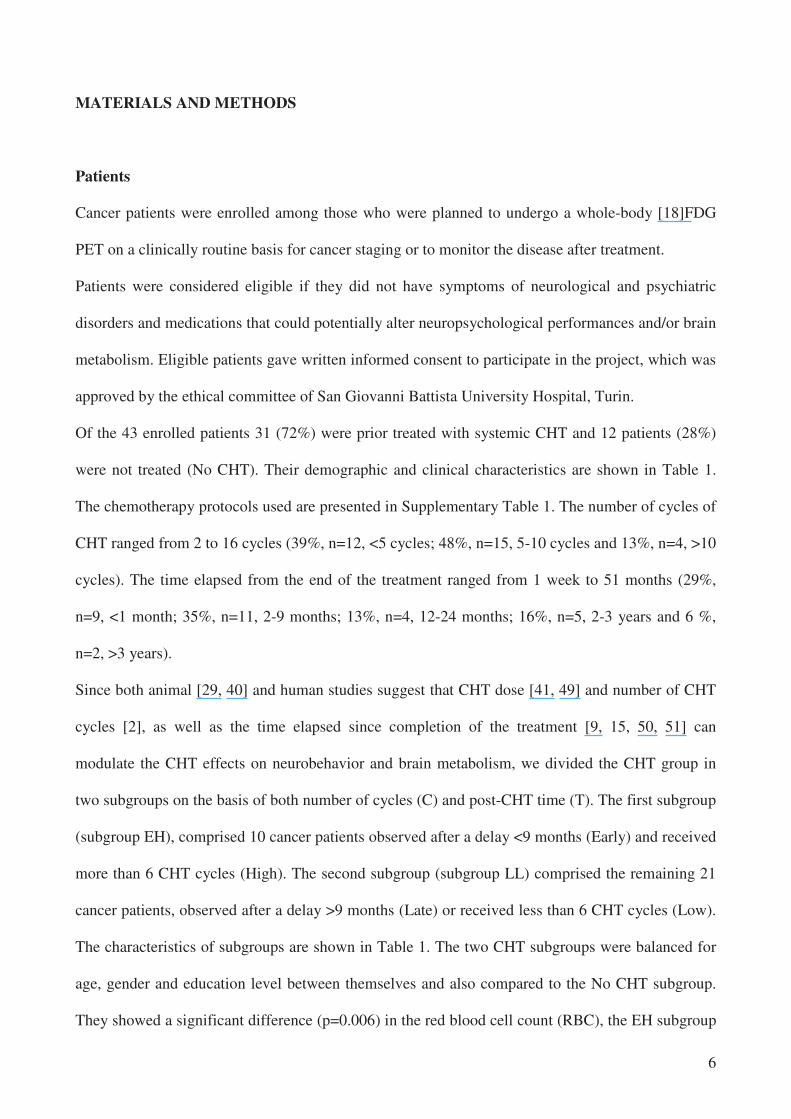
MATERIALS AND METHODS
Patients
Cancer patients were enrolled among those who were planned to undergo a whole-body [18]FDG
PET on a clinically routine basis for cancer staging or to monitor the disease after treatment.
Patients were considered eligible if they did not have symptoms of neurological and psychiatric
disorders and medications that could potentially alter neuropsychological performances and/or brain
metabolism. Eligible patients gave written informed consent to participate in the project, which was
approved by the ethical committee of San Giovanni Battista University Hospital, Turin.
Of the 43 enrolled patients 31 (72%) were prior treated with systemic CHT and 12 patients (28%)
were not treated (No CHT). Their demographic and clinical characteristics are shown in Table 1.
The chemotherapy protocols used are presented in Supplementary Table 1. The number of cycles of
CHT ranged from 2 to 16 cycles (39%, n=12, <5 cycles; 48%, n=15, 5-10 cycles and 13%, n=4, >10
cycles). The time elapsed from the end of the treatment ranged from 1 week to 51 months (29%,
n=9, <1 month; 35%, n=11, 2-9 months; 13%, n=4, 12-24 months; 16%, n=5, 2-3 years and 6 %,
n=2, >3 years).
Since both animal [29, 40] and human studies suggest that CHT dose [41, 49] and number of CHT
cycles [2], as well as the time elapsed since completion of the treatment [9, 15, 50, 51] can
modulate the CHT effects on neurobehavior and brain metabolism, we divided the CHT group in
two subgroups on the basis of both number of cycles (C) and post-CHT time (T). The first subgroup
(subgroup EH), comprised 10 cancer patients observed after a delay <9 months (Early) and received
more than 6 CHT cycles (High). The second subgroup (subgroup LL) comprised the remaining 21
cancer patients, observed after a delay >9 months (Late) or received less than 6 CHT cycles (Low).
The characteristics of subgroups are shown in Table 1. The two CHT subgroups were balanced for
age, gender and education level between themselves and also compared to the No CHT subgroup.
They showed a significant difference (p=0.006) in the red blood cell count (RBC), the EH subgroup

7
showing a greater degree of anemia. This latter finding was somewhat expected since anemia
frequently occur in cancer patients and its incidence and severity increases with CHT [34]. Finally,
within the Late cancer patients, we selected, for further subanalysis, a subgroup (LH) comprising
only those patients (n=9) investigated after a delay >9 months (Late) and received ≥6 CHT cycles
(High).
Neuropsychological examination
The assessment battery of psychological and neuropsychological tests included: Mini Mental State
Examination (MMSE), Trail Making Test B (TMT-B), Phonemic Fluency, Short Story Test,
Hospital Anxiety and Depression Scale (HADS), Montgomery-Asberg Depression Rating Scale
(MADRS), State and Trait Anxiety Inventory (STAI).
PET Scanning
In a quiet waiting room participants, lying in a supine position, were asked to refrain from moving
and instructed “to keep their eyes closed, to not engage in any structured mental activity such as
counting, rehearsing, etc., and to avoid to fall asleep”. They were then blindfolded and ear plugged
and received intravenously about 4.5–5.5 MBq kg−1 of 2-deoxy-2 [18F]fluoro-D-glucose (FDG).
About 30 minutes later PET/CT scan was performed by a Philips Gemini scanner (Philips Medical
System, Cleveland, Ohio, USA). The brain scan acquisition time was of 20 minutes. Reconstructed
brain images had a dimension of 128 x 128 x 90 voxels (2 x 2 x 2 mm3). After the planned whole
body FDG PET/CT examination was performed, the coronal, sagittal and transverse data sets were
reconstructed using an 3D iterative technique (row action maximum likelihood algorithm, RAMLA-
3D) and corrected with single scatter simulation (SSS).
Statistical parametric mapping analysis
[18]FDG-PET brain images were preprocessed and voxel-based statistical analyses were performed
using SPM2 (www.fil.ion.ucl.ac.uk/spm) running on MATLAB 6.5 software. All images were non
linearly spatially normalized into the Montreal Neurological Institute (MNI) space and smoothed
with an isotropic Gaussian kernel with 12 mm FWHM. Confounding effects of global activities

8
differences were removed by normalizing the count of each voxel to the mean count of a
standardized pontine region of interest (ROI) in order to avoid a biased normalization [5].
The hypothesis of a negative linear association between the rCMRglc and C was tested on the
whole CHT group (n=21) on a voxel-by-voxel basis using the SPM2 single-subject covariate only
option. Age, T (months) and hormonal status (see supplementary materials for its definition) were
entered in the general linear model as nuisance factors.
The hypothesis of a positive linear association between the rCMRglc and the time elapsed since the
end of the treatment was tested with the same SPM option with age, gender and C entered as
nuisance factors.
Between subgroups (EH versus LL; EH versus No CHT; LL versus No CHT; No CHT versus CHT)
comparison analyses were performed using the ANCOVA model using age, hormonal status and
education level as covariate of no interest.
Results were thresholded at p<0.005 uncorrected for multiple comparisons, with an extent threshold
cluster extent (Ke) of 20 voxels. Statistical inferences were performed by applying the Random
Field Theory. Clusters with p≤0.05 corrected for multiple comparisons were considered as
significant.
For subanalyses, we examined the correlations between neuropsychological scores and regional
glucose metabolism of the voxels of interest. Patient characteristic data were analyzed with
Kruskal-Wallis test for continuous variables and χ2 test for categorical variables. Pearson’s
correlations was used to analyze rCMRglc data resulting from SMP2 analysis. SPSS 13.0 was used
for statistical analysis, p<0.05 was considered significant. To compare correlations between
subgroups in our sample we used the Fisher’s Z-test.
Supplementary Material
The supplementary material contains a complete section of Material and Methods with all the steps
of patients selection, all the neuropsychological tests descriptions, the detailed PET scanning and
statistical procedures used.

9
RESULTS
Correlation between T and rCMRglc
A large cluster (9798 voxels) involving bilaterally the pregenual anterior cingulate cortex, the
anterior thalamic nuclei, most of the right PFC, including the inferior (BA44, BA9), middle (BA9,
BA46), superior (BA10) and medial frontal (Supplementary Motor Area, BA6) gyri as well as the
left middle cingulate cortex showed a significant (Z=4.15) positive correlation between T and the
rCMRglc (see Table 3, Supplementary Tables 2, 3 and Figure 1a, 2a).
Correlation between C and rCMRglc
A significant (Z=3.66) large cluster (4555 voxels) encompassing both the prefrontal cortices (PFC)
and the left temporal pole was negatively correlated with C (see Table 3, Supplementary Tables 2, 3
and Figure 1b, 2a). The PFC involvement included the right dorsolateral PFC (DLPFC, BA9 and
BA46), the right ventrolateral PFC (BA44), both the frontal poles (right BA10 and left BA11) and
the left medial PFC (BA10). As it can be appreciated in the Figure 1, both the temporal poles were
involved (BA38) even if the significant threshold was reached, as reported on the table, only on the
left side. The body of Corpus Callosum and the right side of the posterior limb of the internal
capsule were included in this cluster.
Comparison between No CHT (n=12) and CHT (n=31) subgroups
No significant clusters survived in a whole brain analysis thresholded at p<0.005. However, by
applying a small volume correction (SVC), a left parahippocampus cluster (177 voxel) showed a
significant (Z=3.13, p=0.039 corrected for multiple comparison) rCMRglc decrease in patients
having received CHT compared to non treated ones (Table 3). The SVC was performed since
several previous animal studies [44, 53] indicate this region as one of the most vulnerable to the
adverse effects on brain functions induced by the CHT (see Table 3, Supplementary Table 4, 5 and
Figure 3a).
Comparison between No CHT (n=12) and EH (n=10) subgroups

10
Compared to No CHT, the EH patients showed (see Table 3, Supplementary Table 4, 5 and Figure
1c, 2b) a bilateral lower rCMRglc in the DLPFC (Z=4.42), including the middle and medial frontal
(BA9, BA10, BA46), in the precentral gyri (BA4), in the cunei (BA19) and in cerebellum; right-
sided involvement was shown in the precuneus (BA7), in the lingual and in the parahippocampal
gyri (BA19); left-sided involvement in the superior temporal gyrus (BA38) and in the posterior
(BA30) and middle anterior cingulate cortex (BA32). Both the anterior and posterior left corona
radiata and the right anterior corona radiata were included in this cluster.
Comparison between No CHT (n=12) and LL (n=21) subgroups
No suprathreshold cluster was revealed.
Comparison between EH (n=10) and LL (n=21) subgroups
Compared to LL, the EH patients showed a lower rCMRglc in two main large clusters involving the
right and medial occipital cortex, the right temporal cortex and the prefrontal cortex bilaterally (see
Table 3, Supplementary Table 4, 5 and Figures 1d, 2b). The most significant posterior cluster
(Z=3.61) included, on the right hemisphere, the fusiform and middle occipital gyri (BA19), the
inferior (BA37) and medial (BA39, BA19) temporal gyri, the precuneus (BA7) and, medially, both
cunei (BA19). The anterior prefrontal cluster included the middle frontal gyrus (BA11) on both
sides, the right middle and medial frontal gyri (BA47, BA10), the right superior frontal gyrus
(BA10, BA11), the left medial frontal gyrus (BA25) an the right superior temporal gyrus (BA38).
Neuropsychological scores and rCMRglc
We did not find any significant correlation between rCMRglc and neuropsychological or
psychological variables in the total sample, in the CHT and in the No CHT groups. In the CHT
subgroups no cluster survived to a correction for multiple comparison.
We did not find any significant difference in the neuropsychological performances of our subgroups
(Table 2).
Comparison between EH (n=10) and LH (n=9) subgroups

11
This comparison was performed by applying at p=0.0058 to have the same threshold t=2.90 as in
the above EH<LL comparison (see Table 3, Supplementary Table 4, 5 and Figure 1e). Compared to
LH, the EH subgroup showed a lower rCMRglc in both the DLPFC, including the middle (BA10)
and superior frontal gyri (BA10), and in the middle cingulate cortex (BA32). The CMRglc was
moreover asymmetrically reduced in the left pregenual cingulate cortex (BA32) and the right
superior frontal gyrus (BA9). Only the left cluster (DLPFC, MCC, pgACC) survived the correction
for multiple comparisons.
Comparison between No CHT (n=12) and LH (n=9) subgroups
No suprathreshold cluster was revealed.

12
DISCUSSION
Amongst the several competing heuristic models of CHT-induced brain damage (see Figure 3c, 3d,
3e) which can be proposed through the analysis of the available neuropsychological and
neuroimaging data, conclusive or convincing evidence favouring the one or the other has still not
been reached. To address these questions we performed a set of correlation analysis exploring the
relationships between the rCMRglc and T or C. We then performed a set of comparisons intended
to confirm and strengthen the former analysis. The correlation analysis between the rCMRglc and T
uncovered a set of brain areas (including the right middle, inferior and superior frontal gyri along
with other midline and subcortical brain regions, as well as white matter regions including the body
of corpus callosum and the posterior limb of internal capsule) partially reproduced and confirmed
by the comparison of the two subgroups of CHT-treated patients (EH<LL, see Table 3,
Supplementary Table 4, 5 and Figure 1c, 2b). Moreover, partially overlapping results were obtained
in the comparison of the EH subgroup with the No CHT subgroup. Interestingly, the peak of
greatest rCMRglc decrease found in this latter comparison in the right middle frontal gyrus (see
Table 3, Supplementary Table 4, 5 and Figure 1c, 2b) was very close (x, y, z = 38, 62, 6) to that
reported (x, y, z = 30, 64, 4) by a previous cited structural study [19] in a comparison between
treated and non treated cancer patients. Our data therefore strongly support a reversible model of
CHT-induced brain damage (see Figure 3d, 3e) suggesting that the chemotherapy-induced cerebral
glucose metabolic impairment could be transient and rapidly (~1 year) reversible over the time,
paralleling or even preceding the structural recovery of the CHT targeted brain regions. These
results are in agreement with findings emerging from controlled longitudinal neuropsychological
studies [9, 15, 50, 51] indicating that the cognitive changes tend to fully or partially resolve over 1
year. These assumptions on the reversibility of brain metabolic impairment must however be taken
with caution. Obviously in a cross-sectional study as the present work, the real dynamics of the
metabolic changes triggered by the CHT cannot be adequately studied. Furthermore, we cannot

13
exclude that a subset of brain regions did not recover or recover only partially over the time as
suggested by some neuropsychological [2, 8] and neuroimaging [24, 45] studies. Candidate regions
which could have, in the present study, a longer lasting metabolic impairment are the precentral gyri
(BA4), a set of midline cortical structures such as left medial frontal gyrus (BA9, BA6) and the
right posterior cingulate cortex (BA30), as well as the left middle frontal gyrus (BA46, BA8) and
the cerebellum. These regions indeed showed a lower rCMRglc in the EH<No CHT comparison
(see Table 3, Supplementary Table 4 and Figure 1c, 2b), but not in the EH<LL and in EH<LH
comparisons (see Table 3, Supplementary Table 4 and Figure 1d, 1e, 2b) and did not show any
significant positive correlation with T (see Table 3, Supplementary Tables 2, 3 and Figure 1a, 2a).
Since both the No CHT>LL and No CHT>LH comparisons did not give significant results we
suppose that these areas only partially recovered over time. With respect to the cerebellum, the
partial recovery hypothesis suggested by our data, is consistent with previous [O-15] water PET
[45] and fMRI studies [24].
A further region showing an incomplete recovery over time was the left parahippocampus, which
showed in the comparison of non treated with the whole group of treated patients (No CHT>CHT:
see Table 3, Supplementary Table 4, 5 and Figure 3) a significantly lower rCMRglc. A subanalysis
evidenced that, compared to non treated patients, the rCMRglc of this region was significantly
(p=0.006) lower in patients investigated at a mean of more than 1 year after the completion of CHT
and having received a C comparable to the EH subgroup (LH subgroup, see Figure 3b).
To gain more insights on the mechanisms underlying these chemotherapy-related adverse effects we
looked for a relationship between C and the cerebral glucose metabolism. The voxel-based
correlation analysis evidenced a set of brain areas (including the right superior, middle, inferior
frontal gyri, the left middle frontal and superior temporal gyri) showing a significant negative
association between C and the rCMRglc, which partially overlapped those uncovered by both the
comparative and correlation analysis described above. These results therefore support a model in
which the CHT-induced brain damage appears to be related to C (Figure 3d), in agreement with

14
previous neuropsychological data [2] reporting a negative relationship between C and the cognitive
performance.
The pattern of CHT-induced brain metabolic impairment, markedly characterized by a
disproportionate involvement of frontal lobes, is reminiscent of that seen in ageing [10, 23, 32, 48]
and some age-related neurodegenerative processes [46]. However, a salient finding of our study was
that the wide frontal metabolic impairment evidenced in the EH subgroup was not associated with
any significant cognitive impairment (Table 2). Such mismatch between metabolic and cognitive
data is well known in the field of Alzheimer’s disease (AD) FDG-PET studies. In cognitively
normal subjects at genetic risk of developing AD, such as apolipoprotein E (ApoE) E4 carriers,
such studies showed a reduced glucose metabolism in the same regions of the brain as in patients
with probable AD [37-39] such as the retrosplenial, the parietal and the frontal cortex. Moreover
they evidenced that in these cognitively normal subjects this reduced glucose metabolism could be
associated with perceived loss of memory ability [13] and subjective cognitive complaints [31].
This could be relevant since, as reported by previous studies, cancer survivors treated with CHT
often self-report higher levels of cognitive problems but, as was seen in this work, perform
normally on neuropsychological tests [16, 35]. Furthermore, recent functional and structural studies
have shown that cognitively healthy people with a maternal family history of late onset AD (FHm),
have a rCMRglc reductions [30] and less gray matter volume [18] in AD-vulnerable brain regions,
including the frontal cortex, compared to subjects with no parental history of AD. Interestingly,
compared to subjects with a negative history those with a FHm showed the lowest CMRglc in the
right superior frontal gyrus at coordinates (x, y, z = 34, 61, 4), similar to those found by us (x, y, z =
38, 62, 6). Moreover, FHm subjects compared to subjects with a paternal familial history of late
onset AD showed a lower CMRglc in the superior frontal gyrus at coordinates (x, y, z = 30, 63, 1).
Hypometabolism in FHm is thought to be due to a combination of dysfunction of mitochondria [54]
(maternally inherited), increased oxidative stress, and possible mitochondrial DNA mutations [25],
leading to CMRglc changes in vulnerable brain regions [33]. Many of these processes have been

15
proposed as candidate mechanisms mediating the adverse effects of CHT on brain functions [1].
Oxidative DNA damage and decreased mitochondrial function are well established processes
underlying brain aging changes [27], findings leading Maccormick [26] to hypothesize that adverse
effects associated with CHT might be related to acceleration of the ageing process. Inspired by this
hypothesis we performed a post-hoc analysis looking for differences in the correlations between age
and the rCMRglc of regions showing a lower glucose metabolism in the EH<No CHT subgroups
comparison. This analysis showed that, compared to non treated patients, the CMRglc of the medial
posterior cortices in the EH patients had a more significant and negative association with age
(Fisher’s z test: p<0.05, see Supplementary Table 6 and Figure 4a, 4b), meaning that older subjects
undergo an higher than expected CHT-induced metabolic impairment. Taken together, these
findings lead us to speculate that CHT induces aging-like and/or potentiates aging-related processes
such as oxidative stress, and decreased mitochondrial function which could lead to the rCMRglc
reduction evidenced, in patients receiving CHT.
The supplementary materials contains an extended in depth discussion and the study limitations.
Conclusions
This study evidenced significant chemotherapy-related changes of glucose metabolism in multiple
brain regions involving both the cortex and the white matter, with a prevailing involvement of the
frontal lobes. Such metabolic changes appear to be positively related in many of these same areas
with the time elapsed from the end of the treatment suggesting that they are transient and rapidly
reversible. A subset of these areas undergoes a metabolic impairment proportional to the number of
CHT cycles while a subset, including the cerebellum and midline cortical regions, present evidences
of partial or delayed metabolic recovery.
AKNOWLEDGEMENTS
Authors would like to thank patients who participated in the study and their families.
We wish to thank Dr. Francesca Giunta for her contribution to this paper.

16
References
1 . Ahles TA, Saykin AJ (2007) Candidate mechanisms for chemotherapy-induced cognitive
changes. Nat Rev Cancer 7:192-201
2. Ahles TA, Saykin AJ, Furstenberg CT, Cole B, Mott LA, Skalla K, Whedon MB, Bivens S,
Mitchell T, Greenberg ER, Silberfarb PM (2002) Neuropsychologic impact of standard-dose
systemic chemotherapy in long-term survivors of breast cancer and lymphoma. J Clin Oncol
20:485-493
3. Ahles TA, Silberfarb PM, Herndon J, 2nd, Maurer LH, Kornblith AB, Aisner J, Perry MC,
Eaton WL, Zacharski LL, Green MR, Holland JC (1998) Psychologic and neuropsychologic
functioning of patients with limited small-cell lung cancer treated with chemotherapy and
radiation therapy with or without warfarin: a study by the Cancer and Leukemia Group B. J
Clin Oncol 16:1954-1960
4. Anderson-Hanley C, Sherman ML, Riggs R, Agocha VB, Compas BE (2003)
Neuropsychological effects of treatments for adults with cancer: a meta-analysis and review
of the literature. J Int Neuropsychol Soc 9:967-982
5. Borghammer P, Cumming P, Aanerud J, Gjedde A (2009) Artefactual subcortical
hyperperfusion in PET studies normalized to global mean: lessons from Parkinson's disease.
Neuroimage 45:249-257
6. Brown MS, Simon JH, Stemmer SM, Stears JC, Scherzinger A, Cagnoni PJ, Jones RB
(1995) MR and proton spectroscopy of white matter disease induced by high-dose
chemotherapy with bone marrow transplant in advanced breast carcinoma. AJNR Am J
Neuroradiol 16:2013-2020
7. Brown MS, Stemmer SM, Simon JH, Stears JC, Jones RB, Cagnoni PJ, Sheeder JL (1998)
White matter disease induced by high-dose chemotherapy: longitudinal study with MR
imaging and proton spectroscopy. AJNR Am J Neuroradiol 19:217-221

17
8. Castellon S, Ganz P, Bower J, Petersen L, Abraham L, Greendale G (2004) Neurocognitive
Performance in Breast Cancer Survivors Exposed to Adjuvant Chemotherapy and
Tamoxifen. Journal of Clinical and Experimental Neuropsychology (Neuropsychology,
Development and Cognition: Section A) 26:955-969
9. Collins B, Mackenzie J, Stewart A, Bielajew C, Verma S (2009) Cognitive effects of
chemotherapy in post-menopausal breast cancer patients 1 year after treatment.
Psychooncology 18:134-143
10. de Leon MJ, Convit A, Wolf OT, Tarshish CY, DeSanti S, Rusinek H, Tsui W, Kandil E,
Scherer AJ, Roche A, Imossi A, Thorn E, Bobinski M, Caraos C, Lesbre P, Schlyer D,
Poirier J, Reisberg B, Fowler J (2001) Prediction of cognitive decline in normal elderly
subjects with 2-[(18)F]fluoro-2-deoxy-D-glucose/poitron-emission tomography (FDG/PET).
Proc Natl Acad Sci U S A 98:10966-10971
11. Deprez S, Amant F, Yigit R, Porke K, Verhoeven J, Van den Stock J, Smeets A, Christiaens
M-R, Leemans A, Van Hecke W, Vandenberghe J, Vandenbulcke M, Sunaert S (In press,
2010) Chemotherapy-induced structural changes in cerebral white matter and its correlation
with impaired cognitive functioning in breast cancer patients. Human Brain Mapping
12. Donovan KA, Small BJ, Andrykowski MA, Schmitt FA, Munster P, Jacobsen PB (2005)
Cognitive functioning after adjuvant chemotherapy and/or radiotherapy for early-stage
breast carcinoma. Cancer 104:2499-2507
13. Ercoli L, Siddarth P, Huang SC, Miller K, Bookheimer SY, Wright BC, Phelps ME, Small
G (2006) Perceived loss of memory ability and cerebral metabolic decline in persons with
the apolipoprotein E-IV genetic risk for Alzheimer disease. Arch Gen Psychiatry 63:442-
448
14. Falleti MG, Sanfilippo A, Maruff P, Weih L, Phillips KA (2005) The nature and severity of
cognitive impairment associated with adjuvant chemotherapy in women with breast cancer:
a meta-analysis of the current literature. Brain Cogn 59:60-70

18
15. Fan HG, Houede-Tchen N, Yi QL, Chemerynsky I, Downie FP, Sabate K, Tannock IF
(2005) Fatigue, menopausal symptoms, and cognitive function in women after adjuvant
chemotherapy for breast cancer: 1- and 2-year follow-up of a prospective controlled study. J
Clin Oncol 23:8025-8032
16. Ferguson RJ, McDonald BC, Saykin AJ, Ahles TA (2007) Brain structure and function
differences in monozygotic twins: possible effects of breast cancer chemotherapy. J Clin
Oncol 25:3866-3870
17. Freeman JR, Broshek DK (2002) Assessing cognitive dysfunction in breast cancer: what are
the tools? Clin Breast Cancer 3 Suppl 3:S91-99
18. Honea RA, Swerdlow RH, Vidoni ED, Goodwin J, Burns JM (2010) Reduced gray matter
volume in normal adults with a maternal family history of Alzheimer disease. Neurology
74:113-120
19. Inagaki M, Yoshikawa E, Matsuoka Y, Sugawara Y, Nakano T, Akechi T, Wada N, Imoto
S, Murakami K, Uchitomi Y (2007) Smaller regional volumes of brain gray and white
matter demonstrated in breast cancer survivors exposed to adjuvant chemotherapy. Cancer
109:146-156
20. Jansen CE, Dodd MJ, Miaskowski CA, Dowling GA, Kramer J (2008) Preliminary results
of a longitudinal study of changes in cognitive function in breast cancer patients undergoing
chemotherapy with doxorubicin and cyclophosphamide. Psychooncology 17:1189-1195
21. Jansen CE, Miaskowski C, Dodd M, Dowling G, Kramer J (2005) A metaanalysis of studies
of the effects of cancer chemotherapy on various domains of cognitive function. Cancer
104:2222-2233
22. Jenkins V, Shilling V, Deutsch G, Bloomfield D, Morris R, Allan S, Bishop H, Hodson N,
Mitra S, Sadler G, Shah E, Stein R, Whitehead S, Winstanley J (2006) A 3-year prospective
study of the effects of adjuvant treatments on cognition in women with early stage breast
cancer. Br J Cancer 94:828-834

19
23. Kalpouzos G, Chetelat G, Baron JC, Landeau B, Mevel K, Godeau C, Barre L, Constans
JM, Viader F, Eustache F, Desgranges B (2009) Voxel-based mapping of brain gray matter
volume and glucose metabolism profiles in normal aging. Neurobiol Aging 30:112-124
24. Kesler SR, Bennett FC, Mahaffey ML, Spiegel D (2009) Regional brain activation during
verbal declarative memory in metastatic breast cancer. Clin Cancer Res 15:6665-6673
25. Lin MT, Beal MF (2006) Mitochondrial dysfunction and oxidative stress in
neurodegenerative diseases. Nature 443:787-795
26. Maccormick RE (2006) Possible acceleration of aging by adjuvant chemotherapy: a cause of
early onset frailty? Med Hypotheses 67:212-215
27. Mattson MP, Magnus T (2006) Ageing and neuronal vulnerability. Nat Rev Neurosci 7:278-
294
28. Mehlsen M, Pedersen AD, Jensen AB, Zachariae R (2009) No indications of cognitive side-
effects in a prospective study of breast cancer patients receiving adjuvant chemotherapy.
Psychooncology 18:248-257
29. Mignone RG, Weber ET (2006) Potent inhibition of cell proliferation in the hippocampal
dentate gyrus of mice by the chemotherapeutic drug thioTEPA. Brain Res 1111:26-29
30. Mosconi L, Brys M, Switalski R, Mistur R, Glodzik L, Pirraglia E, Tsui W, De Santi S, de
Leon MJ (2007) Maternal family history of Alzheimer's disease predisposes to reduced
brain glucose metabolism. Proc Natl Acad Sci U S A 104:19067-19072
31. Mosconi L, De Santi S, Brys M, Tsui WH, Pirraglia E, Glodzik-Sobanska L, Rich KE,
Switalski R, Mehta PD, Pratico D, Zinkowski R, Blennow K, de Leon MJ (2008)
Hypometabolism and altered cerebrospinal fluid markers in normal apolipoprotein E E4
carriers with subjective memory complaints. Biol Psychiatry 63:609-618
32. Mosconi L, De Santi S, Li J, Tsui WH, Li Y, Boppana M, Laska E, Rusinek H, de Leon MJ
(2008) Hippocampal hypometabolism predicts cognitive decline from normal aging.
Neurobiol Aging 29:676-692

20
33. Mosconi L, Mistur R, Switalski R, Brys M, Glodzik L, Rich K, Pirraglia E, Tsui W, De
Santi S, de Leon MJ (2009) Declining brain glucose metabolism in normal individuals with
a maternal history of Alzheimer disease. Neurology 72:513-520
34. O'Shaughnessy JA (2002) Effects of epoetin alfa on cognitive function, mood, asthenia, and
quality of life in women with breast cancer undergoing adjuvant chemotherapy. Clin Breast
Cancer 3 Suppl 3:S116-120
35. Pullens MJ, De Vries J, Roukema JA (2009) Subjective cognitive dysfunction in breast
cancer patients: a systematic review. Psychooncology
36. Reid-Arndt SA, Yee A, Perry MC, Hsieh C (2009) Cognitive and psychological factors
associated with early posttreatment functional outcomes in breast cancer survivors. J
Psychosoc Oncol 27:415-434
37. Reiman EM, Caselli RJ, Chen K, Alexander GE, Bandy D, Frost J (2001) Declining brain
activity in cognitively normal apolipoprotein E epsilon 4 heterozygotes: A foundation for
using positron emission tomography to efficiently test treatments to prevent Alzheimer's
disease. Proc Natl Acad Sci U S A 98:3334-3339
38. Reiman EM, Caselli RJ, Yun LS, Chen K, Bandy D, Minoshima S, Thibodeau SN, Osborne
D (1996) Preclinical evidence of Alzheimer's disease in persons homozygous for the epsilon
4 allele for apolipoprotein E. N Engl J Med 334:752-758
39. Reiman EM, Chen K, Alexander GE, Caselli RJ, Bandy D, Osborne D, Saunders AM,
Hardy J (2004) Functional brain abnormalities in young adults at genetic risk for late-onset
Alzheimer's dementia. Proc Natl Acad Sci U S A 101:284-289
40. Rzeski W, Pruskil S, Macke A, Felderhoff-Mueser U, Reiher AK, Hoerster F, Jansma C,
Jarosz B, Stefovska V, Bittigau P, Ikonomidou C (2004) Anticancer agents are potent
neurotoxins in vitro and in vivo. Ann Neurol 56:351-360

21
41. Schagen SB, Muller MJ, Boogerd W, Mellenbergh GJ, van Dam FS (2006) Change in
cognitive function after chemotherapy: a prospective longitudinal study in breast cancer
patients. J Natl Cancer Inst 98:1742-1745
42. Schagen SB, van Dam FS, Muller MJ, Boogerd W, Lindeboom J, Bruning PF (1999)
Cognitive deficits after postoperative adjuvant chemotherapy for breast carcinoma. Cancer
85:640-650
43. Scherwath A, Mehnert A, Schleimer B, Schirmer L, Fehlauer F, Kreienberg R, Metzner B,
Thiel E, Zander AR, Schulz-Kindermann F, Koch U (2006) Neuropsychological function in
high-risk breast cancer survivors after stem-cell supported high-dose therapy versus
standard-dose chemotherapy: evaluation of long-term treatment effects. Ann Oncol 17:415-
423
44. Seigers R, Timmermans J, van der Horn HJ, de Vries EF, Dierckx RA, Visser L, Schagen
SB, van Dam FS, Koolhaas JM, Buwalda B (2010) Methotrexate reduces hippocampal
blood vessel density and activates microglia in rats but does not elevate central cytokine
release. Behav Brain Res 207:265-272
45. Silverman DH, Dy CJ, Castellon SA, Lai J, Pio BS, Abraham L, Waddell K, Petersen L,
Phelps ME, Ganz PA (2007) Altered frontocortical, cerebellar, and basal ganglia activity in
adjuvant-treated breast cancer survivors 5-10 years after chemotherapy. Breast Cancer Res
Treat 103:303-311
46. Silverman DHS (2004) Brain 18F-FDG PET in the diagnosis of neurodegenerative
dementias: comparison with perfusion SPECT and with clinical evaluations lacking nuclear
imaging. Journal of nuclear medicine : official publication, Society of Nuclear Medicine
45:594-607
47. Stemmer SM, Stears JC, Burton BS, Jones RB, Simon JH (1994) White matter changes in
patients with breast cancer treated with high-dose chemotherapy and autologous bone
marrow support. AJNR Am J Neuroradiol 15:1267-1273

22
48. Tumeh PC, Alavi A, Houseni M, Greenfield A, Chryssikos T, Newberg A, Torigian DA,
Moonis G (2007) Structural and functional imaging correlates for age-related changes in the
brain. Semin Nucl Med 37:69-87
49. van Dam FS, Schagen SB, Muller MJ, Boogerd W, vd Wall E, Droogleever Fortuyn ME,
Rodenhuis S (1998) Impairment of cognitive function in women receiving adjuvant
treatment for high-risk breast cancer: high-dose versus standard-dose chemotherapy. J Natl
Cancer Inst 90:210-218
50. Wagner LI, Sweet JJ, Butt Z (2006) Trajectory of cognitive impairment during breast cancer
treatment: a prospective analysis.ASCO Meeting Abstracts 8500. Journal of clinical
oncology : official journal of the American Society of Clinical Oncology 24:4685
51. Wefel JS, Lenzi R, Theriault RL, Davis RN, Meyers CA (2004) The cognitive sequelae of
standard-dose adjuvant chemotherapy in women with breast carcinoma: results of a
prospective, randomized, longitudinal trial. Cancer 100:2292-2299
52. Wieneke MH, Dienst ER (1995) Neuropsychological Assessment of Cognitive Functioning
Following Chemotherapy for Breast Cancer. Psycho-Oncology 41:61-66
53. Yang M, Kim JS, Song MS, Kim SH, Kang SS, Bae CS, Kim JC, Wang H, Shin T, Moon C
(2010) Cyclophosphamide impairs hippocampus-dependent learning and memory in adult
mice: Possible involvement of hippocampal neurogenesis in chemotherapy-induced memory
deficits. Neurobiol Learn Mem 93:487-494
54. Yao J, Irwin RW, Zhao L, Nilsen J, Hamilton RT, Brinton RD (2009) Mitochondrial
bioenergetic deficit precedes Alzheimer's pathology in female mouse model of Alzheimer's
disease. Proc Natl Acad Sci U S A 106:14670-14675
23
TABLES
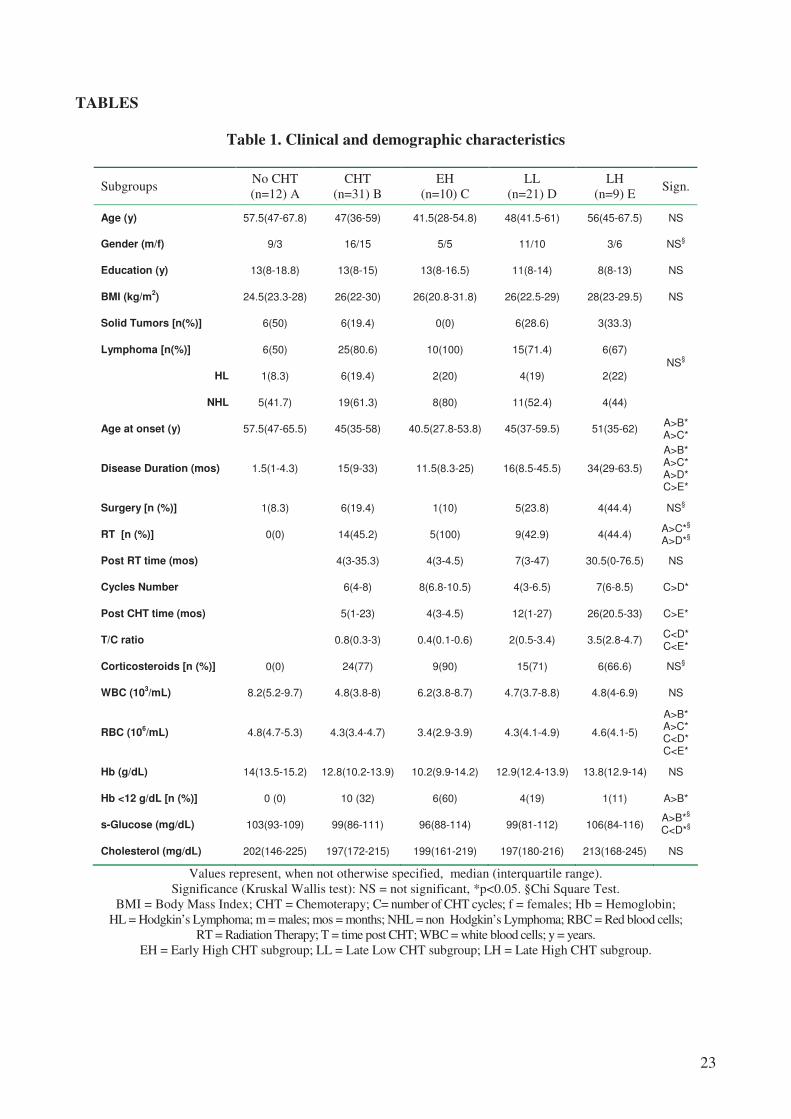
Table 1. Clinical and demographic characteristics
Subgroups No CHT
(n=12) A
CHT
(n=31) B
EH
(n=10) C
LL
(n=21) D
LH
(n=9) E Sign.
Age (y) 57.5(47-67.8) 47(36-59) 41.5(28-54.8) 48(41.5-61) 56(45-67.5) NS
Gender (m/f) 9/3 16/15 5/5 11/10 3/6 NS§
Education (y) 13(8-18.8) 13(8-15) 13(8-16.5) 11(8-14) 8(8-13) NS
BMI (kg/m2) 24.5(23.3-28) 26(22-30) 26(20.8-31.8) 26(22.5-29) 28(23-29.5) NS
Solid Tumors [n(%)] 6(50) 6(19.4) 0(0) 6(28.6) 3(33.3)
Lymphoma [n(%)] 6(50) 25(80.6) 10(100) 15(71.4) 6(67)
HL 1(8.3) 6(19.4) 2(20) 4(19) 2(22)
NHL 5(41.7) 19(61.3) 8(80) 11(52.4) 4(44)
NS§
Age at onset (y) 57.5(47-65.5) 45(35-58) 40.5(27.8-53.8) 45(37-59.5) 51(35-62) A>B* A>C*
Disease Duration (mos) 1.5(1-4.3) 15(9-33) 11.5(8.3-25) 16(8.5-45.5) 34(29-63.5)
A>B* A>C* A>D* C>E*
Surgery [n (%)] 1(8.3) 6(19.4) 1(10) 5(23.8) 4(44.4) NS§
RT [n (%)] 0(0) 14(45.2) 5(100) 9(42.9) 4(44.4) A>C*
§
A>D*§
Post RT time (mos) 4(3-35.3) 4(3-4.5) 7(3-47) 30.5(0-76.5) NS
Cycles Number 6(4-8) 8(6.8-10.5) 4(3-6.5) 7(6-8.5) C>D*
Post CHT time (mos) 5(1-23) 4(3-4.5) 12(1-27) 26(20.5-33) C>E*
T/C ratio 0.8(0.3-3) 0.4(0.1-0.6) 2(0.5-3.4) 3.5(2.8-4.7) C<D* C<E*
Corticosteroids [n (%)] 0(0) 24(77) 9(90) 15(71) 6(66.6) NS§
WBC (103/mL) 8.2(5.2-9.7) 4.8(3.8-8) 6.2(3.8-8.7) 4.7(3.7-8.8) 4.8(4-6.9) NS
RBC (106/mL) 4.8(4.7-5.3) 4.3(3.4-4.7) 3.4(2.9-3.9) 4.3(4.1-4.9) 4.6(4.1-5)
A>B* A>C* C<D* C<E*
Hb (g/dL) 14(13.5-15.2) 12.8(10.2-13.9) 10.2(9.9-14.2) 12.9(12.4-13.9) 13.8(12.9-14) NS
Hb <12 g/dL [n (%)] 0 (0) 10 (32) 6(60) 4(19) 1(11) A>B*
s-Glucose (mg/dL) 103(93-109) 99(86-111) 96(88-114) 99(81-112) 106(84-116) A>B*
§
C<D*§
Cholesterol (mg/dL) 202(146-225) 197(172-215) 199(161-219) 197(180-216) 213(168-245) NS
Values represent, when not otherwise specified, median (interquartile range).
Significance (Kruskal Wallis test): NS = not significant, *p<0.05. §Chi Square Test.
BMI = Body Mass Index; CHT = Chemoterapy; C= number of CHT cycles; f = females; Hb = Hemoglobin;
HL = Hodgkin’s Lymphoma; m = males; mos = months; NHL = non Hodgkin’s Lymphoma; RBC = Red blood cells;
RT = Radiation Therapy; T = time post CHT; WBC = white blood cells; y = years.
EH = Early High CHT subgroup; LL = Late Low CHT subgroup; LH = Late High CHT subgroup.

24
Table 2. Neurobehavioral characteristics
Subgroups No CHT
(n=12) A
CHT
(n=31) B
EH
(n=10) C
LL
(n=21) D
LH
(n=9) E Sign.
MMSE <23.8 n(%)
27.4(26.2-28.3) 0(0)
26.6(25.6-27.6) 2(6)
26.7(25.6-27.8) 1(10)
26.5(25.5-27.5) 1(5)
27.2(25.4-27.5) 1(10)
NS
Verbal Fluency <17.5 n(%)
34.2(31.7-39.4) 0(0)
30.7(24.2-41.6) 3(10)
29.1(22-36) 1(10)
30.8(25.1-42.4) 2(10)
30.8(27.4-42.8) 0(0)
NS
Short Story <7.25 n(%)
11.9(7.8-12.8) 3(25)
11.7(8.9-12.9) 2(6)
12.3(9.6-12.9) 0(0)
11.6(8.9-13.3) 2(10)
11.7(10-14.1) 0(0)
NS
TMT-B (n=42) >283’’ n(%)
86(63.8-116.8) 0(0)
80(53.3-128.8) 0(0)
116(73-140.3) 0(0)
78(43-109.8) 0(0)
78(25.3-82.3) 0(0)
NS
MADRS >11 n(%)
9.5(5.3-12.8) 5(41)
6.0(3-15) 11(35)
11.5(3.8-17.5) 5(50)
5.0(3-13.5) 6(28)
4.0(1-6) 0(0)
NS
HADS-D (n=40) >8 n(%)
5(4-8) 3(25)
5(1-9) 8(26)
5(0.8-8.8) 2(20)
4(1-9) 6(28)
3(0-8.5) 2(22)
NS
HADS-A (n=40) >8 n(%)
5(2-8) 6(50)
5(2-8) 8(26)
5(3.8-7.8) 3(30)
5(1-8) 5(24)
1(0.5-7) 2(22)
NS
HADS-T (n=40) >13 n(%)
11(7-14) 8(66)
10(5-17) 7(23)
11(5.8-17.3) 3(30)
9(3-18) 4(19)
8(0.5-13.5) 2(22)
NS
STAI-Y1 (n=37) >50 n(%)
48(37.3-53) 4(33)
41(36-53.5) 8(26)
41(37.5-52) 2(20)
41(35.2-54.5) 6(28)
41(38-46.3) 1(11)
NS
STAI-Y2 (n=37) >50 n(%)
44(34-51) 3(25)
44(34-58.8) 9(29)
44(32.8-48.3) 3(30)
45(36.3-63.3) 6(28)
43(35.5-60.8) 2(22)
NS
Significance (Kruskal Wallis test): NS = not significant.
HADS-D = Hospital Anxiety and Depression Scale: Depression; HADS-A = Hospital Anxiety and Depression Scale:
Anxiety; HADS-T = Hospital Anxiety and Depression Scale: Total; MADRS = Montgomery-Asberg Depression Rating
Scale; MMSE = Mini Mental State Examination; STAI = State Trait Anxiety Inventory; TMT = Trail Making Test.
CHT = Chemotherapy; EH = Early High CHT subgroup; LL = Late Low CHT subgroup; LH = Late High CHT subgroup.
Other annotations as in Table 1.

25
Table 3. Voxel-based analysis
Talairach Coordinates Cerebral Region BA p corr. Ke z
x y z
Between subgroups comparison analysis (n=43) No CHT (n=12) > CHT (n=31)
(L) Parahippocampus (Uncus) 28 0.039 (SVC) 177 3.13 -24 4 -29
Between subgroups comparison analysis (n=22) No CHT (n=12) > EH (n=10)
(R) Middle Frontal Gyrus 10 <0.001 7622 4.42 38 62 6
(R) Superior Frontal Gyrus 10 3.92 34 57 14
(L) Cuneus 19 <0.001 3657 4.41 -2 -82 37
(R) Cuneus 19 4.25 8 -78 33
(L) Medial Frontal Gyrus (SMA) 6 <0.001 6644 4.15 -6 -7 52
(L) Middle Frontal Gyrus 46 3.82 -48 34 26
(L) Cerebellum Tonsilla - 0.001 2493 3.61 -36 -51 -40
(L) Cerebellum Tuber - 3.06 -32 -64 -29
(R) Cerebellum Tonsilla - 0.017 1447 3.50 36 -41 -35
(R) Cerebellum Culmen - 3.07 42 -42 -23
(R) Anterior Corona Radiata WM 3.56 12 34 -8 3.56 12
(L) Anterior Corona Radiata WM 3.02 -14 34 -12 3.02 -14
Between subgroups comparison analysis (n=33) No CHT (n=12) > LL (n=21)
No suprathreshold cluster
Between subgroups comparison analysis (n=19) No CHT (n=10) > LH (n=9)
No suprathreshold cluster
Between subgroups comparison analysis (n=31) EH (n=10) < LL (n=21)
(R) Fusiform Gyrus 19 0.025 2714 3.61 30 -65 -9
(R) Middle Occipital Gyrus 19 3.29 44 -80 2
(R) Middle Frontal Gyrus 10 0.001 5263 3.43 42 52 20
(L) Middle Frontal Gyrus 11 3.22 -22 30 -13
Between subgroups comparison analysis (n=31) EH (n=10) < LH (n=9)
(R) Superior Frontal Gyrus 10 0.012** 1074 3.94 40 59 16
(R) Superior Frontal Gyrus 9 3.24 38 44 29
(L) Middle Frontal Gyrus 10 0.046 1557 3.86 -40 53 18
(L) Anterior MCC 32 3.02 -6 18 38
Negative correlations with the number of CHT cycles in the CHT subgroup (n=31)
(L) Superior Temporal Gyrus 38 0.002 4555 3.66 -46 16 -19
(R) Middle Frontal Gyrus 9 3.37 48 6 37
Positive correlations with the post-CHT time in the CHT subgroup (n=31)
(L) Subgenual ACC 25 <0.001 9798 4.15 -2 9 -9
(R) Middle Frontal Gyrus 46 3.50 55 30 24
(L) Body of Corpus Callosum WM <0.001 9798 3.67 10 7 27
(R) Posterior Limb of Internal Capsule WM 2.93 18 -3 15
Height threshold p = 0.005 uncorrected for multiple correlations; p corr. = p corrected for multiple correlations;
SVC = Small Volume Correction.
ACC = Anterior Cingulate Cortex; BA = Brodmann Area; CHT = chemotherapy; Ke = cluster extent; L = left; R =
right; SMA = Supplementary Motor Area; WM = White Matter.
EH = Early High CHT subgroup; LL = Late Low CHT subgroup; LH = Late High CHT subgroup.

26
FIGURES
Figure 1. Patterns of CHT-induced rCMRglc changes
T-maps obtained by correlations (a-b) and comparisons (c-d) analysis overlaid on canonical 3-D brain templates. Red
coloured maps show positive correlations (a) or comparisons (d); blue coloured maps show negative correlations (b) or
comparisons (c). CHT = chemotherapy; EH = Early High subgroup; LL = Late Low subgroup. As it can be appreciated,
at the cortical level a significant overlap exist among the four voxel-based analysis results.
27
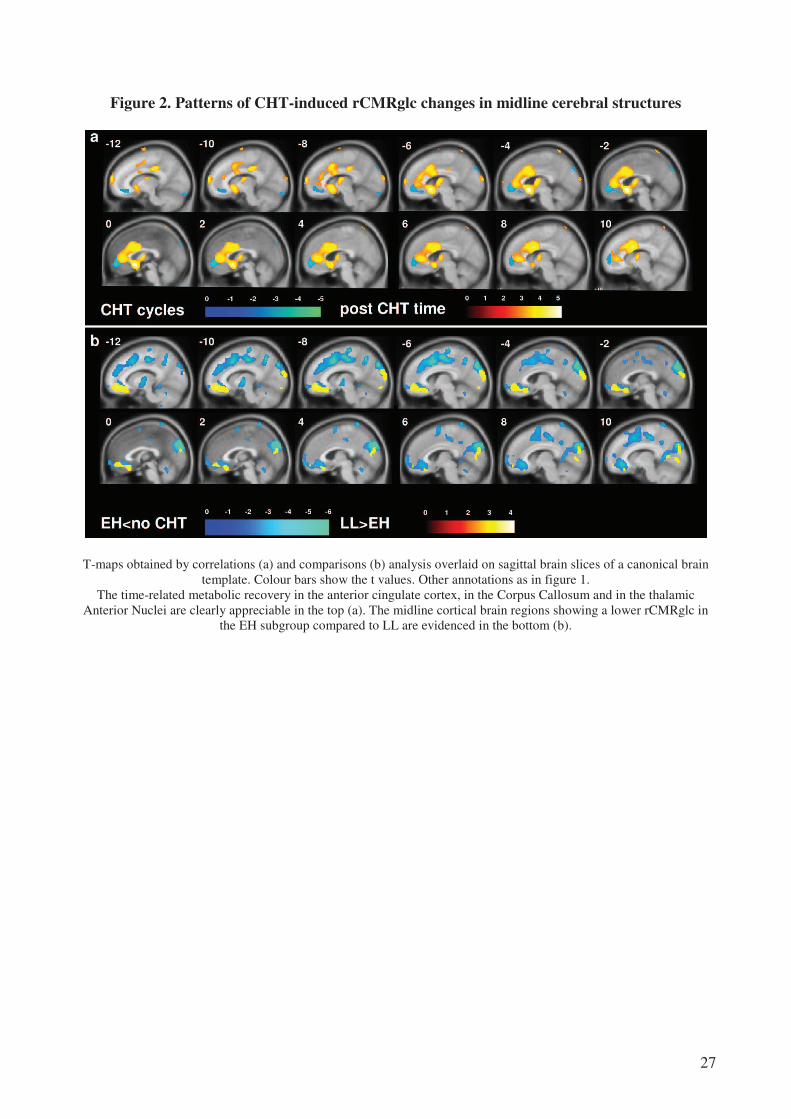
Figure 2. Patterns of CHT-induced rCMRglc changes in midline cerebral structures
T-maps obtained by correlations (a) and comparisons (b) analysis overlaid on sagittal brain slices of a canonical brain
template. Colour bars show the t values. Other annotations as in figure 1.
The time-related metabolic recovery in the anterior cingulate cortex, in the Corpus Callosum and in the thalamic
Anterior Nuclei are clearly appreciable in the top (a). The midline cortical brain regions showing a lower rCMRglc in
the EH subgroup compared to LL are evidenced in the bottom (b).

28
Figure 3. Comparison between the No CHT (n=12) and the CHT (n=21) groups
The whole group of patients having received chemotherapy compared to those non treated shows a significant lower
rCMRglc in the left parahippocampus (a). Subanalysis indicates (b) the significant rCMRglc difference between the two
subgroups (EH and LH) of CHT patients and the lack of a complete metabolic recovery in the LH subgroup (one
asterisk=p<0.05, two asterisks=p<0.01). These findings are consistent with a time-dependent (d-e) against a non time-
dependent (c, irreversible impairment) heuristic model of CHT-induced rCMRglc changes. The models take in account
moreover the possible cumulative neurotoxic effects of the CHT cycles (asterisk).

29
Figure 4. Ageing in the No CHT (n=12) and EH (n=10) groups
Compared to non treated patients, the rCMRglc of the medial posterior cortices showed in the EH patients a more
significant and negative association with age (a, b). Blue dots = females, green dots = males.

30
SUPPLEMENTARY MATERIALS
EXTENDED MATERIALS AND METHODS
Patients
Cancer patients were enrolled among those who were planned to undergo a whole-body [18]FDG
PET on a clinically routine basis for cancer staging or to monitor the disease after treatment. The
week before the scan session patients received a call from a researcher who initially described the
aim and the procedure of the study and performed a brief standardized medical and neurobehavioral
screening focused on signs and symptoms of neurological and psychiatric disorders and medications
that could potentially alter neuropsychological performances and/or brain metabolism. On the day
of the scan eligible patients completed session the medical assessment and gave written informed
consent to participate in the project, which was approved by the ethical committee of our institution.
Cancer patients were excluded from the study if they had signs or symptoms of CNS disease, had
received intrathecal therapy or CNS radiation therapy, had an history of neurologic disorder,
including head injury with loss of consciousness or had an axis I psychiatric disorder (Diagnostic
and Statistical Manual of Mental Disorders, Fourth Edition) such as drug abuse, mood, anxiety and
psychotic-spectrum disorders.
Of the 45 eligible cancer patients who agreed to participate 2 were excluded once the FDG-PET
scan was acquired since their brains showed metabolic patterns (clinically silent marked inter-
hemispheric asymmetry, ventricular dilatation) that made them not suitable for the subsequent
voxel-based analysis. Of the remaining 43 patients 31 (72%) were prior treated with systemic CHT
and 12 patients (28%) were not treated (No CHT). Their demographic and clinical characteristics
are shown in Table 1. Within the CHT patients the majority (n=19, 61%) had a non-Hodgkin’s
lymphoma (NHL), 6 (19%) a Hodgkin’s lymphoma (HL) and 6 (19%) a solid tumor (sarcoma, n=1;
breast cancer, n=3; bladder cancer, n=1; rectal cancer=1). Among them, 15 patients had not been

31
previously treated with surgery and radiation therapy (RT), 2 underwent surgery alone, 10 RT alone
and 4 both surgery and RT. Within the 12 No CHT patients, 5 (41%) had a NHL, 1 (8%) a HL and
6 (50%) a solid tumor (bladder cancer, n=1; breast cancer=2; lung cancer, n=1; rectal cancer=2). Of
these patients, only 1 underwent surgery while no one was subjected to radiotherapy.
The ABVD [Adriamycin (doxorubicin), bleomycin, vinblastine and dacarbazine] chemotherapy
protocol (one of the most common CHT regimens for treating Hodgkin's Lymphoma) was used in
19% (n=6) of patients. The CHOP protocol [cyclophosphamide, hydroxydaunorubicin, Oncovin
(vincristine), and prednisone/prednisolone] (widely employed in the treatment of NHL) was used in
39% (n=12) of patients, in all but one case associated with the monoclonal antibody rituximab, this
latter being used in other combinations in more than 55% (n=17) of all cases. Corticosteroid therapy
was used in about 77% (n=24) of patients. Other, less frequently used regimens, are presented in
Supplementary Table 1. The number of cycles of CHT ranged from 2 to 16 cycles with 39% (n=12)
of treatments consisting of less than 5 cycles, 48% (n=15) of less than 10 cycles and only 13%
(n=4) in more than 10 cycles. The time elapsed from the end of the treatment ranged from 1 week
(recorded as 0 months) to more than 4 years (51 months) with 29% (n=9) of cases observed after 1
month or less since the end of the treatment, 35% (n=11) between 2 and 9 months, 13% (n=4)
between 12 months and two years, 16% (n=5) between 2 and 3 years and only 6 % (n=2) observed
after more than 3 years from the end of the treatment.
Since both animal [32, 48] and human studies suggest that CHT dose [49, 56] and number of CHT
cycles [3], as well as the time elapsed since completion of the treatment [13, 19, 59, 61] can
modulate the CHT effects on neurobehavior and brain metabolism, we divided the CHT group in
two subgroups on the basis of both number of cycles (C) and post-CHT time (T). We reasoned that
patients having received an higher number of cycles and investigated in a shorter delay from the end
of the CHT could have undergone greater neurobehavioral and metabolic disturbances if compared
to patients after a longer delay or having received a lower number of cycles. To maximize the
chance of finding these anticorrelated effects (that is a negative association between C and the

32
rCMRglc and a positive association between the T and the rCMRglc) we defined two cut-off scores
(a C and a T cut-off), dividing the two subgroups on the basis of the following criteria: number of
patients match for age, gender and education level, maximal C, T and T/C ratio differences
between subgroups. We empirically found that, within our CHT group, the most parsimonious cut-
offs satisfying these criteria were T=9 months and C=6 cycles. The first subgroup (subgroup EH),
comprised 10 cancer patients observed after a delay <9 months (Early) and having received more
than 6 CHT cycles (High). The second subgroup (subgroup LL) comprised the remaining 21 cancer
patients, observed after a delay >9 months (Late) or having received less than 6 CHT cycles (Low).
The characteristics of subgroups are shown in Table 1. The two CHT subgroups were balanced for
age, gender and education level between themselves and also compared to the No CHT subgroup.
They showed a significant difference (p=0.006) in the red blood cell count (RBC), the EH subgroup
showing a greater degree of anemia. This latter finding was somewhat expected since anemia
frequently occurs in cancer patients and its incidence and severity increases with CHT [42]. Finally,
within the Late cancer patients we select, for further subanalysis, a subgroup (LH) comprising only
those patients (n=9) investigated after a delay >9 months (Late) and received ≥6 CHT cycles (High)
which were matched for age, gender and education level with all others subgroups (see Table 1 E),
matched with the EH subgroup for number of cycles, and significantly different, compared to EH
subgroup, with respect to post-CHT time (p<0.0001) and T/C ratio (p<0.0001).
Neuropsychological examination
The assessment battery of psychological and neuropsychological tests included: Mini Mental State
Examination (MMSE), Trail Making Test B (TMT-B), Phonemic Fluency, Short Story Test,
Hospital Anxiety and Depression Scale (HADS), Montgomery-Asberg Depression Rating Scale
(MADRS), State and Trait Anxiety Inventory (STAI). The Italian standardization of the tests was
used when available [54]. The neuropsychological battery was administered in a session of half an
hour, following a standard protocol, in a quiet, private room in the Hospital before the PET scan.
The psychological self-report scales were filled by the subjects after the neuropsychological

33
assessment. Mini Mental State Examination (MMSE), used to assess the presence of general
cognitive impairment [21], is a brief 30-point questionnaire test commonly used to screen for
dementia. It samples various functions including time and place orientation, repeating lists of
words, arithmetic such as the serial sevens, language use and comprehension, copy of a geometric
drawing and basic motor skills. MMSE was corrected for age and education and the cut-off for
normality was 23.8. The Trail Making Test part B, used to test the visual sustained and alternating
attention [22, 47], requires a subject to connect the dots of 25 consecutive targets on a sheet of
paper in which the targets are letters and numbers that the subject alternates in crescent order (1, A,
2, B, 3, C, etc.). The goal of the subject is to finish the test as quickly as possible. The Trail Making
Test is age and education corrected and the cut-off for normality was 283’’. Phonemic Fluency,
used to evaluate the retrieval of words with an uncommon searching trategy [41], requires to name
as many F-, A- and S- beginning words as possible in consecutive 1-min time periods, exclusive of
perseverations or out-of-category words. The score is the total number of words retrieved. This test
was age and education corrected and the cut-off for normality was 17.35. Short Stories Test
evaluates verbal logical memory with the immediate and delayed free recall of verbal information
[41]. The examiner reads to the examinee a text containing 27 elements to remind. After the reading
an immediate recall is administered, then a delayed recall after 10’. The score is the sum of the
reminded logical concepts in the two trials, the maximum score per trial is 8, the concepts are
scored on the basis of their relevance in the story. We used 7.25 as cut-off for normality for the total
score. HADS [63] Italian version [14] was used to evaluate the psychological distress in a non-
psychiatric setting. It is composed of two self-report scales of 14 items, 7 regarding anxiety and 7
regarding depression. The two scores can be calculated separately with a cut-off of 8 to detect the
presence of anxiety and depression [9]. By calculating the sum of the two scales, it is possible to
identify the presence of disturbance in adaptation (cut-off 13). No psychological distress is
evidenced if the sum of the two scores totals <13. MADRS is a 10-item scale of depression severity
that is based on patient report and clinical observation. This measure was designed to be sensitive to

34
symptom change in clinical trials [34]. Scores on the MADRS range from 0 to 60, with higher
scores indicating greater severity of depressive symptomatology, we used a cut-off of 11 to identify
a patient as depressed or not [64, 65]. The STAI consists of two self-evaluation scales designed to
assess state-anxiety (form Y1) and trait-anxiety (form Y2) separately. The state-anxiety scale
evaluates a transitory state-anxiety in which unpleasant feelings, tension, and intensity vary
according to the situation. The trait-anxiety scale assesses a longer-term personality characteristic.
Each scale contains 20 items, each of which is rated from 1 to 4. Clinically significant levels of
state-anxiety or trait-anxiety were defined as scores ≥50 on the state-anxiety or trait-anxiety sub
scale [52, 53].
PET Scanning
In a quiet waiting room participants, lying in a supine position, were asked to refrain from moving
and instructed “to keep their eyes closed, to not engage in any structured mental activity such as
counting, rehearsing, etc., and to avoid to fall asleep”. They were then blindfolded and ear plugged
and received intravenously about 4.5–5.5 MBq kg−1
of 2-deoxy-2 [18F]fluoro-D-glucose (FDG).
Subjects were previously asked to fast for at least 6 h before PET. About 30 minutes later PET/CT
scan was performed by a Philips Gemini scanner (Phillips Medical System, Cleveland, Ohio, USA).
The Gemini comprises a Philips MX 8000D dual-slice CT scanner with a gadolinium
oxyorthosilicate GSO-based Allegro PET scanner. The PET scanner has an axial field of view
(FOV) of 18 cm, a transaxial FOV of 30 cm, a full width at half maximum (FWHM) axial
resolution of 5 mm and a transaxial resolution of 4.8 mm. A low-powered CT scan (120 kV, tube
current 30 mA) is performed to correct attenuation. To minimize head motion, the subject’s head
was placed in a thermoplastic head holder mounted on the scanner table. The brain scan acquisition
time was of 20 minutes. Reconstructed DICOM (Digital Imaging and Communications in
Medicine) brain images with a dimension of 128 x 128 x 90 voxel (voxel dimension = 2 x 2 x 2
mm3) were converted in Analyze format using MRIConvert, a free software application
(http://lcni.uoregon.edu/~jolinda/MRIConvert). After the planned whole body FDG PET/CT

35
examination was performed, the coronal, sagittal and transverse data sets were reconstructed using
an 3D iterative technique (row action maximum likelihood algorithm, RAMLA-3D) and corrected
with single scatter simulation (SSS).
Statistical parametric mapping analysis
[18]FDG PET brain images were preprocessed and voxel-based statistical analyses were performed
using SPM2 (www.fil.ion.ucl.ac.uk/spm) running on MATLAB 6.5 software. All images were non
linearly spatially normalized into the Montreal Neurological Institute (MNI) space and smoothed
with an isotropic Gaussian kernel with 12 mm FWHM. Voxel size was set at 2 x 2 x 2 mm3.
Confounding effects of global activities differences were removed by normalizing the count of each
voxel to the mean count of a standardized pontine region of interest (ROI) in order to avoid a biased
normalization [5]. The pons was chosen on the basis of its relative stability an late involvement in
neurodegenerative diseases such as Alzheimer disease [33], a finding leading other investigators to
use it as reference region [11, 37, 57]. The ROI was a rectangular multislice region (x/x’=-8/8,
y/y’=-32/-24, z/z’=-44/-34; MNI space) sampling 144 voxels on the central pontine region and
manually drawn on the PET SPM template using the MRIcro application
(http://www.sph.sc.edu/comd /rorden/mricro.html). Both ROI coordinates and dimensions were
chosen to avoid low-counts background voxel sampling and to minimize the random noise effect. A
previous careful visual inspection of the pons was conducted on each spatially normalized but non
smoothed brain scan in order to detect metabolic changes which could alter the ROI measure. The
same ROI was then employed on each spatial normalized and smoothed brain image and the pons
mean voxel values (−
pY ) sampled. Using the image calculation tool of SPM, the scaled voxel values
( 'Y ) of each brain was set at )/('−
= pYYY were Y was the non scaled (“raw”) voxel value. Only
voxel values greater than 80% of the whole brain mean MRglc were included in the analysis. Two
correlation analysis and four between groups comparisons were performed. The hypothesis of a
negative linear associations between the regional cerebral metabolic rate of glucose (rCMRglc) and

36
the number of CHT cycles was tested on the whole CHT group (n=21) on a voxel-by-voxel basis
using the SPM2 single-subject covariate only option. Age, post-CHT time (months) and a
categorical variable that we label “hormonal status” [defined as follows: pre menopause females
(n=5) =0, females with drug-induced amenorrhea (n=3) =1; post menopause females (n=7) =2;
males (n=16) =3] were entered in the general linear model as nuisance factors. This variable was
used as confounding factor in order to minimize the recognized confounding multiple effects of
estrogens on brain functions [8, 25]. The hypothesis of a positive linear associations between the
rCMRglc and the time elapsed since the end of the treatment was tested with the same SPM option
with age, gender and number of CHT cycles entered as nuisance factors. comparisons between
subgroups (EH versus LL; EH versus No CHT; LL versus No CHT; No CHT versus CHT) were
performed using the ANCOVA model using age, hormonal status and education level as covariates
of no interest.
The set of SPM t-statistics resulting from these analysis were transformed into SPM Z scores.
Statistical inferences were performed by applying the Random Field Theory. Results were
thresholded at p<0.005 uncorrected for multiple comparisons, with an extent threshold cluster
extent (Ke) of 20 voxels. This threshold is the same than previously used in FDG-PET studies in
neurodegenerative disease such as Alzheimer’s disease or mild cognitive impairment and estimated
to provide the best compromise, neither too liberal nor over-conservative with risk of type 2 errors.
The MNI peaks coordinates of the SPM t were converted into the Talairach coordinates using the
Brett transformation (http://imaging.mrc-cbu.cam.ac.uk/imaging/MniTalairach). Then the Talairach
Daemon was used ([28], http://www.talairach.org) to label the transformed coordinates respect to
hemisphere, lobe and gyrus. Only coordinates within 2 mm to a gray matter where classified. The
cingulate cortex was defined according to the four division model proposed by Vogt et al. [58].
For the other coordinates we inspected whether they fell inside a white matter fasciculus
overlapping the MNI peaks coordinates with the ICBM DTI-81 (http://www.loni.ucla.edu/Atlases/)

37
with the MRIcron viewer (http://www.cabiatl.com/mricro/mricron). This atlas includes the most
relevant fasciculi in the MNI space extracted by the mean of 81 subjects' DTI.
Clusters with p≤0.05 corrected for multiple comparisons were considered as significant.
For subanalyses, we examined the correlations between neuropsychological scores and regional
glucose metabolism of the voxels of interest: where cancer patients exposed to adjuvant CHT had a
significantly lower metabolism and regions where a significant correlation was found. Mean
regional CMRglc of the most significant clusters (see Table 3 and Supplementary Table 6) were
calculated by using the volume of interest (VOI) function in the SPM2 software.
Patient characteristic data were analyzed with Kruskal-Wallis test for continuous variables and χ2
test for categorical variables. Pearson’s correlations was used to analyze rCMRglc data resulting
from SMP2 analysis. SPSS 13.0 (SPSS Inc., Chicago, IL, USA) was used for statistical analysis,
p<0.05 was considered significant. To compare the medians of two defined subgroups we used a
Kruskal-Wallis non-parametric 2 independent samples test. To compare neurobehavioral
characteristic of No CHT, EH, LL we used a Kruskal-Wallis non parametric 3 independent sample
test. To compare correlations between subgroups in our sample we used the Fisher’s Z-test. This is
a simple Z test computed on the Fisher transformed correlation coefficients (so to become normally
distributed).

38
EXTENDED DISCUSSION
Several neuroimaging studies have consistently shown that CHT induces structural [1, 6, 7, 16, 24]
and functional [17, 20, 50] brain changes involving both the cortex and the white matter and with a
prevailing involvement of the prefrontal cortex. However the time course of such changes are less
well consistently defined with a study suggesting a complete recovery of the structural damage few
years after the completion of the treatment [24] and others reporting a longer lasting functional
impairment [27, 50]. Moreover, no previous neuroimaging study has investigated whether, in
agreement with some neuropshychological studies, the CHT-induced brain damage could be related
to the dose or the number of cycles of chemotherapic agents. Thus, neither conclusive nor
convincing evidence has been reached favouring the one or the other among the several competing
heuristic models of CHT-induced brain damage which can be proposed by means of the analysis of
the available neuropsychological and neuroimaging data (see Figure 3c, 3d). To address these
questions, we performed a set of correlation analyses exploring, in patients investigated at different
times after the completion of treatment, the relationships between the rCMRglc and both these two
variables, that is the time post-CHT and the number of cycles. We then performed a set of
comparisons intended to confirm and strengthen the former analysis. The correlation analysis
between the rCMRglc and the time post-CHT, in which the number of cycles was treated as
confounding factor, uncovered a set of brain areas (including the right middle, inferior and superior
frontal gyri along with others midline and subcortical brain regions as well as white matter regions
including the body of corpus callosum and the posterior limb of internal capsule) showing a
significant positive association between the rCMRglc and the time elapsed from treatment. These
results were partially reproduced and confirmed by the comparison of the two subgroups of CHT-
treated patients (EH<LL) (see Table 3, Supplementary Table 4, 5 and Figure 1c, 2b). Partially
overlapping results were moreover obtained in the comparison of the EH subgroup with the non
treated subgroup (EH<No CHT). Interestingly, the peak of greatest rCMRglc decrease found in this

39
latter comparison in the right middle frontal gyrus (see Table 3, Supplementary Table 4, 5 and
Figure 1c, 2b) was very close (x, y, z = 38, 62, 6) to that reported (x, y, z = 30, 64, 4) by a previous
cited structural study [24] in a comparison between treated and non treated cancer patients. Our data
therefore strongly support a reversible model of CHT-induced brain damage (see Figure 3c, 3d)
suggesting that the chemotherapy-induced cerebral glucose metabolic impairment could be transient
and rapidly (~1 year) reversible over the time, paralleling or even preceding the structural recovery
of the CHT targeted brain regions. These results are in agreement with findings emerging from
controlled longitudinal neuropsychological studies [13, 19, 59, 61] indicating that the cognitive
changes tend to fully or partially resolve over 1 year. These assumptions on the reversibility of
brain metabolic impairment must however be taken with caution. In a cross-sectional study as the
present work, the real dynamics of the metabolic changes triggered by the CHT obviously cannot
be adequately studied. Furthermore, we cannot exclude that a subset of brain regions did not
recover or recovered only partially over the time, as suggested by some neuropsychological [3, 10]
and neuroimaging [27, 50] studies. Candidate regions which could have, in the present study, a
longer lasting metabolic impairment are the precentral gyri (BA4), a set of midline cortical
structures such as left medial frontal gyrus (BA9, BA6) and the right posterior cingulate cortex
(BA30), as well as the left middle frontal gyrus (BA46, BA8) and the cerebellum. These regions
indeed showed a lower rCMRglc in the EH<No CHT comparison (see Table 3, Supplementary
Table 4 and Figure 1c, 2b), but not in the EH<LL and in EH<LH comparisons (see Table 3,
Supplementary Table 4 and Figure 1d, 1e, 2b) and did not show any significant positive correlation
with the post-CHT time (see Table 3, Supplementary Tables 2, 3 and Figure 1a, 2a). Since both the
No CHT>LL and No CHT>LH comparisons did not give significant results we suppose that these
areas have only partially recovered over time. With respect to the cerebellum, the partial recovery
hypothesis suggested by our data, is consistent with previous [O-15] water PET [50] and fMRI
studies [27] reporting an altered cerebellar recruitment during a memory task in breast cancer
women investigated at 3-5 and 5–10 years, respectively, after completion of CHT and compared to

40
a control sample. If one considers the wide prefrontal metabolic impairment involving both the gray
and the white matter the bilateral cerebellar metabolic lower glucose metabolism is not surprising. It
could result from a disruption of the fronto-cortico-cerebellar networking, that is, from the
disconnection of one of the afferent loops.
A further region showing an incomplete recovery over time was the left parahippocampus, which
showed in the comparison of non treated with the whole group of treated patients (No CHT>CHT:
see Table 3, Supplementary Table 4, 5 and Figure 3) a significantly lower rCMRglc. A subanalysis
evidenced that, compared to non treated patients, the rCMRglc of this region was significantly
(p=0.006) lower in patients investigated at a mean of more than 1 year after the completion of CHT
and having received a number of CHT cycles comparable to the EH subgroup (LH subgroup) (see
Figure 3b).
To gain more insights on the mechanisms underlying these chemotherapy-related adverse effects we
looked for a relationship between the number of cycles and the cerebral glucose metabolism. The
voxel-based correlation analysis evidenced a set of brain areas (including the right superior, middle,
inferior frontal gyri, the left middle frontal and superior temporal gyri) showing a significant
negative association between the number of CHT cycles and the rCMRglc, which partially
overlapped those uncovered by both the comparative and correlation analysis described above.
These results support therefore a model in which the CHT-induced brain damage appears to be
related to the number of CHT cycles (Figure 3d), in agreement with previous neuropsychological
data [3] reporting a negative relationship between the number of cycles and the cognitive
performance. We were however unable to replicate in our sample of cognitively unimpaired cancer
patients this latter finding.
The pattern of CHT-induced brain metabolic impairment, markedly characterized by a
disproportionate involvement of frontal lobes, is reminiscent of that seen in ageing [15, 26, 37, 55]
and some age-related neurodegenerative processes [51]. However, a salient finding of our study was
that the wide frontal metabolic impairment evidenced in the EH subgroup was not associated with

41
any significant cognitive impairment (Table 2). Such mismatch between metabolic and cognitive
data is well known in the field of Alzheimer’s disease (AD) FDG-PET studies. In cognitively
normal subjects at genetic risk of developing AD, such as apolipoprotein E (ApoE) E4 carriers,
such studies showed a reduced glucose metabolism in the same regions of the brain as in patients
with probable AD [44-46] such as the retrosplenial, the parietal and the frontal cortex. Moreover
they evidenced that in these cognitively normal subjects this reduced glucose metabolism could be
associated with perceived loss of memory ability [18] and subjective cognitive complaints [36]. For
example, in cognitively normal ApoE4 carriers, the rCMRglc of parahippocampal gyrus was the
most accurate predictor of the subjective cognitive complaints reported by participants [36]. The
parahippocampal gyrus was, in our study, one of the brain region targeted by the CHT and not
showing evidence of a complete metabolic recovery. This could be relevant since, as reported by
previous studies, cancer survivors treated with CHT often self-report higher levels of cognitive
problems but, as was seen in this work, perform normally on neuropsychological tests [20, 43].
Furthermore, recent functional and structural studies have showed that cognitively healthy people
with a maternal family history of late onset AD (FHm), have a rCMRglc reductions [35] and less
gray matter volume [23] in AD-vulnerable brain regions, including the frontal cortex, compared to
subjects with no parental history of AD. Interestingly, compared to subjects with a negative history
those with a FHm showed the lowest CMRglc in the right superior frontal gyrus at coordinates (x,
y, z = 34, 61, 4), similar to those found by us (x, y, z = 38, 62, 6). Moreover, FHm subjects
compared to subjects with a paternal familial history of late onset AD showed a lower CMRglc in
the superior frontal gyrus at coordinates (x, y, z = 30, 63, 1). Hypometabolism in FHm is thought to
be due to a combination of dysfunction of mitochondria [62] (maternally inherited), increased
oxidative stress, and possible mitochondrial DNA (mtDNA) mutations [29], leading to CMRglc
changes in vulnerable brain regions [38]. Many of these processes has been proposed as candidate
mechanism mediating the adverse effects of CHT on brain functions [2]. For example, evidence for
oxidative DNA damage was found in peripheral blood lymphocytes after CHT for breast cancer [4,
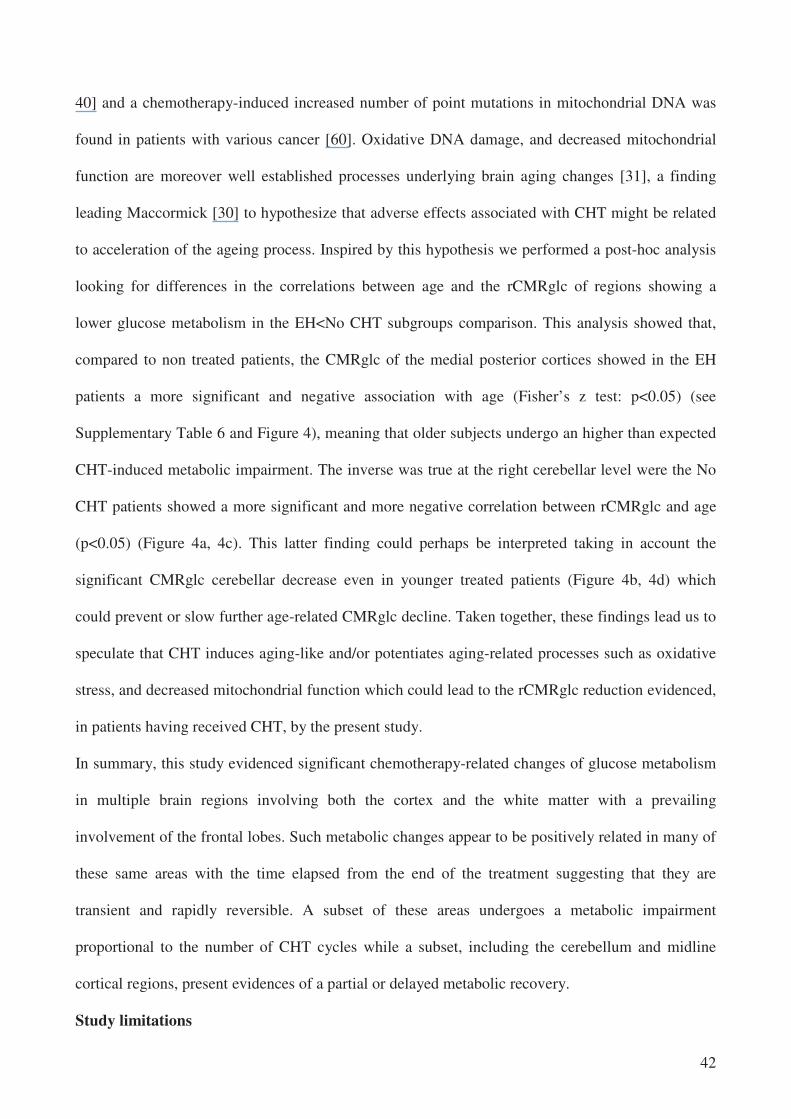
42
40] and a chemotherapy-induced increased number of point mutations in mitochondrial DNA was
found in patients with various cancer [60]. Oxidative DNA damage, and decreased mitochondrial
function are moreover well established processes underlying brain aging changes [31], a finding
leading Maccormick [30] to hypothesize that adverse effects associated with CHT might be related
to acceleration of the ageing process. Inspired by this hypothesis we performed a post-hoc analysis
looking for differences in the correlations between age and the rCMRglc of regions showing a
lower glucose metabolism in the EH<No CHT subgroups comparison. This analysis showed that,
compared to non treated patients, the CMRglc of the medial posterior cortices showed in the EH
patients a more significant and negative association with age (Fisher’s z test: p<0.05) (see
Supplementary Table 6 and Figure 4), meaning that older subjects undergo an higher than expected
CHT-induced metabolic impairment. The inverse was true at the right cerebellar level were the No
CHT patients showed a more significant and more negative correlation between rCMRglc and age
(p<0.05) (Figure 4a, 4c). This latter finding could perhaps be interpreted taking in account the
significant CMRglc cerebellar decrease even in younger treated patients (Figure 4b, 4d) which
could prevent or slow further age-related CMRglc decline. Taken together, these findings lead us to
speculate that CHT induces aging-like and/or potentiates aging-related processes such as oxidative
stress, and decreased mitochondrial function which could lead to the rCMRglc reduction evidenced,
in patients having received CHT, by the present study.
In summary, this study evidenced significant chemotherapy-related changes of glucose metabolism
in multiple brain regions involving both the cortex and the white matter with a prevailing
involvement of the frontal lobes. Such metabolic changes appear to be positively related in many of
these same areas with the time elapsed from the end of the treatment suggesting that they are
transient and rapidly reversible. A subset of these areas undergoes a metabolic impairment
proportional to the number of CHT cycles while a subset, including the cerebellum and midline
cortical regions, present evidences of a partial or delayed metabolic recovery.
Study limitations

43
Some limits in our study came by its cross-sectional design, as only a longitudinal study could
definitely demonstrate the relationship between rCMRglc and post-CHT time or number of cycles
that we observed. Another problem was the heterogeneity of our sample, that was formed by
different kind of cancer patients who received many kind of different adjuvant CHT protocols. This
could be a confounding in determining how treatments (radiotherapy, corticosteroids, different
combination of drugs) can interact and contribute to the brain damaging mechanisms. In animals
this type of interacting noxious effects was demonstrated [39], but we did not have the possibility of
explore this topic.
For the same motivation the non commensurability of the doses of very different treatments
received by patients prevent us to discriminate between a pure dose dependency, a pure CHT
duration dependency or a mixed/interaction form of dependency. The number of CHT cycles, in
fact, could be thought as a mere proxy of either the above aspects, since an higher number of cycles
could correlate with an higher dose, but also with a longer time of exposition. We cannot exclude,
however, that the number of cycles represents the number of times that the system came in contact
with CHT and the complex cascade of events triggered by this exposition. So this repeated
interaction per se could be a factor that guide the changes and the adaptation mechanisms activated
as a response by the system.
Still the heterogeneity of our sample could be interpreted also as a strength of this work, since the
observed reversibility remains very significant in spite of possible confounding factors underlying
this heterogeneity.
Lower RBC and Hb (chemotherapy-induced bone marrow suppression) constituted the main
differences between the subgroups in our sample, so it could be worthy to better characterize the
relationship between the brain’s CHT-induced changes and these alterations (or the underlying
mechanisms). Unfortunately we did not have enough elements to attend to this task, but we can
suggest that future work should investigate in this direction. We can however affirm that the
anaemia was not the sole or first causative factor of the metabolic lowering and its subsequent

44
recovery because, excluding from the sample the anaemic patient (Hb<12 g/dL), the correlation
analysis showed similar results (not shown).
The subgroups did not statistically differ at any neuropsychological or psychological test. If it was
not surprising that the psychological profile of cancer patients could be largely overlapping during
diagnosis and treatment (with presence of depression, anxiety and stress), it was more concerning
that, although we found an altered rCMRglc, comparing the subgroup we did not find any
neuropsychological deficit. This could be due to the successful compensation of the brain that
maintains its behavioral performance at cost of metabolic adaptation and changes (potentially
stressfull in the long last period) or at an insufficient sensitivity of the neuropsychological tests
(respect to our sample’s size and CHT-induced changes). A further element that may have reduced
the difference between the groups, was the use of the No CHT subgroup as control group, in fact, it
has been found that the cancer patients also before the adjuvant CHT can show alterations in the
brain activity and in behavioral tasks compared to healthy subjects [2, 12]. We cannot enrol healthy
volunteers in our study due the Italian legislation that prohibit the prescription of a PET in persons
not suffering from any disease.

45
SUPPLEMENTARY FIGURES
Supplementary Figure 1. Cerebellum in the No CHT (n=12) and EH (n=10) groups
Compared to non treated patients, the rCMRglc of the right cerebellar cortices showed in the EH patients a less
significant association with age (a, b), but a general lower level of rCMRglc. In blue females, in green males.

46
SUPPLEMENTARY TABLES
Supplementary Table 1. Chemotherapy protocols and drugs
Cycles
Number
(patients)
Protocols Drugs Subgroups
2 (1) MEC Methotrexate, epirubicin, cisplatin LL
2 (1) R-CHOP Rituximab, cyclophosphamide, doxorubicin, vincristine, prednisone LL
3 (3) R-CHOP Rituximab, cyclophosphamide, doxorubicin, vincristine, prednisone LL
3 (1) Nigro 5-fluorouracil, mitomycin LL
4 (2) ABVD Doxorubicin, bleomycin, vinblastine, dacarbazine LL
4 (3) R-CHOP Rituximab, cyclophosphamide, doxorubicin, vincristine, prednisone LL/LH
4 (1) EPIRUBICIN Epirubicin LL
6 (1) R-CNOP Rituximab, cyclophosphamide, mitoxantrone, vincristine, prednisone LL/LH
6 (1) CHOP Cyclophosphamide, doxorubicin, vincristine, prednisone LL
6 (1) ABVD Doxorubicin, bleomycin, vinblastine, dacarbazine LL/LH
6 (1) FEC Fluorouracil (5FU), epirubicin, cyclophosphamide LL/LH
7 (1) TXT/EPI Docetaxel, epirubicin LL/LH
8 (1) CMF Cyclophosphamide, methotrexate,5-fluorouracil LL/LH
8 (1) R-CVP Rituximab, cyclophosphamide, vincristine, prednisolone LL/LH
9 (1) R-FND Fludarabina, mitoxantrone, dexametasone, rituximab LL/LH
12 (1)
ABVD+
DHAP+
EDX+
IGEV+
BEACOP-R+
GITMO GLOBAL
-Doxorubicin, bleomycin, vinblastine, decarbazine -Cisplatin, cytarabine, desametasone -Cyclophosphamide -Ifosfamide, gemcitabine, vinorelbine -Bleomycin, etoposide, doxorubicin, cyclophosphamide, vincristine, procarbazine, prednisone, rituximab -Melphalan, ThioTEPA, Cyclophosphamide
LL/LH
6 (1) HD-AraC+
R-HDS+
R-EPOCH
-Cytarabine -Rituximab -Rituximab, Cyclophosphamide, etoposide, aletuzumab, doxorubicin, vincristine, prednisone
EH
6 (1) R-CHOP+
MAD-R
-Rituximab, cyclophosphamide, doxorubicin, vincristine, prednisone -Cytarabine, mitoxantrone, rituximab EH
7 (1) VACOP Etoposide, adriamycin,, cyclophosphamide, vincristine, prednisone EH
7 (1) VINCRISTINE +
R-FC+
ZEVALIN
-Vincristine -Rituximab, fludarabine, cyclophosphamide -Zevalin
EH
8 (1) R-CHOP+
RDHAP+
ZBEAM
-Rituximab, cyclophosphamide, doxorubicin, vincristine, prednisone -Rituximab, cisplatin, cytarabine, desametasone -Zevalin,
EH
8 (2) R-CHOP Rituximab, cyclophosphamide, doxorubicin, vincristine, prednisone EH
10 (1) ABVD+
BEACOPP
-Doxorubicin, bleomycin, vinblastine, decarbazine -Bleomycin, etoposide, doxorubicin, cyclophosphamide, vincristine, procarbazine, prednisone
EH
12 (1) R-VACOPB Rituximab, VP16, adriamycin, cyclophosphamide, vincristine, prednisone, bleomycin EH
16 (1)
ABVD+
BEACOPP+
IGEV+
DHAP
-Doxorubicin, bleomycin, vinblastine, decarbazine -Bleomycin, etoposide, doxorubicin, cyclophosphamide, vincristine, procarbazine, prednisone
-Ifosfamide, gemcitabine, vinorelbine
-Cisplatin, cytarabine, desametasone
EH
EH = Early High CHT subgroup; LL = Late Low CHT subgroup; LH = Late High CHT subgroup.

47
Supplementary Table 2. Grey matter rCMRglc correlation analysis in CHT subgroup (n=31)
Talairach Coordinates Cerebral Region
BA p corr. Ke Z
x y z
Negative correlations with the number of chemotherapy cycles
(L) Superior Temporal Gyrus 38 0.002 4555 3.66 -46 16 -19
(R) Middle Frontal Gyrus 9 3.37 48 6 37
(R) Middle Frontal Gyrus 46 3.32 48 36 28
(R) Middle Frontal Gyrus 9 3.13 36 29 32
(L) Middle Frontal Gyrus 11 3.12 -22 32 -12
(L) Medial Frontal Gyrus 10 3.02 0 50 -7
(R) Middle Frontal Gyrus 10 2.97 30 63 10
(R) Superior Frontal Gyrus 10 2.90 34 54 23
(R) Inferior Frontal Gyrus 44 2.83 53 9 20
Positive correlations with the post chemotherapy time
(L) Subgenual ACC 25 <0.001 9798 4.15 -2 9 -9
(R) Middle Frontal Gyrus 46 3.50 55 30 24
(R) Superior Frontal Gyrus 10 3.41 36 61 14
(R) Medial Frontal Gyrus (SMA) 6 3.37 16 -7 56
(R) Middle Frontal Gyrus 9 3.34 48 12 36
(R) Inferior Frontal Gyrus 44 3.33 51 7 20
(R) Pregenual ACC 32 3.32 2 39 2
(L) Thalamus AN - 3.28 -6 -5 9
(R) Precentral Gyrus 9 3.28 38 25 34
(R) Inferior Frontal Gyrus 9 3.27 51 7 31
(L) Anterior MCC 32 3.27 -4 17 32
(R) Thalamus VAN - 3.11 10 -3 8
(L) Posterior MCC 24 2.99 -14 -3 48
(L) Pregenual ACC 32 2.98 -6 36 17
(R) Superior Frontal Gyrus 9 2.81 18 58 27
Height threshold p = 0.005 uncorrected for multiple correlations; p corr. = p corrected for multiple correlations;
ACC = Anterior Cingulate Cortex; AN = Anterior Nucleus; BA = Brodmann Area; CHT = chemotherapy;
Ke = cluster extent; L = left; R = right; MCC = Middle Cingulate Cortex;
SMA = Supplementary Motor Area; VAN = Ventral Anterior Nucleus.

48
Supplementary Table 3. White matter rCMRglc correlation analysis in CHT subgroup (n=31)
Talairach Coordinates White Matter Fasciculus
p corr. Ke Z
x y z
Negative correlations with the number of chemotherapy cycles
No suprathreshold cluster
Positive correlations with the post chemotherapy time
(L) Body of Corpus Callosum <0.001 9798 3.67 10 7 27
(R) Posterior Limb of Internal Capsule 2.93 18 -3 15
Height threshold p = 0.005 uncorrected for multiple correlations; p corr. = p corrected for multiple correlations;
BA = Brodmann Area; CHT = chemotherapy; Ke = cluster extent; L = left; R = right.

49
Supplementary Table 4. Grey matter rCMRglc, comparison between subgroups (n=43)
Talairach Coordinates Cerebral Region
BA p corr. Ke Z
x y z
No CHT (n=12) > CHT (n=31)
(L) Parahippocampus (Uncus) 28 0.039 (SVC) 177 3.13 -24 4 -29
No CHT (n=12) > EH (n=10)
(R) Middle Frontal Gyrus 10 <0.001 7622 4.42 38 62 6
(R) Superior Frontal Gyrus 10 3.92 34 57 14
(R) Medial Frontal Gyrus 10 3.91 22 51 12
(R) Precentral Gyrus 4 3.74 61 -6 39
(L) Superior Temporal Gyrus 38 3.26 -24 10 -32
(L) Precentral Gyrus 4 3.24 40 -13 49
(L) Cuneus 19 <0.001 3657 4.41 -2 -82 37
(R) Cuneus 19 4.25 8 -78 33
(R) Parahippocampal Gyrus 19 3.82 24 -47 -5
(R) Lingual Gyrus 19 3.68 24 -68 -2
(R) Dorsal PCC 30 3.49 16 -54 6
(R) Precuneus 7 3.27 20 -58 49
(L) Medial Frontal Gyrus (SMA) 6 <0.001 6644 4.15 -6 -7 52
(L) Middle Frontal Gyrus 46 3.82 -48 34 26
(L) Middle Frontal Gyrus 10 3.37 -32 63 8
(L) Medial Frontal Gyrus 9 3.27 -8 38 26
(R) Anterior MCC 32 3.24 12 18 40
(R) Medial Frontal Gyrus (SMA) 6 3.14 6 5 61
(L) Middle Frontal Gyrus 8 3.10 -40 29 43
(L) Cerebellum Tonsilla - 0.001 2493 3.61 -36 -51 -40
(L) Cerebellum Tuber - 3.06 -32 -64 -29
(R) Cerebellum Tonsilla - 0.017 1447 3.50 36 -41 -35
(R) Cerebellum Culmen - 3.07 42 -42 -23
No CHT (n=12) > LL (n=21)
No suprathreshold cluster
EH (n=10) < LL (n=21)
(R) Fusiform Gyrus 19 0.025 2714 3.61 30 -65 -9
(R) Middle Occipital Gyrus 19 3.29 44 -80 2
(R) Lingual Gyrus 18 3.23 18 -80 0
(R) Inferior Temporal Gyrus 37 3.12 51 -55 -6
(L) Cuneus 19 3.11 -6 -94 23
(R) Medial Temporal Gyrus 39 3.06 38 -72 27
(R) Precuneus 7 2.93 16 -78 37
(R) Cuneus 18 2.87 10 -84 24
(R) Cuneus 19 2.74 18 -88 21
(R) Medial Temporal Gyrus 19 2.68 57 -69 14
(R) Middle Frontal Gyrus 10 0.001 5263 3.43 42 52 20
(L) Middle Frontal Gyrus 11 3.22 -22 30 -13
(R) Superior Frontal Gyrus 10 3.17 22 56 -6
(R) Middle Frontal Gyrus 11 3.17 22 30 -15

50
(R) Superior Frontal Gyrus 11 3.03 34 57 -14
(R) Middle Frontal Gyrus 10 2.97 42 54 -4
(L) Medial Frontal Gyrus 25 2.84 -4 24 -15
(R) Middle Frontal Gyrus 47 2.69 44 38 -8
(R) Superior Temporal Gyrus 38 2.65 30 15 -38
(R) Medial Frontal Gyrus 10 2.60 16 55 8
EH (n=10) < LH (n=9)
(R) Superior Frontal Gyrus 10 0.012 1074 3.94 40 59 16
(R) Superior Frontal Gyrus 9 3.24 38 44 29
(R) Middle Frontal Gyrus 10 3.07 44 60 -3
(L) Middle Frontal Gyrus 10 0.046 1557 3.86 -40 53 18
(L) Anterior MCC 32 3.02 -6 18 38
(R) Anterior MCC 32 2.85 10 21 28
(L) pregenual ACC 32 2.80 -6 34 22
(L) Superior Frontal Gyrus 10 2.72 -26 59 23
Height threshold p = 0.005 uncorrected for multiple correlations; p corr. = p corrected for multiple correlations;
SVC = Small Volume Correction.
ACC = Anterior Cingulate Cortex; BA = Brodmann Area; CHT = chemotherapy; Ke = cluster extent;
L = left; R = right; MCC = Middle Cingulate Cortex; PCC = Posterior Cingulate Cortex; SMA = Supplementary Motor Area.
EH = Early High CHT subgroup; LL = Late Low CHT subgroup; LH = Late High CHT subgroup.
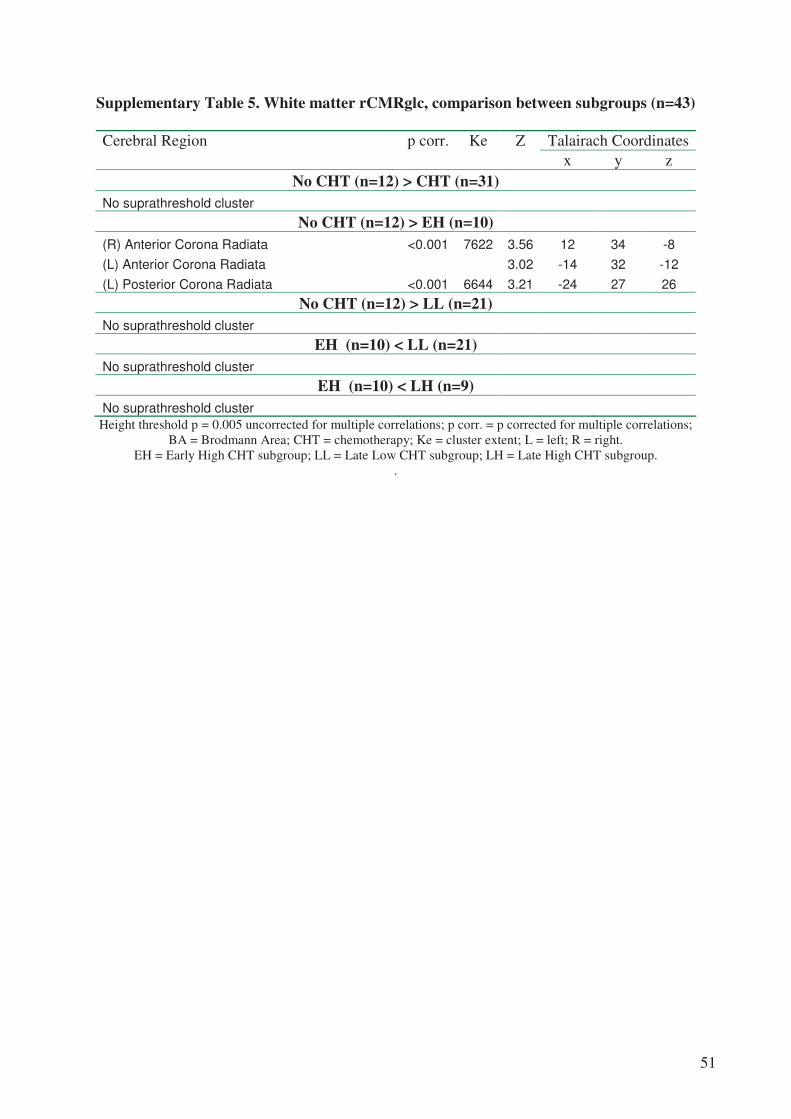
51
Supplementary Table 5. White matter rCMRglc, comparison between subgroups (n=43)
Talairach Coordinates Cerebral Region
p corr. Ke Z
x y z
No CHT (n=12) > CHT (n=31)
No suprathreshold cluster
No CHT (n=12) > EH (n=10)
(R) Anterior Corona Radiata <0.001 7622 3.56 12 34 -8
(L) Anterior Corona Radiata 3.02 -14 32 -12
(L) Posterior Corona Radiata <0.001 6644 3.21 -24 27 26
No CHT (n=12) > LL (n=21)
No suprathreshold cluster
EH (n=10) < LL (n=21)
No suprathreshold cluster
EH (n=10) < LH (n=9)
No suprathreshold cluster
Height threshold p = 0.005 uncorrected for multiple correlations; p corr. = p corrected for multiple correlations;
BA = Brodmann Area; CHT = chemotherapy; Ke = cluster extent; L = left; R = right.
EH = Early High CHT subgroup; LL = Late Low CHT subgroup; LH = Late High CHT subgroup.
.
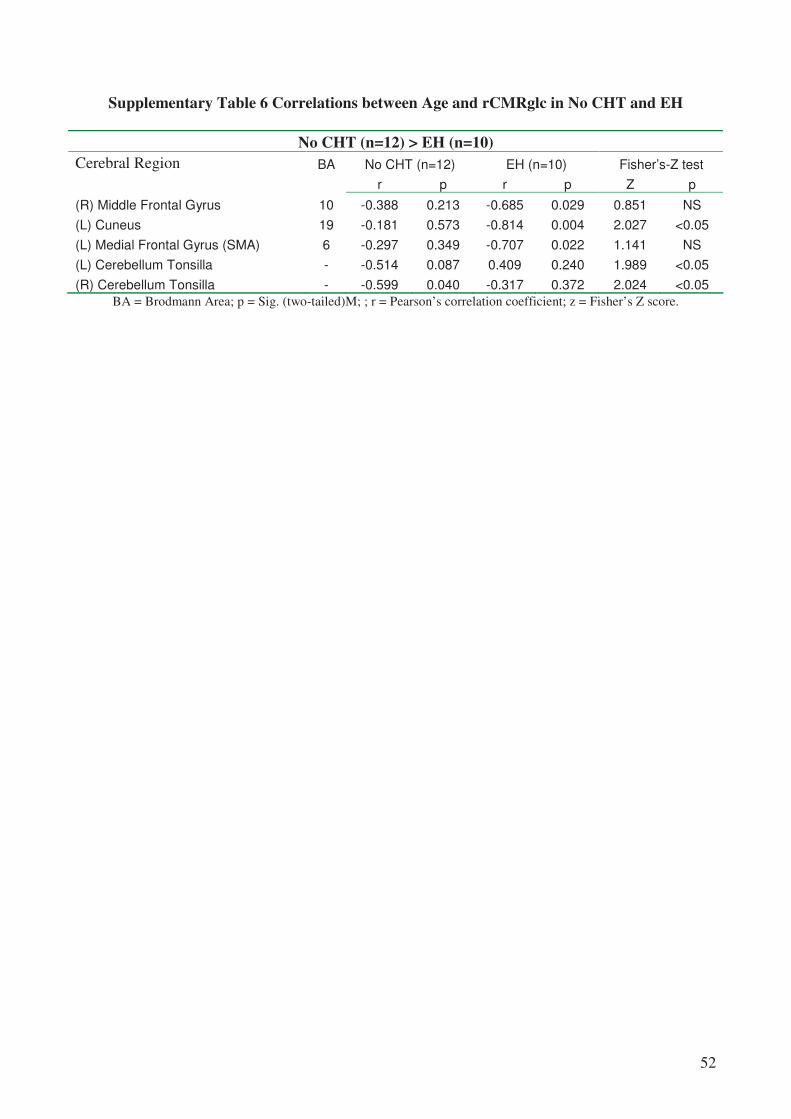
52
Supplementary Table 6 Correlations between Age and rCMRglc in No CHT and EH
No CHT (n=12) > EH (n=10)
Cerebral Region BA No CHT (n=12) EH (n=10) Fisher’s-Z test
r p r p Z p
(R) Middle Frontal Gyrus 10 -0.388 0.213 -0.685 0.029 0.851 NS
(L) Cuneus 19 -0.181 0.573 -0.814 0.004 2.027 <0.05
(L) Medial Frontal Gyrus (SMA) 6 -0.297 0.349 -0.707 0.022 1.141 NS
(L) Cerebellum Tonsilla - -0.514 0.087 0.409 0.240 1.989 <0.05
(R) Cerebellum Tonsilla - -0.599 0.040 -0.317 0.372 2.024 <0.05
BA = Brodmann Area; p = Sig. (two-tailed)M; ; r = Pearson’s correlation coefficient; z = Fisher’s Z score.

53
REFERENCES
1. Abraham J, Haut MW, Moran MT, Filburn S, Lemiuex S, Kuwabara H (2008) Adjuvant
chemotherapy for breast cancer: effects on cerebral white matter seen in diffusion tensor
imaging. Clin Breast Cancer 8:88-91
2. Ahles TA, Saykin AJ (2007) Candidate mechanisms for chemotherapy-induced cognitive
changes. Nat Rev Cancer 7:192-201
3. Ahles TA, Saykin AJ, Furstenberg CT, Cole B, Mott LA, Skalla K, Whedon MB, Bivens S,
Mitchell T, Greenberg ER, Silberfarb PM (2002) Neuropsychologic impact of standard-dose
systemic chemotherapy in long-term survivors of breast cancer and lymphoma. J Clin Oncol
20:485-493
4. Blasiak J, Arabski M, Krupa R, Wozniak K, Rykala J, Kolacinska A, Morawiec Z,
Drzewoski J, Zadrozny M (2004) Basal, oxidative and alkylative DNA damage, DNA repair
efficacy and mutagen sensitivity in breast cancer. Mutat Res 554:139-148
5. Borghammer P, Cumming P, Aanerud J, Gjedde A (2009) Artefactual subcortical
hyperperfusion in PET studies normalized to global mean: lessons from Parkinson's disease.
Neuroimage 45:249-257
6. Brown MS, Simon JH, Stemmer SM, Stears JC, Scherzinger A, Cagnoni PJ, Jones RB
(1995) MR and proton spectroscopy of white matter disease induced by high-dose
chemotherapy with bone marrow transplant in advanced breast carcinoma. AJNR Am J
Neuroradiol 16:2013-2020
7. Brown MS, Stemmer SM, Simon JH, Stears JC, Jones RB, Cagnoni PJ, Sheeder JL (1998)
White matter disease induced by high-dose chemotherapy: longitudinal study with MR
imaging and proton spectroscopy. AJNR Am J Neuroradiol 19:217-221
8. Cahill L (2006) Why sex matters for neuroscience. Nat Rev Neurosci 7:477-484

54
9. Castelli L, Binaschi L, Caldera P, Torta R (2009) Depression in lung cancer patients: is the
HADS an effective screening tool? Support Care Cancer
10. Castellon S, Ganz P, Bower J, Petersen L, Abraham L, Greendale G (2004) Neurocognitive
Performance in Breast Cancer Survivors Exposed to Adjuvant Chemotherapy and
Tamoxifen. !
Journal of Clinical and Experimental Neuropsychology (Neuropsychology,
Development and Cognition: Section A) 26:955-969
11. Choo IH, Lee DY, Youn JC, Jhoo JH, Kim KW, Lee DS, Lee JS, Woo JI (2007)
Topographic patterns of brain functional impairment progression according to clinical
severity staging in 116 Alzheimer disease patients: FDG-PET study. Alzheimer Dis Assoc
Disord 21:77-84
12. Cimprich B, Reuter-Lorenz P, Nelson J, Clark PM, Therrien B, Normolle D, Berman MG,
Hayes DF, Noll DC, Peltier S, Welsh RC (2010) Prechemotherapy alterations in brain
function in women with breast cancer. Journal of Clinical and Experimental
Neuropsychology 32:324 - 331
13. Collins B, Mackenzie J, Stewart A, Bielajew C, Verma S (2009) Cognitive effects of
chemotherapy in post-menopausal breast cancer patients 1 year after treatment.
Psychooncology 18:134-143
14. Costantini M, Musso M, Viterbori P, Bonci F, Del Mastro L, Garrone O, Venturini M,
Morasso G (1999) Detecting psychological distress in cancer patients: validity of the Italian
version of the Hospital Anxiety and Depression Scale. Support Care Cancer 7:121-127
15. de Leon MJ, Convit A, Wolf OT, Tarshish CY, DeSanti S, Rusinek H, Tsui W, Kandil E,
Scherer AJ, Roche A, Imossi A, Thorn E, Bobinski M, Caraos C, Lesbre P, Schlyer D,
Poirier J, Reisberg B, Fowler J (2001) Prediction of cognitive decline in normal elderly
55
subjects with 2-[(18)F]fluoro-2-deoxy-D-glucose/poitron-emission tomography (FDG/PET).
Proc Natl Acad Sci U S A 98:10966-10971
16. Deprez S, Amant F, Yigit R, Porke K, Verhoeven J, Van den Stock J, Smeets A, Christiaens
M-R, Leemans A, Van Hecke W, Vandenberghe J, Vandenbulcke M, Sunaert S (In press,
2010) Chemotherapy-induced structural changes in cerebral white matter and its correlation
with impaired cognitive functioning in breast cancer patients. Human Brain Mapping
17. Eberling JL, Wu C, Tong-Turnbeaugh R, Jagust WJ (2004) Estrogen- and tamoxifen-
associated effects on brain structure and function. Neuroimage 21:364-371
18. Ercoli L, Siddarth P, Huang SC, Miller K, Bookheimer SY, Wright BC, Phelps ME, Small
G (2006) Perceived loss of memory ability and cerebral metabolic decline in persons with
the apolipoprotein E-IV genetic risk for Alzheimer disease. Arch Gen Psychiatry 63:442-
448
19. Fan HG, Houede-Tchen N, Yi QL, Chemerynsky I, Downie FP, Sabate K, Tannock IF
(2005) Fatigue, menopausal symptoms, and cognitive function in women after adjuvant
chemotherapy for breast cancer: 1- and 2-year follow-up of a prospective controlled study. J
Clin Oncol 23:8025-8032
20. Ferguson RJ, McDonald BC, Saykin AJ, Ahles TA (2007) Brain structure and function
differences in monozygotic twins: possible effects of breast cancer chemotherapy. J Clin
Oncol 25:3866-3870
21. Folstein MF, Folstein SE, McHugh PR (1975) "Mini-mental state". A practical method for
grading the cognitive state of patients for the clinician. J Psychiatr Res 12:189-198
22. Giovagnoli AR, Del Pesce M, Mascheroni S, Simoncelli M, Laiacona M, Capitani E (1996)
Trail making test: normative values from 287 normal adult controls. Ital J Neurol Sci
17:305-309

56
23. Honea RA, Swerdlow RH, Vidoni ED, Goodwin J, Burns JM (2010) Reduced gray matter
volume in normal adults with a maternal family history of Alzheimer disease. Neurology
74:113-120
24. Inagaki M, Yoshikawa E, Matsuoka Y, Sugawara Y, Nakano T, Akechi T, Wada N, Imoto
S, Murakami K, Uchitomi Y (2007) Smaller regional volumes of brain gray and white
matter demonstrated in breast cancer survivors exposed to adjuvant chemotherapy. Cancer
109:146-156
25. Kajantie E, Phillips DI (2006) The effects of sex and hormonal status on the physiological
response to acute psychosocial stress. Psychoneuroendocrinology 31:151-178
26. Kalpouzos G, Chetelat G, Baron JC, Landeau B, Mevel K, Godeau C, Barre L, Constans
JM, Viader F, Eustache F, Desgranges B (2009) Voxel-based mapping of brain gray matter
volume and glucose metabolism profiles in normal aging. Neurobiol Aging 30:112-124
27. Kesler SR, Bennett FC, Mahaffey ML, Spiegel D (2009) Regional brain activation during
verbal declarative memory in metastatic breast cancer. Clin Cancer Res 15:6665-6673
28. Lancaster JL, Woldorff MG, Parsons LM, Liotti M, Freitas CS, Rainey L, Kochunov PV,
Nickerson D, Mikiten SA, Fox PT (2000) Automated Talairach atlas labels for functional
brain mapping. Hum Brain Mapp 10:120-131
29. Lin MT, Beal MF (2006) Mitochondrial dysfunction and oxidative stress in
neurodegenerative diseases. Nature 443:787-795
30. Maccormick RE (2006) Possible acceleration of aging by adjuvant chemotherapy: a cause of
early onset frailty? Med Hypotheses 67:212-215
31. Mattson MP, Magnus T (2006) Ageing and neuronal vulnerability. Nat Rev Neurosci 7:278-
294
32. Mignone RG, Weber ET (2006) Potent inhibition of cell proliferation in the hippocampal
dentate gyrus of mice by the chemotherapeutic drug thioTEPA. Brain Res 1111:26-29

57
33. Minoshima S, Frey KA, Foster NL, Kuhl DE (1995) Preserved pontine glucose metabolism
in Alzheimer disease: a reference region for functional brain image (PET) analysis. J
Comput Assist Tomogr 19:541-547
34. Montgomery SA, Asberg M (1979) A new depression scale designed to be sensitive to
change. Br J Psychiatry 134:382-389
35. Mosconi L, Brys M, Switalski R, Mistur R, Glodzik L, Pirraglia E, Tsui W, De Santi S, de
Leon MJ (2007) Maternal family history of Alzheimer's disease predisposes to reduced
brain glucose metabolism. Proc Natl Acad Sci U S A 104:19067-19072
36. Mosconi L, De Santi S, Brys M, Tsui WH, Pirraglia E, Glodzik-Sobanska L, Rich KE,
Switalski R, Mehta PD, Pratico D, Zinkowski R, Blennow K, de Leon MJ (2008)
Hypometabolism and altered cerebrospinal fluid markers in normal apolipoprotein E E4
carriers with subjective memory complaints. Biol Psychiatry 63:609-618
37. Mosconi L, De Santi S, Li J, Tsui WH, Li Y, Boppana M, Laska E, Rusinek H, de Leon MJ
(2008) Hippocampal hypometabolism predicts cognitive decline from normal aging.
Neurobiol Aging 29:676-692
38. Mosconi L, Mistur R, Switalski R, Brys M, Glodzik L, Rich K, Pirraglia E, Tsui W, De
Santi S, de Leon MJ (2009) Declining brain glucose metabolism in normal individuals with
a maternal history of Alzheimer disease. Neurology 72:513-520
39. Mullenix PJ, Kernan WJ, Schunior A, Howes A, Waber DP, Sallan SE, Tarbell NJ (1994)
Interactions of steroid, methotrexate, and radiation determine neurotoxicity in an animal
model to study therapy for childhood leukemia. Pediatr Res 35:171-178
40. Nadin SB, Vargas-Roig LM, Drago G, Ibarra J, Ciocca DR (2006) DNA damage and repair
in peripheral blood lymphocytes from healthy individuals and cancer patients: a pilot study
on the implications in the clinical response to chemotherapy. Cancer Lett 239:84-97

58
41. Novelli G, Papagno C, Capitani E, Laiacona M, Cappa SF, Vallar G (1986) Tre test clinici
di ricerca e produzione lessicale. Taratura su soggetti normali. Archivio di Psicologia,
Neurologia e Psichiatria 47:477-506
42. O'Shaughnessy JA (2002) Effects of epoetin alfa on cognitive function, mood, asthenia, and
quality of life in women with breast cancer undergoing adjuvant chemotherapy. Clin Breast
Cancer 3 Suppl 3:S116-120
43. Pullens MJ, De Vries J, Roukema JA (2009) Subjective cognitive dysfunction in breast
cancer patients: a systematic review. Psychooncology
44. Reiman EM, Caselli RJ, Chen K, Alexander GE, Bandy D, Frost J (2001) Declining brain
activity in cognitively normal apolipoprotein E epsilon 4 heterozygotes: A foundation for
using positron emission tomography to efficiently test treatments to prevent Alzheimer's
disease. Proc Natl Acad Sci U S A 98:3334-3339
45. Reiman EM, Caselli RJ, Yun LS, Chen K, Bandy D, Minoshima S, Thibodeau SN, Osborne
D (1996) Preclinical evidence of Alzheimer's disease in persons homozygous for the epsilon
4 allele for apolipoprotein E. N Engl J Med 334:752-758
46. Reiman EM, Chen K, Alexander GE, Caselli RJ, Bandy D, Osborne D, Saunders AM,
Hardy J (2004) Functional brain abnormalities in young adults at genetic risk for late-onset
Alzheimer's dementia. Proc Natl Acad Sci U S A 101:284-289
47. Reitan RM (1955) The relation of the trail making test to organic brain damage. J Consult
Psychol 19:393-394
48. Rzeski W, Pruskil S, Macke A, Felderhoff-Mueser U, Reiher AK, Hoerster F, Jansma C,
Jarosz B, Stefovska V, Bittigau P, Ikonomidou C (2004) Anticancer agents are potent
neurotoxins in vitro and in vivo. Ann Neurol 56:351-360
49. Schagen SB, Muller MJ, Boogerd W, Mellenbergh GJ, van Dam FS (2006) Change in
cognitive function after chemotherapy: a prospective longitudinal study in breast cancer

59
50. Silverman DH, Dy CJ, Castellon SA, Lai J, Pio BS, Abraham L, Waddell K, Petersen L,
Phelps ME, Ganz PA (2007) Altered frontocortical, cerebellar, and basal ganglia activity in
adjuvant-treated breast cancer survivors 5-10 years after chemotherapy. Breast Cancer Res
Treat 103:303-311
51. Silverman DHS (2004) Brain 18F-FDG PET in the diagnosis of neurodegenerative
dementias: comparison with perfusion SPECT and with clinical evaluations lacking nuclear
imaging. Journal of nuclear medicine : official publication, Society of Nuclear Medicine
45:594-607
52. Spielberger CD (1983) Manual for the state/trait anxiety inventory (form Y) : (self
evaluation questionnaire). Consulting Psychologists Press, Palo Alto
53. Spielberger CD (1996) STAI. State-Trait Anxiety Inventory. Forma Y. Organizzazioni
Speciali, Florence
54. Spinnler H, Tognoni G (1987) Standardizzazione e taratura italiana di test neuropsicologici.
Ital J Neurol Sci 6 (suppl 8)
55. Tumeh PC, Alavi A, Houseni M, Greenfield A, Chryssikos T, Newberg A, Torigian DA,
Moonis G (2007) Structural and functional imaging correlates for age-related changes in the
brain. Semin Nucl Med 37:69-87
56. van Dam FS, Schagen SB, Muller MJ, Boogerd W, vd Wall E, Droogleever Fortuyn ME,
Rodenhuis S (1998) Impairment of cognitive function in women receiving adjuvant
treatment for high-risk breast cancer: high-dose versus standard-dose chemotherapy. J Natl
Cancer Inst 90:210-218
57. Vander Borght T, Minoshima S, Giordani B, Foster NL, Frey KA, Berent S, Albin RL,
Koeppe RA, Kuhl DE (1997) Cerebral metabolic differences in Parkinson's and Alzheimer's
diseases matched for dementia severity. J Nucl Med 38:797-802
58. Vogt BA (2005) Pain and emotion interactions in subregions of the cingulate gyrus. Nat Rev
Neurosci 6:533-544
60
59. Wagner LI, Sweet JJ, Butt Z (2006) Trajectory of cognitive impairment during breast cancer
treatment: a prospective analysis.ASCO Meeting Abstracts 8500. Journal of clinical
oncology : official journal of the American Society of Clinical Oncology 24:4685
60. Wardell TM, Ferguson E, Chinnery PF, Borthwick GM, Taylor RW, Jackson G, Craft A,
Lightowlers RN, Howell N, Turnbull DM (2003) Changes in the human mitochondrial
genome after treatment of malignant disease. Mutat Res 525:19-27
61. Wefel JS, Lenzi R, Theriault RL, Davis RN, Meyers CA (2004) The cognitive sequelae of
standard-dose adjuvant chemotherapy in women with breast carcinoma: results of a
prospective, randomized, longitudinal trial. Cancer 100:2292-2299
62. Yao J, Irwin RW, Zhao L, Nilsen J, Hamilton RT, Brinton RD (2009) Mitochondrial
bioenergetic deficit precedes Alzheimer's pathology in female mouse model of Alzheimer's
disease. Proc Natl Acad Sci U S A 106:14670-14675
63. Zigmond AS, Snaith RP (1983) The hospital anxiety and depression scale. Acta Psychiatr
Scand 67:361-370
64. Zimmerman M, Posternak MA, Chelminski I (2004) Derivation of a definition of remission
on the Montgomery-Asberg depression rating scale corresponding to the definition of
remission on the Hamilton rating scale for depression. J Psychiatr Res 38:577-582
65. Zimmerman M, Posternak MA, Chelminski I (2004) Implications of using different cut-offs
on symptom severity scales to define remission from depression. Int Clin Psychopharmacol
19:215-220