Chemical thermodynamics in steam power cycles data ...
300
Reference NBS PUBLICATIONS mdSIR 85-3205 Chemical Thermodynamics in Steam Power Cycles Data Requirements Proceedings of a Workshop held at The National Bureau of Standards, Gaithersburg, Maryland February 8-9, 1 983 Otakar Jonas and Howard J. White, Jr. U.S. DEPARTMENT OF COMMERCE National Bureau of Standards Office of Standard Reference Data Gaithersburg, MD 20899 July 1985 ’ ^ i i Sponsored by; The ASME Research Committee on the Properties of Steam The ASME Research Committee on Water in Thermal Power Systems r The Electric Power Research Institute ^l)C — The National Bureau of Standards iUU .IJbb 148b AlllDb 034023
-
Upload
khangminh22 -
Category
Documents
-
view
1 -
download
0
Transcript of Chemical thermodynamics in steam power cycles data ...
Reference
NBS
PUBLICATIONS
mdSIR 85-3205
Chemical Thermodynamics in
Steam Power Cycles DataRequirements
Proceedings of a Workshop held at
The National Bureau of Standards,
Gaithersburg, Maryland
February 8-9, 1 983
Otakar Jonas and Howard J. White, Jr.
U.S. DEPARTMENT OF COMMERCENational Bureau of Standards
Office of Standard Reference Data
Gaithersburg, MD 20899
July 1985
’ ^i
i Sponsored by;
The ASME Research Committee on the Properties of SteamThe ASME Research Committee on Water in Thermal Power Systems
r The Electric Power Research Institute
^l)C — The National Bureau of Standards
iUU
.IJbb
148b
AlllDb 034023

ITATIONAL BUREAUOF STANDARDS
ilBRARY
NBSIR 85-3205> 9 9
CHEMICAL THERMODYNAMICS IN
STEAM POWER CYCLES DATAREQUIREMENTS
Proceedings of a Workshop held at
The National Bureau of Standards
Gaithersburg, Maryland
February 8-9, 1 983
Otakar Jonas and Howard J. White, Jr.
U.S. DEPARTMENT OF COMMERCENational Bureau of Standards
Office of Standard Reference Data
Gaithersburg, MD 20899
July 1985
Sponsored by:
The ASME Research Committee on the Properties of SteamThe ASME Research Committee on Water in Thermal Power Systems
The Electric Power Research Institute
The National Bureau of Standards
U.S. DEPARTMENT OF COMMERCE. Malcolm Baldrige, Secretary
NATIONAL BUREAU OF STANDARDS, Ernest Ambler, Director

I*
FOREWORD
A workshop on the needs for chemical thermodynamic data in steampower cycles was held at the National Bureau of Standards in
Gaithersburg, Maryland, February 8-9, 1983. In these proceedingsthe purpose of the workshop is presented and the principal conclusionsand recommendations are stated.
The texts or extended abstracts of most of the papers presented arealso given.
i

SPONSORSHIP AND CREDITS
The workshop was sponsored by the ASME Research Committee onthe Properties of Steam, the ASME Research Committee on Waterin Thermal Power Systems, the Office of Standard ReferenceData of the National Bureau of Standards, and the Electric PowerResearch Institute and was organized by Mr. Otakar Jonas,Westinghouse Electric, and Dr. Howard J. White, Jr., Office of
Standard Reference Data.
ii

CONTENTS
Foreword i
Sponsorship and Credits ii
Contents iii
Introduction 1
Background 1
Current Status 1
Objectives of the Workshop 2
ScopeFormatRelated Activities 3
Conclusions and Recommendations 4
Summary 4
Conclusions and Recommendations of Working Groups 6
Group I Reactors 6
Group II PWR Steam Generators and Fossil Boilers 9
Group III Turbines 11
Group IV The Pre-Boiler Cycle 15
Presentations 17
Introduction R. Spencer 18
Power System ChemicalTransport 0. Jonas 21
Waterside Corrosion and •
Its Control in FossilUtility Steam Generators F. Pocock 38
Water Quality in BoilingWater Reactor Cycles M. Maddagiri 103
Turbine Steam Chemistry W. T. Lindsay, Jr. 110Reactor Chemistry P. Cohen 159Basic Aqueous Chemistry at
High Temperatures andPressures at ORNL R. E. Mesmer 167
Aqueous Solutions at HighTemperatures R. Wood 179
Distribution of ChemicalSpecies Between Waterand Steam P. Cohen 195
Thermodynamics and Electro-chemistry of Corrosion G. Theus 203
Correlation of Data for
Electrolytes in Waterand Steam J, Pei per 224
iii
rj
ro
Evaluated Data and DataBases; Chemical Thermo-dynamics in the SteamPower Cycle D. Garvin 239
EPRI and ASME Research Com-mittee on Water in ThermalPower Cycles 0. Jonas 269
lAPS and ASME Research Com-mittee on the Propertiesof Steam
and
H. J. White, Jr. 277
Appendix I Agenda 278
Appendix II Attendance List 280
iv
INTRODUCTION
Background
It is estimated that corrosion in U.S. power systems costs about $1.5
billion annually. A large proportion of the 15 percent loss in capacity
of the 560,000 MW U.S. electric power system has been caused by corrosion
of boilers, turbines, condensers, and other components of the steam-
water cycle. Similar problems occur in steam power systems used for ship
propulsion or industrial purposes.
Most of these corrosion problems result from the interaction of water-
borne impurities, which may be acids, bases, salts, or oxides, organicor inorganic in nature, with the materials of construction of the systems,
which are primarily metalSo Feedwater is pretreated before use, but the
fact that impurities may be concentrated at specific locations within the
system makes possible the presence locally of even concentrated solutionsof materials that enter the system in a very dilute state.
Corrosion is controlled through purification of water and addition ofwater-treatment chemicals. The concentrations and thermodynamic proper-ties of the impurities change throughout the power cycle with the temperature,pressure, phase of the solvent (water or steam), and reactions of theimpurities with one another and with water-treatment chemicals. A necessarystep toward obtaining better corrosion control is an understanding of thechemical -thermodynamic behavior of the substances in question over therange of parameters met in the power cycle. Reference data are needed on
substances, which may be present in the power cycle as impurities, water-treatment chemicals, corrosion products, and their mixtures over the tempera-ture and pressure ranges found in power cycles.
Current Status
Many data relevant to this need exist in the literature. More are beingproduced from projects being carried out under sponsorship of industrialorganizations such as EPRI. The International Association for the Propertiesof Steam, through its Working Group IV, Chemical Thermodynamics in PowerCycles, has been collecting and reviewing data on the systems Na0H/H20,NaCl/H20, Si02/H20, and magneti te/H20. However, the comprehensiveauthoritative tables that power engineers and scientists need in their workare not available.
Provision of such tables in a timely fashion will require an extensivecoordinated effort. Experimental data must be compiled and evaluated.Possible equations for correlating, interpolating, and extrapolating datamust be obtained and tested. A comprehensive, coordinated, thermodynamicallyconsistent set of reference data of tested reliability must be prepared and
1
made available. Groups that carry out such tasks in a systematic wayare often referred to as data centers. A data center assigned the taskof providing such tables would be expected to coordinate its effortswith the ongoing activities mentioned above and to provide a focal pointfor information on the thermodynamics of power cycles.
Objective of the Workshop
The participants in the workshop were asked to review the needs of theU.S. power industry for reference data for the solution of corrosion prob-lems in steam power systems, with particular emphasis on the thermodynamicdata discussed above. They were also asked to consider the desirabilityof establishing a data center to meet these needs. Finally, they wereasked to establish the chemical substances, ranges of parameters, and
types of data that should be involved.
Scope
The scope of the workshop was limited to data on chemical compounds, per-tinent to steam cycles, found in fossil and nuclear power plants includingthe primary nuclear cycle. To the extent practicable, cycles found in
industrial, ship-propulsion, and geothermal uses were considered. Analyticaltechniques and sensor development were not covered.
Format
The workshop took place over a two-day period. On the first day, plenarylectures defining the current status of the field were given. These wereof two kinds. In one session observations of the presence and effects ofvarious substances in major components of power systems were discussed.These included studies of operating systems and special tests on industrialequipment. In the other session, the current status of the thermodynamicsof aqueous systems was discussed. Presentations covered the availableexperimental data and the current capability to correlate and predict datafor relevant systems.
Working groups were formed on the following topics:
Working Group I
Working Group II
Working Group III
Working Group IV
Reactors
PWR Steam Generators and Fossil Boilers
Turbines
The Pre-Boiler Cycle
2
The working groups were asked to consider the needs for chemical thermo-
dynamic data in general and the following specific items:
What would an ideal thermodynamic data base for your topic
contain? Substances, properties, reaction, ranges of tempera-ture and pressure, other parameters such as pH, p02, emf?
Are treatment of complex ions, hydrolysis of ions, complexmixtures involved? What are the most important cases? Howwould you suggest that they be treated?
To what extent can these needs be met with existing measure-ments and correlation techniques, and what new measurementsmust be made and what new correlation and prediction techniquesdeveloped?
Are there any special data requirements introduced when inter-facial phenomena and corrosion are considered?
What kinds of data products would you find most useful? Tables?Figures, e.g., Pourbaix Diagrams? Computer tapes? "How to
calculate it" data books? Would you expect the reliability ofthe data to be evaluated?
Do you think that a group devoted to preparing such dataproducts (a data center) is necessary or highly desirable?
•
After the meetings of the working groups, the chairmen reported in a
plenary session to allow discussion involving members of different work-ing groups.
Related Activities
Each of the sponsors of the workshop is involved in obtaining or evaluatingdata of the type considered here. In addition, the International Associa-tion for the Properties of Steam is also concerned with such data. For a
variety of reasons, none of these organizations can be expected to carryout the activities considered here independently, although each would be
expected to cooperate with any program that might be established.
3
CONCLUSIONS AND RECOMMENDATIONS
Summary
The following are the conclusions and recommendations of the workshopdrawn from the conclusions of the individual working groups and thejoint discussion. The recommendations of each working group are alsogiven separately:
1. The users of steam for power generation, propulsion, and indus-trial purposes urgently need chemical thermodynamic data pertinent to
their systems. The principal stimulus is provided by corrosion problemsfor the solution of which such data provide a necessary base. Other typesof data, principally kinetic data, are also important. A data centershould be established to collect, evaluate, correlate, predict, and dis-seminate reference data and recommend research in areas where suitabledata are not available.
2. A temperature range from room temperature to 650°C (1200°F) anda pressure range from 0 to 41 MPa (6000 psia) should be covered. Both the
liquid (water) and the vapor (steam) phases are important over the entirerange of concentration of solute achievable, and the systems may be multi-component solutions. Furthermore, many of the substances of interest containions which can be hydrolyzed, oxidized, or involved in complex formationso that these internal equilibria must be taken into account and the proper-ties of a solution depend on its pH and pO as well as the concentration ofsolute. Finally, the solutions are in contact with solid surfaces withwhich they* can interact.
Data needed include:
° Activity coefficients
° Redox, hydrolysis, hydration and other equilibrium constantsinvolving dissolved ions
° Phase equilibria, especially solubilities and liquid-vapordistribution coefficients
°Af G°(T), Af H°(T), S° (T), C° (T), V (Tx P)
° Adsorption
° Ion-solid interactions
° Possibly surface tensions and colloidal properties in some caseso
4

3 . The chemical systems for which data are needed involve manycommon cations and anions, gases (O2 H2 N2 H2S . . . ) and water treat-
ment additives (ammonia, hydrazine, cyclohexylamine,morphol ine,
chelants, phosphates, polyphosphates . . .)
Specific chemical systems for which properties are most needed includewater and steam solutions of:
° NaOH, silica, chlorides, sulfates and other sulphur compounds,carbonates, fluorides, borates, iodides
° Volatile and nonvolatile pH control additives, oxygen scavengers,and H2O2
° Ions of structural metals (Fe, Cr, Ni , Co, Mo, Mn, Cu, Zr, Zn)
such as Fe'’"^, Fe+^, HFeO-^ and other hydrate species, Cr+ 2,
Cr04" 2
, HCrO"^, Ni+^, NiO"^, cobalt species obtained from radio-active transport, etc.
° Metal oxides, mixed oxides, and hydroxides
In addition, mention was made of chemical cleaning agents, colloids, andsome organic substances. The following cations and anions were identifiedas of importance by one or more working groups:
Cations Anions
Aluminum BoratesAmmonium CarbonatesCal ci urn Carboxyl atesChromium Chi oridesCobal
t
FI uoridesCopper HydroxidesHydrogen IodidesHydrazinium Ni tratesIron Other OrganicsLithium OxidesMagnesium PhosphatesManganese PolythionatesMolybdenum Sil i catesNickel Sul fatesPotassium Sul fidesSodi urn
Zi nc
Zirconium
5
4. Equations should be developed to provide detailed thermodynamicdata under conditions found throughout the power cycle. Ideally, thiswould include not only the fluid phases but the surface phases on struc-tural materials, although the latter would represent a longer-term goal.A variety of output mechanisms should be considered including tables,graphs, formulations, handbooks, and automated outputs such as tapes andpossibly on-line services.
Conclusions and Recommendations of the Working Groups
Working Group I, Reactors
Chairman: D. Cubicciotti, EPRI
Secretary: V. Parker, NBS
Participants: Do Garvin, NBS
Do Schl uderberg , Babcock and WilcoxJo Hicks, Babcock and Wilcox
After a general discussion by Hicks and Schluderberg on the types ofproblems encountered in the various components of the PWR's and BWR's, wedecided to concern outselves primarily with the problems associated withthe presently operated PWR's. The data needs and uses are in the areasof:
1. Deposition of solids (more important in the secondary circuits)
2o Vapor transport •
3. Corrosion redox reactions
4. Chemical cleaning
The specific important components for each category are detailed in this
report.
The types of thermodynamic data needed are those that define the chemicalstability of the various components presently known to exist or thosepossible by virtue of the conditions present. The A^G°(T), solubilities,equilibrium constants, and the activity coefficients, AfH°(T), S°(T),
C°(T,P), V(T,P) in the range room temperature to 700°F, and P range up to
2§00 psi are needed.
A strong comment was made by the Chairman that useful data need not just
be "hard" good accurate NBS-type data, but estimated "rough" ballparkengineering estimates that will indicate limits, i.e., the importance of
the species or the potential reaction that might be occurring.
6
In addition, methods are needed for estimating the above-mentionedthermodynamic properties for immediate use by the engineer.
Specifically, data on the following species and their derivatives areneeded:
1 . a) For the input system, dissolved in H 20 (ji), LiOH(aq),
0H“(aq), H2B02 (aq), and BO^ ion, and other B ions or species.
b) In the steam phase, solubility of H2> O2, N2, H2O2, I species
are needed.
2 . In solution, information is needed on the ions of the struc-+2 +3
tural metals, Fe, Cr, Co, Ni , such as Fe , Fe , HFeO^, and+2 -2 -
^
other hydrated species, Cr ’ CrO^ , HCrO^, etc. Cobalt species
obtained from radioactive transport, Ni , and other oxygenated_2
species such as Ni 02 ,as well as Mn and Mo species.
In addition, properties for SO^, SOZ, S2O2, S.Og, HS~, S , H2S, and otherpossible S species in solution^are needed.
Of secondary importance, information is needed on complexes formed withthe structural metals by Cl", OH", F", or the additives such as EDTA,citric acid, picric acid, resins, CCK, as well as on the I species in
solution (I", lO^).
3 . In the solid phase, information is needed on the colloids trans-ported, the passive films formed, as well as the corrosive filmsand tfie nature, structure, and thermodynamic differences of thesefilms from the crystalline material.
The mixed oxides, spinel type of Fe-Ni, Fe-Cr, Li-Zr, Mo, Mn are a parti-cular concern. Mixed chloride oxides of the structural metals areimportant, as well as the sulfides of the structural metals. (Is it
possible that MoS2(c) + ^20(1 or g) forms H2S(g) under operating conditions?)
Of secondary importance, information on the following compounds is needed:AI2O2, AHOH)^, Si 02 » CaSO^, CaCO^, MgSO. , a and y FeOOH, CrOOH, and FeOCl
,
which are involved in the corrosion films.
The thermodynamic properties of the various colloidal material are needed,as well as those resins formed containing and NH2 groups.
7

The direct emphatic answer to question 6: Is a data center for chemical
thermodynamics in steam power cycles necessary or highly desirable: YES,
All five participants agreed.
As has been indicated, this data center should include estimates as well
as "firm" values.
The output (question 5) from this data center should be tables of dataand/or equations. The output should be compatible (units, conventions,reference states, etc.) with other well-known thermo-data centers' output.
Estimation procedures (a how-to manual) should be another output. Someinterest was also expressed for computer tapes. Pourbaix diagrams werenot considered to be a primary output but to be something to be derivedfrom the evaluated data giving the thermodynamic properties, e.g.,
C , A^H°, K^, etc., cited earlier.
8
Working Group II, Steam Generators and Boilers
Chairman: P. Bryant, Combustion Engineering
Secretary: J. Oscarson, BYU
Participants
:
M. J. Angwin, EPRI
J. W. Cobble, San Diego UniversityP. Colombo, NalcoP. CohenJ. Cooper, Naval Research LaboratoryF. Gabriel li, Combustion EngineeringJ. Kruger, NBS
J. Leibovitz, NWT Corp.R. Mesmer, Oak Ridge National LaboratoriesG. J. Theus, Babcock and WilcoxR. Wood, University of Delaware
1. We focused almost entirely on concentrated solutions because the
consensus was that corrosion problems in PWR steam generators and
fossil boilers are primarily associated with heated crevices: viz,
evaporation and concentration of salts.
After considerable discussion, the following parameters were consideredto be of greatest importance: pH, solubility, and redox potential.The practical product therefrom is generation of Pourbaix diagramswhich can provide a predictive capability for corrosion of steamgenerator or boiler materials in concentrated salt solutions prevalentin heated crevices.
2. Salts of chlorides and sulfates as well as pH control additives in
concert with the oxides of the metals of construction were consideredthe constituents of prime importance.
The following were chloride compounds identified as most important toput in the data base (some may already exist and need to be reviewed,whilst others may need to be measured): FeCl-, CuCK, MgCl^, NaCl
,
HCl, NH^Cl, NiCl^.^
Other chlorides of less import but worthy of evaluation include:CuCl , CrCl
2» and CaCl
2.
Similarly, most important sulfur compounds were identified as follows:Na2S0^, FeSO^. J2S0^, Na2S202, MgSO^, and (NH^)2S0^.
Alkali pH control additives were as follows: NaOH, Na^CO^, Ca(OH)-,and
9
Complex mixtures were considered and judged important because theyrepresent reality. Three complex systems were recommended on whichto initiate studies:
a) Na2S0^, H2S0^, NaCl mixture
b) FeCl2
» HCl , Na2S0^ mixture
c) HaOH, H^PO^ mixture
Solids in contact with the saturated solutions need to be considered;of prime importance are the oxides of the materials of constructionplus copper-copper oxides and the following salts: CaSO^, CaCOo,and Mg( 0H)
2.
Solids which should be considered include oxychlorides and oxysulphatesof the transition metals plus precipitated solids.
In the steam phase, solubilities of the following hydrated speciesneed to be addressed: NaCl, Na2S0^, NH^, H2S0^, HCl, Si02>and copper compounds.
These needs cannot be real istical ly met with existing measurements andcorrelation techniques. New measurements by and large must be initi-ated.
4. Colloidal interactions and ion exchange characteristics of the oxideson the materials of construction represent special data requirements.
5. Tables, as well as computer tapes, of the standard free energies ofall species (in solution) and the free energies as a function of ionicstrength plus free energies of the solids at P^n-r recommended.Free energies of gaseous species as a function^of pressure are necessary.Finally, all data are needed from 25 to 550°C.
6. The answer to this question is "yes;" although not discussed in the
context of this meeting, it is my personal opinion that resourcesallocated to quantification of the above thermodynamic propertiesneed to be put in perspective with resources required to understandmore fully operative corrosion mechanisms in nuclear steam generatorsand fossil boilers.
10

Working Group III: Turbines
Chairman: W. T. Lindsay, Jr., Westinghouse
Secretary: G. C. Gould, GE
Participants: J. Has tie, NBS
0. Jonas, WestinghouseT. Passell, EPRI
J. C. Pei per, Arizona State U.
R. C. Spencer, GE
B. Staples, NBS
Answers to questions given to chairmen:
1. What would an ideal thermodynamic data base for your topic contain?Substances, properties, reaction, ranges of temperature and pressure,other parameters such as pH, p02> emf?
la. Substances One problem is to narrow down the list
LithiumSodi urn
PotassiumAmmoniumMagnesiumCal ciumChromiumManganeseIronNickel
CopperZincA1 umi numEtc.
BoratesCarbonatesSilicatesNitratesOxidesHydroxidesPhosphatesSul fatesSul f idesChloridesCarboxyl atesOther OrganicsEtc.
And mixtures too!
lb. Properties
1) Chem. Potential of pure substances and theirActivities mixtures in all phases
2) Phase EquilibriaLiquid-sol id-vaporPhase diagramTable of K's
11
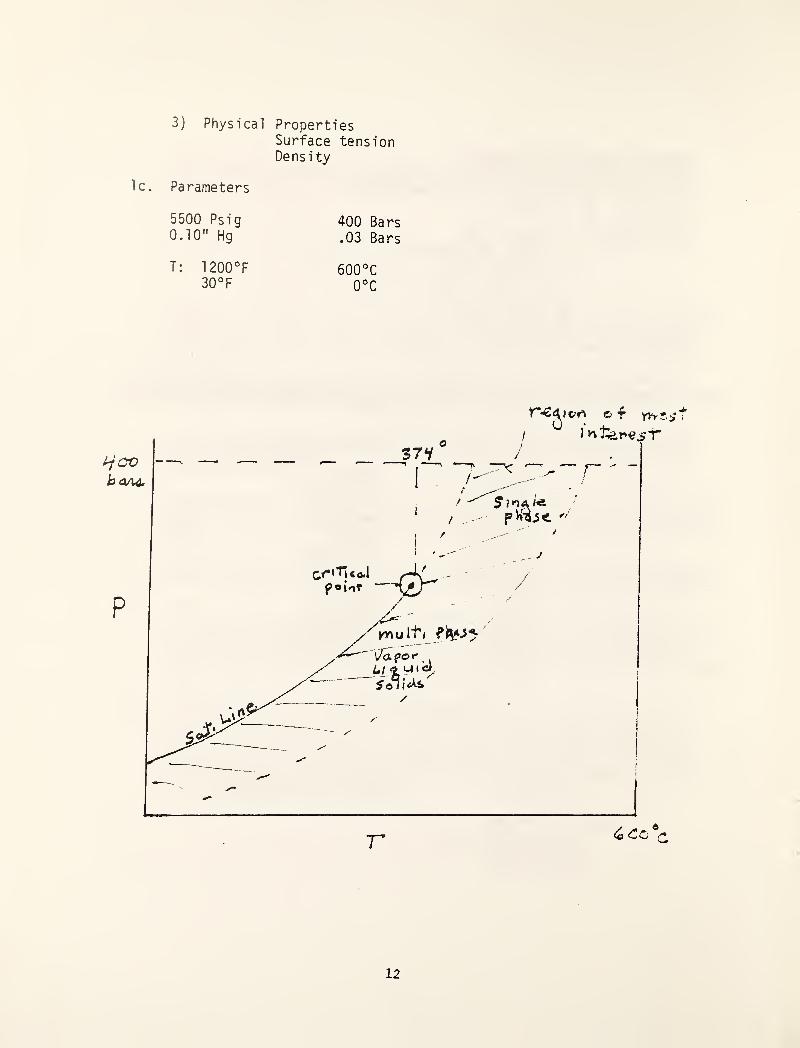
3) Physical PropertiesSurface tensionDensity
Ic. Parameters
5500 Psig 400 BarsO-IO" Hg .03 Bars
T: 1200°F 600°C30°F o°C
12

2. Is treatment of complex ions, hydrolysis of ions, complex mixtures
involved? What are the most important cases? How would you suggest
that they be treated?
Hydrolysis in aqueous phaseMixtures are very important
Important Cases: Si02 - CuO - CU2O - Na20 - Fe^"'’
SO3 - NH3 - FeO - PO4 - CO2 - Cl - O2
H2O system
How to Treat: Start single (binary) and build (complex)
Use interactive model (Pitzer)
Questions of speciation need to be addressed(Sol ution Model
)
Important Complexes: Chloride, hydroxyl , and others from the listabove.
3 . To what extent can these needs be met with existing measurementsand correlation techniques, and what new measurements must be madeand what new correlation and prediction techniques developed?
NaCl and NaOH are probably the best explored but still only 60 percentof data.
What new is needed?
° Low pressure solubility
° Hydrolytic dissociation NaClg + H20g 3: HClg + NaOHg
Techniques: Modern spectroscopic technique(Raman, laser, etc.)Flow micro-calorimetry
Development of more reliablepredictive techniques.
13

4. Are there any special data requirements introduced when interfacialphenomena and corrosion are considered?
° Surface energy° Ion-solid interactions° Adsorption
Corrosion is the main problem
Need: Redox potentialpH
(Pourbaix diagrams)
5. What kinds of data products would you find most useful? Tables?Figures, e.g., Pourbaix diagrams? Computer tapes? "How to calculateit" data books? Would you expect the reliability of the data to be
evaluated?
° On-line, interactive, computer access° Figures (Pourbaix diagrams, etc.)° Tables and equations° Access to the original data° Books° Computer tapes
6. Do you think that a group devoted to preparing such data products(a data center) is necessary or highly desirable?
YES!
14
Working Group IV: The Pre-Boiler Cycle
Chairman: E. E. Coulter, Babcock and Wilcox
Secretary: R. N. Goldberg, NBS
Participants: 0. Jonas, WestinghouseJ. Kelly, NalcoK. Lehner, Wisconsin Electric PowerM. Maddagiri, Bechtel PowerW. Marshall, Oak Ridge National LaboratoriesF. Pocock, Babcock and Wilcox
Conclusions
1. Erosion and/or corrosion and tfie contaminants thus formed are the most
important problems in the pre-boiler system.
2. The prevention or minimization of corrosion products must be addressedduring fabrication, storage, outages as well as during the operationof the boiler. These problems must also be addressed by the systemdesignerso
3. A wealth of data exists on the rates of corrosion of various materialsunder various conditions. Some of the pertinent knowledge is important,but has not or perhaps cannot be easily quantified. Examples includeexfoliation and erosion by moisture.
Recommendations
1. That a retrievable information base be established which consists ofboth quantitative and qualitative data. The qualitative types ofdata include:
(a) the behavior of additives
(b) the characteristics of alloys (e.g., the degree of exfoliationand erosion by moisture droplets in high-velocity steam.
(c) specific failures and operating characteristics of various typesof boiler systems.
(d) economic, health, and ecological aspects of boiler technology.
15

The quantitative data should have as its aim the ability to predict thechemistry (i.e., the amounts of species present in a given system) likelyto be found under various types of boiler operation. The physical quan-tities of concern to such a data base include both kinetic and equilibriumdata. There is also a need for interpretive programs which can be usedwith the data base to calculate amounts of species under a wide varietyof temperatures
,pressures, and compositions (i.e., the data need to be
made as useful as possible).
2. That a number of power plants be "fingerprinted" as to composition of
boiler water at various locations in the plant so that one can understandfor such a system of plants how the materials interact with the environ-ment and how the contaminants migrate through the system.
16

PRESENTATIONS
Introduction R. Spencer
Water and Steam Chemistry Seesion
Power System ChemicalTransport
Waterside Corrosion andIts Control in FossilUtility Steam Generators
Water Quality in BoilingWater Reactor Cycles
Turbine Steam ChemistryReactor Chemistry
Chemical Thermodynamics Session
Basic Aqueous Chemistry at
High Temperatures andPressures at ORNL
Aqueous Solutions at HighTemperatures
Distribution of ChemicalSpecies Between Waterand Steam
Thermodynamics and Electro-chemistry of Corrosion
Correlation of Data forElectrolytes in Waterand Steam
Evaluated Data and DataBases: Chemical Thermo-dynamics in the SteamPower Cycle
Collateral Activities
C. Jonas
F. Pocock
G. Gould and M. MaddagiriW. T. Lindsay, Jr.
P. Cohen
R. E. Mesmer and W. L. Marshall
R. Wood
P. Cohen
G. The us
J. Peiper
D. Garvin
EPRI and ASME Research Com-mittee on Water in ThermalPower Cycles C. Jonas
lAPS and ASME Research Com-mittee on the Propertiesof Steam H. J. White, Jr.
17
Introduction
Robert C. SpencerGeneral Electric Company
Schenectady, New York
At the end of World War II - in the mid 1940's - typical utility steam powerplant units were rated in the 30 to 50 MW size range with steam conditions of
850 pounds, 900 degrees - nonreheat with perhaps four heaters in the feedwatercycle. Partly as a result of wartime developments, materials technology was at
a point where many advances in steam conditions and power plant equipment werepossible. Thus, the first postwar decade saw rapid advances in steam conditionsand an almost complete adoption of the reheat cycle. By the time the 1960'srolled around, double reheat units at 3500 pounds 1 050/1 050/1 050F were in servicewith several units at even higher conditions. The period also saw steam turbineefficiency undergo rapid advancement with the introduction of the tremendouscalculating ability of the computer and advanced manufacturing capability to
make complex twisted airfoil shapes.
However, by the 60 's steam conditions and cycles had been pushed about as far as
materials technology and economics then allowed. In searching for new waysto reduce the cost of electricity, the industry turned to reducing the pounds ofmaterial to produce a KW - the so called economy of scale. This led to largerunit ratings - first of the cross compound or two shaft type primarily because ofgenerator size limitations. However, by the late 1960's larger generator ratingsbecame available and the introduction of longer last stage vanes/or buckets as someof us call them, permitted a rapid increase in single shaft unit ratings.
Problems with units using 1050F steam temperature became evident in the mid 1960's.The industry backed away from 1050F and more frequently selected lOOO/lOOOF steamtemperature.
To recapture the heat rate loss due to temperature reduction, initial pressure was
frequently increased to the supercritical 3500 pound level. Thus, the periodfrom the middle 1960's to the mid 70's saw rapid growth in single shaft unit ratings
coupled with a swing to 3500 pound throttle pressure. But by the mid 1970's,the industry realized the reliability and availability of many of the large 3500
pound plants were not meeting expectations. With 20/20 hindsight, it is apparentthat the equipment troubles were primarily associated with the rapid increase in
unit ratings rather than the 3500 pound steam conditions. However, the morecomplex operating requirements of 3500 pound conditions contributed to the industryrapidly backing away from supercritical steam conditions.
Now let me briefly step back again to the mid 1950's when research and developmentinto nuclear power had progressed to the point where orders for commercialunits were possible. The low pressure and temperature steam from light water
reactors provides a relatively short expansion energy range and expands almostentirely in the moisture region of the mollier chart. The relatively large
ratings of nuclear units, the low throttle pressure and short expansion energyrange leads to large steam mass flows and even larger volume flows at both
turbine inlet and exhaust. These conditions naturally lead to the use of low
18
speed, 1800 RPM turbine generators. The high moisture content of the wet
^
steam expansion caused turbine designers concern about water droplet erosion
(similar to the impact type erosion of the last stage buckets of fossil
turbines) and the erosion-corrosion that could result on internal surfaces
(^washing erosion) and erosion in leakage paths (wire drawing). Also, the
magnitude of the efficiency losses associated with the high moisture levels was
a further uncertainty. Additional concerns stemmed from the rel atively unknown
effects of oxygenated steam and radioactivity upon materials. While initial
units utilized a non-reheat cycle, steam reheat was selected for many later
plants. As with fossil plants, pressures of economy of scale led to larger
units with ratings of over 1100 MW in service by the mid 1970's.
So we see that from world war II we had a brief period of rebuilding and
reorganizing manufacturing capability followed by a decade of rapid advances
in plant efficiency through the application of higher steam conditions, the
universal use of the reheat cycle and strides in turbine efficiency; that
period was followed by a decade where the cost of power generation was reduced
thru economy-of-scal e or fewer pounds of material per KW.
These advances leading to lower cost power generation were a major contributor
to the growth of the U.S. economy during this period. It would not have been
possible without the application of the most advanced knowledge of materials
behavior, the application of sophisticated computer calculated stress analysismethods and the use of higher alloy steels and modern steel-making technology.
Together these factors permitted designs which utilized not only strongermaterials but also applied them at stresses much nearer to their ultimatecapability.
While during this period there had been periodic problems eventuallyattributed to what we might collectively call water or steam chemistry -
adequate and workable. Solutions were found despite the fact that in manyinstances a real fundamental understanding of the problem was lacking.
However, by the mid 1970's, industry's attention was focused on the reliabilityand availability of plant equipment while it simultaneously coped withthe energy crisis; air, water, and land environmental concerns; nuclearlicensing and other problems; and the increasingly difficult economicenvironment.
An increasingly larger portion of reliability and availability problems seemedto be associated with steam and water chemistry - failure of last stage bucketspitting of components, instances of massive deposits in turbine steam paths,nuclear steam generator problems, MSR's and now a major industry problem withthe shafts and wheels of nuclear low pressure turbines.
In attempting to understand these problems and develop solutions, it becameincreasingly apparent that the state of knowledge was grossly inadequate.Therefore, programs were put in place in this country and overseas by individualcompanies, industry associations, universities, and governments. Each programwas directed to obtaining the basic data for a selected chemical solutionbelieved to be associated with a particular problem. In many cases, the datagathered covered only a narrow range of parameters, was of questionable
19

quality, and all too frequently not generally available to the industryas a whole.
The magnitude and urgency of the problem no longer will permit this
approach. Experimental data must be collected, compiled, and evaluatedon a more organized and industry wide basis. The data must not only be
evaluated but equations for correlating, interpolating, and extrapolatingthe data must be developed. Those of us who have been involved in the muchsimpler but similar task for pure water know that this is an effort thatwill not likely be accomplished in a timely manner by any one existingorganization.
The challenge to this workshop is to develop a detailed statement of thescope of the problem, the current state of knowledge, and a specificationof a proposed solution, which may require the establishment of a datacenter to carry out these tasks.
Gentlemen - let's get on with finding a solution to this important industrywide problem.
20
POWER SYSTEM CHEMICAL TRANSPORT
Otakar Jonas
1113 Faun Rd., Wilmington, DE. 19803
Results of field measurements of chemical transport of ionic impurities
and some theoretical considerations are presented and a comprehensive list
of chemicals found in steam systems is attached. The report gives typical
concentrations of measured species in water and steam and points to
differences between the established views and measured chemical transport
characteristics of different power systems.
The chemical transport studies, in combination with chemical thermo-
dynamics, should provide a link between the impurity source and
local chemistry on steam cycle component surfaces which in turn could be
used to evaluate corrosion.
21


Transport of Ionic Impurities In Fossil and PWR Cycles New Observations
By Otakar Jonas, Westinghouse Electric Corporation, Philadelphia, Pennsylvania IWC-81-40
INTRODUCTION
In order to minimize corrosion of steam power system
components, sources, concentrations, chemical transport,
and local reactions and concentration processes for impuri-
ties as well as water treatment chemicals have to be knownand controlled.
Over 150 chemicals have been already identified through
surveys of turbine and boiler deposits, water treatment
practices and analysis of water and steam (1 to 1 ll^Sources
of impurities and the system chemical transport have been
discussed and cycle chemistry described (12 to 22).
By now, we have analyzed cycle chemistry in forty-four
fossil and PWR utility units. Eleven units were monitored
for extended periods of time, rest of the units were sampledonce at high steady load only. Steady load chemistry of
twenty units was measured as a part of the EPRI project
RP912 (11).
Using advanced chemical instrumentation and liquid ion
chromatographic analytical techniques capable to analyze
low ppb ( 10“®) concentrations of impurities, we were able to
measure chemical transport characteristics such as total
carry-over of important ions, impurity separation in Mois-
ture Separator Reheaters (MSRs), ionic balances, fluctua-
tion of concentrations, effectiveness of condensate polish-
ing, resin rinse, some transient effects, etc. Results of the
above work with emphasis on new observations, together
with some related laboratory experiments are discussed in
this paper.
The new observations include formation of volatile spe-
cies and high vaporous carry-over of chlorides and sulfates,
hydrolysis of sodium chloride, acidification of turbine
steam, low carry-over of PO^, very low equilibrium solubil-
ity ofNaOH and NaCl in superheated steam, high solubil-
ity of NH4CI, adsorption of NaOH on dry surfaces, verifi-
cation of “salt zone” and a periodic destruction of Wilsonline by an oscillating shock wave.
The data suggest that some traditional views on chemical
transport need to be reviewed and that attention should be
given not only to concentrations of impunties and local
concentrating mechanisms, but to the ionic balances as
well. Discussion of local transport and concentration proc-
esses and effects of system design on chemicaf transport
can be found elsewhere (4, 5, 10, 1 1, 13, 14, 15, 19, 21 to 27)
and is not included in this paper.
More comprehensive report with data from individual
units, including an update on deposit chemistry, chemical
thermodynamics, and sampling and analysis methods is
being prepared as an EPRI Topical Report, RP912-1 (11).
WATER AND STEAM CHEMISTRYImpurity concentrations were determined in low pres-
sure (LP) turbine steam, boiler water or feedwater (feed-
water in the case of once-through boilers and PWR steamgenerators, and drum water or blowdown in the case ofdrum boilers and recirculating PWR-steam generators). In
some cases, samples from additional sources in the water/
steam cycle, such as the main steam, condensate pump dis-
charge, and reheat steam were analyzed.
Due to the complex effects of transient operation on the
chemistry of water and steam, the steam and water were
sampled during a steady normal operation only. The re-
sults, therefore, represent typical chemistries under steady
conditions. They include Na"^. K“, NH^“. Cl". SO^-“.
P04^“, dissolved oxygen, silica, and pH data.
The units selected for the sampling program were chosen
to cover different types of steam supply systems, water
treatment, condensate polishing, and condensate cooling.
Forty-two units were sampled between July 1978 and Feb-
ruary 1980. A matrix showing distribution of the sampledunits is given in Table 1.
Steam and water sampling was from the existing sample
lines. Low pressure turbine steam was sampled from a sur-
face tap at the LP inlet or with a Westinghouse developed
nozzle. Liquid ion chromatography was used to analyze
sodium, ammomium, chloride, sulfate and phosphate,
silica was determined photometrically per ASTM D859.dissolved oxygen was measured by the indigo-carmine
method, pH was measured on site with a portable meter.
Chemistries of individual units are included in the Topi-
cal Report (11). Summary of the data (averages, maxima,minima, LP steam to blowdown ratios and sodium to anion
molar ratios) are listed in Table 2. A distribution of the
average concentrations of chloride, sulfate, and sodium for
major unit types and for all the 42 sampled units is given in
Table 3 and Figure 1. Because of the inherent scatter of
individual data points, unit averages were chosen as moremeaningful for this statistic. Sulfate distributions are addedfor comparison and because a sulfate limit may be intro-
duced in the future. Results of sampling around the cycle
of a 480 MW, 3500 psi, once-through supercritical fossil
unit with Powdex condensate polishing and salt water con-
denser cooling are shown in Table 4. The high levels of
chloride and sodium indicate a presence of cooling water
impurities and unsatisfactory performance of the conden-sate polishers. Hotwell cation conductivity of 0.35 ^S cmsupports this observation. The polishers apparently removesome NH
4but add sodium and chloride. Repeated samples
of feedwater show small chemistry variations, but the
TABLE 1
Plant Distribution Matrix
Uatar Treatment Condensate Cool ino
Salt
i Cool Ini
Bolltr Typ« AVT Sracltlsn Fresn Tower
Orun 14 3 6 6 5
Fossil
Onca-Ctirough ” 14 6 7 1
Raci rculating S.S. 9 S 3 1
PVR
Onca-throuqh S.G. 2 . 1 1
Total 14 28 17 17 8
Reprinted from the I’roreedings or the
42nd Lntern.i t Lena 1 Water ton t c rence ,
Pittsburg, PA 1*^81 with permissionC International Water Conference
)*Appendix A22


TAIJLE
2
Siimiiiiiiy
of
Analytical
Kcsiills:
Steam,
I'cedwatcr
ami
Iluiler
Ulnwdowii
CNfcOO &— &
S
tn
o
o o oO o
o oo o
e oo oir>
CM O«n oV «M
to CM «*>
P«> 91 to
o o ocsj m M
to
8 “ 2
o u«« <1
c o >> « « ^ o
e e oV
o o o
to O O toto o a «to Cl ^
«i« to CM
I ^ M OJ
• • W o( e o >M ^ o
to O CM
A 91 O
S 3 S
e o o^ O r«*
CM lO
09 to «-•
e CM o
<n o oM CM ««
O CM totn mm (OO
9» M e «> m t< X X ^
o e o^ 91 —V CM
to
91 O
A dO« to V
e o CM
CM O
^ lO tO
00 ^ ^
•• o oM CMV* >
88291 to CM
to <n
91 91 O
to
V to O
< * • .
91 M e
^ <o
« 91 to
S O CMtO —
eto
CM CM
23
*Averi
9cof
unit
<ver«ges
**Hcil4r
Rillo

3 =
- J^ J 100-
90»-
60K•*0 r2or0 *-
N«
<3 <5 <10
Concentration, ppo
<20
All Units
PWR-Hec
Drum - PO4
Once Through- AVT
FIGURE 1
Statistical Distribution of Unit Averages with Respect to Con'
centrations in Steam
Steam samples show typical fluctuations. The unit has
known condenser tube corrosion problems (copper alloy),
high air inleakage, turbine corrosion and erosion problemsand high levels of suspended oxides. To keep oxygen andpH under control, high dosing of hydrazine and ammoniais used. This tends to decrease the exchange efficiency
of the condensate polishers and adds to condenser tube cor-
rosion.
The results of a more extensive sampling program in onefossil drum boiler unit (KA6) are given in Table 5. The unit
IS a 626 MWc, 1900 psi, drum boiler unit with condensate
polishers and a cooling tower. It uses phosphate boiler
TABLE 3
Number and (Percent) of Steam Chemistrv’ Averages WithinRange
Sanqe (poB)
Unit No. of
Ion Type <3 <5 <10 <20 Units
Cl ORUM/PO4 6 (43) 10 (71) 13 (93) 14 ( 100 )14
DRUM/AVT 2 3 3 3 3
PUR. Rec. 4 (44) 5 (55) 9 ( 100 ) 9 ( 100 ) 3
PUR, OT 1 1 2 2 2
OT/AVT 5 (36) 7 (50) 12 (36) 14 ( 100 )14
ALL IS (43) 26 (62) 39 (93) 42( 100 )
42
SO4 DRU«/P0i 5 (43) 3 (57) 11 (79) 12 (36) 14
DRUM/AVT 2 2 3 3 3
PUR, Rec. 3 (.33) 3 (.38) 6 (.75) 3 ( 100 ) 3
PUR. OT 1 1 2 2 2
OT/AVT 3 (57) 9 (64) 12 (36) 13 (93) 14
ALL 20 (49) 23 (56) 34 (33) 33 (93) 41
PO4 ORUM/PO4 4 (57) 6 (36) 6 (36) 7 ( 100 )7
ORUM/AVT 0 1 2 2 2
PUR, Rec. 5 (63) 7 (38) 8 ( 100 ) 3 ( 100 )3
PUR, OT 1 1 2 2
OT/AVT 5 (71) 6 (36) 6 (36) 6 (36)
ALL IS (53) 21 (31) 24 (92) 23 (38) 26
Na DRUM PO4 6 (46) 7 (54) 10 (77) 11 (85) 13
ORUM/AVT 2 3 3 3 3
PMt, Rec. 4 (50) 7 (38) 7 ( 88 ) 3 ( 100 )3
PW. OT 0 0 1 2 2
OT/AVT 4 (29) 7 (50) 12 ( 86 ) 14 ( 100 )14
ALL 16 (40) 24 (60) 33 (33) 38 (95) 40
TABLE 4
Chemistry of the 480 MW Supercritical Once-Through Unit
Source Time pH
Spec. Cond.
(uS/ca)<^2
(ppP)
Na*
(ppb)
NH,
(ppn)
cr(ppb)
soj-
(ppb)
P0^‘
(ppp)
NO3
(poh)
SiO,
(ppb)
LP Steam 13:05 32 1.68 42 <1 <1 <l <10
13:14 7.5* 1.60* 10.5* 3.5* <1* <1*
13:ia 3 1.65 2 <1 <1 <1
(4th e»tract1on 13:22 4 1.74 5 <1 <1 <1
point) 13:25 8.7 (23*C)
13:30 9.6
14:30 <1
Feeilwater 11:15 9.5 9.S (26*011:10 7 2.1 SO <1 <1 <1 <10
11:15 7 2.5 so <1 <1 <1
11:20 4 2.6 55 <1 <1 <1
11:25 4 2,3 60 <1 <l <1
13:45 <l
Main Steoa 12:00 18 1.7 31 <1 <1 <1 <10
12:04 9.4 9.8 (26*0
Condensate 11:55 9.5
Pump Discharge 12:00 9.0 (26*012:12 12 l.S 9 <1 <l <1
Polisher Out 11:35
11:40 9.2 5.9 (26*0 14 0.8 IS <1 <1 <1
Deaerator Out 11:30
11:35 9.2 9.7 (28*0 5 2.1 9 <1 <1 <1
•Average of 4 determinations
24

TABLE 5
Chemistr>' of the 626 MW, 1900 PSIG, Drum Boiler Unit (KA4)
Spec. Cond. ®2 SIO7(ppb)
cr soj- poj* Ha* HH4*
Source Tleie pH* (uS/cm) (pp6 ) (ppb) (ppb) (ppb) (ppb) (p(*») Remarks
L. P. StCM 13:30 <5
14:33 M 3.9 <S <10 3 <1 <1 10 O.Sl Duplicate analysis from
4 <1 <1 10 0.50 sane sample container
1S:11 7.0 10 4 <1 s 0.63
IS: 18 7.2 7 2 <1 s 0.61
Ha In Sten 15:0S 7.0 <10 7 3 <1 s 0.48
Orui Stean IS: 04 6.9 4 2 <1 s 0.50
Orui Hater 13:30
14:40 0.9 26.S
<S
100 40 131 2.9 pp« 2.9 PPM <5 ppb Duplicate anilysls froM
38 134 3.0 PPM 2.9 PPM <S ppb sane sample container
1S:03 8.4 100 34 132 3.1 PPM 2.9 PPM <S ppb
1S:2S 8.6 100 34 13S 3.0 ppa 2.9 ppa <S ppb
Feeduater
(Econonlzer Inlet)
1S:00 7.2 4 <1 <1 12 0.50
Condensate
(Fwep Discharge)
1S:0S 6.6 <10 3 <1 <1 0 0.S5
NOTE: Concentrations are given In ppb unless specified otherwise. Other Ions of Interest, Including K^, F*, NOj, NO3 , nere belon the detection
Halt, I.e., <1 ppb.
water treatment and hydrazine for oxygen scavenging. It is
interesting that the total carry-over (ratio of steam to drumwater chemistry) is different for each ionic species. If wecombine the main plus LP steam data and all drum water
data, the total average carry-overs, K, are: Kq = 16%,
Kso, = 1-7%. Kpo^ <0.03%, = 0.2%, Kgio, < 10%.
Carry-over of phosphate is very low, and carry-over of
chlorides is very high. Similar carry-overs are observed in
other units. Steam and water pH seem to be lower than
what corresponds to the concentrations of phosphate andammonia. This could be due to COo or an analytical error.
Results of around the cycle sampling of a 835 MW PWRunit (SI) with recirculating steam generators are in Table 6.
The sampling was performed during an experimental boric
acid addition period and immediately following recovery
from a major condenser tube leakage incident. The data
provide information on the distribution of boric acid
around the cycle. The unit has almost continual condenser
leakage and uses brackish water for condenser cooling.
With no polishers, the chemistry is controlled by blow-
down. It is noted that some of the sodium, chloride, andboron are separated between the HP steam and LP turbine
by the MSRs. This is a recorded feature of the PWR cycle
design (21).
The main observations derived from the steam, blow-
down and feedwater chemistry data representing a “onemoment” chemistry of a unit operating at a steady high
load are:
1 . Average concentration {group averages) of chlorides, sul-
fates, phosphates and sodium in LP steam is less than 10
ppb in all types of unit sampled. Chloride average is
highest in once-through fossil turbines (5.1 ppb), sulfate
average is highest in PWR turbines (9 ppb), sodium av-
erage in drum boiler, PO, turbines (8.5 ppb). Average
ammonia concentration is highest in the fossil OT units
( 1 100 ppb), average silica is about the same for all units,
average oxygen is highest in PWR—recirculating units
(12.8 ppb) but more oxygen data is needed for better
confidence. Average pH is lowest in the drum, PO^ units
(7.6) and highest in the fossil OT units (9.3), consistent
with the ammonia concentration.
2 . Frequency distribution of unit averages for chloride, sul-
fate, phosphate and sodium in low pressure turbine
steam is in Table 3 and Figure 1. The averages are dis-
tributed into four groups (<3, <5, < 10, and <20) cor-
responding to different steam purity limits (<3 is for
information only) for sodium and chloride (5). 71% of
drum boiler PO4 units meet the chloride limit of <5ppb, 54% meet the sodium limit of <5 ppb. Only 50% of
TABLE 6
Water and Steam Chemistry of the SI PWR Recirculating Unit
During a Boric Acid Addition E.xperiment
Sampling Point
Ha
(ppb)
Cl
(ppb)
SO*
(ppb)
SlOj
(ppb)
B*
(ppm) pH
Steam Generator A
Blowdown
770 1220 159 120 5.85 3.25
Steam Generator A
)f> Steam Condensate
32 28 4 <30 0.21 3.95
H? Drain Tank** 30 14 8 <30 0.32 3.75
LP Steam Condensate 16 9 7 <30 0.C4 9.15
Condenser Hot Well 4 10 5 <30 0.04 9.00
•determination of H38O3 as boron.
••Collects MSR drain In addition to condensate from HP turbineextraction steam used In reheater and certain feed water beaters.
25
oncc-lhrough fossil and 55% of PWR recirculating units
meet the <5 ppb chloride limit. For all units together,
about 60% meet the chloride and sodium <5 ppb limit
and more than 80% meet < 10 ppb limit.
This shows that the <5 ppb limit for normal opera-
tion can be met but that a significant number of units
need to improve the purity of steam.
3. Blowdown concentrations in drum boiler and PWR re-
circulating units reflect the typical 3 to 10 ppm level
phosphate treatment in most fossil units and AVT treat-
ment in few fossil and all sampled PWR units.
4. Feedwater concentrations in fossil once-through units
are similar to the steam concentrations, with ammoniaand pH higher in steam due to the decomposition of
hydrazine.
5. Carry-over from a boiler drum or a PWR recirculating
steam generators is indicated as the ratio of LP steam to
blowdown in Table 2. In many units (but not all), the
carry-over of chlorides and sulfates is much higher (up
to 6*0%) than e.xpected from the ’‘classical” considera-
tions of mechanical and vaporous carry-over. It seems to
increase with ammonia concentration. Carry-over of
sodium is low, indicating low mechanical carry-over. It
is interesting to note that a drum boiler AVT unit using
morpholine, which had an average 1 150 ppb of chloride
and 1435 ppb of sodium in the blowdown had also low
carry-over (0.21%) of chloride. This is consistent with
the distribution coefficient of NaCl. Other units, with
much lower concentrations of chloride, even those bal-
anced in the blowdown by sodium, have a much higher
carry-over of chloride.
The difference between the carry-over of sodium
(low) and anions (high) causes a change in the chemical
balance from drum water to steam and acidification of
turbine moisture and deposits. Similar effects were ob-
served during chemical monitoring at the Arkansas
Power & Light, ANO-1, PWR once-through unit (8, 18).
where more sodium was separated in the MSRs and a
higher proportion of chlorides and sulfates was carried
into the LP turbine.
The above observations are significant. They indicate
that the reduction of drum water impurities does not
always reduce their concentration in the steam. While
ammonia may be sufficient to prevent corrosion in the
single phase liquid environments, it may not always be
adequate for turbine protection when corrosive anions
are present.
6. Inherent scatter of concentrations of ionic species can be
observed in many units. It is observed in both methods
of sampling (cartridges, bottles) in steam, feedwater,
and blowdown samples. As the multiple analyses of
some samples show, the scatter is not due to a poor ana-
lytical accuracy. We don’t know what causes the scatter.
It could be an effect of sampling where plated out impu-
rities break loose and make the sample nonhomogenous,
adsorption of ionic species on oxide particles, erosion of
deposits on blades and boiler and MSR tubes, or oscilla-
tion of the wet-dry transition somewhere in the system
causing periodic washing and drying.
Due to this inherent scatter, collection of a single sam-
ple may not prove to be a meaningful representation of
the average chemistry. More detailed study of this scat-
ter and a microscopic analysis of deposits and sus-
pended particles is needed to evaluate whether the
chemical -transport by particulates is significant.
7. Sodium to anion molar ratios were calculated for some
units for steam, feedwater and blowdown. The LP steam
ratios in drum boiler and PWR recirculating units are
much lower than the blowdown ratios, indicating acidi-
fication of the steam. Most of the steam ratios are less
than one, some are extremely low. This is consistent
with the observation of higher carry-over of anions than
of sodium. In the turbines with low sodium to anion
ratio (assuming the absence of cations other than am-
monia), the protection of metal surfaces against acid
corrosion is dependent upon the concentration of am-
monia at the surface.
8. Sodium to phosphate molar ratio in the drum, PO^ units
varies in blowdown and steam over a wide range. In
steam, it is often higher than in the blowdown (for ex-
ample, unit KA4, 4.0 in blowdown to >27.5 in steam),
sometimes lower.
9. Boric acid distribution in one PWR recirculating unit
follows the following ratios;
blowdown: HP steam: LP steam = 5.81 : 0.21 : 0.04
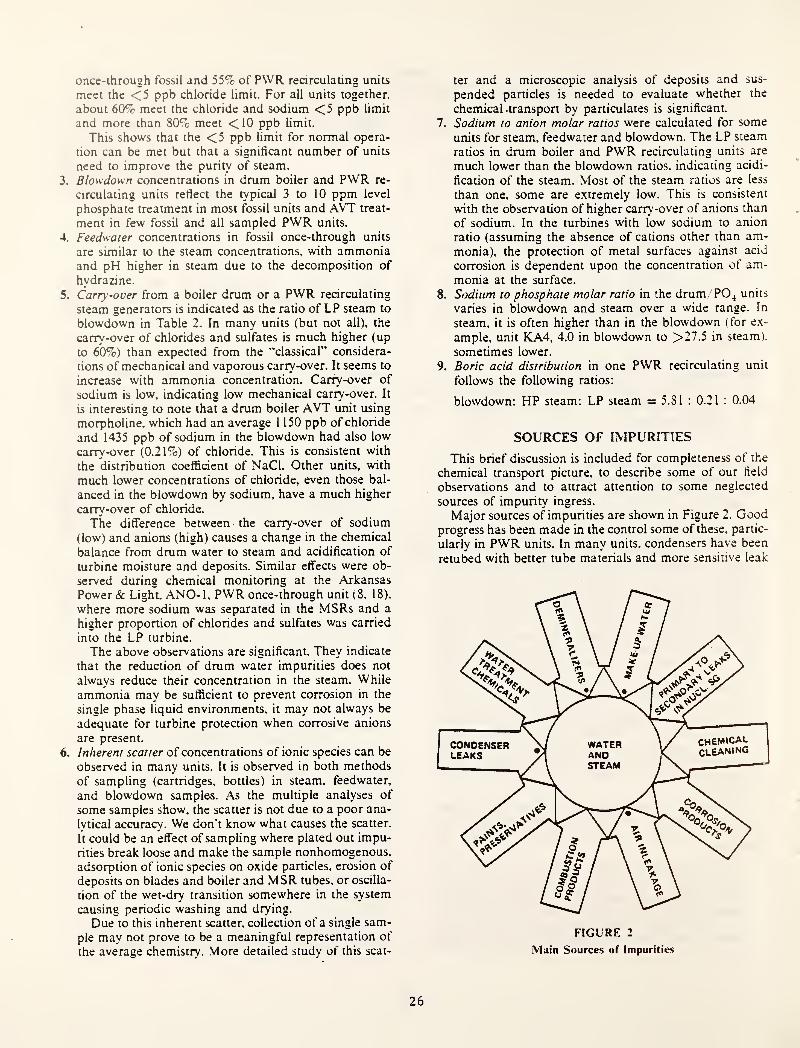
SOURCES OF IMPURITIES
This brief discussion is included for completeness of the
chemical transport picture, to describe some of our field
observations and to attract attention to some neglected
sources of impurity ingress.
Major sources of impurities are shown in Figure 2. Goodprogress has been made in the control some of these, partic-
ularly in PWR units. In many units, condensers have been
retubed with better tube materials and more sensitive leak
26
detection methods are being used. The operation ofconden-
sate polishers is improving, but leakage of chlorides, sul-
fates and sodium is still marginal in too many units. Qual-
ity control programs for regeneration and water treatment
chemicals is being implemented to limit (mostly) chloride
contamination.
Condenser leaks are the most frequent source of impuri-
ties in the U.S. utility units (28-29). Depending upon the
chemistry of the cooling water, they can result in either acid
or caustic contamination of the steam system. Good treat-
ment of the effects of condenser leakage on boUer water
chemistry is in (15 and 30). We have observed changes of
system chemistry during condenser leaks. In one case, in a
once-through subcritical fossil unit with condensate polish-
ers in NH4-OH form, chlorides and sulfates in all streams
increased about tenfold for 24 hours during power opera-
tion with coincident condenser inleakage.
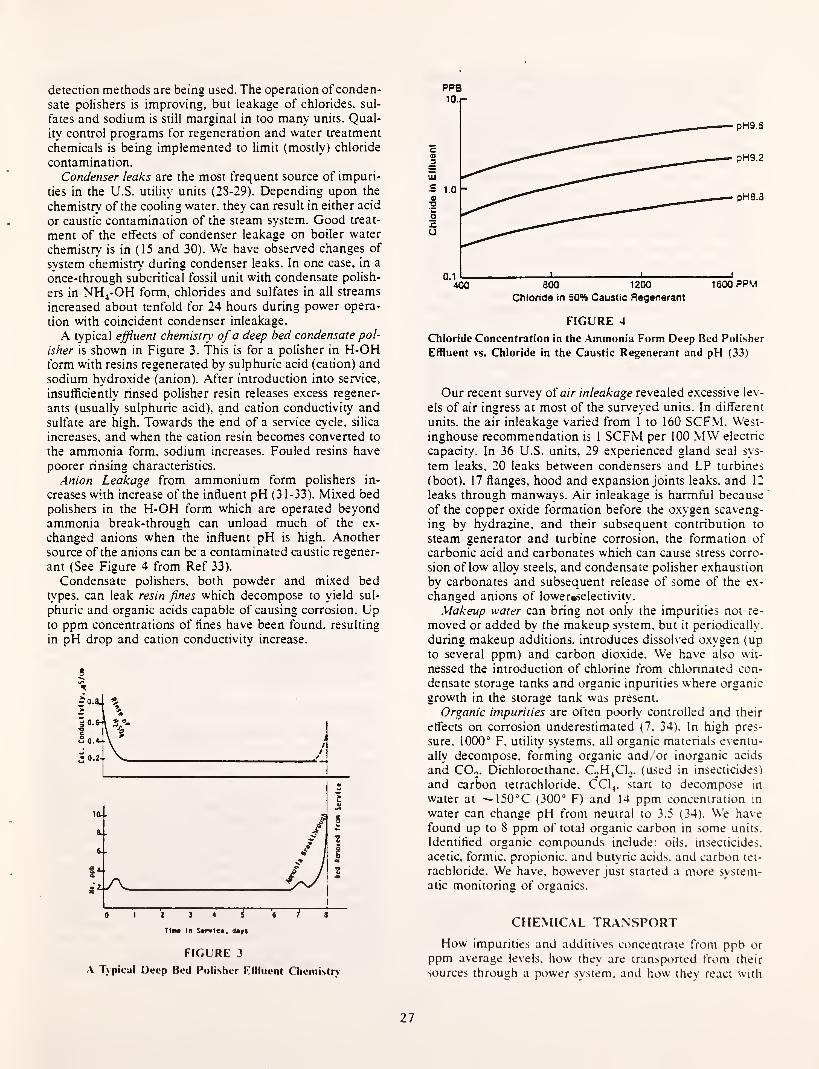
A typical effluent chemistry ofa deep bed condensate pol-
isher is shown in Figure 3. This is for a polisher in H-OHform with resins regenerated by sulphuric acid (cation) and
sodium hydroxide (anion). After introduction into service,
insufficiently rinsed polisher resin releases excess regener-
ants (usually sulphuric acid), and cation conductivity and
sulfate are high. Towards the end of a service cycle, silica
increases, and when the cation resin becomes converted to
the ammonia form, sodium increases. Fouled resins have
poorer rinsing characteristics.
Anion Leakage from ammonium form polishers in-
creases with increase of the influent pH (31-33). Mixed bed
polishers in the H-OH form which are operated beyondammonia break-through can unload much of the ex-
changed anions when the influent pH is high. Another
source of the anions can be a contaminated caustic regener-
ant (See Figure 4 from Ref 33).
Condensate polishers, both powder and mixed bed
types, can leak resin fines which decompose to yield sul-
phuric and organic acids capable of causing corrosion. Upto ppm concentrations of fines have been found, resulting
in pH drop and cation conductivity increase.
8«/»
FIGURE 3
A Typical Deep Bed Polisher ElUuent Chemistry
PPB
pH9.S
?H9.2
pHS.a
PPM
FIGURE 4
Chloride Concentration in the Ammonia Form Deep Bed Polisher
Effluent vs. Chloride in the Cau.stic Regenerant and pH (33)
Our recent survey of air inleakage revealed excessive lev-
els of air ingress at most of the surveyed units. In different
units, the air inleakage varied from 1 to 160 SCFM. West-
inghouse recommendation is 1 SCFM per 100 MW electric
capacity. In 36 U.S. units, 29 experienced gland seal sys-
tem leaks, 20 leaks between condensers and UP turbines
(boot), 17 flanges, hood and expansion joints leaks, and 12
leaks through manways. Air inleakage is harmful because
of the copper oxide formation before the oxygen scaveng-
ing by hydrazine, and their subsequent contribution to
steam generator and turbine corrosion, the formation of
carbonic acid and carbonates which can cause stress corro-
sion of low alloy steels, and condensate polisher exhaustion
by carbonates and subsequent release of some of the ex-
changed anions of lower«selectivity.
Makeup water can bring not only the impurities not re-
moved or added by the makeup system, but it periodically,
during makeup additions, introduces dissolved oxygen (up
to several ppm) and carbon dioxide. We have also wit-
nessed the introduction of chlorine from chlorinated con-
densate storage tanks and organic inpurities where organic
growth in the storage tank was present.
Organic impurities are often poorly controlled and their
effects on corrosion underestimated (7. 34). In high pres-
sure, 1000° F. utility systems, all organic materials eventu-
ally decompose, forming organic and/or inorganic acids
and COo. Dichloroethane. C.jH^Cl.,. (used in insecticides)
and carbon tetrachloride. CCI4
. start to decompose in
water at '-150°C (300° F) and 14 ppm concentration in
water can change pH from neutral to 3.5 (34). We have
found up to 8 ppm of total organic carbon in some units.
Identified organic compounds include: oils, insecticides,
acetic, formic, propionic, and butyric acids, and carbon tet-
rachloride. We have, however just started a more system-
atic monitoring of organics.
CHEMICAL TRANSPORT
How impurities and additives concentrate from ppb or
ppm average levels, how they are transported from their
sources through a power system, and how they react with
27

system metals are factors that govern the system corrosion,
erosion, thermodynamic efficiency, performance of con-
densate polishers, and other parameters.
Chemical transport can be divided into system transport
and local transport processes. The system transport is gov-
erned by the flow of water and steam, chemical reactions in
the bulk water, separation of chemicals in the boiler (me-
chanical and vaporous carryover), blowdown, separation of
gases in condensers, and condensate polishing. Local proc-
esses are governed by local flow conditions, temperature
gradients, geometry (such as crevices), state of oxidation,
solubility, volatility, water chemistry, corrosion, etc.
The new observations discussed in the section on Waterand Steam Chemistry' effect both, the system transport, andthe local processes.
Ideally, ingress of impurities from their sources should
be in balance with their removal by the impurity removal
systems such as condensate polishers and boiler blowdownsystem. Otherwise, impurities will accumulate and concen-trate which usualy leads to problems. However, most of the
time, system components and the whole power system are
in a transient mode with time periods of transients varying
from years (chemical cleaning), to months orweeks (startups)
to days (load changes, polisher exhaustion) to hours (super-
heat and reheat temperature fluctuations) to fraction of a
second (dynamic flow processes, evaporation, condensa-
tion. shock wave). Some of these transients can result in
short term local concentration of impurities and should
therefore also be controlled.
In this section, we will review the transport of ionic im-
purities. combining new observations based on the field
and laboratory data with some previous descriptions.
A schematic description of a drum boiler unit chemical
transport is shown in Figure 5, and a once-through PWRunit in Figure 6.
Important processes governing chemical transport in-
clude;
Solubihty in water
Deposition of salts and oxides from waterDeposition from steam
FIGURE 5
Chemical Transport in a Drum Boiler Unit
FIGURE 6
Chemical Transport in a Once-Through PWR Unit
•Separation from water to steam (mechanical and va-
porous carry-over)
•Volatility
•Chemical reactions in water, steam and in concentrat-
ing solutions
•Chemical reactions in oxides
•Ionization, dissociation, hydrolysis, and hydration
Adsorption and absorption by oxides and other surfaces
Capillary condensation and boiling in oxides
Corrosion
Ion exchange (resins and oxides)
Drying and washing
Evaporation and condensation
Deaeration
Based on the recent data, some traditional views of the
transport processes should be reviewed: in particular the
processes marked by an asterisk in the above list.
SEPARATION FROM BOILER WATER TO STEAM
The presence of impurities in steam is mainly due to the
mechanical and vaporous carry-over. Mechanical carry-
over is the entrainment of water droplets with the steam
leaving a boiler drum or a steam generator. It is controlled
by moisture separating devices, water level, separation ve-
locity and other design features of steam generators. It also
depends upon water chemistry and is sensitive to impuri-
ties causing foaming, such as oils and other organics. Prior
to about 1940, it was not believed that high pressure steam
may act as a solvent for inorganic compounds with very
low vapor pressure, such as salts and hydroxides (35. 37).
This belief was dispelled by the experiments of O. Fuchs
(35-36) and others, and by problems with turbine deposits.
Data on volatile carry-over (distribution ratio, constant, or
coefficient, partition coefficient, etc.) have been measuredby now for a number of compounds.
For constant concentrations and without reactions
28
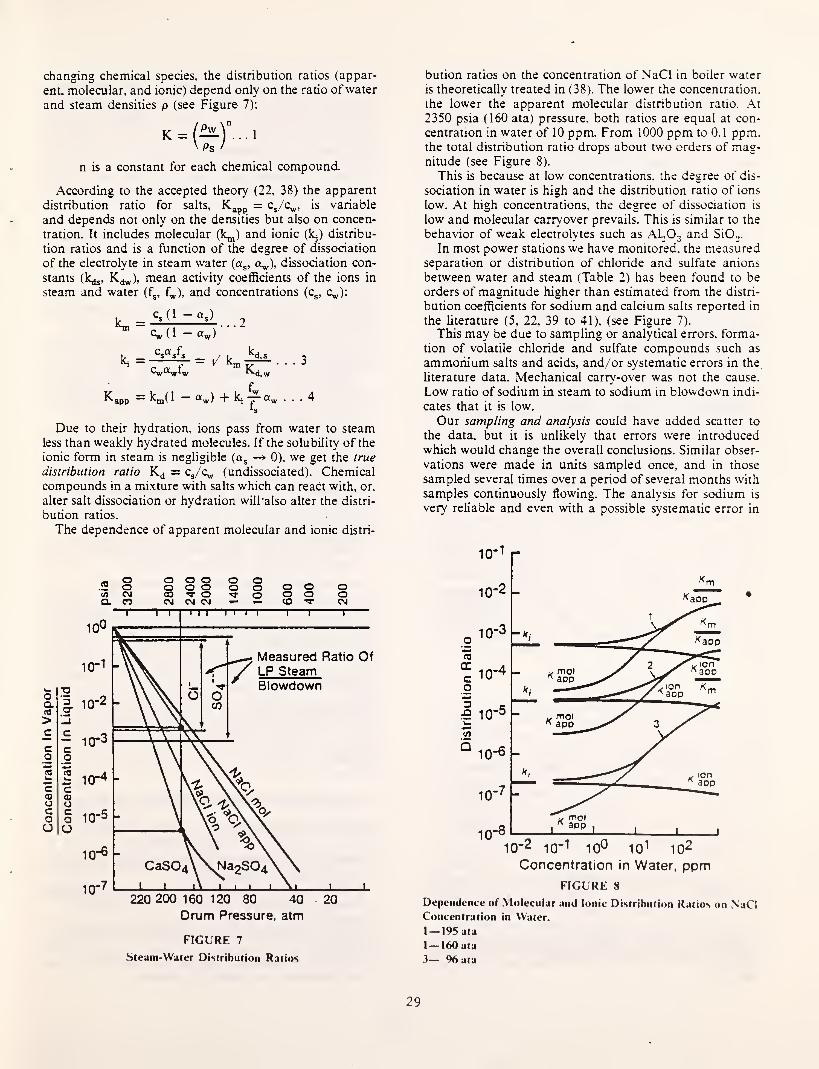
changing chemical species, the distribution ratios (appar-
ent, molecular, and ionic) depend only on the ratio of water
and steam densities p (see Figure 7):
= •'
n is a constant for each chemical compound.
According to the accepted theory (22, 38) the apparent
distribution ratio for salts, K^pp = Cj/c,^, is variable
and depends not only on the densities but also on concen-
tration. It includes molecular (k^j) and ionic (k^) distribu-
tion ratios and is a function of the degree of dissociation
of the electrolyte in steam water (a^, a^), dissociation con-
stants (k^, K^), mean activity coefficients of the ions in
steam and water (fg, f,„), and concentrations (Cg, c^):
j.^ ^s)
2^ "c^(l -a^)”‘
1^ _ ^ ^d.s^
Ki.^
= k„(> - + ki “I
Due to their hydration, ions pass from water to steam
less than weakly hydrated molecules. If the solubility of the
ionic form in steam is negligible (Og — 0), we get the true
distribution ratio = Cg/c„ (undissociated). Chemicalcompounds in a mixture with salts which can react with, or,
alter salt dissociation or hydration will also alter the distri-
bution ratios.
The dependence of apparent molecular and ionic distri-
.2 o<0 CMQ. CO
OOOOO _ _ _ooooo oo oco^o-n’o oo oCMCMCMi-1- o-v CM
oaeg
>
FIGURE 7
Steam-Water Distribution Ratios
bution ratios on the concentration of NaCl in boiler water
is theoretically treated in (38). The lower the concentration,
the lower the apparent molecular distribution ratio. .At
2350 psia (160 ata) pressure, both ratios are equal at con-
centration in water of 10 ppm. From 1000 ppm to 0.1 ppm,the total distribution ratio drops about two orders of mag-nitude (see Figure 8).
This is because at low concentrations, the degree of dis-
sociation in water is high and the distribution ratio of ions
low. At high concentrations, the degree of dissociation is
low and molecular carryover prevails. This is similar to the
behavior of weak electrolytes such as AI0O3 and SiO,.
In most power stations we have monitored, the measuredseparation or distribution of chloride and sulfate anions
between water and steam (Table 2) has been found to be
orders of magnitude higher than estimated from the distri-
bution coefficients for sodium and calcium salts reported in
the literature (5, 22, 39 to 41), (see Figure 7).
This may be due to sampling or analytical errors, forma-
tion of volatile chloride and sulfate compounds such as
ammonium salts and acids, and/or systematic errors in the
literature data. Mechanical carry-over was not the cause.
Low ratio of sodium in steam to sodium in blowdown indi-
cates that it is low.
Our sampling and analysis could have added scatter to
the data, but it is unlikely that errors were introduced
which would change the overall conclusions. Similar obser-
vations were made in units sampled once, and in those
sampled several times over a period of several months with
samples continuously flowing. The analysis for sodium is
very reliable and even with a possible systematic error in
FIGURE 8
Dependence of Molecular and Ionic Distribution Ratios on NaCIConcentration in Water.
I— 195 ata
I— 160 ata
3— % ata
29

the analysis of low level chlorides and sulfates, their distri-
bution ratios would still be high.
Formation of Volatile chloride and sulfate compounds is
the most likely reason for the high distribution coefficients
observed. Volatile compounds can form in makeup andcondensate polishing systems as a result of unequal re-
moval of cations vs. anions, changing sodium to anion
ratio, on metal surfaces, in crevices, in oxide deposits, in
low pH regions by dissociation of neutral salts, by changing
balances of reactions in water and in concentrating salt
mixtures (precipitation of magnesium hydroxide from a
concentrated sea salt) (15), and by hydrolysis of magne-sium and sodium salts in high temperature water and solid
salt deposits in superheated regions (42-43). For instance,
the conditions leading to low pH and a generation of hy-
drochloric acid are discussed by Turner (15) and Gamsey(26) and illustrated in Figure 9. Hydrolysis of sodium salts,
such as NaCl hydrolysis observed by Dr. Rogers (EPRI
—
RP968- 1 ) may be a major contributor to the high carryover
even when the impurities enter system as neutral salts (for
example, seawater inleakage). In the experiments of Dr.
Rogers, superheated steam was carried through solid NaCl,
condensed and analyzed. A highly alkaline deposit wasfound in the precondenser tubing and the final condensate
was acidic. This was observed at temperatures as low as
250“C. Similar observations were made during tests of a
boiler loop at 19.4 MPa (2813 psia), where hydrolysis of
NaCl and deposition ofNaOH occurred on a dry wall of anexperimental loop (42). Hydrolysis, combined with peri-
FIGURE 9
Solution pH vs. iNaCl Concentration and Different NaOH;NaCIRatios for Solutions Containing .Vlagnesium and Sodium Chlo-
rides (15)
odic washing and drying of salt, such as may occur in su-
perheater tubes, can lead to a periodic release of hydro-
chloric acid, followed by washing of sodium hydroxide.
Salts deposited in turbines can also hydrolize. In fossil tur-
bines, the inlet temperature is typically 1000’ F (538°C)
and according to the above data, hydrolysis is still possible
at 480° F (250°C) which is well within the low pressure
turbine. In nuclear turbines, hydrolysis is possible in the
high pressure turbines of once-through PWR units and in
the reheater and inlet stages of low pressure PWR turbines,
where the temperature is about 500° F (260°C). Sodiumchloride is frequently found in turbine deposits throughout
the superheated regions.
Review of the literature on vaporous carryover and dis-
cussions with some investigators leads to the following
speculations about possible reasons for the differences be-
tween the field and laboratory data:
1 . Actual boiler water composition is so different from the
single compound solutions used in the laboratory workthat the laboratory data do not apply. We are mainly
referring to the presence of volatile amines, carbon di-
oxide, nitrogen (from air inleakage and decomposition
of hydrazine) and volatile organic impurities.
2. The experimental setup did not represent boiler condi-
tions such as local concentrations on heat transfer sur-
faces, crevices, sludge, oxidized surfaces, etc.
3. The experiments were performed at much higher con-
centrations than those currently encountered and there
is an undiscovered increase of the distribution ratio at
ppb concentrations.
4. Because much of the previous data was based on so-
dium analysis only, there could have been higher carry-
over of anions but it was not detected.
We have found two references where analysis of both,
sodium and anions is reported. Rebright (44) found in lab-
oratory tests that vaporous carry-over of sodium chloride at
concentrations in water over 3000 ppm is stochiometric andMartynova and Samoilov (45) found a stochiometric trans-
port into steam of salts and some mixtures (NaOH -i-
NaCl. LiCl -I- NaCl, NaCl + NaoSO^). This was also
measured at high concentrations of salts in water. They
limited their conclusions to the pressure and temperature
region where hydrolysis is insignificant and where the salts
behave as weak electrolytes in their vapor solutions, and to
substances which do not react or displace the system equi-
librium.
TRANSPORT OF IMPURITIES IN TURBINES
Transport processes in turbines have been described be-
fore (1-7. 19, 27. 37, 46). They include:
• Precipitation and deposition due to the decreasing solu-
bility in superheated steam.
• Direct deposition of mechanical carry-over and oxides.
• Evaporation and drying on superheated surfaces.
• Hydrolysis.
• Changing volatility and distribution between steam and
moisture.
• Separation of soluble impurities with moisture in mois-
ture separators and turbine extractions.
30
In addition to the new field observations described in
this paper, the following laboratory data and our field
measurements of conductance within the turbine salt zone
are of importance:
• Static (equilibrium) solubility of sodium hydroxide andsodium chloride under low pressure turbine steam condi-
tions (47) is several orders of magnitude lower (10“^ to
10“' ppb) than the estimated dynamic solubility (few
ppb), and is not therefore applicable to the control of
steam chemistry.
• Ammonium chloride solubility under the above steam
conditions is about 100 ppm as chloride which indicates
high volatility of this salt (48). It is estimated that this
salt would not concentrate on LP turbine surfaces by
precipitation in superheated steam and deposition be-
cause its concentration would not reach such high levels.
• Presence of crystalline sodium hydroxide on autoclave
surfaces and stress corrosion of some stainless steel trans-
ducer casings during a steady state exposure to a satu-
rated solution of NaOH in superheated steam (49) indi-
cates that an unknown impurity concentration
mechanism can be active.
• Existence of liigher concentrations of salts within the
predicted LP turbine salt concentration zone in the su-
perheat region above saturation line has been confirmed
by surface conductance measurements in four operating
turbines (46). A lack of conductance response to the time
of exposure and to the increase of the average concentra-
tion of salts remains to be explained.• Periodic destruction of the Wilson line by an oscillating
shock wave has been obser\’ed in a 1-D nozzle at tran-
sonic steam flow conditions. This could mean that high
frequency (about 50 Hz) transients such as this exist in
LP turbines (19).
SUMMARY AND CONCLUSIONSThe development of new analytical techniques, such as
liquid ion chromatography and ion specific electrodes is
making it possible to monitor the chemical transport char-
acteristics of steam power systems. The sensitivity of the
analytical methods to low ppb concentrations is neededbecause of the water and steam purity requirements ofmodem power systems.
By field monitoring of more than forty power stations,
we have established typical levels of major chemical spe-
cies in water and steam and found:
• Very high vaporous carry-over of chlorides and sulfates
(up to 60%) and its dependence on ammonia concentra-tion.
• Carry-over of sodium to be about what is expected for
sodium salts.
• Acidification of steam due to the lower sodium/anionratio in steam than in drum boiler water.
• Very low carry-over of PO4 in units with PO^ treatment.• Inherent scatter of impurity concentrations in steam and
water.
• Distribution of boric acid in PWR systems.
The most important observation is that the vaporouscarry-over of chlorides and sulfates is orders of magnitudehigher than calculated for sodium salts using laboratory
data. This has an impact upon the system, and particularly
steam and local chemistry control. Not only concentration,
but also ionic ratios must be considered when evaluating
chemistry control and corrosion effects.
New observations related to impurity transport and con-
centration mechanisms in turbines include:
• Very low equilibrium solubility of NaOH and NaCl. not
applicable to the dynamic situation in turbines.
• High solubility of arnmonium chloride.
• New deposition mechanism (from equilibrated vapor)
for NaOH.• Confirmation of higher salt concentration in the “salt
zone” near the saturation line.
• Periodic destruction of the Wilson line by an oscillating
shock wave in a one-dimensional model of a transonic
flow.
The above observations indicate that much basic data
applicable to turbines needs to be ascertained and refined.
Panicularly dynamic data, data on effects of metal sur-
faces, and data related to local processes and transients.
The system transient chemistry discussion is limited
since the amount of experimental data is small. It is possi-
ble that most of the system chemical and corrosion prob-
lems may be caused by high concentration transients. Thedynamics of concentration processes in crevices and by-
deposition, washing, dissolution, and hideout needs to be
better understood to improve possible control during tran-
sients. This is particularly needed for peaking units.
There is a gap between the field and laboratory data andsome laboratory research projects, even some currently ac-
tive, do not appear to represent real life conditions (non-
representative chemical conditions in thermodynamic andcorrosion testing, no dynamic considerations). Published
thermodynamic data are scattered through many different
journals, many are not readily available and are in foreign
languages. These data need to be collected, critically evalu-
ated, statistically correlated, made available, and applied.
Slow progress is being made through the International As-sociation for Properties of Steam *IAPS), Working GroupIV on Chemical Thermodynamics in Steam Power Cycles.
RECOMMENDATIONS1 . Since the total carry-over, particularly of chlorides and
sulfates and some other chemical transport processes are
not predictable, the chemical characteristics of every
power system should be experimentally established.
This should be done shortly after commissioning of newunits and periodically about every five years of service.
2. Distribution between water and steam for important
chemical mixtures and compounds should be deter-
mined. All ions should be analyzed in both phases andthe effects of concentration. pH. ammonia, hydrazine,
oxygen, hydrogen, hydroxide, oxides and crevices, es-
tablished.
3. Due to the acidification of steam, other possible changesin ionic balances from water to steam, and hydrolisis ofsalts, turbine steam should be sampled and analyzed. .At
least sodium, cation conductivity and pH should bemonitored continuously to describe transient chemistrv
.
4 . In control of sources of impurities, more attention
31

should be given to the operation of condensate polish-
ers, resin fines, air inleakage, organic impurities, andpurity of water treatment and regeneration chemicals.
5. The relationship between deposition and turbine steam
chemistry should be studied in an actual or a modelturbine under ty'pical power station steam conditions
representing phosphate, ammonia, morpholine and cy-
clohexylamine water treatments. In-situ surface chemis-
try should be also measured.
6. Laboratory steam solubility programs should include’
mixtures of chemicals, including volatile amines, carbondioxide, and sodium phosphates. In addition to dissolu-
tion measurements, precipitation, deposition, and ad-
sorption measurements should be performed and hy-
drolysis of frequently present salts should be
investigated. The deposited surfaces should be chemi-
cally and microscopically characterized. All investiga-
tors should measure solubility and deposition under two
or three “standard” conditions of pressure and tempera-
ture. Stressed specimens of several materials susceptible
to stress corrosion cracking (U-bends) should be placed
in the superheated steam space of the autoclaves in
which salts are dissolving to determine whether the ad-
sorbed corrodents can cause cracking.
7. A compilation, review, and statistical correlation of all
available chemical thermodynamic data, such as solu-
bility in steam and water, dissociation, ionization, distri-
bution coefficients and chemical activities, of majorimpurities, oxides and water treatment chemicals is
needed for theoretical evaluation of power system envi-
ronments.
8. Research on chemical thermodynamics under transient
conditions, panicularly applicable to peaking units
should be initiated and field experience monitored andanalyzed. Water and steam chemistry specifications for
peaking operation need to be formulated.
ACKNOWLEDGMENTSThe author is grateful to the utilities who let us monitor
their chemistry, and to the Westinghouse engineers andtechnicians who helped to collect and analyze the samples.
Dr. A. Pebler participated in the development of steam
sampling and in the station chemistry monitoring program.
REFERENCES
1. Jonas. O., Survey of Steam Turbine Deposits. Proc. 34th In-
ternational Water Conference (Pittsburgh). 73-81 (1973).
2. Jonas. O.. Indentification and Behavior of Turbine SteamImpurities. Corrosion 77. NACE (San Francisco). Paper No.124 (1977).
3. Kirsch. H.. and Pollann. S.. Depo.sition of Corrosion Prod-
ucts in the Water Steam Cycle of Steam Generating Plants.
Chemie-Ingenieur Technik. 40. 897-903 (1968).
4. Martynova. O. 1., and Rogatskin. B. S., Deposition of Salts
and Corrosion Products in Supercritical Turbine Flow Sec-
tions. Teploenergetika. 17, 50-54 ( 1970).
5. Jonas. O.. Turbine Steam Purity. .Southeastern Electric E.x-
change. Washington. D. C.. April. 1978. Also Combustion.50. No. 6. 11-27. (1978).
6. Straub. F. B.. Cause and Prevention of Turbine-Blade De-posits. Transactions of the ASME, 57. 447-454 ( 1935).
7. Bodmer. M., .Acid Corrosion in Steam Turbine.s. Combus-
tion. March 1978. p. 35. reprinted from Brown Boveri Rev.. 5.
(1977).
8. Rice, J. K.. Characterization of Impurities in the Feedwater.
Steam and Condensate Cycle of a Once-Through SteamGenerating Plant. Paper No. IWC-80-16. 41st International
Water Conference. Pittsburgh. October 20-22. ( 1980).
9. Jonas, O., A Critical Overview of Power Station Samplingand Analysis of W'ater and Steam. Panel Presentation. .ASTMD-19, ASME Symposium on Power Plant Instrument for
Measurement of High Purity W'ater Quality. Milwaukee.June 9-10, 1980, will be published as ASTM—STP.
10. Jonas. O.. Turbine Steam Impurities. Paper Presented at a
Seminar on Water Chemistry and Corrosion in the Steam-Water Loops of Nuclear Power Stations. .ADERP. Electncite
de France. Seillac, March 17 to 21. 1980.
11. Jonas, O.. Pebler, A.. Characterization of Steam Turbine
Environment. Westinghouse-EPRI RP912-2. Topical Report,
to be published.
12. Jonas, O., Control of Turbine-Steam Chemistry. Power 125.
33-42 (1981), S. O. Strauss, editor.
13. Jonas, O.. Transfer of Chemicals in Steam Power Systems.
lEEE-ASME Joint Power Generation Conference. (Buffalo.
New York), Paper No. 76-JPGC-Pwr-12. (1976) also Com-bustion, March 1977, p. 33.
14. Jonas. O., Transfer of Chemicals in PWR Systems: Second-ary Side. BNES Conf. on Water Chemistry of Nuclear Reac-
tor Systems, 1977, (Bournemouth), Paper No. 50.
15. Turner, D. J.. A Study of the Solution Chemistry of Boiler
Water During a Condenser Leak. High Temperature. HighPressure Electrochemistry in Ag. Solns.. NACE p. 188 ( 1977).
16. Hicks, J. H.. Mravich. N. J.. Pocock, F. J.. "Nuclear SteamSupply System Water Chemistry Research”. Proceeding of
the American Power Conference. 33. 790 (1971).
17. CEGB. Chemical Control of Boiler Feedwater. Boiler Waterand Saturated Steam for Drum-type and Once-ThroughBoilers. General Operation Memorandum 72. (1975).
18. Jonas, O., Arkansas Power & Light Turbine Chemical Moni-toring. Westinghouse Electric-EPRI RP-1 124-2, Final Re-
port, to be published.
19. Jonas, O.. Lindsay, W. T. Jr., Evans, N. A., Turbine SteamPurity— 1979 update. Paper presented at the 9th ICPS. Mu-nich. September 1979.
20. Peterson. S. H.. Bellows. J. C.. Pensenstadler. D. F.. andHickam. W. M.. Steam Purity Monitoring for Turbine Corro-
sion Control: A Total Plant Survey. Presented at the 40th
Annual Meeting of the International Water Conference.
Pittsburgh. Pennsylvania October 30-November 1. 1979.
21. Jonas. O.. Increase of Impurities Concentration in Once-Through Units with Forward Pumped Moisture Drains
Combustion, p. 20. August. 1977.
22. Cohen. P.. Water Coolant Technology of Power Reactors,
Amer. Nucl. Soc.. (1980).
23. Cohen. P.. Chemical Thermohydraulics of Steam Generating
Systems Paper Presented at a Seminar on Water Chemistry
and Corrosion in the Steam-Water Loops of Nuclear PowerStations, ADERP, Electricite de France. Seillac. March 17 to
21. 1980.
24. Mann. G. .M.. Distribution of Sodium Chloride and SodiumHydroxide between Steam and Water at Dry out in an E.xper-
imental Once-Through Boiler. Chem. Eng. Science. 30 249-
260 ( 1979).
25. Styrikovich, M. A., and Khaibuilin. I.. Kh. Physical and
Chemical Processes in Boilers p. 11-28. Moscow. .Acad, of
Sciences ( 1957).
26. Garnsey. R., The Chemistry of Setam Generator Corrosion.
Combustion. 36-44, August. 1980.
27. Lindsay. W. T., Jr.. Behavior of Impurities in Steam Turbines.
Power Engineering, 68-72, .May 1979.
32
28. Nuclear and Large Fossil Unit Operating E.xperiences, EPRlNP-1191, Project 771-4, Final Report, September, 1979.
29. EPRI Steam Plant Surface Condenser Leakage Study,
NP481, March, 1977.
30. Liebowitz. J.. Sawochka. S. G.. .Modeling the Effects of Con-
denser Leakage on PWR Chemistry, Paper No. IWC-80-33,
41st International Water Conference, Pittsburgh (1980).
31. Khodyrev, B. N., Shchapov, G. A., Rudnitskii, E. V.,
Through Removal of Chlorides From Condensate,
Teploenergetika, 17, 27-30 (1970).
32. Abrams, I. M., New Requirements for Ion Exchange in Con-
densate Polishing, 37th International Water Conference,
Pittsburgh ( 1976).
33. Bacon, G. W., Burgess. P. 0., Anion Leakage from Ammo-nium from Condensate Polishers. Stone & Webster paper
presented at ASME-Res. Committee on Water in ThermalPower Systems, April 24. 1978. Chicago.
34. Koravin, V. A., et al. Thermal Decomposition of Organic
Impurities in Boiler Condensates. Energetik, No. 5, 24-25
( 1980).
35. Rudorff. D. W., Solvent Properties of High-Pressure Steam,
Engineering and Boiler House Review, 2-6 (Jan., 1945).
36. Fuchs, O., Action of High Pressure Steam as a Solvent,
Zeitschr. F. Elektrochemie, 47, p. 101 (1941).
37. Straus, F. G., “Steam Turbine Blade Deposits”, University of
Illinois Bulletin No. 59, June 1, 1946.
38. Styrikhovick, M. A., Martynova, O. I., Belova. Z. S., SomeFeatures of the Carryover of Sodium Chloride From Boiling
Water into Steam, Teploenergetika, J2, No. 9, 86-89 ( 1965).
39. Styrikovich, M. A., et al. An Investigation of Salt Solubility
in High Pressure Steam, Doklady of USSR Sci. Academy 100
(6)1125-1126 (1955).
40. Martynova. O. 1.. Solubility of Inorganic Compounds in Sub-
critical and Supercritical Water. ‘Reprint Number: C-2.
NACE Conf. on High Temperature High Pressure Electro-
chemistry in Aqueous Solutions. (1973).
41. Goodstine. S. L.. Vaporous Carryover of Sodium Salts in
High Pressure Steam, Proc. Amer. Power Conf.. 36 784-9
(1974).
42. Pritchard. A. M., Peakall. K. A.. Smart. E.. .A. Minature Water
Loop for Boiler Corrosion and Deposition Studies Proc Int.
Conf. on Water Chemistry of Nuclear Reactor Systems.
BNES, Bournemouth, October 24-27 (1977).
43. Rogers. L. B., Communications to the EPRl on R0969-1 Sol-
ubility of Corrosion Salts in Dry Steam (1980-81).
44. Rubright, M. M.. “The Stoichiometry of the Vaporous
Carry-Over of Sodium Chloride From High-Pressure Boiler
Water,:” Proc. ASTM, 61. 1370-82 (1961).
45. Martynova, O. I., and Samoilov. Yu F.. The Formation of
Solutions of Inorganic Substances in Water Vapour. Russian
J. of Inorg. Chem. 7 (4), 372-375 ( 1962).
46. Steltz, W. G., Lee. P. K.. Lindsay. W. T. Jr., The Verification
of Concentrated Impurities in Low Pressure Steam Turbines
Westinghouse Steam Turbine-Generator Symposium. Char-
lotte, October 21-23, 1980.
47. Allmon, W. E., et al. Deposition of Salts from Steam. Paper
No. IWC-80-15, 4lst International Water Conference, Pitts-
burgh, October 20-22, 1980.
48. Allmon, W. E., et al. Deposition of Salts from Steam, EPRlContract RP 1068-1 Status Report. November 1—December31, 1980.
49. Jonas. O., Prepared Discussion—Deposition of Salts fromSteam (Ref. 47), 41st Int. Water Conf.. Pittsburah. October1980.
33
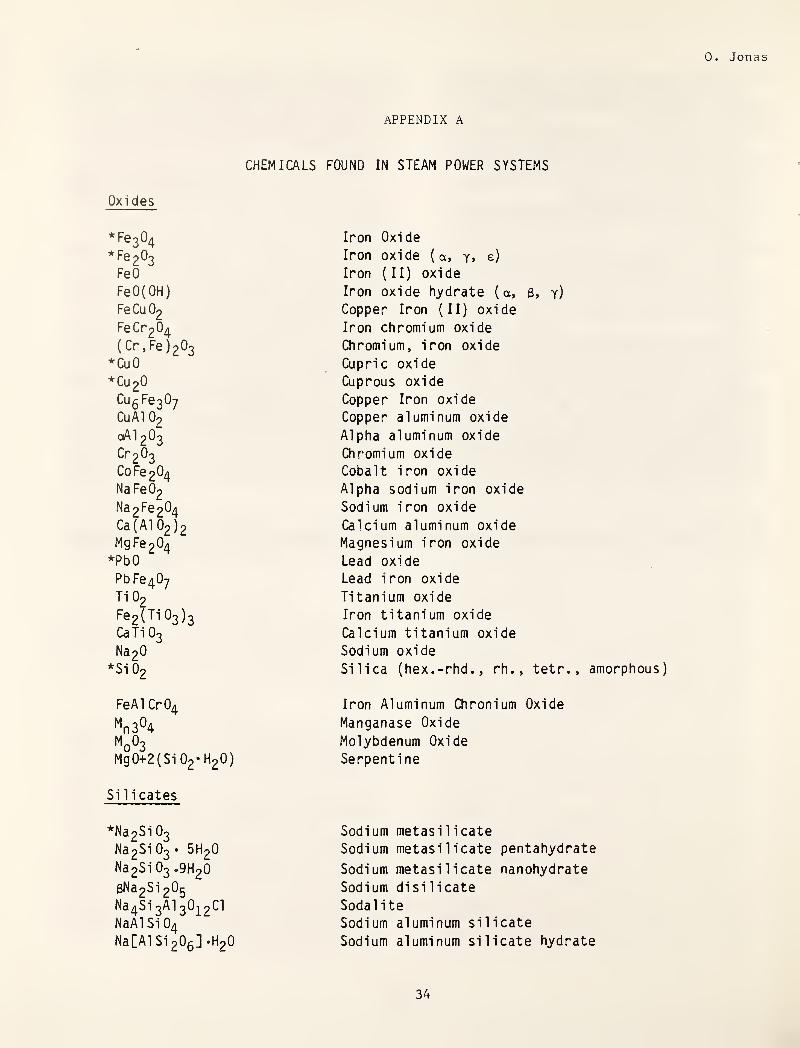
0. Jonas
APPENDIX A
CHEMICALS FOUND IN STEAM POWER SYSTEMS
Oxi des
*F6304
*F6203
FeO
FeO(OH)
Fe Cu O2
FeCr204
(Cr , Fe )203
*CuO
*Cu 20
CugFeaOy
CuAl O2
oAl oO-D
CP203
Co Fe204
NaFe 02
Nd2Fe204
Ca (
A
1 02)2MgFe204
*PbO
PbFe40y
Ti02
Fe2(Ti 03)3Ca Ti O3
Na 2^*Si02
FeAl Cr 04
*^0304
Mg0+2(Si02*H20)
Si li cates
*Na2Si 03
Na2Si O3 • 5H2O
Na2Si 03 .9 H2 O
3Na 2Si 2^5Na
4Si 3AI
^ 02^ 2^^
NaAl Si O4
Na[]Al Si *H20
Iron Oxide
Iron oxide (a, y, e)
Iron (II) oxide
Iron oxide hydrate (a, 3 s y)
Copper Iron (II) oxide
Iron chromium oxide
Chromium, iron oxide
Cupric oxide
Cuprous oxide
Copper Iron oxide
Copper aluminum oxide
Alpha aluminum oxide
Chromium oxide
Cobalt iron oxide
Alpha sodium iron oxide
Sodium iron oxide
Calcium aluminum oxide
Magnesium iron oxide
Lead oxide
Lead iron oxide
Titanium oxide
Iron titanium oxide
Calcium titanium oxide
Sodium oxide
Silica (hex.-rhd., rh., tetr., amorphous)
Iron Aluminum Chronium Oxide
Manganase Oxide
Molybdenum Oxide
Serpenti ne
Sodium metasilicate
Sodium metasilicate pentahydrate
Sodium metasilicate nanohydrate
Sodium disi licate
Sodal i te
Sodium aluminum silicate
Sodium aluminum silicate hydrate
34

Nd^Al 2Si ‘ZHoO
Na4Al
3Si 30 ^ 2 (
0^^
Na8Al6S04(Si 04)0Na FeSi oOg
Nag[Cl (A 1 Si 04)5]NaAlSigOg
NagCa2l-( Si 04)g]A 1 2Si O3KAl Si 2^3KNa3 Si ^4)4KNa3(AlSi04)5
*^0 33^^0MgiL(0H)2Si50i5.2H20+4H20Mg6[(0H)8Si40^Q]
Ca2Si 2^4Ca
3Si 2^7
Ca2Al 2Si 30 ]^q(0H )2
Ca2Si O4 »H20
6^17^Ca (
A
1 2Si 4O 2
)
*6H20
Ca2NaH[Si30g]
Ca2Al 2Si3^]^o^ ^2
CaMg(Si205)
Ca2Mg5(0HSi 4O11 )2
3A1 2034Na 20 *6Si O2 *S 03
Fe2SiO4
(Fe,Mg)7Sig022(0H)2
^^8^^ 6^^ 5024^°^4MgSiO(OH)
Mg3[(0H)Si40^Q]
Zri2Si O4
ZrSi O4
Amorphous silicon compounds
Sodium aluminum silicate hydrate
Sodium aluminum silicate hydroxide
Sodium aluminum sulfate silicate
Sodium iron silicate
Sodium chloro hexa-al umi num silicate
Sodium aluminum silicate
Sodium calcium carbonate aluminum silicate
Aluminum silicate
Potassium aluminum silicate
Potassium sodium aluminum silicate
Potassium tri -sodium aluminum silicate
Nephel i ne
Sepi ol ite
Magnesium octa-hydride silicate
Calcium silicate
Calcium si licate
Calcium aluminum silicate hydroxide
Calcium silicate hydrate
Calcium silicate hydroxide (Xonotlite)
Calcium aluminum silicate hydrate
Sodium calcium silicate hydroxide (Pectolite)
Calcium aluminum silicate hydroxide
Calcium magnesium silicate
Calcium magnesium hydroxide silicate
Nosel ite
Iron silicate
Iron magnesium hydroxide silicate
Sodium aluminum molybdenum oxide silicate
Magnesium Silicate Hydroxide
Magnesium hydroxide silicate
Zinc silicate
Zi rconi urn Si licate
Sulfates
*Na2S04
Na 2^ 2 ^6* 2 ^
2^
FeS04
FeS04 »H20
Na Fe(S 04)2 -IZHgO
CaNa2(S04)2
Cu4S0^( OH)g
Na2Cu ( SO4 )2Cu Fe(0H)2S04
AI2SO4
Sodium sulfate
Sodium sulfate di hydrate
Iron (II) sulfate
Iron (II) sulfate hydrate
Sodium iron sulfate dodeci hydrate
Calcium sodium sulfate
Copper sulfate hydrate
Sodium copper sulfate
Copper iron sulfate hydrate
Aluminum sulfate
35
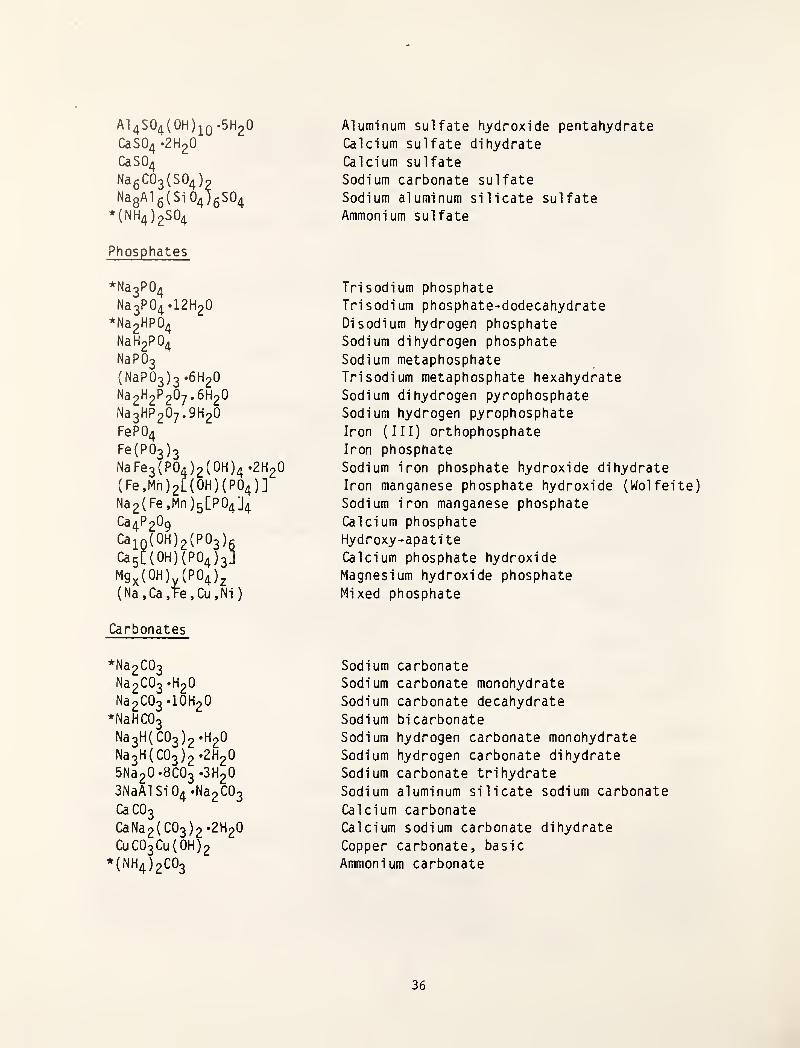
Al4S04(0H)^Q.5H20
CaS04 -2H20
Cd SO4
( ^^4 )?
^38^16(51 04)5504*(NH4)2S04
Phosphates
*Na3P 04
Na3P04.12H20
*Na2HP 04
NaH2P 04
NaP 03(NaP 03)3 *^^ 2
^
Na2^2P 2^7*^^2^Na3HP20y.9H20
FeP 04Fe(P 03)3Na Fe
3(P 04 ) 2 ( 0H) 4
«2 H20(Fe,Mn)2[(0H)(P04)]
Na2(Fe,Mn)5[P04J4
Ca4P20g
0^10 (^^)2^ ^^3 ^6
Ca5[(0H)(P04)3]
Mgx(OH) (P 04 )^
(Na ,Ca ,Te,Cu ,Ni
)
Carbonates
Aluminum sulfate hydroxide pentahydrate
Calcium sulfate dihydrate
Calcium sulfate
Sodium carbonate sulfate
Sodium aluminum silicate sulfate
Ammonium sulfate
Tri sodium phosphate
Tri sodi urn phosphate-dodecahydrate
Di sodium hydrogen phosphate
Sodium di hydrogen phosphate
Sodium metaphosphate
Tri sodi urn metaphosphate hexahydrate
Sodium di hydrogen pyrophosphate
Sodium hydrogen pyrophosphate
Iron (III) orthophosphate
Iron phosphate
Sodium iron phosphate hydroxide di hydrate
Iron manganese phosphate hydroxide (Wolfeite)
Sodium iron manganese phosphate
Calcium phosphate
Hydroxy-apatite
Calcium phosphate hydroxide
Magnesium hydroxide phosphate
Mixed phosphate
*Na2C03
Na 2 *H20Na2C03*10H20
*NaHC03
Na 3H ( CO3) 2
*H20
Na3H(C03)2‘2H20
5Na20-8C03 *3H20
3NaAlSi04 «Na2C03
CaC03
CaNa2(C03)2 *2H20
CUCO3 Cu(0H)2
*(NH4)2C03
Sodium carbonate
Sodium carbonate monohydrate
Sodium carbonate decahydrate
Sodium bicarbonate
Sodium hydrogen carbonate monohydrate
Sodium hydrogen carbonate di hydrate
Sodium carbonate trihydrate
Sodium aluminum silicate sodium carbonate
Calcium carbonate
Calcium sodium carbonate di hydrate
Copper carbonate, basic
Ammonium carbonate
36
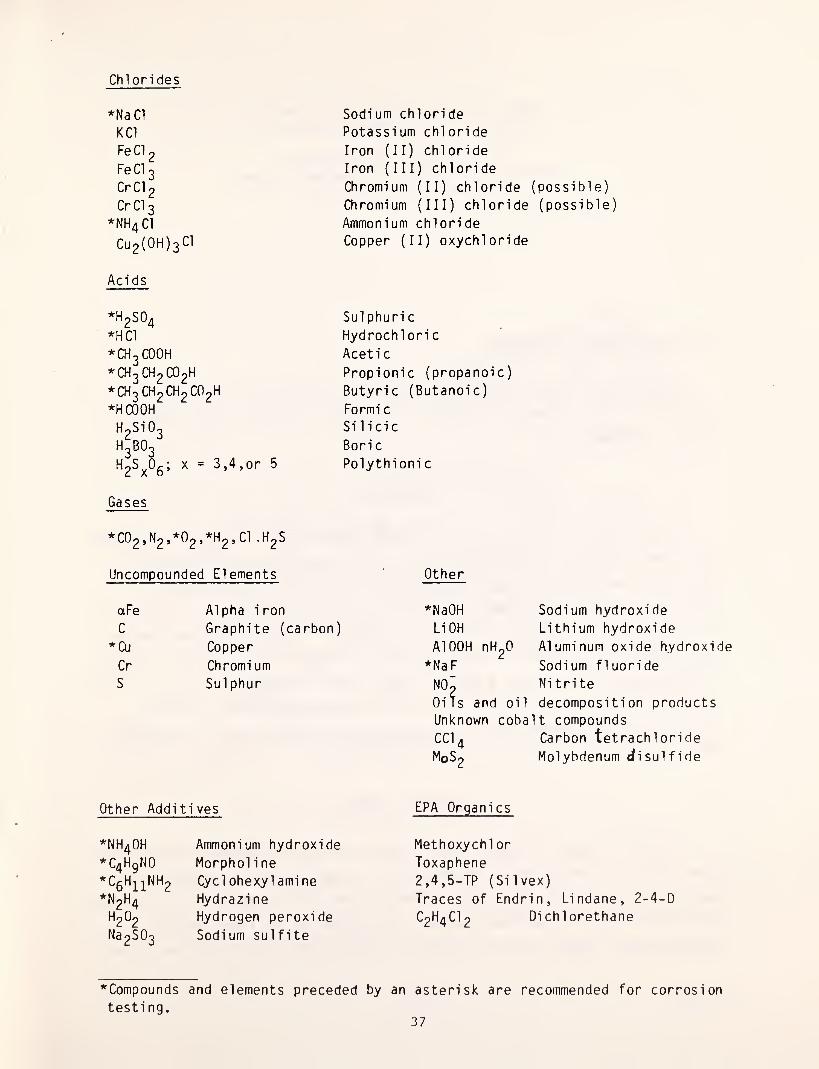
Chlorides
*NaCl
KCl
FeCl^
FeCl3
CrCl2
CrCl3
*NH 4 C 1
Cu 2(0H)3 Cl
Acids
Sodium chloride
Potassium chloride
Iron (II) chloride
Iron (III) chloride
Chromium (II) chloride (possible)
Chromium (III) chloride (possible)
Ammonium chloride
Copper (II) oxychloride
*H2S04
*HC1
*CH3C00H
*CH3CH2C02H
*CHoCHpCHpCOpH
*HC00H
H2Si 02
H2BO3
^2^x^6’^ ^ 3, 4, or 5
Gases
Sul phuri
c
Hydrochloric
Aceti
c
Propionic (propanoic)
Butyric (Butanoic)
Formi
c
Silicic
Bori c
Polythionic
*C02,N2,*02,*H2,C1 ,H2S
Uncompounded Elements
aFe Alpha iron
C Graphite (carbon)
*Cu Copper
Cr Chromium
S Sulphur
Other Additives
*NH40H Ammonium hydroxide
*C4HgN0 Morphol i ne
*C6HiiNH2 Cyclohexyl amine
*N2H4 Hydrazi ne
H2O2
Hydrogen peroxide
Na2S 03 Sodium sulfite
Other
*NaOH
Li OH
AlOOH nH20
*NaF
N0‘
Sodium hydroxide
Lithium hydroxide
Aluminum oxide hydroxide
Sodium fluoride
Nitrite
Oits and oil decomposition products
Unknown cobalt compounds
CCI 4 Carbon tetrachl oride
Molybdenum disulfideMoS
EPA Organics
Methoxychl or
Toxaphene
2,4,5-TP (Silvex)
Traces of Endrin, Lindane, 2-4-D
C2H4CI
2Di chi orethane
*Compounds and elements preceded by an asterisk are recommended for corrosion
testing.37
Waterside Corrosion and its Controlin Fossil Utility Steam Generators
F. J. Pocock, Sr. ScientistBabcock & Wilcox Co. - A McDermott Company
Alliance Research Center
Cycle Heat Transfer Equipment
Figures 1, 2 and 3 show typical diagrams of fossil utility and high
pressure Industrial power plant cycle arrangements including water chemistry
control equipment.
Condenser
The condenser (Figure 4) is a shell and tube heat exchanger with a carbon
steel shell, usually copper alloy tubing with tubesheets constructed of
materials compatible with the tubing alloy and designed to avoid galvanic
corrosion. It is quite common to install sacrificial anodes in the water box
of the condenser to prevent the latter. The use of coatings is also common.
Among the tubing alloys utilized are admiralty metal (aluminum-brass), copper
nickel alloys 90-10, 70-30, stainless steels and titanium. Titanium is rapidly
coming into use in nuclear power stations in response to internal boiler
corrosion problems associated with copper bearing deposits and in a further
effort to simplify and optimize water conditioning.
Feedwater Heater
Feedwater heaters (Figure 5) are shell and tube arrangements that utilize
bleed steam to preheat the feedwater before it reaches the steam generator
(boiler). In the past, these were commonly tubed with copper alloys of similar
alloy composition to condenser tubing. More recently, in large utility
installations, these units are tubed with carbon steel and/or stainless steel.
38

HVORAZIWe MCASURIMG
FIGURE 1. A FOSSIL UTILITY STEAM GENERATING SYSTEM VTETH RECIRCULATING STEAMGENERATOR
39Ref 1

FIGURE 2. ONCE-THROUGH STEAM GENERATING SYSTEM
40
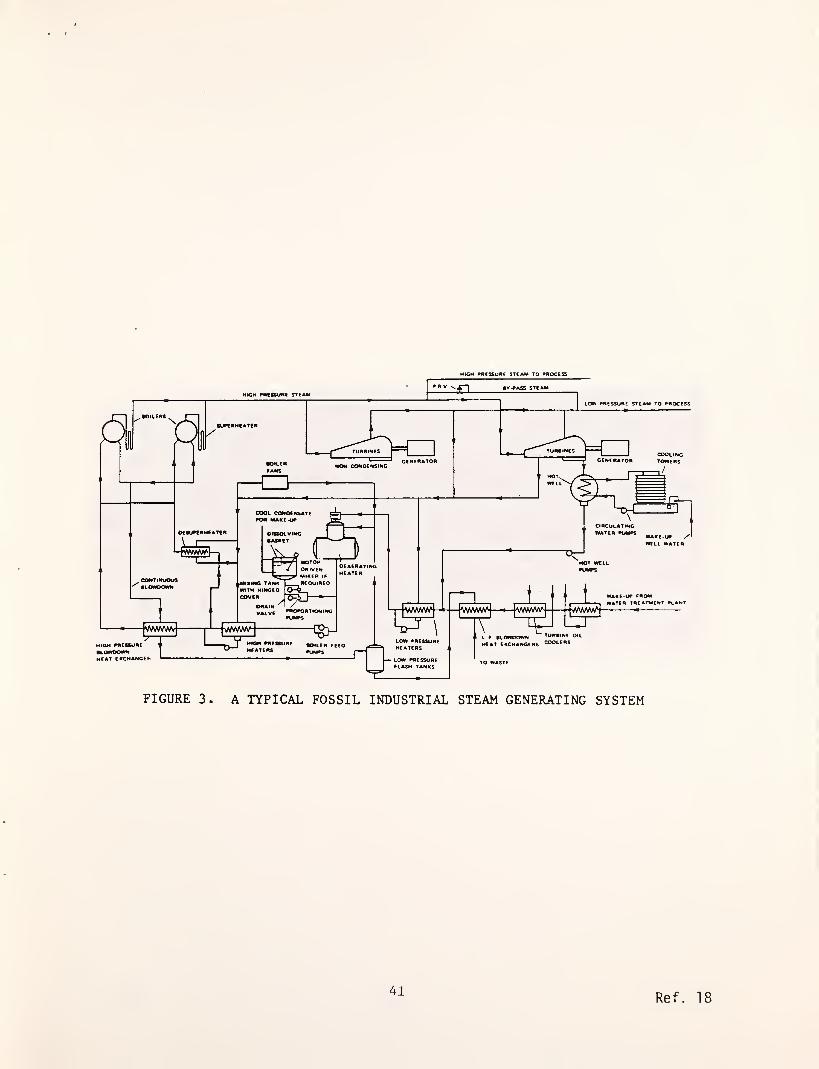
HIGH PMESSUMC STEAM TO AAOCESS
41Ref 18

42Ref 23

TUBE SUPPORTTUBESHEET
FIGURE 5. FEEDWATER HEATER
42a Ref. 23


Deaerators (Figures 6 and 7) are usually open heaters containing either
tray systems or spray systems whereby the incoming feedwater can be
counter-currently scrubbed with steam to reduce its dissolved gas content.
Well designed deaerators commonly have exiting water essentially free of
dissolved gases. Dissolved oxygen is usually at a concentration of less than
ten parts per billion. Deaeration is also accomplished in the condenser.
Figure 8 shows the efficiency of deaerating condensers as a function of
air removal capacity.
Cycle Purification Equipment
There are many devices designed to purify returned condensate. The two
basic principles used are ion-exchange and filtration.
Condensate Polishing
The ion exchange method is called condensate polishing when ion-
exchange resins are applied and used in this way. In utility deep bed
condensate polishing practice (Figure 9) the ion-exchange resins are moved
hydraulically from the cycle for regeneration by acids and bases, the
reason being concern for contaminating the cycle equipment, piping and
steam generators with material damaging regenerant chemicals. The cation
resin in these systems can be employed in either the hydrogen form or a
cycle chemical additive form such as ammonium hydroxide or morpholine.
The removal of dissolved cations (metal ions) is less effective in the
latter forms and much additional care with regeneration methods must be
employed. The anion resin is always operated in the hydroxide form.
Powdered Resin Systems (Figure 10) are widely utilized. These
systems using a ground resin mixture (<400 mesh) of varying amounts of
cation and anion materials are excellent filters. They are usually
operated in the cycle pH correctant additive form and new resins are
always used. These are in a highly degenerated form as shipped by the
manufacturer.
43

DIRECT CONTACT VENTCONDEN8INQ t PRE-HEATINOSECTION
ON END PLATE
FIGURE 6. TRAY TYPE DEAERATOR
44
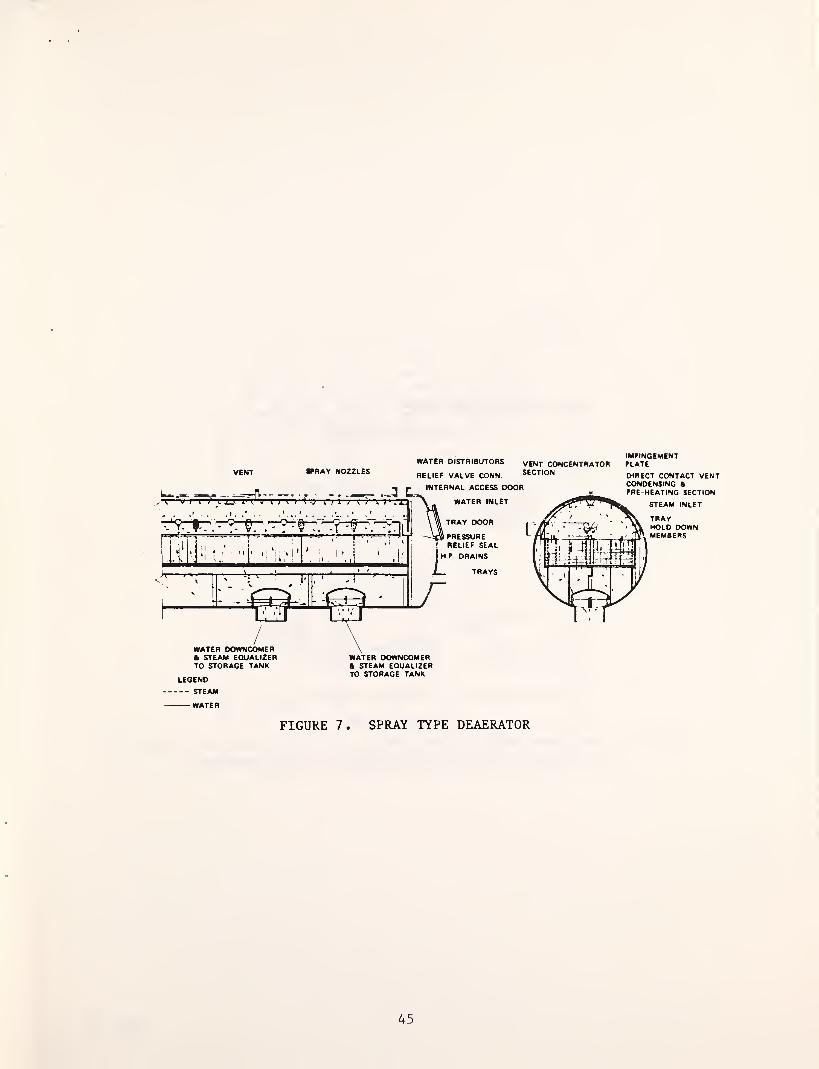
VENT »RAV NOZZLES
IMPINGEMENTWATER DISTRIBUTORS ve^t CONCENTRATOR PLATE
RELIEF VALVE CONN SECTION
LEGEND
STEARI
WATER
TO STORAGE TANK
DIRECT CONTACT VENTCONDENSING B
FIGURE 7. SPRAY TYPE DEAERATOR
45
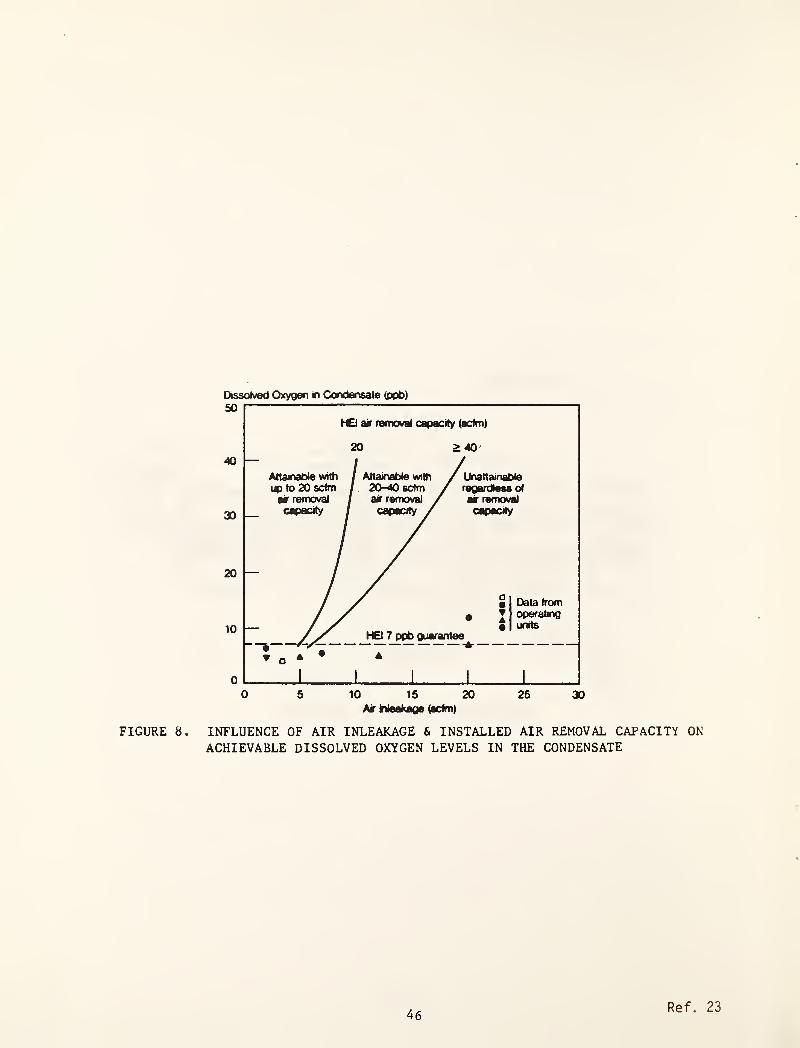
Ossoived Oxygen in Condensate (ppb)
FIGURE 8. INFLUENCE OF AIR INLEAKAGE & INSTALLED AIR REMOVAL CAPACITY ON
ACHIEVABLE DISSOLVED OXYGEN LEVELS IN THE CONDENSATE
46Ref. 23
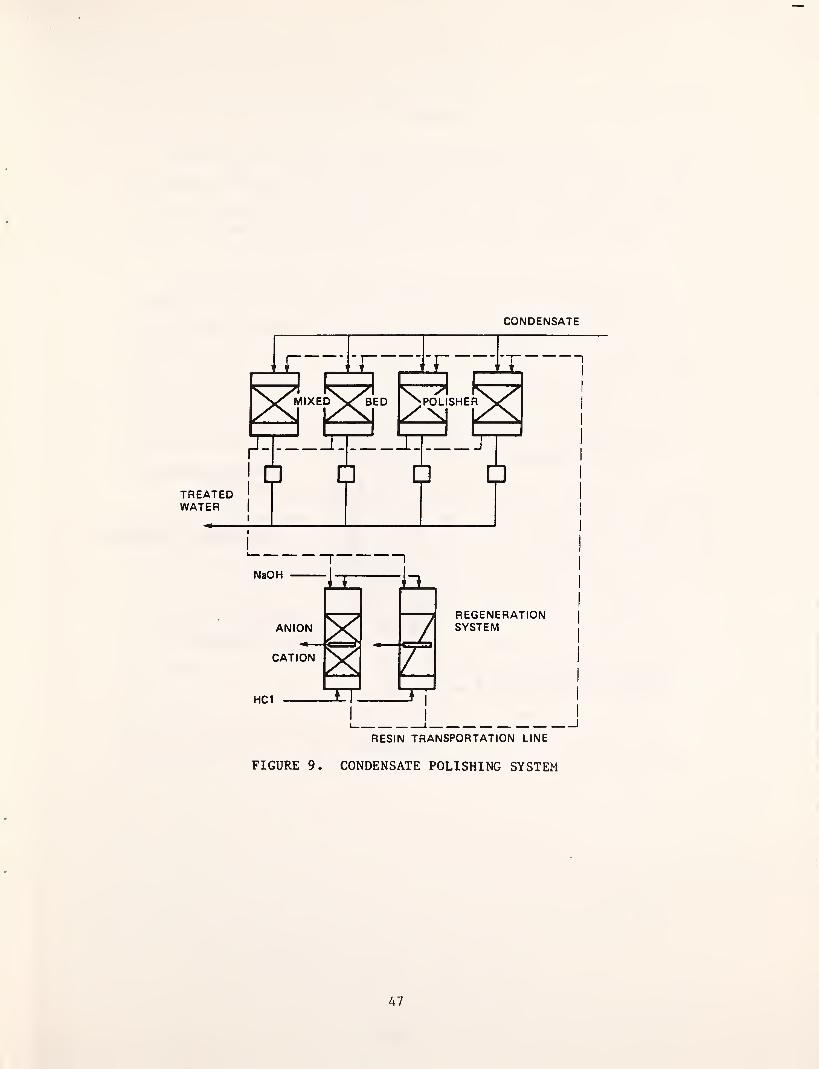
CONDENSATE
FIGURE 9. CONDENSATE POLISHING SYSTEM
47

FIGURE 10.
48
Filtration
Condensate filtration (Figure 11) is normally carried out by either
cellulose cartridge, cellulose precoat or more recently electromagnetic
filters (Figure 12). In industrial plants, cation resins have also been
used in the sodium form to remove corrosion product particulates.
Cellulose precoat filter systems are employed alone to filter
suspended solids (usually corrosion products) or in combination with
ion-exchange condensate polishers. The cellulose precoat material is
called Sulka-Floc and is pure cellulose. It is precoated onto filter
system substrates that can be made of either plastic or stainless steel,
although stainless steel filter systems are usually employed. The
cellulose cartridge filters have been less popular in utility service
because of the need to disassemble equipment to install new filters.
A newer development has been the electromagnetic filter first widely
applied in Europe where preboiler systems contain very little copper other
than in the surface condenser. These have been introduced into the United
States in the past ten years as the tendency to remove copper from utility
cycles has increased. They are capable of very effective removal of iron
oxide corrosion (magnetite) particles in the size range encountered in
utility systems. They have the additional capability of effective use at
high temperatures (below the Curie point) which ion-exchange condensate
polishers do not. Resin ion exchangers are limited by the thermal
degradation of the plastic resin beads and/or exchange site groups.
Recent experimentation with thermally treated resins has shown some
promise for moisture separator drain purification at high temperatures.
49
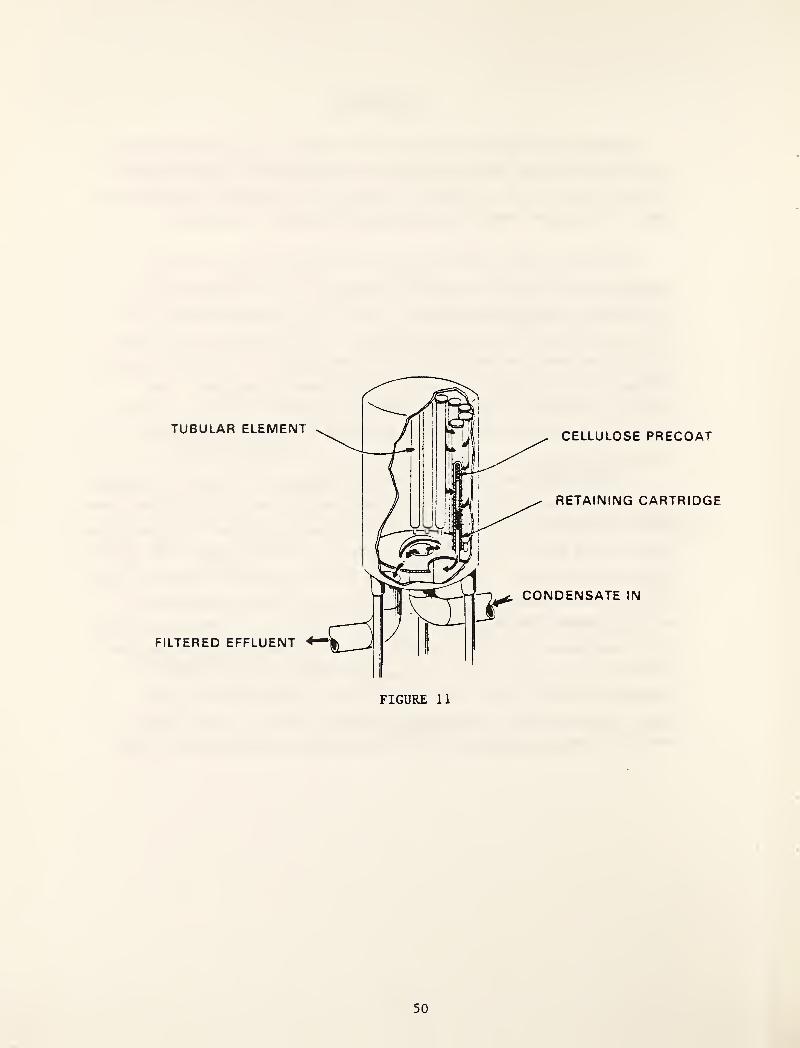
50

i 1 y.
IMPROVEMENT OF EXISTING
FEEDWATER CYCLE . OUTLETFLUSH
0 OUTLET—^ ^
BYPASS Y
0 o o oo c o oo o o oo c o oo o o oo o o o0 o ooo o o o
ELECTROMAGNETICFILTER
POWER/CONTROL UNIT ACTUATES
ALL VALVES SHOWN IN THE
PROPER SEQUENCE T"1(AINLET
(ALL CXINDITIONSI
Electromagnetic FilterElectromagnetic Filter Installation
FIGURE 12
51
Monitoring Instrumentation
There are many kinds of monitoring instrumentation available to
automatically assess the quality of the feedwater. Principal among these are
those that monitor dissolved gases (chiefly dissolved oxygen and hydrogen),
monitor conductivity (measure of dissolved solids and dissolved ionized gases
[CO^, NH^, etc.]), monitor pH (measure of acidity and basicity) and monitor
specific cations (metals) and anion (radicals, SO^ = Cl” etc.) known to be
damaging to component structural materials.
Dissolved Gases
The dissolved gases of principal interest to the corrosion processes
in utility cycles are oxygen and carbon dioxide. A gas of interest to the
monitoring of ongoing corrosion processes is hydrogen.
Instrumentation for dissolved oxygen and dissolved hydrogen are
readily available. Usually, dissolved oxygen instrumentation depends on
electrochemical cell action (current generated by redox processes) while
dissolved hydrogen is monitored by measuring the very high thermal
conductance of hydrogen gas after it is scrubbed from the sample stream.
Reliable monitoring instrumentation for carbon dioxide is not available
although several devices have been designed to scrub this gas from the
water and measure the resulting differential conductivity.
Conductivity Measurement
Electrical conductance is a quantitative measure of the dissolved
ionized solids and gases in water when properly applied. Two types of
instrumentation are utilized in utility plants. One, specific
conductance, measures the gross ionized solids and gas content of the
water and is especially useful in power plants for controlling the
injection of pH additives like ammonium hydroxide and morpholine. Cation
conductance depends on acid conductivity after cationic ion-exchange.
This is a sensitive measure of condenser leakage through the conversion of
sulfates and chlorides to their corresponding acids. This acid conversion
52
of the anions enhances the conductivity measurement because of the greater
conductance of acids as compared with neutral salts and/or bases. It does
not measure cation hydroxides (sodium hydroxide, etc.) and therefore
cannot indicate the leakage of sodium hydroxide into the cyle.
pH is a measure of acidity or basicity of the water and is equivalent
to the negative log of the activity of the hydrogen ion. Important to the
utilization of this monitoring equipment (and a common mistake) is the
knowledge that the instrumentation whether manually or automatically
compensated measures pH at sample temperatures. If evaluation of
corrosion potential to standard conditions (25°C, 77°F) is desired, proper
calculation and/or nomographs must be used to convert the measured pH to
reference values at 25°C, 77°F for the type of volatile condensate
treatment additive utilized. The same is true for solid alkaline
additives used in boiler water treatment.
Anion and Cation Measurement
Anion measurement has long been a problem except for gross measure by
cation conductivity. Recently developed process ion-chromatographs hold
promise for the physical measurement of these on-line at least in a
semi-continuous monitoring mode. Cations are now commonly measured by
selective ion electrodes. A common and well developed monitor is the
sodium ion electrode and is widely applied for assessing moisture
carryover in steam. A chloride specific electrode is also coming rapidly
into use in power plants. Currently, the only available method of
monitoring low concentrations of sulfate ion is the ion-chromatograph.
Corrosion Behavior of Cycle Components
This discussion will be principally concerned with the corrosion
protection of the preboiler system and to a lesser extent, the condenser as
these surfaces are the source of porous waterside deposits in steam generator
tubing.
53
Steel Feedwater Preheaters
Currently carbon steel or stainless steel preheaters are being employed in
nuclear and fossil once-through boiler cycles. They are also being retrofitted
to nuclear recirculating systems. Carbon steel tubed heaters were first widely
applied during World War II (copper shortage) and then designers returned to
the traditional copper alloy heat exchangers when material shortages were
alleviated. Problems with copper transport in supercritical cycles twenty
years ago and more currently with recirculating nuclear steam generator
localized support plate corrosion problems have led to a prol i feration of steel
tubed heaters both here and abroad. Both vertical and horizontal shell and
tube exchangers are employed in various cycles. Concerns for carbon steel are
corrosion product pick-up on both the shell and tube side and inlet corrosion-
erosion problems. For stainless stell tubed heaters, there is a concern for
stress corrosion cracking by either dissolved oxygen, chorides and/or
hydroxides. There is also a concern for reduced sulfur species intergranul ar
attack in sensitized weld heat affected zones. These latter can be a
catastrophic corrosion problem. Because of the better corrosion resistance
afforded by the higher alloy material, corrosion product pick-up is
significantly reduced by their application. More recently, ferritic stainless
steel alloys are being utilized for this purpose in Europe.
Copper alloy tubed feedwater heaters have been constructed of a full range
of alloys that include 90-10 and 70-30 copper nickel. Monel and aluminum
brasses. Copper has been an attractive alloy because of its good thermal .
conductance. Discussions about its use have included the desirability of
utilizing a single (steel) alloy in the water/steam cycle for simplified water
treatment, cost, and additional complications in boiler chemical cleaning
caused by copper bearing deposits etc.
54
Copper alloy condensers have involved similar discussions, although it can
be shown that improved alloy conductance for this application is not a major
part of total heat conductance. Some have shown this factor to be on the order
of 10% of the total temperature drop through the wall. Fouling, surface
oxidation, and condensing film coefficients are more important. For nuclear
service, titanium is becoming the alloy of choice although because of required
thinner sections for proper heat transfer, vibration concerns are enhanced.
There are three general reference pH ranges used to reduce corrosion
product pick-up and these are dependent on pre-boiler component alloy material
choice. All are stated at a reference pH of 25°C (77°F). For copper alloy
tubed heaters, the pH range most accepted is 8. 8-9. 2. For carbon steel tubed
heaters, the most accepted pH range is 9. 3-9. 6. Where stainless steel tubing
is employed (even with copper condensers) a pH as low as 8.5 is acceptable.
The pH chosen sets the concentration of volatile additive and has significant
impact on the unit process - condensate polishing - if employed. Figures 13
and 14 illustrate the effect of pH on corrosion (metal ion pick-up) of these
materi al s.
55

FIGURE 13. IRON PICK-UP AT ECONOMIZER INLET - CARBON STEEL FEEDWATER
HEATER TRAIN
56Ref. 4, 24

I/Brf
FIGURE 14. DEPENDENCE OF CORROSION OF BRASS ON pH VALUE WHENALKALIZING WITH AMMONIUM HYDROXIDE
57Ref. 21

Once-Through Steam Generators
Figure 15 is an illustration of a 3,500 psig (24.1 MPa), 1050°F (565. 6°C)
reheat Universal Pressure Boiler. The required feedwater conditions. Table 1,
are the same for both sub and supercritical once-through steam generators. The
allowable contaminant limits in the feedwater must be less than their
solubility in the exiting steam to avoid deposition in the steam generator.
This is possible for the dissolved solids but is not possible for
balance-of-plant corrosion products. Therefore, these latter are limited to
concentration levels acceptable for periodic chemical cleaning. The
concentration levels acceptable for this objective are controlled by careful
balance-of-plant material, design choices and water conditioning along with the
utilization of condensate purification equipment.
Figure 16 shows a typical rippled magnetite deposit in a supercritical
once-through steam generator tube. Figure 17 shows the effect of this deposit
on heat transfer at various heat absorption rates.
Because of the dissolution of dissolved solids in the exiting steam,
"under-deposit" concentrated chemical attack corrosion failures are not
experienced in these types of steam generators. Tube metal overheat type
failures can and do occur, therefore the accumulation of deposition must be
controlled to an acceptable level by periodic chemical cleaning that will
prevent these insulating deposit induced tubing failures. An additional reason
for chemical cleaning is the characteristic "rippled deposit" formation. This
latter deposition pattern leads, to increased steam generator pressure drop and
related requirements for additional feedpump capacity if system load reduction
is to be avoided. The source of these oxydic deposits can be both internal and
external. The current belief is that 'v 50% of the tube deposit accumulations
have their source as corrosion products from the preboiler system while the
remainder is due to solubilization and redepositing of the magnetite protective
oxide longer. The solubility of magnetite as a function of pH is shown in
Figure 18.
58

FIGURE 15. BABCOCK & WILCOX UNIVERSAL PRESSURE BOILER
59
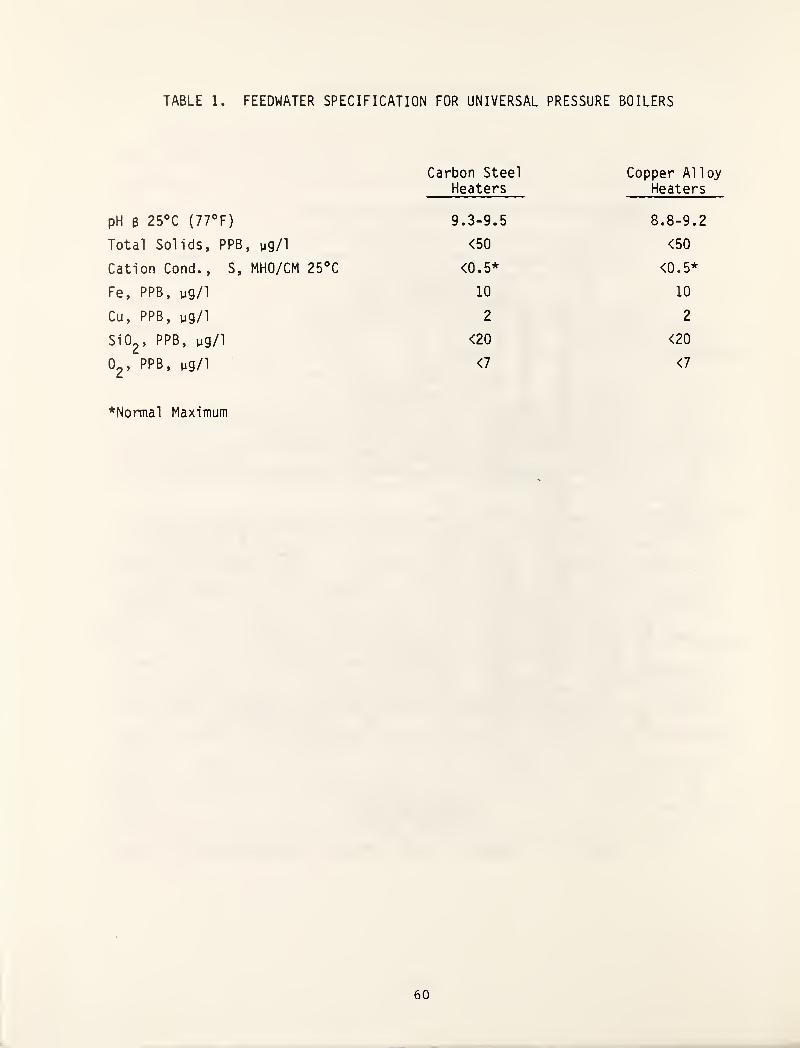
TABLE 1. FEEDWATER SPECIFICATION FOR UNIVERSAL PRESSURE BOILERS
Carbon SteelHeaters
Copper A1 loy
Heaters
pH B 25°C (77°F) 9. 3-9.
5
8.8-9.
2
Total Solids, PPB, yg/1 <50 <50
Cation Cond., S, MHO/CM 25°C <0.5* <0.5*
Fe, PPB, ug/1 10 10
Cu, PPB, ug/1 2 2
SiO^. PPB, ug/1 <20 <20
0,, PPB, ug/1 <7 <7
Normal Maximum

Typical internal fluid side surface
appearance of the magnetite layer in a
once>through boiler furnace tube.
Nickel plating
Porous overlay
Protectiveoxide layer
Base metal
().() 1 ini t' —H
Transverse section through internal
Magnetite layer in a once-throughboiler furnace tube.
FIGURE 16.
61Ref. 1
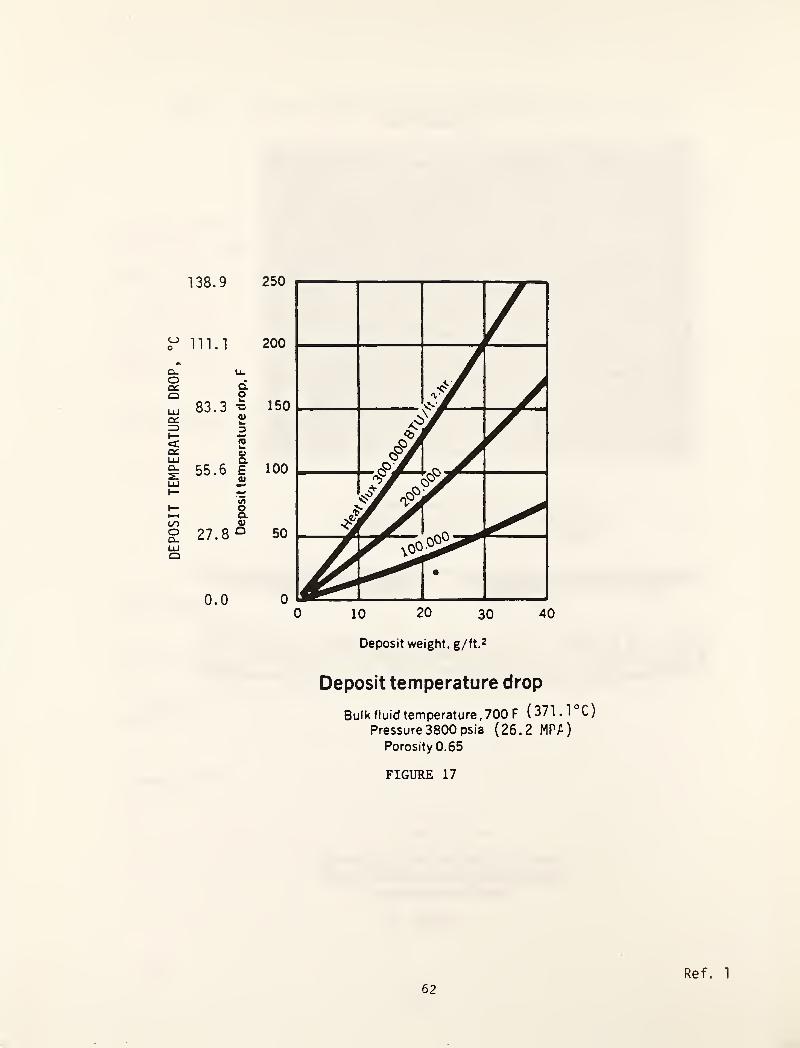
DEPOSIT
TEMPERATURE
DROP,
138.9
^ in.i
u.
d
83.3 -DVw315w0>
55.6 £0)
’55
a0)
27.8 ^
0.0
Deposit weight, g/ft.^
Deposit temperature drop
Bulk fluid temperature ,700 F ( 371 . 1 °C)
Pressure 3800 psia (26.2 MP/^)
Porosity 0.65
FIGURE 17
62
Ref. 1

100
80 -
60 -
9Jt
m
a. 40 —
20
0.1 mg NH3/kg
0.2 mg NH3/kg
O 0.3 mg NH3/kg
• 0.45 mg NH3/kg
If 1.0 mg NH3/kg
A 2.0 mg NH3/kg
T
50 100 150 200 250 300 350
FIGURE 18. MAGNETITE SOLUBILITY AS A FUNCTION OF TEMPERATUREAT VARIOUS AMMONIA CONCENTRATIONS
63 Ref. 21

Recirculating Boilers
Figures 19 and 20 show typical high recirculating pressure boilers of the
Industrial and utility types. Since some industrial boilers approach utility
boiler high pressures, they are treated similarly from a water conditioning
standpoint. Heat absorption (transfer) rates are probably the largest single
factor related to waterside deposition. Figure 21 illustrates the general heat
absorption pattern in high duty recirculating boilers.
ABMA and B&W Water Quality Guidelines
Tables 2 and 3 contain typical B&W high pressure utility feedwater and
boiler water quality limits for drum-type units. Table 4 contains the current
ABMA* guidelines. Table 5 contains typical turbine supplier steam purity
1 imi ts.
Boiler Water Treatment
Figure 22 shows the trend in boiler water internal treatment for
recirculating drum type boilers in a 1971 ASME survey.
It is obvious that the favored internal treatment in the absence of
condensate polishing is the addition of sodium phosphate. The method of
addition is by congruent control.
Congruent control refers to the ratio of sodium to phosphate in the bulk
water. The intention is that this ratio shall always result in the formation
of phosphate chemicals rather than sodium hydroxide when concentrated to near
dryness (Figure 23).
Figure 24 shows the reason that sodium phosphates are employed rather than
other alkaline phosphates. It is based on the relative corrosion rates of
mild steel when the salts are concentrated in high quality regions under
deposits.
*ABMA American Boiler Manufacturers Association
64
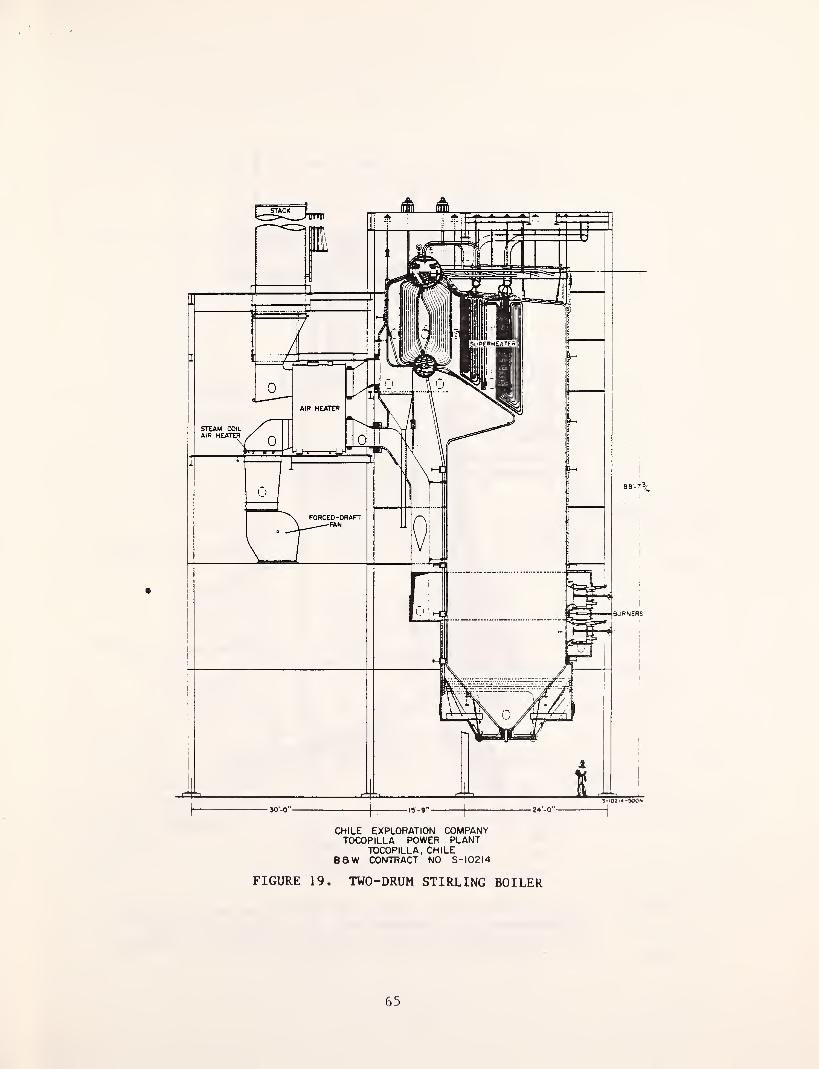
fstack
CHILE EXPLORATION COMPANYTOCOPILLA POWER PLANT
TOCOPILLA, CHILEsaw CONTRACT NO S- 102 14
FIGURE 19. TWO-DRUM STIRLING BOILER
65
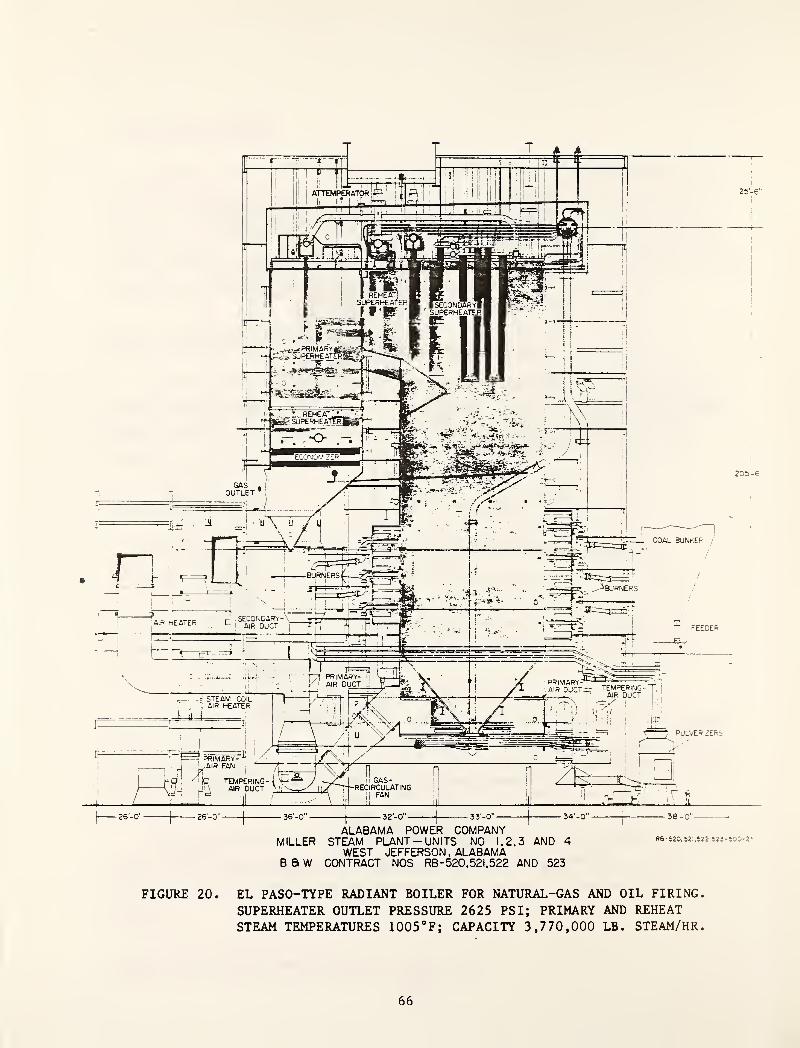
ALABAMA POWER COMPANYMILLER STEAM PLANT-UNITS NO 1.2.3 AND 4
WEST JEFFERSON . ALABAMAB a W CONTRACT NOS RB-520.521,522 AND 523
38 - 0 ' -
R6-5a0,52;,52::,525-50u-2-.
FIGURE 20. EL PASO-TYPE RADIANT BOILER FOR NATURAL-GAS AND OIL FIRING.
SUPERHEATER OUTLET PRESSURE 2625 PS I; PRIMARY AND REHEAT
STEAM TEMPERATURES 1005°F; CAPACITY 3,770,000 LB. STEAM/HR.
66

Steam
Risers
FIGURE 21. THE CIRCULATION LOOP Ref. 25
67

TABLE 2
BaW RECOMMENDED WATER QUALITY LIMITS
FOR HIGH PRESSURE-DRUM TYPE BOILERS
(ABOVE 2,000 PSI DESIGN)
FEEDWATER BOILER WATER
MAX. LIMIT MAX. LIMIT
OXYGEN .007 PPM (mg/1
)
TOTAL SOLIDS 15 PPM (mg/1)
IRON .010 PPM (mg/1
)
NaaP 04 3-10 PPM (mg/1)
COPPER .005 PPM (mg/1
)
HYDROXIDE 1 PPM (mg/1)
HARDNESS 0 PPM pH 9.0-10.0
CARBON DIOXIDE 0 PPM SILICA AS DETERMINED*BY DRUM
ORGANIC 0 PPM PRESSURE
pH 8. 5-9.2
SODIUM
*As determined by Turbine Manufacturer Limits

TABLE 3
BaW Feedwater Quality LimitsDrum Type Boilers Less Than 2,000 psi
DISS. OXYGEN AS ppm (mg/1 ) 0^
IRON AS ppm (mg/1 ) FE
COPPER AS ppm (mg/1 ) CU
HARDNESS, ppm (mg/1)
ORGANIC, ppm (mg/1)
pH 25°C (77°F)
Below 600 to600 psi 1000 psi
0.007 .007
0.1 0.05
0.05 0.03
0* 0*
0 0
8.0 - 9.5 8.0 - 9.5
*Temporary maximum of 1.0 ppm (mg/1) permitted.
69 Ref. 6

TABLE 4
WATERTUBE BOILERS*
RECOMMENDED BOILER WATER LIMITS AND ASSOCIATED STEAM PURITY
At Scndy-Stm. Full-Load Oparttion
DrunPressure
psig
RangeTotal DissolvedSolids^ BoilerWater ppn (MAX)
Rangej
Total AUal1nTty‘Boiler Water
ppn
Suspended SolidsBoiler Waterppn (MAX)
Range, ^
Total Dissolved SoMds ’
Steanppn (MAX expected value'-
Dnim-TYPa Boilan
0 - 300 700 - 3500 140 - 700 15 0.2 - 1.0301 - 450 600 - 3000 120 - 600 10 0.2 - 1.0
451 - 600 500 - 2500 100 - 500 8 0.2 - 1.0
601 - 750 200 - 1600 40 - 200 5 0.1 - 0.5
751 - 900 150 - 1200 30 - 150 3 0.1 - 0.5
901 - 1000 125 - 625 25 - 125 1 0.1 - 0.5
1001 - 1800 100 NOTE (3) 1 0.1
1801 - 2350 50 N/A 0.1
2351 - 2600 25 N/A 0.052601 - 2900 15 N/A 0.05
Onca-Throuen Boilvn
1400 and Above 0.05 N/A N/A 0.05
NOTES;
1. Actual values within the range reflect the TDS in the feed water. Higher values are for high
solids, lower values are for low solids In the feed water.2. Actual values within the range are directly proportional to the actual value of TDS of boiler
water. Higher values are for the high solids, lower values are for low solids In the boiler water.3. Dictated by boiler water treatment.4. These values are exclusive of silica.
* Draft - 3rd Edition. 1M2
•Published by The American Boiler Manufacturers Association - Draft 3rd Addition, 1982
70
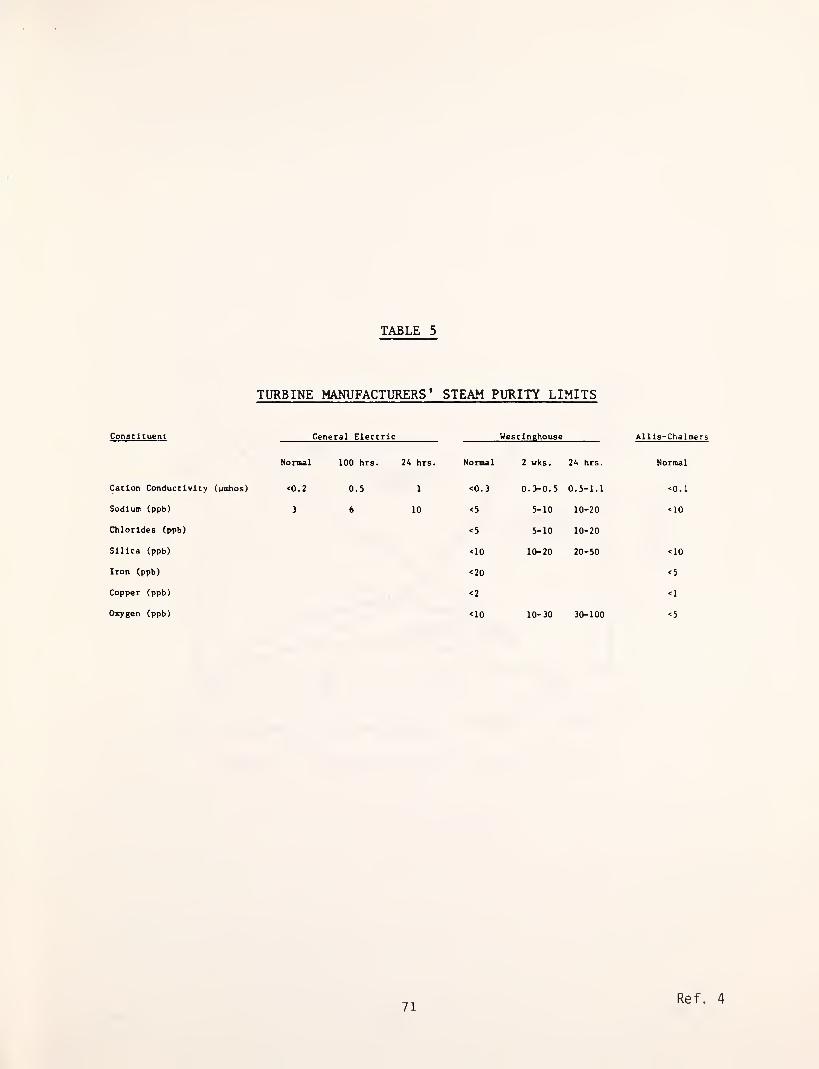
TABLE 5
TURBINE MANUFACTURERS' STEAM PURITY LIMITS
Constituent General Electric Uestinchouse All is-Chalmers
Normal 100 hrs. 24 hrs. Normal 2 wks. 24 hrs. Normal
Cation Conductivity (umhos) <0.2 0.5 1 <0.3 0.3-0.
5
0. 5-1.1 <0.1
Sodium (ppb) 3 6 10 <5 5-10 10-20 <10
Chlorides (ppb) <5 5-10 10-20
Silica (ppb) <10 10-20 20-50 <10
Iron (ppb) <20 <5
Copper (ppb) <2 <1
Oxygen (ppb) <10 10-30 30-100 <5
71Ref. 4

%OF
TOTAL
FIGURE 22. TRENDS IN BOILER WATER TREATMENT (1955-1970)
72Ref. 3
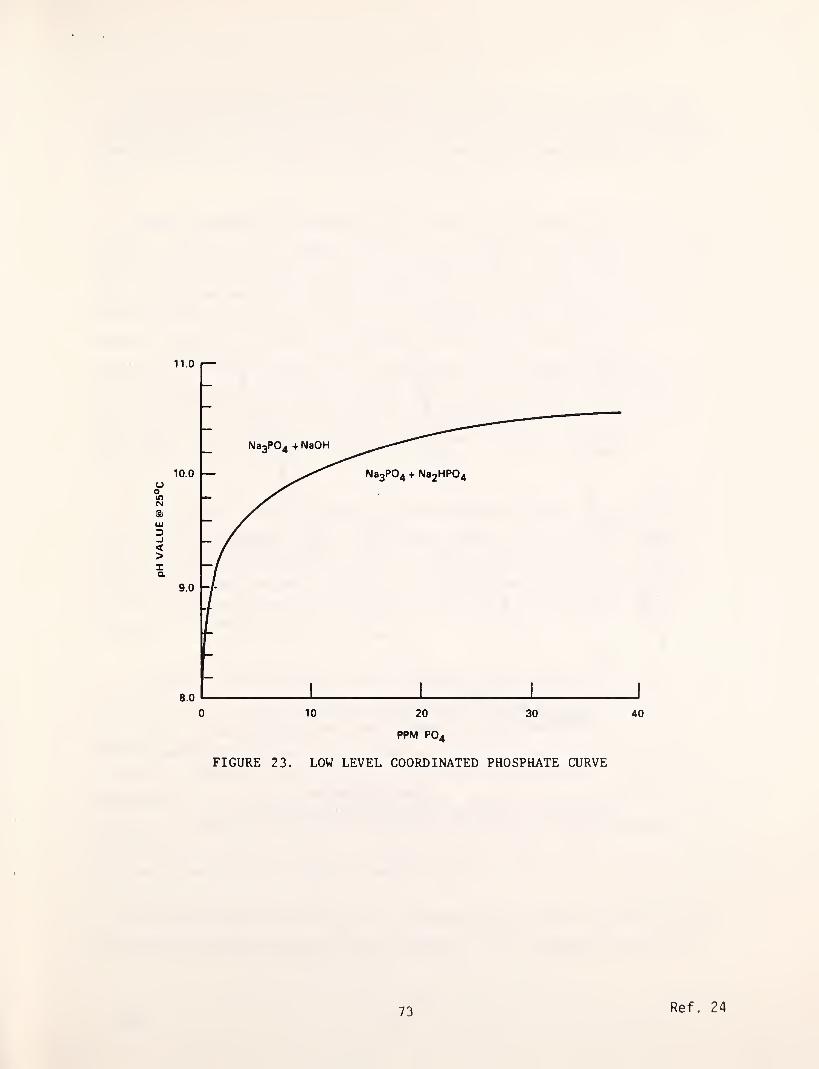
pH
VALUE
@
25°C
PPM PO4
FIGURE 23. LOW LEVEL COORDINATED PHOSPHATE CURVE
73 Ref. 24
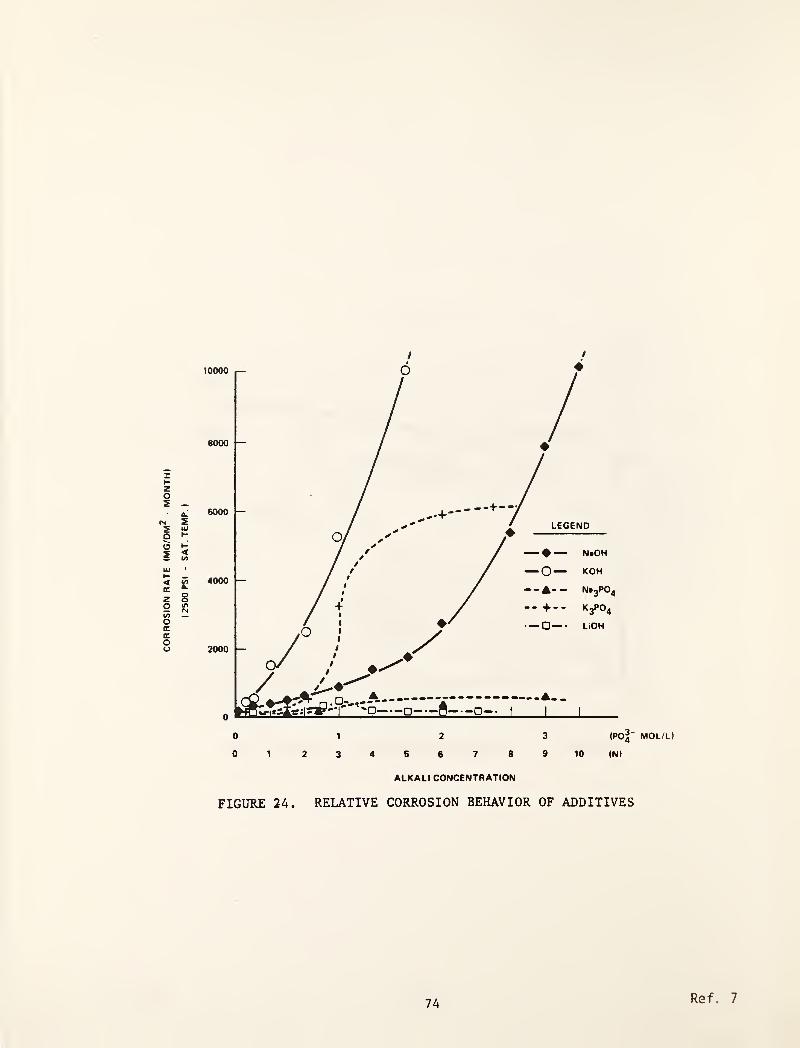
CORROSION
RATE
(MG/DM^
MONTH)
ALKALI CONCENTRATION
FIGURE 24. RELATIVE CORROSION BEHAVIOR OF ADDITIVES
VOL/L)
74 Ref. 7
Measurement of the dissolved solids in the boiler water is made in the
blowdown water. Preferably this blowdown sample tap will be located under the
steam separators at a location where the highest boiler water concentrations
occur.
Another approach to internal boiler water conditioning employs chelating
agents. Two of the most common employed are Ethylene Diamene Tetra Aceta Acid
(ETDA) or its salts and Nitrillo Triacetic Acid (NTA). Both chemicals combine
with calcium and magnesium hardness materials to prevent their precipitation.
Commonly, those materials are applied at pressures under 1200 psi for this
purpose. However, in the Soviet Union, EDTA has also been applied in
supercritical once-through cycles to help with iron transport problems. The
principal problem with chelate chemical additives is control. Overfeed can
lead to severe boiler tube corrosion while underfeed allows hardness salt
deposition. With available analysis techniques, precision control is
difficult.
More recently organic polymers are becoming widely used as additives in
industrial boilers. Sometimes these are in combination with chelating agents.
Recent data suggest that these treatment compositions overcome some of the
possible chelating corrosion problems and improve the transport of suspended
corrosion products (iron oxides) by maintaining them in suspension for
bl owdown.
In Europe, a new treatment method has evolved over the past decade. This
was called neutral water treatment and employs the addition of 200-300 ppb of
dissolved oxygen either in the gaseous form or by hydrogen peroxide. More
recently, this has been modified by the addition of a small amount of ammonia
to elevate pH slightly (the latter is called the Combined Neutral Water
Treatment). It is employed with once-through steam generators having all steel
preboiler systems with the exception of condensers. Full flow condensate
polishing is required to assure a feedwater purity before additives equivalent
to a conductance of less than O.lu mhos/cm (us).
This technique is widely applied in Germany with some utilization in the
Soviet Union and other eastern block countries. It is dependent on the low
75
corrosion rates of carbon steel in high purity water with small amounts of
dissolved oxygen. It is a type of anodic inhibition and, again, very strict
water purity controls are required .
Chemical additives are utilized to remove the last traces of dissolved
oxygen from the power plant cycle. The common additives that have been applied
in the past are hydrazine (N^H^) and sodium sulfite (Na^SO^). Tables 6 and 7
contain the advantages and disadvantages of these chemicals.
Above pressures of 1500 psig, only hydrazine is applied as the thermal
decomposition products of sodium sulfite are considered inimical to turbine
materials. Another limitation to the use of sodium sulfite is the addition of
dissolved solids to the boiler water through reaction with dissolved oxygen.
The reaction products of dissolved oxygen and hydrazine are nitrogen and
water while the thermal degradation products are hydrogen and
ammonia - dissolved gases commonly found in power plant cycles.
In 1978, NiOSH (the research arm of OSHA) issued a document suggesting
that hydrazine had carcinogous effects. This has not been promulgated into law
by OSHA but has led water treatment companies to investigate replacement
additives. Many of these are being field tested at present. Among the
chemical formulations being investigated for their usefulness as dissolved
oxygen scavengers are hydroquinone, isomers of ascorbic acid, restructured urea
compounds, etc.
These are currently being researched for their effectiveness during cycle
equipment wet storage (cold condition) as well as the characteristics and
impact on corrosion processes of various cycle materials by their thermal
degradation products.
Chemical additives are commonly applied to the remainder of the cycle to
protect surfaces exposed to returned steam condensate. Two types of additives
are employed. They are neutralizing amines (morpholine and cyclohexyl amine)
and filming amines (Octadecyl amine and ethoxylated soya amine). The former
76
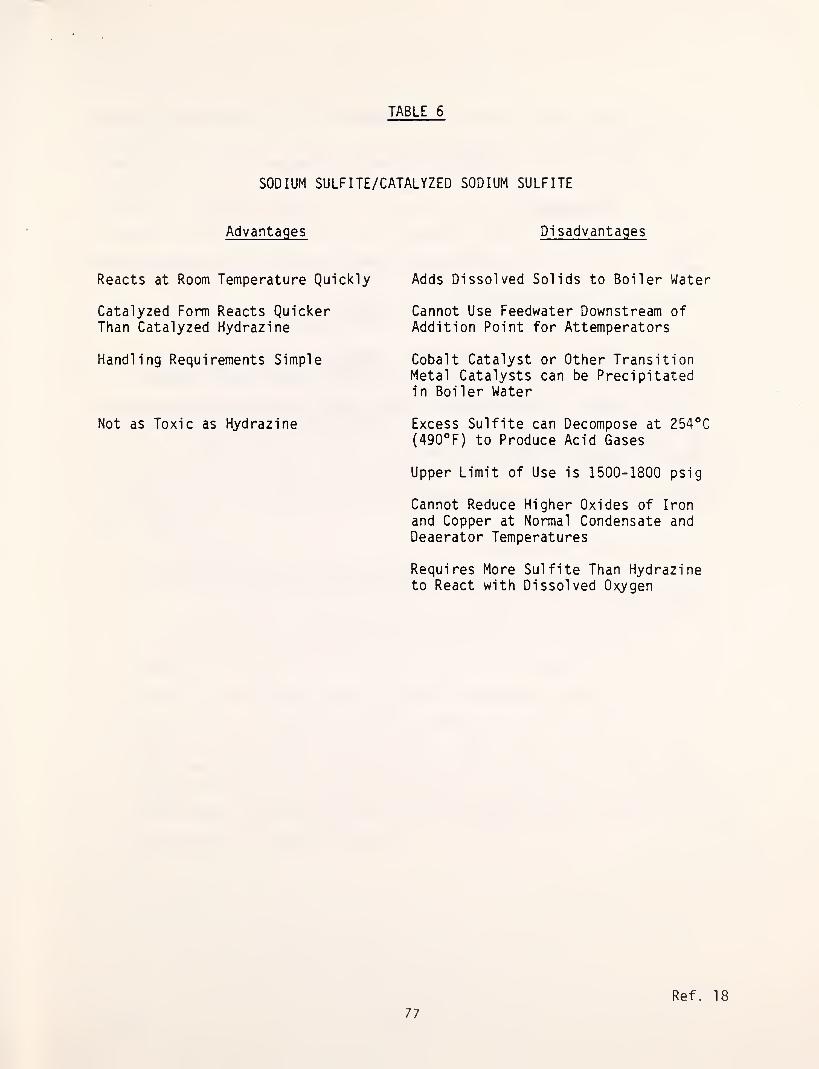
TABLE 6
SODIUM SULFITE/CATALYZED SODIUM SULFITE
Advantages Pi sadvantaqes
Reacts at Room Temperature Quickly
Catalyzed Form Reacts QuickerThan Catalyzed Hydrazine
Handling Requirements Simple
Not as Toxic as Hydrazine
Adds Dissolved Solids to Boiler Water
Cannot Use Feedwater Downstream ofAddition Point for Attemperators
Cobalt Catalyst or Other TransitionMetal Catalysts can be Precipitatedin Boiler Water
Excess Sulfite can Decompose at 254°C(490°F) to Produce Acid Gases
Upper Limit of Use is 1500-1800 psig
Cannot Reduce Higher Oxides of Iron
and Copper at Normal Condensate andDeaerator Temperatures
Requires More Sulfite Than Hydrazineto React with Dissolved Oxygen
77
Ref. 18
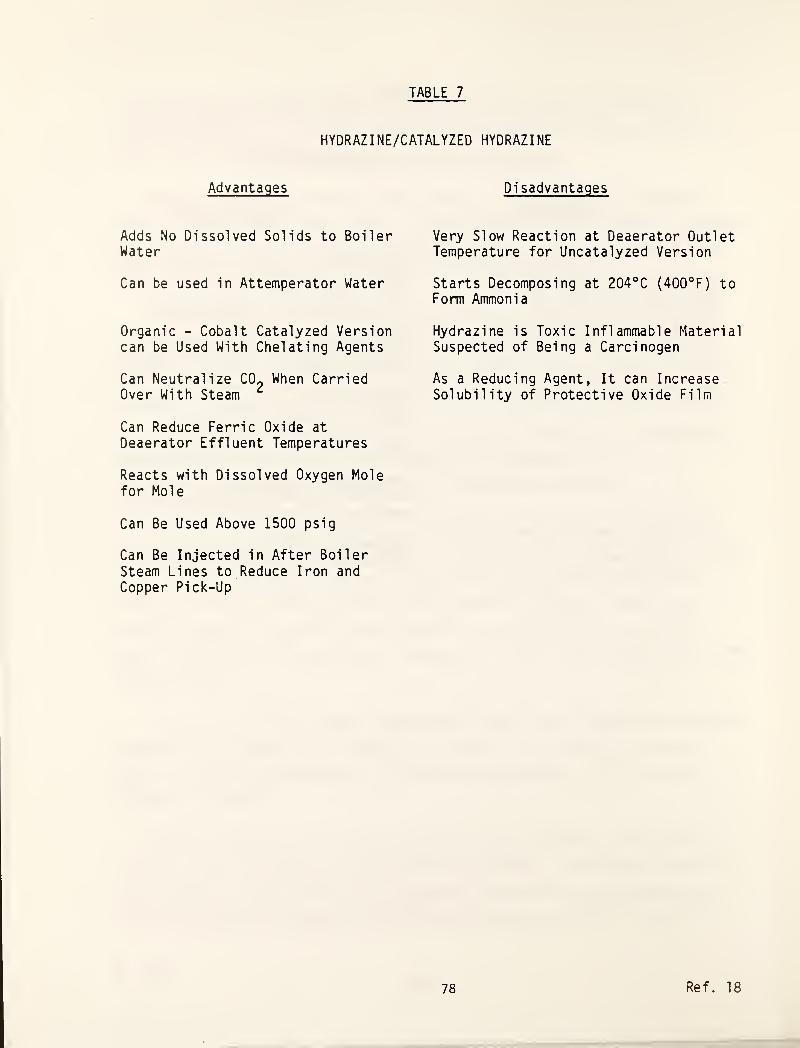
TABLE 7
HYDRAZINE/CATALYZED HYDRAZINE
Advantages Disadvantages
Adds No Dissolved Solids to BoilerWater
Very Slow Reaction at Deaerator OutletTemperature for Uncatalyzed Version
Can be used in Attemperator Water Starts Decomposing at 204®C (400®F) toForm Ammonia
Organic - Cobalt Catalyzed Versioncan be Used With Chelating Agents
Hydrazine is Toxic Inflammable MaterialSuspected of Being a Carcinogen
Can Neutralize CO^ When CarriedOver With Steam
^
Can Reduce Ferric Oxide at
Deaerator Effluent Temperatures
Reacts with Dissolved Oxygen Molefor Mole
Can Be Used Above 1500 psig
Can Be Injected in After BoilerSteam Lines to Reduce Iron andCopper Pick-Up
As a Reducing Agent, It can IncreaseSolubility of Protective Oxide Film
78 Ref. 18

neutralizes traces of acid by elevating pH while the latter deposit a
non-wetable protective film on surfaces in the return piping and associated
components to protect against corrosion by oxygen and carbon dioxide. The
resulting balance-of-plant component and piping protection reduces the
corrosion products available for transport to the steam generator. Filming
amines are usually employed only in industrial plants. In condensate polished
return cycles, they could foul ion exchange resins.
Boiler Tube Damage
Figures 25, 26, 27, and 28 show "under deposit" corrosion which may reveal
itself only by tube thinning under the porous deposit due to concentrated
boiler water contaminant and/or treatment chemical attack or associated with
"hydrogen damage" (decarborization) of the steel. The latter causes dramatic
failures in which pieces of steel are blown out of the boiler tubes. Figure 29
shows how that boiler water "under deposit" concentration may occur. Figure 30
shows how boiler salts may distribute themselves between the tube wall and the
bulk fluid.
Effects of Soluble Salt Concentration
Trace soluble (and corrosive) constituents in the boiler water can be
concentrated by such a method to very high concentrations adjacent to the
tube wall. This results in rapid attack of the tube metal and subsequent
failure. The exchange and distribution of chemicals between steam and
water film in the deposits and the bulk boiler water would most likely be
similar to that reported by Martynova (Figure 30). Another commonly
discussed mechanism of concentration is the "concentrating film" theory as
shown in Figure 31 for sodium hydroxide. The latter theory preceded more
finite data on the distribution of salts between steam and water, but both
mechanisms are probably involved.
79

FIGURE 25. "UNDERDEPOSIT” HYDROGEN DAMAGE - CYCLONE BARREL TUBE
80 Ref. 22

81Ref. 22

FIGURE 27. SECTIONS OF FURNACE WALL TUBING EXHIBITING "UNDERDEPOSIT"BULK CORROSION ATTACK (GOUGING)
Ref. 22
82

FIGURE 28. A SECTION SHOWING BULGING OF THE TUBE AS A RESULT OF THINNINGBY CORROSION (lOX)
83 Ref. 22
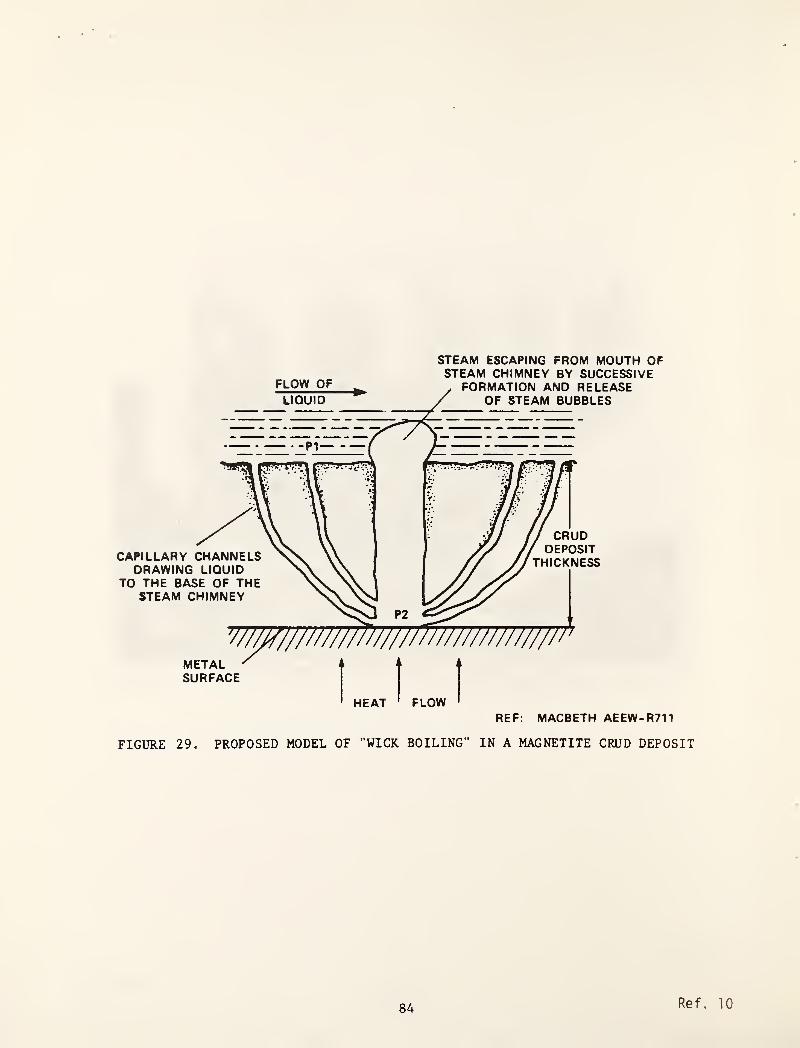
STEAM ESCAPING FROM MOUTH OFSTEAM CHIMNEY BY SUCCESSIVE
84 Ref. 10

MARTYNVA, O. I. (MOSCOW POWER INSTITUTE) ANDAKOLZIN, P. A. (ALL UNION INSTITUTE, INDUSTRIALWATER ENGINEERING, P. 29, DECEMeER 1969)
FIGURE 30
85Ref. n
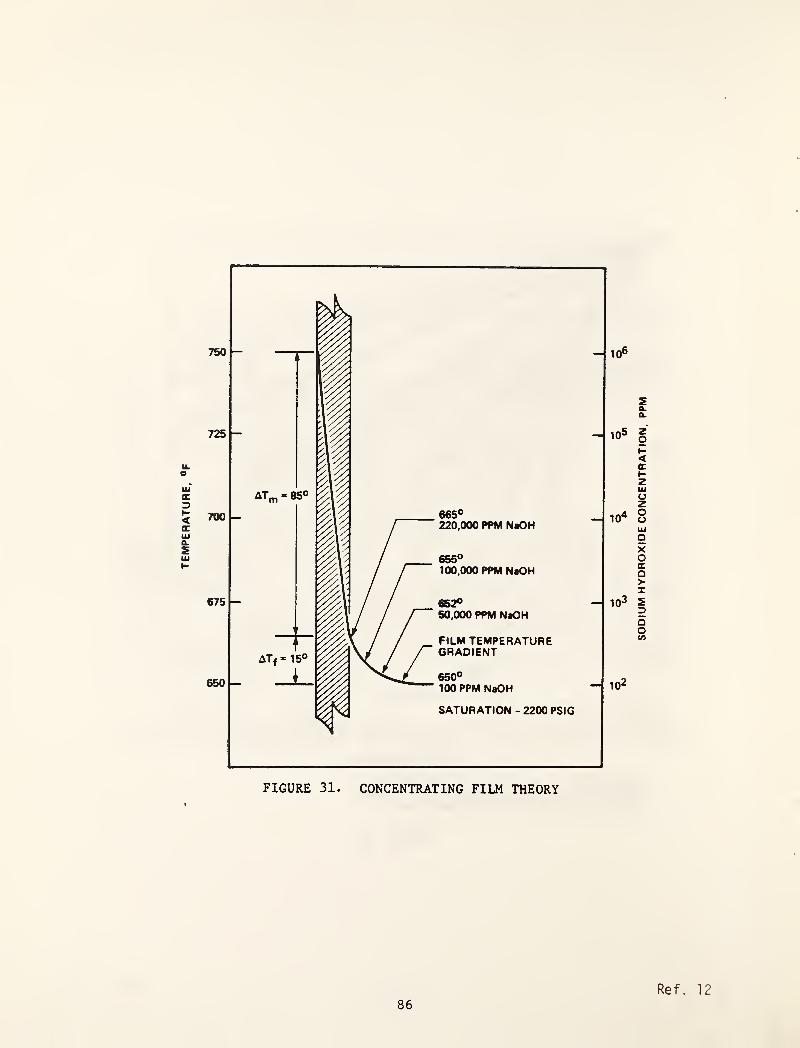
86Ref. 12
SODIUM
HYDROXIDE
CONCENTRATION,
PPM

Corrosion Fatigue
Figures 32 and 33 are pictures of a damaged studded furnace floor
tube caused by inadequate circulation in a high heat input zone. The
cyclic heating and cooling caused "corrosion fatigue" of the tube metal.
Causes of such damage may relate to the thickness of the external
slag layer (radiant heat input shield) and condition of the "chrome ore"
coatings on the studs (additional protection against localized heat input)
on the fire side of the tube as well as contributions of accumulated
deposits formed by feedwater contaminants or a combination of these as
shown.
Stress Corrosion Cracking
Austenitic stainless steel superheater tubes sometimes are damaged by
stress corrosion cracking in either chi oride-or-hydroxide-contai ning
environments.
Figures 34 and 35 show examples of "caustic" stress corrosion caused
by the inadvertent introduction of a "caustic" containing boiler "boil
out" cleaning solutions into a superheater. The boiler had been fired for
only a few hours. Replacement of the superheater was required. This is
not an uncommon type of tubing damage and further emphasizes the need for
care and thought in chemical cleaning of fossil boilers.
The damage was primarily located at the stressed support locations
and ring welds (heat affected zones).
87

FIGURE 32. A SECTION OF STUDDED FURNACE FLOOR TUBING SHOWINGWATERSIDE CORROSION FATIGUE DAMAGE AND EXTERNALTHERMAL STRESS NOTCHES
88Ref. 22

FIGURE 33. INTERIJAL SURFACE CORROSION FATIGUE NOTCHES (lOOX)
89Ref. 22

FIGURE 34. A FAILED STAINLESS STEEL (SS 304) SECONDARY SUPERHEATERTUBE (CAUSTIC STRESS CORROSION) (IX)
90Ref. 22
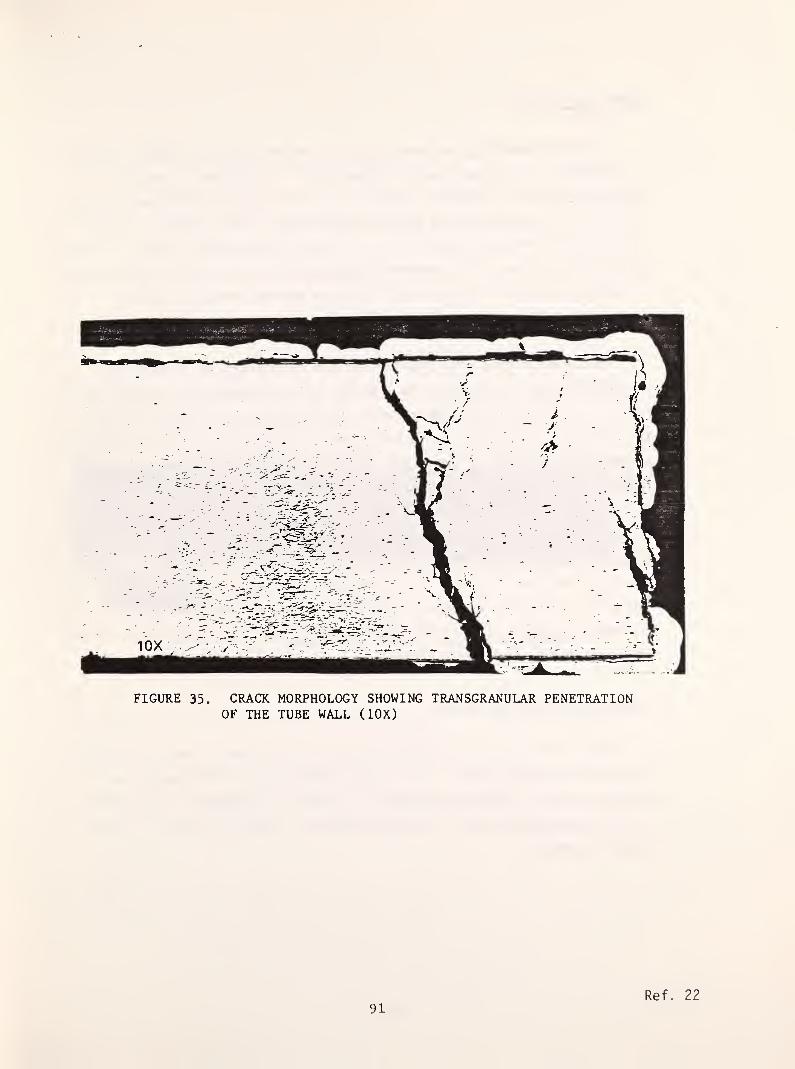
FIGURE 35. CRACK MORPHOLOGY SHOWING TRANSGRANULAR PENETRATIONOF THE TUBE WALL (lOX)
91Ref. 22
steam Blanketing
"Steam blanketing" or departure from nucleate boiling (DNB) can lead
to failures of the type shown in Figure 36. The problem is due to
improper mass flow in boiler tubes in relation to heat input and pressure.
This limit is also affected by tube inclination. One example of the
latter is insufficient velocity in inclined "slag screen" tubes in a "high
heat input" region. The observed damage would be at the top of the tube
in such a case and is characteristically a narrow corroded region
(sometimes referred to as "ghost lines").
Failures of this type usually exhibit themselves by "ghostline"
corrosive attack on the tube wall which, if it proceeds far enough, will
result in the type of damage shown. In this case, the tube was locally
thinned and a pressure rupture occurred. This type of attack is sometimes
accompanied by gross accumulation of corrosion product oxides on the
waterside due to severe localized tube metal attack. We have demonstrated
this type of failure by penetrating a steam generator tube in as little as
24 hours with the addition of 10-15 ppm caustic in high purity water under
controlled DNB conditions in the laboratory. Again, this type of tube
damage is not one of the most common types. It must involve a corrosive
substance in the boiler water. Subcritical once-through boilers
constantly operate under these same physical conditions without corrosion
in a high-purity water environment.
Industrial Boiler Corrosion
Modern industrial boilers are subject to the same kinds of problems
that plague utility units. There are, however, some differences due
mainly to lower feedwater qualities and less rigid control of feedwater
and internal boiler water treatment practices. The following are some
typical examples.
92

1
FIGURE 36. APPEARANCE OF "STEAM BLANKETING" ATTACK ON
A FURNACE WALL TUBE
93
Ref. 22

Caustic Embrittlement
The caustic embrittlement type failure as shown in Figure 37 is
seldom encountered in modern boilers. With increasing pressure, higher
duty units, better water conditioning, etc., "hydrogen damage" problems
and usually associated with utility boilers and as depicted in Figures 24
and 25, are becoming more common. "Caustic embrittlement" was an
important consideration in riveted drums with their many crevices but is
much less of a problem in modern "all -welded" boiler construction.
However, this tube failure confirms the necessity to be careful -- even
now -- with crevice areas and high concenrations of "free caustic" in the
boiler water. In modern boilers, caustic embrittlement usually occurs as
a result of leaking tube seats. The corrosion attack usually takes place
in a few inches beyond the drum or header and progresses from the external
tube surface inward.
Oxygen Attack
"Dissolved oxygen" attack takes several forms. It contributes to the
amount of "preboiler corrosion products" transported to the boiler which,
in turn, contributes to "underdeposit" pitting type damage in economizer
tubes, boiler drums, and steam generating tubes during operation.
It is the common denominator of corrosive attack under the
out-of-service conditions such as shipment and field storage and also
during equipment maintenance outages. A particular problem that is not
given the attention it deserves is the storage (layup) of superheater
loops under out-of-service conditions. Figure 38 is typical of the
metal lographic structures of dissolved oxygen pitting attack. The proper
utilization of modern deaerating equipment, the judicious use of oxygen
scavengers, and proper control methods can avoid this problem.
Chelants are, of course, effective in reducing boiler water sludge by
sequestering the residual feedwater hardness salts (magnesium and calcium)
and thereby contributing to the boiler tube cleanliness.
94
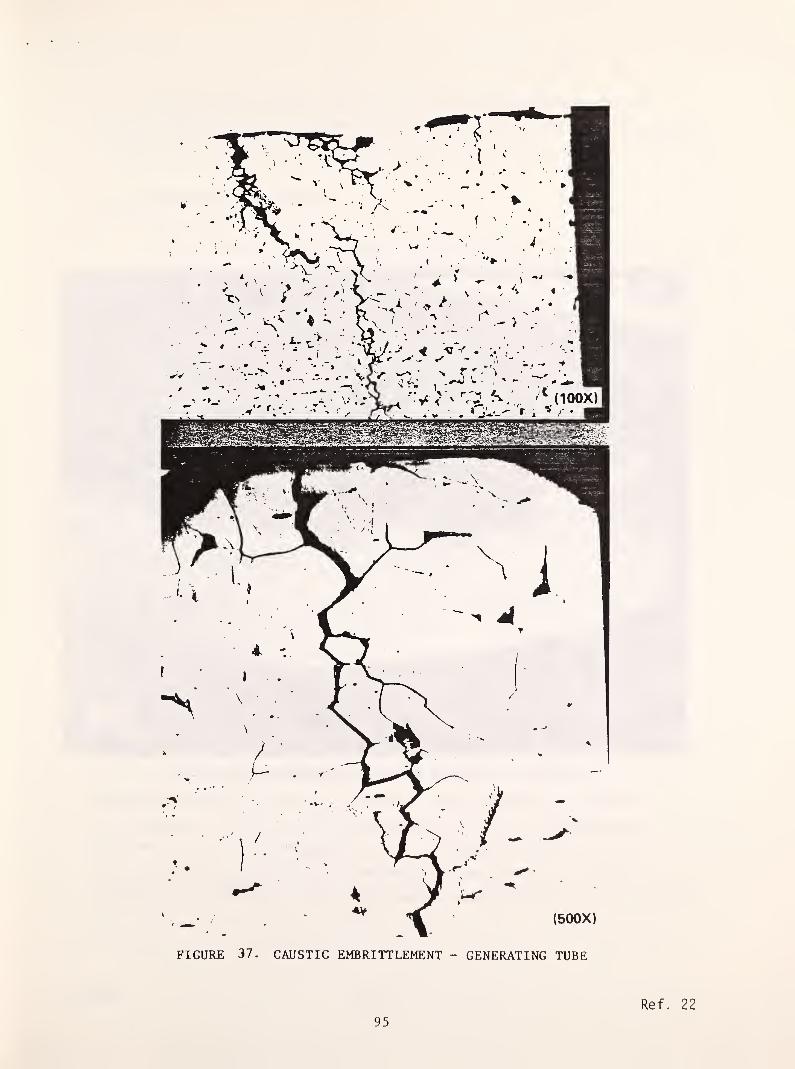
FIGURE 37. CAUSTIC EMBRITTLEMENT - GENERATING TUBE
95
Ref. 22

FIGURE 38. OXYGEN PITTING - ECONOMIZER TUBE (lOX)
Ref.96
22

The corrosive damage caused by chelant overfeed (Figure 39) is
usually more prevalent in areas of high steam quality and high velocities
in the boiler or areas of high turbulence in the economizer.
Low Temperature Acid Attack
There is another all too common and unnecessary form of corrosive
tube damage. Low temperature acid attack can result from improperly
inhibited cleaning solvents or by not completely neutralizing chemical
cleaning solvents and rinsing them from the boiler after chemical
cleaning.
The corrosive attack is usually preferential to highly stressed
pressure parts and its appearance is not unlike the attack (Figure 38)
attributed to chelants. Metal 1 ographical ly, it can be differentiated from
pitting corrosion by the obvious dissolution of inclusion "stringers" in
the boiler steel. Pitting by dissolved oxygen or bulk transcrystal 1 ine
"under-deposit" corrosion does not usually result in this.
Summary and Conclusions
These are typical of the pressure part damage experienced by utility
and industrial recirculating steam generators. Corrective actions for
these are adequate. The equipment, in most cases, must be cleaned, water
treatment methods and feedwater purification improved, and better
long-term water technology management employed.
The requirements for system modifications (design changes) to correct
for such things as improper mass flow in tubes are very infrequent and the
appropriate action is usually apparent. More important are careful
considerations regarding the choice of materials in system components in
the bal ance-of-pl ant (feedwater heaters, condensers, heat exchangers,
etc.) to insure compatibility with the best possible water treatment
additive system program without compromises and tradeoffs in the corrosion
97
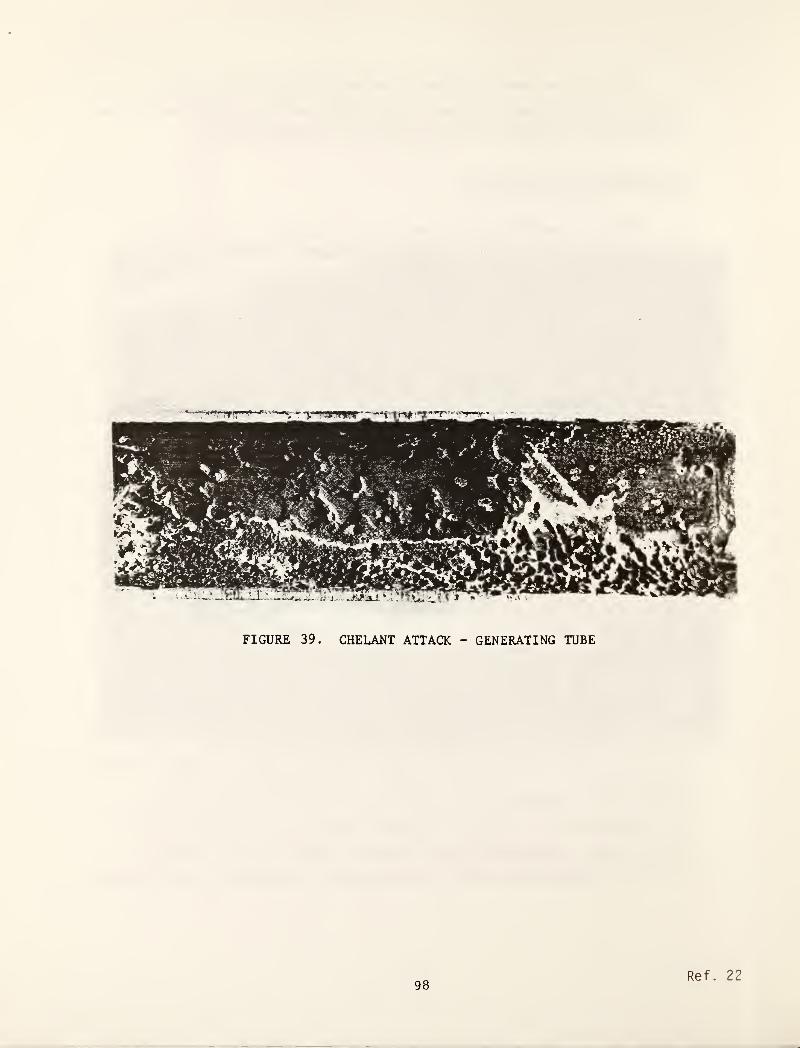
FIGURE 39. CHELANT ATTACK - GENERATING TUBE
98Ref. 22
rate of one part of the system as opposed to another. This results in
cleaner boilers—and clean boilers with good circulation have fewer
problems and higher availabilities.
Chemical Cleaning
No water treatment process or component design arrangement can assure
steam generator (boiler) cleanliness over its entire design life.
Therefore, viable chemical cleaning methodology has been developed for
cleaning both modern high pressure industrial and utility steam
generators.
Preboiler Cycle
One of the very important things to do is degreasing by alkaline
cleaning and flushing of the preboiler cycle after construction to remove
construction lubricants and other dirt and debris before start-up. Beyond
that, if there has been any significant rusting and oxidation of component
surfaces during storage, erection, and hydrotesting, it may be desirable
to also acid clean these surfaces. It is important that competent,
experienced contractors do this work or almost irreparable damage to the
system components can occur. Proper post cleaning storage under
controlled conditions is equally important so that the surfaces remain
clean and free from rust.
Steam Generator
Steam generator cleaning is carried out in a similar manner with
approved and inhibited cleaning solvents by one of the established
processes. This may be repeated several times during the life of the
equipment to insure clean heat transfer surfaces for reliable, trouble
free operation. Recirculating steam generators (boilers) are normally
cleaned by properly inhibited mineral acids (hydrochloric) by either the
circulation or soaking methods. Once-through steam generators are cleaned
by organic (chloride free) chemical cleaning chemicals. (Usually either
inhibited hydroxy-acetic formic acid mixtures of formulations consisting
99

of ethylene diamine tetra acetic acid (ETDA). The once-through steam
generator usually contains austenitic steel which is subject to stress
corrosion cracking in hydrochloric acid.
More recently, because of exfoliation of oxides from superheater/
reheater steam-side surfaces after long periods of operation, these
surfaces are being chemically cleaned. Properly inhibited organic
cleaning materials are employed for this purpose. Because of the low
pressure drop through the superheater/reheater banks, it is doubly
important that the steam generator manufacturer as well as competent
chemical cleaning contractors be involved in such a cleaning process.
100

REFERENCES
1. K. H. Haller, N. J. Mravich, and J. W. Seifert, "The Nature and Behaviorof Corrosion Products in Once-Through Boilers", Paper No. 9, NACECORROSION/71.
2. K. H. Haller, R. A. Lee, and J. S. Slotnik, "Heat Transfer and FrictionCharacteristics of Porous Magnetite Layers in Once-Through Boilers",ASME Paper 71-WA/HT-45.
3. H. A. Klein, et. al., "A Field Survey of Internal Boiler Tube Corrosion in
High Pressure Utility Boilers", in Proceedings of the American PowerConferen ce , Vol. 33, 1971, pp. 702-709.
4. F. J. Pocock, "Waterside Corrosion and Contaminant Transport Control forModern Central Station Steam Supply Systems", NACE Corrosion in the PowerIndustry Conference, Montreal, Canada, September 27-29, 1977.
5. B. W. Bussert, R. M. Corran, and G. C. Gould, "The Effect of WaterChemistry on the Reliability of Modern Large Steam Turbines", ASME Paper78-JPGC-PWR-9.
6. Water Treatment for High Pressure Drum Type Boilers , Technical Brochure,The Babcock & Wilcox Company, Barberton, Ohio.
7. Private Communication.
8. E. P. Partridge, "Hydrogen Damage in Power Boilers", Paper No. 63 PWR-9,The National Power Conference, Cincinnati, Ohio, September 23-26, 1963.
9. W. C. Ames and J. A. Lux, "An Experimental Investigation of HydrogenDamage in Boiler Tubing", The American Power Conference, April 25-27,1967.
10. R. V. Macbeth, R. Trenberth, and R. W. Wood, "An Investigation into theEffect of 'Crud' Deposits on Surface Temperature, Dry-Out, and PressureDrop with Forced Convection Boiling of Water at 69 Bar in an AnnularTest Section". UKEA Report No. AEEW-R705, Winfrith, Dorchester, UK, 1971.
11. P. A. Akolzin and 0. I. Martynova, "High Purity Steam Research in theU.S.S.R.", Industrial Water Engineering , December, 1969, p. 29.
12. H. M. Rivers, "Concentrating Films - Their Role in Boiler Scale andCorrosion Problems", in Proceedings of the Twelfth Annual Water Conference ,
Pittsburgh, Pennsylvania, October 22-24, 1951, pp. 131-137.
13. F. Gabrielli, W. R. Sylvester, and G. W. Thimot, "Contamination Preventionof Superheaters and Reheaters During Initial Startup and Operation",American Power Conference, Chicago, Illinois, April 20-22, 1976.
14. Babcock & Wilcox Company Internal Research Report.
101
15. K. W. Herman, "Causes and Cures of Waterside Problems in IndustrialBoiler Systems", Combustion , August, 1978.
16. J. Dawson, Jr., and T. J. Tvedt, "Fifteen Years of Operating Experiencewith ETDA in High Pressure Industrial Boilers," American Power Conference,Chicago, Illinois, April 25, 1978.
17. J. S. Beecher, I. B. Dick, R. W. Lane, and L. H. Vaughn, "How to DetermineWhen a Boiler Requires Chemical Cleaning", Task Force Report, ASMEResearch Committee on Water in Thermal Power Systems.
18. J. S. Beecher, J. Moulds, "Corrosion Control in Steam Generating Systems,The Role of Sulfite, Hydrazine, Neutralizing Amines and Ammonia", WaterChemistry and Corrosion Problems in Power and Industrial Plants , PECS,Hungary, August 27, 28, and 29, 1981.
19. "Consensus on Operating Practices for the Control of Feedwater and BoilerWater Quality in Modern Industrial Boilers," published by the AmericanSociety of Mechanical Engineers, 1979.
20. "Occupational Exposure to Hydrazines", DHEW (NIOSH) Publication No. 78-172,U.S. Dept, of Health, Education and Welfare, National Institute forOccupational Safety and Health pp. 1-168 (1978).
21. P. H. Effertz, et al, "Combined Oxygen/Ammonia Conditioning Process ofWater-Steam Loops in Power Stations with Once-Through Boilers,"Allianz Technical Information, D-8000 Munich 44, P. 0. Box 24, W. Germany.
22. Pocock, F. J., Lux, J. A., "Waterside Corrosion in Fossil Fired SteamGenerators," HIA Symposium on the Effect of Water Chemistry on Corrosion-Induced Failures in Power Systems," National Association of CorrosionEngineers, Atlanta, Georgia, March 12-16, 1979.
23. Coit, R. L., "Design Trends in United States Utility Feedwater Heatersand Condensers," Paper No. 2, International Nickel Power Conference,Lausanne, Switzerland, 1972.
24. Pocock, F. J., et al , "Control of Iron Pick-Up in Cycles Utilizing Steel
Feedwater Heaters," Proceedings of the American Power Conference,
Chicago, Illinois, 1966.
25. Pocock, F. J,, Banweg, A., "Current Waterside Concerns in Fossil Utility
Steam Generators," Paper NO. 100, 162nd Annual Meeting, The Electrochemical
Society, Detroit, Michigan, October 17-21, 1982.
102

WATER QUALITY IN BOILING WATER
REACTOR CYCLES
M. MADDAGIRI
MOISTURE SEPARATORAND REHEATER
Direct cycle power system. Stenm generated in the reactor vessel is
used directly to drive the turbine-generator.
103
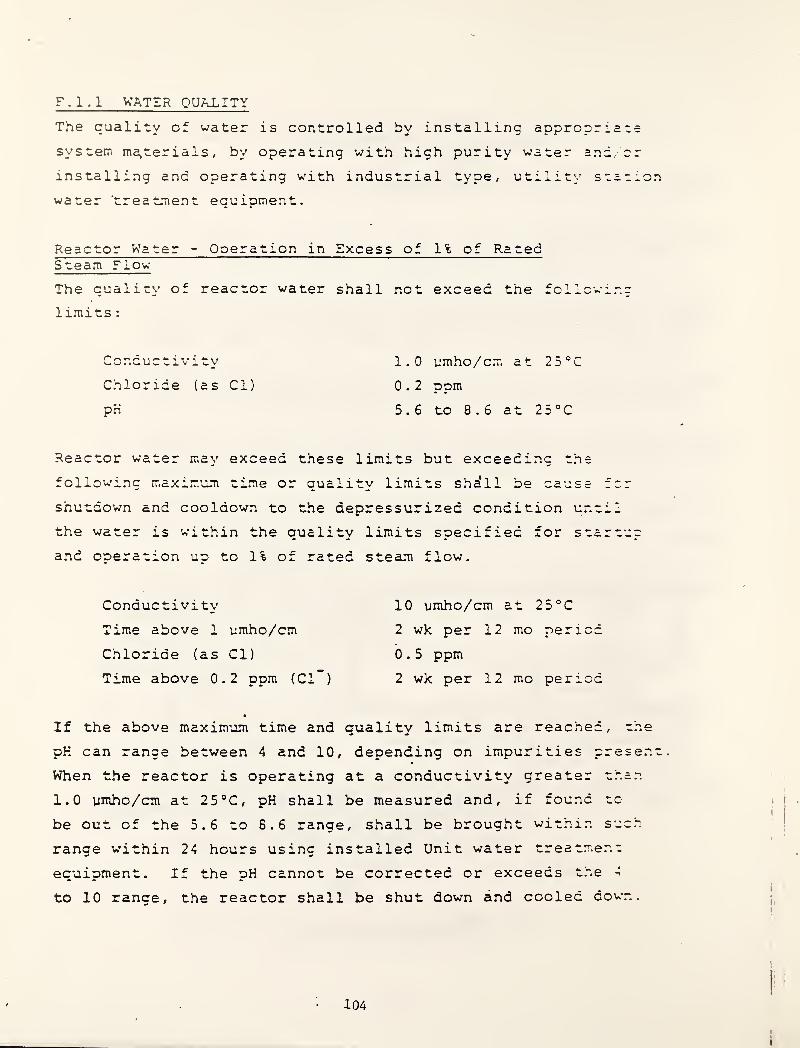
F.1.1 WATER QUALITY
The quality of water is controlled by installing appropriate
system ma,terials, by operating with high purity water and, or
installing and operating with industrial type, utility starion
water ’treatment equipment.
Reactor Water - Operation in Excess of 1% of RatedSteam Flow
The quality of reactor water shall not exceed the follcwinc
limits
:
Conduc tivi ty ot
—1 umho/c.m
Chloride (as Cl) 0.2 ppm
pH 5.6 to 8.6 a
Reactor water may exceed these limits but exceeding the
following maximum time or quality limits shall be cause fcr
shutdown and cooldown to the depressurized condition until
the water is within the quality limits specified for startup
and operation up to 1% of rated steam flow.
Conductivity
Time above 1 umho/cm
Chloride (as Cl)
Time above 0.2 ppm (Cl )
10 umho/cm at 25°C
2 wk per 12 mo period
0 . 5 ppm
2 wk per 12 mo period
If the above maximum time and quality limits are reached , the
pK can range between 4 and 10, depending on impurities present.
When the reactor is operating at a conductivity greater than
1.0 umho/cm at 25 °C, pH shall be measured and, if found to
be out of the 5.6 to 8.6 range, shall be brought within such
range w’ithin 24 hours using installed Unit water treatm.ent
equipment. If the pH cannot be corrected or exceeds the 4
to 10 range, the reactor shall be shut down and cooled down.
104
i

cleaning or testing, the quality of the water shall be
monitored and shall meet the water quality requirements
specified for reactor water with the reactor vessel in a
depressurized condition (see above)
.
Any time prior to fuel loading, when the reactor vessel is
heated above 200°F (93°C) for cleaning or testing, the quality
of water shall be monitored and shall not exceed the following
limits
:
Conductivity
Chloride (as Cl)'
pH
2 umho/cm at 25°C
0 . 2 ppm
5.6 to 8.6 at 25“C
Feedwater
The Unit design shall include the features specified herein
to minimize and/or control the reactor feedwater input of
materials specified below.
During normal operation the quality of feedwater to the
reactor vessel (measured before the outboard isolation valve
except as noted) shall not exceed the following limits:
Conductivity
Metallic impurity
Oxygen
Chlorides (Cl)
<0.1 umho/cm at 25*CTmeasured after the con-densate treatment system)
£15 ppb of which no morethan 2 ppb may be copper
200 ppb maximum; 20 ppbminimum (measured afterthe condensate treatmentsystem)
Feedwater chloride con-centrations shall be main-tained within limits suchthat chloride concentrationlimits in reactor waterspecified for operation upto and in excess of ofrated steam flow are main-tained
105

I
I
!
I h' “ i'vA, •,/ ~\i'-.. !A.T I .
iz
£--£:TIVE fuel POV/E!^ YEA!EL EF:M ;
lUW PADIATICN F_/UnTc
'..';l/-,TlON F'iE_0 iE Ul L!>- 'P 0'\ TnEEIPI— LT lE\ "IP \E-
'RE FEB APPENDIX ?l Fl C- Z~
FIG 2 106
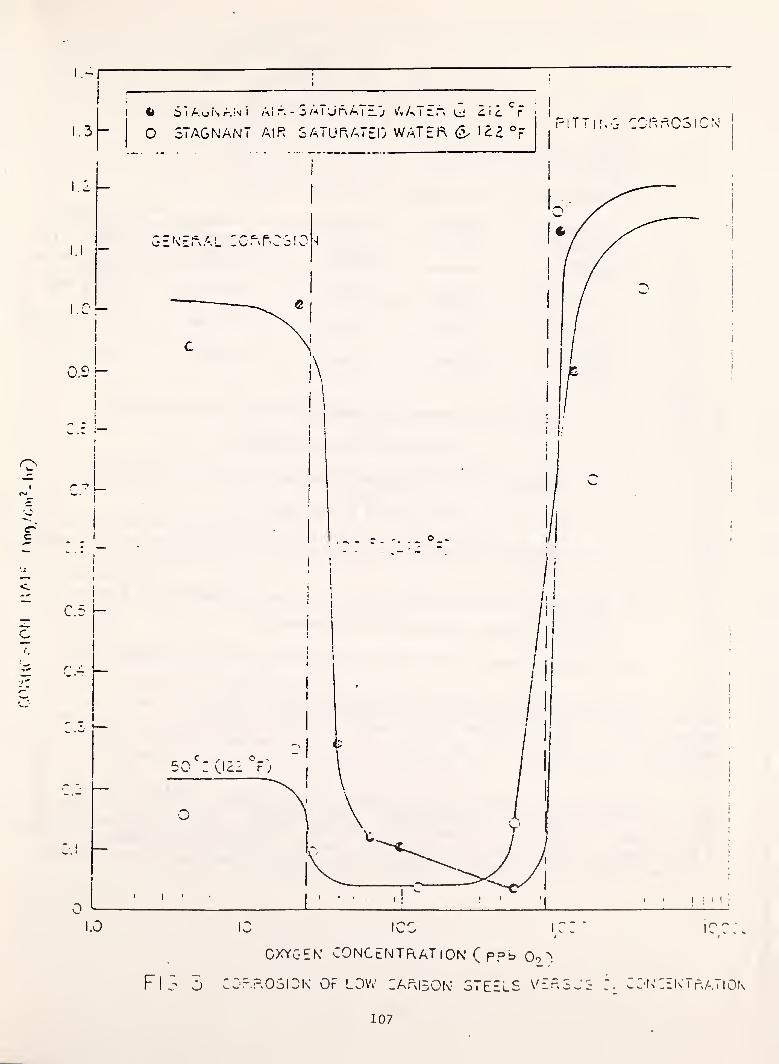
I
c
c
C
.3
S"i A.vjis A.!v i Ai "
O STAGNANT AlR
SAT’JAATz.T v'vAT”~ ici
SATURATED WATEK (5. ISE °FITT SCRRCSiCN
107

(2) Corrosion Product Control
(a) Performance of Condensate Purification System
CorrosionProductTyoe
Deep-Bed(D/B)
Deep-Bedwi th
URC***
Filter-Demi nerali zer
(F/D)
Dual
(D/B + F/D)
Insol uble* 'v.lO ppb 5-6 ppb 2-3 ppb n.0.3 ppb
Soluble** _<2 ppb <2 ppb 3-4 ppb 0. 1-0.2 ppb
Total 'V'12 ppb 5-7 ppb 'vS ppb 'v.0.5 ppb
Insoluble = Corrosion Products retained on 0.45 micron
Mi Hi pore^ fi Iter membrane.
Soluble = Corrosion Products penetrating a 0.45 micron
Cp)Mi llipore^ filter membrane.
Deeo-5ed system with effective use of ultrasonic resin cleaners(URC).
(b) Corrosion product concentration in forward-pumped drain stream is
21 ppb, steady state, and 31 ppb average.
(c) Forward- pumped drain flow is 30 percent of total feedwacer flow.
3. 1.1.1 Plants with Fully Cascading Feedwater Heater Drains . Select a fi Iter-demine ralTzeFrTr^a^aiip^^D^G^vTTirrTnnjrErai'orTTFTeril^^ if the chlorideconcentration in the condenser cooling water is less than 40 ppm. If chlorideconcentration is greater than 40 ppm, select a deep-bed demineralizer with an
ultrasonic resin cleaner. For additional margin, select a dual treatment system.
3. 1.1. 2 Plants with Forward- Pumped Feedv/ater Heater Drains . Select a filter-
demine ralT2irnT”crrrorTae~concerrt7iTron~TfPEni'Tondens^^ water is less
than 40 ppm. If chloride is greater than 40 ppm, select a dual treaL-.ent system.
A deep-bed demineralizer with an ultrasonic resin cleaner may be adequate, if
the forward-pump drain system is designed to minimize corrosion/erosion effects.
108

TURBINE
c/1
O un (/I
I
I
109
FIGURE
1
NON-REMEAT,
CASCADE
FEEDWATER
HEATER
DRAINS

TURBINE STEAM CHEMISTRY
W. T. Lindsay, Jr.
Westinghouse R&D CenterPittsburgh, PA 15235
ABSTRACT
This presentation is intended to introduce the subject, summarize problemsand progress, and give the author’s view of the role chemical thermo-dynamics has or could have in this area. Topics discussed are: theturbine part of the steam cycle; chemical composition of steam; sources of
impurities; effects of impurities; the condensation process and its
consequences; fluid composition modeling for turbine steam; shortcomingsin the data base; and recommended priorities for expansion of the database
.
The main topics discussed in this presentation are covered by thefollowing papers, which are reproduced here in lieu of a written summary:
1. Behavior of Impurities in Steam Turbines.” W. T. Lindsay, Jr., PowerEngineering ^ (No. 5), 68-72 (1979).
Reprinted with permission (c) Copyright Technical Publishing a Dunand Bradstreet Company.
2. ’’Turbine Steam Purity - 19179 Update.” 0. Jonas, W. T. Lindsay, Jr.
and N. A. Evans, pages 595-607 in ’’Water and Steam. Their Propertiesand Industrial Applications,” J. Straub and K. Scheffer, eds.
(Pergamon Press, Oxford, 1980).
Reprints with permission (c) Copyright Pergamon Press Inc.
3. ’’Steam Purity Analysis Instrumentation for Turbines and Power
Plants.” W. M. Hickam, S. H. Peterson, D. F. Pensenstadler ,and
J. C. Bellows. Advances in Instrumentation Vol. 36, Part 2, 1981.
Reprinted with permission (c) Copyright Instrument Society of America
4. ’’The Verification of Concentrated Impurities in Low-Pressure Steam
Turbines.” W. G. Steltz, P. K. Lee, and W. T. Lindsay, Jr., J. of
Engineering for Power 105 ,1923-198 (1983).
Requested with permission (c) Copyright American Society of Mechanical
Engineers
110
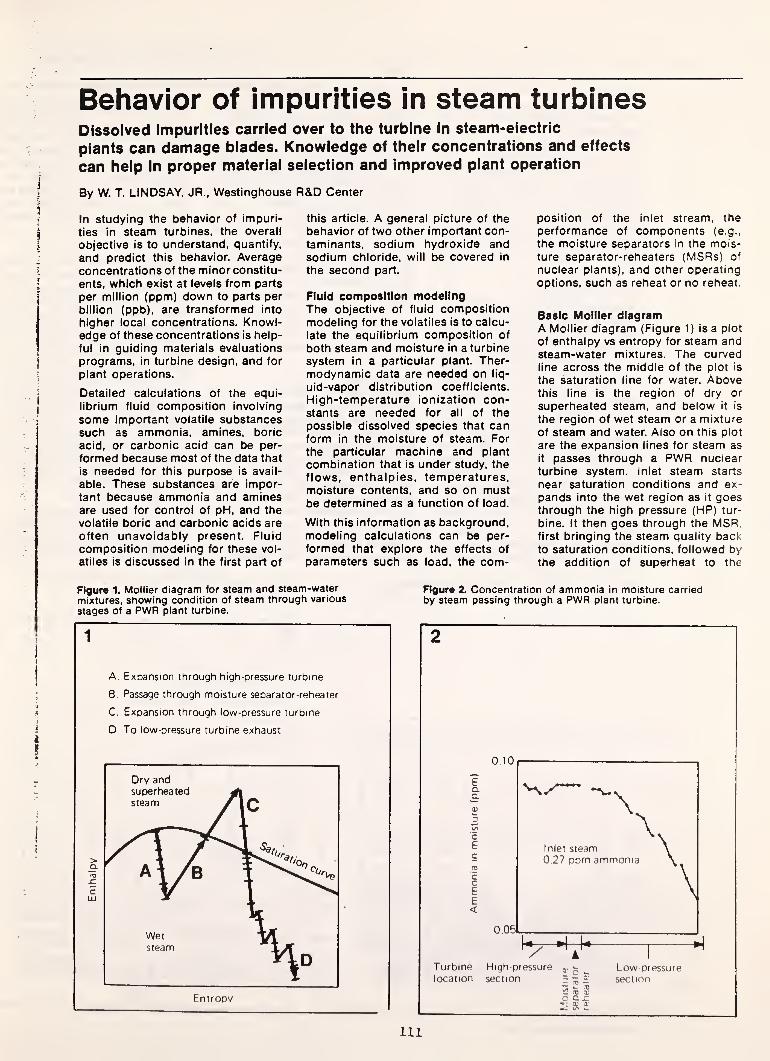
Behavior of impurities in steam turbinesDissolved impurities carried over to the turbine in steam-eiectric
plants can damage blades. Knowledge of their concentrations and effects
can help in proper material selection and improved plant operation
By W. T. LINDSAY, JR., Westinghouse R&D Center
In studying the behavior of impuri-
ties in steam turbines, the overall
objective is to understand, quantify,
and predict this behavior. Average
concentrations of the minor constitu-
ents, which exist at levels from parts
per million (ppm) down to parts per
billion (ppb), are transformed into
higher local concentrations. Knowl-edge of these concentrations is help-
ful in guiding materials evaluations
programs, in turbine design, and for
plant operations.
Detailed calculations of the equi-
librium fluid composition involving
some important volatile substancessuch as ammonia, amines, boric
acid, or carbonic acid can be per-
formed because most of the data that
is needed for this purpose is avail-
able. These substances are impor-tant because ammonia and aminesare used for control of pH, and the
volatile boric and carbonic acids are
often unavoidably present. Fluid
composition modeling for these vol-
atiles is discussed in the first part of
this article. A general picture of the
behavior of two other important con-taminants, sodium hydroxide andsodium chloride, will be covered in
the second part.
Fluid composition modelingThe objective of fluid compositionmodeling for the volatiles is to calcu-
late the equilibrium composition of
both steam and moisture in a turbine
system in a particular plant. Ther-
modynamic data are needed on liq-
uid-vapor distribution coefficients.
High-temperature ionization con-stants are needed for all of the
possible dissolved species that canform in the moisture of steam. For
the particular machine and plant
combination that is under study, the
flows, enthalpies, temperatures,moisture contents, and so on mustbe determined as a function of load.
With this information as background,modeling calculations can be per-
formed that explore the effects of
parameters such as load, the com-
position of the inlet stream, the
performance of components (e.g.,
the moisture separators in the mois-
ture separator-reheaters (MSRs) of
nuclear plants), and other operating
options, such as reheat or no reheat.
Basic Molller diagramA Mollier diagram (Figure 1) is a plot
of enthalpy vs entropy for steam andsteam-water mixtures. The curvedline across the middle of the plot is
the saturation line for water. Abovethis line is the region of dry or
superheated steam, and below it is
the region of wet steam or a mixture
of steam and water. Also on this plot
are the expansion lines for steam as
it passes through a PWR nuclear
turbine system. Inlet steam starts
near saturation conditions and ex-
pands into the wet region as it goesthrough the high pressure (HP) tur-
bine. It then goes through the MSR.first bringing the steam quality backto saturation conditions, followed bythe addition of superheat to the
Figure 1. Mollier diagram for steam and steam-watermixtures, showing condition of steam through various
stages of a PWR plant turbine.
1
A. Expansion through high-pressure turbine
B. Passage through moisture separator-reheater
C. Expansion through low-pressure turbine
D To low-pressure turbine exhaust
Figure 2. Concentration of ammonia in moisture carried
by steam passing through a PWR plant turbine.
2
Turbine High-pressure Low-pressurelocation section 5^5 section
111
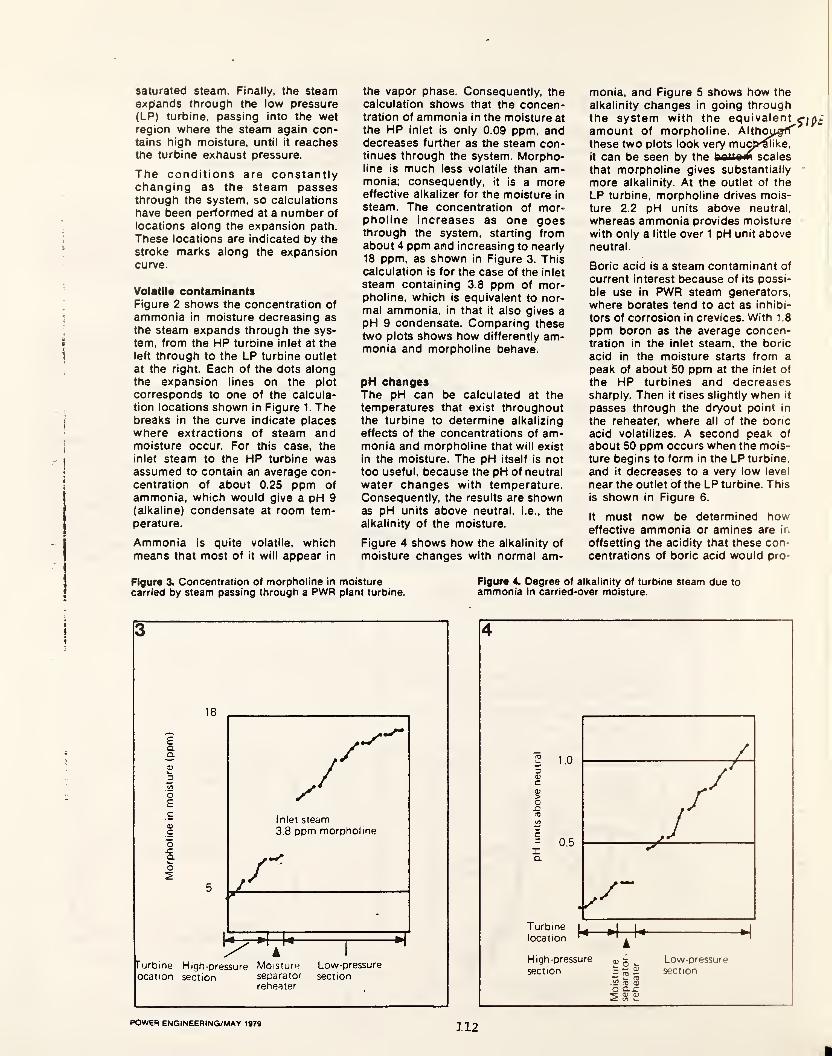
saturated steam. Finally, the steamexpands through the low pressure(LP) turbine, passing into the wetregion where the steam again con-tains high moisture, until it reachesthe turbine exhaust pressure.
The conditions are constantlychanging as the steam passesthrough the system, so calculations
have been performed at a number of
locations along the expansion path.
These locations are indicated by thestroke marks along the expansioncurve.
Volatile contaminantsFigure 2 shows the concentration of
ammonia in moisture decreasing as
the steam expands through the sys-
tem, from the HP turbine inlet at the
left through to the LP turbine outlet
at the right. Each of the dots alongthe expansion lines on the plot
corresponds to one of the calcula-
tion locations shown in Figure 1. Thebreaks in the curve indicate placeswhere extractions of steam andmoisture occur. For this case, the
inlet steam to the HP turbine wasassumed to contain an average con-centration of about 0.25 ppm of
ammonia, which would give a pH 9(alkaline) condensate at room tem-perature.
Ammonia is quite volatile, whichmeans that most of it will appear in
the vapor phase. Consequently, thecalculation shows that the concen-tration of ammonia in the moisture at
the HP inlet is only 0.09 ppm, anddecreases further as the steam con-tinues through the system. Morpho-line is much less volatile than am-monia; consequently, it is a moreeffective alkalizer for the moisture in
steam. The concentration of mor-pholine increases as one goesthrough the system, starting fromabout 4 ppm and increasing to nearly
18 ppm, as shown in Figure 3. Thiscalculation is for the case of the inlet
steam containing 3.8 ppm of mor-pholine, which is equivalent to nor-mal ammonia, in that it also gives apH 9 condensate. Comparing thesetwo plots shows how differently am-monia and morpholine behave.
pH changesThe pH can be calculated at thetemperatures that exist throughoutthe turbine to determine alkalizing
effects of the concentrations of am-monia and morpholine that will exist
in the moisture. The pH itself is not
too useful, because the pH of neutral
water changes with temperature.Consequently, the results are shownas pH units above neutral, i.e., the
alkalinity of the moisture.
Figure 4 shows how the alkalinity of
moisture changes with normal am-
monia, and Figure 5 shows how the
alkalinity changes in going throughthe system with the equivalentamount of morpholine.these two plots look very muc^>^ke,it can be seen by the battofw scales
that morpholine gives substantially
more alkalinity. At the outlet of the
LP turbine, morpholine drives mois-
ture 2.2 pH units above neutral,
whereas ammonia provides moisture
with only a little over 1 pH unit aboveneutral.
Boric acid is a steam contaminant of
current interest because of its possi-
ble use in PWR steam generators,
where borates tend to act as inhibi-
tors of corrosion in crevices. With 1.8
ppm boron as the average concen-tration in the inlet steam, the boric
acid in the moisture starts from a
peak of about 50 ppm at the inlet of
the HP turbines and decreasessharply. Then it rises slightly when it
passes through the dryout point in
the reheater, where all of the boric
acid volatilizes. A second peak of
about 50 ppm occurs when the mois-
ture begins to form in the LP turbine,
and it decreases to a very low level
near the outlet of the LP turbine. This
is shown in Figure 6.
It must now be determined howeffective ammonia or amines are in
offsetting the acidity that these con-
centrations of boric acid would pro-
Flgure 3. Concentration of morpholine in moisture Figure 4. Degree of alkalinity of turbine steam due to
carried by steam passing through a PWR plant turbine. ammonia in carried-over moisture.
£aaXI
5
oEc03c
oCL
r urbine
ocation section separator sectionreheater
03
c03>on
ICL
Turbinelocation
High-pressure
section2 0 *-
3 r.55 fO 03
o Cl^^ 03 03
Low-pressuresection
POWER ENGINEERING/MAV 1979 112
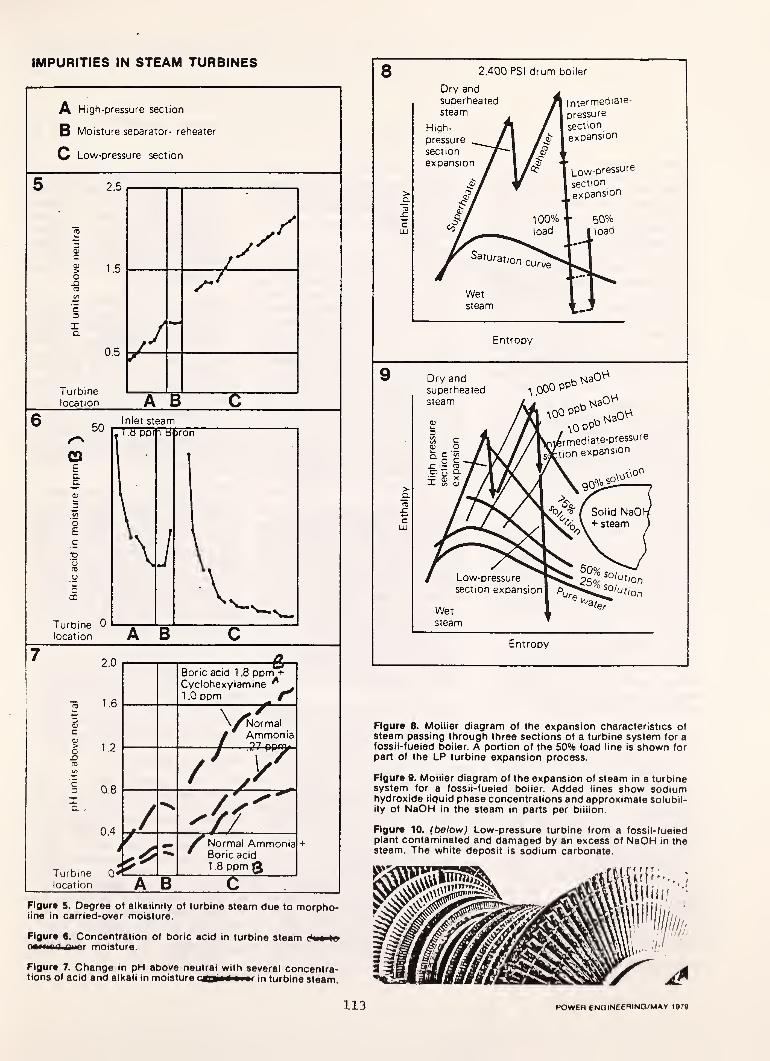
IMPURITIES IN STEAM TURBINES
Figur* 5. Degree of alkalinity of turbine steam due to morpho-line in carried-over moisture.
Figure 6 . Concentration of boric acid in turbine steamoexiorl miior moisture.
Figure 7. Change in pH above neutral with several concentra-tions of acid and alkali in moisture caa0n4m‘f( in turbine steam.
0 2.400 PSI drum boiler
Figure 8. Mollier diagram of the expansion characteristics ofsteam passing through three sections of a turbine system for afossil-fueled boiler. A portion of the 50% load line is shown forpart of the LP turbine expansion process.
Figure 9. Mollier diagram of the expansion of steam in a turbinesystem for a fossil-fueled boiler. Added lines show sodiumhydroxide liquid phase concentrations and approximate solubil-ity of NaOH in the steam in parts per billion.
Figure 10. (below) Low-pressure turbine from a fossil-fueledplant contaminated and damaged by an excess of NaOH in thesteam. The white deposit is sodium carbonate
113 POWER ENQINEERING/MAY 1979

duce in moisture. The center line in
Figure 7 shows the relative alkalinity
when normal ammonia is present.
The lower curve shows that boric
acid depresses the pH of normalammonia by about 0.3 pH unit wheremoisture begins to form in the LPturbine and 0.4 pH unit at its outlet.
The upper line shows that an amine,
at the amount equivalent to normalammonia, gives a higher pH. evenwith boric acid, than would happenwith normal ammonia alone. In this
example the amine is cyclohexyla-
mine. but very much the same result
is obtained when morpholine is usedin the calculation at the amount that
is equivalent to normal ammonia.
In other words, the use of either of
these amines, morpholine or cyclo-
hexylamine, more than compensatesfor the pH depression that boric acid
would cause. This is desirable be-
cause a higher pH (additional alka-
linity) in moisture is better for tur-
bine materials with respect to manypossible corrosion effects.
The uses of fluid composition mod-eling can be expanded to accommo-date other situations. Application
may be useful in cases where non-volatiies. such as sodium hydroxideand sodium chloride, are present
with volatile acids and bases. Adesirabie application is the inclusion
of the effects of oxidation-reduction
reactions, since chemicals that par-
ticipate in these kinds of reactions
have an effect on the corrosivity of
turbine moisture. These calculations
could be modified to include non-equilibrium effects, as well.
Non-volatile contaminantsThe non-volatile contaminants men-tioned above are quite different fromthe volatiles. The first is sodiumhydroxide, and it is important for tworeasons. First, caustic contamination
of steam can happen a number of
different ways, and it seems to hap-
pen with distressing regularity. It can
be caused by improper regeneration
of condensate poiishers; it can becaused by chemistry upsets in phos-phate-treated boilers; or it can becaused by poor steam separation in
drum boilers that are being deliber-
ately treated with low-level free
caustic. Second, no practical turbine
POWER ENGINEERING/MAY 1979
materiais can stand up under thecorrosive or stress corrosion effects
of concentrated caustic. Sodium hy-droxide has probably damaged moreturbines than any other single con-taminant.
It is useful to describe the behaviorof sodium hydroxide in connectionwith a Mollier chart. Plotted on theMollier chart of Figure 8 are expan-sion lines for steam passing througha turbine system for a fossil fuel unit
with a 2400-psi drum boiler. After
evaporation, the steam passesthrough the superheater, expandsthrough the HP turbine, is reheated
and expands again through the inter-
mediate pressure (IP) turbine, andpasses through most of the LP tur-
bine before it enters the wet region.
A part of the LP expansion line for
50% load is shown to the right, whereit can be seen how the dry-to-wet
transition shifts to a different loca-
tion in the turbine at reduced load.
Solutions of sodium hydroxide canbe very concentrated: these concen-trated solutions have elevated boil-
ing points so they can exist in the
region of superheated steam. Lines
showing sodium hydroxide concen-trations of 25% to 90% are shown in
the Mollier diagram of Figure 9.
These concentrated solutions cover
almost all the region traversed by the
steam expansion line. It is only in the
wet region, near the outlet of the LPturbine, where the sodium hydroxideconcentration becomes so dilute as
to be non-corrosive.
The solubility of sodium hydroxidein steam must be found so a deter-
mination can be made of how con-tamination level affects the location
of damage. Some lines have beenadded to Figure 9 indicating the
approximate values of sodium hy-
droxide solubility in steam. Informa-
tion from measurements made so far
is incomplete, but EPRI-sponsoredresearch projects now underwaymay provide better results.
By combining these two sets of lines
on a Mollier chart, it can be seen howa caustic contamination incident that
would put a quantity (say 100 ppb)of sodium hydroxide in the steamcould produce a 90% concentrate of
sodium hydroxide as a liquid some-
llA
where in the IP turbine, as indicated
by the intersection of the 100 pbbsolubility limit and the IP steamexpansion line. Damage could also
occur in the LP turbine, but caustic
contamination effects are not limited
to the interiors of turbines. For ex-
ample, crossover piping has suffered
from caustic damage.
Figure 10 is a photograph of an LPturbine that was damaged by caustic
contamination when used with a
fossil-fueled unit. A heavy white
encrustation of sodium carbonate is
visibie on two of the rows of blades
on both halves of the turbine. So-dium carbonate is formed whenparts coated with concentrated so-
dium hydroxide are exposed to air. In
this incident, the caustic contamina-tion most probabiy resulted fromimproper regeneration of conden-sate poiishers.
Another contaminant of great impor-
tance is sodium chioride. Salt is a
very common contaminant of steam,
and its concentrated solutions cancause pitting, corrosion fatigue, andstress corrosion cracking. The ther-
modynamic properties of sodiumchloride are very different from those
of sodium hydroxide, because it has
a more limited solubility. The sameMollier chart and the same expan-
sion lines for a 2400-psi drum boiier
turbine system are shown in Figure
11. The shaded band is the oniy
region where concentrated salt solu-
tions are stable. Above the shadedband, only pure dry sodium chloride
is stable in the dry, superheated
steam. Below the band, in the wet
region, salt contamination becomesso dilute as to be without muchcorrosive significance.
Along the upper boundary of the
shaded region there are solutions
that are saturated with solid salt. At
the point where the LP expansion
line crosses into this region, the
concentration is 28% sodium chlo-
ride at the upper boundary and close
to 0% at the lower boundary. Theimportant feature is that corrosively
significant solutions of salt are ther-
modynamically stable only within
one stage of the LP turbine. This
location can shift slightly as the
load changes.

IMPURITIES IN STEAM TURBINES
11
HPsection
expan-
Figure 11. Mollier diagram of the expansion of steam in a turbinesystem for a boiler with NaCI contained in the steam. Estimatedsolubility of dry salt in superheated steam is shown in ppb.
Figure 12. Magnified portion of the Mollier diagram of Figure 11
showing expansion through the LP section of the turbine in theregion of concentrated NaCI solutions.
Estimates of the solubility of sodiumchloride in steam can be made as
was done before with sodium hydrox-ide. These estimates should not berelied upon completely with respect
_to their absolute values, but Figure11 shows approximately how the
solubility of salt in steam varies. A28% solution of salt can be producedfrom very low levels of steam con-tamination.
Localized effects
It is interesting to look more closely
at the place where the expansion line
crosses the region of stable NaCIsolutions. Figure 12 shows a magni-fied view of the region. Expansionthrough one stage of the turbine
covers the region from A to C. Theregion from A to B includes the
expansion across the stationary
blades, and B to C represents the
expansion across the rotating blades.
The pressure between the stationary
blades and the rotating blades is
indicated on the Mollier chart by the
constant pressure line B-B'. Thepressure at the outlet of the stage,
after the rotating blades, is indicated
by the constant pressure line C-C'.
There are many local effects goingon inside turbines, and the expan-sion line represents only conditionsalong the mam steam flow path.
Steam that passes through the con-
trolled leakage seal at the tip of the
rotating blade will expand at con-stant enthalpy along the horizontal
arrow from B to C, on the constantpressure line C-C', because it doesno work. This steam could depositsolid sodium chloride but not anysolution. However, with the condi-tions prevailing, wet steam at condi-tion C could intermittently mix into
the region where the deposit hasbeen formed and wet it. There couldthus be an alternating wet and dry
situation in a very local region nearthe seal.
Another interesting localized effect
could occur near the tips or near the
base of the blades, where the ma-chine is not as efficient in extracting
work from the steam. This is illus-
trated by the lower arrow from B to
the point C 2 , where the expansionpath lies entirely in the region of
concentrated liquid solutions.
Corrosive effects due to sodiumchloride contamination can be foundwherever concentrated solutions of
sodiurji chloride persist. These are
very localized within one stage of the
turbine and can be formed from very
Iqw levels of salt contamination.
SummaryIt has been noted that different
impurities behave differently For ex-
ample, solutions of sodium chloride
are stable only in a narrow band nearthe liquid-vapor saturation line,
whereas solutions of sodium hydrox-ide can exist over the entire range of
expansion from the inlet to the high
pressure turbine to the beginning of
the wet region in the low pressure
turbine near the exhaust. This meansthat the corrosive effects of sodiumchloride are very localized, while
those of sodium hydroxide can oc-
cur anywhere, depending on the
level of contamination.
In addition, fluid composition model-ing has been shown to be a useful
new tool for quantifying turbine ma-terials' environments. The use of this
technique makes it possible to pro-
vide realistic predictions that are
specific and detailed enough to bevery helpful in guiding designs andestablishing operating procedures.
The technique can be expanded to
have greater generality, and calcu-
lations can always be refined as newand more reliable basic data are gen-erated by research programs. END
To obtain an axira copy of this articia,
circia 204 on Readar Sarvica Card
115POWER ENGINEERING/MAY 1979
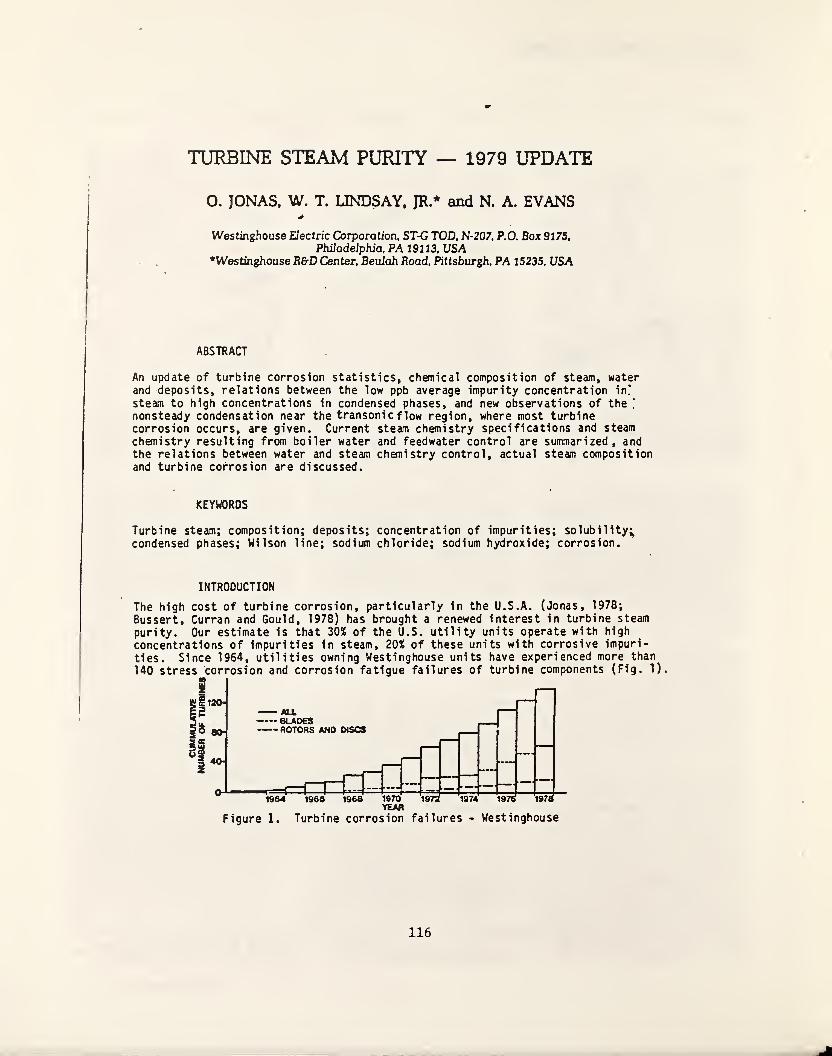
TURBINE STEAM PURITY — 1979 UPDATE
O. JONAS, W. T. LINDSAY. JR.* and N. A. EVANS
Westinghouse Electric Corporation, ST-G TOD, N-207, P.O. Box 9175,
PhJadeiphia, PA 19113, USAWestinghouse R&D Center, Beulah Road, Kttsburgh, PA 15235, USA
ABSTRACT
An update of turbine corrosion statistics, chemical composition of steam, waterand deposits, relations between the low ppb average impurity concentration in?
steam to high concentrations in condensed phases, and new observations of the'
nonsteady condensation near the transonic flow region, where most turbinecorrosion occurs, are given. Current steam chemistry specifications and steam
chemistry resulting from boiler water and feedwater control are summarized, andthe relations between water and steam chemistry control, actual steam compositionand turbine corrosion are discussed.
KEYWORDS
Turbine steam; composition; deposits; concentration of impurities; solubility;^
condensed phases; Wilson line; sodium chloride; sodium hydroxide; corrosion.
INTRODUCTION
The high cost of turbine corrosion, particularly In the U.S.A. (Jonas, 1978;
Bussert, Curran and Gould, 1978) has brought a renewed interest in turbine steam
purity. Our estimate is that 30% of the U.S. utility units operate with high
concentrations of impurities in steam, 20% of these units with corrosive impuri-
ties. Since 1964, utilities owning Westinghouse units have experienced more than
140 stress corrosion and corrosion fatigue failures of turbine components (Fig. 1
YEAR
Figure 1. Turbine corrosion failures - Westinghouse
).
116

0. Jonas, W. T. Linsday Jr. and N. A. Evans
The Edison Electric Institute's recent survey of 125 units in the U.S., repre-
senting all makes of turbines, found that corrosion-related blade failures have
been a problem in 73 units with a total generating capacity of 39,000 MW.
Since the early steam and deposit chemistry studies (summarized by Pocock, 1979
and Jonas, 1978), not only was the chemical control in some U.S. power stations
relaxed, but also larger units came on-line with higher steam flows, more turbines
with supersonic flow velocities, and more once-through boilers and units using
all volatile water tpeatment. In some geographical regions, corrosion problems
could relate to increased levels of industrial and agricultural pollutants in the
cooling and/or makeup^water . The effects of the above changes on steam chemistry,
as well as many equilibrium, and more importantly, dynamic properties of steam
with impurities are little understood. Some research, in our opinion not enough,
has been initiated to improve the understanding. As indicated in recent discussions
of the ASME Research Committee on Water in Thermal Power Systems, some of which
are summarized by Rice and Passell (1978), and in conclusions and recommendations
of the Electric Power Research Institute workshops on Steam Purity for Turbine
Protection (1979), and on Corrosion Fatigue of Steam Turbine Blading Alloys
(1979), much of the current research is not directly applicable to the control of
chemistry of turbine steam with the complex mixtures of impurities and additives,
flow velocities up to supersonic, steam expansion rates 1_ ^ up to about 3000 s"sP dt
;
and the presence of metal surfaces of various roughness and degree of oxidation.
In spite of the lack of knowledge of chemical thermodynamics of steam with
impurities, impurity limits for turbine steam have been recommended (Jonas,
1978) or specified (Allis Chalmers Co., General Electric Co., 1977; VGB, 1972,
1973; CEGB, 1975; Martynova, 1972). These are based partly on limited thermo-
dynamic data and partly on experience and analytical detection limits. Where
steam purity limits have not been specified, such as for example in the JapaneseStandard JIS B8223 (1976), boiler water limits for recycle boilers and feedwaterspecifications for once-through boilers control the steam chemistry. Whetherthese specifications are too conservative and force unnecessary operating costs,
or whether they are not strict and comprehensive enough and could result in
turbine corrosion, will be tested by service experience.
COMPOSITION OF WATER, STEAM, AND DEPOSITS
Through surveys of deposit composition (Jonas, 1973, 1975, 1978) and monitoring of
condensed steam and water chemistry of about 200 modern utility units, and afterinclusion of data by Kirsh and Pollmann (1968) and Martynova and Rogatskin (1970),a list of chemicals found in steam turbines (Table 1) was compiled. It containsmore than 160 compounds and elements. The deposits were analyzed semiquanti tatively
,
by wet chemical methods, and by X-ray diffraction. Water and condensed steam sampleswere analyzed by wet methods, including liquid ion chromatography and by continuousanalyzers. EPA chemicals (pollutants) were analyzed by gas chromatography. Somecompounds, such as for example ammonium salts, were not identified directly, butwere inferred from the stoichiometric balance of the liquid samples. With the
exception of acids, gases, EPA chemicals, volatile additives and ammonium salts,all of the chemicals in Table 1 have been identified in turbine deposits, i.e., in
a concentrated form. Deposit composition only partially reflects the "in-situ“chemistry of a running turbine. Some components may be washed away by moistureduring unit shutdown, others will react with air and metallic surfaces after shut-down, and some can volatilize. Concentrations in liquid samples were from sub-ppbto ppm, in deposits from a fraction of a percent to almost 100%. In addition to
the identification of chemicals listed in Table 1, low pressure turbine steamcompositions (averages, standard deviations and maxima) are given in Table 2. Theaverages and standard deviations are from fourteen turbines sampled at high steadyload, except for the case of sodium for which one unit with extremely high sodiumlevels (up tq 250 ppb) was excluded. Including that unit, average Na =« 18.8 ppb,standard deviation 50.7 ppb.
117
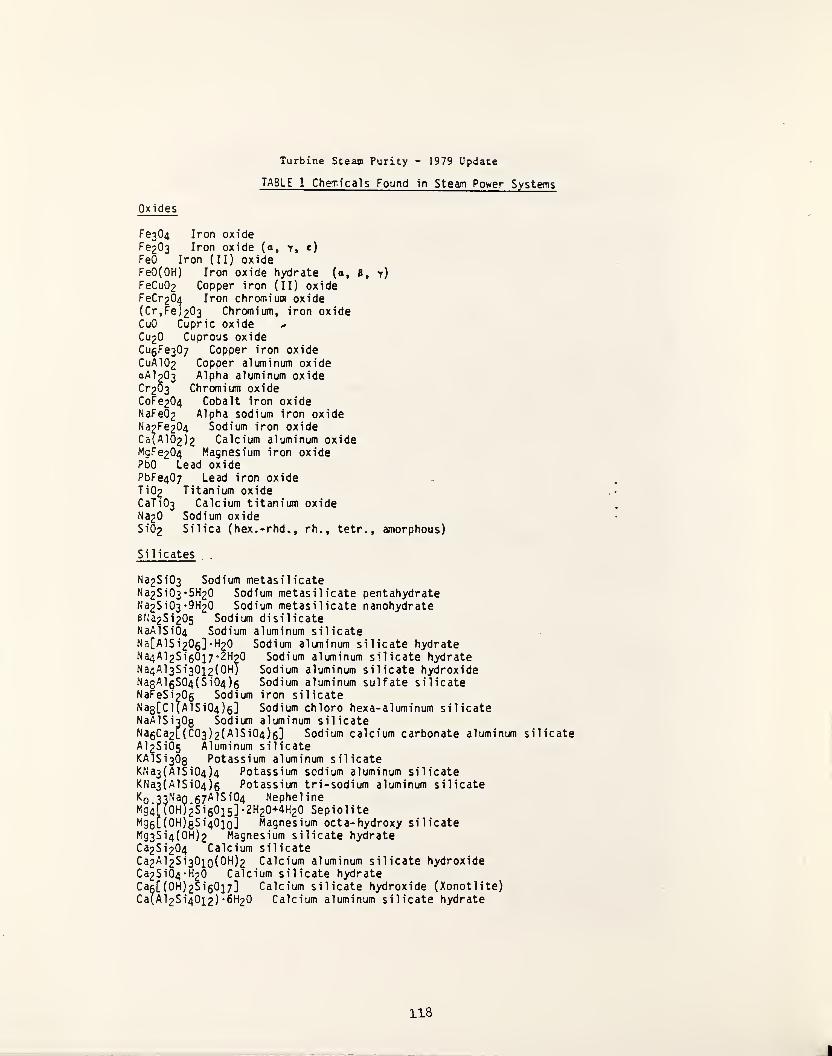
Oxides
Turbine Steam Purity - 1979 Update
TABLE 1 Chemicals Found in Steam Power Systems
Fe304 Iron oxideFe203 Iron oxide (a, y, c)
FeO Iron (II) oxideFeO(OH) Iron oxide hydrate (a, B, y)FeCu02 Copper iron (II) oxideFeCr 204 Iron chromiua oxide(Cr,FeJ 203 Chromium, iron oxideCuO Cupric oxideCu20 Cuprous oxideCu5 Fe307 Copper iron oxideCuA 102 Copper aluminum oxideaAl 203 Alpha aluminum oxideCr203 Chromium oxideCoFe204 Cobalt iron oxideNaFe02 Alpha sodium iron oxideNa 2 Fe204 Sodium iron oxideCa(A102)2 Calcium aluminum oxideMgFe204 Magnesium iron oxidePbO Lead oxidePbFe407 Lead iron oxideTi 02 Titanium oxideCaTi 03 Calcium titanium oxideNa20 Sodium oxideSi 02 Silica (hex.-rhd., rh., tetr., amorphous)
Si 1 i cates .
Na2 Si 03 Sodium metasilicateNa2 Si 03
* 5 H20 Sodium metasil icate pentahydrateNa2 Si 03
' 9 H20 Sodium metasi 1 icate nanohydrate6 fJa2 Si 205 Sodi urn di sil icateNaAlSi 04 Sodium aluminum silicateNa[AlSi 206 ] •H 2O Sodium aluminum silicate hydrateNa4 Al 2 Si 60 i 7
' 2 H20 Sodium aluminum silicate hydrateNa4 Al 3 Si 30 i 2 ( 0H) Sodium aluminum silicate hydroxideNa8 Al 5 S04 (Si 04)6 Sodium aluminum sulfate silicateNaFeSipOg Sodium iron silicateN 38 [Cl(AlSi 04 )g] Sodium chloro hexa-aluminum silicateNaAlSiiOg Sodium aluminum silicateNa5Ca2 L(C03 ) 2 (AlSi 04 ) 5 ] Sodium calcium carbonate aluminum silicateAl 2 Si 05 Aluminum silicateKAlSigOg Potassium aluminum silicateKNa3 (AlSi 04)4 Potassium sodium aluminum silicateKNa3(AlSi04)6 Potassium tri-sodium aluminum silicate•^0 33^^0 67^15^04 NephelineMg 4 [( 0H) 2 Si 60 i 5 ]- 2 H20+4 H20 SepioliteM96[ Magnesium octa-hydroxy silicateMg 3 Si 4 ( 0 H )2 Magnesium silicate hydrateCa2 Si 204 Calcium silicateCa2 Al 2 Si 30io(OH )2 Calcium aluminum silicate hydroxideCa2 Si 04 -H20 Calcium silicate hydrateCag[
(
0 H) 2Sig0 i 7 ] Calcium silicate hydroxide (Xonotlite)Ca(Al 2 Si40 x 2 )
•
6 H2O Calcium aluminum silicate hydrate
118
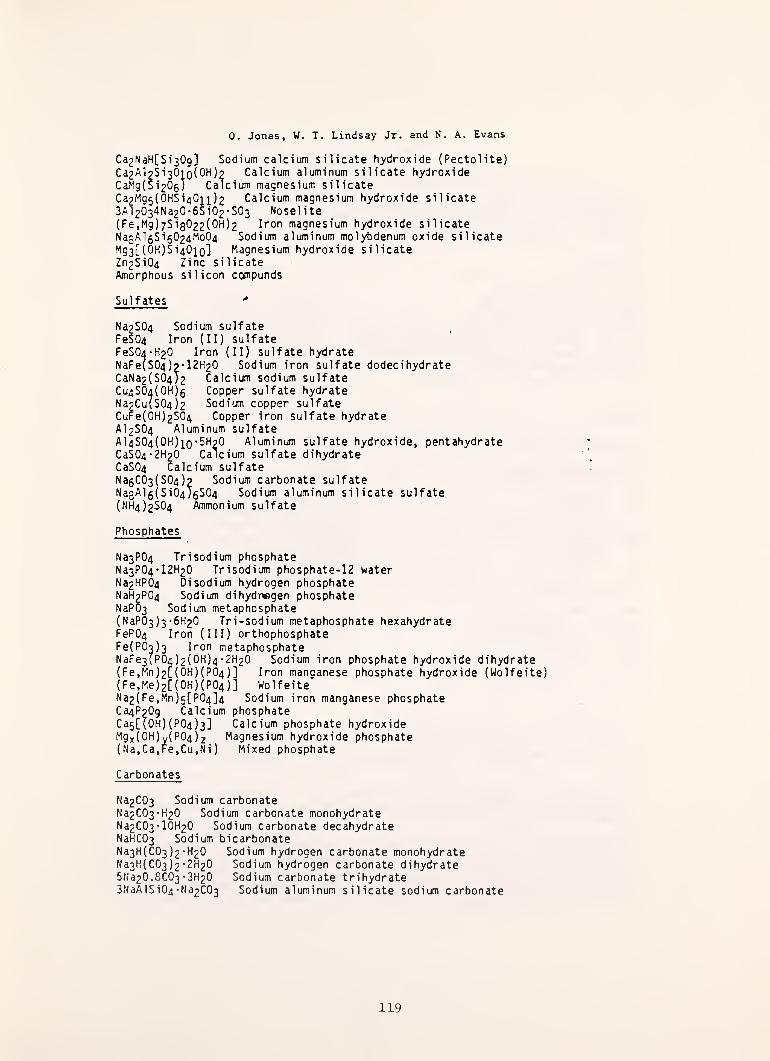
0. Jonas, W. T. Lindsay Jr. and N. A. Evans
Ca2 NaH[Si 309 ] Sodium calcium silicate hydroxide (Pectolite)
Ca2 Al 2 Si 30io(OH )2 Calcium aluminum silicate hydroxideCaMg(Si 205 ) Calcium magnesium silicateCa2 Mg 5 ( 0HSi 40 ii )2 Calcium magnesium hydroxide silicate
3 Al 2034 Na20 - 6 Si 02 -S03 Noselite(Fe,Mg) 7 Si 3022 ( 0 H )2 Iron magnesium hydroxide silicateNdsAl 5 S
i
5024 Mo04 Sodium aluminum molybdenum oxide silicate
^93[ (OH)Si40iol Magnesium hydroxide silicateZn2 Si 04 Zinc silicateAmorphous silicon cgmpunds
Sulfates **
Na2 S 04 Sodium sulfateFeS04 Iron (II) sulfateFeS0a-H20 Iron (II) sulfate hydrateNaFe(S04 ) 2
’ 12 H20 Sodium iron sulfate dodecihydrateCaNa2 (S04)2 Calcium sodium sulfateCu4 S0d( 0 H )5 Copper sulfate hydrateNa2Cu(S04)2 Sodium copper sulfateCuFe( 0 H) 2 S04 Copper iron sulfate hydrateAI 2SO4 Aluminum sulfateAl 4 S 04 ( 0 H) 10
* 5^20 Aluminum sulfate hydroxide, pentahydrateCaS04 - 2 H20 Calcium sulfate dihydrateCaS04 Calcium sulfateNa5 C03 (S04)2 Sodium carbonate sulfateNa3Al 5 (Si 04 ; 6 S04 Sodium aluminum silicate sulfate(NH4 ) 2S04 Ammonium sulfate
Phosphates
Na3 P04 Tri sodium phosphateNa3 P 04
' 12H20 Trisodium phosphate-12 waterNa2 HP 04 Di sodium hydrogen phosphateNaH 2 P04 Sodium dihydncgen phosphateNaP 03 Sodium metaphosphate(NaP 03 ) 3
- 6 H20 Tri-sodium metaphosphate hexahydrateFeP 04 Iron (III) orthophosphateFe(P03)3 Iron metaphosphateNaFe 3 (P 04 ) 2 ( 0 H) 4
• 2 H 2O Sodium iron phosphate hydroxide dihydrate(Fe,Mn
)
2 L (OH) (PO4 ) ] Iron manganese phosphate hydroxide (Wolfeite)(Fe,Me) 2 [( 0H)(P04 )] WolfeiteNa2 (Fe,Mn) 5 [P04]4 Sodium iron manganese phosphateCa4 P 20g Calcium phosphateCa 5 [ (OH) (PO4 ) 3 ] Calcium phosphate hydroxide
Mgx( 0H)y(P 04)2 Magnesium hydroxide phosphate(Na,Ca,Fe,Cu,Ni ) Mixed phosphate
Carbonates
Na2 C03 Sodium carbonateN 32 C03 -H20 Sodium carbonate monohydrateNa 2 C03
- 10H20 Sodium carbonate decahydrateNaHC03 Sodium bicarbonateNa 3 H(C03 ) 2 -H20 Sodium hydrogen carbonate monohydrateNa 3 H(C03 ) 2
’ 2 H20 Sodium hydrogen carbonate dihydrate5 Na20 . 8 C03 ‘ 3 H20 Sodium carbonate trihydrate3NaAlS
i
04 -Na2 C03 Sodium aluminum silicate sodium carbonate
119
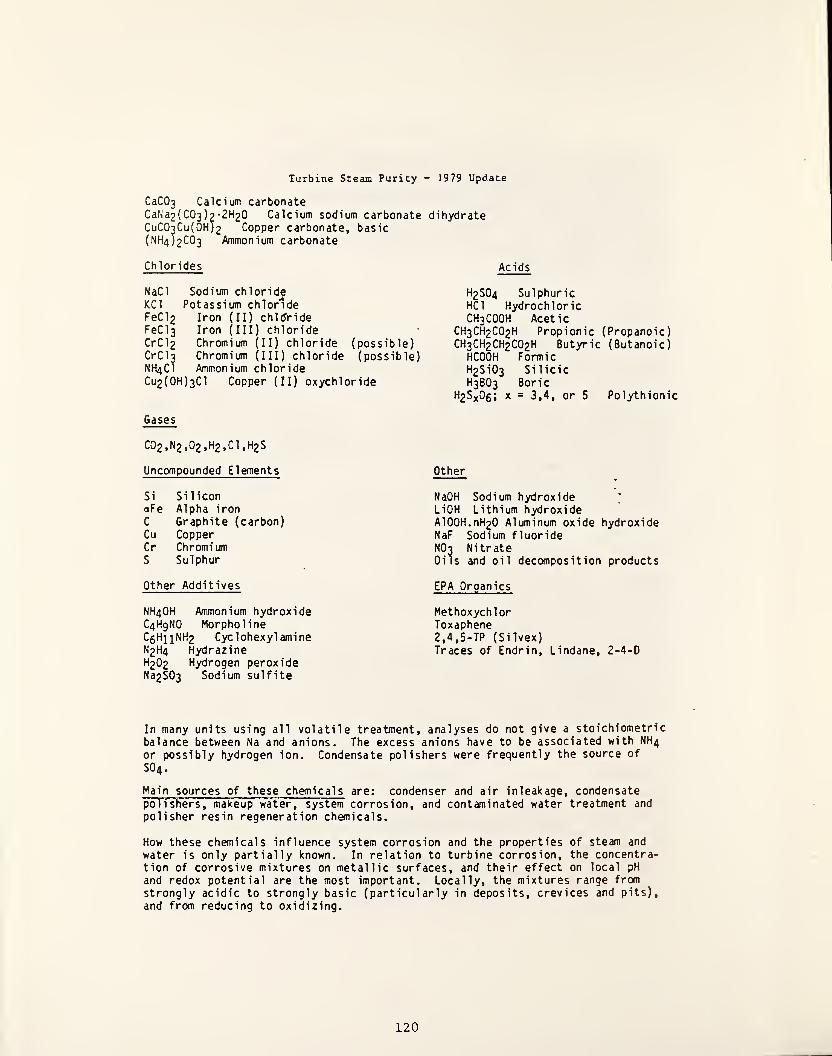
Turbine Steam Purity - 1979 Update
CaC03 Calcium carbonateCaNa2(C03)2-2H20 Calcium sodium carbonate dihydrateCuC07Cu( 0H)2 Copper carbonate, basic(NH4)2C03 Ammonium carbonate
Chlorides Acids
NaCl Sodium chlorideKCl Potassium chloridePeCl2 Iron (II) chlorideFeCl3 Iron (III) chlorideCrCl2 Chromium (II) chloride (possible)CrCl3 Chromium (III) chloride (possible)NH4C1 Ammonium chlorideCu2(0H)3C1 Copper (II) oxychloride
Gases
H2SO4 SulphuricHCl HydrochloricCH3COOH Acetic
CH3CH2CO2H Propionic (Propanoic)CH3CH2CH2CO2H Butyric (Butanoic)
fcoOH ^ FormicH2Si03 SilicicH3BO3 Boric
^ ~ 3,4, or 5 Polythionic
C02,N2,02,H2,C1,H2S
Uncompounded Elements
Si Si 1 iconaFe Alpha iron
c Graphite (carbon)Cu CopperCr ChromiumS Sulphur
Other
NaOH Sodium hydroxide;
LiOH Lithium hydroxideA100H.nH20 Aluminum oxide hydroxideNaF Sodium fluorideNOt NitrateOils and oil decomposition products
Other Additives EPA Organics
NH4OH Ammonium hydroxideC4HgN0 MorpholineC5 Hi]^NH2 CyclohexylamineN2H4 HydrazineH2O2 Hydrogen peroxideNa2S03 Sodium sulfite
MethoxychlorToxaphene2,4,5-TP (Silvex)Traces of Endrin, Lindane, 2-4-D
In many units using all volatile treatment, analyses do not give a stoichiometric
balance between Na and anions. The excess anions have to be associated with NH4
or possibly hydrogen ion. Condensate polishers were frequently the source of
SO4.
Main sources of these chemicals are: condenser and air inleakage, condensatepolishers, makeup water, system corrosion, and contaminated water treatment and
polisher resin regeneration chemicals.
How these chemicals influence system corrosion and the properties of steam and
water is only partially known. In relation to turbine corrosion, the concentra-tion of corrosive mixtures on metallic surfaces, and their effect on local pH
and redox potential are the most important. Locally, the mixtures range from
strongly acidic to strongly basic (particularly in deposits, crevices and pits),
and from reducing to oxidizing.
120
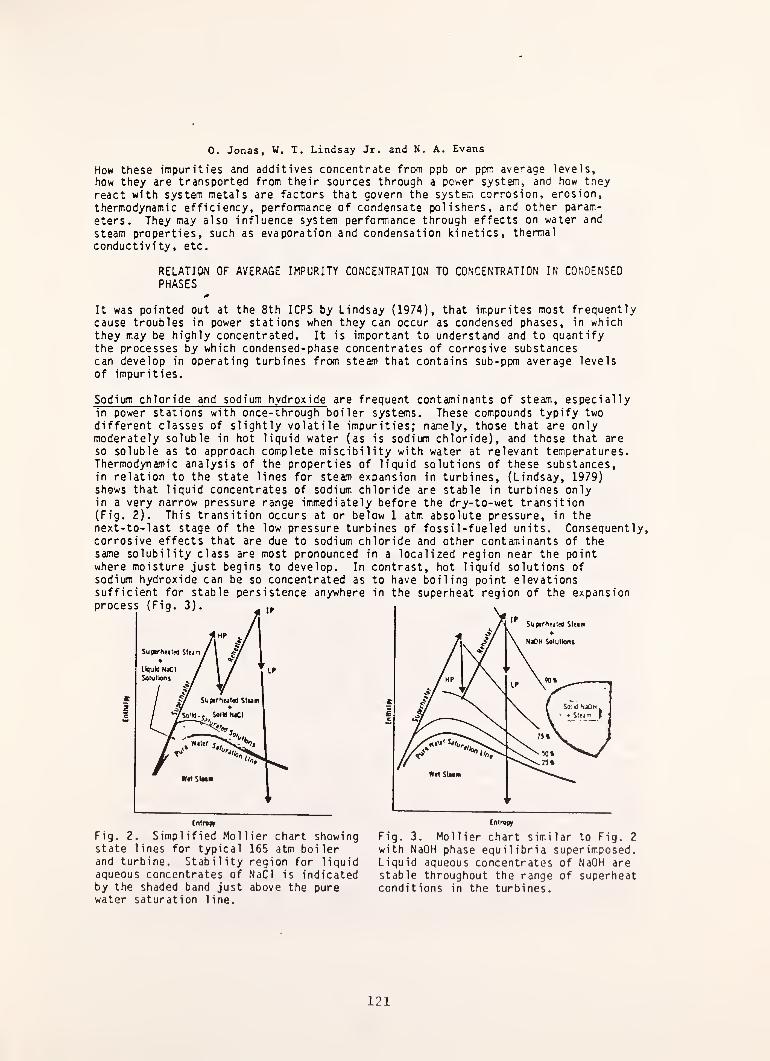
0. Jonas, W. T. Lindsay Jr. and N. A. Evans
How these impurities and additives concentrate from ppb or ppm average levels,
how they are transported from their sources through a power system, and how theyreact with system metals are factors that govern the syst&m corrosion, erosion,
thermodynamic efficiency, performance of condensate polishers, and other param-
eters. They may also influence system perfonriance through effects on water and
steam properties, such as evaporation and condensation kinetics, thermal
conductivity, etc.
RELATION OF AVERAGE IMPURITY CONCENTRATION TO CONCENTRATION IN CONDENSEDPHASES
It was pointed out at the 8th ICPS by Lindsay (1974), that impurites most frequentlycause troubles in power stations when they can occur as condensed phases, in whichthey may be highly concentrated. It is important to understand and to quantifythe processes by which condensed-phase concentrates of corrosive substancescan develop in operating turbines from steam that contains sub-ppm average levels
of impurities.
Sodium chloride and sodium hydroxide are frequent contaminants of steam, especiallyin power stations with once-through boiler systems. These compounds typify two
different classes of slightly volatile impurities; namely, those that are onlymoderately soluble in hot liquid water (as is sodium chloride), and those that are
so soluble as to approach complete miscibility with water at relevant temperatures.Thermodynamic analysis of the properties of liquid solutions of these substances,in relation to the state lines for steam expansion in turbines, (Lindsay, 1979)shows that liquid concentrates of sodium chloride are stable in turbines onlyin a very narrow pressure range immediately before the dry-to-wet transition(Fig. 2). This transition occurs at or below 1 atm absolute pressure, in thenext-to-last stage of the low pressure turbines of fossil-fueled units. Consequently,corrosive effects that are due to sodium chloride and other contaminants of thesame solubility class are most pronounced in a localized region near the pointwhere moisture just begins to develop. In contrast, hot liquid solutions ofsodium hydroxide can be so concentrated as to have boiling point elevationssufficient for stable persistence anywhere in the superheat region of the expansion
Fig. 2. Simplified Mollier chart showingstate lines for typical 165 atm boilerand turbine. Stability region for liquidaqueous concentrates of NaCl is indicatedby the shaded band just above the purewater saturation line.
Fig. 3. Mollier chart similar to Fig. 2
with NaOH phase equilibria superimposed.Liquid aqueous concentrates of NaOH arestable throughout the range of superheatconditions in the turbines.
121
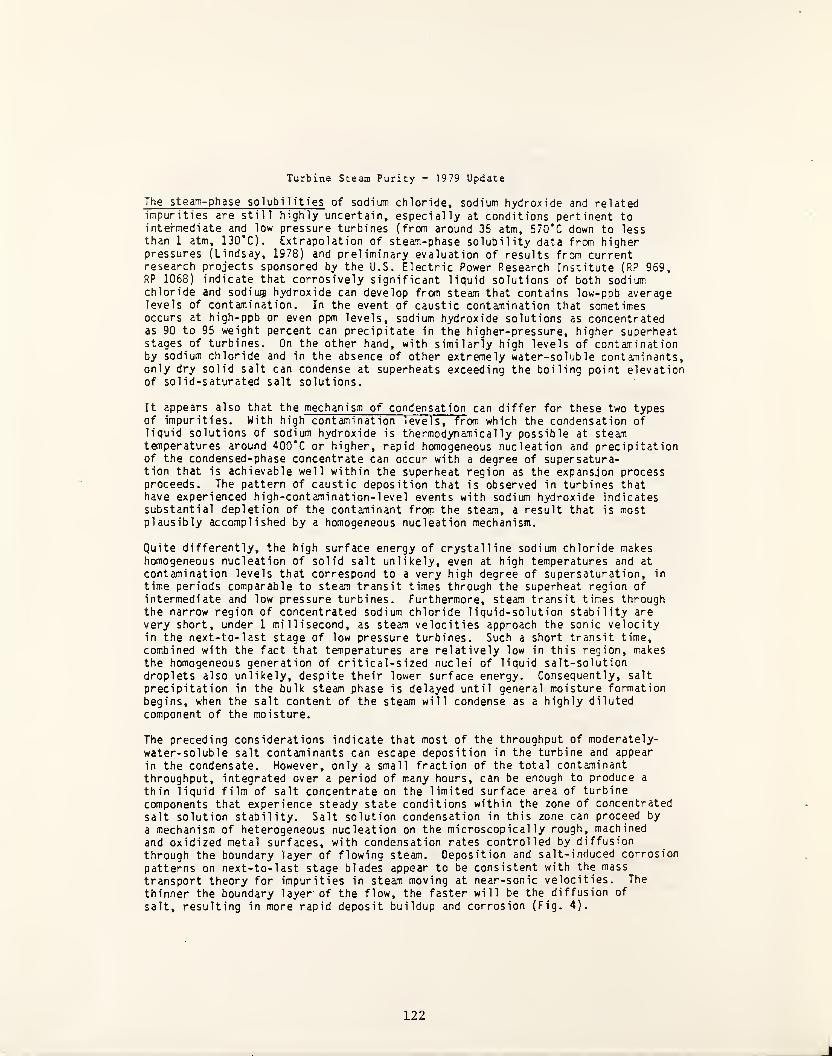
Turbine Steam Purity - 1979 Update
The steam-phase solubilities of sodium chloride, sodium hydroxide and relatedimpurities are still highly uncertain, especially at conditions pertinent tointermediate and low pressure turbines (from around 35 atm, 570*C down to lessthan 1 atm, 130*C). Extrapolation of steam-phase solubility data from higherpressures (Lindsay, 1978) and preliminary evaluation of results from currentresearch projects sponsored by the U.S. Electric Power Research Institute (RP 969,RP 1068) indicate that corrosively significant liquid solutions of both sodiumchloride and sodiu® hydroxide can develop from steam that contains low-ppb averagelevels of contamination. In the event of caustic contamination that sometimesoccurs at high-ppb or even ppm levels, sodium hydroxide solutions as concentratedas 90 to 95 weight percent can precipitate in the higher-pressure, higher superheatstages of turbines. On the other hand, with similarly high levels of contaminationby sodium chloride and in the absence of other extremely water-soluble contaminants,only dry solid salt can condense at superheats exceeding the boiling point elevationof solid-saturated salt solutions.
It appears also that the mechanism of condensation can differ for these two typesof impurities. With high contamination levels, from which the condensation ofliquid solutions of sodium hydroxide is thermodynamically possible at steamtemperatures around 400*C or higher, rapid homogeneous nucleation and precipitationof the condensed-phase concentrate can occur with a degree of supersatura-tion that is achievable well within the superheat region as the expansjon processproceeds. The pattern of caustic deposition that is observed in turbines thathave experienced high-contamination-level events with sodium hydroxide indicatessubstantial depletion of the contaminant from the steam, a result that is mostplausibly accomplished by a homogeneous nucleation mechanism.
Quite differently, the high surface energy of crystalline sodium chloride makeshomogeneous nucleation of solid salt unlikely, even at high temperatures and at
contamination levels that correspond to a very high degree of supersaturation, in
time periods comparable to steam transit times through the superheat region of
intermediate and low pressure turbines. Furthermore, steam transit times throughthe narrow region of concentrated sodium chloride liquid-solution stability are
very short, under 1 millisecond, as steam velocities approach the sonic velocityin the next-to-last stage of low pressure turbines. Such a short transit time,combined with the fact that temperatures are relatively low in this region, makesthe homogeneous generation of critical-sized nuclei of liquid salt-solutiondroplets also unlikely, despite their lower surface energy. Consequently, salt
precipitation in the bulk steam phase is delayed until general moisture formationbegins, when the salt content of the steam will condense as a highly diluted
component of the moisture.
The preceding considerations indicate that most of the throughput of moderately-
water-soluble salt contaminants can escape deposition in the turbine and appear
in the condensate. However, only a small fraction of the total contaminantthroughput, integrated over a period of many hours, can be enough to produce a
thin liquid film of salt concentrate on the limited surface area of turbine
components that experience steady state conditions within the zone of concentrated
salt solution stability. Salt solution condensation in this zone can proceed by
a mechanism of heterogeneous nucleation on the microscopically rough, machined
and oxidized metal surfaces, with condensation rates controlled by diffusion
through the boundary layer of flowing steam. Deposition and salt-induced corrosion
patterns on next-to-last stage blades appear to be consistent with the mass
transport theory for impurities in steam moving at near-sonic velocities. The
thinner the boundary layer of the flow, the faster will be the diffusion of
salt, resulting in more rapid deposit buildup and corrosion (Fig. 4).
122

0. Jonas, W. T. Lindsay Jr. and N. A. Evans
Fig. 4. Interferogram of flow through a cascade ofturbine blades. The boundary line is thinnestover the convex surfaces. Inlet Mach number
0.364, outlet Mach number 1.125.
Much additional data on both the thermodynamic and transport properties of steam
impurities are needed for a completely quantitative analysis of the processes
whereby ppm to ppb average levels of contaminants are transformed to corrosivelysignificant concentrates in turbines. Nevertheless, preliminary considerations,
based on limited data and supplemented by both theory and field observations, have
already provided useful insights that can help materials specialists, turbinedesigners, and plant operators in their efforts to reduce turbine corrosion.
CONDENSATION AND TRANSONIC FLOW
Additional effects are produced directly by the flow dynamics, since certainkinetic processes in high speed steam flow are too slow to maintain physical and
thermodynamic equilibrium. As an example, at sonic flow speeds, with steamconditions corresponding to the low pressure turbine steam, nucleation and
droplet growth rate are so slow that there is supersaturation until condensationavalanches at a theoretical moisture level of 3 to 4%, on the so called Wilsonline. Furthermore, at supersonic speeds, embedded shock waves will produce j'ump
increases in pressure, temperature, and density which affect not only contaminantsolution kinetics and concentration, but will also cause moisture re-evaporation.Recent observations in a one dimensional nozzle flow indicate that under certaincircumstances such re-evaporation can result in a significant fluid mechanicalinstability, with periodic destruction and re-establishment of both the shockwave and the condensation front (see sequence of shadowgraphs in Figure 5).
Steam for these experiments was generated in a recirculating boiler with moistureseparators, and was superheated by expansion through an orifice. Initially, theboiler was filled with de-ionized water without chemical additives. During theboiler operation with only occasional blowdown, impurities may have concentrated.
Nonuniformities in the three dimensional turbine flow may change or diminish theabove nonequilibrium phenomena. This remains to be investigated in a bladecascade and in a turbine. Investigation of effects of nonsteady relaxation willbe included because of its importance in localized blade corrosion by sodiumchloride, which appears in a narrow region at the condensation line.
123
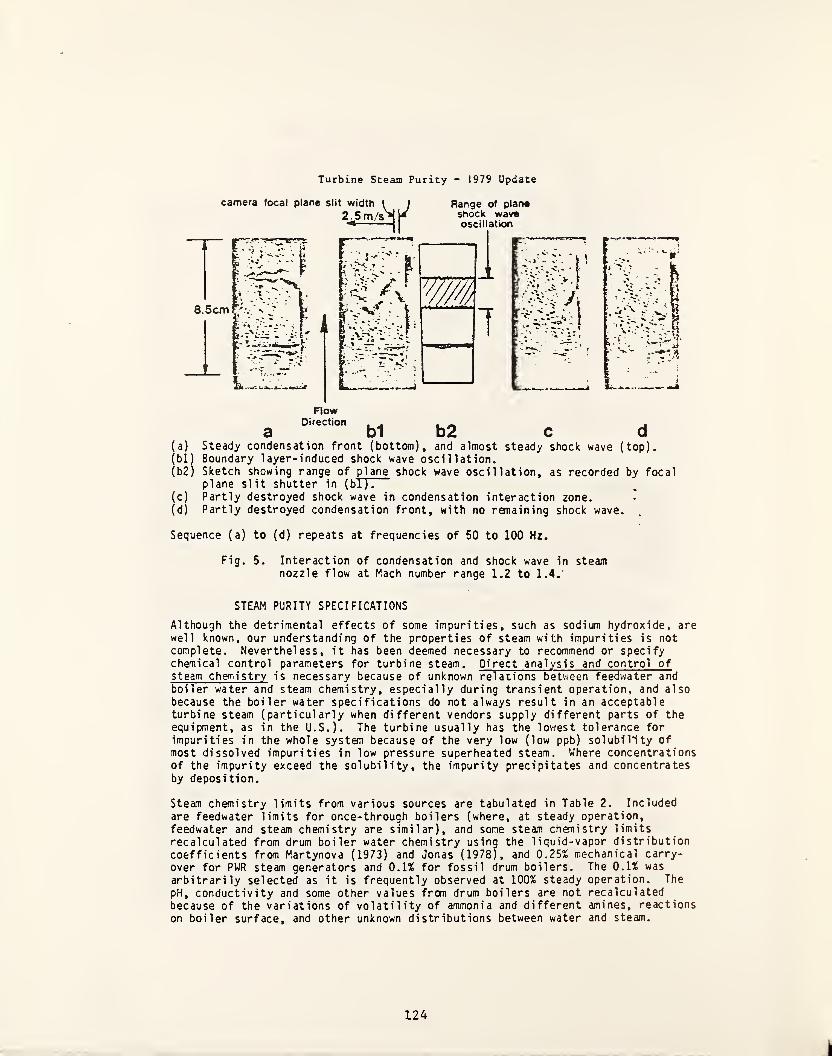
Turbine Steam Purity - 1979 Update
camera focal plane slit width
2.5 m/s J Range of planeshock waveoscillation
FlowDirection . ^ •
a b1 b2 c d(a) Steady condensation front (bottom), and almost steady shock wave (top),(bl) Boundary layer-induced shock wave oscillation.(b2) Sketch showing range of plane shock wave oscillation, as recorded by focal
plane slit shutter in (bTT^(c) Partly destroyed shock wave in condensation interaction zone.(d) Partly destroyed condensation front, with no remaining shock wave.
Sequence (a) to (d) repeats at frequencies of 50 to 100 Hz.
Fig. 5. Interaction of condensation and shock wave in steamnozzle flow at Mach number range 1.2 to 1.4.
STEAM PURITY SPECIFICATIONS
Although the detrimental effects of some impurities, such as sodium hydroxide, arewell known, our understanding of the properties of steam with impurities is notcomplete. Nevertheless, it has been deemed necessary to recommend or specifychemical control parameters for turbine steam. Direct analysis and control ofsteam chemistry is necessary because of unknown relations between feedwater andboiler water and steam chemistry, especially during transient operation, and alsobecause the boiler water specifications do not always result in an acceptableturbine steam (particularly when different vendors supply different parts of theequipment, as in the U.S.). The turbine usually has the lowest tolerance for
impurities in the whole system because of the very low (low ppb) solubility ofmost dissolved impurities in low pressure superheated steam. Where concentrationsof the impurity exceed the solubility, the impurity precipitates and concentratesby deposition.
Steam chemistry limits from various sources are tabulated in Table 2. Included
are feedwater limits for once-through boilers (where, at steady operation,feedwater and steam chemistry are similar), and some steam chemistry limits
recalculated from drum boiler water chemistry using the liquid-vapor distribution
coefficients from Martynova (1973) and Jonas (1978), and 0,25% mechanical carry-
over for PWR steam generators and 0.1% for fossil drum boilers. The 0.1% was
arbitrarily selected as it is frequently observed at 100% steady operation. The
pH, conductivity and some other values from drum boilers are not recalculated
because of the variations of volatility of ammonia and different amines, reactionson boiler surface, and other unknown distributions between water and steam.
124
I
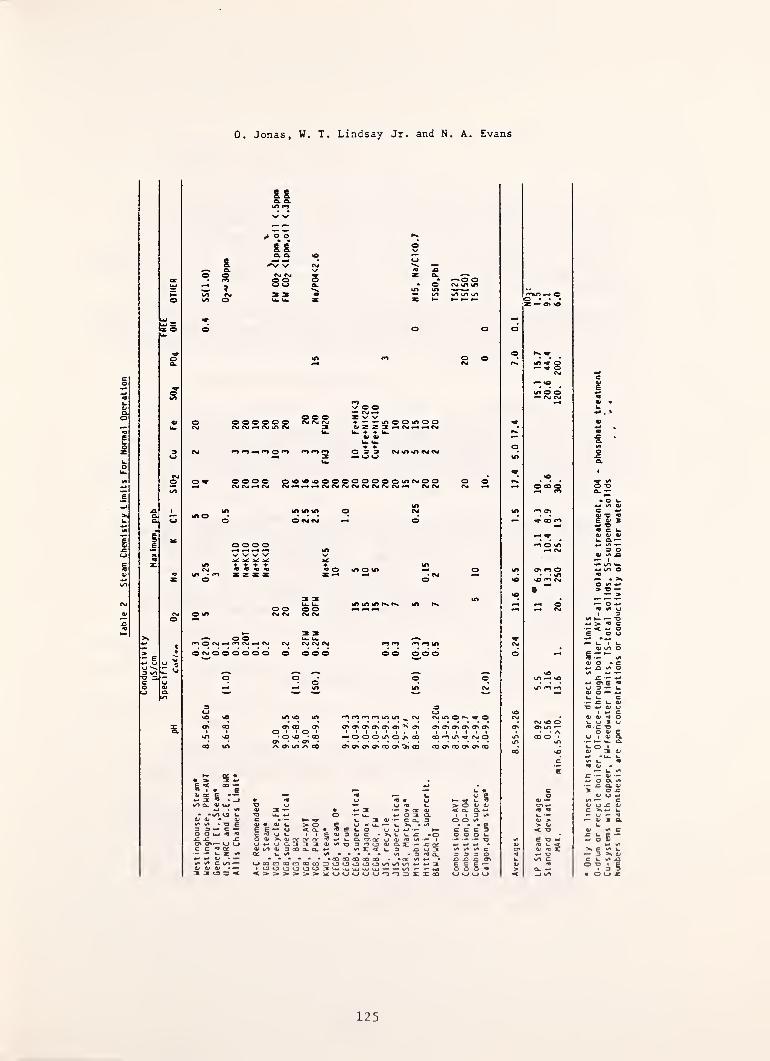
Table
2
Steam
Chenlstry
Umlts
For
Nonndl
Operation
0. Jonas, W. T. Lindsay Jr. and N. A. Evans
3
S.
" i
g.g.o. a,I/) fn
o. a
<M «VJo oo o
o o o o o o(NJ (NJ *>4 CM CN4
V O O-• CM ^* S/ V'— -^u^OOM^OO0;z Z 3^CM^^CMW 4' Cb
4)
O CM CM
^ ^ ^ ^4- 4-
« ^ ^
in o*) r>«» ^
OCMOOOOOOCM CM CM
o o dc^ »n
odd
in io <n
o 7 ? o ?. o 'CO
av • • o> •
^ ^ in /\ 00
^ in in ^ ^^ ^ O' O' ^ O'
•^ooonoj'coOVC^OiOiCOOi^CO
CM in o ^ O
00 in ^ CM oCO ^0 CO
Sf .
25 §m a. 0^
5LGO —
S
3 3 —o o uiJZ .cO' OT^ <
c c (
•— — L. ;W W QJWi </* C *
0» OiX 3 o ;
-QU.W o W030.C ••— t— ^ U 3<V->-CC^3
f«0>u >0 C UKi^—e— C» <Ou« ^guo UW«-»-»- -•^uu t i£o;3a»c *ooo;>ta<ceocQe^«-*^Q.^Qeijii'^'Ci'»- io«-»uc*J33 300 a.iQ.1— £q:<L«n<u3coa.a.w i^x<w3 nu3
OC l.*/' m m » m m• ••-•••CDCOCOCOffl -•QCW'W •
ooocacocsaoco3ooooOinin«nw«-«3I 0000003wuJUjiaJixj — —
w 6^ i- ^
» o Qj 0;«t Q. Q. w
I • 3O O V'
C C C So o o ^— •— •'* -O
cnin •- OO • • •
Z Oi
'CZS
tn O'
^ CO
O' cn o• . vn
iO m CM
n ^ <n
n m
GjO' w^ <9
e -o «<r> ^Oj >0 Xw o<n c
f9
Q. w
125
•
Only
the
lines
with
astenc
are
direct
steam
limits
0-drum
or
recycle
boiler,
OT-once-throuqh
boiler,
AVT-all
volatile
treatment,
P04
-
phosphate
treatment
Cu-systens
with
copper,
FU-feedwater
limits,
TS-total
solids,
SS-suspended
solids
w
«
hmbers
In
parenthesis
are
ppm
concentrations
or
conductivity
of
boiler
water
*
'

Turbine Steam Purity - 1979 Update
In addition to the individual steam, feedwater and recalculated recycle boilerspecifications, relevant averages and results of an experimental field steamsampling program (averages and maxima at steady load) of fourteen different LP
turbines are given in Table 2. Fossil (drum and once-through ) and PWR units weresampled, and the samples were analyzed by ion chromatography. pH was measured by
a pH electrode, silica was analyzed by colorimetry, and oxygen by the indigo-carminemethod.
w
The compilation of different specifications in Table 2 shows that, for most fossiland PWR systems, pH, cation conductivity, oxygen, sodium, silica and copper limitsare similar. There is, however, a great variation in allowable chloride and iron,
and some steam chemistries resulting from feedwater specifications may not be
good enough for the turbine.
DISCUSSION
The chemical composition of industrial "pure" H2 O can be very complex. It is
not unusual to find low concentrations of more than fifteen chemicals in thewater and steam of one power system. As shown in this paper, the variety of
compositions found through the power industry is almost endless. In addition to
the chemical variations, there are changing thermodynamic conditions of water and
steam, particularly in the turbine.
The question arises whether a "rational" control of water and steam chemistry(based on chemical thermodynamic data), which would result in 30 to 50 yeartrouble-free service of the equipment, is possible. Anyway, very little chemical
thermodynamic data are available right now to support fully "rational" control.
The other principal approaches to chemical control are:
. Operation to the best achievable purity, which md^ cost too much.
. Operation based on analysis of experience, which may take too much time
to acquire.. Operation with chemical additives, such as low level phosphates in drum
boilers (it is not so clear what additives should be used in once-through and
PWR steam systems).. Operation by any control method, plus cleaning, plus provision of spare parts,
plus use of more corrosion resistant materials.
For the current steam chemistry control, particularly under the U.S. conditions
and practices, a mixed approach, such as in Table 3 is recommended.
TABLE 3 Recommended Mixed Approach for Steam Chemistry Control
"Rational": Concentration of chemicals below solubility in dry steam,
optimum pH and O2 .
Best Achievable: Control of condenser leaks and air inleakage, polisher
operation in H-OH form, pure water treatment chemicals.
Experience: Cation conductivity <0.2 pS/cm, O2 < 10 ppb,
Na < 5 ppb, Si 02 = 10 to 20 ppb; GOOD
Systems with Cu, AVT; NOT SO 6000
Drum boilers with low PO4 ; GOOD
Once-through systems more sensitive
126

0. Jonas, W. T. Lindsay Jr. and N. A. Evans
. Additives: PO4 ,AVT additives ?
Cheiants - problems in high P,T unitsNeed higher pH in low pressure turbines
. Turbine Washing: By wet steam immediately after contamination.Clean the whole system
Spare Parts: Yes
*
As more relevant data become available, better steam chemistry control limits
will be formulated on the rational basis. To speed up this process, measurementsof behaviour of water and steam with impurities and additives in actual turbines,
or under closely simulated turbine conditions, are necessary. The equilibriumdata measured so far are only a background. Needed measurements include in situ
conductivity, pH, oxygen, moisture and redox potential monitoring.
CONCLUSIONS AND RECOMMENDATIONS
1. Even without any further research on chemical thermodynamics of steam withimpurities, most of the turbine corrosion problems can be eliminated bybetter control of impurity ingress through condenser and air inleakage, ?-
better performance of condensate polishers, and control of purity of watertreatment chemicals. Designing with low stresses, proper system design, and
system materials selection would all further improve the situation. Proofof this is the successful operation of many turbines, particularly in
England, Germany and Japan.
2. Better basic understanding (currently insufficient) would allow optimizationof the water chemistry control practices, long time corrosion damage predic-tions, and improved design.
3. Current research, while necessary, bears little relevance to the complexchemical and thermodynamic situation in a turbine. It should be extended tocover a study of precipitation, deposition and washing in actual turbines,“in situ" identification of steam impurities, a study of steam and watersampling techniques, and a three-dimensional study of condensation and
transonic flow.
4. Current steam purity specifications and recommendations, while not absolutelyaccurate, are necessary for better control of turbine corrosion. Theyshould be improved as better data and/or experience are available.
REFERENCES
Jonas, 0., (1978). Turbine steam purity. Combustion, 50 , No. 6 ,
11-27.Bussert, B.W., R.M. Curran and G.C. Gould, ( 1978) . The effect of water chemistry
on the reliability of modern large turbines. ASME Paper No. 78-JPGC-Pwr-9,1 - 6 .
Pocock, F.J., (1979). The importance of understanding the steam environment.9th ICPS, Munich.
Rice, J.K., and T.O. Passell, (1978). Determination of impurities in steam -
a research program. Proc. 39th Int. Water Conf. (Pittsburg h). 11-20. EPRI,(1979). Workshop on Steam Purity For Turbine Protection (Charlotte, N.C.).EPRI, (1979). Workshop on Corrosion Fatigue of Steam Turbine Blading Alloys(Ismaning, DBR).
127

Turbine Steam Purity-1979 Update
V6B, (1973). Guidelines for the Feedwater and Boiler Water of Steam Water TubeBoilers with more than 64 bars Operating Pressure (VGB-Richtlinien fur dasWasser in Kernkr aftwerken mit Leichtwasser-reaktoren) . VGB-Kraftwerks-TechnikMitteilungen, 52(2) , 167-172.
VGB, (1973). Guidelines for Water in Nuclear Power Plants with Light-WaterReactors, (Neue Richtlinien fur das Kessel spei swasser und das Kesselwasser vonOampferzeugern) . VGB-Kraftwerks-Technik Mittei lungen
, 53(4) , 207-209.CEGB, (1975). Chemical Control of Boiler Feedwater, Boiler Water and Saturated
Steam for Drum-type aiyl Once-through Boilers. General Operation Memorandum 72.
Martynova, 0. I . , (1972). Das Verhalten von Korrosionsprodukten in Wasser-Dampfkreisl aufenbei Hohen Temperature. VGB-Spei sewassertagung , 8.13.
Jonas, 0., (1973). Survey of steam turbine deposits. Proc. 34th Internate WaterConf. (Pittsburgh)
, 73-81.
Jonas, 0., (1977). Identification and behavior of turbine steam impurities.Corrosion 77, NACE (San Francisco) , Paper No. 124.
Kirsch, H., and S. Pollann, (1968). Deposition of corrosion products in thewater steam cycle of steam generating plants. Chemie-Ingenieur Technik, 40,897-903.
Martynova, O.I., and B. S. Rogatskin, (1970). Deposition of salts and corrosionproducts in supercritical turbine flow sections. Teploenergetika
, 17 ,50-54.
Lindsay, W.T., Jr., (1974). Some examples of physical-chemical processesoccuring in the water and steam of power stations. Proc. 8th InternationalConf. on Properties of Steam (Giens, France) , 713.
Lindsay, W.T., Jr. (1979). Behavior of impurities in steam turbines. PowerEngineering, 83 , (No. 5), 68-72.
Lindsay, W.T., Jr. (1978). Physical chemistry of impurities in steam turbines.Paper presented at Westinghouse Steam Turbine-Generator Technology Symposdium(Charlotte, N.C.).
EPRI Project RP 969, Prof. L. B. Rogers, University of Georgia, Athens, Georgia(EPRI Project Manager, Dr. T. 0. Passell).
EPRI Project RP 1068, Babcock & Wilcox Research Center, Alliance, Ohio and
General Elecric Co., Schenectady, N.Y. (EPRI Project Manager, Or. T.O. Passell).Martynova, O.I., (1973). Solubility of Inorganic Compounds in Subcritical
and Supercritical Water. Conf. on High Temp. High Pressure Electrochemistryin Aqueous Solutions. (Surry), Preprint C-2.
128
STEAM PURITY ANALYSIS INSTRUMENTATION FOR TURBINES AND POWER PLANTS
W. M. Hickam, S. H. Peterson, D. F. Pensenstadler , and J. C. BellowsWestinghouse Research & Development Center
Pittsburgh, Pennsylvania 15235
ABSTRACT
Organizations responsible for the generation of the nation's
electricity recognize the necessity of steam/condensate chemistry
control in plant operation in order to minimize chemical corrosion-
related component failures. In order to better determine and control
the steam purity in operating turbines and power plants, instrumented
analysis methods and systems have been developed and applied in plant
tests. The developments include the following: (1) Ion chromatograph
for steam/condensate analysis; (2) On-line steam analyzer system for
continuous monitoring of turbine steam; and (3) Computerized systems for
data collection, analysis, graphing, and storage. Each of the instru-
mented systems will be described and results presented on their use in
assessing the* steam/condensate chemistry of operating power plants.
* Current address: Westinghouse Steam Turbine Generators Division,Philadelphia, PA.
129

INTRODUCTION
Power plants continuously recycle water between the condensate
and steam phases for use as an intermediate energy transport fluid. The
condensate/steam cycle which couples the thermal energy supplied by
fossil or nuclear fuel to the generator electrical output via steam
turbines is a highly complex chemical process. In many plants this
process utilizes pressure changes greater than 2000 psi and temperature
changes greater than 900°F in the reprocessing of millions of pounds per
hour of steam/condensate—the largest volume of the highest purity
material processed today. In addition to purity control, the process
requires precise control of additive chemistry.
Failure to maintain a high purity and controlled chemical
environment within operating plants will accelerate component corrosion,
a major cause for turbine failures. It is imperative that both the
man*ifacturer and the operator of power plants J^e fully cognizant of the
steam/condensate chemical control constraints in order to achieve high
turbine reliability and availability.
This paper will describe power plant instrumentation and instru-
mental methods for use in power plants to analyze and monitor the
steam/condensate. It will encompass steam/condensate criteria,
instrumentation development, plant testing of instrumental analysis
systems, plant test results and conclusions, and identify
product/services deemed beneficial to operators of power plants.
STEAM PURITY CRITERIA
Corrosion related turbine component failures have increased over
the past fifteen years. (1) The turbine components experiencing chemical
attack include blades, tenons, shrouds, blade lashing, piping, expansion
bellows, and disks. However, examination of turbine operating histories
130
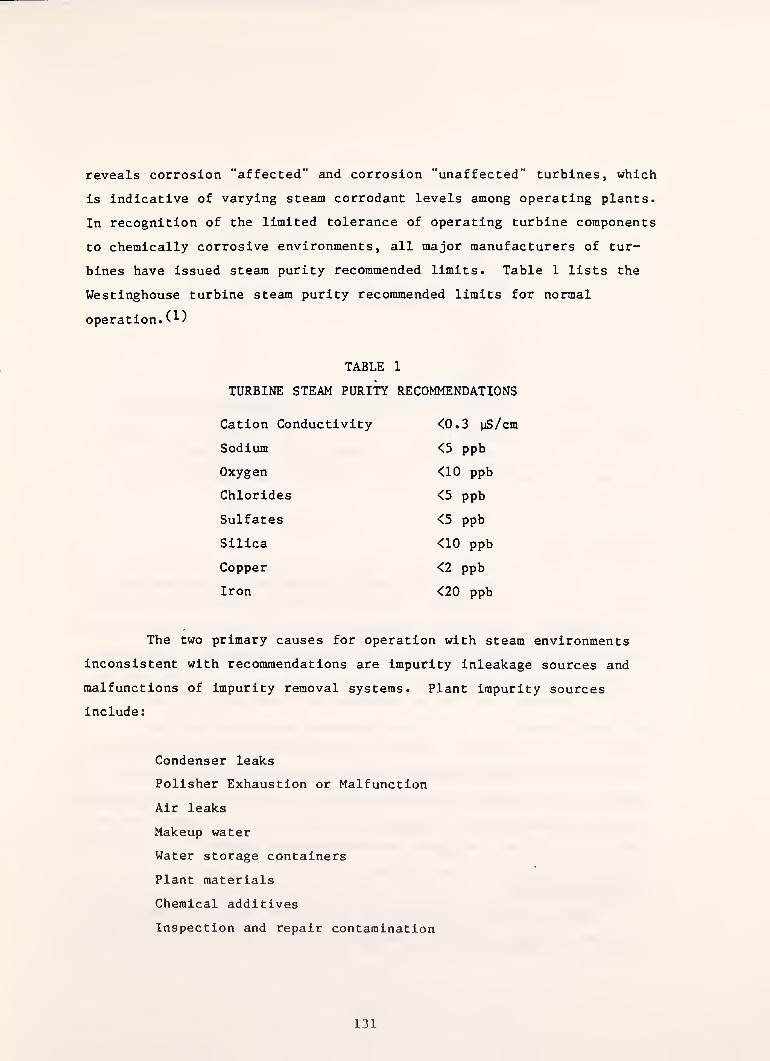
reveals corrosion "affected" and corrosion "unaffected" turbines, which
is indicative of varying steam corrodant levels among operating plants.
In recognition of the limited tolerance of operating turbine components
to chemically corrosive environments, all major manufacturers of tur-
bines have issued steam purity recommended limits. Table 1 lists the
Westinghouse turbine steam purity recommended limits for normal
operation.
)
TABLE 1
TURBINE STEAM PURITf RECOMMENDATIONS
Cation Conductivity <0.3 yS/cm
Sodium <5 ppb
Oxygen <10 ppb
Chlorides <5 ppb
Sulfates <5 ppb
Silica <10 ppb
Copper <2 ppb
Iron <20 ppb
The two primary causes for operation with steam environments
inconsistent with recommendations are impurity inleakage sources and
malfunctions of impurity removal systems. Plant impurity sources
include;
Condenser leaks
Polisher Exhaustion or Malfunction
Air leaks
Makeup water
Water storage containers
Plant materials
Chemical additives
Inspection and repair contamination
131
Assurance of the functionality of impurity removal systems is
essential and includes:
Polishers
Blowdown
Moisture separators
Exhaust pumps
Deaerators
Filters
Plants operating free of impurity inleakage sources and with
fully functional Impurity removal systems maintain steam environments
consistent with the steam purity recommendations and evidence little or
no significant corrosion of turbine components over many years of
operation.
INSTRUMENTATION
Our instrumentation development program has focused on plant
monitoring and analysis needs for better defining and maintaining the
steam/condensate environment to minimize corrosion risks. Continuous
monitors were preferred but where they were not available, grab sample
analysis methods were developed. Table 2 lists typical plant chemical
control parameters analyzed by continuous monitors and by laboratory
grab sample analysis. An on-line steam analyzer system has been
developed for the control parameters designated (o) under Continuous
Analysis and ion chromatographic methods for similarly designated
parameters listed under Laboratory Analysis. Automated methods of data
recording, analysis, and graphing by computer techniques have been an
integral part of the instrumentation development program.
Ion Chromatography
Small, Stevens, and Bauman^^) of the Dow Chemical Company were
the first to report the development of ion chromatography in 1975, and
132

TABLE 2
CHEMISTRY CONTROL PARAMETERS
Continuous Analysis
o pH
o Specific Conductivity
o Cation Conductivity
o Sodium
o Oxygen
o Chloride
Ammonia
Hydrazine
Silica
Air
Hydrogen
Carbon Dioxide
Laboratory Analysis
o Sodium
o Chloride
o Sulfate
Phosphate
Silica
Iron
Copper
Organics
pH
almost simultaneously Dionex introduced a commercial instrument based on
this development. Ion chromatography combines new separator ion exchange
resins with a unique suppressor column/conductivity cell detection
system to achieve cation or anion analyses. The electrical output
consists of time dependent conductivity signals, identifiable with
specific cations or anions, for which the peak, heights are a linear
function of concentration.
The early instruments made possible, for the first time, the
direct analysis of cations and anions in water at a concentration level
of one part per million. Through the combined instrumentation develop-
ments of Dionex and methodology developments of Westlnghouse, a useful
sensitivity of one part per billion was achieved for the first time in
the laboratory for sodium, chloride, and sulfate in 1977.^^^
In order to make available to power plants this newer and needed
capability for analyzing steam/condensate samples, the remote analysis
of grab samples collected from power plants and the use of the Ion
chromatograph in a power plant environment were investigated.
133
Today, the collecting of condensate samples at a domestic power
plant, their shipment by commercial carriers, and analysis at a remote
laboratory is a fully-tested and practical methodology. In addition,
its use in servicing the needs of plants around the world is under
consideration.
The first use of the ion chromatograph in a power plant environ-
ment for steam/condensate analysis was at the Commonwealth Edison
Kincaid plant in a Westinghouse-conducted test in June, 1978. Through
this and other plant tests the ion chromatograph was demonstrated to be
acceptable for use in a power plant environment and to have operator
requirements consistent with typical plant staffing capabilities.
Today, some seventy-five utilities in the United States and throughout
the world have in-house capabilities for ion chromatographic analysis of
steam/condensate samples and the usage is growing rapidly. Figure 1 is
a photograph of a Dionex ion chromatograph equipped for simultaneous
anion and cation analysis.
STEAM ANALYZER SYSTEM
A steam analyzer system has been developed for continuously
monitoring the steam entering turbines. The system consists of a steam
sampling nozzle, valve, sample condenser, and analyzer cabinet equipped
with both multipoint chart and magnetic tape cassette recorders. The
system provides continuous analysis for pH, specific and cation
conductivities, oxygen, and sodium. It also provides a record of time,
sample temperature, plant load, and turbine identification. The system
is designed to accommodate a chloride monitor which is being evaluated.
Figure 2 is a flow diagram of the steam analyzer/data reduction system.
Photographs of the sampling nozzle/steam valve, sampling condenser, and
analyzer system are shown in Figures 3, 4, and 5.
Computer software and hardware systems have been developed for
processing data logged on tape cassettes. A data processing facility
equipped with tape reader, minicomputer, video display tube, terminal
and printer has been established and is shown in Figure 6. The data are
134

sent to a Univac 1100 computer which provides data analysis, graphing,
reporting, and data storage.
PLANT TESTS
Both ion chromatography and the continuous steam analyzer system
have been extensively tested in analyzing power plant steam/condensate
environments. Two types of plant tests have been developed for this
purpose. One test utilizes only the continuous steam analyzer system
and the second, identified as a total plant survey, includes the use of
the steam analyzer, two ion chromatographs and existing plant chemical
instrumentation.
Steam Analyzer System Plant Test
A steam analyzer plant test, including planning, conducting
test, and reporting typically requires an elapsed time of 6-9 months.
The major steps for conducting this test are:
Plant selection criteria
Customer test proposal and acceptance
Site preparation and analyzer installation
3-6 months monitoring of turbine steam; data transfer
Data analysis and reporting
Follow-up visits
Site preparation includes nozzle Installation and requires plant shut-
down. Data transfer for computerized processing is by mailed tape
cassettes.
The first steam analyzer Installation for conducting a plant
test was completed in November, 1977. Since that time, eight analyzer
systems have been used at twenty-three plant sites In the steam
monitoring of twenty-eight turbines. Table 3 lists the analyzer number,
test period, plant site, and unit number for these tests. All plants
listed are fossil plants, except for Turkey Point, Beaver Valley and
Indian Point, which are nuclear plants.
135
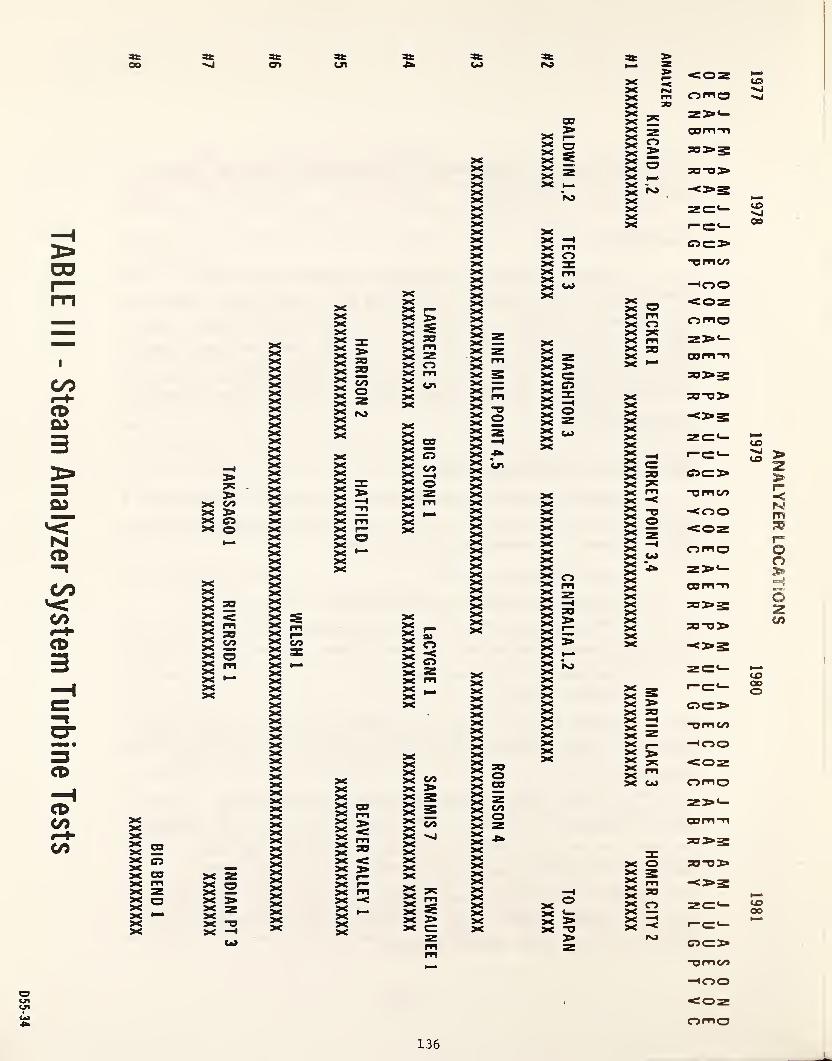
TABLE
III
-
Steam
Analyzer
System
Turbine
Tests
IXI
OO% %
o>
X —XX
XX aX o
X SX <>< mX -HX ^X _X °
XX
X zX oX —XX 2XX "OX -HCO
XXXXXXXXXXXXXXXXXXXXXXXXXXXXXXXX €X r-X t/»
X ^X »—XXXXXXXXXXXXXXXXXXXXXXXXXXXXXXX
%CJ1
XXXX 2X 5X 2X j/5
X ^X «X roXX
XXXX 2s >X Z!X mX r—X og -XX
XXX t—X 3>
X ^XX zX oX mXX
XX 00
X «55 55
X gXX H-XX
XXX CO
gsXX ^X <55 ^X r—X mX -<X ^XX
c/>
XXXXXX ^X ^X ^55X ^XXXXXXX mX 12X sX I>X c=
% %CO fS> z
X -<coz
XX P»Jm omoX so
00XX X 2!><—
X ^ XX z OOm ~n
X 55 o55 s
XXXo x^S
XX X =X ^ XXo xx>
XX X XX Kj -C>3X ro XX X zc:«—X XX XX XXX X —<X mX X o
“om c/3X X acX X mXX 55 u, —tooX X <ozXX
XX oXX
XX mo omoXX 2 X
XX Xm ZSbt—X X X 50X m X =2 X commX X 3> XX s X c: x>3X X ciXX m X ^X ^ X xx>XXX
“Oo 55 oX ZXXX -<J>3
XX mm^X OJX XXX X XX XXXX
«1 XXX OOX XXX XX
XX m-<
X X X “O -<ooX X X oXX XXXX coz
XXXXXX
XXX-HCO
omoXXXXXXXXX
XX oX mX SX ^X =X SX >X [Z
XXXXXXXXX
JFMA
AEAP
NBRR
X 3>XXX -<3>3X ^
XXXXX
XXXXXXXXX s
3>
JJA
uuu
NLGX X X X
XXXXXX
XXX—
<
mm CO
X X X —tooX X X 3>XXXX
?oo00
X XXXXXmCO
cozomo
XX z Z3>«—X COXX oz commXX 4b xl»3XX z xxs*X X oX X ajXXXX X ®
XXXXmXo
-<>3
X X *— XXX X J>X -oXX -< •-<=«-
x» rvj OC=mm CO
—too, coz
Omo
t©
CD«*JOO
CO
>-<fS!m
oo•H
ozCO
CDOOo
CDOO
136
Total Plant Survey
In order to better define the chemical conditions of the
steam/condensate cycle, and, when needed, the corrective action
requirements, a Total Plant Survey Test was developed. In this test the
condensate and the steam from 6-10 sampling points are analyzed using
both grab sample analysis and continuous monitors. Some of the require-
ments for conducting the test are:
Staff: 10
Duration: 7 Days
Plant Operation: Base Load, Cyclic Load, Shutdown, Startup
Equipment: Steam Analyzer System
2 Ion Chromatographs
Plant Instrumentation
Information gathered during the test includes:
Steam analyzer record for turbine steam
Cation and anion analyses of 250 grab samples
Periodic readings of 25 plant instruments
The extensive information gathered under various plant load
conditions provides a basis for assessing the steam/condensate environ-
ment. In plants found to be operating outside recommended turbine steam
purity limits, analysis of the data serves to identify causes and
established corrective action requirements. Total plant surveys have
been conducted for:
Kincaid Unit IH
Decker Creek Unit
Big Stone Unit //I
Takasago Unit //I
Riverside Unit //I
Lacygne Unit //I
137

The listing includes both drum and once-through plants and plants which
have and have not experienced turbine corrosion.
RESULTS
In order to better reduce and interpret the significance of the
large amount of data collected from steam analyzer system plant tests
and total plant surveys, it was necessary to develop computerized
methods of data analysis and graphing. Two plants tested were selected
to illustrate the steam/condensate conditions found.
Figure 7 is computer-graphed data from the steam analyzer
monitoring low pressure turbine steam of plant #1. Each of the moni-
tored parameters are plotted for daily high, daily low, and dally average
values. The average values are connected with a solid line. The straight
solid lines displayed on the cation conductivity, sodium, and oxygen plots
are the Westinghouse recommended limits for normal operation. The daily
highs and lows of the load plot indicate that the plant is used for load
following. The large differences in the highs and lows for cation conduc-
tivity and sodium plots indicate chemical excursions, likely associated
with load changes, and suggest a large impurity deposit inventory in the
steam/condensate system.
Concurrent with steam analyzer system data collected in plant
#1, some 250 grab sample analyses were performed by ion chromatography.
Figure 8 is a computer-plotted graph of distributions found in the
sodium, chloride, and sulfate analyses of the condensate and steam
samples. The graph shows that a significant fraction of the analyzed
samples exceed 5 parts per billion of the three impurities. Turbine
corrosion problems have been experienced in this plant.
A total plant survey similar to that conducted at plant #1 was
also conducted at a second plant identified as plant #2. Figure 9 is a
computer plotted graph of the steam analyzer data. The load graph shows
that this plant also is operated as a load following plant. Note the
small differences in daily highs and lows of monitored chemical
138
parameters and the magnitudes of the cation conductivity and sodium
levels found compared to the recommended steam purity limit lines.
Over two-hundred grab samples from plant #2 were analyzed by ion
chromatography for sodium, chloride, and sulfate. Figure 10 is a plot
of the analysis of samples collected from the condensate pump discharge
during the same time period as shown in Figure 9. All values are well
below the Westinghouse recommended steam purity limits for these
condensate samples as was found for all steam/condensate sampling
points. This turbine has experienced no corrosion failures over several
years of operation.
CONCLUSIONS
The steam/condensate instrumentation and analysis methods
developed and evaluated through extensive testing at operating fossil
plants have served to better define the operating environment of
individual plants and the steam/condensate environment differences in
plants. Both the steam analyzer plant tests and the total plant survey
tests have provided information, whereby recommendations and corrective
action steps for improving the steam environment could be made. Plants
incorporating into their operations the instrumentation and methodolo-
gies described, namely, ion chromatographic analysis of grab samples,
steam analyzing system, and computerized data analysis, all of which are
currently available as products and services, can better maintain a
steam/condensate environment consistent with good chemical plant
practices.
The information gained through the analysis of the
steam/condensate environment of nearly thirty operating plants can be
summarized as follows:
Turbine steam purity recommended limits for normal operation are
achievable during plant operation at all loads.
139
Turbine steam purity recommended limits are exceeded in many
operating plants.
Operation within the steam purity recommended limits for normal
operation will reduce turbine corrosion failures.
ACKNOWLEDGMENT
The electric utilities' permission to monitor their plants and
the assistance provided by their staffs in conducting the listed plant
tests is gratefully acknowledged.
Several engineers and technicians of both the Steam Turbine
Generators Division and the R&D Center participated in the numerous
plant tests reported. Their contributions to and support of the program
described is acknowledged.
140
REFERENCES
1. Turbine Steam Purity. 0. Jonas. Southeastern Electric Exchange,Washington, D. C. (1978).
2. Novel Ion Exchange Chromatographic Method Using ConductimetricDetection. H. Small, T. Stevens, and W. Bauman. Anal. Chem.
, 47,
1801 (1975).
3. Characterization of the Steam Turbine Chemical Environment. G. L.
Carlson. Westinghouse Steam Turbine Generator Technology Symposium,Charlotte, N.C. (1978).
4. Steam Purity Monitoring for Turbine Corrosion Control: A TotalPlant Survey. S. H. Peterson et al. Paper No. IWC-79-26,International Water Conference, Pittsburgh, Pa.
,November, 1979.
5. Steam/Condensate Chemical Maintenance and Control in Power PlantOperations. W. M. Hickam et al. Paper No. IWC-80-18, InternationalWater Conference, Pittsburgh, Pa.
,October, 1980
141

Ipl? 'iil'tat^no:T ’,r^.
Si
'*"44*
.j .» . . snA«?«)’UV;r4*-^i/>»04(ifl#>{l^ ‘|ifw*Xc**R^
‘ - • »'ipil^'Wwiv jf.
*ov - i«r.i 13«i
,
• •of ' '^1 ^
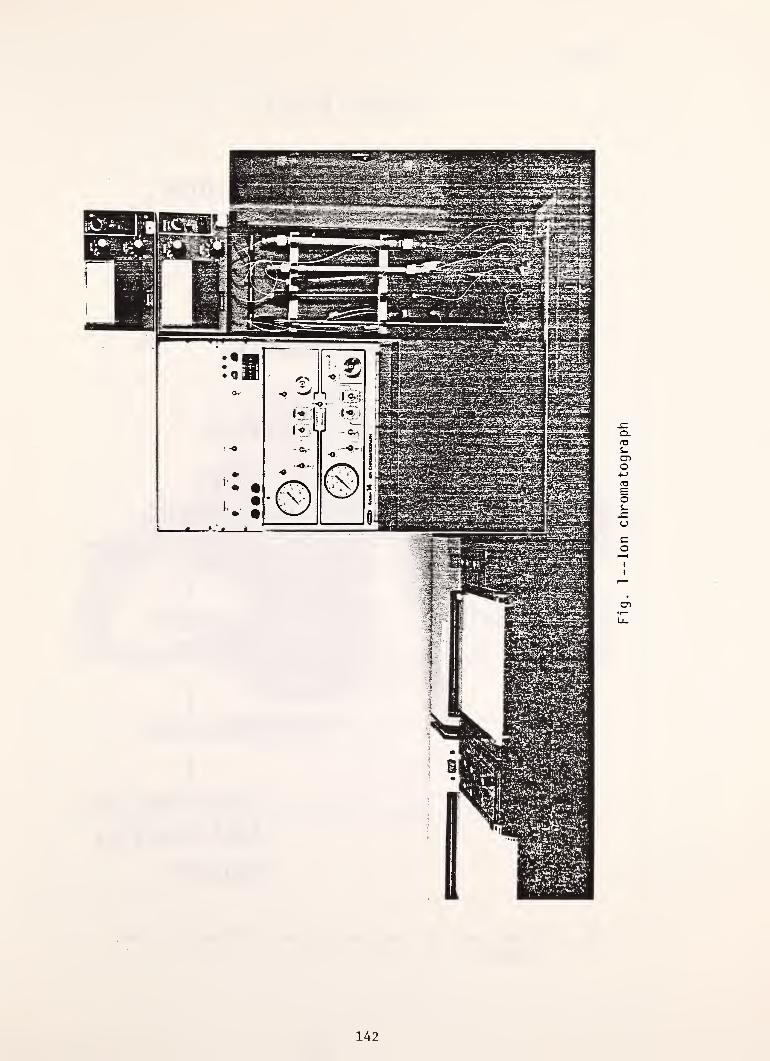
142
Fig.
1—
Ion
chromatograph

D20-60
Power Plant
1
Low Pressure Steam Turbine
Steam Sample Nozzle
Sample Condenser
Steam Purity Analyzer
Strip Chart Magnetic
Recorder Tape Recorder
i
Steam Purity Magnetic
Record Tape Reader
CompL\
Data Graphing
And Analysis
Reports
Fig. 2--F10W chart for steam analyzer and information output
systems
143
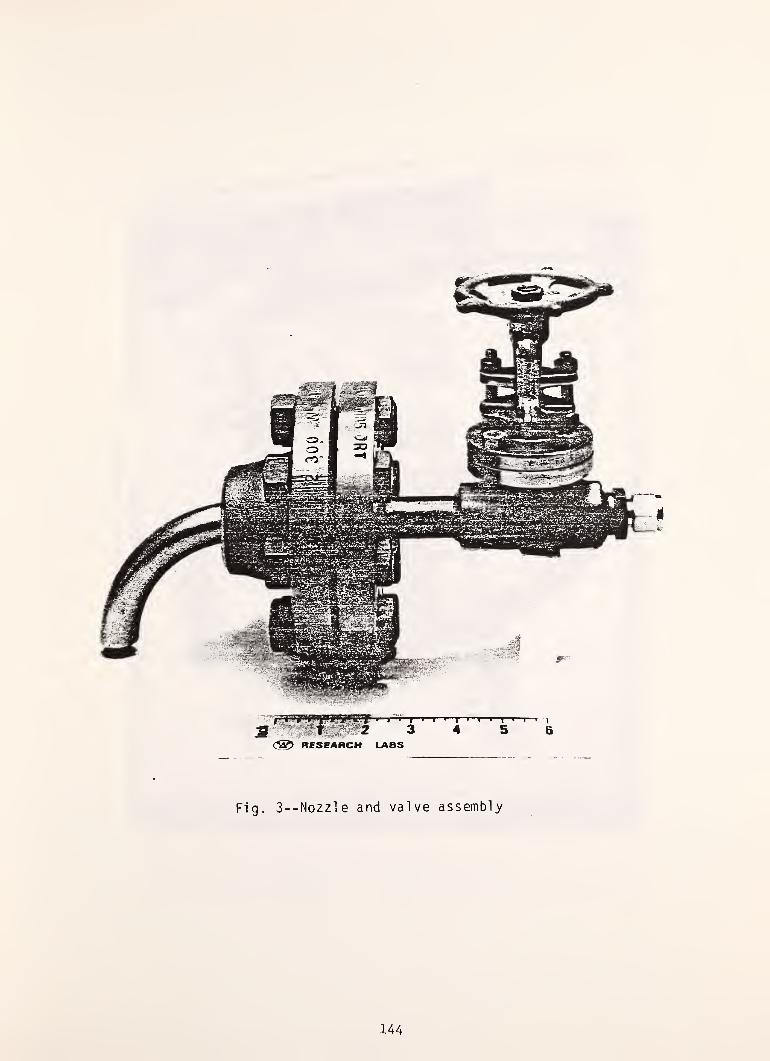
Fig. 3--Nozzle and valve assembly
144

145
-Sample
condensers
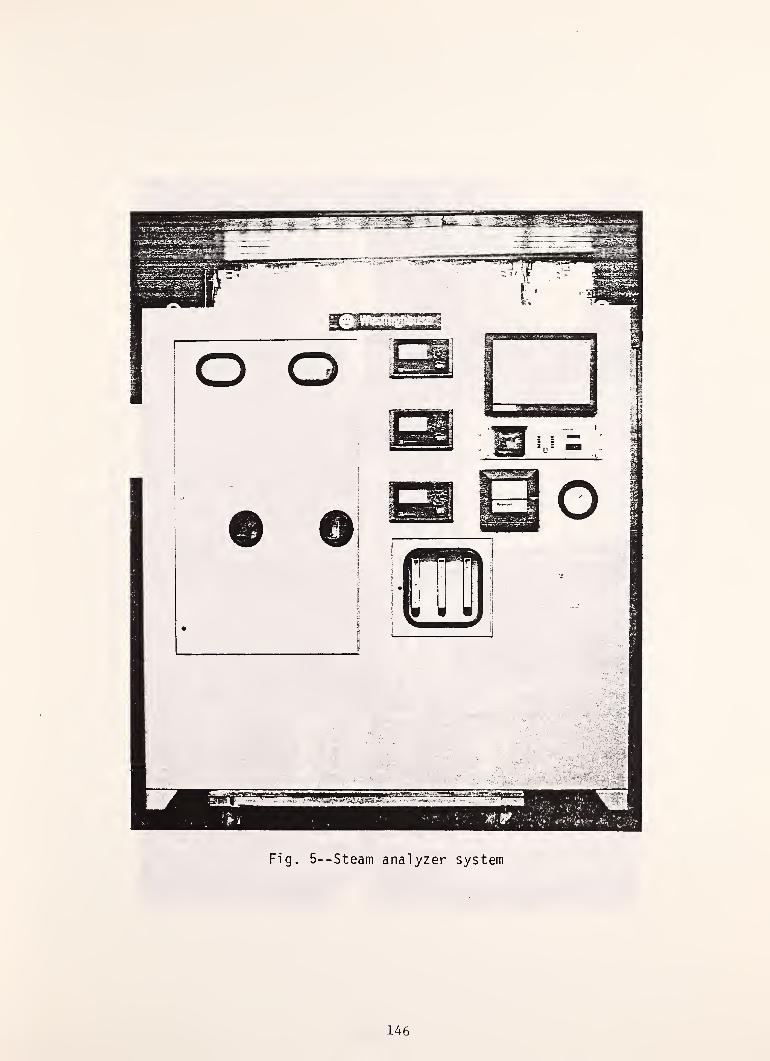
Fig. 5--Steam analyzer system
146

147
-Steam/condensate
data
processing
center
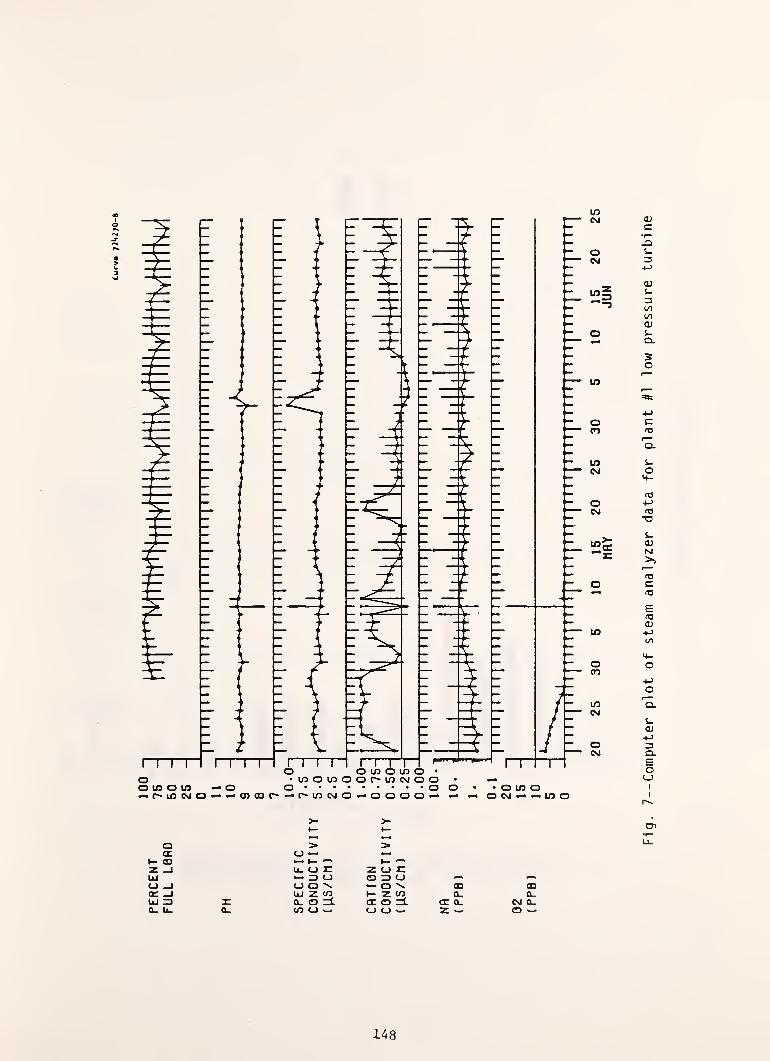
Curva
72<4270-B
a(Xa
UJ<_) _ICC _I(U 3a. u.
>(J —— —Li. (_> II— =)<_)CJ Q \UJ z <nQ- CD xi.CO (_) —
z cj i:0 3 0— Q ^t— Z COCC O I±O O
oO-
cr Q_z —
oQ.
CM 0-CD w
148
Fig.
7--Computer
plot
of
steam
analyzer
data
for
plant
^1
low
pressure
turbine

Nfli CL- S04
Fig. 8--Di stri butions of sodium, chloride, and sulfate
concentrations (ppb) for samples from plant #1
149
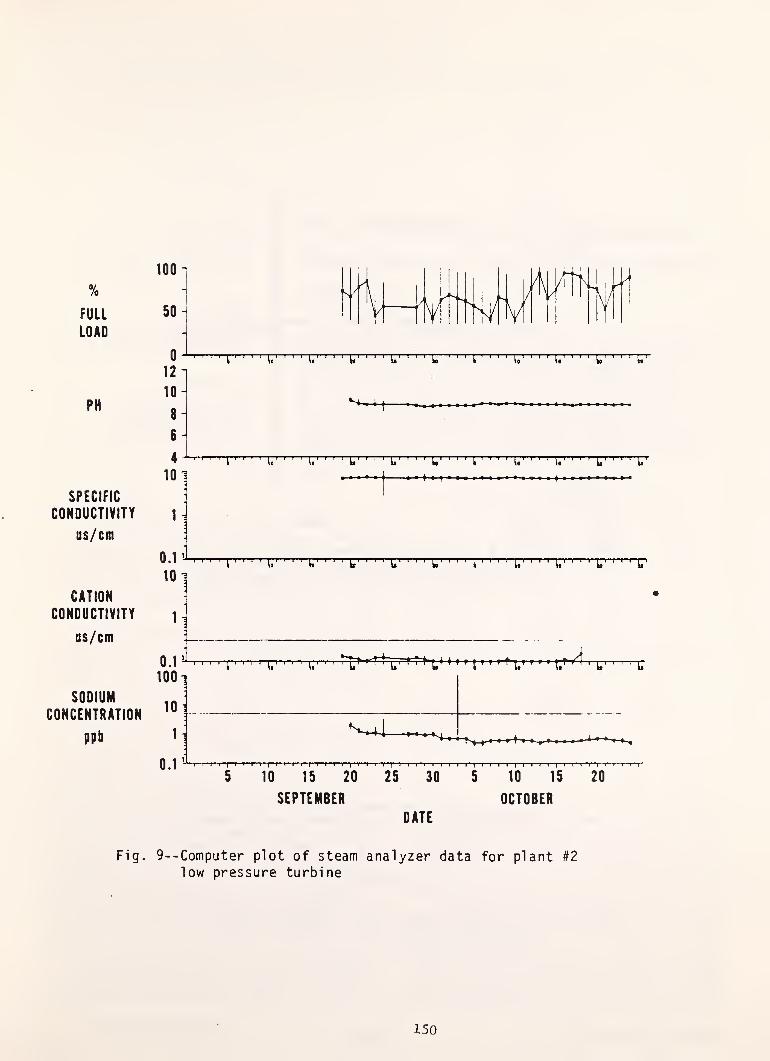
PH
SPECIFIC
CONDUCTIVITY
us/cm
CATION
CONDUCTIVITY
us/cm
SODIUM
CONCENTRATION
ppb
0^—T—12
-
10 -
8
6
4
1 T r'T 1 I I I I I 1 I II
I I > 1 I I I I 1I
I I I II
I > 1 I [ I ' I 1 1 [ I
I I II
I t I I' |~T~ r r II
I » > » I1 > I I
[t I > »
SEPTEMBER OCTOBER
DATE
Fig. 9--Computer plot of steam analyzer data for plant #2
low pressure turbine
150
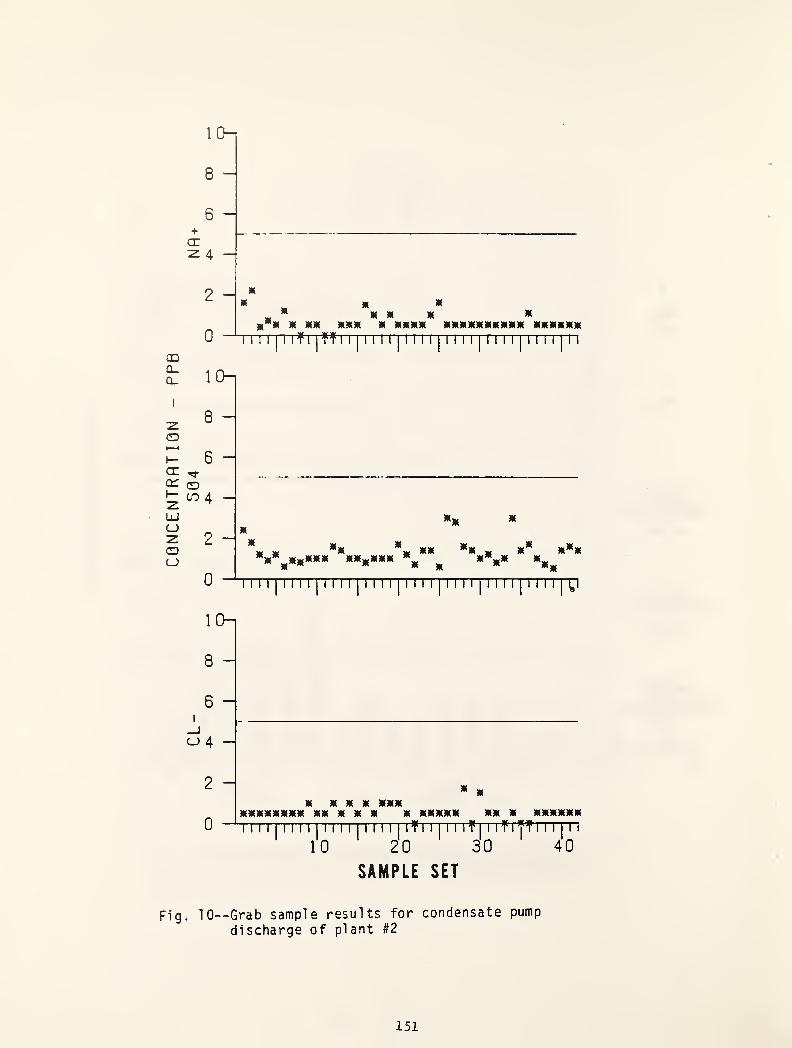
C0NCENTRHTI0N
-
PPB
1 0—
8 -
6 H+cr^ 4 H
2 H
0 •
M KX XX XXX X xxxx xxxxxxxxxx xxxxxx
1
1[1 if I |Tf I I
I
I 1 I
I'lM 1 1 1
1 1n 1
11 1 1 M 1
1
ICH
8 -
6 -I
04 -
2
0
K X X M XXX^ XX X XXXXXX
1 11 1 1 1 1
1 1 1 1 1 1if I'lTi I if 1 1 if iff 1 1 rrrTT
10 20 30 40
SAMPLE SET
Fig. 10““Grab sample results for condensate pump
discharge of plant #2
151
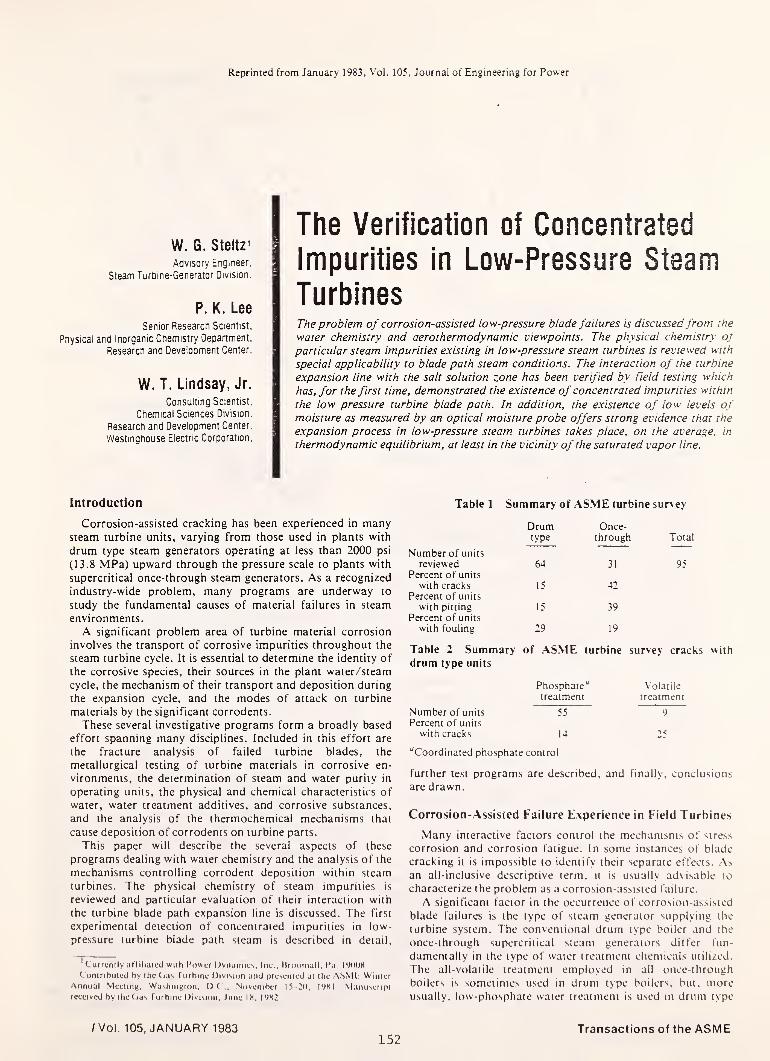
Reprinted from January 1983, Vol. 105, Journal of Engineering for Power
W. G. Steltz^
Advisory Engineer.
Steam Turtiine-Generator Division.
P. K. Lee
Senior Research Scientist.
Physical ahd Inorganic Chemistry Department.
Research and Development Center.
W. T. Lindsay, Jr.
Consulting Scientist.
Chemical Sciences Division.
Research and Development Center.
Westinghouse Electric Corporation.
IThe Verification of Concentrated
Impurities in Low-Pressure Steam
TurbinesThe problem of corrosion-assisted low-pressure blade failures is discussedfrom the
water chemistry and aerothermodynamic viewpoints. The physical chemistry ofparticular steam impurities existing in low-pressure steam turbines is reviewed with
special applicability to blade path steam conditions. The interaction of the turbine
expansion line with the salt solution zone has been verified by field testing which
has, for the first time, demonstrated the existence of concentrated impurities within
the low pressure turbine blade path. In addition, the existence of low levels ofmoisture as measured by an optical moisture probe offers strong evidence that the
expansion process in low-pressure steam, turbines takes place, on the average, in
thermodynamic equilibrium, at least in the vicinity of the saturated vapor line.
Introduction
Corrosion-assisted cracking has been experienced in manysteam turbine units, varying from those used in plants with
drum type steam generators operating at less than 2000 psi
(13.8 MPa) upward through the pressure scale to plants with
supercritical once-through steam generators. As a recognized
industry-wide problem, many programs are underway to
study the fundamental causes of material failures in steam
environments.
A significant problem area of turbine material corrosion
involves the transport of corrosive impurities throughout the
steam turbine cycle. It is essential to determine the identity of
the corrosive species, their sources in the plant water/steam
cycle, the mechanism of their transport and deposition during
the expansion cycle, and the modes of attack on turbine
materials by the significant corrodents.
These several investigative programs form a broadly based
effort spanning many disciplines. Included in this effort are
the fracture analysis of failed turbine blades, the
metallurgical testing of turbine materials in corrosive en-
vironments, the determination of steam and water purity in
operating units, the physical and chemical characteristics of
water, water treatment additives, and corrosive substances,
and the analysis of the thermochemical mechanisms that
cause deposition of corrodents on turbine parts.
This paper will describe the several aspects of these
programs dealing with water chemistry and the analysis of the
mechanisms controlling corrodent deposition within steam
turbines. The physical chemistry of steam impurities is
reviewed and particular evaluation of their interaction with
the turbine blade path expansion line is discussed. The first
experimental detection of concentrated impurities in low-
pressure turbine blade path steam is described in detail,
^ Currently alflliatcci wuh Power Dynamics. Inc.. Uroomall. Pa. I'XlOH
Coninbuleil by ihe (<as Turbine Division and preseiiied ai the AS.Mt. WimerAnnual Meetinii, Washiiiglon, D(
.November 15-20. IVXI. Manuscnpi
received by the (/as Turbine Division, June IK, IVK2.
Table 1 Summary of ASME turbine survey
Drum Once-type through Total
Number of units
reviewed 64 31 95
Percent of units
with cracks
Percent of units
15 42
with pitting
Percent of units
15 39
with fouling 29 19
Table 2 Summary of .\SME turbine survey cracks
drum type units
Phosphate4/
Volatile
treatment treatment
Number of units
Percent of units
55 9
with cracks 14 15
“Coordinated phosphate control
further test programs are described, and finally, conclusions
are drawn.
Corrosion-Assisted Failure Experience in Field Turbines
Many interactive factors control the mechanisms of stress
corrosion and corrosion fatigue. In some instances of blade
cracking it is impossible to identify their separate effects. ,\s
an all-inclusive descriptive term, it is usually advisable to
characterize the problem as a corrosion-assisted failure.
A significant factor in the occurrence of corrosion-assisted
blade failures is the type of steam generator supplying the
turbine system. 7 he conventional drum type boiler and the
once-through supercritical steam generators ditfer fun-
damentally in the type of water treatment chemicals utilized.
The all-volatile treatment employed in all once-through
boilers is sometimes used in drum type boilers, but. moreusually, low-phosphate water treatment is used in drum type
/Vol. 105, JANUARY 1983152
Transactions of the ASME

^0
it
1 1
2az
Iu
0 01
TURBINEUNIT „ „
Fig. 1 Deposit analyses for Cl ~ from penultimate blades of twenty-
four Westinghouse fossil low-pressure turbines. Range indicates
average to maximum values.
boilers. A recent survey sponsored by the ASME Committeeon Water for Thermal Power Systems evaluated 95 boiler-
turbine systems; these 95 were comprised of 31 once-through
and 64 drum type boilers [1]. These results are summarized in
Tables 1 and II.
Although these survey results consistently indicate that
corrosion-assisted turbine failures are more prevalent in
boiler systems which utilize all-volatile water treatment, other
significant factors such as the use and maintenance of
polishers and the transfer of undesirable chemical species
throughout the turbine cycle could also have a profoundinfluence on turbine blading distress.
A substance which contributes significantly to material
corrosion is sodium chloride. Figure I shows the weight
percent of chloride in deposits taken from twenty-four fossil
low-pressure turbine elements, some of which have been
inspected more than once [2]. The units are classified in the
lower portion of the figure into a group that has had blade
failures, and a group that has operated without blade
problems.
Chloride is considered to be a primary turbine material
corrodent, as is substantiated by the units which have ex-
perienced failures generally having a high fraction of chloride
in their deposits.
While chloride is considered to be a primary factor in
corrosion-assisted cracking, other chemical species have also
been shown to contribute to turbine corrosion. These species
include sulfate, caustic, and dissolved oxygen. The sodiumion itself is not considered to be corrosive, but is usually the
charge compensating cation found in deposits with the anions
mentioned above.
Physical Chemistry Aspects of Impurities in Steam
The purpose of a behavior study of impurities in steam
turbines is to develop understanding, quantification, and the
prediction of their behavior in order to control and ameliorate
their undesirable effects on turbine materials. Concentrations
of the minor constituents, which exist at levels from parts per
million (ppm) down to parts per billion (ppb), are trans-
formed into higher local concentrations. Detailed calculations
of the equilibrium fluid composition involving some im-
portant volatile substances can now be performed [3] as mostof the data needed for this purpose is available.
The characteristics of nonvolatile contaminants are quite
I I ! 1 1 I M r I M I I I M r I M I I I
ii I I
• • I..
NOBLADEFAILURES
FAILED BLADES
lllllLlllllLlLlLLiJ_lllllllllllll_L i_L
i/)(d CO o ^
2,400 PSl(i6.5 MPa^ORUM BOILER
Fig. 2 Simplified Mollier diagram showing turbine expansion lines at100 and 50 percent load
Fig. 3 Simplified Mollier diagram showing turbine expansion lines
and sodium hydroxide liquid phase concentrations
different from the volatiles normally used in water treatment.
Two substances are of considerable concern to the turbine
designer. The first is sodium hydroxide, which has probably
damaged more turbines than any other single contaminant.
Caustic contamination of steam can occur in a number of
different ways. It can be caused by improper regeneration of
condensate polishers, by chemistry upsets in phosphate-
treated boilers, or by poor steam separation in drum boilers
that are being deliberately treated with low-level free caustic.
Plotted on the Mollier diagram of Fig. 2 are expansion lines
for steam passing through a fossil fueled turbine system with
a 2400 psi (16.5 MPa) drum boiler. A part of the LP ex-
pansion line for 50 percent load is shown to the right, where it
can be seen how the dry-to-wet transition location (the
saturated vapor line) shifts to a different location in the
turbine at reduced load. Solutions of sodium hydroxide can be
very concentrated with substantially elevated boiling points,
so they can exist in the superheated steam region. Lines
showing sodium hydroxide concentrations of 25 to 90 percent
are shown in the Mollier diagram of Fig. 3. These con-
centrated solutions cover almost all the region traversed by
the steam expansion line. It is only in the wet region, near the
outlet of the low pressure turbine, where the sodiumhydroxide concentration becomes so dilute as to be non-
corrosive.
The second contaminant of great significance is sodium
chloride. Salt is a very common contaminant of steam, and its
Journal of Engineering for Power153
JANUARY 1983, Vol. 105

ENTROPY
Fig. 4 Simplified Mollier diagram showing turbine expansion lines
and sodium chloride liquid solution zone
FINAL STAGE ‘^PENULTIMATE—STAGE
Fig. 6 Transverse probe locations at Encina No. 4, San Diego Gas andElectric Company
Fig. 5 Typical conductance sensor
concentrated solutions have been shown to cause pitting,
corrosion fatigue, and stress corrosion craoicing. The ther-
modynamic properties of sodium chloride are quite different
from those of sodium hydroxide, as it has a more limited
solubility. The same Mollier diagram and the same expansion
lines for a 2400 psi (16.5 MPa) drum boiler turbine system are
shown in Fig. 4. The shaded zone is the only region where
concentrated salt solutions are stable. Above the shaded zone,
only pure dry sodium chloride is stable in superheated steam.
Below the zone in the wet region, salt contamination becomes
so dilute as to be without much corrosive significance. Asimilar band of salt solution stability exists for other com-pounds that are moderately soluble in water.
The upper boundary of the shaded zone is the three-phase
boundary at which steam, solid sodium chloride, and liquid
solutions saturated with sodium chloride coexist. The position
of the three-phase boundary for other salts depends on the
boiling point elevation of their solid-saturated solutions. With
sodium chloride, the concentration is approximately 28
weight percent at the condition where the low-pressure fossil
turbine expansion line crosses this boundary (at about 220°F(104°C)) and is essentially 0 percent at the equilibrium
saturated vapor line.
The important feature is that corrosively significant
solutions of sodium chloride, and solutions of other salts with
limited maximum boiling points, are thermodynamicallystable within one stage of the low-pressure turbine.
In summary, solutions of sodium chloride and other
moderately water soluble salts are stable only in a narrowband near the liquid-vapor saturation line, whereas solutions
of sodium hydroxide and similarly highly soluble compoundscan exist in the entire superheated steam region, riuis, in a
steam turbine, this means that the corrosive effects of sodium
Fig. 7 Encina No. 4 test plan for conductance measurements at the
inlet to L-1C
chloride are very localized, while those of sodium hydroxide
can occur anywhere, depending on the level of contamination.
Field Verification of Concentrated Impurities Within
Low-Pressure Steam Turbines
A key factor pertaining to the cause and effect of impurities
in blade path steam is the determination of the physical
processes which concentrate these impurities into corrosive
solutions. Development activities led to a field test programfor verification of the existence of the “salt solution zone"
phenomenon in operating turbines.
A measurement device capable of immersion in the blade
path steam was conceived as a “surface conductance probe"and designed, developed, and constructed at the Research andDevelopment Center. A typical conductance sensor, which is
attached to a long support barrel to form a complete probe, is
shown in Fig. 5. The sensing element itself consists of two
parallel platinum electrodes spaced less than a millimeter
apart, held in place and separated by an insulating block oi
MACOR'. The electrical signal developed by the sensor is
affected by the conductance of a Hiiid film deposited on the
insulating surface between the two electrodes. The con-
ductance, in turn, depends on the chemical species compri.sing
the lluid; in the case of pure water, very low levels of con-
ductance are developed. On the other hand, ionizable
dissolved impurities increase the conductance by orders of
magnitude. Laboratory calibration of several probes at the
'
I ratJcmiitk »l Corning (ilass Works.
Vol. 105, JANUARY 1983154 Transactions of the ASME
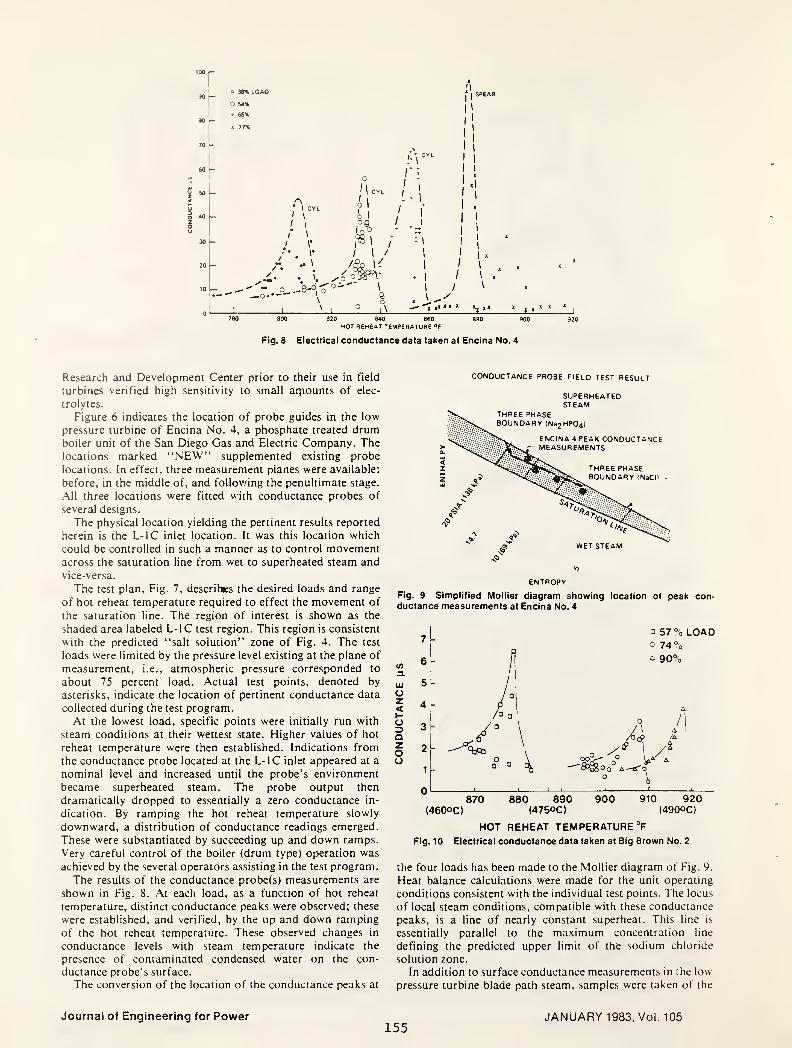
100
0 38% LOAD
0 S4%
* 65%
1 77%
M
r\
\ CYLI
»
/ \
/*\
,•••
^ \
o
^1 CYL
O I
!*r
r<
I
" - o_.-8-°,o—0 -*
I0->'
I
/
4"
\
9o ,4
I 1
/ '
y I* * * *
320 340 360
HOT REHEAT TEMPERATURE »F
Fig. 8 Electrical conductance data taken at Encina No. 4
Research and Development Center prior to their use in field
turbines verified high sensitivity to small arpounts of elec-
trolytes.
Figure 6 indicates the location of probe guides in the low
pressure turbine of Encina No. 4, a phosphate treated drumboiler unit of the San Diego Gas and Electric Company. Thelocations marked “NEW” supplemented existing probe
locations. In effect, three measurement planes were available:
before, in the middle of, and following the penultimate stage.
All three locations were fitted with conductance probes of
several designs.
The physical location yielding the pertinent results reported
herein is the L-IC inlet location. It was this location which
could be controlled in such a manner as to control movementacross the saturation line from wet to superheated steam and
vice-versa.
The test plan. Fig. 7, describes the desired loads and range
of hot reheat temperature required to effect the movement of
the saturation line. The region of interest is shown as the
shaded area labeled L-IC test region. This region is consistent
with the predicted “salt solution” zone of Fig. 4. The test
loads were limited by the pressure level existing at the plane of
measurement, i.e., atmospheric pressure corresponded to ^about 75 percent load. Actual test points, denoted by
asterisks, indicate the location of pertinent conductance data ^collected during the test program. <At the lowest load, specific points were initially run with o
steam conditions at their wettest state. Higher values of hot §reheat temperature were then established. Indications from ^the conductance probe located at the L-IC inlet appeared at a onominal level and increased until the probe’s environment
became superheated steam. The probe output then
dramatically dropped to essentially a zero conductance in-
dication. By ramping the hot reheat temperature slowly
downward, a distribution of conductance readings emerged.
These were substantiated by succeeding up and down ramps.
Very careful control of the boiler (drum type) operation was
achieved by the several operators assisting in the test program.
The results of the conductance probe(s) measurements are
shown in Fig. 8. At each load, as a function of hot reheat
temperature, distinct conductance peaks were observed; these
were established, and verified, by the up and down ramping
of the hot reheat temperature. These observed changes in
conductance levels with steam temperature indicate the
presence of contaminated condensed water on the con-
ductance probe’s surface.
The conversion of the location of the conductance peaks at
CONDUCTANCE PROBE FIELD TEST RESULT
/ SUPERHEATED' STEAM
ENTROPY
Fig. 9 Simplified Mollier diagram showing location of peak con-ductance measurements at Encina No. 4
Ql 1 ^ ^ ^ 1 1 ^
870 880 890 900 910 920(460OC) (4750C) (4900C)
HOT REHEAT TEMPERATURE °F
Fig. 10 Electrical conductance data taken at Big Brown No. 2
the four loads has been made to the Mollier diagram of Fig. 9.
Heat balance calculations were made for the unit operating
conditions consistent with the individual test points. The locus
of local steam conditions, compatible with these conductance
peaks, is a line of nearly constant superheat. This line is
essentially parallel to the maximum concentration line
defining the predicted upper limit of the sodium chloride
solution zone.
In addition to surface conductance measurements in the low
pressure turbine blade path steam, samples were taken of the
Journal of Engineering for Power155
JANUARY 1983, Vol, 105
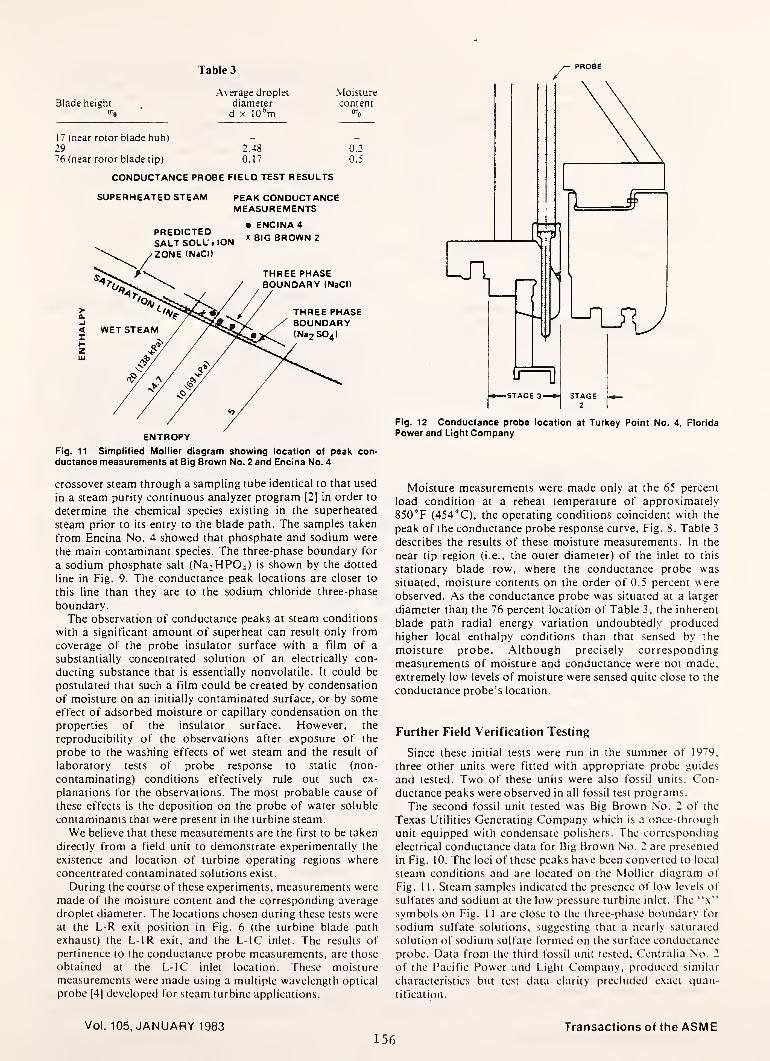
Table 3PROBE
Average droplet MoistureBlade height diameter content
07o d X 10*m 9^0
17 (near rotor blade hub) _ _
29 2.48 0.3
76 (near rotor blade tip) 0.17 0.5
CONDUCTANCE PROBE FIELD TEST RESULTS
SUPERHEATED STEAM
PREDICTEDSALT SOLL .ION
PEAK CONDUCTANCEMEASUREMENTS
• ENCINA 4
X BIG BROWN 2
Fig. 11 Simplified Mollier diagram showing location of peak con-
ductance measurements at Big Brown No. 2 and Encina No. 4
crossover steam through a sampling tube identical to that used
in a steam purity continuous analyzer program [2] in order to
determine the chemical species existing in the superheated
steam prior to its entry to the blade path. The samples taken
from Encina No. 4 showed that phosphate and sodium were
the main contaminant species. The three-phase boundary for
a sodium phosphate salt (NaiHPOj) is shown by the dotted
line in Fig. 9. The conductance peak locations are closer to
this line than they are to the sodium chloride three-phase
boundary.
The observation of conductance peaks at steam conditions
with a significant amount of superheat can result only from
coverage of the probe insulator surface with a film of a
substantially concentrated solution of an electrically con-
ducting substance that is essentially nonvolatile. It could be
postulated that such a film could be created by condensation
of moisture on an initially contaminated surface, or by someeffect of adsorbed moisture or capillary condensation on the
properties of the insulator surface. However, the
reproducibility of the observations after exposure of the
probe to the washing effects of wet steam and the result of
laboratory tests of probe response to static (non-
contaminating) conditions effectively rule out such ex-
planations for the observations. The most probable cause of
these effects is the deposition on the probe of water soluble
contaminants that were present in the turbine steam.
We believe that these measurements are the first to be taken
directly from a field unit to demonstrate experimentally the
existence and location of turbine operating regions where
concentrated contaminated solutions exist.
During the course of these experiments, measurements were
made of the moisture content and the corresponding average
droplet diameter. The locations chosen during these tests were
at the L-R exit position in Fig. 6 (the turbine blade path
exhaust) the L-IR exit, and the L-IC inlet. The results of
pertinence to the conductance probe measurements, are those
obtained at the L-IC inlet location. These moisture
measurements were made using a multiple wavelength optical
probe [4| developed for steam turbine applications.
Fig. 12 Conductance probe location at Turkey Point No. 4, Florida
Power and Light Company
Moisture measurements were made only at the 65 percent
load condition at a reheat temperature of approximately
850°F (454°C), the operating conditions coincident with the
peak of the conductance probe response curve. Fig. 8. Table 3
describes the results of these moisture measurements. In the
near tip region (i.e., the outer diameter) of the inlet to this
stationary blade row, where the conductance probe was
situated, moisture contents on the order of 0.5 percent were
observed. As the conductance probe was situated at a larger
diameter than the 76 percent location of Table 3, the inherent
blade path radial energy variation undoubtedly produced
higher local enthalpy conditions than that sensed by the
moisture probe. Although precisely correspondingmeasurements of moisture and conductance were not made,
extremely low levels of moisture were sensed quite close to the
conductance probe’s location.
Further Field Verification Testing
Since these initial tests were run in the summer of 1979,
three other units were fitted with appropriate probe guides
and tested. Two of these units were also fossil units. Con-
ductance peaks were observed in all fossil test programs.
The second fossil unit tested was Big Brown No. 2 of the
Texas Utilities Generating Company which is a once-through
unit equipped with condensate polishers. The corresponding
electrical conductance data for Big Brown No. 2 are presented
in Fig. 10. The loci of these peaks have been converted to local
steam conditions and are located on the Mollier diagram of
Fig. 1 1 . Steam samples indicated the presence of low levels of
sulfates and sodium at the low pressure turbine inlet. The “\"
symbols on Fig. 1 1 are close to the three-phase boundary for
sodium sulfate solutions, suggesting that a nearly saturated
solution of sodium sulfate formed on the surface conductance
probe. Data from the third fossil unit tested, Centralia No. 2
of the Pacific Power and Light Company, produced similar
characteristics but test data clarity precluded exact quan-
tification.
Vol. 105, JANUARY 1983156
Transactions of the ASME
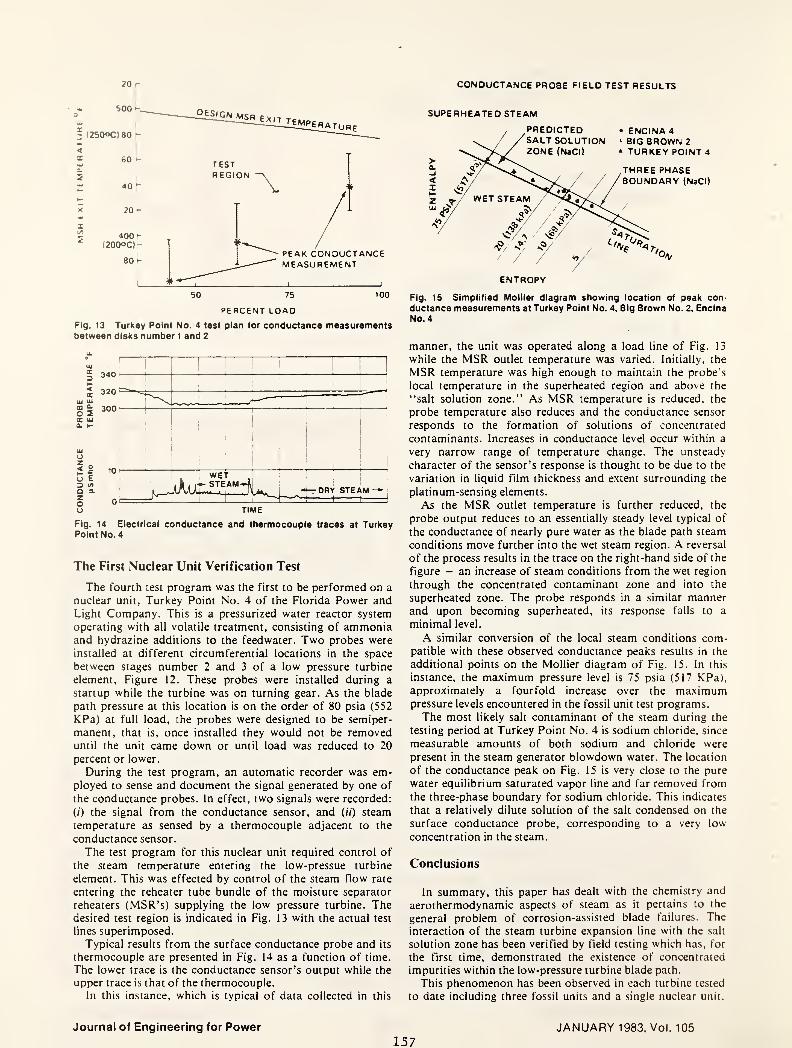
20 CONDUCTANCE PROBE FIELD TEST RESULTS
PERCENT LOAD
Fig. 13 Turkey Point No. 4 test plan for conductance measurementsbetween disks number 1 and 2
Fig. 14 Electrical conductance and thermocouple traces at TurkeyPoint No. 4
The First Nuclear Unit Verification Test
The fourth test program was the first to be performed on a
nuclear unit, Turkey Point No. 4 of the Florida Power andLight Company. This is a pressurized water reactor system
operating with all volatile treatment, consisting of ammoniaand hydrazine additions to the feedwater. Two probes were
installed at different circumferential locations in the space
between stages number 2 and 3 of a low pressure turbine
element. Figure 12. These probes were installed during a
startup while the turbine was on turning gear. As the blade
path pressure at this location is on the order of 80 psia (552
KPa) at full load, the probes were designed to be semiper-
manent, that is, once installed they would not be removeduntil the unit came down or until load was reduced to 20
percent or lower.
During the test program, an automatic recorder was em-ployed to sense and document the signal generated by one of
the conductance probes. In effect, two signals were recorded:
(/) the signal from the conductance sensor, and (//) steam
temperature as sensed by a thermocouple adjacent to the
conductance sensor.
The test program for this nuclear unit required control of
the steam temperature entering the low-pressue turbine
element. This was effected by control of the steam flow rate
entering the reheater tube bundle of the moisture separator
reheaters (MSR’s) supplying the low pressure turbine. Thedesired test region is indicated in Fig. 13 with the actual test
lines superimposed.
Typical results from the surface conductance probe and its
thermocouple are presented in Fig. 14 as a function of time.
The lower trace is the conductance sensor’s output while the
upper trace is that of the thermocouple.
In this instance, which is typical of data collected in this
SUPERHEATED STEAM
, PREDICTED • ENCINA 4
/ /salt SOLUTION BIG BROWN 2\ t// zone (NaCi) * TURKEY POINT 4
THREE PHASE/BOUNDARY (NaCi)
/
/ / / /
ENTROPY
Fig. 15 Simplified Mollier diagram showing location of peak con-
ductance measurements at Turkey Point No. 4, Big Brown No. 2, EncinaNo. 4
manner, the unit was operated along a load line of Fig. 13
while the MSR outlet temperature was varied. Initially, the
MSR temperature was high enough to maintain the probe’s
local temperature in the superheated region and above the
“salt solution zone.’’ As MSR temperature is reduced, the
probe temperature also reduces and the conductance sensor
responds to the formation of solutions of concentrated
contaminants. Increases in conductance level occur within a
very narrow range of temperature change. The unsteady
character of the sensor’s response is thought to be due to the
variation in liquid film thickness and extent surrounding the
platinum-sensing elements.
As the MSR outlet temperature is further reduced, the
probe output reduces to an essentially steady level typical of
the conductance of nearly pure water as the blade path steam
conditions move further into the wet steam region. A reversal
of the process results in the trace on the right-hand side of the
figure - an increase of steam conditions from the wet region
through the concentrated contaminant zone and into the
superheated zone. The probe responds in a similar mannerand upon becoming superheated, its response falls to a
minimal level.
A similar conversion of the local steam conditions com-patible with these observed conductance peaks results in the
additional points on the Mollier diagram of Fig. 15. In this
instance, the maximum pressure level is 75 psia (517 KPa),
approximately a fourfold increase over the maximumpressure levels encountered in the fossil unit test programs.
The most likely salt contaminant of the steam during the
testing period at Turkey Point No. 4 is sodium chloride, since
measurable amounts of both sodium and chloride were
present in the steam generator blowdown water. The location
of the conductance peak on Fig. 15 is very close to the pure
water equilibrium saturated vapor line and far removed from
the three-phase boundary for sodium chloride. This indicates
that a relatively dilute solution of the salt condensed on the
surface conductance probe, corresponding to a very low
concentration in the steam.
Conclusions
In summary, this paper has dealt with the chemistry and
aerothermodynamic aspects of steam as it pertains to the
general problem of corrosion-assisted blade failures. The
interaction of the steam turbine expansion line with the salt
solution zone has been verified by field testing which has, for
the first time, demonstrated the existence of concentrated
impurities within the low-pressure turbine blade path.
This phenomenon has been observed in each turbine tested
to date including three fossil units and a single nuclear unit.
Journal of Engineering for Power157
JANUARY 1983, Vol. 105

These units represent three different physical designs installed
by four different utilities located throughout the UnitedStates. The boiler systems delivering steam to these turbines
include both once-through and drum type fossil boilers; the
nuclear unit was of the pressurized water reactor type. Watertreatment techniques varied between units and included
phosphate treated subcritical drum type boilers, all volatile
treated supercritical once-through boilers, and the all volatile
water treatment of the nuclear steam supply system.
Regardless of these variations, the observed results andconclusions are the same.
In the unit in which moisture measurements were obtainedin conjunction with electrical conductance measurements, a
relationship was observed between the two measurement sets.
Very slight, but measurable amounts of moisture were sensedby the moisture probe when turbine operating conditions wereheld in the immediate vicinity of the conductance peak. Thesedroplets were generally less than 2.5 x 10"* m in diameterand the indicated moisture content less than or equal to 0.5
percent.
These findings also support the contention that steam
flowing in low-pressure steam turbines tends to approximate
equilibrium conditions. These moisture measurements madein the vicinity of the equilibrium saturated vapor line, albeit
with some experimental uncertainty, have been made under
local steam conditions ranging up to 75 psia (517 KPa) and at
local Mach numbers from 0.5 to 0.8. The possibility of local
supersaturation of the steam flow in expanding turbine
passages cannot be dismissed, as hosts of laboratory data
confirm this phenomenon. These current findings indicate
that in the flow spaces between blade rows, steam tends
toward the equilibrium state, that is, “on the average,” steam
tends to follow the equilibrium characteristics defined by
many publications in this area. It is quite logical that
equilibrium and nonequilibrium flow processes coexist in
steam turbines. Local conditions within nozzles or rotating
blade rows generally experience very high rates of expansion,
conducive to subcooling and delay in achieving equilibrium
conditions.
Some degree of uncertainty must be assigned to these test
data and to their implications. For example, tests of this type
in power plant installations utilizing delicate and sophisticated
instruments and electronic systems must be coordinated with
plant operations and to some degree depend on the accuracyof plant operational instruments. The final determination of
local steam conditions surrounding the surface conductanceprobe depends on these operating parameters by way of
turbine cycle heat balance calculation procedures.The exact chemical species responsible for the conductance
probe response were not measured and are, of course, a
source of speculation. These important factors have yet to be
resolved; they have, however, prompted continued activity in
this area and are significant links in the chain relating the
corrosion phenomena to steam turbine reliability.
Acknowledgments
The authors wish to express their appreciation to the
Westinghouse Electric Corporation for permission to publish
this paper and to certain individuals without whom these
results could not have been achieved, especially L. D. Smith,
S, Anderson, and W. Snyder,
References
1 Gabrielli, F., and Grabowski, H. A., "Steam Purity at High Pressures-System Considerations,” presented at the Joint Power Generation Conference1979.
2 Peterson, S. H., Bellows, J. C., Pensentadler, D. F., and Hickam, VV.
M., “Steam Purity Monitoring for Turbine Corrosion Control: .A Total PlantSurvey,” International Water Conference, 1979, Paper No. IWC-79-26.
3 Lindsay, Jr., W. T., “Behavior of Impurities in Steam Turbines,” PowerEngineering, Vol. 83, No. 5. 1979.
4 Wyler, J. S., and Desai, K. J., "Moisture Measurements in a LowPressure Steam Turbine Using a Laser Light Scattering Probe," .ASMEH0OI08, 1977.
Vol. 105, JANUARY 1983 158 Transactions of the ASME


REACTOR CHEMISTRY
Paul Cohen
Water was an obvious candidate for moderator and coolant functions in
the nuclear fission reactors and was so employed in the plutonium production
reactors. For power applications two options were available for light water cooled
and moderated reactors: to allow the water to boil in the reactor to produce
steam directly (the boiling water reactor, BWR) or to use the water as a pressurized
non-boiling heat transfer agent, transferring heat through a bsirrier in a steam
generator to form steam (pressurized water reactor) PWR.
A considerable amount of radiolysis occurs in the BWR. The water in the
circuit contains about 0.2-0. 3 ppm oxygen. Despite the presence of a stoichiometric
amount of hydrogen, the environment is oxidizing. In the PWR, radiolysis is low
and can be effectively suppressed by the convenient maintenance in the non-boiling
system of about 1-2 ppm of dissolved hydrogen. The electrochemical potential
is close to that of the hydrogen electrode.
These two conditions produced a difference in material selection and behavior
in the two types of plants. For the BWR it dictated that the coolant had to be
very low in electrolytes (aside from consideration of formation of undesirable
nuclides) to control corrosion. In the PWR it permitted the optimization of pH
to control corrosion and deposit formation, for which LiOH was found to be optimum,
and the utilization of boron as boric acid to control reactivity.
159

These accomplishments were not without side effects. The corrosion of
zirconium alloy fuel cladding in the BWR environment in effect limits the temperature
and pressure of operation, to a range comparable to that obtained in the PWR
steam generator. Cracking of sensitized stainless steel in the oxidizing environment
has prompted studies of reduction of the potential by some hydrogen additions.
In the PWR, the high temperatures resulting from the necessary pressurization
and indirect cycle are close to limiting with respect to the cladding. Concentration
of lithium in deposits can lead to excessive corrosion of zirconium alloys; the
oxide appears to be particularly sensitive to the lithium ion (Fig. 1).
In both systems, corrosion products are transported to the core where they
deposit and are irradiated. The nuclides formed are released and are transported
to and deposited on or incorporated in the oxides of the various surfaces over
the entire system. Numerous studies have been undertaken to understand and
control this process. These include the solubility of corrosion products in reactor
coolant as a function of temperature, composition and coolant pH, as well as
the colloidal behavior of particulates. In addition to the radiological effects,
the deposits have had undesirable effects on fuel clad temperature and fluid friction.
Typically, in the BWR the transported corrosion product is hematite, in the PWR,
with Inconel 600 steam generators, it is a nickel substituted magnetile Ni^Fe2_j^0^,
with X up to about 0.6.
The current approach to PWR chemistry is to select conditions so that the solubility
of the corrosion products increases as the coolant traverses the reactor. In principle
this will prevent supersaturation and deposition of solubles and assure the dissolution
of deposited particulates. This requires a knowledge of the effect of coolant chemistry
on pH, and the effect of pH on corrosion product solubility.
160
Fig. 2 shows the pH of solutions of boric acid and lithium as a function of temperature.
Fig 3 shows the solubility of magnetite as a function of acid or base concentration.
Fig. 4 shows curves of the solubility of magnetite for various conditions as a
function of temperature, illustrating the principle stated earlier.
The tactic now most widely employed is to specify the chemistry according
to these principles, resulting in an operating curve, as shown in Fig. 5. Although
reasonably successful this strategy has not resolved all problems, and attention
is now being directed to the behavior of particulates in the reactor coolant system,
particle deposition on surfaces and particle-particle interaction, as a function
of chemistry and thermohydraulic conditions.
In the BWR, as noted earlier studies and trials are being undertaken of partial
suppression of radiolysis with hydrogen additions, to control pipe corrosion. A
major consideration will be the effect on deposit formation and their consequences.
161
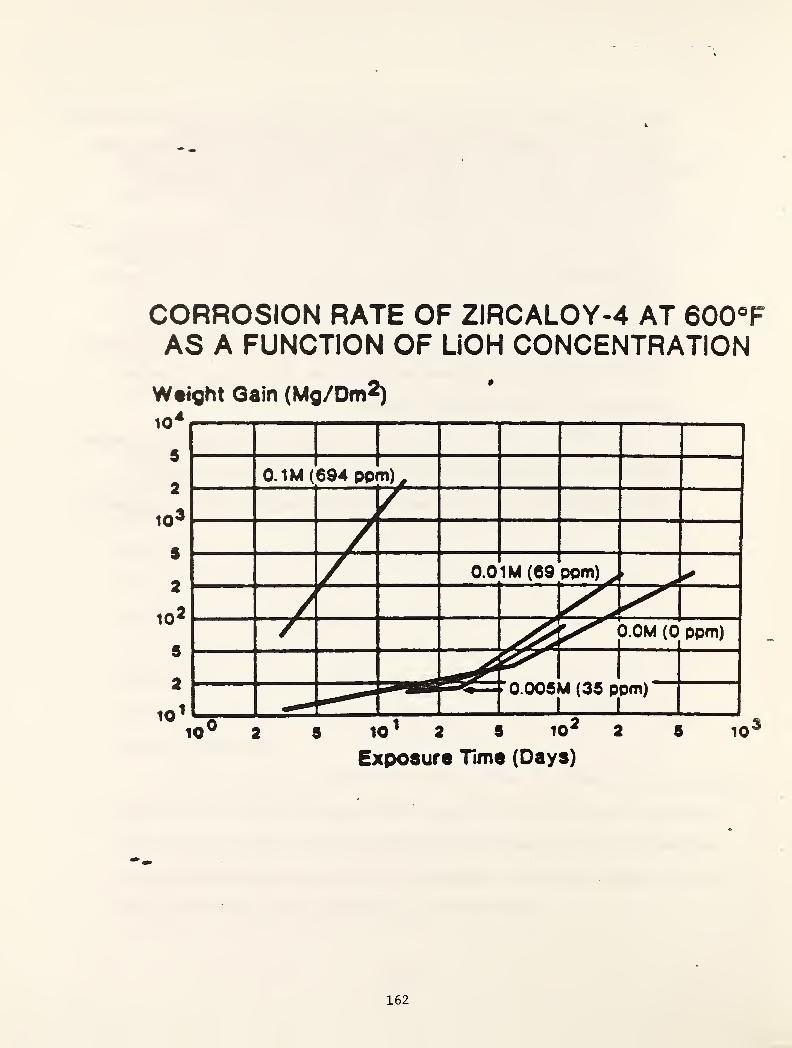
CORROSION RATE OF ZIRCALOY-4 AT 600®FAS A FUNCTION OF LiOH CONCENTRATION
Wtight Gain (Mg/Dm^)10^1 —r r
- r--
5
Exposure Time (Days)
162
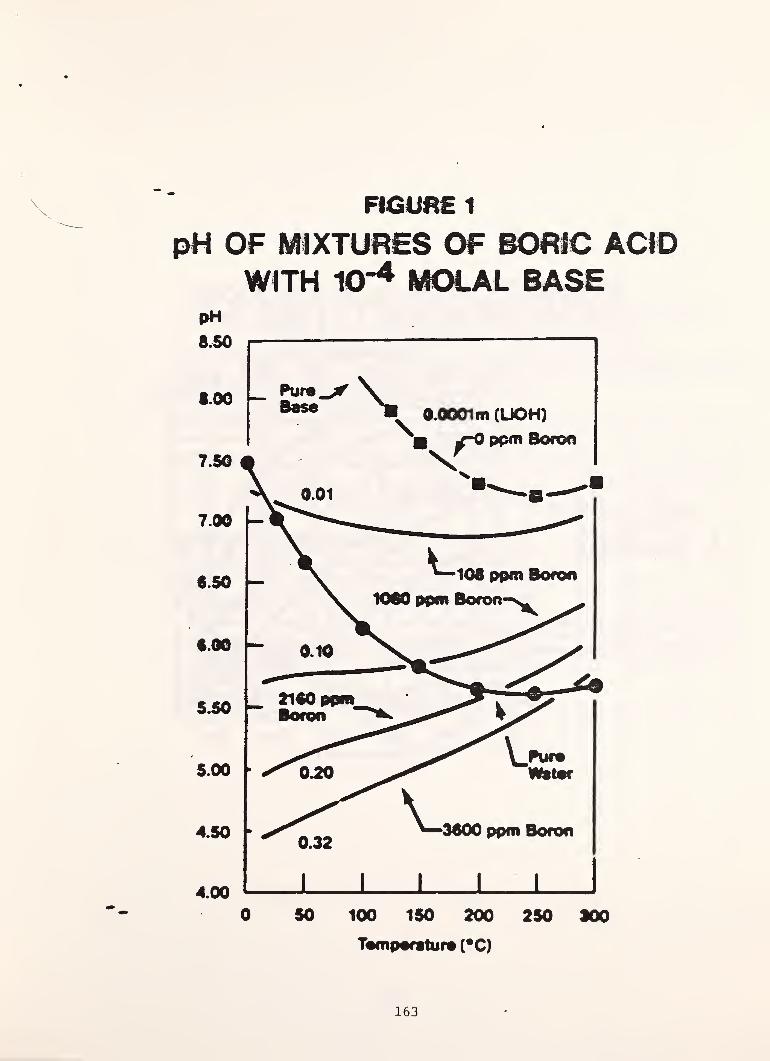
\ FIGUfi£ 1
pH OF M4XTUHES OF BOHIC ACIDWiTH 10*^ MCX.AL BASE
pH
163

SOLUBIUTY OF FE3O4 IN SOLUTIONSSATURATED WITH H2 AT 1 ATM. 25^
Concentratioiioi Fe in
Solution (/fc/4
Tamparitura (*C)
164

FE SOLUBILITY VERSUS TEMPERATUREFOR SOLUTIONS CONTAJNINQ
500 PPM AND VARYING LI CONCENTRATIONFe Solubility /^oles/Kg
0.7
0.6
0.5
04
0.3
0.2
0.1
0.0250 260 270 260 200 300 310 320 330 340 350
Tomperature (•€)
165
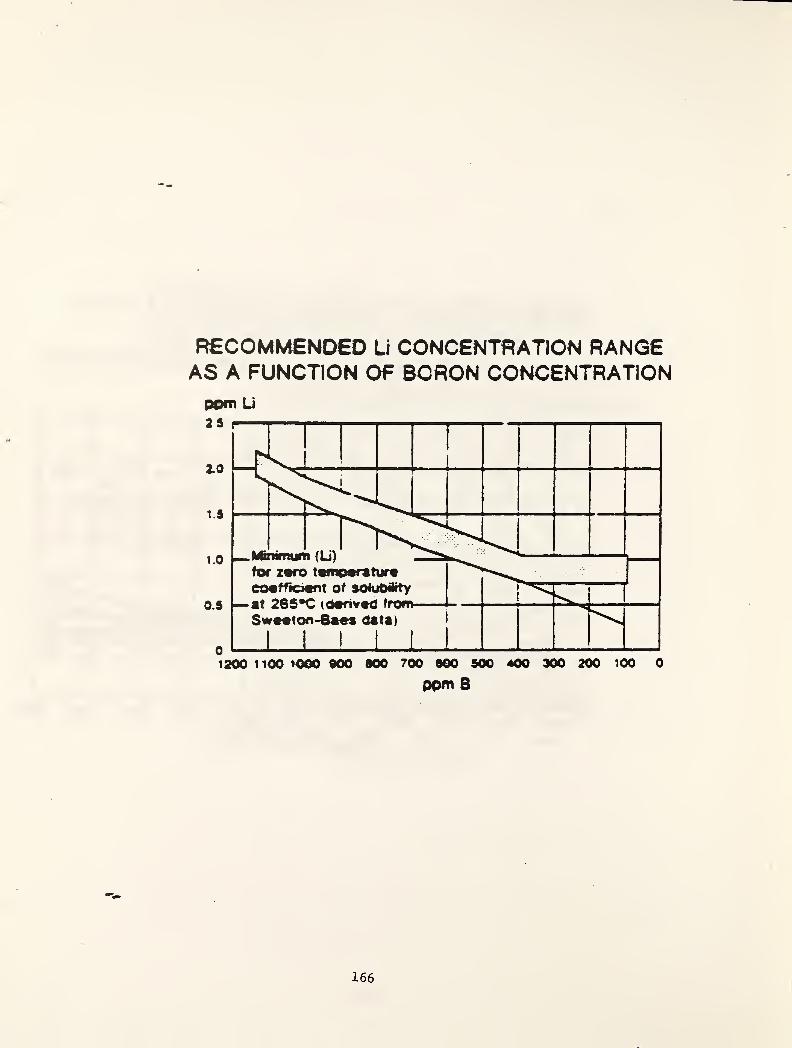
RECOMMENCED Li CONCENTRATION RANGEAS A FUNCTION Of BORON CONCENTRATIONPOm U
ppm B
166
( Basic Aqueous Chefnistry at High Temperatures and Pressures at ORNL*
R. E, MesmarChemistry Division
Oak Ridge National LaboratoryOak Ridge, Tennessee 37830
The Chemistry Division at Oak Ridge National Laboratory has had a program in
basic aqueous chemistry since the 1950' s when work was being done on the homoge-
neous reactor experiment (UO2 SO4 dissolved in H2SO4 solution) with over two
hundred publications over the years as the purposes changed. Many new tech-
niques were developed and applied in that program to aqueous systems at tem-
peratures up to 300° and sometimes 800°C.
The program has been devoted to precise quantitative measurements on systems
applicable in reactor coolants, steam generators, desalination, and hydrothermal
geochemistry as well as basic correlations. Most work has been in the use of
conductance, hydrogen electrode cells, isopiestic and calorimetric techniques as
well as phase equilibrium measurements. Many scientists have been involved
notably Marshall, Sweeton, Lietzke, Holmes, Busey, Baes and myself. I will
review in a very brief way some of the highlights of the program and Bill
Marshall will follow with some elaboration on phase studies and other research
with which he has been directly involved.
* Research sponsored by the Division of Chemical Sciences, Office of BasicEnergy Sciences, !J.S. Department of Energy under contract W-7405-eng-26 withthe Union Carbide Corporation.
167
BASIC AQUEOUS CHEMISTRY
TO
HIGH TEMPERATURES AND PRESSURES
(Oak Ridge National Laboratory)
Equilibrium Studies
• Phase studies (350 PsATN.)PHOSPHATE; SILICA; OXIDES; HYDROXIDES; SULFATES
• POTENTIOMETRY (300°C^ PsATN-^ACID-BASE IONIZATION; HYDROLYSIS; HCl ACTIVITIES
• Conductance (800°C^ 4000 bars)1:1 AND 2:1 ASSOCIATION^ IONIZATION OF ACIDS& bases
® Spectrophotometryl2 solution chemistry
® Modeling
Thermodynamics of Electrolytes
® ISOPIESTIC studies (250°C^ PsATN.)CHLORIDES^ sulfates^ HYDROXIDES^ MIXTURES
® Mixing calorimetry (500°C^ 400 bars)HEATS OF dilution^ MIXING^ REACTION
• Modeling
168
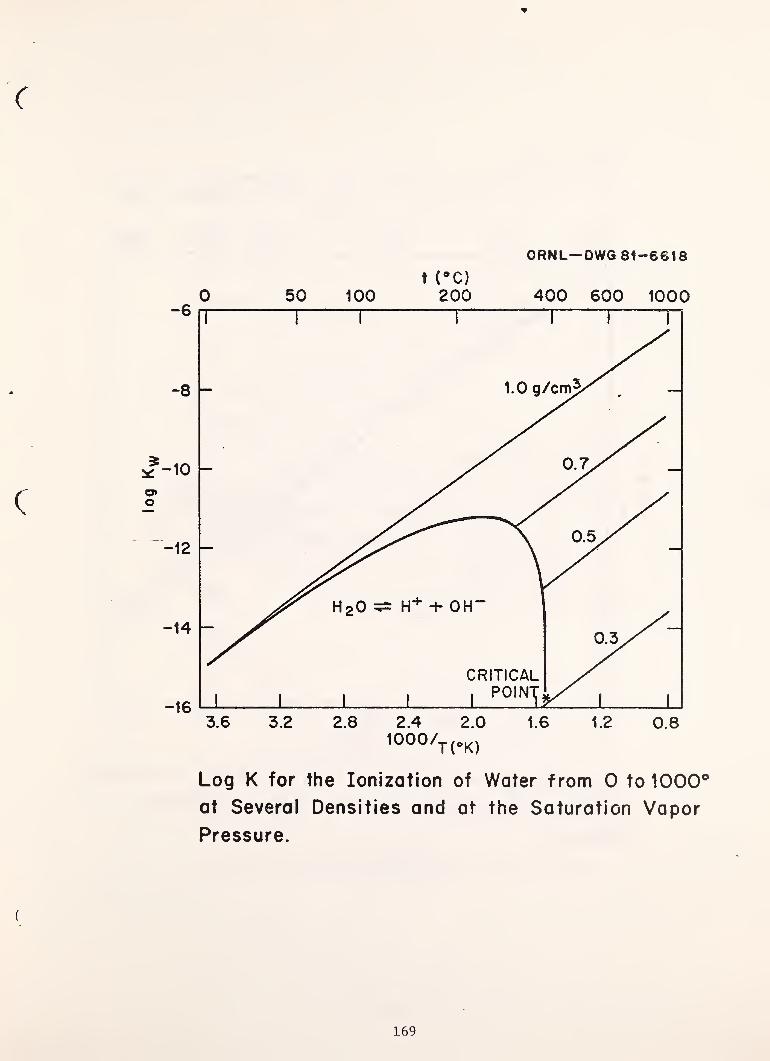
ORNL—DWG 81-6618
r
c
50 100t (*C)200 400 600 1000
Log K for the Ionization of Water from 0 to 1000’
at Several Densities and at the Saturation Vapor
Pressure.
(
169

(
ORNL-DWG 81-6640
t(“C)
50 100 200 400 600 1000
1000/j(o|^)
Log K for the Protonation of Ammonia From 0 tolOOO^C.
At Several Densities and at the Saturation Vapor
Pressure.
170

log
K
ORNL-OWG 77-14135ft
tCC)
300 250 200 150 100 50 0
0.0017 0.0021 0.0025 0.0029 0.0033 0.0037
VrCK)
Log K vs / T for Ionization Reactions of Weok Acids and Weak Boses
from 0" to 300 "C.
171

(
ORNL-DWG 8i-6624
t CO300 200 iOO 50 0
^000/t(ok)
Neutralization Reactions: e.g. HA-t-OR .:i^:H20 + A
172
log
K
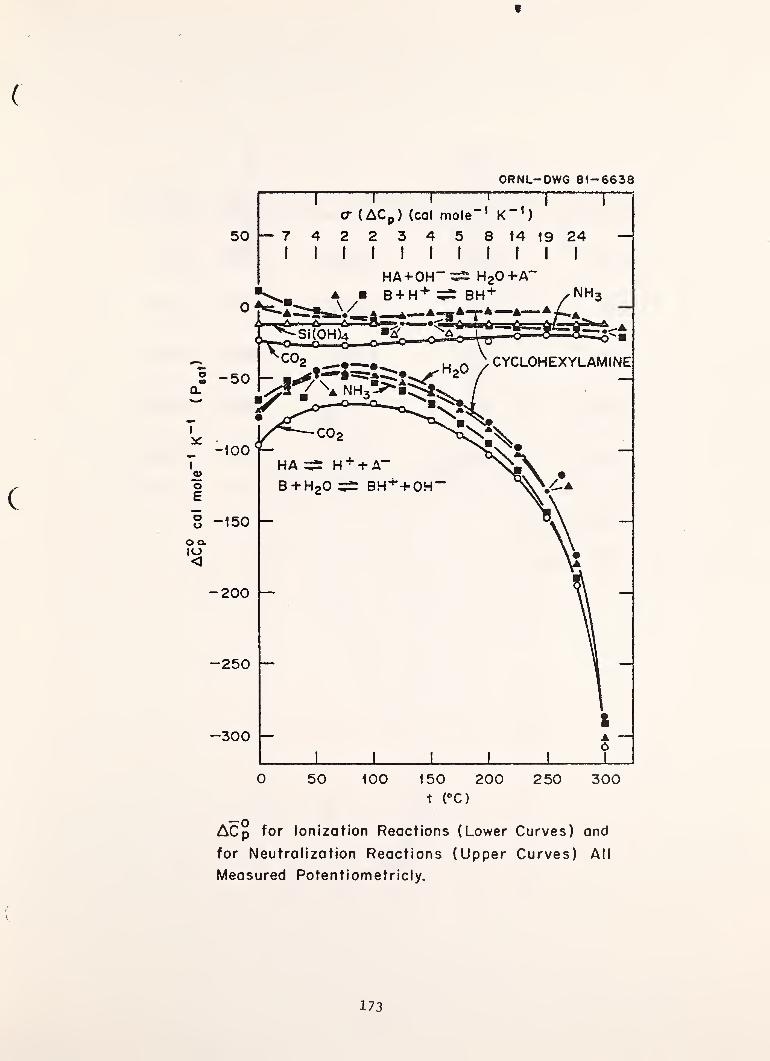
f
ORNL-DWG 81-6638
ACp for Ionization Reactions (Lower Curves) and
for Neutralization Reactions (Upper Curves) All
Measured Potentiometricly.
173

c
ISOPIESTIC STUDIES OF AQUEOUS SYSTEMS (110 - 250°C)
*j t » «•
LiCl MgCl2 Li2S0i^ NoCl + KCl
•j t •
KCl CQCI2 NQ2S0^ NaCl + LlCl
•j t *
CsCl SrCl2 K2SO4 NaCi CsCl
* * «NiCl2 BQCI2 CS2SO4 NaCl + CaCl2
t « tNiSO^ C0CI2 MgSO^ KCl + CaCl2
C ^Published
"^In press
174
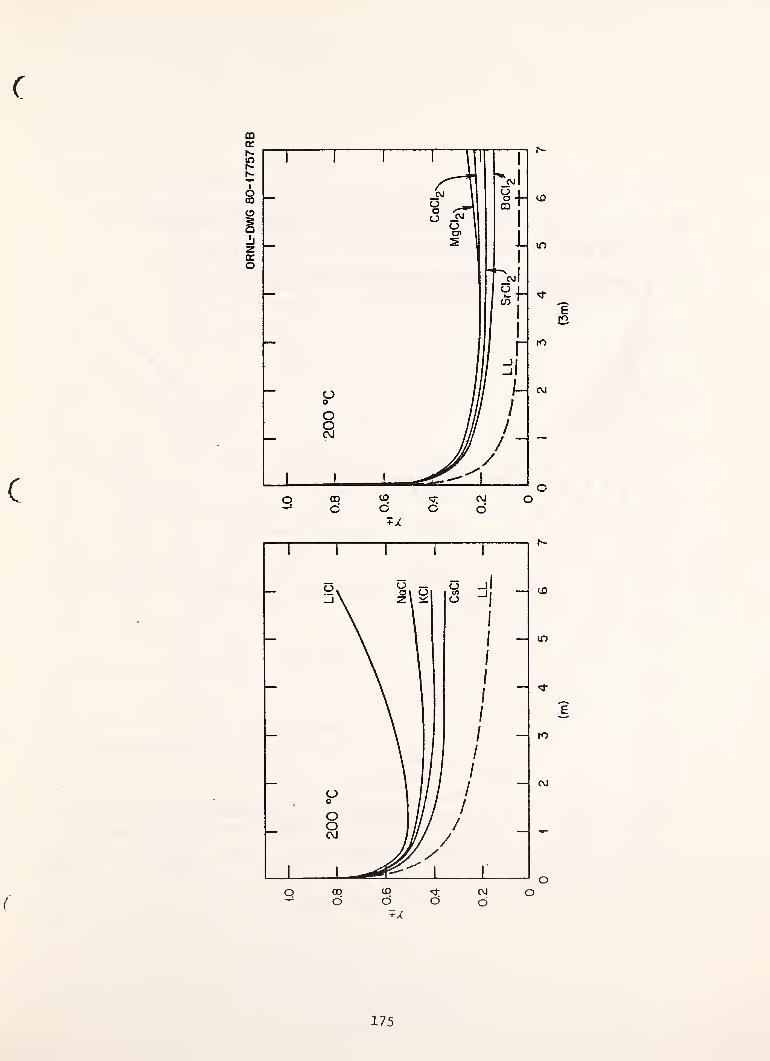
c
m
O CD to CM Od CD C) b
175

NqCI
ORNL-DWG 82-11486
MEAN ACTIVITY COEFFICIENT OF AQUEOUS NoCI ATSATURATION PRESSURE (400° AT 415 bars)
176

ORNL-DWG 80-14463R
ENTHALPY OF DILUTION OF AQUEOUS NaCI
177
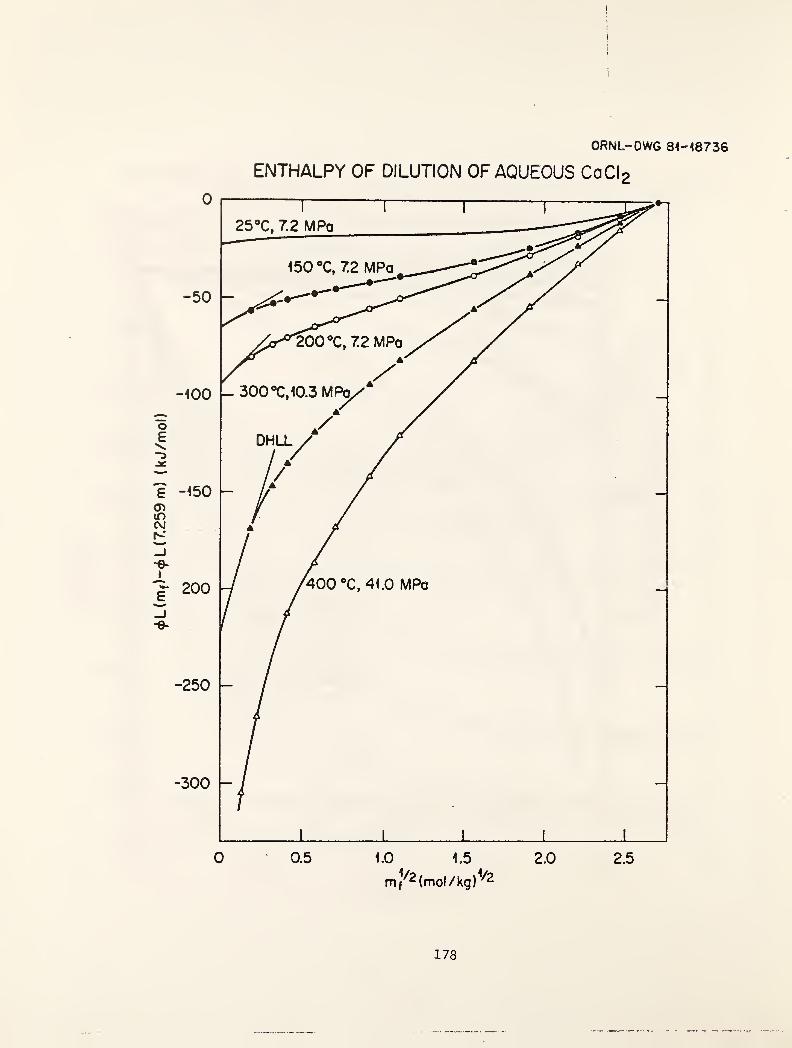
{
ORNL-DWG 8^-<8736
ENTHALPY OF DILUTION OF AQUEOUS CoCIa
178
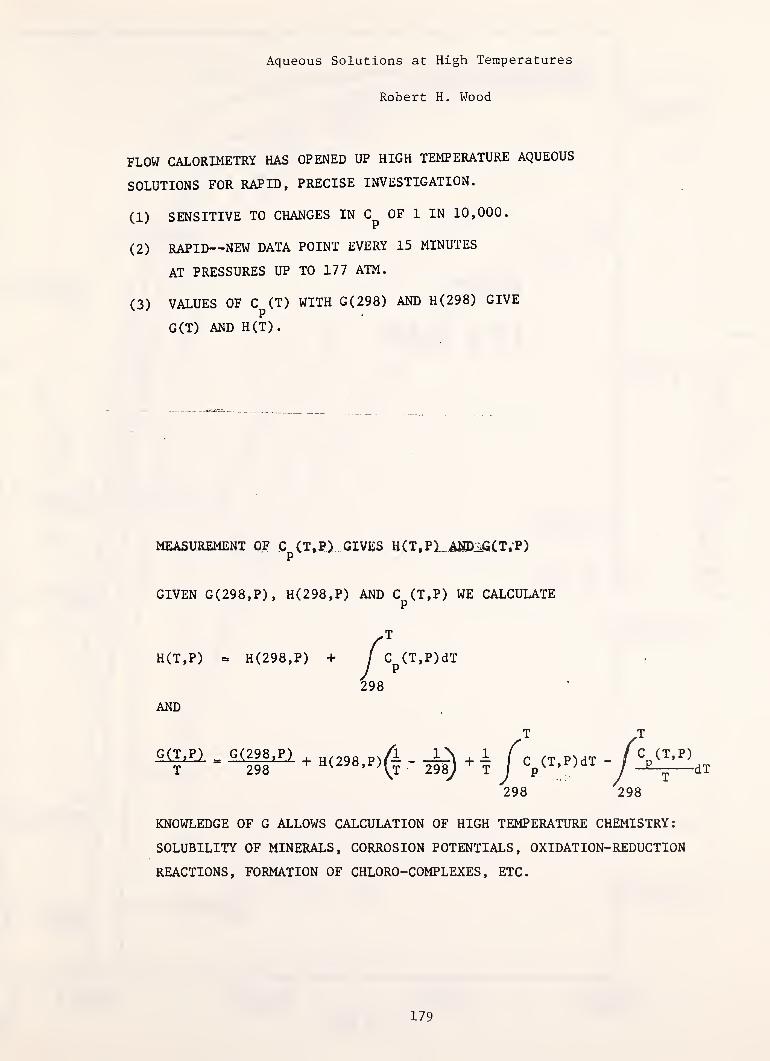
Aqueous Solutions at High Temperatures
Robert H. Wood
FLOW CALORIMETRY HAS OPENED UP HIGH TEMPERATURE AQUEOUS
SOLUTIONS FOR RAPID, PRECISE INVESTIGATION.
(1) SENSITIVE TO CHANGES IN C^ OF 1 IN 10,000.
(2) RAPID-NEW DATA POINT EVERY 15 MINUTES
AT PRESSURES UP TO 177 ATM.
(3) VALUES OF Cp(T) WITH G(298) AND H(298) GIVE
G(T) AND H(T).
MEASUREMENT OF Cp(T,P) GIVES H(T,PX_ AJ©lifi(T;P)
GIVEN G(298,P), H(298,P) AND Cp(T,P) WE CALCULATE
H(T,P) = H(298,P) + /T
C (T,P)dTP
298
AND
T ,T
298 298
KNOWLEDGE OF G ALLOWS CALCULATION OF HIGH TEMPERATURE CHEMISTRY;
SOLUBILITY OF MINERALS, CORROSION POTENTIALS, OXIDATION-REDUCTION
REACTIONS, FORMATION OF CHLORO-COMPLEXES , ETC.

/J
K
mol

K
mol
131
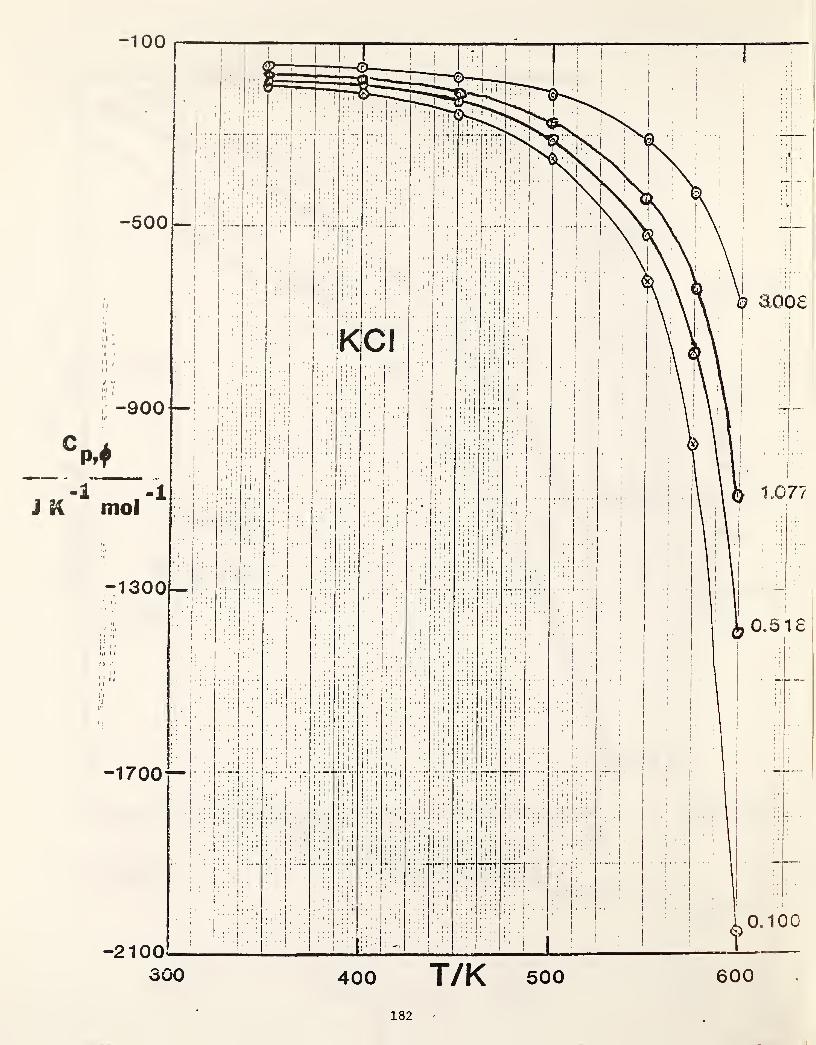
182

133
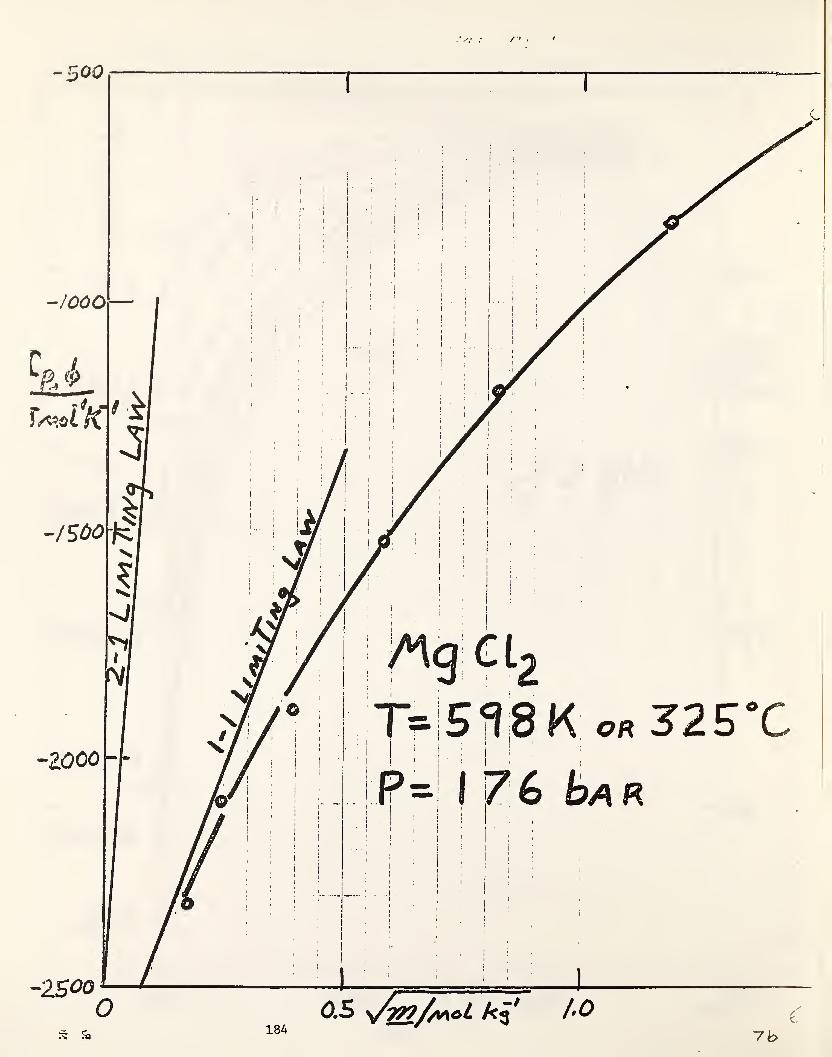
18A0,5 \/t99/a/kcL 1*0
vh

/J
K^mol
T/K
185

TEMPERATURE. ®C
186

CORRESPONDING STATES PREDICTION OF c^/J
T/K
m 397.97 497.73 603.39
-1mol kg
0.0996 4.185 4.483 6.289
4.180 4.470 6.263
0.4940 4.086 4.333 5.545
4.070 4.312 5.625
3.000 3.570 3.650 3.894
3.564 3.669 3.996
EXPERIMENTAL
CONCLUSIONSV
1) THIS TREATMENT WORKS AMAZINGLY WELL FOR NaCl.
2) IT NEEDS FURTHER TESTS ON OTHER SALTS.
3) NOT EXPECTED TO WORK FOR TEMPERATURES WHERE THE STATE OF IONIZATIONOF THE SALT IS NOT SIMILAR TO THAT NEAR THE CRITICAL POINT.
PREDICTIONS ;
1) MARSHALL AND JONES FIND THAT MANY SALTS (LiCl, NaCl, KCl, KBr, KI,
CSNO3 , KHSO4 , NH4CI) HAVE VERY SIMILAR T^ AT THE SAME MOLALITY.
PRESUMABLY P^ IS ALSO SIMILAR AND CORRESPONDING STATES THEORY
PREDICTS SIMILAR C„ . RECENT EXPERIMENTAL EVIDENCE SUPPORTS THIS(COBBLE & MURRAY, LINDSAY, CRISS)
.
2) ANY SOLUTE WILL HAVE C ^ or -«> AT THE CRITICAL POINTP,<l>
DEPENDING ON WHETHER THE CRITICAL POINT IS SHIFTED UP OR DOWN INTEMPERATURE BY THE SOLUTE.
QUESTION :
CAN THIS EQUATION PREDICT SUPERCRITICAL HEAT CAPACITIES?
187
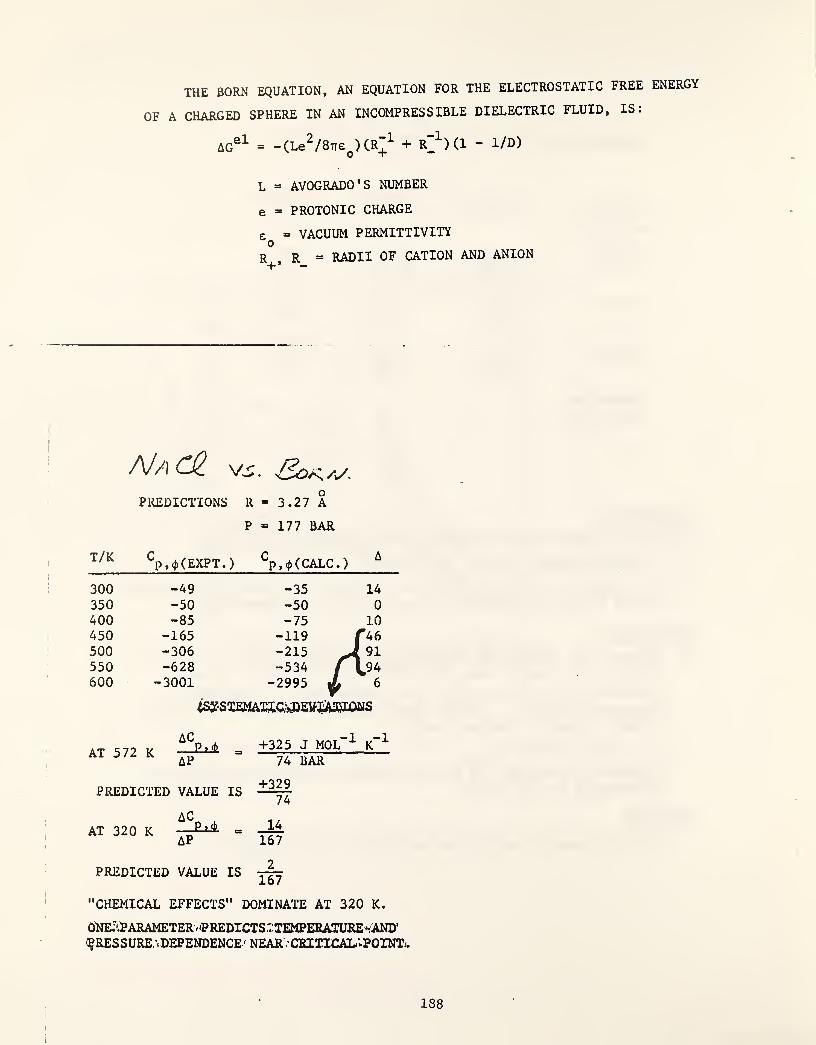
THE BORN EQUATION, AN EQUATION FOR THE ELECTROSTATIC FREE ENERGY
OF A CHARGED SPHERE IN AN INCOMPRESSIBLE DIELECTRIC FLUID, IS:
= -(Le^/87re^)CR"^ + r”^)(1 - 1 /D )
L = AVOGRADO'S NUMBER
e = PROTONIC CHARGE
e » VACUUM PERMITTIVITY
R_^, R = RADII OF CATION AND ANION
NaCH ys. SoKyy.PREDICTIONS R = 3.27 A
P » 177 BAR
T/KS,<|,(EXPT.) S,«J>(CALC.)
A
300 -49 -35 14
350 -50 -50 0
400 -85 -75 10450 -165 -119
1f46
500 -306 -215 J 91550 -628 -534 l94600 -3001 -2995 |L 6
ACAT 572 K =
AP
PREDICTED VALUE IS
ACAT 320 K =
AP
PREDICTED VALUE IS
"CHEMICAL EFFECTS" DOMINATE AT 320 K.
+325 J mol"-*- K~74 BAR
+32974
14
167
2
167
o'nei^:parameterv<predicts,-:temperaturevand'
^RESSURE'.DEPENDENCE' NEAR.CEITICAL'vPOINT..
188
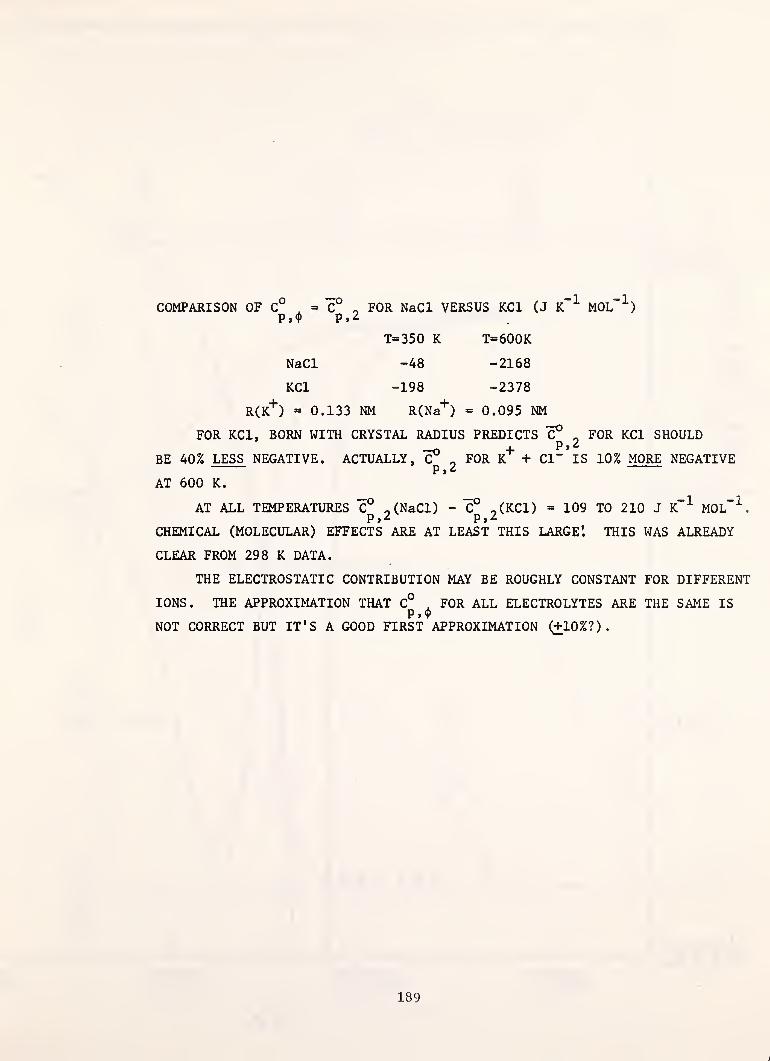
COMPARISON OF C° = „ FOR NaCl VERSUS KCl (J K“^ MOL"^)P»<P P»2
T=350 K T=600K
NaCl “48 -2168
KCl -198 -2378
RCk"^) » 0.133 NM R(Na*^) = 0.095 NM
FOR KCl, BORN WITH CRYSTAL RADIUS PREDICTS C? ^ FOR KCl SHOULD-o +
BE 40% LESS NEGATIVE. ACTUALLY. ^ ^ FOR K + Cl" IS 10% MORE NEGATIVEp,2
AT 600 K.
AT ALL TEMPERATURES C° „(NaCl) - C° ^(KCl) = 109 TO 210 J k"^ MOL”^.
CHEMICAL (MOLECULAR) EFFECTS ARE AT LEAST THIS LARGE'. THIS WAS ALREADY
CLEAR FROM 298 K DATA.
THE ELECTROSTATIC CONTRIBUTION MAY BE ROUGHLY CONSTANT FOR DIFFERENT
IONS. THE APPROXIMATION THAT C° ^ FOR ALL ELECTROLYTES ARE THE SAME ISP,<l>
NOT CORRECT BUT IT'S A GOOD FIRST APPROXIMATION (+10%?).
189
>
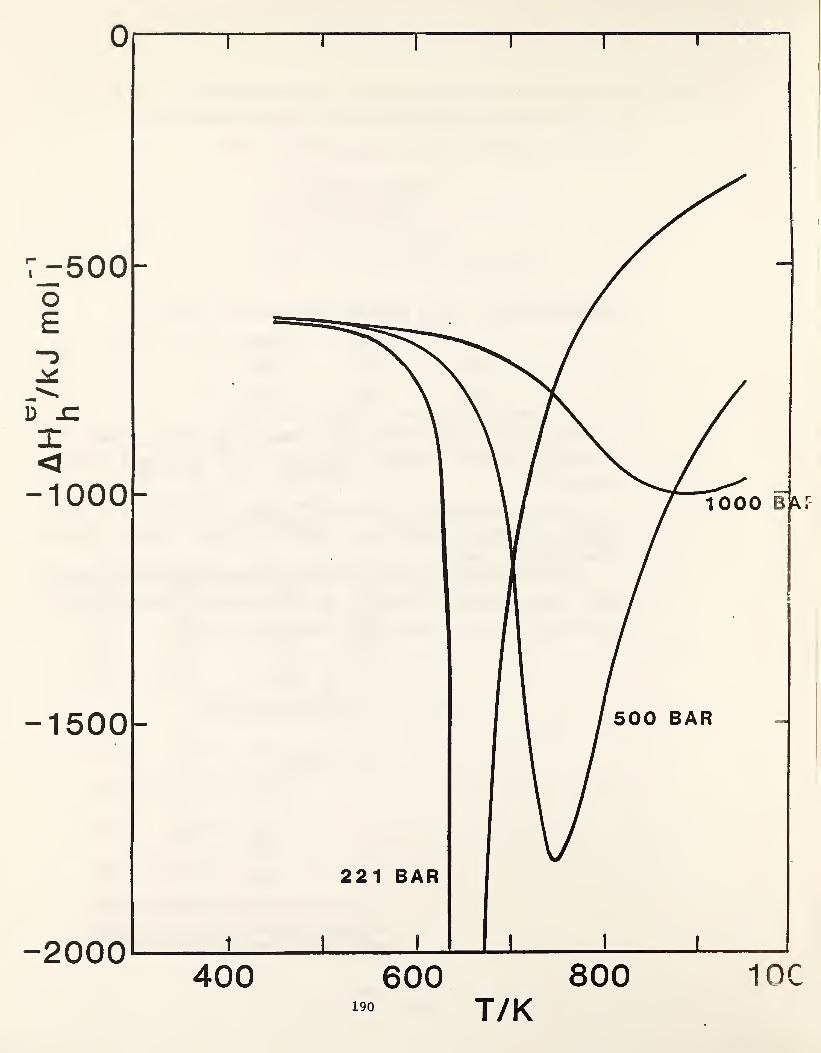

400
600
800
1000
el
AGu /kJ moln
o) roo o oo o o o
191
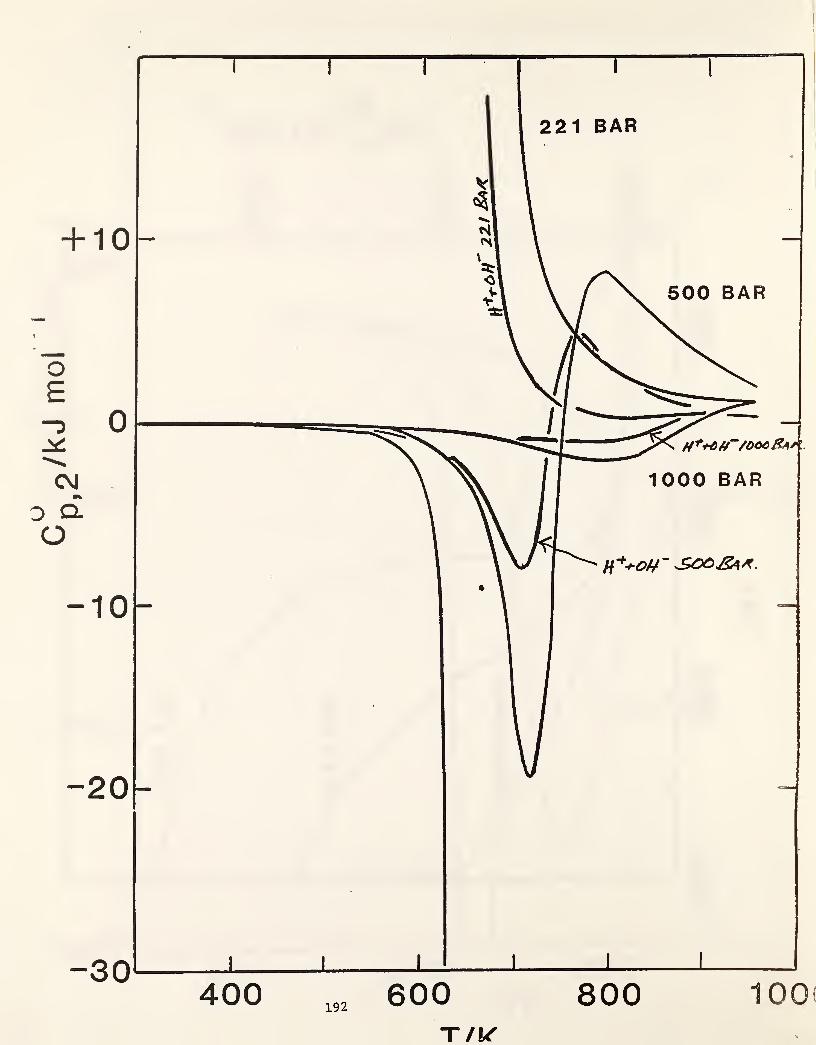
/kJ
mol
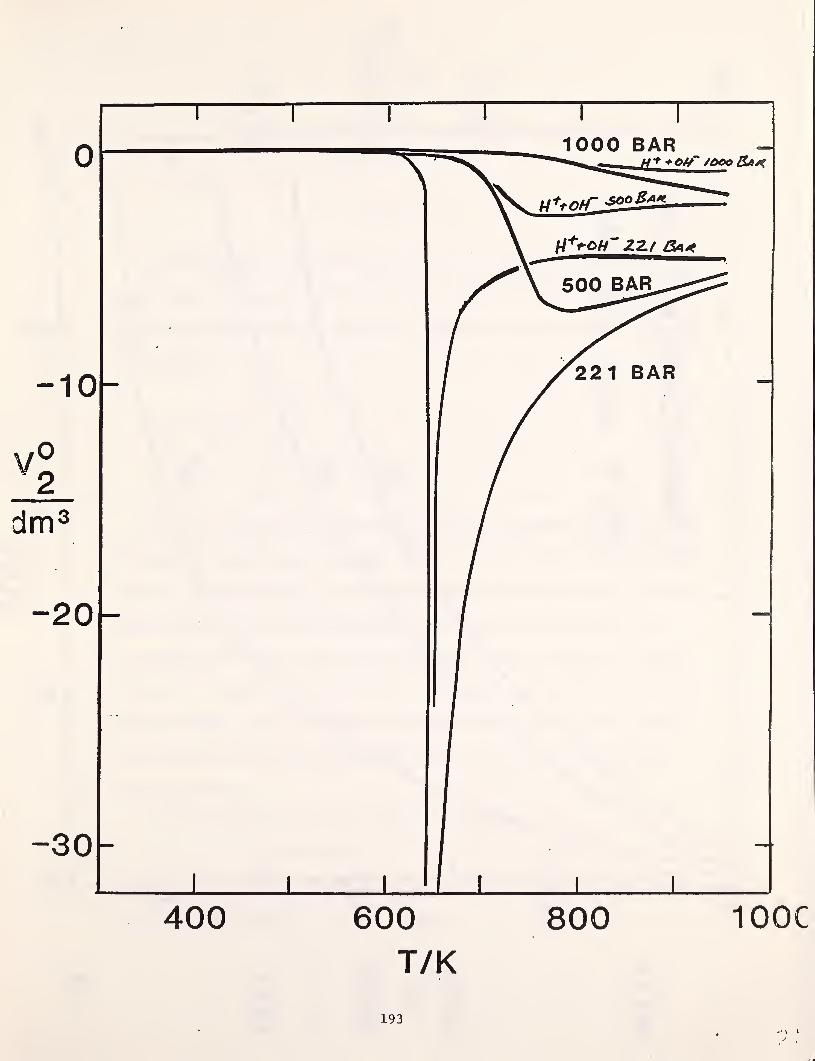
OCM
193.• \ »

COMPRESSIBLE
FLUID
R/A

DISTRIBUTION OF CHEMICAL SPECIES BETWEEN
WATER AND STEAM
by Paul Cohen
The distribution of chemical species between two phases, water and steam
is governed by the phase rule. The extended system can consist of three phases,
liquid, vapor and solid and two components, water and solid (if there is no reaction).
W riting
P + F = C + 2.
We have, for 1, v, only
F = C - P + 2
F = 2
Thus, if temperature and pressure are fixed, the compositions of both phases
are fixed. This applies only for species which do not react with water, i.e., acids
or bases. In the case of salts, which can hydrolyze, an additional degree of freedom
exists, namely the ratio of the quantities of the two phases. This follows from
the independent mobility of the hydrolysis products. Thus at equilibrium between
the phases the ratio of the cation and anion of the salt does not have to be identical
in the two phases. Only the overall ratio has to correspond to the salt composition.
Thus incongruent volatility of salts from liquid to vapor is to be expected and
has been observed.
At the saturated solution line, there are three phases
F=C+2-P=l
Thus, if either pressure or temperature are fixed, the other and the compositions
of the phases are defined.
195

In the superheated region, solid and vapor only, the composition of the solid
(hydration) and composition of the vapor are fixed, if pressure and temperature
are fixed.
Two systems have been studied extensively, Si02 - H2O and NaCl - H
2O.
They represent solutions with limited or extended solubility in the liquid, and
high and low solubility in the vapor respectively (Figs. 1 and 2). Both materials
are common in the steam cycle and are technologically important. The transported
solids produce deposits in turbines (Si02 ) or create potentially destructive environments
in turbines (NaCl).
For control in the boiler, the region of dilute solutions is of interest, where
the apparent distribution constant, Kj^,
is of the order of 10 to 10 , Fig.
3. For turbine phenomena, at lower temperatures but high superheat, the distribution
-9 -8coefficients are very low, of the order of 10 - 10 ,
with high concentrations
in the liquid phase, and low concentrations in the vapor phase. Therein lies the
technical problem. Very dilute steam solutions can produce very concentrated
solutions in equilibrium. Fig. 4. These two sets of data are roughly correlated
as follows:
A. log S = yy\ logPy^+ H + B.
Tpy is the steam density. T is the absolute temp, m, H, and B
are constants, S is the steam phase concentration in equilibrium
with solid salt.
B. K D-
wherep^,pv are the densities V) the liquid and vapor phases, n is a constant,
and is an apparent distribution coefficient for dilute solutions, see
Fig. 3.
196

Given the data for the solid solubility and thermodynamic data for the liquid solutions,
the complete field should be calculable. This has been attempted by the writer
for NaCl (requiring hydrolysis) with only moderate success. Recently, Pitzer has
attempted to model the solubility of salts after the hydration of the individual
ions, as observed by mass spectrometry (Fig. 5) with moderate success.
Further understanding of this field will require studies of systems without
hydrolysis. LiOH is most suitable, for it has limited solubility in the liquid phase,
and correlation of the two fields 1, v, // s, v would be possible.
197
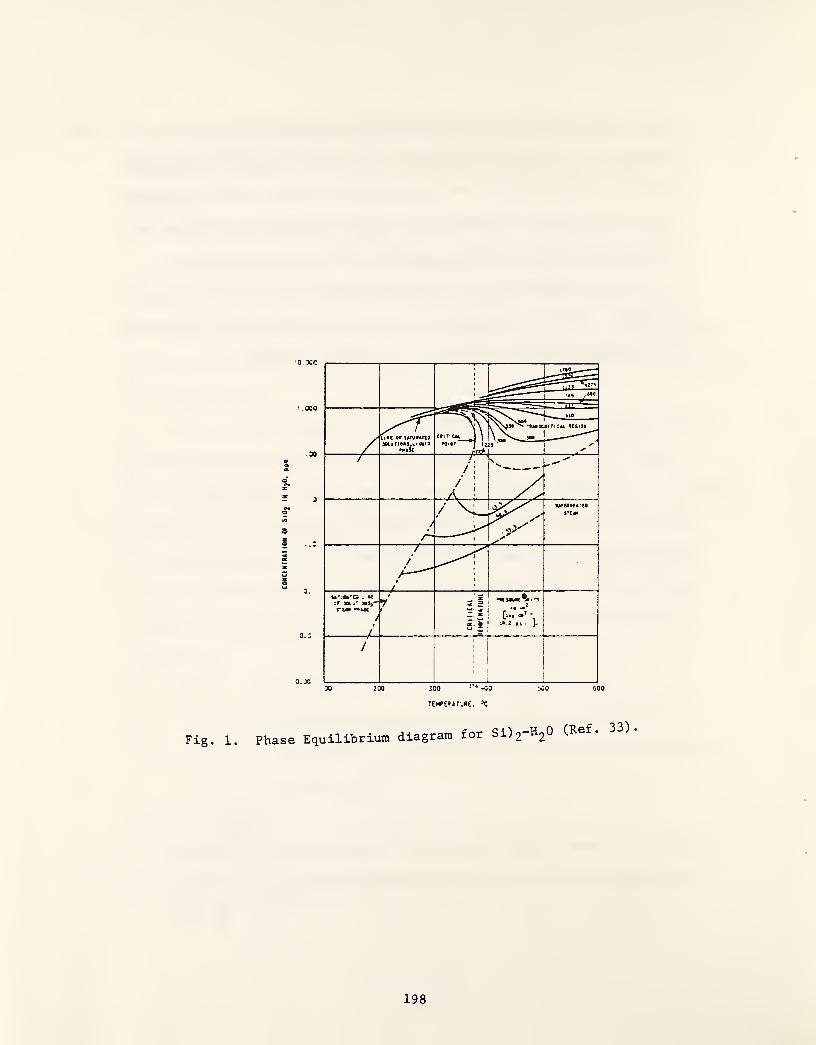
Fig. 1. Phase Equilibrium diagram for Si)2"^2® (Ref.
198

Fig. 2. Phase equilibrium diagrams for system NaCl-H^O (Ref. 33)
199
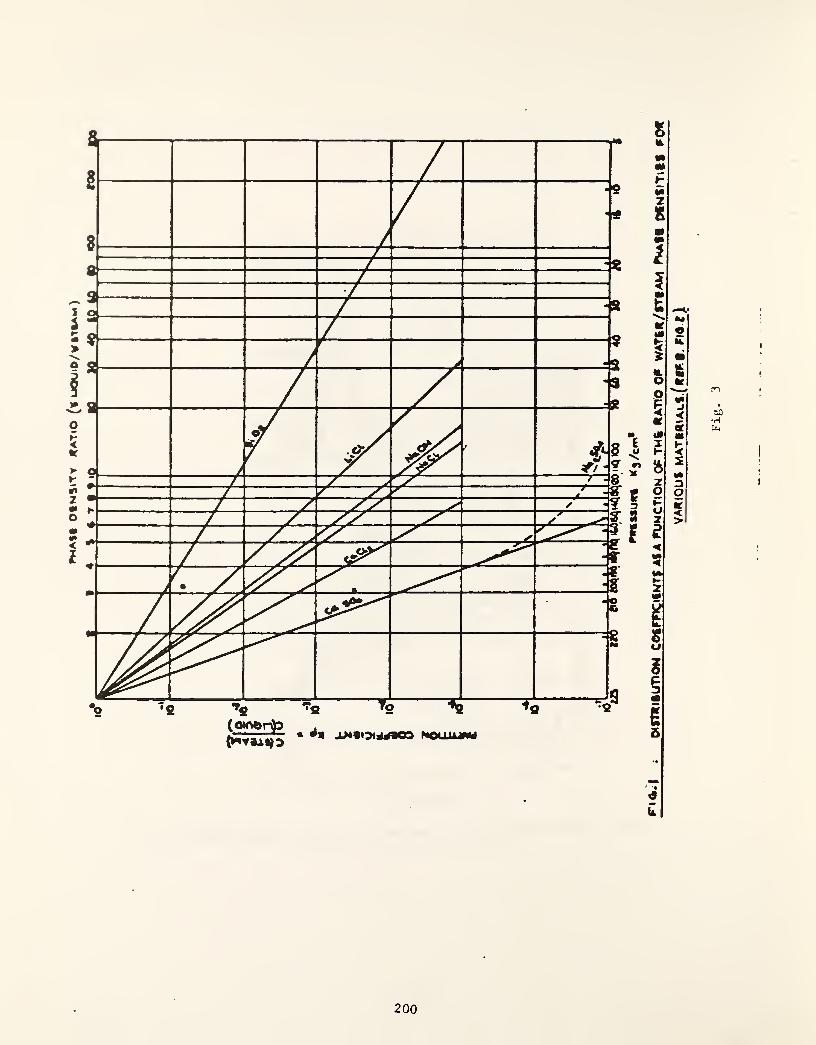
^A«|
OtNVTV
flATiO
(«
UOUiO/V»T%Am)
200
PWfSSUlVt
K3/cm*
i
DtfTKHunON
CetFFlCUMTtAtA
FUMCTIOKUy
THfc
RATIO
py
WATjU/lTtAM
P»<Atl
OiMtiTtit
FQ<
VA^IOm
MATl«iAnY«t^
•Fla
)̂

DISmiBUnON
NATIO,
TBMKRATUIIi (*Fi
Fig- 4
201
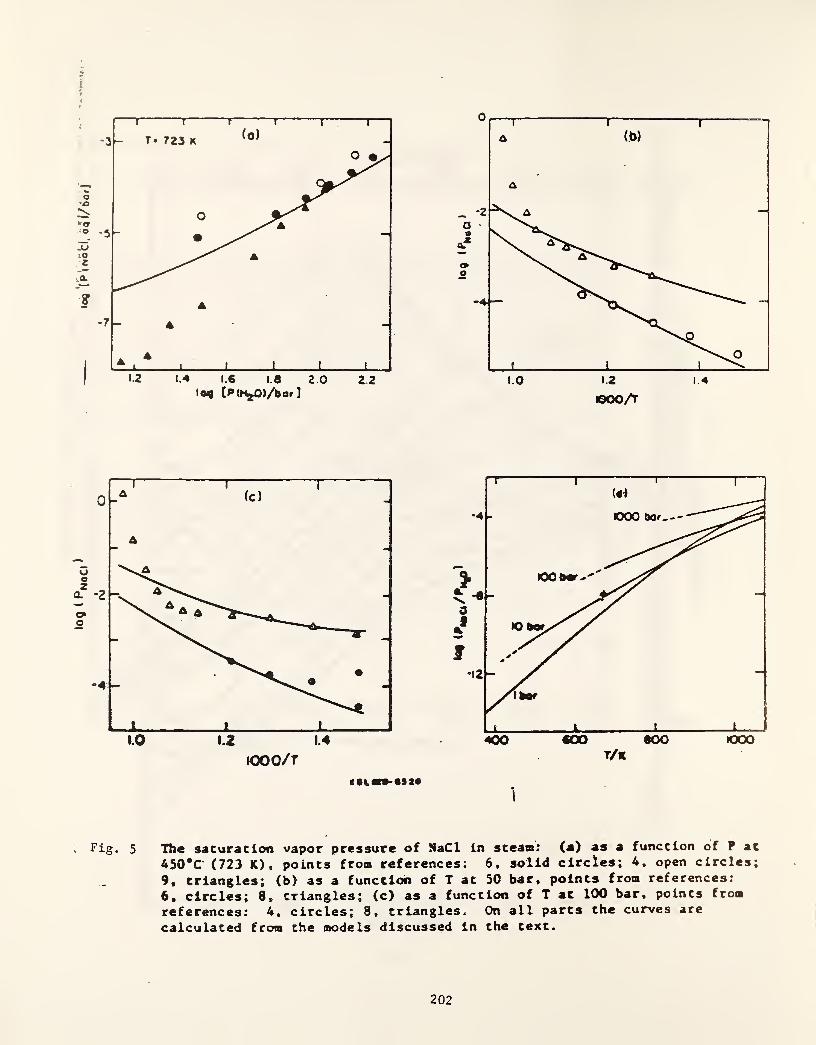
r
lOOO/T
• «SS«
Fig. 5 The sacuraclon vapor pressure of NaCi in steam: (a) as a function of P at
450*C (723 K), points from references: 6, solid circles; 4, open circles;
9, triangles; (b) as a function of T at 50 bar, points from references:
6, circles; 8, triangles; (c) as a function of T at 1(X) bar, points from
references: 4, circles; 8, triangles. On all parts the curves are
calculated from the models discussed In the text.
202

Thermodynamics and Electrochemistry of Corrosion
G. J. Theus
1 '
5 jjE
E S3 OI
jS Q3
iS"!X 3toa e.
E -0u
UJ ^“= 5
22
5 z
1 o2 2X c
infic I
m Hrt-2
O 5Q <g|z =^ U.
QZ3li.
eg -I
z2 Ir- in
zc -
E §edin 03
203

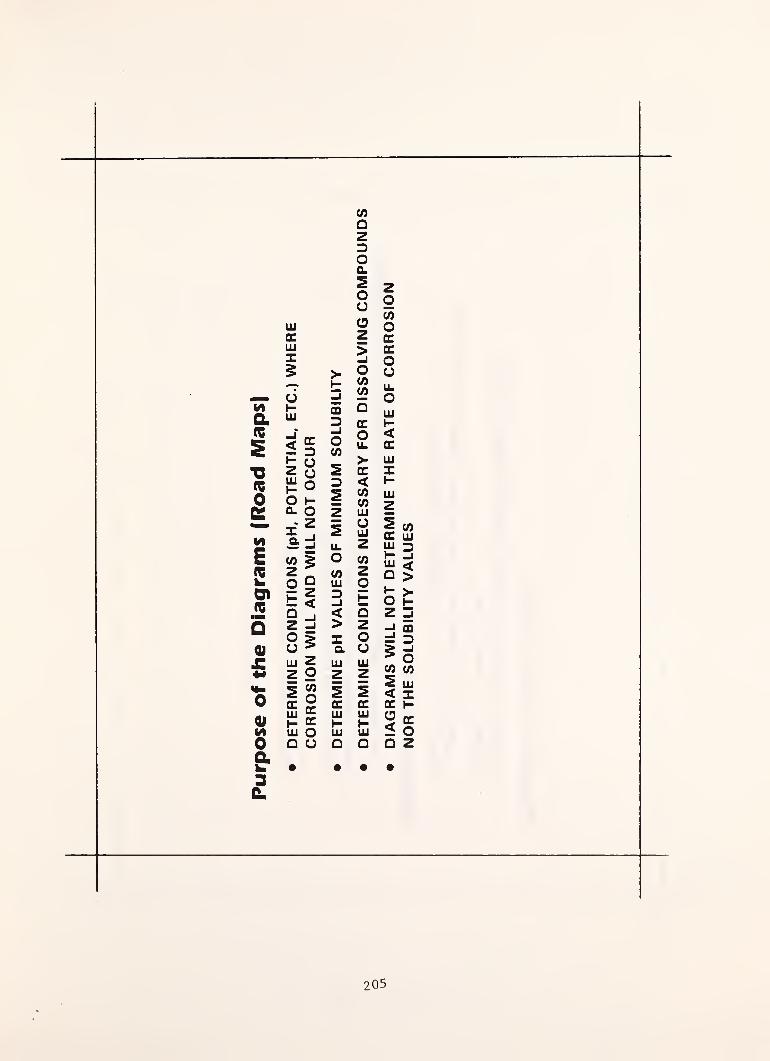
aST3tZ
0KME2O)(C
c
QlM0au3C.
UJccHIX$
uHHI
P =28SoO H0. O
IICO
zgHQZooUJ
z _
HI OQ O
CO
QzDO0.
sOuCD
z>
> OH W „~ CO ^d X OCD
DOCO
SD
Z
QZ<
zo
2X
XoH>X<COCOHi
CJUJ
zCO
zgH
COUJD—I
<>XaUJ HI
z z
QZoCJ
sX
zgoXXoo
HI HIH ”UJ UJ
Q O
HII-<XUJXHUJ
Z
iisS3S?O HZ
di5 oCO CO
S UJ< XX I-
< oQ Z
205

Mt!01
2^
Q.
01
lUcc
DHD11.
9o><oI-
0)
UJ
ffi
<a.
< w u
lij
0 501 o0 0-
ak •3G.
tu>^ 2o o5£lUcc zQ. g2 wQ o
CCcc
Ou
Qz<uiccUJ
Q
Oz<UJ>OCO
OH
ooI-
oHCO
ozo<Q<UJ
9>occCL
CO
3UJ-Jca
OccCL
z9CO
occcc
oo
CO
<0.
Qz<y~
zUJccccDo
ts0)
akCL
OJ
£
O)0000£
S
CO
3<cc
o<QUJZ
HUDCC.
HCO
zouoI-
s<cc
CD
OCC0.
ccUJHD0.
SOo<CL
oUJ>Ui
Q
O<UJCC
UJCQ
z<^co
QUJ
QOSUJOQ
<< ^s
O w
is<
UJ -
UJ
Z 2
|2cc ocUJ OZ 0.I- cc
ii
z<CJ
<I-<Q
UJH<CCDUO<z
CO
QzDoCL
ooQUJz9-jCQ
<COUJ
206
i
207

208

Moc30aE0u
000)
CA3Q
(0 <
N0 <0
(A
a.
UJ>HlA 00 o UJ
O1
00
0)CM o
CC
<OUJLL
0) 1- z U.H < o UJ
>1 II II II
co :e
N o0 o 1- CACA |CM (A
0U)
ua
(Z
Q
k0cUJ
01
QikLL
UJ-jCQca
OOOz<
00O)
tf)
o (0
(A
000)
CM
I-3-j
O(A
(A3O
r-'
<n
< <0
(A o m UJ(A 00 3 nI (u
• Eo
0) 1-
1 0 a
w#CM
n 0^
0<
1 W
(AUJ
M0 <0
CA
O+ CA
Od
1
zCA
CM
O A 00 z 5 z 2oolA
UJa.CA
0)
0
3OCL
c go
c
M Q +CD s K i K
«itz
UJ>-J
o (0 II
ouQ
COjcM
II
oH<
C0|CM
II
Mc
CACA
II
p 0 o000)CM
Zo
000)CM
0 Q O0)
CD CA0CO
s0CO0 r“ CM CO
209
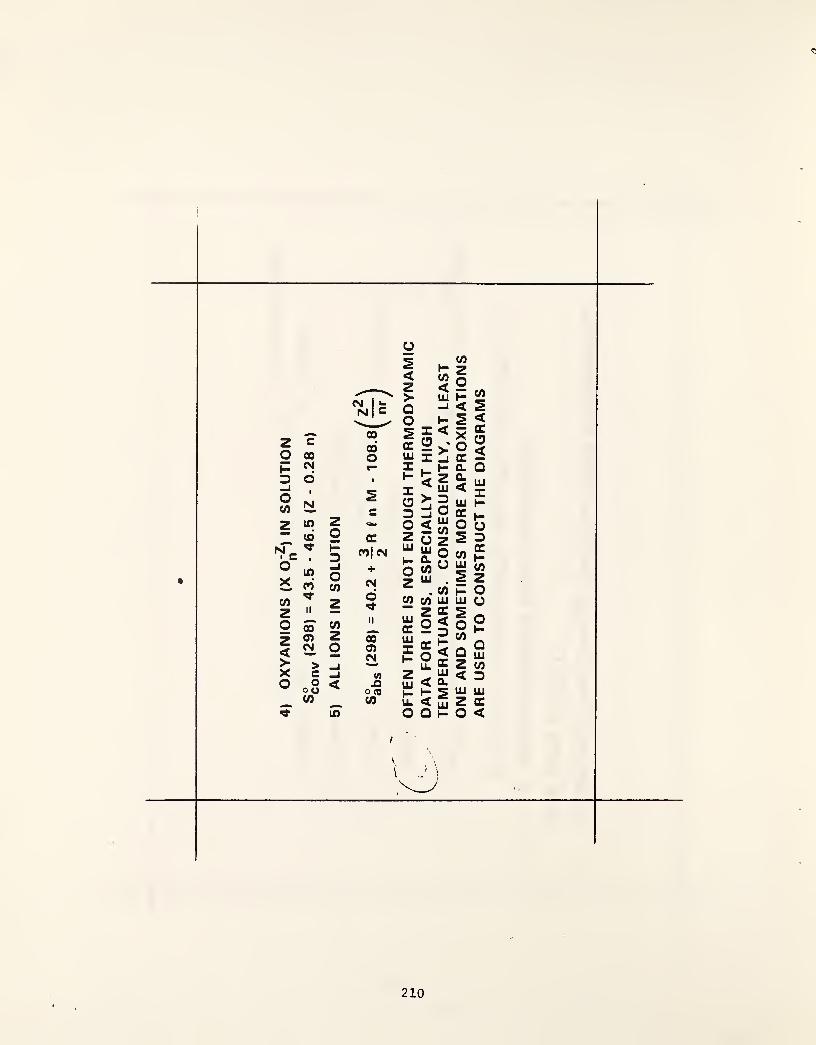
210

POTENTIAL
(VOLT
VS.
SHE)
FIGURE POTENTIAL-pH DIAGRAM FOR Fe-H20 SYSTEM AT 25°C
Ajon " 10"®, Ag^ 1, AjQij^j 1
211
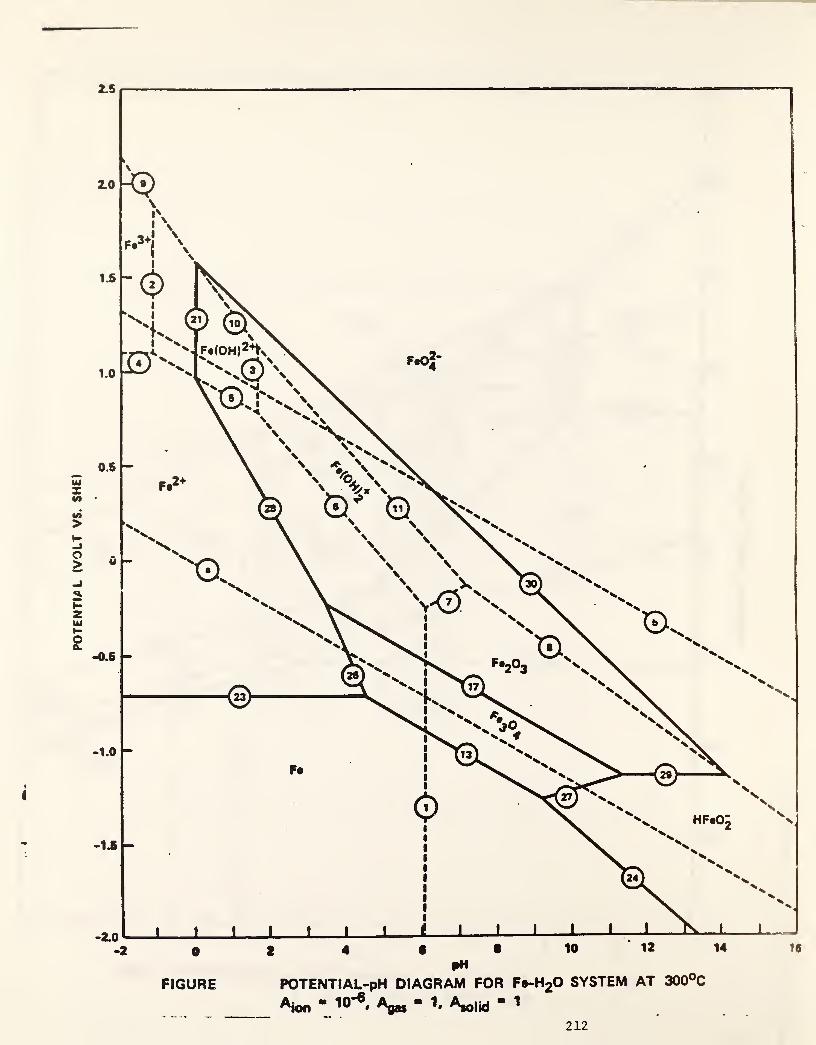
POTENTI/)
L
<VOLT
VS.
SHEJ
2.5
FIGURE POTENTIAL-pH DIAGRAM FOR F»-H20 SYSTEM AT 300°C
A|on • 10"^, Agj, 1, “ 1
212
•N

POTENTIAL
(VOLT
VS.
SHE)
<
»M
FIGURE ' POTENTIAL-ipH DIAGRAM FOR Fe-^-HoO SYSTEM AT'25°C—fl —1 ^
^ion * » ^di$solvd sulfide“
» ^^gas"
^solid“ ^
213

POTENTIAL
(VOLT)
Z
AXIS
THREE DIMENSIONAL DIAGRAM FOR Fe - H2OAT TEMPERATURE FROM 25 TO 300°C
214
215
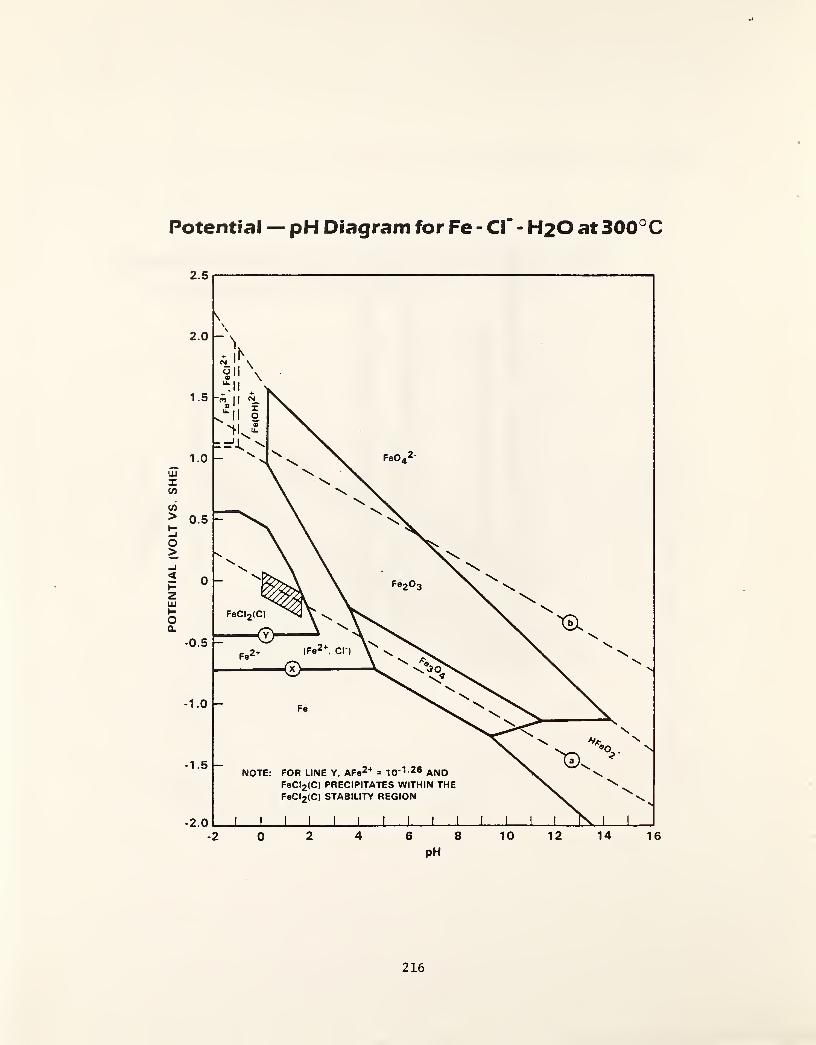
POTENTIAL
(VOLT
VS.
SHE)
Potential — pH Diagramfor Fe-cr-H20 at 300°C
216
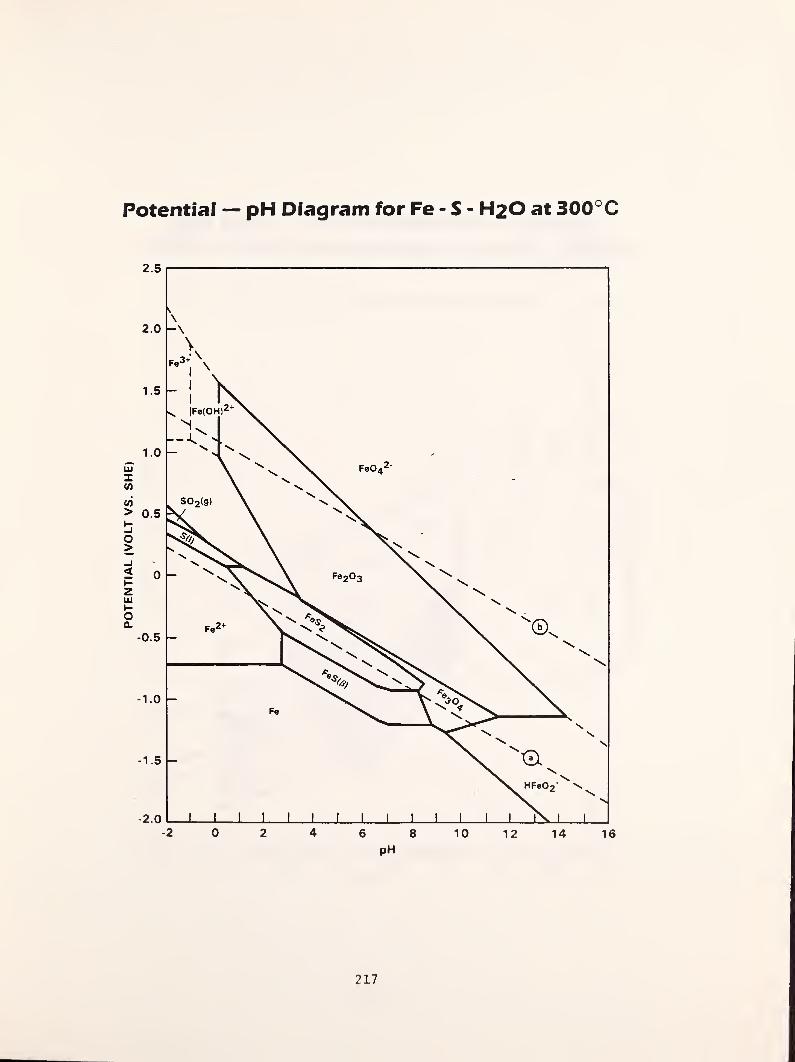
POTENTIAL
(VOLT
VS.
SHE)
Potential — pH Diagram for Fe - S - H2O at 300°
C
217

POTENTIAL
(VOLT
VS.
SHE)
Potential — pH Diagram of Fe > H2O withCr(OH)3 Stability Region on Top of it at 100°C
218

POTENTIAL
(VOLT
VS.
SHE)
Potential — pH Diagram of Fe - H2O with
Cr(OH)3 Stability Region on Top of it at BOO'^C
219
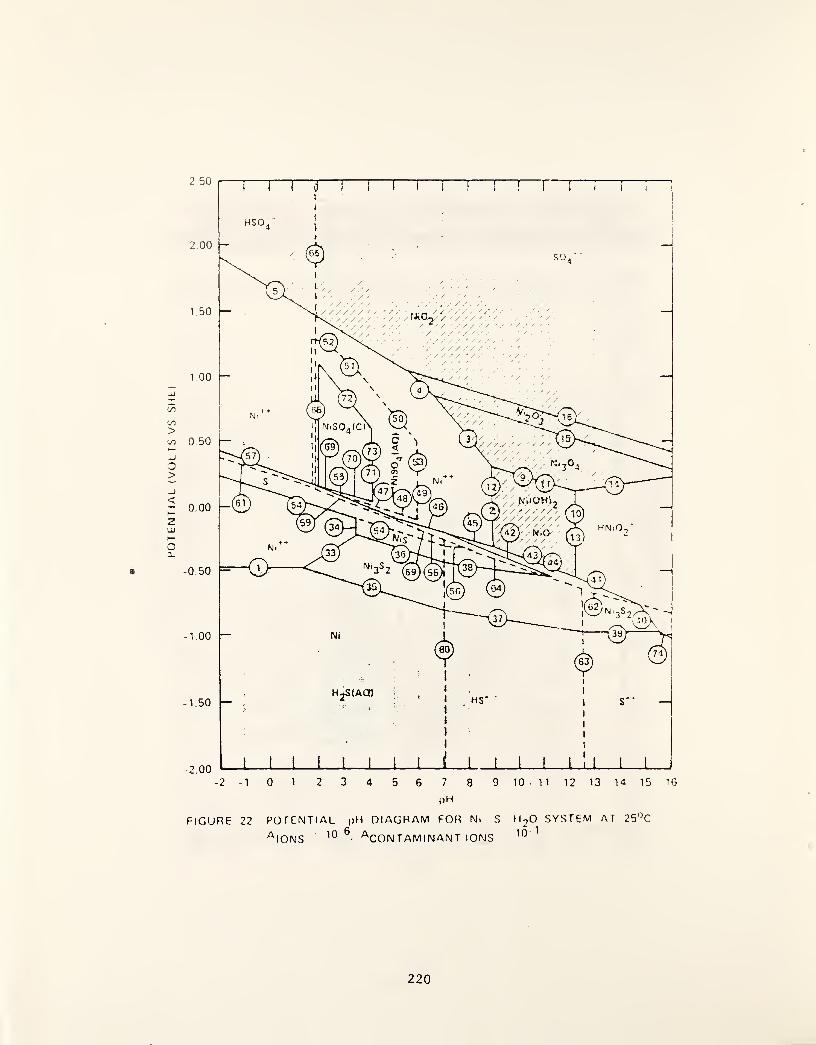
POTENTIAL
(VOLTS
vs
SHE)
|)H
FIGURE 22 POTENTIAL ()U DIAGRAM FOR N. S lUO SYSTEM AT 25'^C
fi
^lONS '^CONTAMINANT IONS
220
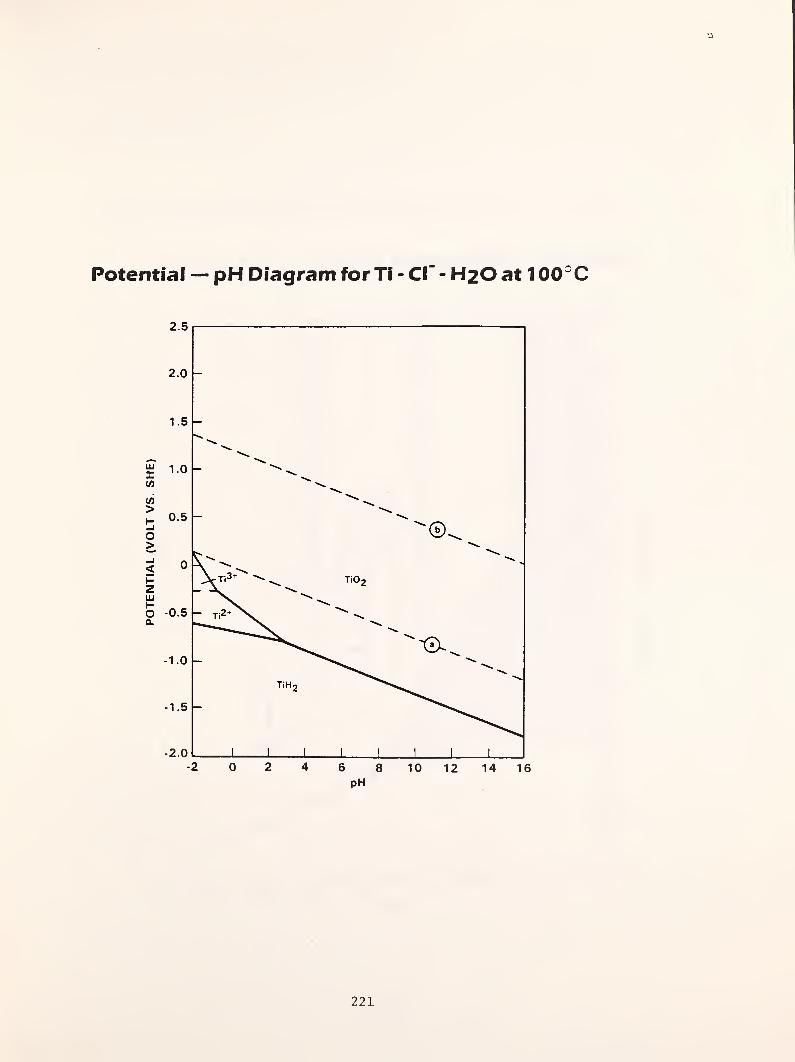
POTENTIAL
(VOLT
VS.
SHE)
Potential — pH Diagram for Ti - Cl” - H2O at 1 00°
C
221

POTENTIAL
(VOLT
VS.
SHE)
Potential — pH Diagram for Ti - F“ - H2O at 100°C
222
c
(C
EE3l/l
flC
O
(/)
a.
<
G<Ooc
LU(/)
DliJ
CC
<C/3
2<QC
o<QX<OQ
OCDoQ.
liJ
w CQ
2. <UJ-iOQ
OCC
-J
<><
a. >-i
zg
G<
(/i lU
o OC
ococ
oo < </)
GZ<
CDz
zo
1-
<G
Zg
OCLU
t<
> (/) O o f”lU <
G < CQ GoCA
zUi <
LU
OC 0C OOC
oQ.lU
z>
U.
ooUL i<
oz
G>-
O
GO2
c/3
g
(/)
gz>G
H*O <
OCocLU
HlU
2XlUOS
Q D I G OCliJ o h- X LU LUOC o LU IQ. < • • z H
223

Correlation of Data for Electrolytes in Water and Steam
J. Christopher Pei per*Department of Chemistry
University of California, BerkeleyBerkeley, CA 94720
(Paper presented at the Workshop on
Cycles, held at the National Bureau8-9, 1983).
Chemical Thermodynamics in Steam Powerof Standards, Gaithersburg, MD, February
%
*Present address: Department of ChemistryArizona State UniversityTempe, Arizona 85287
224

Introducti on
Two problems must be addressed in correlating data for use in steam power
generation and associated technologies: First, the aqueous solutions involved
are multi-component systems with overall composition ranging from extreme
dilution to solute saturation. Second, these solutions are present as liquid-
or gas-like fluids at temperatures to 800 K and pressures to 500 bar.
Therefore, correlative techniques must apply over a wide range of
conditions. This paper briefly describes three complementary formulations:
the ion-interaction (or virial coefficient) equations of Pitzer, the older
equations of van Laar, and an ion-hydration model.
Ion-interaction Model
The ion-interaction model is based upon a virial expansion in the solute
concentration or molality; molality is preferred since it is temperature-
independent. This approach has an excellent theoretical basis. MacMillan and
Mayer^ established for dilute solutions a treatment formally similar to that
for nonideal gases, provided intermolecular potentials are replaced with
potentials of mean force for the solvent of interest. Thus second and higher
virial coefficients may be computed from well-known statistical mechanical
formulas; for electrolytes this computation is not strai ghtforward due to the
long-range nature of the coulombic potential. But Mayer^ and others have
shown that a Debye-Huckel term accounting for electrostatic effects may be
combined with a virial expansion accounting for short-range interactions. In
this case, however, virial coefficients depend upon the ionic strength as well
as temperature and pressure.
This theoretical basis was used by Pitzer^ in developing practical
equations for the thermodynamic properties of electrolyte solutions. His
basic equation is postulated for the excess Gibbs energy of the solution;
other thermodynamic quantities may be obtained by differentiation
n RTw
f+Z .m.m.\..+E .. mmm u1 .J 1 J IJ 1 ,J ,k 1 j k ^jk ( 1 )
0XHere G /n^ is the excess Gibbs energy per kilogram of solvent and m^ , mj
,
etc., are the molalities of ions or neutral species. Electrostatic
interactions lead to the Debye-Huckel term, f, which is dependent upon ionic
225
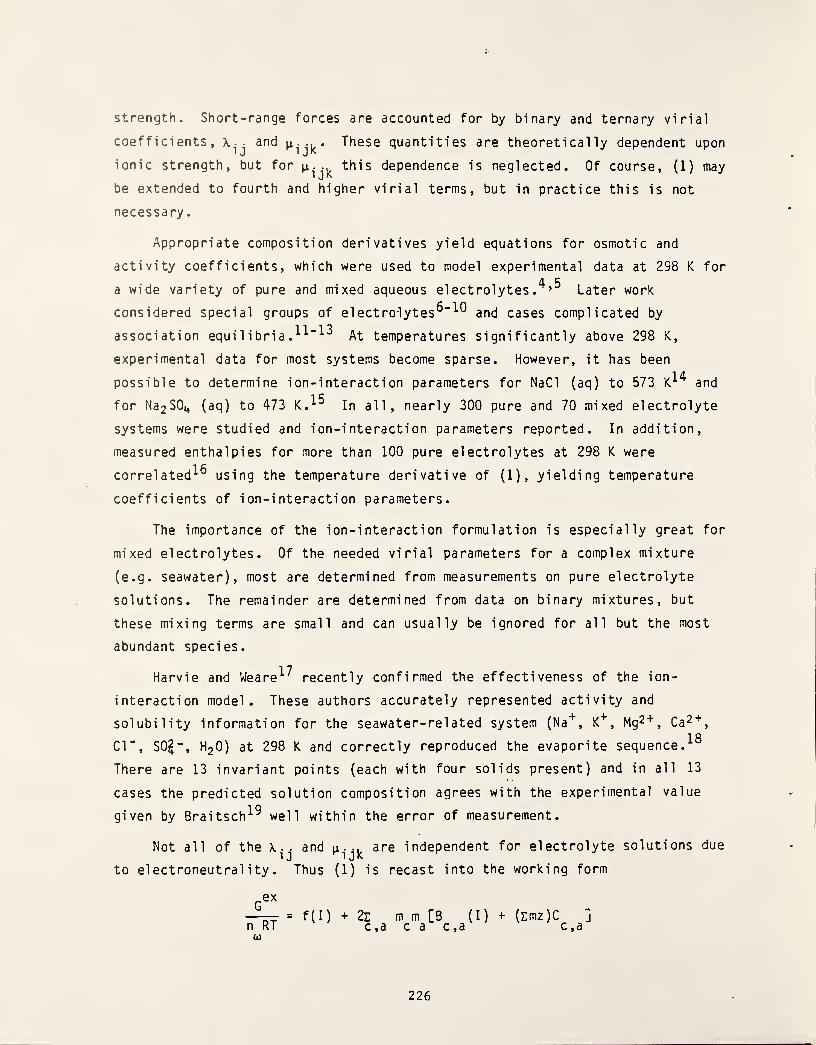
strength. Short-range forces are accounted for by binary and ternary virial
coefficients, . and These quantities are theoretically dependent upon
ionic strength, but for this dependence is neglected. Of course, (1) may
be extended to fourth and higher virial terms, but in practice this is not
necessary
.
Appropriate composition derivatives yield equations for osmotic and
activity coefficients, which were used to model experimental data at 298 K forn c
a wide variety of pure and mixed aqueous electrolytes. ’ Later work
considered special groups of electrolytes®"^^ and cases complicated by
association equilibria. At temperatures significantly above 298 K,
experimental data for most systems become sparse. However, it has been
possible to determine ion-interaction parameters for NaCl (aq) to 573 and
for Na 2 S04 (aq) to 473 In all, nearly 300 pure and 70 mixed electrolyte
systems were studied and ion-interaction parameters reported. In addition,
measured enthalpies for more than 100 pure electrolytes at 298 K were
correlated^® using the temperature derivative of (1), yielding temperature
coefficients of ion-interaction parameters.
The importance of the ion-interaction formulation is especially great for
mixed electrolytes. Of the needed virial parameters for a complex mixture
(e.g. seawater), most are determined from measurements on pure electrolyte
solutions. The remainder are determined from data on binary mixtures, but
these mixing terms are small and can usually be ignored for all but the most
abundant species.
Harvie and Weare^^ recently confirmed the effectiveness of the ion-
interaction model. These authors accurately represented activity and
solubility information for the seawater-related system (Na'*’, K'*’, Mg^'*’, Ca^'*',
1
8
Cl", S0^“, H2 O) at 298 K and correctly reproduced the evaporite sequence.
There are 13 invariant points (each with four solids present) and in all 13
cases the predicted solution composition agrees with the experimental value
given by Braitsch^^ well within the error of measurement.
Not all of the and are independent for electrolyte solutions due1 J 1 J K
to electroneutrality. Thus (1) is recast into the working form
.ex
-TTF = f(I) + 2zn RT c,a0)
m m [B (I ) + (Emz)C j
226
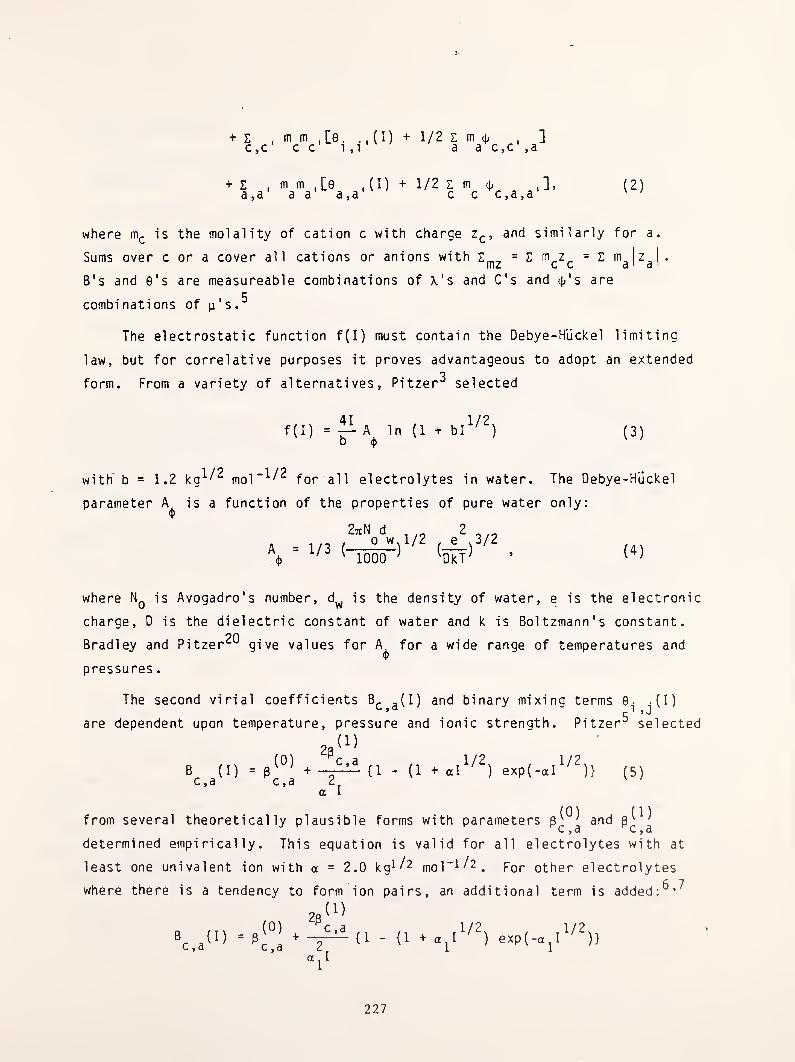
(2 )
+ Z ,mm,[e. .,(!) + 1/2 Z m 4; , ]c,c c c 1,1 a a c,c ,a
+ z,m m
,[e
,(I) + 1/2 Z m 4,
,],
a, a a a a, a c c c,a,a
where is the molality of cation c with charge z^, and similarly for a.
Sums over c or a cover all cations or anions with z„, = Z m^z^ = z m Iz^l.
B's and 0's are measureable combinations of \'s and C's and 4<'s are
combinations of
The electrostatic function f(I) must contain the Debye-Huckel limiting
law, but for correlative purposes it proves advantageous to adopt an extended
form. From a variety of alternatives, Pitzer^ selected
f(I) = ^ A In (1 +K A
1/2,(3)
wiith b = 1.2 kg^/^ mol"^/^ for all electrolytes in water. The Debye-Huckel
parameter is a function of the properties of pure water only:4>
2uN d 2
A = 1/3 (
o_w. 1/2 /_e_x3/2
\ ^1000
’
^DkT^(4)
where is Avogadro's number, d^ is the density of water, e is the electronic
charge, D is the dielectric constant of water and k is Boltzmann's constant.
Bradley and Pitzer^^ give values for A for a wide range of temperatures and
pressures
.
The second virial coefficients B^ ,(I) and binary mixing terms 0. .(I)
are dependent upon temperature, pressure and ionic strength. Pitzer^ selected
23‘1>
B (I) = 3^°' + {1 - (1 + exp(-ad''^) (5)C)d C)d ca I
from several theoreti cal ly plausible forms with parameters andC 9 d C ) d
determined empirically. This equation is valid for all electrolytes with at
least one univalent ion with a = 2.0 kg^^^ niol"^/^, pgr other electrolytes
where there is a tendency to form ion pairs, an additional term is added:^’^
“l‘
227
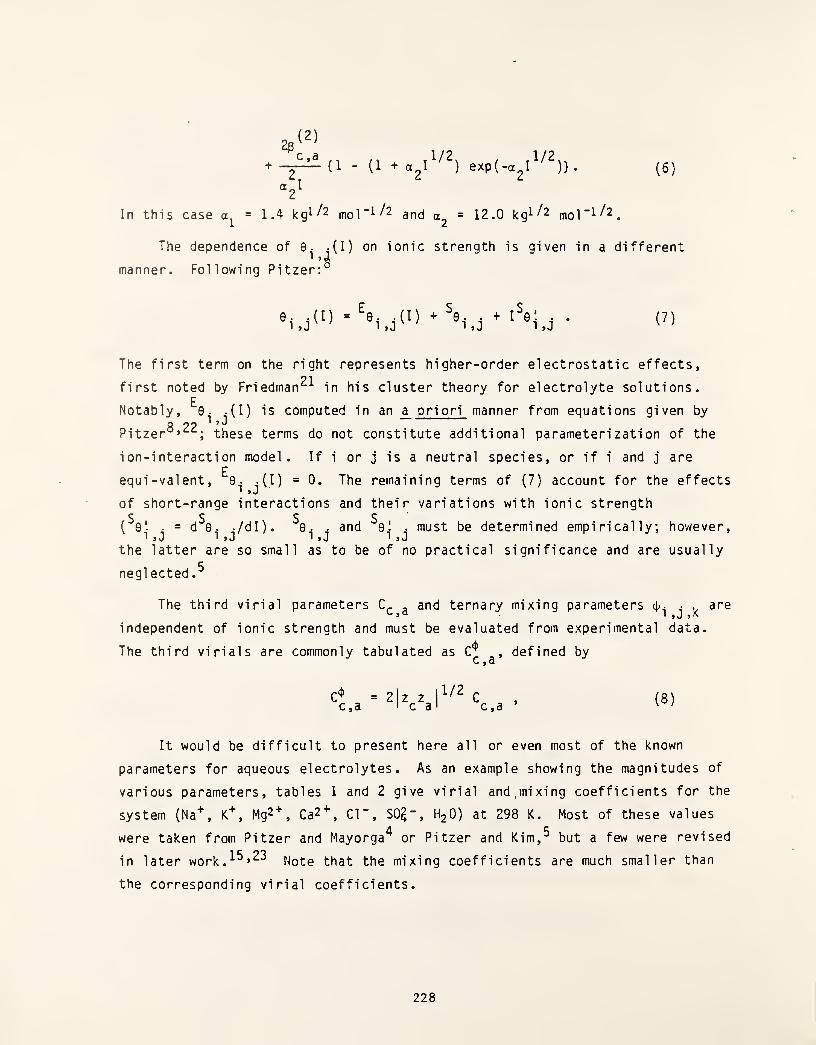
( 6 )
23( 2 )
+ ^^{1 - (1 exp(-a2l^^^)}.
"2^
In this case = 1.4 and = 12.0 kgl/2 ,t,q]-i/2^
The dependence of 0. .(I) on ionic strength is given in a different'
’smanner. Following Pitzer:
0. .(I) = ^0. .(I) + ^0. . + 1^0'. .
( 7 )
The first term on the right represents higher-order electrostatic effects,
first noted by Friedman^--^ in his cluster theory for electrolyte solutions.
Notably, ^0. .(I) is computed in an a priori manner from equations given byQ Op '
Pitzer°>‘^‘^ ; these terms do not constitute additional parameterization of the
ion-interaction model. If i or j is a neutral species, or if i and j are
equi-valent, ^0. .(I) = 0. The remaining terms of (7) account for the effects1 J J
of short-range interactions and their variations with ionic strength
(^0* . = d\. ./dl). , _
the latter are so small as to be of no practical significance and are usually
neglected.^
S S0. . and 0^I . must be determined empirically; however.
The third virial parameters , and ternary mixing parameters 4;- • . arejd 1 , J jK
independent of ionic strength and must be evaluated from experimental data.
The third vi rials are commonly tabulated as defined byC 9 a
C4)c,a
= 2 z zI c a
1/2c ,a ( 8 )
It would be difficult to present here all or even most of the known
parameters for aqueous electrolytes. As an example showing the magnitudes of
various parameters, tables 1 and 2 give virial and, mixing coefficients for the
system (Na'*’, Ca^'*’, Cl", SO^", H2 O) at 298 K. Most of these values
were taken from Pitzer and Mayorga^ or Pitzer and Kim,^ but a few were revised
in later work.^^»^^ Note that the mixing coefficients are much smaller than
the corresponding virial coefficients.
228

van Laar Equations
For very concentrated solutions, a virial expansion is not
satisfactory. Presumably a nonrandom distribution of ions (with oppositely
charged species close to one another) applies from the fused salt through the
range of high solute concentration, leading to large virial coefficients of
all orders. Only in dilute solutions will the ion distribution approach
randomness. However, the properties of concentrated electrolytes are
dominated by short-range forces, just as with non-electrolytes, and one
expects equations developed for the latter to be appropriate.
There are two systems for which the vapor pressure of water, hence its
activity, was measured over the full compositional range from dilute solution
to fused salt.^^"^® For each system, (Ag,Tl )N 03 -H20 or (Li ,K)N 03 -H20 , the
salt is a simple eutectic mixture. The results are shown in figure 1 which
also includes data for other systems with a large but limited solubility.
Compositor in the mole fraction given on a completely ionized basis,
xi = ni/(nj_ + vn 2 )with n^ and n2 the moles of solvent and solute and v the
number of ions in the salt.
The similarity of these curves to those for non-electrolytes is apparent,
with Henry's law and Raoult's law regions clearly visible. The dashed line
representing ideal solution behavior neglects short-range and electrostatic
interactions. This similarity encouraged application to ionic solutions of
simple equations derived for non-electrolyte systems. One of the simplest and
most successful had its origins in the work of van Laar.^^ Prausnitz^^
discusses this equation and the contribution of Margules, Hildebrand,
Scatchard, Guggenheim and others to this topic. For the activity of either
component, referenced to the pure liquid, one has (water is component 1):
The nonideality parameter oj, occasionally written w/RT, represents the
difference in i ntermol ecul ar attraction of unlike species as compared to the
mean of intermolecular attractions for pairs of like species. The second
parameter (b^/b 2 )is sometimes equated with the molar volume ratio for each
In a^ = In Xj^ + w^z^ In a^ = In x^ + .
= 0),(b /bj (9)
229

species in the liquid or with the ratio of molecular volumes. For ionic
solutions it is best to regard (bi/b 2 )as a freely adjustable parameter.
Least-squares fits of (9) to data for the two completely miscible systems
yields
= 1.02, (b^/b2
)= 0.50 for (Ag ,T1 )N02~H20
, and
= -0.89, (b^/b2 )
= 1.2 for (Li ,K)N02-H20 .
A Debye-Huckel term was not included in either calculation; if included,
agreement is improved in the water-rich region.
Of course, the van Laar equations may be reformulated for mul ti -component
solutions
.
Ion Hydration Model
The behavior of an electrolyte when dissolved in steam is quite different
than when dissolved in liquid water: Gaseous ions, with or without attached
water molecules, tend to aggregate in neutral or near-neutral clusters. Under
these conditions an ion hydration model is more appropriate.
For an ion dissolved in steam, the first few hydration steps are most
important since the energy binding a water molecule to an ion-water cluster
decreases rapidly as the cluster size increases. Therefore, its seems
reasonable to treat distant water molecules separately from those which are
tightly bound. The "outer-shell" effects of distant water molecules are
easily and accurately included via the Born model, which Professor Wood
discusses in greater detail elsewhere in these proceedings. The Born equation
for the Gibbs energy of solvation is
( 10 )
where R* is the effective radius of a spherical cavity in the dielectric
solvent (in the present case, steam) which contains the ion; s is the
dielectric constant or relative permitivity of the solvent, is the vacuum
permitivity and e is the protonic charge. The dielectric constant of steam
may be taken from Quist and Marshal 1^^ or Uematsu and Frank. For the
present work, the equation given by Quist and Marshall was adopted since its
form is theoretically satisfactory for extrapol ati on to higher temperatures
230

from the range of experimental measurement. A value of 6 A was chosen for R*,
the effective size of the ion-water cluster, after a few preliminary
calculations
.
"Inner-shell" effects are best included by stepwise hydration equilibria;
for NaCl the solute:
[Na(H20)n_i]‘" + H2O = [Na(H20)n]‘", C
[Cl(H20)n.i]- + H2O = [Cl (H20)n]',
NaCl(H20)n.i + H2O = NaCl(H20)n, (11)
Kebarle and associ ates^^ determined the K^'*' and Kp" from mass spectrometric
measurements. By measuring Kp'*’ and Kp" at several temperatures they
obtained aH and aS as well. Table 3 summarizes their results; the linearn n
equation accurately reproduce Kebarle's values to n = 6 (the limit of
measurement) and form the basis for extrapolation to slightly larger n.
There are, however, no molecular-level data for hydrates of the Na"'’Cl"
pair. Physically, one expects the first two or three water molecules to bind
to Na''' since its hydration enthalpies are much larger than those for Cl“. But
the presence of Cl" will lower the attachment to Na"'' and a value intermediate
between those of Na"^ and Cl" seems appropriate. Some additional guidance in
selecting values for the AH°p and AS®p may be obtained from the solubility of
NaCl in steam. The measurements of Martynova, Styrikovich, et a1 .
,
SourincLjan and Kennedy, and Gal obardes , et al . were considered.
Unfortunately , these measurements are difficult and uncertainties in the final
results quite large; nevertheless, reasonable agreement was obtained with all
data, except those of Sourirdyan and Kennedy, with the values given in table
3c
.
Many thermodynamic properties may be computed from (10) and (11) with the
values of table 3. Figure 2 shows the solubility of NaCl in steam for a wide
range of conditions. At the relatively low pressures and moderate
temperatures where steam turbines are usually operated, NaCl solubility is
lO'll or less. This is smaller than the value currently obtainable by current
technology for the purification of boiler feed water. Figure 3 gives the
231

ionization constant of NaCl in steam; the experimental data are those of Quist
and Marshall. At 1073 K, the computed results fit very smoothly with
experimental values. At lower temperatures, the curves take on a distinct
S-shape with a gradually increasing slope connecting the low and high density
regions. Below the critical temperature of water this must become a
discontinuity in both log p and log K.
Extension of the hydration model to other species is strai ghtforward , and
Pitzer^® has considered the hydration of H'*' and OH". Molecular-level data are
required, but even crude estimates of the enthalpies and entropies of
hydration yield much-needed information on the behavior of electrolytes in
steam.
232

References
1. Macmillan, W. G. and Mayer, J. E., J. Chem. Phys,, 1945, 13, 276.
2. Mayer, J. E., J. Chem. Phys., 1950 , 18, 1426.
3. Pitzer, K. S., J. Phys. Chem., 1973 , 77 , 268.
4. Pitzer, K. S. and Mayorga, G., J. Phys. Chem., 1973 , 77, 2300.
5. Pitzer, K. S. and Kim, J. J., J. Am. Chem. Soc., 1974, 96, 5701 .
6. Pitzer, K. S. and Mayorga, G., J. Solution Chem., 1974, 3, 539.
7. Pitzer, K. S. and Silvester, L. F., J. Phys. Chem., 1978, 82, 1239.
8. Pitzer, K. S., J. Solution Chem., 1975, 4, 249.
9. Pitzer, K. S., Peterson, J. R., and Silvester, L. F., J. Solution Chem.,
1978 , 7, 45.
10. Downes, C. J. and Pitzer K. S., J. Solution Chem., 1976 , 5, 389.
11. Pitzer, K. S., Roy, R. N., and Silvester, L. F., J. Am. Chem. Soc., 1977,
99, 4930.
12. Pitzer, K. S. and Silvester, L. F., J. Solution Chem., 1976, 5, 269.
13. Peiper, J. C., and Pitzer, K. S., J. Chem. Thermodynamics, 1982 , 14, 613.
14. Pitzer, K. S., Peiper, J. C., and Busey, R. H., J. Phys. Chem. Ref.
Data., submitted; see also Lasrence Berkeley Laboratory Report No. 15512,
available from Technical Information Division, Lawrence Berkeley
Laboratory, Berkeley, CA 94720.
15. Rogers, P. S. Z. and Pitzer, K. S., J. Phys. Chem., 1981 , 85, 2886 .
16. Silvester, L. F. and Pitzer, K. S., J. Solution Chem., 1978, 7, 327.
17. Harvie, C. E. and Weare, J. H., Geochim. Cosmochim. Acta, 1980 , 44, 981 .
18. Eugster, H., Harvie, C. E., and Weare, J. H., Geochim. Cosmochim. Acta,
1980, 44, 1335.
19. Braitsch, 0., "Salt Deposits: Their Origin and Composition,"
Spri nger-Verl ag, 1971.
20. Bradley, D. J. and Pitzer, K. S., J. Phys. Chem., 1979, 83, 1599 .
21. Friedman, H. F., "Ionic Solution Theory," Interscience, New York, 1962.
22. Pitzer, K. S., J. Phys. Chem., submitted.
23. Rogers, P. S. Z., Report, 1981, LBL-12356, Avail NTIS or Technical
Information Division, Lawrence Berkeley Laboratory, Berkeley, CA 94720.
24. Trudelle, M-C., Abraham, M., and Sangster, J., Can. J. Chem., 1977, 55,
1713.
25. Tripp, T. B. and Braunstein, J., J. Am. Chem. Soc., 1954 , 73, 1984.
26. Braunstein, H. and Braunstein, J., J. Chem. Thermodynami cs ,1971 , 3, 419.
233

27. van Laar, J. J., Z. physilk. Chem., 1910 , 72, 723,
28. Prausnitz, J. M., "Molecular Thermodynamics of Fluid-Phase Equilibria,"
Prentice-Hall, Inc., Englewood Cliffs, NJ, 1969.
29. Quist, A. S. and Marshall, W. L., J. Phys. Chem., 1965 , 69, 3165.
30. Uematsu, M. and Franck, E. U., J. Phys. Chem. Ref. Data, 1980, 9, 1291.
31. Ozldic, I. and Kebarle, P., J. Phys. Chem. 1970, 74, 1466.
32. Anshadi , M., Yamdagni ,R., and Kebarle, P., J. Phys. Chem., 1970 , 74,
1475.
33. Martynova, 0. L., Zh. Fiz. Khim. 1964 , 38, 1065; Russ. J. Phys. Chem.,
1964 , 38, 587.
34. Styrikovich, M. A., Martynova, 0. L., and Mingulina, E. I., Dokl. Akad.
Nauk. SSSR, 1966, 171, 911; also see the English translation, 1966
, 171,
783.
35. Sourirdljan, S. and Kennedy, G. C., Am. J. Sci . , 1962 , 260, 15.
36. Galobardes, J. F., Van Hare, 0. R., and Rogers, L. B., J. Chem. Eng.
Data, 1981, 26, 363.
37. Quist, A. S. and Marshall, W. L., J. Phys. Chem., 1968, 72, 684.
38. Pitzer, K. S., J. Phys. Chem., 1982, 86, 4704.
234

Table 1. Parameters for virial coefficient equations at 25“C
M X TO ^MX ^MX TO
Na Cl .07650 .2264 — .00127
Na .01958 1.1130 — .005 7
K Cl .04835 .2122 — -.00084
K so,4
.04995 .7793 — 0
Mg Cl .35235 1.6815 — .00519
Mg SO4
.22100 3.3430 -37.23 .025
Ca Cl .31590 1.6140 — -.00034
Ca t/J0 .20000 3.1973 -54.24 0
Table 2. Parameters for mixed electrolytes with thevirial coefficient equations (at 25°C)
i 3 kS9.,
ij ijk
Na K Cl -.012 -.0018SO,
4-.010
Na Mg CZ. .07 -.012SO,
4-.010
Na Ca Cl .07 -.014SO
4-.067
K Mg C^ .0 -.022
so. -.048
K Ca Cl .032 -.025so,
4-
Mg Ca Cl .010 0
SO,4
.020
Cl SO4
Na .03 0
K -.005Mg -.020Ca -.027
235

Table 3. Enthalpies and Entropies of
Na"^, Cl" and Na'''Cl".
Hydration of
n T*/K cal K"^mol"^ kcal mol"^
a. (Na'*’)
1 700 21.5 24.0
2 550 22.2 19.8
3 450 21.9 15.8
4+ 350 25.0 13.8 - 1.5(n-4)
b. (Cl")
1 400 16.5 13.1
2 400 20.8 12.7
3 350 23.2 11.7
4+ 330 25.8 11.1 - 0.5(n-4)
c. (Na'^Cl")
1 500 22 17.5
2 500 22 13.5
3 500 22 9.5
4+ 500 25 9.5 - 0.8(n-4)
236
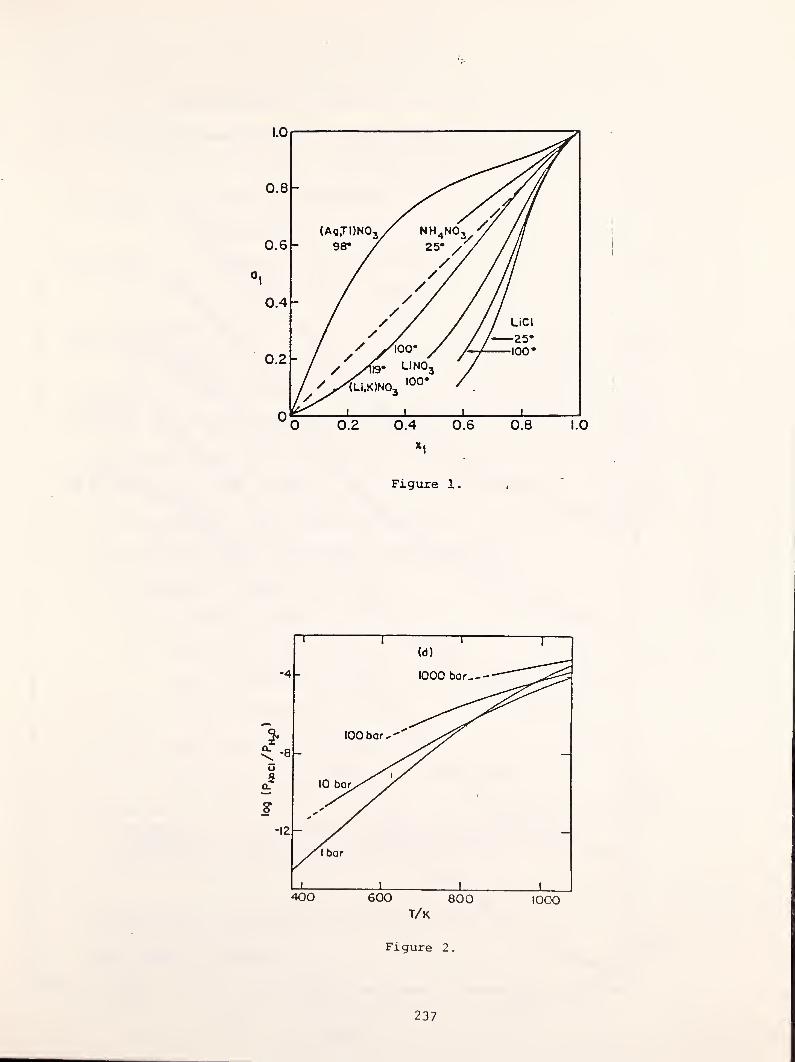
Figure 1.
Figure 2.
237
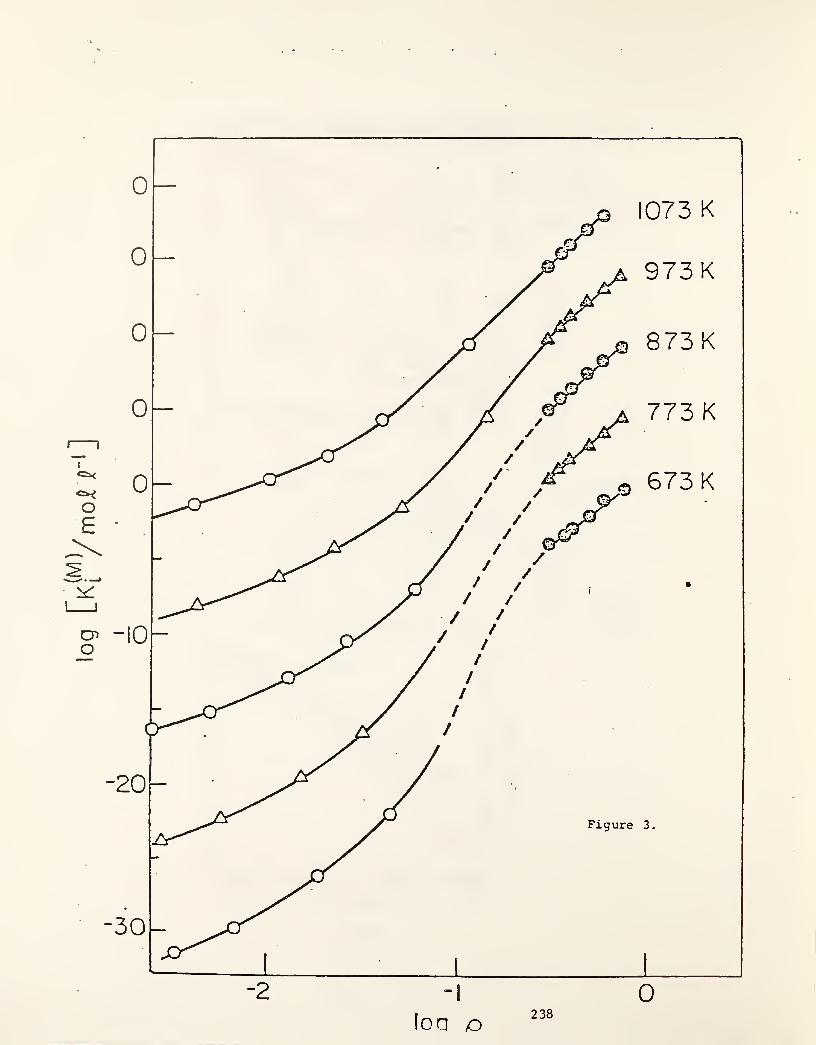
moj?
-2
loa o 238
0
Evaluated Data and Data Bases: Chemical
Thermodynamics in the Steam Power Cycle
David Garvin, Robert N. Goldberg and Bert R. Staples
Chemical Thermodynamics Division
Center for Chemical Physics
National Bureau of Standards
Washington, D.C. 20234
1 . Introduction
The subject of this paper is the thermodynamic data needed in the
solution of chemical problems that arise in steam power plants. We shall
discuss what these problems are (as interpreted by thermodynamicists)
,
what types of data are needed for solving them, how the data can be codified
effectively and what reliable codified data are now available. We shall
also consider the issue of technology transfer: how to get the data from
the laboratory to the engineer and the plant designer.
2. How to get the data
Our plan has two parts.
a. First make maximum use of the existing data: Reinterpret
them, intercompare different studies, correlate the best of them,
guided by theory.
\
b. Then make new measurements:
Fill gaps, resolve ambiguities, extend ranges and test theories.
Expanded version of a presentation at the Workshop on "Chemical
Thermodynamics in Steam Pov/er Cycles. Data Requirements,"Gaithersburg, Maryland, February 8-9, 1983.
CONTRIBUTION OF THE NATIONAL BUREAU OF STANDARDS.
NOT SUBJECT TO COPYRIGHT.
239
The second part is easier to understand than the first. It is measurement .
It is fun. It is feasible. Many of the experts are here today, the instruments
are nearly sufficient, but measurement is costly and attacks only a small
segment of the problem at a time. We believe that, for an applied program,
there must be a clearly stated reason for each measurement project.
The first part is the evaluation of the existing data . This is a
different approach and, for many scientists and engineers, less familiar. In
it all available data are intercompared and the best of them are melded into
a thermodynamically consistent whole. This means that results from emf,
partial pressure, solubility and calorimetric studies are treated together.
The systematic errors become painfully apparent and the gaps very visible.
The method is feasible, it is rapid (compared to measurement), less costly,
covers the entire problem and points out what still needs to be done.
As an example of maximizing the use of existing data, consider Figure 1,
the relative apparent molar enthalpy of aqueous CaCl2
solutions at 25 ®C. The
measurements span the time period 1849 to 1975. They define this property very
well, except at the highest molalities (for which the data are both old and
extrapolated from higher temperatures). Measure something else first.
This evaluation of data - reviewing the literature - is a task most
thermochemists are sure that they can do (if they only had the time). We
argue that this task is most efficiently done in a specialized data program.\
The next section describes such a data program. Later sections of this paper
cover data needs and data sources.
240

3. Structure and Activities of a Thermodynamic Data Project
3.1 General
Solution of the problems of chemistry in power cycles will require
both measurement and evaluation of data. What the data evaluation part should
be and do is discussed in this section. Later we consider what data are avail-
able, how they should be organized and what substances should be studied.
There are two principal guidelines to follow in setting up a data project:
It should be specialized to the project at hand, and each component of it
should be limited to the treatment of one class of information.
There are two reasons for adhering to these guidelines. First, in order
to advance rapidly, a project in support of an applied program must concentrate
its effort - high temperature aqueous chemistry is a large subject. This
means building upon evaluations made by others, and extending them.
Second, data comes by discipl ine, . for the most part, and so do experts.
There is some technical gain from mixing thermochemists, kineticists, and
fluid flow specialists, but not as much as for measurement projects. On the
other hand they can share the same computer, report writing and literature
collection facilities with profit.
The organization plan given here is based on data components of larger,
successful scientific studies: rocketry - of which the JANAF Tables are a
legacy, atmospheric chemistry - the CIAP program on the SST and aerosols, and
the current CO2
studies, and coal stack gas clean up.

3.2 Organization of a Data Project
The optimum organization scheme calls for two distinct parts:
A core group of thermodynami cists to compile and correlate data and to
prepare recomnended values, and an advisory group of experts to delineate
problems, assist with reviews on special topics and to monitor the work.
This dual structure provides breadth and knowledge of the applied problem plus
ability to actually supply the data recommended by the advisory group.
3.3 Activities
The principal things a data project should do are listed below.
a. Identify data needs.
b. Collect relevant data.
c. Evaluate existing data.
d. Promote needed measurements.
e. Distribute recommended values and information.
f. Consult for participants.
g. Develop new interpretations, correlating procedures, and
predictive schemes.
h. Provide liaison with experimental groups.
i. Hold workshops for participants - to distribute the results promptly.
This list shows that a data project can do more than provide reliable data,
it can serve as a focus for a larger program.'
In the remainder of this paper we shall address only item a, above, the
identification of data needs. This is done both to show the point from which
a data project would start and also to provide the participants with infor-
mation about data sources they can use today. The other items in the list
are self-explaining.
242

4. Data Needs for High Temperature Aqueous Systems
4.1 Scope
Our consideration of data needs is restricted to thermodynamic data
needs. But more than solutions must be considered: there are many two-phase
systems involved and a good bit of chemistry.
The principal application of the data is in the prediction of the
composition of a system under conditions of equilibrium. This may mean
spatially local equilibrium or a dynamic steady state. That is, the major
+3goal is to be able to answer questions such as: given T, p, pH, [Fe ],
[Cl’], what precipitate forms, what vapor species are there, and what are
their partial pressures?
Answers based on thermodynamics can then be extended by or compared with
kinetic studies.
The material presented below is based on two sources. These are a study
of the literature of aqueous solution thermodynamics (research and applications)
and our interpretation of the presentations made at this workshop.
4.2 Problems to be Solved
Most of the problems require the treatment of chemical and physical equilibri
The more important ones for which data are needed are
a. solubility in water, acid, base, and salt solutions;
b. vapor pressures of both solvent and solute;
c. emfs for oxidation- reduction reactions;
d. complexation, ion pairing, and chelation;
e. hydrolysis and other chemical reactions, both in solution'
and with solids;
f. chemical transport via colloidal suspensions;
Data on oxidation-reduction reactions is the most important, corrosion
is the problem. The others are ones to be solved along the way.
243

4.3 Thermodynamic Organization of the Problems and of the Data
All of the problems to be solved require a knowledge of equilibrium
constants and the activities of the species involved. This means that the
solutions of the problem and codification and correlation of the data can
be organized around the Gibbs energy of each process and its derivatives
with respect to temperature, pressure and composition, that is enthalpies,
heat capacities and molar volumes. The relationships are:
Funct ions
r T,p
0(A^GVT)3T)p =
(3A^H/3T)p =
(3A^G/3p)^
Here is a change in a process, G is Gibbs energy, H is enthalpy, Cp is
heat capacity, K is an equilibrium constant and T, p and V are temperature,
pressure and volume, respectively. These equations show that what is needed
is an equation of state:
A^G ( T, P, x)
or, as a minimum:
A^G(T°, x), a^H(T% x), A^Cp(T, x), a^V(T, x)
where T® is a reference temperature, and x is the composition variable.
Interestingly enough, both of these approaches are feasible. They can be
illustrated for the excess properties of solutions. Silvester and Pitzer (1977)
and, more recently, Pitzer, Peiper and Busey (1983) have provided equations of
state for NaCl solutions, and Phutela and Pitzer (1983) one for CaCl2
. The "mimmum
set" approach is illustrated by our current evaluation of data on CaCl2
* Figure 1
shows the enthalpy and figure 2 shows a Gibbs energy property, the osmotic coeff-
icient, at 25,®C, Figure 3 shows the heat capacity at four temperatures.
-RT In K
-aH®/T^
aV
244
4.4 Thermodynamic Properties That Must be Retrievable From a Data Base
The problems of interest are listed in Section 4.2. The basic thermodynamic
functions are displayed in Section 4.3. In practice this set of functions for
a practical data base must be expanded. A fairly large number of properties
must be either correlated or made available to the user. These are shown in
Figure 4. They include both the properties of solutions (thermophysical
properties - such as the excess properties G , H , C , V which summarizer
activity coefficients and other deviations from ideality) and the properties
of the chemicals that react in all phases (thermochemical properties - A^G, a^H,
A^V, A^Cp). All of these are needed as a function of temperature and, where it
matters, of pressure.
It must be emphasized that the problems listed in Section 4.2 can be solved
if values are known for the functions given in Figure 4. Often it is easier to
extrapolate these functions than the "direct" answers to the problems.
4.5 How to Get the Data Out of the Data Base
All of the discussion so far is summarized in Figure 5 which pulls
together the evaluation process, the data base, and its outputs. High temperature
aqueous solution thermodynamics covers such a wide range of temperature, pressure
and composition, and involves such a wide selection of substances that a very
strong case can be made for letting the user specify exactly which output
data he wants. Therefore we recommend a data base coupled to powerful inter-
pretative programs for this applied project.
The traditional method is to make up tables. This certainly will
continue. Tables are very useful for answering spot questions. We suggest,
however, that the tables be kept to skeleton form and that major use be made
of equations. The equations can give you exactly what you want; the tables
provide a check on trends and on the programming of the equations.
The big gain in efficiency comes when the equations are embedded in programs
that can solve the pertinent problems. If you want solubilities, let the proper
program calculate them for you. Furthermore, and most important, if you are
245
dealing with a complex mixture, let an equil ibrium-miniinization program determine
the speciation for you.
4.6 Substances and Systems to be Included in the Data Base
This is where the work is tailored to fit the problem of power cycle
chemistry. It is here that the collective knowledge of the participants in
this workshop can be applied. Jonas has presented at this workshop an ex-
tensive list of substances that have been identified either by analysis or
that can be deduced from a knowledge of materials added to the water cycles.
Most of these identified substances are solids from deposits and corrosion
products. A different view of the problem comes from considering the species
in solution.
Some of the soluble species that might be found in power cycle chemistry
are listed in Figure 6. This list is based on presentations made at the work-
shop, the list provided by Jonas and articles on applied problems in aqueous
chemistry. The list includes the simple metal ions, which usually are hydrated
in aqueous solutions, oxy-anions and a wide variety of complex ions: ion-pairs,
complexes with additives, hydrolysis products and amphoteric species. All of
these complexes will increase the apparent solubilities of the metal cations
and will also influence the effective corrosion potentials. Our criteria for
listing species in figure 6 are that they are known to exist in solution at
room temperature, there is information showing that the complexes are quite
stable and there is a reasonable presumption that they also will be stable at
higher temperatures.
We do not expect all of these species to be present in significant
concentrations throughout the power cycle solutions. Indeed, the conditions
in those solutions vary greatly - from very dilute solutions in reactor cooling
cycles to saturated hot brines on turbine blades. Many detailed modeling
studies will be needed to sort out which species are important in which parts
of the power cycle solutions. These studies should be made in the early phases
of a data program.246

4.7 Data That Can be Used in This Program
There are many data available that can be used here. Some of them have
been evaluated. There are, however, flaws in this data set. First, the
temperature and pressure ranges do not match the power cycle chemistry problem,
second there are data missing and, third, there is no coherent source for
thermodynamic data. Instead there are many sources. A selection of compiled
data is given in Appendix I.
In general, there is good coverage of activities at 25 ®C and 1 atmosphere,
reasonably adequate thermal data for solutions of common salts, but very few
heat capacity data. There are very few data of any kind on aqueous solutions
at high temperatures. Both new measurements and theoretical extensions of the
existing data base will be needed.
The compiled thermochemical data on solids and gases are in moderately
good shape. Some of the compilations of data are, however, out of date and the
impact of new data must be considered in the present application. Even so, as
much as possible -these existing data should be used. Needs for highly accurate
data may cause all of these statements to be revised. Needs for high accuracy
will mean special, high accuracy, measurements.
4.8 Data Centers and Machine-readable Data Bases .
We have not identified any publicly available interactive data bases
that might be easily applied to this problem. On the other hand almost every-
body has files of data - for local use. It is an activity of much larger mag-
nitude to provide them for general use and to maintain them.
A few current or potential data measures may be mentioned. The tables in
NBS Technical Note 270 are now part of the Chemical Information System (CIS) and
are retrievable by customers of CIS. A magnetic tape version of these tables
also is being sold by the NBS Office of Standard Reference Data. At NBS we
are developing a data base of activity coefficients covering the approximately
400 salts mentioned earlier. It is not yet available.
247

There are several data centers and projects from which information on the
properties of solutions can be obtained. Three of them at NBS are the Electrolyte
Data Center, (B.R. Staples); the Alloy Data Center (K. Bhansali); and the
Phase Diagram for Ceramicists project (L. Cook). At the U. S. Geological Survey,
Reston, VA. , there is the National Center for The Thermodynamic Data for Minerals
(J. Haas). At the Lawrence Berkeley Laboratories , Dr. Sidney Phillips, has
available correlated data on stability constants for 20 metal species, up to
350 °C, and selected data on solubilities, density and viscosity.
Professor R.H. Wood is developing a plan to collect and distribute files of
newly measured data. These would then be available for correlation and integration
into applied projects. This plan is being developed on a grant from the NBS
Office of Standard Reference Data. It should be helpful on this project.
4.9 Cal culational Systems
One future direction of research which we consider to be of great importance
is the development of well -documented and generally available computer
programs which, when coupled with a data base, can be routinely used by both
specialist and non-specialists for the calculation of the thermodynamic
properties of aqueous solutions. (See section 4.5) Under thermodynamic properties
we include all of the excess, partial molar, and apparent molar properties and
the amounts of the various substances and aqueous species present in the solution
or in other phases in equilibrium with the solution. Pourbaix type diagrams
would also be valuable outputs.
Systems on which such calculations need to be made include strong, weak,
and hydrolyzable electrolytes and non-electrolytes and in multi -component mixtures
over a wide range of temperature and pressure. While we are aware of scattered
developments in this direction [Edwards, Newman and Prausnitz (1975, 1978)
248

Zemaitis, NPL], some of which are proprietary, we are not aware of any extensive
compatible sets of codes which are generally available for routine use on
aqueous solutions. Such codes when coupled with extensive data bases and reliable
estimation procedures are the essential thermodynamic tools needed to solve the
practical problems.
249
References
1. Barry, T.I.; Dinsdale, A.T.; Jones, G.P.' "A Databank for Metallurgical
and Thennochemical Calculations"; NPL Report DMA (B) 11, Nat. Physical
Laboratory, Teddington, UK, October 1980.
2. Edwards, T.H.; Maurer, G.; Newman, J.; Prausnitz, J.H.; A.I.Ch.E. J.: 24,
966, (1978).
3. Edwards, T.J.; Newman, J.; Prausnitz, J.H.; A. I .Ch. E. J . ; 21, 248 (1975).
4. Phutela, R.C.; Pitzer, K.S.; "Thermodynamics of Aqueous Calcium Chloride".
J. Solution Chem. (in review 1983).
5. Pitzer, K.S.; Peiper, J.C.; Busey, R.H.; J. Phys. Chem. Reference Data
(in review 1983).
6. Silvester, L.F.; Pitzer, K.S.; J. Phys. Chem. 81, 22 (1977).
7. Staples, B.R.; "Evaluation of Thermodynamic Properties of Aqueous
Electrolytes" in "Thermodynamics of Aqueous Systems with Industrial
Applications"; Newman, S.A., ed. ; ACS Symposium Series No. 133,
Am. Chem. Soc., Washington, D.C., Chap. 27.
8. Zemaitis, J.F., Jr.; "Predicting Vapor-Liquid-Solid Equilibria in
Multicomponent Aqueous Solutions of Electrolytes"; in "Thermodynamics of
Aqueous Systems with Industrial Applications," Newman, S.A., ed.;
ACS Symposium Series No. 133, Am. Chem. Soc., Washington, D.C.,
Chap. 10.
250
FIGURE CAPTIONS
Figure 1. Evaluated apparent molar enthalpy of aqueous calcium chloride at
298.15 K, versus square root of molality. Data measured
from 1849 to 1975 are included and correlated using the Pitzer equation.
X = -» 0), = 3L^/3n^ where n^ = moles
of water. Some data have been adjusted from higher and lower
temperatures.
(Prepared for the CODATA Thermodynamics Tables by V.B. Parker and
D. Garvin 1983).
Figure 2. Evaluated osmotic coefficient (0) of alkaline earth chlorides at 298.15 K
versus molality. 1 - 0 = (nyvMRT) (3G^^/3n^)^2j p
Staples (1980).
Figure 3. Evaluated apparent molar heat capacity of aqueous calcium chloride
solutions as a function of temperature and composition. At temperatures
other than 298.15 K, the correlations are largely based on the un-
published data of White, Gates and Wood. (Prepared for the CODATA
Thermodynamic Tables by B.R. Staples, 1983).
Figure 4. Thermodynamic Properties for which values are needed in aqueous
solution chemistry.
Figure 5. Evaluation and Retrieval of Data.
Figure 6. Substances of interest in the chemistry that occurs in various
stages of the power cycle.
251
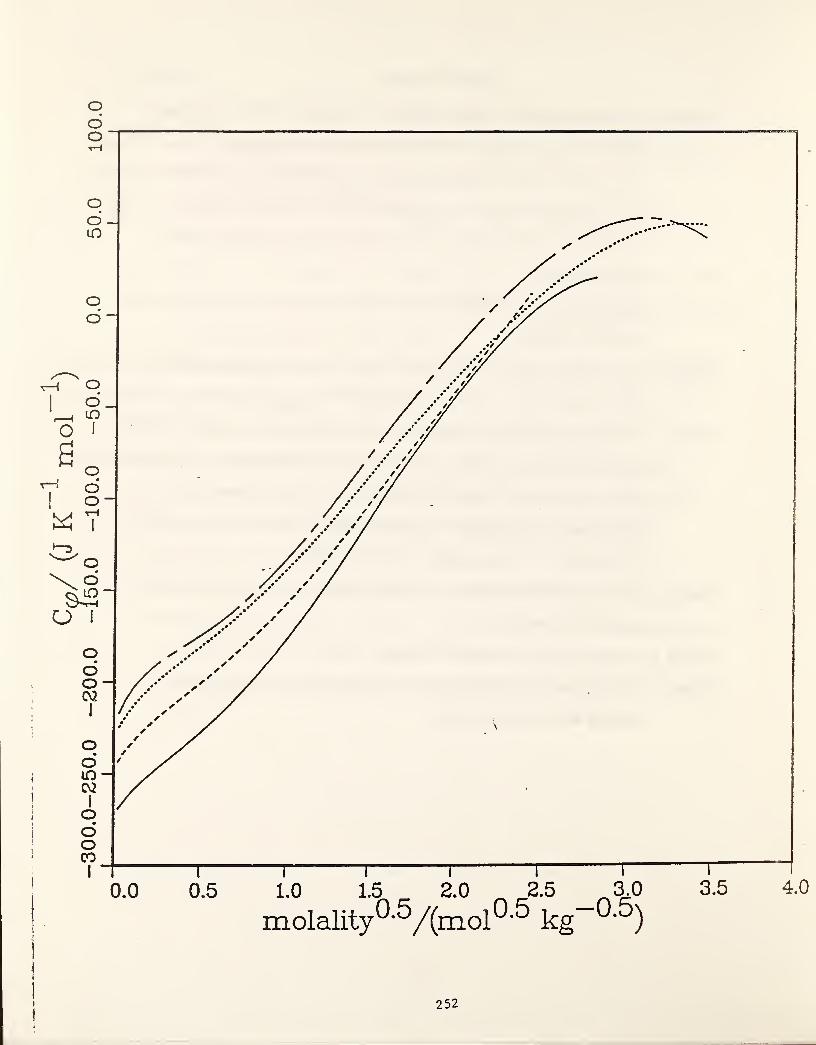
—
300
.0—
250.0
—
200.0
—
150.0
—
100.0
-
50.0
0.0
50.0
100.0
I 252
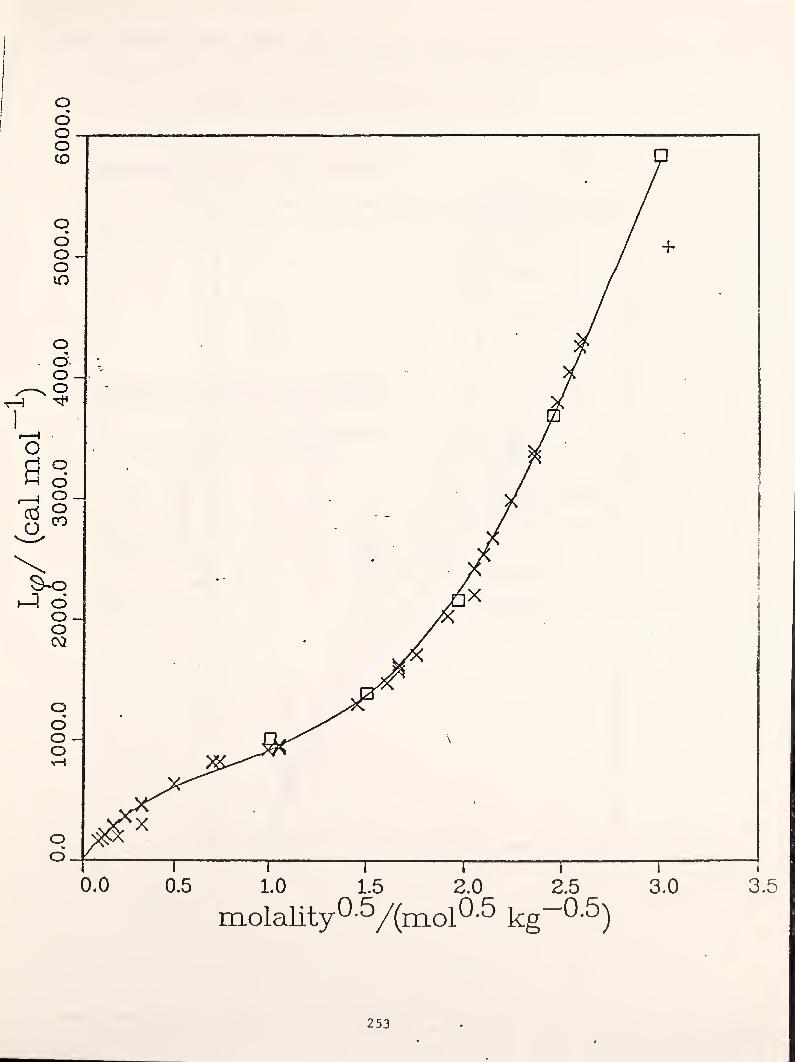
253

254
I
T

Figure 4. Useful Thermodynamic Properties
Thermochemical Properties of Substances
^H“(s, 1, g)
(s. 1, g)
Uses
Calculate K
T dependence of K
Heat balance
T dependence of H
r P dependence of G and H
Thermophysical Properties of Solutions Uses
pXG , 0» and "interaction parameters"
Lg. L, 4
Sa’ ‘^1’ '^2
wex
Activities of solute andsolvent
T dependence of activities,dilution effects
exT dependence of H
P dependence of G, H
Mixing rules Estimates for multi -componentmixtures
255

EVALUATED
DATA
BASE
:z;
oCO
HHH:z:
oCOoHH
-Hp:5
P3
HHCOo
H ffiKH
a.<! Ph HHP oO* p:: O' oW o w
COwo:z;
www
256

Figure 6.
Soluble species for power cycle chemistry
The species that may be expected to be in solution in the various parts
of the power cycle are given in the figure. They are based on known
additives and the composition of deposits. Simple (hydrated) cations are
shown at the left margin while anions and other ligands head each column.
The complex ions, ion pairs and hydrolysis products in the body of the
figure are those that would predominate in 0.01 mol kg""* of each ligand.
\
257

OH' X' HSO' HjPO- NH3
, N2H^
+9
0'^
sof HPof OtherFe
^FeO^I Fe(0H' FeF* FeSOJ; etc. FeHPO| Fe(NO), FeEDTA'
Fe"2 Fe( 0H)2
, FeF2 FeSO^, etc. FeHPoJ FeNO^t FeHSiO^^
Fe*3 FeC^t etc.FeEDTA*, Fe(OH)!
CUO2T HCuO' CuF^ CuSOJ CuHPO® Cu(NH
3)^"^, etc.
CuCl'^, etc. CUSO3
, etc.
CuBr"^ CuEDTA^'
ZnO^, HZn02 ZnF"^ ZnSO^, etc. ZnHPO® Zn(NH3)^^, etc.
ZnOH^, Zn(OH)° ZnCl"^, etc. Zn(N2H^)^''’, etc.
ZnOHCl 0
AlO' A1 F^^, AIF^- AlOH^^, etc.
Cr02 , CrOH^'*’, etc. CrCl2
, etc. CrSoJ CrHPoJ
Cr(IV) CrO^' HCrO^
CoSO^, etc. CoHPOJ Co(NH3
)2^, etc.
m 2 -CoEDTA^
Ni( 0H )3 NiSO° NiHPO^ Ni(NH3
)2
'*',etc.
Ni(N2H^)
2^, etc.
NiEDTA^'
Mg^'^ MgOH"^ MgSOJ MgHPOJ MgEDTA^'
CaSO| CaHPO° CaEDTA^'
other cations (which may form complexes)
TlO^t Ti(0H)^t Zr^"^, ZrOOH'^, Li"^, Na'^, k"^, H30'^, NhJ,
Other anions
HS", SO^T S20^; HSO3, CO3; HCO3, HCOO", BO3T BO2, B^O^; NO2, NO',
ethyl enedi amine tetraacetic acid
Neutral
s
O2. H2O2, N2, N2H^, CO2, C2H4Cl2(dichloroethane), C^H^NO (morpholine),
methoxychlor , toxaphene, 2, 4, 5-TP.258

DATA COMPILED FOR AQUEOUS SOLUTION THERMODYNAMICS(extracted largely from Goldberg, R.N., NBS Special Publication 454
2nd edition 1933, in preparation)
General Sources
CODATA Recommended Key Values for Thermodynamics 1977(CODATA Bulletin No. 28 (1978) and Tentative Set of Key Values forThermodynamics: Parts VI, VII, and VIII, CODATA Special Reports:No. 4 (March 1977), No. 7 (April 1978), and No. 8 (April 1980)).
Wagman, D.D., Evans, W. H. , Parker, V.B.Halow, I., Bailey, S. M. , Schumm, R. H., Churney, K. L., and Nuttall, R. L.
Selected Values of Chemical Thermodynamic PropertiesNational Bureau of Standards Technical Note 270 (U. S. Government PrintingOffice, Viashington , DC 20402 Parts 3 (1968) to 8(1981).Also being published as: The NBS Tables of Chemical Thermodynamic Properties,J. Phys. Chem. Ref. Data Supplement 2 (1982) in press.
Medvedev, V. A., Bergman, G. A., Gurvich, L. V., Yungman, V. S., Vorob'ev,A. F., Kolesov, V. P., and others (V.P. Glushko, general editor)Thermal Constants of Substances(Viniti, Moscow, Volume 1(1965) to 10(1981). (In Russian).
Stul 1 , D. R. , Prophet, H.
JANAF Thermochemical Tables, 2nd ed.
,
National Standard Reference Data Series, NBS, Washington, DC 1971 No. 37.
Supplements: Chase, M. W.Jr., Curnutt, J. L., Hu, A. T. , Prophet, H. , Syverud, A. N.
Vialker, L. C., J. Phys. Chem. Ref. Data £, 311-480; (1974), Chase, M. W. Jr.,
Curnutt, J. L., Prophet, H. , McDonald, R, A., Syverud, A, N.,
J. Phys. Chem. Ref. Data 4, 1-175 (1975), Chase, M. W. Jr., Curnutt,. J. L.,
McDonald, R. A., Syverud, A. N.
J. Phys. Chem. Ref. Data 7_, 793-940 (1978). Chase, M. W. , Jr., Curnutt, J. L.,
Downey, J.R., Jr., McDonald, R. A. Syverud, A. N., and Valenzuela, E. A. ,
J. Phys. Chem. Ref. Data. 11 695-940 (1982).
Gurvich, L. V., Bergman, G. A., Veits, I, V., Medvedev, V. A.,
Khachkuruzov , G. A., Yungman, V. S., Eds., Glushko, V. P., Gen. Ed.,
"Thermodynamic Properties of Individual Substances" ( Izadatel ' stvo "Nauka",
Moscow, Vol. 1 (1978), Vol . 2 (1979), Vol . 3 (1981). (In Russian).
Robie, R. A., Hemingway, B. S. ,and Fisher, J. R.
Thermodynarni CpProperties of Minerals and Related Substances at 298.15 K
and 1 Bar (10^ Pascals) Pressure and at Higher Temperatures
.
([U.S.] Geological Survey Bulletin 1452, U. S. Government Printing Office,
Washington, DC 1978).
259
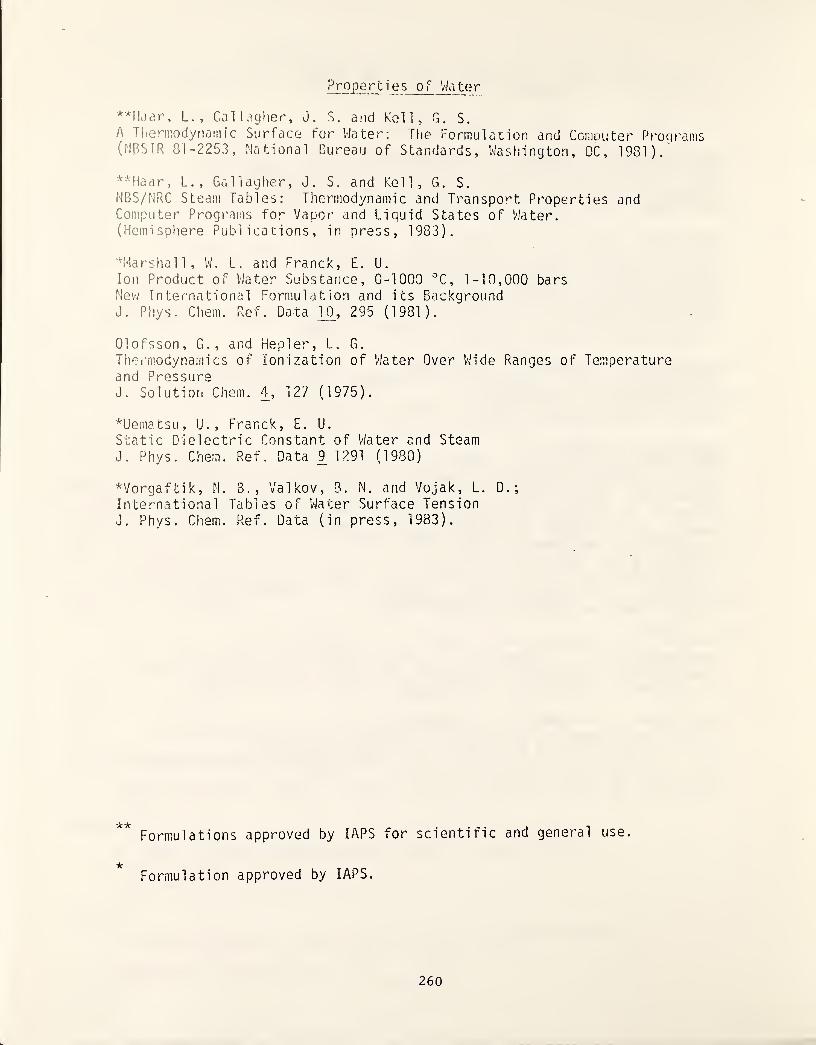
s _o r Water
L., Callaqher, J. S. and Koll, G. S.
A Tliern;odynam i c Surface for Water: Ffie formulation and Computer Procjrams(NBSIR 81-2253, National Bureau of Standards, Wasliington, DC, 1981).
**Haar, L., Gallagher, J, S. and Kell, G. S.
NBS/MRC Steam Tables: Thermodynamic and Transpo^'t Properties andComputer Programs for Vapor and Liquid States of Water.(Hemisphere Publications, in press, 1983).
Hlarshall, W. L. and Franck, E. U.
Ion Product of Water Substance, 0-1000 '’C, 1-10,000 barsNev/ International Formulation and its BackgroundJ. Phys. Chem. Ref. Data 10_, 295 (1981 ).
Olofsson, G., and Hepler, L. G.
Thet’rnodynamics of Ionization of Water Over Wide Ranges of Temperatureand PressureJ. Solutiori Chem. 4, 127 (1975).
*Uematsu, U., Franck, E. U.
Static Dielectric Constant of Water and Steamd. Phys, Chem. Ref. Data ^ 1291 (1980)
*Vorgaftik, M. B., Valkov, 3. N. and Vojak, L. D.;
International Tables of Water Surface TensionJ. Phys. Criem. Ref. Data (in press, 1983).
Formulations approved by lAPS for scientific and general use.
"ic
Formulation approved by lAPS.
260

Thermal and Volumetric Properties of Solutions
Parker, V. B.
Thermal Properties of Aqueous Uni-univalent ElectrolytesNSRDS-NBS 2, (U. S. Government Printing Office, 1965).
Mishchenko, K. P., and Pol toratzki i , G. M,
Aspects of the Thermodynamics and Structure of Aqueous and Non-AqueousElectrolyte Solutions(Izd. "Khimia", Leningrad, 1968) (In Russian).
Wagman, et al., NBS TN 270, loc. cit.
Medvedev, et al . "Thermal Constants of Substances," loc. cit.
Barrier, H. E. and Scheurman, R. V.
Handbook of Thermochemical Data for Compounds and Aqueous Species(John Wiley and Sons, New York, 1978).
D'Ans, J., Surawski , H., Synowietz, C.
Densities of Binary, Aqueous Systems and Heat Capacities of Liquid Systemsin Landol t-Bornstein , "Numerical Data and Functional Relationships in Scienceand Technology" New Series K.-H. Hellwege, editor-in-chief(Springer-Verlag, Berlin, 1977). Group IV Volume 1, part b.
Millero, F. J.
The Molal Volumes of ElectrolytesChemical Reviews, 7]_, 147 (1971 ).
Millero, F. J.
The Partial Molal Volumes of Electrolytes in Aqueous Solutions.Compilation of the Partial Molal Volumes of Electrolytes at InfiniteDilution, V*^ and the Apparent Molal Volume Concentration DependenceConstants, S* and b , at Various Temperatures , in
"Water and Aqueous Solutions," R. A. Horne (editor)(Wi 1 ey-Interscience , New York 1972).
Millero, F. J,
Effects of Pressure and Temperature on Activity Coefficients in
"Activity Coefficients in Electrolyte Solutions," R. M. Pytkowicz (editor)
(CRC press, Boca Raton, Florida, 1979). Volume II, page 63.
261

Activities in £lcctrQiyt&_ Si^iitJ on^
Hamer, W. J., and Wu , Y.C.
Osmotic Coefficients and Mean Activity Coefficients of Uni -Uni valentElectrolytes in Water at 25 °C.Journal of Physical and Chemical Reference Data, 1_, 1047 (1972).
Wu , Y. C. , and Hamer, W. J.
Electrochemical Data. Part XIV. Osmotic Coefficients and Mean ActivityCoefficient of a Series of Uni-Bivalent and Bi-Univalent Electrolytes inAqueous Solutions at 25 ”C. Part XVI. Osmetic Coefficients and MeanActivity Coefficients of a Number of Uni -Tri valent and Tri-UnivalentElectrolytes in Aqueous Solution at 25 °C.
(National Bureau of Standards Reports No. 10052 and 10083, U. S. Departmentof Commerce, 1969).
Staples, B. R. and R. L. NuttallThe Activity and Osmotic Coefficient of Aqueous CaCI^J. Phys. Chem. Reference Data, 6, 385 (1977).
at 298.15 K
Staples, B. R.
Ionic Equilibrium Constants of Aqueous Alkaline Earth SaltsEnviron. Sci. Tech., 1_2, 339 (1978).
Goldberg, R. N., and R. L. NuttallEvaluated Activity and Osmotic Coefficients for Aqueous Solutions: TheAlkaline Earth Metal HalidesJ. Phys. Chem. Ref. Data, 7_, 253 (1978),
Goldberg, R. N., R. L. Nuttall, and B. R. StaplesEvaluated Activity and Osmotic Coefficients for Aqueous Solutions: Iron
Chloride and the Bi-univalent Compounds of Nickel and CobaltJ. Phys. Chem. Ref. Data, 8_, 923 (1979).
Goldber'g, R. N.
Evaluated Activity and Osmotic Coefficients for Aqueous Solutions:
Bi-univalent Compounds of Lead, Copper, Manganese, and UraniumJ. Phys. Ref. Data, 8, 1005 (1979).
Staples, B, R. and Wobbeking, T. F.
A Compilation of Thermodynamic and Transport Properties of Aqueous
Sulfuric AcidNBSIR 81-2276, (National Bureau of Standards, June 1981.)
Parker, V. B. ,Staples, B. R., Jobe, T. L., Neumann, D
A Report on Some Thermodynamic Data for Desulfurization Processes
NBSIR 81-2345, (National Bureau of Standards, September 1981.)
Goldberg, R. N.
Evaluated Activity and Osmotic Coefficients for Aqueous Solutions:
Bi -Univalent Compounds of Zinc, Cadmium, and Ethylene bis(tri-methylammonium)
Chloride and Iodide
J, Phys. Chem. Ref. Data 1_0, 1 (1981).
262
Goldberg, R. N.
Evaluated Activity and Osmotic Coefficients for Aqueous Solutions:Thirty-Six Uni -Bivalent ElectrolytesJ. Phys. Chem. Ref. Data, 10, 671 (1981).
Staples, B. R.
Activity and Osmotic Coefficients of the Alkali Metal NitritesJ. Phys. Chem. Ref. Data, lOi, 765 (1981 ).
Staples, B. R.
Activity and Osmotic Coefficient of Aqueous Sulfuric Acid at 298.15 K
J. Phys. Chem. Reference Data, 10, 779 (1981).
Joseph, R. E. and Staples, B. R.
,
A Compilation of Thermodynamic and Transport Properties of AqueousPotassium HydroxideNBSIR 81-2356, (National Bureau of Standards, January 1982.)
Smi th-Magowan , D. R. , and Goldberg, R. N.,
"A Bibliography of Sources of Experimental Data Leading to ThermalProperties of Binary Aqueous Electrolyte Solutions,"NBS Special Publication 537, (U. S. Government Printing Office, Washington,DC, 1979).
Goldberg, R. N., Staples, B. R., Nuttall, R. L., and Arbuckle, R.
"A Bibliography of Sources of Experimental Data Leading to Activityor Osmotic Coefficients for Polyvalent Electrolytes in Aqueous Solution,"NBS Special Publication 485, (U.S. Government Printing Office,Washington, DC), July 1977.
Pitzer, K.S.
Thermodynamic Properties of Aqueous Solutions of Bivalent SulphatesJ. Chem. Soc. Faraday Trans II 6^, 101 (1972).
Pitzer, K.S. and Mayorga, G.
Thermodynamics of El ectrolytes . II. Activity and Osmotic Coefficients for
Strong Electrolytes with One or Both Ions UnivalentJ. Phys. Chem. 1J_, 2300 (1973).
Pitzer, K.S. and Mayorga, G.
Thermodynami cs of Electrolytes. III. Activity and Osmotic Coefficients
for 2-2 ElectrolytesJ. Solution Chem. _3, 539 (1974).
Pitzer, K.S. and Kim, J.J.
Thermodynamics of Electrolytes IV. Activity and Osmotic Coefficients for
Mixed ElectrolytesJ. Amer. Chem. Soc. %, 5701 (1974).
Pitzer, K.S. and Silvester, L. F.
Thermodynamics of Electrolytes. VI. Weak Electrolytes Including H,P0.
J. Solution Cliem. _5_, 269 (1976),
Pitzer, K, S., Roy, R.N., and Silvester, L. F.
I iiermodynam i cs of L 1 ec trol y tes . VII. Sulfuric Acid
J. Aiik.t. Chem. Soc. 99, 4930 (1977).
263

SilvGSi.or, 1. . F. and Pitzer, K. S.
Theniiod.ynamicG of FI octroi ytos . YHI Hi gh-Teiiiperaturo Properties,Including Fnthalpy and Heat Capacity, with Application to Sodium Chloride,d. Phys. Chein. 8I_, 18F2 (1 977).
Pitzer, K. S. , Peterson, J.R., and Silvester, L. F.
Thermodynamics of Electrolytes. IX. Rare Earth Chlorides, Nitrates andPerchl orates
.
J. Solution Chem, 45 (1978).
Silvester, L. F. a!id Pitzer, K.S.Thermodynamics of Electrolytes. X. Enthalpy and the Effect of Temperatureon the Activity Coefficients.J. Solution Chem. 7_, 327 (1978).
Pitzer, K.S. and Silvester, L. F.
Thermodynamics of Electrolytes. 11. Properties of 3:2, 4:2, and OtherHigh-Valence TypesJ. Phys. Chem. 1239 (1978).
Pitzer, K.S. and Peiper, J. C.
Activity Coefficients of Aqueous NaHCO..
J. Phys. Chem. 84, 2396 (1980).
Peiper, J. C. and Pitzer, K.S.
Tliermodynamics of Aqueous Carbonate Solutions Including Mixtures of
Sodium Carbonate, Bicarbonate, and ChlorideJ. Chem. Thermodynamics 1_4, 613 (1982).
Rogers, P.S.Z. and Pitzer, K.S.
Volumetric Properties of Aqueous Sodium Chloride SolutionsJ. Phys. Chem. Ref. Data 1J_, 15 (1982)
Pitzer, K.S.
Theory: Ion Interaction Approachin "Activity Coefficients in Electrolyte Solutions"Pytkowicz, R. M. (editor)(CRC Press, Boca Raton, Horida, 1979) (Volume I, page 157).
Helgeson, H. C., Kirkham, D. H.
Theoretical Prediction of the Thermodynamic Behavior of Aqueous
Electrolytes at High Pressures and Temperatures . Parts I through IV
(Am. J. Science, New Haven, CT). Bound reprints originally published as:
Part I. Summary of the Thermodynamic/El ectrostatic
Properties of the Solvent,
Am. J. Sci .274 , 1089 -1198 (1974)
Part II. Debye-Huckel Parameters for Activity Coefficients
and Relative Partial Molar Properties,
Am. J. Sci. 274 1199-1261 (1974)
264

Part III. Equation of State for Aqueous Species atInfinite DilutionAm. J. Sci. 276, 97-240 (1977)
, and Flowers, G. C.
,
Part IV. Calculation of ActivityCoefficients, Osmotic Coefficients and Apparent Molal andStandard and Relative Partial Molal Properties to 600 °C and5 KB,
Am. J. Sci. 1249-1516 (1981 )
Harried, H. S. , and Owen, B. B.
The Physical Chemistry of Electrolytic Solutions (3rd Edition)(Reinhold Publishing Corporation, New York, 1958).
Robinson, R. A., and Stokes, R. H.
Electrolyte Solutions(Buttervrorths Scientific Publications, London, 1959, 2nd ed.).
Lobo, V.M.M.Electrolyte Solutions: Literature Data on Thermodynamic and Transport Properties.(Revista de Faculdade de Ciencias da Universidade de Coimbra, 1975).
Offprint, Volume 50.
265
So 1 ubi I i t iGS
Linko, W. F.
Solubilities: Inorganic and Meta 1 -Organic Compounds--A Compilation ofSolubility Data from the Periodical Licerature. (Originated by A. Seidel.)(Volume I A-Ir; D. Van Mostrand Co., Princeton, New Jersey, 1958;Volume II K-Z; American Chemical Society, Washington, DC, 1965).
Stephen, J., and Stephen, T. (editors, first five volumes), andSilcock, H. (editor, 1979 - )
Solubilities of Inorganic Compounds," Transl . of "Spravochnik porastvorimosti
"
(Perqamnn Press, Oxford, 1963, 1964, and 1979).
Nyvlt, J.
Solid-Liquid Phase Equilibria(Elsevier Scientific Publishing Co., Amsterdam, 1977).
Kertes, A. S., edi tor-in-chiefSolubility Data Series(Pergamon Press, New York 1979 to 1981).
This eighteen volume series, prepared under the auspices of IIIPAC.
The volumes which have been issued to data or are planned with theirtitles and editors, are:
Volume 1
Volume 2
Volume 3
Volume 4
Volume 5
Volume 6
Volume 7
Volume 8
Volume 9
Volume 10
Volume 11
Volume 12
Volume 13
Volume 14
Volume 15
Volume 16
Volume 17
Volume 18
H. L. Clever, "Helium and Neon"H. L. Clever, "Krypton, Xenon, and Radon"M. Salomon, "Silver Azide, Cyanide, Cyananiides, CyanateSelenocyanate and Thiocyanate"H. L. Clever, "Argon"R. Battino, "Oxygen and Ozone"J. W. Lorimer, "A1 kal ine-earth Metal Sulfates" •
E. M. Woolley, "Silver Halides"P. Farrell, "Mono- and Di saccharides in Water"
R. Cohen-Adad, "Alkali Metal Chlorides"
J. E. Bauman, "Alkali Metal and A1 kal ine-earth Metal Oxides and
Hyroxides in Water"
b". Scrosati and C. A. Vincent, "Alkali Metal, Alkaline-earth
Metal and Ammonium Halides. Amide Solvents"
Z. Falus and C. Guminski, "Metals in Mercury"
C. [.. Young, "Oxides of Nitrogen, Sulfur and Chlorine"
R. Battino, "Nitrogen"
H. L. Clever and W. Gerrard, "Hydrogen Ha Mdse in Non-Aqueous Solvents"
A. L. Horvath, "Halogenated Benzenes"^
E. Wilhelm and C. L. Young, "Hydrogen, Deuterium, Fluorine and Chlorine'
0. Popovych, "Tetrapher.yl borates"
Battino, R. and Clever, H. L.
The Solubility of Gases in Liquids
Chemical Reviews, 66, 395 (1966).
266
Complexation in Solution
Sillen, L. G., Martell, A. E.
Stability Constants of Metal Ion Complexes, Section I;
Inorganic Ligands, Section II; Organic Ligands (second edition)Special Publication No. 17, 1964, and Supplement No. 1, SpecialPublication No. 25, 1971. (The Chemical Society, London, England)SP 17 is the 2nd edition of S.P. 6 (1957) and S.P. 7 (1958).
Critical Stability Constants
Martell, A. E., and Smith, R. M.
Smith, R. M. , and Martell, A. E.
Martell, A. i. and Smith, R. M.,
Smith, R. M., and Martell, A. E.
(Plenum Press, New York)
Baes, C. F., Jr., and Mesmer, R. E.
The Hydrolysis of Cations(John Wiley & Sons, New York, 1976)
Christensen, J. J., Eatough, D. J. , and Izatt, R. M.
Handbook of Metal Ligand Heats and Related Thermodynamic Quantities(second edition)(Marcel Dekker, Inc., New York, 1975)
Christensen, J. J., Hansen, L. D., and Izatt, R. M.
Handbook of Proton. Ionization Heats and Related Thermodynamic Quantities
(John Wiley & Sons, New York, 1976).
(1974) Vol . 1 Amino Acids(1975) Vol. 2. Amines
(1977) Vol. 3. Other Organic Ligands
(1976) Vol. 4. Inorganic Complexes'
267
Mi seel laneous
Dymond, J. H. , and Smith, E. B.
Tlie Vi rial Coefficients of Gases(Clarendon Press, Oxford, 1980).
Armstrong, G.T. , and Goldberg, Ri N.
An Annotated Bibliograpny of Compiled Thermodynamic Data Sourcesfor' Biochemical and Aqueous Systems (1930-1975). Equilibrium,Enthalpy, Heat Capacity and Entropy Data.National Bureau Standards Special Publication 454 (1976).(U. S. Government Printing Office, Washington, DC) 2nd ed. in preparation 1933
Freeman, R. D. , editorBulletin of Chemical Thermodynamics(Thermochemi stry , Inc., Stillwater, Oklahoma). Annual, vol . 23 (1980).
February 1933
268

COLLATERAL ACTIVITIES
0. Jonas, H. J. White, Jr.
In the U.S. many of the activities related to steam power system waterchemistry, corrosion, and chemical thermodynamics are centered around the
Electric Power Research Institute (EPRI), American Society of MechanicalEngineers (ASME) Research Committees on Water in Thermal Power Systems andon the Properties of Steam, American Society for Testing and Materials(ASTM) Committee D-19 on Water and the National Association of CorrosionEngineers (NACE). In addition there are international activities of theInternational Association for the Properties of Steam.
EPRI activities are concentrated in the Coal Combustion Systems Division(see Figure 1 for objections), and in the Nuclear Power Division'ssubprograms (see Figure 2a, b, c). Specific EPRI projects are listed in
Table 1.
Groups and activities of the ASME Research Committee on Water in ThermalPower Systems are listed in Table 2.
269
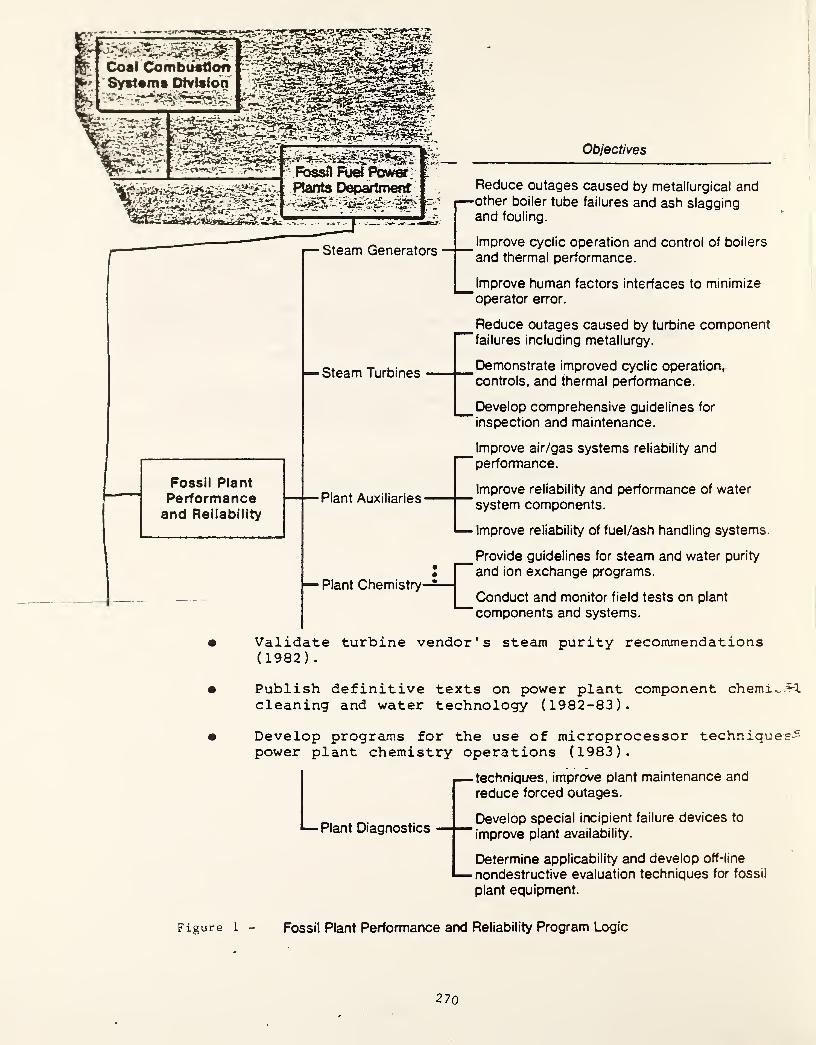
Coaf CombudiionSystama Dfvlsfon _
-; **M
s:!^j^iz.
- 7—^-' f- Fbssfl Riel Ptw& '•
Objectives
— Steam Generators
— Steam Turbines
Fossil Plant
Performanceand Reliability
•Plant Auxiliaries-
Reduce outages caused by metallurgical and—other boiler tube failures and ash slaggingand fouling.
_Improve cyclic operation and control of boilers
"and thermal performance.
Improve human factors interfaces to minimize
"operator error.
_Reduce outages caused by turbine component
"failures including metallurgy.
_Demonstrate improved cyclic operatioxv
" controls, and thermal performance.
Develop comprehensive guidelines for
inspection and maintenance.
Improve air/gas systems reliability and" performance.
Improve reliability and performance of water
"system components.
— Improve reliability of fuel/ash handling systems.
— Plant Chemistry
Provide guidelines for steam and water purity
and ion exchange programs.
Conduct and monitor field tests on plant
components and systems.
Validate turbine vendor's steam purity recommendations(1982)
.
Publish definitive texts on power plant component chemx^.^cleaning and water technology (1982-83).
Develop programs for the use of microprocessor techniques-power plant chemistry operations (1983).
^—techniques, improve plant maintenance and
reduce forced outages.
Develop special incipient failure devices to
"improve plant availability.
Determine applicability and develop off-line
— nondestructive evaluation techniques for fossil
plant equipment.
— Plant Diagnostics
Figure 1 - Fossil Plant Performance and Reliability Program Logic
270
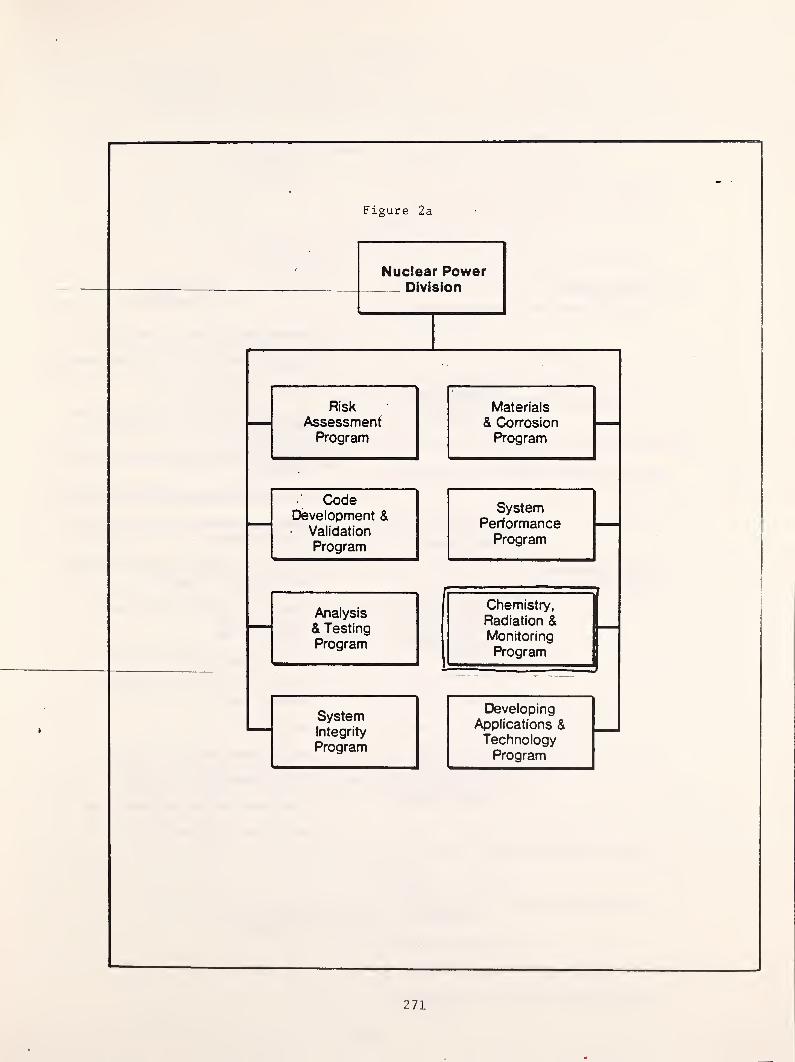
271

Figure 2b
Subprogram
>
Steam GeneratorTechnology
Approach Technology
— Denting and Corrosion Mechanisms
— Water Chemistry and Purity Requirements
Chemistry andCorrosion
— Evaluation of Plant Data
Crevice Corrosion and Concentration
Modeling
Alternate Water Chemistry for Corrosion
Inhibition
Materials Selection
and Testing
p— On-Line Corrosion Monitor Development
_Characterization and Improvement of
”Existing Materials
_ Examination and Qualification of SteamGenerator Components
Thermal, Hydraulic
and Structural
Testing andAnalysis
Thermal andHydraulic CodeDevelopment
— Evaluation of Alternate Materials
— Water Hammer
— Model Steam Generator Testing
___Steam Generator Instrumentation
Development
— Vibration
— Model Development
— Code Comparisons
— Verification With Model Boiler Data
— Verification With Field Data
272
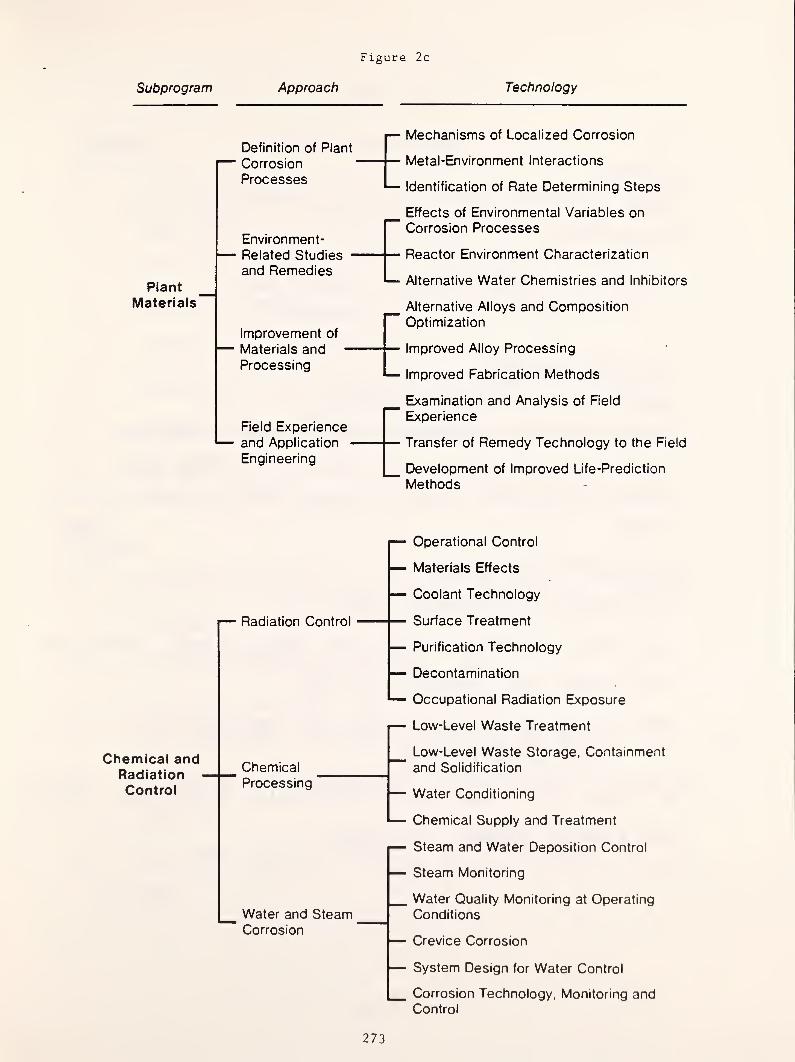
Figure 2c
Subprogram
Plant
Materials
Chemical andRadiationControl
Approach Technology
Definition of Plant
Corrosion
Processes
Environment-
Related Studies
and Remedies
— Mechanisms of Localized Corrosion
— Metal-Environment Interactions
— Identification of Rate Determining Steps
Effects of Environmental Variables onCorrosion Processes
— Reactor Environment Characterization
— Alternative Water Chemistries and Inhibitors
Improvement of
Materials andProcessing
Field Experience
and Application
Engineering
Alternative Alloys and CompositionOptimization
— Improved Alloy Processing
— Improved Fabrication Methods
Examination and Analysis of Field
Experience
— Transfer of Remedy Technology to the Field
Development of Improved Life-Prediction
Methods
Radiation Control
Chemical
Processing
Water and SteamCorrosion
Operational Control
Materials Effects
Coolant Technology
Surface Treatment
Purification Technology
Decontamination
Occupational Radiation Exposure
Low-Level Waste Treatment
Low-Level Waste Storage. Containmentand Solidification
Water Conditioning
Chemical Supply and Treatment
Steam and Water Deposition Control
Steam Monitoring
Water Quality Monitoring at Operating
Conditions
Crevice Corrosion
System Design for Water Control
Corrosion Technology. Monitoring andControl
273

Table 1
SPECIFIC EPRI PROJECTS
REACTORS ;
DURING AND POST ACCIDENT ANALYSIS IN THE PWR PRIMARY CYCLE
D. CUBICCIOTTI
PROPERTIES OF COLLOIDS RP966-1 CLARKSON COLL.
MATIJEVIC'
PWR STEAM GENERATORS :
CHEMICAL ASPECTS OF DENTING CEBELCOR
CHEMISTRY OF CORROSION PRODUCING SALTS IN LWR RP967-1 B&W
CHEN, THEUS
CHEMICAL THERMODYNAMIC STUDIES OF AGUEOUS TRACE COMPONENTS RP311-2
IN LWR COBBLE
OXYGEN SUPPRESSION IN BWRS
PWR CHEMISTRY FOLLOW PROGRAM RP699-1 (W)
EVALUATION OF SECONDARY SYSTEM OXYGEN CONTROL IN PWRS BURNS & ROE
PWR SECONDARY WATER CHEMISTRY GUIDELINES
MONITORING OF CREVICE CHEMISTRY BY LASER RAMAN SPECTROSCOPY
WESTINGHOUSE ELECTRIC
pH control AGENTS SAN DIEGO STATE UNIVERSITY, WESTINGHOUSE RP1571-3
OXYGEN CONTROL MEASURES T.O. PASSELL
274

Table 1 ( cont .
)
TURBINES
0 LP PWR TURBINE DISC CRACKING (INCLUDES CHEMICAL MONITORING)
0 CORROSION FATIGUE OF TURBINE BLADES RP-912 (INCLUDES SURVEY
OF CYCLE CHEMISTRY IN 42 UNITS AND DEPOSITS IN 120 UNITS)
0 EFFECTS OF PHOSPHATE ENVIRONMENTS ON TURBINE MATERIALS
RP1886-1 EPRI - GENERAL ELECTRIC CO.
0 SOLUBILITY OF NaOH IN SUPERHEATED STEAM BABCOCK &
WILCOX, GENERAL ELECTRIC, T.O. PASSEL, W. ALLMAN, G. GOULD
0 NEUTRON ACTIVATION ANALYSIS OF TURBINE DEPOSITS, RP1409.
GENERAL
0 PROGRAMS ON CHEMICAL ANALYSIS AND MONITORING AND CORROSION
TESTING.
0 SURVEY OF CONDENSATE POLISHING B&W
0 BWR RESIN INTRUSION BATTELLE, RP1653-2
0 HIGH TEMPERATURE pH,HYDROGEN, AND REDOX MONITORING SRI, RP1168-1
0 ESTIMATION OF DIFFUSION COEFF. OF ELECTROLYTES IN HOT WATER
RP5146-1
0 HIGH TEMP. BEHAVIOR OF CHEMICAL SPECIES IN WATER, RP1167-5,
CEGB
275

Table 2
ASME RESEARCH COMMITTEE ON
WATER IN THERMAL POWER SYSTEMS
UTILITY SUBCOMMITTEE
INDUSTRIAL SUBCOMMITTEE
AQUEOUS DISCHARGE SUBCOMMITTEE
HANDBOOK PROJECT
LIAISON WITH THE ASTM RESEARCH COMMITTEE ON THE PROPERTIES OF
STEAM AND I APS
EEI LIAISON
POWER DIVISION LIAISON
NACE LIAISON
ASTM U-19 LIAISON
TECHNICAL PAPERS SUBCOMMITTEE
ACTIVITIES: SURVEYS, PROPOSING RESEARCH, CONFERENCES, REGULAR
_ _ INFORMATION EXCHANGE
0 UTILITY AND INDUSTRIAL TURBINE SURVEYS
0 WATER CHEMISTRY FOR INDUSTRIAL BOILERS
0 LAYUP GUIDELINES
0 ANALYTICAL ROUND ROBIN PROPOSAL (ppb)
0 SAMPLING STEAM PROPOSAL
0 AIR INLEAKAGE AND ORGANICS SURVEY
0 BIBLIOGRAPHY OF CONDENSATE POLISHING
0 CHEMICAL CLEANING
0 STEAM GENERATOR CHEMISTRY
0 SLUDGE HANDLING AND DISPOSAL
0 CONTAMINATION - DECONTAMINATION
0 AQUEOUS DISCHARGES
276

International Association for the Properties of Steam
The International Association for the Properties of Steam (lAPS) is an
organization devoted to the preparation and promulgation of
internationally-agreed-upon , critically evaluated reference data on the
properties of water, steam, and aqueous solutions. The properties covered
are those of importance to the power industry.
Countries are members of lAPS and each member country pays yearly dues to
support lAPS and maintains a National Committee on the Properties of Steamwhich coordinates and encourages research on the properties of steamwithin the country and provides the country’s official delegates to lAPS.
The official delegates form the Executive Committee of lAPS which managesthe association's activities. The technical activities of lAPS are
carried out by working groups and subcommittees. At present there are the
following;
Working Group 1, Equilibrium PropertiesWorking Group 2, Transport PropertiesWorking Group 3. Other Properties Especially Surface and Electrical
PropertiesWorking Group 4, Chemical Thermodynamics of Power CyclesSubcommittee on Industrial Calculations
The best known product put out by lAPS and its predecessors is the 1967IFC Formulation for. Industrial Use which is used in almost all industrialcalculations for specifications and which forms the basis for the variousnational steam tables, such as that put out by ASME in the USA. In
addition, lAPS has issued the following releases which are current:
Release on Viscosity and Thermal Conductivity of Heavy Water Substance,September 1982 - Revised February 14, 1984Release on Static Dielectric Constant of Water Substance, September 1977
Release on lAPS Statement, 1983 1 of Values of Temperature, Pressure andDensity of Ordinary and Heavy Water Substances at Their RespectiveCritical Points
Release on Surface Tension of Water Substance, September 1975Release on Thermal Conductivity of Water Substance, 1977, as amended in
1982Release on the Dynamic Viscosity of Water Substance as amended in 1982Release on the Ion Product of Water Substance, May 1980
Currently, Working Group IV is actively engaged in evaluating data for thefour systems NaCl/H20, Na0H/H20, Si02/H20 and Fe^0y/H20. Each of thesesystems is important in power-plant chemistry.
ASME Research Committee on the Properties of Steam
The ASME Research Committee on the Properties of Steam encourages andcoordinates research on the properties of steam and serves as the U.S.National Committee on the Properties of Steam. In this latter capacity itsends the U.S. delegates to lAPS meetings and sets U.S. policy withrespect to matters treated by lAPS.
277
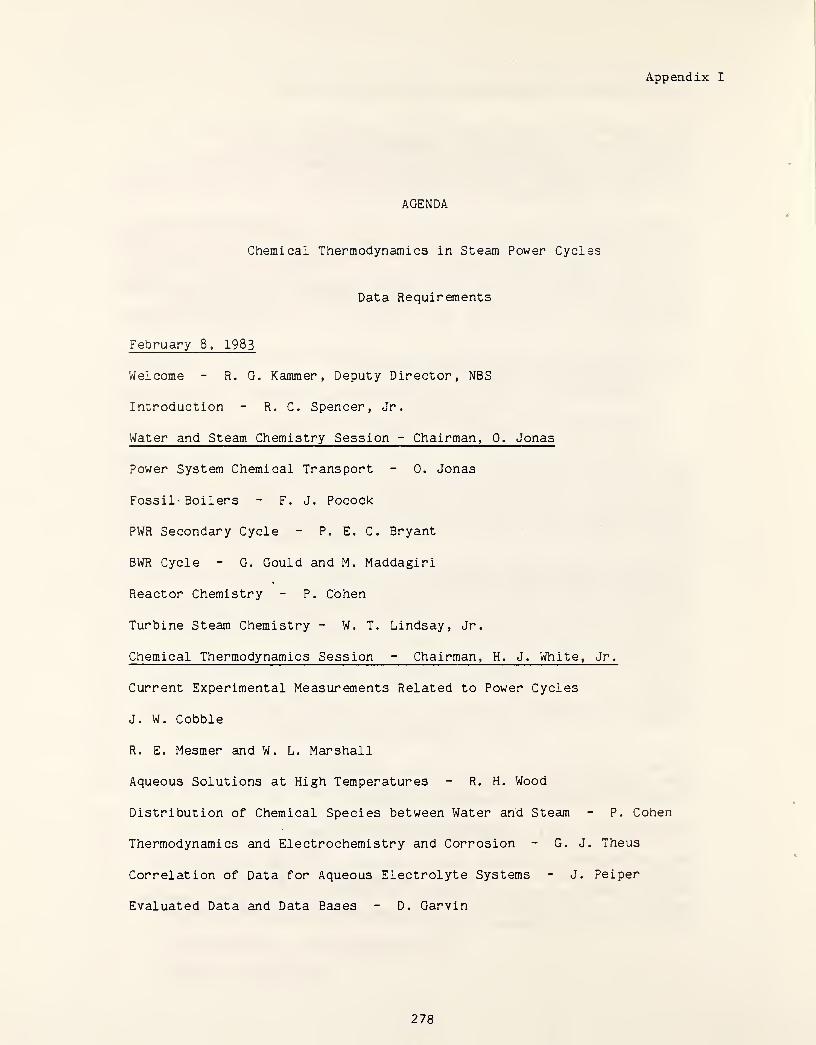
Appendix I
AGENDA
Chemical Thermodynamics in Steam Power Cycles
Data Requirements
February 8, 1983
Welcome - R. G. Kammer , Deputy Director, NBS
Introduction - R. C. Spencer, Jr.
Water and Steam Chemistry Session - Chairman, 0. Jonas
Power System Chemical Transport - 0. Jonas
Fossil- Boilers - F. J. Pocock
PWR Secondary Cycle - P. E. C. Bryant
BWR Cycle - G. Gould and M. Maddagiri
Reactor Chemistry - P. Cohen
Turbine Steam Chemistry - W. T. Lindsay, Jr.
Chemical Thermodynamics Session - Chairman, H. J. White, Jr.
Current Experimental Measurements Related to Power Cycles
J. W. Cobble
R. E. Mesmer and W. L. Marshall
Aqueous Solutions at High Temperatures - R. H. Wood
Distribution of Chemical Species between Water and Steam - P. Cohen
Thermodynamics and Electrochemistry and Corrosion - G. J. Theus
Correlation of Data for Aqueous Electrolyte Systems - J. Pei per
Evaluated Data and Data Bases - D. Garvin
278
2
February 9, 1983
Collateral Activities
EPRI and ASME Research Committee on Water in Thermal Power Cycles0. Jonas
lAPS and ASME Research Committee on the Properties of SteamH. J. White, Jr.
Working Group I, Reactors, Lecture Room B
Chairman - D. CubicciottiSecretary - V. B. Parker
Working Group II, PWR Steam Generators and Fossil Boilers, Lee. Room D
Chairman - P. E. C. BryantSecretary - J. Oscarson
Working Group III, Turbines, Room 111
Chairman - W. T. Lindsay, Jr.
Secretary - G. Gould
Working Group IV, Pre-Boiler Cycle, Room 113
Chairman - E. CoulterSecretary - R. N. Goldberg
Presentations of Conclusions and Recommendations of Individual WorkingGroups
Working Group I
Working Group II
Working Group III
Working Group IV
Discussion - Conclusions and Recommendations of the Workshop
279

Appendix II
WORKSHOP ON CHEMICAL THERMODYNAMICS
February 8-9, 1983
Attendance List
M. AngwinEPRI
P.O. Box 10412Palo Alto, CA 94303
(41 5)855-2481
J. CooperNaval Research Laboratory (Code 5133)
4555 Overlook Avenue, S.W.Washinoton, DC 20375(202)767-3115
P. AusloosNational Bureau of StandardsChem. Bldg. Room B343Washington, DC 20234
(301)921-2439
O. BonnellNational Bureau of StandardsMatls. Bldg., Room A329Washington, DC 20234
(301 )921 -2711
P. E. C. BryantCombustion Eng. Inc.
Combustion Div.
Dept. 9453-401
1000 Prospect Hill Road
Windsor, Connecticut 05095(203)683-6268
J. W. CobbleChemistry Dept.San Diego State UniversitySan Diego, CA 92182-0419
(61 9)265-5139
P, Cohen3024 Beachwood BoulevardPittsburgh, PA 15217(412)521-5786
P. Col umboNalco Chemical Company1801 Diehl RoadNaperville, Illinois 60540(312)961-9500 x204S
E. CoulterBabcock & Wilcox91 Stirling AvenueBarberton, Ohio 44203(216)860-1126
D. CubicciottiEPRIP 0. Box 10412Palo Alto, CA 94303(415)855-2069
F. GabrielliCombustion Engineering Inc.
1000 Prospect Hill Road
Windsor, Connecticut 05095(203)688-1911 x2485
D. GarvinNational Bureau of StandardsChemistry Bldg., Room A161
Washington, DC 20234
(301 )921-2773
L. GevantmanNational Bureau of StandardsPhysics Bldg., Room A318Washington. DC 20234(301)921-3442
R. GoldbergNational Bureau of StandardsPhysics Bldg , Room A303Washington, DC 20234
(301)921 2752
280
G. GouldGeneral Electric CompanyBldg. 55 - Room 233
1 River RoadSchnectady, New York 12345
(513)385-2113
J. HastieNational Bureau of StandardsMaterials Bldg,, Room A329Washington, DC 20234
(301 )921-3618/2S59
J. HicksBabcock & WilcoxUtility Power Generation DivisionOld Forest Road, P.O. Box 1260Lynchburg, Virginia 24505(804)385-3482
O. JonasWestinghouse Electric Corp. N-206P. O. Box 9175Philadelphia, PA 17113(215)237-2958
J. KellyNalco Chemical Company1801 Diehl RoadNaperville, Illinois 60556(312)961-9500 x2021
J. KrugerNational Bureau of StandardsMaterials Bldg., Room B254Washington, DC 20234(301 )921 -2094
K. LehnerWisconsin Electric Power Co.231 W. Michigan StreetMilv/aukee, Wisconsin 53201(414)277-2422
J. LeibovitzNWT Corporation7015 Realm DriveSan Jose, CA 95119(408)281-1100
D. R. Lide, JrNational Bureau of StandardsPhysics Bldg., Room A323Washington, DC 20234(301 )921-2467
W, T, Lindsay, Jr
Westinghouse R2.D Center1310 Beulah RoadPittsburgh, PA 1 5235(412)256-3696
M. MaddagiriBechtel PowerP.O. Box 3965San Francisco, CA 94119(415)768-0623
W. Marshall
Research StaffChemistry DivisionOak Ridge National LaboratoryP.O. Box X
Oak Ridge Tennessee 27830(615)574-4960
R. E. MesmerOak Ridge National LaboratoryP.O. Sox X
Oak Ridge, Tennessee 27830(615)574-4958
R. NuttallNational Bureau of StandardsChemistry Bldg., Room A1 52
Washington, DC 20234
(301 )921 -21 08
J. Oscarson350K C3 Dept, of Engr.
Brigham Young UniversityProvo, Utah 84602(801 )378-6240
V. ParkerNational Bureau of StandardsChemistry Bldg., Room A1 52
Washington, DC 20234
(301 )921 -21 09
281
T. PassellEPRINuclear Eng. and OperationsP.O. Box 10412Palo Alto, CA 94303
(415)355 2070
O. Pei per
Dept, of ChemistryArizona State UniversityTempe, Arizona 85287
(602)965-5697
F. PocockBabcock & WilcoxP. O. Box 835Alliance, Ohio 44601
(216)821-9110 x428
D. SchluderbergBabcock & WilcoxBox 1260Lynchburg, VA 24505(703)385-3110
R. SpencerGeneral Electric CompanyBldg. 273 - Room 244
Schenectady, New York 12345
(518)385-31 53
B. StaplesNational Bureau of StandardsChemistry Bldg., A1 64
Washington, DC 20234
(301 )921-3632
6. TheusBabcock i Wilcox R&DP.O. Box 835Alliance, Ohio 44601
(216)821-9110 x343
D. VeneskyNaval Research LaboratoryCode 61304555 Overlook Avenue, S.W.VJashington, DC 20375(202)767-3557
H. d. White, Jr.
National Bureau of StandardsPhysics Bldg., Room A316Washington, DC 20234
(301
)
921 -2531
R. WoodUniversity of DelawareChemistry DepartmentNewark, Delaware 19711
(302)
738-2941
282
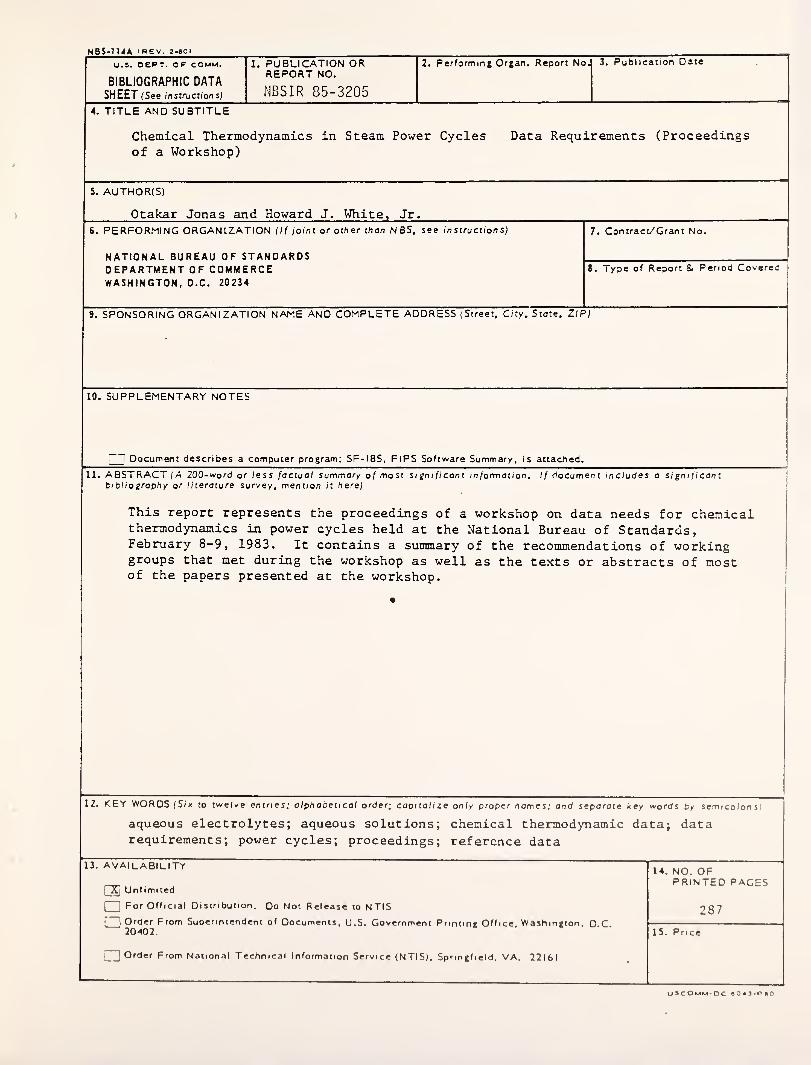
HSS«n4A <BEV. 2*eci
U.s. OEPT, OF COMM.
BIBLIOGRAPHIC DATASHEET (See instruciions)
1. PUBLICATION ORREPORT NO.
NBSIR 85-3205
2. Performing Organ. Report NoJ 3. Publication Date
4. TITLE and subtitle
Chemical Thermodynamics in Steam Power Cycles Data Requirements (Proceedingsof a Workshop)
5. AUTHOR(S)
Otakar Jonas and Howard J. White, Jr.
6. performing organization (If Joint or other than NBS, see instructions) 7. Contract/Grant No.
NATIONAL BUREAU OF STANDARDSDEPARTMENT OF COMMERCE 8. Type of Report 8, Period Covereo
WASHINGTON, D.C. 20234
9. SPONSORING ORGANIZATION NAME AND COMPLETE ADDRESS (Street. City, State. ZIP)
10. supplementary NOTES
' ^ Document describes a computer program; SF-185, FlPS Software Summary, is attached.
11. ABSTRACT (A 200-word or less factual summary of most significant information. If document includes a significantbibliography or literature survey, mention it here)
This report represents the proceedings of a workshop on data needs for chemicalthermodynamics in power cycles held at the National Bureau of Standards,February 8-9, 1983. It contains a summary of the recommendations of workinggroups that met during the workshop as well as the texts or abstracts of mostof the papers presented at the workshop.
12. KEY WORDS (Six to twelve entries; alphabetical order; capitalize only proper names; and separate key words by semicolon si
aqueous electrolytes; aqueous solutions; chemical thermodynamic data; datarequirements; power cycles; proceedings; reference data
13. AVAILABILITY
Uni imi ted
1 1For Official Distribution. Do Not Release to NTIS
r 1Order From Superintendent of Documents. U.S. Government Printing Office. Washington. D.C20402.
]
Order From National Technical Information Service (NTIS). Springfield, VA. 22161
14. NO. OFPRINTED PAGES
287
15. Price
USCOmm-OC «0.J-p«O

e
t gtU *»cr%.
'
« 3 rttmm7 i
.
"1 m'PJ
Jr^»3
|)'V V, ;
i-ito
'i»T
m.
‘
' JStsn®''
''»2^
rr- '"l^.
S*A "ra'S'9?¥-'
1 1 -'A-'f*' j
"'iffl; 'I’t'A
; .,-,j
./i-
V*«<Wo»>n«ii
«3ftJb ;4ji^»!w^; itr
taOA^ 0'9t»•^‘K'pssv‘
»•
(»M(i1iK> ni T
s?
rs
1


\
i
if
I