Chemical Thermodynamics for Metals and Materials
319
-
Upload
khangminh22 -
Category
Documents
-
view
1 -
download
0
Transcript of Chemical Thermodynamics for Metals and Materials
CHEMICAL THERMODYNAMICS
FOR METALS AND MATERIALS
CHEMICAL THERMODYNAMICS
FOR METALS AND MATERIALS
HAE-GEON LEE Pohang University of Science & Technology
Korea
Imperial College Press

Published by
Imperial College Press 57 Shelton Street Covent Garden London WC2H 9HE
Distributed by
World Scientific Publishing Co. Pte. Ltd. P 0 Box 128, Farrer Road, Singapore 912805 USA office: Suite lB, 1060 Main Street, River Edge, NJ 07661 VK oflce: 57 Shelton Street, Covent Garden, London WC2H 9HE
British Library Cataloguing-in-Publication Data A catalogue record for this book is available from the British Library.
First published 1999 Reprinted 2000
CHEMICAL THERMODYNAMICS FOR METALS AND MATERIALS
Copyright 0 1999 by Imperial College Press and World Scientific Publishing Co. Pte. Ltd. All rights reserved. This book, or parts thereof; may not be reproduced in any form or by any means, electronic or mechanical, including photocopying, recording or any information storage and retrieval system now known or to be invented, without written permission from the Publisher.
For photocopying of material in this volume, please pay a copying fee through the Copyright Clearance Center, Inc., 222 Rosewood Drive, Danvers, MA 01923, USA. In this case permission to photocopy is not required from the publisher.
ISBN 1-86094-177-X
Printed in Singapore by FuIsIand Offset Printing
To
Myoung-Hi
and
Hanna, Rebecca and Chris

PREFACE
This book with CD-ROM presents classical thermodynamics with an emphasis on chemical aspects. It is written primarily for students and graduate engineers of metals and materials. Since its treatment of the subject is sufficiently general, students in related fields such as physical chemistry and chemical engineering can also use it.
As thermodynamics is a key discipline in most science and engineering fields, a great number of books, each claiming originality in presentation and approach, have been published on the subject. However, thermodynamics is still a confusing subject for uninitiated students and an “easy to forget” one for graduate engineers.
After many years of experience both teaching thermodynamics at university and actually practising it in industry, I have concluded that the most effective way of presenting thermodynamics is to simulate the method that a lecturer would employ in class. When teaching, the lecturer may write important equations and concepts on the board, draw underlines, circle or place tick marks to emphasise important points, draw arrows to indicate relationships, use coloured chalk for visual effect, and erase some parts to write new lines. He/she may even repeat some parts to stress their importance. A book written on paper alone cannot properly simulate the techniques mentioned above.
This package consists of a book and a computer-aided learning package, and is both unique and beneficial in that it simulates the classroom interaction much more closely due to its employment of multimedia capabilities. Unlike the passive presentation found in most textbooks, this package provides the user with an interactive learning environment. Fast topic selection, free repetition and cross-referencing by toggling between sections or even other packages are just some of the advantages this package has. This approach is in many important respects better than those adopted by other available books on the subject.
This package provides a comprehensive treatment of all the important topics of thermodynamics. It is comprised of a number of smaller sections, each of which deals with a specific topic of thermodynamics. Each section is divided into three parts:
Text : This part covers the fundamental concepts of thermodynamics.
Examples : This part presents extended concepts through questions and aniwers.
Exercises : This part develops skills necessary to deal with numeric problems.
This book is intended for use primarily at the undergraduate level, but will also -be useful to the practising graduate engineers in industry.
Having been evolved from my teaching materials, this book unavoidably includes a blending of knowledge of many other authors with that of my own. I acknowledge their contributions. I am indebted to my teacher, Professor Y.K. Rao for introducing me to the
vii

viii Chemical Thermodynamics for Metals and Muterials
world of thermodynamics. I am particularly grateful to my former colleague Professor Peter Hayes at The University of Queensland, Australia, for making many useful comments and giving me constant encouragement.
I want to acknowledge the major effort expended by many of my students: Y. B. Kang, T. I . Kim, C. M. Park and S . S . Lee for helping me to design this electronic book and H. J. Kong for helping to typeset the manuscript.
I am also pleased to acknowledge the financial support from The Commonwealth
Finally, I am deeply thankful to my wife and children for the love and encouragement
Government of Australia and Pohang University of Science and Technology, Korea.
they have given to me.
Hae-Geon Lee
CONTENTS
Preface vii
1. Fundamental Principles and Functions
1.1 First Law of Thermodynamics
1.1.1 Heat, Work and Internal Energy 1.1.2 Enthalpy and Heat Capacity 1.1.3 Enthalpy Change (AH)
1.2 Second Law of Thermodynamics
1.2.1 Reversible and Irreversible Processes 1.2.2 Entropy (S) 1.2.3 Criterion of Equilibrium 1.2.4 Heat Engines
1.3 Auxiliary Functions
1.3.1 Free Energies 1.3.2 Effect of Pressure on Free Energy 1.3.3 Effect of Temperature on Free Energy 1.3.4 Some Useful Equations
1.4 Third Law of Thermodynamics
1.4.1 Third Law of Thermodynamics 1.4.2 Absolute Entropies
1.5 Calculation of Enthalpies and Free Energies 1.5.1 Standard States 1.5.2 Heat of Formation 1.5.3 Heat of Reaction 1.5.4 Adiabatic Flame Temperature 1.5.5 Gibbs Free Energy Changes
1
1
1 6
13
16
16 17 27 28
32
32 37 38 40
43
43 45
47 47 49 51 55 51
ix
X Chemical Thermodynamics for Metals and Materials
2. Solutions 61
2.1 Behaviour of Gases
2.1.1 Ideal Gases 2.1.2 Fugacities and Real Gases
2.2 Thermodynamic Functions of Mixing
2.2.1 Activities and Chemical Potentials 2.2.2 Partiai Properties
2.3 Behaviour of Solutions
2.3.1 Ideal Solutions 2.3.2 Non-ideal Solutions and Excess Properties 2.3.3 Dilute Solutions 2.3.4 Gibbs-Duhem Equation 2.3.5 Solution Models
3. Equilibria
3.1 Reaction Equilibria
3.1.1 Equilibrium Constant 3.1.2 Criteria of Reaction Equilibrium 3.1.3 Effect of Temperature on Equilibrium Constant 3.1.4 Effect of Pressure on Equilibrium Constant 3.1.5 Le Chatelier's Principle 3.1.6 Alternative Standard States 3.1.7 Interaction Coefficients 3.1.8 ElIingham Diagram
3.2 Phase Equilibria
3.2. I Phase Rule 3.2.2 Phase Transformations 3.2.3 Phase Equilibria and Free Energies
4. Phase Diagrams
61
61 64
67
67 74
80
80 83 87 89 92
97
97
97 101 1 1 1 114 116 117 125 127
131
131 136 144
157
4.1 Unary Systems
4.1.1 Pressure-Temperature Diagrams
157
157
Contents
4.1.2 Allotropy
xi
163
4.2 Binary Systems
4.2.1 Binary Liquid Systems 4.2.2 Binary Systems without Solid Solution 4.2.3 Binary Systems with Solid Solution 4.2.4 Thermodynamic Models
4.3 Ternary Systems
4.3.1 Composition Triangles 4.3.2 Polythermal Projections 4.3.3 Isothermal Sections
5. Electrochemistry
5.1 Electrochemical Concepts and Thermodynamics
5.1.1 Basic Electrochemical Concepts 5.1.2 Electrochemical Cell Thermodynamics
5.2 Electrochemical Cells
5.2.1 Cells and Electrodes 5.2.2 Concentration Cells
5.3 Aqueous Solutions
5.3.1 Activities in Aqueous Solutions 5.3.2 Solubility Products
Appendices I Heats of formation, standard entropies and heat capacities I1 Standard free energies of formation 111 Properties of Selected Elements IV Standard half-cell potentials in aqueous solutions
166
166 177 186 195
204
204 21 1 223
233
233
233 236
243
243 25 1
260
260 268
273 275 283 297 301
Index 305
CHAPTER 1
FUNDAMENTAL PRINCIPLES AND FUNCTIONS
1.1. Fint Law of Thermodynamics
1.1 . I. Heat, Work and Internal Energy
The First Law of Thermodynamics is really a statement of the Principle of Conservation of Energy:
Energy can neither be created, nor destroyed. Energy can be transported or converted from one form to another, but cannot be either created or destroyed. Chtmical andor physical changes are accompanied by changes in energy.
Heat energy Work or mechanical energy Electrical energy Chemical energy
The typas of energy commonly encountered include:
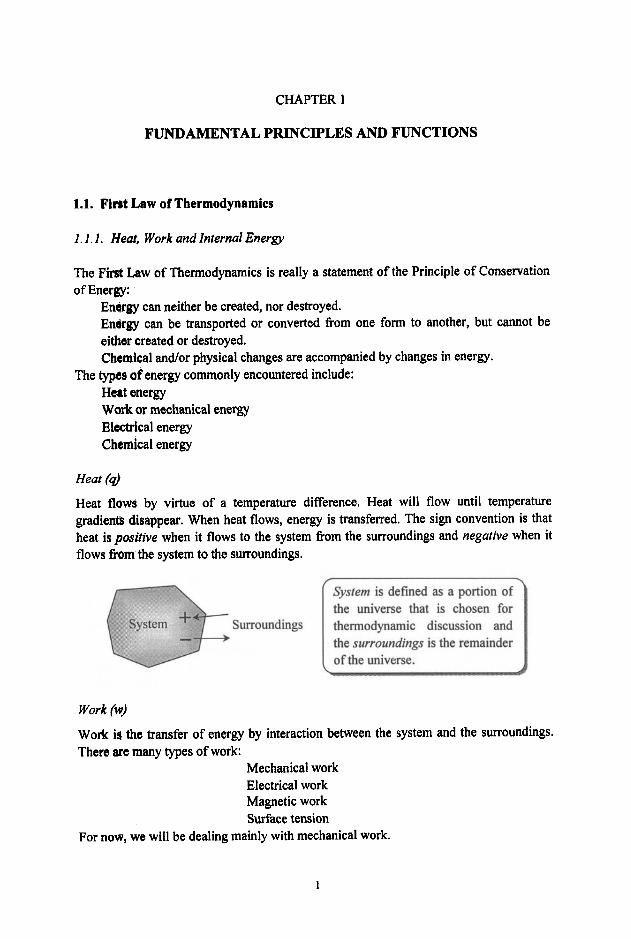
Heat (d Heat flows by virtue of a temperature difference. Heat will flow until temperature gradients disappear. When heat flows, energy is transferred. The sign convention is that heat is positive when it flows to the system froin the surroundings and negative when it flows Mm the system to the surroundings.
System is defined as a portion of the universe that is chosen for
of the universe.
Work (w)
Work is the transfer of energy by interaction between the system and the surroundings. There are many types of work:
Mechanical work Electrical work Magnetic work Surface tension
For now, we will be dealing mainly with mechanical work.
2 Chemical Thermodynamics for Meials and Materials
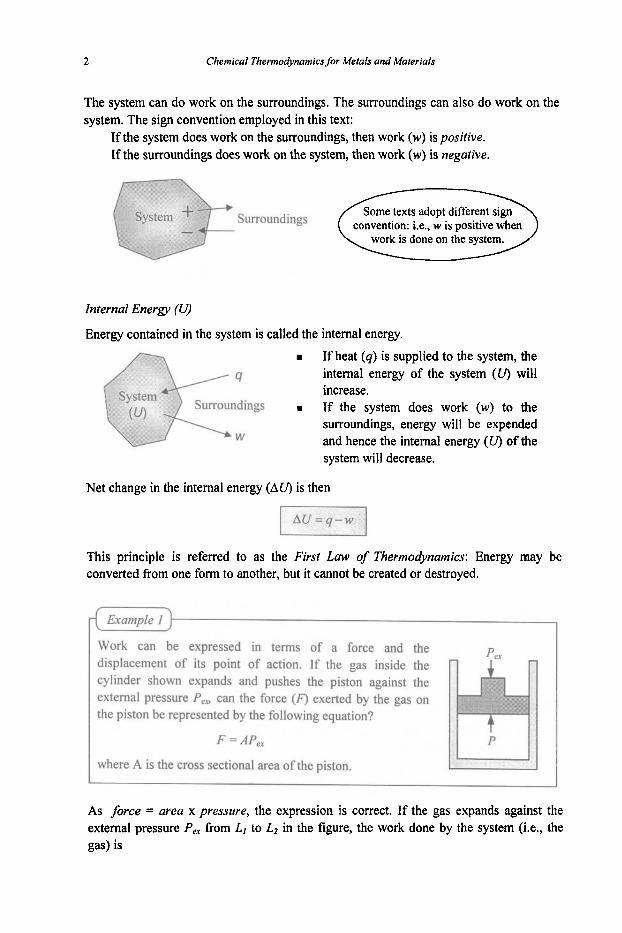
The system can do work on the surroundings. The surroundings can also do work on the system. The sign convention employed in this text:
If the system does work on the surroundings, then work (w) is positive. If the surroundings does work on the system, then work (w) is negative.
convention: i.e., w is positive when work is done on the system.
Surroundings
Internal Energy (U)
Energy contained in the system is called the internal energy.
If heat (4) is supplied to the system, the internal energy of the system (U) will increase.
Surroundings D If the system does work (w) to the surroundings, energy will be expended and hence the internal energy (U) of the
4
W
system will decrease.
Net change in the internal energy (AU) is then
This principle is referred to as the First Law of Thermodynamics: Energy may be converted from one form to another, but it cannot be created or destroyed.
Example I
Work can be expressed in terms of a force and the displacement of its point of action. If the gas inside the cylinder shown expands and pushes the piston against the external pressure P,, can the force (F) exerted by the gas on the piston be represented by the following equation?
F = AP,
where A is the cross sectional area of the piston.
As force = area x pressure, the expression is correct. If the gas expands against the external pressure P , from LI to L2 in the figure, the work done by the system (i.e., the gas) is
3 Fundumentd Principies and Functions
If the external pressure is continuously adjusted so that it is kept the same as the internal pressure P,
w = I tPdV
Work under these conditions is called reversible work.
Work is a mode of energy transfer which occurs due to the existence of imbalance of forces between the system and the surroundings. When the forces are infinitesimal& unbalanced throughout the process in which energy is transferred as work, then the process is said to be reversible.
D 1
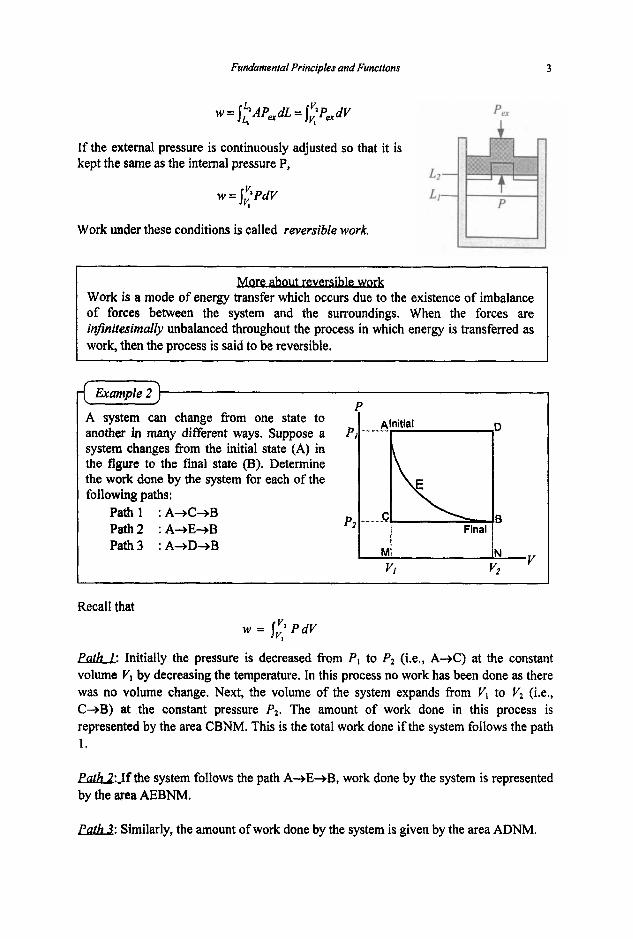
Alnitial ~D . A system can change from one state to another in many different ways. Suppose a system changes from the initial state (A) in the figure to the final state (B). Determine the work done by the system for each of the following paths:
PI
C B Path1 :A+C+B Path2 :A+E+B Path3 :A+D+B
Final p2
N V , M vt v2
Recall that w = 1; PdV
I
parh: Initially the pressure is decreased from P I to P2 (Le., A+C) at the constant volume V, by decreasing the temperature. In this process no work has been done as there was no volume change. Next, the volume of the system expands from V , to V2 (i.e., C+B) at the constant pressure P2. The amount of work done in this process is represented by the area CBNM. This is the total work done if the system follows the path 1.
Parh2:Jf the system follows the path A+E+B, work done by the system is represented by the area AEBNM.
W: Similarly, the amount of work done by the system is given by the area ADNM.

4 Chemical Thermodynamics for Metals and Materials
The amount of work done by the system depends on the path taken, and hence cannot be evaluated without a knowledge of the path.
Suppose that a substance can exist in several different states as shown in the figure. The substance in state A undergoes a change to state B via state 1, and then comes back to state A via states 2 and 3. Is the gain of internal energy in the forward process (A+B) different from the loss in the backward process (B+A)?
No. It should be the same. If different, the system will return to the initial state A with a net gain of internal energy. In other words, if different, the system will gain even more energy by repeating the process from nowhere. This is contrary to the First Law of Thermodynamics. Therefore the internal energy gained in the forward process must be equal to that lost in the return process. We have seen here that internal energy (U) differs from heat (9) and work (w) in that it depends only on the state of the system, not on the path it takes. Functions which depend only on the initial and final states and not on path are called statefunctions.
Which of the following thermodynamic terms are state functions? Temperature (0, Pressure (P), Heat (q), Work (w), Volume (V)
State fbnctions : T, P, V Non-state functions : q, w
State fknctions which depend on the mass of material are called extensive properties (e.g., U, V). On the other hand some state functions are independent of the amount of materials. These are called intensive properties (e.g., P, T).
Thermodynamics is largely concerned with the relations between state functions which characterise systems:
A state function can be integrated between the initial (A) and final (B) states, being independent of integration path.
(Example) AU = J:dU
An exact differential can be written in terms of partial derivatives. For instance, as U =AT v),
Fu&mental Principles and Functions 5
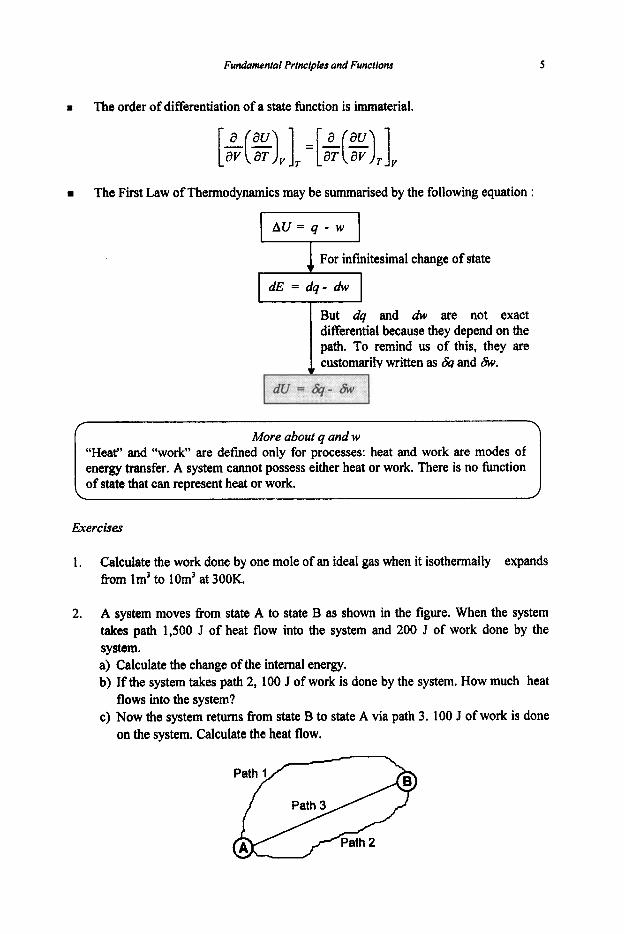
D The order of differentiation of a state function is immaterial.
The First Law of Thermodynamics may be summarised by the following equation :
change of state
dE = dq- ab
But dq and ab are not exact differential because they depend on the path. To remind us of this, they are customarily written as & and SW.
1 More about q and w “Heat” and “work” are defined only for processes: heat and work are modes of energy transfer. A system cannot possess either heat or work. There is no h c t i o n of state that can represent heat or work.
Exercises
1. Calculate the work done by one mole of an ideal gas when it isothermally expands fiom lm3 to 10m3 at 300K.
2. A system moves fiom state A to state B as shown in the figure. When the system takes path 1,500 J of heat flow into the system and 200 J of work done by the system.
Calculate the change of the internal energy. If the system takes path 2, 100 J of work is done by the system. How much heat flows into the system? Now the system returns from state B to state A via path 3. 100 J of work is done on the system. Calculate the heat flow.
6 Chemical Thermot$mamfcs for Metals and Materials
1.1.2 Enthalpy and Heat Capacity
Enthalpy (H)
If a process takes place at constant volume,
w = P A V = O
From the first law of thermodynamics,
Therefore, the increase or decrease in internal energy of the system is equal to the heat absorbed or released, respectively, at constant volume. If a process is carried out at a constant pressure rather than at a constant volume, then the work done by the system as a result of the volume change is
2 w = j; PdV = PJ, d V = P(V, - v1 )
From the fwst law of thermodynamics,
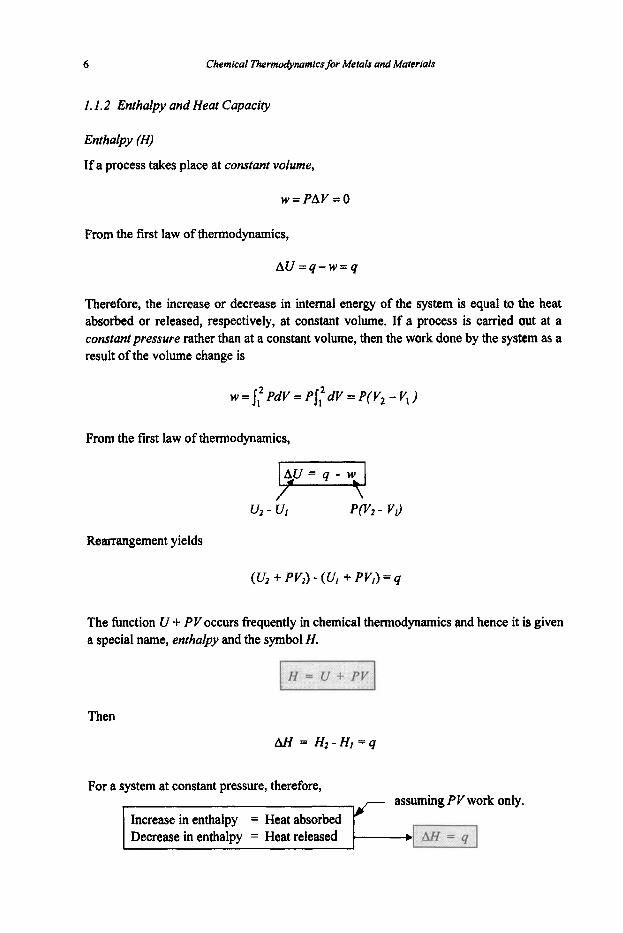
Rearrangement yields
(Wt + PV2) - (U, + PV,) = q
The function U + P V occurs frequently in chemical thermodynamics and hence it is given a special name, enthalpy and the symbol H.
Then
For a system at constant pressure, therefore, assuming P V work only.
Fundamental Principles and Functions
at constant volume, I
7
at constant pressure,
For changes at other than constant pressure, AH still has a defmite value, but AH f q.
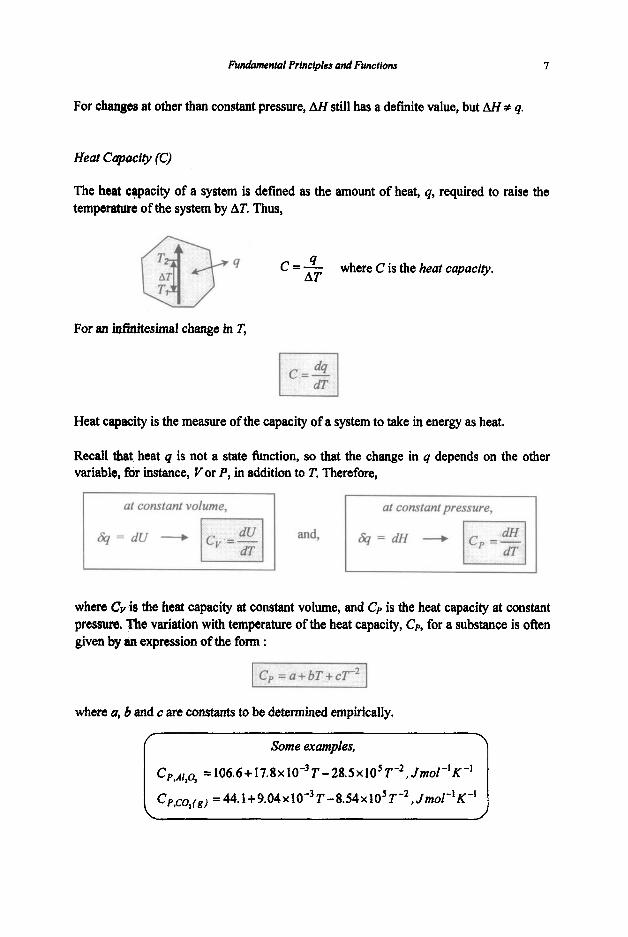
Heat Capaciy (C)
The heat capacity of a system is defined as the amount of heat, q, required to raise the temperature of the system by AT. Thus,
4 C=- where C is the heat capacity. AT
For an bfinitesimal change in T,
Heat capacity is the measure of the capacity of a system to take in energy as heat.
I I I I
where Cv is the heat capacity at constant volume, and Cp is the heat capacity at constant pressure. The variation with temperature of the heat capacity, Cp, for a substance is often given by an expression of the form :
where U, b and c are constants to be determined empirically.
CP,AI,O, = 106.6 + 17.8 x IQ9 T - 28.5 x 10’ T-2 , Jmol-’K-’
Cp,co,(gl = 44.1 + 9.04~10-~ T - 8 . 5 4 ~ 10’ T - 2 , Jmol-’K-’
8 Chemical Thennodynamics for Metals and Materials
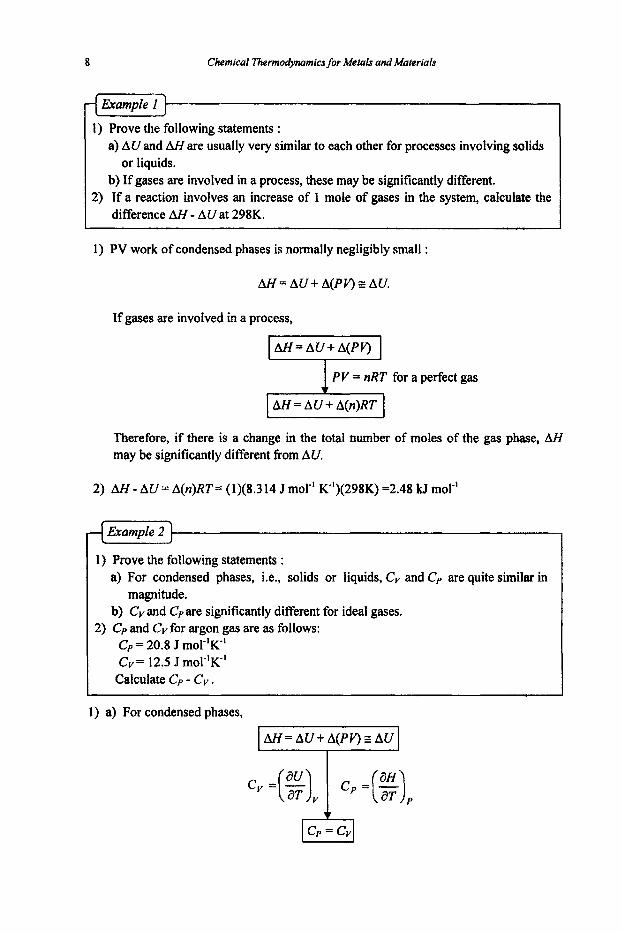
Example 1
1) Prove the following statements : a) AU and AH are usually very similar to each other for processes involving solids
b) If gases are involved in a process, these may be significantly different.
difference AH - AU at 298K.
or liquids.
2) If a reaction involves an increase of 1 mole of gases in the system, calculate the
1) PV work of condensed phases is normally negligibly small :
A H = A U + A ( P V ) z A U .
If gases are involved in a process,
AH=AU+A(PV)
PV = nRT for a perfect gas
Therefore, if there is a change in the total number of moles of the gas phase, AH may be significantly different from AU.
2) AH - AU = A(n)RT= (1)(8.3 14 J mor' K-')(298K) =2.48 kJ mol-'
Erample 2
1) Prove the following statements : a) For condensed phases, i.e., solids or liquids, Cv and Cp are quite similar in
b) Cy and Cp are significantly different for ideal gases. magnitude.
2) Cp and Cv for argon gas are as follows: Cp = 20.8 J mor'K' Cv= 12.5 J mor'K'
Calculate Cp - Cv .
I ) a) For condensed phases,
A€€= A U + A(PV) AU
Funabmental Principles and Functions 9
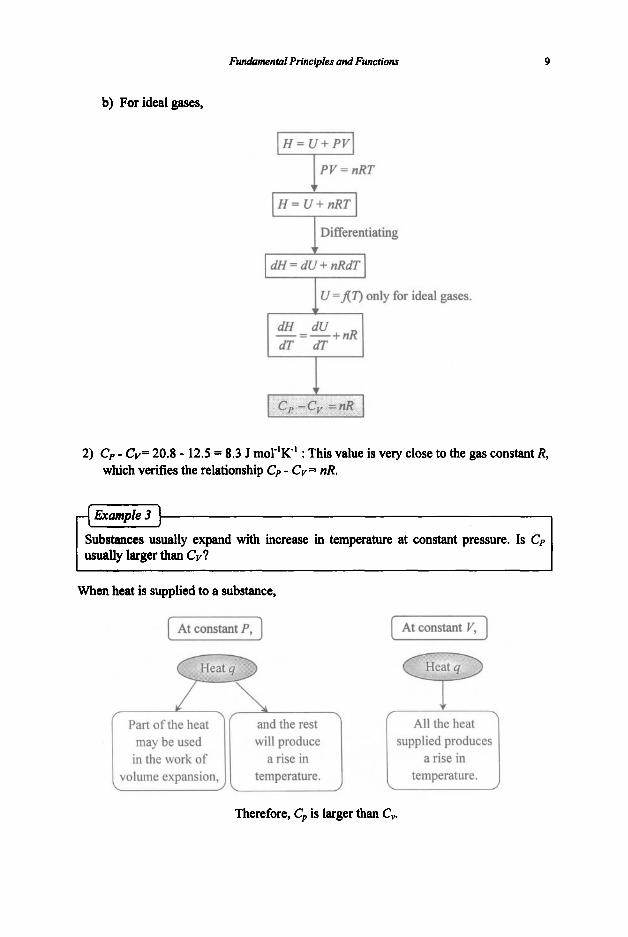
b) For ideal gases,
PV = nRT
I H = U + nRT I I Differentiating + I dH= d U + nRdT
I U =An only for ideal gases. Ff -= -+nR
2) C, - Cv= 20.8 - 12.5 = 8.3 J rnoT'K' : This value is very close to the gas constant R, which verifies the relationship Cp - CV = nR.
Substances usually expand with increase in temperature at constant pressure. Is Cp usually larger than CV?
When heat is supplied to a substance,
[ At constantp, ]
may be used in the work of
k and the rest will produce supplied produces
a rise in temperature. temperature.
All the heat
a rise in
Therefore, C, is larger than C,.

10 Chemical Thermodynamics for Melals and Materials
More rigorous analysis:
from the definition of
1 c, -cv =(g)
The contribution to Cp caused by change in the volume of the system against the constant external pressure.
The contribution from the energy required for the change in volume against the internal cohesive forces acting between the constituent particles of a substance. For liquids and solids, which have strong internal cohesive forces, the term (aU/aT)P is large. For gases this term is usually small compared with P. An ideal gas is a gas consisting of non-interacting particles, and hence this term is zero.
1 c, -cv = P(%) P
PV = RT
Fumiamental Principles and Functions 11
dT dV T V
Cv - = -R- L
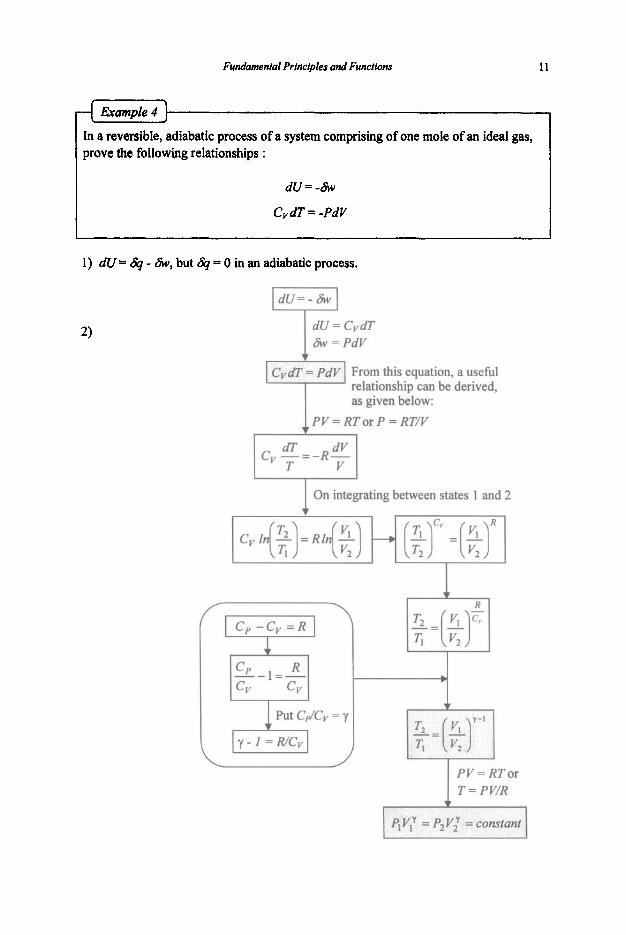
I In a reversible, adiabatic process of a system comprising of one mole of an ideal gas, prove the following relationships :
d u x - &
CvdT = -PdV 1 I
1) dU= & - &, but & = 0 in an adiabatic process.
1 T = PV/R

12 Chemical ThermodyMmics for Metals and Materials
Example 5
For reversible adiabatic expansion of an ideal gas, we have seen
PV = c (constant)
When a system comprising of one mole of an ideal gas changes its state from ( P j , Vj, T j ) to (P2, V2, T2), prove that work done by the system is
P V Y = c
1 On integrating
c = P,V,Y = P2V.Ly I I I
For an ideal gas, PV = RT And knowing Cp - Cv = R, and
CKv= Y
Exercises
1 . When heat is supplied to an ice-water mixture at O'C, some of the ice melts, but the temperature remains unchanged at OOC. What is the value of Cp of the ice-water mixture?
2. Metallic vapours generally have a monatomic constitution. According to the kinetic theory of gases, only three translational degrees of freedom need to be considered for a monatomic gas and hence the translational kinetic energy is given by
Fwrdamental Princ@les and Functions 13
E =$nRT
1) Calculate AH when the temperature of 3 moles of the gas is raised fiom 700 to
2) Calculate Cy for the gas. 3) Calculate Cp for the gas.
1,000K.
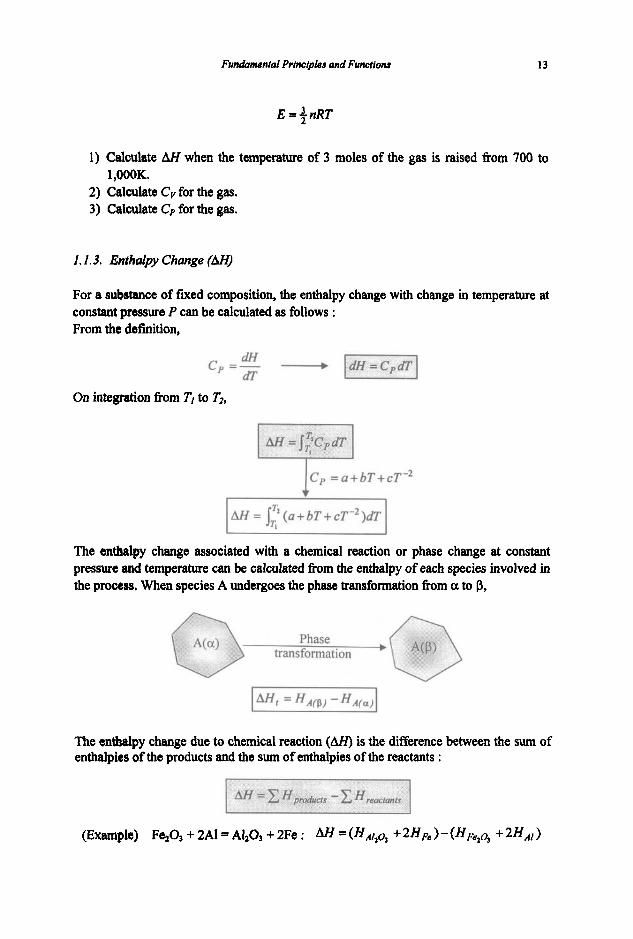
I . I. 3. Enthal’ Change (M)
For a substance of fixed composition, the enthalpy change with change in temperature at constant pressure P can be calculated as follows : From tha definition,
On integration fiom Tl to T2,
p p =a+bT+cT-’
IAH = IT2(a+bT+cT-*)dT Tl I The enthalpy change associated with a chemical reaction or phase change at constant pressure and temperature can be calculated from the enthalpy of each species involved in the process. When species A undergoes the phase transformation from a to p,
The enthalpy change due to chemical reaction (AH) is the difference between the sum of enthalpits of the products and the sum of enthalpies of the reactants :

14 Chemical Thermodynamics for Metals and Materials
Pure copper melts at 1,084"C. Calculate the enthalpy change when 1 mole of copper is heated from 1,OOO"C to 1,lOO"C. (Cp,cu(rl = 3 1.4 J mol"R', C,,,, = 22.6 + 6.28 x IO'T, J mol-'K1, Heat of fusion (AH,) : 13,OOOJ mol-I)
Total enthalpy change = Enthalpy change associated with heating of solid copper to the melting temperature + Heat of fusion at the melting temperature + Enthalpy change associated with heating of liquid copper to the temperature of 1,lOO"C.
1373 Heating of liquid Cu AHI, = J,257Cp.cu(l)dT = 340J moT'
AHl = 13,000 J mol-'
1357 Heating ofsolid Cu Ms = 1,273CpCuls)dT = 2,590J mol-'
Total enthalpy change, AH = Ms + AHl + AH" = 15,9305 mol-'
Molten copper is supercooled to 5°C below its true melting point (1,084"C). Nucleation of solid copper then takes place and solidification proceeds under adiabatic conditions. Calculate the percentage of the solid copper.
I I
1,084"C
1,079"C
I Reversible
h Path
r . The actual path is not convenient for thermodynamic calculations in this case, because copper solidifies during the process and the heats of fusion at temperatures other than the true melting point are not readily known. . ,
Instead, it is more convenient to take imaginary paths : 1) Liquid copper is heated from 1,079"C to 1,084"C (path I), and then 2) portion of the liquid copper solidifies at the true melting point (path 2).

Fundamental Principles and Functions 15
Since enthalpy is a state function, the enthalpy change along this imaginary paths should be the same as that along the true path.
where x = fraction of copper solidified, AHt = heat of fusion of copper (1 3,OOOJ mol-')
As solidification proceeds under adiabatic conditions,
Therefore, x = 0.012 : fraction of solid copper
Example 3
Consider the reaction between methane and oxygen to produce carbon dioxide and water vapor.
Reaction path 1 : CH, + 202 + COz + 2Hz0 Reaction path 2 : CI& + C + 2H2
AHl A f f z a
M Z C
I-, 2Hz + 0 2 -P 2H20 Af f2b L c + 02 -b CO2 Provethat AHl = AHz0 + + AHZc.
Because enthalpy is a state property, the enthalpy change depends on the initial and final states only, not on the path the process follows. As the sum of all the reactions in path 2 results in the same reaction as the one in path 1, the enthalpy change should be the same for both paths. The additive properties of enthalpy is known as Hess 's Law. According to this law,
0
0
the enthalpy change associated with a given chemical reaction is the same whether it takes place in one or several states, or enthalpies or enthalpy changes may be added or subtracted in parallel with the same manipulations performed on their respective components or reactions.
The above is in fact a different expression of the state property of enthalpy.
Exercises
1. The melting point of CaTiSiOs is 1,400"C and the heat of fusion at the normal melting point is 123,700J mol-'. Calculate the heat of fusion at 1,300"C. Cp,sd,d= 177.4 + 23.2xlO"T- 4O.3x1O5T2, J mol-'K'
16 Chemical llrermo&namics for Metals and Materials
non-equilibrium state. process, the system has become degraded, i.e., energy which was available for doing useful work to the surroundings has become converted into thermal energy (heat) in which form it is no longer available for external purposes.
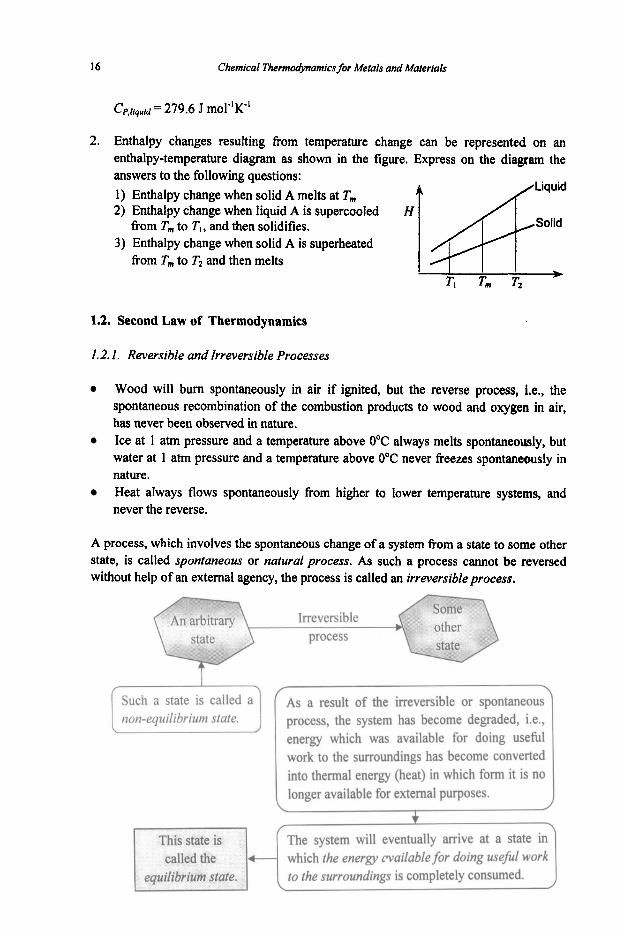
Cp,liguid = 279.6 J mol"K"
4)-
2. Enthalpy changes resulting from temperature change can be represented on an enthalpy-temperature diagram as shown in the figure. Express on the diagram the answers to the following questions: 1) Enthalpy change when solid A melts at T,,, 2) Enthalpy change when liquid A is supercooled
3) Enthalpy change when solid A is superheated from T,,, to T,, and then solidifies.
from T,,, to T, and then melts Tt T m Tt
which the energv cvailable for doing useful work
1.2. Second Law of Thermodynamics
to the surroundings is completely consumed.
1.2. I . Reversible and Irreversible Processes
Wood will burn spontaneously in air if ignited, but the reverse process, i.e., the spontaneous recombination of the combustion products to wood and oxygen in air, has never been observed in nature. Ice at 1 atm pressure and a temperature above 0°C always melts spontaneously, but water at 1 atm pressure and a temperature above 0°C never freezes spontaneously in nature. Heat always flows spontaneously from higher to lower temperature systems, and never the reverse.
A process, which involves the spontaneous change of a system from a state to some other state, is called spontaneous or natural process. As such a process cannot be reversed without help of an external agency, the process is called an irreversibieprocess.
Fudamental Principles and Functions 17
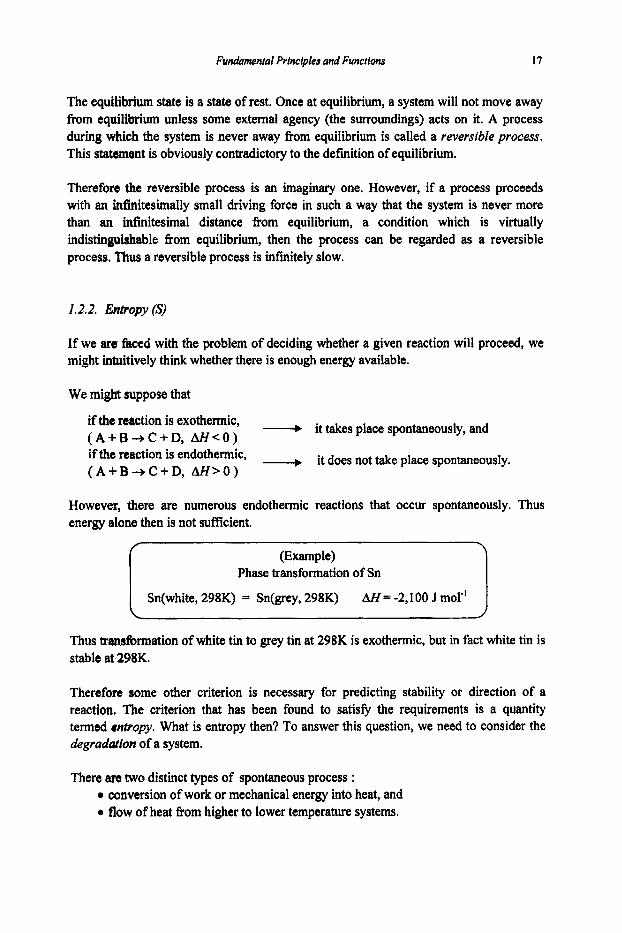
The equilibrium state is a state of rest. Once at equilibrium, a system will not move away from equilibrium unless some external agency (the surroundings) acts on it. A process during which the system is never away from equilibrium is called a reversible process. This statement is obviously contradictory to the defmition of equilibrium.
Therefore the reversible process is an imaginary one. However, if a process proceeds with an infinitesimally small driving force in such a way that the system is never more than an infinitesimal distance from equilibrium, a condition which is virtually indistinguishable fkom equilibrium, then the process can be regarded as a reversible process. Thus a reversible process is infmitely slow.
1.2.2. Entropy (s)
If we are tfrced with the problem of deciding whether a given reaction will proceed, we might intuitively think whether there is enough energy available.
We might suppose that
if the reaction is exothermic, ( A + B + C + D , M < O )
+ it takes place spontaneously, and
+ it does not take place spontaneously. if the reaction is endothermic, ( A + B + C + D , A H > O )
However, there are numerous endothermic reactions that occur spontaneously. Thus energy alone then is not sufficient.
(Example) Phase transformation of Sn
I Sn(white, 298K) = Sn(grey, 298K) AZf = -2,100 J mol-' I Thus tramfirmation of white tin to grey tin at 298K is exothermic, but in fact white tin is stable at 298K.
Therefore some other criterion is necessary for predicting stability or direction of a reaction. The criterion that has been found to satisfjl the requirements is a quantity termed rntropy. What is entropy then? To answer this question, we need to consider the degraddlon of a system.
There are two distinct types of spontaneous process : 0 conversion of work or mechanical energy into heat, and 0 flow of heat from higher to lower temperature systems.

18 Chemical Thermodynamics for Metals and Materials
First consider the degradation of mechanical energy of the following system :
Frictionless piston
3
Reservoir
T
0
Now the system is at equilibrium and the piston does not move in either direction.
Initially the temperature inside the cylinder equals that of the heat reservoir at T. The pressure inside the cylinder is the saturation vapour pressure (Pi ) of water at T. The external pressure, PO, is kept the same as the internal pressure P,., PO = Pi
0
0
If the external pressure is suddenly decreased by dP, the piston moves out due to the pressure imbalance (Refer to the following figure). The volume inside the cylinder expands and the internal pressure decreases. Water vaporises and heat flows from the reservoir because the vaporisation is endothermic. After one mole of water has vaporised, the external pressure is restored to its original value, PO and thus equilibrium is restored.
Frictionless piston
1 water vapour
Heat Reservoir
T
In the process described above, the system (cylinder) pressure of PO - dP. The amount of work done is
did work against the external
where V = molar volume of water vapour.
Fundomental Princtples and Functions 19
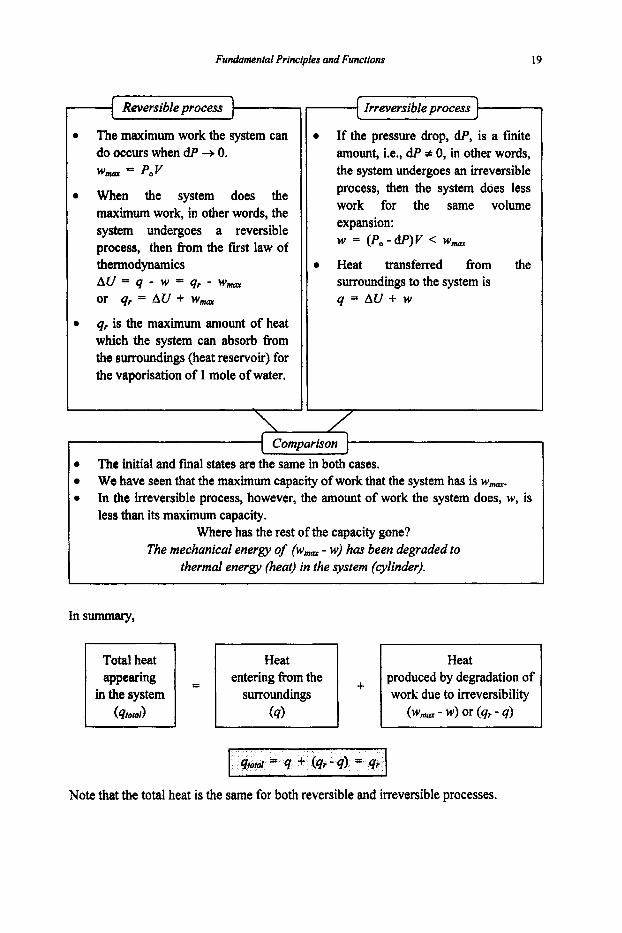
I Comparison j - 0
0
The initial and final states are the same in both cases. We have seen that the maximum capacity of work that the system has is wma. In the irreversible process, however, the amount of work the system does, w, is less than its maximum capacity.
Where has the rest of the capacity gone? The mechanical energy of (wmm - w) has been degraded to
thermal energy (heat) in the system (cylinder).
Reversible process I The maximum work the system can do occurs when dP + 0. w,, = P,V
When the system does the maximum work, in other words, the system undergoes a reversible process, then fiom the fmt law of thermodynamics AU = (7 - w = qr - Wmax
or q r = AU + w,,
qr is the maximum amount of heat which the system can absorb fiom the surroundings (heat reservoir) for the vaporisation of 1 mole of water.
-1 Irreversibie process 1 If the pressure drop, dP, is a finite amount, i.e., dP # 0, in other words, the system undergoes an irreversible process, then the system does less work for the same volume expansion: w = (P,-dP)V < w,,
Heat transferred from the surroundings to the system is q = A U + w
In summary,
~~ ~~ ~
Heat entering from the
surroundings (4
produced by degradation of work due to irreversibility
(wmm - w) or (qr - d
Note that the total heat is the same for both reversible and irreversible processes.

20 Chemical Thermodynamics for Metals and Materiafs
The fact that less heat enters from the surroundings in the irreversible process than in the reversible process is due to the heat produced by the degradation of work in the irreversible process. Therefore an irreversible process is one in which the system is degraded during the process. The extent of degradation, however, differs from process to process. This suggests that there exists a quantitative measure of the extent of degradation, or degree of irreversibility, of a process. Consider the following example in which energy is transferred by heat flow :
Heat q is to flow Erom the hot body to the cold body. The flow may take place either (1) directly from the hot to cold bodies, i.e., Path 1, or (2) from the hot to warm to cold bodies, i.e., Path 2 + Path 3. Each of these processes is spontaneous and hence irreversible. Therefore degradation occurs in each process.
0
IPath1 = path2 + path3 I Therefore, and Thus,
Degradation in Path 1 > Degradation in Path 2, Degradation in Path 1 > Degradation in Path 3. Path 1 is more irreversible than either Path 2 or Path 3.
Examination of these three paths clearly indicates that the degree of irreversibility is related to temperature T and the amount of heat q.
0
0
The more the heat flow, the higher the degree of irreversibility. The lower the temperature of the body to which heat flows, the higher the degree of irreversibility.
Therefore,
Fwuhmental Principles and Functions 21
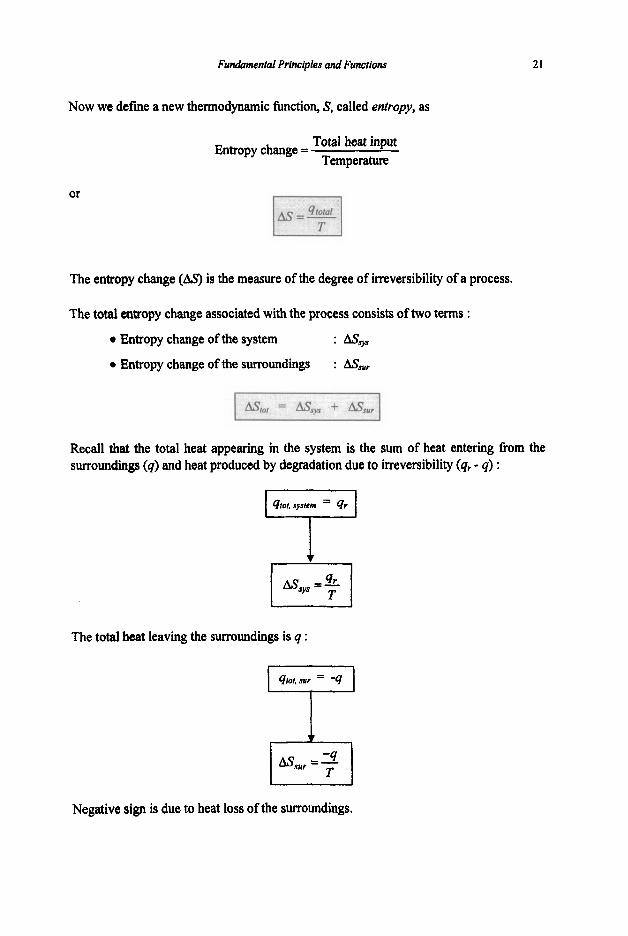
Now we defme a new thermodynamic function, 8, called entropy, as
Total heat input Temperatute
Entropy change =
or
The entropy change (AS) is the measure of the degree of irreversibility of a process.
The total entropy change associated with the process consists of two terms :
0 Entropy change of the system : s y s
0 Entropy change of the surroundings : ASsu,
Recall that the total heat appearing in the system is the sum of heat entering from the surroundings (q) and heat produced by degradation due to irreversibility (q, - q) :
1
The total heat leaving the surroundings is q :
Negative sign is due to heat loss of the surroundings.
22
the total entropy change is zero; i.e., the entropy gain of the system is equal to the entropy loss of the
surroundings, or vice versa. In other words there is no creation of
Chemical Thermodynamics for Metals and Materials
total entropy change is always positive; i.e., there is a net
creation of entropy, Degradation of work due to its irreversible nature accounts for
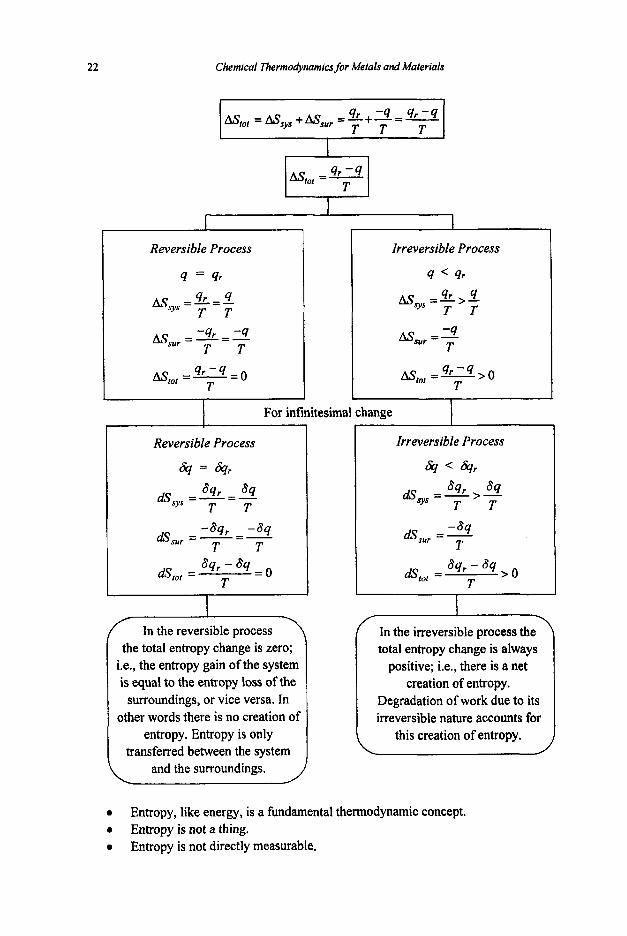
-4 - 4 r - 4 As@, = Assys + Assur = 4. + - - - I , T T T I
entropy. Entropy is only transferred between the system
Reversible Process
4 = 8
=%=4
=9r=-4
AstOl = 2 = 0
T T - T T sur
4 - 4 T
this creation of entropy.
I For infinitesimal change
Reversible Process
& = &r
0
0
0
Entropy, like energy, is a findmental thermodynamic concept. Entropy is not a thing. Entropy is not directly measurable.
Fundanrental Principles and Funcltons 23
S So- T%T I T‘ - 1 0 T -
0
0
The
CP s, = 0
Refer to the 3rd law S; = 1, P T
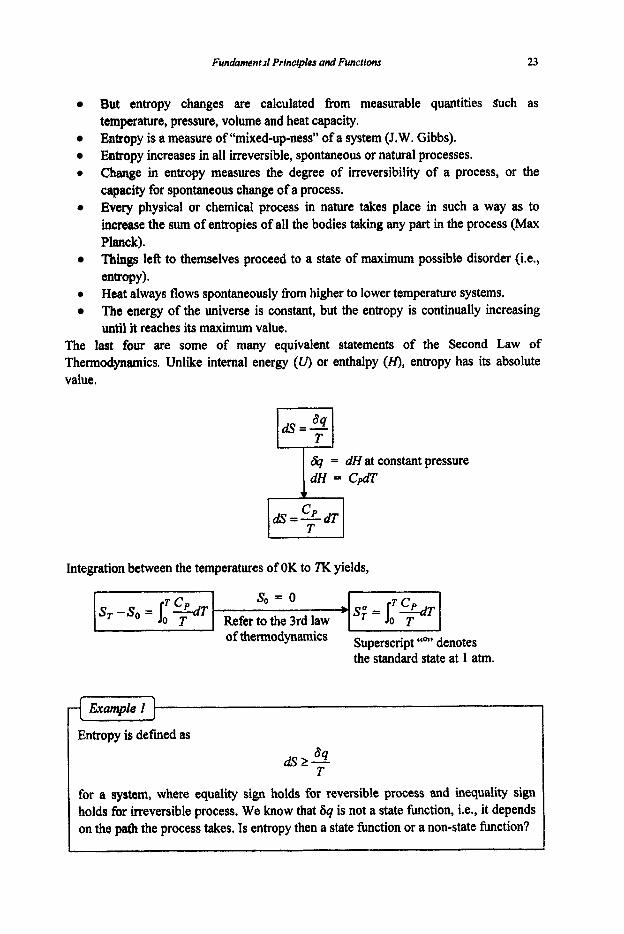
But entropy changes are calculated from measurable quantities $uch as temperature, pressure, volume and heat capacity. Entropy is a measure of “mixed-up-ness” of a system (J.W. Gibbs). Entropy increases in all irreversible, spontaneous or natural processes. Change in entropy measures the degree of irreversibility of a process, or the capacity for spontaneous change of a process. Every physicai or chemical process in nature takes place in such a way as to increase the sum of entropies of all the bodies taking any part in the process (Max Plauck). Things left to themselves proceed to a state of maximum possible disorder (i.e., entropy). Heat always flows spontaneously from higher to lower temperature systems. The energy of the universe is constant, but the entropy is continually increasing until it reaches its maximum value.
last four are some of many equivalent statements of the Second Law of . -
Thermodynamics. Unlike internal energy (U) or enthalpy (H), entropy has its absolute value.
6q = dH at constant pressure dH = CpdT
Integration between the temperatures of OK to 7K yields,
Exanpie 3
Entropy is defined as
for a system, where equality sign hoids for reversible process and inequality sign holds for irreversible process. We know that 8q is not a state function, i.e., it depends on the path the process takes. Is entropy then a state hnction or a non-state function?

24 Chemical Thermodynamics for Metals and Materials
Consider one mole of a perfect gas.
I dU = 6q - 6w I First law of thermodynamics
6q = 6qr for a reversible process 6w = PdV for PV work
dU = CvdT
PV = RT for one mole of a perfect gas 1 I GS = 6q,/ Tby definition
I I ,..,..,, _" .................... " ...................... "
1 This side depends only on the initial and final states. (Tl, Vl and T2, V2)
So does this.
Therefore S is a state function for a perfect gas. More general arguments of this type enable us to show that entropy is a state function for all substances.
Example 2
If one mole of a perfect gas undergoes an isothermal process, is AS independent of pressure?
From Example 1,
T, = T2 = constant,
P V = RT = constant
The entropy change depends on the pressure change. This equation tells us that as the pressure is raised the entropy of a gas decreases: i.e., molecules in the gas become more ordered.

Fundamental Principles and Functions 25
Example 3
When a system undergoes a process at a constant pressure, does the entropy change depend on the temperature?
As entropy is a state function, we are free to choose a path from the initial and fmal states. The path along which a process takes place reversibly would be most convenient for thermodynamic calculations, because the heat absorbed or released can be directly related to the entropy change :
dS - - for a reversible process I -:I
E = 5 ) 0 at constant pressure. Cl This equation tells us that the entropy of a substance held at constant pressure increases when the temperature increases.
Example 4
Suppose that energy is transferred spontaneously as heat q from a system at a fixed temperature T, to a system at a fixed temperature T, without performing any work. Prove that the total entropy change of the process, AS,o,ot, is positive.
Recall I
69 69 where 6 q : heat from the surroundings 1 l~sys=T++J 6 4': heat from degradation of work
No work + No degradation of work to heat
This equation is valid irrespective of whether or not the process U s y s =- is reversible, provided that no energy is transferred by the system
in terms of work.
26 Chemical Thermodynamics for Metals and Materials
q I w = o
-4 As, =- r,
4 As, =- T2 f
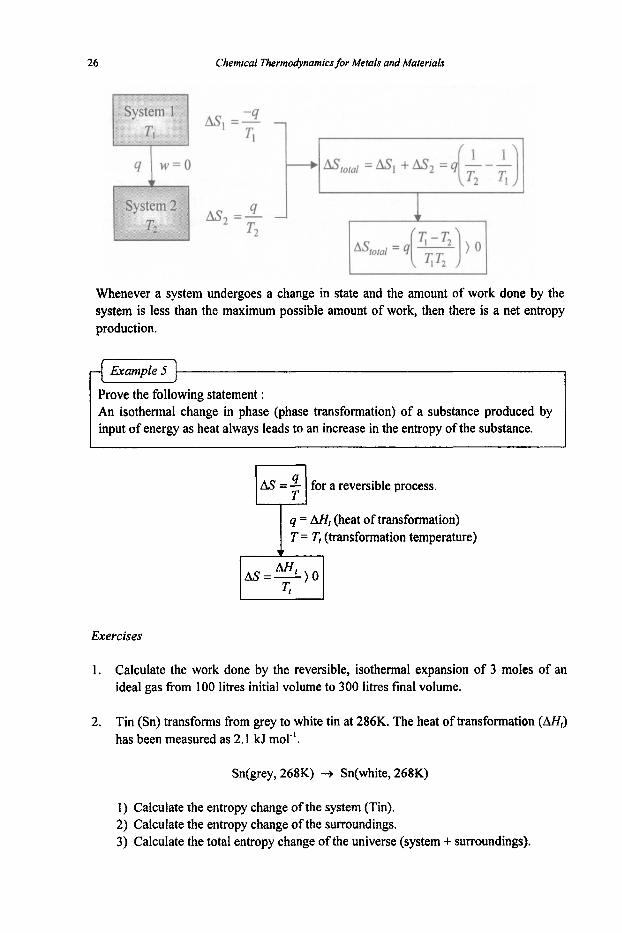
Whenever a system undergoes a change in state and the amount of work done by the system is less than the maximum possible amount of work, then there is a net entropy production.
Example 5
Prove the following statement : An isothermal change in phase (phase transformation) of a substance produced by input of energy as heat always leads to an increase in the entropy of the substance.
for a reversible process.
q = AH, (heat of transformation) T = Tt (transformation temperature)
Exercises
1. Calculate the work done by the reversible, isothermal expansion of 3 moles of an ideal gas from 100 litres initial volume to 300 litres final volume.
2. Tin (Sn) transforms from grey to white tin at 286K. The heat of transformation (M,) has been measured as 2.1 kJ mar'.
Sn(grey, 268K) -+ Sn(white, 268K)
1) Calculate the entropy change of the system (Tin). 2) Calculate the entropy change of the surroundings. 3) Calculate the total entropy change of the universe (system + surroundings).
Funabmental Principles and Functiom
I
A1 Fe Fe203 A1203
(J moT'R') 28.3 27.2 87.5 51.1
27
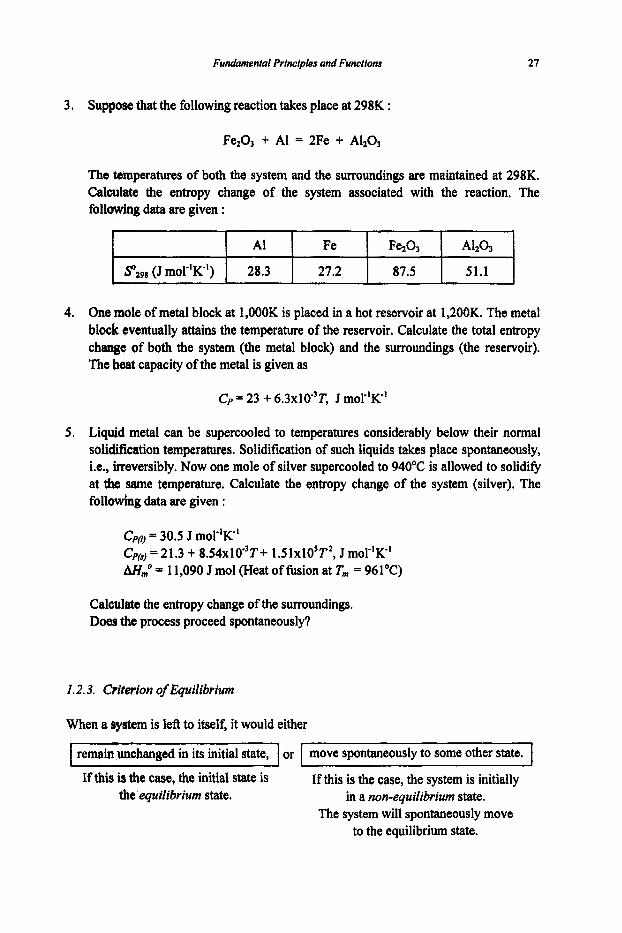
3. Suppose that the following reaction takes place at 298K :
FezOJ + A1 = 2Fe + AlzOl
4. One mole of metal block at 1,000K is placed in a hot reservoir at 1,200K. The metal block eventually attains the temperature of the reservoir. Calculate the total entropy change of both the system (the metal block) and the surroundings (the reservoir). The heat capacity of the metal is given as
Cp = 23 + 6.3xlO"T, J mol-'K"
5 . Liquid metal can be supercooled to temperatures considerably below their normal solidiflation temperatures. Solidification of such liquids takes place spontaneously, i.e., irreversibly. Now one mole of silver supercooled to 94OOC is allowed to solidify at the same temperature. Calculate the entropy change of the system (silver). The following data are given :
Cpo, = 30.5 J mor'R'
AH,,,' = 1 1,090 J mol (Heat of hsion at T, = 96 1 "C) = 21.3 + 8.54x10³T+ 1.51x10⁵T2, J mol-'R'
Calculate the entropy change of the surroundings. Does the process proceed spontaneously?
1.2.3. Criterion of Equilibrium
When a system is left to itself, it would either
I remain unchanged in its initial state, I or I move spontaneously to some other state. I I I I I
If this is the case, the initial state is the equilibrium state.
If this is the case, the system is initially in a non-equilibrium state.
The system will spontaneously move to the equilibrium state.
28 Chemical Thermodynamics for Metals and Materials
0
0
0
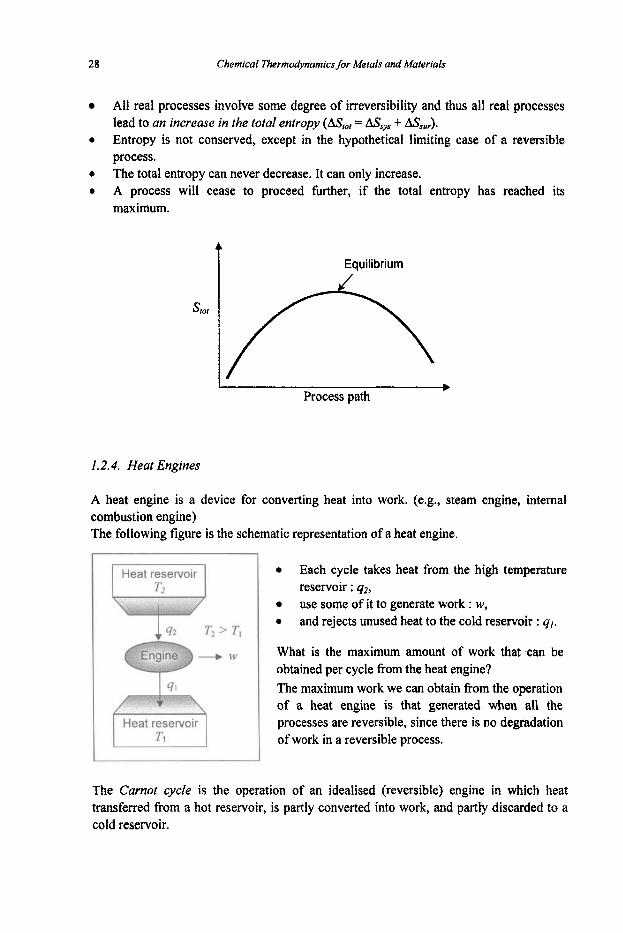
All real processes involve some degree of irreversibility and thus all real processes lead to an increase in the total entropy (A&,, = AS,,, + ASs,,). Entropy is not conserved, except in the hypothetical limiting case of a reversible process. The total entropy can never decrease. It can only increase. A process will cease to proceed hrther, if the total entropy has reached its maximum.
t Equilibrium
I * Process path
1.2.4. Heat Engines
A heat engine is a device for converting heat into work. (e.g., steam engine, internal combustion engine) The following figure is the schematic representation of a heat engine.
Heat reservoir 1 Tz
I Heat reservoir 1 T1
0
Each cycle takes heat from the high temperature reservoir : q2, use some of it to generate work : w, and rejects unused heat to the cold reservoir : 4).
What is the maximum amount of work that can be obtained per cycle from the heat engine? The maximum work we can obtain from the operation of a heat engine is that generated when all the processes are reversible, since there is no degradation of work in a reversible process.
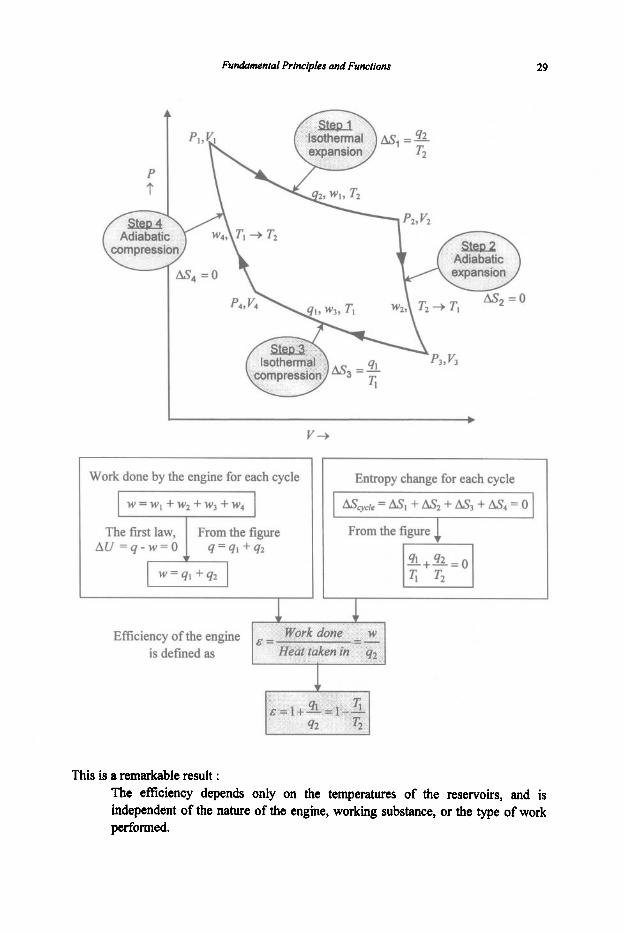
The Carnot cycfe is the operation of an idealised (reversible) engine in which heat transferred from a hot reservoir, is partly converted into work, and partly discarded to a cold reservoir.
Fundamentai Principles and Functions 29
P t
Work done by the engine for each cycle Entropy change for each cycle
Efficiency of the engine is defined as
This is II remarkable result : The efficiency depends only on the temperatures of the reservoirs, and is independent of the nature of the engine, working substance, or the type of work performed.

30 Chemical Thermodynamics for Metals and Materials
&ycyCle = U, + A& = 0
Example 1
If any part of the operation of the Carnot engine is irreversible, prove that the following relationship holds:
for a complete cycle.
Entropy is a state fimction and hence is independent of the path a system takes.
1 for a complete cycle
As,>% T, 1 From the first law,
E=-< 1--
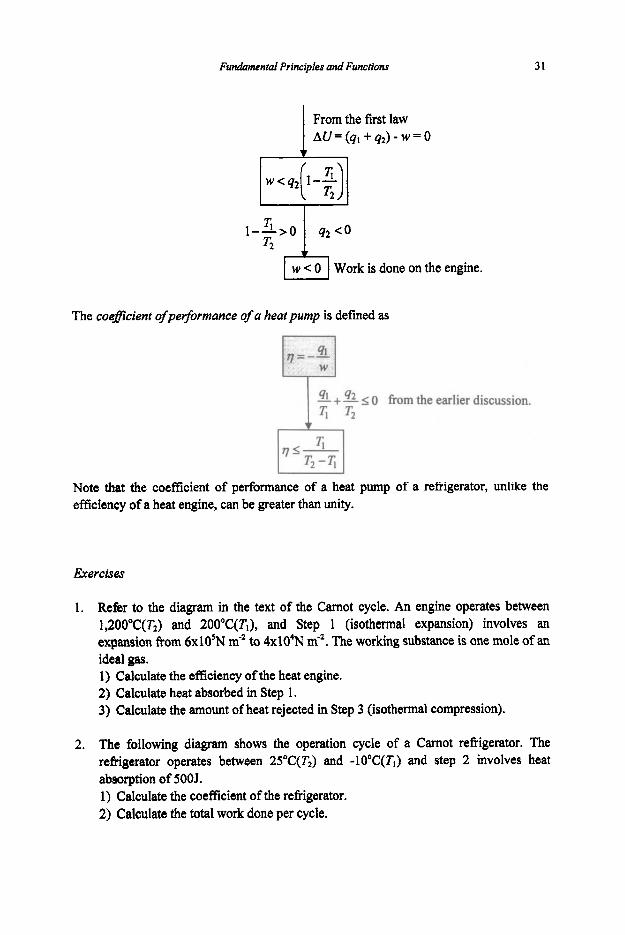
A Carnot engine can be run in reverse and used to transfer energy as heat from a low temperature reservoir to a high temperature reservoir. The device is called a heat pump, if it is used as a heat source, or a refrigerator, if it is used to remove heat. Prove that in the latter case work must be done on the engine.
Heat reservoir 1L-l I + W
I ' I
Just as for a Carnot engine running in the forward direction we have an engine running in the reverse direction.
I
I I
Funahental Prtncrples and Functions 31
From the first law AU=(qi+qZ)-w=O
w < 0 I Work is done on the engine.
The coefticient of per&ormance of a heat pump is defined as
5% + 42 s 0 from the earlier discussion. I T i T2
Note that the coefficient of performance of a heat pump of a reEgerator, unlike the efficiency of a heat engine, can be greater than unity.
Exercises
1. ReEer to the diagram in the text of the Camot cycle. An engine operates between 1,2OO0C(T2) and 2OO0C(T,), and Step 1 (isothermal expansion) involves an expansion from 6x10SN m-' to 4x10⁴N me'. The working substance is one mole of an ideal gas. 1) Calculate the efficiency of the heat engine. 2) Calculate heat absorbed in Step 1. 3) Calculate the amount of heat rejected in Step 3 (isothermal compression).
2. The following diagram shows the operation cycle of a Camot refrigerator. The refrigerator operates between 2SoC(T2) and -lO"C(T,) and step 2 involves heat absorption of 5005. 1) Calculate the coefficient of the refrigerator. 2) Calculate the total work done per cycle.
32
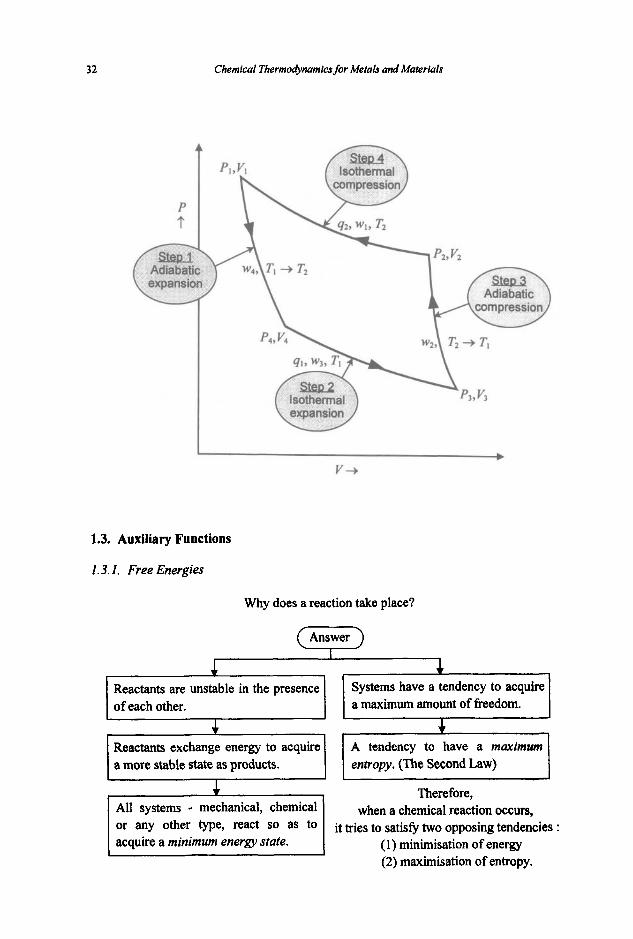
Reactants are unstable in the presence of each other.
Reactants exchange energy to acquire a more stable state as products.
4
Chemical Thermodynamics for Metals and Materials
Systems have a tendency to acqdre a maximum amount of fi-eedom.
4 A tendency to have a mavimwn entropy. (The Second Law)
I v+
All systems - mechanical, chemical Or mY other m e , react SO as to acquire a minimum energy state.
1.3. Auxiliary Functions
when a chemical reaction occurs, it tries to satisfy two opposing tendencies :
(1) minimisation of energy
1.3. I . Free Energies
Why does a reaction take place?
Fundamental Prlnciples and Functtons 33
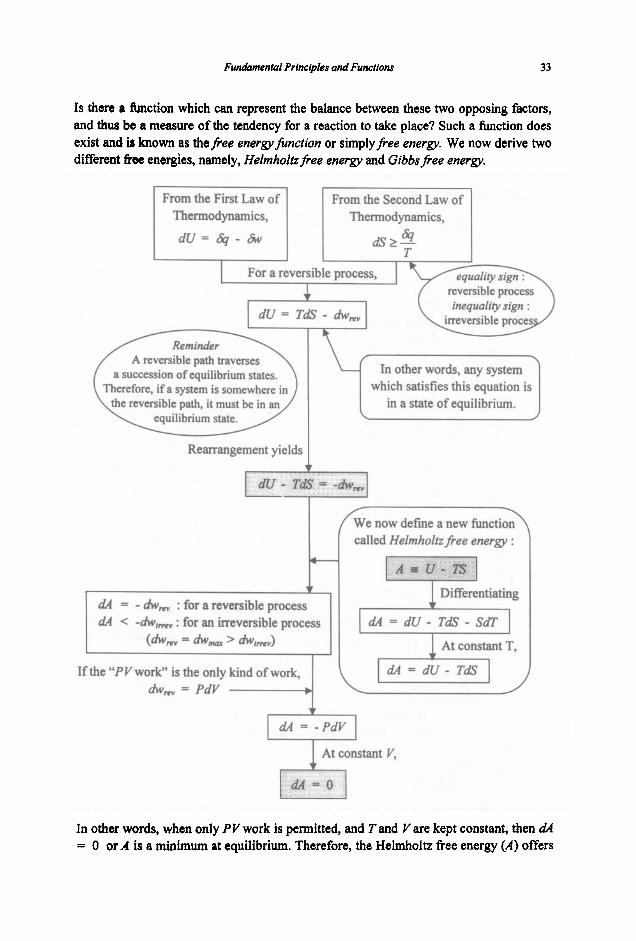
Is there a function which can represent the balance between these two opposing factors, and thus be a measure of the tendency for a reaction to take place? Such a function does exist and is known as thefiee energyfunction or simplyfiee energy. We now derive two different floe energies, namely, Helmholtzfi.ee energy and Gibbsfiee energy.
Differentiating
&i = d l l - TdS- SdT
At constant T,
d4 = dU - TdS I
In other wards, when only PV work is permitted, and T and V are kept constant, then a% = 0 or A is a minimum at equilibrium. Therefore, the Helmholtz free energy (A) offers
34 Chemical ThermodyMmics for Metals and Marertals
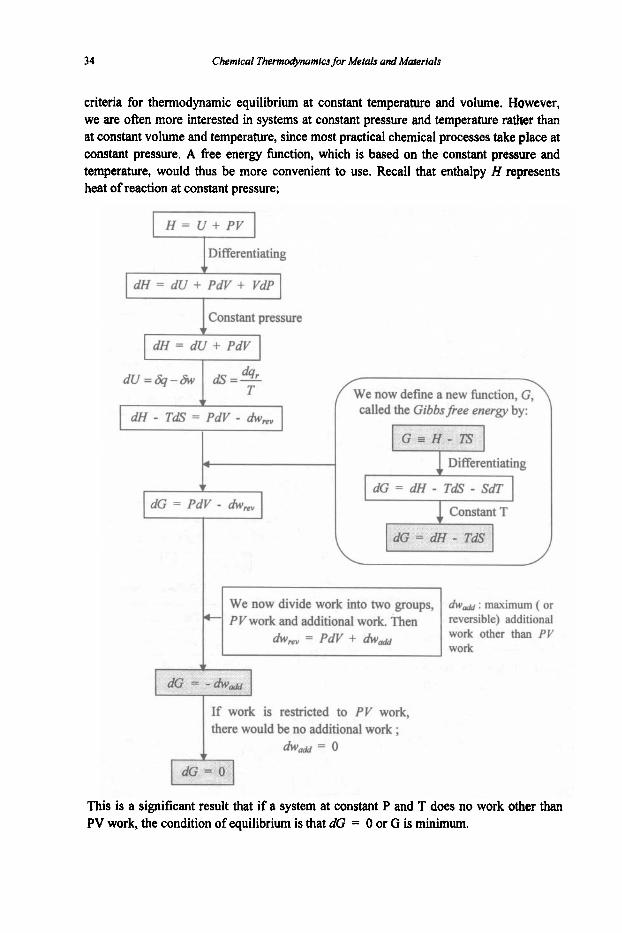
criteria for thermodynamic equilibrium at constant temperature and volume. However, we are often more interested in systems at constant pressure and temperature rather than at constant volume and temperature, since most practical chemical processes take place at constant pressure. A free energy function, which is based on the constant pressure and temperature, would thus be more convenient to use. Recall that enthalpy H represents heat of reaction at constant pressure;
Differentiating
dH = dU + PdV + VdP
I constant pressure
dG = PdV - hmv
~
dG = PdV - hmv T f w e now define a new function,
called the Gibbsfiee energy by:
1 Differentiating
I dG = dH - TdS - SdT I
d w d : maximum ( or revemib*e) additional work other than PV work
= PdV + dW-
there would be no additional work ;
This is a significant result that if a system at constant P and T does no work other than PV work, the condition of equilibrium is that dG = 0 or G is minimum.
Fundamental Principles and Functions 35
Is the following statement true? The sum of the entropy change of the system and surroundings is zero for a reversible process and is greater that zero for a spontaneous process. Therefore one must Calculate S for both the system and the surroundings to find whether a process is at equilibrium or not. However, if the Gibbs free energy function (G) is used instead, one need to calculate the Gibbs fiee energy change of the system (AGsys) only, because AG,, alone is sufficient to indicate whether or not a given process is
I potentially spontaneous.
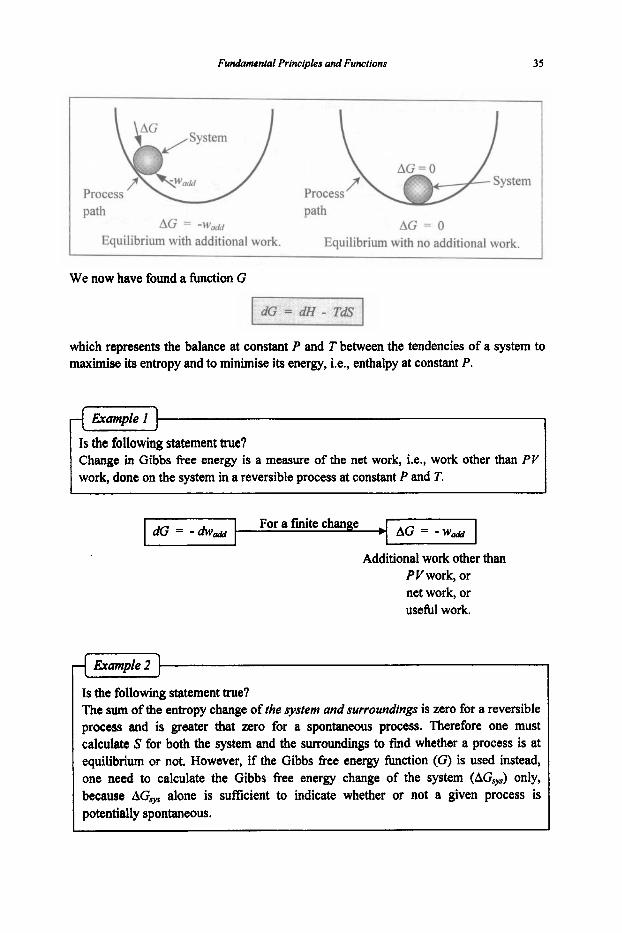
path path AG = -W,dd
Equilibrium with additional work. AG = 0
Equilibrium with no additional work.
We now have found a function G
which represents the balance at constant P and T between the tendencies of a system to maximise its entropy and to minimise its energy, i.e., enthalpy at constant P.
Example I
Is the following statement true? Change in Gibbs eee energy is a measure of the net work, Le., work other than PV work, done on the system in a reversible process at constant P and T.
For a finite change I dG = - d w d 1 AG = -w& - I I
Additional work other than PY work, or net work, or usefbl work.
36 Chemical Thermodynamics for Metals and Materials
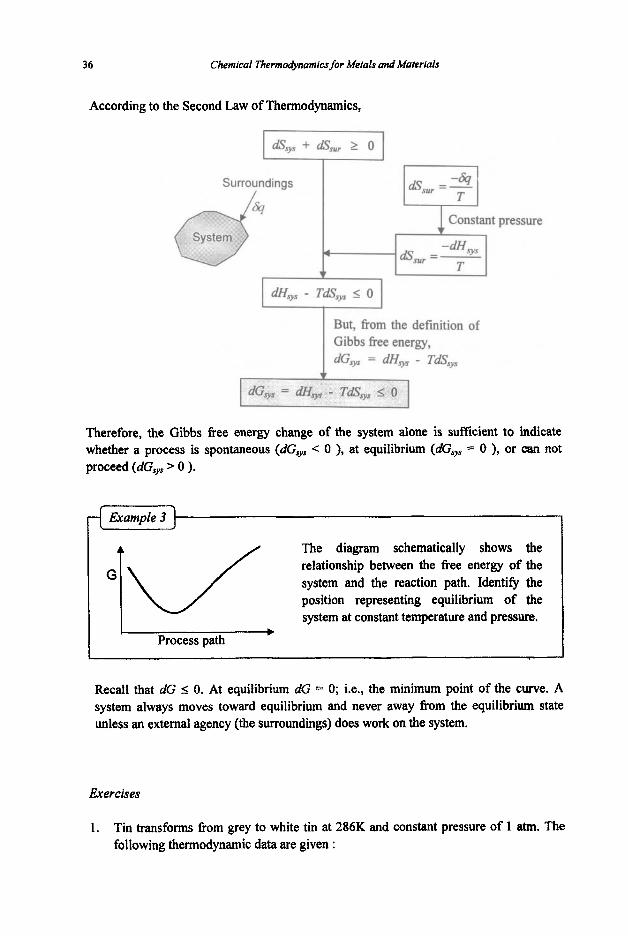
According to the Second Law of Thermodynamics,
Surroundings I
1 c o n s y pressure
& =- T sur
But, from the definition of Gibbs free energy, dGvs = dH9 - TdSsys
Therefore, the Gibbs free energy change of the system alone is sufficient to indicate whether a process is spontaneous (dGsys C 0 ), at equilibrium (dG,, = 0 ), or can not proceed (dGsys > 0 ).
Example 3
I
G
The diagram schematically shows the relationship between the free energy of the system and the reaction path. Identify the position representing equilibrium of the system at constant temperature and pressure.
Process path
Recall that dG I 0. At equilibrium dG = 0; i.e., the minimum point of the curve. A system always moves toward equilibrium and never away from the equilibrium state unless an external agency (the surroundings) does work on the system.
Exercises
1. Tin transforms fiom grey to white tin at 286K and constant pressure of 1 am. The following thermodynamic data are given :
Funakamental Principh and Functions 37
Cp = 21.6 + 18.2xlO-'T, J mor'K' for both grey and white tin Heat of transformation (AH,") = 2.1 J mor' at 286K
1) Calculate the free energy change (AG) of the transformation at 286K and latm. 2) Calculate AG of the transformation at 293K and latm. 3) Is the transformation at 293K spontaneous?
1.3.2. meet of Pressure on Free Energy
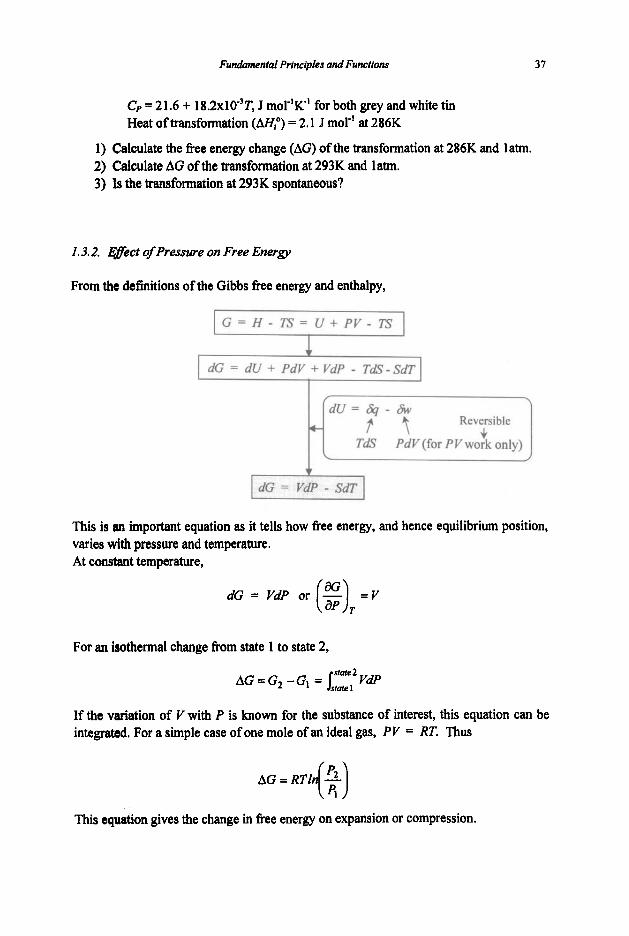
From the definitions of the Gibbs free energy and enthalpy,
I G = H - T S = U + P V - T S I F dG = dW + PdV + VdP - T&-SdT
Reversible
This is an important equation as it tells how free energy, and hence equilibrium position, varies with pressure and temperature. At constant temperature,
aG dG = VdP or (F) = V T
For an isothermal change from state 1 to state 2,
AG = G, - G, = state, VdP state 1
If the variation of V with P is known for the substance of interest, this equation CM be integrated. For a simple case of one mole of an ideal gas, PV = RT. Thus
AG = RTIn(2)
This equation gives the change in free energy on expansion or compression.
38 Chemical Thermodynamics for Metals and Materials
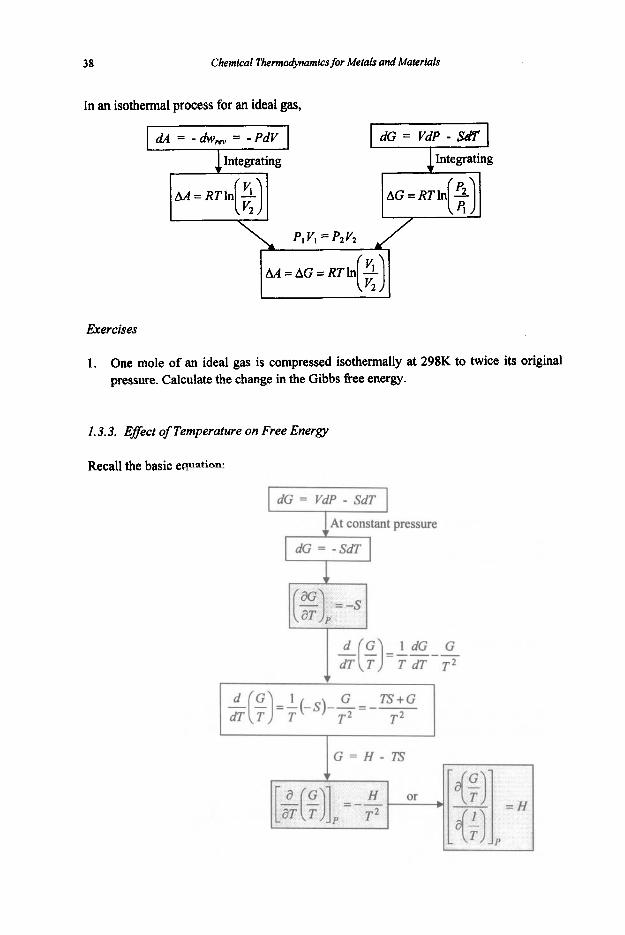
In an isothermal process for an ideal gas,
Exercises
1. One mole of an ideal gas is compressed isothermally at 298K to twice its original pressure. Calculate the change in the Gibbs free energy.
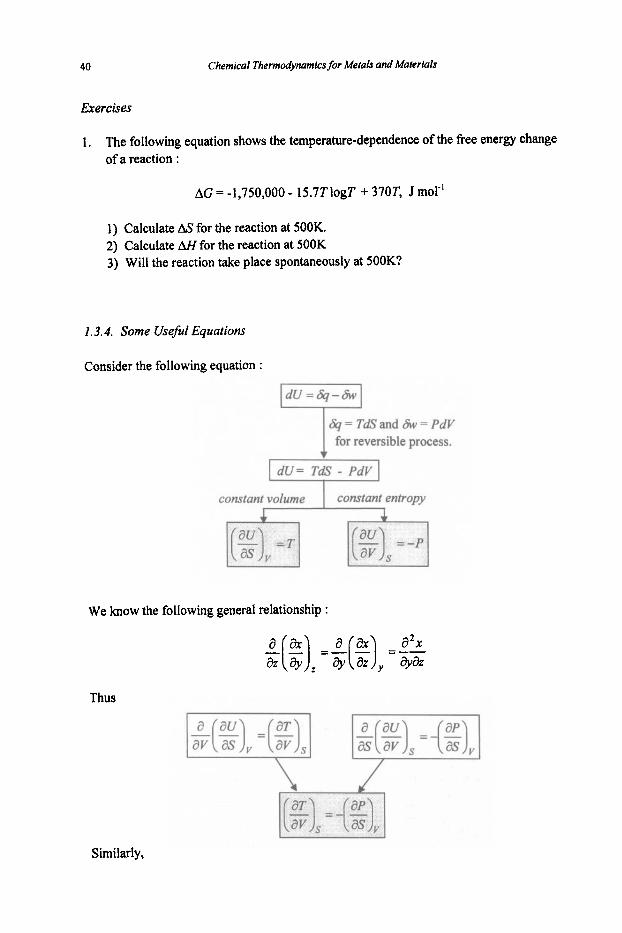
1.3.3. Efect of Temperature on Free Energy
Recall the basic equation:
I dG = VdP - SdT

Fundamental Principles and Functions 39
The equations given above in the shaded boxes are called the Gibbs-Helmholtz equations. These permit us to calculate the change in enthalpy AH and entropy AS fiom a knowledge of AG. They relate the temperature dependence of free energy, and hence the position of equilibrium to the enthalpy change.
Internal energy (U), enthalpy ( I f ) , entropy (S), Helmholtz free energy (A) and Gibbs free energy (G') are functions of state. Each of these can be expressed as a function of two state variables. Prove the following relationships :
= V (g) =V (g) = T S P
I
I dG = VdP -SdT I
Constant pressure d P = Q
Constant temperature dT= 0
+ 1 dH= dU+ PdV+ YdP 1
Constant pressure d P = Q
Constant entropy Cl
40 Chemical Thermodynamics for Metals and Materials
Exercises
1. The following equation shows the temperature-dependence of the free energy change of a reaction :
AG = -1,750,000 - 15.7TlogT + 370T, J mol-'
I) Calculate AS for the reaction at 500K. 2) Calculate AH for the reaction at 500K 3) Will the reaction take place spontaneously at SOOK?
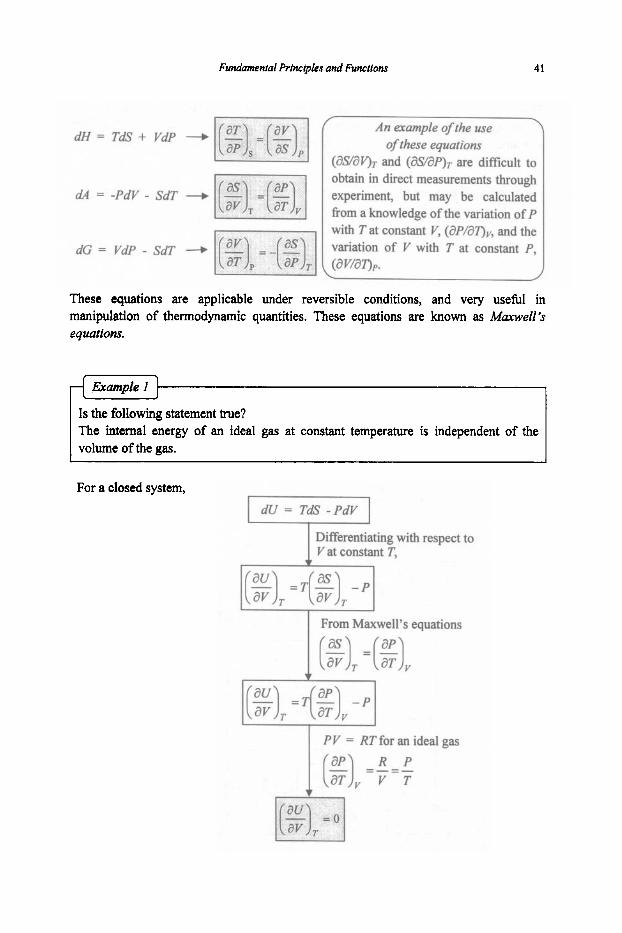
1.3.4. Some Useful Equations
Consider the following equation :
for reversible process.
1 dU= TaS - PdV I constant volume 1 constant entropy
1
We know the following general relationship :
Thus
Similarly,
Fundamentat Princtpies and Functions 41
dH = Trtr + VdP -b
dA = -PdV - SdT -b
dG = VdP - SdT --*
An example of the use of these equations
(awav), and (as/dp)T are difficult to obtain in direct measurements through experiment, but may be calculated from a knowledge of the variation of P with Tat constant V, (dP/dT)v, and the variation of V with T at constant P,
F .
(av/aqp. /
These equations are applicable under reversible conditions, and very useful in manipulation of thermodynamic quantities. These equations are known as M m e l l ’ s equations.
Ejcample I
Is the following statement true? The internal energy of an ideal gas at constant temperature is independent of the volume of the gas.
For a closed system, I dU = T d s - P d V 1
Differentiating with respect to Vat constant T,
From Maxwell’s equations I ( g ) T = ( % ) v
1 PV = RT for an ideal gas
42 Chemical Thermodynamics for Metals and Materials
Thus, the statement is true; i.e., the internal energy of an ideal gas i s independent of the volume of the gas at constant temperature. In a similar way, one may prove the following statement : The enthalpy of an ideal gas is independent of the pressure of the gas.
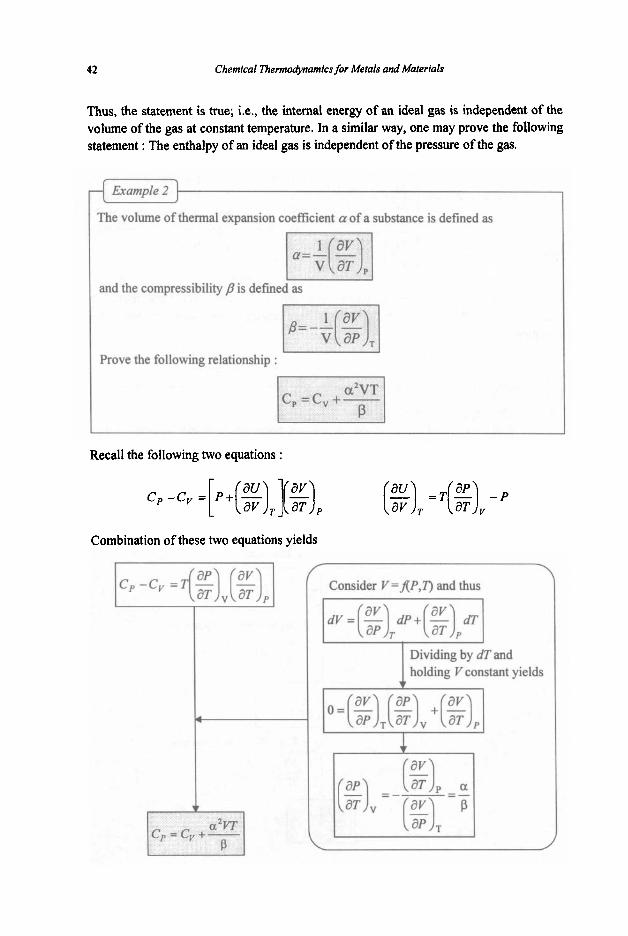
Example 2 ~~
The volume of thermal expansion coefficient a of a substance is defined as
and the compressibility /? is defined as
I I Prove the following relationship :
c, =Cv+-
Recall the following two equations :
CP -cv = [ p + ( g ) , 1 ( 3 P
Combination of these two equations yields
r / \
Consider V=JTP,T) and thus
holding V constant yields
Fundamsntal Principles and Functions 43
This equation shows that Cv can be obtained from Cp, compressibility and thermal expansioa coefficient for a substance. For solids, Cv is generally more difficult to measure experimentally and the equation offers a way to overcome this difficulty.
1.4. Third Law of Thermodynamics
1.4. I . Third Law of Thermodynamics
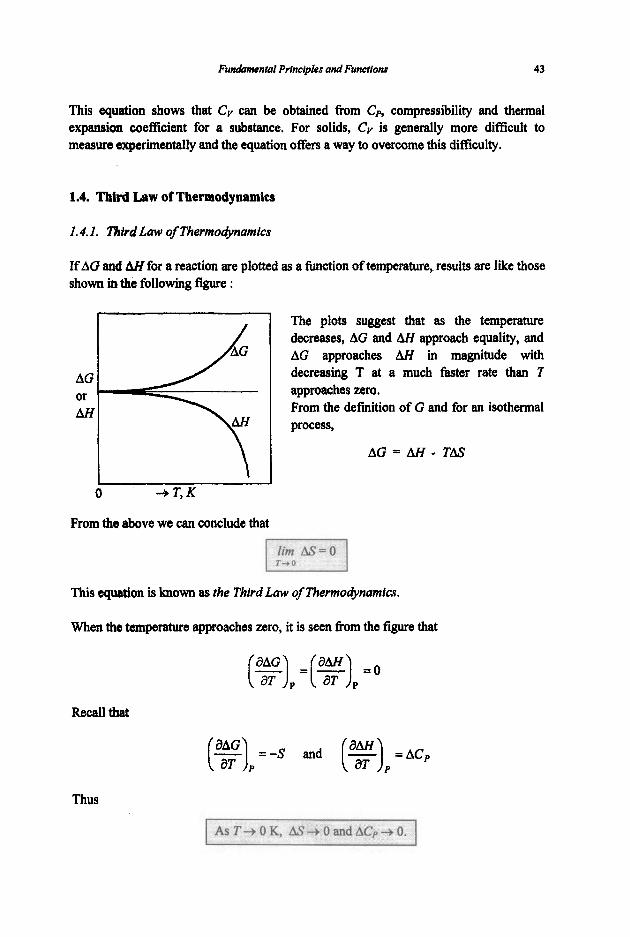
If AG and AH for a reaction are plotted as a function of temperature, results are like those shown in the following figure :
AG or AH
The plots suggest that as the temperature decreases, AG and AH approach equality, and AG approaches AH in magnitude with decreasing T at a much faster rate than 7 approaches zero. From the definition of G and for an isothermal process,
AG = AH - TAS
I I
0 3 T,K
From the above we can conclude that
This equation is known as the Third Law of Thermodynamics.
When the temperature approaches zero, it is seen from the figure that
Recall that
( F ) ~ = - S aAG and (%) =ACp
P
Thus
44 Chemical Thermodynamics for Metals and Matertals
The third law is different from the first two laws : 1) The third law does not give rise to a new thermodynamic function. (1st law + U,
2) The third law applies only at T + 0, whereas the first two laws hold at all
What the third law does say is that the entropy change M for any isothermal thermodynamic process becomes zero in the limit of 0 K.
2nd law + S)
temperatures.
Example I
Prove the following statements : The third law does not give rise to a new thermodynamic function. (1st law + U, and 2nd law + S) The third law applies only at T + 0, whereas the first two laws hold at all temperatures.
What the third law does say is that the entropy change AS for any isothermal thermodynamic process becomes zero in the limit of OK.
Erample 2
Is the following true? For the reaction
2A&) + PbSO4 = Pb(s) + A ~ ~ S O ~ ( S )
(Sum of the entropy of the products) - (Sum of the entropy of the reactants) = 0 at OK.
According to the third law, ASmuclio,, + 0 as T + 0. In the limit at T = OK, ASreacl,m = 0
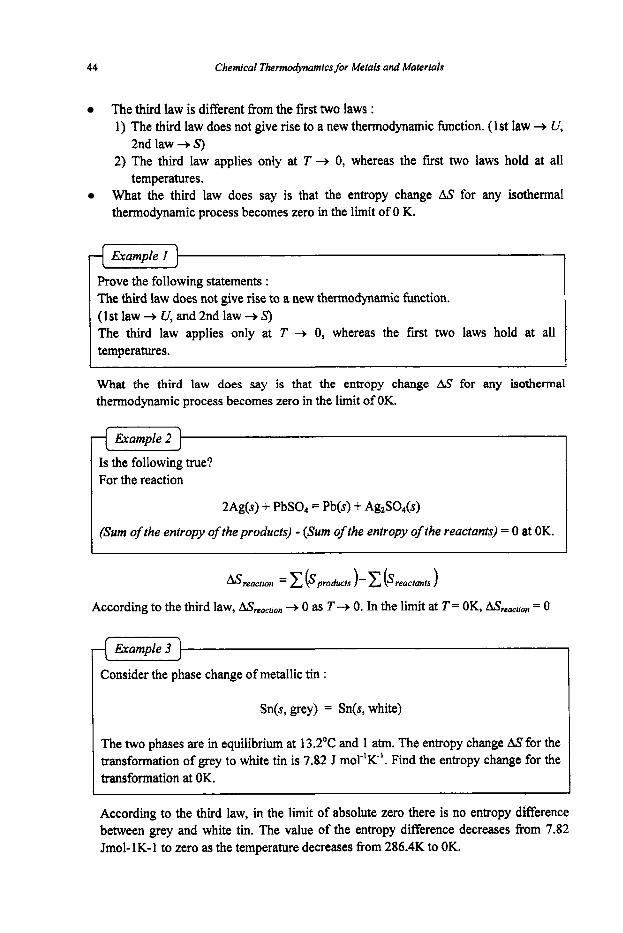
Consider the phase change of metallic tin :
Sn(s, grey) = Sn(s, white)
The two phases are in equilibrium at 13.2OC and 1 atm. The entropy change A S for the transformation of grey to white tin is 7.82 J mol-'K". Find the entropy change for the transformation at OK.
According to the third law, in the limit of absolute zero there is no entropy difference between grey and white tin. The value of the entropy difference decreases from 7.82 Jmol- 1 K-1 to zero as the temperature decreases fkom 286.4K to OK.
Fundamental Principles and Functions
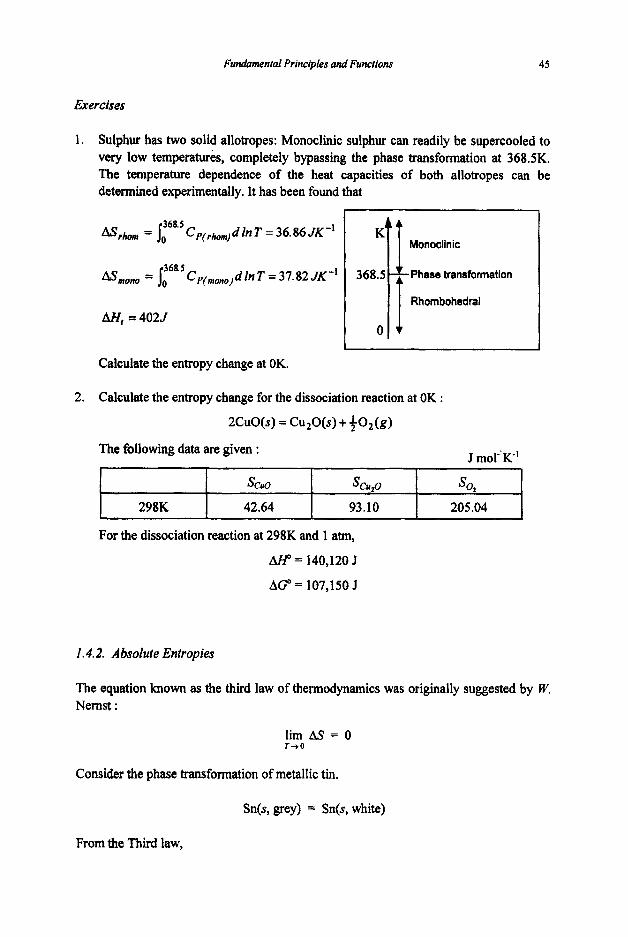
368.5 AS,, = I, AS,,,, = jo
Ah', = 402J
Cp(Fhomj d In T = 36.86 JK -' Cp(,,,jdInT = 37.82 J K - I
368 5
45
Monoclinic
368.5 Phase transformation
Rhombohedral 'R 0
Exercises
298K
1. Sulphur has two solid allotropes: Monoclinic sulphur can readily be supercooled to very low temperatures, completely bypassing the phase transformation at 368.5K. The temperature dependence of the heat capacities of both allotropes can be determined experimentally. It has been found that
1
&"U sc.,o so2 42.64 93.10 205.04
I Calculate the entropy change at OK.
2. Calculate the entropy change for the dissociation reaction at OK :
2CuO(s) = Cu,O(s) + +O2(g)
For the dissociation reaction at 298K and 1 am,
A M = 140,120 J
AG" = 107,150 J
1.4.2. Absolute Entropies
The equation known as the third law of thermodynamics was originally suggested by W. Nernst :
Consider the phase transfonnation of metallic tin.
Sn(s, grey) = Sn(s, white)
From the Third law,

46 Chemical Thermodynamics for Metals and Materials
- or Ssn(s. while) - Ssn(s. grey)
However, this does not necessarily mean that
Max Planck offered a different version of the Third law :
Planck's hypothesis is based on the statistical thermodynamics in that the entropy is related to the number of possible energy states for a given energy or thermodynamic probability W :
where k is Boltzmann's constant. At absolute zero there is only one way in which the energy can be distributed in a system; i.e., atoms or molecules and electrons are all in the lowest available quantum states and therefore
w = 1
Thus
S = O a t T = O .
Planck's statement of the Third law suggests that a scale for the absolute value of entropy can be set up :
1) Set the entropy of a substance equal to zero at T = 0 K. 2) Determine the entropy increase from 0 K to the T of interest. 3) Set the result equal to the absolute entropy of the substance at that temperature.
Recall that the entropy change under isobaric conditions is given by
Integration yields

Fundamental Principles and Functions 47
T sT =I, T%dT T = (y+aT2)dT
At low temperatures, especially near absolute zero, data on heat capacities are lacking for many substances. This lack of data is overcome by making extrapolations to lower temperatures. In this regard the following relationships for heat capacity Cp have proved usefil at low temperatures :
cP = aTl Cp = bF
cP = f i+ UP Cp =jp” + ald : ferromagnetic crystals below the magnetic transition
c p = mTl
: most nonmagnetic, nonmetallic crystals : layer lattice crystals, like graphite and boron nitride, and
: metals surface heat capacity
temperature
temperature : antiferromagnetic crystals below the magnetic transition
y= 0 at low T
For metals y can be neglected at low temperatures (but not at T < IK). Express entropy for metals at low temperatures as a function of heat capacity.
,
1.5. Calculation of Enthalpies and Free Energies
I. 5. I. Standard States
Absolute values of many thermodynamic properties cannot be obtained. This difficulty is overcome by choosing a reference or standard state so that properties can be given in terms of the difference between the state of interest and the reference or standard state.
Hypothetical axis for a thermodynamic property.
- ~ - The state of interest. This value cannot be measured. b The particular choice of a standard state is arbitrary.
The difference between the two states. This value can be measured.
.-- - The standard state. This value cannot be measured, either.
I

48 Chemical ntermodynamics for Metals and Materials
Solid The most stabb, pure substance
at 1 atm pressure and the temperature specified.
The standard states for solids, liquids and gases which are most commonly used l?om the point of view of convenience are,
Liquid Gas The most stable, Ideal gas pure substance
at 1 atm pressure and the temperature specified.
at 1 atm pressure and the temperature specified.
a-Ti P-Ti
Data on the enthalpy change of titanium (Ti) at 298K is given as follows:
0 3,350Jmol"
I I AH I
Which is incorrectly stated in the following? 1) a-Ti is the stable form at 298K. 2) a-Ti is the standard state at 298K. 3) The enthalpy of p-Ti is 3,350Jmol-I. 4) The enthalpy difference between a- and P-Ti, i.e., H p ~ j - Her,, is 3,3505 mol'.
The incorrectly stated one is 3). The value of 3,350 Jmol-' merely indicates that the enthalpy of P-Ti is larger than that of a-Ti by 3,350 Jmol-'
Example 2
Discuss the validity of the following statements : 1. Unless otherwise specified, the standard state of an element i customarily chosen
to be at a pressure of Iatm and in the most stable structure of that element at the temperature at which it is investigated.
2. However it is possible to choose as a standard state one that does not correspond to the most stable form of the species under consideration.
3. The standard state may also correspond to a virtual state, one that cannot be physically obtained but that can be theoretically defined and for which properties of interest can be calculated.
1) This statement describes the general definition of the standard state. 2) This statement is also true. For example, it may be convenient to choose as the
standard state of HzO at 298K that of the gas instead of the liquid, or one may choose at 298K the fcc structure of iron (austenite) rather than the bcc one (ferrite).
3) This statement is also correct. Further discussion in detail is given in Section 3.1.5.
Fundamental Prlnclples and Functions
Species H, Jmol"
49
A B2 AB AB2
20 30 30 40
1.5.2. Heat of Formation
Species A
AHfi Jmor' 0
We shall recall that the enthalpy change for a process (e.g., a chemical reaction), AH, is equal to the value of the heat absorbed or evolved when the process (e.g., reaction) takes place at a constant pressure :
B2 AB AB2
0 -5 -10
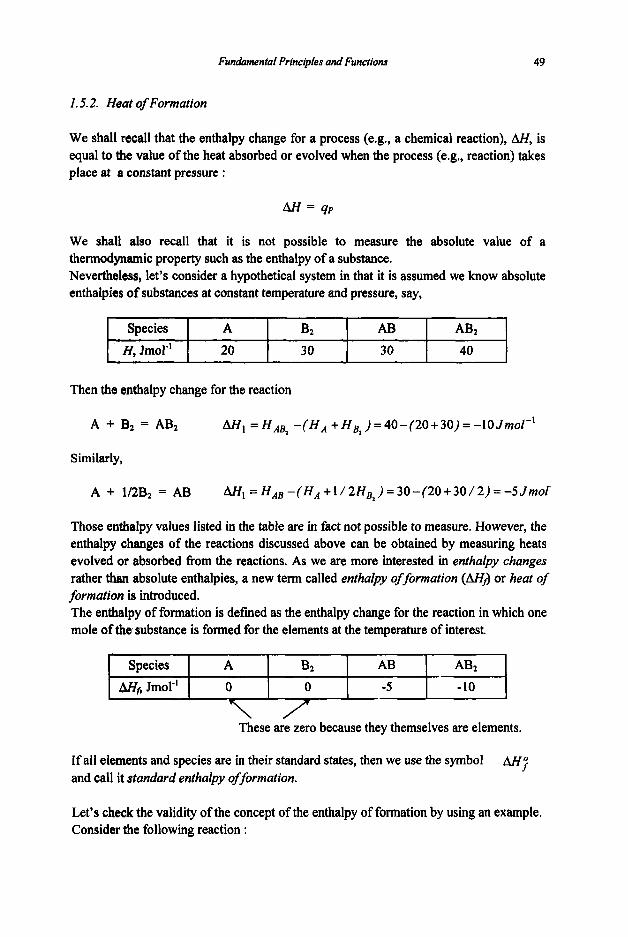
We shall also recall that it is not possible to measure the absolute value of a thermodynamic property such as the enthalpy of a substance. Nevertheless, let's consider a hypothetical system in that it is assumed we know absolute enthalpies of substances at constant temperature and pressure, say,
Then the enthalpy change for the reaction
A + B2 = AB2 AH, = H A B 2 - ( H A +HB, )=40- (20+30)=-10Jmol - '
Similarly,
Those enthalpy values listed in the table are in fact not possible to measure. However, the enthalpy changes of the reactions discussed above can be obtained by measuring heats evolved or absorbed flom the reactions. As we are more interested in enthalpy changes rather than absolute enthalpies, a new term called enthalpy of formation (Mf) or heat of formation is introduced. The enthalpy of formation is defined as the enthalpy change for the reaction in which one mole of the substance is formed for the elements at the temperature of interest.
If all elements and species are in their standard states, then we use the symbol and call it standard enthalpy of formation.
M;
Let's check the validity of the concept of the enthalpy of formation by using an example. Consider the following reaction :

50
AH;
Chemical Thermodynamics for Metals and Materials
Ca(s)* €I2@)* H(g) Sn(s,w)* Sn(s,g) CaO(s) CaCO,(s) 0 0 0 0 2.51 -643.3 -1,207.1
AB + 1/2B2 = AB2 M3
By using absolute values of H, By using enthalpy of formation,
AH3 = 40 - ( 30 + 3012) = -5 Jmol" AH3 = -10 - ( -5 + 0) = -5 Jmol-'
Note that assigning a value of zero to AH; for each element in its most stable form at the standard state does not affect our calculations in any way. Thus, the enthalpies of formation (AH,) or the standard enthalpies of formation (U:) which are experimentally measurable are of great practical value and give an easy way of determining the enthalpy change accompanying a process or a reaction.
Example 1
Standard sources of thermodynamic data list the heat or enthalpy of formation at a standard or reference temperature. Most commonly room temperature (298K or 298.15K to be more precise) is chosen as the reference temperature. A few examples
"*" represents the standard state. Find an element or species the standard enthalpy of formation (U;) of which is incorrectly specified. Is the following reaction exothermic or endothermic?
Sn(s, white) + Sn(s, grey)
1) As H&) is specified as the standard state, M F of H(g) is not zero. It is
2) Sn(s,white) + Sn(s,grey) : AH = 2.5 1 - 0 = 2.5 1 > 0 : endothermic reaction. experimentally found to be 2 18kJ mol-I.
Are the following statements all true? 1) The standard enthalpy of formation is defmed as the heat change that results
when one mole of a compound is formed from its elements at a pressure of 1 atm. 2) Although the standard state does not specify a temperature, it is customary that
we always use Ah'F values measured at 25°C (298.15K to be exact).
Both statements are correct. Once M; is known at 25"C, then AHfat other temperatures can be calculated using information on the heat capacity. Refer to Section 1.5.3 for fiwther discussion.
Fundamental Principles and Functions
CO2 + 2Hz0
51
+ ZH(products) = Hco2 + 2 H ~ , o
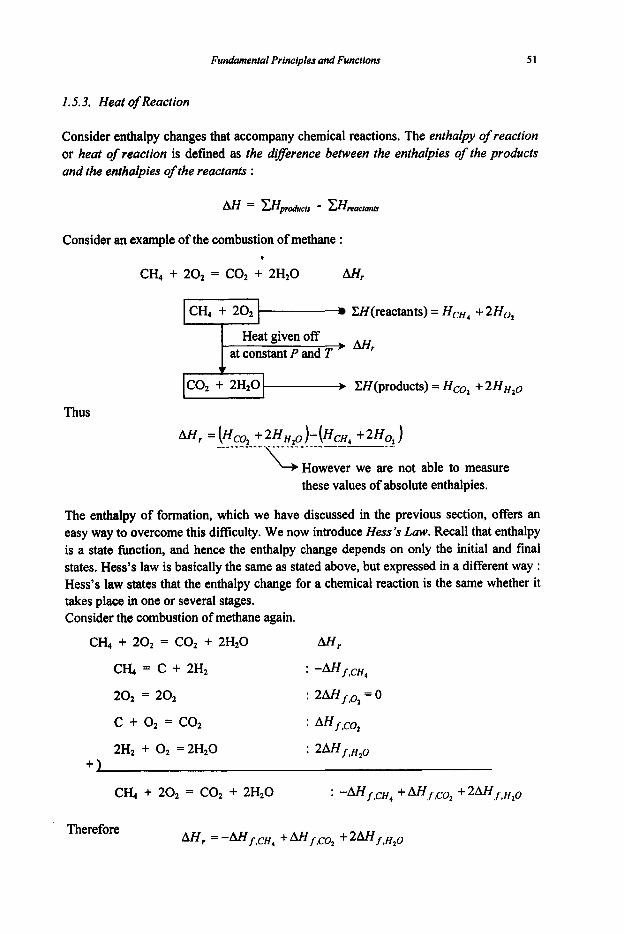
I. 5.3. Heat of Reaction
Consider enthalpy changes that accompany chemical reactions. The enthalpy of reaction or heat of reaction is defined as the direrence between the enthalpies of the products and the enthalpies of the reactants :
Consider an example of the combustion of methane : s
CH( + 202 = CO2 + 2H20 Iw,
ZH(reactants) = HCH, + 2H0,
Thus
L H o w e v e r we are not able to measure these values of absolute enthalpies.
The enthalpy of formation, which we have discussed in the previous section, offers an easy way to overcome this difficulty. We now introduce Hess 's Law. Recall that enthalpy is a state function, and hence the enthalpy change depends on only the initial and final states. Hess's law is basically the same as stated above, but expressed in a different way : Hess's law states that the enthalpy change for a chemical reaction is the same whether it takes place in one or several stages. Consider the combustion of methane again.
CH4 + 202 = CO2 + 2H20 M r
CH, = C + 2H2 : -MfCH4
202 = 202
c + 0 2 = CO2
: 2AHs#0, = 0
: ~ f , C O ,
2H2 + 0 2 =2HzO : 2AHf,H10 +)
CH, + 202 = CO2 + 2H20 : -MfeCH4 + L v I f C 0 2 + 2Mf,H10
Therefore

52
or
Chemical Thermodynamics for Metals and Materials
mr = (K/&_+ 2-YL!!&!! - W . C H I ) Weighted sum of Weighted sum of the enthalpies of the enthalpies of formation of the formation of the
products reactants
Now it is in order to generalise our discussion. Consider the following reaction :
aA f bB = cC + dD A H r
The heat of reaction is given by
This equation applies to a system undergoing a chemical reaction at constant pressure and temperature.
If AHp > 0, the reaction takes place with an absorption of heat from surroundings (endothermic). If AHr < 0, the reaction takes place with an evolution of heat to the surroundings (exothermic).
0
0
If temperature is not constant, but changes, recall that
(3, = C p or dH = CpdT at constant P.
For a system undergoing a temperature change from T, to T,,
AH = IT2CpdT TI
Consider a general reaction which occurs at a constant pressure :
aA + bB = CC + dD ~ ~" ~~" .........
Enthalpy change of reactants (a moles of A and b moles of B) undergoing temperature change from Tl to T,.
M r e a c , = H7'l ,react - HT,rreact
= j; W , , A + bC,,,)dT
But the enthalpy change of reaction at T2 is
Enthalpy change of products (c moles of C and d moles of D) undergoing temperature change from T, to T2.
M p r o d = HT2,prod - Hlisprod

Fundamental Principles and Functions 53
Thus
where AHr,q = heat of reaction at T,, and
ACP = (ccP,C dcP,D) - (aCP,A bcP,B)
This equatiion is known as Kirchho&’s law in integral form. It enables us to calculate the heat of reaction at different temperatures by knowing the heat of reaction at one temporatwe+ say, 298K, and heat capacities of reactants and products. In a diffarsntal form,
Considerageneralreaction aA + &B = cC + dD. The fotlowing figure shows the change of enthalpy of reactants and the products with temperature. Answer to each of the following questions :
A
H
1) Which point represents the sum of enthalpies of reactants at T,?
2) Which point represents the sum of enthalpies of the products at T2?
3) Which one represents the enthalpy change of the products with change in temperature from T1 to T2?
4) Which one is the heat of reaction at m n 121
exothermic at T2? 5 ) Is the reaction endothermic or MHZ
Tt TZ
1) a 2) d 3) M4 (= d - b) 4) A& (= d - c) 5 ) Exothermic (U3 < 0)
54 Chemical Thermo&namfcs for Metals and Materials
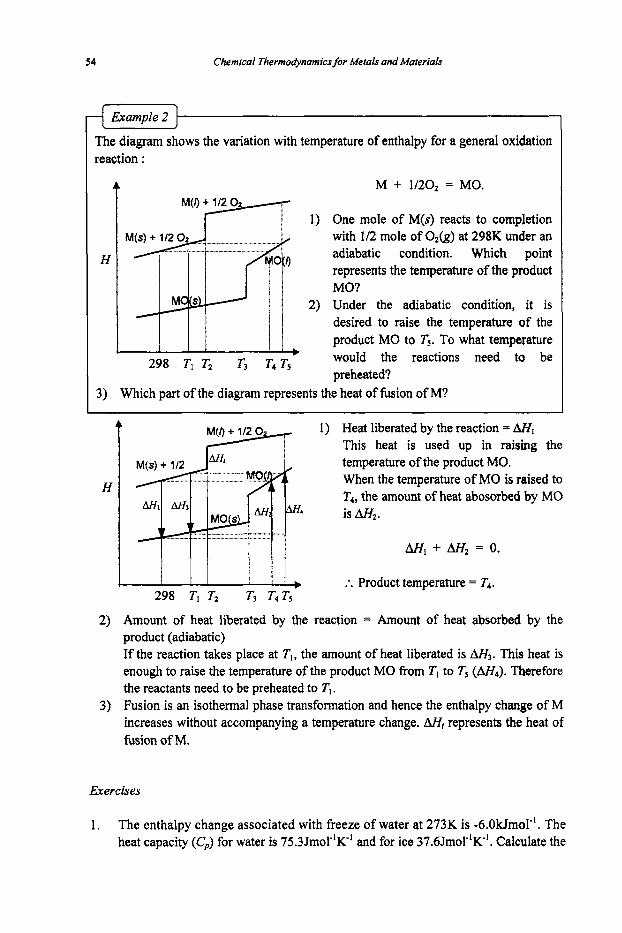
ExampIe 2
The diagram shows the variation with temperature of enthalpy for a general oxidation reaction :
4 M + 1/20, = MO.
1) One mole of M(s) reacts to completion with 112 mole of O&) at 298K under an adiabatic condition. Which point represents the temperature of the product MO?
2) Under the adiabatic condition, it is desired to raise the temperature of the product MO to Ts. To what temperature would the reactions need to be preheated?
H
1 298 TI T2 TS T4 Ts
3) Which part of the diagram represents the heat of fusion of M?
t 1) Heat liberated by the reaction = AHl This heat is used up in raising the temperature of the product MO. When the temperature of MO is raised to T4, the amount of heat abosorbed by MO is A&.
H
M, + AH2 = 0.
:. Product temperature = T4. b 298 T1 TZ T3 T4 T5
2) Amount of heat liberated by the reaction = Amount of heat absorbed by the product (adiabatic) If the reaction takes place at T,, the amount of heat liberated is AH3. This heat is enough to raise the temperature of the product MO from T, to T5 (A&). Therefore the reactants need to be preheated to Tl.
3) Fusion is an isothermal phase transformation and hence the enthalpy change of M increases without accompanying a temperature change. AH, represents the heat of fusion of M.
Exercises
1. The enthalpy change associated with freeze of water at 273K is -6.OkJmol". The heat capacity (CJ for water is 75.3JmoP'R' and for ice 37,6Jmol-'K-'. Calculate the
Fundamental Principles and Functions
A H O J Z S S r, (kTmol-I) (K) (kJmol")
-348.1
-1 10.5
0
0 693 (s+ r) 7.28
1,18O(l+g) 114.2
55
CP (Jmol-IK-')
49.0 + 5.10~10"T- 9 . 1 2 ~ 1 0 ~ T ~
28.4 + 4.10~10'2'- 0.46x1OsTz
17.2 + 4.27~10'2'- 8.8x1OSTz
22.4 + 1 0 . 0 ~ 1 0 ~ ~
31.4
20.8
enthalpy change when water fieezes at 263K.
2. The enthalpy changes at 298K and latm for the hydrogenation and for the combustion of propane are given below :
C,&O + HZO = C3Hsk) C3Hs(g) + 502(g) = 3COZ(g) + 4HzO(I)
AHI = -124kJmol-' AHz=-2,220kJmol~'
In addition the enthalpy change at 298K and latm of the following reaction is known :
H20 + 1 /2020 = HZO(C) A& = -286kJmoI'
Calculate the heat liberated by the combustion of one mole of propane at 298K and 1 atm.
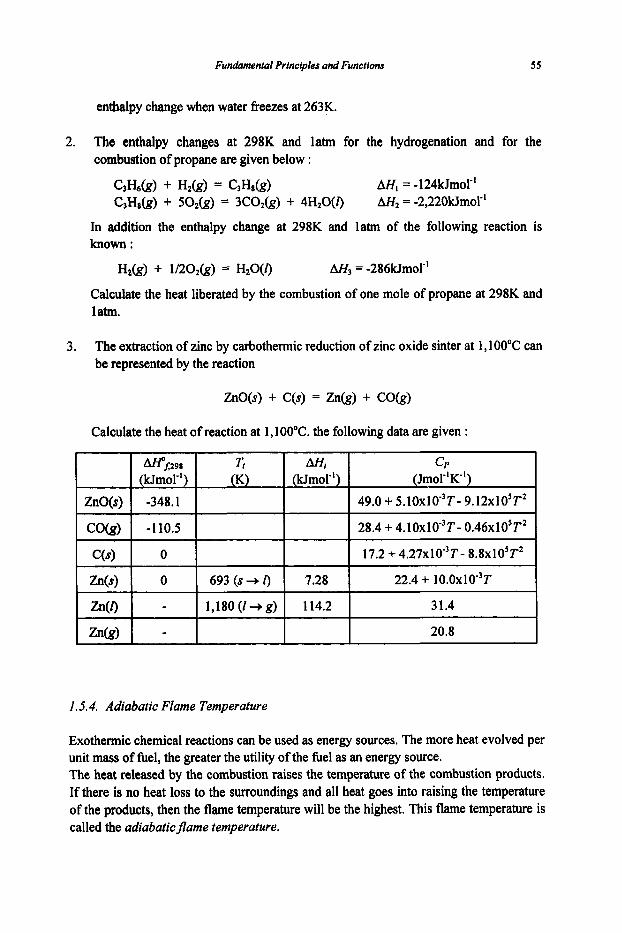
3. The extraction of zinc by carbothennic reduction of zinc oxide sinter at 1,lOO"C can be represented by the reaction
ZnO(s) + C(s) = Zn(g) + CO&)
Calculate the heat of reaction at 1,lOO"C. the following data are given :
ZnO(s) k 1.5.4. Adiabatic Flame Temperature
Exothermic chemical reactions can be used as energy sources. The more heat evolved per unit mass of fuel, the greater the utility of the fbel as an energy source. The heat released by the combustion raises the temperature of the combustion products. If there is no heat loss to the surroundings and all heat goes into raising the temperature of the products, then the flame temperature will be the highest. This flame temperature is called the adiabaticflame temperature.

56 Chemical Thermodynamics~or Metals and Materials
Fuel Air
For a steady-flow adiabatic combustion system, the total enthalpy is conserved: p*/ + PI+ =
Consider the following exothermic reaction :
A C
+ r,J I I I
Reaction path
The reaction proceeds to completion and all the heat generated by the reaction is used in raising the temperature of the product. You are asked to calculate the adiabatic flame temperature (Tf). Referring to the diagram given below, answer the following question: Do the following relationships hold?
1) The equation is correct because the total enthalpy is conserved and the enthalpy is a state finction so that the enthalpy change is independent of the path the process takes as long as the initial and final states are kept unchanged. The adiabatic flame temperature Tfcan be found by solving the equation for T’
2) This equation is also correct. We can construct several different paths between the initial and final states because enthalpy is a state function.
Funhmntal Principles and Functionr
(Jmol-') Cp (Jmol-'K-')
57
02@)
N2&)
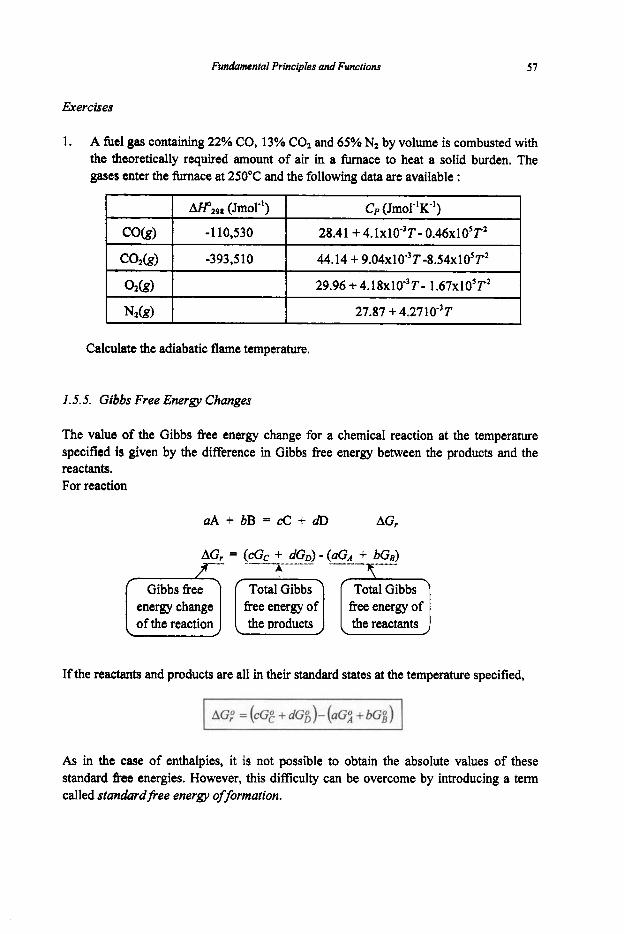
Exercises
29.96 + 4.18~10-~?'- 1.67x10⁵T2
27.87 + 4.2710-3T
CO2&) I -393,510 I 44.14 + 9.04x10³T-8.54x10⁵T2
Calculate the adiabatic flame temperature.
I . 5.5. Gibbs Free Energy Changes
The value of the Gibbs free energy change for a chemical reaction at the temperature specified is given by the difference in Gibbs free enerw between the products and the reactants. For reaction
aA + bB = cC + dD AG,
AG, = (CGC + dGD)-(aGA + bGB)
the reactants
If the reactants and products are all in their standard states at the temperature specified,
As in the case of enthalpies, it is not possible to obtain the absolute values of these standard fkee energies. However, this difficulty can be overcome by introducing a term called standardfiee energy offormation.
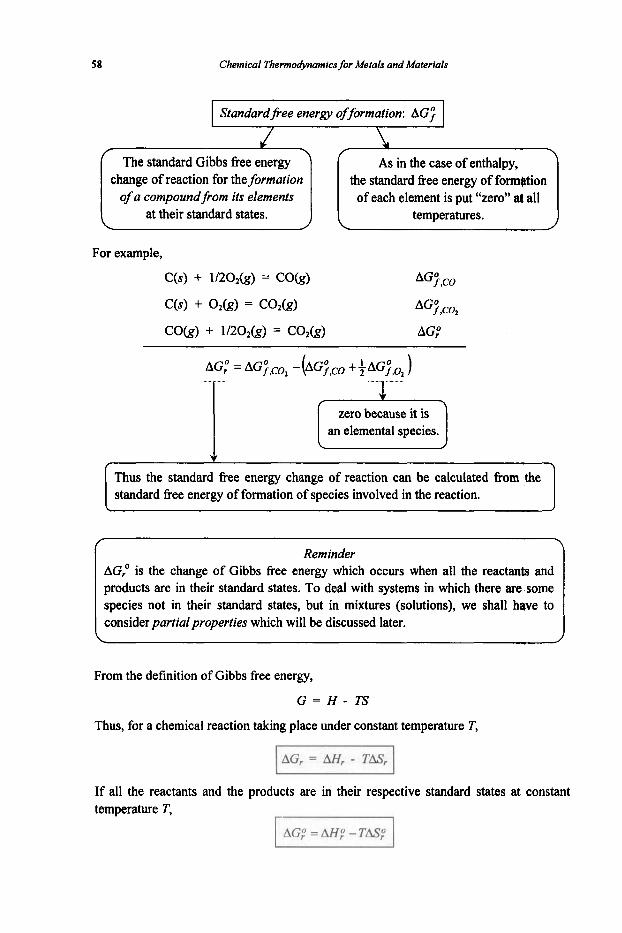
58
change of reaction for the formation of a compoundfiom its elements
the standard fiee energy of formation of each element is put "zero" at all
Chemical Thermodynamics for Metals and Materials
at their standard states. temperatures.
For example,
Thus the standard fiee energy change of reaction can be calculated from the standard free energy of formation of species involved in the reaction.
Reminder AG," is the change of Gibbs free energy which occurs when all the reactants and products are in their standard states. To deal with systems in which there are some species not in their standard states, but in mixtures (solutions), we shall have to I consider partial properties which will be discussed later.
From the definition of Gibbs free energy,
G = H - T S
Thus, for a chemical reaction taking place under constant temperature T,
If all the reactants and the products are in their respective standard states at constant temperature T,

Fundanrental Principles and Functions 59
Consider the following reaction of formation of species AB2 :
A + 2B = AB2 AGY,AB2 T = constant
The fol€owing statements are all true. Discuss the application of the statements using the example of the formation of TiSi2(s).
1) AG;.AB2 is the difference between the free energy of 1 mole of AB2 and the sum of the free energies of 1 mole of A and 2 moles of B, all in their standard states at temperature T. AG;,ABl is the standard free energy of formation of compound AB2 measured
with the free energy scale established by setting 2)
AG7.A = O and AGT,B = O .
3) The state of each element (i.e., A or B) for which the above relationships are set, that is, the standard state of each element, is arbitrarily chosen.
4) The firm of element A or B for which the free energy of formation is taken zero must be the same form for which Aii; = 0 is taken.
1) Ti + 2Si = TiSi2
2) AG;,nsrl is the standard free energy of formation of TiS& measured with the basis
of AGY,Ti = O and AG7,si =O.
3) The standard state of a species can be arbitrarily chosen
4) As G is related with H by G = H - TS, the standard state should be consistent.
AG;,Tist2 = GFtSi, -(Gg + 2G&)
Consider the following reaction :
AB + B = AB2 AG,O T=constant
Check the validity of each of the following statements :
1) AG,O is the difference between the free energy of 1 mole of AB2 and the sum of the Bee energies of 1 mole of AB and 1 mole of B, all in their standard states at temperature T.
2) The choice of a standard state is arbitrary. If we choose the most stable and pure form of AB at temperature T as its standard state, however, we must choose the most stable and pure forms of all other species (i.e., B and AB,) as their respective standard states.
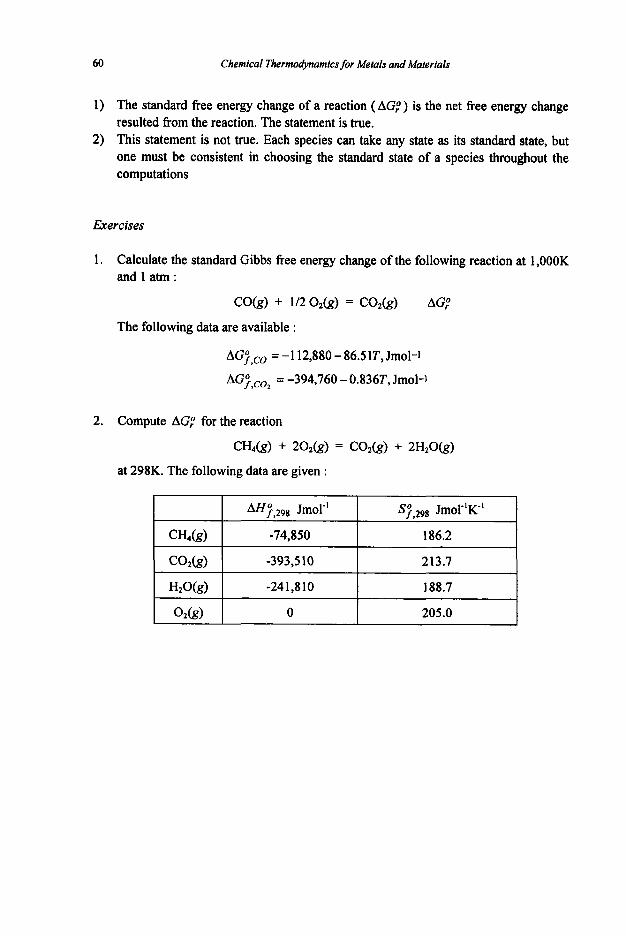
60 Chemical Thermodynamics for Metals and Malerials
CH4k)
C02@
H20@
02k)
1) The standard free energy change of a reaction ( AG,") is the net free energy change resulted from the reaction. The statement is true.
2) This statement is not true. Each species can take any state as its standard state, but one must be consistent in choosing the standard state of a species throughout the computations
M ; , 2 g 8 Jmorl S;,298 Jmor'K-'
-74,850 186.2
-3933 10 213.7
-24 1,8 10 188.7
0 205.0
Exercises
1. Calculate the standard Gibbs free energy change of the following reaction at 1,000K and la tm:
CO&) + 1/202(g) = CO&) AG,"
The following data are available :
AG;,co = -1 12,880 - 86.5 lT, Jmol-1
AGY,coI = -394,760 - 0.8363, Jmol-1
2. Compute AG," for the reaction
CH4k) + 202k) = CO2k) + 2HzOk)
at 298K. The following data are given :
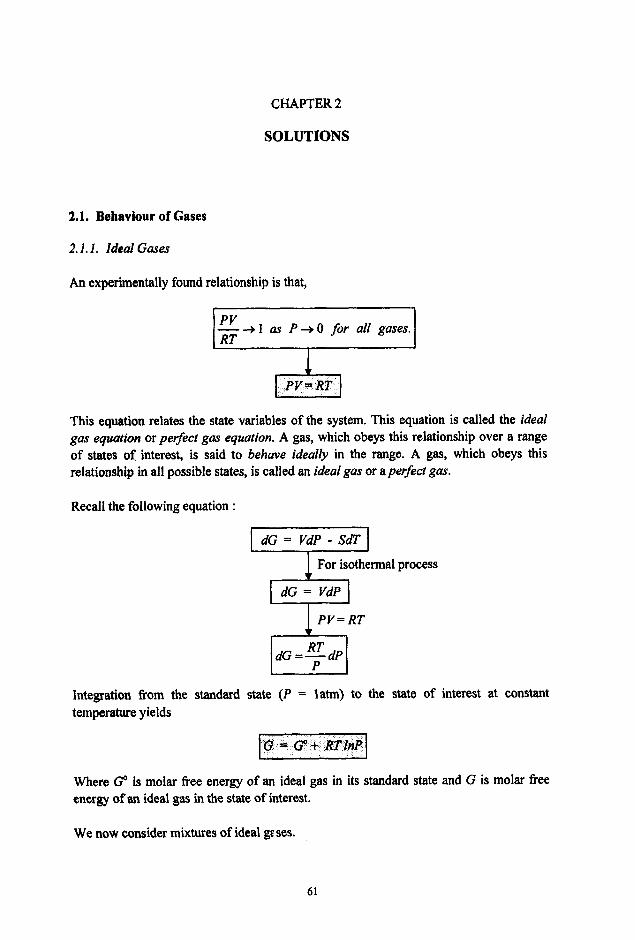
CHAPTER 2
SOLUTIONS
2.1. Behaviour of Gases
2.1.1, Ideal Gases
An experimentally found relationship is that,
-+ 1 as P + O for all gases. 1;; , I ril PV=RT
This equation relates the state variables of the system. This equation is called the ideal gas equation or pe$ect gas equation. A gas, which obeys this relationship over a range of states of interest, is said to behave ideally in the range. A gas, which obeys this relationship in all possible states, is called an ideal gas or apeifect gas.
Recall the following equation :
For isothermal process
I PV=RT
Integration from the standard state (P = latm) to the state of interest at constant temperature yields
Where e is molar f?ee energy of an ideal gas in its standard state and G is molar free energy of an ideal gas in the state of interest.
We now consider mixtures of ideal gt ses.
61
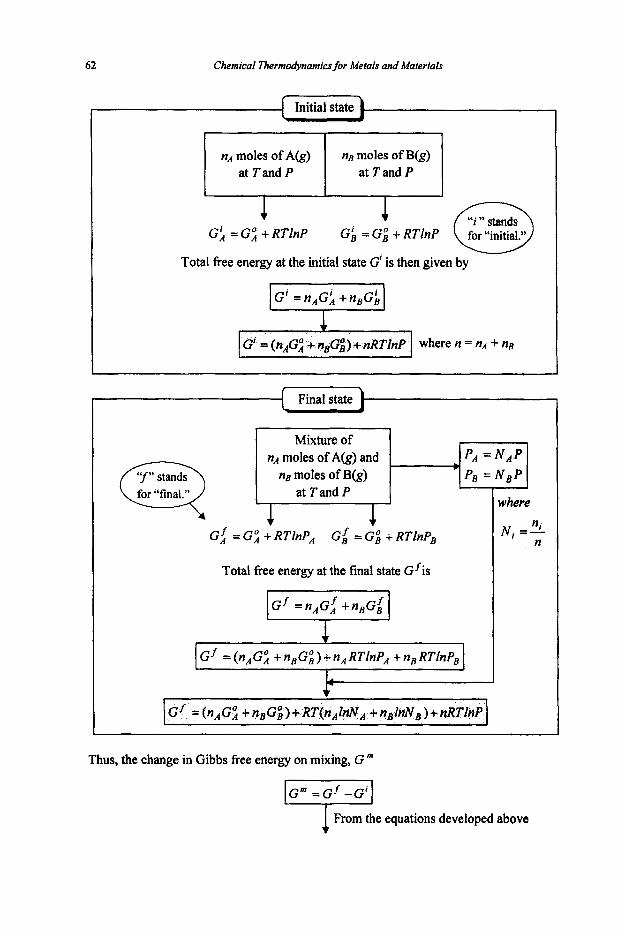
62 Chemical Thermodynamics for Metals and Materials
Mixture of
ns moles of B(g) at Tand P
nA moles of A(g) and
at Tand P atTandP
Total free energy at the initial state G' is then given by
PA = N A P ' P , = N B P -
where n = nA + nB
i
I
Total free energy at the final state Gf is I
, +-
I
ni n
Ni f-
Thus, the change in Gibbs free energy on mixing, G *
1 From the equations developed above

63
CM = RT(NA In NA + NB In N B ) Gibbs free energy change for the formation of one mole of mixture or solution.
G , = G i + RTlnP, Gibbs free energy of one mole of A after mixing or in solution
G , = Gg + RTlnP, Gibbs free energy of one mole of B after mixing or in solution
I
Solutions
G" For one mole of the mixture, GM = - , n
GA and GB (later we will be using symbols E t ) are called partial molar flee energies of A and B, respectively. These are also called chemical potentials 01,). GM is called relative rnularfiee energy of the solution. A fuller discussion on these properties is given in Section 2.2.2. Note that G < 0 because N, < 0. Therefore mixing is a spontaneous process.
For SM and H',
G - H - T S b For ideal gases, no heat is evolved,
or absorbed in the mixing process.
Exercises
1. nA moles of gas A and ne moles of gas B are mixed at constant temperature and pressure. Calculate the ratio of A and B which minimises the free energy of the mixture. Assume that both A and B are ideal gases.
2. A lm' cylinder contains H&) at 298K and latm, and is connected to another cylinder which contains 3m3 O,(g) at 298K and 0.8atm. When the valve is opened, the gases diffuse into each other and form a homogeneous mixture under isothermal conditions. Calculate the free energy change of mixing, G", for the process. Assume the gases behave ideally.

64 Chemical Thermodynamics for Metals and Materials
We now express V as a function of P: 0 Volume of real gas Vwai 0
0 The difference (a) is : a = h&a/ - Vwa1 = RT/P - Vwa/ 0 Rearrangement yields : V=RT/P-a whereV=V,,, ,
If the gas were ideal, the volume would be : V,deol = RT/P
2.1.2. Fugacities and Real Gases
In the previous section we have developed the following equation for an ideal gas:
G = Go + RTlnP
If a gas deviates from ideality, this equation ceases to apply. However, it is desired to preserve this simple form of expression as much as possible for non-ideal, real gases. The above equation shows that the free energy G is a linear function of the logarithm of the pressure of an ideal gas. Now, let’s introduce a function which when used in place of the real pressure ensures linearity between G and the logarithm of this function in any state of any gas. This function is called figaciry (f ), a sort of corrected pressure.
G = Go + RTln f
dG = RT d In f
I Integration fiom P = o to a state of interest,
RTdlnf = lps0 P=P ( p - a ) d p / RT I jP=O p = p
1 Rearrangement yields

SOIUtiOns 65
This equation enables us to evaluate the fugacity at any pressure and temperature, provided that data on PVT for the gas of interest are available.
Graphicdl Method 1. 2.
Plot the deviation (a) from ideality of the gas against P. Evaluate the area between the integration limit.
Analytical Method 1. Express a as a hc t ion of P. 2. Evaluate the integral analytically.
We now discuss more on the analytical method. Rearrangement of the above equation yields
We introduce a term called the compressibility factor 2 --Er--- defined 2s
a = RT/P - V
2 is 1 for ideal gases, but for real gases, it is a hc t ion of the state of the system, e.g., Z =
AP,T). Some equations of state for non-ideal gases are given below:
PV RT - = I + B,P + B ~ P ~ +.-
PV c, c, RT v v2
- = I + - + - + . . .
where B,‘s and C,’s are called virial coeficients and depend only on the temperature.

66 Chemical Thermodynamics for Metals and Materials
At low pressure or densities the first two terms in the state equations are sufficient to represent the state :
Thus it is now possible to evaluate analytically the integral in the previous equatioE.
Example 1
A real gas obeys the following equation of state:
PV =RT + BP
where B is independent of pressure and is a function of temperature only. Choose an incorrect one from the following relationships:
WI (==J PV= RT+ BP
1 z=1+-
Expanding the exponential term, and taking the fvst two terms,
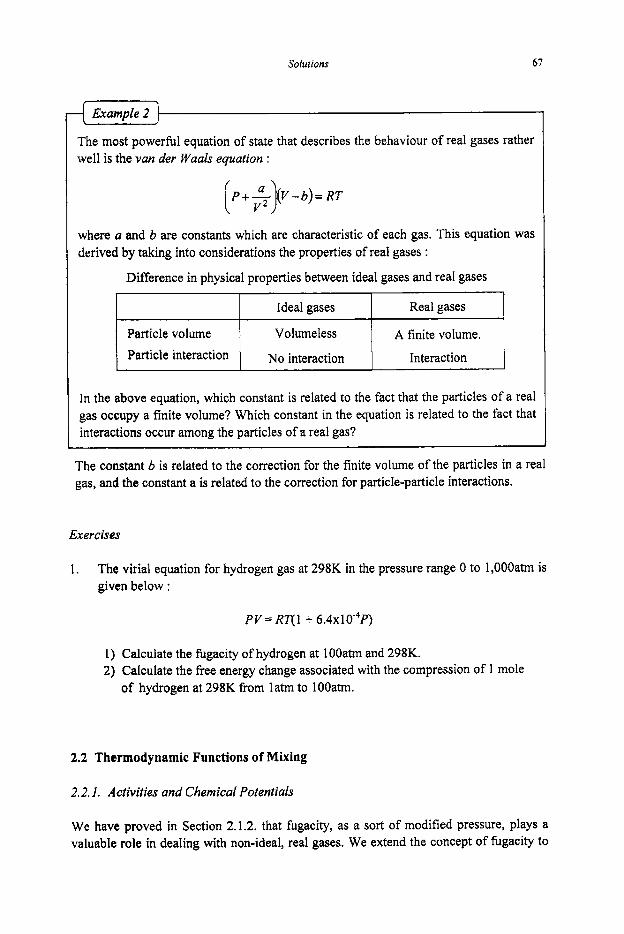
Solutions 67
Ideal gases
Particle volume Volumeless
The most powerful equation of state that describes the behaviour of real gases rather well is the van der Waafs equation :
Real gases
A finite volume.
( P + F ) ( Y - b ) = R T
1 Particle interaction I No interaction I Interaction I
In the above equation, which constant is related to the fact that the particles of a real gas occupy a finite volume? Which constant in the equation is related to the fact that interactions occur among the particles of a real gas?
The constant b is related to the correction for the finite volume of the particles in a real gas, and the constant a is related to the correction for particle-particle interactions.
Exercises
1. The virial equation for hydrogen gas at 298K in the pressure range 0 to 1,OOOatm is given below :
PY= RT(1+ 6.4~10'~P)
1) Calculate the fugacity of hydrogen at lOOatm and 298K. 2) Calculate the free energy change associated with the compression of 1 mole
of hydrogen at 298K from 1 atm to 1 OOatm.
2.2 Thermodynamic Functions of Mixing
2.2.1. Activities and Chemical Potenfiafs
We have proved in Section 2.1.2. that fugacity, as a sort of modified pressure, plays a valuable role in dealing with non-ideal, real gases. We extend the concept of fugacity to
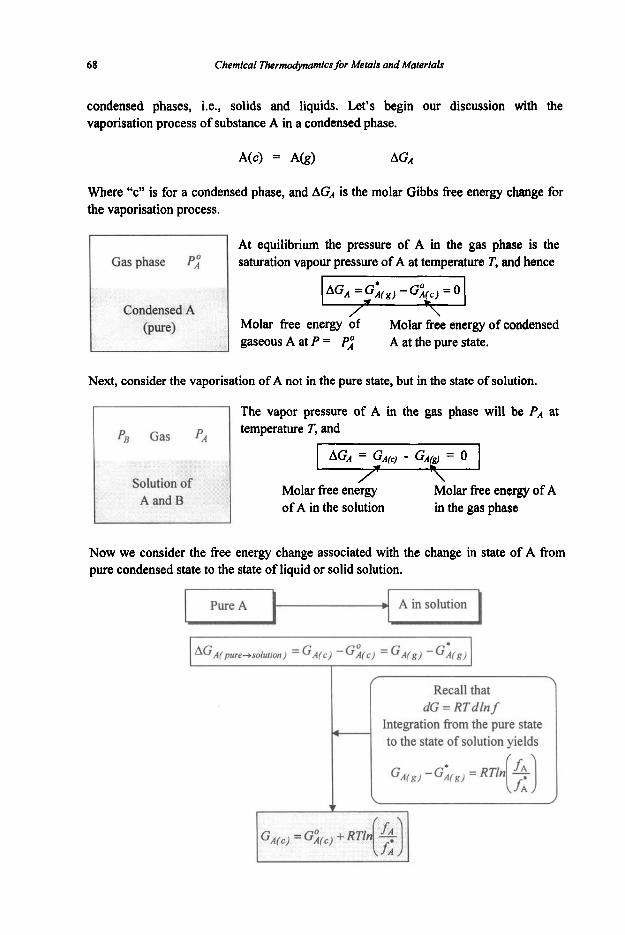
68 Chemical Thermodynamics for Metals and Materials
Pure A
condensed phases, i.e., solids and liquids. Let’s begin our discussion with the vaporisation process of substance A in a condensed phase.
- A in solution
Where “c” is for a condensed phase, and AGA is the molar Gibbs free energy change for the vaporisation process.
At equilibrium the pressure of A in the gas phase is the saturation vapour pressure of A at temperature T, and hence
I
AGA = GA(g) - GA(c) =
Molar free energy of gaseous A at P = Pi
Molar free energy of condensed A at the pure state.
Next, consider the vaporisation of A not in the pure state, but in the state of solution.
-1 The vapor pressure of A in the gas phase will be PA at temperature T, and 1 PE Gas pA 1
Molar free energy of A in the solution
Molar free energy of A in the gas phase
Recall that dG = RTdln f
Integration from the pure state to the state of solution yields
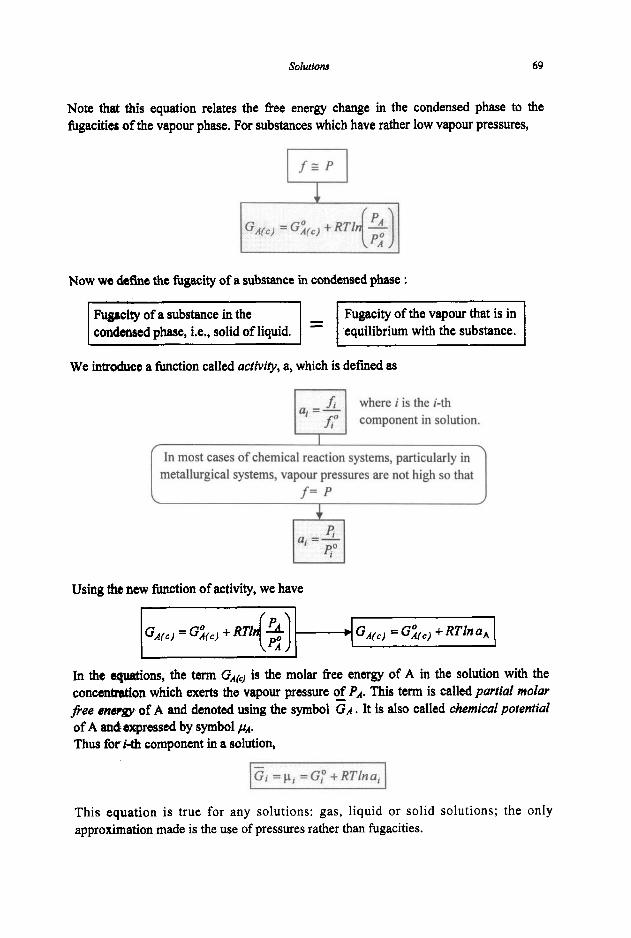
soiIIt~ons 69
Note that this equation relates the free energy change in the condensed phase to the figacitia of the vapour phase. For substances which have rather low vapour pressures,
Now we define the fiigacity of a substance in condensed phase :
Fugacity of the vapour that is in equilibrium with the substance.
We introduce a function called activiQ, a, which is defined as
where i is the i-th component in solution.
t
In most cases of chemical reaction systems, particularly in metallurgical systems, vapour pressures are not high so that
f - P
Using the new function of activity, we have
I
In the equations, the term GAn is the molar free energy of A in the solution with the concentration which exerts the vapour pressure of PA. This term is called partial molar fiee me?@ of A and denoted using the symbol ER. It is also called chemical potential of A an& expressed by symbol p ~ . Thus for 1-tb component in a solution,
This equation is true for any solutions: gas, liquid or solid solutions; the only approximation made is the use of pressures rather than fugacities.
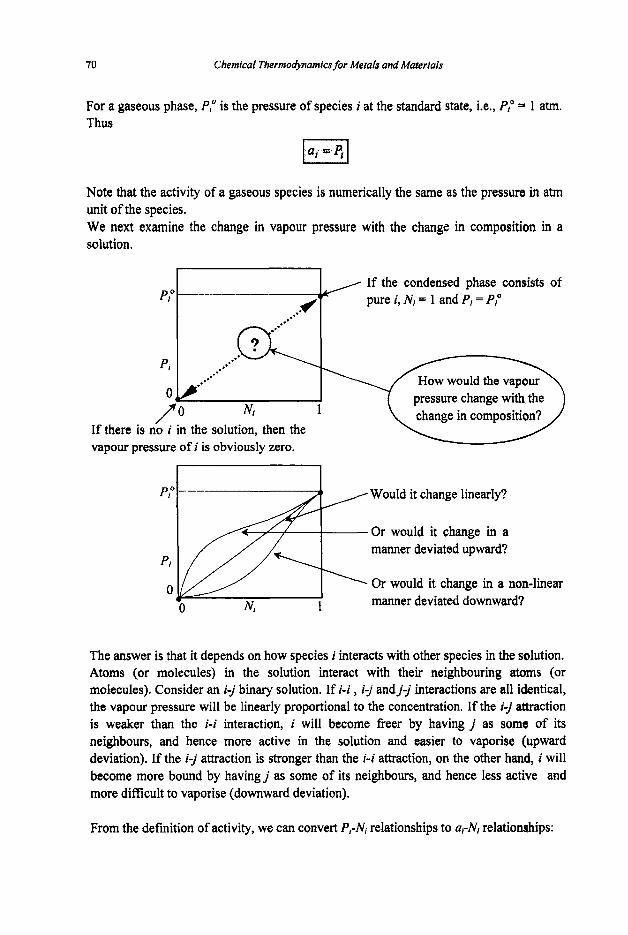
70 Chemical Thermo&namtcsfor Metals and Materials
For a gaseous phase, PP is the pressure of species i at the standard state, i.e., PP = 1 atm. Thus
Note that the activity of a gaseous species is numerically the same as the pressure in atm unit of the species. We next examine the change in vapour pressure with the change in composition in a solution.
If the condensed phase consists of pure i, N, = 1 and Pi = PP
,.*. .*
How would the vapour O/ pressure change with the
*.*' Pi
.**
f o If there is no i in the solution, then the vapour pressure of i is obviously zero.
Would it change linearly?
Or would it change in a manner deviated upward?
\ Or would it change in a non-linear manner deviated downward?
The answer is that it depends on how species i interacts with other species in the solution. Atoms (or molecules) in the solution interact with their neighbouring atoms (or molecules). Consider an i-j binary solution. If i-i , i-j andj-j interactions are all identical, the vapour pressure will be linearly proportional to the concentration. If the i-f attraction is weaker than the i-i interaction, i will become fieer by having j as some of its neighbours, and hence more active in the solution and easier to vaporise (upward deviation). If the i-j attraction is stronger than the i-i attraction, on the other hand, i will become more bound by havingj as some of its neighbours, and hence less active and more difficult to vaporise (downward deviation).
From the definition of activity, we can convert PrNi relationships to a,-& relationships:
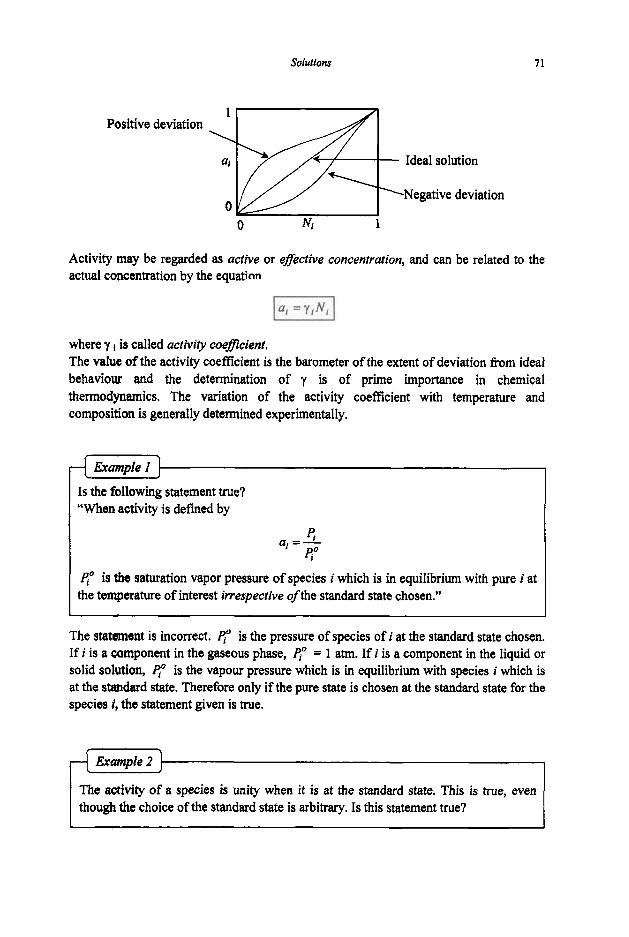
Solutiom
Is the following statement true? “When activity is defmed by
71
0 1
Activity may be regarded as active or eflective concentration, and can be reIated to the actual concentration by the equation
where y is called activiv coefficen?. The value of the activity coefficient is the barometer of the extent of deviation from ideal behaviour and the determination of y is of prime importance in chemical thermodynamics. The variation of the activity coefficient with temperature and composition is generally determined experimentally.
4 4 O
a, =-
4” is the saturation vapor pressure of species i which is in equilibrium with pure i at the temperature of interest irrespective ofthe standard state chosen.”
The statement is incorrect. 4“ is the pressure of species of i at the standard state choser If i is a component in the gaseous phase, 4” = 1 atm. If i is a component in the liquid or solid solution, 4’ is the vapour pressure which is in equilibrium with species i which is at the standard state. Therefore only if the pure state is chosen at the standard state for the species i, the statement given is true.
The activity of a species is unity when it is at the standard state. This is true, even though the choice of the standard state is arbitrary. Is this statement true?
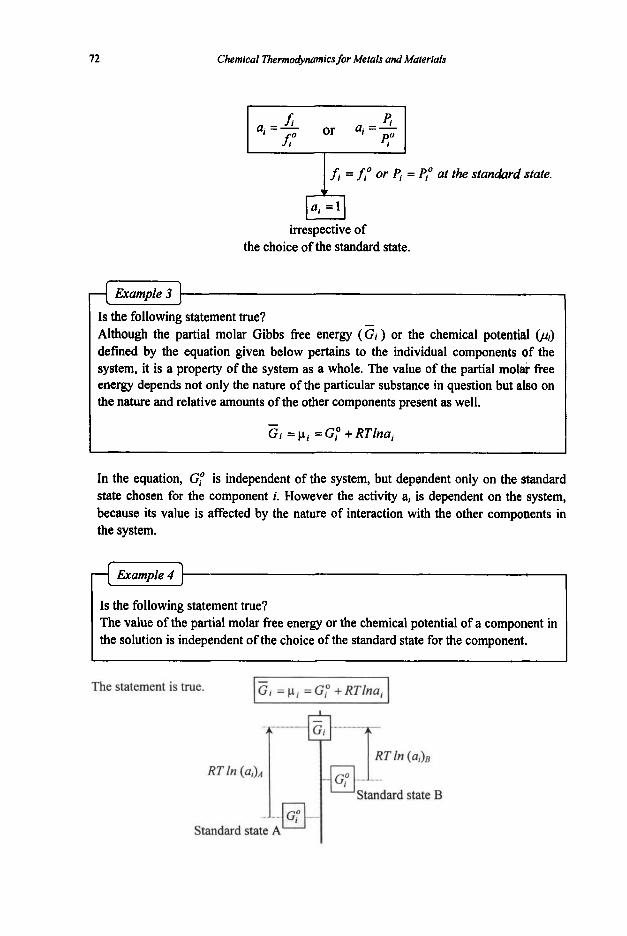
12 Chemical Thermodynamics for Metals and Materials
I = f," or P, = P," at the standard state.
irrespective of the choice of the standard state.
-( Example3 J Is the following statement true? Although the partial molar Gibbs free energy ( G i ) or the chemical potential 01,) defmed by the equation given below pertains to the individual components of the system, it is a property of the system as a whole. The value of the partial molar free energy depends not only the nature of the particular substance in question but also on the nature and relative amounts of the other components present as well.
- Gi = p, = GP + RTlna,
In the equation, G,O is independent of the system, but dependent only on the standard state chosen for the component i. However the activity a, is dependent on the system, because its value is affected by the nature of interaction with the other components in the system.
Example 4
Is the following statement true? The value of the partial molar free energy or the chemical potential of a component in the solution is independent of the choice of the standard state for the component.
- The statement is true. IG,=pi=GP+RTlnaiI
I I
(a l )B
state B
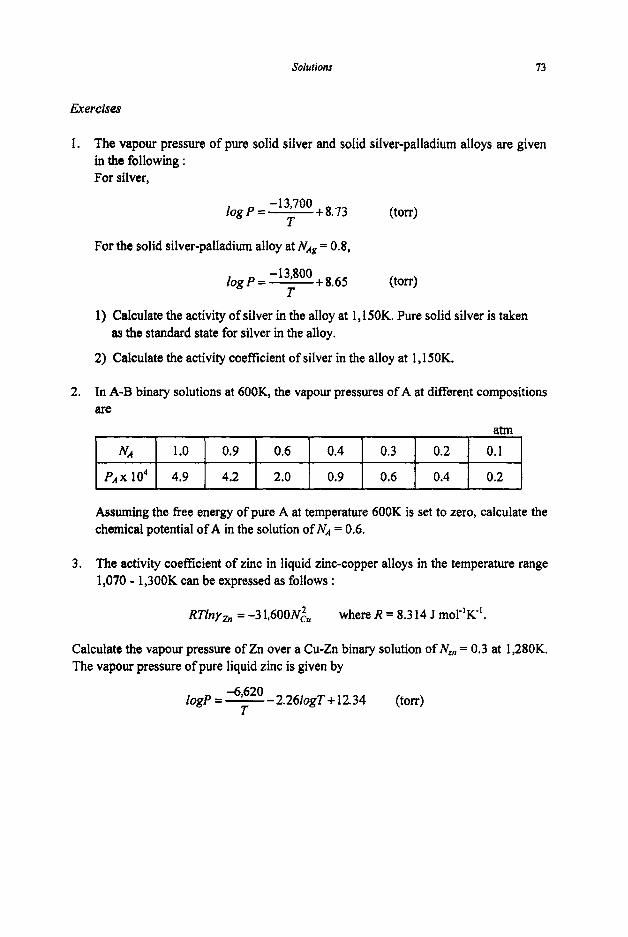
Solutions
HA
P A X 104
73
1.0 0.9 0.6 0.4 0.3 0.2 0.1
4.9 4.2 2.0 0.9 0.6 0.4 0.2
Exercises
1. The vapour pressure of pure solid silver and solid silver-palladium alloys are given in the following : For silver,
For the solid siiver-palladium alloy at NAg = 0.8,
1) Calculate the activity of silver in the alloy at 1,150K. Pure solid silver is taken
2) Calculate the activity coefficient of silver in the alloy at 1,150K.
as the standard state for silver in the alloy.
Assuming the free energy of pure A at temperature 600K is set to zero, calculate the chemical potential of A in the solution of N. = 0.6.
3. The activity coefficient of zinc in liquid zinc-copper alloys in the temperature range 1,070 - 1,300K can be expressed as follows :
RTlny, = -31,6OON& where R = 8.3 14 J moT'K-'.
Calculate the vapour pressure of Zn over a Cu-Zn binary solution of N, = 0.3 at 1,280K. The vapour pressure of pure liquid zinc is given by
l0gP = - 4J620 - 2.26iogT+ 12.34 (ton) T
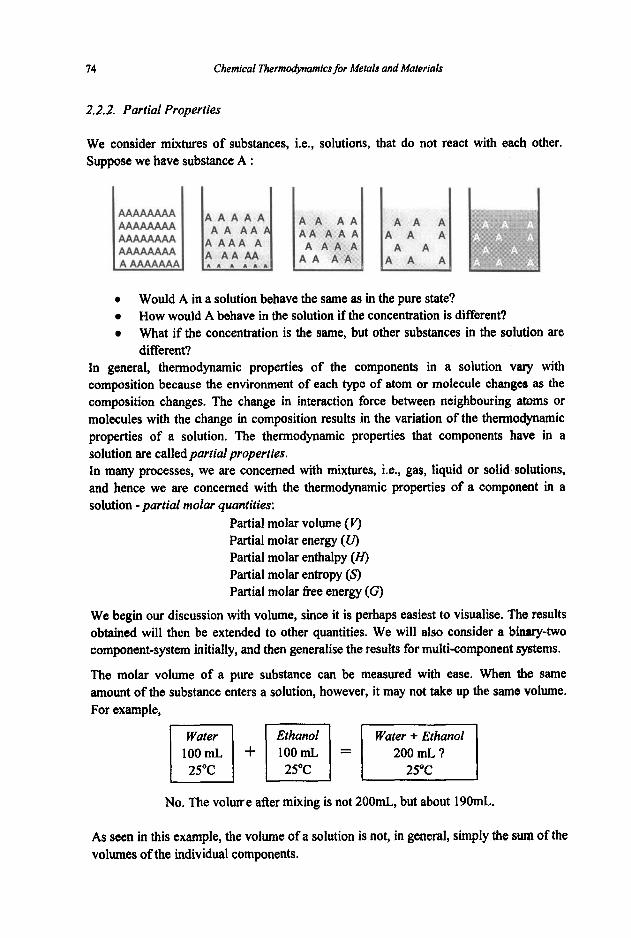
74 Chemical Thermodynamics for Metals and Materials
2.2.2. Partial Properties
We consider mixtures of substances, i.e., solutions, that do not react with each other. Suppose we have substance A :
0 Would A in a solution behave the same as in the pure state? How would A behave in the solution if the concentration is different? What if the concentration is the same, but other substances in the solution are different?
In general, thermodynamic properties of the components in a solution vary with composition because the environment of each type of atom or molecule changes as the composition changes. The change in interaction force between neighbouring atoms or molecules with the change in composition results in the variation of the thermodynamic properties of a solution. The thermodynamic properties that components have in a solution are called partial properties. In many processes, we are concerned with mixtures, i.e., gas, liquid or solid solutions, and hence we are concerned with the thermodynamic properties of a component in a solution - partial molar quantities:
Partial molar volume (V) Partial molar energy (U) Partial molar enthalpy (H) Partial molar entropy (9 Partial molar free energy (G>
We begin our discussion with volume, since it is perhaps easiest to visualise. The results obtained will then be extended to other quantities. We will also consider a binary-two component-system initially, and then generalise the results for multi-component systems.
The molar volume of a pure substance can be measured with ease. When the same amount of the substance enters a solution, however, it may not take up the same volume. For example,
Water + Ethanol El + El = El No. The volurre after mixing is not 200mL, but about 190mL.
As seen in this example, the volume of a solution is not, in general, simply the sum of the volumes of the individual components.
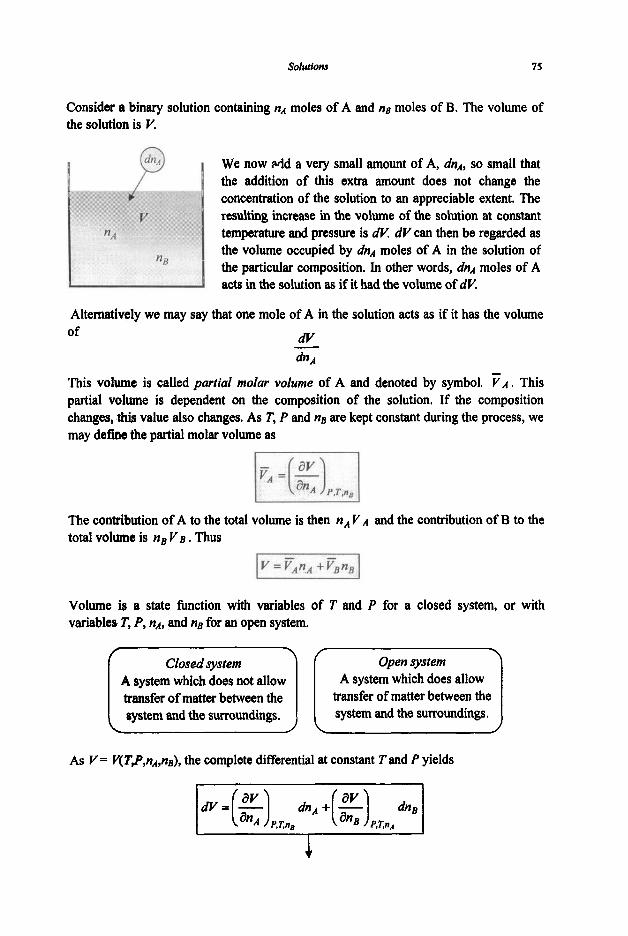
Solutions 75
Consider a binary solution containing nA moles of A and n~ moles of B. The volume of the solution is V.
We now wld a very small amount of A, dnA, so small that the addition of this extra amount does not change the concentration of the solution to an appreciable extent. The resulting increase in the volume of the solution at constant temperature and pressure is dV. dV can then be regarded as the volume occupied by dnA moles of A in the solution of the particular composition. In other words, dnA moles of A acts in the solution as if it had the volume of dV.
Alternatively we may say that one mole of A in the solution acts as if it has the volume
dv of
dnA This volume is called partial molar volume of A and denoted by symbol. F A . This partial volume is dependent on the composition of the solution. If the composition changes, this value also changes. As T, P and nB are kept constant during the process, we may define the partial molar volume as
_L
The contribution of A to the total volume is then nA V A and the contribution of B to the total volume is nE Y E . Thus
Volume is a state function with variables of T and P for a closed system, or with variables 7', P, n ~ , and nB for an open system.
A system which does not allow transfer of matter between the system and the surroundings.
A system which does allow transfer of matter between the system and the surroundings.
As V= V(TJ-',nA,ne), the complete differential at constant T and P yields

76
ofpartrial NAdEA +N,dEB = 0
Chemical ThermodyMmics for Metals and Materials
NAdsA +N,dS, = 0
1
Comparison of the above two differential equations yields I 1 Dividing by the total number of moles, n,
It is also readily seen that
r 1
where V is the molar volume of the solution or infegrul molur volume.
Similar equations may be developed for other thermodynamic properties:
I 1 Enthalpy 1 Entropy
Defmition of
properties
I I I
Free energy
- G A =
This equation is particularly important and called
Gibbs-Duhem equation.
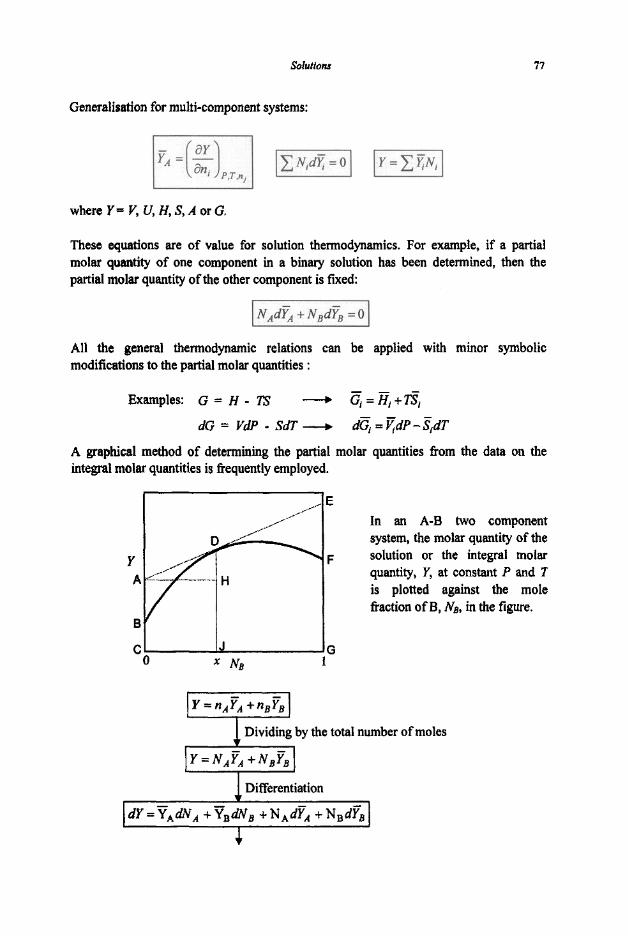
solutions 77
Generalisation for mufti-component systems:
where Y = V, U, H, S, A or G.
These equations are of value for solution thermodynamics. For example, if a partial molar quantity of one component in a binary solution has been determined, then the partial molar quantity of the other component is fixed:
I NAdc -+ NBd& = 0 I All the general thermodynamic relations can be applied with minor symbolic modifications to the partial molar quantities :
Examples: G = H - TS -+ G = q + T g
dG = VdP - SdT 4 dG =TdP-&dT
A graphical method of determining the partial molar quantities from the data on the integral molar quantities is eequently employed.
E ,. .-/ ,IC
,,/' In an A-B two component system, the molar quantity of the solution or the integral molar quantity, Y, at constant P and 7 is plotted against the mole fiaction of B, NB, in the figure.
1 F
C J G 0 * Nil 1
1 Dividing by the total number of moles
I Differentiation
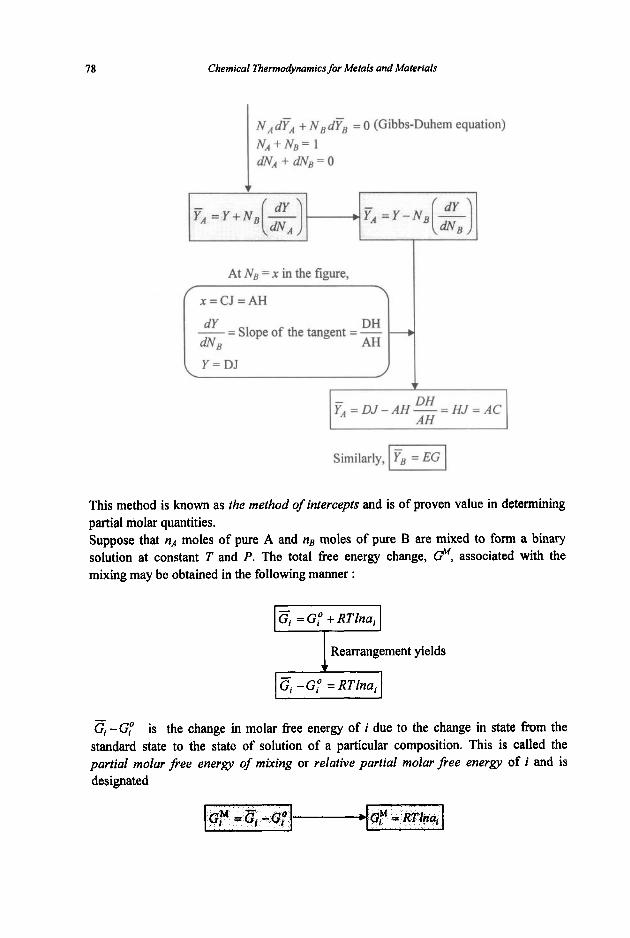
78
At NE = x in the figure,
f , = CJ = AH dY DH - = Slope of the tangent = - -+
d N B AH
\ Y=DJ
Chemical Thermodynamics for Metals and Materials
w
I DH I AH 5 = D J - A H - = HJ = AC
similarly, I F, = EG I This method is known as the method of intercepts and is of proven value in determining partial molar quantities. Suppose that nA moles of pure A and nB moles of pure B are mixed to form a binary solution at constant T and P. The total fiee energy mixing may be obtained in the following manner :
change, G", associated with the
I = G,? + RTInai I Rearrangement yields 1 I -G,? = RTlna, I
-Gf is the change in molar fiee energy of i due to the change in state h m the standard state to the state of solution of a particular composition. This is called the partial molar free energy of mixing or relative partial molar free energy of i and is designated

solutions 79
The ftee energy before mixing afer mixiig
The ftee energy
= nAGy +nBGF = RT(nA lnaA + nB h a B )
This is called the relative integral molarfiee energy or the molarfiee energy of mixing. The method of tangential intercepts which we have applied for determination of partial molar quantities from the integral molar quantities can also apply to the relative quantities :
0
For a solution of specified composition, the relative partial molar entropy can be determined ftom the data on activities at different temperatures. Recall that
Gf" = RTina, Note that data on activities at different temperatures enable us to evaluate the differential in the equation.
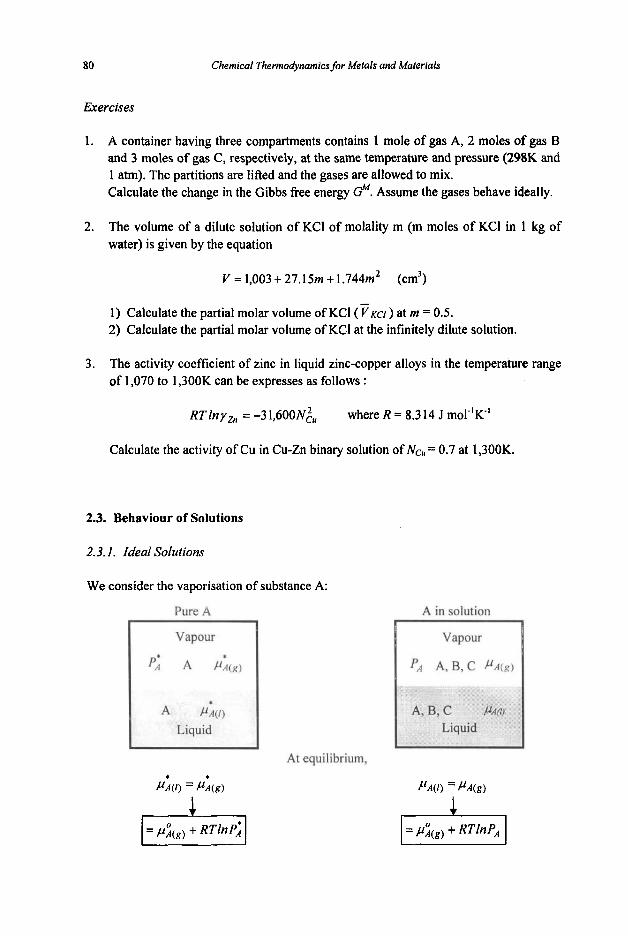
80 Chemical Thermodynamics for Metals and Materials
Exercises
1. A container having three compartments contains 1 mole of gas A, 2 moles of gas B and 3 moles of gas C, respectively, at the same temperature and pressure (298K and 1 am). The partitions are lifted and the gases are allowed to mix. Calculate the change in the Gibbs free energy G'? Assume the gases behave ideally.
2. The volume of a dilute solution of KCI of molality m (m moles of KCI in 1 kg of water) is given by the equation
V = 1,003 + 27.15m + 1.744m2 (cm3)
1) Calculate the partial molar volume of KCI ( FKCI ) at m = 0.5. 2) Calculate the partial molar volume of KCI at the infinitely dilute solution.
3. The activity coefficient of zinc in liquid zinc-copper alloys in the temperature range of 1,070 to 1,300K can be expresses as follows :
RTIn yzn = -3 1,60ON& where R = 8.3 14 J mo1"K'
Calculate the activity of Cu in Cu-Zn binary solution of NcU = 0.7 at 1,300K.
2.3. Behaviour of Solutions
2.3. I . Ideal Solutions
We consider the vaporisation of substance A:
Pure A A in solution
At equilibrium,
Vapour
PA A, B, C
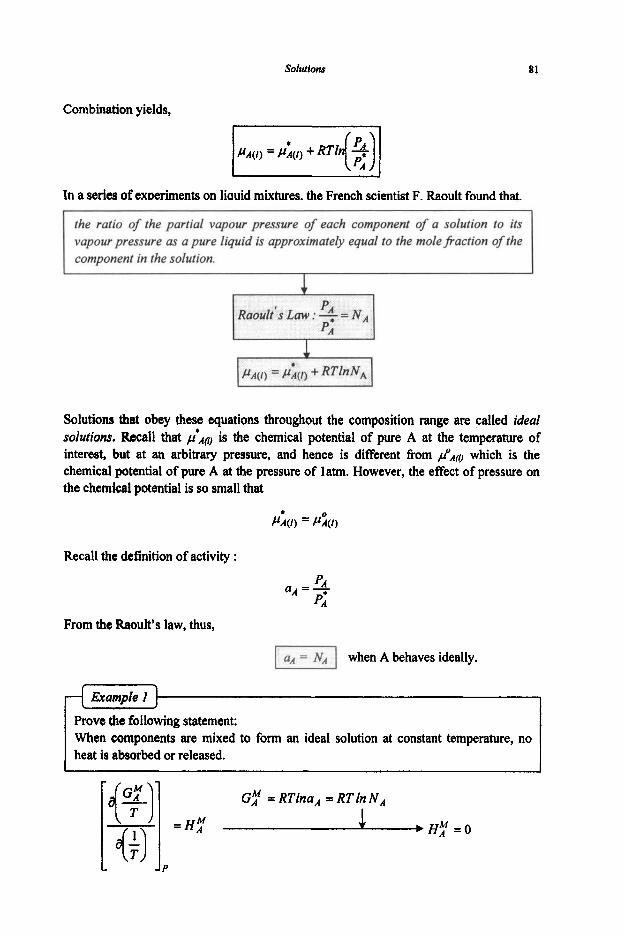
solutions
Prove &a following statement: When components are mixed to form an ideal solution at constant temperature, no heat is absorbed or released.
81
Combination yields,
In a series of experiments on liquid mixtures, the French scientist F. Raoult found that,
the ratio of the partial vapour pressure of each component of a solution to its vapour pressure as a pure liquid is approximately equal to the mole fiaction of the component in the solution.
1
Solutions that obey these equations throughout the composition range are called ideal solutions. Recall that p ' ~ 0 is the chemical potential of pure A at the temperature of interest, but at an arbitrary pressure, and hence is different from g A g , which is the chemical potential of pure A at the pressure of lam. However, the effect of pressure on the chemical potential is so small that
P i ( / ) = &(I)
Recall the defmition of activity :
From the Raoult's law, thus,
when A behaves ideally.

82 Chemical Thermo@namics for Metafs and Materials
Example 2
Prove the following statement : If species A behaves ideally in the whole composition range of A-B binary solutions, the species B also behaves ideally.
Recall the Gibbs-Duhem equation
I G,! = RTlna,
I (Ideal behaviour of A: 7
dlna, = - = d l n N , 1 7: I I integration yields 4
I lna, ==InNB +constant I But, as NB + 1, as + 1. Thus, constant = 0.
Exercises
1. Liquids A and B are completely miscible and forms an ideal solution. The vapour pressures of two liquids are 2xlO”atm and 5xlO”atm at temperature T, respectively. Calculate the mole fraction of A in liquid phase when the vapour pressure is 4x10³ am.

soturions 83
2. An ideal solution is made of 79mol% of A, 20mol% of B and lmol% of C at 298K and latm.
1) Calculate the relative partial molar fee energy of A, GY . 2) calculate the relative integral molar fiee energy ofthe solution, @. 3) Calculate the relative partial molar entropy of A, SF .
3. A liquid gold-copper alloy contains 45mol% of copper and behaves ideally at 1,320K. Calculate the amount of heat absorbed in the system when lg of solid copper is dissolved isothermally at this temperature in a large bath of the alloy of this composition. The following data given :
CP.C~{,) = 22.64 + 6.28xlO-'T, J mol-'R' Cp,cug)= 3 1.38 J moT'K' AH;,cu= 12,980 J mop' (Heat of fusion of Cu) Tm,c,,= 1,083"C (melting point of Cu) Mcu = 63.5 (atomic weight of Cu)
Calculate the change in entropy of the system in the above process.
4. A solution is composed of benzene (B) and toluene (T). The Raoult's law holds for both benzene and toluene. The equilibrium vapour pressures of benzene and toluene are 102.4kPa and 39.0kPa, respectively, at 81°C. Calculate the mole fraction of benzene in the vapour which is in equilibrium with the NB = 0.5 solution.
2.3.2. Non-ideal Solutions and Excess Properties
I solutions I t I
I
Raoult's law
=i = Y i Ni 1 &q 1 deviation
Negative r-l deviation
lml

84 Chemical Thermodynamics for Metals and Materials
Knowledge of the variation of the value of y with temperature and composition is of prime importance in solution thermodynamics. Now a question arises as to how to express the extent of deviation of this value fiom ideal behaviour. As we have discussed in the preceding section, in ideal solutions attractive forces between the unlike molecules in solution are the same as those between the like molecules in the pure phase. Therefore the escaping tendency of the component i in an ideal solution is the same as that in its pure state. From the Raoult's law,
P, = NiP,* for ideal solutions
The positive deviation is characterised by vapour pressures higher than those calculated for ideal solution. If the attraction between the unlike molecules (i-j) is weaker than the mutual attraction of like molecules (i-i or j- j) , then the escaping tendencies of the molecules are higher than the escaping tendencies in the individual pure states.
The negative deviation, on the other hand, is characterised by vapour pressures lower than those calculated for ideal solution. If the attraction between the unlike molecules (i- j ) is stronger than the mutual attraction of the like molecules (i-i orj-j), then the escaping tendencies of the molecules in the solutions are lower than escaping tendencies in the individual liquids. Thus
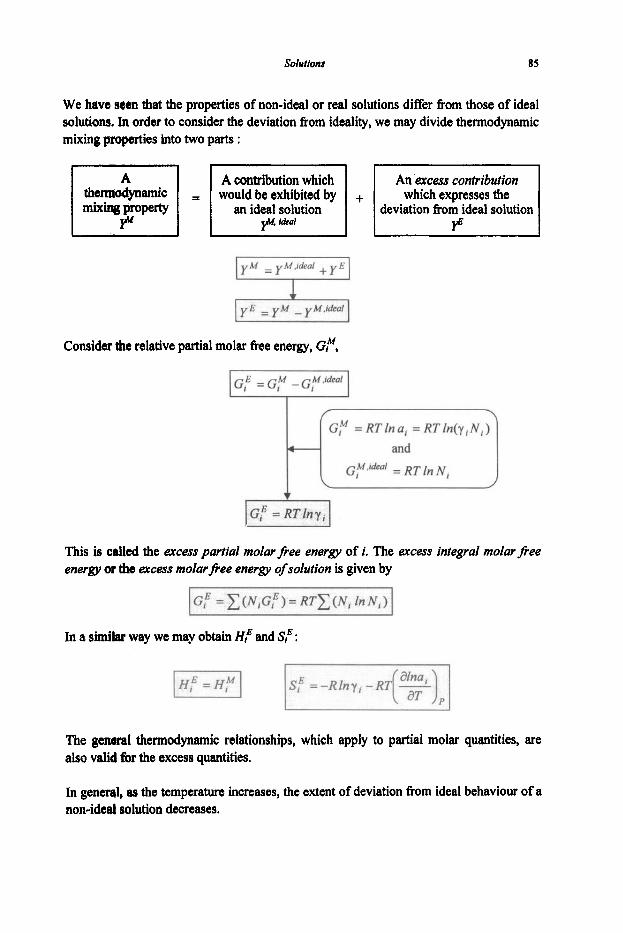
solulioru 85
We have seen that the properties of non-ideal or real solutions differ from those of ideal solutions. In order to consider the deviation from ideality, we may divide thermodynamic mixing pmpcrties Into two parts :
I t h e m & d c an ideal solution p, I&al
which expresses the deviation fiom ideal solution
is called the excess property.
Consider the relative partial molar flee energy, Gf",
GY = RTlna, = RTln(y,N,)
This is called the excess partial molar fiee energy of i. The excess integral molar fiee energy or the excess molarfiee energy of solution is given by
In a simlk way we may obtain lf: and SF :
The gemral thermodynamic relationships, which apply to partial molar quantities, are also valid fior the excess quantities,
In gened, as the temperature increases, the extent of deviation Erom ideal behaviour of a non-ideaf solution decreases.

86 Chemical Thermodynnmicsfor Metals and Materials
Thus in a solution, if y, > 1, then yi decreases as T increases. If yi < 1, then yf increases as T increases.
The activity coefficient of a particular component in solution is a measure of the interaction that occurs between atoms or molecules in solution. If yi > I , then G," > 0 (recall G," = RT lny,).
Example I
Prove that, if a component in a solution exhibits positive deviation from ideality, i.e., yf > 1, then the solution process is endothermic.
Recall that, if > 1, increase in T results in decrease in yt. Thus the left-hand side of the above equation becomes negative and hence Hi" is positive - endothermic. In a simiIar way one may find that, if y, < 1, then the solution process is exothermic. If the solution process in an z- j binary system is endothermic, the i-i and j - j attractions are greater than the i-j attraction. i atoms attempt to have only i atoms as nearest neighbours - tendency toward phase separation or clustering.
If the solution process is exothermic, the i-i andj-j attractions are smaller than the i-j attraction. i atoms attempt to have onlyj atoms as nearest neighbours, a n d j atoms attempt to have only i atoms as nearest neighbours - tendency toward compound formation.

solur ions 87
1. The excess integral molar free energy of the Ga-P binary solution containing up to 50mol% P is
Gfi = (-7.53 T - 2,500)NpNh, Jmol"
Calculate the amount of heat associated with the formation of one mole of solution containiig 20mol% P.
2. The integral molar enthalpy and entropy of the Cd-Zn liquid alloy at 432°C are described by the following empirical equations :
= 6,700Ncdvz, - 1 ,50ONz,, In Nzn, Jmol-'
fl = -8.4(N~dh Ncd -I- Nz,,ln Nz,) Jmor'K'
Calculate the excess partial molar free energy of cadmium, G:~, at Ncd = 0.5.
2.3.3. Dilute Solutions
When the following relationship holds:
Vapour pressure of i in equilibrium with
( 4 1
then we say that the solute i in the solution obeys Raoult's law and behaves ideally. The ideal behaviour is graphically represented in the following figure :

88 Chemical Thermodynamics for Metals and Materials
A E a =-=- A* E*
In real solution, on the other hand, the vapour pressure of a solute deviates from Raoult's law.
4 Hewy+s law
I I
When a solution is sufficiently dilute in component i, the vapour pressure exerted by component i is linearly proportional to the concentration of component i .
This relationship is known as Henry's Law.
Note that k, is the slope of the tangent drawn from the zero concentration. Note also that, if k, = Pi', then Henry's law becomes identical to Raoult's law. Thus, Henry's law may be considered more general than Raoult's law. From the figure we can see that the component i obeys Henry's law up to the mole fraction of x.
0
Summary of fiaoult s law and Henry's law:
r )
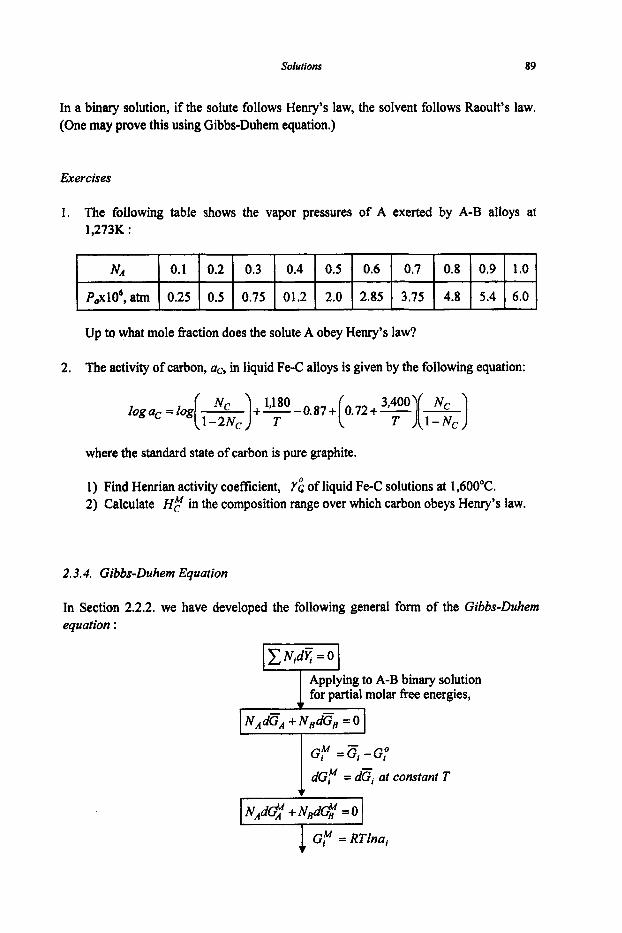
solutions 89
NA 0.1 0.2 0.3 0.4 0.5
P,,xlO',atm 0.25 0.5 0.75 01.2 2.0
In a binary solution, if the solute follows Henry's law, the solvent follows Raoult's law. (One may prove this using Gibbs-Duhem equation.)
0.6 0.7 0.8 0.9 1.0
2.85 3.75 4.8 5.4 6.0
Exercises
1. The following table shows the vapor pressures of A exerted by A-B alloys at 1,273K :
2. The activity of carbon, ac, in liquid Fe-C alloys is given by the following equation:
where the standard state of carbon is pure graphite.
1) Find Henrian activity coefficient, Y z of liquid Fe-C solutions at 1,600"C. 2) Calculate HF in the composition range over which carbon obeys Henry's law.
2.3.4. Gibbs-Duhem Equation
In Section 2.2.2. we have developed the following general form of the Gibbs-Duhem equation :
to A-B binary solution for partial molar free energies,
- GM =Gi-G,O
dG,! = d G at constant T
INAd#+NBd@=OI
1 GM = RTlna,
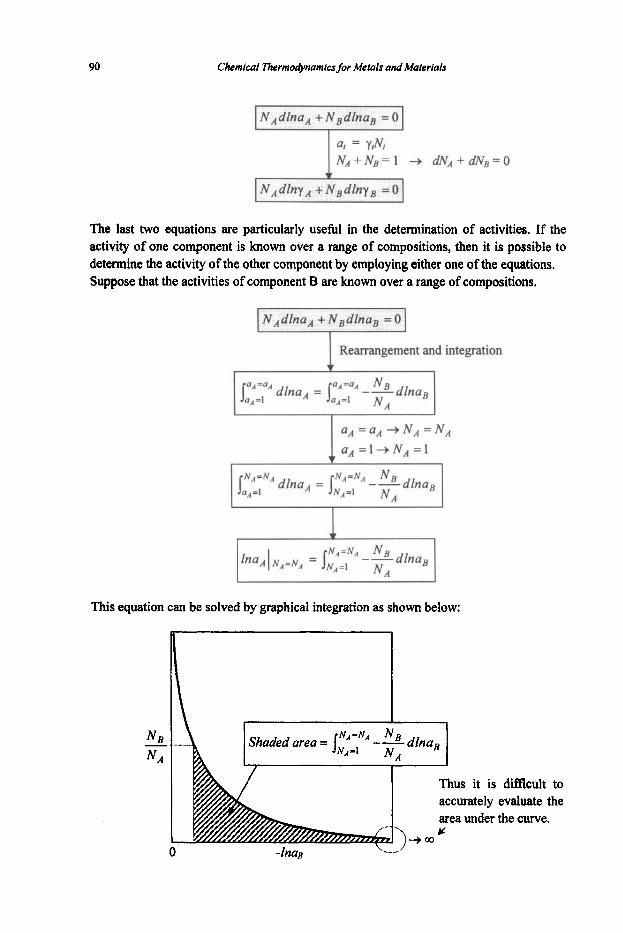
90 Chemlcal ThermodyMmics for Metals and Materials
NAdlna, + NBdlnaB = 0
The last two equations are particularly useful in the determination of activities. If the activity of one component is known over a range of compositions, then it is possible to determine the activity of the other component by employing either one of the equations. Suppose that the activities of component B are known over a range of compositions.
Rearrangement and integration
This equation can be solved by graphical integration as shown beiow:
I \ I
Thus it is difflcult to accurately evaluate the area under the curve.
0
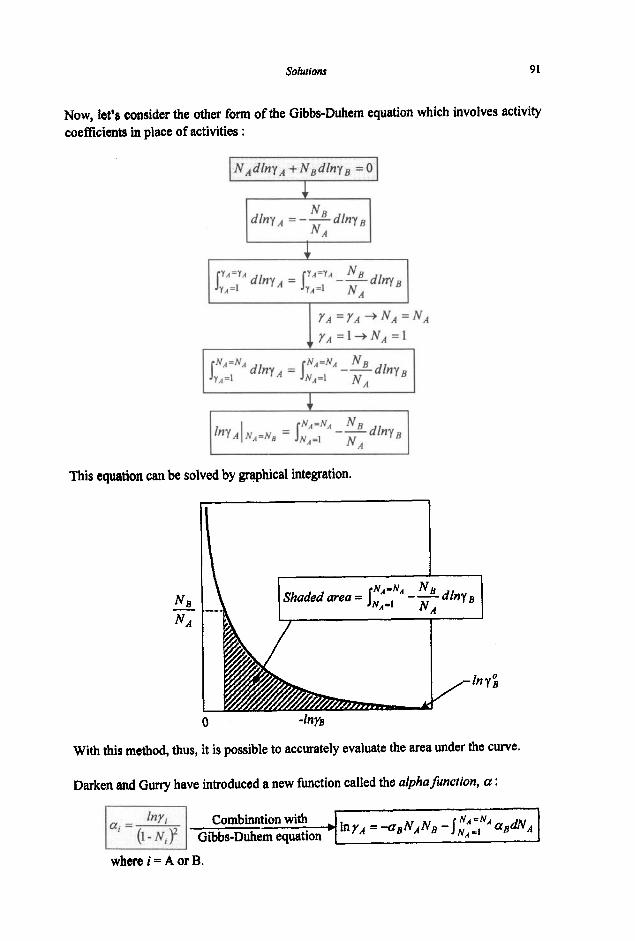
Solutiom 91
Now, let’s consider the other form of the Gibbs-Duhem equation which involves activity coefficients in place of activities :
This equation can be solved by graphical integration.
I.
0
With this method, thus, it is possible to accurately evaluate the area under the curve.
Darken and Guny have introduced a new function called the alpha function, a :
where i = A or B.
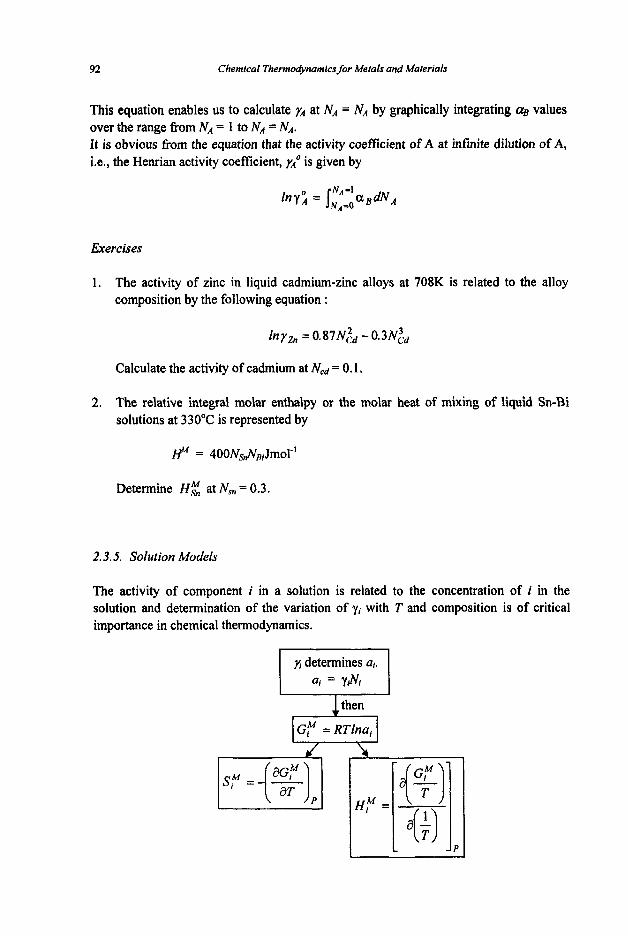
92 Chemical Thermodynamics for Metals and Materials
This equation enables us to calculate 7~ at NA = NA by graphically integrating CZB values over the range ffom NA = 1 to NA = NA. It is obvious from the equation that the activity coefficient of A at infinite dilution of A, i.e., the Henrian activity coefficient, yAo is given by
Exercises
1. The activity of zinc in liquid cadmium-zinc alloys at 708K is related to the alloy composition by the following equation :
lny , = 0 . 8 l N & -0.3N&
Calculate the activity of cadmium at Ncd = 0.1,
2. The relative integral molar enthdpy or the molar heat of mixing of liquid Sn-Bi solutions at 330°C is represented by
# = 400Ns,&IJmol~'
Determine Hg at N , = 0.3.
2.3.5. Solution Models
The activity of component i in a solution is related to the concentration of i in the solution and determination of the variation of yi with T and composition is of critical importance in chemical thermodynamics.
yi determines al. Qi = %N,
I G F = RTlna, I

solur ions 93
Several formalisms have been developed to relate the activity coefficient of a component in the sofution to the temperature and composition of the solution. We now discuss the following two models :
Regular solution model Margules formalism
Regular SoIutions
Some solutions exhibit that mixing is random (ideal solution), but net heat absorbed or released is not zero (E.r" # 0: non-ideal solution). Solutions, which exhibit the behaviour above-mentioned, are called regular solurions.
for A-B binary solution,
Hildebrand. showed that in the regular binary A-B solution,
st is called the interaction parameter and independent of composition and temperature. Let's examine the properties of a regular solution using the concept of excess properties.
Comparing the excess free energies with the excess enthalpies, we obtain
for regular solutions
* J.H. Hildebrand, J. Amer. Chem. Soc., 51,1929,p66-80
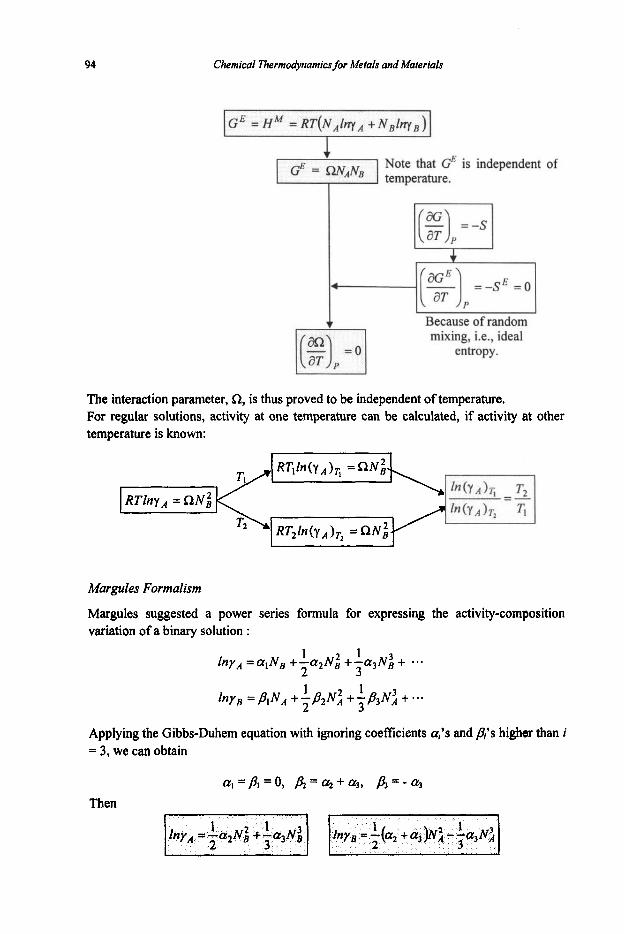
94
4
Chemical Thermodynamics for Me fais and Maferials
4 [g) = - S f i = O P
Note that GE is independent of +I temperature.
The interaction parameter, n, is thus proved to be independent of temperature. For regular solutions, activity at one temperature can be calculated, if activity at other temperature is known:
Margules Formalism
Margules suggested a power series formula for expressing the activity-composition variation of a binary solution :
1 1 2 3
lny, = a , N s + - a , N i + - a 3 N i +
hy, =PIN, + T & N ~ 1 + 7 $ 3 N ~ 1 3 +-..
Applying the Gibbs-Duhem equation with ignoring coefficients a,'s and f l s higher than i = 3, we can obtain
Then
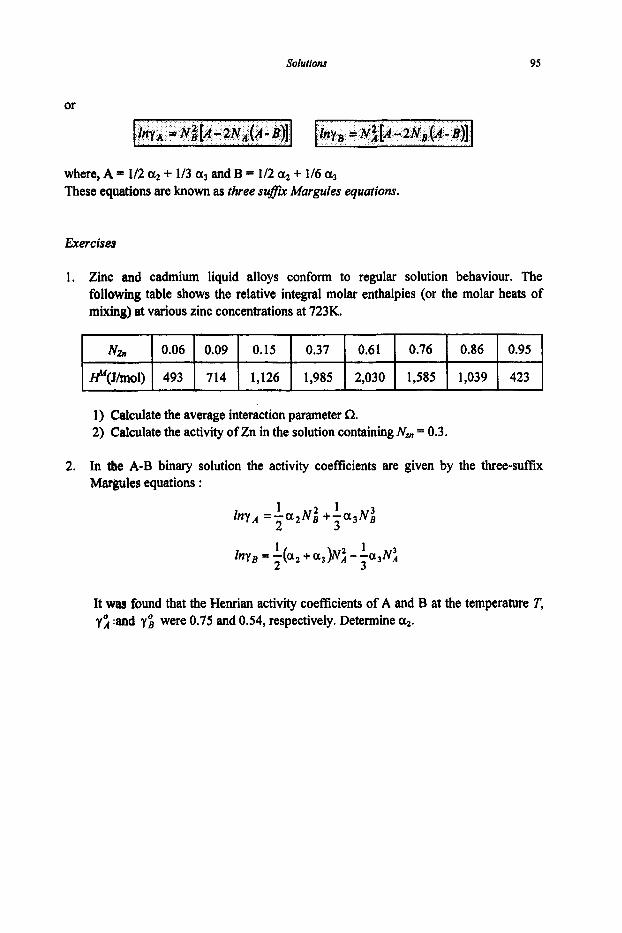
Solutiom
Na 0.06 0.09 0.15 0.37 0.61
rr"<Jlmol) 493 714 1,126 1,985 2,030
95
0.76 0.86 0.95
1,585 1,039 423
or
where, A = 1/2 az + 113 al and B = 1/2 a2 + 116 a3 These equations are known as three sufu Margules equations.
Exercises
1. Zinc and cadmium liquid alloys conform to regular solution behaviour. The following table shows the relative integral molar enthalpies (or the molar heats of mixing) at various zinc concentrations at 723K.
1) Calculate the average interaction parameter Q. 2) Calculate the activity of Zn in the solution containing N, = 0.3.
2. In the A-B binary solution the activity coefficients are given by the three-suffix Matgules equations :
It was found that the Henrian activity coefficients of A and B at the temperature T, y i and y i were 0.75 and 0.54, respectively. Determine az.


CHAPTER 3
EQUILIBRIA
3.1.
3.1.
Reaction Equilibria
Equilibrium Constant
Consider a general chemical reaction occurring at constant temperature and pressure :
aA + 6B + ... = mM + nN +
where U, 6, ..., my n, ... are stoichiometric coefficients indicating the number of moles of respective species A, By ..., My N, ....
Let AGr denote the free energy change associated with the above reaction.
I - - ZGmaCt,, = aG, +bGB +..* Z G p d , = mGM +nGN +** .
and, for any species in solution, - - = GP + RTlna,
activity quotient, Q as
i M where AG; =(mG& +nGg +..)-(aGi +6Gi +..) + The free energy change of reaction when all reactants and products are at their respective standard states - Standardfiee
\ , energy change of reaction,
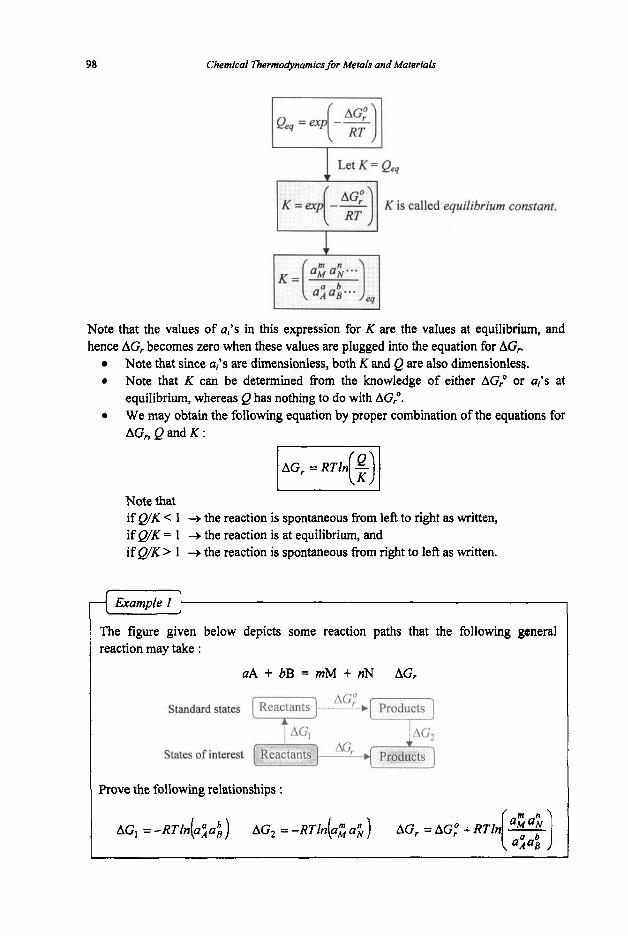
98 Chemical Thermodynamics for Metals and Materials
K is called equilibrium constant.
Note that the values of al’s in this expression for K are the values at equilibrium, and hence AG, becomes zero when these values are plugged into the equation for AG,,
Note that since a,‘s are dimensionless, both K and Q are also dimensionless. Note that K can be determined from the knowledge of either AG,O or al’s at equilibrium, whereas Q has nothing to do with AG,O. We may obtain the following equation by proper combination of the equations for AG,, Q and K :
0
0
Note that if Q/K < 1 + the reaction is spontaneous from left to right as written, if Q/K = 1 + the reaction is at equilibrium, and if Q/K > 1 + the reaction is spontaneous from right to left as written.
The figure given below depicts some reaction paths that the following general reaction may take :
aA + bB = mM + nN AGp
Standard states [F] W L P r o d q c t s ]
I AC;, c c
States of interest
1 Prove the following relationships :
AGl = -RTln(a:af;) AG, = -RTln(aga$ AGr = AGp + RTln [;:I -
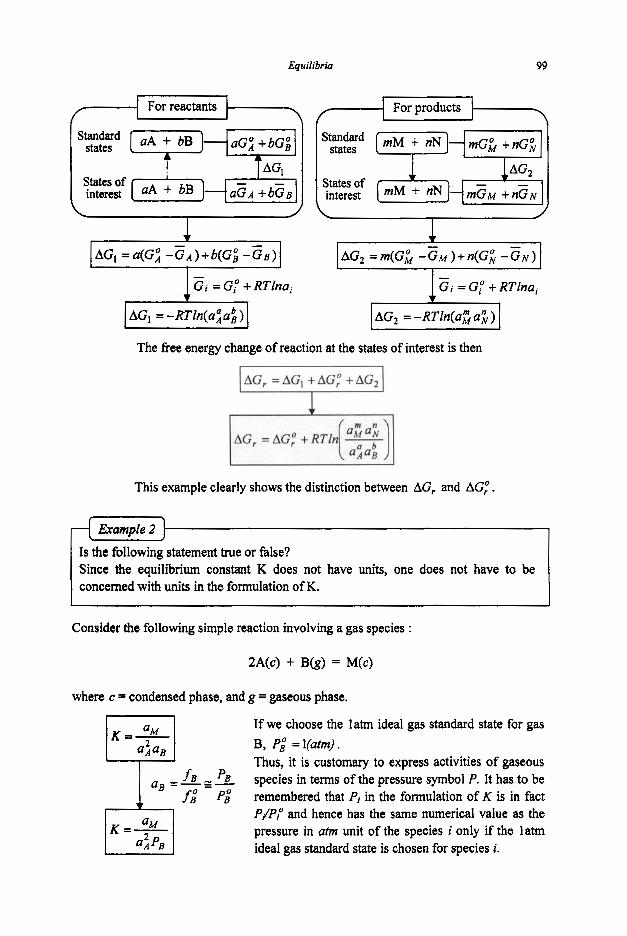
Equifibria 99
Is the following statement m e or false? Since the equilibrium constant K does not have units, one does not have to be concerned with units in the formulation of K.
For reactants For products
states
interest
I 1 1 I I
The free energy change of reaction at the states of interest is then
This example clearly shows the distinction between AG, and AG; .
2A(c) + B(g) = M(c)
where c = condensed phase, and g = gaseous phase.
If we choose the latm ideal gas standard state for gas B, Pi = l(atm). Thus, it is customary to express activities of gaseous species in terms of the pressure symbol P. It has to be remembered that P, in the formulation of K is in fact PJP; and hence has the same numerical value as the pressure in atm unit of the species i only if the l a m ideal gas standard state is chosen for species i.
aB = & = - !!L fi Pi
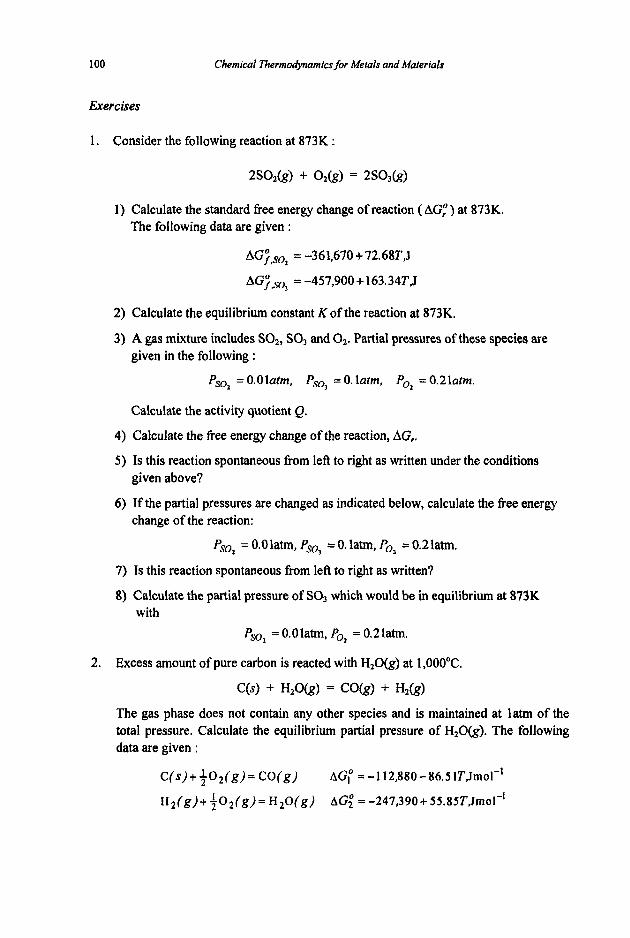
100 Chemical Thermodynamics for Metals and Materials
Exercises
1. Consider the following reaction at 873K :
1) Calculate the standard 6ee energy change of reaction ( AGyO ) at 873K. The following data are given :
AG?,so, = -361,670 + 72.683,J
AG;,sq = -457,900 + 163.34T,J
2) Calculate the equilibrium constant K of the reaction at 873K.
3) A gas mixture includes SO2, SO3 and Oz. Partial pressures of these species are given in the following :
Pso, = O.Olatm, Pso, = 0. latm, PO, = O.2latm.
Calculate the activity quotient Q.
4) Calculate the free energy change of the reaction, AG,. 5 ) Is this reaction spontaneous from left to right as written under the conditions
6) If the partial pressures are changed as indicated below, calculate the free energy
Pso, = O.Olatm, Pso, = 0. latm, PO, = 0.2latm.
given above?
change of the reaction:
7) Is this reaction spontaneous from left to right as written?
8) Calculate the partial pressure of SO3 which would be in equilibrium at 873K
Pso, = O.Olatm, PO, = 0.2latm. with
2. Excess amount of pure carbon is reacted with H20(g) at 1,OOO"C.
C(4 + H20k) = CO&) + HZ&)
The gas phase does not contain any other species and is maintained at latm of the total pressure. Calculate the equilibrium partial pressure of H20(g). The following data are given :
C ( s ) + t 0 2 ( g ) = CO(g)
H2(g)+ +02(g)= H 2 0 ( g )
AG; = -1 12,880-86.S1T,Jmol-'
AG; = -247,390+ 55.85T,Jmol-'
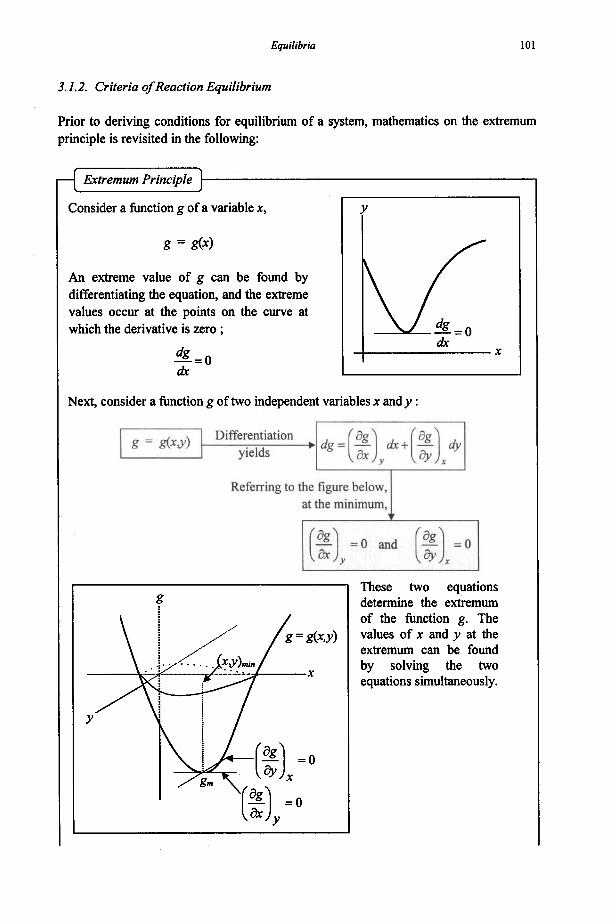
Equilibria 101
3.1.2. Criteria of Reaction Equilibrium
Prior to deriving conditions for equilibrium of a system, mathematics on the extremum principle is revisited in the following:
4 Extremum Principle t I
Consider a function g of a variable x,
An extreme value of g can be found by differentiating the equation, and the extreme values occur at the points on the curve at which the derivative is zero ;
-=o dg dx
X dx
Next, consider a function g of two independent variables x and y :
Differentiation yields
Referring to the figure below, at the minimum,
These two equations determine the extremum of the function g. The values of x and y at the extremum can be found by solving the two equations simultaneously.
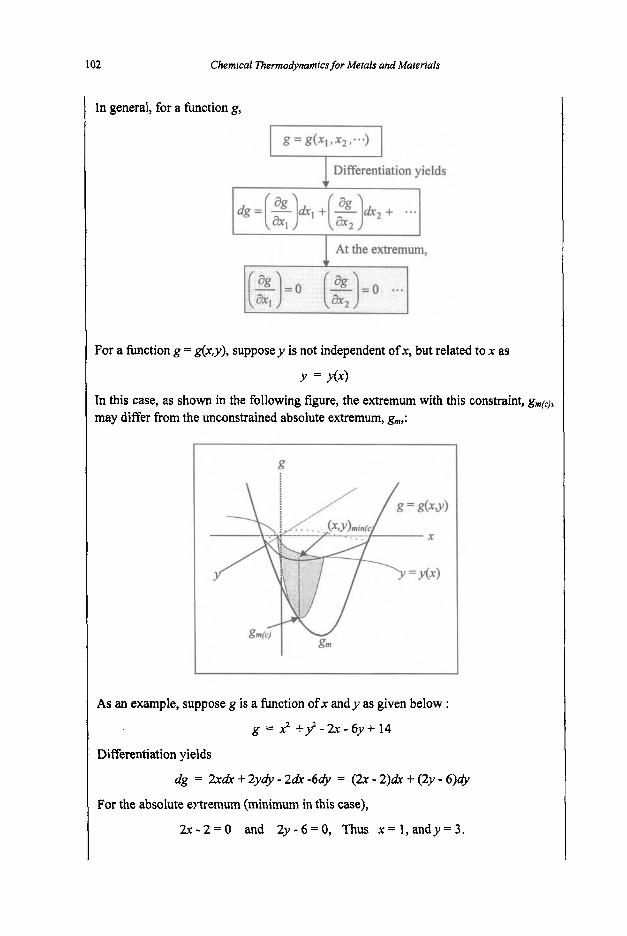
102 Chemical Therntodynamicsfor Metals and Materials
In general, for a function g,
I At the extremum,
For a function g = g(x,y), suppose y is not independent of x, but related to x as
Y = y(x)
In this case, as shown in the following figure, the extremum with this constraint, g,(+ may differ from the unconstrained absolute extremum, g,,,,:
As an example, suppose g is a function of x and y as given below :
g = ~ ~ t - $ - k - 6 y t - 1 4
Differentiation yields
dg = 2xdr+2~@-2dr-6@ = ( 2 ~ - 2 ) & + ( 2 ~ - 6 ) @
For the absolute eytremum (minimum in this case),
2x-2=0 and 2 y - 6 = 0 , Thus x=I ,andy=3.
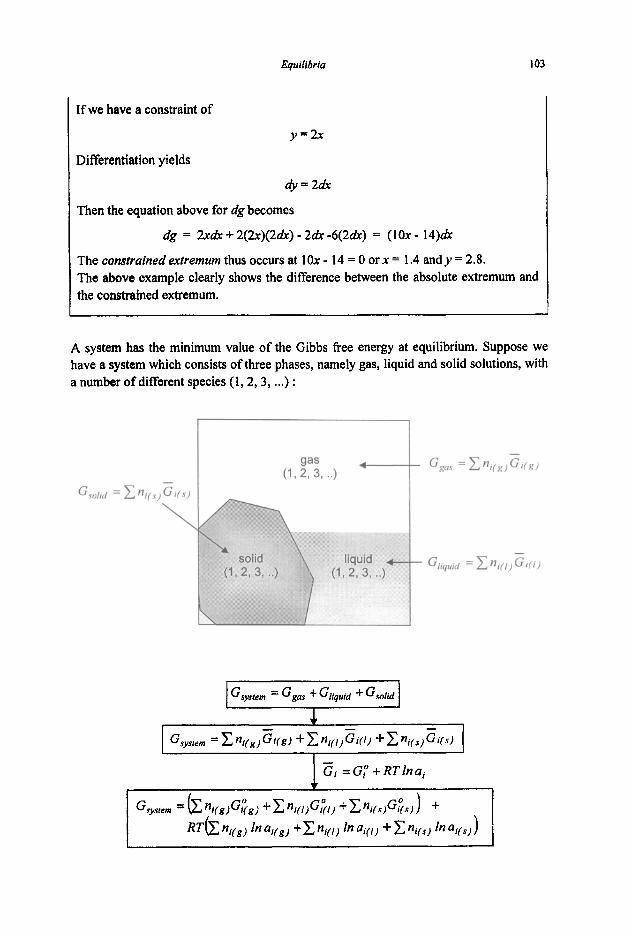
Equilibria 103
If we have a constraint of
y=2X
Differentiation yields
4 = 2 &
Then the equation above for dg becomes
dg = 2X& + 2(2x)(2&) - 2& -6(2&) = ( 1 0 ~ - 14)rfx
The constrained mtremum thus occurs at 1Ox - 14 = 0 or x = 1.4 and y = 2.8. The above example clearly shows the difference between the absolute extremum and the constrained extremum.
A system has the minimum value of the Gibbs free energy at equilibrium. Suppose we have a system which consists of three phases, namely gas, liquid and solid solutions, with a number of different species (1,2,3, ...) :
The total Gibbs free energy of the system (G,y,,m )
I Gi =GP + RTlna,
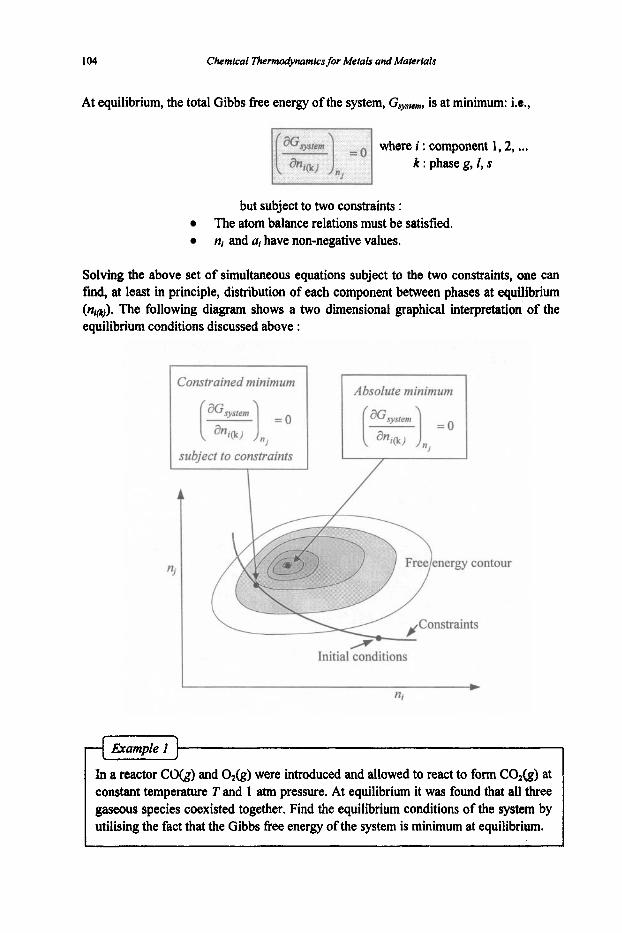
104 Chemical Thermodynanrics for Metals and Materials
At equilibrium, the total Gibbs ftee energy of the system, GsYslern, is at minimum: i.e.,
where i : component 1,2, ... k : phase g, I, s
but subject to two constraints : The atom balance relations must be satisfied. nl and at have non-negative values.
Solving the above set of simultaneous equations subject to the two constraints, one can find, at least in principle, distribution of each component between phases at equilibrium (nt@,). The following diagram shows a two dimensional graphical interpretation of the equilibrium conditions discussed above :
Constrained minimum
(-) = o " I
subject to constraints v
Absolute minimum
[-) = o "i
n.,
Initial conditions
In a reactor CO@ and O&) were introduced and allowed to react to form CO&) at constant temperature T and 1 atm pressure. At equilibrium it was found that all three gaseous species coexisted together. Find the equilibrium conditions of the system by utilising the fact that the Gibbs free energy of the system is minimum at equilibrium.
I
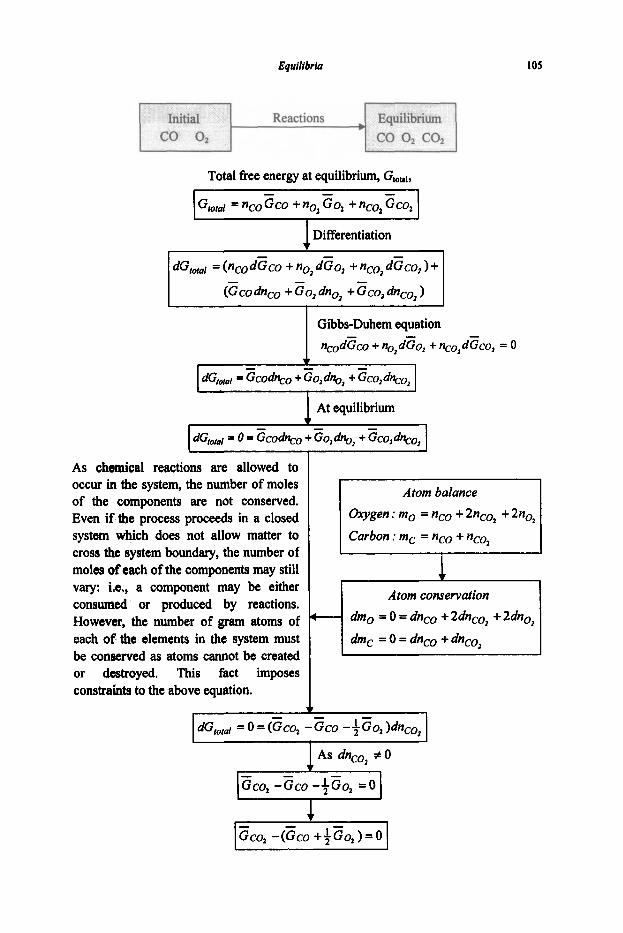
Equllibrta
occur in the system, the number of moles of the components are not conserved. Even if the process proceeds in a closed systom which does not allow matter to cross the system boundary, the number of moles of each of the components may still
105
Atom balance Oxygen : mo = nco + 2nco1 + 2nO2 Carbon : mc = nco + ncol
i
1
Total free energy at equilibrium, GmuI,
G,,, = nco Gco + nol Gol + ncol Gco,
Differentiation
Gibbs-Duhem equation ncod&o + %,d-do, + nco,dGco, = 0
-
1 At equilibrium
I I
As chemical reactions are allowed to I
Atom conservation dmo = 0 = dnco + 2dnc0, + 2dn0,
vary: i.e., a component may be either consumed or produced by reactions. However, the number of gram atoms of each of the elements in the system must be conserved as atoms cannot be created or destroyed. This fact imposes constraints to the above equation.
dm, = 0 = dnco + dnco, I
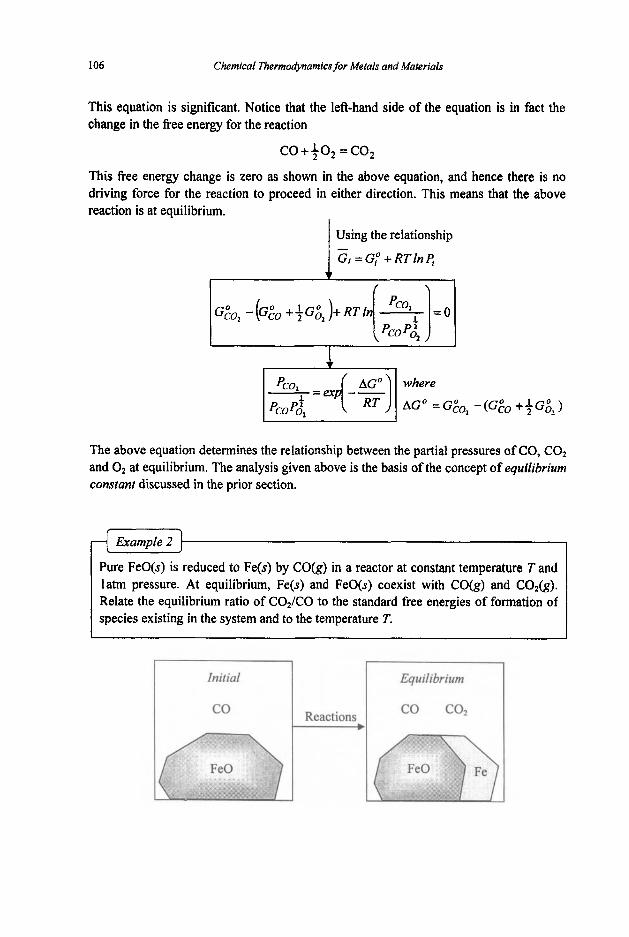
106 Chemical Thermo&namicsfor Metals and Materials
This equation is significant. Notice that the left-hand side of the equation is in fact the change in the free energy for the reaction
CO+$O, =CO,
This free energy change is zero as shown in the above equation, and hence there is no driving force for the reaction to proceed in either direction. This means that the above reaction is at equilibrium.
Using the relationship
The above equation determines the relationship between the partial pressures of CO, CO2 and O2 at equilibrium. The analysis given above is the basis of the concept of equilibrium constant discussed in the prior section.
Pure FeO(s) is reduced to Fe(s) by CO&) in a reactor at constant temperature T and latm pressure. At equilibrium, Fe(s) and FeO(s) coexist with CO(g) and CO&). Relate the equilibrium ratio of C02/C0 to the standard free energies of formation of species existing in the system and to the temperature T.
I I
Initial m r - l Equilibrium
CO I CO CO, Reactions
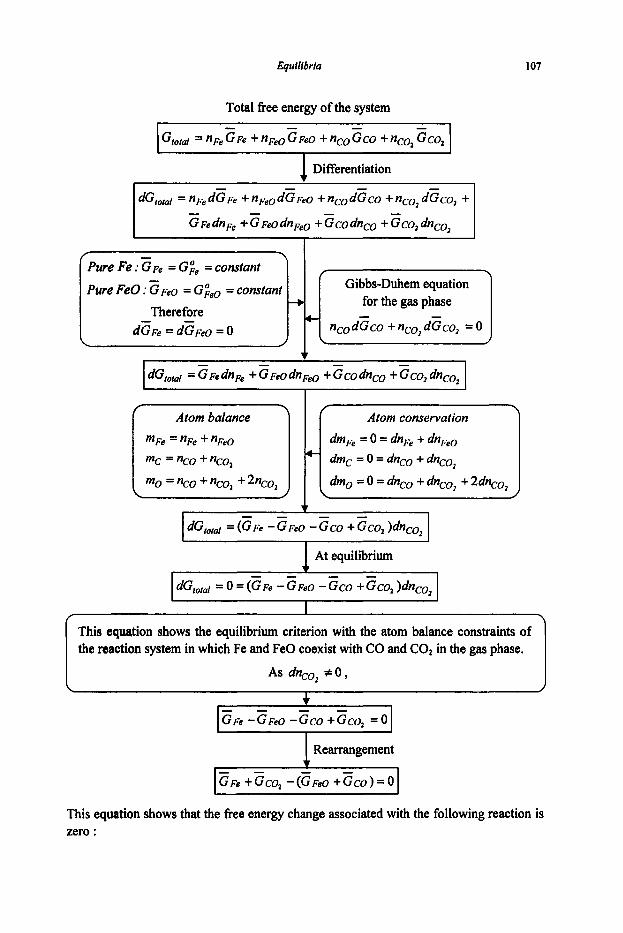
107
- /Pure Fe : GFe = Gge = constant '
Pure Fe0 : G Fe0 = GFeo = constant
dGFe = dGFeo = O L J
- -b
Therefore - -
Equilibria
Gibbs-Duhem equation for the gas phase
ncodGco + nco, dGco, = 0 - -
\ w
Total free energy of the system
- Atom conservation
mFe = nFe nFeO dmFe = 0 = dnFe + dnFeo
mc = nco + "CO, dm, = 0 = dnco + dnco,
dm, = 0 = dnco + dnco, + 2dncol
- - - - dGtotai = (G F= - G Fe0 - Gco + Gco, )dnco, ,-, At equilibrium
dGtotai = 0 = (GFe - G Fe0 - GCO + Gco, )dnco,
This equation shows the equilibrium criterion with the atom balance constraints of the reaction system in which Fe and Fe0 coexist with CO and CO2 in the gas phase.
As d"C0, f 0,
Rearrangement
GFe +Gco, -(GFeO +Gco)=O
This equation shows that the fiee energy change associated with the following reaction is zero :
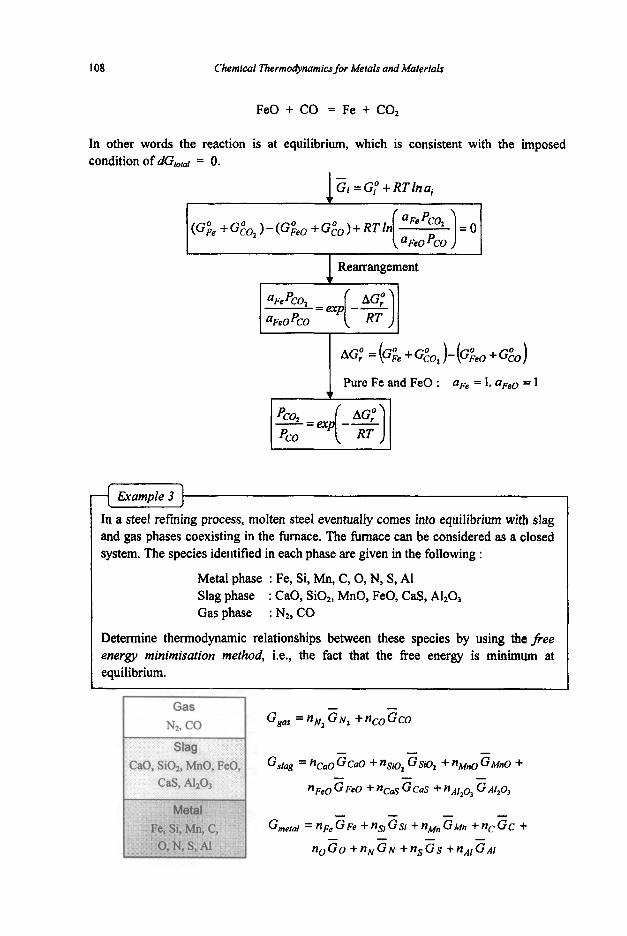
108 Chemical Thermodynamics for Metals and Materials
Fe0 + CO = Fe + CO2
In other words the reaction is at equilibrium, which is consistent with the imposed condition of dG,,t = 0.
- Gi =G,O + RTlna,
(G;e +GEo2)-(GFeo +GE0)+ RTIn [ ::o:;)=O Rearrangement
Example 3
In a steel refming process, molten steel eventually comes into equilibrium with slag and gas phases coexisting in the funrace. The fbmace can be considered as a closed system. The species identified in each phase are given in the following :
Metal phase : Fe, Si, Mn, C, 0, N, S, A1 Slag phase : CaO, SO2, MnO, FeO, CaS, A1203 Gas phase : N2, CO
Determine thermodynamic relationships between these species by using the free energy minimisation method, i.e., the fact that the free energy is minimum at equilibrium.

Equilibria
Substituting Ggm, Gsiag, and Gmetoi with the equations given above, and applying Gibbs-Duhem equation,
109
b
‘ Notice that each of these reactions indicates that the free energy change of the corresponding reaction must be zero: i.e., the reaction is at equilibrium.
1/2Nz = N c + o = c o CaO + S = CaS + 0 Mn + 0 = MnO Si + 20 = SiO, Fe + 0 = Fe0 2AI + 3 0 = A1203 \
- - (G AI,O~ - 2G AI - 350) dnAi,O,
At equilibrium, dGtoul = 0 and h i ’ s f 0

110 Chemical Thermodynamics for Metals and Materials
The above analysis results in an important conclusion : If a system is at equilibrium, all subsystems in the system must also be at equilibrium.
Combining each of the above equations with the equation Gi = G,’ + RT In a,
where AGE = GE -*GI;2
where AGEo = GEo - GZ - Gg
where AG& = GEOs + Gg - G& - G,O
where AGhno = Ghn0 - GLn - GZ
where AGliol = G&ol -G!i -2Gs
where AGR, = GEeo - G;e - Gg
where AGillo, = G;ll0, - 2Gi1 - 3G:
If the system is at equilibrium, all of the above equations must be satisfied simultaneously. Each of the equations is the condition for equilibrium of the corresponding reaction which occurs in the system. Notice that the number of equations, i.e., the number of independent reactions (r) is related with the number of components (c) and the number of elements (e) by the equation
For instance, for the system under discussion, c = 16 (N2, CO, CaO, SOz, MnO, FeO, CaS, AI2O3, Fe, Si, Mn, C, 0, N, S , AI) e = 9 (N, C , 0, Ca, Si, Mn, Fe, S, Al) r = 1 6 - 9 = 7 More discussion with rigor is given in the section 3.2.1.
Equiltbrta
Species
AG;(Jmol-')
111
K CO CO2 K2CO3
0 -235,100 -396,300 -708,700
Exercises
1. A system consisting of ZnO(s), C(s), CO&), Zn(g), CO2&) and 0, is at equilibrium at 1200K and latm. Using the free energy minimisation method, calculate the equilibrium partial pressures for gaseous species in the system. The following data are given :
Zn(g*O,(g)=ZnO(s) AGO = -460,240+ 198.32T,Jmol-'
C(s)+O,(g)=CO(g)
C(s)+02(g)=C02(g)
AGO = -1 12,880 - 86.51T,Jmol-'
AGO = -394,760 - 0.836T,Jmol-'
2. Excess K2C03 and C are heated together in an initially evacuated vessel to a temperature of 1,400K and allowed to reach equilibrium. No liquid or solid phases are hrmed. The gas phase contains K, CO and CO2. Calculate the partial pressures of these species at 1,440K. Use the free energy minimisation method. The following data are given :
3. A reducing gas mixture consisting of 24 mol% CO, 4 mol% CO2, 60 mol% Hz and 12 mol% HzO is passed through a packed bed of wustite (FeO) pellets held at 1,100K. The pressure is maintained constant at 2.8atm. Assuming that the gas phase and the solids are in equilibrium, calculate the composition of the exit gas phase using the fkee energy minimisation method. The following data are given :
C(s) ++O2(g) = CO(g) AC" = -1 12,880-86.51T,Jmol-'
C(s)+ 02(g) = C02(g) AGO = -394,760 - 0,836T,Jmol-'
Fe(s) + +O2(g) = FeO(s) AGO = -264,000 + 64.59T,Jmol-'
H2(g) + $02(g) = H20(g) AGO = -247,390 +- 55.85T,Jmol-'
3.1.3. Effect of Temperature on Equilibrium Constant
How will the position of equi'ibrium change when the temperature is altered? We can answer this question b:, using the thennodpanic relations we have developed so far.
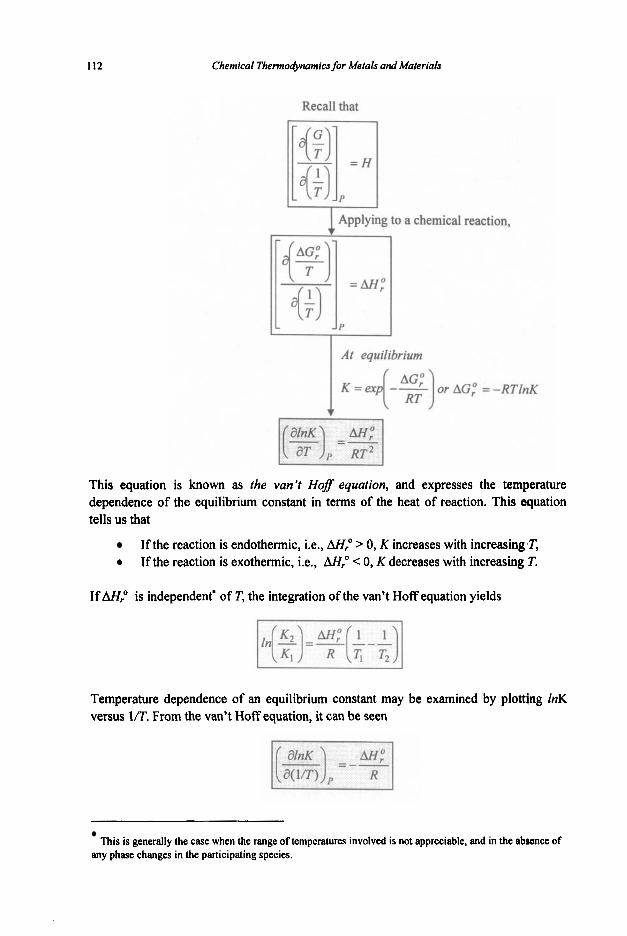
112 Chemical Thermodynnmics for Metals and Materials
Recall that [#] = H
P 1 Applying to a chemical reaction,
) or AGP = -RTlnK
This equation is known as the van't Hofl equation, and expresses the temperature dependence of the equilibrium constant in terms of the heat of reaction. This equation tells us that
0
0
If the reaction is endothermic, i.e., AH," > 0, K increases with increasing T, If the reaction is exothermic, i.e., AH," 0, K decreases with increasing T.
If AH," is independent' of T, the integration of the van't Hoff equation yields
Temperature dependence of an equilibrium constant may be examined by plotting InK versus VT. From the van't Hoff equation, it can be seen
This is generally the case when the range of temperatures involved is not appreciable, and in the absence of any phase changes in the participating species.

Equilibriu 113
The temperature dependence of an equilibrium constant can thus be determined by plotting InK versus 1/2?
the slope of the line is
-- AH," R
l/T
As the slope of the line is positive as shown, the reaction is exothermic. In other words, AH," <o.
Exercises
The equilibrium constant for the ammonia synthesis reaction
is 775 at 25°C based on 1 atm ideal gas standard states. The enthalpy change associated with the reaction, or simply the heat of reaction, AH,", is -45.9kJ. Assuming that AH," is independent of temperature, estimate the equilibrium constant for the reaction at 45°C.
Equilibrium of the system containing MnO(s), h4n304(s) and O&) was examined. Both MnO and Mn304 were pure and stable states. It was found that equilibrium partial pressures of oxygen were
PO, = 1.4xlO"atm at l,OOO°C
PO, = 2.8~1O-~atm at l,lOO°C
Calculate the heat of reaction AHyO of the reaction
3MnO(s) + 302(g) = Mn304(s)
Assume that AH," is independent of T.
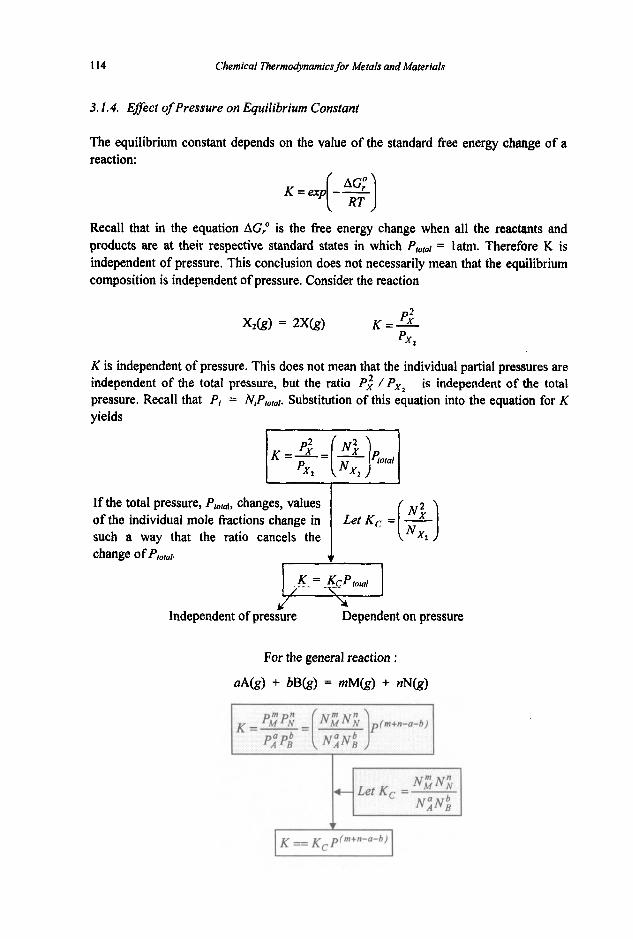
I14 Chemical Thermo&namics for Metals and Materials
3.1.4. Efect of Pressure on Equilibrium Constant
The equilibrium constant depends on the value of the standard free energy change of a reaction:
Recall that in the equation AG: is the fiee energy change when all the reactants and products are at their respective standard states in which P,,o~ = latm. Therefore K is independent of pressure. This conclusion does not necessarily mean that the equilibrium composition is independent of pressure. Consider the reaction
XZk) = 2X(g) K = - p: PXl
K is independent of pressure. This does not mean that the individual partial pressures are independent of the total pressure, but the ratio Pj / Px, is independent of ?he total pressure. Recall that PI = N,Plo,a~. Substitution of this equation into the equation for K yields
of the individual mole hctions change in If the total pressure, Plold, changes, values
such a way that the ratio cancels the change of Plola/.
Y Dependent on pressure Independent of pressure
For the general reaction :
aA(g) + bB(g) = mM(g) + nN(g)

Equllibria 115
lu, is the equilibrium constant expressed in concentrations, and note that it is independent of pressure, only if m+n-a-b = 0 i.e., no net change in the number of moles by the reaction.
Consider the reaction
If the total pressure in the reactor is increased by injecting an inert gas into the reactor, would the equilibrium constant K change?
~ ~
Consider the defmition of partial pressure : Partial pressures of perfect gases are the pressures that each species would exert if it were alone in the system. Therefore the presence of another gas has no effect on the equilibrium constant and on the equilibrium molar concentrations (e.g., moVcd) of species so long as the gases are perfect.
Example 2
Consider the reaction
If the tow pressure in the reactor is increased by compression, would the equilibrium constant K change? Would the partial pressures of the individual species change?
Recall that
AG," is independent of pressure and hence K is independent of pressure.
As K 1s independent of pressure, Pj / PA (= IQ should also be independent of pressure. However, the compression, or pressure change in general, adjusts the individual partial pressures of the species in such a way that, although the partial pressure of each species changes, their ratio appearing in the equilibrium constant expression remains unchanged.
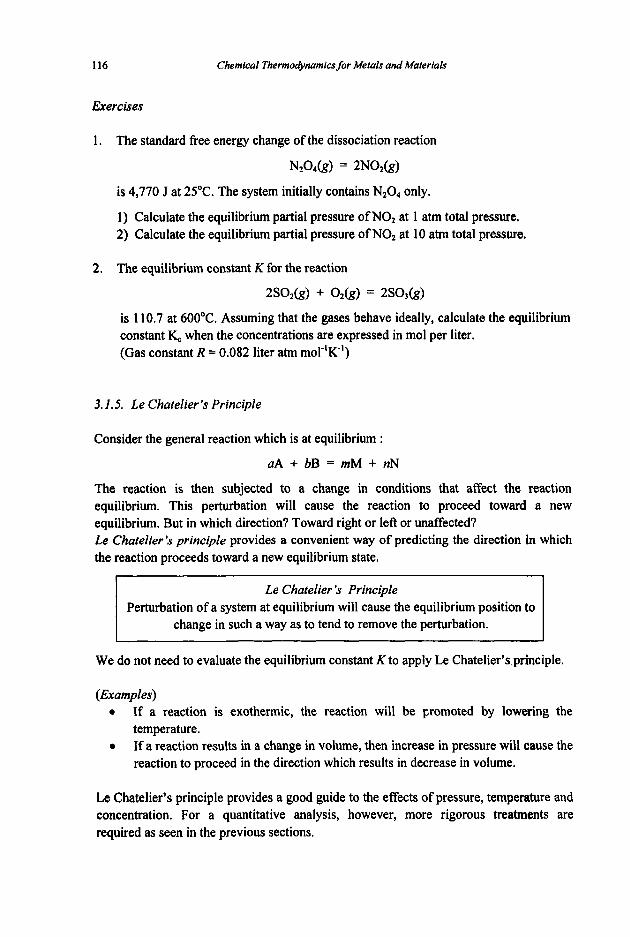
116 Chemical Thermodynamlcs for Metals and Materials
Exercises
1. The standard free energy change of the dissociation reaction
NZ04k) = 2NOzk)
is 4,770 J at 25°C. The system initially contains N204 only.
1) Calculate the equilibrium partial pressure of NOz at 1 atm total pressure. 2) Calculate the equilibrium partial pressure of NOz at 10 atm total pressure.
2. The equilibrium constant K for the reaction
2SOZk) + Ozk) = 2S03(g)
is 110.7 at 600°C. Assuming that the gases behave ideally, calculate the equilibrium constant K, when the concentrations are expressed in mol per liter. (Gas constant R = 0.082 liter atm m o l k ’ )
3.1.5. Le Chatelier’s Principle
Consider the general reaction which is at equilibrium :
aA + bB = mM + nN
The reaction is then subjected to a change in conditions that affect the reaction equilibrium. This perturbation will cause the reaction to proceed toward a new equilibrium. But in which direction? Toward right or left or unaffected? Le Chatelier ’s principle provides a convenient way of predicting the direction in which the reaction proceeds toward a new equilibrium state.
Le Chatelier ’s Principle Perturbation of a system at equilibrium will cause the equilibrium position to r change in such a way as to tend to remove the perturbation.
We do not need to evaluate the equilibrium constant K to apply Le Chatelier’s principle.
(Examples) 0
0
If a reaction is exothermic, the reaction will be promoted by lowering the temperature. If a reaction results in a change in volume, then increase in pressure will cause the reaction to proceed in the direction which results in decrease in volume.
Le Chatelier’s principle provides a good guide to the effects of pressure, temperature and concentration. For a quantitative analysis, however, more rigorous treatments are required as seen in the previous sections.
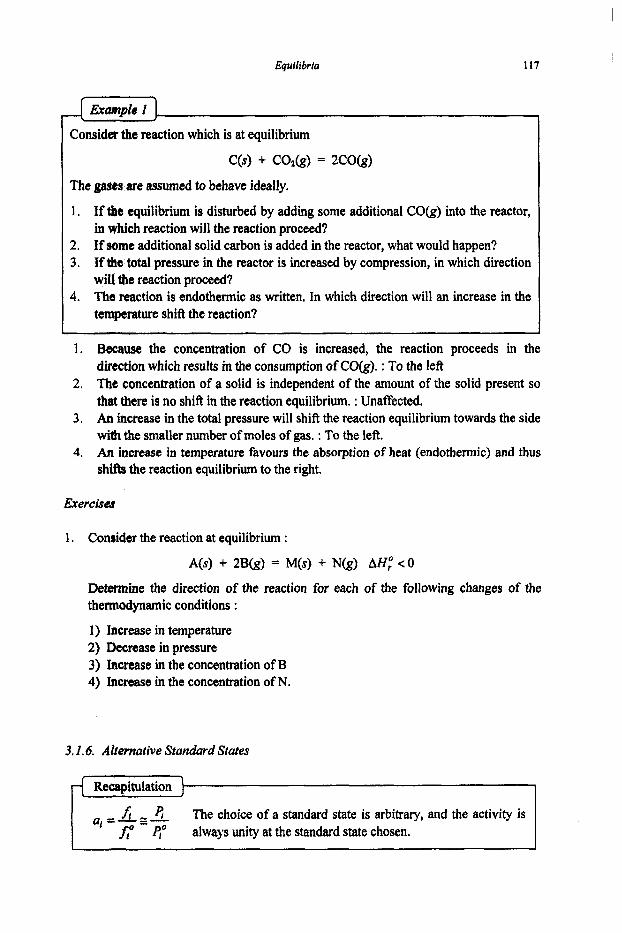
Equilibria 117
Example I
Consider the reaction which is at equilibrium
C(s) + CO&) = 2CO(g)
The gases are assumed to behave ideally.
1. If the equilibrium is disturbed by adding some additional CO&) into the reactor, in which reaction will the reaction proceed?
2. If some additional solid carbon is added in the reactor, what would happen? 3. If the total pressure in the reactor is increased by compression, in which direction
will the reaction proceed? 4. The reaction is endothennic as written. In which direction will an increase in the
temperature shift the reaction?
1. Because the concentration of CO is increased, the reaction proceeds in the direction which results in the consumption of CO(g). : To the left
2. The concentration of a solid is independent of the amount of the solid present so that there is no shift in the reaction equilibrium. : Unaffected.
3. An increase in the total pressure will shift the reaction equilibrium towards the side with the smaller number of moles of gas. : To the left.
4. An increase in temperature favours the absorption of heat (endothermic) and thus shifts the reaction equilibrium to the right.
Exercises
1. Consider the reaction at equilibrium :
A@) + 2B&) = M(s) + N(g) AH: < O
Determine the direction of the reaction for each of the following changes of the thermodynamic conditions :
1) Increase in temperature 2) Decrease in pressure 3) lncrease in the concentration of B 4) Increase in the concentration of N.
3.1.6. Alternative Standard States
Recapitulation ) 1 a, =A=- 4 ' - 8'
The choice of a standard state is arbitrary, and the activity is always unity at the standard state chosen.
I I
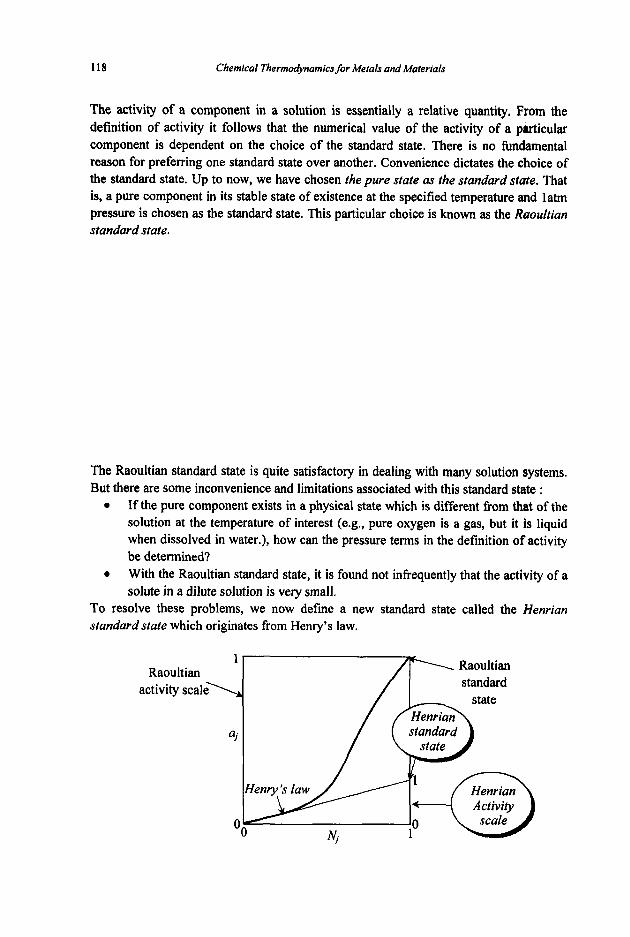
118 Chemical Thermodynamics for Metals and Materials
The activity of a component in a solution is essentially a relative quantity, From the definition of activity it follows that the numerical value of the activity of a particular component is dependent on the choice of the standard state. There is no fUndamental reason for preferring one standard state over another. Convenience dictates the choice of the standard state. Up to now, we have chosen the pure state as the standard state. That is, a pure component in its stable state of existence at the specified temperature and latm pressure is chosen as the standard state. This particular choice is known as the Ruoultiun standard state.
are based on the Raoultian standard
The Raoultian standard state is quite satisfactory in dealing with many solution systems. But there are some inconvenience and limitations associated with this standard state :
If the pure component exists in a physical state which is different from that of the solution at the temperature of interest (e.g., pure oxygen is a gas, but it is liquid when dissolved in water.), how can the pressure terms in the definition of activity be determined? With the Raoultian standard state, it is found not infrequently that the activity of a solute in a dilute solution is very small.
To resolve these problems, we now define a new standard state called the Henriun standard state which originates from Henry’s law.
0
0
Raoultian activity scale\

Equiiibrio I19
1. If j obeys Henry’s law, the value of the activity on the Henrian scale is numerically equal to the mole fraction ofj.
2. The numerical value of the activity of j at the Henrian standard state is 1 on
The Henrian standard state is a hypothetical, non-physical state for componentj. suppose that we are interest in the composition marked x in the following figure :
Raoultian activity scale \
QJOO Henrian
Note that the numerical values are different for the same composition x.
-
at the mde fraction
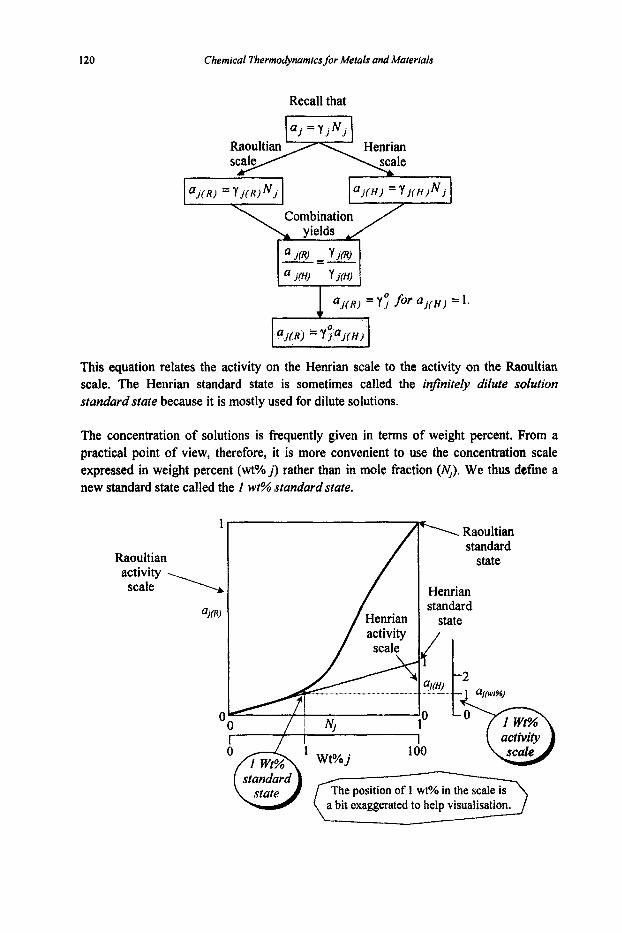
120 Chemical Thermo&namicsfor Metals and Materials
Recall that
a J ( R 1 Y J m
a,@) YI(H)
-=-
aJ(R) = Y," for ~ J ( H ) = 1.
This equation relates the activity on the Henrian scale to the activity on the Raoultian scale. The Henrian standard state is sometimes called the infinite& dilute solution standard state because it is mostly used for dilute solutions.
The concentration of solutions is frequently given in terms of weight percent. From a practical point of view, therefore, it is more convenient to use the concentration scale expressed in weight percent (wt"/.j) rather than in mole fraction (4). We thus defme a new standard state called the I wt% standard state.
1
Henrian activity
standard
1 Raoultian standard
state
Henrian standard
state
' I
I w m activiw
100 Wt% j
The position of I wt% in the scale is
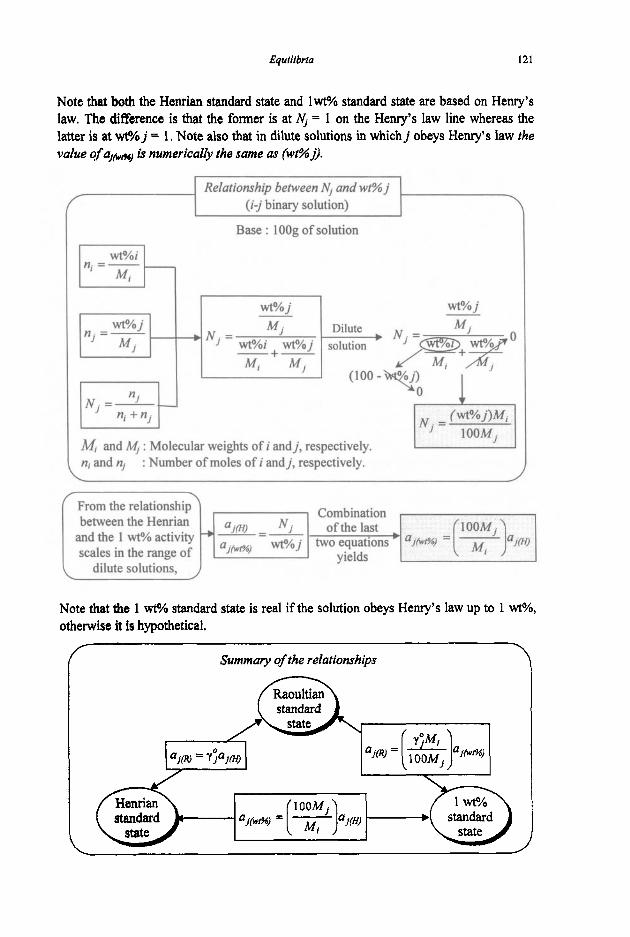
Equilibriia 121
n r = - . wt% j 4
Note that both the Henrian standard state and Iwt% standard state are based on Henry’s law. The difference is that the former is at N, = 1 on the Henry’s law line whereas the latter is at wt‘?? j = 1. Note also that in dilute solutions in which j obeys Henry’s law rhe value ofa,@- is numerically the same as fwt%j],
wt% j wt% j
MJ DiIute N~ = wto/oi wto/.j sotution
’ -+- M, M,
Relationship between NI and wr% j (i-j binary solution)
Base : lOOg of solution
\
From the relationship
scales in the range of dilute solutions.
Note that the 1 wt% standard state is real if the solution obeys Henry’s law up to 1 wto/o, otherwise it is hypothetical.
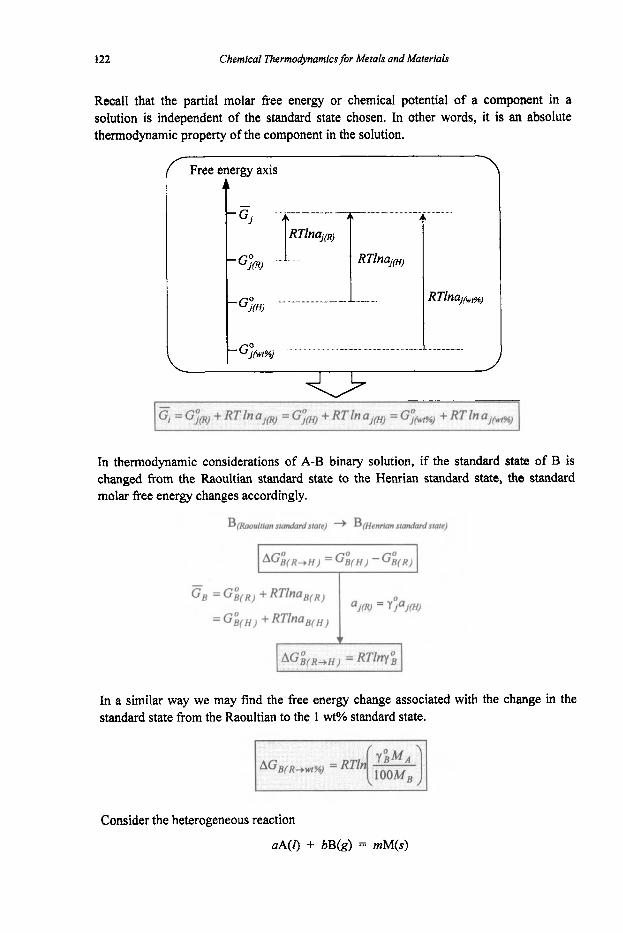
122 Chemical Thermodynamics for Metals and Materials
Recall that the partial molar free energy or chemical potential of a component in a solution is independent of the standard state chosen. In other words, it is an absolute thermodynamic property of the component in the solution.
Free energy axis
t
t G:cwi%) ........ . .....................
In thermodynamic considerations of A-B binary solution, if the standard state of B is changed from the Raoultian standard state to the Henrian standard state, the standard molar free energy changes accordingly.
B(Raosltian statkiadstate) + Bpenrian sranabrdstate)
In a similar way we may find the free energy change associated with the change in the standard state from the Raoultian to the 1 wt% standard state.
Consider the heterogeneous reaction
aA(l) + bB(g) = rnM(s)

Equilibria 123
(1) - (3) aA (1, H) + bB(g, R) = mM(s, R)
The standard free energy change at temperature T for the reaction is AG," when Raoultian standard states, i.e., pure liquid A, gaseous B and pure solid M at latm are used.
aA (1, Raoultian) + bB(g, Raoultian) = mM(s, Raoultian) AG:,,
AG:, = AG:, - aRTlny;
It is sometimes more convenient to use alternative standard states for the species involved in the reaction. When the standard state of liquid A is changed from Raoultian to Henrian standard state, the free energy change of the reaction
aA ( I , Henrian) + bB(g, Raoultian) = mM(s, Raoultian) AG,"#2
can be obtained as follows :
(1) (2) A (1, R) = A (LH) AG$(R+H) = RTlny$
(3)
aA (1, R) + bB(g, R) = mM(s, R) AG:,,
aA (1, R) = aA (1, H ) aAG$(R+H) = aRTlnyi
Similarly, if the standard state of A is changed from Raoultian to 1 wt?? standard state,
aA (1, I wt%) + bB(g, Raoultian) = mM(s, Raoultian) AG:,,
where MA and Mx are molecular weights of A and solvent X in the A-X binary solution.
Recall that This equation is valid for all standard states.
We often use symbol f to denote the activity coefficient for 1 wt% standard state.

124 Chemical Thermodynamics for Metals and Materials
As both the Henrian and 1 wt% standard states are based on Henry's law, for dilute solutions,
Exercises
1. The activity of silicon in a binary Fe-Si Iiquid alloy containing Ns, = 0.02 is 0.000022 at 1,600"C relative to the Raoultian standard state. The Henrian activity coefficient ygi is experimentally determined to be 0.001 1.
1) Calculate the activity of silicon in the same alloy, but relative to the Henrian
2) Calculate the change of the standard molar free energy of silicon for the change
3) Calculate the activity of silicon relative to the 1 wt% standard state. The
standard state.
of the standard state from Raoultian to Henrian.
molecular weights of Fe and Si are 55.85 and 28.09, respectively.
2. A liquid Fe-A1 alloy is in equilibrium at 1,600"C with a A1203-saturated slag and a gas phase containing oxygen. The partial pressure of oxygen in the gas phase is maintained at 5 x 10et4 am. Calculate the activity of aluminium in the alloy in 1 wt% standard state. The following data are given :
2AI(f)+$O2 (g)=Af,O, ( s ) AG," = -1,077,500J
for ail the species at Raoultian standard states.
y$f = 0.029 M, = 55.85 M A , = 26.98
3. The residual oxygen present in a copper melt can be removed by equilibrating the melt with a H20-H2 gas mixture. It is desired to keep the oxygen concentration in the copper melt lower than 0.001 wt% at 1,200"C. Calculate the ratio of H20 to H1 in the gas mixture which is in equilibrium with 0.001 wt% oxygen in the melt. The following data are given:
H*(g)-$02(g) = H,O(g)
i 0 2 ( g ) = O(wt%) fog& = -0.158 [Wto?O]
AG: = -247,400 + 55.85T,J
AG; = -85,350 + 18.54TJ

Equilibria 125
3.1.7. Interaction Coefficients
Much of the discussion thus far has been concerned with binary solutions. Most practical systems, however, are more complex and consist of several components. It is now in order to examine the thermodynamics of solutions which contain several dilute solutes. The activity of B in dilute solution with respect to the Henrian standard state is given by
a B ( H ) = f B N B
where& is the activity coefftcient of B on the Henrian activity scale. First, suppose that we have the A-B binary solution, and let f i denote the activity coefficient of B in the A-B binary solution in which B is the only solute. Then
Next, consider the A-B-C binary solution. Holding the concentration of B constant, we add a small amount of C. C will then influence the interaction between A and B in the solution, and hence alter the activity coefficient of B.
where&‘ is the effect of C on the activity coefficient of B. For the A-B-C-D quaternary solution,
B C D f B = f B f B f B
In this relationship it is assumed that addition of D in the solution does not give any influence onfsC and vice versa. This condition is generally satisfactory in most practical systems. For a multicomponent system in general,
Taking logarithms,
Since lnfe is some function of the mole fractions of B, C, D, ..., the Taylor-series expansion yields

126 Chemical Thermodynamics for Metals and Materials
Define interaction coeficient, d.
From a practical point of view it is often more convenient to use weight percent for expressing the concentrations in conjunction with the 1 wt?h standard state and logarithms to the base ten.
The last two equations offer an important means in calculating the activity coefficient of a dilute solute in multicomponent solutions.
These equations are valid only for dilute solution because of approximations taken in the Taylor-series expansion :
Approximations As the Henrian standard state is chosen, NB + 0, fB = fBo = 1. For dilute solutions, the second and higher order terms are negligible.
0 The following relations exist between interaction coefficients :
where A, B : solutes S : solvent
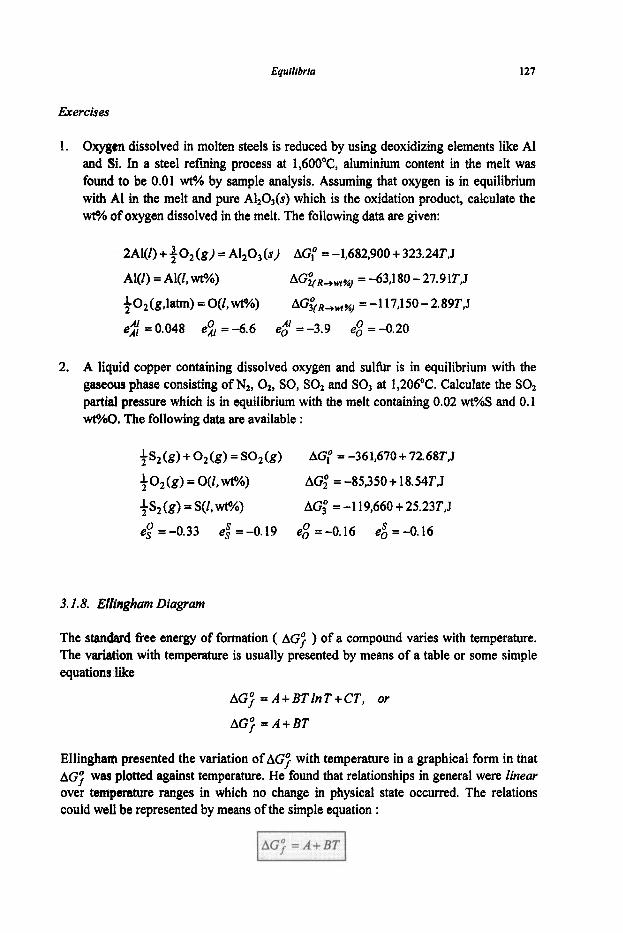
Eguilibria 127
Exercises
1. Oxygen dissolved in molten steels is reduced by using deoxidizing elements like A1 and Si. In a steel refrning process at 1,6OO0C, aluminium content in the melt was found to be 0.01 wt?? by sample analysis. Assuming that oxygen is in equilibrium with A1 in the melt and pure Al,O,(s) which is the oxidation product, calculate the wt?h of oxygen dissolved in the melt. The following data are given:
2Al(l) ++O,(g) = A1203(~) AGP = -1,682,900+ 323.24T,J
Al(1) = AI@, MA) AGi(R+w,a6/ = -63,180 - 27.91T,J
$O2(g,latm) = O(l,wt%) AG~~R+wt%) =-117,150-2.89T,J
ei; = 0.048 e:[ = -6.6 e2' = -3.9 eg = -0.20
2. A liquid copper containing dissolved oxygen and s u l k is in equilibrium with the gaseous phase consisting of Nz, 02, SO, SOz and SO3 at 1,206OC. Calculate the SO2 partial pressure which is in equilibrium with the melt containing 0.02 wt%S and 0.1 wt?/iO. The following data are available :
ts,(g)+O2(g)=SO,(g) AGP =-361,670+72.68T,J
+O,(g) = O(l,W?!)
+s2(g)=s(I,wt%)
AG; = -85,350-k 18.54T,J
AG; = -1 19,660 + 25.23T,J
ef = -0.33 e i = -0.19 eg = -0.16 eg = -0.16
3.1.8. Ellingham Diagram
The standard free energy of formation ( AG; ) of a compound varies with temperature. The variation with temperature is usually presented by means of a table or some simple equations like
AG? =A+BTlnT+CT, or
AG; = A + BT
Ellingham presented the variation of AG? with temperature in a graphical form in that AG; was plotted against temperature. He found that relationships in general were linear over temperature ranges in which no change in physical state occurred. The relations could well be represented by means of the simple equation :

128 Chemical Thermodynamics for Metals and Materials
In plotting AG; -T diagrams Ellingham made use of A6; which is the standard free energy of formation of the compound, not per mole of the compound, but per male of the gaseous element consumed. For instance,
3 2Cr(s)+-02(g) = Cr203(s) AG; 2
4 2 -Cr(s) + O,(g) = -Cr20,(s) AE; 3 3
Consider a general reaction of formation
M + 0 2 & } = MO2 AE; = A + BT
AZ;
t as the ~ I ~ ~ n g ~ a m diagram
+ T,"C
Recall that
IAC; = -RTlnKI
aM = aMo2 = 1
when M andM02 are pure.
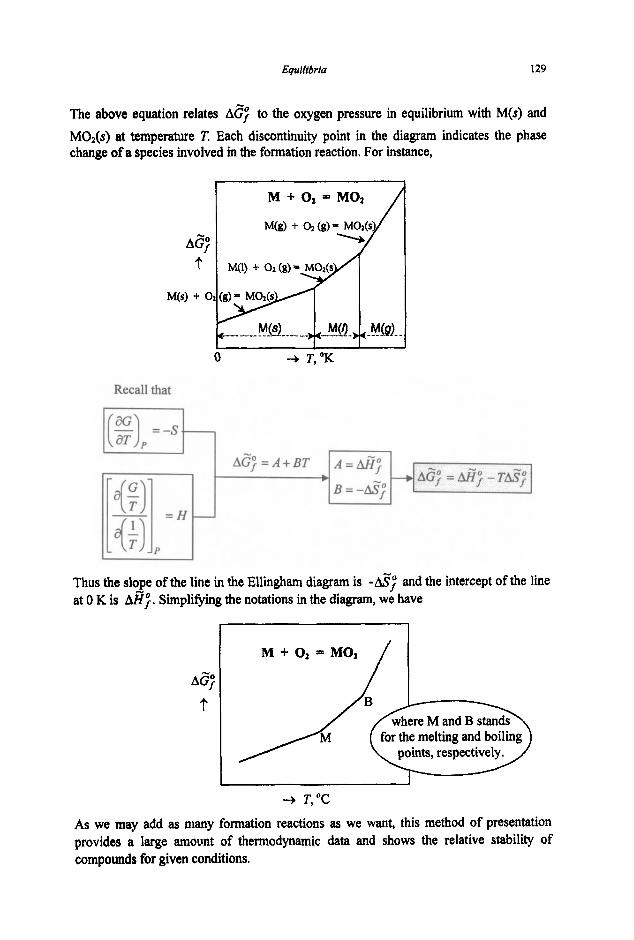
Equilf&rfa 129
The above equation relates AG; to the oxygen pressure in equilibrium with M(s) and MO&) at temperature T. Each discontinuity point in the diagram indicates the phase change of a species involved in the formation reaction. For instance,
Recall that
1 I I -_
Thus the slope of the line in the Ellimgham diagram is -s; and the intercept of the line at 0 K is d;. Simplifying the notations in the diagram, we have
M + 0 2 MO2
AG; ?
for the melting and boiling
+ T,"C
As we may add as many formation reactions as we want, this method of presentation provides a large m o m t of thermodynamic data and shows the relative stability of compounds for given conditions.
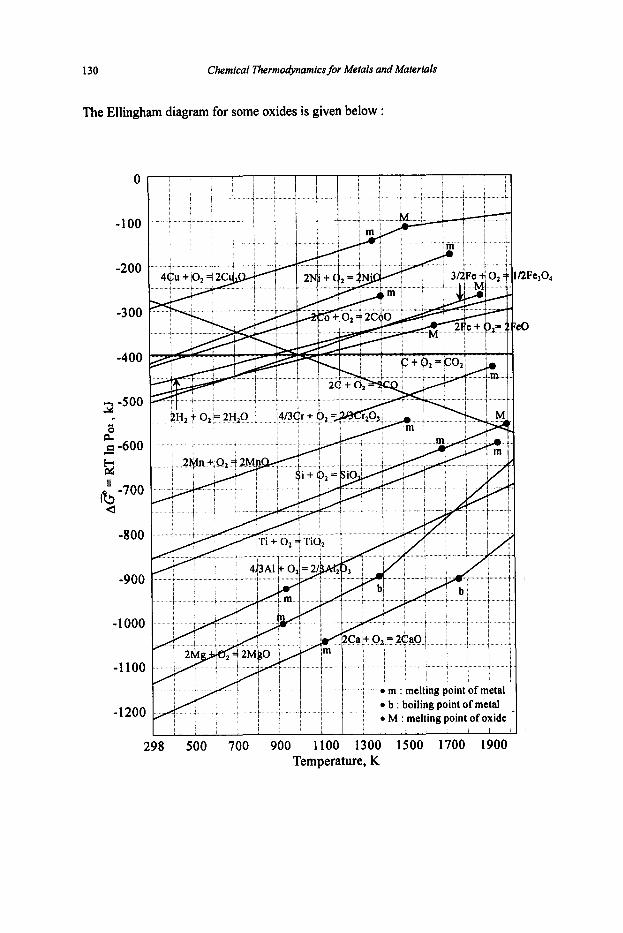
130 Chemical Thermodynamics for Metals and Materials
The Ellingham diagram for some oxides is given below :
* l i b
, 8 .
298 500 700 900 1100 1300 1500 1700 1900 Temperature, K
2Fe304
0
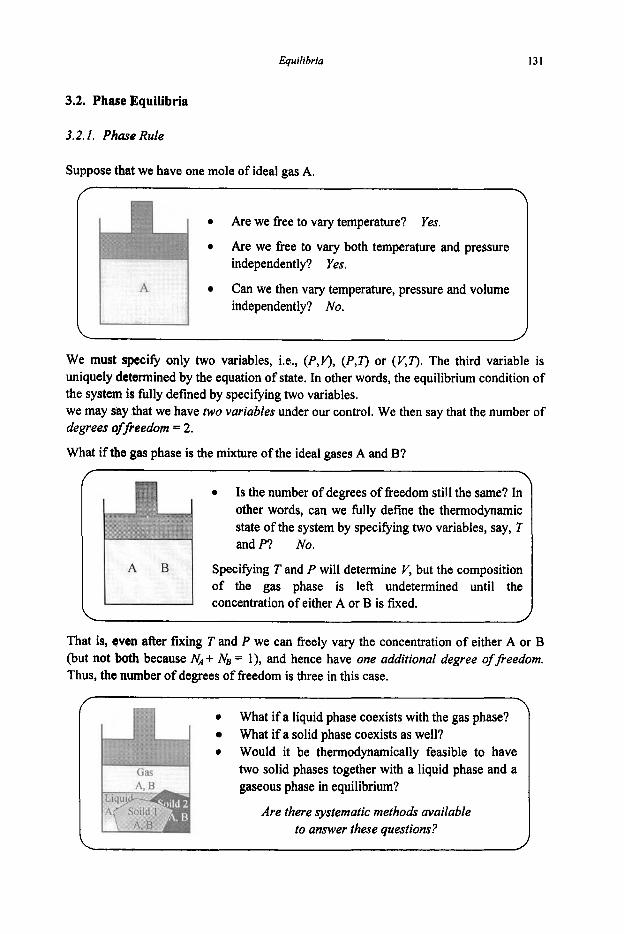
Equilibria 131
3.2. Phase Equilibria
3.2.1. Phase Rule
Suppose that we have one mole of ideal gas A.
0 Are we free to vary temperature? Yes.
0 Are we free to vary both temperature and pressure independently? Yes.
Can we then vary temperature, pressure and volume independently? No.
0
We must specify only two variables, i.e., (P,V), (P,T) or (V,T). The third variable is uniquely determined by the equation of state. In other words, the equilibrium condition of the system is filly defined by specifying two variables. we may say that we have two variables under our control. We then say that the number of degrees ofpeedom = 2 .
What if the gas phase is the mixture of the ideal gases A and B?
/ \ 0 Is the number of degrees of freedom still the same? In
other words, can we filly defme the thermodynamic state of the system by specifying two variables, say, 7 and P? No.
Specifying T and P will determine V, but the composition of the gas phase is left undetermined until the concentration of either A or B is fixed.
That is, oven after fixing T and P we can freely vary the concentration of either A or B (but not both because NA + NB = l) , and hence have one additional degree of freedom. Thus, the number of degrees of freedom is three in this case.
I 0
0
What if a liquid phase coexists with the gas phase? What if a solid phase coexists as well? Would it be thermodynamically feasible to have two solid phases together with a liquid phase and a gaseous phase in equilibrium?
Are there systematic methods available to answer these questions?
i

132 Chemical ThermodyMmics for Metals and Materials
J.W. Gibbs developed the thermodynamic methods for the characterisation of equilibrium states of heterogeneous systems involving any number of substances. Before deriving a thermodynamic method for the characterisation of equilibrium states of heterogeneous systems, we define two important terms: i.e., phase and component.
Phase
Phase is defined as a physically distinct, homogeneous and mechanically separable part of a system.
(Examples) 0 The ice - water -steam system at 0°C has three distinct phases: solid(ice),
Yapours and gases, either pure or mixed, constitute a single phase because the
Solutions (liquid and solid) are single phases. Immiscible Iiquidr constitute separate phases (e.g., liquid slag and metal in a
liquid(water) and gas(steam).
component gases are miscible.
furnace)
Component
The number of components of a system is the minimum number of composition variables that must be specified in order to completely define the composition of each phase in the system. 'The number of components is not necessarily the same as the number of elements, species or compounds present in the system, but given by
I.-.-.] where c = number of components,
s = number of chemically distinct constituents, r = number of algebraic relationships among the composition variables
(Examples) In the nitrogen-hydrogen-ammonia system
A non-reactive mixture of N2(g), H2(g) and NH&) at a low temperature
s = 3, r = 0 + c = 3
0 A mixture of N&), H2(g) and H&) at a high temperature where the following equilibrium is established :
&i,
PN, pi, N&) + 3H&) = 2NH3(g) K = -
Thus, s = 3 , r = 1 + c = 2 Each independent chemical reaction at equilibrium gives rise to a restrictive condition.
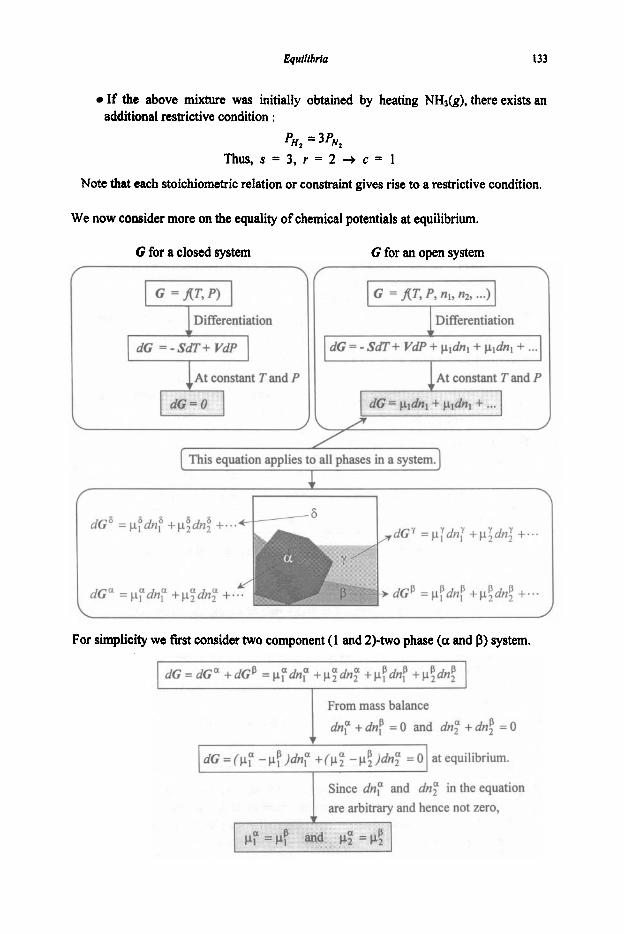
Equilibrta 133
If the above mixture was initially obtained by heating NH&, there exists an additional restrictive condition :
pH, = 3pN,
Thus, s = 3, r = 2 + c = 1
Note that each stoichiometric relation or constraint gives rise to a restrictive condition.
We now consider more on the equality of chemical potentials at equilibrium.
G for a closed system G for an open system %
This equation applies to all phases in a system.
.c
For simplicity we first consider two component (1 and 2)-two phase (a and p) system.
I dG = dG" +dCP =p1Qdn? +p;dnF +pfdnp +p2dn, P P I From mass balance dnp +drip = O and dn: +dnf = O I Since dnr and dn: intheequation are arbitrary and hence not zero,
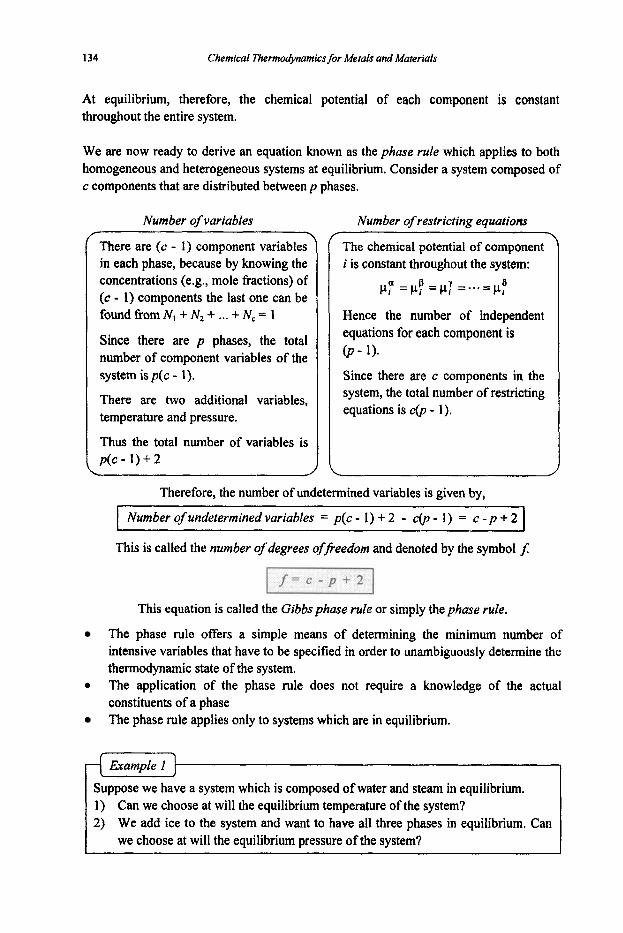
134 Chemical Thermo&namics for Metals and Materials
At equilibrium, therefore, the chemical potential of each component is constant throughout the entire system.
We are now ready to derive an equation known as the phase rule which applies to both homogeneous and heterogeneous systems at equilibrium. Consider a system composed of c components that are distributed between p phases.
Number of variables L \
There are (c - 1) component variables in each phase, because by knowing the concentrations (e.g., mole fractions) of (c - 1) components the last one can be found from N I + N2 + ... +N,= 1
Since there are p phases, the total number of component variables of the system isp(c - 1).
There are two additional variables, temperature and pressure.
Thus the total number of variables is p(c- 1)+2
Number of restricting equations
The chemical potential of component i is constant throughout the system:
\
pP i l l =,P =pY =...= ,a Hence the number of independent equations for each component is (P- 1)- Since there are c components in the system, the total number of restricting equations is c(p - 1).
Therefore, the number of undetermined variables is given by,
Number of undetermined variables = p(c - 1) + 2 - c(p - 1) = c - p + 2
This is called the number of degrees offieedom and denoted by the symbol f.
This equation is called the Gibbsphase rule or simply the phase rule.
The phase rule offers a simple means of determining the minimum number of intensive variables that have to be specified in order to unambiguously determine the thermodynamic state of the system. The application of the phase rule does not require a knowledge of the actual constituents of a phase The phase rule applies only to systems which are in equilibrium.
0
Example I Suppose we have a system which is composed of water and steam in equilibrium. 1) Can we choose at will the equilibrium temperature of the system? 2) We add ice to the system and want to have all three phases in equilibrium. Can
we choose at will the equilibrium pressure of the system?
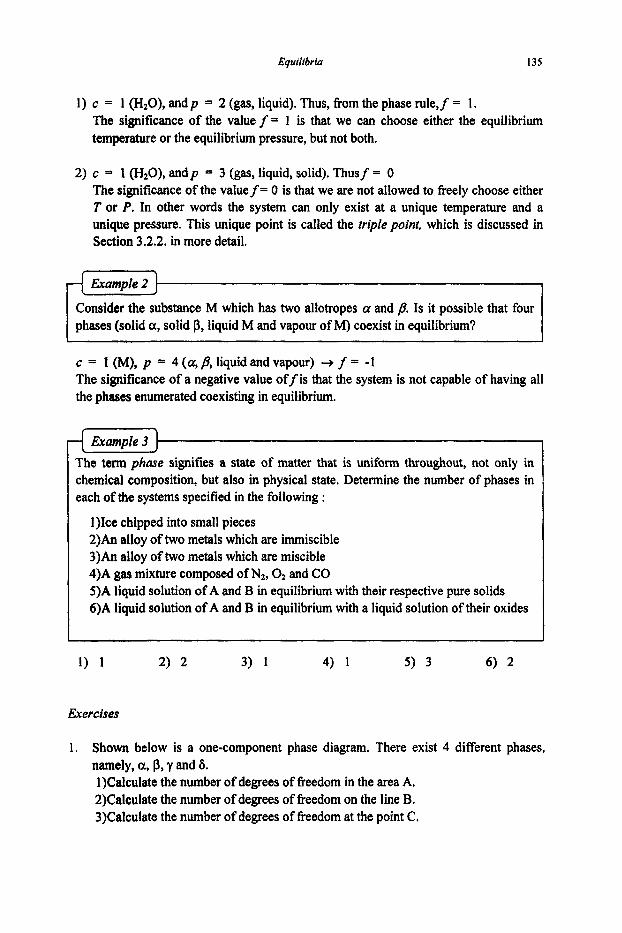
Equilibria 135
The term phase signifies a state of matter that is uniform throughout, not only in chemical composition, but also in physical state. Determine the number of phases in each of the systems specified in the following :
1)Ice chipped into small pieces 2)An alloy of two metals which are immiscible 3)An alloy of two metals which are miscible 4)A gas mixture composed of N2, O2 and CO 5)A liquid solution of A and B in equilibrium with their respective pure solids 6)A liquid solution of A and B in equilibrium with a liquid solution of their oxides
,
~
1) c = 1 (H20), andp = 2 (gas, liquid). Thus, from the phase rule, f = 1. The significance of the value f = 1 is that we can choose either the equilibrium temperature or the equilibrium pressure, but not both.
2) c = 1 (H20), andp = 3 (gas, liquid, solid). Thusf = 0 The significance of the value f = 0 is that we are not allowed to freely choose either T or P. In other words the system can only exist at a unique temperature and a unique pressure. This unique point is called the triple point, which is discussed in Section 3.2.2. in more detail.
f i m p l e 2
Consider the substance M which has two allotropes a and p. Is it possible that four phases (solid a, solid p, liquid M and vapour of M) coexist in equilibrium?
c = 1 (M), p = 4(a,~,liquidandvapour) + f = -1 The significance of a negative value offis that the system is not capable of having all the phases enumerated coexisting in equilibrium.
Exercises
1. Shown below is a one-component phase diagram. There exist 4 different phases, namely, a, p, y and 6. 1)Calculate the number of degrees of freedom in the area A. 2)Calculate the number of degrees of tkeedom on the line B. 3)CalcuIate the number of degrees of freedom at the point C,
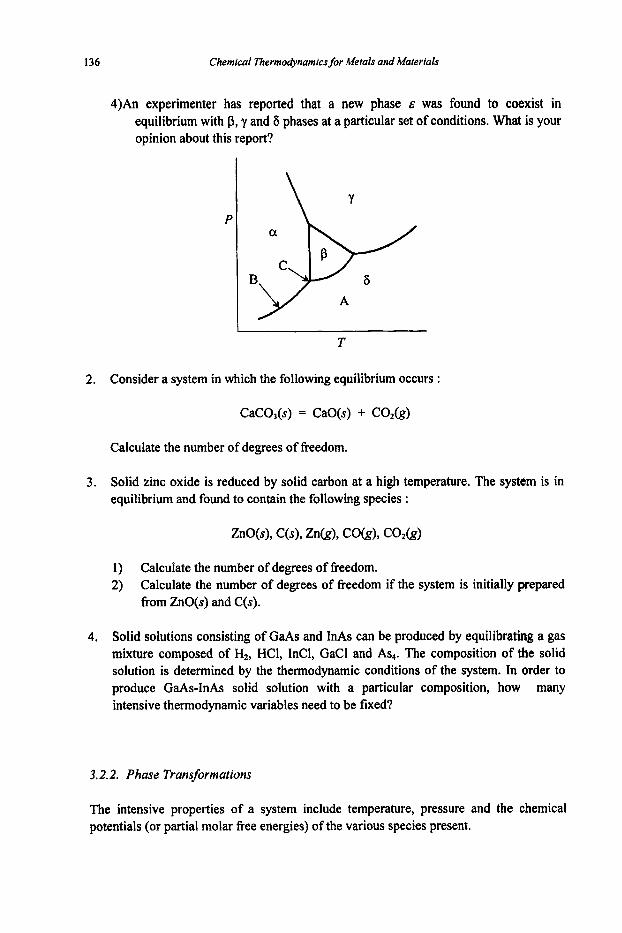
136 Chemical Thermodynamics for Metals and Materials
4)An experimenter has reported that a new phase E was found to coexist in equilibrium with 0, y and 6 phases at a particular set of conditions. What is your opinion about this report?
T
2, Consider a system in which the following equilibrium occurs :
CaC03(s) = CaO(s) + CO2&)
Calculate the number of degrees of freedom.
3. Solid zinc oxide is reduced by solid carbon at a high temperature. The system is in equilibrium and found to contain the following species :
1) 2)
Calculate the number of degrees of freedom. Calculate the number of degrees of freedom if the system is initially prepared from ZnO(s) and C(s).
4. Solid solutions consisting of GaAs and InAs can be produced by equilibrating a gas mixture composed of Hf, HCI, InCI, GaCl and Asq. The composition of the solid solution is determined by the thermodynamic conditions of the system. In order to produce GaAs-InAs solid solution with a particular composition, how many intensive thermodynamic variables need to be fixed?
3.2.2. Phase Transformations
The intensive properties of a system include temperature, pressure and the chemical potentials (or partial molar free energies) of the various species present.

Equilibrin 137
If there is a difference in temperature, the transfer of energy occurs as heat: Temperature is a measure of the tendency of heat to leave the system.
If €here is a difference in pressure, the transfer of energy occurs as PV work: Pressure is a measure of the tendency towards mechanical work
If them is a difference in chemical potential, the transfer of energy occurs as tramfir of matter. Chemical potential is a measure of the tendency of the species to leave the phasa, to react or to spread throughout the phase through chemical reaction, diflbion, etc.
A substance with a higher chemical potential has a spontaneous tendency to move to a state with fower chemical potential. Why do solid substances melt upon heating? Why do liquid substances vaporise rather than solidify upon heating? Why do phase transitions occur? The chemical potential provides the key to these questions. Consider a one- component system :
This equation shows that, because entropy is always positive, the chemical potential of a pure substance decreases as the temperature is increased. As S,, > S,, > S,,, the slope of the plot of p versus T is steeper for the vapour than for the liquid, and steeper for the liquid than for the solid.
CI
\ Solid
J Below this temperature, J.+,) C &I) and hence &U solid phase is more stable. Above this temperature, on the other hand, the liquid is more stable. At T,, the chemical potential of the solid and the liquid are the same and hence both phases coexist. T, : Melting temperawe
Below this temperature, < peg) and hence the liquid phase is more stable. Above this temperature, on the other hand, the gas is more stable. At Tb, the chemical potential of the liquid and the gas are the same and hence both phases coexist. Tb : Boiling temperature

138 Chemical Thermodynamics for Metals and Materials
A phase transition, the spontaneous conversion from one phase to another, occurs at a characteristic temperature for a given pressure. This characteristic temperature is called the transition temperature.
Next, examine the effect of pressure on the chemical potential:
As V is always positive, an increase in pressure increases the chemical potential of any pure substance. For most substances, V,, V,, and hence, from the equation, an increase in pressure increases the chemical potential of the liquid more than that of the solid.
A
Tm Tm T b (low P) (high P )
Thus an increase in pressure results in an increase in the melting temperature. If VIO < V(s,, however, an increase in pressure effects a decrease in T,,,. (e.g., Vwo,e, < V,=,> It would be useful to combine the effects of temperature and pressure on phase transition of a substance in a same diagram.
This figure is known as the phase diagram of a substance. It shows the thermodynamically stable phases at different pressures and temperatures. The lines

Equilibria 139
Re call that dG=dp=VdP-SdT
separating phases are called as phase boundaries at which two phases coexist in equilibrium. The point “t” is the triple point at which three phases coexist in equilibrium.
Therefore dpa =VadP-SadT
Now, a question arises, “Is there a way to quantitatively describe the phase boundaries in terms of P and T?” The phase rule predicts the existence of the phase boundaries, but does not give any clue on the shape (slope) of the boundaries. To answer the above question, we make use of the fact that at equilibrium the chemical potential of a substance is the same in all phases present.
(@-s“> Entropy change (hs) associated
Consider the phases a and f! which are in equilibrium.
(P- v“) Volume change (AV) associated
‘ T L e r e n t iat ion
Rearrangement yields
dT (VP-Y“)
with the phase change of a the phase change of a + f3
-=- dT AV
For a transition 6-om one another under equilibrium conditions AH at constant temperature and pressure, 1 AY =
1 AG E AH - TAS = 0
This equation is known as the Clapeyron equation. The Clapeyron equation is limited to equilibria involving phases of fixed composition (e.g., one-component system) because p has been assumed independent of composition :
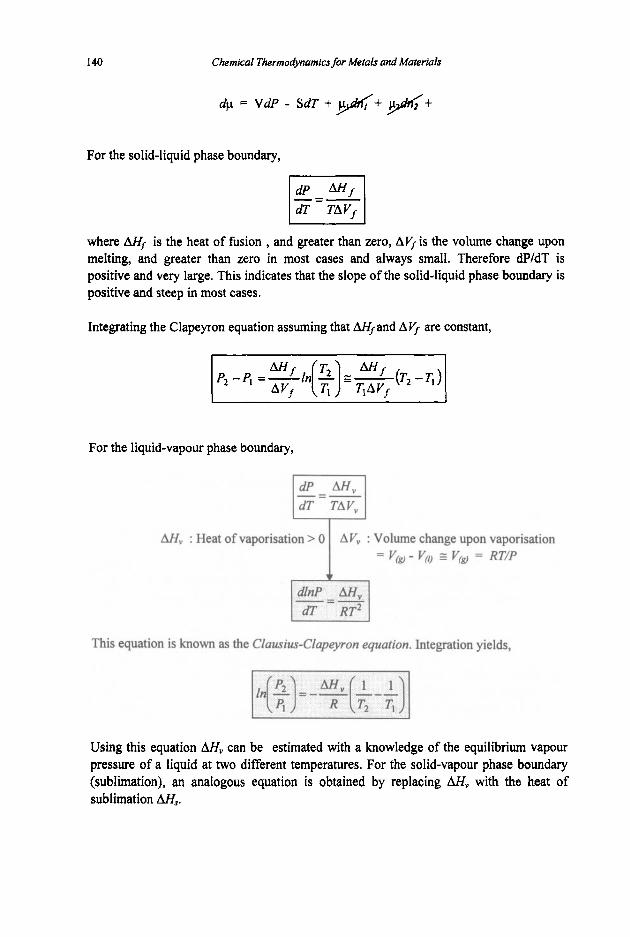
140
AH, : Heat of vaporisation > 0
Chemicaf Thermodynamics for Metals and Matertds
AV, : Volume change upon vaporisation = V, - Vgj z V, = RT/P
dp = VdP - SdT + &+ ++
For the solid-liquid phase boundary,
where Mr is the heat of fusion , and greater than zero, AVf is the volume change upon melting, and greater than zero in most cases and always small. Therefore dP/dT is positive and very large. This indicates that the slope of the solid-liquid phase boundary is positive and steep in most cases.
Integrating the Clapeyron equation assuming that AZ+and A 5 are constant,
For the liquid-vapour phase boundary,
This equation is known as the Clausius-Clapeyron equation. Integration yields,
Using this equation M, can be estimated with a knowledge of the equilibrium vapour pressure of a liquid at two different temperatures. For the solid-vapour phase boundary (sublimation), an analogous equation is obtained by replacing AHH, with the heat of subIimation Ms.

Equilibria 141
Shown is the sketch of the phase diagram of carbon. For the phase change from graphite to liquid carbon along the line PQ, choose the correct one :
1) v(&zph#te) ' v(llqutld,
2) V(&zph&) = V(7lqwkfJ
3) V(pph&e) < v(ilqslld,
200 -
I
0 1000 2000 3000 4000
m<
From Clapeyron equation,
7 0 (from the slope) dT TAVf
Al+ > 0 (Fusion is endothermic.) ! Example 2
Substance A in the condensed phase is in equilibrium with its own vapour at temperature T. A is the only species in the gas phase. Now an inert gas is introduced into the system so that the total pressure rises from P" to P '. Assuming that the inert gas behaves ideally with A and does not dissolve in the condensed phase, choose the correct one from the following :
1. The vapour pressure of A is independent of the total pressure of the system. 2. The vapour pressure of A is affected by the total pressure, but the change in the
vapour pressure is generally negligibly small. 3. The vapour pressure of A is affected to a large extent by the total pressure.
From the knowledge that A in the condensed phase is in equilibrium with A in the gaseous phase,
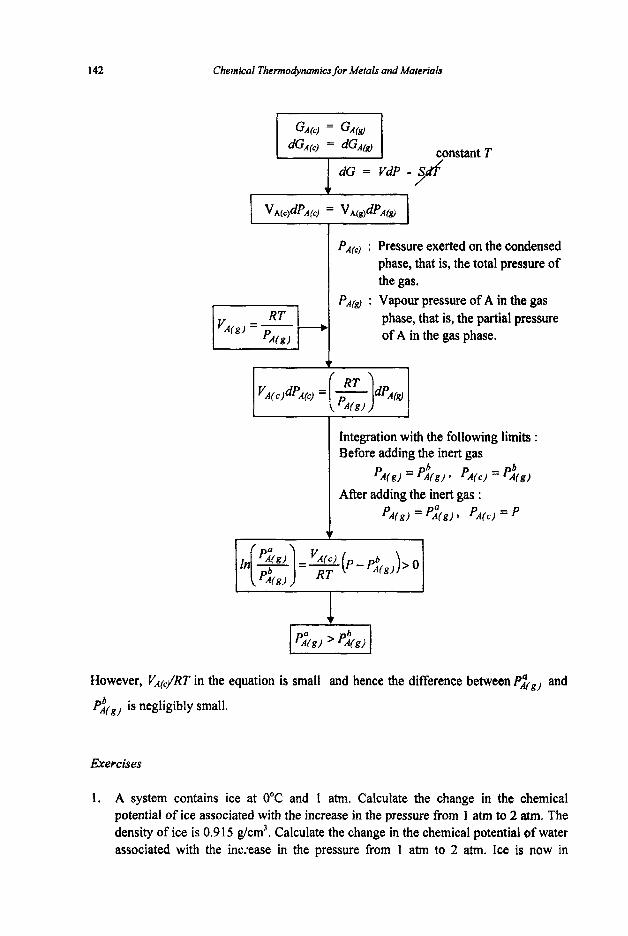
142
Integration with the following limits : Before adding the inert gas
After adding the inert gas : ' A ( g ) = ' ; (g) * ' A ( c ) = ' ;(g)
'A (g ) = ' I ( g ) 3 pA(c) =
Chemical Thermo&namicsfor Metals and Materials
r -
1 dG = VdP -@
Pressure exerted on the condensed phase, that is, the total pressure of the gas. Vapour pressure of A in the gas phase, that is, the partial pressure ofA in the gas phase.
However, V A ( ~ ~ R T in the equation is small and hence the difference between P+g, and
P;(*) is negligibly small.
Exercises
1. A system contains ice at 0°C and 1 atm. Calculate the change in the chemical potential of ice associated with the increase in the pressure from 1 atm to 2 atm. The density of ice is 0.915 g/cm'. Calculate the change in the chemical potential of water associated with the inctease in the pressure from 1 a m to 2 atm. Ice is now in
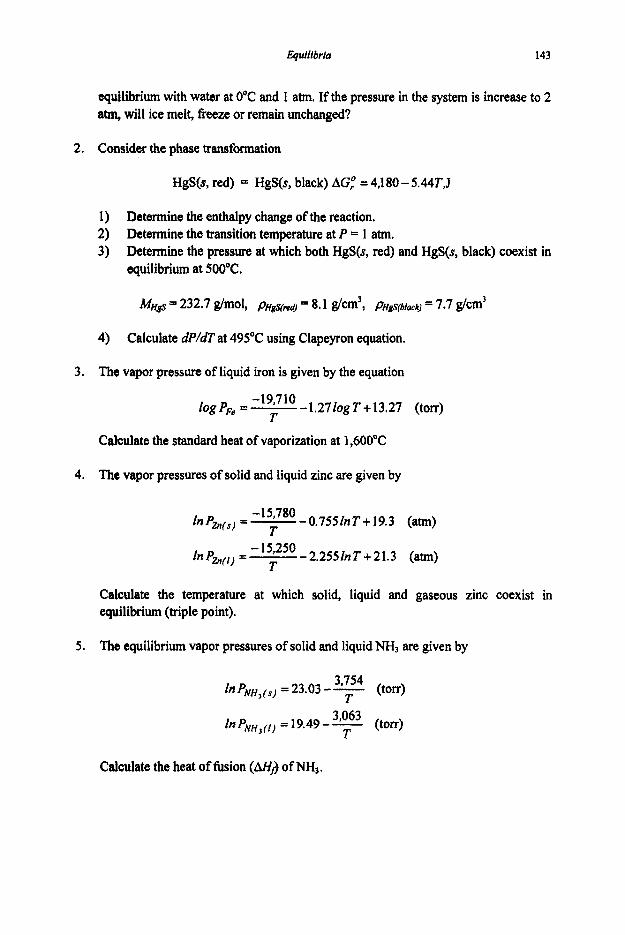
Equilibria 143
equilibrium with water at 0°C and 1 am. If the pressure in the system is increase to 2 atm, will ice melt, fieeze or remain unchanged?
2. Consider the phase transformation
HgS(s, red) = HgS(s, black) AG: = 4,180 - 5.44T,J
1) 2 ) 3 )
Determine the enthalpy change of the reaction. Determine the transition temperature at P = 1 atm. Determine the pressure at which both HgS(s, red) and HgS(s, black) coexist in equilibrium at 500°C.
4) Calculate dP/dT at 495°C using Clapeyron equation.
3. The vapor pressure of liquid iron is given by the equation
1.27 log T + 13.27 (torr) -1 9,710
T log PFe = - -
Calculate the standard heat of vaporization at 1,600"C
4. The vapor pressures of solid and liquid zinc are given by
0.755fnT + 19.3 (atm) In Pa(,) = - - -15,780 T
2.255ZnT+21.3 (atm) fn = - - - 15,250 T
Calculate the temperature at which solid, liquid and gaseous zinc coexist in equilibrium (triple point).
5. The equilibrium vapor pressures of solid and liquid NH3 are given by
l"P~ff>() ) =19.49-- 31063 (torr} T
Calculate the heat of hsion (Mf) of NH3.
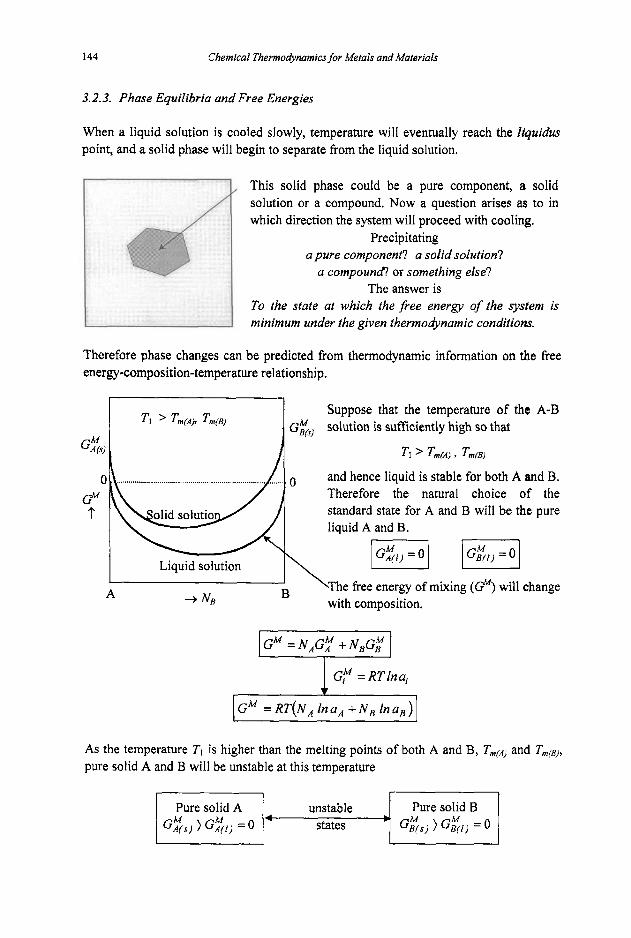
144 Chemical Thermo&iamicsfor Metals and Materials
3.2.3. Phase Equilibria and Free Energies
When a liquid solution is cooled slowly, temperature will eventually reach the liquidus point, and a solid phase will begin to separate from the liquid solution.
/ This solid phase could be a pure component, a solid solution or a compound. Now a question arises as to in which direction the system will proceed with cooling.
Precipitating a pure component? a solid solution?
a compound? or something else? The answer is
To the state at which the fiee energy of the system is m~nimum under the given thermodynamic conditiom.
Therefore phase changes can be predicted from thermodynamic information on the free energy-composition-temperature relationship.
T l Tm(A/. Tm@)
Liquid solution
Suppose that the temperature of the A-B solution is sufficiently high so that
TI ' Tm(A) T ~ ( E )
and hence liquid is stable for both A and B. Therefore the natural choice of the standard state for A and B wiH be the pure liquid A and B.
I A
' B \The free energy of mixing (@) will change
NE with composition.
As the temperature T, is higher than the melting points of both A and B, TmrAl and Tnl(~] , pure solid A and B will be unstable at this temperature

Eguilibria 14s
Pure liquid A unstable G%r, ) GZS, = o states
The free energy of mixing (@) of the solid solution, if it existed indeed, will vary with composition as shown in the figure.
Pure liquid B GZl, ) GZS, = 0
At the temperature T,, therefore, liquid solutions have free energies lower than solid solutions, and hence are stable over the entire range of composition.
Next, suppose that the temperature of the A-B solution is sufficiently low so that T1 < Tm(A/1 Tm[B)
T2 < T&A) I TmtB)
and hence solid is stable for both A and B. Therefore the natural choice of the standard state for A and B will be the pure solid A and B. F’Oi PI The free energy of mixing (@) wit1 change
A B with composition.
As the temperature T, is lower than the melting points of both A and B, Tm(AJ and TmcB,, pure liquid A and B will be unstable at this temperature
! I I 1
The free energy of mixing (#) of the liquid solution, if it existed, will vary with composition as shown in the figure.
At the temperature T2, therefore, solid solutions are stable over the entire range of composition.
If the change in the Bee energy of mixing (@) of a mixture with composition is concave downward at constant temperature and pressure, why is homogeneous solution is stable over the entire range of composition? Consider a mixture of A and B with an average composition of “a” shown in the following figure. If this mixture forms a homogeneous solution (CL), the free energy of mixing of the solution is given by G:. Is there any way to lower the free energy of mixing below this vahe? If the mixture forms two separate phases, p and y, with the composition of b and c, respectively, the molar free energies of mixing are Gf and
Gf , respectively. As the average composition of the system (sum of p and y phases)
must be the same as the initial mixture (a), the proportion of each phase is given by

146 Chemical Thermodynamics for Metals and Materials
U I
I
The average free energy of mixing of the mixture of p and yphases is thus G," as shown in the figure. It is clear that the phase separation has resulted in an increase in the free energy of mixing (G," > GaM) and hence there is no way of lowering the fiee energy of mixing below GaM.
Now we have a question as to the shape of the free energy curve: Why is the curve of @ versus Ni concave downward?
~
@ < 0 always and concave downward.
I I T, Pconstant
I I
A -P BB B

147
At high I: - @will dominate, and hence @ (= IT - 7@ will be concave
downward.
At low T, fl term dominates, and hence
composition in a more complicated manner. G“ (= - @) will change with
0
f
Consider a solution of composition “a” at constant temperature and pressure. If the solution does not dissociate, but maintains homogeneity, @ of the solution is represented by “J” in the figure. It can be seen from the figure that it is possible to lower
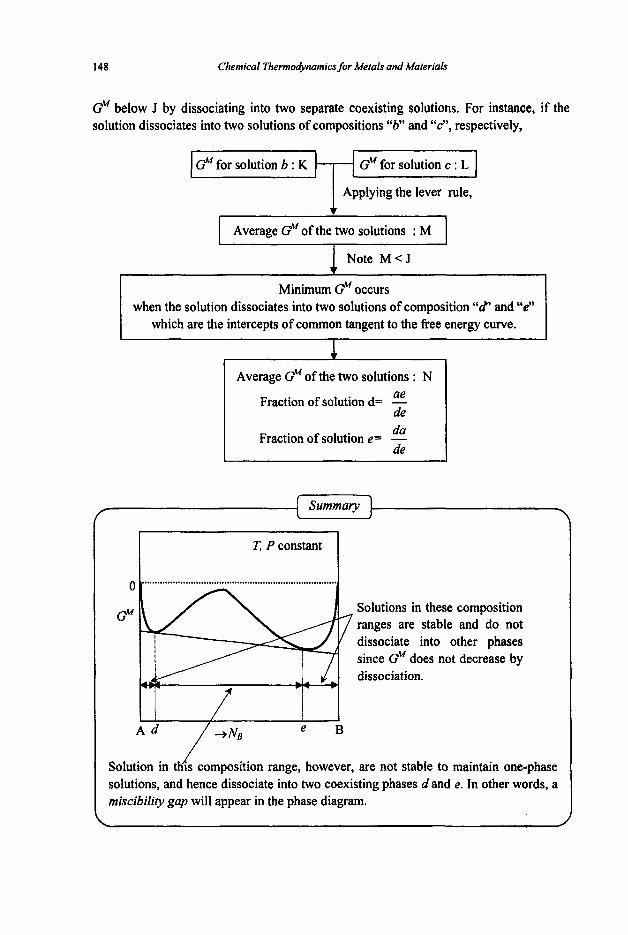
148 Chemical Thermodynamics for Metals and Materials
@ below J by dissociating into two separate coexisting solutions. For instance, if the solution dissociates into two solutions of compositions “8’ and “c”, respectively,
I Average @ of the two solutions : M I
Minimum @ occurs when the solution dissociates into two solutions of composition “6 and “e”
which are the intercepts of common tangent to the fiee energy curve.
I Average @ of the two solutions : N I I I ae Fraction of solution d= -
de da Fraction of solution e= - de
Y
- T Pconstant
Solutions in these composition ranges are stable and do not dissociate into other phases since @ does not decrease by dissociation.
are not stable to maintain one-phase solutions, and hence dissociate into two coexisting phases d and e. In other words, a miscibility gap will appear in the phase diagram.
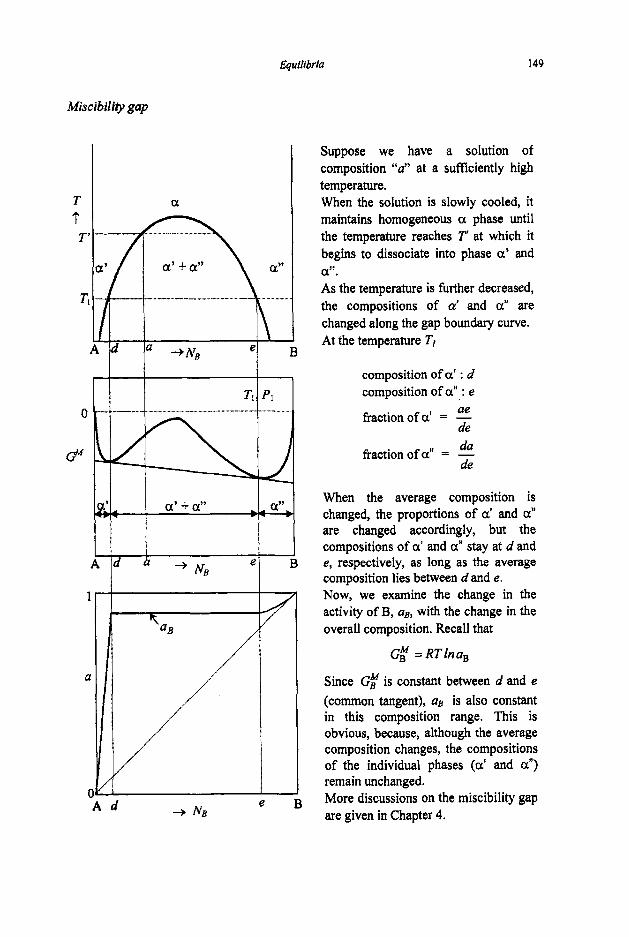
149
T
Miscibility gap
a +r T
T ‘k A
eoi- A
....... ............
U’
-_ ”_ 1
I
Tl ...... ” .............. ” .-
e + NB d t r
J ........
’1 B
€3
7 /
Suppose we have a solution of composition “aJ7 at a sufficiently high temperature. When the solution is slowly cooled, it maintains homogeneous a phase until the temperature reaches T‘ at which it begins to dissociate into phase a’ and a”. As the temperature is M e r decreased, the compositions of a‘ and a” are changed along the gap boundary curve. At the temperature TI
composition of a’ : d composition of a” : e
ae fraction of a’ = -
de da
fraction of a” = - de
When the average composition is changed, the proportions of a’ and ax are changed accordingly, but the compositions of a1 and a” stay at d and e, respectively, as long as the average composition lies between d and e. Now, we examine the change in the activity of B, uB, with the change in the overall composition. Recall that
Gf =RTlna,
Since Gf is constant between d and e (common tangent), aB is also constant in this composition range. This is obvious , because , although the average composition changes, the compositions of the individual phases (a’ and a”) remain unchanged. More discussions on the miscibility gap are given in Chapter 4.

150 Chemical Thermodynamics for Metals and Materials
We now consider an A-B binary solution at temperature Tt which is above the melting point of A (T,,,A), but below the melting point of B (T,,,B).
Stable -B : Solid -P Solid phase standard state phases
G&s,pm) = 0 A : Liquid + Liquid phase standard state GZlSpm) = 0
4 Solid A : unstable 4-1
I 1 I
GZS)
‘Free energy of mixing of solid solutions
Free energy of mixing of liquid solutions
Liquid
Coexistence of liquid and solid
solutions ;I: A
\ B * NB Solid solutions
I
Liquid + Solid
~
This is an example of phase diagrams
when A and 0 have the same or similar crystal structures.
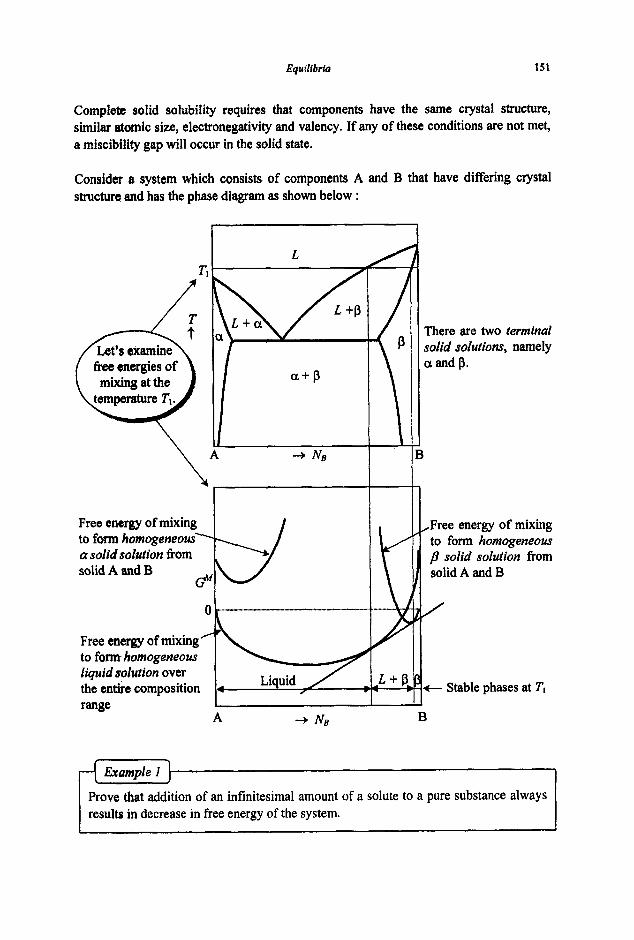
Equflfbria 151
Complete solid solubility requires that components have the same crystal structure, similar atomic size, electronegativity and valency. If any of these conditions are not met, a miscibility gap will occur in the solid state.
Consider a system which consists of components A and B that have differing crystal structure and has the phase diagram as shown below :
I L
Free energy of
solid A and B
ILz Li uid
Free energy of mixing to form homogeneous liquid solution over the entire composition range
A 3 NB
There are two terminal solid solutions, namely a and P.
I B Free energy of mixing to form homogeneous p solid solution from
t Stable phases at T,
B
Exurnpie 1 } Prove that addition of an infinitesimal amount of a solute to a pure substance always results in decrease in free energy of the system.

152 Chemical Thermodyncimics for Metals and Materials
The fiee energy of mixing of the solution, or the relative integral molar free energy, @, for a A-B binary solutions given by
I NA + NB = 1 and differentiation
WhenNg+O, - NB 4 0 1-NB
1 andhence
the change in @with NB at NB E 0 is negative, irrespective of the vahes of and yB.
Exampie 2 If the temperature is not much lower than the true melting point (T,,,), the free energy of fusion can be estimated by the following equation :
I Prove the above equation.
At the true melting point.
I AGO/=O
fq =- PI At the temperature T,
Change in AH and AS with a small change in T is -I negligibly small. Thus AHr G AH; ASf AS;. I t
I
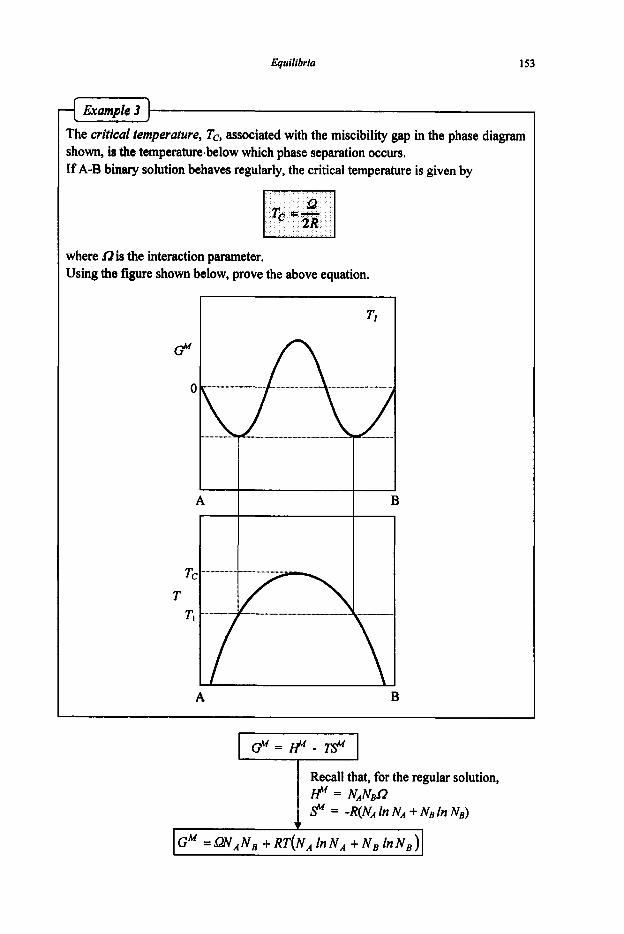
Equilibria 153
Example 3 The critical temperature, Tc, associated with the miscibility gap in the phase diagram shown, is the temperature.below which phase separation occurs. If A-B binary solution behaves regularly, the critical temperature is given by
where R is the interaction parameter. Using the figure shown below, prove the above equation.
T
A B
Recall that, for the regular solution,
fl = -R(NA In NA + NB In NE) HM = NANBO

I54 Chemical Thermodynamics for Metals and Materials
Example 4
Shown is the free energy of mixing versus composition diagram of the A- B binary system at the temperature 7 and the pressure P. The diagram shows two terminal phases, a and (3, and one intermediate phase y. If the overall composition of the system is given by the point X shown in the diagram, find the stable equilibrium phase(s) at 7 and P.
CP
0
-
This is the equation which represents the free energy curve in the figure. 0 Below Tc, the equation gives two minima and hence two inflection points as shown. 0 Above Tc, the equation gives a curve concave downward.
At Tc, the two minima and the two inflection points coincide. Mathematically,
Combination of the above two equations yields
] The maximum T occurs at
1
The minimum value of free energy the system with the composition of X cm have is found by drawing the common tange?’ to the free energy curves of a and p phases. For the system at the overall composition of X, the equilibrium structure is the mixture of phase a and phase p with the following proportions (refer to the figure below.):
Xb ax Fraction of a = - Fraction of p = - ab ab
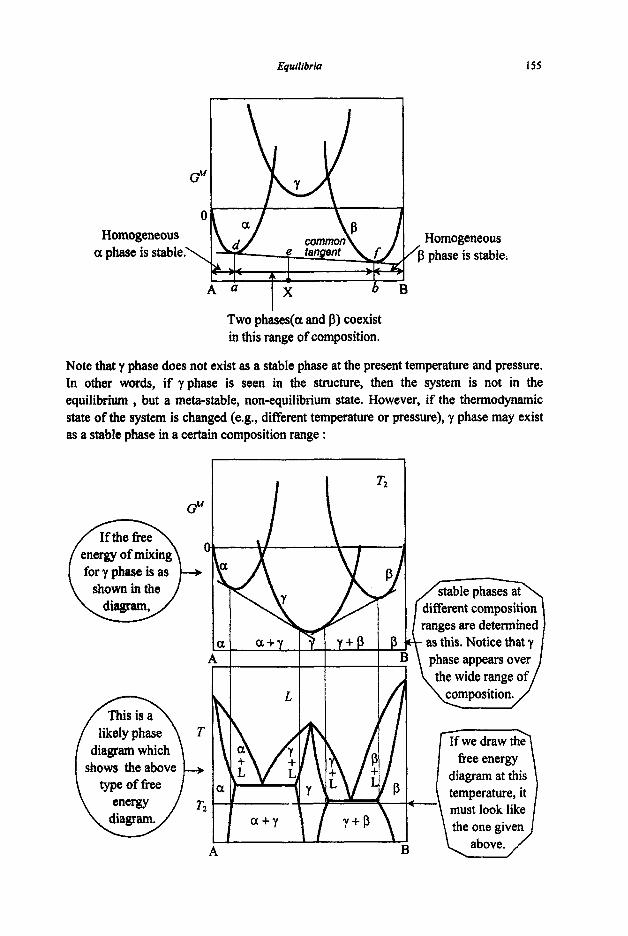
Equilibria 155
@
0
a phase is stable.\ Homogeneous
A a X b
Two phases(a and f3) coexist in this range of composition.
Homogeneous /p phase is stable.
I
Note that y phase does not exist as a stable phase at the present temperature and pressure. In other words, if yphase is seen in the structure, then the system is not in the equilibrium , but a meta-stabfe, non-equilibrium state. However, if the thermodynamic state of the system is changed (e.g., different temperature or pressure), y phase may exist as a stable phase in a certain composition range :
ranges are determine as this. Notice th
A

156 Chemical Thermodynamics for Metals and Materials
Exercises
1. The A-B binary system conforms to regular solution behaviour and the interaction parameter R is 17,400 J/mol. Find the critical temperature Tc below which phase separation occurs. Calculate the compositions of a' and a" in equilibrium at 900K.
2. At 1273K, a copper-zinc alloy containing 16mol% Zn lies on the solidus, and that on the liquidus contains 20.6mol% Zn. The activity coefficient of Zn in liquid Cu-Zn alloys, relative to the pure liquid zinc standard state, is represented by
RT l n y , = -19,246N& where R = 8.3 14Jmol-'K-'
Find activity of copper in the alloy of the solidus composition, relative to the pure solid copper standard state. The standard free energy of fusion of copper is given by
AG;,cu =6,883-8.7451nT + 3 . 1 3 8 ~ 1 0 - ~ T ~ +53.1393, Jmol-'
3. Shown below is the diagram of free energy of mixing of liquid and solid solutions of the A-B binary system at temperature T,. 1 ) 2)
Is it true that T, < T,,,(A) and T, < T,,,(B) ?. T.0, is the melting point of i. The diagram shown occurs when the heat of mixing, H", is positive. Prove that
Hzl id ) H&,d
I I A B

CHAPTER 4
PHASE DIAGRAMS
4.1. Unary Systems
4.1. I . Presstire-Temperature Diagrams
Phase changes are effected by three externally controllable variables. These are pressure, temperature and composition. In a one-component system, or unary system, however, the composition does not vary, but must always be unity. Therefore there are only two variables which can vary: pressure and temperature. Every possible combination of temperature and pressure can be readily represented by points on a two-dimensional diagram.
P
T
Any vertical line on this P-T field represents the same temperature, and is called "isotherm".
.._I." \
Any horizontal line on this P-T field represents the same pressure and is called "isobar". -
The threo states or phases, namely solid, liquid and gas, can be represented by the correspodhg areas in the P-T field :
P
... . .............. ................................ ...p...'...:*..... .~..~.~.~.~.~.~~.~.~....~... ......'.. ...........
9:. ..:...:> .: ................................. ;+.. ................................. .............................. ....... ~ ...........
phase is stable in ...$.$.:. *..*a\ ........ $... .......... .'."...; / ......................... .. 2 .................... ................. ..,
r
T
Boundaries separating these phases are called phase boundaries.

158 Chemical Thermodynamics for Metals and Materials
Combinations of P and T which give
points falling within this area permit only
the solid phase to exist 1. at equilibrium.
Similarly this is the area in which the
liquid phase is stable
k
area permitting the gas phase to exist at
Solid Liquid
T
Points falling directly on the phase boundaries represent conditions which require that two neighbouring phases coexist at equilibrium :
e.g.:
, > The boundary A-0
defines conditions of P and T which allow a solid and a vapour
to coexist and is called sublimation
curve. \ 1
point a : coexistence of the solid and gas phases point b : coexistence of the solid and liquid phases point c : coexistence of the liquid and gas phases 'i [ = ' a representsthe
conditions under which a solid and
a liquid can coexist and called
OUllU
\ was
I b T
The point 0 represents a set of conditions under which all three
phases coexist in equilibrium and is called the triple point.
/
\
P Combinations of P
and Tfalling on the boundary 0-C allows coexistence
of liquid and vapour phases and
the boundary is called vaporisation
curve. - The vaporisation curve (0-C) does not extend indefmitely, but ends abruptly at point C which is called the critical point. Let's examine the physical significance of the critical point. Suppose that a liquid is contained in a sealed vessel and in equilibrium with its vapour at the temperature T, (Fig A). When the liquid is heated, the vapour pressure increases and hence

Phase Diagrams 159
the density of the vapour phase increases, but the quantity of the liquid decreases due to vaporisation and the density of the liquid decreases due to thermal expansion (Fig B). Eventually there comes to a stage at which the density of the vapour becomes equal to that of the remainiig liquid and the interface between the two phases disappears and thus the two phases are indistinguishable (Fig C).
Fig A Fig B Fig C
The temperature at which the interface disappears is called the critical temperature (Tc), and the corresponding vapour pressure is called the critical pressure Pc. At and above Tc, therefore, the liquid phase does not exist.
Now we discuss dynamic changes which take place when a system under equilibrium is disturbed by change in temperature or pressure. Consider a system represented by point k, in which the liquid and vapour phases are in equilibrium at T, and P I . If the temperature of the system is suddenly increased to T2 while keeping the total volume constant, the initial equilibrium conditions are disturbed and the position of the system is now shifted to point m. This appears to put the system into a single phase (vapour phase) region. The position of m is however not the equilibrium one for the system, because the volume of the system is kept constant. What should happen in reality is that the thermal energy supplied to raise temperature will cause the liquid to vaporise and hence increase the pressure of the system to Pz so that a new equilibrium is established at point n.
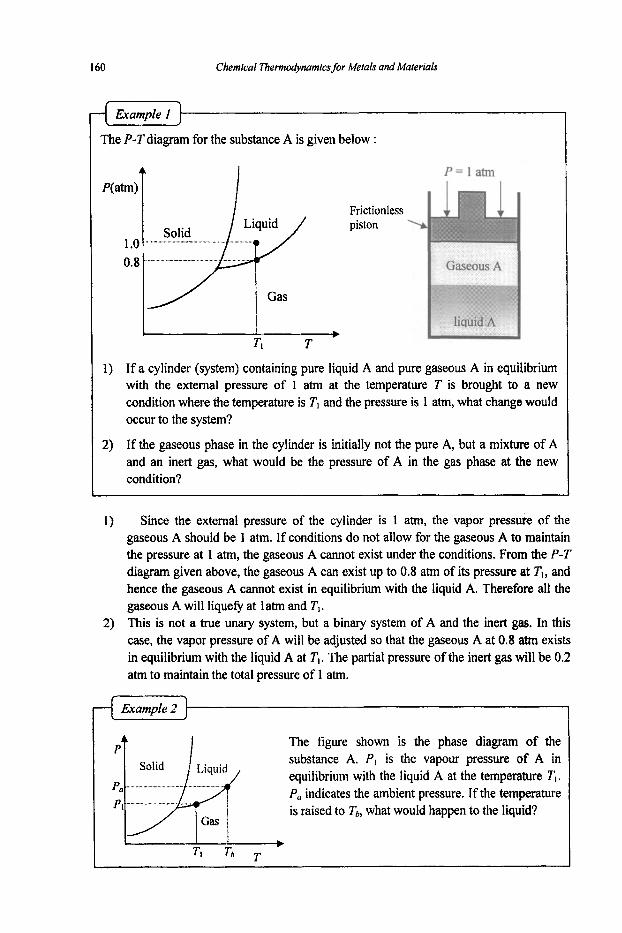
I60 Chemical ThermodyMmics for Metals and Malerials
The P-T diagram for the substance A is given below :
I Liquid /
Solid ...... "" _
P = l a t m
Gas
v I T
1) If a cylinder (system) containing pure liquid A and pure gaseous A in equilibrium with the external pressure of 1 atm at the temperature T is brought to a new condition where the temperature is Tl and the pressure is 1 atm, what change would occur to the system?
2) If the gaseous phase in the cylinder is initially not the pure A, but a mixture of A and an inert gas, what would be the pressure of A in the gas phase at the new condition?
1) Since the external pressure of the cylinder is 1 atm, the vapor pressure of the gaseous A should be 1 atm. If conditions do not allow for the gaseous A to maintain the pressure at 1 atm, the gaseous A cannot exist under the conditions. From the P-T diagram given above, the gaseous A can exist up to 0.8 atm of its pressure at T,, and hence the gaseous A cannot exist in equilibrium with the liquid A. Therefore all the gaseous A will liquefy at 1 atm and T, .
2) This is not a true unary system, but a binary system of A and the inert gas. In this case, the vapor pressure of A will be adjusted so that the gaseous A at 0.8 atm exists in equilibrium with the liquid A at T, . The partial pressure of the inert gas will be 0.2 atm to maintain the total pressure of 1 atm.
Example 2
The figure shown is the phase diagram of the substance A. PI is the vapour pressure of A in equilibrium with the liquid A at the temperature T, . PO indicates the ambient pressure. If the temperature is raised to T,, what would happen to the liquid?
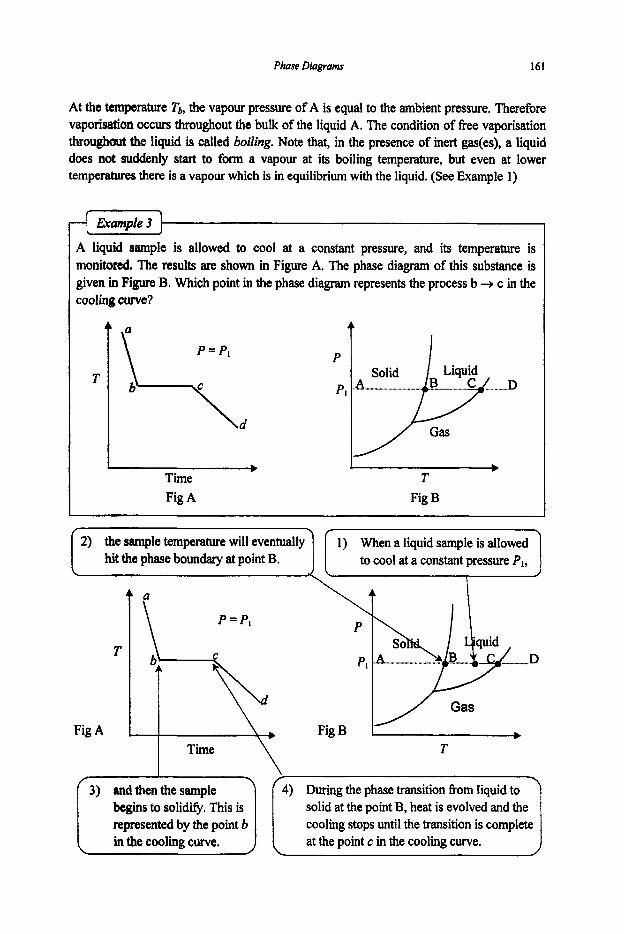
Phase Diagram 161
At the temperature Tb, the vapour pressure of A is equal to the ambient pressure. Therefore vaporisation occurs throughout the bulk of the liquid A. The condition of Eree vaporisation throughout ?he liquid is called boiling. Note that, in the presence of inert gas(es), a liquid does not suddenly start to form a vapour at its boiling temperature, but even at lower t e m p e m there is a vapour which is in equilibrium with the liquid. (See Example 1)
E X a m p q q
A Iiquid sample is allowed to cool at a constant pressure, and its temperature is monitored, The results are shown in Figure A. The phase diagram of this substance is given in Figure B. Which point in the phase diagram represents the process b + c in the cooling curve?
Fig A
Solid Liquid
c
T Fig B
T
Fig A
\ P
PI
Fig B T
f 3) and then the sample 1 (4) During the phase transition fiom liquid to ~
begins to solidi@. This is represented by the point b
solid at the point B, heat is evolved and the cooling stops until the transition is complete
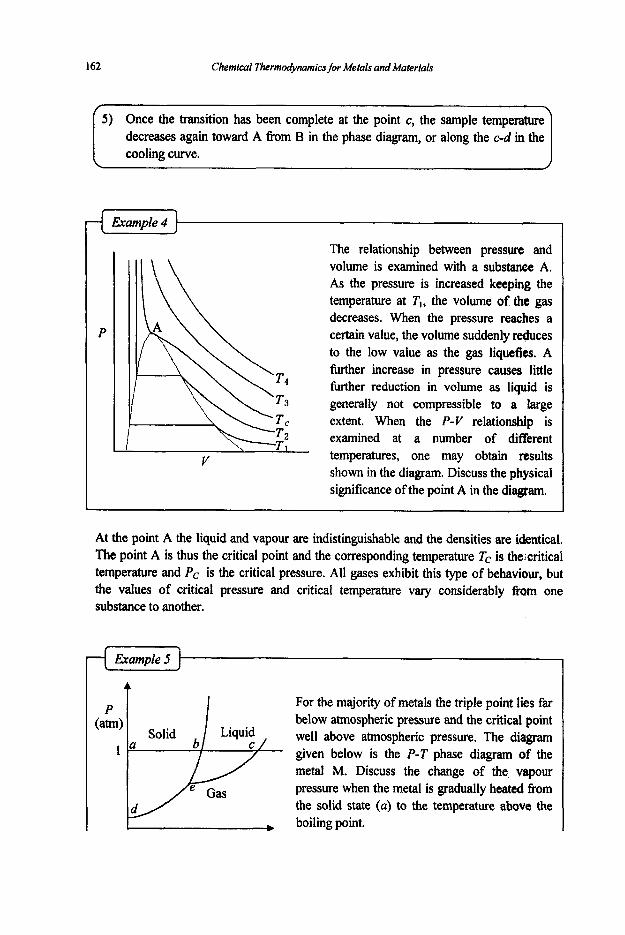
1 62 Chemical Thermodynamics for Metals and Materials
decreases again toward A from B in the phase diagram, or along the c-d in the
volume is examined with a substance A. As the pressure is increased keeping the temperature at T,, the volume of the gas
Example 4 J I
decreases. When the pressure reaches a certain value, the volume suddenly reduces to the low value as the gas liquefies. A further increase in pressure causes little
The relationship between pressure and I
T4 fiwther reduction in volume as liquid is T3 generally not compressible to a large T c extent. When the P-V relationship is
At the point A the liquid and vapour are indistinguishable and the densities are identical. The point A is thus the critical point and the corresponding temperature Tc is the critical temperature and PC is the critical pressure. All gases exhibit this type of behaviour, but the values of critical pressure and critical temperature vary considerably from one substance to another.
Example 5
For the majority of metals the triple point lies far below atmospheric pressure and the critical point well above atmospheric pressure. The diagram given below is the P-T phase diagram of the metal M. Discuss the change of the vapour pressure when the metal is gradually heated fiom the solid state (U) to the temperature above the boiling point.
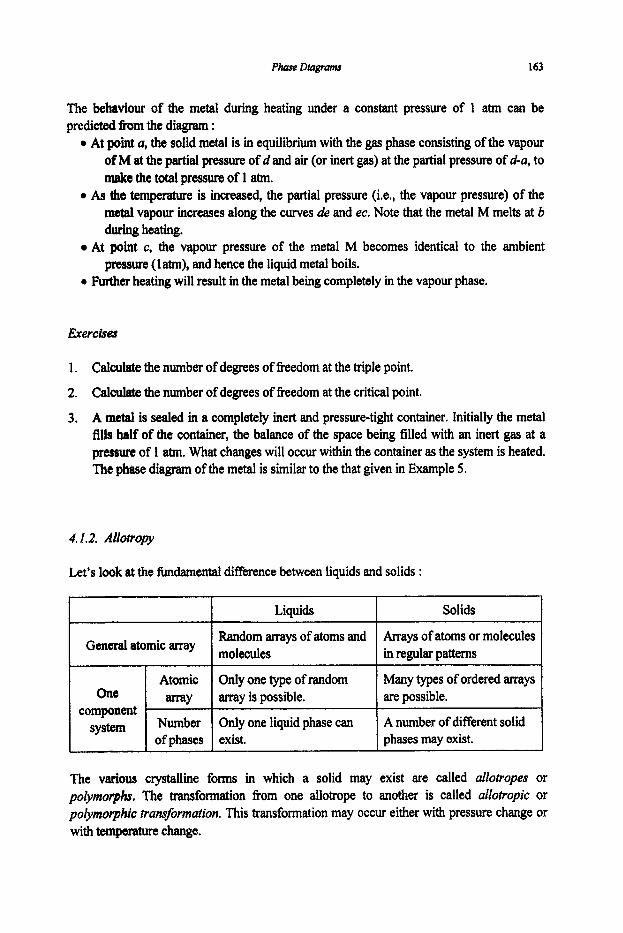
Phase Diagrams 163
Liquids
The befuvlour of the metal during heating under a constant pressure of 1 atm can be predicted &om the diagram :
0 At point a, the solid metal is in equilibrium with the gas phase consisting of the vapour of M at the partial pressure of d and air (or inert gas) at the partial pressure of d-a, to make the total pressure of 1 atm.
0 As the temperature is increased, the partial pressure (i.e., the vapour pressure) of the metal vapour increases along the curves de and ec. Note that the metal M melts at b during heating.
At point c, the vapour pressure of the metal M becomes identical to the ambient pressure (latm), and hence the liquid metal boils.
0 Further heating will result in the metal being completely in the vapour phase.
Solids
1. Calculate the number of degrees of freedom at the triple point.
2. Calculate the number of degrees of freedom at the critical point.
3. A metal is sealed in a completely inert and pressure-tight container. Initially the metal fills half of the container, the balance of the space being filled with an inert gas at a pressure of 1 atm, What changes will occur within the container as the system is heated. The phase diagram of the metal is similar to the that given in Example 5.
Random arrays of atoms and molecules General atomic array
4.1.2. Allotrop
Arrays of atoms or molecules in regular patterns
Let’s look at the fundamental difference between liquids and solids :
Atomic One array
system Number of vhases
component
Only one type of random array is possible. are possible.
Only one liquid phase can exist. phases may exist.
Many types of ordered arrays
A number of different solid
The various crystalline forms in which a solid may exist are called allotropes or polymuqk. The transformation from one allotrope to another is called allotropic or polymorphic tramformation. This transformation may occur either with pressure change or with temperature change.

164 Chemical Thermodynamics for Metals and Materials
Suppose there are two possible solid phases, say a and p, in a given substance, and the free energies of cx and p vary as shown in the following figure :
t G
Note that
0
0 G, < G, at T > and hence p phase is more stable, and 0
G, < Gp at T c & and hence 01 phase is more stable,
GIiq < G, at T > T, and hence the liquid phase is more stable.
The fkee energy curves corresponding to phase stability are then the curve for 01 in the cx phase stable region, the curve for p in the p phase stable region and the curve for the liquid in the liquid phase stable region.
0
0
T, is the temperature of allotropic transformation fkom CL to p phase and T, is the melting point. By combining with the effect of pressure we can construct a P-T diagram for a substance of interest. At a given pressure, say, the atmospheric pressure, PO, as shown in the following diagram, as the ct phase solid is heated, it transforms to the p phase at T,, and the p phase, upon W e r heating, melts at T,, and the liquid boils at Tv.
‘1 liquid
T
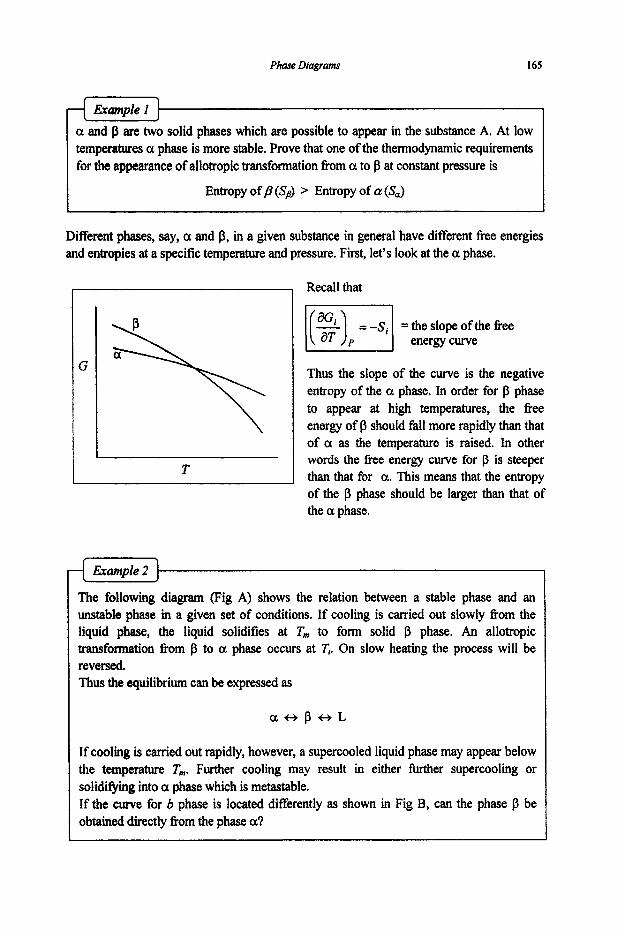
P k e Diagrams 165
Example I a and p are two solid phases which are possible to appear in the substance A. At low temperatures 01 phase is more stable. Prove that one of the thermodynamic requirements for the appearance of allotropic transformation from 01 to f j at constant pressure is
Entropy of p (Sp) > Entropy of a (S,)
Different phases, say, 01 and fj, in a given substance in general have different fiee energies and entropies at a specific temperature and pressure. First, let’s look at the a phase.
T I
Recall that
= -Si = the slope of the fiee energy curve 1
Thus the slope of the curve is the negative entropy of the a phase. In order for p phase to appear at high temperatures, the fiee energy of fj should fall more rapidly than that of a as the temperature is raised. In other words the f?ee energy curve for p is steeper than that for a. This means that the entropy of the p phase should be larger than that of the a phase.
Example 2
The following diagram (Fig A) shows the relation between a stable phase and an unstable phase in a given set of conditions. If cooling is carried out slowly from the liquid phase, the liquid solidifies at T, to form solid p phase. An allotropic transformation from p to a phase occurs at T,. On slow heating the process will be reversed. Thus the equilibrium can be expressed as
a t , p t , L
If cooling is carried out rapidly, however, a supercooled liquid phase may appear below the temperature T,. Further cooling may result in either Eurther supercooling or solidifying into a phase which is metastable. If the curve for b phase is located differently as shown in Fig B, can the phase p be obtained directly from the phase a?

166 Chemical Thermodynamics for Metals and Materials
P
T T
Note from Fig B that the transition point from a to p phase lies above the melting point of both 01 and p phases. Thus the transition from a to p cannot be observed. The only way to produce the p phase is
0 to melt the a phase, and then to rapidly cool the melt (supercooling).
Exercises
1. The following is the phase diagram of sulphur. The stable form of sulphur at ordinary temperature is a sulphur which has a rhombic crystal structure. At what temperature will rhombic sulphur melt upon slow heating? If the sulphur is heated rapidly, at what temperature will it melt?
4.2. Binary Systems
4.2.1. Binary Liquid Systems
When two liquids are brought together, they may
0
0 be completely immiscible.
totally dissolve in one another in all proportions, partially dissolve in one another, or
Total miscibility
Consider the A-B binary liquid system in equilibrium with the vapour phase at a constant temperature. Is the composition of the vapour the same as that of the liquid? Not necessarily. Let’s apply the Gibbs-Duhem equation to the liquid phase.
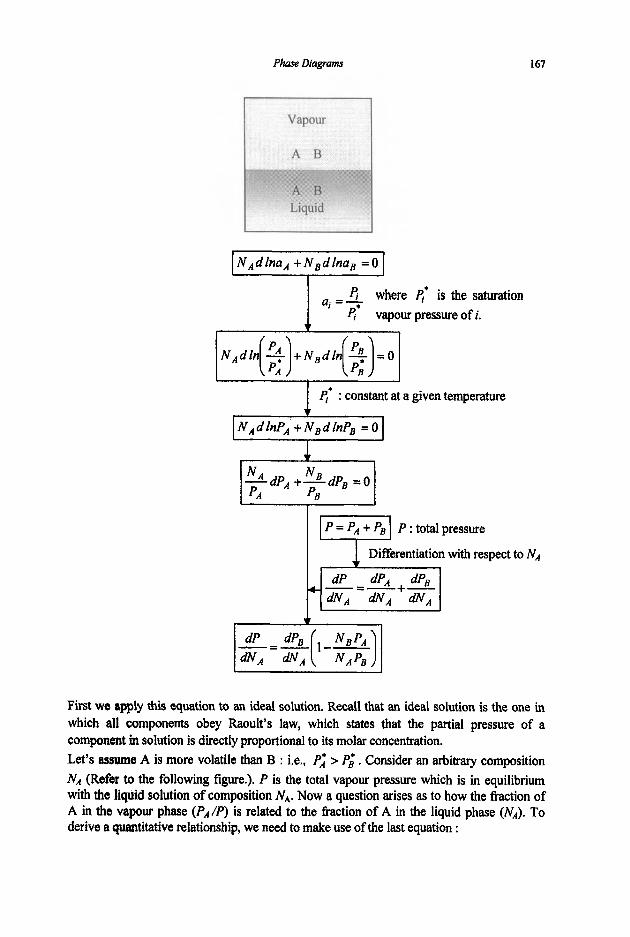
Phase Diagrams 167
I pi* : constant at a given temperature
P : total pressure
I 1 Differentiation with respect to NA
First we apply this equation to an ideal solution. Recall that an ideal solution is the one in which all components obey Raoult's law, which states that the partial pressure of a component in solution is directly proportional to its molar concentration. Let's assume A is more volatile than B : i.e., P; > P,' , Consider an arbitrary composition NA (Refer to the following figure.). P is the total vapour pressure which is in equilibrium with the liquid solution of composition N,,, Now a question arises as to how the fraction of A in the vapour phase (P,/P) is related to the hction of A in the liquid phase (NA). To derive a quantitative relationship, we need to make use of the last equation :

168 Chemical ThermodyMmics far Metals and Materials
-=--- d p ~ - -pi : - (slope of Ps curve) d p ~ &A dNB
1
This last equation tells us that even for the ideal solution the mole Ikaction of a component in the vapour phase is not the same as that in the liquid phase. In the A-B binary solution of

Phase LWgrwns 169
the above example in which A is more volatile than B, the vapour phase is richer in A than the liquid phase.
the composition of the vapour that is
the liquid at the uressm P.
in eqdlilRiium with
P-- Fraction of A in the
1
A +NB B
by connecting all the points,
PB’
A B
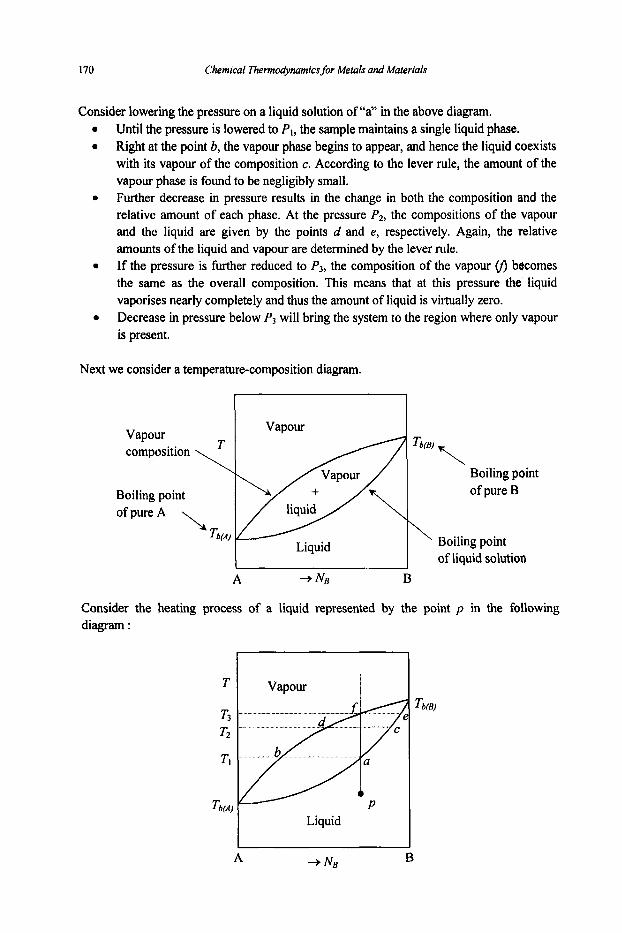
170 Chemical Thennodynamics for Metals and Materials
Consider lowering the pressure on a liquid solution of “a” in the above diagram. Until the pressure is lowered to P I , the sample maintains a single liquid phase. Right at the point b, the vapour phase begins to appear, and hence the liquid coexists with its vapour of the composition c. According to the lever rule, the amount of the vapour phase is found to be negligibly small. Further decrease in pressure results in the change in both the composition and the relative amount of each phase. At the pressure P2, the compositions of the vapour and the liquid are given by the points d and e, respectively. Again, the relative amounts of the liquid and vapour are determined by the lever rule. If the pressure is M e r reduced to P3, the composition of the vapour v) becomes the same as the overall composition. This means that at this pressure the liquid vaporises nearly completely and thus the amount of liquid is virtually zero. Decrease in pressure below P3 will bring the system to the region where only vapour is present.
Next we consider a temperature-composition diagram.
Boiling point
Liquid
A + NB B
Boiling point of pure B
\
Boiling point of liquid solution
Consider the heating process of a liquid represented by the point p in the following diagram :
A B

Phase Diagram 171
When the total vapour pressure curve for a liquid solution shows a minimum or a maximum, i.e.,
0
Until the temperature of the system reaches TI, only the liquid phase exists. At T, the liquid begins to boil. The compositions of the liquid and vapour are given by the points a and b, respectively. However, the amount of the vapour is negligibly small. Note that the vapour is richer in A than the liquid, since A is more volatile. On further heating, the compositions of both the liquid and the vapour are re- adjusted : the liquid composition fiom a toward c along the curve (liquidus), and the vapour fiom b toward d along the curve (vaporus). At T2 the liquid of c coexists in equilibrium with the vapour of d. The proportion of each phase is determined by the lever rule. At T3 the composition of the vapour v) becomes equal to that of the original liquid. This means that the liquid vaporises at this temperature nearly completely and hence the liquid of the composition e is present only as a trace. At temperatures higher than T3 only vapour phase can exist.
0
It is obvious that the boiling point curve in temperature-composition diagrams will show a maximum or minimum. As
Although temperature-composition phase diagrams of many liquids are similar to the one for an ideal solution shown above, there are a number of important solutions which exhibit a marked deviation. Recall the following equation which we have developed earlier :
-- - 0, dP
Therefore the composition of the vapour is the same as that of the liquid.
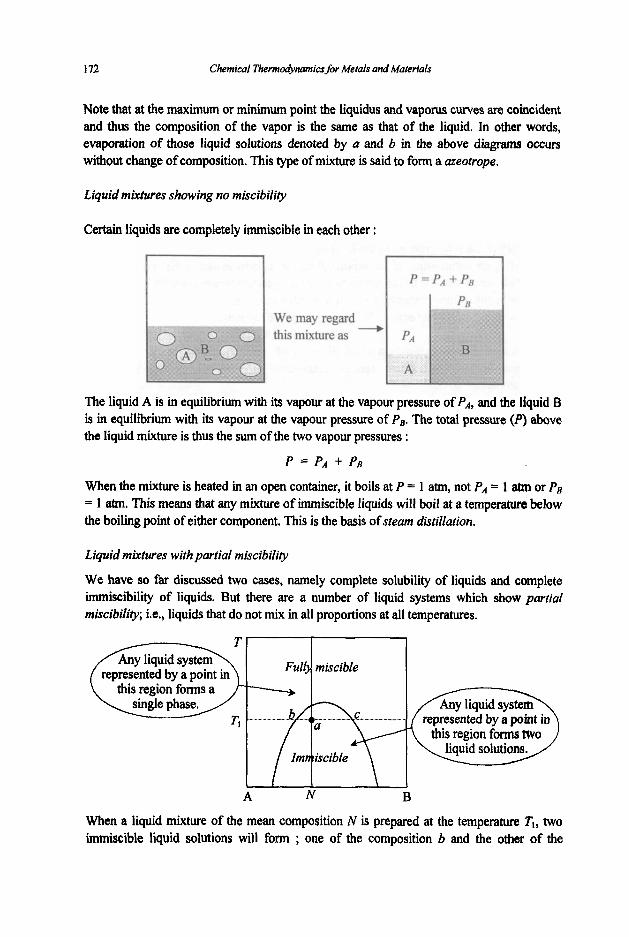
1 72 Chemical T h e t m ~ m i c s for Metals and Materials
Note that at the maximum or minimum point the liquidus and vaporus curves are coincident and thus the composition of the vapor is the same as that of the liquid. In other words, evaporation of those liquid solutions denoted by a and b in the above diagrams occurs without change of composition. This type of mixture is said to form a azeotrope.
Liquid mixtures showing no miscibility
Certain liquids are completely immiscible in each other :
The liquid A is in equilibrium with is in equilibrium with its vapour at
its vapour at the vapour pressure of PA, and the liquid B the vapour pressure of Pe. The total pressure (P) above
the liquid mixture is thus the sum of the two vapour pressures :
P = P.4 P B
When the mixture is heated in an open container, it boils at P = 1 atm, not PA = 1 atm or PB = 1 atm. This means that any mixture of immiscible liquids will boil at a temperature below the boiling point of either component. This is the basis of steam distillation.
Liquid mixtures with partial miscibility
We have so far discussed two cases, namely complete solubility of liquids and complete immiscibility of liquids. But there are a number of liquid systems which show partial miscibility; i.e., liquids that do not mix in all proportions at all temperatures.
A N B
When a liquid mixture of the mean composition N is prepared at the temperature T,, two immiscible liquid solutions will form ; one of the composition b and the other of the

Phase Diagrams 173
composition c. This point a in the diagram indicates merely the mean composition of the tW0 immiscible solutions.
A d N e B
When a homogeneous liquid solution represented by the point a in the above diagram is cooled, the phase separation into two immiscible solutions (b and c) occurs at the temperature TI. On M e r cooling compositions of both liquids change along the phase boundaries (bd and ce). Tc is the highest temperature at which phase separation can occur and is called the critical temperature. Given below are diagrams which are representative of partial miscibility or phase separation :
1 Homogeneous liquid solution T
Two phase region
Homogeneous
1 Homogeneous
I 1 liquid solution
A B A B A B Fig A Fig B Fig C
As can be seen in Fig B, some systems show a lower critical temperature below which they form a homogeneous liquid solution in all proportions and above which they separate into two phases. Some systems have both upper and lower critical temperatures (Fig C).
We now consider systems which include a vapour phase together with liquid mixtures with partial miscibility. The first example is a system which shows partial miscibility and a minimum boiling point azeotrope.
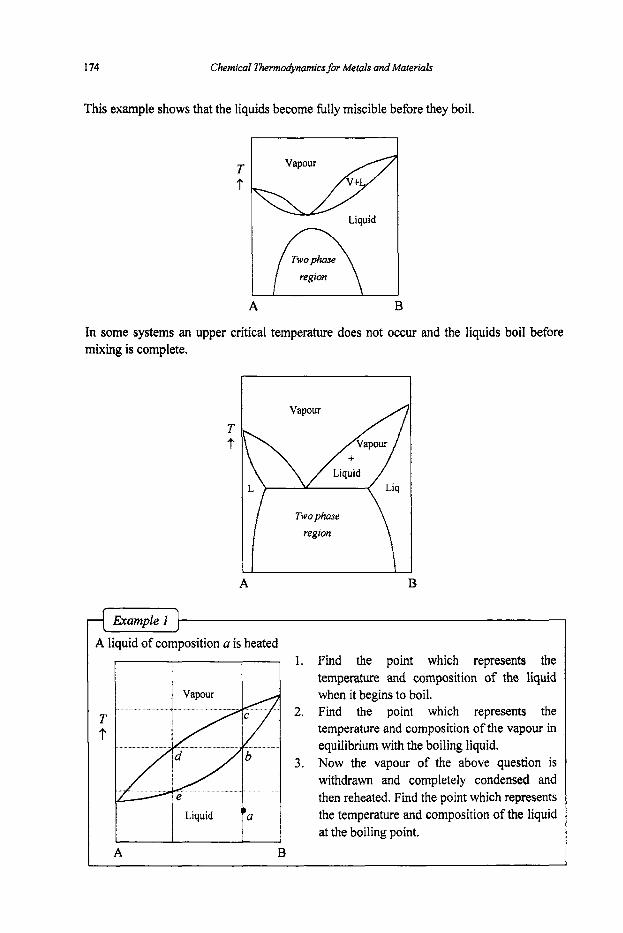
1 74 Chemical ~ ~ ~ ~ m i c s ~ o r Metais and Materials
Liquid
This example shows that the liquids become fully miscible before they boil.
''a the temperature and composition of the liquid at the boiling point. 1
Twophase region
A B
In some systems an upper critical temperature does not occur and the liquids boil before mixing is complete.
T t
A B
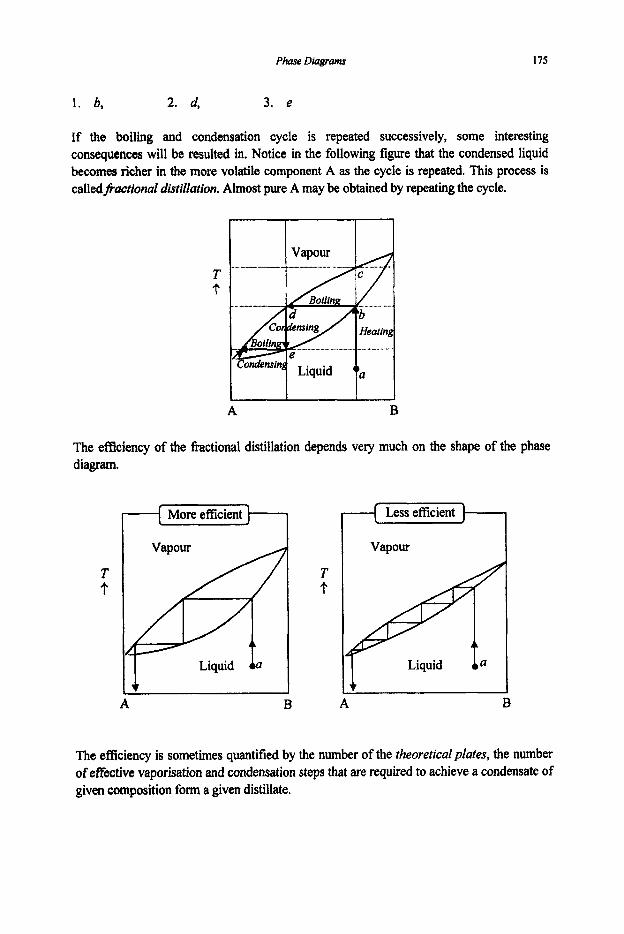
Phase Diagrams 175
1. b, 2. d, 3. e
If the boiling and condensation cycle is repeated successively, some interesting consequences will be resulted in, Notice in the foilowing figure that the condensed liquid becomes richer in the more volatile component A as the cycle is repeated. This process is calledpactional distillation. Almost pure A may be obtained by repeating the cycle.
T t
A B
The efficiency of the fractional distillation depends very much on the shape of the phase diagram.
T t
I More efficient 1 I
T t
Vapour
A B A
The efficiency is sometimes quantified by the number of the theoretical plates, the number of effective vaporisation and condensation steps that are required to achieve a condensate of given composition form a given distillate.
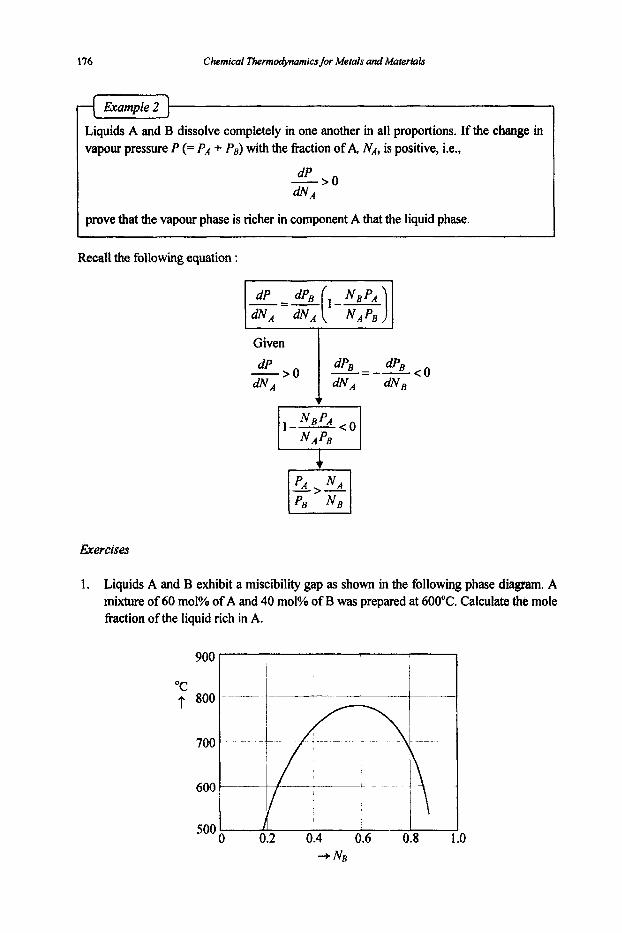
176 Chemical ThennOdyMmlcs for Metals and Materials
Liquids A and B dissolve completely in one another in all proportions. If the change in vapour pressure P (= PA + PB) with the fraction of A, NA, is positive, i.e.,
I prove that the vapour phase is richer in component A that the liquid phase.
Recall the following equation :
Exercises
1. Liquids A and B exhibit a miscibility gap as shown in the following phase diagram. A mixture of 60 mol% of A and 40 mol% of B was prepared at 600°C. Calculate the mole firaction of the liquid rich in A.
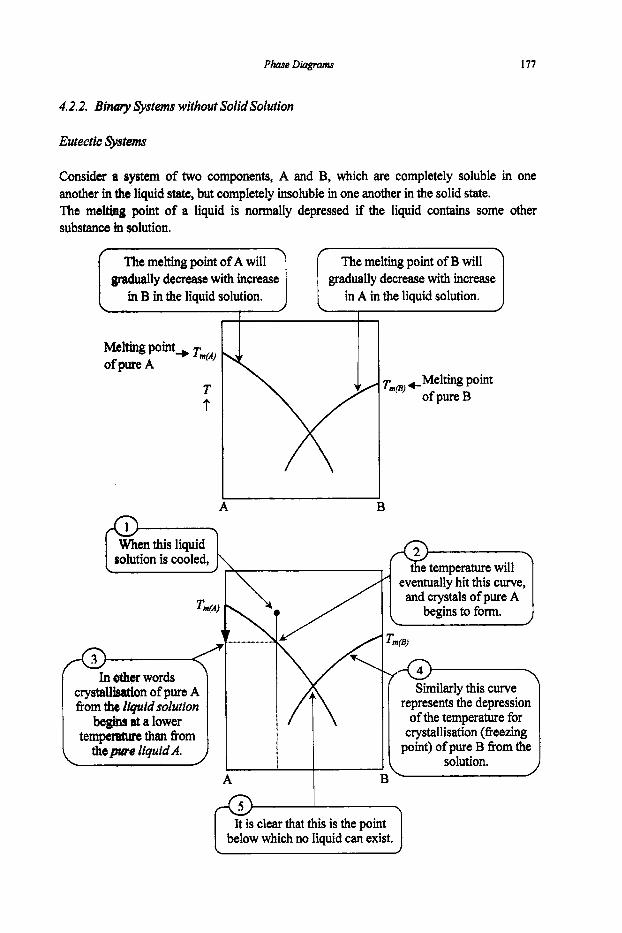
Phase Diagram 177
4.2.2. Binmy Systems without Solid Solution
Eutecttc wfems
Consider a system of two components, A and B, which are completely soluble in one another in the liquid state, but completely insolubb in one another in the solid state. The meltbig point of a liquid is normally depressed if the liquid contains some other substance in solution.
gradually decrease with increase in A in the liquid solution. in B in the liquid solution.
solution is cooled,
I In other words crysWisation of pure A fiom the liquid solution
bagins at a lower t e m p e m than flom
the pure liquid A.
A
eventually hit this curve, and crystals of pure A
begins to form.
\
Similarly this curve represents the depression
of the temperature for crystallisation (fieezing
point) of pure B fkom the solution.
\ /
below which no liquid can exist.
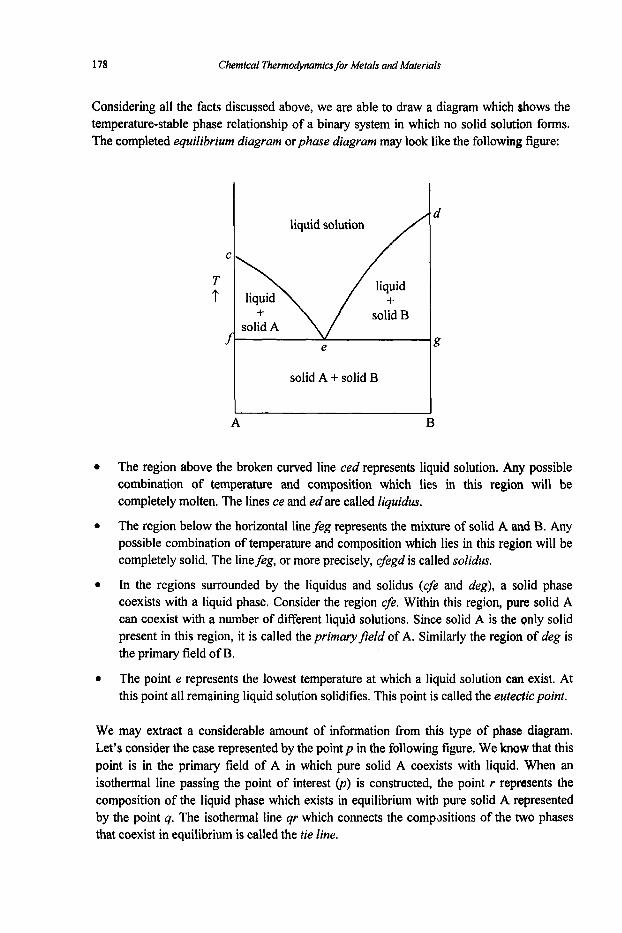
178 Chemical ThermodynamicsJor Metals and Materials
Considering all the facts discussed above, we are able to draw a diagram which shows the temperature-stable phase relationship of a binary system in which no solid solution forms. The completed equilibrium diagram orphase diagram may look like the following figure:
solid A + solid B
A B
The region above the broken curved line ced represents liquid solution. Any possible combination of temperature and composition which lies in this region will be completely molten. The lines ce and ed are called liquidus.
The region below the horizontal linefeg represents the mixture of solid A and B. Any possible combination of temperature and composition which lies in this region will be completely solid. The linefeg, or more precisely, cfegd is called solidus.
In the regions surrounded by the liquidus and solidus (cfe and deg), a solid phase coexists with a liquid phase. Consider the region c$e. Within this region, pure solid A can coexist with a number of different liquid solutions. Since solid A is the only solid present in this region, it is called the primaryjeld of A. Similarly the region of deg is the primary field of B.
The point e represents the lowest temperature at which a liquid solution can exist. At this point all remaining liquid solution solidifies. This point is called the eutectic point.
We may extract a considerable amount of information from this type of phase diagram. Let’s consider the case represented by the point p in the following figure. We know that this point is in the primary field of A in which pure solid A coexists with liquid. When an isothermal line passing the point of interest (p) is constructed, the point r represents the composition of the liquid phase which exists in equilibrium with pure solid A represented by the point q. The isothermal line qr which connects the compasitions of the two phases that coexist in equilibrium is called the tie line.

Phase Diagram 179
f C 4
f e
The relative ~ o ~ t of each phase is determined according to the lever rule :
Fraction of solid A = - pr Fraction of liquid = q p qr
The m i ~ o s ~ c ~ e at point p therefore would look like the figure given below :
We now consider the eutectic point e. If the temperature is just above the eutectic temperature, it is a single liquid phase that is present. If the tempe~ture is just below the eutectic temperature, however, two solid phases, solid A and solid B, are present. At the eutectic point, therefore, all three phases, i.e., solid A, d i d B and liquid, coexist in equilibrium. We may thus write a reaction which occurs at :he eutectic point :
L(e) = A(s) + B(s)
This is called the phase reaction for the eufectic reaction. On coofig at the eutectic point the reaction will proceed to the right. On heating the reaction will proceed to the leR. Solids produced by the eutectic reaction is in general a fine grain mixture of A and €3.
We now examine the coaling of a composition fiom the liquid state to the complete solid state.

180 Chemical Thermodynamics for Metals and Materials
1 I A t B
When the liquid solution o is cooled, it remains in liquid until the temperature reaches the point m.
At m, pure solid A(n) begins to precipitate.
On fiuther cooling the system enters the two phase region, and at p the system consists of pure solid A(q) and liquid solution of r. Note that the liquid composition has been changed from m to r along the liquidus mr.
At just above the eutectic temperature, the composition of the liquid in equilibrium with solid A is e.
The fraction of the liquid =fs / f e . On further cooling to just below the eutectic temperature, the remaining liquid which has the eutectic composition will fieeze immediately according to the eutectic reaction. The solid structure will thus be the mixture of the primary phase of A and the eutectic structure which is the fine mixture of A and B.
The solid phase regionfABg thus can be divided into two sub-regions:fAte for solid A + eutectic and etBg for solid B + eutectic.
In a binary system two components may undergo a chemical reaction to form a compound. The compound formed may possess a definite or congruent melting point. If this is the case, the compound forms a separate phase and possesses a different crystal structure fiom those of the constituents. From many points of view a compound with a congruent melting point can be regarded as a pure substance. This type of compound will coexist in equilibrium with a liquid of identical composition. In other words the compound does not decompose below its melting point. The phase diagram of a binary system which forms a congruently-melting compound is somewhat different from the one shown above.
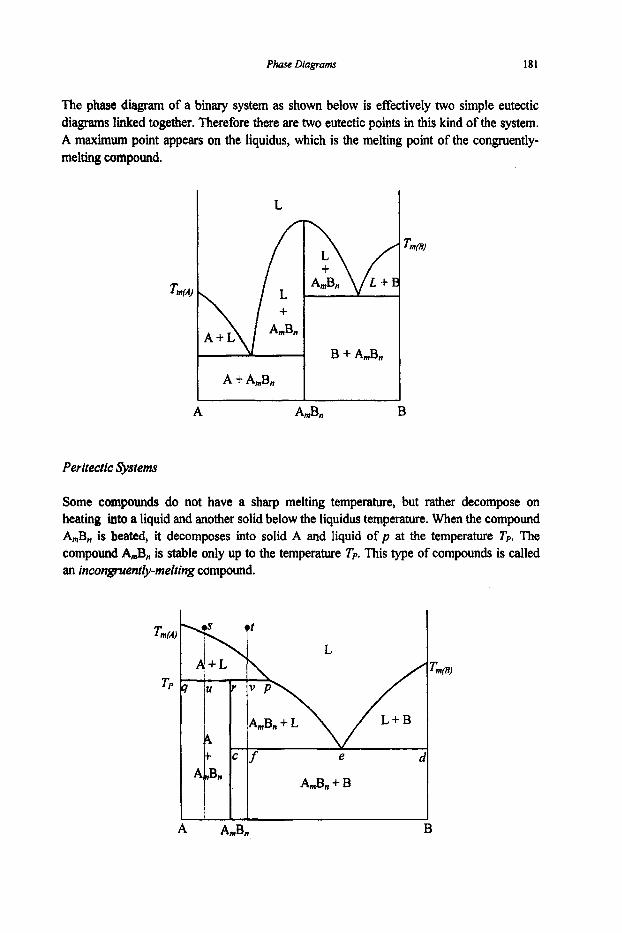
Phase Diagrams 181
The phase diagram of a binary system as shown below is effectively two simple eutectic diagrams linked together. Therefore there are two eutectic points in this kind of the system. A maximum point appears on the liquidus, which is the melting point of the congruently- melting compound.
TmM)
L
l!i A + A,,,&,
B + AmBn
Peritectic Systems
Some compounds do not have a sharp melting temperature, but rather decompose on heating into a liquid and another solid below the liquidus temperature. When the compound A,B, is heated, it decomposes into solid A and liquid of p at the temperature Tp. The compound A&, is stable only up to the temperature Tp. This type of compounds is called an incongruent&-melting compound.
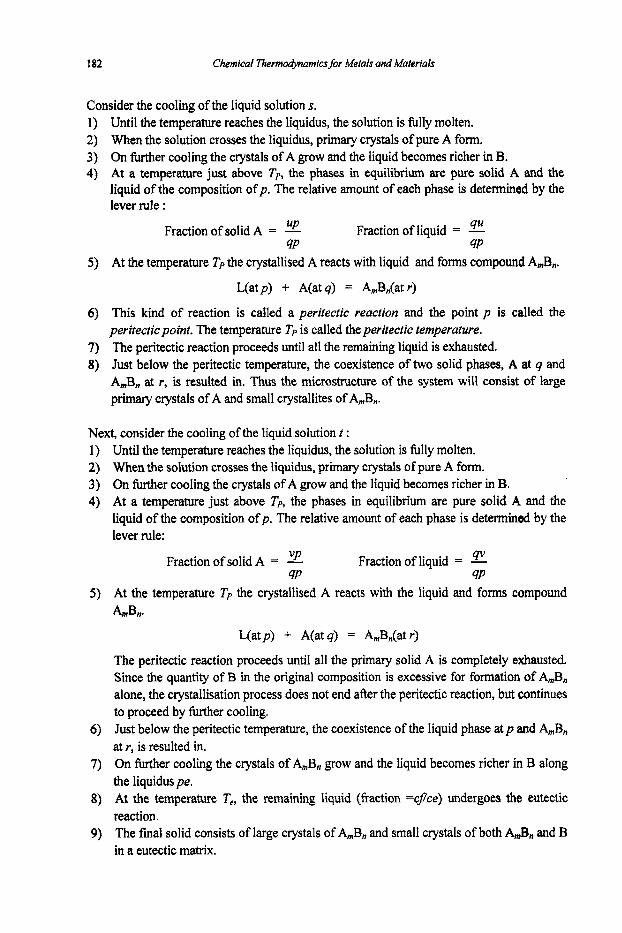
182 Chemical T%ermo&arnics for Metals and Materials
Consider the cooling of the liquid solution s. 1) Until the temperature reaches the liquidus, the solution is fully molten. 2) When the solution crosses the liquidus, primary crystals of pure A form. 3) On fiuther cooling the crystals of A grow and the liquid becomes richer in B. 4) At a temperature just above Tp, the phases in equilibrium are pure solid A and the
liquid of the composition of p. The relative amount of each phase is determined by the lever rule :
9u Fractionofliquid = - BP FractionofsolidA = - 9P 9P
5 ) At the temperature Tp the crystallised A reacts with liquid and forms compound A,B,.
L(atp) + A(at q) = A,B,(at r)
6) This kind of reaction is called a peritectic reaction and the point p is called the peritectic point. The temperature Tp is called the peritectic temperature.
7) The peritectic reaction proceeds until all the remaining liquid is exhausted. 8) Just below the peritectic temperature, the coexistence of two solid phases, A at q and
A,B, at r, is resulted in. Thus the microstructure of the system will consist of large primary crystals of A and small CrystalIites of A,,,B,.
Next, consider the cooling of the liquid solution t : Until the temperature reaches the liquidus, the solution is filly molten. When the solution crosses the liquidus, primary crystals of pure A form. On further cooling the crystals of A grow and the liquid becomes richer in B. At a temperature just above Tp, the phases in equilibrium are pure solid A and the liquid of the composition ofp. The relative amount of each phase is determined by the lever rule:
qv Fraction of liquid = - VP Fraction of solid A = - 9P 9F
At the temperature Tp the crystallised A reacts with the liquid and forms compound AmBB.
L(atp) i- A(at 9) = A,,,Bn(at r)
The peritectic reaction proceeds until all the primary solid A is completely exhausted. Since the quantity of B in the original composition is excessive for formation of A,B, alone, the crystallisation process does not end after the peritectic reaction, but continues to proceed by further cooling. Just below the peritectic temperature, the coexistence of the liquid phase at p and A,B, at r, is resulted in. On further cooling the crystals of A,B, grow and the liquid becomes richer in B along the liquidus pe. At the temperature T,, the remaining liquid (fraction =cf/ce) undergoes the eutectic reaction. The fmal solid consists of large crystals of A,B, and small crystals of both A S f l and B in a eutectic matrix.

Phase Dtagrams 183
Monotectic &stems
The phase diagram given below shows a two-phase region consisting of two different liquids which are not miscible.
A B
Consider the cooling of the liquid solution of s. 1) At the liquidus (p), the melt begins to separate into two liquids, L, (atp) and 2) As the temperature decreases, the compositions of the liquids alter along the liquidus
pm and qn, respectively. 3) At the temperature T,, the liquid phase L, (at m) decomposes into pure solid A (at 0)
and liquid
(at 4).
(at n). This reaction may be written as
L, (atm) = A(ato) + b(atn)
This kind of reaction is called a monotectic reaction and the point m is referred to as the rnonotectic point.
f ianple~ J It is pcdble, for any conceivable combination of temperature and total composition, to determine by inspection of the phase diagram exactly what phases will be present at equilibrium. It is also possible to determine the exact amount of each particular phase present under any given est of conditions. Consider a simple eutectic system shown in the following figure. When the melt s is cooled, find
I 1) the hction of the primary solid phase of A just above the eutectic temperature T,, 2) the hction of the eutectic structure (mixture of frne crystals of A and B) just below
T,, 3) the fraction of A in the eutectic structure below T,, 4) the fraction of P in total, i.e., the sum of A in the primary phase and the eutectic.
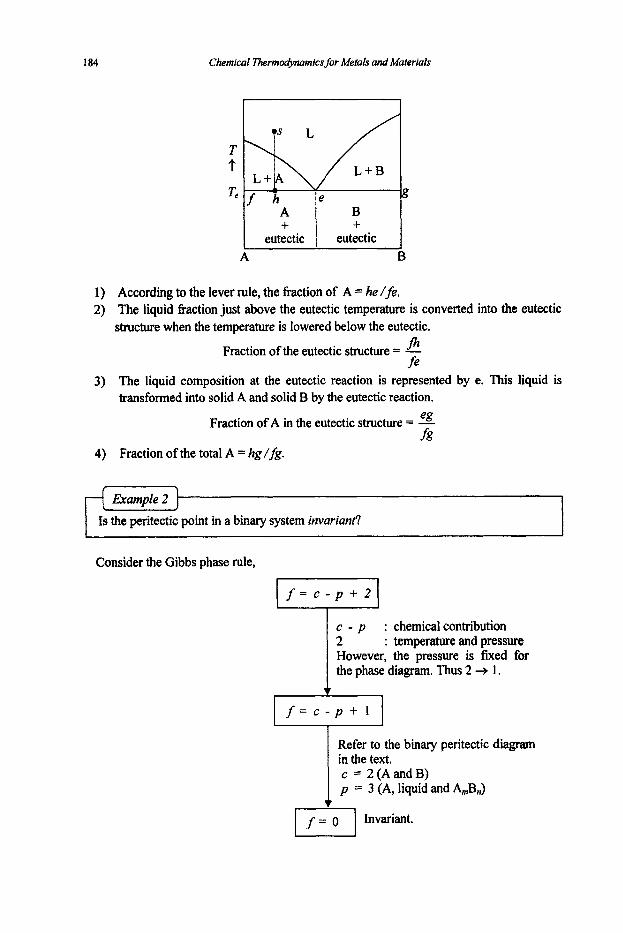
184 Chemlcal7hermodynamics for Metals and Materials
T t Tt? -;.Ji f h
+ I eutectic 1 eutectic +
B
1) According to the lever rule, the hction of A = he /fe. 2) The liquid flaction just above the eutectic temperature is converted into the eutectic
structure when the temperature is lowered below the eutectic. F se Fraction of the eutectic structure = -
3) The liquid composition at the eutectic reaction is represented by e. This liquid is transformed into solid A and solid B by the eutectic reaction.
eg Fraction of A in the eutectic structure = - f g
4) Fraction of the total A = hg / fg.
Example 2 Is the peritectic point in a binary system invuriant?
Consider the Gibbs phase rule,
c - p : chemicalcontribution
However, the pressure is fixed for the phase diagram. Thus 2 3 1 .
: temperature and pressure
Refer to the binary peritectic diagram in the text. c = 2(AandB) p = 3 (A, liquid and A,BJ
Invariant.
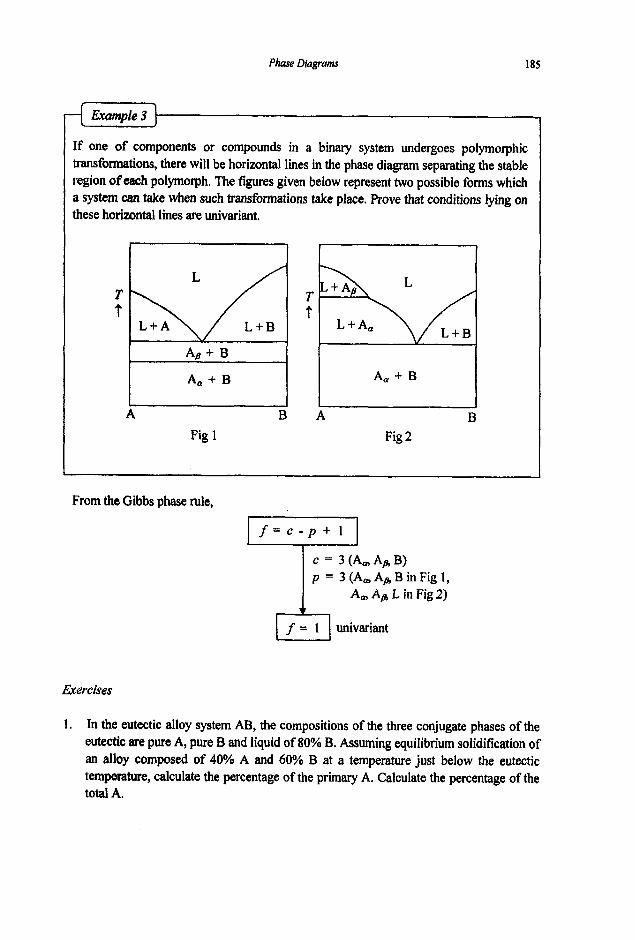
Phase Diagrams 185
AB + B
A, + B
If one of components or compounds in a binary system undergoes polymorphic transformations, there will be horizontal lines in the phase diagram separating the stable region of each polymorph. The figures given below represent two possible forms which a system can take when such transformations take place. Prove that conditions lying on these horizontal lines are univariant.
A, + B
From the Gibbs phase rule,
c = 3 (Am A s B) p = 3(A,AbBinFig l ,
Am A s L in Fig2)
Exercises
1, In the eutectic alloy system AB, the compositions of the three conjugate phases of the eutectfc are pure A, pure B and liquid of 80% B. Assuming equilibrium solidification of an alloy composed of 40% A and 60% B at a temperature just below the eutectic temperature, calculate the percentage of the primary A. Calculate the percentage of the total A.
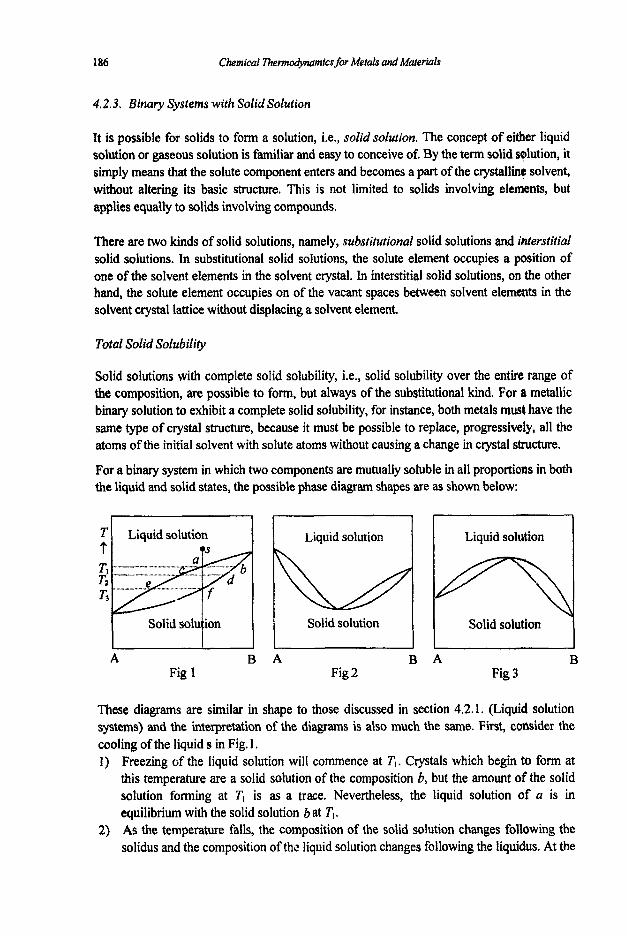
186 Chemicaf irhennodyMmicsfor Metals and Materials
Liquid solution
4.2.3. Binary Systems with Solid Solution
Liquid solution
It is possible for solids to form a solution, i.e., solid solution. The concept of either liquid solution or gaseous solution is familiar and easy to conceive of. By the term solid solution, it simply means that the solute component enters and becomes a part of the crystalline solvent, without altering its basic structure. This is not limited to solids involving elements, but applies equally to solids involving compounds.
There are two kinds of solid solutions, namely, substitutional solid solutions and interstitial solid solutions. In substitutional solid solutions, the solute element occupies a position of one of the solvent elements in the solvent crystal. In interstitial solid solutions, on the other hand, the solute element occupies on of the vacant spaces between solvent elements in the solvent crystal lattice without displacing a solvent element.
Total Solid Solubility
Solid solutions with complete solid solubility, i.e., solid solubility over the entire range of the composition, are possible to form, but always of the substitutional kind. For a metallic binary solution to exhibit a complete solid solubility, for instance, both metals must have the same type of crystal structure, because it must be possible to replace, progressively, all the atoms of the initial solvent with solute atoms without causing a change in crystal structure.
For a binary system in which two components are mutually soluble in all proportions in both the liquid and solid states, the possible phase diagram shapes are as shown below:
These diagrams are similar in shape to those discussed in section 4.2.1. (Liquid solution systems) and the interpretation of the diagrams is also much the same. First, consider the cooling of the liquid s in Fig. 1.
Freezing cifthe liquidsolution will commence at T,. Crystals which begin to form at this temperature are a solid solution of the composition b, but the amount of the solid solution forming at T, is as a trace. Nevertheless, the liquid solution of a is in equilibrium with the solid solution bat T,. As the temperature falls, the composition of the solid solution changes following the solidus and the composition of the liquid solution changes following the liquidus. At the

Phase D&gmtns 187
temperatwe T,, the liquid solution of c and the solid solution of d coexist in equilibrimn. The relative amount of each phase is determined by the lever rule.
3) At T3, solidification is complete, and further cooling will bring the system to the solid phase.
Fig 2 and 3 show the minimum and maximum melting points, respectively. The solid solution which corresponds to the minimum or maximum melting point behaves much like a pure component. It melts and freezes undergoing no changes in composition. In other words it melts congruently.
Partial Solid Solubility
In many cases, atom size, crystal smcture or other factors restrict the ease with which solute atoms can be dissolved in the solvent in the solid state. Thus it is much more common to find that solids are partly soluble in one another rather than be either completely soluble or completely insoluble. The following is an example of a phase diagram for a binary system which shows partial solid solubility :
where a $ : solid solutions. ae, be : liquidus ac, cci, bd : solidus cJ;dg :solvus.
Note that the solvus cfdenotes the solubility limit of B in A, and the solvus dg shows the solubility limit of A in B. Consider the cooling of the solution s. 1) At q, solidification begins. On further cooling the solid composition changes along the
soliduspc, and the liquid composition along the liquidus ue. 2) When the system arrives at the eutectic temperature, the liquid left undergoes the
eutectic transformation:
L(at e) = a(at c) + $(at d)
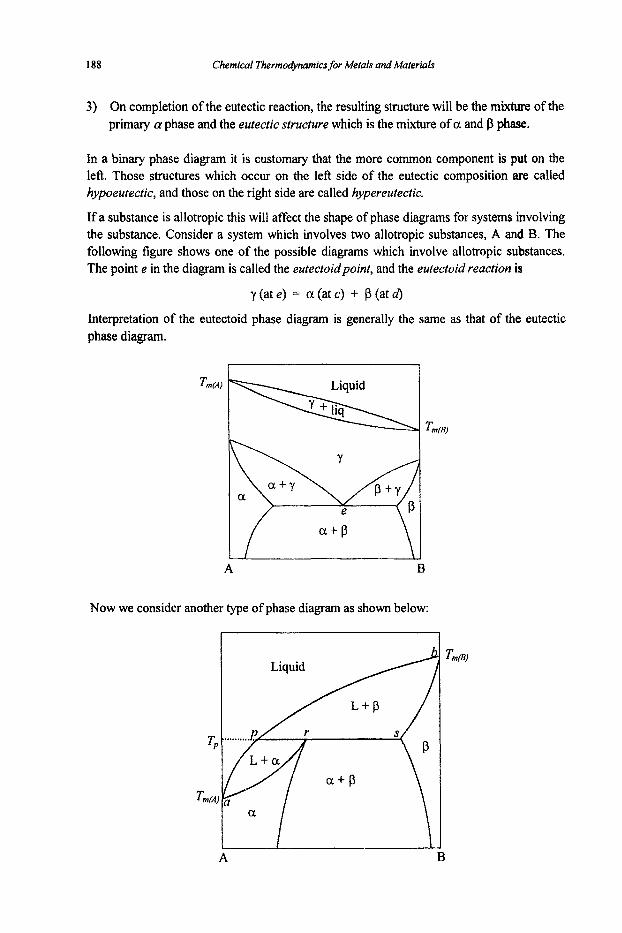
188 Chemical Thermodynamics for Metals and Materials
3) On completion of the eutectic reaction, the resulting structure will be the mixture of the primary a phase and the eutectic structure which is the mixture of a and phase.
In a binary phase diagram it is customary that the more common component is put on the left. Those structures which occur on the left side of the eutectic composition are called hypoeutectic, and those on the right side are called hypereutectic.
If a substance is allotropic this will affect the shape of phase diagrams for systems involving the substance. Consider a system which involves two allotropic substances, A and B. The following figure shows one of the possible diagrams which involve allotropic substances. The point e in the diagram is called the eutectoidpoint, and the eutectoid reaction is
y (at e) = cc (at c) + f3 (at d)
Interpretation of the eutectoid phase diagram is generally the same as that of the eutectic phase diagram.
A B
Now we consider another type of phase diagram as shown below:
B
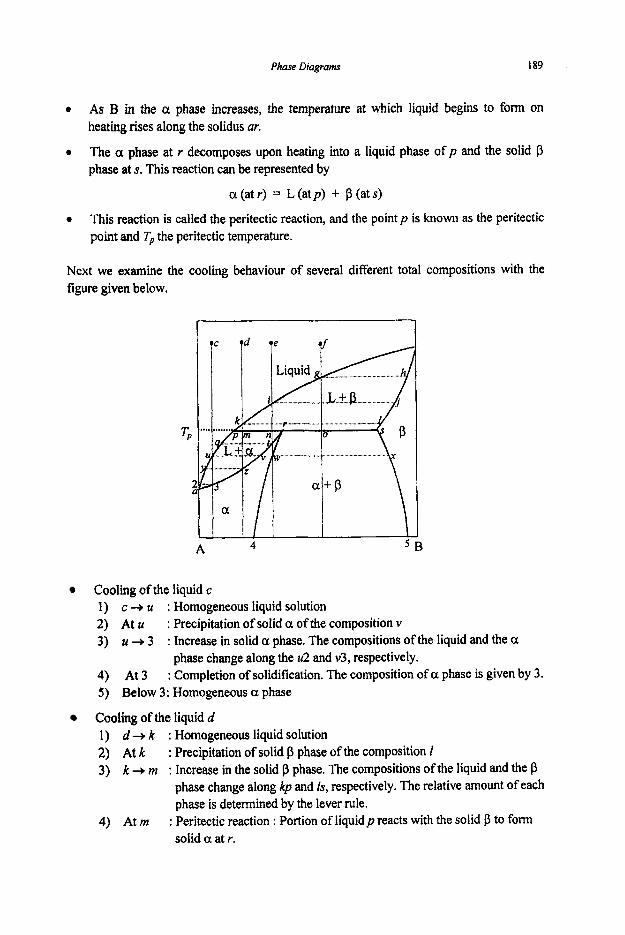
Phase Diagram I89
As B in the a phase increases, the temperature at which liquid begins to form on heating rises along the solidus ur.
The a phase at r decomposes upon heating into a liquid phase o f p and the solid f3 phase at s. This reaction can be represented by
a (at r) = L (atp) + f3 (at s)
This reaction is called the peritectic reaction, and the point p is known as the peritectic point and T, the peritectic temperature.
Next we examine the cooling behaviour of several different total compositions with the figure given below.
~~
4 A 5 B
Cooling of the liquid c 1) c + U : Homogeneous liquid solution 2) At U : Precipitation of solid a of the composition v 3) U + 3 : Increase in solid a phase. The compositions of the liquid and the a
4) At 3 : Completion of solidification. The composition of a phase is given by 3. 5 ) Below 3: Homogeneous a phase
Cooling of the liquid d 1) d + k : Homogeneous liquid solution 2) At k : Precipitation of solid p phase of the composition 1 3) k + m : Increase in the solid p phase. The compositions of the liquid and the p
phase change along the u2 and v3, respectively.
phase change along kp and Is, respectively. The relative amount of each phase is determined by the lever rule.
solid a at r. 4) Ar m : Peritectic reaction : Portion of liquidp reacts with the solid p to form

190 Chemical 7%ermcx+numfcsfor Metals and Maferfals
L (at p ) + p (at s) = a (at r)
On completion of the peritectic reaction, the system consists of the liquidp and the solid a at r.
change along py and rz, respectively. 5 ) m + z
6) At z : Completion of solidification. 7) Below z : Homogeneous a phase
Cooling of the liquid e 1) e + i : Homogeneous liquid solution 2) At i 3) i + n
: Increase in the a phase. The compositions of the liquid and the a phase
: Precipitation of solid p phase of the compositionj : Increase in the solid p phase. The compositions of the liquid and the p phase change along ip andjs, respectively. The relative amount of each phase is determined by the lever rule.
solid a at r. 4) At n : Peritectic reaction : Portion of liquidp reacts with the solid p to form
L(atp) + p(ats) = a(atr)
On completion of the peritectic reaction, the system consists of the liquid p and the solid a at r. : Increase in the a phase. The compositions of the liquid and the a phase change alongpq and rt, respectively.
5 ) n + t
6 ) At t : Completion of solidification. 7) i + w : Homogeneous a phase 8) At w 9) Below w: Mixture of the a and p phases. The compositions of the a and p phases
change along the solvus w4 and x5, respectively. The relative amount of each phase is determined by the lever rule.
: Precipitation of p phase of the composition x
Cooling of the liquidf 1) f+ g : Homogeneous liquid solution 2) At g : Precipitation of solid p phase of the composition h 3) g + o : Increase in the solid p phase. The compositions of the liquid and the p
phase change along gp and hs, respectively. The relative amount of each phase is determined by the lever rule.
form solid a at r. 4) At o : Peritectic reaction : All liquidp reacts with a portion of the solid p to
L (atp) + p (at s) = a (at r)
On completion of the peritectic reaction, the system consists of the solid POat s and the solid aa t r.
5 ) Belcw o: Mixture of the a and p phases. The compositions of the CL and p phases change along the solvus r4 and $5, respectively. The relative amount of each phase is determined by the lever rule.

Phase DlUgrUm~
Given below are some other types of binary phase diagrams
T t
191
A B A B Fig 1 Fig 2
where 01 and p phases : terminal solidsolutions Y Phase y in Fig I y in Fig 2
: intermediate solid solution : congruently melting : incongruently melting
Interpretation of these diagrams is much the same as those discussed previously.
The Fig 1 in the following shows part of the phase diagram of the A-B binary system. When a liquid sample of the composition x was cooled to the room temperature, it was found that each crystal or grain was richer in A toward the centre (Fig 2). Discuss the solidification process which would enable the formation of this non-uniform concentration grain structure and determine whether the structure shown in Fig 2 is the equilibrium one.
A X B Fig 1 Fig 2

1 92 Chemical ThermodyMmlcs for Metals and Materials
True equilibrium 6eezing is almost unattainable in practice, because it requires that both phases, the liquid and the solid, be homogeneous throughout at all times. This is possible only if a sufficiently long time is given at each decrement of temperature. Therefore equilibrium fi-eeFng requires infinitesimally slow rates of heat extraction and thus with ordinary cooling rates certain departures 6om equilibrium are to be expected.
Consider the cooling of the liquid solution of s in the following diagram.
h Liquid
A X
The liquid remains homogeneous upon cooling fi-om s to b. Freezing begins at Tl with the deposition of crystals of the composition a. As cooling proceeds, the liquid composition changes along the liquidus. Solid forming at T, will have the composition of e and the liquid has the composition
During cooling 60m T, to T2, a number of new nuclei form, each with the composition given by the solidus ae at its formation temperature. These nuclei will grow at the expense of the liquid. At the temperature T2, none other than crystals having the composition e is in equilibrium with the liquid. However, not enough time is available for the compositions within the solid to change fully to the equilibrium values. Therefore the solid will have compositions ranging 6om c to e with an average somewhere between the two, say, d. On fitrther cooling the liquid composition changes along the liquidus fi, the equilibrium solid composition along the solidus eh, and the average composition of the solid in a real practice along the line dg.
off:

Phase Diupnts 193
Solidification would be completed at T,, should equilibrium be maintained during the cooling. In reality, however, there is still liquid remaining.
gh Fraction of liquid remained = - gi
0
0
On firther cooling, the liquid composition changes along the liquidus il and the average solid composition along the line &. At Z‘,, solidification is completed. It is thus seen that nonequilibrium freezing is characterised by 1) 2) 3) 4) In summary, the solidification begins with the formation of numerous solid nuclei and the growth of these nuclei follows. Each nucleus has a gradient of Composition from its centre to the periphery. This nonequilibrium effect is referred to as coring.
increased temperature range over which liquid and solid are present Tt f) T3 for equiIibrium solidification T, e, T4 for nonequilibrium solidification a composition range remaining in the solids ( at leastj f) k).
0
Consider the A-B binary system. If A and B [j
form a random solid solution with, say, 10 atom percent B, the probability of finding a B atom on any specific lattice site is just 0.1. Under certain conditions, however, B atoms may favour certain specific sites than the reat. E atom will then preferentially rC position themselves on these specific sites. The probability of finding B atoms in these sites will greatly increase. This type of arrangment is referred to as an ordered stmctwe. The process in which a random disoKLsaed solid solution is r e m g e d into an ordered solid solution is called an order- disorder transition. Discuss the order-disorder transition using the phape diagram given :
B A where
U : disordered phase U’ : ordered phase
~~~ ~
0
6
0
0
ordertd structure in the o’ field Dhdered structure in the o field Coexistence of ordered and disordered structures in the (0 + U’) field Disordered structure only at temperatures above Tc

194 Chemfcal ThennodynamicsJor Metals and Materials
Erercises
1. Consider the A-B binary peritectic system as shown in the following diagram :
When liquid x is cooled maintaining equilibrium conditions, calculate wt?? a that exists just above the peritectic temeperature Tp, When liquid y is cooled maintaining equilibrium conditions, calculate wt?? p that exists just below the peritectic temperature T,.
A 10 25 40 60 -+ B (wt'?)
2. Phase diagram is one way of expressing thermodynamic equilibrium of a system, Every part of a phase diagram therefore has to conform to thermodynamic principles. Find errors in the phase diagrams shown below. Justify your answer.
A B A B
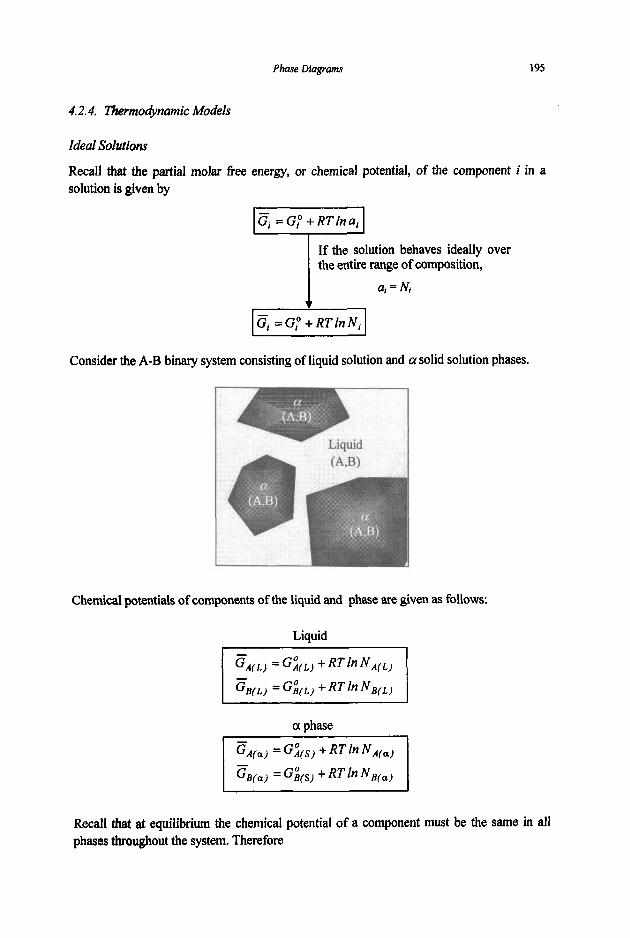
Phase Diagrams 195
4.2.4. Thermodynamic Models
Ideal Solutions
Recall that the partial molar fiee energy, or chemical potential, of the component i in a solution is given by
If the solution behaves ideally over the entire range of composition,
Consider the A-B binary system consisting of liquid solution and a solid solution phases.
Chemical potentials of components of the liquid and phase are given as follows:
Liquid
a phase
Recall that at equilibrium the chemical potential of a component must be the same in all phases throughout the system. Therefore
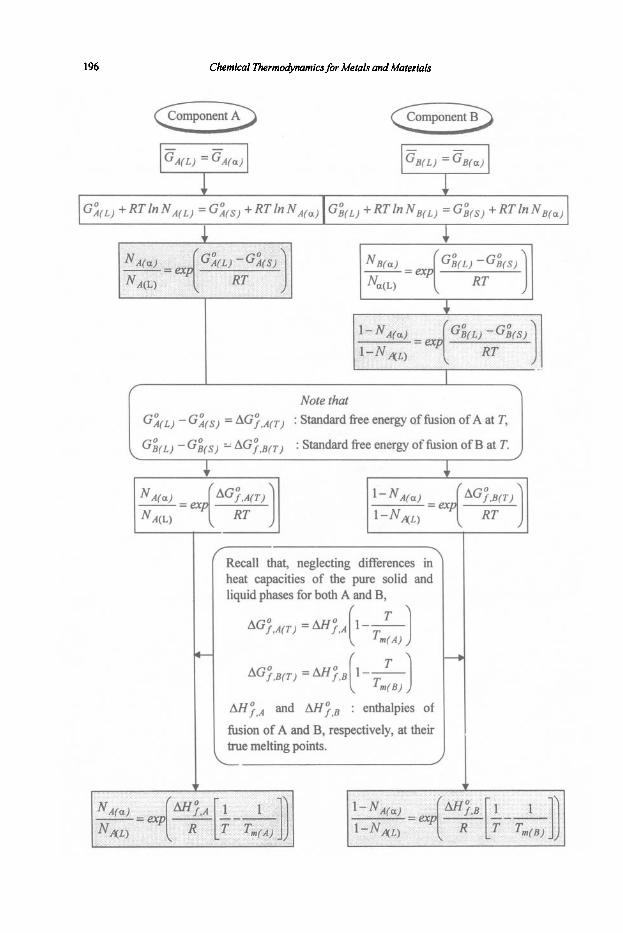
196
G:(,) - G:(,) = AG;,A(T) : Standard fiee energy af fusion of A at T,
Chemical ThermodynomicsJor Metals and Materials
Component A - Component B - = exp l - N A ( a )
I -NqL) I
Recall that, neglecting differences in heat capacities of the pure solid and liquid phases for both A and B,
AGY,A(T) = M;J (I- L, % A )
Mi,A and A H i B S : enthalpies of fusion of A and B, respectively, at their true melting points.
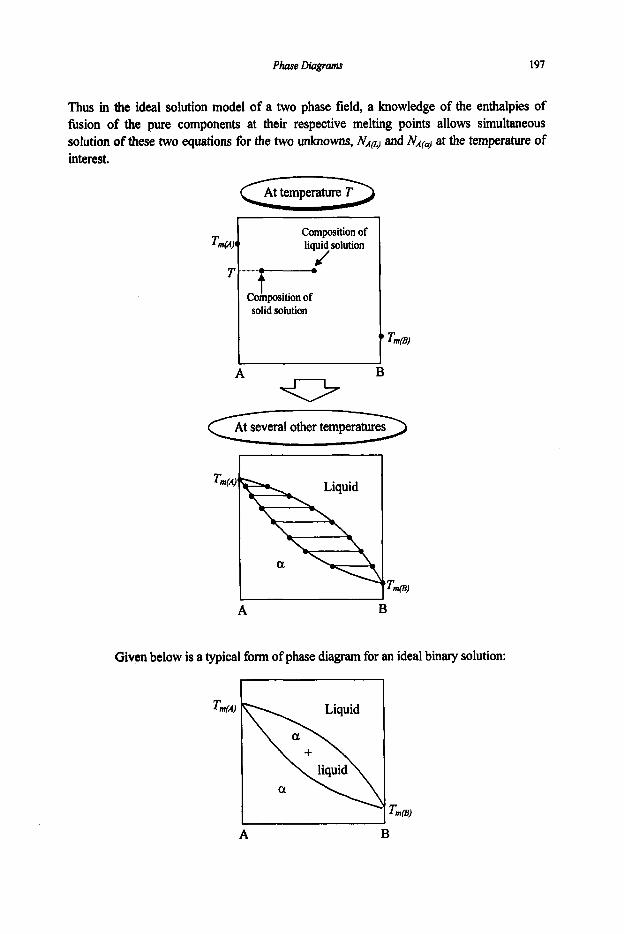
Phase Diagrams 197
Tm(A)q
T
Thus in €he ideal solution model of a two phase field, a knowledge of the enthalpies of fusion of the pure components at their respective melting points allows simultaneous solution of these two equations for the two unknowns, NAG, and N A ( ~ at the temperature of interest.
Composition of liquid solution J
t Composition of solid solution
A B
Given below is a typical form of phase diagram for an ideal binary solution:
I I
A B

198 Chemical Therm@namics for Metals and Materials
Pattern of a phase diagram depends on values of the enthalpies of fusion of the components in the solution, i.e., A I Y ; ~ ~ and AH;tB , and some examples are shown below ;
T 7
A B A B
Liquid
A 1
T
Liquid
Non-ideal Solutions
Recall that the partial molar free energy, or chemical potential, of the component i in a solution is given by
=G,? + RTlna,
Consider the A-B binary system consisting of cx and p solid solutions.
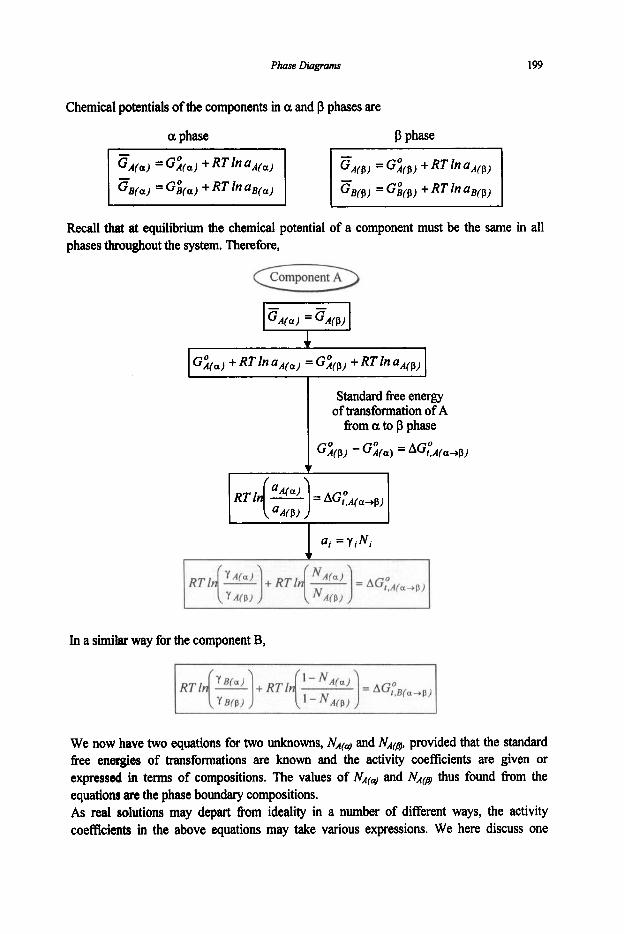
Phase Diagrams 199
Chemical potentials of the components in a and p phases are
a phase P phase
I I E B ( ~ ) = G&a) + RT1n aB(a) I
Recall that at equilibrium the chemical potential of a component must be the same in all phases throughout the system. Therefore,
1 Gf;(,) + RT In aA(a) = Gicp) -I RT In aA(p)
Standard free energy of transformation of A
from a to p phase
.
In a similar way for the component B,
We now have two equations for two unknowns, NA(4 and NA(B, provided that the standard free energies of transformations are known and the activity coefficients are given or expressed in terms of compositions. The values of NA(4 and N A ( ~ thus found from the equations are the phase boundary compositions. As real solutions may depart from ideality in a number of different ways, the activity coefficients in the above equations may take various expressions. We here discuss one
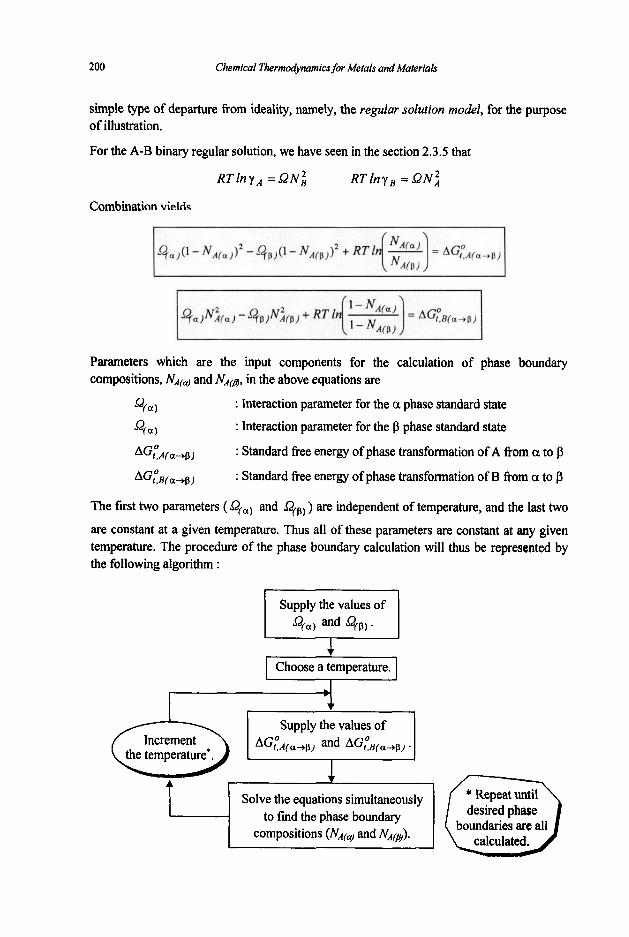
200 Chemical Thermodynamics for Metals and Materials
simple type of departure from ideality, namely, the regular solution model, for the purpose of illustration.
For the A-B binary regular solution, we have seen in the section 2.3.5 that
R T l i l y A = Q N i RTln y B = QN:
Combination yields,
Parameters which are the input components for the calculation of phase boundary compositions, NACCl) and NAla, in the above equations are
Q(a)
Qfa)
AGtA( a-@)
AG&a+p,
: Interaction parameter for the 01 phase standard state
: Interaction parameter for the p phase standard state
: Standard free energy of phase transformation of A &om 01 to p : Standard free energy of phase transformation of B from ct to p
The first two parameters ( Qfa) and Qcp,) are independent of temperature, and the last two
are constant at a given temperature. Thus all of these parameters are constant at any given temperature. The procedure of the phase boundary calculation will thus be represented by the following algorithm :
Choose a temperature.
Supply the values of AGtA(a+p) and AG&a-+p) .
1 * Repeat until desired phase
boundaries are all calculated.
Solve the equations simultaneously to fmd the phase boundary
compositions ( N A c ~ and NA(B).

Phase Diagram 20 1
The regular solution model is much more flexible than the ideal solution model and a wide variety of phase diagrams can be produced with this model. Topographical changes in the phase diagram for a system A-B with regular solid and liquid phases brought about by systematic changes in the interaction parameters, and 0 , are illustrated in the following.* Melting points of pure A and B are assumed 800K and 1,200K, respectively, and standard entropies of fusion of A and B are assumed to be 10 J/mol K.
-10 - 20
(a I I b l
I l l Iml ;m
1 * 1
* Pelton, A.D. and Thompson, W.T.: hog. Solid State Chem. 10, part 3,1975, pl19

202 Chemical %rmodynamics for Metals and Materials
Example 1
Prove that, if the heat capacity of pure iiquid phase is the same as that of pure solid phase for both A and B in the A-B binary system, the equations of the liquidus and solidus are
At the melting point, T,(A)
AG;,A(Tm) = O = M ; e A ( T m ) -Tm(A)s;oA(Tm)
For B, in a similar way,

Phase Dhgmms 203
If the assumption that the heat capacities of the pure liquid and solid A are equal is unwammld, the expression for the standard fiee energy of h i o n of A at T must be corrected :
Exercises
1. Metals A and B behave ideally in both liquid and solid solutions. Calculate compositions of the solid and liquid solutions in equilibrium at 1,250K. The following idonnation is known :
A : T, 1,350K M;,A = 1,5OOJmol-'
B : T, = 700K M ; # B = 3,3OOJmol-'
2. Components A and B behave regularly in both liquid and solid solutions. Find the cornpasitions of the liquid and solid solutions in equilibrium at 1,300K. The following data are available :
A : T, = 1,350K M ; , A = 9,33OJmol-'
B : T, = 1,150K AH; ,B = 9,76OJmol-'
Cl,,) = --5,6OOJmol-' = -1 1,40OJmol-'
3. The A-B binary system behaves ideally in both its liquid and solid solutions. The element A melts at 1,500K with the heat of h i o n of 14,700 Jmor', and the heat
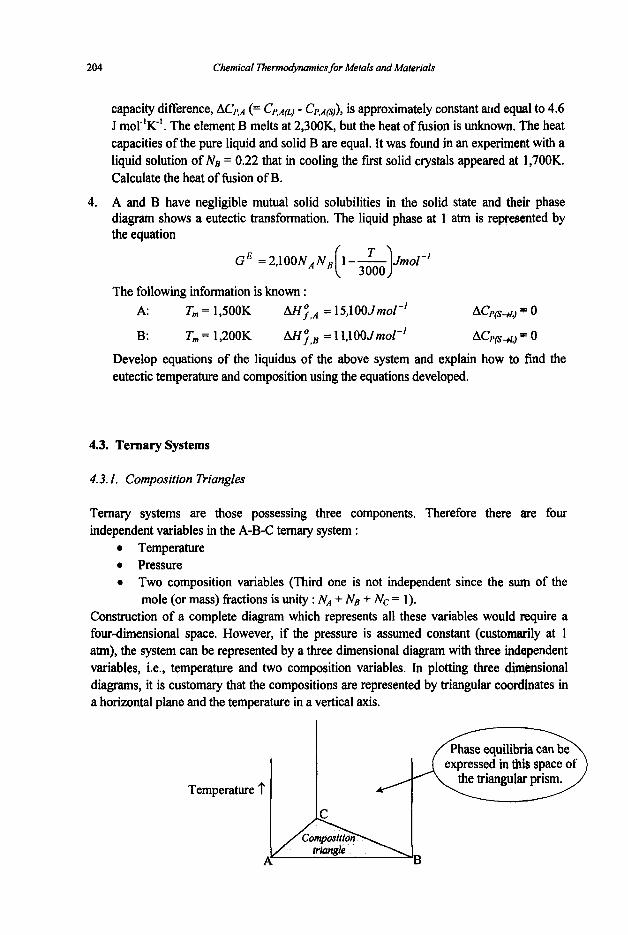
204 Chemical Thermodynamics for Metals and Materials
capacity difference, ACP~A (= CpsA(L) - C P A ~ ) , is approximately constant aid equal to 4.6 J moIlK-'. The element B melts at 2,30OK, but the heat of fusion is unknown. The heat capacities of the pure liquid and solid B are equal. It was found in an experiment with a liquid solution of NB = 0.22 that in cooling the fust solid crystals appeared at 1,700K. Calculate the heat of hsion of B.
4. A and B have negligible mutual solid solubilities in the solid state and their phase diagram shows a eutectic transformation. The liquid phase at 1 atm is represented by the equation
The following information is known : A: T,,, = 1,500K AH;,A = 15,10OJm01-~ ACP(s.4) = 0
B: T,,, = 1,200K AH;#B = 11,10OJmoI-' ACP(S.4) = 0
Develop equations of the liquidus of the above system and explain how to find the eutectic temperature and composition using the equations developed.
4.3. Ternary Systems
4.3. I . Composition Triangles
Ternary systems are those possessing three components. Therefore there are four independent variables in the A-B-C ternary system :
0 Temperature 0 Pressure 0 Two composition variables (Third one is not independent since the sum of the
mole (or mass) fiactions is unity : NA + NB + NC = 1). Construction of a complete diagram which represents all these variables would require a fourdimensional space. However, if the pressure is assumed constant (customarily at 1 atm), the system can be represented by a three dimensional diagram with three independent variables, i.e., temperature and two composition variables. In plotting three dimensional diagrams, it is customary that the compositions are represented by triangular coordinates in a horizontal plane and the temperature in a vertical axis.
Temperature t
B
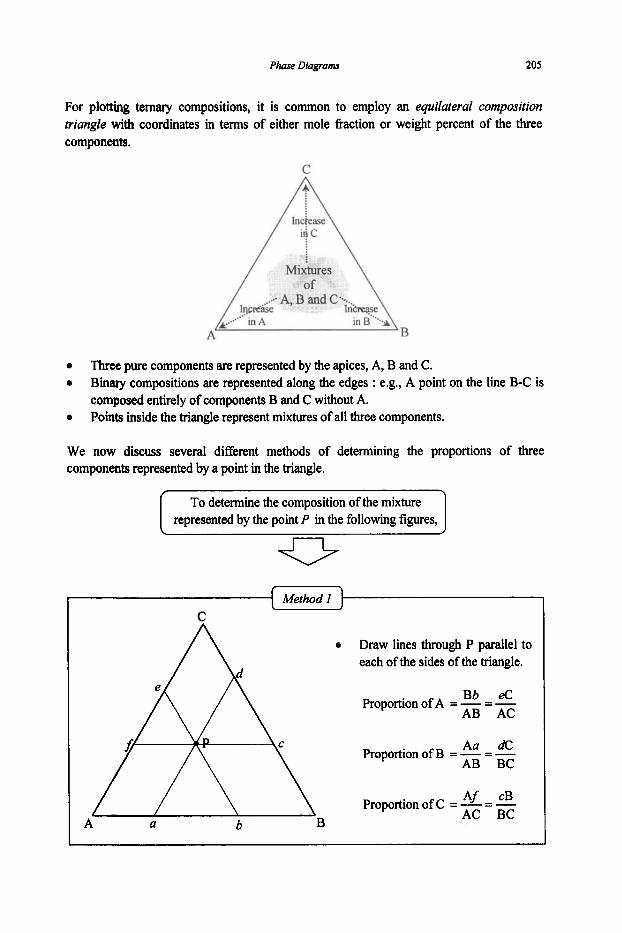
Phase Diagram 205
To determine the composition of the mixture represented by the point P in the following figures,
For plotting ternary compositions, it is common to employ an equilateral composition triangle with coordinates in terms of either mole fraction or weight percent of the three components.
B
0
0
Three pure components are represented by the apices, A, B and C. Binary compositions are represented along the edges : e.g., A point on the line B-C is composed entirely of components B and C without A. Points inside the triangle represent mixtures of all three components.
We now discuss several different methods of determining the proportions of three components represented by a point in the triangle.
0 Draw lines through P parallel to each of the sides of the triangle.
Bb eC Proportion of A = - = - AB AC
Aa dC Proportion of B = - = - AB BC
Af cB Proportion of C = - = - AC BC A a b B

206 Chemical Thermodynamics for Metals and Materials
C 0 Draw lines through P parallel to each of the sides of the triangle.
0 Notice that each side is now divided into three parts.
0 If the side A-B is chosen,
bB Proportion of A = - AB Aa Proportion of B = - AB ab Proportion of C = - AB
The composition can also be found fiom the sides B-C and A-C. The two end parts of each line represent the proportions of the components at the opposite ends and the middle part represents the proportion of the third component.
Draw lines from apices through P to the opposite sides of the triangle.
Proportion of A - cB Proportion of B Ac
--
Proportion of B Ca Proportion of C aB
Proportion of C - Ab Proportion of A bC
_-
All the methods presented above are based on the same principle: i.e., the material balance using the lever rule. Therefore these are not limited to equilateral triangles, but equally valid for scalene triangles which frequently appear when dealing with subsystems.

Phase Diagrams 207
Consider the subsystem XYZ within the system ABC.
C
A f)
0
0
Pointg X, Y and Z are mixtures of A, B and C and the composition of each point can be determined by one of the methods described above. Since the point P is inside the subsystem XYZ, it may be considered as a mixture of X, YandZ:
bZ Proportion of X = - xz ab Proportion of Y = - xz Xa Proportion of Z = - xz
Another important relationship which can be drawn fiom composition triangles is that
“If any two mixtures (or solutions) or components are mixed together, the composition of the resultant mixture lies on the straight line which joins the original two compositions.”
C 0
0
0
0
B
If the component C is added to the binary mixture D, the composition of the resultant ternary mixture lies on the line CD. If the component B is added to the ternary mixture X, the composition of the mixture lies on the line XB. If the two ternary mixtures, Y and Z, are mixed together, the composition of the mixture lies on the line YZ. In all cases, the position of the resultant mixture on the line is determined by the lever rule.
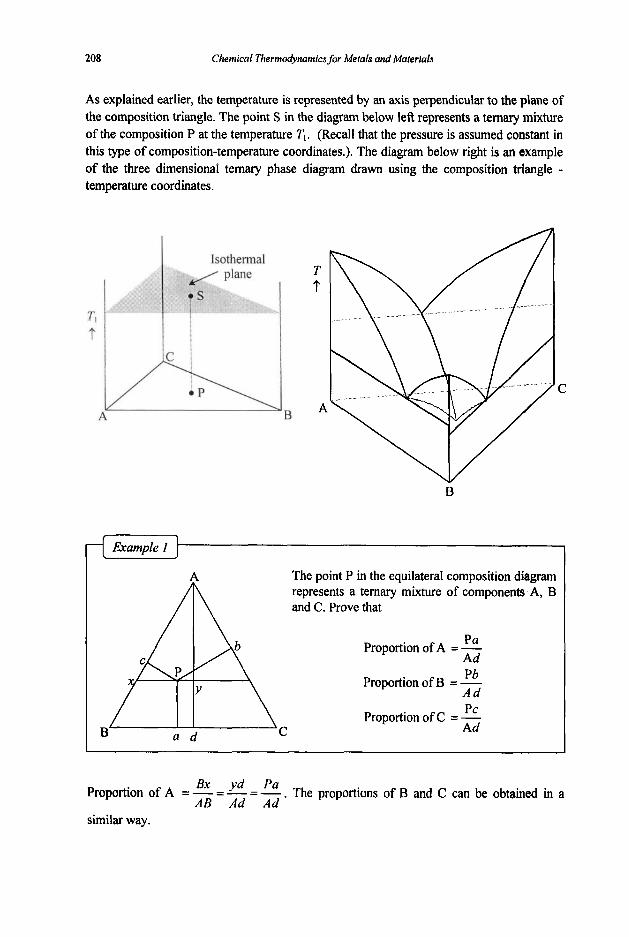
208 Chemical Thermodynamicsfor Metals and Materials
A The point P in the equilateral composition diagram represents a ternary mixture of components A, B and C. Prove that
Pa Proportion of A = - Ad Pb Proportion of B = - Ad Pc Proportion of C = -
C Ad B a d
L
As explained earlier, the temperature is represented by an axis perpendicular to the plane of the composition triangle. The point S in the diagram below left represents a ternary mixwe of the composition P at the temperature T, . (Recall that the pressure is assumed constant in this type of composition-temperature coordinates.). The diagram below right is an example of the three dimensional ternary phase diagram drawn using the composition triangle - temperature coordinates.
I /
B
C
Bx yd Pa AB Ad Ad
Proportion of A = - = - = - . The proportions of B and C can be obtained in a
similar way.
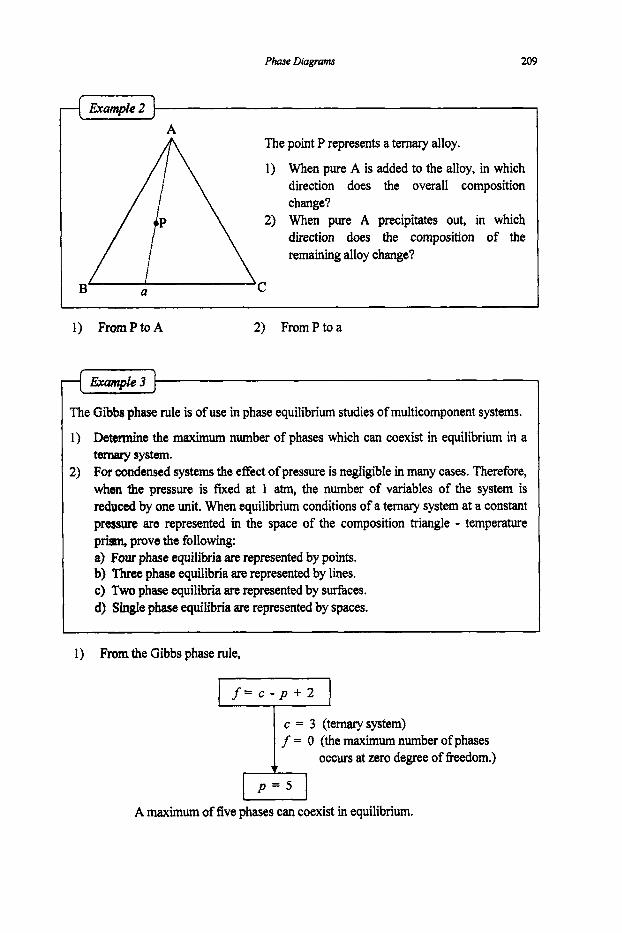
Phase Diugrams 209
A The point P represents a temary alloy.
1) When pure A is added to the alloy, in which direction does the overall composition change?
2) When pure A precipitates out, in which direction does the composition of the remainiig alloy change?
a c
11 FrnmPtnA 21 FrnmPtna - I ------- -- - - -I - - - - - - - -- -
I The Gibbs phase rule is of use in phase equilibrium studies of multicomponent systems.
Determine the maximum number of phases which can coexist in equilibrium in a tenrary system. For condensed systems the effect of pressure is negligible in many cases. Therefore, when the pressure is fured at 1 atm, the number of variables of the system is reduced by one unit. When equilibrium conditions of a temary system at a constant pressure are represented in the space of the composition triangle - temperature prim, prove the following: a) Four phase equilibria are represented by points. b) Three phase equilibria are represented by lines. c) Two phase equilibria are represented by surfaces. d) Single phase equilibria are represented by spaces.
1) From the Gibbs phase rule,
f = c - p + 2
c = 3 (temarysystem) f = 0 (the maximum number of phases
occurs at zero degree of freedom.)
A maximum of five phases can coexist in equilibrium.
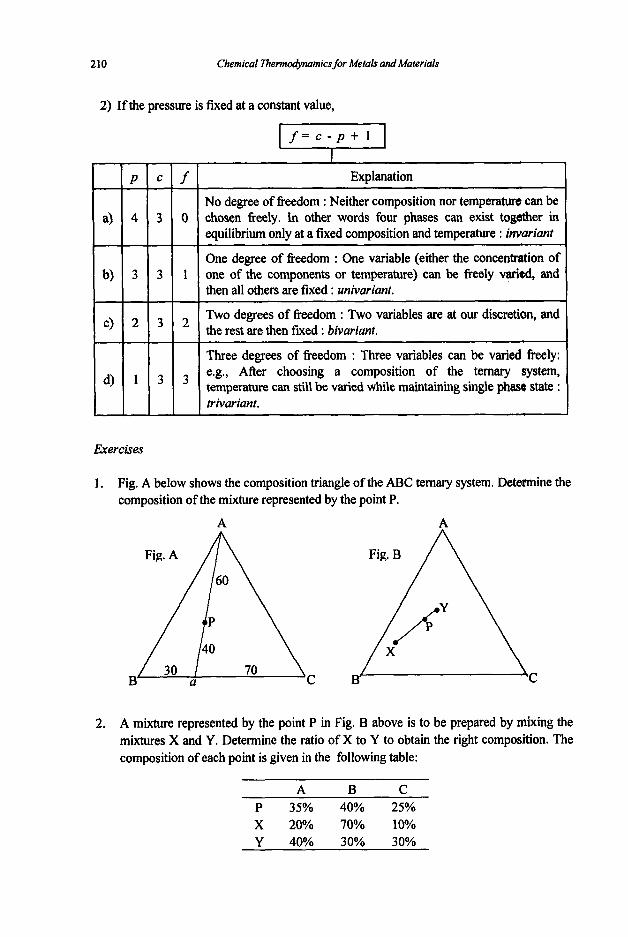
210 Chemical Thermodynamics for Metals and Materials
2) If the pressure is fuced at a constant value,
Explanat ion
No degree of freedom : Neither composition nor temperature can be chosen freely. In other words four phases can exist together in equilibrium only at a fixed composition and temperature : invariant
One degree of fkeedom : One variable (either the concentration of one of the components or temperature) can be freely varitd, and
I then all others are fixed : univariant.
Two degrees of freedom : Two variables are at our discretion, and the rest are then fured : bivuriunt.
Three degrees of freedom : Three variables can be varied freely: e.g., After choosing a composition of the ternary system, temperature can still be varied while maintainiig single phase state : trivariant.
Exercises
1, Fig. A below shows the composition triangle of the ABC ternary system. Determine the composition of the mixture represented by the point P.
A A
2. A mixture represented by the point P in Fig. B above is to be prepared by mixing the mixtures X and Y. Determine the ratio of X to Y to obtain the right composition. The composition of each point is given in the following table:
~~ ~
A B C P 35% 40% 25% X 20% 70% 100/0 Y 40% 30% 30%

Phase Diagrams
In thejigwe, point a : BC binary eutectic point b : AC binary eutectic point c : AB binary eutectic point e : ABC ternary eutectic
0
21 1
4.3.2. Polythermal Projections
This figure represents a simple ternary phase diagram. However, it has the disadvantage that lines in the figure are not seen in true length, and hence it is difficult to obtain quantitative information.
C
A
There are two ways to solve this problem: 1) A two dimensional representation of the ternary liquidus surface on the base
composition triangle. 2) Two dimensional isothermal diagrams which represent isothermal plane intersections
with various surfaces (liquidus, solidus, etc). The first method consists of a pofythermal projection of all features (liquidus, etc) down onto the base composition triangle.
The figure below shows such a polythermal projection of a simple ternary eutectic system without solid solution like the one represented by the figure above.

212 Chemical Thermodynamics for Metals and Materials
Now, let’s examine crystallisation paths of this simple ternary system. If a liquid of composition p is allowed to cool,
0 The liquid solution remains liquid until the system temperature reaches the liquidus.
0 At the liquidus, pure solid A begins to crystallise.
0 As the temperature decreases further, solid A continues to precipitate out of the liquid, and hence the liquid is depleted in A and the liquid composition changes along the line P4. At q, the second phase B appears, and the liquid composition moves along the curve qe. Until it reaches the ternary eutectic point e, both A and B crystallise.
At e, solid phases A, B and C crystallise and the temperature remains constant until all liquid has exhausted.
The final product will consist of large crystals of A and B which have crystallised before reaching the point e, and small crystals of eutectic structure of A, B and C which have crystallised at the point e .
0
0
0
The polythermal projection is generally given with constant temperature lines as shown in the following figure:
These lines are called liquidus isotherms. The intersections of adjoining liquidus surfaces like ue, be and ce are called the boundary curves. When a liquid whose composition lies in the region surrounded by Aceb is cooled, the first crystalline phase that appears is A, and hence A is called the primuy phase and the region Aceb is the primayfleld of A. In this field, solid A is the last solid to disappear when any composition within this field is heated. Similarly,B and C are primary phases in their respective primary fields, Baec and Caeb.
In multicomponent systems, compounds are frequently formed between components. The following phase diagrams are for ABC ternary system forming a binary compound AB which melts congruently, as it is stable at its melting point :
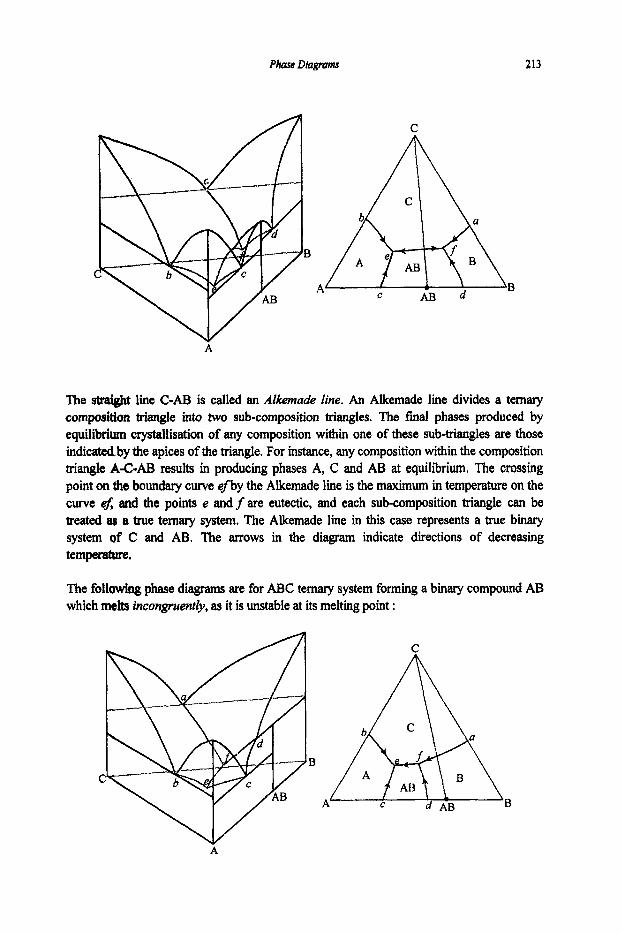
Phase Diagrams 213
C
A
The straight line C-AB is called an Alkemude line. An Alkemade line divides a ternary composition triangle into two sub-composition triangles. The final phases produced by equilibrium crystallisation of any composition within one of these sub-triangles are those indicatedby the apices of the triangle. For instance, any composition within the composition triangle A-C-AE3 resuIts in producing phases A, C and AB at equilibrium. The crossing point on the boundary curve ef by the Alkemade l i e is the maximum in temperature on the curve t$ and the points e and fare eutectic, and each sub-composition triangle can be treated as a true ternary system. The Alkemade line in this case represents a true binary system of C and AB. The arrows in the diagram indicate directions of decreasing temperatwe.
The following phase diagrams are for ABC ternary system forming a bmary compound AB which melts incongmenf&, as it is unstable at its meIting point :
C
B
A C B
U’ A

214 Chemical Tlzermcdynamics for Metals and Materials
In this case, the Alkemade line C-AB does not cross the boundary curve (efl between these primary phases. Now, we state the Alkemade theorem in a more general form :
The direction of falling temperature on the boundary curve of two intersecting primary phase areas is atways away from the Alkemade line.
If the Alkemade line intersects the boundary curve, the point of intersection represents a temperature maximum on the boundary curve. If the Alkemade line does not intersect the boundary curve, then temperature maximum on the curve is represented by that end which if prolonged would intersect the Alkemade line.
Now, it is obvious from the Alkemade theorem that for the case of the incongruently- melting compound as shown above only the point e is eutectic. It is also apparent by examining the above phase diagrams for the congruently-melting compound and the incongruently-melting compound that the composition of the compound lies
within the primary field of the compound if it has a congruent melting point, and outside theprimaryfield ofthe cornpound if it has an incongruent meIting point.
The ternary invariant points (e.g., e and f in the above diagrams) that appear in a system without solid solution are either ternary eutectics or ternary peritectics. Whether it is eutectic or peritectic is determined by the directions of falling temperatures along the boundary curves.
If an invariant point is the minimum point in temperature along all three boundary curves, it is a ternary eutectic. If the point is not the minimum point, it is a ternary peritectic.
In the previous diagrams, points e and f for the congruently-melting compound are both ternary eutectic. On the other hand, for the incongruently-melting compound the point e is the ternary eutectic, whereas the pointfis the ternary peritectic.
Alkemade lines are also called in many different ways including conjugation lines andjoins. Both Alkemade lines and Alkemade triangles (composition triangles produced by Alkemade lines) are of use in the understanding of ternary systems. They play an essential role in understanding crystallisation or heating paths :
c This figure is a simple ternary phase diagram which shows a ternary eutectic at the point e. Explain the crystallisation path of each of liquids represented by the points p, q, and r. Explain also the change in (1) liquid composition, (2) mean solid composition, (3) solid phase@), (4) instantaneous composition of solids crystallising, and (5 ) change in the ratio of liquid to solid
C B phases.
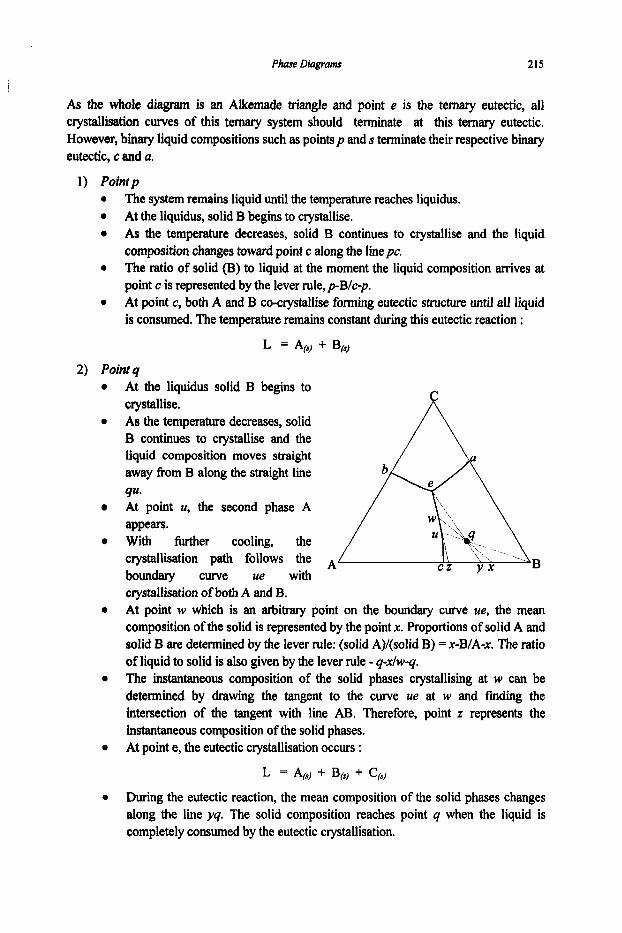
P h e Diagrams 215
As the whole diagram is an Alkemade triangle and point e is the ternary eutectic, all crystallisation curves of this ternary system should terminate at this ternary eutectic. However, binary liquid compositions such as pointsp and s terminate their respective binary eutectic, c and a.
1 ) Point p 0
0
0
The system remains liquid until the temperature reaches liquidus. At the liquidus, solid B begins to crystallise. As the temperature decreases, solid B continues to crystallise and the liquid composition changes toward point c along the linepc. The ratio of solid (B) to liquid at the moment the liquid composition arrives at point c is represented by the lever rule, pB/c-p. At point c, both A and B co-crystallise forming eutectic structure until all liquid is consumed. The temperature remains constant during this eutectic reaction :
L = A($ 4- B(s)
2) Point q 0
0
At the liquidus solid B begins to crystallise. As the temperature decreases, solid B continues to crystallise and the liquid composition moves straight away fiom B along the straight line ¶U* At point U, the second phase A appears. With further cooling, the crystallisation path follows the A boundary curve ue with crystallisation of both A and B. At point w which is an arbitrary point on the boundary curve ue, the mean Composition of the solid is represented by the point x. Proportions of solid A and solid B are determined by the lever rule: (solid A)/(solid B) = x-B/A-x. The ratio of liquid to solid is also given by the lever rule - q-x/w-q. The instantaneous composition of the solid phases crystallising at w can be determined by drawing the tangent to the curve ue at w and fmding the intersection of the tangent with line AB. Therefore, point z represents the instantaneous composition of the solid phases. At point e, the eutectic crystallisation occurs :
0
0
0
L = A(3) + B(s) + C(S)
0 During the eutectic reaction, the mean composition of the solid phases changes along the line yq. The solid composition reaches point q when the liquid is completely consumed by the eutectic crystallisation.

216 Chemical ThermodyMmics for Metals and Materials
0
0
In summary, the liquid composition changes along the path quwe, whereas the mean composition of solid phases follows the path B.xyq. The final structure of the system after complete solidification consists of large crystals of A and B which have been crystallised during the path qme and a mixture of small crystals of A, B and C (eutectic structure).
3) Point r 0 The crystallisation path can be determined in the same manner as the above case.
However, the second phase crystallising in this case is C instead of B.
Example 2
This figure is a phase diagram of ABC ternary system which forms two binary compounds, AC and BC.
1) Why is an Alkemade line connecting A and BC not drawn? 2) Describe crystallisation paths of liquid compositions p,q and r. 3 ) Describe heating paths of mean solid compositions ofp ,q and r. 4) Would the compounds AC and BC melt congruently or incongruently?
) Because the primary fields o f A and BC are not in contact with each other, and hence these two fields do not form a boundary curve.
2) Point p
As point p lies in the Alkemade triangle C-AC-BC, the final solid phases in equilibrium should be C, AC and BC. From the figure given below,
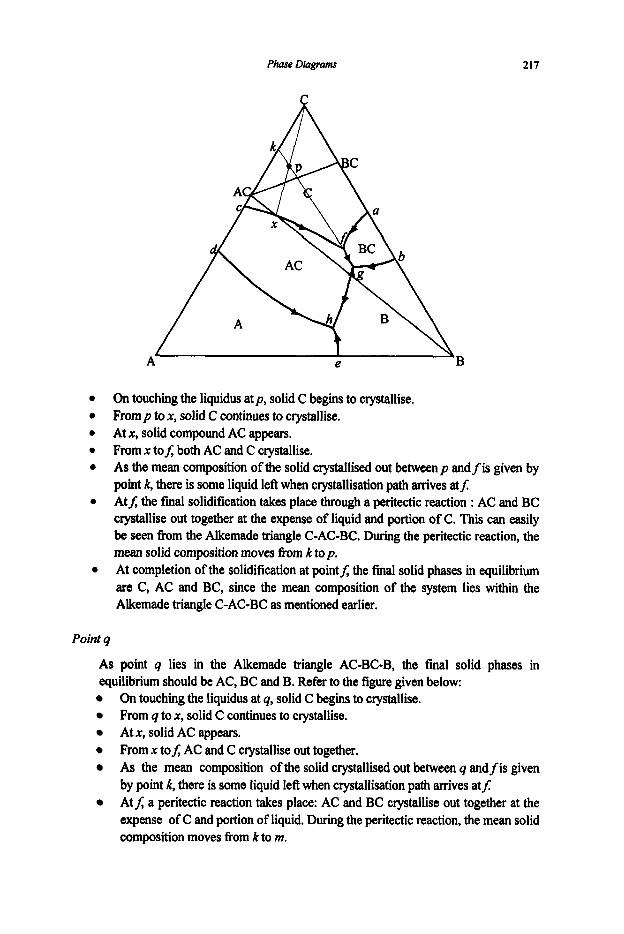
Phase Diagram 217
On touching the liquidus at p, solid C begins to crystallise. From p to x, solid C continues to crystallise. At x, solid compound AC appears. From x tof; both AC and C crystallise. As the mean composition of the solid crystallised out between p andfis given by point k, there is some liquid left when crystallisation path arrives at$ Atf; the final solidification takes place through a peritectic reaction : AC and BC crystallise out together at the expense of liquid and portion of C. This can easily be seen fkom the Alkemade triangle C-AC-BC. During the peritectic reaction, the mean solid composition moves fkom k top. At completion of the solidification at point5 the final solid phases in equilibrium are C, AC and BC, since the mean composition of the system lies within the Alkemade triangle C-AC-BC as mentioned earlier.
Point q
As point q lies in the Alkemade triangle AC-BC-B, the final solid phases in equilibrium should be AC, BC and B. Refer to the figure given below:
On touching the liquidus at q, solid C begins to crystallise. From q to x, solid C continues to crystallise. At x, solid AC appears. From x tof; AC and C crystallise out together. As the mean composition of the solid crystallised out between q andfis given by point k, there is some liquid left when crystallisation path arrives at$ At 1; a peritectic reaction takes place: AC and BC crystallise out together at the expense of C and portion of liquid. During the peritectic reaction, the mean solid composition moves fiom k to m.
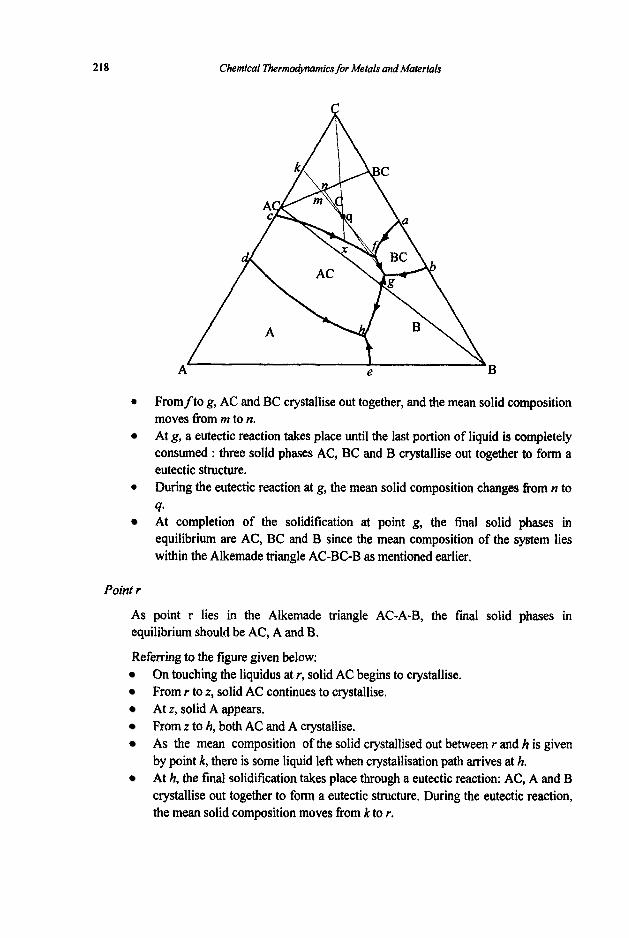
218 Chemical nKrmodynamics for Metals and Materials
0 Fromfto g, AC and BC crystallise out together, and the mean solid composition moves €rom m to n. At g, a eutectic reaction takes place until the last portion of liquid is completely consumed : three solid phases AC, BC and B crystallise out together to form a eutectic structure. During the eutectic reaction at g, the mean solid composition changes eom n to 4. At completion of the solidification at point g, the final solid phases in equilibrium are AC, BC and B since the mean composition of the system lies within the Alkemade triangle AC-BC-B as mentioned earlier.
0
Point r
As point r lies in the Alkemade triangle AC-A-B, the fmal solid phases in equilibrium should be AC, A and B.
Referring to the figure given below; On touching the liquidus at r, solid AC begins to crystallise. From r to z, solid AC continues to crystallise. At z, solid A appears. From z to h, both AC and A crystallise. As the mean composition of the solid crystallised out between r and h is given by point k, there is some liquid left when crystallisation path arrives at h. At h, the final solidification takes place through a eutectic reaction: AC, A and B crystallise out together to form a eutectic structure. During the eutectic reaction, the mean solid composition moves from k to r.
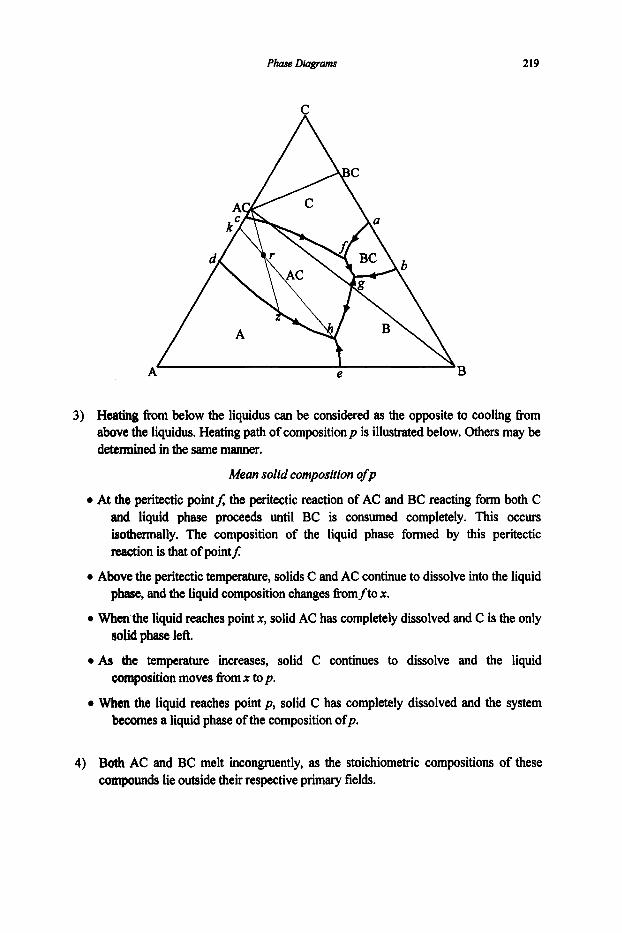
Phase D i a g r m 219
3) Heating from below the liquidus can be considered as the opposite to cooling from above the liquidus. Heating path of composition p is illustrated below. Others may be determined in the same manner.
Mean solid composition ofp
0 At the peritectic point f; the peritectic reaction of AC and BC reacting form both C and liquid phase proceeds until BC is consumed completely. This occurs isothermally. The composition of the liquid phase formed by this peritectic d o n is that of point$
0 Above the peritectic temprature, solids C and AC continue to dissolve into the liquid phase, and the liquid composition changes fiomfto x.
0 When the liquid reaches point x, solid AC has completely dissolved and C is the only solid phase left.
0 As the temperature increases, solid C continues to dissolve and the liquid composition moves fiom x top.
0 When the liquid reaches point p, solid C has completely dissolved and the system becomes a liquid phase of the composition ofp.
4) Both AC and BC melt incongruently, as the stoichiometric compositions of these compounds lie outside their respective primary fields.
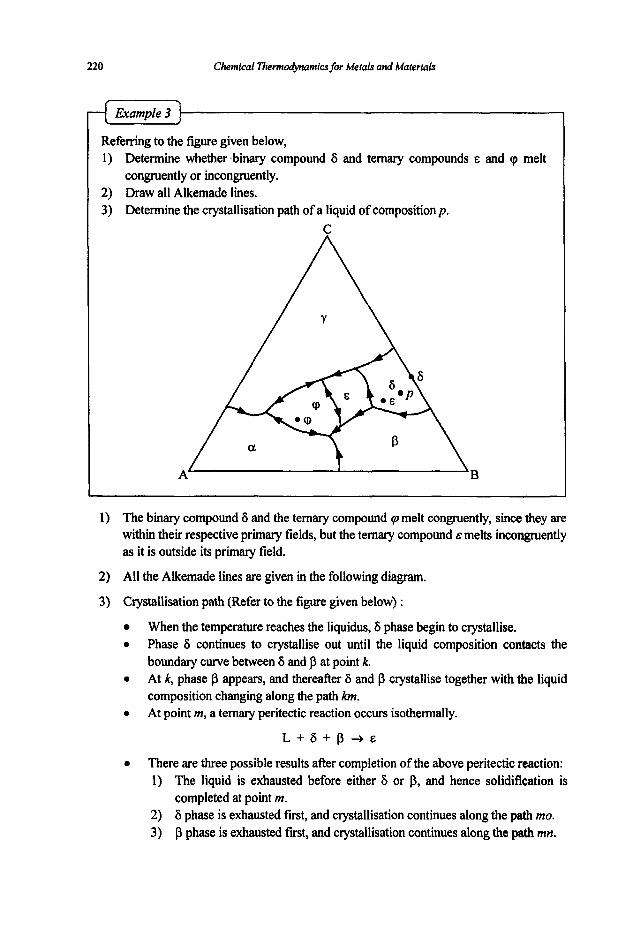
220 Cherntcal Thennodynamics for Metals and Materials
Example 3
Referring to the figure given below, Determine whether .binary compound 6 and ternary compounds E and cp melt congruently or incongruently. Draw all Alkemade lines. Determine the crystallisation path of a liquid of compositionp.
C
1) The binary compound 6 and the ternary compound p melt congruently, since they are within their respective primary fields, but the ternary compound &melts incongruently as it is outside its primary field.
2) All the Alkemade lines are given in the following diagram.
3) Crystallisation path (Refer to the figure given below) :
0
0
0
When the temperature reaches the liquidus, 6 phase begin to crystallise. Phase 6 continues to crystallise out until the liquid composition contacts the boundary curve between 6 and p at point k. At k, phase p appears, and thereafter 6 and p crystallise together with the liquid composition changing along the path km. At point m, a ternary peritectic reaction occurs isothermally.
L + G + p + E
0 There are three possible results after completion of the above peritectic reaction: 1) The liquid is exhausted before either 6 or p, and hence solidification is
completed at point m. 2) 6 phase is exhausted first, and crystallisation continues along the path mo. 3) p phase is exhausted fist, and crystallisation continues along the path mn.
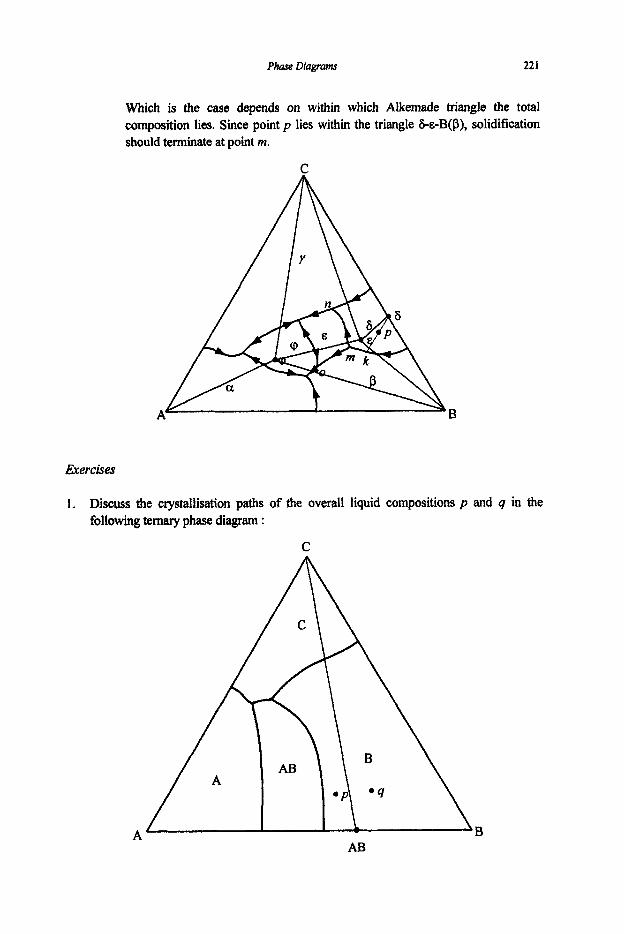
Phase Diagrm 221
Which is the case depends on within which Alkemade triangle the total composition lies. Since point p lies within the triangle ~-E-B(P), solidification should terminate at point m.
Exercises
1. Discuss the crystallisation paths following ternary phase diagram :
of the overall liquid compositions p and q in the
C
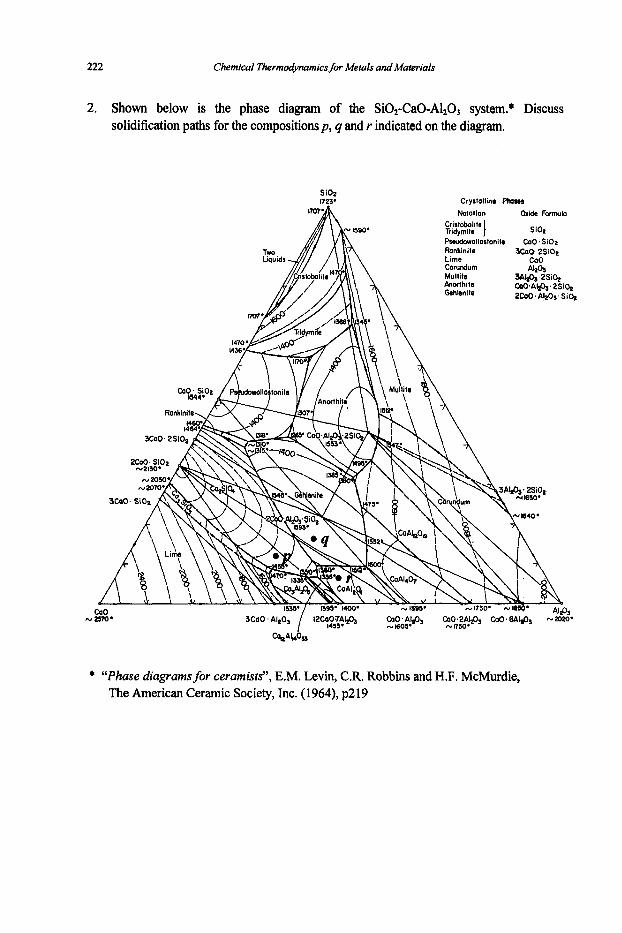
222 Chemical ThermodyMmics for Metals and Materials
2. Shown below is the phase diagram of the SiO2-Ca0-Al2O3 system.* Discuss solidification paths for the compositions p , q and r indicated on the diagram.
* “Phase diagramsfor ceramists”, E.M. Levin, C.R. Robbins and H.F. McMurdie, The American Ceramic Society, Inc. ( 1964), p2 19
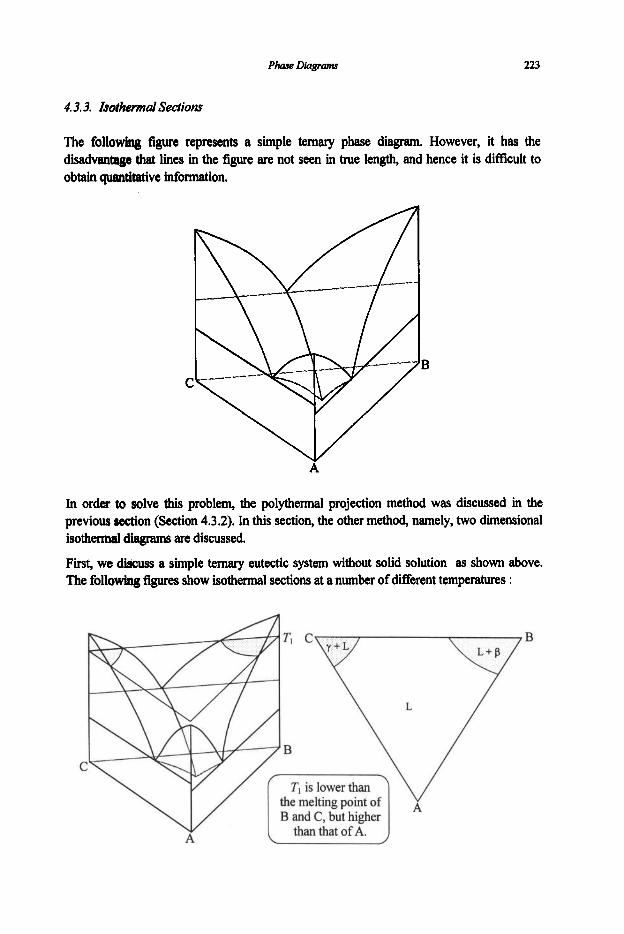
Phase Diagrams 223
4.3.3. hothsrmal Sections
The following figure represents a simple ternary phase diagram. However, it has the disadvantage that l i e s in the figure are not seen in true length, and hence it is difficult to obtain quantitative information.
A
In order to solve this problem, the polythermal projection method was discussed in the previous section (Section 4.3.2). In this section, the other method, namely, two dimensional isothermal dhgrams are discussed.
First, we disouss a simple ternary eutectic system without solid solution as shown above. The following figures show isothermal sections at a number of different temperatures :
B
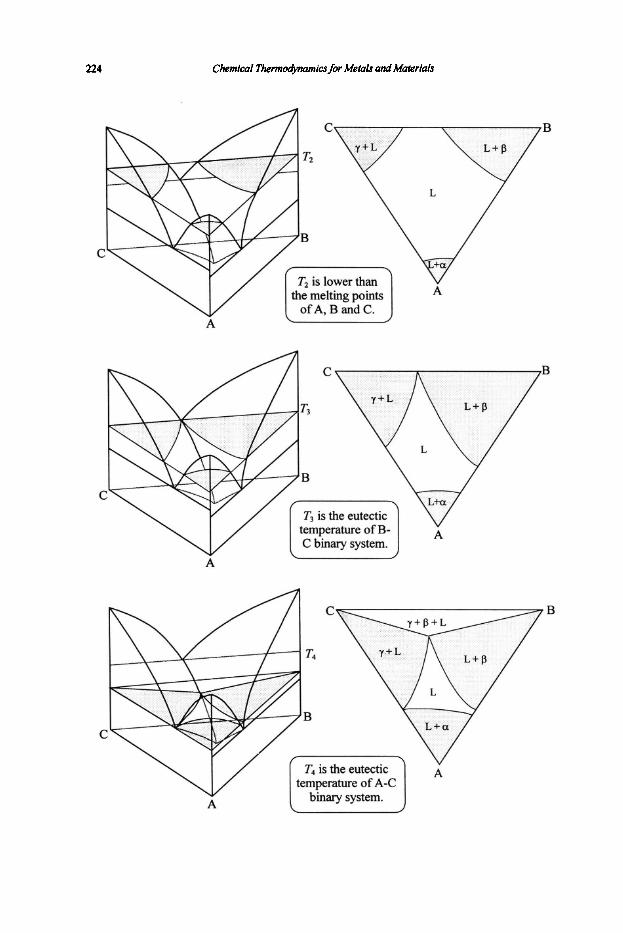
224 Chemical Thermodynamics for Metals and Makrials
B
c
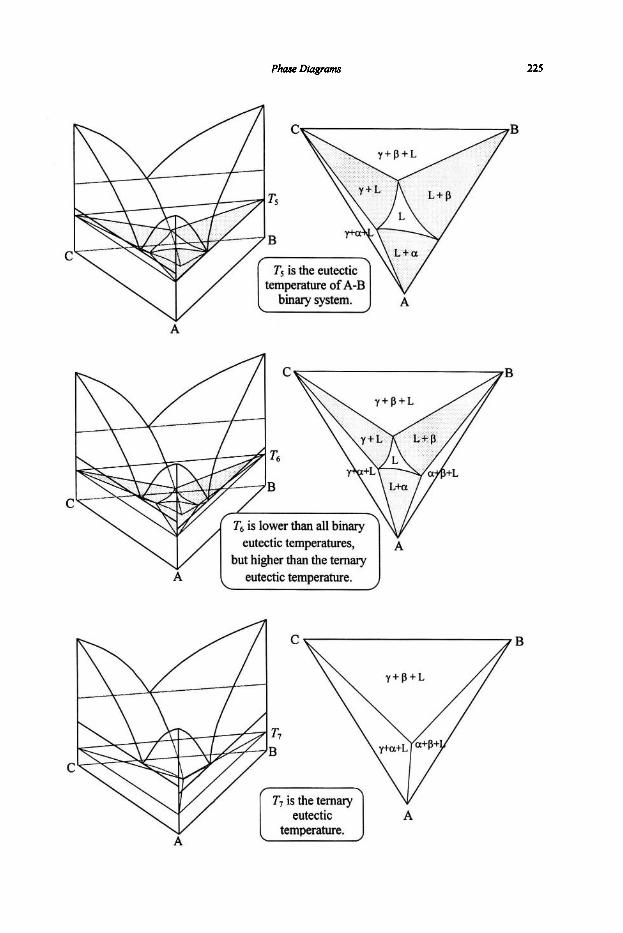
Phase Dkzgratns 225
A
C
C B
eutectic temperature.
B
C
A
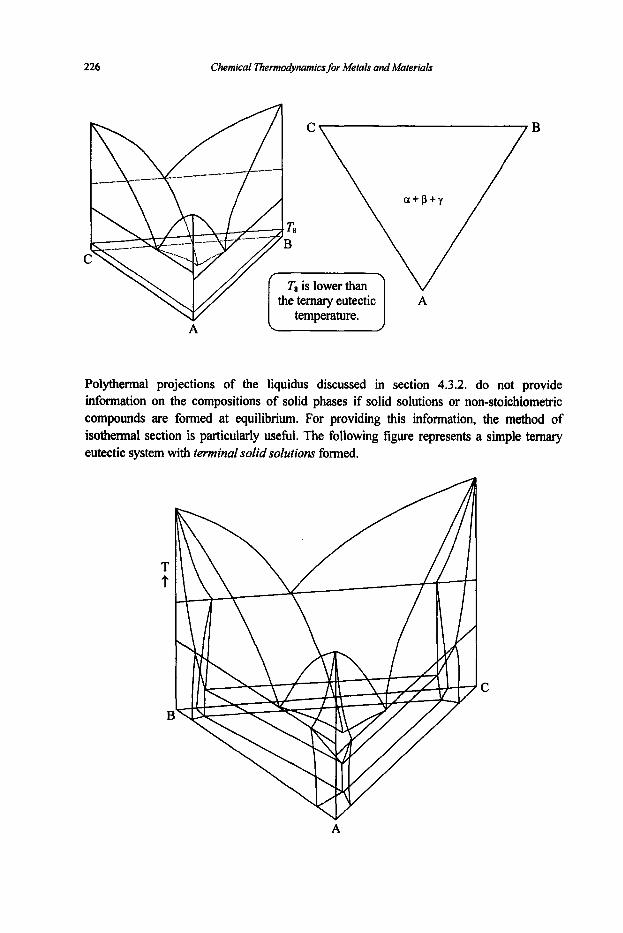
226 Chemical Thermo&amics for Metals and Materials
Polythermal projections of the liquidus discussed in section 4.3.2. do not provide information on the compositions of solid phases if solid solutions or non-stoichiometric compounds are formed at equilibrium. For providing this information, the method of isothermal section is particularly useful. The following figure represents a simple ternary eutectic system with terminal solid solutions formed.
A

Phase Diagrams 227
Shown in the following are the isothermal sections at a number of different temperatures of an hypothetical system AE3C like the one given above :
A
B C

228 Chemical Thermodynamics for Metals and Materials
A A
0
If the overall composition of an alloy lies within the liquid phase region at a particular temperature, the alloy will exist as liquid. If the overall composition lies within one of the solid solution regions, the alloy will exist as the corresponding solid solution. If the composition lies within one of two-phase regions, say, p and liquid phases, both P and liquid phases will coexist.
Now a question arises as to how to determine the compositions of p phase and the liquid phase which are in equilibrium with each other. The usual practice is to include tie lines in the isothermal sections, which join the composition points of conjugate phuses which coexist in equilibrium at a given temperature and pressure.
Tie lines are in fact common tangents to the Gibbs free energy surfaces of the phases that coexist in equilibrium. Let’s assume that 01 and p phases, both of which form solid solutions, coexist. The following figure shows two arbitrary surfaces, 01 and p :
P
Common
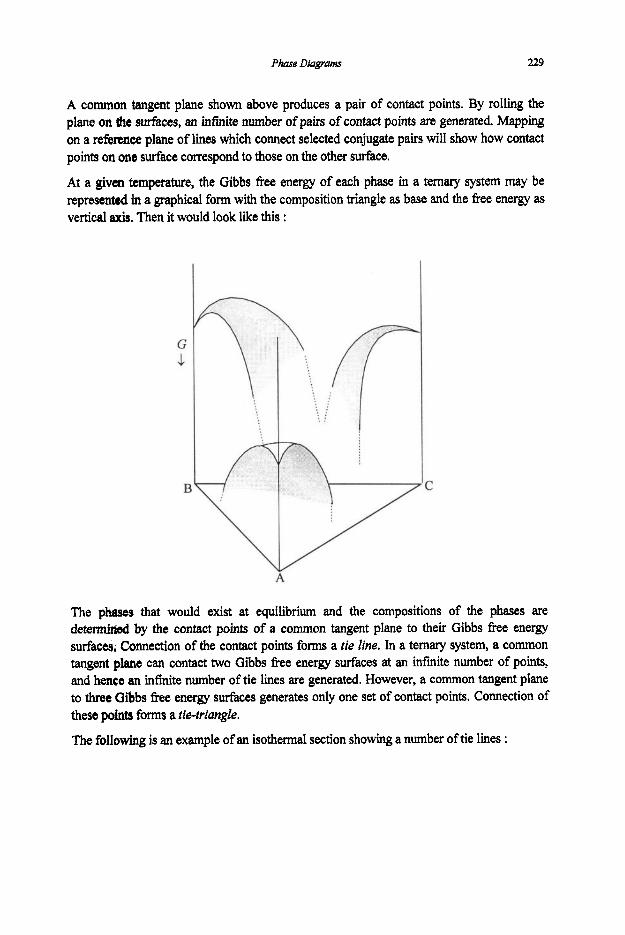
Phase Diagrams 229
A common tangent plane shown above produces a pair of contact points. By rolling the plane on &e surfaces, an inkite number of pairs of contact points are generated. Mapping on a reference plane of l i e s which connect selected conjugate pairs will show how contact points on one surface correspond to those on the other surface.
At a given temperature, the Gibbs flee energy of each phase in a ternary system may be represented in a graphical form with the composition triangle as base and the flee energy as vertical axis. Then it would look l i e this :
A
The phases that would exist at equilibrium and the compositions of the phases are determined by the contact points of a common tangent plane to their Gibbs free energy surfaces. Connection of the contact points forms a tie line. In a ternary system, a common tangent plane can contact two Gibbs fiee energy surfaces at an infiite number of points, and henee an infinite number of tie lines are generated. However, a common tangent plane to three Gibbs free energy surfaces generates only one set of contact points. Connection of these points forms a tie-triangle.
The following is an example of an isothermal section showing a number of tie lines :

230 Chemical Rerm&namics for Metals and Materials
B C
V A
4 Bampde I J In construction of isothermal sections or isothermal ternary phase diagrams a tie triangle together with contacting single phase and two-phase areas play an important role. In fact it may be considered as a building block of isothermal phase diagrams. Isothermal ternary phase diagrams are composed of a number of these building blocks. Shown below is an example of a tie-triangle with adjacent single and two phase areas :
1.
2.
3.
Determine relative proportion of each phase that exist at equilibrium for a system of overaI1 composition ofp in the diagram. Determine the fraction of a phase that exist at equilibrium for the overall composition of q. Are the boundary curves at the a phase corner correct?

Phase Diagram 23 1
Pn 1) Fraction of a phase = - mn qr 2) Fraction of aphase = - ar
3) Both extensions of the boundary curves of the single phase areas must project either into the triangle (y corner), or outside triangle (p corner), but not in mix. The ct corner is wrong.
Exercises
1. 2.
Prove that tie lines must not cross each other within any two phase region. AJ3C ternary system forms three binary eutectics and a ternary eutectic as shown below. Discuss equilibrium cooling paths for the overall compositions p, q and r indicated in the diagram. Discuss also the change in microstructure that should occur during cooling.
A

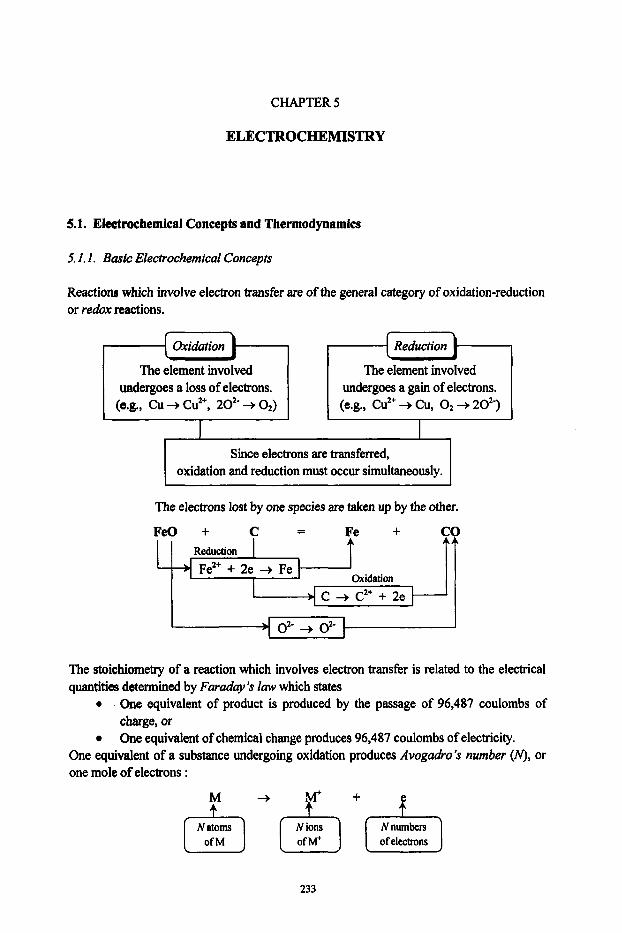
CHAPTER 5
ELECTROCHEMISTRY
Reduction
Oxidation Fe2+ + 2e -+ Fe
c -+ c'+ + 2e
5.1. Electrochemical Concepts and Thermodynamics
5. I. 1. Basic Electrochemical Concepts
Reactions which involve electron transfer are of the general category of oxidation-reduction or redox reactions.
The element involved undergoes a loss of electrons.
(e.g., cu -+ CU", 20'- -+ 02)
I
The element involved undergoes a gain of electrons. (e.g., CU" + CU, 0' + 20'?
I Since electrons are transferred,
oxidation and reduction must occur simultaneously.
The electrons lost by one species are taken up by the other.
L
The stoichimetry of a reaction which involves electron transfer is related to the electrical quantities determined by Faradcly's law which states
One equivalent of product is produced by the passage of 96,487 coulombs of charge, or One equivalent of chemical change produces 96,487 coulombs of electricity.
0
One equivalent of a substance undergoing oxidation produces Avogadro's number (N), or one mole of electrons :
[x5] [5] of electrons
233
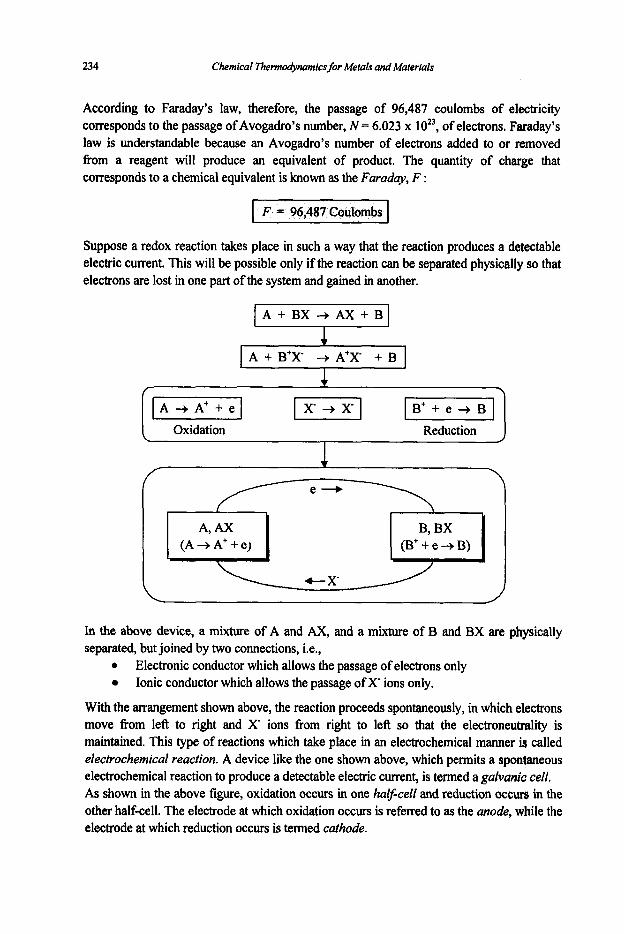
234 Chemical Thermodynanrics for Metals and Materials
According to Faraday’s law, therefore, the passage of 96,487 coulombs of electricity corresponds to the passage of Avogadro’s number, N = 6.023 x 10²³, of electrons. Faraday’s law is understandable because an Avogadro’s number of electrons added to or removed from a reagent will produce an equivalent of product. The quantity of charge that corresponds to a chemical equivalent is known as the Faraday, F :
I F = 96,487 Coulombs I Suppose a redox reaction takes place in such a way that the reaction produces a detectable electric current. This will be possible only if the reaction can be separated physically so that electrons are lost in one part of the system and gained in another.
Oxidation Reduction
In the above device, a mixture of A and AX, and a mixture of B and BX are physically separated, but joined by two connections, i.e.,
0 Electronic conductor which allows the passage of electrons only Ionic conductor which allows the passage of X- ions only.
With the arrangement shown above, the reaction proceeds spontaneously, in which electrons move from left to right and X- ions from right to left so that the electroneutrality is maintained. This type of reactions which take place in an electrochemical manner is called electrochemical reaction. A device like the one shown above, which permits a spontaneous electrochemical reaction to produce a detectable electric current., is termed a galvunic cell. As shown in the above figure, oxidation occurs in one half-cell and reduction occurs in the other half-cell. The electrode at which oxidation occurs is referred to as the anode, while the electrode at which reduction occurs is termed cathode.
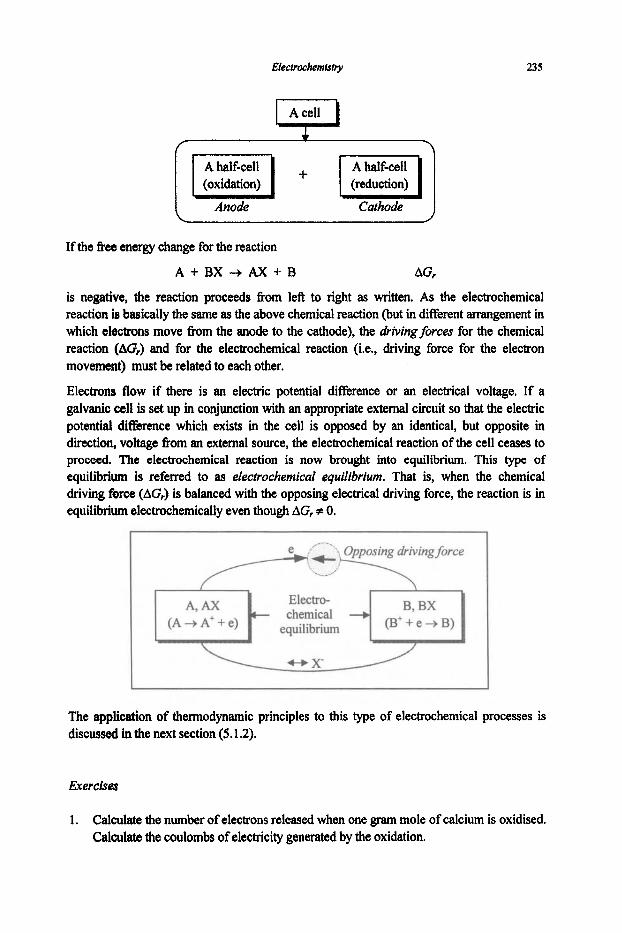
235
(oxidation) (reduction)
If the free energy change for the reaction
A + BX AX + B AGr
is negative, the reaction proceeds fkom left to right as written. As the electrochemical reaction is basically the same as the above chemical reaction (but in different arrangement in which electrons move fkom the anode to the cathode), the &ivingjbrces for the chemical reaction (AGJ and for the electrochemical reaction (Le., driving force for the electron movement) must be related to each other.
Electrons flow if there is an electric potential difference or an electrical voltage. If a galvanic cell is set up in conjunction with an appropriate external circuit so that the electric potential difference which exists in the cell is opposed by an identical, but opposite in direction, voltage fiom an external source, the electrochemical reaction of the cell ceases to proceed. The electrochemical reaction is now brought into equilibrium. This type of equilibrium is referred to as electrochemical equilibrium. That is, when the chemical driving force (AGr) is balanced with the opposing electrical driving force, the reaction is in equilibrium electrochemically even though AGr f: 0.
The application of thennodynamic principles to this type of electrochemical processes is discussed in the next section (5.1.2).
Exercises
1. Calculate the number of electrons released when one gram mole of calcium is oxidised. Calculate the coulombs of electricity generated by the oxidation.

236 Chemical Thermodynamics for Metals and Materials
2. The galvanic cell performs an electric work when the electrochemical reaction of the cell occurs. As work is not a state function, the amount of work which a system does depends on the path it takes for given initial and final states. Under what conditions does the amount of work the cell performs become maximum?
5.1.2. Electrochernical Cell Thermodynamics
Consider the reaction
A + BX + AX -t B AG, < 0
If the mixture of all reactants and products is in a same reactor, the above chemical reaction will proceed fiom left to right with a driving force equivalent to the free energy change of AG,. The reaction will continue until AGr = 0. If a galvanic cell is constructed as shown below, the same reaction will occur, but in an electrochemical manner.
B, BX (B++ e + B)
Electro- chemical --+
equilibrium
e* X'
A, Ax (A -+ *' + e,
In the absence of the opposing driving force, the electron transfer fiom left to right, which enables the electrochemical reaction to occur, will enjoy the fill driving force equivalent to AG,. If an external force opposing to this driving force is applied, the net driving force for the electron transfer will be reduced accordingly. The electrochemical reaction of the cell will then suffer a decrease in the driving force. When the opposing external force (voltage) is increased to exactly balance the driving force of the electrochemical reaction of the cell, the electrons will cease to flow and so will the cell reaction.
Now we examine the amount of work the cell performs under various conditions. To help understand the concept of work of a cell, the case of gas expansion in a cylinder is reviewed below :
Piston (frictionless)

Electrochemistry 231
0
0
0
0
0
If Pu, = 0, the piston moves without doing work because there is nothing to work against. If Pal is increased, the piston moves with doing work against P,,. If P,, is only infinitesimally smaller than P,",, i.e., P,, = Pin, - dP, the piston moves with doing the maximum work, w-, against Pup If P,, is infinitesimally larger than PI,,, i.e., P,, = P/,,, + dP, the direction of the piston movement will be reversed. The last two cases depict the conditions for reversibility of gas expansion.
Work under reversible conditiom (w& = the maximum work (wmm)
-1 Work of electrochemical cells has analogy with work of gas expansion discussed above.
Opposing force from external source (V,,)
B, BX (B' + e + B)
Electro- chemical A, Ax
(A+A'+e) equilibrium
*x
If there is no opposing force fiom an external source, i.e., V,, = 0, electrons will move without doing work because there is nothing to work against.
If the external opposing force ( Vul) is increased, the electrons move with doing work against Vu,. The net driving force for the electron transfer (AV) is
AV V,N - Vat
If V,, is only infinitesimally smaller than Vm,,, i.e.,
V,, = - dV
the electrons move with doing maximum work, w-, against V,,. Since the net driving force for the electron transfer is infmitely small ( d o , the cell reaction will proceed at an infinitely slow rate, but performing the maximum work.
If V,, is only infinitesimally larger than Vce//, i.e.,
V,, = V,rr + dV
the direction of the electron transfer is reversed. In other words, the direction of the cell reaction can be reversed by an infinitesimal change in the external opposing force.
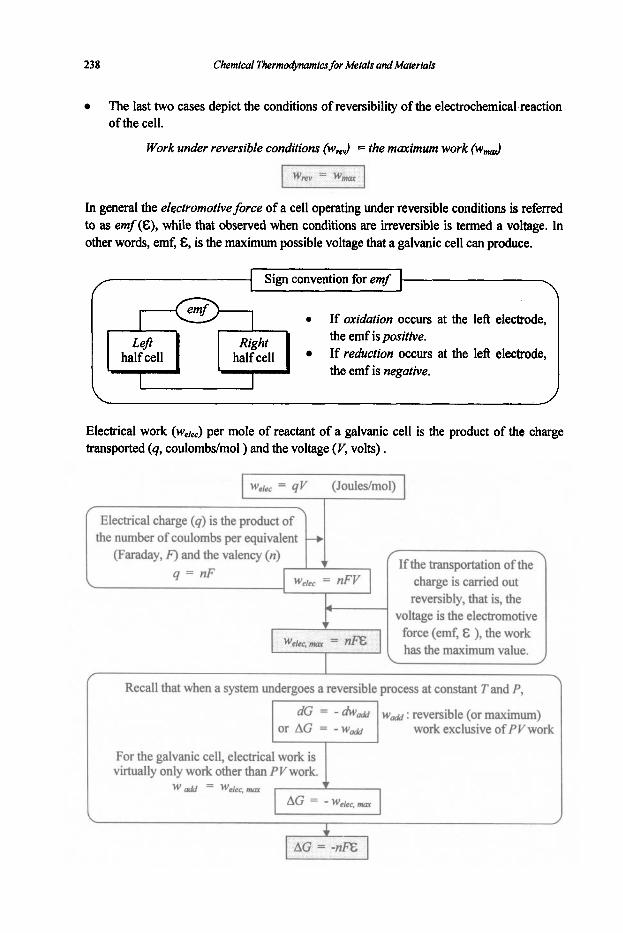
238 Chemical ThermodyMmics for Metals and Makrials
Sign convention for emf
The last two cases depict the conditions of reversibility of the electrochemical reaction of the cell.
\
Work under reversible conditions ( w d = the maximum work ( w d
-1 In general the electromotive force of a cell operating under reversible conditions is referred to as emf(€), while that observed when conditions are irreversible is termed a voltage. In other words, emf, E, is the maximum possible voltage that a galvanic cell can produce.
the emf is positive.
the emf is negative. [-I Fl If reduction occurs at the left electrode,
Electrical work (welec) per mole of reactant of a galvanic cell is the product of the charge transported (q, coulombs/mol ) and the voltage (V, volts) .
r
Electrical charge (q) is the product of the number of coulombs per equivalent
(Faraday, F) and the valency (n) q = nF
1 'Ifthe transportation ofthe \ we/,, = nFV charge is carried out
reversibly, that is, the voltage is the electromotive
force (emf, E ), the work ~ has the maximum value. 1 we'w*nun: = I
Recall that when a system undergoes a reversible process at constant T and P,
or AG = -w& w d : reversible (or maximum)
work exclusive of PY work
For the galvanic cell, electrical work is virtually only work other than PV work.
W add = Weter, mm
\
4 AG = 4%

239
This equation is significant in that :
0
It enables us to measure AG for the reaction by applying an opposing electric potential of magnitude &externally, which results in no current to flow. It means that when the chemical driving force (AG) is exactly balanced by the external opposing voltage (-€), the whole system (the cell) is at equilibrium, i.e., electrochemical equilibrium. The measured AG can be used as a criterion of whether the process (or reaction) will take place spontaneously when all the species involved in the cell reactions are mixed in a reactor under otherwise same conditions.
Consider the general reaction
aA + bB = mM + nN AG
AG=AGo +RTln - (::)I If this reaction takes place electrochemically,
AGO= +FEo I
E" : emf when all species are present in their standard states.
This equation is known as the Nernst equation, and it plays a central role in electrochemistry .
This equation enables us to determine how the emf of a cell should vary with composition. The emf at the standard states (E") can be determined by constructing the cell with all the reagents at unit activity. Activities or activity coefficients of reagents can be obtained.
0
We now derive several important equations in terms of emf :
I
I (g) : temperature coeficient
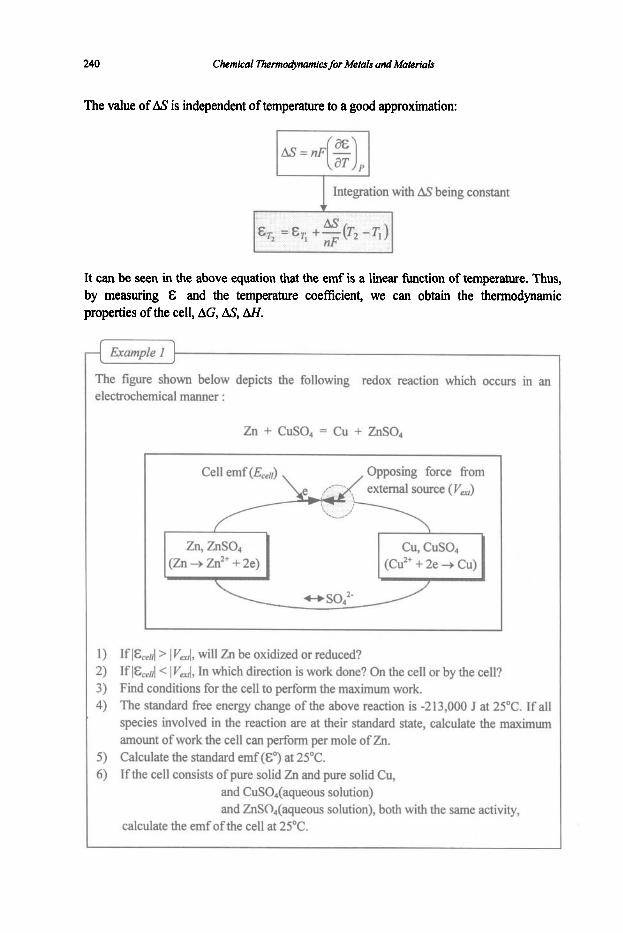
240 Chemical ThermalyMmics for Metals and Materials
The value of AS is independent of temperature to a good approximation:
I Integration with AS being constant
It can be seen in the above equation that the emf is a linear function of temperature. Thus, by measuring E and the temperature coefficient, we can obtain the thermodynamic properties of the cell, AG, AS, LW.
Example I
The figure shown below depicts the following redox reaction which occurs in an electrochemical manner :
Zn + CuSO, = Cu + ZnSO,
1) IflE 11 > I Vall, will Zn be oxidized or reduced? 2) If ~EwIl~ < I Verrl, In which direction is work done? On the cell or by the cell? 3) Find conditions for the cell to perform the maximum work. 4) The standard free energy change of the above reaction is -213,000 J at 25°C. If all
species involved in the reaction are at their standard state, calculate the maximum amount of work the cell can perform per mole of Zn.
5 ) Calculate the standard emf (E") at 25°C. 6) If the cell consists of pure solid Zn and pure solid Cu,
and CuSO,(aqueous solution) and ZnSO,(aqueous solution), both with the same activity,
calculate the emf of the cell at 25°C.
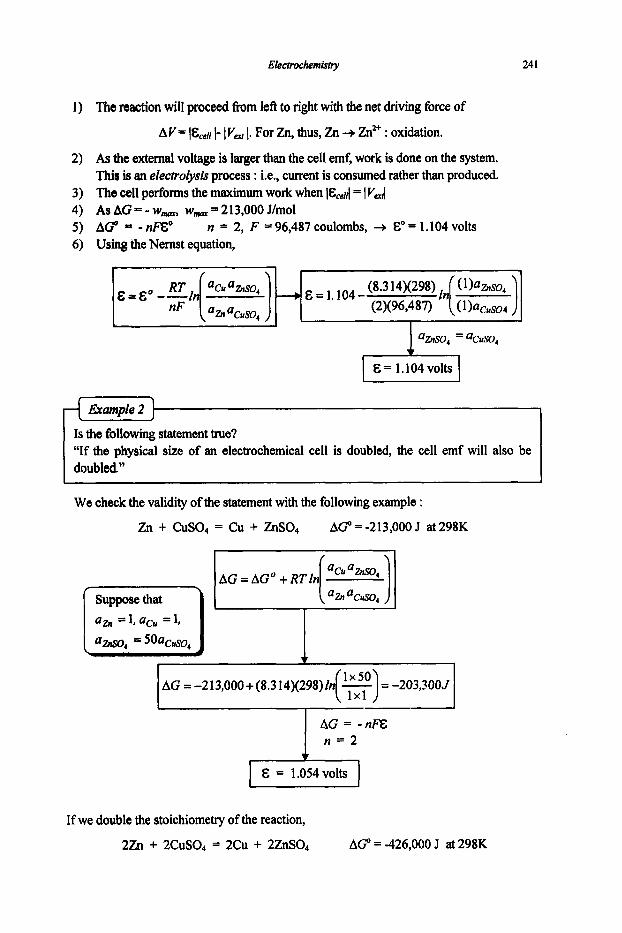
ElectrochemMry 24 I
The reaction will proceed from left to right with the net driving force of
A V = I&n// 1- I V,, I. For Zn, thus, Zn + Zn*' : oxidation.
As the external voltage is larger than the cell emf, work is done on the system. This is an electrolysis process : i.e., current is consumed rather than produced. The cell performs the maximum work when I&nld = I V,,l As AG = - w-, w- = 213,000 J/mol AGO -nF€" Using the Nernst equation,
n = 2, F = 96,487 coulombs, + E" = 1.104 volts
E = 1.104 - c - %so, - acuso4
E = 1.104volts
Example 2
Is the following statement true? "If the physical size of an electrochemical cell is doubled, the cell emf will also be doubled"
~~ ~ ~-
We check the validity of the statement with the following example :
Zn + CuS04 = Cu + ZnSO, AG"=-213,000 J at298K
AG = -nFE
I E = 1.054volts I
If we double the stoichiometry of the reaction,
2Zn + 2CuS04 = 2Cu + 2ZnS04 AG" = -426,000 J at 298K
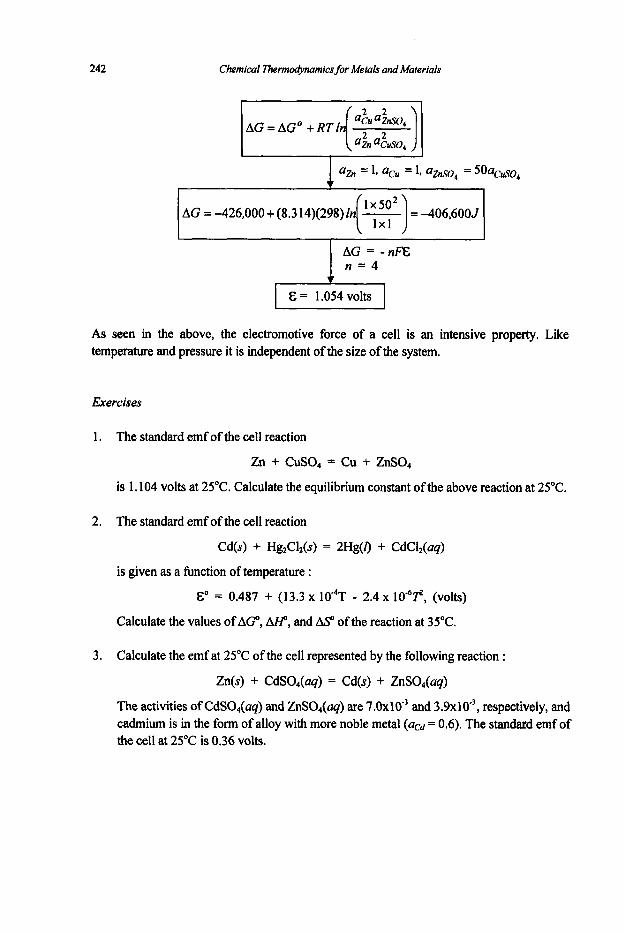
242 Chemical Thennodynamics for Metals andhfaterials
azn = 1, a,, = 1, az,,So, = 50ac,,s~, 1 AG = -426,000+(8.314)(298)In
AG = -nFE
As seen in the above, the electromotive force of a cell is an intensive property. Like temperature and pressure it is independent of the size of the system.
Exercises
1. The standard emf of the cell reaction
Zn + CuSO, = Cu + ZnSO,
is 1.104 volts at 25°C. Calculate the equilibrium constant of the above reaction at 25°C.
2. The standard emf of the cell reaction
Cd(s) + H&Cl,(s) = 2Hg(I) + CdC12(aq)
is given as a function of temperature :
E" = 0.487 + (13.3 x 10⁴T - 2.4 x 10", (volts)
Calculate the values of AGO, AFP, and AS' of the reaction at 35°C.
3. Calculate the emf at 25°C of the cell represented by the following reaction :
Zn(s) + CdS04(aq) = Cd(s) + ZnS04(uq)
The activities of CdSO,(aq) and ZnS04(aq) are 7 . 0 ~ 1 0 ~ and 3.9xlO3, respectively, and cadmium is in the form of alloy with more noble metal (acd = 0.6). The standard emf of the cell at 25°C is 0.36 volts.
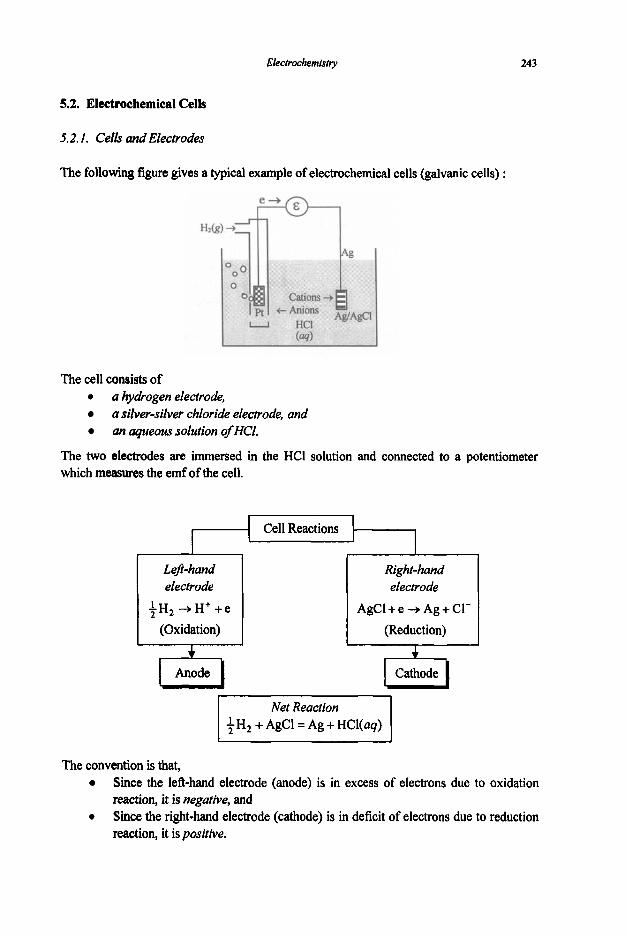
Electrachemiswy
5.2. Electrochemical Cells
243
5.2.1. Cells and Electrodes
The following figure gives a typical example of electrochemical cells (galvanic cells) :
The cell consists of 0 a hydogen electrode,
a silver-silver chloride electrode, and an aqueous solution of HCI.
The two electrodes are immersed in the HCl solution and connected to a potentiometer which measures the emf of the cell.
Cell Reactions
Left-hand electrode
LH, + H + + e i-l (Oxidation)
I
Right- hand electrode
AgCl + e + Ag + Cl- (Reduction)
fi Cathode
Net Reaction i H 2 + AgCl = Ag + HCl(aq)
The convention is that,
0
Since the left-hand electrode (anode) is in excess of electrons due to oxidation reaction) it is negative) and Since the right-hand electrode (cathode) is in deficit of electrons due to reduction reaction, it is positive.
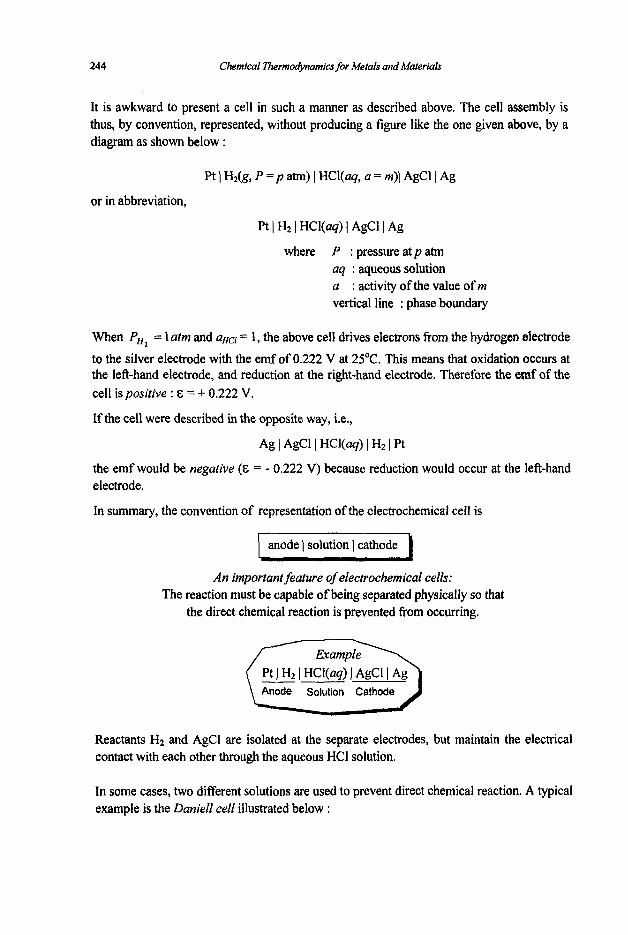
244 Chemical Thermodynamics for Meials and Materials
It is awkward to present a cell in such a manner as described above. The cell assembly is thus, by convention, represented, without producing a figure like the one given above, by a diagram as shown below :
Pt 1 Hz(g, P = p atm) 1 HCl(aq, a = m)l AgCl1 Ag
or in abbreviation,
Pt I H2 I H C W ) I AgCl I Ag
where P : pressure at p atm aq : aqueous solution a : activity of the value of m vertical line : phase boundary
When PH, = 1 atm and aHCl = 1 , the above cell drives electrons from the hydrogen electrode to the silver electrode with the emf of 0.222 V at 25OC. This means that oxidation occurs at the left-hand electrode, and reduction at the right-hand electrode. Therefore the emf of the cell ispositive : & = + 0.222 V.
If the cell were described in the opposite way, i.e.,
Ag I AgCl I H W 9 ) I H2 I Pt
the emf would be negative (E = - 0.222 V) because reduction would occur at the left-hand electrode.
In summary, the convention of representation of the electrochemicaf cell is
1 anode 1 solution I cathode I An important feature of electrochemical cells:
The reaction must be capable of being separated physically so that the direct chemical reaction is prevented from occurring.
Reactants Hz and AgCl are isolated at the separate electrodes, but maintain the electrical contact with each other through the aqueous HCI solution.
In some cases, two different solutions are used to prevent direct chemical reaction. A typical example is the rtanieff cell illustrated below :

Elecr*ochemistry 245
I Zn Ic.
Anode Cathode
The cell comprises
0
a zinc anode dipping into ZnSO, solution, a copper cathode dipping into CuSO., solution, and a porous diaphragm which prevents the two solutions fiom mixing, but allows electrical contact by the passage of SO,- ions through it.
The two solutions constitute the electrobte of the cell, which is the medium through which ionic c m n t flows.
Cell reactions:
Anode: Zn + SOi-(aq) = ZnSO,(aq) + 2e or Zn = Znz+(uq) + 2e Cathode: CuSO,(uq) + 2e = Cu + SOf(uq) Cu"(agl+ 2e = Cu Net : Zn + Cuz'(uq) = Zn2'(uq) + Cu
Again, it is not convenient to draw the cell figure and write the cell reactions as shown above. The eel1 is thus conventionally represented by the following diagram :
or Zn + CuS04(uq) = ZnSO,(uq) + Cu or
or Zn I ZnSO,(uq) i CuSO,(uq) I Cu
Zn I Zn2+(uq) i Cu2+(uq) I cu where the dashed vertical line represents the porous diaphragm separating the two aqueous solutions. The emf of the cell depends on the activities of ZnSO, and CuSO, (recall the Nemst equation). Suppose all the reagents of the cell are in their standard states at 25"C, i.e., Zn (pure), cu(pure), ZnS04(saturated) and CuSO.,(saturated).
AG = - nFEo AG" = -2 13,000 J at 25°C ' n = 2
~ h u s , Zn 1 Znz+(uq) i Cuz+(uq) 1 cu E" = 1.104 V
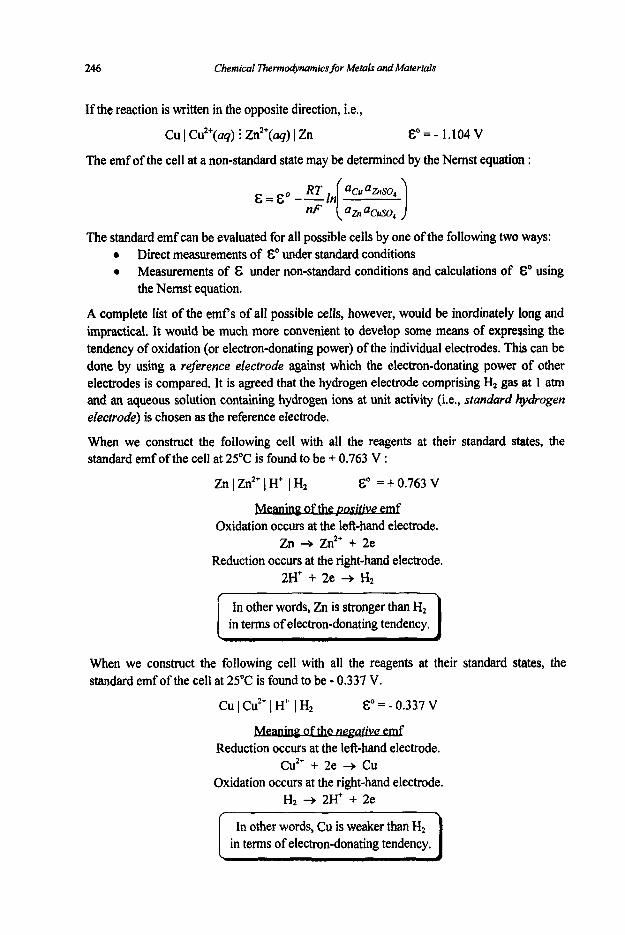
246 Chemicol Thermodynamics for Metals ond Moteriols
If the reaction is written in the opposite direction, i.e.,
cu 1 Cuz+(aq) i Zn2+(aq) I Zn E"=- 1.104V
The emf of the cell at a non-standard state may be determined by the Nernst equation :
nF azn Qcuso,
The standard emf can be evaluated for all possible cells by one of the following two ways: 0
0
Direct measurements of E" under standard conditions Measurements of E under non-standard conditions and calculations of E" using the Nernst equation.
A complete list of the emf s of all possible cells, however, would be inordinately long and impractical. It would be much more convenient to develop some means of expressing the tendency of oxidation (or electron-donating power) of the individual electrodes. This can be done by using a reference electrode against which the electron-donating power of other electrodes is compared. It is agreed that the hydrogen electrode comprising H2 gas at 1 atm and an aqueous solution containing hydrogen ions at unit activity (i.e., standard hydrogen electrode) is chosen as the reference electrode.
When we construct the following cell with all the reagents at their standard states, the standard emf of the cell at 25°C is found to be + 0.763 V :
2nIZn'"IH' IH2
Oxidation occurs at the left-hand electrode. Zn + Zn2+ + 2e
Reduction occurs at the right-hand electrode. 21ii' + 2e + Hz
Go = + 0.763 V
When we construct the following cell with all the reagents at their stanL..rd states, the standard emf of the cell at 25°C is found to be - 0.337 V.
Cu I Cu2' I H' I H2 E"= - 0.337 V
Reduction occurs at the left-hand electrode. CU*+ + 2e + cu
Oxidation occurs at the right-hand electrode. H1 + 2H' + 2e

Eleclrmhemishy 241
If the above results may be presented using a diagram as follows:
Electron-donating power, or
tendency of oxidation (E)
4 zn -+ Zn2+ + 2e h.c--?r
A&" = + 0.763 V A&' = + 1.1 V
A&" = - 0.331 V
I ' I
From the above figure one can easily see that Zn is stronger than Cu in terms of the electrondonating power and hence, if we construct a cell with Zn and Cu as follows, the standard emf of the cell will be + 1.1 V (= 0.763V + 0.337V).
ZII I Zn2+(aq) i Cu2+(aq) I cu E" = 1 .1 v Although it is impossible to measure the emf of a single half-cell or electrode like H2 -+ 2 P + 2e and Zn + Zn2+ + 2e, it is possible to assign an emf value for a cell, not an absolute value, but a value relative to the standard hydrogen electrode. This last statement is equivalent to saying that the standard hydrogen electrode is assigned a standard emf of zero. The value of the emf of a single electrode, or half-cell, which is relative to the standard hydrogen electrode, is called the standard (single) electrode potential or the standard haF cell potential.
0.763
Standard electrode potentials
(Oxidation) (E"), volts
- 0.337
If we are concerned with the electron-accepting power, i.e., the tendency of reduction, the emf is the same in the numerical value as the one for the oxidation, but opposite in sign, i.e.,
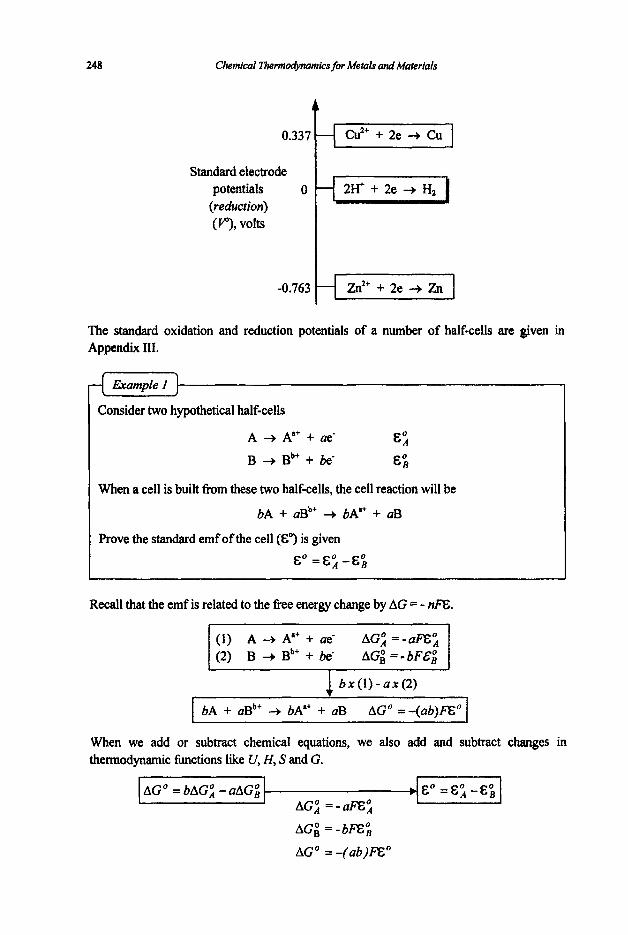
248 Chemical Thermo@mmics for MetaLp and Materials
0.337 Cu2' + 2e 3 Cu 7 Standard electrode
potentials (reduction) (V), volts
-0.763
The standard oxidation and reduction potentials of a number of half-cells are given in Appendix 111.
Example I
Consider two hypothetical half-cells
A -+ A"' + ae-
B + Bb' + be- EOA
EOs
When a cell is built from these two half-cells, the cell reaction will be
bA + aBb' + bA" + uB Prove the standard emf of the cell (E") is given
E0 =E; -E;
Recall that the emf is related to the free energy change by AG = - nFE.
(1) A 3 A" + ae- AG; =-a=:
b x ( l ) - a x ( 2 )
bA + aBb+ 3 bA'' + uB AGO = -(ab)l;Eo
When we add or subtract chemical equations, we also add and subtract changes in thermodynamic hc t ions like U, H, S and G.
AG; = -bFE;
AGO =-(ab)FEo
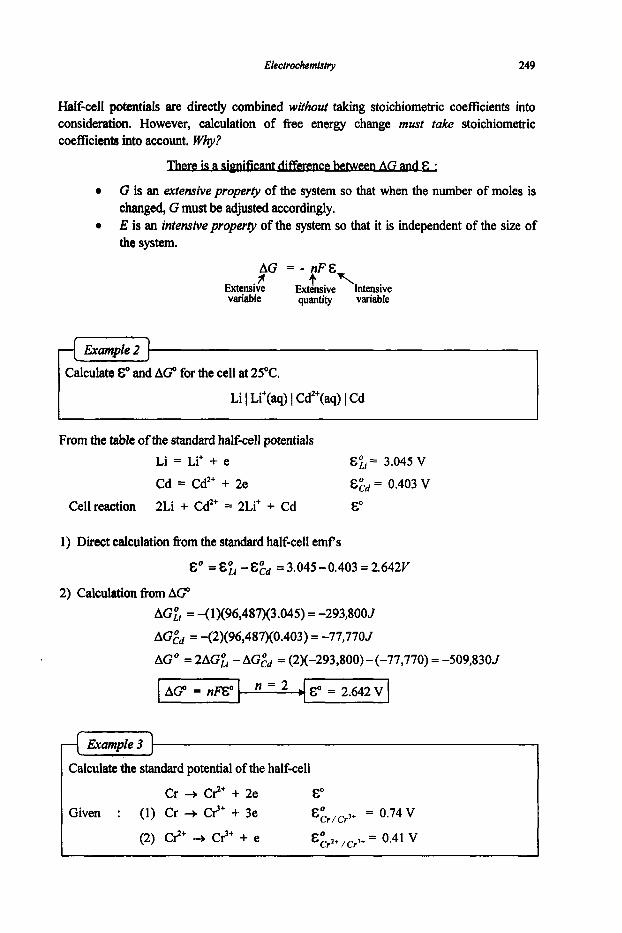
Elechmherniswy 249
Calculate E" and A C for the cell at 25°C.
Half-cell potentials are directly combined without taking stoichiometric coefficients into consideration. However, calculation of fiee energy change must take stoichiometric coefficients into account. Why?
AG andE: 0
0
G is an extensive property of the system so that when the number of moles is changed, G must be adjusted accordingly. E is an intensive property of the system so that it is independent of the size of the system.
AG = - n F E Extensive f l & L i v e \Intensive variable quantity variable
I Li I Li'(aq) I Cd"(aq) I Cd I ~ ~ ~~ ~~ ~~ ~
From the table of the standard half-cell potentials Li = Li+ + e E:, = 3.045 V
Cd = Cd" + 2e E& = 0.403 V
Cellreaction 2Li + Cd2' = 2Li' + Cd E"
1) Direct calculation fiom the standard half-cell emf s
E0 -E& =3.045-0.403=2.6421/
2) Calculation fiom AGO AGfi = -(1)(96,487)(3.045) = -293,8001
AG& = -(2)(96,487)(0.403) = -77,770J
AGO = 2AGzj -AG& = (2)(-293,800)-(-77,770) = -509,8301
Calculate the standard potential of the half-cell
Cr + c++ + 2e E" Given : (1) Cr + CIf' + 3e &:r/cr't = 0.74 V

250
AGP = -(3)~(96,487)~(0.74) = -214,2005
AG,O = -(1)~(96,487)~(0.41) = -39,5605
AGO = AGF - AG; = -2 14,200 - (-39,560) = -1 74,6405
n = 2
Chemical Thermodynamics for Metals andhfaterials
A G = -nFE"
I f ?
L E" = 0.905 V I cf: Direct calculation : E' = E' cr/crl+ - Eir2+,Cr3+ =
"When half-cell potentials are combined to produce a new half-cell, the potentials are not additive. When in doubt, do the calculation of E fiom AG."
: Incorrect
Exercises
1. Write the electrode reactions and the cell reactions for the following galvanic cells, and calculate the standard emf s of the cells at 25°C. Determine the positive electrodes :
1) c u I CuCl,(aq) I Cl*&), Pt
2) Ag, AgCl I HCl(aq) IlHWq) I A@r, Ag
2. Devise galvanic cells in which the cell reactions are the following :
1) Fe + CuS04(aq) = FeSO.,(uq) + Cu
2) Pb(s) + PbO&) + ~ H , S O ~ ( U ~ ) = 2PbS04(~) + 2H20(1)
Indicate electrode reactions in each case. Calculate the standard emf of each of the cells at 25°C.
3. Calculate the standard emf (E") and the equilibrium constant ( K ) at 2J°C for the reaction

25 1
5.2.2. Concentration Cells
When two half-cells are connected, an electrochemical cell is formed. The connection is made by bringing the solutions in the half-cells into contact so that ions can pass between them.
0 If these two solutions are the same, there is no liquid junction, and we have a cell without transference. If these two solutions are different, transport of ions across the junction will cause irreversible changes in the two electrolytes, and we have a cell with transfirence.
The driving force of a cell may come fiom a chemical reaction or from a physical change. When the driving force of a cell is changes in composition (concentration) of species (or of gas pressures), the cell is called concentration cell. The change in concentration can occur either in the electrolyte or in the electrodes.
The electrochemical cells can therefore be classified as follows :
Electrochemical Cells
I Chemical Cells Concentration Cells I Transference Transference Concentration Concentration
To form an electrode concentration cell the electrode material must have a variable concentration. Amalgam and gaseous electrodes fall into this classification. An example of electrode concentration cells is the one in which two amalgam electrodes of different concentrations dip into a solution containing the solute metal ions.
Hg-Cd(acd(1,) 1 CdSO,(solution) I Hg-Cd(ac+,) 1 L I
LeJ-hand electrode Right-hand electrode (anode) (cathode)
Cd(uCd(1)) + Cd" + 2e Cd2' + 2e + cd(acdn,)
Net cell reaction
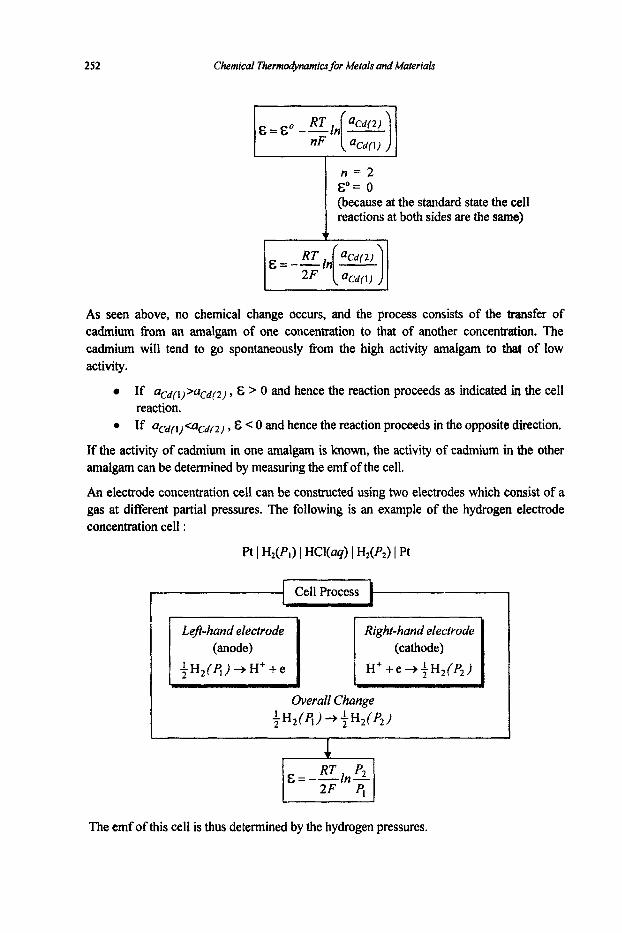
252 Chemical Therm@namics for Metals and Materials
n = 2 EO= 0 (because at the standard state the cell reactions at both sides are the same) I
As seen above, no chemical change occurs, and the process consists of the transfer of cadmium from an amalgam of one concentration to that of another concentration. The cadmium will tend to go spontaneously fiom the high activity amalgam to that of low activity.
If aCd(l)>ffCd(2), & > 0 and hence the reaction proceeds as indicated in the cell reaction.
0 If acd(l)<acd(2) , E < 0 and hence the reaction proceeds in the opposite direction.
If the activity of cadmium in one amalgam is known, the activity of cadmium in the other amalgam can be determined by measuring the emf of the cell.
An electrode concentration cell can be constructed using two electrodes which consist of a gas at different partial pressures. The following is an example of the hydrogen electrode concentration cell :
Cell Process
Lefl-hand electrode Right-hand electrode
H+ + e -+ 4 H 2 ( 4 )
The emf of this cell is thus determined by the hydrogen pressures.

Eleclrochemisby 253
It has been found that ZrOz(s) stabilised with CaO or YO, is an ionic conductor of oxygen ions in certain ranges of oxygen pressure and temperature. Using this material as the solid electrolyte, an oxygen concentration cell can be constructed
R Q(g, PO, (0) I Zfl2+CaO I 02k, PO, ( c ) 1,
Schematic diagram of oxygen concentration cell (Oxygen sensor:
PO1 (to be measured)
+ F'twire (electronic conductor)
This type of oxygen concentration cell called the q g e n sensor is of considerable use in high temperature processing of metals and materials and in combustion processes. The oxygen sensor with proper design enables in situ measurements of
0 oxygen partial pressure in a gas mixture, 0 equilibrium oxygen potential in a metal-metal oxide mixture, and 0 oxygen content in a liquid metal. 0 activity of a metal in an alloy
activity of an oxide in an oxide solution.

254 Chemical Thermodynamics for Metals and Materials
at each of the half-cells
2 ~ r -I- $0, = cr203
The oxygen pressure of the reference electrode ( PoZIref) ) can be futed either
by using a gas mixture containing oxygen of known pressure (e.g., air), or by using a metal-metal oxide mixture.
I
N i + f 0 2 = NiO
a N ~ O K N t = I
~ N I P&Nl)
‘O2 ( N I ) = i:
2 ~ r + $0, = cr203 M + M O
,g., Cr + Cr203)
Cr, Cr203 I ZrOz(+CaO) I Ni, NiO
Net Process
f ‘2 (‘0, ( N i ) ) + f O2 (cr)
Emf of the cell
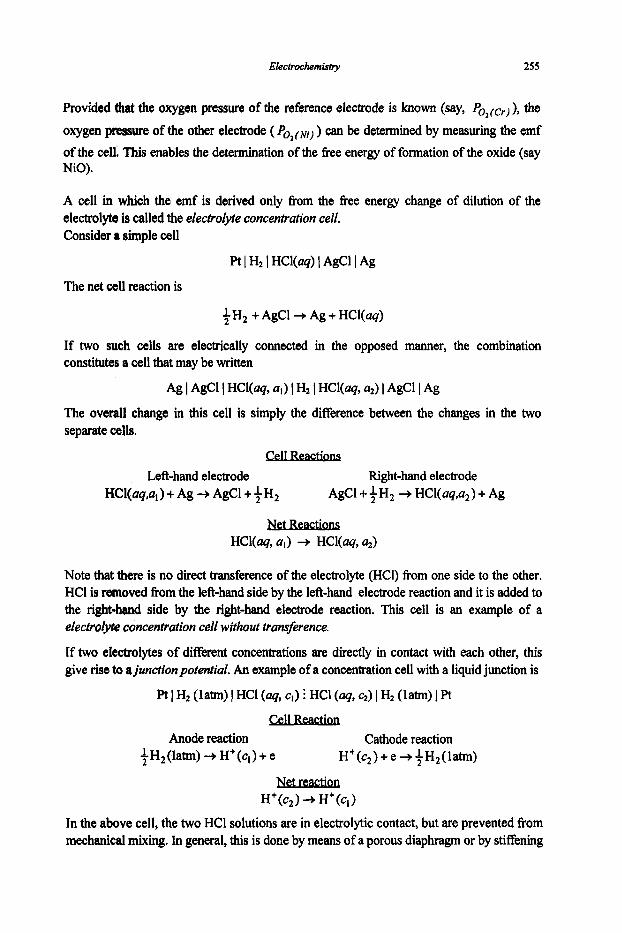
Electrochemistry 255
Provided that the oxygen pressure of the reference electrode is known (say, the oxygen pressure of the other electrode ( POIfNi) ) can be determined by measuring the emf of the cell. This enables the determination of the fiee energy of formation of the oxide (say NiO).
A cell in which the emf is derived only from the fiee energy change of dilution of the electrolyte is called the electrolyte concentrution cell. Consider a simple cell
The net cell reaction is
1 H 2 2 + AgCl+ Ag + HCl(uq)
If two such cells are electrically connected in the opposed manner, the combination constitutes a cell that may be written
Ag I AgCl I HCl(aq, 4) I H2 I HCl(aq, U21 I AgCl I Ag
The overall change in this cell is simply the difference between the changes in the two separate cells.
Left-hand electrode Right-hand electrode HCl(uq,q) + Ag + AgCl + +H2 AgCl + t H 2 + HCl(aq,a2) + Ag
HCKaq, 4 + HCNaq, a21
Note that there is no direct transference of the electrolyte (HCl) from one side to the other. HCl is removed h m the left-hand side by the left-hand electrode reaction and it is added to the right-hand side by the right-hand electrode reaction. This cell is an example of a electrolyte Concentration cell without trunsfirence.
If two electrolytes of different concentrations are directly in contact with each other, this give rise to a junction potentid. An example of a concentration cell with a liquid junction is
R I H2 (latm) 1 HCl (uq, cl) i HCl (uq, c2) I H2 (latm) I Pt
Anode reaction Cathode reaction iH2(latm) + H+(c,) + e H+(c2) + e + t H2( latm)
H+(c2) + H+(c,) In the above cell, the two HCl solutions are in electrolytic contact, but are prevented from mechanical mixing. In general, this is done by means of a porous diaphragm or by stiffening
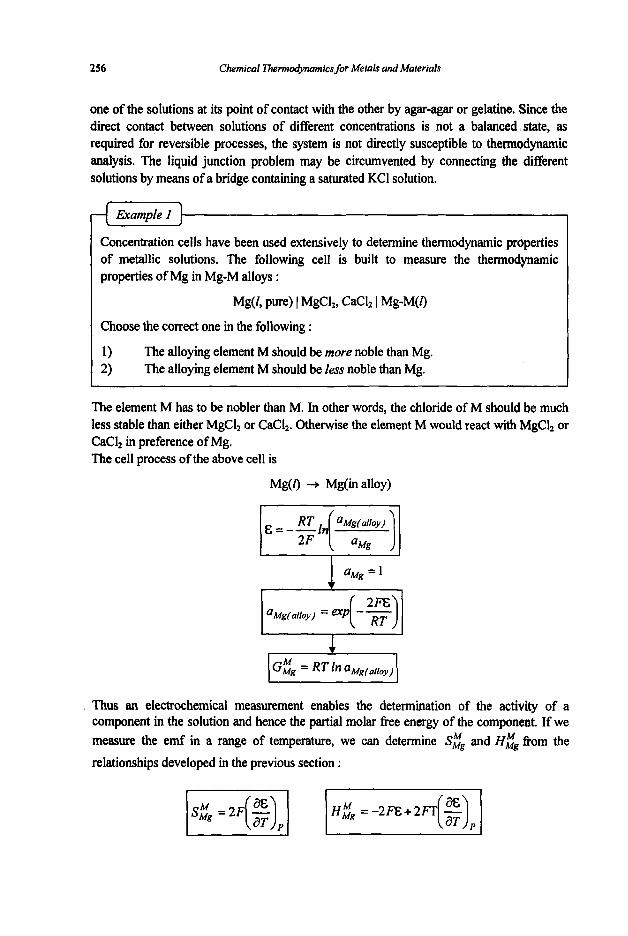
256 Chemical Thennodynamics for Metals and Materials
one of the solutions at its point of contact with the other by agar-agar or gelatine. Since the direct contact between solutions of different concentrations is not a balanced state, as required for reversible processes, the system is not directly susceptible to thennodynamic analysis. The liquid junction problem may be circumvented by connecting the different solutions by means of a bridge containing a saturated KCI solution.
Example I
Concentration cells have been used extensively to determine thermodynamic properties of metallic solutions. The following cell is built to measure the thermodynamic properties of Mg in Mg-M alloys :
Mg(k pure) I MgCL CaCl2 I Mg-WI)
Choose the correct one in the following :
1) 2)
The alloying element M should be more noble than Mg. The alloying element M should be less noble than Mg.
The element M has to be nobler than M. In other words, the chloride of M should be much less stable than either MgClz or CaCI,. Otherwise the element M would react with MgCl, or CaClz in preference of Mg. The cell process of the above cell is
Mg(l) -+ Mg(ina1loy)
Thus an electrochemical measurement enables the determination of the activity of a component in the solution and hence the partial molar free energy of the component. If we measure the emf in a range of temperature, we can determine Szg and HEg fkom the relationships developed in the previous section :
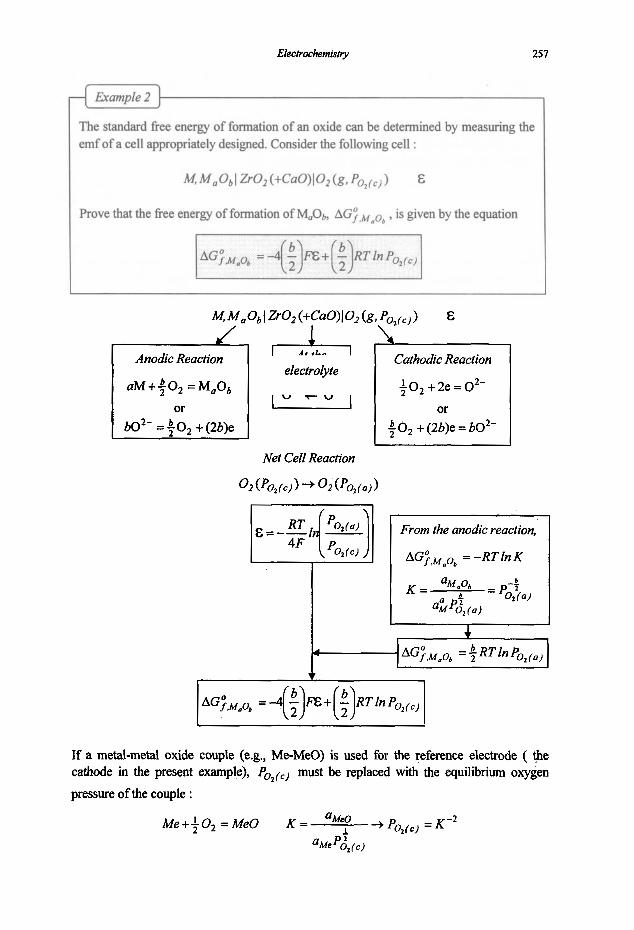
257
r I Example2 J I
The standard flee energy of formation of an oxide can be determined by measuring the emf of a cell appropriately designed. Consider the following cell :
M M a 0, I zro2 (+cao>l 0.2 (8, ( c )
Prove that the flee energy of formation of WOb, AG;,M,Ob , is given by the equation
I I
From the anodic reaction,
AG;*,aob = -RT In K
If a metal-metal oxide couple (e.g., Me-MeO) is used for the reference electrode ( the cathode in the present example), must be replaced with the equilibrium oxygen pressure of the couple :
+ Po2(c) = K - 2 aMeO Me++O,=MeO K = , aMe pZz ( C )
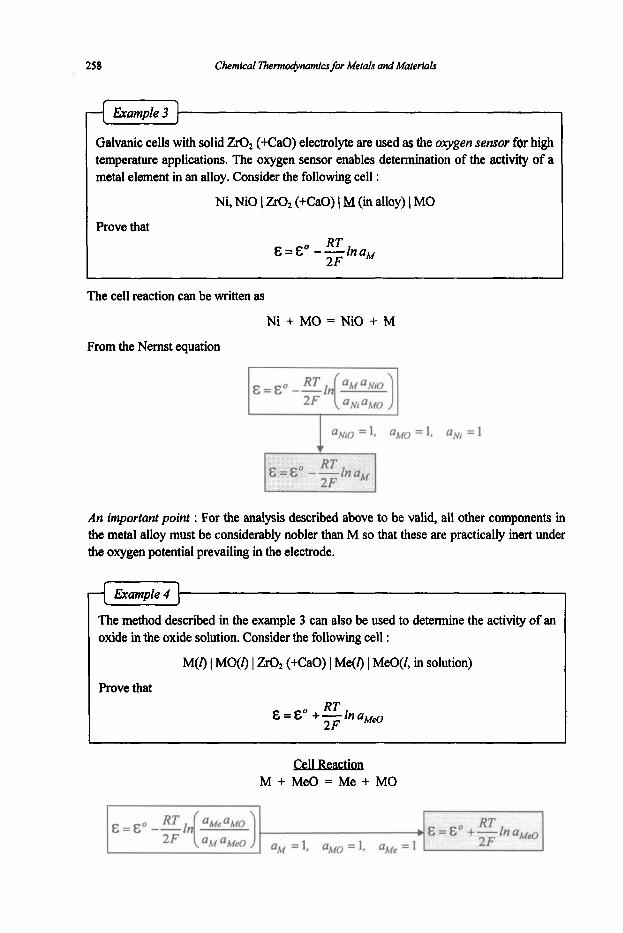
258 Chemical Thennodynamicsjor Metals and Materials
Example 3
Galvanic cells with solid Zr02 (+CaO) electrolyte are used as the oxygen sensor for high temperature applications. The oxygen sensor enables determination of the activity of a metal element in an alloy. Consider the following cell :
Ni, NiO I ZIQ (+CaO) I M (in alloy) I MO
Prove that
In aM RT & = & O - -
2F
The cell reaction can be written as
Ni + MO = NiO + M
From the Nernst equation
An important point : For the analysis described above to be valid, all other components in the metal alloy must be considerably nobler than M so that these are practically inert under the oxygen potential prevailing in the electrode.
Example 4
The method described in the example 3 can also be used to determine the activity of an oxide in the oxide solution. Consider the following cell :
M(I) I MO(I) I Zr02 (KaO) I Me(0 I MeO(l, in solution)
Prove that RT
E = 6" +-In aMeo 2F
M + Me0 = Me + MO
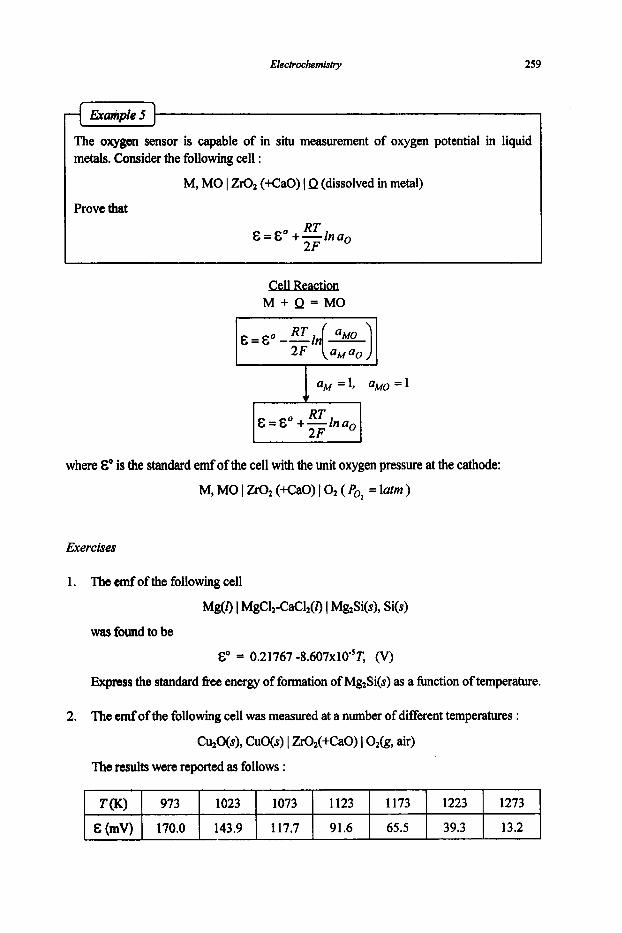
Elechochemishy 259
&(mV)
The o q p sensor is capable of in situ measurement of oxygen potential in liquid metals. Consider the following cell :
M, MO I ZrOz (+CaO) I Q (dissolved in metal)
Prove that
170.0 143.9 117.7 91.6 65.5 39.3 13.2
RT 2F
& = E" +-In a.
M + Q = M O
U, =1, aMo = 1 1 1 E = +=In a. RT I
where E" is the standard emf of the cell with the unit oxygen pressure at the cathode:
M, MO I Zr02 (+CaO) I O2 ( PO, = lutm )
Exercises
1. The emf of the following cell
Mg(Z) I MgC12-CaC12(1) 1 MgsSi(s), Si(s)
was found to be
&O = 0.21767 -8.6O7x1V5T, (V)
Express the standard free energy of formation of Mg2Si(s) as a function of temperature.
2. The emf of the following cell was measured at a number of different temperatures :
Cu20(s), CuO(s) I Zr02(+CaO) I 02(g, air)
The results were reported as follows :
T ( K ) I 973 I 1023 I 1073 1 1123 1 1173 I 1223 I 1273
260 Chemical Thermodynamics for Metals and Materials
Calculate the standard free energy of formation of CuO(s) as a hc t ion of temperature. The free energy of formation of Cu20 is given :
AG;,cu,o = -168,400+ 71.25T, J/mole
3. The activity of chromium in liquid Ni-Cr alloys was measured using the followhg cell :
Pt I Cr(s), CrZO,(s) I Zr02(+CaO) I Ni-Cr(f), Cr203 I Pt The cell emf was measured to be 125 mV at 1,600"C for the Ni-Cr alloy of Nc, =
0.109. Calculate the activity of Cr in the alloy.
4. The oxygen content of molten iron can be measured using the following cell :
pt I Cr(s), Cr203(s) I Zr02(+CaO) 1 Q (in liquid Fe) )MO Derive an equation which relates the measured emf to the oxygen content (wt%) in the Fe melt at 1,600"C. The following data are given :
2Cr + 402 = Cr20, AG& = -1,110,100 +247.32T, Jmole-'
+ 0 2 ( g ) =O(lwt?!) AGA =-117,150-2.8872, Jmole-'
1 wt?? in Fe melt standard state. 7
5.3. Aqueous Solutions
5.3. I . Activities in Aqueous Solutions
The thermodynamics properties of an electrolytic solution are generally described by using the activities of different ionic species present in the solution. The problem of defming activities is however somewhat more complicated in electrolytic solution than in solutions of nonelectrolytes. The requirement of overall electrical neutrality in the solution prevents any increase in the charge due to negative ions. Consider the 1:l electrolyte AB which dissociates into At ions and B- ions in the aqueous solution.
A B = A + + B -
The partial molar free energies of the two ions, CA+ , CBI , are,
- - G,, = GZ, + RTlna,, and G,- = Gi- + RTlnaB_
From the defmition of the partial molar flee energy,
26 1
Where mA+ and mB- are the molalities of A+ and B' ions, respectively, in the solution. The molaZ?v is defined as the number of moles of solute in 1,OOOg of water (H,O).
As the molaljty of an ion ( mA+ and mB- ) cannot be altered independently, it is not
possible to measure either CA+ or , In order to overcome this difficulty, we introduce mean thermodynamics properties of two ions.
Suppose that n moles of AB are dissolved in water :
G = nGA+ + nGB- G : Total fiee energy of A'and B w 1
I C = nGi+ + nGi. + nRT In (aA+ aB- ) I G in the above equation is the total free energy of 2n moles of ions ( n moles of A+ ion and n moles of B- ions). If we define the mean partial molar free energy of ion ( G* ) as
where n+ is the number of moles of positive ions and n- is the number of moles of negative ians.

262 Chemical ThermodyMmics for Metals and Materials
aA+ = yA+mA+ aB- = yB-mB.
Activities in aqueous solution are generally based on the 1 molality standard state.
ai
1 molality standard state
4
1 molality standard
The mean ionic molality ( m, ) and the mean ionic activity coeflcient ( y* ) are defined as
I
As the activities in aqueous electrolyte solutions are defined with respect to the 1 molality standard state ( or infinitely dilute solution standard state), the activity of an ionic species becomes equal to its molality as the concentration approaches zero (Henry’s Law).
Thus, at infinite dilution, y A + = 1, y B - = 1, and y* = 1 , and hence
For a 1-1 electrolyte, mA+ = mB- = m:B , and hence a, = m& .
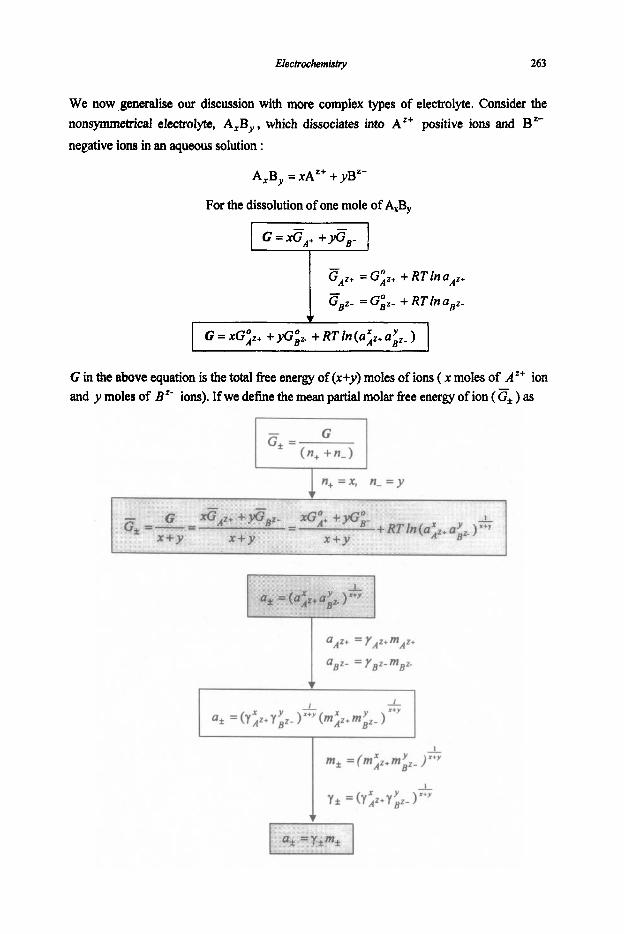
Ekctrochemishy 263
We now ,generalise our discussion with more complex types of electrolyte. Consider the nonsymmetrical electrolyte, A$,, which dissociates into A'' positive ions and B'- negative ions in an aqueous solution :
A,B, = ,Az' + yB"-
For the dissolution of one mole of AxBy
cAz+ = Giz+ + RTin aAz+
GEz- = Giz- + RT In aBz-
C = xGiz+ + yGiz . + RT In (aiz+ a iZ- )
G in the above equation is the total flee enerB of (x+y) moles of ions ( x moles of At+ ion and y moles of Bz- ions). If we define the mean partial molar flee energy of ion ( c* ) as
n + = x , n-=Y 1
I 1 1

264 Chemical ThennodyMmicsfor Metals and Materials
The total Gibbs free energy of the ions in the electrically neutral solution is the sum of the free energies of positive ions and of negative ions :
G = XC:~+ + yGiZ. + RT In (
ideal solution (G“ )
aAZ+ = y A Z + m A Z + aBZ- = y B z - mBz-
Excess free energy
1 Alldeviationsfrom 1 ideality am contained
in this tenn.
cL7 G=GId + R T l n y y y )
Observed deviations from ideal behaviour are ascribed to electrical interactions between ions. Oppositely charged ions attract each other. As a result, in the immediate neighbourhood of a given ion, an oppositely charged ion is more likely to be found. Overall the solution is electrically neutral, but near any given ion there is an excess of oppositely charged ions. Consequently the chemical potential of an ion is lowered as a results of its electrostatic interaction with its ionic neighbours. This lowering of energy appears as the difference between the Gibbs free energy G and the ideal value GId of the solution; i.e., R T l n y r + Y ) .
On the assumption that deviations of a dilute solution from ideality are caused entirely by the electrostatic interactions, the activity coefficient can be calculated fiom the Debye-H U ckel limiting law :
[ logy, =-o.50qz+z-11”2 1 where
z+,z- : I :
charge numbers of positive and negative ions, respectively ionic strength of the solution

Electtochemisfly 265
Consider the solution of La2(S04X at a molality m. Express the mean ionic activity a, in ternof y* and m.
1 I
7
m* = [(2m)2(3m)3]"5 = 108" m
Values of the mean ionic activity coefficients for several electrolytes in water at 25OC are given in the following table :
Mean activity coefficients y+ for strong electrolytes at 25OC EIetro- Molality(m) 'm 0.001 0.002 0.005 0.01 0.05 0.1 0.5 1.0 2.0 4.0 HCl 0.996 0.952 0.928 0.904 0.830 0.796 0.758 0.809 1.01 1.76
0.965 0.951 0.927 0.902 0.823 0.785 0.830 0.757 0.639 0.544 0.340 0.265 0.89 0.85 0.785 0.725 0.57 0.515 0.89 0.85 0.78 0.72 0.58 0.52 0.74 0.53 0.41 0.21 0.16 0.89 0.86 0.80 0.75 0.62 0.58 0.965 0.952 0.927 0.901 0.815 0.769 0.89 0.78 0.71 0.52 0.43
0.56 0.966 0.953 0.929 0.904 0.823 0.780 0.86 0.80 0.70 0.61 0.88 0.84 0.77 0.71 0.56 0.50
0.92 0.90 0.82 0.8 0.966 0.934 0.914 0.844 0.800
0.40 0.22 0.18
0.82
0.715 0.720 0.783 0.982 0.154 0.130 0.124 0.171 0.52 0.71 0.42 0.43 0.51 0.068 0.047 0.59 0.67 0.651 0.606 0.576 0.579
0.52 0.62 1.05 0.68 0.66 0.67 0.78
0.38 0.33 0.69 0.68 0.73 0.76 0.695 0.686 0.088 0.064
0.70 0.61 - 0.48 0.39 0.15 0.065 0.045 0.036
Calculate the mean activities of HCl and CuCl, in the aqueous solution at 25°C. The concentration of both electrolytes is 0.01 molality.
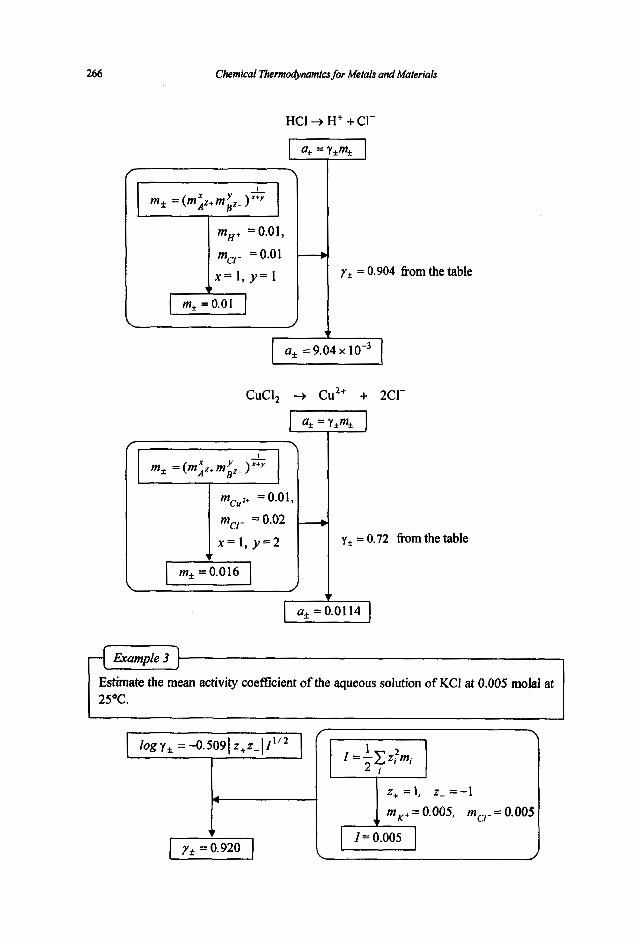
266 Chemical Thennodynmnics for Metals and Materials
HCI + H+ + C1- I 1 a*=
mH+ =0.01,
mc,- = 0.0 1
x = 1, y = 1
m, = 0.01
'*m* I
,Y* = 0.904 from the table
CUCI, + cu2+ + 2c1-
mf = ( m ~ z , m Y , l 8 -
mcu2+ =0.01,
mc.- = 0.02
x = 1, y = 2 I I m, =0.016 I /
y* = 0.72 from the table 1 e z l a, = 0.01 14
Example 3
Estimate the mean activity coefficient of the aqueous solution of KCl at 0.005 molal at
I I 25'C.
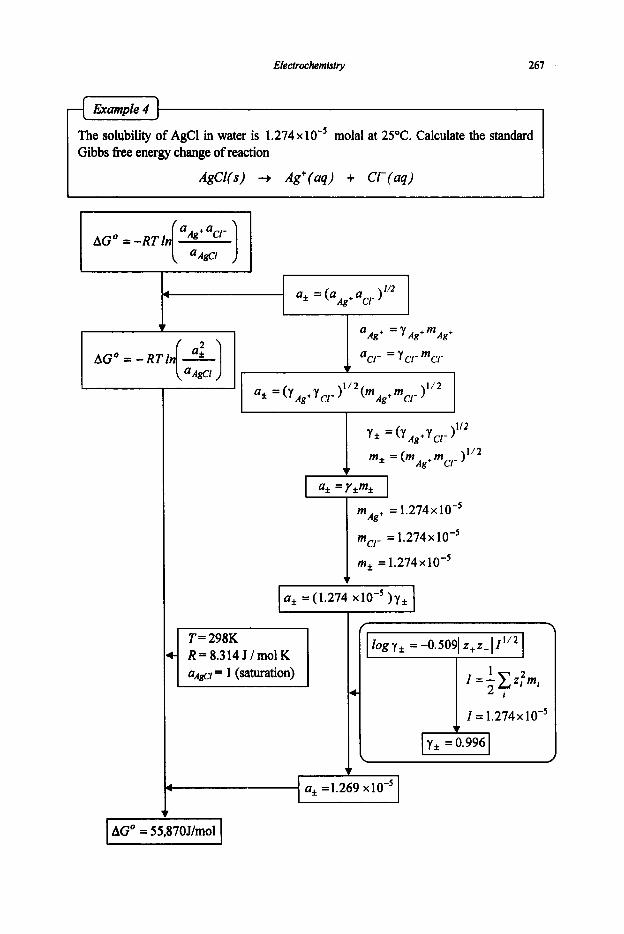
Elecrrochentistty 267
hkample 4
The solubility of AgCl in water is 1 . 2 7 4 ~ 10-5 molal at 25°C. Calculate the standard Gibbs free energy change of reaction
AgCl(s) + Ag+(aq) + Cl-(aq)
1/2
a, =(1.274 xlO-')y,
R = 8.3 14 J / mol K
I y, =0.996
1 AGO = 55,87OJ/mol I
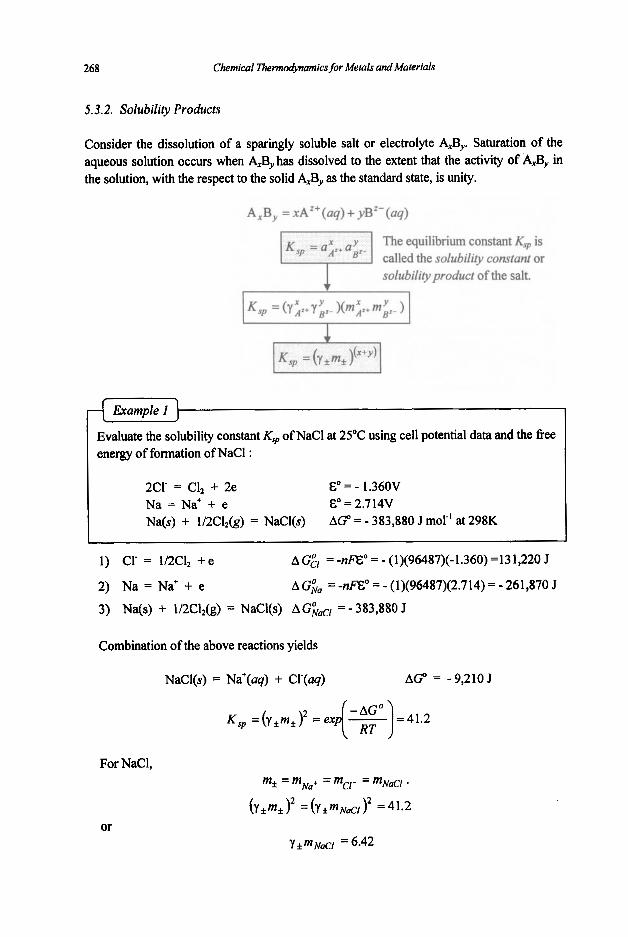
268 Chemical Thermodynamics for Metals and Materials
5.3.2. Solubility Products
Consider the dissolution of a sparingly soluble salt or electrolyte A,BY Saturation of the aqueous solution occurs when A,By has dissolved to the extent that the activity of AxBy in the solution, with the respect to the solid AxBy as the standard state, is unity.
A,B, = xAz+(uq) + yBz-(uq)
The equilibrium constant Kbp is called the solubility constant or solubility product of the salt.
Evaluate the solubility constant Ksp of NaCl at 25°C using cell potential data and the fiee energy of formation of NaCl :
2C1' = C12 + 2e E' = - 1.360V Na = Na' + e Na(s) + 1/2Cl2(g) = NaCl(s)
E' = 2.714V AG" = - 383,880 J mol" at 298K
1) Cl- = 1/2C12 + e
2) Na = Na' + e 3) Na(s) + 1/2C12(g) = NaCl(s) = - 383,880 J
AG& = -nFE" = - (1)(96487)(-1.360) =131,220 J
AG$a = -nE' = - (1)(96487)(2.714) = - 261,870 J
Combination of the above reactions yields
NaCl(s) = Na+(uq) + CI-(uq) AG" = - 9,210 J
For NaCl,
or

Electroehemistry 269
ExampIe 2
Calculate the concentrations of H' and OH' in water at 25°C. Use cell potential data.
From the table of the standard half-cell potentials,
H2 + 20H- = 2H20 + 2e Hz = 2H' + 2e
E" = 0.828V E" = ov
Combination yields
H20 = H' + OH- E" = -0.828V
I y:mHt mOH- = 9 . 9 ~ 1 0 - l ~ I
y* 2 I(very dilute) mHt = moH- (f iom stoichiometry)
Definition
where fH'] : molarity of H' Molarity :
PH = -10g[H']
b
solute per liter of water.
For dilute solutions, molarity s molality
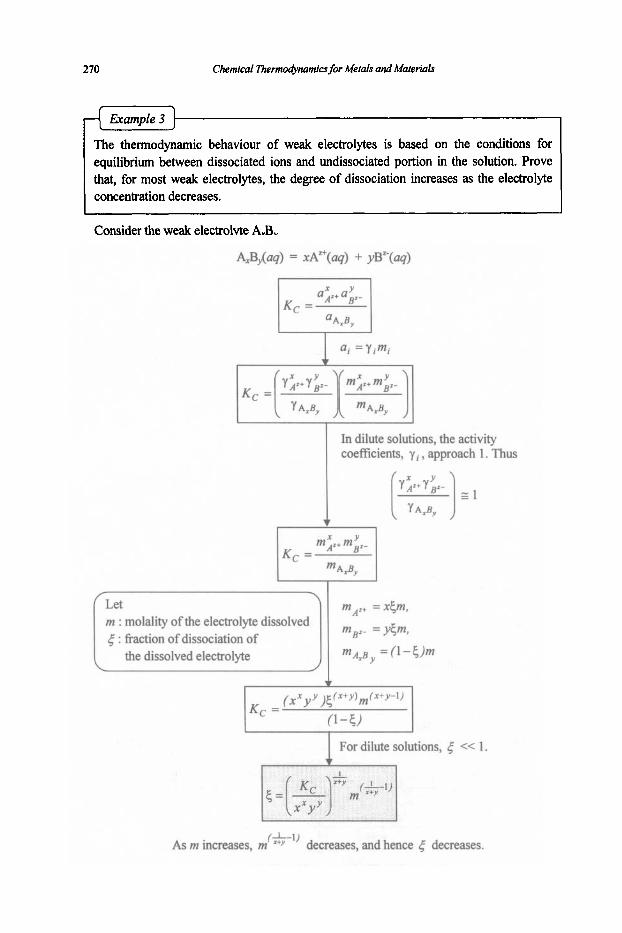
270 Chemical Thermodynamics for Metals and Materials
The thermodynamic behaviour of weak electrolytes is based on the conditions for equilibrium between dissociated ions and undissociated portion in the solution. Prove that, for most weak electrolytes, the degree of dissociation increases as the electrolyte concentration decreases.
Consider the weak electrolyte A,B,
AxB,(uq) = xA"+(uq) + yB'-(uq)
In dilute solutions, the activity coefficients, yi , approach 1. Thus
m : molality of the electrolyte dissolved 5 : fraction of dissociation of
the dissolved electrolyte
1 For dilute solutions, 6 << 1.
As m increases, m (&') decreases, and hence 4 decreases.

A strong electrolyte is defined as a compound that, when added to a solvent, dissociates completely into its ionic components. If a strong acid such as HC1 is dissolved in water, it dissaciates completely into H+ ions and CT ions. Calculate the pH of a 0.1 molal solutio~ of HCl in water.
A solution is prepared by mixing two litres of 0.02 molal HCl and one litre of 0.05 molal NaOH. Calculate the pH of the solution. HCl and NaOH are both strong electrolytes.
Every HCl molecule dissociates forming one H' ion.
I I
0.04r + 0.04Cr + 0.05Na" +
0.01OH + 0.04 HZO nHC1 = 2x0.02
Upon mixing, 0.04 mole of H' reacts with 0.04 mole of OH' to form 0.04 mole of H20, leaving 0.01 mole of OH. The total volume of the solution becomes 3 litres.
l m o H - =[OH-]=-- Oool - 0.0033mo1e/litre 3
E?] = 303 x 10'2 mole/litrepl
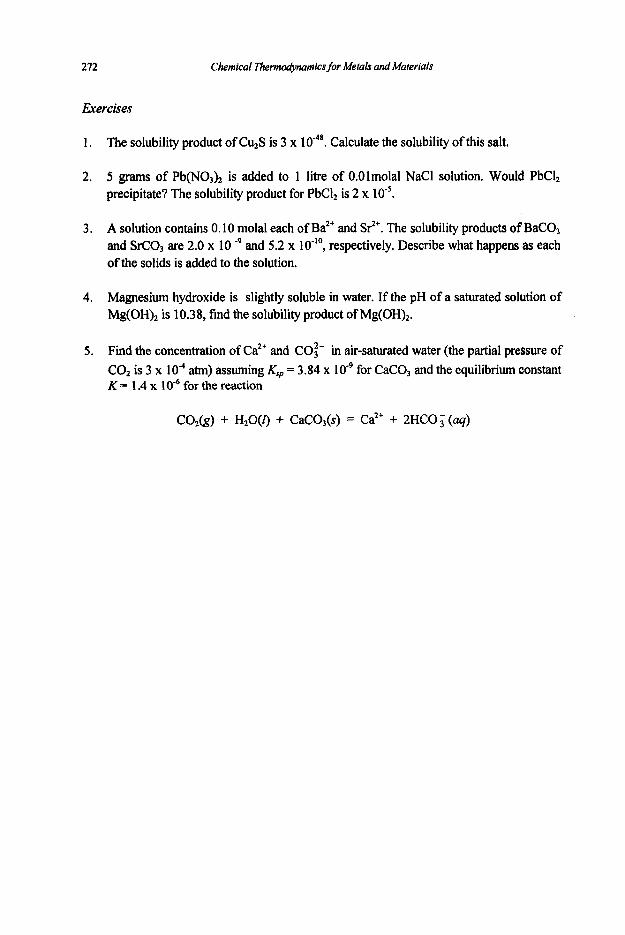
272 Chemical Thermodynamics for Metals and Materials
Exercises
1. The solubility product of Cu2S is 3 x 10⁴*. Calculate the solubility of this salt.
2. 5 grams of Pb(NO3)Z is added to 1 litre of O.Olmola1 NaCl solution. Would PbC12 precipitate? The solubility product for PbC& is 2 x 10'.
3. A solution contains 0.10 molal each of Ba" and SJ' . The solubility products of BaCO, and W O s are 2.0 x 10 -9 and 5.2 x I O ' O , respectively. Describe what happens as each of the solids is added to the solution.
4. Magnesium hydroxide is slightly soluble in water. If the pH of a saturated solution of Mg(OH), is 10.38, find the solubility product of Mg(OH),.
5. Find the concentration of Ca" and CO:- in air-saturated water (the partial pressure of CO2 is 3 x 10⁴ atm) assuming Ksp = 3.84 x 10⁹ for CaCO, and the equilibrium constant K = 1.4 x 10⁶ for the reaction
CO2&) + HzOQ + CaC03(s) = Ca" + 2HC0 (uq)
Appendices
Appendix I
Appendix I1
Appendix I11
Appendix IV
Heats of formation, standard entropies and heat capacities
Standard free energies of formation
Properties of selected elements
Standard half-cell potentiab in aqueous solutions

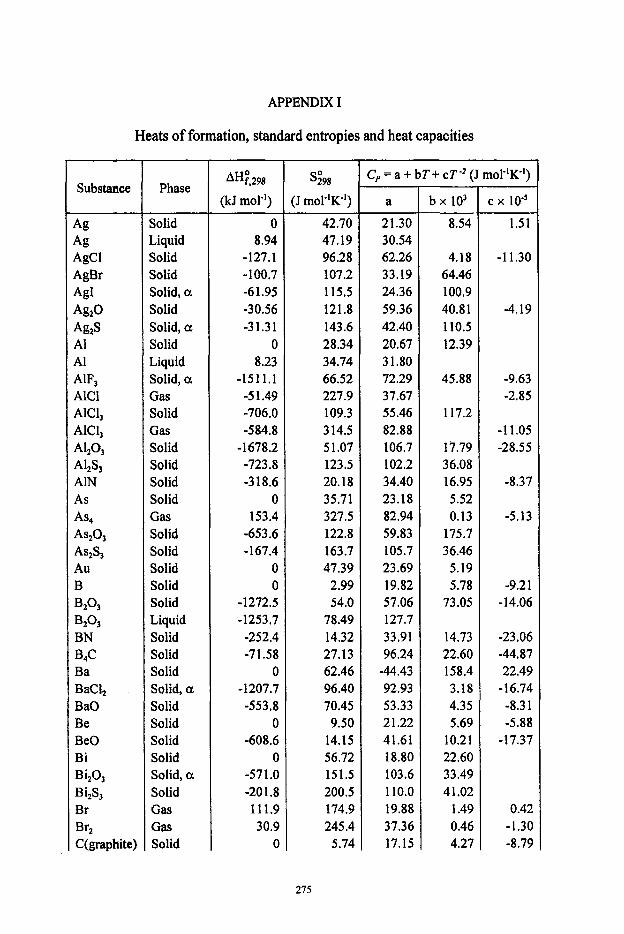
APPENDIX I
Heats of formation, standard entropies and heat capacities
Substance
Ag Ag AgCl AgBr AgI Ag2O Ag2S A1 A1 AlF, AlCl AlC1, AlC1, A W 3 A183 A1N AS
As4
A U
B B203
B203 BN B4C Ba BaClz BaO Be Be0 Bi B i203 Bi2S3 Br Br2 C(graphite)
Phase
Solid Liquid Solid Solid Solid, ct Solid Solid, ci Solid Liquid Solid, ct Sas Solid Sas Solid Solid Solid Solid Gas Solid Solid Solid Solid Solid Liquid Solid Solid Solid Solid, ci Solid Solid Solid Solid Solid, ct Solid Gas Gas Solid
AH!,298
(kJ mol-I)
0 8.94
-127.1 -100.7 -6 1.95 -30.56 -31.31
0 8.23
-1511.1 -5 1.49 -706.0 -584.8
-1678.2 -723.8 -3 18.6
0 153.4
-653.6 -167.4
0 0
-1272.5 -1253.7 -252.4 -71.58
0 -1207.7 -553.8
0 -608.6
0 -57 1 .O -20 1.8 111.9 30.9
0
S,098
:J mol-'K') 42.70 47.19 96.28 107.2 115.5 121.8 143.6 28.34 34.74 66.52 227.9 109.3 3 14.5 5 1.07 123.5 20.18 35.71 327.5 122.8 163.7 47.39
2.99 54.0
78.49 14.32 27.13 62.46 96.40 70.45 9.50
14.15 56.72 151.5 200.5 174.9 245.4
5.74
215
Cp=a+ bT+~T-~(Jrnol - 'K ' )
a 21.30 30.54 62.26 33.19 24.36 59.36 42.40 20.67 31.80 72.29 37.67 55.46 82.88 106.7 102.2 34.40 23.18 82.94 59.83 105.7 23.69 19.82 57.06 127.7 33.91 96.24
-44.43 92.93 53.33 2 1.22 41.61 18.80 103.6 110.0 19.88 37.36 17.15
b x 103
8.54
4.18 64.46 100.9 40.81 110.5 12.39
45.88
117.2
17.79 36.08 16.95 5.52 0.13
175.7 36.46 5.19 5.78
73.05
14.73 22.60 158.4 3.18 4.35 5.69
10.2 1 22.60 33.49 4 1.02
1.49 0.46 4.27
c x 105
1.51
-11.30
-4.19
-9.63 -2.85
-11.05 -28.55
-8.37
-5.13
-9.21 -14.06
-23.06 -44.87 22.49
-16.74 -8.3 1 -5.88
-17.37
0.42 -1.30 -8.79
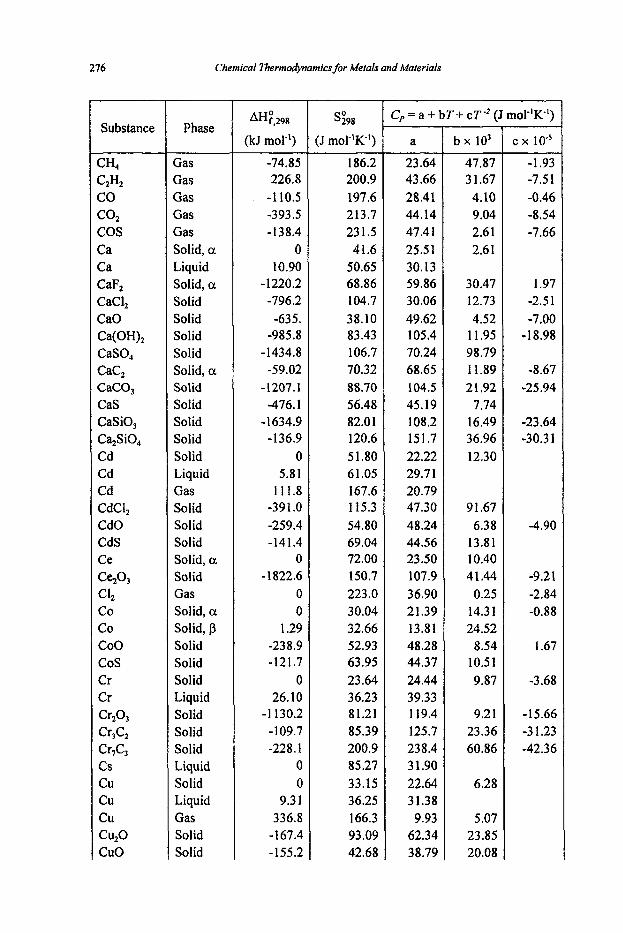
276 Chemical Thermodynamics for Metals and Materials
Substance
CH.l C2H2 CO CO2 cos Ca Ca CaF, CaCI, CaO Ca(OH)2 CaSO, CaC, CaCO, CaS CaSiO, CqSiO, Cd Cd Cd CdCI, CdO CdS Ce Ce203
Cl2 CO CO c o o c o s Cr Cr crZ03
Cr3c2
Cr,G cs c u cu cu cu,o CUO
Phase
Gas Gas Gas Gas Gas Solid, a Liquid Solid, a Solid Solid Solid Solid Solid, a Solid Solid Solid Solid Solid Liquid Gas Solid Solid Solid Solid, a Solid Gas Solid, a Solid, p Solid Solid Solid Liquid Solid Solid Solid Liquid Solid Liquid Gas Solid Solid
W . 2 9 8
(kJ mole')
-74.85 226.8
-1 10.5 -393.5 -138.4
0 10.90
-1220.2 -796.2 -63 5
-985.8 -1434.8 -59.02
-1207.1 -476.1
-1634.9 -136.9
0 5.81
11 1.8 -391.0 -259.4 -141.4
0 - 1822.6
0 0
1.29 -238.9 -121.7
0 26.10
-1 130.2 - 109.7 -228.1
0 0
9.3 1 336.8
- 167.4 -155.2
186.2 200.9 197.6 213.7 23 1.5 41.6
50.65 68.86 104.7 38.10 83.43 106.7 70.32 88.70 56.48 82.01 120.6 5 1.80 61.05 167.6 115.3 54.80 69.04 72.00 150.7 223.0 30.04 32.66 52.93 63.95 23.64 36.23 81.21 85.39 200.9 85.27 33.15 36.25 166.3 93.09 42.68
C, = a + bT+ cT-* (J mol-'K'') -
a 23.64 43.66 28.41 44.14 47.4 1 25.5 1 30.13 59.86 30.06 49.62 105.4 70.24 68.65 104.5 45.19 108.2 151.7 22.22 29.7 1 20.79 47.30 48.24 44.56 23.50 107.9 36.90 21.39 13.81 48.28 44.37 24.44 39.33 1 19.4 125.7 238.4 3 1.90 22.64 31.38 9.93
62.34 38.79
b x 10'
47.87 3 1.67 4.10 9.04 2.6 1 2.6 1
30.47 12.73 4.52
11.95 98.79 1 1.89 2 1.92
7.74 16.49 36.96 12.30
91.67 6.38
13.81 10.40 41.44
0.25 14.3 1 24.52
8.54 10.5 1 9.87
9.2 1 23.36 60.86
6.28
5.07 23.85 20.08
c x 105
-1.93 -7.5 1 -0.46 -8.54 -7.66
1.97 -2.5 1 -7.00
-18.98
-8.67 -25.94
-23.64 -30.3 1
-4.90
-9.21 -2.84 -0.88
1.67
-3.68
-15.66 -3 1.23 -42.36
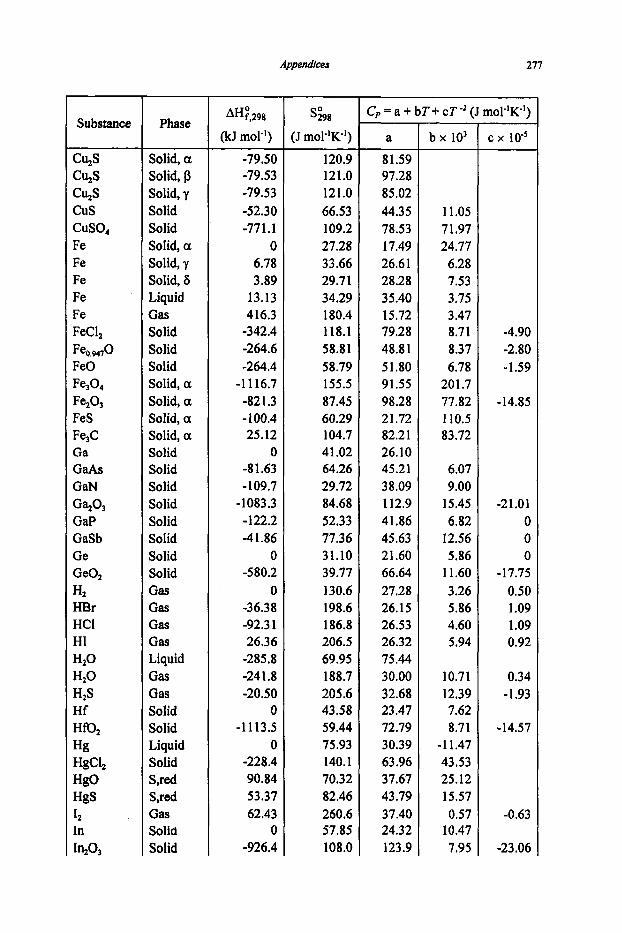
Appendices 271
Substance Phase
Solid, a Solid, p Solid, y Solid Solid Solid, a Solid, y Solid, 6 Liquid Gas Solid Solid Solid Solid, a Solid, a Solid, a Solid, a Solid Solid Solid Solid Solid Solid Solid Solid GtlS Gas GtlS Gas Liquil Gas Gas Solid Solid Liquid Solid S,red S,red Gas Solid Solid
AH:,298
(kJ mot') -79.50 -79.53 -79.53 -52.30 -771.1
0 6.78 3.89
13.13 416.3
-342.4 -264.6 -264.4
-1 116.7 -82 1.3 - 100.4 25.12
0 -8 1.63 -109.7
-1083.3 -122.2 -41.86
0 -580.2
0 -36.38 -92.3 1 26.36
-285.8 -241.8 -20.50
0 -1 113.5
0 -228.4 90.84 53.37 62.43
0 -926.4
%98
(J m0t'K-l)
120.9 121.0 121.0 66.53 109.2 27.28 33.66 29.71 34.29 180.4 118.1 58.81 58.79 155.5 87.45 60.29 104.7 41.02 64.26 29.72 84.68 52.33 77.36 31.10 39.77 130.6 198.6 186.8 206.5 69.95 188.7 205.6 43.58 59.44 75.93 140.1 70.32 82.46 260.6 57.85 108.0
C,=a+ bT+cT"(Jmol"K')
a 81.59 97.28 85.02 44.35 78.53 17.49 26.61 28.28 35.40 15.72 79.28 48.81 5 1 .SO 91.55 98.28 21.72 82.2 1 26.10 45.21 38.09 112.9 41.86 45.63 2 1.60 66.64 27.28 26.15 26.53 26.32 75.44 30.00 32.68 23.47 72.79 30.39 63.96 37.67 43.79 37.40 24.32 123.9
b x lo3
11.05 7 1.97 24.77 6.28 7.53 3.75 3.47 8.71 8.37 6.78
201.7 77.82 110.5 83.72
6.07 9.00
15.45 6.82
12.56 5.86
11.60 3.26 5.86 4.60 5.94
10.7 1 12.39 7.62 8.71
-11.47 43.53 25.12 15.57 0.57
10.47 7.95
c x 105
-4.90 -2.80 -1.59
-14.85
-21.01 0 0 0
-17.75 0.50 1.09 1.09 0.92
0.34 -1.93
-14.57
-0.63
-23.06
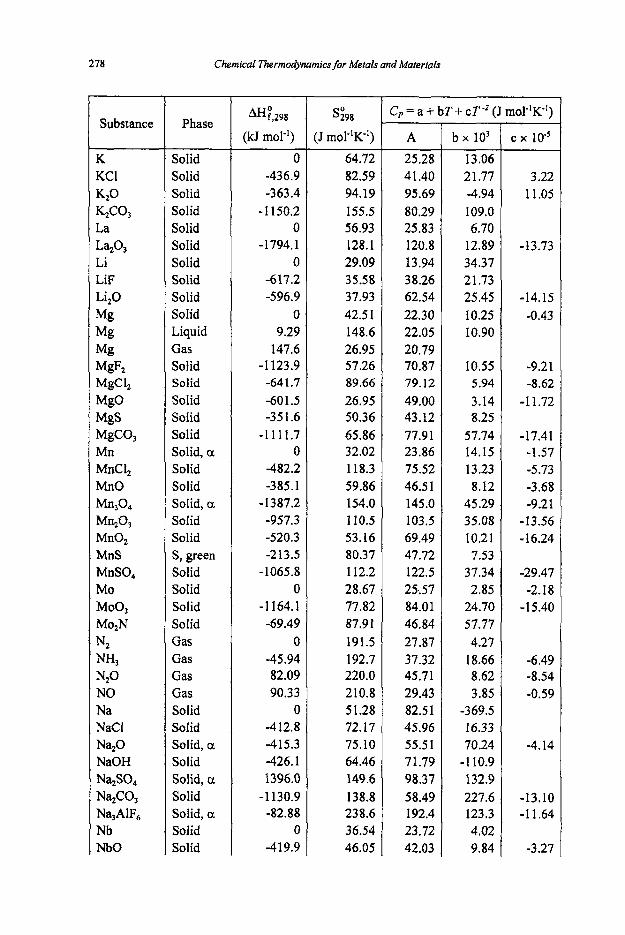
278 Chemical ThermodyMmics far Metais and Materials
Phase
SoIid Solid Solid Solid Solid Solid Solid Solid Solid Solid Liquid Gas Solid Solid Solid Solid Solid Solid, a Solid Solid SoIid, a Solid Solid S, green Solid SoIid Solid Solid Gas Gas Gas Gas Solid Solid Solid, a Solid Solid, 01
Solid Solid, a Solid Solid
AHF,.298
(kJ mol") 0
-436.9 -363.4
-1 150.2 0
-1794.1 0
-617.2 -596.9
0 9.29
147.6 -1 123.9
-64 1.7 -60 1.5 -35 1.6
-1111.7 0
-482.2 -385.1
-1387.2 -957.3 -520.3 -213.5
-1065.8 0
-1 164.1 -69.49
0 -45.94 82.09 90.33
0 -412.8 -415.3
1396.0 -426.1
-1 130.9 -82.88
0 -4 19.9
sg98
(J mol-'K-') 64.72 82.59 94.19 155.5 56.93 128.1 29.09 35.58 37.93 42.5 I 148.6 26.95 57.26 89.66 26.95 50.36 65.86 32.02 1 18.3 59.86 154.0 I 10.5 53.16 80.37 112.2 28.67 77.82 87.91 191.5 192.7 220.0 210.8 5 1.28 72.17 75.10 64.46 149.6 138.8 238.6 36.54 46.05
C, = a f bT+ cT-' (J mol"K-')
A
25.28 4 1.40 95.69 80.29 25.83 120.8 13.94 38.26 62.54 22.30 22.05 20.79 70.87 79.12 49.00 43.12 77.91 23.86 75.52 46.5 1 145.0 103.5 69.49 47.72 122.5
84.0 1 46.84 27.87 37.32 45.71 29.43 82.51 45.96 55.5 1 7 1.79 98.37 58.49 192.4 23.72 42.03
25.57
b x lo3 13.06 21.77 -4.94 109.0 6.70
12.89 34.37 21.73 25.45 10.25 10.90
10.55 5 9 4 3.14 8.25
57.74 14.15 13.23 8.12
45.29 35.08 10.2 1 7.53
37.34 2.85
24.70 57.77 4.27
18.66 8.62 3.85
16.33 70.24
132.9 227.6 123.3 4.02 9.84
-369.5
-1 10.9
e x 1 0 5
3.22 1 1.05
-13.73
-14.15 -0.43
-9.21 -8.62
-1 1.72
-17.41 -1.57 -5.73 -3.68 -9.21
-13.56 - 16.24
-29.47 -2.18
-15.40
-6.49 -8.54 -0.59
-4.14
-13.10 -1 1.64
-3.27

Appendices 279
Substance
Nb02 Ni Ni Ni NiC12 NiO NiO NiO NiS NiSO, 0 2 P PZOS Pb Pb Pb PbCl, PbCI, PbO PbO PbO PbS S S SZ so2 so, Sb SbCI, Sb203 Sb2S3 Se SeO, Si Si Sic SiCl, SiCi, Sil, SiO, Si,N4
Phase
Solid, U
Solid, Q
Solid, p Liquid Solid Solid, U
Solid, p Solid, y Solid, U
Solid Gas S, white Solid Solid Liquid Gas Solid Liquid S, red S, yellow Liquid Gas S, ortho S, mono Gas Gas Gas Solid Gas Solid Solid Solid Solid Solid Liquid Solid Gas Gas Solid Solid Solid
AW,*B (kJ mol-‘)
-795.3 0
0.63 8.32
-305.6 -240.6 -240.6 -240.6 -94.14 -873.6
0 0
-1492.7 0
4.29 195.6
-359.6 -174.1 -219.3 -217.9 -195.4 131.9
0 0.34
128.5 -296.8 -395.7
0 -313.7 -708.9 -205.1
0 -225.2
0 455.9
-66.98 -167.4 -663.1 -199.3 -190.7 -745.1
%!Ill
:J m0l”K-I) 55.67 29.87 30.95 27.38 97.74 38.08 38.08 38.08 52.93 103.9 205.0 41.1 1 114.5 64.80 71.72 175.3 136.1 317.3 65.27 67.36 85.97 251.5 32.05 32.97 228.1 248.1 256.7 45.54 337.4 141.1 182.1 42.28 66.72 18.84 167.9 16.53 282.0 33 1 .O 265.6 41.46 113.0
C, = a + bT + cT -’ (J mol-’K-’)
a
61.45 12.54 25.10 38.91 73.26
58.10 46.80 43.76 126.0 29.96 19.13 74.93 23.56 32.43 6.67
67.39 118.1 38.20 45.09 65.00 44.62 14.81 68.35 36.49 43.43 57.32 23.06 43.12 79.95 101.9 17.90 69.61 23.94 25.62 50.78 57.60 101.5 82.00 46,95 43.91
-20.88
~~
b x 10’
25.79 35.82 7.53
13.23 157.2
8.46 22.20 41.53 4.18
15.82 162.4 9.75
-3.10 8.96
16.74
25.52 12.23
16.41 24.06
0.67 10.63 26.86 7.28
239.0 71.58 60.57 25.12 3.90 2.47
1.97 0.38 6.87
87.49 34.3 1
1 .oo
-1 18.6
c x 10-5 -10.13
2.47
-4.98 16.28
-2.90
-1.67
-15.61
0.73
-3.77 -5.94
-13.05
-1 1.05 -4.14
-49.23 -5.65
-1 1.51
-11.30 -6.03
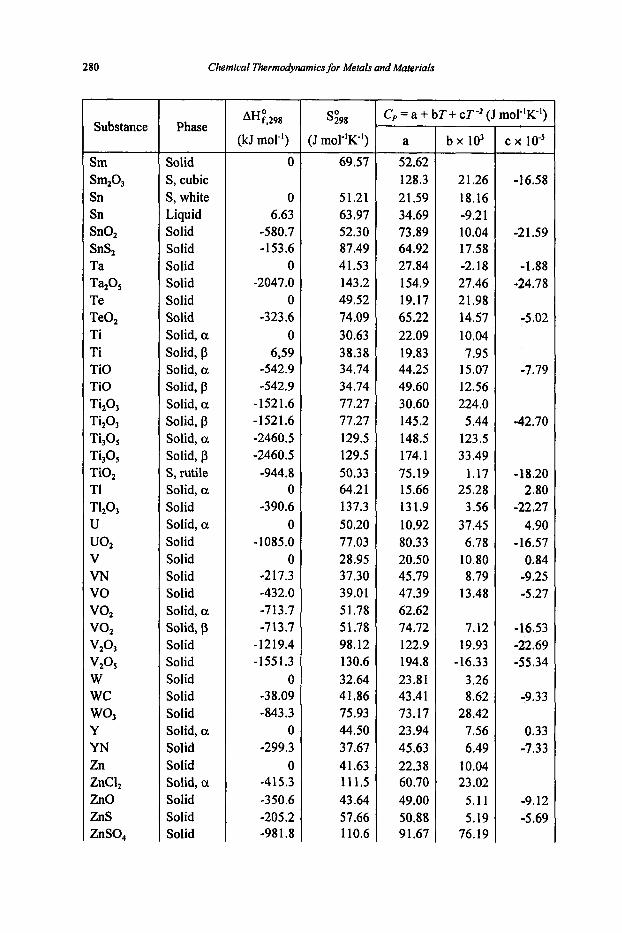
280 Chemical Thermodynamics for Metals and Materials
Substance
Sm
Sn Sn SnO, SnS, Ta
Te TeO, Ti Ti TiO TiO Ti,O, Ti20, Ti,O, Ti,O, TiO, TI T120, U U02 V VN vo VOZ VOZ
VZO,
Sm203
TazO,
v2°3
W wc
Y YN Zn ZnC1, ZnO ZnS ZnSO,
WO,
Phase
Solid S, cubic S, white Liquid Solid Solid Solid Solid Solid Solid Solid, a Solid, (3 Solid, a Solid, p Solid, a Solid, p Solid, a Solid, p S, rutile Solid, a Solid Solid, a Solid Solid Solid Solid Solid, a Solid, (3 Solid Solid Solid Solid Solid Solid, a Solid Solid Solid, a Solid Solid Solid
0
0 6.63
-580.7 -153.6
0 -2047.0
0 -323.6
0 6,59
-542.9 -542.9
-152 1.6 -1521.6 -2460.5 -2460.5 -944.8
0 -390.6
0 -1085.0
0 -217.3 -432.0 -713.7 -713.7
-1219.4 -155 1.3
0 -38.09 -843.3
0 -299.3
0 -415.3 -350.6 -205.2 -981.8
%98
(J mol"K') 69.57
51.21 63.97 52.30 87.49 41.53 143.2 49.52 74.09 30.63 38.38 34.74 34.74 77.27 77.27 129.5 129.5 50.33 64.2 1 137.3 50.20 77.03 28.95 37.30 39.01 5 1.78 51.78 98.12 130.6 32.64 41.86 75.93 44.50 37.67 4 1.63 111.5 43.64 57.66 110.6
C, = a + bT + cT-* (J mol-lK-')
a 52.62 128.3 2 1.59 34.69 73.89 64.92 27.84 154.9 19.17 65.22 22.09 19.83 44.25 49.60 30.60 145.2 148.5 174.1 75.19 15.66 131.9 10.92 80.33 20.50 45.79 47.39 62.62 74.72 122.9 194.8 23.81 43.41 73.17 23.94 45.63 22.38 60.70 49.00 50.88 91.67
b x 103
21.26 18.16
10.04 17.58
27.46 21.98 14.57 10.04 7.95
15.07 12.56 224.0 5.44
123.5 33.49
1.17 25.28
3.56 37.45 6.78
10.80 8.79
13.48
7.12 19.93
3 -26 8.62
28.42 7.56 6.49
10.04 23.02
5.1 1 5.19
76.19
-9.2 1
-2.18
-16.33
c x lO-,
-16.58
-21,59
-1.88 -24.78
-5.02
-7.79
-42.70
-18.20 2.80
4.90
0.84
-22.27
-16.57
-9.25 -5.27
-16.53 -22.69 -55.34
-9.33
0.33 -7.33
-9.12 -5.69
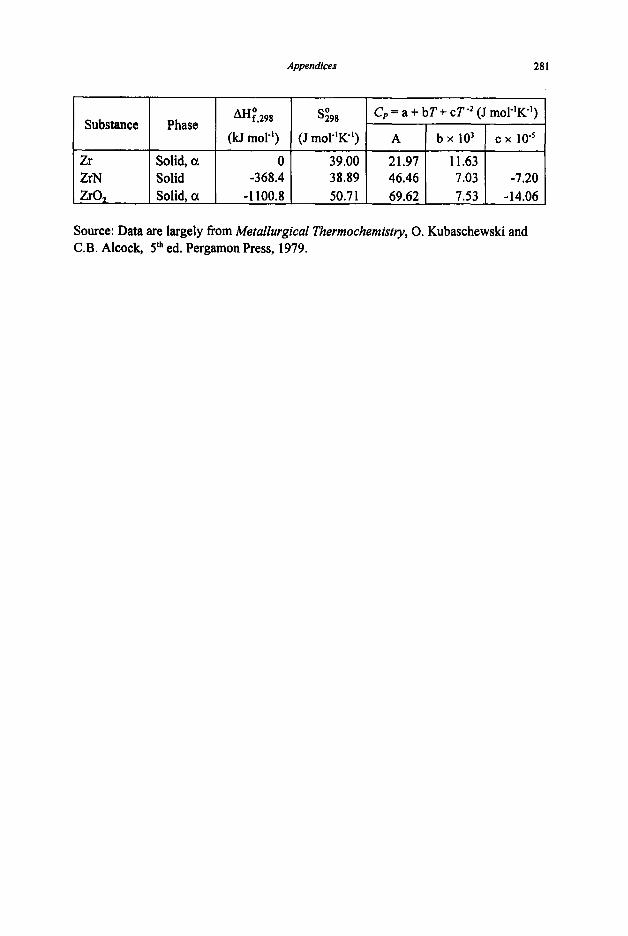
Appendices 281
AH;,29* Si98 Substance I Phase 1 1 (kJ mol-') (J molW')
Solid, a 39.00 Solid -368.4 38.89
ZrO Solid, a -1 100.8 50.7 1
C, = a + bT+ CT-' (J mol-'K")
46.46 69.62 -14.06
Source: Data are largely fiom Metallurgical Thermochemistry, 0. Kubaschewski and C.B. Alcock, 5" ed. Pergamon Press, 1979.

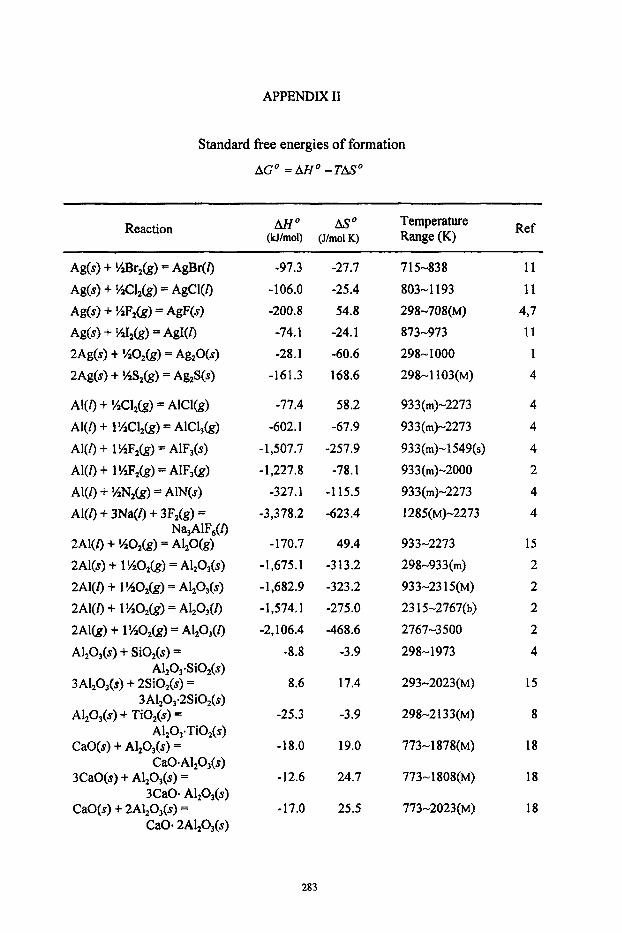
APPENDIX I1
Standard free energies of formation
AGO = M O -TMO
Reaction Ref AHO As0 Temperature (kl/mol) (J/mol K) Range (K)
Ag(s) + %Br,(g) = AgBr(l)
Ag(s) + %Cl&) = AgCl(Z) A&) + %F&) = AgF(s) Ag(s) + %I&) = AgI(I) 2Ag(s) + %O& = Ag,O(s)
2Ag(s) + %S@ = Ag,S(s)
Al(0 + %C12(g) = AlCl(g)
Al(0 + 1 %F2(g) = AIF,(s) Al(0 + 1 %F,(g) = AlF,(g) Al(0 + %N& = AIN(s) AI(0 -t 3Na(l) + 3F,(g) =
2Al(l) + %Oz(g) = Al,O(g) 2Al(s) + 1 %02(g) = Al,03(s)
2A1(0 + 1 ‘/aO,(g) = AlzO,(I) 2Al(g) + l%O,(g) = Al,03(1) A1203(s) + SiO,(s) =
Al,O,.SiO,(s) 3A1,03(s) + 2SiOZ(s) =
3A1,0,-2Si02(s) Al,O,(s) + TiO,(s) =
Al,O,~TiO,(s) CaO(s) + Al,O,(s) =
CaO- Al,O,(s) 3CaO(s) + Al,O,(s) =
3Ca0. A1201(s) CaO(s) + 2AI20,(s) =
CaO- 2A120,(s)
AI(I) + 1 %Cl,(g) = AlCl,(g)
N%AIl;,(I)
2Al(l) + 1 %OZ(g) = AlZOj(s)
-97.3
-106.0 -200.8 -74.1 -28.1
-161.3
-77.4 -602.1
-1,507.7 -1,227.8
-327.1 -3,378.2
-170.7 -1,675.1 -1,682.9 -1,574.1 -2,106.4
-8.8
8.6
-25.3
-18.0
-12.6
-17.0
-27.7
-25.4 54.8
-24.1 -60.6 168.6
58.2 -67.9
-257.9 -78.1
-115.5
-623.4
49.4 -313.2 -323.2 -275.0 -468.6
-3.9
17.4
-3.9
19.0
24.7
25.5
715-838 11
803-1 193 11
298-708(M) 417 873-973 11 298-1 000 1
298-1 1 0 3 ( ~ ) 4
93 3 (m)-2273 4 933(m)-2273 4
933(m)-1549(s) 4 93 3 (m)-2000 2 933(m)-2273 4 1285(M)-2273 4
933-2273 15 298-933(m) 2
933-23 15(M) 2 23 15-2767(b) 2 2767-3500 2
298-1973 4
293-2023(M) 15
298-2 133(M) 8
773-1 878(M) 18
773-1808(M) 18
773-2023(M) 18
283
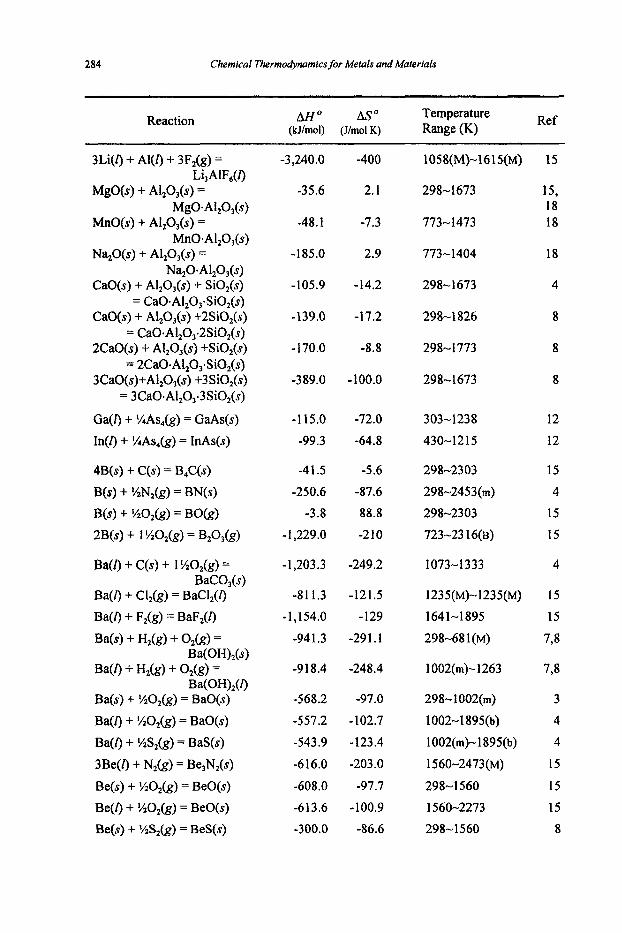
284 Chemical Thermodynamics for Metals and Materials
Reaction Ref m0 As0 Temperature (M/mol) (J/mol K) Range (K)
3Li(l) + AI(l) -I- 3F2(g) =
MgO(s) + Al,O,(s) =
MnO(s) + Al,O,(s) =
N+O(s) + Al,O,(s) = N+O.Al,O,(s)
CaO(s) + Al,O,(s) + SiO,(s) = Ca0.A1,03.Si0,(s)
CaO(s) f AI,O,(s) +2SiO,(s) = Ca0.A 1,0,.2 S i02( s)
2CaO(s) f Al,O,(s) +SiO,(s) = 2Ca0-A1,O,.SiO2(s)
3CaO(s)+Al,O,(s) +3SiO,(s) = 3Ca0-A1,0,.3Si02(s)
Ga(l) + %As&) = GaAs(s) In(0 + %As& = InAs(s)
Li,AIF,(I)
MgO.Al,O,(s)
MnO.Al,O,(s)
4B(s) + C(s) = B4C(s)
B(s) + %N,(g) = BN(s) B(s) + '/O,(g) = BO(g) 2B(s) + 1 %O&) = B203(g)
Ba(l) + C(s) + 1 %O,(g) =
Ba(l) + Clz(g) = BaCl,(I) BaCO,(s)
BaQ + F k ) = BaF2(C) Ba(4 + H,(g) + 0,k) =
Ba(0 + H,k) + 02k) =
Ba(OH),(s)
Ba(OH),(I) Ba(s) + %O,(g) = BaO(s)
Ba(l) + %O,(g) = BaO(s) Ba(0 + %S,(g) = BaS(s) 3Be(l) + N2(g) = Be,N,(s) Be@) + !40z(g) = BeO(s) Be(/) + %O,(g) = BeO(s) Be@) + %S,(g) = BeSfs)
-3,240.0
-35.6
-48.1
-185.0
-105.9
-139.0
-170.0
-389.0
-115.0 -99.3
-41.5 -250.6
-3.8 - 1,229.0
- 1,203.3
-811.3 -1,154.0
-94 1.3
-918.4
-568.2 -557.2 -543.9 -616.0
-608.0 -613.6 -300.0
-400
2.1
-7.3
2.9
-14.2
-17.2
-8.8
- 100.0
-72.0 -64.8
-5.6 -87.6 88.8
-210
-249.2
-121.5 -129
-291.1
-248.4
-97.0
-102.7 -123.4 -203.0
-97.7 -100.9
-86.6
1058(M)-16 15(M)
298-1 673
773-1473
773-1404
298-1673
298-1 826
298-1773
298- 1673
303-1238 430-12 15
298-2303 298-2453(m) 298-2303 723-23 16(B)
1073-1 333
1235(M)-1235(M) 164 1-1 895 298-68 1 (M)
1002(m)- 1263
298-1 002(m) 1002-1 895(b) 1002(m)-1895(b) 1560-2473(M)
298-1560 1560-2273 298-1560
15
15, 18 18
18
4
8
8
8
12 12
15
4
15 15
4
15 15
798
738
3 4 4
15
15 15 8
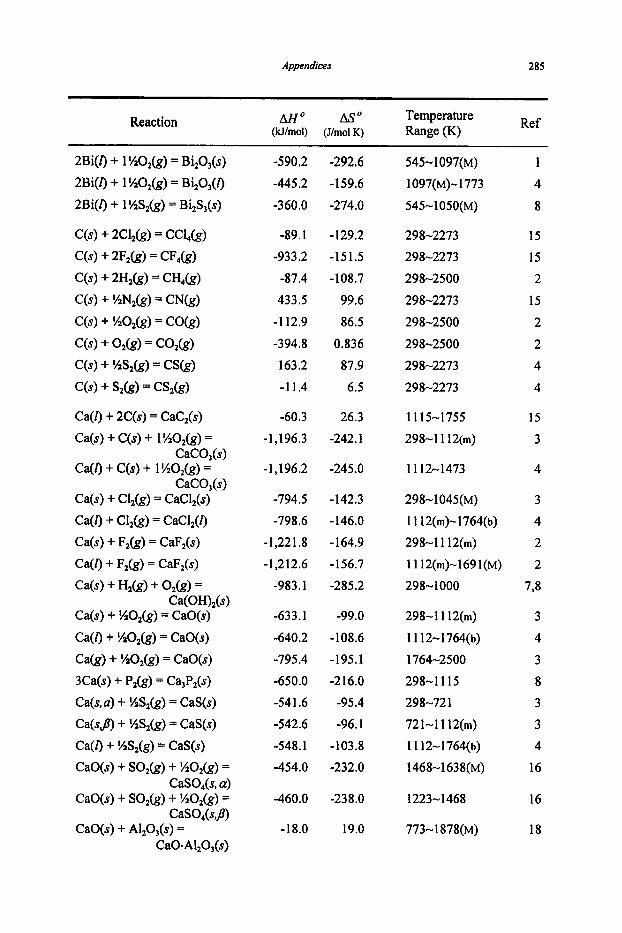
Appendices 285
Reaction Ref AHo Aso Temperature (kllmol) (Jhol K) Range (K)
2BiQ + 1 %O,(g) = Bi,03(s) 2Bi(l) + 1 %O,(g) = Biz03(l) 2Bi(Z) + 1 %S,(g) = Bi2S3(s)
C(s) + 2C12(g) = CC14(g)
C(s) + 2Fz(g) = CF,(g)
C(s) + 2H,(g) = CH4k)
C(s) + %O,(g) = CO&)
C(s) + 0,k) = co,o C(s) + %SZ(g) = CS(g)
C(s) + S,k) = CSZk)
C(s) + %N,(g) = CN(g)
Ca(l) + 2C(s) = CaC,(s) Ca(s) + C(s) + 1 %Oz(g) =
Ca(l) + C(s) + 1 %O,(g) =
Ca(s) + Cl2(g) = CaCl,(s) Ca(l) + Cl,(g) = CaCI,(l) Ca(s) + F,(g) = CaF,(s) Ca(l) + F,(g) = CaF,(s)
CaCO,(s)
CaCO,(s)
taw + H 2 0 + 0 2 0 = Ca(OH),(s)
Ca(s) + SO&) = CaO(s)
Ca(l) + %02(g) = CaO(s) Cak) + %O,(g) = CaO(s) 3Ca(s) + P,(g) = Ca3P,(s) Ca(s, a) + %S2(g) = CaS(s) Ca(sJ3) + %S,(g) = CaS(s) Ca(l) + %S,(g) = CaS(s) CaO(s) + SOz@) + SOz@) =
CaSO,(s, a) CaO(s) + SO2&) + %O&) =
CaSO,(s,J) CaO(s) + Al,O,(s) =
Ca0.A120,(s)
-590.2 -445.2
-360.0
-89.1 -933.2 -87.4 433.5
-1 12.9 -394.8 163.2 -11.4
-60.3 -1,196.3
- 1,196.2
-794.5 -798.6
-1,22 1.8 -1,2 12.6
-983.1
-633.1
-640.2 -795.4 -650.0 -54 1.6 -542.6 -548.1 -454.0
-460.0
-18.0
-292.6 -159.6
-274.0
-129.2 -151.5 -108.7
99.6 86.5
0.836 87.9 6.5
26.3 -242.1
-245.0
-142.3 -146.0 -164.9 -156.7 -285.2
-99.0
-108.6 -195.1 -216.0 -95.4 -96.1
-103.8 -232.0
-238.0
19.0
545-1097(M) 1097(M)- 1773
545-1050(M)
298-2273 298-2273 298-2500 298-2273
298-2500 298-2500 298-2273 298-2273
11 15-1755 298-1 112(m)
11 12-1473
298-1045(M) 11 12(m)-1764(b) 298-1 112(m) 11 12(m)-1691(~) 298-1000
298-1 112(m)
11 12-1764(b) 1764-2500 298-1115 298-72 1
721-1 112(m) 11 12-1764(b) 1468-1638(M)
1223-1468
773-1878(M)
1 4
8
15 15 2
15 2 2 4 4
15 3
4
3 4 2 2
798
3
4 3 8 3 3 4
16
16
18
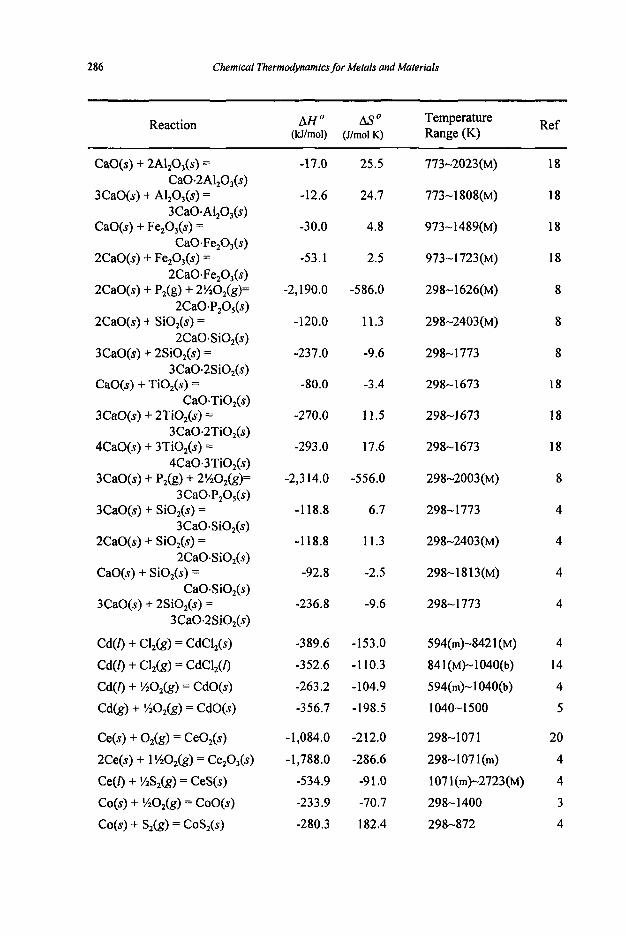
286 Chemical ThermodyMmics for Metals and Materials
Reaction Ref A H o Aso Temperature (kJ/mOl) (Jlmol K) Range (K)
CaO(s) + 2Al,O,(s) = CaO.2Al2O,(s)
3CaO(s) + Al,O,(s) = 3Ca0.Al,03(s)
CaO(s) + Fe,O,(s) =
CaO.Fe,O,(s) 2CaO(s) + Fe,O,(s) =
2Ca0.Fe,03(s) 2CaO(s) + P,(g) + 2%0,(g)=
2CaO.P2O,(s) 2CaO(s) + SiO,(s) =
2CaO.SiO,(s) 3CaO(s) + 2SiO,(s) =
3Ca0.2Si02(s) CaO(s) + TiO,(s) =
CaO.TiO,(s) 3CaO(s) + 2TiO,(s) =
3Ca0.2TiO2(s) 4CaO(s) + 3TiO,(s) =
4Ca0.3TiO2(s) 3CaO(s) + Pz(g) + 2%0,(g)=
3Ca0.P,05(s) 3CaO(s) + SiO,(s) =
3CaO.SiO2(s) 2CaO(s) + SiO,(s) =
2CaO.SiO2(s) CaO(s) + SiO,(s) =
CaO.SiO,(s) 3CaO(s) + 2SiO,(s) =
3Ca0.2Si02(s)
Cd(0 + Cl,(g) = CdCl,(s)
Cd(0 + Cl,(g) = CdC1,(0 Cd(0 + %O,(g) = CdO(s) Cd(g) + %O,(g) = CdO(s)
Ce(s) + O,(g) = CeO,(s)
2Ce(s) + 1 %O,(g) = Ce,03(s) Ce(0 + %S,(g) = CeS(s)
CO(#) + %O,(g) = CoO(s) Co(s) + S,(g) = CoS,(s)
-17.0
-12.6
-30.0
-53.1
-2,190.0
-120.0
-237.0
-80.0
-270.0
-293.0
-2,3 14.0
-1 18.8
-1 18.8
-92.8
-236.8
-389.6
-352.6 -263.2
-356.7
-1,084.0
-1,788.0
-534.9 -233.9
-280.3
25.5
24.7
4.8
2.5
-586.0
11.3
-9.6
-3.4
11.5
17.6
-556.0
6.7
11.3
-2.5
-9.6
-153.0
-1 10.3 -104.9
-198.5
-212.0
-286.6
-91 .O
-70.7
182.4
773-2023(M)
773-1808(~)
973-1489(M)
973-1 723(M)
298-1626(M)
298-2403(M)
298-
298-
298-
298-
773
673
673
673
298-2003(M)
298-1773
298-2403(M)
298-18 13(M)
298-1773
594(m)-842 1 (M)
841(M)-1040(b) 594(m)-1040(b)
1040-1500
298-1 07 1 298-1071(m)
1071(m)-2723(M) 298-1400
298-872
18
18
18
18
8
8
8
18
18
18
8
4
4
4
4
4
14 4
5
20
4
4 3 4
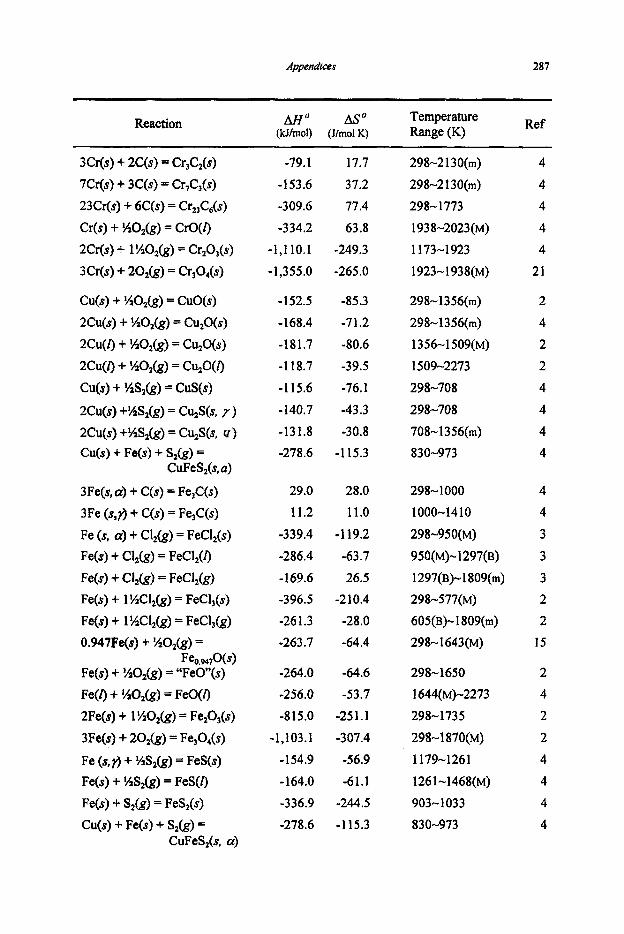
Appendices 287
Reaction Ref M O Aso Temperature (kJ/mol) (J/mol K) Range (K)
3Cr(s) + 2C(s) = Cr3C2(s) 7Cr(s) + 3C(s) = Cr,C&) 23Cr(s) + 6C(s) = Crz3C6(s) Cr(s) + goz@) = CrO(r) 2Cr(s) + 1 %O,(g) = Cr20,(s) 3Cr(s) + 202(g) = Cr,O,(s)
Cu(s) + %O,(g) = CuO(s)
2Cu(s) + %O,(g) = Cu,O(s) 2CU(E) + %O,(g) = C&O(S) 2CU(f) + %O,(g) = C&O(i) Cu(s) + %S&) = CuS(s)
2Cu(s) +%S,(g) = CU2S(s, 7) 2Cu(s) +%S,(g) = C&S(S, U)
CuFeS,(s, a) Cu(s) + Fe@) + S,(g) =
3Fe(s, a) + C(s) = Fe&) 3Fe (s*r) + C(s) = Fe&)
Fe (s, a) + Cl,(g) = FeCl,(s) Fe@) + Cl,(g) = FeCI,(i) Fe(s) + Cl,(g) = FeCl,(g) Fe($) + 1 %Cl,(g) = FeCl,(s) Fe@) + 1 %C&) = FeCl,(g) 0.947Fe(s) + %Oz(g) =
Fe0.947O(s) Fe@) + %02(g) = “FeO”(s) F e 0 i WO,(g) = FeOQ 2Fe(s) + 1 SO&) = Fe,O,(s)
3Fe(s) + 20,(g) = Fe30,(s)
Fe (s, r) + %Sz(g) = FeS(s) Fe(s) + %Sz(g) = FeS(r) Fe(s) + S,(g) = FeS,(s) Cu(s) + Fe($) + S,(g) =
CuFeS,(s, a)
-79.1 -153.6 -309.6 -334.2
-1,110.1 -1,355.0
-152.5 - 168.4 -181.7 -1 18.7
-115.6 -140.7 -131.8 -278.6
29.0 11.2
-339.4 -286.4 -169.6 -396.5 -26 1.3 -263.7
-264.0 -256.0 -815.0
-1,103.1 -154.9 -164.0 -336.9 -278.6
17.7 37.2 77.4 63.8
-249.3 -265.0
-85.3 -71.2
-80.6 -39.5 -76.1
-43.3 -30.8
-1 15.3
28.0 11.0
-1 19.2 -63.7 26.5
-2 10.4 -28.0 -64.4
-64.6 -53.7
-251.1
-307.4 -56.9 -61.1
-244.5 -1 15.3
298-2 130(m) 4 298-2 130(m) 4
1938-2023(M) 4 1 173-1 923 4
1923-1 938(M) 21
298-1773 4
298- 13 56(m)
298-1 356(m) 1356-1 509(M) 1509-2273
298-708
298-708 708-1356(m) 830-973
298-1000 1000-14 10
298-950(M) 950(M)- 1297(B) 1297(B)-1809(m) 298-577(M) 605(B)-1809(m) 298- 1643(M)
2
4 2 2
4 4
3 3
3 2 2
15
298-1 650 2 1644(M)-2273 4
298- 1735 2 298-1 870(M) 2
1179-1261 4 126 1-1468(M) 4 903-1033 4 830-973 4

288 Chemical Thermodynamics for Metals and Materials
Reaction Ref A l l o Aso Temperature
(W/mol) (J/mol K) Range (K)
Ga(0 + %As,&) = GaAs(s)
Ga(0 + %Cl,(g) = GaCl(g)
Ga(0 + 1 %Cl,@) = GaC13(g)
2Ga(0 + 1 %O,(g) = GqO,(s)
Ga(0 + %P4(g) = GaP(s)
Ga(0 + %S,(g) = GaS(s) 2Ga(0 + 1 %S,(g) = G%S,(s)
Ge(s) + O,(g) = GeO,(s)
%H2(g) + %Br,(g) = HBr(g) %H&) + %Cl&) = HCl(g) %H,(g) + %F,(g) = HF(g)
%H&) + %I,&) = HI&)
Hz(g) + %O,(g) = H@(g)
%H,(g) + %S,(g) = HS(g)
H2k) + %S2(g) = H$(g)
Hf(s) + O,&) = HfO,(s,u)
Hg(l)+ %O,(g) = HgO(s, red)
Hg(0+ %S,(g) = HgS(s,red)
HgS(s, black) = HgS(s, red)
I n 0 + %As,@ = InAs(s) In(0 + %Cl,(g) = InCl(0
In(0 + %Cl,(g) = InCl(g)
In(0 + 1 %Cl,(g) = InCl,(s)
In(0 + 1 %Cl,(g) = InCl,(g)
In(0 + %P&) = InP(s)
Ir(s) + O,(g) = IrO,(s)
Ir(s) + S,(g) = IrS,(s) 2K(0 + C(s) + 1 %O,(g) =
2K(g) + C(s) + 1 %O,(g) = K2C03(s)
K2C03(s)
-1 15.0
-79.6 -442 .O
-1,089.9
-142.3
-276.0 -719.6
-575.0
-53.6 -94.1
-274.5 -4.2
-247.4
79.7
-91.6
- 1,060.0
-90.8
-53.0 -4.0
-99.3 -169.1
-87.2
-533.4
-375.0
-92.4
-234.0 -268.0
-1,149.3
-1,277.1
-72.0
52.4
84.7
-323.6
-77.0 -111.0
-318.4
-188.0
6.9
6.4 3.5 8.8
-55.8
15.5
-50.6
-174.0
-70.3
-82.0 -6.3
-64.8
-37.1
56.3
-242.4
-36.7
-74.1
-170.0 - 190.0 -288.5
-4 10.4
303- 123 8 303-2000
351(M)-575(~)
303(m)-2068(~)
303-1790(M)
303-1233(M) 303(m)-1363(M)
298-12 10
298-2273
298-2273 298-2273
298-2273
298-2500 7 18-2273
298-2273
298-1973
298-773
298-618 6 18-61 8
430- 12 1 5
498(M)-88 l(B)
430(m)-2000
430(m)-856(M)
500-800 430- 1328(M)
298-1273 298- 1273 336(m)-1037(b)
1037-1 174(M)
12
12
3,8 4
798 8 4
8
4
4 4 4
2
2
4
7
15
3 3
12
7 3 12
7,8
398
733 7 8
2
2
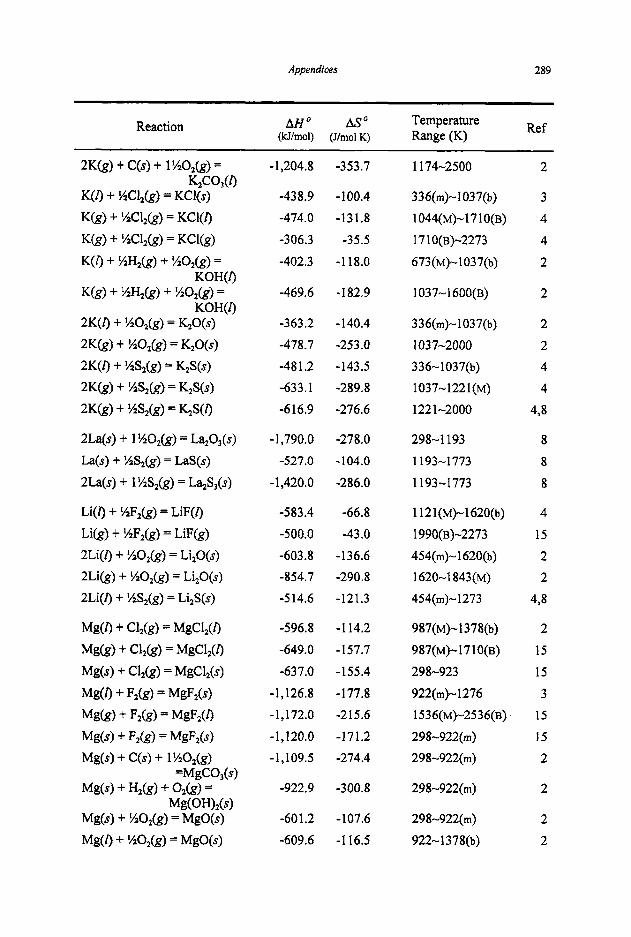
Appendices 289
Reaction Ref AHo Aso Temperature (klfmol) (Jlmol K) Range (a
- 1,204.8
-438.9 -474.0
-306.3 -402.3
-469.6
-363.2 -478.7 -48 1.2 -633.1 -6 16.9
-I ,790.0 -527.0
-1,420.0
-583.4 -500.0 -603.8 -854.7 -5 14.6
-596.8 -649.0 -637.0
-1,126.8 - 1,172.0
-1,120.0 -1,109.5
-922.9
-60 1.2 -609.6
-353.7
- 1 00.4 -131.8
-35.5 -1 18.0
-182.9
-140.4 -253.0 -143.5 -289.8 -276.6
-278.0 -104.0
-286.0
-66.8 -43.0
-136.6 -290.8 -121.3
-1 14.2 -157.7 -155.4
-177.8 -215.6
-171.2 -274.4
-300.8
-107.6 -1 16.5
1 174-2500
336(m)-1037(b) 1044(~)-1710(B) 1710(~)-2273 673(M)-1037(b)
1037-1 600(B)
336(m)-1037(b) 1 03 7-2000 336-1037(b) 1037-1 22 1 (M) 122 1-2000
298-1 193 1193-1773
1193-1773
1121(~)-1620(b) 1990(B)-2273 454(rn)-1620(b) 1620-1 843(M) 454(m)-1273
987(~)-1378(b) 987(~)-17 10(~)
298-923
922(m)- 1276 1536(~)-2536(~) 298-922(m) 298-922(m)
298-922(rn)
298-922(m) 922-1 378(b)
2
3 4 4 2
2
2 2 4 4
4,8
8 8
8
4 15 2 2
4 8
2 15 15 3
15 15
2
2
2 2
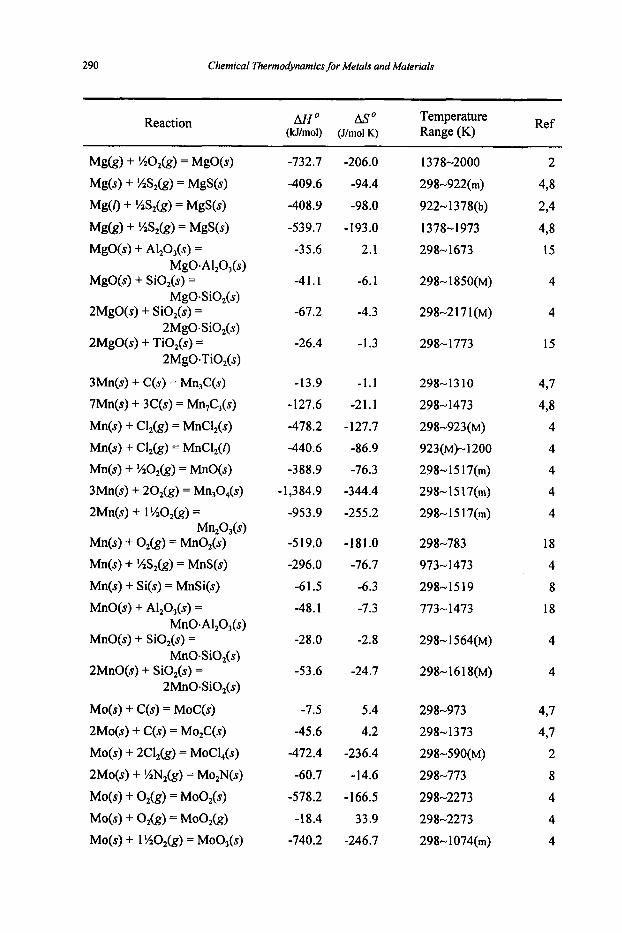
290 Chemical Thermodynamics for Metals and Materials
Reaction
-
Ref A H O Aso Temperature (kJ/mOl) (J/mol K) Range (K)
Mg(g) + %O,(g) = MgO(s)
Mg(s) + %S,(g) = MgS(s)
Mg(l) + %S,(g) = MgS(s)
Mg(g) + %S,(g) = MgS(s) MgO(s) + Al,O,(s) =
MgO(s) + SiO,(s) =
2MgO(s) + SiO,(s) =
2MgO(s) + TiO,(s) =
3Mn(s) + C(s) = Mn,C(s)
7Mn(s) + 3C(s) = Mn,C,(s)
Mn(s) + Cl,(g) = MnCl,(s)
MgO*Al,O,(s)
MgO.SiO,(s)
2MgOSO,(s)
2MgO.TiO2(s)
Mn(s) + Cl,(g) = MnCI,(I)
Mn(s) + %O,(g) = MnO(s)
3Mn(s) + 202(g) = Mn,O,(s)
2Mn(s) + 1 %O,(g) =
Mn(s) + O,(g) = MnO,(s)
Mn(s) + %S,(g) = MnS(s) Mn(s) + Si(s) = MnSi(s)
MnO(s) + Al,O,(s) =
MnO(s) + SiO,(s) =
2MnO(s) + SiO,(s) =
MO@) + C(s) = MoC(s)
2Mo(s) + C(s) = Mo,C(s)
Mo(s) + 2Cl,(g) = MoCl,(s)
2Mo(s) + %N,(g) = Mo,N(s)
MO@) + O,(g) = MOO,@) Mo(s) + O,(g) = MOO,&)
Mo(s) + 1 %02(g) = MOO,@)
Mn*O,(s)
MnO.Al,O,(s)
MnO-SiO,(s)
2MnO-SiO2(s)
-732.7
-409.6
-408.9
-539.7
-35.6
-41.1
-67.2
-26.4
-13.9
-127.6
-478.2 -440.6
-388.9 ,1,3 84.9
-953.9
-5 19.0
-296.0
-6 1.5
-48.1
-28.0
-53.6
-7.5 -45.6
-472.4
-60.7
-578.2
-18.4 -740.2
-206.0
-94.4
-98.0
-193.0
2.1
-6.1
-4.3
-1.3
-1.1
-21.1
-127.7
-86.9
-76.3 -344.4
-255.2
-181.0
-76.7 -6.3
-7.3
-2.8
-24.7
5.4 4.2
-236.4
-14.6
- 166.5
33.9 -246.7
1378-2000
298-922(m)
922-1378(b)
1378-1 973
298- 1673
298-2 17 1 (M)
298-1773
298-13 10
298-1473
298-923(M)
923(M)-1200
298-1517(m) 298-1517(m)
298-1 5 17(m)
298-783 973-1473
298-1519
773-1 473
298-1564(M)
298-973
298-1 373
298-590(~)
298-773
298-2273
298-2273 298-1074(m)
2
498
294
438 15
4
4
15
497
4,8 4 4
4 4
4
18 4
8
18
4
4
497
497 2
8
4 4
4

Appendices 291
Reaction Ref AHO As0 Temperature (kl/mol) (J/mol K) Range (K)
Mo(s) + 1 SO&) = MOO#)
Mo(s) + 1 %O&) = MOO&) 2Mo(s) + l%S2(g) =
Mo(s) + S,(g) = MoS,(s)
Na(l) + %Cl,@) = NaCl(s) Na(g) + %Cl,@) = NaCl(1) Na(l) + '/F,(g) = NaF(s) Na(g) + %F,(g) = NaF(C) 3Na(g) + Al(I) + 3F,(g) =
2Na(I) + C(s) + 1 %O,(g) =
2Na(g) + C(s) + 1 %O,(g) =
Na(l) + '/ZH,(g) + %O,(g) = NaOH(I)
Na(g) + %H&) + %O,(g) = NaOH(Z)
2Na(C) + %O,(g) = N%O(s) 2Na(g) + SO,&) = N%O(s) 2Na(g) + %02(g) = N%O(f) 2Na(I) + %S,(g) = N%S(s)
2Na(g) + MS2(g) = N%S(s) 2Na(g) + %S2(g) = N%S(C)
%N,(g) + 1 %H2(g) = NH,(g)
Mo2S1(s)
Na,AlFdC)
N%COl(s)
N%CO1(C)
%N,(g) + %O&) = NOk)
%N,O + 0,k) = NO,(g)
2Nb(s) + C(s) = Nb,C(s) Nb(s) + 0.98C(s)= NbC,,,(s)
Nb(s) + 02k) = NbO,(s) 2Nb(s) + 2%0,(g) =Nb,O,(s) Nb(s) + %02(g) = NbO(s) 3Ni(s) + C(s) = Ni,C(s) Ni(s) + Cl,(g) = NiCl,(s)
-664.5
-359.8 -594.1
-397.5
-41 1.6 -464.4 -576.6 -624.3
-3,378.2
-1 127.5
- 1,229.6
-408.1
-486.6
-42 1.6 -571.7 -5 19.8 -394.0
-521.2 -610.9
-53.7 90.4 32.3
-194.0 -137.0 -784.0
-1,888.0 -415.0
39.7 -305.4
-176.6
-59.4 -265.3
-1 82.0
-93.1 -133.9 -105.5 -148.2 -623.4
-273.6
-362.5
-125.7
-192.5
-141.3 -269.8 -234.3
-83.7 -200.1 -274.7
-1 16.5 12.7
-63.3
-11.7 -2.4 -167 -420
-87.0 17.1
-146.4
1074-2000 298-2273 298-1473
298-1458(M)
37 1 (m)-lO74(M) 1074(M)-1738(B) 37 1 (m)- 1269(M) 1269(M)-2060(~)
1285(M)-2273
371(m)-1156(b)
1123(M)-2500
592(~)-1156(b)
1156(b)-1663(B)
371(m)-1156(b) 1156-1405(M) 1405-2223 371(m)-1156(b) 1156-1223(M) 1223-2000
298-2273 298-2273 298-2273
298-1 773 298-1773 298-2 175(M) 298-1785(M) 298-22 10 298-773 298-1260
2
4
478
4,8
4 4 4
4 4
2
2
2
2
4 2 2 2 2 2
274 4
15
7 15
15 15 15
478 4
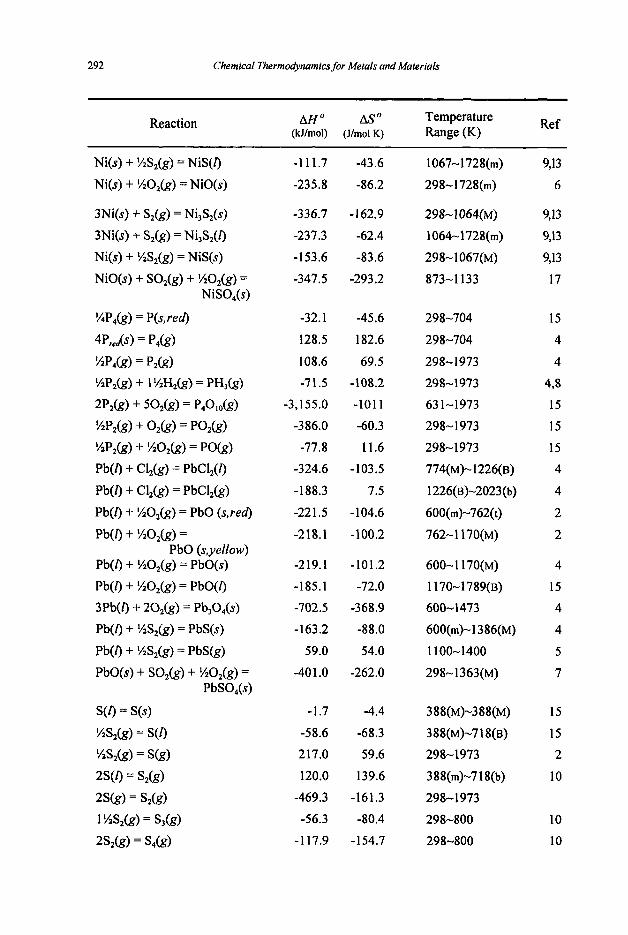
292 Chemical Thermodynamics for Metals and Materials
Reaction Ref A H o Aso Temperature (kJlmOl) (J/mol K) Range (K)
Ni(s) + %S2(g) = NiS(l)
Ni(s) + %O,(g) = NiO(s)
3Ni(s) + S, (g ) = Ni,S,(s) 3Ni(s) + S,(g) = Ni3S2(l) Ni(s) + %S,(g) = NiS(s) NiO(s) + SO2@) + %Oz(g) =
NiSO,(s)
%P4(g) = P(s, red)
4Prem = P,k)
'/P,&) = P2k)
2P2k) + 50,k) = P,O,,(g) '/zp2(g> + 02k) = P02k) %P,(g) + %02(g) = PO&) Pb(l) + Cl,(g) = PbCl,(l)
Pb(l) + Cl,(g) = PbCl,(g)
Pb(0 + %O,(g) = PbO (s,red)
Pb(l) + %O,(g) = PbO (s,yellow)
Pb(f) + %O,(g) = PbO(s) Pb(0 + %O,(g) = PbO(l) 3Pb(l) + 20,(g) = Pb,O,(s)
Pb(l) + %S2(g) = PbS(s) Pb(l) + %S,(g) = PbS(g)
PbO(s) + S02(g) + %O,(g) = PbS04(s)
S(0 = S(s) %S,(g) = S ( l ) %S,(g) = S(g)
2S(O = S2k)
2%) = S,k) 1 %S,(g) = S,(g)
2S*k) = S4k)
%P2(g) + 1 %H,(g) = PH,(g)
-111.7 -43.6
-235.8 -86.2
-336.7 -162.9
-237.3 -62.4
-153.6 -83.6 -347.5 -293.2
-32.1 -45.6
128.5 182.6
108.6 69.5 -71.5 -108.2
-3,155.0 -101 1
-386.0 -60.3 -77.8 11.6
-324.6 -103.5
-188.3 7.5
-221.5 -104.6
-218.1 -100.2
-219.1 -101.2
-185.1 -72.0 -702.5 -368.9 -163.2 -88.0
59.0 54.0
-401 .O -262.0
-1.7 -4.4
-58.6 -68.3 217.0 59.6
120.0 139.6 -469.3 -161.3 -56.3 -80.4
-1 17.9 -154.7
1067-1 728(m)
298-1728(m)
298-1 064(M)
1064-1728(m) 298-1 067(M)
873-1 133
298-704
298-704
298-1973 298-1 973
631-1973 298-1973
298-1973 774(M)-1226(B)
1226(B)-2023(b)
600(m)-762(t)
762-1 170(M)
600-1 170(M) 1170-1789(~) 600-1 473
600(m)-1386(M)
1100-1400
298-1 363(M)
388(M)-388(M)
388(M)-718(B) 298-1973 388(m)-718(b)
298-1973 298-800 298-800
9,13
6
9,13 9,13
9,13
17
15
4
4
4-8 15
15 15 4
4
2
2
4
15 4 4
5
7
15
15 2
10
10 10
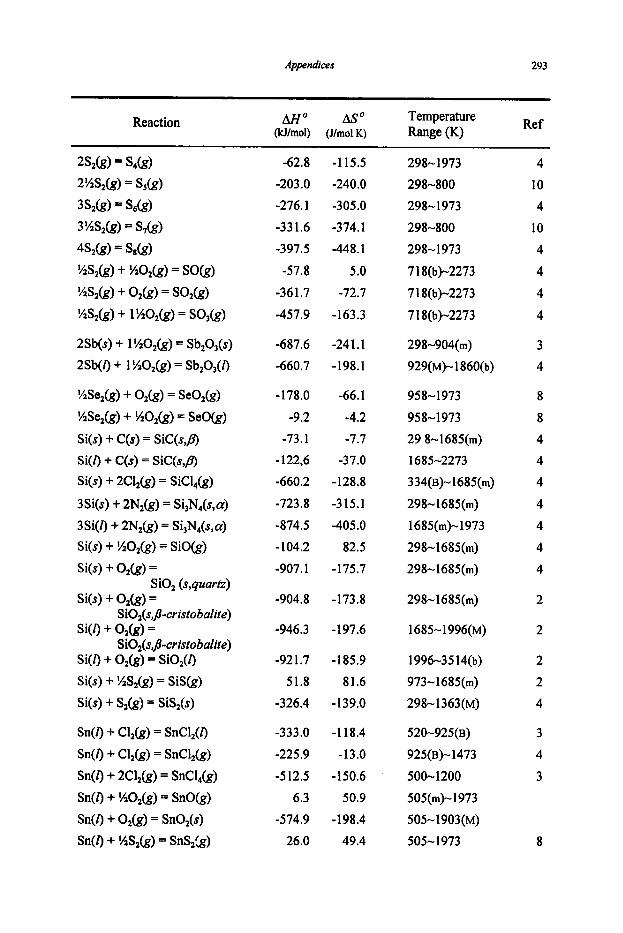
Appendices 293
Reaction Ref AHo Aso Temperature (kJ/mol) (J/mol K) R w i s (K)
2SZk) = S,@) 2%S,(g) = S,(g)
3Sz(g) = S&) 3 %S&) = S,(g) 4 S k ) = S8k) %S,(g) + SO&) = SO&) %S,(g) + 0,k) = SOZk) %S,(g) + 1 '/O,(g) = SO&)
2Sb(~) + 1%O,(g) = Sb,Oj(s) 2Sb(l) + 1 %O,(g) = Sb,03(l)
%Se,(g) + O,(g) = SeO,(g) %Se,(g) + %O,(g) = SeO(g) Si(s) + C(s) = SiC(s,p) Si(l) + C(s) = SiC(s,p) Si(s) + 2Cl,(g) = SiC14(g)
3 Si(s) + 2N,(g) = Si,N,(s, a) 3Si(l) + 2N,(g) = Si,N,(s,a) Si(s) + %02(g) = SiO(g) Si(s) + O,(g) =
Si(s) + O&) =
Si(l) + O,(g) =
Si(l) + O,(g) = SiO,(l) Si(s) + %S,(g) = SiS(g) Si(s) + S,(g) = SiS2(s)
Sn(l) + Cl,(g) = SnCl,(Z) Sn(l) + Cl,(g) = SnCl,(g) Sn(0 + 2Cl,(g) = SnCl,(g) Sn(l) + %O,(g) = SnO(g) Sn(l) + O,(g) = SnO,(s) Sn(l) + %Sz(g) = SnS,(g)
SiO, (s,quartz)
SiO,(sJ-cristo balite)
SiO,(sJ-cristobalite)
-62.8 -115.5 -203.0 -240.0 -276.1 -305.0 -33 1.6 -374.1 -397.5 -448.1 -57.8 5.0
-361.7 -72.7 -457.9 -163.3
-687.6 -241.1 -660.7 -198.1
-178.0 -66.1 -9.2 -4.2
-73.1 -7.7 -122,6 -37.0 -660.2 -128.8
-723.8 -315.1 -874.5 -405.0 -104.2 82.5 -907.1 -175.7
-904.8 -173.8
-946.3 -197.6
-921.7 -185.9 51.8 81.6
-326.4 -139.0
-333.0 -1 18.4 -225.9 -13.0 -512.5 -150.6
6.3 50.9 -574.9 -198.4
26.0 49.4
298- 1973 298-800 298-1973 298-800 298-1973
7 18(b)-2273 71 8(b)-2273
71 8(b)-2273
298-904(m) 929(~)-1860(b)
958-1973 958-1 973 29 8-1685(m) 1685-2273 334(B)-1685(m)
298-1685(m) 1685(m)-1973 298-1685(m) 298-1685(m)
298-1685(m)
1685-1 996(M)
1996-35 14(b) 973-1685(m)
298-1363(M)
520-925(~) 925(B)- 1473
500-1200 505(m)-1 973 505-1903(M) 505-1973
4 10 4
10 4 4
4 4
3 4
8
8 4 4
4
4 4 4 4
2
2
2 2 4
3 4
3
8

294 Chemical Thermodynamics for Metals and Materials
Reaction Ref A H o AYo Temperature (kJ/mol) (J/mol K) Rage (K)
Ta(s) + %O,(g) = TaO(g)
T a w + O M = TaO2k)
%Te,(g) + %O,(g) = TeO(l)
Ti(s) + B(s) = TiB(s)
Ti(s) + 2B(s) = TiB,(s) Ti(s) + O,(g) =
TiO, (s,rutile) Ti(s) + 2Cl,(g) = TiCl,(g)
3Ti(s) + 2%0,(g) = Ti,O,(s)
2Ti(s) + 1 %O,(g) = Ti20,(s) Ti(s) + %O,(g) = TiO (s&)
U(I) + C(s) = UC(s)
U(s) + 02k) = UO,(s)
W O + OAg) = U02M
U($) + %N2(s) = UN(s)
V(s) + B(s) = VB(s)
V(s> + 0.23N2k) = VN0,&)
V(s) + 0,k) = VO,(s)
V(s) + %O,(g) = VO(s)
W(s)+ C(s)= WC(s) 2W(s)+ C(s)= W,C(s)
V(s) + %N,(g) = VN(s)
2V(s) + I %O,(g) = V,O,(s)
Zn(0 + %S,(g) = ZnS(s)
Zn(g) + %S2(g) = ZnS(s) Zn(g) + %S2(g) = ZnS(g)
Zr(s) + 2B(s) = ZrB,(s)
Zr(s) + C(s) = ZrC(s) Zr(s) + %N,(g) = ZrN(s)
Zr(s) + %S,(g) = ZrS(g)
188.0
-209.0
-7.1
-163.0 -285.0
-94 1 .O
-764.0
-2,435.1 -1,502.1
-5 14.6
-109.6
-292.9
-1,079.5
- 1,086.6
-138.0
- 130.0 -214.6
-706.0
-1,203.0
-425 .O
-42.3 -30.5
-277.8
-375.4 5.0
-328.0
-196.6 -363 .O 237.2
87.0
20.5
6.0
-5.9 -20.5
-177.6
-121.5
-420.5
-258.1 -74.1 -1.8
-80.8
-167.4 -172.3
-5.9 -44.4
-82.4
-155.0
-238.0
-80.0
-5.0 2.3
-107.9 -191.6
-30.5
-23.4
-9.2 -92.0
78.2
298-2273 298-2273
1282-1 973
298-1 939
298-1939
298- 1943(m)
298-1943(m)
298- 1943(m) 298- 1943(m) 298- 1943(m)
1405(m)-1800
298-1405(m)
298-1405(m)
1405-2273
298-2273
298-1973 298-26 19
298-1633(M)
298-2343
298-2073
1173-1575 1575-1673
693(m)-118o(b)
1 120-2000
1 180-1 973 298-2 125
298-2 125(m) 298-2 125(m)
298-2 125(m)
15 15
8
15
15
4
4
4 4 4
497
477 3 4
8
15 4
15
15
15
4
19
498 3
4,8 15
477 497
498

Appendices 295
Zr(s) + S,(g) = ZrS,(s) -698.7 -178.2 298-1823(M) 4 4
Note : (m) = melting point of metal, (M) = melting point of compound (b) = boiling point of metal, (B) = boiling point of compound
References :
1.
2.
3.
4.
5 . 6. 7.
8.
9. 10. 11.
12. 13.
14.
15.
16.
17.
18.
19.
J.P. Coughlin, Contributions to the Data on Theoretical Metallurgy. XII. Heats and Free Energies of Formation of Inorganic Oxides, Bulletin 542, Bureau of Mines, U.S. Department of the Interior, Washington, D.C., 1954. D.R. stull and H. prophet, JANAF Thermochemical Tables, 2" ed., NSRDS-NBS 37, US. Department of Commerce, Washington, D.C., 1971. 0. Kubaschewski and C. B. Alcock, Metallurgical Thermochemistry, Sh ed., Pergamon Press, New York, 1979. E. T. Turkdogan, Physical Chemistry of High Temperature Technology, Academic Press, New York, 1980. H. H. Kellogg, Trans. Met. Soc. AIME, 236:602, 1966. H . H. Kellogg, J. Chem. Eng. Data, 14:41, 1969. I. Barin and 0. Knacke, Thermodynamical Properties of Inorganic Substances, Springer-Verlag, New York, 1973. I. Barin, 0. Knacke, and 0. Kubaschewski, Thermodynamical Properties of Inorganic Substances, Supplement, Springer-Verlag, New York, 1977. M. Nagamori and T. R. Ingraham, Metall. Trans., 1: 1821, 1970. H. H. Kellogg, Metall. Trans., 2:2161, 1971. G. J. Jam and G.M. Dijkhuis, in Molten Salts, v01.2, NBS, US. Department of Commerce, Washington, D.C., 1969. H. Nagai, J. Electrochem. Soc., 126: 1400, 1979. A. D. Mah and L.B. Pankratz, Contributions to the Data on Theoretical Metallurgy, XVI. Thermodynamic properties of Nickel and Its Inorganic Compounds, Bulletin 668, Bureau of Mines, U.S. Department of the Interior, Washington, D.C. 1976. L. B. Pankratz, Thermodynamic Properties of Halides, Bulletin 674, Bureau of Mines, U.S. Department of the interior, Washington, D.C. 1984. M.W. chase, JANAF Thermochemical Tables, 31d ed.,1985, American chem. Soc. And the American institute of physics for the national Bureau of standard. J . phys. Chem. Re$ Data Vol14, Supplement NO. 1, Michigan 48674 USA, 1985. Twkdogan, E. T. Rice, B. B., and Vinters, J. V. Surfde and Sulfate Solid Solubiliry in Lime, Metall. Trans., 5 , 1527-35., 1974 Skeaff, J. M. and Espelund, A. W., An E.M. F. Method for sulfate-oxide equilibria results for the Mg, Mn, Fe, Ni, Ca and Zn system., Can. Metall., Q., 12, 445-58., 1973 Kubaschewski, O., The thermodynamic properties of double oxides High temperature - High pressure, 4, 1-12., 1972. Gupta, D. K. and seigle. L. L., Free energies of formation of WC and W,C, and the thermodynamic properties of carbon in solid tungsten, Metall. Trans. A6, 1939-44,
296 Chemical Thermodynamics for Metals and Materials
1975.
Eng. Data, 13,405-8, 1968. 20. Baker, F. B. and Holley, C. E., Enthalpy offormation of cerium sesquioxide. J. chem.
21. Toker, N., ph. D., Thesis., Pennsylvania state university, 1977.
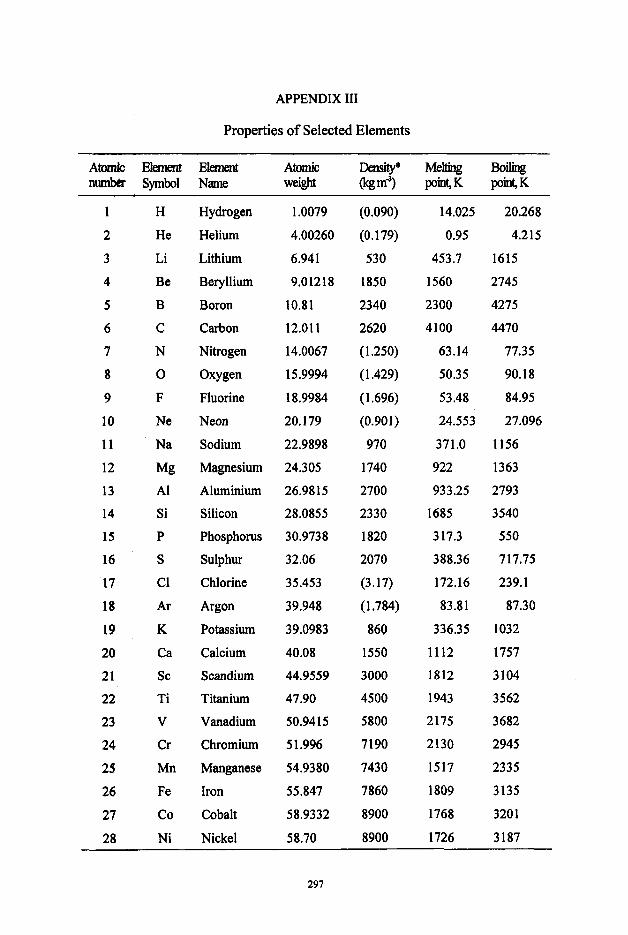
APPENDIX I11
Properties of Selected Elements
Atomic Elemenl Element AtOmiC Density* Melting Boiling number Symbol Name weight (kgmJ) p o a K poirqK
1
2
3
4
5
6
7 8
9
10
11
12
13
14
15
16
17
18
19
20
21
22
23
24
25
26
27
28
H He
Li
Be
B
C
N
0
F
Ne
Na
Mg A1
Si P
S Cl
Ar K
Ca
s c
Ti
V
Cr
Mn Fe
CO
Ni
Hydrogen
Helium
Lithium
Beryllium
Boron
Carbon
Nitrogen
Oxygen
Fluorine
Neon
Sodium
Magnesium
Aluminium
Silicon
Phosphorus
Sulphur
Chlorine
Argon
Potassium
Calcium
Scandium
Titanium
Vanadium
Chromium
Manganese
Iron
Cobalt
Nickel
1.0079
4.00260
6.941
9.0 121 8
10.81
12.01 1
14.0067
15.9994
18.9984
20.179
22.9898
24.305
26.9815
28.0855
30.9738
32.06
35.453
39.948
39.0983
40.08
44.9559
47.90
50.94 15
5 1.996
54.9380
55.847
58.9332
58.70
(0.090)
(0.179)
530
1850
2340
2620
(1.250)
(1.429)
(1.696)
(0.901)
970
1740
2700
2330
1820
2070
(3.17)
(1.784)
860
1550
3000
4500
5800
7190
7430
7860
8900
8900
14.025
0.95
453.7
1560
2300
4100
63.14
50.35
53.48
24.553
371.0
922
933.25
1685
3 17.3
388.36
172.16
83.81
336.35
1112
1812
1943
2175
2130
1517
1809
1768
1726
20.268
4.2 15
1615
2745
4275
4470
77.35
90.18
84.95
27.096
1156
1363
2793
3540
550
7 17.75
239.1
87.30
1032
1757
3104
3562
3682
2945
2335
3135
320 1
3187
297

298 Chemical Thermodynamics for Metals and Materials
Atomic Element Element Atomic Density* Melting B o i n u m k Symbol Name weight (kgm3) p o ~ K point,K
29
30
31
32
33
34
35
36
37
38
39
40
41
42
43
44
45
46
47
48
49
50
51
52
53
54
55
56
57
58
60
c u
Zn
Ga
Ge
As
Se
Br
Kr
Rb
Sr
Y
Zr
Nb
MO Tc
Ru
Rh
Pd
Ag Cd
In
Sn Sb
Te
I
Xe
cs Ba
La
Ce
Nd
Copper
Zinc
Gallium
Germanium
Arsenic
Selenium
Bromine
Krypton
Rubidium
Strontium
Yttrium
Zirconium
Niobium
Molybdenum
Technetium
Ruthenium
Rhodium
Palladium
Silver
Cadmium
Indium
Tin
Antimony
Tellurium
Iodine
Xenon
Cesium
Barium
Lanthanum
Cerium
Neodymium
63.546
65.38
69.72
72.59
74.92 1 6
78.96
79.904
83.80
85.4678
87.62
88.9059
91.22
92.9064
95.94
98
101.07
102.9055
106.4
107.868
112.41
114.82
1 18.69
121.75
127.60
126.9045
131.30
132.9054
137.33
138.9055
140.12
144.24
8960
7140
5910
5320
5720
4800
3 120
(3.74)
1530
2600
4500
6490
8550
10200
11500
12200
12400
12000
10500
8650
73 10
7300
6680
6240
4920
(5.89)
1870
3500
6700
6780
7000
1357.6
692.73
302.90
1210.4
494
265.9
1 15.78
3 12.64
1041
1799
2125
2740
2890
2473
2523
2236
1825
1234
594.18
429.76
505.06
904
722.65
386.7
161.36
301.55
1002
1193
1071
1289
2836
1180
2478
3 107
876
95 8
332.25
119.80
96 1
1650
361 1
4682
5017
4912
4538
4423
3970
3237
2436
1040
2346
2876
1860
1261
458.4
165.03
944
2171
3730
3699
3341

Appendices 299
~
Atomic Element Element Atomic Density* Melting Boiling number symbol Name weight (kgm-3 pointK point,K
62
72
73
74
75
76
77
78
79
80
81
82
83
84
86
88
89
90
92
94
Sm
Hf
Ta
W
Re
OS Ir
Pt
Au
Hi3 TI
Pb
Bi
PO
Rn
Ra
Ac
Th
U
Pu
Samarium
Hafnium
Tantalum
Tungsten
Rhenium
Osmium
Iridium
Platinum
Gold
Mercury
Thallium
Lead
Bismuth Polonium
Radon
Radium
Actium
Thorium
Uranium
Plutonium
150.4 7540
178.49 13100
180.9479 16600
183.85 19300
186.207 21000
190.2 22400
192.22 22500
195.09 2 1400
196.9665 19300
200.59 13530
204.37 11850
207.2 1 1400
208.9804 9800
209 9400
222 (9.91)
226.0254 5000
227.0278 10070
232.0381 11700
238.029 18900
244 19800
1345 2064
2500 4876
3287 573 1
3680 5828
3453 5869
3300 5285
2716 470 1
2045 4100
1337.58 3130
234.28 630
577 1746
600.6 2023
544.52 1837
527 1235
202 610
973 1809
1323 3473
2028 506 1
1405 4407
913 3503
* Density at 300K for solids and liquids, and at 273K for gases indicated by ( ).

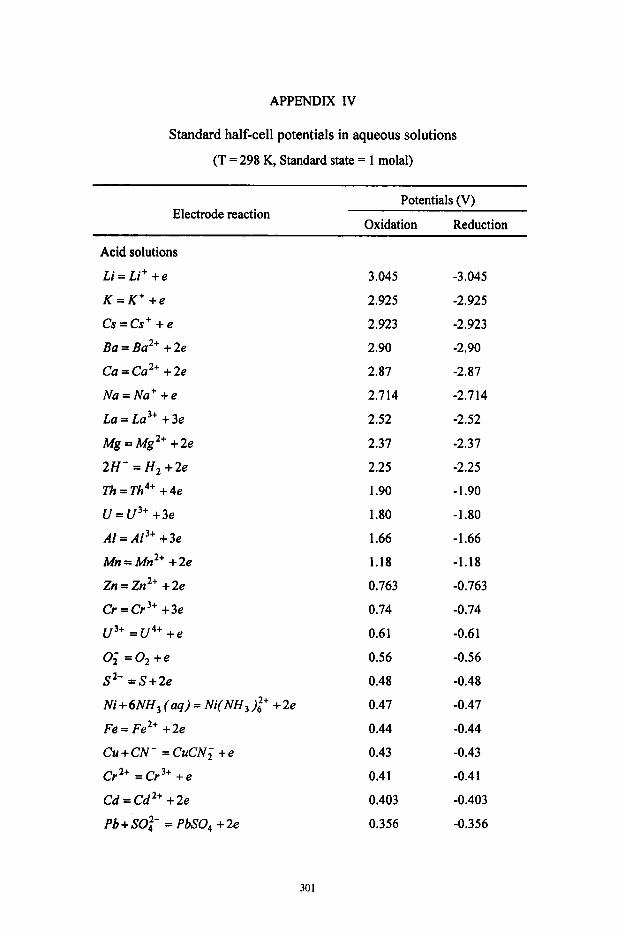
APPENDIX IV
Standard half-cell potentials in aqueous solutions
(T = 298 K, Standard state = 1 molal)
Potentials (V)
Oxidation Reduction Electrode reaction
Acid solutions
Li=Li+ + e
K = K + + e
Cs=Cs+ + e
Ba = Ba2+ + 2e
Ca = Ca2+ + 2e
N a = N a + + e
La = ~ a ~ + + 3e
Mg=Mg2++2e
2H- = H, +2e
Th = Th4+ + 4e
U =u3+ +3e
Al = AI3+ + 3e
Mn = Mn2+ + 2e
Zn = Zn2+ +2e
c r = c r 3 + +3e u3+ =u4+ + e
0; =O, +e
s'- = ~ + 2 e
Ni+6NH3 (aq) = Ni(NH3)i+ +2e
Fe = Fe2+ + 2e
Cu+CN- = CuCN; +e
cr2+ =Cr3+ + e
Cd = Cd 2+ + 2e
Pb+SOi- = PbS04 +2e
3.045
2.925
2.923
2.90
2.87
2.7 14
2.52
2.37
2.25
1.90
1.80
1.66
1.18
0.763
0.74
0.61
0.56
0.48
0.47
0.44
0.43
0.4 1
0.403
0.356
-3.045
-2.925
-2.923
-2.90
-2.87
-2.714
-2.52
-2.37
-2.25
-1.90
-1.80
-1.66
-1.18
-0.763
-0.74
-0.61
-0.56
-0.48
-0.47
-0.44
-0.43
-0.4 1
-0.403
-0.356
301

302 Chemical Thermodynamics for Metals and Materials
~~ ~~
Potentials (V)
Oxidat ion Reduction Electrode reaction
T I = T I + + e
CO = CO,+ +2e
Pb+2Cl- = PbC1, +2e
Ni = Ni2+ + 2e
A g + I - = AgI+e
Sn = Sn2+ +2e
Pb = Pb2+ +2e
Cu + 2NH3(aq) = Cu(NH,); + e
H , = 2 H + +2e
2~,0,2- = s,o,~- + 2e
Ag+Br- = AgBr+e
H 2 S = S + 2 H + + e
Sn = Sn2+ +2e
Ag + Cl- = AgCl + e
2Hg+2Cl- = Hg,Cl, +2e
c u = c u 2 + +2e
Cu=Cu+ + e
21- = I , +2e
Fe2+ = Fe3+ + e
2Hg = Hgi+ +2e
Ag = Ag+ + e
Hg;' =2Hg2+ +2e
Au + 4Cl- = AuCl; + 3e
2Br- = Br, (1) + 2e
H 2 0 = + 0 , + 2 H + +2e
Mn2+ + 2 H 2 0 = M n 0 , +4Ht +2e
2Cr3+ +7H20=Cr20;- +14H+ +6e
2Cl- = Cl, +2e
Pb2' + 2 H 2 0 = PbO, ++4H+ +2e
0.336
0.277
0.268
0.250
0.151
0.136
0.126
0.12
0.000
-0.08
-0.095
-0.141
-0.15
-0.222
-0.2677
-0.337
-0.521
-0.5355
-0.771
-0.789
-0.799 1
-0.920
-1.0
- 1.065
- 1.229
-1.23
-1.33
-1.3595
-1.455
-0.336
-0.277
-0.268
-0.250
-0.151
-0.136
-0.126
-0.12
0.000
0.08
0.095
0.141
0.15
0.222
0.2677
0.337
0.52 1
0.5355
0.771
0.789
0.7991
0.920
1 .o 1.065
1.229
1.23
1.33
1.3595
1.455

Appendices 303
Potentials (V)
Oxidation Reduction Electrode reaction
~ e ' + = ce4+ +e PbSO, +2H,O= PbO, +SO:- +4H+ +2e
CO*+ = co3+ + e
Ag+ = Agz+ +e 2 ~ 0 : - = s,o,~- + 2e
O2 + H,O = 0, +2H+ i 2 e
2F- = F, +2e
SO:- = s ( s ) + ~ o , i 2 e
Basic solutions
Ca + 2 0 H - = Ca(OH), + 2e
Cr + 3 0 H - = &(OH), -k 3e
Zn + 4 0 H - = Zn0;- + 2H,O + 2e
CN- + 20H- = CNO- + H,O + 2e
SO:- + 20H- = SO:- + H , 0 + 2e
Fe + 2 0 H - = Fe(OH), + 2e
H , +20H- = 2H20+2e
Ni + 2 0 H - = Ni(OH), + 2e
Fe(OH), +OH- = Fe(OH), + e
2Cu+2OH- =Cu,0+H20+2e
2Ag+20H- = Ag20+H20+2e
4 0 N - =O, +2H20+4e
H g P = 2Hg2+ +2e
0, +20H- = 0, + H20+2e
-1.61
-1.685
-1.82
-1.98
-2.01
-2.07
-2.89
-3.8587
3.03
1.3
1.126
0.97
0.93
0.877
0.828
0.72
0.56
0.358
-0.344
-0.40 1
-0.920
-1.24
1.61
1.685
1.82
1.98
2.01
2.07
2.89
3.8587
-3.03
-1.3
-1.126
-0.97
-0.93
-0.877
-0.828
-0.72
-.56
-0.358
0.344
0.401
0.920
1.24

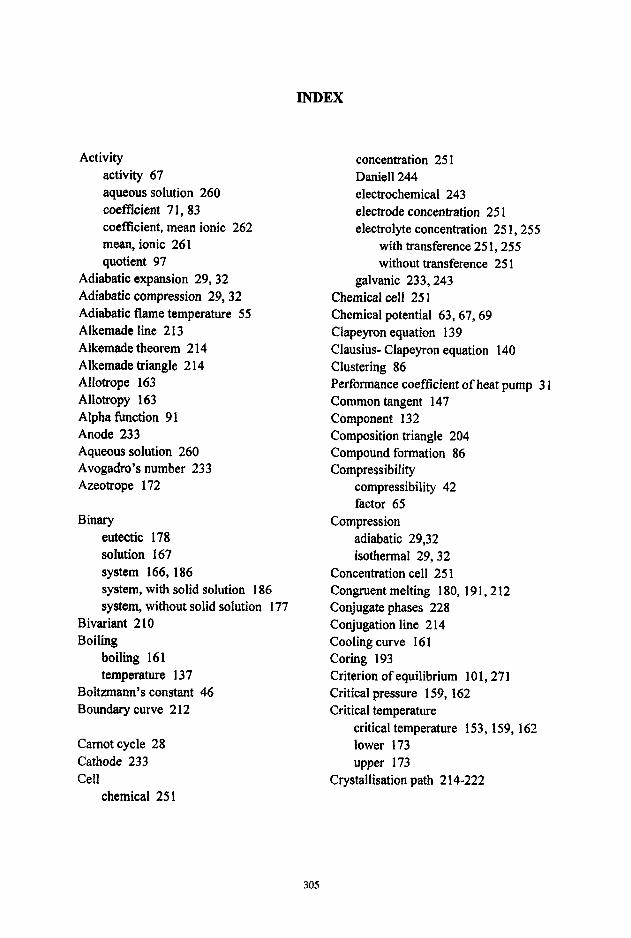
INDEX
Activity activity 67 aqueous solution 260 coefficient 7 1,83 coefficient, mean ionic 262 mean, ionic 261 quotient 97
Adiabatic expansion 29, 32 Adiabatic compression 29,32 Adiabatic flame temperature 55 Alkemade line 213 Alkemade theorem 2 14 Alkemade triangle 2 14 Allotrope 163 Allotropy 163 Alpha h c t i o n 9 1 Anode 233 Aqueous solution 260 Avogadro's number 233 Azeotrope 172
Binary eutectic 178 solution 167 system 166, 186 system, with solid solution 186 system, without solid solution 177
Bivariant 2 10 Boiling
boiling 161 temperature 137
Boltnann's constant 46 Boundary curve 2 12
Carnotcycle 28 Cathode 233 Cell
chemical 251
concentration 25 1 Daniel1 244 electrochemical 243 electrode concentration 25 1 electrolyte concentration 25 1,255
with transference 25 1,255 without transference 25 1
galvanic 233,243 Chemical cell 25 1 Chemical potential 63, 67,69 Clapeyron equation 139 Clausius- Clapeyron equation 140 Clustering 86 Performance coefficient of heat pump 3 1 Common tangent 147 Component 132 Composition triangle 204 Compound formation 86 Compressibility
compressibility 42 factor 65
Compression adiabatic 29,32 isothermal 29,32
Concentration cell 25 1 Congruent melting 180, 191,212 Conjugate phases 228 Conjugation line 214 Cooling curve 16 1 Coring 193 Criterion of equilibrium 101, 271 Critical pressure 159, 162 Critical temperature
critical temperature 153, 159, 162 lower 173 upper 173
Crystallisation path 2 14-222
305
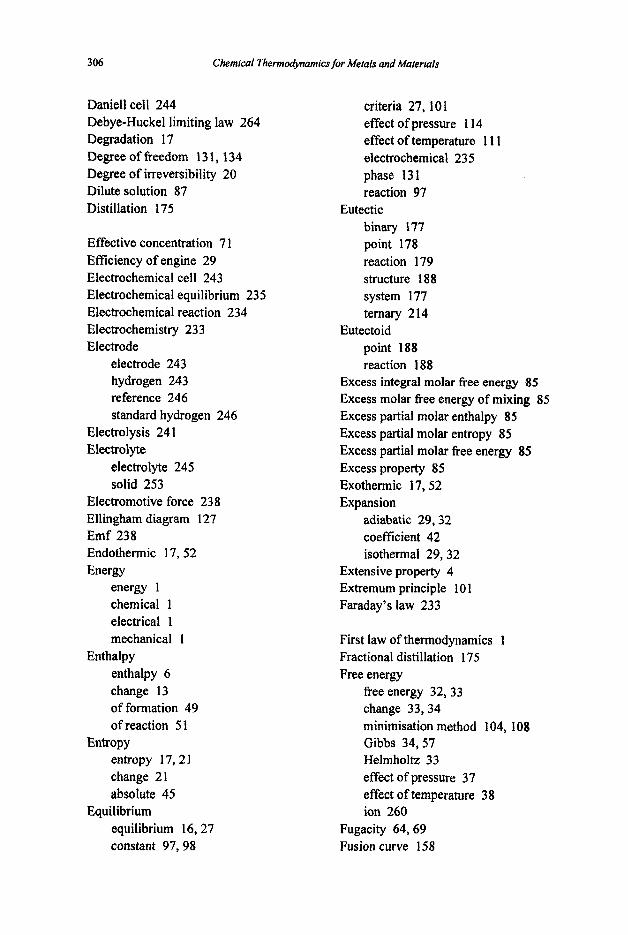
306 Chemical ThermodyMmics for Metals and Materials
Daniel1 cell 244 Debye-Huckel limiting law 264 Degradation 17 Degree of fieedom 13 1 , 134 Degree of irreversibility 20 Dilute solution 87 Distillation 175
Effective concentration 7 1 Eficiency of engine 29 Electrochemical cell 243 Electrochemical equilibrium 23 5 Electrochemical reaction 234 Electrochemistry 233 Electrode
electrode 243 hydrogen 243 reference 246 standard hydrogen 246
Electrolysis 24 1 Electrolyte
electrolyte 245 solid 253
Electromotive force 238 Ellingham diagram 127 Emf 238 Endothermic 17,52 Energy
energy 1 chemical 1 electrical 1 mechanical 1
enthalpy 6 change 13 of formation 49 of reaction 5 1
entropy 17,21 change 21 absoIute 45
equilibrium 16,27 constant 97,98
Enthalpy
Entropy
Equilibrium
criteria 27, 101 effect of pressure 1 14 effect of temperature 1 1 1 electrochemical 235 phase 131 reaction 97
binary 177 point 178 reaction 179 structure 188 system 177 ternary 214
point 188 reaction 188
Eutectic
Eutectoid
Excess integral molar free energy 85 Excess molar fi-ee energy of mixing 85 Excess partial molar enthalpy 85 Excess partial molar entropy 85 Excess partial molar free energy 85 Excess property 85 Exothermic 17,52 Expansion
adiabatic 29,32 coefficient 42 isothermal 29, 32
Extensive property 4 Extremum principle 101 Faraday’s law 233
First law of thermodynamics 1 Fractional distillation 175 Free energy
free energy 32,33 change 33,34 minimisation method 104, 108 Gibbs 34,57 Helmholtz 33 effect of pressure 37 effect of temperature 38 ion 260
Fugacity 64,69 Fusion curve 158

307
Galvanic cell 233,243 Gibbs h e energy
Gibbs f?ee energy 34,57 chage 34 ofmixing 62
Gibbs phase rule 134 Gibbs-Duhem equation 76, 89 Gibbs-Helmholtz equations 39
Half-cell 233 Heat 1 Heat capacity
heatcapacity 7 constant pressure 7 constant volume 7
H e a t e w e 28 Heat of formation 49 Heat of fusion 14 Heat of reaction 5 1 Heatpump 29 Heat reservoir 28,30 Heating path 2 19 Henry’slaw 88 Hess’s law 15 Hydrogen electrode 243 Hypereutactic 188 Hypoeutectic 188
Idealgas 61 Ideal gas equation 6 1 Ideal solution 80,8 1,83 Incongruent melting 18 1,19 1,2 13 Integral molar volume 76 Integral property 76 Intensive property 4 Interaction coefficient 125 Interaction parameter 93 Intermediate phase 154 Internal energy 1 Invariant 184,2 10 Irreversibility 20 Irreversible process 16 Isobar 157
Isotherm isotherm 157 liquidus 212
Isothermal plane 208 Isothermal compression 29,32 Isothermal expension 29’32 Isothermal section 223
Join 214 Junction potential 255
Kirchhoff’s law 53
Le Chatelier’s principle 116 Leverrule 148 Liquid solution 144 Liquidus 171, 178 Liquidus isotherm 2 12
Margules equation Margules equation 94 threesufix 95
Maxwell’s equations 41 Mean activity coefficient 262 Mean activity of ion 262 Mean ionic molality 262 Mean molar free energy of ion 26 1 Mean thermodynamic property 26 1 Melting temperature 137 Melting
congruent 180,19 1 2 12 incongruent 181,191,213
Meta-stable phase 155 Miscibility gap 148 Miscibility
miscibility 166, 172 partial 172 total 166
Molality 261 Molar free energy of mixing 79 Molarity 269 Monotectic
point 183 reaction 183

308 Chemical Thermodymmics for Metais and Materials
system 183
Natural process 16 Negative deviation 83 Nernst equation 239 Non-equilibrium state 16,27 Non-ideal solution 83 Non-state function 4
Order-disorder transition 193 Ordered structure 193 Oxidation 233 Oxygen sensor 253
Partial molar energy 74 Partial molar enthalpy 74 Partial molar entropy 74 Partial molar free energy
partial molar free energy 63,74 ofmixing 78 mean 261
Partial molar volume 74,75 Partial property 74 Perfect gas 61 Perfect gas equation 6 1 Peritectic
point 18 1 reaction 182 system 181 temperature 18 1 ternary 214
pH 269 Phase
phase 132 boundary 139,157 diagram 150, 157, 178 equilibrium 13 1 intermediate 154 meta-stable 155 primary 212 reaction 179 separation 86, 147 terminal 151, 154 transformation 136
transition 138 Phase rule 131, 134 Polymorphic transformation 163 Polymorph 163 Polythermal projection 2 1 1 Positive deviation 83 Pressure-Temperature diagram 157 Primary field 178,212 Primary phase 2 12
Raoult’s law 81 Realgas 64 Reduction 233 Reference electrode 246 Reference state 47 Regular solution 93 Relative integral molar free energy 79 Relative molar free energy 61 Relative partial molar free energy 78 Reversible process 16, 17 Reversible work 3
Second law of thermodynamics 16 Solid electrolyte 253 Solid solubility
solid solubility 186 partial 187 total 186
Solid solution intermediate 19 1 interstitial 186 substitutional 186 terminal 191,226
Solidus 178 Solubility constant 268 Solubility product 268 Solution model 92 Solution
solution 61 aqueous 260 dilute 87 ideal 80,s 1,83 liquid 144 model 92
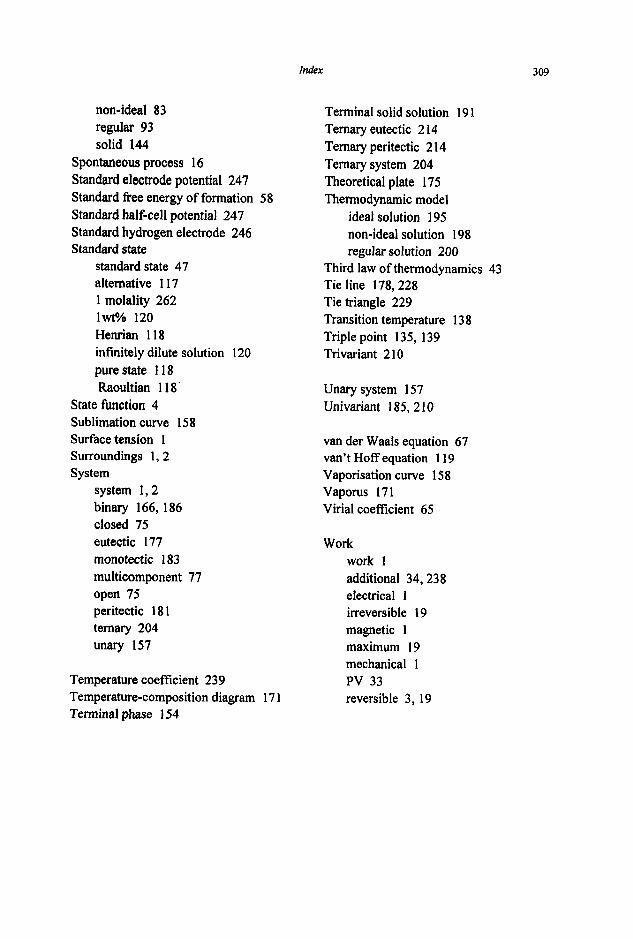
Index 309
non-ideal 83 regular 93 solid 144
Spontaneous process 16 Standard electrode potential 247 Standard free energy of formation 58 Standard half-cell potential 247 Standard hydrogen electrode 246 Standard state
standard state 47 alternative 1 17 1 molality 262 lwt?? 120 Henrian 118 infinitely dilute solution 120 pure state 1 18 Raoultian 1 18
State function 4 Sublimation curve 158 Surface tension 1 Surroundings 1,2 System
system 1,2 binary 166, 186 closed 75 eutectic 177 monotectic 183 multicomponent 77 open 75 peritectic 18 1 ternary 204 unary 157
Temperature coefficient 239 Temperature-composition diagram 17 1 Terminal phase 154
Terminal solid solution 191 Ternary eutectic 2 14 Ternary peritectic 2 14 Ternary system 204 Theoretical plate 175 Thermodynamic model
ideal solution 195 non-ideal solution 198 regular solution 200
Third law of thermodynamics 43 Tie line 178,228 Tie triangle 229 Transition temperature 138 Triple point 135, 139 Trivariant 2 10
Unary system 157 Univariant 185,210
van der Waals equation 67 van’t Hoff equation 1 19 Vaporisation curve 158 Vaporus 171 Virial coefficient 65
Work work 1 additional 34,238 electrical 1 irreversible 19 magnetic 1 maximum 19 mechanical 1 PV 33 reversible 3, 19