Chemical and biological characteristics of streams in the Owabi watershed
10
Environ Monit Assess (2010) 161:413–422 DOI 10.1007/s10661-009-0757-4 Chemical and biological characteristics of streams in the Owabi watershed Osei Akoto · Theophilus Nicolas Bruce · Godfred Darko Received: 23 June 2008 / Accepted: 27 January 2009 / Published online: 25 February 2009 © Springer Science + Business Media B.V. 2009 Abstract In this investigation, concentrations of physico-chemical and bacteriological qualities of water samples from the major streams within the Owabi watershed in Kumasi, Ghana, were mea- sured at five different locations. The streams were moderately soft and neutral, having a mean pH range of 7.08 ± 0.2 to 7.88 ± 0.6. Total dissolved solids, total suspended solids, grease and oil, al- kalinity, and the major ion levels varied signifi- cantly at each sampling site. Nutrient levels were however low and did not show any clear variation at sample locations. The bacteriological quality of the water was poor, rendering it unsafe for domestic purposes without treatment. The poor bacteriological quality was due to direct contam- ination by animal and human wastes. The streams have an appreciable self-purification capacity which is stressed by persistent pollution overloads caused by expanding human activities within the O. Akoto (B ) · G. Darko Department of Chemistry, Kwame Nkrumah University of Science and Technology, Kumasi, Ghana e-mail: [email protected] T. N. Bruce Department of Theoretical and Applied Biology, Kwame Nkrumah University of Science and Technology, Kumasi, Ghana catchment. Cluster analysis performed on the data to determine pollution patterns between the streams depicts that River Owabi was less pol- luted, Rivers Akyeampomene and Sukobri were moderately polluted, while River Pumpunase was highly polluted. Keywords Bacteriological · Physico-chemical · Pollution · Self-purification · Surface water Introduction The increasing vulnerability of natural resources and the environment to pollution is one of the grand challenges to humanity in recent times. Water, which is essential to all forms of life and makes about 50–97% of the weight of all plants and animals, is the most poorly managed resource in the world (Buchholz 1998; Fakayode 2005). About 20% of the world’s population lack ac- cess to safe drinking water (UNEP 2000). The quality of surface water is constantly changing in response to daily, seasonal, and climatic rhythms. The quality of surface water also depends on the equilibrium between the physical, chemical, and biological characteristics of the surrounding envi- ronment (Svobodová et al. 1993; Langmuir 1997; Lester and Birkett 1999). The proportion of avail- able but polluted water is continuously increasing
Transcript of Chemical and biological characteristics of streams in the Owabi watershed

Environ Monit Assess (2010) 161:413–422DOI 10.1007/s10661-009-0757-4
Chemical and biological characteristics of streamsin the Owabi watershed
Osei Akoto · Theophilus Nicolas Bruce ·Godfred Darko
Received: 23 June 2008 / Accepted: 27 January 2009 / Published online: 25 February 2009© Springer Science + Business Media B.V. 2009
Abstract In this investigation, concentrations ofphysico-chemical and bacteriological qualities ofwater samples from the major streams within theOwabi watershed in Kumasi, Ghana, were mea-sured at five different locations. The streams weremoderately soft and neutral, having a mean pHrange of 7.08 ± 0.2 to 7.88 ± 0.6. Total dissolvedsolids, total suspended solids, grease and oil, al-kalinity, and the major ion levels varied signifi-cantly at each sampling site. Nutrient levels werehowever low and did not show any clear variationat sample locations. The bacteriological qualityof the water was poor, rendering it unsafe fordomestic purposes without treatment. The poorbacteriological quality was due to direct contam-ination by animal and human wastes. The streamshave an appreciable self-purification capacitywhich is stressed by persistent pollution overloadscaused by expanding human activities within the
O. Akoto (B) · G. DarkoDepartment of Chemistry, Kwame NkrumahUniversity of Scienceand Technology, Kumasi, Ghanae-mail: [email protected]
T. N. BruceDepartment of Theoretical and Applied Biology,Kwame Nkrumah University of Science andTechnology, Kumasi, Ghana
catchment. Cluster analysis performed on thedata to determine pollution patterns between thestreams depicts that River Owabi was less pol-luted, Rivers Akyeampomene and Sukobri weremoderately polluted, while River Pumpunase washighly polluted.
Keywords Bacteriological · Physico-chemical ·Pollution · Self-purification · Surface water
Introduction
The increasing vulnerability of natural resourcesand the environment to pollution is one of thegrand challenges to humanity in recent times.Water, which is essential to all forms of life andmakes about 50–97% of the weight of all plantsand animals, is the most poorly managed resourcein the world (Buchholz 1998; Fakayode 2005).About 20% of the world’s population lack ac-cess to safe drinking water (UNEP 2000). Thequality of surface water is constantly changing inresponse to daily, seasonal, and climatic rhythms.The quality of surface water also depends on theequilibrium between the physical, chemical, andbiological characteristics of the surrounding envi-ronment (Svobodová et al. 1993; Langmuir 1997;Lester and Birkett 1999). The proportion of avail-able but polluted water is continuously increasing

414 Environ Monit Assess (2010) 161:413–422
as a result of changes in the modes of industrialactivities, agricultural production, and increasingurbanization (Pestle 1997).
In Ghana, like in most other African coun-tries, water resources have been under increasingthreat of pollution in recent years. This is partlydue to the increase in the number of humansettlement lacking proper town planning alongriverbanks. This applies especially to peri-urbanareas, surrounding the larger metropolis of whichthe Owabi watershed is an example. Many suchsettlements have developed with no proper watersupply and sanitation services and the inhabitantsdepend on surface water for drinking and do-mestic purposes (UNEP 2000; Statistical Service2000). This creates a situation that poses a serioushealth risk to the people (Verma and Srivastava1990).
The Owabi watershed is one of the most im-portant water resources in Ghana. Apart fromthe fact that treated water from the reservoirserves as a source of water supply to some partsof Kumasi, the untreated water from the riverswithin the watershed serve as the source of waterfor the rural and farming communities within thecatchment area. Water from the rivers are mainlyused for domestic purposes like cooking, drinking,washing, and bathing. Farmers who grow vegeta-bles along the banks of these rivers during the dryseason use the water from these rivers to watertheir crops (McGregor et al. 2000). The rivers alsoserve as sinks for industrial and domestic wastes.Pollution of the water bodies and the accompany-ing depletion of their resources can put the livesof humans and aquatic organisms, which dependon these rivers, in danger. Unfortunately, there isno information on the impact of human activitieson the quality of water within the catchment.The purpose of this study was to assess chemicaland biological pollution of the water in the majorrivers within the Owabi catchment whose banksare highly subjected to human activities. Dataobtained from this research will be vital for policymakers in the implementation of responsible wa-ter quality regulations, for characterizing and re-mediating contaminations, and for the protectionof the health of humans and aquatic organisms.
Materials and methods
Description of the study area
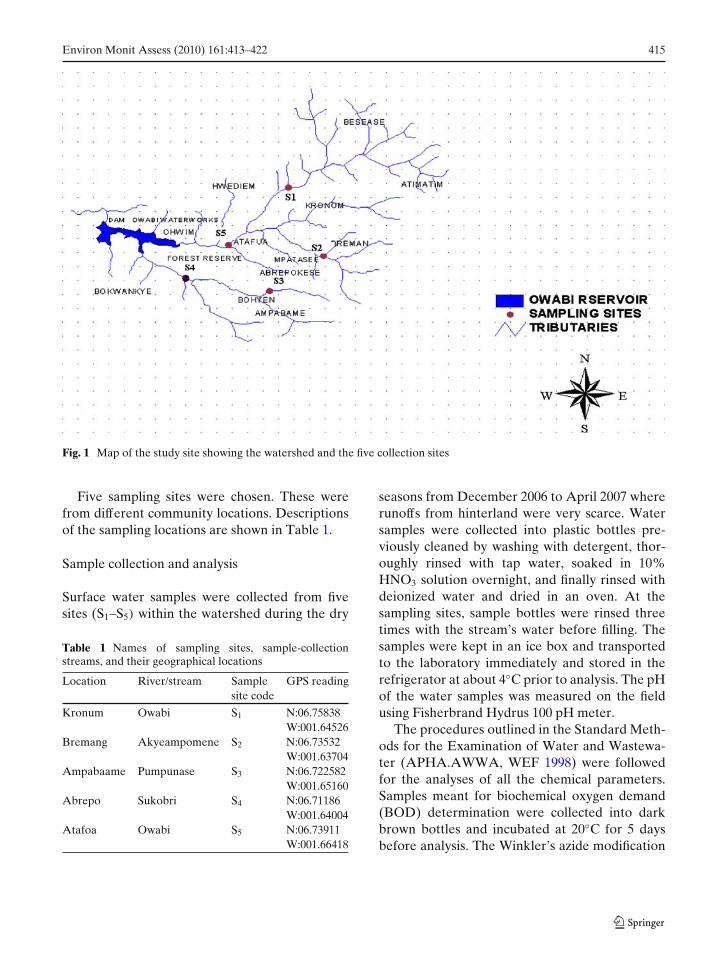
The study was carried out on the Owabi water-shed (Fig. 1), which is located within the KumasiMetropolitan Assembly (KMA) in the Ashantiregion of Ghana. Kumasi is the Ashanti regionalcapital and is the second largest city in Ghana.KMA is approximately 483 km north of the equa-tor and 161 km north of the Gulf of Guinea. Withover 2.5 million inhabitants, the city spans a radiusof about 29 to 32 km (Statistical Service 2000). Onthe basis of land use, the study area can be de-marcated into four categories: agriculture, humansettlement, vegetation cover, and water bodies.The catchment area is densely populated becauseof rapid urbanization and agricultural growth dur-ing the past few decades. The rivers and theirtributaries within the catchment run through somecommunities within the Kumasi Metropolis. Themain sources of water pollution include municipalwaste from suburbs like Kronum, Bremang, andAbrepo that are situated within the catchment aswell as industrial effluents from small-scale indus-tries dotted along the tributaries.
The layout of the Owabi catchment area andthe sample collection points are shown in Fig. 1.The main water bodies that feed the catchmentare Rivers Owabi, Sukobri, Akyeampomene,Pumpunase, and Afu. River Owabi flows throughagricultural lands close to the village of Maaseand then joins other tributaries from the ur-ban area at Atafoa, a rapidly urbanizing agri-cultural village (McGregor et al. 2000). RiverAkyeampomene flows through Bremang andSuame townships. Human and developmental ac-tivities are sited very closely to the banks of thisriver. At Bremang, most of the drains and gut-ters in the entire township are channeled into thestream. River Pumpunase, originating from theMampong range near Ampabaame, flows north-westwards through Bohyen township. It is joinedby other streams before emptying into the Owabireservoir. It carries municipal wastewater and in-dustrial effluents from the towns and settlementsthrough which it flows.
Environ Monit Assess (2010) 161:413–422 415
Fig. 1 Map of the study site showing the watershed and the five collection sites
Five sampling sites were chosen. These werefrom different community locations. Descriptionsof the sampling locations are shown in Table 1.
Sample collection and analysis
Surface water samples were collected from fivesites (S1–S5) within the watershed during the dry
Table 1 Names of sampling sites, sample-collectionstreams, and their geographical locations
Location River/stream Sample GPS readingsite code
Kronum Owabi S1 N:06.75838W:001.64526
Bremang Akyeampomene S2 N:06.73532W:001.63704
Ampabaame Pumpunase S3 N:06.722582W:001.65160
Abrepo Sukobri S4 N:06.71186W:001.64004
Atafoa Owabi S5 N:06.73911W:001.66418
seasons from December 2006 to April 2007 whererunoffs from hinterland were very scarce. Watersamples were collected into plastic bottles pre-viously cleaned by washing with detergent, thor-oughly rinsed with tap water, soaked in 10%HNO3 solution overnight, and finally rinsed withdeionized water and dried in an oven. At thesampling sites, sample bottles were rinsed threetimes with the stream’s water before filling. Thesamples were kept in an ice box and transportedto the laboratory immediately and stored in therefrigerator at about 4◦C prior to analysis. The pHof the water samples was measured on the fieldusing Fisherbrand Hydrus 100 pH meter.
The procedures outlined in the Standard Meth-ods for the Examination of Water and Wastewa-ter (APHA.AWWA, WEF 1998) were followedfor the analyses of all the chemical parameters.Samples meant for biochemical oxygen demand(BOD) determination were collected into darkbrown bottles and incubated at 20◦C for 5 daysbefore analysis. The Winkler’s azide modification
416 Environ Monit Assess (2010) 161:413–422
method was used for measuring dissolved oxygen(DO) in the samples. BOD was determined as thedifference between DO of sample for day 1 andday 5 for the same sample after incubation at 20◦Cfor 5 days.
NO3–N was measured by employing hydrazinereduction followed by spectrophotometric deter-mination at 520 nm; NO2–N was determined bydiazotization and spectrophotometric determina-tion at 540 nm and ammonium by reaction withalkaline salicylate in the presence of chlorine toform a blue-green indophenol complex and mea-sured at 640 nm. Phosphate was determined byreaction with ammonium molybdate and ascorbicacid, and measured at 880 nm. Total dissolvedsolids (TDS) and suspended solids (TSS) weremeasured gravimetrically after drying in an ovenat 105◦C to a constant weight. Fluoride was de-termined by SPADNS method and total hardness,alkalinity, and chloride were determined by titri-metric methods.
Fecal coliforms were determined by most prob-able number (MPN) method using Oxoid CM 509at 44◦C and confirmed by MacConkey No. 3 agar(Oxoid CM115). Escherichia coli were confirmedby the presence of acid and gas in tryptone brothat 35◦C after further incubation for 24 h (Fenget al. 2002). All reagents were analytical gradeand instruments were pre-calibrated prior to mea-surement. Replicate analyses were carried out foreach determination to ascertain reproducibilityand quality assurance.
Statistical analysis
Statistical analyses of the results at each site werecarried out using both Microsoft Excel 2003 Edi-tion and Statistical Package for Social Science(SPSS) 1.30 for windows software. All errors werecalculated at the 95% confidence level.
Results and discussion
The range, mean, and standard deviation ofhardness and dissolved ion concentration in thestreams are presented in Table 2. Calcium hard-ness (Ca-H) recorded a minimum concentrationof 79 ± 20.3 mg/L in River Owabi at Kronumand a maximum concentration of 132 ± 22.8 mg/Lin River Pumpunase at Ampabaame. Magnesiumhardness (Mg-H) ranged from 20 ± 16.2 to 96 ±30.8 mg/L. Minimum and maximum Mg-H valueswere reported in water samples from Kronumand Abrepo townships, respectively. Ca-H andMg-H were combined to form total hardness(TH). TH varied from a minimum of 99 ±24.9 mg/L to a maximum of 215 ± 87.8 mg/L insamples from Kronum and Abrepo townships,respectively. World Health Organization (WHO)recommended safe permissible limit for TH is100–500 mg/L. TH was within permissible limit inall the samples. Ca-H and Mg-H were also withintheir permissible limits in all the streams. Chloride(Cl−) varied from a minimum of 37 ± 16.4 mg/L
Table 2 Range, mean, and SD of total hardness and dissolved ion concentrations of the water samples during the samplingperiod
Parameters/sites Total hardness (mg/L) Ca-H (mg/L) Mg-H (mg/L) SO2−4 (mg/L) Cl−(mg/L) F−(mg/L)
S1; range 60–125 56–101 2–44 12.1–32.0 18–61 0.21–0.40Mean ± SD 99 ± 24.9 79 ± 20.3 20 ± 16.2 19.43 ± 6.6 37 ± 16.4 0.33 ± 0.06S2; range 114–190 68–160 14–112 48.0–92.0 76–96 0.40–0.65Mean ± SD 148 ± 33.1 105 ± 32.8 44 ± 36 64.4 ± 16.5 83 ± 7 0.51 ± 0.08S3; range 164–182 100–164 4.0–80.5 48–91 136–181 0.65–0.85Mean ± SD 172 ± 8.0 132 ± 22.8 40 ± 25.9 61.6 ± 15.9 157 ± 15.2 0.7 ± 0.07S4; range 160–382 80–156 28.0–278.0 31–71 90–121 0.45–0.65Mean ± SD 215 ± 87.8 121 ± 27.8 96 ± 30.8 39.8 ± 16.2 10 ± 10.7 0.57 ± 0.07S5; range 100–182 76–130 19–54 22.6–41.0 40–72 0.03–0.32Mean ± SD 136 ± 28.4 106 ± 19.1 39 ± 11.8 27.65 ± 6.9 58 ± 11.5 0.13 ± 0.12NaturalBackground – 12 1–99 0.1–10 7.8 –WHO limit 500 75 30 250 250 1.5
Environ Monit Assess (2010) 161:413–422 417
recorded from Kronum township to a maximumof 157 ± 15.2 mg/L observed from Ampabaametownship. The chloride content was lower thanpermissible limit (250 mg/L) in all the samples.High content of chloride gives a salty taste to thewater. Sulfates (SO2−
4 ) recorded a mean minimumof 19.43 ± 6.6 mg/L from Kronum and maximumof 64.4 ± 16.5 mg/L from Bremang. These levelswere lower than WHO permissible levels. Thestreams within the catchment had low fluoride ionconcentrations and were below the WHO maxi-mum acceptable limits (1.5 mg/L) for drinking anddomestic water. The maximum and minimum con-centrations were recorded in R. Pumpunase (0.73± 0.02 mg/L) and R. Owabi at Atafoa (0.13 ±0.04 mg/L), respectively.
The patterns of ionic dominance in all thestreams were different except that of R. Owabisampled at Kronum and Atafoa which had thesame ionic dominance pattern of calcium > chlo-ride > magnesium > sulfate. Generally, ionicdominance of the Owabi catchment was in con-trast with the ionic dominance pattern of calcium> magnesium > sulfate > chloride for freshwater(Burton and Liss 1976; Stumn and Morgan 1981).The dominance of chloride over sulfate could bemainly due to domestic and anthropogenic pointsources (Ansa-Asare and Asante 2005; Karikariand Ansa-Asare 2006). The dominance of calciumover the other ions in all five streams except R.Pumpunase reflects a true picture of most trop-ical freshwaters (Karikari and Bosque-Hamilton2004).
The stream water samples exhibited an alkalinepH. The mean pH values of water samples fromthe streams varied between 7.08 ± 0.24 at site S1
and 7.88 ± 0.61 at site S3 during the samplingperiod (Table 3). No significant difference wasnoticed in the observed pH ranges at each site andthe variation due to change in sampling locationwas also not significant. The WHO range for pH inwater for domestic use is 6.5 to 8.5 (WHO 2003).All of the values of pH obtained for the streamsfell within this range but were slightly above thenatural background level of 7.0. This increasein pH of the water samples above the normalbackground levels may be due to the presence ofdissolved carbonates and bicarbonates which areknown to affect pH of almost all surface water(Chapman 1996).
TDS is a common indicator of polluted waters(Tay 2007). The mean levels of TDS measured inthe samples varied between 119 ± 57.6 and 572 ±38.9 mg/L in Owabi River sampled from Kronumand Pumpunase River from Ampabaame, respec-tively (Table 3). The TDS levels at each samplingsite differed significantly and the variation due tochange in sampling location was also significant(p < 0.05). All the values were below the min-imum standard (1,000 mg/L) set by the WHO.The values did not exceed the critical value abovewhich some long-term health problems might beanticipated (Kempster et al. 1997). According toMacCutcheon et al. (1983), the palatability of wa-ter with TDS level less than 600 mg/L is generallyconsidered to be good, whereas water with TDS
Table 3 Range, mean, and SD of particulates and oil and grease levels of the water samples during the sampling period
Parameter/sites pH TDS (mg/L) TSS (mg/L) Alkalinity (mg/L) Oil and grease (mg/L)
S1; range 6.75–7.40 28–197 16.0–38.3 156–212 195.2–600.3Mean ± SD 7.08 ± 0.02 119 ± 57.6 24.76 ± 9.3 173 ± 24 398.3 ± 170.5S2; range 7.20–7.92 28–401 450–960 239–474 56–82Mean ± SD 7.56 ± 0.3 275 ± 146 58.9 ± 19.5 328 ± 83.1 68.2 ± 8.7S3; range 7.10–8.81 31–855 28–472 420–841 80.5–121.1Mean ± SD 7.88 ± 0.6 572 ± 38.9 179 ± 160.5 608 ± 151.3 98.6 ± 16.4S4; range 7.35–7.93 28–558 150–77.0 320–681 230.1–302.0Mean ± SD 7.55 ± 0.2 351 ± 209.1 34.74 ± 23.3 485 ± 141.4 254.7 ± 34.5S5; range 7.30–7.67 26–253 10.0–26.9 180–324 14.4–66.0Mean ± SD 7.57 ± 0.1 169 ± 90.6 17.48 ± 5.4 251 ± 57.7 35.8 ± 22.6NaturalBackground 7.0 – – – –WHO limit 6.60–8.50 1,000 20 400 10

418 Environ Monit Assess (2010) 161:413–422
greater than 1,200 mg/L becomes increasinglyunpalatable. Hence, the water from the streamscould be considered palatable since the averageTDS for all the streams were less than 600 mg/L.
The mean TSS values ranged from 17.48 ± 1.7to 179.3 ± 50.8 mg/L. The highest mean valuewas recorded for R. Pumpunase while R. Owabi(Atafoa) recorded the least. The values differedsignificantly from one location to another (p <
0.05). The results showed that the levels of TSSin the samples, except that of River Pumpunase,were above the WHO recommended value of lessthan 20 mg/L. River Pumpunase recorded thehighest mean alkalinity (608 ± 47.9 mg/L) whileR. Owabi (Kronum) recorded the lowest (173 ±7.6 mg/L). These values indicate that the streamshave a good buffering capacity.
All the streams recorded mean concentrationsof oil and grease above the WHO maximum per-missible levels of 10 mg/L for water for domesticuse. R. Owabi sampled at Atafoa recorded theminimum value of 35.8 ± 7.1 mg/L while the max-imum value of 398.3 ± 53.9 mg/L was recordedin R. Owabi at Kronum. The high concentrationsof grease and oil in the rivers were the result ofhuman activities such as fuel service stations, auto-mechanic workshops, and car washing bays scat-tered along the stream banks and nearby locationswithin the catchment area.
Concentrations of nutrients and dissolved oxy-gen (DO) are shown in Table 4. The DO levelsdid not differ significantly from one location toanother (p < 0.05), being lowest in the samples
from S3 with a mean value of 0.37 ± 0.18 mg/Land highest at S1 (1.99 ± 1.44 mg/L). The lowDO values at the various sampling points mightbe attributed to the fact that the waste dischargewithin the watershed contains high concentrationof organic matter and nutrients that are highlyoxygen demanding (Chapman 1996). DO con-centration in unpolluted water is normally about8–10 mg/L at 25◦C (DFID 1999). Concentrationsbelow 5 mg/L adversely affect aquatic life. Thelow levels of DO in the streams, therefore, makethem unsuitable to support aquatic ecosystem.
The levels of biochemical oxygen demand(BOD) varied significantly at each sampling siteand the variation due to change in sampling lo-cation was also significant (p < 0.05). The meanvalues recorded (Table 4) for all the water sampleswere far above the 3 mg/L recommended limit fornatural waters (WHO 2004). River Pumpunasesampled at Ampabaame with the lowest meanDO value registered the highest mean BOD valueof 423.9 ± 13.3 mg/L and R. Owabi sampled atKronum had the lowest value of 19.42 ± 4.0 mg/L.The high BOD levels suggest that the pollutionof the stream is more of organic origin. Com-pared to average concentrations in urban streamsin Ghana, the mean BOD values obtained forthese streams were similar to those reported fromsamples from the Korle Lagoon (153.02 mg/L)in Accra and the Subin River (161.029 mg/L) inKumasi (Obiri-Danso et al. 2005).
NO3–N, NO2–N, and NH4–N are consid-ered to be non-cumulative toxins (Dallas and
Table 4 Range, mean, and SD of nutrient BOD and DO levels of the streams during the sampling period
Parameter/site s NO2–N (mg/L) NO3–N (mg/L) NH4–N (mg/L) PO3−4 (mg/L) BOD (mg/L DO (mg/L)
S1; range 0.0–0.03 0.01–0.17 0.0–0.03 0.12–0.93 5–36 0.4–4.4Mean ± SD 0.009 ± 0.01 0.098 ± 0.04 0.014 ± 0.007 0.76 ± 0.2 19.42 ± 12.75 1.91 ± 1.44S2; range 0.002–0.006 ND–0.25 0.01–0.03 3.8–4.42 53–109 1.3–3.5Mean ± SD 0.003 ± 0.001 0.14 ± 0.09 0.016 ± 0.007 4.08 ± 0.21 80.8 ± 22.87 2.06 ± 0.81S3; range ND–0.01 ND–0.24 0.0–0.02 2.1–2.7 385–501 0.2–0.7Mean ± SD 0.004 ± 0.004 0.123 ± 0.09 0.011 ± 0.006 2.43 ± 0.18 423.9 ± 42.10 0.37 ± 0.18S4; range ND–0.06 0.09–0.44 0.01–0.04 2.25–3.17 69–192 0.2–1.5Mean ± SD 0.002 ± 0.001 0.24 ± 0.12 0.019 ± 0.01 2.632 ± 0.36 102 ± 47.93 0.66 ± 0.58S5; range 0.01–0.012 0.07–0.86 0.01–0.04 4.3–11.20 20–42 0.7–2.2Mean ± SD 0.007 ± 0.047 0.32 ± 0.29 0.031 ± 0.03 7.916 ± 2.41 28 ± 8.33 1.35 ± 0.60NaturalBackground – 0.23 – 0.02 1–3 7WHO limit 1.0 10.0 1.5 < 0.3 < 3 –

Environ Monit Assess (2010) 161:413–422 419
Day 1993). High concentrations of NO3–N andNO2–N are potential health risks, particularly inpregnant women and infants under 6 years ofage (Kempster et al. 1997). NO3–N at elevatedconcentrations can cause cyanosis in infants. Tasteand odor problems may arise when the NH4–Hlevel is greater than 2 mg/L. All the streams in thecatchment recorded NO3–N, NO2–N, and NH4–Nconcentrations lower than the WHO permissiblelimit for drinking water. The result is presentedin Table 4. The patterns of nitrate and nitriteconcentrations did not follow any particular order.Apart from S5, all the sampling sites showed anincrease in nitrite concentration from March toApril, which could be a result of human activitiesaround these areas.
The Owabi River (Atafoa) registered the high-est mean phosphate concentration of 7.916 ±0.76 mg/L while samples from Kronum recordedthe lowest (0.764 ± 0.08 mg/L). All the valueswere above the WHO recommended levels ofless than 0.3 mg/L. High concentration of phos-phate in water bodies is an indication of pollu-tion and is largely responsible for eutrophication(MacCutcheon et al. 1983). The high phosphatelevels in all the streams may have come fromsmall-scale farming activities found along thebanks of the streams (Sharpley et al. 1987). Thelevels of phosphate in the streams suggest that theuntreated water could not be recommended fordrinking and other domestic purposes. Phosphateis an essential component of biological cycles andpromotes algal growth in the water bodies. Thehigh phosphate levels recorded for these streamsare a threat to the survival of the streams.
Generally, concentrations of nutrients in thestreams were low which could probably be as aresult of low runoffs since this work was done inthe dry season. Ansa-Asare and Asante (1998) re-ported that there is a general decrease in nutrientconcentration in the dry season. Of all the nutri-ents, phosphorus was exceptionally high in all thestreams. The ratio of N:P in the streams rangedfrom 1:29 in R. Akyeampomene at Bremangto 1:7 in R. Owabi at Kronum. These high phos-phorus levels indicate higher algal blooms in thestreams, which could lead to eutrophication. Thehigh phosphate levels in the streams may be at-tributed to phosphate-rich sewage material from
the town and the banks that are dumped into thestreams (MacCutcheon et al. 1983). It could alsocome from drains rich in detergents (Akpabli andDrah 2001). The streams are dammed, abstracted,and treated to supply water to parts of Kumasi andits environs. Eutrophication could increase watertreatment cost through filter clogging in watertreatment works.
The results obtained for microbial analysis areshown in Table 5. Fecal coliform and E. colipollution were widespread, and the entire wa-tershed is not suitable for domestic use withouttreatment. For agricultural purposes, vegetableswatered with these streams may be contaminated.The logarithmic mean fecal coliform count rangedbetween 10.87 ± 0.36 MPN/100 mL and 13.07 ±0.29 MPN/100 mL for River Akyeampomene sam-pled at Bremang and River Pumpunase sampledat Ampabaame, respectively. The high fecal co-liform counts in the streams are signs of biolog-ical contamination of the streams by pathogens.The high fecal coliform levels observed make thestreams unsuitable for swimming, boating, andfishing (WHO 2004; Millipore 1991). It also indi-cates significant health risks to humans and otheraquatic animals. The highest E. coli concentrationwas recorded in R. Owabi (Atafoa) at a loga-rithmic mean of 11.32 ± 0.27 MPN/100 mL andthe least was observed in R. Akyeampomene ata logarithmic mean of 9.61 ± 0.3 MPN/100 mL.High E. coli counts detected in the streams
Table 5 Range, mean, and standard deviation of fecalcoliform and E. coli concentrations of the feeding streamsof Owabi reservoir during the sampling period
Parameter/site Fecal coliform E. coli(MPNLog/100 mL) (MPNLog/100 mL)
S1; range 10.18–13.96 8.32–11.86Mean ± SD 11.88 ± 1.38 10.04 ± 1.20S2; range 9.32–12.86 8.18–10.86Mean ± SD 10.87 ± 1.15 9.61 ± 0.96S3; range 11.32–14.37 9.96–11.96Mean ± SD 13.07 ± 0.93 (10.68 ± 0.22)S4; range 10.96–12.62 8.86–11.86Mean ± SD 11.65 ± 0.53 9.83 ± 0.94S5; range 12.62–13.96 9.32–12.32Mean ± SD 13.45 ± 0.47 11.32 ± 0.86WHO limit 0 Absent
420 Environ Monit Assess (2010) 161:413–422
indicated heavy pollution. The results suggest thatthe general sanitary qualities of the water in thecatchment, as indicated by fecal coliform and E.coli counts, are unacceptable. For water to beconsidered as no risk to human health, the fecalcoliform and E. coli count/100 mL should be zero(WHO 2004). The poor microbial quality might bedue to contamination caused by human activitiesand livestock that graze along the banks of therivers.
Self-purification is the ability of water bodies(streams) to reduce or eliminate the undesirablecontaminants (Mehrdadi et al. 2006). The pol-lutants in R. Owabi sampled at Kronum (up-stream), were compared with R. Owabi sampledat Atafoa (downstream) using the Student’s t test.Five parameters decreased in concentration fromupstream to downstream. Out of the five para-meters, DO did not decrease significantly. Theremaining parameters (grease and oil, F−, NO−
2 ,and TSS) decreased significantly in their concen-trations downstream (p < 0.01). The Owabi Riverexhibited a high self-purification capacity for theseparameters. This means that the Owabi River hasa high self-purification capacity for these parame-ters and that it can purify itself when it is pollutedupstream. However, 13 parameters showed an in-crease in concentration downstream. Out of the13 parameters, only five (TDS, alkalinity, NO−
3 ,PO3−
4 , and fecal coliform) recorded significant in-crease (p > 0.05). This stream does not have theability to purify itself completely when pollutedupstream.
River Pumpunase (upstream) was also com-pared with River Sukobri (downstream) to deter-mine the self-purification capacity of the stream.Eight parameters decreased in concentration as
the water flowed downstream. Only TSS andNO−
2 showed a significant decrease in concen-tration (p < 0.05). Ten parameters showed in-crease in concentrations when the stream floweddownstream. TH, DO, Mg-H, PO3−
4 , and greaseand oil showed significant increase (p > 0.05)downstream. The Sukobri River showed self-purification ability when it flows downstream.
Although the streams have an appreciableself-purification capacity, the capacity is strainedby persistent pollution overloads. The pollutionplight of the streams is because they are flankedby expanding human settlements; institutional andsocio-economic activities are also scattered chaot-ically within the catchment.
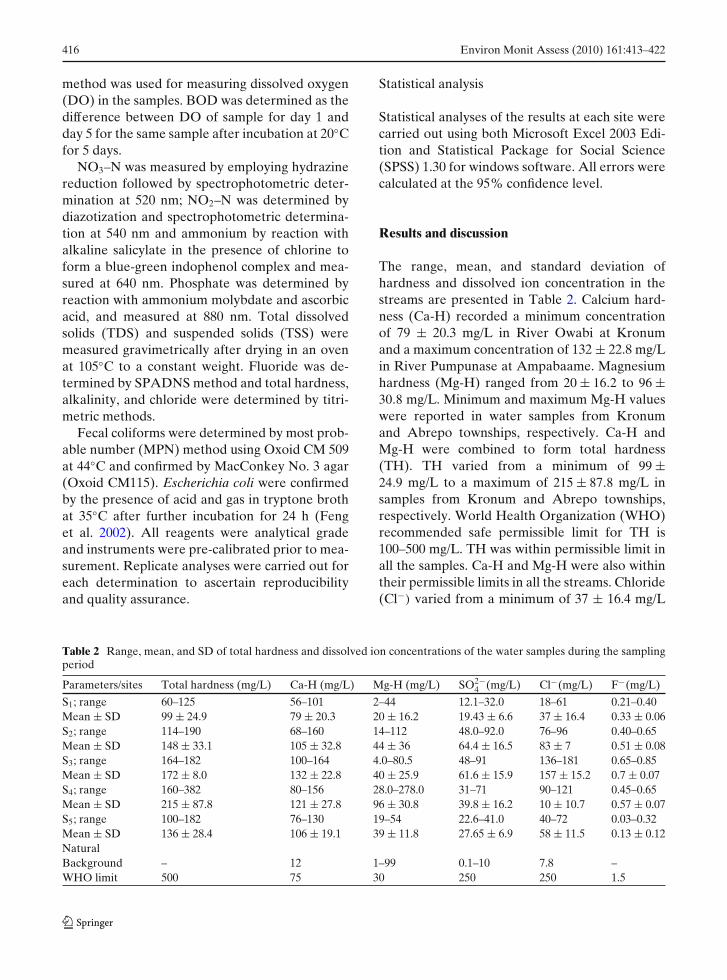
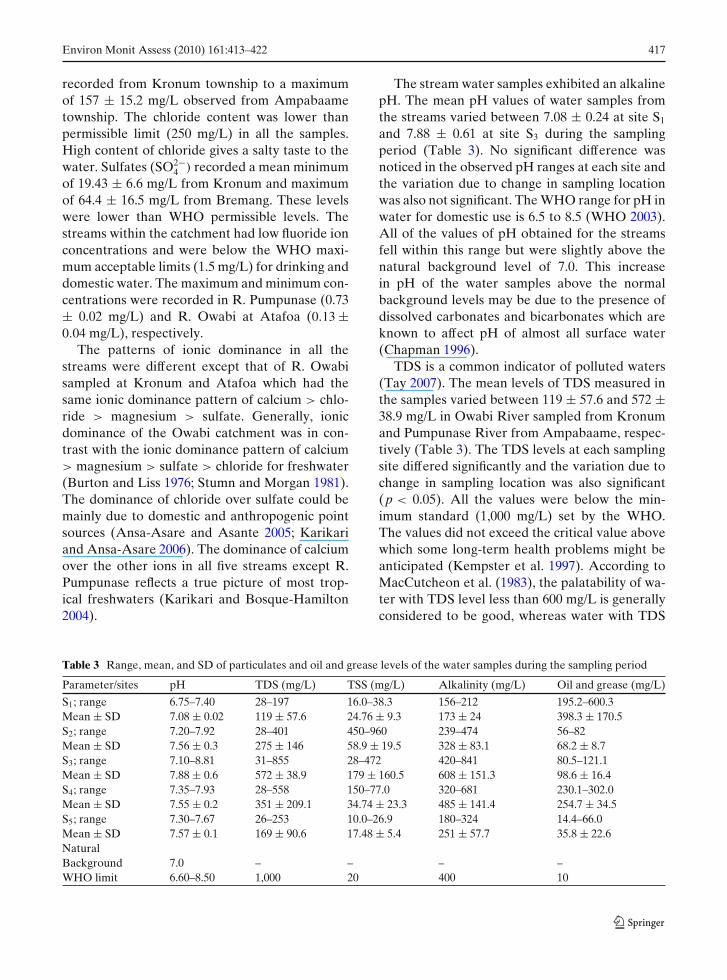
In order to detect similarities in terms of pol-lution between the streams, cluster analysis wasperformed on the available dataset. As shownin Fig. 2, dendrogram of cluster analysis de-picts three distinct clusters, namely, less polluted,moderately polluted, and highly polluted. Clus-ter 1 consisting of R. Owabi at Kronum andAtafoa sampling points is said to be less pol-luted. This area is characterized by small-scalefarming activities which are scarcely practicedduring the dry season. Cluster 2 comprises ofR. Akyeampomene and R. Sukobri. R. Akyeam-pomene passes through Suame light industrialarea which is noted for high discharge of do-mestic waste due to improper sanitation and dis-charges from automobile workshops. This clusterwas moderately polluted. The third cluster rep-resents R. Pumpunase which showed a markedpollution level in this study. River Pumpunase islocated at Ampabaame, just adjacent to an IslamicSenior High School. Pollution from drains fromthe school, human settlements, and miscellaneous
Fig. 2 Dendrogramshowing spatial similarityand site groupingsaccording to surfacewater qualitycharacteristics of thestreams within thecatchment area
Rescaled Distance Cluster Combine
Environ Monit Assess (2010) 161:413–422 421
activities along the banks could account for therelatively high pollution levels of the stream.
Conclusion
The results indicated that most of the physico-chemical quality parameters of the major riverssampled were within the WHO limits for drinkingwater and, therefore, may be suitable for domesticpurposes. In contrast, the bacteriological qualityof the water points, as suggested by the fecal col-iform and E. coli counts, far exceeded the WHOstandard for potable water. In general, the bacte-riological quality of the water was unacceptable,and would pose serious health risks to consumerswho use them without treatment. The poor bacte-riological quality was due to direct contaminationby animal and human wastes.
Self-purification abilities of streams revealedthat, although the streams have an appreciableself-purification capacity, the capacity is stressedby persistent pollution overloads along the causeof water flow by expanding human activities.Results of cluster analysis on pollution distribu-tion patterns of the streams suggested that RiverPumpunase located at Ampabaame was the mostpolluted.
Acknowledgements The authors are grateful to the man-agement and staff of Ghana Water Company Limited,Kumasi, for allowing the use of some equipment in theirlaboratory for this work.
References
Ansa-Asare, O. D., & Asante, K. A. (1998). A com-parative study of the nutrient status of two reser-voirs in southeast Ghana. Lakes and Reservoirs,Research and Management, 3, 205–217. doi:10.1046/j.1440-1770.1998.00074.x.
Ansa-Asare, O. D., & Asante, K. A. (2005). The waterquality of Birim Stream in South-East of Ghana. WestAfrican Journal of Applied Ecology, 8, 23–34.
Akpabli, C. K., & Drah, G. K. (2001). Water quality of themain tributaries of the Densu Stream. Journal of theGhana Science Association, 3(2), 84–94.
APHA.AWWA, WEF (1998). Standard methods for theexamination of water and wastewater (20th ed.).Washington, DC: APHA.
Buchholz, R. A. (1998). Principles of environmental man-agement. The greening of business (2nd ed.). London:Prentice-Hall.
Burton, J. D., & Liss, P. S. (1976). Estuarine chemistry. NewYork: Academic. 7:229.
Chapman, D. (1996). Water quality assessment. A guide tothe used of biota, sediments and water in environmentalmonitoring (2nd ed.). London: E. and F. N. Spon.
Dallas, H. F., & Day, J. A. (1993). The effect of water qualityvariables on rivers and ecosystems. Water ResearchMonitoring Commission report No. TT 61/93. SouthAfrica.
DFID (1999). A Simple Methodology for Water QualityMonitoring. Report OD 142 (KAR Project R6662).In G. R. Pearce, M. R. Chandhry, & S. Ghulum (Eds.),A simple methodology for water quality monitoring(p. 16). HR Wallingford: UK.
Feng, P., Weagant, S. D., & Grant, M. A. (2002). Enumera-tion of Escherichia coli and the Coliform Bacteria. USFDA/CFSAN.
Fakayode, S. O. (2005). Impact of industrial effluents onwater quality of the receiving Alaro River in Ibadan,Nigeria. AJEAM-RAGEE, 10, 1–13.
Karikari, A. Y., & Ansa-Asare, O. D. (2006). Physico-chemical and microbial water quality assessment ofDensu Stream of Ghana. West African Journal ofApplied Ecology, 10(10), 158.
Karikari, A. Y., & Bosque-Hamilton, E. K. (2004). The wa-ter quality of Lake Bosomtwi and its feeder streams.Journal of the Ghana Science Association, 6, 117–127.
Kempster, P. L., Van Vliet, H. R., & Kuhn, A. (1997).The need for guide to bridge the gap between idealdrinking water quality and quality which is practicable,available and acceptable. Water South Africa, 23(20),163–167.
Langmuir, D. (1997). Aqueous environmental geochem-istry. Upper Saddle River: Prentice-Hall.
Lester, J. N., & Birkett, J. W. (1999). Microbiology andchemistry for environmental scientists and engineers(2nd ed.) New York: E and FN Spon. Management,Office of Water Quality, Assessment Branch, SurveysSection, Indianapolis.
MacCutcheon, S. C., Martin, J. L., & Barnwell, T. O.,Jr. (1983). Water quality. In Handbook of hydrology.New York: McGraw-Hill.
McGregor, D. F. M., Thompson, D. A., & Simon, D.(2000). Water quality and management in peri-urbanKumasi, Ghana. Case Study 16 inland-water linkagesin rural watersheds. Rome: FAO. Electronic workshop.
Mehrdadi, N., Ghobadi, M., Nasrabadi, T., & Hoveidi, H.(2006). Evaluation of the quality and self purifica-tion potential of Tajan Stream using QUAL2E Model.Iranian Journal of Environmental Health Science andEngineering, 3(3), 199–204.
Millipore. (1991). Water microbiology. Laboratories andfield procedures (p. 32). Bedford: Millipore.
Obiri-Danso, K., Weobong, C. A. A., & Jones, K. (2005).Aspects of health-related microbiology of the Subin,

422 Environ Monit Assess (2010) 161:413–422
an urban stream in Kumasi, Ghana. Journal of Waterand Health, 3, 69–76.
Pestle, S. (1997). Fairing water scarcities. World Watch En-vironmental Alert Series, 38, 239.
Sharpley, A. N., Smith, S. J., & Naney, J. W. (1987). Theenvironmental impact of agricultural nitrogen andphosphorus use. Journal of Agricultural and FoodChemistry, 35, 812–817. doi:10.1021/jf00077a043.
Statistical Service (2000). Ghana population and housingcensus, statistical service. Accra: Ghana Publishing.
Stumn, W., & Morgan, J. J. (1981). Aquatic chemistry(p. 780). New York: Willey.
Svobodová, Z., Lloyd, R., Máchová, J., & Vykusová, B.(1993). Water quality and fish health. EIFAC Technicalpaper No. 54. FAO.
Tay, C. K. (2007). Chemical characteristics of groundwaterin the Akatsi and Ketu Districts of the Volta Region,
Ghana. West African Journal of Applied Ecology, 11,3–25.
UNEP (2000). Global Environmental Outlook, UnitedNations Environment Programme Global State of theEnvironment Report, 2000.
Verma, B. L., & Srivastava, R. N. (1990). Measurementof the personal cost of illness due to some majorwater-related issues in an Indian rural population.International Journal of Epidemiology, 19, 169–176.doi:10.1093/ije/19.1.169.
WHO (2003). Background document for preparation ofWHO Guidelines for drinking-water quality. Geneva,World Health Organization. WHO/SDE/WSH/03.04
WHO (2004). Guidelines for drinking water quality (Ad-dendum). Geneva. www.who.int/water_sanitation-health/publications/facts2004/en/index.html