Characterizing T-cell receptor gamma-variable gene in Aotus nancymaae owl monkey peripheral blood
11
Characterizing T-cell receptor g -variable gene in Aotus nancymaae owl monkey peripheral blood J.E. Guerrero D.P. Pacheco C.F. Sua ´rez P. Martı ´nez F. Aristizabal C.A. Moncada M.E. Patarroyo M.A. Patarroyo Authors’ affiliations: J.E. Guerrero 1,2* , D.P. Pacheco 1* , C.F. Sua ´rez 1* , P. Martı ´nez 1,2 , F. Aristizabal 2 , C.A. Moncada 1 , M.E. Patarroyo 1,2 , M.A. Patarroyo 1,2* 1 Molecular Biology Department, Fundacio ´n Instituto de Inmunologı ´a de Colombia, Santa Fe de Bogota ´, Colombia 2 Universidad Nacional de Colombia, Bogota ´, Colombia Correspondence to: M. A. Patarroyo Fundacio ´n Instituto de Inmunologı ´a de Colombia Calle 26 No 50-00 Santa Fe de Bogota ´, Colombia Tel: þ57 1 3244672x141 Fax: þ57 1 4815269 e-mail: [email protected] Abstract: gd T lymphocytes have a heterodimeric complex formed by the association of g and d chains as receptor. Proliferation of this lymphocyte population has been observed, when infection by several pathogens such as Mycobacterium tuberculosis and Plasmodium spp. occurs. The New World Monkey Aotus nancymaae has become a very good experimental model for the immunological and physiopathological study of these infectious agents. The A. nancymaae g-variable region was characterized from peripheral blood samples by using cDNA and genomic DNA polymerase chain reaction amplification, DNA sequencing, and dot-blot hybridization techniques. Seventeen different T-cell receptor g-variable (TCRGV) sequences were obtained. These sequences were distributed among TCRGV subsets 1, 2, or 3, according to human subset classification. Although no subset 4 amplification was obtained, this subset was detected by dot-blot hybridization. The presence of these 4 subsets resembles the behavior displayed by ‘gd-low species’ (humans and mice), where high diversity among these lymphocytes can be observed. Homologies greater than 70% were found with respect to humans. Sequence convergence between human and A. nancymaae subsets 1 and 3 highlights Aotus as a promising model for studying these lymphocyte functions. gd T lymphocytes use a heterodimer complex formed by g- and d-chain association (1). The gd population is variable in different species; the ‘gd-low’ species include humans and mice, whose gd T cells constitute a very limited proportion, about 5% of total T lymphocytes in peripheral blood. However, within these species, gd T lymphocytes in tissues, especially in gut and reproductive epithelia, may account for almost half of the T cells (2). The ‘gd high’ group includes sheep, cattle, rabbits, and chicken, where gd T cells comprise up to 60% of the peripheral T-cell population (3). In humans, gd T lymphocytes have been classified into groups under different properties, for example, classified by particular Key words: Aotus; evolution; gd T lymphocytes; Platyrrhini; T-cell receptor Acknowledgments: We are greatly indebted to P. Ca ´rdenas, Y.P. de Coan ˜a, F. Carrillo, M. Mancera, and F. Guzma ´n for their valuable help in preparing this manuscript, to R. Rodrı ´guez for his help in obtaining the monkey blood samples, and to J. Garry for patiently revising the manuscript. This work was financed by the Colombian Ministry of Public Health. Received 10 May 2003, revised 19 June 2003, accepted for publication 15 July 2003 Copyright ß Blackwell Munksgaard 2003 Tissue Antigens. Tissue Antigens 2003 62: 472–482 Printed in Denmark. All rights reserved * The authors made equal contributions to this work. 472
Transcript of Characterizing T-cell receptor gamma-variable gene in Aotus nancymaae owl monkey peripheral blood
Characterizing T-cell receptor g -variablegene in Aotus nancymaae owl monkey
peripheral blood
J.E. Guerrero
D.P. Pacheco
C.F. Suarez
P. Martınez
F. Aristizabal
C.A. Moncada
M.E. Patarroyo
M.A. Patarroyo
Authors’ affiliations:
J.E. Guerrero1,2*,
D.P. Pacheco1*,
C.F. Suarez1*,
P. Martınez1,2,
F. Aristizabal2,
C.A. Moncada1,
M.E. Patarroyo1,2,
M.A. Patarroyo1,2*
1Molecular Biology
Department, Fundacion
Instituto de Inmunologıa de
Colombia, Santa Fe de
Bogota, Colombia
2Universidad Nacional de
Colombia, Bogota, Colombia
Correspondence to:
M. A. Patarroyo
Fundacion Instituto de
Inmunologıa de Colombia
Calle 26 No 50-00
Santa Fe de Bogota,
Colombia
Tel: þ57 1 3244672x141
Fax: þ57 1 4815269
e-mail: [email protected]
Abstract: gd T lymphocytes have a heterodimeric complex formed by the
association of g and d chains as receptor. Proliferation of this lymphocyte
population has been observed, when infection by several pathogens such as
Mycobacterium tuberculosis and Plasmodium spp. occurs. The New World
Monkey Aotus nancymaae has become a very good experimental model for
the immunological and physiopathological study of these infectious agents.
The A. nancymaae g-variable region was characterized from peripheral blood
samples by using cDNA and genomic DNA polymerase chain reaction
amplification, DNA sequencing, and dot-blot hybridization techniques.
Seventeen different T-cell receptor g-variable (TCRGV) sequences wereobtained. These sequences were distributed among TCRGV subsets 1, 2, or 3,
according to human subset classification. Although no subset 4 amplification
was obtained, this subset was detected by dot-blot hybridization. The
presence of these 4 subsets resembles the behavior displayed by ‘gd-lowspecies’ (humans and mice), where high diversity among these lymphocytes
can be observed. Homologies greater than 70% were found with respect to
humans. Sequence convergence between human and A. nancymaae subsets
1 and 3 highlights Aotus as a promising model for studying these lymphocyte
functions.
gd T lymphocytes use a heterodimer complex formed by g- and
d-chain association (1). The gd population is variable in different
species; the ‘gd-low’ species include humans and mice, whose gd
T cells constitute a very limited proportion, about 5% of total
T lymphocytes in peripheral blood. However, within these species,
gd T lymphocytes in tissues, especially in gut and reproductive
epithelia, may account for almost half of the T cells (2). The ‘gd
high’ group includes sheep, cattle, rabbits, and chicken, where gd
T cells comprise up to 60% of the peripheral T-cell population (3).
In humans, gd T lymphocytes have been classified into groups
under different properties, for example, classified by particular
Key words:
Aotus; evolution; gd T lymphocytes; Platyrrhini;
T-cell receptor
Acknowledgments:
We are greatly indebted to P. Cardenas, Y.P. de
Coana, F. Carrillo, M. Mancera, and F. Guzman
for their valuable help in preparing this
manuscript, to R. Rodrıguez for his help in
obtaining the monkey blood samples, and to
J. Garry for patiently revising the manuscript. This
work was financed by the Colombian Ministry of
Public Health.
Received 10 May 2003, revised 19 June 2003,
accepted for publication 15 July 2003
Copyright � Blackwell Munksgaard 2003
Tissue Antigens.
Tissue Antigens 2003 62: 472–482
Printed in Denmark. All rights reserved*The authors made equal contributions to this work.
472
expressed g-variable gene segments as well as their specific
anatomical location. Subset 1 (S1) is formed by the group displaying
any of the variable g segments (Vg2, Vg3, Vg4, Vg5, and Vg8), these
lymphocytes being mainly located in bowel and colon mucosa (4–6).
Subset 2 (S2) comprises Vg9 segment-expressing lymphocytes,
preferentially located in peripheral blood (7). Finally, subsets 3 (S3)
and 4 (S4) are conformed by Vg10 and Vg11 segments, respectively;
these last subsets do not have a specific location. Those lymphocytes
prevailing both in peripheral blood and secondary lymphoid tissues
carry out an immune-response regulatory function, whilst gd
T lymphocytes located in mucosa act as cytotoxic lymphocytes (8, 9).
T-cell receptor diversity is mainly generated by germline recombin-
ation of variable (V), diversity (D), and joining (J) gene segments to
form the variable domain (V-J in g and V-D-J in d chains, respect-
ively). This variable domain is responsible for interacting with the
antigen. Each variable segment (V) has been divided into five regions
according to its function: two complementarity-determining regions
(CDRs) and three framework regions (FRs). CDRs form loops and are
in direct contact with antigen, whilst FRs adopt b-sheet conformation
providing structural support (10). Previous studies have shown that
positive Darwinian selection is displayed in immunoglobulin (Ig)
CDRs and T-cell receptor b (TCRb) but not in their respective FRs.
This selection is associated with high diversity at CDR level.
gd T lymphocytes have been proposed as ancestral to ab T and B
cells, because they posses characteristics of both cellular types, such
as direct antigenic recognition (like B cells) and a membrane receptor
(like abT cells) (2, 3). Gamma and delta variable genes are grouped in a
restricted chromosome region and constitute a multigene family, as
occurs in other Ig superfamily members. The evolution of these genes
may be driven by some processes concerning the genomic organization
pattern, such as the concerted evolution process or the birth-and-death
evolution model. These phenomena have been demonstrated for major
histocompatibility complex (MHC) gene families, light and heavy Ig
chains, and variable b TCR gene families (11).
gd T-lymphocyte proliferation has been observed in pathogenic
processes caused by Mycobacterium tuberculosis, Plasmodium sp.,
Toxoplasma gondii, Yersinia enterocolitica, Epstein–Barr virus and
early human immunodeficiency viral infections (12–17), responding
primarily to non-peptide antigens, phosphoantigens, alkylamines,
heat-shock proteins and non-classical MHC class I molecules, such
as MIC A and B (8, 18). Their recognition is carried out directly,
contrary to what happens with ab T lymphocytes in which such
recognition is indirectly mediated via MHC-dependent antigen
presentation (19).
Aotus monkeys can be infected by Plasmodium parasites causing
human malaria, therefore becoming a valuable animal model for
malaria vaccine development and antimalarial drug screening
(20–22). The Aotus immune system [ab T-lymphocyte receptors
(23), class I (24) and class II MHC molecules (25, 26), Igs (27), and
cytokines (28)] has been molecularly characterized at our institute for
better understanding of the parasite–host interaction in this experi-
mental model. High molecular similarity has generally been shown to
date between human and Aotus sequences.
Because gd T lymphocytes are involved in immune response
modulation against malaria, genetic rearrangement studies of those
gene segments encoding splenic owl monkey gd T-cell receptor
molecules have been done at molecular and functional level (29),
demonstrating that this primate constitutes an excellent animal
model for investigating the role of T cells during immune responses
against this infectious disease.
This study focuses on characterizing the gd T-cell peripheral blood
population, emphasizing molecular diversity, subset identification,
comparative analysis with previously reported primate sequences,
and synonymous and non-synonymous substitutions within the dif-
ferent regions constituting the molecule. An explanation of the
evolutionary relationship phenomena occurring in this type of multi-
gene family is also discussed.
Materials and methods
Animals
About 3ml of blood was obtained from each A. nancymaae monkey
(14 animals) by venipuncture. Monkeys were kept at our institute’s
experimental primate station in Leticia (Amazon), in accordance with
CCAC (Committee on Care and Use of Laboratory Animals, US)
guidelines and the Colombian National Institute of Health guidelines
for the use of laboratory animals, supervised by the Colombian
Wildlife Corporation (CORPOAMAZONIA). No antigenic stimulus
was applied, in order to study gd T-lymphocyte diversity in healthy
animals.
RNA and genomic DNA extraction, cDNA synthesis,
cloning, and sequencing
Total A. nancymaae heparin-anticoagulated peripheral blood samples
were obtained for mononuclear cell isolation. Lymphocytes were
separated by gradient centrifugation on Ficoll–Hypaque.
Total RNA was extracted from peripheral blood lymphocytes with
Trizol reagent (Gibco BRL, Rockville, MD) and used for cDNA
synthesis. Reverse transcription mixture contained 200U Moloney
murine leukemia virus reverse transcriptase (MMLV-RT), 5� RT
buffer, 10mM dNTPs, and 5mM oligo dT (Promega, Madison, WI).
The reaction was incubated for 1 h at 42 and 95�C for 5min for
Guerrero et al : T-cell receptor g-variable gene
Tissue Antigens 2003: 62: 472–482 473
first-strand cDNA synthesis. Genomic DNA was extracted with
Wizard DNA genomic Preps (Promega).
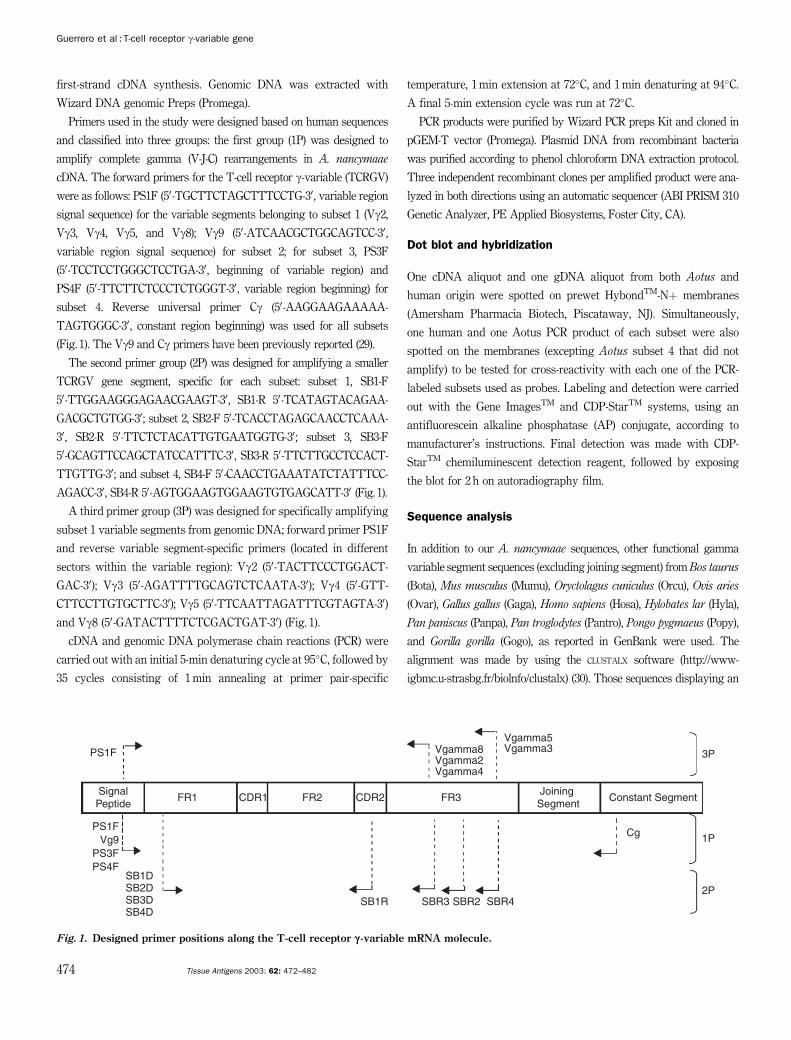
Primers used in the study were designed based on human sequences
and classified into three groups: the first group (1P) was designed to
amplify complete gamma (V-J-C) rearrangements in A. nancymaae
cDNA. The forward primers for the T-cell receptor g-variable (TCRGV)
were as follows: PS1F (50-TGCTTCTAGCTTTCCTG-30, variable region
signal sequence) for the variable segments belonging to subset 1 (Vg2,
Vg3, Vg4, Vg5, and Vg8); Vg9 (50-ATCAACGCTGGCAGTCC-30,
variable region signal sequence) for subset 2; for subset 3, PS3F
(50-TCCTCCTGGGCTCCTGA-30, beginning of variable region) and
PS4F (50-TTCTTCTCCCTCTGGGT-30, variable region beginning) for
subset 4. Reverse universal primer Cg (50-AAGGAAGAAAAA-
TAGTGGGC-30, constant region beginning) was used for all subsets
(Fig. 1). The Vg9 and Cg primers have been previously reported (29).
The second primer group (2P) was designed for amplifying a smaller
TCRGV gene segment, specific for each subset: subset 1, SB1-F
50-TTGGAAGGGAGAACGAAGT-30, SB1-R 50-TCATAGTACAGAA-
GACGCTGTGG-30; subset 2, SB2-F 50-TCACCTAGAGCAACCTCAAA-
30, SB2-R 50-TTCTCTACATTGTGAATGGTG-30; subset 3, SB3-F
50-GCAGTTCCAGCTATCCATTTC-30, SB3-R 50-TTCTTGCCTCCACT-
TTGTTG-30; and subset 4, SB4-F 50-CAACCTGAAATATCTATTTCC-
AGACC-30, SB4-R 50-AGTGGAAGTGGAAGTGTGAGCATT-30 (Fig. 1).
A third primer group (3P) was designed for specifically amplifying
subset 1 variable segments from genomic DNA; forward primer PS1F
and reverse variable segment-specific primers (located in different
sectors within the variable region): Vg2 (50-TACTTCCCTGGACT-
GAC-30); Vg3 (50-AGATTTTGCAGTCTCAATA-30); Vg4 (50-GTT-
CTTCCTTGTGCTTC-30); Vg5 (50-TTCAATTAGATTTCGTAGTA-30)
and Vg8 (50-GATACTTTTCTCGACTGAT-30) (Fig. 1).
cDNA and genomic DNA polymerase chain reactions (PCR) were
carried out with an initial 5-min denaturing cycle at 95�C, followed by
35 cycles consisting of 1min annealing at primer pair-specific
temperature, 1min extension at 72�C, and 1min denaturing at 94�C.
A final 5-min extension cycle was run at 72�C.
PCR products were purified by Wizard PCR preps Kit and cloned in
pGEM-T vector (Promega). Plasmid DNA from recombinant bacteria
was purified according to phenol chloroform DNA extraction protocol.
Three independent recombinant clones per amplified product were ana-
lyzed in both directions using an automatic sequencer (ABI PRISM 310
Genetic Analyzer, PE Applied Biosystems, Foster City, CA).
Dot blot and hybridization
One cDNA aliquot and one gDNA aliquot from both Aotus and
human origin were spotted on prewet HybondTM-Nþ membranes
(Amersham Pharmacia Biotech, Piscataway, NJ). Simultaneously,
one human and one Aotus PCR product of each subset were also
spotted on the membranes (excepting Aotus subset 4 that did not
amplify) to be tested for cross-reactivity with each one of the PCR-
labeled subsets used as probes. Labeling and detection were carried
out with the Gene ImagesTM and CDP-StarTM systems, using an
antifluorescein alkaline phosphatase (AP) conjugate, according to
manufacturer’s instructions. Final detection was made with CDP-
StarTM chemiluminescent detection reagent, followed by exposing
the blot for 2 h on autoradiography film.
Sequence analysis
In addition to our A. nancymaae sequences, other functional gamma
variable segment sequences (excluding joining segment) fromBos taurus
(Bota), Mus musculus (Mumu), Oryctolagus cuniculus (Orcu), Ovis aries
(Ovar), Gallus gallus (Gaga), Homo sapiens (Hosa), Hylobates lar (Hyla),
Pan paniscus (Panpa), Pan troglodytes (Pantro), Pongo pygmaeus (Popy),
and Gorilla gorilla (Gogo), as reported in GenBank were used. The
alignment was made by using the CLUSTALX software (http://www-
igbmc.u-strasbg.fr/biolnfo/clustalx) (30). Those sequences displaying an
PS1F
SignalPeptide
FR1 FR2 FR3CDR1 CDR2Joining Segment
Constant Segment
SB1D
SB1R SBR3 SBR2 SBR4SB2DSB3DSB4D
Cg
3P
1P
2P
PS1F
PS3FPS4F
Vg9
Vgamma8Vgamma2
Vgamma5Vgamma3
Vgamma4
Fig. 1. Designed primer positions along the T-cell receptor g-variable mRNA molecule.
Guerrero et al : T-cell receptor g-variable gene
474 Tissue Antigens 2003: 62: 472–482
intraspecific identity value higher than 98%, detected by GENEDOC
software (http://www.psc.edu/biomed/genedoc/) (31), were eliminated.
Homology analysis was carried out with respect to the shortest sequence
in all cases. The alignment reported in the EMBLALIGN alignment
database (http://srs.ebi.ac.uk/) (32), accession number ALIGN_000537,
contains the GenBank accession numbers for each sequence. Partial
sequences were excluded.
Phylogenetic trees were constructed with MEGA-2.1 software (http://
www.megasoftware.net/) (33) using parsimony (34) and distance
methods such as minimum evolution (ME) (35) and neighbor-joining
(NJ). Genetic distances were estimated by using the P, Jukes-Cantor
(36), and Kimura two-parameter (37) distances for nucleotide and P,
gamma and Poisson-corrected distances for amino acid sequences.
Bootstrap analysis and internal branch test (38) (1000 replicates each)
were used to assign confidence levels to branch nodes (values greater
than 70% for bootstrap and 95% for internal branch test were
considered significant). Rates of synonymous and non-synonymous
substitutions and associated variance (assessed by the bootstrap
method with 1000 replicates) were calculated by Nei and Gojobori’s
method (39) using MEGA-2.1 for FRs and CDRs. Maximum likelihood
(ML) analyses were performed with PHYLIP-3.6 software (40).
Nomenclature and variable segment classification of sequences
employed in this analysis agree with that previously reported in
1995 (41), using the IMMUNOGENETICS database (IMGT, http://imgt.
cines.fr/home.html).
Results and discussion
TCR gamma segments were specifically amplified by PCR, either
from DNA or from cDNA extracted from A. nancymaae peripheral
blood (findings are summarized in Table 1).
Eleven TCRGV sequences from cDNA and 12 other sequences
from genomic DNA were obtained. All primer combinations success-
fully amplified human controls.
Only subsets 1 and 2 from A. nancymaae cDNA were successfully
amplified by 1P primers, while no amplification was obtained when
using subset 3 and 4 primers. Subset 1, subset 2, and subset 3 were
amplified from both cDNA and genomic DNA when 2P primers were
used. We performed genomic DNA specific amplification of this
subset in A. nancymaae using 3P primers, because subset 1 possesses
higher allelic groups than other subsets in humans. Only the
segment-specific variable primers for Vg5 and Vg8 showed a positive
amplification.
Sequences obtained were included in a group when the identity
among them at nucleotide level was higher than 98%. According to
this, those subset 1 sequences obtained were classified into four
Sequences obtained in the present work
Specimens
Subset Source Primers Groups GenBank ID 1 2 3 4 5 6 7 8 9 10 11 12 13 14
S1 cDNA PS1F-Cg GVa AY245680 X
AY245681 X X X
AY245682 X
AY245683 X
AY245684 X
AY245685 X
AY245686 X
Genomic DNA PS1F-Vg5 GVb AY245676 X
AY245675 X
GVc AY245677 X
PS1F-Vg8 AY245678 X
GVd AY245679 X
S2 cDNA Vg9-Cg GVe AY245688 X
AY245687 X
S3 Genomic DNA SB3-D SB3-R Gvf AY289743 X
Gvg AY289744 X X X X X
Gvh AY289745 X
The sequences chosen for subsequent analysis are shown in bold.
Table 1
Guerrero et al : T-cell receptor g-variable gene
Tissue Antigens 2003: 62: 472–482 475
groups: GVa, GVb, GVc, and GVd. Only one sequence group could be
distinguished in subset 2 (GVe). Subset 3 showed three groups: GVf,
GVg, and GVh. GVf and GVg had high similarity to previously
reported human subset 3. Some of the GVa subgroup (subset 1) and
GVe (Vg9, subset 2) sequences were identical or had a high homology
to previously reported Aotus sequences (29). Only two sequences
were observed in more than one individual (Table 1).
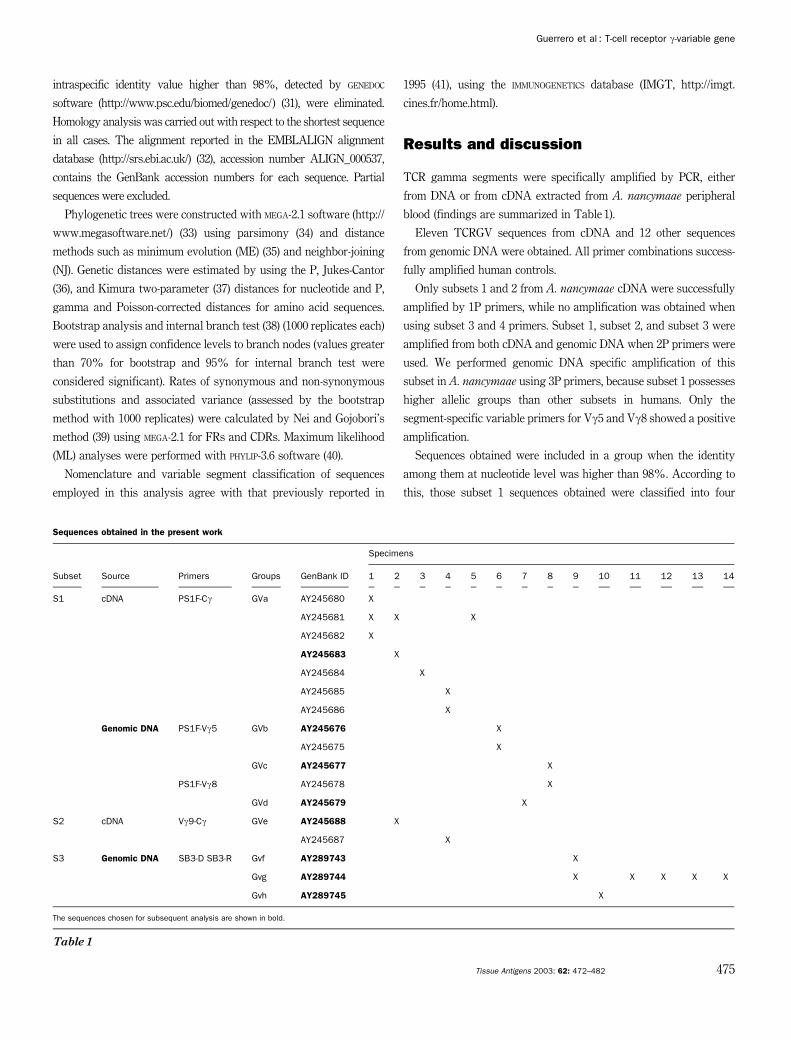
The presence of subset 3 sequences, as well as the evolutionary
relatedness of A. nancymaae to humans, suggested that A. nancy-
maae diversity would likely behave as ‘gd-low’ species do, having a
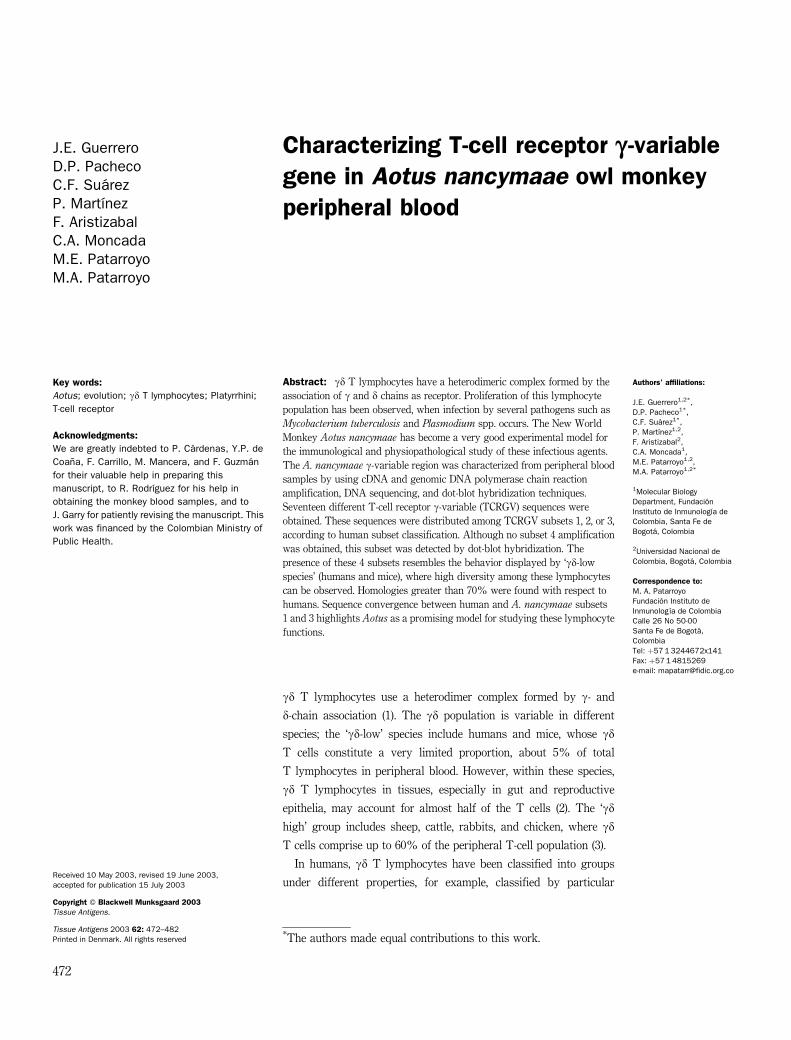
high subset number. Dot blot hybridization, using a human PCR-
labeled subset 4 sequence as probe, was performed for screening
subset 4 presence in A. nancymaae, because no PCR amplification
was obtained with the primer sets used. Positive results were
obtained from both A. nancymaae gDNA and cDNA, ratifying this
subset presence in owl monkeys, suggesting primer bias as being
responsible for the negative PCR result. Subset 1, 2, 3, and 4 probes
were tested against each subset-specific amplification product in dot
blot assays to discard intersubset cross-reactivity. No cross-reactivity
was observed (Fig. 2). These results suggest that owl monkeys
belong to the ‘gd-low’ species (3).
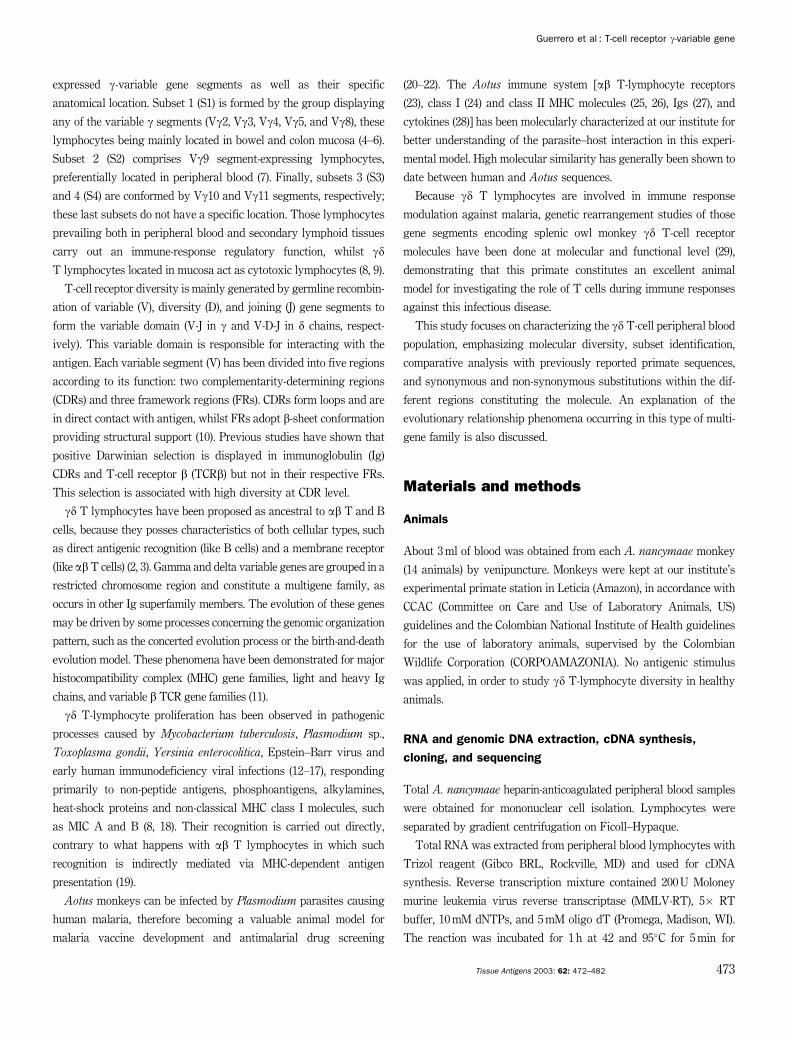
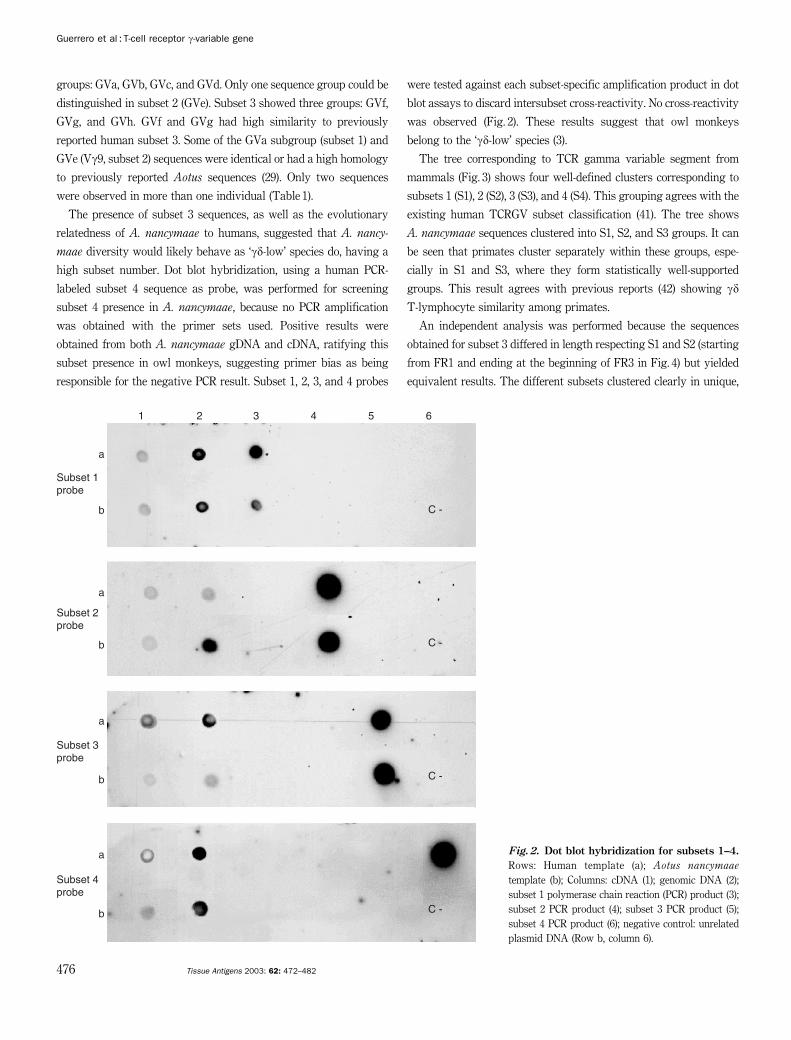
The tree corresponding to TCR gamma variable segment from
mammals (Fig. 3) shows four well-defined clusters corresponding to
subsets 1 (S1), 2 (S2), 3 (S3), and 4 (S4). This grouping agrees with the
existing human TCRGV subset classification (41). The tree shows
A. nancymaae sequences clustered into S1, S2, and S3 groups. It can
be seen that primates cluster separately within these groups, espe-
cially in S1 and S3, where they form statistically well-supported
groups. This result agrees with previous reports (42) showing gd
T-lymphocyte similarity among primates.
An independent analysis was performed because the sequences
obtained for subset 3 differed in length respecting S1 and S2 (starting
from FR1 and ending at the beginning of FR3 in Fig. 4) but yielded
equivalent results. The different subsets clustered clearly in unique,
1 2 3 4 5 6
a
b
Subset 1probe
a
b
Subset 2probe
a
b
Subset 3probe
a
b
Subset 4probe
C -
C -
C -
C -
Fig. 2. Dot blot hybridization for subsets 1–4.
Rows: Human template (a); Aotus nancymaae
template (b); Columns: cDNA (1); genomic DNA (2);
subset 1 polymerase chain reaction (PCR) product (3);
subset 2 PCR product (4); subset 3 PCR product (5);
subset 4 PCR product (6); negative control: unrelated
plasmid DNA (Row b, column 6).
Guerrero et al : T-cell receptor g-variable gene
476 Tissue Antigens 2003: 62: 472–482
well-supported groups. S3 sequences showed a close relationship to
primate S3 sequences. Aona-GVh was the most divergent sequence in
the primate S3 cluster; however, Aona-GVg was identical to the
human TCRGV10 sequence and only differed in one residue respect-
ing Aona-GVf (Fig. 3B).
Topologies obtained for both nucleotide and amino acid sequences by
several methods (ME, NJ, ML, and Parsimony) displayed the same groups,
these being supported by significant CP and bootstrap values (Fig. 3
denotes eachnode significantly supported in all calculationswithin a circle).
Global distribution throughout subsets was also maintained when
only FR regions were considered (both at nucleotide and at amino
acid level). Although the relationship between sequences inside each
FR might has varied, A. nancymaae and human FR sequences were
always related (data not shown).
CDRs maintained this global cluster pattern only at nucleotide
level, but the S4 cluster was not maintained at amino acid level;
however, S4 sequences remained related to each other and conserved
their clustering to S3. Such subset grouping was maintained in
primates. Considering CDR2 only, A. nancymaae and human
sequences were not found in a unique cluster (A. nancymaae
sequences are related to TCRGV from Bovidae, followed by human
sequences in S1), but when CDR1 or CDRs as a whole were consid-
ered, A. nancymaae and human sequences formed an exclusive group
(data not shown).
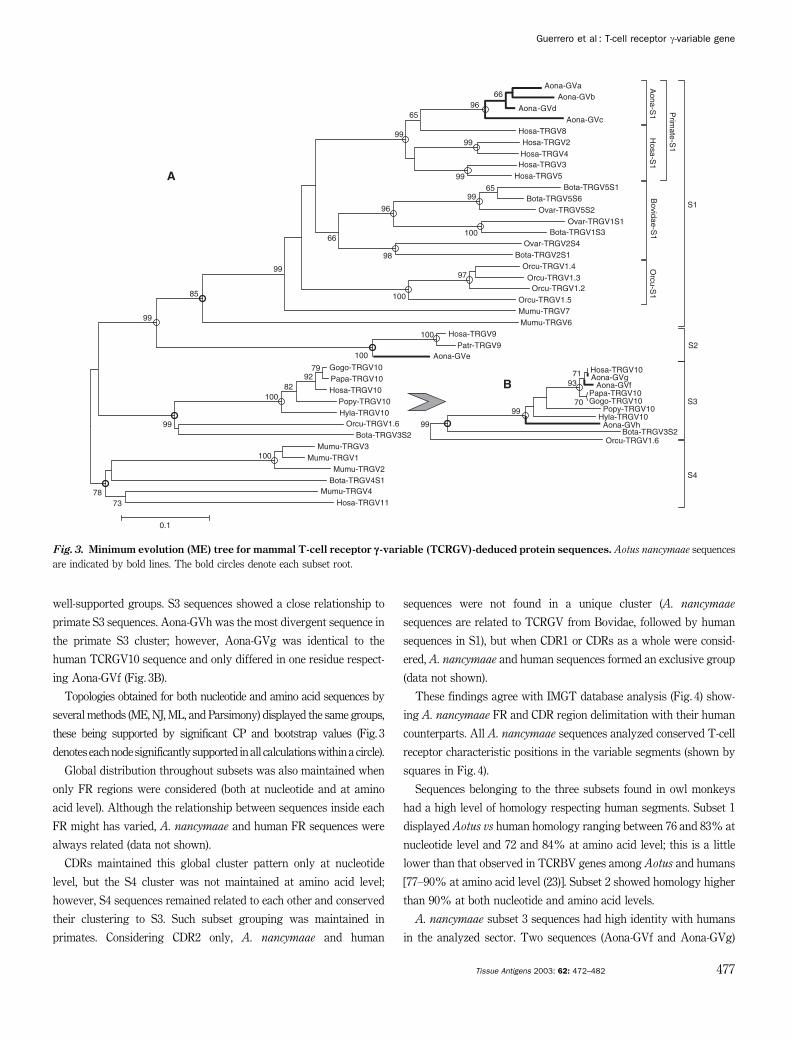
These findings agree with IMGT database analysis (Fig. 4) show-
ing A. nancymaae FR and CDR region delimitation with their human
counterparts. All A. nancymaae sequences analyzed conserved T-cell
receptor characteristic positions in the variable segments (shown by
squares in Fig. 4).
Sequences belonging to the three subsets found in owl monkeys
had a high level of homology respecting human segments. Subset 1
displayed Aotus vs human homology ranging between 76 and 83% at
nucleotide level and 72 and 84% at amino acid level; this is a little
lower than that observed in TCRBV genes among Aotus and humans
[77–90% at amino acid level (23)]. Subset 2 showed homology higher
than 90% at both nucleotide and amino acid levels.
A. nancymaae subset 3 sequences had high identity with humans
in the analyzed sector. Two sequences (Aona-GVf and Aona-GVg)
Aona-GVaAona-GVb
Aona-GVdAona-GVc
Aona-S
1Hosa-TRGV8Hosa-TRGV2Hosa-TRGV4Hosa-TRGV3
Hosa-TRGV5
Hosa-S
1
Prim
ate-S1
Bota-TRGV5S1Bota-TRGV5S6
Ovar-TRGV5S2Ovar-TRGV1S1
Bota-TRGV1S3Ovar-TRGV2S4
Bota-TRGV2S1
Bovidae-S
1
Orcu-TRGV1.4Orcu-TRGV1.3
Orcu-TRGV1.2Orcu-TRGV1.5
Orcu-S
1
Mumu-TRGV7Mumu-TRGV6
S1
Hosa-TRGV9Patr-TRGV9
Aona-GVeS2
Gogo-TRGV10Papa-TRGV10Hosa-TRGV10
Popy-TRGV10Hyla-TRGV10
Orcu-TRGV1.6Bota-TRGV3S2
S3
Mumu-TRGV3Mumu-TRGV1
Mumu-TRGV2Bota-TRGV4S1
Mumu-TRGV4Hosa-TRGV11
S4
100
100
100
7992
82100
99
7378
97
100
6599
99
85 100
96
98
6696
99
99
65
99
66
99
0.1
Hosa-TRGV10Aona-GVg
Aona-GVfPapa-TRGV10Gogo-TRGV10
Popy-TRGV10Hyla-TRGV10
Aona-GVhBota-TRGV3S2
Orcu-TRGV1.6
70
7193
99
99
A
B
Fig. 3. Minimum evolution (ME) tree for mammal T-cell receptor g -variable (TCRGV)-deduced protein sequences. Aotus nancymaae sequences
are indicated by bold lines. The bold circles denote each subset root.
Guerrero et al : T-cell receptor g-variable gene
Tissue Antigens 2003: 62: 472–482 477
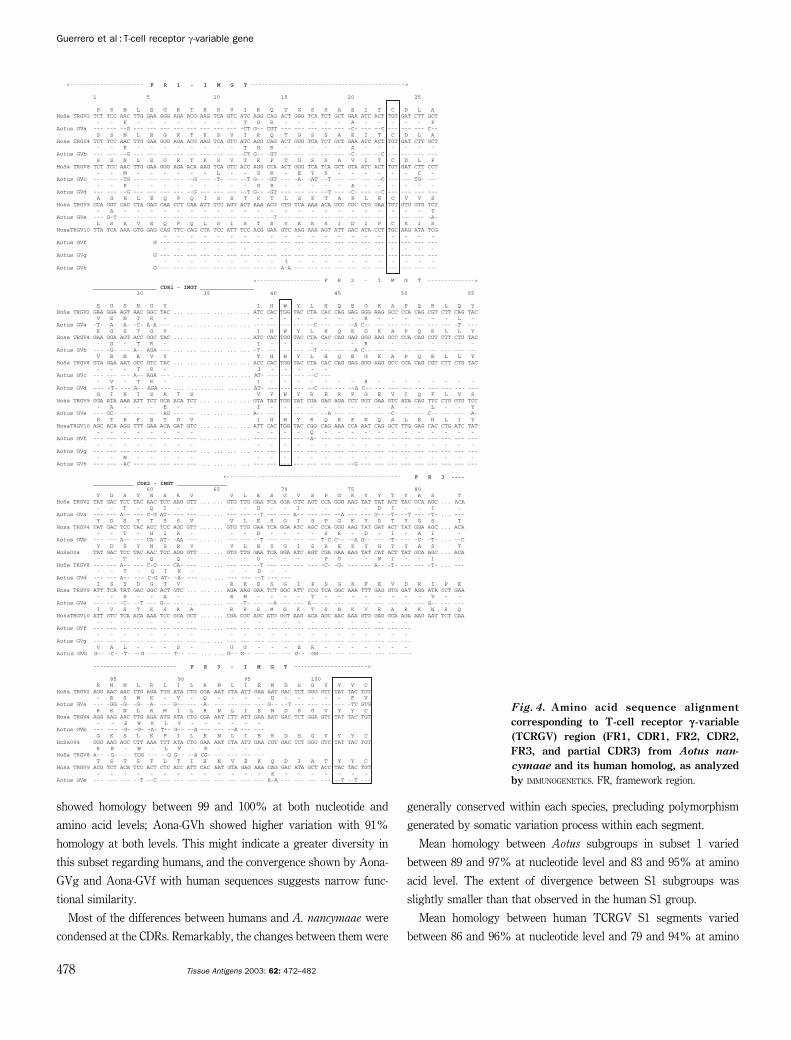
showed homology between 99 and 100% at both nucleotide and
amino acid levels; Aona-GVh showed higher variation with 91%
homology at both levels. This might indicate a greater diversity in
this subset regarding humans, and the convergence shown by Aona-
GVg and Aona-GVf with human sequences suggests narrow func-
tional similarity.
Most of the differences between humans and A. nancymaae were
condensed at the CDRs. Remarkably, the changes between them were
generally conserved within each species, precluding polymorphism
generated by somatic variation process within each segment.
Mean homology between Aotus subgroups in subset 1 varied
between 89 and 97% at nucleotide level and 83 and 95% at amino
acid level. The extent of divergence between S1 subgroups was
slightly smaller than that observed in the human S1 group.
Mean homology between human TCRGV S1 segments varied
between 86 and 96% at nucleotide level and 79 and 94% at amino
<---------------------- F R 1 - I M G T ---------------------------------------------->
1 5 10 15 20 25
S S N L E G R T K S V I R Q T G S S A E I T C D L AHoSa TRGV2 TCT TCC AAC TTG GAA GGG AGA ACG AAG TCA GTC ATC AGG CAG ACT GGG TCA TCT GCT GAA ATC ACT TGT GAT CTT GCT - - K - - - - - - - - T G R - - - - - A - - - - - PAotus GVa --- --- --G --- --- --- --- --- --- --- --- -CT G-- CGT --- --- --- --- --- -C- --- --C --- --- --- C-- S S N L E G R T K S V I R Q T G S S A E I T C D L AHosa TRGV4 TCT TCC AAC TTG GAA GGG AGA ACG AAG TCA GTC ATC AGG CAG ACT GGG TCA TCT GCT GAA ATC ACT TGT GAT CTT GCT - - K - - - - - - - - T G R - - - - - A - - - - - -Aotus GVb --- --- --G --- --- --- --- --- --- --- --- -CT G-- -GT --- --- --- --- --- -C- --- --C --- --- --- --- S S N L E G R T K S V T R P T G S S A V I T C D L PHoSa TRGV8 TCT TCC AAC TTG GAA GGG AGA ACA AAG TCA GTC ACC AGG CCA ACT GGG TCA TCA GCT GTA ATC ACT TGT GAT CTT CCT - - M - - - - - - L - - G R - E Y S - - - - - - C -Aotus GVc --- --- -TG --- --- --- --- --G --- -T- --- --T G-- -GT --- -A- -AT --T --- --- --- --C --- --- TG- --- - - K - - - - - - - - - G R - - - - - A - - - - - -Aotus GVd --- --- --G --- --- --- --- --G --- --- --- --T G-- -GT --- --- --- --T --- -C- --- --C --- --- --- --- A G H L E Q P Q I S S T K T L S K T A R L E C V V SHosa TRGV9 GCA GGT CAC CTA GAG CAA CCT CAA ATT TCC AGT ACT AAA ACG CTG TCA AAA ACA GCC CGC CTG GAA TGT GTG GTG TCT - A - - - - - - - - - - - - - - - - - - - - - - - YAotus GVe --- G-T --- --- --- --- --- --- --- --- --- --- --- --T --- --- --- --- --- --- --- --- --- --- --- -A- L S K V E Q F Q L S I S T E V K K S I D I P C K I SHosaTRGV10 TTA TCA AAA GTG GAG CAG TTC CAG CTA TCC ATT TCC ACG GAA GTC AAG AAA AGT ATT GAC ATA CCT TGC AAG ATA TCG - - - - - - - - - - - - - - - - - - - - -Aotus GVf G --- --- --- --- --- --- --- --- --- --- --- --- --- --- --- --- --- --- --- --- --- - - - - - - - - - - - - - - - - - - - - -Aotus GVg G --- --- --- --- --- --- --- --- --- --- --- --- --- --- --- --- --- --- --- --- --- - - - - - - - - - I - - - - - - - - - - -Aotus GVh G --- --- --- --- --- --- --- --- --- A-A --- --- --- --- --- --- --- --- --- --- ---
<------------------- F R 2 - I M G T --------------> ___________________ CDR1 - IMGT ________________ 30 35 40 45 50 55
E G S N G Y I H W Y L H Q E G K A P Q R L Q YHoSa TRGV2 GAA GGA AGT AAC GGC TAC ... ... ... ... ... ... ATC CAC TGG TAC CTA CAC CAG GAG GGG AAG GCC CCA CAG CGT CTT CAG TAC V E N T R - - - - - - - - - R - - - - - - L -Aotus GVa -T- -A- -A- -C- A-A --- ... ... ... ... ... ... --- --- --- --- --C --- --- --A C-- --- --- --- --- --- --- -T- --- E G S T G Y I H W Y L H Q E G K A P Q R L L YHosa TRGV4 GAA GGA AGT ACC GGC TAC ... ... ... ... ... ... ATC CAC TGG TAC CTA CAC CAG GAG GGG AAG GCC CCA CAG CGT CTT CTG TAC - G - T R - I - - - - - - - R - - - - - - - -Aotus GVb --- -G- --- A-- AGA --- ... ... ... ... ... ... –T- --- --- --- --T --- --- --A C-- --- --- --- --- --- --- --- --- V E N A V Y T H W Y L H Q E G K A P Q R L L YHoSa TRGV8 GTA GAA AAT GCC GTC TAC ... ... ... ... ... ... ACC CAC TGG TAC CTA CAC CAG GAG GGG AAG GCC CCA CAG CGT CTT CTG TAC - - - T R - I - - - - -Aotus GVc --- --- --- A-- AGA --- ... ... ... ... ... ... AT- --- --- --- --C --- - V - T R - I - - - - - - - R - - - - - - - -Aotus GVd --- -T- --- A-- AGA --- ... ... ... ... ... ... AT- --- --- --- --C --- --- --A C-- --- --- --- --- --- --- --- --- G I K I S A T S V Y W Y R E R P G E V I Q F L V SHosa TRGV9 GGA ATA AAA ATT TCT GCA ACA TCT ... ... ... ... GTA TAT TGG TAT CGA GAG AGA CCT GGT GAA GTC ATA CAG TTC CTG GTG TCC - A - - - E - - I - - - - - - - - - A - - L - - YAotus GVe --- GC- --- --- --- -AG --- --- ... ... ... ... A-- --- --- --- --- --A --- --- --- --- -C- --- --- C-- --- --- -A- S T R F E T D V I H W Y R Q K P N Q A L E H L I YHosaTRGV10 AGC ACA AGG TTT GAA ACA GAT GTC ... ... ... ... ATT CAC TGG TAC CGG CAG AAA CCA AAT CAG GCT TTG GAG CAC CTG ATC TAT - - - - - - - - - - - - Q - - - - - - - - - - - -Aotus GVf --- --- --- --- --- --- --- --- ... ... ... ... --- --- --- --- -A- --- --- --- --- --- --- --- --- --- --- --- --- - - - - - - - - - - - - - - - - - - - - - - - - -Aotus GVg --- --- --- --- --- --- --- --- ... ... ... ... --- --- --- --- --- --- --- --- --- --- --- --- --- --- --- --- --- - - N - - - - - - - - - - - - - - - - - - - - - -Aotus GVh --- --- -AC --- --- --- --- --- ... ... ... ... --- --- --- --- --- --- --- --G --- --- --- --- --- --- --- --- ---
<---------------------------------------------------- F R 3 ---- ____________ CDR2 - IMGT _______________ 60 65 70 75 80 Y D S Y N S K V V L E S G V S P G K Y Y T Y A S THoSa TRGV2 TAT GAC TCC TAC AAC TCC AAG GTT ... ... GTG TTG GAA TCA GGA GTC AGT CCA GGG AAG TAT TAT ACT TAC GCA AGC ... ACA - - T - Q I - - - - D - - I - - - - - D I - - I -Aotus GVa --- --- A-- --- C-G AT- --- --- ... ... --- --- --T --- --- A-- --- --- --A --- --- G-- -T- --T --- -T- ... --- Y D S Y T S S V V L E S G I S P G K Y D T Y G S THosa TRGV4 TAT GAC TCC TAC ACC TCC AGC GTT ... ... GTG TTG GAA TCA GGA ATC AGC CCA GGG AAG TAT GAT ACT TAT GGA AGC ... ACA - - T - H I K - - - D - - - - S R - D - I - A I -Aotus GVb --- --- A-- --- CA- AT- -AA --- ... ... --- --- --T --- --- --- --- T-C C-- --A G-- --- -T- --- -C- -T- ... --C Y D S Y N S R V V L E S G I S R E K Y H T Y A S THoSa004 TAT GAC TCC TAC AAC TCC AGG GTT ... ... GTG TTG GAA TCA GGA ATC AGT CGA GAA AAG TAT CAT ACT TAT GCA AGC ... ACA - - T - Q - Q - - - D - - - - P G - - N I - - I -HoSa TRGV8 --- --- A-- --- C-G --- CA- --- ... ... --- --- --T --- --- --- --- -C- -G- --- --- A-- -T- --- --- -T- ... --- - - T - Q I K - - - D - -Aotus GVd --- --- A-- --- C-G AT- -A- --- ... ... --- --- --T --- --- I S Y D G T V R K E S G I P S G K F E V D R I P EHosa TRGV9 ATT TCA TAT GAC GGC ACT GTC ... ... ... AGA AAG GAA TCT GGC ATT CCG TCA GGC AAA TTT GAG GTG GAT AGG ATA CCT GAA - - S - - A - R M - - - - T - - - - - - - - V - -Aotus GVe --- --- -C- --T --- G-- --- ... ... ... --- -T- --- --A --- --- A-- --- --- --- --- --- --- --- --- G-- --- --- I V S T K S A A R R S M G K T S N K V E A R K N S QHosaTRGV10 ATT GTC TCA ACA AAA TCC GCA GCT ... ... CGA CGC AGC ATG GGT AAG ACA AGC AAC AAA GTG GAG GCA AGA AAG AAT TCT CAA - - - - - - - - - - - - - - - - - - - - - -Aotus GVf --- --- --- --- --- --- --- --- ... ... --- --- --- --- --- --- --- --- --- --- --- --- --- --- - - - - - - - - - - - - - - - - - - - - - -Aotus GVg --- --- --- --- --- --- --- --- ... ... --- --- --- --- --- --- --- --- --- --- --- --- --- --- V A L - - - S - G G - - - E R - - - - - - -Aotus GVh G-- -C- -T- --G --- --- T-- --- ... ... G-- G-- --- --- --- G-- -GG --- --- --- --- --- --- ---
------------------------- F R 3 - I M G T ---------------------->
85 90 95 100 R N N L R L I L R N L I E N D S G V Y Y CHoSa TRGV2 AGG AAC AAC TTG AGA TTG ATA CTG CGA AAT CTA ATT GAA AAT GAC TCT GGG GTC TAT TAC TGT - R S W K - V - Q - - - - D - - - - - F VAotus GVa --- -GG –G- -G- -A- --- G-- --- -A- --- --- --- --- G-- --T --- --- --- --- -TT GTG R K N L R M I L R N L I E N D S G V Y Y CHosa TRGV4 AGG AAG AAC TTG AGA ATG ATA CTG CGA AAT CTT ATT GAA AAT GAC TCT GGA GTC TAT TAC TGT - - S W K L V - - - - - -Aotus GVb --- --- -G- -G- -A- T-- G-- --A --- --- --A --- --- G K S L K F I L E N L I E R D S G V Y Y CHoSa004 GGG AAG AGC CTT AAA TTT ATA CTG GAA AAT CTA ATT GAA CGT GAC TCT GGG GTC TAT TAC TGT R R - W - L V - R - - - -HoSa TRGV8 A-- -G- --- TGG --- --G G-- --A CG- --- --- --- --- T S T S T L T I H N V E K Q D I A T Y Y CHosa TRGV9 ACG TCT ACA TCC ACT CTC ACC ATT CAC AAT GTA GAG AAA CAG GAC ATA GCT ACC TAC TAC TGT - - - - - - - - - - - - - K - - - - - - -Aotus GVe --- --- --- --T –-C --- --- --- --- --- --- --- --- A-A --- --- --- --- --T --T ---
Fig. 4. Amino acid sequence alignment
corresponding to T-cell receptor g -variable(TCRGV) region (FR1, CDR1, FR2, CDR2,
FR3, and partial CDR3) from Aotus nan-
cymaae and its human homolog, as analyzed
by IMMUNOGENETICS. FR, framework region.
Guerrero et al : T-cell receptor g-variable gene
478 Tissue Antigens 2003: 62: 472–482
acid level, indicating that A. nancymaae have a similar degree of
intraspecies divergence to that exhibited by human subset 1 and the
same degree of sequence conservation as subset 2.
Although both A. nancymaae and humans clustered together, owl
monkey sequences were grouped in a well-defined cluster in subset 1
(Fig. 3A), whereas human sequences showed more instability within
the S1 primate group (there was low statistical support for its
branches and variant clustering pattern, depending on the phylo-
genetic inference method used). The precise relationship between
humans and A. nancymaae remains ambiguous, independently of
the phylogenetic method employed. The extent of divergence
between A. nancymaae and human sequences is equivalent to the
divergence observed among just human sequences. This divergence
is greater than that observed among A. nancymaae sequences only.
This type of TCRGV primate segment clustering was consistent with
a species-specific evolution pattern.
Accordingly, specific primers for each TCRGV segment subset 1
deduced from consensus human FR3 regions were used to perform
the PCRs from A. nancymaae genomic DNA. A. nancymaae
sequences obtained did not cluster with the human segments from
which the primers had been deduced. This finding reveals that
species-specific changes at segment level inside each species is
occurring, indicating the conservation of some motifs at FR3 level
between humans and owl monkeys.
This species-specific pattern was shared with rabbits, but not with
Bovidae (sheep and cows), where each segment clustered together,
maintaining a trans-specific pattern. Other analyses based on the
available sequences, including non-mammal sequences (chicken,
skate, and clawed frogs, data not shown) have shown that a spe-
cies-specific cluster pattern is the most common in subset 1. The
species-specific behavior of S1 contrasts with the trans-specific rela-
tionship observed in a, b, and d TCR genes (3, 11). The remaining
TCRGV subsets showed noticeable low polymorphism, also contrast-
ing with a and b TCR genes. These phenomena (low diversity and
species-specific patterns) might indicate a different way of TCRGV
gene evolution agreeing with a homogenization process as shown in
the tree describing the origin of several groups (Bovidae S1, Orcu S1,
and Aona S1) (Fig. 3). Other groups (S2 and S3) showed a pattern
0
5
10
15
20
25
30
All Molecule FRs FR1 FR2 FR3 CDRs CDR1 CDR2
Num
ber
of d
iffer
ence
s (a
a) w
ithin
spe
cies
Homo Aotus
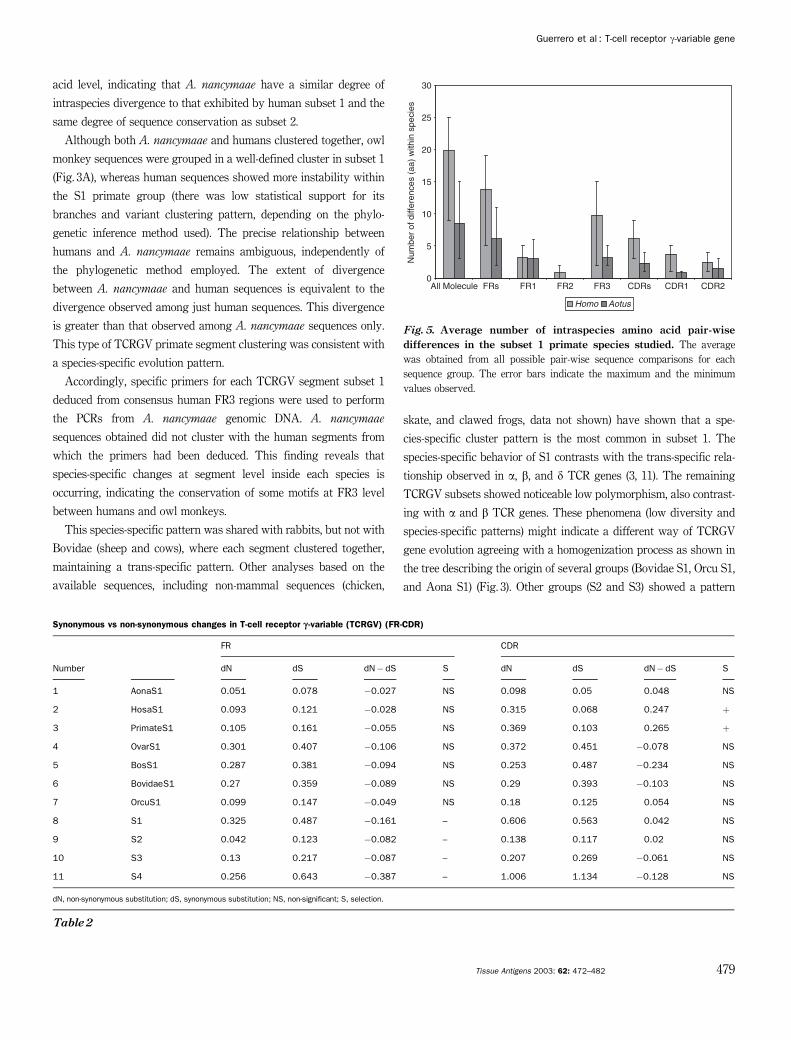
Fig. 5. Average number of intraspecies amino acid pair-wise
differences in the subset 1 primate species studied. The average
was obtained from all possible pair-wise sequence comparisons for each
sequence group. The error bars indicate the maximum and the minimum
values observed.
Synonymous vs non-synonymous changes in T-cell receptor g -variable (TCRGV) (FR-CDR)
FR CDR
Number dN dS dN� dS S dN dS dN� dS S
1 AonaS1 0.051 0.078 �0.027 NS 0.098 0.05 0.048 NS
2 HosaS1 0.093 0.121 �0.028 NS 0.315 0.068 0.247 þ
3 PrimateS1 0.105 0.161 �0.055 NS 0.369 0.103 0.265 þ
4 OvarS1 0.301 0.407 �0.106 NS 0.372 0.451 �0.078 NS
5 BosS1 0.287 0.381 �0.094 NS 0.253 0.487 �0.234 NS
6 BovidaeS1 0.27 0.359 �0.089 NS 0.29 0.393 �0.103 NS
7 OrcuS1 0.099 0.147 �0.049 NS 0.18 0.125 0.054 NS
8 S1 0.325 0.487 �0.161 – 0.606 0.563 0.042 NS
9 S2 0.042 0.123 �0.082 – 0.138 0.117 0.02 NS
10 S3 0.13 0.217 �0.087 – 0.207 0.269 �0.061 NS
11 S4 0.256 0.643 �0.387 – 1.006 1.134 �0.128 NS
dN, non-synonymous substitution; dS, synonymous substitution; NS, non-significant; S, selection.
Table 2
Guerrero et al : T-cell receptor g-variable gene
Tissue Antigens 2003: 62: 472–482 479
similar to species phylogeny, while S4 displayed a trans-specific
pattern. The overall TCRGV evolutive forms are more heterogeneous
than that observed in other TCRV genes (a, b, and d).
A. nancymaae is the least variable species within subset 1. Primate
S1 showed variability equivalent to that observed in rabbits and
lower than that observed in Bovidae. These tendencies were
maintained in each of the gene sectors. Figure 5 shows that the
average difference in owl monkeys was at least half of that observed
in humans at amino acid level; the same was true at nucleotide level
(data not shown). This was the general tendency in all of the gene
sectors, with the exception of FR1, where the variability observed
between these species was similar.
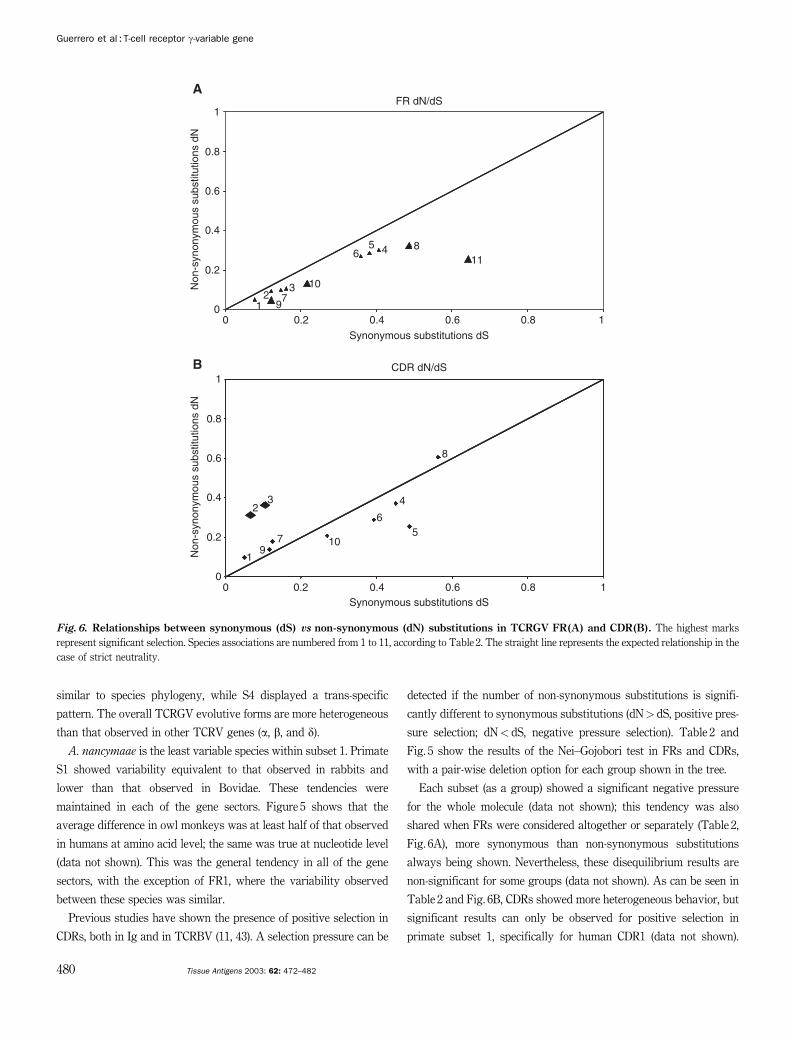
Previous studies have shown the presence of positive selection in
CDRs, both in Ig and in TCRBV (11, 43). A selection pressure can be
detected if the number of non-synonymous substitutions is signifi-
cantly different to synonymous substitutions (dN> dS, positive pres-
sure selection; dN< dS, negative pressure selection). Table 2 and
Fig. 5 show the results of the Nei–Gojobori test in FRs and CDRs,
with a pair-wise deletion option for each group shown in the tree.
Each subset (as a group) showed a significant negative pressure
for the whole molecule (data not shown); this tendency was also
shared when FRs were considered altogether or separately (Table 2,
Fig. 6A), more synonymous than non-synonymous substitutions
always being shown. Nevertheless, these disequilibrium results are
non-significant for some groups (data not shown). As can be seen in
Table 2 and Fig. 6B, CDRs showed more heterogeneous behavior, but
significant results can only be observed for positive selection in
primate subset 1, specifically for human CDR1 (data not shown).
0
0.2
0.4
0.6
0.8
1
0
A
B
0.2 0.4 0.6 0.8 1
Synonymous substitutions dS
Synonymous substitutions dS
1 92 7
3
65 4 8
11
10Non
-syn
onym
ous
subs
titut
ions
dN
Non
-syn
onym
ous
subs
titut
ions
dN
0
0.2
0.4
0.6
0.8
1
0 0.2 0.4 0.6 0.8 1
19
7
23
10
65
4
8
FR dN/dS
CDR dN/dS
Fig. 6. Relationships between synonymous (dS) vs non-synonymous (dN) substitutions in TCRGV FR(A) and CDR(B). The highest marks
represent significant selection. Species associations are numbered from 1 to 11, according to Table 2. The straight line represents the expected relationship in the
case of strict neutrality.
Guerrero et al : T-cell receptor g-variable gene
480 Tissue Antigens 2003: 62: 472–482
A. nancymaae also showed little tendency to accumulate non-
synonymous substitution in CDRs, but such behavior was negligible.
This pattern contrasts with that observed in TCRBV, where a clear
purifying selection in the FRs and a sharp positive selection in CDRs
exist (11).
Although many groups were close to neutral behavior, these
results suggest a conserving phenomenon for TCRGV (including
A. nancymaae), generally comprising all sequence components.
The presence of four subsets in A. nancymaae (S4 could not
be amplified, but was identified in cDNA and gDNA), equivalent
to those present in humans, suggests that A. nancymaae
monkeys belong within the ‘gd-low’ group (including humans
and mice, as they have a high degree of diversity in the TCR-V
and IGV genes) (3, 44). On the contrary, ‘gd-high’ species display
a lower diversity, compensated maybe by a higher gd cell
proportion.
Although the function of gd lymphocytes is not fully understood,
their presence correlates with an immunosurveillance role, as demon-
strated by studies where a high level of expression for subsets 1 and 2
was found in humans infected with P. falciparum malaria (45). The
presence and homology of the same subtypes among A. nancymaae
and humans at sequence level lead to the hypothesis of a similar role
for this kind of cell in A. nancymaae. Human and owl monkey subset 1
convergence at CDR level provides evidence of such homology,
suggesting similar recognition properties. Subset 3 also exhibits con-
vergence; functional similarity among owl monkey human subset 2 has
previously been shown (Daubenberger). These findings highlight
A. nancymaae as a promising model for studying TCRGV function.
References
1. Hayday AC. Gamma delta cells: a right time
and a right place for a conserved third way of
protection. Annu Rev Immunol 2000: 18:
975–1026.
2. Richards MH, Nelson JL. The evolution of
vertebrate antigen receptors: a phylogenetic
approach. Mol Biol Evol 2000: 17: 146–55.
3. Su C, Jakobsen I, Gu X, Nei M. Diversity and
evolution of T-cell receptor variable region
genes in mammals and birds. Immunogenetics
1999: 50: 301–8.
4. Kabelitz D, Glatzel A, Wesch D. Antigen
recognition by human gammadelta T
lymphocytes. Int Arch Allergy Immunol 2000:
122: 1–7.
5. Lahn M. The role of gammadelta T cells in the
airways. J Mol Med 2000: 78: 409–25.
6. Hanninen A, Harrison LC. Gamma delta
T cells as mediators of mucosal tolerance: the
autoimmune diabetes model. Immunol Rev
2000: 173: 109–19.
7. Haas W, Pereira P, Tonegawa S. Gamma/delta
cells. Annu Rev Immunol 1993: 11: 637–85.
8. Kaufmann SH. Gamma/delta and other
unconventional T lymphocytes: what do they
see and what do they do? Proc Natl Acad Sci
USA 1996: 93: 2272–9.
9. Steinle A, Groh V, Spies T. Diversification,
expression, and gamma delta T cell
recognition of evolutionarily distant members
of the MIC family of major histocompatibility
complex class I-related molecules. Proc Natl
Acad Sci USA 1998: 95: 12510–5.
10. Allison TJ, Winter CC, Fournie JJ, Bonneville M,
Garboczi DN. Structure of a human
gammadelta T-cell antigen receptor. Nature
2001: 411: 820–4.
11. Su C, Nei M. Evolutionary dynamics of the
T-cell receptor VB gene family as inferred
from the human and mouse genomic
sequences. Mol Biol Evol 2001: 18: 503–13.
12. O’Brien RL, Happ MP, Dallas A, Palmer E,
Kubo R, Born WK. Stimulation of a major
subset of lymphocytes expressing T cell
receptor gamma delta by an antigen derived
from Mycobacterium tuberculosis. Cell 1989:
57: 667–74.
13. Havran WL, Boismenu R. Activation and
function of gamma delta T cells. Curr Opin
Immunol 1994: 6: 442–6.
14. Perera MK, Carter R, Goonewardene R,
Mendis KN. Transient increase in circulating
gamma/delta T cells during Plasmodium vivax
malarial paroxysms. J Exp Med 1994: 179:
311–5.
15. Tanaka Y, Morita CT, Nieves E, Brenner MB,
Bloom BR. Natural and synthetic non-peptide
antigens recognized by human gamma delta
T cells. Nature 1995: 375: 155–8.
16. Poquet Y, Halary F, Champagne E et al.
Human gamma delta T cells in tuberculosis.
Res Immunol 1996: 147: 542–9.
17. Bukowski JF, Morita CT, Brenner MB. Human
gamma delta T cells recognize alkylamines
derived from microbes, edible plants, and tea:
implications for innate immunity. Immunity
1999: 11: 57–65.
18. Groh V, Steinle A, Bauer S, Spies T.
Recognition of stress-induced MHC molecules
by intestinal epithelial gammadelta T cells.
Science 1998: 279: 1737–40.
19. Davis MM, Chien Y. Issues concerning the
nature of antigen recognition by alpha beta
and gamma delta T-cell receptors. Immunol
Today 1995: 16: 316–8.
20. Lujan R, ChapmanWL, HansonWL, Dennis VA.
Leishmania braziliensis: development of
primary and satellite lesions in the
experimentally infected owl monkey, Aotus
trivirgatus. Exp Parasitol 1986: 61: 348–58.
21. Collins WE. Nonhuman primate models. II.
Infection of Saimiri and Aotus monkeys with
Plasmodium vivax. Methods Mol Med 2002:
72: 85–92.
22. Noya O, Gonzalez-Rico S, Rodriguez R,
Arrechedera H, Patarroyo ME, Alarcon de
Noya B. Schistosoma mansoni infection in owl
monkeys (Aontus nancymai): evidence for
early elimination adult worms. Acta Trop
1998: 70: 257–67.
23. Vecino W, Daubenberger C, Rodriguez R,
Moreno A, Patarroyo M, Pluschke G. Sequence
and diversity of T-cell receptor beta-chain
V and J genes of the owl monkey Aotus
nancymaae. Immunogenetics 1999: 49: 792–9.
24. Suarez CF, Cardenas PP, Llanos-Ballestas EJ
et al. Alpha 1 and Alpha 2 Domains of Aotus
MHC Class I and Catarrhini MHC Class Ia
share similar characteristics. Tissue Antigens
2003: 61: 362–73.
Guerrero et al : T-cell receptor g-variable gene
Tissue Antigens 2003: 62: 472–482 481
25. Diaz D, Naegeli M, Rodriguez R et al.
Sequence and diversity of MHC DQA and
DQB genes of the owl monkey Aotus
nancymaae. Immunogenetics 2000: 51:
528–37.
26. Nino-Vasquez JJ, Vogel D, Rodriguez R et al.
Sequence and diversity of DRB genes of Aotus
nancymaae, a primate model for human
malaria parasites. Immunogenetics 2000: 51:
219–30.
27. Diaz OL, Daubenberger CA, Rodriguez R et al.
Immunoglobulin kappa light-chain V, J, and C
gene sequences of the owl monkey Aotus
nancymaae. Immunogenetics 2000: 51: 212–8.
28. Hernandez EC, Suarez CF, Mendez JA,
Echeverry SJ, Murillo LA, Patarroyo ME.
Identification, cloning, and sequencing of
different cytokine genes in four species of owl
monkey. Immunogenetics 2002: 54: 645–53.
29. Daubenberger CA, Salomon M, Vecino W et al.
Functional and structural similarity of
V gamma 9V delta 2 T cells in humans and
Aotus monkeys, a primate infection model for
Plasmodium falciparum malaria. J Immunol
2001: 167: 6421–30.
30. Thompson JD, Gibson TJ, Plewniak F,
Jeanmougin F, Higgins DG. The CLUSTAL_X
windows interface: flexible strategies for
multiple sequence alignment aided by quality
analysis tools. Nucleic Acids Res 1997: 25:
4876–82.
31. Nicholas KB, Noicholos HBJ, Deerfield DWI.
Genedoc. Analysis and visualization of genetic
variation. EMBNEW NEWS 1997: 4: 14.
32. Lombard V, Camon EB, Parkinson HE,
Hingamp P, Stoesser G, Redaschi N. EMBL-
Align: a new public nucleotide and amino acid
multiple sequence alignment database.
Bioinformatics 2002: 18: 763–4.
33. Kumar S, Tamura K, Jakobsen IB, Nei M.
MEGA2: molecular evolutionary genetics
analysis software. Bioinformatics 2001: 17:
1244–5.
34. Fitch W. Toward defining the course of
evolution: minimum change for a specified
tree topology. Syst Zool 1971: 20: 406–16.
35. Rzhetsky A, Nei M. Theoretical foundation of
the minimum-evolution method of
phylogenetic inference.Mol Biol Evol 1993: 10:
1073–95.
36. Jukes T. Evolution of protein molecules. In:
Munro HN, ed. In: Mammalian Protein
Metabolism. New York: New York Academic,
1969: 21–132.
37. Kimura M. A simple method for estimating
evolutionary rates of base substitutions
through comparative studies of nucleotide
sequences. J Mol Evol 1980: 16: 111–20.
38. Sitnikova T. Bootstrap method of interior-
branch test for phylogenetic trees. Mol Biol
Evol 1996: 13: 605–11.
39. Nei M, Gojobori T. Simple methods for
estimating the numbers of synonymous and
nonsynonymous nucleotide substitutions. Mol
Biol Evol 1986: 3: 418–26.
40. Felsenstein J. PHYLIP – Phylogeny Inference
Package (Version 3.6). Cladistics 1989: 5:
164–6.
41. Arden B, Clark SP, Kabelitz D, Mak TW.
Human T-cell receptor variable gene segment
families. Immunogenetics 1995: 42: 455–500.
42. Sturm E, Bontrop RE, Vreugdenhil RJ, Otting N,
Bolhuis RL. T-cell receptor gamma/delta:
comparison of gene configurations and
function between humans and chimpanzees.
Immunogenetics 1992: 36: 294–301.
43. Tanaka T, Nei M. Positive Darwinian
selection observed at the variable-region genes
of immunoglobulins. Mol Biol Evol 1989: 6:
447–59.
44. Sitnikova T, Nei M. Evolution of
immunoglobulin kappa chain variable region
genes in vertebrates. Mol Biol Evol 1998: 15:
50–60.
45. Ho M, Tongtawe P, Kriangkum J et al.
Polyclonal expansion of peripheral gamma
delta T cells in human Plasmodium
falciparum malaria. Infect Immun 1994: 62:
855–62.
Guerrero et al : T-cell receptor g-variable gene
482 Tissue Antigens 2003: 62: 472–482