Imaginarios Sociales de la comunidad en el pueblo mágico de el fuerte, Sinaloa, México
Upload
khangminh22Category
view
0download
0
i
Characterization of Hass and Fuerte Avocado (Persea americana) Varieties Grown
in Wondogenet and Optimization of Some Oil Extraction Parameters
By Kenbon Beyene
Advisor: Dr.Eng. Shimelis Admassu (Assoc. Prof.)
A Thesis Submitted to
School of Chemical and Bioengineering
Presented in Partial Fulfillment of the Requirements for the Degree of Master of
Science in Chemical Engineering (Food Engineering Stream)
Addis Ababa University
Addis Ababa, Ethiopia
November, 2017

ii
Addis Ababa University
Addis Ababa Institute of Technology
School of Chemical and Bioengineering
This is to certify that the thesis prepared by Kenbon Beyene, entitled “Characterization of Hass
and Fuerte Avocado (Persea americana) Varieties Grown in Wondogenet and Optimization of its
Oil Extraction Conditions” and submitted in partial fulfilments of requirement for the degree of
masters of Science (Food Engineering) complies with the regulation of the university and meet
the accepted standard with respect to originality and quality.
Kenbon Beyene
Submitted by Signature Date
Approved and Signed by the Examining Committee
Dr. Eng. Shimelis Admassu (Assoc. Prof.)
Advisor Signature Date
Dr. Solomon Kiros
Internal Examiner Signature Date
Eng. Gizachew Shiferaw
External Examiner Signature Date
Dr. Eng. Abubeker Yimam (Assoc. Prof.)
Chairperson, School’s graduate committee Signature Date

iii
Acknowledgements
First and foremost I am pleased to thank the “Almighty God”, the source of all knowledge and
wisdom, for his guidance and blessing, for helping me start, pursue and successfully complete
my studies. “In whom are hid all the treasures of wisdom and knowledge”, Col 2:3. Next, I
would like to thank all the people and organizations who contributed to this thesis.
I am very grateful to my advisor, Dr. Eng. Shimellis Admassu, for his constant support,
encouragement, unreserved guidance and constructive suggestions and comments from the
stage of proposal to this end. He made sprit of research enthusiasm and zeal in me.
Also, I express my gratitude thanks to Birhane G. for having given me an opportunity to
work on interesting projects and for his support and encouragement.
All the technical help especially Debebe, Yemane and Woineshet, thank you for helping me
during laboratory experiments. And also all my colleagues’ thank you for all the fun we had
while struggling through all the two years life.
Wondogenet agricultural research center, thank you for providing/allowing me the raw
material/ avocado (especially Basaznew and Wondimu).
Food Science and Nutrition laboratory of Addis Ababa University, Bless agri-food
laboratory, Human nutrition laboratory of Ethiopian Public Health Institute, for providing me
conducting the laboratory experiments.
Also, I would like to acknowledge School of Chemical and Bio-Engineering of Addis Ababa
University for acceptance and training me in the program, and to all the staff members of the
school for helping me in my effort to be fruitful.
Finally, I extend my heartfelt gratitude to my parents and siblings for all the love and
support, especially my great brother, “Yadeta” you are a star for me. Also my darling fiancée
J.G thanks for all your love and endless support, putting me and the completion of this thesis
first.
iv
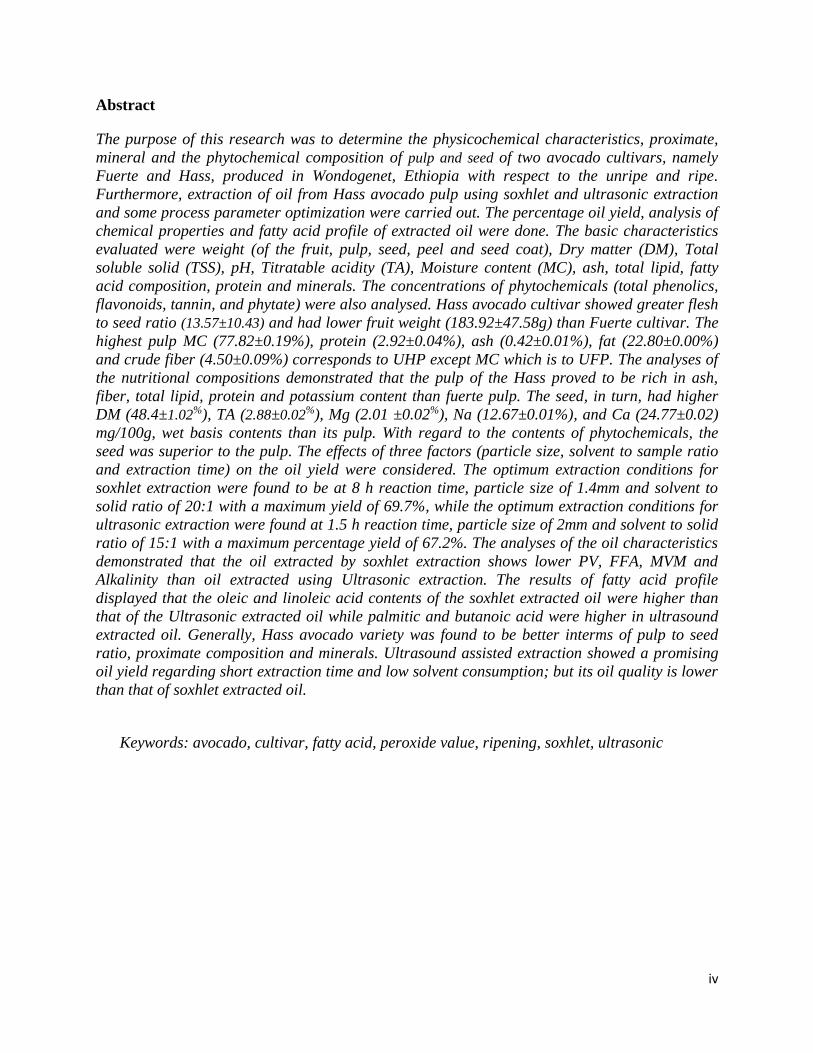
Abstract
The purpose of this research was to determine the physicochemical characteristics, proximate,
mineral and the phytochemical composition of pulp and seed of two avocado cultivars, namely
Fuerte and Hass, produced in Wondogenet, Ethiopia with respect to the unripe and ripe.
Furthermore, extraction of oil from Hass avocado pulp using soxhlet and ultrasonic extraction
and some process parameter optimization were carried out. The percentage oil yield, analysis of
chemical properties and fatty acid profile of extracted oil were done. The basic characteristics
evaluated were weight (of the fruit, pulp, seed, peel and seed coat), Dry matter (DM), Total
soluble solid (TSS), pH, Titratable acidity (TA), Moisture content (MC), ash, total lipid, fatty
acid composition, protein and minerals. The concentrations of phytochemicals (total phenolics,
flavonoids, tannin, and phytate) were also analysed. Hass avocado cultivar showed greater flesh
to seed ratio (13.57±10.43) and had lower fruit weight (183.92±47.58g) than Fuerte cultivar. The
highest pulp MC (77.82±0.19%), protein (2.92±0.04%), ash (0.42±0.01%), fat (22.80±0.00%)
and crude fiber (4.50±0.09%) corresponds to UHP except MC which is to UFP. The analyses of
the nutritional compositions demonstrated that the pulp of the Hass proved to be rich in ash,
fiber, total lipid, protein and potassium content than fuerte pulp. The seed, in turn, had higher
DM (48.4±1.02%), TA (2.88±0.02%), Mg (2.01 ±0.02%), Na (12.67±0.01%), and Ca (24.77±0.02)
mg/100g, wet basis contents than its pulp. With regard to the contents of phytochemicals, the
seed was superior to the pulp. The effects of three factors (particle size, solvent to sample ratio
and extraction time) on the oil yield were considered. The optimum extraction conditions for
soxhlet extraction were found to be at 8 h reaction time, particle size of 1.4mm and solvent to
solid ratio of 20:1 with a maximum yield of 69.7%, while the optimum extraction conditions for
ultrasonic extraction were found at 1.5 h reaction time, particle size of 2mm and solvent to solid
ratio of 15:1 with a maximum percentage yield of 67.2%. The analyses of the oil characteristics
demonstrated that the oil extracted by soxhlet extraction shows lower PV, FFA, MVM and
Alkalinity than oil extracted using Ultrasonic extraction. The results of fatty acid profile
displayed that the oleic and linoleic acid contents of the soxhlet extracted oil were higher than
that of the Ultrasonic extracted oil while palmitic and butanoic acid were higher in ultrasound
extracted oil. Generally, Hass avocado variety was found to be better interms of pulp to seed
ratio, proximate composition and minerals. Ultrasound assisted extraction showed a promising
oil yield regarding short extraction time and low solvent consumption; but its oil quality is lower
than that of soxhlet extracted oil.
Keywords: avocado, cultivar, fatty acid, peroxide value, ripening, soxhlet, ultrasonic
v
Table of Contents
Page
Acknowledgements iii
Abstract iv
List of Figures ix
Acronyms x
CHAPTER ONE 1
1. Introduction 1
1.1. Background 1
1.2. Statement of the problem 3
1.3. Objective of the research 4
1.3.1. General objective 4
1.3.2. Specific objectives 4
1.4. Significance and scope of the study 5
CHAPTER TWO 6
2. Literature Review 6
2.1. Overview of Avocado 6
2.1.1. The Avocado Fruit and its seeds 6
2.2. Global Avocado Production 9
2.2.1. World avocado production 9
2.2.2. Avocado production in Africa 10
2.2.3. Avocado production in Ethiopia 11
2.3. Avocado quality characteristics 13
2.3.1. Physical properties 14
2.3.2. Sensory properties 16
2.3.3. Chemical properties 16
2.4. Nutritional value, health benefits and uses of avocado 19
2.5. Phytochemicals composition 21
2.6. Avocado oil processing methods and oil characteristics 25
2.6.1. Avocado oil processing methods 25
2.6.2. Factors that influence avocado oil yields 31
vi
2.6.3. Avocado oil characteristics 32
2.7. Concluding remarks 33
CHAPTER THREE 35
3. Materials and Methods 35
3.1 Materials 35
3.1.1 Raw Material collection, transportation, storage and sample preparation 35
3.2. Framework of the thesis 36
3.3. Processing Methods 37
3.3.1. Extraction of oil using soxhlet Extraction 37
3.3.2. Extraction of oil using Ultrasound Assisted Extraction 37
3.4. Analytical Methods 38
3.4.1. Physicochemical analyses 38
3.4.2. Proximate Composition Analyses 39
3.4.3. Mineral Composition Analyses 42
3.4.4. Phytochemical Analyses 43
3.4.5. Quality characterization of extracted avocado oil 45
3.5. Experimental Design and Statistical Data Analysis 48
CHAPTER FOUR 50
4. Results and Discussion 50
4.1. Physical properties of avocado 50
4.2. Chemical properties of avocado pulp and seed 50
4.3. Proximate composition of avocado pulp and seed 53
4.4. Mineral composition of avocado pulp and seed 56
4.5. Phytochemical composition of avocado pulp and seed 59
4.6. Yield of avocado oil extracted using soxhlet and ultrasound assisted extraction 61
4.6.1. Effect of raw material particle size on oil yield 65
4.6.2. Effect of solvent to solid ratio on oil yield 66
4.6.3. Effect of extraction time on oil yield 67
4.6.4. Interaction effect of solvent to sample ratio and extraction time on oil yield 68
4.7. Quality characterization of the extracted avocado oil 70
CHAPTER FIVE 75

vii
5. Conclusions and Recommendations 75
5.1. Conclusions 75
5.2. Recommendations 76
References 77
Appendixes 90

viii
List of Tables
Page
Table 2.1 Fruit characteristics of different avocado cultivars 8
Table 2.2 Composition of Avocado seed 9
Table 2.3 Africa top 10 avocado producing countries (2008-2012, in mt) 11
Table 2.4 Summary of major fruit crops produced in Ethiopia in 2012/2013 cropping season 13
Table 2.5 Nutritional profile of US-grown avocados and avocado oil (per 100 g) 21
Table 4.1 Physical properties of avocado 50
Table 4.2 Chemical properties of avocado pulp and seed 53
Table 4.3 Proximate composition of avocado pulp and seed 56
Table 4.4 Mineral composition of pulp and seed of avocado variety in wet basis 58
Table 4.5 Phytochemical composition of pulp and seed of avocado variety in wet basis 61
Table 4.6 Actual and predicted oil Yield value by soxhlet extraction 63
Table 4.7 Actual and predicted oil Yield value by ultrasound extraction 64
Table 4.8. Quality characteristics of oil extracted by UAE and Soxhlet Extraction 72
List of Tables under Appendixes
Appendix A1 ANOVA for Response Surface Quadratic model of oil yield from ultrasound 90
Appendix A2 ANOVA for Response Surface Quadratic Model of oil yield from soxhlet 91

ix
List of Figures
Page
Figure 2.1 World avocado production trend (2000 - 2012) in '000mt 10
Figure 2.2: Proposed structures of phytic acid. Source: Reddy (2002) 23
Figure 3.1 Frameworks of Experiments 36
Figure 4.1 One Factor Plot of effect of Particle Size on oil yield for (a) ultrasonic extraction (b)
soxhlet extraction 66
Figure 4.2 One Factor Plot of effect of solvent to sample ratio on oil yield for (a) ultrasonic
extraction and (b) soxhlet extraction 67
Figure 4.3 One Factor Plot of effect of extraction time on oil yield for (a) ultrasonic extraction
and (b) soxhlet extraction 68
Figure 4.4 graph of effect of solvent to sample ratio and extraction time on oil yield for soxhlet
extraction (a) Interaction graph (b) contour plot (c) 3D surface 69
Figure 4.5 GC-MS result for ultrasound extracted oil. 73
Figure 4.6 GC-MS result for soxhlet extracted oil. 74
List of Figures under Appendixes
Appendix B1 Standard calibration curve of D-catechin for the determination of tannin
content 92
Appendix B2 Standard calibration curve of phytic acid for the determination of phytate content
of pulp 92
Appendix B3 Standard calibration curve of phytic acid for the determination of phytate content
of seed 93
Appendix B4 Standard calibration curve of gallic acid for the determination of total phenolic
content 93
Appendix B5 Standard calibration curve of quercetin for the determination of total flavonoid
content 94
Appendix C Some of the pictures and photos taken during conducting research 94

x
Acronyms
Acronyms Nomenclature
AAS Atomic Absorption Spectrophotometry
CRFG California Rare Fruit Growers
CSA Central Statistical Authority
DM Dry Matter
FAO Food and Agricultural Organizations
FAOSTAT Food and agricultural Organization statistics
HCl Hydrochloric Acid
HDL High Density Lipoprotein
LDL Low Density Lipoprotein
MC Moisture Content
M-T Magness-Taylor
R & D Research and Development
RFP Ripe Fuerte Pulp
RFS Ripe Fuerte Seed
RHP Ripe Hass Pulp
RHS Ripe Hass Seed
RH Relative Humidity
SAS Statistical Analysis System
SEO Soxhlet Extracted Oil
SNNP Southern Nations Nationalities and peoples
TSS Total Soluble Solids
TTA Total Titratable Acidity
USDA United States Department of Agriculture
UEO Ultrasound Extracted Oil
UFP Unripe Fuerte Pulp
UFS Unripe Fuerte Seed
UHP Unripe Hass Pulp
UHS Unripe Hass Seed
USAE Ultrasound Assisted Extraction
WARC Wondogenet Agricultural Research Center

1
CHAPTER ONE
1. Introduction
1.1. Background
Avocado (Percea americana) is a tropical and mediterrenian trees and shrubs which belongs to
the Lauraceae family. Lauraceae family trees are trees those are ever green and soft leafs which
includes avocado, laurel, cinnamon, saffras and green-heart (a timber of the Guianas). The
English name is derived from the Spanish word ‘abogado’, which was avocet in French. Its tree
is a fruit plant originated in the Americas, especially Mexico and Central and South America,
belonging to the Lauraceae family and Perseal genus (Maranca, 1980).
Avocado is one of the climacteric fruits of an excellent nutritional quality with low sugar content
which makes avocado very recommendable source of high energy food for those who are
diabetic. It is highly consumed in the world due to the presence of unsaturated lipids and its
relevance in improving and maintaining healthy heart and circulatory system. Its fat contents
make it a valuable source of energy as well as a potential raw material for the manufacture of
pleasantly tasting spreads for breads and biscuits. Besides, the lipids contain linoleic acid, a
polyunsaturated fatty acid which together with alpha linoleic acid (Omega-3 fatty acid) form
vital parts of body structures, perform important roles in immune system and vision, help form
cell membranes and produce hormone-like compounds called eicocasnoids (Wardlaw & Kessel,
2002). The oil content of the fruit depends upon its ecological origin and on the cultivar, as for
example, in Guatemalan and Mexican cultivars, the oil content varies from 10 to 13% and from
15 to 25%, respectively (Biale & Young, 1971).
From a nutritional point of view, avocado is an important and high caloric fruit. Indeed its high
content of unsaturated fatty acids is one of its distinguishing characteristics. Moreover, avocado
is rich in vitamin E, ascorbic acid, vitamin B6, b-carotene, and potassium (Bergh, 1992).
Avocados are divided into three horticultural races or species according to the areas of origin and
distinctive features: Guatemalan (Persea nubigena var. guatamalensis L. Wms.), Mexican (P.
americana var. drymifolia Blake), West Indian (P. americana Mill. var. americana). Hybrid forms

2
exist between all three types which are more cultivated now (CRFG, 1998). In Ethiopia there are
about six types of avocado cultivars registered for production which are hybrids of original races.
These are Hass, Fuerte, Pinkerton, Nabal, Bacon and Ettinger (FAO, 2010). These cultivars have
different chemical composition, phytochemical composition, physicochemical properties and
ripening time. But, their composition (pulp and seed), physicochemical properties and oil
extraction conditions are not studied and characterized yet which were investigated in this study.
Annual avocado production in Ethiopia is 25633.16 tons. The crop is now produced by
1,149,074.00 farmers countrywide who collectively farm more than 8938.24 ha of land (CSA,
2012/13). According to Garedew (2010) even though avocado has economically and socially
play a significant role its production is confronted by a number of constraints:- this are
degeneration of fruits, disease problem and absence of agronomic practices.
The avocado cultivars ‘Fuerte’ and ‘Hass’ are the most commercially valuable varieties and
account for up to two-thirds of the avocado production around the world. Hence, most studies of
avocado quality characteristics use these two cultivars (Ashton et al., 2006; Rodríguez-Carpena
et al., 2011; Villa-Rodríguez et al., 2011). However, similar studies on avocado varieties grown
in Ethiopia have been limited.
Avocado pulp is enriched with oil which can be extracted by different extraction methods. A
number of new methods for extracting oils have been investigated in recent years, including
mechanical compression (Karaj and Müller, 2011), ultrasonic extraction (Ozkan et al., 2007),
microwave extraction (Kumaran and Karunakaran, 2007), and supercritical fluid extraction
(Louli et al., 2004). Compared with traditional Soxhlet extraction, ultrasonic extraction provides
higher selectivity, is less time-consuming, has lower energy consumption and reduced emissions
(Ward et al., 1985). It is also environmentally friendly because most of the extraction solvent can
be recovered, and the equipment is inexpensive. So, application of ultrasonic extraction for
extraction of oil from avocado and optimization of some extraction parameters should be done.

3
1.2. Statement of the problem
Horticulture can be an important factor for economic development and contribute to increased
food security and improve the populations’ nutrition intake (Weinberger & Lumpkin, 2007). The
growing population and changing dietary habits in Ethiopia has increased the demand for fruit
(ILRI, 2011). Especially the demand for local fruits with higher quality for example mango,
papaya, apple and avocado are emerging. Two examples of fruits were the production have
increased with over 60 percent during the last 10 years in Ethiopia is avocado and mango (www,
faostat, 2, 2014; www, faostat, 3, 2014).
In order to increase food availability, diversification and consume nutritious fruit it is therefore
not enough to increase the productivity in agriculture, there is also a need to identify which
variety is more nutritious by characterizing the variety of each fruit specifically avocado. This
fruit can be consumed either fresh or processed in to different forms like juice, salads,
guacamole, oil etc. In this case avocado is useful to reduce hunger and malnutrition and promote
agricultural growth. In the future, this fruit could represent the raw material for oil extraction and
other processed products. Even if avocado production in Ethiopia is increasing, the inter-cultivar
variety of this fruit is not characterized yet interms of its Physical property and chemical
composition including oil content and phytochemical composition since it may differ due to
location, cultivar (variety), harvesting season, ripening, maturity level etc. which may cause a
general loss. The lipid content in avocados varies greatly with the cultivar, and the same is
observed for fatty acid composition, which depends on growth rate and variety (Tango et al,
2004). Concerning the region of cultivation, differences may reside not only between countries,
as suggested by Landahl, Meyer, and Terry (2009), but also between different geographical
locations within the same country, due to variation in climate, soil composition, and other
environmental factors. Therefore, the choice of an avocado cultivar for oil extraction might be
based on lipid content as well as on fatty acid composition (which is related to the intended use
of the oil) Isabelle Santana1 et al. (2015).
Also at present only the flesh (pulp) part is commonly utilized in Ethiopia and its seed part is
rejected due to its poor taste, lack of information on its nutritional composition. So this study
helps to characterize the composition of avocado seed and recommend development of some

4
products from it. Utilization of it may also helpful in reducing the cost for its disposal and
minimize environmental waste.
However, it is rich in oil content but in Ethiopia its oil is not commonly extracted and its
extraction condition is not optimized. Furthermore, the fatty acid content and characteristics of
Ethiopian avocado oil have, however, not been determined. Different extraction methods (using
soxhlet and Ultrasound assisted extraction) have influence on quantity (yield) and quality of oil.
So, extraction of oil from avocado using different extraction methods can improve oil yield and
minimize economic loss. Therefore, Ethiopia needs further understanding of the fruit and its
main components; its variation in composition among different cultivars and also produce oil
from it.
1.3. Objective of the research
1.3.1. General objective
The main objectives of this research were characterization of Hass and Fuerte avocado variety
grown in Ethiopia (Wondogenet) and optimization of some oil extraction parameters for Hass variety.
1.3.2. Specific objectives
The Specific Objectives of the research were to:
determine the physicochemical properties of selected unripe and ripe avocado varieties
(Hass and Fuerte).
analyse mineral content, proximate and phytochemical composition of the avocado pulp
and seed of selected unripe and ripe varieties.
optimize some extraction parameters (particle size, solvent to sample ratio and extraction
time) of soxhlet and ultrasound assisted extraction and evaluate their effects on the yield
of oil.
characterize the extracted avocado oil at optimum condition and compare their results.
perform analyses of fatty acid composition of avocado oil.

5
1.4. Significance and scope of the study
In recent years, avocado production and consumption is increasing in Ethiopia due to its high
nutritional composition and health benefit as well as good economic aspect. Despite its
importance, no work has so far been carried out on characterization and seeing inter-cultivar
variations of avocado grown in Ethiopia. Also, extraction of oil using different extraction
methods and its condition optimization was not carried out. So, characterization of some avocado
cultivars grown in Ethiopia and extraction of oil from it is necessary in order to minimize loss
(economic and nutritional), select cultivars which is mostly nutritious, select cultivar which
contains high oil content and produce it, select cultivars which contains much of pulp (flesh)
rather than seed and skin. Since Ethiopia has a large agricultural sector and there is increasing
interest in the growth of small and developing farmers, if a new market for avocado fruit can be
created by production of high quality avocado oil at a premium price, more small and developing
farmers would be interested in cultivating avocado fruit. This will in turn benefit the agricultural
and economic sectors in the long term. Oil production can also create an alternative market for
the commercial farmer, which has the benefit of less risk, compared to the fresh fruit market
where visual appearance of the fruit is very important. From this study many individuals and
organizations will be benefited which may include: Individual avocado producer (farmer) and
consumer, food security sector, avocado producing farms, industry sector, ministry of agriculture
and horticulture, research institute, avocado suppliers, traders and exporters.
In this research physicochemical properties of avocado fruit varieties (Hass and Fuerte) were
studied. Also proximate, mineral and phytochemical composition of avocado pulp and seed of
selected varieties were determined. Furthermore, effects of different oil extraction methods on
the yield of oil were investigated and their extraction conditions were optimized. The extracted
oil were characterized and analyzed including interms of its fatty acid profile.

6
CHAPTER TWO
2. Literature Review
2.1. Overview of Avocado
2.1.1. The Avocado Fruit and its seeds
The avocado fruit is botanically described as a berry with a thick, fleshy mesocarp surrounding a
single large seed. Fruits are globose, have a yellow-green to maroon or purple skin, which can be
smooth or warty, and range in weight from 50g to 1 kg. The avocado fruit consists of an exocarp
or rind, a fleshy mesocarp, a thin fleshy endocarp (collectively the flesh or pulp) and the seed.
The edible flesh or mesocarp contributes to 50 to 80% of total fruit while the large seed of the
avocado comprises 10 to 25% of the total fruit weight (Lewis, 1978). The seed consists of two
fleshy cotyledons covered by two thin seed coats adhering to each other. The cotyledons consist
of parenchyma tissue with scattered oil drops and contain starch as the main storage material
(Biale and Young, 1971).
Avocados are divided into three horticultural races or species according to the areas of origin and
distinctive features: Guatemalan (Persea nubigena var. guatamalensis L. Wms.), Mexican (P.
americana var. drymifolia Blake-), West Indian (P. americana Mill. var. americana). Hybrid
forms exist between all three types (CRFG, 1998).
The Mexican race originated from the highlands in Mexico. Mexican avocados mature relatively
quickly within six to eight months and are the richest of all avocados with as much as 30% lipid
content. Fruit from the Guatemalan race also originated from the highlands in Central America
and have thick woody skins and are generally the latest maturing of the three races (Schaffer and
Andersen, 1994), taking a year or longer before they are ready for harvest. Guatemalan avocados
are generally small (the size of a tennis ball) and typically have a lipid content around 8 to 15
percent (Smith et al., 1992). The West Indian race occurs in lowland forests of Central America
and northwestern parts of South America. The West Indian avocados are large, have a leathery
skin, mature in 6 to 9 months, weight up to 1.5 kilograms and have the lowest lipid content (only
3 to 10 percent) of all avocados (Smith et al., 1992).

7
West Indian avocados are the most cold sensitive and well adapted to high temperatures. Due to
their origin in the cool highlands, fruit of the Mexican race are the most cold tolerant and
because of this, they do not show normal development in high temperatures either. On the other
hand avocados of the Guatemalan race fall in between the other two showing more sensitivity to
high temperatures (Whitmore, 1986).
Most avocado trees grown in commercial plantations are a mix of Guatemala and Mexican
ancestors or have Guatemala and West Indian parents. Avocado cultivars found in the market are
the result of selection among the three avocado races with advantages for commercialization and
cross-breeding work done basically in California, US (CAC, 1998).
Systematic studies have classified more than 500 varieties; however, most of them have been
discarded in order to "create" commercial varieties, which adapt to production in commercial
scale (Smith et al., 1992). From this large number of varieties, most have had productivity
problems (production time, amount of fruit), quality (protein and fat content), and commercial
handling problems (resistance to transportation, etc.). Commercial varieties are developed from
the selection and improvement of these types, or by hybridation. For example, from the Antillean
type the Pollock, Peterson, and Waldin varieties are obtained; from the Guatemalan, MacArthur,
Orotava, Nabal, Anaheim, Hass, Booth 7, Booth 8; and from the Mexican: Puebla, Mayapán,
Zutano, Topa-Topa, and Bacon. Some hybrid varieties are: Mexican-Guatemalan: Fuerte,
Ettinger, Rincón, Robusto, Lula. Antillean-Guatemalan: Gema, Choquette (Rodríguez-Suppo,
1992).
Once the edible pulp is separated, the skin and seed are left as residues. The seed has lower lipid
content than pulp; therefore, seeds are not considered important in processes such as the
obtaining of oil. However, Lee (1981) found that the fatty acids in the seed have higher levels of
polyunsaturated acids than in the pulp.

8
Table 2.1 Fruit characteristics of different avocado cultivars.
Cultivar Fruit shape Skin color Flesh color Fruit weight
Hass Ovate Purplish black Creamy yellow 140 t0 400 g
Fuerte Pyriform Green Pale yellow 170 t0 500 g
Edranol Pyriform Dark green Buttery yellow 255 to 500 g
Ryan Pyriform Green Golden yellow 255 to 420 g
Pinkerton Prominantly
pebbled
Dark green Cream-colored 230 to 425 g
Ettinger Pyriform Bright green Light cream to yellow 170 to 570 g
Bacon Ovate Green Very pale yellow to green 170 to 510 g
Source: Whiley et al. (1996b)
Proteins, carbohydrates, vitamin C and phytochemicals are present in both the dry and fresh seed
samples. Carbohydrates exist in varying amounts in the avocado seeds depending on the
different activities that took place in the fruit during storage process before the analysis. During
storage, fruits lose weight, shrivel and change colour, lose acidity and ascorbic acid but gain
sweetness (Pareek et al., 2009). Also during this period, the enzyme activity, sugar and
carotenoid contents increase with corresponding decrease in acidity, pectin and tannin content.
To compare the carbohydrates in both fresh and dry seeds it needs a test that is specific for a
specific type of carbohydrates. The study by Flitsch & Rein (2003), explains the vital functions
of carbohydrate found in avocado seeds as supplying energy for the body process. Some of the
carbohydrates are immediately utilized by the tissues and the remaining is stored as glycogen in
the liver and muscles and some are stored as adipose tissues for future energy needs (Flitsch &
Rein, 2003).
Avocado seed also contains a diverse number of nutrients and phytochemical compounds of
nutritional value. Some of the phytochemical compounds found in avocado seeds are tannins,
saponins and flavonoids which are used as antioxidants, lower bad cholesterol level etc. The
phytochemical compounds in avocado seeds are responsible for color and organoleptic properties
and also for prevention and treatment of many health conditions, including cancer, heart disease,
diabetes, and high blood pressure (Kushi et al, 2006). There is some evidence that certain
phytochemicals may help prevent the formation of potential carcinogens (substances that cause

9
cancer), block the action of carcinogens on their target organs or tissues, or act on cells to
suppress cancer development (Kushi et al., 2006).
Table 2.2 Composition of Avocado seed
Composition Percentage
Water 50.4%
Wet Basis (%) Dry Basis (%)
Ash 1.3 2.7
Protein 2.5 5.0
Reducing sugars 1.6 3.2
Common sugars 0.6 1.2
Starch 29.6 60.0
Pentosans 1.6 3.3
Arabinos 2.0 4.1
Ether Extract 1.0 2.0
Fiber 3.7 7.2
Undetermined 5.6 11.3
Source: California Avocado Association (1934)
2.2.Global Avocado Production
2.2.1. World avocado production
World production of avocados has increased more than fourfold over the past four decades,
according to FAO. World production in 2010 production was about 3,581,711 metric tons (mt) it
increased to 4,188,912mt in 2012. Mexico is the largest producer of avocados in the world,
followed by Chile, Indonesia, Dominican Republic and USA. According to FAO data, Mexico
produced 1.1mln mt, Indonesia 224,000mt, Chile 330,000mt, Dominican Republic 275,000mt
and USA 149,000mt. The growth in production has been fuelled by increasing public awareness
on healthy eating habits as well as economic growths coupled with disposable income. It is
important to note that globally and indeed it has to be the case in Tanzania that the major driver
for avocado production is domestic consumption. Statistics show that exports accounts for less
than 20% of the production in major producing countries. For example in Mexico, the largest
producer consumes 35 per cent of the World avocado production, per capita consumption since
the 2000s had reached 9 kilos per annum, however, imports are competing with domestic
market as a result Mexicans now eat about 7 kilos/annum2.

10
Source FAOSTAT
Figure 2.1. World avocado production trend (2000 - 2012) in '000mt
2.2.2. Avocado production in Africa
Over a period of 2005 – 2012 avocado production in Africa has grown but unevenly from
497,339mt in 2005 to 751,881mt in 2012. The leading producers with their volumes in mt in
2012 were Kenya (186,292mt), Rwanda (145,000mt), South Africa (91,603mt), Cameroon
(72,000mt) and DRC (70,000mt). With an exception of South Africa all the other four top
ranking producers lie closer to the equator with tropical conditions. Africa’s annual production
growth has been closer to the global rate that between 2005 and 2012 averaged at 6.4%. Year-on-
year growths have been the highest in Morocco (23%), Tanzania (20%), Rwanda (18%) and
Kenya (10%). In absolute terms Kenya and Rwanda carry more weight due to the larger base
while a country like Tanzania had a smaller base of 22,000mt.
It is promising to know that the crop has market foothold in both export and domestic markets,
data from the South African Subtropical Growers Association indicate that 45 % of total
production is exported, 15 % is processed, 25 % is consumed in local markets and 15 % is sold
on the informal markets. While South Africa ranks low in terms of volume of fruit produced, it
has the most advanced subsector and is among the top five of exporters. Other Africa exporters
are Ethiopia, Cameroon, Rwanda and Kenya. It also has a well advanced R&D base.
11
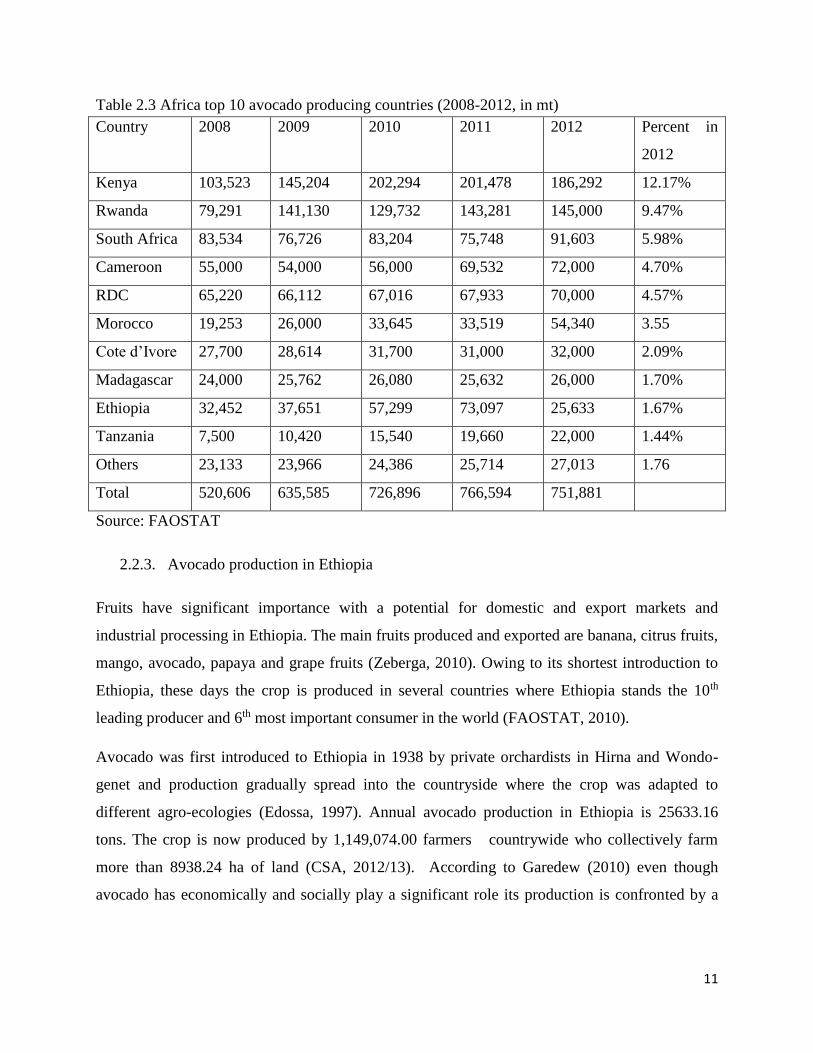
Table 2.3 Africa top 10 avocado producing countries (2008-2012, in mt)
Country 2008 2009 2010 2011 2012 Percent in
2012
Kenya 103,523 145,204 202,294 201,478 186,292 12.17%
Rwanda 79,291 141,130 129,732 143,281 145,000 9.47%
South Africa 83,534 76,726 83,204 75,748 91,603 5.98%
Cameroon 55,000 54,000 56,000 69,532 72,000 4.70%
RDC 65,220 66,112 67,016 67,933 70,000 4.57%
Morocco 19,253 26,000 33,645 33,519 54,340 3.55
Cote d’Ivore 27,700 28,614 31,700 31,000 32,000 2.09%
Madagascar 24,000 25,762 26,080 25,632 26,000 1.70%
Ethiopia 32,452 37,651 57,299 73,097 25,633 1.67%
Tanzania 7,500 10,420 15,540 19,660 22,000 1.44%
Others 23,133 23,966 24,386 25,714 27,013 1.76
Total 520,606 635,585 726,896 766,594 751,881
Source: FAOSTAT
2.2.3. Avocado production in Ethiopia
Fruits have significant importance with a potential for domestic and export markets and
industrial processing in Ethiopia. The main fruits produced and exported are banana, citrus fruits,
mango, avocado, papaya and grape fruits (Zeberga, 2010). Owing to its shortest introduction to
Ethiopia, these days the crop is produced in several countries where Ethiopia stands the 10th
leading producer and 6th most important consumer in the world (FAOSTAT, 2010).
Avocado was first introduced to Ethiopia in 1938 by private orchardists in Hirna and Wondo-
genet and production gradually spread into the countryside where the crop was adapted to
different agro-ecologies (Edossa, 1997). Annual avocado production in Ethiopia is 25633.16
tons. The crop is now produced by 1,149,074.00 farmers countrywide who collectively farm
more than 8938.24 ha of land (CSA, 2012/13). According to Garedew (2010) even though
avocado has economically and socially play a significant role its production is confronted by a

12
number of constraints;- this are degeneration of fruits, disease problem and absence of
agronomic practices.
According to FAO, (2010) description of some varieties introduced in Ethiopia and presently
available includes:
Hass: high yielding, resistant to main pests and diseases. not presenting a marked biennial
fruiting behavior. Fruit size variable; oil % in the fruit: medium, month to ripen: 9, seed size:
small; cold tolerance: medium
Pinkerton: high yielding; fruit size; medium; oil % in the fruit: high; month to ripen: 6-8; seed
size: big; cold tolerance: medium
Fuerte: a Mexican Guatemalan cross; medium yielding, fruit size , small to medium; oil % is
high; month to ripen 5-6; seed size : tolerant to frost.
Bacon: high yielding; medium size fruit; oil % high; tolerant to cold -5oC
Ettinger: a Mexican Guatemalan cross, resistant to cold
Nabal: Guatemalan type, big size fruit; suitable for warm climate.
In general, fruit production is still backward, the business is underdeveloped and the private
sector is not much attracted. In connection with this lack of access to improved varieties,
production is exclusively based on distribution of mixed materials; consequently the local seed
system has come out as best-bet arena and is now a common route for seedling dissemination
(Ayelech, 2011 ). CSA (2013) indicated Avocado as one of the second potential fruit crop
produced in Ethiopia.
Ethiopian Farmers produce avocado without knowing its variety. Knowing their variety is useful
in selecting variety which give high yield, high oil content and also in determining time of
harvesting. In Ethiopia avocado is consumed mostly as a juice either alone or mixed with other
fruit juice and also as a salad. Its juice is consumed round a year especially during fasting days
and mostly utilized by urban dwellers rather than rural dwellers due unavailability of it
everywhere since avocado is not produced all over Ethiopia. Eating small amount of avocado
feels stomach full which incase useful in reducing weight due to its high fat content. Its fat
content among different varieties in Ethiopia is not yet investigated which was determined in this
study.
13
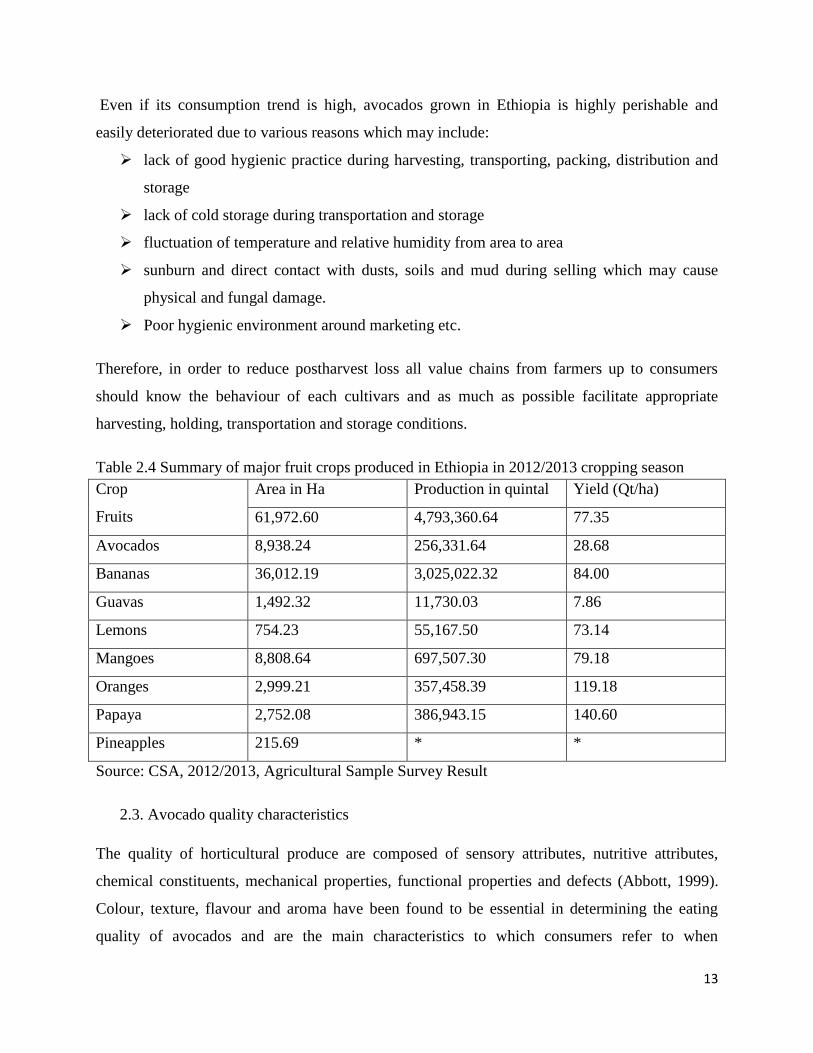
Even if its consumption trend is high, avocados grown in Ethiopia is highly perishable and
easily deteriorated due to various reasons which may include:
lack of good hygienic practice during harvesting, transporting, packing, distribution and
storage
lack of cold storage during transportation and storage
fluctuation of temperature and relative humidity from area to area
sunburn and direct contact with dusts, soils and mud during selling which may cause
physical and fungal damage.
Poor hygienic environment around marketing etc.
Therefore, in order to reduce postharvest loss all value chains from farmers up to consumers
should know the behaviour of each cultivars and as much as possible facilitate appropriate
harvesting, holding, transportation and storage conditions.
Table 2.4 Summary of major fruit crops produced in Ethiopia in 2012/2013 cropping season
Crop
Fruits
Area in Ha Production in quintal Yield (Qt/ha)
61,972.60 4,793,360.64 77.35
Avocados 8,938.24 256,331.64 28.68
Bananas 36,012.19 3,025,022.32 84.00
Guavas 1,492.32 11,730.03 7.86
Lemons 754.23 55,167.50 73.14
Mangoes 8,808.64 697,507.30 79.18
Oranges 2,999.21 357,458.39 119.18
Papaya 2,752.08 386,943.15 140.60
Pineapples 215.69 * *
Source: CSA, 2012/2013, Agricultural Sample Survey Result
2.3. Avocado quality characteristics
The quality of horticultural produce are composed of sensory attributes, nutritive attributes,
chemical constituents, mechanical properties, functional properties and defects (Abbott, 1999).
Colour, texture, flavour and aroma have been found to be essential in determining the eating
quality of avocados and are the main characteristics to which consumers refer to when

14
purchasing (Lee et al., 1983). In order to investigate and maintain the quality of avocados it is
essential to be aware of the quality related attributes which are outlined here.
2.3.1. Physical properties
Physical properties are mainly related to the appearance and aesthetic appeal of avocados to
which consumers are initially exposed influencing their decision to purchase. The physical
quality parameters of avocados include skin colour, firmness, texture, and physiological
disorders.
a. Skin colour
Avocado skin colour is an important indication of the stage of ripening for industry and
consumers (Arzate-Vázquez et al., 2011). Skin colour can be measured either objectively,
commonly using a chroma meter or colorimeter or alternatively using subjective means by
experienced sensory panellists using eye colour rating. Skin colour is found to vary among
different avocado cultivars. The ‘Hass’ variety is characteristic of a colour change from green to
purple and eventually black (Arzate-Vazquez et al., 2011). However, Chen et al. (2009) revealed
that the skin colour of the ‘Sharwil’ variety does not darken with maturity. Therefore, other
methods must be utilised to distinguish the various stages of maturity.
b. Firmness
The firmness of avocados is a vital determinant in assessing the degree of ripening (Mizrach and
Flitsanov, 1999; Arzate Vazquez et al., 2011). Firmness can be described as the resistance to
penetration (Mizrach and Flitsanov, 1999) determined by employing invasive, such as hand
tactile methods, destructive methods such as the Magness-Taylor puncture test (M-T), or non-
destructive methods such as impulse response and ultrasonic methods. Destructive techniques do
not allow for continuity in monitoring on a commercial basis but is, rather, well suited for
laboratory analysis. Mizrach and Flitsanov (1999) employed ultrasonic techniques to evaluate the
firmness in a non-destructive manner which rendered comparable results to that of destructive
methods.
c. Texture
Texture is a significant indicator of avocado quality and of concern to the consumer
(Maftoonazad and Ramaswamy, 2008; Landahl et al., 2009). Avocados undergo drastic changes
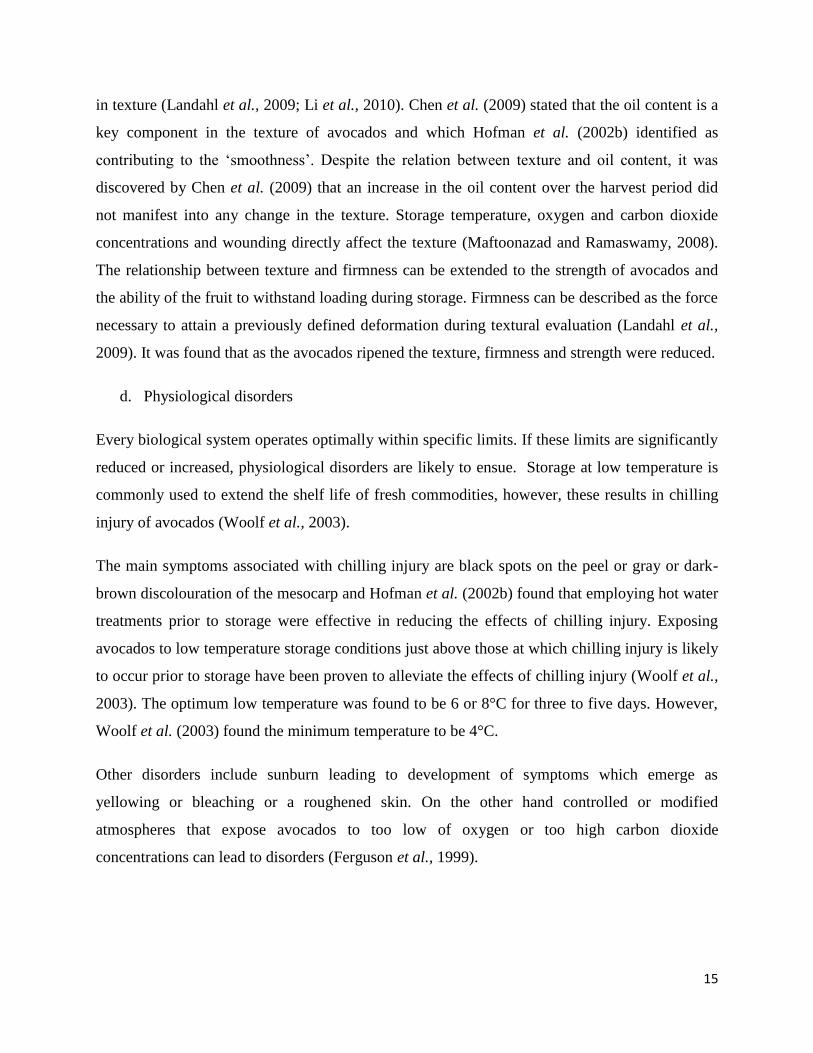
15
in texture (Landahl et al., 2009; Li et al., 2010). Chen et al. (2009) stated that the oil content is a
key component in the texture of avocados and which Hofman et al. (2002b) identified as
contributing to the ‘smoothness’. Despite the relation between texture and oil content, it was
discovered by Chen et al. (2009) that an increase in the oil content over the harvest period did
not manifest into any change in the texture. Storage temperature, oxygen and carbon dioxide
concentrations and wounding directly affect the texture (Maftoonazad and Ramaswamy, 2008).
The relationship between texture and firmness can be extended to the strength of avocados and
the ability of the fruit to withstand loading during storage. Firmness can be described as the force
necessary to attain a previously defined deformation during textural evaluation (Landahl et al.,
2009). It was found that as the avocados ripened the texture, firmness and strength were reduced.
d. Physiological disorders
Every biological system operates optimally within specific limits. If these limits are significantly
reduced or increased, physiological disorders are likely to ensue. Storage at low temperature is
commonly used to extend the shelf life of fresh commodities, however, these results in chilling
injury of avocados (Woolf et al., 2003).
The main symptoms associated with chilling injury are black spots on the peel or gray or dark-
brown discolouration of the mesocarp and Hofman et al. (2002b) found that employing hot water
treatments prior to storage were effective in reducing the effects of chilling injury. Exposing
avocados to low temperature storage conditions just above those at which chilling injury is likely
to occur prior to storage have been proven to alleviate the effects of chilling injury (Woolf et al.,
2003). The optimum low temperature was found to be 6 or 8°C for three to five days. However,
Woolf et al. (2003) found the minimum temperature to be 4°C.
Other disorders include sunburn leading to development of symptoms which emerge as
yellowing or bleaching or a roughened skin. On the other hand controlled or modified
atmospheres that expose avocados to too low of oxygen or too high carbon dioxide
concentrations can lead to disorders (Ferguson et al., 1999).

16
2.3.2. Sensory properties
One of the main sensory properties of avocados is flavour which encompasses both aroma and
taste and forms an important component of the eating quality of the fruit (Abbott, 1999).
a. Flavour
Workneh and Osthoff (2010) and Paull and Duarte (2011) defined flavor as the ratio of sugar to
acid influenced by temperature as in the case of grapefruit held at 8ºC resulting in a sugar and
acid decline as compared to those stored at 12ºC. Premature harvesting can lead to an
undesirable taste (Wu et al., 2011). The off flavour can be ascribed to increased levels of ethanol
and acetaldehyde (Paull and Duarte, 2011). Burdon et al. (2007) observed that exposure of
‘Hass’ to oxygen and carbon dioxide concentrations of less than 0.5% and up to 20%,
respectively, resulted in increased levels of acetaldehyde and ethanol. As with texture, the oil
content also forms a key component of flavour (Chen et al., 2009) and, hence, it can be deduced
that a positive correlation exists between texture and taste.
2.3.3. Chemical properties
Identification of horticultural maturity is often difficult to determine in avocados as changes in
external appearance are sometimes not easily distinguishable (Lee et al., 1983). Other techniques
of determining maturity and that employ chemical properties are therefore required. The
chemical properties of avocados discussed here are total soluble sugar, pH, total titratable acid,
moisture content, dry matter and oil content.
a. Total soluble sugars
Carbohydrates are an essential source of energy for growth, development and maintenance in
avocados (Liu et al., 1999b). Five major soluble sugars were identified within the avocado
include the rare seven carbon (C7) reducing sugar mannoheptulose, its reduced polyol form,
perseitol, the common disaccharide sucrose, and its component hexoses, fructose and glucose.
These constituted approximately 98% of the total soluble sugars (TSS). Liu et al. (1999b)
demonstrated that ripening of avocados at 20°C resulted in a considerable decline in the TSS in
the peel and flesh, particularly the C7 sugars, and that a decrease in the TSS was concomitant
with an increase in the oil content. During storage at 1 and 5°C a decrease in the TSS was
observed but at a slower rate. Similarly Liu et al. (2002) found a decrease in the C7 sugars

17
during the progression of the ripening process. During avocado growth, carbohydrates are stored;
however, once the fruit is harvested these carbohydrates are consumed for postharvest
physiological processes such as respiration via enzymatic mechanisms that metabolize the C7
sugars (Liu et al., 1999b). This suggests that the C7 sugars play an important role in the
respiration of the avocado during the ripening process.
b. pH
Avocado pH lies in the range of 6 to 6.5 (Soliva-Fortuny et al., 2004). Maftoonazad and
Ramaswamy (2008) observed that the pH decreased with time during storage. Avocados treated
with pectin based coatings illustrated a slower rate of decrease in pH values compared to
untreated fruit and those exposed to higher temperatures. Exposure to low oxygen and/or high
carbon dioxide for short periods of time has been used as a pretreatment to alleviate
physiological disorders and for enhanced storage atmospheres. These conditions can also lead to
a decrease in the intracellular pH thereby altering the various physiological processes that are
dependent upon pH (Ke et al., 1995). Avocados subjected to (a) 0.25% oxygen, (b) 20% oxygen
in combination with 80% carbon dioxide or (c) 0.25% oxygen and 80% carbon dioxide reduced
the pH value from 6.9 to 6.7, 6.3, and 6.3, respectively, at 20°C (Ke et al., 1995). Similarly
Lange and Kader (1997) stored avocados at 20°C in atmospheres of varying concentrations of
oxygen and carbon dioxide and found that concentrations of (a) 21% oxygen, (b) 20% carbon
dioxide (17% oxygen and the remainder Nitrogen) and (c) 40% carbon dioxide (13% oxygen and
the remainder Nitrogen) produced pH values of 7.0, 6.6 and 6.4 respectively. These show that the
lowest concentration of oxygen and highest concentration of carbon dioxide results in a
reduction of pH to form an acidic medium.
c. Total titratable acid
Acidity is associated with both sweetness and sourness of fruit. The method used to measure
acidity is titratable acidity. Maftoonazad and Ramaswamy (2008) observed an increase in the
titratable acid at higher storage temperatures in both pectin-based coated and non-coated
avocados. Holcroft and Kader (1999) showed that strawberries exposed to higher concentrations
of carbon dioxide at 5°C exhibited increased pH and decreased levels of titratable acidity.
Mangoes subjected to postharvest treatments, packaging and storage for 28 days resulted in a
decrease in the titratable acidity from 3.42 to 0.2% (Tefera et al., 2007). It can thus be deduced

18
that the postharvest changes in strawberries and mangos differ to that of avocados in terms of
total titratable acidity.
d. Moisture content
Moisture content is the preferred indicator of maturity in South Africa with the recommended
moisture content in the range of 69 to 75% depending on the cultivar (Mans et al., 1995). Export
of early season ‘Fuerte’ commences once the moisture content has reached 78 to 80% equivalent
to oil content of 9 to 11 standards of moisture percent (Dodd et al., 2008).
e. Oil content
Avocado is considered to be an important oil fruit and oil content serves as a significant indicator
of fruit maturity (Hofman et al., 2002a; Ozdemir and Topuz, 2004). As the fruit matures, the
concentration of oil within the mesocarp increases as described by Hofman et al. (2002a),
Ozdemir and Topuz (2004) and Chen et al. (2009). This increase in oil results in a reduction in
the water by the same amount within the fruit implying that the percentage of total water plus oil
remains constant throughout the avocado life (Hofman et al., 2002a; Ozdemir and Topuz, 2004).
Lee et al. (1983) and Chen et al. (2009) observed a close correlation between the percentage oil
content and percentage dry matter. The minimum oil content necessary for marketing avocado
fruit is 8%. After maturation, values greater than 20% can occur. These values occur in the
period between harvesting, when commercial maturity is reached and full maturation, when the
oil content increases and change occurs in the oil composition. Concentrations of unsaturated
fatty acids increase and those of saturated fatty acids decrease (Martinez & Moreno, 1995).
The oil content of the fruit depends upon its ecological origin and on the cultivar, as for example,
in Guatemalan and Mexican cultivars, the oil content varies from 10 to 13% and from 15 to 25%,
respectively (Biale and Young, 1971), while in the fruits from Carrebean, a low fat (2.5 to 5%)
has been reported (Hatton et al., 1964).
f. Dry matter
Hofman et al. (2002a) referred to percentage dry matter determination as an alternative to oil
content determination in assessing the maturity. Extending the maturation stage of the avocado
allows for more oil accumulation and dry matter however the risk of increased disease is
introduced. Maturity standards are being used by avocado producing countries to avoid

19
marketing of low quality immature fruit. The standards adopted are the Californian minimum dry
matter of 20.8% for ‘Hass’ or a slightly higher minimum dry matter content of approximately
25% to decrease disorders during storage. An oil content of 8% has been reported by Ozdemir
and Topuz (2004) to be acceptable for marketing of avocados. Villa-Rodriguez et al. (2011)
found that the dry matter had increased from 31.65 to 36.52% over eight days at 15°C and
thereafter decreased to 32.91 on the day 12.
Hofman et al. (2000) suggested that the percentage oil content and dry matter are not suitable
indicators of avocado maturity in late-harvested ‘Hass’ due to late harvested fruit having
inconsistent changes. No distinct correlation could be drawn between the effect of varying
temperature and relative humidity on the percentage dry matter and oil content of avocados
during storage, thus, motivating research to be conducted in this field.
2.4. Nutritional value, health benefits and uses of avocado
Composition of nutrients of any fruit may vary depending on the variety, grade of ripening,
climate and composition of soil, and fertilizers. Avocados have significantly higher lipid content
(8–25%) as compared to other fruits. The avocados have diverse fats yet they are one of the best
foods one can eat. They are full of nutrients and heart-healthy compounds. According to USDA
report in 2004, each 100g (3.5oz) of avocado pulp gives 670KJ (160Kcal) of energy; 75% of
which is from its fat. It contains 2.13g saturated fatty acid, 9.80g monounsaturated and 1.82g
polyunsaturated fatty acids. 2g of that amount was protein while water was 73.23g. The avocado
also contains many vitamins and minerals; especially it contains 35% more potassium than
banana which has 358mg per 100g. 75% of the high fibre content is insoluble while 25% is
soluble (Naveh et al., 2002). The health benefits of avocados are quite obvious, from their
nutritional components and hence cannot be overemphasized. High intake of avocados lowers
blood cholesterol levels (low density lipoprotein, harmful cholesterol) due to its high content of
High density lipoproteins (HDL), helpful cholesterol (Naveh et al., 2002).
The avocados are a great source of liteine, a carotenoid that works as an antioxidant and helps
protect against eye disease. Avocado helps in weight loss because the monounsaturated fats
make one feel full and resist temptation to eat. It contains good amount of fiber both soluble and
insoluble. Fiber is needed by the digestive system to run smoothly. Oleic acid is a fat that

20
activates the part of the brain that makes one feel full, and it is also present in avocado. Oleic
acid in avocado has been shown to produce greater level of satiety than less healthy saturated fats
and Trans fats contained in processed food. The processed products of avocado pulp include the
paste, puree, and guacamole. Guacamole is a fruit pulp seasoned with salt, onion, lemon, pepper
and tomato, being produced not only in an artisanal way but also marketed by some US
companies (Daiuto et al., 2011).
The sensory quality of guacamole of Hass variety made without chemical additives and stored
under refrigeration was evaluated according to the type of packaging used. A greater consumers’
acceptance was observed for the product stored in container with gas barrier when compared to
that stored in polyethylene package (Daiuto et al., 2011). Although these authors have also
considered that the heat treatment may have been effective on the polyphenol oxidase
inactivation, it can result in the development of bitterness and off-flavors in avocado, which
changes the guacamole texture, negatively contributing to a mashed appearance.
Chaves et al. (2013) studied avocado pulp Margarida variety dehydrated and defatted by cold
pressing and avocado oil to partially replace wheat flour and butter, respectively, in whole grain
crackers. The authors reported that the flour from avocado pulp, in general, showed
characteristics similar to those of conventional flour and whole wheat flour. The biscuits had
higher minerals and fiber levels, with good sensory acceptance.
Meat derivatives can also be supplemented with avocado pulp, since most of these processed
foods contain relatively high levels of saturated fats in the formulation whose consumption is
restricted by health issues. Thus, an alternative to reduce and enhance fatty acids balance is the
incorporation of fats or vegetable oils in emulsified meat products. The replacement of animal
fats by vegetable oils in meat products has been studied with positive effects on the chemical,
physical and sensory characteristics of the products, but with negative effects on water activity
and texture (Lugo, 2006).
21
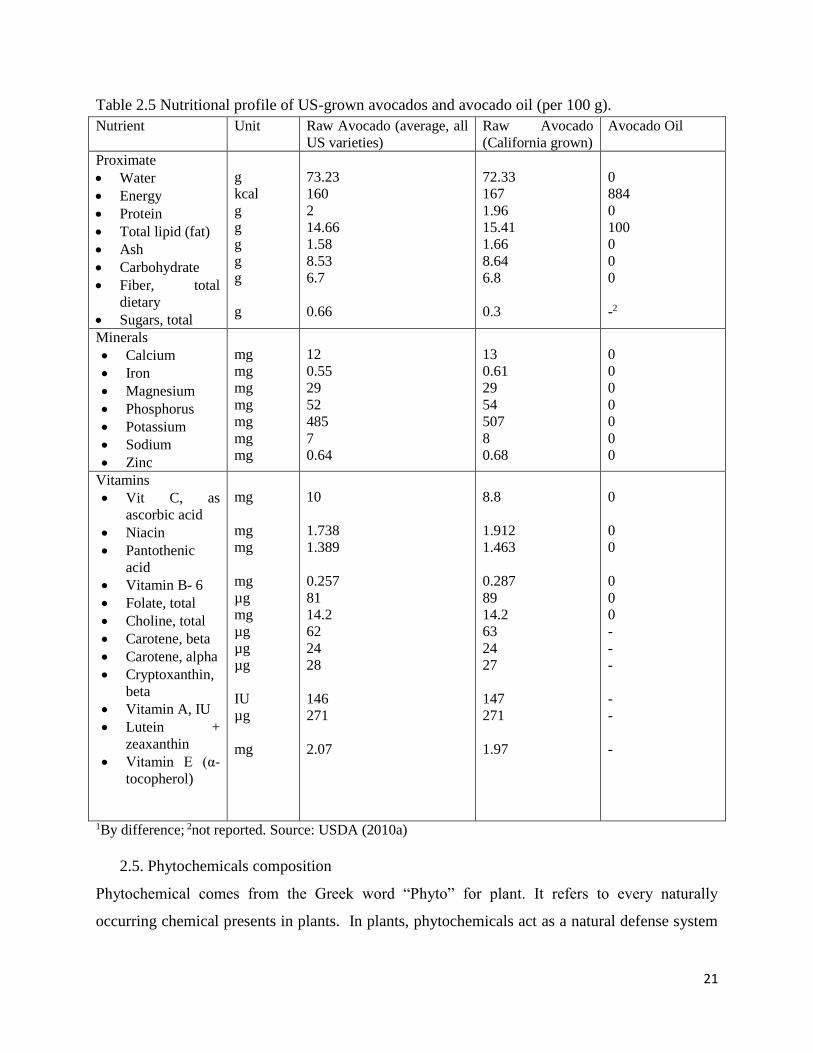
Table 2.5 Nutritional profile of US-grown avocados and avocado oil (per 100 g).
Nutrient Unit Raw Avocado (average, all
US varieties)
Raw Avocado
(California grown)
Avocado Oil
Proximate
Water
Energy
Protein
Total lipid (fat)
Ash
Carbohydrate
Fiber, total
dietary
Sugars, total
g
kcal
g
g
g
g
g
g
73.23
160
2
14.66
1.58
8.53
6.7
0.66
72.33
167
1.96
15.41
1.66
8.64
6.8
0.3
0
884
0
100
0
0
0
-2
Minerals
Calcium
Iron
Magnesium
Phosphorus
Potassium
Sodium
Zinc
mg
mg
mg
mg
mg
mg
mg
12
0.55
29
52
485
7
0.64
13
0.61
29
54
507
8
0.68
0
0
0
0
0
0
0
Vitamins
Vit C, as
ascorbic acid
Niacin
Pantothenic
acid
Vitamin B- 6
Folate, total
Choline, total
Carotene, beta
Carotene, alpha
Cryptoxanthin,
beta
Vitamin A, IU
Lutein +
zeaxanthin
Vitamin E (α-
tocopherol)
mg
mg
mg
mg
µg
mg
µg
µg
µg
IU
µg
mg
10
1.738
1.389
0.257
81
14.2
62
24
28
146
271
2.07
8.8
1.912
1.463
0.287
89
14.2
63
24
27
147
271
1.97
0
0
0
0
0
0
-
-
-
-
-
-
1By difference; 2not reported. Source: USDA (2010a)
2.5. Phytochemicals composition
Phytochemical comes from the Greek word “Phyto” for plant. It refers to every naturally
occurring chemical presents in plants. In plants, phytochemicals act as a natural defense system

22
for host plants and provide colour, aroma and flavour. Phytochemicals are present in a variety of
plants utilized as important components of both human and animal diets. These include fruits,
seeds, herbs and vegetables. Herbs and spices are harmless sources for obtaining natural
antioxidants (Okwu, 2004).
Phytochemicals found in plant foods have both adverse effects and health benefits. For example,
phytic acid, lectins, phenolic compounds (tannins), saponins and enzyme (amylase and protease)
inhibitors have been shown to reduce the availability of nutrients and cause growth inhibition,
while phytoestrogens and lignans have been linked with infertility problems. However, phytic
acid, lectins, phenolic compounds, amylase inhibitors and saponins have also been shown to
reduce the blood glucose and insulin responses to starchy foods and/or the plasma cholesterol
and triglycerides. In addition, phytic acid, phenolics, saponins, protease inhibitors,
phytoestrogens and lignans have been related to reduce cancer risks. Because anti-nutrients can
also be mitigating agents, they need re-evaluation and perhaps a change in name in the future
(Sidhu & Oakenful, 1986).
2.5.1. Phytic Acid
Phytic acid (myoinositol 1, 2, 3,4,5,6, hexakis-dihydrogen phosphate; PA) is present in foods in
concentrations ranging from 0.1 to 6.0%. It is found as crystalline globoid inside protein bodies
in the cotyledon of legumes or oilseeds or in the bran region of the cereal grains (Reddy et al.,
1982). Salts of phytic acid, designated as phytates, are found in plants, animals and soil. Phytate
is ubiquitous among plant seeds and grains, comprising 0.5 to 5 percent (w/w). It is primarily
present as a salt of the mono- and divalent cations K+, Mg 2+, and Ca 2+ and accumulates in the
seeds during the ripening period. Phytate is regarded as the primary storage form of both
phosphate and inositol in plant seeds and grains (Loewus, 2002). Because phytate is a naturally
occurring compound formed during maturation of plant seeds and grains, it is a common
constituent of plant-derived foods. Depending on the amount of plant-derived foods in the diet
and the grade of food processing, the daily intake of phytate can be as high as 4500 mg (Reddy,
2002).

23
Figure 2.2: Proposed structures of phytic acid. Source: Reddy (2002)
Health benefits of phytate
A significant negative relationship was observed between the blood glucose responses to
different starchy foods, expressed as glycemic index, and the intake of phytic acid (Yoon et al.,
1983). The addition of PA (0.2-9%) to the diet of rats significantly reduced the plasma
cholesterol and triglyceride levels (Sharma, 1984). This was suggested to be related to the ability
of PA to bind to Zn and thus lower the plasma Zn to copper (Cu) ratio; lower ratios tend to
predispose humans to cardiovascular disease. Certain minerals such as iron and copper catalyze
oxidative enzymes that generate free radicals, resulting in undesirable oxidative damage such as
cell membrane damage (produces leaky cells). Because phytates have the ability to chelate
minerals that participate in undesirable oxidative reactions, phytates have been suggested to have
protective effects. The ability of phytates to chelate the divalent minerals makes them a natural
antioxidant.
Phytate as an antinutrient
The major concern about the presence of phytate in the diet is its negative effect on mineral
uptake. Minerals of concern in this regard would include Zn 2+, Fe 2+ / 3+, Ca 2+, Mg 2+, Mn 2+, and
Cu 2+ (Vucenik, 2003). Its highly negatively charged structure at a wide range of pH values
makes it very reactive with other positively charged ions such as minerals, forming insoluble
complexes which are less available for digestion and absorption in the small intestine. This is the
main reason why PA has traditionally been considered as an antinutrient. The adverse effect of
PA in mineral availability depends on a number of factors including the concentration of PA and
the strength of its binding with different minerals. For example, zinc (Zn) forms one of the
strongest mineral complexes with PA (Evans & Martin, 1988).

24
PA can also react directly with the positively charged group or indirectly with the negatively
charged group of the proteins mediated by a positively charged mineral ion such as calcium. It
can bind with starch either directly by hydrogen bonding with the phosphate group or indirectly
through the proteins to which it is associated with. The formation of these complexes is likewise
thought to reduce the solubility and digestibility of the proteins or starch and several in-vitro
studies have indeed shown reductions in protein digestibility by PA and in-vivo (Atwal et al.,
1980).
2.5.2. Phenolic compounds
Phenolic compounds encompass a wide variety of compounds characterized by the presence of
an aromatic ring with one or more hydroxyl groups and a variety of substituents. Flavonoids
have a basic C6C3-C6 structure and include the anthocyanin pigments, flavonols, flavanoids and
isoflavones. They occur mostly as glycosides except the flavanols which tend to polymerise to
condensed tannins. The tannins could be classified either as condensed or hydrolysable. Most
condensed tannins are polymers of flavan-3-ols (catechins) or flavan-3, 4-diols
(leucoanthocyanins) while most hydrolysable tannins are glucose or polyhydric alcohol esterified
with gallic acid (gallotannins) or hexahydrodiphenic acid (ellagitannins). The stable dilactone of
the latter is ellagic acid (Deshpande et al., 1984). Tannins may be classified as polyphenolic
substances (Shimelis and Rakshit, 2007).
Health benefits of Phenolic compounds
Several phenolics (e.g. chlorogenic acid, gallic acid, caffeic acid, tannin acid, catechin) have
been shown to inhibit the mutagenic effects of both direct-acting carcinogens (e.g.
benzo(a)pyrene diol epoxide) and carcinogens that require metabolic activation (e.g. aflatoxin B)
and to trap nitrite, thus reducing the nitrosating species and preventing the endogenous formation
of carcinogenic nitroseamines (Stich & Rosin, 1984).
Anti-nutritional effect of Phenolic compounds
The anti-nutritional and toxic effects of phenolic compounds, particularly the tannins, have been
categorized as depression in food/feed intake, formation of the less digestible tannin-dietary
protein complexes, inhibition of digestive enzymes, increased excretion of endogenous protein,
malfunctions in digestive tract, and toxicity of absorbed tannin or its metabolites. Increased risks
25
of cancer of the mouth and esophagus have been linked to dietary tannins in some
epidemiological studies. Although the depressed food intake has been related in part to the
astringent taste of the phenolic compounds, the adverse effects of tannins have traditionally been
attributed to their ability to bind with proteins and hence inhibit their digestion and absorption
(Butler, 1989).
Tannins decreased feed consumption in animals, bind dietary protein and digestive enzymes to
form complexes that are not readily digestible. Tannins form another group of phenolic
compounds, usually divided into hydrolysable tannins and condensed tannins
(proanthocyanidins), and are caustic and bitter-tasting. They bind and precipitate proteins,
decreasing enzyme- resistant substrates formed by interaction between tannins and
protein/starch. Digestibility of the substrates is compromised by interaction between tannin and
the enzymes (Deshpande and Salunke, 1982), the digestibility of protein and carbohydrate.
2.6. Avocado oil processing methods and oil characteristics
2.6.1. Avocado oil processing methods
Avocado is one of the few cultivated fruits in which oil is a main component on dry basis. The
oil content is in the range of 15-30% depending on the variety, and is mainly mono-unsaturated
with the predominant fatty acid being oleic acid. According to Werman and Neeman (1987), of
all fruits only olive and palm can rival the avocado in oil content.
Avocado oil is valued as edible oil due to its health-enhancing qualities and is especially used in
the treatment of connective tissue diseases. This oil is of good quality because the processed fruit
from which the oil is obtained is still intrinsically sound and is only termed second grade because
of its appearance (black or brown spots, rough skin, shape and size), which is not appealing to
the consumer (Eyres et al., 2006).
The avocado oil can be extracted in different ways. It is contained in a finely-dispersed emulsion
in the cells of the fruit pulp. Hence, the extraction process requires rupturing not only the cell
walls, but also the structure of the emulsion (Lewis et al., 1978). Traditionally, this oil used to be
obtained by mashing the pulp in water, then heating and skimming off the supernatant oil. Later,
for cost reasons, most producers started to extract oil from dried fruits by means of solvents

26
(Sadir, 1972; Human, 1987; Martinez Nieto et al., 1988). Two main methods are in use to extract
avocado oil for industrial production. According to the second method, fruits are dried and
pressed at high temperature, subsequently oil is extracted by means of organic solvents. In the
first method, oil is separated from fruits by centrifugal or pressing forces, then oil cells are
submitted to mechanical and enzymatic destruction (Human, 1987; Werman and Neeman, 1987;
Martinez Nieto et al., 1988; Bizmana et al., 1993). The first method was developed in order to
cut energy costs and minimise the air pollution caused by organic solvents. Nevertheless, in both
cases, the crude avocado oil still needs to be refined before final consumption and use in the
cosmetic industry, where it is particularly appreciated for its high vitamin E content and
emollient properties, although it is considered marginal as a food product (Eyres et al., 2001).
The first attempt to develop a method to produce cold-pressed oil intended to obtain high-quality
edible oil was made back in the late 1990’s by a New Zealand company in collaboration with
Alfa Laval (Eyres et al., 2001). In the follow paragraph let compare shortly the main extraction
methods: chemical extraction by solvent, traditional mechanical extraction, microwave assisted
extraction, cold-pressed mechanical method and ultrasound assisted extraction.
Chemical extraction by solvents
Organic solvent extraction is the most widespread. Warm air drying of the pulp followed by
hexane solvent extraction yields 95% oil (oil extracted/oil content). The resulting oil is brownish
with a high pigment content and needs to be refined for most applications. Refining consists of
three steps: deacidification to remove free fatty acids which are less than 1% in good-quality
fruits; bleaching to remove chlorophylls and their degradation products, pheophytins, as well as
carotenoids; de-odourisation. When oil is sold crude, it is generally winterised at 5°C and
drummed in lacquer-lined drums (Human, 1987; Martinez Nieto et al., 1988).
Although hexane extraction is a mild, well-known extraction method, large amounts of solvent is
needed which is expensive and environmentally hazardous. Carbon dioxide is a non-toxic and
environmentally compatible fluid for the extraction of edible oils (Garcia et al., 1996). Carbon
dioxide is an inert solvent which is non-reactive and does not form other type of chemical
compounds. When the extraction process completes, the carbon dioxide will be returned back to
gas phase and released to air. Therefore it does not leave any residual in the oil and pure oil can

27
be obtain. But this new technology is very expensive due to its sophisticated operation and
control. Consequently, it is not yet widely used. Supercritical carbon dioxide (SC-CO2)
extraction has been proven to be a viable alternative for hexane as avocado oil extracted with
these two methods have been shown to have similar fatty acid profiles (Botha, 2004). The
micro-component content and composition as well as oxidative stability of avocado oil extracted
with SC-CO2 have, however, not been determined. Furthermore, the effects of progressive
extraction on the micro-component distribution and oxidative stability are not known.
Traditional mechanical extraction
The mechanical method has been used traditionally in locations where drying facilities and/or
solvent extraction units cannot be installed. However these processes have poor yields and
frequently require the use of chemical aids.
Avocado oil extraction was generally obtained by peeling and destoning the fruit, mashing the
pulp and eventually drying it, then heating the paste with hot water with chalk and/or NaCl, and
spinning, pressing or skimming off (by natural decantation) the oil (Werman and Neeman, 1987;
Bizmana et al., 1993). The centrifugation/pressing yield is 60-80% (oil extracted/oil content)
depending on the fruit variety.
An extensive literature describes the mechanical method and compares different process
conditions in relation to yield and oil quality. After peeling and de-stoning, the pulp is mashed
with hot water. Werman and Neeman (1987) recommend a dilution ratio of 1/3 and a 30-min
treatment at 75°C. Bizmana et al. (1993) found the best combination with a dilution ratio of 1/5
and a 5-min treatment at 98°C. Traditionally, the mechanical method gives low yields, which can
however be increased by maintaining the pH between 4.0 and 5.5 by adding chalk (CaCO3,
CaSO4) or salt (NaCl) to the paste before centrifugation. The presence of monovalent and
divalent cations activates enzymes with pectinase activity, therefore at certain concentrations the
cellulolytic and proteolytic activities are unaffected. The addition of salts favours the extraction
from difficult pastes (Dominguez et al., 1994). Bizimana et al. (1993) reported good results with
an addition of 5% (w/w) CaCO3 or CaSO4. NaCl improves oil extraction only at a low
concentration (<15%), but it causes a significant corrosion of the equipment (Werman and
Neeman, 1987). Also when the traditional mechanical method is used, the resulting oil normally

28
needs to be refined depending on the desired use. The refining system is the same described in
the previous paragraph.
In a complete review about avocado oil (Jacobsberg, 1988), the author maintains that the
mechanical extraction method compared with the chemical method and without chemical aids
offers the best-quality oil, but it has poor cost/benefit ratio.
Cold-pressed extraction
This is an alternative way to extracting oil from plant. This ancient method uses mechanical
pressure to force the oils out from the leaves. In the late 1990’s, a processing company in New
Zealand began production of cold-pressed avocado oil (CPAO) to be sold as culinary oil for
salads and cooking (Eyres et al., 2001). CPAO is not refined and maintains the chemical,
organoleptic and flavour profile of the fruit flesh. In the 2008/2009 season, the New Zealand
processors produced more than 150,000 liters of CPAO with approximately 3% of the avocado
crop grown for oil production (Wong et al., 2010). Today CPAO is produced also in Chile, South
Africa, Kenya, Israel, Samoa and other countries.
Microwave assisted extraction
More recently has been demonstrated that oil extracted from pressed and microwave-dried
avocado pulp presented the lowest acid and peroxide values and the highest oxidative stability in
contrast with the oil from ethanol extraction. Microwaves have been used in assisting the
extraction of essential components and oil due to their environmentally friendly and economical
traits. In microwave assisted extraction (MAE), rapid generation of heat and pressure within the
biological system forces out compounds from the biological matrix, producing good quality
extracts with better target compound recovery. The efficiency of the MAE process depends on
time, temperature, solid-liquid ratio, type and composition of solvent used (Hemwimon et al.,
2007). Combining microwave drying and pressing of avocado pulp seems to be able to led to a
superior quality avocado oil (Santana et al., 2015).

29
Ultrasound assisted extraction (UAE)
Introduction to sonochemistry: Sonochemistry studies the effects of ultrasonic sound waves on
chemical and physical reactions. Ultrasound is a sound which is at a frequency beyond the range
of human hearing (>20 kHz). Ultrasonic devices use transducers which convert electrical energy
to sound energy to produce an ultrasonic field. The use of ultrasound can be divided into two
separate areas; diagnostic and power ultrasound (Mason, 1990).
Diagnostic ultrasound is the most commonly known form of ultrasound. This employs high
frequency sound waves from 3-10 MHz as a diagnostic tool in the field of medical imaging.
Sound waves at this level of low power and high frequency do not leave permanent effects to the
medium that it is exposed to, making it ideal for non-invasive. The most common known use is
in foetal imaging; however it also has applications for detecting cancerous growth within the
body (Phull and Mason, 1999). Ultrasound uses a pulse/echo technique to produce an image
from within the body (Mason, 1990).
Power ultrasound employed for the disruption of microalgae, focuses on low frequency sound
waves that range from 20-100 kHz. The range of practical uses for power ultrasound is truly
enormous. It is employed in many industries such as engineering and biological sciences for uses
ranging from emulsification to impregnating dyes into leather (Sivakumar et al., 2007). Power
ultrasound induces permanent changes in the medium they are exposed to due to a mechanism
called acoustic cavitation (Mason, 1990).
Cavitation: When a liquid is exposed to low frequency sound waves (20-100 kHz) acoustic
cavitation bubbles are produced. These are microscopic bubbles which in a matter of
milliseconds form, grow and collapse, creating microscopic “hot spots” of extremely high
pressures and heat upon their collapse. These “hot spots” are of great interest because of the
range of their potential applications. The extreme conditions created by these “hot spots” lead to
excited states, bond breakage and free radical production within the medium. The advantages of
this from an industrial point of view is that these effects can lead to higher yields of output,
shorter reaction times and less hazardous conditions needed for chemical reactions to take place
(Bonrath, 2003).

30
In addition to cavitation, mechanical forces associated with ultrasound have also been shown to
disrupt cell walls and cause the release of compounds such as lipids (Cravotto et al., 2008).
Shock waves are an example of a physical mechanical force associated with ultrasound due to
waves of extreme pressure created outside the cavitation bubble after collapse (Mason and
Lorimer, 2002). When a cavitation bubble is formed near a solid surface, for an example the cell
wall of a microalgal cell, the cavitation bubble will form and collapse in a non-spherical shape.
When collapsing in this shape the bubble will form a high pressured localized liquid jet against
the solid surface. The combination of shock waves and liquid jet formation cause intense shear
forces within the liquid media to break open cell walls.
The use of ultrasound in combination with solvents, also known as Ultrasound Assisted
Extraction (UAE) to extract products from plant cells has been employed recently to extract
numerous products from plant cells. UAE is often found to increase the efficiency of the
extraction process. An example of this is the extraction of anti-oxidants from Rosmarinus
offcinalis in which UAE is more effective than traditional extraction and carried out at a lower
temperature with less solvent (Paniwnyk, 2009). UAE has also been employed to extract oil from
oleaginous crops such as soy bean, vegetables and seaweed. This technique resulted in an
increase in extraction efficiency of up to 50% from each source by comparison to the soxhlet
method (Cravotto et al., 2008).
Cravotto et al. (2008) developed an UAE method to extract oils from milled seaweed (SW),
macroalgae and milled pure soybean germ (SG). Firstly, lipids were extracted from the two
species using hexane in a separating funnel and by soxhlet extraction using hexane. The amount
of lipid extracted from SW was 2% - dry biomass for the separating funnel method and 4.8% for
the soxhlet extraction which took 4 hours. For SG, the separating funnel extracted a lipid content
of 3.5% of the dry weight and the soxhlet extraction removed 8.6%, but this method took 8
hours. Cravotto et al. (2008) employed a number of ultrasonic devices which were developed
and produced in-house. Generally, they recovered a lipid yield up to 24.7% for seaweed and
17.7% for soybean germ through changing some processing parameters.
Lou et al. (2010) developed an UAE method to extract oils from the chickpea plant. This
involved mixing 1g of crushed chickpea powder with 8.5 ml of hexane: isopropanol (3:1) in a 50
31
ml beaker. The sample was immersed in a 40 kHz ultrasonic cleaning bath (DL-360B, Shanghai
Zhixin Instruments Co. Ltd.) and sonicated for 90 minutes at 50°C. The ultrasonic power
entering this system was 230 W. After extraction the solvent was evaporated using a rotary
evaporator and the remaining oil quantified. Results indicated that the amount of lipids extracted
from the dry weight peaked at 80% after 30 minutes. This result was 35% higher than the amount
of lipids extracted using the same method but without ultrasound.
2.6.2. Factors that influence avocado oil yields
Avocado fruits with high oil content must be used in the production of oil. Various factors
however are known to affect the oil content of fruits and percentage oil yield during extraction
which may include:
Variety/Cultivar: - Different cultivars vary in oil content upon maturity and only those with high
oil content should be considered. Because the oil is contained in the pulp or flesh, cultivars with
high proportion of flesh and minimum seed and peel should also be selected (Human, 1987).
Many studies have confirmed the Hass cultivar to be superior in quality with all the favourable
attributes (Human, 1987).
Maturity stage: - The time at which the fruits of any given cultivar is harvested was noted by
Arpaia et al. (2006) to have the greatest impact on the oil content of the fruits. Maturity is when
the fruit is most suitable for human consumption and not for processing. Some cultivars mature
early while others mature much later and understanding this becomes very important for
choosing when to harvest. However it is understood that when avocado fruits mature their
moisture content lower while their oil increases and leaving the fruits on the trees much
longer after maturity tend to increase oil content (Human, 1987).
Location and growth conditions: - The study of avocado postharvest quality by Arpaia et al.
(2006) also noted differences in oil content for the same cultivar due to different locations and
growth conditions such as soil fertility. Sun exposed fruits were also found by Woolf et al.
(1999), to yield higher levels of oil than those fruits in the shade.
Particle Size: Oil extraction yield was higher as particle size decreased and contact time
increased. The effect of particle size is associated to an increase in cellular damage as particle

32
size decreases. This favors removal of the oil on the particle surface and diffusion of n-hexane
within the particle (Şaşmaz, 1996). Pre-extraction heat treatment causes expansion and rupture of
cell structures, which enhances material plasticity and permeability, it also facilitates oil release
and thus increase yield (Li, Bellmer, & Brusewitz, 1999).
Solvent to Sample ratio: The meal: solvent ratio marks the difference in oil yield up to a certain
extent. A high initial extraction rate is attributed to rapid solution of the oil on the solid’s surface
and a higher conduction mass transference force anticipated by the high solvent concentration. A
slower rate can be attributed to a lower motive force resulting from a lower solvent
concentration. Extraction with solvents is a mass transfer process in which materials (oils) are
moved from one phase to another to separate one or more compounds from a mixture (Giraldo et
al., 2010). The meal: solvent ratio is one of the most important variables in the extraction
process, such that at higher solvent proportions the mass transfer coefficient increases, producing
greater oil extraction. Material transfer from a particle by solvent effect is called leaching or
percolation. Leaching involves a complex mechanism that implies transfer of a solvent to the
surface of solid particles, penetration of the solvent into the solid matrix, incorporation of the
solute into the solvent by diffusion, and transfer of the solute into the bulk solvent (Adu-
Amankwa, 2006).
2.6.3. Avocado oil characteristics
Most of the beneficial attributes associated with eating avocados are mostly preserved in the oil
and for this reason is very valuable. The composition and in particular properties of the oil
varies according to how it is produced whether it be crude, virgin or refined according to the
method and number of successive operations involved in its production (Simental and Escalona,
2004).
According to Eyres et al. (2006); Botha (2004); Human (1987) study, avocado oil shows very
similarity with olive oil which has Acidity Value (as oleic) 2.0 – 0.08 %, Peroxide value 3.3-0.1
meq/kg fat), Iodine value 87-75 (from GLC), Specific Gravity 0.912- 0.916 (25oC). The acidity
value and peroxide values indicate stability in terms of minimal hydrolysis and lipase activities.
The oil is also free of cholesterol and carbohydrate.

33
The high peroxide value in crude oil might be as a result of the effect of moisture, atmospheric
oxygen and light on the oils leading to a progressive increase in the peroxide value. The
hydroperoxide formation may subsequently decompose into secondary oxidation products on
storage, majority of which have unpleasant odours or flavour (Jambunathan and Reddy, 1991).
The Iodine value is indicating a high degree of unsaturation. A typical avocado oil is comprised
mostly of monounsaturated fatty acids (74%), 11% polyunsaturated fatty acids and about 13%
saturated (Arpaia et al., 2006). These percentages vary slightly with cultivars and other
influential factors but the oil is very similar to olive oil. It is this high level of monounsaturated
fat which gives the desirable effect of being “anti-cholesterol” as it prevents the formation of
clots the major cause of coronary heart disease.
The high iodine value indicates dehydrogenation. It is a measure of unsaturation in lipid, which
again determines the degree of flow. Decrease in iodine value indicates lipid oxidation and this
might be due to metallic ions present among other factors, which enhances or promotes oxidation
after the formation of hydro-peroxide (Ruize et al., 1995).
2.7. Concluding remarks
Avocado is one of the climacteric fruits of an excellent nutritional quality with low sugar content
which makes avocado very recommendable source of high energy food for those who are
diabetic. It is classified into three horticultural races which are: Mexican, Guatemalan and West
Indian. The quality of avocado are mainly composed of physical properties (color, texture and
physical disorders), chemical (dry matter, TSS, TA, oil content and moisture content) and
sensory properties (flavor).
In Ethiopia it is one of the main fruits produced and exported including banana, citrus fruits,
mango, papaya and grape fruits (Zeberga, 2010). Owing to its shortest introduction to Ethiopia,
these days the crop is produced in several countries where Ethiopia stands the 10th leading
producer and 6th most important consumer in the world (FAOSTAT, 2010).
The lipid content in avocados varies greatly with the cultivar, and the same is observed for fatty
acid composition, which depends on growth rate and variety (Tango et al, 2004). Since Ethiopia
has a large agricultural sector and there is increasing interest in the growth of small and

34
developing farmers, if a new market for avocado fruit can be created by production of high
quality avocado oil at a premium price, more small and developing farmers would be interested
in cultivating avocado fruit. This will in turn benefit the agricultural and economic sectors in the
long term. Oil production can also create an alternative market for the commercial farmer,
which has the benefit of less risk, compared to the fresh fruit market where visual appearance of
the fruit is very important. Various factors however are known to affect the oil content of fruits
and percentage oil yield during extraction which may include: cultivar, maturity, Location and
growth conditions, Solvent to Sample ratio, particle size, type of solvent, extraction time etc.
Avocado pulp is enriched with oil which can be extracted by different extraction methods. A
number of new methods for extracting oils have been investigated in recent years, including
mechanical compression (Karaj and Müller, 2011), ultrasonic extraction (Ozkan et al., 2007),
microwave extraction (Kumaran and Karunakaran, 2007) and supercritical fluid extraction (Louli
et al., 2004). Compared with traditional Soxhlet extraction, ultrasonic extraction provides higher
selectivity, is less time-consuming, has lower energy consumption and reduced emissions (Ward,
et al., 1985). It is also environmentally friendly because most of the extraction solvent can be
recovered, and the equipment is inexpensive. So, application of ultrasonic extraction for
extraction of oil from avocado and optimization of its extraction condition should be done.
The composition and in particular properties of the oil varies according to how it is produced
whether it be crude, virgin or refined according to the method and number of successive
operations involved in its production (Simental & Escalona, 2004). Avocado oil shows very
similarity with Olive oil which has Acidity Value (as oleic) 2.0 – 0.08 %, Peroxide value 3.3-0.1
meq/kg fat), Iodine value 87-75 (from GLC), Specific Gravity 0.912- 0.916 (25oC).

35
CHAPTER THREE
3. Materials and Methods
3.1 Materials
3.1.1 Raw Material collection, transportation, storage and sample preparation
Avocado Fruit: Avocado fruit (Hass and Fuerte variety) were picked and collected at the mature
green stage of development from each cultivar of different stands on a farm of WARC
(Wondogenet Agricultural Research Center), SNNP regional State of Ethiopia. These fruits were
packed by carton box and transported to Food Engineering Laboratory, Addis Ababa Institute of
Technology, and some of them were transferred to Food and Human Nutrition laboratory, Addis
Ababa University and other food laboratory. Some of the fruits were stored at room temperature
for about a week and ripened. To keep ripening uniformity overlapping of fruits on storage were
avoided. The unripe and ripe avocado fruits were wiped off any dust, washed with distilled
water, dried and weighed. The pulp of the fruit was cut into halves from the stem to the tip end.
The seed and skin were removed and weighed, care was being taken to free the skin from
adhering to the pulp. The pulp and seed was oven dried, crushed and ground for chemical
property, proximate, mineral and phytochemical analysis. Also, its pulp was needed for oil
extraction.
Equipments:-The equipment used for the experiment were: knife, Computerized UV/Vis
Spectrophotometer (model UV-752), condenser, sieves, volumetric flasks, vacuum rotary
evaporator (Fisatom, model 801), drying oven (Tecnal, model DHG-9203A), furnace
(Gallenkamp, modelSX-2.5-10), coffee grinder (Mouliner,AR1044), tray, centrifuge (Labtech,
model AVI-558) refrigerator(WestPoint, model WRES-358.X), soxhlet, Sonicator, Kjeldhal,
Erlenmeyer flasks, sensitive balance (Electronic balance,FA2004B), pH meter, measuring
beaker, quantitative filter paper which is equivalent to what man No. 42., Laboratory
thermometer, spoon, pipette, micropipette, vortex mixer(DLAB ,model MX-SVB6F035754), test
tubes, cuvettes (1cm, 2ml plastic or glass), racer, Kjeldhal flask (model KDN-102F).

36
Chemicals:- The chemicals used in the experiment were: Hydrogen Peroxide, copper sulfate,
Vanillin reagent, Petroleum ether, hexane, Ethanol, Methanol, Folin Ciocalteu Reagent, Gallic
acid, D-catechin, sodium carbonate, ascorbic acid, aluminum chloride (AlCl3), Sodium nitrite
(NaNO2), Sodium hydroxide (NaOH), sulfuric acid, HCl, KI, sodium thiosulfate,
phenolphthalein indicator, boric acid, acetylene, acetic acid and starch were purchased and used
during the investigation.
3.2. Framework of the thesis
In this research the pulp and seed of two avocado cultivars (Hass and Fuerte) were selected and
their physicochemical properties, proximate, mineral and phytochemical composition were
determined. Furthermore, effects of different oil extraction methods on the yield of oil were
investigated and some of their extraction parameters were optimized. The extracted oil were
characterized and analyzed including its fatty acid profile.
Figure 3.1 Frameworks of the thesis
Pulp Seed
Mineral
Constituents
Mg
Ca
Fe
Zn
Na & K
Chemical
Properties
DM
TSS
pH
TTA
Physical
Properties
Weight
Flesh to
seed ratio
Oil chemical properties
PV
FFA
IV
AV, MVM & Alk.
Avocado variety (unri-
pe and ripe fuerte, hass)
)
Proximate
Analysis
Moisture
content
Protein
Ash
Crude fiber
Crude fat/ Oil
Carbohydrate
Phytochemical
Analysis
Total
Flavonoids
Total phenols
Phytates
Tannins
Oil Extraction using UAE
and soxhlet Extraction Oil Yield
Seed FA profile
Seed

37
3.3. Processing Methods
Two extraction techniques (Soxhlet and Ultrasonic) were used to obtain avocado oils that were
subjected to fatty acid and oil characteristic analyses. The effects of different extraction
conditions on the yield of oil were determined. Results were compared to evaluate the efficiency
of the extraction methods. Gas chromatography was used to determine the fatty acid composition
of the oil.
3.3.1. Extraction of oil using soxhlet Extraction
The extraction was carried out according to AOAC (2005) with some modifications. To
implement each of the experimental runs designed with the aid of Design Expert using the Box-
Behnken design of the response surface methodology, the dried and ground avocado pulp (ten
gram per sample) was packed inside a thimble bag and placed inside the thimble chamber of the
250 ml Soxhlet extractor. The extractor itself was placed inside a thermostatic water bath. A
round bottom flask containing n-hexane as well as a condenser was fixed to the extractor. The
flask was heated to a temperature above the boiling point of the solvent. The solvent then
vaporized and passed through the prepared sample to remove its oil. The mixture obtained
(solvent and oil) moved directly into the round bottom flask. The process was allowed to
continue for the specified time, as obtained from the experimental design. Thereafter, the oil
extracted was recovered by distilling the solvent using rotary evaporator. At the end of each
experiment, the yield of the oil was obtained using the following relationship.
𝑂𝑖𝑙 𝑌𝑖𝑒𝑙𝑑 =𝑊3 − 𝑊1
𝑊2∗ 100% (3.1)
Where, W1 is the weight of flask, W2 is the weight of sample, W3 is the weight of flask and
extracted oil
3.3.2. Extraction of oil using Ultrasound Assisted Extraction
The extraction was carried out according to Cravotto et al. (2008) and Lou et al. (2010) with
some modifications. Fresh avocado pulp were dried in an oven at 60°C until their weights were
constant, and they were then ground into powders and separated by particle size of 1.4mm, 2mm
and 2.6mm mesh. The general method for extraction involved weighing avocado powder (10 g)
into a 250 ml flask. Then the extraction solvent (hexane) was added depending on the solvent to

38
sample ratio and the flask was placed in the ultrasonic water bath. The following extraction
conditions were investigated for optimization: particle size of avocado pulp powder, extraction
time and solvent–solid ratio. After the extraction, the solution was reduced on a rotary evaporator
and the solvent was recovered. The avocado oil was weighed and the extraction yield was
calculated as above stated.
3.4. Analytical Methods
3.4.1. Physicochemical analyses
The weight of the whole fruit, separated pulp, seed, seed coat and peel were measured using a
weighing balance. The flesh to seed ratio was also done.
Percentage weight loss: Weights of avocado fruit were r`ecorded before and after storage at room
temperature, using an electronic balance (Sartorius BP 6100, R & M marketing, UK). The
difference in the weight was expressed as the percentage weight loss (Anthony et al., 2003).
Dry Matter Content Determination: The dry matter (DM) was determined according to the Lee
method (Lee, 1981). The petridishes used for the moisture determination were dried at 130 οC for
1hr using drying oven. The dishes were removed and kept in a desiccator for about 30 minutes.
The mass of empty dishes were measured as M1. This was regulated until constant weight was
obtained. About 10g of the sample was weighed using analytical balance in to the dish and
recorded as M2. The sample was mixed thoroughly and dried at 60 οC until it reached a constant
weight. And it was taken and kept in a desiccator to cool. After cooling the weight was taken as
M3 and then kept in oven for another 15 minutes. Then it was removed and allowed to cool in a
desiccator and again the weight was taken. This process was repeated until constant weight was
obtained. Then, the dry matter content was calculated using the following formulae:-
Dry Matter (%) = 𝑀3 − 𝑀1
𝑀2 − 𝑀1∗ 100 (3.2)
Where, M1 = weight of the dish, M2 = weight of the dish and the sample before drying, M3 =
weight of the dish and the sample after drying

39
Total soluble solids (TSS): Avocados were peeled and diced. About ten (10) g sample of
avocado pulp and seed was blended with distilled water (40 ml) in a homogenizer (Black &
Decker, BX 250, Hunt Valley, USA) for 2 min. The homogenate was filtered through a muslin
cloth and few drops of the filtrate was used to measure TSS using a hand-held Refractometer
(ATC-1E, ATAGO Co. Ltd., Japan). The readings were taken and results expressed in ºBx.
(AOAC, 1994).
pH: pH of the filtrates were measured using a digital pH meter (PC 510, EUTECH Instruments,
Singapore) (Anthony et al., 2003).
Titratable acidity (TA) (% acid): Ten (10) ml samples of filtrates prepared for the TSS test was
pipetted to a 50-ml beaker and titrated against 0.1 N NaOH with phenolphthalein as the pH
indicator until pink color was obtained. TA was calculated as number of milliliters of 0.1 N
NaOH multiplied by an appropriate conversion factor. The conversion factor of 0.075 was
chosen based on tartaric acid, a predominant acid in avocado. TA, expressed as % tartaric acid
(AOAC, 1994) can be calculated as follows:
𝑇𝐴 (%) =ml NaOH x N(NaOH) x acid meq.factor
𝑚𝑙 𝑗𝑢𝑖𝑐𝑒 𝑡𝑖𝑡𝑟𝑎𝑡𝑒𝑑∗ 100 (3.3)
3.4.2. Proximate Composition Analyses
Moisture Content Determination (AOAC 925.09, 2000)
The aluminum dishes used for the moisture determination were dried at 130οC dried for 1hr
using drying oven. The dishes were removed and kept in a desiccator for about 30 minutes. The
weight of empty dishes were measured as M1. This was regulated until constant weight was
obtained. About 5g of the sample was weighed using analytical balance in to the dish and
recorded as M2. The sample was mixed thoroughly and dried at 60οC until constant weight
obtained. And it was taken and kept in a desiccator to cool. After cooling the weight was taken as
M3 and then kept in oven for another 15 minutes. Then it was removed and allowed to cool in a
desiccator and again the weight was taken. This process was repeated until constant weight was
obtained. Then, the moisture content was calculated using the following formulae:-

40
MC (%) = 𝑀2 − 𝑀3
𝑀2 − 𝑀1∗ 100 (3.4)
Where, M1 = Mass of the dish, M2 = Mass of the dish and the sample before drying, M3 = Mass
of the dish and the sample after drying.
Crude Protein Analysis (AOAC 979.09, 2000)
About 0.5g of powdered sample was weighed on analytical balance and transferred to the
digestion flask. Then 6ml of H2SO4 and 3.5ml of 30% H2O2 was added in to the digestion flask
step by step. The tubes were shaken observing a violent reaction. After this violent reaction
disappeared 3g of the catalyst mixture (Cu2SO4: K2SO4) was added in to the digestion flask. The
solution was then digested at 370 οC for 4hr. After digestion was completed, the content in the
flask was diluted by distilled water and concentrated sodium hydroxide (40%) was added to
neutralize the acid and to make the solution slightly alkaline.
(NH4)2SO4 + 2NaOH 2NH3 +2H2O +Na2SO4
The ammonia was then distilled into a receiving flask that consisted solution of excess boric acid
(4%). The borate ion was formed as a result of the reaction of the boric acid and the ammonia
and this was titrated with standard acid (0.1N HCl) until the green color changes to pink.
The total nitrogen content was calculated using the following formulae:
NH3 + H3BO3 NH4+ + H2BO3
-
Nitrogen(%) = 𝑉𝐻𝐶𝑙∗𝑁𝐻𝐶𝑙 ∗14.01
𝑀∗ 100 (3.5)
% Protein = % N ∗ 6.25 (3.6)
V HCl = Volume of HCl consumed until the end point of titration, N HCl = Normality of HCl,
14.01= Molecular weight of nitrogen, M = Weight of sample on dry basis
Crude Fat Determination (AOAC 4.5.01, 2000)
The flasks used for the extraction were washed and then dried in drying oven at 92 οC for 1hr
and cooled in a desiccator. The weight of the cooled flasks were measured by analytical balance
and recorded as M1. About 2g of the powdered sample was weighed in to each thimble lined with
cotton at their bottom. The thimbles with its sample content were placed in to the Soxhlet
extraction apparatus. Then 50 ml of petroleum ether was added in to each flask and the

41
extraction process was done for about 4hr followed by removing this flask with its content
from the Soxhlet, it was placed in drying oven at 92οC for 1hr. The flasks with their contents
were then placed in a desiccator for 30 minutes. The weight of each flask together with its fat
contents was measured as M2. Then, the total lipid amount was calculated using the following
formulae:-
Fat(%) = 𝑀2 − 𝑀1
𝑀∗ 100 (3.7)
Where, M2= weight of flask and extracted lipid, M1= weight of dried flask, M = weight of
sample on dry basis.
Crude Fiber Determination (AOAC 962.09, 2000)
About 1.6g of the sample was weighed in 600 ml beaker using analytical balance. About 200 ml
of 1.25% H2SO4 solution was added to each beaker and allowed to boil for 30 minutes by
stirring and rotating it periodically on a hot plate. During boiling the level was kept constant by
addition of hot distilled water. After 30 minutes 20ml of 28% potassium hydroxide was added
and again allowed to boil for another 30 minutes. The level was still kept constant by addition of
hot distilled water. Then after 30 minutes the solution was filtered through crucibles containing
calcite sand by placing it on (Buchner funnel fitted with No.9 rubber stopper). During filtration
the sample was washed with hot distilled water followed by 1% H2SO4, hot distilled water, 1%
NaOH and finally with acetone. The crucible with its content was dried for 2h at 130 ±2οC in
drying oven and cooled in a desiccator and weighed as M1. Then it was ashed for 30 minutes at
550οC in muffle furnace and was cooled in a desiccator. Finally, it was weighed as M2. The
difference in the weights M1-M2 represents the weight of fiber (Raghuramulu et al., 2003).
Crude Fiber(%) = (100 − (Moisture + Fat)) ∗ (𝑀1 − 𝑀2)
M∗ 100 (3.8)
Where, M1= weight of the crucible, the sand and fiber M2= weight of the crucible and the sand
M = Weight of sample on dry basis
Crude Ash Determination (AOAC 923.03, 2000)
The porcelain dishes used for the analysis were washed by dilute hydrochloric acid on boiling
and washed with distilled and de-mineralized water respectively. Then dried at 120 οC in an

42
oven and ignited at 550 οC in furnace for 30 minutes. Then the dishes were removed from
furnace and cooled in a desiccator. The weight of the dish was measured as M1. About 2.5g of
sample powder was being weighed in to the porcelain dish and recorded as M2. The sample was
charred at 120 οC for 4h in a hot plate, until the whole content becomes carbonized. Then the
sample was placed in a furnace at 550 οC until free from carbon and the residue appears grayish
white after 5h. The sample was removed from the furnace and placed in a desiccator.
Finally the mass was weighed as M3. And the total ash content was calculated with the following
formulae:-
Crude Ash (%) = 𝑀3 − 𝑀1
𝑀2 − 𝑀1∗ 100 (3.9)
Where, M1=weight of the dried dish/ crucible, M2= weight of the dish and the sample, M3=
weight of the dish and the ash
Total and Utilizable Carbohydrate Determination
The total carbohydrate was calculated by difference and Utilizable carbohydrate was calculated
by difference with the exclusion of crude fiber. This is expressed mathematically as follows:
% Total carbohydrate = (100 − (% MC + % protein + % ash + % fat + %fiber (3.10)
% Utilizable carbohydrate = (100 − (% MC + % protein + % ash + % fat (3.11)
Total energy calculation in kilo Calories
The total energy content in each sample was calculated as follows:
Total energy (kcal) = ((Carbohydrate × 4) + (Protein × 4) + (Lipid × 9)) (3.12)
3.4.3. Mineral Composition Analyses
The ash was dissolved by 5 ml of 6 N HCl at low temperature on hotplate for about 2 hrs. Then,
7 ml of 3 N HCl was added and heated on a hot plate until the solution boils. The digest was
cooled and filtered through a filter paper (42 mm, whatmann) in to a 50 ml volumetric flask.
Then 5 ml 3 N HCl was added to the dishes and heated to dissolve the residue in the dishes and
then transferred to the volumetric flask. Then the filter paper was washed thoroughly and the
washing was collected in the flask made to the mark. After wards the mineral concentration was

43
determined by AAS. For calcium determination 2.5 ml of 10 % Lanthanum chloride solution was
added to the flask. Then diluted to 50 ml mark with de-ionized water. The blank was prepared
by taking the same amount of reagents through the steps all of the above without sample.
The instrument was set based on the instruction given in the manual. The calibration solutions
and the reagent blank solutions were measured first. Then the samples were run following the
calibration values. The calibration curve was prepared for the required metal by plotting
the absorption values against the metal concentration in ppm. The mineral contents of each
sample were calculated using the following formulae:-
Metal content (mg/100g) = (𝑎−𝑏)∗𝑉
10∗𝑤∗ 100 (3.13)
Where; W = weight of the sample in g, V = volume in ml of the extract, a= concentration in ppm
of sample solution, b= concentration in ppm of blank solution.
3.4.4. Phytochemical Analyses
Phytate
The phytate content in the sample was determined according to the method described by Latta
and Eskin (1980) method, and later modified by Vaintraub and Lapteva (1988) with some
modifications. About 0.05g of seed and 0.4g of pulp of dried sample was extracted with 10ml of
2.4% HCl in methanol for 1hr at ambient temperature and centrifuged (3000 rpm) for 30
minutes. The clear supernatant was used for the phytate estimation. About 2ml of Wade reagent
(0.03% solution of FeC13.6H2O containing 0.3% sulfosalicylic acid in water) was added to
3ml of the sample solution and the mixture was centrifuged. The absorbance at 500 nm was
measured using spectrophotometer. The phytate concentration was calculated from the difference
between the absorbance of the control (3ml of water + 2ml Wade reagent) and that of the assayed
sample. The concentration of phytate was calculated using phytic acid standard curve and the
results were expressed as of phytic acids in mg per 100g dry weight.
To prepare the phytic acid standard curve, a series of standard solution was prepared containing
5–40 mg/ml phytic acid in water. About 3ml of the standards was pipetted into 15ml centrifuge
tubes with 3ml of water used as a zero level. To each tube was added about 1ml of the wade

44
reagent, and the solution was mixed on a vortex mixer for 5s. The mixture was centrifuged for 10
minutes and the supernatant read at 500ηm was read by using water as a blank.
phytic acid in µg/g = [(𝐴𝑠 − 𝐴𝑏) − 𝑖𝑛𝑡𝑒𝑟𝑐𝑒𝑝𝑡] ∗ 10
𝑠𝑙𝑜𝑝𝑒 ∗ 𝑊 ∗ 3 (3.14)
Where, As= sample absorbance, Ab= blank absorbance, W= weight of sample
Tannin analysis
Tannin content was determined by the method of Burns (1971) with some modifications. About
two gram of sample was weighed in a screw cap test tube and extracted with 10ml of 1% HCl in
methanol for 24 hours at room temperature with mechanical shaking. After 24 hours shaking, the
solution was centrifuged at 1000rpm for 5 minutes. About 1ml of supernatant was taken and
mixed with 5 ml of vanillin-HCl reagent (prepared by combining equal volume of 8%
concentrated HCl in methanol and 4% vanillin in methanol).
D-catechin was used as standard for condensed tannin determination. A 40mg of D-catechin was
weighed and dissolved in 1000 ml of 1% HCl in methanol, which was used as stock solution.
About 0, 0.2, 0.4, 0.6, 0.8 and 1 ml of stock solution was taken in test tube and the volume of
each test tube was adjusted to 1ml with 1% HCl in methanol. About 5ml of vanillin HCl reagent
was added into each test tube. After 20 minutes, the absorbance of sample solutions and the
standard solution were measured at 500nm by using water to zero the spectrophotometer, and the
calibration curve was constructed from the series of standard solution using SPSS-20. A standard
curve was made from absorbance versus concentration and the slope and intercept were used for
calculation. Concentration of tannin was read in mg of D-catechin per 100gm of sample.
Tannin inmg
100g=
𝑠𝑎𝑚𝑝𝑙𝑒 𝑎𝑏𝑠𝑜𝑟𝑏𝑎𝑛𝑐𝑒 − 𝑖𝑛𝑡𝑒𝑟𝑐𝑒𝑝𝑡
𝑠𝑙𝑜𝑝𝑒 ∗ 𝑑𝑒𝑛𝑠𝑖𝑡𝑦 ∗ 𝑤𝑒𝑖𝑔ℎ𝑡 𝑜𝑓 𝑠𝑎𝑚𝑝𝑙𝑒 ∗ 10∗ 100 (3.15)
Total Phenol and Total Flavonoid Determination
Extraction: The phenolic compounds were extracted according to the method reported by
Singleton and Rossi (1965) with slight modifications. The avocado pulp and seed was ground

45
into powder in a mortar and about 5g of ground sample was accurately weighed in a screw-
capped tube.
The phytochemicals were extracted with 50ml of methanol and vortexed for 1 min. The samples
were digested overnight, filtered and the filtrate was evaporated using rotary evaporator and then
stored mixing with methanol based on the obtained yield. The supernatant was used for
determination of total phenolics and total flavonoids.
Determination of total phenolic content: Total phenolic contents of the fruit pulp and seed
extracts were measured using a modified colorimetric Folin-Ciocalteu method (Singleton and
Rossi, 1965) with further slight modifications. The Folin–Ciocalteu (F–C) reagent is sensitive to
reducing compounds, polyphenols and thus produces a blue colour complex. Fruit extracts (0.5
ml) were placed in a test tube. Folin-Ciocalteu reagent (2.5 ml) was added to the solution and
allowed to react for 3 min. The reaction was neutralized with 2 ml of sodium carbonate (7.5 %).
Absorbance at 765 nm was read after 30 min. Gallic acid was used as standard and data were
expressed as mg Gallic acid equivalents (GA)/ g FW.
Determination of total flavonoid content: The total flavonoid content of the samples was
measured using a colorimetric method (Zhishen et al., 1999; Dewanto et al., 2002). The
methanolic extract (250 µl) was mixed respectively with 1.25 ml DI water and 75 µl of 5%
NaNO2 solution, then allowed to mix for 6 min. After addition of 150 µl of 10% AlCl3 solution
and mixing for 5 min, the reaction was initiated by adding 0.5 ml of 1 N NaOH and the total
volume was made up to 2.5 ml with DI water. Sample absorbance was read at 510 nm using a
UV/vis spectrophotometer. (+)- Catechin standard was used as standard and total flavonoid
content was expressed as µg (+)-catechin equivalents (CE)/g FW.
3.4.5. Quality characterization of extracted avocado oil
Determination of peroxide value (PV): AOAC 965.33
About Five grams of the oil was dissolved in 30 ml of glacial acetic acid: chloroform (3:2, v/v).
0.5 ml of saturated KI was added and iodine was liberated by the reaction with the peroxide. The
solution was then titrated with standardized sodium thiosulphate using starch indicator. The
peroxide value (PV) was determined as follows:
𝑃𝑉 (𝑚𝐸𝑞/𝐾𝑔) =(S − B) x N x 1000
Sample weight (g) (3.16)

46
Where S = Sample titre value, B = Blank titre value, M = Molarity of Na2S2O3.
Determination of Iodine value (IV)
Iodine value of the oil was assayed according to the titration method of Pearson (1970). About
two gram of oil sample was weighed into a dry 250ml glass stopper bottle and 10ml of carbon
tetrachloride was added to the oil. About 20ml of Wij’s solution was then added and allowed to
stand in the dark for 30 min. 15 ml of 10% potassium iodide and 100 ml of water were added and
the resulting mixture was then titrated with 0.1 N sodium thiosulphate solution using starch as
indicator just before the end point. A blank determination was carried out alongside the oil
samples. The iodine value was calculated as follows:
𝐼𝑜𝑑𝑖𝑛𝑒 𝑣𝑎𝑙𝑢𝑒 (𝐼𝑉) =(B − S) x Nx 12.69
Sample weight (g) (3.17)
Where B = blank titre value, S = sample titre value, N = Normality of Na2S2O3, 12.69 =
Conversion factor from Meq. Na2S2O3 to gram iodine, molecular weight of iodine is 126.9 g
Determination of percentage free fatty acids (%FFA): AOAC 940.28
About two grams of well-mixed sample was accurately weighed into a conical flask in to which
10 ml of neutralized 95% ethanol and phenolphthalein were added. This was then titrated with
0.1 N NaOH, shaking constantly until a pink colour persisted for 30 s. The percentage free fatty
acid was calculated from Equation 3.18:
%𝐹𝐹𝐴 =V × N × 2.82 mg
Sample weight (g) (3.18)
Where V=Volume of NaOH, N= Normality of NaOH, 2.82=Conversion factor for oleic acid
Acid value determination: AOAC 940.28
Acid value is defined as the milligrams of KOH required for neutralization of free fatty acids
present in one gram of oil. About ten ml of neutral alcohol was added to two gram of avocado oil
sample and titrated against KOH solution. The acid value was calculated using the formula:
AV =(B−S)∗N∗56.11
M (3.19)
Where, B, S = is the volume in ml of standard KOH required to titrate the blank and the sample
respectively, N = is the normality of KOH solution/NaOH solution, M = is the weight in g of the
oil (sample), 56.1 = molecular weight of KOH.

47
Moisture and volatile matters – oven method: AOAC 926.12
About 5g prepared test sample were weighed in to a vessel which has been previously dried for
30 minutes at 105oC and weighed. The sample within the vessel was dried to constant weight at
105 oC and cooled in the desiccators for 30 minutes and weighed. % loss in weight was reported
as moisture and volatile matter.
% Loss in weight =𝑊1 − 𝑊2
𝑊1∗ 100 (3.20)
Where W1 = Weight before drying, W2= Weight after drying
Determination of Soap Content: ISO 10539
About 40g of the test portion was weighed and added in to the test tube, which has been
previously well rinsed with the test solution (prepared by adding 0.5ml of the bromophenol
blue indicator to each 100ml of the aqueous acetone just before use and titrating with 0.01N
acid until it is just yellow in color). About 1 ml of water, warmed on the steam bath was
added to it and shaken vigorously. About 50 ml of the neutralized aqueous acetone was then
added and after warming on the steam bath, the test tube was well shaken and the contents
allowed standing until they separate into two layers. If soap is present in the oil, the upper
layer will be colored green or blue. Then, 0.01 N HCl shall be added preferably from micro
burette, until the yellow color is restored. The process of warming and shaking was continued
until the yellow color in the upper layer remains permanent. In order to readily perceive
difference in color between the layers, a blank determination was carried out. Dissolved soap,
as sodium oleate, was calculated as follows:
% by mass =0.304 ∗ V
M (3.21)
Where, V = volume of 0.01N HCl, ml; M = weight of the test portion used, g
Fatty Acid Analysis of extracted avocado oil
Conversion of Triglycerides to Fatty Acid Methyl Ester (FAME): Fatty acids were transformed
to their methyl esters (FAME) following AOAC method. About 0.5g of lipids were weighed and
immediately resuspended in 5 ml of chloroform and stored at -20°C. To determine its fatty acid

48
composition, a 50 µl subsample of the lipid-in- chloroform was treated with 100µl of 0.5 N
sodium methoxide in methanol (prepared with a solution of dimethoxypropane and methanol
(95:5, v/v). Esterification of fatty acids to fatty acid methyl esters (FAME) was completed after
standing at room temperature for 15 minutes. Sulfuric acid (400 µl of 0.125 N) was added and
fatty acid methyl esters were recovered in 7.5 ml of petroleum ether (boiling point 60-80°C).
Gas Chromatography Analysis: About one µl of fatty acid methyl esters in petroleum ether was
injected into the gas chromatograph (Hewlett Packard model 5890A), equipped with a Supelco
fused silica capillary column No. 11484-02A, catalogue No. 2-4019 (30 m x 0.25mm ID x 0.2
µm film Mfg.) and a flame ionisation detector (FID). The temperature was 100°C initially, then
increased by 15°C per minute to 190°C and held at 190°C for 25 minutes. Injector and detector
temperatures were at 200 and 220°C respectively. The fatty acid peaks in lipid samples were
identified by comparison with the retention times of fatty acids in the standard mixture, and the
amount calculated as a percentage of the total lipids and as grams of fatty acid per 100 grams of
fruit (fresh weight).
3.5. Experimental Design and Statistical Data Analysis
Response Surface Methodology: Response surface methodology is a powerful technique that
allows optimization and determination of the best conditions to maximize the desired responses.
There are different multilevel designs that have been used for the optimization of variables in
many studies such as central composite design (CCD) and Box–Behnken design (BBD) (Grosso
et al., 2014).
The Box-Behnken design was selected in this study as it has a higher efficiency compared with
CCD and is more efficient than a factorial design (Ferreira et al., 2007). The optimum
conditions were found by analyzing the response surface plots aiming for the highest reachable
response variable for each independent parameter.
There were two investigations: characterization of avocado and Optimization of different oil
extraction conditions. For characterization of avocado there were, avocado variety (Hass and
Fuerte) of pulp parts and seed parts and condition of avocado (unripe and ripe). For Optimization
there were two extraction methods:

49
1) Ultrasound assisted extraction with three factors and three levels: Particle size (1.4mm, 2mm,
2.6mm), Solvent to sample ratio (5:1, 10:1, 15:1) and extraction time (30, 60, 90 min).
2) Conventional soxhlet extraction with three factors and three levels: Particle size (1.4mm,
2mm, 2.6mm), and sample to solvent ratio (15:1, 20:1, 25:1) and Extraction time (4, 6, 8 hour).
Data were statistically analyzed by one-way analysis of variance (ANOVA) followed by Tukey’s
test using SPSS (version 20) and design expert. After obtaining the responses (oil yield) from
each of the experiments, the values (the responses) were entered into the appropriate column in
Design Expert, and the response together with the factors considered were analysed, and a
quadratic models relating the percentage oil yield to the factors considered were developed for
the extraction. In order to get a model that would best fit the experimental results and take care
of effects of all the factors, the developed models were modified. The modifications carried out
resulted in improvements in the performances of the models. Using the modified models, a
numerical optimization was carried out and the optimum conditions of the factors investigated
for the extraction were obtained.
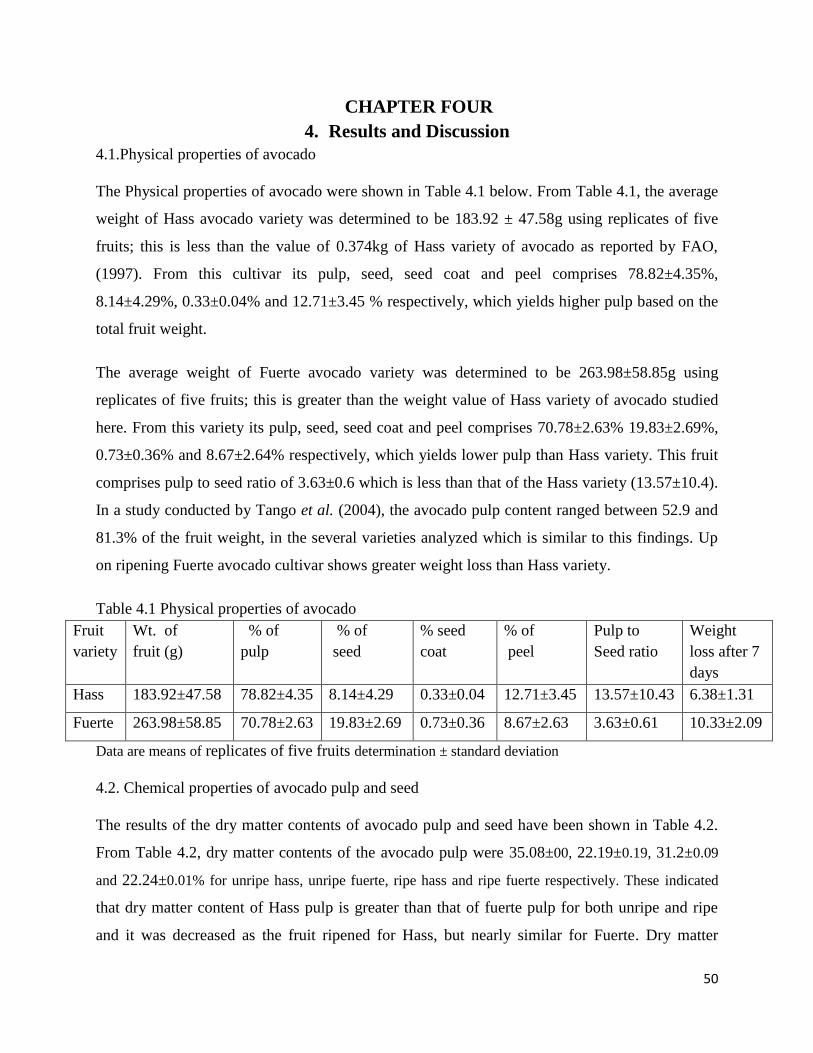
50
CHAPTER FOUR
4. Results and Discussion
4.1.Physical properties of avocado
The Physical properties of avocado were shown in Table 4.1 below. From Table 4.1, the average
weight of Hass avocado variety was determined to be 183.92 ± 47.58g using replicates of five
fruits; this is less than the value of 0.374kg of Hass variety of avocado as reported by FAO,
(1997). From this cultivar its pulp, seed, seed coat and peel comprises 78.82±4.35%,
8.14±4.29%, 0.33±0.04% and 12.71±3.45 % respectively, which yields higher pulp based on the
total fruit weight.
The average weight of Fuerte avocado variety was determined to be 263.98±58.85g using
replicates of five fruits; this is greater than the weight value of Hass variety of avocado studied
here. From this variety its pulp, seed, seed coat and peel comprises 70.78±2.63% 19.83±2.69%,
0.73±0.36% and 8.67±2.64% respectively, which yields lower pulp than Hass variety. This fruit
comprises pulp to seed ratio of 3.63±0.6 which is less than that of the Hass variety (13.57±10.4).
In a study conducted by Tango et al. (2004), the avocado pulp content ranged between 52.9 and
81.3% of the fruit weight, in the several varieties analyzed which is similar to this findings. Up
on ripening Fuerte avocado cultivar shows greater weight loss than Hass variety.
Table 4.1 Physical properties of avocado
Fruit
variety
Wt. of
fruit (g)
% of
pulp
% of
seed
% seed
coat
% of
peel
Pulp to
Seed ratio
Weight
loss after 7
days
Hass 183.92±47.58 78.82±4.35 8.14±4.29 0.33±0.04 12.71±3.45 13.57±10.43 6.38±1.31
Fuerte 263.98±58.85 70.78±2.63 19.83±2.69 0.73±0.36 8.67±2.63 3.63±0.61 10.33±2.09
Data are means of replicates of five fruits determination ± standard deviation
4.2. Chemical properties of avocado pulp and seed
The results of the dry matter contents of avocado pulp and seed have been shown in Table 4.2.
From Table 4.2, dry matter contents of the avocado pulp were 35.08±00, 22.19±0.19, 31.2±0.09
and 22.24±0.01% for unripe hass, unripe fuerte, ripe hass and ripe fuerte respectively. These indicated
that dry matter content of Hass pulp is greater than that of fuerte pulp for both unripe and ripe
and it was decreased as the fruit ripened for Hass, but nearly similar for Fuerte. Dry matter

51
contents of the seed were 48.4±1.02, 45.48±1.17, 45.91±0.03 and 38.17±0.23 for unripe hass, unripe
fuerte, ripe hass and ripe fuerte respectively. These indicated that dry matter content of Hass seed is
greater than that of fuerte seed and it was decreased for the ripened fruit. Villa-Rodriguez et al.
(2011) found that the dry matter had increased from 31.65 to 36.52% over eight days at 15°C and
thereafter decreased to 32.91 on the day 12. High dry matter content implies that the fruit
contains high oil percentage and low moisture content.
The result of the pH value of avocado pulp and seed is shown in Table 4.2. The obtained pH
value of the pulp were 6.67±0.02, 6.58±0.11, 6.75±0.04 and 6.69±0.01for unripe hass, unripe
fuerte, ripe hass and ripe fuerte respectively. The study revealed that hass pulp has greater pH
than fuerte pulp and it is slightly increased as the fruit ripened. The results in the Table 4.2
shown that the pH value of avocado seed were between 4.68±0.11 and 5.24±0.03. The minimum
pH corresponds to UFS and the maximum belongs to RHS. UHP and RFP had a pH value of
4.96±0.06 and 5.19±0.12 respectively. The seed had lower pH than the pulp and it was greater for
Hass seed. The obtained pH value of avocado pulp is comparable to the result (6 to 6.5) and (6.4
to 7.0) reported by Soliva-Fortuny et al. (2004) and Lange and Kader (1997) respectively. Since
pH of fruit is nearest to 7 it implies that avocado pulp is neutral (neither acidic nor basic).
The analysed total soluble solid of avocado pulp were 6.55±0.04, 5.70±0.04, 5.77±0.06 and
4.95±0.22°Bx for unripe Hass pulp, unripe Fuerte pulp, ripe Hass pulp and ripe Fuerte pulp
respectively. These indicate that pulp of Hass avocado variety contains higher TSS than Fuerte,
which may be due to the difference in variety and maturity level. From the obtained result there
was a slight decrease as the fruit ripens for both varieties which may due to the consumption of
stored carbohydrate during respiration process. Liu et al. (1999b) demonstrated that ripening of
avocados at 20°C resulted in a considerable decline in the TSS in the peel and flesh. Similar
pattern was also observed by Rathore et al. (2007). It was observed that total soluble solids
contents were increased from 10 to 16.23 % up to 6 day of their storage and thereafter, a gradual
decrease up to (6.13 %) was observed after 15th days of storage period. The increase in TSS
might be due to the alteration in cell wall structure and breakdown of complex carbohydrates
into simple sugars during storage. This increase and decrease in TSS are directly correlated with
hydrolytic changes in starch and conversion of starch to sugar being an important index of
ripening process in mango and other climacteric fruit and further hydrolysis decreased the TSS
52
during storage (Kays, 1991). The obtained avocado pulp TSS was superior to those reported for
‘Hass’ avocados of American origin (5.1±0.1°Brix) (Arias et al., 2012), but lower than those
reported for ‘Hass’ avocados from New Zealand (~9° Brix) (Burdon et al., 2007). So, this low
sugar content makes it an ideal food source for diabetics.
The total soluble solid of avocado seed was 3.39±0.01, 3.26±0.08, 3.35±0.04 and 3.25±0.01 for
unripe Hass seed, unripe Fuerte seed, ripe Hass seed and ripe Fuerte seed respectively. These
indicate that seed of Hass avocado cultivar contains higher TSS than Fuerte, which may be due
to the difference in variety and maturity level. From the obtained result there is nearly similar
TSS between unripe and ripe fruit seed varieties. The obtained avocado seed TSS was lower than
its pulp and those reported for Algarvian Hass avocados (3.54±1.97°Brix) reported by Ana et al.
(2013).
The result of the total titratable acidity of avocado pulp and seed has been reported in Table 4.2.
The pulp of Hass avocado cultivar contains lower TA than Fuerte and there was a decrease in TA
of ripened fruit for both varieties which may be due to the consumption of organic acid during
respiration as the fruit ripens and increasing its pH. The obtained acidity of the pulp was found to
be superior to that exhibited by ‘Hass’ avocados of American origin (0.04±0.01% citric acid)
(Arias et al., 2012), but lower than the value of Algarvian Hass avocados (1.07±0.02) for the ripe
pulp as reported by Ana et al. (2013). The difference might be due to the difference in
environmental location, maturity stage and harvesting season.
According to Hernández-Muñoz et al. (2006) the total acidity is a measure of the organic acid
content. The predominant acid found in avocados is tartaric acid although, theoretically, every
species capable of donating a proton, including fatty acids, also contribute to the total acidity of
the fruit (Omar et al., 2012). It has been suggested that during storage, fruits utilize organic acids
for metabolic activities and this results in a decrease in the TA content during the storage periods
which is similar with the present findings.
The total acidity tends to decrease during the ripening period as a result of the breathing process
or conversion in to sugars. These results coincided with those Doreyappa-Gowda and Huddar
(2001), who reported the similar pattern in different varieties of mango fruit stored at 18-34οC
under gone a series of physico-chemical changes during ripening and the major changes were

53
considerably increased in pH from 2.85 to 4.38 and decreased in acidity from 2.71 to 0.04%
during ripening. These results further correspond with Srinivasa et al. (2002), who found that
titratable acidity values of Alphonso mango either packed in carton or control sample also
showed a decreasing trend from 2.17% to 0.08% on 12 day when stored at ambient temperature
27±1οC and 65% RH.
The total acidity of avocado seed were 2.60±0.04, 2.88±0.04, 2.45±0.03 and 2.44±0.04 for unripe
Hass seed, unripe Fuerte seed, ripe Hass seed and ripe Fuerte seed respectively, which indicates
that the seed of Hass avocado cultivar contains lower TA than Fuerte and there is a decrease in
TA as the fruit ripens for both varieties which may be due to the consumption of organic acid
during respiration as the fruit ripens and increasing its pH. In case of comparing total acidity of
the pulp and seed it is superior in its seed due to highly presence of organic acid and low pH in
its seed and the obtained total acidity of the seed was lower than the result of Algarvian Hass
seed (2.67±0.17) reported by Ana et al. (2013).
Table 4.2 Chemical properties of avocado pulp and seed
consti
tuents
Avocado variety
Hass Fuerte
Pulp Seed Pulp seed
Unripe ripe unripe Ripe unripe Ripe unripe ripe
DM 35.08±
0.00 d
31.2±
0.09 e
48.4±1
.02 a
45.91±
0.03 b
22.19±
0.19 f
22.24±
0.01 f
45.48±
1.17 b
38.17±
0.23 c
pH 6.67±0.
02a
6.75±
0.04a
4.96±0
.06 bc
5.24±0
.03 b
6.58±0.
11a
6.69±0.
01a
4.68±0
.11 c
5.19±0
.12b
TSS 6.55±0.
04a
5.77±
0.06b
3.39±0
.01d
3.35±0
.04 d
5.70±0.
04b
4.95±0.
22 c
3.26±0
.08 d
3.25±0
.01 d
TA 1.30±0.
03 e
0.65±
0.02 g
2.60±0.
04 b
2.47±0.
06 bc
1.78±0.
06 d
0.90±0.
04 f
2.88±0.
02 a
2.44±0.
02 c
* Data are means of duplicate determination ± standard deviation
The mean values followed by different superscript letters in the same row are significantly different (p ≤
0.05) according to the Tukey’s multiple range test.
4.3. Proximate composition of avocado pulp and seed
Tables 4.3 showed the proximate analysis of unripe pulp, unripe seed, ripe pulp and ripe seed of
both Hass and Fuerte avocado varieties. From the result, Fuerte avocado pulp had higher
moisture content than Hass and the moisture content was slightly decreased as the fruit ripened
for fuerte, but increased for Hass variety. The moisture content of avocado seed were

54
51.60±1.02, 54.52±1.17, 54.09±0.02, and 61.83±0.23% for unripe Hass seed, unripe Fuerte seed,
ripe Hass seed and ripe Fuerte seed respectively. Its ripe contains high moisture content relative
to unripe. The obtained moisture content for fuerte was nearly similar with the result (77.72%)
reported by Orhevba and Jinadu (2011).
The obtained protein content of avocado pulp were 2.92±0.04, 2.25±0.05, 2.84±0.08 and
1.77±0.03% for unripe Hass pulp, unripe Fuerte pulp, ripe Hass pulp and ripe Fuerte pulp
respectively. These values were closer to the values of 2g and 1.72g obtained by USDA, (2009)
and FAO, (1989) respectively. The protein content of Hass pulp was greater than that of Fuerte
pulp for both unripe and ripe fruits and its content was decreased as the fruit ripened. The result
was nearly similar with California and Florida avocado, where the protein content ranged from
1.21 to 2.26% as reported by Hall et al. (1955) and Slater et al. (1975) respectively. The study
revealed that avocado seed had high protein content than its pulp for both Hass and Fuerte
cultivars, which indicates the possibility of its seed in the development of some products. The
protein content of unripe fuerte seed is greater than that of unripe Hass seed and its content
decreases as the fruit ripens for fuerte seed, but shows a slight increase for Hass seed.
The evaluated ash content of avocado pulp were 0.42±0.00, 0.27±0.00, 0.37±00 and 0.27±00%
for the corresponding unripe hass pulp, unripe fuerte pulp, ripe hass pulp and ripe fuerte pulp
respectively. This shows that ash content of Hass pulp was greater than that of fuerte pulp and
decreased as the fruit ripens for Hass pulp, but constant for Fuerte pulp. The obtained result was
nearly similar to the range (0.4-1.68%) reported by FAO (1989) for fuerte variety. Similar to the
pulp, ash content of Hass seed was greater than that of fuerte, but its content decreased as the
fruit ripened for seed of both varieties. Similar pattern was also observed by Olaeta et al. (2007)
with slight variation, who reported decrease of ash content for ripe Fuerte seed but increase for
ripe Hass seed. Generally, the ash content of studied avocado seed and pulp were ranged
between 0.46 to 0.77 and 0.27 to 0.42% of the fresh-weight material respectively. This ash
content of avocado pulp and seed was significant in that it contains nutritionally important
minerals.
The fat content of avocado pulp were 22.80±0.00, 14.48±0.08, 22.07±0.11 and 15.03±0.00% for
the corresponding unripe hass pulp, unripe fuerte pulp, ripe hass pulp and ripe fuerte pulp
55
respectively; this is higher than the value of 9.1% reported by Ikhuoria and Maliki (2007). The
obtained lipid contents of the fuerte pulp was comparable to the result (15.39%) reported by
Pushkar et al. (2001), but lower than the result (22.1 %) and (20%) reported by Tango et al.
(1972) and Freitas et al. (1993) respectively. The obtained result indicate that pulp of Hass
avocado cultivar contains higher oil content than Fuerte, which may be due to the difference in
variety and maturity level. From the obtained result there is a slight decrease for the ripe fruit of
Hass cultivar, but a slight increase for fuerte cultivar. This may be due to a slight increment of
moisture content in Hass and a slight decline of it in Fuerte cultivar, since as the moisture content
increases the fat/oil content decreases. Lipid concentrations ranging from 15 to 30% in Fuerte,
Bacon and Hass cultivars were also reported by Biale and Young (1971). Also the fat content of
seed is higher in Hass cultivar, but in both the fat content of seed is lower than the result reported
by Olaeta et al. (2007), who observed the higher oil content for seeds coming from ripe
avocados. The obtained result was superior for fuerte seed, but lower for Hass seed than the
result reported by Olaeta et al. (2007), which might be due to the maturity level and location.
Also, the obtained seed lipid content were lower than the result (1.87%) reported by Pushkar et
al. (2001).
The obtained crude fiber content of avocado pulp were ranged between 1.46±0.01 and 4.50±0.09
g/100g The total dietary fiber content of the avocado pulp in both cultivars was higher than the
value of 0.4 g/100g reported by Moreno et al. (2003), but lower than the value of 6.3g/100g
reported by Gondim et al. (2005). The fiber content of avocado seed was 4.46±0.78, 4.73±0.03,
3.72±0.23 and 4.84±0.01g/100g for unripe Hass, unripe Fuerte, ripe Hass and ripe Fuerte seed
respectively. The seed of Hass cultivar contains lower fiber content than fuerte, and its content
increases as the fruit ripens for both varieties. Similar pattern was observed by Olaeta et al.
(2007) eventhough reported as Hass seed contains higher fiber content. The obtained seed fiber
content was superior to the one reported by Olaeta et al. (2007).
The total carbohydrate content of avocado pulp were ranged between 2.92±0.36 and 4.44±0.14%
where avocado hass pulp contains greater total carbohydrate content than fuerte pulp and its
content shows a slight decrease as the fruit ripens for both cultivars. The total carbohydrate
content of avocado seed were 39.11±1.91, 35.42±1.21, 37.51±0.26 and 30.44±0.33% for unripe
Hass seed, unripe Fuerte seed, ripe Hass seed and ripe Fuerte seed respectively. This indicates

56
that avocado hass seed contains greater total carbohydrate content than fuerte seed and shows a
slight decrease as the fruit ripens for both cultivars, which implies that starch stored during fruit
growth was decomposed and consumed during fruit ripening as a result of metabolism.
Table 4.3 Proximate composition of avocado pulp and seed of Hass and Fuerte variety in wet
basis.
Constituents
Avocado variety
Hass Fuerte
Pulp Seed Pulp seed
unripe ripe Unripe ripe unripe Ripe unripe ripe
MC (%) 64.92±
0.00c
68.81±
0.09b
51.60±
1.02a
54.09±0.
02e
77.82±0.
19a
77.74±0.
04a
54.52±
1.17e
61.83±
0.23d
Protein (%) 2.92±0.
04 c
2.84±0.
08c
2.96±0.
12bc
3.21±0.0
0b
2.25±0.0
6d
1.77±0.0
3e
3.58±0.
00a
1.94±0.
09e
Ash (%) 0.42±0.
01e
0.37±0.
00f
0.77±0.
01a
0.55±0.0
0c
0.27±0.0
g
0.27±0.0
1g
0.73±0.
01b
0.46±0.
01d
Fat (%) 22.80±
0.00a
22.07±
0.11b
1.21±0.
00 e
0.92±0.0
0 f
14.48±0.
08d
15.03±0.
00c
1.14±0.
00 e
0.57±0.
00 g
Fiber (%) 4.50±0.
09 a
2.99±0.
1 bc
4.46±0.
78 a
3.72±0.2
3ab
1.46±0.0
1d
2.17±0.0
0cd
4.73±0.
03 a
4.84±0.
01a
Total carboh-
ydrate (%)
4.44±0.
05 e
2.93±0.
18 f
39.11±
0.65a
37.51±0.
23b
3.72±0.1
3ef
3.02±0.0
3 f
35.42±
0.03c
30.44±
0.08d
Total Energy
(kcal)
234.62
±0.38a
221.65
±0.06b
179.19
±3.07c
171.16±
0.91d
154.17±
0.42f
154.42±
0.00f
166.25
±0.11e
134.65
±0.04g
* Data are means of duplicate determination ± standard deviation. The mean values followed by different
superscript letters in the same row are significantly different (p ≤ 0.05) according to the Tukey’s multiple
range test.
4.4. Mineral composition of avocado pulp and seed
Diet is responsible for several existing problems relating to human health. Deficiency diseases
could be prevented by sufficient intake of specific micronutrients that are involved in many
biochemical processes. Vegetables and fruits are particularly important sources of minerals
(Milton, 2003). Diets high in fruits and vegetables are also linked to decrease risk of diseases
such as diabetes and cancer and daily consumption of these foods is being encouraged (Leterme,
2002).
Tables 4.4 showed the mineral analysis of unripe pulp, unripe seed, ripe pulp and ripe seed of
both Hass and Fuerte variety. Hass pulp contains more magnesium content than Fuerte pulp and
its content was decreased for ripened fruit. The obtained magnesium content of the seed of
57
unripe Hass, unripe fuerte, ripe Hass and ripe Fuerte cultivars were 2.02 ±0.02, 1.89 ±0.01,
1.91±0.00 and 1.59±0.00mg/100g respectively. Also, like the result of the pulp, the magnesium
content of the seed of Hass cultivar was greater than that of Fuerte and its content was decreased
for ripe fruit. While the magnesium content was compared for pulp and seed, it was higher in
seed part for both cultivars. The magnesium content of both varieties was lower than that of
avocados varieties grown in US which is 29mg/100g (USDA 2010a).
The obtained calcium content of the avocado pulp of unripe Hass, unripe fuerte, ripe Hass and
ripe Fuerte cultivars were 15.35±0.07, 11.02±0.01, 13.55±0.10, and 13.69±0.10mg/100g
respectively. These indicate that Hass pulp contains more calcium content than Fuerte pulp and
its content was decreased as the fruit ripened for Hass pulp but increased for fuerte. The obtained
calcium content of the seed of unripe Hass, unripe fuerte, ripe Hass and ripe Fuerte cultivars
were 24.77±0.02, 16.42±0.06, 23.43±0.09 and 21.00±0.05 respectively. Also, like the result of
the pulp, the calcium content of the seed of Hass cultivar was greater than that of Fuerte and its
content was decreased for ripe Hass but increased for Fuerte seed. While the calcium content was
compared for pulp and seed, it was higher in seed part for both cultivars. The calcium content of
both varieties was higher than that of avocado varieties grown in US which is 12mg/100g (USDA
2010a).
The studied avocado pulp had iron content of 1.12±0.00, 0.53±0.01, 0.96±0.01 and
0.92±0.01mg/100g for unripe Hass pulp, unripe Fuerte pulp, ripe Hass pulp and ripe Fuerte pulp
respectively. These indicate that Hass pulp contains more iron content than Fuerte pulp and its
content was decreased as the fruit ripened for Hass pulp but increased for fuerte. The iron
content of avocado seed were 1.00±0.03, 0.57±0.01, 1.05±0.01and 0.83±0.00mg/100g for unripe
Hass seed, unripe Fuerte seed, ripe Hass seed and ripe Fuerte seed respectively. Also, like the
result of the pulp, the iron content of the seed of Hass cultivar was higher than that of Fuerte and
its content was slightly increased for ripe fruits of both cultivar seed. While the iron content was
compared for pulp and seed, it was nearly similar for both cultivars. The iron content of both
varieties was higher than that of avocados varieties grown in US which is 0.55mg/100g (USDA
2010a).

58
The zinc content of avocado pulp were 0.72±0.02, 0.44±0.00, 0.55±0.00, and 0.43±0.00
mg/100gm for unripe Hass pulp, unripe Fuerte pulp, ripe Hass pulp and ripe Fuerte pulp
respectively. These indicate that Hass pulp contains more zinc content than Fuerte pulp and its
content was decreased for the ripened fruit of Hass pulp but slightly increased for fuerte. The
zinc content of avocado seed were 0.36±0.01, 0.27±0.00, 0.46±0.00 and 0.40±0.00 mg/100g for
unripe Hass seed, unripe Fuerte seed, ripe Hass seed and ripe Fuerte seed respectively. Like the
result of the pulp, the zinc content of the seed of Hass cultivar was higher than that of Fuerte and
its content was increased for ripe seed. While the zinc content was compared for pulp and seed, it
was higher in pulp part for both cultivars. The zinc content of both varieties was nearly similar to
that of avocados varieties grown in US which is 0.64mg/100g (USDA, 2010a).
The results in the Table 4.4 show that the K contents of avocado pulp were between 516.03±4.44
and 783.29±2.31mg/100g. The results show that ripening increased the K content of avocado
pulp. Also, the K contents of avocado seed were between 502.11±10.64 and 594.51±15.34
mg/100g. The minimum K content corresponds to unripe hass seed and the maximum belongs to
unripe fuerte seed. Ripe hass pulp and ripe fuerte pulp had a K content of 506.64±0.23 mg /100g
and 558.99 ±3.32 mg/100g respectively. The K contents of avocado pulp were higher than
avocados varieties grown in US and California which is 485 and 507mg/100g respectively (USDA,
2010a).
Table 4.4 Mineral composition of pulp and seed of avocado variety (mg/100g, WB).
Mineral
Constitu
ents
Avocado variety
Hass Fuerte
Pulp Seed pulp seed
Unripe Ripe Unripe ripe unripe ripe unripe ripe
Mg 1.46±0.0
1 d
1.26±0.0
0 e
2.02
±0.01a
1.91±0.0
0 b
0.91±0.0
0 f
0.92±0.0
1 f
1.89
±0.01b
1.59±0.
00 c
Ca 15.35±0.
08e
13.56±0.
11f
24.77±0.
02a
23.43±0.
08b
11.02±0.
01g
13.69±0.
11f
16.42±0.
06d
21.00±
0.06c
Fe 1.12±0.0
0a
0.96±0.0
1cd
1.00±0.0
3bc
1.05±0.0
1b
0.53±0.0
1f
0.92±0.0
1d
0.57±0.0
1f
0.83±0.
01e
Zn 0.72±0.0
2a
0.55±0.0
0b
0.36±0.0
1e
0.46±0.0
1c
0.44±0.0
0c
0.43±0.0
0cd
0.27±0.0
2f
0.40±0.
00d
Na 9.81±0.0
0 f
9.95±0.0
3 e
11.59±0.
25 b
12.67±0.
01 a
8.75±0.0
8 g
5.33±0.0
1 h
10.81±0.
28 c
10.58±
0.07d
K 770.64±
0.16 b
783.29±2
.31 a
502.11±1
0.64 h
506.64±
0.23 g
516.03±
4.44 f
639.32±
1.01 c
594.51±
15.34 d
558.99
±3.32 e
59
* Data are means of duplicate determination ± standard deviation. The mean values followed by
different superscript letters in the same row are significantly different (p ≤ 0.05) according to the Tukey’s
multiple range test.
The sodium content of the avocado pulp were 9.81±0.00mg/100g, 8.75±0.08mg/100g,
9.95±0.03mg/100g and 5.33±0.01mg/100g for the corresponding UHP, UFP, RHP and RFP
respectively; these were higher than avocados varieties grown in US and California which is 7
and 8mg/100g (USDA, 2010a). Avocado seed had sodium content values varied from 10.58±0.07
to 12.67±0.01mg/100g. The minimum corresponds to RFS and the maximum to RHS. The UHS
and UFS had a Na content of 11.59±0.25mg/100g and 10.81±0.28 mg/100g, respectively.
Significant (P > 0.05) difference was observed between all the samples in zinc content. The
results of zinc content of the seed samples were higher than that of the pulp.
In general, a variation in mineral distribution was noted between varieties. The composition and
concentration levels of these nutrients varied significantly among cultivars. Potassium was the
most abundant macro-mineral and Calcium was the second most common mineral. Appreciable
amounts of sodium and magnesium were also noted. With regard to micronutrients (Table 4.4),
the concentration of iron and zinc was the lowest of quantified minerals observed in the varieties
studied.
4.5. Phytochemical composition of avocado pulp and seed
The investigated phytate content of an avocado pulp and seed are given in Table 4.5. The
investigated phytate content of avocado pulp were 4.22±0.06, 3.05±0.13, 2.73±0.03, and
2.53±0.13% (i.e. its concentration ranged between 2.53 and 4.22%) for unripe Hass pulp, unripe
Fuerte pulp, ripe Hass pulp and ripe Fuerte pulp respectively. The phytates content of Hass pulp
is greater than that of Fuerte pulp for both unripe and ripe fruits and its content decreased for the
ripe fruit. Also the phytates content of avocado seed were 49.12±0.25, 34.78±0.12, 45.82±0.36
and 37.68±0.10 (ranged between 34.78 and 49.12%) for unripe Hass seed, unripe fuerte seed,
ripe Hass seed and ripe fuerte seed respectively. The study revealed that avocado seed contains
high phytates content than its pulp for both Hass and Fuerte cultivars.
Tannins affect nutritive value of food by forming a complex with protein (both substrate and
enzyme) thereby inhibiting digestion and absorption (Oboh and Elusian, 2007). The tannin

60
determinations of the two avocado pulp and seed are shown in table 4.5. The tannin content of
avocado pulp were 0.99±0.02, 0.67±0.08, 0.68±0.06 and 0.81±0.02% for corresponding UHP,
UFP, RHP and RFP respectively. This shows that tannin content of Hass pulp is greater than that
of fuerte pulp and decrease when the fruit ripen for Hass pulp, but a slight increase for Fuerte
pulp. The tannin content of avocado seed were 13.72±3.21, 14.66±7.62, 7.31±0.41 and
11.24±0.89% for unripe Hass, unripe Fuerte, ripe Hass and ripe Fuerte respectively.
The investigated Phenol content of an avocado pulp and seed are given in Table 4.5. The Phenol
content of avocado pulp were 0.03±0.03, 0.04±0.02, 0.02±0.04 and 0.01±0.01mg/100g for unripe
Hass pulp, unripe Fuerte pulp, ripe Hass pulp and ripe Fuerte pulp respectively. This shows that
Phenol content of Fuerte pulp is greater than that of Hass pulp when unripe stage but lower when
they are in ripe form. The Phenol content of avocado seed were 0.42±1.11, 0.23±0.39, 0.07±0.02
and 0.17±0.92mg/100g for unripe Hass, unripe Fuerte, ripe Hass and ripe Fuerte respectively.
This Phenol content of seed is greater than that of its pulp. The results reveal that the pulp has
lower levels of phenolics than those found in Mexican ‘Hass’ avocados (4.9±0.7 mg GAE/g FW)
and Algarvian avocado of ‘Hass’ variety (4.102 ±0.69 mg/g) (Ana et al., 2013), except
comparable for UFP. The obtained unripe pulp phenolic levels in other cases are superior to
those reported for the Hass fruit of Turkish provenance (1.20±0.02 g/kg FW) (Golukcu and
Ozdemir, 2010). Also the seeds has lower levels of phenolics than those found in Mexican
‘Hass’ avocados (51.6±1.6 mg GAE/g FW) (Wang et al., 2010) but higher levels than Algarvian
avocado of ‘Hass’ variety (7.040±0.13mg/g) (Ana et al., 2013).
The obtained Flavonoid content of an avocado pulp and seed are given in Table 4.5. The
Flavonoid content of avocado pulp were 0.01±0.00, 0.01±0.06, 0.02±0.04, and
0.01±0.04mg/100g for unripe Hass pulp, unripe Fuerte pulp, ripe Hass pulp and ripe Fuerte pulp
respectively. This shows that Flavonoid content of Fuerte pulp is greater than that of Hass pulp
for unripe fruit but lower for ripe one. The Flavonoid content of avocado seed were 0.27±1.12,
0.07±0.25, 0.06±0.42 and 0.05±0.01mg/100g for unripe Hass, unripe Fuerte, ripe Hass and ripe
Fuerte respectively. This Flavonoid content of Hass seed is greater than that of Fuerte seed and
its content decreased for ripe fruit. The results revealed that in the avocado seed the highest
levels of total phenolics and flavonoids are found rather than its pulp. This agrees with the results
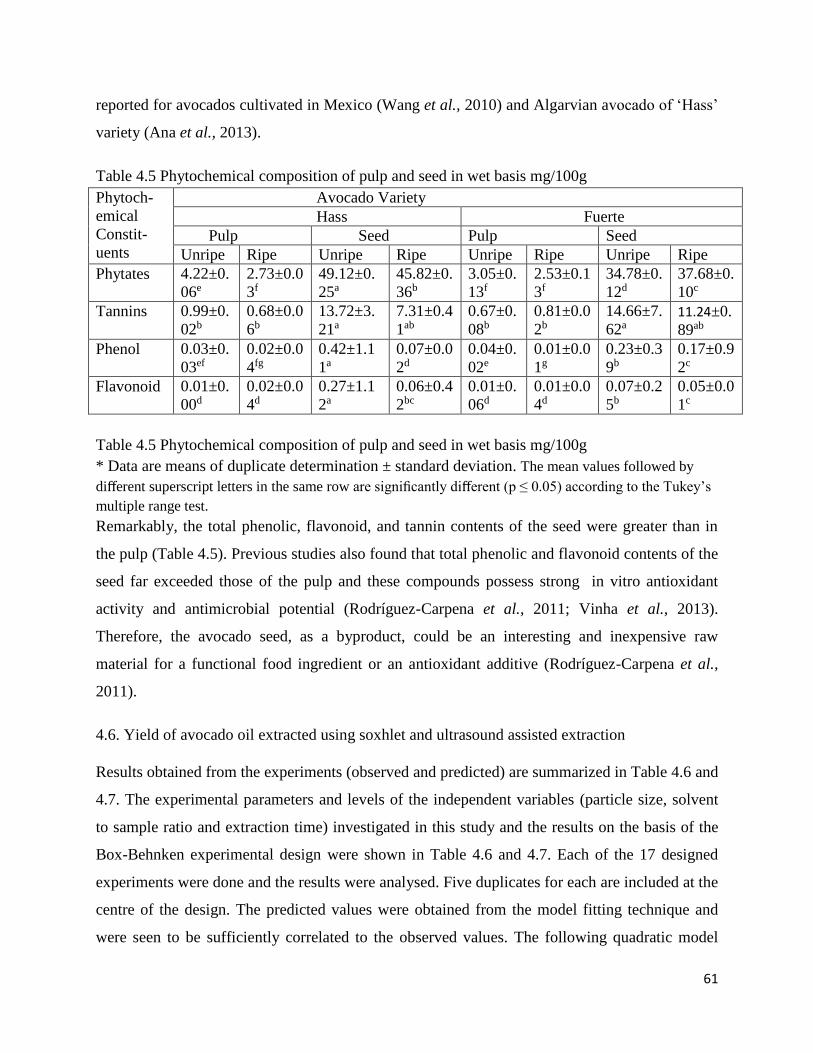
61
reported for avocados cultivated in Mexico (Wang et al., 2010) and Algarvian avocado of ‘Hass’
variety (Ana et al., 2013).
Table 4.5 Phytochemical composition of pulp and seed in wet basis mg/100g
Phytoch-
emical
Constit-
uents
Avocado Variety
Hass Fuerte
Pulp Seed Pulp Seed
Unripe Ripe Unripe Ripe Unripe Ripe Unripe Ripe
Phytates 4.22±0.
06e
2.73±0.0
3f
49.12±0.
25a
45.82±0.
36b
3.05±0.
13f
2.53±0.1
3f
34.78±0.
12d
37.68±0.
10c
Tannins 0.99±0.
02b
0.68±0.0
6b
13.72±3.
21a
7.31±0.4
1ab
0.67±0.
08b
0.81±0.0
2b
14.66±7.
62a 11.24±0.
89ab
Phenol 0.03±0.
03ef
0.02±0.0
4fg
0.42±1.1
1a
0.07±0.0
2d
0.04±0.
02e
0.01±0.0
1g
0.23±0.3
9b
0.17±0.9
2c
Flavonoid 0.01±0.
00d
0.02±0.0
4d
0.27±1.1
2a
0.06±0.4
2bc
0.01±0.
06d
0.01±0.0
4d
0.07±0.2
5b
0.05±0.0
1c
Table 4.5 Phytochemical composition of pulp and seed in wet basis mg/100g
* Data are means of duplicate determination ± standard deviation. The mean values followed by
different superscript letters in the same row are significantly different (p ≤ 0.05) according to the Tukey’s
multiple range test.
Remarkably, the total phenolic, flavonoid, and tannin contents of the seed were greater than in
the pulp (Table 4.5). Previous studies also found that total phenolic and flavonoid contents of the
seed far exceeded those of the pulp and these compounds possess strong in vitro antioxidant
activity and antimicrobial potential (Rodríguez-Carpena et al., 2011; Vinha et al., 2013).
Therefore, the avocado seed, as a byproduct, could be an interesting and inexpensive raw
material for a functional food ingredient or an antioxidant additive (Rodríguez-Carpena et al.,
2011).
4.6. Yield of avocado oil extracted using soxhlet and ultrasound assisted extraction
Results obtained from the experiments (observed and predicted) are summarized in Table 4.6 and
4.7. The experimental parameters and levels of the independent variables (particle size, solvent
to sample ratio and extraction time) investigated in this study and the results on the basis of the
Box-Behnken experimental design were shown in Table 4.6 and 4.7. Each of the 17 designed
experiments were done and the results were analysed. Five duplicates for each are included at the
centre of the design. The predicted values were obtained from the model fitting technique and
were seen to be sufficiently correlated to the observed values. The following quadratic model

62
equation (in coded factors) that correlates the yield of oil of ultrasound and soxhlet to various
process parameters is given by Eq. (4.1 & 4.2).
Final Equation in Terms of Coded Factors: for ultrasound
Yield =+59.61-3.92 * A+4.54 * B+10.65 * C-2.76 * B2-6.00 * C2 (4.1)
Final Equation in Terms of Coded Factors: for soxhlet
Yield =+64.69-3.49 * A+4.88 * B+10.29 * C-4.94 * B2-8.11 * C2+2.92 * B * C (4.2)
From the experimental results in Table 4.6 & 4.7 and equation (4.1 & 4.2), the second order
response functions representing Y is the response for oil yield, A the coded value of particle
size, B the coded value of solvent to sample ratio and C the coded value of extraction time. The
closer the value of R2 to unity, the better the empirical models fit the actual data. On the other
hand, the smaller the value of R2, the lesser will be the relevance of the dependent variables in
the model in explaining the behaviour of variations (Cao et al., 2008). Thus, the predicted values
match the observed values reasonably well, with R2 of 0.97 and 0.96 for ultrasound and soxhlet
respectively.
Statistical analysis obtained from the analysis of variance (ANOVA) for response surface
reduced quadratic model is shown in Table A2. The value of “P>F” for models is less than 0.05,
indicated that the model is significant which is desirable as it indicates that the terms in the
model have a significant effect on the response. The value of P<0.0001 indicates that there is
only a 0.01% chance that a “model F-value” this large could occur due to noise. Generally P-
values lower than 0.01 indicate that the model is considered to be statistically significant at the
99% confidence level (Ravikumar et al., 2005). Values greater than 0.1000 indicate the model
terms are not significant.

63
Table 4.6 Actual and predicted oil Yield value by soxhlet extraction
Standard
Order
Run
Order
Factor 1
A: Particle
Size
Factor 2
B: Solvent:
Sample ratio
Factor 3
C:Extraction
time
Actual
Value
Predicted
Value
Residual
1 15 1.4 15 6 59.5 58.37 1.13
2 17 2.6 15 6 47.2 51.39 -4.19
3 13 1.4 25 6 67.9 68.12 -0.22
4 8 2.6 25 6 60.5 61.14 -0.64
5 5 1.4 20 4 45.6 49.78 -4.18
6 14 2.6 20 4 42.1 42.81 -0.71
7 6 1.4 20 8 69.7 70.36 -0.66
8 7 2.6 20 8 65 63.38 1.62
9 16 2 15 4 42.4 39.41 2.99
10 2 2 25 4 45.2 43.31 1.89
11 12 2 15 8 54.2 54.13 0.069
12 3 2 25 8 68.7 69.73 -1.03
13 11 2 20 6 65.8 64.69 1.11
14 10 2 20 6 65.3 64.69 0.61
15 4 2 20 6 65.4 64.69 0.71
16 1 2 20 6 64.7 64.69 0.01
17 9 2 20 6 66.2 64.69 1.51
It can be observed that the variable with the largest effect on oil yield is the linear term of
extraction time (C) followed by the linear term of solvent to sample ratio (B), quadratic term of
extraction time (C2), linear term of particle size (A) and quadratic term of solvent to sample ratio
(B2) for ultrasound extraction and for soxhlet linear term of extraction time (C) followed by
quadratic term of extraction time (C2), the linear term of solvent to sample ratio (B), linear term
of particle size (A) and quadratic term of solvent to sample ratio (B2) (see Table A1 and A2 of
“F” ANOVA under appendixes). However, the quadratic term of particle size (A2) and all the
interaction terms (AB, AC and BC) are found to be insignificant (p>0.05), except BC on soxhlet
extraction. Regression analysis of the experimental data also shows that solvent to sample ratio
and extraction time had significant positive while particle size has negative linear effects on oil
yield (Eq. 4.1). The insignificant model terms can be removed and may result in an improved
model.

64
Table 4.7 Actual and predicted oil Yield value by ultrasound extraction
Standard
Order
Run
Order
Factor 1
A:particle
size
Factor 2
B:solvent:
sample ratio
Factor 3
C:extraction
time
Actual
Value
Predicted
Value
Residual
1 4 1.4 5 60 56.76 56.22 0.54
2 8 2.6 5 60 45.17 48.39 -3.22
3 6 1.4 15 60 65.79 65.31 0.48
4 13 2.6 15 60 57.12 57.47 -0.35
5 1 1.4 10 30 44 46.88 -2.88
6 11 2.6 10 30 39.98 39.05 0.93
7 10 1.4 10 90 66.09 68.18 -0.69
8 9 2.6 10 90 60.42 60.34 0.081
9 17 2 5 30 38.8 35.66 3.14
10 14 2 15 30 43.56 44.75 -1.19
11 12 2 5 90 56.5 56.95 -0.46
12 2 2 15 90 67.1 66.04 1.06
13 5 2 10 60 60.55 59.61 0.94
14 16 2 10 60 59.24 59.61 -0.38
15 7 2 10 60 61.84 59.61 2.23
16 3 2 10 60 60.09 59.61 0.48
17 15 2 10 60 58.9 59.61 -0.71
From Table 4.6, the soxhlet extraction parameters that provided the highest yield was optimized
as follows: particle size of 1.4 mm, Solvent to solid ratio of 20: 1 and extraction time of 8hr
which yields 69.7 g oil/100g DW. Also, from Table 4.7, the ultrasonic extraction conditions was
optimized as follows: particle size of 2 mm, Solvent to solid ratio of 15: 1 and extraction time of
90 min which yields 67.1 g oil/100 g DW.
A comparably higher yield of avocado oil was obtained using the soxhlet extraction (Table 4.6),
than ultrasonic extraction (Table 4.7), which is in agreement with a study performed by Ricardo
et al. (2014), Döker et al. (2010) and Mageshni Reddy et al. (2012). But, this extraction method

65
used high organic solvent and was more time consumer (8hr compared with 90 min). In other
words, ultrasonic extraction yields interesting amount by using less solvent and consuming less
time compared to soxhlet extraction. Yields by ultrasound and soxhlet techniques lay between
38.8 to 67.1% (Table 4.7) and 42.1 to 69.7% (Table 4.6) respectively. The comparison between
oil extraction yield (69.7%) from avocado pulp by soxhlet and the oil content percentage in the
initial matrix (70.75±0.35%), shows that almost all (about 98.5%) of the oil in the initial matrix
was extracted. Soxhlet extraction yield was higher because the solvent was almost pure in each
reflux solvent in the equipment in addition to use of high organic solvent and long time. Thus,
the concentration gradient between solid matrix and solvent was always high and the equilibrium
of extraction was constantly modified to enable oil solubility.
4.6.1. Effect of raw material particle size on oil yield
The effect of particle size is associated to an increase in cellular damage as particle size
decreases. This favors removal of the oil on the particle surface and diffusion of n-hexane within
the particle (Şaşmaz, 1996). The length of diffusion pathways will also decrease when the
particle size decreases, resulting in the increase of mass transfer rate for the process (Pronyk, and
Mazza, 2009). This can be noted in this results, which show that extraction yield reduced as
particle size increased, and improved with smaller particle sizes (Figures 4.1a and b).
In this study, two types of extraction techniques i.e. ultrasound extraction and soxhlet extraction
were considered. The range of particle size is 1.4mm to 2.6mm separated by sieving. Figure 4.1a
and b illustrates the effect of raw material particle sizes on the yields of oil extracted by
ultrasound and soxhlet techniques, respectively. The extraction yield of oil was better for smaller
particles (1.4mm) compared to larger ones (2.6mm). Operating with solvent to sample ratio of
10:1 in a 60 minutes extraction, an increase of about from 55.7 % to 63.5% of the oil yield was
obtained when raw material particle size is reduced from 2.6mm to 1.4mm. Similar trend is
observed for soxhlet extraction as illustrated by Figure 4.1(b), which shows reduction of oil yield
as particle size increased. The results show that among the three raw material particle size, 2mm
for ultrasound extraction and 1.4mm for soxhlet extraction was most effective (optimum)
condition.
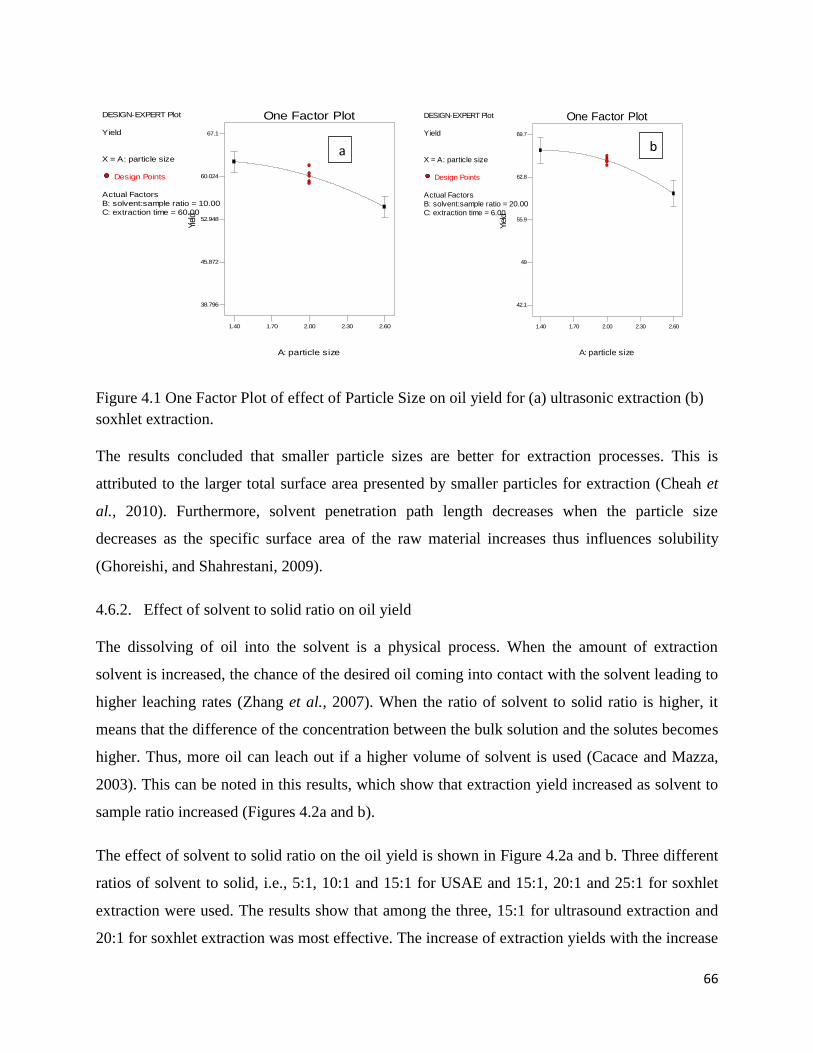
66
Figure 4.1 One Factor Plot of effect of Particle Size on oil yield for (a) ultrasonic extraction (b)
soxhlet extraction.
The results concluded that smaller particle sizes are better for extraction processes. This is
attributed to the larger total surface area presented by smaller particles for extraction (Cheah et
al., 2010). Furthermore, solvent penetration path length decreases when the particle size
decreases as the specific surface area of the raw material increases thus influences solubility
(Ghoreishi, and Shahrestani, 2009).
4.6.2. Effect of solvent to solid ratio on oil yield
The dissolving of oil into the solvent is a physical process. When the amount of extraction
solvent is increased, the chance of the desired oil coming into contact with the solvent leading to
higher leaching rates (Zhang et al., 2007). When the ratio of solvent to solid ratio is higher, it
means that the difference of the concentration between the bulk solution and the solutes becomes
higher. Thus, more oil can leach out if a higher volume of solvent is used (Cacace and Mazza,
2003). This can be noted in this results, which show that extraction yield increased as solvent to
sample ratio increased (Figures 4.2a and b).
The effect of solvent to solid ratio on the oil yield is shown in Figure 4.2a and b. Three different
ratios of solvent to solid, i.e., 5:1, 10:1 and 15:1 for USAE and 15:1, 20:1 and 25:1 for soxhlet
extraction were used. The results show that among the three, 15:1 for ultrasound extraction and
20:1 for soxhlet extraction was most effective. The increase of extraction yields with the increase
DESIGN-EXPERT Plot
Yield
X = A: particle size
Design Points
Actual Factors
B: solvent:sample ratio = 10.00
C: extraction time = 60.00
1.40 1.70 2.00 2.30 2.60
38.796
45.872
52.948
60.024
67.1
A: particle size
Yiel
d
One Factor Plot DESIGN-EXPERT Plot
Yield
X = A: particle size
Design Points
Actual Factors
B: solvent:sample ratio = 20.00
C: extraction time = 6.00
1.40 1.70 2.00 2.30 2.60
42.1
49
55.9
62.8
69.7
A: particle size
Yie
ld
One Factor Plot
a b

67
of solvent to solid ratio is consistent with mass transfer principles. Smaller volumes of solvent
can lead to incomplete target extraction while larger volumes can make the extraction procedure
becomes complex and wasteful (Touati and Meniai, 2011).
Figure 4.2 One Factor Plot of effect of solvent to sample ratio on oil yield for (a) ultrasonic
extraction and (b) soxhlet extraction.
Therefore, suitable solvent to solid ratio is preferred in order to achieve higher extraction yields.
Based on the figure 4.2a and b, the optimum solvent to solid ratio is 15:1 and 20:1 for ultrasound
extraction and soxhlet extraction, respectively.
4.6.3. Effect of extraction time on oil yield
It is important to determine the duration of the extraction process required to extract the desired
compounds. Typically, this would be the time at which equilibrium of solvent concentration
between inner and outer cells is established (Zhang et al., 2007). Extraction time is crucial in
solvent extraction of oil as appropriate extraction time can result in time and cost saving. This
could have been due to the longer amount of time the solute and solvent were in contact with
each other. Longer contact time favored the system to have more mass transfer. However,
excessive extraction time would be unnecessary as the solvent and sample would be in final
equilibrium after certain duration. This is based on Fick’s second law of diffusion by then; the
rate of extraction of compounds would decelerate (Teixeira et al., 2014).
DESIGN-EXPERT Plot
Yield
X = B: solvent:sample ratio
Design Points
Actual Factors
A: particle size = 2.00
C: extraction time = 60.00
5.00 7.50 10.00 12.50 15.00
38.796
45.872
52.948
60.024
67.1
B: solvent:sample ratio
Yie
ld
One Factor Plot DESIGN-EXPERT Plot
Yield
X = B: solvent:sample ratio
Design Points
Actual Factors
A: particle size = 2.00
C: extraction time = 6.00
15.00 17.50 20.00 22.50 25.00
42.1
49
55.9
62.8
69.7
B: solvent:sample ratio
Yie
ld
One Factor PlotWarning! Factor involved in an interaction.
a b
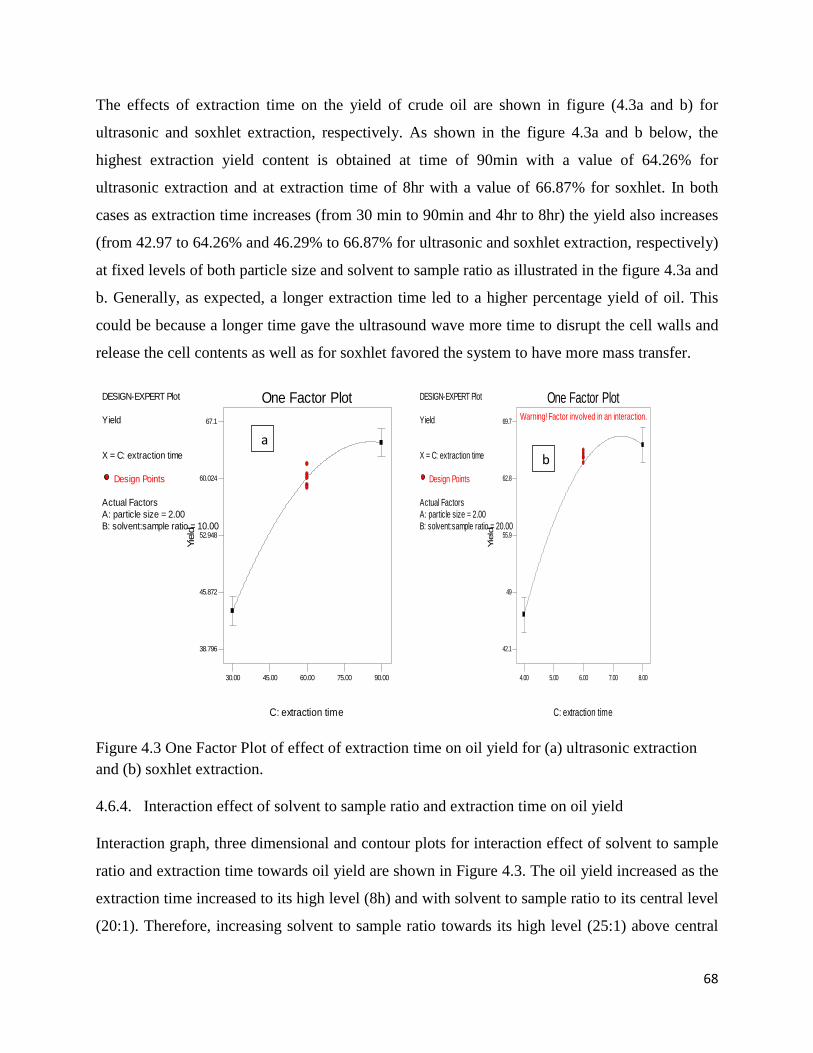
68
The effects of extraction time on the yield of crude oil are shown in figure (4.3a and b) for
ultrasonic and soxhlet extraction, respectively. As shown in the figure 4.3a and b below, the
highest extraction yield content is obtained at time of 90min with a value of 64.26% for
ultrasonic extraction and at extraction time of 8hr with a value of 66.87% for soxhlet. In both
cases as extraction time increases (from 30 min to 90min and 4hr to 8hr) the yield also increases
(from 42.97 to 64.26% and 46.29% to 66.87% for ultrasonic and soxhlet extraction, respectively)
at fixed levels of both particle size and solvent to sample ratio as illustrated in the figure 4.3a and
b. Generally, as expected, a longer extraction time led to a higher percentage yield of oil. This
could be because a longer time gave the ultrasound wave more time to disrupt the cell walls and
release the cell contents as well as for soxhlet favored the system to have more mass transfer.
Figure 4.3 One Factor Plot of effect of extraction time on oil yield for (a) ultrasonic extraction
and (b) soxhlet extraction.
4.6.4. Interaction effect of solvent to sample ratio and extraction time on oil yield
Interaction graph, three dimensional and contour plots for interaction effect of solvent to sample
ratio and extraction time towards oil yield are shown in Figure 4.3. The oil yield increased as the
extraction time increased to its high level (8h) and with solvent to sample ratio to its central level
(20:1). Therefore, increasing solvent to sample ratio towards its high level (25:1) above central
DESIGN-EXPERT Plot
Yield
X = C: extraction time
Design Points
Actual Factors
A: particle size = 2.00
B: solvent:sample ratio = 10.00
30.00 45.00 60.00 75.00 90.00
38.796
45.872
52.948
60.024
67.1
C: extraction time
Yie
ld
One Factor Plot DESIGN-EXPERT Plot
Yield
X = C: extraction time
Design Points
Actual Factors
A: particle size = 2.00
B: solvent:sample ratio = 20.00
4.00 5.00 6.00 7.00 8.00
42.1
49
55.9
62.8
69.7
C: extraction time
Yie
ld
One Factor PlotWarning! Factor involved in an interaction.
a
b
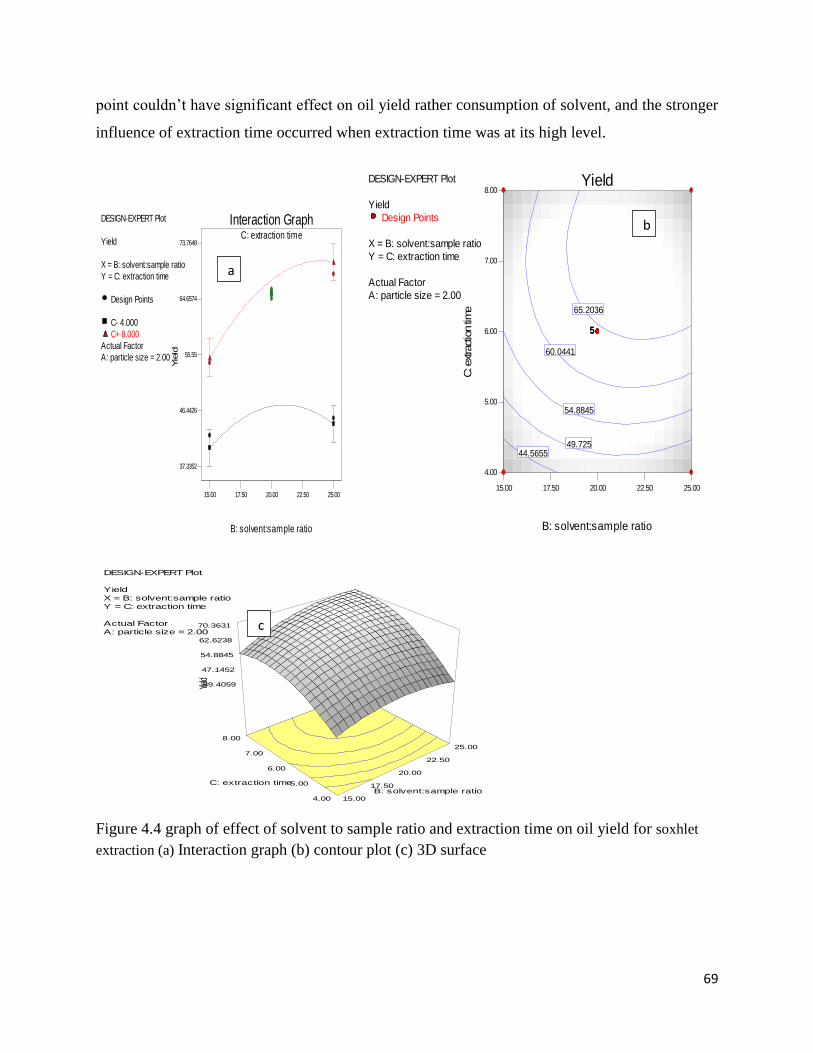
69
point couldn’t have significant effect on oil yield rather consumption of solvent, and the stronger
influence of extraction time occurred when extraction time was at its high level.
Figure 4.4 graph of effect of solvent to sample ratio and extraction time on oil yield for soxhlet
extraction (a) Interaction graph (b) contour plot (c) 3D surface
DESIGN-EXPERT Plot
Yield
X = B: solvent:sample ratio
Y = C: extraction time
Design Points
C- 4.000
C+ 8.000
Actual Factor
A: particle size = 2.00
C: extraction time
Interaction Graph
B: solvent:sample ratio
Yie
ld
15.00 17.50 20.00 22.50 25.00
37.3352
46.4426
55.55
64.6574
73.7648
DESIGN-EXPERT Plot
Yield
Design Points
X = B: solvent:sample ratio
Y = C: extraction time
Actual Factor
A: particle size = 2.00
Yield
B: solvent:sample ratio
C: e
xtra
ctio
n ti
me
15.00 17.50 20.00 22.50 25.00
4.00
5.00
6.00
7.00
8.00
44.565549.725
54.8845
60.0441
65.2036
55555
DESIGN-EXPERT Plot
Yield
X = B: solvent:sample ratio
Y = C: extraction time
Actual Factor
A: particle size = 2.00
39.4059
47.1452
54.8845
62.6238
70.3631
Yield
15.00
17.50
20.00
22.50
25.00
4.00
5.00
6.00
7.00
8.00
B: solvent:sample ratio
C: extraction time
a
c
b

70
4.7. Quality characterization of the extracted avocado oil
The highest percentage oil yield was achieved by soxhlet (69.7%) and lower yield was by
ultrasonic extraction (67.1%). The oil yield differences of the extraction method could be
attributed to the differences in their chemical properties and their fatty acid composition. The
avocado oil obtained from soxhlet and ultrasonic extraction was analysed for various parameters
as shown in Table 4.8. The oil extracted by soxhlet extraction comprises lower moisture and
volatile matter, free fatty acid, acid value, alkalinity and Peroxide value than the oil extracted by
Ultrasound assisted extraction. The obtained result was superior to the result reported by Woolf
et al. (2009) where Moisture <1%, FFA <0.5%, AV <1% except in the range for PV (<4).
Acid Value: AV indicated the free fatty acids present in fats and oils. High degree acid value can
be related with degree of oxidation during preparation or storage. The good quality of oil
generally has low acid value. Since SEO had lower acid value (2.31±0.01 mgKOH/g) than UEO
(2.65±0.00 mgKOH/g), it indicated that the quality of SEO was better than UEO. These results are
found within the range of minimum (1) and maximum (7) values for the acid value properties of
avocado oil reported by Eckey (1954). The analyzed oil also comprises higher acid value than
the result (1.23 ± 0.02) reported by Pushkar et al. (2001), the result (1.23) reported for the Fuerte
cultivar (Bora et al., 2001) and (1.46) reported for avocado grown in Mexico (Moreno et al.,
2003). The low acid value obtained for avocado oil in this study therefore suggests that the oil is
edible and less susceptible to rancidity. The variation may be due to the differences in variety of
plant, cultivation climate, ripening stage, solvent type, extraction time and temperature.
Free fatty acid: The percentage free fatty acid (FFA) value of oil is a crucial parameter in
determining the quality of oil because the lower the FFA, the higher the quality of the oil
especially in terms of its edibility. The percentage free fatty acid of UEO (1.33±0.00 g/100g), is
slightly higher than SEO (1.16±0.86 g/100g). Low FFA content of the oil is also indicative of low
susceptibility to enzymatic hydrolysis and could be an advantage over oils with high free fatty
acids value which can become off-flavor during storage (Bailey, 1954).
Peroxide Value: Peroxide value is a measure of the content of hydro-peroxides in oil which are
the primary reaction product formed in the initial stages of oxidation of oil and therefore gives an
indication of the likely occurrence of the process of lipid peroxidation (Onwuka, 2005). The

71
peroxide value of the UEO (2.74±0.36) was higher than that of the SEO (0.23±0.00). Nearly
similar peroxide values of the pulp oil were found by other researchers, such as 2.5 by Soares et
al. (1991), but a lower value than UEO and higher value than SEO (1.4), was reported by Bora et
al. (2001), (1.40 ± 0.215) was reported by Pushkar et al. (2001). Much higher values of peroxide
values, varying from 3.7 to 12.74, were reported by Moreno et al., (2003). These differences may
be due to fruit production in different places, climate, and soil composition. The extent of
oxidative activity in oil may be estimated by Peroxide Value (PV). The number of peroxides
present in vegetable oils reflect its oxidative level and thus tend to become rancid. The peroxide
value of UEO was higher than SEO, indicating that UEO is unstable against oxidation than SEO.
A product with peroxide value above 10 meq kg–1 is classified at high oxidation state
(Moigradean et al., 2012). This result may be due to the presence of chlorophylls as photo-
sensitizers which have not been removed in crude avocado oil samples. Besides, avocado oil
should exhibit a high rate of oxidation due to its high content of unsaturated fatty acids.
Unsaturated fatty acids easily react with oxygen to form peroxides. Peroxide values of avocado
oil have been reported in the range of 5.1-12.3 meq kg–1 (Quinones-Islas et al., 2013).
Iodine Value: The iodine value (IV) indicates the unsaturation degree of fats and oils (Lusas et
al., 2012). Higher iodine value is attributed to high unsaturation. The slightly higher iodine
value (78.6) of SEO gives the indication that SEO contains more unsaturated fatty acid than
UEO (75.3). These results are lower than the range of 82-95 reported by Moreno et al. (2003) but
consistent with some reports stating that the number of IV for avocado oil was in the range of 65-
95 (AOCS, 1998). The results obtained for the iodine value also agree with the data (77.6)
reported by Bora et al. (2001) for avocado oil.
Fatty acid Profile of avocado oil
Oil quality is a significant concern of consumers, particularly for the contents of oleic and
linoleic acids which are proven as healthy sources of oil for human body. Avocados store mainly
oleic, palmitic, palmitoleic, and linoleic acids (Tango et al., 2004). Thus, oil analyses was
performed to determine the content of aforesaid and other fatty acids in the present study. The
FA composition of oils obtained for the different extraction methods are presented in Table 4.8.
The analyzed oil consisted of four different FAs; two unsaturated FAs and two saturated FAs.
MUFAs, oleic (C18:1) and SFA, palmitic (C16:0) acids, are predominant constituents of

72
avocado oils. Linoleic (C18:2) acid was only detected in oil extracted by soxhlet and for
saturated fatty acids, butyric acid was only detected in oils extracted by ultrasound extraction.
The lower percentages of FAs produced by USAE could be due to short extraction time and low
solvent to sample ratio. USAE is relatively rapid; increasing the extraction time could increase
the yield as well as fatty acid composition.
Mazliak (1971), reports eight fatty acids were identified in the pulp oil of cultivar Fuerte, while
Southwell et al. (1990) reported the presence of only six fatty acids. But in this study, only four
fatty acids in the pulp oil of Hass cultivar were identified. In all the cultivars C18:1 (oleic acid)
was always the principal fatty acid followed by C16:0 (Palmitic) and C18:2 (linoleic). Similar to
these reports, in this study the major fatty acid observed was C18:1 followed by C16:0 and
C18:2. This also agrees with a previous report by Sinyinda (1998), Haiyan et al. (2007) and
Moreno et al. (2003). However, the concentrations of these fatty acids in the pulp oil were
different from the cited reports. In this study the observed principal fatty acid concentration was
46.46-59.59%, 23.66-24.66% and 7.62% for oleic, palmitic and linoleic acid respectively. These
fatty acid concentration value were nearly similar (in the range) with that of reported by Woolf et
al. (2009), which was: Palmitic acid (16:0) 10%-25%, Oleic acid (18:1) 60%-80%, Linoleic acid
(18:2) 7%-20%. But, Martinez et al. (1988), reported a range of 60-65, 15-19 and 11-12%,
respectively for the same fatty acids in the oil from Bacon, Fuerte, and Hass cultivars. This
quantitative difference is may be due to the difference in fruits geographical location and other
factors such as maturity, ripening stage and solvent type.
Table 4.8. Quality characteristics of oil extracted by UAE and Soxhlet Extraction
Parameters USAE SOXHLET Unit
Moisture and volatile matter 8.47±0.09 2.27±0.01 %(g/100g)
Free Fatty Acid 1.34±0.01 1.17±0.01 %(g/100g)
Acid Value 2.65±0.00 2.32±0.01 mgKOH/g
Alkalinity (Soap Content) 0.11±0.00 0.004±0.00 %(g/100g)
Peroxide Value 2.75±0.01 0.23±0.01 meq/kg
Iodine value 75.3±0.14 78.6±0.14 (g/100 g)
palmitic acid (16:0) 24.01 23.66 %
oleic acid (18:1) 46.46 59.59 %
Linoleic acid (18:2) ND 7.62 %
Butyric acid (4:0) 1.38 ND %
Results are expressed as the mean of duplicate ± Standard deviation. ND: Not Detected

73
Generally, Soxhlet extracted avocado oil had the lowest acid, peroxide values, FFA, MVM than
ultrasonic extracted oil. Brazilian legislation for oils and fats (BRASIL, 2005) does not propose
specific standards for avocado oil. However, acid and peroxide values are standardized for
pressed and crude oils, where the maximum allowed acid value is 4.0mgKOH/g and the peroxide
value cannot exceed 15mEq O2/kg. In contrast, Mexico does have specifications for avocado oil
(NMX-F-052-SCFI-2008); the maximum allowed acid and peroxide values are 1.5% oleic acid
and 10mEqO2/kg, respectively. In the present work, oils from both processes presented acid and
peroxide values below the limits set by Brazilian legislation.
Figure 4.5. GC-MS result for ultrasound extracted oil.

74
Figure 4.6 GC-MS result for soxhlet extracted oil.
As the lipid content in avocados varies greatly with the variety and the same is also observed for
fatty acid composition, which depends on growth rate and variety (Tango et al., 2004). Avocados
store mainly oleic, palmitic, palmitoleic, and linoleic acids. Concerning the region of cultivation,
differences may reside not only between countries, as suggested by Landahl et al. (2009), but
also between different geographical locations within the same country, due to variation in
climate, soil composition, and other environmental factors. Therefore, the choice of an avocado
cultivar for oil extraction might be based on lipid content as well as on fatty acid composition
(which is related to the intended use of the oil) (Isabelle Santana1 et al., 2015).

75
CHAPTER FIVE
5. Conclusions and Recommendations
5.1. Conclusions
This study was aimed to characterize the pulp and seed of the Hass and Fuerte varieties of the
avocado fruit. From the result it was concluded that the higher pulp yield, lipid (22.80±0.00%),
protein (2.92±0.04%), ash (0.42±0.01%) and fiber(4.50±0.09%) concentrations found in the Hass
variety of unripe fruit which make this fruit to be more palatable and suitable for pulp oil
extraction, while higher moisture content (77.82±0.19%) was found in unripe fuerte. The seed of
Fuerte variety was accounted with higher moisture (61.83±0.23%), ash, protein (3.58±0.00%)
and fiber (4.76±0.01%) contents than those of the Hass variety. Also, higher TSS and lower TTA
was observed in the pulp of Hass cultivar while this was nearly similar in its seeds.
The results clearly showed that all the studied phytochemical concentration was higher in
avocado seed than its pulp. All Phytate, phenol and flavonoid was also higher in unripe Hass
seed cultivar except tannin which was higher in unripe Fuerte seed. In case of its pulp Phytate
and tannin concentration was higher in unripe Hass avocado cultivar while total phenol and
flavonoid was higher in unripe Fuerte cultivar which reveals that phytochemical concentration
was higher mostly in unripe fruit.
The results also show that a variety of fatty acids was detected in the pulp oils extracted using
soxhlet and ultrasonic from Hass avocado cultivar in the present study. Relatively high contents
of oleic (59.59) and linoleic (24.01) acids present in the avocado pulp oil reveal that this variety
was rich sources of ω-6 fatty acids and it is needed to reduce LDL and maintain HDL, which is
responsible in reducing cancers and cardiovascular diseases.
Also, in the present study, ultrasonic and soxhlet extraction of avocado oil was optimized. The
yield of oil increased with decreasing particle size, increasing extraction (Ultrasonication) time
and solvent to solid ratio. The comparison of the two techniques shows that the soxhlet
extraction provided the greater yield (69.7%). This fact may be explained because extractions
were conducted above the boiling point of the solvents, takes longer extraction time and
consumes more solvents. It may also occur because this technique uses practically pure solvent

76
in each refluxing which makes the mass transfer easier. Eventhough the method presented, UAE,
gives lower quality and quantity, but it has the advantage of easy operation, shorter extraction
time and reduced solvent consumption and can be used for sequential extraction of fatty acids.
Gas chromatography analysis showed that the fatty acid composition of the avocado oil obtained
by ultrasonic extraction was nearly similar to that of oil obtained by Soxhlet extraction. So,
Ultrasonic extraction is a useful and environmentally friendly extraction method that could be
applied to the production of other plant oils and active substances.
5.2. Recommendations
From the study result, both avocado cultivars appeared to be promising in nutrition and
phytochemical point of view and also the optimization of extraction condition was gave an
attractive yield. Based on the result found the following recommendations were made.
The composition of avocado fruit may vary with location, season, variety and maturity especially
the principal (fat) content. Therefore, characterization of avocado fruit from other location as
well as other variety from the present study’s location should be conducted.
Since avocado seed was rich in phytochemicals and somewhat proteins, further research should
be conducted on it in order to utilize it in medicinal purposes and formulate some products
including animal feed rather than wasting it and also if bioactive compounds of avocado is
needed it should be extracted from unripe fruit since ripening decreases the content of
phytochemicals.
These findings clearly prove that USAE has enormous potential as a novel method of oil
extraction. More research on the effects of other parameters affecting the efficiency of USAEs
could help make this technique more economically feasible for industrial applications.
The power of ultrasonic device I used could not be adjusted and its temperature was controlled
by replacing the water in the bath. But if the temperature is self-controlled and the power was
adjusted to examine the effect of ultrasonic power and temperature on the extraction yield and
quality of oil it will better.

77
References
Abbott, J. A. (1999). Quality measurement of fruits and vegetable. Posth. Biol. Technol.
15(3):207-225.
Adu-Amankwa, B. (2006). Mass transfer and leaching rates of Griffonia active ingredients in
Griffonia simplicifolia biomass with ethyl alcohol as solvent. Journal of Ghana
Institution of Engineers, 4(2), 17–20.
Ana F. Vinha, Joana Moreira and Sérgio V. P. Barreira (2013). Physicochemical Parameters,
Phyto-chemical Composition and Antioxidant Activity of the Algarvian Avocado (Persea
americana Mill.). Journal of Agricultural Science; Vol. 5, No. 12.
Anthony, S., Abeywickrama, K. and Wijeratnam, W. S. (2003). The effect of spraying essential
oils of Cymbopogon nardus, C. flexuosus and Ocimum basilicum on postharvest diseases
and storage life of Embul banana. Journal of Horticultural Science and Biotechnology.
21: 211-216.
AOAC (1990). Official Methods of Analysis 15th edition. Association of Official Analytical
Chemists Washington D.C.
AOCS. (1998). Official Method Cd 1d-92, Iodine Value of Fats and Oils, Cyclohexane-Acetic
Acid Method. In: Official Methods and Recommended Practices of the American Oil
Chemists, Firestone, D. (Ed.). 5th Edn. AOCS. Champaign.
Arias, L. E. H., Gómez, J. H. P. and Salazar, J. A. (2012). Application of the matrixes
engineering on the development of minimally processed Hass avocado (Persea
americana Mill) with additions of vitamin C and calcium. Revista Lasallista
Investigación, 9(2): 44–54.
Arpaia, M., Jacman C.R., Woolf A., White A., Thompson J.F., Slaughter D.S. (2006). Avocado
Postharvest Quality. Proc. California Avocado Research Symposium. P 143-155
Arzate-Vazquez, I., Chanona-Perez, J.J., de Jesus Perea-Flores, M., Calderón-Domínguez. G.,
Moreno-Armendáriz, M.A., Calvo, H., Godoy-Calderón, S., Quevedo, R., Gutierrez
Lopez, G. (2011). Image processing applied to classification of avocado variety Hass
(Persea americana Mill.) during the ripening process. Food Bioproc. Technol. 4(7):1307-
1313.
Ashton, O.B.O., Wong, M., McGhie, T.K., Vather, R., Wang, Y., Requejo-Jackman, C.,
Ramankutty, P., Woolf, A. B. (2006). Pigments in avocado tissue and oil. Journal of
Agriculture and Food Chemistry. 54(26):10151-10158.
Atwal, A., Eskin, N., McDonald, B. and Vaisey-Genser, M. (1980). The effects of phytase on
nitrogen utilization and zinc metabolism in young rats. Nutrition Reports International.
21, 257-67.

78
Ayelech, T. (2011). Market chain analysis of fruits for Goma woreda Jimma zone, Oromia
regional state’ A Thesis Submitted to School of Graduate Studies of Haramaya
University.
Bailey, E.A. (1954). Industrial Oil and Fat Products. 3rd Edn., Interscience Publishers, London.
Biale, J.B. and Young, R.E. (1971).The avocado pear. In: The Biochemistry of Fruits and Their
Products. A.C. Hulme (edition), Academic Press, New York.
Bonrath, W. (2003). Industrial applications of sonochemistry in the syntheses of vitamin-
building blocks. Ultrasonics Sonochemistry. 10. 55-59.
Bora, P. S., Narain, N., Rocha, R. V. M., & Paulo, M. Q. (2001). Characterization of the oils
from the pulp and seeds of avocado (cultivar Fuerte) fruits. Grasas y Aceites, 52 (3-4),
171-174.
Botha, M.B. (2004). Supercritical fluid extraction of avocado oil. South African Avocado
Growers Association Yearbook, 27:24-27
BRASIL. ANVISA, Resolução RDC n° 270, de 22 de setembro de (2005). Regulamento técnico
para óleos vegetais, gorduras vegetais e creme vegetal.
Burdon, J., Lallu, N., Yearsley, C., Burmeister, D., Billing, D. (2007). The kinetics of
acetaldehyde and ethanol accumulation in 'Hass' avocado fruit during induction and
recovery from low oxygen and high carbon dioxide conditions. Posth. Biol. Technol.
43(2):207-214.
Burns, R.E. (1971). Method of estimation of tannin in grain sorghum. Agron. J. 63:511
Butler, L. G. (1989). New perspectives on the antinutritive effects of tannins. In Food Proteins,
ed. Kinsella, J. E. & Soucie W. G. AOCS, Champaign, IL, USA, pp. 402-9.
Cacace, J. E. and Mazza, G. (2003). Mass Transfer Process during Extraction of Phenolic
Compounds from Milled Berries. Food and Eng. 59: 379–389.
California Rare Fruit Growers (CRFG) Inc. 1998 Internet site.
http://marketreport.com/avocados.htm
Cao, w., Zhang, C., Hong, P. & Ji, H. (2008). Response surface methodology for autolysis
parameters optimization of shrimp head and amino acids released during autolysis. Food
Chemistry 109: 176-183.
Chaves, M.A. et al (2013). Preparation of whole cookie using avocado pulp flour and oil.
Boletim do Centro de Pesquisa e Processamento de Alimentos, v.31, p.215-226.
Cheah, E. L. C., Heng, P. W. S., Chan, L. W. (2010). Optimization of Supercritical Fluid
Extraction and Pressurized Liquid Extraction of Active Principles from Magnolia
officinalis using the Taguchi Design. Sep. Purif Technol. 71: 293–301.

79
Cheeke, P.R., Piacente, S. and Oleszek, W. (2006). Anti-inflammatory and anti-arthritic effects
of Yucca Schidigera: A review. J. Inflammation 3: 1-7.
Chen, N.J., Wall, M.M., Paull, R.E., Follett, P.A. (2009). Variation in ‘Sharwil’ avocado
maturity during the harvest season and resistance to fruit fly infestation. Hortscience
44(6):1655-1661.
Cravotto, G., Boffa, L., Mantegna, S., Perego, P., Avogadro, M. and Cintas, P. (2008). Improved
extraction of vegetable oils under high-intensity ultrasound and/or microwaves.
Ultrasonics Sonochemistry. 15. 898-902.
CSA, (2013). Agricultural Sample Survey 2012 / 2013; Volume I, Report on Area and
Production of Major Crops, Statistical Bulletin 532; Addis Ababa, Ethiopia.
Daiuto, E.R et al. (2011). Sensory analysis of cold-stored guacamole added with α-tocopherol
and ascorbic acid. Revista Ceres, v.58, n.2, p.140-148.
Deshpande, S. Sathe, S. K., and Salunkhe, D. K. (1984). Chemistry and safety of plant
polyphenols. In Nutritional and Toxicological Aspects of Food Safety, ed. M. Friedman.
Plenum Press, New York, USA, pp. 457-95.
Dewanto, V., X.Z., Adom, K.K., and Liu, R.H. (2002). Thermal processing enhances the
nutritional value of tomatoes by increasing total antioxidant activity. J Agricult Food
Chem. 50:3010–3014.
Dodd, M., Cronje, P., Taylor, M., Huysamer, M., Fruger, F., Lotz, E., van de Merwe, K. (2008).
A review of the postharvest handling of fruits in South Africa over the past twenty five
years. South Afr. J. Plant Soil. 27(1):97-116.
Döker, O., Salgin, U., Yildiz, N., Aydoğmuş, M., Çalimli, A (2010). Extraction of sesame seed
oil using supercritical CO2 and mathematical modeling, Journal of Food Engineering, v.
97, n. 3, p. 360-366.
Doreyappy-Gowda, I. N. D and Huddar, A. G. (2001). Studies on ripening changes in mango
(Mangifera indica L.) fruits. J. Food Sci. Tec. Mysore, 38: 135-137.
Edossa Etissa (1997). Selection of Avocado (Persea Americana) Collection of Desirable Fruit
Characteristics and Yield at Jimma, Proceedings of the 8th Annual Conference of
the Crop Science Society of Ethiopia, Feb. 26-27, Addis Ababa, Ethiopia, pp: 26-35.
Ensminger, A.H. (1994). Foods and Nutrition encyclopedia, CRC Press. pp. 527
Evans, W.J. and Martin, C.J. (1988). Interaction of Mg(II), Co(II), Ni(II) and Zn(II) with phytic
acid, VIII. A calorimetric study. Journal of Inorganic Biochemistry, 32, 259 – 67.
Eyres, L., Sherpa, N; Hendriks, G. (2006). Avocado Oil- A new edible Oil from Australasia.
Institute of Food, Nutrition and Human Health, Massey University, New Zealand.

80
Faostat. (2014). Country profiles Ethiopia (www.faostat.fao.org)
http://faostat.fao.org/CountryProfiles/Country_Profile/Direct.aspx?lang=en&area=238.
Faostat. (2014). Production-avocado Ethiopia
http://faostat.fao.org/site/567/DesktopDefault.aspx?PageID=567#ancor
Ferguson, I., Volz, R., Woolf, A. (1999). Preharvest factors affecting physiology disorders of
fruit. Posth. Biol. Technol. 15(3):255-262.
Ferreira, S. L. C., Bruns, R. E., Ferreira, H. S., Matos, G. D., David, J. M., Brandão, G. C., dos
Santos, W. N. L. (2007). Box-Behnken design: an alternative for the optimization of
analytical methods. Analytica Chimica Acta, 597(2), 179-186.
Flitsch, S. and Rein, L.U. (2003). “Sugars Tied to the Spot”. Nature; 421: (219-226).
Freitas, S. P., Lago, R. C. A., Jablonka, F. H. and Hartman, L. (1993). Extraction aqueuse
enzimatique de l’huile d’avocat a partir de la pulpe fraîche. Rev. Fr. Corps Gras. 41,
365–371.
Garcia, A., de Lucas, A., Rincon, J., Alvarez, A., Gracia, I., Garcia, M.A. (1996). Supercritical
carbon dioxide extraction of fatty and waxy material from rice bran. J Am Oil Chem Soc.
73:1127-1131
Garedew, W. and Tsegaye, B. (2011). ‘Trends of Avocado (Persea americana) Production and its
Constraints in ManaWoreda, Jimma Zone: A Potential Crop for Coffee Diversification.
Journal of Trends in Horticultural Research, 1: 20-26.
Ghoreishi, S. M., Shahrestani, R. G. (2009). Subcritical Water Extraction of Mannitol from Olive
Leaves. J. Food Eng. 93: 474–481.
Giraldo, Y. H., Velásquez, J. J. and Cuartas, A. P. (2010). Extracción con solventes y
purificación de aceite a partir de semillas de Jatropha curcas. Revista De
Investigaciones Aplicadas, 4(2), 77–86.
Golukcu, M. and Ozdemir, F. (2010). Changes in phenolic composition of avocado cultivars
during harvesting time. Chemistry Natural Compounds, 46(1), 112-115.
Gondim, J. A. M., Moura, M. F., Dantas, A. S., Medeiros, R. L. S. and Santos, K. M. (2005).
Composição centesimal e de minerais em cascas de frutas. Ciência e Tecnologia de
Alimentos, 25(4), 825-827.
Grosso, C., Ferreres, F., Gil-Izquierdo, A., Valentão, P., Sampaio, M., Lima, J. and Andrade, P.
B. (2014). Box–Behnken factorial design to obtain a phenolic-rich extract from the aerial
parts of Chelidonium majus L. Talanta, 130, 128-136.
Gutteridge, A. and Thornton, J.M. (2005). Understanding nature's catalytic toolkit‟. Trends in
Biochemical Sciences; 30.

81
Habib Ahmed Rathore, Tariq Masud, Shehla Sammi and Aijaz Hussain Soomro (2007): Effect
of Storage on Physico-Chemical Composition and Sensory Properties of Mango. Pakistan
Journal of Nutrition 6 (2): 143-148, 2007 ISSN 1680-5194.
Haiyan, Z., D.R. Bedgood Jr., A.G. Bishop, P.D. Prenzler and K. Robards (2007). Endogenous
biophenol, fatty acid and volatile profiles of selected oils. Food Chem., 100: 1544-1551.
Hall, A. P., Moore, J. G. and Morgan, A. F. (1955). Journal of Agriculture and Food Chemistry
3, 250.
Hartman, L. and Lago, R. C. A. (1973). Rapid preparation of fatty acid methyl esters from lipids.
Laboratory Practice. 22, 475-476.
Hatton, J., Harding, P. L. and Reeder, W. F. (1964). Seasonal changes in Florida avocados.
Proc. Fla. State Hortic. Soc. 72, 349-353.
Hemwimon, S., Pavasant, P. and Shotipruk, A. (2007). Microwave-assisted extraction of
antioxidative anthraquinones from roots of Morinda citrifolia. Separation and Purification
Technology, 54, 44-50.
Hérnandez-Muñoz, P., Almenar, E., Ocio, M. J. and Gavara, R. (2006). Effect of calcium dips
and chitosan coating on postharvest life of strawberries (Fragaria x ananassa). Postharvest
Biology Technology, 39(3), 247-253.
Hofman, P.J., Jobin-Décor, M., Giles, J. (2000). Percentage of dry matter and oil content are not
reliable indicators of fruit maturity or quality in late-harvested ‘Hass’ avocado.
Hortscience 35(4):694–695.
Hofman, P.J., Stubbings, B.A., Adkins, M.F., Meiburg, G.F., Woolf, A.B. (2002b). Hot water
treatments improve ‘Hass’ avocado fruit quality after cold disinfestations. Posth. Biol.
Technol. 24(2):183-192.
Holcroft, D.M., Kader, A.A. (1999). Controlled atmosphere-induced changes in pH and organic
acid metabolism may affect color of stored strawberry fruit. Posth. Biol. Technol.
17(1):19-32.
Human, T.P. (1987). Oil as a byproduct of the avocado. South African Avocado Growers’
Association Yearbook. 10:159-162
Ikhuoria, E.U., Maliki, M., (2001). Characterization of Avocado Pear (Persea americana) and
African Pear (Dacryodesedulis) Extract. Biotechnology 7, 950- 952.
ILRI (2011). Fruits - A synthesis of IPMS value-chain development experiences. ILRI, Nairobi.
Isabelle Santana, Luciana M.F. dos Reis, Alexandre G. Torres, Lourdes M.C. Cabral and Suely
P. Freitas (2015). Avocado (Persea americana Mill.) oil produced by microwave drying
and expeller pressing exhibits low acidity and high oxidative stability. Eur. J. Lipid
Sci. Technol. 2015, 999–1007

82
Jambunathan C., Reddy PS. (1991). Storage and determination of oils. 3rd ed. Canon Press, pp.
85-98.
Karaj, S. and Müller, J. (2011). “Optimizing mechanical oil extraction of Jatropha curcas L.
seeds with respect to press capacity, oil recovery and energy efficiency,” Industrial
Crops and Products, vol. 34, no. 1, pp. 1010–1016, 2011.
Kays, S.J., (1991). Postharvest Phys. of Perishable Plant Products. Vas Nostrand Rein Hold took,
AVI Publishing Co, pp: 149-316.
Ke, D., Yahia, E., Hess, B., Zhou, L., Kader, A.A. (1995). Regulation of fermentative
metabolism in avocado fruit under oxygen and carbon dioxide stresses. J. Am. Soc. Hort.
Sci. 120(3):481-490.
Kumaran, A. and Karunakaran, R. J. (2007). “In vitro antioxidant activities of methanol extracts
of five Phyllanthus species from India,” LWT —Food Science and Technology, vol. 40,
no. 2, pp. 344–352, 2007.
Kushi, L.H., Byers, T. and Doyle, C. (2006). American Cancer society Nutrition and Physical
Activity Guidelines Advisory committee. American Cancer Society guidelines on
Nutrition.
Landahl, S., Meyer, M. D., Terry, L. A. (2009). Spatial and temporal analysis of textural and
biochemical changes of imported avocado cv. Hass during fruit ripening. J. Agric. Food
Chem. 57(15):7039-7047.
Lange, D.L., Kader, A.A. (1997). Effects of elevated carbon dioxide on key mitochondrial
respiratory enzymes in ‘Hass’ avocado fruit and fruit disks. J. Am. Soc. Hort. Sci.
122(2):238-244.
Latta, M. and Eskin, M.A. (1980). Simple and rapid colorimetric determination of phytate. J.
Agri. Food Chem. 28: 1313-1315
Lee, S. (1981). Methods for percent oil analysis of avocado fruit. Calif. Avoc.Soc.Yearb. 65:133-
141
Lee, S.K., Young, R.E., Schiffman, P.M., Coggins, J.C.W. (1983). Maturity studies of avocado
fruit based on picking dates and dry weight. J. Amer. Soc. Hort. Sci. 108(3):390-394.
Leterme, P. (2002). Recommendations by health organizations for pulse consumption. British
Journal of Nutrition 88, S239-S242.
Lewis, C., Morris, R. and O’Brien, K. (1978). The Oil Content of Avocado Mesocarp. Journal of
Science, Food and Agriculture. 29, 243-249.
Li, M., Bellmer, D. D. and Brusewitz, G. H. (1999). Pecan kernel break- age and oil extracted by
supercritical CO2 as affected by moisture content. Journal of Food Science, 64, 1084–
1088.
83
Liu, X., Robinson, P.W., Madore, M.A., Witney, G.W., Arpaia, M.L. (1999b). ‘Hass’ avocado
carbohydrate fluctuations. II. Fruit growth and ripening. J. Am. Soc. Hort. Sci.
124(6):679-681.
Liu, X., Sievert, J., Arpaia, M.L., Madore, M.A. (2002). Postulated physiological roles of the
seven-carbon sugars, mannoheptulose, and perseitol in avocado. Journal of American
Society of Horticultural Science 127, 108–114.
Lobit, P., Soing, P., Genard, M., Habib, R. (2002). Theoretical analysis of relationships between
composition, pH, and titratable acidity of peach fruit. J. Plant Nutr. 25(12):2775-2792.
Loewus, F.A. (2002). Biosynthesis of phytate in food grains and seeds. In: Reddy NR, Sathe SK
(Eds.). Food Phytates. CRC Press, Boca Raton Florida; 53–61.
Lou, Z., Wang, H., Zhang, M., and Wang, Z. (2010). Improved extraction of oil from chickpea
under ultrasound in a dynamic system. Journal of Food Engineering. 98. 13-18.
Louli, V., Folas, G., Voutsas, E. and Magoulas, K. (2004). “Extraction of parsley seed oil by
supercritical CO2,” The Journal of Supercritical Fluids, vol. 30, no. 2, pp. 163–174,
2004.
Lugo, U.R. (2006). Substitución de lardo por grasa vegetal en salchichas: incorporación de
pasta de aguacate. Efecto de la inhibición del oscurecimiento enzimático sobre el color.
Revista de Ciência e Tecnologia de Alimentos, v.26, n.2, p.441-445.
Lusas, E.W., M.S. Alam, R.C. Clough and M.N. Riaz, (2012). Animal and Vegetable Fats, Oils
and Waxes. In: Handbook of Industrial Chemistry and Biotechnology, Kent, J.A. (Ed.).
Springer, New York, USA., ISBN-13: 9781461442592, pp: 1323-1402.
Maftoonazad, N., Ramaswamy, H.S. (2008). Effect of pectin-based coating on the kinetics of
quality change associated with stored avocados. J. Food Proc. Preserv. 32(4):621-643.
Mageshni Reddy, Roshila Moodley and Sreekanth B. Jonnalagadda (2012). Fatty acid profile
and elemental content of avocado (Persea americana Mill.) oil –effect of extraction
methods, Journal of Environmental Science and Health, Part B, 47:6, 529-537.
Mans, C.C., Donkin, D.J., Boshoff, M. (1995). Maturity and storage temperature regimes for
KwaZulu Natal avocados. South African Avocado Growers’ Association Yearbook
18:102-105.
Maranca, G. (1980). Fruticultura comercial manga e abacate. São Paulo: Nobel, 1980.
Martinez Nieto, L., Camacho, R. F., Rodriguez, V. S., & Moreno, R. M. V. (1988). Extraction
and characterization of avocado oil. Grasas y Aceites, 39, 272- 277.
Mason, T.J. (1990). Critical Reports on Applied Chemistry 28: Chemistry with Ultrasound.1. 2-
4. Mason, T.J. (1991). Practical Sonochemistry.1. 22-24.

84
Mazliak, P. (1971). Avocado lipid constituents. Fruits 26, 615-623.
Milton, K. (2003). Micronutrient intakes of wild primates: are humans different? Comparative
Biochemistry and Physiology. Part A 136, 47-59.
Mizrach, A., Flitsanov, U. (1999). Nondestructive ultrasonic determination of avocado softening
process. J. Food Eng. 40(3):139-144.
Moigradean, D., M.A. Poiana and I. Gogoasa, (2012). Quality characteristics and oxidative
stability of coconut oil during storage. J. Agroaliment. Process. Technol., 18: 272-276.
Moreno, A. O., Dorantes, L., Galíndez, J. and Guzmán, R. I. (2003). Effect of different
extraction methods on fatty acids, volatile compounds, and physical and chemical
properties of avocado (Persea americana Mill.) oil. J. Agric. Food Chem., 51, 2216–
2221.
Naveh, E., Werman, M.J., Sabo, E. and Neeman, I. (2002). Defatted avocado pulp reduces body
weight and total heatic fat but increases plasma cholesterol in male rats fed diets with
cholesterol. Journal of Nutrition 132(7) 2015-2018.
NMX-F-052-SCFI-2008. Norma Mexicana. Aceite de aguacate especificaciones. 2008, 10.
Oboh, G. and Elusiyan, C. A. (2007). Changes in the nutrient and anti-nutrient content of micro-
fungi fermented cassava flour produced from low- and medium-cyanide variety of
cassava tubers. African J. of Biotech. 6: 2150-2157.
Okwu, D.E., (2004). Phytochemicals and vitamins content of indigenous spices of South Easter
Nigeria. Journal of sustain Agriculture and Environment, 6: 30-34.
Olaeta, J. A., Undurraga, P. and Espinosa, G. (2007). Evolución del contenido de aceite y
compuestos no saponificables en paltas (Persea americana Mill.) CVS. Hass, Fuerte e
Isabel. Actas VI Congreso Mundial del Aguacate; 12-16.
Omar, A. F., Atan, H. and MatJafri, M. Z. (2012). NIR Spectroscopic properties of aqueous acids
solutions. Molecules, 17, 7440-7450.
Onwuka, G. I. (2005). Food Analysis and Instrumentation (Theory and Practice). 1st Edn.
Napthali Prints, Surulere, Lagos-Nigeria, Pp 140-160.
Orhevba, B.A. and A.O. Jinadu (2011). Determination of physicochemical properties and
nutritional contents of avocado pear (Persea americana M.). Acad. Res. Int. 1,372-380.
Ozdemir, F., Topuz, A. (2004). Changes in dry matter, oil content and fatty acids composition of
avocado during harvesting time and post-harvesting ripening period. Food Chem.
86(1):79-83.

85
Ozkan, B. G. Simsek and Kuleasan, H. (2007). “Antioxidant activities of Satureja cilicica
essential oil in butter and in vitro,” Journal of Food Engineering, vol. 79, no. 4, pp.
1391–1396, 2007.
Paniwnyk, L., Cai, H., Albu, S., Mason, T.J., and Cole, R. (2009). The enhancement and scale
up of the extraction of anti-oxidants from Rosmarius officinalis using ultrasound.
Ultrasonics Sonochemistry. 16. 287-292.
Pareek, S., Kitimoja, L., Kaushik, R.A. and Paliwal, R. (2009). Postharvest physiology and
storage of ber. Stew Postharvest Review 5(5), 1-10
Paull, R.E., Duarte, O. (2011). Postharvest Technology. In: ed. Paull, RE and Duarte, O, Tropical
Fruits. Volume 1, Ch 5, 101-122. CABI, Wallingford, Oxfordshire.
Phull, S.S., and Mason, T.J. (1999). The use of ultrasound in microbiology. Advances in
Sonochemistry. 5. 175-207.
Pronyk, C., Mazza, G. (2009). Design and Scale-up of Pressurized Fluid Extractors for Food and
Bioproducts. J. Food Eng. 95: 215–226.
Pushkar S. Bora, Narendra Narain, Rosalynd V.M. Rocha and Marçal Queiroz Paulo (2001).
Characterization of the oils from the pulp and seeds of avocado (cultivar: Fuerte) fruits
Vol. 52. Fasc. 3-4 (2001), 171-174
Quinones-Islas, N., O.G. Meza-Marquez, G. Osorio-Revilla and T. Gallardo-Velazquez, (2013).
Detection of adulterants in avocado oil by Mid-FTIR spectroscopy and multivariate
analysis. Food Res. Int., 51: 148-154.
Raghuramulu, N., Madhavan, N.K. and Kalyanasundaram, S. (2003). “A Manual of Laboratory
Techniques”. National Institute of Nutrition, Indian Council of Medical Research,
Hyderabad, India. pp: 56-58.
Ravikumar, K., Pakshirajan, K., Swaminathan, T. and Balu, K. (2005). Optimization of batch
process parameters using response surface methodology for dye removal by a novel
adsorbent. Chemical Engineering Journal 105: 131-138.
Reddy, N. R., Sathe, S. K. and Salunkhe, D. K. (1982). Phytates in legumes and cereals.
Advanced Food Research, 28, l-92.
Reddy, N.R. (2002). Occurrence, distribution, content, and dietary intake of phytate. In: Reddy NR, Sathe
SK (Eds.). Food Phytates. CRC Press, Boca Raton Florida; 25–51.
Ricardo Cardoso de Oliveira1, Terezinha Aparecida Guedes, Marcelino Luiz Gimenes, and Sueli
Teresa Davantel de Barros (2014). Effect of process variables on the oil extraction from
passion fruit seeds by conventional and non-conventional techniques. ISSN on-line:
1807- 8664

86
Rodríguez-Carpena, J. G., Morcuende, D., Andrade, M. J., Kylli, P. and Estevez, M. (2011).
Avocado (Persea americana Mill.) phenolics, in vitro antioxidant and antimicrobial
activities, and inhibition of lipid and protein oxidation in porcine patties. Journal of
Agricultural Food Chemistry, 59, 5625-5635.
Rodríguez Suppo, Florencio. (1992). El Aguacate. AGT Editor, S.A. México, D.F. 3ª
reimpresión.
Ruize MC, Margaret TM, Dobarganea MC (1995). Quantitative and distribution of altered fatty
acids in frying fats. JAOCS, 72(10): 1171-1176.
Sagar Secretaría de Agricultura, Ganadería y Desarrollo Rural. (1999). Revista "Claridades
Agropecuarias", No. 65 "El Aguacate". Enero de 1999.
Şaşmaz, D. A. (1996). Evaluation of the diffusion coefficient of rapeseed oil during solvent
extraction with hexane. Journal of the American Oil Chemist’s Society, 73(5), 669–
671.
Seifu Zeberga, (2010). Production and quality evaluation of spray dried fruit products.
Shimelis Admassu, Sudip Kumar Rakshit (2007). Effect of processing on antinutrients and in
vitro protein digestibility of kidney bean (Phaseolus vulgaris L.) varieties grown in East
Africa. Food Chemistry 103, 161–172.
Sidhu, G. S. & Oakenful, D. G. (1986). A mechanism for the hypocholesterolemic activity of
saponins. British Journal of Nutrition 55, 643-9.
Simental, J., Escalona, H., EstarrUn, M. (2004). Nutraceutical Composition of Avocado Oil
(Crude, Virgin, and Refined) Through the Operations for its Industrial Production.
Mexico, AOCS Archives
Singleton and Rossi (1965). Analysis of total phenols and other oxidation substrates and
antioxidants by means of the Folin-Ciocalteu reagent. Meth Enzymol. 299:152-178.
Sivakumar, V., Ravi Verma, V., Rao, P.G. (2007). Studies on the use of power ultrasound in
solid–liquid myrobalan extraction process. J. Clean. Prod. 15: 1813–1818.
Slater, G. G., Shankman, S., Shepherd, J. S. and Alphin-Slater, R. B. (1975). Seasonal Variation
in the Composition of California Avocados. Journal Agricultural Food Chemistry, 23.
(3), 468-474.
Smith, N. J. H., Williams, J.T., Plucknett, D, L., Talbot, J. P. (1992). Tropical Forests and Their
Crops. Comstock Publishing Associates.
Soares, S. E., Mancini Filho, J., Turatti, J. M., & Tango, J. S. (1991). Caracterização física,
química e avaliação da estabilidade do óleo de abacate (Persea americana Mill.) nas

87
diferentes etapas do processo de refinação. Revista de Farmácia e Bioquímica da
Universidade de São Paulo, 27(1), 70-82.
Soliva-Fortuny, R.C., Elez-Martinez, P., Sebastian-Caldero, M. and Martin-Belloso, O. (2004).
Effect of combined methods of preservation on the naturally occurring microflora of
avocado puree. Food Control. 15(1):11-17.
Southwell, K. H., Harris, R. V. and Swetman, A. A. (1990). Extraction and refining of oil
obtained from dried avocado fruit using a small expeller. Tropical Science, 30(2), 121-131.
Srinivasa, P.C., Baskaran, R., Ramesh, M.N., Prashanth, K.V.H. and Tharanathan, R.N. (2002).
Storage studies of mango packed using biodegradable chitosan film. Eur. Food Res.
Tech., 215: 504-508.
Stich, H. F. & Rosin, M. P. (1984). Naturally occurring phenolics as antimutagenic and
anticarcinogenic agents. In Nutritional and Toxicological Aspects of Food Safety, ed. M.
Friedman. Plenum Press, New York, USA. pp. l-29.
Szentmih´ alyi, K., Vinkler, P., Lakatos, B., Ill´ es, V., Then, M (2002). Rose-hip (Rosa canina
L.) oil obtained from waste hip seeds by different extraction methods. Bioresource
Technology. 82, 195–201.
Tango, J. A., Carvalho, C. R. L., and Soares, N. B. (2004). Caracterização física e química de
frutos de abacate visando a seu potencial para extração de óleo. Rev. Bras. Frutic.
26, 17–23.
Tefera, A., Seyoum, T., Woldetsadlik (2007). Effect of Disinfection, Packaging, and Storage
Environment on the Shelf Life of Mango.
Teixeira, A., Baenas, N., Dominguez-Perles, R., Barros, A., Rosa, E., Moreno, D. A. (2014).
Natural Bioactive Compounds from Winery By-Products as Health Promoters. A Review.
International Journal of Molecular Sciences, 15(9), 15638-15678.
Touati, S., Meniai, A. H. (2011). Experimental Study of the Extraction of Copper (II) from
Sulphuric Acid by Means of Sodium Diethyldithiocarbamate (SDDT). World
Academy Sci., Eng. Technol. 76: 542–545.
USDA [United States Dept of Agriculture]. (2010). Nutrient Database. http://www.nal.usda.gov/.
Vaintraub and Lapteva, (1988). Colorimetric determination of phytate in unpurified extracts of seeds, and
the products of their processing. Analytical Biochemistry, 175:227-230
Villa-Rodriguez, J.A., Molina-Corral, F.J., Ayala-Zavala, J.F., Olivas, G.I., González-Aguilar
, G.A. (2011). Effect of maturity stage on the content of fatty acids and antioxidant
activity of ‘Hass’ avocado. Food Res. Int. 44(5):1231-1237.

88
Vucenik, I., Shamsuddin, A.M. (2003). Cancer inhibition by inositol hexaphosphate (IP6) and
inositol: From laboratory to clinic. Journal of Nutrition 133: 3778S–3784S.
Ward, J. T., Basford, W. D., Hawkins, J. H. (1985). Holliday, Oilseed Rape, Farming Press,
Suffolk, UK, 1985.
Wardlaw, G.M and Kessel, M.W. (2002). Perspectives in Nutrition. 5th edition, McGraw-Hill
Companies Inc. New York, USA.
Weinberger, K., Lumpkin, T. A. (2007). Diversification into horticulture and poverty reduction:
a research agenda. World Development 2007, 35, 8:1464–1480.
Werman, M.J., Neeman, I. (1987). Avocado oil production and chemical characteristics.
Journal of American Oil Chemists Society. 64, 229-232.
Whiley, A.W; Saranah, J.B; Cull, B.W. and Pegg, k. G. (1987). Effective Management of
Avocado Tree Growth Cycles Can Assist with Productivity Gain. Proceedings Avocado
Seminar held at Tauranga.
Whiley, A.W., Rasmussen, T.S., Saranah, J.B., Wolstenholme, B.N. (1996b). Delayed harvest
effects on yield, fruit size and starch cycling in avocado (Persea americana Mill.) in
subtropical environments. II. The late-maturing cv. Hass. Scientia Horticulturae 66(1-
2):35-49.
Whitmore, J. S. (1986). The Climatic Suitability of South Africa for Production of Avocados.
NPWCAR Project. CSIR Pretoria.
Woolf, A. B., Cox, K. A., White, A. & Ferguson, I. B. (2003). Low temperature conditioning
treatments reduce external chilling injury of ‘Hass’ avocados. Postharvest Biology
Technology, 28, 1:113-122.
Woolf, A., Wong, M., Eyres, L., McGhie, T., Lund, C., Olsson, S., Wang, Y., Bulley, C., Wang,
M., Friel, E. and Requejo-Jackman, C. (2009). Avocado oil. In: Moreau, R.A. and
Kamal-Eldin, A. (eds) Gourmet and Health-Promoting Speciality Oils. AOCS Press,
Urbana, IL, pp. 73–125.
Workneh, T.S., Osthoff, G. (2010). A review on integrated agro-technology of vegetables. Afr. J.
Biotechnol. 9(54):9307-9327.
Wu, C.T., Roan SF, Hsiung TC, Chen IZ, Shyr JJ, Wakana A. (2011). Effect of harvest maturity
and heat pretreatment on the quality of low temperature storage avocados in Taiwan. J
Facul. Agric. Kyus. Univ. 56(2):255-262.
Yoon, J. H., Thompson, L. U. and Jenkins, D. J. A. (1983). The effect of phytic acid on in-vitro
rate of starch digestibility and blood glucose response. American Journal of Clinical.
Nutrition 38, 83542.

89
Zhang, S., Bi, H., Liu, C. (2007). Extraction of Bio-active Components from Rhodiola
Sachalinensis under Ultrahigh Hydrostatic Pressure. Sep. Purif. Technol. 57: 277–282
Zhishen J., Mengcheng T., Jianming W. (1999). The determination of flavonoid contents in
mulberry and their scavenging effects on superoxide radicals. Food Chem. 64:555–559.

90
Appendixes
Appendix A1. ANOVA for Response Surface Quadratic Model of oil yield from ultrasound
extraction
Response: Yield from ultrasound
ANOVA for Response Surface Quadratic Model
Analysis of variance table [Partial sum of squares]
Sum of Mean F
Source Squares DF Square Value Prob > F Model 1406.36 9 156.26 52.67 < 0.0001 significant
A 122.77 1 122.77 41.38 0.0004
B 165.13 1 165.13 55.65 0.0001
C 906.66 1 906.66 305.57 < 0.0001
A2 6.21 1 6.21 2.09 0.1911
B2 30.70 1 30.70 10.35 0.0147
C2 148.33 1 148.33 49.99 0.0002
AB 2.14 1 2.14 0.72 0.4238
AC 2.33 1 2.33 0.78 0.4054
BC 8.53 1 8.53 2.87 0.1339
Residual 20.77 7 2.97
Lack of Fit 15.36 3 5.12 3.79 0.1155 not significant
Pure Error 5.41 4 1.35
Cor Total 1427.13 16
The Model F-value of 52.67 implies the model is significant. There is only a 0.01%
chance that a "Model F-Value" this large could occur due to noise.
Values of "Prob > F" less than 0.0500 indicate model terms are significant. In this case
A, B, C, B2, C2 are significant model terms. Values greater than 0.1000 indicate the model terms
are not significant.

91
Appendix A2. ANOVA for Response Surface Quadratic Model of oil yield from soxhlet
extraction
Response: Yield from soxhlet extraction
ANOVA for Response Surface Quadratic Model
Analysis of variance table [Partial sum of squares]
Sum of Mean F
Source Squares DF Square Value Prob > F
Model 1590.23 9 176.69 33.13 < 0.0001 significant
A 97.30 1 97.30 18.25 0.0037
B 190.13 1 190.13 35.65 0.0006
C 846.66 1 846.66 158.76 < 0.0001
A2 14.65 1 14.65 2.75 0.1415
B2 98.63 1 98.63 18.50 0.0036
C2 270.49 1 270.49 50.72 0.0002
AB 6.00 1 6.00 1.13 0.3240
AC 0.36 1 0.36 0.068 0.8025
BC 34.22 1 34.22 6.42 0.0390
Residual 37.33 7 5.33
Lack of Fit 36.06 3 12.02 37.92 0.0021 significant
Pure Error 1.27 4 0.32
Cor Total 1627.56 16
The Model F-value of 33.13 implies the model is significant. There is only a 0.01% chance that
a "Model F-Value" this large could occur due to noise.
Values of "Prob > F" less than 0.0500 indicate model terms are significant. In this case A, B, C,
B2, C2, BC are significant model terms. Values greater than 0.1000 indicate the model terms are
not significant.

92
Appendix B1. Standard calibration curve of D-catechin for the determination of tannin content.
Appendix B2. Standard calibration curve of phytic acid for the determination of phytate content
of pulp.
y = 0.2483x + 0.008R² = 0.9928
0
0.05
0.1
0.15
0.2
0 0.2 0.4 0.6 0.8
Absorban
ce
Concentration
abs
abs
Linear (abs)
y = -0.0076x + 0.3543R² = 0.9873
0
0.05
0.1
0.15
0.2
0.25
0.3
0.35
0 10 20 30 40
Absorban
ce
Concentration
Series1

93
Appendix B3. Standard calibration curve of phytic acid for the determination of phytate content
of seed.
Appendix B4. Standard calibration curve of gallic acid for the determination of total phenolic
content.
y = -0.0094x + 0.4433R² = 0.9947
0
0.1
0.2
0.3
0.4
0.5
0 10 20 30 40
Absorban
ce
Concentration
abs
abs
Linear (abs)
0.08
0.214
0.426
0.624
0.855
0.994
y = 0.1026x + 0.0023R² = 0.9952
0
0.2
0.4
0.6
0.8
1
1.2
0 5 10 15
Absorban
ce
Concentration
abs
abs
Linear (abs)

94
Appendix B5. Standard calibration curve of quercetin for the determination of total flavonoid
content.
Appendix C. Some of the pictures and photos taken during research was conducted.
Collecting raw material Hass avocado variety
Cut and sliced avocado preparing sample
y = 0.1027x + 0.128R² = 0.9973
0
0.5
1
1.5
0 5 10 15
Absorban
ce
Concentration
abs
abs
Linear (abs)

95
Filtration samples for phenol and flavonoid determination
Measuring for phytate determination ashing fat determination
For Protein determinatin Titration Oil product
Copyright © 2022 FDOKUMEN