Characterization of cerebral hemodynamic phases following severe head trauma: hypoperfusion,...
11
ISTURBANCES of the cerebral circulation play a key role in the pathophysiology of head injury. Isch- emic brain damage has been identified histologi- cally in approximately 90% of patients who die following closed head injury. 21 Ischemia has been called the single most important secondary insult, and several clinical head trauma studies have linked low cerebral blood flow (CBF) to poor outcome. 8–10,26,42,46,47,49 Several factors may result in posttraumatic cerebral ischemia: increased intracra- nial pressure (ICP), systemic arterial hypotension, cere- bral edema, focal tissue compression from hematomas, and microvascular pathology. 19,23,35,39,48,53 Another potential cause of cerebral ischemia is the posttraumatic spasm of the large cerebral arteries (vasospasm), which has been documented by angiographic and transcranial Doppler (TCD) studies. 33,36,37,57,60,63 Posttraumatic vasospasm has been associated with the finding of cerebral infarction on late computerized tomography (CT) scans and with poor outcome in some head-injured patients. 12,36,37,50 Cerebral hyperemia has also been observed following head injury and has been related to cerebral swelling, increased ICP, and poor outcome. 11,17,29,39,43 For several reasons it is criti- cally important to understand the evolution and timing of these trauma-induced physiological derangements. First, the temporal correlation of cerebral circulatory changes with other physiological and clinical trends will provide new insights into the pathophysiology of brain injury. Sec- ond, clinical monitoring techniques that focus on isch- emia, hyperemia, or vasospasm must be planned with the proper time courses in mind. Third, therapeutic strategies intended to counteract specific circulatory disturbances must be administered at the appropriate time. Although previously published studies have defined certain elements of the cerebral hemodynamic response to head injury, none has provided a comprehensive, day- to-day description of trauma-induced cerebral circulatory J. Neurosurg. / Volume 87 / July, 1997 J Neurosurg 87:9–19, 1997 Characterization of cerebral hemodynamic phases following severe head trauma: hypoperfusion, hyperemia, and vasospasm NEIL A. MARTIN, M.D., RAVISH V. P ATWARDHAN, M.D., MICHAEL J. ALEXANDER, M.D., CYNTHIA ZANE AFRICK, M.D., JAE HONG LEE, M.D., EHUD SHALMON, M.D., DAVID A. HOVDA, PH.D., AND DONALD P. BECKER, M.D. University of California at Los Angeles Cerebral Blood Flow Laboratory, Brain Injury Research Center, and Division of Neurosurgery, University of California at Los Angeles School of Medicine, Los Angeles, California U The extent and timing of posttraumatic cerebral hemodynamic disturbances have significant implications for the monitoring and treatment of patients with head injury. This prospective study of cerebral blood flow (CBF) (measured using 133 Xe clearance) and transcranial Doppler (TCD) measurements in 125 patients with severe head trauma has defined three distinct hemodynamic phases during the first 2 weeks after injury. The phases are further characterized by measurements of cerebral arteriovenous oxygen difference (AVDO 2 ) and cerebral metabolic rate of oxygen (CMRO 2 ). Phase I (hypoperfusion phase) occurs on the day of injury (Day 0) and is defined by a low CBF 15 calculat- ed from cerebral clearance curves integrated to 15 minutes (mean CBF 15 32.3 6 2 ml/100 g/minute), normal middle cerebral artery (MCA) velocity (mean V MCA 56.7 6 2.9 cm/second), normal hemispheric index ([HI], mean HI 1.67 6 0.11), and normal AVDO 2 (mean AVDO 2 5.4 6 0.5 vol%). The CMRO 2 is approximately 50% of normal (mean CMRO 2 1.77 6 0.18 ml/100 g/minute) during this phase and remains depressed during the second and third phases. In Phase II (hyperemia phase, Days 1–3), CBF increases (46.8 6 3 ml/100 g/minute), AVDO 2 falls (3.8 6 0.1 vol%), V MCA rises (86 6 3.7 cm/second), and the HI remains less than 3 (2.41 6 0.1). In Phase III (vasospasm phase, Days 4–15), there is a fall in CBF (35.7 6 3.8 ml/100 g/minute), a further increase in V MCA (96.7 6 6.3 cm/second), and a pronounced rise in the HI (2.87 6 0.22). This is the first study in which CBF, metabolic, and TCD measurements are combined to define the characteristics and time courses of, and to suggest etiological factors for, the distinct cerebral hemodynamic phases that occur after severe craniocerebral trauma. This research is consistent with and builds on the findings of previous investigations and may provide a useful temporal framework for the organization of existing knowledge regarding posttraumatic cere- brovascular and metabolic pathophysiology. KEY WORDS • cerebral blood flow • cerebral metabolism • head injury • hyperemia • ischemia • transcranial Doppler ultrasound • vasospasm D 9
Transcript of Characterization of cerebral hemodynamic phases following severe head trauma: hypoperfusion,...
ISTURBANCES of the cerebral circulation play a keyrole in the pathophysiology of head injury. Isch-emic brain damage has been identified histologi-
cally in approximately 90% of patients who die followingclosed head injury.21 Ischemia has been called the singlemost important secondary insult, and several clinical headtrauma studies have linked low cerebral blood flow (CBF)to poor outcome.8–10,26,42,46,47,49 Several factors may resultin posttraumatic cerebral ischemia: increased intracra-nial pressure (ICP), systemic arterial hypotension, cere-bral edema, focal tissue compression from hematomas,and microvascular pathology.19,23,35,39,48,53 Another potentialcause of cerebral ischemia is the posttraumatic spasm ofthe large cerebral arteries (vasospasm), which has beendocumented by angiographic and transcranial Doppler(TCD) studies.33,36,37,57,60,63 Posttraumatic vasospasm hasbeen associated with the finding of cerebral infarction onlate computerized tomography (CT) scans and with poor
outcome in some head-injured patients.12,36,37,50 Cerebralhyperemia has also been observed following head injuryand has been related to cerebral swelling, increased ICP,and poor outcome.11,17,29,39,43 For several reasons it is criti-cally important to understand the evolution and timing ofthese trauma-induced physiological derangements. First,the temporal correlation of cerebral circulatory changeswith other physiological and clinical trends will providenew insights into the pathophysiology of brain injury. Sec-ond, clinical monitoring techniques that focus on isch-emia, hyperemia, or vasospasm must be planned with theproper time courses in mind. Third, therapeutic strategiesintended to counteract specific circulatory disturbancesmust be administered at the appropriate time.
Although previously published studies have definedcertain elements of the cerebral hemodynamic responseto head injury, none has provided a comprehensive, day-to-day description of trauma-induced cerebral circulatory
J. Neurosurg. / Volume 87 / July, 1997
J Neurosurg 87:9–19, 1997
Characterization of cerebral hemodynamic phases followingsevere head trauma: hypoperfusion, hyperemia, andvasospasm
NEIL A. MARTIN, M.D., RAVISH V. PATWARDHAN, M.D., MICHAEL J. ALEXANDER, M.D.,CYNTHIA ZANE AFRICK, M.D., JAE HONG LEE, M.D., EHUD SHALMON, M.D.,DAVID A. HOVDA, PH.D., AND DONALD P. BECKER, M.D.
University of California at Los Angeles Cerebral Blood Flow Laboratory, Brain Injury ResearchCenter, and Division of Neurosurgery, University of California at Los Angeles School of Medicine,Los Angeles, California
U The extent and timing of posttraumatic cerebral hemodynamic disturbances have significant implications for themonitoring and treatment of patients with head injury. This prospective study of cerebral blood flow (CBF) (measuredusing 133Xe clearance) and transcranial Doppler (TCD) measurements in 125 patients with severe head trauma hasdefined three distinct hemodynamic phases during the first 2 weeks after injury. The phases are further characterizedby measurements of cerebral arteriovenous oxygen difference (AVDO
2) and cerebral metabolic rate of oxygen
(CMRO2). Phase I (hypoperfusion phase) occurs on the day of injury (Day 0) and is defined by a low CBF
15calculat-
ed from cerebral clearance curves integrated to 15 minutes (mean CBF15
32.3 6 2 ml/100 g/minute), normal middlecerebral artery (MCA) velocity (mean V
MCA56.7 6 2.9 cm/second), normal hemispheric index ([HI], mean HI 1.67 6
0.11), and normal AVDO2
(mean AVDO2
5.4 6 0.5 vol%). The CMRO2
is approximately 50% of normal (meanCMRO
21.77 6 0.18 ml/100 g/minute) during this phase and remains depressed during the second and third phases. In
Phase II (hyperemia phase, Days 1–3), CBF increases (46.8 6 3 ml/100 g/minute), AVDO2
falls (3.8 6 0.1 vol%),V
MCArises (86 6 3.7 cm/second), and the HI remains less than 3 (2.41 6 0.1). In Phase III (vasospasm phase, Days
4–15), there is a fall in CBF (35.7 6 3.8 ml/100 g/minute), a further increase in VMCA
(96.7 6 6.3 cm/second), and apronounced rise in the HI (2.87 6 0.22).
This is the first study in which CBF, metabolic, and TCD measurements are combined to define the characteristicsand time courses of, and to suggest etiological factors for, the distinct cerebral hemodynamic phases that occur aftersevere craniocerebral trauma. This research is consistent with and builds on the findings of previous investigations andmay provide a useful temporal framework for the organization of existing knowledge regarding posttraumatic cere-brovascular and metabolic pathophysiology.
KEY WORDS • cerebral blood flow • cerebral metabolism • head injury •hyperemia • ischemia • transcranial Doppler ultrasound • vasospasm
D
9

disturbances. The first study that combined an analysis ofCBF and TCD measurements to delineate the time-depen-dent posttraumatic cerebral hemodynamic changes thatoccur after craniocerebral trauma was presented by thisresearch group in 1992.69 That pilot project defined threedistinct phases: I, hypoperfusion during the first 24 hours(postinjury Day 0); II, hyperemia on postinjury Days 1 to3; and III, vasospasm during Days 4 to 14. To validatethese preliminary findings, the University of California atLos Angeles (UCLA) Brain Injury Research Center(BIRC) initiated a prospective study of trauma-inducedcerebral circulatory disturbances in August 1992. We haveanalyzed the physiological measurements obtained in 125severely head injured patients and have confirmed the ex-istence of these three distinct hemodynamic phases. Theseresults indicate that there is a stereotypical pattern of cere-bral hemodynamic alterations that is generally found aftersevere traumatic brain injury. Recognition of this phasicpattern should prove useful in the future for the planningof monitoring in patients suffering from head trauma andfor the design of time-dependent therapeutic strategies.
Clinical Material and Methods
Study Design and Patient Population
The data presented in this report were collected pro-spectively during the evaluation and management of 125patients with severe closed head injury who were admit-ted to UCLA or Harbor/UCLA Medical Centers betweenAugust 1992 and January 1995. This study included twosubgroups. The first group included 91 patients who un-derwent serial CBF, cerebral metabolism, and/or TCDevaluations as part of their enrollment (with family con-sent) in an institutional review board–approved prospec-tive traumatic brain injury cohort study of epidemiologi-cal, clinical, and physiological predictors of long-termneuropsychological outcome (the UCLA BIRC project).The second group was composed of 34 patients whounderwent CBF, cerebral metabolic, and/or TCD evalua-tions as part of their clinical management. Because theclinical characteristics and the temporal pattern defined bythe CBF and TCD studies in these two groups were simi-lar, the groups were combined for the analyses reported inthis paper. The mean age of the patients in this study was33 6 14.6 years (range 16–80 years), and 83% of thepatients were male. Admission Glasgow Coma Scale58
(GCS) scores ranged from 3 to 8 (median 6).35 Patientswith multisystem trauma were not excluded. Twelvepatients in whom CBF and TCD studies were obtaineddied during the course of their hospitalization. All studies,including those obtained as patients neared brain death,were included in this analysis.
Management Protocol
The patients were admitted directly to the neurosurgi-cal intensive care unit (ICU), after an initial head CTscan was obtained, or postoperatively. Craniotomies wereperformed for removal of hematomas and/or other decom-pressive procedures in 60 patients. Intracranial pressurewas measured in 106 patients by means of a ventricu-lostomy (Becker EDMS II drainage system; Pudenz–
Schulte Medical, Goleta, CA) or a fiberoptic ICP monitor(model V240; Camino Laboratories, San Diego, CA). Thetherapeutic protocol in the ICU included maintenance ofICP below 20 mm Hg and cerebral perfusion pressure(CPP) above 70 mm Hg. Intracranial hypertension (ICP .20 mm Hg) was treated in a sequential fashion: position-ing the patient with the head elevated to 30˚ and inducingmild hyperventilation (PaCO
230–35 mm Hg), followed
by ventricular CSF drainage, narcotic sedation, neuro-muscular blockade, and bolus mannitol therapy as needed.The CPP was kept above 70 mm Hg by controlling theICP and with the use of intravascular volume expansionand vasopressor therapy when necessary. In three of thestudy patients with intractably increased ICP (ICP > 30mm Hg for 30 minutes), barbiturate coma (titrated to elec-troencephalogram burst suppression) was induced at somepoint during the hospital stay.
The management protocol at UCLA and Harbor/UCLAMedical Centers includes intensive cerebral hemodynam-ic monitoring. Ideally, CBF and TCD studies were per-formed as soon as possible after admission and repeatedregularly until the patient died, recovered, or was eithertransferred or discharged. Recently, jugular bulb venousblood sampling and calculation of brain arteriovenousoxygen difference (AVDO
2) have become a standard com-
ponent of intensive monitoring to assess the adequacyof cerebral oxygen delivery. Significant abnormalitiesin CBF, TCD results, or cerebral AVDO
2measurements
prompted a careful assessment of the relevant physiologi-cal parameters (arterial blood pressure, ICP, PaCO
2, PaO
2
and oxygen saturation, and hematocrit). These parameterswere optimized when the CBF and TCD measurementsdemonstrated a marked disturbance in the cerebral he-modynamic status (for example, hyperventilation was re-duced and low PaCO
2was corrected in patients with
markedly reduced CBF). Beyond this, no specific treat-ment was administered for TCD-diagnosed vasospasm.
Measurement Techniques
Transcranial Doppler Ultrasonography. The middlecerebral artery (MCA) and extracranial (EC) internalcarotid artery (ICA) were insonated using a 2-MHz pulsedTCD device (Cerebrovascular Diagnostic System; Neuro-gard/Nicolet, Madison, WI) via transtemporal and sub-mandibular methods respectively, as previously describedby Aaslid, et al.1 The flow parameters that were recordedand analyzed included the mean velocities (the time meanof the peak velocities over the course of four cardiac cy-cles) for the MCA (V
MCA) and extracranial ICA (V
EC–ICA). The
pulsatility index (PI = [systolic velocity 2 diastolic veloc-ity]/mean velocity) was also measured for each of thesevessels; normal MCA values are 0.71 6 0.13, whereasextracranial ICA values are 0.74 6 0.13.56 A direct rela-tionship between the PI and increased peripheral vascularresistance has been demonstrated, if other hemodynamicfactors, such as arterial pulse pressure, remain constant.30
Because the extracranial ICA is not involved in vaso-spasm, velocity changes in this vessel result from changesin CBF rather than from changes in arterial diameter.Therefore V
EC–ICAcan be used as an index of CBF and the
ratio of VMCA
to VEC–ICA
(VMCA
/VEC–ICA
) can be used to distinguishhyperemia from vasospasm. In hyperemia, both V
MCAand
N. A. Martin, et al.
10 J. Neurosurg. / Volume 87 / July, 1997

VEC–ICA
are increased, and the ratio remains normal (1.7 60.4).31 In vasospasm, the V
MCAis increased, the V
EC–ICAis un-
changed or decreased, and thus the ratio is increased.Lindegaard, et al.,31 have written that a V
MCA/V
EC–ICA ratio
greater than 3 corresponds to angiographically visiblespasm. This ratio has been referred to as the “Lindegaardratio” or the “hemispheric index” (HI). In this report thepresence of vasospasm is determined by the simultaneousfinding of V
MCAgreater than 120 cm/second, and V
MCA/V
EC–ICA
greater than 3.As a part of the routine clinical assessment, TCD stud-
ies were generally performed within 24 to 48 hours ofadmission and serial studies were performed for up to 3weeks or more after admission. Patients enrolled in theBIRC project were studied, as much as possible, accord-ing to a prospectively established schedule (on Days 0, 1,2, 3, 5, 7, 9, 10, 12, and 14). A total of 789 TCD studieswere performed in 120 patients.
Global CBF Measurements. Intravenous 133Xe-CBFstudies were performed using a portable apparatus (Cor-texplorer 10; Ceretronix, Randers, Denmark) as previ-ously described.3,9,26,42–44 Approximately 20 to 30 mCi of133Xe gas dissolved in saline was injected intravenouslyfor each study. The portable CBF unit was used to es-timate cerebral perfusion by analyzing 133Xe wash-outcurves measured over 11 minutes by five probes posi-tioned over each cerebral hemisphere (primarily over theMCA territory). Analytic computer software was thenused to extrapolate the data to 15 minutes, referencing thebrain clearance curves to the clearance curve of exhaledend-tidal xenon-133 (which is used to estimate the arteri-al concentration of xenon-133). A modified height-over-area method was used to calculate CBF
15. This CBF index
represents the mean flow of both fast- and slow-clearingcompartments, is insensitive to “slippage,” is more stablethan individual compartment parameters in pathologicalconditions, correlates well with CBF measurements madeusing stable Xe-CT scanning, and has been used exten-sively in head trauma research.3,8,9,26,42–44 Blood pressure,hematocrit, ICP, and PaCO
2were recorded at the time of
each study. The CBF15
values for all 10 detectors wereaveraged and the mean was judged to represent the glo-bal CBF for that test. The CBF
15values were corrected to
a standard PaCO2
of 34 mm Hg (“corrected CBF15”),
assuming a 3% increase in CBF for each 1-mm Hg in-crease in PaCO
2(following the convention of Obrist and
colleagues43).A total of 313 CBF studies were performed in 69 of the
125 patients. Patients were missed during periods when atrained technologist was not available or when equipmentmalfunction precluded study, indicating that these patientswere missed at random. The subgroup in which CBF stud-ies were performed is representative of the group as awhole because the patients did not differ significantly inage (33.3 6 15.8 years), gender (83% male), or medianadmission GCS score (6) from the entire study cohort orfrom the patients who underwent TCD testing.
The first study on a given head-injured patient was typ-ically performed within 48 hours of admission and manywere performed within 24 hours of admission (with threestudies within 12 hours). For clinical assessment, serialstudies were performed in patients over the subsequentweeks. Patients in the BIRC project were studied, as
much as possible, according to a prospectively establishedschedule (on Days 0, 1, 3, 5, 10, and 14). Scheduled stud-ies were missed or rescheduled for a variety of reasonssuch as delays in obtaining consent, patient unavailabilityduring surgery, equipment malfunction, and radioisotopeunavailability. Many CBF (and TCD) studies scheduledfor the 2nd week after injury were not performed becausestable patients were transferred to other medical or reha-bilitation facilities (often at the request of managed healthcare organizations)—this is a source of bias that must berecognized.
Jugular Bulb Catheter Studies. Jugular bulb catheteriza-tion was included as a part of routine management and theBIRC investigative protocol relatively recently. As soonas possible after admission to the ICU, retrograde cath-eterization of the internal jugular vein was accomplishedusing a No. 4 French fiberoptic intravascular oxygen sat-uration catheter (model U440; Abbott Laboratories, N.Chicago, IL). The catheter was introduced percutaneous-ly and advanced to the jugular bulb at the base of theskull. The position was verified by lateral skull x-ray film.While the catheter was in place (usually for 5–7 days af-ter insertion, occasionally up to postinjury Days 10–12),jugular venous and radial arterial blood samples weredrawn every 8 hours, and values for AVDO
2were calcu-
lated.26,27 Simultaneous PaCO2
readings were recorded.The AVDO
2values were corrected to a PaCO
2of 34 mm
Hg, assuming an increase of 3% in AVDO2
for every 1-mm Hg decrease in PaCO
2(again after the convention of
Obrist and colleagues43). The CMRO2was estimated from
the product of AVDO2and the global value for CBF
15.43
A total of 369 measurements of AVDO2
were made in26 patients. This subgroup appears to be representative ofthe group as a whole (mean age 36.6 6 17.7 years; medi-an GCS score 5; 77% male).
Measurements of ICP and CPP. Measurements of ICPwere acquired during the time of CBF study. The CPP val-ues were calculated from the ICP and the mean arterialpressure measurements recorded at the time of study.
Definition of Timing of Posttraumatic CerebralHemodynamic Phases
The daily values for CBF, TCD, and AVDO2
measure-ments and physiological parameters were grouped into thethree temporal phases as they were defined by our pilotproject.69 That preliminary study, based on CBF and TCDstudies in 32 patients suffering from head trauma, identi-fied three posttraumatic cerebral hemodynamic phases:Phase I, first 24 hours after injury (postinjury Day 0);Phase II, 24 to 96 hours after injury (postinjury Days 1–3);and Phase III (postinjury Days 4–14). The pilot study alsoincluded a fourth phase (postinjury Weeks 2 and 3) duringwhich the CBF and TCD abnormalities began to resolve.Because of the paucity and irregular timing of CBF andTCD studies beyond 14 days postinjury, we have notincluded these late measurements in this report.
Statistical Analysis
The values for CBF, TCD, metabolic, and physiologicalmeasurements were sorted by postinjury day and the dailymean values (6 standard error of the mean [SEM]) werecalculated. Because fewer daily measurements were ob-
J. Neurosurg. / Volume 87 / July, 1997
Hemodynamics in severe head injury
11

tained after postinjury Day 3, from that point onward themeasurements for 2 consecutive days were pooled and themean values (6 SEM) for that 2-day period were calcu-lated. The daily mean values (6 SEM) were used to gen-erate the time-course graphs (Fig. 1). The curves weregenerated using a least-squares polynomial curve-fittingfunction. The values for the various parameters were al-so grouped according to phase, and the mean values (6SEM) for each phase were calculated (Tables 1 and 2).
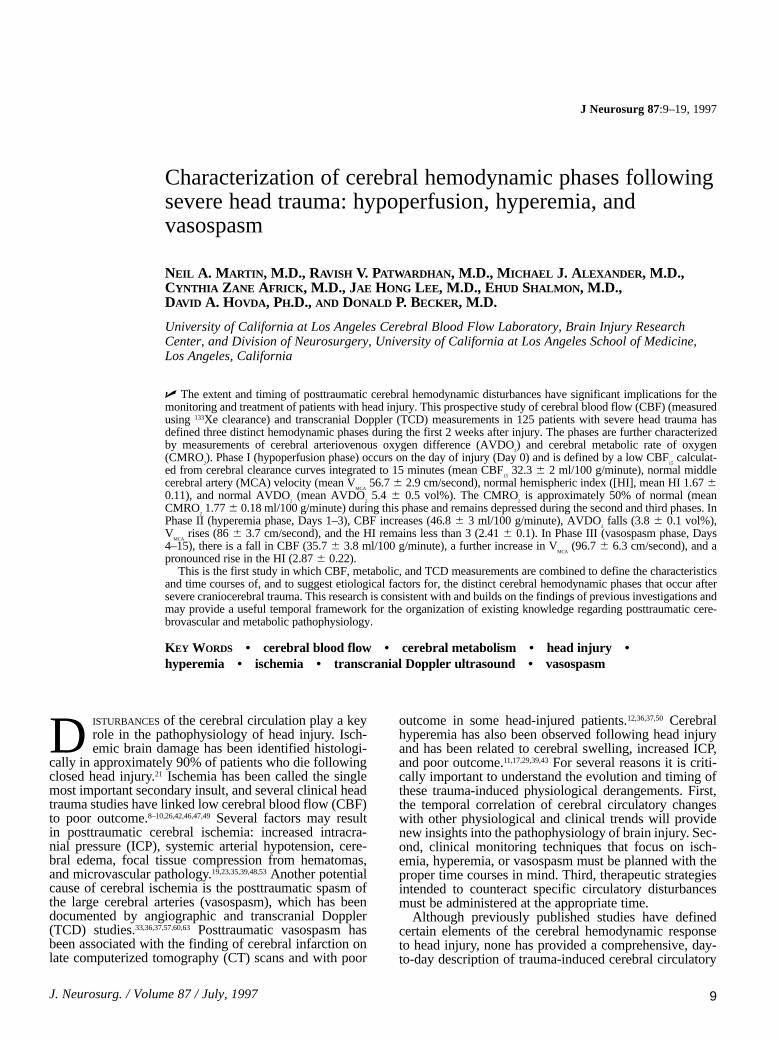
To describe the distribution of CBF and TCD measure-ments within the three phases, all studies performed dur-ing each phase were sorted into quantitatively stratifiedgroups defined by the values indicated in Fig. 2. The rela-tive frequency of studies in each group, for each phase, areillustrated in this figure.
Two-sample, equal variance–based t-tests with Bonfer-roni correction were used to confirm that the three hemo-dynamic phases, based on CO
2-corrected CBF
15, V
MCA,
and HI, were separate and distinct. These tests werealso used to assess any statistically significant differencesin AVDO
2, CMRO
2, PI, ICP, and CPP values between
phases.
Results
Patterns of CBF and Blood Flow Velocity After HeadInjury
The daily mean values (6 SEM) of the key parameters
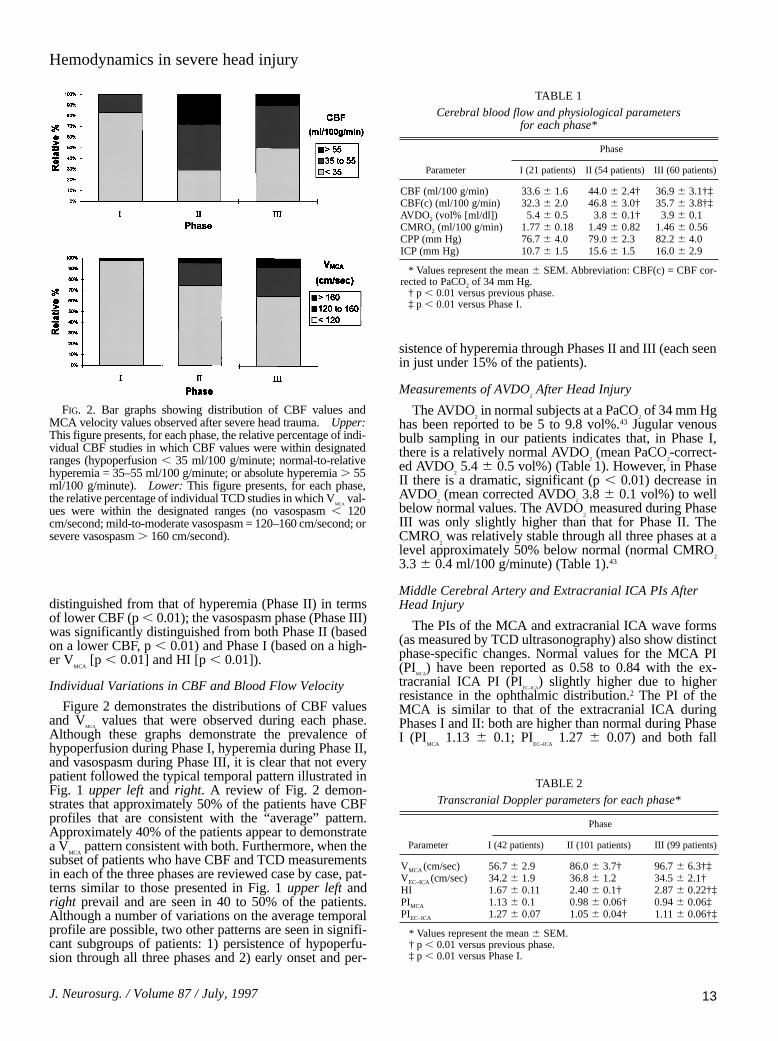
derived from CBF and TCD studies are illustrated graph-ically in Fig. 1 upper left and right. For comparison, pre-vious studies have described the normal adult mean V
MCAas
34 to 86 cm/second and the mean VEC–ICA
as 28 to 46 cm/sec-ond.2 Earlier studies using the intravenous 133Xe methodfor determining CBF have shown normal CBF
15to be
44.1 6 5.6 ml/100 g/minute at a PaCO2of 34 mm Hg.43
Simultaneous analysis of the daily mean CBF andMCA velocities reveals that the data conform to the pat-tern defined in our pilot study (Tables 1–3).69 There arethree distinct posttraumatic hemodynamic phases (Table3). Phase I (the first 24 hours after injury) is referred to asthe hypoperfusion phase and is defined by a low CBF(mean corrected CBF
1532.3 6 2 ml/100 g/minute),
a normal VMCA
(mean VMCA
56.7 6 2.9 cm/second), and anormal HI (mean HI 1.67 6 0.11). In Phase II (hyperemiaphase, Days 1–3) the CBF is transiently increased (meancorrected CBF
1546.8 6 3 ml/100 g/minute), the V
MCAis
rapidly rising (mean VMCA
86 6 3.7 cm/second), and the HIis normal (mean HI 2.40 6 0.1). The third phase(vasospasm phase, Days 4–15) is characterized by a vari-able but gradually declining CBF (mean corrected CBF
15
35.7 6 3.8 ml/100 g/minute; lowest corrected CBF15
32.7 6 6 ml/100 g/minute on Day 8). The VMCA
increasessignificantly in this phase (mean V
MCA96.7 6 6.3 cm/sec-
ond; highest VMCA
111 6 10.2 cm/second on Day 11), andthe HI rises significantly (mean HI 2.87 6 0.22).
The phase of hypoperfusion (Phase I) was significantly
N. A. Martin, et al.
12 J. Neurosurg. / Volume 87 / July, 1997
FIG. 1. Graphs displaying the time courses of posttraumaticCBF (adjusted to a PaCO
2of 34 mm Hg), MCA velocity, and CPP
observed after severe head trauma. Upper Left: The mean CBFvalues (6 SEM) for all patients who were studied each day arerepresented. Upper Right: The mean MCA velocity values (6SEM) were measured using TCD ultrasonography. Lower: Thedaily mean CPP values were arrived at using the following formu-la: CPP = mean arterial pressure 2 mean ICP (6 SEM). PostinjuryDay 0 designates the first 24 hours after injury. The three cerebralhemodynamic phases are indicated at the bottom of the graph(Phase I, hypoperfusion; Phase II, hyperemia; and Phase III, vaso-spasm).
distinguished from that of hyperemia (Phase II) in termsof lower CBF (p , 0.01); the vasospasm phase (Phase III)was significantly distinguished from both Phase II (basedon a lower CBF, p , 0.01) and Phase I (based on a high-er V
MCA[p , 0.01] and HI [p , 0.01]).
Individual Variations in CBF and Blood Flow Velocity
Figure 2 demonstrates the distributions of CBF valuesand V
MCAvalues that were observed during each phase.
Although these graphs demonstrate the prevalence ofhypoperfusion during Phase I, hyperemia during Phase II,and vasospasm during Phase III, it is clear that not everypatient followed the typical temporal pattern illustrated inFig. 1 upper left and right. A review of Fig. 2 demon-strates that approximately 50% of the patients have CBFprofiles that are consistent with the “average” pattern.Approximately 40% of the patients appear to demonstratea V
MCApattern consistent with both. Furthermore, when the
subset of patients who have CBF and TCD measurementsin each of the three phases are reviewed case by case, pat-terns similar to those presented in Fig. 1 upper left andright prevail and are seen in 40 to 50% of the patients.Although a number of variations on the average temporalprofile are possible, two other patterns are seen in signifi-cant subgroups of patients: 1) persistence of hypoperfu-sion through all three phases and 2) early onset and per-
sistence of hyperemia through Phases II and III (each seenin just under 15% of the patients).
Measurements of AVDO2After Head Injury
The AVDO2in normal subjects at a PaCO
2of 34 mm Hg
has been reported to be 5 to 9.8 vol%.43 Jugular venousbulb sampling in our patients indicates that, in Phase I,there is a relatively normal AVDO
2(mean PaCO
2-correct-
ed AVDO25.4 6 0.5 vol%) (Table 1). However, in Phase
II there is a dramatic, significant (p , 0.01) decrease inAVDO
2(mean corrected AVDO
23.8 6 0.1 vol%) to well
below normal values. The AVDO2measured during Phase
III was only slightly higher than that for Phase II. TheCMRO
2was relatively stable through all three phases at a
level approximately 50% below normal (normal CMRO2
3.3 6 0.4 ml/100 g/minute) (Table 1).43
Middle Cerebral Artery and Extracranial ICA PIs AfterHead Injury
The PIs of the MCA and extracranial ICA wave forms(as measured by TCD ultrasonography) also show distinctphase-specific changes. Normal values for the MCA PI(PI
MCA) have been reported as 0.58 to 0.84 with the ex-
tracranial ICA PI (PIEC–ICA
) slightly higher due to higherresistance in the ophthalmic distribution.2 The PI of theMCA is similar to that of the extracranial ICA duringPhases I and II: both are higher than normal during PhaseI (PI
MCA1.13 6 0.1; PI
EC–ICA1.27 6 0.07) and both fall
J. Neurosurg. / Volume 87 / July, 1997
Hemodynamics in severe head injury
13
FIG. 2. Bar graphs showing distribution of CBF values andMCA velocity values observed after severe head trauma. Upper:This figure presents, for each phase, the relative percentage of indi-vidual CBF studies in which CBF values were within designatedranges (hypoperfusion , 35 ml/100 g/minute; normal-to-relativehyperemia = 35–55 ml/100 g/minute; or absolute hyperemia . 55ml/100 g/minute). Lower: This figure presents, for each phase,the relative percentage of individual TCD studies in which V
MCAval-
ues were within the designated ranges (no vasospasm , 120cm/second; mild-to-moderate vasospasm = 120–160 cm/second; orsevere vasospasm . 160 cm/second).
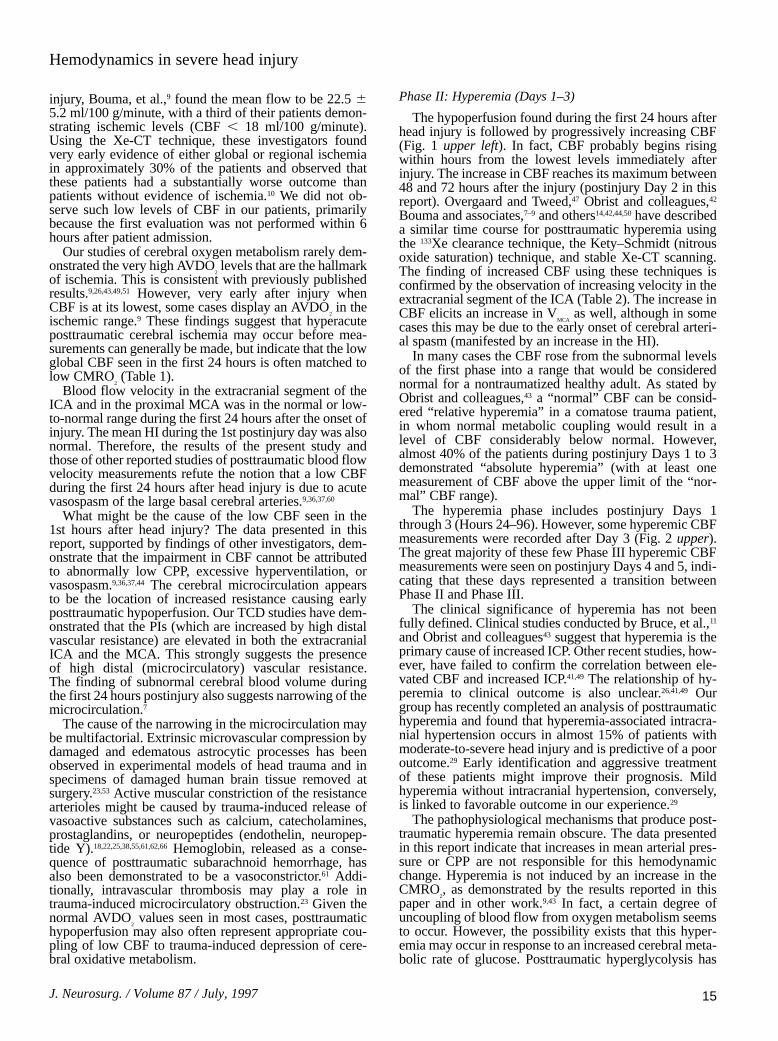
TABLE 1Cerebral blood flow and physiological parameters
for each phase*
Phase
Parameter I (21 patients) II (54 patients) III (60 patients)
CBF (ml/100 g/min) 33.6 6 1.6 44.0 6 2.4† 36.9 6 3.1†‡CBF(c) (ml/100 g/min) 32.3 6 2.0 46.8 6 3.0† 35.7 6 3.8†‡AVDO2 (vol% [ml/dl]) 5.4 6 0.5 3.8 6 0.1† 3.9 6 0.1 CMRO2 (ml/100 g/min) 1.77 6 0.18 1.49 6 0.82 1.46 6 0.56CPP (mm Hg) 76.7 6 4.0 79.0 6 2.3 82.2 6 4.0ICP (mm Hg) 10.7 6 1.5 15.6 6 1.5 16.0 6 2.9
* Values represent the mean 6 SEM. Abbreviation: CBF(c) = CBF cor-rected to PaCO2 of 34 mm Hg.
† p , 0.01 versus previous phase.‡ p , 0.01 versus Phase I.
TABLE 2Transcranial Doppler parameters for each phase*
Phase
Parameter I (42 patients) II (101 patients) III (99 patients)
VMCA (cm/sec) 56.7 6 2.9 86.0 6 3.7† 96.7 6 6.3†‡VEC–ICA (cm/sec) 34.2 6 1.9 36.8 6 1.2 34.5 6 2.1†HI 1.67 6 0.11 2.40 6 0.1† 2.87 6 0.22†‡PIMCA 1.13 6 0.1 0.98 6 0.06† 0.94 6 0.06‡PIEC–ICA 1.27 6 0.07 1.05 6 0.04† 1.11 6 0.06†‡
* Values represent the mean 6 SEM.† p , 0.01 versus previous phase.‡ p , 0.01 versus Phase I.
toward normal values during Phase II (PIMCA
0.98 6 0.06;PI
EC–ICA1.05 6 0.04) (Table 2). The PIs in these two vessels,
however, diverge during Phase III (PIMCA
0.94 6 0.06;PI
EC–ICA1.11 6 0.06) (Table 2).
Intracranial Pressure and CPP After Head Injury
The mean ICP values were above 10 mm Hg all 15 daysafter injury (reaching a maximum on Day 10 of 18.2 6 2.1mm Hg) (Table 1). Although individual ICP recordingswere often more than 20 mm Hg, the daily mean for thegroup as a whole never exceeded 20 mm Hg due to theaggressive ICP management that was a part of the stan-dard treatment protocol. The mean daily CPP values forthe group remained stable between 70 and 90 mm Hgthroughout the entire course (Fig. 1 lower).
Ischemia During the Three Phases
None of the 21 patients in whom CBF measurementswere obtained during Phase I demonstrated severe hypo-perfusion (CBF
15, or PaCO
2-corrected CBF
15≤ 20 ml/100
g/minute). One patient had an (CO2-uncorrected) AVDO
2
measurement of 10.3 vol% when his PCO2was 22 mm Hg
(no CBF measurement was made at the time). No otherpatient had an (CO
2-uncorrected) AVDO
2above 7 vol%
during Phase I. It should be noted that only three of21 CBF studies and no AVDO
2measurements in this re-
port were made before 12 hours postinjury. During PhaseII, three of 100 (CO
2-uncorrected) CBF measurements
showed the CBF15
to be less than 20 ml/100 g/minute. No(CO
2-uncorrected) AVDO
2measurements were above 8
vol% and only three of 95 values were over 7 vol%(PCO
2≤ 30 mm Hg in these three cases). During Phase III,
28 of 182 (CO2-uncorrected) CBF measurements dem-
onstrated the CBF15
to be less than 20 ml/100 g/minute. No(CO
2-uncorrected) AVDO
2values were over 8 vol% and
only four of 269 measurements were above 7 vol% (allwith PCO
2≤ 31 mm Hg).
Hyperemia During the Three Phases
The pattern defined by the daily CBF values showed ahigher mean flow during postinjury Days 1 to 3, but therewas considerable heterogeneity in the CBF measurementsfor postinjury Phases II and III (Figs. 1 upper left and 2upper). Phase I was the most homogeneous, with only16.7% of the CBF values falling in the hyperemic range.Phase II had the widest variety of values, with CBF
15val-
ues ranging from 13 to 99 ml/100 g/minute. Twenty-sevenpercent of the Phase II CBF values were in the range of
absolute hyperemia (≥ 55 ml/100 g/minute). Ten percentof the Phase II CBF values were greater than 70 ml/100g/minute, which represented 75% of all of the very highCBF values recorded in the first 2 weeks. Overall, 38.8%of patients studied during this phase had at least oneDay 1 to 3 CBF measurement above 55 ml/100 g/minute.Postinjury Days 4 and 5 represented a transition fromPhase II to Phase III: almost all of the Phase III CBF val-ues above 55 ml/100 g/minute were seen during these 2days. Beyond Day 5, most of the CBF values were low.
Vasospasm During the Three Phases
Vasospasm of the MCA was defined as ipsilateral VMCA
above 120 cm/second with an HI above 3. Using this cri-terion, we found that 50.4% of patients had at least oneTCD study consistent with vasospasm during their hospi-tal course. Overall, 37.6% of the patients were classifiedas having mild-to-moderate spasm (V
MCA120–160 cm/sec-
ond and HI 3–4), and 12.8% were classified as havingsevere spasm (V
MCA≥ 160 cm/second and HI ≥ 4).
The time course of the spasm is apparent (Figs. 1 upperleft and 2 lower). Only one patient had a V
MCAgreater than
120 cm/second during the first 24 hours after injury (Fig.2 lower). Although some patients developed mild-to-mod-erate spasm during Phase II, almost all of the severe casesof spasm were seen during Phase III (Fig. 2 lower).However, it is important to note that during Phase III therewere fewer TCD studies demonstrating evidence of spasmthan CBF studies showing low blood flow (that is, manylow CBF measurements during Phase III were not associ-ated with vasospasm).
Discussion
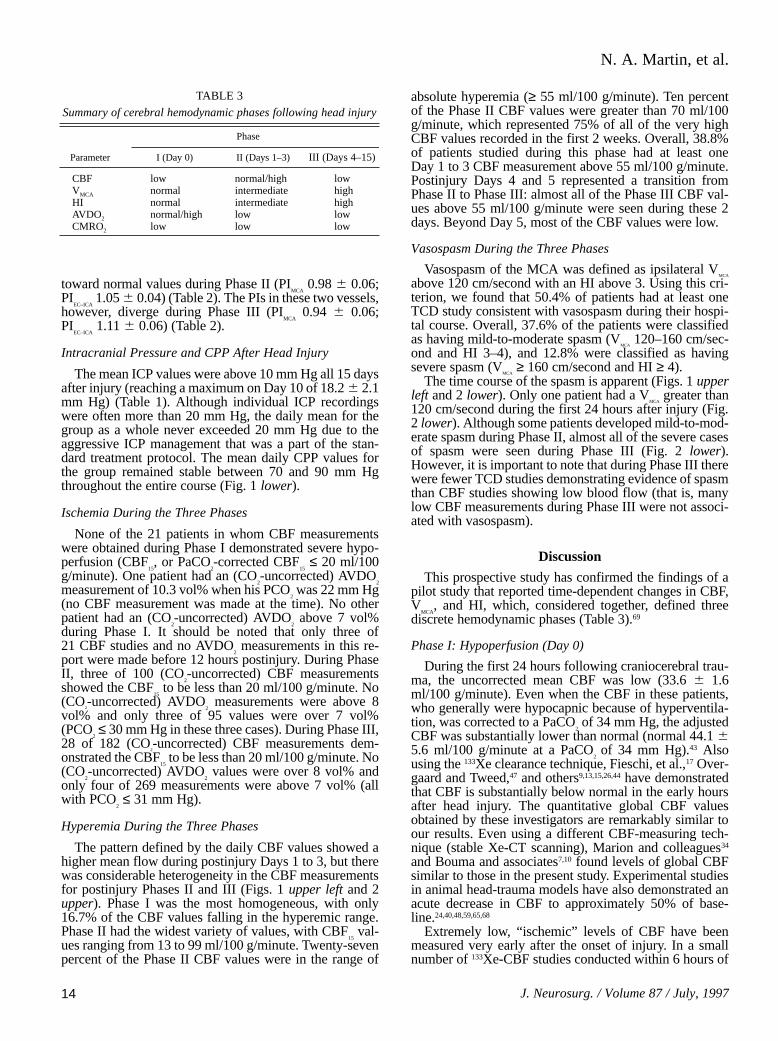
This prospective study has confirmed the findings of apilot study that reported time-dependent changes in CBF,V
MCA, and HI, which, considered together, defined three
discrete hemodynamic phases (Table 3).69
Phase I: Hypoperfusion (Day 0)
During the first 24 hours following craniocerebral trau-ma, the uncorrected mean CBF was low (33.6 6 1.6ml/100 g/minute). Even when the CBF in these patients,who generally were hypocapnic because of hyperventila-tion, was corrected to a PaCO
2of 34 mm Hg, the adjusted
CBF was substantially lower than normal (normal 44.1 65.6 ml/100 g/minute at a PaCO
2 of 34 mm Hg).43 Also
using the 133Xe clearance technique, Fieschi, et al.,17 Over-gaard and Tweed,47 and others9,13,15,26,44 have demonstratedthat CBF is substantially below normal in the early hoursafter head injury. The quantitative global CBF valuesobtained by these investigators are remarkably similar toour results. Even using a different CBF-measuring tech-nique (stable Xe-CT scanning), Marion and colleagues34
and Bouma and associates7,10 found levels of global CBFsimilar to those in the present study. Experimental studiesin animal head-trauma models have also demonstrated anacute decrease in CBF to approximately 50% of base-line.24,40,48,59,65,68
Extremely low, “ischemic” levels of CBF have beenmeasured very early after the onset of injury. In a smallnumber of 133Xe-CBF studies conducted within 6 hours of
N. A. Martin, et al.
14 J. Neurosurg. / Volume 87 / July, 1997
TABLE 3Summary of cerebral hemodynamic phases following head injury
Phase
Parameter I (Day 0) II (Days 1–3) III (Days 4–15)
CBF low normal/high lowVMCA normal intermediate highHI normal intermediate highAVDO2 normal/high low lowCMRO2 low low low
injury, Bouma, et al.,9 found the mean flow to be 22.5 65.2 ml/100 g/minute, with a third of their patients demon-strating ischemic levels (CBF , 18 ml/100 g/minute).Using the Xe-CT technique, these investigators foundvery early evidence of either global or regional ischemiain approximately 30% of the patients and observed thatthese patients had a substantially worse outcome thanpatients without evidence of ischemia.10 We did not ob-serve such low levels of CBF in our patients, primarilybecause the first evaluation was not performed within 6hours after patient admission.
Our studies of cerebral oxygen metabolism rarely dem-onstrated the very high AVDO
2levels that are the hallmark
of ischemia. This is consistent with previously publishedresults.9,26,43,49,51 However, very early after injury whenCBF is at its lowest, some cases display an AVDO
2in the
ischemic range.9 These findings suggest that hyperacuteposttraumatic cerebral ischemia may occur before mea-surements can generally be made, but indicate that the lowglobal CBF seen in the first 24 hours is often matched tolow CMRO
2(Table 1).
Blood flow velocity in the extracranial segment of theICA and in the proximal MCA was in the normal or low-to-normal range during the first 24 hours after the onset ofinjury. The mean HI during the 1st postinjury day was alsonormal. Therefore, the results of the present study andthose of other reported studies of posttraumatic blood flowvelocity measurements refute the notion that a low CBFduring the first 24 hours after head injury is due to acutevasospasm of the large basal cerebral arteries.9,36,37,60
What might be the cause of the low CBF seen in the1st hours after head injury? The data presented in thisreport, supported by findings of other investigators, dem-onstrate that the impairment in CBF cannot be attributedto abnormally low CPP, excessive hyperventilation, orvasospasm.9,36,37,44 The cerebral microcirculation appearsto be the location of increased resistance causing earlyposttraumatic hypoperfusion. Our TCD studies have dem-onstrated that the PIs (which are increased by high distalvascular resistance) are elevated in both the extracranialICA and the MCA. This strongly suggests the presenceof high distal (microcirculatory) vascular resistance.The finding of subnormal cerebral blood volume duringthe first 24 hours postinjury also suggests narrowing of themicrocirculation.7
The cause of the narrowing in the microcirculation maybe multifactorial. Extrinsic microvascular compression bydamaged and edematous astrocytic processes has beenobserved in experimental models of head trauma and inspecimens of damaged human brain tissue removed atsurgery.23,53 Active muscular constriction of the resistancearterioles might be caused by trauma-induced release ofvasoactive substances such as calcium, catecholamines,prostaglandins, or neuropeptides (endothelin, neuropep-tide Y).18,22,25,38,55,61,62,66 Hemoglobin, released as a conse-quence of posttraumatic subarachnoid hemorrhage, hasalso been demonstrated to be a vasoconstrictor.61 Addi-tionally, intravascular thrombosis may play a role intrauma-induced microcirculatory obstruction.23 Given thenormal AVDO
2values seen in most cases, posttraumatic
hypoperfusion may also often represent appropriate cou-pling of low CBF to trauma-induced depression of cere-bral oxidative metabolism.
Phase II: Hyperemia (Days 1–3)
The hypoperfusion found during the first 24 hours afterhead injury is followed by progressively increasing CBF(Fig. 1 upper left). In fact, CBF probably begins risingwithin hours from the lowest levels immediately afterinjury. The increase in CBF reaches its maximum between48 and 72 hours after the injury (postinjury Day 2 in thisreport). Overgaard and Tweed,47 Obrist and colleagues,42
Bouma and associates,7–9 and others14,42,44,50 have describeda similar time course for posttraumatic hyperemia usingthe 133Xe clearance technique, the Kety–Schmidt (nitrousoxide saturation) technique, and stable Xe-CT scanning.The finding of increased CBF using these techniques isconfirmed by the observation of increasing velocity in theextracranial segment of the ICA (Table 2). The increase inCBF elicits an increase in V
MCAas well, although in some
cases this may be due to the early onset of cerebral arteri-al spasm (manifested by an increase in the HI).
In many cases the CBF rose from the subnormal levelsof the first phase into a range that would be considerednormal for a nontraumatized healthy adult. As stated byObrist and colleagues,43 a “normal” CBF can be consid-ered “relative hyperemia” in a comatose trauma patient,in whom normal metabolic coupling would result in alevel of CBF considerably below normal. However,almost 40% of the patients during postinjury Days 1 to 3demonstrated “absolute hyperemia” (with at least onemeasurement of CBF above the upper limit of the “nor-mal” CBF range).
The hyperemia phase includes postinjury Days 1through 3 (Hours 24–96). However, some hyperemic CBFmeasurements were recorded after Day 3 (Fig. 2 upper).The great majority of these few Phase III hyperemic CBFmeasurements were seen on postinjury Days 4 and 5, indi-cating that these days represented a transition betweenPhase II and Phase III.
The clinical significance of hyperemia has not beenfully defined. Clinical studies conducted by Bruce, et al.,11
and Obrist and colleagues43 suggest that hyperemia is theprimary cause of increased ICP. Other recent studies, how-ever, have failed to confirm the correlation between ele-vated CBF and increased ICP.41,49 The relationship of hy-peremia to clinical outcome is also unclear.26,41,49 Ourgroup has recently completed an analysis of posttraumatichyperemia and found that hyperemia-associated intracra-nial hypertension occurs in almost 15% of patients withmoderate-to-severe head injury and is predictive of a pooroutcome.29 Early identification and aggressive treatmentof these patients might improve their prognosis. Mildhyperemia without intracranial hypertension, conversely,is linked to favorable outcome in our experience.29
The pathophysiological mechanisms that produce post-traumatic hyperemia remain obscure. The data presentedin this report indicate that increases in mean arterial pres-sure or CPP are not responsible for this hemodynamicchange. Hyperemia is not induced by an increase in theCMRO
2, as demonstrated by the results reported in this
paper and in other work.9,43 In fact, a certain degree ofuncoupling of blood flow from oxygen metabolism seemsto occur. However, the possibility exists that this hyper-emia may occur in response to an increased cerebral meta-bolic rate of glucose. Posttraumatic hyperglycolysis has
J. Neurosurg. / Volume 87 / July, 1997
Hemodynamics in severe head injury
15

been identified in animal models of head trauma by An-dersen and Marmarou,4 Hovda, et al.,24 and Yoshino andcolleagues.67 Recent positron emission tomography stud-ies of glucose metabolism in patients with head trauma atUCLA have demonstrated global and regional hypergly-colysis in some patients during this time period.5,6
The PIs in both the ICA and the MCA fall on postinjuryDay 1 (Table 2), providing evidence that the hyperemicphase is associated with a drop in distal cerebrovascu-lar resistance. The generation of vasodilatory metabolites(lactic acid, neuropeptides, and adenosine) has been asso-ciated with hyperemia, or “luxury perfusion,” followingischemic damage to the brain and may play a role in post-traumatic hyperemia.13,14,32,64 Alternatively, there may be adelayed onset of mechanically induced vascular smooth-muscle dysfunction (or “vasoparalysis”) that results in adecrease in cerebrovascular resistance and an increase inblood flow.20
The cause of the termination of the hyperemic phaseis not entirely clear. This may result from the clearanceof vasodilatory metabolites, recovery of vascular smooth-muscle function, or resolution of posttraumatic hypergly-colysis. However, examination of the MCA PIs indicatesthat this phase is not necessarily terminated by an increasein distal vascular resistance (Table 2). Our data indicatethat the hyperemic phase may resolve, in part, becauselarge artery spasm occurs.
Phase III: Vasospasm (Days 4–14)
In the third phase, the physiological findings includeincreasing V
MCAand an increasing HI (Fig. 1 upper right
and Table 2). These findings are consistent with the on-set of vasospasm involving the proximal segment of theMCAs. The increase in the V
MCAis clearly due to progres-
sive arterial narrowing and not to a flow effect, becauseCBF falls during this phase.12,20,36 Furthermore, an increas-ing PI found in the cervical segment of the ICA indicatesan increase in downstream resistance, presumably due tothe narrowing of the MCA. Approximately 50% of ourpatients developed significant MCA spasm, evidenced byMCA velocities greater than 120 cm/second and by a con-comitant HI over 3. Although AVDO
2recordings during
Phase III rarely demonstrated the high levels associatedwith ischemia, focal vasospasm-induced ischemia mayhave been missed using this global measurement tech-nique.
Until recently, posttraumatic vasospasm had only beendefined using angiography.32,57,63 The largest angiographicstudy, by Suwanwela and Suwanwela,57 found that 18.6%of patients with moderate-to-severe head injury had nar-rowing of at least one intracranial artery. The study ofposttraumatic vasospasm using TCD ultrasonographyhas allowed sequential noninvasive assessment of arterialnarrowing following head injury. Weber, et al.,60 foundincreased MCA velocities consistent with spasm in 40%of head-injured patients. Gomez and associates20 usedTCD ultrasonography in combination with angiographyto confirm the finding of posttraumatic vasospasm. Ourgroup’s 1992 study36 demonstrated TCD and CBF evi-dence of vasospasm in 27% of head-injured patients (withangiographic confirmation in three patients with severespasm). This study demonstrated that MCA vasospasm
began at approximately postinjury Day 4 and persisted foras long as 3 weeks after head injury. The degree of thespasm demonstrated in these studies has, in some cases,been as severe as that seen in patients with aneurysmalsubarachnoid hemorrhage who develop delayed ischemicdeficit. A more recent report published by our center,based on a larger group of patients, suggests that posttrau-matic spasm is associated with poor clinical outcome.37
However, less than 15% of patients have TCD findingsthat suggest severe vasospasm, whereas almost 50% ofCBF measurements during Phase III show low flow. It isprobable that low CBF during this phase is often coupledto persistent posttraumatic hypometabolism. The mea-surements of cerebral oxygen metabolism obtained duringthis time demonstrate that CMRO
2remains approximately
50% of normal. Recent positron emission tomographystudies (using [18F]fluorodeoxyglucose) in head-injuredpatients have shown that the cerebral metabolic rate ofglucose is also suppressed beyond the first 4 or 5 daysafter injury.5,6 Therefore, this phase includes vasospasm insome cases, and low CBF coupled to low cerebral metab-olism in others.
Resolution of Posttraumatic Hemodynamic Changes
This research study does not address the late resolutionof trauma-induced hemodynamic disturbances because ofthe paucity of CBF or TCD evaluations performed beyond2 weeks after injury (most patients have been dischargedor transferred by this time). The few cases that had latermeasurements (reported in our pilot study) demonstratedgradual recoveries toward normal on the part of CBF andMCA velocities beginning 2 to 3 weeks after injury.69 Apreviously published study of posttraumatic vasospasmalso showed resolution of even the most severe cases after3 to 4 weeks.36 It seems that the fourth phase of the post-traumatic cerebral hemodynamic pattern should be termedthe “recovery phase,” beginning 2 to 3 weeks after onsetand probably lasting weeks to months.
Shortcomings, Flaws, and Sources of Bias
Because of the logistical problems involved in perform-ing TCD and CBF evaluations during the 1st clinicallybusy hours after admission to the emergency department,we have obtained few studies within 12 hours of injury.The earliest cerebral hemodynamic and metabolic alter-ations must be inferred from the few other clinical studiesthat have focused on the earliest hours and from laborato-ry investigations. The true prevalence of hyperacute isch-emia (within the first 1 or 2 hours) in head-injured patientsremains to be determined.
The CBF and metabolic measurements reported in thispaper represent global alterations. Focal disturbances inflow or metabolism caused by discrete traumatic lesions(hematomas or contusions) or related to isolated vascularpathology (focal spasm or dissection) will be “blurred”or may be missed entirely. Furthermore, subcortical, cere-bellar, and brainstem CBF and metabolism are not spe-cifically evaluated using the techniques discussed in thiswork. For regional flow and metabolism measurementsone must refer to autoradiographic studies conducted inexperimental models of head trauma or to the few clinical
N. A. Martin, et al.
16 J. Neurosurg. / Volume 87 / July, 1997

studies performed with tomographic techniques.7,10,34 Posi-tron emission tomography (using 15O-containing tra-cers for CBF and oxygen metabolism measurements and[18F]fluorodeoxyglucose for glucose metabolism measure-ments) is the most promising, although logistically diffi-cult, technique for defining pathophysiology on a region-al scale. We have begun such studies and plan to extendthese over the next several years.5,6
One of the inherent flaws in this project is the inabilityto study patients who have been transferred to other med-ical facilities or rehabilitation units or discharged from thehospital. Therefore, it is likely that the data in later phasesare skewed toward patients with more severe injuries andmore complicated hospital stays.
It is important to recognize that not every patient expe-rienced the typical hemodynamic alterations during eachpostinjury phase (Fig. 2). Studies in progress will addressCBF changes and vasospasm in clinically important sub-groups (stratified by age, CT findings, presence or ab-sence of intracranial hypertension, outcome, and so forth).In a fashion similar to that used by Robertson and col-leagues,49 future studies must address the importance ofvariations on the “average” temporal profile of hemody-namic disturbances.
Potential Therapeutic Implications
In Phase I, hypoperfusion may be a critical secondaryinsult to the traumatized brain, with ischemia and infarc-tion compounding the initial mechanical injury. Phase I,therefore, requires rigorous maintenance of normal CPP,normal oxygenation, and a normal hematocrit level. Ingeneral, profound hyperventilation should be avoided be-cause, as Sheinberg, et al.,54 have demonstrated, hypo-carbia may lead to more profound hypoperfusion and aconcomitant poor outcome. Potential strategies for futuretherapy for the low blood flow of Phase I include inducedarterial hypertension; pharmacological agents that mightreverse the increase in small vessel resistance that ap-pears to be present; or therapies (drugs or hypothermia)that protect neurons from ischemia-induced biochemicalevents.
Recent work performed at our center and others hasindicated that the hyperemia of Phase II may be associat-ed with harmful intracranial hypertension.11,29,43 Becausethis phase is not associated with MCA spasm or usuallywith a high AVDO
2indicating inadequate oxygen deliv-
ery, hyperventilation should be safe during Phase II.During this phase, the prominence of hyperemia suggeststhat “CPP therapy” using pressor-induced arterial hyper-tension should be used cautiously and should, perhaps, beguided by CBF measurements.52
Phase III appears to be a more important phase thangenerally appreciated. It is reasonable to propose that thevasospasm that occurs in some patients in Phase III shouldbe monitored using TCD ultrasonography and treatedin the same way as vasospasm that follows aneurysmalsubarachnoid hemorrhage—with volume expansion andinduced arterial hypertension.28,45 Treatment with nimo-dipine (or yet-to-be-developed drugs) may reduce theischemic neurological damage that may occur during thisphase. For particularly severe symptomatic cases, balloonangioplasty may be considered.16
Acknowledgments
The authors wish to thank Walter Obrist, Ph.D., David Stump,Ph.D., and David Beyda, M.D., for their advice and assistance withthe CBF measurement technique. We would also like to acknowl-edge Kathleen Thomas-Lukes, Brenda Rinsky, and Oscar Barcenasfor performing the TCD studies presented in this report, and EulaMckinney and Karen Einstein for secretarial assistance.
References
1. Aaslid R, Markwalder TH, Nornes H: Noninvasive transcranialDoppler ultrasound recording of flow velocity in basal cerebralarteries. J Neurosurg 57:769–774, 1982
2. Adams RJ, Nichols FT, Hess DC: Normal values and physio-logical variables, in Newell DW, Aaslid R (eds): TranscranialDoppler. New York: Raven Press, 1992, pp 41–48
3. Agnoli A, Prencipe M, Priori AM, et al: Measurements of therCBF by intravenous injection of 133Xe. A comparative studywith the intra-arterial injection method, in Brock M, FieschiC, Ingvar DH, et al (eds): Cerebral Blood Flow. Clinicaland Experimental Results. Berlin: Springer-Verlag, 1969, pp31–34
4. Andersen BJ, Marmarou A: Post-traumatic selective stimula-tion of glycolysis. Brain Res 585:184–189, 1992
5. Bergsneider M, Hovda DA, Shalmon E, et al: Cerebral hy-perglycolysis following severe traumatic brain injury in hu-mans: a positron emission tomography study. J Neurosurg 86:241–251, 1997
6. Bergsneider M, Kelly DF, Shalmon E, et al: Dynamic changesin cerebral glucose metabolism following severe head injury asmeasured by positron emission tomography. J Cereb BloodFlow Metab 15 (Suppl 1):S26, 1995 (Abstract)
7. Bouma GJ, Muizelaar JP: Cerebral blood flow, cerebral bloodvolume, and cerebrovascular reactivity after severe head injury.J Neurotrauma 9 (Suppl 1):S333–S348, 1992
8. Bouma GJ, Muizelaar JP: Evaluation of regional cerebral bloodflow in acute head injury by stable xenon-enhanced computer-ized tomography. Acta Neurochir Suppl 59:34–40, 1993
9. Bouma GJ, Muizelaar JP, Choi SC, et al: Cerebral circulationand metabolism after severe traumatic brain injury: the elusiverole of ischemia. J Neurosurg 75:685–693, 1991
10. Bouma GJ, Muizelaar JP, Stringer WA, et al: Ultra-early eval-uation of regional cerebral blood flow in severely head-injuredpatients using xenon-enhanced computerized tomography. JNeurosurg 77:360–368, 1992
11. Bruce DA, Langfitt TW, Miller JD, et al: Regional cerebralblood flow, intracranial pressure, and brain metabolism in co-matose patients. J Neurosurg 38:131–144, 1973
12. Chan KH, Dearden NM, Miller JD: The significance of post-traumatic increase in cerebral blood flow velocity: a transcra-nial Doppler ultrasound study. Neurosurgery 30:697–700,1992
13. De Salles AAF, Muizelaar JP, Young HF: Hyperglycemia,cerebrospinal fluid lactic acidosis, and cerebral blood flow inseverely head-injured patients. Neurosurgery 21:45–50, 1987
14. Enevoldsen EM, Cold G, Jensen FT, et al: Dynamic changes inregional CBF, intraventricular pressure, CSF pH and lactatelevels during the acute phase of head injury. J Neurosurg44:191–214, 1976
15. Enevoldsen EM, Jensen FT: Compartmental analysis of region-al cerebral blood flow in patients with acute severe head in-juries. J Neurosurg 47:699–712, 1977
16. Eskridge JM, Newell DW, Pendleton GA: Transluminal angio-plasty for treatment of vasospasm. Neurosurg Clin North Am1:387–399, 1990
17. Fieschi C, Battistini N, Beduschi A, et al: Regional cerebralblood flow and intraventricular pressure in acute head injuries.J Neurol Neurosurg Psychiatry 37:1378–1388, 1974
J. Neurosurg. / Volume 87 / July, 1997
Hemodynamics in severe head injury
17

18. Fineman I, Hovda DA, Smith M, et al: Concussive brain injuryis associated with a prolonged accumulation of calcium: a 45Caautoradiographic study. Brain Res 624:94–102, 1993
19. Gobiet W, Grote W, Bock WJ: The relation between intracra-nial pressure, mean arterial pressure and cerebral blood flow inpatients with severe head injury. Acta Neurochir 32:13–24,1975
20. Gomez CR, Backer RJ, Bucholz RD: Transcranial Dopplerultrasound following closed head injury: vasospasm or vasopa-ralysis? Surg Neurol 35:30–35, 1991
21. Graham DI, Adams JH, Doyle D: Ischaemic brain damage infatal non-missile head injuries. J Neurol Sci 39:213–234, 1978
22. Hayes RL, Jenkins LW, Lyeth BG: Neurotransmitter-mediatedmechanisms of traumatic brain injury: acetylcholine and exci-tatory amino acids. J Neurotrauma 9 (Suppl 1):S173–S187,1992
23. Hekmatpanah J, Hekmatpanah CR: Microvascular alterationsfollowing cerebral contusion in rats. Light, scanning, and elec-tron microscope study. J Neurosurg 62:888–897, 1985
24. Hovda DA, Lee SM, Smith ML, et al: The neurochemical andmetabolic cascade following brain injury: moving from animalmodels to man. J Neurotrauma 12:903–906, 1995
25. Huger F, Patrick G: Effect of concussive head injury on centralcatecholamine levels and synthesis rates in rat brain regions. JNeurochem 33:89–95, 1979
26. Jaggi JL, Obrist WD, Gennarelli TA, et al: Relationship of earlycerebral blood flow and metabolism to outcome in acute headinjury. J Neurosurg 72:176–182, 1990
27. Jakobsen M, Enevoldsen E: Retrograde catheterization ofthe right internal jugular vein for serial measurements of cere-bral venous oxygen content. J Cereb Blood Flow Metab 9:717–720, 1989
28. Kassell NF, Peerless SJ, Durward QJ, et al: Treatment of isch-emic deficits from vasospasm with intravascular volume ex-pansion and induced arterial hypertension. Neurosurgery 11:337–343, 1982
29. Kelly DF, Kordestani RK, Martin NA, et al: Hyperemia fol-lowing traumatic brain injury: relationship to intracranial hy-pertension and outcome. J Neurosurg 85:762–771, 1996
30. Legarth J, Thorup E: Characteristics of Doppler blood-velocitywaveforms in a cardiovascular in vitro model. II: The influenceof peripheral resistance, perfusion pressure and blood flow.Scand J Clin Lab Invest 49:459–464, 1989
31. Lindegaard KF, Nornes H, Bakke SJ, et al: Cerebral vasospasmdiagnosis by means of angiography and blood velocity mea-surements. Acta Neurochir 100:12–24, 1989
32. MacFarlane R, Moskowitz MA, Sakas DE, et al: The roleof neuroeffector mechanisms in cerebral hyperperfusion syn-dromes. J Neurosurg 75:845–855, 1991
33. Macpherson P, Graham DI: Correlation between angiographicfindings and the ischaemia of head injury. J Neurol NeurosurgPsychiatry 41:122–127, 1978
34. Marion DW, Darby J, Yonas H: Acute regional cerebral bloodflow changes caused by severe head injuries. J Neurosurg 74:407–414, 1991
35. Marmarou A, Ward JD, Young HF, et al: Impact of ICP insta-bility and hypotension on outcome in patients with severe headtrauma. J Neurosurg 75 (Suppl):S59–S66, 1991
36. Martin NA, Doberstein C, Alexander M, et al: Posttraumaticcerebral arterial spasm. J Neurotrauma 12:897–901, 1995
37. Martin NA, Doberstein C, Zane C, et al: Posttraumatic cerebralarterial spasm: transcranial Doppler ultrasound, cerebral bloodflow, and angiographic findings. J Neurosurg 77:575–583,1992
38. McIntosh TK, Ferriero D: Changes in neuropeptide Y after ex-perimental traumatic injury in the rat. J Cereb Blood FlowMetab 12:697–702, 1992
39. Miller JD, Dearden NM, Piper IR, et al: Control of intracranial
pressure in patients with severe head injury. J Neurotrauma 9(Suppl 1):S317–S326, 1992
40. Muir JK, Boerschel M, Ellis EF: Continuous monitoring ofposttraumatic cerebral blood flow using laser-Doppler flowme-try. J Neurotrauma 9:355–362, 1992
41. Muizelaar JP, Marmarou A, DeSalles AAF, et al: Cerebralblood flow and metabolism in severely head-injured children.Part 1: Relationship with GCS score, outcome, ICP, and PVI. JNeurosurg 71:63–71, 1989
42. Obrist WD, Gennarelli TA, Segawa H, et al: Relation of cere-bral blood flow to neurological status and outcome in head-in-jured patients. J Neurosurg 51:292–300, 1979
43. Obrist WD, Langfitt TW, Jaggi JL, et al: Cerebral blood flowand metabolism in comatose patients with acute head injury.Relationship to intracranial hypertension. J Neurosurg 61:241–253, 1984
44. Obrist WD, Marion DW, Aggarwal S, et al: Time course ofcerebral blood flow and metabolism in comatose patients withacute head injury. J Cereb Blood Flow Metab 13:S571, 1993(Abstract)
45. Origitano TC, Wascher TM, Reichman OH, et al: Sustained in-creased cerebral blood flow with prophylactic hypertensive hy-pervolemic hemodilution (“Triple-H” therapy) after subarach-noid hemorrhage. Neurosurgery 27:729–748, 1990
46. Overgaard J, Mosdal C, Tweed WA: Cerebral circulation afterhead injury. Part 3: Does reduced regional cerebral blood flowdetermine recovery of brain function after blunt head injury? JNeurosurg 55:63–74, 1981
47. Overgaard J, Tweed WA: Cerebral circulation after head injury.Part 1: Cerebral blood flow and its regulation after closed headinjury with emphasis on clinical correlations. J Neurosurg41:531–541, 1974
48. Pfenninger EG, Reith A, Breitig D, et al: Early changes of in-tracranial pressure, perfusion pressure, and blood flow afteracute head injury. Part 1: An experimental study of the under-lying pathophysiology. J Neurosurg 70:774–779, 1989
49. Robertson CS, Contant CF, Narayan RK, et al: Cerebral bloodflow, AVDO
2, and neurologic outcome in head-injured patients.
J Neurotrauma 9 (Suppl 1):S349–S358, 199250. Robertson CS, Grossman RG, Goodman JC, et al: The predic-
tive values of cerebral anaerobic metabolism with cerebral in-farction after head injury. J Neurosurg 67:361–368, 1987
51. Robertson CS, Narayan RK, Gokaslan ZL, et al: Cerebral arte-riovenous oxygen difference as an estimate of cerebral bloodflow in comatose patients. J Neurosurg 70:222–230, 1989
52. Rosner MJ, Rosner SD, Johnson AH: Cerebral perfusion pres-sure: management protocol and clinical results. J Neurosurg83:949–962, 1995
53. Schröder ML, Muizelaar JP, Bullock MR, et al: Focal ischemiadue to traumatic contusions documented by stable xenon-CTand ultrastructural studies. J Neurosurg 82:966–971, 1995
54. Sheinberg M, Kanter MJ, Robertson CS, et al: Continuous mon-itoring of jugular venous oxygen saturation in head-injured pa-tients. J Neurosurg 76:212–217, 1992
55. Shohami E, Novikov M, Bass R, et al: Closed head injury trig-gers early production of TNF alpha and IL-6 by brain tissue. JCereb Blood Flow Metab 14:615–619, 1994
56. Sorteberg W, Langmoen IA, Lindegaard KF, et al: Side-to-sidedifferences and day-to-day variations of transcranial Dopplerparameters in normal subjects. J Ultrasound Med 9:403–409,1990
57. Suwanwela C, Suwanwela N: Intracranial arterial narrowingand spasm in acute head injury. J Neurosurg 36:314–323,1972
58. Teasdale G, Jennett B: Assessment of coma and impaired con-sciousness. A practical scale. Lancet 2:81–84, 1974
59. Velarde F, Fisher DT, Hovda DA, et al: Fluid percussion injuryinduces prolonged changes in cerebral blood flow. J Neuro-trauma 9:402, 1992 (Abstract)
N. A. Martin, et al.
18 J. Neurosurg. / Volume 87 / July, 1997
60. Weber M, Grolimund P, Seiler RW: Evaluation of posttraumat-ic cerebral blood flow velocities by transcranial Doppler ultra-sonography. Neurosurgery 27:106–112, 1990
61. White RP: Responses of isolated cerebral arteries to vasoactiveagents. Neurosurg Clin North Am 1:401–415, 1990
62. White RP, Hagen AA: Cerebrovascular actions of prosta-glandins. Pharmacol Ther 18:313–331, 1982
63. Wilkins RH, Odom GL: Intracranial arterial spasm associatedwith craniocerebral trauma. J Neurosurg 32:626–633, 1970
64. Winn HR, Rubio R, Berne RM: Brain adenosine concentrationduring hypoxia in rats. Am J Physiol 241:H235–H242, 1981
65. Yamakami I, McIntosh TK: Alterations in regional cerebralblood flow following brain injury in the rat. J Cereb BloodFlow Metab 11:655–660, 1991
66. Yanagisawa M, Kurihara H, Kimura S, et al: A novel potentvasoconstrictor peptide produced by vascular endothelial cells.Nature 332:411–415, 1988
67. Yoshino A, Hovda DA, Kawamata T, et al: Dynamic changesin local cerebral glucose utilization following cerebral concus-sion in rats: evidence of a hyper- and subsequent hypometabol-ic state. Brain Res 561:106–119, 1991
68. Yuan XQ, Prough DS, Smith TL, et al: The effects of traumat-ic brain injury on regional cerebral blood flow in rats. J Neuro-trauma 5:289–301, 1988
69. Zane CJ, Khanna R, Martin N, et al: Patterns of cerebral bloodflow and transcranial Doppler ultrasound velocities followinghead injury. J Neurosurg 76:399A, 1992 (Abstract)
Manuscript received May 29, 1996.Accepted in final form January 27, 1997.This study was funded by Grant No. NS 30308 (UCLA Brain
Injury Research Center, D. P. Becker, Principal Investigator; Cere-bral Blood Flow Project, N. A. Martin, Project Investigator) fromthe National Institute for Neurological Disorders and Stroke; and bygifts from the MacDonald Family Foundation, and the PermanentCharities Committee of the Entertainment Industry.
Address reprint requests to: Neil A. Martin, M.D., Division ofNeurosurgery, UCLA Medical Center, CHS 74-140, 10833 LeConte Avenue, Los Angeles, California 90024–7039. email: [email protected].
J. Neurosurg. / Volume 87 / July, 1997
Hemodynamics in severe head injury
19