Characterization of binding interactions between green tea flavanoids and milk proteins
7
Characterization of binding interactions between green tea flavanoids and milk proteins Zerrin Yuksel a, * , Elif Avci b , Yasar Kemal Erdem b a Canakkale Onsekiz Mart University, Department of Food Technology, Bayramic Vocational Collage, Canakkale, Turkey b Hacettepe University, Department of Food Engineering, Beytepe, Turkey article info Article history: Received 29 April 2009 Received in revised form 22 October 2009 Accepted 17 December 2009 Keywords: Green tea Flavanoids Milk proteins Casein Binding Hydrophobicity ITC abstract Flavanoids are known to interact with proteins to form complexes whose properties depend on the struc- ture of both the flavanoids and the protein. In this study, the fluorescent probe binding method (fluorim- etry analysis) and isothermal titration calorimetry (ITC) analysis were used to characterize binding interactions of green tea (GT) flavanoids and milk proteins. The hydrophobicity of the surface sites of milk proteins was estimated using the reconstituted milk–green tea and casein–green tea systems. Reconsti- tuted milk–green tea and casein–green tea samples were prepared with different solid-non-fat (SNF) and casein (Cn) concentrations, respectively. It was observed that the number of surface hydrophobic sites decreased in the presence of GT flavanoids for all SNF and Cn concentrations. The decrease in protein sur- face hydrophobicity was explained by the hydrophobic binding between milk proteins and GT flavanoids. The binding enthalpies obtained from ITC analysis implied that interaction was non-covalent between catechin and b-casein. Ó 2009 Elsevier Ltd. All rights reserved. 1. Introduction Polyphenols and phenolic compounds are synthesized as sec- ondary plant metabolites by plants and are widely distributed in the plant kingdom (Ratnavathi & Sashidhar, 1998). Polyphenols have received much attention because of their potential health benefits (Papadopoulou, Green, & Frazier, 2005). Beneficial effects of tea have been attributed to the strong antioxidative activity of the tea phenolic compounds, known as tea catechins (Jaziri, Slama, Mhadhbi, Urdaci, & Hamdi, 2009). Phenolic compounds comprise an aromatic ring, bearing one or more hydroxyl substituent and range from simple phenolic compounds to highly polymerized compounds (Balasundram, Sundram, & Sammon, 2006). The cate- chins represent nearly 80% of the total flavanoid content of green tea (GT). Major tea catechins include epicatechin (EC), epigalloca- techin (EGC), epigallocatechingallate (EGCG) and epicatechingal- late (ECG). With epidemiological and biological data supporting a potential protective role for tea and tea catechins, development of new products with tea as an active ingredient has expanded (Ferruzi & Green, 2006). It is thought that the interacting ability of GT flavanoids with proteins is important, as well as their antioxidant capacity. The importance of interaction between GT catechins and proteins may result from possible alterations of their bioavailability and functionality. Most of the literature suggests that hydrophobic and hydrogen bondings are responsible for polyphenol–protein interactions. However, it was observed that in a heat stability as- say, which was carried out at 140 °C, hydrophobic and hydrogen bondings were negligible. The ability of polyphenols to interact covalently with proteins has also been suggested (O’Connell and Fox, 1999). It was reported that phenolic compounds have an ability to interact with proteins (even precipitate), especially proline-rich proteins (such as salivary proteins and caseins) (Fox, 2001). Proline groups (e.g., in b-Cn) have a strong affinity for the hydroxyl (–OH) groups of catechins (Arts et al., 2002). There was a study of the effect of tea extracts on the colloidal stability of milk. Addition of tea extracts increased the heat stabil- ity of milk, increased coagulation time and slightly increased the alcohol stability of milk (O’Connell, Fox, Tan-Kintia, & Fox, 1998). Milk proteins have a common feature related to their cross-link- ing affinity, and its effect on texture, as well as nutritional proper- ties. The reactions of milk proteins with some functional groups of other compounds in food have gained increasing attention in food research. The major milk proteins, caseins, have a micelle structure which is formed mainly via electrostatic interactions, and that is a major result of the hydrophobic character of casein fractions. The casein fractions are a s1 -, a s2 -, b- and j-caseins, of which the molar ratio is about 4:1:4:1.6, respectively. The properties of the caseins 0308-8146/$ - see front matter Ó 2009 Elsevier Ltd. All rights reserved. doi:10.1016/j.foodchem.2009.12.064 * Corresponding author. Tel.: +90 286 773 2512; fax: +90 286 773 2513. E-mail address: [email protected] (Z. Yuksel). Food Chemistry 121 (2010) 450–456 Contents lists available at ScienceDirect Food Chemistry journal homepage: www.elsevier.com/locate/foodchem
-
Upload
marmaraedu -
Category
Documents
-
view
3 -
download
0
Transcript of Characterization of binding interactions between green tea flavanoids and milk proteins

Food Chemistry 121 (2010) 450–456
Contents lists available at ScienceDirect
Food Chemistry
journal homepage: www.elsevier .com/locate / foodchem
Characterization of binding interactions between green tea flavanoidsand milk proteins
Zerrin Yuksel a,*, Elif Avci b, Yasar Kemal Erdem b
a Canakkale Onsekiz Mart University, Department of Food Technology, Bayramic Vocational Collage, Canakkale, Turkeyb Hacettepe University, Department of Food Engineering, Beytepe, Turkey
a r t i c l e i n f o
Article history:Received 29 April 2009Received in revised form 22 October 2009Accepted 17 December 2009
Keywords:Green teaFlavanoidsMilk proteinsCaseinBindingHydrophobicityITC
0308-8146/$ - see front matter � 2009 Elsevier Ltd. Adoi:10.1016/j.foodchem.2009.12.064
* Corresponding author. Tel.: +90 286 773 2512; faE-mail address: [email protected] (Z. Yuksel).
a b s t r a c t
Flavanoids are known to interact with proteins to form complexes whose properties depend on the struc-ture of both the flavanoids and the protein. In this study, the fluorescent probe binding method (fluorim-etry analysis) and isothermal titration calorimetry (ITC) analysis were used to characterize bindinginteractions of green tea (GT) flavanoids and milk proteins. The hydrophobicity of the surface sites of milkproteins was estimated using the reconstituted milk–green tea and casein–green tea systems. Reconsti-tuted milk–green tea and casein–green tea samples were prepared with different solid-non-fat (SNF) andcasein (Cn) concentrations, respectively. It was observed that the number of surface hydrophobic sitesdecreased in the presence of GT flavanoids for all SNF and Cn concentrations. The decrease in protein sur-face hydrophobicity was explained by the hydrophobic binding between milk proteins and GT flavanoids.The binding enthalpies obtained from ITC analysis implied that interaction was non-covalent betweencatechin and b-casein.
� 2009 Elsevier Ltd. All rights reserved.
1. Introduction
Polyphenols and phenolic compounds are synthesized as sec-ondary plant metabolites by plants and are widely distributed inthe plant kingdom (Ratnavathi & Sashidhar, 1998). Polyphenolshave received much attention because of their potential healthbenefits (Papadopoulou, Green, & Frazier, 2005). Beneficial effectsof tea have been attributed to the strong antioxidative activity ofthe tea phenolic compounds, known as tea catechins (Jaziri, Slama,Mhadhbi, Urdaci, & Hamdi, 2009). Phenolic compounds comprisean aromatic ring, bearing one or more hydroxyl substituent andrange from simple phenolic compounds to highly polymerizedcompounds (Balasundram, Sundram, & Sammon, 2006). The cate-chins represent nearly 80% of the total flavanoid content of greentea (GT). Major tea catechins include epicatechin (EC), epigalloca-techin (EGC), epigallocatechingallate (EGCG) and epicatechingal-late (ECG). With epidemiological and biological data supporting apotential protective role for tea and tea catechins, developmentof new products with tea as an active ingredient has expanded(Ferruzi & Green, 2006).
It is thought that the interacting ability of GT flavanoids withproteins is important, as well as their antioxidant capacity. Theimportance of interaction between GT catechins and proteins
ll rights reserved.
x: +90 286 773 2513.
may result from possible alterations of their bioavailability andfunctionality. Most of the literature suggests that hydrophobicand hydrogen bondings are responsible for polyphenol–proteininteractions. However, it was observed that in a heat stability as-say, which was carried out at 140 �C, hydrophobic and hydrogenbondings were negligible. The ability of polyphenols to interactcovalently with proteins has also been suggested (O’Connell andFox, 1999).
It was reported that phenolic compounds have an ability tointeract with proteins (even precipitate), especially proline-richproteins (such as salivary proteins and caseins) (Fox, 2001). Prolinegroups (e.g., in b-Cn) have a strong affinity for the hydroxyl (–OH)groups of catechins (Arts et al., 2002).
There was a study of the effect of tea extracts on the colloidalstability of milk. Addition of tea extracts increased the heat stabil-ity of milk, increased coagulation time and slightly increased thealcohol stability of milk (O’Connell, Fox, Tan-Kintia, & Fox, 1998).
Milk proteins have a common feature related to their cross-link-ing affinity, and its effect on texture, as well as nutritional proper-ties. The reactions of milk proteins with some functional groups ofother compounds in food have gained increasing attention in foodresearch. The major milk proteins, caseins, have a micelle structurewhich is formed mainly via electrostatic interactions, and that is amajor result of the hydrophobic character of casein fractions. Thecasein fractions are as1-, as2-, b- and j-caseins, of which the molarratio is about 4:1:4:1.6, respectively. The properties of the caseins
Z. Yuksel et al. / Food Chemistry 121 (2010) 450–456 451
differ from those of most proteins. Caseins are hydrophobic; theyhave a fairly high charge, many prolines and a few cystine residues(Walstra, Geurts, Noomen, Jellema, & van Boekel, 1999). So, caseinsshow a tendency to associate with other proteins, and also someligands, according to the hydrophobic character of the micelle.Caseins are known to be proline-rich proteins. The hydrophobicityof proteins is determined by several methods. The most popularone is by using an anionic fluorescent probe of the aromatic sul-phonic class, e.g., 1-anilinonapthalene-8-sulfonate (ANS). Titrationof protein solutions with increasing concentrations of fluorescentprobe provides information on both the number and affinity ofbinding sites (Erdem, 2000).
Isothermal titration calorimetry (ITC) is the most direct methodfor measuring the heat change on formation of a complex at con-stant temperature. Since a titration experiment is performed inwhich L (catechin) is titrated, a solution of M (b-Cn) binding iso-therms is obtained. After each addition of aliquots of a small ali-quot of L, the heat released or absorbed in the sample cell ismeasured with respect to a reference cell filled with buffer. Thebinding isotherms were further analyzed by fitting the data to abinding model to yield the binding constant, K, and the bindingparameters, n, DS and DH (Frazier, Papadopoulou, & Green, 2006;Jelesarov & Bosshard, 1999).
Polyphenols may intract covalently or non-covalently with pro-teins. The non-covalent interactions between phenolic compoundsand proteins have been suggested to be created by hydrophobicinteractions, which may subsequently be stabilized by hydrogenbonding (Prigent et al., 2003). However, the natures of the interac-tions between polyphenols and proteins are still unclear.
The aim of this study is to contribute to the studies on the asso-ciation/binding type of GT flavanoids and milk proteins. The studywas carried out both in reconstituted milk (RS) and casein (Cn) sys-tems, by the fluorescent probe binding method for milk–GT andcasein–GT systems and ITC for b-casein and (+)catechin mixture.
2. Materials and methods
Dried green tea leaves were purchased from the local market(Ankara, Turkey). The green tea (GT) infusion was obtained byextraction of GT at 80 �C/10 min with deionized water, then coarsefiltering. The skim milk powder was obtained from Enka Dairy S.C.(Konya, Turkey). Reconstituted milk was prepared in deionizedwater at given concentrations (8, 10, 12, 14, and 16%) at 40 �C.
Technical bovine casein (Sigma, Cat. No. 7078, Germany) wasdispersed in phosphate buffer (50 mM, pH 6.8) at given concentra-tions (1, 1.5, 2.0, 2.5, 3.0, and 4.0%). For sample preparations, dilu-tions of the samples were carried out using deionized water andphosphate buffer (50 mM, pH 6.8) for reconstituted milk (RS) andcasein (Cn), respectively. Addition of GT infusion to the reconsti-tuted milk samples and casein samples was performed to arriveat a distinct value of total phenolic content. Undiluted and diluted(1:1) samples were used for fluorimetry analyses. This dilutionyielded a dilute medium for protein characterization.
The total phenolic content of the green tea infusions was deter-mined using the Folin–Ciocalteu method (Rababah, Hettiarachchy,& Horax, 2004), with some modifications.
The protein content of the samples was determined accordingto the Bradford (1976) method. The fluorescent probe used was1-anilinonapthalene-8-sulfonate (ANS, Merck Cat. No. 10762, Ger-many). The relative fluorescence of the samples was measured byusing a Perkin–Elmer Model LS50B spectrofluorimeter (UK) witha normal (glass) cell, at kex = 390 nm, kem = 480 nm. The main aimin this procedure is to reach a maximum fluorescence which wouldshow a saturated fluorescent marker (ANS) binding. The differentconcentrations (1, 5 and 10 mM) of ANS solutions were prepared
and used for ANS titration. Final concentration of ANS in the milkwas between 0 and 136 lM during the titration. Before ANS titra-tion, fluorescence of the samples was measured as a blank. Milksamples or casein solutions do not show a fluorescence or havethe lowest level of fluorescence alone whereas the ‘‘ANS–proteincomplex” has a marked fluorescence. All values were calculatedas the averages of four different kinetic approaches: Lineweaver–Burk, Hanes–Woolf, Eadie–Hofstee and Michelis–Menten (Bonomi,Iametti, Pagliarini, & Solaroli, 1994; Erdem, 2000).
ITC was used to determine the thermodynamic properties of(+)catechin–b-casein interaction. The reaction was studied at25 �C using a TAM III microcalorimeter (TA Instruments, New Cas-tle, Delaware, USA). Before analysis, the ITC calibration was per-formed (Wadsö & Goldberg, 2001) by diluting aqueous sucrosesolution (Sigma Co., St. Louis, MO). The DH of dilution determinedwas within the acceptable limits, confirming that the instrumentwas functioning properly.
(+)Catechin and b-casein were suspended in phosphate buffer(50 mM, pH 6.8) and the reference ampoule was filled with buffersolution. (+)Catechin solution (8.75 mM) was placed in a 250 llsyringe and 800 ll of casein solution (0.26 mM) were placed inthe sample ampoule. The (+)catechin solution was injected by acomputer-controlled pump in 12 injections (10 ll/injection), intothe stirred sample ampoule containing SEB solution. Heat releasedwith each injection was measured by the calorimeter in dynamiccorrection mode. A blank experiment was performed by titrating(+)catechin solution into PBS to determine the heats of dilutionwhich were subtracted from the heats of interaction. Binding con-stant (K), the change in enthalpy (DH), the change in free energy(DG) and the change in entropy (DS) were determined by usingthe software package of TAM Assistant supplied by TA Instruments.
All Figures were drawn with the values of the average of thethree determinations. The kinetic approach was carried out usinga personal computer. Statistical analyses were carried out usingMicrosoft�-Excel.
3. Results and discussion
3.1. General
The main approach of the study was to use the relative fluores-cence intensity parameters obtained from the ANS titration, tostudy the possible associations between the milk proteins and GTflavanoids in terms of hydrophobicity.
It is well known that ANS binds to the casein micelleshydrophobically. It was assumed that there were two types ofhydrophobic sites (weak and strong) on the surface of the micelle(Erdem, 2000) to which ANS binds.
Spectrofluorometric analysis depends on the gaining of fluores-cent character with ANS binding to hydrophobic regions of mi-celles, in both casein solution and reconstituted milk. ANS is notfluorescent in the solution alone, whereas the ANS–protein com-plex shows fluorescent character and the given wavelengths ofemission and excitation were specific for this complex. However,the samples without ANS were measured as blank and used in esti-mation of the ANS, including samples to eliminate the turbidity af-fect. So, measured fluorescence values depend only on ANS boundto the proteins.
There appears to be a general consensus on the hydrophobicinteractions between the proteins and flavanoids, in the literature;an alteration in the formation of ‘‘ANS–protein” complex forminghydrophobically would be expected in the presence of GTflavanoids.
The tendency to interaction between caseins and flavanoids wasobserved at constant and at increasing protein concentrations. The

(a)
(b)
Fig. 1. ANS titration curves of (a) reconstituted milk samples, (b) green tea includedreconstituted milk samples with increasing SNF concentration.
(a)
(b)
Fig. 2. ANS titration curves of (a) casein solution samples (b) green tea includedcasein solution samples with increasing casein content.
452 Z. Yuksel et al. / Food Chemistry 121 (2010) 450–456
increasing substrate (protein) concentration was used for explain-ing the kinetic mechanism of the reaction. The constant proteinconcentration of reconstituted milk and casein samples was fixedat 3%, with increasing phenolic content (50–1600 ppm). The sam-ples were examined for relative intensity of fluorescence (ANStitration). When the results of kinetic parameters were evaluated,the samples containing 200 ppm of phenolics exhibited the mostadequate kinetic data. However, the kinetics of the results showedthat the data which were obtained above 200 ppm could not beevaluated (data are not shown). Thus, 200 ppm of phenolics waschosen for the study, and samples were prepared at protein con-centrations of 1–4%.
Kinetic data were obtained from ANS titration curves (Figs. 1and 2). In the data, F denotes the amount of fluorescence createdby the number of ANS bonded surface hydrophobic sites on thecasein micelles. Thus, Fmax represents both the maximum fluores-cence that could be attained under the given conditions and alsothe maximum number of surface sites allowable, to which ANScould be bound. 1/Kd gives the binding affinity of ANS to the milkproteins. If 1/Kd increases, it means the binding affinity of ANS alsoincreases. Fmax/Kd denotes the tightness of the binding. An increasein Fmax/Kd denotes an increase in the strength of binding. The spec-trofluorimetric data and the estimated results are given in Table 1.ANS titration curves are shown in Fig. 1 for reconstituted milk andFig. 2 for casein samples. PSH is the protein surface hydrophobicityindex, that is the average tightness per protein, and it was calcu-lated using Eq. (1).
PSH ¼ Fmax=Kd � ½P� ð1Þ
3.2. Reconstituted milk/green tea system
As it is shown in Figs. 1 and 2, the presence of GT flavanoids andthe protein concentration of the samples affect the fluorescenceintensity of the milk protein system. The increasing ANS concen-tration during the ANS titration supplies an increased hydrophobicbinding agent to the system. It was observed that the relativeintensity of fluorescence was increased to a maximum (Fmax) andit was then kept almost constant. The differences between slopesand units of the curves caused by both the protein concentrationand the presence of GT, contribute to the explanation of interactionof milk proteins and GT flavanoids. The highest slope of the curves(means the most attractive interaction between proteins and ANS)was observed at the lowest protein concentration without GT flav-anoids. The slope was decreased with increasing protein contentdue to possible protein–protein interactions with increasing pro-tein concentration, caused by decreased collision length betweenthem. The lowest slope was observed for the sample of the highestprotein content with GT flavanoids.
It was observed that the GT flavanoids prevented the binding ofANS to the casein micelles due to possible interactions betweencaseins and GT flavanoids. First of all, the hydrophobic affinity ofGT for the ANS was tested and it was found that the relative fluo-rescence values were 0 ± 0.17. This means that there were no sig-nificant interaction between the GT flavanoids and ANS.
Drastic changes in the spectrofluorometric data were observedin reconstituted milk samples, including the green tea. It was foundthat the number of surface hydrophobic sites (Fmax) decreaseddrastically with the presence of GT flavanoids at different solids-non-fat (SNF) concentrations (Fig. 3(a)). The observed decrease ofthe number of surface hydrophobic sites (Fmax) showed that GT
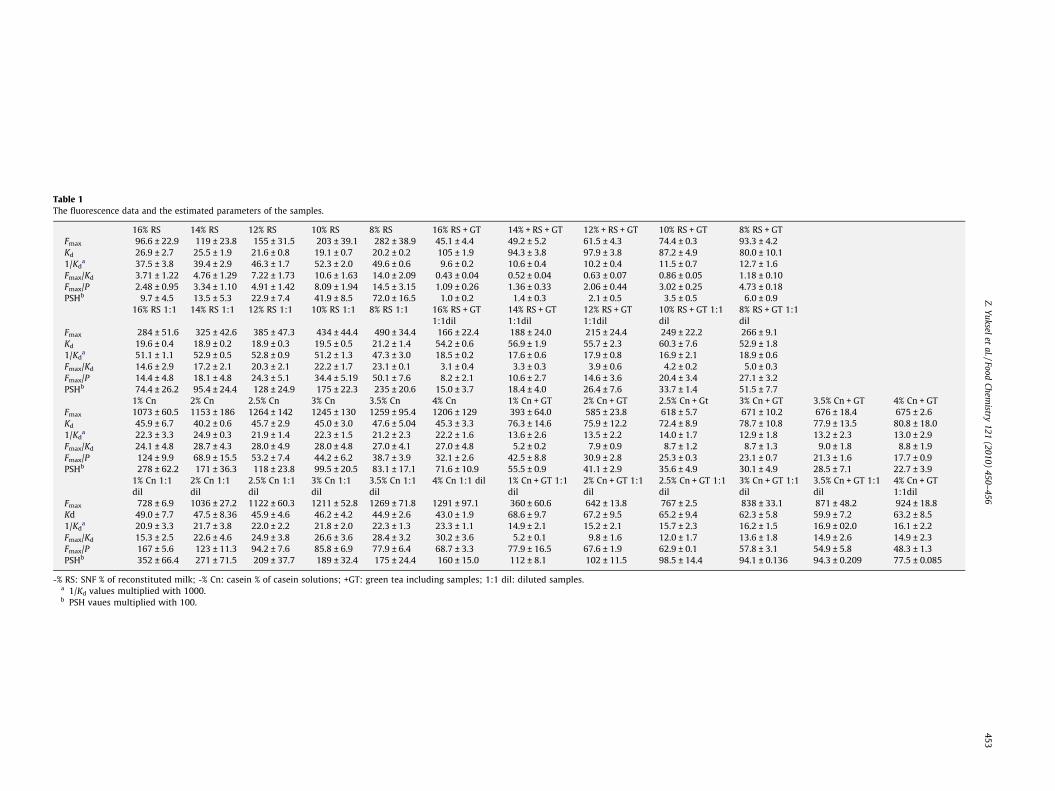
Table 1The fluorescence data and the estimated parameters of the samples.
16% RS 14% RS 12% RS 10% RS 8% RS 16% RS + GT 14% + RS + GT 12% + RS + GT 10% RS + GT 8% RS + GTFmax 96.6 ± 22.9 119 ± 23.8 155 ± 31.5 203 ± 39.1 282 ± 38.9 45.1 ± 4.4 49.2 ± 5.2 61.5 ± 4.3 74.4 ± 0.3 93.3 ± 4.2Kd 26.9 ± 2.7 25.5 ± 1.9 21.6 ± 0.8 19.1 ± 0.7 20.2 ± 0.2 105 ± 1.9 94.3 ± 3.8 97.9 ± 3.8 87.2 ± 4.9 80.0 ± 10.11/Kd
a 37.5 ± 3.8 39.4 ± 2.9 46.3 ± 1.7 52.3 ± 2.0 49.6 ± 0.6 9.6 ± 0.2 10.6 ± 0.4 10.2 ± 0.4 11.5 ± 0.7 12.7 ± 1.6Fmax/Kd 3.71 ± 1.22 4.76 ± 1.29 7.22 ± 1.73 10.6 ± 1.63 14.0 ± 2.09 0.43 ± 0.04 0.52 ± 0.04 0.63 ± 0.07 0.86 ± 0.05 1.18 ± 0.10Fmax/P 2.48 ± 0.95 3.34 ± 1.10 4.91 ± 1.42 8.09 ± 1.94 14.5 ± 3.15 1.09 ± 0.26 1.36 ± 0.33 2.06 ± 0.44 3.02 ± 0.25 4.73 ± 0.18PSHb 9.7 ± 4.5 13.5 ± 5.3 22.9 ± 7.4 41.9 ± 8.5 72.0 ± 16.5 1.0 ± 0.2 1.4 ± 0.3 2.1 ± 0.5 3.5 ± 0.5 6.0 ± 0.9
16% RS 1:1 14% RS 1:1 12% RS 1:1 10% RS 1:1 8% RS 1:1 16% RS + GT1:1dil
14% RS + GT1:1dil
12% RS + GT1:1dil
10% RS + GT 1:1dil
8% RS + GT 1:1dil
Fmax 284 ± 51.6 325 ± 42.6 385 ± 47.3 434 ± 44.4 490 ± 34.4 166 ± 22.4 188 ± 24.0 215 ± 24.4 249 ± 22.2 266 ± 9.1Kd 19.6 ± 0.4 18.9 ± 0.2 18.9 ± 0.3 19.5 ± 0.5 21.2 ± 1.4 54.2 ± 0.6 56.9 ± 1.9 55.7 ± 2.3 60.3 ± 7.6 52.9 ± 1.81/Kd
a 51.1 ± 1.1 52.9 ± 0.5 52.8 ± 0.9 51.2 ± 1.3 47.3 ± 3.0 18.5 ± 0.2 17.6 ± 0.6 17.9 ± 0.8 16.9 ± 2.1 18.9 ± 0.6Fmax/Kd 14.6 ± 2.9 17.2 ± 2.1 20.3 ± 2.1 22.2 ± 1.7 23.1 ± 0.1 3.1 ± 0.4 3.3 ± 0.3 3.9 ± 0.6 4.2 ± 0.2 5.0 ± 0.3Fmax/P 14.4 ± 4.8 18.1 ± 4.8 24.3 ± 5.1 34.4 ± 5.19 50.1 ± 7.6 8.2 ± 2.1 10.6 ± 2.7 14.6 ± 3.6 20.4 ± 3.4 27.1 ± 3.2PSHb 74.4 ± 26.2 95.4 ± 24.4 128 ± 24.9 175 ± 22.3 235 ± 20.6 15.0 ± 3.7 18.4 ± 4.0 26.4 ± 7.6 33.7 ± 1.4 51.5 ± 7.7
1% Cn 2% Cn 2.5% Cn 3% Cn 3.5% Cn 4% Cn 1% Cn + GT 2% Cn + GT 2.5% Cn + Gt 3% Cn + GT 3.5% Cn + GT 4% Cn + GTFmax 1073 ± 60.5 1153 ± 186 1264 ± 142 1245 ± 130 1259 ± 95.4 1206 ± 129 393 ± 64.0 585 ± 23.8 618 ± 5.7 671 ± 10.2 676 ± 18.4 675 ± 2.6Kd 45.9 ± 6.7 40.2 ± 0.6 45.7 ± 2.9 45.0 ± 3.0 47.6 ± 5.04 45.3 ± 3.3 76.3 ± 14.6 75.9 ± 12.2 72.4 ± 8.9 78.7 ± 10.8 77.9 ± 13.5 80.8 ± 18.01/Kd
a 22.3 ± 3.3 24.9 ± 0.3 21.9 ± 1.4 22.3 ± 1.5 21.2 ± 2.3 22.2 ± 1.6 13.6 ± 2.6 13.5 ± 2.2 14.0 ± 1.7 12.9 ± 1.8 13.2 ± 2.3 13.0 ± 2.9Fmax/Kd 24.1 ± 4.8 28.7 ± 4.3 28.0 ± 4.9 28.0 ± 4.8 27.0 ± 4.1 27.0 ± 4.8 5.2 ± 0.2 7.9 ± 0.9 8.7 ± 1.2 8.7 ± 1.3 9.0 ± 1.8 8.8 ± 1.9Fmax/P 124 ± 9.9 68.9 ± 15.5 53.2 ± 7.4 44.2 ± 6.2 38.7 ± 3.9 32.1 ± 2.6 42.5 ± 8.8 30.9 ± 2.8 25.3 ± 0.3 23.1 ± 0.7 21.3 ± 1.6 17.7 ± 0.9PSHb 278 ± 62.2 171 ± 36.3 118 ± 23.8 99.5 ± 20.5 83.1 ± 17.1 71.6 ± 10.9 55.5 ± 0.9 41.1 ± 2.9 35.6 ± 4.9 30.1 ± 4.9 28.5 ± 7.1 22.7 ± 3.9
1% Cn 1:1dil
2% Cn 1:1dil
2.5% Cn 1:1dil
3% Cn 1:1dil
3.5% Cn 1:1dil
4% Cn 1:1 dil 1% Cn + GT 1:1dil
2% Cn + GT 1:1dil
2.5% Cn + GT 1:1dil
3% Cn + GT 1:1dil
3.5% Cn + GT 1:1dil
4% Cn + GT1:1dil
Fmax 728 ± 6.9 1036 ± 27.2 1122 ± 60.3 1211 ± 52.8 1269 ± 71.8 1291 ± 97.1 360 ± 60.6 642 ± 13.8 767 ± 2.5 838 ± 33.1 871 ± 48.2 924 ± 18.8Kd 49.0 ± 7.7 47.5 ± 8.36 45.9 ± 4.6 46.2 ± 4.2 44.9 ± 2.6 43.0 ± 1.9 68.6 ± 9.7 67.2 ± 9.5 65.2 ± 9.4 62.3 ± 5.8 59.9 ± 7.2 63.2 ± 8.51/Kd
a 20.9 ± 3.3 21.7 ± 3.8 22.0 ± 2.2 21.8 ± 2.0 22.3 ± 1.3 23.3 ± 1.1 14.9 ± 2.1 15.2 ± 2.1 15.7 ± 2.3 16.2 ± 1.5 16.9 ± 02.0 16.1 ± 2.2Fmax/Kd 15.3 ± 2.5 22.6 ± 4.6 24.9 ± 3.8 26.6 ± 3.6 28.4 ± 3.2 30.2 ± 3.6 5.2 ± 0.1 9.8 ± 1.6 12.0 ± 1.7 13.6 ± 1.8 14.9 ± 2.6 14.9 ± 2.3Fmax/P 167 ± 5.6 123 ± 11.3 94.2 ± 7.6 85.8 ± 6.9 77.9 ± 6.4 68.7 ± 3.3 77.9 ± 16.5 67.6 ± 1.9 62.9 ± 0.1 57.8 ± 3.1 54.9 ± 5.8 48.3 ± 1.3PSHb 352 ± 66.4 271 ± 71.5 209 ± 37.7 189 ± 32.4 175 ± 24.4 160 ± 15.0 112 ± 8.1 102 ± 11.5 98.5 ± 14.4 94.1 ± 0.136 94.3 ± 0.209 77.5 ± 0.085
-% RS: SNF % of reconstituted milk; -% Cn: casein % of casein solutions; +GT: green tea including samples; 1:1 dil: diluted samples.a 1/Kd values multiplied with 1000.b PSH vaues multiplied with 100.
Z.Yukselet
al./FoodChem
istry121
(2010)450–
456453
(a)
(b)
(c)
(d)
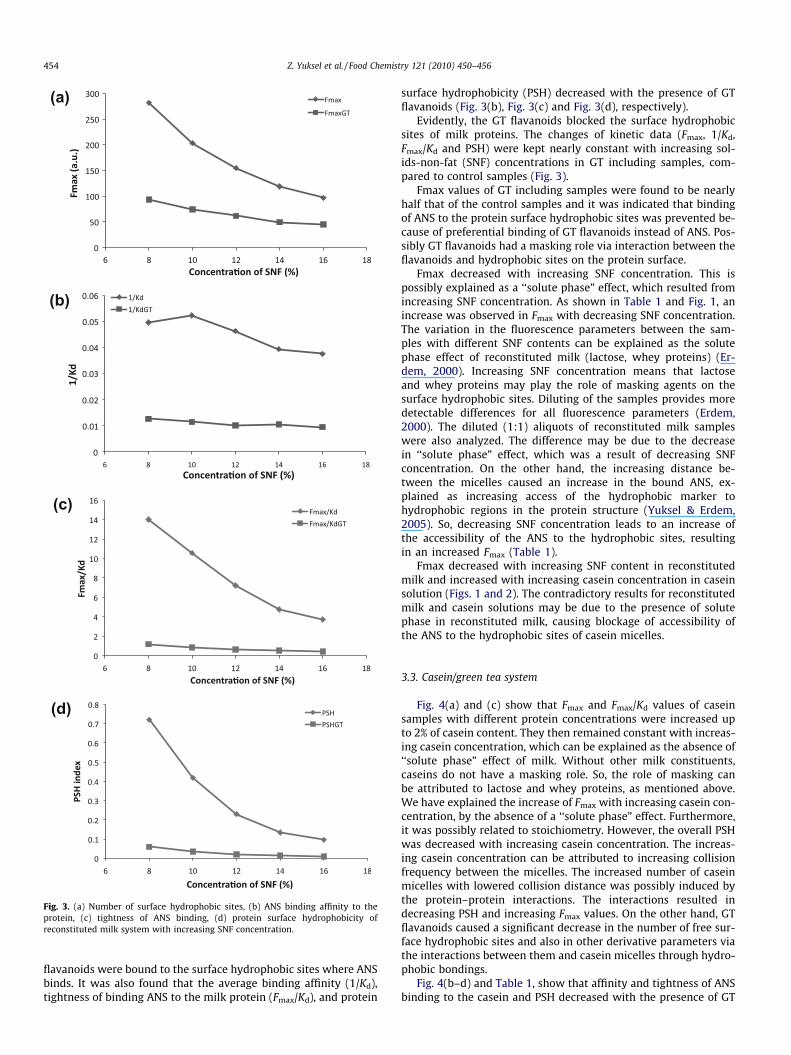
Fig. 3. (a) Number of surface hydrophobic sites, (b) ANS binding affinity to theprotein, (c) tightness of ANS binding, (d) protein surface hydrophobicity ofreconstituted milk system with increasing SNF concentration.
454 Z. Yuksel et al. / Food Chemistry 121 (2010) 450–456
flavanoids were bound to the surface hydrophobic sites where ANSbinds. It was also found that the average binding affinity (1/Kd),tightness of binding ANS to the milk protein (Fmax/Kd), and protein
surface hydrophobicity (PSH) decreased with the presence of GTflavanoids (Fig. 3(b), Fig. 3(c) and Fig. 3(d), respectively).
Evidently, the GT flavanoids blocked the surface hydrophobicsites of milk proteins. The changes of kinetic data (Fmax, 1/Kd,Fmax/Kd and PSH) were kept nearly constant with increasing sol-ids-non-fat (SNF) concentrations in GT including samples, com-pared to control samples (Fig. 3).
Fmax values of GT including samples were found to be nearlyhalf that of the control samples and it was indicated that bindingof ANS to the protein surface hydrophobic sites was prevented be-cause of preferential binding of GT flavanoids instead of ANS. Pos-sibly GT flavanoids had a masking role via interaction between theflavanoids and hydrophobic sites on the protein surface.
Fmax decreased with increasing SNF concentration. This ispossibly explained as a ‘‘solute phase” effect, which resulted fromincreasing SNF concentration. As shown in Table 1 and Fig. 1, anincrease was observed in Fmax with decreasing SNF concentration.The variation in the fluorescence parameters between the sam-ples with different SNF contents can be explained as the solutephase effect of reconstituted milk (lactose, whey proteins) (Er-dem, 2000). Increasing SNF concentration means that lactoseand whey proteins may play the role of masking agents on thesurface hydrophobic sites. Diluting of the samples provides moredetectable differences for all fluorescence parameters (Erdem,2000). The diluted (1:1) aliquots of reconstituted milk sampleswere also analyzed. The difference may be due to the decreasein ‘‘solute phase” effect, which was a result of decreasing SNFconcentration. On the other hand, the increasing distance be-tween the micelles caused an increase in the bound ANS, ex-plained as increasing access of the hydrophobic marker tohydrophobic regions in the protein structure (Yuksel & Erdem,2005). So, decreasing SNF concentration leads to an increase ofthe accessibility of the ANS to the hydrophobic sites, resultingin an increased Fmax (Table 1).
Fmax decreased with increasing SNF content in reconstitutedmilk and increased with increasing casein concentration in caseinsolution (Figs. 1 and 2). The contradictory results for reconstitutedmilk and casein solutions may be due to the presence of solutephase in reconstituted milk, causing blockage of accessibility ofthe ANS to the hydrophobic sites of casein micelles.
3.3. Casein/green tea system
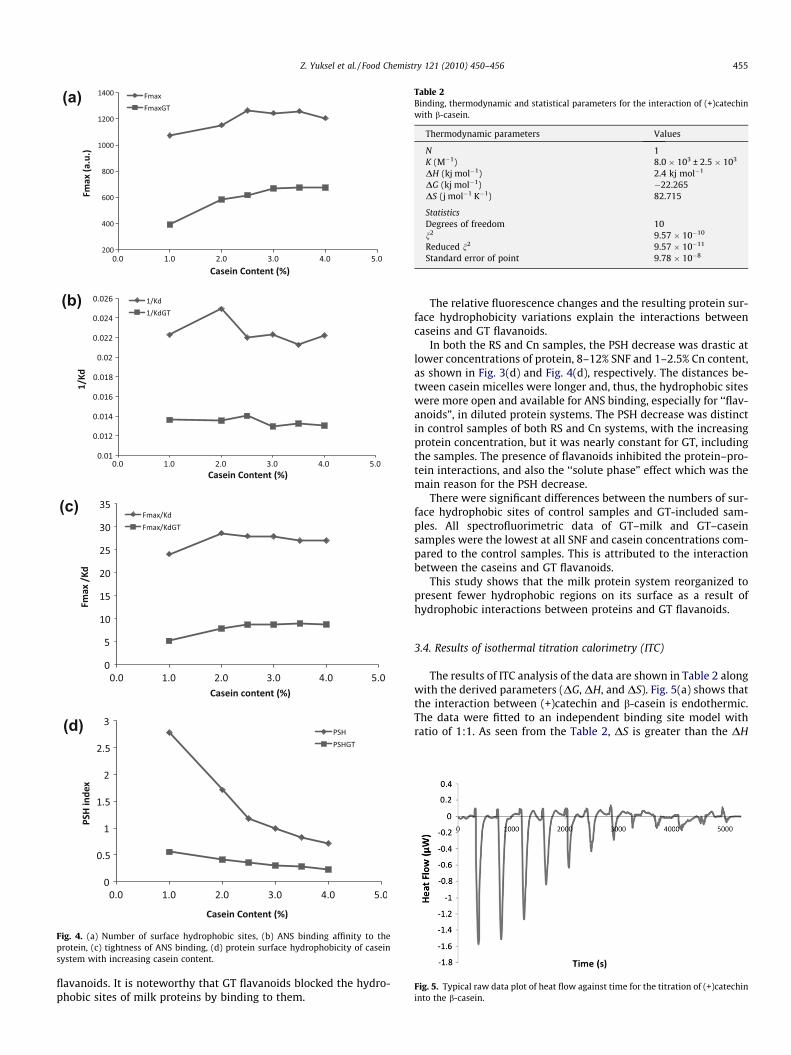
Fig. 4(a) and (c) show that Fmax and Fmax/Kd values of caseinsamples with different protein concentrations were increased upto 2% of casein content. They then remained constant with increas-ing casein concentration, which can be explained as the absence of‘‘solute phase” effect of milk. Without other milk constituents,caseins do not have a masking role. So, the role of masking canbe attributed to lactose and whey proteins, as mentioned above.We have explained the increase of Fmax with increasing casein con-centration, by the absence of a ‘‘solute phase” effect. Furthermore,it was possibly related to stoichiometry. However, the overall PSHwas decreased with increasing casein concentration. The increas-ing casein concentration can be attributed to increasing collisionfrequency between the micelles. The increased number of caseinmicelles with lowered collision distance was possibly induced bythe protein–protein interactions. The interactions resulted indecreasing PSH and increasing Fmax values. On the other hand, GTflavanoids caused a significant decrease in the number of free sur-face hydrophobic sites and also in other derivative parameters viathe interactions between them and casein micelles through hydro-phobic bondings.
Fig. 4(b–d) and Table 1, show that affinity and tightness of ANSbinding to the casein and PSH decreased with the presence of GT
(a)
(b)
(d)
(c)
Fig. 4. (a) Number of surface hydrophobic sites, (b) ANS binding affinity to theprotein, (c) tightness of ANS binding, (d) protein surface hydrophobicity of caseinsystem with increasing casein content.
Table 2Binding, thermodynamic and statistical parameters for the interaction of (+)catechinwith b-casein.
Thermodynamic parameters Values
N 1K (M�1) 8.0 � 103 ± 2.5 � 103
DH (kj mol�1) 2.4 kj mol�1
DG (kj mol�1) �22.265DS (j mol�1 K�1) 82.715
StatisticsDegrees of freedom 10n2 9.57 � 10�10
Reduced n2 9.57 � 10�11
Standard error of point 9.78 � 10�8
Fig. 5. Typical raw data plot of heat flow against time for the titration of (+)catechininto the b-casein.
Z. Yuksel et al. / Food Chemistry 121 (2010) 450–456 455
flavanoids. It is noteworthy that GT flavanoids blocked the hydro-phobic sites of milk proteins by binding to them.
The relative fluorescence changes and the resulting protein sur-face hydrophobicity variations explain the interactions betweencaseins and GT flavanoids.
In both the RS and Cn samples, the PSH decrease was drastic atlower concentrations of protein, 8–12% SNF and 1–2.5% Cn content,as shown in Fig. 3(d) and Fig. 4(d), respectively. The distances be-tween casein micelles were longer and, thus, the hydrophobic siteswere more open and available for ANS binding, especially for ‘‘flav-anoids”, in diluted protein systems. The PSH decrease was distinctin control samples of both RS and Cn systems, with the increasingprotein concentration, but it was nearly constant for GT, includingthe samples. The presence of flavanoids inhibited the protein–pro-tein interactions, and also the ‘‘solute phase” effect which was themain reason for the PSH decrease.
There were significant differences between the numbers of sur-face hydrophobic sites of control samples and GT-included sam-ples. All spectrofluorimetric data of GT–milk and GT–caseinsamples were the lowest at all SNF and casein concentrations com-pared to the control samples. This is attributed to the interactionbetween the caseins and GT flavanoids.
This study shows that the milk protein system reorganized topresent fewer hydrophobic regions on its surface as a result ofhydrophobic interactions between proteins and GT flavanoids.
3.4. Results of isothermal titration calorimetry (ITC)
The results of ITC analysis of the data are shown in Table 2 alongwith the derived parameters (DG, DH, and DS). Fig. 5(a) shows thatthe interaction between (+)catechin and b-casein is endothermic.The data were fitted to an independent binding site model withratio of 1:1. As seen from the Table 2, DS is greater than the DH
456 Z. Yuksel et al. / Food Chemistry 121 (2010) 450–456
value, which means that the reaction was entropically driven. Theexplanation for the entropically driven reaction was the hydrationeffect during the complex formation, so that water molecules werereleased from the complex interface (Jelesarov & Bosshard, 1999).
The negative free energy meant a requirement for a spontane-ous biomolecular reaction. The binding enthalpies implied thatthe interaction was non-covalent since the enthalpies were toolow for covalent bond formation to have occurred (200–400 kj/mol) (Frazier et al., 2006).
4. Conclusions
The aim of the present study was to investigate the bindingtype between GT flavanoids and milk proteins, using different ap-proaches. No studies have been undertaken to characterize bind-ing interactions between GT flavanoids and milk proteins withPSH measurement. This method was deemed appropriate todetermine any alteration that might occur on hydrophobic siteson the protein, via any substance, because of specific binding ofANS to the hydrophobic sites of the protein surface. The decreasein fluorescence indicated hydrophobic bonding between polyphe-nols and milk proteins. Results of ITC analysis also support thisfinding.
The hydrophobic bindings and the decrease in hydrophobic re-gions of the protein system were important. Hydrophobic pro-tein–polyphenol interactions were demonstrated. The term 1/Kd,which means the binding affinity of ANS to the protein surfacehydrophobic sites, decreased with the presence of GT flavanoids.This finding showed that flavanoids had a greater affinity forthe surface hydrophobic sites of protein. Flavanoids might bindpreferentially to the hydrophobic sites of the proteins with re-spect to ANS. Furthermore, the tightness of ANS binding (Fmax/Kd) was reduced by the flavanoids. After the formation of the flav-anoid–protein binding, only weak hydrophobic sites remained onthe surface of the micelles to which ANS could bind. Hydrophobicsites which were located on the protein surface were masked viathe presence of GT flavanoids. Thus, the study demonstrates thehydrophobic binding that occurs between GT flavanoids and milkproteins.
Cross-linking of milk proteins is an important fact because ofpotential effects on textural properties of milk products, e.g., yo-gurt and cheese. The cross-linking effect of green tea flavanoidson milk proteins can be used for manufacturing of novel milk prod-ucts with desired textural properties. Therefore, interactions ofgreen tea flavanoids with milk proteins must be considered in thisregard. Nevertheless, they may be acceptable food additives be-cause of their antioxidant and anticarcinogenic activities; so theyalso contribute to the functionality of the products. Displayingthe interactions of flavanoids with milk proteins is a necessary sub-ject, as they may be potential food additives.
Acknowledgments
The authors express their gratitude to Dr. Levent Tezcan for hispermission to use the spectrofluorimeter and to Miss. F. Ceyda Du-dak for ITC measurements.
References
Arts, M. J. T. J., Haenen, G. R. M. M., Wilms, L. C., Beetstra, S. A. J. N., Heijnen, C. G. M.,Voss, H. P., et al. (2002). Interactions between flavonols and proteins: Effect onthe total antioxidant capacity. Journal of Agriculture and Food Chemistry, 50,1184–1187.
Balasundram, N., Sundram, K., & Sammon, S. (2006). Phenolic compounds in plantsand agri-industrial by-products: Antioxidant activity, occurrence and potentialuses. Food Chemistry, 99, 191–203.
Bonomi, F., Iametti, S., Pagliarini, E., & Solaroli, G. (1994). Thermal sensitivity ofmares’milk proteins. Journal of Dairy Research, 61, 419–422.
Bradford, M. M. (1976). A rapid and sensitive method for quantitation of microgramquantities of protein utilizing the principle of protein–dye binding. AnalyticalBiochemistry, 72, 248–254.
Erdem, Y. K. (2000). Influence of ultrafiltration on modification of surfacehydrophobic sites of the milk protein system in the course of renneting.Journal of Food Engineering, 44, 63–70.
Ferruzi, M. G., & Green, R. J. (2006). Analysis of catechins from milk–tea beveragesby enzyme assisted extraction followed by high performance liquidchromatography. Food Chemistry, 99, 484–491.
Fox, P. F. (2001). Milk proteins as food ingredients. International Journal of DairyTechnology, 54(2), 41–55.
Frazier, R. A., Papadopoulou, A., & Green, R. J. (2006). Isothermal titrationcalorimetry study of epicatechin binding to serum albumin. Journal ofPharmaceutical and Biomedical Analysis, 41, 1602–1605.
Jaziri, I., Slama, M. B., Mhadhbi, H., Urdaci, M. C., & Hamdi, M. (2009). Effect of greenand black teas (Camellia sinensis L.) on the characteristic microflora of yogurtduring fermentation and refrigerated storage. Food Chemistry, 112, 614–620.
Jelesarov, I., & Bosshard, H. R. (1999). Isothermal titration calorimetry anddifferential scanning calorimetry as complementary tools to investigate theenergetics of biomolecular recognition. Journal of Molecular Recognition, 12,3–18.
O’Connell, J. E., & Fox, P. F. (1999). Proposed mechanism for the effect of polyphenolson the heat stability of milk. International Dairy Journal, 9, 523–536.
O’Connell, J. E., Fox, P. D., Tan-Kintia, R., & Fox, P. F. (1998). Effect of tea, coffee andcocoa extracts on the colloidal stability of milk and concentrated milk.International Dairy Journal, 8, 689–693.
Papadopoulou, A., Green, R. J., & Frazier, R. A. (2005). Interaction of flavonoids withbovine serum albumin: A fluorescence quenching study. Journal of Agricultureand Food Chemistry, 53, 158–163.
Prigent, S. V. E., Gruppen, H., Visser, A. J. W. G., van Koningsveld, G. A., de Jong, G. A.H., & Voragen, A. G. J. (2003). Effect of non-covalent interactions with 5-o-coffeoylquinic acid (chlorogenic acid) on the heat denaturation and solubility ofglobular proteins. Journal of Agriculture and Food Chemistry, 51, 5088–5095.
Rababah, T. M., Hettiarachchy, N. S., & Horax, R. (2004). Total phenolics andantioxidant activities of fenugreek, green tea, black tea, grape seed, ginger,rosemary, gotu kola, and ginkgo extracts, vitamin E, and ter-butylhydroquinone. Journal of Agriculture and Food Chemistry, 52, 5183–5186.
Ratnavathi, C. V., & Sashidhar, R. B. (1998). Microassay for the quantitation ofprotein precipitable polyphenols: Use of bovine serum albumin–benzidineconjugate as a protein probe. Food Chemistry, 61(3), 373–380.
Wadsö, I., & Goldberg, R. N. (2001). Standards in isothermal microcalorimetry. Pureand Applied Chemistry, 73(10), 1625–1639.
Walstra, P., Geurts, T. J., Noomen, A., Jellema, A., & van Boekel, M. A. J. S. (1999).Dairy technology. New York, Basel: Marcel Dekker, Inc..
Yuksel, Z., & Erdem, Y. K. (2005). The influence of main milk components on thehyrophobic interactions of milk protein system on the course of heat treatment.Journal of Food Engineering, 67, 301–308.