Class X Chapter 7 – Metallurgy Chemistry - Clarify Knowledge
Upload
independentCategory
view
4download
0
INTERNATIONAL JOURNAL OF RESEARCH IN AERONAUTICAL AND MECHANICAL ENGINEERING
Vol.2 Issue.2,
February 2014.
Pgs: 131-147
Ramesh.B.T 131
ISSN (ONLINE): 2321-3051
INTERNATIONAL JOURNAL OF RESEARCH IN AERONAUTICAL AND MECHANICAL ENGINEERING
Characterization of Al Based Nano composites Using Powder Metallurgy Technique
Ramesh.B.T
Department of Mechanical Engineering, STJ Institute of Technology, Rannebennur
Author Correspondence: Telephone: +91-9900784915 Email address: [email protected]
Abstract
Aluminum based metal matrix composites (MMCs) are appropriate materials for structural applications in the
aircraft and automotive industries because they are ductile, highly conductive, and lightweight and have a high strength-to-weight ratio. Uniform dispersion of the fine reinforcements and a fine-grained matrix improve the mechanical properties of the composite. The present work proposes to take aluminum as the matix and nanomaterials such as carbon nanotube, graphene and nano-diamond as reinforcement to get the nanocomposites. The synthesis is carried out by powder metallurgy technique. Further the works propose to study the microstructural study and density, hardness, wear study of these nano composites with different volume fraction. Scanning electron is done to know the distribution of matrix and reinforcement. Keywords: Nano composites, Powder Metallurgy, Aluminium.
1. Introduction
A composite material is a system composed of a mixture or combination of two or more macro-constituents differing in form and/or material composition and that are essentially insoluble in each other. Composite materials contain a matrix with one or more physically distinct, distributed phase known as reinforcement or fillers, to get required properties. The reinforcement is added to the matrix in order to obtain the desired properties like strength, stiffness, toughness.
We can found less work on Nano composite materials used as reinforcements, produced by different fabrication methods, to investigate the micro structural and mechanical properties of fabricated nanocomposite. A K Srivastava et.al,[1] have discussed in their paper that experiments carried out on aluminum-carbon nanotubes, produced using catalytic chemical vapour deposition method, are prepared with initial composition of aluminum homogeneously mixed with 1,2,4 and 10wt% nanotubes and subsequently hot pressed. The experimental result shows that carbon nanotubes uniformly distributed in aluminum matrix with a higher concentration of the tubes at the grain boundaries. ZHANG Mei-juan et.al, [2] studied on magnesium matrix composites reinforced by graphite particles and Al2O3 short fibres were fabricated by squeeze-infiltration technique. The microstructures and wear properties of the composites with different Ce contents of 0, 0.4%, 0.8% and 1.0%, respectively, were investigated. The results reveal that Ce enriches around the boundaries of
INTERNATIONAL JOURNAL OF RESEARCH IN AERONAUTICAL AND MECHANICAL ENGINEERING
Vol.2 Issue.2,
February 2014.
Pgs: 131-147
Ramesh.B.T 132
graphite particles and forms Al3Ce phase with Al. Z. Razavi Hesabi et.al, [3] worked on Al-5vol% Al2O3 micro and nanocomposite were produced by mechanical milling followed by hot powder extrusion. To determine the effect of nanoparticles on high temperature properties, specimens were annealed at 350 ºC and then tensile test was conducted at 300 ºC. Fracture surfaces were observed by SEM. The result reveals that with the addition of 5 vol% Al2O3 nanoparticles, tensile strength of Al was increased from 116 to365 MPa. S.R Bakshi et.al, [4] this review summarises that the mechanical property improvements achieved by addition of CNTs in various metal matrix system .the factor determining strengthening achieved by CNTs in different metal matrixes .
Kyung Tae Kim et.al, [5] in this paper, the CNT reinforced Cu matrix nanocomposites were fabricated by spark plasma sintering (SPS) of high energy ball-milled nano-sized Cu powders with multi-wall CNTs, and followed by cold rolling process. The CNT/Cu nanocomposites show a tensile strength of 281MPa, which is approximately 1.6 times higher than that of monolithic Cu. H. R. Shahverdi et.al, [6] In this study Al-5 (Vol) % SiC nanocomposite powder has been successfully synthesized by high-energy planetary milling of Al and SiC powders for a period of 25 h at a ball-to-powder ratio of 15:1. The changes of the lattice strain, the crystallite size of the matrix phase, and the nanocomposite powder microstructure with time have been investigated by X-ray diffraction (XRD), X-ray mapping, and scanning electron microscopy (SEM) analyses. Javed Iqbal et.al, [7] this paper reveals that Carbon Nanotubes are one the most important materials of future. Discovered in 1991, they have reached a stage of attracting the interests of many companies worldwide for their large scale production. They possess remarkable electrical, mechanical, optical, thermal and chemical properties, which make them a perfect “fit” for many engineering applications. A.A. Khalil et.al, [8] Production of a homogenous, high strength and net shape structural components made from aluminum-silicon carbide composites can be achieved using powder metallurgy (PM) technology. In the present work the problem of low strength of the aluminum silicon carbide produced by powder metallurgy (PM) is solved by rising the sintering temperature of the composite above the melting temperature of the aluminum. The microstructure for each composition examined to study both the homogeneity and the interaction between the constituents.
H. Kaftelen et.al, [9] suggest that Nano-diamond powders were used as a reinforcement material in aluminum matrix to improve physical and mechanical properties of composites. Composite powders of aluminum matrix reinforced with ultra dispersed nano-diamond particles were produced by high energy ball milling (8000D Spex mixer mill) under Arc atmosphere for four different mechanical alloying (MA) times, i.e. 30, 60, 90 and 120 min. K. Hanada et.al, [10] in this study, Al-Si alloy-based nanocomposite with dispersed detonation nano-diamond as reinforcement is fabricated by powder metallurgy method. Rapid solidified Al-Si alloy powder and detonation nano-diamond of 1 % by volume are mechanically mixed at 500 rpm for 4 hours, then the detonation nano-diamond used as additives are graphite nano-diamond (as-synthesized) and nanodiamond (as-refined). Stephen F et.al, [11] in this paper composite of graphene platelets and aluminum were made using ball milling, hot extrusion. The mechanical properties and micro structure were studied using hardness and tensile test, as well as electron microscopy, x-ray differential scanning calorimeter. Compared to the pure aluminium and multi walled carbon nanotube composites, the graphene-aluminum composite showed decreased strength and hardness.
2. Material and Methods
Among all materials, aluminum based metal matrix composites (MMCs) are appropriate materials for structural applications in the aircraft and automotive industries because they are ductile, highly conductive, corrosion resistance and lightweight and have a high strength-to-weight ratio [12-18]. Uniform dispersion of the fine reinforcements and a fine-grained matrix improve the mechanical properties of the composite.
The particulates reinforced metal matrix composite (MMC) is one of the new structural materials, and a rapid development can be seen in recent years because of excellent properties and wide application prospects in the near future. Based on size and shape we are going to select reinforcement material, carbon nanotube is considered among several nanocomposite materials. Carbon nanotubes been expected as an ideal reinforcement to improve the mechanical performance of monolithic materials due to their high elastic modulus, strength and aspect ratio [19]. The fabrication process by which graphene is synthesized defines its properties and as a result
INTERNATIONAL JOURNAL OF RESEARCH IN AERONAUTICAL AND MECHANICAL ENGINEERING
Vol.2 Issue.2,
February 2014.
Pgs: 131-147
Ramesh.B.T 133
of its applications [20-21]. It should be noted that there is no single method of graphene synthesis that yields graphene exhibiting the optimum properties for all potential applications; therefore, many routes for the synthesis of graphene have been reported [22-25]. Nanodiamond have been synthesized by the detonation technique, laser ablation [26], high energy ball milling of high pressure high temperature diamond micro crystals.
The powder metallurgy is one of the popular solid state methods used in production of metal matrix composites. Powder processing involves cold pressing and sintering, or hot pressing to fabricate primarily particle- or whisker-reinforced MMCs. Carbon nanotubes are initially dispersed in a solvent and sonicated for 20 min and it is been evaporated by heating the solvent.
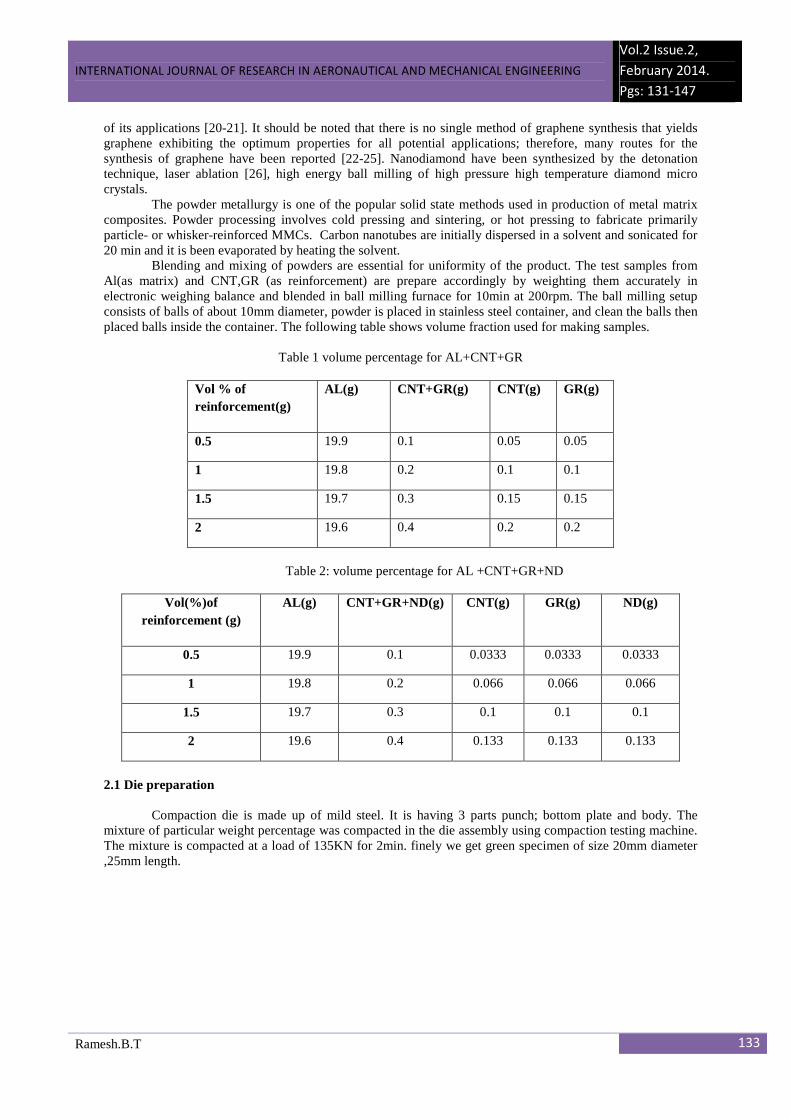
Blending and mixing of powders are essential for uniformity of the product. The test samples from Al(as matrix) and CNT,GR (as reinforcement) are prepare accordingly by weighting them accurately in electronic weighing balance and blended in ball milling furnace for 10min at 200rpm. The ball milling setup consists of balls of about 10mm diameter, powder is placed in stainless steel container, and clean the balls then placed balls inside the container. The following table shows volume fraction used for making samples.
Table 1 volume percentage for AL+CNT+GR
Vol % of reinforcement(g)
AL(g) CNT+GR(g) CNT(g) GR(g)
0.5 19.9 0.1 0.05 0.05
1 19.8 0.2 0.1 0.1
1.5 19.7 0.3 0.15 0.15
2 19.6 0.4 0.2 0.2
Table 2: volume percentage for AL +CNT+GR+ND
Vol(%)of
reinforcement (g) AL(g) CNT+GR+ND(g) CNT(g) GR(g) ND(g)
0.5 19.9 0.1 0.0333 0.0333 0.0333
1 19.8 0.2 0.066 0.066 0.066
1.5 19.7 0.3 0.1 0.1 0.1
2 19.6 0.4 0.133 0.133 0.133
2.1 Die preparation
Compaction die is made up of mild steel. It is having 3 parts punch; bottom plate and body. The mixture of particular weight percentage was compacted in the die assembly using compaction testing machine. The mixture is compacted at a load of 135KN for 2min. finely we get green specimen of size 20mm diameter ,25mm length.
INTERNATIONAL JOURNAL OF RESEARCH IN AERONAUTICAL AND MECHANICAL ENGINEERING
Vol.2 Issue.2,
February 2014.
Pgs: 131-147
Ramesh.B.T 134
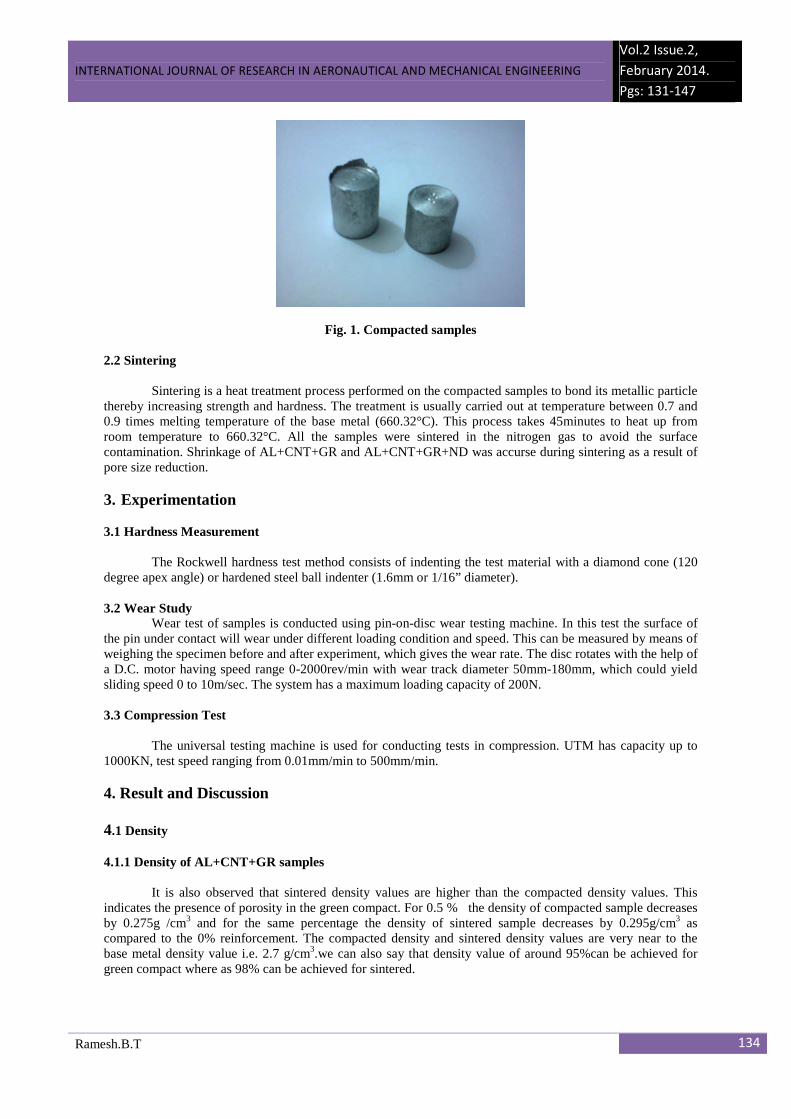
Fig. 1. Compacted samples 2.2 Sintering
Sintering is a heat treatment process performed on the compacted samples to bond its metallic particle thereby increasing strength and hardness. The treatment is usually carried out at temperature between 0.7 and 0.9 times melting temperature of the base metal (660.32°C). This process takes 45minutes to heat up from room temperature to 660.32°C. All the samples were sintered in the nitrogen gas to avoid the surface contamination. Shrinkage of AL+CNT+GR and AL+CNT+GR+ND was accurse during sintering as a result of pore size reduction.
3. Experimentation 3.1 Hardness Measurement
The Rockwell hardness test method consists of indenting the test material with a diamond cone (120
degree apex angle) or hardened steel ball indenter (1.6mm or 1/16” diameter). 3.2 Wear Study
Wear test of samples is conducted using pin-on-disc wear testing machine. In this test the surface of the pin under contact will wear under different loading condition and speed. This can be measured by means of weighing the specimen before and after experiment, which gives the wear rate. The disc rotates with the help of a D.C. motor having speed range 0-2000rev/min with wear track diameter 50mm-180mm, which could yield sliding speed 0 to 10m/sec. The system has a maximum loading capacity of 200N.
3.3 Compression Test
The universal testing machine is used for conducting tests in compression. UTM has capacity up to 1000KN, test speed ranging from 0.01mm/min to 500mm/min.
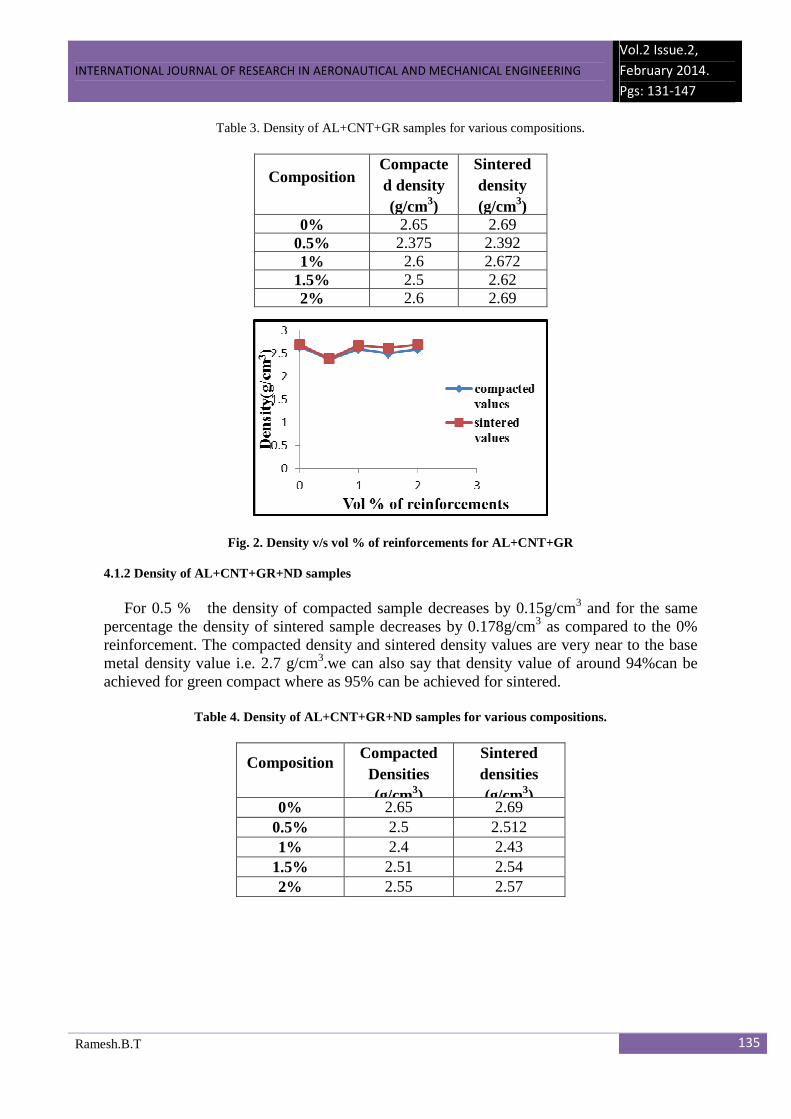
4. Result and Discussion 4.1 Density 4.1.1 Density of AL+CNT+GR samples It is also observed that sintered density values are higher than the compacted density values. This indicates the presence of porosity in the green compact. For 0.5 % the density of compacted sample decreases by 0.275g /cm3 and for the same percentage the density of sintered sample decreases by 0.295g/cm3 as compared to the 0% reinforcement. The compacted density and sintered density values are very near to the base metal density value i.e. 2.7 g/cm3.we can also say that density value of around 95%can be achieved for green compact where as 98% can be achieved for sintered.
INTERNATIONAL JOURNAL OF RESEARCH IN AERONAUTICAL AND MECHANICAL ENGINEERING
Vol.2 Issue.2,
February 2014.
Pgs: 131-147
Ramesh.B.T 135
Table 3. Density of AL+CNT+GR samples for various compositions.
Fig. 2. Density v/s vol % of reinforcements for AL+CNT+GR
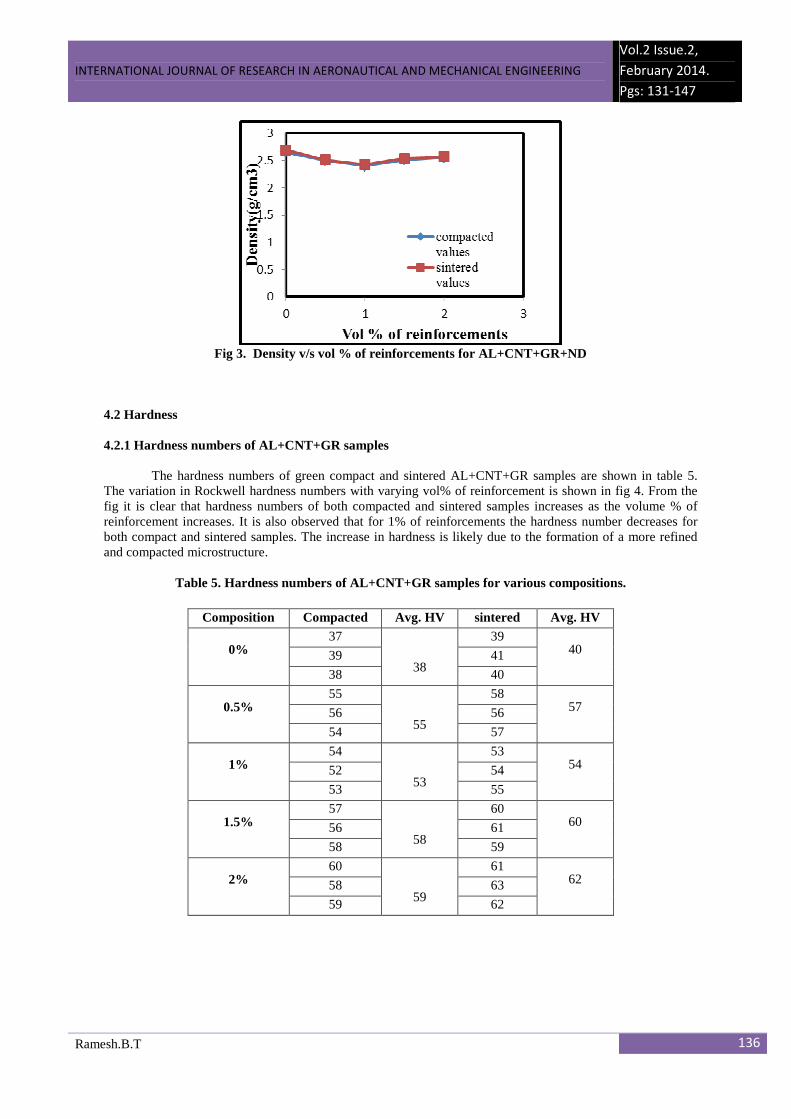
4.1.2 Density of AL+CNT+GR+ND samples For 0.5 % the density of compacted sample decreases by 0.15g/cm3 and for the same percentage the density of sintered sample decreases by 0.178g/cm3 as compared to the 0% reinforcement. The compacted density and sintered density values are very near to the base metal density value i.e. 2.7 g/cm3.we can also say that density value of around 94%can be achieved for green compact where as 95% can be achieved for sintered.
Table 4. Density of AL+CNT+GR+ND samples for various compositions.
Composition Compacted
Densities (g/cm3)
Sintered densities (g/cm3)
0% 2.65 2.69 0.5% 2.5 2.512 1% 2.4 2.43
1.5% 2.51 2.54 2% 2.55 2.57
Composition Compacted density (g/cm3)
Sintered density (g/cm3)
0% 2.65 2.69 0.5% 2.375 2.392 1% 2.6 2.672
1.5% 2.5 2.62 2% 2.6 2.69
INTERNATIONAL JOURNAL OF RESEARCH IN AERONAUTICAL AND MECHANICAL ENGINEERING
Vol.2 Issue.2,
February 2014.
Pgs: 131-147
Ramesh.B.T 136
Fig 3. Density v/s vol % of reinforcements for AL+CNT+GR+ND
4.2 Hardness 4.2.1 Hardness numbers of AL+CNT+GR samples
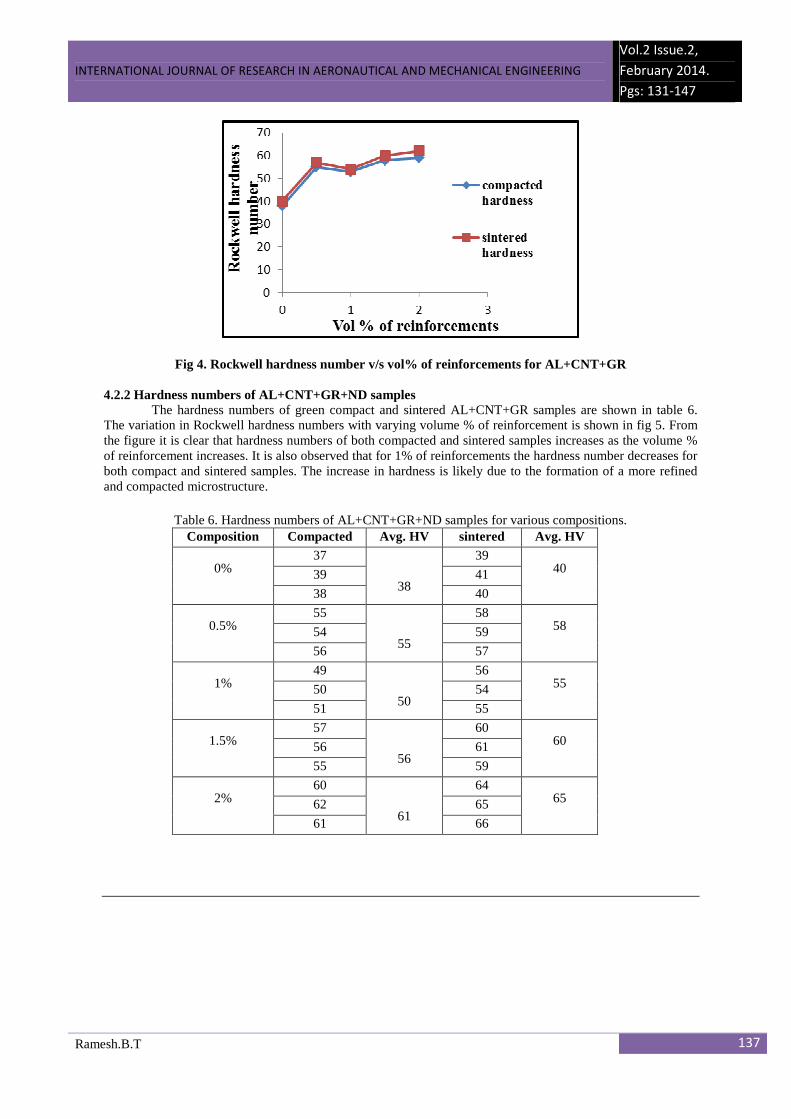
The hardness numbers of green compact and sintered AL+CNT+GR samples are shown in table 5. The variation in Rockwell hardness numbers with varying vol% of reinforcement is shown in fig 4. From the fig it is clear that hardness numbers of both compacted and sintered samples increases as the volume % of reinforcement increases. It is also observed that for 1% of reinforcements the hardness number decreases for both compact and sintered samples. The increase in hardness is likely due to the formation of a more refined and compacted microstructure.
Table 5. Hardness numbers of AL+CNT+GR samples for various compositions.
Composition Compacted Avg. HV sintered Avg. HV
0% 37
38
39 40 39 41
38 40
0.5% 55
55
58 57 56 56
54 57
1% 54
53
53 54 52 54
53 55
1.5% 57
58
60 60 56 61
58 59
2% 60
59
61 62 58 63
59 62
INTERNATIONAL JOURNAL OF RESEARCH IN AERONAUTICAL AND MECHANICAL ENGINEERING
Vol.2 Issue.2,
February 2014.
Pgs: 131-147
Ramesh.B.T 137
Fig 4. Rockwell hardness number v/s vol% of reinforcements for AL+CNT+GR 4.2.2 Hardness numbers of AL+CNT+GR+ND samples
The hardness numbers of green compact and sintered AL+CNT+GR samples are shown in table 6. The variation in Rockwell hardness numbers with varying volume % of reinforcement is shown in fig 5. From the figure it is clear that hardness numbers of both compacted and sintered samples increases as the volume % of reinforcement increases. It is also observed that for 1% of reinforcements the hardness number decreases for both compact and sintered samples. The increase in hardness is likely due to the formation of a more refined and compacted microstructure.
Table 6. Hardness numbers of AL+CNT+GR+ND samples for various compositions.
Composition Compacted Avg. HV sintered Avg. HV
0% 37
38
39 40 39 41
38 40
0.5% 55
55
58 58 54 59
56 57
1% 49
50
56 55 50 54
51 55
1.5% 57
56
60 60 56 61
55 59
2% 60
61
64 65 62 65
61 66
INTERNATIONAL JOURNAL OF RESEARCH IN AERONAUTICAL AND MECHANICAL ENGINEERING
Vol.2 Issue.2,
February 2014.
Pgs: 131-147
Ramesh.B.T 138
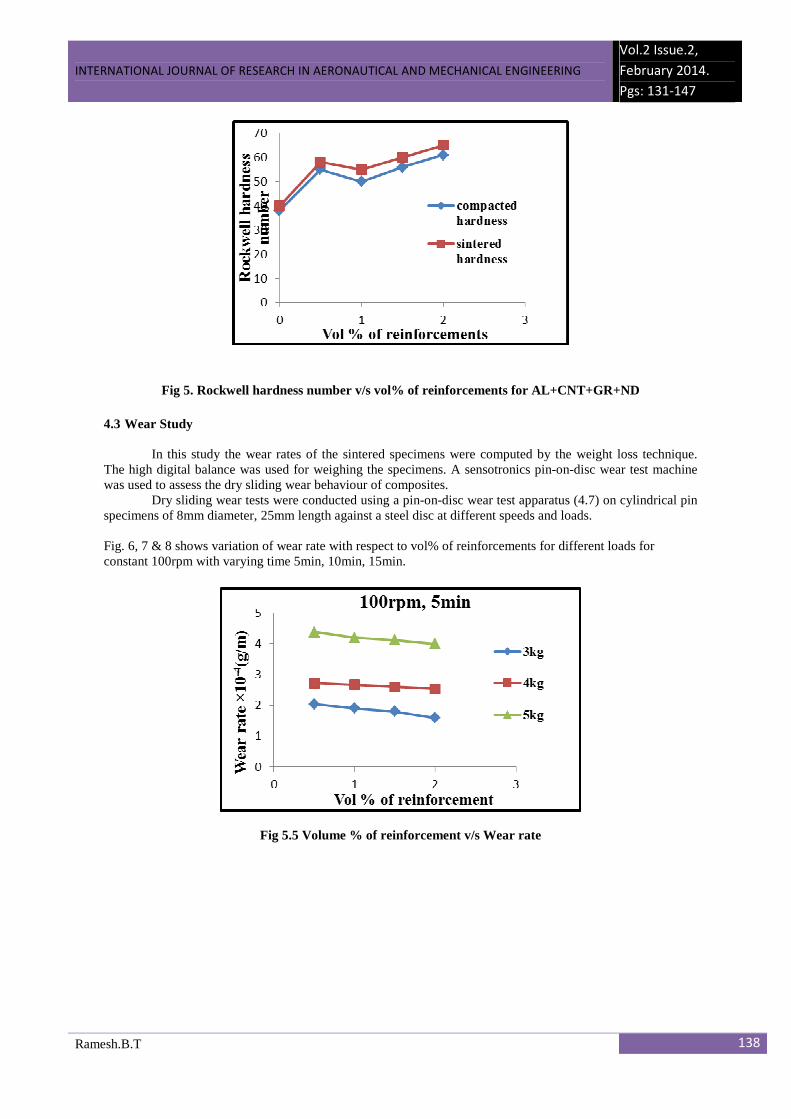
Fig 5. Rockwell hardness number v/s vol% of reinforcements for AL+CNT+GR+ND 4.3 Wear Study
In this study the wear rates of the sintered specimens were computed by the weight loss technique.
The high digital balance was used for weighing the specimens. A sensotronics pin-on-disc wear test machine was used to assess the dry sliding wear behaviour of composites.
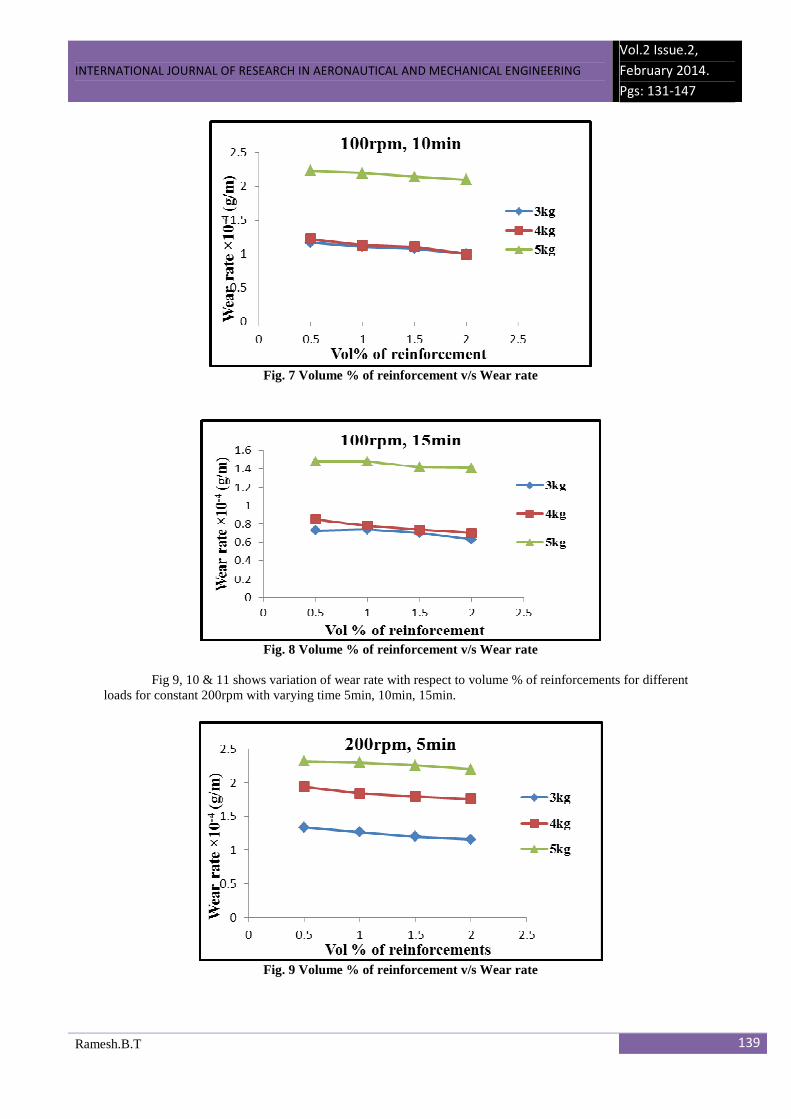
Dry sliding wear tests were conducted using a pin-on-disc wear test apparatus (4.7) on cylindrical pin specimens of 8mm diameter, 25mm length against a steel disc at different speeds and loads. Fig. 6, 7 & 8 shows variation of wear rate with respect to vol% of reinforcements for different loads for constant 100rpm with varying time 5min, 10min, 15min.
Fig 5.5 Volume % of reinforcement v/s Wear rate
INTERNATIONAL JOURNAL OF RESEARCH IN AERONAUTICAL AND MECHANICAL ENGINEERING
Vol.2 Issue.2,
February 2014.
Pgs: 131-147
Ramesh.B.T 139
Fig. 7 Volume % of reinforcement v/s Wear rate
Fig. 8 Volume % of reinforcement v/s Wear rate
Fig 9, 10 & 11 shows variation of wear rate with respect to volume % of reinforcements for different
loads for constant 200rpm with varying time 5min, 10min, 15min.
Fig. 9 Volume % of reinforcement v/s Wear rate
INTERNATIONAL JOURNAL OF RESEARCH IN AERONAUTICAL AND MECHANICAL ENGINEERING
Vol.2 Issue.2,
February 2014.
Pgs: 131-147
Ramesh.B.T 140
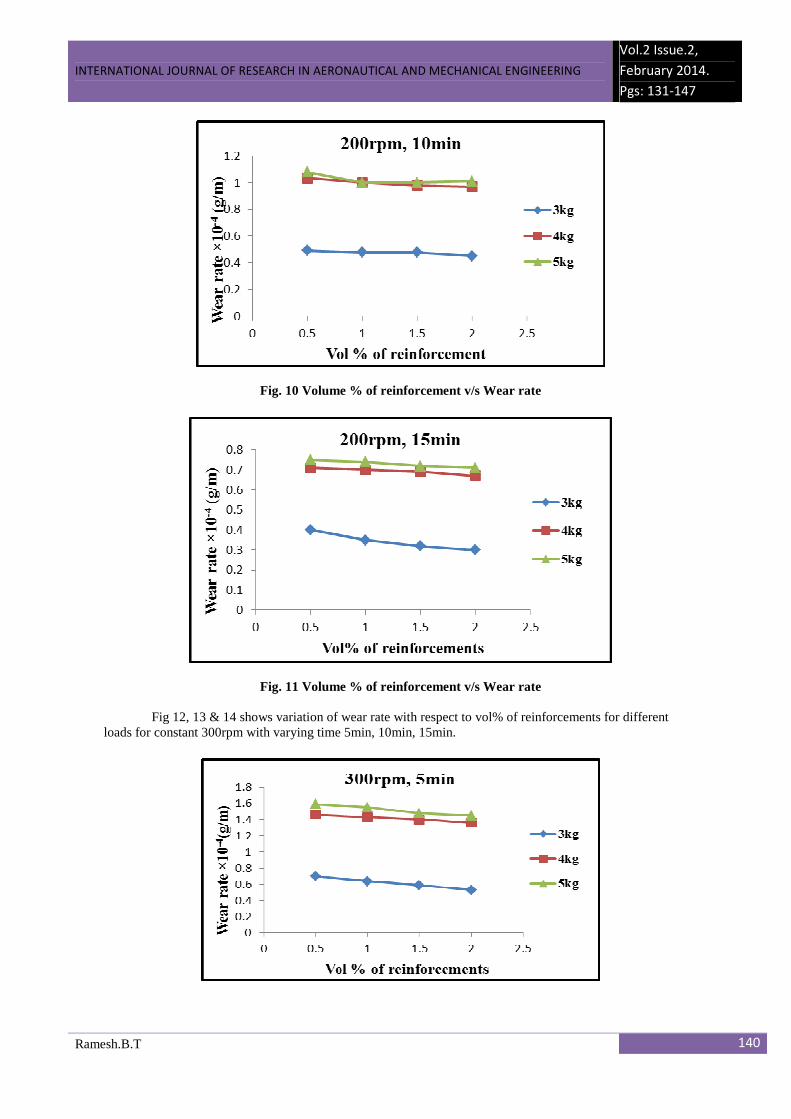
Fig. 10 Volume % of reinforcement v/s Wear rate
Fig. 11 Volume % of reinforcement v/s Wear rate
Fig 12, 13 & 14 shows variation of wear rate with respect to vol% of reinforcements for different loads for constant 300rpm with varying time 5min, 10min, 15min.
INTERNATIONAL JOURNAL OF RESEARCH IN AERONAUTICAL AND MECHANICAL ENGINEERING
Vol.2 Issue.2,
February 2014.
Pgs: 131-147
Ramesh.B.T 141
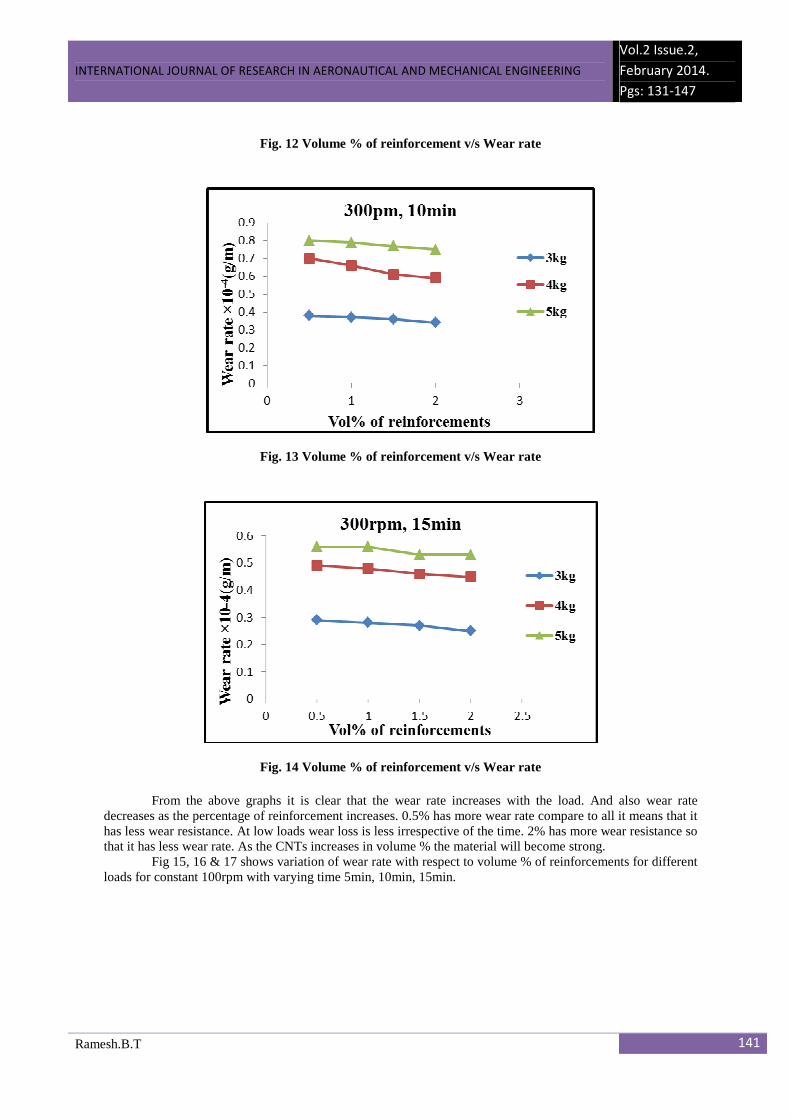
Fig. 12 Volume % of reinforcement v/s Wear rate
Fig. 13 Volume % of reinforcement v/s Wear rate
Fig. 14 Volume % of reinforcement v/s Wear rate
From the above graphs it is clear that the wear rate increases with the load. And also wear rate decreases as the percentage of reinforcement increases. 0.5% has more wear rate compare to all it means that it has less wear resistance. At low loads wear loss is less irrespective of the time. 2% has more wear resistance so that it has less wear rate. As the CNTs increases in volume % the material will become strong.
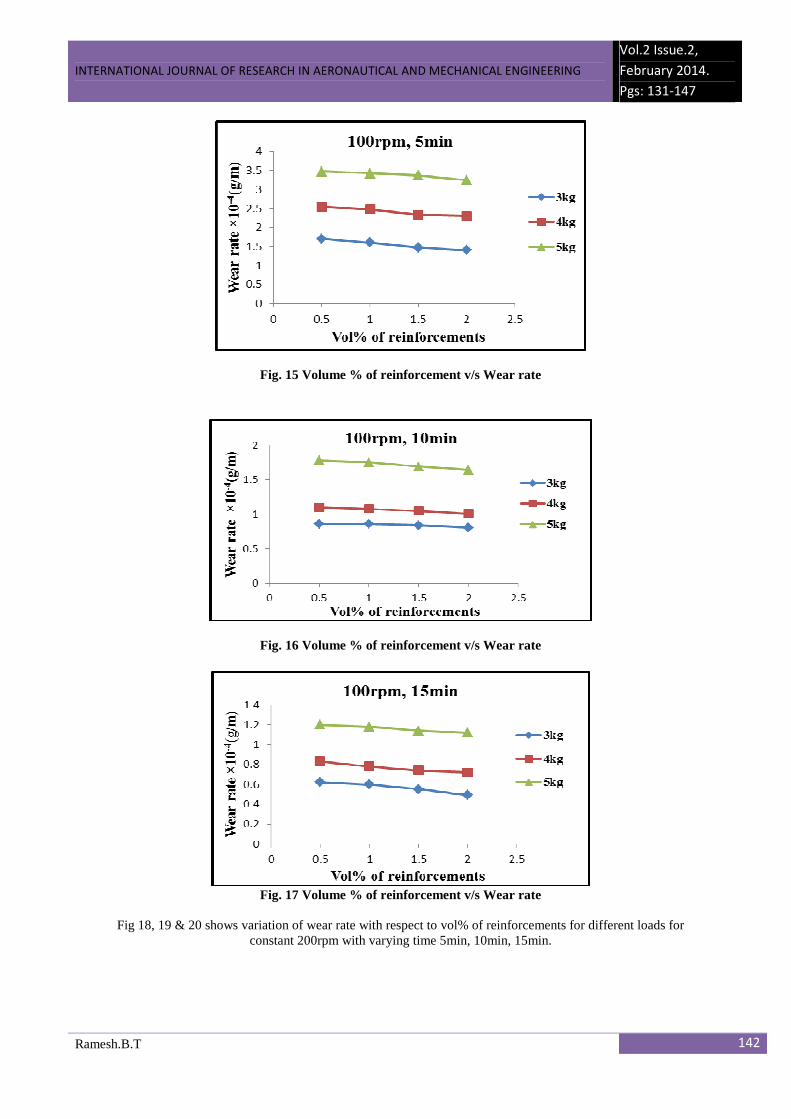
Fig 15, 16 & 17 shows variation of wear rate with respect to volume % of reinforcements for different loads for constant 100rpm with varying time 5min, 10min, 15min.
INTERNATIONAL JOURNAL OF RESEARCH IN AERONAUTICAL AND MECHANICAL ENGINEERING
Vol.2 Issue.2,
February 2014.
Pgs: 131-147
Ramesh.B.T 142
Fig. 15 Volume % of reinforcement v/s Wear rate
Fig. 16 Volume % of reinforcement v/s Wear rate
Fig. 17 Volume % of reinforcement v/s Wear rate
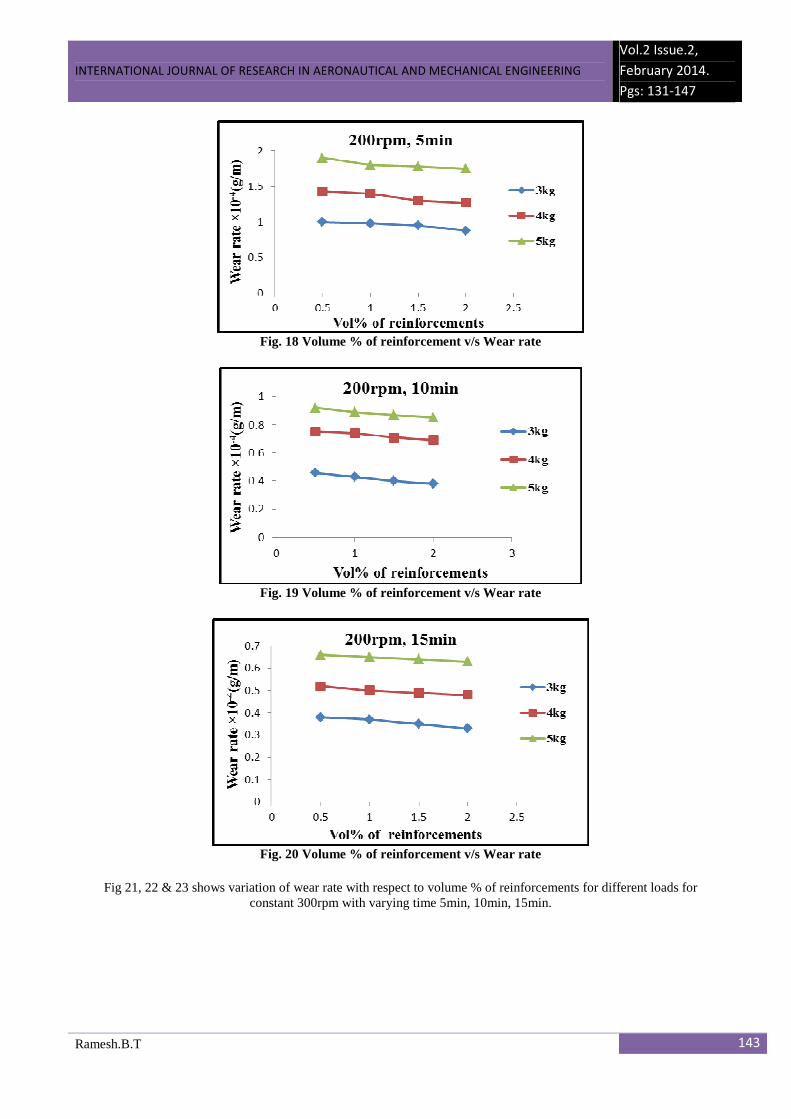
Fig 18, 19 & 20 shows variation of wear rate with respect to vol% of reinforcements for different loads for
constant 200rpm with varying time 5min, 10min, 15min.
INTERNATIONAL JOURNAL OF RESEARCH IN AERONAUTICAL AND MECHANICAL ENGINEERING
Vol.2 Issue.2,
February 2014.
Pgs: 131-147
Ramesh.B.T 143
Fig. 18 Volume % of reinforcement v/s Wear rate
Fig. 19 Volume % of reinforcement v/s Wear rate
Fig. 20 Volume % of reinforcement v/s Wear rate
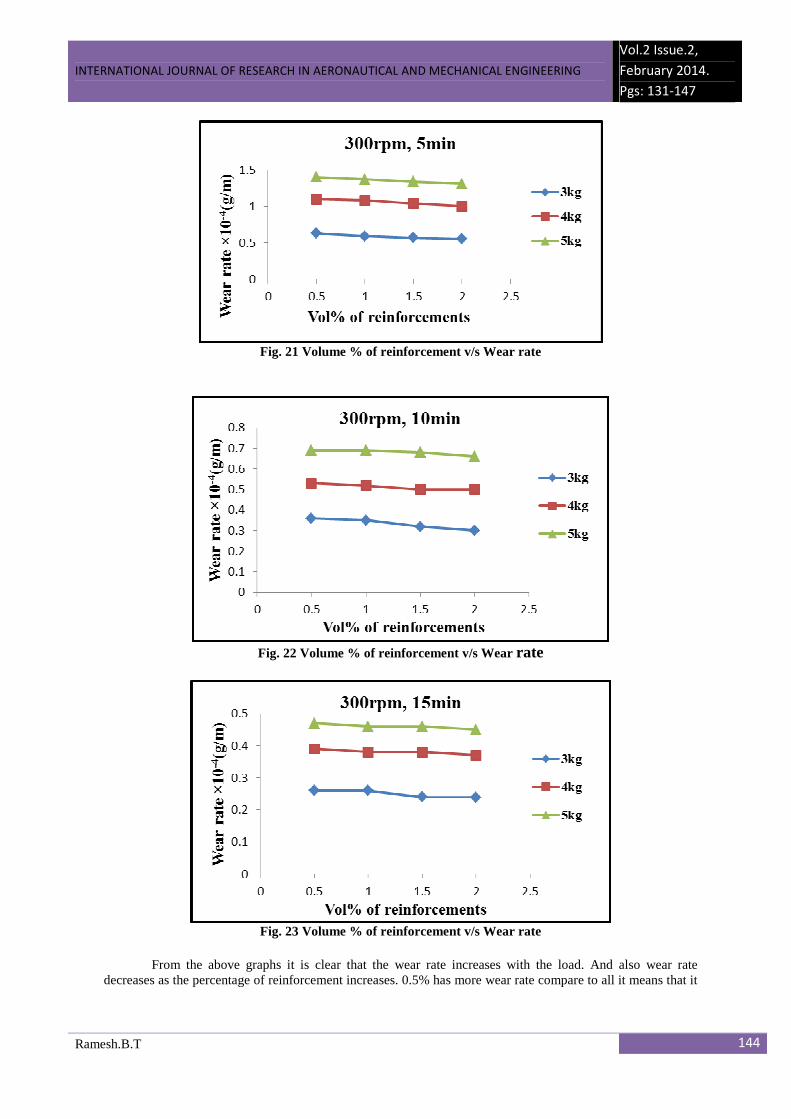
Fig 21, 22 & 23 shows variation of wear rate with respect to volume % of reinforcements for different loads for
constant 300rpm with varying time 5min, 10min, 15min.
INTERNATIONAL JOURNAL OF RESEARCH IN AERONAUTICAL AND MECHANICAL ENGINEERING
Vol.2 Issue.2,
February 2014.
Pgs: 131-147
Ramesh.B.T 144
Fig. 21 Volume % of reinforcement v/s Wear rate
Fig. 22 Volume % of reinforcement v/s Wear rate
Fig. 23 Volume % of reinforcement v/s Wear rate
From the above graphs it is clear that the wear rate increases with the load. And also wear rate
decreases as the percentage of reinforcement increases. 0.5% has more wear rate compare to all it means that it
INTERNATIONAL JOURNAL OF RESEARCH IN AERONAUTICAL AND MECHANICAL ENGINEERING
Vol.2 Issue.2,
February 2014.
Pgs: 131-147
Ramesh.B.T 145
has less wear resistance. At low loads wear loss is less irrespective of the time. 2% has more wear resistance so that it has less wear rate. As the CNTs increases in vol% the material will become strong. 4.4 COMPRESSION TEST
In this test we took specimen of 20mm diameter and 20mm length and this specimen is placed between the table and the lower cross heads of the universal testing machine and set the dial of the machine to a suitable range and adjust the testing machine and compress meter to reads zero, Apply the load gradually and make simultaneous observation of load and compress meter reading and finally yield point and maximum load recorded (95KN) after this measure the diameter and final length of the specimen, Finally plotted the graph compressive strength vs % of CNT.
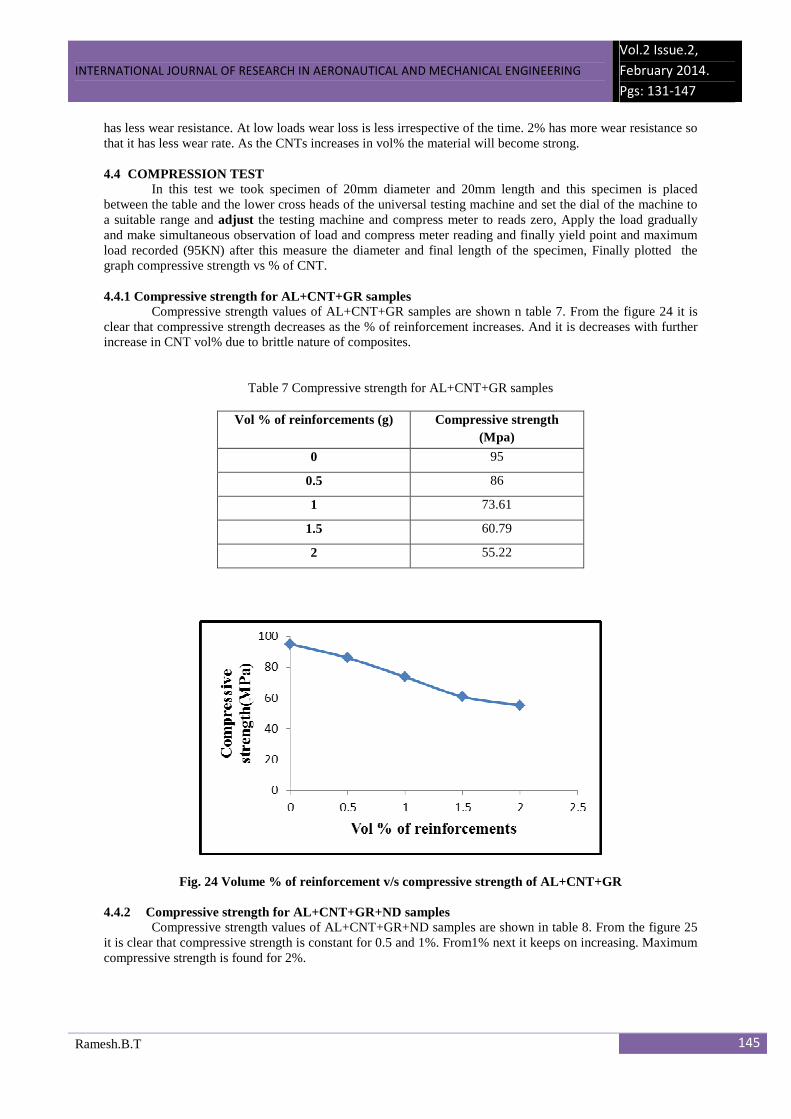
4.4.1 Compressive strength for AL+CNT+GR samples
Compressive strength values of AL+CNT+GR samples are shown n table 7. From the figure 24 it is clear that compressive strength decreases as the % of reinforcement increases. And it is decreases with further increase in CNT vol% due to brittle nature of composites.
Table 7 Compressive strength for AL+CNT+GR samples
Vol % of reinforcements (g) Compressive strength (Mpa)
0 95
0.5 86
1 73.61
1.5 60.79
2 55.22
Fig. 24 Volume % of reinforcement v/s compressive strength of AL+CNT+GR
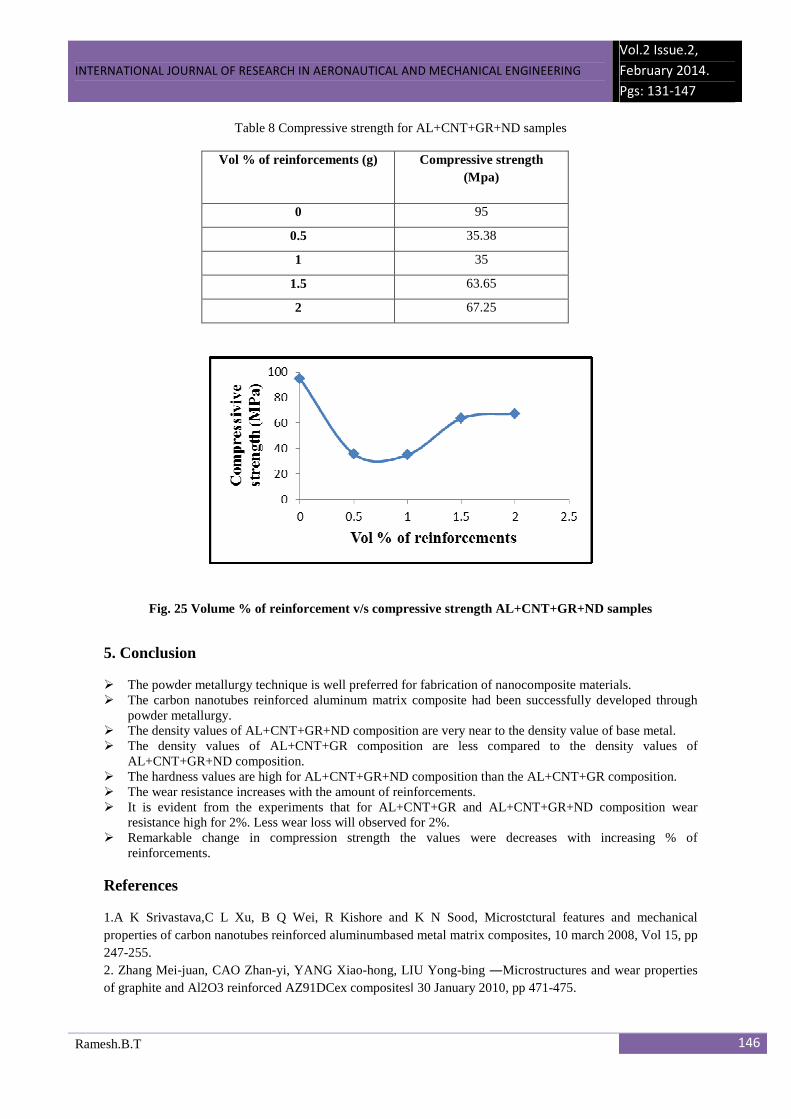
4.4.2 Compressive strength for AL+CNT+GR+ND samples Compressive strength values of AL+CNT+GR+ND samples are shown in table 8. From the figure 25
it is clear that compressive strength is constant for 0.5 and 1%. From1% next it keeps on increasing. Maximum compressive strength is found for 2%.
INTERNATIONAL JOURNAL OF RESEARCH IN AERONAUTICAL AND MECHANICAL ENGINEERING
Vol.2 Issue.2,
February 2014.
Pgs: 131-147
Ramesh.B.T 146
Table 8 Compressive strength for AL+CNT+GR+ND samples
Fig. 25 Volume % of reinforcement v/s compressive strength AL+CNT+GR+ND samples
5. Conclusion � The powder metallurgy technique is well preferred for fabrication of nanocomposite materials. � The carbon nanotubes reinforced aluminum matrix composite had been successfully developed through
powder metallurgy. � The density values of AL+CNT+GR+ND composition are very near to the density value of base metal. � The density values of AL+CNT+GR composition are less compared to the density values of
AL+CNT+GR+ND composition. � The hardness values are high for AL+CNT+GR+ND composition than the AL+CNT+GR composition. � The wear resistance increases with the amount of reinforcements. � It is evident from the experiments that for AL+CNT+GR and AL+CNT+GR+ND composition wear
resistance high for 2%. Less wear loss will observed for 2%. � Remarkable change in compression strength the values were decreases with increasing % of
reinforcements.
References 1.A K Srivastava,C L Xu, B Q Wei, R Kishore and K N Sood, Microstctural features and mechanical properties of carbon nanotubes reinforced aluminumbased metal matrix composites, 10 march 2008, Vol 15, pp 247-255. 2. Zhang Mei-juan, CAO Zhan-yi, YANG Xiao-hong, LIU Yong-bing ―Microstructures and wear properties of graphite and Al2O3 reinforced AZ91DCex compositesǁ 30 January 2010, pp 471-475.
Vol % of reinforcements (g) Compressive strength (Mpa)
0 95
0.5 35.38
1 35
1.5 63.65
2 67.25
INTERNATIONAL JOURNAL OF RESEARCH IN AERONAUTICAL AND MECHANICAL ENGINEERING
Vol.2 Issue.2,
February 2014.
Pgs: 131-147
Ramesh.B.T 147
3. Z. Razavi Hesabi and J.J. Gracio ―An Investigation on Mechanical Properties of Aluminum Matrix Nanocompositesǁ. 4. S. R. Bakshi, D. Lahiri and A. Agarwal ―Carbon nanotube reinforced metal matrix composites – a reviewǁ. 5. Kyung Tae Kim, Seung Cha, Seong Hyeon Hong, Soon Hyung Hong ―Microstructures and tensile behavior of carbon nanotube reinforced Cu matrix nanocompositesǁ 27 April 2006, pp 27-33. 6. H. R. Shahverdi and T. Rostamzadeh ―Microstructure study on Al-5%sic nanocomposite Powdersǁ December 2010, Vol 87. Javed Iqbal, Muhammad Musaddique Ali Rafique ―Production of Carbon Nanotubes by Different Routes— A Reviewǁ 29 May 2011, vol 1, pp 29-34. 8. A.A. Khalil, W. M. Khairaldien, and M. R. Bayoumi ―Production of Aluminum- Silicon Carbide Composites Using Powder Metallurgy at Sintering Temperatures above the Aluminum Melting Pointǁ. 9. H. Kaftelen, M L Ovecoğlu ―Production of Nanodiamond Reinforced Al Composites by Mechanical Alloyingǁ. 10. K. Hanada and T Sano ―Study on Al-Si alloy-based nanocomposite with dispersed detonation nanodiamondǁ. 11. Stephen F Bartolucci, Joseph Paras, Mohammad A Rafiee, Javad Rafiee, Sabrina Lee, Deepak Kapoor, Nikhil KoraTkar ―Graphene-aluminum nanocompositesǁ 2011, pp 7933-7937. 12. Prabhu, B., Suryanarayana, C., An, L., Vaidyanathan, R., " Effect of Reinforcement Volume Fraction on the Mechanical Properties of Al—SiC Nanocomposites Produced by Mechanical Alloying and Consolidation", Material Science Engineering A, 2006. Vol. 425,192-200 13. Ogel, B. and Gurbuz, R., "Microstructural Characterization and Tensile Properties of Hot Pressed Al-Sic Composites Prepared From Pure Al and Cu Powders", Materials Science and Engineering A,2001, 14. Ozcatalbas, Y., "Investigation of the machinability behaviour of Al4C3 reinforced Al-based composite produced by mechanical alloying technique", Compos. Sci. Technol. 2008, Vol. 63, 53,61 15. Yang, Y., Lan, J., Li, X., "Study on bulk aluminum matrix nano-composite fabricated by ultrasonic dispersion of nano-sized SiC particles in molten aluminum alloy", Materials Science and Engineering A, 2004. Vol. 380, 378–383 16. Babu, A. S., Jayabalan, V., "Weibull Probability Model for Fracture Strength of Aluminium (1101)-Alumina Particle Reinforced Metal Matrix Composite", J. Mater. Sci. Technol. 2009, Vol. 25, 341-343 17. Wu, J. M., Li, Z. Z.," Nanostructured composite obtained by mechanically driven reduction reaction of CuO and Al powder mixture", Journal of Alloys and Compounds, 2000. Vol. 299, 9–16 18. Bakshi, S. R, Lahiriand, D., Agarwal, A., "Carbon nanotube reinforced metal matrix composites–areview", International Materials Reviews, 2010, Vol. 55, pp 41-64 , Vol. 301, pp 213-220. 19. P.J.F. Harris, Int. Mater. Rev. Vol.49, NO.1, 2004, pp 31–43. 20. S. J. Guo and S. J. Dong, Chem. Soc. Rev., 2011, 40, 2644. 21. M. Pumera, Chem. Soc. Rev., 2010, 39, 4146. 22. N. G. Shang, P. Papakonstantinou, M. McMullan, M. Chu, A. Stamboulis, A. Potenza, S. S. Dhesi and H. Marchetto, Adv. Funct. Mater., 2008, 18, 3506. 23. G. Nandamuri, S. Roumimov and R. Solanki, Nanotechnology, 2010, 21, 145604. 24. X. Li, W. Cai, J. An, S. Kim, J. Nah, D. Yang, R. Piner, A. Velamakanni, I. Jung,E. Tutuc, S. K. Banerjee, L. Colombo and R. S. Ruoff, Science, 2009, 324, 1312. 25. A. Srivastava, C. Galande, L. Ci, L. Song, C. Rai, D. Jariwala, K. F. Kelly and P.M. Ajayan, Chem. Mater., 2010, 22, 3457. 26. Yang G.W, Wang J.B, and Liu, ―Preparation of nano crystaline diamond using pulsed laser induced reacting quenchingǁ. Journals of physics and condenced material.vol 10, 7923-7927, 1998.
Copyright © 2022 FDOKUMEN