Multichannel, full waveform and flexible electrode combination ...
Upload
independentCategory
view
1download
0
J. Electroanal. Chem., 157 (1983) 165--174 165 Elsevier Sequoia S.A., Lausanne -- Printed in The Netherlands
Preliminary note
CHARACTERIZATION OF A RUTHENIUM ELECTRODE BY UNDERPOTENTIAL DEPOSITION OF COPPER
M.A. QUIROZ and Y. MEAS
Universidad Autonoma Metropolitana -- Iztapalapa, Departamento de Quimica, P. O. Box 55-534, 09340 Mexico, D.F. (Mexico)
E. LAMY-PITARA and J. BARBIER
Laboratoire de Chimie 4, LA 350, Universit$ de Poitiers, 40, Avenue du Recteur Pineau, 86022 Poitiers (France)
(Received 4th July 1983; in revised form 9th August 1983)
INTRODUCTION
A large number of studies on the electrochemical and electrocatalytic prop- erties of ruthenium in the metallic form [1--10] or combined with oxygen [11--15] appeared recently in the literature. On the other hand some compara- tive studies have been reported in order to correlate the behaviour of ruthenium in electrocatalysis and in heterogeneous catalysis [16,17].
All these studies point out that the adsorption characteristics of this metal concerning hydrogen and oxygen are more complex than those encountered with the other group VIII metals [18,19]. Moreover, many authors assume that, besides the adsorption of hydrogen (which occurs in different potential ranges according to the different authors), there is a significant absorption of hydrogen. This is supported by the hydrogen evolution, which begins at potentials rather positive and by the important solubility of hydrogen into the metal [ 9].
There is no sufficient experimental evidence yet for this absorption process (except in refs. 4, 6 and 9). Therefore the question arises whether the hydrogen is absorbed into the bulk of metallic ruthenium or not. We must also point out that in gas-phase; catalysis,: there is no report about hydrogen absorption, but the im- portant dispersion of results concerning H/Ru, O/Ru and H/O stoichiometry [20--22] could probably be explained by the occurrence of this process.
Beside this problem, the surface oxidation of ruthenium begins at a very low potential (ca. +0.25 V/RHE) before the end of hydrogen desorption, leading to an overlap of these two processes. Moreover, this behaviour makes difficult the use of hydrogen adsorption as a method of surface area measurement. Woods and co-workers [ 1 ] suggest that the integration of the current--potential curves between 0.2 and 0.9 V provides a means of evaluation of the surface area, assum- ing the completion of a monolayer of adsorbed oxygen of 1 : 1 stoichiometry. But this statement is in disagreement with the results of other authors [ 2,6,10,23] observing that in this potential region the formation of different oxygenated species is possible.
0022-0728/83/$03.00 © 1983 Elsevier Sequoia S.A.

166
Therefore, we arrived to the conclusion that the hydrogen adsorption and the oxygen adsorption on the Ru cannot be directly used to measure the true surface area, and we suggest making use of the underpotential deposition (UPD) prop- erty of some metals for the characterization of Ru electrodes.
Indeed there are many results about the structural and thermodynamic prop- erties of UPD metallic adatoms [24--26] and about their effect on electro- catalytic reactions [ 27--30]. But there is very little work concerning their pos- sible application as a means of surface characterization [31--33]. Thus, in this paper, we used the underpotential deposition of copper to characterize a Ru electrode. There are two reasons for this choice. Firstly, this metal has been ex- tensively studied as adatom on dif ferent metallic substrates. Secondly, some re- cent work on the characterization by LEED, AES, TDS and work function meth- ods [34--36], of a Cu layer thermally deposited on a Ru single crystal, have shown that the copper forms a bidimensional monolayer before bulk deposition. The same behaviour is reported for Ru+Cu bimetallic catalysts [37,38].
EXPERIMENTAL
The experiments were carried out in 0.5 M H2SO4 solutions prepared with sulphuric acid (96% suprapur Merck) and threefold distilled water. CuSO4 10-6--10 -4 M solutions (Merck, p.a.) were used for the copper underpotential deposition experiments. The working electrodes were prepared by electrochem- ical deposition of Ru on a Pt wire (of about 1.6 cm 2 geometric area) using a 1% RuC13 • H20 solution in 0.1 M HC1. The deposition potential was 0.02 V/RHE, the deposition current was about 7 to 8 mA and the temperature 25°C. The initially deposited ruthenium is unstable and it becomes more stable after prolonged potential cycling, which causes an important diminution of the surface area. The counter electrode was a Pt wire and the reference electrode a saturated mercurous sulphate electrode. All the potentials have been reported on the RHE scale. The electrochemical cell is a classical one and the electronic equipment con- sists of a Wenking LB 75 potentiostat , a Tacussel GSTP signal generator and a Sefram X--Y recorder.
RESULTS AND DISCUSSION
Adsorption and desorption of hydrogen and oxygen on ruthenium
Figure l a shows the voltammograms for an electrode of Ru deposited on a Pt wire. This figure is similar to Fig. 1 of ref. 6. However, in our case the roughness factor is much lower (about 15 against at least 100 in ref. 6). The negative poten- tial limit has been chosen at +0.03 V in order to avoid hydrogen evolution as far as possible. Between +0.03 and +0.20 V the hydrogen adsorption--desorption region can be distinguished by an anodic peak at about +0.040 V. The increase of the anodic current beginning at about +0.25 V, during the positive potential sweep, is due to the oxygen adsorption, which is desorbed in a broad peak at about +0.35 to +0.40 V during the negative potential sweep.
The quantities of electricity for the oxydation, Qo a, and the reduction, Qo c, of the Ru surface are calculated as a func t ion of the positive potential limit (Table

167
+150 a
+05o
Eo
- Q50
-~00
-1.so b
-250 I 2
J 0 0.2 0.4 0.6 0.8 1.O/v(RHE )
/
Fig. 1. (a) Potent iodynamic I--E prof i les for a ruthenized Pt electrode, at 10 mV/s in 0.5 M H2SO 4 at 25°C. Upper potent ia l l im i t o f the sweep f r om 0.3 to 1.1 V in 0.1 V steps. (b) Charge vs. potent ia l prof i le obtained by integrat ion o f the I--E curves giving the surface ox ida t ion state.
1).Qoa and Qo c are obtained by integration of the cu~ent--potential c u r v e s from +0.03 V to the given upper potential limit and subtraction of the quantity of elec- tricity corresponding to the hydrogen adsorption--desorption. However, the charge of the double layer, which is difficult to measure experimentally, is not
a a n c deducted, but it seems [ 1 ] that it is negligible with respect to Qo d Qo" The equality of Qo a and Qo c shows that the reduction of the oxide species
formed at each potential is complete at the lower limit of the potential sweep (+0.03 V). Hence, the initial surface state is regenerated at the end of each poten- tial sweep.
+I00
168
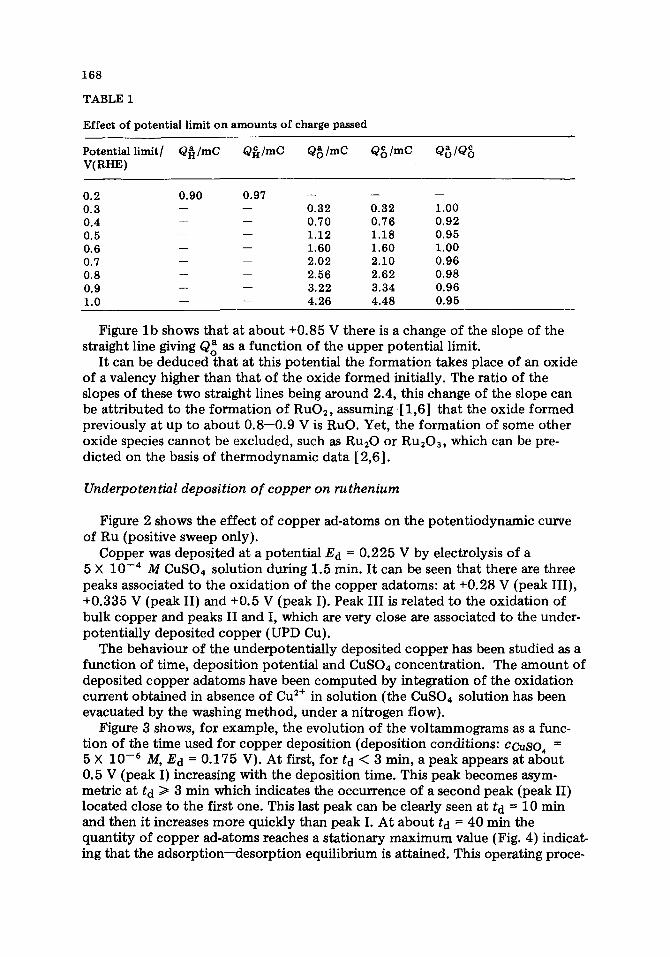
TABLE 1
Effect of potential limit on amounts of charge passed
Potential limit• Q~/mC Q~/mC Q~ImC Q~/mC Q~IQ~) V(RHE)
0 . 2 0 . 9 0 0 . 9 7 - - - - - -
0 . 3 - - - - 0 . 3 2 0 . 3 2 1 . 0 0
0 . 4 - - - - 0 . 7 0 0 . 7 6 0 . 9 2
0 . 5 - - - - 1 . 1 2 1 . 1 8 0 . 9 5
0 . 6 - - - - 1 . 6 0 1 . 6 0 1 . 0 0
0 . 7 - - - - 2 . 0 2 2 . 1 0 0 . 9 6
0 . 8 - - - - 2 . 5 6 2 . 6 2 0 . 9 8
0 . 9 - - - - 3 . 2 2 3 . 3 4 0 . 9 6
1 . 0 - - - - 4 . 2 6 4 . 4 8 0 . 9 5
Figure l b shows that at about +0.85 V there is a change of the slope of the straight line giving Qo a as a function of the upper potential limit.
It can be deduced that at this potential the formation takes place of an oxide of a valency higher than that of the oxide formed initially. The ratio of the slopes of these two straight lines being around 2.4, this change of the slope can be attributed to the formation of RuO2, assuming [ 1,6] that the oxide formed previously at up to about 0.8--0.9 V is RuO. Yet, the formation of some other oxide species cannot be excluded, such as Ru20 or Ru203, which can be pre- dicted on the basis of thermodynamic data [2,6].
Underpotential deposition o f copper on ruthenium
Figure 2 shows the effect of copper ad-atoms on the potent iodynamic curve of Ru (positive sweep only).
Copper was deposited at a potential E d = 0.225 V by electrolysis of a 5 X 10 -4 M CuSO4 solution during 1.5 min. I t can be seen that there are three peaks associated to the oxidation of the copper adatoms: at +0.28 V (peak III), +0.335 V (peak II) and +0.5 V (peak I). Peak III is related to the oxidation of bulk copper and peaks II and I, which are very close are associated to the under- potentially deposited copper (UPD Cu).
The behaviour of the underpotentially deposited copper has been studied as a function of time, deposition potential and CuSO4 concentration. The amount of deposited copper adatoms have been computed by integration of the oxidation current obtained in absence of Cu 2+ in solution (the CuSO4 solution has been evacuated by the washing method, under a nitrogen flow).
Figure 3 shows, for example, the evolution of the voltammograms as a func- tion of the time used for copper deposition (deposition conditions: ccuso4 = 5 × 10 -4 M, E d = 0.175 V). At first, for td <~ 3 min, a peak appears at about 0.5 V (peak I) increasing with the deposition time. This peak becomes asym- metric at td 1> 3 min which indicates the occurrence of a second peak (peak II) located close to the first one. This last peak can be clearly seen at td = 10 min and then it increases more quickly than peak I. At about td -- 40 min the quanti ty of copper ad-atoms reaches a stationary maximum value (Fig. 4) indicat~ ing that the adsorption--desorption equilibrium is attained. This operating proce-

1 6 9
9 0 ,,~
6 ( 1
3 0
P,, ) 0.2
~ "~" ~" I I , I / 0 . 4 0-6 0.8 1,0
E / V ( R H E )
Fig. 2. A n o d i c p o t e n t i o d y n a m i c I--E curves for the e l e c t r o o x i d a t i o n o f Cu ad-atoms e lectro- depos i t ed on Ru in a Cu2+-free 0 .5 M H2SO 4 so lut ion . S w e e p rate 10 m V / s . D e p o s i t i o n condi - t ions: Ede p = 0 . 2 2 5 V / R H E , [Cu =+ ] = 5 × 1 0 - 4 M, tde p = 1 .5 rain. First po tent ia l sweep: str ipping o f Cu ad-atoms; f o l l o w i n g potent ia l sweep: bare Ru surface.
<C 5 4 - - - 6 0
iI . . . . . 3 0
. . . . 2 0
. . . . . 15 42
. . . . 1 3 6
a o
. . . . 3
2 4
1 8
- - - - - 1 . 5
1 2
6 1 - --1.0
0 0,2 0.4 0.6 0.8 1.0 E/V(RHE)
Fig. 3. Anodic potentiodynamic I - -E profile at 50 mV/s obtained after holding the potential at 0.175 V in a 0.5 M H2SO 4 + 5 x !0 -6 M CuSO 4 solution for different times of adsorption t d (in rain). The curves are obtained' in a Cu=+-free 0.5 M H2SO 4 solution.
dure has been used to measure the quant i t ies of e lectr ic i ty associa ted to the oxi- da t ion o f Cu ada toms as a func t ion o f d i f fe ren t depos i t ion potent ia l s and Cu ~+ concent ra t ions .
The results are summar ized in Fig. 5. As it can be seen, the a m o u n t o f the underpo ten t i aUy adsorbed coppe r reaches a p la teau at a b o u t 0 .15 - -0 .20 V for

170
2.0
(9
O 1.5
1.C
0,5
P i ,,,1 l 0 20 40 60 80
t / rain
Fig. 4. Charge associated to UPD of Cu ad-atoms vs. the adsorption time (obtained by integra- tion of the curves given in Fig. 3).
CuSO4 concentrations of 10 -4 M and 5 × 10 -4 M (Fig. 5A, B), which indicates the completion of a monolayer. When the deposition potential becomes more negative than the thermodynamic one a narrow peak (peak III, Fig. 2) develops increasingly with time, characteristic of the bulk-copper stripping. For increasing CuSO4 concentrat ions the potential length of the plateau decreases (Fig. 5C) and for c = 10 -4 M it disappears (Fig. 5D). In this last case the deposition of bulk copper is starting before the completion of one monolayer of copper adatoms. In Fig. 5A--C it can be seen that there is a change of the slope of the isotherms at about 30--40% of a monolayer. This can be related to the presence of two strip- ping peaks for the UPD copper, i.e. the presence of two states for underpotential- ly deposited copper. These results prove that the underpotential deposition of copper on ruthenium is possible and this system behaves like the Cu/Pt system [33,39,40]. Indeed, in this latter case there are also three main stripping peaks, the more negative being that of bulk copper and the two others those of UPD copper. But contrary to the industr ialplat inum catalysts studied by Reilley and co-workers [33], bulk copper deposition does not occur, in the case of Cu/Ru, before the monolayer completion (Fig. 5A--C). This can be explained by the large value of the rugosity factor of the Pt electrode (about 2300 in ref. 33) com- pared to that of the Ru electrode (about 2--3).
The presence of two stripping peaks in the potential region of UPD of copper on Pt has been extensively studied, particularly on single crystal planes of low Miller indexes [32,41,42]. Most of the authors concluded that there is no direct

A
u E
~ o
0
I I I I
I I I I
C
I 1 ,V-
I I
I t 0.1 0.2 0.3 0.4 0.1
E /V(RHE)
B
171
,/ D
t t
! I I 0.2 0.3 0.4
Fig. 5. Adsorp t ion isotherms for Cu ad-atoms underpo ten t i a l ly depos i ted on Ru vs. the poten- tial o f adsorp t ion for d i f ferent Cu 2+ concent ra t ions : (A) 1 × 10 - 6 , (B) 5 × 10 -~ , (C) 1 × 10 - s and (D) 5 × 10 - 4 M. The star indicates the copper bulk deposi t ion.
correlation between the peaks of hydrogen adsorption and those of copper ad- sorption on different crystal planes. However, Reflley and co-workers assigned these peaks to particular sites, while Kolb et al. [41] found that the behaviour of Cu on polycrystalline Pt is the result of the superposition of those of the three single crystal planes. These last authors also showed, with the help of optical

172
measurements, that at a coverage of about 0.50 the initial structure of the Cu ad- atoms layer is changed t o :a more dense structure.
This explanation seems to apply also to the Cu/Ru system. Indeed the peak of the strongly adsorbed copper (peak I) appears first for increasing adsorption time, while the peak of the weakly adsorbed copper (peak II) appears later on for 10 - 6 M~< c ~< 10 - s M (Fig. 3).
Moreover, their ratio depends on the deposition potential: for the more posi- tive potentials (Ed > 0.275 V) peak I is preponderant , whereas for more negative potentials (Ed < 0.275 V), peak II is revealed by a displacement of the peak potential towards the negative potentials and by an increase of the half width or the appearance of a shoulder. Thus, the coverage by the strongly adsorbed cop- per (Fig. 5) is about 40% of a monolayer and the relative slopes of the two linear parts of the isotherm have a ratio of 1/2. This probably proves that at 40% of a monolayer the structure of the initial layer of adsorbed copper changes into a twofold more dense structure.
There is a similarity between the electrochemical UPD of copper on ruthenium and the thermal deposition of Cu on a single crystal (0001) plane of Ru, which was studied by LEED, Auger spectroscopy, thermodesorpt ion and "work func- tions", by Ertl and co-workers [34].
The LEED results show that there are three steps of the Cu deposition: at first, up to about 1013 atoms/cm 2, the copper is randomly distributed on the Ru sur- face, then, when the Cu surface concentrat ion increases to about 2--5 × 10¹⁴ atoms/cm 2, a coalescence of the copper nuclei occurs, giving an overlayer which exhibits a (111)-preferred orientation. Finally, for a Cu concentrat ion of about 1--4 × 10 is a toms/cm 2, a three-dimensional epitaxial Cu overlayer is built up dis- playing an hexagonal structure (according to the epitaxial relationship: (111)Cu// (0001)Ru and (101)Cu/ / (1010)Ru) . We can thus conclude that the first Cu monolayer follows the hexagonal symmetry of the Ru substrate, as it is the general rule with the UPD of adatoms.
In the Cu/Ru system there is a partial overlap of the region of Cu adsorption with that of oxygen adsorption as in the case of Cu/Rh system [43]. There cer- tainly is an inhibition of the oxygen adsorption in presence of Cu ad-atoms, but during the first positive potential sweep, the Cu desorption probably allows the oxygen adsorption to occur, so that the total initial amount of oxygen is again found during the first negative sweep. But it must be pointed ou t that the UPD of Cu :occurs at rather negative potentials, up to about 0.40 V, where the quan- t i ty of adsorbed oxygen is very small (about 5% of ,the Ru surface) and that the Cu monolayer is achieved at even more negative potentials (0.15--0.20 V) where the quanti ty of adsorbed oxygen is negligible.
The above information, concerning the formation of a Cu monolayer of the same symmetry as the substrate, allows the assumption of a ratio Cu : Ru = 1 : 1. This agrees with the atomic radii o f the two metals which are very close (0.128 nm for Cu and 0.134 nm for Ru). On this basis, the true surface area can be calculated from the charge associated to a monolayer of Cu on Ru: 1960/2 . 251 = 3.9 cm 2, where the quanti ty of electricity corresponding to an electron per site of Ru is taken equal to 251 ~C [1].
If the difference of the atomic radius is taken into account, the relationship: Q a / 2 A Q H = RRu,..Cu2/R 2 [44] can be applied, giving AQ H = 892 uC and a surface

173
area of 3.6 cm 2, but it seems [45] that the ad-atoms are not closely packed even when a compact monolayer is formed. Therefore the first estimation should be the more realistic, i f at +0.85 V an oxygen monolayer is built [1], the surface area of the same Ru electrode would be 1.2 cm 2 (calculated with Qo a = 600 uC). From the comparison of this last value with the surface estimation based on the copper monolayer it can be deduced that at the potential where the change of the slope occurs (on the Qa--E plot (Fig. lb)) , only 31% of the surface area is covered by RuO. Thus, in this case the estimation of the true surface area of a Ru electrode using UDP of Cu ad-atoms appears as the more appropriate method.
REFERENCES
1 D. Michell, D.A.J. Rand and R. Woods, J. Electroanal. Chem., 89 (1978) 11. 2 R. Lezna, N.R. de Tacconi and A.J. Arvfa, private communication, 1983. 3 S. Hadzi-Jordanov, Prilozi-Makedon. Akad. Nauk. Umet. Odd. Prir. Mat. Nauki, 11 (1979)
35. 4 S. Hadzi-Jordanov, H. Angerstein-Kozlowska, M. Vukovid and B.E. Conway, J. Phys. Chem.,
81 (1977) 2271. 5 M. Vukovid, H. Angerstein-Kozlowska and B.E. Conway, J. Appl. Electrochem.,
12 (1982) 193. 6 S. Hadzi-Jordanov, H. Angerstein-Kozlowska, M. Vukovi~ and B.E. Conway, J.
Electrochem. Soc., 125 (1978) 1471. 7 L.D. Burke, J.K. Mulcahy and S. Venkatesan, J. Electroanal. Chem., 81 (1977) 339. 8 L.D. Burke and J.K. Mulcahy, J. Electroanal. Chem., 73 (1976) 207. 9 V.S. Bagotzky, A.M. Skundin and E.K. Tuseeva, Electrochim. Acta, 21 (1976) 29.
10 O.G. Deryagina and N.D. Tomashov, Elektrokhimiya, 17 (1981) 1238. 11 G. Iwakura, K. Hirao and H. Tamura, Electrochim. Acta, 22 (1977) 335. 12 W. O'Grady, G. Iwakura, J. Huang and E. Yeager in M.W. Breiter (Ed.), Proc. Symposium
on Electrocatalysis, The Electrochemical Society, Princeton, 1974, p. 286. 13 L.D. Burke and O.J. Murphy, J. Electroanal. Chem., 96 (1979) 19. 14 L.D. Burke and O.J. Murphy, J. Electroanal. Chem., 109 (1980) 199. 15 L.D. Burke and O.J. Murphy, J. Electroanal. Chem., 112 (1980) 39. 16 P.N. Ross, K. Kinoshita, A.J. Scarpellino and P. Stonehart, J. Electroanal. Chem.,
63 (1975) 97. 17 K. Kinoshita and P.N. Ross, J. Electroanal. Chem., 78 (1977) 313. 18 R. Woods in A.J. Bard (Ed.), Electroanalytical Chemistry, Vol. 9, Marcel Dekker,
New York, 1976, p. 1. 19 R. Woods, Israel J. Chem., 18 (1979) 118. 20 K.G. Taylor, J. Catal., 38 (1975) 299. 21 H. Kubicka, J. Catal., 12 (1968) 223. 22 J.G. Goodwin, Jr., J. Catal., 68 (1981) 227. 23 H. Angerstein-Kozlowska, B.E. Conway, B. Barnett and J. Mozota, J. Electroanal. Chem.,
100 (1979) 417. 24 H. Gerischer, D.M. Kolb and M. Przasnyski, Surf. Sci., 43 (1974) 662. 25 D.M. Kolb in H. Geriseher and C.W. Tobias (Eds.), Advances in Electrochemistry and
Electrochemical Engineering, Vol. 11, John Wiley, New York, 1978, p. 125. 26 K. Jiittner and W.J. Lorenz, Z. Phys. Chem., (Wiesbaden), 122 (1980) 163. 27 M. Watanabe and S. Motoo, J. Electroanal. Chem., 60 (1975) 267,275; 98 (1979) 203. 28 R.R. Ad~i~, D.N. Simi~, A.R. Despi~ and D.M. Dra~i(~, J. Electroanal. Chem., 80 (1977) 81. 29 R.R. Ad~id, Isr. J. Chem., 18 (1979) 166. 30 A.M. E1 Halin, K. Jiittner and W.J. Lorenz, J. Electroanal. Chem., 106 (1980) 193. 31 K. Kinoshita and P. Stonehart in J. O'M. Bockris and B.E. Conway (Eds.), Modern
Aspects of Electrochemistry, Vol. 12, Plenum, New York, 1977, p , 183.

174
32 C.L. Scortichini and C.N. Reilley, J. Electroanal. Chem., 139 (1982) 233; C.L. Scortichini, F.E. Woodward and C.N. Reilley, ibid., 139 (1982) 265.
33 C.L. Scortichini and C.N. Reilley, J. Catal., 79 (1983) 138. 34 K. Christmann, G. Ertl and H. Shimizu, J. Catal., 61 (1980) 397. 35 H. Shimizu, K. Christmann and G. Ertl, J. Catal., 61 (1980) 412. 36 J.G. Vickerman, K. Christmann and G. Ertl, J. Catal., 71 (1981) 175. 37 J.H. Sinfelt, Y.L. Lam, J.A. Cusumano and A.E. Barnett, J. Catal., 42 (1976) 227. 38 J.H. Sinfelt, G.H. Via and F.W. Lytle, J. Chem. Phys., 72 (1980) 4832. 39 S.H. Cadle and S. Bruckenstein, Anal. Chem., 43 (1971) 1858. 40 N. Furuya and S. Motoo, J. Electroanal. Chem., 72 (1976) 165. 41 D.M. Kolb, R. Kotz and K. Yamamoto, Surf. Sci., 87 (1979) 20. 42 R. Faure, Th~se d'Etat, Grenoble, 1982. 43 B. Parajon Costa, C.D. Palleta, N.R. de Tacconi and A.J. Arvia, J. Electroanal. Chem.,
145 (1983) 189. 44 B.J. Bowles, Nature (London), 212 (1966) 1456. 45 N. Furuya and S. Motoo, J. Electroanal. Chem., 98 (1979) 189.
Copyright © 2022 FDOKUMEN