Characteristic cortical thickness patterns in adolescents with autism spectrum disorders:...
24
Characteristic cortical thickness patterns in adolescents with autism spectrum disorders: Interactions with age and intellectual ability revealed by canonical correlation analysis Masaya Misaki 1 , Gregory L Wallace 1 , Nathan Dankner 1 , Alex Martin 1 , and Peter A Bandettini 1 1 Laboratory of Brain and Cognition, National Institute of Mental Health, National Institute of Health Abstract To investigate patterns and correlates of cortical thickness in adolescent males with autism spectrum disorders (ASD) versus matched typically developing controls, we applied kernel canonical correlation analysis to whole brain cortical thickness with the explaining variables of diagnosis, age, full-scale IQ, and their interactions. The analysis found that canonical variates (patterns of cortical thickness) correlated with each of these variables. The diagnosis- and age-by- diagnosis-related canonical variates showed thinner cortex for participants with ASD, which is consistent with previous studies using a univariate analysis. In addition, the multivariate statistics found larger affected regions with higher sensitivity than those found using univariate analysis. An IQ-related effect was also found with the multivariate analysis. The effects of IQ and age-by-IQ interaction on cortical thickness differed between the diagnostics groups. For typically developing adolescents, IQ was positively correlated with cortical thickness in orbitofrontal, postcentral and superior temporal regions, and greater thinning with age was seen in dorsal frontal areas in the superior IQ (> 120) group. These associations between IQ and cortical thickness were not seen in the ASD group. Differing relationships between IQ and cortical thickness implies independent associations between measures of intelligence and brain structure in ASD versus typically developing controls. We discuss these findings vis-à-vis prior results obtained utilizing univariate methods. Keywords autism spectrum disorders; kernel canonical correlation analysis; varimax rotation; cortical thickness; developmental change Introduction Autism spectrum disorders (ASD) are characterized by impairments in social interaction, communication, and repetitive behavior (American Psychiatric Association, 2000). Many studies have shown an atypical developmental trajectory of brain anatomy, particularly gray matter structures, in ASD compared to patterns observed in typical development (Hardan et Corresponding author, Masaya Misaki, Section on Functional Imaging Methods, Laboratory of Brain and Cognition, National Institute of Mental Health, National Institutes of Health. 10 Center Dr. MSC 1148, Bethesda, MD 20892-1148 USA, TEL: 301-402-1358, FAX: 301-402-1370, [email protected]. Publisher's Disclaimer: This is a PDF file of an unedited manuscript that has been accepted for publication. As a service to our customers we are providing this early version of the manuscript. The manuscript will undergo copyediting, typesetting, and review of the resulting proof before it is published in its final citable form. Please note that during the production process errors may be discovered which could affect the content, and all legal disclaimers that apply to the journal pertain. NIH Public Access Author Manuscript Neuroimage. Author manuscript; available in PMC 2013 April 15. Published in final edited form as: Neuroimage. 2012 April 15; 60(3): 1890–1901. doi:10.1016/j.neuroimage.2012.01.120. NIH-PA Author Manuscript NIH-PA Author Manuscript NIH-PA Author Manuscript
Transcript of Characteristic cortical thickness patterns in adolescents with autism spectrum disorders:...
Characteristic cortical thickness patterns in adolescents withautism spectrum disorders: Interactions with age andintellectual ability revealed by canonical correlation analysis
Masaya Misaki1, Gregory L Wallace1, Nathan Dankner1, Alex Martin1, and Peter ABandettini11Laboratory of Brain and Cognition, National Institute of Mental Health, National Institute of Health
AbstractTo investigate patterns and correlates of cortical thickness in adolescent males with autismspectrum disorders (ASD) versus matched typically developing controls, we applied kernelcanonical correlation analysis to whole brain cortical thickness with the explaining variables ofdiagnosis, age, full-scale IQ, and their interactions. The analysis found that canonical variates(patterns of cortical thickness) correlated with each of these variables. The diagnosis- and age-by-diagnosis-related canonical variates showed thinner cortex for participants with ASD, which isconsistent with previous studies using a univariate analysis. In addition, the multivariate statisticsfound larger affected regions with higher sensitivity than those found using univariate analysis. AnIQ-related effect was also found with the multivariate analysis. The effects of IQ and age-by-IQinteraction on cortical thickness differed between the diagnostics groups. For typically developingadolescents, IQ was positively correlated with cortical thickness in orbitofrontal, postcentral andsuperior temporal regions, and greater thinning with age was seen in dorsal frontal areas in thesuperior IQ (> 120) group. These associations between IQ and cortical thickness were not seen inthe ASD group. Differing relationships between IQ and cortical thickness implies independentassociations between measures of intelligence and brain structure in ASD versus typicallydeveloping controls. We discuss these findings vis-à-vis prior results obtained utilizing univariatemethods.
Keywordsautism spectrum disorders; kernel canonical correlation analysis; varimax rotation; corticalthickness; developmental change
IntroductionAutism spectrum disorders (ASD) are characterized by impairments in social interaction,communication, and repetitive behavior (American Psychiatric Association, 2000). Manystudies have shown an atypical developmental trajectory of brain anatomy, particularly graymatter structures, in ASD compared to patterns observed in typical development (Hardan et
Corresponding author, Masaya Misaki, Section on Functional Imaging Methods, Laboratory of Brain and Cognition, NationalInstitute of Mental Health, National Institutes of Health. 10 Center Dr. MSC 1148, Bethesda, MD 20892-1148 USA, TEL:301-402-1358, FAX: 301-402-1370, [email protected]'s Disclaimer: This is a PDF file of an unedited manuscript that has been accepted for publication. As a service to ourcustomers we are providing this early version of the manuscript. The manuscript will undergo copyediting, typesetting, and review ofthe resulting proof before it is published in its final citable form. Please note that during the production process errors may bediscovered which could affect the content, and all legal disclaimers that apply to the journal pertain.
NIH Public AccessAuthor ManuscriptNeuroimage. Author manuscript; available in PMC 2013 April 15.
Published in final edited form as:Neuroimage. 2012 April 15; 60(3): 1890–1901. doi:10.1016/j.neuroimage.2012.01.120.
NIH
-PA Author Manuscript
NIH
-PA Author Manuscript
NIH
-PA Author Manuscript

al., 2009; Raznahan et al. 2010; Redcay and Courchesne, 2005; Scheel et al., 2011; Wallaceet al., 2010, for review, see Amaral et al., 2008; Courchesne et al., 2007). These studiesindicate that age is an important factor and key to understanding neuroanatomicaldifferences in ASD.
In addition to age, intellectual ability (measured via IQ scores) is also related to gray matterstructures in typical development (Narr et al., 2007; Shaw et al., 2006; Sowell et al., 2004;Wilke et al., 2003). However, discrepant associations between gray matter structure and IQin ASD (versus typically developing individuals) have not been shown. Hardan et al. (2006)investigating the cortical thickness differences between typically developing and ASDchildren, report that no significant correlation between IQ score and cortical thickness wasfound in either group. Hadjikhani et al. (2006) also did not find any significant correlationbetween IQ and cortical thinning in ASD adults. These negative results even for typicallydeveloping participants could be due to limited sensitivity of their analyses with smallsample sizes.
While most of the previous studies use univariate approaches in which the effect of ASD isevaluated at each local region independently, multivariate approaches may more effectivelycharacterize neuroanatomical differences in ASD with higher sensitivity: the effect of ASDis not likely to be restricted to a specific brain region but instead distributed in broad areas;therefore, regional differences can be correlated with one another. In fact, it has been shownthat multivariate classification analyses, in which multiple brain regions are used as amultivariate dataset, are more effective in discriminating an ASD group from controls thanevaluating their difference at each individual region. Ecker et al. (2010), for example, showhigh accuracy of classification between ASD and control groups using a whole brain graymatter volume as input for a multivariate classification analysis (support vector machine),while no statistically significant difference between groups was observed with voxel-basedanalysis. Jiao et al. (2010) also demonstrated that multivariate classification analyses coulddiscriminate ASD children from controls with high accuracy when they used corticalthickness of multiple regions as input for the analysis. They show that cortical thickness is abetter classifier of groups than gray matter volume.
While the multivariate classification analysis handles multiple brain regions as amultivariate dataset, its output is still univariate (class label). This analysis, therefore, cannotaccount for age and IQ effects on multiple brain regions. In the previous studies these effectswere excluded beforehand; any possible age confounds were removed at each voxel by aunivariate regression in Ecker et al. (2010), or participants’ ages were restricted to a smallrange in Jiao et al. (2010). In the current analysis, however, we do not exclude these factorsbeforehand because we were interested in evaluating how they and their interactions withgroup affected multivariate pattern of whole brain cortical thickness.
To investigate cortical thickness in ASD in a multivariate framework with age and IQinteractions taken into consideration, we utilized kernel canonical correlation analysis(KCCA) (Hardoon et al., 2004) in this study. Canonical correlation analysis (CCA)(Hotelling, 1936) evaluates correlations between two multidimensional datasets, so that itcan find relationships between cortical thicknesses in multiple brain regions and multiplefactors of ASD, age, and IQ. KCCA is an extension of CCA using a kernel method to handlea large dimensional dataset efficiently and robustly.
Even when we have two multidimensional datasets, multiple regression analysis orPearson’s correlation analysis can be utilized if we collapse the dataset into multipleunivariate cases. This is called the ‘mass-univariate’ approach, in which data from eachvoxel/vertex is used as a univariate value, and univariate correlation analysis or multiple
Misaki et al. Page 2
Neuroimage. Author manuscript; available in PMC 2013 April 15.
NIH
-PA Author Manuscript
NIH
-PA Author Manuscript
NIH
-PA Author Manuscript
regression analysis is repeated for each voxel/vertex. However, CCA is disparate from themass-univariate approach. While the mass-univariate approach evaluates correlation at eachbrain region independently, CCA can find a pattern correlation; a correlation between linearcombinations of multiple variables, so that it can extract more information that can be seenin a pattern of multiple brain regions but cannot be seen at an individual brain region.
Although CCA has been used in analyses of brain imaging data (Correa et al., 2010;Hardoon et al., 2009), it has not, to our knowledge, been applied to evaluations of corticalthickness in ASD. This analysis enables us to find multivariate patterns of cortical thicknesscorrelating with multiple explaining variables. We applied KCCA to the cortical thicknessdata from groups of ASD and age and IQ matched typically developing control males.
Materials and MethodsThe cortical thickness data used in this study was the same as in Wallace et al. (2010). Onlythe summary of demographics is described here. More details regarding diagnosticprocedure, medication history, and criteria for exclusion of participants can be found inWallace et al. (2010).
ParticipantsParticipants were 40 typically developing (TD) males (12–23 years of age, mean = 17.04, sd= 2.73) and 41 males with an autism spectrum disorder (12–24 years of age, mean = 16.75,sd = 2.84) recruited from the Washington, DC metropolitan area. Informed assent andconsent were obtained from all participants and/or their parent/guardian when appropriate inaccordance with a National Institutes of Health Institutional Review Board-approvedprotocol.
Participants with autism spectrum disorders (ASD) included 26 with Asperger’s syndrome,11 with high-functioning autism, three with pervasive developmental disorder not otherwisespecified, and one with either Asperger’s syndrome or high-functioning autism, which couldnot be distinguished because of missing early language developmental milestones data. AnASD diagnosis was based on both Diagnostic and Statistical Manual-IV (DSM-IV) criteriaas assessed by an experienced clinician and scores from the Autism Diagnostic Interview(ADI or ADI-R; Le Couteur et al., 1989; Lord et al., 1994) and/or the Autism DiagnosticObservation Schedule (Lord et al., 2000), administered by a trained, research-reliableclinician.
Full-scale IQ (FSIQ) was measured for all participants using the Wechsler AbbreviatedScale of Intelligence (34 ASD, 40 TD), the Wechsler Adult Intelligence Scale-III (threeASD), the Wechsler Intelligence Scale for Children-III (two ASD), or the WechslerIntelligence Scale for Children-IV (two ASD). FSIQ did not differ between groups withscores ranging from 85–143 (mean = 113.27, sd = 15.09) for the ASD group and 97–136(mean = 114.03, sd = 10.74) for the TD group. Participant groups also did not differ in termsof handedness (ASD: right/left = 37/4, TD: 36/4).
Imaging parameters and cortical thickness calculationA T1-weighted structural image was obtained from each subject with a magnetizationprepared rapid gradient echo sequence on a 3 T General Electric Signa scanner (Milwaukee,Wisconsin) using an 8-channel head coil. Imaging parameters were 124 axial slices, 224 ×224 acquisition matrix, flip angle = 6 degrees, field of view = 24 cm, and voxel size = 1.07 ×1.07 × 1.2 mm.
Misaki et al. Page 3
Neuroimage. Author manuscript; available in PMC 2013 April 15.
NIH
-PA Author Manuscript
NIH
-PA Author Manuscript
NIH
-PA Author Manuscript

The FreeSurfer image analysis suite (http://surfer.nmr.mgh.harvard.edu/) was used to extractcortical thickness. Cortical surface models were delineated on the gray/white boundary andon the pial surface (Dale et al., 1999; Fischl and Dale, 2000; Fischl et al., 1999). Spatialintensity gradients across tissue classes were used to create surface maps that are capable ofdetecting sub-millimeter differences between areas. The resulting surface models werereviewed for accuracy and manually edited when needed. Cortical thickness was quantifiedat each surface location (vertex) as the distance from the gray/white boundary to the pialsurface (Fischl and Dale, 2000). This method of cortical thickness measurement has beenvalidated in Rosas et al. (2002), Kuperberg et al. (2003), and Salat et al. (2004), and hasshown good reliability across sites and platforms (Han et al., 2006).
Vertex-wise cortical thickness values were mapped onto a normalized cortical surface andsmoothed with a 15 mm full width at half maximum kernel. After excluding unreliable areasin the hippocampus and amygdala (cortex label in the FreeSurfer was used as an inclusivemask), 299,881 cortical thickness values on the normalized surface of both hemisphereswere obtained for each participant. These values were used in the kernel canonicalcorrelation analysis.
Kernel canonical correlation analysisThe canonical correlation analysis (CCA) finds linear combinations of two multidimensionaldatasets that have maximum correlation with each other (Hotelling, 1936). Given the twomultidimensional datasets, X (each column corresponds to the explaining variablesincluding age, IQ, diagnosis and their interactions, and each row corresponds to oneparticipant) and Y (each column corresponds to cortical thickness at one vertex, and eachrow corresponds to one participant), canonical correlation ρ is defined as:
(1)
where SXX = X’X, SYY = Y’Y, and SXY = X’Y. wx and wY are column vectors. wx is givenby solving the following eigenproblem:
(2)
where B = SXX−1SXYSYY
−1SYX. Thus, canonical correlation ρ is given as a square root ofeigenvalue of B and wx as an eigenvector of B. wy is given by:
(3)
In the CCA, multiple canonical correlations can be evaluated with the eigenvalues of B,therefore the CCA can be seen as mapping the original data spaces onto the canonicalvariate spaces whose dimensions are highly correlated with each other.
When the dimensionality of the data is larger than the number of samples, like in the currentcase with a dimensionality of nearly 300,000 for 81 samples, CCA is prone to overfit tonoise of data, that is, it could find correlations of noise in each dataset. To avoid overfitting(Bishop, 2007), a regularization technique, which restricts the complexity of the model, isused. In this study we used the kernel canonical correlation analysis (KCCA) withregularization.
Misaki et al. Page 4
Neuroimage. Author manuscript; available in PMC 2013 April 15.
NIH
-PA Author Manuscript
NIH
-PA Author Manuscript
NIH
-PA Author Manuscript

We used the MATLAB implementation of KCCA by Hadoon et al. (2004), which isavailable on the website(http://www.davidroihardoon.com/Professional/Code_files/kcca_package.tar.gz). Here, wedescribe only the procedures of the analysis. For proofs, refer to Hadoon et al. (2004).
In this analysis, original data space X and Y are mapped onto kernel spaces KX and KYrespectively,
(4)
(5)
where <,> is an inner product operator and ϕ is a kernel function. We used a linear kernel for
both X and Y, so that ϕ is identity . The kernel matrices, KX andKY, are further mapped onto a reduced dimensionality space, RX and RY, using the partialGram-Schmidt orthogonalization (Hardoon et al., 2004). The canonical correlation analysiswas applied to these RX and RY. The canonical correlation ρ and weight matrix for RX aregiven by solving the following eigenproblem:
(6)
where ZYY = RY’RY, ZXY = RX’RY, ZYX = RY’RX, and S is a Cholesky decomposition of B= κZXX+(1−κ)I,. κ is a regularization parameter taking a value between 0 and 1. Weightmatrix for RY is given by:
(7)
As shown in Hardoon et al. (2004), κ controls the flexibility of the mapping from the inputdataset to the canonical variate. This parameter penalizes the norm of the weight values (seeHardoon et al., 2004 for detailed derivation); larger values of κ penalize complex mappingto the canonical variate more, resulting in reducing the flexibility of the analysis. Byoptimizing κ, we can control the balance of the analysis flexibility and the risk of overfitting.The procedure of κ optimization is described in the next section.
The weight matrices in the reduced kernel space were then transformed to the kernel space:
(8)
(9)
These weight matrices for the kernel space were further transformed to the original dataspace:
(10)
(11)
With these weight matrices, the canonical variates U and V were defined as:
Misaki et al. Page 5
Neuroimage. Author manuscript; available in PMC 2013 April 15.
NIH
-PA Author Manuscript
NIH
-PA Author Manuscript
NIH
-PA Author Manuscript
(12)
(13)
In the current analysis, we used seven explaining variables for X; age, FSIQ, diagnosis(ASD = +1, TD = −1), and their interactions of diagnosis-by-age, diagnosis-by-FSIQ, age-by-FSIQ, and diagnosis-by-age-by-FSIQ. Age and FSIQ variables were normalized to zeromean and unit variance. Interaction terms were made by multiplying the variables. Corticalthickness values were also normalized at each vertex across participants.
While we used a linear kernel for both X and Y in equation (4) and (5), KCCA can findnonlinear canonical correlations when a nonlinear kernel is used. We have tested quadraticpolynomial kernels for X, but no canonical correlations were statistically significant in thepermutation test described in the next section. This suggests that a higher-order kernel wasprone to overfit and the sample size was not enough to evaluate higher-order canonicalcorrelations, or a linear kernel was enough for the current dataset. In fact, Shaw et al. (2008)show that most brain regions across the cortex demonstrate linear changes during typicaladolescent development.
Optimization of the regularization parameterThe regularization parameter κ was optimized by the permutation test. We randomlypermuted sample combinations between X and Y, then KCCA was applied to the permuteddatasets. Repeating this procedure gave us an empirical null distribution of the canonicalcorrelations. The significance of the canonical correlation was evaluated with the Wilks’lambda (Krzanowski, 2000) for taking all orders of canonical correlations into account.Wilks’ lambda is defined as:
(14)
where ρk is a kth canonical correlation and D is the number of canonical correlations. For agiven κ, false positive rate of λ1 was estimated by the permutation test with 500 repetitions.The optimal value of κ that returns the most significant λ1 was searched with the line-search(Nocedal and Wright, 2006) between 0 and 1.
Statistical thresholding the canonical correlationSeven canonical correlations were evaluated by the KCCA for the current dataset. We usedthe permutation test to discard non-significant canonical variates. The same procedures ofthe permutation test described above were repeated 10,000 times with a fixed regularizationparameter, κ, optimized in the previous step. The false positive rate (p value) for each λi wasestimated. We took the canonical correlations until the p value was less than the threshold ofp < 0.05.
Rotating the canonical variate spaceResults of the canonical correlation analysis are usually difficult to interpret since thecomplex effects of multiple variables are distributed across multiple canonical variates. Forclear interpretation of the KCCA results, we rotated the extracted canonical variate spaceusing the varimax rotation (Kaiser, 1958). This method rotates the loading matrix tomaximize the sum of variances of squared loading:
Misaki et al. Page 6
Neuroimage. Author manuscript; available in PMC 2013 April 15.
NIH
-PA Author Manuscript
NIH
-PA Author Manuscript
NIH
-PA Author Manuscript
(15)
where Λ is a D by m loading matrix (D: dimensionality of original data, m: number ofcanonical correlations after thresholding). R is an m by D rotation matrix. We applied thevarimax rotation to the correlation matrix between the canonical variates V in equation (13)and the explaining variables X to find a multivariate pattern of cortical thickness that iscorrelated with a specific explaining variable. That is, we used a correlation matrix betweenV and X as the loading matrix Λ in equation (15). This rotation makes each canonicalvariate related to a specific explaining variable. It should be noted that the varimax rotationis an orthogonal rotation, so that mutual orthogonality across canonical variates is kept afterrotation. We used the rotatefactors function in the Statistics Toolbox of MATLAB(MathWorks, Natick, MA). The rotation R evaluated with the varimax was applied for WXand WY in equations (10) and (11) to obtain the rotated canonical variates:
(16)
(17)
In the results, we focused on the canonical variates VR as a pattern of cortical thickness,each of which is correlated with a specific explaining variable.
ResultsThe optimal regularization parameter was almost 1.00 (1.00 – 7.45e−9). This indicates thatwe need strong regularization for the best generalized result. In fact, without theregularization parameter all the canonical correlations were 1.0 and none of them weresignificant with permutation testing.
Table 1 shows the canonical correlations estimated by the KCCA before the varimaxrotation. Statistical significance (p values) was evaluated using a permutation test with10,000 repetitions. Seven canonical correlations were extracted with the seven explainingvariables. All the canonical variates were significant (p < 0.05). We used these sevenvariables to make a canonical variate space V in equation (13), and then rotated it with thevarimax to make VR in the equation (17).
Table 2 shows percentages of cortical thickness variance explained by the explainingvariables via canonical variates. Each percentage (Sxi) was evaluated with
, where corr(a,b) is a correlation between a and b. Svk is a ratioof cortical thickness variance explained by the canonical variate Vk, which was evaluated
with , where SST is a sum of squared variance of the corticalthickness, which was equal to the number of vertex since all Y values were normalized. Asseen in the table, age had the largest effect on cortical thickness, and the second largest wasdiagnosis. The main effect of IQ was not as large as those of age and diagnosis; however, itsinteractions with diagnosis explained more variance than its main effect.
Figures 1 to 7 show the characteristics of each of the rotated canonical variates. In thesefigures, the relationship between the canonical variate and an explaining variable that was
Misaki et al. Page 7
Neuroimage. Author manuscript; available in PMC 2013 April 15.
NIH
-PA Author Manuscript
NIH
-PA Author Manuscript
NIH
-PA Author Manuscript

maximally correlated with the canonical variate are shown in A. Panel B shows the plot ofcorrelations between the canonical variate and all explaining variables. Figures 1B to 7Bshow that each canonical variate was correlated with each of the explaining variables.
To see which brain regions were related to the canonical variate, correlation values betweenthe canonical variate and cortical thickness were mapped onto an inflated surface model ofthe template brain in Figures 1C to 7C. While we could use the weight matrix (WYR inequation 17) as a measure of the relationship, correlation values allowed us to evaluate theirrelationship with a simple statistical method. This map was thresholded at each vertex (p <0.01) and then thresholded with multiple comparison correction for cluster size (p < 0.01).For the cluster size thresholding we used the null distribution of cluster size that wasestimated with 10000 iterations of Monte Carlo simulation. The threshold was chosen to bethe same as that in the previous study using the same dataset (Wallace et al. 2010), allowingthe results to be compared.
To help to interpret the meaning of the canonical variate, actual cortical thickness wasplotted against the explaining variable for three representative regions located at a local peakof the map in Figures 1D to 7D. In these graphs, the cortical thickness values were averagecortical thicknesses in a circle of 7.5 mm radius centered at the arrowed location in panel C.It should be noted that these plots show the univariate effect in each brain region, so thattheir results are not necessarily as significant as the multivariate results shown in panel A.While we show the R2 values to indicate how the data aligned on the fitted line, thesefigures are shown only for helping interpret the meaning of the canonical variate.
Figure 1 shows the age-related canonical variate. Cortical thinning with age was seen inmany areas, including right prefrontal cortex and medial regions of the frontal to occipitalcortices. Age-related cortical thickening was seen only in anterior temporal regions.
Figure 2 shows the canonical variates correlated with full-scale IQ (FSIQ) scores. Corticalthickening with FSIQ was seen in the orbitofrontal, postcentral, right precentral, and leftmedial superior frontal regions. Thinning with higher IQ was seen in the insular and anteriortemporal regions.
Figure 3 shows the canonical variate correlated with diagnosis. ASD-related corticalthinning was seen in broad regions specifically in the parietal, superior and ventral temporal,superior frontal, and medial regions extending from the frontal to parietal areas.
Figure 4 shows the canonical variate correlated with the two-way interaction of diagnosis byage. This canonical variate was negatively related with age for typically developingparticipants, but positively related for participants with ASD. This interaction effect wasseen in the left prefrontal, right precentral, and right parietal regions. In these regions,cortical thickness was thinning with age in the TD group, but no change was seen in theASD group; plots of cortical thickness against age (Fig. 4D-b and 4D-c) revealed thickercortex for TD than ASD participants at younger ages, but the difference was reduced atolder ages due to cortical thinning in the TD group with increasing age. An interaction in theopposite direction was seen in the ventral temporal areas including the fusiform andparahippocampal regions. In these regions, there was cortical thinning with age in the ASDgroup but there was no age-related change in the TD group. As seen in Figure 4D-a, ASDparticipants had similar cortical thickness values to those of the TD group at younger agesbut there was thinning with age in the ASD participants, resulting in thinner cortex for thisgroup at older ages.
Figure 5 shows the canonical variate correlated with the two-way interaction of diagnosis byFSIQ. This canonical variate was negatively related to FSIQ for TD participants, but
Misaki et al. Page 8
Neuroimage. Author manuscript; available in PMC 2013 April 15.
NIH
-PA Author Manuscript
NIH
-PA Author Manuscript
NIH
-PA Author Manuscript
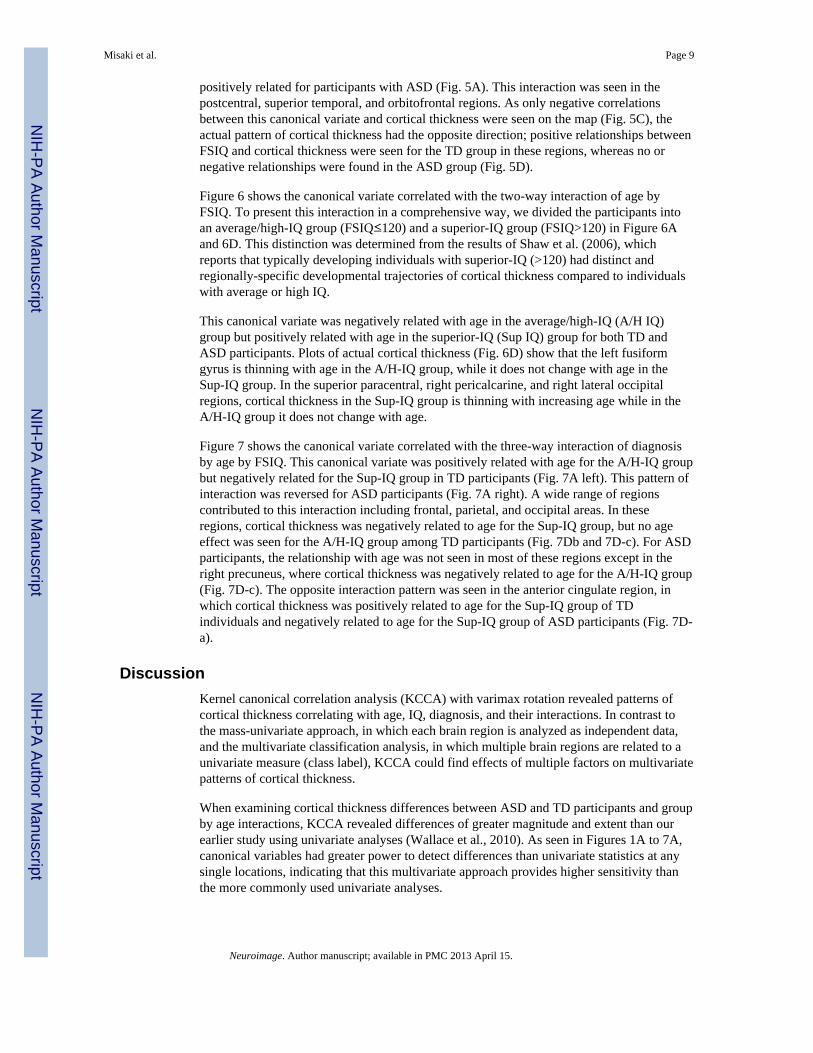
positively related for participants with ASD (Fig. 5A). This interaction was seen in thepostcentral, superior temporal, and orbitofrontal regions. As only negative correlationsbetween this canonical variate and cortical thickness were seen on the map (Fig. 5C), theactual pattern of cortical thickness had the opposite direction; positive relationships betweenFSIQ and cortical thickness were seen for the TD group in these regions, whereas no ornegative relationships were found in the ASD group (Fig. 5D).
Figure 6 shows the canonical variate correlated with the two-way interaction of age byFSIQ. To present this interaction in a comprehensive way, we divided the participants intoan average/high-IQ group (FSIQ≤120) and a superior-IQ group (FSIQ>120) in Figure 6Aand 6D. This distinction was determined from the results of Shaw et al. (2006), whichreports that typically developing individuals with superior-IQ (>120) had distinct andregionally-specific developmental trajectories of cortical thickness compared to individualswith average or high IQ.
This canonical variate was negatively related with age in the average/high-IQ (A/H IQ)group but positively related with age in the superior-IQ (Sup IQ) group for both TD andASD participants. Plots of actual cortical thickness (Fig. 6D) show that the left fusiformgyrus is thinning with age in the A/H-IQ group, while it does not change with age in theSup-IQ group. In the superior paracentral, right pericalcarine, and right lateral occipitalregions, cortical thickness in the Sup-IQ group is thinning with increasing age while in theA/H-IQ group it does not change with age.
Figure 7 shows the canonical variate correlated with the three-way interaction of diagnosisby age by FSIQ. This canonical variate was positively related with age for the A/H-IQ groupbut negatively related for the Sup-IQ group in TD participants (Fig. 7A left). This pattern ofinteraction was reversed for ASD participants (Fig. 7A right). A wide range of regionscontributed to this interaction including frontal, parietal, and occipital areas. In theseregions, cortical thickness was negatively related to age for the Sup-IQ group, but no ageeffect was seen for the A/H-IQ group among TD participants (Fig. 7Db and 7D-c). For ASDparticipants, the relationship with age was not seen in most of these regions except in theright precuneus, where cortical thickness was negatively related to age for the A/H-IQ group(Fig. 7D-c). The opposite interaction pattern was seen in the anterior cingulate region, inwhich cortical thickness was positively related to age for the Sup-IQ group of TDindividuals and negatively related to age for the Sup-IQ group of ASD participants (Fig. 7D-a).
DiscussionKernel canonical correlation analysis (KCCA) with varimax rotation revealed patterns ofcortical thickness correlating with age, IQ, diagnosis, and their interactions. In contrast tothe mass-univariate approach, in which each brain region is analyzed as independent data,and the multivariate classification analysis, in which multiple brain regions are related to aunivariate measure (class label), KCCA could find effects of multiple factors on multivariatepatterns of cortical thickness.
When examining cortical thickness differences between ASD and TD participants and groupby age interactions, KCCA revealed differences of greater magnitude and extent than ourearlier study using univariate analyses (Wallace et al., 2010). As seen in Figures 1A to 7A,canonical variables had greater power to detect differences than univariate statistics at anysingle locations, indicating that this multivariate approach provides higher sensitivity thanthe more commonly used univariate analyses.
Misaki et al. Page 9
Neuroimage. Author manuscript; available in PMC 2013 April 15.
NIH
-PA Author Manuscript
NIH
-PA Author Manuscript
NIH
-PA Author Manuscript

High sensitivity of multivariate analysis, however, also means increased risk of falsepositive findings. To confirm the robustness of the current results, we used permutationtesting. Furthermore in the following sections, to examine the validity of the current results,we compare them with previous studies investigating cortical thickness during adolescenceusing univariate analyses and consider the meaning of the multivariate analysis results.
Canonical variate as a pattern of cortical thicknessBefore we evaluate the current results compared with previous reports, we should note themeaning of the canonical variate as a pattern of cortical thickness. Canonical correlationanalysis finds a correlation between linear combinations (patterns) of multivariate datasets.That is, the canonical correlation is not a summary of correlations between each of a set ofsingle variables in the datasets but a correlation between multivariate patterns. In the currentanalysis, while one explaining variable corresponded to one of the canonical variatesbecause we rotated the weight matrices to do so, one canonical variate represented a patternof multiple regions’ cortical thicknesses. The maps in Figure 1C to 7C do not indicate adirect relationship between cortical thickness and the explaining variable. A combination ofcortical thicknesses in these regions was correlated with the explaining variable.
In some regions, raw cortical thickness values (Figs. 1D to 7D) can be seen as inconsistentwith a multivariate effect; for example, Figure 2Da indicates an interaction of IQ withdiagnosis, while this is shown as a region for the main effect of IQ. These results, however,do not contradict each other considering that the plots of Figures 1D to 7D show a univariateeffect in each region. Since one region could be affected by multiple factors, the interactioneffect can be seen as mixed with the main effect in the univariate plots. In the canonicalvariates, in contrast, multiple factors are orthogonalized with each other.
While in the following discussion we evaluate effects of explaining variables on corticalthickness at various brain locations, we do not claim each region in the results isindependently related to the explaining variable like in a univariate analysis. All regions inthe map have to be combined together to achieve a high canonical correlation. We shouldremember our results show multivariate patterns of cortical thickness correlated withexplaining variables.
Age and IQ effects on the cortical thicknessThe age-related canonical variate (Fig. 1) showed cortical thinning with age in many areasof the brain, and thickening in anterior temporal regions. These results are consistent withprevious studies investigating human cortical development (Gogtay et al., 2004; Raznahan etal., 2011; Salat et al., 2004; Shaw et al., 2008; Sowell et al., 2003, for review, see Giedd andRapoport, 2010). Shaw et al., (2008) showed that cortical thickness in most brain regionsdecreases with age during adolescence, and that some regions of the brain, including anteriorportions of the superior temporal gyrus, has a late developmental peak (around 18 years ofage), so that cortical thickness in this region continues to thicken in adolescence. Theconsistency between our results and these earlier studies supports the validity of the currentanalysis method.
The IQ related cortical thickness pattern, however, was different from the previous report byShaw et al. (2006). They found positive correlations of cortical thickness with IQ inprefrontal and inferior parietal regions during adolescence. In contrast, our results (Fig. 2)showed that only portions of the previously implicated regions were related to IQ scores.This difference is likely due to the nature of the canonical correlation analysis. The CCAextracts multiple effects simultaneously with orthogonalization across them. Thus, thevariance explained by one canonical variate is excluded from the effect of the other
Misaki et al. Page 10
Neuroimage. Author manuscript; available in PMC 2013 April 15.
NIH
-PA Author Manuscript
NIH
-PA Author Manuscript
NIH
-PA Author Manuscript

canonical variates. In the current case, the variances in most of the dorsal frontal areas wereexplained by the three-way interaction of age, IQ, and diagnosis (Fig. 7); therefore, anindependent effect of IQ was not seen in these regions.
The mutual orthogonality between the canonical variates also has a preferable effect inevaluating the results; the ASD-related effects can be evaluated free from the general effectsof age and IQ.
Characteristic cortical thickness pattern for ASDFor the ASD-related effects, we compared the current results with those of Wallace et al.(2010), in which a univariate analysis was applied to the same dataset. The regions withASD-related cortical thinning found with the multivariate analysis (Fig. 3) overlapped withthe regions found with a univariate analysis in Wallace et al. (2010) (see Fig. 1 in Wallace etal., 2010). While both studies pinpointed overlapping regions of group differences, themultivariate analysis extracted larger regions than those found using the univariate analysis.The regions in the map, however, did not necessarily have a significant correlation in theunivariate analysis. All regions on the map worked together as a pattern and this pattern wascorrelated with diagnosis. Therefore, previous studies reporting localized differences inASD samples using the mass-univariate approach (e.g. Chung et al. 2005; Scheel et al.,2011) do not necessarily contradict the current results.
The interaction of age and diagnosis was also consistent with the univariate analysis inWallace et al. (2010). They found greater age-related cortical thinning in the left fusiformarea of ASD participants. This thinning was included in the pattern map of the CCA.Wallace et al. (2010) also showed that cortical thickness in the right parietal region isthinner for ASD than for TD participants at younger ages (≤17 years) but the difference isdiminished at older ages (>17 years). This interaction effect was also found in the currentanalysis, which can be seen in the red regions of Figure 4C and in Figure 4D-c. Scheel et al.(2011) also found a consistent age-by-diagnosis interaction in the right parietal andprecentral regions as well as in the left parietal region with a univariate analysis, suggestingvalidity of this interaction effect.
In addition to the aforementioned regions, right ventral temporal/parahippocampal and leftprefrontal regions were included in the pattern of cortical thickness. While the effects ofASD on these regions were not significant with a univariate analysis, they contributedsignificantly to the canonical variate correlating with the age-by-diagnosis interaction. Thisresult indicates that the age-related changes in all of these regions follow a similar pattern,which differentiates the ASD group from the TD group.
Interaction of IQ effect with ASDThe pattern of cortical thickness correlating with the interaction of IQ by diagnosis includedthe orbitofrontal, postcentral, superior temporal, and ventral occipital regions (Fig. 5C). Inthese regions, cortical thickness was positively correlated with IQ for the TD participants,whereas no or negative relations were seen for the ASD participants. These regions partlyoverlap with the results of Shaw et al. (2006) for TD participants in early adulthood (17–29yr). Considering these regions survived after excluding the interaction effects of age-by-IQand age-by-IQ-by-diagnosis, this result suggests that the positive IQ effect in these regionsdid not interact with age and remains until early adulthood in typical development. Thecurrent analysis also showed that this IQ effect was not seen within the ASD group.
Shaw et al. (2006) also found an interaction of age and IQ affecting cortical developmentamong TD participants. Their results show that the peak age of cortical thickening is delayedfor the Sup-IQ (>120) group (around 12 years) relative to the A/H-IQ (≤120) group (around
Misaki et al. Page 11
Neuroimage. Author manuscript; available in PMC 2013 April 15.
NIH
-PA Author Manuscript
NIH
-PA Author Manuscript
NIH
-PA Author Manuscript

9 years) in superior/medial frontal and left middle temporal areas, resulting in thicker cortexin these regions for Sup-IQ in 12 year olds. This difference is transient as the Sup-IQ groupdisplays greater cortical thinning during adolescence.
In our results, the age by IQ interaction was seen only in small regions of superior precentraland right occipital areas (Fig. 6). Most of the regions indicated by Shaw et al. (2006)overlapped with our three-way interaction findings as depicted in Figure 7C. This three-wayinteraction indicates that the age by IQ interaction effect on cortical thickness was differentbetween TD and ASD participants.
The three-way interaction between diagnosis, age, and IQ (Fig. 7) revealed enhancedthinning for the Sup-IQ group of TD participants, which was consistent with results fromShaw et al. (2006). The ASD group did not display this age by IQ interaction, but anopposite pattern was seen in the right precuneus; the A/H-IQ ASD group had enhancedcortical thinning with age in this region. Also found was cortical thickening for the Sup-IQgroup of TD participants and thinning for the Sup-IQ group of ASD individuals in the leftanterior cingulate (Fig. 7D-a). These regions comprise the pattern of cortical thicknesscharacterizing the difference of age by IQ interaction effects between TD and ASDparticipants.
ConclusionThe use of a multivariate approach, kernel canonical correlation analysis, revealed patternsand correlates of cortical thickness in ASD that were not detected as sensitively usingunivariate methods. The consistency of the current results with prior studies supports thevalidity of the current analytic method. In addition, our results suggest differing IQ-corticalthickness relationships between ASD and TD groups, which has not been previouslyreported. This finding is suggestive of independent associations between intelligence andbrain structure in ASD versus typically developing controls.
The current results, however, were limited to male adolescents with relatively high IQscores. We cannot generalize these findings to females, other age ranges, and individualswith both ASD and intellectual disabilities. Although the limitation of sample coveragerestricts the generalization of our findings, the KCCA method itself has potential to revealmore complex relationships between wide-ranging variables. With datasets of relativelylarge size and wide-coverage (e.g., in terms of age and/or IQ), the potential of themultivariate analysis will be demonstrated more prominently.
AcknowledgmentsThis study was supported by the Intramural Research Program of the National Institutes of Health, NationalInstitute of Mental Health (NIMH).
ReferencesAmaral DG, Schumann CM, Nordahl CW. Neuroanatomy of autism. Trends in Neurosciences. 2008;
31:137–145. [PubMed: 18258309]American Psychiatric Association. Diagnostic and Statistical Manual of Mental Disorders DSM-IV-
TR Fourth Edition (Text Revision). Washington, DC: American Psychiatric Publishing; 2000.Bishop, CM. Pattern Recognition and Machine Learning. New York: Springer; 2007.Chung MK, Robbins SM, Dalton KM, Davidson RJ, Alexander AL, Evans AC. Cortical thickness
analysis in autism with heat kernel smoothing. NeuroImage. 2005; 25:1256–1265. [PubMed:15850743]
Misaki et al. Page 12
Neuroimage. Author manuscript; available in PMC 2013 April 15.
NIH
-PA Author Manuscript
NIH
-PA Author Manuscript
NIH
-PA Author Manuscript

Correa NM, Adali T, Yi-Ou L, Calhoun VD. Canonical Correlation Analysis for Data Fusion andGroup Inferences. Signal Processing Magazine, IEEE. 2010; 27:39–50.
Courchesne E, Pierce K, Schumann CM, Redcay E, Buckwalter JA, Kennedy DP, Morgan J. Mappingearly brain development in autism. Neuron. 2007; 56:399–413. [PubMed: 17964254]
Dale AM, Fischl B, Sereno MI. Cortical surface-based analysis: I Segmentation and surfacereconstruction. NeuroImage. 1999; 9:179–194. [PubMed: 9931268]
Ecker C, Rocha-Rego V, Johnston P, Mourao-Miranda J, Marquand A, Daly EM, Brammer MJ,Murphy C, Murphy DG. Investigating the predictive value of whole-brain structural MR scans inautism: A pattern classification approach. NeuroImage. 2010; 49:44–56. [PubMed: 19683584]
Fischl B, Dale AM. Measuring the thickness of the human cerebral cortex from magnetic resonanceimages. Proc Natl Acad Sci U S A. 2000; 97:11050–11055. [PubMed: 10984517]
Fischl B, Sereno MI, Dale AM. Cortical surface-based analysis: II. Inflation, flattening, and a surface-based coordinate system. NeuroImage. 1999; 9:195–207. [PubMed: 9931269]
Giedd JN, Rapoport JL. Structural MRI of Pediatric Brain Development: What Have We Learned andWhere Are We Going? Neuron. 2010; 67:728–734. [PubMed: 20826305]
Gogtay N, Giedd JN, Lusk L, Hayashi KM, Greenstein D, Vaituzis AC, Nugent TF, Herman DH,Clasen LS, Toga AW, Rapoport JL, Thompson PM. Dynamic mapping of human corticaldevelopment during childhood through early adulthood. Proceedings of the National Academy ofSciences of the United States of America. 2004; 101:8174–8179. [PubMed: 15148381]
Hadjikhani N, Joseph RM, Snyder J, Tager-Flusberg H. Anatomical differences in the mirror neuronsystem and social cognition network in autism. Cerebral Cortex. 2006; 16:1276–1282. [PubMed:16306324]
Han X, Jovicich J, Salat D, van der Kouwe A, Quinn B, Czanner S, Busa E, Pacheco J, Albert M,Killiany R, Maguire P, Rosas D, Makris N, Dale A, Dickerson B, Fischl B. Reliability of MRI-derived measurements of human cerebral cortical thickness: the effects of field strength, scannerupgrade and manufacturer. NeuroImage. 2006; 32:180–194. [PubMed: 16651008]
Hardan AY, Libove RA, Keshavan MS, Melhem NM, Minshew NJ. A preliminary longitudinalmagnetic resonance imaging study of brain volume and cortical thickness in autism. BiologicalPsychiatry. 2009; 66:320–326. [PubMed: 19520362]
Hardan AY, Muddasani S, Vemulapalli M, Keshavan MS, Minshew NJ. An MRI study of increasedcortical thickness in autism. American Journal of Psychiatry. 2006; 163:1290–1292. [PubMed:16816240]
Hardoon DR, Ettinger U, Mourao-Miranda J, Antonova E, Collier D, Kumari V, Williams SCR,Brammer M. Correlation-based multivariate analysis of genetic influence on brain volume.Neuroscience Letters. 2009; 450:281–286. [PubMed: 19028548]
Hardoon DR, Szedmak S, Shawe-Taylor J. Canonical correlation analysis: An overview withapplication to learning methods. Neural Computation. 2004; 16:2639–2664. [PubMed: 15516276]
Hotelling H. Relations between two sets of variants. Biometrika. 1936; 28:321–377.Jiao Y, Chen R, Ke X, Chu K, Lu Z, Herskovits EH. Predictive models of autism spectrum disorder
based on brain regional cortical thickness. NeuroImage. 2010Kaiser HF. The varimax criterion for analytic rotation in factor analysis. Psychometrika. 1958;
23:187–200.Krzanowski, WJ. Principles of multivariate analysis : a user's perspective. Oxford University Press;
2000.Kuperberg GR, Broome MR, McGuire PK, David AS, Eddy M, Ozawa F, Goff D, West WC, Williams
SCR, Van der Kouwe AJW, Salat DH, Dale AM, Fischl B. Regionally localized thinning of thecerebral cortex in schizophrenia. Archives of General Psychiatry. 2003; 60:878–888. [PubMed:12963669]
Le Couteur A, Rutter M, Lord C, Rios P, Robertson S, Holdgrafer M, McLennan J. Autism diagnosticinterview: A standardized investigator-based instrument. Journal of Autism and DevelopmentalDisorders. 1989; 19:363–387. [PubMed: 2793783]
Lord C, Rutter M, Couteur AL. Autism diagnostic interview-revised: A revised version of a diagnosticinterview for caregivers of individuals with possible pervasive developmental disorders. Journal ofAutism and Developmental Disorders. 1994; 24:659–685. [PubMed: 7814313]
Misaki et al. Page 13
Neuroimage. Author manuscript; available in PMC 2013 April 15.
NIH
-PA Author Manuscript
NIH
-PA Author Manuscript
NIH
-PA Author Manuscript

Lord C, Risi S, Lambrecht L, Cook EH Jr, Leventhal BL, Dilavore PC, Pickles A, Rutter M. TheAutism Diagnostic Observation Schedule-Generic: A standard measure of social andcommunication deficits associated with the spectrum of autism. Journal of Autism andDevelopmental Disorders. 2000; 30:205–223. [PubMed: 11055457]
Narr KL, Woods RP, Thompson PM, Szeszko P, Robinson D, Dimtcheva T, Gurbani M, Toga AW,Bilder RM. Relationships between IQ and regional cortical gray matter thickness in healthy adults.Cerebral Cortex. 2007; 17:2163–2171. [PubMed: 17118969]
Nocedal, J.; Wright, S. Numerical Optimization (Springer Series in Operations Research and FinancialEngineering). Springer; 2006.
Raznahan A, Shaw P, Lalonde F, Stockman M, Wallace GL, Greenstein D, Clasen L, Gogtay N, GieddJN. How does your cortex grow? Journal of Neuroscience. 2011; 31:7174–7177. [PubMed:21562281]
Raznahan A, Toro R, Daly E, Robertson D, Murphy C, Deeley Q, Bolton PF, Paus T, Murphy DGM.Cortical anatomy in autism spectrum disorder: An in vivo MRI study on the effect of age. CerebralCortex. 2010; 20:1332–1340. [PubMed: 19819933]
Redcay E, Courchesne E. When is the brain enlarged in autism? A meta-analysis of all brain sizereports. Biol Psychiatry. 2005; 58:1–9. [PubMed: 15935993]
Rosas HD, Liu AK, Hersch S, Glessner M, Ferrante RJ, Salat DH, Van Der Kouwe A, Jenkins BG,Dale AM, Fischl B. Regional and progressive thinning of the cortical ribbon in Huntington'sdisease. Neurology. 2002; 58:695–701. [PubMed: 11889230]
Salat DH, Buckner RL, Snyder AZ, Greve DN, Desikan RSR, Busa E, Morris JC, Dale AM, Fischl B.Thinning of the cerebral cortex in aging. Cerebral Cortex. 2004; 14:721–730. [PubMed:15054051]
Scheel C, Rotarska-Jagiela A, Schilbach L, Lehnhardt FG, Krug B, Vogeley K, Tepest R. Imagingderived cortical thickness reduction in high-functioning autism: Key regions and temporal slope.NeuroImage. 2011; 58:391–400. [PubMed: 21749926]
Shaw P, Greenstein D, Lerch J, Clasen L, Lenroot R, Gogtay N, Evans A, Rapoport J, Giedd J.Intellectual ability and cortical development in children and adolescents. Nature. 2006; 440:676–679. [PubMed: 16572172]
Shaw P, Kabani NJ, Lerch JP, Eckstrand K, Lenroot R, Gogtay N, Greenstein D, Clasen L, Evans A,Rapoport JL, Giedd JN, Wise SP. Neurodevelopmental trajectories of the human cerebral cortex.Journal of Neuroscience. 2008; 28:3586–3594. [PubMed: 18385317]
Sowell ER, Peterson BS, Thompson PM, Welcome SE, Henkenius AL, Toga AW. Mapping corticalchange across the human life span. Nature Neuroscience. 2003; 6:309–315.
Sowell ER, Thompson PM, Leonard CM, Welcome SE, Kan E, Toga AW. Longitudinal mapping ofcortical thickness and brain growth in normal children. Journal of Neuroscience. 2004; 24:8223–8231. [PubMed: 15385605]
Wallace GL, Dankner N, Kenworthy L, Giedd JN, Martin A. Age-related temporal and parietalcortical thinning in autism spectrum disorders. Brain. 2010; 133:3745–3754. [PubMed: 20926367]
Wilke M, Sohn JH, Byars AW, Holland SK. Bright spots: Correlations of gray matter volume with IQin a normal pediatric population. NeuroImage. 2003; 20:202–215. [PubMed: 14527581]
Misaki et al. Page 14
Neuroimage. Author manuscript; available in PMC 2013 April 15.
NIH
-PA Author Manuscript
NIH
-PA Author Manuscript
NIH
-PA Author Manuscript

Figure 1.Characteristics of the age-related canonical variate. A) Plot of canonical variate against age.Black squares represent typically developing (TD) participants and red circles representparticipants with autism spectrum disorders (ASD). Linear regression was performed foreach of the TD and ASD groups. The R2 value indicates a ratio of total variance explainedby a fitted line (*: p < 0.05, †: p < 0.01, ‡: p < 0.001). B) Pearson correlations between thecanonical variate and explaining variables. C) Map of Pearson correlations between thecanonical variate and cortical thickness at each vertex on an inflated surface model of thetemplate brain. The first two columns present data from the left hemisphere while the lattertwo columns present data from the right hemisphere. The map was thresholded at eachvertex (p < 0.01) and then thresholded with multiple comparison correction for cluster size(p < 0.01). D) Plots of the cortical thicknesses at three representative regions located at a
Misaki et al. Page 15
Neuroimage. Author manuscript; available in PMC 2013 April 15.
NIH
-PA Author Manuscript
NIH
-PA Author Manuscript
NIH
-PA Author Manuscript

peak of the correlation map in C. Average cortical thicknesses in a circle of 7.5-mm radiuswere plotted against the age. Center of the circle region is indicated by arrow in C.
Misaki et al. Page 16
Neuroimage. Author manuscript; available in PMC 2013 April 15.
NIH
-PA Author Manuscript
NIH
-PA Author Manuscript
NIH
-PA Author Manuscript
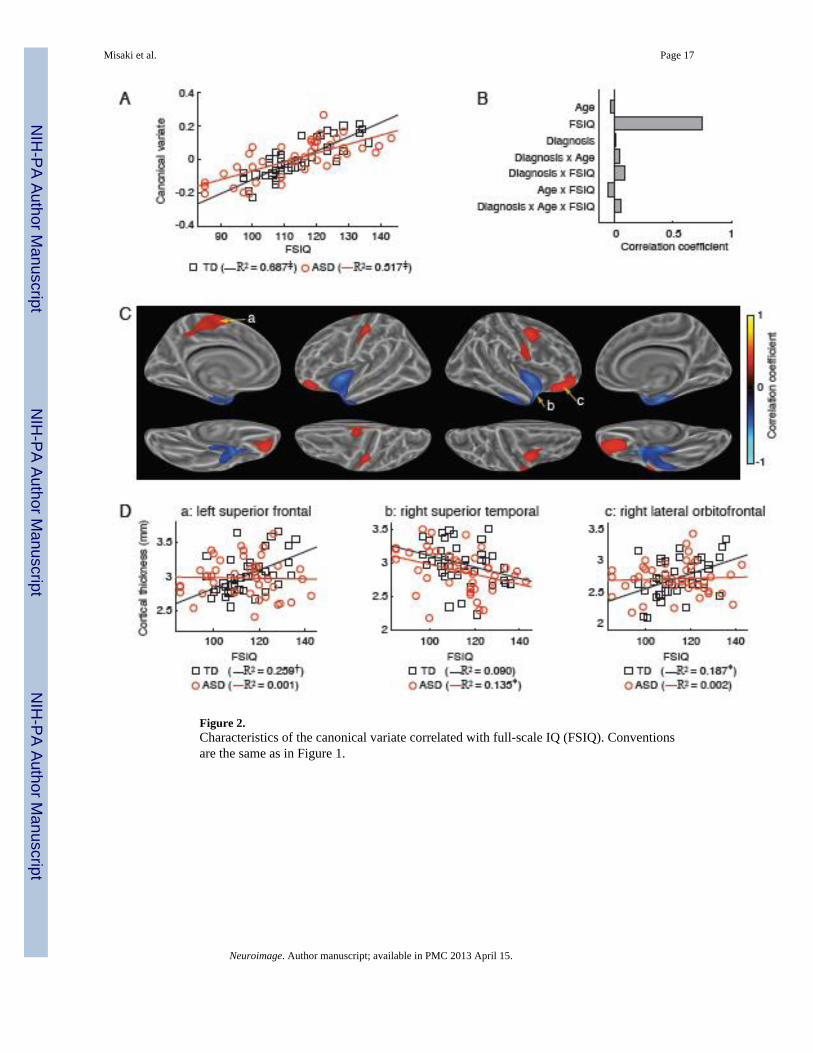
Figure 2.Characteristics of the canonical variate correlated with full-scale IQ (FSIQ). Conventionsare the same as in Figure 1.
Misaki et al. Page 17
Neuroimage. Author manuscript; available in PMC 2013 April 15.
NIH
-PA Author Manuscript
NIH
-PA Author Manuscript
NIH
-PA Author Manuscript
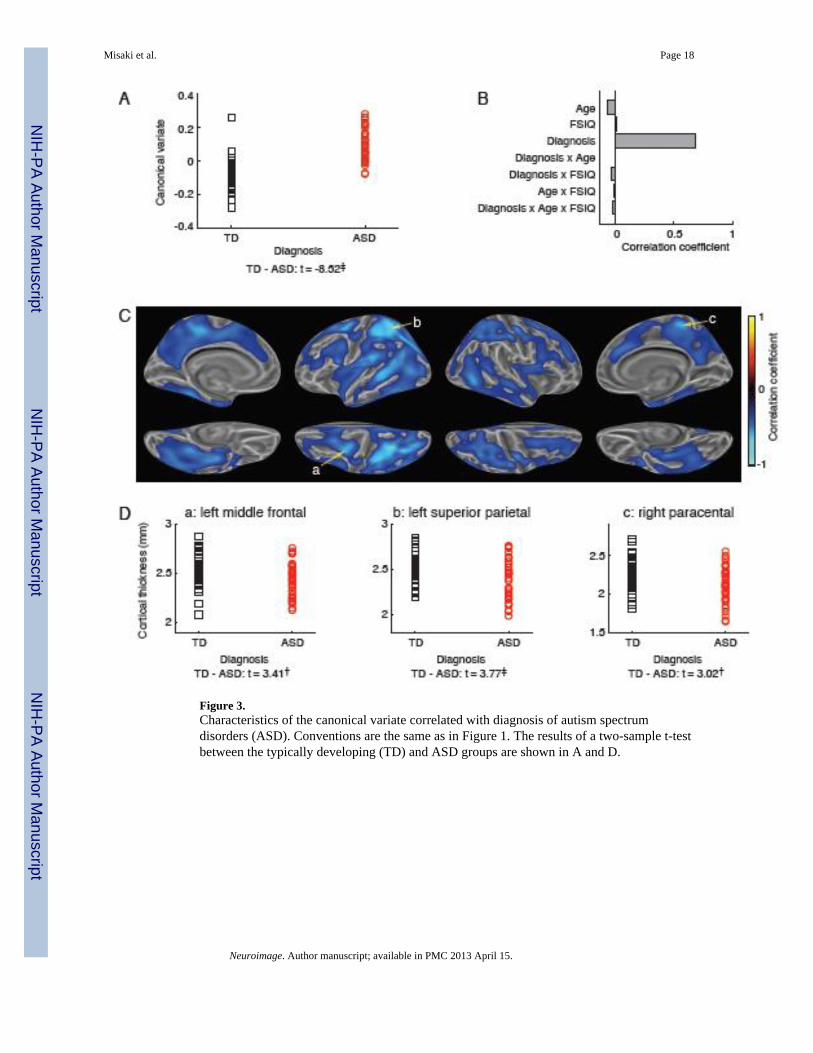
Figure 3.Characteristics of the canonical variate correlated with diagnosis of autism spectrumdisorders (ASD). Conventions are the same as in Figure 1. The results of a two-sample t-testbetween the typically developing (TD) and ASD groups are shown in A and D.
Misaki et al. Page 18
Neuroimage. Author manuscript; available in PMC 2013 April 15.
NIH
-PA Author Manuscript
NIH
-PA Author Manuscript
NIH
-PA Author Manuscript
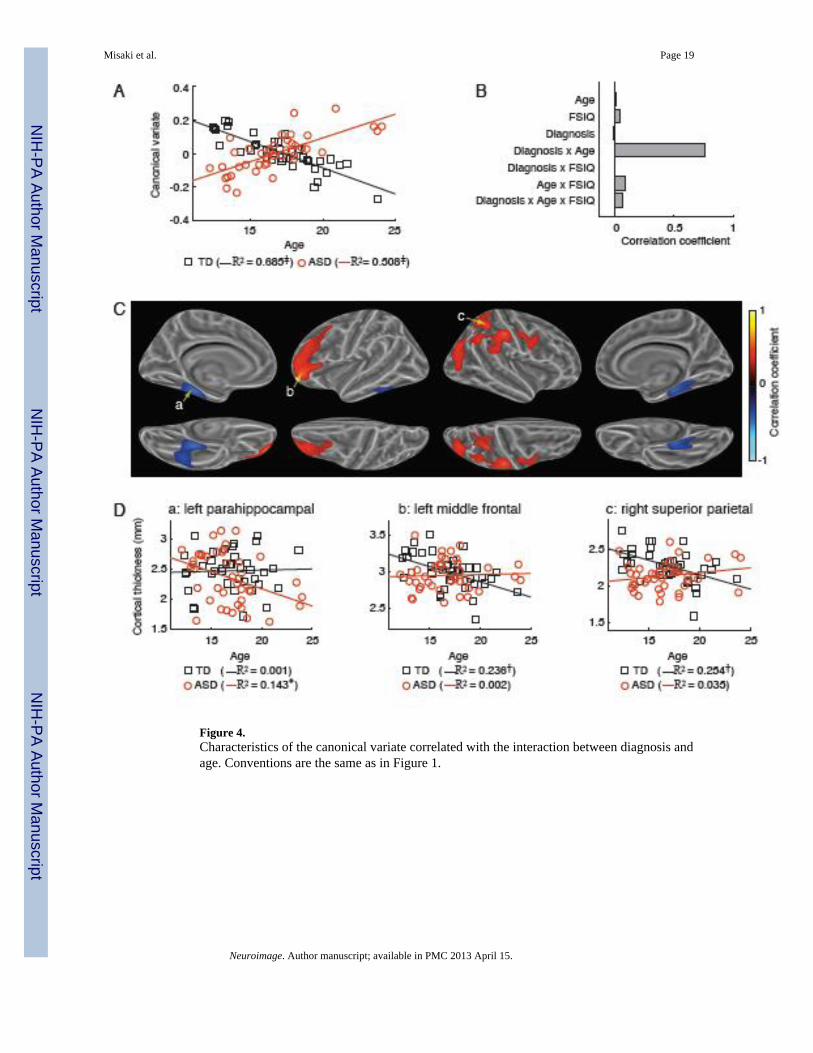
Figure 4.Characteristics of the canonical variate correlated with the interaction between diagnosis andage. Conventions are the same as in Figure 1.
Misaki et al. Page 19
Neuroimage. Author manuscript; available in PMC 2013 April 15.
NIH
-PA Author Manuscript
NIH
-PA Author Manuscript
NIH
-PA Author Manuscript
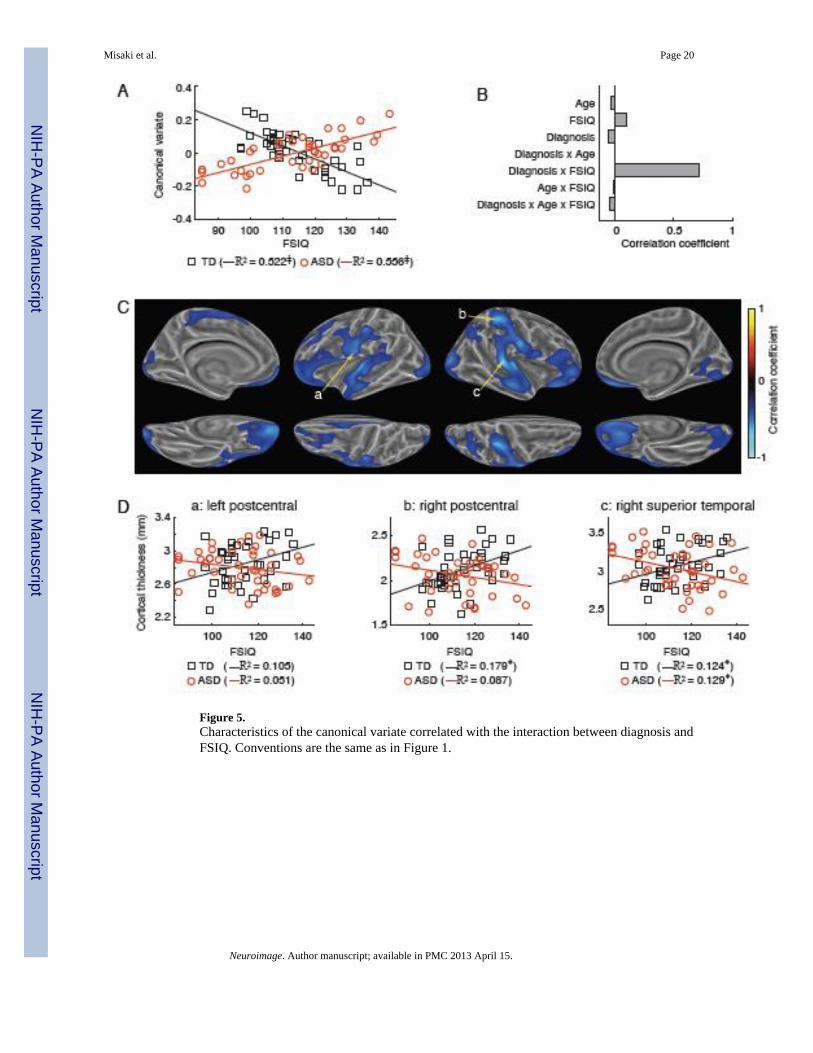
Figure 5.Characteristics of the canonical variate correlated with the interaction between diagnosis andFSIQ. Conventions are the same as in Figure 1.
Misaki et al. Page 20
Neuroimage. Author manuscript; available in PMC 2013 April 15.
NIH
-PA Author Manuscript
NIH
-PA Author Manuscript
NIH
-PA Author Manuscript
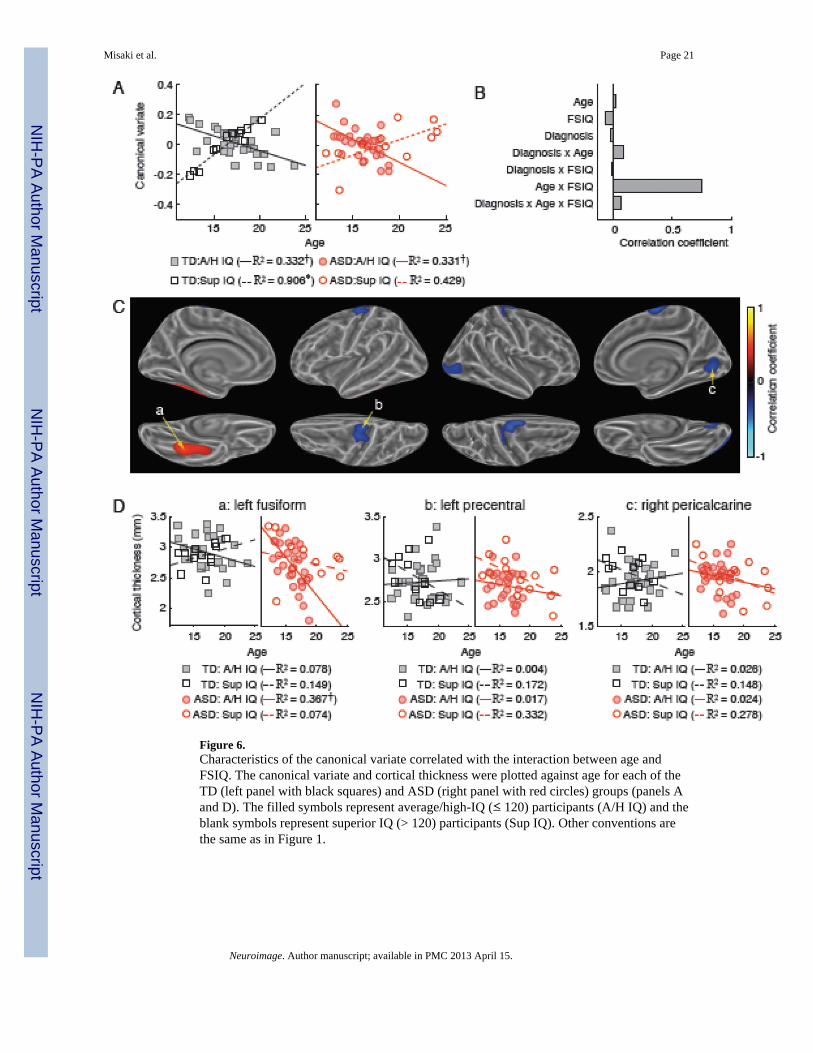
Figure 6.Characteristics of the canonical variate correlated with the interaction between age andFSIQ. The canonical variate and cortical thickness were plotted against age for each of theTD (left panel with black squares) and ASD (right panel with red circles) groups (panels Aand D). The filled symbols represent average/high-IQ (≤ 120) participants (A/H IQ) and theblank symbols represent superior IQ (> 120) participants (Sup IQ). Other conventions arethe same as in Figure 1.
Misaki et al. Page 21
Neuroimage. Author manuscript; available in PMC 2013 April 15.
NIH
-PA Author Manuscript
NIH
-PA Author Manuscript
NIH
-PA Author Manuscript
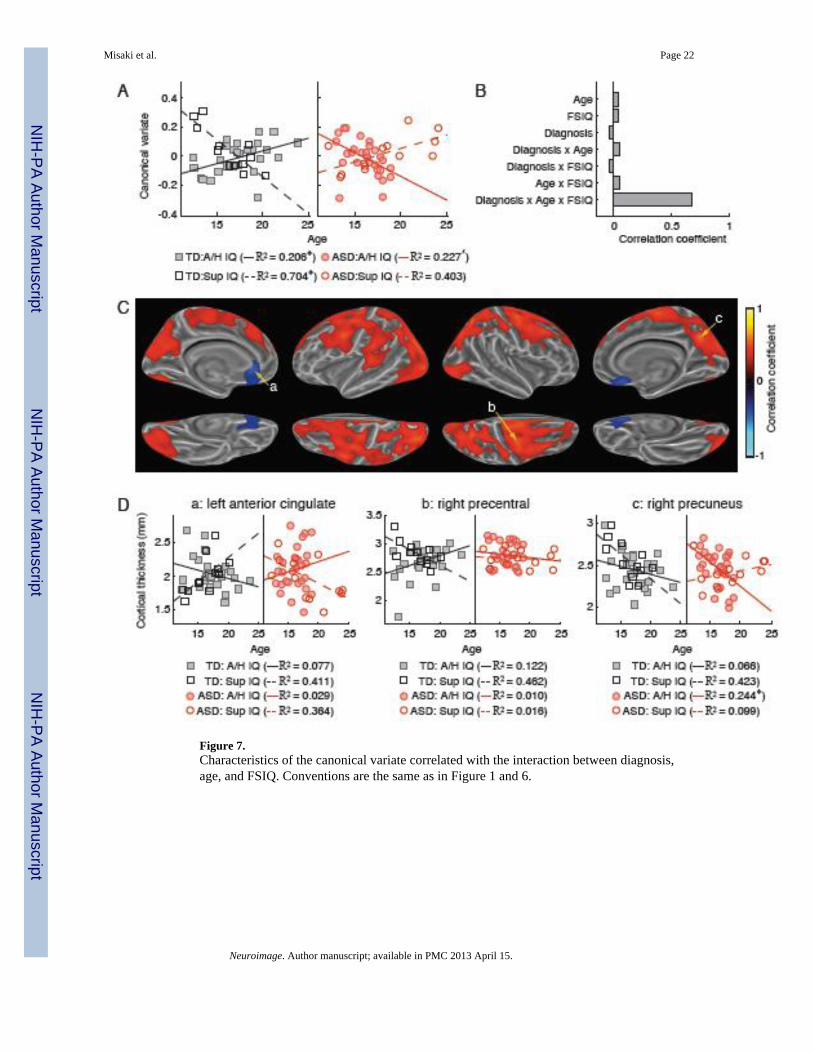
Figure 7.Characteristics of the canonical variate correlated with the interaction between diagnosis,age, and FSIQ. Conventions are the same as in Figure 1 and 6.
Misaki et al. Page 22
Neuroimage. Author manuscript; available in PMC 2013 April 15.
NIH
-PA Author Manuscript
NIH
-PA Author Manuscript
NIH
-PA Author Manuscript

NIH
-PA Author Manuscript
NIH
-PA Author Manuscript
NIH
-PA Author Manuscript
Misaki et al. Page 23
Table 1
Canonical correlations between the whole-brain cortical thickness and the explaining variables of age, full-scale IQ (FSIQ), autism diagnosis, and interactions of diagnosis by age, diagnosis by FSIQ, age by FSIQ, anddiagnosis by age by FSIQ. p values were estimated with the permutation test.
Order ofcanonical
correlation
Canonicalcorrelation
p value
1 0.8247 0.0124
2 0.8071 0.0072
3 0.8059 0.0056
4 0.7456 0.0103
5 0.7449 0.0026
6 0.7268 0.0011
7 0.5601 0.0059
Neuroimage. Author manuscript; available in PMC 2013 April 15.

NIH
-PA Author Manuscript
NIH
-PA Author Manuscript
NIH
-PA Author Manuscript
Misaki et al. Page 24
Table 2
Percentages of cortical thickness variance explained by the explaining variables via canonical variates.
Explaining variable Explained varianceof cortical thickness
(%)
Age 5.692
Full-scale IQ (FSIQ) 2.071
Autism diagnosis 4.892
Diagnosis × Age 1.880
Diagnosis × FSIQ 3.215
Age × FSIQ 1.411
Diagnosis × Age × FSIQ 3.226
Total 22.389
Neuroimage. Author manuscript; available in PMC 2013 April 15.