Is the Consequence of Superluminal Signalling to Physics Absolute Motion through an Ether?
Upload
independentCategory
view
4download
0
Characterisation of Blends Based on
Hydroxyethylcellulose and Maleic
Acid-alt-Methyl Vinyl Ether
Olga V. Khutoryanskaya,1 Vitaliy V. Khutoryanskiy,2 Richard A. Pethrick*1
1 University of Strathclyde, Department of Pure & Applied Chemistry, University of Strathclyde, Thomas Graham Building,295 Cathedral Street, Glasgow, G1 1XL, UKE-mail: [email protected]
2 University of Manchester, School of Pharmacy and Pharmaceutical Sciences, Coupland III, Coupland Street, Manchester,M13 9PL, UK
Received: February 15, 2005; Revised: May 25, 2005; Accepted: May 30, 2005; DOI: 10.1002/macp.200500069
Keywords: cellulose ether; hydrogen bonding; hydrophilic polymers; polymer-polymer miscibility; water-soluble polymers
Introduction
Polymeric blends based on water-soluble polymers are of
considerable interest because they are relatively easy to
prepare and have a variety of potential uses including bio-
medical and pharmaceutical applications,[1–3] as polymer
membranes,[4,5] coatings and packaging films,[6] and in
electronics.[7] Miscibility of polymers in a blend are drama-
tically influenced by the presence of specific interactions;
hydrogen bonding and electrostatic interactions[8,9] being
the most important. Hydrogen bonding is responsible for
miscibility in a number of different systems containing
poly(carboxylic acids) and non-ionic polymers. Specific
interactions have also been reported in blends between
poly(acrylic acid) (PAA) and various water-soluble poly-
saccharides.[3,10–15] Complete miscibility as a rule is attri-
buted to the strong intermacromolecular hydrogen bonding
between the component polymers. Studies on blends of
water-soluble polysaccharides and carboxylic acid copoly-
mers containing the groups, which are not able to form
hydrogen bonds, are quite limited. Bumbuet. al. have report-
ed studies on blends based on maleic acid-vinyl acetate
Summary: Hydrophilic polymeric films based on blends ofhydroxyethylcellulose and maleic acid-co-methyl vinyl etherwere produced by casting from aqueous solutions. The phy-sicochemical properties of the blends have been assessedusing Fourier transform infrared spectroscopy, thermal gravi-metric analysis, differential scanning calorimetry, dielectricspectroscopy, etc. The pristine films exhibit complete misci-bility due to the formation of intermacromolecular hydrogenbonding. The thermal treatment of the blend films leads tocross-linking via intermacromolecular esterification andanhydride formation. The cross-linked materials are able toswell in water and their swelling degree can be easily con-trolled by temperature and thermal treatment time. The for-mation of the crosslinks is apparent in the dynamic propertiesof the blends as observed through the mechanical relaxationand dielectric relaxation spectra. The dielectric character-istics of the material are influenced by the effects of change inthe local structure of the blend on the ionic conductionprocesses and the rate of dipolar relaxation. Separation ofthese processes is attempted using the dielectric modulusmethod. Significant deviations from a simple additive rule ofmixing on the activation energy are observed consistent with
hydrogen bonding and crosslinking of the matrix. This paperindicates a method for the creation of films with good mech-anical and physical characteristics by exposing the blends to arelatively mild thermal treatment.
Scheme of hydrogen bonding between hydroxyethylcellu-lose and maleic acid-co-methyl vinyl ether.
Macromol. Chem. Phys. 2005, 206, 1497–1510 DOI: 10.1002/macp.200500069 � 2005 WILEY-VCH Verlag GmbH & Co. KGaA, Weinheim
Full Paper 1497
(MA-VA) copolymer and dextran,[16] pullulan[17] and
hydroxypropylcellulose.[18] This copolymer consists of
alternating MA units with two carboxylic groups and vinyl
acetate units, which are not active in formation of hydrogen
bonds. The presence of intermacromolecular hydrogen
bonding and the formation of ester bonds lead to com-
patibility at 85–95 wt.-% of dextran in the blend, but lower
compositions of dextran are immiscible and phase separa-
tion is observed.[16] The blends containing greater than 85%
of pullulan are homogeneous, whereas the blends with lower
amount of polysaccharide show distinct phase separa-
tion.[17] The blends of MA-VAwith HPC containing 10–30
and 70–90% of the polysaccharide exhibit single Tg values
and are transparent, supporting the assumption of their
complete miscibility.[18] The films containing 60% of HPC
did not show a glass transition and the blend containing 50%
HPC could not be produced because of precipitation of
interpolymer complex of MA-VA/HPC. The miscibility of
the blends was explained in terms of the balance of hydro-
gen-bonding and hydrophobic interactions between the
component polymers. A similar hypothesis was previously
used to interpret complexation of dextran and HPC with
respect to PAA.[3] Indeed, HPC exhibits much a higher
ability to interact with PAA via hydrogen bonding and
hydrophobic interactions than dextran, which justifies the
poorer ability of the latter polymer to form miscible blends
with MA-VA.
This paper reports studies on blends based on hydroxy-
ethylcellulose (HEC) and an alternating copolymer of
methyl vinyl ether and maleic acid (PMVEMAc). PMVE-
MAc is a water-soluble copolymer containing MA units
with two carboxylic groups, which can act as proton-donors
and form hydrogen bonds with hydroxyl and ether groups of
HEC. The second component of this copolymer is methyl
vinyl ether (MVE) can also act as proton-acceptor with
respect to the hydroxyl groups of HEC. The purpose of this
work was to prepare the polymeric films based on HEC-
PMVEMAc, to assess the miscibility of the polymers in the
blends and to evaluate the possibility of the polymers cross-
linking.
Experimental Part
Materials and Film Preparation
Poly[(methyl vinyl ether)-alt-(maleic acid)] (Mw � 1.98�106 Da) and hydroxyethylcellulose (DS¼ 1, MS¼ 2, Mw �2.5� 105 Da) were supplied by Sigma-Aldrich and usedwithout further purification. The binary polymeric blends wereobtained by mixing PMVEMAc and HEC aqueous solutions(2 wt.-%) in different proportions and stirring at roomtemperature for 30 min. The films were prepared from aqueoussolutions of pure polymers and their blends, by casting onpolystyrene Petri dishes. After evaporation of solvent (water)over 2–3 d at room temperature the films were stored in a desic-cator. All films had a thickness of approximately 0.04–0.06 mm.
Thermal Treatment
The thermal treatment of the film has been performed in atemperature-controlled oven under vacuum.
Determination of Swelling Degree
The degree of the films swelling (DS) in water was gra-vimetrically determined by the following formula:
DS ¼ ðm� m0Þ=m0 ð1Þ
where m and m0 are the weights of the film sample in swollenand dry state, respectively. The experiments were performed intriplicates and the average DS was calculated and reported.
Modulated Temperature Differential ScanningCalorimetry (MTDSC)
MTDSC studies were performed on a TA Q1000 over atemperature range from�80 to 250 8C, under an atmosphere ofdry nitrogen at a flow rate of 20 mL/min. The samples weretypically between approximately 1–2 mg and 4.7–5.3 mg. Thesamples were first heated from 30 to 70 8C at a heating rate of5 8C/min and held for 60 min isothermally, and then cooled to�80 8C at a rate of 10 8C/min and then heated again at the samerate to 250 8C.
Thermogravimetric Analysis (TGA)
TGA was performed on a Shimadzu ThermogravimetricAnalyzer (TG-51) in nitrogen atmosphere at a heating rate of10 8C/min and a temperature range from room temperature to500 8C. The nitrogen flow rate was 20 mL/min.
Fourier Transformed Infrared (FTIR) Spectroscopy
FTIR spectra of the samples were recorded using KBr discswith a Perkin-Elmer spectrometer at a resolution of 4 cm�1
with 10 scans.
Dielectric Relaxation Spectroscopy
The dielectric properties of the films were measured using theSI1260 Impedance/gain phase analyzer (Solartron) and Novo-control system (Novotronic (Novocontrol GmbH), Broadbanddielectric converter and Microtronic). The frequency and tem-perature range were 0.1–1 MHz and 25–70 8C, respectively.The time of temperature stabilisation was 10 min. Electrodediameter was 9.985 mm. Heating rate was 10 8C/min. Themethod used has been described previously.[19]
Results and Discussion
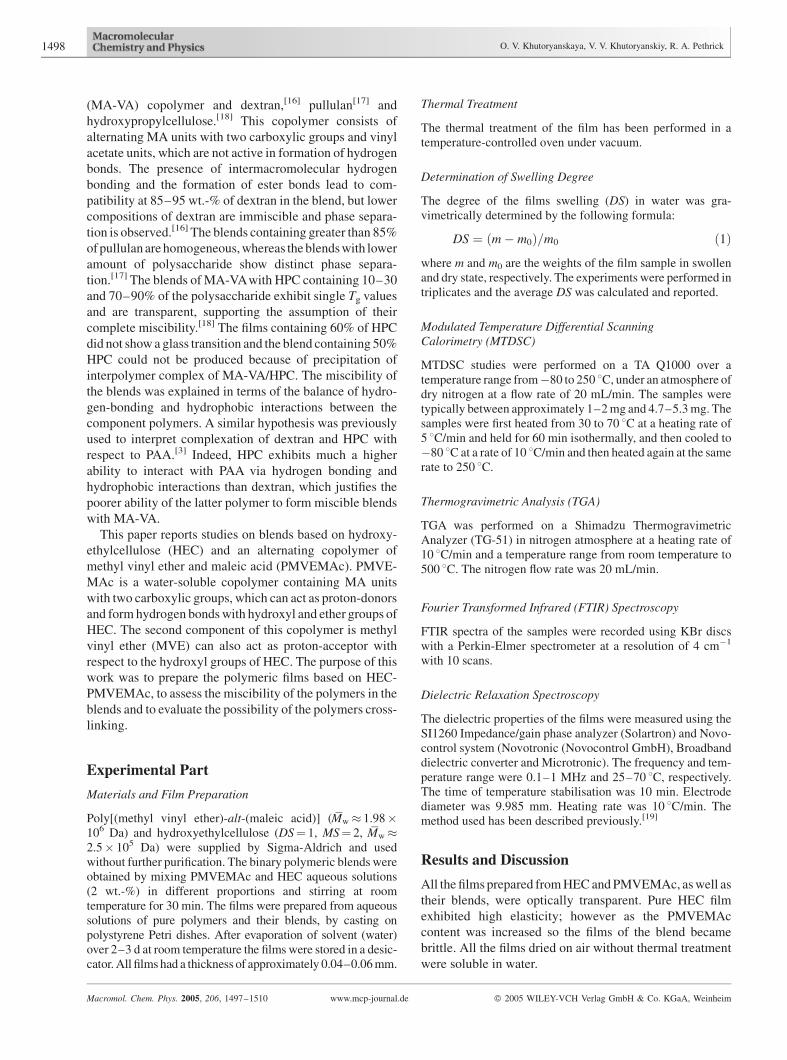
All the films prepared from HEC and PMVEMAc, as well as
their blends, were optically transparent. Pure HEC film
exhibited high elasticity; however as the PMVEMAc
content was increased so the films of the blend became
brittle. All the films dried on air without thermal treatment
were soluble in water.
1498 O. V. Khutoryanskaya, V. V. Khutoryanskiy, R. A. Pethrick
Macromol. Chem. Phys. 2005, 206, 1497–1510 www.mcp-journal.de � 2005 WILEY-VCH Verlag GmbH & Co. KGaA, Weinheim

Infrared Spectroscopy
The FTIR spectra were recorded for the films based on
PMVEMAc, HEC as well as their blends dried in three
different regimes: dried on air at room temperature
(Figure 1), heated at 70 8C for 24 h (Figure 2) and heated
to 200 8C with 10 8C/min and then cooled to a room
temperature (Figure 3). The bands characteristic for OH-
stretching vibrations of PMVEMAc are observed at 3 553,
3 455 and 3 636 cm�1 for air-dried sample, the film treated
at 70 8C for 24 h and the sample heated up to 200 8C,
respectively. The shift of this band upon thermal treatment
at 70 8C is attributed to the loss of some of the residual
solvent water molecules bound by hydrogen bonding with
carboxylic groups of PMVEMAc. The assignment of this
band to this interaction is in agreement with the data of
Rocco and co-workers for pure PMVEMAc.[19] The
dramatic shift of this band after the thermal heating until
200 8C is likely due to the dehydration of the carboxylic
groups of the copolymer with the reformation of anhydride
cycles. The two shoulders at 1 846 and 1 779 cm�1 typical
for maleic anhydride cycles observed in the spectrum of
PMVEMAc powder disappear completely in the spectrum
of the air-dried film due to the hydrolysis of anhydride
cycles into COOH groups in the presence of water in course
of casting process. The film dried under relatively mild
conditions at 70 8C, shows these bands again at 1 849 and
1 781 cm�1 indicating reformation of the anhydride struc-
ture. These changes to the anhydride are also reflected in the
shifts of the band at 1 185 cm�1 in the PMVEMAc powder
Figure 1. FTIR spectra of air-dried HEC, PMVEMAc and their blends.
Characterisation of Blends Based on Hydroxyethylcellulose and Maleic Acid-alt-Methyl Vinyl Ether 1499
Macromol. Chem. Phys. 2005, 206, 1497–1510 www.mcp-journal.de � 2005 WILEY-VCH Verlag GmbH & Co. KGaA, Weinheim

to 1 191 cm�1 in the air-dried film and to 1 188 cm�1 in the
thermally treated film. Another important feature of
the PMVEMAc spectra is the presence of the band at
1 092 cm�1 assigned to the C-O-C stretching vibration of
MVE units. The PMVEMAc film heated to 200 8C(Figure 3) shows the presence of the bands at 1 860 and
1 779 cm�1 assigned to the presence of anhydride bonds and
the intensity of these bands is markedly increased. The
band at 1 779 cm�1 for this film is no longer a shoulder but
has become quite a strong peak, which indicates that most of
the free carboxylic groups of PMVEMAc have been trans-
formed into anhydrides under these conditions. The band at
1 184–1 191 cm�1 observed in the spectra of PMVEMAc
powder, air-dried film and the sample dried at 70 8C is
shifted to 1 225 cm�1 upon heating up to 200 8C, which also
consistent with anhydride formation in the material.
The FTIR spectrum of pure HEC is consistent with the
data earlier reported by Langkilde and Svantesson.[20] For
air-dried pure HEC film we can observe the shift of the OH-
stretching vibration band at 3 445 cm�1 found for the HEC
Figure 2. FTIR spectra of HEC, PMVEMAc and their blends (thermal treatment 24 h at70 8C).
1500 O. V. Khutoryanskaya, V. V. Khutoryanskiy, R. A. Pethrick
Macromol. Chem. Phys. 2005, 206, 1497–1510 www.mcp-journal.de � 2005 WILEY-VCH Verlag GmbH & Co. KGaA, Weinheim
powder to 3 427 cm�1 and appearance of a new shoulder
around 3 200 cm�1, which may be ascribed to hydrogen
bonding of OH-groups with water molecules. The HEC film
treated thermally at 70 8C shows this band at 3 434 cm�1
and the sample heated up to 200 8C at 3 439 cm�1. In air-
dried HEC film, there is a band at 1 635 cm�1 due to water
molecules absorbed in the amorphous regions of the poly-
mer.[21,22] After thermal treatment of the film sample both at
70 8C and at 200 8C, this band is observed at 1 641 and
1 639 cm�1, respectively, and additionally a new band at
1 728–1 743 cm�1 appears. The latter band can be associ-
ated with the presence of small amount of COOH-groups,
which is formed as a result of oxidation of the OH-groups at
higher temperatures.
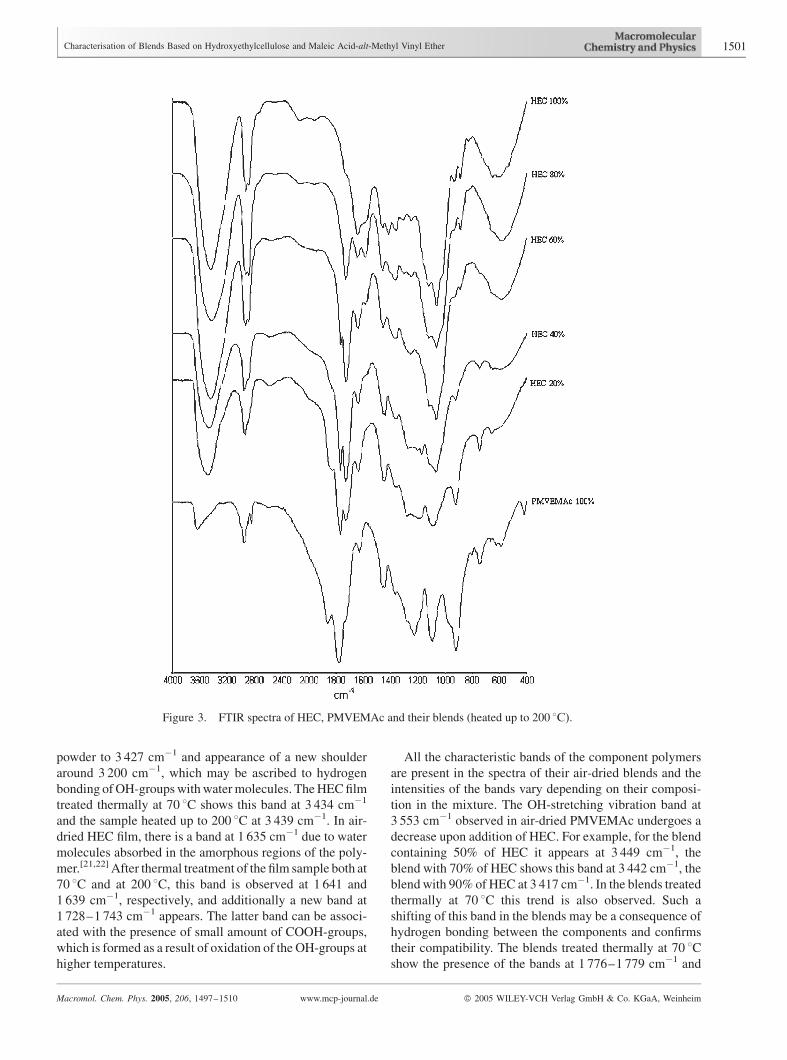
All the characteristic bands of the component polymers
are present in the spectra of their air-dried blends and the
intensities of the bands vary depending on their composi-
tion in the mixture. The OH-stretching vibration band at
3 553 cm�1 observed in air-dried PMVEMAc undergoes a
decrease upon addition of HEC. For example, for the blend
containing 50% of HEC it appears at 3 449 cm�1, the
blend with 70% of HEC shows this band at 3 442 cm�1, the
blend with 90% of HEC at 3 417 cm�1. In the blends treated
thermally at 70 8C this trend is also observed. Such a
shifting of this band in the blends may be a consequence of
hydrogen bonding between the components and confirms
their compatibility. The blends treated thermally at 70 8Cshow the presence of the bands at 1 776–1 779 cm�1 and
Figure 3. FTIR spectra of HEC, PMVEMAc and their blends (heated up to 200 8C).
Characterisation of Blends Based on Hydroxyethylcellulose and Maleic Acid-alt-Methyl Vinyl Ether 1501
Macromol. Chem. Phys. 2005, 206, 1497–1510 www.mcp-journal.de � 2005 WILEY-VCH Verlag GmbH & Co. KGaA, Weinheim
1 843–1 848 cm�1 are observed, which can be associated
with the formation of anhydride groups. In the blends
treated thermally at 200 8C these bands are situated at
1 765–1 779 and 1 826–1 846 cm�1. The appearance of the
new band at 1 172–1 177 cm�1 in the spectra of thermally
treated blends is the evidence of esterification reaction
between carboxylic groups of PMVEMAc and OH-groups
of HEC. Similar new band at 1 168–1 170 cm�1 was
observed by Bumbu and co-workers for the blends of maleic
acid-alt-vinyl acetate with hydroxyethylcellulose.[18]
Thermogravimetric Analysis
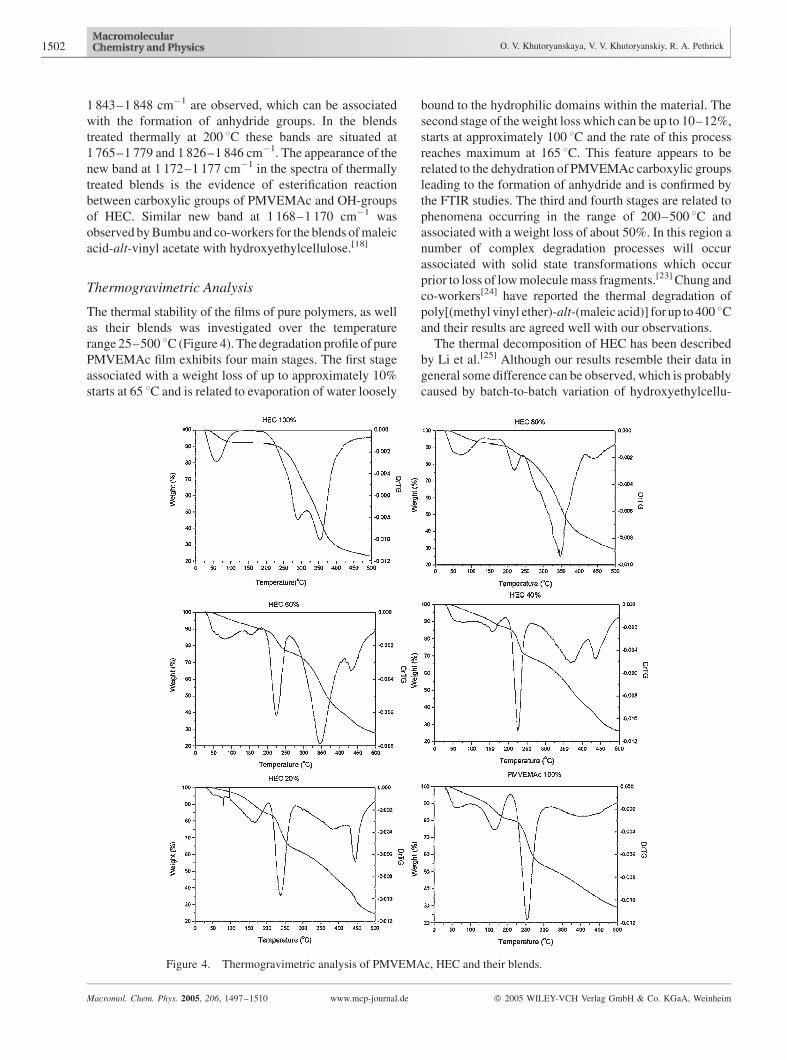
The thermal stability of the films of pure polymers, as well
as their blends was investigated over the temperature
range 25–500 8C (Figure 4). The degradation profile of pure
PMVEMAc film exhibits four main stages. The first stage
associated with a weight loss of up to approximately 10%
starts at 65 8C and is related to evaporation of water loosely
bound to the hydrophilic domains within the material. The
second stage of the weight loss which can be up to 10–12%,
starts at approximately 100 8C and the rate of this process
reaches maximum at 165 8C. This feature appears to be
related to the dehydration of PMVEMAc carboxylic groups
leading to the formation of anhydride and is confirmed by
the FTIR studies. The third and fourth stages are related to
phenomena occurring in the range of 200–500 8C and
associated with a weight loss of about 50%. In this region a
number of complex degradation processes will occur
associated with solid state transformations which occur
prior to loss of low molecule mass fragments.[23] Chung and
co-workers[24] have reported the thermal degradation of
poly[(methyl vinyl ether)-alt-(maleic acid)] for up to 400 8Cand their results are agreed well with our observations.
The thermal decomposition of HEC has been described
by Li et al.[25] Although our results resemble their data in
general some difference can be observed, which is probably
caused by batch-to-batch variation of hydroxyethylcellu-
Figure 4. Thermogravimetric analysis of PMVEMAc, HEC and their blends.
1502 O. V. Khutoryanskaya, V. V. Khutoryanskiy, R. A. Pethrick
Macromol. Chem. Phys. 2005, 206, 1497–1510 www.mcp-journal.de � 2005 WILEY-VCH Verlag GmbH & Co. KGaA, Weinheim
lose. The weight loss curve of our HEC sample is char-
acterised by two processes. Starting at 60 8C, a decrease in
sample mass of�8% is observed, caused by the elimination
of unbound water. The weight of the sample is practically
constant between 60 8C and 200 8C, but the further increase
in temperature results in significant weight loss and occur-
rence of two subsequent decomposition processes, which is
clearly seen from the derivative weight curve. The amount
of char obtained at 400 8C is about 25%, in a good
agreement with earlier data.[25]
The thermal behaviour of the blends is more complex and
depends on the composition of the blend. Starting at approx-
imately 50 8C all blends lose up to 10% of mass, which is
due to the evaporation of water loosely bound to the
hydrophilic domains. An increase of PMVEMAc content in
the blend from 10 to 20% leads to a partial suppression
of the double thermal feature characteristic of the HEC
that has the maximum rate of weight loss at 293 8C. The
blends with PMVEMAc content from 30 to 80% exhibit the
major thermal effects in the temperature regions 195–
275 8C and 270–420 8C, which represent the degradation
features of the synthetic copolymer and HEC, respectively.
However the thermal effect typical for pure PMVEMAC at
about 250 8C is observed at much lower temperature in the
blends (for example, at about 225 8C for the blend
containing 40% of PMVEMAC). All these changes in the
degradation profile of the blends compared to the pure
polymers indicate on the presence of specific interactions
between the components, which confirms their miscibility
in the blend.
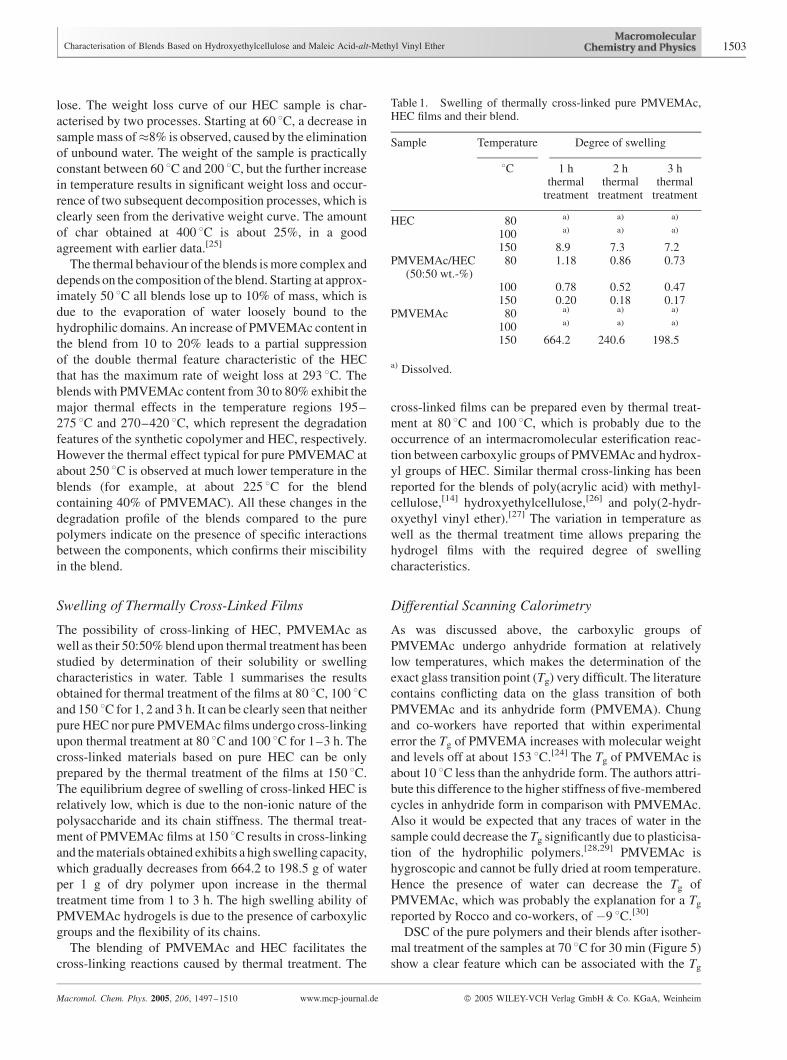
Swelling of Thermally Cross-Linked Films
The possibility of cross-linking of HEC, PMVEMAc as
well as their 50:50% blend upon thermal treatment has been
studied by determination of their solubility or swelling
characteristics in water. Table 1 summarises the results
obtained for thermal treatment of the films at 80 8C, 100 8Cand 150 8C for 1, 2 and 3 h. It can be clearly seen that neither
pure HEC nor pure PMVEMAc films undergo cross-linking
upon thermal treatment at 80 8C and 100 8C for 1–3 h. The
cross-linked materials based on pure HEC can be only
prepared by the thermal treatment of the films at 150 8C.
The equilibrium degree of swelling of cross-linked HEC is
relatively low, which is due to the non-ionic nature of the
polysaccharide and its chain stiffness. The thermal treat-
ment of PMVEMAc films at 150 8C results in cross-linking
and the materials obtained exhibits a high swelling capacity,
which gradually decreases from 664.2 to 198.5 g of water
per 1 g of dry polymer upon increase in the thermal
treatment time from 1 to 3 h. The high swelling ability of
PMVEMAc hydrogels is due to the presence of carboxylic
groups and the flexibility of its chains.
The blending of PMVEMAc and HEC facilitates the
cross-linking reactions caused by thermal treatment. The
cross-linked films can be prepared even by thermal treat-
ment at 80 8C and 100 8C, which is probably due to the
occurrence of an intermacromolecular esterification reac-
tion between carboxylic groups of PMVEMAc and hydrox-
yl groups of HEC. Similar thermal cross-linking has been
reported for the blends of poly(acrylic acid) with methyl-
cellulose,[14] hydroxyethylcellulose,[26] and poly(2-hydr-
oxyethyl vinyl ether).[27] The variation in temperature as
well as the thermal treatment time allows preparing the
hydrogel films with the required degree of swelling
characteristics.
Differential Scanning Calorimetry
As was discussed above, the carboxylic groups of
PMVEMAc undergo anhydride formation at relatively
low temperatures, which makes the determination of the
exact glass transition point (Tg) very difficult. The literature
contains conflicting data on the glass transition of both
PMVEMAc and its anhydride form (PMVEMA). Chung
and co-workers have reported that within experimental
error the Tg of PMVEMA increases with molecular weight
and levels off at about 153 8C.[24] The Tg of PMVEMAc is
about 10 8C less than the anhydride form. The authors attri-
bute this difference to the higher stiffness of five-membered
cycles in anhydride form in comparison with PMVEMAc.
Also it would be expected that any traces of water in the
sample could decrease the Tg significantly due to plasticisa-
tion of the hydrophilic polymers.[28,29] PMVEMAc is
hygroscopic and cannot be fully dried at room temperature.
Hence the presence of water can decrease the Tg of
PMVEMAc, which was probably the explanation for a Tg
reported by Rocco and co-workers, of �9 8C.[30]
DSC of the pure polymers and their blends after isother-
mal treatment of the samples at 70 8C for 30 min (Figure 5)
show a clear feature which can be associated with the Tg
Table 1. Swelling of thermally cross-linked pure PMVEMAc,HEC films and their blend.
Sample Temperature Degree of swelling
8C 1 hthermal
treatment
2 hthermal
treatment
3 hthermal
treatment
HEC 80 a) a) a)
100 a) a) a)
150 8.9 7.3 7.2PMVEMAc/HEC
(50:50 wt.-%)80 1.18 0.86 0.73
100 0.78 0.52 0.47150 0.20 0.18 0.17
PMVEMAc 80 a) a) a)
100 a) a) a)
150 664.2 240.6 198.5
a) Dissolved.
Characterisation of Blends Based on Hydroxyethylcellulose and Maleic Acid-alt-Methyl Vinyl Ether 1503
Macromol. Chem. Phys. 2005, 206, 1497–1510 www.mcp-journal.de � 2005 WILEY-VCH Verlag GmbH & Co. KGaA, Weinheim

process. However, we have to admit that this feature may be
significantly affected by a dehydration process of the carbox-
ylic groups discussed earlier. Pure PMVEMAc shows
the thermal effect at 149 8C, which is close to the Tg value
reported by Chung and co-workers.[24] The Tg value of pure
HEC is observed at 97 8C. The Tg values for the polymers
and their blends are also presented in Table 2. It can be seen
that the blends show the presence of a single Tg, which is in
between the thermal transitions of the pure components.
This is an additional proof of the components complete
miscibility. Slightly different behaviour is observed for the
samples held isothermally for 60 min. In the 80, 70 and 60%
blends, holding the films isothermally for 60 min generates
a higher temperature peak, which can be ascribed to the
formation of the intermacromolecular esterification reac-
tion between carboxylic groups of PMVEMAc and hydrox-
yl groups of HEC constraining the motion of the polymer.
Changes in the peak profile and location are consistent with
the effects of water loss and change of the environment with
polymer composition. Crosslinking to form a polymer net-
work and loss of plasticizing due to water leads to an
increase in theTg. The main transition moves consistently to
higher temperature consistent with loss of water increasing
the Tg and the appearance of the higher temperature feature
reflects the effects of crosslinking.
Dynamic Mechanical Thermal Analysis
In order to further clarify the nature of the thermal transi-
tions in HEC, PMVEMAc and their blends dynamic mech-
anical thermal analysis (DMTA) was performed. Before the
analysis was performed, the air-dried films were thermally
treated in the oven at 50 8C for 3 d to remove any traces of
water. Figure 6 shows the dependence of modulus and
damping factor for the film of pure HEC. It can be clearly
seen that the film exhibits the thermal transitions at about
35 8C and 115 8C. The existence of two glass transitions in
the films based on blends of poly(acrylic acid)/poly(2-
hydroxyethyl vinyl ether) as well as pure poly(acrylic acid)
has been previously explained on the basis of the materials
containing plasticised regions and non-plasticised re-
gions.[31] Taking into account that the pure HEC has a very
good ability to retain water even the sample dried at 50 8Cfor 3 d shows two glass transitions, typical for plasticised
and unplasticised HEC. The first glass-transition could be
related to a glass transition typical for samples containing
water traces. Since the samples were analyzed in open-air
conditions, and water traces are eliminated between 50–
100 8C; thereafter the second glass transition, typical for dry
samples, is observed. In order to confirm this hypothesis,
the HEC sample which had been previously dried at 50 8Cfor 3 d was left in air for a further 3 d assuming that it will
absorb some water. It can be clearly seen from Figure 7, that
the first glass transition for this sample is observed at 70 8Cand it is much more pronounced. The second glass
transition of this sample is observed at 104 8C as a shoulder
on the damping factor curve, which may indicate that even
in these conditions the sample still contains some traces of
water compared to the samples shown on Figure 6. Our
results on the glass transition of pure HEC are in a good
Figure 5. DSC curves of PMVEMAc, HEC and their blends; [a]Equilibration at 70 8C and held isothermally for 30 min,periodicity 4 8C and amplitude 100 s; [b] Equilibration at70 8C and held isothermally for 60 min, periodicity 0.5 8C andamplitude 100 s.
Table 2. Glass transition temperatures of HEC, PMVEMAc andtheir blends. [a] Equilibration at 70 8C and held isothermally for30.00 min, [b] Equilibration at 70 8C and held isothermally for60 min.
Sample Tpeak [a] Tpeak [b]
8C 8C
HEC 100% 97 –HEC 90% – –HEC 80% 129 149HEC 70% 139 149HEC 60% 141 148HEC 50% 143 149HEC 40% 139 160HEC 30% 141 148HEC 20% 145 160HEC 10% 149 150PMVEMAc 100% 149 152
1504 O. V. Khutoryanskaya, V. V. Khutoryanskiy, R. A. Pethrick
Macromol. Chem. Phys. 2005, 206, 1497–1510 www.mcp-journal.de � 2005 WILEY-VCH Verlag GmbH & Co. KGaA, Weinheim
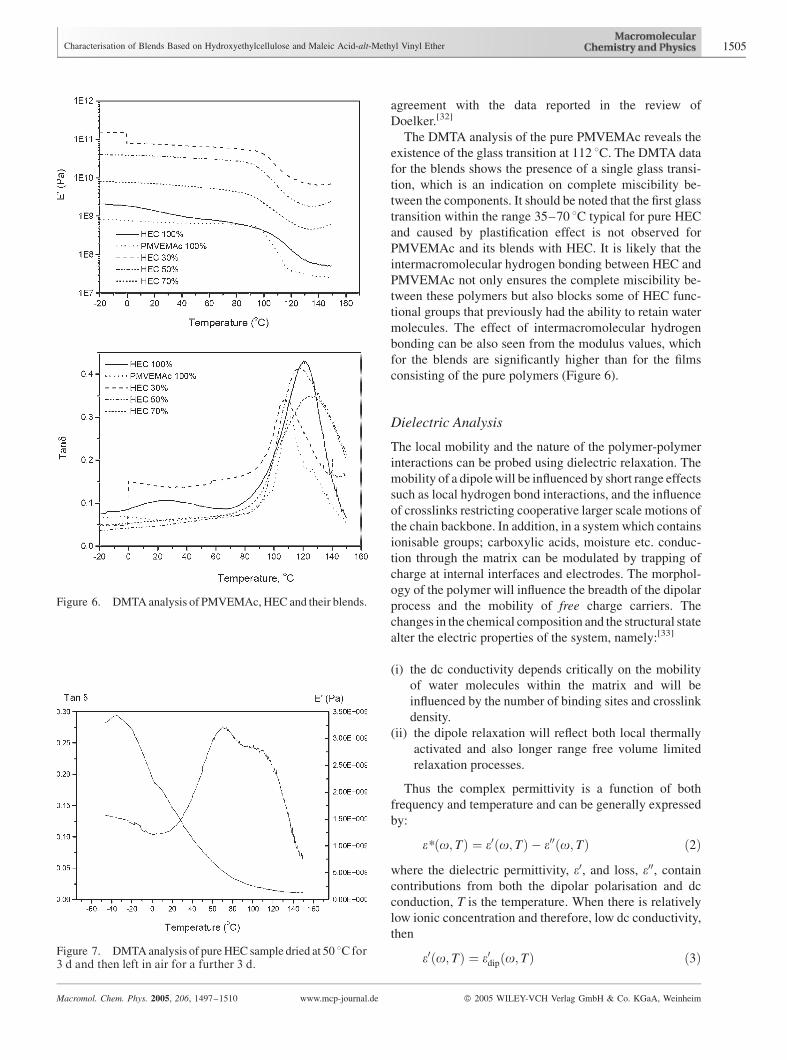
agreement with the data reported in the review of
Doelker.[32]
The DMTA analysis of the pure PMVEMAc reveals the
existence of the glass transition at 112 8C. The DMTA data
for the blends shows the presence of a single glass transi-
tion, which is an indication on complete miscibility be-
tween the components. It should be noted that the first glass
transition within the range 35–70 8C typical for pure HEC
and caused by plastification effect is not observed for
PMVEMAc and its blends with HEC. It is likely that the
intermacromolecular hydrogen bonding between HEC and
PMVEMAc not only ensures the complete miscibility be-
tween these polymers but also blocks some of HEC func-
tional groups that previously had the ability to retain water
molecules. The effect of intermacromolecular hydrogen
bonding can be also seen from the modulus values, which
for the blends are significantly higher than for the films
consisting of the pure polymers (Figure 6).
Dielectric Analysis
The local mobility and the nature of the polymer-polymer
interactions can be probed using dielectric relaxation. The
mobility of a dipole will be influenced by short range effects
such as local hydrogen bond interactions, and the influence
of crosslinks restricting cooperative larger scale motions of
the chain backbone. In addition, in a system which contains
ionisable groups; carboxylic acids, moisture etc. conduc-
tion through the matrix can be modulated by trapping of
charge at internal interfaces and electrodes. The morphol-
ogy of the polymer will influence the breadth of the dipolar
process and the mobility of free charge carriers. The
changes in the chemical composition and the structural state
alter the electric properties of the system, namely:[33]
(i) the dc conductivity depends critically on the mobility
of water molecules within the matrix and will be
influenced by the number of binding sites and crosslink
density.
(ii) the dipole relaxation will reflect both local thermally
activated and also longer range free volume limited
relaxation processes.
Thus the complex permittivity is a function of both
frequency and temperature and can be generally expressed
by:
e*ðo; TÞ ¼ e0ðo; TÞ � e00ðo; TÞ ð2Þ
where the dielectric permittivity, e0, and loss, e00, contain
contributions from both the dipolar polarisation and dc
conduction, T is the temperature. When there is relatively
low ionic concentration and therefore, low dc conductivity,
then
e0ðo; TÞ ¼ e0dipðo; TÞ ð3Þ
Figure 6. DMTA analysis of PMVEMAc, HEC and their blends.
Figure 7. DMTA analysis of pure HEC sample dried at 50 8C for3 d and then left in air for a further 3 d.
Characterisation of Blends Based on Hydroxyethylcellulose and Maleic Acid-alt-Methyl Vinyl Ether 1505
Macromol. Chem. Phys. 2005, 206, 1497–1510 www.mcp-journal.de � 2005 WILEY-VCH Verlag GmbH & Co. KGaA, Weinheim
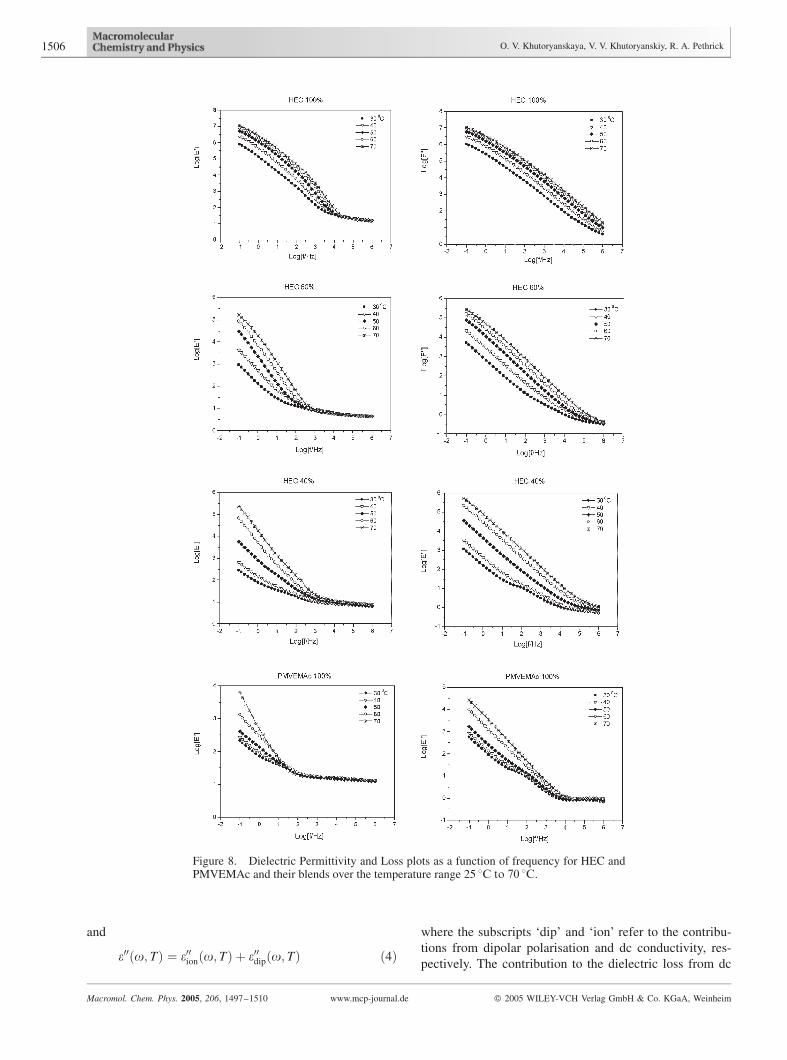
and
e00ðo; TÞ ¼ e00ionðo; TÞ þ e00dipðo; TÞ ð4Þ
where the subscripts ‘dip’ and ‘ion’ refer to the contribu-
tions from dipolar polarisation and dc conductivity, res-
pectively. The contribution to the dielectric loss from dc
Figure 8. Dielectric Permittivity and Loss plots as a function of frequency for HEC andPMVEMAc and their blends over the temperature range 25 8C to 70 8C.
1506 O. V. Khutoryanskaya, V. V. Khutoryanskiy, R. A. Pethrick
Macromol. Chem. Phys. 2005, 206, 1497–1510 www.mcp-journal.de � 2005 WILEY-VCH Verlag GmbH & Co. KGaA, Weinheim
conductivity, s, is given by
e00ion ¼ soeo
ð5Þ
At low frequencies, the contribution to the dielectric
loss from dipolar orientation is negligible. Studies of the
dielectric relaxation of HEC and PMVEMAc are presented
in Figure 8. All the systems show a very large low frequency
permittivity and loss behaviour and are typical of hydrated
polymer systems. In addition to processes attributed to ionic
conduction, features can be observed as a result of
microphase separation and ionic trapping within the matrix.
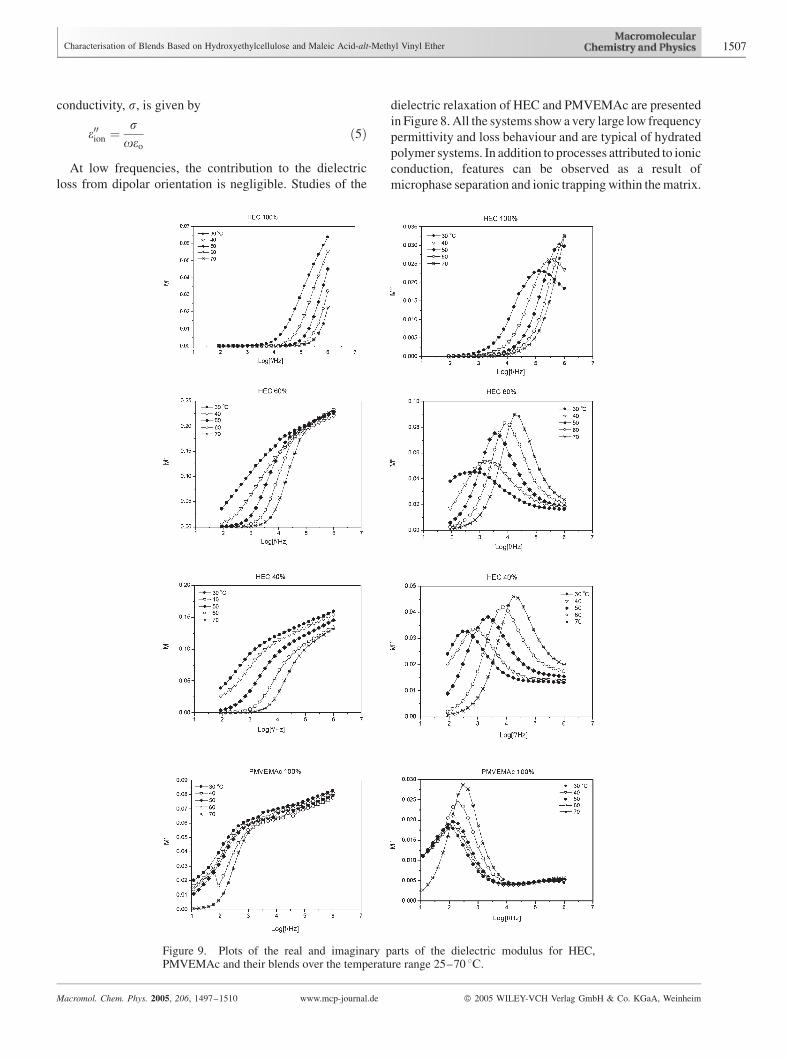
Figure 9. Plots of the real and imaginary parts of the dielectric modulus for HEC,PMVEMAc and their blends over the temperature range 25–70 8C.
Characterisation of Blends Based on Hydroxyethylcellulose and Maleic Acid-alt-Methyl Vinyl Ether 1507
Macromol. Chem. Phys. 2005, 206, 1497–1510 www.mcp-journal.de � 2005 WILEY-VCH Verlag GmbH & Co. KGaA, Weinheim

The HEC can form ordered regions at a nano scale and these
will generate interfacial polarisation effects. In order to
separate the various contributions the data are transformed
into the modulus representation, Figure 9. The measured
values for the dielectric permittivity, e0, and the dielectric
loss, e00, may be transformed into the complex electric
modulus, M*, using the following equations:
M* ¼ 1
e*¼ M0 þ iM00 ð6Þ
where
M0 ¼ e0
e02 þ e002ð7Þ
and
M00 ¼ e00
e02 þ e002ð8Þ
where M0 and M00 are the real and imaginary components of
the complex electrical modulus. WhenM* is entirely due to
ionic conduction it is related to conductivity relaxation
time, ts, by the equation
M*ðo; TÞ ¼ Ms
iotsðTÞ1 þ iotsðTÞ
� �ð9Þ
where
ts ¼eoes
sð10Þ
and
Ms ¼ e�1s ð11Þ
also M0 and M00 obey the following equation
½M00ðo; TÞ�2 þ ½M0ðo; TÞ � 1=2MsðTÞ�2 ¼ ½1=2MsðTÞ�2
ð12Þ
Thus if the only contribution to the complex dielectric
permittivity was from ionic conduction, a complex plane
plot ofM00 againstM0 would be semicircular with a radius of1=2Ms and centre on the M0 axis. If other contributions, such
as dipolar contributions were present the plot would deviate
from the semicircular shape. The modulus plots indicate
clearly more than one process occurring in the frequency
range investigated and comparison with the other data we
can ascribe the processes to local chain motion and ionic
conductivity. The modulus plots clear show the temperature
dependence of conduction process and the shift of the peak
in the dielectric modulus M00 gives an activation energy plot
shown in Figure 10. The shift in the dielectric loss e00 at
10 Hz, Figure 11, senses the higher frequency dielectric
process associated with chain motion and leads to the calcu-
lated activation energies listed in Table 3, for the homo-
polymers and their blends. A plot of the variation of the
activation energies with composition, Figure 12, shows
the variation of the activation energies with composition.
The error in determination of the activation energies was not
greater than 10%. It is evident that the energy required for
the conduction and chain reorientation processes are signi-
ficantly higher in the blends than in the homo polymers. The
increased activation energy over an above the values pre-
dicted using a simple additive relationship is indicative of
the presence of additional interactions between the chains
influencing both conduction through the matrix and the
motion of local dipoles within the matrix. These increased
activation energies are consistent with the spectroscopic
evidence of thermally generated crosslinks, hydrogen
bonding and additional interactions between neighbouring
chains. Close inspection of the dielectric modulus,
Figure 13, for PMVEMAc indicates that there are possible
Figure 10. Activation energy plots derived from the shift in thedielectric loss with temperature at 10 Hz.
Figure 11. Activation energy plots derived from shift of themodulus peak with temperature.
1508 O. V. Khutoryanskaya, V. V. Khutoryanskiy, R. A. Pethrick
Macromol. Chem. Phys. 2005, 206, 1497–1510 www.mcp-journal.de � 2005 WILEY-VCH Verlag GmbH & Co. KGaA, Weinheim
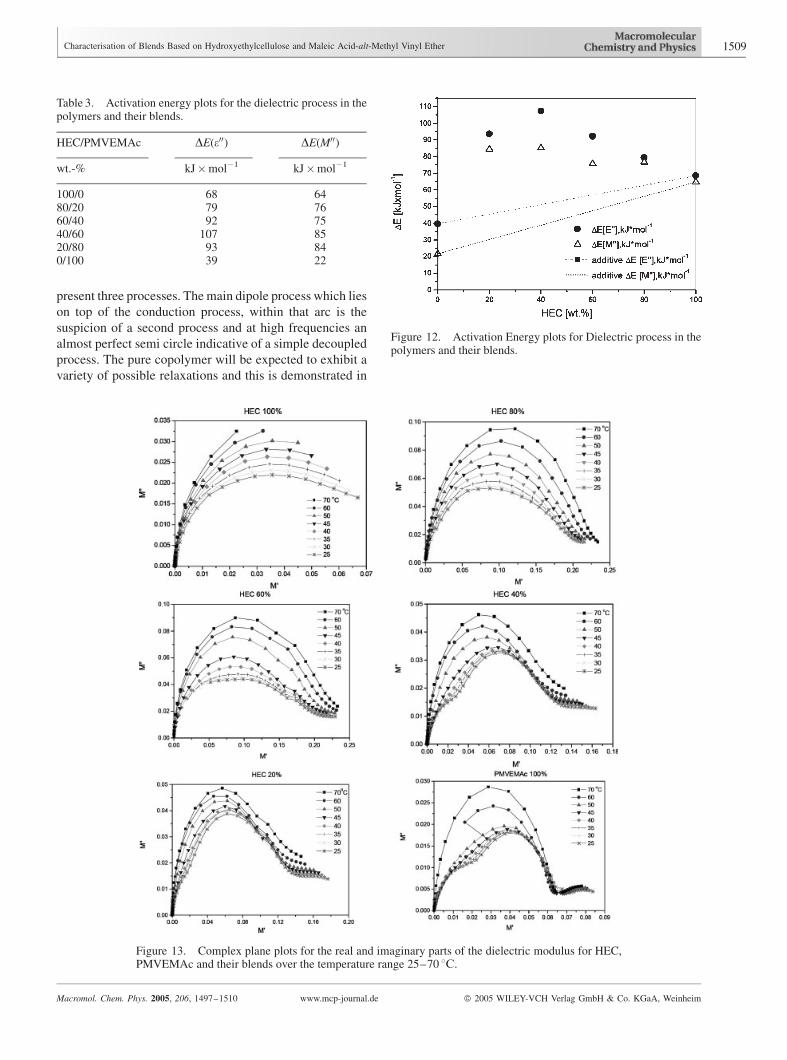
present three processes. The main dipole process which lies
on top of the conduction process, within that arc is the
suspicion of a second process and at high frequencies an
almost perfect semi circle indicative of a simple decoupled
process. The pure copolymer will be expected to exhibit a
variety of possible relaxations and this is demonstrated in
Figure 12. Activation Energy plots for Dielectric process in thepolymers and their blends.
Figure 13. Complex plane plots for the real and imaginary parts of the dielectric modulus for HEC,PMVEMAc and their blends over the temperature range 25–70 8C.
Table 3. Activation energy plots for the dielectric process in thepolymers and their blends.
HEC/PMVEMAc DE(e00) DE(M00)
wt.-% kJ�mol�1 kJ�mol�1
100/0 68 6480/20 79 7660/40 92 7540/60 107 8520/80 93 840/100 39 22
Characterisation of Blends Based on Hydroxyethylcellulose and Maleic Acid-alt-Methyl Vinyl Ether 1509
Macromol. Chem. Phys. 2005, 206, 1497–1510 www.mcp-journal.de � 2005 WILEY-VCH Verlag GmbH & Co. KGaA, Weinheim
these plots. In contrast the HEC exhibits two processes, a
dipole process on the top of a simple conduction process.
The blends exhibit a mixture of these processes which vary
in relation to the overall composition of the blend.
Conclusion
The hydrophilic films prepared by blending of hydroxy-
ethylcellulose and maleic acid-co-methyl vinyl ether exhib-
it complete miscibility between the components, which is
due to the intermolecular hydrogen bonding. The thermal
treatment of the blends leads to polymers cross-linking via
intermacromolecular esterification and anhydride forma-
tion and the resulted materials are able to swell in water and
form hydrogels. The presence of the crosslinking reaction is
demonstrated in both infrared spectra and swelling studies
and also in TGA/DSC analysis. The thermally activated
crosslinking reactions occurring in these blends also lead to
an increase in the low temperature modulus and inhibit the
mobility of charge carriers and the motion of dipoles in the
matrix.
Acknowledgements: The assistance of Dr. David Hayward isgratefully acknowledged.
[1] M. G. Cascone, B. Sim, S. Downes, Biomaterials 1995, 16,569.
[2] D. Ameye, J. Voorspoels, P. Foreman, J. Tsai, P. Richardson,S. Geresh, J. P. Remon, J. Controlled Release 2002, 79, 73.
[3] Z. S. Nurkeeva, G. A. Mun, V. V. Khutoryanskiy, Macromol.Biosci. 2003, 3, 283.
[4] J. B. Xu, J. P. Bartley, R. A. Johnson, J. Membr. Sci. 2003,218, 131.
[5] H. Matsuyama, A. Terada, T. Nakagawara, Y. Kitamura, M.Teramoto, J. Membr. Sci. 1999, 163, 221.
[6] E. Chiellini, P. Cinelli, E. G. Fernandes, E.-R. S. Kenawy, A.Lazzeri, Biomacromolecules 2001, 2, 806.
[7] D. M. DeLongchamp, P. T. Hammond, Langmuir 2004, 20,5403.
[8] M. M. Coleman, P. C. Painter, Prog. Polym. Sci. 1995, 20, 1.[9] M. Jiang, M. Li, M. Xiang, H. Zhou, Adv. Polym. Sci. 1999,
146, 121.
[10] O. Nikolaeva, T. Budtova, Yu. Brestkin, Z. Zoolshoev, S.Frenkel, J. Appl. Polym. Sci. 1999, 72, 1523.
[11] O. V. Nikolaeva, T. V. Budtova, V. Alexeev, S. Frenkel,J. Polym. Sci., Part B: Polym. Phys. 2000, 38, 1323.
[12] M. G. Cascone, G. Polacco, L. Lazzeri, N. Barbani, J. Appl.Polym. Sci. 1997, 66, 2089.
[13] C. Cristallini, N. Barbani, P. Giusti, L. Lazzeri, M. G.Cascone, G. Ciardelli, Macromol. Chem. Phys. 2001, 202,2104.
[14] V. V. Khutoryanskiy, M. G. Cascone, L. Lazerri, Z. S.Nurkeeva, G. A. Mun, R. A. Mangazbaeva,Polym. Int. 2003,52, 62.
[15] V. V. Khutoryanskiy, M. G. Cascone, L. Lazzeri, N. Barbani,Z. S. Nurkeeva, G. A. Mun, A. V. Dubolazov, Polym. Int.2004, 53, 307.
[16] G.-G. Bumbu, C. Vasile, G. C. Chitanu, A. Carpov, Polym.Degrad. Stabil. 2001, 72, 99.
[17] G.-G. Bumbu, C. Vasile, G. C. Chitanu, A. Carpov, J. Appl.Polym. Sci. 2002, 86, 1782.
[18] G.-G. Bumbu, C. Vasile, M. C. Popescu, H. Darie, G. C.Chitanu, G. Singurel, A. Carpov, J. Appl. Polym. Sci. 2003,88, 2585.
[19] R. A. Pethrick, D. Hayward, M. G. B. Mahboubian-Jones,J. Phys. E: Sci. Instrum. 1984, 17, 683.
[20] F. W. Langkilde, A. Svantesson, J. Pharm. Biomed. Anal.1995, 13, 409.
[21] L. M. Zhang, Colloid Polym. Sci. 1999, 277, 886.[22] C. Y. Liang, R. H. Marchessault, J. Polym. Sci. 1959, 39,
269.[23] I. C. McNeill, S. Ahmed, S. Rendall, Polym. Degrad. Stabil.
1998, 62, 85.[24] K. H. Chung, C. S. Wu, E. G. Malawer, J. Appl. Polym. Sci.
1990, 41, 793.[25] X.-G. Li, M.-R. Huang, H. Bai, J. Appl. Polym. Sci. 1999, 73,
2927.[26] Y. J. Bo, V. V. Khutoryanskiy, G. A. Mun, Z. S. Nurkeeva,
Polym. Sci. A 2002, 44, 1094.[27] Z. S. Nurkeeva, G. A. Mun, V. V. Khutoryanskiy, A. B.
Bitekenova, A. B. Dzhusupbekova, K. Park, J. Appl. Polym.Sci. 2003, 90, 137.
[28] P. Molyneux, ‘‘Water-Soluble Synthetic Polymers: Proper-ties and Behavior’’, CRC Press, Florida 1983, V.1.
[29] ‘‘Hydrogels in Medicine and Pharmacy’’, Vol. 1–3, N.Peppas, Ed., CRC Press, Boca Raton, Florida 1987.
[30] A. M. Rocco, R. P. Pereira, M. I. Felisberti, Polymer 2001,42, 5199.
[31] V. V. Khutoryanskiy, M. G. Cascone, L. Lazzeri, N. Barbani,Z. S. Nurkeeva, G. A. Mun, A. B. Bitekenova, A. B.Dzhusupbekova, Macromol. Biosci. 2003, 3, 117.
[32] E. Doelker, Adv. Polym. Sci. 1993, 107, 199.[33] G. P. Johari, in: ‘‘Chemistry and Technology of Epoxy
Resins’’, Blackie Academic & Professional, London 1998,p. 175.
1510 O. V. Khutoryanskaya, V. V. Khutoryanskiy, R. A. Pethrick
Macromol. Chem. Phys. 2005, 206, 1497–1510 www.mcp-journal.de � 2005 WILEY-VCH Verlag GmbH & Co. KGaA, Weinheim
Copyright © 2022 FDOKUMEN