Chapter - V SHELTER - CMDA
40
V-1 Chapter - V SHELTER Shelter is a basic need. When the need for shelter is not satisfied, it becomes almost impossible for an individual to think of satisfying his family aspirations and intellectual needs. Primary responsibility of any city is to provide its members with a decent and habitable shelter. A standard housing does not mean merely land and building, but includes basic service like water supply, sanitation and access roads. 5.02 Demand for housing is a universal phenomenon, which exists in all societies, but it varies from “no shelter” to “better shelter”; consequently it is related to economic level of households. An assessment of housing need, demand and supply becomes necessary to work out a meaningful shelter strategy. 5.03 “Housing Need” is an expression of housing requirements, and it is computed based on (i) available housing stock in the base year, (ii) no. of households at the base year, (iii) rate of demolition of dilapidated/deteriorating structures for reconstruction, and (iv) rate of clearance/conversion of ‘Katcha’/slum structures for better housing. 5.04 ‘Housing demand’ is related to market with reference to purchasing power, affordability, willingness to raise funds and it may be assessed based on the following major factors viz. (i) the economy of doing a house (temporal choices), (ii) affordability, (iii) willingness to pay (including for construction, maintenance, resource mobilization), (iv) availability and accessibility of housing finance, and (v) availability of residential plot/flats at affordable prices. 5.05 Normally, ‘housing demand’ is less than ‘housing need’ in a developing economy like ours, and these converge when society’s economic level is rich, distributed with less disparity and stable. Hence a housing policy at Metropolitan level has to take into account of the factors concerned with the housing needs and demand. Housing Scenario in CMA 5.06 The decadal growth of households and housing units is given in the Table No. 5.01. (It shows that the housing requirement gap is not significant for the period 1971- 91 and there is significant gap in the year 2001).
-
Upload
khangminh22 -
Category
Documents
-
view
2 -
download
0
Transcript of Chapter - V SHELTER - CMDA
V-1
Chapter - V
SHELTER
Shelter is a basic need. When the need for shelter is not satisfied, it becomes
almost impossible for an individual to think of satisfying his family aspirations and
intellectual needs. Primary responsibility of any city is to provide its members with a
decent and habitable shelter. A standard housing does not mean merely land and
building, but includes basic service like water supply, sanitation and access roads.
5.02 Demand for housing is a universal phenomenon, which exists in all societies,
but it varies from “no shelter” to “better shelter”; consequently it is related to economic
level of households. An assessment of housing need, demand and supply becomes
necessary to work out a meaningful shelter strategy.
5.03 “Housing Need” is an expression of housing requirements, and it is computed
based on (i) available housing stock in the base year, (ii) no. of households at the base
year, (iii) rate of demolition of dilapidated/deteriorating structures for reconstruction,
and (iv) rate of clearance/conversion of ‘Katcha’/slum structures for better housing.
5.04 ‘Housing demand’ is related to market with reference to purchasing power,
affordability, willingness to raise funds and it may be assessed based on the following
major factors viz. (i) the economy of doing a house (temporal choices), (ii) affordability,
(iii) willingness to pay (including for construction, maintenance, resource mobilization),
(iv) availability and accessibility of housing finance, and (v) availability of residential
plot/flats at affordable prices.
5.05 Normally, ‘housing demand’ is less than ‘housing need’ in a developing economy
like ours, and these converge when society’s economic level is rich, distributed with less
disparity and stable. Hence a housing policy at Metropolitan level has to take into
account of the factors concerned with the housing needs and demand.
Housing Scenario in CMA
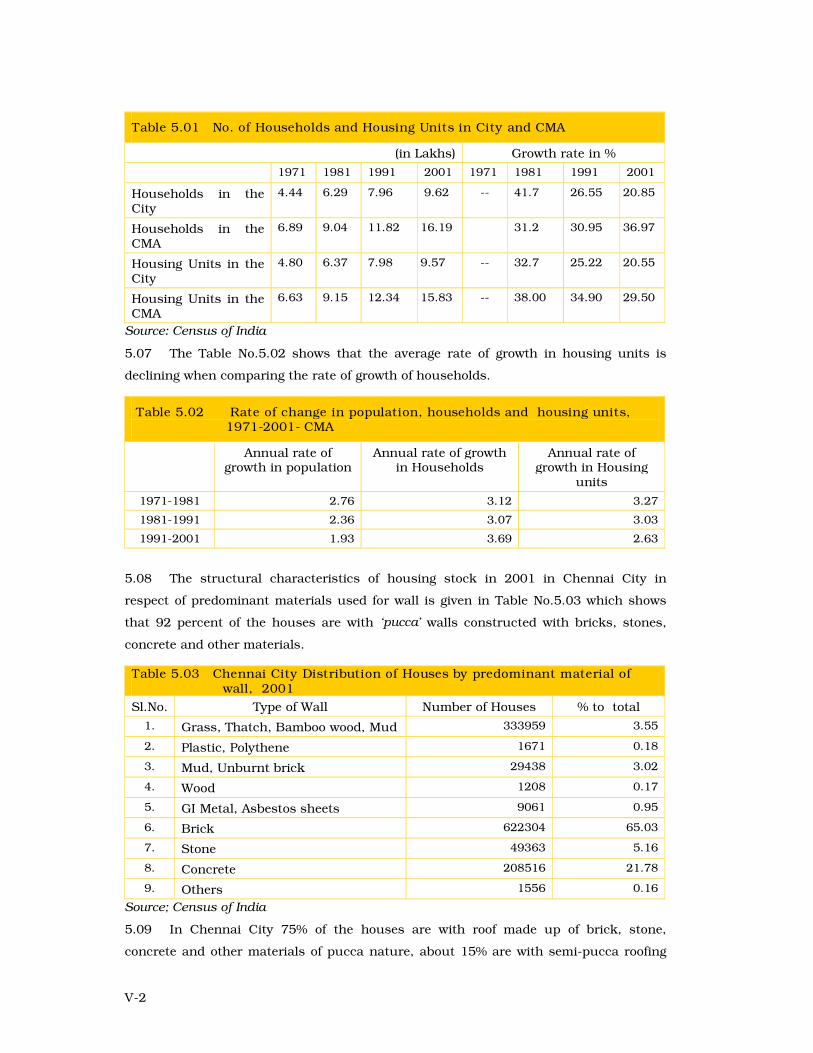
5.06 The decadal growth of households and housing units is given in the Table No.
5.01. (It shows that the housing requirement gap is not significant for the period 1971-
91 and there is significant gap in the year 2001).
V-2
Table 5.01 No. of Households and Housing Units in City and CMA
(in Lakhs) Growth rate in %
1971 1981 1991 2001 1971 1981 1991 2001
Households in the City
4.44 6.29 7.96 9.62 -- 41.7 26.55 20.85
Households in the CMA
6.89 9.04 11.82 16.19 31.2 30.95 36.97
Housing Units in the City
4.80 6.37 7.98 9.57 -- 32.7 25.22 20.55
Housing Units in the CMA
6.63 9.15 12.34 15.83 -- 38.00 34.90 29.50
Source: Census of India
5.07 The Table No.5.02 shows that the average rate of growth in housing units is
declining when comparing the rate of growth of households.
Table 5.02 Rate of change in population, households and housing units, 1971-2001- CMA
Annual rate of growth in population
Annual rate of growth in Households
Annual rate of growth in Housing
units
1971-1981 2.76 3.12 3.27
1981-1991 2.36 3.07 3.03
1991-2001 1.93 3.69 2.63
5.08 The structural characteristics of housing stock in 2001 in Chennai City in
respect of predominant materials used for wall is given in Table No.5.03 which shows
that 92 percent of the houses are with ‘pucca’ walls constructed with bricks, stones,
concrete and other materials.
Table 5.03 Chennai City Distribution of Houses by predominant material of wall, 2001
Sl.No. Type of Wall Number of Houses % to total
1. Grass, Thatch, Bamboo wood, Mud 333959 3.55
2. Plastic, Polythene 1671 0.18
3. Mud, Unburnt brick 29438 3.02
4. Wood 1208 0.17
5. GI Metal, Asbestos sheets 9061 0.95
6. Brick 622304 65.03
7. Stone 49363 5.16
8. Concrete 208516 21.78
9. Others 1556 0.16
Source; Census of India
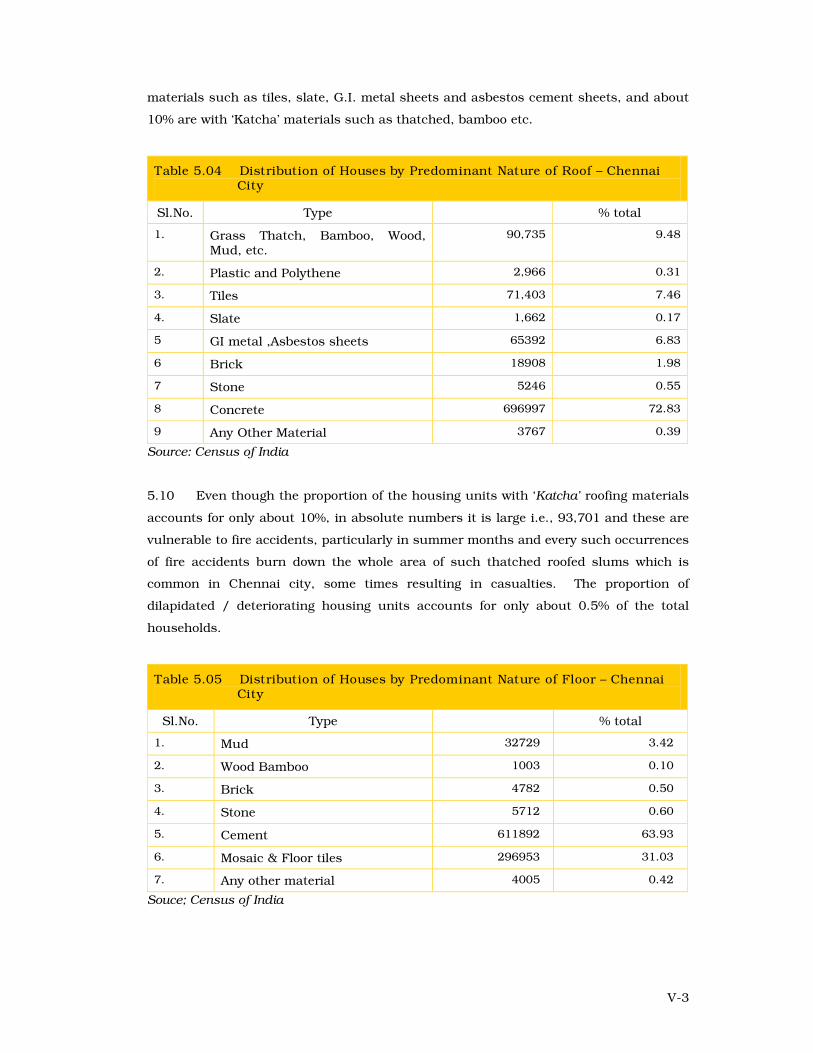
5.09 In Chennai City 75% of the houses are with roof made up of brick, stone,
concrete and other materials of pucca nature, about 15% are with semi-pucca roofing
V-3
materials such as tiles, slate, G.I. metal sheets and asbestos cement sheets, and about
10% are with ‘Katcha’ materials such as thatched, bamboo etc.
Table 5.04 Distribution of Houses by Predominant Nature of Roof – Chennai City
Sl.No. Type % total
1. Grass Thatch, Bamboo, Wood, Mud, etc.
90,735 9.48
2. Plastic and Polythene 2,966 0.31
3. Tiles 71,403 7.46
4. Slate 1,662 0.17
5 GI metal ,Asbestos sheets 65392 6.83
6 Brick 18908 1.98
7 Stone 5246 0.55
8 Concrete 696997 72.83
9 Any Other Material 3767 0.39
Source: Census of India
5.10 Even though the proportion of the housing units with ‘Katcha’ roofing materials
accounts for only about 10%, in absolute numbers it is large i.e., 93,701 and these are
vulnerable to fire accidents, particularly in summer months and every such occurrences
of fire accidents burn down the whole area of such thatched roofed slums which is
common in Chennai city, some times resulting in casualties. The proportion of
dilapidated / deteriorating housing units accounts for only about 0.5% of the total
households.
Table 5.05 Distribution of Houses by Predominant Nature of Floor – Chennai City
Sl.No. Type % total
1. Mud 32729 3.42
2. Wood Bamboo 1003 0.10
3. Brick 4782 0.50
4. Stone 5712 0.60
5. Cement 611892 63.93
6. Mosaic & Floor tiles 296953 31.03
7. Any other material 4005 0.42
Souce; Census of India
V-4
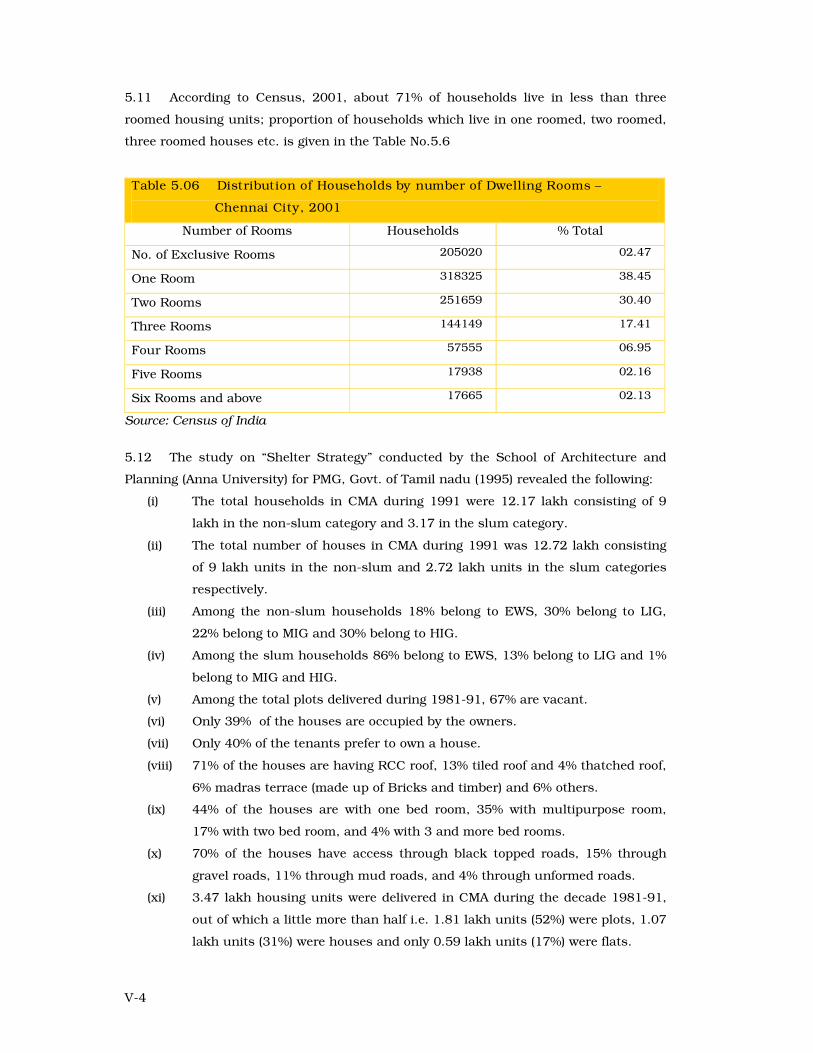
5.11 According to Census, 2001, about 71% of households live in less than three
roomed housing units; proportion of households which live in one roomed, two roomed,
three roomed houses etc. is given in the Table No.5.6
Table 5.06 Distribution of Households by number of Dwelling Rooms –
Chennai City, 2001
Number of Rooms Households % Total
No. of Exclusive Rooms 205020 02.47
One Room 318325 38.45
Two Rooms 251659 30.40
Three Rooms 144149 17.41
Four Rooms 57555 06.95
Five Rooms 17938 02.16
Six Rooms and above 17665 02.13
Source: Census of India
5.12 The study on “Shelter Strategy” conducted by the School of Architecture and
Planning (Anna University) for PMG, Govt. of Tamil nadu (1995) revealed the following:
(i) The total households in CMA during 1991 were 12.17 lakh consisting of 9
lakh in the non-slum category and 3.17 in the slum category.
(ii) The total number of houses in CMA during 1991 was 12.72 lakh consisting
of 9 lakh units in the non-slum and 2.72 lakh units in the slum categories
respectively.
(iii) Among the non-slum households 18% belong to EWS, 30% belong to LIG,
22% belong to MIG and 30% belong to HIG.
(iv) Among the slum households 86% belong to EWS, 13% belong to LIG and 1%
belong to MIG and HIG.
(v) Among the total plots delivered during 1981-91, 67% are vacant.
(vi) Only 39% of the houses are occupied by the owners.
(vii) Only 40% of the tenants prefer to own a house.
(viii) 71% of the houses are having RCC roof, 13% tiled roof and 4% thatched roof,
6% madras terrace (made up of Bricks and timber) and 6% others.
(ix) 44% of the houses are with one bed room, 35% with multipurpose room,
17% with two bed room, and 4% with 3 and more bed rooms.
(x) 70% of the houses have access through black topped roads, 15% through
gravel roads, 11% through mud roads, and 4% through unformed roads.
(xi) 3.47 lakh housing units were delivered in CMA during the decade 1981-91,
out of which a little more than half i.e. 1.81 lakh units (52%) were plots, 1.07
lakh units (31%) were houses and only 0.59 lakh units (17%) were flats.
V-5
(xii) The private sector has delivered more than three fourth of the above housing
units i.e. about 2.73 lakh units (79%), the public sector has delivered about
0.71 lakh units (21%) and the co-operative sector has delivered 0.35 lakh
plots, 0.30 lakh flats and 0.06 lakh houses.
(xiii) TNHB has delivered, 0.43 lakh housing units consisting of 0.30 lakh plots
(71%), 0.05 lakh houses (12%) and 0.07 lakh flats (17%).
(xiv) Out of the total housing units delivered by TNHB, 51% are meant for EWS,
24% are for LIG, 12% are for MIG and 13% are for HIG.
(xv) Out of the total 0.30 lakh serviced plots delivered by TNHB more than 20,000
plots are meant for EWS, more than 8000 plots are for LIG, more than 1000
plots are for MIG and only about 400 plots are for HIG.
(xvi) TNSCB has taken up more than fourteen different schemes out of which ten
schemes are meant for physical improvement of slums and four schemes are
meant for financial assistance to the slum households for improving their
shelter units.
(xvii) TNSCB has delivered as much as about 12,000 tenements, about 700
houses and about 5000 serviced plots. Nearly 1.88 lakh households were
benefited under different environmental improvement schemes.
(xviii) The private sector delivered about 2.73 lakh housing units consisting of
about 1.43 lakh plots, about 1.01 lakh houses and about 0.29 lakh flats.
(xix) The annual delivery rate of all the housing units put together was 16000
during 1981 which increased to 41000 units during 1991, an increase 1.5
times. The annual delivery rate of plots alone was 10,000 units during 1981
which increased to 18000 units during 1991, an increase of 80%. The
annual delivery of houses has registered a 150% increase from about 7000
units during 1981 to about 18000 units during 1991. The annual delivery
rate of flats increased from 1000 units during 1983 to about 6000 units
during 1991, a fivefold increase.
(xx) The share of approved plots among the total plots was only 16% during 1981
which has increased to 50% in 1991, but the delivery of unapproved plots
has been almost constant around 8000 – 10000 units during the decade
1981-91.
(xxi) The annual delivery rate of approved houses has increased from 4000 units
during 1981 to 14,000 units during 1991 (250% increase) and that of
unapproved houses increased from 2000 units in 1981 to 4000 units in 1991
(only 100% increase).
(xxii) Built units consisting of houses and flats were delivered under regular
programme and serviced plots were delivered under MUDP I, II and TNUDP.
V-6
(xxiii) Under the regular programme, the current practice is to deliver only flats and
that too for HIG only.
(xxiv) Most of the plots delivered under MUDP I, II and TNUDP were meant for EWS
and LIG.
(xxv) All these types of housing units were provided with all required physical and
social infrastructure facilities.
(xxvi) The sources of funding for regular programme were HUDCO, LIC and NHB
and that for MUDP I & II was World Bank assistance.
(xxvii) The plinth area of tenements delivered has been about 30 m2 during 1981-
82, which was gradually reduced to about 17m2 by 1990-91. However the
cost of tenement has increased from Rs.10,000 per unit during 1981-82 to
about Rs.50,000 per unit during 1990-91.
(xxviii) The environment of some of the existing slums was improved under ASIS and
such other schemes by providing toilets, water supply, black topped roads,
drainage, etc.
(xxix) In the case of MUDP I, II & TNUDP, the above facilities were provided with
better quality as the cost per family sanctioned was more. Further under
these World Bank aided schemes, patta for the site under enjoyment was
also issued to the beneficiary in addition to making available the loan for
improvement/construction house.
5.13 Study on “Effective Demand for Housing in Tamil Nadu” was conducted in 1995
by the Consultants M/s. STEM for PMG, Govt. of Tamil Nadu. Covering a sample size of
2255 households in respect of Chennai Urban Agglomeration. The following were the
outcome of the study.
(i) Social Profile of Households
Madras Urban Agglomeration is spread over Madras and part of the
Chengalpattu-MGR District. Total estimated households are 1.14 million covering 5.4
million population. Nearly 92 % of SC & ST households are from lower income groups
i.e., EWS and LIG. The percentage of male population is more than (52 %) female
population (48% per cent) in MUA. More than 8% are above 59 years of age group. Two
out of every three households have been staying at the same place for more than 20
years. Nearly 45% of the households have migrated to MUA. While more than 75% of
migrant households moved in from other towns, thus urban-urban migration is a major
flow. About 10% of migrant households are from other states and 51% from the same
district. Majority of migrants from other states fall in the higher income groups. About
30% of households migrated only for employment purpose, followed by movement of
household or spouse.
V-7
(ii) Economic Profile of Households
About 38% of the households have an income less than Rs.1101 per month,
while 9% draw less than Rs.501 per month. 3% of the households have an income of
less than Rs.250 per month. EWS and LIG groups account for 72% of the households.
The city, thus, has more of poor people houses, on the ground than of rich people
houses, as a skyline. In the case of EWS, the expenditure is more than their monthly
income. Major source of income is wages, salary and pension for 90% of households,
other investments account only 7%. Of the earning head of households 14% are above
59 years of age and 6% are females as head of households. Only 29% of the members
are earners. And only 28% of the households have assets. About 76% of a household's
expenditure go for the major and main item of food and essential.
(iii) Physical Profile of Buildings
Nearly 77% of the buildings are accessible through tar roads, and only 14% are
approachable through mud roads. 36% of EWS buildings and 31% of LIG buildings
roofs and walls are of temporary materials namely thatch/grass. 35% of EWS buildings
are dilapidated. 18% of the buildings comprise flats and 41% are independent
buildings. 8% of the buildings are put to residential and commercial uses. 53% of the
buildings are within 20 years of age. 14% are between 20 to 40 years of age. Nearly 7%
of buildings are of more than 3 floors. On an average 2.81 households occupy each
building. Average house cost is thrice the annual income of a household.
(iv) Amenities
On an average only 12% of the households have no power supply, however in the
case of EWS category nearly one in four households have no electric connection.
Municipal water supply, own well or bore well, public tap or hand pump together cover
around 89% of the households. 71% of the households have private bathing facilities.
70% of the households have private toilet facility. 65% of households have facilities to
dispose sewage into municipal connections and 33% have septic tank or soak pit and
remaining percent have open drain and dry latrines. Availability of amenities increases
with the rise in income and EWS has far less amenities than others.
(v) Tenure Status and Mode of Property Acquisition
About 46% of the buildings are rented houses and 54% are own houses. Nearly
95% of tenant households do not have any property. Of the owned households, 23% are
ancestral property and 22% are purchased from private party. 32% of the households
have made full payment for purchased property and only 7% have paid partial payment.
Percentage of houses owned increases with rise in income.
V-8
(vi) Changing Pattern of Residence (Mobility)
About 45% of the households changed their residence within the town. One in
four of the households moved on so within the past 2 years. Two thirds of the
households moved in the past ten years. Only 11% have moved 20 years back.
Construction of own houses and availability of better facilities are the two major reasons
for change of residence. About 9% of EWS households and 5 to 7% of other income
group households are forced to vacate.
(vii) Perception on Owning Property
In the case of owners as well as tenants, housing demand is mainly subdued
and suppressed due to lack of finance. About 94% of households do not wish to own
property in the place of residence. About 93% of tenant households did not express
their desire to own property. About 95% of the owner households also did not want to
own a second property. While lack of financial resources was a main reason for not to
own a property in the case of all the three categories, already owned a house was
another major reason. Due to lack of financial resources, 59% of households do not
want to own property. About 30% of households wish to own a plot for an investment
whereas 70% want to build a house. About 96% of the households did not want to
upgrade their house.
(viii) Awareness of House Financing Institutions
Around 2% of households are aware of the HFI’s terms and condition for loans.
Of the institutions that were known as House Financing Agency, banks, LIC and TNHB
were the most prominent. The interest rates charge by HFI’s was reasonable for the
majority of households. The procedures for obtaining loans from HFI’s were formed to
be cumbersome by 34% of households and reasonable for nearly 37% of households.
More than 40% of those who aware of the HFI’s have approached them for loan.
(ix) House Financing and Repayment Plan
Personal savings formed the main source for financing house building for 55% of
households. Sale of assets, loan from friends, and banks were the other major sources.
About 19% of the monthly income was being paid as monthly installments to repay
loan. Only 50% wished to cut down expenditure to repay housing loan. 66% wished to
take up additional work for the same purpose. Banks and financial institutions were
the major source for financing up gradation of the house. Average expected expenditure
on upgrading a house was 1.8 times that of upgrading a EWS house. Upgrading a HIG
house cost nearly two and a half times that of a EWS house.
V-9
(x) Perceptions on Major Problems in Housing
Arranging own funds and obtaining a loan were found to be time consuming and
difficult, more than 25% of households found it very difficult. Preparation of plans and
getting them approved were difficult for more than 30% and very difficult for 18% of the
households. Getting water, sewerage and electricity connections were not a problem for
nearly 40% of the households. Getting skilled workmen was not a problem in urban
areas like Madras.
(xi) Housing Needs and Demand
Housing needs were computed for 3 scenarios. Housing needs vary from 10% to
23% of total housing stock. In the EWS category, it varies from 19% to 40% units. The
housing demand is computed for 5 scenarios. It varies from 1.61% to 22%. The
effective housing demand should be based on mixed socio-economic variables. EWS
households who desire a house, but cannot afford it, do not come under housing
demand and need to be addressed separately.
Slums
5.14 The Government of India Slum Areas (Improvement and Clearance) Act of 1954
defines a slum as "any predominantly residential area where the dwellings by reason of
dilapidation, overcrowding, faulty arrangement, lack of ventilation, light or sanitary
facilities or any combination of these factors are detrimental to safety, health or morals.
In 1971, the Tamil Nadu Slum Clearance Board, drafting officials from Survey,
Statistical, Revenue and Town Planning Departments then, conducted Socio-Economic
survey of Madras Slums. For the purpose of the survey, a slum was taken to mean
“hutting areas with huts erected in a haphazard manner without proper access, without
protected water supply and drainage arrangements and so congested as to allow a little
free flow of air to get in”. Some of the observations found made in the report are
extracted below:
“Slums generally present the most unhygienic, ugliest, nauseating scene.
During rainy season, the whole area gets flooded, the path ways become swampy and
the entire colony become as fertile breeding place for mosquitoes, exposing the slum
dwellers living in the area to all sorts of diseases. During summer, the thatched huts
are prone to fire accidents. Thus, the slum dwellers’ life is the most miserable one,
devoid of all basic amenities.
5.15 To ease the difficulties of the slum dwellers, attempts were made earlier to clear
the slums in Madras City. In North Madras, the Corporation of Madras and in South
Madras the City Improvement Trust and subsequently, the Tamil Nadu Housing Board
V-10
were looking after the slum clearance work. They, apart from constructing flats for the
low and middle income groups, allotted open developed plots, measuring 20’ x 40’ in
certain areas to slum families. However, further allotments required vast areas of land,
and the scheme was given up owing to scarcity of land within the city.
5.16 The Government of Tamil Nadu hold the view that slums are not acts of God, but
of human folly and that they can be banished by wise planning and resolute action.
5.17 The Tamil Nadu Government realized that the feeble, halting, incomplete and
disconcerted measures of the past have to give place to a comprehensive, integrated and
concerted policy to be put through on an emergency footing. It also realized that unless
programmes of slum clearance and settlements of slum dwellers are drawn on a more
realistic basis, relating them to economic opportunities and provision of social services
and social welfare services, the results may well turn out to be frustrating. It also
recognized the fact that the slum dwellers are an essential element in city life, and that
they are as necessary as any other section of the population for the life of the city.”
5.18 The TNSCB was formed in 1970 and the Tamil Nadu Slum (Improvement and
Clearance) Act, was enacted in 1971. The following are the objectives of the Board:
(1) To clear all the slums in Madras city within a targeted period,
(2) To prevent further growth of slums in Madras city,
(3) To give protection to the slum dwellers from eviction and to re-house them in
modern tenements and
(4) To provide basic amenities such as drinking water supply, electricity, storm
water drainage etc. to certain slum areas until they are finally cleared.
5.19 The Socio-economic Survey 1971 report lists the following as the main findings.
(1) Causes of slums in Chennai:
(i) Poverty - Frequent failure of monsoons led to mass influx of agricultural
labourers from the adjoining districts to the city. After coming to the city
they pick up any manual job (unmindful of the hardships) such as head load
carriers, rickshaw pullers, cart pullers, domestic servants, petty vendors,
carpenters, masons and other manual works. The income they derive from
their jobs was very low which was hardly sufficient for a balanced diet, so
they were unable to pay for rents for securing decent dwellings and hence
squatted on open spaces available near their work spots.
(ii) Physical conditions - The low-lying areas and water fronts served as fertile
grounds for the growth of slums.
V-11
(iii) Population growth – Rapid growth of population (then) attributed mainly due
to impetus given to industrial activities after independence in the public
sector. As the development of housing activities were not commensurate
with the demand created by the increasing population, slums were formed.
(iv) Industrial growth - There were 371 factories in 1946 it increased to 1431 in
1971 in the city. These industries acted as pull for the mass influx of skilled,
semi-skilled and unskilled labourers into the city from the districts of the
state and from other states in our country.
(v) Development of Trade & Commerce – Due to location of harbour in the city,
George Town had become an important commercial center. Gradually the
commercial activities extended to the other parts of the city. Many labourers
in the commercial areas due to the non-availability of homes on rent within
their means were forced to live in slums.
(vi) Absence of Planning - Madras City had grown (then) without any plan for
factories and office buildings. Labourers who were in these establishments
put up cheap dwelling units in the intervening spaces due to the desire to
live near their work spots.
(vii) Political reasons – The christening of slums in the name of political leaders
made it difficult for the owners of the land to evict the unauthorized hut
dwellers.
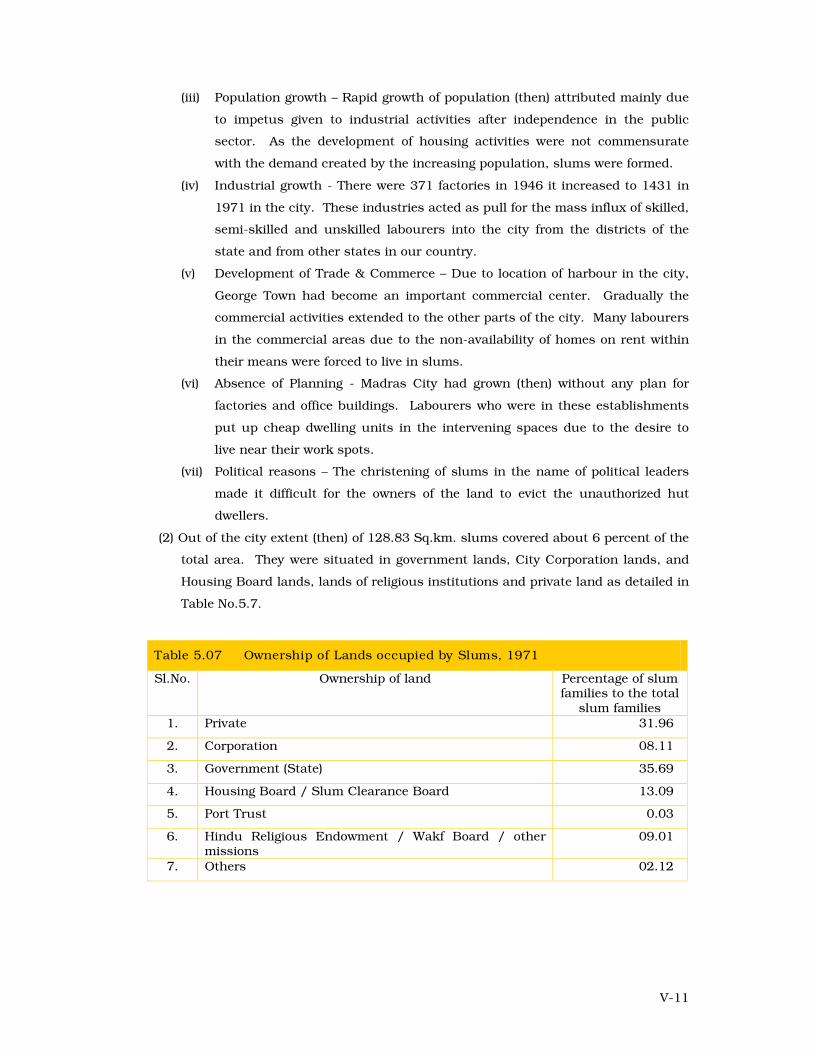
(2) Out of the city extent (then) of 128.83 Sq.km. slums covered about 6 percent of the
total area. They were situated in government lands, City Corporation lands, and
Housing Board lands, lands of religious institutions and private land as detailed in
Table No.5.7.
Table 5.07 Ownership of Lands occupied by Slums, 1971
Sl.No. Ownership of land Percentage of slum families to the total
slum families 1. Private 31.96
2. Corporation 08.11
3. Government (State) 35.69
4. Housing Board / Slum Clearance Board 13.09
5. Port Trust 0.03
6. Hindu Religious Endowment / Wakf Board / other missions
09.01
7. Others 02.12
V-12
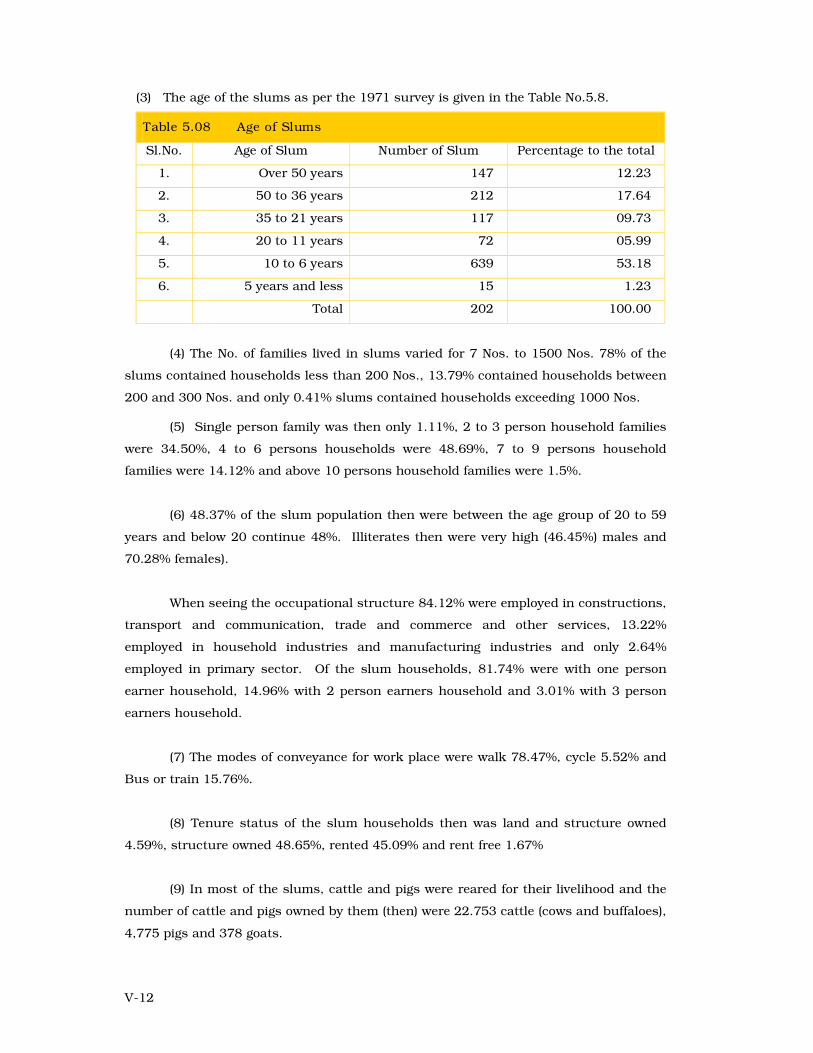
(3) The age of the slums as per the 1971 survey is given in the Table No.5.8.
Table 5.08 Age of Slums
Sl.No. Age of Slum Number of Slum Percentage to the total
1. Over 50 years 147 12.23
2. 50 to 36 years 212 17.64
3. 35 to 21 years 117 09.73
4. 20 to 11 years 72 05.99
5. 10 to 6 years 639 53.18
6. 5 years and less 15 1.23
Total 202 100.00
(4) The No. of families lived in slums varied for 7 Nos. to 1500 Nos. 78% of the
slums contained households less than 200 Nos., 13.79% contained households between
200 and 300 Nos. and only 0.41% slums contained households exceeding 1000 Nos.
(5) Single person family was then only 1.11%, 2 to 3 person household families
were 34.50%, 4 to 6 persons households were 48.69%, 7 to 9 persons household
families were 14.12% and above 10 persons household families were 1.5%.
(6) 48.37% of the slum population then were between the age group of 20 to 59
years and below 20 continue 48%. Illiterates then were very high (46.45%) males and
70.28% females).
When seeing the occupational structure 84.12% were employed in constructions,
transport and communication, trade and commerce and other services, 13.22%
employed in household industries and manufacturing industries and only 2.64%
employed in primary sector. Of the slum households, 81.74% were with one person
earner household, 14.96% with 2 person earners household and 3.01% with 3 person
earners household.
(7) The modes of conveyance for work place were walk 78.47%, cycle 5.52% and
Bus or train 15.76%.
(8) Tenure status of the slum households then was land and structure owned
4.59%, structure owned 48.65%, rented 45.09% and rent free 1.67%
(9) In most of the slums, cattle and pigs were reared for their livelihood and the
number of cattle and pigs owned by them (then) were 22.753 cattle (cows and buffaloes),
4,775 pigs and 378 goats.
V-13
(10) There were 2147 families living in different parts of the city on pavements
(with total population 9,129). It was observed then that these people could not afford
either to build a hut in a slum or to hire a hut on rent.
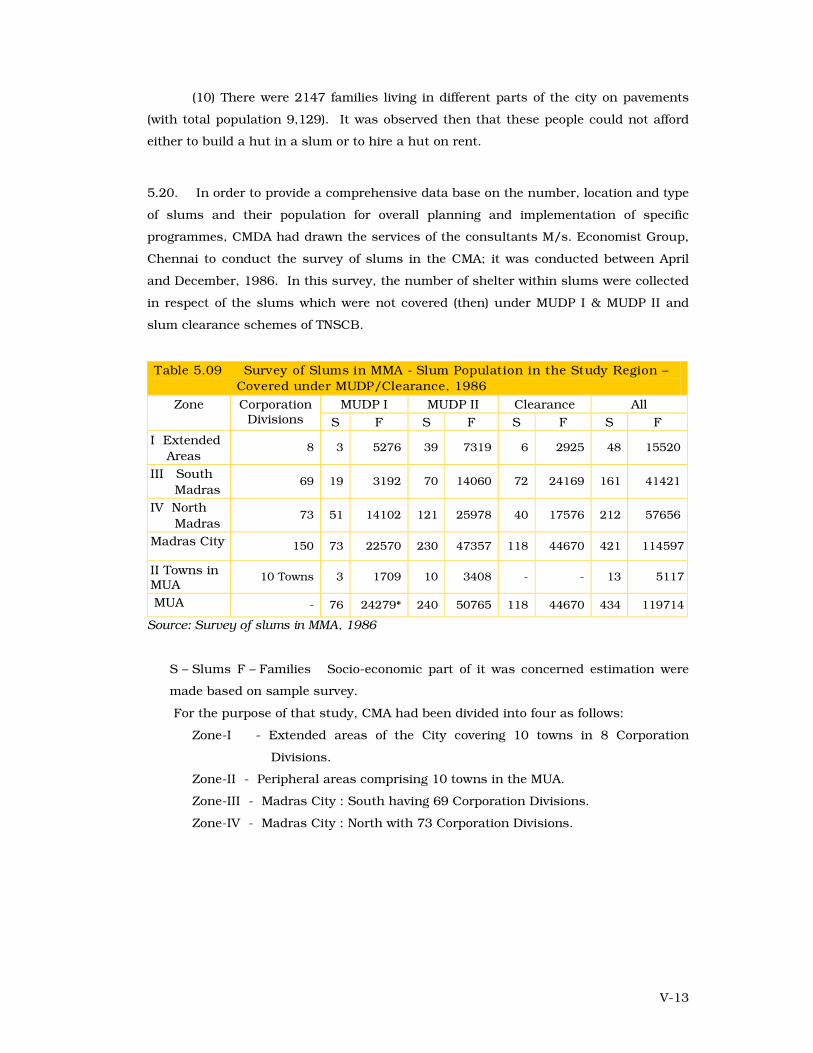
5.20. In order to provide a comprehensive data base on the number, location and type
of slums and their population for overall planning and implementation of specific
programmes, CMDA had drawn the services of the consultants M/s. Economist Group,
Chennai to conduct the survey of slums in the CMA; it was conducted between April
and December, 1986. In this survey, the number of shelter within slums were collected
in respect of the slums which were not covered (then) under MUDP I & MUDP II and
slum clearance schemes of TNSCB.
Table 5.09 Survey of Slums in MMA - Slum Population in the Study Region –
Covered under MUDP/Clearance, 1986
MUDP I MUDP II Clearance All Zone Corporation Divisions S F S F S F S F
I Extended
Areas 8 3 5276 39 7319 6 2925 48 15520
III South
Madras 69 19 3192 70 14060 72 24169 161 41421
IV North
Madras 73 51 14102 121 25978 40 17576 212 57656
Madras City 150 73 22570 230 47357 118 44670 421 114597
II Towns in MUA
10 Towns 3 1709 10 3408 - - 13 5117
MUA - 76 24279* 240 50765 118 44670 434 119714
Source: Survey of slums in MMA, 1986
S – Slums F – Families Socio-economic part of it was concerned estimation were
made based on sample survey.
For the purpose of that study, CMA had been divided into four as follows:
Zone-I - Extended areas of the City covering 10 towns in 8 Corporation
Divisions.
Zone-II - Peripheral areas comprising 10 towns in the MUA.
Zone-III - Madras City : South having 69 Corporation Divisions.
Zone-IV - Madras City : North with 73 Corporation Divisions.
V-14
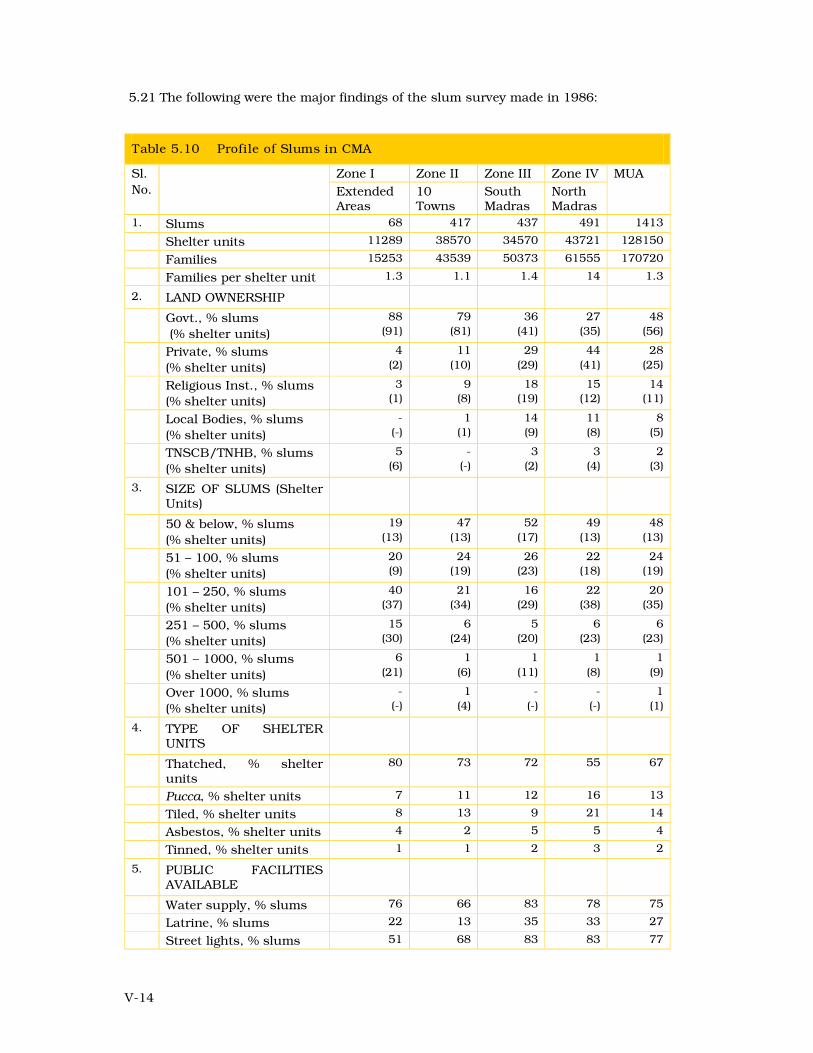
5.21 The following were the major findings of the slum survey made in 1986:
Table 5.10 Profile of Slums in CMA
Zone I Zone II Zone III Zone IV Sl.
No.
Extended Areas
10 Towns
South Madras
North Madras
MUA
1. Slums 68 417 437 491 1413
Shelter units 11289 38570 34570 43721 128150
Families 15253 43539 50373 61555 170720
Families per shelter unit 1.3 1.1 1.4 14 1.3
2. LAND OWNERSHIP
Govt., % slums
(% shelter units)
88
(91)
79
(81)
36
(41)
27
(35)
48
(56)
Private, % slums
(% shelter units)
4
(2)
11
(10)
29
(29)
44
(41)
28
(25)
Religious Inst., % slums
(% shelter units)
3
(1)
9
(8)
18
(19)
15
(12)
14
(11)
Local Bodies, % slums
(% shelter units)
-
(-)
1
(1)
14
(9)
11
(8)
8
(5)
TNSCB/TNHB, % slums
(% shelter units)
5
(6)
-
(-)
3
(2)
3
(4)
2
(3)
3. SIZE OF SLUMS (Shelter Units)
50 & below, % slums
(% shelter units)
19
(13)
47
(13)
52
(17)
49
(13)
48
(13)
51 – 100, % slums
(% shelter units)
20
(9)
24
(19)
26
(23)
22
(18)
24
(19)
101 – 250, % slums
(% shelter units)
40
(37)
21
(34)
16
(29)
22
(38)
20
(35)
251 – 500, % slums
(% shelter units)
15
(30)
6
(24)
5
(20)
6
(23)
6
(23)
501 – 1000, % slums
(% shelter units)
6
(21)
1
(6)
1
(11)
1
(8)
1
(9)
Over 1000, % slums
(% shelter units)
-
(-)
1
(4)
-
(-)
-
(-)
1
(1)
4. TYPE OF SHELTER UNITS
Thatched, % shelter units
80 73 72 55 67
Pucca, % shelter units 7 11 12 16 13
Tiled, % shelter units 8 13 9 21 14
Asbestos, % shelter units 4 2 5 5 4
Tinned, % shelter units 1 1 2 3 2
5. PUBLIC FACILITIES AVAILABLE
Water supply, % slums 76 66 83 78 75
Latrine, % slums 22 13 35 33 27
Street lights, % slums 51 68 83 83 77
V-15
6. DEMOGRAPHY
Population 77790 226403 246828 326242 877262
Families 15253 43539 50373 61555 170720
Family size 5.1 5.2 4.9 5.3 5.1
Sex ratio 953 934 953 940 942
Upto 17 yrs., % population
43 42 42 41 42
18-45 yrs., % population 46 45 45 45 45
Illiterates, % population 33 29 39 33 33
Standard X or less, % population
60 60 53 58 57
7. EARNER PROFILE
Earners, % population 28 28 33 30 30
Female, % earners 13 14 22 17 17
Unskilled, % earners 45 46 63 61 56
Earner per family 1.4 1.4 1.6 1.6 1.5
Dependents per earner 2.5 2.6 2.1 2.3 2.4
8. DEPENDENTS
Dependents, % population
72 72 67 70 70
Females, % dependents 63 60 60 62 63
Unemployed 18-45 years, % population
48 49 42 46 46
Women 18-45 years, % unemployed
88 85 88 84 86
Children 6-17 years neither in school nor employed, % population 6-17 years
36 24 30 30 28
9. OTHERS
Monthly family income, Rs.
685 700 615 730 686
Monthly per capita 135 135 126 139 134
Monthly family expenditure, Rs.
680 690 609 715 676
Families in rented house,%
35 32 38 49 39
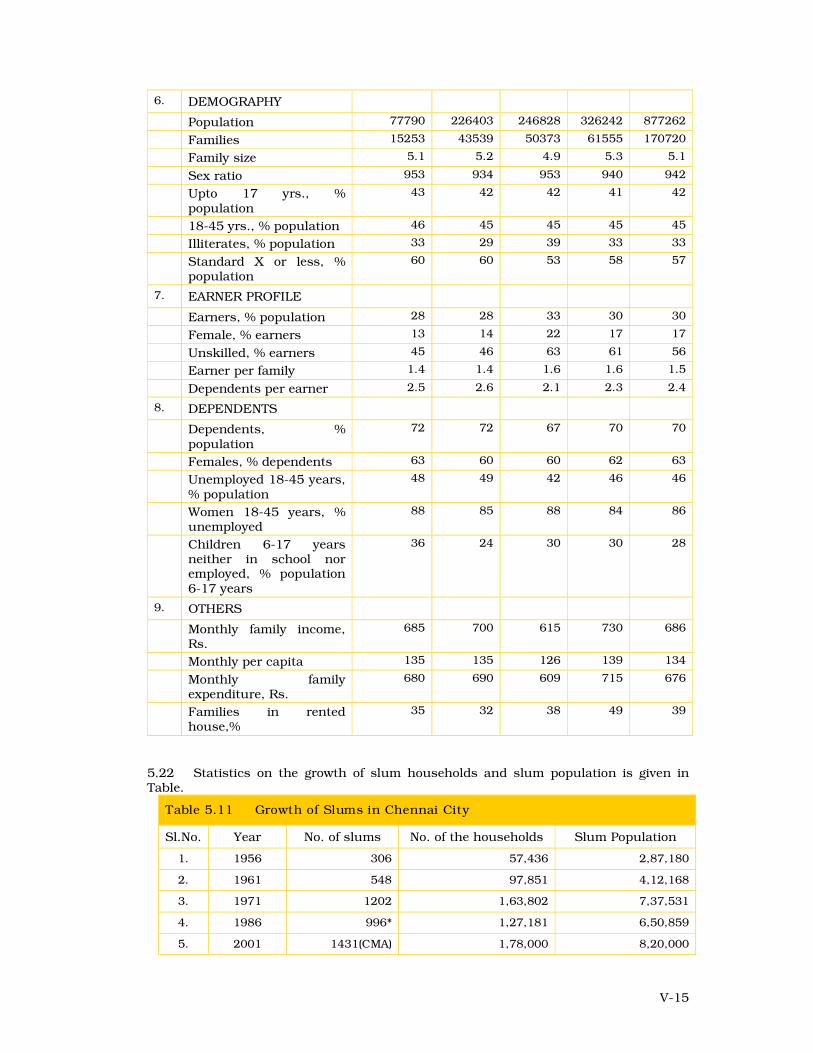
5.22 Statistics on the growth of slum households and slum population is given in Table.
Table 5.11 Growth of Slums in Chennai City
Sl.No. Year No. of slums No. of the households Slum Population
1. 1956 306 57,436 2,87,180
2. 1961 548 97,851 4,12,168
3. 1971 1202 1,63,802 7,37,531
4. 1986 996* 1,27,181 6,50,859
5. 2001 1431(CMA) 1,78,000 8,20,000
V-16
Note: *Excluding the slums in 10 towns as per 1986 survey, and also improved/cleared
ones given in Table 5.09 ante.
5.23 Under the World Bank funded TNUDP II , pre feasibility study on ‘Identification of
Environmental Infrastructure Requirement in Slums in Chennai Metropolitan Area” for
TNSCB in 2005 was conducted by the consultants IN-RIMT Hydrabad. The major
findings of the study are as follows:
(i) A total of 1473 slums were covered under the survey and this excludes the
slums covered by MUDP and TNUDP
(ii) Out of 1473 slums 1231 slums are classified as developed and 242 slums
are classified as undeveloped in CMA.
(iii) Out of 242 undeveloped slums, 122 slums are located in objectionable area
such as river, road margin etc.
(iv) 120 slums are located in the unobjectionable areas
(v) The total population and total number of families in 242 undeveloped slums
are 71 840 and 3.29 lakhs.
(vi) The total number of Dwelling Units are 46248 of which 6081, 22691 and
17548 units are pucca, semi pucca and kutcha structures respectively. The
composition of semi-pucca and kutcha were of 52 percent and 26 percent
respectively.
(vii) Two families were occupying each dwelling unit indicating a deficit equivalent
to the existing total number of dwelling units. The number of persons
occupying each dwelling unit is also found to be higher with about 7 persons
per house.
(viii) About 78% of families owned the houses.
(ix) Most of the house owners (about 85%) did not enjoy the patta for their
houses.
(x) As regards Income levels about 85% of the families were living below the
poverty line.
(xi) About 91.5% of the households expressed their willingness to pay for
improved housing.
Water Supply:
(xii) These Slums in Chennai City were not served with piped water supply. The
sources of water included open wells; bore wells and public water tanks.
(xiii) The number of persons sharing the public water tank/tap is very high with
an average of about 620 persons per water tank/tap.
V-17
(xiv) The slums in Chennai City predominantly (about 90%) depend on supplies
through municipal water tankers. 1% have own municipal connection. 3.7 %
have access to public taps.
(xv) 73.8% of the respondents have access to daily water supply .About 24%
enjoy water supply on alternate days.1.4% of households do not have regular
frequency in water supply.
(xvi) 56% of the households in all zones had community water supply available
within a distance of 50 metres and another 21% had within 50-100 metres.
For the remaining 12.1 % the water sources were available beyond 100
metres.
(xvii) A majority of households (90%) had water storage facilities other than
overhead tank, under ground tank or storage drums within their property.
(xviii) Nearly 66.7% of the respondents indicated that water was available more
than 50 liters of water per day; with about 11.4% saying that they had more
than 100 liters a day. 29.4 % of households received water supply less than
50 litres.
(xix) About 71% of slum dwellers purchase the drinking water
Sanitation (Sewerage and Latrine):
(xx) The number of persons sharing the public toilet seats and public urinals is
very high with an average of about 1086 persons and 2817 persons per toilet
seat and urinals respectively.
(xxi) 29.2% of the households are using individual latrine/pit another 48.3
percent household use community/public latrine. 22.5% use other means
including open defecation.
(xxii) With regard to distance of public latrines, about 6% of the households have
to walk more than 100 metres, to use the community toilet/public
latrines;1.8% of household have to go beyond 250 metres. A majority of
households have access to community toilets /public latrine facilities within
50 m distance.
(xxiii) 68.2 % of households do not have sewer connection
(xxiv) Majority of the households who did not have sewer connection were willing to
avail a new connection at a price.
Storm Water Drain:
(xxv) 38.9% of households indicated its availability and 61.1% indicate its
absence.
(xxvi) 12% of the households are incurring expenditure on sewerage and drainage.
V-18
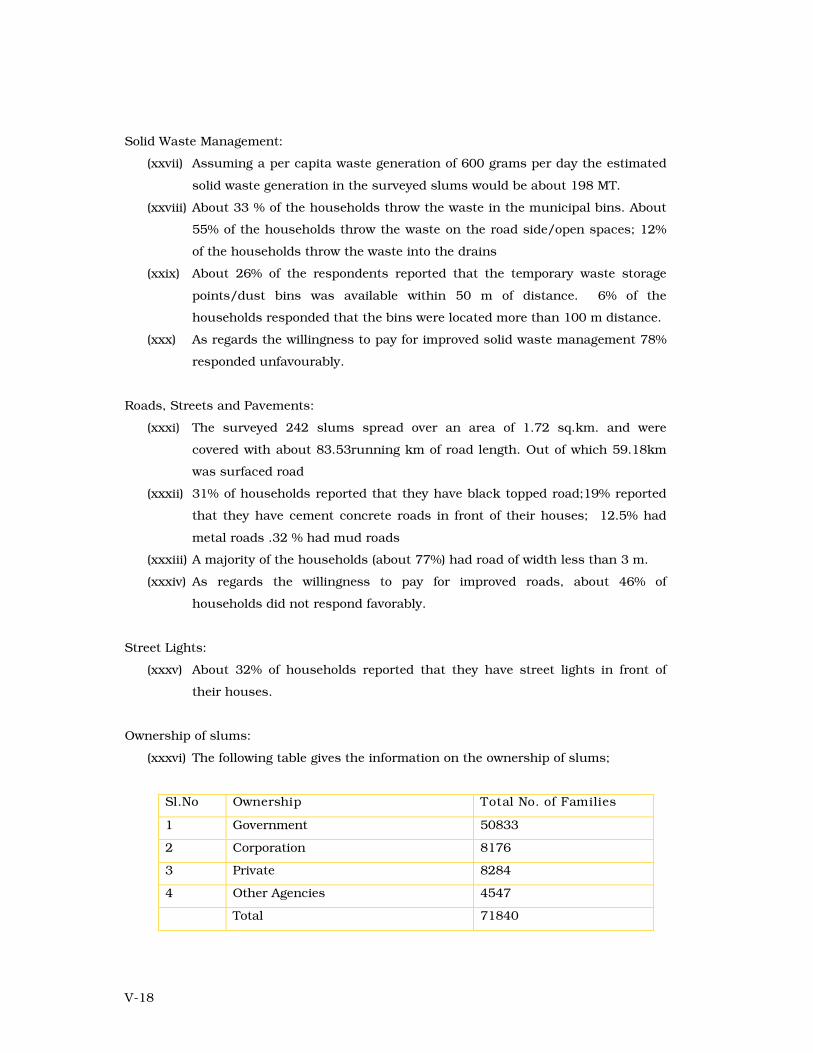
Solid Waste Management:
(xxvii) Assuming a per capita waste generation of 600 grams per day the estimated
solid waste generation in the surveyed slums would be about 198 MT.
(xxviii) About 33 % of the households throw the waste in the municipal bins. About
55% of the households throw the waste on the road side/open spaces; 12%
of the households throw the waste into the drains
(xxix) About 26% of the respondents reported that the temporary waste storage
points/dust bins was available within 50 m of distance. 6% of the
households responded that the bins were located more than 100 m distance.
(xxx) As regards the willingness to pay for improved solid waste management 78%
responded unfavourably.
Roads, Streets and Pavements:
(xxxi) The surveyed 242 slums spread over an area of 1.72 sq.km. and were
covered with about 83.53running km of road length. Out of which 59.18km
was surfaced road
(xxxii) 31% of households reported that they have black topped road;19% reported
that they have cement concrete roads in front of their houses; 12.5% had
metal roads .32 % had mud roads
(xxxiii) A majority of the households (about 77%) had road of width less than 3 m.
(xxxiv) As regards the willingness to pay for improved roads, about 46% of
households did not respond favorably.
Street Lights:
(xxxv) About 32% of households reported that they have street lights in front of
their houses.
Ownership of slums:
(xxxvi) The following table gives the information on the ownership of slums;
Sl.No Ownership Total No. of Families
1 Government 50833
2 Corporation 8176
3 Private 8284
4 Other Agencies 4547
Total 71840
V-19
Schemes implemented by TNSCB in CMA
5.24 The following are the major schemes implemented by TNSCB in tackling the
problems of slums and improving their conditions:
(i) Slum Clearance Scheme:- Under this scheme, the slum dwellers are
rehabilitated in storeyed tenements either insitu or in a resettlement site.
Tenements are allotted either on rental basis or on hire purchase basis.
TNSCB has constructed 69594 No. of tenements from 1970 to 2004 in
Chennai. In addition TNHB had constructed 10,423 slum tenements in
Chennai.
(ii) Environmental Improvement Scheme (EIS):- Public fountain for water supply
(for every 10 families) common bath and W.C. (for every 5 families) and street
lights (for every 40 metres of road) were provided under this scheme. This
scheme was discontinued in 1978. Under this scheme about 55,000 families
were benefited..
(iii) Accelerated Slum Improvement Scheme (ASIS):– This scheme was started in
1927 and under this scheme also common infrastructures were provided in
slum areas under the Government’s 20 Point Programme. This scheme was
discontinued in 1991. About 50,000 households were benefited by this
scheme.
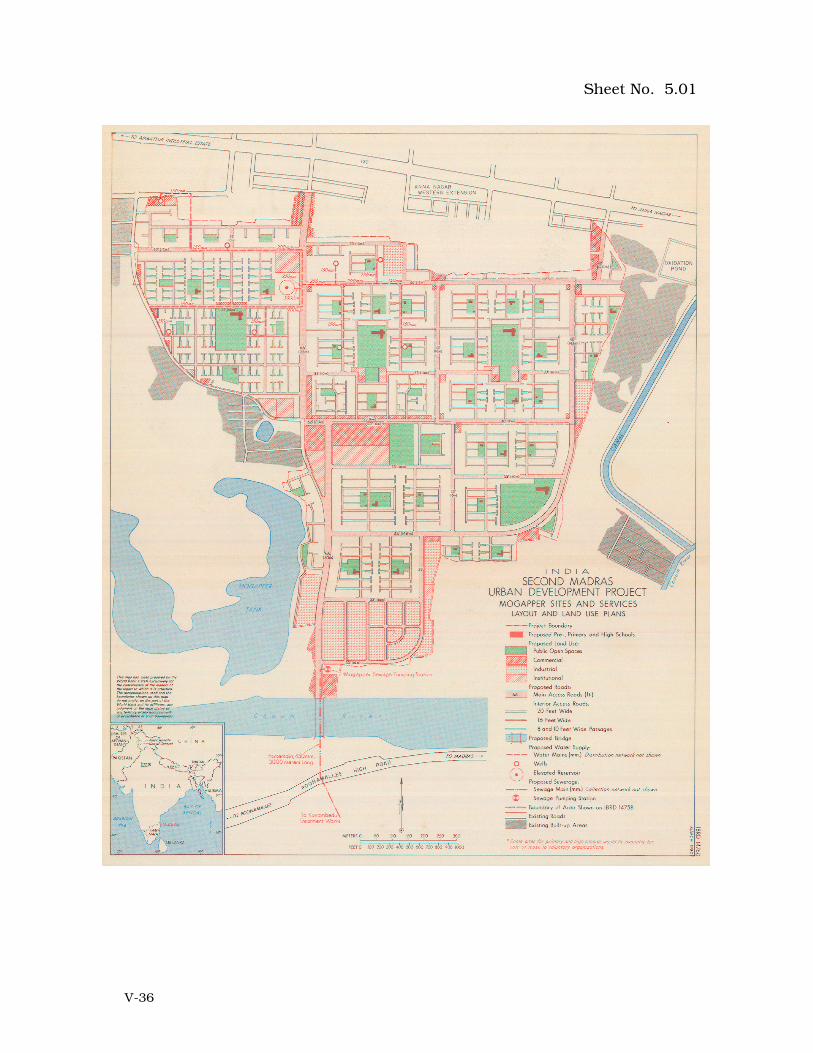
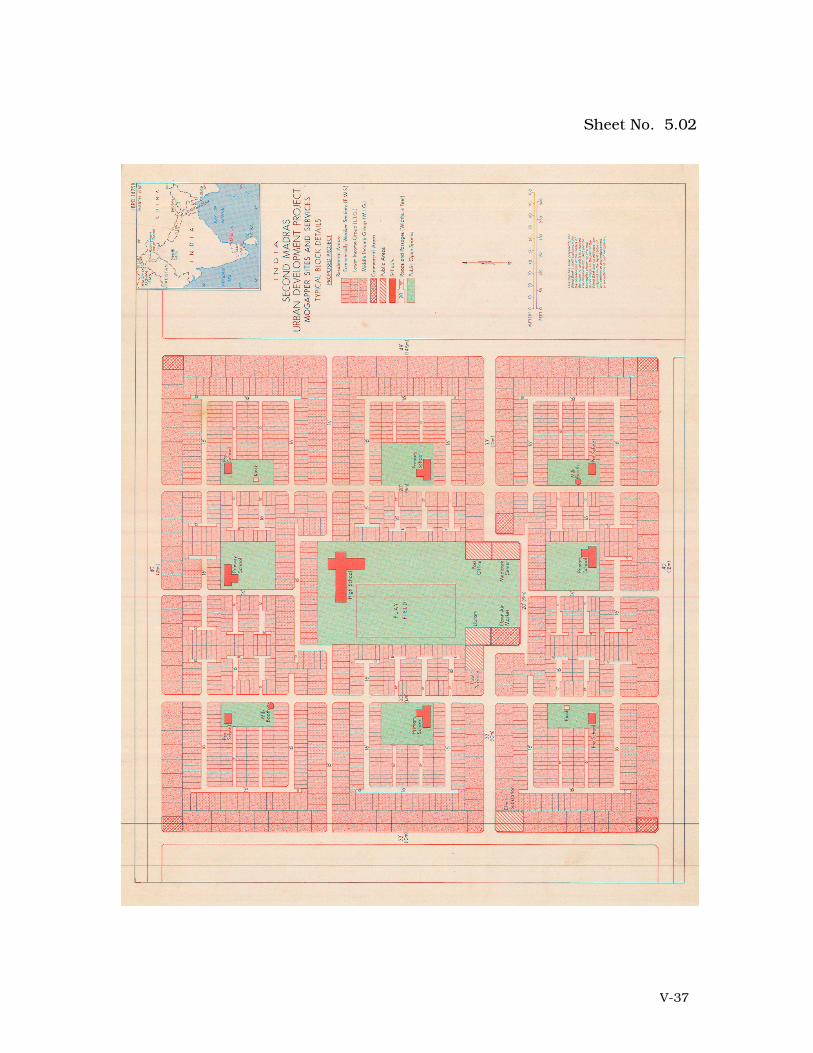
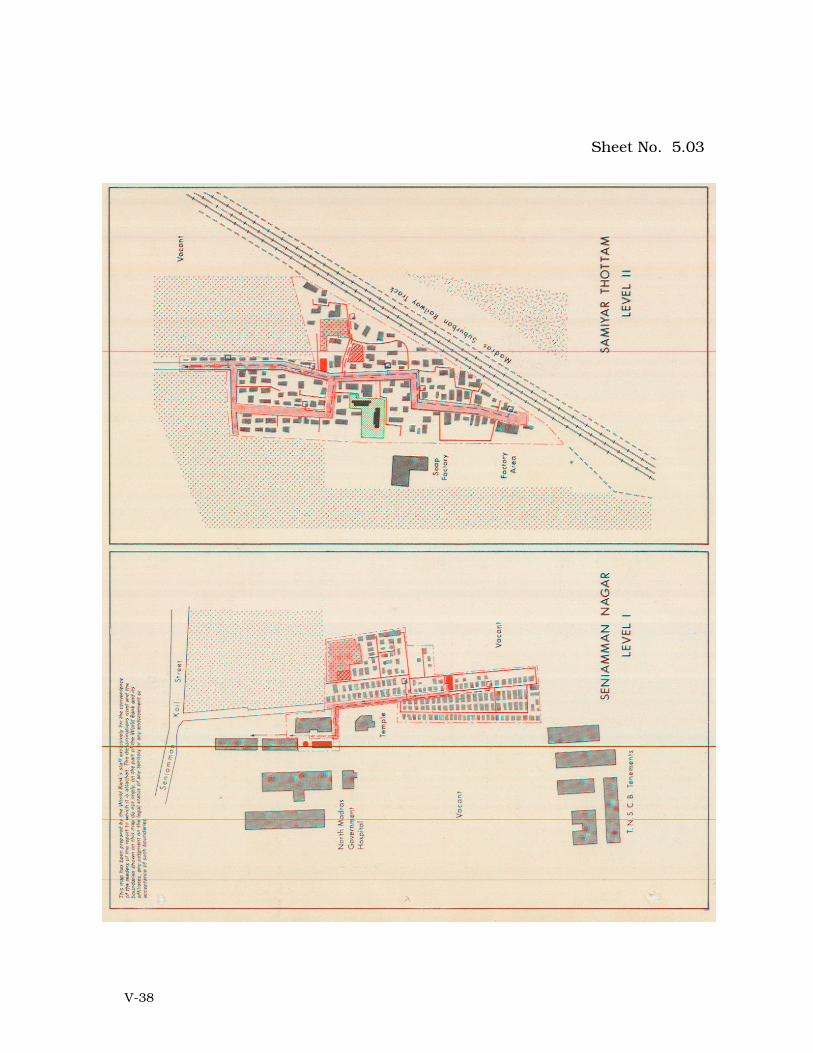
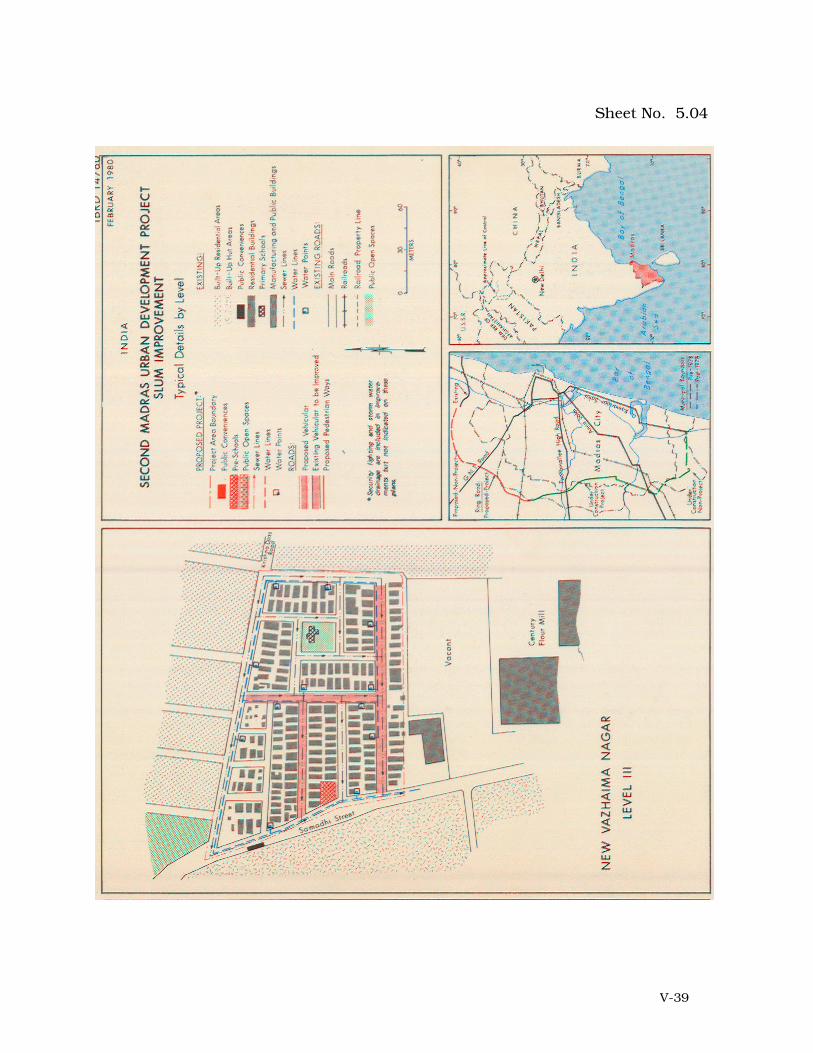
(iv) Slum Improvement Scheme under MUDP I and II and TNUDP-I:- The
project comprised of provision of security of tenure, basic infrastructure
services and community facilities. The infrastructure improvements include:
a) new and improved roads, footpaths and drainage (storm and waste
water), with vehicular access provided no more than 50 m from each hut
and pedestrian access provided for each hut;
b) Water supply, with one public standpipe per 10 households;
c) Public latrines and washing facilities, with one toilet and one bath facility
per 10 households; and
d) Community facilities: 10 primary schools, 3 high schools, plots for pre-
schools (1 per 100 households) and cottage industry centers (1 per 365
households)
The layouts of these slums were prepared “As-is-where-is” basis and security
of tenure provided to the slum dwellers as part of the improvement package
by selling the improved plots to the inhabitants on hire-purchase basis, with
freehold titles to be issued on completion of payments. About 25,000
households in slums on government lands were benefited under the
MUDP-I implemented from 1971 to 1982, about 50,000 households were
V-20
benefited under the MUDP-II (1980-1988) and about 45,000 households
were benefited under TNUDP-I (1988-1995). A typical slum improvement
layout implemented under the MUDP is given in the sheets annexed.
(v) Shelter for Shelter less Scheme: - Affordable houses for slum dwellers were
constructed on serviced plots, using locally available materials and adopting
low cost techniques. They were allotted to slum families on hire purchase
basis. It was tried a pilot project in Chennai by TNSCB with GOI grant 20%,
GTN grant 15% and HUDCO loan component 65%. 2982 No. of families
were benefited under the scheme.
(vi) TNSCB’s Sites & Services Scheme: - Land acquired under the TNULC Act and
allotted to TNSCB was used for this scheme. Open plot developments with
basic infrastructures made therein with loan assistance from HUDCO and
the slum dwellers in objectionable areas resettled; the cost recovered from
the resettlements over a period of 20 years. 1473 no. of families were
benefited under the scheme.
(vii) Pavement Dwellers Housing Scheme: - Under this scheme, serviced plots
with core housing were allotted to the identified pavement dwellers. It was
funded by the GOI (Rs.4, 000/- per household) GTN (Rs.1000/- per
household) and HUDCO loan (Rs.8, 000/- per household) 7787 no. of
families benefited under this scheme.
(viii) Cash Loan Scheme: - Cash loan assistance for construction of house over the
plot allotted by TNSCB under Lease-cum-Sale basis was given by TNSCB. It
was financed by HUDCO as loan.15, 554 families were benefited under this
scheme
(ix) Mass Housing Scheme: - Apart from providing basic infrastructures in slum
areas, grant to the slum family for conversion of thatched roof to tiled roof or
mud walls to brick walls was given under the scheme. 97650 No. Of
families benefited under the scheme.
(x) Nehru Rozgor Yojana: - Loan assistance of Rs.4, 150/- per slum family
(repayable I n 10 years) was given for up gradation of their shelter. It was
implemented by TNSCB with grant assistance from GOI & GTN and loan
assistance from HUDCO.14, 000 No. of families benefited by this scheme
(xi) Resettlement under Special Problem Grant of Eleventh Finance Commission:
- Under this, TNSCB availing grant from GOI and resettled 3,252 families
from objectionable areas in storeyed tenements in CMA.
(xii) R&R under Flood Alleviation Programme: - TNSCB has identified that
33313 families are on the river margins and B'canal in the CMA. About 8164
tenements were constructed and a part of the above families (about 3000)
were resettled. It is being implemented with Government of India’s VAMBAY
V-21
Grant, TUFIDCO loan under Mega Cities programme apart from allocation in
the budget.
Pavement Dwellers:
5.25 According to Survey of Pavement dweller in Chennai City conducted by the
consultant SPARC for CMDA in 1989-90, the number of households who were living on
pavements was 9491 at 405 clusters at an average of about 23 households at a place;
their population was 40763 (20811 Male and 19950 Female) with 40.2% children
population. Unlike other old cities in India namely Delhi, Mumbai, Calcutta the number
of pavement dwellers in Chennai is relatively few
5.26 TNSCB is presently following the approaches in dealing with slum housing
problem in Chennai.
i) In case of moderately dense slums where it is possible to rehouse them in
storeyed tenement in-site, TNSCB construct storeyed tenements to
accommodates these slum dwellers.
ii) In cases of low dense slums, where it is possible to earmark plots of
reasonable extent and internal roads of reasonable width these slums are
improved by provision of required bulk amenities; land tenure given if it lies
in Government lands.
iii) In case of slums, which lie in an objectionable area such as river margins,
road margins in the alignment of lands required for MRTS development etc.,
they are shifted from the objectionable locations and resettled &
rehabilitated in the areas outside the city where land is available for such
proposed developments.
5.27 TNSCB could not do much to the very high density slums which could neither be
taken up for slum improvement programme nor under slum clearance tenements
construction programme except for provision of basic amenities such as water supply,
street lights & sanitation facilities.
V-22
5.28 According to revised figures available in respect of slum households in Chennai
corporation as per 2001 census, slum population is 8.20 lakhs and the TNSCB has
estimated that the slum families in undeveloped slums works out to 1.10 lakhs; out of
which according to TNSCB / PWD Survey 2000, slum families living in objectionable
slums (on river margins, canals, road margins and seashore were 75498. TNSCB has
also estimated that there are about 34752 families in unobjectionable areas and further
there are 6150 families who live in slum conditions in the encroached parts of the
tenement areas which have been reserved as parks, public purpose sites etc.
5.29 TNSCB has also estimated that the tenement constructions to house slums
dwellers from early 70's are reaching its life and in the next 10 years most of these
tenements have to be reconstructed and TNSCB has estimated that about 46,500
tenements units have to be reconstructed.
Delivery of Housing
5.30 The delivery agencies in CMA can be broadly classified as public, co-operative
and private sector. Under the public sector, the agencies operating mainly are TNHB
and TNSCB; the agencies which provided housing to its employees are TNPHC,
Railways, P&T and CPWD, Port Trust, etc.
Tamil Nadu Housing Board
5.31 Tamil Nadu Housing Board was established as a statutory body in 1961 under
the Tamil Nadu State Housing Board Act, 1961.
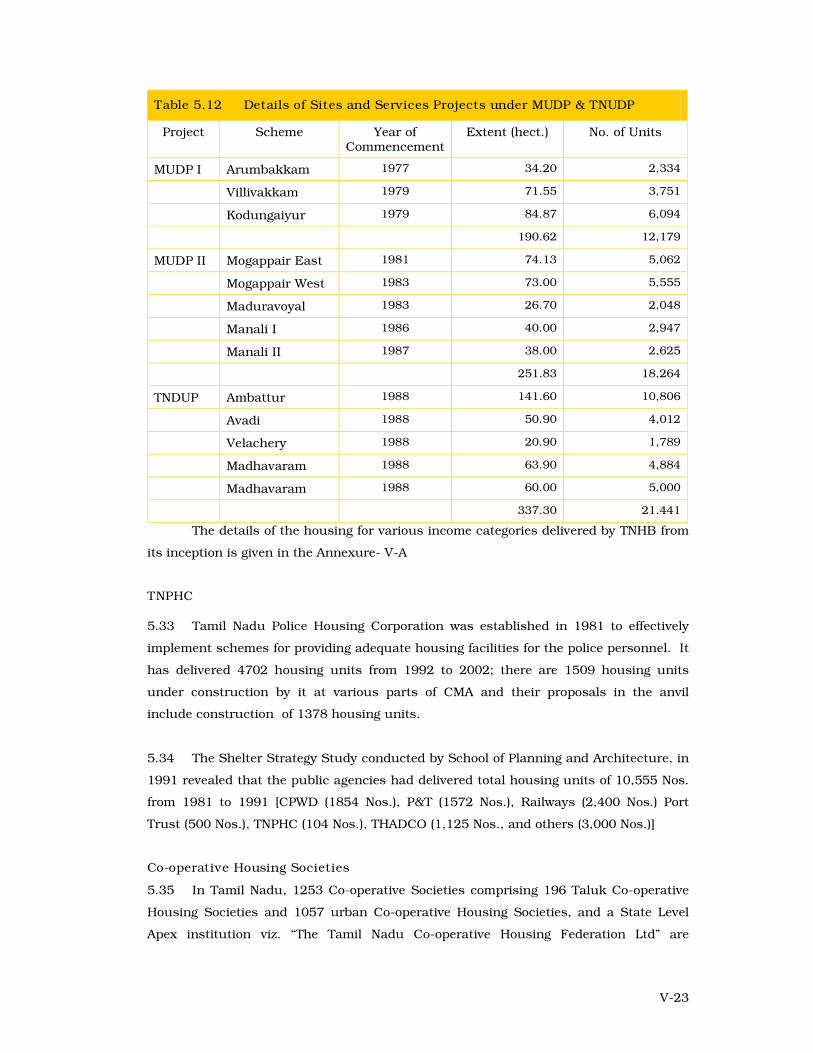
5.32 TNHB has been delivering the housing under their different programmes viz.
Regular programme, MUDP & TNDUP. TNHB was delivering serviced plots and
constructed houses and flats under these programmes. TNHB had developed large
neighbourhoods with all amenities and facilities within CMA at Arignar Anna Nagar,
K.K. Nagar, Ashok Nagar, Bharathi Nagar, South Madras Neighbourhood Scheme
(comprising Indira Nagar, Besant Nagar and Sashtri Nagar), Thiruvanmiyur, Tambaram
etc. TNHB has also developed Sites and Services Schemes under MUDP-I, MUDP-II and
TNUDP at Arumbakkam, Villivakkam, Kodungaiyur, Mogappair (East), Mogappair
(West), Maduravoyal, Manali, Madhavaram, Ambattur, Avadi and Velachery. The details
of the housing delivered under MUDP & TNUDP is given in the Table No.5.12.
V-23
Table 5.12 Details of Sites and Services Projects under MUDP & TNUDP
Project Scheme Year of Commencement
Extent (hect.) No. of Units
MUDP I Arumbakkam 1977 34.20 2,334
Villivakkam 1979 71.55 3,751
Kodungaiyur 1979 84.87 6,094
190.62 12,179
MUDP II Mogappair East 1981 74.13 5,062
Mogappair West 1983 73.00 5,555
Maduravoyal 1983 26.70 2,048
Manali I 1986 40.00 2,947
Manali II 1987 38.00 2,625
251.83 18,264
TNDUP Ambattur 1988 141.60 10,806
Avadi 1988 50.90 4,012
Velachery 1988 20.90 1,789
Madhavaram 1988 63.90 4,884
Madhavaram 1988 60.00 5,000
337.30 21.441
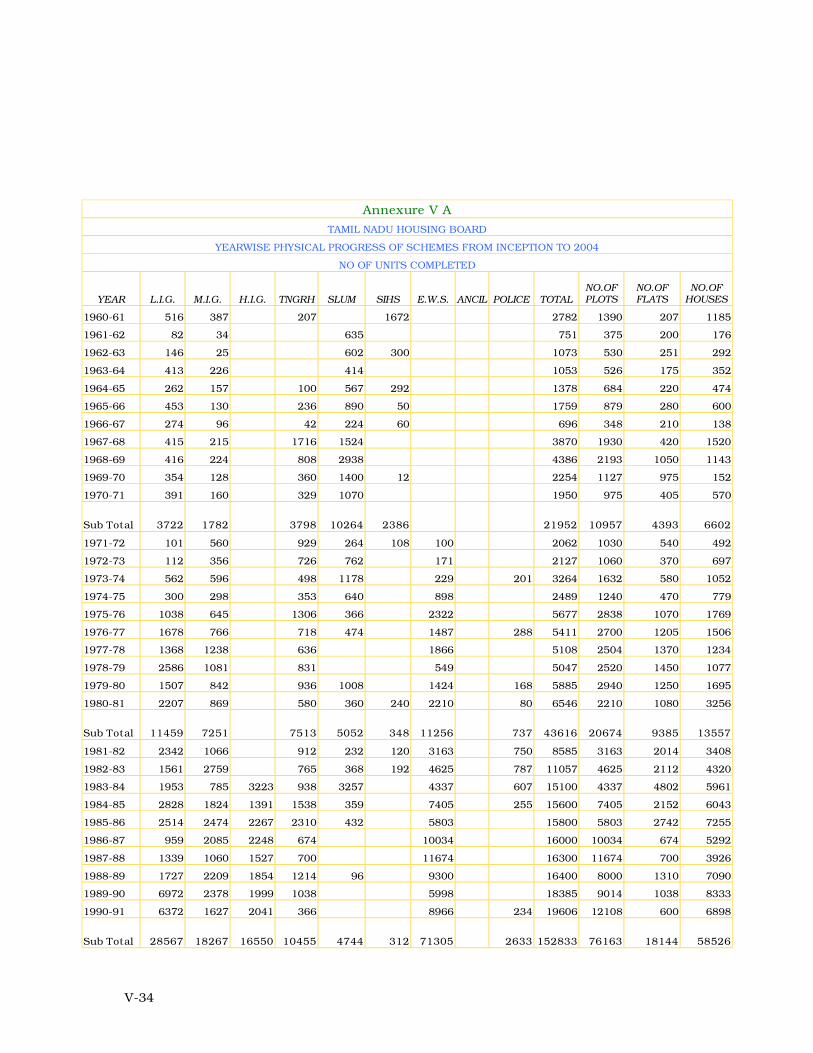
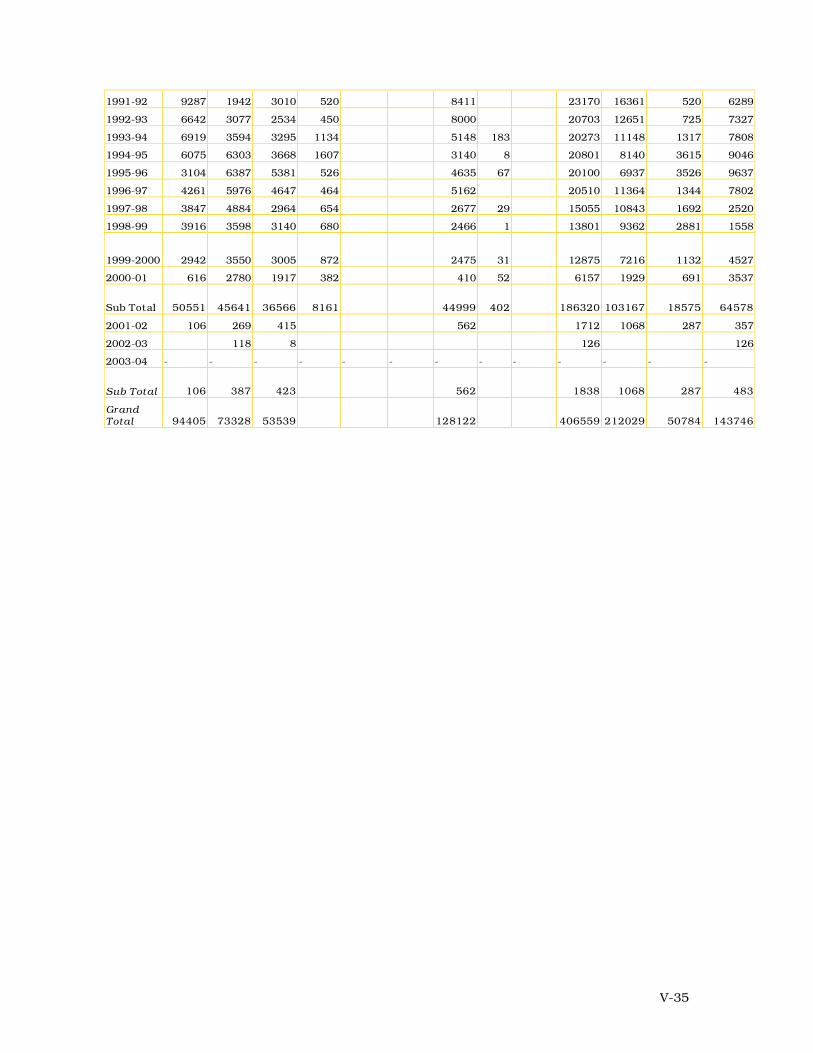
The details of the housing for various income categories delivered by TNHB from
its inception is given in the Annexure- V-A
TNPHC
5.33 Tamil Nadu Police Housing Corporation was established in 1981 to effectively
implement schemes for providing adequate housing facilities for the police personnel. It
has delivered 4702 housing units from 1992 to 2002; there are 1509 housing units
under construction by it at various parts of CMA and their proposals in the anvil
include construction of 1378 housing units.
5.34 The Shelter Strategy Study conducted by School of Planning and Architecture, in
1991 revealed that the public agencies had delivered total housing units of 10,555 Nos.
from 1981 to 1991 [CPWD (1854 Nos.), P&T (1572 Nos.), Railways (2,400 Nos.) Port
Trust (500 Nos.), TNPHC (104 Nos.), THADCO (1,125 Nos., and others (3,000 Nos.)]
Co-operative Housing Societies
5.35 In Tamil Nadu, 1253 Co-operative Societies comprising 196 Taluk Co-operative
Housing Societies and 1057 urban Co-operative Housing Societies, and a State Level
Apex institution viz. “The Tamil Nadu Co-operative Housing Federation Ltd” are
V-24
functioning to cater to the housing needs of its members. The schemes implemented
through co-operative housing societies are:
1. Rural Housing Scheme for Economically Weaker Sections.
2. Special Housing Scheme for Economically Weaker Sections in Urban areas.
3. LIG, MIG Schemes in Rural areas.
4. Urban Housing Schemes.
5. Valmiki Amedkar Awas Yojana (VAMBAY) Scheme
6. Repairs and Renewal of existing houses.
Though the number of households benefited in the State from these societies
upto the end of 2004 was 11.36 lakhs, their role in delivery of housing in CMA is
minimal. According to the School of Planning and Architecture’s Shelter Strategy
Study, the number of plots delivered by the Co-operative Societies from 1981 to 1991
was only 2,489 in CMA.
Private Sector
5.36 It can be broadly divided into two. The first one being the private individuals or
owner private who construct the house by himself, initially with a smaller floor area and
adding incrementally when necessity arises and his fund position improves. The second
one being the organized private agencies or real estate developers/promoters who
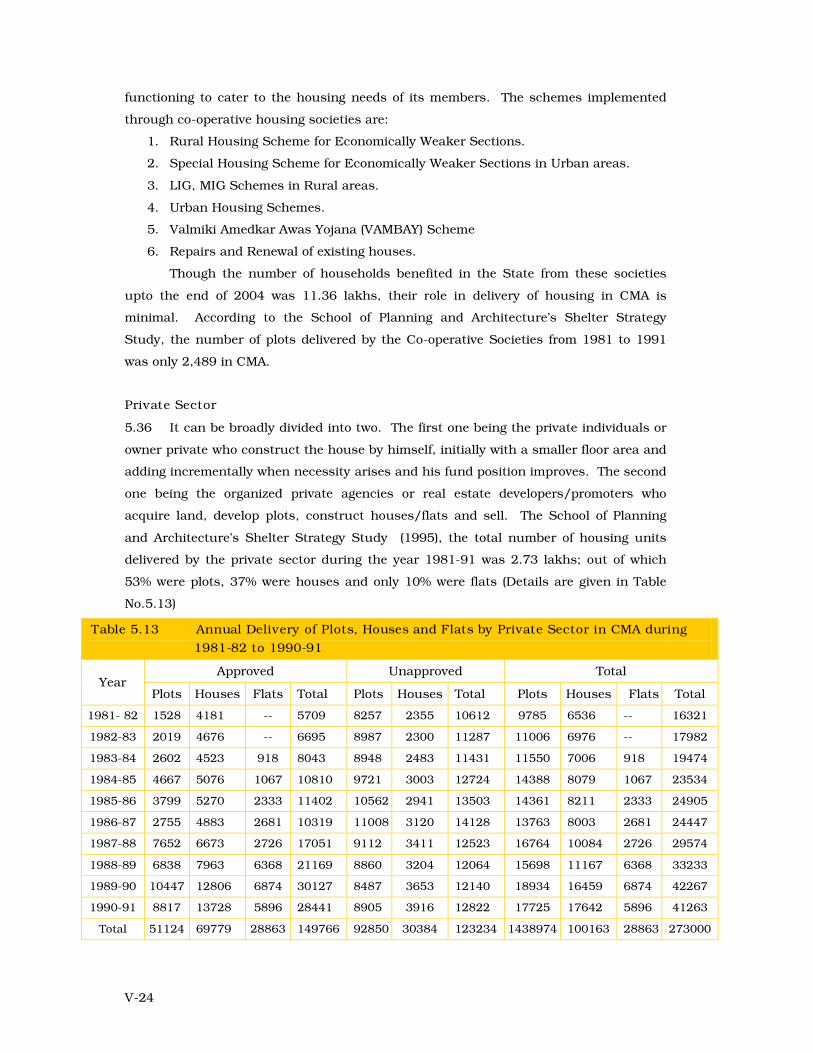
acquire land, develop plots, construct houses/flats and sell. The School of Planning
and Architecture’s Shelter Strategy Study (1995), the total number of housing units
delivered by the private sector during the year 1981-91 was 2.73 lakhs; out of which
53% were plots, 37% were houses and only 10% were flats (Details are given in Table
No.5.13)
Table 5.13 Annual Delivery of Plots, Houses and Flats by Private Sector in CMA during
1981-82 to 1990-91
Approved Unapproved Total Year
Plots Houses Flats Total Plots Houses Total Plots Houses Flats Total
1981- 82 1528 4181 -- 5709 8257 2355 10612 9785 6536 -- 16321
1982-83 2019 4676 -- 6695 8987 2300 11287 11006 6976 -- 17982
1983-84 2602 4523 918 8043 8948 2483 11431 11550 7006 918 19474
1984-85 4667 5076 1067 10810 9721 3003 12724 14388 8079 1067 23534
1985-86 3799 5270 2333 11402 10562 2941 13503 14361 8211 2333 24905
1986-87 2755 4883 2681 10319 11008 3120 14128 13763 8003 2681 24447
1987-88 7652 6673 2726 17051 9112 3411 12523 16764 10084 2726 29574
1988-89 6838 7963 6368 21169 8860 3204 12064 15698 11167 6368 33233
1989-90 10447 12806 6874 30127 8487 3653 12140 18934 16459 6874 42267
1990-91 8817 13728 5896 28441 8905 3916 12822 17725 17642 5896 41263
Total 51124 69779 28863 149766 92850 30384 123234 1438974 100163 28863 273000
V-25
5.37 The flatted housing units delivered by the real estate developers / promoters serve
only the needs of the MIG and HIG households. LIG housing needs are met by the
owner private developments.
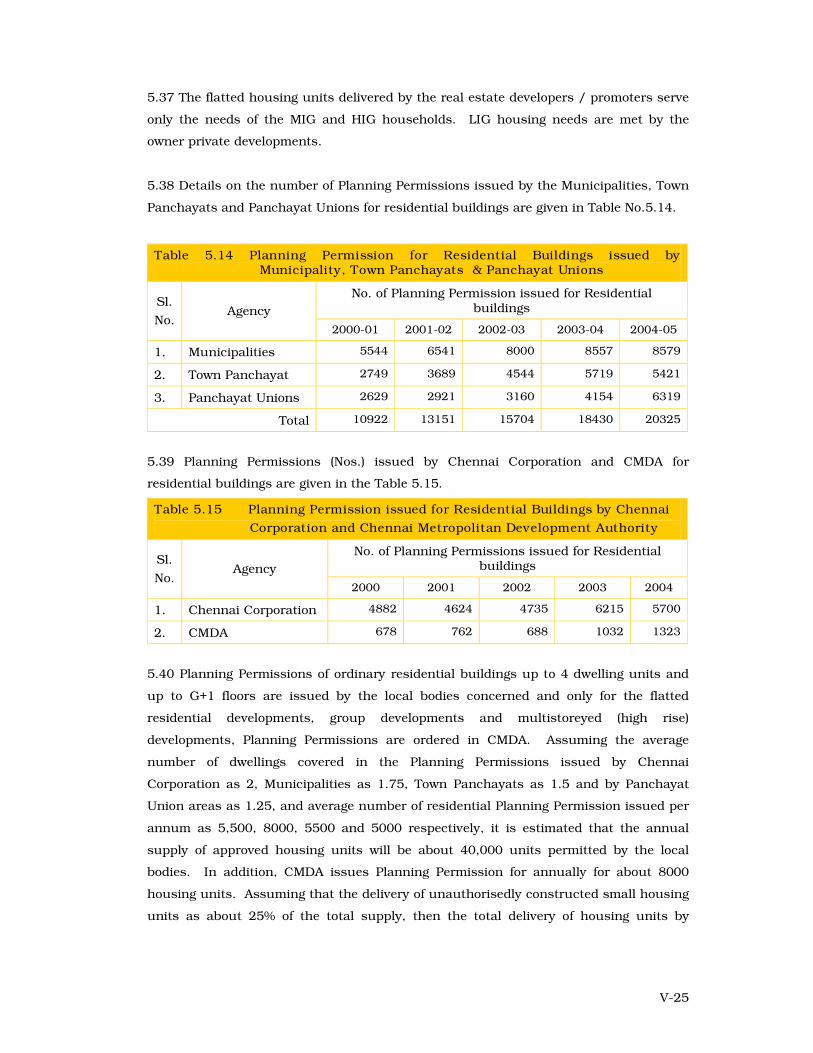
5.38 Details on the number of Planning Permissions issued by the Municipalities, Town
Panchayats and Panchayat Unions for residential buildings are given in Table No.5.14.
Table 5.14 Planning Permission for Residential Buildings issued by Municipality, Town Panchayats & Panchayat Unions
No. of Planning Permission issued for Residential buildings
Sl.
No. Agency
2000-01 2001-02 2002-03 2003-04 2004-05
1. Municipalities 5544 6541 8000 8557 8579
2. Town Panchayat 2749 3689 4544 5719 5421
3. Panchayat Unions 2629 2921 3160 4154 6319
Total 10922 13151 15704 18430 20325
5.39 Planning Permissions (Nos.) issued by Chennai Corporation and CMDA for
residential buildings are given in the Table 5.15.
Table 5.15 Planning Permission issued for Residential Buildings by Chennai
Corporation and Chennai Metropolitan Development Authority
No. of Planning Permissions issued for Residential buildings
Sl.
No. Agency
2000 2001 2002 2003 2004
1. Chennai Corporation 4882 4624 4735 6215 5700
2. CMDA 678 762 688 1032 1323
5.40 Planning Permissions of ordinary residential buildings up to 4 dwelling units and
up to G+1 floors are issued by the local bodies concerned and only for the flatted
residential developments, group developments and multistoreyed (high rise)
developments, Planning Permissions are ordered in CMDA. Assuming the average
number of dwellings covered in the Planning Permissions issued by Chennai
Corporation as 2, Municipalities as 1.75, Town Panchayats as 1.5 and by Panchayat
Union areas as 1.25, and average number of residential Planning Permission issued per
annum as 5,500, 8000, 5500 and 5000 respectively, it is estimated that the annual
supply of approved housing units will be about 40,000 units permitted by the local
bodies. In addition, CMDA issues Planning Permission for annually for about 8000
housing units. Assuming that the delivery of unauthorisedly constructed small housing
units as about 25% of the total supply, then the total delivery of housing units by
V-26
private will be about 60,000 units per annum if the present trend continues; it excludes
the housing plots delivered by public.
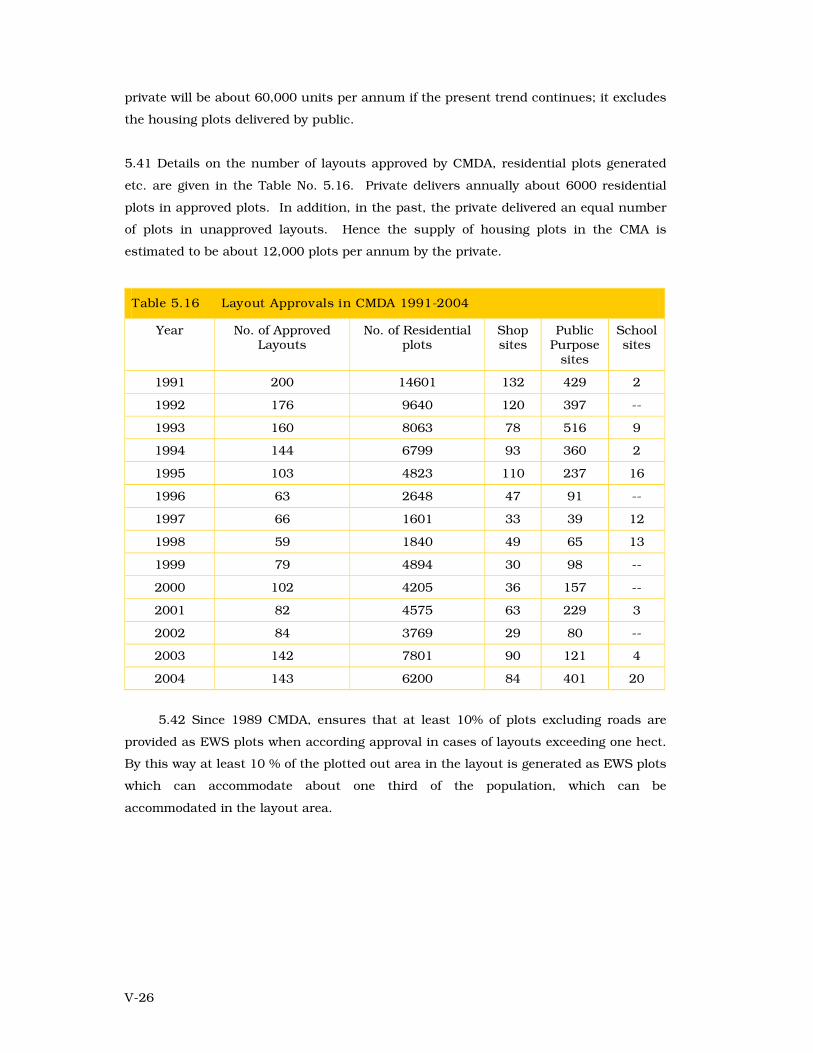
5.41 Details on the number of layouts approved by CMDA, residential plots generated
etc. are given in the Table No. 5.16. Private delivers annually about 6000 residential
plots in approved plots. In addition, in the past, the private delivered an equal number
of plots in unapproved layouts. Hence the supply of housing plots in the CMA is
estimated to be about 12,000 plots per annum by the private.
Table 5.16 Layout Approvals in CMDA 1991-2004
Year No. of Approved Layouts
No. of Residential plots
Shop sites
Public Purpose
sites
School sites
1991 200 14601 132 429 2
1992 176 9640 120 397 --
1993 160 8063 78 516 9
1994 144 6799 93 360 2
1995 103 4823 110 237 16
1996 63 2648 47 91 --
1997 66 1601 33 39 12
1998 59 1840 49 65 13
1999 79 4894 30 98 --
2000 102 4205 36 157 --
2001 82 4575 63 229 3
2002 84 3769 29 80 --
2003 142 7801 90 121 4
2004 143 6200 84 401 20
5.42 Since 1989 CMDA, ensures that at least 10% of plots excluding roads are
provided as EWS plots when according approval in cases of layouts exceeding one hect.
By this way at least 10 % of the plotted out area in the layout is generated as EWS plots
which can accommodate about one third of the population, which can be
accommodated in the layout area.
V-27
Projection of Housing Demand
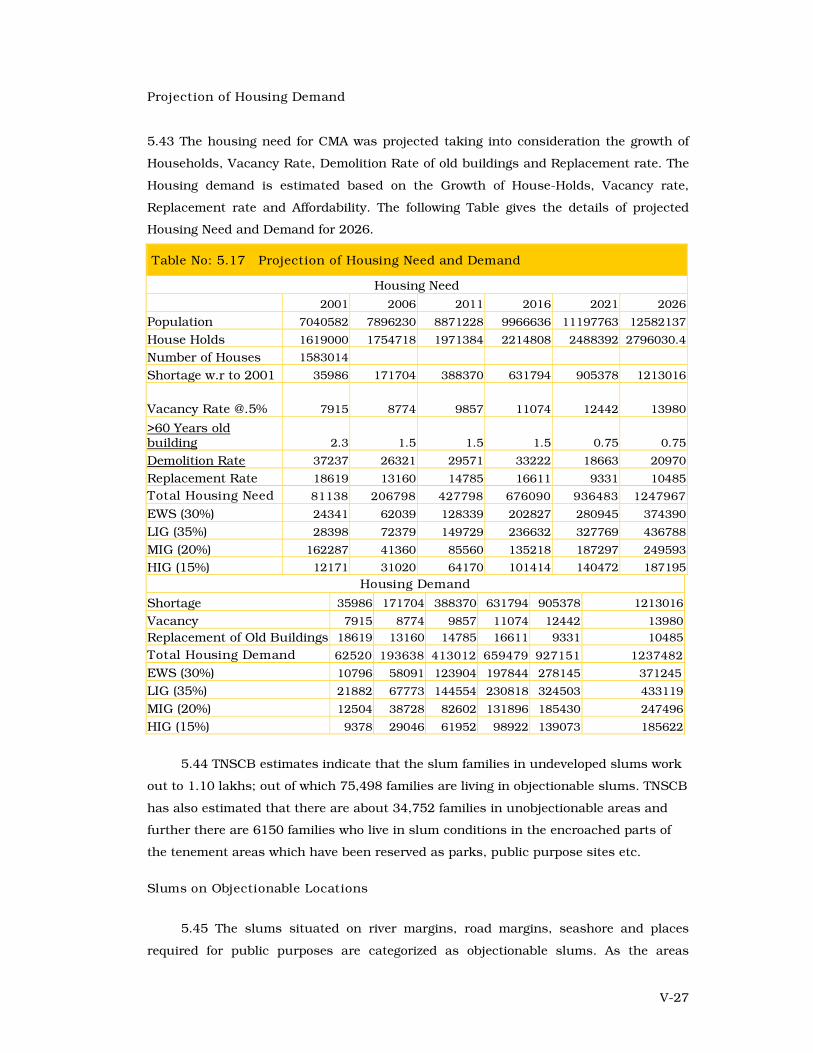
5.43 The housing need for CMA was projected taking into consideration the growth of
Households, Vacancy Rate, Demolition Rate of old buildings and Replacement rate. The
Housing demand is estimated based on the Growth of House-Holds, Vacancy rate,
Replacement rate and Affordability. The following Table gives the details of projected
Housing Need and Demand for 2026.
Table No: 5.17 Projection of Housing Need and Demand
Housing Need
2001 2006 2011 2016 2021 2026
Population 7040582 7896230 8871228 9966636 11197763 12582137
House Holds 1619000 1754718 1971384 2214808 2488392 2796030.4
Number of Houses 1583014
Shortage w.r to 2001 35986 171704 388370 631794 905378 1213016
Vacancy Rate @.5% 7915 8774 9857 11074 12442 13980
>60 Years old building 2.3 1.5 1.5 1.5 0.75 0.75
Demolition Rate 37237 26321 29571 33222 18663 20970
Replacement Rate 18619 13160 14785 16611 9331 10485
Total Housing Need 81138 206798 427798 676090 936483 1247967
EWS (30%) 24341 62039 128339 202827 280945 374390
LIG (35%) 28398 72379 149729 236632 327769 436788
MIG (20%) 162287 41360 85560 135218 187297 249593
HIG (15%) 12171 31020 64170 101414 140472 187195
Housing Demand
Shortage 35986 171704 388370 631794 905378 1213016
Vacancy 7915 8774 9857 11074 12442 13980
Replacement of Old Buildings 18619 13160 14785 16611 9331 10485
Total Housing Demand 62520 193638 413012 659479 927151 1237482
EWS (30%) 10796 58091 123904 197844 278145 371245
LIG (35%) 21882 67773 144554 230818 324503 433119
MIG (20%) 12504 38728 82602 131896 185430 247496
HIG (15%) 9378 29046 61952 98922 139073 185622
5.44 TNSCB estimates indicate that the slum families in undeveloped slums work
out to 1.10 lakhs; out of which 75,498 families are living in objectionable slums. TNSCB
has also estimated that there are about 34,752 families in unobjectionable areas and
further there are 6150 families who live in slum conditions in the encroached parts of
the tenement areas which have been reserved as parks, public purpose sites etc.
Slums on Objectionable Locations
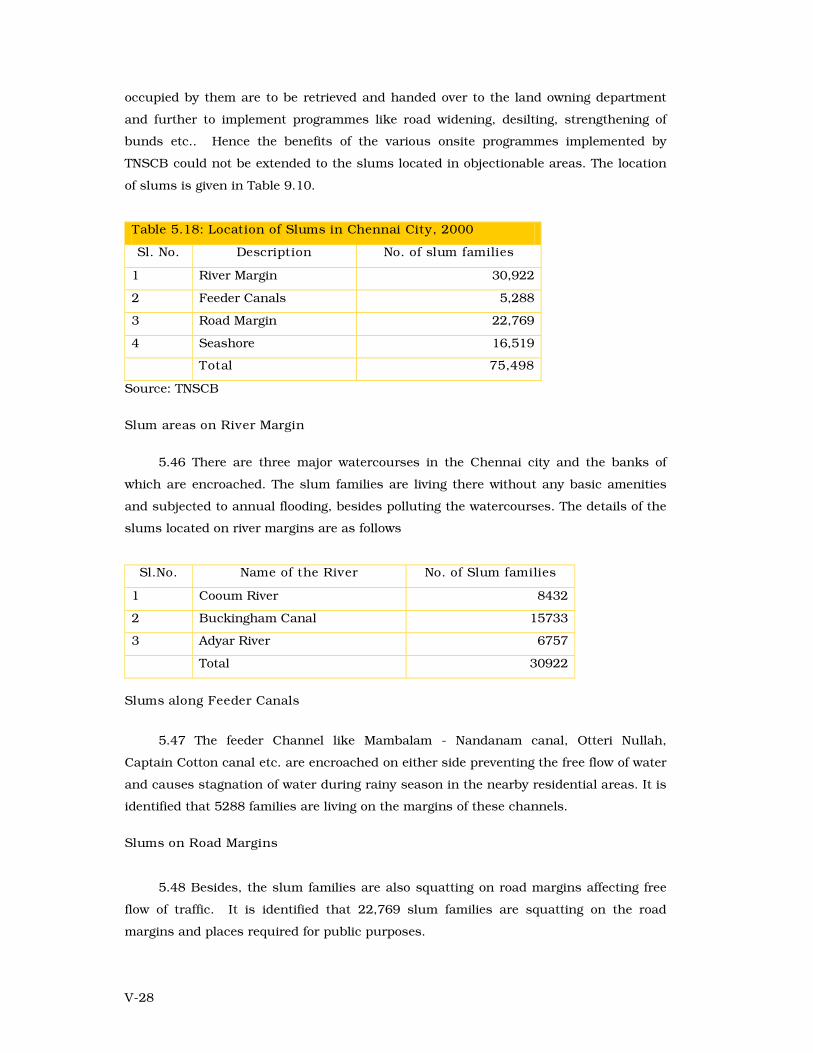
5.45 The slums situated on river margins, road margins, seashore and places
required for public purposes are categorized as objectionable slums. As the areas
V-28
occupied by them are to be retrieved and handed over to the land owning department
and further to implement programmes like road widening, desilting, strengthening of
bunds etc.. Hence the benefits of the various onsite programmes implemented by
TNSCB could not be extended to the slums located in objectionable areas. The location
of slums is given in Table 9.10.
Table 5.18: Location of Slums in Chennai City, 2000
Sl. No. Description No. of slum families
1 River Margin 30,922
2 Feeder Canals 5,288
3 Road Margin 22,769
4 Seashore 16,519
Total 75,498
Source: TNSCB
Slum areas on River Margin
5.46 There are three major watercourses in the Chennai city and the banks of
which are encroached. The slum families are living there without any basic amenities
and subjected to annual flooding, besides polluting the watercourses. The details of the
slums located on river margins are as follows
Sl.No. Name of the River No. of Slum families
1 Cooum River 8432
2 Buckingham Canal 15733
3 Adyar River 6757
Total 30922
Slums along Feeder Canals
5.47 The feeder Channel like Mambalam - Nandanam canal, Otteri Nullah,
Captain Cotton canal etc. are encroached on either side preventing the free flow of water
and causes stagnation of water during rainy season in the nearby residential areas. It is
identified that 5288 families are living on the margins of these channels.
Slums on Road Margins
5.48 Besides, the slum families are also squatting on road margins affecting free
flow of traffic. It is identified that 22,769 slum families are squatting on the road
margins and places required for public purposes.
V-29
Seashore
5.49 The Chennai District Collector has identified that 16519 slum families living
on seashore have been affected by Tsunami disaster. Of these 2200 families have been
already been rehabilitated at Semmancheri. The remaining families are to be resettled in
tenements.
Slums on Unobjectionable Locations
5.50 Besides, Tamil Nadu Slum Clearance Board has identified that 34,752
families are living in slum situated on unobjectionable locations as per Tamil Nadu
Slum Clearance Board Survey. These families are living in deplorable conditions and
required to be developed through provision of housing and infrastructure. These slums
are dense often subjected to fire accidents, flood etc.
5.51 These slum families squatting on river margins are polluting the river courses
in Chennai city and preventing the desilting operations weakening the bunds etc. The
slum families living in hutments on road margins are causing accidents preventing the
widening of the road and free flow of traffic. Besides, the slums situated on the
alignment of the public welfare project like MRTS are preventing the implementation of
such time bound projects. Similarly the slums situated near the Marina are an eyesore
for the visitors besides polluting such public places.
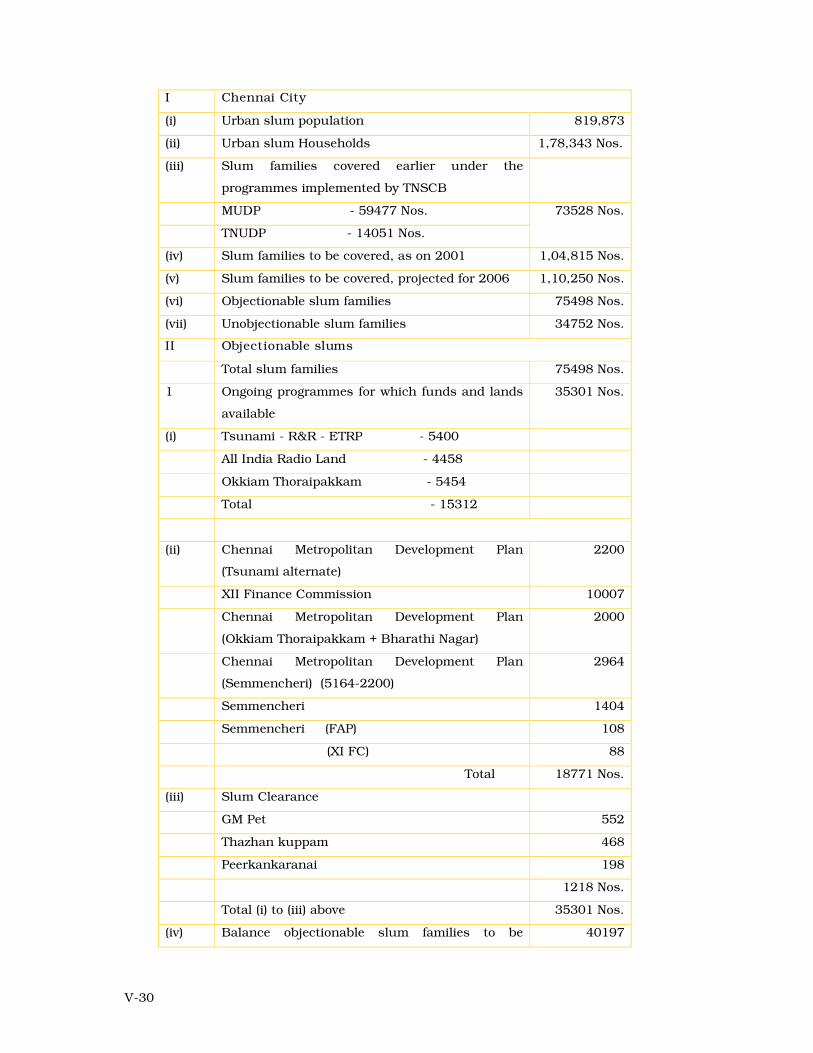
5.52 Details of the TNSCB's programmes being implemented, on the anvil and
proposed are given below:
V-30
I Chennai City
(i) Urban slum population 819,873
(ii) Urban slum Households 1,78,343 Nos.
(iii) Slum families covered earlier under the
programmes implemented by TNSCB
MUDP - 59477 Nos.
TNUDP - 14051 Nos.
73528 Nos.
(iv) Slum families to be covered, as on 2001 1,04,815 Nos.
(v) Slum families to be covered, projected for 2006 1,10,250 Nos.
(vi) Objectionable slum families 75498 Nos.
(vii) Unobjectionable slum families 34752 Nos.
II Objectionable slums
Total slum families 75498 Nos.
1 Ongoing programmes for which funds and lands
available
35301 Nos.
(i) Tsunami - R&R - ETRP - 5400
All India Radio Land - 4458
Okkiam Thoraipakkam - 5454
Total - 15312
(ii) Chennai Metropolitan Development Plan
(Tsunami alternate)
2200
XII Finance Commission 10007
Chennai Metropolitan Development Plan
(Okkiam Thoraipakkam + Bharathi Nagar)
2000
Chennai Metropolitan Development Plan
(Semmencheri) (5164-2200)
2964
Semmencheri 1404
Semmencheri (FAP) 108
(XI FC) 88
Total 18771 Nos.
(iii) Slum Clearance
GM Pet 552
Thazhan kuppam 468
Peerkankaranai 198
1218 Nos.
Total (i) to (iii) above 35301 Nos.
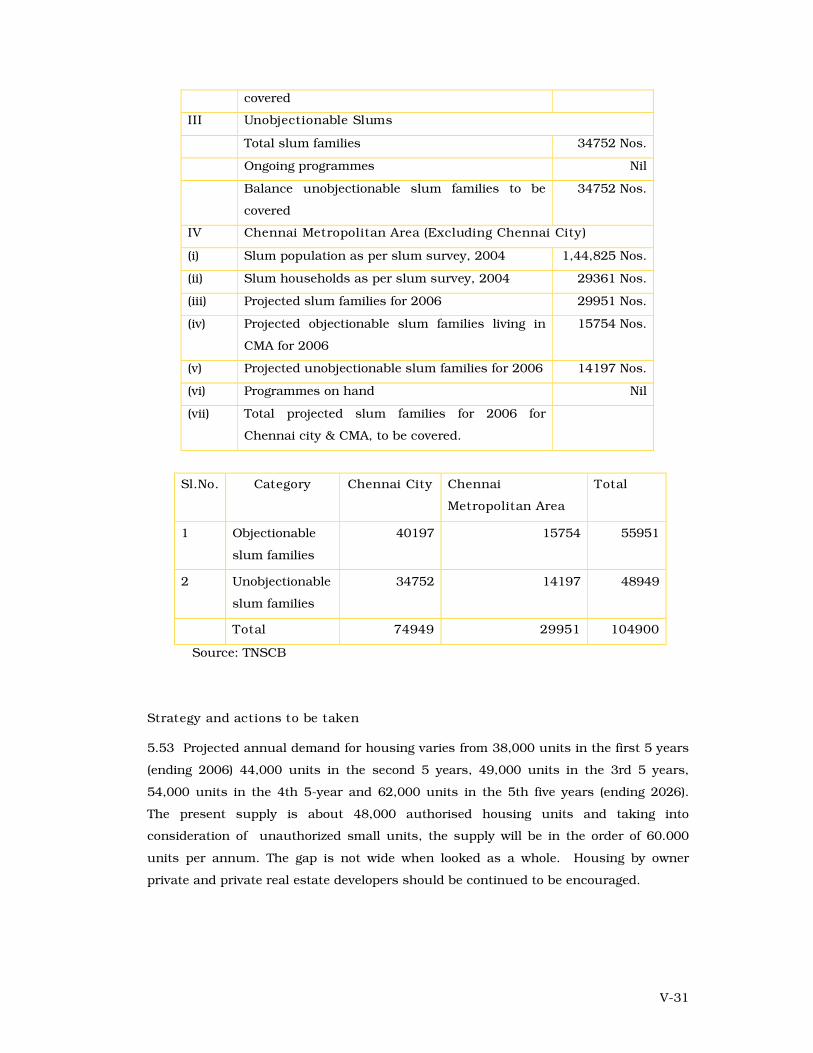
(iv) Balance objectionable slum families to be 40197
V-31
covered
III Unobjectionable Slums
Total slum families 34752 Nos.
Ongoing programmes Nil
Balance unobjectionable slum families to be
covered
34752 Nos.
IV Chennai Metropolitan Area (Excluding Chennai City)
(i) Slum population as per slum survey, 2004 1,44,825 Nos.
(ii) Slum households as per slum survey, 2004 29361 Nos.
(iii) Projected slum families for 2006 29951 Nos.
(iv) Projected objectionable slum families living in
CMA for 2006
15754 Nos.
(v) Projected unobjectionable slum families for 2006 14197 Nos.
(vi) Programmes on hand Nil
(vii) Total projected slum families for 2006 for
Chennai city & CMA, to be covered.
Sl.No. Category Chennai City Chennai
Metropolitan Area
Total
1 Objectionable
slum families
40197 15754 55951
2 Unobjectionable
slum families
34752 14197 48949
Total 74949 29951 104900
Source: TNSCB
Strategy and actions to be taken
5.53 Projected annual demand for housing varies from 38,000 units in the first 5 years
(ending 2006) 44,000 units in the second 5 years, 49,000 units in the 3rd 5 years,
54,000 units in the 4th 5-year and 62,000 units in the 5th five years (ending 2026).
The present supply is about 48,000 authorised housing units and taking into
consideration of unauthorized small units, the supply will be in the order of 60.000
units per annum. The gap is not wide when looked as a whole. Housing by owner
private and private real estate developers should be continued to be encouraged.
V-32
5.54 Government agencies like TNHB can only play a major role in providing affordable
housing to lower MIG, LIG and EWS people, by cross subsidies. Such agencies can only
make large-scale planned neighbourhood developments with all infrastructures, which
can have catalytic effect for private developments around.
5.55 In the recent years, the funding for housing activities in CMA have increased and
HDFC, LIC, Commercial Banks and also HUDCO are the major financial institutions,
which provide financial assistance for housing.
5.56 TNHB may have to play a major role as provider of serviced housing plots leaving
the construction of housing units to private by private-public participation or by co-
operative societies or by private real estate developers or owner, private. It should
regard itself as a facilitator rather than builder of houses.
5.57 A standard housing includes basic services like water supply, sanitation and
proper access roads. Before the Government declared that the layout of house sites
unauthorisedly is opposed to public policy and prohibited registration of plots therein, a
number of unauthorized layouts had come up in the last 30 years, which lack basic
services. These unapproved layout areas should be properly merged with the urban
fabric by framing suitable regulation and permitting constructions in these plots.
5.58 Considering land cost, availability of developable lands, land requirements,
affordability etc., space standards for housing developments have been reviewed and
modified in the Development regulations forming part of this Master Plan.
5.59 The intention of large scale land acquisition and neighbourhood developments by
Government agencies like TNHB is to minimize undesirable speculation and increase in
land costs, and ensure planned development with special reference to the needs of the
lower income groups. However, in the past freezing of large extents of lands, slow land
acquisition process and slow housing developments by the public agencies had
sometimes opposite effects on housing supply and particularly to the poor. TNHB has
initiated acquisition proceedings for about 1700 acres of land in 8 villages in CMA for
Satellite Town development, which may add considerable quantum to the housing
supply in future. TNHB has also proposed to acquire few thousand acres in the areas
around the city and they have already identified the locations with survey number
details and communicated the same to CMDA for freezing of developments; if action is
taken to acquire these lands and develop residential neighbourhoods, it could also help
in solving the housing problems for this metropolis.
V-33
5.60 One may accept that 'house' means not necessarily a pucca or permanent
building, but one that shelter adequately. Slums to be viewed as self initiated housing
action and self generated housing stock (not for demolition but for improvement); slum
dwellers to be viewed as productive resources, but not as an unproductive burden to the
society.
5.61 In our conditions, the slums pose problems primarily of health, environment
and basic services; the formal housing is secondary.
5.62 Provision of adequate shelter to the poor slum dwellers involves different
dimensions. Firstly, the improvement of physical surroundings by public agencies so
that it has adequate basic services such as water supply, drainage, sanitation, street
lighting, and other physical conditions leading to better hygienic environment.
Secondly, the improvement of the actual structures that the slum dwellers live in,
preferably by themselves (extending assistance in terms of financial and physical
resources). Thirdly, the improvement of the whole economic and social environment
beyond the mere physical condition they live in. All these dimensions of the problems of
shelter for the urban poor and their shelter improvement should be addressed.
5.63 Slum survey covering cent percent of the slum population, as that of done in
1971 should be carried out to create a clear database for better planning of shelter
problems of these urban poor and their economic upliftment.
5.64 Comprehensive plan for shelter for those urban poor should be made by TNSCB;
financially feasible and institutionally viable programmes should be worked out (instead
of trying to tackle the problem in a piecemeal manner) with certain amount of cost
recovery, with full involvement of the beneficiaries and also the local bodies concerned.
5.65 TNSCB should also segregate the objectionable slums which requires
resettlement in the nearby sites or elsewhere; high dense slums which cannot be
improved 'As - is - where - is' require to be housed in storeyed tenements; for slums
which can be improved 'As-is-where-is' etc. plans may be prepared with phasing and the
same implemented in order to achieve the goal of total eradication of slums in near
future, say at the maximum by 2021.
5.66 Early action to develop New Towns around the city / CMA with all infrastructure
facilities including those required for the IT developments at international standards to
be taken. It would not only meet the demand of space for IT developments with all
attendant infrastructure facilities but also the housing demand in the way the target
population likes. It would also give an opportunity to planners to plan and develop high
rise well planned areas as one finds at Shangai, Singapore etc.
V-34
Annexure V A
TAMIL NADU HOUSING BOARD
YEARWISE PHYSICAL PROGRESS OF SCHEMES FROM INCEPTION TO 2004
NO OF UNITS COMPLETED
YEAR L.I.G. M.I.G. H.I.G. TNGRH SLUM SIHS E.W.S. ANCIL POLICE TOTAL NO.OF PLOTS
NO.OF FLATS
NO.OF HOUSES
1960-61 516 387 207 1672 2782 1390 207 1185
1961-62 82 34 635 751 375 200 176
1962-63 146 25 602 300 1073 530 251 292
1963-64 413 226 414 1053 526 175 352
1964-65 262 157 100 567 292 1378 684 220 474
1965-66 453 130 236 890 50 1759 879 280 600
1966-67 274 96 42 224 60 696 348 210 138
1967-68 415 215 1716 1524 3870 1930 420 1520
1968-69 416 224 808 2938 4386 2193 1050 1143
1969-70 354 128 360 1400 12 2254 1127 975 152
1970-71 391 160 329 1070 1950 975 405 570
Sub Total 3722 1782 3798 10264 2386 21952 10957 4393 6602
1971-72 101 560 929 264 108 100 2062 1030 540 492
1972-73 112 356 726 762 171 2127 1060 370 697
1973-74 562 596 498 1178 229 201 3264 1632 580 1052
1974-75 300 298 353 640 898 2489 1240 470 779
1975-76 1038 645 1306 366 2322 5677 2838 1070 1769
1976-77 1678 766 718 474 1487 288 5411 2700 1205 1506
1977-78 1368 1238 636 1866 5108 2504 1370 1234
1978-79 2586 1081 831 549 5047 2520 1450 1077
1979-80 1507 842 936 1008 1424 168 5885 2940 1250 1695
1980-81 2207 869 580 360 240 2210 80 6546 2210 1080 3256
Sub Total 11459 7251 7513 5052 348 11256 737 43616 20674 9385 13557
1981-82 2342 1066 912 232 120 3163 750 8585 3163 2014 3408
1982-83 1561 2759 765 368 192 4625 787 11057 4625 2112 4320
1983-84 1953 785 3223 938 3257 4337 607 15100 4337 4802 5961
1984-85 2828 1824 1391 1538 359 7405 255 15600 7405 2152 6043
1985-86 2514 2474 2267 2310 432 5803 15800 5803 2742 7255
1986-87 959 2085 2248 674 10034 16000 10034 674 5292
1987-88 1339 1060 1527 700 11674 16300 11674 700 3926
1988-89 1727 2209 1854 1214 96 9300 16400 8000 1310 7090
1989-90 6972 2378 1999 1038 5998 18385 9014 1038 8333
1990-91 6372 1627 2041 366 8966 234 19606 12108 600 6898
Sub Total 28567 18267 16550 10455 4744 312 71305 2633 152833 76163 18144 58526
V-35
1991-92 9287 1942 3010 520 8411 23170 16361 520 6289
1992-93 6642 3077 2534 450 8000 20703 12651 725 7327
1993-94 6919 3594 3295 1134 5148 183 20273 11148 1317 7808
1994-95 6075 6303 3668 1607 3140 8 20801 8140 3615 9046
1995-96 3104 6387 5381 526 4635 67 20100 6937 3526 9637
1996-97 4261 5976 4647 464 5162 20510 11364 1344 7802
1997-98 3847 4884 2964 654 2677 29 15055 10843 1692 2520
1998-99 3916 3598 3140 680 2466 1 13801 9362 2881 1558
1999-2000 2942 3550 3005 872 2475 31 12875 7216 1132 4527
2000-01 616 2780 1917 382 410 52 6157 1929 691 3537
Sub Total 50551 45641 36566 8161 44999 402 186320 103167 18575 64578
2001-02 106 269 415 562 1712 1068 287 357
2002-03 118 8 126 126
2003-04 - - - - - - - - - - - - -
Sub Total 106 387 423 562 1838 1068 287 483
Grand Total 94405 73328 53539 128122 406559 212029 50784 143746
V-36
Sheet No. 5.01
V-37
Sheet No. 5.02
V-38
Sheet No. 5.03
V-39
Sheet No. 5.04
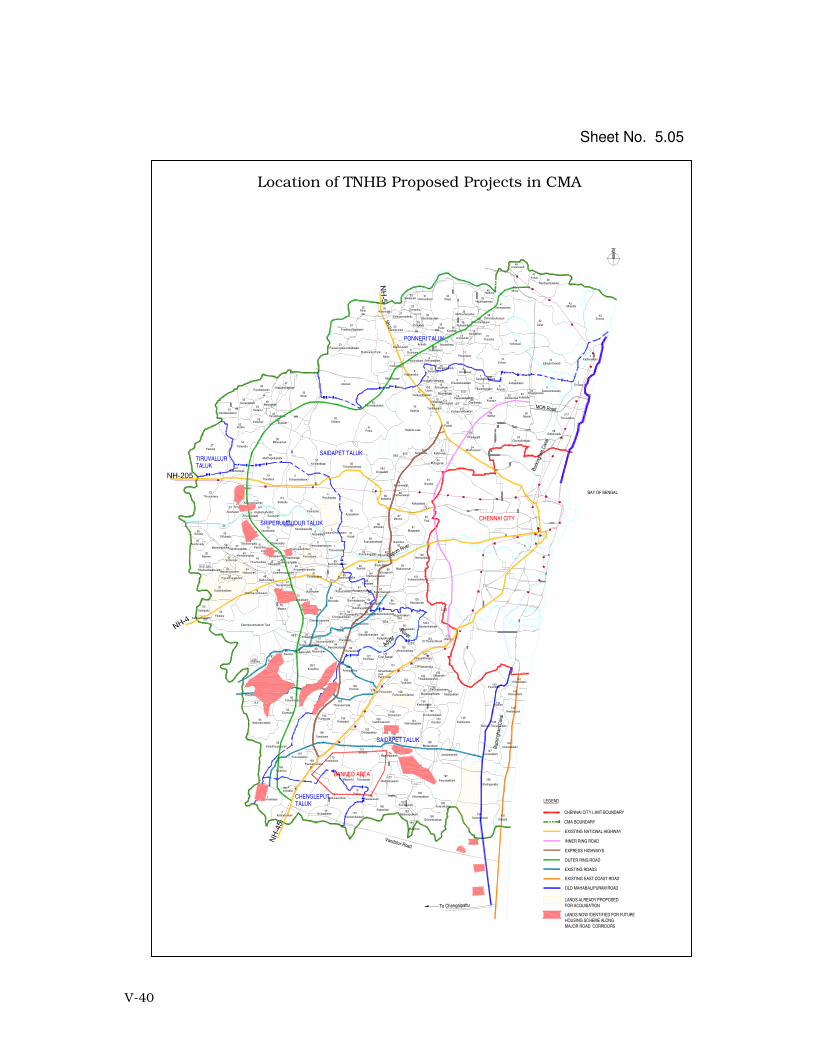
V-40
34
1
2
3
4
5
6
7
8
9
10
11
10
12
13/214
18 17/2
19
13/117/1
16
38
2223 24
26
56
21
35
7
15
3463
64
40
39
42
43
4748
46
45
53
50
49
52
54
55
56
57
41
58
59/1
6061
8889
90
5
4
87 80
86
82
83
72
8
11
14
15
6/3
10
49
47
46
43
42
40
39
41
35
36
17
38
37
15
43
3130
29
32
33
19
11
21
27
2625
24
23
22
9
14
2
27/2
13
27/1
26
27
38
30
31/2 31/135
34
40
44
76
32
33
112
109
74
75
73
72
53 57
56
5554
63
62
96
99
100
101
98 102
65/2
67
65/1
58
94
93
61
71
41
42
1312
48
50
59
92
60
52
46
45 4943
37
25
16
47
51
70
69
68
82
8384
8185/2
86
87108
78
77 80
127126
128
79
85/1
88
91
90
89
129
131
132
133
134
148
143
141
142
145
144
149
158
155
157156
160
159
151165
164
92
94
93
167
168
169170
173
174
175
176
187
188
1
2
3
9
11179
10
178
180
181
183
182
186
185190
177172171
8
3
4
29
28
Kollati
Nandiyambakkam
Athipattu
Ennore
Madiyur
Seemapuram
Vellivoyal
Edayanchavadi
Nayar
Mahfushanpettai
Kodipallam
Thirunilai
Pudupakkam
GirudalapuramSothuperambedu
Surapattu
NerkundramSekkanjeri
Sholavaram
Ankadu Marambedu
Periamullavoyal
Chinnamullavoyal
Erumaivettipalayam
Palayaerumaivettipalayam
Nallur
Sembilivaram
Siruniyam
Vijayanallur
Attanthangal
Padiyanallur
Pannivakkam Sothupakkam
Perungayur
Palavoyal
Thiruthakiriyampattu
Athivakkam
Sirugavoor
Alamadi
Pammadukulam
Vellanur
Pottur
Morai
Redhills Lake
Redhills
Vilangadupakkam
Sendrambakkam
Kadapakkam
AriyalurThiyambakkam
Kosapur
Sholavaram Tank
Layon
NaravariKuppam
Tundakalani
Puzhal
Madhavaram
Vilakkupatti
Vadapurambakkam
Mathur
ChinnaSekkadu
Sathangadu
Amulavoyal Vaikkadu
Manali
Sadayankuppam
51Keelakandaiyur
Karlapakkam
Kadavur
Melpakkam
PandeswaramArakkambakkam
Tenambakkam
Velacheri
Alathur
Palavedu
Mittanamalli
KovilpadagaiThirumullaivoyal
Vilinjiambakkam
Sekkadu
KoratturMenambedu
Oragadam
Thandarai
Mukthapudupattu
Nadukuttagai
Chembarambakkam Melagaram
Meppur
Varadharajapuram
Nazarathpettai
Poonamallee
Agraharam
Mangadu
Kulamanivakkam
Malayambakkam
Madavilagam
Neduncheri
Parvathirajapuram
Chikkarayapuram
Kovur
Thandalam
Gerugambakkam
Kulapakkam
Manapakkam
MugalivakkamMadanandapuram
Porur
Kulathuvancheri
Paraniputhur
Peripanicheri
RentankattalaiTharapakkam
Sirukulathur
Kavanur
Kunrathur
Manancheri
Daravur
MunnankattalaiThirunageswaram
Anakaputhur
Polichalur
MinambakkamcumPallavaram
Minambakkam
Cowl Bazaar
Nanganallur
Pallavaram(Zamin)
Tirusulam
Nemilicheri
Keelakattalai
NanmangalamHasthinapuramPulikoradu
Kadapperi
Thiruneermalai
Thirumudivakkam
Palanthandalam
Erumaiyur
Nandambakkam
Poonthandalam
Naduveerapattu
Varadharajapuram
Mudichur
Perungalathur
Selaiyur
ThiruvanjeriMeppedu
IrumbuliyurPeerkankaranai
Rajakilpakkam
Madambakkam
Vengavasal
Sithalapakkam
Kovilancheri
Agaramten
Kaspapuram
Puthur
Nedunkundram
Kulapakkam
Ottiyambakkam
Arasankalani
SemmancheriUthandi
147
146
Karapakkam
Injambakkam
Okkiam Thuraipakkam
Pallikaranai
Valasaravakkam
Maduravoyal
Vanagaram
Numbal
Chettiyaragaram
AyyappanthangalKatturpakkam
Goparasanallur
RamapuramSrinivasapuram
Senneerkuppam
Pattravakkam
Ambattur
Kakapallam
Padi
Mogappair
Mannur
Athipattu
Nolambur
Ayapakkam
Adayalampattu
SundaraSholavaram
Ayanambakkam85
Melpakkam
Veeraragavapuram
ParivakkamPidarithangal
Vayalanallur
Chokkanallur
Kavalcheri
Thirumanam
Mothirambedu
Kilmanambedu
Thirukovilpattu
Thirumazhisai
Nemam
Nochimedu
Korattur
Vellavedu
ThirumalarajapuramNarasingapuram
Kuttambakkam
Chettipattu
PalanjurKattirambakkam
Chembarambakkam Tank
163R.F.
166
Tambaram
Vallur
50
Minjur
Vichoor
VadakaraiLayongrant Chettimedu20
Payasambakkam
Alinjivakkam
37
Thiruvottiyur
Melsinglimedu
62/1Surappattu Kathirvedu
Puttagaram
KaranodaiAthur
Pudur
20Kummanur
44Pulikutti
19
20
2324
22
21
6/2
6/4
17
6/1
Nemilicheri
Thiruninravur
Agraharam
Annambedu
Karunakaracheri
Anaikattucheri
Sorancheri
Ayalcheri
Amudurmedu
7Kannapalayam
Sittukadu
23
39
Panaveduthottam
Kolappancheri
AriyappancheriMelmanambedu
36
UdayarkoilThukkanampattu
Ariyamarundanallur
Venkatapuram
Kollaicheri
Mannivakkam
Vandalur
KelambakkamVengambakkam
Gowrivakkam
Perumbakkam
Madurapakkam
Mulacheri
184
191
189
Sholinganallur
Jaladampettai
150
Medavakkam
Sivaram
Neelangarai
Palavakkam
Perungudi
KottivakkamThalakkanancheri
135Ullagaram
Muvarasampattu
Perundavakkam
152
153
Kovilambakkam
Kulathur
154Madipakkam
125
122/3
123120
122/1Nandambakkam
St.Thomas MountAlandur
124
Palavanthangal
66
Chinnapanicheri
Thelliyaragaram
Moulivakkam64
Sivabudam
Nerkundram
Palaripattu
3
Paruthipattu
27Pakkam
162Chitlapakkam
161Sembakkam
Pammal 130Issa Pallavaram
81
Ariyanvoyal
Valuthigaimedu
16
Arumandai
12
Thiruverkadu
1
9
Koladi91
2
84Perumalagaram
25Elanthancheri
Ernavur
Kathivakkam1
122/2
18Kandigai
62/259/2
28Orakkadu
97Karambakkam
95Tandalam
CMA BOUNDARY
CHENNAI CITY LIMIT BOUNDARY
INNER RING ROAD
EXISTING NATIONAL HIGHWAY
LEGEND
PONNERI TALUK
SAIDAPET TALUK
SRIPERUMBUDUR TALUK
TIRUVALLURTALUK
CHENGLEPUTTALUK
CHENNAI CITY
SAIDAPET TALUK
BAY OF BENGAL
NH
-5
OUTER RING ROAD
EXPRESS HIGHWAYS
EXISTING EAST COAST ROAD
Cooum River
Ady
ar
River
Buc
king
ham
Can
al
Buc
king
ham
Can
al
MOR Road
EXISTING ROADS
OLD MAHABALIPURAM ROAD
LANDS ALREADY PROPOSED
FOR ACQUISATION
LANDS NOW IDENTIFIED FOR FUTURE
HOUSING SCHEME ALONG
MAJOR ROAD CORRIDORS
Vandalur Road
To Chengalpattu
BANNED AREA
Location of TNHB Proposed Projects in CMA
Sheet No. 5.05