CHAPTER-II - INTOSAI Community Portal
49
CHAPTER-II
-
Upload
khangminh22 -
Category
Documents
-
view
1 -
download
0
Transcript of CHAPTER-II - INTOSAI Community Portal
CHAPTER-II
21
2.1 Performance Audit on Operational performance of Gas Turbine
Power Stations of Tamil Nadu Generation and Distribution
Corporation Limited
Executive Summary
Tamil Nadu Generation and Distribution Corporation Limited
(TANGEDCO) had installed its own power generation plants of 7,144 MW
capacity, which included the capacity of 516.08 MW (7.22 per cent) of Gas
Turbine Power Stations (GTPS) as on 31 March 2017.
The operational performance of GTPS was earlier reviewed by Audit in
2007-08 and 2009-10 (as a part of the performance audit of the entire
generation activities of TANGEDCO). To assess the efforts taken by
TANGEDCO since then for improving the performance of GTPS, a
Performance Audit on the operational performance of GTPS was taken up
covering the period 2012-17.
Operational performance
Three out of four GTPS, viz., Kuttalam Gas Turbine Power Station
(KGTPS), Thirumakottai Gas Turbine Power Station (TGTPS) and
Valuthur Gas Turbine Power Station-II (VGTPS-II) achieved the average
Plant Load Factor (PLF) ranging from 40.88 to 50.46 per cent against the
norm of 80 per cent resulting in loss of generation of 4,396.66 MU valued at
` 1,203.46 crore. Due to non-achievement of the normative PLF, Tamil
Nadu Electricity Regulatory Commission (TNERC) disallowed fixed cost
claims amounting to ` 1,830.02 crore for the purpose of tariff fixation.
Only in VGTPS-I, the capacity utilisation was more than 85 per cent in all
the years upto 2016-17. But, in TGTPS, KGTPS and VGTPS-II, the
capacity utilisation declined from 78.79 per cent (2012-13) to 40.38 per cent
(2016-17), 74.19 per cent (2013-14) to 46.29 per cent (2016-17) and 83.86
per cent (2013-14) to 73.08 per cent (2016-17) respectively. The low capacity
utilisation was due to not carrying out periodical maintenance, forced
outages, reduced generation due to operational problems and Station Heat
Rate (SHR) being high, running the station with partial load due to
inadequate supply of fuel, etc.
TANGEDCO did not adhere to the committed annual maintenance
schedules, which led to forced outages in GTPS and loss of generation of
2,491.59 MU valued at ` 749.56 crore in three GTPS.
CHAPTER-II
Audit Report (Public Sector Undertakings) for the year ended 31 March 2017
22
Forced outages
VGTPS-II tripped in January 2015, within the warranty period. Though
TANGEDCO found that the Original Equipment Manufacturer (OEM) was
also responsible for the tripping of the unit, it bore the entire cost of
rectification of ` 58.74 crore citing urgency and also suffered loss of
generation of 1,354.73 MU valued at ` 407.02 crore.
TANGEDCO did not have a spare rotor as a backup in any of the GTPS.
Consequently, KGTPS was kept under forced shut down for a period of one
year from 22 February 2012 to 21 February 2013 resulting in generation
loss of 708 MU valued at ` 191.16 crore.
Under-performance
The Steam Turbine Generators (STG) of GTPS worked for 1,30,263 hours
against the available 1,75,296 hours. Further, the STG did not generate the
possible output during the actual hours worked resulting in loss of
generation of 1,494.09 MU valued at ` 465.26 crore.
Excess Station Heat Rate
Due to excess station heat rate, the GTPS consumed excess gas valued at
` 249.08 crore in the five years ending 2016-17 and became liable to
purchase 19,763 numbers of Energy Saving certificates valued at ` 20.07
crore as penalty.
Excess auxiliary consumption
Except VGTPS-I, all the other GTPS failed to achieve auxiliary
consumption norm of six per cent during 2012-17, resulting in
non-availability of 118.13 MU of power valued at ` 36.60 crore for sale.
Fuel management
Due to shortfall in supply of committed quantity of gas by Gas Authority of
India Limited (GAIL), there was loss of generation of 1,993.84 MU with
contribution loss of ` 599.60 crore.
KGTPS and VGTPS-II paid ` 38.83 crore of minimum guaranteed
off-take charges to GAIL for short drawal of gas on account of forced
outages.
Issues concerning environment
The emission levels of Nitrogen Oxides in GTPS were within the norms in
all the five years covered by audit, but the levels of effluent were more than
the permissible limit in TGTPS, VGTPS-I and VGTPS-II. In TGTPS, the
accumulation of the chemical sludge was neither measured nor disposed off
since October 2013.
Due to non-registration of the GTPS for Clean Development Mechanism
(CDM) benefits, TANGEDCO lost 15.28 lakh Carbon Emission Reduction
Credits for the period 2012-17 resulting in loss of potential revenue of
` 39.12 crore.

Chapter-II Performance Audit relating to Government Company
23
Conclusion
During the performance audit period of 2012-17, the PLF was achieved only
in VGTPS-I and the remaining GTPS had achieved average PLF ranging
from 40.88 to 50.46 per cent. The lower PLF led to loss of generation to the
extent of 4,396.66 MU valued at ` 1,203.46 crore. Besides this, forced
outages, operation of GTPS at partial loads, not carrying out mandatory
maintenances, not maintaining the station heat rate and auxiliary
consumption within the norms were noticed. The issues concerning the
environment were in the areas of water pollution and non-registration of
GTPS for CDM benefits.
Recommendations
In view of the findings, audit, inter alia, recommended to achieve normative
PLF, carry out mandatory inspections, avoid forced outages and lower
capacity utilisation, ensure availability of gas for running the plants at
optimum level.
Introduction
2.1.1 Tamil Nadu Generation and Distribution Corporation Limited
(TANGEDCO) is engaged in generation and distribution of electricity in the State and had installed its own power generation plants of 7,144 MW capacity
as on 31 March 2017 including coal based thermal capacity of 4,320 MW. It also receives power from the Central Generating Stations, Independent/Captive Power Projects, renewable power projects etc. As the
thermal power plants are dependent on availability of coal and are subject to stringent environmental controls, large scale expansion of coal based thermal
plants by TANGEDCO was not feasible. On the other hand, natural gas is a clean fuel compared to coal and can be efficiently used for power generation.
Taking this into account, TANGEDCO established (1996) a major Natural
Gas based power project for a capacity of 120 MW, viz., the Basin Bridge Gas Turbine Power station (BBGTPS) near Chennai. Due to non-availability of
natural gas within Chennai, the BBGTPS is operated only as a peak hour station19 using the high cost fuel Naphtha.
Consequent to the discovery of natural gas in the Cauvery basin and in
Ramnad district of Tamil Nadu, TANGEDCO established (between February 2001 and March 2004) three Gas Turbine Power Stations (GTPS) of a total
capacity of 303.88 MW on combined cycle mode at Thirumakottai (Tiruvarur district), Kuttalam (Nagapattinam district) and Valuthur (Ramnad district). Later on, Valuthur Phase-II (VGTPS-II) gas station was commissioned during
August 2008 with installed capacity of 92.2 MW. The natural gas required for these GTPS is supplied by Gas Authority of India Limited (GAIL) based on
the agreements between GAIL and TANGEDCO. The total installed capacity of all GTPS as on 31 March 2017 was 516.08 MW (Annexure-3) and are in
19 The station is operated only during peak hours to meet the high demand and for
generation of reactive power for stabilisation of the grid.
Audit Report (Public Sector Undertakings) for the year ended 31 March 2017
24
operation for eight to 21 years. The GTPS constituted 7.22 per cent of the total installed power generation capacity of TANGEDCO.
Generation process in a gas turbine power station
2.1.2 In a GTPS, ambient air is compressed and as a consequence, its
temperature rises. The hot air is used to burn the fuel (natural gas or a liquid fuel like Naptha), which rotates the turbine and drives the generator that produces electricity. The flue gas that exits has temperature of 500-640 ºC
and it is transferred to a Heat Recovery Steam Generator for producing steam to drive a steam turbine generator for further power generation. This
combination of gas and steam cycle to generate electricity is called a “combined cycle gas turbine” plant.
Organisational set up
2.1.3 The activities relating to GTPS are managed at TANGEDCO’s Headquarters by the Director (Generation), who is assisted by the Chief
Engineer (Gas Turbine Schemes). At the field level, GTPS are headed by the Superintending Engineers, who are assisted by the functional Executive Engineers.
Scope and methodology of audit
2.1.4 The operational performance of TANGEDCO’s GTPS was reviewed
earlier by us in 2007-08 and also in 2009-10 (as part of the Performance Audit on generation activities of TANGEDCO). The issues brought out in these reports were (i) shortfall in generation due to partial load operation resulting in
loss of generation, (ii) not carrying out scheduled and regular maintenance resulting in forced outages,20 besides damage to critical equipments,
(iii) payments for unutilised gas to GAIL, (iv) non-monitoring and control of auxiliary consumption of power, (v) inadequate facility for evacuation of generated power and (vi) non-monitoring of the quality of ambient air and
effluents. These reviews are yet to be discussed by the Committee on Public Undertakings.
To assess the efforts taken by TANGEDCO since then for improving the performance of the GTPS, a Performance Audit on the Operational performance of GTPS was taken up covering the period 2012-2017. The audit
commenced with an Entry Conference on 4 April 2017 with the Principal Secretary to the Government, Energy Department to explain the audit scope
and objectives. The audit methodology involved scrutiny of records at TANGEDCO’s Headquarters as well as in four GTPS with regard to their activities relating to power generation. The methodology also involved
interaction with auditee personnel, analysis of the data with reference to audit criteria, raising audit enquiries and issue of draft audit findings to the
management for their comments. Besides, data available on the websites of Central Electricity Authority (CEA), Power and other Ministries of the Governments of India and the State and other recognised websites were
20 A forced outage results from emergency conditions requiring that the component of
the plant is taken out of service immediately.
Chapter-II Performance Audit relating to Government Company
25
utilised for analysing the performance of GTPS. The Draft Performance Audit Report was also discussed with the Principal Secretary to the Government,
Energy Department in the Exit Conference held on 31 October 2017. The views expressed by the Government in the Exit Conference along with the
replies received from the Government (October 2017) were considered and incorporated, wherever found appropriate, while finalising the report.
Audit objectives
2.1.5 The Objectives of the Performance Audit were to assess whether:
the operational performance of GTPS was in accordance with the
standards prescribed and GTPS were operated efficiently;
fuel management was efficient; and
GTPS complied with the pollution control norms.
Audit Criteria
2.1.6 The criteria considered for assessing the achievement of audit objectives included the following:
Norms/guidelines prescribed by CEA, Central Electricity Regulatory Commission (CERC) and Tamil Nadu Electricity Regulatory Commission (TNERC) relating to the operational performance of
GTPS;
Norms prescribed by Original Equipment Manufacturers (OEM) for
efficient and optimum utilisation of the plant capacity;
Board Minutes, circulars etc., of TANGEDCO;
Parameters fixed for plant availability, Plant Load Factor (PLF)21 and planned outages, etc.;
Comparison with best performers in the region/all India averages;
Gas supply agreements with Gas Authority of India Limited (GAIL)
and
Acts/Rules relating to Environmental issues.
21 PLF is the ratio between actual generation and maximum possible generation at
installed capacity.
Audit Report (Public Sector Undertakings) for the year ended 31 March 2017
26
Audit Findings
The audit findings are given below:
Operational Performance
2.1.7 The details of profit/loss in operations of the three combined cycle Gas
Turbine Power Stations (GTPS)22 at Thirumakottai (TGTPS), Kuttalam (KGTPS) and Valuthur (VGTPS-I and II) during the five year period
2012-2017 are indicated in Annexure-4.
It could be seen that:
There was contribution23 from all the three GTPS in all the years upto
2016-17. But, the contribution was eroded by high fixed cost resulting in loss in respect of TGTPS (except 2012-13) and KGTPS (except 2014-15).
In VGTPS, the better performance of Phase-I was off-set by the poor performance of Phase-II. Consequently, the station’s profit, which was at
` 87.52 crore in 2012-13 declined to ` 33.42 crore in 2016-17.
In exercise of its powers conferred under the Electricity Act, 2003, the
TNERC determines the tariff taking into account the total annual fixed and variable cost incurred by TANGEDCO for generation and distribution of
power. Regulation 42 of TNERC’s Tariff Regulations, 2005 provided that the recovery of fixed cost of GTPS below the normative level of 80 per cent would be on pro-rata basis. Since the GTPS did not achieve the
normative PLF during the five year period 2012-17, TNERC disallowed fixed cost claims amounting to ` 1,830.02 crore24 for the purpose of tariff
fixation. As this amount was not included in the tariff, it was absorbed by TANGEDCO, thereby increasing its loss to that extent.
Non-achievement of normative Plant Load Factor
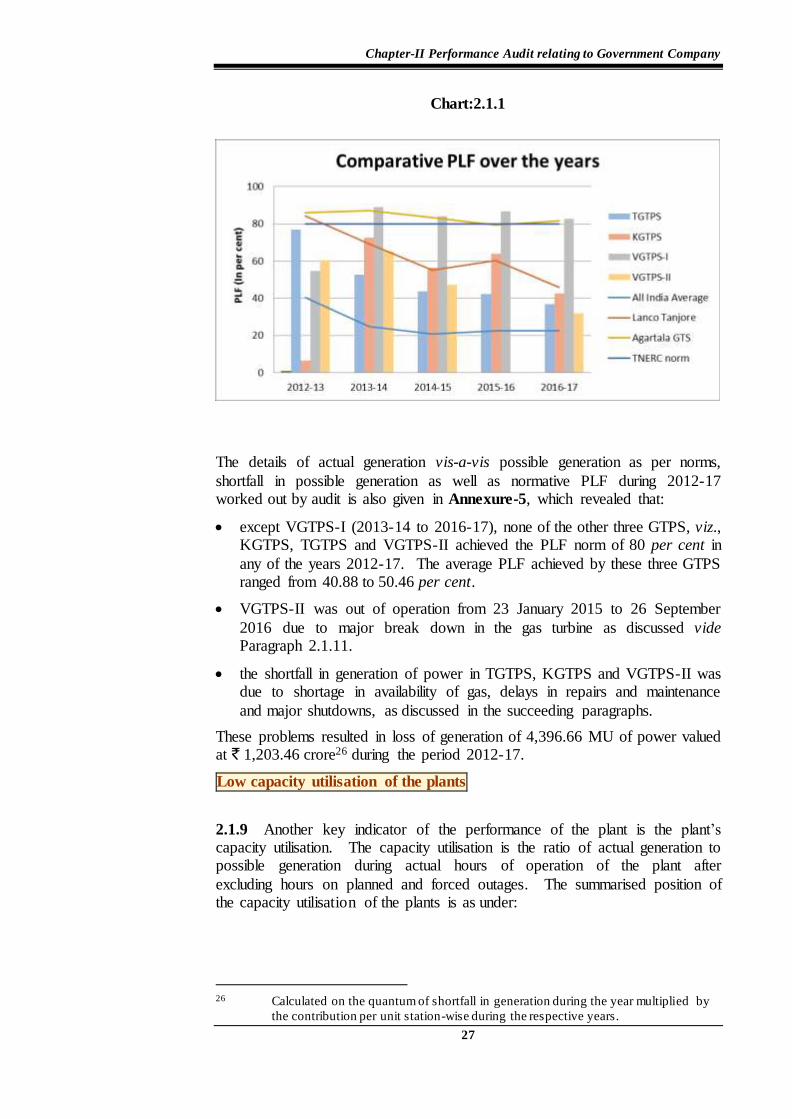
2.1.8 Regulation 37 of the TNERC (Terms and Conditions for
Determination of Tariff) Regulations, 2005,25 specifying Norms of Operations of Thermal Power Generating stations, prescribed a PLF of 80 per cent for all the three combined cycle GTPS. The following chart indicates the actual PLF
of the three GTPS in comparison with the TNERC norm, national average and the best performing similar gas power station in the country (Agartala Gas
Turbine Station in the Central Sector) and a private generation plant in the Kuttalam region (Lanco Tanjore Power).
22 BBGTPS is not considered for this analysis as it is a peak hour station and is not
operated continuously. Audit findings on BBGTPS are discussed separately in the
report. 23 Contribution is the difference between average rate of realisation per unit of power
sold and the variable cost incurred on its generation. 24 TGTPS: ` 585.33 crore, KGTPS: ` 721.81 crore and VGTPS-I & II: ` 522.88 crore
worked out by audit on the basis of TNERC’s Tariff Orders dated 11 August 2017. 25 As amended upto 31 December 2009.
Chapter-II Performance Audit relating to Government Company
27
Chart:2.1.1
The details of actual generation vis-a-vis possible generation as per norms,
shortfall in possible generation as well as normative PLF during 2012-17 worked out by audit is also given in Annexure-5, which revealed that:
except VGTPS-I (2013-14 to 2016-17), none of the other three GTPS, viz., KGTPS, TGTPS and VGTPS-II achieved the PLF norm of 80 per cent in
any of the years 2012-17. The average PLF achieved by these three GTPS ranged from 40.88 to 50.46 per cent.
VGTPS-II was out of operation from 23 January 2015 to 26 September
2016 due to major break down in the gas turbine as discussed vide Paragraph 2.1.11.
the shortfall in generation of power in TGTPS, KGTPS and VGTPS-II was due to shortage in availability of gas, delays in repairs and maintenance
and major shutdowns, as discussed in the succeeding paragraphs.
These problems resulted in loss of generation of 4,396.66 MU of power valued at ` 1,203.46 crore26 during the period 2012-17.
Low capacity utilisation of the plants
2.1.9 Another key indicator of the performance of the plant is the plant’s capacity utilisation. The capacity utilisation is the ratio of actual generation to possible generation during actual hours of operation of the plant after
excluding hours on planned and forced outages. The summarised position of the capacity utilisation of the plants is as under:
26 Calculated on the quantum of shortfall in generation during the year multiplied by
the contribution per unit station-wise during the respective years.

Audit Report (Public Sector Undertakings) for the year ended 31 March 2017
28
Table:2.1.2 Capacity utilisation
(in MU)
Yea
r
TGTPS KGTPS VGTPS-I VGTPS-II
To
tal
po
ssib
le
gen
era
tio
n f
or a
ctual
ho
urs
wo
rk
ed
Gro
ss
gen
era
tio
n
To
tal
ca
pa
cit
y
uti
lisa
tio
n
(per
cen
t)
To
tal
po
ssib
le
gen
era
tio
n f
or a
ctual
ho
urs
wo
rk
ed
Gro
ss
gen
era
tio
n
To
tal
ca
pa
cit
y
uti
lisa
tio
n
(per
cen
t)
To
tal
po
ssib
le
gen
era
tio
n f
or a
ctual
ho
urs
wo
rk
ed
Gro
ss
gen
era
tio
n
To
tal
ca
pa
cit
y
uti
lisa
tio
n
(per
cen
t)
To
tal
po
ssib
le
gen
era
tio
n f
or a
ctual
ho
urs
wo
rk
ed
Gro
ss
gen
era
tio
n
To
tal
ca
pa
cit
y
uti
lisa
tio
n
(per
cen
t)
2012-13 922.43 726.74 78.79 89.73 55.84 62.23 486.34 449.41 92.41 627.05 488.02 77.83
2013-14 875.74 497.92 56.86 864.46 641.37 74.19 786.81 729.33 92.69 627.61 526.33 83.86
2014-15 873.80 413.70 47.34 839.07 497.36 59.28 774.31 700.58 90.48 481.13 380.30 79.04
2015-16 784.29 399.10 50.89 870.09 563.68 64.78 776.65 721.18 92.86 0.00* 0.00
* 0.00
*
2016-17 861.70 347.98 40.38 813.42 376.50 46.29 804.05 688.17 85.59 381.07 278.48 73.08
(Source: Data furnished by the Company)
* VGTPS-II was shut down during 2015-16
From the table, it could be seen that only in VGTPS-I, the capacity utilisation was more than 85 per cent in all the years upto 2016-17. However, in TGTPS, KGTPS and VGTPS-II, the capacity utilisation declined from 78.79 per cent
(2012-13) to 40.38 per cent (2016-17), 74.19 per cent (2013-14) to 46.29 per cent (2016-17) and 83.86 per cent (2013-14) to 73.08 per cent (2016-17)
respectively. The main reasons for the low capacity utilisation were not carrying out periodical maintenance, forced outages, reduced generation due to operational problems and Station Heat Rate (SHR) being high, running the
station with partial load due to inadequate supply of fuel. These factors are discussed in the following paragraphs.
Delays in carrying out periodical maintenance
2.1.10 A proper plan for carrying out timely repair and periodical
maintenance would ensure optimum utilisation of existing facilities. As per the recommendations of the OEM, (i) combustion and borescopic inspection27 of GTPS is to be carried out after every 8,000 firing hours, (ii) hot gas path
inspection28 after 24,000 firing hours and (iii) major inspection after 48,000 firing hours.29 The details of mandatory inspections to be carried out vis-a-vis
the actual inspections in the three GTPS since their commissioning, are indicated in Annexure-6. In this connection, we observed that:
Though CEA had stressed upon the necessity to have a written
maintenance policy for the power plants, TANGEDCO had not laid down a maintenance policy for GTPS. Further, it had not adhered to the
inspection schedule prescribed for GTPS by OEM as detailed in the following table:
27 Combustion Inspection is a short dis -assembly shutdown inspection of fuel nozzles,
liners, cross fire tubes, spark plugs, flame detectors etc. Borescope is an optical
device used where the area to be inspected is inaccessible by other means. 28 The purpose of hot gas path inspection is to examine all of the internal rotating and
stationery components in the total path of the hot gas (as produced in the combustion
chamber). 29 Gas turbine components are subjected to a series of maintenance inspections at
specified intervals based on equivalent operating hours of the unit.
Chapter-II Performance Audit relating to Government Company
29
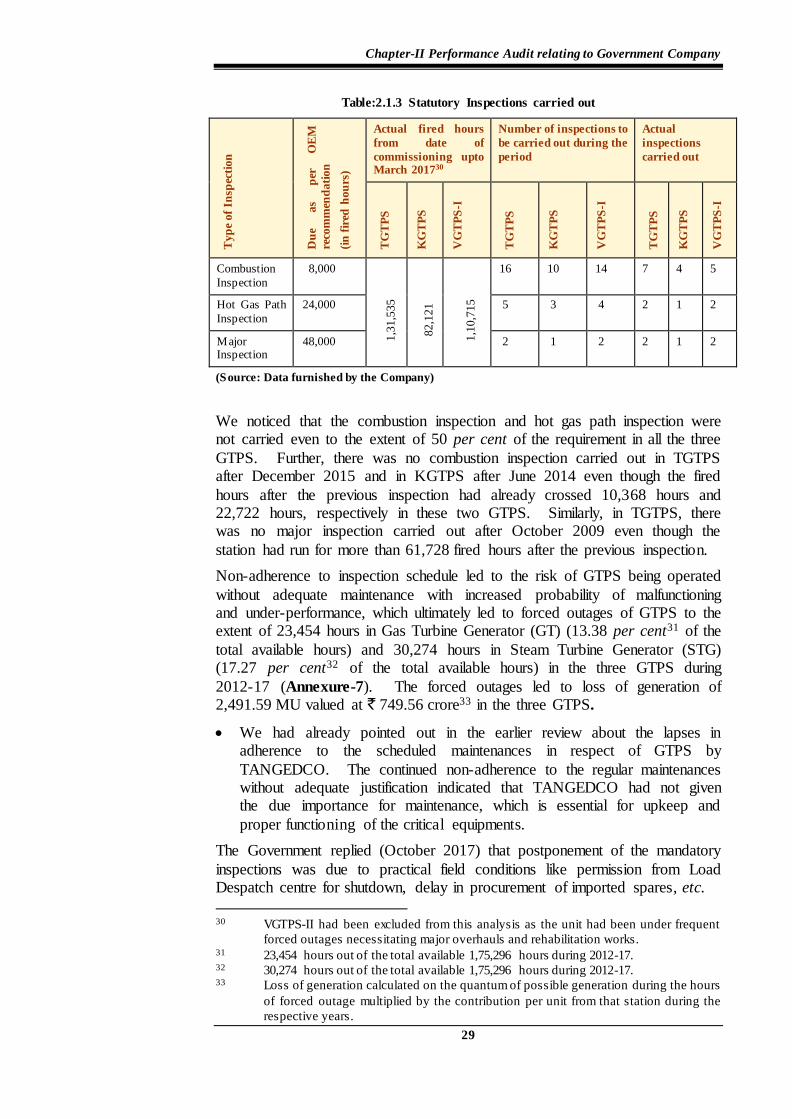
Table:2.1.3 Statutory Inspections carried out
Typ
e of
Insp
ecti
on
Du
e as
per
O
EM
reco
mm
end
ati
on
(in
fir
ed h
ou
rs)
Actual fired hours
from date of
commissioning upto March 201730
Number of inspections to
be carried out during the
period
Actual
inspections
carried out
TG
TP
S
KG
TP
S
VG
TP
S-I
TG
TP
S
KG
TP
S
VG
TP
S-I
TG
TP
S
KG
TP
S
VG
TP
S-I
Combustion
Inspection
8,000
1,3
1,5
35
82,1
21
1,1
0,7
15
16 10 14 7 4 5
Hot Gas Path
Inspection
24,000 5 3 4 2 1 2
Major Inspection
48,000 2 1 2 2 1 2
(Source: Data furnished by the Company)
We noticed that the combustion inspection and hot gas path inspection were not carried even to the extent of 50 per cent of the requirement in all the three
GTPS. Further, there was no combustion inspection carried out in TGTPS after December 2015 and in KGTPS after June 2014 even though the fired
hours after the previous inspection had already crossed 10,368 hours and 22,722 hours, respectively in these two GTPS. Similarly, in TGTPS, there was no major inspection carried out after October 2009 even though the
station had run for more than 61,728 fired hours after the previous inspection.
Non-adherence to inspection schedule led to the risk of GTPS being operated
without adequate maintenance with increased probability of malfunctioning and under-performance, which ultimately led to forced outages of GTPS to the extent of 23,454 hours in Gas Turbine Generator (GT) (13.38 per cent31 of the
total available hours) and 30,274 hours in Steam Turbine Generator (STG) (17.27 per cent32 of the total available hours) in the three GTPS during
2012-17 (Annexure-7). The forced outages led to loss of generation of 2,491.59 MU valued at ` 749.56 crore33 in the three GTPS.
We had already pointed out in the earlier review about the lapses in adherence to the scheduled maintenances in respect of GTPS by
TANGEDCO. The continued non-adherence to the regular maintenances without adequate justification indicated that TANGEDCO had not given the due importance for maintenance, which is essential for upkeep and
proper functioning of the critical equipments.
The Government replied (October 2017) that postponement of the mandatory
inspections was due to practical field conditions like permission from Load Despatch centre for shutdown, delay in procurement of imported spares, etc.
30 VGTPS-II had been excluded from this analysis as the unit had been under frequent
forced outages necessitating major overhauls and rehabilitation works. 31 23,454 hours out of the total available 1,75,296 hours during 2012-17. 32 30,274 hours out of the total available 1,75,296 hours during 2012-17. 33 Loss of generation calculated on the quantum of possible generation during the hours
of forced outage multiplied by the contribution per unit from that station during the
respective years.
Audit Report (Public Sector Undertakings) for the year ended 31 March 2017
30
Since annual maintenance schedules were committed well in advance to the Regional Power Committee by TANTRANSCO, which also controls the Load
Despatch Centre, the reply regarding seeking permission from it is not acceptable. The fact, therefore, remained that not carrying out the inspection
within the stipulated time resulted in instances of forced outages, which are discussed in the succeeding paragraphs:
Forced outages
Continued breakdown of the GT in VGTPS-II
2.1.11 All GTPS of TANGEDCO were erected by BHEL except Phase-II of
VGTPS, which was awarded (May 2006) to BGR Energy Systems Limited (BGR) for a contract price of ` 355.53 crore. The OEM of the station was
M/s ANSALDO, Italy and the unit started its commercial operation in February 2009. The GT and Gas Booster Compressor (GBC) were of new
type34 in which the temperature of the gas at the inlet of the GT was to be restricted to a maximum of 50º C, whereas no such restriction was attached in
respect of all other GTPS. A mention was already made in the Report of the CAG for the year ended 31 March 2015 – Government of Tamil Nadu, Public Sector Undertakings (Paragraph 4.9) about acceptance of new type of GBC
recommended by the supplier without having operational experience either by TANGEDCO or by the Indian supplier, viz., BGR and verifying its operational
risk leading to frequent defects in the GT and the resultant avoidable expenditure.
During the present audit, we noticed that between April 2012 and March 2014,
VGTPS-II suffered breakdowns for 102 days (GT) and 169 days (ST) due to problems associated with defective air filter, activation of surge protection
relay, failure of bearing in Inlet Guide Vane, etc. Considering the above, TANGEDCO carried out (November/December 2014) major overhauling of GT and generator of the unit through ANSALDO at a cost of ` 15.71 crore.
The unit again tripped on 23 January 2015, within the warranty period of one year, due to high vibration in the GT bearing. ANSALDO, which inspected
the GT, observed that the damages could be repaired only by replacement of the major parts of GT. The warranty claim of TANGEDCO was rejected by
ANSALDO on the grounds that the cause of failure was entry of foreign particles into the compressor inlet, which was not covered under warranty conditions.
Citing urgency in rectification of the fault in GT, TANGEDCO issued (February 2016) purchase orders/works contracts for a total value of ` 58.74
crore. After rectification, the unit was brought back into operation on 26 September 2016.
We observed in this regard that:
34 In a normal centrifugal GBC, lubrication was required only for the bearings, whereas
in reciprocating GBC used in this unit, continuous lubrication for movement of
piston was essential and there is a possibility that the lube oil may escape and contact
with the natural gas during operation of GT.
Chapter-II Performance Audit relating to Government Company
31
Even though TANGEDCO noted (April 2015) that the failure of GT was
due to negligence on the part of ANSALDO while carrying out the scheduled maintenance during November-December 2014, it failed to prepare a check list of items to be ‘covered and not covered’ during the
scheduled maintenance to enable pinpointing ANSALDO’s deficiencies, causing failure of GT.
TANGEDCO decided (September 2015) to form a technical committee consisting of external members to study the causes for the failure and suggest ways for revival of the project. The committee concluded that
ANSALDO was equally responsible for completing the overhaul activity without analysing certain repeated failures and for not having advised
TANGEDCO for corrective operations. But it did not work out the financial liability of ANSALDO for such lapses and recommended (January 2016) for the revival of the unit by ANSALDO in view of
urgency in bringing back the unit into service. TANGEDCO accepted the recommendation as it was felt that any replacement of the ANSALDO
make GT with another GT would result in reduced efficiency/increased heat rate and may not be cost effective. Thus, the decision not to fix responsibility for ANSALDO’s lapses in maintenance and to bear the
entire cost of rectification of ` 58.74 crore was a forced decision
considering the urgency in repairing the plant and was not on merits.
Due to continued shutdown of the plant from 23 January 2015 to 26
September 2016, TANGEDCO suffered generation loss of 1,354.73 MU valued at ` 407.02 crore.
The Government replied (October 2017) that the GT tripped because of frequency variation/grid condition which could not be predicted and controlled. The fact, however, remained that the unit tripped immediately
after carrying out the major overhaul. TANGEDCO observed that the ineffectiveness of the works carried out by ANSALDO, led to subsequent
breakdown of the unit.
As the unit was having frequent operational problems taking longer time
for ANSALDO to rectify the defects, it was envisaged (January 2013) to provide an Advanced Diagnostic Analysis (ADA) monitoring system for the unit to enable round the clock monitoring of the operations by
ANSALDO from Italy. Accordingly, contract was awarded (October/December 2013) and the system was installed (December 2014)
at a cost of ` 2.09 crore with annual maintenance and internet connectivity cost of ` 32 lakh. As the unit was shut down from January 2015 to
September 2016, the ADA was not put to the intended use till September 2016. The dedicated internet connection also remained disconnected from
July 2015 onwards till date (October 2017). Thus, the capital investment and the annual maintenance cost of ` 2.41 crore incurred on this system
became infructuous.
Audit Report (Public Sector Undertakings) for the year ended 31 March 2017
32
Forced outage due to delay in refurbishment
2.1.12 TANGEDCO had four GT rotors35 in service, one each in TGTPS,
KGTPS and VGTPS-I and II. During major inspections conducted in VGTPS-I and TGTPS during August/September 2009, damages were noticed
in the rotor parts in both GTPS. While a new one was installed in TGTPS, the existing rotor was reconditioned and installed in VGTPS-I.
As the old retrieved rotor in TGTPS had severe damages in its rotor blades,
TANGEDCO proposed (December 2009) refurbishment of the damaged rotor. Administrative approval was accorded (January 2010) for the refurbishment.
As the item was proprietary in nature, protracted negotiations were held with the OEM, BHEL for finalisation of the rotor price. The negotiations were finally concluded in July 2011 at a cost of ` 10.63 crore.
Before purchase order could be issued for the refurbishment, the rotor in KGTPS failed (October 2011). As the repairing of the damaged GT would
take four to five months, TANGEDCO decided to utilise the GT rotor already removed (October 2009) from TGTPS in its existing damaged condition at
KGTPS, to bring the unit back into service at the earliest.
Accordingly, the GT rotor of TGTPS was diverted and erected at KGTPS and the station was re-commissioned (23 November 2011) after incurring an
expenditure of ` 2.50 crore. TANGEDCO decided to get the failed rotor in
KGTPS repaired first and purchase order was issued (9 January 2012) at the rates already finalised for TGTPS (` 10.63 crore). While repair works were
still pending, the replaced GT also failed (22 February 2012) leaving the station under complete shutdown. One more purchase order was issued (18
April 2012) for reconditioning of this rotor at a cost of ` 10.14 crore, which was subsequently enhanced to ` 27.18 crore in November 2013 due to
additional works.
In the meanwhile, the GT in VGTPS-I also failed (26 June 2012) forcing
TANGEDCO to divert the refurbished rotor (order for which was placed in January 2012) to VGTPS-I and it resumed operations from 18 October 2012.
A new rotor was procured at a cost of ` 56 crore and KGTPS was brought back to service on 21 February 2013. The rotor for which refurbishment order
was placed in April 2012 was received in VGTPS-I and is being kept as spare.
We observed in this regard that:
TANGEDCO did not have a spare rotor initially to serve as a back-up for
any emergencies.
Protracted deliberations on the issue of refurbishing the failed rotor in
TGTPS for over 22 months from October 2009 till July 2011, led to non-availability of the damaged GT for emergency use, which had a
cascading effect since no replacement was available for both VGTPS-I and KGTPS.
35 A rotor is a device having blades radiating from a central hub that is rotated to
produce magnetic field.
Chapter-II Performance Audit relating to Government Company
33
Consequently, KGTPS was kept under forced shut down for a period of
one year from 22 February 2012 to 21 February 2013 resulting in generation loss of 708 MU36 valued at ` 191.16 crore.
While replying, the Government stated (October 2017) that since this was the first instance of refurbishment of GT rotor, some additional time was consumed to ascertain the feasibility, cost reasonableness and economy of
refurbishment of the rotor, etc. The fact, however, remained that TANGEDCO failed to get the GT repaired in time from September 2009
onwards, which mainly resulted in forced shutdown of the station and the resultant loss of generation.
Forced shut down due to delay in taking up major inspection
2.1.13 Major Inspection of Gas Turbine as per norms (after 48,000 hours) is a statutory requirement for reliable and sustained power generation. Major
inspection of the 95 MW VGTPS-I was planned to be taken up only during May 2012 after the station had clocked more than 72,000 fired hours.
In the meantime, it was noticed (January 2012) that the vibration level in the load gear box increased whenever grid frequency exceeded 50 Hz. Due to this problem, raising the load on GT beyond 50 MW (against the full capacity of
60 MW) resulted in tripping of GT on three occasions during February 2012. Consequently, VGTPS-I was under forced shutdown from 11 March 2012 and
the same was re-commissioned on 02 May 2012 after major overhaul and replacement of major spares worth ` 30.44 crore, leading to a generation loss
of 69.29 MU valued at ` 33.44 crore during the period March-May 2012.
But, the unit once again failed on 26 June 2012 due to damages in GT
requiring complete dismantling, repairing and re-commissioning of it. After repair work including replacement of the GT rotor (meant for KGTPS and
diverted to VGTPS-I in July 2012), the unit recommenced operations from 18 October 2012. The cost of rectification work (including ` 10.63 crore being
the cost of the diverted rotor) worked out to ` 12.65 crore.
We observed in this regard that the failure of the GT reflected inadequacies of
major inspection carried out in May 2012, which resulted in non-availability of the unit from 26 June 2012 to 18 October 2012 resulting in loss of
generation of 262.20 MU valued at ` 79.18 crore, which was avoidable.
Under-performance
Under-performance of steam turbine generator
2.1.14 As per the designed parameters of GTPS, the steam turbine generators in each of the combined cycle plants were capable of generating 334.89 MU (TGTPS), 324.12 MU (KGTPS), 307.48 MU (VGTPS-I) and 295.21 MU
(VGTPS-II) per annum at 100 per cent capacity utilisation. Our examination of the outputs of the STG in the three GTPS during 2012-17 revealed that the STGs worked only for 1,30,263 hours against the total available 1,75,296
36 For an Installed capacity of 101 MW at the PLF of 80% for 365 days
(101X80%X8.76 MU/ per annum).
Audit Report (Public Sector Undertakings) for the year ended 31 March 2017
34
hours indicating STG availability factor37 of only 74.31 per cent. Further, the STGs also did not generate the maximum possible output during the hours
worked resulting in loss of generation of 1,494.09 MU valued at ` 465.26
crore (Annexure-8). The poor performance of STGs were due to reasons like steam loss, poor vacuum in condenser, etc., causing the STG to run at restricted loads in all the three GTPS.
A detailed analysis of the STG of TGTPS revealed that:
there was complete outage from 31 August 2015 to 6 November 2015
resulting in loss of 1,633 hours due to high vibrations in the turbine blades causing loss of generation of 62.45 MU valued at ` 16.61 crore.
TGTPS uses a water cooled condenser,38 which was in service from 2001. The water requirement for the condenser was met from six bore wells.
The water based condenser was envisaged in this plant during the commissioning stage when there was abundant availability of raw water.
Due to passage of time, supply of water from its bore wells (250 tonnes/hour) was reduced causing frequent shut down of the STG due to puncture and choking of the condenser tubes. This had resulted in shutting
down of the STG to the extent of 620 hours and loss of generation of 23.70 MU valued at ` 6.79 crore during the period from October 2011 to August
2014. It was, therefore, decided (September 2014) to replace the water cooled condenser with an air cooled one at an estimated cost of ` 32.85
crore with estimated payback period of two years. However, the replacement was not executed as BHEL, the OEM had recommended (July
2015) for modification in the STG before switching over to air cooled condenser. Consequently, the problems associated with the water cooled
condenser persisted till date (October 2017) resulting in frequent shutdown of the STG and leading to the complete failure of the STG from 11 March 2017 to 20 May 2017 causing loss of generation of 54.52 MU valued at
` 18.54 crore.
The Government replied (October 2017) that tendering was in progress for
erection of the air cooled condenser. The fact, however, remained that though the proposal for replacement of condenser was initiated in September 2014,
the same was not completed till date resulting in persistence of the problem in the plant.
Delay in rectifying the problem of high wheel space temperature
2.1.15 The GT of 64 MW capacity at KGTPS was not operated beyond 55
MW due to its ‘High wheel space39 temperature’ reaching alarming level. In the absence of adequate cool air to reduce the high wheel space temperature, KGTPS had to reduce the quantum of gas injection to keep the wheel space
37 Availability factor is the amount of time that a plant is able to produce electricity
over a certain period, divided by the amount of the time in the period. 38 A condenser is a device used to condense a substance from its gaseous to its liquid
state. 39 Wheel space is the area between nozzles of the turbine stator and turbine buckets of
the turbine rotor. The temperature measured in this area is known as wheel space
temperature.
Chapter-II Performance Audit relating to Government Company
35
temperature within the permissible limits. When the station was taken up for combustion inspection in June 2014, it was found out by BHEL (the OEM)
that the old refurbished Load Gear Box (LGB) fitted in the GT rotor in January 2013 was the main reason for the rise in temperature as vibration level
started increasing whenever the load was raised beyond 55 MW. Though a new LGB was installed (June 2014), the problem persisted. The problem was rectified only in June 2016 after replacement of the old bearings with a new
one. Audit worked out the loss of generation due to the high wheel space temperature problem during the test checked period from April 2013 to
December 2015 as 13.33 MU valued at ` 3.60 crore.
Excess Station Heat Rate
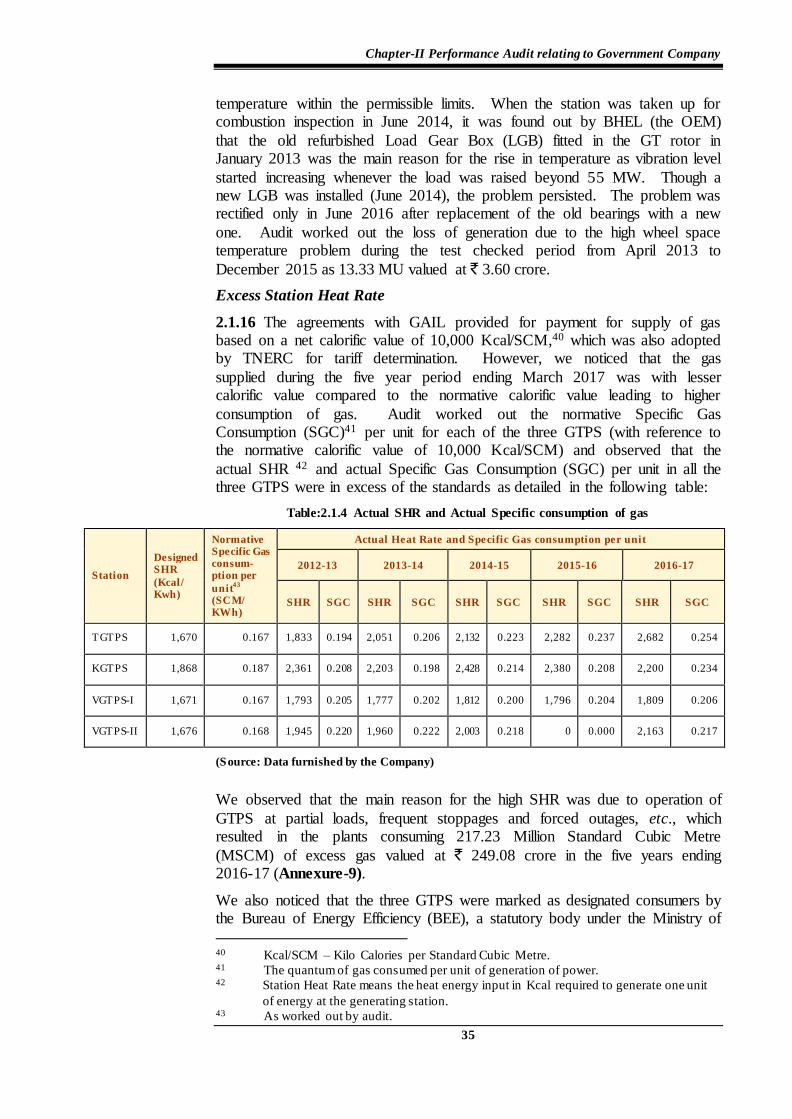
2.1.16 The agreements with GAIL provided for payment for supply of gas based on a net calorific value of 10,000 Kcal/SCM,40 which was also adopted by TNERC for tariff determination. However, we noticed that the gas
supplied during the five year period ending March 2017 was with lesser calorific value compared to the normative calorific value leading to higher
consumption of gas. Audit worked out the normative Specific Gas Consumption (SGC)41 per unit for each of the three GTPS (with reference to the normative calorific value of 10,000 Kcal/SCM) and observed that the
actual SHR 42 and actual Specific Gas Consumption (SGC) per unit in all the three GTPS were in excess of the standards as detailed in the following table:
Table:2.1.4 Actual SHR and Actual Specific consumption of gas
Station
Designed SHR
(Kcal/ Kwh)
Normative Specific Gas consum-ption per
unit43
(SCM/ KWh)
Actual Heat Rate and Specific Gas consumption per unit
2012-13 2013-14 2014-15 2015-16 2016-17
SHR SGC SHR SGC SHR SGC SHR SGC SHR SGC
TGTPS 1,670 0.167 1,833 0.194 2,051 0.206 2,132 0.223 2,282 0.237 2,682 0.254
KGTPS 1,868 0.187 2,361 0.208 2,203 0.198 2,428 0.214 2,380 0.208 2,200 0.234
VGTPS-I 1,671 0.167 1,793 0.205 1,777 0.202 1,812 0.200 1,796 0.204 1,809 0.206
VGTPS-II 1,676 0.168 1,945 0.220 1,960 0.222 2,003 0.218 0 0.000 2,163 0.217
(Source: Data furnished by the Company)
We observed that the main reason for the high SHR was due to operation of
GTPS at partial loads, frequent stoppages and forced outages, etc., which resulted in the plants consuming 217.23 Million Standard Cubic Metre
(MSCM) of excess gas valued at ` 249.08 crore in the five years ending 2016-17 (Annexure-9).
We also noticed that the three GTPS were marked as designated consumers by the Bureau of Energy Efficiency (BEE), a statutory body under the Ministry of
40 Kcal/SCM – Kilo Calories per Standard Cubic Metre. 41 The quantum of gas consumed per unit of generation of power. 42 Station Heat Rate means the heat energy input in Kcal required to generate one unit
of energy at the generating station. 43 As worked out by audit.
Audit Report (Public Sector Undertakings) for the year ended 31 March 2017
36
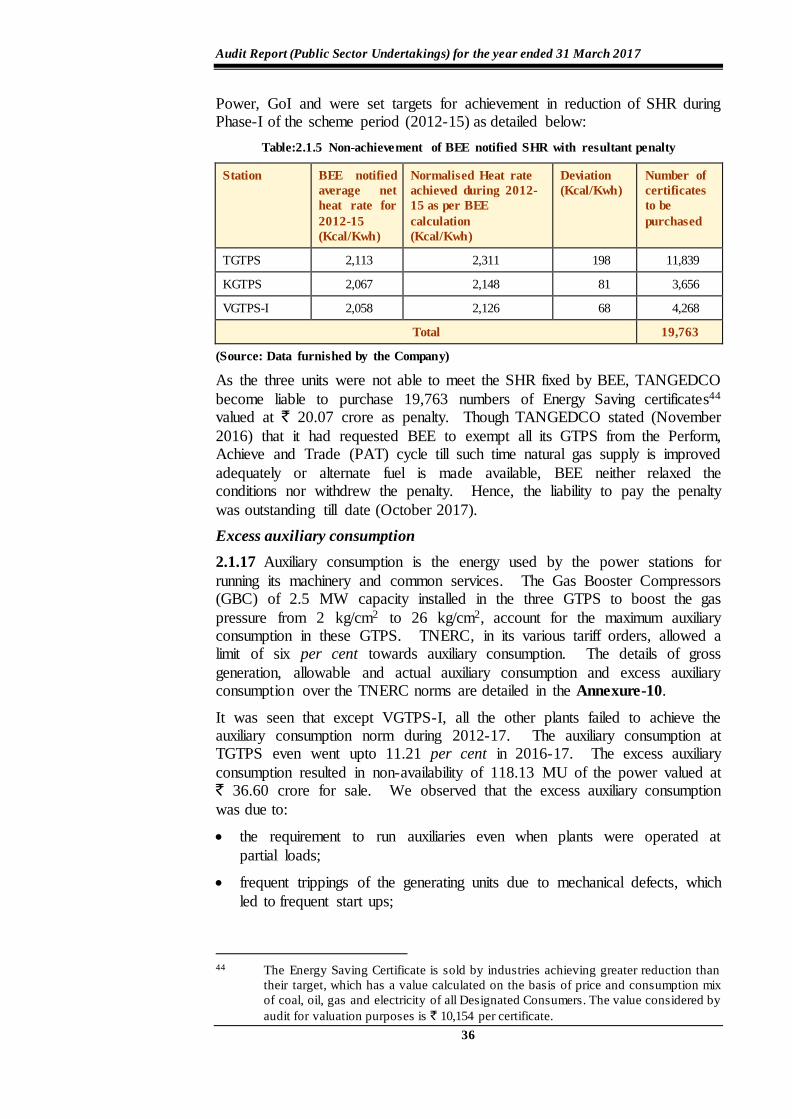
Power, GoI and were set targets for achievement in reduction of SHR during Phase-I of the scheme period (2012-15) as detailed below:
Table:2.1.5 Non-achievement of BEE notified SHR with resultant penalty
Station BEE notified
average net
heat rate for
2012-15
(Kcal/Kwh)
Normalised Heat rate
achieved during 2012-
15 as per BEE
calculation
(Kcal/Kwh)
Deviation
(Kcal/Kwh)
Number of
certificates
to be
purchased
TGTPS 2,113 2,311 198 11,839
KGTPS 2,067 2,148 81 3,656
VGTPS-I 2,058 2,126 68 4,268
Total 19,763
(Source: Data furnished by the Company)
As the three units were not able to meet the SHR fixed by BEE, TANGEDCO
become liable to purchase 19,763 numbers of Energy Saving certificates44 valued at ` 20.07 crore as penalty. Though TANGEDCO stated (November
2016) that it had requested BEE to exempt all its GTPS from the Perform, Achieve and Trade (PAT) cycle till such time natural gas supply is improved
adequately or alternate fuel is made available, BEE neither relaxed the conditions nor withdrew the penalty. Hence, the liability to pay the penalty
was outstanding till date (October 2017).
Excess auxiliary consumption
2.1.17 Auxiliary consumption is the energy used by the power stations for
running its machinery and common services. The Gas Booster Compressors (GBC) of 2.5 MW capacity installed in the three GTPS to boost the gas
pressure from 2 kg/cm2 to 26 kg/cm2, account for the maximum auxiliary consumption in these GTPS. TNERC, in its various tariff orders, allowed a limit of six per cent towards auxiliary consumption. The details of gross
generation, allowable and actual auxiliary consumption and excess auxiliary consumption over the TNERC norms are detailed in the Annexure-10.
It was seen that except VGTPS-I, all the other plants failed to achieve the auxiliary consumption norm during 2012-17. The auxiliary consumption at TGTPS even went upto 11.21 per cent in 2016-17. The excess auxiliary
consumption resulted in non-availability of 118.13 MU of the power valued at ` 36.60 crore for sale. We observed that the excess auxiliary consumption
was due to:
the requirement to run auxiliaries even when plants were operated at
partial loads;
frequent trippings of the generating units due to mechanical defects, which
led to frequent start ups;
44 The Energy Saving Certificate is sold by industries achieving greater reduction than
their target, which has a value calculated on the basis of price and consumption mix
of coal, oil, gas and electricity of all Designated Consumers. The value considered by
audit for valuation purposes is ` 10,154 per certificate.
Chapter-II Performance Audit relating to Government Company
37
taking minimum period of five to six hours to attain maximum generation,
during which period the auxiliaries were required to be maintained in normal working condition.
the designed norm for auxiliary consumption of these plants ranged45 from
4.72 per cent of the gross generation (TGTPS) to 5.26 per cent (VGTPS-I). However, TNERC had allowed an auxiliary consumption of
six per cent considering the limitations of the plants due to inadequate supply of fuel. Though the plants did not achieve the relaxed norm fixed by TNERC for auxiliary consumption, TANGEDCO had not taken any
remedial measures to control the auxiliary consumption within the norms.
Performance of Basin Bridge Power Station
2.1.18 The Basin Bridge Power Station (BBGTPS) could be operated by multi fuels such as Naptha and Natural gas. However, due to non-availability of
natural gas at Chennai, the station uses Naptha as fuel and is being operated as a peak hour station only for a few hours a day as per instructions of the State Load Despatch Centre. The proposal made (August 2007) for conversion of
the plant into a regular combined cycle generating station for a capacity of 220 MW by using natural gas as fuel has not fructified so far due to the delay
in completion of the Liquefied Natural Gas Import Terminal Project46 at the Ennore Port.
Owing to the high cost of operation of this station, TNERC permitted this
station to generate power only during contingencies that too with its prior approval. With effect from January 2010, the station is run for generation of
reactive power47 to improve the voltage profile of the grid.
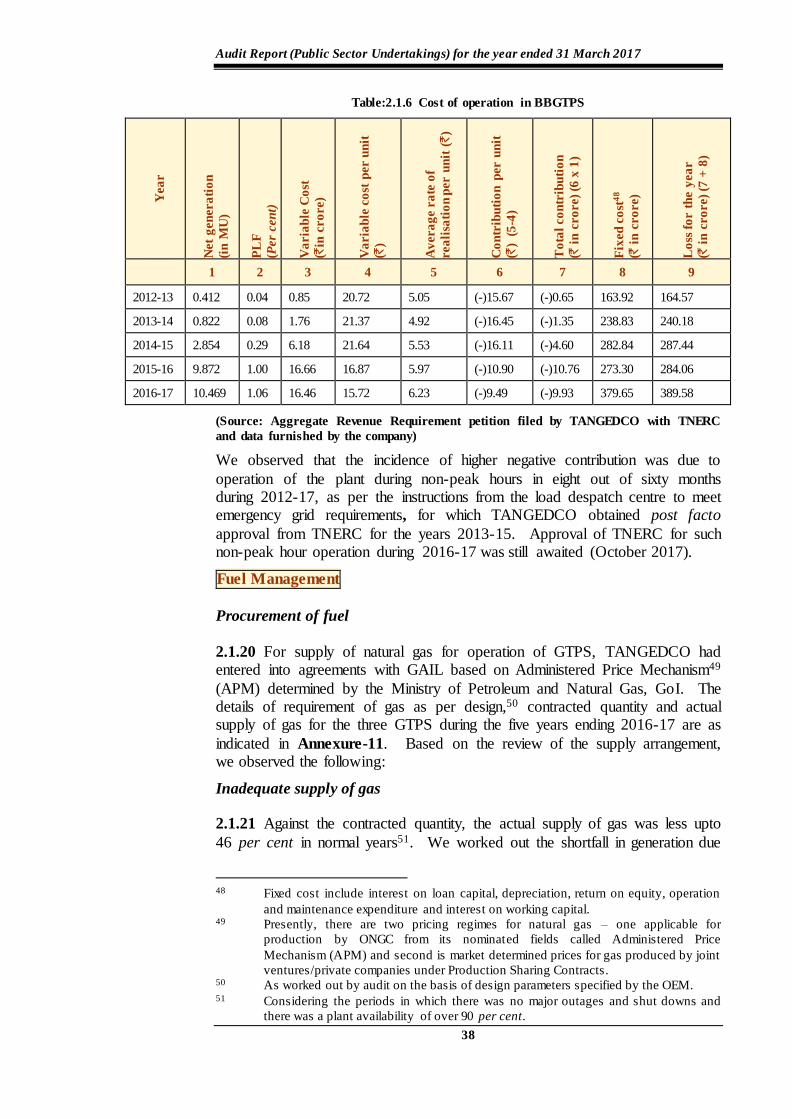
2.1.19 Audit observed that the variable cost relating to the station was very high ranging from ` 15.72 to ` 21.64 per unit compared to ` 1.91 to ` 3.31 in
TGTPS, ` 2.22 to ` 4.28 in KGTPS and ` 2.03 to ` 3.48 in VGTPS-I and II.
Consequently, the station was earning negative contribution throughout the five year period resulting in non-recovery of fixed costs as shown below:
45 TGTPS - 4.72 per cent, KGTPS – 5.25 per cent, VGTPS-I - 5.26 per cent and
VGTPS-II - 5.10 per cent. 46 A joint venture project of Tamil Nadu Industrial Development Corporation and
Indian Oil Corporation Limited. 47 Synchronous condenser mode is used to adjust conditions in the power transmission
grid to either generate or absorb reactive power as needed to stabilise the grid’s
voltage.
Audit Report (Public Sector Undertakings) for the year ended 31 March 2017
38
Table:2.1.6 Cost of operation in BBGTPS
Yea
r
Net
gen
era
tio
n
(in
MU
)
PL
F
(Per
cen
t)
Va
ria
ble
Co
st
(`in
cro
re)
Va
ria
ble
co
st p
er u
nit
(`)
Av
era
ge r
ate
of
rea
lisa
tio
n p
er u
nit
(`
)
Co
ntr
ibu
tio
n p
er u
nit
(`)
(5
-4)
To
tal
co
ntr
ibu
tio
n
(` i
n c
ro
re)
(6 x
1)
Fix
ed
co
st4
8
(` i
n c
ro
re)
Lo
ss f
or t
he y
ea
r
(` i
n c
ro
re)
(7 +
8)
1 2 3 4 5 6 7 8 9
2012-13 0.412 0.04 0.85 20.72 5.05 (-)15.67 (-)0.65 163.92 164.57
2013-14 0.822 0.08 1.76 21.37 4.92 (-)16.45 (-)1.35 238.83 240.18
2014-15 2.854 0.29 6.18 21.64 5.53 (-)16.11 (-)4.60 282.84 287.44
2015-16 9.872 1.00 16.66 16.87 5.97 (-)10.90 (-)10.76 273.30 284.06
2016-17 10.469 1.06 16.46 15.72 6.23 (-)9.49 (-)9.93 379.65 389.58
(Source: Aggregate Revenue Requirement petition filed by TANGEDCO with TNERC
and data furnished by the company)
We observed that the incidence of higher negative contribution was due to
operation of the plant during non-peak hours in eight out of sixty months during 2012-17, as per the instructions from the load despatch centre to meet emergency grid requirements, for which TANGEDCO obtained post facto
approval from TNERC for the years 2013-15. Approval of TNERC for such non-peak hour operation during 2016-17 was still awaited (October 2017).
Fuel Management
Procurement of fuel
2.1.20 For supply of natural gas for operation of GTPS, TANGEDCO had entered into agreements with GAIL based on Administered Price Mechanism49
(APM) determined by the Ministry of Petroleum and Natural Gas, GoI. The details of requirement of gas as per design,50 contracted quantity and actual supply of gas for the three GTPS during the five years ending 2016-17 are as
indicated in Annexure-11. Based on the review of the supply arrangement, we observed the following:
Inadequate supply of gas
2.1.21 Against the contracted quantity, the actual supply of gas was less upto
46 per cent in normal years51. We worked out the shortfall in generation due
48 Fixed cost include interest on loan capital, depreciation, return on equity, operation
and maintenance expenditure and interest on working capital. 49 Presently, there are two pricing regimes for natural gas – one applicable for
production by ONGC from its nominated fields called Administered Price
Mechanism (APM) and second is market determined prices for gas produced by joint
ventures/private companies under Production Sharing Contracts. 50 As worked out by audit on the basis of design parameters specified by the OEM. 51 Considering the periods in which there was no major outages and shut downs and
there was a plant availability of over 90 per cent.
Chapter-II Performance Audit relating to Government Company
39
to short supply of the committed quantity of gas in three GTPS when there were no major outages as 1,993.84 MU with a contribution loss of
` 599.60 crore (Annexure-12). In addition, there were instances of short
supply of gas due to unplanned repair and maintenance works carried out by GAIL, which were not synchronised with the maintenance work carried out by GTPS resulting in loss of generation equivalent to 52.81 MU valued at
` 15.25 crore.
To compensate the short supply of gas, TANGEDCO was forced to purchase
additional gas for KGTPS and VGTPS-I and II at the Market Driven Price, which was higher than the price under APM. The additional expenditure
incurred in this regard during the five years 2012-17 in these two GTPS amounted to `18.90 crore52.
Shortfall in drawal of gas
2.1.22 While on the one hand TANGEDCO suffered due to short supply of
gas, there were instances, where KGTPS and VGTPS-II had paid ` 38.83 crore to GAIL being the MGO53 charges during 2012-15 for short drawal of
gas on account of forced outages. Audit observed that the payment of MGO could have been avoided if adequate periodical and scheduled maintenances
were carried out on time as discussed in Paragraph 2.1.10.
Additional expenditure due to short supply of gas
2.1.23 As per the Gas Supply Agreement entered with GAIL, TANGEDCO
was to pay transmission charges of ` 20.79 lakh per month in addition to the
cost of gas. We noticed that against the total availability of 8.00 lakh SCM per day from the Kuttalam zone of the Cauvery basin, GAIL had already allotted 11.6 lakh SCM of gas per day to TANGEDCO (4.5 lakh SCM) and to
other captive/private power projects (7.10 lakh SCM). Thus, there was an inherent over allotment to the extent of 3.6 lakh SCM per day. To overcome
the resultant short supply, GAIL proposed (August 2004) inter-connection of the Kuttalam zone with the Narimanam zone by laying a pipeline to carry additional 3.00 lakh SCM of gas per day to its consumers. The proposal
involved payment of additional transmission charges by TANGEDCO on monthly basis. The inter-connection was completed in July 2005 and
TANGEDCO started paying additional monthly transmission charges of ` 33.98 lakh per month from July 2005 to April 2006 and ` 32.91 lakh per
month54 thereafter.
We observed that against the envisaged quantity of 164 million SCM per year after completion of the inter-connection work, the actual supply to
TANGEDCO did not cross a maximum of 138 million SCM per year. Therefore, the inter-connection and the payment of additional transmission
52 Calculated at the differential price per thousand SCM/per MMBTU and not
considering other charges like transmission charges, marketing margin etc. 53 As per agreement, TANGEDCO has to pay for actual drawal of gas subject to a
minimum of 90 per cent of the annual quantity, which is Minimum Guaranteed
Off-take quantity. 54 Re-worked by GAIL later.
Audit Report (Public Sector Undertakings) for the year ended 31 March 2017
40
charges of ` 7.90 crore during the period from April 2012 to March 201455 did
not yield the desired results.
Inequitable agreements with GAIL
2.1.24 A review of the Gas Supply and Transmission agreements between TANGEDCO and GAIL revealed that the following clauses of the agreements
were not on equitable basis as detailed below:
Article 4.3 dealing with delivery pressure provided that GAIL would maintain gauge pressure in the range of 2 to 5 KG/cm2 subject to
availability of matching pressure from ONGC and other sources. However, in cases where the pressure of gas received was not sufficient,
TANGEDCO was to bear the additional cost of compression of gas. It is pertinent to note that due to drop in pressure in supply of gas at the required level, there were trippings and forced outages totaling to 447
hours resulting in loss of generation to the extent of 19.71 MU valued at ` 5.70 crore in the three GTPS during 2012-17.
Article 5.2 of the agreement required TANGEDCO to pay for 90 per cent of the allotted quantity as Minimum Quantity, whereas there was no
reciprocal clause for payment of penalty by GAIL in the event of its failure to supply MGO quantity of gas. TANGEDCO was forced to pay ` 38.83
crore as MGO during the review period, whereas there was no similar penalty on GAIL for the short supply.
The price of gas paid by TANGEDCO to GAIL (both APM and non-APM) is governed by Article 10 of the Gas Sale agreements. The gas
price is linked to a net calorific value of 10,000 Kcal/SCM. In addition, GAIL is also paid, marketing margin at applicable rates on the same
10,000 Net Calorific Value. Our review revealed that while marketing margin was claimed correctly in respect of APM gas, by linking it to the actual net calorific value, there was no such linking in respect of the gas
supplied under non-APM category. This lacuna resulted in additional payment to GAIL to the extent of ` 1.89 crore during 2012-17.
The Government replied (October 2017) that GAIL had been requested for appropriate modifications of the above clauses. It is, however, noted that
since TANGEDCO is also a public sector undertaking like GAIL and as the MGO clause was included in GAIL’s interest, a corresponding clause in TANGEDCO’s interest could be included.
Issues concerning Environment
2.1.25 In order to regulate pollution levels and minimise the adverse impact on the environment, the GoI has enacted various Acts such as the Water (Prevention and Control of Pollution) Act, 1974, the Air (Prevention and
Control of Pollution) Act, 1981, the Environment (Protection) Act, 1986, etc. The Tamil Nadu Pollution Control Board (TNPCB) is the regulating authority
to ensure compliance to the provisions of these statutes in the State.
55 From April 2014, the transmission charges levied by GAIL for all GTPS was revised
based on Petroleum and Natural Gas Regulatory Board’s order dated 11 July 2014
based on actual quantum supplied.
Chapter-II Performance Audit relating to Government Company
41
Our analysis of the adherence to the provisions of these Acts by GTPS revealed the following:
Air Pollution
2.1.26 Emissions of GTPS include Nitrogen Oxides (NOx), which are formed
in the localised high temperature regions of the combustor. Ministry of Environment, Forest and Climate Change (MoEFCC), GoI had prescribed
NOx emission standards for natural gas/naphtha based thermal power plants as 75/100 ppm56 respectively. We noticed that the emission levels of NOx from the four GTPS were within the norms in all the five years covered by audit.
Water Pollution
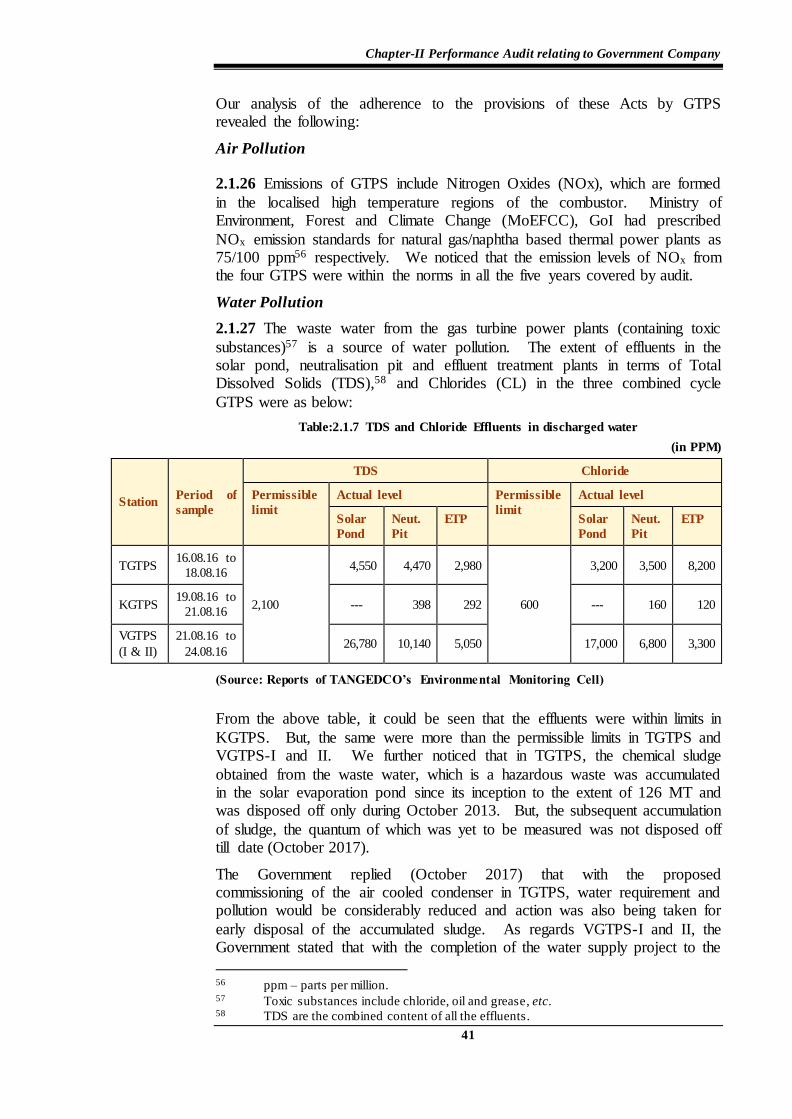
2.1.27 The waste water from the gas turbine power plants (containing toxic
substances)57 is a source of water pollution. The extent of effluents in the solar pond, neutralisation pit and effluent treatment plants in terms of Total Dissolved Solids (TDS),58 and Chlorides (CL) in the three combined cycle
GTPS were as below:
Table:2.1.7 TDS and Chloride Effluents in discharged water
(in PPM)
Station Period of
sample
TDS Chloride
Permissible
limit
Actual level Permissible
limit
Actual level
Solar
Pond
Neut.
Pit
ETP Solar
Pond
Neut.
Pit
ETP
TGTPS 16.08.16 to
18.08.16
2,100
4,550 4,470 2,980
600
3,200 3,500 8,200
KGTPS 19.08.16 to
21.08.16 --- 398 292 --- 160 120
VGTPS
(I & II)
21.08.16 to
24.08.16 26,780 10,140 5,050 17,000 6,800 3,300
(Source: Reports of TANGEDCO’s Environmental Monitoring Cell)
From the above table, it could be seen that the effluents were within limits in
KGTPS. But, the same were more than the permissible limits in TGTPS and VGTPS-I and II. We further noticed that in TGTPS, the chemical sludge
obtained from the waste water, which is a hazardous waste was accumulated in the solar evaporation pond since its inception to the extent of 126 MT and was disposed off only during October 2013. But, the subsequent accumulation
of sludge, the quantum of which was yet to be measured was not disposed off till date (October 2017).
The Government replied (October 2017) that with the proposed commissioning of the air cooled condenser in TGTPS, water requirement and pollution would be considerably reduced and action was also being taken for
early disposal of the accumulated sludge. As regards VGTPS-I and II, the Government stated that with the completion of the water supply project to the
56 ppm – parts per million. 57 Toxic substances include chloride, oil and grease, etc. 58 TDS are the combined content of all the effluents.
Audit Report (Public Sector Undertakings) for the year ended 31 March 2017
42
station, the problem of high TDS and chlorides would be solved in the near future.
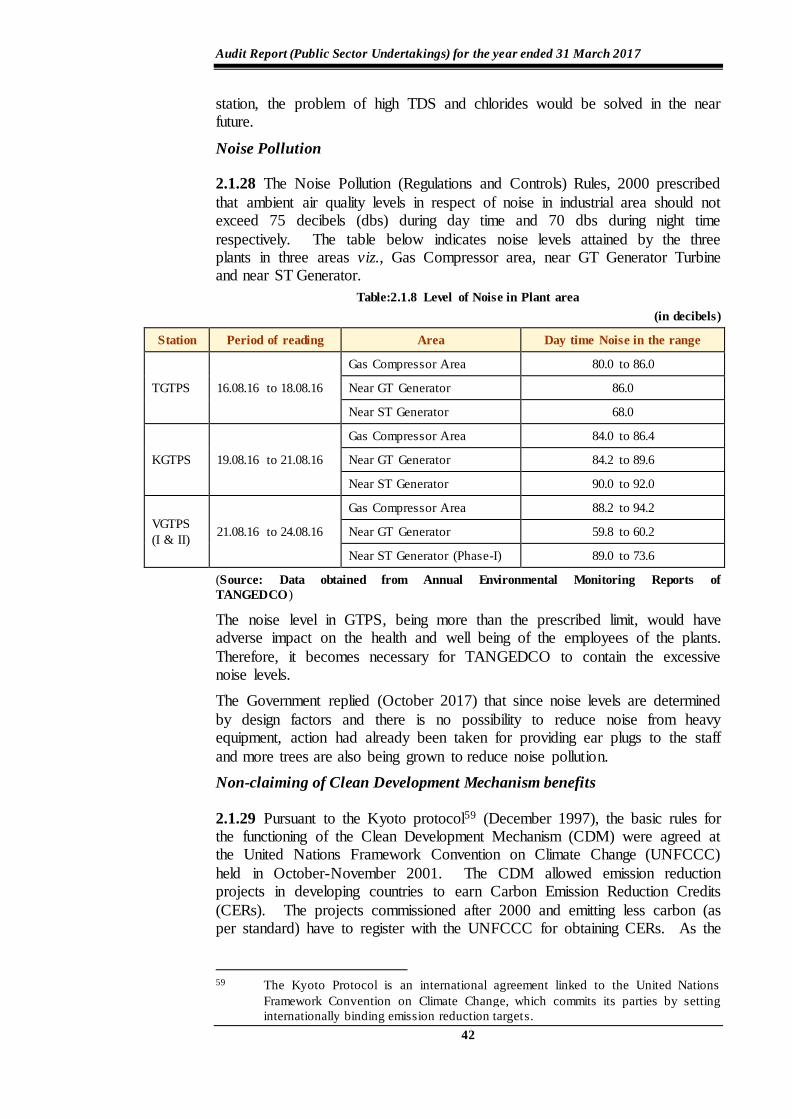
Noise Pollution
2.1.28 The Noise Pollution (Regulations and Controls) Rules, 2000 prescribed
that ambient air quality levels in respect of noise in industrial area should not exceed 75 decibels (dbs) during day time and 70 dbs during night time
respectively. The table below indicates noise levels attained by the three plants in three areas viz., Gas Compressor area, near GT Generator Turbine and near ST Generator.
Table:2.1.8 Level of Noise in Plant area
(in decibels)
Station Period of reading Area Day time Noise in the range
TGTPS 16.08.16 to 18.08.16
Gas Compressor Area 80.0 to 86.0
Near GT Generator 86.0
Near ST Generator 68.0
KGTPS 19.08.16 to 21.08.16
Gas Compressor Area 84.0 to 86.4
Near GT Generator 84.2 to 89.6
Near ST Generator 90.0 to 92.0
VGTPS
(I & II) 21.08.16 to 24.08.16
Gas Compressor Area 88.2 to 94.2
Near GT Generator 59.8 to 60.2
Near ST Generator (Phase-I) 89.0 to 73.6
(Source: Data obtained from Annual Environmental Monitoring Reports of
TANGEDCO)
The noise level in GTPS, being more than the prescribed limit, would have adverse impact on the health and well being of the employees of the plants.
Therefore, it becomes necessary for TANGEDCO to contain the excessive noise levels.
The Government replied (October 2017) that since noise levels are determined
by design factors and there is no possibility to reduce noise from heavy equipment, action had already been taken for providing ear plugs to the staff
and more trees are also being grown to reduce noise pollution.
Non-claiming of Clean Development Mechanism benefits
2.1.29 Pursuant to the Kyoto protocol59 (December 1997), the basic rules for the functioning of the Clean Development Mechanism (CDM) were agreed at the United Nations Framework Convention on Climate Change (UNFCCC)
held in October-November 2001. The CDM allowed emission reduction projects in developing countries to earn Carbon Emission Reduction Credits
(CERs). The projects commissioned after 2000 and emitting less carbon (as per standard) have to register with the UNFCCC for obtaining CERs. As the
59 The Kyoto Protocol is an international agreement linked to the United Nations
Framework Convention on Climate Change, which commits its parties by setting
internationally binding emission reduction targets.
Chapter-II Performance Audit relating to Government Company
43
GTPS are using cleaner fuel and emits less carbon dioxide for generation of power they are eligible for registration under UNFCCC.
We noticed that though TANGEDCO accorded approval (January 2008) for pursuing benefits under CDM for its GTPS, the proposal was subsequently
dropped (May 2009) citing the presumed risk of the projects becoming ineligible due to stringent rules for claiming the CDM benefits. Instead, VGTPS-II alone was registered under the alternate Voluntary Carbon
Standards60 (VCS) scheme and 1,70,473 Verified Carbon Units (VCUs) were received (November 2011) relating to the period May 2008 to January 2010.
The VCUs were traded in June 2014 for an amount of ` 36.32 lakh after incurring a total expenditure of ` 42.94 lakh in the process. No further claim
towards VCUs for VGTPS-II was subsequently made.
We observed that:
Though TANGEDCO dropped the proposal of registering the GTPS for CDM benefits, LANCO, an Independent Power Producer which was
commissioned in August 2005 got registered with UNFCCC and received 9.98 lakh CERs equivalent to ` 25.55 crore61 as of March 2017.
Due to non-registration of the GTPS for CDM benefits, TANGEDCO lost 15.28 lakh CERs for the period 2012-17 and had foregone a potential
revenue of ` 39.12 crore.
The Government replied (October 2017) that TANGEDCO did not take a decision for further verification and issuance of VCUs as the process involved expenditure and it was imperative for TANGEDCO to recover the expenses
incurred.
The fact, however, remained that TANGEDCO, after initially proposing to
pursue CDM benefits for its GTPS, reversed its decision considering the stringent rules for registration. This led to the non-registration of the projects under CDM and resulted in non-availing of potential revenue amounting to
|` 39.12 crore till 2016-17.
Non-compliance with the provisions of Public Liability Insurance Act
2.1.30 The Public Liability Insurance (PLI) Act, 1992 was enacted to provide immediate relief to the victims of accidents that might occur while handling
hazardous substances. Accordingly, it was mandatory to have an insurance cover for every owner handling hazardous substances above the threshold
quantity listed in the schedule to the Act. We observed that the GTPS, which handle flammable substances like natural gas, naptha and high speed diesel are covered under the PLI Act, as the quantity handled was in excess of the
threshold limits62. The MoEFCC, also in its environmental clearance for the
60 The VCS is a voluntary market for trading of carbon credits outside of compliance
schemes and is more flexible than the CDM. This scheme is sponsored by the
Climate Group, International Emission Trading Association and World Economic
Forum. 61 Calculated as per UNFCCC formula for emission reduction and valued at the average
market price of US $ 4 per CER as per the World Bank Report on State and Trends
of the carbon market, 2016 converted at an exchange rate of 1 US$ = ` 64. 62 15 MT for natural gas, 1,000 MT for naphtha and 25 MT for high speed diesel.
Audit Report (Public Sector Undertakings) for the year ended 31 March 2017
44
various gas turbine power projects, insisted to comply with PLI Act. However, TANGEDCO had so far (March 2017) not taken the mandatory
insurance policies to comply with the PLI Act.
The Government replied (October 2017) that action would be taken for the
public liability insurance.
Acknowledgement
We acknowledge the co-operation and assistance extended by the management
and the staff of TANGEDCO in conducting this Performance Audit.
Conclusion
During the Performance Audit (PA) period of 2012-17, normative PLF of 80 per cent was achieved only by VGTPS-I and the remaining three units had
achieved an average PLF ranging from 40.88 to 50.46 per cent. Similarly, the plants’ capacity utilisation declined from 78.79 to 40.38 per cent in TGTPS
and 74.19 to 46.29 per cent in KGTPS.
The lower PLF and capacity utilisation led to loss of generation to the
extent of 4,396.66 MU valued at ` 1,203.46 crore, which was due to (i) not carrying out even 50 per cent of the periodical maintenance as prescribed,
(ii) forced outages due to controllable factors such as delay in carrying out refurbishment and non-replacement of water cooled condenser, etc., (iii) lower capacity of plants due to operational problems and (iv) running
GTPS with partial loads due to short supply of fuel.
Due to poor performance/maintenance of the GTPS, TANGEDCO had to
incur the following additional expenditure, loss of generation or liability:
Avoidable extra expenditure of ` 58.74 crore in VGTPS-II because of
installation of new type GT and GBC, the operation of which were not familiar either to TANGEDCO or to the Indian supplier viz., BGR.
The excess SHR of all GTPS resulted in additional consumption of 217.23 million SCM of gas valued at ` 249.08 crore, besides liability to purchase
energy saving certificate for ` 20.07 crore as penalty.
All the three GTPS not achieving even the relaxed auxiliary consumption norm of 6 per cent leading to non-availability of 118.13 MU of power
valued at ` 36.60 crore for sale.
Loss of potential generation to the extent of 1,993.84 MU with
contribution loss of ` 599.60 crore due to short supply of committed
quantity of gas by GAIL.
TANGEDCO had the following deficiencies with reference to the pollution control norms:
Though the levels of air pollution of GTPS were within the norm, the water pollution was more than the norm in TGTPS and VGTPS-I and II.
Due to non-registration of GTPS for getting CDM benefits, TANGEDCO had foregone a potential revenue of ` 39.12 crore.
Chapter-II Performance Audit relating to Government Company
45
Mandatory insurance policies in compliance with the Public Liability
Insurance Act, 1992 were not taken.
Recommendations
In the light of the above conclusion, TANGEDCO needs to:
achieve normative PLF of 80 per cent in KGTPS, TGTPS and VGTPS-II
as was achieved in VGTPS-I.
carry out mandatory inspections of the plants to identify the operational
problems.
avoid forced outages and lower capacity utilisation.
find out a permanent solution for the operational problems of VGTPS-II.
ensure availability of gas for running the plants at the optimum level,
through appropriate provisions in the agreement.
explore modifications in the clauses of the agreement with GAIL, which
are not on equitable basis.
ensure conformation to pollution control norms and procedures.
46
2.2 Information Technology Audit of Drug Distribution
Management System in Tamil Nadu Medical Services
Corporation
Executive Summary
Tamil Nadu Medical Services Corporation (TNMSC) Limited is engaged in
procurement and supply of drugs, medicines, surgical sutures. TNMSC
makes procurements through tenders, stores the stocks in warehouses and
supplies to Government medical institutions.
TNMSC had computerised all its major activities through two application
software viz., Drug Distribution Management System (DDMS) and
Warehouse Information System (WIS).
Audit of DDMS brought out the following significant findings:
The tender processing module of DDMS was not comprehensive
rendering the data held in the system incomplete and unreliable.
Incorrect mapping of business rules in the system resulted in excess
projection of requirement in the pre-order statements due to non-
consideration of excess stock available in some warehouses.
The software failed to prevent placing of orders on blacklisted suppliers
due to non-integration of the blacklist module with the purchase order
module.
The system failed to detect/prevent data entry errors in the dates of
manufacturing and expiry, making it ineffective in handling outward
transfer of drugs and reports on short expiry drugs, pre-order level and
stock-out level.
Despite availability of stock, delay in capturing laboratory test reports
resulted in non-supply of drugs in 43,039 instances during 2012-17.
590 drugs valuing ` 16.13 crore expired during 2012-17 included 306
drugs valuing ̀ 5.93 crore which were supplied beyond the stipulated 30
days after manufacturing.
Due to delay in communication of “stop issue” order and batch number
mismatch, in 982 instances, drugs, which failed in quality test were issued
to medical institutions after “stop issue” order date.
The system did not calculate penalty for non-supply or short supply of
drugs, leading to non-collection of penalty to the tune of ` 40.90 crore
during 2012-17.
TNMSC did not implement Disaster Recovery Plan and Business
Continuity plan, as envisaged in the e-Security policy of Government of
Tamil Nadu.
Chapter-II IT Audit on Tamil Nadu Medical Services Corporation
47
Introduction
2.2.1 Tamil Nadu Medical Services Corporation Limited (TNMSC) was
established (July 1994) with the objective of procurement, storage and timely distribution of quality drugs, medicines, surgical sutures at the most economica l cost to cater to the need of all medical institutions63 coming under Directorate
of Medical Education, Directorate of Medical & Rural Health Services and Directorate of Public Health and Preventive Medicine.
TNMSC had 29 warehouses throughout the State for storage and distribution of drugs to medical institutions. The total requirements of drugs, medicines and surgical items are finalised by TNMSC by getting the requirements from the
Medical Directorates every year. The major activities64 of TNMSC were computerised in 1995 as it plays a crucial role in catering to the day-to-day
medical needs of the Government medical institutions.
Organisational structure
2.2.2 TNMSC is managed by its Board of Directors with Principal Secretary, Health & Family Welfare as its Chairman. The Managing Director, who is
usually an IAS officer, heads the operations. At the district level, the warehouse operations are managed by the Warehouse-in-charge and Assistant Warehouse-
in-charge.
Objectives of computerisation
2.2.3 In order to assist the management in planning, procurement and distribution of drugs to the stakeholders, TNMSC had computerised all its major
activities through two application softwares viz., Drug Distribution Management System (DDMS) and Warehouse Information System (WIS). DDMS is a centralised database maintained in TNMSC head office. The district
warehouses use DDMS and WIS for carrying out their day-to-day functions. In addition, there is Management Information System (MIS) application software
to generate reports65 for DDMS and WIS.
The above applications are deployed in a mid-range server at the Head Office and desktops at the 29 district warehouses. Initially, these software were
developed and maintained by an external agency. From the year 2010 onwards, further development, customisation and maintenance were carried out in-house.
63 District Head Quarters Hospitals, Taluk Head Quarters Hospitals, Medical College
Hospitals, Primary Health Centres. 64 Identification of Drugs, Forecasting, Tendering, Order Processing & Scheduling,
Inventory (stock) management, Passbook utilisation, Quality Control and Bill
Processing. 65 Tender details, EMD/SD Details, Up-to-date stock (warehouses and QC Section),
Inwards, Outwards, Consumptions, Unexecuted, Passbook Utilisation, Non-moving,
Short-expiries, Nil-stocks, Pending quality results, NOC details, Frozen details, Bill
clearance, Sanction order and Cheque details .
Audit Report (Public Sector Undertakings) for the year ended 31 March 2017
48
Audit objectives
2.2.4 The audit objectives were to examine:
Whether the Information Technology (IT) system was used effective ly
by TNMSC as per the policy documents on drug procurement and quality control;
Whether computerisation was in accordance with the IT policy of the Government and as per the norms of an IT enabled system; and
Whether existing IT-enabled Management Information System was adequate and effectively used for monitoring.
Audit criteria
2.2.5 The audit findings were benchmarked against the following criteria:
Government Orders issued by Health Department on procurement of drugs by TNMSC;
Circulars/instructions issued by TNMSC and Directorates;
Tender documents and agreements for procurement of IT assets/drugs;
Policy documents of TNMSC on drug procurement and quality control; and
System Requirement specifications, user manuals and data dictionary.
Scope and methodology
2.2.6 The IT audit covered the application software viz., DDMS, WIS and
MIS. The period covered by Audit was from April 2012 to March 2017. Audit scrutinised the manual records/files at the Head Office of TNMSC and eight66 district warehouses and analysed data available in DDMS and WIS (Oracle data
dumps) using SQL queries. The audit team visited the eight sampled warehouses for assessing the working of the above two modules. In addition,
the team visited one Government medical institution67 in each of the selected eight districts. The audit was conducted from April to September 2017. An Entry Conference was held with Principal Secretary to Government, Health and
Family Welfare Department and Managing Director of TNMSC on 24 April 2017. The Draft IT Audit Report was also discussed with the Principa l
Secretary to Government, Health and Family Welfare Department in the Exit Conference on 16 November 2017. The views expressed by the Government/TNMSC during the Exit Conference as well as the reply received
from the Government in November 2017 were considered, wherever found necessary.
66 Selected through random sampling method - Chennai (KK Nagar Warehouse),
Dharmapuri, Dindigul, Erode, Thanjavur, Tiruchirappalli, Tirunelveli and Villupuram. 67 Government Headquarters Hospitals (Tambaram-Chennai, Villupuram, Srirangam-
Tiruchirappalli, Erode, Dindigul and Dharmapuri) and Government Medical College
Hospitals (Thanjavur and Tirunelveli)
Chapter-II IT Audit on Tamil Nadu Medical Services Corporation
49
Tender and Procurement
2.2.7 The tenders are received in two covers, Cover-A (technical bid) and Cover-B (price bid). During scrutiny of Cover-A, it would be ensured that all
tender requirements had been met. Subsequently, Cover-B would be opened and the details of the price quoted by the tenderer are fed into the software.
Based on the data entry carried out in the system, the provisional list of tenderers
with their rate for each drug is generated and placed before the Tender Committee68 of the Board and the lowest (L-1) rates are approved. Thereafter,
willingness of other bidders for matching L-1 rate is obtained and 60 per cent of the order is placed on L-1 and the balance 40 per cent is shared among other bidders, who agreed to match the price of L-1. Performance security is obtained
from all bidders and agreement is executed before purchase orders are placed for supply of drugs.
Deficiencies in Tender processing system in DDMS
2.2.8 As per TNMSC manual, the officers nominated to scrutinise tender
documents are required to record the conformity or otherwise of the documents in the checklist for updating computer system. Thereafter, the EDP section
would be responsible for entering the rates quoted in Cover-B and taking printout of comparative statement.
The information involved in this process is captured in DDMS database. During
the scrutiny of the database for the period 2012-13 to 2016-17, following points relating to tender processing were noticed:
(i) The table COVERA_DETAILS of DDMS, which captured details of documents received, did capture the documents/certificates, which were actually received. When the CHECKLIST table, which had the list of
documents to be received, was compared with COVERA_DETAILS1 table, it was noticed that in 165 instances (relating to 11 tenders out of 48 tenders), the
remarks column indicating the document submitted was not complete.
It was noticed that only the details of non-submission of documents by the tenderers were captured in the system and forwarded to the purchase department
for following it up with the tenderers to obtain them before short-listing the tenderers for opening of Cover-B (financial bid). After the production of the
documents by the tenderers, the purchase department considered their technica l bid as complete. The receipt of pending documents, however, were not updated in the system. As a result, the database was showing bidders short listed were
eligible for opening of Cover-B although they had not submitted requisite documents.
(ii) In the table COVERA_DETAILS3, details of Earnest Money Deposit (EMD) and Security Deposit were captured. These details would have a bearing while refunding these deposits to the tenderers. The deficiencies noticed in this
table during analysis are as follows:
68 Comprising of Chairman, Health Secretary; Managing Director, TNMSC; Director,
Finance; Joint Secretary, Finance Department; Director of Medical Education .
Audit Report (Public Sector Undertakings) for the year ended 31 March 2017
50
Though EMD was collected in all cases, the system showed
non-collection of EMD in 107 instances (relating to 27 tenders and 84 tenderers). This was evidently due to non-capturing of data.
Similarly, in 521 instances (relating to 38 tenders and 266 tenderers),
Security Deposit was shown as not collected from L-1 or bidders matching their rates with L-1 price on whom orders were placed.
Though the application software had been developed with necessary tables to capture the relevant information so as to automate the functionality, the tender processing which is one of the components of DDMS application software for
finalising L-1 supplier was partial and the data held in the system was incomplete and unreliable. Since the application software has provisions for
processing of the tenders through system, online submission of tenders may be considered to ensure that the bids submitted by the tenderers were received without any omission.
The Government accepted (November 2017) that information were not being properly updated/verified. It was further stated that customisation of payment
module in DDMS application to link with EMD/SD details was in progress during 2016-17.
Inconsistencies in Pre-order statements
2.2.9 The drug wise consumption/requirement details of all the warehouses including the manufacturing capacity of the supplier furnished by the suppliers
at the tender finalisation stage were used for preparing the pre-order statements. The actual requirement of quantity of drug to be ordered (tender quantity) from
the supplier were arrived at by taking into account the past six months’ consumption in all the warehouses and reducing the ground stock available in the warehouses and pipeline stock. The pre-order statement generated by the
computer system was the input for placing purchase orders (PO) and hence, it was a critical stage in procurement process.
The data relating to pre-order statement pertaining to the year 2016-17, which was generated and stored as a database, was produced to audit. For the years 2014-15 and 2015-16 hard copy of the pre-order statement was produced to
audit. On scrutiny, the following observations were made:
(a) Incorrect mapping of business rule in IT system leading to excess
procurement
Audit scrutiny indicated that pre-order statements were prepared without taking into account ground stock at warehouses in 232 cases, which resulted in excess
procurement of drugs/medicines. This happened due to incorrect mapping of business rules in the computer system.
Excess holding of stock resulted in avoidable investment in drugs not required for consumption in the immediate future and would run the risk of expiry.
The Government stated (November 2017) that a decision was taken to consider
the stock position of individual warehouses rather than the stock of State. However, from the year 2017-18, the decision was revised to consider the stock
of State for re-order level instead of the individual requirement of the warehouses and also to issue suitable inter-warehouse transfers automatica l ly
Chapter-II IT Audit on Tamil Nadu Medical Services Corporation
51
for the movement of the drugs from the available warehouses to the required warehouses.
TNMSC should have taken steps for inter-warehouse transfers instead of raising purchase orders to meet the requirement of individual warehouses when the
excess stock position was exhibited in the other warehouses as per the pre-order statements generated by the system.
(b) Manual modifications in system-generated pre-order statements
As per clause 13.4 (i) and (ii) of the Tender document, the supplier should supply at least 50 per cent of the ordered quantity within 45 days from date of
purchase order and balance quantity within next 15 days. There was no condition that preference would be given to the supplier who promised to supply within 10 days.
It was observed from the pre-order statements that quantities to be ordered on finalised suppliers were frequently modified manually by purchase section. We
noticed that out of 4,259 drugs, manual modifications were carried out in the pre-order statements of 1,591 (37.36 per cent) drugs.
Instances of manual interventions violating the policy are detailed in
Table 2.2.1:
Table 2.2.1: Instances of manual intervention in the purchase order
Sl.No. Pre-order Statement
number
Drug
code
Instances of manual intervention
1.
14.10.2014/01:28:04
2 The purchase department manually modified
the pre-order statement and placed entire order
on L-1.
104 The purchase department manually modified
the pre-order statement to place the entire order
on L-1 supplier on the ground that the firm had
agreed to supply in short period of 10 days.
114 The purchase department manually modified
the pre-order statement to place the entire order
on one supplier, who matched his rates with
L-1 on the ground that the previous purchase
order was not placed on him and he had agreed
to supply the ordered quantity in short period of
10 days. Thus, the L-1 and another supplier
who matched his rate with L-1 were not
considered.
232 The purchase department manually modified
the pre-order statement to place the order for the
entire quantity on L-1 bidder on the ground that
the L-1 bidder was ready to supply in 10 days.
2.
16001201703271205
16 The supplier who matched L-1 rate was given
order for more than the system-generated
quantity without asking L-1 supplier to increase
the production capacity resulting in supplier
who matched L-1 rate getting 63 per cent of the
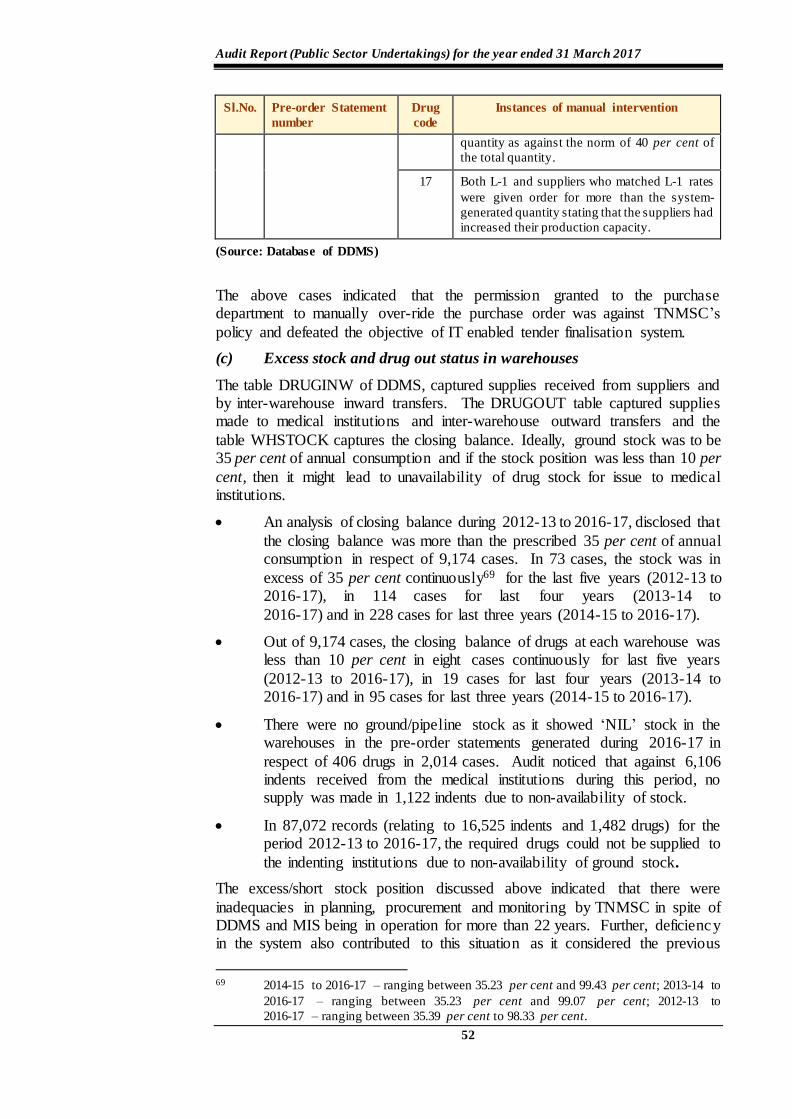
Audit Report (Public Sector Undertakings) for the year ended 31 March 2017
52
Sl.No. Pre-order Statement
number
Drug
code
Instances of manual intervention
quantity as against the norm of 40 per cent of
the total quantity.
17 Both L-1 and suppliers who matched L-1 rates
were given order for more than the system-
generated quantity stating that the suppliers had
increased their production capacity.
(Source: Database of DDMS)
The above cases indicated that the permission granted to the purchase department to manually over-ride the purchase order was against TNMSC’s
policy and defeated the objective of IT enabled tender finalisation system.
(c) Excess stock and drug out status in warehouses
The table DRUGINW of DDMS, captured supplies received from suppliers and by inter-warehouse inward transfers. The DRUGOUT table captured supplies made to medical institutions and inter-warehouse outward transfers and the
table WHSTOCK captures the closing balance. Ideally, ground stock was to be 35 per cent of annual consumption and if the stock position was less than 10 per
cent, then it might lead to unavailability of drug stock for issue to medical institutions.
An analysis of closing balance during 2012-13 to 2016-17, disclosed that
the closing balance was more than the prescribed 35 per cent of annual consumption in respect of 9,174 cases. In 73 cases, the stock was in
excess of 35 per cent continuously69 for the last five years (2012-13 to 2016-17), in 114 cases for last four years (2013-14 to
2016-17) and in 228 cases for last three years (2014-15 to 2016-17).
Out of 9,174 cases, the closing balance of drugs at each warehouse was less than 10 per cent in eight cases continuously for last five years
(2012-13 to 2016-17), in 19 cases for last four years (2013-14 to 2016-17) and in 95 cases for last three years (2014-15 to 2016-17).
There were no ground/pipeline stock as it showed ‘NIL’ stock in the warehouses in the pre-order statements generated during 2016-17 in
respect of 406 drugs in 2,014 cases. Audit noticed that against 6,106 indents received from the medical institutions during this period, no supply was made in 1,122 indents due to non-availability of stock.
In 87,072 records (relating to 16,525 indents and 1,482 drugs) for the period 2012-13 to 2016-17, the required drugs could not be supplied to
the indenting institutions due to non-availability of ground stock.
The excess/short stock position discussed above indicated that there were
inadequacies in planning, procurement and monitoring by TNMSC in spite of DDMS and MIS being in operation for more than 22 years. Further, deficiency in the system also contributed to this situation as it considered the previous
69 2014-15 to 2016-17 – ranging between 35.23 per cent and 99.43 per cent; 2013-14 to
2016-17 – ranging between 35.23 per cent and 99.07 per cent; 2012-13 to
2016-17 – ranging between 35.39 per cent to 98.33 per cent.
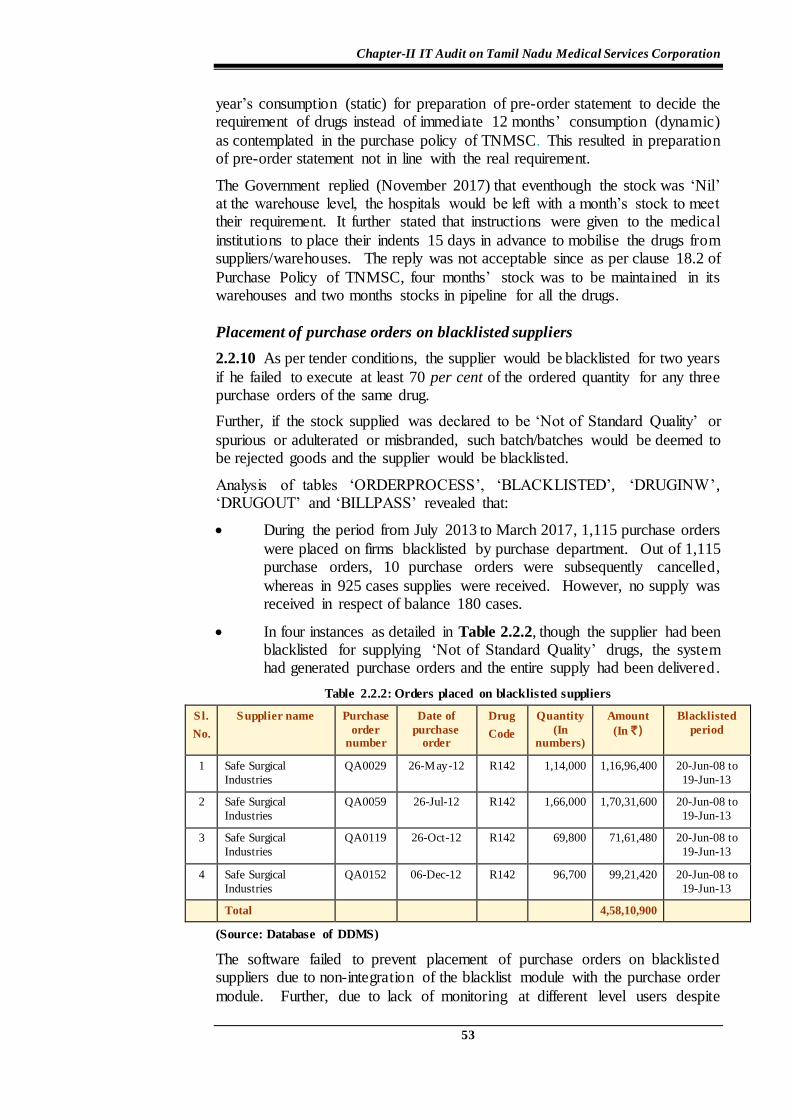
Chapter-II IT Audit on Tamil Nadu Medical Services Corporation
53
year’s consumption (static) for preparation of pre-order statement to decide the requirement of drugs instead of immediate 12 months’ consumption (dynamic)
as contemplated in the purchase policy of TNMSC. This resulted in preparation of pre-order statement not in line with the real requirement.
The Government replied (November 2017) that eventhough the stock was ‘Nil’ at the warehouse level, the hospitals would be left with a month’s stock to meet their requirement. It further stated that instructions were given to the medical
institutions to place their indents 15 days in advance to mobilise the drugs from suppliers/warehouses. The reply was not acceptable since as per clause 18.2 of
Purchase Policy of TNMSC, four months’ stock was to be maintained in its warehouses and two months stocks in pipeline for all the drugs.
Placement of purchase orders on blacklisted suppliers
2.2.10 As per tender conditions, the supplier would be blacklisted for two years
if he failed to execute at least 70 per cent of the ordered quantity for any three purchase orders of the same drug.
Further, if the stock supplied was declared to be ‘Not of Standard Quality’ or
spurious or adulterated or misbranded, such batch/batches would be deemed to be rejected goods and the supplier would be blacklisted.
Analysis of tables ‘ORDERPROCESS’, ‘BLACKLISTED’, ‘DRUGINW’, ‘DRUGOUT’ and ‘BILLPASS’ revealed that:
During the period from July 2013 to March 2017, 1,115 purchase orders
were placed on firms blacklisted by purchase department. Out of 1,115 purchase orders, 10 purchase orders were subsequently cancelled,
whereas in 925 cases supplies were received. However, no supply was received in respect of balance 180 cases.
In four instances as detailed in Table 2.2.2, though the supplier had been blacklisted for supplying ‘Not of Standard Quality’ drugs, the system had generated purchase orders and the entire supply had been delivered.
Table 2.2.2: Orders placed on blacklisted suppliers
Sl.
No.
Supplier name Purchase
order number
Date of
purchase order
Drug
Code
Quantity
(In numbers)
Amount
(In `)
Blacklisted
period
1 Safe Surgical
Industries
QA0029 26-May-12 R142 1,14,000 1,16,96,400 20-Jun-08 to
19-Jun-13
2 Safe Surgical
Industries
QA0059 26-Jul-12 R142 1,66,000 1,70,31,600 20-Jun-08 to
19-Jun-13
3 Safe Surgical
Industries
QA0119 26-Oct-12 R142 69,800 71,61,480 20-Jun-08 to
19-Jun-13
4 Safe Surgical
Industries
QA0152 06-Dec-12 R142 96,700 99,21,420 20-Jun-08 to
19-Jun-13
Total 4,58,10,900
(Source: Database of DDMS)
The software failed to prevent placement of purchase orders on blacklisted suppliers due to non-integration of the blacklist module with the purchase order
module. Further, due to lack of monitoring at different level users despite
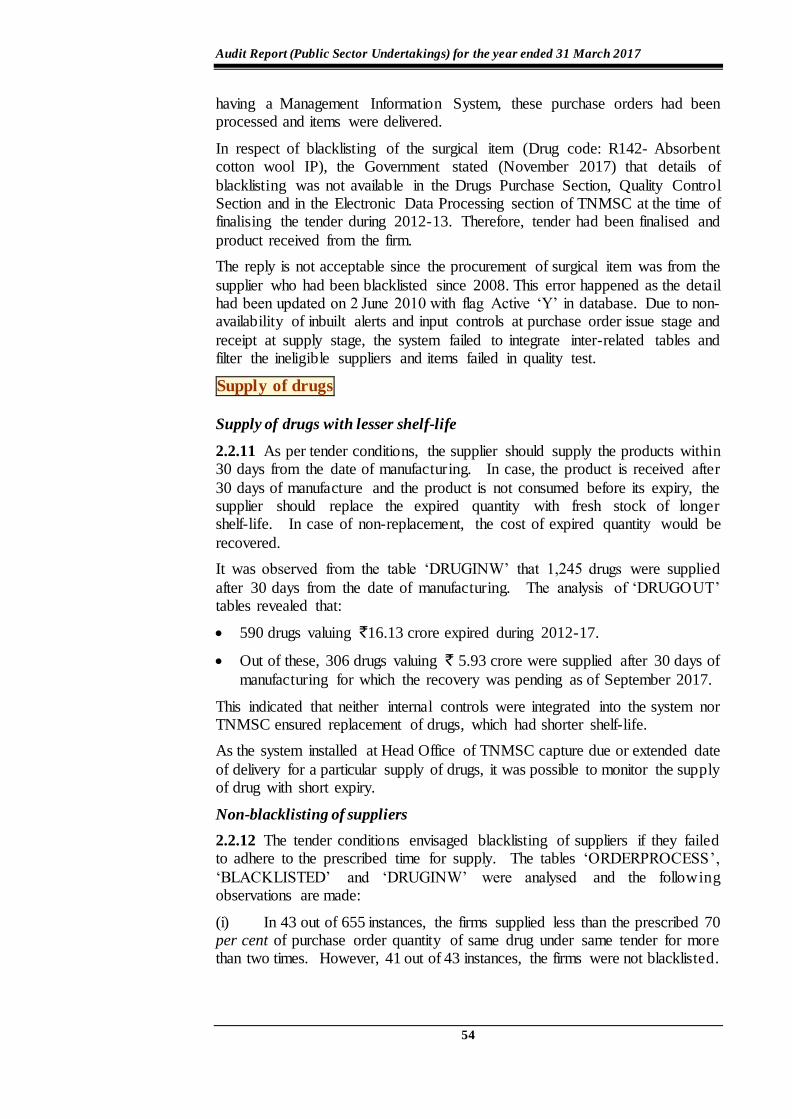
Audit Report (Public Sector Undertakings) for the year ended 31 March 2017
54
having a Management Information System, these purchase orders had been processed and items were delivered.
In respect of blacklisting of the surgical item (Drug code: R142- Absorbent cotton wool IP), the Government stated (November 2017) that details of
blacklisting was not available in the Drugs Purchase Section, Quality Control Section and in the Electronic Data Processing section of TNMSC at the time of finalising the tender during 2012-13. Therefore, tender had been finalised and
product received from the firm.
The reply is not acceptable since the procurement of surgical item was from the
supplier who had been blacklisted since 2008. This error happened as the detail had been updated on 2 June 2010 with flag Active ‘Y’ in database. Due to non-availability of inbuilt alerts and input controls at purchase order issue stage and
receipt at supply stage, the system failed to integrate inter-related tables and filter the ineligible suppliers and items failed in quality test.
Supply of drugs
Supply of drugs with lesser shelf-life
2.2.11 As per tender conditions, the supplier should supply the products within 30 days from the date of manufacturing. In case, the product is received after
30 days of manufacture and the product is not consumed before its expiry, the supplier should replace the expired quantity with fresh stock of longer shelf-life. In case of non-replacement, the cost of expired quantity would be
recovered.
It was observed from the table ‘DRUGINW’ that 1,245 drugs were supplied
after 30 days from the date of manufacturing. The analysis of ‘DRUGOUT’ tables revealed that:
590 drugs valuing `16.13 crore expired during 2012-17.
Out of these, 306 drugs valuing ` 5.93 crore were supplied after 30 days of
manufacturing for which the recovery was pending as of September 2017.
This indicated that neither internal controls were integrated into the system nor TNMSC ensured replacement of drugs, which had shorter shelf-life.
As the system installed at Head Office of TNMSC capture due or extended date
of delivery for a particular supply of drugs, it was possible to monitor the supply of drug with short expiry.
Non-blacklisting of suppliers
2.2.12 The tender conditions envisaged blacklisting of suppliers if they failed to adhere to the prescribed time for supply. The tables ‘ORDERPROCESS’,
‘BLACKLISTED’ and ‘DRUGINW’ were analysed and the following observations are made:
(i) In 43 out of 655 instances, the firms supplied less than the prescribed 70 per cent of purchase order quantity of same drug under same tender for more than two times. However, 41 out of 43 instances, the firms were not blacklisted.
Chapter-II IT Audit on Tamil Nadu Medical Services Corporation
55
(ii) Though 115 purchase orders were cancelled due to failure of the suppliers to adhere to tender conditions warranting blacklisting, the system did
not blacklist the suppliers automatically.
The Government stated (November 2017) that the majority of suppliers failed
to acknowledge the receipt of purchase orders issued to them. Though the system had been designed to prevent acceptance of supply beyond the stipulated date of delivery at the warehouse, the system failed to cancel such purchase
orders.
(iii) Whenever the supplier defaults in supply of drugs, TNMSC resorted to
placement of Emergency Purchase Orders (EPOs) on another supplier at the risk and cost of the defaulted supplier. It had been observed that during 2012-17, 145 EPOs were placed, which included 138 EPOs with higher cost amounting
to ` 3.37 crore. As the system was not designed to capture recovery of the amount from the defaulted suppliers, audit could not ascertain the recovery of
differential cost by TNMSC from the defaulted suppliers.
Thus, the system failed to detect the habitual defaulters and lack of monitor ing
at different levels, which resulted in issue of purchase orders to defaulted suppliers and resultant EPOs at higher cost.
The Government stated (November 2017) that they had implemented a module
in DDMS in October 2017 to generate blacklist report on performance, as per the tender conditions. Further, necessary modifications had been made in
DDMS to indicate the details of blacklisted suppliers in the pre-order statement and also to restrict purchase order entry on such supplier and such errors would not occur in future.
Discrepancies in data capture
2.2.13 On receipt of goods, the warehouse-in-charge entered the details of
receipt in Inwards Goods Register and handed over the same to Data Entry Operator for capturing the inward drug details in the system. As the data was stored in the database without any verification and authorisation by the
warehouse-in-charge, there were errors in capture of manufacturing/expiry date of drugs for same Purchase Order Numbers, Drug Codes and Batch Numbers as
detailed in Table 2.2.3.
Table 2.2.3: Discrepancy in data capture
Sl.
No.
Type of error Number of
instances
Error impact on shelf-life of the
drug
1 Errors in capture of expiry date across
all warehouses
3,082 (-) 3,653 days to (+) 6,200 days
2 Errors in capture of expiry date within a
warehouse
10 (-) 365 days to (+) 365 days
3 Errors in capture of manufacturing date
across all warehouses
1,889 (-) 1,248 days to (+) 9,131 days
4 Errors in capture of manufacturing date
within a warehouse
16 (-) 214 days to (+) 731 days
(Source: Database of DDMS)
As errors in expiry date would affect the chain report for transfer of drugs, short expiry drugs etc., the failure of the system to detect/prevent these errors at input
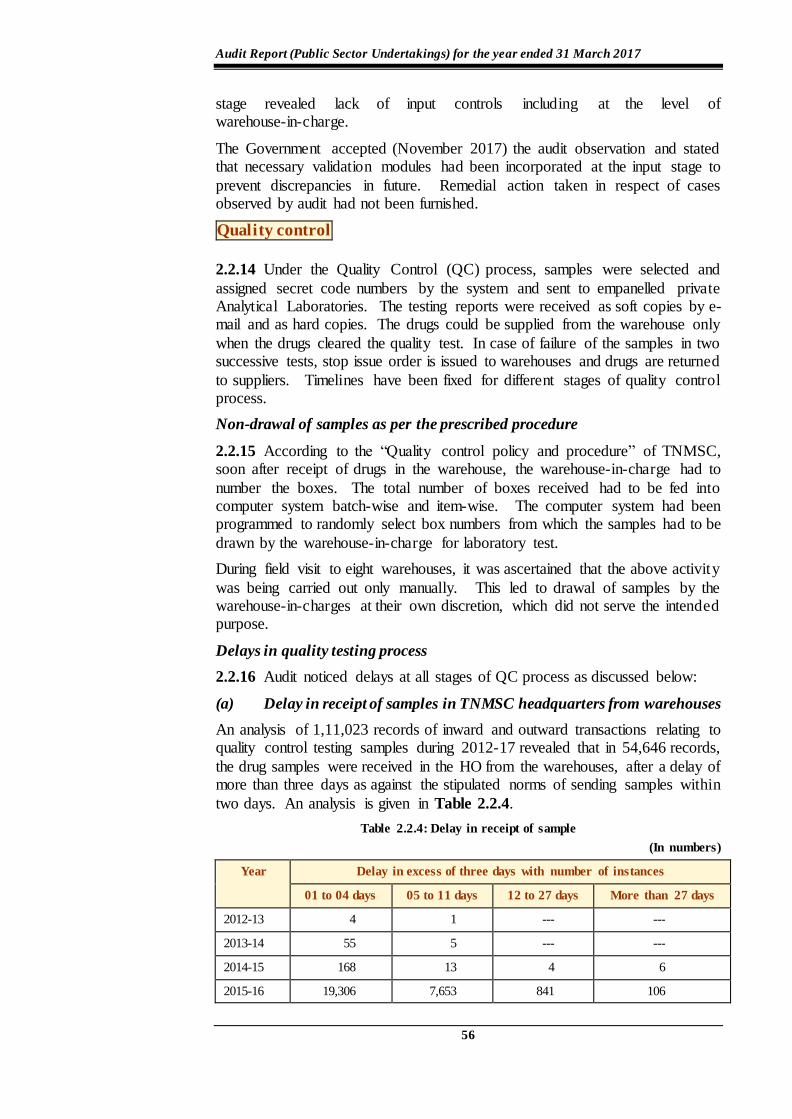
Audit Report (Public Sector Undertakings) for the year ended 31 March 2017
56
stage revealed lack of input controls including at the level of warehouse-in-charge.
The Government accepted (November 2017) the audit observation and stated that necessary validation modules had been incorporated at the input stage to
prevent discrepancies in future. Remedial action taken in respect of cases observed by audit had not been furnished.
Quality control
2.2.14 Under the Quality Control (QC) process, samples were selected and
assigned secret code numbers by the system and sent to empanelled private Analytical Laboratories. The testing reports were received as soft copies by e-mail and as hard copies. The drugs could be supplied from the warehouse only
when the drugs cleared the quality test. In case of failure of the samples in two successive tests, stop issue order is issued to warehouses and drugs are returned
to suppliers. Timelines have been fixed for different stages of quality control process.
Non-drawal of samples as per the prescribed procedure
2.2.15 According to the “Quality control policy and procedure” of TNMSC, soon after receipt of drugs in the warehouse, the warehouse-in-charge had to
number the boxes. The total number of boxes received had to be fed into computer system batch-wise and item-wise. The computer system had been programmed to randomly select box numbers from which the samples had to be
drawn by the warehouse-in-charge for laboratory test.
During field visit to eight warehouses, it was ascertained that the above activity
was being carried out only manually. This led to drawal of samples by the warehouse-in-charges at their own discretion, which did not serve the intended purpose.
Delays in quality testing process
2.2.16 Audit noticed delays at all stages of QC process as discussed below:
(a) Delay in receipt of samples in TNMSC headquarters from warehouses
An analysis of 1,11,023 records of inward and outward transactions relating to quality control testing samples during 2012-17 revealed that in 54,646 records,
the drug samples were received in the HO from the warehouses, after a delay of more than three days as against the stipulated norms of sending samples within
two days. An analysis is given in Table 2.2.4.
Table 2.2.4: Delay in receipt of sample
(In numbers)
Year Delay in excess of three days with number of instances
01 to 04 days 05 to 11 days 12 to 27 days More than 27 days
2012-13 4 1 --- ---
2013-14 55 5 --- ---
2014-15 168 13 4 6
2015-16 19,306 7,653 841 106
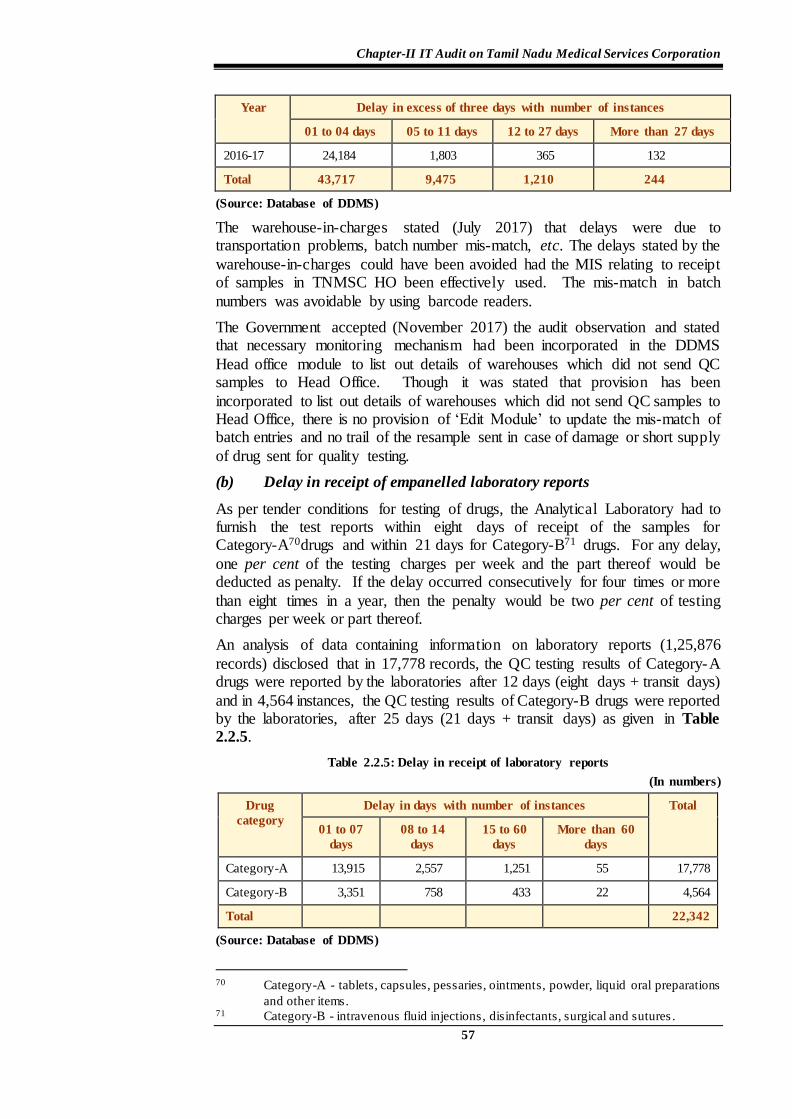
Chapter-II IT Audit on Tamil Nadu Medical Services Corporation
57
Year Delay in excess of three days with number of instances
01 to 04 days 05 to 11 days 12 to 27 days More than 27 days
2016-17 24,184 1,803 365 132
Total 43,717 9,475 1,210 244
(Source: Database of DDMS)
The warehouse-in-charges stated (July 2017) that delays were due to transportation problems, batch number mis-match, etc. The delays stated by the
warehouse-in-charges could have been avoided had the MIS relating to receipt of samples in TNMSC HO been effectively used. The mis-match in batch
numbers was avoidable by using barcode readers.
The Government accepted (November 2017) the audit observation and stated that necessary monitoring mechanism had been incorporated in the DDMS
Head office module to list out details of warehouses which did not send QC samples to Head Office. Though it was stated that provision has been
incorporated to list out details of warehouses which did not send QC samples to Head Office, there is no provision of ‘Edit Module’ to update the mis-match of batch entries and no trail of the resample sent in case of damage or short supply
of drug sent for quality testing.
(b) Delay in receipt of empanelled laboratory reports
As per tender conditions for testing of drugs, the Analytical Laboratory had to furnish the test reports within eight days of receipt of the samples for Category-A70drugs and within 21 days for Category-B71 drugs. For any delay,
one per cent of the testing charges per week and the part thereof would be deducted as penalty. If the delay occurred consecutively for four times or more
than eight times in a year, then the penalty would be two per cent of testing charges per week or part thereof.
An analysis of data containing information on laboratory reports (1,25,876
records) disclosed that in 17,778 records, the QC testing results of Category-A drugs were reported by the laboratories after 12 days (eight days + transit days)
and in 4,564 instances, the QC testing results of Category-B drugs were reported by the laboratories, after 25 days (21 days + transit days) as given in Table
2.2.5.
Table 2.2.5: Delay in receipt of laboratory reports
(In numbers)
Drug
category
Delay in days with number of instances Total
01 to 07
days
08 to 14
days
15 to 60
days
More than 60
days
Category-A 13,915 2,557 1,251 55 17,778
Category-B 3,351 758 433 22 4,564
Total 22,342
(Source: Database of DDMS)
70 Category-A - tablets, capsules, pessaries, ointments, powder, liquid oral preparations
and other items. 71 Category-B - intravenous fluid injections, disinfectants, surgical and sutures .
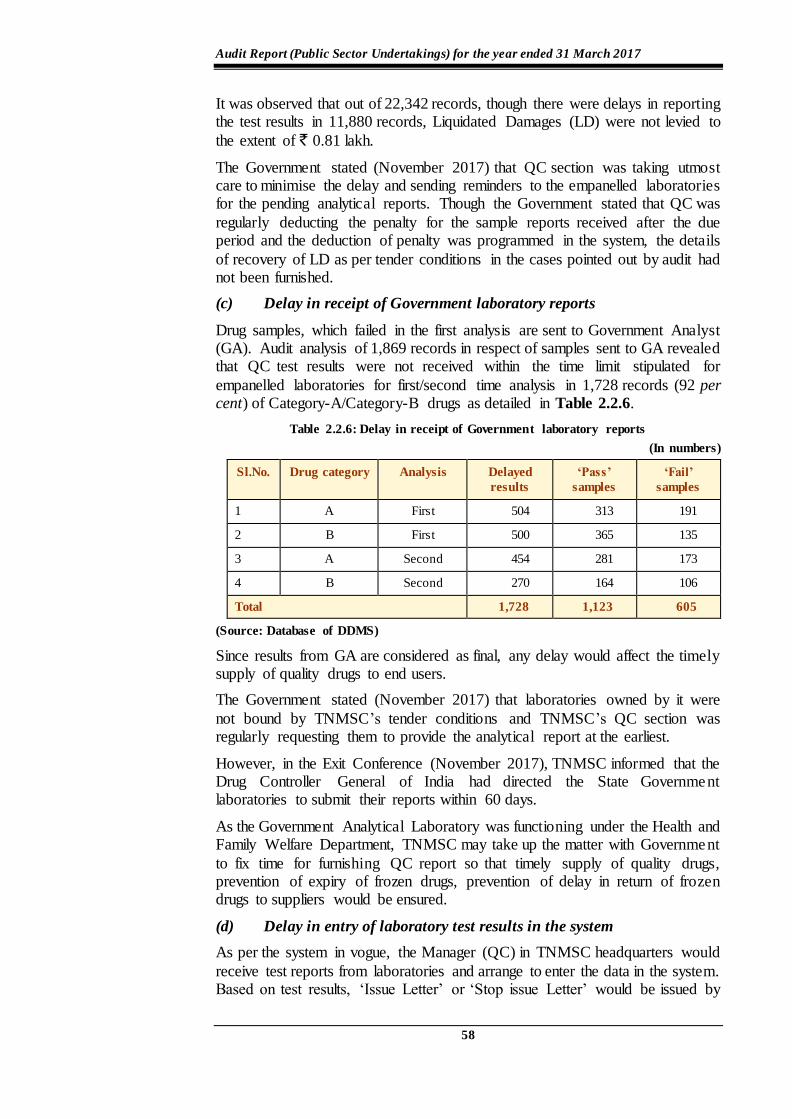
Audit Report (Public Sector Undertakings) for the year ended 31 March 2017
58
It was observed that out of 22,342 records, though there were delays in reporting the test results in 11,880 records, Liquidated Damages (LD) were not levied to
the extent of ` 0.81 lakh.
The Government stated (November 2017) that QC section was taking utmost care to minimise the delay and sending reminders to the empanelled laboratories for the pending analytical reports. Though the Government stated that QC was
regularly deducting the penalty for the sample reports received after the due period and the deduction of penalty was programmed in the system, the details
of recovery of LD as per tender conditions in the cases pointed out by audit had not been furnished.
(c) Delay in receipt of Government laboratory reports
Drug samples, which failed in the first analysis are sent to Government Analyst (GA). Audit analysis of 1,869 records in respect of samples sent to GA revealed that QC test results were not received within the time limit stipulated for
empanelled laboratories for first/second time analysis in 1,728 records (92 per cent) of Category-A/Category-B drugs as detailed in Table 2.2.6.
Table 2.2.6: Delay in receipt of Government laboratory reports
(In numbers)
Sl.No. Drug category Analysis Delayed
results
‘Pass’
samples
‘Fail’
samples
1 A First 504 313 191
2 B First 500 365 135
3 A Second 454 281 173
4 B Second 270 164 106
Total 1,728 1,123 605
(Source: Database of DDMS)
Since results from GA are considered as final, any delay would affect the timely supply of quality drugs to end users.
The Government stated (November 2017) that laboratories owned by it were
not bound by TNMSC’s tender conditions and TNMSC’s QC section was regularly requesting them to provide the analytical report at the earliest.
However, in the Exit Conference (November 2017), TNMSC informed that the Drug Controller General of India had directed the State Government laboratories to submit their reports within 60 days.
As the Government Analytical Laboratory was functioning under the Health and Family Welfare Department, TNMSC may take up the matter with Government
to fix time for furnishing QC report so that timely supply of quality drugs, prevention of expiry of frozen drugs, prevention of delay in return of frozen drugs to suppliers would be ensured.
(d) Delay in entry of laboratory test results in the system
As per the system in vogue, the Manager (QC) in TNMSC headquarters would
receive test reports from laboratories and arrange to enter the data in the system. Based on test results, ‘Issue Letter’ or ‘Stop issue Letter’ would be issued by
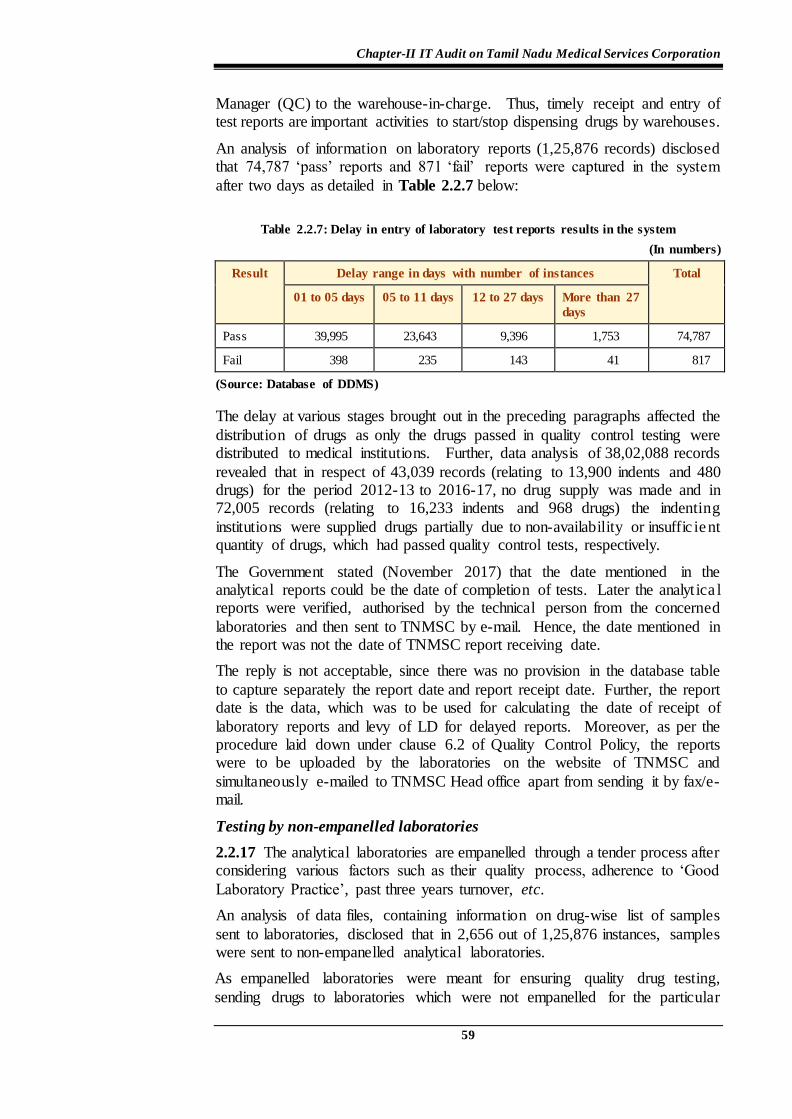
Chapter-II IT Audit on Tamil Nadu Medical Services Corporation
59
Manager (QC) to the warehouse-in-charge. Thus, timely receipt and entry of test reports are important activities to start/stop dispensing drugs by warehouses.
An analysis of information on laboratory reports (1,25,876 records) disclosed that 74,787 ‘pass’ reports and 871 ‘fail’ reports were captured in the system
after two days as detailed in Table 2.2.7 below:
Table 2.2.7: Delay in entry of laboratory test reports results in the system
(In numbers)
Result Delay range in days with number of instances Total
01 to 05 days 05 to 11 days 12 to 27 days More than 27
days
Pass 39,995 23,643 9,396 1,753 74,787
Fail 398 235 143 41 817
(Source: Database of DDMS)
The delay at various stages brought out in the preceding paragraphs affected the
distribution of drugs as only the drugs passed in quality control testing were distributed to medical institutions. Further, data analysis of 38,02,088 records
revealed that in respect of 43,039 records (relating to 13,900 indents and 480 drugs) for the period 2012-13 to 2016-17, no drug supply was made and in 72,005 records (relating to 16,233 indents and 968 drugs) the indenting
institutions were supplied drugs partially due to non-availability or insuffic ient quantity of drugs, which had passed quality control tests, respectively.
The Government stated (November 2017) that the date mentioned in the analytical reports could be the date of completion of tests. Later the analyt ica l reports were verified, authorised by the technical person from the concerned
laboratories and then sent to TNMSC by e-mail. Hence, the date mentioned in the report was not the date of TNMSC report receiving date.
The reply is not acceptable, since there was no provision in the database table
to capture separately the report date and report receipt date. Further, the report date is the data, which was to be used for calculating the date of receipt of
laboratory reports and levy of LD for delayed reports. Moreover, as per the procedure laid down under clause 6.2 of Quality Control Policy, the reports were to be uploaded by the laboratories on the website of TNMSC and
simultaneously e-mailed to TNMSC Head office apart from sending it by fax/e-mail.
Testing by non-empanelled laboratories
2.2.17 The analytical laboratories are empanelled through a tender process after considering various factors such as their quality process, adherence to ‘Good
Laboratory Practice’, past three years turnover, etc.
An analysis of data files, containing information on drug-wise list of samples
sent to laboratories, disclosed that in 2,656 out of 1,25,876 instances, samples were sent to non-empanelled analytical laboratories.
As empanelled laboratories were meant for ensuring quality drug testing,
sending drugs to laboratories which were not empanelled for the particular
Audit Report (Public Sector Undertakings) for the year ended 31 March 2017
60
financial year/particular drug was on account of deficiencies in the computer system.
The Government replied (November 2017) that due to urgency, such samples were sent to other laboratories after obtaining willingness from them. The reply
was not acceptable as it was a deviation from the prescribed procedure for empanelment of analytical testing laboratories. Further, the reply was silent about the approval of the Board for entrusting the samples for quality tests to
non-empanelled laboratories.
Non-inclusion of drug batches for sample selection
2.2.18 As per the system being followed, drug-wise and batch-wise samples are selected by the system from the samples received from the warehouses and sent to analytical laboratories for QC test.
An analysis of data disclosed that during 2014-17, a total of 384 batches of drugs were missed out in the sample selection process for quality test, rendering the
selection process deficient.
In response to specific instances pointed out by audit, TNMSC stated that the sample drugs were omitted in the random sampling as they were not listed in
MIS report. Audit observed that the MIS report, which was being relied upon, was deficient as it was restricted to the current financial year and hence the year-
end transactions of the previous year were not displayed.
The Government accepted (November 2017) the audit observation and stated that application software had been modified in such a way that sample selection
module automatically search entries both from current year and previous year tables to avoid delay and manual intervention.
Non-analysis of stocks held for more than six months
2.2.19 With a view to ensure the quality of the drugs during the storage period, samples were to be drawn from the lots which were lying in the warehouse for
more than six months. An analysis of data on inward and outward transaction of drugs revealed that during 2012-17, supplies made in 6,949 instances, which
were lying in the warehouses for more than six months were not sent for second time QC testing.
There was no provision in the software application to generate the list of drugs,
which were lying without being quality tested for the second time after six months.
During field visit to eight district warehouses, it was noticed that 81 drugs were reported (2014-17) to be ‘Not of Standard Quality’ by Government Drug Inspectors. Since, the prescribed procedures for re-testing of quality after six
months were not followed, these quality issues were not detected in-house before distribution to hospitals.
The Government accepted (November 2017) the audit observation and stated that necessary modules had been implemented in DDMS to list out pending samples to QC section to ensure quality of drugs throughout the shelf life of the
drug as prescribed. However, no reply had been furnished on deputing officers for inspection at warehouses to draw random samples for quality check.
Chapter-II IT Audit on Tamil Nadu Medical Services Corporation
61
Not blacklisting the suppliers of failed drugs
2.2.20 An analysis of data on laboratory reports (1,25,876 records) and
blacklisting of the suppliers (113 records) disclosed that in 61 instances, a drug supplied by 46 suppliers, failed in Government laboratories more than once
within tender period. But the suppliers of the drugs were not blacklisted as per QC policy and terms and conditions of tender.
The above deficiencies revealed that in spite of requisite data available in the
system, no provision had been made to identify the suppliers, whose drugs had failed repeatedly to enable the management to take necessary action against
defaulters.
Not blacklisting the laboratories despite discrepancies in their results
2.2.21 As per tender conditions, if there were repeated variations72 in the
analytical reports furnished by the empanelled laboratories, they would be blacklisted for a period of two years.
An analysis of data of laboratory reports (1,25,876 records) disclosed that only 1,176 entries were made for the fields,73 which related to the analytical test details. This omission had resulted in non-review of laboratory reports through
the system. It was also observed that QC test results of same drug of same batch within a short period differed between two empanelled laboratories and between
an empanelled laboratory and Government analyst in respect of 2,184 samples during 2012-17.
Periodical reviews were not conducted by TNMSC in respect of above
mentioned 2,184 samples involving 41 laboratories, where the results differed. The system did not generate any report on laboratories producing conflic t ing
reports. This resulted in failure to blacklist the laboratories concerned so as to ensure supply of quality drugs.
The Government, while accepting the audit observation, replied (November
2017) that due to increase in the number of samples year after year, compared to the available laboratories, blacklisting clause of the tender condition could
not be enforced. The Government stated that several other parameters were also to be considered. However, these information were not captured due to lack of provision in the system, which had resulted in non-review of laboratory reports
through system.
Sending more than one sample drugs to Analytical Laboratories
2.2.22 As per the QC policy, the samples received from the warehouses were to be segregated drug-wise and batch number-wise and then the common batches of the drugs were eliminated and samples randomly selected by the
system.
An analysis of data relating to laboratory reports (1,25,876 records) disclosed
that in 2,017 records, samples from same batch number for the same drug were
72 If there is any variation in the analytical reports furnished by the empanelled
laboratories (either pass or fail) with the Government Laboratory for 3 times in assay
and 4 times for parameters other than assay for any drug in a year, the empanelled
laboratory would be blacklisted for a period of 2 years besides forfeiture of the security
deposit after following the due process. 73 ‘MILLIGRAM1’, ‘MILLIGRAM2’, ‘PERCENT1’ and ‘PERCENT2.’
Audit Report (Public Sector Undertakings) for the year ended 31 March 2017
62
selected and sent for analysis, resulting in duplicate testing of these samples and incurring excess expenditure of ` 9.92 lakh.
The Government replied (November 2017) that as per instructions, random
sample was being selected in DDMS application software based on purchase order number, drug code and batch number. The reply was not acceptable as it was a deviation from clause 4.2 of the Quality control policy for sample analysis
which contemplated that the sample receipts from warehouses were segregated drug-wise and batch number-wise.
Distribution of drugs
2.2.23 The medical institutions draw their requirement of drugs from their
jurisdictional warehouse using indents. The value of drugs and other supplies issued were debited in the Medicine Pass Book issued to the institut ion
indicating the annual budget.
Distribution of drugs after “stop issue” order
2.2.24 If a drug failed in the quality test of the analytical laboratory or in the
Government analytical laboratory, TNMSC headquarters issued the “stop issue” order to all warehouses and also issued instructions to retrieve any quantity
already issued to the medical institutions.
An analysis of the data held in ‘lab result’ and ‘drug out’ tables revealed that in 982 out of 25,680 instances, during 2014-17, drugs were issued to various
medical institutions by the warehouses, after the date of “stop issue” order by TNMSC headquarters. This was due to the non-updating of the latest test results,
in an automated manner.
The district warehouse-in-charges in the eight test-checked warehouses replied (July 2017) that due to delay in receipt of “stop issue” orders at the warehouses
and batch number mismatch, drugs were continued to be issued to medical institutions after the “stop issue” order date.
As the warehouse database is accessible to TNMSC Electronic Data Processing, controls should have been included in the application software to ensure that distribution of drugs was not done after issue of “stop issue” order. This
deficiency in the software had resulted in continued distribution of sub-standard drugs even after “stop issue” order.
The Government, while accepting the audit observation, replied (November
2017) that necessary changes had been incorporated in the application software from July 2017 to prevent issue of drugs which failed the quality test.
Deficiencies in transfer of stock between warehouses
2.2.25 TNMSC has a policy to conduct a fortnightly review of short expiry drugs lying in the warehouses so as to transfer the same to the needy warehouses
for issue before expiry. These transfers were effected by TNMSC Head office based on the request from the needy warehouse or on its own initiative.
An analysis of WHTRASFER table, which contain the information on transfer between warehouses, indicated non-adherence to transfer proposals as indicated in Table 2.2.8.
Chapter-II IT Audit on Tamil Nadu Medical Services Corporation
63
Table 2.2.8: Inter-warehouse transfer of drugs
Year Transfer Proposals Drug-
wise
transfers
not done
(In numbers)
Percentage
of drug-
wise
transfer
not done
Total
number of transfer
orders
Total
number of drugs
Total
quantity (In numbers)
2012-13 11,123 594 44,85,05,015 1,873 16.84
2013-14 11,729 691 33,62,12,443 10,492 89.45
2014-15 13,115 608 41,34,04,203 2,950 22.49
2015-16 7,186 552 28,20,50,451 643 8.95
2016-17 11,658 804 29,64,25,231 1,009 8.66
Total 54,811 3,249 177,65,97,343 16,967 30.96
(Source: Database of DDMS)
It could be seen that out of total drug-wise 54,811 transfers, 16,967 transfers were not effected.
We observed that poor planning with regard to scheduling of deliver ies, inadequate assessment of requirement and monitoring of supplies led to number
of inter-warehouse transfers. We also observed that necessary controls in the application software could have minimised these inter-warehouse transfers.
Difference in value of drugs between ‘indent master’ and ‘indent details’
2.2.26 The major details of indents received viz., indent number, passbook number of the medical institution, date of indent and total value of the drugs
indented are stored in the ‘Indent Master’ table of the database at the warehouse. The details of drugs issued and value of each drug (indent number is the linking or key field between the master and detail table) are stored in the ‘Indent Detail’
table. In other words, the total value of the drugs issued under an indent is sum of the value of each drug in the indent detail table and under no circumstances the total value of drugs and sum of break-up value of each drug can differ.
However, in 173 cases involving 24 warehouses, it was noticed that there was a difference in value between the two tables discussed above indicating lack of
referential integrity.
The Government replied (November 2017) that the validation mechanism is being incorporated at the back end in the new module to avoid the variations
pointed out by audit.
Payments to suppliers
Non-levy of penalty for short supply
2.2.27 As per the tender conditions, if the supplier failed to execute the supply within the stipulated time, TNMSC was at liberty to make alternative purchase and impose a penalty of upto 30 per cent on the value of unexecuted order.
(a) Non-supply
Audit noticed that supply was not received in respect of 2,603 purchase orders.
Out of these, TNMSC levied penalty of ` 7.30 crore for non-supply in respect
Audit Report (Public Sector Undertakings) for the year ended 31 March 2017
64
of 915 purchase orders. But, the system did not generate the penalty amount for the unexecuted quantity, which worked out to ` 34.77 crore.74
The Government stated (November 2017) that supply had been made in respect
of 788 cases and in remaining cases, penalty had been calculated and recovered fully/partially. As of October 2017, ` 13.13 crore had been recovered and
` 7.63 crore was pending recovery.
The fact, however, remained that no recovery has been initiated in respect of the
balance amount of ` 14.01 crore pointed out by audit.
(b) Partial supply
An analysis of data containing information on placement of purchase orders, supply at warehouses and payments disclosed that in 8,033 purchase orders,
supplies were partially made. In 4,595 purchase orders, penalty of 30 per cent was not generated by the system for the unexecuted value of the purchase orders, which worked out to ` 6.13 crore.
The audit trail revealed that lack of documentation (Data Flow Diagrams, Data
Dictionary, etc.,) had rendered the data available in the system incomplete, inconsistent and unreliable for calculation of penalty for unexecuted value of supply order.
The Government replied (November 2017) that the data required for audit trail was available in the system.
The reply was not acceptable as the details of unexecuted quantity, date of supply, penalty for unexecuted quantity, etc., were not available in the database provided by TNMSC.
Refund of penalty despite non-supply
2.2.28 An analysis of data containing information on placement of purchase
orders, supply at warehouses and payments, revealed that out of 1,385 cases of refund of penalty on unexecuted orders, in 791 cases the penalty amounts were refunded in full though the unexecuted portion of the order were not supplied.
In the remaining 594 cases, the penalty was refunded either fully or partially though there were unexecuted portions of supply.
Audit observed that there was no rule provision in TNMSC to refund the penalty. It was also observed that system had failed to correlate the supplies and the refund of penalty, resulting in return of the penalty even in the cases of
non/partial supply.
The Government stated (November 2017) that in respect of 594 cases, it had
levied penalty of ` 4.08 crore. It further stated that the penalty was refunded in respect of the balance 791 cases based on the tender condition for refund in case
of damaged supplies. The reply is not acceptable since the tender condition provided for refund of a maximum of five per cent on each order quantity for Ampoules, Vials and Glass Bottles and two per cent for remaining drugs in
74 2012-13 – `5.26 crore (264 cases); 2013-14 – ̀ 4.06 crore (108 cases); 2014-15 – ̀ 1.23
crore (57 cases); 2015-16 – `0.09 crore (nine cases) and 2016-17 – ̀ 24.13 crore (1,250
cases).
Chapter-II IT Audit on Tamil Nadu Medical Services Corporation
65
damaged supplies. Thus, the amount refunded in violation of the above condition, resulted in loss of ` 62.39 lakh.
Levy of penalty on empanelled laboratories
2.2.29 As per tender conditions, Analytical Laboratories had to furnish the test reports within eight days for Category-A and 21 days for Category-B drugs. For any delay, one per cent of the testing charges per week and the part thereof
would be deducted as penalty. For repeated delays75 the penalty would be two per cent of testing charges per week and part thereof.
An analysis of data of laboratory reports (1,25,876 records) revealed that in 81 instances involving 14,332 records, the test results from empanelled laboratories were received with delay occurrences of more than eight times in a
year or delay of more than ten days. Contrary to the tender conditions to levy penalty at two per cent, the system levied penalty at one per cent.
In 5,179 out of 23,595 records, penalty was levied though the testing results
were received within the stipulated time.
Thus, the systems failed to correlate the data relating to date of sending samples
to laboratories for quality testing and the date of receipt of laboratory results based on which the penalty is calculated. This resulted in incorrect calculat ion of penalty by the system and unwarranted correspondence with the laboratories.
The Government stated (November 2017) that audit had calculated the delay from the difference in days between ‘date sent’ and ‘report date’ whereas
TNMSC calculated the difference in days between ‘date sent’ and ‘result entry date’ and accordingly penalty was deducted from their payment.
The reply of the Government is not acceptable due to the fact that as per clause
23 (h) of the tender condition, the report was to be sent by e-mail/fax to TNMSC head office as soon as the test is completed. Audit observed that the test report
should be sent to TNMSC as soon as the test was completed and that date (report date) should be reckoned for arriving difference in days to levy penalty, in case the stipulated days exceeded 8 and 21 days for Category-A and Category-B,
respectively. Even if the analysis to work out the delay in submitting the report was calculated as per the reply of TNMSC, there were 414 out of 23,595
records, where penalty had been levied though the testing results had been received within the stipulated time.
Demurrage charges not computed
2.2.30 As per tender conditions, drugs found to be ‘Not of Standard Quality’ was to be taken back by the supplier within 30 days of communication of test
results. In case of failure by the supplier, TNMSC would collect demurrage charges, at the rate of two per cent per week, on the value of the drugs rejected.
Such unlifted/rejected stocks would be liable to be destroyed after 90 days.
We computed that ` 6.38 lakh and ` 2.36 lakh was leviable as demurrage during
2015-16 and 2016-17, respectively. TNMSC, however, did not collect any demurrage charges.
75 If the delay occurred consecutively for four times or more than eight times in a year or
a delay of more than 10 days occurs over the time period stipulated .
Audit Report (Public Sector Undertakings) for the year ended 31 March 2017
66
Audit observed that though the required data for such calculation was availab le in the database, no provision was available in the application software to
automatically work out the demurrage charges, which resulted in financial loss to TNMSC.
Government accepted (November 2017) the audit observation and stated that the application software was being customised to collect demurrage from respective suppliers.
General
Change management control and documentation
2.2.31 The e-Security Policy of 2010 of Government of Tamil Nadu, contemplated that maintenance of software developed by the department has to
be logged to ensure changes are authorised, tested and accepted to mainta in software accuracy and integrity.
The present system was evolved by incorporating the changes required from time-to-time. The change management76 from FoxPro application was carried out after re-engineering and documented. However, while upgrading to web-
based architecture, the re-engineering process was neither done nor supported by change management control process and documentation.
To cite an instance, in the warehouses, both DDMS and WIS application software were used. It was seen that DDMS was modified 18 times in warehouses during the year 2016-17.
We observed that whenever there was a change of architecture (from client-server to web-based) or changes are made in the existing application
software to cater to the needs of the user departments, there should be change management process and documentation for efficient and effective management of the IT System with transparency.
Deficiencies brought out by audit in this report were also due to absence of the change management controls and documentation.
The Government replied (November 2017) that the basic system flow was not changed from the earlier version of documentation and only the business logic and data dictionary changed from time-to-time, needed to be documented. It
also stated that on completion of migration process, the existing document would be updated.
Lack of third-party IT Security Assessments
2.2.32 According to the e-security policy, 2010 of GoTN, Government or third party IT security assessments of all IT devices, applications and assets was to
be carried out annually. The ‘e-Security Policy’ envisaged comprehens ive vulnerability assessment covering all devices and applications that formed the
network.
76 Change management arising from various factors including hardware or software
change, change in a process, change in technology, change in configuration etc., is one
of the key disciplines of IT service management, which ensures a systematic and
efficient approach to managing change in order to minimise the number and impact of
any related incidents upon service.
Chapter-II IT Audit on Tamil Nadu Medical Services Corporation
67
We noticed that such assessments for ensuring the security of the IT Systems were never carried out till date (September 2017). As a result, TNMSC had no
inkling of the security issues and other vulnerabilities of the system relied upon for its functions.
While accepting the audit observation, the Government stated that (November 2017) necessary steps had been taken to conduct IT Security audit of their web portals and IT infrastructure. However, no timeline has been indicated in the
reply.
Non-adherence to business continuity planning and disaster recovery Site
2.2.33 The e-Security Policy, 2010 of GoTN envisaged contingency planning which included (a) definition of critical information, threats, controls, system environment and roles and responsibilities, (b) establishment of critical
information back-up services and (c) determination of recovery strategies (preventive/maintenance/corrective). However, except taking periodical back-
up of the data held in TNMSC headquarters and warehouses and storing them in server systems/external storage devices, no plan and setup was in place in TNMSC. Considering the criticality of the IT Systems through which the day-
to-day functions of TNMSC were carried out, Audit observed that a business continuity and disaster recovery plan, as envisaged in the e-Security policy is
required.
The Government accepted (November 2017) the audit observation and stated that on completion of the planned migration of application software into web-
based, the application would be hosted at Tamil Nadu State Data Centre with support from existing disaster and recovery infrastructure. However, no time-
line has been indicated in the reply, for the planned conversion.
Conclusion
The computerised activities of TNMSC while catering to the day-to-day
medical needs of the Government medical institutions had deficiencies which were attributable to ineffective implementation and dilution of the system controls by manual interventions.
Inadequate mapping of business rules, lack of change management control processes and documentation were noticed.
Tender processing data held in the system was incomplete and unreliab le and purchase order quantities worked out by the system were manually
modified.
Inadequate planning and non-adherence to procurement policy resulted in
excess/short stock position noticed in warehouses.
TNMSC accepted supply of drugs with lesser-shelf life and also did not
obtain replacement of drugs received after expiry valued at ` 5.93 crore.
The prescribed procedure for drawal of samples was not followed. TNMSC
could have avoided delay at various stages in quality control through alerts in the system.
Audit Report (Public Sector Undertakings) for the year ended 31 March 2017
68
Non implementation of validation controls in the application software
resulted in issue of drugs even after generation of “stop issue” order in the system.
The system was deficient in blacklisting the defaulting supplier/laborator ies.
The system had deficiencies in calculating the penalty on unexecuted orders, refunds, liquidated damages and demurrage charges.
There was no business continuity and disaster recovery plan. No third party e-security assessment was carried out so far.
Recommendations
TNMSC may ensure
Overall effective utilisation of the system in tender processing by limit ing
human intervention to the minimum.
Complete automation and eliminating human intervention in bid submiss ion
and processing, deciding bidder-wise order quantity with audit trail and blacklisting of suppliers/laboratories to enhance transparency.
Incorporation of controls into the system to ensure replacement of drugs
which had shorter shelf life at the time of supply and to prevent distribution of sub-standard drugs after ‘stop issue’ order.
Streamlining of inter-warehouse transfers with added features in the system.
Proper mapping of business rules on charging of penalty on unexecuted
purchase orders, refunds, liquidated damages and demurrage charges.
Efficient use of MIS reports to avoid delays in quality control process at
various stages and to monitor stock position at warehouses.
Documentation of system upgrades and business continuity & disaster
recovery plans.