Chapter 9: Analysis Techniques - Rapeutation
29
FAA System Safety Handbook, Chapter 9: Analysis Techniques December 30, 2000 Chapter 9: Analysis Techniques 9.0 ANALYSIS TECHNIQUES .......................................................................................................... 2 9.1 INTRODUCTION ......................................................................................................................... 2 9.2 FAULT HAZARD ANALYSIS ..................................................................................................... 2 9.3 FAULT TREE ANALYSIS ........................................................................................................... 4 9.4 COMMON CAUSE FAILURE ANALYSIS................................................................................. 7 9.5 SNEAK CIRCUIT ANALYSIS..................................................................................................... 8 9.6 ENERGY TRACE ....................................................................................................................... 10 9.7 FAILURE MODES, EFFECTS, AND CRITICALITY ANALYSIS (FMECA) ....................... 13 9.8 OTHER METHODOLOGIES.................................................................................................... 14
-
Upload
khangminh22 -
Category
Documents
-
view
0 -
download
0
Transcript of Chapter 9: Analysis Techniques - Rapeutation

FAA System Safety Handbook, Chapter 9: Analysis Techniques December 30, 2000
Chapter 9: Analysis Techniques
9.0 ANALYSIS TECHNIQUES.......................................................................................................... 2
9.1 INTRODUCTION ......................................................................................................................... 2
9.2 FAULT HAZARD ANALYSIS ..................................................................................................... 2
9.3 FAULT TREE ANALYSIS ........................................................................................................... 4
9.4 COMMON CAUSE FAILURE ANALYSIS................................................................................. 7
9.5 SNEAK CIRCUIT ANALYSIS..................................................................................................... 8
9.6 ENERGY TRACE ....................................................................................................................... 10
9.7 FAILURE MODES, EFFECTS, AND CRITICALITY ANALYSIS (FMECA) ....................... 13
9.8 OTHER METHODOLOGIES.................................................................................................... 14

FAA System Safety Handbook, Chapter 9: Analysis Techniques December 30, 2000
9 - 2
9.0 Analysis Techniques
9.1 Introduction Many analysis tools are available to perform hazard analyses for each program. These range from the relatively simple to the complex. In general, however, they fall into two categories:
Event, e.g., What would cause an airplane crash or what will cause air space encroachment?
Consequence, e.g., What could happen if the pilot has too many tasks to do during taxi, or what could happen if a pump motor shaft bearing froze?
This chapter describes characteristics of many popular analysis approaches and, in some cases, provides procedures and examples of these techniques. The analysis techniques covered in this chapter are the following:
Fault Hazard
Fault Tree
Common Cause Failure
Sneak Circuit
Energy Trace
Failure Modes, Effects, and Criticality Analysis (FMECA)
9.2 Fault Hazard Analysis The Fault Hazard Analysis is a deductive method of analysis that can be used exclusively as a qualitative analysis or, if desired, expanded to a quantitative one. The fault hazard analysis requires a detailed investigation of the subsystems to determine component hazard modes, causes of these hazards, and resultant effects to the subsystem and its operation. This type of analysis is a form of a family of reliability analyses called failure mode and effects analysis (FMEA) and FMECA. The chief difference between the FMEA/FMECA and the fault hazard analysis is a matter of depth. Wherein the FMEA or FMECA looks at all failures and their effects, the fault hazard analysis is charged only with consideration of those effects that are safety related. The Fault Hazard Analysis of a subsystem is an engineering analysis that answers a series of questions:
What can fail?
How it can fail?
How frequently will it fail?
What are the effects of the failure?

FAA System Safety Handbook, Chapter 9: Analysis Techniques December 30, 2000
9 - 3
How important, from a safety viewpoint, are the effects of the failure?
A Fault Hazard Analysis can be used for a number of purposes:
Aid in system design concept selection
Support "functional mechanizing" of hardware
"Design out" critical safety failure modes
Assist in operational planning
Provide inputs to management risk control efforts
The fault hazard analysis must consider both "catastrophic" and "out-of-tolerance modes" of failure. For example, a five-percent, 5K (plus or minus 250 ohm) resistor can have as functional failure modes failing open or failing short, while the out-of-tolerance modes might include too low or too high a resistance. To conduct a fault hazard analysis, it is necessary to know and understand certain system characteristics:
Equipment mission
Operational constraints
Success and failure boundaries
Realistic failure modes and a measure of their probability of occurrence.
The procedural steps are:
1. The system is divided into modules (usually functional or partitioning) that can be handled effectively.
2. Functional diagrams, schematics, and drawings for the system and each subsystem are then reviewed to determine their interrelationships and the interrelationships of the component subassemblies. This review may be done by the preparation and use of block diagrams.
3. For analyses performed down to the component level, a complete component list with the specific function of each component is prepared for each module as it is to be analyzed. For those cases when the analyses are to be performed at the functional or partitioning level, this list is for the lowest analysis level.
4. Operational and environmental stresses affecting the system are reviewed for adverse effects on the system or its components.
5. Significant failure mechanisms that could occur and affect components are determined from analysis of the engineering drawings and functional diagrams. Effects of subsystem failures are then considered.
6. The failure modes of individual components that would lead to the various possible failure mechanisms of the subsystem are then identified. Basically, it is the failure of the component that produces the failure of the entire system. However, since some components may have more than
FAA System Safety Handbook, Chapter 9: Analysis Techniques December 30, 2000
9 - 4
one failure mode, each mode must be analyzed for its effect on the assembly and then on the subsystem. This may be accomplished by tabulating all failure modes and listing the effects of each, e.g. a resistor that might fail open or short, high or low). An understanding of physics of failure is necessary. For example, most resistors cannot fail in a shorted mode. If the analyst does not understand this, considerable effort may be wasted on attempting to control a nonrealistic hazard.
7. All conditions that affect a component or assembly should be listed to indicate whether there are special periods of operation, stress, personnel action, or combinations of events that would increase the probabilities of failure or damage.
8. The risk category should be assigned. 9. Preventative or corrective measures to eliminate or control the risks are listed. 10. Initial probability rates are entered. These are "best judgments" and are revised as the design
process goes on. Care must be taken to make sure that the probability represents that of the particular failure mode being evaluated. A single failure rate is often provided to cover all of a component's failure modes rather than separate ones for each. For example, MIL-HBK-217, a common source of failure rates, does not provide a failure rate for capacitor shorts, another for opens, and a third for changes in value. It simply provides a single failure for each operating condition (temperature, electrical stress, and so forth).
11. A preliminary criticality analysis may be performed as a final step. The Fault Hazard analysis has some serious limitations. They include:
1. A subsystem is likely to have failures that do not result in accidents. Tracking all of these in the System Safety Program (SSP) is a costly, inefficient process. If this is the approach to be used, combining it with an FMEA (or FMECA) performed by the reliability program can save some costs.
2. This approach concentrates usually on hardware failures, to a lesser extent on software failures, and often inadequate, attention is given to human factors. For example, a switch with an extremely low failure rate may be dropped from consideration, but the wrong placement of the switch may lead to an accident. The adjacent placement of a power switch and a light switch, especially of similar designs, will lead to operator errors.
3. Environmental conditions are usually considered, but the probability of occurrence of these conditions is rarely considered. This may result in applying controls for unrealistic events.
4. Probability of failure leading to hardware related hazards ignores latent defects introduced through substandard manufacturing processes. Thus some hazards may be missed.
5. One of the greatest pitfalls in fault hazard analysis (and in other techniques) is over precision in mathematical analysis. Too often, analysts try to obtain "exact" numbers from "inexact" data, and too much time may be spent on improving preciseness of the analysis rather than on eliminating the hazards.
9.3 Fault Tree Analysis Fault Tree Analysis (FTA) is a popular and productive hazard identification tool. It provides a standardized discipline to evaluate and control hazards. The FTA process is used to solve a wide variety of problems ranging from safety to management issues. This tool is used by the professional safety and reliability community to both prevent and resolve hazards and failures. Both qualitative and quantitative methods are used to identify areas in a system that are most critical to safe operation. Either approach is effective. The output is a graphical presentation providing

FAA System Safety Handbook, Chapter 9: Analysis Techniques December 30, 2000
9 - 5
technical and administrative personnel with a map of "failure or hazard" paths. FTA symbols may be found in Figure 8- 5. The reviewer and the analyst must develop an insight into system behavior, particularly those aspects that might lead to the hazard under investigation. Qualitative FTAs are cost effective and invaluable safety engineering tools. The generation of a qualitative fault tree is always the first step. Quantitative approaches multiply the usefulness of the FTA but are more expensive and often very difficult to perform. An FTA (similar to a logic diagram) is a "deductive" analytical tool used to study a specific undesired event such as "engine failure." The "deductive" approach begins with a defined undesired event, usually a postulated accident condition, and systematically considers all known events, faults, and occurrences that could cause or contribute to the occurrence of the undesired event. Top level events may be identified through any safety analysis approach, through operational experience, or through a "Could it happen?" hypotheses. The procedural steps of performing a FTA are:
1. Assume a system state and identify and clearly document state the top level undesired event(s). This is often accomplished by using the PHL or PHA. Alternatively, design documentation such as schematics, flow diagrams, level B & C documentation may reviewed.
2. Develop the upper levels of the trees via a top down process. That is determine the intermediate failures and combinations of failures or events that are the minimum to cause the next higher level event to occur. The logical relationships are graphically generated as described below using standardized FTA logic symbols.
3. Continue the top down process until the root causes for each branch is identified and/or until further decomposition is not considered necessary.
4. Assign probabilities of failure to the lowest level event in each branch of the tree. This may be through predictions, allocations, or historical data.
5. Establish a Boolean equation for the tree using Boolean logic and evaluate the probability of the undesired top level event.
6. Compare to the system level requirement. If it the requirement is not met, implement corrective action. Corrective actions vary from redesign to analysis refinement.
The FTA is a graphical logic representation of fault events that may occur to a functional system. This logical analysis must be a functional representation of the system and must include all combinations of system fault events that can cause or contribute to the undesired event. Each contributing fault event should be further analyzed to determine the logical relationships of underlying fault events that may cause them. This tree of fault events is expanded until all "input" fault events are defined in terms of basic, identifiable faults that may then be quantified for computation of probabilities, if desired. When the tree has been completed, it becomes a logic gate network of fault paths, both singular and multiple, containing combinations of events and conditions that include primary, secondary, and upstream inputs that may influence or command the hazardous mode.

FAA System Safety Handbook, Chapter 9: Analysis Techniques December 30, 2000
9 - 6
EngineFailure
O1
Fuel1
Cooling2
Ignition3
O4O3O2
NoFuel
FuelPump
2
Filter3
Carbu-retor 4
Fan2
NoCoolant
1
Ignit.Sys.#1
Pump 3
O4
Seal1
Bearing2
Frozen1
Friction2
Loose3
Ignit.Sys.#2
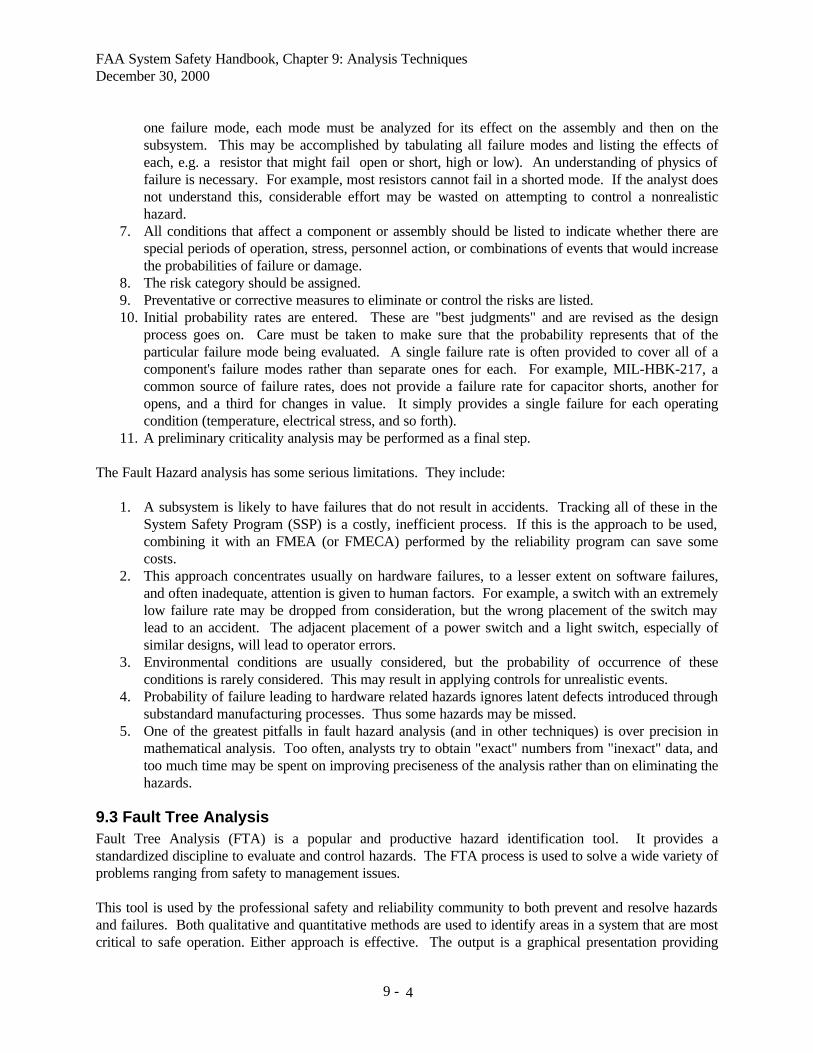
Figure 9-1: Sample Engine Failure Fault Tree Standardized symbology is used and is shown in Figure 8-5. A non-technical person can, with minimal training, determine from the fault tree, the combination and alternatives of events that may lead to failure or a hazard. Figure 9-1 is a sample fault tree for an aircraft engine failure. In this sample there are three possible causes of engine failure: fuel flow, coolant, or ignition failure. The alternatives and combinations leading to any of these conditions may also be determined by inspection of the FTA. Based on available data, probabilities of occurrences for each event can be assigned. Algebraic expressions can be formulated to determine the probability of the top level event occurring. This can be compared to acceptable thresholds and the necessity and direction of corrective action determined. The FTA shows the logical connections between failure events and the top level hazard or event. "Event," the terminology used, is an occurrence of any kind. Hazards and normal or abnormal system operations are examples. For example, both "engine overheats" and "frozen bearing" are abnormal events. Events are shown as some combination of rectangles, circles, triangles, diamonds, and "houses." Rectangles represent events that are a combination of lower level events. Circles represent events that require no further expansion. Triangles reflect events that are dependent on lower level events where the analyst has chosen to develop the fault tree further. Diamonds represent events that are not developed further, usually due to insufficient information. Depending upon criticality, it may be necessary to develop these branches further.
FAA System Safety Handbook, Chapter 9: Analysis Techniques December 30, 2000
9 - 7
In the aircraft engine example, a coolant pump failure may be caused by a seal failure. This level was not further developed. The example does not include a "house." That symbol illustrates a normal (versus failure) event. If the hazard were "unintentional stowing of the landing goal", a normal condition for the hazard would be the presence of electrical power. FTA symbols can depict all aspects of NAS events. The example reflects a hardware based problem. More typically, software (incorrect assumptions or boundary conditions), human factors (inadequate displays), and environment conditions (ice) are also included, as appropriate. Events can be further broken down as primary and secondary. A primary event is a coolant pump failure caused by a bad bearing. A secondary event would be a pump failure caused by ice through the omission of antifreeze in the coolant on a cold day. The analyst may also distinguish between faults and failures. An ignition turned off at the wrong time is a fault, an ignition switch that will not conduct current is an example of failure. Events are linked together by "AND" and "OR" logic gates. The latter is used in the example for both fuel flow and carburetor failures. For example, fuel flow failures can be caused by either a failed fuel pump or a blocked fuel filter. An "AND" gate is used for the ignition failure illustrating that the ignition systems are redundant. That is both must fail for the engine to fail. These logic gates are called Boolean gates or operators. Boolean algebra is used for the quantitative approach. The "AND" and "OR" gates are numbered sequentially A# or O# respectively in Figure 9-1. As previously stated, the FTA is built through a deductive "top down" process. It is a deductive process in that it considers combinations of events in the "cause" path as opposed to the inductive approach, which does not. The process is asking a series of logical questions such as "What could cause the engine to fail?" When all causes are identified, the series of questions is repeated at the next lower level, i.e., "What would prevent fuel flow?" Interdependent relationships are established in the same manner. When a quantitative analysis is performed, probabilities of occurrences are assigned to each event. The values are determined through analytical processes such as reliability predictions, engineering estimates, or the reduction of field data (when available). A completed tree is called a Boolean model. The probability of occurrence of the top level hazard is calculated by generating a Boolean equation. It expresses the chain of events required for the hazard to occur. Such an equation may reflect several alternative paths. Boolean equations rapidly become very complex for simple looking trees. They usually require computer modeling for solution. In addition to evaluating the significance of a risk and the likelihood of occurrence, FTAs facilitate presentations of the hazards, causes, and discussions of safety issues. They can contribute to the generation of the Master Minimum Equipment List (MMEL). The FTA's graphical format is superior to the tabular or matrix format in that the inter-relationships are obvious. The FTA graphic format is a good tool for the analyst not knowledgeable of the system being examined. The matrix format is still necessary for a hazard analysis to pick up severity, criticality, family tree, probability of event, cause of event, and other information. Being a top-down approach, in contrast to the fault hazard and FMECA, the FTA may miss some non-obvious top level hazards.
9.4 Common Cause Failure Analysis Common Cause Failure Analysis (CCFA) is an extension of FTA to identify "coupling factors" that can cause component failures to be potentially interdependent. Primary events of minimal cut sets from the

FAA System Safety Handbook, Chapter 9: Analysis Techniques December 30, 2000
9 - 8
FTA are examined through the development of matrices to determine if failures are linked to some common cause relating to environment, location, secondary causes, human error, or quality control. A cut set is a set of basic events (e.g., a set of component failures) whose occurrence causes the system to fail. A minimum cut set is one that has been reduced to eliminate all redundant "fault paths." CCFA provides a better understanding of the interdependent relationship between FTA events and their causes. It analyzes safety systems for "real" redundancy. This analysis provides additional insight into system failures after development of a detailed FTA when data on components, physical layout, operators, and inspectors are available. The procedural steps for a CCA are:
1. Establish "Critical Tree Groups." This often accomplished utilizing FMECAs, FTA, and Sneak Circuit Analyses (SCA) to limit the scope of analysis to the critical components or functions. THE FTA identifies critical functions, the FMECA critical components, and the SCA "hidden" inter-relationships.
2. Identify common components within the groups of "1." above. These might be redundant processors sharing a common power source or redundant hydraulic lines/systems being fed by a common hydraulic pump. Alternatively, it might be totally redundant hydraulic lines placed physically adjacent to each other.
3. Identify credible failure modes such as shorts, fluid leaks, defective operational procedures, etc. 4. Identify common cause credible failure modes. This requires understanding of the system/hardware
involved, the use of "lessons learned", and historical data. 5. Summarize analysis results including identification of corrective action.
9.5 Sneak Circuit Analysis Sneak Circuit Analysis (SCA) is a unique method of evaluating electrical circuits. SCA employs recognition of topological patterns that are characteristic of all circuits and systems. The purpose of this analysis technique is to uncover latent (sneak) circuits and conditions that inhibit desired functions or cause undesired functions to occur, without a component having failed. The process is convert schematic diagrams to topographical drawings and search for sneak circuits. This is a labor intensive process best performed by special purpose software. Figure 9-2 shows an automobile circuit that contains a sneak circuit. The sneak path is through the directional switch and flasher, the brake light switch, and the radio.
Figure 9-2: A Sneak Circuit
FAA System Safety Handbook, Chapter 9: Analysis Techniques December 30, 2000
9 - 9
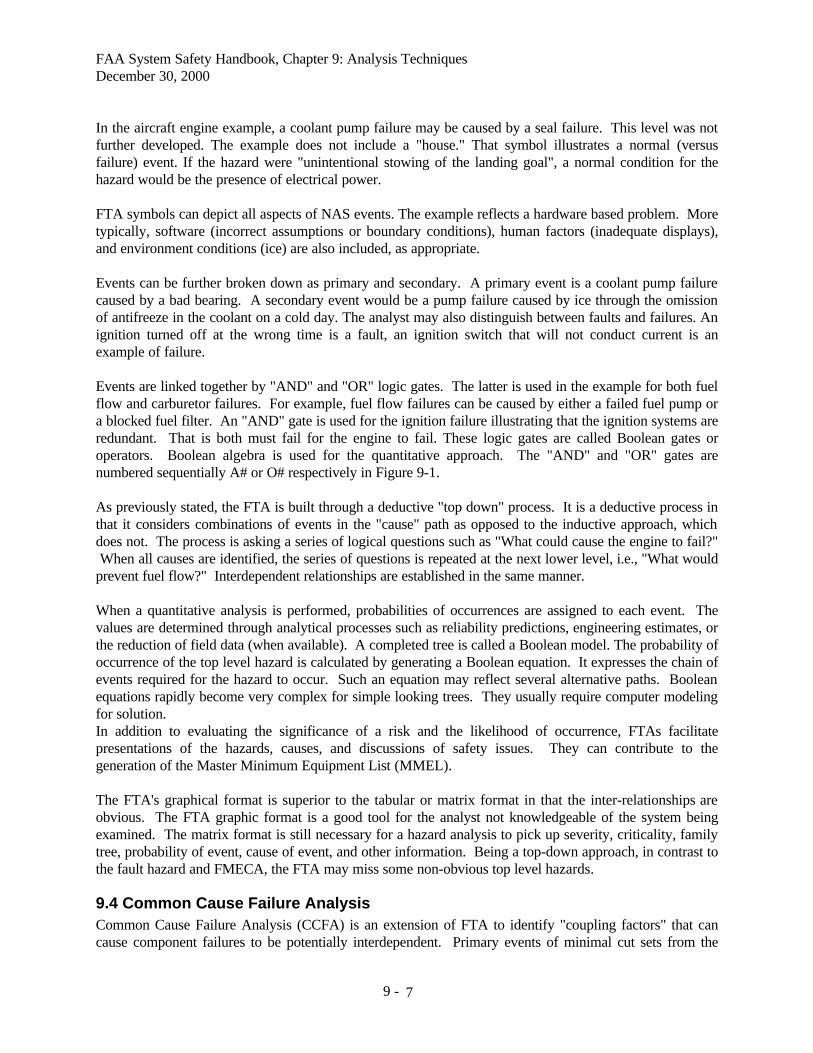
The latent nature of sneak circuits and the realization that they are found in all types of electrical/electronic systems suggests that the application of SCA to any system that is required to operate with a high reliability is valuable. This process is quite expensive and is often limited to highly critical (from the safety viewpoint) systems. Applications include many systems outside the FAA such as nuclear plant safety subsystems, ordnance handling systems, and space craft. Consideration should be given to utilizing this tool for FAA applications that eliminate human control such as an autopilot. The fact that the circuits can be broken down into the patterns shown allows a series of clues to be applied for recognition of possible sneak circuit conditions. These clues help to identify combinations of controls and loads that are involved in all types of sneak circuits. Analysis of the node-topographs for sneak circuit conditions is done systematically with the application of sneak circuit clues to one node at a time. When all of the clues that apply to a particular pattern have been considered, it is assured that all possible sneak circuits that could result from that portion of the circuit have been identified. The clues help the analyst to determine the different ways a given circuit pattern can produce a "sneak." Figure 9-3 is a node topograph equivalent of Figure 9-2
Power
DirectionalSwitch
Flasher
Lights BrakeLight
Switch
Radio
Figure 9-3: Topical Node Representation of Sneak Circuit
There are four basic categories of sneak circuits that will be found.
Sneak Paths - allow current to flow along an unsuspected route
Sneak Timing - causes functions to be inhibited or to occur unexpectedly
Sneak Labels - cause incorrect stimuli to be initiated
Sneak Indicators - cause ambiguous or false displays

FAA System Safety Handbook, Chapter 9: Analysis Techniques December 30, 2000
9 - 10
In addition to the identification of sneak circuits, results include disclosure of data errors and areas of design concern. Data errors are identified and reported incrementally on Drawing Error Reports from the time of data receipt through the analysis period. These errors generally consist of lack of agreement between or within input documents. Conditions of design concern are primarily identified during the network tree analysis. Design concern conditions include:
Unsuppressed or improperly suppressed inductive loads
Excess or unnecessary components
Lack of redundancy
Failure points.
The three resultant products of SCA (sneak circuit, design concern, and drawing error conditions) are reported with an explanation of the condition found, illustrated as required, and accompanied with a recommendation for correction.
9.6 Energy Trace This hazard analysis approach addresses all sources of uncontrolled and controlled energy that have the potential to cause an accident. Examples include utility electrical power and aircraft fuel. Sources of energy causing accidents can be associated with the product or process (e.g., flammability or electrical shock), the resource if different than the product/process (e.g., smoking near flammable fluids), and the items/conditions surrounding the system or resource of concern (e.g., vehicles or taxing aircraft). A large number of hazardous situations are related to uncontrolled energy associated with the product or the resource being protected (e.g., human error). Some hazards are passive in nature (e.g., sharp edges and corners are a hazard to a maintenance technician working in a confined area). The purpose of energy trace analysis is to ensure that all hazards and their immediate causes are identified. Once the hazards and their causes are identified, they can be used as top events in a fault tree or used to verify the completeness of a fault hazard analysis. Consequently, the energy trace analysis method complements but does not replace other analyses, such as fault trees, sneak circuit analyses, event trees, and FMEAs. Identification of energy sources and energy transfer processes is the key element in the energy source analysis procedure. Once sources of energy have been identified, the analyst eliminates or controls the hazard using the system safety precedence described in Chapter 3, Table 3-1. These analyses point out potential unwanted conditions that could conceivably happen. Each condition is evaluated further to assess its hazard potential. The analysis and control procedures discussed throughout this handbook are applied to the identified hazards. Fourteen energy trace analysis procedural steps are:
1. Identify the resource being protected (personnel or equipment) to guide the direction of the analysis toward the identification of only those conditions (i.e., hazards) that would be critical or catastrophic from a mission viewpoint.
2. Identify system and subsystems, and safety critical components.
FAA System Safety Handbook, Chapter 9: Analysis Techniques December 30, 2000
9 - 11
3. Identify the operational phase(s), such as preflight, taxi, takeoff, cruise, landing, that each system/subsystem/component will experience. It is often desirable to report results of hazard analyses for each separate operational phase.
4. Identify the operating states for the subsystems/components (e.g., on/off, pressurized, hot, cooled) during each operational phase.
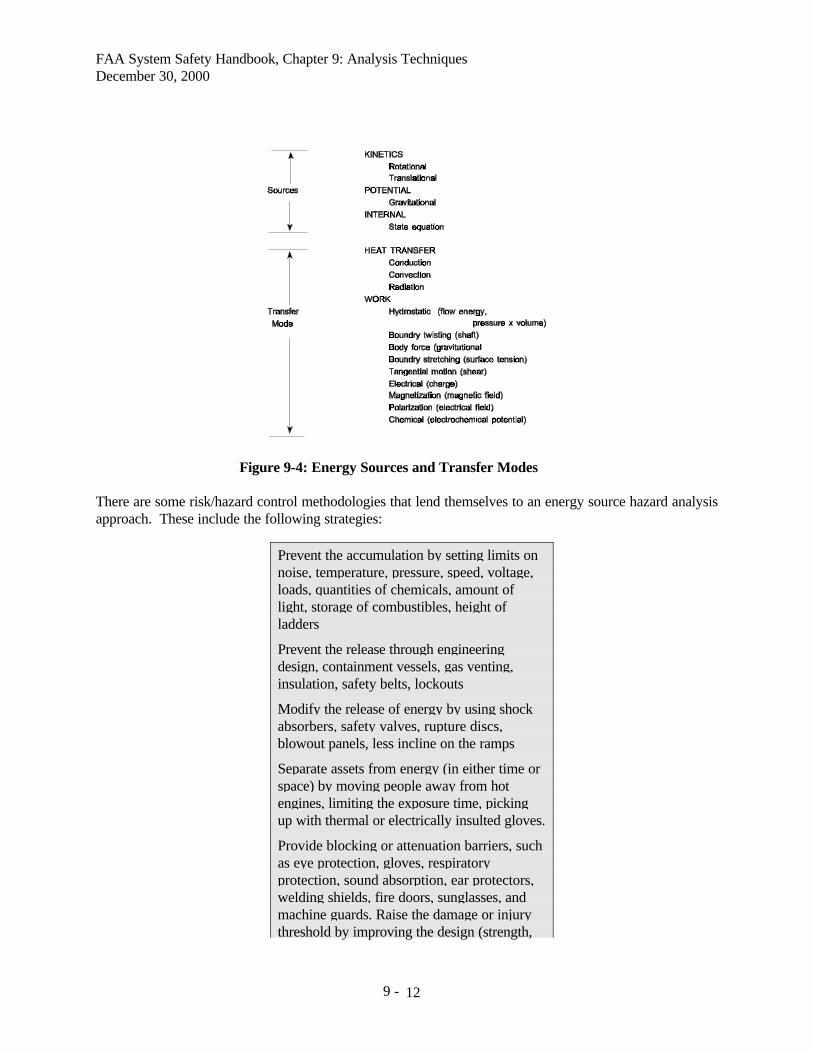
5. Identify the energy sources or transfer modes that are associated with each subsystem and each operating state. A list of general energy source types and energy transfer mechanisms is presented in Figure 9-4.
6. Identify the energy release mechanism for each energy source (released or transferred in an uncontrolled/unplanned manner). It is possible that a normal (i.e., as designed) energy release could interact adversely with other components in a manner not previously or adequately considered.
7. Review a generic threat checklist for each component and energy source or transfer mode. Experience has shown that certain threats are associated with specific energy sources and components.
8. Identify causal factors associated with each energy release mechanism. A hazard causal factor may have subordinate or underlying causal factors associated with it. For instance, excessive stress may be a "top level" factor. The excessive stress may, in turn, be caused by secondary factors such as inadequate design, material flaws, poor quality welds, excessive loads due to pressure or structural bending. By systematically evaluating such causal factors, an analyst may identify potential design or operating deficiencies that could lead to hazardous conditions. Causal factors are identified independent of the probability of occurrence of the factor; the main question to be answered is: Can the causal factor occur or exist?
9. Identify the potential accident that could result from energy released by a particular release mechanism.
10. Define the hazardous consequences that could result given the accident specified in the previous step.
11. Evaluate the hazard category (i.e., critical, catastrophic, or other) associated with the potential accident.
12. Identify the specific hazard associated with the component and the energy source or transfer mode relative to the resource being protected.
13. Recommend actions to control the hazardous conditions. 14. Specify verification procedures to assure that the controls have been implemented adequately.
FAA System Safety Handbook, Chapter 9: Analysis Techniques December 30, 2000
9 - 12
Figure 9-4: Energy Sources and Transfer Modes There are some risk/hazard control methodologies that lend themselves to an energy source hazard analysis approach. These include the following strategies:
Prevent the accumulation by setting limits on noise, temperature, pressure, speed, voltage, loads, quantities of chemicals, amount of light, storage of combustibles, height of ladders
Prevent the release through engineering design, containment vessels, gas venting, insulation, safety belts, lockouts
Modify the release of energy by using shock absorbers, safety valves, rupture discs, blowout panels, less incline on the ramps
Separate assets from energy (in either time or space) by moving people away from hot engines, limiting the exposure time, picking up with thermal or electrically insulted gloves.
Provide blocking or attenuation barriers, such as eye protection, gloves, respiratory protection, sound absorption, ear protectors, welding shields, fire doors, sunglasses, and machine guards. Raise the damage or injury threshold by improving the design (strength,

FAA System Safety Handbook, Chapter 9: Analysis Techniques December 30, 2000
9 - 13
size), immunizing against disease, or warming up by exercise
And by establishing contingency response such as early detection of energy release, first aid, emergency showers, general disaster plans, recovery of system operation procedures.
9.7 Failure Modes, Effects, and Criticality Analysis (FMECA) FMECAs and FMEAs are important reliability programs tools that provide data usable by the SSP. The performance of an FMEA is the first step in generating the FMECA. Both types of analyses can serve as a final product depending on the situation. An FMECA is generated from an FMEA by adding a criticality figure of merit. These analyses are performed for reliability, safety, and supportability information. The FMECA version is more commonly used and is more suited for hazard control. Hazard analyses typically use a top down analysis methodology (e.g., Fault Tree). The approach first identifies specific hazards and isolates all possible (or probable) causes. The FMEA/FMECA may be performed either top down or bottoms-up, usually the latter. Hazard analyses consider failures, operating procedures, human factors, and transient conditions in the list of hazard causes. The FMECA is more limited. It only considers failures (hardware and software). It is generated from a different set of questions than the HA: “If this fails, what is the impact on the system? Can I detect it? Will it cause anything else to fail?” If so, the induced failure is called a secondary failure. FMEAs may be performed at the hardware or functional level and often are a combination of both. For economic reasons, the FMEA often is performed at the functional level below the printed circuit board or software module assembly level and at hardware or smaller code groups at higher assembly levels. The approach is to characterize the results of all probable component failure modes or every low level function. A frozen bearing (component) or a shaft unable to turn (function) are valid failure modes. The procedural approach to generating an FMEA is comparable to that of the Fault Hazard Analysis. The first step is to list all components or low level functions. Then, by examining system block diagrams, schematics, etc., the function of each component is identified. Next, all reasonably possible failure modes of the lowest “component” being analyzed are identified. Using a coolant pump bearing as an example (see Figure 9-5), they might include frozen, high friction, or too much play. For each identified failure mode, the effect at the local level, an intermediate level, and the top system level are recorded. A local effect might be “the shaft won’t turn”, the intermediate “pump won’t circulate coolant”, and the system level “engine overheat and fail”. At this point in the analysis, the FMEA might identify a hazard. The analyst next documents the method of fault detection. This input is valuable for designing self test features or the test interface of a system. More importantly, it can alert an air crew to a failure in process prior to a catastrophic event. A frozen pump bearing might be detected by monitoring power to the pump motor or coolant temperature. Given adequate warning, the engine can be shut down before damage or the aircraft landed prior to engine failure. Next, compensating provisions are identified as the first step in determining the impact of the failure. If there are redundant pumps or combined cooling techniques, the

FAA System Safety Handbook, Chapter 9: Analysis Techniques December 30, 2000
9 - 14
significance of the failure is less than if the engine depends on a single pump. The severity categories used for the hazard analysis can be used as the severity class in the FMEA. A comments column is usually added to the FMEA to provide additional information that might assist the reviewer in understanding any FMEA column. Adding a criticality figure of merit is needed to generate the FMECA, shown in Figure 9-5, from the FMEA. Assigning severity levels can not be performed without first identifying the purpose of the FMECA. For example, a component with a high failure rate would have a high severity factor for a reliability analysis: a long lead time or expensive part would be more important in a supportability analysis. Neither may be significant from a safety perspective. Therefore, a safety analysis requires a unique criticality index or equation. The assignment of a criticality index is called a criticality analysis. The Index is a mathematical combination of severity and probability of occurrence (likelihood of occurrence).
Figure 9-5: Sample Failure Modes, Effects, and Criticality Analysis
Item/ Function
Function Failure Modes
Failure Local
Next Higher
Primary End Effects
Failure Detection Method
Compen-sation Provisions
Severity Class
Fail Rate
Pump bearing
Facilitate shaft rotation
Frozen Shaft won’t rotate
Pump failure
Engine failure
Engine Temp
Air cooling I
High Friction
Shaft turns slowly
Loss of cooling capacity
Engine runs hot
“ “ “ “ II
Loose (Wear)
Shaft slips
“ “ Low Horse Power
“ “ “ “ III
Severity Class: I-Catastrophic to IV-Incidental Not shown are columns that may be added including frequency class, interfaces, and comments. The FMECA and the hazard analyses provided some redundant information but more importantly some complementary information. The HA considers human factors and systems interface problems, the FMECA does not. The FMECA, however, is not more likely to identify hazards caused by component or software module failure than the HA, which considers compensating and fault detection features. These are all important safety data.
9.8 Other Methodologies The System Safety Society has developed a System Safety Analysis Handbook.
1 The handbook describes in
summary manner 106 safety methodologies and techniques that are employed by modern system safety practitioners. The following table presents the applicable methods and techniques that are appropriate for use within the FAA. The method or technique is listed, along with a brief summary, applicability and use. Further research and reference may be needed to apply a new method or technique. A reference is provided
1 Stephens, Richard, A. and Talso, Warner, System safety Analysis Handbook: A Source Book for Safety Practitioners, System Safety Society, 2nd Edition, August 1999.

FAA System Safety Handbook, Chapter 9: Analysis Techniques December 30, 2000
9 - 15
for additional readings in Appendix C. The FAA’s Office of System Safety can provide instruction and assistance in the applications of the listed methods and techniques.
FAA System Safety Handbook, Chapter 9: Analysis Techniques December 30, 2000
9 - 16
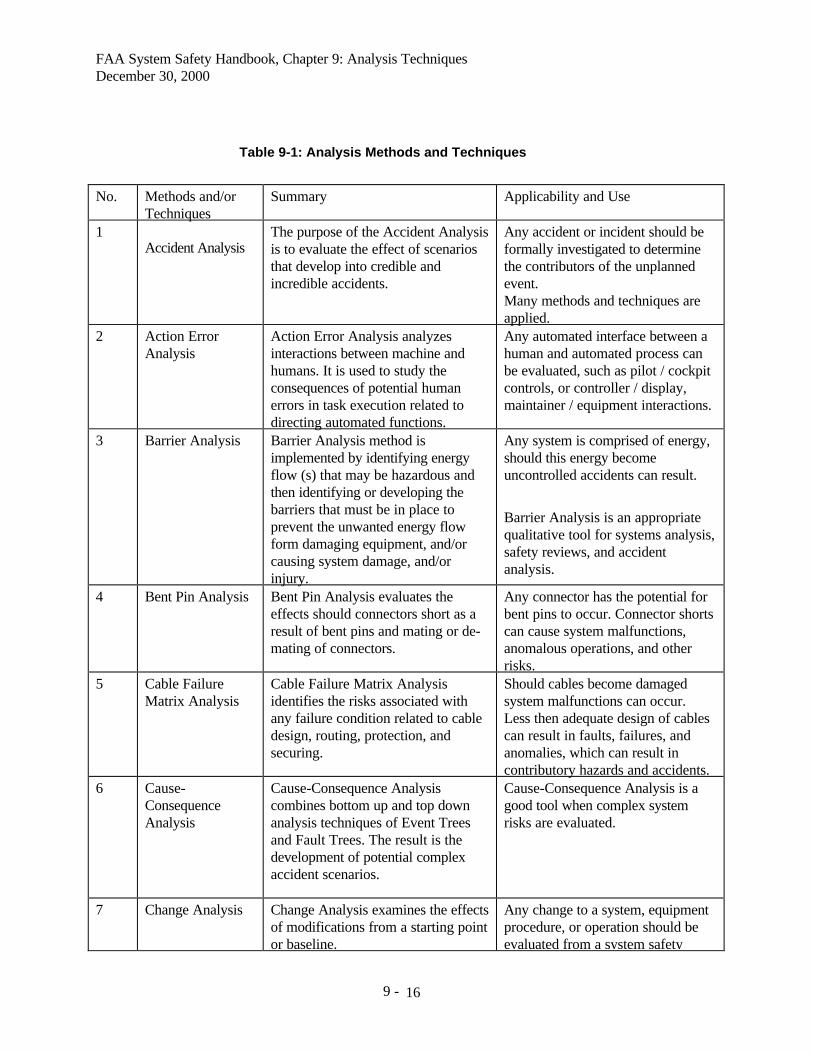
Table 9-1: Analysis Methods and Techniques
No. Methods and/or
Techniques Summary Applicability and Use
1 Accident Analysis
The purpose of the Accident Analysis is to evaluate the effect of scenarios that develop into credible and incredible accidents.
Any accident or incident should be formally investigated to determine the contributors of the unplanned event. Many methods and techniques are applied.
2 Action Error Analysis
Action Error Analysis analyzes interactions between machine and humans. It is used to study the consequences of potential human errors in task execution related to directing automated functions.
Any automated interface between a human and automated process can be evaluated, such as pilot / cockpit controls, or controller / display, maintainer / equipment interactions.
3 Barrier Analysis Barrier Analysis method is implemented by identifying energy flow (s) that may be hazardous and then identifying or developing the barriers that must be in place to prevent the unwanted energy flow form damaging equipment, and/or causing system damage, and/or injury.
Any system is comprised of energy, should this energy become uncontrolled accidents can result.
Barrier Analysis is an appropriate qualitative tool for systems analysis, safety reviews, and accident analysis.
4 Bent Pin Analysis Bent Pin Analysis evaluates the effects should connectors short as a result of bent pins and mating or de-mating of connectors.
Any connector has the potential for bent pins to occur. Connector shorts can cause system malfunctions, anomalous operations, and other risks.
5 Cable Failure Matrix Analysis
Cable Failure Matrix Analysis identifies the risks associated with any failure condition related to cable design, routing, protection, and securing.
Should cables become damaged system malfunctions can occur. Less then adequate design of cables can result in faults, failures, and anomalies, which can result in contributory hazards and accidents.
6 Cause-Consequence Analysis
Cause-Consequence Analysis combines bottom up and top down analysis techniques of Event Trees and Fault Trees. The result is the development of potential complex accident scenarios.
Cause-Consequence Analysis is a good tool when complex system risks are evaluated.
7 Change Analysis Change Analysis examines the effects of modifications from a starting point or baseline.
Any change to a system, equipment procedure, or operation should be evaluated from a system safety
FAA System Safety Handbook, Chapter 9: Analysis Techniques December 30, 2000
9 - 17
No. Methods and/or Techniques
Summary Applicability and Use
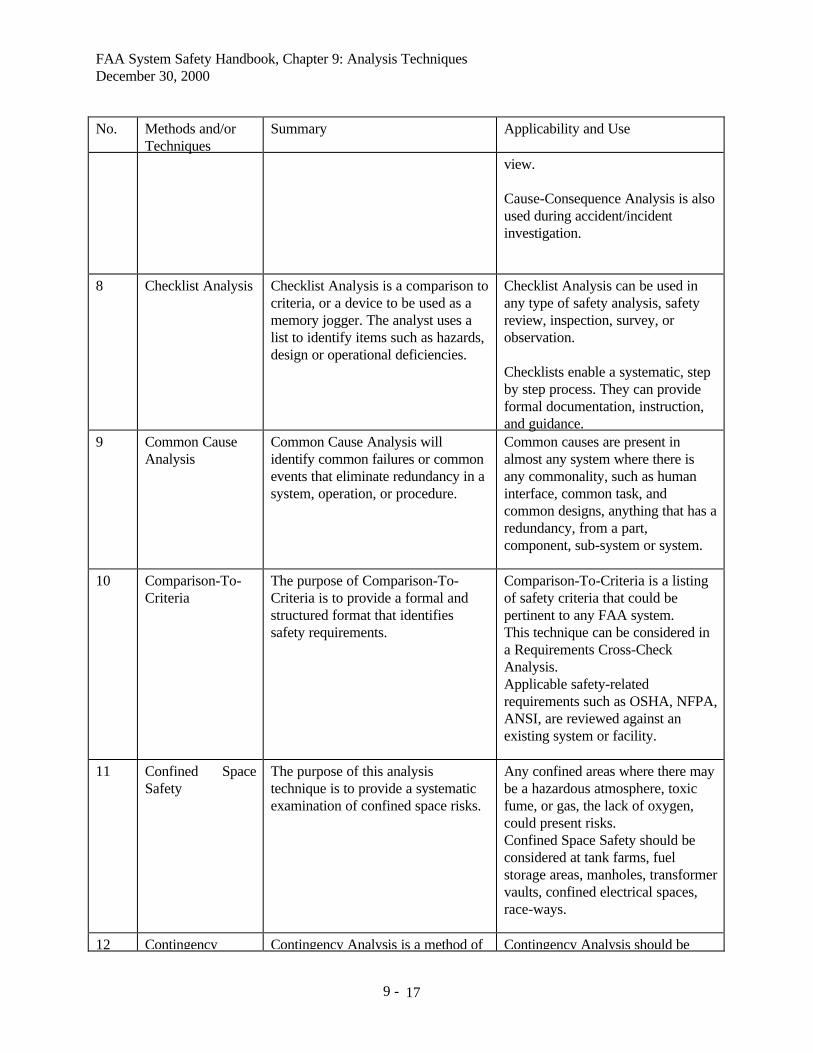
view. Cause-Consequence Analysis is also used during accident/incident investigation.
8 Checklist Analysis Checklist Analysis is a comparison to criteria, or a device to be used as a memory jogger. The analyst uses a list to identify items such as hazards, design or operational deficiencies.
Checklist Analysis can be used in any type of safety analysis, safety review, inspection, survey, or observation. Checklists enable a systematic, step by step process. They can provide formal documentation, instruction, and guidance.
9 Common Cause Analysis
Common Cause Analysis will identify common failures or common events that eliminate redundancy in a system, operation, or procedure.
Common causes are present in almost any system where there is any commonality, such as human interface, common task, and common designs, anything that has a redundancy, from a part, component, sub-system or system.
10 Comparison-To-Criteria
The purpose of Comparison-To-Criteria is to provide a formal and structured format that identifies safety requirements.
Comparison-To-Criteria is a listing of safety criteria that could be pertinent to any FAA system. This technique can be considered in a Requirements Cross-Check Analysis. Applicable safety-related requirements such as OSHA, NFPA, ANSI, are reviewed against an existing system or facility.
11 Confined Space Safety
The purpose of this analysis technique is to provide a systematic examination of confined space risks.
Any confined areas where there may be a hazardous atmosphere, toxic fume, or gas, the lack of oxygen, could present risks. Confined Space Safety should be considered at tank farms, fuel storage areas, manholes, transformer vaults, confined electrical spaces, race-ways.
12 Contingency Contingency Analysis is a method of Contingency Analysis should be
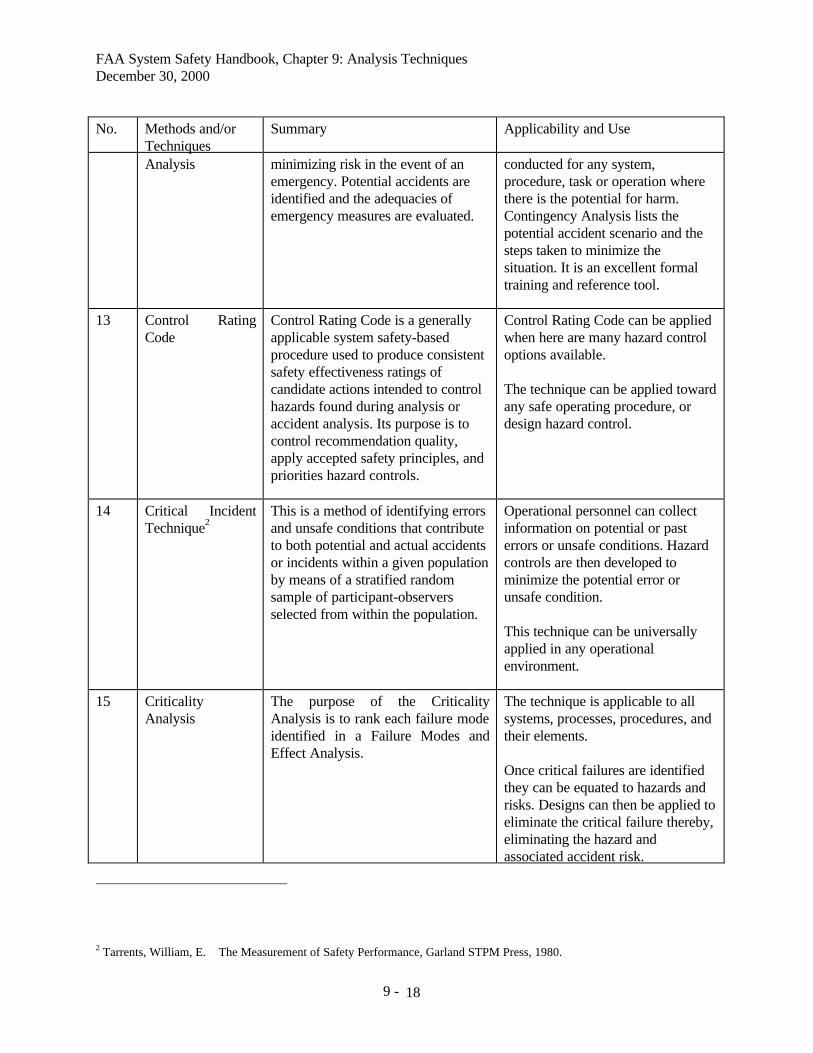
FAA System Safety Handbook, Chapter 9: Analysis Techniques December 30, 2000
9 - 18
No. Methods and/or Techniques
Summary Applicability and Use
Analysis minimizing risk in the event of an emergency. Potential accidents are identified and the adequacies of emergency measures are evaluated.
conducted for any system, procedure, task or operation where there is the potential for harm. Contingency Analysis lists the potential accident scenario and the steps taken to minimize the situation. It is an excellent formal training and reference tool.
13 Control Rating Code
Control Rating Code is a generally applicable system safety-based procedure used to produce consistent safety effectiveness ratings of candidate actions intended to control hazards found during analysis or accident analysis. Its purpose is to control recommendation quality, apply accepted safety principles, and priorities hazard controls.
Control Rating Code can be applied when here are many hazard control options available. The technique can be applied toward any safe operating procedure, or design hazard control.
14 Critical Incident Technique2
This is a method of identifying errors and unsafe conditions that contribute to both potential and actual accidents or incidents within a given population by means of a stratified random sample of participant-observers selected from within the population.
Operational personnel can collect information on potential or past errors or unsafe conditions. Hazard controls are then developed to minimize the potential error or unsafe condition. This technique can be universally applied in any operational environment.
15 Criticality Analysis
The purpose of the Criticality Analysis is to rank each failure mode identified in a Failure Modes and Effect Analysis.
The technique is applicable to all systems, processes, procedures, and their elements. Once critical failures are identified they can be equated to hazards and risks. Designs can then be applied to eliminate the critical failure thereby, eliminating the hazard and associated accident risk.
2 Tarrents, William, E. The Measurement of Safety Performance, Garland STPM Press, 1980.
FAA System Safety Handbook, Chapter 9: Analysis Techniques December 30, 2000
9 - 19
No. Methods and/or Techniques
Summary Applicability and Use
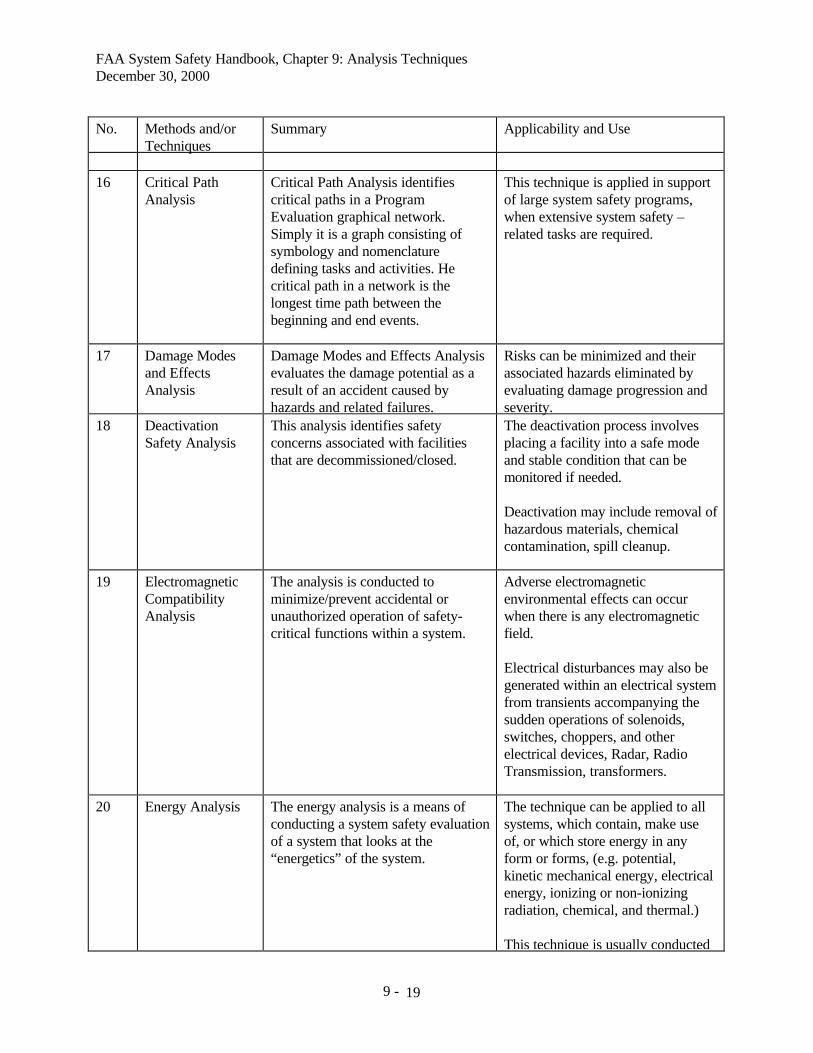
16 Critical Path
Analysis Critical Path Analysis identifies critical paths in a Program Evaluation graphical network. Simply it is a graph consisting of symbology and nomenclature defining tasks and activities. He critical path in a network is the longest time path between the beginning and end events.
This technique is applied in support of large system safety programs, when extensive system safety –related tasks are required.
17 Damage Modes and Effects Analysis
Damage Modes and Effects Analysis evaluates the damage potential as a result of an accident caused by hazards and related failures.
Risks can be minimized and their associated hazards eliminated by evaluating damage progression and severity.
18 Deactivation Safety Analysis
This analysis identifies safety concerns associated with facilities that are decommissioned/closed.
The deactivation process involves placing a facility into a safe mode and stable condition that can be monitored if needed. Deactivation may include removal of hazardous materials, chemical contamination, spill cleanup.
19 Electromagnetic Compatibility Analysis
The analysis is conducted to minimize/prevent accidental or unauthorized operation of safety-critical functions within a system.
Adverse electromagnetic environmental effects can occur when there is any electromagnetic field. Electrical disturbances may also be generated within an electrical system from transients accompanying the sudden operations of solenoids, switches, choppers, and other electrical devices, Radar, Radio Transmission, transformers.
20 Energy Analysis The energy analysis is a means of conducting a system safety evaluation of a system that looks at the “energetics” of the system.
The technique can be applied to all systems, which contain, make use of, or which store energy in any form or forms, (e.g. potential, kinetic mechanical energy, electrical energy, ionizing or non-ionizing radiation, chemical, and thermal.) This technique is usually conducted

FAA System Safety Handbook, Chapter 9: Analysis Techniques December 30, 2000
9 - 20
No. Methods and/or Techniques
Summary Applicability and Use
in conjunction with Barrier Analysis.
21 Energy Trace and Barrier Analysis
Energy Trace and Barrier Analysis is similar to Energy Analysis and Barrier Analysis. The analysis can produce a consistent, detailed understanding of the sources and nature of energy flows that can or did produce accidental harm.
The technique can be applied to all systems, which contain, make use of, or which store energy in any form or forms, (e.g. potential, kinetic mechanical energy, electrical energy, ionizing or non-ionizing radiation, chemical, and thermal.)
22 Energy Trace Checklist
Similar to Energy Trace and Barrier Analysis, Energy Analysis and Barrier Analysis. The analysis aids in the identification of hazards associated with energetics within a system, by use of a specifically designed checklist.
The analysis could be used when conducting evaluation and surveys for hazard identification associated with all forms of energy. The use of a checklist can provide a systematic way of collecting information on many similar exposures.
23 Environmental Risk Analysis
The analysis is conducted to assess the risk of environmental noncompliance that may result in hazards and associated risks.
The analysis is conducted for any system that uses or produces toxic hazardous materials that could cause harm to people and the environment.
24 Event and Casual Factor Charting
Event and Casual Factor Charting utilizes a block diagram to depict cause and effect.
The technique is effective for solving complicated problems because it provides a means to organize the data, provides a summary of what is known and unknown about the event, and results in a detailed sequence of facts and activities.
25 Event Tree Analysis
An Event Tree models the sequence of events that results from a single initiating event.
The tool can be used to organize, characterize, and quantify potential accidents in a methodical manner. The analysis is accomplished by selecting initiating events, both desired and undesired, and develop their consequences through consideration of system/component failure-and-success alternatives.
26 Explosives Safety This method enables the safety Explosives Safety Analysis can be

FAA System Safety Handbook, Chapter 9: Analysis Techniques December 30, 2000
9 - 21
No. Methods and/or Techniques
Summary Applicability and Use
Analysis professional to identify and evaluate explosive hazards associated with facilities or operations.
used to identify hazards and risks related to any explosive potential, i.e. fuel storage, compressed gases, transformers, batteries.
27 External Events Analysis
The purpose of External Events Analysis is to focus attention on those adverse events that are outside of the system under study. It is to further hypothesize the range of events that may have an effect on the system being examined.
The occurrence of an external event such as an earthquake is evaluated and affects on structures, systems, and components in a facility are analyzed.
28 Facility System Safety Analysis
System safety analysis techniques are applied to facilities and its operations.
Facilities are analyzed to identify hazards and potential accidents associated with the facility and systems, components, equipment, or structures.
29 Failure Mode and Effects Analysis (FMEA)
The FMEA is a reliability analysis that is a bottom up approach to evaluate failures within a system.
Any electrical, electronics, avionics, or hardware system, sub-system can be analyzed to identify failures and failure modes.
30 Failure Mode and Effects Criticality Analysis (FMECA)
Same as above with the addition of Criticality. Failure modes are classified as to their criticality.
As above.
31 Fault Hazard Analysis
A system safety technique that is an offshoot from FMEA. Similar to FMEA above however failures that could present hazards are evaluated. Hazards and failure are not the same. Hazards are the potential for harm, they are unsafe acts or conditions. When a failure results in an unsafe condition it is considered a hazard. Many hazards contribute to a particular risk.
Any electrical, electronics, avionics, or hardware system, sub-system can be analyzed to identify failures, malfunctions, anomalies, faults, that can result is hazards.
32 Fault Isolation Methodology
The method is used to determine and locate faults in large-scale ground based systems. Examples of specific methods applied are; Half-Step Search, Sequential Removal/Replacement, Mass
Determine faults in any large-scale ground based system that is computer controlled.
FAA System Safety Handbook, Chapter 9: Analysis Techniques December 30, 2000
9 - 22
No. Methods and/or Techniques
Summary Applicability and Use
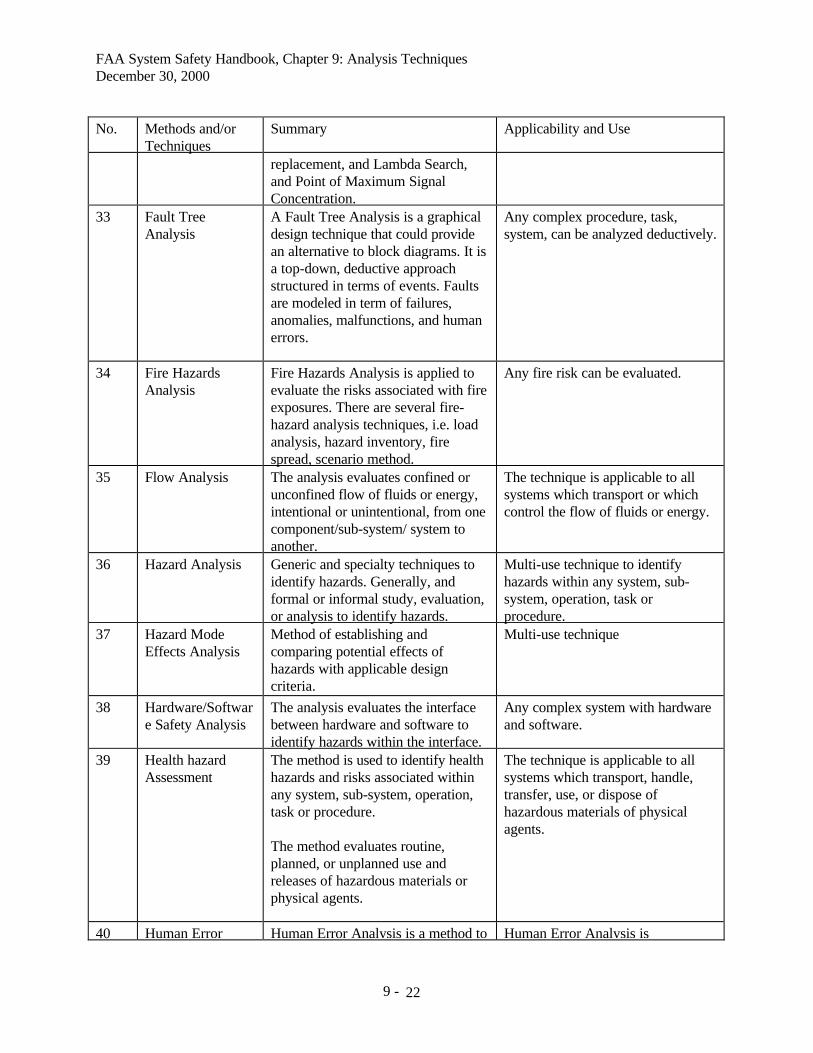
replacement, and Lambda Search, and Point of Maximum Signal Concentration.
33 Fault Tree Analysis
A Fault Tree Analysis is a graphical design technique that could provide an alternative to block diagrams. It is a top-down, deductive approach structured in terms of events. Faults are modeled in term of failures, anomalies, malfunctions, and human errors.
Any complex procedure, task, system, can be analyzed deductively.
34 Fire Hazards Analysis
Fire Hazards Analysis is applied to evaluate the risks associated with fire exposures. There are several fire-hazard analysis techniques, i.e. load analysis, hazard inventory, fire spread, scenario method.
Any fire risk can be evaluated.
35 Flow Analysis The analysis evaluates confined or unconfined flow of fluids or energy, intentional or unintentional, from one component/sub-system/ system to another.
The technique is applicable to all systems which transport or which control the flow of fluids or energy.
36 Hazard Analysis Generic and specialty techniques to identify hazards. Generally, and formal or informal study, evaluation, or analysis to identify hazards.
Multi-use technique to identify hazards within any system, sub-system, operation, task or procedure.
37 Hazard Mode Effects Analysis
Method of establishing and comparing potential effects of hazards with applicable design criteria.
Multi-use technique
38 Hardware/Software Safety Analysis
The analysis evaluates the interface between hardware and software to identify hazards within the interface.
Any complex system with hardware and software.
39 Health hazard Assessment
The method is used to identify health hazards and risks associated within any system, sub-system, operation, task or procedure. The method evaluates routine, planned, or unplanned use and releases of hazardous materials or physical agents.
The technique is applicable to all systems which transport, handle, transfer, use, or dispose of hazardous materials of physical agents.
40 Human Error Human Error Analysis is a method to Human Error Analysis is

FAA System Safety Handbook, Chapter 9: Analysis Techniques December 30, 2000
9 - 23
No. Methods and/or Techniques
Summary Applicability and Use
Analysis evaluate the human interface and error potential within the human /system and to determine human-error-related hazards. Many techniques can be applied in this human factors evaluation. Contributory hazards are the result of unsafe acts such as errors in design, procedures, and tasks.
appropriate to evaluate any human/machine interface.
41 Human Factors Analysis
Human Factors Analysis represents an entire discipline that considers the human engineering aspects of design. There are many methods and techniques to formally and informally consider the human engineering interface of the system. There are specialty considerations such as ergonomics, bio-machines, anthropometrics.
Human Factors Analysis is appropriate for all situations were the human interfaces with the system and human-related hazards and risks are present. The human is considered a main sub-system.
42 Human Reliability Analysis
The purpose of the Human Reliability Analysis is to assess factors that may impact human reliability in the operation of the system.
The analysis is appropriate were reliable human performance in necessary for the success of the human-machine systems.
43 Interface Analysis The analysis is used to identify hazards due to interface incompatibilities. The methodology entails seeking those physical and functional incompatibilities between adjacent, interconnected, or interacting elements of a system which, if allowed to persist under all conditions of operation, would generate risks.
Interface Analysis is applicable to all systems. All interfaces should be investigated; machine-software, environment-human, environment-machine, human-human, machine-machine, etc.
44 Job Safety Analysis
This technique is used to assess the various ways a task may be performed so that the most efficient and appropriate way to do a task is selected.
Job Safety Analysis can be applied to evaluate any job, task, human function, or operation.

FAA System Safety Handbook, Chapter 9: Analysis Techniques December 30, 2000
9 - 24
No. Methods and/or Techniques
Summary Applicability and Use
Each job is broken down into tasks, or steps, and hazards associated with each task or step are identifies. Controls are then defined to decrease the risk associated with the particular hazards.
45 Laser Safety Analysis
This analysis enables the evaluation of the use of Lasers from a safety view.
The analysis is appropriate for any laser operation, i.e. construction, experimentation, and testing.
46 Management Oversight and Risk Tree (MORT)
MORT technique is used to systematically analyze an accident in order to examine and determine detailed information about the process and accident contributors.
This is an accident investigation technique that can be applied to analyze any accident.
47 Materials Compatibility Analysis
Materials Compatibility Analysis provides as assessment of materials utilized within a particular design. Any potential degradation that can occur due to material incompatibility is evaluated.
Materials Compatibility Analysis in universally appropriate throughout most systems.
48 Maximum Credible Accident/Worst Case
The technique is to determine the upper bounds on a potential environment without regard to the probability of occurrence of the particular potential accident.
Similar to Scenario Analysis, this technique is used to conduct a System Hazard Analysis. The technique is universally appropriate.
49 Modeling; Simulation
There are many forms of modeling techniques that are used in system engineering. Failures, events, flows, functions, energy forms, random variables, hardware configuration, accident sequences, operational tasks, all can be modeled.
Modeling is appropriate for any system or system safety analysis.
50 Naked Man This technique is to evaluate a system by looking at the bare system (controls) needed for operation without any external features added in order to determine the need/value of control to decrease risk.
The technique is universally appropriate.
51 Network Logic Analysis
Network Logic Analysis is a method to examine a system in terms of mathematical representation in order
The technique is universally appropriate to complex systems.

FAA System Safety Handbook, Chapter 9: Analysis Techniques December 30, 2000
9 - 25
No. Methods and/or Techniques
Summary Applicability and Use
to gain insight into a system that might not ordinarily be achieved.
52 Operating and Support Hazard Analysis
The analysis is performed to identify and evaluate hazards/risks associated with the environment, personnel, procedures, and equipment involved throughout the operation of a system.
The analysis is appropriate for all operational and support efforts.
53 Petri Net Analysis Petri Net Analysis is a method to model unique states of a complex system. Petri Nets can be used to model system components, or sub-systems at a wide range of abstraction levels; e.g., conceptual, top – down, detail design, or actual implementations of hardware, software, or combinations.
The technique is universally appropriate to complex systems.
54 Preliminary Hazard Analysis
Preliminary Hazard Analysis (PHA) is the initial analysis effort within system safety. The PHA is an extension of a Preliminary Hazard List. As the design matures the PHA evolved into a system of sub-system hazard analysis.
The technique is universally appropriate.
55 Preliminary Hazard List
Preliminary Hazard List (PHL) is also an initial analysis effort within system safety. Lists of initial hazards or potential accidents are listed during concept development.
The technique is universally appropriate.
56 Procedure Analysis
Procedure Analysis is a step-by-step analysis of specific procedures to identify hazards or risks associated with procedures.
The technique is universally appropriate.
57 Production System Hazard Analysis
Production System Hazard Analysis is used to identify hazards that may be introduced during the production phase of system development which could impair safety and to identify their means of control. The interface between the product and the production process is examined
The technique is appropriate during development and production of complex systems and complex subsystems.
58 Prototype Development
Prototype Development provides a Modeling/Simulation analysis the
This technique is appropriate during the early phases of pre-production
FAA System Safety Handbook, Chapter 9: Analysis Techniques December 30, 2000
9 - 26
No. Methods and/or Techniques
Summary Applicability and Use
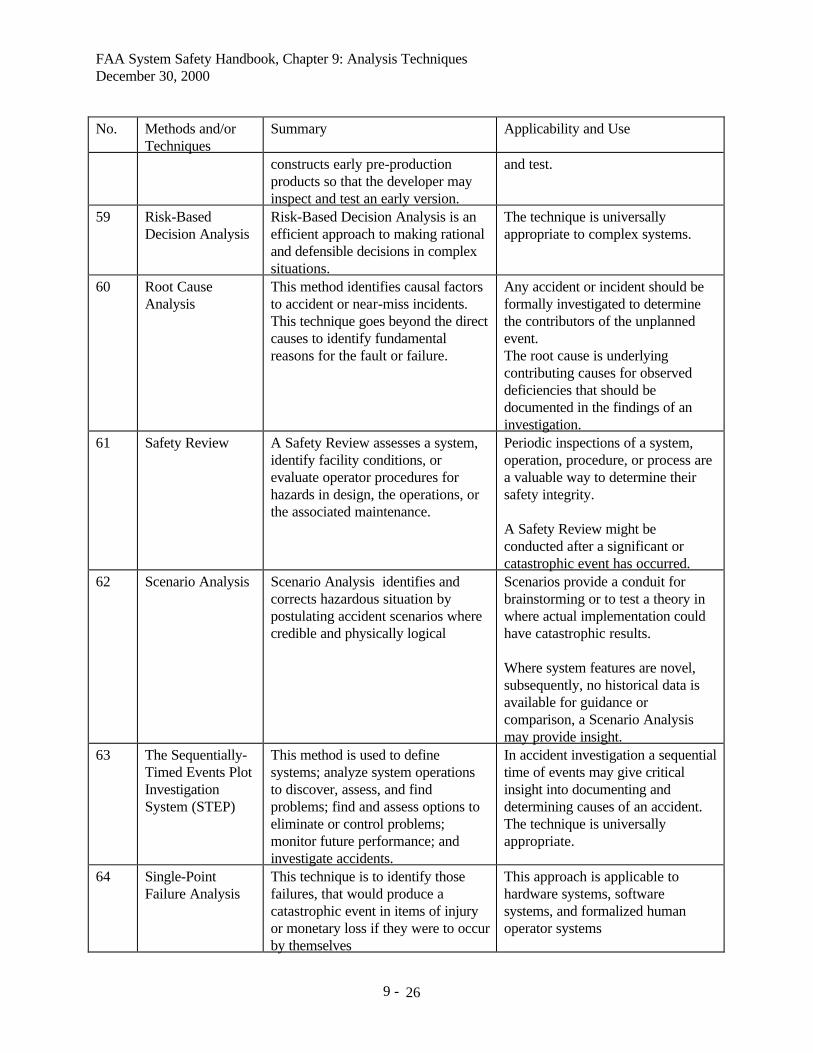
constructs early pre-production products so that the developer may inspect and test an early version.
and test.
59 Risk-Based Decision Analysis
Risk-Based Decision Analysis is an efficient approach to making rational and defensible decisions in complex situations.
The technique is universally appropriate to complex systems.
60 Root Cause Analysis
This method identifies causal factors to accident or near-miss incidents. This technique goes beyond the direct causes to identify fundamental reasons for the fault or failure.
Any accident or incident should be formally investigated to determine the contributors of the unplanned event. The root cause is underlying contributing causes for observed deficiencies that should be documented in the findings of an investigation.
61 Safety Review A Safety Review assesses a system, identify facility conditions, or evaluate operator procedures for hazards in design, the operations, or the associated maintenance.
Periodic inspections of a system, operation, procedure, or process are a valuable way to determine their safety integrity. A Safety Review might be conducted after a significant or catastrophic event has occurred.
62 Scenario Analysis Scenario Analysis identifies and corrects hazardous situation by postulating accident scenarios where credible and physically logical
Scenarios provide a conduit for brainstorming or to test a theory in where actual implementation could have catastrophic results. Where system features are novel, subsequently, no historical data is available for guidance or comparison, a Scenario Analysis may provide insight.
63 The Sequentially-Timed Events Plot Investigation System (STEP)
This method is used to define systems; analyze system operations to discover, assess, and find problems; find and assess options to eliminate or control problems; monitor future performance; and investigate accidents.
In accident investigation a sequential time of events may give critical insight into documenting and determining causes of an accident. The technique is universally appropriate.
64 Single-Point Failure Analysis
This technique is to identify those failures, that would produce a catastrophic event in items of injury or monetary loss if they were to occur by themselves
This approach is applicable to hardware systems, software systems, and formalized human operator systems

FAA System Safety Handbook, Chapter 9: Analysis Techniques December 30, 2000
9 - 27
No. Methods and/or Techniques
Summary Applicability and Use
65 Sneak-Circuit Analysis
Sneak-Circuit Analysis identifies unintended paths or control sequences that may result in undesired events or inappropriately time events.
This technique is applicable to control and energy-delivery delivery circuits of all kinds, whether electronic/electrical, pneumatic, or hydraulic.
66 Software Failure Modes and Effects Analysis
This technique identifies software related design deficiencies through analysis of process flow-charting. It also identifies areas for verification/validation and test evaluation.
Software is embedded into vital and critical systems of current as well as future aircraft, facilities, and equipment. This methodology can be used for any software process; however, application to software controlled hardware systems is the predominate application. It can be used to analyze control, sequencing, timing monitoring, and the ability to take a system from an unsafe to a safe condition.
67 Software Fault Tree Analysis
This technique is employed to identify the root cause(s) of a “top” undesired event. To assure adequate protection of safety critical functions by inhibits interlocks, and/or hardware.
Any software process at any level of development or change can be analyzed deductively. However, the predominate application is software controlled hardware systems.
68 Software Hazard Analysis
The purpose of this technique is to identify, evaluate, and eliminate or mitigate software hazards by means of a structured analytical approach that is integrated into the software development process.
This practice is universally appropriate to software systems.
69 Software Sneak Circuit Analysis
Software Sneak Circuit Analysis (SSCA) is designed to discover program logic that could cause undesired program outputs or inhibits, or incorrect sequencing/timing.
The technique is universally appropriate to any software program.
70 Structural Safety Analysis
This method is used to validate mechanical structures. Inadequate structural assessment results in increased risk due to potential for latent design problems.
The approach is appropriate to structural design; i.e., airframe.
71 Subsystem Hazard Analysis
Subsystem Hazard Analysis (SSHA) identifies hazards and their effects that may occur as a result of design.
This protocol is appropriate to subsystems only.
72 System Hazard System Hazard Analysis purpose is Any closed loop hazard
FAA System Safety Handbook, Chapter 9: Analysis Techniques December 30, 2000
9 - 28
No. Methods and/or Techniques
Summary Applicability and Use
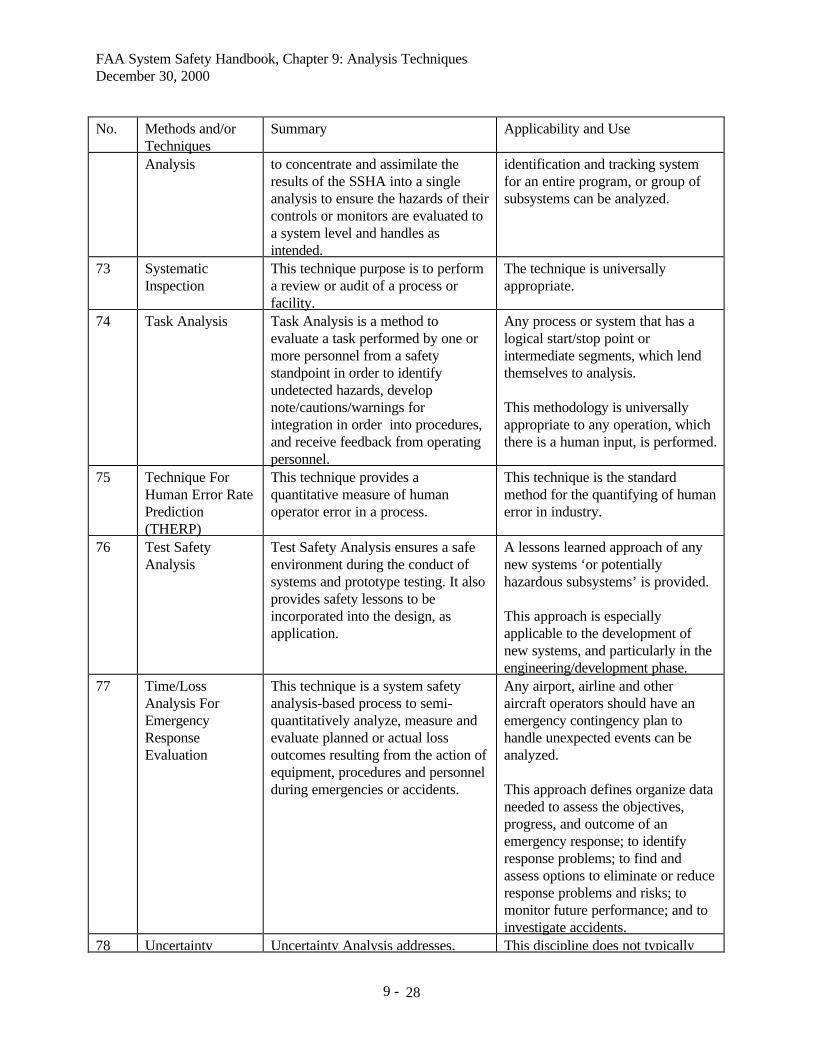
Analysis to concentrate and assimilate the results of the SSHA into a single analysis to ensure the hazards of their controls or monitors are evaluated to a system level and handles as intended.
identification and tracking system for an entire program, or group of subsystems can be analyzed.
73 Systematic Inspection
This technique purpose is to perform a review or audit of a process or facility.
The technique is universally appropriate.
74 Task Analysis Task Analysis is a method to evaluate a task performed by one or more personnel from a safety standpoint in order to identify undetected hazards, develop note/cautions/warnings for integration in order into procedures, and receive feedback from operating personnel.
Any process or system that has a logical start/stop point or intermediate segments, which lend themselves to analysis. This methodology is universally appropriate to any operation, which there is a human input, is performed.
75 Technique For Human Error Rate Prediction (THERP)
This technique provides a quantitative measure of human operator error in a process.
This technique is the standard method for the quantifying of human error in industry.
76 Test Safety Analysis
Test Safety Analysis ensures a safe environment during the conduct of systems and prototype testing. It also provides safety lessons to be incorporated into the design, as application.
A lessons learned approach of any new systems ‘or potentially hazardous subsystems’ is provided. This approach is especially applicable to the development of new systems, and particularly in the engineering/development phase.
77 Time/Loss Analysis For Emergency Response Evaluation
This technique is a system safety analysis-based process to semi-quantitatively analyze, measure and evaluate planned or actual loss outcomes resulting from the action of equipment, procedures and personnel during emergencies or accidents.
Any airport, airline and other aircraft operators should have an emergency contingency plan to handle unexpected events can be analyzed. This approach defines organize data needed to assess the objectives, progress, and outcome of an emergency response; to identify response problems; to find and assess options to eliminate or reduce response problems and risks; to monitor future performance; and to investigate accidents.
78 Uncertainty Uncertainty Analysis addresses, This discipline does not typically

FAA System Safety Handbook, Chapter 9: Analysis Techniques December 30, 2000
9 - 29
No. Methods and/or Techniques
Summary Applicability and Use
Analysis quantitatively and qualitatively, those factors that cause the results of an analysis to be uncertain.
address uncertainty explicitly and there are arguments that all analyses should. This is an region of great potential application.
79 Walk-Trough Analysis
This technique is a systematic analysis that should be used to determine and correct root causes of unplanned occurrences related to maintenance.
This technique is applicable to maintenance.
80 What-If Analysis What-If Analysis methodology identifies hazards, hazardous situations, or specific accident events that could produce an undesirable consequence.
The technique is universally appropriate.
81 What-If/Checklist Analysis
What-If or Checklist Analysis is a simple method of applying logic in a deterministic manner.
The technique is universally appropriate.