Chapter 6 Solutions
18
Answers to Review Questions 1. The real rate of interest is the rate that creates an equilibrium between the supply of savings and demand for investment funds. The nominal rate of interest is the actual rate of interest charged by the supplier and paid by the demander. The nominal rate of interest differs from the real rate of interest due to two factors: (1) a premium due to inflationary expectations (IP) and (2) a premium due to issuer and issue characteristic risks (RP). The nominal rate of interest for a security can be defined as r 1 r * IP RP. For a 3-month U.S. Treasury bill, the nominal rate of interest can be stated as r 1 r * IP. The default risk premium, RP, is assumed to be zero since the security is backed by the U.S. government; this security is commonly considered the risk-free asset. 2. The term structure of interest rates is the relationship of the rate of return to the time to maturity for any class of similar-risk securities. The graphic presentation of this relationship is the yield curve. 3. For a given class of securities, the slope of the curve reflects an expectation about the movement of interest rates over time. The most commonly used class of securities is U.S. Treasury securities. a. Downward sloping: Long-term borrowing costs are lower than short-term borrowing costs. b. Upward sloping: Short-term borrowing costs are lower than long-term borrowing costs. c. Flat: Borrowing costs are relatively similar for short- and long-term loans. The upward-sloping yield curve has been the most prevalent historically. 4. a. According to the expectations theory, the yield curve reflects investor expectations about future interest rates, with the differences based on inflation expectations. The curve can take any of the three forms. An upward-sloping curve is the result of increasing inflationary expectations, and vice versa. b. The liquidity preference theory is an explanation for the upward-sloping yield curve. This theory states that long-term rates are generally higher than short-term rates due to the desire of investors for greater liquidity, and thus a premium must be offered to attract adequate long-term investment. c. The market segmentation theory is another theory that can explain any of the three curve shapes. Since the market for loans can be segmented based on maturity, sources of supply and demand for loans within each segment determine the prevailing interest rate. If supply is greater than demand for short-term funds at a time when demand for long-term loans is higher than the supply of funding, the yield curve would be upward sloping. Obviously, the reverse also holds true. 5. In the Fisher equation, r r * IP RP, the risk premium, RP, consists of the following issuer- and issue-related components: Default risk : The possibility that the issuer will not pay the contractual interest or principal as scheduled. Maturity (interest rate) risk: The possibility that changes in the interest rates on similar securities will cause the value of the security to change by a greater amount the longer its maturity, and vice versa. Liquidity risk: The ease with which securities can be converted to cash without a loss in value. Contractual provisions: Covenants included in a debt agreement or stock issue defining the rights and restrictions of the issuer and the purchaser. These can increase or reduce the risk of a security. Tax risk: Certain securities issued by agencies of state and local governments are exempt from federal, and in some cases state and local taxes, thereby reducing the nominal rate of interest by an amount that brings the return into line with the after-tax return on a taxable issue of similar risk.
-
Upload
independent -
Category
Documents
-
view
1 -
download
0
Transcript of Chapter 6 Solutions

Answers to Review Questions
1. The real rate of interest is the rate that creates an equilibrium between the supply of savings and
demand for investment funds. The nominal rate of interest is the actual rate of interest charged by the
supplier and paid by the demander. The nominal rate of interest differs from the real rate of interest
due to two factors: (1) a premium due to inflationary expectations (IP) and (2) a premium due to
issuer and issue characteristic risks (RP). The nominal rate of interest for a security can be defined as
r1 r* IP RP. For a 3-month U.S. Treasury bill, the nominal rate of interest can be stated as r1
r* IP. The default risk premium, RP, is assumed to be zero since the security is backed by the U.S.
government; this security is commonly considered the risk-free asset.
2. The term structure of interest rates is the relationship of the rate of return to the time to maturity for
any class of similar-risk securities. The graphic presentation of this relationship is the yield curve.
3. For a given class of securities, the slope of the curve reflects an expectation about the movement of
interest rates over time. The most commonly used class of securities is U.S. Treasury securities.
a. Downward sloping: Long-term borrowing costs are lower than short-term borrowing costs.
b. Upward sloping: Short-term borrowing costs are lower than long-term borrowing costs.
c. Flat: Borrowing costs are relatively similar for short- and long-term loans.
The upward-sloping yield curve has been the most prevalent historically.
4. a. According to the expectations theory, the yield curve reflects investor expectations about future
interest rates, with the differences based on inflation expectations. The curve can take any of the
three forms. An upward-sloping curve is the result of increasing inflationary expectations, and vice versa.
b. The liquidity preference theory is an explanation for the upward-sloping yield curve. This theory
states that long-term rates are generally higher than short-term rates due to the desire of
investors for greater liquidity, and thus a premium must be offered to attract adequate long-term investment.
c. The market segmentation theory is another theory that can explain any of the three curve shapes.
Since the market for loans can be segmented based on maturity, sources of supply and demand for
loans within each segment determine the prevailing interest rate. If supply is greater than demand
for short-term funds at a time when demand for long-term loans is higher than the supply of funding, the yield curve would be upward sloping. Obviously, the reverse also holds true.
5. In the Fisher equation, r r* IP RP, the risk premium, RP, consists of the following issuer- and
issue-related components:
Default risk: The possibility that the issuer will not pay the contractual interest or principal as
scheduled.
Maturity (interest rate) risk: The possibility that changes in the interest rates on similar securities will cause the value of the security to change by a greater amount the longer its maturity, and vice versa.
Liquidity risk: The ease with which securities can be converted to cash without a loss in value.
Contractual provisions: Covenants included in a debt agreement or stock issue defining the rights and restrictions of the issuer and the purchaser. These can increase or reduce the risk of a security.
Tax risk: Certain securities issued by agencies of state and local governments are exempt from
federal, and in some cases state and local taxes, thereby reducing the nominal rate of interest by an amount that brings the return into line with the after-tax return on a taxable issue of similar risk.
The risks that are debt specific are default, maturity, and contractual provisions.
6. Most corporate bonds are issued in denominations of $1,000 with maturities of 10 to 30 years. The
stated interest rate on a bond represents the percentage of the bond’s par value that will be paid out
annually, although the actual payments may be divided up and made quarterly or semiannually.
Both bond indentures and trustees are means of protecting the bondholders. The bond indenture is a
complex and lengthy legal document stating the conditions under which a bond is issued. The trustee
may be a paid individual, corporation, or commercial bank trust department that acts as a third-party
―watch dog‖ on behalf of the bondholders to ensure that the issuer does not default on its contractual
commitment to the bondholders.
7. Long-term lenders include restrictive covenants in loan agreements in order to place certain
operating and/or financial constraints on the borrower. These constraints are intended to assure the
lender that the borrowing firm will maintain a specified financial condition and managerial structure
during the term of the loan. Since the lender is committing funds for a long period of time, he seeks
to protect himself against adverse financial developments that may affect the borrower. The
restrictive provisions (also called negative covenants) differ from the so-called standard debt
provisions in that they place certain constraints on the firm’s operations, whereas the standard
provisions (also called affirmative covenants) require the firm to operate in a respectable and
businesslike manner. Standard provisions include such requirements as providing audited financial
statements on a regular schedule, paying taxes and liabilities when due, maintaining all facilities in
good working order, and keeping accounting records in accordance with generally accepted
accounting procedures (GAAP).
Violation of any of the standard or restrictive loan provisions gives the lender the right to demand
immediate repayment of both accrued interest and principal of the loan. However, the lender does
not normally demand immediate repayment but instead evaluates the situation in order to determine
if the violation is serious enough to jeopardize the loan. The lender’s options are: Waive the violation,
waive the violation and renegotiate terms of the original agreement, or demand repayment.
8. Short-term borrowing is normally less expensive than long-term borrowing due to the greater
uncertainty associated with longer maturity loans. The major factors affecting the cost of long-term debt
(or the interest rate), in addition to loan maturity, are loan size, borrower risk, and the basic cost of
money.
9. If a bond has a conversion feature, the bondholders have the option of converting the bond into a
certain number of shares of stock within a certain period of time. A call feature gives the issuer the
opportunity to repurchase, or call, bonds at a stated price prior to maturity. It provides extra
compensation to bondholders for the potential opportunity losses that would result if the bond were
called due to declining interest rates. This feature allows the issuer to retire outstanding debt prior to
maturity and, in the case of convertibles, to force conversion. Stock purchase warrants, which are
sometimes included as part of a bond issue, give the holder the right to purchase a certain number of
shares of common stock at a specified price.
10. Current yields are calculated by dividing the annual interest payment by the current price. Bonds
are quoted in percentage of par terms, to the thousandths place. Hence, corporate bond prices are
effectively quoted in dollars and cents. A quote of 98.621 means the bond is priced at 98.621% of
par, or $986.21.

Bonds are rated by independent rating agencies such as Moody’s and Standard & Poor’s with respect
to their overall quality, as measured by the safety of repayment of principal and interest. Ratings are
the result of detailed financial ratio and cash flow analyses of the issuing firm. The bond rating
affects the rate of return on the bond. The higher the rating, the less risk and the lower the yield.
11. Eurobonds are bonds issued by an international borrower and sold to investors in countries with
currencies other than that in which the bond is denominated. For example, a dollar-denominated
Eurobond issued by an American corporation can be sold to French, German, Swiss, or Japanese
investors. A foreign bond, on the other hand, is issued by a foreign borrower in a host country’s
capital market and denominated in the host currency. An example is a French-franc denominated
bond issued in France by an English company.
12. A financial manager must understand the valuation process in order to judge the value of benefits
received from stocks, bonds, and other assets in view of their risk, return, and combined impact on
share value.
13. Three key inputs to the valuation process are:
a. Cash flows—the cash generated from ownership of the asset;
b. Timing—the time period(s) in which cash flows are received; and
c. Required return—the interest rate used to discount the future cash flows to a PV. The selection
of the required return allows the level of risk to be adjusted; the higher the risk, the higher the required return (discount rate).
14. The valuation process applies to assets that provide an intermittent cash flow or even a single cash
flow over any time period.
15. The value of any asset is the PV of future cash flows expected from the asset over the relevant time
period. The three key inputs in the valuation process are cash flows, the required rate of return, and
the timing of cash flows. The equation for value is:
1 20 1 2(1 ) (1 ) (1 )
n
n
CFCF CFV
r r r
where:
V0 value of the asset at time zero
CF1 cash flow expected at the end of year t
r appropriate required return (discount rate)
n relevant time period
16. The basic bond valuation equation for a bond that pays annual interest is:
0
1
1 1
(1 ) (1 )
n
t nd dt
V I Mr r
where:
V0 value of a bond that pays annual interest
I interest
n years to maturity
M dollar par value
rd required return on the bond
To find the value of bonds paying interest semiannually, the basic bond valuation equation is
adjusted as follows to account for the more frequent payment of interest:

a. The annual interest must be converted to semiannual interest by dividing by two.
b. The number of years to maturity must be multiplied by two.
c. The required return must be converted to a semiannual rate by dividing it by two.
17. A bond sells at a discount when the required return exceeds the coupon rate. A bond sells at a
premium when the required return is less than the coupon rate. A bond sells at par value when the
required return equals the coupon rate. The coupon rate is generally a fixed rate of interest, whereas
the required return fluctuates with shifts in the cost of long-term funds due to economic conditions
and/or risk of the issuing firm. The disparity between the required rate and the coupon rate will cause
the bond to be sold at a discount or premium.
18. If the required return on a bond is constant until maturity and different from the coupon interest rate,
the bond’s value approaches its $1,000 par value as the time to maturity declines.
19. To protect against the impact of rising interest rates, a risk-averse investor would prefer bonds with
short periods until maturity. The responsiveness of the bond’s market value to interest rate
fluctuations is an increasing function of the time to maturity.
20. The yield-to-maturity (YTM) on a bond is the rate investors earn if they buy the bond at a specific
price and hold it until maturity. The YTM can be found precisely by using a hand-held financial
calculator and using the time value functions. Enter the B0 as the PV, and the I as the annual
payment, and the n as the number of periods until maturity. Have the calculator solve for the interest
rate. This interest value is the YTM. Many calculators are already programmed to solve for the
internal rate of return (IRR). Using this feature will also obtain the YTM since the YTM and IRR are
determined the same way. Spreadsheets include a formula for computing the yield to maturity.
Answers to Warm-Up Exercises
E6-1. Finding the real rate of interest
Answer: r* RF IP
0.8% 1.23% IP
IP 1.23 0.08 0.43%
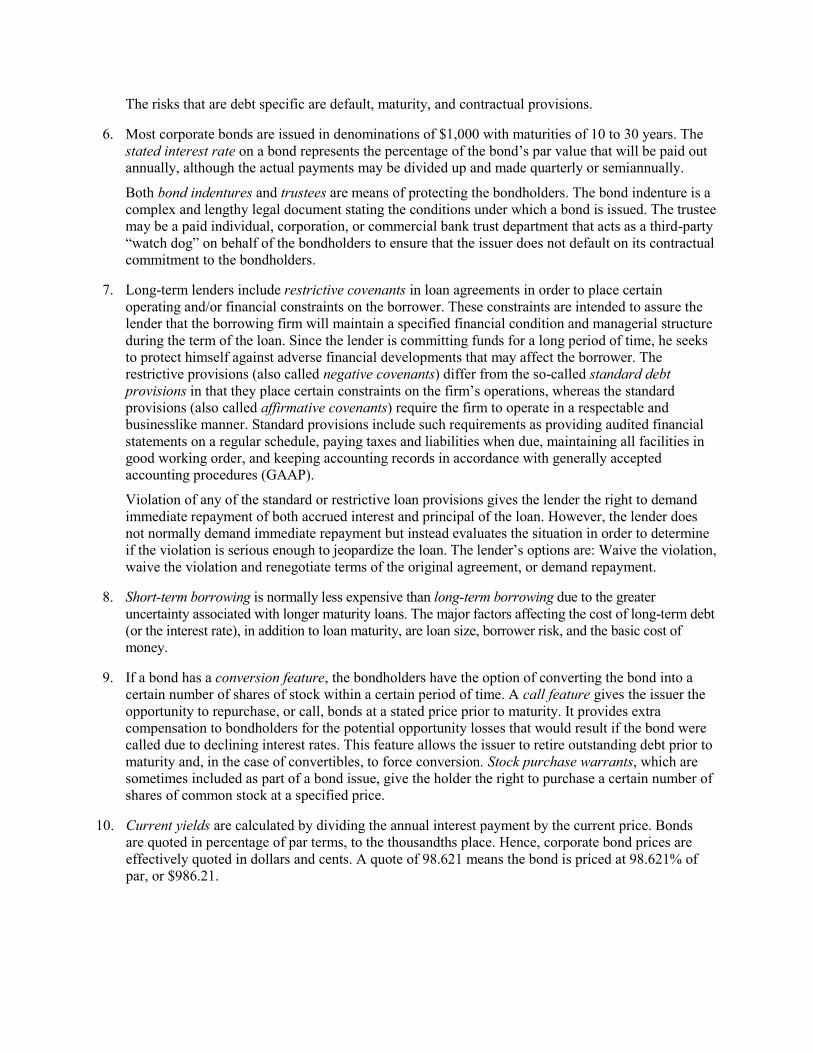
E6-2. Yield curve
b. {(4.51% 10) (3.7% 5)} 5
{45.1% 18.5%} 5
26.6% 5 5.32%
c. (3.01% 3) (2.68% 2) 9.03% 5.36% 3.67%
d. Yield curves may slope up for many reasons beyond expectations of rising interest rates. According
to liquidity preference theory, long-term interest rates tend to be higher than short-term rates
because longer-term debt has lower liquidity, higher responsiveness to general interest rate
movements, and borrower willingness to pay a higher interest rate to lock in money for a
longer period of time. In addition to expectations theory and liquidity preference theory,
market segmentation theory allows for additional interest rate increases arising from either limited availability of funds or greater demand for funds at longer maturities.
E6-3. Calculating inflation expectation
Answer: The inflation expectation for a specific maturity is the difference between the yield and the
real interest rate at that maturity.
Maturity Yield Real Rate of Interest Inflation Expectation
3 months 1.41% 0.80% 0.61%
6 months 1.71 0.80 0.91
2 years 2.68 0.80 1.88
3 years 3.01 0.80 2.21
5 years 3.70 0.80 2.90
10 years 4.51 0.80 3.71
30 years 5.25 0.80 4.45
E6-4. Real returns
Answer: A T-bill can experience a negative real return if its interest rate is less than the inflation rate as
measured by the CPI. The real return would be zero if the T-bill rate was 3.3% exactly matching
the CPI rate. To obtain a minimum 2% real return, the T-bill rate would have to be at least 5.3%.

E6-5. Calculating risk premium
Answer: We calculate the risk premium of other securities by subtracting the risk-free rate, 4.51%, from each nominal interest rate.
Security Nominal Interest Rate Risk Premium
AAA 5.12% 5.12% 4.51% 0.61%
BBB 5.78 5.78% 4.51% 1.27%
B 7.82 7.82% 4.51% 3.31%
E6-6. The basic valuation model
Answer: Find the PV of the cash flow stream for each asset by discounting the expected cash flows
using the respective required return.
Asset 1: PV $500 0.15 $3,333.33
Asset 2: 2 3
$1,200 $1,500 $850$2,969.20
1.10 (1.10) (1.10)PV
E6-7. Calculating the PV of a bond when the required return exceeds the coupon rate
Answer: The PV of a bond is the PV of its future cash flows. In the case of the 5-year bond, the
expected cash flows are $1,200 at the end of each year for 5 years, plus the face value of the
bond that will be received at the maturity of the bond (end of year 5). You may use the bond
valuation formula found in your text or you may use a financial calculator. The solution
presented below is derived using a financial calculator. Set the calculator on 1 period/year.
PV of interest: PMT 1,200
I 8%/year
N 5 periods
Solve for PV $4,791.25
PV of the bond’s face value: FV $20,000
N 5 periods
I 8%/year
Solve for PV $13,611.66
The PV of this bond is $4,791.25 $13,611.66 $18,402.91.
This answer is consistent with the knowledge that when interest rates rise, the values of
previously issued bonds fall. The present value is a cash outflow, or cost to investor.
E6-8. Bond valuations using required rates of return
Answer: a. Student answers will vary but any required rate of return above the coupon rate will
cause the bond to sell at a discount, while at a required return of 4.5% the bond will sell
at par. Any required rate of return below the coupon rate will cause the bond to sell at a
premium.
b. Student answers will vary but should be consistent with their answers to part a.
Solutions to Problems
P6-1. Interest rate fundamentals: The real rate of return
LG1; Basic
Real rate of return 5.5% 3.0% 2.5%
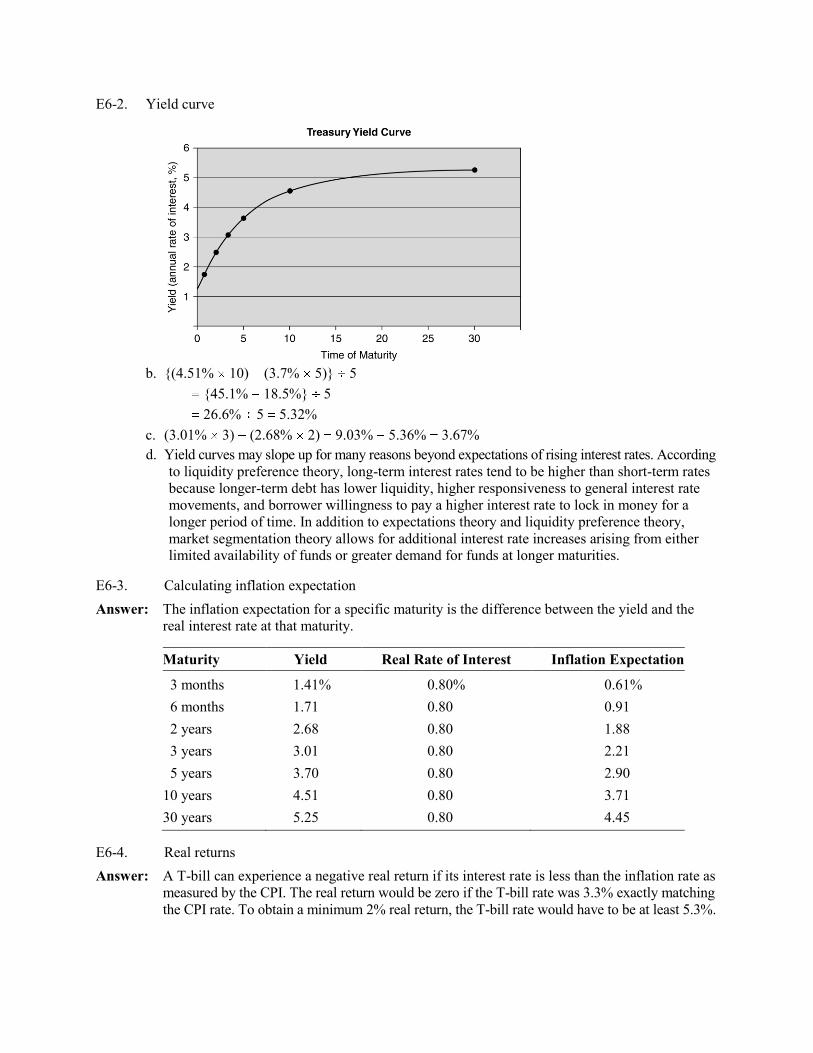
P6-2. Real rate of interest
LG 1; Intermediate
a.
b. The real rate of interest creates an equilibrium between the supply of savings and the demand
for funds, which is shown on the graph as the intersection of lines for current suppliers and
current demanders; r 4%.
c. See graph.
d. A change in the tax law causes an upward shift in the demand curve, causing the equilibrium
point between the supply curve and the demand curve (the real rate of interest) to rise from
r0 4% to r0 6% (intersection of lines for current suppliers and demanders after new law).
P6-3. Personal finance: Real and nominal rates of interest
LG 1; Intermediate
a. 4 shirts
b. $100 ($100 0.09) $109
c. $25 ($25 .05) $26.25
d. The number of polo shirts in one year $109 $26.25 4.1524. He can buy 3.8% more
shirts (4.1524 4 0.0381).
e. The real rate of return is 9% 5% 4%. The change in the number of shirts that can be
purchased is determined by the real rate of return since the portion of the nominal return for
expected inflation (5%) is available just to maintain the ability to purchase the same number
of shirts.
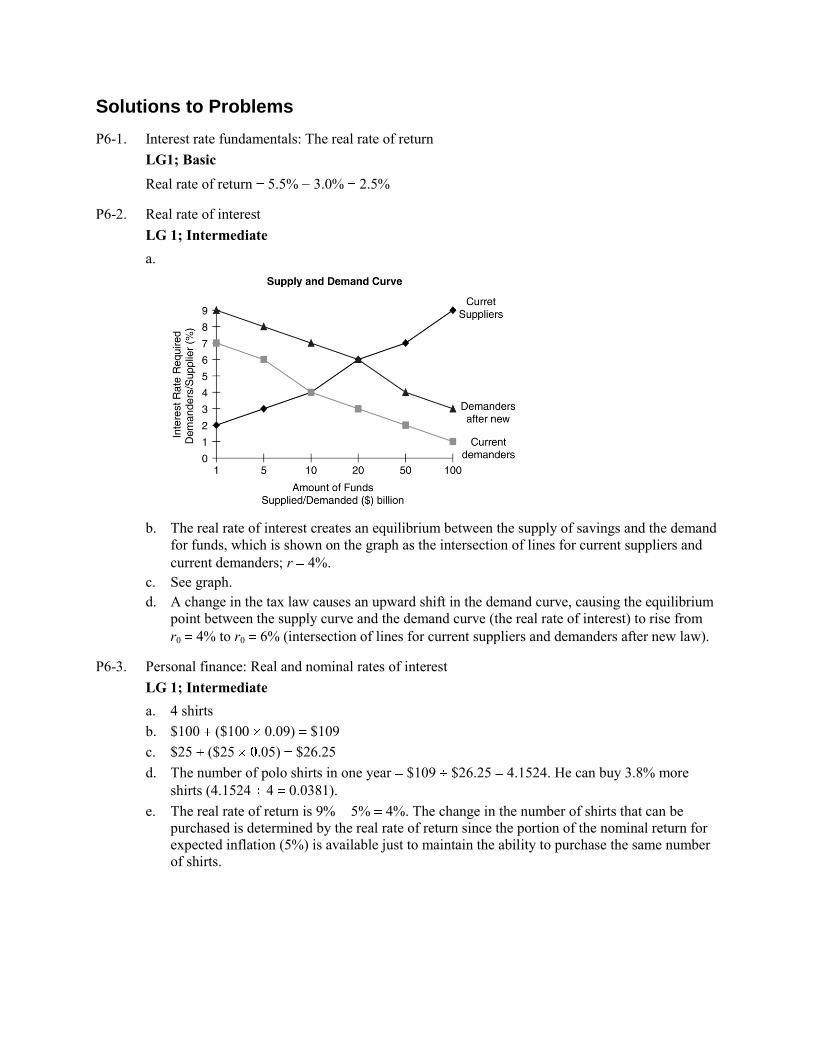
P6-4. Yield curve
LG 1; Intermediate
a.
b. The yield curve is slightly downward sloping, reflecting lower expected future rates of
interest. The curve may reflect a general expectation for an economic recovery due to
inflation coming under control and a stimulating impact on the economy from the lower
rates. However, a slowing economy may diminish the perceived need for funds and the
resulting interest rate being paid for cash. Obviously, the second scenario is not good for
business and highlights the challenge of forecasting the future based on the term structure of
interest rates.
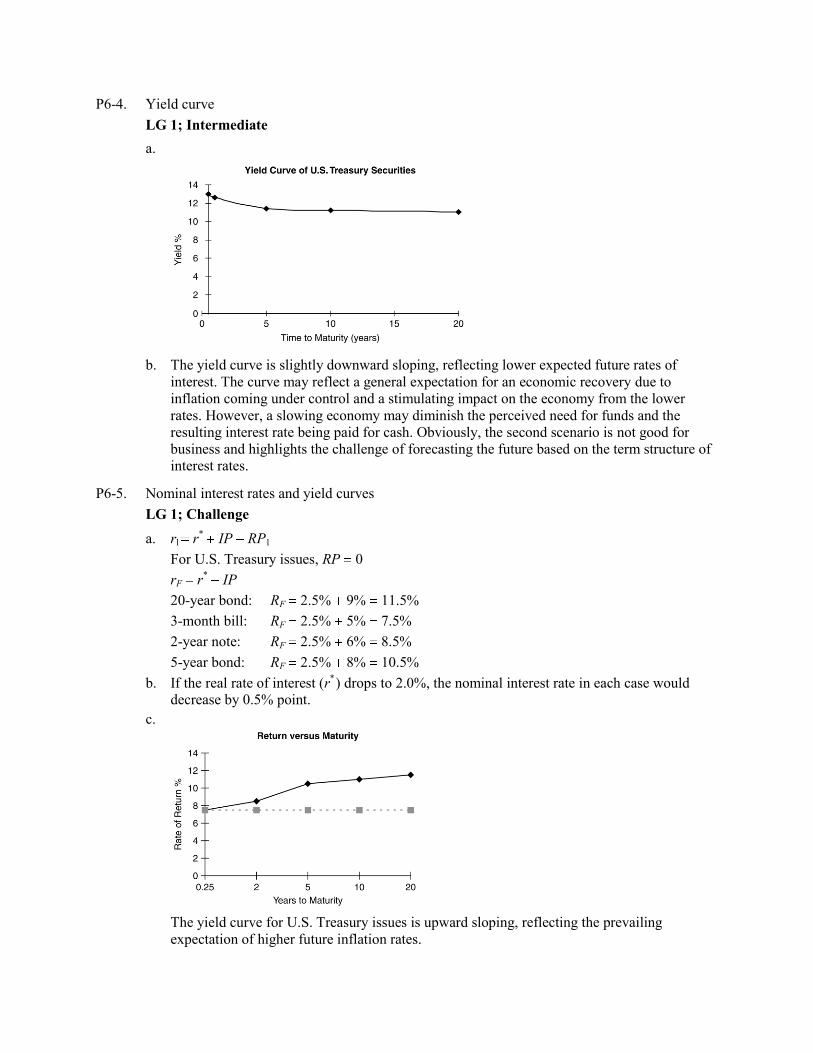
P6-5. Nominal interest rates and yield curves
LG 1; Challenge
a. rl r* IP RP1
For U.S. Treasury issues, RP 0
rF r* IP
20-year bond: RF 2.5% 9% 11.5%
3-month bill: RF 2.5% 5% 7.5%
2-year note: RF 2.5% 6% 8.5%
5-year bond: RF 2.5% 8% 10.5%
b. If the real rate of interest (r*) drops to 2.0%, the nominal interest rate in each case would
decrease by 0.5% point.
c.
The yield curve for U.S. Treasury issues is upward sloping, reflecting the prevailing
expectation of higher future inflation rates.

d. Followers of the liquidity preference theory would state that the upward sloping shape of the
curve is due to the desire by lenders to lend short term and the desire by business to borrow
long term. The dashed line in the part c graph shows what the curve would look like without the existence of liquidity preference, ignoring the other yield curve theories.
e. Market segmentation theorists would argue that the upward slope is due to the fact that under
current economic conditions there is greater demand for long-term loans for items such as
real estate than for short-term loans such as seasonal needs.
P6-6. Nominal and real rates and yield curves
LG 1; Challenge
Real rate of interest (r*):
ri r* IP RP
RP 0 for Treasury issues
r* ri IP
a.
Security
Nominal
Rate (rj)
–
IP
Real Rate of
Interest (r*)
A 12.6% – 9.5% 3.1%
B 11.2% – 8.2% 3.0%
C 13.0% – 10.0% 3.0%
D 11.0% – 8.1% 2.9%
E 11.4% – 8.3% 3.1%
b. The real rate of interest decreased from January to March, remained stable from March
through August, and finally increased in December. Forces that may be responsible
for a change in the real rate of interest include changing economic conditions such as the international trade balance, a federal government budget deficit, or changes in tax legislation.
c.
d. The yield curve is slightly downward sloping, reflecting lower expected future rates of
interest. The curve may reflect a current, general expectation for an economic recovery due
to inflation coming under control and a stimulating impact on the economy from the lower rates.

P6-7. Term structure of interest rates
LG 1; Intermediate
a.
b. and c.
Five years ago, the yield curve was relatively flat, reflecting expectations of stable interest
rates. Two years ago, the yield curve was downward sloping, reflecting lower expected
interest rates, which could be due to a decline in the expected level of inflation. Today, the
yield curve is upward sloping, reflecting higher expected future rates of interest.
d. Five years ago, the 10-year bond was paying 9.5%, which would result in approximately
95% in interest over the coming decade. At the same time, the 5-year bond was paying just
9.3%, or a total of 46.5% over the five years. According to the expectations theory, investors
must have expected the current 5-year rate to be 9.7% because at that rate, the total return
over ten years would have been the same on a 10-year bond and on two consecutive 5-year bonds. The numbers are given below.
{(9.5% 10) (9.3% 5)} 5
{95% 46.5%} 5
48.6% 5 9.7%
P6-8. Risk-free rate and risk premiums
LG 1; Basic
a. Risk-free rate: RF r* IP
Security r* IP RF
A 3% 6% 9%
B 3% 9% 12%
C 3% 8% 11%
D 3% 5% 8%
E 3% 11% 14%
b. Since the expected inflation rates differ, it is probable that the maturity of each security differs.
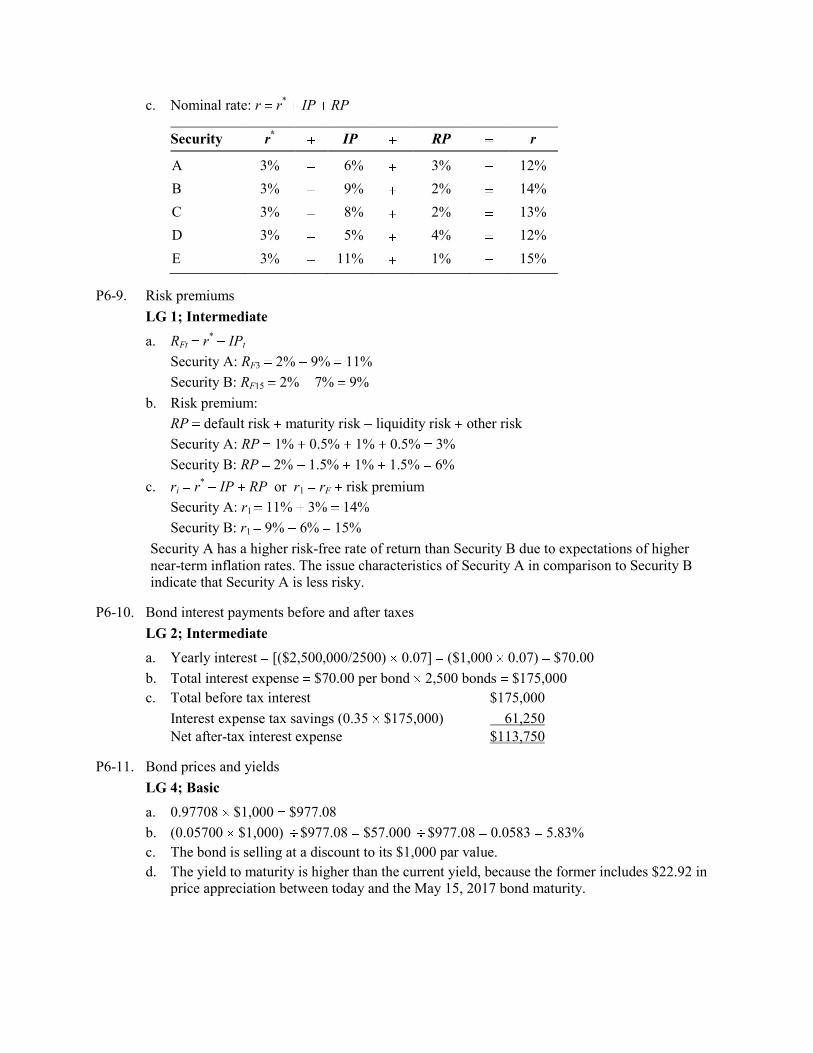
c. Nominal rate: r r* IP RP
Security r* IP RP r
A 3% 6% 3% 12%
B 3% 9% 2% 14%
C 3% 8% 2% 13%
D 3% 5% 4% 12%
E 3% 11% 1% 15%
P6-9. Risk premiums
LG 1; Intermediate
a. RFt r* IPt
Security A: RF3 2% 9% 11%
Security B: RF15 2% 7% 9%
b. Risk premium:
RP default risk maturity risk liquidity risk other risk
Security A: RP 1% 0.5% 1% 0.5% 3%
Security B: RP 2% 1.5% 1% 1.5% 6%
c. ri r* IP RP or r1 rF risk premium
Security A: r1 11% 3% 14%
Security B: r1 9% 6% 15%
Security A has a higher risk-free rate of return than Security B due to expectations of higher
near-term inflation rates. The issue characteristics of Security A in comparison to Security B indicate that Security A is less risky.
P6-10. Bond interest payments before and after taxes
LG 2; Intermediate
a. Yearly interest [($2,500,000/2500) 0.07] ($1,000 0.07) $70.00
b. Total interest expense $70.00 per bond 2,500 bonds $175,000
c. Total before tax interest $175,000
Interest expense tax savings (0.35 $175,000) 61,250
Net after-tax interest expense $113,750
P6-11. Bond prices and yields
LG 4; Basic
a. 0.97708 $1,000 $977.08
b. (0.05700 $1,000) $977.08 $57.000 $977.08 0.0583 5.83%
c. The bond is selling at a discount to its $1,000 par value.
d. The yield to maturity is higher than the current yield, because the former includes $22.92 in price appreciation between today and the May 15, 2017 bond maturity.

P6-12. Personal finance: Valuation fundamentals
LG 4; Basic
a. Cash flows: CF1 5 $1,200
CF5 $5,000
Required return: 6%
b. 3 51 2 40 1 2 3 4 5(1 ) (1 ) (1 ) (1 ) (1 )
CF CFCF CF CFV
r r r r r
0 1 2 3 4 5
$1,200 $1,200 $1,200 $1,200 $6,200
(1 0.06) (1 0.06) (1 0.06) (1 0.06) (1 0.06)V
0$8,791V
Using Calculator:
N 5, I 6, PMT $1,200, FV $5,000
Solve for PV: $8791
The maximum price you should be willing to pay for the car is $8,791, since if you paid more
than that amount, you would be receiving less than your required 6% return.
P6-13. Valuation of assets
LG 4; Basic
Present Value of
Asset End of Year Amount Cash Flows
A 1 $ 5,000 N 3, I 18 $10,871.36
2 $ 5,000 PMT $5,000
3 $ 5,000
B 1– $ 300 1 0.15 $2,000
C 1 0 N 5, I 16 $16,663.96
2 0 FV $35,000
3 0
4 0
5 $35,000
D 1–5 $ 1,500 N 6, I 12, $9,713.53
6 8,500 PMT $1,500
FV $7,000
E 1 $ 2,000 Use Cash Flow Worksheet
$14,115.27
2 3,000
3 5,000
4 7,000
5 4,000
6 1,000

P6-14. Personal finance: Asset valuation and risk
LG 4; Intermediate
a.
N
PMT
@ 10%
Low Risk
@ 15%
Average Risk
@ 22%
High Risk
CF1–4 $3,000 $ 9,510 $ 8,565 $ 7,481
CF5 15,000 9,314 7,455 5,550
Calculator solutions: $18,823.42 $16,022.59 $13,030.91
b. The maximum price Laura should pay is $13,030.92. Unable to assess the risk, Laura would use the most conservative price, therefore assuming the highest risk.
c. By increasing the risk of receiving cash flow from an asset, the required rate of return
increases, which reduces the value of the asset.
P6-15. Basic bond valuation
LG 5; Intermediate
a. I 10%, N 16, PMT $120, FV $1,000
Solve for PV $1,156.47
b. Since Complex Systems’ bonds were issued, there may have been a shift in the supply-demand relationship for money or a change in the risk of the firm.
c. I 12%, N 16, PMT $120, FV $1,000
Solve for PV: $1,000
When the required return is equal to the coupon rate, the bond value is equal to the par value.
In contrast to part a above, if the required return is less than the coupon rate, the bond will sell at a premium (its value will be greater than par).
P6-16. Bond valuation—annual interest
LG 5; Basic
Bond Calculator Inputs Calculator Solution
A N 20, I 12, PMT 0.14 $1,000 $140, FV 1,000 $1,149.39
B N 16, I 8, PMT 0.08 $1,000 $80, FV $1,000 $1,000.00
C N 8, I 13, PMT 0.10 $100 $10, FV $100 $ 85.60
D N 13, I 18, PMT 0.16 $500 $80, FV $500 $ 450.90
E N 10, I 10, PMT 0.12 $1,000 $120, FV $1,000 $1,122.89

P6-17. Bond value and changing required returns
LG 5; Intermediate
a.
Bond Calculator Inputs Calculator Solution
(1) N 12, I 11%, PMT $110, FV $1,000 $1,000.00
(2) N 12, I 15%, PMT $110, FV $1,000 $ 783.18
(3) N 12, I 8%, PMT $110, FV $1,000 $1,226.08
b.
c. When the required return is less than the coupon rate, the market value is greater than the par
value and the bond sells at a premium. When the required return is greater than the coupon
rate, the market value is less than the par value; the bond therefore sells at a discount.
d. The required return on the bond is likely to differ from the coupon interest rate because either
(1) economic conditions have changed, causing a shift in the basic cost of long-term funds,
or
(2) the firm’s risk has changed.
P6-19. Personal finance: Bond value and time—changing required returns
LG 5; Challenge
a.
Bond Calculator Inputs Calculator Solution
(1) N 5, I 8%, PMT $110, FV $1,000 $1,119.78
(2) N 5, I 11%, PMT $110, FV $1,000 $1,000.00
(3) N 5, I 14%, PMT $110, FV $1,000 $ 897.01
b.
Bond Table Values Calculator Solution
(1) N 15, I 8%, PMT $110, FV $1,000 $1,256.78
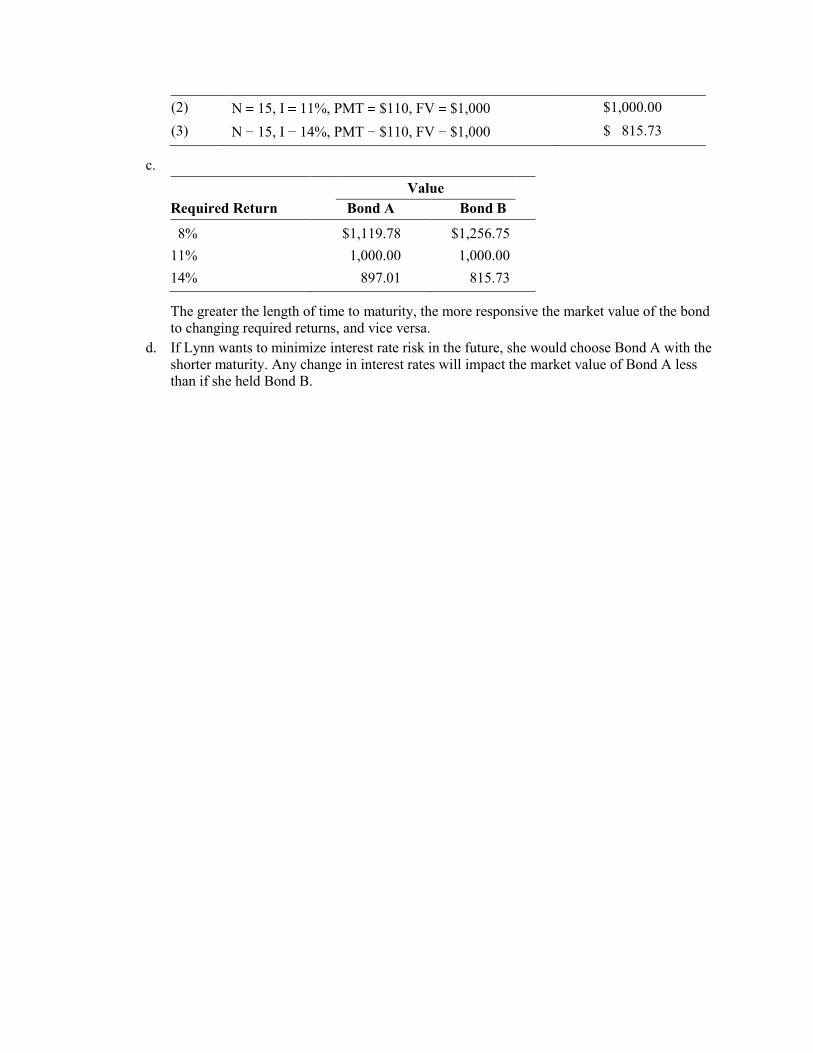
(2) N 15, I 11%, PMT $110, FV $1,000 $1,000.00
(3) N 15, I 14%, PMT $110, FV $1,000 $ 815.73
c.
Value
Required Return Bond A Bond B
8% $1,119.78 $1,256.75
11% 1,000.00 1,000.00
14% 897.01 815.73
The greater the length of time to maturity, the more responsive the market value of the bond
to changing required returns, and vice versa.
d. If Lynn wants to minimize interest rate risk in the future, she would choose Bond A with the
shorter maturity. Any change in interest rates will impact the market value of Bond A less than if she held Bond B.

P6-20. Yield to maturity
LG 6; Basic
Bond A is selling at a discount to par.
Bond B is selling at par value.
Bond C is selling at a premium to par.
Bond D is selling at a discount to par.
Bond E is selling at a premium to par.
P6-21. Yield to maturity
LG 6; Intermediate
a. Using a financial calculator, the YTM is 12.685%. The correctness of this number is proven
by putting the YTM in the bond valuation model. This proof is as follows:
N 15, I 12.685%, PMT $120, FV $1,000
Solve for PV $955.00
Since PV is $955.00 and the market value of the bond is $955, the YTM is equal to the rate derived on the financial calculator.
b. The market value of the bond approaches its par value as the time to maturity declines. The
yield to maturity approaches the coupon interest rate as the time to maturity declines.
P6-22. LG 6: Yield to maturity
LG 6; Intermediate
a.
Calculator
Bond Approximate YTM Solution
A $90 [($1,000 $820) 8]
[($1,000 $820) 2] 12.36% 12.71%
B 12.00% 12.00%
C $60 [($500 $560) 12]
[($500 $560) 2] $10.38% 10.22%
D $150 [($1,000 $1,120) 10]
[($1,000 $1,120 2] 13.02% 12.81%
E $50 [($1,000 $900) 3]
[($1,000 $900) 2] 8.77% 8.95%
b. The market value of the bond approaches its par value as the time to maturity declines. The
yield-to-maturity approaches the coupon interest rate as the time to maturity declines. Case B
highlights the fact that if the current price equals the par value, the coupon interest rate
equals the yield to maturity (regardless of the number of years to maturity).

P6-24. Bond valuation—semiannual interest
LG 6; Intermediate
N 6 2 12, I 14 2 7%, PMT 0.10 $1,000 2 $50; FV $1,000
Solve for PV $ $841.15
P6-25. Bond valuation—semiannual interest
LG 6; Intermediate
Bond Computer Inputs Calculator Solution
A N 24, I 4%, PMT $50, FV $1,000 $1,152.47
B N 40, I 6%, PMT $60, FV $1,000 $1,000.00
C N 10, I 7%, PMT $30, FV $500 $ 464.88
D N 20, I 5%, PMT $70, FV $1,000 $1,249.24
E N 8, I 7%, PMT $3, FV $100 $ 76.11

P6-26. Bond valuation—quarterly interest
LG 6; Challenge
N 4 10 40, I 12% 4 3.0%, PMT 3, PMT 0.10 $5,000 4 $125, FV $5,000
Solve for PV $4,422.13
P6-27. Ethics problem
LG 6; Intermediate
Student answers will vary. Some students may argue that such a policy decreases the reliability
of the rating agency’s bond ratings since the rating is not purely based on the quantitative and
nonquantitative factors that should be considered. One of the goals of the new law is to
discourage such a practice. Other students may argue that, like a loss leader, ratings are a way to
generate additional business for the rating firm.