
Chapter 6 Chapter 6 TEMPORAL FACTORS IN VISUAL ...
64
V Reprinted from: HANDBOOK VOL V Seeing (£)l9/5 ACADEMIC PRESS, INC N«w York San Franc'wco Londo* Chapter 6 Chapter 6 TEMPORAL FACTORS IN VISUAL PERCEPTION LEO GANZ I. Introduction 169 11. Bloch's Law of Tempoial Summation 170 HI. Temporal Summation with Double Pulses 173 IV. Linear Systems Analysis of the Response to Temporal Transients 176 A. Fourier Analysis 176 B. The Sensitivity of the Visual System to Sinusoidally Modulated Light 176 C. Kelly's Linear Model 178 D. The Unit Impulse Response 180 E. The Relationship between Bloch's Law and the Temporal Modula- tion Transfer Function 182 V. Visual Persistence 182 VI. The Perception cf Succession 186 VII. Visual Numerosity 187 VIII. Homogeneous Light Masking 188 A. Empirical Studies 188 IX. Metacontrast 193 A. Empirical Studies 193 B. Neurophysiological Indices 200 " C. Theories 201 X. Visual Noise Masking 211 A. Empirical Studies 211 B. Theories 215 XL Spatio-Temporal Interactions 222 References 227 I. INTRODUCTION Time, as a parameter of examination in research on visual perception, is so universal that it cannot really be contained satisfactorily within the confines of a single handbook chapter. In order to bring the subject down to a manageable chunk, we have addressed ourselves really to only one issue: the relatively poor temporal resolution of the visual system. Consider the "picture" generated by a television screen. A single beam creates a small spot which moves across the entire screen in approximately 1/60
-
Upload
khangminh22 -
Category
Documents
-
view
0 -
download
0
Transcript of Chapter 6 Chapter 6 TEMPORAL FACTORS IN VISUAL ...

V
Reprinted from:HANDBOOK
OF PERCEPTION,
VOL VSeeing(£)l9/5
ACADEMIC PRESS, INCN«w York San Franc'wco Londo*
Chapter 6Chapter 6
TEMPORAL FACTORS IN VISUAL PERCEPTIONLEO GANZ
I. Introduction 16911. Bloch's Law ofTempoial Summation 170
HI. Temporal Summation with Double Pulses 173IV. Linear Systems Analysis of the Response to TemporalTransients 176
A. Fourier Analysis 176B. The Sensitivity of the Visual System to Sinusoidally Modulated Light 176C. Kelly's Linear Model 178D. The Unit Impulse Response 180E. The Relationship between Bloch's Law and the Temporal Modula-
tion TransferFunction 182V. Visual Persistence 182
VI. The Perception cfSuccession 186VII. Visual Numerosity 187
VIII. Homogeneous Light Masking 188A. Empirical Studies 188
IX. Metacontrast 193A. Empirical Studies 193B. Neurophysiological Indices 200
"C. Theories 201
X. Visual Noise Masking 211A. Empirical Studies 211B. Theories 215
XL Spatio-Temporal Interactions 222References 227
I. INTRODUCTION
Time, as a parameter of examination in research on visual perception,is so universal that it cannot really be contained satisfactorily within theconfines of a single handbook chapter. In order to bring the subject downto a manageable chunk, we have addressed ourselves really to only oneissue: the relatively poor temporal resolution of the visual system. Considerthe "picture" generated by a television screen. A single beam creates asmall spot which moves across the entire screen in approximately 1/60

I / * 1
LEO GANZ170
.
sec. The fact that we do indeed see a picture rather than a single spotsuggests immediately that the visual system integrates over time periodsof the order of 17 msec or longer. Or consider reading. Our eyes executesaccades which take an insignificant amount of time, interspersed by 200msec or so of fixation. If we attempted to increase our reading rate byshortening the fixation time to 100 msec or less, we would soon find inter-ference effects of one fixation on another both backward and forward intime. In other words, the visual system can be considered time-integrative:It is so constructed that light quanta are integrated in time bins of 17-100msec, or longer.
"This chapter will concern itself with this time bin property and its impli-
cations for visual perception.
11. BLOCH'S LAW OF TEMPORAL SUMMATION
The basic law underlying a wide variety of temporal perceptual phenomena is Bloch's law ( 1885 ) :
where / is the threshold intensity, t is the duration of the test, and k isa constant. It states simply that, for threshold phenomena, the same visual .effect will be obtained if the product of intensity and duration is maintainedconstant, so long as the duration time is less than the critical duration t.
Phrased differently, the law states that below the critical duration, the mag-nitude of a visual effect near threshold is constant when the total numberof quanta absorbed from light pulse(s) is constant; this constancy is notaffected by the wave shape of the light pulse(s). An example of the opera-tion of Bloch's law is shown in Fig. 1, taken from an experiment by Baum-gardt and Hillmann (1961). The task involved the threshold detection ofa fairly large disk (48.6 square degrees of visual angle). When the loga-rithm of the threshold intensity is plotted against the logarithm of the light-pulse duration, as is done in Fig. 1, Bloch's law predicts a negative linearslope of 1.0. We see in the figure that this is indeed true for both observersup to a duration of 100 msec. The function assumes a shallower slopewith flashes of longer duration, indicating less than perfect temporal inte-gration above 100 msec. The estimate of t, the critical duration, is therefore100msec.
"Estimates of the critical duration of about 100 msec have been obtained
in a wide variety of experimental determinations. In foveal vision, Herrick(1956) found t = 99 msec; Barlow (1958) reports perfect temporal sum-mation for pulse durations up to 100 msec. Blackwell (1963) reports ex-
"
I -t = fc, t <T. (1)

■
< t
6. TEMPORAL FACTORS IN VISUAL PERCEPTION 171
\
"
Log Duration (msec)
Fig. 1. An illustration of Bloch's law. The logarithm of the intensity of a flashthreshold (units are arbitrary) plotted against the logarithm of its duration. Fordurations under 100 msec the slope = —1. This slope indicates / X ' = k at thresh-old. Data for two observers. Flash wavelength = 520 nm. Target size = 7°sl'.[From Baumgardt & Hillmann (1961).]
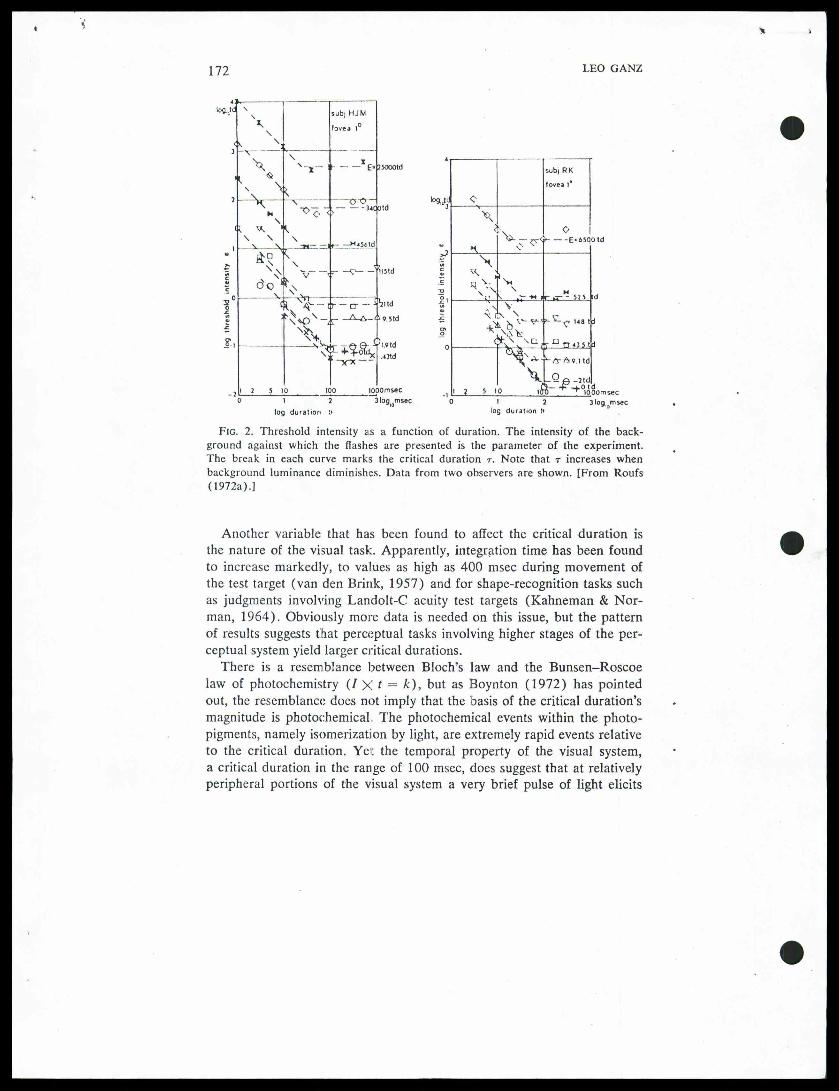
periments suggesting T = 87 msec at threshold. Johnson and Bartlett(1956) used the b-wave of the human electroretinogram, measuring flashintensity needed to obtain a standard-sizedb-wave, and varying pulse dura-tion as an experimental parameter. They found Bloch's law held up tothe critical duration of 100 msec." Although earlier studies suggested that thecritical duration becomes verysmall when large targets are used (Graham & Margaria, 1935), more re-cent investigations such as Baumgardt and Hillmann's (1961), illustratedhere in Fig. 1, show, in fact, that critical duration remains constant—about 100 msec—for fairly sizable targets. One variable that does affectthe critical duration is the luminance of the background. As shown in Fig.2, light pulses presented against bright backgrounds yield shorter criticaldurations than against dark backgrounds (Graham & Kemp, 1938; Barlow,1958; Sperling & Jollife, 1965; Roufs, 1972a). More specifically, it hasbeen shown that the inverse of the critical duration, M, varies logarithmi-cally with adaptation level (Matin, 1968). This is of theoretical interestbecause, as we shall see in Section IV, the impulse response of the visualsystem also becomes more rapid at high background luminances.
"
>t » >
172 LEO GANZ
lofl.li
"
3 log. mseclog duration 0
Fig. 2. Threshold intensity as a function of duration. The intensity of the back-ground against which the flashes are presented is the parameter of the experiment.The break in each curve marks the critical duration t. Note that t increases whenbackground luminance diminishes. Data from two observers are shown. [From Roufs(1972a).]
Another variable that has been found to affect the critical duration isthe nature of the visual task. Apparently, integration time has been foundto increase markedly, to values as high as 400 msec during movement ofthe test target (van den Brink, 1957) and for shape-recognition tasks suchas judgments involving Landolt-C acuity test targets (Kahneman & Nor-man, 1964). Obviously more data is needed on this issue, but the patternof results suggests that perceptual tasks involving higher stages of the per-ceptual system yield larger critical durations.
"There is a resemblance between Bloch's law and the Bunsen-Roscoe
law of photochemistry (/ X t = fc), but as Boynton (1972) has pointedout, the resemblance does not imply that the basis of the critical duration'smagnitude is photochemical, The photochemical events within the photo-pigments, namely isomerization by light, are extremely rapid events relativeto the critical duration. Yet the temporal property of the visual system,a critical duration in the range of 100 msec, does suggest that at relativelyperipheral portions of the visual system a very brief pulse of light elicits
"
'}" 1 I '—«-cld \ subjHJW
x
fovea
1°
3 — 'V \ .
M,
s -v— !l E"2soootd
\\ -o-c,-i "»<d
v '«,
\ \
\, \ \. a_=.=u r_L____is»M
! oNo '^-
-2 ' ? ?
IQ
lo° . IQpOmsec0 l 2 3 log msec"10
log duratiori
v>
*W! 9 Thr^shnlrl intpn^itv
hq pi
fnnr
-£Motd' 1000msec

f
tI"
6. IF.MPORAI. I ACTORS IN VISUAL PERCEPTION 173
"
"
"
Fio. 3. Intracellular rocoidingfrom within individual rods andcones of the mudpuppy. A com- jparison of the receptor potentialsof rods and cones to pulses of 7.6lighl, 180 msec in duration. Thenumbers to the left of each re-cord is the log intensity of theflash. Note the slow decay of theresponses; the records on the gjright are plotted on a slower timescale to illustrate this. Rods areslower both in onset and decay g mVi_than cones. TFrom Fain & Dowl- 20C
L
me
ing (1973).]
a comparatively longresponse. For example, Fig. 3 shows a receptorpoten-tial recorded from within a single cone or single rod receptor of the mud-puppy retina, and obtained with brief flashes (Fain & Dowling, 1973).The voltage envelope rises and decays much more slowly than the stimuluspulse. In fact, as we might expect from Bloch's law, when the stimuli aremuch briefer than the critical duration, the rise and decay function is inde-pendent of the duration or wave shape of the light pulse. Thus, in largemeasure, the temporal properties that comprise Bloch's law are determinedwithin the visual receptors themselves, presumably at a stage in the chainof events after the isomerization itself. The relative slowness of the criticalduration suggests a mechanism such as the diffusion of ions within theouter segments of the rods and cones. Note in Fig. 3 that the temporalparameters of rods are considerably slower than cones.
The change in time constant with background luminance can also beattributed to receptor mechanisms, or receptor interactions. In Fig. 4 we
see the receptor potential of cones recorded extracellularly from the mon-key eye (Whitten & Brown, 1973). In the dark-adapted state (record 0)the cone shows a very slow decay of its receptor potential. As backgroundintensity increases (records 10, 20, . . . etc.), the decay becomes morerapid. It should also be noted that the decay is exponential in shape, whichmay explain some characteristics of metacontrast and masking. This is dis-cussed in Sections IX and X.
111. TEMPORAL SUMMATION WITH DOUBLE PULSES
If instead of presenting a subject with a single light pulse of variableduration, we substitute a double pulse varying in stimulus onset-to-onset

*'I *
174 LEO GANZ
"
320 msec 320 msec
Fig. 4. Cone receptor potentials from monkey retina. A 320-msec flash is presentedevery 10 sec. Record 0 is obtained under dark adaptation. Records 10, 20,30, . . . etc. are obtained with successively brighter backgrounds. Note that the de-cay becomes more rapid as background level increases. [From Whitten & Brown(1973).]
asynchrony (SOA), the results obtained are no longer as simple. The maincomplication appears to be that, in response to a very brief light pulse,the visual system goes through a bivalent sequence of excitation followedby inhibition which, if the interval is appropriate (40-70 msec) will attenu-ate the impact of the second pulse. For example, Baumgardt and Segal(1946), working at suprathreshold levels presented pairs of equiluminous10-msec light pulses in the shape of two concentric squares of unequalsize to the same .retinal region. They obtained temporal summation onlyif they kept SOA very short, below 40 msec. If the asynchrony was withinthe range 50-80 msec, then the inner square was dimmed relative to itsappearance when presented alone. At an asynchrony above 100 msec, theinhibitory interaction diminished progressively. Using a detection thresholdmeasure, Ikeda (1965) reported similar results (see also Rashbass, 1970).Two pulses of 12.5-msec duration were presented against a brighter ora dimmer background. Both positive (lighter than the background) andnegative pulses (darker than the background) were used. Results areshown in Fig. 5, expressed as a summation index that equals 1 when tem-poral integration is complete and .10 when the pulses are exerting indepen-dent effects. The figure shows that temporal integration is complete when
"
"
<■■
■J.
1756. TEMPORAL FACTORS IN VISUAL PERCEPTION
"
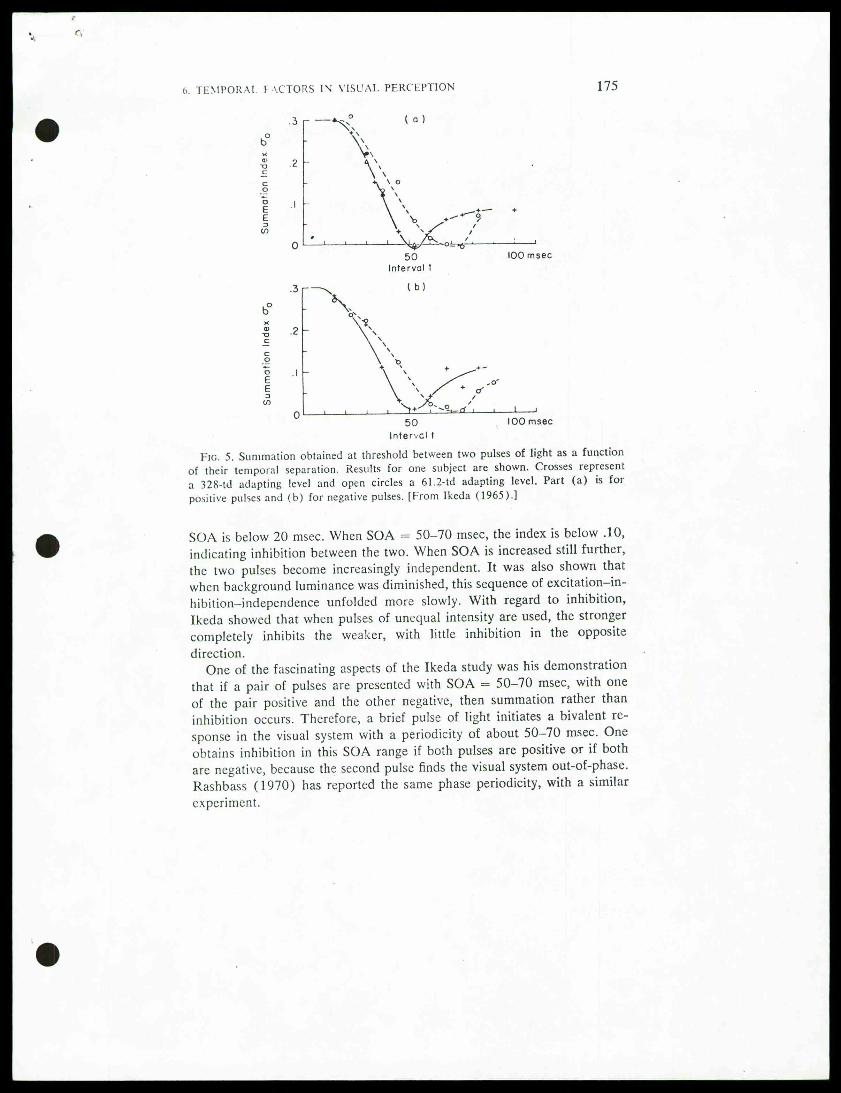
Fig. 5. Summation obtained at threshold between two pulses of light as a functionof their temporal separation. Results for one subject are shown. Crosses represent
a 328-td adapting level and open circles a 61.2-td adapting level. Part (a) is forpositive pulses and (b) for negative pulses. [From Ikeda (1965).]
SOA is below 20 msec. When SOA = 50-70 msec, the index is below .10,indicating inhibition between the two. When SOA is increased still further,the two pulses become increasingly independent. It was also shown thatwhen background luminance was diminished, this sequence of excitation-in-hibition-independence unfolded more slowly. With regard to inhibition,Ikeda showed that when pulses of unequal intensity are used, the strongercompletely inhibits the weaker, with little inhibition in the oppositedirection.
"One of the fascinating aspects of the Ikeda study was his demonstration
that if a pair of pulses are presented with SOA = 50-70 msec, with oneof the pair positive and the other negative, then summation rather thaninhibition occurs. Therefore, a brief pulse of light initiates a bivalent re-sponse in the visual system with a periodicity of about 50-70 msec. Oneobtains inhibition in this SOA range if both pulses are positive or if bothare negative, because the second pulse finds the visual system out-of-phase.Rashbass (1970) has reported the same phase periodicity, with a similarexperiment.
"

y "i*
176 LEO GANZ
IV. LINEAR SYSTEMS ANALYSIS OF THE RESPONSE TOTEMPORAL TRANSIENTS "A. Fourier Analysis
The concept of Fourier analysis states simply that a periodic phenome-non of any wave shape whatsoever can be analyzed into a series of sinu-soids made up of the fundamental frequency and of integer multiplesthereof, of that frequency (i.e., harmonics), each harmonic having a par-ticular amplitudeand phase.
Inversely, the concept of Fourier synthesis states that by combining afundamental frequency with a series of harmonics with designated ampli-tude and phase for each, one can reconstruct any designated periodic waveshape. Linear systems analysis begins with the assumption that the visualsystem is linear. Specifically, it is assumed that the principle of linearsuperposition holds in the visual system:
(2)
namely that the output resulting from two inputs combined equals the sumof the outputs to the separate components. The response of the visual sys-tem is certainly nonlinear. Nevertheless, over small dynamic ranges, thesuperposition assumption proves to be a workable and convenientapproximation.
B. The Sensitivity of the Visual System to Sinusoidally ModulatedLight
"One can predict the response of a linear system to any temporal transientif one knows the system's response to the sine wave components into whichthe transient can be decomposed by Fourier analysis. The visual systemis viewed as a filter network that can transfer sinusoidal inputs of varyingfrequencies with differing efficiencies. This transfer characteristic is calledthe temporal modulation transfer function (TMTF). It is determined bypresenting observers with sinusoidally flickering light and measuring, foreach frequency of flicker, what amplitude is needed to obtain a standardamplitude response. A visual stimulus that is flickering sinusoidally hasa luminance function,
(3)
where t is time, L is the average luminance, <o is the flicker frequency inradians, and m is the amplitude of modulation. Thus, m represents theheight of the peak above the mean luminance level. The terms are depictedin Fig. 6. Ives (1922a,b) performed some of the earliest experiments using
"
F(a + b) = F(a) + F(b),
f(t) = L{\ + m sin wt),
f
1776. TEMPORAL FACTORS IN VISUAL PERCEPTION
"
"
"
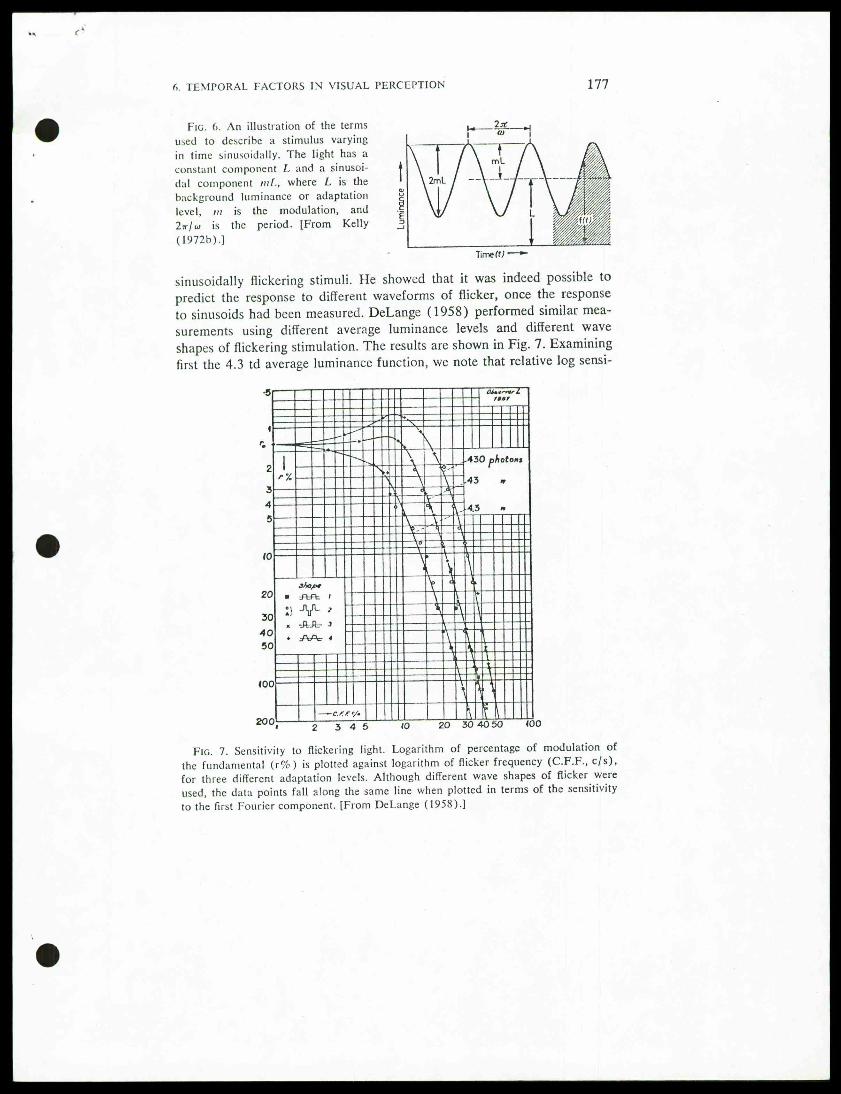
Fig. 6. An illustration of the termsused to describe a stimulus varyingin time sinusoidally. The light has aconstant component L and a sinusoi-dal component mf., where L is thebackground luminance or adaptationlevel, m is the modulation, and2*7 w is the period. [From Kelly(1972b).]
sinusoidally flickering stimuli. He showed that it was indeed possible topredict the response to different waveforms of flicker, once the responseto sinusoids had been measured. DeLange (1958) performed similar mea-surements using different average luminance levels and different waveshapes of flickering stimulation. The results are shown in Fig. 7. Examiningfirst the 4.3 td average luminance function, we note that relative log sensi-
Fig. 7. Sensitivity to flickering light. Logarithm of percentage of modulation ofthe fundamental (r%) is plotted against logarithm of flicker frequency (C.F.F., c/s),
for three different adaptation levels. Although different wave shapes of flicker wereused, the data points fall along the same line when plotted in terms of the sensitivity
to the first Fourier component. [From DeLange (1958).]

■>
>
178 LEO GANZ
tivity (i.e.—log % modulation) is high at low frequencies and then dropsalmost linearly on this log-log plot at high frequencies, from 7 Hz upward.At an average retinal illuminance of 4.3 td, the visual system is respondingas a simple low-pass filter with a corner frequency of 7 Hz. One of theinteresting aspects of the DeLange results is that the data points with differ-ing symbols all fall along the same function. As the legend indicates, theyrefer to flickering stimuli with different wave shapes (square wave, rec-tangular wave, trapezoidal wave, etc.). The fact that their threshold modu-lation is the same proves that above 10 Hz the threshold of a flickeringtarget of any waveform is entirely predictable from the threshold to thefundamental frequency of the sinusoid of that waveform. The higher har-monics evidently do not affect the threshold. This great simplification con-firms Ives, and lends support to the rationale for applying linear systemsapproaches.
"
Figure 7 demonstrates that with higher average luminance levels (43,then 430 td) relative sensitivity to higher frequency improves and a peakof sensitivity develops at 8-10 Hz. This means that at higher photopicadaptation levels, the visual system begins to resemble a filter with bothlow- and high-frequency cutoff properties. Kelly (1959) has shown thatthe low-frequency cutoff is very sensitive to the spatial properties of theflickering field. In Fig. 8 it can be seen that the low-frequency cutoff ismore profound when a large flickering field with blurred edges is used(curve b in Fig. 8) than when a small, sharp-edged field is used (curve ain Fig. 8). In other words, we are less sensitive to slow flicker when thefield is large. It is thought: likely that the mechanism responsible for thesespatially dependent phenomena is lateral inhibition with an appropriatelyslow time-constanl: (Levinson, 1964;Kelly, 1969). "C. Kelly's Linear Model
It is beyond the scope of this chapter to consider theories of flicker inany depth (the reader interested in becoming acquainted with more theo-retical treatments should consult the following: Ives, 1922b; Matin, 1968;Levinson, 1968; Sperling & Sondhi, 1968; Kelly, 1971a,b). A few briefcomments, however, may be useful. If TMTF functions of the sort shownin Fig. 5 are plotted not in relative terms, but in absolute units, one obtainsfunctions such as those in Fig. 9 (Kelly, 1971a). Once more, the differingcurves are obtained at different levels of adaptation, the lowest one depict-ing the highest photopic background level against which flicker is measured.Note particularly that the highest frequency portions fall very close to the[Gdrw)]-1 function (see Kelly, 1971a, for a derivation of this function).This high-frequency asymptote expresses, it is believed, some physical pro-
"

I
»
6. TEMPORAL FACTORS IN VISUAL PERCEPTION 179
"
FREQUENCY (Hz)
Fig. 8. The effect of target size on sensitivity to flicker, (a) 2° sharp-edged targetwith steady surround; (b) 65° flickering target with blurred edges; (c) 4° sharp-edged target with darksurround. [From Kelly (1959).]
cess in the visual system, which is incapable of following high oscillations,specifically a linear diffusion process (Ives, 1922b; Veringa, 1970; Kelly,1971a). Presumably this diffusion process actually entails the transportof photoproducts and/or ionic currents initiated by the action of a lightpulse, transport of these within the receptor cell and its surrounding me-dium. Such physical diffusion involves temporal dispersion. As a result,the visual system cannot faithfullyfollow higher frequencies of flicker. Suchtemporal dispersion probably underlies all phenomena involving temporalintegration. Therefore, this one fact has a surprisingly variegated set ofconsequences for perception, e.g., Bloch's law, the phenomena of masking,and metacontrast.
"A second aspect of flicker that Kelly (1971a) has analyzed (see also
Sperling & Sondhi, 1968) is that at high photopic background luminancelevels (e.g., the filled circles in Fig. 9) there is a pronounced drop in low-frequency sensitivity; by way of contrast, at low luminance levels (e.g.,filled squares), low-frequency sensitivity is level from 5 Hz down. In otherwords, the visual system contains an inhibitory mechanism, which operatespredominantly with stimuli flickering at low frequencies, and which only
"

<. I
180 LEO GANZ
"Fig. 9. Sine wave flicker thresholdsplotted
in terms of absolute sensitivity againstflicker frequency for six different adaptationlevels. [From Kelly (1971a).]
FREQUENCY
(Hi)
"comes into operation at higher background luminance levels. We have aof this inhibitory mechanism from a factstrong hint as to the character
ts shown in Fig. 5, namely that the threebackground levels, all join at low flicker-fre-
depicted in DeLarige's resultscurves, representing differentquencies. This means relative thresholds are independent of backgroundlevel, at those frequencies. In other words, Weber's law (A/// = k) oper-ates particularly at low flicker-frequencies. In turn, Weber's law inpliesthat a momentary stimulus input is divided by current levels of input. InKelly's (1971a) model of flicker this is conceptualized as a negative feed-back loop (or several) that passes low frequencies and has a gain thatincreases with background luminance.
D. The Unit Impulse Response
Once the transfer function for sinusoidal waveforms is known, one canpredict the response to any temporal pattern of visual stimulation (bearing
"

»* I
1816. TEMPORAL FACTORS IN VISUAL PERCEPTION
"
TIME (mt-c)
" Fie. 10. Impulse response functions at four different adaptation levels, as derivedfrom a theoretical model of sensitivity to sinusoidal flicker [From Kelly (1971a).]
in mind that the amplitude of the signal should be small enough so thatconsidering the visual system as a linear system will remain a reasonableassumption). In particular, it is instructive to examine the predicted re-sponse of the system to a transient visual stimulus, i.e., a very brief pulseof light. This is the so-called unit-impulse response. It is simply theFouriertransform of the temporal modulation transfer function. One computationalrealization of this transform is shown in Fig. 10, takenfrom Kelly (1971a;see also Sperling & Sondhi, 1968). The inferred impulse response of thevisual system to a brief transient pulse is shown for four levels of back-ground luminance. For the highest background level (846 td) the visualsystem responds, after a latency of about 20 msec, with a positive-negativesequence, which occupies some additional 60 msec, even when the light
"

1V I
pulse is extremely brief. Note also that the impulse response becomes con-siderably slower as background luminance diminishes. For example, at abackground luminance of .7 td, the positive-negative sequence acquiresa duration of some 160 msec. Comparing Figs. 5 and 10 reveals a strikingconvergence between flicker and two-pulse experiments. "E. The Relationship between Bloch's Law and the Temporal Modulation
Transfer FunctionBloch's law can be deduced from the linear analytic system as follows:
When a light pulse is shortened but kept constant in total energy, theFourier analysis of these shortened pulses remains unchanged, except forthe addition of some very high frequencies. If the duration of the originalflash was quite brief relative to the total length of the unit-impulse re-sponse, then these added high frequencies will be in a range of the transferfunction to which the observer is insensitive, and therefore will not con-tribute significantly to the detection of the flash. However, when the dura-tion of such a constant-energy flash exceeds the critical duration t, thenlow frequencies are added which are prone to inhibition by the Weber-lawmechanism, thus, less than perfect summation can be expected, and Bloch'slaw will no longer apply.
Both psychophysical studies (Matin, 1968; Sperling & Sondhi, 1968;Kelly, 1971a,b; Roufs, 1972a,b) and physiological studies (DeVoe,1967a,b) have had some success in predicting the visual system's responseto single flashes from the TMTF extracted from sinusoidal-flicker studies.
"V. VISUAL PERSISTENCE
The studies of critical duration and the unit-impulse response inferredfrom two-pulse interaction and sinusoidal flicker experiments leaves littledoubt that a visual sensation will outlast any brief light pulse by at least60-100 msec. In a sense, the unit-impulse response, with its minimum dura-tion of 60-100 msec, means there is a perceptual time quantum. No matterhow short the stimulus, perceptual experience will be no briefer than60-100 msec. As we have already seen, theresponse of the peripheral gen-erator mechanism of that perceptual experience is never briefer than the60-100-msec unit-impulse response. In this section, we will review a num-ber of approaches to measure the duration of perceptual experience.
Some of the earliest observations have been described elsewhere (Boyn-ton, 1972) and will therefore not be repeated here, except to mentiond'Arcy's (1773; see Boynton, 1972) experiment, in which he mounteda luminous source on a rotat-ng wheel and noted that with a rotation time
"
182 LEO GANZ
I
1836. TEMPORAL FACTORS IN VISUAL PERCEPTION
" logitd )
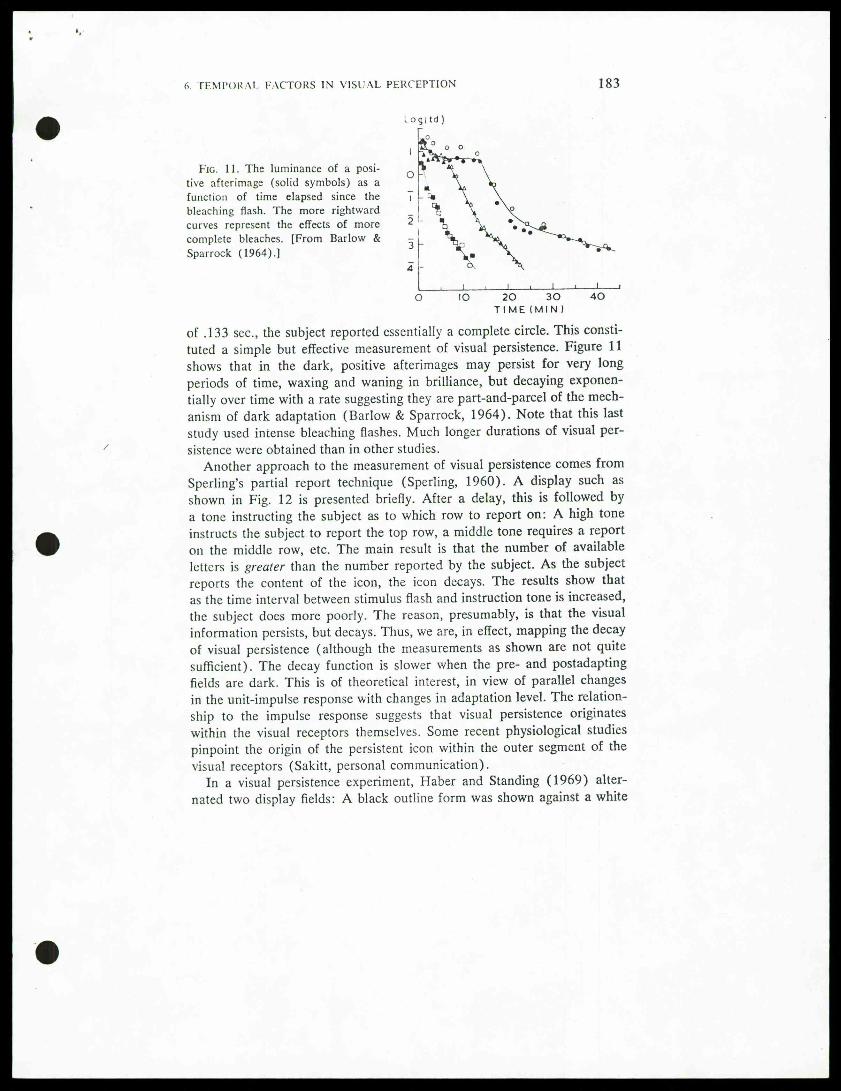
Fig. 11. The luminance of a posi-tive afterimage (solid symbols) as afunction of time elapsed since thebleaching flash. The more rightwardcurves represent the effects of morecomplete bleaches. [From Barlow &Sparrock (1964).]
TIME (MIN )
of .133 sec, the subject reported essentially a complete circle. This consti-tuted a simple but effective measurementof visual persistence. Figure 11shows that in the dark, positive afterimages may persist for very longperiods of time, waxing and waning in brilliance, but decaying exponen-tially over time with a rate suggesting they are part-and-parcel of the mech-anism of dark adaptation (Barlow & Sparrock, 1964). Note that this laststudy used intense bleaching flashes. Much longer durations of visual per-sistence were obtained than in other studies.
Another approach to the measurement of visual persistence comes fromSperling's partial report technique (Sperling, 1960). A display such asshown in Fig. 12 is presented briefly. After a delay, this is followed bya tone instructing the subject as to which row to report on: A high toneinstructs the subject to report the top row, a middle tone requires a reporton the middle row, etc. The main result is that the number of availableletters is greater than the number reported by the subject. As the subjectreports the content of the icon, the icon decays. The results show thatas the time interval between stimulus flash and instruction tone is increased,the subject does more poorly. The reason, presumably, is that the visualinformation persists, but decays. Thus, we are, in effect, mapping the decayof visual persistence (although the measurements as shown are not quitesufficient). The decay function is slower when the pre- and postadaptingfields are dark. This is of theoretical interest, in view of parallel changesin the unit-impulse response with changes in adaptation level. The relation-ship to the impulse response suggests that visual persistence originateswithin the visual receptors themselves. Some recent physiological studiespinpoint the origin of the persistent icon within the outer segment of thevisual receptors (Sakitt, personal communication).
"
In a visual persistence experiment, Haber and Standing (1969) alter-nated two display fields: A black outline form was shown against a white
"

*« . t
184 LEO GANZ
"
"Fig. 12. Partial reporl technique for estimating the decay of visual (i.e., iconic)information. Three horizontal arrays of letters are presented, very briefly, followedby a tone. A high, middle, or low tone-pitch instructs the subject whether to reportthe top, middle, or bottom array. The proportion of letters reported correctly isplotted against the length of the delay between visual exposure and tone. The decayin recognition performance as the tone is progressively delayed presumably reflectsthe decay of iconic information. It might be noted that this decay is considerablyslower when pre- and postexposure adaptation level is low. [From Averbach &Sperling (1960).]
background, then an intervening white background, then the form returnedfor 10 msec, etc., alternating in this way for 10 cycles. The duration ofthe intervening blackground was lengthened until the subject reported per-ceiving the form as having completely faded away before it reappeared(a technique similar in strategy to d'Arcy's). Complete fading required
"
ier —— una
■
TOTAL AVAILABLE INFORMATIONUl ie a/[\* **■ PP-E-FIELD AND POST-FIEIO DARHffl ; I *- PPE-FIELD ANO POST-FIELD
'LIGHT'
\~,i 1 \ ■» £
!'"" ri M^ .j
§"■ i M 2v. I '-
Z
* I
-
*£ 4 | INFORMATION IN MEMORY REPORT " LU| -*- PR£-FiELD AND POSr-FiELO DARK
«o-PRE-FIELD AND POST-FIELD 'LIGHT'oLJLuu-. , , , CCL J
Q
-o:> Oil 2 J a
■>
.DELAY OF INSTRUCTION (sec)

■■
6. lEMPOKAI FACTORS IN VISUAL PERCEPTION 185
" Fig. 13. The subject adjustsa click so its onset appears tocoincide with the onset of thelight flash. On other trials hedoes the same with the offsetof the flash. The interclick in-terval estimates directly visualpersistence. As the duration ofthe light flash diminishes, ap-parent persistence also dimin-ishes, reaching a plateau atabout 400 msec in the dark-adapted state (Dark|F|Dark)and 200 msec in the light-adapted state (AF|F|AF). AFand dark refer to a light anddark background
field,
respec-tively. The field prior to thestimulus or following it couldbe either light or dark. Para-digm 1 to 4 represents the fourpermutations. [From Haber &Standing (1970).]
" Stimulus Duration (msec)
about 250 msec. When the background was dark, persistence increasedto 400 msec. More recently, these same authors (Haber & Standing, 1970)used a technique first described by Sperling to measure visual persistence.A form was presented briefly. On some trials the perceiver was asked toset a tone so that the onset of the tone seemed to occur simultaneouslywith the onset of the figure. On other trials he was asked to set the toneso its onset synchronized with the offset of the figure. The difference be-tween the two task-settings measures the apparent persistence of the visualform. Figure 13 shows how the duration of perceptual experience is relatedto the duration of the visual stimulus. As the duration of the stimulus di-minishes, the phenomenological duration drops. Note, however, that ap-parent duration drops down to an asymptotic value of 200 msec in thelight-adapted state and 400 msec in the dark adapted state, even withthe briefest stimuli. (The drop in persistence at very low duration is an
"

X
186 LEO GANZ
"'\ ','" M* " .
Fig. 14. Split stimulus pattern used to measure visualpersistence. The two upper dot patterns appear random.
* " » When superimposed, subjects can read the letters VOH.
"""*"" Visual persistence permits the letters to be recognized
"" "" * even with some asynchrony between the two presenta-tions [From Eriksen & Collins (1967).]
"W.*Vir
artifact, due to absence of Intensity X Time constancy.) Increased persis-tence under dark-adapted conditions implicates the unit-impulse responseas underlying visual persistence. It should be noted, however, that theirperceptual estimates of persistence are twice as long as those obtained fromretinal responses to pulses.
A split stimulus presentation of letters has also been used to estimatevisual persistence (Eriksen & Collins, 1967, 1968). As shown in Fig. 14dots are placed on a background of two separate stimulus fields in sucha way that when the two are optically superimposed, they form lettersagainst a pattern of dots. According to the notion of a decaying trace,the subject should do more poorly if the two fields are separated by a timeinterval, since the subject must integrate the dimmed dots of the first withthe fresh trace of the second field. Figure 15 (Eriksen & Collins, 1968)shows this is indeed what is found, the results indicate a trace decayingover at least 100 msec. It is also apparent, in comparing the 1967 and
1968 studies that the rate of trace decay is slower when the backgroundis darker, results reminiscent of Sperling ( 1960), and anticipatory of Haberand Standing (1969). The rate changes with adaptation level providestrong evidence that retinal mechanisms, specifically the unit impulse ofthe receptor generator (see Section IV) provides the basic pacesetter formore central mechanisms of pattern recognition.
"VI. THE PERCEPTION OF SUCCESSION
We have noted the relatively lengthy persistence of visual sensations.Such persistence must interfere with the perception of visual asynchrony.Schmidt and Kristofferson (1963) measured the threshold for visual-audi-
"

<■
187TEMPORAI FACTORS IN VISUAL PERCEPTION(<
"
"
"
ISI (msec)
Fig. 15. Probability of correct recognition of spatally superimposed stimulus halves(see Fig. 14) as a function of their temporal asynchrony, i.e., their interstimulusinterval (ISI). The different curves, e.g., 5-5, represent the intensities of the firstand second halves, respectively. [From Eriksen & Collins (1968).]
Tory asynchrony by presenting subjects with a click-flash pair. Subjects were
at chance levels for asynchronies of 10 msec or less and were virtuallyperfect at asynchronies of 60 msec or more. In between, their performancewas almost linearlyrelated to asynchrony.
VII. VISUAL NUMEROSITY
One of the interesting consequences of the 60-250 msec range of visualpersistence is that when trains of flashes are presented within that range,a subject will predictably underestimate the number in the train (Cheatham& White, 1952; Forsyth & Chapanis, 1958). Two or three light pulses pre-sented at a rate of three or four per second can be counted veridically.But if the flicker rate of the train of flashes is increased, perceived numeros-ity approaches asymptote at six to eight per second, no matter how high theflicker rate. An asymptote of eight per second represents a perceptualgrouping of events into 125 msec time bins. For example, when 14 flasheswere presented at 30 flashes per second (a flash-train duration of 430msec) subjects most frequently reported seeing four flashes, a flash beingperceived approximately every 100 msec of stimulation (White, 1963).

188 LEO GANZ
At least two factors appear to affect numerosity judgments. The durationof perceptual integration, i.e., the complement of the asymptotic numeros-ity rate, is of the same order of magnitude as the duration of the unit-im-pulse response. Moreover, background luminance levels lower perceivednumerosity (White, 1963), implicating peripheral determinants such as theunit impulse response of the rod and cone receptors. More centrally, cyclesof cortical excitability have been implicated since in man the excitabilitycycles average 100 msec in duration (Ciganek, 1964; see also Gastaut,Roger, Corriol, & Naquet, 1951). Visual evoked potentials often show a100-msec periodicity (Harter& White, 1967).
"VIII. HOMOGENEOUS LIGHT MASKING
A. Empirical Studies
It is well known that our sensitivity to an increment of light (Al) ismuch reduced when A/ is superimposed on a larger luminous background(/). For low background-luminances the Rose-DeVries law operates:k = A//y7 (Kelly, 1972a). At higher background luminances Weber'slaw operates: k = M/I (Kelly, 1972a). If A/ and / are presented as briefflashes, we can predict that their impacts on the visual system will followa time course enduring 100 msec or longer, dictated by the unit impulseresponse. If the detection of light is not instantaneous, then we can expectsubstantial interactions between A/ and /, even if the two are presentedasynchronously. We should expect interactions so long as SOA is brieferthan the unit impulse response (UIR), since when SOA < UIR there issome duration of temporal overlap between A/ and /. "An early, and by now classical, study of masking was performed byCrawford (1947). A fairly large conditioning field was turned on for about.5 sec. A small circular test target of .01 sec duration was sometimes pre-sented just before and sometimes just after the onset of the conditioningfield. The detection threshold for the test target was measured. Resultstaken from one subject are shown in Fig. 16. As might have been expected,the detection threshold for the test flash was raised when the test was super-imposed on the conditioning field. What was surprising, however, was thefact that even when the test preceded the mask by as much as 50-60 msec,the test was still masked. Crawford concluded that such backward maskingcould only occur if: (1 ) the conditioning field is more intense and thereforeits conduction time is less to the brain locus where the detection judgmentis made (the so-called overtake hypothesis), or (2) ". . . the process ofperception of the test stimulus, including the receptive processes in the
"
Ml I
6. TEMPORAL FACTORS IN VISUAL PERCEPTION 189
"
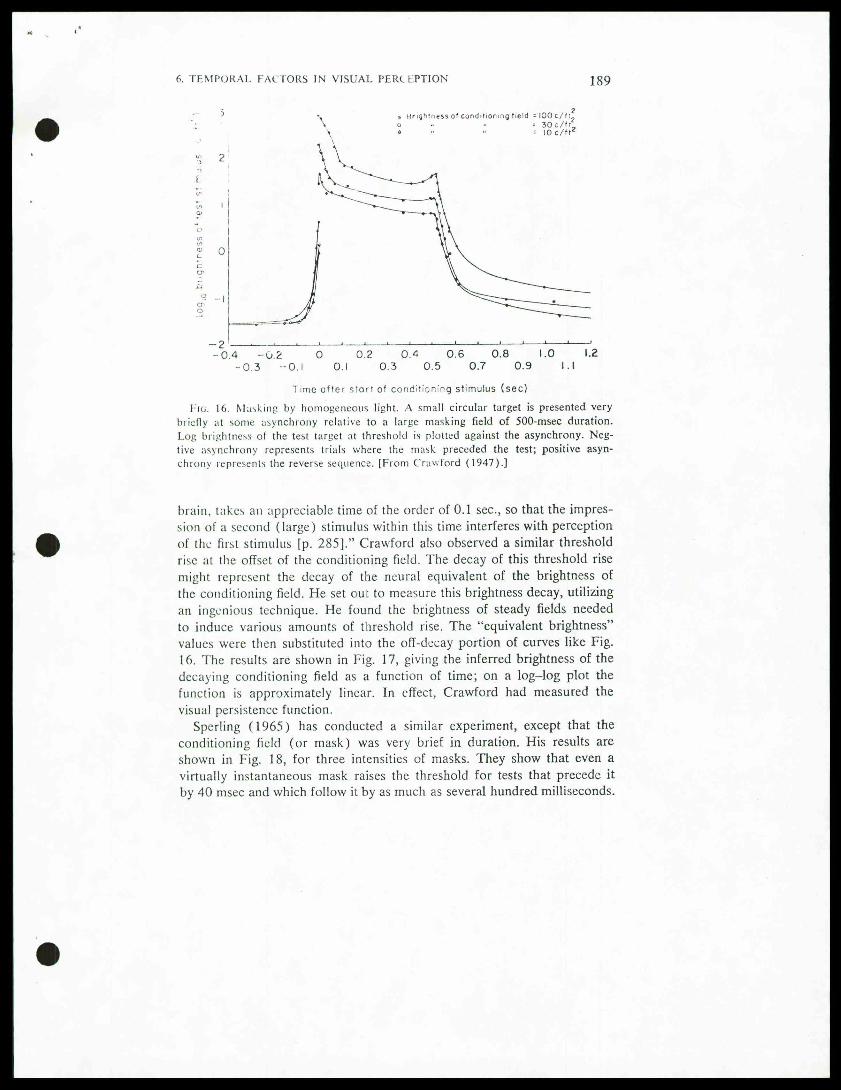
Time after start of conditioning stimulus (sec)Fig. 16. Masking by homogeneous light. A small circular target is presented very
briefly at some asynchrony relative to a large masking field of 500-msec duration.Log brightness of the test target at threshold is plotted against the asynchrony. Neg-live asynchrony represents trials where the mask preceded the test; positive asyn-chrony represents the reverse sequence. [From Crawford (1947).]
brain, takes an appreciable time of the order of 0.1 sec, so that the impres-sion of a second (large) stimulus within this time interferes with perceptionof the first stimulus [p. 285]." Crawford also observed a similar thresholdrise at the offset of the conditioning field. The decay of this threshold risemight represent the decay of the neural equivalent of the brightness ofthe conditioning field. He set out to measure this brightness decay, utilizingan ingenious technique. He found the brightness of steady fields neededto induce various amounts of threshold rise. The "equivalent brightness"values were then substituted into the off-decay portion of curves like Fig.16. The results are shown in Fig. 17, giving the inferred brightness of thedecaying conditioning field as a function of time; on a log-log plot thefunction is approximately linear. In effect, Crawford had measured thevisual persistence function.
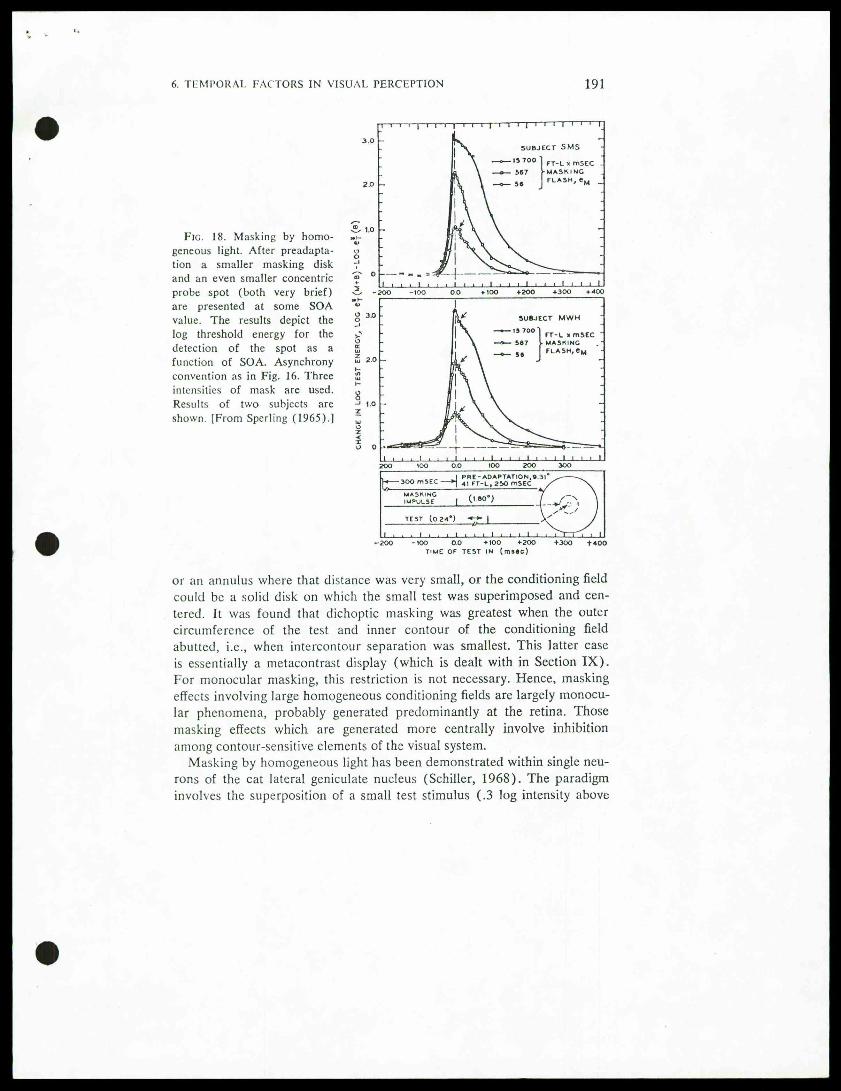
"Sperling (1965) has conducted a similar experiment, except that the
conditioning field (or mask) was very brief in duration. His results areshown in Fig. 18, for three intensities of masks. They show that even avirtually instantaneous mask raises the threshold for tests that precede itby 40 msec and which follow it by as much as several hundred milliseconds.
"

"- >
190 LEO GANZ
z
ft/isn
BviCHTNtrss: 48 c/ft "
log time (sec)
Fig. 17. The brightness decay function for a brief test flash as determined bythe equivalent background brightness technique. [From Crawford (1947).]
"In addition, his results followed Weber's law, since the magnitude of thethresholdrise is proportional to the intensity of the mask.
Does masking by homogeneous light occur at the periphery of the visualsystem, at the retina, or more centrally? Addressing themselves to this ques-tion, Battcrsby, Oestcrreich, and Sturr (1964) have isolated some of thefactors that determine whether masking by light will be monocular or bi-nocular (or dichoptic). In dichoptic masking, the test target can be maskedby a conditioning field presented to the other eye; in monocular maskingboth are presented to the same eye. In their experiment, the detection thresh-old for a small disk (I°2o') was measured, presented at various asyn-chronies to a larger concentric masking annulus (whose outer diameterwas 6°4o')-The magnitude of the threshold rise measured the maskingeffect. The geometry of the: conditioning field was varied: It could be anannulus with a large distance separating the outer circumference of theconcentric test target from the inner diameter of the conditioning annulus,
"
6. TEMPORAL FACTORS IN VISUAL PERCEPTION 191
"S 1.0
Fig. 18. Masking by homo-geneous light. After preadapta-tion a smaller masking diskand an even smaller concentricprobe spot (both very brief)are presented at some SOAvalue. The results depict thelog threshold energy for thedetection of the spot as afunction of SOA. Asynchronyconvention as in Fig. 16. Threeintensities of mask are used.Results of two subjects areshown. [From Sperling (1965).]
" T"ME OF TEST IN (msftc)
or an annulus where that distance was very small, or theconditioning fieldcould be a solid disk on which the small test was superimposed and cen-tered. It was found that dichoptic masking was greatest when the outercircumference of the test and inner contour of the conditioning fieldabutted, i.e., when intercontour separation was smallest. This latter caseis essentially a metacontrast display (which is dealt with in Section IX).For monocular masking, this restriction is not necessary. Hence, maskingeffects involving large homogeneousconditioning fields are largely monocu-lar phenomena, probably generated predominantly at the retina. Thosemasking effects which are generated more centrally involve inhibitionamongcontour-sensitive elements of the visual system.
Masking by homogeneouslight has been demonstrated within single neu-rons of the cat lateral geniculate nucleus (Schiller, 1968). The paradigminvolves the superposition of a small test stimulus (.3 log intensity above
"
«>oo
-200 -100 0.0 +100 +200 +300 +400

4
LEO GANZ192
"Fig. 19. Masking by homogeneous
light in single neurons of the lateral
Sll
+
SI2
l|^ 4 geniculate nucleus. Each record de-
.!.....!,
cts a poststimulus histogram, i.e.,
ISI
300 msec
spike frequency as a function of timefollowing the stimulus presentation.In the top record, a weak (.3 log
—jmLi.i.i.j.m.,.11.*.. above threshold) 1° disk is flashed
ISI
100msecbriefly in the middle of the on-center,off-surround receptive field. In thebottom record a larger and more
jy^,..
,i.
i , powerful masking disk (3 logs abovethreshold) is flashed again centered
ISI
50 msec
on the receptive field. The records inbetween show combined presentations. at interstimulus intervals of 10-300
,fv-
i ■-. msgc The vert;ca j arrow shows the
ISI
20 msec
onset of the second stimulus. [Schiller(1968).]
ISI
10msec
"
SI2
2 sec
threshold) presented on a large more intense background field (3.0 logintensity above threshold). The results are shown in Fig. 19. Each graphdepicts a poststimulus histogram, the ordinate representing spike fre-quency and the abcissa 2 sec of time following the stimulus. The top record,which is labeled St 1, shows that the test stimulus, when presented alone,produces a small number of action potentials with a peak latency at 60msec. The masking stimulus alone, St 2, gives the record at the bottomof Fig. 19: a large sharp response with a peak having a latency of about25 msec. When St 1 is followed by St 2 at an interstimulus interval (ISI)of 300 msec (second record from the top), both responses to St 1 andto St 2 can be clearly discerned. At an ISI of 50 msec (middle record)the response to the second begins to infringe on the first. At shorter ISIs,only the second response is present—the one to the masking stimulus.These effects neatly parallel in every respect the psychophysical effects.
"

6. TEMPORAL FACTORS IN VISUAL PERCEPTION 193
The experiments also provide a confirmation of Boynton's (1958, 1961)conceptualization that masking by homogeneous light is predominantly re-lated to the massive on- and off-discharge caused by the masking stimulus." We began this section on homogeneous light masking by attributing theeffects to poor temporal resolution, or, if the reader prefers, to extensivetemporal integration in the visual system. Suppose a test and mask stimulusare presented at an asynchrony such that at threshold intensity levels, thetest target is more difficult to detect. If the test target is now increasedin intensity to suprathreshold levels, and presented at the same asynchrony,the test stimulus is found to be brighter in the test-mask presentation thanin the test-alone presentation (Donchin & Lindsley, 1965). Although theresults seem paradoxical, they are not, since the effect is simply a reflectionof the temporal summation of the test and mask. More specifically, it seemsparadoxical that, at threshold, the test target is harder to detect, but atsuprathreshold levels, it is brighter than when presented alone. However,the difference in results is inherent in the subject's task. In a detectiontask the observer must distinguish between background-alone trials andtest-plus-background trials. Any temporal integration of the two makestheir resolution more difficult for the subject. In a brightness-matching task,the subject need not resolve test from background. Any temporal integra-tion of the two will enhance both.
IX. METACONTRAST
A. Empirical Studies
" Metacontrast involves the masking of one contour by another closelyadjoining it. One of the sources of fascination of this phenomenon is thatwhen the test contour and masking contour are of approximately the sameintensity, optimal masking is not obtained when the two contours are pre-sented together, but rather when the test contour precedes the mask bysome 50-100 msec (so-called Type B metacontrast, Kahneman, 1968).It is puzzling that one needs to separate two causal agents in time in orderto obtain a maximum interaction between the two. The fact that the effectappears retroactive, the masking stimulus coming after the test stimulus,has also intrigued investigators.
A study by Alpern (1953) investigated many of the essential parametersunderlying metacontrast. Subjects were presented a brief test object (b inFig. 20) to the right eye, while fixating the point z. At some asynchronyrelative to the test object, two abutting, contrast-inducing rectangles (ormasks) were presented briefly (c and c' in Fig. 20) also to the right eye.
"
LEO GANZ194
0.5°
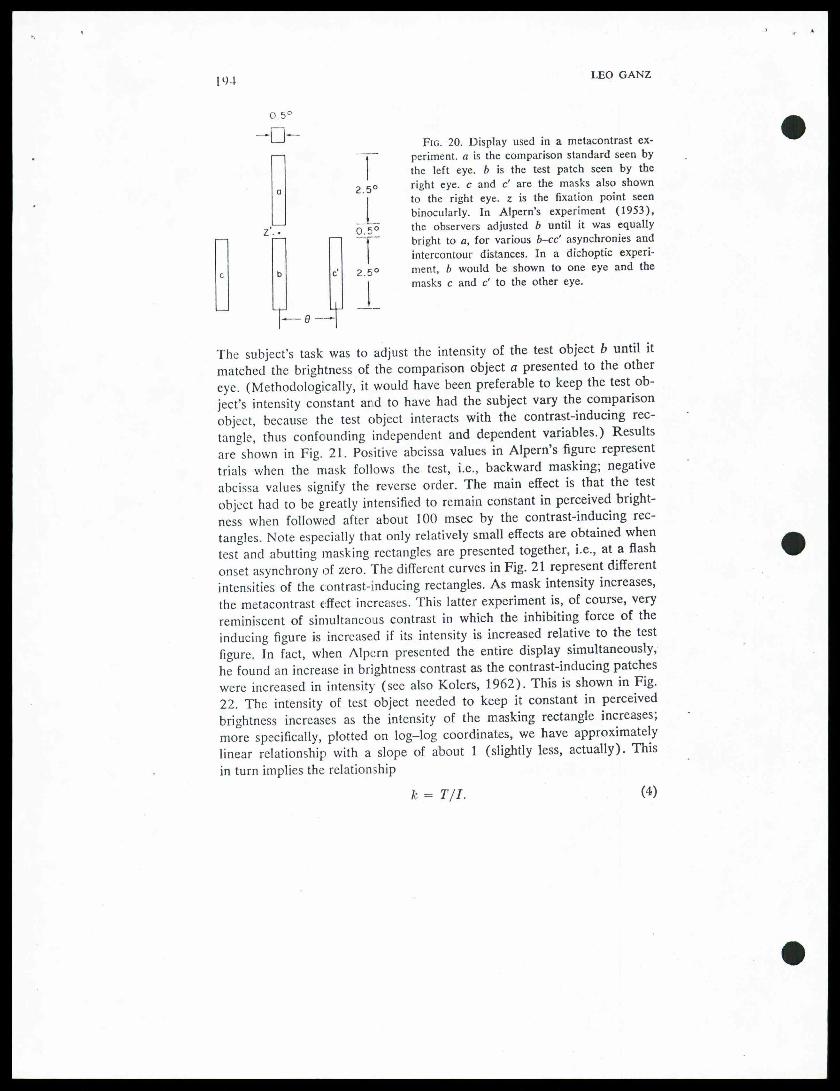
"Fig. 20. Display used in a metacontrast ex-periment, a is the comparison standard seen bythe left eye. b is the test patch seen by the
co right eye. c and c' are the masks also shownI to the right eye. z is the fixation point seen
binocularly. In Alpern's experiment (1953),
7* 5~Vs the observers adjusted b until it was equally—I
r~\
M~ bright to a, for various b-cc' asynchronies andintercontour distances. In a dichoptic experi-
b c. 25o ment, b would be shown to one eye and themasks c and c' to the other eye.
I*l ~
Z
c
The subject's task was to adjust the intensity of the test object b until it
matched the brightness of the comparison object a presented to the othereye. (Methodologically, it would have been preferable to keep the test ob-ject's intensity constant and to have had the subject vary the comparisonobject, because the test object interacts with the contrast-inducing rec-tangle! thus confounding independent and dependent variables.) Resultsare shown in Fig. 21. Positive abcissa values in Alpern's figure representtrials when the mask follows the test, i.e., backward masking; negativeabcissa values signify the reverse order. The main effect is that the test
object had to be greatly intensified to remain constant in perceived bright-ness when followed after about 100 msec by the contrast-inducing rec-tangles. Note especially that only relatively small effects are obtained whentest and abutting masking rectangles are presented together, i.e., at a flashonset asynchrony of zero. The different curves in Fig. 21 represent differentintensities of the contrast-inducing rectangles. As mask intensity increases,the metacontrast effect increases. This latter experiment is, of course, veryreminiscent of simultaneous contrast in which the inhibiting force of theinducing figure is increased if its intensity is increased relative to the test
figure. In fact, when Alpern presented the entire display simultaneously,he found an increase in brightness contrast as the contrast-inducing patcheswere increased in intensity (see also Kolers, 1962). This is shown in Fig.
22. The intensity of test object needed to keep it constant in perceivedbrightness increases as the intensity of the masking rectangle increases;
more specifically, plotted on log-log coordinates, we have approximatelylinear relationship with a slope of about 1 (slightly less, actually). Thisin turn implies the relationship
"
(4)
"
k = T/I.

)
1956. TEMPORAL EACTORS IN VISUAL PERCEPTION
"
FLASH ONSET ASYNCHRONY (msec)
Fig. 21. Metacontrast masking as a function of SOA. The ordinate depicts theintensity of the test patch (B b) needed to match a constant comparison standard.Therefore, high values reflect masking by the abutting masks. The different curvesrepresent different mask intensities (#<■-."), a parameter of the experiment. Luminanceof the standard was about 11 ft-L. All flashes were 5 msec. Positive asynchronyrepresents a test-then-masksequence. Data for one observerare shown. [From Alpern(1953).]" The perceived brightness of a test object {T) is constant when its intensityratio to an adjoining inducing field (/) is kept constant (see also Heine-mann, 1955). This recalls Weber's law (k = A///), and suggests thatmetacontrast is a temporal manifestation of simultaneous contrast.
The metacontrast phenomenon is known to be highly sensitive to inter-contour distance between test and inducing figure. For example, Werner(1935) observed that when a disk-shaped test object is followed by a half-annulus-shaped masking stimulus, only the portion of the disk near thehalf annulus was masked. Similarly, Alpern (1953) observed that metacon-trast was markedly reduced when intercontour distances were increasedbeyond .75° of visual angle. And it will be recalled that Battersby et al.1964) found that masking by light is not sensitive to intercontour distance,whereas metacontrast is. Thus, it is likely that metacontrast involves lateralinhibition particularly among contour-sensitive mechanisms.
"

i
LEO GANZ196
"Fig. 22. Similarities betweenmetacontrast and simultaneouscon-trast. Intensity of the test patchneeded to match the comparisonstandard when the test patch isaccompanied by two abuttingmasking patches, presented simul-taneously. Strength of masking asa function of mask intensity isdepicted for two observers. [FromAlpern (1953).]
LOG c .. c/(ft-L )
Fig. 23. Effect of distance be-tween the test patch contours andmask patch contours on strengthof metacontrast. Ordinate and ab- "cissa are as in Figure 21. For _i
clarity the curves have been dis- *"placed upward: 0 = .5° shifted up o50
ft-L,
c = 0.75° up 30
ft-L,
6 = ro
I.o° up 20
ft-L,
0 = 1.5° up 10ft-L. [From Alpern (1953).]
FLASH ONSET ASYNCHRONY (msecl
The degree of sensitivity to iAlpern's results in Fig. 23. Therectangle drops markedly as theii
intercontour distance can be observed inmasking effect of the adjoining contrast
n from the test object increases.their separationOne aspect of the intercontour separation experiment which is of some
"
Be- 1.06 ft-L. , |
" -R V.H jA*Sc
-C—
CONTINUOUS « .» /
EXPOSURE
/ /2- / ,
A //k 1///'
OL_0L_ i _i— 1 1—10 12 3

1976. TEMPORAL FACTORS IN VISL'AL PER* EPTION
theoretical interest is that the flash onset asynchrony (SOA) at which maxi-mum metacontrast is obtained shifts with changes in test-mask contourseparation, figure 23 shows that at an intercontour distance of .50°, peakmetacontrast occurs at SOA = 110 msec; at .75°, the peak is at SOA= 90-100 msec; and at I.oo°, the peak is at 80 msec. Thus, the flashonset asynchrony at which maximum metacontrast occurs decreases asintercontour distance increases. The results suggest that as the intercontourdistance is increased, the inhibitory influence of the mask is delayed. Thisdelay, in turn, makes it necessary to present the mask sooner, to regainan optimal effect. Since the presumed delay of the mask's inhibitory effectincreases, as intercontour distance increases, it is plausible to suggest thatthe inhibitory process (presumably cortical) requires time to move acrossneural (cortical) tissue. In fact, that data permits an estimation of thevelocity of .25° of visual angle (or its equivalent as projected ontoneural tissue) in 10 msec. For example, assuming the effects in Alpern'sexperiment were primarily cortical and assuming a projection of 1° ofvisual angle to 6 mm of cortex, we obtain an estimated propagation velocityof .25° X (6 mm/l°)/10 msec = .15 m sec" 1 , for the spread of the lateralinhibition. This seems slow, but not unreasonable.
"
Metacontrast can be generated dichoptically to the same degree asmonoptically (Kolcrs & Rosner, 1960; Schiller & Wiener, 1963; Schiller,1965;Battersby et al., 1964; Weisstein&Growney, 1969;Weisstein, 1971).It differs conspicuously in this regard from masking by homogeneous light(Battersby et al., 1964), reflecting, no doubt, the fact that metacontrastis a contour effect, as it is only obtained with test-mask contours abutting,and with the fact that contours are processed cortically, where binocularinteractions occur." The metacontrast paradigm can be used to measure the speed of percep-tual processing. One can conceptualize form recognition as beginning witha dynamic iconic phase, in which an isomorphic representation of the stim-ulus is generated within the visual system. It ends with the encoding andstoring of that information in a nonisomorphic representation (e.g., a ver-bal code), or in a structural (nontransient) iconic form. Once a form isencoded, masking can no longer operate. Hence, encoding time is thesmallest test-mask asynchrony at which no metacontrast is obtained. Weis-stein (1966) used the metacontrast paradigm to examine whether severalletters can be encoded in the same time as a single letter. This would bethe case were encoding performed in parallel. She presented subjects witha letter O or a letter D followed by a concentric masking ring. The subject'stask was to recognize the letter. Figure 24 shows that an inverted U-shapedmetacontrast function is generated. Moreover, the presentation of numer-ous forms clearly generatesa broader metacontrast function than presenta-
"

1
LEO GANZ
o40 "35
o30
H>
€?oo.
to
25
20o3owo
15
a>
10o
20 10 20 30 40 50 60 70 80 90 100 110 120
ISI (msec)
Fie. 24. Metacontrast functions generated in a letter recognition task. The filledcircles represent data from an experiment in which a letter D or O was shownin one of four positions, followed by a masking ring. The unfilled circles are froman experiment in which four letters were shown, followed by a single masking ringconcentric with one olf the letters. The squares represent an experiment in whicha bar marker was used as a masking stimulus rather than a ring. The subject's taskin each case was to identify the letter within the ring or near the bar. Metacontrastis seen to extend over a longer delay between letter and mask when several lettersmust be processed. [From Weisstein (1966).] "tion of a single form. Hence, total encoding time is longer when numerousforms must be processed, suggesting either than the forms are encodedsequentially or by a parallel encoder with limited energy.
Typically, studies involving masking by homogeneous light generatefunctions where masking is most intense at SOA = 0, and greater asyn-chronies yield smaller masking effects, whether the test precedes or followsthe mask (see Fig. 18 for an illustration of a peak SOA = 0 function).We have seen that numerous experiments with adjoining contours generateU-shaped functions with maximum masking at SOA c; 30-100 msec. Astudy (Weisstein, 1971) elucidates some of the factors predisposing to oneor the other. The geometryof the stimulus display partook of both masking
"
198
_£>

6. TEMPORAL FACTORS IN VISUAL PERCEPTION 199
"
DELTA I DELTA I
Fig. 25. An experiment containing both masking by homogeneous light and byadjoining contours. A 1° white disk is followed by a concentric I°2o' white disk.Observers estimate the completeness of disk remaining. The geometric mean of com-pleteness ratings is plotted against the asynchrony between test and mask. Positiveasynchrony denotes a test-then-mask sequence. The functions A-E represent decreas-ing target energy. For clarity, each function has been offset two estimation points.Left functions: monoptic viewing. Right side: dichoptic viewing. [From Weisstein(1971).]
by homogeneous light and masking by adjoining contours. A white testdisk (1°) was followed by a somewhat larger white masking disk (I°2o').Fig. 25 depicts brightness estimates as a function of onset asynchrony(called delta in the figure) between test and mask. A metacontrast effectis manifested as a low brightness estimate. The curves on the right repre-sent results obtained with a dichoptic presentation. Curves from A to Edescribe masking functions in which the test disk is made progressivelyweaker. We see that the functions become broader, with more maskingat SOA = 0 when the test/mask intensity ratio becomes smaller. In otherwords, obtaining metacontrast with a peak effect at SOA = 100 msec de-pends on the test and mask being of approximately equal intensities. Theleft-hand curves A-E represent masking functions obtained with the sametest/mask energy relations, but with a monocular presentation. Note espe-cially curve A where two troughs are obtained, one at SOA = 0 and oneat SOA = 100 msec. Weisstein reasons that the SOA = 0 trough repre-sents masking effects generated at the retina (and possibly LGN), becauseit is not obtained dichoptically. She also shows that the SOA = 0 troughis not obtained where the test disk fits concentrically inside the mask annu-
"
"
,
LEO GANZ200
lus so that test and mask share adjoining contours. The SOA = 100-msectrough is obtained under the latter conditions. In other words, the twoasynchronies where masking is obtained—one at SOA = 0 and one atSOA = 100 msec—reflect different sorts of visual processing at differentlevels within the visual system: the first generated by homogeneous mask-ing stimuli presumably at the retina (and possibly LGN); the secondgenerated by contour-sensitive mechanisms within the visual cortex.
"B. Neurophysiological Indices
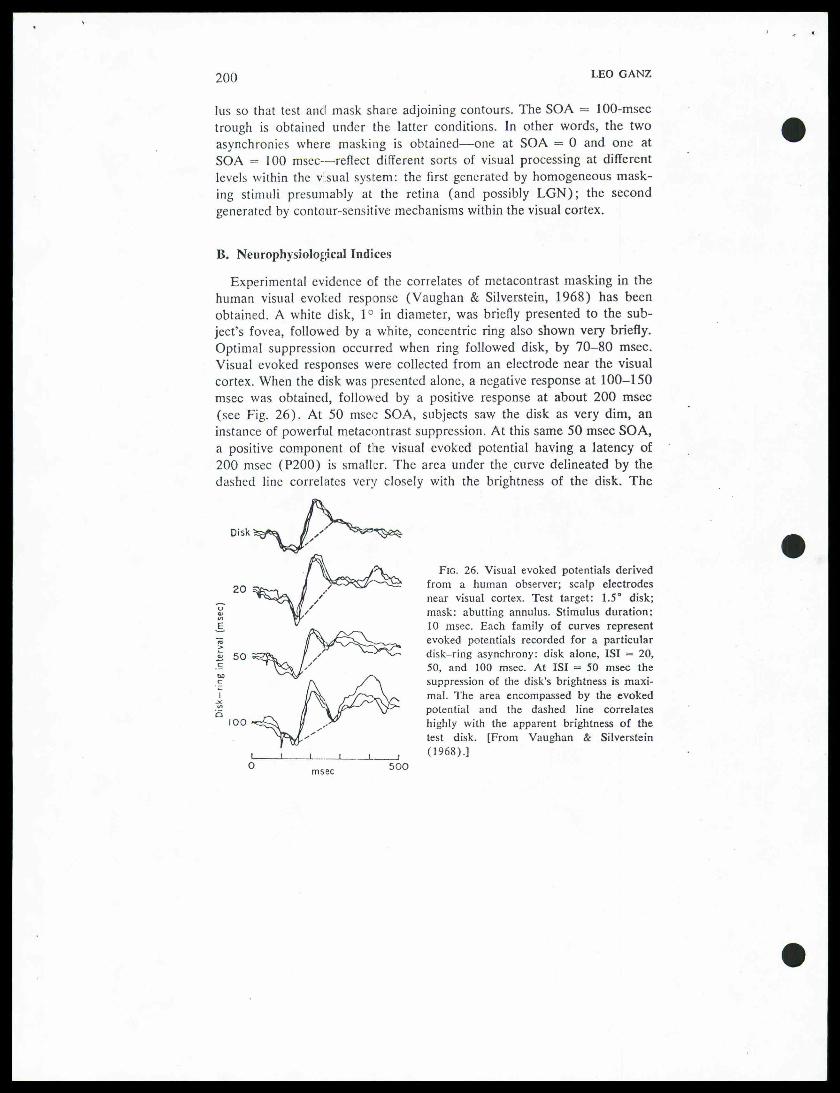
Experimental evidence of the correlates of metacontrast masking in thehuman visual evoked response (Vaughan & Silverstein, 1968) has beenobtained. A white disk, 1° in diameter, was briefly presented to the sub-ject's fovea, followed by a white, concentric ring also shown very briefly.Optimal suppression occurred when ring followed disk, by 70-80 msec.Visual evoked responses were collected from an electrode near the visualcortex. When the disk was presented alone, a negative response at 100-150msec was obtained, followed by a positive response at about 200 msec(see Fig. 26). At 50 msec SOA, subjects saw the disk as very dim, aninstance of powerful metacontrast suppression. At this same 50 msec SOA,a positive component of the visual evoked potential having a latency of200 msec (P200) is smaller. The area under the curve delineated by thedashed line correlates very closely with the brightness of the disk. The
Disk "^2^ "Fig. 26. Visual evoked potentials derived7i£~->^£^'"^S^ from a human observer; scalp electrodes20
near visual cortex. Test target: 1.5° disk;mask: abutting annulus. Stimulus duration:10 msec. Each family of curves represent
o
a>
E. „ evoked potentials recorded for a particular
disk-ring asynchrony: disk alone, ISI = 20,50, and 100 msec. At ISI = 50 msec the
TO>a)
t-
50
w jY\ suppression of the disk's brightness is maxi-fY~~^\\Y^ ma c area encomPassed by the evoked
1!n~^ v potential and the dashed line correlates.V" highly with the apparent brightness of the
c
—S100
test disk. [From Vaughan & Silverstein_j (1968).]
o 500msec
"

*
6. TEMPORAL FACTORS IN VISUAL PERCEPTION 201
Vaughan and Silverstein experiment suggests a possible link between meta-contrast and the unit-impulse response generated at the visual cortex. Ifthe potentials generated at the visual cortex have a basic 100-msec period-icity, (cf. Harter & White, 1967), then the disruptive effect of the annulusis related to the fact that the masking ring is presented 180° out of phase.For example, consider what occurs at ISI = 50 msec (as illustrated inFig. 26). P2OO (a positive component of 200-msec latency) generated bythe disk is added to Nl5O (a negative component of 150-msec latency)generated by the ring. The net effect is that the potentials cancel each otherto some extent. It is suggested that metacontrast is theperceptual correlateof this cancellation. A theory of metacontrast utilizing similar conceptshas been formulated (Bridgeman, 1971). It fails to explain, however, whythe masking ring is not itself suppressed, since its P2OO also is greatly di-minished, as can be seen in Fig. 26 at the 50-msec ISI. Phrased differently,the approach fails to predict the primarily retroactive character ofmetacontrast.
"
C. Theories
I. Fast Inhibitory Component, Slow Excitatory Component
It has been difficult to explain why, under appropriate circumstances,maximum masking is obtained not at SOA = 0, where it would be ex-pected, but at SOA values as large as 80-100 msec. One recurring typeof theory is exemplified by the overtake hypothesis, suggested by Crawford(1947) as an explanation of backward masking. It states that becauselatency at synaptic junctions of the CNS is inversely related to intensity,the more intense conditioning stimulus overtakes the masking stimulus inits race to the visual cortex. This makes it possible to present the maskearlier than the test stimulus and still obtain an inhibitory interaction be-tween the two. We have noted, however, that metacontrast is best obtainedwhen test and mask are of equal intensity. Crawford's explanation is inap-plicable under those conditions.
"Alpern (1953) modified Crawford's hypothesis, while retaining the same
logic. Instead of assuming different transmission times, he postulated twoseparate processes generated by both test and mask at the retina: a fastinhibitory component (which might be photochemical) and a more delayedexcitatory component (which would be neural). According to this explana-tion, metacontrast results from an interaction between the delayed excita-tory component generated by the test object and the fast inhibitory compo-nent generated by the mask. Since metacontrast effects are obtained with
"

<
LEO GANZ202
"Fig. 27. A neural network with temporal properties which Weisstein has shown
could account for metacontrast. The target
S,
stimulates in turn neurons «,,, ni2
(which has a slow course) and then excites n„ (their individual time courses areshown in a, b, c, g). The mask S._ stimulates in turn neurons n„, «« («2. has arelatively fast time course compared to neuron iu<) and then inhibits neuron «»(their individual time courses are shown in d, c,
f,
g). Neurons nn and n., are"peripheral" and «,., n-a, and na are central. The excitatory contribution of n,2 andthe inhibitory contribution of n«_ summate algebraically at the synapse with nu , adecision neuron, whose cummulative frequency of firing is then translated into aresponse measure, e.g., percentage of detection, or magnitude estimation. [From Weis-stein (19721.1
full efficacy in dichoptic presentations, the test-mask interactions must becortical. Hence Alpern's theory of two types of retinal processes cannotexplain metacontrast.
Weisstein has formulated a theoretical model retaining the notion of fast-inhibition and slow-excitation (Weisstein, 1968, 1972). The model as-sumes that the test and mask interact at some central locus of the visualsystem, with the mask exerting lateral inhibition. The key assumption isthat, with equally intense stimuli, excitation and inhibition develop atdifferent rates, the inhibitory process developing more quickly than theexcitatory process. A schematic illustration of the model is shown in thefive-neuron network depicted in Fig. 27. We see that the test (Si) andmask (5..) are presented simultaneously as a flash, activating their respec-tive "peripheral" neurons nn and n2l . These in turn activate ni2 and « 22 ,which are more central. And finally, the interaction occurs at neuron Mi-Neuron nr, has an excitatory effect on n,-, and a slow time-course; neuronn.o has an inhibitory effect on ni:, and a faster time-course (50-60 msecfaster than the excitatory neuron n y,). Hence, to obtain maximum inhibi-tion, one presents the mask some 50-60 msec after the test. Fitting timeconstants to the five neurons, and simulating a metacontrast presentation,
"
"

."
203( ITMI'ORM I \CTORS IN VISUAL PERC I.PTION
" FIG. 2S. A comparison betweenobserved monoptic metacontrastand metacontrast predicted from aneural-net (see Fig. 27). The solidconnected curves are empiricalmetacontrast functions obtained bypresenting a 16-msec, 1° disk anda 16-msec concentric, abuttingannulus. The vertical lines ate theoutput of a simulated neural net-work similar to Fig. 27. Verticalcoordinates represent brightness ofthe disc and the horizontal co-ordinates represent disk-annulusSOA, as shown by the time cali-bration lines in the lower right ofeach frame. The numbers 1-5 rep-resent target/ mask luminanceratios of 1.0, .5, .2, .125, and.0625, respectively. Data from twosubjects are shown. [From Weis-stein (1972).]
(bl At
" one obtains the results shown in Fig. 28, where prediction and observedmetacontrast is compared for two subjects (TJ and BW). The curvesnumbered 1-5 represent five different ratios of test/mask intensity. Themodel is moderately successful.
Two serious weaknesses are apparent. The first concerns the assumptionthat inhibitory processes develop more quickly than excitatory, by a differ-ence of some 50 msec or more. This would be a very striking neurophysio-logical phenomenon if it were true, easily measured, yet there is noneurophysiological evidence to support it, and much evidence against it.Intracellular recording in neurons of the visual cortex shows that bothdepolarizing (EPSP) and hyperpolarizing (IPSP) postsynaptic potentialscan be elicited by electrical stimulation of the LGN (Li, Ortiz-Galvin,Chou, & Howard, 1960). The latency of IPSPs is consistently .8 mseclonger than the initial EPSP (Watanabe, Konishi, & Creutzfeldt, 1966).This is not only much too small a difference to account for metacontrast
"

«
»
LEO GANZ204
masking at SOA = 80-100 msec, but the difference is in the wrong direc-tion. Furthermore, this difference in latency is true whether the locus ofstimulus is the optic chiasm, LGN or the optic radiation fibers. Hence,the difference is not one of conduction time, but a difference between anEPSP generated in visual cortex monosynaptically and an IPSP generatedafter mediation by an internuncial neuron, and hence disynaptically. Thepicture of visual cortex network connectivity that emerges is one in whichall afferent input to visual cortex from LGN is excitatory directly ontopyramidal and stellate cells and that inhibition is then generated intrinsi-cally within visual cortex. (An excellent discussion of these issues can befound in Bishop, Coombs, and Henry, 1971.) These neurophysiologicalobservations are consistent with anatomical observations that all specificafferent synaptic endings on both stellate and pyramidal cells are excitatory(Colonnier & Rossignol, 1969; Jones & Powell, 1970). These facts aresimply incompatible with the postulation of an inhibitory process some50 msec or more faster than its accompanying excitatory process.
"
A second weakness of Weisstein's model concerns its lack of parsimony.Six constants are fitted to each of five neurons, making a total of 30 con-stants to fit a simple U-shaped function to empirical data with a resultingfit that is far from perfect. Might not other models work as well with thatmany fitted constants, or fewer?
2. Networks of Mutual Lateral Inhibitionamong Decaying Traces
It is possible to explain the fact that metacontrast is optimal at SOAas high as 50-100 msec without recourse to inequalities in the velocityof inhibitory and excitatory components. A different group of theories pro-ceeds from characteristics of reciprocal lateral inhibition. "Figure 29 shows how the brightness of a disk is affected by a simulta-neously presented annulus (Heinemann, 1955). Each curve represents aparticular intensity of the test disk. The abcissa represents the annulus in-tensity; the ordinate represents a measurement of the perceived brightnessof the disk. The functions show that there is little inhibition of the disk'sbrightness until test and disk are equal in intensity. As the intensity ofthe annulus surpasses that of the disk, the disk drops precipitously in per-ceived brightness. Metacontrast can be conceptualized as the temporal re-creation of these relationships. When the test disk and masking annulusare of equal intensity and presented together, they only exert moderateinhibiting effects on each other. If the test disk is shown first, it decaysin intensity by the time the annulus is presented. The two traces then decaytogether, with the annulus more intense throughout the subsequent decay,
"

\<
6. TEMPORAL FACTORS IN VISUAL PERCEPTION 205
"
Itaneous contrast in a disk-annulus display. The stimuli are arrangedwhite comparison standard is viewed by the left eye. A white test-disk
Fig. 29. Simultaneousas in Fig. 20. A white ccis viewed by the right eye.with contours abutting. The
The white mask-annulus is concentric with the test-disksubject is asked to adjust the intensity of the comparison
standard until it matches the test disk in brightness. Various intensities of mask-annuliare used. In the figure, the ordinate (L.) represents log luminance of the comparisonstandard when it matches the test; the abcissa (Li) represents log luminance ofthe mask-annulus. The parameters on the curves are the luminances of the test fieldsin Log millilamberts. The results show that the brightness of the test pattern (asmeasured by the comparison standard) is little affected as the mask-annulus increasesin brightness until test and mask are equal.
Thereafter,
test brightness drops pre-cipitously with further increases in mask brightness. Results are from one observer.[From Heinemann (1955).]" and therefore exerting more suppression of the test disk. If disk and annu-lus are presented at a large asynchrony, then the brightness of the diskhas been encoded prior to the arrival of the annulus and the two do notinteract. Thus three factors need to be known to account for metacontrast:lateral inhibition between simultaneously presented test objects and masksof unequal intensity, their rate of decay, and encoding time. In a recentstudy, some of these factors have been examined with a disk-annulusstimulus pair (Sukale-Wolf, 1971). As to lateral inhibition, this isshown in Fig. 30 for two subjects. Subjects fixated the small cross shownin the figure and were asked to recognize a letter D or O presented for20 msec at various intensities, sometimes surrounded by a masking annulusand sometimes not. Actually, on masking trials two annuli were used, leftand right of fixation; the test letter could thus be presented either to theleft or right of fixation, but this is not essential. The results show that,
"

«
206
LEO GANZ
"
"Fig. 30. First step in the prediction of metacontrast from simultaneous brightnesscontrast. Subjects are asked to identify a white letter D or O presented very brieflyat various energy levels. The triangles represent percentage of error of recognitionas a function of the energy level of the letters. The circles represent the same task,but with a white standard annulus presented simultaneously with the letter.SBC = Simultaneous Brightness Contrast. Results of two observers are shown. [FromSukale-Wolf (1971).]
as expected, recognition is poorer if the test is weaker and that the maskfurther diminishes performance. If we transform the recognition probabili-ties into Z-transforms using cumulative Gaussian distributions, and plotagainst log intensity, we obtain fair approximations to linear functionsshown in Fig. 31. In other words, when no mask is shown we obtained
(5)
"
Z- = 1.35(log /) + .606,

i
6. TEMPORAL FACTORS IN VISUAL PERCEPTION 207
"
i i i I I1 1 1 1 1
80 60„„A, 40 20 0
SOA
(mwc)
Fig. 31. The results shown in Fig 30 plotted using a z-transform of percent correct and a log intensity abscissa. The two-recognition functions (with annulus, A,„„ami without annulus, Am,) are approximately linear and equal in slope. The maineffect of the mask is to change the vertical positionof the functions. The SOA abcissais explained in the text. Results of three observers. [From Sukale-Wolf (1971).]
and when the disk was presented with a masking annulus, we obtained
" The major effect of the mask is to lower Z about .8, for all intensitiesof test objects.
The next step in the analysis is to measure the temporal decay of the Otest object. This was done using Crawford's (1947) equivalent backgroundtechnique. There were two steps to the decay analysis. In Step A, subjectswere asked to detect a small probe spot that was superimposed spatially onthe O (see the display in Fig. 32), but presented at various asynchronies.Figure 32 shows that detection of the probe improves as time after O off-set increases. In Step B, the same probe spot was superimposed on the O,the two were presented together, but the intensity of O was varied. Resultsare shown in Figure 33. Combining Steps A and B, we can find for eachSOA, value in Step A the equivalent O brightness in Step B that producedthe same probability of a correct probe spot detection. Figure 34 depictsthe log of that equivalent brightness plotted against time, for three indivi-dual subjects. The equation log I = 1.3 — .01 SOAi(msec) fits the data
"
Zm. = 1.53(10g /) - .223. (6)

>
LEO GANZ208
"
SOA
(msec )
Background
Test stimulus
' -5 msec\jl ,Probe spot
"s-.-iSOA -0-20msec
Time (ssc )0 I 2 3 4 5 6
Seconds
Fig. 32. The next step in the prediction of metacontrast is to measure the decayof the test letter using Crawford's (1947) equivalent brightness method. In StepA, a small white spot of 5-msec duration is superimposed spatially on test letter
O,
but presented at various asynchronies. On half the trials only the letter is shown.The subject's task is to detect the spot. The results show that detection of the spotimproves as SOA increases. [Frori Sukale-YVolf (1971 ).]
"of all three subjects. The semilog plot suggests the test object decayslinearly as an exponential function of time. Substituting into (6), weobtain for the masking condition:
Since we now know the rate of decay of the test figure, and we knowthe probability of recognition of a letter of a particular intensity whetherinhibited by the annulus mask or not, then recognition probability undermetacontrast presentation should equal
where Pe
soy
is the probability that encoding is completed at time SOAi.This states simply that the Z-transform of a correct recognition probabilityat some stimulus onset asynchrony (SOAi in msec) equals the product of
"
y2O msec
Zms = 1.58[1.,3 - .01 SOAi] - .223 = 1.77 - .0153 SOA; . (7)
ZSOA. = t^BTS ' PESOAi] + [Zm3 ■(1 - PEsoa,)}, (8)

6. TEMPORAI FACTORS IN VISUAL PERCEPTION 209
"
Probe spot
Time ismc ) , , -i
r
— 1 1
r
0 1 2 3 4 3 6Seconds
Fig. 33. Step B in the derivation of the test letter's decay function involves meas-uring how well the small probe spot is detected when superimposed spatially on thetest letter, the two being shown simultaneously. The results show that detection ofthe probe spot improves as the test letter O is made less intense. [From Sukale-Wolf(1971). l
" Z-transformed probability of recognition under no-masking conditions[Zut* from Eg. (5)1 times the probability that encoding is completed at time(SOA, ) plus the product of Z-transformed probability of recognition undermasking conditions [Z„, 3 from Eg. (7)] times the probability that encodingis not completed at time (SOAi).
If we assume that encoding time averages E msec, with a standard devia-tion «r
/;
, and that encoding time follows a Gaussian error function, then atany SOA,, the probability that the test letter is encoded by the time themask is presented is given by
(9)
The concept of encoding time is examined again in Section X, where itsempirical determination is described.
"
f^StJA,
/TT^ /— oo *
\ r. c,
I
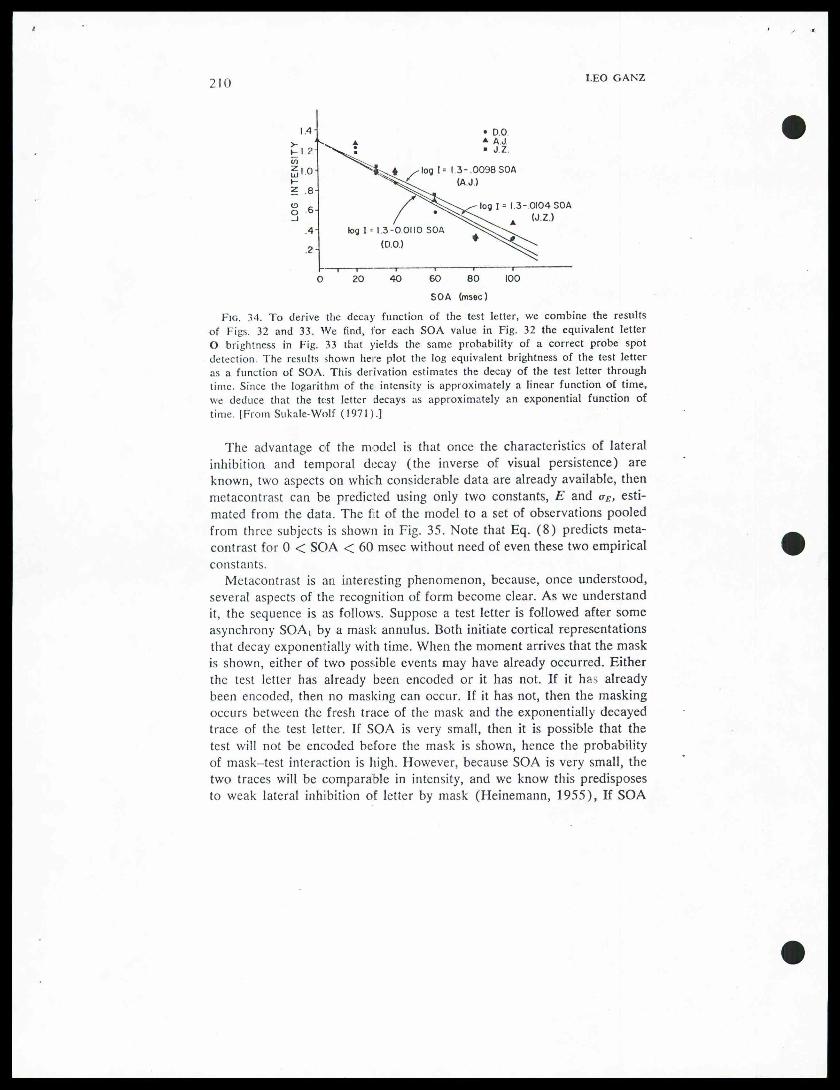
J
LEO GANZ210
"SOA (msec)
Fig. 34. To derive the decay function of the test letter, we combine the resultsof Figs. 32 and 33. We
find,
for each SOA value in Fig. 32 the equivalent letterO brightness in Fig. 33 that yields the same probability of a correct probe spotdetection. The results shown here plot the log equivalent brightness of the test letteras a function of SOA. This derivation estimates the decay of the test letter throughtime. Since the logarithm of the intensity is approximately a linear function of time,we deduce that the test letter decays as approximately an exponential function oftime. [From Sukale-Wolf (1971).]
The advantage of the model is that once the characteristics of lateralinhibition and temporal decay (the inverse of visual persistence) areknown, two aspects on which considerable data are already available, thenmetacontrast can be predicted using only two constants, E and oE, esti-mated from the data. The fit of the model to a set of observations pooledfrom three subjects is shown in Fig. 35. Note that Eg. (8) predicts meta-contrast for 0 < SOA < 60 msec without need of even these two empiricalconstants. "Metacontrast is an interesting phenomenon, because, once understood,several aspects of the recognition of form become clear. As we understandit, the sequence is as follows. Suppose a test letter is followed after someasynchrony SOAi by a mask annulus. Both initiate cortical representationsthat decay exponentially with time. When the moment arrives that the maskis shown, either of two possible events may have already occurred. Eitherthe test letter has already been encoded or it has not. If it has alreadybeen encoded, then no masking can occur. If it has not, then the maskingoccurs between the fresh trace of the mask and the exponentially decayedtrace of the test letter. If SOA is very small, then it is possible that thetest will not be encoded before the mask is shown, hence the probabilityof mask-test interaction is high. However, because SOA is very small, thetwo traces will be comparable in intensity, and we know this predisposesto weak lateral inhibition of letter by mask (Heinemann, 1955), If SOA
"
log 1= I 3- 0104 SOA

6. TEMPORAL FACTORS IN VISUAL PERCEPTION 211
Fig. 35. A comparison between empirical results of a metacontrastexperiment andprediction from a model involving lateral inhibition between two decaying traces.In the experiment (Sukale-Wolf, 1971), a test letter D or O is presented briefly, fol-lowed after some asynchrony by a concentric masking annulus. The subject fixated a
cross, and the test figures were shown either right or left of
fixation,
followed by apair of masking annuli. The circular symbols are obtained from pooled data (N =3; 128 observations per subject). The Z-transforms of the probability of an error inletter recognition is plotted against SOA. Z, - — 1.77 — .015(SOA,) is Eg. (7) inthe text, derived from measurements of the decaying iconic representation. The con-tinuous curve is from Eg. (8) and (9) (see text for details) with two fitted con-stants: Encoding time E = 90 msec and SD of encoding time o-E = 15 msec.
is very large, then fresh trace of the mask interacts with a very weak traceof the test letter; however, the probability is great that the test letter isalready encoded and thus the eventual interaction does not affect recogni-tion probability. Between these two SOA values, masking is greater. Hence,it is simple to see why a curvilinear relationship of masking to SOAemerges when test and mask are equal in intensity." The metacontrast effect suggests that the iconic representation of thetest figure can be fully generated, then decay, and then be strongly inhibitedby the subsequent fresh trace of the mask, before transfer to an encodedmemory region occurs. This supports the concept of "erasure" (Averbach& Sperling, 1960). Metacontrast implies that it is the status of the iconicstorage at the moment of encoding transfer which is critical for patternrecognition.
X. VISUAL NOISE MASKING
A. Empirical StudiesThe third type of masking stimulus that has been used to analyze tem-
poral factors in perception is the visual-noise mask, consisting of a random
"

t
t
LEO GANZ212
"Fig. 36. An illustration of the differentialmasking effects of superimposed regular andrandom patterns. [From Coltheart & Arthur(1972).]
assortment of odds-and-ends arrayed in an irregular manner. An exampleis shown in the lower part of Fig. 36. Note that when the word "stove"is superimposed on such a random-array, it is effectivelycamouflaged, i.e.,masked. To study temporal factors, investigators have introduced an asyn-chrony between test object and visual noise. The general characteristicsof visual-noise masking are that it is maximal when test and mask are syn-chronous, that it can be obtained when the mask precedes the test as whenthe mask follows the test, and that it can be readily obtained with a dichop-tic presentation (Kinsbourne & Warrington, 1962a,b; Schiller, 1965; Schil-ler & Wiener, 1963:. Smith & Schiller, 1966). However, dichoptic forwardmasking is reported to be fairly weak, whereas dichoptic backward maskingis strong (Smith & Schiller, 1966; Greenspoon & Eriksen, 1968). The factthat visual-noise masking is obtained in a dichoptic presentation representsa distinct difference from masking by homogeneous light, which can onlybe obtained monocularly. Presumably, it reflects the fact that visual-noisemasking involves forms interacting with each other at a cortical locus.
"The results of an extensive parametric study of visual-noise maskingby Kinsbourne and Warrington (1962a) are depicted in Fig. 37. Letterswere presented in a tachistoscope followed after some particular asyn-chrony by a random masking pattern. Letters and masks were of equalluminance and contrast, but the duration of each was varied. Each datumin Fig. 37 shows the combination of test duration, mask duration, andSOA at which consistent perceptual recognition was just obtained. In otherwords, these are all isorecognition contours. The data points are mediansof seven subjects. At short SOAs, the strength of the mask is approximatelyproportional to the strength of the test letter, as shown in Table I, takenfrom Fig. 37 at SOA = 10 msec. Except for the 6.4-msec test duration,the other values give approximately test duration/mask duration ~ y2 .Thus, for very small SOA values, visual noise masking follows Weber'slaw. This in turn suggests that what is involved in visual noise maskingis a subject's ability to discriminate those contours belonging to the testobject from those belonging to the mask. The fact that this occurs under
"
-_£«.k<;«^^i. J_+,£_Jtt 1Sfi&^'^K

*
2136. TEMPORAI FACTORS IN VISUAL PERCEPTION
Fig 37 Results of an experiment on visual-noise masking. Letters were presented
in a tachistoscope followed after some particular asynchrony by a random masking
pattern. Letters and mask were of equal luminance and contrast, but the durations
of each as well as their asynchrony were varied independently. Every point in the
figure represents a triplet of test duration, mask duration, and SOA where observers
are just beginning to be consistently correct. Thus all points represent the same level
of performance. The symbols are medians of seven subjects. Log mask duration
is plotted against SOA. The different symbols represent different test-letter energy
levels. [Adapted from Kinsbourne & Warrington (1962a).]
" TABLE I
The Relationship between Test Letter and Visual Noise Mask Energy Level
for Equal Performance Levels at a Short SOA (10 msec)

LEO GANZ
ITABLE II
1Tub Uklatiosmiii-bctwkh T.iE Test Lrteh Ehmot Level and Encoding Time
it Encoding time
(msec)Log test letter duration
(.log msec) Product
26.5.398 66 526.853 0.505 26.544 0.00226.037.0.699
31.5 25.4.800 4.0.902 10.0
" Encoding time is defined by the SOA at which an arbitrarily intense mask still doesnot affect recognition performance. These are represented by vertical asymptotes in Fig-
ure 37, adapted from Kinsbourne and Warrington (1962a).
test mask asynchronies larger than zero is due to the visual persistence
of the unit impulse response.At larger SOA values, the curves in Fig. 37 rise linearly and thenbecome
vertical. The SOA value at which thefunctions become verticalKinsbourneand Warrington call the critical interval, since at this SOA, a mask, how-ever intense, will not affect recognition. It could also be termed the encod-ing time, since, once exceeded, the visual representation is evidently nolonger in its dynamic visual iconic stage. The test stimulus is now encodedin some form, presumably noniconic. Table II shows that (except for the
.902 log msec duration) log encoding time varies inversely with log test
intensity: encoding time X log test intensity - k. It would appear that aprocess is initiated within visual cortex which must reach some thresholdlevel before transfer from iconic to noniconic store can occur. The velocity
with which that threshold is reached is proportional to the logarithm ofstimulus strength. , .
A third aspect of Fig. 37 which deserves attention is the steady rising
linear portion prior to the critical interval. The different test durations yielda family of lines of approximately equal slope. What do these linear slopessignify? As SOA increases, the mask must be made more powerful to keepperformance equivalent, presumably because when SOA is large the maskhas only just gotten started by the time encoding is completed. Put in otherwords, the linear rising function in Fig. 37 measures the temporal decayof the icon initiated by the masking stimulus. Since the function is linearon a semilogarithmic plot, it implies that some segment of the mask's unit-
214

6. TEMPORAL FACTORS IN VISUAL PERCEPTION 215
impulse response is an cxponetial function: ent or eM with aas a rateparameter. In other words, the mask's trace decays exponentially with time." B. Theories
1. Processing Interruption
The original impetus for the use of random-patterned masks was to at-tempt to control the length of time during which a visual form was availableto a subject in an iconic representation in order to measure encoding time.Sperling (1963, 1967; Averbach & Sperling, 1960) recognized that visualpersistence was so lengthy that for brief visual displays icon-availability-duration was independent of the duration of the display. Therefore, theduration of the test stimulus gave no insight into the length of time neededfor processing the iconic representation. He suggested that by presentinga visual-noise mask, one could interrupt the process of encoding the icon.Interruption theories emphasize the notion that time is needed for encodingthe icon. If there is insufficient time, because a masking stimulus is pre-sented before encoding is completed, processing will be interrupted, andthe subject will be unable to identify the stimulus. Closely related is thenotion that the mask erases the test stimulus icon, replacing the test stimu-lus, and thus terminating its processing and delegating it to oblivion (Aver-bach & Coriell, 1961). If this assumption were true, one could clock theencoding process by noting how many letters in an array could be identifiedfor a particular test-mask SOA. For example, Sperling (1963) reportedthat when an array of letters was presented followed by a visual-noisemask, the subject could identify an additional letter for each additional10 msec SOA, up to a maximum of 4.5 letters, which represents a short-term memory limitation. He interpreted these results to mean that theiconic representation is processed sequentially at the rate of 1 letter/ 10msec. Although interruption theory seems appropriate in metacontrast phe-nomena, several weaknesses have been evident in its application to visual-noise masking. First, it cannot deal with forward masking, especially wheretest and mask are approximately equal in energy. During forward masking,the test would follow the mask, and thus interrupt the processing of themask, but there would be no stimulus to interrupt the processing of thetest, and thus interruption theory would not predict any forward maskingeffect. Yet, as we have already noted, it is readily obtained. Similarly, in-stances where SOA is zero or near zero cannot be handled. Is processingtime really zero or near zero in these instances? Kinsbourne and Warring-ton's results (see Fig. 37) show that recognition probability followsWeber's law in such cases, a result more consonant with integration theory.
"
"

> »
IN VISUAL PERCEPTION 2136. TEMPORAI I ACTORS
"
SOA (msec)
Fig. 37. Results of an experiment on visual-noise masking. Letters were presentedin a tachistoscope followed after some particular asynchrony by a random maskingpattern. Letters and mask were of equal luminance and contrast, but the durationsof each as well as their asynchrony were varied independently. Every point in thefigure represents a triplet of test duration, mask duration, and SOA where observersare just beginning to be consistently correct. Thus all points represent the same levelof performance. The symbols are medians of seven subjects. Log mask durationis plotted against SOA. The different symbols represent different test-letter energylevels. [Adapted from Kinsbourne & Warrington (1962a).]
"TABLE I
The Relationship between Test Tetter and Visual Noise Mask Energy Level
fou
Equal Performance Levels at a Short SOA (10 msec)
"

LEO GANZ210
" 2. Integration Theory
This theory assumes that the masking stimulus summates with, ratherthan replaces, the test stimulus, so long as the interval between the two
is less than the critical duration (see the section on Bloch's law). For ex-ample, Kinsbourne and Warrington (1962b) maintain that when the timebetween onset of target and onset of masking stimulus is sufficiently brief,". . . the two stimuli are treated as 'simultaneous' and are recorded asa composite image, without temporal differentiation. When this compositeimage includes a random pattern ... it may prove too complex for retro-spective analysis [p. 245]." Eriksen has presented a very closely relatedconceptualization of "luminance summation-contrast reduction" initially toexplain masking by homogeneous light (Eriksen & Hoffman, 1963;Eriksen& Lappin, 1964; Eriksen, 1966; see also Thompson, 1966). He and hiscolleagues suggested that masking effects under certain experimental ar-rangements could be attributed to a reduced effective contrast from thestimulus figures arising from luminance summation. Eriksen (1966) formu-lates it this way: Suppose that a black letter on a white surround is pre-sented for 10 msec and is followed immediately by a white masking back-ground also for 10 msec. Because the total 20 msec is still below the criticalduration, the eye integrates the two perfectly. The white background is10 mL in luminance and the black letter is 1 mL, so that the contrastratio of the letter against its background, when presented alone is 1:10.When presented with the subsequent white mask, the white areas summateto give total equivalent to a 20-mL flash, and the 1-mL black letter and
10-mL white background summate to give 11 mL in the letter area, givinga contrast ratio of 11 :20. Therefore, contrast is much reduced comparedto the single stimulus presentation, and hence, the level of letter recognitionperformance may well drop in the combined presentation. As SOA betweentest and mask increases (either in the forward or backward masking direc-tion) the critical duration is approached, temporal integration becomes im-perfect, and the results are now part way between what is expected fora simultaneous or near simultaneous presentation, on the one hand, andpresentation of the test stimulus alone, on the other. Their studies indicatethat integration theory can make a fairly accurate prediction of how muchperformance will decrease for masks presented at small SOA values.
"Subsequently, the same approach has been used to account for the inte-
gration of two patterned stimuli presented sequentially. Integration theorypredicts the visual-noise mask is effective in lowering recognition perfor-mance to the extent that the mask and test stimulus integrate temporally,so that the features of the mask become added to those of the test, whichcauses errors of recognition. Thus, an oblique feature from the mask ran-
"

(.. II MPORAI I ACTORS IN VISUAL PERCEPTION 217
clom pattern becomes integrated with a letter P in the test pattern whenSOA is not 100 high, and the subject reports R, which is scored as anerror. Such an analysis yields a critical difference between interruptiontheory and integration theory. For interruption theory, the mask need onlybe sufficiently intense to interrupt ongoing processing; its pattern character-istic is not critical. For integration theory, the form characteristic is highlycritical, since it must be possible to take pieces of the mask and integratethem with the test figure so as to create one of the character sets the subjectis set to recognize, a letter R, etc. Coltheart and Arthur (1972) have testedthe theory by examining the effects of masks differing in confusability. InFig. 36 we see that a regular checkerboard pattern is a poorer simultaneousmask of the word STOVE than an irregular checkerboard. If masking atvarious asynchronies involves integration of test and mask, then the irregu-lar pattern in Fig. 36 should be the better mask. Interruption theory wouldpredict both regular and irregular checkerboards would be equally efficientin interrupting processing of the test (if mask follows test), and hence,no difference in masking efficiency would be expected. Coltheart andArthur (1972) found the irregular pattern considerably more efficient asa mask, at several SOAs, thus supporting integration theory.
"
A similar line of reasoning concerns the strength of the test stimulusvis-a-vis the mask. According to interruption theory, test intensity shouldnot affect the level of masking, since it is presumably because the maskends processing that recognition fails. Integration theory predicts perfor-mance will be related to the integrated test/mask intensity ratio. Kins-bourne and Warrington's results and later studies (Spencer & Shuntich,1970) indicate that increasing test intensity diminishes mask effectiveness.This is shown in Fig. 37 by the fact that when the test is intensified, themask must be intensified to produce equivalent performance, thus corrobo-rating integration theory. "Another test of the interruption-theory-integration-theory controversyin visual noise masking involves the presentation of trios of asynchronousfigures, at varying SOAs (Eriksen & Eriksen, 1971). Three stimuli werepresented to the same foveal region in rapid succession—a letter, a number,and an arrow at one or another orientation—-and the subject was askedto identify all three. At no SOA value did performance drop to chancefor the first and second stimuli, as would be expected if they were beingerased by the succeeding stimuli. Rather, at small SOA values, all threestimuli appear to be present at the same time, giving the effect of a compo-site. It was also evident from their results that longer than 10 msec is neces-sary for each stimulus to be seen because even at 200-msec SOA, somemutual interference among the trio was still evident. It seems reasonablethat encoding time be defined as the shortest SOA at which virtually no
"
LEO GANZ218
masking is obtained. Sperling, Budiansky, Spivak, and Johnson (1971)using multiple sequential masks, have also reported encoding times sub-stantially above 10 msec." The evidence reviewed indicates that many of the facts of visual noisemasking cannot be parsimoniously predicted by the notion that the maskterminates the processing of the test figure. Indeed, the evidence indicatesthat when test and mask are presented at SOA < 50 msec, the test andmask form a composite icon which continues being decoded for 100-200msec more, the duration being governed by visual persistence as deter-mined by the peripheral visual system and encoding time as determinedby the central visual system.
Although perceptual integration does explain many aspects of maskingby random patterns, it should be recalled that masking by adjoining con-tours, i.e., metacontrast (see Section IX), does indeed constitute a formof erasure. Therefore, whether icon integration or icon erasure occurs de-pends essentially on the spatial relationships between test and mask.Erasure occurs when test and mask contours are closely adjoining, equalin intensity and SOA = 50-100 msecs. Integration occurs where SOA isbetween —50 and +50 msec and test and mask contours are not closelyadjacent.
3. Encoding Time Hypothesis
Integration theory, as it has been postulated is probably insufficient toaccount for the facts of visual-noise masking without the concept of encod-ing time. The vertical asymptotes in Fig. 37 indicate that the iconic repre-sentation of a test stimulus is transferred to some other memory bufferafter a critical interval has elapsed—an interval inversely related to thelog intensity of the test stimulus. That other buffer can be iconic or non-iconic, but its information cannot be destroyed by a subsequent maskingstimulus (for a similar conclusion, see also Eriksen and Collins, 1968)."
We suppose that the shape of the visual-noise masking function mustreflect the trailing edges of the unit impulse response (as already de-scribed). Maskingfunctions often have an exponential trailing edge (Craw-ford, 1947; Sperling, 1965; Thompson, 1966), or a close approximationthereof. (A theory of metacontrast dependent on an exponential decayfunction has also been discussed in Section IX.) If true, we would expectvisual-noise masking to show exponential properties. We assume that corti-cal feature encoders are sensitive to subparts of the iconic representation.Theseencoders accumulate energy proportionately to the momentary inten-sity of the icon.
We suppose further that the transfer of information to another memorybuffer occurs, as in a computer operated by program interrupt, at the insti-
"

6. TEMPORAL FACTORS IN VISUAL PERCEPTION 219
gation of the peripheral device, which in our case, is the feature encoder.In other words, once some of the feature encoders have reached threshold,a transfer of information occurs between all encoders (i.e., in parallel)and their associated memory buffers. "The sequence begins with the presentation of a test, object at time instant/ = 0, which initiates an impulse response with, we assume, an exponen-tially decaying trailing edge. If the intensity of the test stimulus is Iv thenthe rate of activation of an appropriate feature encoder at any moment /is I te-">, where a is a rate constant. Therefore, the accumulated activationby such a feature encoder at time / is
Let Ei* represent threshold activation. Once this point is reached, a non-iconic buffer is transferred information by energized feature encoders.Hence, test stimulus encoding time jt* is givenby
(10)
which states, in part, that encoding time is inversely related to log test in-tensity. This deduction is in accord with the results cited in Table II withina range of test intensity values. If the visual-noise mask is presented atSOAi > /t *, then there is no masking, since the test icon information hasalready been transferred to another memory buffer before the start of themask. This accounts for the vertical asymptotes in Figure 37. IfSOA; <;' t*, then there will be a drop in recognition probability, because,at the moment of transfer, both mask-related feature encoders and test-related feature encoders will be energized to some extent. Specifically, atsome moment in time, /,„*, the mask-related feature encoders will reachtransfer threshold, and will initiate a transfer to another memory buffer.At that moment, a mask-related feature encoder will be energized anamount
"At this moment of data transfer, a test-object-related feature encoder willhave received an energy given by
"
Et - h f' c-ai dj = —A [er*i - 1]J° a
"*! 1 (aE * 1\
Em* = [exp(-ajm*) -1]a
Ex =\ — exp[~a(im * + SOAO] - 1a

»*
LEO GANZ
*
We suppose, in accordance with the luminance-summation contrast-reduction hypothesis, that a masking situation resembles a Weber-ratiosituation, as suggested by the results in Table I. In other words, the pro-bability of a correct response pc is directly related to the ratio of test-to-mask activation:
"E t
Vc Et + Em*Simplifying, we get
It exp(-aSOAi) - exp(tijm*)Pv
t
1- pc Im 1 - exp(ajm*)
which, if encoding time is not too long, gives the following approximatelylinear law of visual noise masking:
Equation (11) states that when performance is plotted in terms of loga-rithm of probability correct divided by probability incorrect, a linear func-tion of SOA is obtained, in which the intensity of the mask or the intensityof the test does not change the slope, but only the height of the interceptwith the vertical axis. Figure 38 shows the results of a masking study (Ganz& Morrison, unpublished data) plotted in terms of log[Pc/(l — pc)]- Sub-jects were asked to identify a letter G, C, P, R, or T followed by a visual-noise mask at one of several SOA values. Results represent recognitionperformance for all letters combined. Two levels of intensity were used,an 8- and a 16-msec duration presentation. Note that threeof four subjectsshow a fairly good approximation to a linear function. Moreover, theslopes are the same for the two intensity levels. The rate constant ais approximately .05." To apply Eg. (11) to Kinsbourne and Warrington's results, we recallthat they plotted combinations of test intensity, mask intensity, and SOA(see Fig. 37) with performance maintained constant. In other words,log[p,/(l -Pc.)] = k', yielding, where SOA is less than the test object'sencoding time,
Again, we get log masking intensity a linear function of SOA, with, logtest intensity determining the intercept with the vertical axis. Thus, theequation predicts the linear slope sections of Fig. 37. They are, to a firstapproximation, of equal slope when test intensity is changed.
To reiterate, the encoding time hypothesis of visual-noise masking em-ploys three assumptions. First, feature encoders are activated by test figures
"
220
log[p./0 ~ Pc)] c~ \og(h/Im) + aSOA; +k. (11)
log 7rn = log h + aSOA + k'.

»
■
2216. TEMPORAL FACTORS IN VISUAL PERCEPTION
I "
ol i i i ill I I LIc 0 10 ;_o 30 0 10 20 30SOA (msec)
Fig. 38. Results of a visual noise masking study. Test letters were followed by arandom-contoured field. Data are plotted in terms of \og(p.JPc) against
SOA;
p c isthe probability of correct recognition and p.. = 1 — p c. Two levels of intensity wereused: 8 msec (filled circles) and 16 msec (unfilled circles). Four observers resultsare depicted. Three of four subjects show approximately linear functions with slopeswhich are highly similar drom subject to subject and across intensity levels. Theseeffects may reflect exponential decay functions of the iconic representations. [FromGanz & Morrison, unpublished results.]
"along a time function dictated by the unit-impulse response. The trailingedge of that function is approximately exponential, with a rate constanta, which is independent of the test stimulus intensity. The rate constanta should increase with increased adaptation level. Second, when featureencoders reach a threshold level, this triggers a transfer of information ofall active feature encoders to some other (i.e., nonerasable memorybuffer. Encoding time is simply the latency with which this point is reachedfor some particular stimulus intensity. Where masking occurs, it is becausethe mask-related feature encoder reaches transfer threshold first. Third,the subject's task is to discriminate the test-related feature encoders
from the others. This is done successfully to the extent that test-relatedfeature encoder activation exceeds mask-related feature encoder activation,i.e., it follows Weber's law. The extent of activation is a function both ofstimulus intensity and of activation time, as shown by Eg. (11). Thus, themodel combines Integration theory's notion of luminance summation-con-
"

0
LEO GANZ-)!')
trast reduction with Interruption theory's emphasis on encoding time asdefined by Eg. (10)." XI. SPATIO-TEMPORAL INTERACTIONS
The mechanism of motion direction perception probably involves asequence-discriminating circuit (Barlow & Levick, 1965; Bishop et al.,1971 ), which integrates two or more impulse responses from two differentspatial locations. Therefore, aform of Bloch's law must operate for movingobjects because this temporal integration operates over an amount of timecomparable to the unit impulse response. The fact that integration timeis fixed means that for a periodic stimulus such as a square-wave grating,there should be a relationship between spatial frequency and velocity,namely,
spatial frequency (cycles/degree) X velocity (degrees/sec)= [critical duration (sec/cycle)]-1 . (12)
For example, a grating with wide bars will be visually optimal whenmoved quickly, since a high velocity is needed to bring a new edge to thesequence-discriminator by the time the critical duration T has elapsed. Con-versely, a grating with fine spacing must move slowly to allow an intervalof time r to elapse before the sequence-discriminator is stimulated by anew edge. In this section, we will review some of the evidence bearingon this reciprocity.
" Some years ago, Crook (1937) determined the contrast threshold forthe perception of direction of motion of a square wave grating. Using arange of spatial frequencies and velocities, his results suggest that thethreshold is lowest when the product of grating spatial frequency and veloc-ity is approximately constant. Van Nes, Koenderink, Nas, and Bouman(1967) also report an inverse relationship between spatial frequency andvelocity. Figure 39, drawn from that study, shows that motion enhancesthe visibility of sinusoidal patterns. More specifically, as the figure demon-strates, the lower the spatial frequency, the higher the velocity which en-hances visibility. More recently, Pantle (1970) demonstrated the inverserelationship using a selective adaptation paradigm. After subjects had beenexposed to a stationary adaptation target of low spatial frequency, movingstimuli, particularly those of high velocity, were harder to see. Conversely,after adaptation to a stationary target of high frequency, moving stimuliparticularly at low velocities were harder to see. Breitmeyer (1972, 1973)
"

*<
6. TEMPORAL FACTORS IN VISUAL PERCEPTION 223
"
velocity ( deg/see )
Fig. 39. Sinusoidal bar patterns are moved while their visibility is measured. Theobserver fixates a stationary fixation point and adjusts the modulation of the movingsinusoid until threshold is, reached. We see first that for low spatial frequencies,movement enhances visibility, while: for high spatial frequencies (12 cycles/degreeof visual angle) movement diminishes visibility. Secondly, the velocity at which opti-mal visibility is obtained is higher when spatial frequency is lower. [After van Nesct al. (1967).]
has corroborated and extended this finding. His results are shown in Fig.40. Subjects were exposed to a stationary square-wave for several minutesand then their threshold for the detection of a moving visual-noise texturewas determined. The stationary adapting grating was either 4 cycles/degree(filled circles) or 1.5 cycles/degree (unfilled circles) in spatial frequency.The results demonstrated that with a 4-cycle/degree grating the velocitymost affected (i.e., the largest threshold rise) was at 3 degrees/second.Substituting his values of spatial frequency and velocity into Eg. (12)yields a critical duration of 1/4X3 sec or 82.5 msec. Whereas, with a1.5-cycle/degree grating, the peak threshold rise is at a velocity of 7 de-grees/second, yielding a critical duration of 1/1.5 X 7 sec = 105 msec.Note that a reciprocal relationship exists between adapting spatial fre-quency and velocity of peak threshold rise. The estimated critical durationwhich results is clearly within the range of Bloch's law.
"Breitmeyer, in the same study, also performed the inverse experiment.
Subjects adapted to a visual-noise pattern moving at a particular velocity.
"

«
LEO GANZ224
)
Fig. 40. Observers adapted to a stationary square wave grating of 4 cycles/degree(filled circles) or 1.5 cycles/degree (unfilled circles) in spatial frequency. Then theywere required to detect a random texture pattern moving at some particular velocity.The log increment in threshold for detecting the moving pattern is plotted againstthe velocity of the pattern. Note that adapting to a lower spatial frequency diminishessensitivity for higher velocities. [From Breitmeyer (1972).]
" spatial frequency (cycles/degree)
Fig. 41. The inverse experiment of that shown in Fig. 40. Observers adapt toa random texture moving at 2.5 deg/sec (filled circles) or 6.5 deg/sec (unfilledcircles). After adaptation they are required to detect a stationary square wave patternat some particular spatial frequency. The log increment in threshold for detectingthe stationary grating pattern is plotted against the spatial frequency of the grating.Maximum effects are obtained when a higher velocity of adaptation is coupled witha lower spatial frequency in the test grating and lower velocity coupled with higherspatial frequency. [From Breitmeyer, 1972.]
Then, the contrast threshold needed to detect a stationary grating was mea-sured for a range of spatial frequencies. The results are depicted in Fig.41. Again, the inverse relationship is evident. The high-velocity adaptingpattern increases the threshold, particularly for the lower spatial frequencystationary grating; the lower velocity adapting pattern increases the thresh-old, particularly for the higher spatial frequency stationary grating. The
"

>
2256. TEMPORAL FACTORS IN VISUAL PERCEPTION
associated critical durations, calculated as before, are 77 and 83-100 msec,respectively. "In the initial sections of this chapter, we observed that the impulse re-sponse generated peripherally in the visual system slows down considerablyunder dark adaptation. Therefore, if this response sets the time windowwithin which integration within the motion mechanism occurs, then weshould expect the critical duration extracted from a selective adaptationparadigm such as used by Pantle and Breitmeyer, will yield a larger valuewhen conducted at scotopic luminance levels. Breitmeyer (1972) per-formed the luminance level selective adaptation experiment in both direc-tions. In one experiment, a stationary square wave pattern of 1.6 cycles/de-gree was the adapting pattern. Its effect on the detection of a texturemoving at a number of different velocities was tested. Both patterns, adap-tation and test, were shown at three different adaptation levels correspond-ing to those used by Kelly (1971a,b) see Fig. 10 (p. 181). The resultsare plotted in Fig. 42. As the luminance level drops, the peak thresholdrise occurs at a progressively lower velocity. The product of spatial fre-quency and velocity yields the complement of the critical duration [seeEg. (12)], which is given in Fig. 42 by the numbers in parentheses. Forsubject SG the critical durations are 104, 139, and 204 msec at luminancelevels of 1670, 167, and 16.7 td, respectively. As expected, the criticalduration increases as the adaptation luminance diminishes. These critical
"j i i i i i i 'ii i i—i—i—i—i—i—i.234567 IB 9123456759
velocity (deg/sec)
Fig. 42. The effect of varying background luminance on the spatial frequency-veloc-ity association. Os adapted by viewing a stationary grating under three backgroundluminance levels: 1670 td (filled circles), 167 td (unfilled circles), and 16.7 td (Xsymbols). They were then tested for the detection of a random texture pattern movingat some particular velocity. The log increment in threshold detection is plotted againstthe velocity of the random texture pattern. Numbers in parentheses above thresholdpeaks indicate critical duration, d, in msec, estimated according to the formula:Spatial Frequency x Velocity = 1 /critical duration (see text for details). Note thatthe extracted critical duration becomes longer as background luminance diminishes.[From Breitmeyer (1972).]
"

» *
LEO GANZ
durations arc approximately comparable, at each adaptation level, to theduration of a single positive-negative wave of the unit-impulse responsein Fig. 10 for the corresponding luminance level. These results prove thatthe unit-impulse response of the eye is the pacemaker for the cortical se-
quence-discrimination mechanism, which mediates motion perception.Several predictions follow from the hypothesis that the unit-impulse re-
sponse constitutes the pacemaker of the mechanism underlying motion per-ception. An object that moves too slowly, say at velocity v,, will exceedthe critical duration and therefore be suboptimal. One that moves at avelocity
v,
so as to just fill the integration time will activate the mechanismoptimally. At a still higher velocity,
v.,
the object will pass so quickly thatless than complete integration will occur, and thus the mechanism will beless than maximally activated. When background luminance drops (seeFig.10), the unit-impulse response becomes slower. Therefore, it is now V! theslower velocity that maximally activates the mechanism, with v. becomingsuboptimal. We assume that perception is somehow related to maximallyactivated analytic mechanisms. It follows that under reduced backgroundluminance,
v,
should yield the perception of velocity that v 5 does underhigher background luminance. In other words, it is predicted that movingobject of constant velocity should appear more rapid under diminishedbackground luminance, which is in fact what is reported (Brown, 1931,see especially his Table 11).
"
A prediction regarding apparent motion follows from a similar argument.At the level of the sequence-analyzing mechanism which underlies move-
ment perception (Barlow & Levick, 1965; Bishop et al, 1971 ) an apparentmotion sequence is almost as effective as real motion. A drop in back-ground luminance slows the unit-impulse response, which in turn increasesintegration time for the sequence-analyzing mechanisms. Therefore, we
would expect a subject to see apparent motion for larger SOA values be-tween the successfully presented strobed stimuli. A recent study (Ganz
& Rose, unpublished results) shows this to be the case. Subjects made mag-nitude estimates of the perceived vividness of motion in a classical apparentmovement display involving a pair of successively presented stationary lightpulses. Stimulus onset asynchrony was varied over a wide range of valuesfrom zero to above 200 msec. The stimuli were presented against a back-ground at photopic luminance level and also at scotopic luminance levelbut contrast was kept constant. Apparent motion was consistently seenat longer onset asynchronies under scotopic luminance conditions. The en-tire function of apparent motion vividness was displaced toward higherSOAs under scotopic luminance levels. This indicates that for any SOAabove 40-50 msec the same vividness of motion is perceived under pho-topic and scotopic luminance level, if a fixed constant is added to the sco-
"
"
226

s ■» * »»
2276. TEMPORAL FACTORS IN VISUAL PERCEPTION
topic SOA. This is precisely what we should expect if the unit-impulseresponse paces the mechanism underlying motion perception. "References
Alpern, M. Metacontrast. Journal of the Optica! Society of America, 1953, 43,648-657.
Averbach, E., &
Coriell,
A. S. Short-term memory in vision. Bell System TechnicalJournal, 1961, 40, 309-328.
Averbach, E., & Sperling, G. Short-term storage of information in vision. In C.Cherry (Ed.), Information theory. London: Butterworth, 1960. Pp. 196-211.
Barlow, H. B. Temporal and spatial summation in human vision at different back-ground intensities. Journal of Physiology (London), 1958, 141, 337-350.
Barlow, H. 8., & Levick, W. R. The mechanism of directionally selective units inrabbit's retina. Journal of Physiology. 1965, 178, 477-504.
Barlow, H. 8., & Sparrock, J. M. B. The role of after-images in dark adaptation.
Science,
1964, 144, 1309-1314.Battersby, W. S.,
Oesterreich,
R. E., &
Sturr,
J. F. Neural limitations of visual excit-ability. VI I Non-homonymous retrochiasmal interaction. American Journal ofPhysiology. 1964, 206, 1181-1188.
Baumgardt, E., & Hillman, B. M. Duration and size as determinants of peripheralretinal response. Journal of the Optical Society of America, 1961, 51, 340-344.
Baumgardt, E., & Segal, J. La fonction inhibitrice dans le processus visuel. ComptesRendus de Seances de la Socicte de Biologic (Paris), 1946, 140, 231-233.
Bishop, P. 0., Coombs, J.
S.,
& Henry, G. H. Interaction effects of visual contourson the discharge frequency of simple striate neurones. Journal of Physiology,1971, 219, 659-687.
Blackwell. H. R. Neural theories of simple visual discriminations. Journal of theOptical Society of America, 1963, 53, 129-160.
Bloch, A. M. Experience sur la vision. Comptes Rendus de Seances de la Societede Biologic (Paris), 1885, 37, 493^95.
Boynlon, R. M. On-responses in the human visual system as inferred from psycho-physical studies of rapid adaptation. American Medical Association, Archives "of Ophthalmology, 1958, 60, 800-810.
Boynton, R. M. Some temporal factors in vision. In W. A. Rosenblith (Ed.), Sensorycommunication. New York: Wiley, 1961. Pp. 739-756.
Boynton, R. M. Discrimination of homogeneous double pulses of light. In D. Jameson& L. M. Hurvich (Eds.), Handbook of sensory physiology, Vol. VII/4, Visualpsychophysics. Berlin: Springer-Verlag, 1972. Pp. 202-232.
Breitmeyer, B. G. The relation between the detection of size and velocity in humanvision. Unpublished doctoral dissertation, Stanford University, 1972.
Breitmeyer, B. G. A relationship between the detection of size, rate, orientation anddirection in the human visual system. Vision Research, 1973, 13, 41-58.
Bridgeman, B. Metacontrast and lateral inhibition. Psychological Review, 1971, 78,528-539.
Brown, J. F. The visual perception of velocity. Psychologische Forsclumg, 1931,14, 199-232.
Cheatham, P. G., & White, C. T. Temporal numerosity: I. Perceived number asa function of flash number and rate. Journal of Experimental Psychology, 1952,44, 447-451.
"

**
#.
*
LEO GANZ228
"
"
"
Ciganek, L. Excitability cycle of the visual cortex in man. Annals of the New YorkAcademy of Science, 1964, 112, 241-253.
Coltheart, M., & Arthur, B. Evidence for an integration theory of visual masking.Quarterly Journal of Experimental Psychology, 1972, 24, 262-269.
Collonier, ML, & Rossignol, S. Heterogeneity of the cerebral cortex. In H. H. Jasper,A. A. Ward, & A. Pope (Eds.), Basic mechanisms of the epilepsies. Boston:Little, Brown, 1969.
Crawford, B. H. Visual adaptation in relation to brief conditioning stimuli. Proceed-ings of the Royal Society, London, 1947, 1348, 283-302.
Crook,
M. N. Visual discrimination of movement. Journal of Psychology, 1937, 3,541-558.
DeLange, H. Research into the dynamic nature of the human fovea-cortex systems
with intermittent and modulated light. I. Attenuation characteristics with whiteand colored light. Journal of the Optical Society of America, 1958, 48, 777-784.
DeVoe, R. D. Non-linear transient responses from light adapted wolfspider eyes tochanges in background illumination. Journal of General Physiology, 1967,1961-1991. (a)
DeVoe, R. D. A non-linear model for transient responses from light adapted wolf-spider eyes. Journal of General Physiology, 1967, 50, 1993-2030. (b)
Donchin, E., & Lindsley, D. B. Retroactive brightness enhancement with brief pairedflashes of light. Vision Research, 1965, 5, 59-70.
Eriksen, C. W. Temporal luminance summation effects in backward and forwardmasking. Perception & Psychophysics, 1966, 1, 87-92.
Eriksen, C. W., &
Collins,
J. F. Some temporal characteristics of visual pattern per-ception. Journal of ExperimentalPsychology, 1967, 74, 476-484.
Eriksen, C. W., & Collins, J. F. Sensory traces versus the psychological momentin the temporal organization of form. Journal of Experimental Psychology, 1968,77, 376-382.
Eriksen, C. W., & Eriksen, B. A. Visual perceptual processing rates and backwardand forwardmasking. Journal of Experimental Psychology, 1971, 89, 306-313.
Eriksen, C. W., &
Hoffman,
M. Form recognition at brief duration as a functionof adapting field and interval between stimulations. Journal of ExperimentalPsychology, 1963, 66, 485-499.
Eriksen, C. W., & Lappin, J. S. Luminance summation-contrast reduction as a basisfor certain forward and backward masking effects. Psychonomic
Science,
1964,1, 313-314.
Fain, G. L., & Dowling, J. E. Intracellular recordings from single rods and conesin the mudpuppy retina. Science, 1973, 180, 1178-1181.
Forsyth, D. M., & Chapanis, A. Counting repeated light flashes as a function oftheir number, their rate of presentation, and retinal location stimulated. Journalof Experimental Psychology, 1958, 56, 385-391.
Gastaut,
H , Roger, A.,
Corriol,
J., & Naquet, R. Etude electrographique de cycled'excitabilite corticate. Electroencephalography & Clinical Neurophysiology,1951, 3, 401-428.
Graham,
C. H., & Kemp, E. H. Brightness discrimination as a function of the dura-tion of the increment intensity. Journal of General Physiology, 1938, 21,635-650.
Graham,
C. H., & Margaria, R. Area and the intensity-time relation in the peripheralretina. American Journal of Physiology, 1935, 113, 299-305.

♦*«*
2296. TEMPORAL FACTORS IN VISUAL PERCEPTION
"
Greenspoon, T.
S.,
& Eriksen, C. W. Interocular non-independence. Perception andPsychophysics, 1968, 3, 93-96.
Haber, R. N., & Standing, L. G. Direct measures of short-term visual storage. Quar-terly Journal of Experimental Psychology. 1969, 21, 43-54.
Haber, R. N., & Standing, L. G. Direct estimates of apparent duration of a flashfollowed by visual noise. Canadian Journal of Psychology, 1970, 24, 216-229.
Harter, M. R., & White, C. T. Perceived number and evoked cortical potentials."
Science,
1967, 156, 406-408.Hecht, S., Schlaer,
S.,
& Pirenne, M. H. Energy, quanta, and vision. Journal of Gen-
eral Physiology, 1942, 25, 819-840.Heinemann, E. G. Simultaneous brightness induction as a function of inducing and
test-field luminances. Journal of Experimental Psychology, 1955, 50, 89-96.Herrick, R. M. Foveal luminance discrimination as a function of the duration of
the decrement or increment in luminance. Journalof Comparative & Physiologi-
cal Psychology, 1956, 59, 437-443.Ikcda, M. Temporal summation of positive and negative flashes in the visual system.
Journal of the Optical Society of America, 1965, 55, 1527-1534.Ives, H. E. Critical frequency relations in scotopic vision. Journal of the Optical
Society of America, 1922, 6, 254-268. (a)Ives, H. E. A theory of intermittent vision. Journal of the Optical Society of America,
1922, 6, 343-361. (b)Johnson, E. P., & Bartlett N. R. Effect of stimulus duration on electrical responses
of the human retina. Journal of the Optical Society of America, 1956, 46,167-170.
Jones, E. G„ & Powell, T. P. S. An electron microscopic study of the laminar patternand mode of terminationof afferent fibre pathways in the somatic sensory cortexof the cat. Philosophical Transactions of the Royal Society, 1970, 8257, 45-62.
Kahneman, D. Method, findings, and theory in studies of visual masking. Psychologi-
cal Bulletin, 1968, 69, 404-425.Kahneman, D., & Norman, J. The time-intensity relation in visual perception as
a function of observer's task. Journal of Experimental Psychology, 1964, 68,
"215-220.Kelly, D. H. Effects of sharp edges in a flickering field. Journalof the Optical Society
of America, 1959, 49, 730-732.Kelly, D. H. Flickering patterns and lateral inhibition. Journal of the Optical Society
of America, 1969, 59, 1361-1370.Kelly, D. H. Theory of flicker and transient responses. I. Uniform fields. Journal
of the Optical Society of America, 1971, 61, 537-546. (a)Kelly, D. H. Theory of nicker and transient responses. 11. Counterphase gratings.
Journalof the Optical Society of America, 1971, 61, 632-640. (b)Kelly, D. H. Adaptation effects on spatio-temporal sine-wave thresholds. Vision Re-
search, 1972, 12, 89-101. (a)Kelly, D. H. Flicker, ln D. Jameson & L. M. Hurvich (Eds.), Handbook of sensory
physiology, Vol. VII/4, Visual psychophysics. Berlin: Springer-Verlag, 1972. (b)
Kinsbourne, M., & Warrington, E. K. The effect of an after-coming random patternon the perception of brief visual stimuli. Quarterly Journal of ExperimentalPsychology, 1962, 14, 223-234. (a)
Kinsbourne, M., & Warrington, E. K. Further studies on the masking of brief visualstimuli by a random pattern. Quarterly Journal of Experimental Psychology,1962, 14, 235-245. (b)

(
" Kolers, P. A. Intensity and contour effects in visual masking. Vision Research, 19622, 277-294.
Kolers, P. A., & Rosner, B. S. On visual masking (metacontrast): Dichoptic observa-tion. American Journal of Psychology, 1960, 73, 2-21.
Levinson, J. Nonlinear and spatial effects in the perception of flicker. DocumentaOphthalmologic!!, 1964, 18, 36-55.
Levinson, J. Flicker fusion phenomena. Science, 1968, 160,21-28.Li,
Ch.-L., Ortiz-Galvin,
A.,
Chou,
S. N., & Howard, S. Y. Cortical intracellularpotentials in response to stimulation of lateral geniculate body. Journal of Neuro-physiology, 1960, 23, 592-601.
Matin, L. Critical duration, the differential luminance threshold, critical flicker fre-quency, and visual adaptation: A theoretical treatment. Journal of the OpticalSociety of America, 1968, 58, 404-415.
Pantle, A. J. Adaptation to pattern spatial frequency effects on visual movementsensitivity in humans. Journal of the Optical Society of America, 1970, 60,1120-1124.
Rashbass, C. The visibility of transient changes of luminance. Journal of Physiology(London), 1970, 210, 165-186.
Roufs,
J. A. Dynamic properties of vision. I. Experimental relationships betweenflicker and flash thresholds. Vision Research, 1972, 12, 261-278. (a)
Roufs,
J. A. Dynamic properties of vision. 11. Theoretical relationships betweenflickerand flash thresholds. Vision Research, 1972, 12,279-292. (b)
Schiller, P. H. Monoptic and dichoptic visual masking by patterns and by flashes.Journal of Experimental Psychology, 1965, 69, 193-199.
Schiller,
P. Single unit analysis of backward visual masking and metacontrast inthe cat lateral geniculate nucleus. Vision Research, 1968, 8, 855-866.
Schiller,
P. H., & Wiener, M. Monoptic and dichoptic visual masking. Journal ofExperimental Psychology, 1963, 66, 386-393.
Schmidt,
M. W., &
Kristofferson,
A. B. Discrimination of successiveness: A testof a model of attention. Science, 1963, 139, 112-113."
Smith,
M.
C,
&
Schiller,
P. H. Forward and backward masking: A comparison.Canadian Journal of Psychology, 1966, 20, 191-197.
Spencer, T. J., &
Shuntich,
R. Evidence for an interruption theory of backward mask-ing. Journal of Experimental Psychology, 1970, 85, 198-203.
Sperling, G. The information available in brief visual presentations. PsychologicalMonographs, 1960, 74, 1-29.
Sperling, G. A model for visual memory tasks. Human Factors, 1963, 5, 19-31.Sperling, G. Temporal and spatial visual masking: I. Masking by impulse flashes.
Journal of the Optical Society of America, 1965, 55, 541-559.Sperling, G. Successive approximations to a model. for short-term memory. Acta
Psychologia, 1967, 27, 285-292.Sperling,
G.,
Budiansky, J., Spivak, J. G., & Johnson, M. C. Extremely rapid visualsearch: The maximum rate of scanning letters for the presence of a numeral.Science, 1971, 174, 307-311.
Sperling,
G.,
&
Jollife,
C. L. Intensity-time relationship at threshold for spectralstimuli in human vision. Journal of the Optical Soicely of America, 1965, 55,191-19-9.
Sperling,
G.,
&
Sondhi,
M. M. Model for visual luminance of flicker detection. Jour-nal of the Optical Society of America, 1968, 58, 1133-1145.
"
230 LEO GANZ

\ I \
Sukale-Wolf S The prediction of the metacontrast phenomenon from simultaneousbrightness contrast. Unpublished doctoral dissertation, Stanford University, 1971.
Thompson. J. H. What happens to the stimulus in backward masking? Journal ofExperimental Psychology, 1966, 711, 580-586.
van den Brink. G. Retinal summation and the visibility of moving objects. Thesis,
Utrecht 1957. Report WW 1957-1959, Institute for Perception
RVO-TNO,
"Soesterberg. Netherlands;.
Van Nes F L„ Koenderink, J. J., Nas, H., & Bouman, M. A. Spatio-temporalmodu-lation transfer in the human eye. Journal of the Optical Society of America,
1967, 57, 1082-1088.Vaughan, H.
G.,
Jr., & Silverstein, L. Mletacontrast and evoked potentials: A reap-
praisal. Science, 1968, 160, 207-208.Veringa, F. Diffusion model of linear flicker response. Journalof the Optical Society
of America, 1970, 60, 285-286.Watanabe,
S.,
Konishi, M., &
Creutzfeldt,
O. D. Post synaptic potentials in the cats
visual cortex following electrical stimulation of afferent pathways. ExperimentalBrain Research, 1966, 1, 272-283.
Weisstein, N. Backward masking and models of perceptual processing. Journal ofExperimentalPsychology, 1966,72,232-240.
Weisstein, N. A Rashevsky-Landahl neural net: Simulation of metacontrast. Psycho-
logical Review, 1968, 75, 494-521.Weisstein, N. W-shaped and U-shaped functions obtained for monoptic and dichoptic
disk-diskmasking. Perception & Psychophysics, 1971, 9, 275-278.Weisstein, N. Metacontrast. In D. Jameson & L. M. Hurvich (Eds.), Handbook
of sensory physiology, Vol. VII/4, Visual psychophysics. Berlin: Spnnger-
Verlag, 1972. Pp. 233-272.Weisstein, N., & Growney, R. L. Apparent movement and metacontrast: a note on
Kahneman's formulation. Perception & Psychophysics, 1969, 5, 321-328.Werner, H. Studies on contour: I. Qualitative analyses. American Journal of Psychol-
ogy, 1935, 47, 40-64.While, C. T. Temporal numerosity and the psychological unit of duration. Psychology
"cal Monographs, 1963, Whole No. 575.Whitten, D. N., & Brown, K. T. Slowed decay of the monkey's cone receptor potential
by intense stimuli, and protection from this effect by light adaptation. Vision
Research, 1973, 13, 1659-1667.
"
2316. TEMPORAL FACTORS IN VISUAL PERCEPTION