
Chapter 6 fs-Dynamics of Small Gold Clusters: Results ... - Refubium
30
Chapter 6 fs-Dynamics of Small Gold Clusters: Results and Discussion In the previous chapter, the reaction kinetics of small noble metal clusters towards oxygen (O 2 ) and carbon monoxide (CO) could be characterized and the derived cat- alytic cycle for the oxidation reaction of carbon monoxide (CO) to carbon dioxide (CO 2 ) on gas-phase Au − 2 clusters was shown for the first time. In order to gain a better insight into the nuclear dynamics of the molecular systems involved in these reactions, femtosecond (fs) time-resolved spectroscopy is a powerful technique. As discussed in chapter 3, the negative-to-neutral-to-positive (NeNePo) spectroscopy al- lows the study of the nuclear dynamics of neutral molecular systems and presents the advantage of mass selection of the investigated systems prior to and after the interac- tion with the laser field. In this chapter, the results obtained from the investigations of the fs-dynamics of gold clusters via NeNePo spectroscopy will be presented. First, the fs-dynamics of pure gold clusters (Au 2 , Au 3 ) will be studied. The influence of the initial temperature of the molecular ensemble on the nuclear dynamics of gold clusters will be discussed. Subsequently, the first steps in the development of a new spectroscopic method referred to as reactive NeNePo, employed for the investigation of the fs-dynamics of cluster-adsorbate systems, will be presented. 153
-
Upload
khangminh22 -
Category
Documents
-
view
0 -
download
0
Transcript of Chapter 6 fs-Dynamics of Small Gold Clusters: Results ... - Refubium

Chapter 6
fs-Dynamics of Small Gold
Clusters: Results and Discussion
In the previous chapter, the reaction kinetics of small noble metal clusters towards
oxygen (O2) and carbon monoxide (CO) could be characterized and the derived cat-
alytic cycle for the oxidation reaction of carbon monoxide (CO) to carbon dioxide
(CO2) on gas-phase Au−2 clusters was shown for the first time. In order to gain a
better insight into the nuclear dynamics of the molecular systems involved in these
reactions, femtosecond (fs) time-resolved spectroscopy is a powerful technique. As
discussed in chapter 3, the negative-to-neutral-to-positive (NeNePo) spectroscopy al-
lows the study of the nuclear dynamics of neutral molecular systems and presents the
advantage of mass selection of the investigated systems prior to and after the interac-
tion with the laser field. In this chapter, the results obtained from the investigations
of the fs-dynamics of gold clusters via NeNePo spectroscopy will be presented. First,
the fs-dynamics of pure gold clusters (Au2, Au3) will be studied. The influence of
the initial temperature of the molecular ensemble on the nuclear dynamics of gold
clusters will be discussed. Subsequently, the first steps in the development of a new
spectroscopic method referred to as reactive NeNePo, employed for the investigation
of the fs-dynamics of cluster-adsorbate systems, will be presented.
153
154 Chapter 6: fs-Dynamics of Small Gold Clusters: Results and Discussion
6.1 NeNePo Spectroscopy on Au−2 Clusters
In chapter 5, the reactivity of negatively charged gold dimers towards oxygen and
carbon monoxide was presented. It could be shown that Au−2 clusters are able to
catalyze the oxidation reaction of carbon monoxide. In order to fully understand this
chemical process, it is important to investigate the nuclear dynamics of pure clusters
and cluster-adsorbate complexes.
For this, the NeNePo spectroscopy was applied to the investigation of the fs-
dynamics of gold dimers. After the production of the cluster beam and the alignment
of the laser system, the data acquisition was performed as described in chapter 4. The
NeNePo measurements on Au−2 clusters were carried out at an ion trap temperature
of 100 K. The final goal of the experiments consists in the study of the fs-dynamics
of cluster-adsorbate complexes via reactive NeNePo method (as will be shown in
section 6.3). Since the reaction rate constants for the reactivity of negatively charged
Au−2 clusters towards oxygen and carbon monoxide have a high value for a reaction
temperature of 100 K, i.e. the concentration of the reaction products presents a
maximum under the experimental conditions for the measurements presented here,
this value was set as the initial temperature of the anionic gold dimers.
For the detachment process a wavelength of 323 nm (3.84 eV ) was chosen, while
a wavelength of 410 nm (3.03 eV ) was employed for the ionization process. The
vertical detachment energy (V DE) of the Au−2 clusters and the ionization potential
(IP ) of the neutral gold dimers were experimentally found to be EV DE(Au−2 ) = 2.01±
0.01 eV 138,158 and EIP (Au2) = 9.20 ± 0.21 eV ,164 respectively. Since the ionization
potential of the neutral gold dimers has a high value, which is experimentally difficult
to obtain through a one-photon process, a multi-photon process will be involved in the
probe step of the NeNePo measurements on negatively charged gold dimers. In order
to provide sufficient energy for the multi-photon ionization process and to achieve a
one-photon detachment process, the laser power of the pump and probe beams were
chosen to be Pλ=323nm = 1.5 mW and Pλ=410nm = 10 mW at a repetition rate of
1 KHz, respectively.
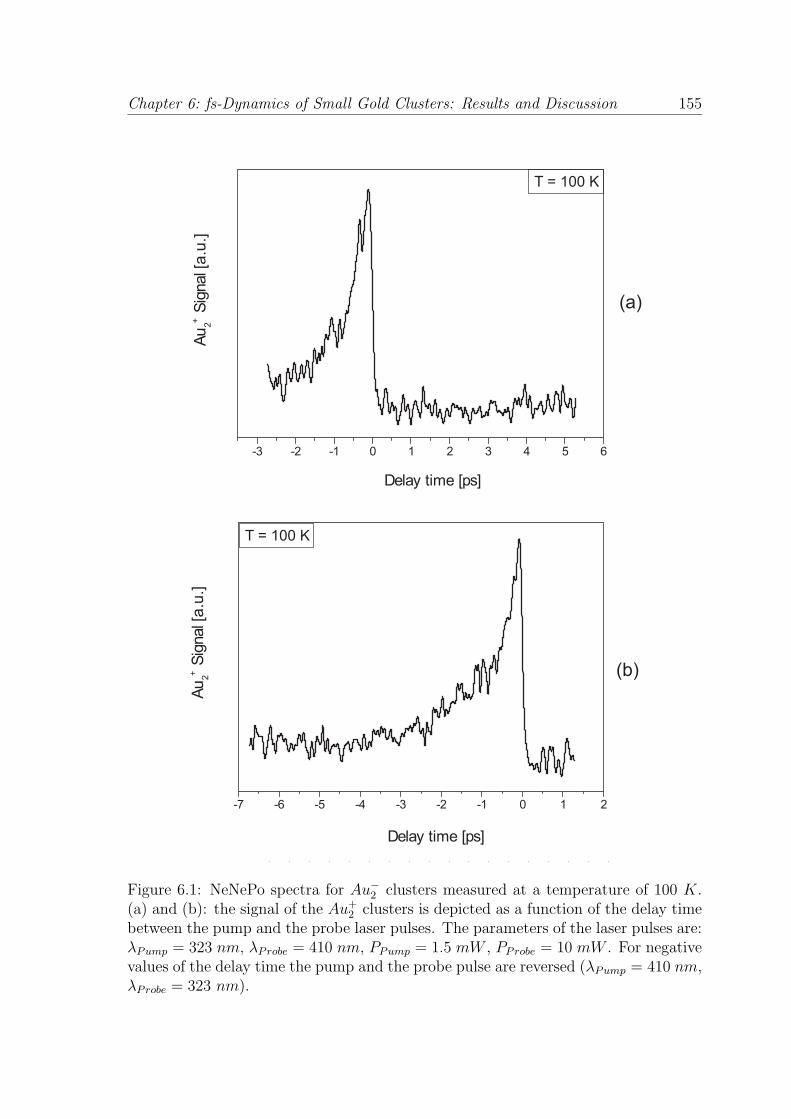
Fig. 6.1 (a) and (b) show the NeNePo spectra for the Au−2 clusters measured
under the experimental conditions discussed above. The positive Au+2 ion signal was
recorded as a function of the delay time (td) between the pump and the probe pulse.
Chapter 6: fs-Dynamics of Small Gold Clusters: Results and Discussion 155
(b)
Au
2+ S
ignal [
a.u
.]
Delay time [ps]
T = 100 K
-7 -6 -5 -4 -3 -2 -1 0 1 2
T = 100 K
(a)
Au
2+ S
ignal [
a.u
.]
Delay time [ps]
-3 -2 -1 0 1 2 3 4 5 6
Figure 6.1: NeNePo spectra for Au−2 clusters measured at a temperature of 100 K.
(a) and (b): the signal of the Au+2 clusters is depicted as a function of the delay time
between the pump and the probe laser pulses. The parameters of the laser pulses are:λPump = 323 nm, λProbe = 410 nm, PPump = 1.5 mW , PProbe = 10 mW . For negativevalues of the delay time the pump and the probe pulse are reversed (λPump = 410 nm,λProbe = 323 nm).
156 Chapter 6: fs-Dynamics of Small Gold Clusters: Results and Discussion
For positive values of the delay time (td > 0), the ultraviolet laser beam represents
the pump pulse and the blue laser beam represents the probe pulse. For negative
values of the delay time (td < 0), the order of the pump and the probe is reversed
and, in this case, the blue laser beam represents the pump pulse, while the ultraviolet
laser beam represents the probe pulse.
From Fig. 6.1 (a), it can be seen that for positive delay times (λPump = 323 nm,
λProbe = 410 nm, PPump = 1.5 mW , PProbe = 10 mW ) no transient signal can be
identified. Surprisingly, for negative delay times (λPump = 410 nm, λProbe = 323 nm,
PPump = 10 mW, PProbe = 1.5 mW) the measured signal shows a significant time-
dependent behavior (see Fig. 6.1 (b)). Starting from td = 0 fs delay time, the signal
increases abruptly and decreases exponentially to the value measured for td > 0.
It is important to note that no Au+ fragment was detected for any investigated
experimental conditions. For the interpretation of the measured pump-probe spectra,
information about the potential energy curves of the anionic, neutral and cationic gold
dimers are required.
In the following, a short overview of the experimentally observed and theoretically
calculated spectroscopic constants for the gold dimers will be presented. The ground
state of the negatively charged Au−2 clusters (X 2Σ+
u ) was investigated by Ho et al.,
via high resolution photoelectron spectroscopy.138 The authors found an equilibrium
bond length of re = 2.58 A, a dissociation energy of De = 1.92 eV = 15485.7 cm−1
and a vibrational frequency of ωe = 149 cm−1.138 Theoretical ab initio calculations
of the electronic ground state of the Au−2 clusters predict a bond length of re =
2.64 A, a dissociation energy of De = 2.01 eV = 16211.6 cm−1 and a vibrational
frequency of ωe = 134.5 cm−1.157 The electronic ground state of positively charged
Au+2 clusters (X 2Σ+
g ) was investigated by combined ion mobility measurements and
density functional calculations. From these studies, a bond length of re = 2.62 A
and a dissociation energy of the Au+2 clusters of De = 2.32 eV = 18711.9 cm−1 was
obtained.125 The vibrational frequency of the electronic ground state of the cationic
gold dimers was theoretically calculated to be ωe = 177 cm−1.165
The neutral gold dimers Au2 were intensively studied, experimentally and the-
oretically. Photoelectron spectroscopy, two-photon ionization spectroscopy as well
as optical absorption spectroscopy were employed for the detection and characteri-
zation of the electronic ground and excited states of the neutral gold dimers in the
Chapter 6: fs-Dynamics of Small Gold Clusters: Results and Discussion 157
gas-phase.132,138,158,164,166 Neutral gold dimers embedded in matrices were studied as
well by using different spectroscopic methods.167–169 Theoretical investigations based
on relativistic methods were carried out, in order to assign the spectroscopic features
of neutral gold dimers.157,161,170–172
The ground state (X 1Σ+g ) of the neutral gold dimers Au2 was investigated by
means of photoelectron spectroscopy and a frequency ωe = 190.9 cm−1, an equilibrium
bond length re = 2.47 A and a dissociation energy De = 2.29 eV = 18469.9 cm−1 were
found.138 Theoretical calculations predict for the electronic ground state X 1Σ+g of the
Au2 clusters a bond length re = 2.45 A,165 a vibrational frequency ωe = 193 cm−1,161
and a dissociation energy De = 2.28 eV = 18389.3 cm−1.157 The first excited state
of the neutral gold dimers is a triplet state denoted as a3Σ+u and corresponds to
an excitation of one of the 6s electrons from a σg orbital into an antibonding σ∗u
orbital. From resonant two-photon ionization spectroscopy experiments on jet-cooled
Au2 clusters, Bishea et al. obtained a frequency of ωe = 87.8 cm−1 and a dissociation
energy of De = 0.23 eV = 1840 cm−1.164 Due to the small dissociation energy, the
authors consider the a3Σ+u state as an extremely weak bound state.164 Itkin et al.
calculated the spectroscopic constants of the electronic ground and excited states of
Au2 neutral clusters and found an equilibrium bond length of re = 2.74 A for the first
excited state a3Σ+u .172
As discussed in chapter 5, one of the consequences of the relativistic effects in gold
is the strong spin-orbit coupling, which leads to a mixing of the electronic states. For
the neutral gold dimers, the ground and the first excited state can be described in a
good approximation according to case (a) of Hund’s rules173 and can be considered
as pure states. All higher excited states require a description according to case (c) of
Hund’s rules173 for mixed states, which makes the assignment and interpretation of
these states more complicated.
The second excited state of the neutral gold dimers, which was observed in gas-
phase experiments is the A′ 1u state.158,164 The spectroscopic constants for this state
are: re = 2.55 A,174 ωe = 223.6 cm−1 and De = 1.18 eV = 9500.7 cm−1.164 The
next energetically higher lying excited state of the gold dimers is denoted as A 0+u
and presents an equilibrium bond length of re = 2.57 A, a vibrational frequency of
ωe = 142.6 cm−1 and a dissociation energy of De = 0.99 eV = 7987.2 cm−1.164 The
B′ 1u state represents the fourth excited state of the neutral gold dimers, which was
158 Chapter 6: fs-Dynamics of Small Gold Clusters: Results and Discussion
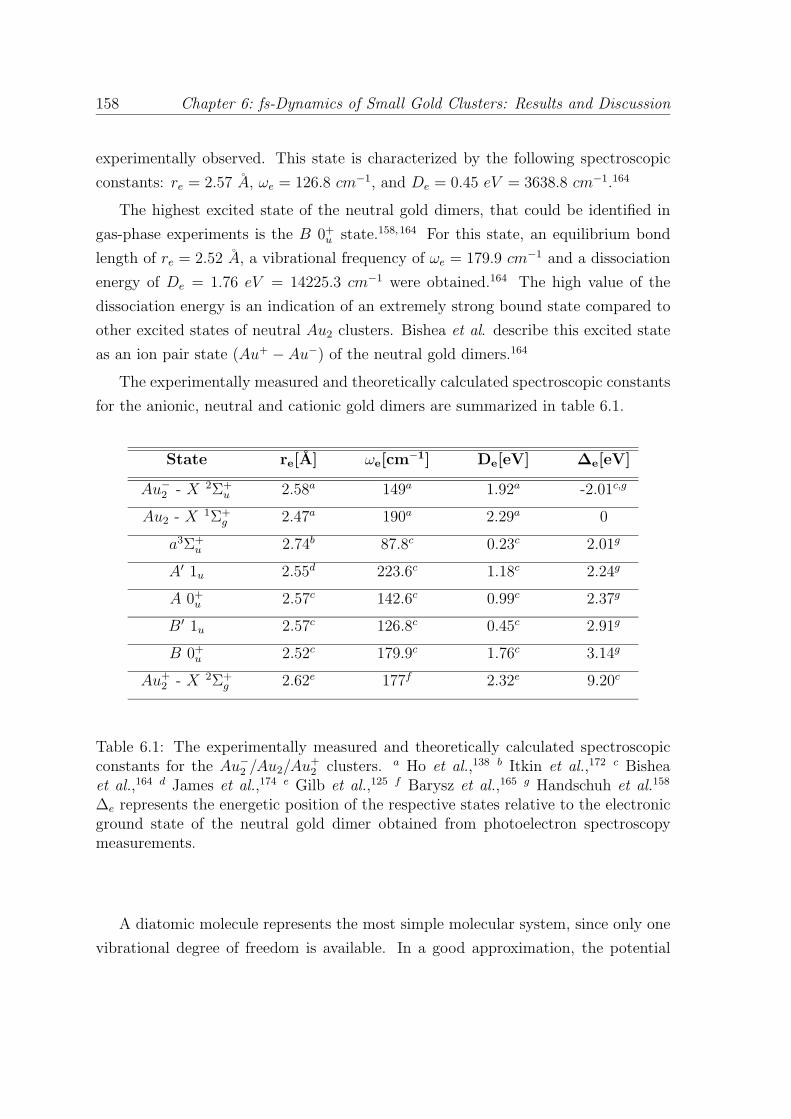
experimentally observed. This state is characterized by the following spectroscopic
constants: re = 2.57 A, ωe = 126.8 cm−1, and De = 0.45 eV = 3638.8 cm−1.164
The highest excited state of the neutral gold dimers, that could be identified in
gas-phase experiments is the B 0+u state.158,164 For this state, an equilibrium bond
length of re = 2.52 A, a vibrational frequency of ωe = 179.9 cm−1 and a dissociation
energy of De = 1.76 eV = 14225.3 cm−1 were obtained.164 The high value of the
dissociation energy is an indication of an extremely strong bound state compared to
other excited states of neutral Au2 clusters. Bishea et al. describe this excited state
as an ion pair state (Au+ − Au−) of the neutral gold dimers.164
The experimentally measured and theoretically calculated spectroscopic constants
for the anionic, neutral and cationic gold dimers are summarized in table 6.1.
State re[A] ωe[cm−1] De[eV] ∆e[eV]
Au−2 - X 2Σ+
u 2.58a 149a 1.92a -2.01c,g
Au2 - X 1Σ+g 2.47a 190a 2.29a 0
a3Σ+u 2.74b 87.8c 0.23c 2.01g
A′ 1u 2.55d 223.6c 1.18c 2.24g
A 0+u 2.57c 142.6c 0.99c 2.37g
B′ 1u 2.57c 126.8c 0.45c 2.91g
B 0+u 2.52c 179.9c 1.76c 3.14g
Au+2 - X 2Σ+
g 2.62e 177f 2.32e 9.20c
Table 6.1: The experimentally measured and theoretically calculated spectroscopicconstants for the Au−
2 /Au2/Au+2 clusters. a Ho et al.,138 b Itkin et al.,172 c Bishea
et al.,164 d James et al.,174 e Gilb et al.,125 f Barysz et al.,165 g Handschuh et al.158
∆e represents the energetic position of the respective states relative to the electronicground state of the neutral gold dimer obtained from photoelectron spectroscopymeasurements.
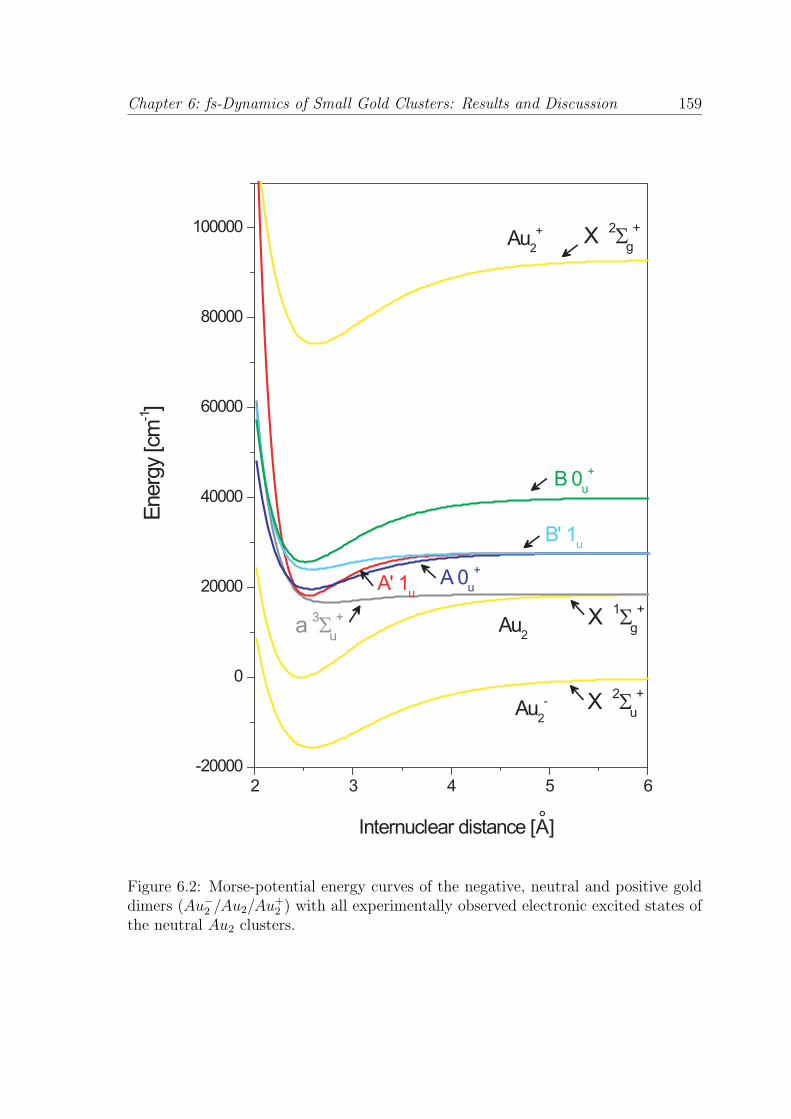
A diatomic molecule represents the most simple molecular system, since only one
vibrational degree of freedom is available. In a good approximation, the potential
Chapter 6: fs-Dynamics of Small Gold Clusters: Results and Discussion 159
Internuclear distance [A]°
Energ
y [c
m-1]
2 3 4 5 6
-20000
0
20000
40000
60000
80000
100000X
2Σ
g
+
X 2Σ
u
+
B 0u
+
B' 1u
A 0u
+
A' 1u
a 3Σ
u
+ X 1Σ
g
+
Au2
+
Au2
Au2
-
Figure 6.2: Morse-potential energy curves of the negative, neutral and positive golddimers (Au−
2 /Au2/Au+2 ) with all experimentally observed electronic excited states of
the neutral Au2 clusters.
160 Chapter 6: fs-Dynamics of Small Gold Clusters: Results and Discussion
energy curves can be described by using the Morse potential:69
V (R) = De[1 − e−a(R−Re)]2 (6.1)
where De represents the dissociation energy of the molecule for a given electronic state,
Re represents the equilibrium bond length for an electronic state of the molecule and
R represents the distance between the two nuclei. a is a quantity which depends on
the specific properties of the molecule and is given by the expression:
a =
(mr
2De
)1/2
ωe (6.2)
where mr denotes the reduced mass of the molecule and ωe denotes the vibrational
frequency of the molecule for a given electronic state. By inserting the experimental
values found in literature for De, Re and ωe, which are summarized in table 6.1,
into the expressions 6.1 and 6.2, the Morse potential energy curves for the negative
(Au−2 − X 2Σ+
u ), neutral (Au2 − X 1Σ+g ) and positive (Au+
2 − X 2Σ+g ) gold dimers,
including the electronic excited states of the neutral (a 3Σ+u , A′ 1u, A 0+
u , B′ 1u,
B 0+u ), can be calculated. The results are presented in Fig. 6.2, where the potential
energy curves for the Au2 clusters are depicted as a function of the internuclear
distance. With the help of this potential energy curve scheme, the interpretation of
the measured NeNePo spectra presented in Fig. 6.1 (a) and (b) can be performed.
In the following, the discussion will focus on the experimental results obtained
for positive values of the delay time (td > 0) between the pump and the probe laser
pulses. Fig. 6.1 (a) shows a NeNePo spectrum measured up to td = 6 ps delay
time. From this spectrum, it can be seen that for positive values of the delay time
no time-dependent dynamics can be observed. Fig. 6.3 shows the scheme of the
pump-probe process for positive values of the delay time, where the ultraviolet laser
pulse (λPump = 323 nm, PPump = 1.5 mW ) represents the pump and the blue laser
pulse (λProbe = 410 nm, PProbe = 10 mW ) represents the probe. By comparing
the energy of the pump pulse (3.84 eV ) to the vertical detachment energy of the
Au−2 clusters (EV DE(Au−
2 ) = 2.01 eV 138,158) and the energetic position of the first
excited state a 3Σ+u of the neutral gold dimers, which is situated about 4 eV above
the anionic ground state,158,163 it can be deduced that only the ground state X 1Σ+g
of the neutral gold dimers Au2 can be populated through a one-photon detachment
process. From photoelectron spectra measured on Au−2 clusters it was observed that

Chapter 6: fs-Dynamics of Small Gold Clusters: Results and Discussion 161
Energ
y [c
m-1]
Internuclear distance [A]°
Probe pulse
Pump pulse
2 3 4 5 6
-20000
0
20000
40000
60000
80000
100000
X 2Σ
g
+
X 2Σ
u
+
B 0u
+
B' 1u
A 0u
+
A' 1u
a 3Σ
u
+
X 1Σ
g
+
Au2
+
Au2
Au2
-
Figure 6.3: The pump-probe scheme for the NeNePo measurements on Au−2 clusters
corresponding to positive values of the delay time between the pump and the probelaser pulses (td > 0). The vertical arrows represent the pump and the probe laserpulses. The characteristics of the laser pulses are: λPump = 323 nm, PPump = 1.5 mW ,λProbe = 410 nm, PProbe = 10 mW .
only low vibrational levels of the neutral gold dimers present favorable Franck-Condon
factors (up to ν(Au2) = 7) and therefore, only these vibrational levels are populated
through a photodetachment process.138 Thus, the fs-pump pulse creates a wave packet

162 Chapter 6: fs-Dynamics of Small Gold Clusters: Results and Discussion
on the ground state of the neutral cluster. The wave packet starts to evolve on the
respective potential energy curve and after a given delay time the second laser pulse
probes the dynamics of the wave packet.
When the pump pulse populates the ground state of the gold dimers, one would
expect to see the oscillations of the wave packet, as previously observed in the case
of the NeNePo experiments on Ag−2 clusters performed in the group of Prof. L.
Woste, where an oscillation with a frequency of f = 185 cm−1 was identified. This
corresponds to the vibrational frequency of the neutral silver dimer in its electronic
ground state.79 Since no wave packet dynamics can be observed for positive values of
the delay time, it can be assumed that the energy of the probe pulse is not sufficient
to ionize the ground state of the gold dimer (EIP (Au2) = 9.20 ± 0.21 eV 164). The
ionization process is considered to be a three-photon process (3× 3.03 eV = 9.09 eV ),
as shown in Fig. 6.3. An ionization step which involves four blue photons would lead
to a direct transition anion → cation and to the disappearance of any time-dependent
signal for positive as well as for negative values of the delay time. In conclusion, the
lack of wave packet dynamics in the transient signal for positive delay times (td > 0)
can be rationalized as a consequence of the high ionization energy for gold dimers.
In the following, the experimental results obtained for negative values of the delay
time between the pump and the probe pulses (td < 0) will be discussed. Fig. 6.4
shows the pump-probe scheme corresponding to negative delay times, when the blue
laser pulse represents the pump pulse (λPump = 410 nm, PPump = 10 mW ) and the
ultraviolet laser pulse represents the probe pulse (λProbe = 323 nm, PProbe = 1.5 mW ).
As shown in Fig. 6.1 (b), for negative delay times (td < 0) an exponential decay of
the NeNePo signal is observed. By fitting the experimental data and taking into
account the temporal width of the laser pulses, a decay time of τ = 1.35 ± 0.24 ps is
obtained. Considering that three blue photons are involved in the photodetachment
process (3× 3.03 = 9.09 eV ), a wave packet is created on an highly excited electronic
state of the neutral gold dimers after the detachment process. By calculating the
difference between the energy of the pump pulse (E(Pump pulse) = 9.09 eV ) and
the vertical detachment energy of the Au−2 clusters (EV DE(Au−
2 ) = 2.01 eV 138,158),
a value of 7.08 eV = 57103.6 cm−1 above the electronic ground state of the neutral
Au2 clusters is obtained for the energetic position of the excited state. The evolution
of the wave packet on this highly excited state is interrogated by the probe pulse. As

Chapter 6: fs-Dynamics of Small Gold Clusters: Results and Discussion 163
Internuclear distance [A]°
Energ
y [c
m-1]
Pump pulse
Probe pulse
2 3 4 5 6
-20000
0
20000
40000
60000
80000
100000
X 2Σ
g
+
X 2Σ
u
+
B 0u
+
B' 1u
A 0u
+
A' 1u
a 3Σ
u
+ X 1Σ
g
+
Au2
+
Au2
Au2
-
Figure 6.4: The pump-probe scheme for the NeNePo measurements on Au−2 clusters
corresponding to negative values of the delay time between the pump and the probelaser pulses (td < 0). The vertical arrows represent the pump and the probe laserpulses. The characteristics of the laser pulses are: λPump = 410 nm, PPump = 10 mW ,λProbe = 323 nm, PProbe = 1.5 mW . The dashed line represents the experimentallyobserved high excited state of the neutral gold dimers .
discussed above, the probe process involves one ultraviolet photon (1× 3.84 eV ), due
to the low intensity of the ultraviolet laser beam.
The highest excited states which were experimentally observed in spectroscopic
164 Chapter 6: fs-Dynamics of Small Gold Clusters: Results and Discussion
measurements on matrix-isolated Au2 clusters are situated at 6.26 eV = 50505 cm−1
and 5.96 eV = 48076 cm−1 above the ground state of the neutral dimer and these
states are currently not assigned.166–169 Due to the lack of theoretical calculations,
the exponential decay of the observed excited state can not be unambiguously as-
signed. Therefore, the possible processes which could lead to the observed decay of
the experimentally measured Au+2 signal will be outlined. One possible interpretation
of the experimental data is based on a dissociation process. If the observed excited
state has a dissociative or a predissociative character, the neutral excited gold dimer
will fragmentate. This could lead to an exponential decay of the population in the
favorable Franck-Condon region for the ionization process. Another process which
could be involved is a radiationless transition into another electronic state. A radi-
ationless transition occurs at the crossing point of two potential energy curves and
the time scale for this type of processes is on the order of 10−10s − 10−13s.69 Since
the measured excited state lies about 7 eV above the ground state of the neutral, it
could be possible that a crossing point with another electronic state is present. In this
case, the measured decay time would characterize the coupling between two excited
electronic states of the gold dimer.
In conclusion, a previously unidentified excited state of the neutral gold dimer
which is located about 7 eV above the ground state is observed for the first time.
A decay time of τ = 1.35 ± 0.24 ps is measured, which could be due to a dissoci-
ation process of the neutral Au2 clusters or a radiationless transition into another
electronic state. However, theoretical calculations are required in order to elucidate
the character of the experimentally observed high excited state of the neutral Au2
clusters.
6.2 NeNePo Spectroscopy on Au−3 Clusters
After the investigation of Au2 clusters, the study of the fs-dynamics of Au3 clus-
ters was performed via NeNePo spectroscopy. The experiments were carried out as
described in chapter 5. Fig. 6.5 (a) and (b) show the NeNePo measurements per-
formed on negatively charged gold trimers measured at an ion trap temperature of
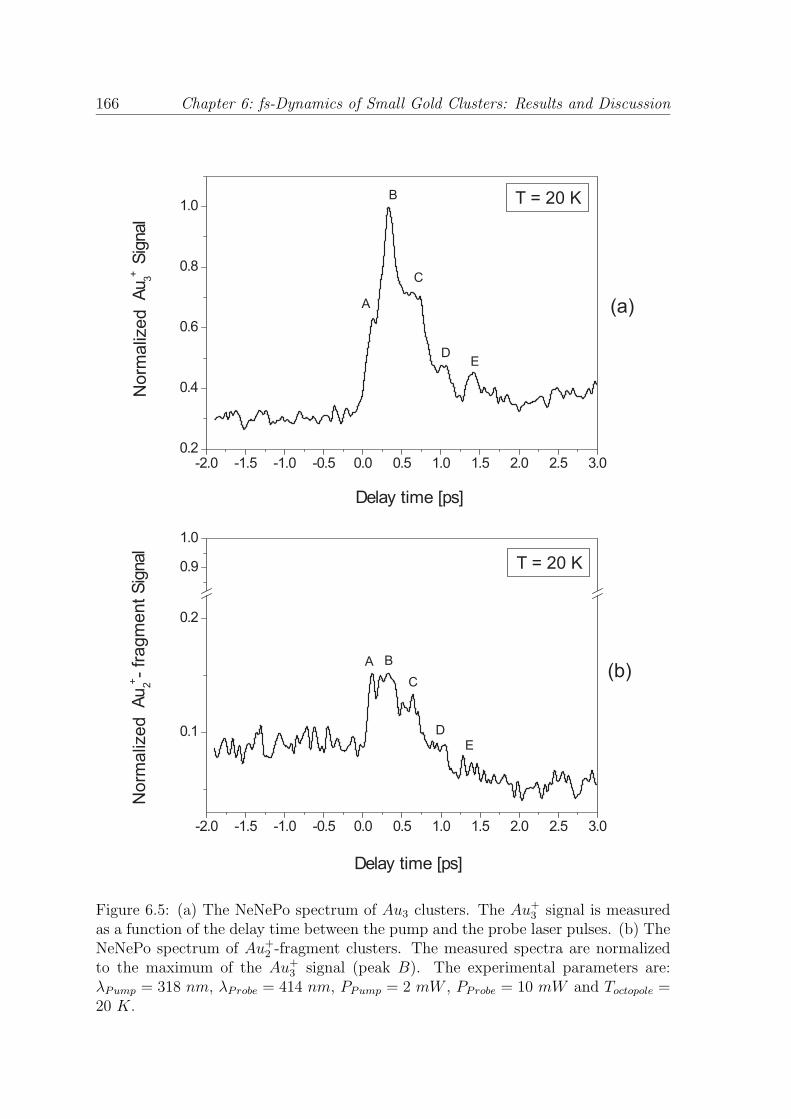
Toctopole = 20 K. The signal of Au+3 clusters (Fig. 6.5 (a)) and Au+
2 -fragment clusters
(Fig. 6.5 (b)) obtained through the NeNePo process was recorded as a function of

Chapter 6: fs-Dynamics of Small Gold Clusters: Results and Discussion 165
the delay time (td) between the pump and the probe laser pulses. The signal of Au+2
clusters arises from the fragmentation of the gold trimers. The measured NeNePo
spectra shown in Fig. 6.5 are normalized to the maximum value of the Au+3 signal
(peak B in Fig. 6.5 (a)). The pump and the probe laser pulses have a wavelength of
λPump = 318 nm (3.90 eV ), λProbe = 414 nm (3.00 eV ) and a power of PPump = 2 mW ,
PProbe = 10 mW , respectively. The vertical detachment energy (VDE) and the ion-
ization potential (IP) of the gold trimers have a value of EV DE(Au−3 ) = 3.9 eV 158,163
and EIP (Au3) = 7.5 eV ,162 respectively. The power of the laser pulses was chosen
so that the photodetachment process involves one ultraviolet photon (1 × 3.90 eV ),
while the ionization process of Au3 clusters involves three blue photons (3× 3.00 eV ).
From Fig. 6.5 (a), it can be clearly seen that the NeNePo spectrum of Au3 clusters
exhibits a pronounced time-dependent behavior for positive values of the delay time
between the pump and the probe laser pulses. Moreover, distinct features which are
denoted with A, B, C, D and E (see Fig. 6.5 (a)) can be observed in the spectrum.
Starting from td = 0 fs delay time, the Au+3 signal increases and, at approximately
td = 0.14 ps peak A appears. The maximum of the transient signal is observed for a
value of the delay time of about td = 0.32 ps (peak B). On the descending part of the
Au+3 signal, three features (C, D and E) can be identified at td = 0.65 ps (peak C),
td = 1.04 ps (peak D) and td = 1.40 ps (peak E). The features B, C, D and E show
a regular temporal spacing, with a time interval between the peaks of approximately
t = 360 ± 30 fs, which represents a frequency of about ω = 93 ± 8 cm−1.
In Fig. 6.5 (b), the transient signal of the Au+2 -fragment clusters is presented as a
function of the delay time between the pump and the probe pulses. By comparing the
intensity of the NeNePo signal for Au+3 clusters (Fig. 6.5 (a)) to the Au+
2 -fragment
cluster signal (Fig. 6.5 (b)), it can be observed that the intensity of the Au+3 signal
is about one order of magnitude higher than the Au+2 -fragment signal. The shape of
the Au+2 -fragment signal reflects all the features (denoted with A, B, C, D, and E)
which are identified in the case of the Au+3 clusters. Taking into account that the
ionization potential of the neutral gold dimers has a value of EIP (Au2) = 9.20 eV ,164
four blue photons would be necessary to ionize the Au2 clusters. Since the power of
the probe laser beam was chosen in order to achieve a three-photon ionization process
of gold trimers (3 × 3.00 eV = 9.00 eV ), it is most probable that the energy of the
probe pulse is not sufficient for the ionization of the gold dimers produced by the
166 Chapter 6: fs-Dynamics of Small Gold Clusters: Results and Discussion
-2.0 -1.5 -1.0 -0.5 0.0 0.5 1.0 1.5 2.0 2.5 3.00.2
0.4
0.6
0.8
1.0
-2.0 -1.5 -1.0 -0.5 0.0 0.5 1.0 1.5 2.0 2.5 3.0
0.1
0.2
0.9
1.0
Au
3+ S
ignal
No
rma
lize
d
Au
2+ - f
rag
me
nt
Sig
nal
No
rma
lize
d
Delay time [ps]
Delay time [ps]
T = 20 K
T = 20 K
(a)
(b)
A
B
C
DE
A B
C
DE
Figure 6.5: (a) The NeNePo spectrum of Au3 clusters. The Au+3 signal is measured
as a function of the delay time between the pump and the probe laser pulses. (b) TheNeNePo spectrum of Au+
2 -fragment clusters. The measured spectra are normalizedto the maximum of the Au+
3 signal (peak B). The experimental parameters are:λPump = 318 nm, λProbe = 414 nm, PPump = 2 mW , PProbe = 10 mW and Toctopole =20 K.
Chapter 6: fs-Dynamics of Small Gold Clusters: Results and Discussion 167
fragmentation of the neutral Au3 clusters. Therefore, the fragmentation process does
not occur on the neutral potential energy surface of the triatomic gold clusters and the
Au+2 -fragment signal arises from the fragmentation of the cationic gold trimers Au+
3 .
Since no theoretical simulations of the NeNePo pump-probe signal for Au3 clusters
are available, a qualitative interpretation of the measured spectra will be performed,
by comparing the presented results with data found in literature.
For the ground state of the negatively charged gold trimers a linear structure with
a D∞h symmetry and a bond length of about re = 2.59 A was found by ion mobility
measurements combined with theoretical calculations.149,161,163 In the case of the
Au+3 cations, experimental and theoretical investigation revealed that the most stable
structure of the electronic ground state is a triangular structure with a D3h symmetry
(equilateral triangle) and a bond length of re = 2.64 A.125,156,170
Experimental studies on gas-phase neutral Au3 clusters have been carried out
by employing photoelectron spectroscopy and resonant two-photon ionization spec-
troscopy methods.132,138,158,163,175 Optical absorbtion and emission spectra of gold
trimers isolated in rare gas matrices have been measured as well.167–169,176 From
these studies, the energetic position of the electronic ground state, as well as a few
excited states of the neutral Au3 clusters were determined. However, there is no
experimental information about the structure of the neutral gold trimers.
Due to the high complexity of the bonding in gold clusters, which exhibit strong
relativistic effects, the theoretical modelling of the isomeric structures is a challenging
task. Similar to the case of Ag3 and Cu3 neutral clusters, theoretical calculations
of neutral gold trimers found a doubly degenerate 2E ′ state with a D3h symmetry
(equilateral triangle) for the electronic ground state. According to the Jahn-Teller
theorem, this degeneracy is removed by splitting the 2E ′ state in two states (2A1 and2B2).
138,161 Three isomeric structures were predicted for the neutral gold trimers: an
acute isosceles triangle with a C2v symmetry corresponding to the 2A1 state, an obtuse
isosceles triangle (C2v symmetry) which corresponds to the 2B2 state and a linear
structure with a D∞h symmetry which corresponds to the 2Σ+u state.157,161,170,177
The results of the theoretical calculations found in literature are in contradiction
with respect to the assignment of the most stable structure of the neutral gold trimers
on the electronic ground state. Wesendrup et al. predicted the acute isosceles triangle
(2A1) with a bond length of re = 2.72 A and an apex angle of θ = 56.2◦ as the
168 Chapter 6: fs-Dynamics of Small Gold Clusters: Results and Discussion
most stable structure, while the obtuse isosceles triangle (2B2, re = 2.61 A, θ =
65.4◦) was found to be energetically approximately 0.007 eV above the acute isosceles
triangular structure.170 The linear isomer (2Σ+u , re = 2.57 A) was predicted to be
a saddle point on the potential energy surface for the electronic ground state of the
neutral Au3 clusters and it was found to be situated approximately 0.1 eV above the
acute isosceles triangular structure. Moreover, the authors suggest that this linear
structure of the neutral Au3 clusters can be probed as “short-lived intermediate” in a
NeNePo scheme experiment.170 Balasubramanian et al. obtained the obtuse isosceles
triangle 2B2, having a bond length of re = 2.60 A and an apex angle of θ = 65.7◦
as the absolute minimum of the potential energy surface for the electronic ground
state of neutral Au3 clusters.177 The acute isosceles triangular structure 2A1 with a
calculated bond length of re = 2.72 A and angle of θ = 56.4◦ lies 0.03 eV higher.
The linear isomeric structure (re = 2.60 A) is positioned about 0.48 eV above the
acute isosceles triangle.177 However, both theoretical studies agree that the potential
energy surface of the neutral gold trimer must be very shallow, since the energy
difference between the two triangular isomers is predicted to be equal to or less than
0.03 eV . By considering the experimental and theoretical data found in literature,
an interpretation of the experimental NeNePo spectra of Au−3 clusters will be given
in the following.
The pump pulse (λPump = 318 nm, EPump = 3.9 eV ) neutralizes the negatively
charged Au−3 clusters and, through the photodetachment process, a vibrational wave
packet is created on the potential energy surface for the electronic ground state of the
neutral gold trimer Au3. Since the Au−3 anion has a linear structure, the initial config-
uration of the neutral Au3 cluster will be linear according to the Franck-Condon prin-
ciple. Similar to the case of NeNePo measurements performed on Ag−3 and Ag2Au−
clusters, at td = 0 fs delay time the Au+3 signal is small (see Fig. 6.5 (a)). Theoretical
simulations of the NeNePo signal carried out for Ag3 and Ag2Au clusters showed that
the linear isomers of the neutral clusters exhibit a higher ionization potential than the
corresponding triangular isomers.75,79 Therefore, the low value of the NeNePo signal
at short delay times in the case of Au3 clusters can be rationalized as a consequence
of a high ionization potential of the neutral linear isomer.
Since the initial linear geometry of the neutral Au3 clusters represents a non-
equilibrium structure, the vibrationally excited gold trimer will undergo a geometrical
Chapter 6: fs-Dynamics of Small Gold Clusters: Results and Discussion 169
relaxation, i.e. it will start to bend from this linear geometry in order to reach the
equilibrium triangular structure. A similar bending motion has been observed as well
in the case of the NeNePo measurements performed on Ag3 and Ag2Au clusters.75,79
As the neutral gold trimer starts to bend, the wave packet created through the pump
pulse starts to evolve on the potential energy surface of the neutral particle and
enters the favorable Franck-Condon detection window for the ionization process. As
a result, the Au+3 signal increases. During the evolution of the wave packet towards
the first local minimum, the feature A appears (see Fig. 6.5 (a)) in the NeNePo
signal. The Au+3 transient signal reaches its maximum value at td = 0.32 ps (peak B
on Fig. 6.5 (a)). This peak can be correlated with a local minimum on the potential
energy surface of the neutral gold trimers which corresponds to a bent structure.
Since the NeNePo signal presents a high intensity, it seems that the Franck-Condon
factors for the ionization process have a high value for this bent structure which is
reached at td = 0.32 ps (peak B). Furthermore, theoretical calculations predict the
existence of an excited state of the Au3 clusters at an energy of about 3 eV above
the ground state.177 The high intensity of peak B might be attributed as well to a
resonant three-photon ionization process, where the absorption of the first photon is
resonant with this excited state.
If the bent geometry of the neutral gold trimer, which corresponds to peak B
would be the absolute minimum of the potential energy surface then the transient
signal would remain constant at this maximum value. However, the Au+3 signal
intensity decreases on a time scale of approximately τ = 1.4 ps (see Fig. 6.5 (a)). This
indicates that the structure of the neutral gold trimer which is probed at td = 0.32 ps
delay time represents an intermediate geometry of the neutral gold trimer and the
wave packet moves further towards the absolute minimum on the potential energy
surface. Taking into account the theoretical calculations presented above, this bent
intermediate structure could be attributed to the isosceles triangular isomer (acute,2A1 after Balasubramanian et al.177 or obtuse, 2B2 after Wesendrup et al.170).
Furthermore, oscillations of the Au+3 NeNePo signal which can be attributed to
the oscillations of the wave packet on a time scale of t = 360 ± 30 fs are identified
on the descending part of the Au3 signal (peak C, D and E on Fig. 6.5 (a)). The time
scale of the oscillations corresponds to a frequency of about ω = 93 ± 8 cm−1. These
oscillations superimposed on the transient signal decay suggest that a bifurcation
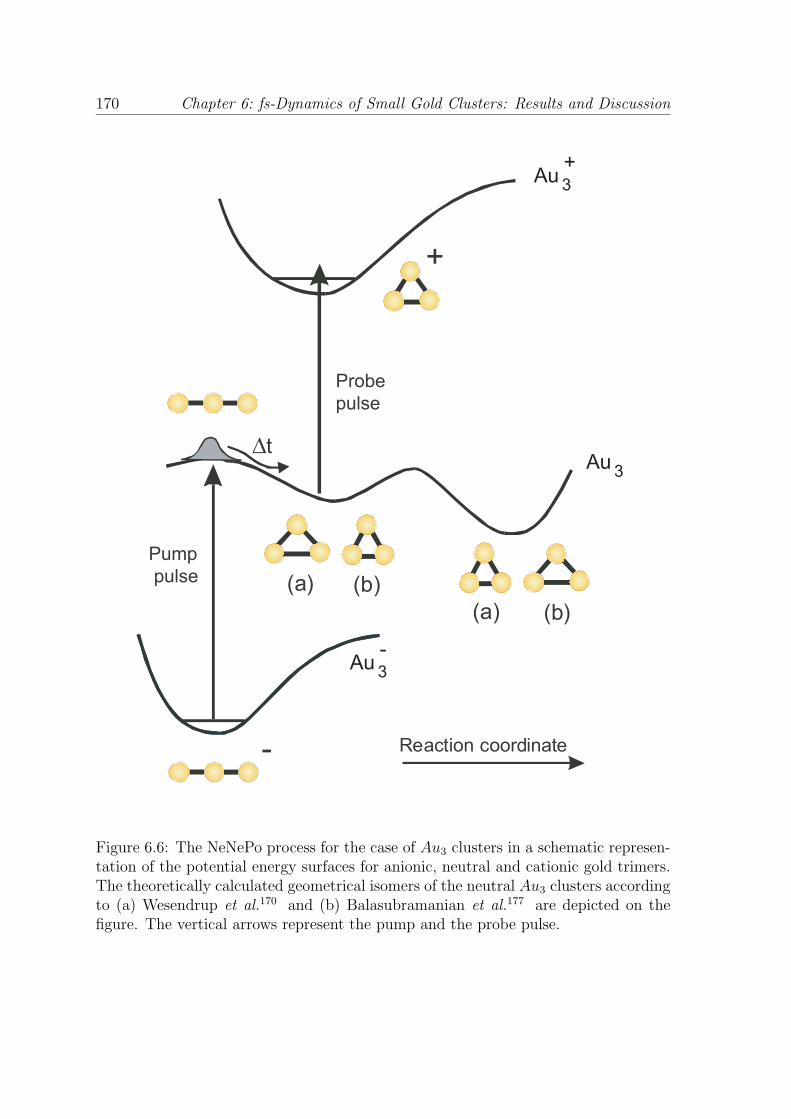
170 Chapter 6: fs-Dynamics of Small Gold Clusters: Results and Discussion
Reaction coordinate
∆t
+
(a) (b)
-
(a) (b)
Au3
-
Au3
Au3
+
Pump
pulse
Probe
pulse
Figure 6.6: The NeNePo process for the case of Au3 clusters in a schematic represen-tation of the potential energy surfaces for anionic, neutral and cationic gold trimers.The theoretically calculated geometrical isomers of the neutral Au3 clusters accordingto (a) Wesendrup et al.170 and (b) Balasubramanian et al.177 are depicted on thefigure. The vertical arrows represent the pump and the probe pulse.

Chapter 6: fs-Dynamics of Small Gold Clusters: Results and Discussion 171
of the wave packet occurs. This means that the wave packet oscillates in the first
local minimum (peak B) and, with every oscillation, part of the wave packet leaks to
another state which might be assigned to the equilibrium geometry on the potential
energy surface (obtuse isosceles triangular geometry according to Balasubramanian
et al.177 or acute isosceles triangular geometry according to Wesendrup et al.170). It
seems that the Franck-Condon detection window for the ionization process is sensitive
only to the intermediate geometry that is reached at td = 0.32 ps delay time and not
to the final equilibrium geometry of the neutral gold trimer (see Fig. 6.5 (a)). Thus,
the decrease of the Au+3 transient signal can be correlated with the evolution of the
wave packet towards the equilibrium structure. A schematic representation of the
pump-probe process for the NeNePo measurements in the case of gold trimers is
presented in Fig. 6.6.
The observed vibrational frequency of the intermediate structure could correspond
to a normal mode of the gold trimer (most probably the bending mode which is pri-
marily involved in the geometrical relaxation) or to a superposition of different normal
modes. Theoretical calculations performed for Ag3 and Cu3 neutral clusters predict
vibrational frequencies for the intermediate isosceles triangular geometry of metal
trimers which are on the same order of magnitude as the one observed in the exper-
iments presented in this work (ωBend(Ag3) = 99 cm−1, ωBend(Cu3) = 151 cm−1).161
However, due to the lack of theoretical studies, the observed vibrational frequency of
93 ± 8 cm−1 for neutral Au3 clusters can not be unambiguously assigned.
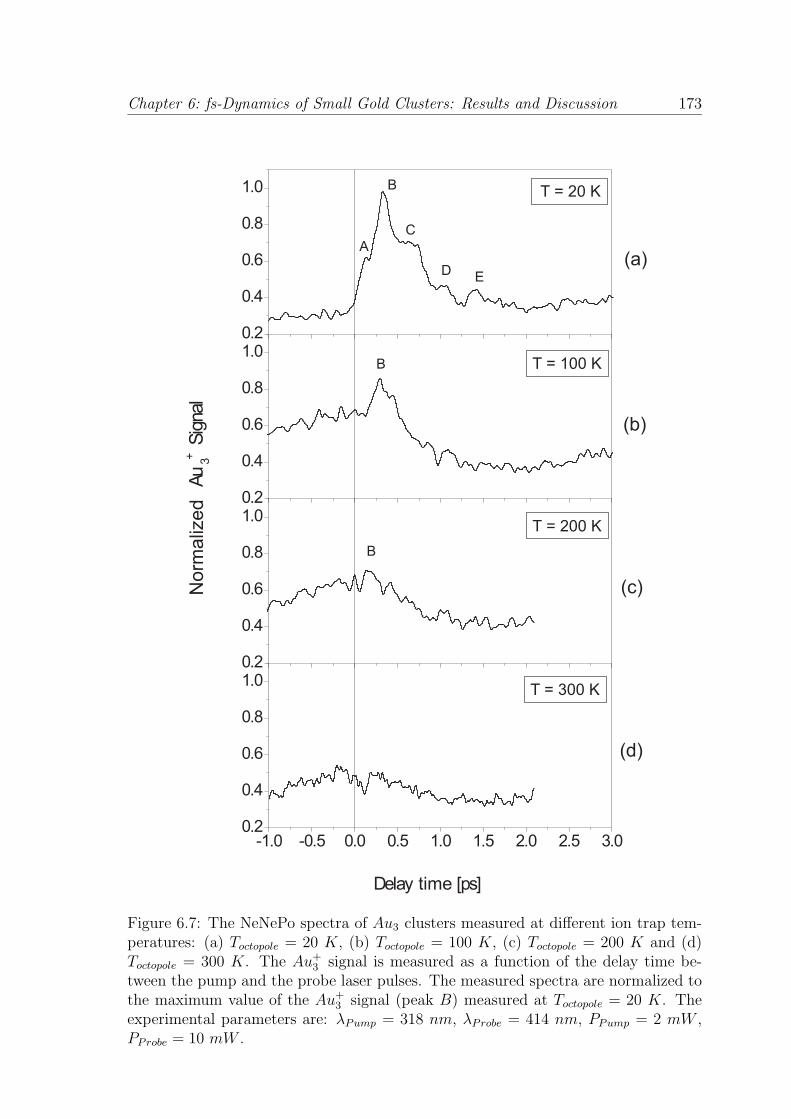
In order to gain further insights into the fs-dynamics of the neutral Au3 clusters,
temperature-dependent NeNePo measurements were performed. In these measure-
ments, the temperature of the octopole ion trap was varied between Toctopole = 20 K
and Toctopole = 300 K. The temperature-dependent NeNePo spectra of gold trimers
are presented in Fig. 6.7, where the signal of the positively charged gold clusters Au+3
is depicted as a function of the delay time between the pump and the probe pulse.
The measured NeNePo spectra are normalized to the maximum value of the
Au+3 signal (peak B) taken for a temperature of the ion trap of Toctopole = 20 K
(Fig. 6.7 (a)). The wavelengths and the energies of the pump and the probe pulses
were maintained constant (λPump = 318 nm, λProbe = 414 nm, PPump = 2 mW ,
PProbe = 10 mW ). By comparing the NeNePo spectrum measured at Toctopole = 20 K
ion trap temperature (Fig. 6.7 (a)) to the spectra measured at higher temperatures

172 Chapter 6: fs-Dynamics of Small Gold Clusters: Results and Discussion
(Fig. 6.7 (b), (c), (d)), it can be observed that the peak structure of the Au+3 signal
vanishes gradually and at an ion trap temperature of Toctopole = 300 K no peak can
be detected anymore in the transient signal. This drastic temperature effect, which
leads to a total change in the shape of the measured NeNePo spectra can be observed
only in the case of gold clusters. For silver clusters Ag373 and mixed silver-gold clus-
ters Ag2Au,79 the increase of the temperature is manifested by a shift in the position
of the signal maximum towards shorter delay times and only a slight change in the
shape of the transient signal is detected. Therefore, the temperature effect must be
correlated to the intrinsic properties of the gold clusters.
The increase of the ion trap temperature leads to a modification of the temperature
of the initial anionic molecular ensemble. At a temperature of Toctopole = 300 K,
more vibrational energy levels of Au−3 cluster can be occupied compared to the low-
temperature case. Through the photodetachment process, the anionic ensemble is
projected on the potential energy surface for the electronic ground state of the neutral
Au3 clusters. Due to the increasing temperature of the initial anionic molecular
ensemble, the wave packet created on the potential energy surface of the neutral is
less localized. Since the isomeric triangular geometries of the neutral gold cluster have
a maximal energy difference comparable with the thermal energy corresponding to an
ion temperature of 300 K and the potential energy surface of the neutral Au3 clusters
is predicted to be very shallow,170,177 the wave packet can not be trapped into a local
minimum and therefore, the peak structure of the transient signal vanishes. This
interpretation is supported as well by the theoretical simulations of Wesendrup et al.,
which predict that the neutral Au3 clusters will not present a defined structure at
room temperature.170
The delocalization of the wave packet as a function of temperature was theoret-
ically calculated for neutral silver clusters Ag3, by employing molecular dynamics
(MD) simulations.77 Bunches of trajectories of neutral Ag3 clusters on the electronic
ground potential energy surface for different temperatures of the molecular ensemble
were simulated. The potential energy surface was calculated in Qs and Qx coordi-
nates, that represent the symmetric stretching mode and the bending mode of the
neutral silver trimer (see section 3.2). From these simulations, it was observed that
the bunch of trajectories is narrow at low temperatures (50 K), while at a temperature
of 300 K the trajectories are more delocalized.77 These theoretical calculations sup-
Chapter 6: fs-Dynamics of Small Gold Clusters: Results and Discussion 173
-1.0 -0.5 0.0 0.5 1.0 1.5 2.0 2.5 3.00.2
0.4
0.6
0.8
1.0
0.2
0.4
0.6
0.8
1.0
0.2
0.4
0.6
0.8
1.0
0.2
0.4
0.6
0.8
1.0
Delay time [ps]
Au
3+ S
igna
l N
orm
aliz
ed
(a)
(b)
(c)
(d)
T = 20 K
T = 100 K
T = 200 K
T = 300 K
A
B
C
DE
B
B
Figure 6.7: The NeNePo spectra of Au3 clusters measured at different ion trap tem-peratures: (a) Toctopole = 20 K, (b) Toctopole = 100 K, (c) Toctopole = 200 K and (d)Toctopole = 300 K. The Au+
3 signal is measured as a function of the delay time be-tween the pump and the probe laser pulses. The measured spectra are normalized tothe maximum value of the Au+
3 signal (peak B) measured at Toctopole = 20 K. Theexperimental parameters are: λPump = 318 nm, λProbe = 414 nm, PPump = 2 mW ,PProbe = 10 mW .

174 Chapter 6: fs-Dynamics of Small Gold Clusters: Results and Discussion
port the interpretation of the experimental NeNePo spectra of Au3 clusters measured
at different temperatures of the octopole ion trap.
In conclusion, the investigation of the fs-dynamics of the neutral Au3 clusters is
performed for the first time by using the NeNePo method. The Au3 clusters show
complicated nuclear dynamics. At low temperatures (Toctopole = 20 K), the relax-
ation from the linear to an intermediate triangular geometry is observed. Moreover,
oscillations of about t = 360 fs which correspond to a frequency of ω = 93 cm−1 of
the intermediate triangular structure can be identified in the NeNePo spectra. With
increasing temperature, the peak structure of the transient signal vanishes and this
result can be correlated with a delocalization of the wave packet on the potential
energy surface for the electronic ground state of the neutral gold trimer. However,
ab initio theoretical calculations of the potential energy surfaces of the anionic, neu-
tral and cationic Au3 clusters would be helpful for a detailed interpretation of the
experimental data.
6.3 Reactive NeNePo Spectroscopy
One of the most important goals of the femtosecond time-resolved spectroscopy is
the investigation of the sequential processes of a chemical reaction in real time, start-
ing from educts and ending with the reaction products. The NeNePo spectroscopy
allows for the study of the molecular fs-dynamics on the electronic ground state of
a neutral system and presents the advantage of mass selection prior to and after
the interaction with the laser field. Since most chemical reactions occur in neutral
molecules, the NeNePo method is particularly suited for this purpose. For the study of
the reaction educts (pure clusters), the “classical” NeNePo spectroscopy method can
be successfully applied to the study of the fs-dynamics of gold dimers and trimers as
it was shown in the previous sections (see section 6.1 and 6.2). In order to investigate
the reaction products or reaction intermediates, that are usually cluster-adsorbate
complexes, a new spectroscopic method was developed, which is referred to as re-
active NeNePo spectroscopy. This method combines the methodology of the cluster
reactivity measurements with the “classical” NeNePo femtosecond time-resolved ex-
periments. The experimental realization is as following: first, negatively charged
clusters are introduced in the octopole ion trap. There, the clusters interact with the
Chapter 6: fs-Dynamics of Small Gold Clusters: Results and Discussion 175
reactant gases for a given reaction time, until the desired reaction product (cluster-
adsorbate complex) is formed. During the reaction product formation process, the
laser beam is blocked by a mechanical shutter. When the yield of the reaction prod-
uct to be investigated reaches a maximum, the shutter opens and the pump and the
probe laser beams are directed inside the octopole ion trap and the cation signal is
detected. It is important to note that in contrast to “classical” NeNePo spectroscopy
where the detection of the positively charged clusters is performed continuously, the
reactive NeNePo method requires a new ion trap cycle for every value of the delay
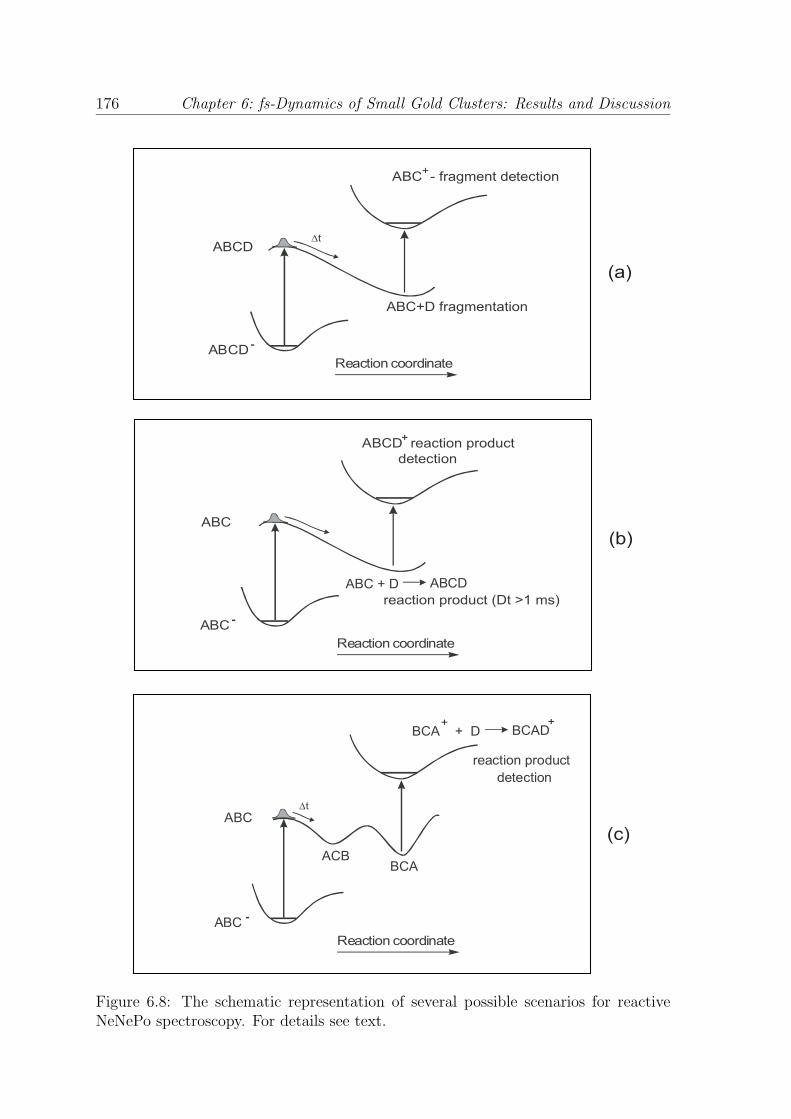
time between the pump and the probe laser pulses. There are several possible scenar-
ios relying on the principle of the reactive NeNePo spectroscopy, and three of them
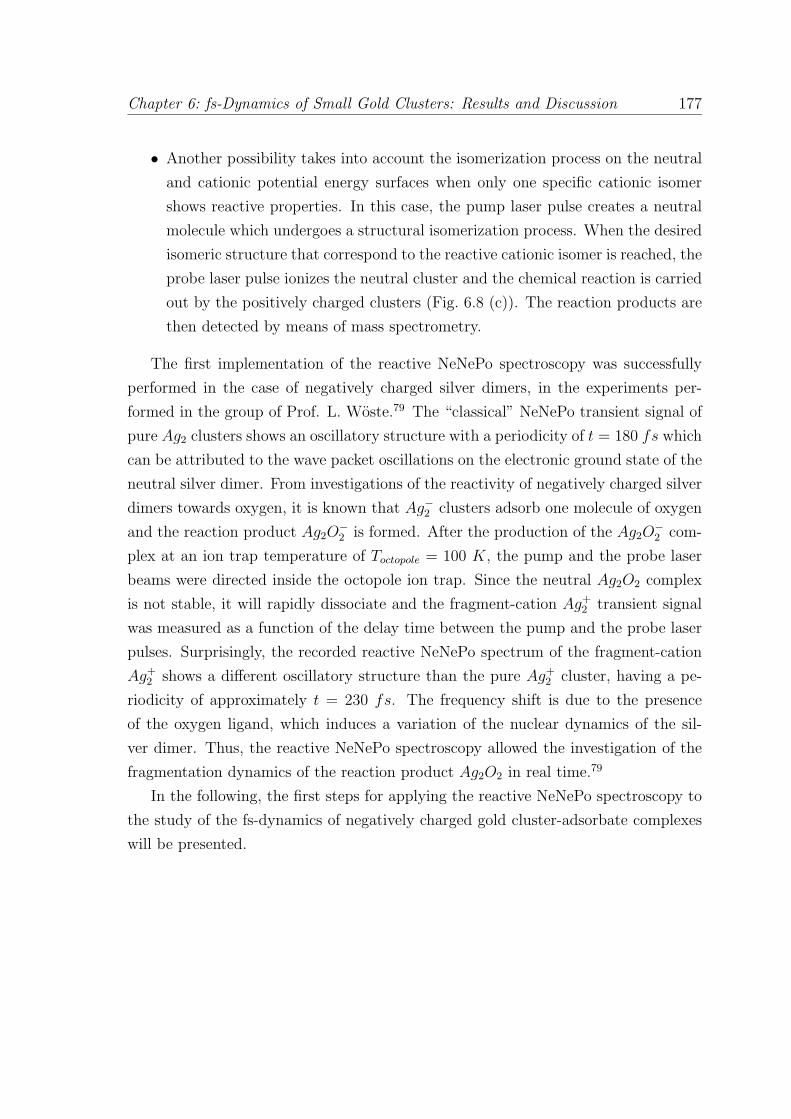
are depicted in Fig. 6.8:
• If the cluster-adsorbate complex is stable only as an anionic system, the cluster-
adsorbate complex will dissociate after the photodetachment process and the
dissociation products will be ionized with the probe laser pulse (see Fig. 6.8 (a)).
In this case, information about the fs-dynamics of the cluster-adsorbate frag-
mentation process can be obtained.
• A chemical reaction which takes place on the neutral potential energy sur-
face of a metal cluster can be started by photodetaching the excess electron of
the negatively charged system with a first laser pulse. After the photodetach-
ment process, the chemical reaction between the neutral system and reactant
molecules takes place and the reaction products can be ionized and subsequently
detected by using a second laser pulse, as shown in Fig. 6.8 (b). It is important
to note that in this case, the time resolution of the experiment is limited by the
reaction product formation rate, which is correlated to the collision frequency
between the neutral clusters and the reactant molecules. In the experiments
presented in this work, the lowest limit for the reaction product formation is on
the millisecond time scale. Although this scenario is not a femtosecond pump-
probe experiment which allows for the study of nuclear dynamics in real time,
it presents the advantage of preparing a well defined neutral system through
mass selection of the anions and a selective ionization of the reaction products
and mass selection of the cations.
176 Chapter 6: fs-Dynamics of Small Gold Clusters: Results and Discussion
∆t
ABCD-
ABCD
ABC+D fragmentation
Reaction coordinate
ABC - fragment detection +
(a)
ABC-
ABC
reaction product (Dt >1 ms)
ABCD reaction product
detection
+
Reaction coordinate
(b)
(c)
∆t
ABC-
ABC
ACB
reaction product
detection
BCA
BCA + D+
BCAD+
Reaction coordinate
ABC + D ABCD
Figure 6.8: The schematic representation of several possible scenarios for reactiveNeNePo spectroscopy. For details see text.
Chapter 6: fs-Dynamics of Small Gold Clusters: Results and Discussion 177
• Another possibility takes into account the isomerization process on the neutral
and cationic potential energy surfaces when only one specific cationic isomer
shows reactive properties. In this case, the pump laser pulse creates a neutral
molecule which undergoes a structural isomerization process. When the desired
isomeric structure that correspond to the reactive cationic isomer is reached, the
probe laser pulse ionizes the neutral cluster and the chemical reaction is carried
out by the positively charged clusters (Fig. 6.8 (c)). The reaction products are
then detected by means of mass spectrometry.
The first implementation of the reactive NeNePo spectroscopy was successfully
performed in the case of negatively charged silver dimers, in the experiments per-
formed in the group of Prof. L. Woste.79 The “classical” NeNePo transient signal of
pure Ag2 clusters shows an oscillatory structure with a periodicity of t = 180 fs which
can be attributed to the wave packet oscillations on the electronic ground state of the
neutral silver dimer. From investigations of the reactivity of negatively charged silver
dimers towards oxygen, it is known that Ag−2 clusters adsorb one molecule of oxygen
and the reaction product Ag2O−2 is formed. After the production of the Ag2O
−2 com-
plex at an ion trap temperature of Toctopole = 100 K, the pump and the probe laser
beams were directed inside the octopole ion trap. Since the neutral Ag2O2 complex
is not stable, it will rapidly dissociate and the fragment-cation Ag+2 transient signal
was measured as a function of the delay time between the pump and the probe laser
pulses. Surprisingly, the recorded reactive NeNePo spectrum of the fragment-cation
Ag+2 shows a different oscillatory structure than the pure Ag+
2 cluster, having a pe-
riodicity of approximately t = 230 fs. The frequency shift is due to the presence
of the oxygen ligand, which induces a variation of the nuclear dynamics of the sil-
ver dimer. Thus, the reactive NeNePo spectroscopy allowed the investigation of the
fragmentation dynamics of the reaction product Ag2O2 in real time.79
In the following, the first steps for applying the reactive NeNePo spectroscopy to
the study of the fs-dynamics of negatively charged gold cluster-adsorbate complexes
will be presented.

178 Chapter 6: fs-Dynamics of Small Gold Clusters: Results and Discussion
6.3.1 Photodetachment of Au2O−2 and Au2CO−
3 Cluster-
Adsorbate Complexes
As shown in section 5.5, negatively charged gold dimers Au−2 are able to catalyze
the oxidation reaction of carbon monoxide with the Au2CO−3 / Au2(CO)O−
2 complexes
as reaction intermediates. The reaction intermediate corresponding to the mass of
the Au2(CO)O−2 complex presents many structural isomers (structure A, B, C, D
and E shown in Fig. 5.25) and only two isomers are involved in the catalytic cycle
for the CO oxidation reaction (structure C and D). In such a case, the reactive
NeNePo spectroscopy is well suited for the identification of different isomers and the
investigation of the fs-dynamics of the respective cluster-adsorbate complexes. In this
section, the first step of the reactive NeNePo spectroscopy, i.e. the photodetachment
process will be discussed.
The experimental procedure is the following: the negatively charged Au−2 clusters
are introduced inside the octopole ion trap and exposed to a mixture of reactive
gases, O2/CO. During the chemical reaction, the laser is blocked by a mechanical
shutter. After a given reaction time treaction, the shutter is opened and the laser beam
is directed into the octopole ion trap. The operation of the laser shutter, as well
as the entrance and exit electrostatic lenses of the ion trap are computer controlled.
The interaction between the negatively charged cluster-adsorbate complexes and the
laser beam occurs for a given time tlaser, after which the laser shutter is closed and
the remaining anions are extracted from the octopole ion trap and analyzed with the
second quadrupole mass spectrometer.
Fig. 6.9 shows the mass spectrum for the reactivity of Au−2 clusters towards oxygen
and carbon monoxide (grey line) measured for a reaction time of treaction = 1000 ms
at a temperature of the octopole ion trap of Toctopole = 100 K. The peaks correspond-
ing to the Au−2 , Au2O
−2 and Au2(CO)O−
2 reaction products can be observed. The
photodepletion mass spectrum (black line) was measured after an opening time of
the laser shutter of tlaser = 2000 ms. Since the repetition rate of the laser system
has a value of 1 kHz, an opening time of the laser shutter of tlaser = 2000 ms corre-
sponds to 2000 laser pulses which irradiate the reaction educts and products inside
the octopole ion trap. The laser beam has a central wavelength of λ = 400 nm and a
power of Plaser = 30 mW . In the case of the photodepletion mass spectrum depicted

Chapter 6: fs-Dynamics of Small Gold Clusters: Results and Discussion 179
Clu
ster si
gnal [a
.u.]
Masse [amu]
T = 100 K
380 400 420 440 460 480 500
Au2(CO)O
2
-
Au2O
2
-
Au2
-
Figure 6.9: Mass spectrum for the reaction of Au−2 clusters with O2 and CO (grey
line). The reaction parameters are: pHe = 0.97 Pa, pO2 = 0.02 Pa, pCO = 0.02 Pa,treaction = 1000 ms, Toctopole = 100 K. The photodepletion mass spectrum (black line)is measured after tlaser = 2000 ms at a wavelength of λ = 400 nm and a laser powerof Plaser = 30 mW .
in Fig. 6.9, the laser beam was focused inside the octopole ion trap by using a lens
with a focal distance of f = 1 m.
From Fig. 6.9, it can be seen that the interaction with the laser beam leads to a
decrease of the Au−2 , Au2O
−2 and Au2(CO)O−
2 signal of about 65 %, 60 % and 55 %,
respectively. It is important to note that no product fragmentation is observed as a
result of the laser irradiation. This can be seen from the corresponding decrease in
the Au−2 and Au2O
−2 signals in the mass spectrum shown in Fig. 6.9.
Since the vertical detachment energy of Au−2 and Au2O
−2 were experimentally
found to be EV DE(Au−2 ) = 2.01 eV 138,158 and EV DE(Au2O
−2 ) = 3.11 eV ,115 respec-
tively and the laser pulse has a central wavelength of λ = 400 nm, which corresponds
to a photon energy of 3.1 eV , a photodetachment process takes place during the in-
teraction with the laser beam, i.e. the excess electron from Au−2 cluster and Au2O
−2

180 Chapter 6: fs-Dynamics of Small Gold Clusters: Results and Discussion
cluster-adsorbate complex is removed. Hence, the corresponding signal of the Au−2
and Au2O−2 anions is depleted.
In the case of the reaction product corresponding to the mass of Au2(CO)O−2
complex, the theoretical calculations predict structural isomers which possess differ-
ent vertical detachment energies. For the digold carbonate complex Au2CO−3 (struc-
ture D in Fig. 5.25) a vertical detachment energy of EV DE(Au2CO−3 ) = 4.67 eV was
calculated, while for the structures CO − Au2 − O−2 (structure A in Fig. 5.25) and
Au2−CO−O−2 (structure C in Fig. 5.25) a value of EV DE(CO−Au2−O−
2 ) = 2.82 eV
and EV DE(Au2 − CO − O−2 ) = 3.82 eV for the vertical detachment energy was pre-
dicted. Moreover, an activation barrier of 0.3 eV was calculated to be involved in
the formation of the Au2CO−3 reaction product.57,150 Taking into account the focus-
ing of the laser beam, it could be assumed that, in the mass spectrum presented in
Fig. 6.9, one-photon as well as multi-photon absorption are involved in the depletion
process. Since the formation of the Au2CO−3 complex requires an energetic activa-
tion, at an ion trap temperature of Toctopole = 100 K the structure A and C can be
observed. For an unambiguous assignment of the Au2(CO)O−2 isomeric structures,
laser pulse wavelength dependent as well as temperature-dependent photodepletion
measurements would be necessary. In conclusion, photodepletion measurements com-
bined with theoretical calculations are able to distinguish between various structural
isomers of negatively charged cluster-adsorbate complexes.
The photodetachment process represents the first step of the reactive NeNePo
spectroscopy on the Au2(CO)O−2 /Au2CO−
3 cluster-adsorbate complex. Different pos-
sible scenarios can be imagined for this system: after the removal of the excess elec-
tron, the complex might dissociate and the dynamics of the Au2-fragment could be
observed by employing a second time-delayed fs-probe pulse that ionizes the Au2-
fragment. In this case, the dissociation process could be monitored in real time. Sim-
ilar to the reactive NeNePo spectroscopy measurements on Ag2O−2 cluster-adsorbate
complex, it could be possible to observe a shift in the vibrational frequency of the Au2-
fragment compared to pure gold clusters. If the neutral and cationic cluster-adsorbate
complex is stable and a geometrical rearrangement takes place, the investigation of
the nuclear dynamics of the neutral cluster-adsorbate complex could be carried out
by employing the reactive NeNePo spectroscopy.
Theoretical calculations performed in the group of Prof. V. Bonacic-Koutecky pre-
Chapter 6: fs-Dynamics of Small Gold Clusters: Results and Discussion 181
dict a stable structure of the neutral Au2(CO)O2 and positively charged Au2(CO)O+2
species.178 However, theoretical calculation of the potential energy surfaces of the in-
vestigated system as well as calculated values of the vertical detachment energies and
ionization potentials are necessary for the implementation of the reactive NeNePo
spectroscopy in the case of Au2(CO)O−2 /Au2CO−
3 cluster-adsorbate complex.

182 Chapter 6: fs-Dynamics of Small Gold Clusters: Results and Discussion