Chapter 4: STA Performance, Compliance and Optimization
114
2006 South Florida Environmental Report Chapter 4 4-1 Chapter 4: STA Performance, Compliance and Optimization Kathleen Pietro, Ron Bearzotti, Michael Chimney, Guy Germain, Nenad Iricanin, Tracey Piccone and Kenton Samfilippo Contributors: Christy Combs, Gary Goforth (District Consultant), George Hwa, David Johnson, Erin Kellis, Tom Kosier, Neil Larson, Ron Mierau, Jana Newman, Dean Powell, LeRoy Rodgers, Dan Thayer and Lou Toth SUMMARY The creation of wetlands to remove excess total phosphorus (TP) from surface waters entering into the Everglades Protection Area is a crucial component of the Everglades restoration program. Over 35,000 acres of wetlands have been built by the South Florida Water Management District (District or SFWMD) and over 6,000 acres have been built by the U.S. Army Corps of Engineers (USACE) in the Everglades area (Figure 4-1). Since 1994, these constructed wetlands, referred to as Stormwater Treatment Areas (STAs), have reduced the TP load that would have gone into the Everglades by over 600 metric tons (mt). In Water Year 2005 (WY2005) (May 1, 2004 through April 30, 2005), the STAs combined received a total of 1,482,754 acre-feet of inflow, equating to an average hydraulic loading rate of 3.6 cm/day and an average nutrient loading rate of 1.9 g/m 2 /yr (Table 4-1). Overall, the flow-weighted total phosphorus entering into the STAs was 147 parts per billion (ppb) and the TP load was 268 mt. The STAs retained 189 mt of TP, reducing the inflow TP load by 71 percent and the inflow TP concentration down to 41 ppb. An overview of the STA operations, vegetation management, phosphorus performance, water quality monitoring, and permit compliance for each of the STAs (STA-1E, STA-1W, STA-2, STA-3/4, STA-5, and STA-6) for WY2005 is presented in this chapter, along with an update of the progress of the STA enhancement projects that were identified in the Long-Term Plan for Achieving Water Quality Goals, the Everglades Protection Area Tributary Basins (Long-Term Plan) (Burns and McDonnell, 2003). Information about the Long-Term Plan is also presented in Chapter 8 of this volume and in the 2005 South Florida Environmental Report – Volume I. The water quality parameters that are addressed include nutrients and physical parameters including but not limited to pH, turbidity, dissolved oxygen, pesticides, major ions, and mercury. This information documents compliance with appropriate conditions of the Everglades Forever Act and the U.S. Environmental Protection Agency’s National Pollution Discharge Elimination System permits. Water quality monitoring within and downstream of the treatment areas demonstrated that the five STAs in operation are in full compliance with state operating permits. The District has performed all sampling and analysis under the latest Laboratory Quality Assurance Manual (SFWMD, dated January 3, 2005) and a Field Quality Assurance Manual (SFWMD, dated January 3, 2005). A signed copy of these statements is provided in Appendix 4-3 of this volume. A summary of STA operations and issues is presented in Table 4-2. The appendices presented with this chapter provide additional details of the monitoring program, as required by state operating permits, as well as plots showing the annual flow, TP load, and TP
Transcript of Chapter 4: STA Performance, Compliance and Optimization

2006 South Florida Environmental Report Chapter 4
4-1
Chapter 4: STA Performance, Compliance and Optimization
Kathleen Pietro, Ron Bearzotti, Michael Chimney, Guy Germain, Nenad Iricanin, Tracey Piccone and Kenton Samfilippo
Contributors: Christy Combs, Gary Goforth (District Consultant), George Hwa,
David Johnson, Erin Kellis, Tom Kosier, Neil Larson, Ron Mierau, Jana Newman, Dean Powell, LeRoy Rodgers, Dan Thayer and Lou Toth
SUMMARY
The creation of wetlands to remove excess total phosphorus (TP) from surface waters entering into the Everglades Protection Area is a crucial component of the Everglades restoration program. Over 35,000 acres of wetlands have been built by the South Florida Water Management District (District or SFWMD) and over 6,000 acres have been built by the U.S. Army Corps of Engineers (USACE) in the Everglades area (Figure 4-1). Since 1994, these constructed wetlands, referred to as Stormwater Treatment Areas (STAs), have reduced the TP load that would have gone into the Everglades by over 600 metric tons (mt). In Water Year 2005 (WY2005) (May 1, 2004 through April 30, 2005), the STAs combined received a total of 1,482,754 acre-feet of inflow, equating to an average hydraulic loading rate of 3.6 cm/day and an average nutrient loading rate of 1.9 g/m2/yr (Table 4-1). Overall, the flow-weighted total phosphorus entering into the STAs was 147 parts per billion (ppb) and the TP load was 268 mt. The STAs retained 189 mt of TP, reducing the inflow TP load by 71 percent and the inflow TP concentration down to 41 ppb.
An overview of the STA operations, vegetation management, phosphorus performance, water quality monitoring, and permit compliance for each of the STAs (STA-1E, STA-1W, STA-2, STA-3/4, STA-5, and STA-6) for WY2005 is presented in this chapter, along with an update of the progress of the STA enhancement projects that were identified in the Long-Term Plan for Achieving Water Quality Goals, the Everglades Protection Area Tributary Basins (Long-Term Plan) (Burns and McDonnell, 2003). Information about the Long-Term Plan is also presented in Chapter 8 of this volume and in the 2005 South Florida Environmental Report – Volume I. The water quality parameters that are addressed include nutrients and physical parameters including but not limited to pH, turbidity, dissolved oxygen, pesticides, major ions, and mercury. This information documents compliance with appropriate conditions of the Everglades Forever Act and the U.S. Environmental Protection Agency’s National Pollution Discharge Elimination System permits. Water quality monitoring within and downstream of the treatment areas demonstrated that the five STAs in operation are in full compliance with state operating permits. The District has performed all sampling and analysis under the latest Laboratory Quality Assurance Manual (SFWMD, dated January 3, 2005) and a Field Quality Assurance Manual (SFWMD, dated January 3, 2005). A signed copy of these statements is provided in Appendix 4-3 of this volume. A summary of STA operations and issues is presented in Table 4-2. The appendices presented with this chapter provide additional details of the monitoring program, as required by state operating permits, as well as plots showing the annual flow, TP load, and TP
Chapter 4 Volume I: The South Florida Environment
4-2
required by state operating permits, as well as plots showing the annual flow, TP load, and TP concentrations for the inflow and outflow of each STA for the years that they have been operating.
Figure 4-1. Location of the Stormwater Treatment Areas (STAs).
STA-6
STA-5
STA 3 / 4
STA-2
STA-1WSTA-1E
Holey LandWildlife
ManagementArea
RotenbergerWildlife
ManagementArea
Big CypressSeminole Indian Reservation
Arthur R. MarshallLoxahatchee
National WildlifeRefuge
WCA 3AWCA 2A
WCA 1EvergladesAgricultural
Area
LakeOkeechobee
Miles
1050
W E
S
N

2006 South Florida Environmental Report Chapter 4
4-3
STA-1W STA-2 STA-3/4 STA-5 STA-6 All STAs
Total Inflow Volume (ac-ft) 341,094 316,273 671,442 119,910 34,035 1,482,754
Hydraulic Loading Rate (cm/d) 5.2 4.1 4.0 2.9 3.2 4.1
Flow-weighted Mean Inflow TP (ppb) 247 126 105 165 78 147
TP Loading Rate (g/m2/yr) *** 4.7 1.9 *** 1.6 *** 1.8 0.9 2.2
Total Inflow TP Load (mt) 103.9 49.1 87.4 24.4 3.3 268.0
Total Outflow Volume (ac-ft) 383,663 371,023 648,872 121,427 22,187 1,547,172
Flow-weighted Mean Outflow TP (ppb) 98 20 13 81 19 41
Total Outflow TP Load (mt) 46.5 9.2 10.4 12.2 0.5 78.9
Hydraulic Residence Time (d) 10 9 NA 15 14
TP Retained (mt) 57.3 39.9 77.0 12.2 2.7 189.2
TP Removal Rate (g/m2/yr) 2.61 1.53 1.37 0.89 0.75 1.56
Load Reduction (%) 55% 81% 88% 50% 84% 71%
TP Retained to Date (mt) 297 91 78 122 28 617
TP Flow-weighted Mean Outflow to Date (ppb) 48 17 13 100 19 41
Table 4-1. STA hydrology and total phosphorus (TP) removal for Water Year 2005 (WY2005). Refer to each STA section for details regarding the operation of each STA, such as treatment cell start-up and flow-through status and temporary loss of effective treatment area due to vegetation rehabilitation or implementation of the Long-Term Plan enhancements.
Note: “TP retained to date” based on the period of record for each STA. The STA-1W record begins in WY1995; the STA-2 record begins in WY2002; the STA-5 record begins in WY2001; and the STA-6 record begins in WY1998. STA-3/4 begins in October of WY2005. *** = loadings are based on the estimated effective treatment area for the STAs, taking into account loss of treatment area due to treatment cells taken off-line at times during the water year (refer to individual STA sections in this chapter).

Chapter 4 Volume I: The South Florida Environment
4-4
STA Operational Status Other Issues
STA-1E In start-up phase. EFA and NPDES final permits were issued by the FDEP on August 30, 2005. On September 20, 2005 FDEP officially concurred with the District’s submittal which documented that the start-up compliance tests for phosphorus and mercury, as outlined in the EFA and NPDES permits, was achieved for the western (Treatment Cells 5, 6, and 7) and central flow ways (Treatment Cells 3, 4N, and 4S) of STA-1E. Accordingly, flow-through operations for these flow ways was authorized. Treatment Cells 1 and 2 remain off-line for construction of the PSTA demonstration project. The PSTA demonstration project is currently scheduled for expected completion of construction in October 2006.
Partially operational: Treatment Cells 1 and 2 remain off-line for construction of the PSTA demonstration project; Hurricane damage to interior levees in Cell 4N.
STA-1W In stabilization phase. In WY2005, there was a diversion through structures G-300 and G-301 of 69,064 ac-ft and 27 mt of TP with a flow-weighted mean TP average of 317 ppb into the Refuge because the capacity of the STA-1W was exceeded.
Partially operational; Northern flow-way (Cells 5A and 5B) temporarily under restricted flow of 150 cfs inflow when S-5A pumping for vegetation rehabilitation; off-line temporarily from January–April 2005 to degrade the limerock berm. Western flow-way (Cells 2 and 4) temporarily off-line from May 2004–July 2004 for vegetation management and fromJanuary 2005 to present for Long-Term Plan enhancement construction. Hurricane damage to G-302, Cell 5 northern levees; vegetation up-rooting.
STA-2 In stabilization phase until STA-1E reaches full capacity flow-through operations There was no diversion around STA-2.
Fully operational; Hurricane damage to northern levee in Cell 3; vegetation up-rooting.
STA-3/4 In stabilization phase. Eastern Flow-way 1 (Cells 1A and 1B) showed net improvement for phosphorus on 12/24/03 and for mercury on 1/15/04; Central Flow-way 2 (Cells 2A and 2B) showed net improvement for phosphorus on 8/5/04 and for mercury on 8/11/04 and has been in flow-through since 9/16/04; Western Flow-way 3 (Cell 3) showed net improvement for phosphorus on 12/24/03 and for mercury on 6/29/04, through a permit modification, flow-through operations was authorized on 3/19/04. In WY2005, there was diversion through structures S-7, S-150, S-8, and G-404/G-357 of 212,361 ac-ft and 8.9 mt of TP with a flow-weighted mean TP average of 34 ppb.
Partially operational; Western Flow-way 3 (Cell 3) temporary off-line from October 2004–June 2005 for Long-Term Plan enhancement construction and was returned to operation on 6/13/05 with a partial flow capacity of 800 cfs.
STA-5 In stabilization phase. In WY2005, there was a diversion through structure G-406 of 30,165 ac-ft and 10.5 mt of TP with a flow-weighted mean TP average of 282 ppb.
Partially operational; Cell 1B temporarily off-line from January 2005 –July 2005 for Long-Term Plan enhancement construction.
STA-6 Fully operational; in post-stabilization phase. Fire at the inflow pump station G-600 in October 2004 destroyed the telemetry, pumps partially operational. District took over ownership of G-600 from U.S. Sugar Corporation in April 2005.
Table 4-2. Summary of STA operations and issues. Operational phases: (1) Start-up, inundate for vegetation growth. No discharge, phase ends when
cell demonstrated net improvement in phosphorus and mercury. (2) Stabilization: discharge, phase ends when 12-month outflow TP ≤ 50 parts per billion (ppb). (3) Post-stabilization: after stabilization phase. The terms “fully operational”
and “partially operational” refer to the status of the treatment cells.

2006 South Florida Environmental Report Chapter 4
4-5
During WY2005, a series of events occurred that affected STA performance. These events ranged from the impact of multiple hurricanes in 2004 to the short-term reduction of treatment area due to construction of Long-Term Plan enhancements. The STAs experienced months of high rainfall, hydraulic overloading, and high TP inflows. The STAs have received stormwater runoff, lake releases, and water supply demand waters. Rainfall was variable, with some months having over two inches more rainfall than the average (Figure 5-34). The hurricanes caused physical damage to the wetlands, degrading levees and structure banks and uprooting submerged aquatic vegetation (SAV), especially at STA-1E, STA-1W, and STA-2. In January 2005, some sections of STA-1W, STA-3/4, and STA-5 were taken out of operation in order to construct Long-Term Plan enhancement elements, such as divide levees and improved water control structures. Those elements of the Long-Term Plan projects that have been started in the STAs are listed in this chapter, identified by the budget code and cross-referenced in Chapter 8 of this volume.
Because of the integrative nature of the regional system, the management of the STAs has been based on using an adaptive approach and real-time data interpretation tools. The focus of the STA operations team has been to implement adaptive management by utilizing real-time data evaluation tools which compare actual data to the long-term average annual value anticipated during design or to the established operations guides. During this reporting period, weekly communication meetings were held, real-time data evaluation was generated, a recover plan was prepared for STA-1W, vegetation management activities have occurred, and site managers continue to be assigned to the STAs. The real-time data evaluation tools use both data regarding stages and water quality information as presented by the site managers to the operations staff, as well as a graphical output that compares the actual flow and TP loads to the long-term average annual values that were anticipated for each STA (Goforth, 2004; www.sfwmd.gov/org/ema/toc/archives/docs/design_envelope_STA_051004.pdf). The recover plan developed for STA-1W was written to encompass both short and long-term projects aimed at reestablishing the vegetation and water flow patterns (www.sfwmd.gov/org/erd/longtermplan/documents.shtml). Weekly communication meetings and the involvement of the site managers and construction engineers and other technical working group meetings have contributed to the operation and management of the STAs.
As part of the adaptive implementation process envisioned by the District’s STA optimization program, it is anticipated that further refinements to the recommended water quality improvement measures would be made at the earliest achievable dates as more scientific and engineering information is obtained. Investigations are under way in each STA, which are summarized in later sections of this chapter. General operational principles that are currently performed in the STA operations are as follows:
• Try to ensure inflows (flows and TP loads) are within the design envelope
• Avoid dryout and maintain a minimum of 15 cm depth of water
• Avoid keeping the water stage too deep for too long by limiting depth to a maximum of 137 cm for 10 days
• Maintain target depths between storm events:
o Emergent vegetation: 38 cm
o Submersed aquatic vegetation (SAV): 45 cm
• Frequent field observations by site managers
Chapter 4 Volume I: The South Florida Environment
4-6
A complete set of references regarding STA operations can be found on the District’s web site at www.sfwmd.gov/org/ema/everglades/consolidated_00/ecr2000/intro.pdf, and the 1995 Basis for Design paper is available online at http://wwwalker.net/pdf/stadesign.pdf.
Vegetation management activities in the STAs have both operational as well as research components. Activities include a large-scale plant inoculation to accelerate SAV recruitment, research studies to evaluate the best methods to treat undesirable vegetation, and percent coverage estimates. The water depth within the treatment cells along with herbicide application and the use of fire are used to manage the vegetation communities. In general, emergent vegetation is encouraged at the beginning of the treatment train where nutrient concentrations are higher and SAV is encouraged in areas further down the flow path. Overall, vegetation management focuses on keeping floating aquatic vegetation at maintenance control levels. The floating aquatic vegetation “shades out” or impedes beneficial submersed and emergent vegetation, which is necessary for proper STA performance. Additionally, emphasis was also placed on controlling expanding emergent vegetation, mainly torpedograss (Panicum repens) and cattail (Typha, spp.), which appears in SAV cells. Research experiments using varying dosages of herbicide along with different water depths and fire regimes have been conducted in WY2005. The final report on the torpedograss control experiment conducted in STA-3/4 can be found on the District’s web site at www.sfwmd.gov/org/erd/longtermplan/documents.shtml. To accelerate the SAV recruitment in STA-3/4, a huge inoculation was conducted by helicopter, using plant material from STA-2 Cell 3. A summary of the vegetation management activities as well as a listing of the herbicides used in the STAs during WY2005 is presented in Table 4-3 as well as under each STA section in this chapter.
Table 4-3. Summary of the amount of herbicides applied to the STAs during WY2005. The active ingredient within the herbicide is listed. Floating vegetation,
such as water hyacinth and water lettuce, was controlled using herbicide containing diquat. Emergent vegetation, such as cattail, torpedograss, and para grass, was controlled using herbicides containing glyphosate or imazapyr. The submersed
plant hydrilla was controlled using herbicide containing endothall.
STA Acres Herbicide containing Glyphosate
(gallons)
Herbicide containing Imazapyr (gallons)
Acres Herbicide containing
Diquat (gallons)
Acres Herbicide containing Endothall (gallons)
STA-1E 1,917.5 1,796.6 479.40 60.0 15.00 - -
STA-1W 161.0 150.75 40.25 635.5 159.25 - -
STA-2 7.0 6.5 1.75 268.0 67.00 151.0 285.0
STA-3/4 2,749.0 2,576.1 687.25 1,117.0 279.25 - -
STA-5 758.0 710.6 189.50 639.25 159.80 - -
STA-6 17.0 15.9 4.25 5.0 1.25 - -

2006 South Florida Environmental Report Chapter 4
4-7
As part of the adaptive management activities, the STAs are evaluated using real-time data as compared to how they were designed. Table 4-4 lists the average long-term design values that were anticipated during design, the actual values for WY2005, and longer-term averages, if the STAs have been in operation for awhile. The long-term average annual design values anticipated during design are presented as guidelines; they are not an annual maximum limit nor are they expected to occur each year. In WY2005, STA-1W, STA-2, and STA-3/4 received inflow and TP loads that were higher than the long-term average annual design values (Table 4-4 and under each STA section of this chapter). STA-1W was the most overloaded and received about two times more flow and almost four times more TP load than the long-term average design value. During August and September 2004, all of the STAs received very high inflow and TP loads. In those two months, STA-1W received more flow than the long-term annual average design amount; STA-2 received about 78 percent more flow, and STA-2, STA-3/4, and STA-5 received about 50 percent more flow than the annual average long-term design amount. Time series plots showing monthly data for WY2005 are found under the individual STA sections in this chapter and plots showing annual data over the entire period of operation for each STA are found in Appendix 4-15. Analysis of the flows and TP loads on a regional scale are presented in Chapters 2 and 3 of this volume.

Chapter 4 Volume I: The South Florida Environment
4-8
STA Parameter Effective Treatment Area (acres)
Average Annual Inflow (ac-ft)
Hydraulic Loading
Rate (cm/day)
Average Annual
Load (kg)
Nutrient Loading
Rate (g/m2/yr)
Flow-weighted Mean TP
(ppb)
Long-Term Average Design
5,130 32,288 2.06 28,759 1.33 176 STA-1E
WY2005 Actual N/A N/A N/A N/A N/A N/A
Long-Term Average Design
6,670 159,985 2.00 27,372 1.01 139
WY2005 Actual 5,436 341,094 4.27 103,872 3.85 247
STA-1W
WY2001–WY2005 --- 319,661 4.20 67,131 2.66 170
Long-Term Average Design
6,430 232,759 3.02 28,800 1.11 100
WY2005 Actual 6,430 316,273 4.11 49,121 1.89 126
STA-2
WY2002–WY2005 --- 267,188 4.91 29,277 1.79 89
Long-Term Average Design
16,543 657,168 3.32 71,591 1.07 88 STA-3/4
WY2005 Actual 13,871 671,442 3.39 87,368 1.30 105
Table 4-4. STA long-term average annual design parameters along with data collected in WY2005. The actual effective treatment area is based on all treatment cells being operational within the STA. In STA-1W, STA-3/4, and STA-5, the effective treatment area is less due to cells being temporarily
off-line for Long-Term Plan enhancements or vegetation rehabilitation.

2006 South Florida Environmental Report Chapter 4
4-9
STA Parameter Effective Treatment Area (acres)
Average Annual Inflow (ac-ft)
Hydraulic Loading
Rate (cm/day)
Average Annual
Load (kg)
Nutrient Loading
Rate (g/m2/yr)
Flow-weighted Mean TP
(ppb)
Long-Term Average Design
4,118 129,083 2.62 28,209 1.69 177
WY2005 Actual 3,398 119,910 2.43 24,420 1.46 165
STA-5
WY2001–WY2005 --- 130,582 2.75 39,045 2.40 242
Long-Term Average Design (w/ Section 2)
2,370 37,442 1.32 3,999 0.42 87
WY2005 Actual 870 34,035 3.27 3,255 0.92 78
STA-6
WY1999–WY2005 --- 47,966 5.26 4,549 1.48 77
Table 4-4. Continued.

Chapter 4 Volume I: The South Florida Environment
4-10
Cell 3
East Distribution Cell
A.R.M. LoxahatcheeNational WildlifeRefuge (WCA 1)
Cell 6 Cell 4N
Cell 4S
Cell 2
Cell 1Cell 5
West Distribution Cell
S-369
C-51 Canal
S-372
S-370
S-364
S-363S-366S-373
S-368
S-374 S-371 G-367
N
S-365
S-375
Cell 7
S-361
S-319
S-362
G-311
EffectiveArea (ac)Cell
1 5562 5523 5894N 6454S 752 5 5716 1,0497 418
Total 5,132 acDischarge Canal
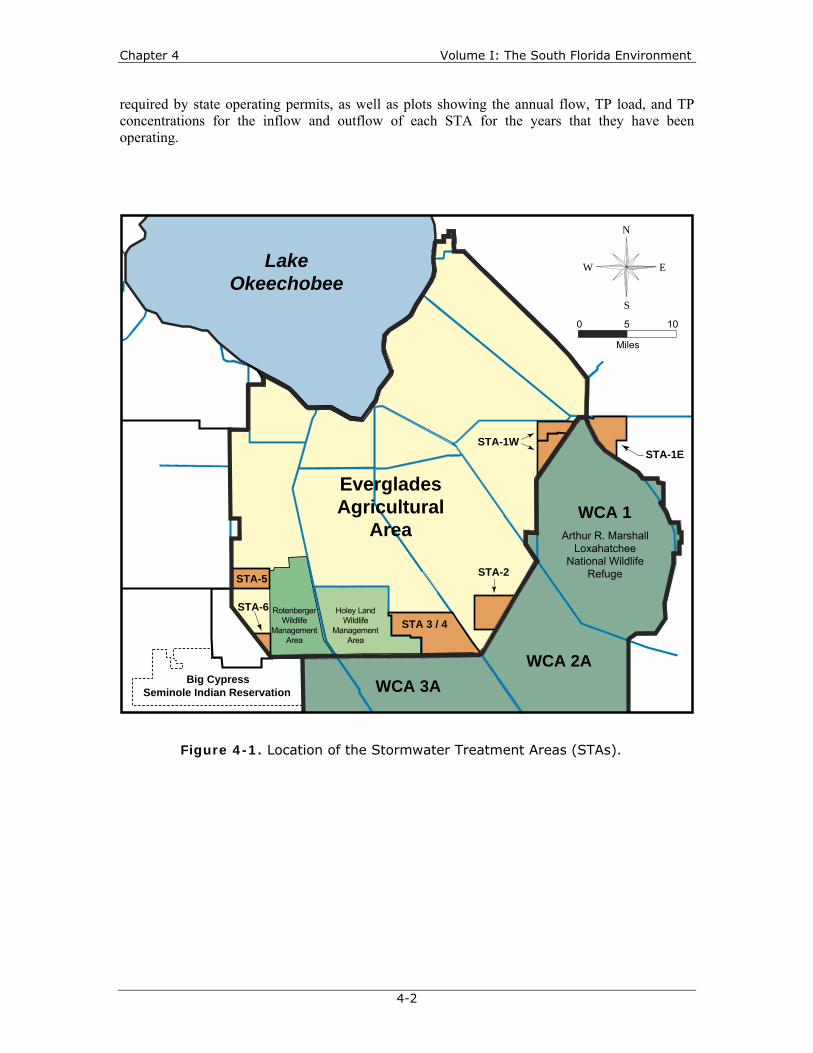
Figure 4-2. Schematic of STA-1E (not to scale). The orange boxes denote pump stations. Green boxes represent culverts.
STA-1E
The construction of Stormwater Treatment Area 1 East (STA-1E) was managed by the U.S. Army Corps of Engineers (USACE). Construction of the STA was completed in June 2004. The Everglades Forever Act (EFA) and National Pollution Discharge Elimination System (NPDES) final permits were issued by Florida Department of Environmental Protection (FDEP) on August 30, 2005. On September 20, 2005 the FDEP officially concurred with the District’s submittal which documented that the start-up compliance tests for phosphorus and mercury, as outlined in the EFA and NPDES permits, was achieved for the western (Treatment Cells 5, 6, and 7) and central flow-ways (Treatment Cells 3, 4N, and 4S) of STA-1E. Accordingly, flow-through operations for these flow ways was authorized. The USACE is currently designing a Periphyton-Based Stormwater Treatment Area (PSTA) demonstration project in Cell 2 and Treatment Cells 1 and 2 will remain off-line until the demonstration project is finished. A schematic of STA-1E is presented in Figure 4-2. The amount of discharge flow and TP load is listed in Table 2C-3.
Based on the 1979–1988 period of flow and total phosphorus (TP) data used during design, STA-1E should receive approximately 94,000 acre-feet (ac-ft) from the C-51 West basin, and approximately 31,000 acre-feet (ac-ft) from the S-5A basin through the G-311 structure. Actual deliveries will vary based on hydrologic conditions in the basins. An updated water quality analysis for the C-51 West basin indicates that the total phosphorus (TP) concentrations and loads to STA-1E were about 38 percent less than previously anticipated (Pietro and Goforth, 2004). This document is listed as the District Technical Publication ERA #430 and also on the Long-Term Plan web site at www.sfwmd.gov/org/erd/longtermplan/documents.shtml. Plans are under way to divert untreated stormwater from Acme Basin B that currently enter the Water Conservation Area 1 (WCA-1) to C-51 for treatment in STA-1E, with a scheduled completion around September 2007. Upon initial operation of STA-1E, though, there will be no Acme Basin B contributing to STA-1E.

2006 South Florida Environmental Report Chapter 4
4-11
STA-1E HURRICANE IMPACTS
The winds and rain from both hurricanes Frances and Jeanne impacted STA-1E. Hurricane Frances also temporarily caused emergency conditions affecting public health that necessitated an Emergency Authorization and Order to operate STA-1E. During Hurricane Jeanne, water was put into STA-1E beginning on September 26, 2004. Erosion damage was found on the interior levees in Cells 4N, 4S, and 6 and repairs are currently under way.
STA-1E VEGETATION MANAGEMENT
Vegetation management at STA-1E focuses on keeping floating aquatic vegetation (FAV) at maintenance control levels. FAV “shades out” or impedes beneficial submersed and emergent vegetation which is necessary for proper STA performance. Along with the FAV treatments, emphasis was placed on controlling expanding emergent vegetation, mainly torpedo grass (Panicum repens) and cattail (Typha spp.), which appear in submersed aquatic vegetation (SAV) cells. In addition to herbicide application, the water level within the treatment cells is manipulated to encourage vegetation growth. In Water Year 2005 (WY2005) (May 1, 2004 through April 30, 2005), 15 gallons of the herbicide containing the active ingredient diquat was used in STA-1E to treat 60 acres to control floating vegetation in the marsh and 1,917.5 acres of emergent vegetation (cattail, torpedo grass, para grass, etc.) was treated with 150.75 gallons of herbicide containing the active ingredient glyphosate and 479.4 gallons of herbicide containing the active ingredient imazapyr.
Four of the eight treatment cells within STA-1E are intended to be “start-up” SAV cells but are dominated by upland terrestrial vegetation. Plans include treating 1,000 acres of terrestrial vegetation and then burning the entire cell prior to flooding. Other projects include the treatment of hardwood invasives, consisting primarily of Brazilian pepper (Schinus terebinthifolius) and melaleuca (Melaleuca quinquenervia).
STA-1E WILDLIFE AND RECREATION
Before STA-1E was flooded, a total of four burrowing owl (Athene cunicularia floridana) nests were found in Cells 1, 2, 4N, and 5. The District received a permit from the Florida Fish and Wildlife Conservation Commission (FWC) to mitigate, and activities included removing the nests after the breeding season, creating another nesting site outside of the STA effective treatment area, and providing starter burrows.
Recreational facilities are proposed to provide public access to STA-1E. The proposed recreational facilities include an asphalt parking area, road improvements, a composting toilet, landscaping and an information kiosk. Pedestrian gates, signage and fencing as needed to define public access areas and to protect sensitive equipment are also proposed.

Chapter 4 Volume I: The South Florida Environment
4-12
STA-1E ENHANCEMENTS
The STA-1E Enhancements project listed in the Long-Term Plan for Achieving Water Quality Goals in the Everglades Protection Area (Long-Term Plan) (Burns & McDonnell, 2003) was for herbicide treatment of Cells 2, 4N, 4S, and 6 and for the conversion from emergent (cattail dominant) to SAV vegetation communities. In the revised Part 2 of the Long-Term Plan dated November 2004, it was also recommended that the SFWMD coordinate with the USACE regarding its proposed PSTA demonstration project in Cell 2.
The current start-up plan for STA-1E has included efforts to establish Cells 6, 4N, and 4S as SAV cells from the beginning. Therefore, activities in these three cells during FY2005 included vegetation management activities such as herbicide application of emergent vegetation and less desirable vegetation. Also, as recommended in the Long-Term Plan, the SFWMD has been coordinating with the USACE regarding the PSTA demonstration project in Cell 2 including revision of the vegetation management activities in that cell for consistency with the demonstration project plan.
2006 South Florida Environmental Report Chapter 4
4-13
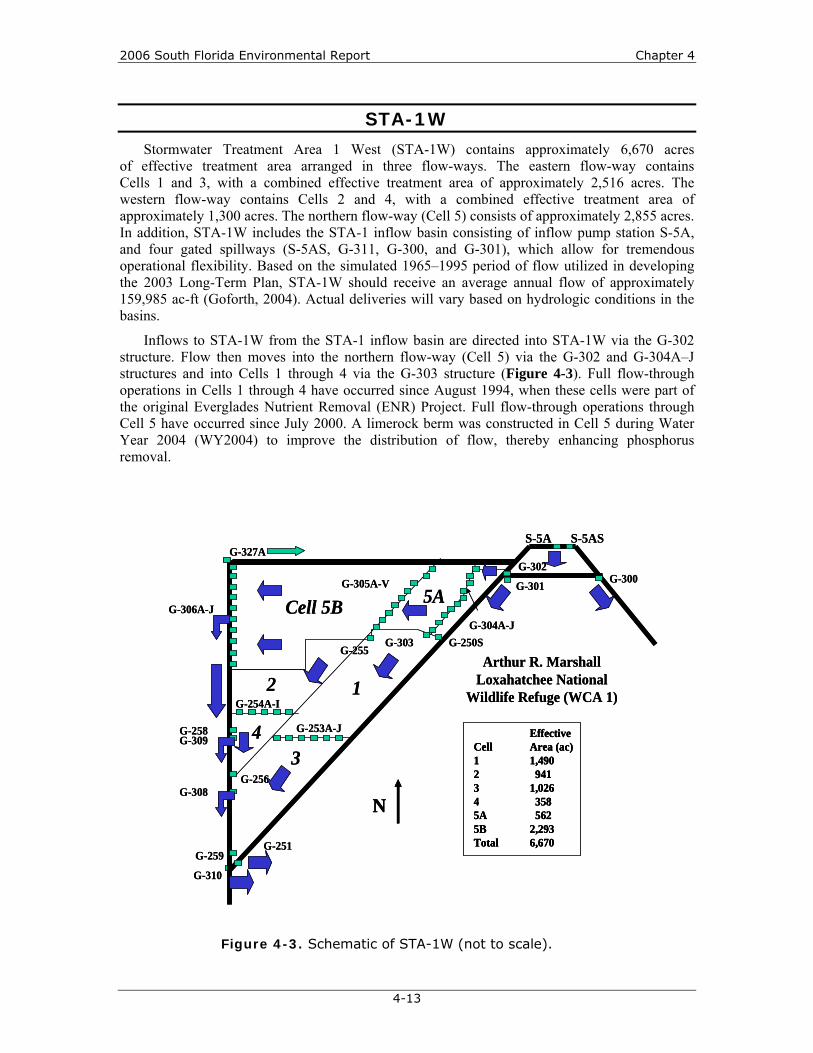
STA-1W
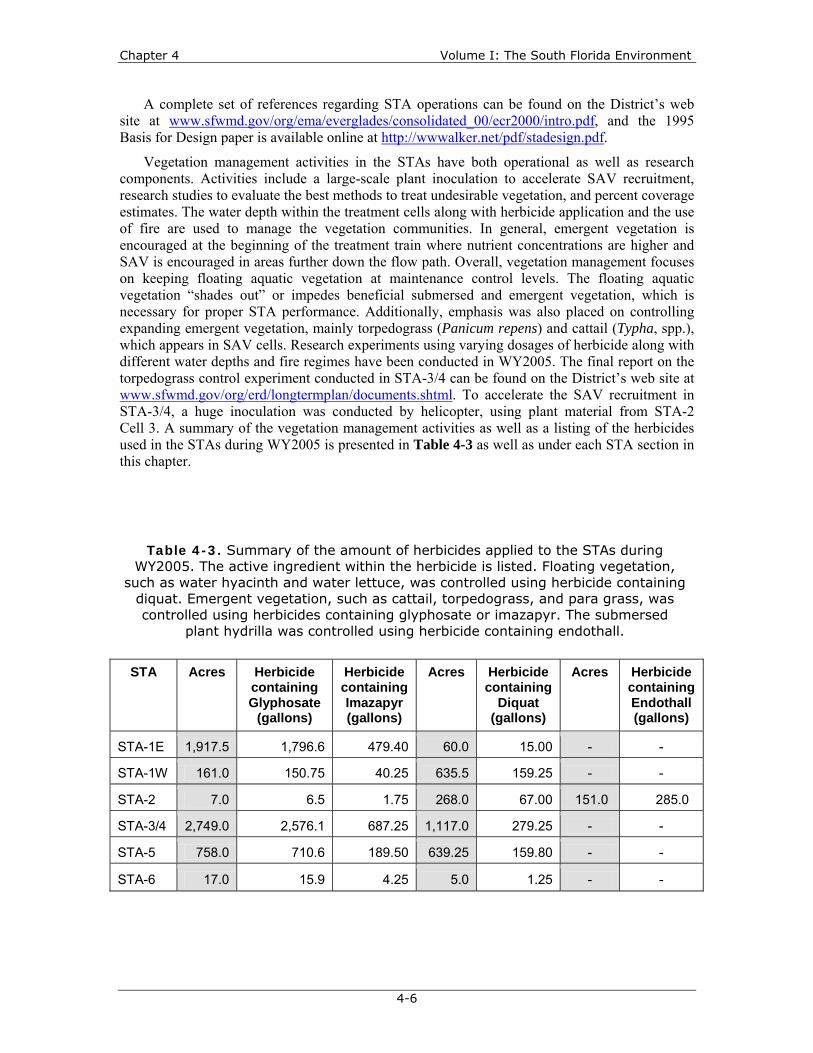
Stormwater Treatment Area 1 West (STA-1W) contains approximately 6,670 acres of effective treatment area arranged in three flow-ways. The eastern flow-way contains Cells 1 and 3, with a combined effective treatment area of approximately 2,516 acres. The western flow-way contains Cells 2 and 4, with a combined effective treatment area of approximately 1,300 acres. The northern flow-way (Cell 5) consists of approximately 2,855 acres. In addition, STA-1W includes the STA-1 inflow basin consisting of inflow pump station S-5A, and four gated spillways (S-5AS, G-311, G-300, and G-301), which allow for tremendous operational flexibility. Based on the simulated 1965–1995 period of flow utilized in developing the 2003 Long-Term Plan, STA-1W should receive an average annual flow of approximately 159,985 ac-ft (Goforth, 2004). Actual deliveries will vary based on hydrologic conditions in the basins.
Inflows to STA-1W from the STA-1 inflow basin are directed into STA-1W via the G-302 structure. Flow then moves into the northern flow-way (Cell 5) via the G-302 and G-304A–J structures and into Cells 1 through 4 via the G-303 structure (Figure 4-3). Full flow-through operations in Cells 1 through 4 have occurred since August 1994, when these cells were part of the original Everglades Nutrient Removal (ENR) Project. Full flow-through operations through Cell 5 have occurred since July 2000. A limerock berm was constructed in Cell 5 during Water Year 2004 (WY2004) to improve the distribution of flow, thereby enhancing phosphorus removal.
S-5A
Cell 5B
12
3
5A
4
Arthur R. Marshall Loxahatchee National
Wildlife Refuge (WCA 1)
S-5AS
G-300G-301
G-250S
G-327A
G-309
G-308
G-251
G-310
G-302
G-303
G-306A-JG-304A-J
G-305A-V
G-253A-J
G-254A-I
G-256
G-255
G-259
G-258 Effective Cell Area (ac) 1 1,490 2 941 3 1,026 4 358 5A 562 5B 2,293 Total 6,670
N
S-5A
Cell 5B
12
3
5A
4
Arthur R. Marshall Loxahatchee National
Wildlife Refuge (WCA 1)
S-5AS
G-300G-301
G-250S
G-327A
G-309
G-308
G-251
G-310
G-302
G-303
G-306A-JG-304A-J
G-305A-V
G-253A-J
G-254A-I
G-256
G-255
G-259
G-258 Effective Cell Area (ac) 1 1,490 2 941 3 1,026 4 358 5A 562 5B 2,293 Total 6,670
Effective Cell Area (ac) 1 1,490 2 941 3 1,026 4 358 5A 562 5B 2,293 Total 6,670
NN
Figure 4-3. Schematic of STA-1W (not to scale).

Chapter 4 Volume I: The South Florida Environment
4-14
STA-1W OPERATIONS
During WY2005, discharge to the STA-1W treatment cells via G-302 was 341,094 ac-ft, equal to an average hydraulic loading rate of 5.2 centimeter per day (cm/d) over the effective treatment area of the STA. These inflows were about 113 percent higher than the long-term average annual simulated inflow for this STA, although annual variability was anticipated (Table 4-4). Had STA-1E been in flow-through operation, these inflows would have been reduced. The volume of treated water discharged from STA-1W to the Arthur R. Marshall Loxahatchee National Wildlife Refuge (Refuge) was 383,663 ac-ft. The difference between the inflow and outflow volumes reflects the net contributions of direct rainfall, evapotranspiration (ET), seepage from the Refuge, seepage losses to adjacent lands, deep percolation, and flow measurement error. In WY2005, STA-1W received 17,829 ac-ft from Lake Okeechobee. A summary of monthly flows during WY2005 is presented in Figure 4-4.
Until STA-1E is fully operational, flows from the S-5A pump stations that exceed the hydraulic capacity of STA-1W will be diverted through the G-300 and G-301 structures into WCA-1. During WY2005, about 69,064 ac-ft (27 mt TP with a mean TP average of 317 parts per billion, or ppb) was diverted in this manner. A detailed breakdown of the diverted flow and loads are presented in the STA-1W Recovery Plan found on the District’s web site at www.sfwmd.gov/org/erd/longtermplan/documents.shtml.
Figure 4-4. Summary of WY2005 flow for STA-1W. Cells 1 and 3 were operational for the entire water year; Cell 5 was under restricted flow beginning in November 2004 for plant rehabilitation due to hurricane damage, was off-line in March 2005 to degrade the limerock berm, then was again operated under restricted flow; Cells 2 and 4 were
taken off-line beginning in January 2005
STA-1W
-
20,000
40,000
60,000
80,000
100,000
120,000
140,000
Flow
(ac-
ft/m
onth
)
Inflow Outflow
Inflow 9,991 22,226 19,951 79,329 109,912 45,777 2,784 17,104 6,946 5,937 17,134 4,003
Outflow 5,118 20,752 18,219 89,672 125,419 66,613 2,126 11,424 14,034 4,280 25,534 471
May-04 Jun-04 Jul-04 Aug-04 Sep-04 Oct-04 Nov-04 Dec-04 Jan-05 Feb-05 Mar-05 Apr-05
2006 South Florida Environmental Report Chapter 4
4-15
Until STA-1E is fully operational, flows from the S-5A pump station that exceed the hydraulic capacity of STA-1W will be diverted through the G-300 and G-301 structures into Water Conservation Area 1 (WCA-1). These structures may also have been used to augment water displaced due to water supply demands. During WY2005, 69,064 ac-ft (27 metric tons, or mt) of TP were diverted in this manner.
The operation of STA-1W over the water year has focused on plant recovery in the treatments cells, response to multiple hurricanes, and implementation of major construction activities in Cells 2, 4, and 5B. To accomplish these tasks, sections of the wetland were taken off-line. To aid in mechanical removal of the floating cattail tussocks in Cell 2 and to encourage SAV growth in Cells 2 and 4, the western flow-way was closed to inflow during the dry season. During WY2003, STA-1W received an enormous amount of inflow (almost 600,000 ac-ft) in response to the high water levels in Lake Okeechobee during summer 2002 that required the District and the USACE to institute extreme operational measures to protect the lake ecosystem and the integrity of the surrounding levee. Thus, from July 2002 through February 2003, deliveries to WCA-1 were passed through STA-1W for treatment prior to discharge to the Refuge (Goforth et al., 2005). This resulted in the inadvertent overload of flow and phosphorus loads to the STA. Immediate management activities were implemented to minimize the long-term adverse impacts of this overload event.
Continuing with the management operational guidelines presented in Chapter 4 of the 2005 South Florida Environmental Report – Volume I (SFER) (Goforth et al., 2005), loading into the STA was reduced and the western flow-way consisting of Cells 2 and 4 was closed to inflow until August 2004. Positive responses were observed, with SAV coverage increasing in Cells 4 and 5 and STA outflow flow-weighted mean (FWM) TP concentrations low, ranging from 29–32 parts per billion (ppb) during May–July 2004. The western flow-way was returned to flow-through operations in August 2004 to reduce the potential for untreated water to go to the Refuge. At this point, all treatment cells were operating. In August 2004, there was a large amount of rainfall at STA-1W. In September 2004, two major hurricanes (Hurricane Frances, a Category 2 hurricane); Hurricane Jeanne, a Category 3 hurricane) impacted STA-1W, delivering high winds and a very large amount of rainfall, about two times the average (Figure 5-34). In response to the heavy rains, STA-1W received more flow in two months than that anticipated for the entire year. Inflows into STA-1W in August–September 2004 totaled 199,241 ac-ft compared to the annual average design of 159,985 ac-ft per year. Simultaneously, the inflow TP concentrations were high, resulting in TP loads also much higher than the design amounts. In August 2004, the TP load was 26,030 kilograms (kg), close to the design average of 27,372 kg per year, and then rose up to 40,150 kg in September 2004. The high TP concentrations measured in early August occurred simultaneously with an internal breach at the Palm Beach Aggregates, which released water into the C-51 canal. TP measured at the auto-sampler at G-302 during this time was 540 ppb. Construction activities were also occurring at the S-5A pump station.
As soon as possible after the hurricanes, inflows to STA-1W were reduced. To help reestablish the SAV communities that were disrupted from the hurricanes and improve the water clarity, inflow into Cell 5 during November 2004 was restricted to a maximum of only 150 cubic feet per second (cfs) of flow when S-5A was pumping. In January 2005, the western flow-way (Cells 2 and 4) was closed down in order to build a divide levee with water control structures in Cell 2 and replace the outflow structure in Cell 4 (Long-Term Plan enhancements). The next month, because the TP concentrations measured at the Cell 5 outflow were high, the water was rerouted through STA-1W using the seepage pump (G-327A) instead of being discharged into the Refuge. The northern flow-way (Cell 5) was closed to inflow during late February 2005 in order to degrade the limerock berm to improve water flow through the cell. Heavy rains experienced in March 2005 impacted STA-1W, especially because only Cells 1 and 3 were operating. The western flow-way dewatering water was also put into Cells 1 and 3.

Chapter 4 Volume I: The South Florida Environment
4-16
STA-1W HURRICANE IMPACTS
The strong winds and heavy rainfall from hurricanes Frances and Jeanne impacted STA-1W. Power outages were experienced a few days following the storms. The power outages experienced during Hurricane Frances caused the shut down of the outflow pump station G-251 during that storm event. During Hurricane Jeanne, the outflow pump station G-310 had to be shut down in order to remove mud that had been deposited in the area. There was physical damage done to STA-1W as a result of the hurricanes. Specifically, erosion at the inflow structure G-302 and at the Cell 5 G-305 culverts, erosion on the north levees, especially severe in Cells 5A and 5B, and erosion of the limerock berm in Cell 5B. Extensive damage was also done to the SAV community in Cell 5B, with most of the SAV uprooted and pushed up onto the northern levee bank. Some movement of the floating cattail tussocks in Cells 1 and 2 was observed. The water within the treatment cell was highly turbid. Repairs were completed in June 2005, and the SAV communities in Cell 5B are slowly reestablishing.
STA-1W MANAGEMENT ACTIVITIES IMPLEMENTED SINCE THE 2002 OVERLOAD EVENT
1. Deliveries from Lake Okeechobee to STA-1W were terminated as of February 15, 2003. This was done despite the continuing need to lower the stage in the lake, and the effort to minimize harmful freshwater releases to the estuaries. Deliveries resumed in WY2005 at a fraction of the WY2003 amount.
2. Weekly operations meetings between STA managers, construction engineers, and operations staff have been conducted to ensure the most efficient and effective coordination of STA operations. Graphics of real-time data compared to the average long-term design envelope estimates and recommendations from the site managers and research regarding operations based on stage and treatment performance are used to aid in decision making. A recovery plan for STA-1W has been prepared and is presently being implemented.
3. Cells 2 and 4 were taken off-line for the balance of the 2004 dry season in order to give this flow-way a period of recovery. In addition, water depths were lowered in order to facilitate increased submerged vegetation growth. The cells were returned to flow-through operation in mid-August 2004 to minimize the potential for diversion of untreated water to the Refuge. Observations indicate a good recovery of SAV vegetation at that time. Cells 2 and 4 were again taken off-line in January 2005 to begin construction of a divide levee in Cell 2, a new outflow structure in Cell 4, cuts in the mid canal berm in Cell 4, and replacement of the G-254 culverts.
4. Vegetation management activities have been completed in STA-1W, including herbicide application and physical removal (floating cattail tussocks in Cell 2, SAV in collection outflow canals in Cell 3).
5. Cell 5 was taken off-line in November 2004. Prior to that, inflows into Cell 5 were reduced in October 2004 to encourage SAV regrowth.
6. A limerock berm was constructed in Cell 5 from February–August 2004. In March 2005, the elevation of the berm was lowered to improve water flow through the cell.
7. The District has increased the coordination with the USACE to expedite the completion of STA-1E. This STA was designed to work in concert with STA-1W to treat a portion of the stormwater runoff from the upstream EAA basin. The District is considering alternative operations until STA-1E is fully operational, the preferable choice being diversion to tide rather than alternatively diverting the extra untreated runoff to the Everglades.
8. The District successfully experimented with delivering water around the Refuge rather than through the Refuge to meet the water supply demands of the local Water Control District.

2006 South Florida Environmental Report Chapter 4
4-17
9. The District expedited the commencement of flow-through operations of STA-3/4, designed to capture and treat approximately 250,000 ac-ft per year of lake water. On February 26, 2004, flow-through operations began for the 6,500-acre eastern flow-way. On June 8, flow-through operations began in the 4,500-acre western flow-way and, on September 16, 2004, flow-through operation began in the central flow-way. It is anticipated that all future Lake Okeechobee releases, whether they are pursuant to the Water Supply and Environment (WSE) regulation schedule, Best Management Practices (BMPs) replacement water, or for water supply to downstream receiving areas, will be directed to STA-3/4 prior to discharge to the Everglades Protection Area (EPA), when practical.
STA-1W VEGETATION MANAGEMENT
The treatment cells at STA-1W are managed to encourage emergent plant growth in Cells 1A, 2A, and 5A and SAV communities in the remaining cells. The target water stages are listed in the operations plan for each treatment cell to encourage the dominant vegetation types. Vegetation management focuses on keeping FAV at maintenance control levels in all STAs. FAV “shades out” or impedes beneficial submersed and emergent vegetation which is necessary for proper STA performance. Along with the FAV treatments, emphasis is also placed on controlling expanding emergent vegetation, mainly torpedograss and cattail, which appears in SAV cells.
Specific Condition 13(b) of the EFA permit requires that the annual Everglades Consolidated Report (currently known as the South Florida Environmental Report) include information regarding the application of herbicides used to exclude and/or eliminate undesirable vegetation within the treatment cells. In WY2005, the District treated a total of 796.5 acres to control vegetation in the marsh, using 159.25 gallons of diquat to treat the floating vegetation and 150.75 gallons of glyphosate and 40.25 gallons of imazapyr to control emergent vegetation (Table 4-3). The District used both aerial and ground-based spray equipment to apply these herbicides.
The hurricanes in September 2004 uprooted most of the SAV in Cell 5B and much plant material was pushed to the northern levee bank. The debris started to decompose and had to be manually removed. Within the treatment cells, the water depths were lowered in order to encourage SAV regrowth and improve water clarity.
STA-1W CELL 5 LIMEROCK BERM [FDEP GRANT AGREEMENT (BC25)]
In FY2003, the District, with funding assistance from the FDEP and the USEPA through FDEP Grant Agreement No. G0040, completed the construction of a limerock berm in STA-1W, Cell 5B. The purpose of the limerock berm project is to demonstrate the benefits of improved hydraulics through compartmentalization at full scale. The monitoring phase of the limerock berm project was initiated in FY2003 and continued in FY2004 and FY2005. In FY2004, a tracer project was initiated in Cell 5 to document the ability of the limerock berm to improve hydraulic distribution within the treatment cell. A description of the tracer project, including the results, is available on the South Florida Water Management District’s web site at www.sfwmd.gov/org/erd/longtermplan/pdfs/STA1W%20Cell5b%20Tracer.pdf. The following is an excerpt from the Executive Summary of this report:
This study revealed that Cell 5B displays remarkably efficient hydraulic characteristics. For example, the tanks-in-series (TIS) value calculated for Cell 5B using the method of moments was 10.6, an extraordinarily high value when compared to previous assessments (TIS range of 1.3 – 3.4 for other STA-1W wetlands). This high hydraulic efficiency was depicted by the “near-plug flow” shape of Cell 5B’s outflow tracer response curve, as well as the comparable export, on a mass basis, of lithium from the wetland’s 10 outflow

Chapter 4 Volume I: The South Florida Environment
4-18
culverts. Cell 5B’s high hydraulic efficiency is probably due to effective distribution of inflows among the 22 culverts at G-305, as well as the absence of pronounced short-circuit pathways. The limerock berm undoubtedly also plays a role in enhancing hydraulic performance of the wetland, but its exact contribution cannot be elucidated from the findings of this study.
In fall 2004, the limerock berm sustained damage both from hurricanes Frances and Jeanne. The damage, consisting of washouts in various locations along the length of the berm, was repaired in late 2004. Subsequently, on January 3, 2005 the District requested approval from the FDEP to lower the top elevation of the limerock berm by about 1 to 1.5 feet. This request was made as a result of recent survey information indicating that the average ground elevation in Cell 5 was 6–12 inches lower than was assumed during the design of the limerock berm (based on information from the original design phase of Cell 5). The change in the assumed average ground elevation resulted in the decision to lower the average operating stage of Cell 5 to provide a more appropriate water depth for SAV; therefore, more of the top of the limerock berm was exposed making it susceptible to scouring and washouts. The FDEP approved the request to lower the top elevation of the limerock berm via e-mail on January 4, 2005. The lowering of the limerock berm was completed in April 2005. The monitoring of the limerock berm and the water quality associated with the treatment cell continued in FY2005. It is anticipated that the final reporting on the monitoring phase of this demonstration project will occur in next year’s SFER.
STA-1W PERMIT STATUS
The data presented in this section demonstrates that STA-1W was in compliance with the EFA and the USEPA’s NPDES operating permits for this reporting period and that discharges do not pose any known danger to public health, safety, or welfare. The EFA permits for the STAs acknowledge that until all the STAs are fully operational, certain STAs may receive higher than normal inflows. Specifically, Specific Condition 14(c) of the STA-1W EFA permit states that STA-1W will remain in the stabilization phase of operation until STA-1E and STA-2 begin flow-through operations. At this time, STA-2 has begun flow-through operations, but STA-1E is not expected to begin full capacity flow-through operations until the PSTA demonstration project is completed (expected completion date is October 2006). Therefore, STA-1W currently remains in the stabilization phase.
STA-1W TOTAL PHOSPHORUS
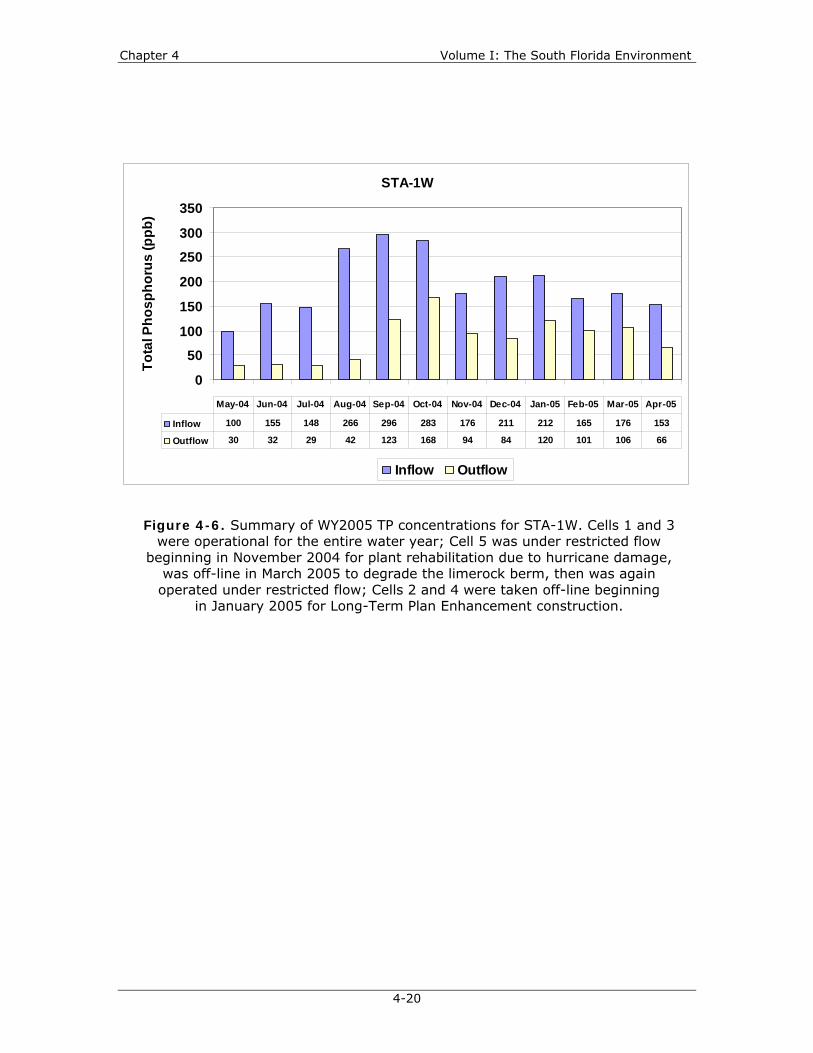
During WY2005, STA-1W received 103.9 mt of TP, equal to a nutrient loading rate of 4.7 grams per square meter (g/m2) (Table 4-4). The TP loading to the system was about 3.8 times greater than the long-term design amount. During WY2005, STA-1W received approximately 6.6 mt of TP from Lake Okeechobee. Approximately 57.3 mt of TP were removed by STA-1W during WY2005. From May 2004 through April 2005, STA-1W reduced TP discharge loads by 55 percent, compared to inflow loadings measured at G-302. Summaries of monthly TP loads and FWM TP concentrations are presented in Figures 4-5 and 4-6. The FWM outflow concentration was 98 ppb, a 66 percent reduction from the inflow concentration of 247 ppb measured at G-302. For informational purposes, the geometric mean TP concentration of the discharge was calculated as 67 ppb, using auto-sampler data from G-251 and G-310. The moving 12-month FWM TP outflow concentration for STA-1W ranged from 41–98 ppb (Figure 4-7).

2006 South Florida Environmental Report Chapter 4
4-19
Figure 4-5. Summary of WY2005 TP loads for STA-1W. Cells 1 and 3 were operational for the entire water year; Cell 5 was under restricted flow beginning in November 2004 for plant rehabilitation due to hurricane damage, was off-line
in March 2005 to degrade the limerock berm, then was again operated under restricted flow; Cells 2 and 4 were taken off-line beginning in January 2005
for Long-Term Plan Enhancement construction.
STA-1W
-
10,000
20,000
30,000
40,000
50,000
Tota
l Pho
spho
rus
Load
(kg)
Inflow Outflow
Inflow 1,233 4,254 3,641 26,030 40,150 15,997 603 4,461 1,814 1,209 3,725 754
Outflow 191 823 657 4,620 19,063 13,776 246 1,187 2,078 531 3,324 38
May-04 Jun-04 Jul-04 Aug-04 Sep-04 Oct-04 Nov-04 Dec-04 Jan-05 Feb-05 Mar-05 Apr-05
Chapter 4 Volume I: The South Florida Environment
4-20
Figure 4-6. Summary of WY2005 TP concentrations for STA-1W. Cells 1 and 3 were operational for the entire water year; Cell 5 was under restricted flow
beginning in November 2004 for plant rehabilitation due to hurricane damage, was off-line in March 2005 to degrade the limerock berm, then was again operated under restricted flow; Cells 2 and 4 were taken off-line beginning
in January 2005 for Long-Term Plan Enhancement construction.
STA-1W
0
50
100
150
200
250
300
350
Tota
l Pho
spho
rus
(ppb
)
Inflow Outflow
Inflow 100 155 148 266 296 283 176 211 212 165 176 153
Outflow 30 32 29 42 123 168 94 84 120 101 106 66
May-04 Jun-04 Jul-04 Aug-04 Sep-04 Oct-04 Nov-04 Dec-04 Jan-05 Feb-05 Mar-05 Apr-05

2006 South Florida Environmental Report Chapter 4
4-21
STA-1W
020406080
100120140160180
Tota
l Pho
spho
rus
(ppb
)
Outflow 30 32 29 42 123 168 94 84 120 101 106 66
12 mo. Moving FWM 45 46 45 41 68 85 87 88 90 93 98 98
May-04
Jun-04 Jul-04 Aug-04
Sep-04 Oct-04 Nov-04 Dec-04 Jan-05 Feb-05 Mar-05 Apr-05
Figure 4-7. Comparison of monthly to 12-month moving average TP concentrations for WY2005 for STA-1W outflow. Cells 1 and 3 were operational
for the entire water year; Cell 5 was under restricted flow beginning in November 2004 for plant rehabilitation due to hurricane damage, was off-line in March 2005 to degrade the limerock berm, then was again
operated under restricted flow; Cells 2 and 4 were taken off-line beginning in January 2005 for Long-Term Plan Enhancement construction.

Chapter 4 Volume I: The South Florida Environment
4-22
STA-1W OTHER WATER QUALITY PARAMETERS
Water quality parameters with Florida Class III standards are identified in Table 4-5. The monitoring data over the water year for non-phosphorus parameters at STA-1W during this reporting period are presented in Appendix 4-1 of this volume, and are summarized in Table 4-6. Temperature, specific conductance, dissolved oxygen (DO), and pH values reported in this chapter are field measurements. Ametryn concentrations were higher in the outflow than the inflow, although these herbicides are not used within this STA. Compliance with the EFA permit is determined based on the following three-part assessment.
1. If the annual average outflow concentration does not cause or contribute to violations of applicable Class III water quality standards, then STA-1W shall be deemed in compliance.
2. If the annual average concentration at the outflow causes or contributes to violations of applicable Class III water quality standards, but it does not exceed or is equal to the annual average concentration at the inflow stations, then STA-1W shall be deemed in compliance.
3. If the annual average concentration at the outflow causes or contributes to violations of applicable Class III water quality standards, and it also exceeds the annual average concentration at the inflow station, then STA-1W shall be deemed out of compliance.
Discharges from STA-1W were determined to be in compliance with the permit by satisfying criterion one above for all non-phosphorus and non-DO parameters with applicable numeric state water quality standards. Both inflow and outflow DO concentrations were lower than the Class III numeric standard. Annual average concentrations of total dissolved solids and dissolved chloride were slightly higher at the outflow compared to the inflow. However, because these parameters have no applicable numeric state water quality standards, STA-1W is deemed to be in full compliance with the permit. Additional requirements for DO are listed in Administrative Order AO-002-EV and are discussed below. Mercury monitoring results are also discussed in Chapter 2B, and the annual permit compliance monitoring report for mercury in the STAs is in Appendix 4-2 of this volume.
The District has included the following documentation to satisfy the remaining monitoring requirements of the EFA permit.
• The District has performed all sampling and analysis under the latest Laboratory Quality Assurance Manual (SFWMD, dated January 3, 2005) and a Field Quality Assurance Manual (SFWMD, dated January 3, 2005).
• A signed copy of these statements is provided in Appendix 4-3 of this volume.

2006 South Florida Environmental Report Chapter 4
4-23
Parameter Units
Dissolved Oxy gen mg/L Greater than or equal to 5.0 mg/L
Spec if ic Conduc tivity µmhos/c mNot greater than 50% of bac kground or greater than 1,275 µmhos/c m, whic hever is greater
pH standard units
Not less than 6.0 or greater than 8.5
Turbidity NTU Less than or equal to 29 NTU above bac kground c onditions
Unionized Ammonia mg/L Less than or equal to 0.02 mg/L
A lkalinity mg/L Not less than 20 mg/L
Total Iron µg/L Less than or equal to 1,000 µg/L
C lass III C riter ia
Table 4-5. Water quality parameters with Florida Class III criteria specified in Section 62-302.530, Florida Administrative Code (F.A.C.).(

Chapter 4 Volume I: The South Florida Environment
4-24
Table 4-6. Summary of annual arithmetic averages and flow-weighted means (FWM) over the water year for all parameters other than TP monitored in STA-1W. For the purpose of these comparisons, FWMs are calculated as the quotient of the cumulative product of the mean daily flow and the sample concentration divided
by the corresponding cumulative daily flows.
Inflow
S5A G251 G310 n Conc. n Conc.
Temperature (°C) 24.7 23.5 24.4 -NA- -NA- -NA- -NA-
Dissolved Oxygen (mg/L) 4.8 1.9 4.1 -NA- -NA- -NA- -NA-
Specific Conductivity (µmhos/cm) 859 955 935 -NA- -NA- -NA- -NA-
pH 7.6 7.4 7.6 -NA- -NA- -NA- -NA-
Turbidity (NTU) 24.1 2.6 5.0 -NA- -NA- -NA- -NA-
Total Dissolved Solids (mg/L) 554 612 609 17 (26) 678 29 (52) 621
Unionized Ammonia (mg/L) 0.007 0.002 0.004 32 (49) 0.010 28 (51) 0.004
Orthophosphate as P (mg/L) 0.096 0.040 0.059 34 (52) 0.148 60 (104) 0.086
Total Dissolved Phosphorus (mg/L) 0.103 0.048 0.069 33 (51) 0.158 57 (100) 0.098
Sulfate (mg/L) 63.1 54.0 60.8 17 (26) 74.7 29 (52) 68.0
Alkalinity (mg/L) 206 239 220 17 (26) 255 29 (52) 222
Dissolved Chloride (mg/L) 104 120 126 17 (26) 115 29 (52) 114
Total Nitrogen (mg/L) 3.19 2.11 2.57 33 (51) 4.49 29 (51) 2.91
Total Dissolved Nitrogen (mg/L) 2.76 1.99 2.46 17 (26) 3.92 29 (51) 2.78
Nitrate + Nitrite (mg/L) 0.759 0.056 0.329 33 (51) 0.977 29 (51) 0.538
Ametryn (µg/L) 0.033 0.047 0.057 5 (7) 0.022 7 (8) 0.048
Atrazine (µg/L) 0.559 0.471 0.476 5 (7) 0.192 7 (8) 0.255
-NA- : Not Applicablen: number of samples with flow (total number of samples)
Flow-Weighted MeansOutflowParameter
Arithmetic MeansTotal Inflow Total Outflow

2006 South Florida Environmental Report Chapter 4
4-25
STA-1W DISSOLVED OXYGEN MONITORING
Introduction
DO concentrations fluctuate naturally in marsh environments, such as the Everglades, routinely falling below the Class III water quality criterion of 5 milligrams per liter (mg/L). STAs also experience natural fluctuations in DO that routinely fall below 5 mg/L, as observed in DO data collected in the Everglades Nutrient Removal Project (ENR Project Monitoring Report Appendices, 1995–1998), and as reported in the 1999 Everglades Interim Report, and in the 2000–2004 Everglades Consolidated Reports. The FDEP recognized the phenomenon of fluctuating DO concentrations in the EFA permit issued to the District for STA-1W (Administrative Order No. AO-002-EV in Exhibit C of Permit No. 503074709, April 13, 1999). To address DO in STA discharges, Section II of the Administrative Orders requires that the District provide the FDEP with an annual report consisting of an analysis demonstrating that DO levels in STA discharges do not adversely change the downstream Everglades ecology or the downstream water quality. The analysis is based on the following:
• Comparison of DO levels in STA discharges with background conditions in receiving waters
• Evaluation of DO levels at representative interior Everglades marsh stations, demonstrating that STA discharges fully maintain and protect the existing designated uses of the downstream waters and that the level of water quality is consistent with applicable anti-degradation requirements
• Evaluation of whether discharges are necessary or desirable and are otherwise in the public interest
• Depiction of the daily and seasonal diel cycles for STA DO discharges during the period covered by the STA annual report
• Comparison of STA effluent with other historical DO data from the EPA, including data from interior marsh stations within the Refuge (receiving effluent from STA-1W), the Rotenberger Wildlife Management Area (RWMA) tract (receiving effluent from STA-5), and any other locations downstream of the STA discharges
• Consideration of the influences of temperature, seasonal weather conditions, aquatic community type, and hydropattern on the diel cycle of the STA discharges
The District developed the following plan to comply with the DO requirements of the Administrative Orders for STA-1W. Under the plan, DO concentrations are measured quarterly with HydrolabTM, DataSonde®, or MiniSonde® probes at 30-minute intervals for four consecutive days at the following locations:
• On the south side of the C-51 canal upstream of S-5A (Figure 4-3) • Downstream of the G-251 and G-310 discharge structures (Figure 4-3) • At sites along the X, Y, and Z transects in the periphery of the interior Refuge
marshes downstream of the combined discharges (Figure 4-8)

Chapter 4 Volume I: The South Florida Environment
4-26
Figure 4-8. Location and classification of water quality monitoring stations in the Refuge.
Z1
G251
Z2
Z3 Z4
Y4G338
S39S10A
S10C
S10D
G949
X0X4
X3
X2
X1
S5AD
G300
G310 G94D
ACME1DS
G301
MESOLOX 9
LOX 8
LOX 7 LOX 6
LOX 5
LOX 4LOX 3
LOX 16LOX 15
LOX 14
LOX 13LOX 12
LOX 11
LOX 10
S10E
EAA
STA1W
STA1E
WCA 2
WCA 1(A.R.M. Loxahatchee
National Wildlife Refuge)
STA2
L-40L-
7
C-51
L-6
L-13
L-15
L-12 L-8
L-36
Hillsboro Canal
EN
R C
olle
ctio
n C
anal
L-39
CanalsRim Canal SiteOutflow SitesInflow SitesInterior Marsh Sites
Legend
31.50Miles

2006 South Florida Environmental Report Chapter 4
4-27
Sampling Dates
Diel oxygen measurement dates and sites associated with STA-1W for WY2005 are provided in Table 4-7.
Comparison of Dissolved Oxygen in STA-1W Discharges with Dissolved Oxygen at Downstream Marshes
Comparisons of DO in STA-1W discharges with DO at downstream marsh sites in the Refuge provide an indication of whether the discharge is affecting the marsh DO concentration or the diel oxygen cycle. The summary statistics for STA-1W outflows and Refuge marsh transect sites are presented in Table 4-8. Discharges from STA-1W structures G-251 and G-310 constitute the flow in the L-7 rim canal unless diversions are made through G-301, or there are outflows from the interior Refuge marsh. The DO concentration and concentrations of other constituents in the discharges affect water quality and vegetation along the fringe of the interior marsh. At times when rim canal stage is higher than interior marsh stage, rim canal water has the potential to flow into the interior marsh. The extent of this penetration is dependent on stage differential. Consequently, STA-1W discharges can affect the quality of water in the interior marsh up to several kilometers from the rim canal.
Examination of the data in Table 4-8 and the notched box and whisker plots in Figure 4-9 indicates that the median diel DO values in discharges from G-251 and G-310 were significantly greater than the values at transect sites Z1, X1, Z2, and X2. This significance is illustrated on Figure 4-9 because the notches for the G-251 and G-310 plots, which represent the approximate
Table 4-7. Deployment dates for diel oxygen measurements at STA-1W structures and associated downstream marsh sites.
Start End Inflow
06/21/2004 06/24/2004 S5AU G251D G310
06/28/2004 06/30/2004 ---- ---- ----
09/23/2004 09/27/2004 S5AU G251D G310
10/04/2004 10/08/2004 ---- ---- ----
12/13/2004 12/16/2004 S5AU G251D G310
01/03/2005 01/07/2005 ---- ---- ----
03/07/2005 03/11/2005 S5AU G251D G310
X1, X2, X3, X4, Z3, Z4
----------------------------------
* Dissolved oxygen data collected at these sites were flagged.
Event Dates Structures
OutflowSites Monitored in Refuge
----------------------------------
X1, X2, X3, X4, Y4, Z1, Z2*, Z3*, Z4
Y4*, Z1, Z3, Z4
----------------------------------
X1, X2, X3, X4, Y4, Z1, Z2, Z3*, Z4

Chapter 4 Volume I: The South Florida Environment
4-28
95-percent confidence interval (95% C.I.) for the medians, do not overlap the notches for Z1, X1, Z2, and X2. Non-overlapping notches indicate that data sets being compared are significantly different.
Further comparisons of medians and notches indicates G-251 had significantly lower DO concentrations than concentrations measured at sites X3, Z3, Z4, Y4 and X4. Site X3 is not significantly different from G-251. DO concentrations in G-310 discharges were significantly greater than concentrations measured at transect sites X3, Z4 and Y4. Sites Z3 and X4 were significantly different from both G251 and G-310, as well as significantly greater than the other marsh sites.
The STA-1W discharges must travel several kilometers down the L-7 canal before reaching the transect locations. Analysis of the data indicates that diel DO concentrations in the STA-1W discharges do not negatively affect the low DO concentrations observed at marsh transect stations Z1, X1, Z2, the closest to the canal, or the more interior marsh sites X2, X3, Z3, Z4, Y4, and X4. The diel DO patterns observed at Z1, X1, Z2 and X2 maybe largely due to the long-term effects of TP loading to the rim canal. Diel oxygen patterns at the more interior marsh transect sites, which are rainfall dominated, are the result of water depth and habitat vegetation differences. Ultimately, TP load reductions to the rim canal of the Refuge should improve DO conditions in the marsh fringe areas affected by canal water penetration. The complete DO data sets collected during WY2005 are presented in Appendix 4-4 of the 2005 SFER – Volume I.
Note: See Appendix 4-4, Table 2 for statistical summaries by event and diel parameter.
Table 4-8. Statistical summary of diel DO at outflow stations (G-251D and G-310) and transect stations (X, Y, and Z) in
the Refuge during six deployment periods.
G251D 613 3.82 0.83 4.22 7.62 1.72
G310 610 4.78 2.61 4.66 6.62 0.88
X1 523 0.75 0.01 0.66 3.65 0.69
X2 362 2.17 0.28 1.31 8.58 1.78
X3 542 4.07 0.35 3.77 10.96 2.42
X4 541 5.37 2.11 4.76 9.81 2.12
Transect Y Y4 360 5.09 1.03 5.19 10.20 2.51
Z1 475 2.26 0.01 1.96 5.96 1.74
Z2 179 1.94 0.01 1.62 5.99 1.74
Z3 477 6.33 0.91 6.68 9.52 1.98
Z4 480 4.47 0.66 4.64 8.64 2.32
Median Maximum Standard Deviation
Outflow
Transect X
Transect Z
MinimumLocation Station Number of Measurements Mean

2006 South Florida Environmental Report Chapter 4
4-29
Figure 4-9. Notched box and whisker plots of diel DO measurements at STA-1W outflow stations (G251D and G310) and along transect sites in the Refuge during eight monitoring periods. The notch on a box plot represents the 95% C.I. about the median, which is represented by the narrowest part
of the notch. The top and bottom of the box represent the 75th and 25th percentiles, respectively. The whiskers represent the highest and lowest
data values that are within two standard deviations of the median. Values above and below the whiskers are greater than two standard deviations form the median. Notches that do not overlap indicate that the data represented
by the boxes being compares are significantly different at the 95% C.I.
Note: See Appendix 4-4, Table 2 for statistical summaries by event and diel parameter.
G251G310 Z1 X1 Z2 X2 X3 Z3 Z4 Y4 X4
MESO01
Monitoring Stations
0
5
10
15
20
Dis
solv
ed O
xyge
n (m
g /L) Mean
Median
No
Mon
itorin
g Pe
rform
ed

Chapter 4 Volume I: The South Florida Environment
4-30
STA-1W RECREATION AND WILDLIFE
STA-1W was opened to water fowl hunts in 2004. Bird watching tours were also conducted. Black-necked stilts (Himantopus mexicanus) were found nesting in Cells 2 and 5B in March 2005. The number of birds nesting interfered with the ability for flow-through in Cell 5. District staff worked with the U.S. Fish and Wildlife Service (USFWS) and several improvements have been initiated in order to prevent the excess nesting. The improvements include (1) degrading the limerock berm in Cell 5 to eliminate exposed fill material, (2) conducting migratory bird surveys (USFWS), and (3) posting signs around the areas of concern to increase awareness of the bird presence.
Recreational facilities are proposed to provide public access to STA-1W. The proposed recreational facilities include an asphalt parking area on the south side of CR 880 and associated road improvements such as an acceleration and deceleration lane in the vicinity of the entrance to the parking lot. The proposed facilities include a canoe launching site and a boardwalk for access to the seepage canal north of the STA. A footbridge is also proposed across the seepage canal to provide pedestrian access to the existing leveled area adjacent to the north end of the limerock berm in Cell 5B. An information kiosk,, a composting toilet, a boardwalk, and landscaping are proposed at this location. Pedestrian gates, signage and fencing as needed to define public access areas and to protect sensitive equipment are also proposed.
STA-1W ENHANCEMENTS [BC20]
STA-1W enhancements (Figure 4-10) consist of the following component elements:
Scheduled for Completion in FY2005
• Replacement of existing structure G-255 with a fully operable control structure (nominal capacity of approximately 585 cubic feet per second, or cfs) [Status: G-255 is flow capable]
• Construction of a new levee across Cell 2, together with a series of culverts for improved flow distribution (G-249 structures) [Status: G-249 structures are flow capable]
• Construction of a small seepage pumping station (designated as G-327B) near the northwest corner of Cell 5B, included in the design to permit withdrawal from the seepage canal to maintain stages in the SAV Cell 5B [Status: construction to begin November 2005]
• Addition of a 150-cfs structure (G-307) to replace G-256 as the primary discharge for Cell 4 [Status: construction to begin November 2005]
• Demolition of G-256 structure and restoring levee section [Status: completed] • Removal of tussock material from Cell 2 [Status: completed] • Excavation of flow way cuts along the C-7 canal, within Cell 4
[Status: completed] • Excavation of flow way cuts along north end of Cell 2A (submerged remnant
farm road) [Status: completed] • Replacement of five existing galvanized pipes along the G-254 levee
[Status: construction to begin in late September 2005]

2006 South Florida Environmental Report Chapter 4
4-31
• Excavation of G-254 distribution and collection canals [Status: completed] • Installation of overhead power line, beginning at Northeast corner of Cell 5A and
continuing along the G-304 levee, providing power to G-255 structure (and future power to G-304 structures) [Status: completed]
Scheduled for Completion in FY2006
• Construction of a new levee across Cell 1, together with a series of fully operable control structures (G-248 structures)
• Herbicide treatment in those parts of Cells 1 and 2 to be converted to SAV • Herbicide treatment of Cell 3 for removal of emergent macrophyte vegetation to
permit development of SAV • Addition of electric motors and telemetry equipment to allow remote operations
of the gates at the G-304 inflow structures to Cell 5 • Enlarging C-6 canal cross section • Power distribution to G-327B pump station and to G-248 structures
Cell 1
Cell 5A
Cell 3
Cell 2
Cell 5B
Cell 4
A.R.M. LoxahatcheeNational WildlifeRefuge (WCA 1)
EffectiveCell Area (ac)1A 745
2A 471
3 1,026 4 358 5A 5625B 2,293
Total 6,670 ac
NG-259
G-258
G-305 A-V
G-304 A-J
G-254 A-I
G-327 A
G-306 A-J
G-256
G-257L-7
Canal
DischargeCanal
Ocean Canal
G-252 H-J
S-5AS
G-300
G-303
G-302
G-308
G-309
S-5A
G-251
G-310
G-250 S
G-253 A-J
P
G-255
G-301
2B 470
1B 745
Cell 5B
Limerock Berm
G-327 B
G-307
G-311
Cell 1
Cell 5A
Cell 3
Cell 2
Cell 5B
Cell 4
EffectiveCell Area (ac)1A 745
2A 471
3 1,026 4 358 5A 5625B 2,293
Total 6,670 ac
NG-259
G-258
G-305 A-V
G-304 A-J
G-254 A-I
G-327 A
G-306 A-J
G-256
G-257L-7
Canal
DischargeCanal
G-252 H-J
S-5AS
G-300
G-303
G-302
G-308
G-309
S-5A
G-251
G-310
G-250 S
G-253 A-J
P
G-255
G-301
2B 470
1B 745
Cell 5B
Limerock Berm
G-327 B
Cell 1
Cell 5A
Cell 3
Cell 2
Cell 5B
Cell 4
EffectiveCell Area (ac)1A 745
2A 471
3 1,026 4 358 5A 5625B 2,293
Total 6,670 ac
NG-259
G-258
G-305 A-V
G-304 A-J
G-254 A-I
G-327 A
G-306 A-J
G-256
G-257L-7
Canal
DischargeCanal
G-252 H-J
S-5AS
G-300
G-303
G-302
G-308
G-309
S-5A
G-251
G-310
G-250 S
G-253 A-J
P
G-255
G-301
2B 470
1B 745
Cell 5B
Limerock Berm
G-327 B
G-307
G-311
Figure 4-10. STA-1W enhancements (not to scale).

Chapter 4 Volume I: The South Florida Environment
4-32
STA-2
Stormwater Treatment Area 2 (STA-2) contains approximately 6,430 acres of effective treatment area arranged in three parallel flow-ways. The eastern flow-way (Cell 1) consists of approximately 1,990 acres of effective treatment area. The center flow-way (Cell 2) consists of approximately 2,220 acres of effective treatment area. The western flow-way (Cell 3) consists of approximately 2,220 acres of effective treatment area. A schematic of STA-2 is presented in Figure 4-11. Based on the simulated 1965–1995 period of flow, the STA should receive a long-term average of approximately 232,759 ac-ft. Actual deliveries will vary based on hydrologic conditions in the basins.
Water enters STA-2 from the S-6 and G-328 pump stations, is distributed by the inflow canal across the north end of the treatment cells, and flows via gravity south through the three treatment cells. Treated water is collected and discharged to WCA-2A via the G-335 outflow pump station. Discharges are directed to areas within WCA-2A that are already impacted by elevated nutrient levels.
WCA-2A
S-6
G-334
G-328G-336 A-F
S-7
G-338
Cell 3 Cell 2 Cell 11990 acres2220 acres2220 acres
G-330 A-EG-332G-335
G-331 A-G G-329 A-D
G-337
G-333 A-E
G-337A
G-336G
3,400-ft gap in levee
S-6
G-334
G-328G-336 A-F
S-7
G-338
1990 acres2220 acres2220 acres
G-330 A-EG-332G-335
G-331 A-G G-329 A-D
G-337
G-333 A-E
G-337A
NG-336G
3,400-ft gap in levee
Figure 4-11. Schematic of STA-2 (not to scale).

2006 South Florida Environmental Report Chapter 4
4-33
STA-2 OPERATIONS
Start-up operations for STA-2 began upon the completion of the three treatment cells in 1999. At that time, water levels were maintained for optimal growth of desired vegetation. Inflow to STA-2 began in June 1999 from G-328, the 450-cfs pump station. Construction of the 3,040-cfs outflow pump station G-335 was completed in 2000, with the final operational testing completed in October 2000. The final construction component (connection of the S-6 pump station to the inflow canal) was completed during the dry season of 2001, a schedule that minimized the potential downtime of pump station S-6. The outflow structures in Cell 1 (G-330s) were retrofitted with weir plates to increase water depths in the cell, which should reduce the frequency and duration of drydowns within the cell.
All treatment cells were operational during WY2005. During WY2005, 316,273 ac-ft of water was captured and treated by STA-2 (Table 4-4). This was about 36 percent greater than the anticipated long-term average annual flow contemplated during design, although annual variability was anticipated. This inflow loading was equal to an average hydraulic load of 4.1 cm/d over the treatment area. The annual volume of treated water discharged to WCA-2A was 371,023 ac-ft. The difference between the inflow and outflow volumes reflects the net contributions of direct rainfall, ET, seepage losses to adjacent lands, deep percolation, and flow measurement error. A summary of monthly flows is presented in Figure 4-12. During WY2005, STA-2 received 11,994 ac-ft from Lake Okeechobee. There was not any flow diverted around STA-2 during WY2005.
STA-2
-
20,000
40,000
60,000
80,000
100,000
120,000
Flow
(ac-
ft/m
onth
)
Inflow Outflow
Inflow 2,104 12,866 16,609 85,647 95,858 27,053 7,074 784 5,282 9,740 49,437 3,818
Outflow 388 8,268 20,338 96,114 107,053 43,575 11,307 803 5,197 4,661 67,433 5,885
May-04 Jun-04 Jul-04 Aug-04 Sep-04 Oct-04 Nov-04 Dec-04 Jan-05 Feb-05 Mar-05 Apr-05
Figure 4-12. Summary of WY2005 flows for STA-2. All treatment cells were operational during WY2005.

Chapter 4 Volume I: The South Florida Environment
4-34
STA-2 HURRICANE IMPACTS
Both hurricanes Frances and Jeanne had an impact on STA-2. During Hurricane Frances, a large amount of SAV (mostly hydrilla, Hydrilla verticillata) was piled onto the northern levee banks of Cells 2 and 3 along with some of the cattails. Minor damage was done to some of the plastic covers for the structure stems. During Hurricane Jeanne, G-335 was shut down for 12 hours due to electrical problems. Damage was also done to the northeastern levee of Cell 3.
STA-2 VEGETATION MANAGEMENT
At STA-2, Treatment Cells 1 and 2 are managed for emergent vegetation and Cell 3 is managed as a SAV dominated cell. The water depth within the treatment cells, along with herbicide application are used to manage the vegetation types. The target water stages to encourage the dominant vegetation types are listed in the operations plan for each treatment cell. In Cell 3, although a majority of the cell is SAV, 500 acres of emergent cattail marsh exists in the southeastern section. It has been identified in the Long-Term Plan that this emergent portion be converted to SAV. Due to the performance of this cell and the pending results of the STA-3/4 demonstration project, this conversion will be deferred. To accelerate and encourage SAV establishment, the SAV in Cell 3 was used to inoculate treatment in STA-3/4, Cell 2B. A harvester was used to gather up the SAV, and helicopters were used to transport the plant material and drop it into 50 different locations within the treatment cell at STA-3/4. Research monitoring was performed to document plant growth. Vegetation coverage maps from December 2003 are found in Appendix 4-12 of the 2005 SFER – Volume I.
Specific Condition 13(b) of the EFA permit requires that the annual report include information regarding the application of herbicides to exclude and/or eliminate undesirable vegetation within the treatment cells. In WY2005, the District treated 275 acres and applied a total of 6.5 gallons of an herbicide containing the active ingredient glyphosate and 1.75 gallons of an herbicide containing the active ingredient imazapyr to control torpedograss and cattail, and 67 gallons of an herbicide containing the active ingredient diquat to control FAV and cattail in Cells 2 and 3. Both aerial and ground-based spray equipment were used to apply these herbicides. Additionally, to study the effectiveness of varying herbicide dosages in reducing hydrilla coverage, one treatment was conducted in STA-2, Cell 3 using 285 gallons of an herbicide containing the active ingredient endothall.
STA-2 PERMIT STATUS
Monitoring data collected for STA-2 demonstrates that this treatment area was in compliance with the EFA and NPDES operating permits for WY2005 and that discharges do not pose any known danger to public health, safety, or welfare. The EFA and NPDES operating permits were issued for this project on September 29, 2000. Each treatment cell in STA-2 operates independently, and the permits authorize discharges when net improvement in TP and mercury is demonstrated for each cell.
Currently STA-2 is in the stabilization phase, having demonstrated net improvement in TP and mercury. In addition, Specific Condition 14(B) of the EFA permit states that STA-2 will remain in the stabilization phase of operation until STA-1E and STA-3/4 begin full capacity flow-through operations. STA-3/4 is in flow-through operations. STA-1E received a permit to discharge from all treatment cells except for Cells 1 and 2. These cells will remain off-line until construction of the PSTA demonstration project is completed (expected completion date is

2006 South Florida Environmental Report Chapter 4
4-35
October 2006). Until STA-1E is in full capacity flow-through operations,, STA-2 will remain in the stabilization phase of operation.
STA-2 TOTAL PHOSPHORUS
Under the design objectives of the EFA, STA-2 is achieving its interim discharge goal of less than 50 ppb for TP. The hydraulic loading to STA-2 was 1.4 times greater than the long-term design criteria and the TP loading to the system was about 1.7 times greater than the long-term design amount. During WY2005, the STA received 49.1 mt of TP, equal to a nutrient loading rate of 1.9 g/m2 (Table 4-4). During WY2005, STA-2 received approximately 2.5 mt of TP from Lake Okeechobee. STA-2 removed approximately 39.9 mt of TP during WY2005. Monthly discharge concentrations were considerably lower than inflow concentrations. Summaries of monthly TP loads and FWM TP concentrations are presented in Figures 4-13 and 4-14, respectively. The annual FWM outflow concentration was 20 ppb, an 84 percent reduction from the inflow concentration of 126 ppb. For informational purposes, the annual geometric mean discharge TP concentration for STA-2 was 19 ppb for WY2005. If an outflow concentration of less than 50 ppb in accordance with the EFA permit for STA-2 had been achieved, then Cells 2 and 3 would have passed the stabilization phase if not for the requirement that STA-2 should remain in the stabilization phase until STA-1E and STA-3/4 begin full flow-through operation. The 12-month moving average TP concentration from STA-2 increased from 14–20 ppb during the course of WY2005 (Figure 4-15).

Chapter 4 Volume I: The South Florida Environment
4-36
STA-2
0
50
100
150
200
Tota
l Pho
spho
rus
(ppb
)
Inflow Outflow
Inflow 30 72 68 102 189 105 96 72 84 141 107 34
Outflow 12 21 15 15 20 31 28 12 15 29 21 25
May-04 Jun-04 Jul-04 Aug-04 Sep-04 Oct-04 Nov-04 Dec-04 Jan-05 Feb-05 Mar-05 Apr-05
Figure 4-14. Summary of WY2005 TP concentrations for STA-2. All treatment cells were operational during WY2005.
Figure 4-13. Summary of WY2005 TP loads for STA-2. All treatment cells were operational during WY2005.
STA-2
-
5,000
10,000
15,000
20,000
25,000To
tal P
hosp
horu
s Lo
ad (k
g)
Inflow Outflow
Inflow 78 1,145 1,391 10,776 22,404 3,492 839 70 545 1,692 6,530 159
Outflow 6 215 365 1,768 2,578 1,677 384 12 98 164 1,779 183
May-04 Jun-04 Jul-04 Aug-04 Sep-04 Oct-04 Nov-04 Dec-04 Jan-05 Feb-05 Mar-05 Apr-05

2006 South Florida Environmental Report Chapter 4
4-37
Figure 4-15. Comparison of monthly to 12-month moving average TP concentrations for WY2005 for STA-2 outflow.
All treatment cells were operational during WY2005.
STA-2
0
5
10
15
20
25
30
35
Tota
l Pho
spho
rus
(ppb
)
Outflow 12 21 15 15 20 31 28 12 15 29 21 25
12 mo. Moving FWM 14 14 14 15 16 19 19 19 19 20 20 20
May-04
Jun-04 Jul-04 Aug-04
Sep-04 Oct-04 Nov-04 Dec-04 Jan-05 Feb-05 Mar-05 Apr-05

Chapter 4 Volume I: The South Florida Environment
4-38
STA-2 OTHER WATER QUALITY PARAMETERS
The monitoring data for the water year for non-phosphorus parameters at STA-2 during this reporting period are presented in Appendix 4-5 and are summarized in Table 4-9. Compliance with the EFA permit is determined based on the following three part assessments:
1. If the annual average outflow concentration does not cause or contribute to violations of applicable Class III water quality standards, then STA-2 shall be deemed in compliance.
2. If the annual average concentration at the outflow causes or contributes to violations of applicable Class III water quality standards, but it does not exceed or is equal to the annual average concentration at the inflow stations, then STA-2 shall be deemed in compliance.
3. If the annual average concentration at the outflow causes or contributes to violations of applicable Class III water quality standards, and it also exceeds the annual average concentration at the inflow station, then STA-2 shall be deemed out of compliance.
Discharges from STA-2 were determined to be in compliance with the permit by satisfying criterion one above for all non-phosphorus and non-DO parameters with applicable numeric state water standards. Additional requirements for DO are listed in Administrative Order AO-006-EV and are discussed below. Annual average concentrations of sulfate were slightly higher at the outflow than at the combined inflow. However, because this parameter has no applicable numeric state water quality standard, STA-2 is deemed to be in full compliance with the permit. Mercury monitoring results are discussed in Chapter 2B. An updated ecological risk assessment of mercury at STA-2 as it pertains to the bald eagle, wood stork, and snail kite is in Appendix 4-6, and the annual permit compliance monitoring report for mercury in the STAs is in Appendix 4-2.
The District has included the following documentation to satisfy the remaining monitoring requirements of the EFA permit:
• The District has performed all sampling and analysis under the latest Laboratory Quality Assurance Manual (SFWMD, dated January 3, 2005) and a Field Quality Assurance Manual (SFWMD, dated January 3, 2005).
• A signed copy of these statements is provided in Appendix 4-3 of this volume.
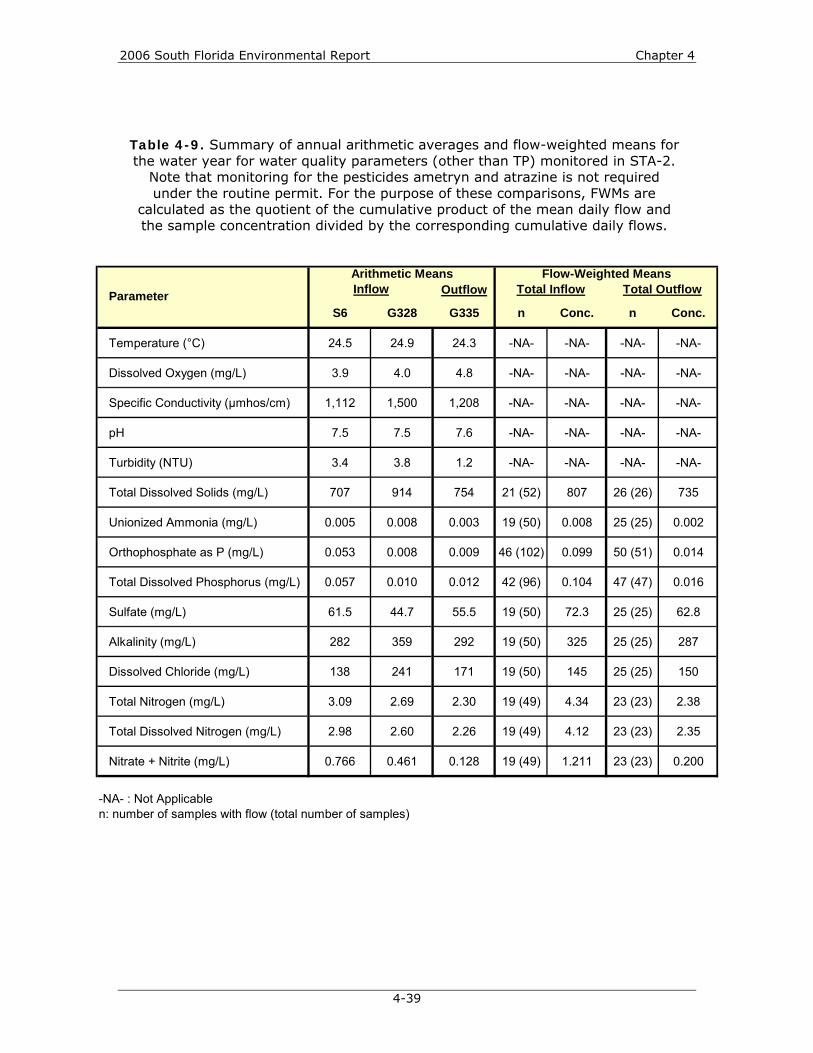
2006 South Florida Environmental Report Chapter 4
4-39
Table 4-9. Summary of annual arithmetic averages and flow-weighted means for the water year for water quality parameters (other than TP) monitored in STA-2.
Note that monitoring for the pesticides ametryn and atrazine is not required under the routine permit. For the purpose of these comparisons, FWMs are
calculated as the quotient of the cumulative product of the mean daily flow and the sample concentration divided by the corresponding cumulative daily flows.
Outflow
S6 G328 G335 n Conc. n Conc.
Temperature (°C) 24.5 24.9 24.3 -NA- -NA- -NA- -NA-
Dissolved Oxygen (mg/L) 3.9 4.0 4.8 -NA- -NA- -NA- -NA-
Specific Conductivity (µmhos/cm) 1,112 1,500 1,208 -NA- -NA- -NA- -NA-
pH 7.5 7.5 7.6 -NA- -NA- -NA- -NA-
Turbidity (NTU) 3.4 3.8 1.2 -NA- -NA- -NA- -NA-
Total Dissolved Solids (mg/L) 707 914 754 21 (52) 807 26 (26) 735
Unionized Ammonia (mg/L) 0.005 0.008 0.003 19 (50) 0.008 25 (25) 0.002
Orthophosphate as P (mg/L) 0.053 0.008 0.009 46 (102) 0.099 50 (51) 0.014
Total Dissolved Phosphorus (mg/L) 0.057 0.010 0.012 42 (96) 0.104 47 (47) 0.016
Sulfate (mg/L) 61.5 44.7 55.5 19 (50) 72.3 25 (25) 62.8
Alkalinity (mg/L) 282 359 292 19 (50) 325 25 (25) 287
Dissolved Chloride (mg/L) 138 241 171 19 (50) 145 25 (25) 150
Total Nitrogen (mg/L) 3.09 2.69 2.30 19 (49) 4.34 23 (23) 2.38
Total Dissolved Nitrogen (mg/L) 2.98 2.60 2.26 19 (49) 4.12 23 (23) 2.35
Nitrate + Nitrite (mg/L) 0.766 0.461 0.128 19 (49) 1.211 23 (23) 0.200
-NA- : Not Applicablen: number of samples with flow (total number of samples)
Parameter
Arithmetic Means Flow-Weighted MeansTotal Inflow Total OutflowInflow
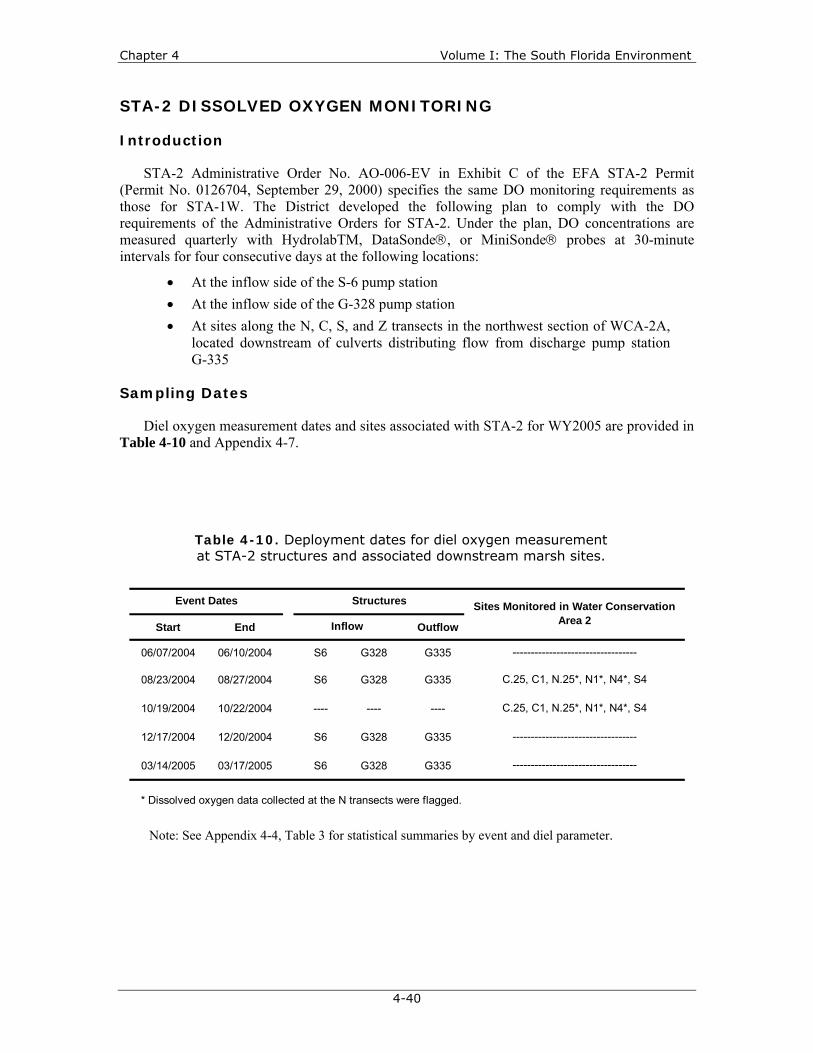
Chapter 4 Volume I: The South Florida Environment
4-40
STA-2 DISSOLVED OXYGEN MONITORING
Introduction
STA-2 Administrative Order No. AO-006-EV in Exhibit C of the EFA STA-2 Permit (Permit No. 0126704, September 29, 2000) specifies the same DO monitoring requirements as those for STA-1W. The District developed the following plan to comply with the DO requirements of the Administrative Orders for STA-2. Under the plan, DO concentrations are measured quarterly with HydrolabTM, DataSonde®, or MiniSonde® probes at 30-minute intervals for four consecutive days at the following locations:
• At the inflow side of the S-6 pump station • At the inflow side of the G-328 pump station • At sites along the N, C, S, and Z transects in the northwest section of WCA-2A,
located downstream of culverts distributing flow from discharge pump station G-335
Sampling Dates
Diel oxygen measurement dates and sites associated with STA-2 for WY2005 are provided in Table 4-10 and Appendix 4-7.
Note: See Appendix 4-4, Table 3 for statistical summaries by event and diel parameter.
Table 4-10. Deployment dates for diel oxygen measurement at STA-2 structures and associated downstream marsh sites.
Start End Outflow
06/07/2004 06/10/2004 S6 G328 G335
08/23/2004 08/27/2004 S6 G328 G335
10/19/2004 10/22/2004 ---- ---- ----
12/17/2004 12/20/2004 S6 G328 G335
03/14/2005 03/17/2005 S6 G328 G335
* Dissolved oxygen data collected at the N transects were flagged.
C.25, C1, N.25*, N1*, N4*, S4
----------------------------------
Event Dates Structures Sites Monitored in Water Conservation Area 2Inflow
C.25, C1, N.25*, N1*, N4*, S4
----------------------------------
----------------------------------

2006 South Florida Environmental Report Chapter 4
4-41
Comparison of Dissolved Oxygen in STA-2 Discharges with Dissolved Oxygen at Downstream WCA-2A Sites
Direct comparisons of DO in STA-2 discharges with DO at downstream marsh sites in WCA-2A (Figure 4-16) cannot be made for all monitoring events in WY2005 because Hydrolab™ deployment dates differed. However, to satisfy permit requirements, summary statistics for STA-2 discharges and WCA-2A marsh transect sites are presented in Table 4-11. Notched box and whisker plots for the sites are presented in Figure 4-17. The complete data sets collected at all sites during WY2005 are found in Appendix 4-6 of the 2005 SFER – Volume I.
The data indicate that diel DO concentrations in G-335 discharges were statistically greater than DO concentrations at all of the marsh transect sites. DO at site S4 was significantly greater than at the other marsh sites.
Figure 4-16. DO monitoring sites in WCA-2.
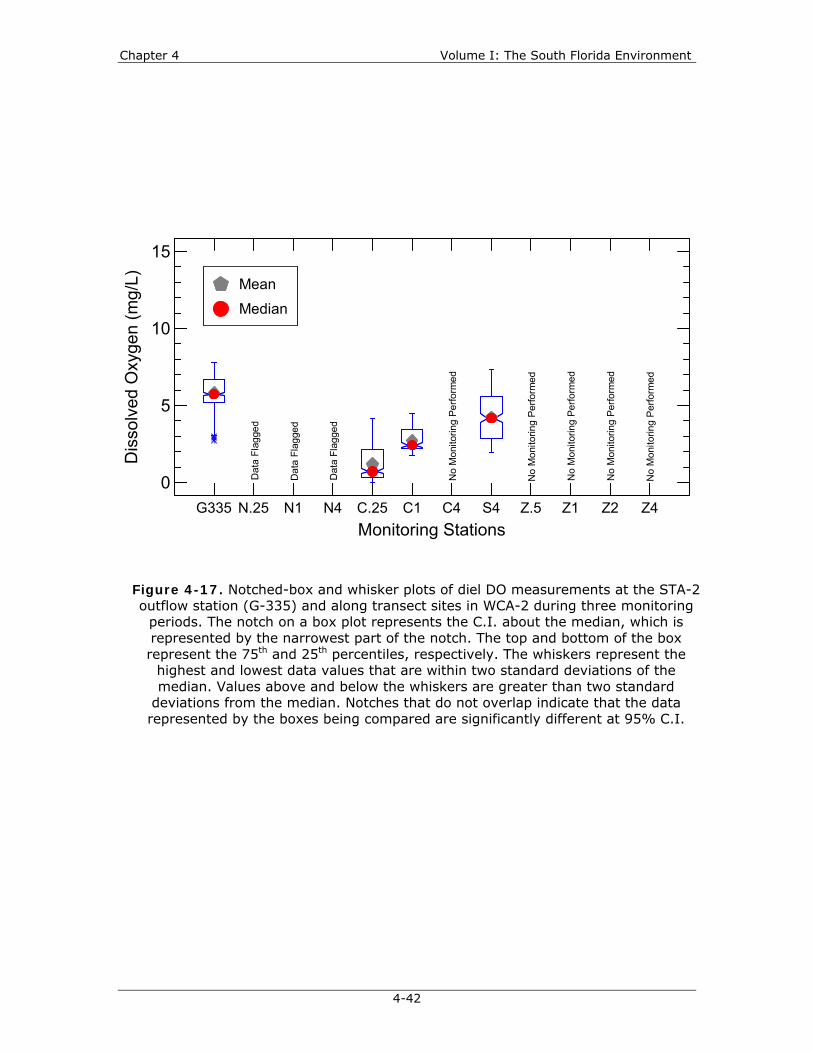
Chapter 4 Volume I: The South Florida Environment
4-42
Figure 4-17. Notched-box and whisker plots of diel DO measurements at the STA-2 outflow station (G-335) and along transect sites in WCA-2 during three monitoring
periods. The notch on a box plot represents the C.I. about the median, which is represented by the narrowest part of the notch. The top and bottom of the box represent the 75th and 25th percentiles, respectively. The whiskers represent the
highest and lowest data values that are within two standard deviations of the median. Values above and below the whiskers are greater than two standard
deviations from the median. Notches that do not overlap indicate that the data represented by the boxes being compared are significantly different at 95% C.I.
G335 N.25 N1 N4 C.25 C1 C4 S4 Z.5 Z1 Z2 Z4Monitoring Stations
0
5
10
15
Dis
solv
ed O
xyge
n (m
g /L) Mean
Median
No
Mon
itorin
g Pe
rform
ed
No
Mon
itorin
g Pe
rform
ed
No
Mon
itorin
g Pe
rform
ed
No
Mon
itorin
g Pe
rform
ed
No
Mon
itorin
g Pe
rform
ed
Dat
a Fl
agge
d
Dat
a Fl
agge
d
Dat
a Fl
agge
d

2006 South Florida Environmental Report Chapter 4
4-43
Table 4-11. Statistical summary of diel DO at the outflow pump station from STA-2 and marsh stations in WCA-2 during WY2004.
Outflow G335 574 5.84 2.69 5.75 7.80 1.16
C.25 340 1.26 ---- 0.74 4.19 1.20
C1 179 2.76 1.76 2.44 4.52 0.72
N1 ---- ---- ---- ---- ---- ----
N4 ---- ---- ---- ---- ---- ----
Transect S S4 179 4.27 1.95 4.19 7.32 1.51
Z.5 ---- ---- ---- ---- ---- ----
Z1 ---- ---- ---- ---- ---- ----
Z2 ---- ---- ---- ---- ---- ----
Transect N
Transect Z
Standard DeviationLocation Station Number of
Measurements Mean Minimum Median Maximum
Transect C

Chapter 4 Volume I: The South Florida Environment
4-44
HYDROLOGIC AND HYDRAULIC ASSESSMENT [BC84(3)] AND INTERNAL MEASUREMENTS [BC84(4)]
The steady-state performance model used in the design of the STAs (Burns & McDonnell, 1993) assumed plug-flow hydraulics. However, tracer studies conducted in STA-1W, Cells 1 and 4, have documented that flow patterns can depart markedly from ideal plug-flow conditions and that large short-circuits may exist (DBEL, 2000; 2003). It is thought that hydraulic inefficiency can reduce TP removal in the STAs (Kadlec, 2000). These non-ideal flow patterns typically will persist until flow is redistributed by some structural means, such as the addition of a levee perpendicular to the direction of flow that subdivides the treatment cell into two smaller areas.
The objective of the Hydrologic and Hydraulic Assessment Project [BC84(3)] is to conduct tracer studies to characterize the hydraulics (i.e., retention time and flow distribution) of Cell 3 in STA-2 both before and after the construction of an internal levee. The objective of the Internal Measurements Project [BC84(4)] is to document the spatial variability of TP concentrations in surface water within Cell 3 based on synoptic grab samples collected during both tracer studies. Work on both projects is being administered through a single contract, which began in October 2004. The final report documenting the first tracer project and associated synoptic internal measurements was submitted in October 2005 and is reprinted in Appendix 4-8 of this volume (also, see the District’s web site at www.sfwmd.gov/org/erd/longtermplan/documents.shtml.)
Approximately 8,524 liters of lithium chloride (LiCl) tracer were distributed among the five inflow culverts of STA-2, Cell 3, a large (2,220-acre) SAV-dominated wetland. Lithium concentrations were monitored at the outflow structure in addition to synoptic monitoring of a network of internally located sampling stations to characterize the internal profiles of both lithium and phosphorus.
Wetland inflow volumes exceeded outflows for much of the study, resulting in increasing stages during the tracer assessment. A water balance was performed to confirm the accuracy of the District’s inflow and outflow data. Approximately 90 percent of inflows were accounted for with measured outflows or stage change. The remaining 10 percent was thought to be due to a combination of seepage and measurement errors.
The lithium tracer reached the outflow structure around six days after tracer injection with the peak outflow lithium concentration (220 micrograms per liter, or μg/L) being observed one day later. Internal monitoring demonstrated that the tracer proceeded most rapidly along the western and central portions of the cell that were regions dominated by SAV. There was a lag in tracer passage through the eastern portion of the cell, which is dominated by cattail and sawgrass. However, both the outflow tracer response curve and the internal tracer profiles generally depicted relatively efficient hydraulic characteristics.
Internal sampling of water column phosphorus species during the study revealed TP levels exceeding 100 μg/L near the inflow region of the cell, but dropped markedly in the downstream half of the wetland. Declines in soluble reactive phosphorus were even more rapid with distance from the inflow location.
Tracer recovery, based on comparing the mass of lithium injected with that recovered at the cell outflow, was 96.6 percent. Lithium concentrations in the seepage return canal remained near background levels during the study. The measured Cell 3 hydraulic retention time (HRT), based on the tracer data, was determined to be 10.8 days, which was identical to the nominal HRT

2006 South Florida Environmental Report Chapter 4
4-45
calculated for the varying flow and stage conditions that prevailed during the study. The tracer data indicated that Cell 3 was hydraulically efficient; it had a tank-in-series value of 5.5.
STA-2 RECREATION
Recreational facilities are proposed to provide public access to STA-2. The proposed recreational facilities include a parking area along the east side of U.S. Highway 27, an information kiosk, a composting toilet, landscaping, and a canoe launching site for access to canals and deepwater areas outside the treatment footprint of the STA. Pedestrian gates, vehicle gates, signage and fencing as needed to define public access areas and to protect sensitive equipment are also proposed The proposed recreational facilities will be located just east of the Okeelanta property bridge that will provide access from U.S. Highway 27
STA-2 EXPANSION & ENHANCEMENTS [BC30]
Expansion of STA-2 includes the construction of a 1,813-acre treatment cell (i.e., a new Cell 4) that will operate in parallel with existing Cells 1, 2, and 3. The design of the new Cell 4 is scheduled to be completed in October 2005. Construction of the new Cell 4 is scheduled to begin in early FY2006 and be completed in July 2007, with the cell being flow-capable by December 31, 2006. The design and construction of Cell 4 is being implemented under the District’s Acceler8 program as part of the Everglades Agricultural Area (EAA) STA Expansion Project. For additional information on the status of the Acceler8 program, see Chapter 7A of this volume.
Enhancements to STA-2 (Figure 4-18) include construction of interior levees and associated water control structures in each of the three existing treatment cells (Cells 1, 2 and 3), as well as conversion of emergent vegetation to SAV in the new downstream cells. The new interior levees, water control structures, and vegetation conversion in existing Cells 1, 2, and 3 are scheduled to occur in a phased approach following commencement of flow-through operation in Cell 4. It is anticipated that the status of these additional enhancement projects will be included in future South Florida Environmental Reports.
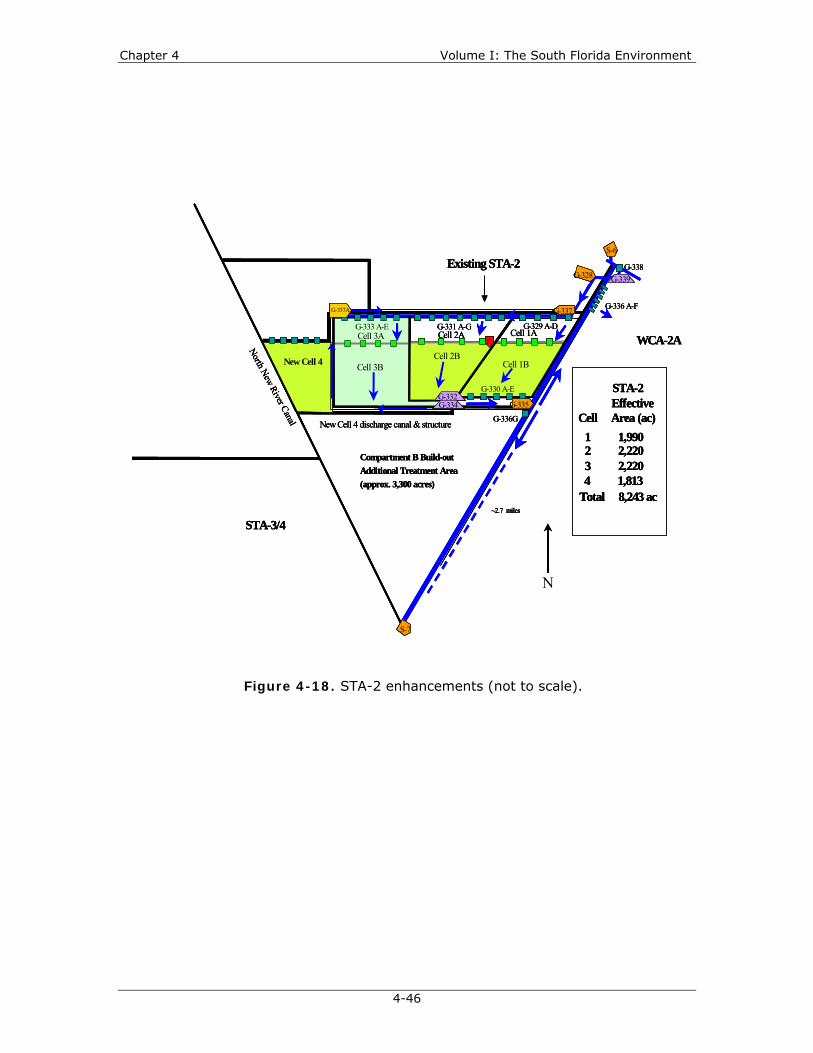
Chapter 4 Volume I: The South Florida Environment
4-46
4 1,813
STA-2
North New River Canal New Cell 4 discharge canal & structure
Existing STA-2
Cell 2ACell 3A Cell 1A
EffectiveCell Area (ac)
1 1,9902 2,220 3 2,220
Total 8,243 ac
G-331 A-G
G-336 A-F
G-329 A-DG-333 A-E
G-330 A-E
G-336G
WCA-2A
G-338
G-335
Cell 3BCell 2B
Cell 1B
P
G-337A
G-332G-334
S-6
G-337
G-328 G-339
~2.7 miles
S-7
New Cell 4
Compartment B Build-out Additional Treatment Area(approx. 3,300 acres)
STA-3/4
4 1,813
STA-2
North New River Canal New Cell 4 discharge canal & structure
Existing STA-2
Cell 2ACell 3A Cell 1A
EffectiveCell Area (ac)
1 1,9902 2,220 3 2,220
Total 8,243 ac
G-331 A-G
G-336 A-F
G-329 A-DG-333 A-E
G-330 A-E
G-336G
WCA-2A
G-338
N
G-335
Cell 3BCell 2B
Cell 1B
P
G-337A
G-332G-334
S-6
G-337
G-328 G-339
~2.7 miles
G-339
~2.7 miles
S-7
New Cell 4
Compartment B Build-out Additional Treatment Area(approx. 3,300 acres)
STA-3/4
Figure 4-18. STA-2 enhancements (not to scale).

2006 South Florida Environmental Report Chapter 4
4-47
STA-3/4
Stormwater Treatment Area 3/4 (STA-3/4) is the largest of the STAs, with approximately 16,543 acres of effective treatment area. A schematic of STA-3/4 is presented in Figure 4-19. During an average year, STA-3/4 should receive approximately 400,000 ac-ft of runoff from upstream basins, and approximately 250,000 ac-ft of Lake Okeechobee releases. At the design performance of 50 ppb, the STA should remove more than 50 tons of phosphorus. STA-3/4 uses the existing S-7 and S-8 pump stations as the outflow facilities. Refurbishment of those stations is under way.
STA-3/4 achieved full flow-through operation on September 16, 2004. Although construction was not wholly complete by the October 1, 2003 target date, the facilities were sufficiently complete to begin start-up operations by October 1, 2003. During the start-up period, some of the water control structures were manually operated. Full electrical operation of all structures was achieved on May 20, 2004, at which time the STA treatment works was deemed complete. Flow-way 1 (Cells 1A and 1B) has been in flow-through since February 2004. The Western Flow-way (Cell 3) began flow-through in June 2004, was temporarily taken off-line between October 2004 through June 2005 to implement Long-Term Plan enhancements (construction of a compartmentalization levee with associated canals and water control structures and conversion of about 2,427 acres of emergent vegetation to SAV), then was returned to service with a partial flow capacity of about 800 cfs around June 13, 2005. A 200-foot gap was put into the western end of the Cell 3 levee to allow flow-through while the Long-Term Plan construction is completed. Flow-way 2 was intentionally kept off-line until after performance enhancements (conversion of vegetation in the southern cell from emergent to SAV from fall 2003 through the summer 2004. In order to minimize flow velocities in the area that was transplanted with vegetation in Cell 2B (see Vegetation Management Demonstration Project in STA-3/4, Cell 2B (BC25) section), discharges did not occur until September 16, 2004. The 2,542-acre Cell 2A was inundated in October 2003 and presently is fully vegetated. The 2,894-acre Cell 2B is the site of the new 400-acre demonstration project of periphyton-based STA (PSTA) and is also the location of a massive vegetation conversion to SAV. On September 16, 2004, the remaining 5,436 acre Flow-way 2 (Cells 2A and 2B) began discharging.

Chapter 4 Volume I: The South Florida Environment
4-48
G-380 A-F G-377 A-E G-374 A-F
G-381 A-F
G-376 A-F
G-375 A-F
G-379 A-E
G-378 A-E
G-383
G-382AG-382B
G-357S-150
Inflow Canal
NNRCanal
Cell 1A
Cell 1B
Cell 2A
Cell 2B
Cell 3
Holey Land(Toe of the Boot)
WCA 3A
N
Supply Canal
L-5 Canal
Cell 3 Discharge Canal
Discharge Canal
Auxiliary SeepagePump Station
Borrow Pits
~10 miles
~8 miles
EffectiveCell Area (ac)1A 3,0391B 3,4882A 2,5422B 2,894 3 4,580
Total 16,543 ac
G-372
G-370
S-7
S-8
G-404
G-371
Figure 4-19. Schematic of STA-3/4 (not to scale).

2006 South Florida Environmental Report Chapter 4
4-49
STA-3/4 OPERATIONS
During WY2005, inflow to STA-3/4 through G-370 and G-372 was 671,442 ac-ft, equal to an average hydraulic loading rate of 4.1 cm/d over the effective treatment area of the STA (Table 4-4). These inflows were slightly higher (2 percent) than the long-term average annual simulated inflow for this STA, although annual variability was anticipated. The volume of treated water discharged from STA-3/4 was 648,872 ac-ft. A summary of monthly flows during WY2005 is presented in Figure 4-20.
The construction of diversion structures G-371 and G-373 is also part of STA-3/4. These structures, located outside the treatment area, will improve the hydraulic diversion of flows into the STA, prevent recirculation of treated water from south of the structures; allow water supply deliveries to the Water Conservation Areas, the Lower East Coast, and the Big Cypress Basin Seminole Indian Reservation; and allow diversion of storms from upstream basins. Before these structures were completed, the District installed earthen plugs across the North New River Canal on September 1, 2004 by the G-371 structure and in the Miami Canal on January 8, 2005 by the G-373 structure. The earthen plugs were removed on June 13, 2005 in response to heavy rains and high storm flows to allow diversion for flood control purposes. However, the gates at G-371 were able to be lowered and there was no diversion around STA-3/4 along the North New River Canal. On July 8, 2005, the gates in G-373 were installed, blocking all flow through the structure and there was no diversion around STA-3/4 along the Miami Canal after that time. The plug in the North New River Canal was reinstalled in early September 2005 (around September 3, 2005) and the plug in the Miami Canal was reinstalled in early January 2005 (around January 8, 2005). During the construction of G-371 and G-373 and before the plugs were reinstalled, there was diversion around STA-3/4 through structures S-7, S-150, S-8, and G-404/G-357 of 212,361 ac-ft (8.9 mt of TP with a flow-weighted mean TP average of 34 ppb) in WY2005.
STA-3/4 HURRICANE IMPACTS
Strong winds and heavy rainfall impacted STA-3/4, although no damage was observed in the wetland.
STA-3/4 VEGETATION MANAGEMENT
At STA-3/4, Treatment Cells 1A, 2A, and 3A are managed as emergent vegetation. Cell 2B underwent a massive conversion from emergent vegetation to SAV, and Cells 1B and 3B will be converted to SAV within the next few years. Water depths within the treatment cells, along with herbicide applications and the use of fire (see BC25 below) are tools used to manage the vegetation communities. The target water stages to encourage the dominant vegetation types are listed in the operations plan. Specific Condition 13(b) of the EFA permit requires that the annual report include information regarding the application of herbicides to exclude and/or eliminate undesirable vegetation within the treatment cells. In STA-3/4, 3,866 acres were treated and 279.25 gallons of diquat was used to control floating vegetation and 2,576.1 gallons of glyphosate and 687.25 gallons of imazapyr were used to treat emergent grasses and cattail (Table 4-3).
VEGETATION MANAGEMENT [BC84(2)]
In STA-3/4, emphasis will be placed on controlling expanding emergent vegetation, mainly torpedograss and cattail, which appears in SAV cells. In addition to these proposed maintenance treatments, vegetation management have plans to treat the hardwood non-target species, consisting primarily of Brazilian pepper and melaleuca in STA-3/4.
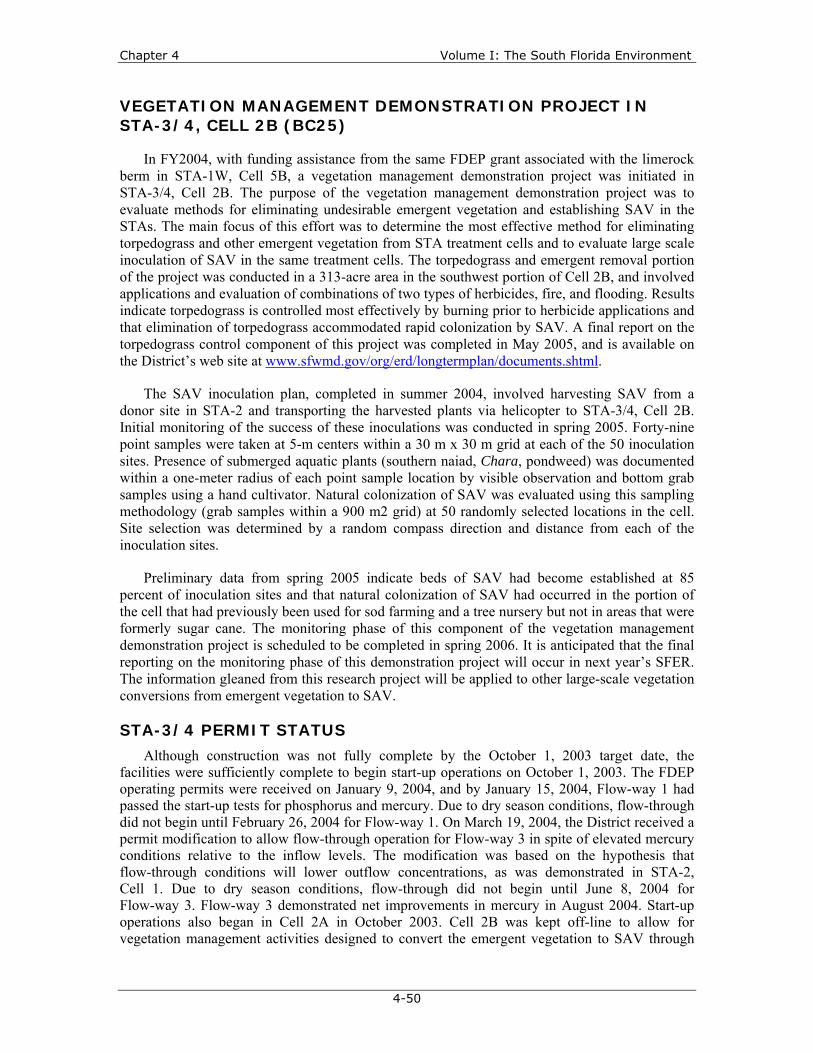
Chapter 4 Volume I: The South Florida Environment
4-50
VEGETATION MANAGEMENT DEMONSTRATION PROJECT IN STA-3/4, CELL 2B (BC25)
In FY2004, with funding assistance from the same FDEP grant associated with the limerock berm in STA-1W, Cell 5B, a vegetation management demonstration project was initiated in STA-3/4, Cell 2B. The purpose of the vegetation management demonstration project was to evaluate methods for eliminating undesirable emergent vegetation and establishing SAV in the STAs. The main focus of this effort was to determine the most effective method for eliminating torpedograss and other emergent vegetation from STA treatment cells and to evaluate large scale inoculation of SAV in the same treatment cells. The torpedograss and emergent removal portion of the project was conducted in a 313-acre area in the southwest portion of Cell 2B, and involved applications and evaluation of combinations of two types of herbicides, fire, and flooding. Results indicate torpedograss is controlled most effectively by burning prior to herbicide applications and that elimination of torpedograss accommodated rapid colonization by SAV. A final report on the torpedograss control component of this project was completed in May 2005, and is available on the District’s web site at www.sfwmd.gov/org/erd/longtermplan/documents.shtml.
The SAV inoculation plan, completed in summer 2004, involved harvesting SAV from a donor site in STA-2 and transporting the harvested plants via helicopter to STA-3/4, Cell 2B. Initial monitoring of the success of these inoculations was conducted in spring 2005. Forty-nine point samples were taken at 5-m centers within a 30 m x 30 m grid at each of the 50 inoculation sites. Presence of submerged aquatic plants (southern naiad, Chara, pondweed) was documented within a one-meter radius of each point sample location by visible observation and bottom grab samples using a hand cultivator. Natural colonization of SAV was evaluated using this sampling methodology (grab samples within a 900 m2 grid) at 50 randomly selected locations in the cell. Site selection was determined by a random compass direction and distance from each of the inoculation sites.
Preliminary data from spring 2005 indicate beds of SAV had become established at 85 percent of inoculation sites and that natural colonization of SAV had occurred in the portion of the cell that had previously been used for sod farming and a tree nursery but not in areas that were formerly sugar cane. The monitoring phase of this component of the vegetation management demonstration project is scheduled to be completed in spring 2006. It is anticipated that the final reporting on the monitoring phase of this demonstration project will occur in next year’s SFER. The information gleaned from this research project will be applied to other large-scale vegetation conversions from emergent vegetation to SAV.
STA-3/4 PERMIT STATUS
Although construction was not fully complete by the October 1, 2003 target date, the facilities were sufficiently complete to begin start-up operations on October 1, 2003. The FDEP operating permits were received on January 9, 2004, and by January 15, 2004, Flow-way 1 had passed the start-up tests for phosphorus and mercury. Due to dry season conditions, flow-through did not begin until February 26, 2004 for Flow-way 1. On March 19, 2004, the District received a permit modification to allow flow-through operation for Flow-way 3 in spite of elevated mercury conditions relative to the inflow levels. The modification was based on the hypothesis that flow-through conditions will lower outflow concentrations, as was demonstrated in STA-2, Cell 1. Due to dry season conditions, flow-through did not begin until June 8, 2004 for Flow-way 3. Flow-way 3 demonstrated net improvements in mercury in August 2004. Start-up operations also began in Cell 2A in October 2003. Cell 2B was kept off-line to allow for vegetation management activities designed to convert the emergent vegetation to SAV through
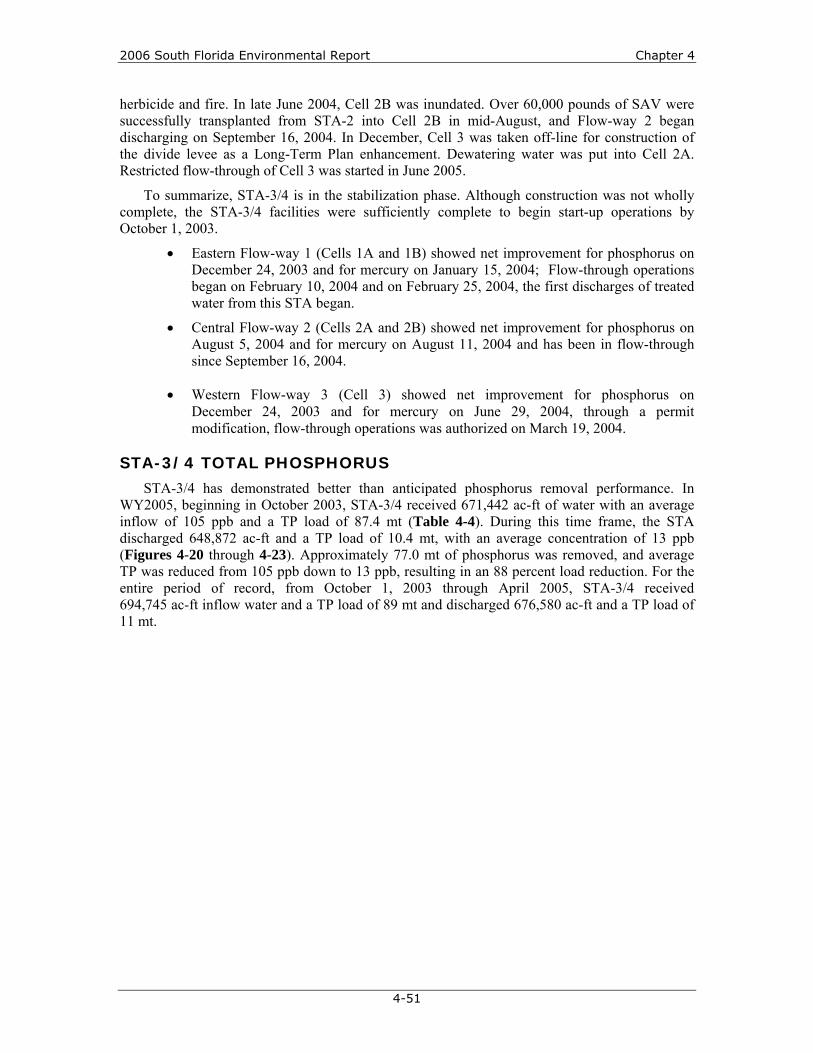
2006 South Florida Environmental Report Chapter 4
4-51
herbicide and fire. In late June 2004, Cell 2B was inundated. Over 60,000 pounds of SAV were successfully transplanted from STA-2 into Cell 2B in mid-August, and Flow-way 2 began discharging on September 16, 2004. In December, Cell 3 was taken off-line for construction of the divide levee as a Long-Term Plan enhancement. Dewatering water was put into Cell 2A. Restricted flow-through of Cell 3 was started in June 2005.
To summarize, STA-3/4 is in the stabilization phase. Although construction was not wholly complete, the STA-3/4 facilities were sufficiently complete to begin start-up operations by October 1, 2003.
• Eastern Flow-way 1 (Cells 1A and 1B) showed net improvement for phosphorus on December 24, 2003 and for mercury on January 15, 2004; Flow-through operations began on February 10, 2004 and on February 25, 2004, the first discharges of treated water from this STA began.
• Central Flow-way 2 (Cells 2A and 2B) showed net improvement for phosphorus on August 5, 2004 and for mercury on August 11, 2004 and has been in flow-through since September 16, 2004.
• Western Flow-way 3 (Cell 3) showed net improvement for phosphorus on December 24, 2003 and for mercury on June 29, 2004, through a permit modification, flow-through operations was authorized on March 19, 2004.
STA-3/4 TOTAL PHOSPHORUS
STA-3/4 has demonstrated better than anticipated phosphorus removal performance. In WY2005, beginning in October 2003, STA-3/4 received 671,442 ac-ft of water with an average inflow of 105 ppb and a TP load of 87.4 mt (Table 4-4). During this time frame, the STA discharged 648,872 ac-ft and a TP load of 10.4 mt, with an average concentration of 13 ppb (Figures 4-20 through 4-23). Approximately 77.0 mt of phosphorus was removed, and average TP was reduced from 105 ppb down to 13 ppb, resulting in an 88 percent load reduction. For the entire period of record, from October 1, 2003 through April 2005, STA-3/4 received 694,745 ac-ft inflow water and a TP load of 89 mt and discharged 676,580 ac-ft and a TP load of 11 mt.

Chapter 4 Volume I: The South Florida Environment
4-52
Figure 4-21. Summary of WY2005 TP loads for STA-3/4. Flow-way 1 was in operation during this entire period, Flow-way 2 began flow-though in September 2005, and
Flow-way 3 was off-line for Long-Term Plan enhancement construction.
STA-3/4
-
5,000
10,000
15,000
20,000
25,000
Tota
l Pho
spho
rus
Load
(kg)
Inflow Outflow
Inflow 90 4,098 3,669 15,976 23,327 4,241 - 5,933 1,180 6,362 9,742 12,752
Outflow - 530 368 2,368 2,534 1,001 - 254 289 441 1,845 781
May-04 Jun-04 Jul-04 Aug-04 Sep-04 Oct-04 Nov-04 Dec-04 Jan-05 Feb-05 Mar-05 Apr-05
Figure 4-20. Summary of WY2005 flow for STA-3/4. Flow-way 1 was in operation during this entire period, Flow-way 2 began flow-though in September 2005, and
Flow-way 3 was off-line for Long-Term Plan enhancement construction.
STA-3/4
-
50,000
100,000
150,000
200,000Fl
ow (a
c-ft/
mon
th)
Inflow Outflow
Inflow 1,400 44,163 36,323 175,200 165,241 43,367 - 28,073 11,235 28,269 89,378 48,793
Outflow - 24,860 24,401 172,881 169,039 64,549 - 24,090 19,385 26,074 84,832 38,763
May-04 Jun-04 Jul-04 Aug-04 Sep-04 Oct-04 Nov-04 Dec-04 Jan-05 Feb-05 Mar-05 Apr-05

2006 South Florida Environmental Report Chapter 4
4-53
Figure 4-22. Summary of WY2005 TP concentrations for STA-3/4. Flow-way 1 was in operation during this entire period, Flow-way 2
began flow-though in September 2005, and Flow-way 3 was off-line for Long-Term Plan enhancement construction.
STA-3/4
0
50
100
150
200
250To
tal P
hosp
horu
s (p
pb)
Inflow Outflow
Inflow 52 75 82 74 114 79 171 85 182 88 212
Outflow 17 12 11 12 13 9 12 14 18 16
May-04 Jun-04 Jul-04 Aug-04 Sep-04 Oct-04 Nov-04 Dec-04 Jan-05 Feb-05 Mar-05 Apr-05
Figure 4-23. Comparison of monthly to 12-month moving average TP concentrations for STA-3/4. Flow-way 1 was in operation during
this entire period, Flow-way 2 began flow-though in September 2005, and Flow-way 3 was off-line for Long-Term Plan enhancement construction.
STA-3/4
02468
101214161820
Tota
l Pho
spho
rus
(ppb
)
Outflow 17 12 11 12 13 9 12 14 18 16
12 mo. Moving FWM 12 12 12 12 13 13
May-04 Jun-04 Jul-04 Aug-04 Sep-04 Oct-04 Nov-04 Dec-04 Jan-05 Feb-05 Mar-05 Apr-05

Chapter 4 Volume I: The South Florida Environment
4-54
STA-3/4 OTHER WATER QUALITY PARAMETERS
The monitoring data for non-phosphorus parameters at STA-3/4 for the water year are presented in Appendix 4-16 and are summarized in Table 4-12. Compliance with the EFA permit is determined based on the following three part assessments:
1. If the annual average outflow concentration does not cause or contribute to violations of applicable Class III water quality standards, then STA-3/4 shall be deemed in compliance.
2. If the annual average concentration at the outflow causes or contributes to violations of applicable Class III water quality standards, but it does not exceed or is equal to the annual average concentration at the inflow stations, then STA-3/4 shall be deemed in compliance.
3. If the annual average concentration at the outflow causes or contributes to violations of applicable Class III water quality standards, and it also exceeds the annual average concentration at the inflow station, then STA-3/4 shall be deemed out of compliance.
In WY2005, Flow-way 1 was operated for the entire water year, although the water quality data shown in Table 4-12 is for all monitoring sites. The annual permit compliance measurements are applied only to the outflow from Flow-way 1 because it was the only treatment train in operation for the entire water year. Discharges from STA-3/4 were determined to be in compliance with the permit by satisfying criterion one above for all non-phosphorus with applicable numeric state water standards. Additional requirements for DO are listed in Administrative Order AO-006-EV will be implemented in WY2006. Annual average concentrations of total dissolved solids and dissolved chloride were slightly higher at the outflow that at the combined inflow. However, because these parameters have no applicable numeric state water quality standard, STA-3/4 is deemed to be in full compliance with the permit.
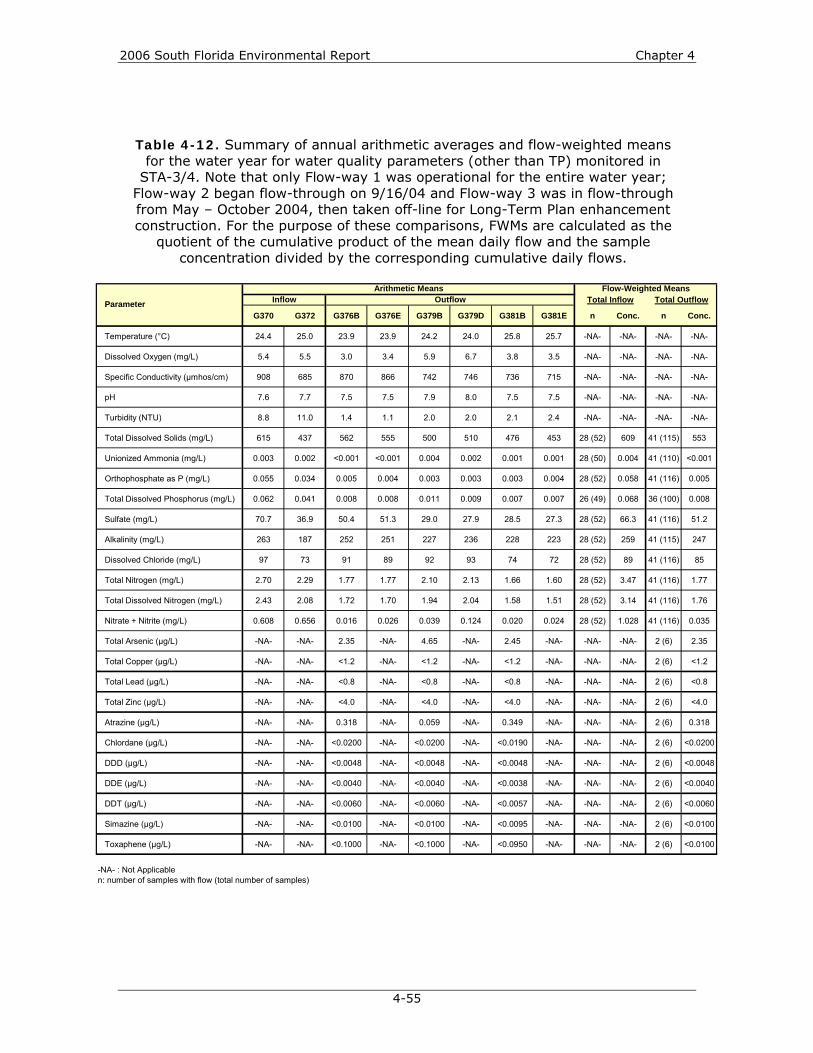
2006 South Florida Environmental Report Chapter 4
4-55
Table 4-12. Summary of annual arithmetic averages and flow-weighted means for the water year for water quality parameters (other than TP) monitored in
STA-3/4. Note that only Flow-way 1 was operational for the entire water year; Flow-way 2 began flow-through on 9/16/04 and Flow-way 3 was in flow-through from May – October 2004, then taken off-line for Long-Term Plan enhancement construction. For the purpose of these comparisons, FWMs are calculated as the
quotient of the cumulative product of the mean daily flow and the sample concentration divided by the corresponding cumulative daily flows.
G370 G372 G376B G376E G379B G379D G381B G381E n Conc. n Conc.
Temperature (°C) 24.4 25.0 23.9 23.9 24.2 24.0 25.8 25.7 -NA- -NA- -NA- -NA-
Dissolved Oxygen (mg/L) 5.4 5.5 3.0 3.4 5.9 6.7 3.8 3.5 -NA- -NA- -NA- -NA-
Specific Conductivity (µmhos/cm) 908 685 870 866 742 746 736 715 -NA- -NA- -NA- -NA-
pH 7.6 7.7 7.5 7.5 7.9 8.0 7.5 7.5 -NA- -NA- -NA- -NA-
Turbidity (NTU) 8.8 11.0 1.4 1.1 2.0 2.0 2.1 2.4 -NA- -NA- -NA- -NA-
Total Dissolved Solids (mg/L) 615 437 562 555 500 510 476 453 28 (52) 609 41 (115) 553
Unionized Ammonia (mg/L) 0.003 0.002 <0.001 <0.001 0.004 0.002 0.001 0.001 28 (50) 0.004 41 (110) <0.001
Orthophosphate as P (mg/L) 0.055 0.034 0.005 0.004 0.003 0.003 0.003 0.004 28 (52) 0.058 41 (116) 0.005
Total Dissolved Phosphorus (mg/L) 0.062 0.041 0.008 0.008 0.011 0.009 0.007 0.007 26 (49) 0.068 36 (100) 0.008
Sulfate (mg/L) 70.7 36.9 50.4 51.3 29.0 27.9 28.5 27.3 28 (52) 66.3 41 (116) 51.2
Alkalinity (mg/L) 263 187 252 251 227 236 228 223 28 (52) 259 41 (115) 247
Dissolved Chloride (mg/L) 97 73 91 89 92 93 74 72 28 (52) 89 41 (116) 85
Total Nitrogen (mg/L) 2.70 2.29 1.77 1.77 2.10 2.13 1.66 1.60 28 (52) 3.47 41 (116) 1.77
Total Dissolved Nitrogen (mg/L) 2.43 2.08 1.72 1.70 1.94 2.04 1.58 1.51 28 (52) 3.14 41 (116) 1.76
Nitrate + Nitrite (mg/L) 0.608 0.656 0.016 0.026 0.039 0.124 0.020 0.024 28 (52) 1.028 41 (116) 0.035
Total Arsenic (µg/L) -NA- -NA- 2.35 -NA- 4.65 -NA- 2.45 -NA- -NA- -NA- 2 (6) 2.35
Total Copper (µg/L) -NA- -NA- <1.2 -NA- <1.2 -NA- <1.2 -NA- -NA- -NA- 2 (6) <1.2
Total Lead (µg/L) -NA- -NA- <0.8 -NA- <0.8 -NA- <0.8 -NA- -NA- -NA- 2 (6) <0.8
Total Zinc (µg/L) -NA- -NA- <4.0 -NA- <4.0 -NA- <4.0 -NA- -NA- -NA- 2 (6) <4.0
Atrazine (µg/L) -NA- -NA- 0.318 -NA- 0.059 -NA- 0.349 -NA- -NA- -NA- 2 (6) 0.318
Chlordane (µg/L) -NA- -NA- <0.0200 -NA- <0.0200 -NA- <0.0190 -NA- -NA- -NA- 2 (6) <0.0200
DDD (µg/L) -NA- -NA- <0.0048 -NA- <0.0048 -NA- <0.0048 -NA- -NA- -NA- 2 (6) <0.0048
DDE (µg/L) -NA- -NA- <0.0040 -NA- <0.0040 -NA- <0.0038 -NA- -NA- -NA- 2 (6) <0.0040
DDT (µg/L) -NA- -NA- <0.0060 -NA- <0.0060 -NA- <0.0057 -NA- -NA- -NA- 2 (6) <0.0060
Simazine (µg/L) -NA- -NA- <0.0100 -NA- <0.0100 -NA- <0.0095 -NA- -NA- -NA- 2 (6) <0.0100
Toxaphene (µg/L) -NA- -NA- <0.1000 -NA- <0.1000 -NA- <0.0950 -NA- -NA- -NA- 2 (6) <0.0100
-NA- : Not Applicablen: number of samples with flow (total number of samples)
Parameter
Flow-Weighted MeansTotal Inflow Total Outflow
Arithmetic MeansInflow Outflow

Chapter 4 Volume I: The South Florida Environment
4-56
STA-3/4 RECREATION
STA 3/4 has public roads along the east and south borders that allow development of multiple public access sites. Using more than one site allows the public to visit different portions of the STA and will minimize public access past the water control structures and data equipment. The proposed recreational facilities near the Griffin Pits include road improvements, an asphalt parking area, an information kiosk, landscaping, a multi-purpose bridge and a composting toilet. This site also proposes two boat ramps (one in the rock pits located south and downstream of treatment cell 2B and one in the stub end of the L-5 canal). A second proposed site will be at the southeast corner and will include a small asphalt parking area, an information kiosk, landscaping, and a composting toilet. A third proposed site along Hwy 27 may be located where guard rails and turning lanes exist that would allow protected parking if allowable by FDOT. This site will have a small asphalt parking area and landscaping.
At each site pedestrian gates, vehicle gates, signage and fencing as needed to define public access areas and to protect sensitive equipment are also proposed.
STA-3/4 ENHANCEMENTS
Enhancements to STA-3/4 (Figure 4-24) include the following features:
• Construction of approximately 3.3 miles of interior levee, subdividing Cell 3 into Cells 3A and 3B
• Construction of additional water control structures through the new levee subdividing Cell 3 into Cells 3A and 3B
• Extension of an overhead power distribution line from the intersection of Interior Levee 3 and Interior Levee 4, extending north along Interior Levee 4 to the new levee across Cell 3, and then west along the new levee across Cell 3 (total length of approximately 3.6 miles)
• Small forward-pumping stations along the interior levees between cells in series to permit withdrawal from upstream emergent marsh cells to maintain stages in the downstream SAV cells. Supplemental flows can be transferred from Cell 2A to Cell 1A through structure G-382A, and between Cell 2A and Cell 3B through structure G-382B
• Herbicide treatment of Cells 1B, 2B, and 3B for removal of emergent macrophyte vegetation to permit development of SAV
• Inoculation of SAV from STA-2 into STA-3/4 by helicopter to accelerate vegetation recruitment
• Construction of the full-scale PSTA demonstration project (see PSTA Investigations [BC83(3)] and PSTA Demonstration Project in STA-3/4 [BC83(4)] sections for additional details)
During FY2005, the Cell 3 interior levee construction was substantially completed. Work on the water control structures through the new Cell 3 levee was also under way in FY2005 and is scheduled for completion in February 2006. Power distribution for the new Cell 3 levee is scheduled to be completed in mid-2006. The vegetation conversion activities were implemented in Cells 2B and 3B in FY2005. Work on the three forward-pumping stations was initiated in FY2005 and is scheduled to be completed in February 2006.

2006 South Florida Environmental Report Chapter 4
4-57
G-380 A-F G-377 A-E G-374 A-F
G-381 A-F
G-376 A-F
G-375 A-F
G-379 A-E
G-378 A-E
G-383
G-382AG-382B
G-357S-150
Inflow Canal
NNRCanal
Cell 1A
Cell 1B
Cell 2A
Cell 2B
Cell 3A
Holey Land(Toe of the Boot)
WCA 3A
N
Supply Canal
L-5 Canal
Cell 3 Discharge Canal
Discharge Canal
Auxiliary SeepagePump Station
Borrow Pits
~10 miles
~8 miles
EffectiveCell Area (ac)1A 3,0391B 3,4882A 2,5422B 2,894 3A 3B
2,1532,427
Total 16,543 ac
G-372
G-370
S-7
S-8
G-404
G-371
Cell 3BP
PP
Figure 4-24. STA-3/4 enhancements (not to scale).

Chapter 4 Volume I: The South Florida Environment
4-58
STA-3/4 PSTA Implementation Project [Bc83(4)]
The STA-3/4 PSTA Implementation Project is a 400-acre section in one of the treatment cells in STA-3/4 (Cell 2B) that was isolated by constructing internal levees to form an upstream, 200-acre cell and two adjacent downstream 100-acre cells. The upstream cell is being managed for SAV. SAV is being established in one of the downstream cells and a periphyton community in the other. The downstream cells will receive a hydraulic load that is proportionate to the load on the entire STA and consistent with its flood control mission. The project is described further in Chimney et al. (2004). Construction of the levees and interior water control structures was essentially complete by March 2005. Construction of the outflow pump station was completed in July 2005. Installation of the telemetry needed to operate the system is scheduled for completion by August–September 2005. The project was flooded in spring 2005 to begin establishing periphyton and SAV. Experience with other District PSTA and SAV projects indicated that it can take from 6–18 months to develop mature plant communities. A temporary outflow pump was installed in late June 2005 to lower water levels within the project and to help promote the SAV growth. Water quality monitoring at this single outflow was initiated at this time. After periphyton and SAV grow-in is substantially complete, the District will begin flow-through operation and initiate water quality monitoring throughout the project to compare treatment performance of the PSTA and SAV cells.

2006 South Florida Environmental Report Chapter 4
4-59
STA-5
Stormwater Treatment Area 5 (STA-5) contains approximately 4,110 acres of effective treatment area arranged in two parallel flow-ways. The northern flow-way (Cells 1A and 1B) consists of approximately 2,055 acres of effective treatment area. The southern flow-way (Cells 2A and 2B) consists of approximately 2,055 acres of effective treatment area. A schematic of STA-5 is presented in Figure 4-25. Based on the simulated 1965–1995 flow period utilized in developing the 2003 Long-Term Plan, it was assumed that STA-5 would receive a long-term average annual discharge of approximately 129,083 ac-ft per year from the C-139 basin. Actual deliveries will vary based on hydrologic conditions in the basin. Runoff that exceeds the hydraulic capacity of STA-5 will be diverted through G-406.
Water enters STA-5 from the west and flows by gravity through the treatment area to the east. Treated water is collected and discharged either to the Rotenberger Wildlife Management Area (RWMA) or the Miami Canal, where the majority of the water moves south to the northwest corner of WCA-3A. A complete description of STA-5 is contained in Chapter 6 of the 2000 Everglades Consolidated Report.
EffectiveCell Area (ac) 1A 835 1B 1,220 2A 835 2B 1,220Total 4,110 ac
Cell 1BCell 1A
Cell 2BCell 2A
G-344 A-D
G-343A-H
Outlet Canal
DischargeCanal
Deer FenceCanal
S&M Canal
Rotenberger WMA
L-3Canal
L-2Canal
G-348
G-342A-D
G-360B
G-360AG-349A
G-350A
G-349B
G-350B
G-406
N
G-410
Figure 4-25. Schematic of STA-5 (not to scale). Not shown is the water supply pump G-507, which is located on the northeast corner of Cell 1B,
and the two barrel culverts (G-345), located at the midpoint between the north and south flow-ways that were installed in the levee in order
to transfer water from Cell 1B to Cell 2B.

Chapter 4 Volume I: The South Florida Environment
4-60
STA-5 OPERATIONS
Since January 2005, Cell 1B was taken off-line in order to improve the water control structures (G-343A–D) and degrade a berm located by the outflow culverts, as part of a Long-Term Plan enhancement. During WY2005, 119,910 ac-ft of water was captured and treated by STA-5 (Table 4-4). This is about 7 percent more than the long-term average annual flow assumed during design, although the design anticipated annual variability. This surface inflow equates to an average hydraulic loading rate of 3.0 cm/d over the effective treatment area of the STA. During WY2005, approximately 30,165 ac-ft (10.5 mt of TP with a flow-weighted mean TP average of 282 ppb) of C-139 basin runoff was diverted around STA-5. In the future, flows and loads that are diverted around STA-5 will be captured and treated in STA-6 Section 2, which is currently scheduled for completion by December 2006. The water supply pump, G-507 was used for only two days (June 1 and 2, 2004) in the water year, and 22.4 ac-ft were pumped during this period. A summary of monthly STA-5 flow is presented in Figure 4-26.
Figure 4-26. Summary of WY2005 flows for STA-5. In WY2005, Cell 1B was temporarily taken off-line for long-Term Plan construction beginning in January 2005; all other treatment cells were operational.
STA-5
-
10,000
20,000
30,000
40,000
50,000
Flow
(ac-
ft/m
onth
)
Inflow Outflow
Inflow 0 2,425 4,728 30,142 36,759 19,652 3,959 914 2,413 286 14,180 4,453
Outflow 20 998 1,781 32,523 45,489 20,365 2,872 809 2 556 11,952 4,060
May-04 Jun-04 Jul-04 Aug-04 Sep-04 Oct-04 Nov-04 Dec-04 Jan-05 Feb-05 Mar-05 Apr-05

2006 South Florida Environmental Report Chapter 4
4-61
STA-5 HURRICANE IMPACTS
Strong winds and heavy rainfall impacted STA-5, although no damage was observed in the wetland.
STA-5 VEGETATION MANAGEMENT
At STA-5, Treatment Cells 1A, 2A, and 2B are managed for emergent vegetation and Cell 1B is managed as a SAV cell. Next year, Cell 2B will be converted to a SAV cell as part of a Long-Term Plan enhancement. The target water stages are listed in the operations plan for each treatment cell to encourage the dominant vegetation types. Specific Condition 13(b) of the EFA permit requires that the annual report include information regarding the application of herbicides used to exclude and/or eliminate undesirable vegetation within the treatment cells. For this reporting period, about 1,397.25 acres of marsh was treated in STA-5 to control emergent and FAV. A total of 159.8 gallons of diquat was applied to treat the FAV, and 710.6 gallons of glyphosate and 189.5 gallons of imazapyr was used to control emergent and ditch bank vegetation (Figure 4-3). Both aerial and ground-based spray equipment were used to apply these herbicides. Vegetation coverage maps from December 2003 are found in Appendix 4-13 of the 2005 SFER – Volume I.
STA-5 PERMIT STATUS
Except for DO, the data presented in this section demonstrates that STA-5 was in compliance with the EFA and NPDES operating permits for WY2005, and that discharges do not pose any known danger to public health, safety, or welfare. The EFA permit states that STA-5 will remain in the stabilization phase of operation until STA-6 Section 2 begins flow-through operations.
STA-5 TOTAL PHOSPHORUS
During WY2005, STA-5 received 24.4 mt of TP. STA-5 removed approximately 12.2 mt of TP during WY2005, equal to a removal rate of approximately 0.89 g/m2/yr (Table 4-4). Summaries of monthly TP loads and FWM TP concentrations are presented in Figures 4-27 and 4-28. The FWM outflow TP concentration was 81 ppb, a 51 percent reduction from the inflow concentration of 165 ppb. The inflow FWM TP during WY2005 is about 1.5 times lower than the FWM TP during WY2004. While the outflow concentration was above the 50-ppb interim target, this does not create a violation of the operating permits, as the STA is still in the stabilization phase. Improved TP reduction is anticipated in the future as BMP measures are implemented for the C-139 basin and as the benefits of vegetation management within the STA are realized. The moving 12-month FWM TP outflow concentration for STA-5 ranged from 81–100 ppb over the course of WY2005 (see Figure 4-29). For informational purposes, the geometric mean discharge TP concentration for STA-5 using auto-sampler data was 74 ppb for WY2005.

Chapter 4 Volume I: The South Florida Environment
4-62
Figure 4-28. Summary of WY2005 TP concentrations for STA-5. In WY2005, Cell 1B was temporarily taken off-line for long-Term Plan construction beginning in January 2005; all other treatment cells were operational.
STA-5
0
50
100
150
200
250
Tota
l Pho
spho
rus
(ppb
)
Inflow Outflow
Inflow 104 143 98 201 216 127 102 100 81 56 95 101
Outflow 75 97 84 52 90 113 61 68 40 71 89 54
May-04 Jun-04 Jul-04 Aug-04 Sep-04 Oct-04 Nov-04 Dec-04 Jan-05 Feb-05 Mar-05 Apr-05
Figure 4-27. Summary of WY2005 TP loads for STA-5. In WY2005, Cell 1B was temporarily taken off-line for long-Term Plan construction beginning in January 2005; all other treatment cells were operational.
STA-5
-
2,000
4,000
6,000
8,000
10,000
12,000To
tal P
hosp
horu
s Lo
ad (k
g)
Inflow Outflow
Inflow 0 427 573 7,469 9,783 3,072 500 113 240 20 1,670 552
Outflow 2 120 186 2,078 5,061 2,834 216 68 0 49 1,312 272
May-04 Jun-04 Jul-04 Aug-04 Sep-04 Oct-04 Nov-04 Dec-04 Jan-05 Feb-05 Mar-05 Apr-05

2006 South Florida Environmental Report Chapter 4
4-63
STA-5
0
20
40
60
80
100
120
Tota
l Pho
spho
rus
(ppb
)
Outflow 75 97 84 52 90 113 61 68 40 71 89 54
12 mo. Moving FWM 97 95 100 91 83 84 83 83 83 82 82 81
May-04
Jun-04 Jul-04 Aug-04
Sep-04 Oct-04 Nov-04 Dec-04 Jan-05 Feb-05 Mar-05 Apr-05
Figure 4-29. Comparison of monthly to 12-month moving average TP concentrations for WY2005 for STA-5 outflow. In WY2005, Cell 1B
was temporarily taken off-line for long-Term Plan construction beginning in January 2005; all other treatment cells were operational.

Chapter 4 Volume I: The South Florida Environment
4-64
STA-5 OTHER WATER QUALITY PARAMETERS
The monitoring data for non-phosphorus parameters at STA-5 for the water year are presented in Appendix 4-9 and summarized in Table 4-13. While ametryn and atrazine concentrations were detected in the outflow, these herbicides are not used within the STA. Compliance with the EFA permit is determined based on the following three-part assessment criterion:
1. If the annual average outflow concentration does not cause or contribute to violations of applicable Class III water quality standards, then STA-5 shall be deemed in compliance.
2. If the annual average concentration at the outflow causes or contributes to violations of applicable Class III water quality standards, but it does not exceed or is equal to the annual average concentration at the inflow stations, then STA-5 shall be deemed in compliance.
3. If the annual average concentration at the outflow causes or contributes to violations of applicable Class III water quality standards, and it also exceeds the annual average concentration at the inflow station, then STA-5 shall be deemed out of compliance.
Discharges from STA-5 were determined to be in compliance with the permit by satisfying criterion one above for all non-phosphorus and non-DO parameters with applicable numeric state water standards. Concentrations of unionized ammonia, dissolved chloride, total nitrogen, and total dissolved nitrogen were slightly higher at the outflow compared to the inflow. However, because these parameters have no applicable numeric state water quality standards, STA-5 is deemed to be in full compliance with the permit. Of interest is that inflow concentrations of sulfate are considerably lower for STA-5 than for the other STAs. However, at this time the causes or significance are unclear. Additional requirements for DO are listed in Administrative Order AO-004-EV and are discussed below. Mercury monitoring results are also discussed in Chapter 2B, and the annual permit compliance monitoring report for mercury in the STAs is in Appendix 4-2 of this volume.
The District has included the following documentation to satisfy the remaining monitoring requirements of the EFA permit:
• The District has performed all sampling and analysis under the latest Laboratory Quality Assurance Manual (SFWMD, dated January 3, 2005) and a Field Quality Assurance Manual (SFWMD, dated January 3, 2005).
• A signed copy of these statements is provided in Appendix 4-3 of this volume.

2006 South Florida Environmental Report Chapter 4
4-65
Table 4-13. Summary of annual arithmetic averages and flow-weighted means for the water year for all parameters (other than TP) monitored in STA-5. Note
that Cell 1B was taken out of operation in January 2005 for Long-Term Plan enhancement construction. Therefore, only Flow-way 2 was functional for the
entire water year. For the purpose of these comparisons, flow-weighted means are calculated as the quotient of the cumulative product of the mean daily flow
and the sample concentration divided by the corresponding cumulative daily flows.
G342A G342B G342C G342D G344A G344B G344C G344D n Conc. n Conc.
Temperature (°C) 25.3 25.0 25.1 24.9 21.8 22.4 22.6 22.4 -NA- -NA- -NA- -NA-
Dissolved Oxygen (mg/L) 5.1 5.3 5.4 5.9 2.1 2.6 2.1 2.1 -NA- -NA- -NA- -NA-
Specific Conductivity (µmhos/cm) 621 603 592 580 507 509 568 548 -NA- -NA- -NA- -NA-
pH 7.6 7.6 7.6 7.7 7.6 7.7 7.4 7.4 -NA- -NA- -NA- -NA-
Turbidity (NTU) 2.8 2.9 3.0 3.2 1.2 1.4 1.9 1.2 -NA- -NA- -NA- -NA-
Total Dissolved Solids (mg/L) 387 368 371 362 310 320 366 347 49 (104) 327 42 (96) 308
Unionized Ammonia (mg/L) 0.001 0.001 0.001 0.001 0.002 0.002 0.001 <0.001 43 (96) 0.001 38 (88) <0.001
Orthophosphate as P (mg/L) 0.040 0.054 0.060 0.064 0.020 0.035 0.061 0.057 100 (204) 0.101 77 (188) 0.057
Total Dissolved Phosphorus (mg/L) 0.052 0.067 0.068 0.074 0.032 0.049 0.072 0.070 94 (198) 0.112 72 (183) 0.068
Sulfate (mg/L) 11.2 10.1 9.8 9.7 11.6 11.1 8.4 7.5 49 (104) 10.4 42 (96) 7.1
Alkalinity (mg/L) 198 207 211 217 130 132 165 165 49 (104) 158 42 (96) 152
Dissolved Chloride (mg/L) 66 57 54 47 69 67 71 67 49 (104) 51 42 (96) 51
Total Nitrogen (mg/L) 1.50 1.45 1.45 1.28 1.50 1.56 1.63 1.54 45 (100) 1.63 38 (92) 1.32
Total Dissolved Nitrogen (mg/L) 1.25 1.17 1.15 1.07 1.39 1.43 1.51 1.41 45 (100) 1.42 38 (92) 1.25
Nitrate + Nitrite (mg/L) 0.047 0.036 0.032 0.020 0.012 0.009 0.009 0.008 45 (100) 0.058 38 (92) 0.010
Ametryn (µg/L) 0.005 0.005 0.005 0.005 0.007 0.009 0.010 0.007 6 (20) 0.010 9 (20) 0.010
Atrazine (µg/L) 0.155 0.088 0.115 0.039 0.428 0.254 0.260 0.186 6 (20) 0.010 9 (20) 0.050
-NA- : Not Applicablen: number of samples with flow (total number of samples)
Parameter
Flow-Weighted MeansTotal Inflow Total OutflowOutflowInflow
Arithmetic Means

Chapter 4 Volume I: The South Florida Environment
4-66
STA-5 DISSOLVED OXYGEN MONITORING
Introduction
STA-5 Administrative Order No. AO-004-EV in Exhibit C of Permit No. 0131842, February 29, 2000, specifies the DO monitoring requirements as STA-1W.
The District developed the following plan to comply with the DO requirements of the Administrative Orders for STA-5. Under the plan, DO concentrations are measured quarterly with HydrolabTM, DataSonde®, or MiniSonde® probes at 30-minute intervals for four consecutive days at the following locations:
• In the discharge canal near structures G-344 and G-344D, to provide representative data whether the discharge is to the Miami Canal, to the RWMA through pump station G-410, or to both sites simultaneously
• On the west bank of the Miami Canal about 100 meters upstream of the confluence of the canal and the STA-5 discharge canal, to measure background conditions in the Miami Canal
• On the west bank of the Miami Canal, about 100 meters downstream of the confluence of the canal and the STA-5 discharge canal, to measure effects of STA-5 discharges to the Miami Canal
• Sites along the north and south transects within the RWMA (Figure 4-30) to measure effects of STA-5 discharges to the RWMA
Sampling Dates
Diel oxygen measurement dates and sites associated with STA-5 for WY2005 are provided in Table 4-14 and Appendix 4-10.
Table 4-14. Deployment dates for diel oxygen measurement at STA-5 structures and sites in the Miami Canal.
Start End
06/14/2004 06/17/2004 STA5DC G344D NMC SMC
08/16/2004 08/20/2004 ------ ------ ------ ------
09/20/2004 09/23/2004 STA5DC G344D NMC SMC
10/25/2004 10/29/2004 ------ ------ ------ ------
12/06/2004 12/09/2004 STA5DC G344D NMC SMC
03/14/2005 03/17/2005 STA5DC G344D NMC SMC
N.25, N1
----------------------------------
----------------------------------
----------------------------------
Event Dates Sites Monitored in Rotenberger TractOutflow
StructuresMiami Canal Sites
N.25, N1, S4
----------------------------------

2006 South Florida Environmental Report Chapter 4
4-67
Figure 4-30. DO monitoring sites in the Rotenberger Wildlife Management Area (RWMA).

Chapter 4 Volume I: The South Florida Environment
4-68
Comparison of Dissolved Oxygen in STA-5 Discharges with Dissolved Oxygen at Miami Canal Sites
Comparisons of DO in STA-5 discharges with DO in the Miami Canal provide an indication of whether the discharge is affecting the canal DO concentrations or the diel cycle. The summary statistics for STA-5 discharges and the downstream sites are presented in Table 4-15. Examination of this table and Figure 4-31 shows that DO concentrations at the Miami Canal sites are statistically significantly greater than the DO concentrations in the discharged waters immediately downstream of the discharge structures. The average of the DO concentrations in the discharge canal ranges from 2.18 to 4.50 mg/L in the Miami Canal. Although the discharge canal intersects the Miami Canal between Miami Canal north and south (NMC and SMC, respectively) monitoring sites, the discharged waters do not appear to have an impact on the downstream site in the canal. No statistically significant difference was observed between the dissolved oxygen data collected at NMC and SMC sites. The complete data sets collected during WY2005 are presented in Appendix 4-9 in this volume.
Due to differences in Hydrolab™ deployment dates, direct comparisons of DO in STA-5 discharges with DO measured in the RWMA cannot be made. However, to satisfy permit requirements, summary statistics for STA-5 discharges and RWMA marsh transect sites are presented in Table 4-15 and Figure 4-31. The data indicate that both STA5DC and G344D exhibited significantly higher DO concentrations than marsh station N.25. In addition, DO levels at STA5DC were significantly higher than either at N1 or S4 in the RWMA (Figure 4-31).

2006 South Florida Environmental Report Chapter 4
4-69
Table 4-15. Statistical summary of diel DO at the outflow stations from STA-5 and stations in the Miami Canal during three deployment periods.
No monitoring was done in the RWMA.
Note: Statistical summaries by event and diel parameter can be found in Appendix 4-4, Table 3.
STA5DC 696 3.57 0.09 3.41 8.21 2.12
G344D 552 2.18 0.12 1.17 6.51 2.02
NMC 699 4.41 2.77 4.21 7.45 1.25
SMC 558 4.50 1.63 4.45 7.30 1.45
N.25 181 0.71 0.21 0.52 2.47 0.43
N1 358 1.93 0.64 1.79 5.00 0.87
S.25 ---- ---- ---- ---- ---- ----
S1 ---- ---- ---- ---- ---- ----
S4 177 1.71 1.18 1.63 2.81 0.29
Median
Transect N
Transect S
Maximum Standard Deviation
Outflow
Canal
Location Station Number of Measurements Mean Minimum

Chapter 4 Volume I: The South Florida Environment
4-70
Figure 4-31. Notched box and whisker plots of diel DO measurements at STA-5 outflow stations STA5DC (formally G344A) and G344D and at sites in the Miami
Canal north (NMC) and Miami Canal south (SMC) during three monitoring periods. The notch on a box plot represents the approximate (95%) C.I. about the median, which is represented by the narrowest part of the notch. The top and bottom of the box represent the 75th and 25th percentiles, respectively. The whiskers represent the highest and lowest data values that are within
two standard deviations of the median. Values above and below the whiskers are greater than two standard deviations from the median. Notches that do not overlap indicate that the data represented by the boxes being compared
are significantly different at the 95% C.I.
STA5DCG344D
NMCSMC
N.25S.25 N1 S1 N4 S4
Monitoring Stations
0
5
10
15
Dis
solv
ed O
xyge
n (m
g /L) Mean
Median
No
Mon
itorin
g P
erfo
rmed
No
Mon
itorin
g Pe
rform
ed

2006 South Florida Environmental Report Chapter 4
4-71
STA-5 RECREATION AND WILDLIFE
STA-5 was opened for the third year for water fowl hunts. Black-necked stilt nests were found on the levee roads but not within the treatment cells and did not impact STA operations.
Recreational facilities are proposed to provide public access to STA-5. The proposed recreational facilities include an asphalt parking area, a composting toilet, landscaping and an information kiosk. Pedestrian gates, signage and fencing as needed to define public access areas and to protect sensitive equipment are also proposed.
STA-5 ENHANCEMENTS
The recommended enhancements to STA-5 include the conversion of Cell 2B from emergent macrophyte vegetation to SAV, modification of existing structures, and expanded treatment area (Figure 4-32). The improvements are discussed below.
Modification of G-343 Structures. The G-343 structures are situated in the north-south interior levee subdividing Cells 1A and 2A from Cells 1B and 2B. Those structures originally consisted of reinforced concrete box culverts controlled by simple weir crests set at the design static water surface elevation in Cells 1A and 2A. The nature of those structures inhibited the District’s ability to control proper flow distribution across the STA. The limited flexibility in operation of the G-343 structures has also contributed to a higher-than-intended frequency and volume of diversion. To address these limitations and afford the District increased flexibility in the operation of STA-5, the existing G-343 structures are being modified through the addition of operable gates and the removal of the upstream weir controls. This modification also require the addition of telemetric control to the structures, coupled with the addition of stilling wells for water level data acquisition in the upper ends of Cells 1B and 2B. Stilling wells presently exist in Cells 1A and 2A upstream of the G-343 structures. It will also be necessary to extend an overhead power transmission line along the interior levee to service the modified water control structures.
In FY2005, the structural modifications to the G-343A–D structures were substantially completed. Telemetry and power distribution for these four structures are scheduled to be completed by May 2006. The G-343E–H structural modifications are scheduled to be completed by May 2006. Power and telemetry for the final for structures are scheduled to be completed by mid-2006.
Additional Seepage Control Facilities. In order to minimize the induced loading on STA-5, it was recommended that an additional seepage return pumping station be constructed near the northwest corner of Cell 1B. This pump station will provide a nominal capacity of 45 cfs, similar to the capacity of existing pumping stations G-349A and G-350A. This seepage pump station is scheduled to be completed by May 2006.
Removal of Obstructions to Flow. Field observations indicated obstructions to flow existed in Cells 1B and 2B. These were likely a result of relatively high ground elevations, possibly an old road bed in the case of Cell 2B. These flow obstructions are being removed as part of the STA-5 enhancements. Cell 1B flow obstructions were removed in FY2005. The Cell 2B flow obstructions are scheduled to be completed by May 2006.

Chapter 4 Volume I: The South Florida Environment
4-72
STA-5 EXPANSION
STA-5 enhancements include the construction of a 2,560-acre treatment cell (i.e., a new Flow-way 3) that will operate in parallel with existing Flow-ways 1 and 2. The design of the new Flow-way 3 is scheduled to be completed in October 2005. Construction of the new Flow-way 3 is scheduled to begin in January 2006 and be completed by March 2007, with the new cell being flow-capable by December 31, 2006. The design and construction of Flow-way 3 is being implemented under the District’s Acceler8 program as part of the EAA STA Expansion Project. Additional information on the status of the Acceler8 program is presented in Chapter 7A of this volume.
Effective Cell Area (ac) 1A 835 1B 1,220 2A 835 2B 1,220 Total 4,110 ac
Cell 1BCell 1A
Cell 2BCell 2A
G-344 A-D
G-343 A-H
Outlet Canal
Discharge Canal
Deer Fence Canal
S&M Canal
Rotenberger WMA
L-3 Canal
G-348
G-342 A-D
G-360B
G-360A G-349A
G-350A
G-349B
G-350B
G-406
N
L-2 Canal
G-410
New Seepage Pump Station
New Seepage Pump Station
New Level Control Culvert
New Level Control Culvert
Modify G-343 Structures
P
P
Figure 4-32. STA-5 enhancements (not to scale).

2006 South Florida Environmental Report Chapter 4
4-73
ROTENBERGER WILDLIFE MANAGEMENT AREA
The Rotenberger Hydropattern Restoration Project is a component of the larger Everglades Construction Project (ECP). The goal of the project is to restore a more natural hydroperiod to slow, alter, and eventually reverse the ecosystem degradation within the Rotenberger Wildlife Management Area caused by drought and seasonal fires, soil oxidation and compaction, and the release of ambient nutrients from soils. Anticipated benefits include the preservation of coverage of the remaining desired vegetative species, the encouragement of desirable wetland vegetation, and the initiation of the process of peat formation. Project features include a 240-cfs electric pump station (G-410) to withdraw treated water from the STA-5 discharge canal for establishing a more natural hydroperiod within the RWMA. This pump station distributes water through a 3.5-mile-long spreader canal located parallel to the west perimeter levee of the RWMA. Discharges out of the RWMA go into the Miami Canal through four gated culverts (G-402A–D) along the eastern boundary of the RWMA. There is a quarter-mile-long collection canal upstream of each outlet structure.
The FDEP issued a modification to the STA-5 EFA permit to include construction and operational authorization for the project in October 2000. This permit established a phased approach to restoration, and recognizes an interagency group including representatives from the District, FDEP, FWC, USACE, and Friends of the Everglades. The permit requires the interagency group to periodically evaluate the progress the project is making toward achieving its restoration goals.
For WY2005, approximately 44,414 ac-ft were directed into the RWMA through G-410, while approximately 34,048 ac-ft were discharged to the Miami Canal from the outlet structures (Figure 4-33). The FWM inflow TP concentration was 71 ppb, yielding a total TP inflow load of about 3,905 kg (Figures 4-34 and 4-35). As the treatment system in STA-5 stabilizes, TP levels entering the RWMA are anticipated to decrease. TP concentrations leaving the RWMA averaged 21 ppb, although the total load was only 897 kg (Figure 4-36). Information about the Rotenberger hydropattern restoration is presented in Chapter 6 of this volume.

Chapter 4 Volume I: The South Florida Environment
4-74
C139Basin
WCA-3A
MiamiCanalRotenberger
WildlifeManagement
AreaL-3
BorrowCanal
Discharge Canal
1220acres
1A 1B
2A 2B835acres
835acres
1220acres
STA-6
Big Cypress SeminoleIndian Reservation
STA-5
S-8G-404L-4
G-410
S&M CanalDeer Fence Canal
L-2Borrow
Canal
G-402B
G-402A
G-402C
G-402D N
Figure 4-33. Schematic of the RWMA (not to scale).

2006 South Florida Environmental Report Chapter 4
4-75
Rotenberger Wildlife Management Area
-
5,000
10,000
15,000
20,000Fl
ow (a
c-ft/
mon
th)
Inflow Outflow
Inflow - 951 1,560 15,387 4,808 12,542 3,070 852 12 672 3,030 1,529
Outflow 20 3 291 13132 15438 5162 0 0 0 2 0 0
May-04 Jun-04 Jul-04 Aug-04 Sep-04 Oct-04 Nov-04 Dec-04 Jan-05 Feb-05 Mar-05 Apr-05
Figure 4-34. Summary of WY2005 flows for the RWMA.
Rotenberger Wildlife Management Area
-
500
1,000
1,500
2,000
Tota
l Pho
spho
rus
Load
(kg)
Inflow Outflow
Inflow - 51 83 801 806 1,637 177 55 0 29 192 72
Outflow 1 0 8 457 328 103 0 0 0 0 0 0
May-04 Jun-04 Jul-04 Aug-04 Sep-04 Oct-04 Nov-04 Dec-04 Jan-05 Feb-05 Mar-05 Apr-05
Figure 4-35. Summary of WY2005 TP loads for the RWMA.

Chapter 4 Volume I: The South Florida Environment
4-76
Rotenberger Wildlife Management Area
020406080
100120140160
Tota
l Pho
spho
rus
(ppb
)
Inflow Outflow
Inflow 44 43 42 136 106 47 53 17 35 51 38
Outflow 34 36 22 28 17 16 13
May-04 Jun-04 Jul-04 Aug-04 Sep-04 Oct-04 Nov-04 Dec-04 Jan-05 Feb-05 Mar-05 Apr-05
Figure 4-36. Summary of WY2005 TP concentrations for the RWMA.

2006 South Florida Environmental Report Chapter 4
4-77
STA-6 SECTION 1
Stormwater Treatment Area 6 (STA-6) Section 1 contains approximately 870 acres of effective treatment area, arranged in two parallel flow-ways. The northern flow-way (Cell 5) consists of approximately 625 acres of effective treatment area. The southern flow-way (Cell 3) consists of approximately 245 acres of effective treatment area. A schematic of STA-6 is presented in Figure 4-37. Based on the simulated 1965–1995 period of flow, the STA should receive a long-term average annual volume of approximately 37,442 ac-ft from the EAA basin, although annual variability is anticipated. Actual deliveries will vary based on hydrologic conditions in the basins.
Water enters the STA from the G-600 pumping station, and travels southeast in the supply canal. Water enters the treatment cells through three broad-crested weirs (G-601, G-602, and G-603), flows by gravity east through the treatment cells, and is discharged through several combination box weir/culvert structures (G-393 and G-354). The treated water is then collected in the discharge canal and flows to the L-4 borrow canal, where the majority of the water moves east to the northwest corner of WCA-3A.
STA-6 Section 2 will add about 1,400 acres of additional treatment area to the STA-5/STA-6 system. This expansion will allow for the capture and treatment of runoff from the C-139 annex located just west of the L-3 borrow canal. STA-6 Section 2 is scheduled to be completed by December 31, 2006.
Schematic of STA-6(not to scale)
L-4 Borrow Canal
G-354 A
G-393 A
Cell 5
Cell 3
L-3 BorrowCanal
245 acres
625 acres
G-605
G-600
G-604
G-393 B
G-393 C
G-354 B
G-354 CG-602
G-601
G-603
G-606G-607
N
Figure 4-37. Schematic of STA-6 (not to scale). Note that structure G-606 is no longer operational.

Chapter 4 Volume I: The South Florida Environment
4-78
STA-6 OPERATIONS
A fire occurred at the inflow pump station G-600 in October 2004, damaging some of the pumps, the pump house, and the telemetry. Manual readings were used to estimate flow. At the end of March 2005, the U.S. Sugar Corporation moved out of Unit 2 and formally transferred the inflow pump station G-600 to the District. Since that time, G-600 has not been used and water in the marsh is solely from rainfall. Dry out conditions were observed in May 2004. During WY2005, 34,035 ac-ft of water was captured by the inflow pump station for STA-6 (Table 4-4), although there existed some undetermined amount of losses to irrigation water supply, and the net flow into the treatment area was less. The inflow was about 9 percent greater than the long-term average assumed during design. Due to seepage losses, ET, and water supply deliveries from the STA, the net volume of treated water discharged from STA-6 during WY2005 was 22,187 ac-ft. A summary of monthly flow is presented in Figure 4-38.
Figure 4-38. Summary of WY2005 flows for STA-6. All treatment cells were operational in WY2005.
STA-6
-
2,000
4,000
6,000
8,000
10,000
Flow
(ac-
ft/m
onth
)
Inflow Outflow
Inflow - 728 3,446 9,186 6,628 3,369 2,153 1,767 1,552 1,727 2,953 524
Outflow - - 1,433 8,478 5,285 2,564 395 111 124 379 3,195 224
May-04 Jun-04 Jul-04 Aug-04 Sep-04 Oct-04 Nov-04 Dec-04 Jan-05 Feb-05 Mar-05 Apr-05

2006 South Florida Environmental Report Chapter 4
4-79
STA-6 HURRICANE IMPACTS
STA-6 received high inflow volumes as a result of the hurricanes, but here was no damage observed to the wetland.
STA-6 VEGETATION MANAGEMENT
At STA-6, both treatment cells have emergent vegetation, with sawgrass and willow dominating in Cell 3 and cattail and grasses dominating in Cell 5. Specific Condition 13(b) of the EFA permit requires that the annual report include information regarding the application of herbicides used to exclude and/or eliminate undesirable vegetation within the treatment cells. For this reporting period, 22 acres were treated using 1.25 gallons of herbicide containing the active ingredient diquat to treat floating aquatic vegetation and 15.9 gallons of herbicide containing the active ingredient glyphosate and 4.25 gallons of herbicide containing the active ingredient imazapyr was used to control emergent vegetation (Table 4-3). Vegetation coverage maps from December 2003 are found in Appendix 4-13 of the 2005 SFER – Volume I.
STA-6 SECTION 1 PERMIT STATUS
The District initiated a water quality monitoring program in STA-6 in December 1997 for the purpose of demonstrating compliance with the above referenced conditions of the operating permit. Presently, STA-6 is in a post-stabilization phase. STA-6 discharges do not pose any known danger to the public health, safety, or welfare. Compliance with Specific Conditions 7(a)(i) and 7(a)(ii) was achieved.
STA-6 TOTAL PHOSPHORUS
STA-6 continues to achieve its interim discharge goal of less than 50 ppb for TP. During WY2005, STA-6 received 3.3 mt of TP, equating to a nutrient loading rate of 0.9 g/m2 (Table 4-4). The TP load was about 19 percent greater than the long-term average anticipated during design. Approximately 2.7 mt of TP was removed by STA-6 during WY2005. During WY2005, STA-6 experienced an 84 percent load reduction in TP (Figure 4-39). Furthermore, monthly discharge concentrations were considerably lower than inflow concentrations (Figure 4-40). The FWM outflow concentration was 19 ppb, well below the EFA permit requirement of 50 ppb. This represents a 76 percent reduction from the inflow concentration of 78 ppb. For informational purposes, the geometric mean TP concentration of the discharge was 17 ppb. The moving 12-month, flow-weighted average outflow ranged from 12–20 ppb during the course of WY2005 (see Figure 4-41).
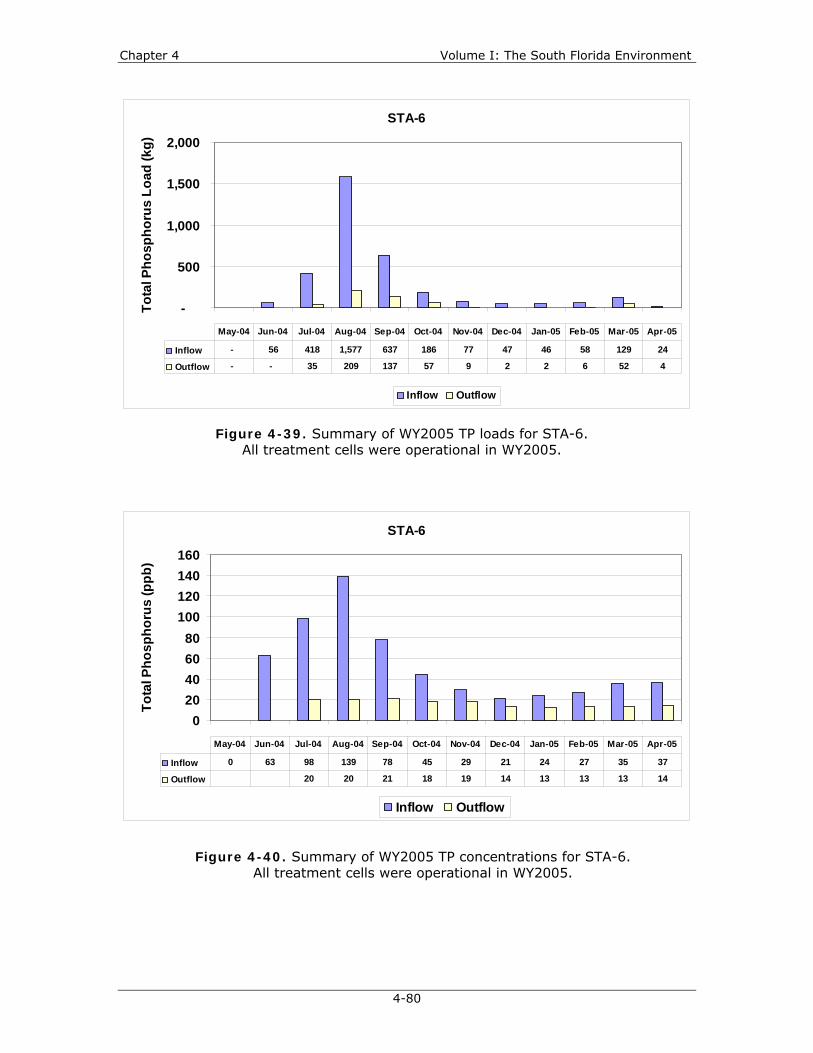
Chapter 4 Volume I: The South Florida Environment
4-80
Figure 4-39. Summary of WY2005 TP loads for STA-6. All treatment cells were operational in WY2005.
STA-6
-
500
1,000
1,500
2,000To
tal P
hosp
horu
s Lo
ad (k
g)
Inflow Outflow
Inflow - 56 418 1,577 637 186 77 47 46 58 129 24
Outflow - - 35 209 137 57 9 2 2 6 52 4
May-04 Jun-04 Jul-04 Aug-04 Sep-04 Oct-04 Nov-04 Dec-04 Jan-05 Feb-05 Mar-05 Apr-05
Figure 4-40. Summary of WY2005 TP concentrations for STA-6. All treatment cells were operational in WY2005.
STA-6
020406080
100120140160
Tota
l Pho
spho
rus
(ppb
)
Inflow Outflow
Inflow 0 63 98 139 78 45 29 21 24 27 35 37
Outflow 20 20 21 18 19 14 13 13 13 14
May-04 Jun-04 Jul-04 Aug-04 Sep-04 Oct-04 Nov-04 Dec-04 Jan-05 Feb-05 Mar-05 Apr-05

2006 South Florida Environmental Report Chapter 4
4-81
STA-6
0
5
10
15
20
25
Tota
l Pho
spho
rus
(ppb
)
Outflow 20 20 21 18 19 14 13 13 13 14
12 mo. Moving FWM 12 12 12 14 17 18 19 19 19 20 19 19
May-04 Jun-04 Jul-04 Aug-04 Sep-04 Oct-04 Nov-04 Dec-04 Jan-05 Feb-05 Mar-05 Apr-05
Figure 4-41. Comparison of monthly to 12-month moving average TP concentrations for WY2005 for STA-6 outflow.
All treatment cells were operational in WY2005.

Chapter 4 Volume I: The South Florida Environment
4-82
STA-6 OTHER WATER QUALITY PARAMETERS
The monitoring data for non-phosphorus parameters at STA-6 for the water year are presented in Appendix 4-11 of this volume and are summarized in Table 4-16. Compliance with the EFA permit is determined based on the following three-part assessment.
1. If the annual average outflow concentration does not cause or contribute to violations of applicable Class III water quality standards, then STA-6 shall be deemed in compliance.
2. If the annual average concentration at the outflow causes or contributes to violations of applicable Class III water quality standards, but it does not exceed or is equal to the annual average concentration at the inflow stations, then STA-6 shall be deemed in compliance.
3. If the annual average concentration at the outflow causes or contributes to violations of applicable Class III water quality standards, and it also exceeds the annual average concentration at the inflow station, then STA-6 shall be deemed out of compliance.
Annual average concentrations of ametryn and atrazine were detected in both the inflow and outflow at STA-6 and outflow values for color, total Kjeldahl nitrogen, sulfate, dissolved chloride, dissolved sodium, dissolved potassium, and dissolved magnesium were slightly higher than inflow values, but because these parameters have no applicable numeric state water quality standards, discharges from STA-6 are deemed to be in full compliance with the permit (see Table 4-16). For STA-6, downstream DO monitoring is not required by the permits. Mercury monitoring results are also discussed in Chapter 2B, and the annual permit compliance monitoring report for mercury in the STAs is in Appendix 4-2 of this volume.
The District has included the following documentation to satisfy the remaining monitoring requirements of the EFA permit:
• The District has performed all sampling and analysis under the latest Laboratory Quality Assurance Manual (SFWMD, dated January 3, 2005) and a Field Quality Assurance Manual (SFWMD, dated January 3, 2005).
• A signed copy of these statements is provided in Appendix 4-3 of this volume.

2006 South Florida Environmental Report Chapter 4
4-83
Table 4-16. Summary of annual arithmetic averages and flow-weighted means for the water year for all parameters (other than TP) monitored in STA-6. For the purpose of these comparisons, flow-weighted means are calculated as the
quotient of the cumulative product of the mean daily flow and the sample concentration divided by the corresponding cumulative daily flows.
Inflow
G600 G354C G393B n Conc. n Conc.
Temperature (°C) 24.5 22.8 21.6 -NA- -NA- -NA- -NA-
Dissolved Oxygen (mg/L) 2.4 3.5 2.6 -NA- -NA- -NA- -NA-
Specific Conductivity (µmhos/cm) 871 752 805 -NA- -NA- -NA- -NA-
pH 7.3 7.5 7.3 -NA- -NA- -NA- -NA-
Turbidity (NTU) 2.2 1.0 1.0 -NA- -NA- -NA- -NA-
Color (PCU) 77 78 87 -NA- -NA- -NA- -NA-
Total Suspended Solids (mg/L) 3.1 1.7 2.3 13 (25) 2.6 29 (46) 1.5
Unionized Ammonia (mg/L) 0.003 0.003 <0.001 13 (24) 0.002 29 (46) <0.001
Total Kjeldahl Nitrogen (mg/L) 1.76 1.82 1.49 13 (25) 1.81 29 (46) 1.46
Orthophosphate as P (mg/L) 0.014 0.005 0.006 32 (50) 0.030 57 (92) 0.007
Total Iron (µg/L) 259 104 107 2 (5) 352 6 (10) 131
Silica (mg/L) 10.83 9.33 8.27 1 (4) 10.60 4 (8) 10.13
Sulfate (mg/L) 19.3 23.4 22.3 1 (4) 21.8 4 (8) 17.0
Alkalinity (mg/L) 282.2 206.2 258.5 13 (25) 278.2 29 (46) 232.8
Dissolved Chloride (mg/L) 94.6 96.5 93.6 13 (25) 89.2 29 (46) 70.6
Dissolved Sodium (mg/L) 62.4 66.5 62.1 1 (4) 72.0 4 (8) 64.5
Dissolved Potassium (mg/L) 4.2 4.6 5.0 1 (4) 4.1 4 (8) 4.8
Dissolved Calcium (mg/L) 105.7 74.1 96.4 13 (25) 104.6 29 (46) 87.0
Dissolved Magnesium (mg/L) 8.6 8.4 8.7 1 (4) 10.2 4 (8) 8.6
Ametryn (µg/L) 0.005 0.012 0.005 3 (5) 0.010 3 (9) 0.013
Atrazine (µg/L) 0.039 0.105 0.051 3 (5) 0.026 4 (10) 0.034
-NA- : Not Applicablen: number of samples with flow (total number of samples)
Parameter
Arithmetic Means Flow-Weighted MeansOutflow Total Inflow Total Outflow

Chapter 4 Volume I: The South Florida Environment
4-84
STA-6 RECREATION
Recreational facilities are proposed to provide public access to STA-6. The proposed facilities include an asphalt parking area, landscaping, pedestrian gates, signage and fencing as needed to define public access areas and to protect sensitive equipment.
STA-6 ENHANCEMENTS AND STA-6 SECTION 2 [BC60]
Enhancements to STA-6 proposed in the revised Part 2 of the Long-Term Plan dated November 2004 included construction of an interior levee and associated water control structures in Cell 5, as well as conversion of emergent vegetation to SAV in the new downstream cell and construction of STA-6 Section 2 (Figure 4-42). The Long-Term Plan also recommended a review of the proposed enhancements to STA-6 Section 1 to asses whether these revisions were justified to improve performance or system efficiency, or to avoid redundant or unnecessary features. This assessment was conducted to predict outflow phosphorus concentrations with the full expansion of the STA into the Compartment C (build-out) area. Based on this evaluation, it was determined that the interior levees and associated water control structures were not required to improve performance in the build-out condition. However, some structural modifications to STA-6 Section 1 are still required to optimize the operation of the STA-5/STA-6 system.
STA-6 Section 2 will add about 1,400 acres of additional treatment area to the STA-5/STA-6 system. This expansion will allow for the capture and treatment of runoff from the C-139 annex located just west of the L-3 borrow canal.
The design of the STA-6 enhancements and STA-6 Section 2 is scheduled to be completed in October 2005. Construction is scheduled to begin in January 2006 and be completed by March 2007, with STA-6 Section 2 being flow-capable by December 31, 2006. The design and construction of STA-6 Enhancements and STA-6 Section 2 is being implemented under the District’s Acceler8 program as part of the Everglades Agricultural Area STA Enhancement project. For additional information on the status of the Acceler8 program, see Chapter 7A of this volume.

2006 South Florida Environmental Report Chapter 4
4-85
Figure 4-42. STA-6 enhancements (not to scale).
Cell 2
Cell 3Cell 4
Cell 5B
L‐3 Canal
N
Discharge Canal
BorrowPit
G‐393 A‐C
G‐352 A‐C G‐354 A‐C
G396 A‐C
G‐351 A‐C
Rotenberger
Inflow Canal
G‐353 A‐C
USSC
Cell 5A
P
G‐607
ReplaceWeir
New PumpStation G‐401
EffectiveArea (ac)Cell
2345A5BTotal 2,282 ac
554245831261391

Chapter 4 Volume I: The South Florida Environment
4-86
STA PERFORMANCE SYNOPSIS
A brief synopsis of phosphorus removal performance may be insightful, as multiple years of STA performance data are available. The flows, TP loads, and FWM TP concentrations going into and out of each STA are presented in Appendix 4-2. The water budgets and phosphorus mass balance calculations for each treatment cell for each STA (excluding STA-3/4) are presented in the Analysis and Interpretation [Bc82(4)] section. The concentrations of the other nutrient parameters measured within the STAs are also presented in that section, along with soil nutrient data.
During WY2005, some of the effective treatment area was temporarily taken off-line for Long-Term Plan enhancements or plant rehabilitation. At STA-1W, Cells 1 and 3 were operational for the entire water year; Cell 5 was under restricted flow beginning in November 2004 for plant rehabilitation due to hurricane damage, was off-line in March 2005 to degrade the limerock berm, then was again operated under restricted flow; Cells 2 and 4 were taken off-line beginning in January 2005 for Long-Term Plan Enhancement construction. At STA-5, Cell 1B was temporarily taken off-line for long-Term Plan construction beginning in January 2005 and all other treatment cells were operational.
In WY2005, STA-1W had higher inflows and much higher TP loading than WY2004. The inflow FWM TP concentration of 247 ppb and outflow concentration of 98 ppb was the highest measured since start-up (Appendix 4-2). STA-2 also experienced higher inflows and much higher TP loads and inflow concentrations in WY2005 compared to prior water years (126 ppb compared to less than 80 ppb) (Appendix 4-2). Although the loading was high going into STA-2, the FWM outflow TP concentration remains low (20 ppb). STA-5 and STA-6 experienced the opposite type of loadings, with inflow flow and TP loads being lower than most prior water years.
Comparisons of the STA performance over the period of operation demonstrate long-term trends. Performance plots of the annual STA settling rates (Figure 4-43) indicate spatial and temporal variability within and among STAs, with all STAs at or above the design settling rate estimate of 10 m/yr. STA-2 had a steep rise in settling rate from prior water years, increasing from 24 m/yr up to 73 m/yr, probably due to the relatively large inflow load being reduced down by 81 percent. Time series plots of the load removal (Figure 4-44) also show variance between the STAs, as well as annual variability within the STAs. Outflow TP concentrations from STAs with low inflow TP concentrations (< 100 ppb) appear to be fairly insensitive to inflow concentrations, suggesting that greater performance can be achieved with improvements due to BMPs in those basins with higher inflow concentrations (i.e., upstream of STA-1W and STA-5).
The STA combined cumulative load removal of 71 percent (Figure 4-45) is slightly higher than the 70 percent design assumption. The load removal was highest for STA-2, STA-3/4, and STA-6 (over 80 percent) and lowest for STA-1W (55 percent) and STA-5 (50 percent). Much variability between the STAs, as well as within an STA, is also observed when comparing the STA TP load removal to inflow loading rate (Figure 4-46). Both STA-1W and STA-5 had Long-Term Plan enhancement construction projects that started during this water year and the reduction of the effective treatment area and the damage sustained to the plant communities within STA-1W due to the hurricane and large floating cattail tussocks impacted the removal efficiencies.
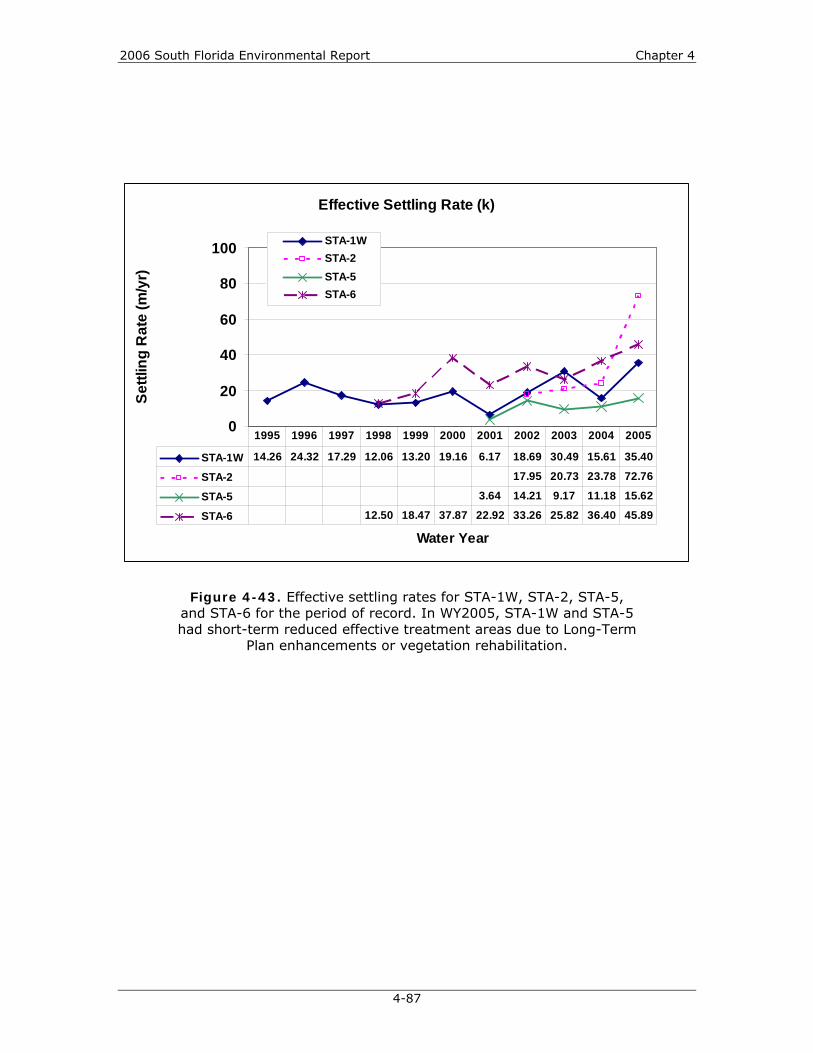
2006 South Florida Environmental Report Chapter 4
4-87
Figure 4-43. Effective settling rates for STA-1W, STA-2, STA-5, and STA-6 for the period of record. In WY2005, STA-1W and STA-5 had short-term reduced effective treatment areas due to Long-Term
Plan enhancements or vegetation rehabilitation.
Effective Settling Rate (k)
0
20
40
60
80
100
Water Year
Settl
ing
Rat
e (m
/yr)
STA-1WSTA-2STA-5STA-6
STA-1W 14.26 24.32 17.29 12.06 13.20 19.16 6.17 18.69 30.49 15.61 35.40
STA-2 17.95 20.73 23.78 72.76
STA-5 3.64 14.21 9.17 11.18 15.62
STA-6 12.50 18.47 37.87 22.92 33.26 25.82 36.40 45.89
1995 1996 1997 1998 1999 2000 2001 2002 2003 2004 2005

Chapter 4 Volume I: The South Florida Environment
4-88
Figure 4-44. STA outflow TP concentration compared to STA inflow concentration. In WY2005, STA-1W and STA-5 had short-term reduced
effective treatment areas due to Long-Term Plan enhancements or vegetation rehabilitation.
STA Performance Sensitivity to Inflow Concentrations
0
20
40
60
80
100
120
140
160
0 50 100 150 200 250 300
Inflow Phosphorus (ppb)
Out
flow
Pho
spho
rus
(ppb
) STA-1W STA-2 STA-3/4 STA-5 STA-6

2006 South Florida Environmental Report Chapter 4
4-89
Figure 4-45. STA phosphorus load removal for the period of record. In WY2005, STA-1W and STA-5 had short-term reduced effective treatment areas due to Long-Term Plan enhancements or vegetation rehabilitation.
Phosphrous Load Removal Cumulative Removal = 71%
40%
50%
60%
70%
80%
90%
100%
1995 1996 1997 1998 1999 2000 2001 2002 2003 2004 2005
Water Year
Load
Rem
oval
(%)
STA-1W STA-2 STA-3/4
STA-5 STA-6
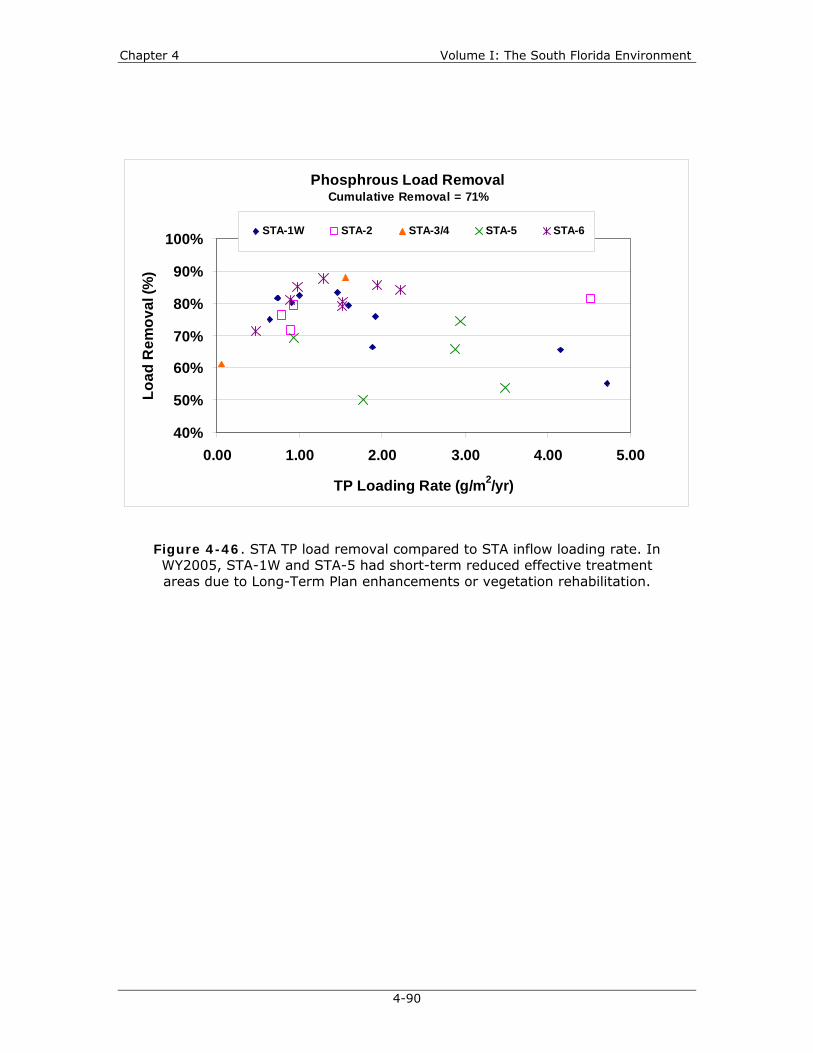
Chapter 4 Volume I: The South Florida Environment
4-90
Phosphrous Load Removal Cumulative Removal = 71%
40%
50%
60%
70%
80%
90%
100%
0.00 1.00 2.00 3.00 4.00 5.00
TP Loading Rate (g/m2/yr)
Load
Rem
oval
(%)
STA-1W STA-2 STA-3/4 STA-5 STA-6
Figure 4-46. STA TP load removal compared to STA inflow loading rate. In WY2005, STA-1W and STA-5 had short-term reduced effective treatment areas due to Long-Term Plan enhancements or vegetation rehabilitation.
2006 South Florida Environmental Report Chapter 4
4-91
ANALYSIS AND INTERPRETATION [Bc82(4)]
One of the major objectives of the Process Development and Engineering (PD&E) component of the Long-Term Plan is to monitor the physical/chemical environment and nutrient sequestration in the STAs. This effort was included in the plan in the belief that a better understanding of wetland structure and function will assist the District in optimizing performance of these treatment systems. Project BC82(4) contributes to this goal by monitoring a number of water quality parameters at the inflow and outflow and developing water and TP budgets for individual STA treatment cells or flow-ways1. Project BC82(4) also is collecting and analyzing sediment cores from each STA to estimate the phosphorus stored in the accumulated detrital material (floc layer). It is our intent to incorporate the change in sediment phosphorus storage over time in the evaluation of STA treatment performance.
Annual water budgets and estimates of annual and seasonal water depths and HRT for treatment cells in the STAs are presented in Tables 4-17 and 4-18 for STA-1W, STA-2, STA-5, and STA-6. STA-3/4 was not included in the analysis because it has only been operational for one year. Treatment cell/flow-way water budgets have been dominated by surface water inflow and outflow over the period of record (POR) in most STAs. The other water budget components usually contributed ≤ 10 percent of total flow. Exceptions to this generalization occurred in the south flow-way of STA-5 and STA-6, Cells 3 and 5, respectively, where seepage losses ranged from 26–40 percent of outflow. The magnitude of water budget errors, in general, has been variable from year to year for any given cell and most cells have a history of both positive and negative errors. Only Cells 2 and 3 of STA-1W had water budget errors that were either all positive or negative, which suggests a consistent measurement bias (i.e., errors were not randomly distributed) in these cells. The annual mean HRT for most flow-ways in the STAs was ≥ 10 days. An exception to this was Cell 3 in STA-6 and the east (Cells 1 and 3) and west (Cells 2 and 4) flow-ways in STA-1W in WY2005, which had shorter HRTs.
The following water quality parameters were monitored at the inflow and outflow of each treatment cell: TP, soluble reactive phosphorus (SRP), total dissolved reactive phosphorus (TDRP), total Kjeldahl nitrogen (TKN), ammonia (NH4), nitrate + nitrite (NOx), chloride (Cl), calcium (Ca), and alkalinity. TP was collected by either auto-samplers (weekly basis) or biweekly grab samples. All other parameters were collected as biweekly grab samples. Dissolved organic phosphorus (DOP) was calculated as DOP = TDRP – SRP; particulate phosphorus (PP) was calculated as PP = TP - TDRP; total nitrogen (TN) was calculated as TN = TKN + NOx. WY2005 data for TP, SRP, DOP, PP TN, TKN, NO4, NOx, Cl, Ca, and alkalinity have been summarized graphically for all sampling location along the flow-ways within each STA. Annual treatment cell TP budgets have been computed for the POR in each STA.
The WY2005 water quality data were evaluated based on changes observed in mean and median concentrations along each flow-way (Figures 4-47 through 4-50). The STAs processed nutrients and other parameters at various levels of efficiency. For example, almost all flow-ways to varying degrees exhibited a concentration reduction in TP, SRP, PP, NO4, and NOx from inflow to outflow (note that concentration decreases were not apparent for NH4 in STA-5 and for SRP in STA-6, Cell 3). Reductions in TN and TKN were not as consistent; there was little net change in STA-1W, Cell 5 (TN and TKN); STA-2, Cells 2 and 3 (TKN); STA-5 (TN and TKN); and STA-6, Cell 5 (TN and TKN). Only STA-6 exhibited a decrease in DOP. The G-308 and G-309 gates in STA-1W create hydraulic short circuits within Cells 3 and 4, respectively, which
1 The District conducts the monitoring of flow and water quality at the inflow and outflow to all the STA treatment cells under Project BC05.

Chapter 4 Volume I: The South Florida Environment
4-92
caused some concern that not all water entering Cells 3 and 4 was receiving full treatment. However, the TP, SRP, and PP concentrations at these water control structures were comparable to levels at the cell outflow structures located further downstream. It appears that releasing water through these gates had minimal impact on the overall treatment performance of Cells 3 and 4. A new water control structure (G-307) is being built to replace the original Cell 3 outflow structure and should aid in alleviating this short-circuit. These data suggest little change or modest increases on Cl levels after passage through most treatment cells. A pronounced decrease in Ca and alkalinity levels occurred in some treatment cells (e.g., STA-1W; west flow-way; STA-2, Cell 3; STA-5; and STA-6, Cell 5) but not others; reduction of these constituents was attributed to photosynthetic activity by periphyton and SAV. It is well documented that intense photosynthesis can remove all free CO2 from the water column resulting in a rise in pH. Plants and algae then begin to assimilate bicarbonate from the water as an alternative carbon source. Wetzel (2001; pg 543) summarizes the cascade of chemical reactions that lead to the precipitation of CaCO3 on leaf surfaces and the subsequent disappearance of Ca from the water column. SAV in the STAs was often found heavily encrusted with Ca deposits.
As noted above for the water budgets, the treatment cell/flow-way TP budgets were dominated by surface water inflow and outflow over the POR in most STAs (Table 4-19). The other TP budget components generally accounted for ≤ 10 percent of the phosphorus mass. Exceptions to this generalization occurred in STA-2, Cell 3, both flow-ways of STA-5 and STA-6, Cells 3 and 5, respectively where seepage losses made up 14–54 percent of total outflow phosphorus. Annual phosphorus mass loading to individual treatment cells has increased dramatically during the last several years in STA-1W, STA-2, and STA-5 compared to TP loading at the beginning of the POR for each wetland; changes in annual TP loading in STA-6 have been more varied. Based on the percent phosphorus mass retained over the POR, the treatment cells in STA-2 have been the most efficient systems (71–87 percent retained), STA-5 and STA-6 had intermediate performance (43–54 percent retained), and STA-1W exhibited mixed results (12–55 percent retained).
The accretion of phosphorus to the sediments constitutes the long-term storage mechanism in the STAs. The District collected and analyzed surficial sediment (0-10 cm cores) and the floc layer samples from STA-1W, 3/4, 2, 5, and 6 in 2003 or 2004 (see field and laboratory methods in Appendix 4B-1 of the 2004 Everglades Consolidated Report). Collection and evaluation of the historic sediments from STA-1E is ongoing with completion expected by next year’s SFER. Maps of spatial variation in sediment and floc layer bulk density, and TP content in STA-1W, 2, 5, and 6 are provided in Appendix 4-14 of this volume. Surficial sediment chemistry varied markedly among the STAs (Figure 4-51). Differences in total nitrogen and carbon content were inversely related to sediment bulk density; sulfur content was inversely related to iron content. The chemical and physical composition of the sandy soils in STA-1E is clearly distinct from the highly organic soils of the other STAs. It has been estimated that 62–123 percent of the inflow TP mass retained to date by the STAs was stored within the floc layer (Table 4-20). The floc TP storage value greater then 100 percent reflects the uncertainty associated with trying to reconcile the TP budget with sediment storage. Sediment nutrient storage in wetlands can be difficult to estimate accurately, hence values of sediment storage that exceed inflow nutrients loads are not uncommon. These data represent baseline conditions in the STAs and will be compared against future sediment/floc layer data when evaluating phosphorus storage in these treatment systems.

2006 South Florida Environmental Report Chapter 4
4-93
Table 4-17. Annual water budgets for flow-ways and treatment cells in the STAs.a
Inflowsb Outflowsb Is Ig P Σinflow Os Og ET Σoutflow ∆S r ε STA-1W, Cell 1 WY2000 177.1 4.0 7.5 188.5 148.5 6.7 7.6 162.8 0.8 24.9 14.2%WY2001 126.5 1.8 5.2 133.4 95.0 7.5 8.3 110.9 -2.3 24.8 20.3%WY2002 159.4 2.8 7.8 169.9 154.5 6.3 7.8 168.6 0.9 0.4 0.2%WY2003 305.2 - 6.2 311.4 316.6 - 7.5 324.1 - -12.7 -4.0%WY2004 193.8 3.0 5.0 201.8 230.6 4.6 7.5 242.8 -3.2 -37.8 -17.0%WY2005 205.0 2.3 6.2 213.5 280.7 2.6 7.5 290.8 -0.1 -77.3 -30.6%TOTAL 1,167.0 13.8 37.9 1,218.6 1,226.0 27.7 46.3 1,300.0 -3.8 -77.6 -6.2%% inflow 95.8% 1.1% 3.1% % outflow 94.3% 2.1% 3.6%
STA-1W, Cell 2 WY2000 73.0 - 5.5 78.5 70.9 23.8 5.4 100.1 0.6 -22.2 -24.9%WY2001 38.7 - 3.7 42.4 47.4 20.5 5.9 73.8 -1.8 -29.6 -50.9%WY2002 66.7 - 5.5 72.2 61.7 17.1 5.6 84.3 0.8 -12.9 -16.5%WY2003 146.7 - 4.5 151.2 152.1 - 5.4 157.4 - -6.3 -4.1%WY2004 109.1 - 3.6 112.7 165.5 12.4 5.4 183.2 -2.5 -68.1 -46.0%WY2005 101.9 - 4.4 106.3 106.7 - 5.3 112.0 - -5.7 -5.3%TOTAL 536.2 - 27.1 563.3 604.3 73.7 33.0 710.9 -2.9 -144.8 -22.7%% inflow 95.2% - 4.8% % outflow 85.0% 10.4% 4.6%
STA-1W, Cell 3 WY2000 89.9 5.2 5.4 100.4 77.6 8.0 5.4 91.0 0.5 8.9 9.3%WY2001 92.2 2.3 3.6 97.1 80.3 7.6 5.8 93.7 -1.0 4.4 4.6%WY2002 143.5 3.6 5.4 152.5 121.6 6.4 5.5 133.4 0.5 18.6 13.0%WY2003 256.9 - 4.4 261.2 198.8 - 5.2 204.0 - 57.2 24.6%WY2004 121.5 3.3 3.5 128.3 66.5 4.4 5.2 76.2 -1.1 53.2 52.0%WY2005 178.9 2.5 4.3 185.6 164.2 2.3 5.2 171.6 0.1 13.9 7.8%TOTAL 881.8 16.8 26.5 925.1 709.0 28.7 32.3 770.0 -1.0 156.2 18.4%% inflow 95.3% 1.8% 2.9% % outflow 92.1% 3.7% 4.2%
STA-1W, Cell 4 WY2000 70.9 - 1.9 72.8 71.9 8.9 1.9 82.8 0.1 -10.1 -13.0%WY2001 47.4 - 1.3 48.7 38.8 7.7 2.1 48.5 -0.5 0.7 1.5%WY2002 61.7 - 2.0 63.7 80.7 6.4 2.0 89.1 0.3 -25.7 -33.6%WY2003 152.1 - 1.6 153.7 194.6 - 1.9 196.5 - -42.9 -24.5%WY2004 165.5 - 1.3 166.7 108.6 4.6 1.9 115.1 -0.8 52.4 37.2%WY2005 106.7 - 1.6 108.2 75.7 - 1.9 77.6 - 30.6 33.0%TOTAL 604.3 - 9.6 613.9 570.4 27.6 11.7 609.6 -0.9 5.1 0.8%% inflow 98.4% - 1.6% % outflow 93.6% 4.5% 1.9%

Chapter 4 Volume I: The South Florida Environment
4-94
Table 4-17. Continued.
Inflows Outflows Is Ig P Σinflow Os Og ET Σoutflow ∆S r ε
STA-1W, Cell 5 WY2000 WY2001 217.8 - 10.3 228.1 15.4 - 16.4 31.9 - 196.2 150.9%WY2002 641.5 - 15.4 656.9 252.7 - 15.5 268.2 - 388.8 84.1%WY2003 402.8 - 12.4 415.2 555.2 - 15.0 570.2 - -154.9 -31.4%WY2004 124.7 2.0 10.6 137.3 139.1 4.3 16.0 159.4 4.7 -26.8 -18.1%WY2005 145.9 - 13.1 159.0 154.0 - 15.8 169.8 -8.4 -2.4 -1.5%TOTAL 1,532.6 - 61.8 1,596.5 1,116.4 - 78.7 1,199.4 - 397.1 28.4%% inflow 96.0% 3.9% % outflow 93.1% 6.6%
STA-2, Cell 1 WY2002 54.1 0.0 12.1 66.3 19.6 0.0 10.8 30.4 0.1 35.7 73.9%WY2003 57.2 0.0 10.3 67.5 36.9 0.0 10.5 47.3 4.6 15.6 27.1%WY2004 78.0 0.0 9.4 87.4 61.3 0.0 10.5 71.8 -0.2 15.8 19.8%WY2005 67.8 0.0 8.9 76.8 70.6 0.0 10.4 81.0 0.1 -4.3 -5.4%TOTAL 257.2 0.0 40.8 297.9 188.5 0.0 42.1 230.6 4.6 62.8 23.8%% inflow 86.3% 0.0% 13.7% % outflow 81.8% 0.0% 18.2%
STA-2, Cell 2 WY2002 77.0 1.6 13.5 92.2 110.2 0.2 12.0 122.4 0.3 -30.6 -28.5%WY2003 149.3 2.0 11.5 162.8 123.8 0.1 11.7 135.5 0.3 26.9 18.1%WY2004 111.6 2.0 10.4 124.0 110.8 0.1 11.7 122.6 -0.1 1.5 1.2%WY2005 172.3 3.6 10.0 185.9 162.8 <0.1 11.6 174.4 -0.2 11.7 6.5%TOTAL 510.2 9.2 45.5 564.9 507.6 0.4 46.9 554.9 0.3 9.6 1.7%% inflow 90.3% 1.6% 8.0% % outflow 91.5% 0.1% 8.5%
STA-2, Cell 3 WY2002 130.8 0.0 13.5 144.3 109.3 28.9 12.0 150.2 0.3 -6.2 -4.2%WY2003 178.7 0.0 11.5 190.2 144.7 19.5 11.7 175.8 0.3 14.1 7.7%WY2004 137.8 0.0 10.4 148.3 129.3 17.1 11.7 158.1 -0.5 -9.3 -6.1%WY2005 173.2 0.0 10.0 183.1 155.9 12.9 11.6 180.4 <0.1 2.8 1.5%TOTAL 620.5 0.0 45.5 665.9 539.2 78.4 46.9 664.5 0.1 1.4 0.2%% inflow 93.2% 0.0% 6.8% % outflow 81.1% 11.8% 7.1%
STA-5, North Flow-way WY2001 43.3 0.0 8.1 51.4 25.4 11.9 11.9 49.2 -2.4 4.7 9.3%WY2002 121.0 0.0 7.5 128.5 103.3 13.1 11.2 127.6 2.7 -1.8 -1.4%WY2003 127.6 0.0 10.1 137.7 124.5 11.9 10.8 147.2 <0.1 -9.4 -6.6%WY2004 135.7 0.0 9.6 145.3 121.7 12.8 10.8 145.3 1.3 -1.3 -0.9%WY2005 114.6 1.1 8.0 123.7 90.2 5.7 10.7 106.6 -3.7 20.9 18.1%TOTAL 542.1 1.1 43.4 586.6 465.1 55.4 55.4 575.8 -2.2 13.0 2.2%% inflow 92.4% 0.2% 7.4% % outflow 80.8% 9.6% 9.6%

2006 South Florida Environmental Report Chapter 4
4-95
Table 4-17. Continued.
Inflows Outflows Is Ig P Σinflow Os Og ET Σoutflow ∆S r ε
STA-5, South Flow-way WY2001 57.4 0.1 8.1 65.6 23.9 36.4 11.9 72.2 -1.5 -5.0 -7.3%WY2002 114.7 <0.1 7.5 122.2 52.3 38.1 11.2 101.6 3.6 17.1 15.3%WY2003 119.6 0.0 10.1 129.7 73.5 44.9 10.8 129.2 -0.4 0.8 0.7%WY2004 89.2 0.0 9.6 98.9 46.7 43.6 10.8 101.1 1.8 -4.1 -4.1%WY2005 68.1 0.0 8.0 76.1 59.6 45.4 10.7 115.7 -1.5 -38.1 -39.7%TOTAL 449.0 0.2 43.4 492.5 256.0 208.4 55.4 519.8 2.0 -29.3 -5.8%% inflow 91.2% 0.0% 8.8% % outflow 49.2% 40.1% 10.7%
STA-6, Cell 3 WY1999 18.5 0.4 1.2 20.1 11.2 6.7 1.5 19.4 <0.1 0.7 3.6%WY2000 28.1 0.3 1.4 29.8 29.2 6.9 1.2 37.4 0.9 -8.4 -25.0%WY2001 17.4 0.4 1.3 19.2 11.4 8.2 1.4 21.0 0.3 -2.2 -10.8%WY2002 24.5 0.2 1.2 25.9 13.4 5.8 1.3 20.5 <0.1 5.4 23.1%WY2003 30.9 0.6 1.2 32.7 17.7 4.0 1.3 23.1 0.8 8.8 31.6%WY2004 24.1 0.1 1.2 25.4 20.8 5.8 1.3 27.9 -0.4 -2.0 -7.6%WY2005 23.0 0.6 1.3 24.8 13.1 7.6 1.3 21.9 0.4 2.6 11.0%TOTAL 166.5 2.7 8.7 178.0 116.8 44.9 9.4 171.1 2.0 4.9 2.8%% inflow 93.6% 1.5% 4.9% % outflow 68.3% 26.3% 5.5%
STA-6, Cell 5 WY1999 30.9 0.0 2.9 33.9 7.3 12.6 3.9 23.8 0.2 9.8 34.1%WY2000 45.3 0.0 3.6 48.9 18.4 14.5 3.1 36.0 1.5 11.4 27.0%WY2001 31.0 0.1 3.4 34.5 17.8 10.0 3.6 31.4 1.0 2.1 6.4%WY2002 41.1 0.0 3.0 44.2 21.1 13.2 3.4 37.6 <0.1 6.5 15.9%WY2003 34.7 <0.1 3.0 37.7 22.6 13.2 3.3 39.1 1.1 -2.5 -6.4%WY2004 24.0 <0.1 3.2 27.2 23.1 12.2 3.3 38.5 -0.8 -10.5 -31.9%WY2005 19.7 <0.1 3.2 23.1 14.3 4.7 3.3 22.3 0.2 0.6 2.8%TOTAL 227.0 0.2 22.2 249.4 124.6 80.3 23.9 228.8 3.0 17.6 7.3%% inflow 91.0% 0.1% 8.9% % outflow 54.5% 35.1% 10.4%
a All water budget terms expressed as hm3 (= 1,000,000 m3); 1 hm3 = 810.713 acre-ft; data provided by W. Abtew and S. Huebner, SFWMD.
b Is = surface water inflow; Ig = groundwater inflow; P = precipitation; Os = surface water outflow; Og = groundwater outflow; ET = evapotranspiration; ΔS = change in storage volume; r = water budget residual [= Σinflow –(Σoutflow +ΔS)]; ε = water budget error [= r/(Σinflow+Σoutflow)/2].

Chapter 4 Volume I: The South Florida Environment
4-96
Table 4-18. Annual and seasonal mean depths
and HRT for treatment cells in the STAs.a
Annual Wet Season Dry season Depth HRT Depth HRT Depth HRT (m) (d) (m) (d) (m) (d) STA-1W, Cell 1 WY2005 0.61 5.1 0.71 3.7 0.54 8.0
STA-1W, Cell 2
WY2005 0.15 2.1 0.55 3.9 -0.14 NA
STA-1W, Cell 3 WY2005 0.27 2.3 0.16 0.9 0.36 4.6
STA-1W, Cell 4 WY2005 0.27 1.6 0.43 1.3 0.16 3.1
STA-1W, Cell 5 WY2005 0.35 21.7 0.52 16.3 0.23 45.4
STA-2, Cell 1 WY2002 -0.31 NA 0.03 0.8 -0.56 NA WY2003 0.08 4.2 -0.05 NA 0.17 7.6 WY2004 0.41 15.1 0.46 10.3 0.37 25.8 WY2005 0.40 14.9 0.45 10.0 0.36 26.9
STA-2, Cell 2 WY2002 0.46 31.0 0.54 18.2 0.40 99.1 WY2003 0.52 29.9 0.50 37.5 0.54 26.4 WY2004 0.57 23.3 0.57 14.2 0.56 44.0 WY2005 0.49 20.3 0.58 14.2 0.42 35.0
STA-2, Cell 3 WY2002 0.63 19.6 0.65 12.2 0.62 36.8 WY2003 0.73 16.2 0.72 10.8 0.73 25.0 WY2004 0.66 17.9 0.64 9.9 0.67 40.9 WY2005 0.51 9.5 0.65 6.5 0.41 20.1
STA-5, Cell 1A (North Flow-way) WY2001 0.37 9.1 0.51 7.2 0.27 14.1 WY2002 0.53 5.2 0.68 3.7 0.43 9.8 WY2003 0.65 5.7 0.74 3.8 0.59 10.1 WY2004 0.65 5.6 0.82 3.6 0.53 13.4 WY2005 0.60 6.5 0.70 4.0 0.52 17.3
STA-5, Cell 1B (North Flow-way) WY2001 0.51 18.1 0.65 13.4 0.40 30.9 WY2002 0.54 7.7 0.49 3.8 0.58 19.4 WY2003 0.53 6.7 0.51 3.8 0.54 13.5 WY2004 0.59 7.4 0.60 3.9 0.59 21.4 WY2005 0.38 6.0 0.62 5.1 0.21 10.0

2006 South Florida Environmental Report Chapter 4
4-97
Table 4-18. Continued.
Annual Wet Season Dry season
Depth HRT Depth HRT Depth HRT (m) (d) (m) (d) (m) (d)
STA-5, Cell 2A (South Flow-way) WY2001 0.45 8.2 0.59 6.2 0.36 13.4 WY2002 0.61 6.7 0.70 4.7 0.54 11.4 WY2003 0.72 6.9 0.79 4.7 0.67 11.3 WY2004 0.70 8.8 0.82 5.6 0.62 18.5 WY2005 0.71 9.1 0.77 6.9 0.66 12.6
STA-5, Cell 2B (South Flow-way) WY2001 0.32 8.3 0.54 8.2 0.16 8.7 WY2002 0.34 5.5 0.39 3.8 0.30 9.3 WY2003 0.44 6.1 0.46 4.0 0.42 10.2 WY2004 0.46 8.3 0.56 5.6 0.38 16.5 WY2005 0.44 8.3 0.52 6.8 0.38 10.7
STA-6, Cell 3 WY1999 0.25 4.8 0.31 4.2 0.21 5.5 WY2000 0.38 4.2 0.64 3.8 0.20 5.6 WY2001 0.34 6.2 0.45 5.1 0.25 8.5 WY2002 0.47 7.3 0.61 6.9 0.36 8.0 WY2003 0.47 6.2 0.56 5.6 0.40 7.0 WY2004 0.58 7.9 0.72 6.1 0.48 11.7 WY2005 0.48 7.7 0.58 6.4 0.41 9.7
STA-6, Cell 5 WY1999 0.26 12.5 0.32 7.9 0.22 9.0 WY2000 0.38 10.6 0.65 7.6 0.19 10.7 WY2001 0.30 13.9 0.46 7.3 0.18 11.1 WY2002 0.48 19.4 0.60 9.7 0.40 12.7 WY2003 0.52 17.4 0.59 10.4 0.46 14.9 WY2004 0.55 19.3 0.71 12.4 0.44 22.4 WY2005 0.49 19.8 0.58 14.3 0.42 32.7 a Data provided by W. Abtew and S. Huebner, SFWMD.
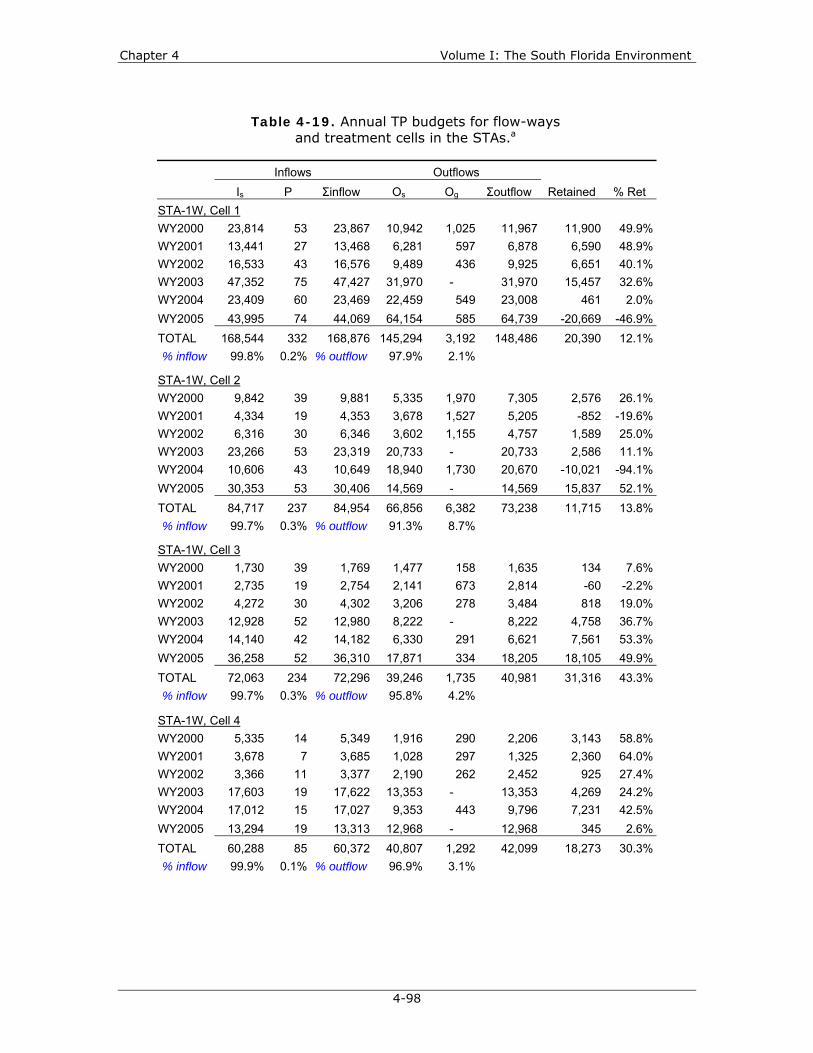
Chapter 4 Volume I: The South Florida Environment
4-98
Table 4-19. Annual TP budgets for flow-ways
and treatment cells in the STAs.a
Inflows Outflows Is P Σinflow Os Og Σoutflow Retained % Ret
STA-1W, Cell 1 WY2000 23,814 53 23,867 10,942 1,025 11,967 11,900 49.9% WY2001 13,441 27 13,468 6,281 597 6,878 6,590 48.9% WY2002 16,533 43 16,576 9,489 436 9,925 6,651 40.1% WY2003 47,352 75 47,427 31,970 - 31,970 15,457 32.6% WY2004 23,409 60 23,469 22,459 549 23,008 461 2.0% WY2005 43,995 74 44,069 64,154 585 64,739 -20,669 -46.9% TOTAL 168,544 332 168,876 145,294 3,192 148,486 20,390 12.1% % inflow 99.8% 0.2% % outflow 97.9% 2.1%
STA-1W, Cell 2 WY2000 9,842 39 9,881 5,335 1,970 7,305 2,576 26.1% WY2001 4,334 19 4,353 3,678 1,527 5,205 -852 -19.6% WY2002 6,316 30 6,346 3,602 1,155 4,757 1,589 25.0% WY2003 23,266 53 23,319 20,733 - 20,733 2,586 11.1% WY2004 10,606 43 10,649 18,940 1,730 20,670 -10,021 -94.1% WY2005 30,353 53 30,406 14,569 - 14,569 15,837 52.1% TOTAL 84,717 237 84,954 66,856 6,382 73,238 11,715 13.8% % inflow 99.7% 0.3% % outflow 91.3% 8.7%
STA-1W, Cell 3 WY2000 1,730 39 1,769 1,477 158 1,635 134 7.6% WY2001 2,735 19 2,754 2,141 673 2,814 -60 -2.2% WY2002 4,272 30 4,302 3,206 278 3,484 818 19.0% WY2003 12,928 52 12,980 8,222 - 8,222 4,758 36.7% WY2004 14,140 42 14,182 6,330 291 6,621 7,561 53.3% WY2005 36,258 52 36,310 17,871 334 18,205 18,105 49.9% TOTAL 72,063 234 72,296 39,246 1,735 40,981 31,316 43.3% % inflow 99.7% 0.3% % outflow 95.8% 4.2%
STA-1W, Cell 4 WY2000 5,335 14 5,349 1,916 290 2,206 3,143 58.8% WY2001 3,678 7 3,685 1,028 297 1,325 2,360 64.0% WY2002 3,366 11 3,377 2,190 262 2,452 925 27.4% WY2003 17,603 19 17,622 13,353 - 13,353 4,269 24.2% WY2004 17,012 15 17,027 9,353 443 9,796 7,231 42.5% WY2005 13,294 19 13,313 12,968 - 12,968 345 2.6% TOTAL 60,288 85 60,372 40,807 1,292 42,099 18,273 30.3% % inflow 99.9% 0.1% % outflow 96.9% 3.1%

2006 South Florida Environmental Report Chapter 4
4-99
Table 4-19. Continued.
Inflows Outflows Is P Σinflow Os Og Σoutflow Retained % Ret
STA-1W, Cell 5 WY2001 24,595 123 24,719 2,019 - 2,019 22,699 91.8% WY2002 87,684 185 87,869 23,397 - 23,397 64,472 73.4% WY2003 62,823 149 62,972 44,176 - 44,176 18,796 29.8% WY2004 14,182 128 14,310 6,587 339 6,926 7,384 51.6% WY2005 38,484 157 38,641 25,565 - 25,565 13,076 33.8% TOTAL 227,769 742 228,511 101,744 339 102,083 126,428 55.3% % inflow 99.7% 0.3% % outflow 99.7% 0.3%
STA-2, Cell 1 WY2002 1,698 146 1,844 425 0 425 1,419 77.0% WY2003 2,985 124 3,109 522 0 522 2,587 83.2% WY2004 6,794 112 6,907 831 0 831 6,076 88.0% WY2005 6,699 107 6,806 708 0 708 6,098 89.6% TOTAL 18,177 489 18,666 2,486 0 2,486 16,181 86.7% % inflow 97.4% 2.6% % outflow 100.0% 0.0%
STA-2, Cell 2 WY2002 2,052 163 2,214 1,742 4 1,745 469 21.2% WY2003 10,334 138 10,472 2,494 3 2,497 7,976 76.2% WY2004 10,279 125 10,404 1,750 4 1,755 8,650 83.1% WY2005 19,485 120 19,604 6,396 1 6,397 13,207 67.4% TOTAL 42,149 546 42,695 12,382 12 12,394 30,301 71.0% % inflow 98.7% 1.3% % outflow 99.9% 0.1%
STA-2, Cell 3 WY2002 3,327 163 3,490 1,819 580 2,398 1,091 31.3% WY2003 9,527 138 9,665 2,279 562 2,841 6,825 70.6% WY2004 11,368 125 11,493 1,743 562 2,305 9,188 79.9% WY2005 18,874 120 18,993 2,754 552 3,306 15,687 82.6% TOTAL 43,096 546 43,642 8,595 2,255 10,850 32,791 75.1% % inflow 98.7% 1.3% % outflow 79.2% 20.8%
STA-5, North Flow-way WY2001 5,608 98 5,705 3,610 1,618 5,228 477 8.4% WY2002 23,748 90 23,838 8,715 1,683 10,397 13,441 56.4% WY2003 23,431 121 23,552 17,965 1,928 19,892 3,660 15.5% WY2004 21,015 116 21,131 8,406 1,326 9,733 11,398 53.9% WY2005 15,037 96 15,133 5,638 516 6,154 8,979 59.3% TOTAL 88,839 520 89,359 44,333 7,071 51,404 37,955 42.5% % inflow 99.4% 0.6% % outflow 86.2% 13.8%

Chapter 4 Volume I: The South Florida Environment
4-100
Table 4-19. Continued.
Inflows Outflows Is P Σinflow Os Og Σoutflow Retained % Ret
STA-5, South Flow-way WY2001 10,883 98 10,981 1,289 3,659 4,948 6,033 54.9% WY2002 26,165 90 26,255 4,327 4,958 9,285 16,970 64.6% WY2003 35,291 121 35,412 8,486 8,296 16,783 18,629 52.6% WY2004 28,556 116 28,671 8,000 10,218 18,219 10,453 36.5% WY2005 10,951 96 11,047 6,558 6,023 12,581 -1,535 -13.9% TOTAL 111,845 520 112,366 28,661 33,155 61,816 50,550 45.0% % inflow 99.5% 0.5% % outflow 46.4% 53.6%
STA-6, Cell 3 WY2000 1,461 17 1,478 114 136 250 1,228 83.1% WY2001 616 16 632 512 312 824 -192 -30.4% WY2002 861 14 876 285 153 438 438 50.0% WY2003 974 14 988 496 116 612 376 38.1% WY2004 802 15 817 275 117 392 425 52.0% WY2005 1,768 15 1,783 239 284 523 1,260 70.7% TOTAL 6,482 91 6,573 1,921 1,116 3,038 3,535 53.8% % inflow 98.6% 1.4% % outflow 63.3% 36.7%
STA-6, Cell 5 WY2000 2,247 43 2,290 120 299 419 1,870 81.7% WY2001 907 40 948 477 410 887 61 6.4% WY2002 1,243 36 1,280 330 216 546 734 57.4% WY2003 1,108 36 1,144 644 362 1,007 138 12.0% WY2004 898 38 936 284 249 533 403 43.0% WY2005 1,422 38 1,460 276 174 450 1,010 69.2% TOTAL 7,826 232 8,058 2,132 1,710 3,842 4,216 52.3% % inflow 97.1% 2.9% % outflow 55.5% 44.5%
a All phosphorus budget terms expressed as kg TP; data provided by W. Abtew and S. Huebner, SFWMD .
b Is = surface water inflow; P = precipitation; Os = surface water outflow; Og = groundwater outflow; Retained = Σinflow – Σoutflow; %Ret = (Retained/Σinflow)*100.

2006 South Florida Environmental Report Chapter 4
4-101
Table 4-20. Summary statistics for STA floc TP content, depth, and bulk density, and estimates of inflow TP mass retained in
the floc layer during the period of operation for each STA.
Floc TP (mg/kg)
Floc depth (cm)
Floc bulk density (g/cm3)
STA Beginning water year
Inflow TP retained by STA
(kg)a
TP in floc (kg)
Inflow TP
stored in floc (%) N Mean SE Mean SE Mean SE
STA-1W WY1995b WY2003c 240,000 162,340 68% 91 721 30 18.6 0.8 0.083 <0.01
STA-2 WY2002 51,000 62,924 123% 74 812 35 5.0 0.2 0.079 0.01STA-3/4 WY2004 900 - - - - - - - - - STA-5 WY2001 110,000 68,610 62% 110 873 41 8.8 0.4 0.074 0.01STA-6 WY1998 25,000 15,570 62% 33 1072 103 8.3 0.5 0.048 0.01
a TP retained from beginning water year through WY2004, as reported in Chapter 4 of the 2005 SFER – Volume I. b Cells 1– 4 c Cell 5B only; Cell 5A not sampled for floc.

Chapter 4 Volume I: The South Florida Environment
4-102
Figure 4-47. Summary of water quality parameters monitored at inflow, mid and outflow locations in the east flow-way, west flow-way, and STA-1W, Cell 5, during WY2005. Phosphorus concentrations in outflow through G-308 and G-309 also are
depicted. TP = total phosphorus; SRP = soluble reactive phosphorus; DOP = dissolved organic phosphorus; TN = total nitrogen; TKN = total Kjeldahl nitrogen;
NH4 = ammonia-nitrogen; NOx = nitrite+nitrate-nitrogen; Cl = chloride; Ca = calcium. Top and bottom of box represent interquartile range; line within each box
is the median; top and bottom of whiskers represent 90th and 10th percentiles, respectively; solid circles are geometric means.

2006 South Florida Environmental Report Chapter 4
4-103
Figure 4-48. Summary of water quality parameters monitored at inflow and outflow locations in Cells 1, 2 and 3 of STA-2 during WY2005.

Chapter 4 Volume I: The South Florida Environment
4-104
Figure 4-49. Summary of water quality parameters monitored at inflow, mid, and outflow locations in the north and south flow-ways
of STA-5 during WY2005.

2006 South Florida Environmental Report Chapter 4
4-105
Figure 4-50. Summary of water quality parameters monitored at inflow and outflow locations in STA-6, Cells 3 and 5, during WY2005.

Chapter 4 Volume I: The South Florida Environment
4-106
Figure 4-51. Summary of surficial sediment chemistry in the STAs based on analysis of 0-10 cm cores collected in 2003. TP= total phosphorus;
TN = total nitrogen; TC = total carbon; S = sulfur; Fe = iron.
2006 South Florida Environmental Report Chapter 4
4-107
PSTA INVESTIGATIONS [BC83(3)]
A Periphyton-Based Stormwater Treatment Area (PSTA) is generally defined as a constructed wetland with a sparse emergent macrophyte community that provides structure to support a dominant periphyton assemblage. PSTA wetlands were studied extensively as part of the District’s Advanced Treatment Technology (ATT) Program and are currently envisioned to be a post-STA technology that is operated at inflow TP concentrations of 50 µg/L (or ppb) or less. The primary nutrient removal mechanisms in a PSTA wetland are direct phosphorus uptake by the periphyton and algal-mediated co-precipitation of phosphorus with calcium carbonate. The objective of the PSTA Investigations Project [BC83(3)] is to track the performance of the District’s ongoing PSTA research projects. During WY2005, the District operated one PSTA research site: the STA-1W south PSTA test cells. The PSTA field-scale test facility discussed in previous reports was decommissioned in October 2004. Construction of the full-scale implementation PSTA project in Cell 2B of STA-3/4 [Project BC83(4)] continued during WY2005. The status of projects BC83(3) and BC83(4) is discussed below.
STA-1W South PSTA Test Cells
The EFA required the District to optimize the treatment performance of the STAs. To comply with this mandate, the District initiated research projects in the STA-1W test cells to evaluate the efficacy of several different treatment technologies, one of which was PSTA. The STA-1W test cells are 30 0.2-hectare (0.5-acre) constructed wetlands designed to be hydrologically isolated from each other. One set of 15 test cells is located in STA-1W, Cell 1 (north test cells), and the other is in STA-1W, Cell 3 (south test cells). The test cells and the ATT research projects conducted in these cells are described in Chimney et al. (2000). All work associated with the ATT Program was concluded in January 2002. Results from the ATT projects have been summarized in previous Everglades Consolidated Reports and in final project reports that can be found on the District’s web site at www.sfwmd.gov/org/erd/ecp/etweb/main_template/report.html.
The District continued monitoring the three south PSTA test cells on a reduced basis after the ATT Program ended to document long-term trends in TP removal in these systems. Two of the south PSTA cells were constructed with 30 cm of shellrock placed over 30 cm of peat (shellrock cells), while the remaining cell only had a peat substrate (peat cell). This section provides an overview of TP removal in the south PSTA test cells for the period from May 1, 2002 through April 30, 2005, which is referred to as the period of extended monitoring.
The south PSTA test cells were operated at a constant hydraulic loading rate of 2.6 cm/d throughout the period of extended monitoring. Water depth averaged 30 cm in all cells in WY2003 (Year 1), 60 cm in WY2004 (Year 2), and 30 cm in WY2005 (Year 3). Grab samples were collected biweekly at the common inflow to the south test cells and at the outflow from each individual PSTA test cell and analyzed for TP. It was apparent that the shellrock cells had substantially better treatment performance than the peat cell; sampling of the peat cell was discontinued in October 2004. Means values discussed in this section are geometric means. Differences in inflow and outflow TP concentrations were compared using analysis of variance analysis (ANOVA) of log10-transformed data pooled over all sampling dates followed by post hoc mean comparison tests (Tukey-Kramer HSD) using SAS JMP®, version 5.

Chapter 4 Volume I: The South Florida Environment
4-108
Mean outflow TP concentrations from the shellrock cells (both 13 µg/L) were significantly lower than the mean inflow TP concentration (51 µg/L) and the peat cell outflow (31 µg/L) (Figure 4-52). Differences in water depth between Year 1 (30 cm) and Year 2 (60 cm) did not significantly affect treatment performance of the shellrock cells (see Figure 4-47 in Goforth et al., 2005). Mean inflow TP concentrations to the south test cells increased substantially after the two hurricanes in September 2004 (pre-hurricane = 39 µg/L; post-hurricane = 128 µg/L). However, outflow from the shellrock cells (pre-hurricane = 13 and 13 µg/L; post-hurricane = 15 and 13 µg/L) was little affected by the change in inflow TP levels. Note that while none of the south PSTA test cells achieved a long-term mean outflow TP concentration of 10 µg/L, individual biweekly values were occasionally at or below this threshold level.
PSTA Field-scale Test Facility
The PSTA field-scale test facility was a 20-acre site located immediately west of STA-2 that consisted of four 5-acre constructed wetlands. Treatment performance in these wetlands was monitored from November 2001–October 2003. Descriptions of the facility and its operation and a summary of phosphorus treatment results can be found in Newman et al. (2003), Chimney et al. (2004), and Goforth et al. (2005). The site was decommissioned in October 2004 and is being incorporated into the footprint of the STA-2, Cell 4, expansion project. No research was conducted in WY2005 at this facility. Summary reports from the two contractors that operated the facility are presented in Appendices 4-13 and 4-14, respectively.
Figure 4-52. Summary of total phosphorus removal in the three STA-1W south PSTA test cells over the entire period of extended monitoring (May 1, 2002
through April 30, 2005). Closed circles represent geometric mean concentrations. Top and bottom of box = 75th and 25th percentile of the data distribution,
respectively; mid-line in box = 50th percentile; ends of whiskers = 10th and 90th percentiles, respectively. Means with different letters are significantly
different from each other at a probability level (α) < 0.05. The dashed line indicates a total phosphorus concentration of 10 µg/L.
Inflow Shellrock 1 Shellrock 2 Peat
Tota
l P (
µg/L
)
20
40
60
80
100
120
Outflow
A
C C
B

2006 South Florida Environmental Report Chapter 4
4-109
STATUS OF OTHER LONG-TERM PLAN PROJECTS
ECP OPERATIONS MONITORING (BC05)
The objective of the ECP Operations Monitoring Project (Bc05) is to collect water quality samples and monitor flow at inflow and outflow locations of all treatment cells within the STAs that are not covered under existing operating permits. Most of the ECP operations monitoring structures are currently being monitored, while additional monitoring stations are scheduled to come on-line by FY2006, as outlined in the Long-Term Plan. Flow is monitored on a continuous basis. Water quality samples analyzed for TP are collected weekly; all other parameters are monitored biweekly. These data will be used to assess the performance of each treatment cell and will contribute to the development of strategies for improving TP removal efficiency in the STAs as a whole.
During WY2005, water quality and flow monitoring in the STAs continued at the ECP operations monitoring stations listed in Table 4-21. As of August 2005, there are no ECP operations monitoring in STA-1E, as this STA is not in flow-through operations. Routine ECP operations monitoring of this facility is projected to begin in FY2006. The installation of monitoring stations in STA-3/4 is largely complete and water quality collection was initiated at the end of WY2005. All ECP operations monitoring in STA-1W is ongoing with the exception of the structures in the western flow-way, (Cells 2 and 4) and in Cell 5, which were closed for construction of the Long-Term Plan recommended enhancements. All ECP operations monitoring in STA-2, STA-5, and STA-6 is ongoing.
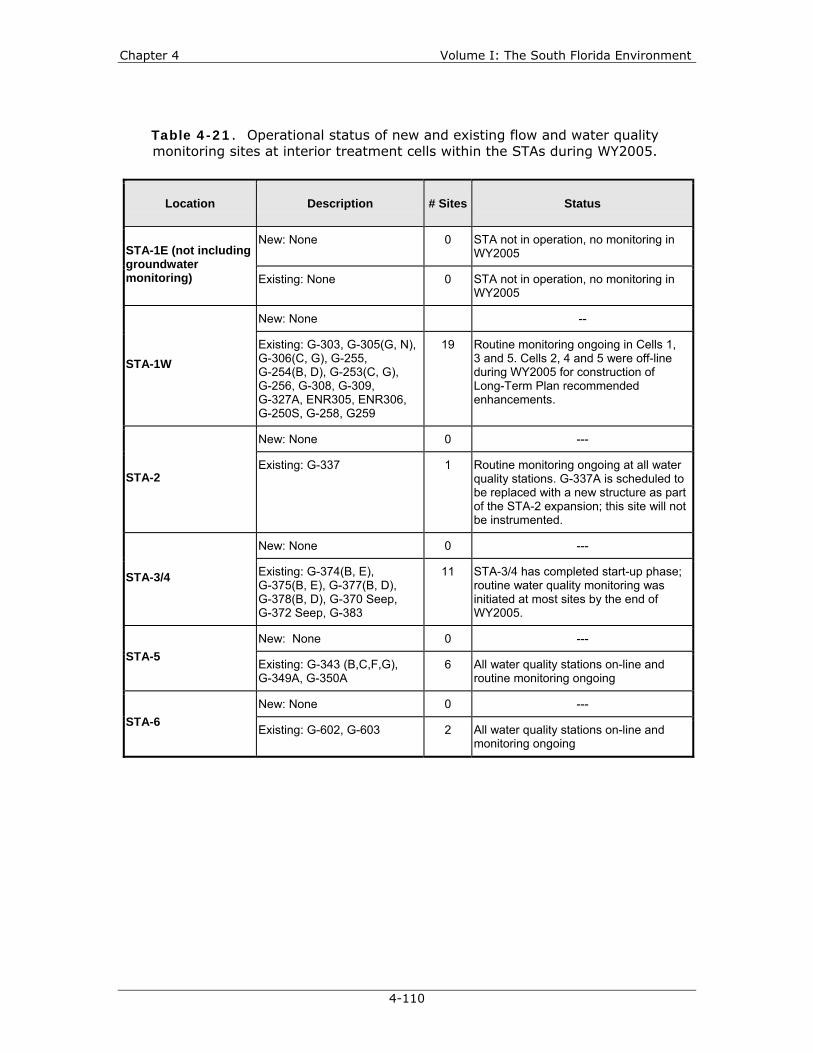
Chapter 4 Volume I: The South Florida Environment
4-110
Location Description # Sites Status
New: None 0 STA not in operation, no monitoring in WY2005 STA-1E (not including
groundwater monitoring) Existing: None 0 STA not in operation, no monitoring in
WY2005
New: None --
STA-1W Existing: G-303, G-305(G, N), G-306(C, G), G-255, G-254(B, D), G-253(C, G), G-256, G-308, G-309, G-327A, ENR305, ENR306, G-250S, G-258, G259
19 Routine monitoring ongoing in Cells 1, 3 and 5. Cells 2, 4 and 5 were off-line during WY2005 for construction of Long-Term Plan recommended enhancements.
New: None 0 ---
STA-2 Existing: G-337 1 Routine monitoring ongoing at all water
quality stations. G-337A is scheduled to be replaced with a new structure as part of the STA-2 expansion; this site will not be instrumented.
New: None 0 ---
STA-3/4 Existing: G-374(B, E), G-375(B, E), G-377(B, D), G-378(B, D), G-370 Seep, G-372 Seep, G-383
11 STA-3/4 has completed start-up phase; routine water quality monitoring was initiated at most sites by the end of WY2005.
New: None 0 --- STA-5 Existing: G-343 (B,C,F,G),
G-349A, G-350A 6 All water quality stations on-line and
routine monitoring ongoing
New: None 0 --- STA-6
Existing: G-602, G-603 2 All water quality stations on-line and monitoring ongoing
Table 4-21. Operational status of new and existing flow and water quality monitoring sites at interior treatment cells within the STAs during WY2005.

2006 South Florida Environmental Report Chapter 4
4-111
STA SITE MANAGEMENT [Bf81]
The District’s Operations and Maintenance Department, Environmental Operations Section, currently staffs three STA site managers (one for STA-1W and STA-1E, one for STA-2 and STA-3/4, and one for STA-5 and STA-6). The primary responsibility of the STA site managers is to coordinate among various departments, divisions, and external stakeholders to facilitate resolution of day-to-day STA management and operation issues. Site managers maintain an onsite presence at STAs to ensure objectives of the STA program are met.
Site managers routinely report observations of changing environmental and site conditions, maintenance concerns, or infrastructure problems to appropriate District staff. Significant additional coordination between the District’s Construction Department and the site managers has been and will be required during the build-out of the Long-Term Plan components. Additionally, site managers coordinate monthly vegetation management surveys with Vegetation Management and Field Operations staff to identify priorities and strategies to meet the overall vegetation goals of the STA program. Site managers also monitor daily stormwater operations and confirm that these operations are consistent with the established STA operation plans.
ACQUISITION OF SURVEY DATA [Bc82(1)]
The Acquisition of Survey Data project ([Bc82(1)] includes completing topographic surveys within the footprints of the STAs to more clearly delineate ground surface elevations between interior levees and control structures. These topographic surveys are being used by another Long-Term Plan project referred to as Update and Maintenance of Hydraulic Models [Bc82(5)]. To date, contractors have completed topographic surveys in STA-1E, STA-1W, STA-2, STA-5, and STA-6. There are two kinds of surveys done. A complete third order run was made to all the structures. Precision is 0.05 times the square root of the distance in miles. An RTK survey was done for the STA-1E topographic work, generally to 0.1 of a foot.
In addition, the Acquisition of Survey Data project includes conducting vertical control surveys at flow measurement stations to confirm, and correct gauge datum elevations, where necessary. As of the end of FY2005, surveys at the following structures have been completed:
• Spillway Structures G-302, G-301, and G-303 • Culvert Structures G-304A–J, G-306A–J, and G-327A • Culvert Structures G-255 and G-305A–V • Culvert Structures G-330A–E • Culvert Structures G-329A–D • Culvert Structures G-331A–G • Culvert Structures G-333A–E • Spillway Structures G-332 and G-334 • Pump Stations G-335, G-337, and G-337A • STA-5 and STA-6 Structures
Surveying of the STA-1E structures is scheduled to begin in FY2006.

Chapter 4 Volume I: The South Florida Environment
4-112
ADDITIONAL FLOW AND WATER QUALITY MONITORING STATIONS [Bc82(2)]
This project consists of establishing 47 new flow and water quality monitoring stations in the STAs. These additional monitoring efforts focus on STA-3/4 (two seepage pumps and nine culverts) and STA-1W (two culverts) in FY2004 and on STA-1E in FY2005 (19 stations). The instrumentation has been completed and flow computation has been implemented at G-258 and G-259 culverts in STA-1W. The registration in DBHYDRO has been completed for G-374B and E, G-375B and E, G-377B and D, G-378B and D, G-383, and seepage pumps G-370 and G-372 in STA-3/4. Currently, flow is computed at all STA-3/4 culverts using the calibrated equations developed for STA-5 inflow/outflow culverts. Flow is also computed at the inflow pumps G-370, G-370S (seepage), G-372, and G-372S (seepage) using the pump manufacturers’ curves at these sites.
Stilling wells have been installed at the following 19 stations in STA1-E: S-363B, S-364B, S-365A and B, S-366B and D, S-367B and D, S-368B and D, S-369A and D, S-370, S-371B, S-372B and D, S-373B, S-374B, and S-375. Certification and validation of these stage sensors and replacement of the gate sensors are in progress, and are expected to be completed by December 2005. Sensors at structures G-380B and E and G-381B and E are under construction, and are to be completed by August 2005.
REVIEW AND CORRECTION OF FLOW MEASUREMENT ANOMALIES [Bc82(3)]
The goal of this project is to address flow estimate uncertainties, and to provide good quality flow data at all major flow stations in the STAs. The project was intended to improve the accuracy of flow data at 32 stations in FY2004 and 48 stations in FY2005. In FY2005, the District performed 18 flow measurements in STA-1W, 26 measurements in STA-2, and 24 measurements in STA-3/4. Calibrated flow equations have been completed and implemented at 100 percent in STA-5 and STA-6, and at 95 percent in STA-1W and STA-2. Theoretical flow equations and flow computation have been implemented 100 percent in STA-1W, STA-2, STA-3/4, STA-5 and STA-6. Due to delays in instrumentation in STA-1E, theoretical flow equations and flow computation will be implemented in this STA in FY2006. The District plans to perform over 200 field flow measurements to complete flow rating calibration analyses at 50 percent of the water control structures in STA-3/4 and STA-1E by the end of FY2006.
UPDATE AND MAINTENANCE OF HYDRAULIC MODELS [Bc82(5)]
In February 2004, a 23-month work order was issued to Sutron Corporation, Inc., for the performance of two-dimensional (2-D) hydraulic modeling of the STAs. In FY2005, linked cells models were developed for STA-2, STA-6 Section 1, STA-1W, and STA-5. For each of these STAs, Existing Conditions models were developed and three flow conditions were simulated: Low Flow, Design Flow, and Peak Flow.
Reports describing the 2-D models developed by Sutron Corporation, Inc., including reports describing models developed in FY2004, is available on the District’s web site at www.sfwmd.gov/org/erd/longtermplan/documents.shtml.
According to the current work order schedule, 2-D models will be developed for STA-1E and STA-3/4 during the last three months of FY2005 and the first three months of FY2006.

2006 South Florida Environmental Report Chapter 4
4-113
OPERATIONAL STRATEGY [Bc84(1)]
No activities were scheduled or completed for this project in FY2005.
VEGETATION MAINTENANCE [Bc84(2)]
This project covers vegetation maintenance activities in STA-2, Cell 3, only. As stated on page 5-27 of the Long-Term Plan, invasion by emergents or other “less desirable” species should be controlled in order to optimize SAV performance of STA-2, Cell 3. Accordingly, patches of emergent cattail and torpedograss were routinely treated with herbicides during the past year. Introduction of biocontrol agent for hydrilla is planned for August 2005. The planned conversion of 500 acres of emergent vegetation that remains from the former Brown’s Farm Wildlife Management Area has been postponed due to continuing good performance of the cell.
RECREATIONAL ACTIVITIES
Recreational facilities are proposed to provide public access to all six of the ECP STAs. The proposed facilities will include components such as boardwalks, bird watching blinds, parking areas, canoe launching sites, boat ramps, composting toilets, information kiosks, landscaping, pedestrian gates, road improvements, signs, and fencing as needed to define public access areas and to protect sensitive equipment.
As recommended in the Revised Part 2 of the Long-Term Plan dated November 2004, the design and engineering of the various recreational facilities is to occur in FY2005 and FY2006, and construction is to occur in FY2006 and FY2007. The District is currently evaluating a proposal to modify the schedule for some of the recreational facilities to allow better coordination between the proposed recreational facilities at STA-2, STA-5, and STA-6 and the proposed Compartments B and C Build-out projects. An update on the status of the design, engineering and construction of the various STA recreational facilities will be provided in next year’s SFER.

Chapter 4 Volume I: The South Florida Environment
4-114
LITERATURE CITED
Burns & McDonnell. 1993. Everglades Protection Project, Palm Beach County, Florida. Appendix A to Settlement Agreement, Conceptual Design of Mediated Technical Plan (Draft), November 5, 1993. 92-166-1-002.
Burns & McDonnell. 2003. Long-Term Plan for Achieving Water Quality Goals, Everglades Protection Area Tributary Basins. Final Report, October 27, 2003.
Chimney, M., M. Nungesser, J. Newman, K. Pietro, G. Germain, T. Lynch, G. Goforth and M. Moustafa. 2000. Chapter 6: Stormwater Treatment Areas – Status of Research and Monitoring to Optimize Effectiveness of Nutrient Removal and Annual Report on Operational Compliance. G. Redfield, ed. In: 2000 Everglades Consolidation Report, South Florida Water Management District, West Palm Beach, FL.
Chimney, M.J., M.K. Nungesser, C. Combs, B. Gu, E. Fogarty-Kellis, J.M. Newman, W. Wagner and L. Wenkert. 2004. Chapter 4B: STA Optimization and Advanced Treatment Technologies. G. Redfield, ed. In: 2004 Everglades Consolidated Report, South Florida Water Management District, West Palm Beach, FL.
DBEL. 2000. Submerged Aquatic Vegetation/Limerock Treatment System Technology for Removing Phosphorus from Everglades Agricultural Waters: Follow-on Study - STA-1W Cell 4 Tracer Study. Final report prepared by DB Environmental Laboratories, Inc. for the South Florida Water Management District, West Palm Beach, FL and the Florida Department of Environmental Protection, Tallahassee, FL.
DBEL. 2003. Assessment of Hydraulic and Ecological Factors Influencing Phosphorus Removal in Stormwater Treatment Area – 1 West. Final Report prepared by DB Environmental Laboratories, Inc. for the Florida Department of Environmental Protection, Tallahassee, FL.
Goforth, G. 2004. The Operational Design Envelope for the STAs. Draft Technical Report, May 2004. South Florida Water Management District, West Palm Beach, FL.
Goforth, G., K. Pietro, M.J. Chimney, J. Newman, T. Bechtel, G. Germain and N. Iricanin. 2005. Chapter 4: STA Performance, Compliance, and Optimization. G. Redfield, ed. In: 2005 South Florida Environmental Report, South Florida Water Management District, West Palm Beach, FL.
Kadlec, R.H. 2000. Failure of the Plug Flow Assumption for ENR Cell 4. Memorandum.
Newman, J.M., G. Goforth, M.J. Chimney, J. Jorge, T. Bechtel, G. Germain, M.K. Nungesser, C. Pathak, D. Rumbold, J. Lopez, L. Fink, B. Gu, K. Cayse, R. Bearzotti, D. Campbell, C. Combs, K. Pietro, N. Iricanin, R. Meeker, G. West and N. Larson. 2003. Chapter 4: Stormwater Treatment Technologies. G. Redfield, ed. In: 2003 Everglades Consolidated Report, South Florida Water Management District, West Palm Beach, FL.
Pietro, K. and G. Goforth. 2004. C-51 West Sub-basin Updated Analysis of Flow and Phosphorus Data. June 2004. South Florida Water Management District, West Palm Beach, FL.
SAS JMP®, Version 5, SAS Institute, Inc., Cary, NC.
Wetzel, R.G. 2001. Limnology: Lake and River Ecosystems, 3rd Edition. Academic Press, San Diego, CA.