Chapter 4: New Adult Patients Starting Renal Replacement Therapy ...
20
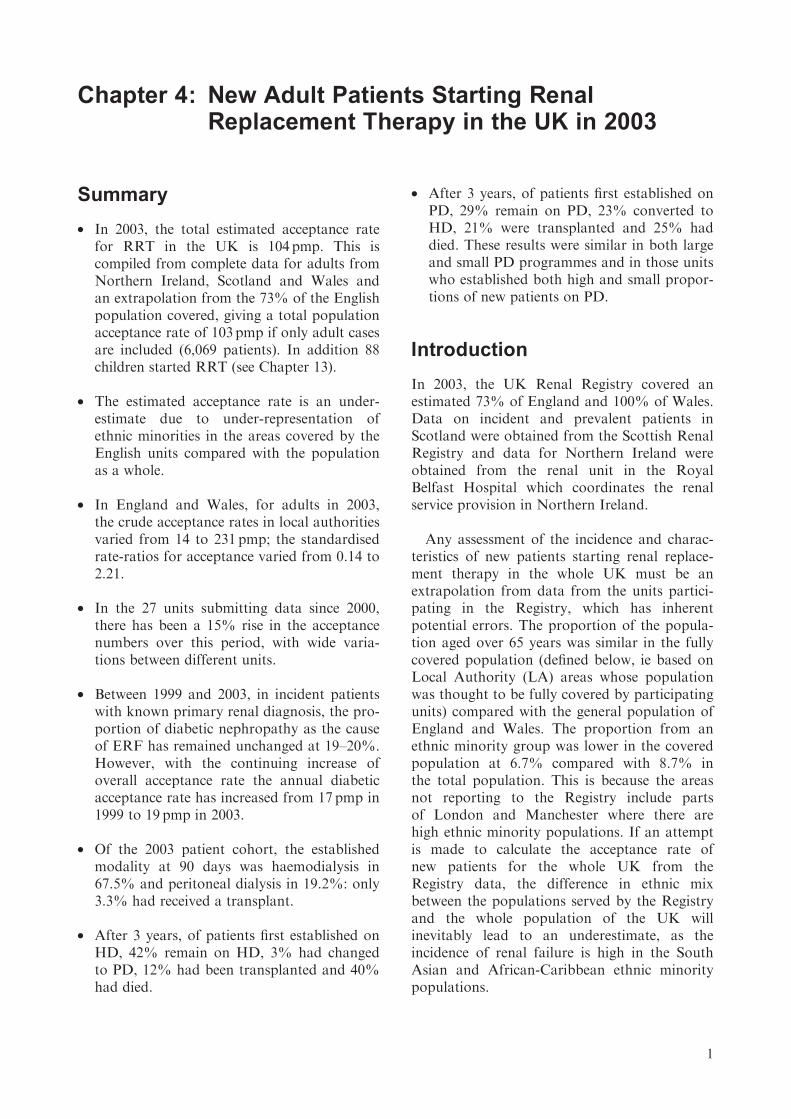
Chapter 4: New Adult Patients Starting Renal Replacement Therapy in the UK in 2003 Summary . In 2003, the total estimated acceptance rate for RRT in the UK is 104 pmp. This is compiled from complete data for adults from Northern Ireland, Scotland and Wales and an extrapolation from the 73% of the English population covered, giving a total population acceptance rate of 103pmp if only adult cases are included (6,069 patients). In addition 88 children started RRT (see Chapter 13). . The estimated acceptance rate is an under- estimate due to under-representation of ethnic minorities in the areas covered by the English units compared with the population as a whole. . In England and Wales, for adults in 2003, the crude acceptance rates in local authorities varied from 14 to 231 pmp; the standardised rate-ratios for acceptance varied from 0.14 to 2.21. . In the 27 units submitting data since 2000, there has been a 15% rise in the acceptance numbers over this period, with wide varia- tions between different units. . Between 1999 and 2003, in incident patients with known primary renal diagnosis, the pro- portion of diabetic nephropathy as the cause of ERF has remained unchanged at 19–20%. However, with the continuing increase of overall acceptance rate the annual diabetic acceptance rate has increased from 17 pmp in 1999 to 19 pmp in 2003. . Of the 2003 patient cohort, the established modality at 90 days was haemodialysis in 67.5% and peritoneal dialysis in 19.2%: only 3.3% had received a transplant. . After 3 years, of patients first established on HD, 42% remain on HD, 3% had changed to PD, 12% had been transplanted and 40% had died. . After 3 years, of patients first established on PD, 29% remain on PD, 23% converted to HD, 21% were transplanted and 25% had died. These results were similar in both large and small PD programmes and in those units who established both high and small propor- tions of new patients on PD. Introduction In 2003, the UK Renal Registry covered an estimated 73% of England and 100% of Wales. Data on incident and prevalent patients in Scotland were obtained from the Scottish Renal Registry and data for Northern Ireland were obtained from the renal unit in the Royal Belfast Hospital which coordinates the renal service provision in Northern Ireland. Any assessment of the incidence and charac- teristics of new patients starting renal replace- ment therapy in the whole UK must be an extrapolation from data from the units partici- pating in the Registry, which has inherent potential errors. The proportion of the popula- tion aged over 65 years was similar in the fully covered population (defined below, ie based on Local Authority (LA) areas whose population was thought to be fully covered by participating units) compared with the general population of England and Wales. The proportion from an ethnic minority group was lower in the covered population at 6.7% compared with 8.7% in the total population. This is because the areas not reporting to the Registry include parts of London and Manchester where there are high ethnic minority populations. If an attempt is made to calculate the acceptance rate of new patients for the whole UK from the Registry data, the difference in ethnic mix between the populations served by the Registry and the whole population of the UK will inevitably lead to an underestimate, as the incidence of renal failure is high in the South Asian and African-Caribbean ethnic minority populations. 1
-
Upload
khangminh22 -
Category
Documents
-
view
2 -
download
0
Transcript of Chapter 4: New Adult Patients Starting Renal Replacement Therapy ...
Chapter 4: New Adult Patients Starting RenalReplacement Therapy in the UK in 2003
Summary
. In 2003, the total estimated acceptance ratefor RRT in the UK is 104 pmp. This iscompiled from complete data for adults fromNorthern Ireland, Scotland and Wales andan extrapolation from the 73% of the Englishpopulation covered, giving a total populationacceptance rate of 103pmp if only adult casesare included (6,069 patients). In addition 88children started RRT (see Chapter 13).
. The estimated acceptance rate is an under-estimate due to under-representation ofethnic minorities in the areas covered by theEnglish units compared with the populationas a whole.
. In England and Wales, for adults in 2003,the crude acceptance rates in local authoritiesvaried from 14 to 231 pmp; the standardisedrate-ratios for acceptance varied from 0.14 to2.21.
. In the 27 units submitting data since 2000,there has been a 15% rise in the acceptancenumbers over this period, with wide varia-tions between different units.
. Between 1999 and 2003, in incident patientswith known primary renal diagnosis, the pro-portion of diabetic nephropathy as the causeof ERF has remained unchanged at 19–20%.However, with the continuing increase ofoverall acceptance rate the annual diabeticacceptance rate has increased from 17 pmp in1999 to 19 pmp in 2003.
. Of the 2003 patient cohort, the establishedmodality at 90 days was haemodialysis in67.5% and peritoneal dialysis in 19.2%: only3.3% had received a transplant.
. After 3 years, of patients first established onHD, 42% remain on HD, 3% had changedto PD, 12% had been transplanted and 40%had died.
. After 3 years, of patients first established onPD, 29% remain on PD, 23% converted toHD, 21% were transplanted and 25% haddied. These results were similar in both largeand small PD programmes and in those unitswho established both high and small propor-tions of new patients on PD.
Introduction
In 2003, the UK Renal Registry covered anestimated 73% of England and 100% of Wales.Data on incident and prevalent patients inScotland were obtained from the Scottish RenalRegistry and data for Northern Ireland wereobtained from the renal unit in the RoyalBelfast Hospital which coordinates the renalservice provision in Northern Ireland.
Any assessment of the incidence and charac-teristics of new patients starting renal replace-ment therapy in the whole UK must be anextrapolation from data from the units partici-pating in the Registry, which has inherentpotential errors. The proportion of the popula-tion aged over 65 years was similar in the fullycovered population (defined below, ie based onLocal Authority (LA) areas whose populationwas thought to be fully covered by participatingunits) compared with the general population ofEngland and Wales. The proportion from anethnic minority group was lower in the coveredpopulation at 6.7% compared with 8.7% inthe total population. This is because the areasnot reporting to the Registry include partsof London and Manchester where there arehigh ethnic minority populations. If an attemptis made to calculate the acceptance rate ofnew patients for the whole UK from theRegistry data, the difference in ethnic mixbetween the populations served by the Registryand the whole population of the UK willinevitably lead to an underestimate, as theincidence of renal failure is high in the SouthAsian and African-Caribbean ethnic minoritypopulations.
1
For comparisons between renal units andbetween local areas fully covered by the RenalRegistry, the data from the Registry are fullyvalid.
Paediatric data, which are not included inthis Chapter, can be found in Chapter 13.
Adult patients accepted forrenal replacement therapy inthe UK, 2003
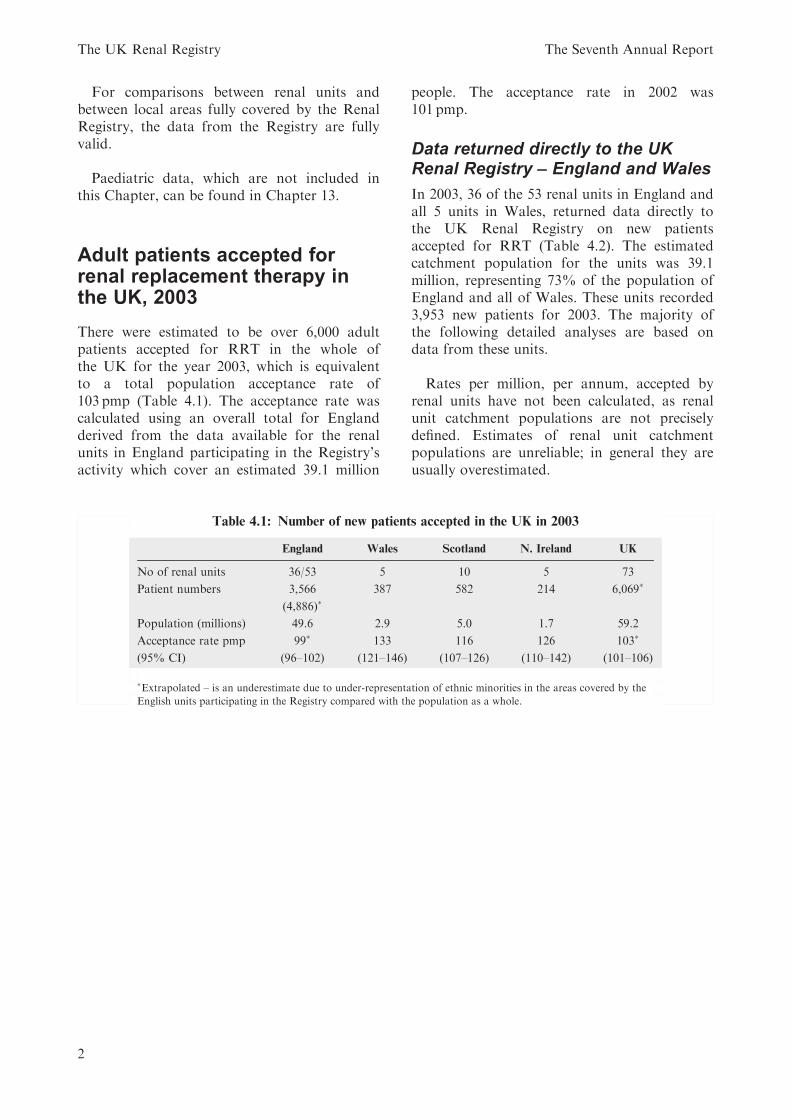
There were estimated to be over 6,000 adultpatients accepted for RRT in the whole ofthe UK for the year 2003, which is equivalentto a total population acceptance rate of103 pmp (Table 4.1). The acceptance rate wascalculated using an overall total for Englandderived from the data available for the renalunits in England participating in the Registry’sactivity which cover an estimated 39.1 million
people. The acceptance rate in 2002 was101 pmp.
Data returned directly to the UKRenal Registry – England and Wales
In 2003, 36 of the 53 renal units in England andall 5 units in Wales, returned data directly tothe UK Renal Registry on new patientsaccepted for RRT (Table 4.2). The estimatedcatchment population for the units was 39.1million, representing 73% of the population ofEngland and all of Wales. These units recorded3,953 new patients for 2003. The majority ofthe following detailed analyses are based ondata from these units.
Rates per million, per annum, accepted byrenal units have not been calculated, as renalunit catchment populations are not preciselydefined. Estimates of renal unit catchmentpopulations are unreliable; in general they areusually overestimated.
Table 4.1: Number of new patients accepted in the UK in 2003
England Wales Scotland N. Ireland UK
No of renal units 36/53 5 10 5 73
Patient numbers 3,566
(4,886)�387 582 214 6,069�
Population (millions) 49.6 2.9 5.0 1.7 59.2
Acceptance rate pmp
(95% CI)
99�
(96–102)
133
(121–146)
116
(107–126)
126
(110–142)
103�
(101–106)
�Extrapolated – is an underestimate due to under-representation of ethnic minorities in the areas covered by the
English units participating in the Registry compared with the population as a whole.
The UK Renal Registry The Seventh Annual Report
2
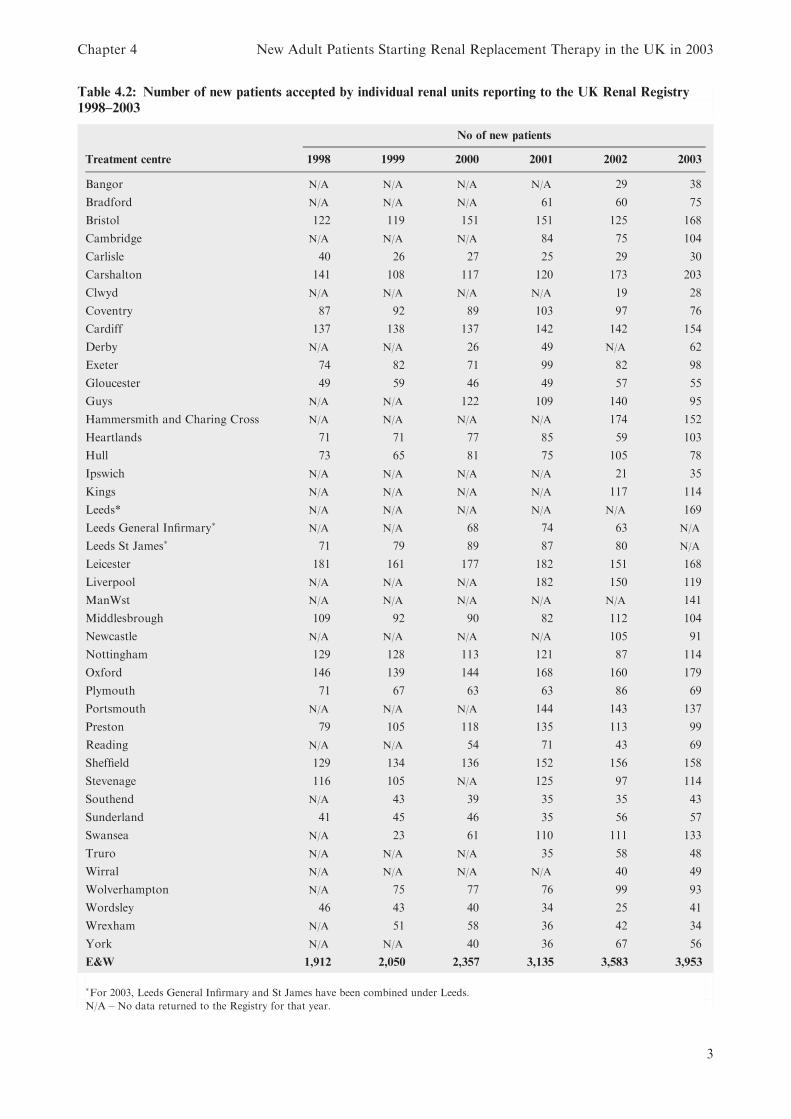
Table 4.2: Number of new patients accepted by individual renal units reporting to the UK Renal Registry
1998–2003
No of new patients
Treatment centre 1998 1999 2000 2001 2002 2003
Bangor N/A N/A N/A N/A 29 38
Bradford N/A N/A N/A 61 60 75
Bristol 122 119 151 151 125 168
Cambridge N/A N/A N/A 84 75 104
Carlisle 40 26 27 25 29 30
Carshalton 141 108 117 120 173 203
Clwyd N/A N/A N/A N/A 19 28
Coventry 87 92 89 103 97 76
Cardiff 137 138 137 142 142 154
Derby N/A N/A 26 49 N/A 62
Exeter 74 82 71 99 82 98
Gloucester 49 59 46 49 57 55
Guys N/A N/A 122 109 140 95
Hammersmith and Charing Cross N/A N/A N/A N/A 174 152
Heartlands 71 71 77 85 59 103
Hull 73 65 81 75 105 78
Ipswich N/A N/A N/A N/A 21 35
Kings N/A N/A N/A N/A 117 114
Leeds* N/A N/A N/A N/A N/A 169
Leeds General Infirmary� N/A N/A 68 74 63 N/A
Leeds St James� 71 79 89 87 80 N/A
Leicester 181 161 177 182 151 168
Liverpool N/A N/A N/A 182 150 119
ManWst N/A N/A N/A N/A N/A 141
Middlesbrough 109 92 90 82 112 104
Newcastle N/A N/A N/A N/A 105 91
Nottingham 129 128 113 121 87 114
Oxford 146 139 144 168 160 179
Plymouth 71 67 63 63 86 69
Portsmouth N/A N/A N/A 144 143 137
Preston 79 105 118 135 113 99
Reading N/A N/A 54 71 43 69
Sheffield 129 134 136 152 156 158
Stevenage 116 105 N/A 125 97 114
Southend N/A 43 39 35 35 43
Sunderland 41 45 46 35 56 57
Swansea N/A 23 61 110 111 133
Truro N/A N/A N/A 35 58 48
Wirral N/A N/A N/A N/A 40 49
Wolverhampton N/A 75 77 76 99 93
Wordsley 46 43 40 34 25 41
Wrexham N/A 51 58 36 42 34
York N/A N/A 40 36 67 56
E&W 1,912 2,050 2,357 3,135 3,583 3,953
�For 2003, Leeds General Infirmary and St James have been combined under Leeds.
N/A – No data returned to the Registry for that year.
Chapter 4 New Adult Patients Starting Renal Replacement Therapy in the UK in 2003
3

Geographical variation inacceptance rates in Englandand Wales
Introduction
Geographical equity of access to RRT is animportant goal of renal service provision. How-ever different areas will have different needs forRRT depending on demographic compositionparticularly age, gender, social deprivation andethnic minority status. Comparison of crudeacceptance rates onto RRT by geographicalarea alone can be misleading without takingaccount of such factors. This section uses ageand gender standardisation as in the 2002Report to compare RRT incident rates andtries to relate these to the ethnic minorityprofile. The impact of social deprivation on theacceptance rate has not been re-analysed for
this year’s report but is recorded in the 2002report. The total population used for thestandardisation is the combination of all LocalAuthority areas for which the Registry hadcomplete coverage in 2003. This analysis isrestricted to England and Wales.
Methods
The methods of calculating the standardisedacceptance rate ratio are described in detail inAppendix D.
In summary, age and gender specific accep-tance rates were first calculated using the avail-able registry data on the number of incidentpatients for the covered area in England andWales and the data on the age and genderbreakdown of the population of each LocalAuthority (LA) area obtained from the 2001
Table 4.3: Age/gender specific acceptance rates in the covered population
N (estimated
population)
N (cases in estimated
population)
Crude rate per million
estimated population in
age and gender group
16–19 Men 862,382 15 17.4Women 827,246 6 7.3
20–24 Men 1,011,524 46 45.5Women 1,007,674 24 23.8
25–29 Men 1,060,351 57 53.8Women 1,097,126 37 33.7
30–34 Men 1,248,816 72 57.7
Women 1,300,041 41 31.5
35–39 Men 1,307,889 89 68.0Women 1,342,029 69 51.4
40–44 Men 1,188,636 90 75.7Women 1,207,214 67 55.5
45–49 Men 1,076,433 144 133.8Women 1,092,413 78 71.4
50–54 Men 1,177,531 149 126.5
Women 1,189,607 94 79.0
55–59 Men 969,583 183 188.7Women 982,151 112 114.0
60–64 Men 826,600 176 212.9Women 854,226 140 163.9
65–74 Men 1,347,444 564 418.6Women 1,529,782 348 227.5
75–79 Men 481,784 258 535.5
Women 669,364 166 248.0
80–84 Men 280,317 159 567.2Women 483,629 91 188.2
85–89 Men 129,904 39 300.2Women 302,094 25 82.8
90þ Men 47,819 11 230.0Women 165,370 4 24.2
The UK Renal Registry The Seventh Annual Report
4
Census data from the Office for National Statis-tics (ONS). These age and gender specific rateswere then used to calculate the expected accep-tance numbers for each LA area. The age andgender standardised acceptance rate ratio istherefore equal to the observed acceptance rate/expected numbers accepted.
A ratio of 1 indicates that the LA area’sacceptance rate was as expected if the age/gender rates found in the total covered popula-tion applied to the LA area’s population struc-ture; a ratio above 1 indicates that the observedrate is greater than expected given the LAarea’s population structure, if the lower con-fidence limit was above 1 this is statisticallysignificant at the 5% level. The converse appliesto standardised rate ratios under one.
Results
Age and Gender
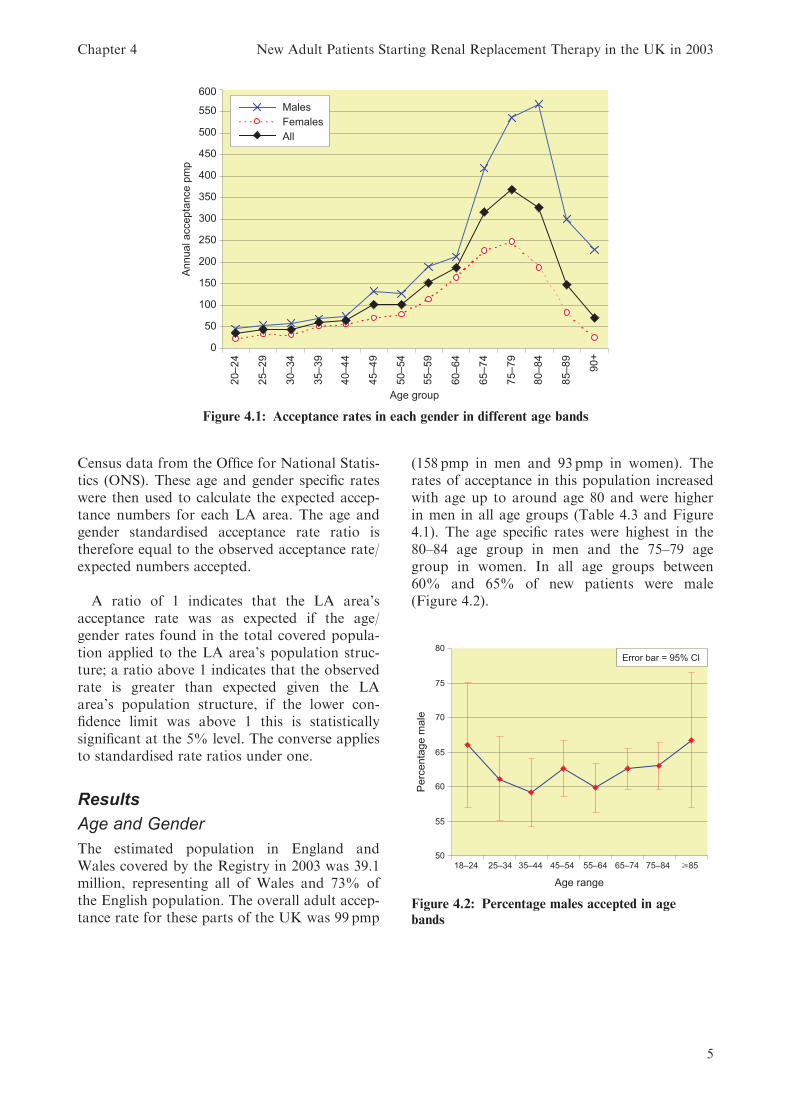
The estimated population in England andWales covered by the Registry in 2003 was 39.1million, representing all of Wales and 73% ofthe English population. The overall adult accep-tance rate for these parts of the UK was 99 pmp
(158 pmp in men and 93 pmp in women). Therates of acceptance in this population increasedwith age up to around age 80 and were higherin men in all age groups (Table 4.3 and Figure4.1). The age specific rates were highest in the80–84 age group in men and the 75–79 agegroup in women. In all age groups between60% and 65% of new patients were male(Figure 4.2).
Figure 4.1: Acceptance rates in each gender in different age bands
Figure 4.2: Percentage males accepted in age
bands
Chapter 4 New Adult Patients Starting Renal Replacement Therapy in the UK in 2003
5
Local Authority acceptance rates
Acceptance rates in Local Authorities withcomplete coverage by the Registry are shown inTable 4.4.
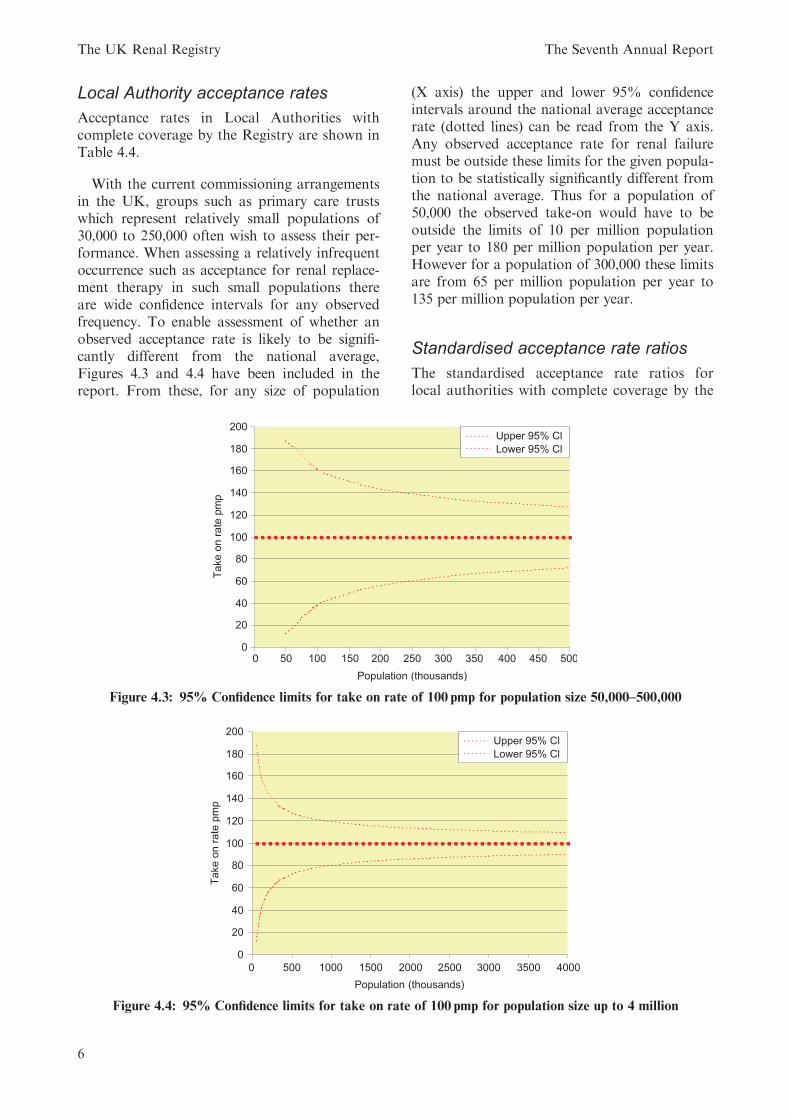
With the current commissioning arrangementsin the UK, groups such as primary care trustswhich represent relatively small populations of30,000 to 250,000 often wish to assess their per-formance. When assessing a relatively infrequentoccurrence such as acceptance for renal replace-ment therapy in such small populations thereare wide confidence intervals for any observedfrequency. To enable assessment of whether anobserved acceptance rate is likely to be signifi-cantly different from the national average,Figures 4.3 and 4.4 have been included in thereport. From these, for any size of population
(X axis) the upper and lower 95% confidenceintervals around the national average acceptancerate (dotted lines) can be read from the Y axis.Any observed acceptance rate for renal failuremust be outside these limits for the given popula-tion to be statistically significantly different fromthe national average. Thus for a population of50,000 the observed take-on would have to beoutside the limits of 10 per million populationper year to 180 per million population per year.However for a population of 300,000 these limitsare from 65 per million population per year to135 per million population per year.
Standardised acceptance rate ratios
The standardised acceptance rate ratios forlocal authorities with complete coverage by the
Figure 4.3: 95% Confidence limits for take on rate of 100 pmp for population size 50,000–500,000
Figure 4.4: 95% Confidence limits for take on rate of 100 pmp for population size up to 4 million
The UK Renal Registry The Seventh Annual Report
6
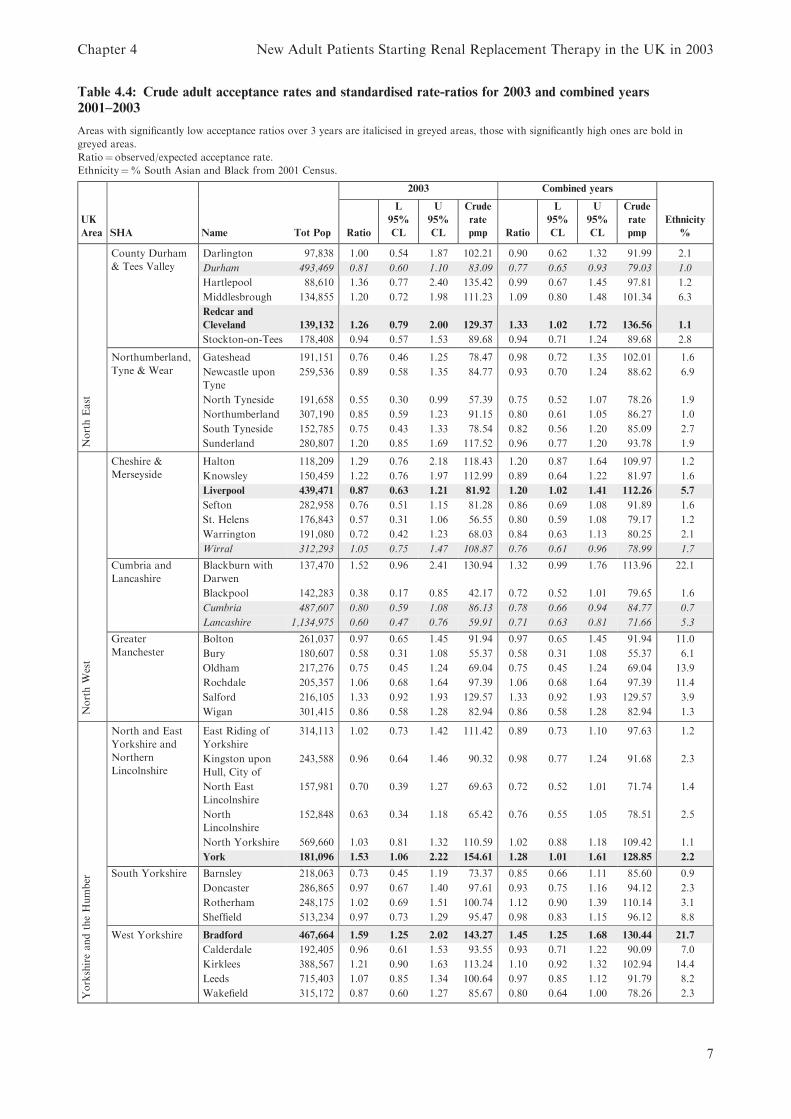
Table 4.4: Crude adult acceptance rates and standardised rate-ratios for 2003 and combined years
2001–2003
Areas with significantly low acceptance ratios over 3 years are italicised in greyed areas, those with significantly high ones are bold in
greyed areas.
Ratio¼observed/expected acceptance rate.
Ethnicity¼% South Asian and Black from 2001 Census.
2003 Combined years
UK
Area SHA Name Tot Pop Ratio
L
95%
CL
U
95%
CL
Crude
rate
pmp Ratio
L
95%
CL
U
95%
CL
Crude
rate
pmp
Ethnicity
%
NorthEast
County Durham
& Tees Valley
Darlington 97,838 1.00 0.54 1.87 102.21 0.90 0.62 1.32 91.99 2.1
Durham 493,469 0.81 0.60 1.10 83.09 0.77 0.65 0.93 79.03 1.0
Hartlepool 88,610 1.36 0.77 2.40 135.42 0.99 0.67 1.45 97.81 1.2
Middlesbrough 134,855 1.20 0.72 1.98 111.23 1.09 0.80 1.48 101.34 6.3
Redcar and
Cleveland 139,132 1.26 0.79 2.00 129.37 1.33 1.02 1.72 136.56 1.1
Stockton-on-Tees 178,408 0.94 0.57 1.53 89.68 0.94 0.71 1.24 89.68 2.8
Northumberland,
Tyne & Wear
Gateshead 191,151 0.76 0.46 1.25 78.47 0.98 0.72 1.35 102.01 1.6
Newcastle upon
Tyne
259,536 0.89 0.58 1.35 84.77 0.93 0.70 1.24 88.62 6.9
North Tyneside 191,658 0.55 0.30 0.99 57.39 0.75 0.52 1.07 78.26 1.9
Northumberland 307,190 0.85 0.59 1.23 91.15 0.80 0.61 1.05 86.27 1.0
South Tyneside 152,785 0.75 0.43 1.33 78.54 0.82 0.56 1.20 85.09 2.7
Sunderland 280,807 1.20 0.85 1.69 117.52 0.96 0.77 1.20 93.78 1.9
NorthWest
Cheshire &
Merseyside
Halton 118,209 1.29 0.76 2.18 118.43 1.20 0.87 1.64 109.97 1.2
Knowsley 150,459 1.22 0.76 1.97 112.99 0.89 0.64 1.22 81.97 1.6
Liverpool 439,471 0.87 0.63 1.21 81.92 1.20 1.02 1.41 112.26 5.7
Sefton 282,958 0.76 0.51 1.15 81.28 0.86 0.69 1.08 91.89 1.6
St. Helens 176,843 0.57 0.31 1.06 56.55 0.80 0.59 1.08 79.17 1.2
Warrington 191,080 0.72 0.42 1.23 68.03 0.84 0.63 1.13 80.25 2.1
Wirral 312,293 1.05 0.75 1.47 108.87 0.76 0.61 0.96 78.99 1.7
Cumbria and
Lancashire
Blackburn with
Darwen
137,470 1.52 0.96 2.41 130.94 1.32 0.99 1.76 113.96 22.1
Blackpool 142,283 0.38 0.17 0.85 42.17 0.72 0.52 1.01 79.65 1.6
Cumbria 487,607 0.80 0.59 1.08 86.13 0.78 0.66 0.94 84.77 0.7
Lancashire 1,134,975 0.60 0.47 0.76 59.91 0.71 0.63 0.81 71.66 5.3
Greater
Manchester
Bolton 261,037 0.97 0.65 1.45 91.94 0.97 0.65 1.45 91.94 11.0
Bury 180,607 0.58 0.31 1.08 55.37 0.58 0.31 1.08 55.37 6.1
Oldham 217,276 0.75 0.45 1.24 69.04 0.75 0.45 1.24 69.04 13.9
Rochdale 205,357 1.06 0.68 1.64 97.39 1.06 0.68 1.64 97.39 11.4
Salford 216,105 1.33 0.92 1.93 129.57 1.33 0.92 1.93 129.57 3.9
Wigan 301,415 0.86 0.58 1.28 82.94 0.86 0.58 1.28 82.94 1.3
YorkshireandtheHumber
North and East
Yorkshire and
Northern
Lincolnshire
East Riding of
Yorkshire
314,113 1.02 0.73 1.42 111.42 0.89 0.73 1.10 97.63 1.2
Kingston upon
Hull, City of
243,588 0.96 0.64 1.46 90.32 0.98 0.77 1.24 91.68 2.3
North East
Lincolnshire
157,981 0.70 0.39 1.27 69.63 0.72 0.52 1.01 71.74 1.4
North
Lincolnshire
152,848 0.63 0.34 1.18 65.42 0.76 0.55 1.05 78.51 2.5
North Yorkshire 569,660 1.03 0.81 1.32 110.59 1.02 0.88 1.18 109.42 1.1
York 181,096 1.53 1.06 2.22 154.61 1.28 1.01 1.61 128.85 2.2
South Yorkshire Barnsley 218,063 0.73 0.45 1.19 73.37 0.85 0.66 1.11 85.60 0.9
Doncaster 286,865 0.97 0.67 1.40 97.61 0.93 0.75 1.16 94.12 2.3
Rotherham 248,175 1.02 0.69 1.51 100.74 1.12 0.90 1.39 110.14 3.1
Sheffield 513,234 0.97 0.73 1.29 95.47 0.98 0.83 1.15 96.12 8.8
West Yorkshire Bradford 467,664 1.59 1.25 2.02 143.27 1.45 1.25 1.68 130.44 21.7
Calderdale 192,405 0.96 0.61 1.53 93.55 0.93 0.71 1.22 90.09 7.0
Kirklees 388,567 1.21 0.90 1.63 113.24 1.10 0.92 1.32 102.94 14.4
Leeds 715,403 1.07 0.85 1.34 100.64 0.97 0.85 1.12 91.79 8.2
Wakefield 315,172 0.87 0.60 1.27 85.67 0.80 0.64 1.00 78.26 2.3
Chapter 4 New Adult Patients Starting Renal Replacement Therapy in the UK in 2003
7
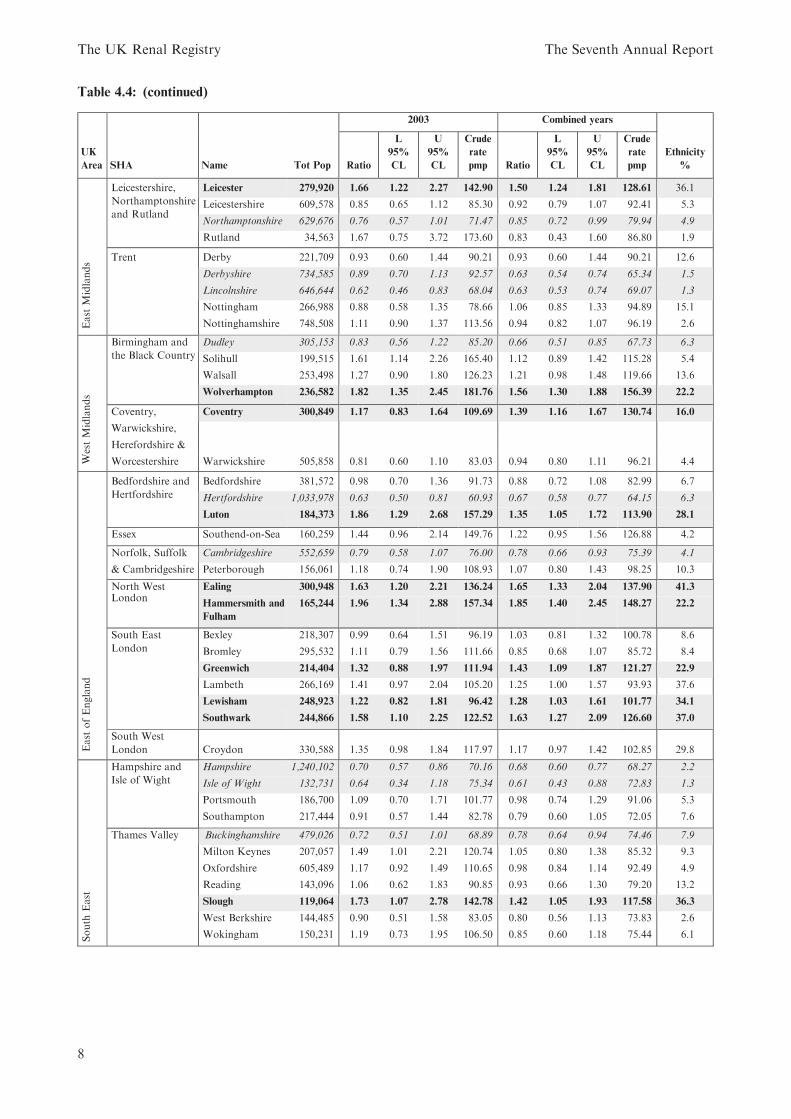
Table 4.4: (continued)
2003 Combined years
UK
Area SHA Name Tot Pop Ratio
L
95%
CL
U
95%
CL
Crude
rate
pmp Ratio
L
95%
CL
U
95%
CL
Crude
rate
pmp
Ethnicity
%
East
Midlands
Leicestershire,
Northamptonshire
and Rutland
Leicester 279,920 1.66 1.22 2.27 142.90 1.50 1.24 1.81 128.61 36.1
Leicestershire 609,578 0.85 0.65 1.12 85.30 0.92 0.79 1.07 92.41 5.3
Northamptonshire 629,676 0.76 0.57 1.01 71.47 0.85 0.72 0.99 79.94 4.9
Rutland 34,563 1.67 0.75 3.72 173.60 0.83 0.43 1.60 86.80 1.9
Trent Derby 221,709 0.93 0.60 1.44 90.21 0.93 0.60 1.44 90.21 12.6
Derbyshire 734,585 0.89 0.70 1.13 92.57 0.63 0.54 0.74 65.34 1.5
Lincolnshire 646,644 0.62 0.46 0.83 68.04 0.63 0.53 0.74 69.07 1.3
Nottingham 266,988 0.88 0.58 1.35 78.66 1.06 0.85 1.33 94.89 15.1
Nottinghamshire 748,508 1.11 0.90 1.37 113.56 0.94 0.82 1.07 96.19 2.6
WestMidlands
Birmingham and
the Black Country
Dudley 305,153 0.83 0.56 1.22 85.20 0.66 0.51 0.85 67.73 6.3
Solihull 199,515 1.61 1.14 2.26 165.40 1.12 0.89 1.42 115.28 5.4
Walsall 253,498 1.27 0.90 1.80 126.23 1.21 0.98 1.48 119.66 13.6
Wolverhampton 236,582 1.82 1.35 2.45 181.76 1.56 1.30 1.88 156.39 22.2
Coventry, Coventry 300,849 1.17 0.83 1.64 109.69 1.39 1.16 1.67 130.74 16.0
Warwickshire,
Herefordshire &
Worcestershire Warwickshire 505,858 0.81 0.60 1.10 83.03 0.94 0.80 1.11 96.21 4.4
East
ofEngland
Bedfordshire and
Hertfordshire
Bedfordshire 381,572 0.98 0.70 1.36 91.73 0.88 0.72 1.08 82.99 6.7
Hertfordshire 1,033,978 0.63 0.50 0.81 60.93 0.67 0.58 0.77 64.15 6.3
Luton 184,373 1.86 1.29 2.68 157.29 1.35 1.05 1.72 113.90 28.1
Essex Southend-on-Sea 160,259 1.44 0.96 2.14 149.76 1.22 0.95 1.56 126.88 4.2
Norfolk, Suffolk Cambridgeshire 552,659 0.79 0.58 1.07 76.00 0.78 0.66 0.93 75.39 4.1
& Cambridgeshire Peterborough 156,061 1.18 0.74 1.90 108.93 1.07 0.80 1.43 98.25 10.3
North West Ealing 300,948 1.63 1.20 2.21 136.24 1.65 1.33 2.04 137.90 41.3London
Hammersmith and
Fulham
165,244 1.96 1.34 2.88 157.34 1.85 1.40 2.45 148.27 22.2
South East
London
Bexley 218,307 0.99 0.64 1.51 96.19 1.03 0.81 1.32 100.78 8.6
Bromley 295,532 1.11 0.79 1.56 111.66 0.85 0.68 1.07 85.72 8.4
Greenwich 214,404 1.32 0.88 1.97 111.94 1.43 1.09 1.87 121.27 22.9
Lambeth 266,169 1.41 0.97 2.04 105.20 1.25 1.00 1.57 93.93 37.6
Lewisham 248,923 1.22 0.82 1.81 96.42 1.28 1.03 1.61 101.77 34.1
Southwark 244,866 1.58 1.10 2.25 122.52 1.63 1.27 2.09 126.60 37.0
South West
London Croydon 330,588 1.35 0.98 1.84 117.97 1.17 0.97 1.42 102.85 29.8
South
East
Hampshire and
Isle of Wight
Hampshire 1,240,102 0.70 0.57 0.86 70.16 0.68 0.60 0.77 68.27 2.2
Isle of Wight 132,731 0.64 0.34 1.18 75.34 0.61 0.43 0.88 72.83 1.3
Portsmouth 186,700 1.09 0.70 1.71 101.77 0.98 0.74 1.29 91.06 5.3
Southampton 217,444 0.91 0.57 1.44 82.78 0.79 0.60 1.05 72.05 7.6
Thames Valley Buckinghamshire 479,026 0.72 0.51 1.01 68.89 0.78 0.64 0.94 74.46 7.9
Milton Keynes 207,057 1.49 1.01 2.21 120.74 1.05 0.80 1.38 85.32 9.3
Oxfordshire 605,489 1.17 0.92 1.49 110.65 0.98 0.84 1.14 92.49 4.9
Reading 143,096 1.06 0.62 1.83 90.85 0.93 0.66 1.30 79.20 13.2
Slough 119,064 1.73 1.07 2.78 142.78 1.42 1.05 1.93 117.58 36.3
West Berkshire 144,485 0.90 0.51 1.58 83.05 0.80 0.56 1.13 73.83 2.6
Wokingham 150,231 1.19 0.73 1.95 106.50 0.85 0.60 1.18 75.44 6.1
The UK Renal Registry The Seventh Annual Report
8
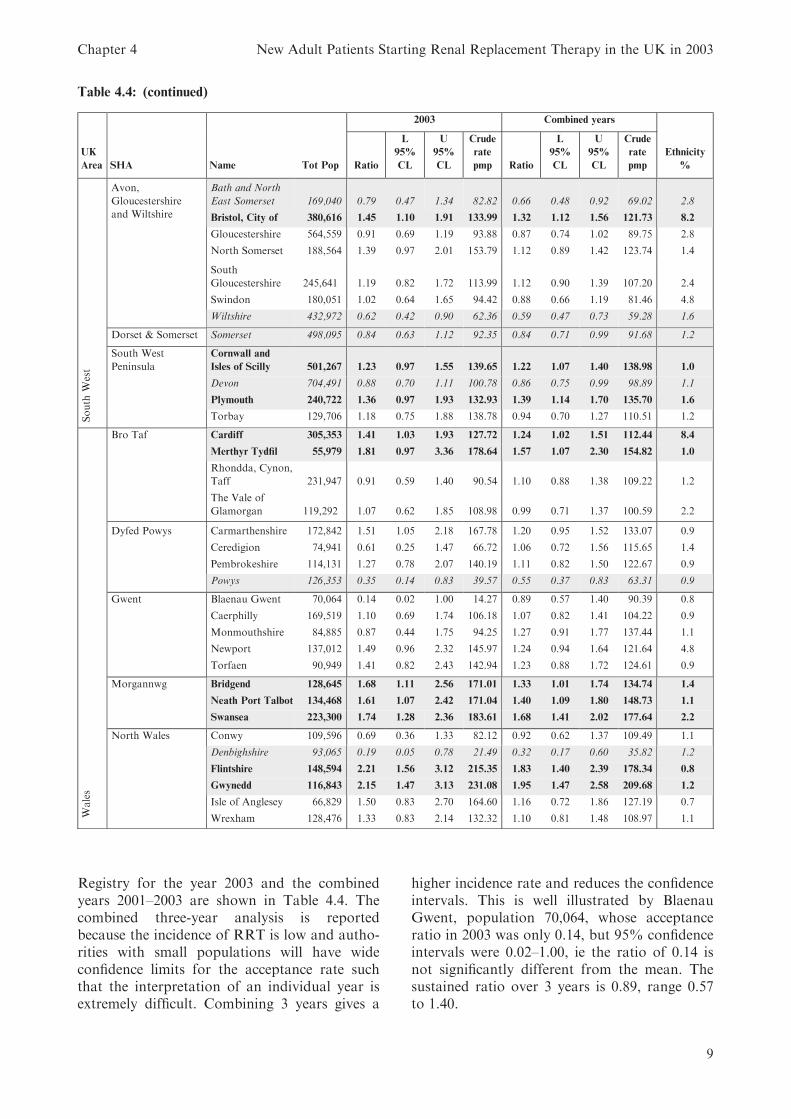
Registry for the year 2003 and the combinedyears 2001–2003 are shown in Table 4.4. Thecombined three-year analysis is reportedbecause the incidence of RRT is low and autho-rities with small populations will have wideconfidence limits for the acceptance rate suchthat the interpretation of an individual year isextremely difficult. Combining 3 years gives a
higher incidence rate and reduces the confidenceintervals. This is well illustrated by BlaenauGwent, population 70,064, whose acceptanceratio in 2003 was only 0.14, but 95% confidenceintervals were 0.02–1.00, ie the ratio of 0.14 isnot significantly different from the mean. Thesustained ratio over 3 years is 0.89, range 0.57to 1.40.
Table 4.4: (continued)
2003 Combined years
UK
Area SHA Name Tot Pop Ratio
L
95%
CL
U
95%
CL
Crude
rate
pmp Ratio
L
95%
CL
U
95%
CL
Crude
rate
pmp
Ethnicity
%
South
West
Avon,
Gloucestershire
and Wiltshire
Bath and North
East Somerset 169,040 0.79 0.47 1.34 82.82 0.66 0.48 0.92 69.02 2.8
Bristol, City of 380,616 1.45 1.10 1.91 133.99 1.32 1.12 1.56 121.73 8.2
Gloucestershire 564,559 0.91 0.69 1.19 93.88 0.87 0.74 1.02 89.75 2.8
North Somerset 188,564 1.39 0.97 2.01 153.79 1.12 0.89 1.42 123.74 1.4
South
Gloucestershire 245,641 1.19 0.82 1.72 113.99 1.12 0.90 1.39 107.20 2.4
Swindon 180,051 1.02 0.64 1.65 94.42 0.88 0.66 1.19 81.46 4.8
Wiltshire 432,972 0.62 0.42 0.90 62.36 0.59 0.47 0.73 59.28 1.6
Dorset & Somerset Somerset 498,095 0.84 0.63 1.12 92.35 0.84 0.71 0.99 91.68 1.2
South West
Peninsula
Cornwall and
Isles of Scilly 501,267 1.23 0.97 1.55 139.65 1.22 1.07 1.40 138.98 1.0
Devon 704,491 0.88 0.70 1.11 100.78 0.86 0.75 0.99 98.89 1.1
Plymouth 240,722 1.36 0.97 1.93 132.93 1.39 1.14 1.70 135.70 1.6
Torbay 129,706 1.18 0.75 1.88 138.78 0.94 0.70 1.27 110.51 1.2
Wales
Bro Taf Cardiff 305,353 1.41 1.03 1.93 127.72 1.24 1.02 1.51 112.44 8.4
Merthyr Tydfil 55,979 1.81 0.97 3.36 178.64 1.57 1.07 2.30 154.82 1.0
Rhondda, Cynon,
Taff 231,947 0.91 0.59 1.40 90.54 1.10 0.88 1.38 109.22 1.2
The Vale of
Glamorgan 119,292 1.07 0.62 1.85 108.98 0.99 0.71 1.37 100.59 2.2
Dyfed Powys Carmarthenshire 172,842 1.51 1.05 2.18 167.78 1.20 0.95 1.52 133.07 0.9
Ceredigion 74,941 0.61 0.25 1.47 66.72 1.06 0.72 1.56 115.65 1.4
Pembrokeshire 114,131 1.27 0.78 2.07 140.19 1.11 0.82 1.50 122.67 0.9
Powys 126,353 0.35 0.14 0.83 39.57 0.55 0.37 0.83 63.31 0.9
Gwent Blaenau Gwent 70,064 0.14 0.02 1.00 14.27 0.89 0.57 1.40 90.39 0.8
Caerphilly 169,519 1.10 0.69 1.74 106.18 1.07 0.82 1.41 104.22 0.9
Monmouthshire 84,885 0.87 0.44 1.75 94.25 1.27 0.91 1.77 137.44 1.1
Newport 137,012 1.49 0.96 2.32 145.97 1.24 0.94 1.64 121.64 4.8
Torfaen 90,949 1.41 0.82 2.43 142.94 1.23 0.88 1.72 124.61 0.9
Morgannwg Bridgend 128,645 1.68 1.11 2.56 171.01 1.33 1.01 1.74 134.74 1.4
Neath Port Talbot 134,468 1.61 1.07 2.42 171.04 1.40 1.09 1.80 148.73 1.1
Swansea 223,300 1.74 1.28 2.36 183.61 1.68 1.41 2.02 177.64 2.2
North Wales Conwy 109,596 0.69 0.36 1.33 82.12 0.92 0.62 1.37 109.49 1.1
Denbighshire 93,065 0.19 0.05 0.78 21.49 0.32 0.17 0.60 35.82 1.2
Flintshire 148,594 2.21 1.56 3.12 215.35 1.83 1.40 2.39 178.34 0.8
Gwynedd 116,843 2.15 1.47 3.13 231.08 1.95 1.47 2.58 209.68 1.2
Isle of Anglesey 66,829 1.50 0.83 2.70 164.60 1.16 0.72 1.86 127.19 0.7
Wrexham 128,476 1.33 0.83 2.14 132.32 1.10 0.81 1.48 108.97 1.1
Chapter 4 New Adult Patients Starting Renal Replacement Therapy in the UK in 2003
9
Discussion
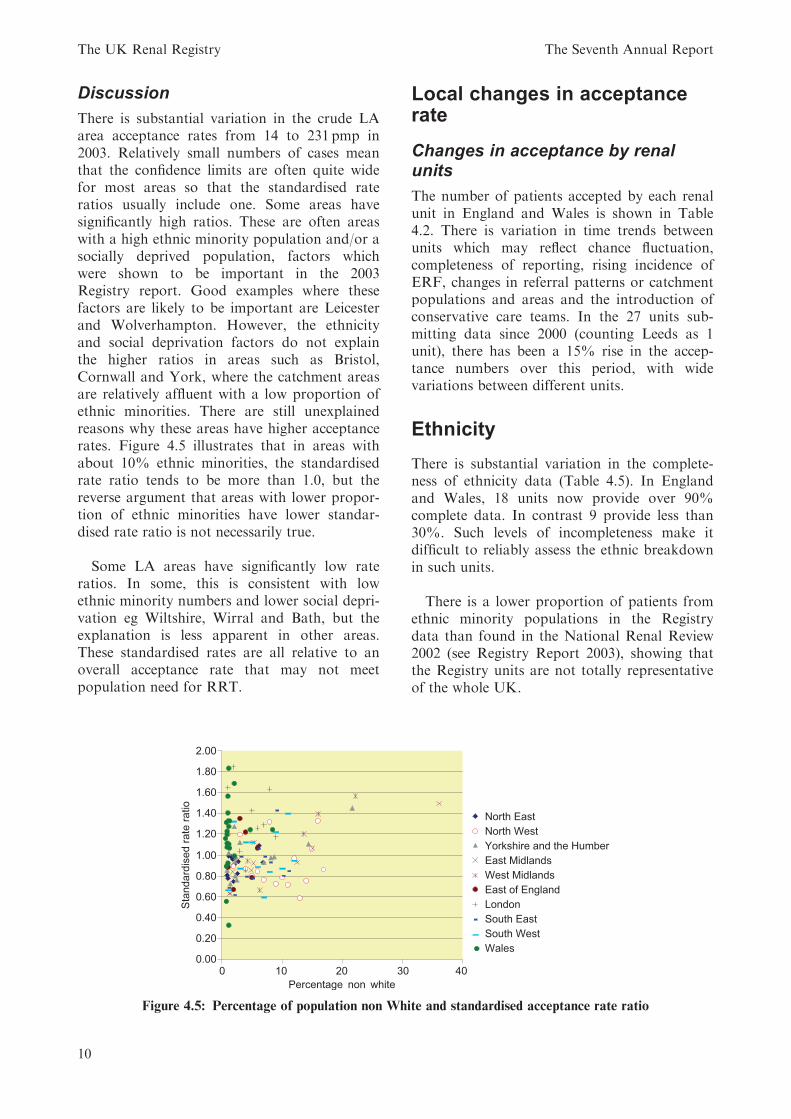
There is substantial variation in the crude LAarea acceptance rates from 14 to 231 pmp in2003. Relatively small numbers of cases meanthat the confidence limits are often quite widefor most areas so that the standardised rateratios usually include one. Some areas havesignificantly high ratios. These are often areaswith a high ethnic minority population and/or asocially deprived population, factors whichwere shown to be important in the 2003Registry report. Good examples where thesefactors are likely to be important are Leicesterand Wolverhampton. However, the ethnicityand social deprivation factors do not explainthe higher ratios in areas such as Bristol,Cornwall and York, where the catchment areasare relatively affluent with a low proportion ofethnic minorities. There are still unexplainedreasons why these areas have higher acceptancerates. Figure 4.5 illustrates that in areas withabout 10% ethnic minorities, the standardisedrate ratio tends to be more than 1.0, but thereverse argument that areas with lower propor-tion of ethnic minorities have lower standar-dised rate ratio is not necessarily true.
Some LA areas have significantly low rateratios. In some, this is consistent with lowethnic minority numbers and lower social depri-vation eg Wiltshire, Wirral and Bath, but theexplanation is less apparent in other areas.These standardised rates are all relative to anoverall acceptance rate that may not meetpopulation need for RRT.
Local changes in acceptancerate
Changes in acceptance by renalunits
The number of patients accepted by each renalunit in England and Wales is shown in Table4.2. There is variation in time trends betweenunits which may reflect chance fluctuation,completeness of reporting, rising incidence ofERF, changes in referral patterns or catchmentpopulations and areas and the introduction ofconservative care teams. In the 27 units sub-mitting data since 2000 (counting Leeds as 1unit), there has been a 15% rise in the accep-tance numbers over this period, with widevariations between different units.
Ethnicity
There is substantial variation in the complete-ness of ethnicity data (Table 4.5). In Englandand Wales, 18 units now provide over 90%complete data. In contrast 9 provide less than30%. Such levels of incompleteness make itdifficult to reliably assess the ethnic breakdownin such units.
There is a lower proportion of patients fromethnic minority populations in the Registrydata than found in the National Renal Review2002 (see Registry Report 2003), showing thatthe Registry units are not totally representativeof the whole UK.
Figure 4.5: Percentage of population non White and standardised acceptance rate ratio
The UK Renal Registry The Seventh Annual Report
10
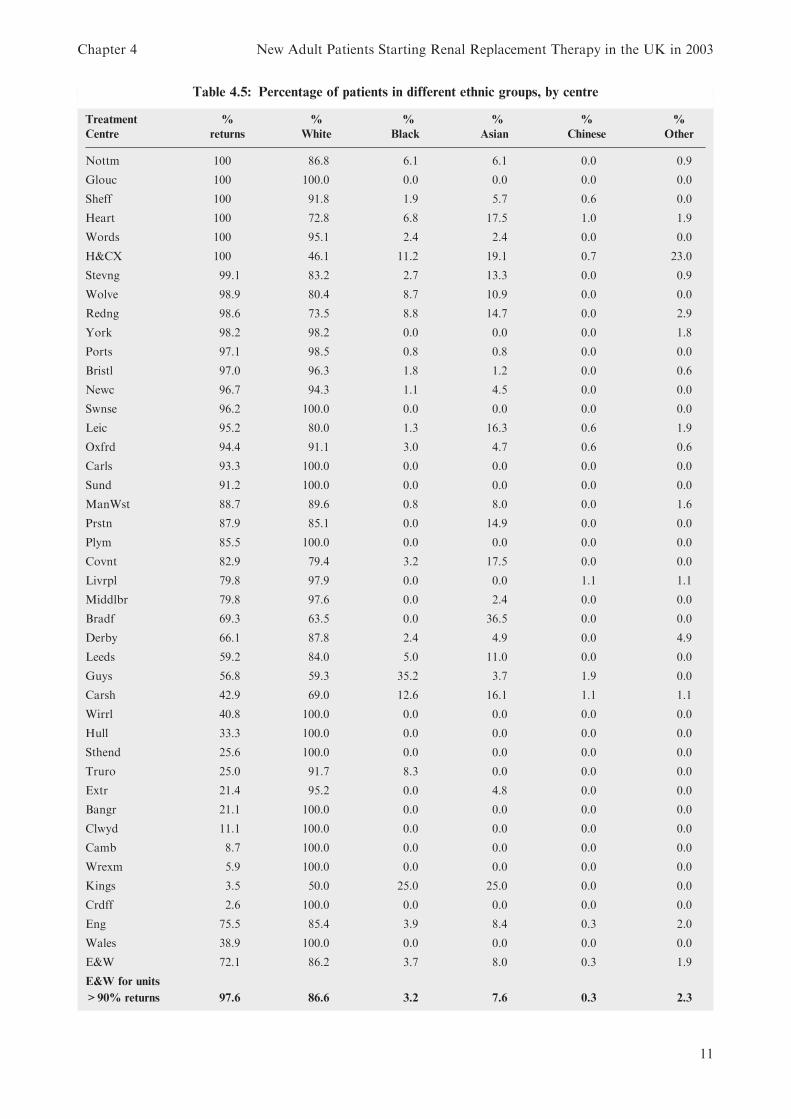
Table 4.5: Percentage of patients in different ethnic groups, by centre
Treatment
Centre
%
returns
%
White
%
Black
%
Asian
%
Chinese
%
Other
Nottm 100 86.8 6.1 6.1 0.0 0.9
Glouc 100 100.0 0.0 0.0 0.0 0.0
Sheff 100 91.8 1.9 5.7 0.6 0.0
Heart 100 72.8 6.8 17.5 1.0 1.9
Words 100 95.1 2.4 2.4 0.0 0.0
H&CX 100 46.1 11.2 19.1 0.7 23.0
Stevng 99.1 83.2 2.7 13.3 0.0 0.9
Wolve 98.9 80.4 8.7 10.9 0.0 0.0
Redng 98.6 73.5 8.8 14.7 0.0 2.9
York 98.2 98.2 0.0 0.0 0.0 1.8
Ports 97.1 98.5 0.8 0.8 0.0 0.0
Bristl 97.0 96.3 1.8 1.2 0.0 0.6
Newc 96.7 94.3 1.1 4.5 0.0 0.0
Swnse 96.2 100.0 0.0 0.0 0.0 0.0
Leic 95.2 80.0 1.3 16.3 0.6 1.9
Oxfrd 94.4 91.1 3.0 4.7 0.6 0.6
Carls 93.3 100.0 0.0 0.0 0.0 0.0
Sund 91.2 100.0 0.0 0.0 0.0 0.0
ManWst 88.7 89.6 0.8 8.0 0.0 1.6
Prstn 87.9 85.1 0.0 14.9 0.0 0.0
Plym 85.5 100.0 0.0 0.0 0.0 0.0
Covnt 82.9 79.4 3.2 17.5 0.0 0.0
Livrpl 79.8 97.9 0.0 0.0 1.1 1.1
Middlbr 79.8 97.6 0.0 2.4 0.0 0.0
Bradf 69.3 63.5 0.0 36.5 0.0 0.0
Derby 66.1 87.8 2.4 4.9 0.0 4.9
Leeds 59.2 84.0 5.0 11.0 0.0 0.0
Guys 56.8 59.3 35.2 3.7 1.9 0.0
Carsh 42.9 69.0 12.6 16.1 1.1 1.1
Wirrl 40.8 100.0 0.0 0.0 0.0 0.0
Hull 33.3 100.0 0.0 0.0 0.0 0.0
Sthend 25.6 100.0 0.0 0.0 0.0 0.0
Truro 25.0 91.7 8.3 0.0 0.0 0.0
Extr 21.4 95.2 0.0 4.8 0.0 0.0
Bangr 21.1 100.0 0.0 0.0 0.0 0.0
Clwyd 11.1 100.0 0.0 0.0 0.0 0.0
Camb 8.7 100.0 0.0 0.0 0.0 0.0
Wrexm 5.9 100.0 0.0 0.0 0.0 0.0
Kings 3.5 50.0 25.0 25.0 0.0 0.0
Crdff 2.6 100.0 0.0 0.0 0.0 0.0
Eng 75.5 85.4 3.9 8.4 0.3 2.0
Wales 38.9 100.0 0.0 0.0 0.0 0.0
E&W 72.1 86.2 3.7 8.0 0.3 1.9
E&W for units
>90% returns 97.6 86.6 3.2 7.6 0.3 2.3
Chapter 4 New Adult Patients Starting Renal Replacement Therapy in the UK in 2003
11
Within the units with over 90% returns thereis significant variation in the percentages of newpatients from the ethnic minorities known tohave high rates of ERF ie South Asian andBlack, ranging from 0% to 30%.
Table 4.6 demonstrates the younger age ofethnic minorities in most, though not all renalunits. There is variation in the age differenceseven in units with a significant ethnic minoritypopulation (eg compare Heartlands withPreston). It is unclear to what extent thisreflects differences in the units’ catchmentpopulations, or patterns of ERF, or referralpathways. Overall new patients from ethnicminorities are 6 years younger than Whites.Compared with similar data for new patients in2002 the median age of ethnic minorities hasincreased by 3 years. This rise in median age
over one year cannot be due simply to theageing of these populations and indicatesincreasing acceptance in older groups amongstethnic minorities.
Age
The median age of patients starting renal repla-cement therapy has risen from 63.0 in 1998 to64.8 in 2001 although there has been no
Table 4.6: Median age of ethnic groups accepted
for RRT
Median age of incident patients
Centre Ethnic minority All
Bradf 62.8 67.1
Bristl 44.2 67.0
Carsh 52.3 63.8
Covnt 53.3 64.0
Derby 67.2 66.5
Extr 54.8 68.8
Guys 44.0 54.9
H&CX 61.8 62.1
Heart 62.4 70.9
Kings 30.8 63.4
Leeds 49.7 61.1
Leic 65.3 65.9
Livrpl 67.7 62.6
ManWst 56.0 60.2
Middlbr 64.9 63.8
Newc 36.6 58.1
Nottm 57.6 66.0
Oxfrd 59.5 65.1
Ports 36.1 63.0
Prstn 51.8 65.6
Redng 64.5 67.5
Sheff 63.9 63.9
Stevng 64.3 64.2
Truro 75.7 69.5
Wolve 55.3 65.6
Words 54.3 68.7
York 57.5 68.0
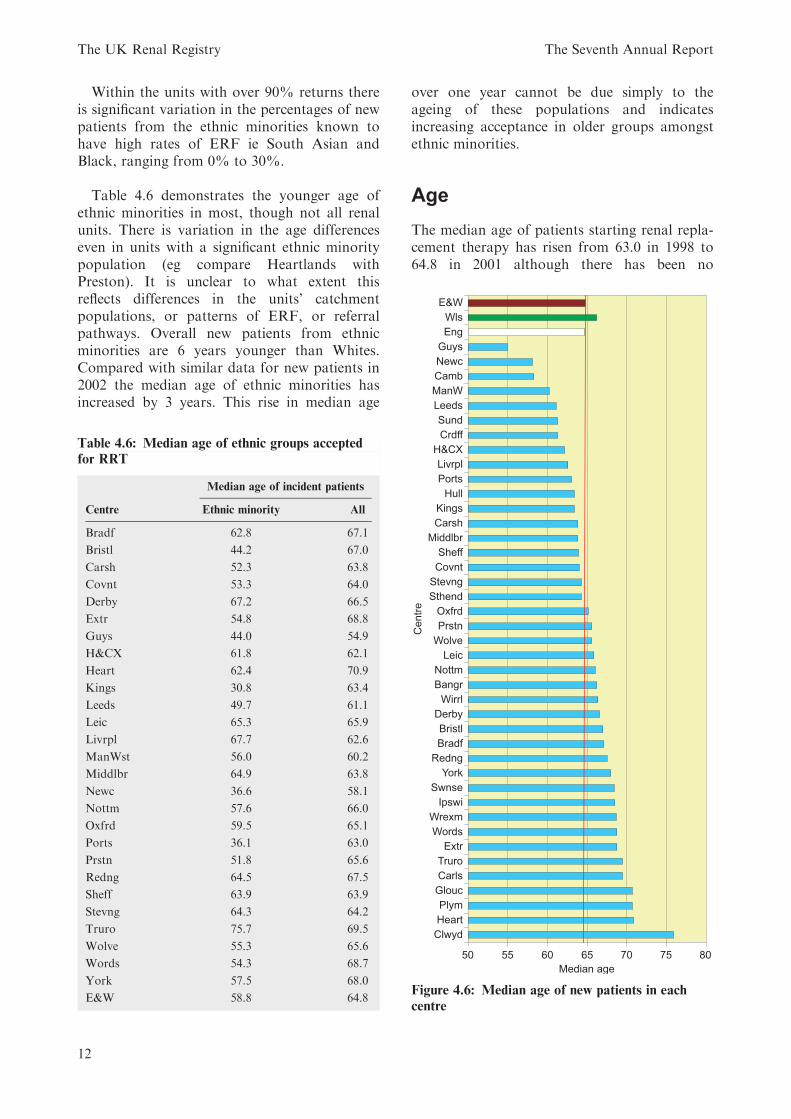
E&W 58.8 64.8Figure 4.6: Median age of new patients in each
centre
The UK Renal Registry The Seventh Annual Report
12
increase in the last 3 years. The proportion ofincident patients aged over 75 has alsoincreased from 17.6% in 1998 to 22.3% in 2003(Table 4.7).
The large variation in median age by centre isshown in Figure 4.6. A few units have a medianage under age 60: in contrast some have medianage over 70.
Gender
Gender specific acceptance rates for the con-tiguous population covered by the UK RenalRegistry are shown in Table 4.1. There hasbeen little change in the overall proportion ofnew cases who are male, which remains at justover 60% (Table 4.8). There was an excess ofmales starting RRT in all age groups in the 2003cohort (Figure 4.1), as in previous years.
Primary renal diagnosis
The distribution of new patients by age, genderand cause of ERF is shown in Tables 4.9 and4.10.
The male : female ratio is over one, asexpected for most types of kidney disease. Thisis somewhat surprising for Adult PolycysticDisease (APKD), as the APKD gene is distri-buted equally amongst the general population:the excess of males may relate to factorsmore common in males which may influencethe rate of progress of renal failure, such ashypertension and reno-vascular disease. Thereis also a gender imbalance in patients withdiabetic nephropathy, this may be for a similarreason.
The aetiology uncertain/glomerulonephritisnot proven group is the most common groupoverall, due to the high incidence in the elderly.
Diabetes is the most common specific causeoverall. This is especially due to the very highincidence in those under 65; apart fromaetiology uncertain it is also the most commoncause in elderly patients. There is a significantvariation between units in the percentagestarting RRT with diabetic kidney disease,which generally follows the pattern of popula-tion distribution of ethnic minorities (Tables4.10, 4.11). After excluding patients with a miss-ing diagnosis, the proportion of patients withdiabetic nephropathy as the cause of ERF hasremained unchanged between 1999 and 2003 at19–20% (19.0% in 1999 and 19.3% in 2003).However with the continuing increase of overall
Table 4.8: Percentage of males, by age, 1998–2003
1998 1999 2000 2001 2002 2003
England & Wales 62.8 62.2 59.3 63.2 61.8 61.9
Table 4.9: Percentage primary renal diagnosis, by age, and gender ratio
Diagnosis E&W <65 E&W >65 E&W All M:F
Aetiology unc./GN NP� 19.7 29.6 24.6 1.5
Glomerulonephritis 12.9 5.9 9.4 2.4
Pyelonephritis 7.8 7.4 7.6 1.4
Diabetes 20.9 14.9 17.9 1.6
Renal Vascular disease 2.4 13.2 7.7 1.6
Hypertension 4.7 5.6 5.1 2.3
Polycystic Kidney 9.4 2.7 6.1 1.3
Other 15.7 13.4 14.6 1.4
Not sent 6.6 7.3 6.9 2.4
No of patients 1,992 1,942 3,953
�GN NP, glomerulonephritis not proven
Table 4.7: Median age and percentage of incident
patients over 75 in England and Wales 1998–2003
Year Median age % over 75
1998 63.0 17.6
1999 63.0 18.3
2000 64.0 21.2
2001 64.8 21.0
2002 65.5 23.5
2003 64.8 22.3
Chapter 4 New Adult Patients Starting Renal Replacement Therapy in the UK in 2003
13
Table 4.10: Percentage distribution of diagnoses for new RRT patients by centre
Unit Not sent
Aetiology
unc./GN NP Diabetes GN
Polycystic
kidney Hypertn
Reno-
vascular
Pyelo-
nephritis Other
Bangr 2.6 39.5 13.2 10.5 2.6 13.2 0.0 5.3 13.2
Bradf 17.3 14.7 14.7 10.7 4.0 5.3 12.0 10.7 10.7
Bristl 3.6 22.6 14.9 11.3 10.1 3.0 10.1 9.5 14.9
Camb 3.8 36.5 21.2 10.6 6.7 1.0 3.8 6.7 9.6
Carls 0.0 23.3 13.3 6.7 13.3 0.0 20.0 10.0 13.3
Carsh 0.5 25.1 25.1 8.9 2.0 3.9 9.9 5.4 19.2
Clwyd 0.0 77.8 22.2 0.0 0.0 0.0 0.0 0.0 0.0
Covnt 0.0 15.8 27.6 11.8 3.9 5.3 7.9 11.8 15.8
Crdff 2.6 37.7 22.7 9.1 3.9 2.6 1.3 9.1 11.0
Derby 45.2 6.5 19.4 6.5 3.2 0.0 4.8 9.7 4.8
Extr 43.9 12.2 6.1 6.1 7.1 0.0 3.1 4.1 17.3
Glouc 1.8 27.3 7.3 12.7 3.6 0.0 14.5 7.3 25.5
Guys 0.0 14.7 21.1 7.4 9.5 11.6 5.3 6.3 24.2
H&CX 0.7 12.5 30.3 8.6 5.3 15.1 3.3 4.6 19.7
Heart 0.0 26.2 30.1 3.9 6.8 1.9 12.6 5.8 12.6
Hull 21.8 19.2 15.4 9.0 10.3 3.8 3.8 7.7 9.0
Ipswi 0.0 48.6 17.1 14.3 8.6 2.9 2.9 2.9 2.9
Kings 2.6 15.8 28.9 10.5 2.6 14.0 3.5 10.5 11.4
Leeds 30.2 8.9 13.0 9.5 7.1 3.6 7.7 10.1 10.1
Leic 3.0 16.7 23.8 13.1 8.9 3.6 13.1 8.3 9.5
Livrpl 0.8 39.5 15.1 8.4 5.0 11.8 3.4 3.4 12.6
ManWst 0.0 68.8 7.1 4.3 3.5 2.1 2.8 3.5 7.8
Middlbr 5.8 27.9 20.2 7.7 7.7 2.9 10.6 5.8 11.5
Newc 2.2 15.4 9.9 16.5 12.1 3.3 5.5 9.9 25.3
Nottm 2.6 25.4 21.1 6.1 5.3 6.1 4.4 12.3 16.7
Oxfrd 2.2 19.6 17.9 12.3 5.6 3.9 8.9 8.9 20.7
Plym 1.4 15.9 20.3 8.7 4.3 1.4 13.0 4.3 30.4
Ports 8.8 18.2 16.8 9.5 4.4 3.6 8.0 9.5 21.2
Prstn 3.0 30.3 9.1 12.1 14.1 6.1 3.0 11.1 11.1
Redng 0.0 23.2 15.9 7.2 7.2 1.4 14.5 17.4 13.0
Sheff 0.0 13.3 17.7 13.3 6.3 10.8 13.3 8.9 16.5
Stevng 0.0 41.2 11.4 4.4 7.0 2.6 3.5 2.6 27.2
Sthend 20.9 27.9 23.3 4.7 7.0 0.0 7.0 4.7 4.7
Sund 0.0 10.5 12.3 22.8 8.8 19.3 8.8 7.0 10.5
Swnse 6.0 18.0 15.0 9.8 2.3 4.5 17.3 6.8 20.3
Truro 8.3 37.5 18.8 16.7 4.2 0.0 6.3 8.3 0.0
Wirrl 0.0 98.0 0.0 0.0 2.0 0.0 0.0 0.0 0.0
Wolve 1.1 19.4 23.7 8.6 3.2 7.5 17.2 9.7 9.7
Words 0.0 24.4 19.5 14.6 12.2 12.2 2.4 2.4 12.2
Wrexm� 38.2 14.7 20.6 0.0 2.9 0.0 5.9 5.9 11.8
York 50.0 7.1 5.4 3.6 7.1 7.1 7.1 7.1 5.4
Eng 6.9 24.1 17.9 9.5 6.4 5.2 7.8 7.6 14.6
Wales 7.1 29.6 18.8 8.4 3.0 4.1 7.3 7.3 14.4
E&W��
6.9 24.6 17.9 9.4 6.1 5.1 7.7 7.6 14.6
*With so few returns from Wrexham, no calculations could be made
**The E&W total is calculated from those units with 80% or more returns.
The UK Renal Registry The Seventh Annual Report
14
acceptance rate the diabetic acceptance rate hasincreased from 17 pmp to 19 pmp.
In the absence of firm definitions for certaindiagnostic categories eg hypertensive diseaseand reno-vascular disease, some centre variationin cause is likely to reflect differences in classifi-cation rather than geographical differences inunderlying disease. Reno-vascular disease is acommon reported cause in the elderly.
First established treatmentmodality
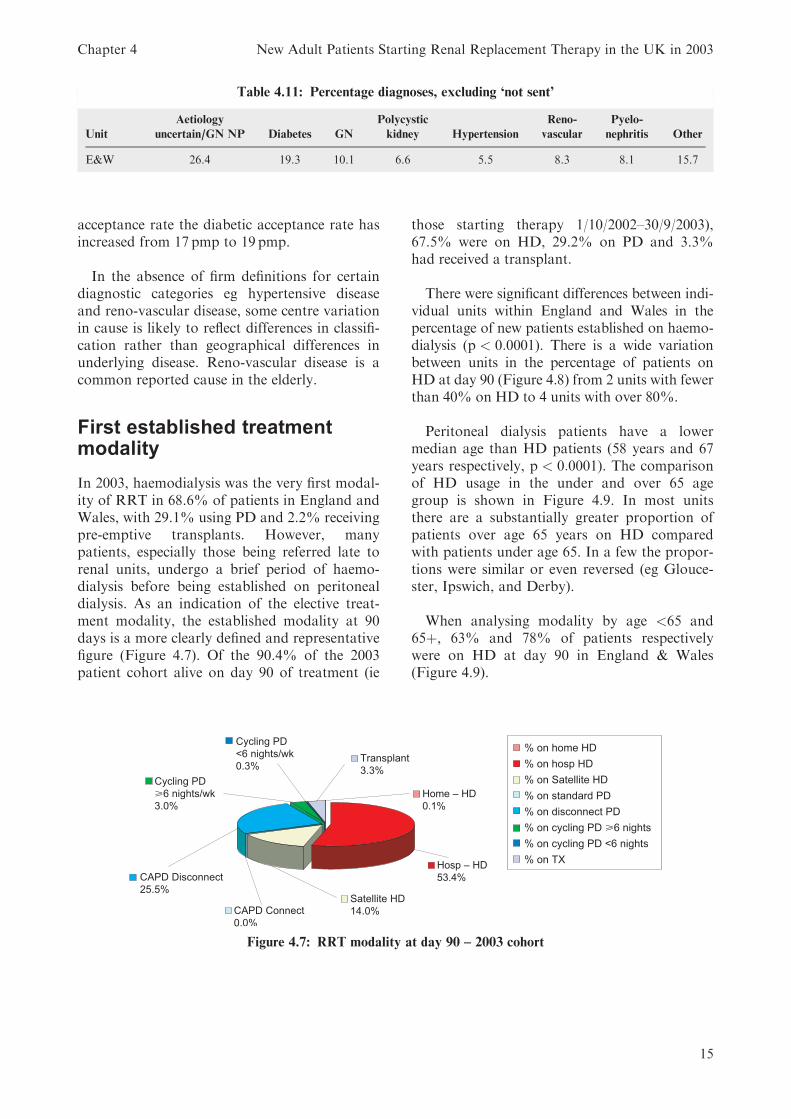
In 2003, haemodialysis was the very first modal-ity of RRT in 68.6% of patients in England andWales, with 29.1% using PD and 2.2% receivingpre-emptive transplants. However, manypatients, especially those being referred late torenal units, undergo a brief period of haemo-dialysis before being established on peritonealdialysis. As an indication of the elective treat-ment modality, the established modality at 90days is a more clearly defined and representativefigure (Figure 4.7). Of the 90.4% of the 2003patient cohort alive on day 90 of treatment (ie
those starting therapy 1/10/2002–30/9/2003),67.5% were on HD, 29.2% on PD and 3.3%had received a transplant.
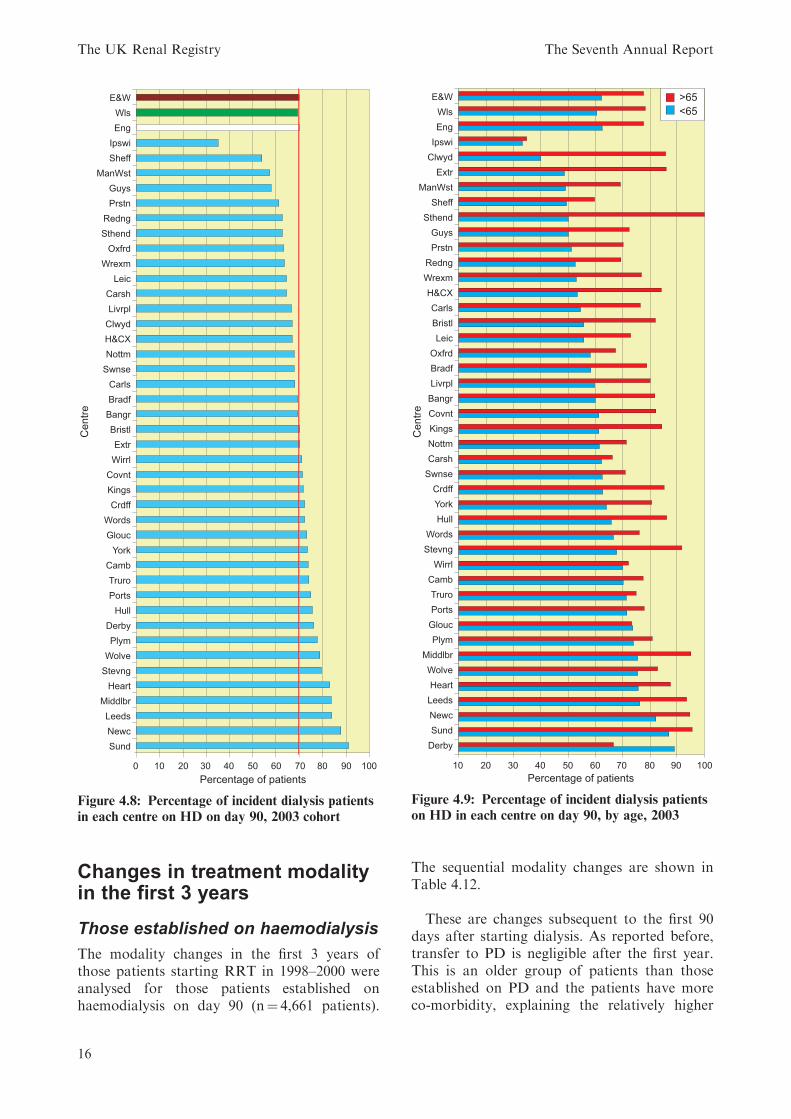
There were significant differences between indi-vidual units within England and Wales in thepercentage of new patients established on haemo-dialysis (p < 0:0001). There is a wide variationbetween units in the percentage of patients onHD at day 90 (Figure 4.8) from 2 units with fewerthan 40% on HD to 4 units with over 80%.
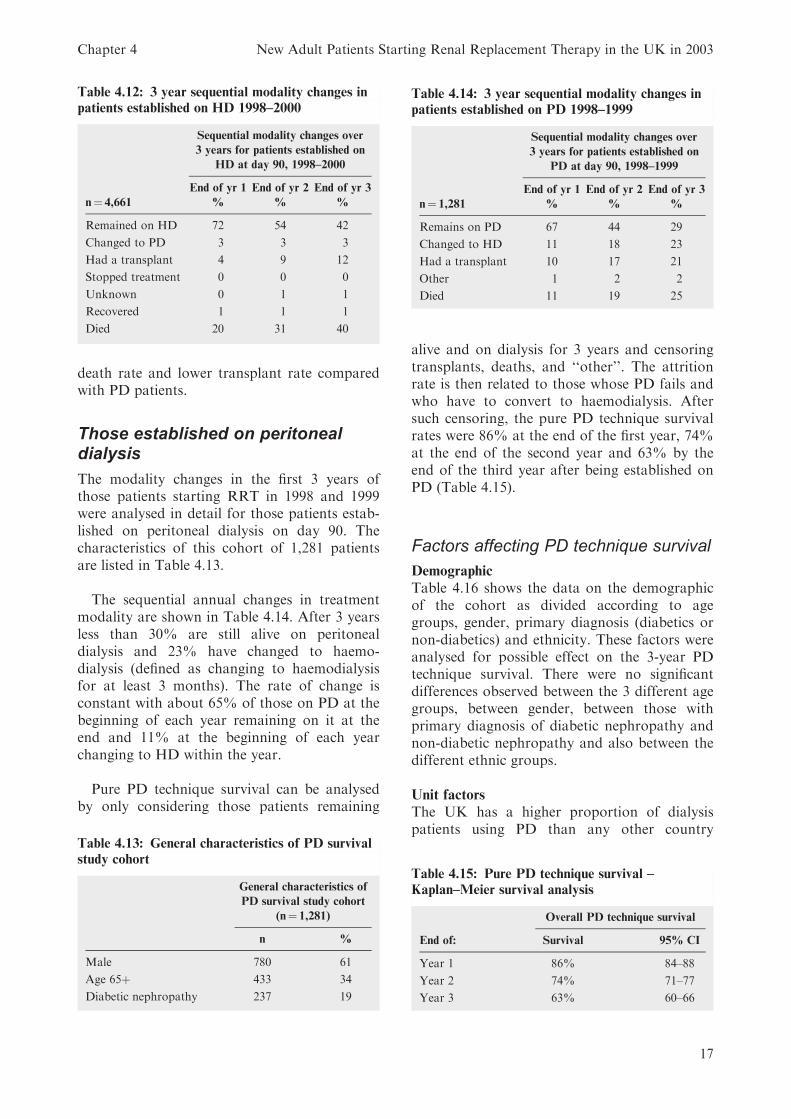
Peritoneal dialysis patients have a lowermedian age than HD patients (58 years and 67years respectively, p < 0:0001). The comparisonof HD usage in the under and over 65 agegroup is shown in Figure 4.9. In most unitsthere are a substantially greater proportion ofpatients over age 65 years on HD comparedwith patients under age 65. In a few the propor-tions were similar or even reversed (eg Glouce-ster, Ipswich, and Derby).
When analysing modality by age <65 and65þ, 63% and 78% of patients respectivelywere on HD at day 90 in England & Wales(Figure 4.9).
Table 4.11: Percentage diagnoses, excluding ‘not sent’
Unit
Aetiology
uncertain/GN NP Diabetes GN
Polycystic
kidney Hypertension
Reno-
vascular
Pyelo-
nephritis Other
E&W 26.4 19.3 10.1 6.6 5.5 8.3 8.1 15.7
Figure 4.7: RRT modality at day 90 – 2003 cohort
Chapter 4 New Adult Patients Starting Renal Replacement Therapy in the UK in 2003
15
Changes in treatment modalityin the first 3 years
Those established on haemodialysis
The modality changes in the first 3 years ofthose patients starting RRT in 1998–2000 wereanalysed for those patients established onhaemodialysis on day 90 (n¼ 4,661 patients).
The sequential modality changes are shown inTable 4.12.
These are changes subsequent to the first 90days after starting dialysis. As reported before,transfer to PD is negligible after the first year.This is an older group of patients than thoseestablished on PD and the patients have moreco-morbidity, explaining the relatively higher
Figure 4.8: Percentage of incident dialysis patients
in each centre on HD on day 90, 2003 cohort
Figure 4.9: Percentage of incident dialysis patients
on HD in each centre on day 90, by age, 2003
The UK Renal Registry The Seventh Annual Report
16
death rate and lower transplant rate comparedwith PD patients.
Those established on peritonealdialysis
The modality changes in the first 3 years ofthose patients starting RRT in 1998 and 1999were analysed in detail for those patients estab-lished on peritoneal dialysis on day 90. Thecharacteristics of this cohort of 1,281 patientsare listed in Table 4.13.
The sequential annual changes in treatmentmodality are shown in Table 4.14. After 3 yearsless than 30% are still alive on peritonealdialysis and 23% have changed to haemo-dialysis (defined as changing to haemodialysisfor at least 3 months). The rate of change isconstant with about 65% of those on PD at thebeginning of each year remaining on it at theend and 11% at the beginning of each yearchanging to HD within the year.
Pure PD technique survival can be analysedby only considering those patients remaining
alive and on dialysis for 3 years and censoringtransplants, deaths, and ‘‘other’’. The attritionrate is then related to those whose PD fails andwho have to convert to haemodialysis. Aftersuch censoring, the pure PD technique survivalrates were 86% at the end of the first year, 74%at the end of the second year and 63% by theend of the third year after being established onPD (Table 4.15).
Factors affecting PD technique survival
Demographic
Table 4.16 shows the data on the demographicof the cohort as divided according to agegroups, gender, primary diagnosis (diabetics ornon-diabetics) and ethnicity. These factors wereanalysed for possible effect on the 3-year PDtechnique survival. There were no significantdifferences observed between the 3 different agegroups, between gender, between those withprimary diagnosis of diabetic nephropathy andnon-diabetic nephropathy and also between thedifferent ethnic groups.
Unit factors
The UK has a higher proportion of dialysispatients using PD than any other country
Table 4.12: 3 year sequential modality changes in
patients established on HD 1998–2000
Sequential modality changes over
3 years for patients established on
HD at day 90, 1998–2000
End of yr 1 End of yr 2 End of yr 3
n¼ 4,661 % % %
Remained on HD 72 54 42
Changed to PD 3 3 3
Had a transplant 4 9 12
Stopped treatment 0 0 0
Unknown 0 1 1
Recovered 1 1 1
Died 20 31 40
Table 4.13: General characteristics of PD survival
study cohort
General characteristics of
PD survival study cohort
(n¼ 1,281)
n %
Male 780 61
Age 65þ 433 34
Diabetic nephropathy 237 19
Table 4.14: 3 year sequential modality changes in
patients established on PD 1998–1999
Sequential modality changes over
3 years for patients established on
PD at day 90, 1998–1999
End of yr 1 End of yr 2 End of yr 3
n¼ 1,281 % % %
Remains on PD 67 44 29
Changed to HD 11 18 23
Had a transplant 10 17 21
Other 1 2 2
Died 11 19 25
Table 4.15: Pure PD technique survival –
Kaplan–Meier survival analysis
Overall PD technique survival
End of: Survival 95% CI
Year 1 86% 84–88
Year 2 74% 71–77
Year 3 63% 60–66
Chapter 4 New Adult Patients Starting Renal Replacement Therapy in the UK in 2003
17
within Europe and within the UK this Chapterhas again demonstrated wide variations betweenunits in the proportion using PD. There havebeen suggestions that in some cases this is dueto lack of haemodialysis resources leading toinappropriate patients being coerced to acceptPD: if this were the case one might expect ahigher technique failure rate in those units dueto an increased number of patients convertingto haemodialysis. To examine this, the cohortwas analysed to study the effect of unit prefer-ences for modality, as judged by the percentageof new RRT patients established on PD, on PDtechnique survival rate. The cohort was alsoanalysed to study the effect on PD techniquesurvival rate of the size of the PD programmewithin a unit, as there have been suggestionsfrom Europe that small PD programmes interms of the actual number of patients on PDmay have a higher failure rate than largerones1,2.
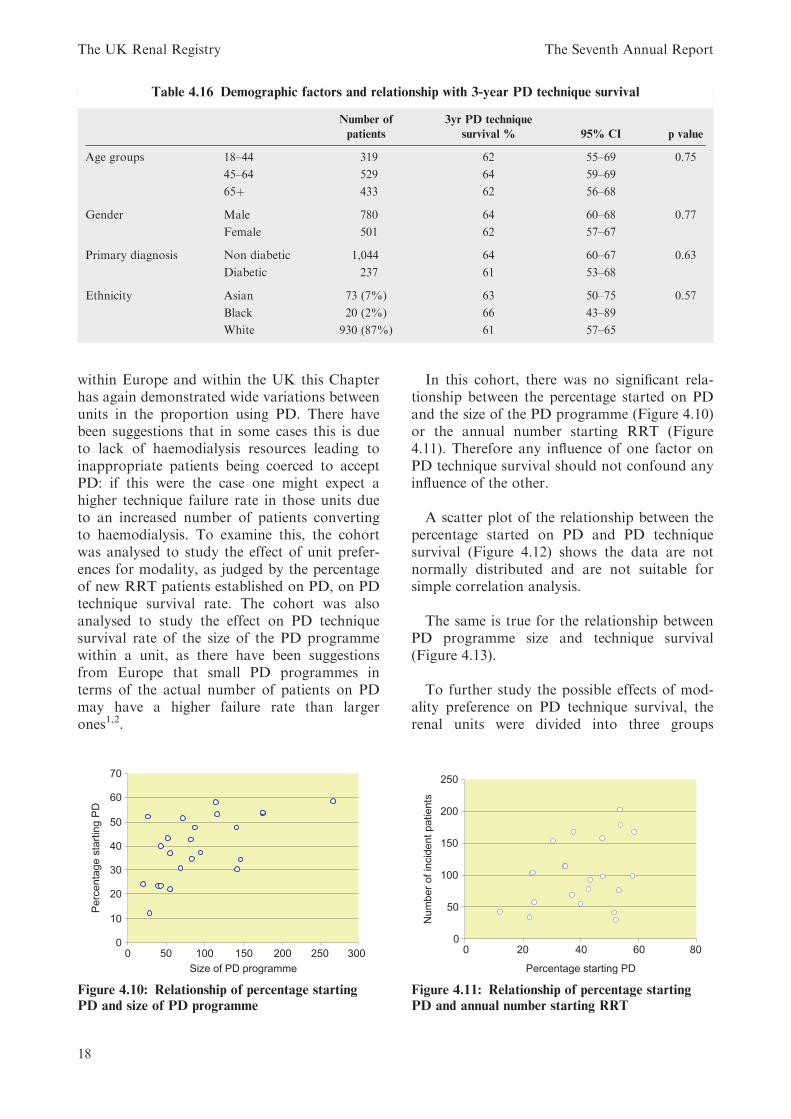
In this cohort, there was no significant rela-tionship between the percentage started on PDand the size of the PD programme (Figure 4.10)or the annual number starting RRT (Figure4.11). Therefore any influence of one factor onPD technique survival should not confound anyinfluence of the other.
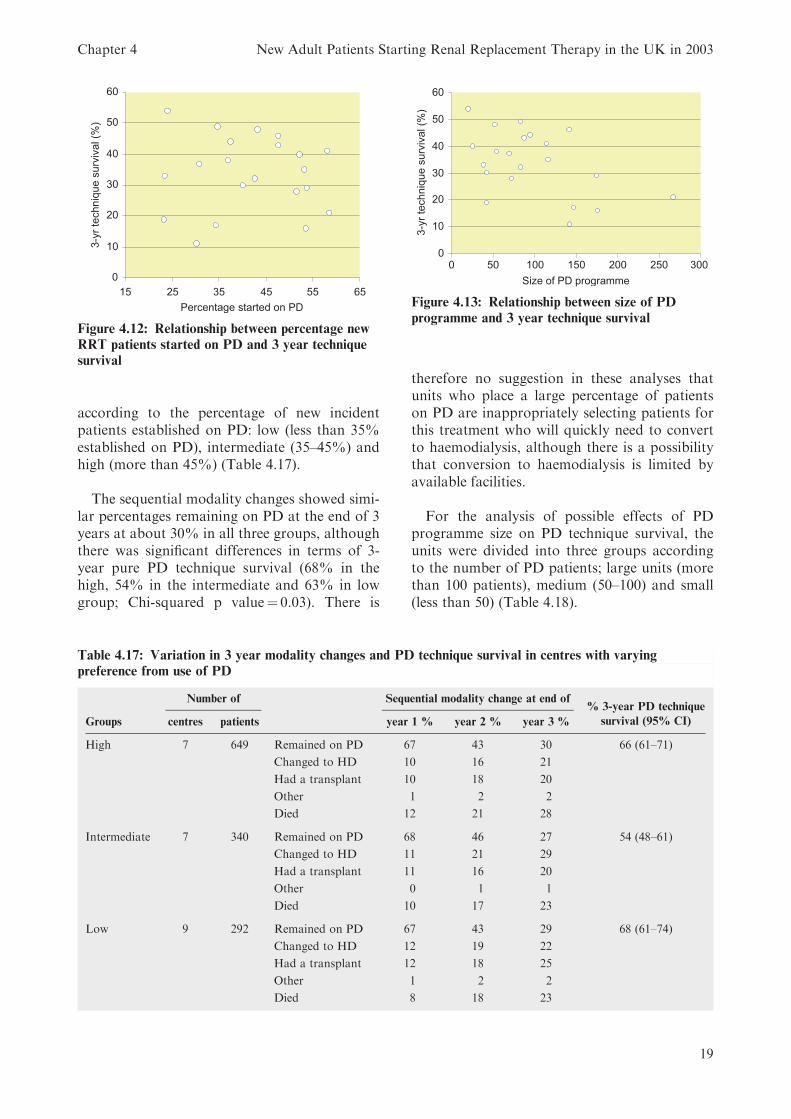
A scatter plot of the relationship between thepercentage started on PD and PD techniquesurvival (Figure 4.12) shows the data are notnormally distributed and are not suitable forsimple correlation analysis.
The same is true for the relationship betweenPD programme size and technique survival(Figure 4.13).
To further study the possible effects of mod-ality preference on PD technique survival, therenal units were divided into three groups
Table 4.16 Demographic factors and relationship with 3-year PD technique survival
Number of
patients
3yr PD technique
survival % 95% CI p value
Age groups 18–44 319 62 55–69 0.75
45–64 529 64 59–69
65þ 433 62 56–68
Gender Male 780 64 60–68 0.77
Female 501 62 57–67
Primary diagnosis Non diabetic 1,044 64 60–67 0.63
Diabetic 237 61 53–68
Ethnicity Asian 73 (7%) 63 50–75 0.57
Black 20 (2%) 66 43–89
White 930 (87%) 61 57–65
Figure 4.10: Relationship of percentage starting
PD and size of PD programme
Figure 4.11: Relationship of percentage starting
PD and annual number starting RRT
The UK Renal Registry The Seventh Annual Report
18
according to the percentage of new incidentpatients established on PD: low (less than 35%established on PD), intermediate (35–45%) andhigh (more than 45%) (Table 4.17).
The sequential modality changes showed simi-lar percentages remaining on PD at the end of 3years at about 30% in all three groups, althoughthere was significant differences in terms of 3-year pure PD technique survival (68% in thehigh, 54% in the intermediate and 63% in lowgroup; Chi-squared p value¼ 0.03). There is
therefore no suggestion in these analyses thatunits who place a large percentage of patientson PD are inappropriately selecting patients forthis treatment who will quickly need to convertto haemodialysis, although there is a possibilitythat conversion to haemodialysis is limited byavailable facilities.
For the analysis of possible effects of PDprogramme size on PD technique survival, theunits were divided into three groups accordingto the number of PD patients; large units (morethan 100 patients), medium (50–100) and small(less than 50) (Table 4.18).
Figure 4.12: Relationship between percentage new
RRT patients started on PD and 3 year technique
survival
Figure 4.13: Relationship between size of PD
programme and 3 year technique survival
Table 4.17: Variation in 3 year modality changes and PD technique survival in centres with varying
preference from use of PD
Number of Sequential modality change at end of% 3-year PD technique
survival (95% CI)Groups centres patients year 1 % year 2 % year 3 %
High 7 649 Remained on PD 67 43 30 66 (61–71)
Changed to HD 10 16 21
Had a transplant 10 18 20
Other 1 2 2
Died 12 21 28
Intermediate 7 340 Remained on PD 68 46 27 54 (48–61)
Changed to HD 11 21 29
Had a transplant 11 16 20
Other 0 1 1
Died 10 17 23
Low 9 292 Remained on PD 67 43 29 68 (61–74)
Changed to HD 12 19 22
Had a transplant 12 18 25
Other 1 2 2
Died 8 18 23
Chapter 4 New Adult Patients Starting Renal Replacement Therapy in the UK in 2003
19
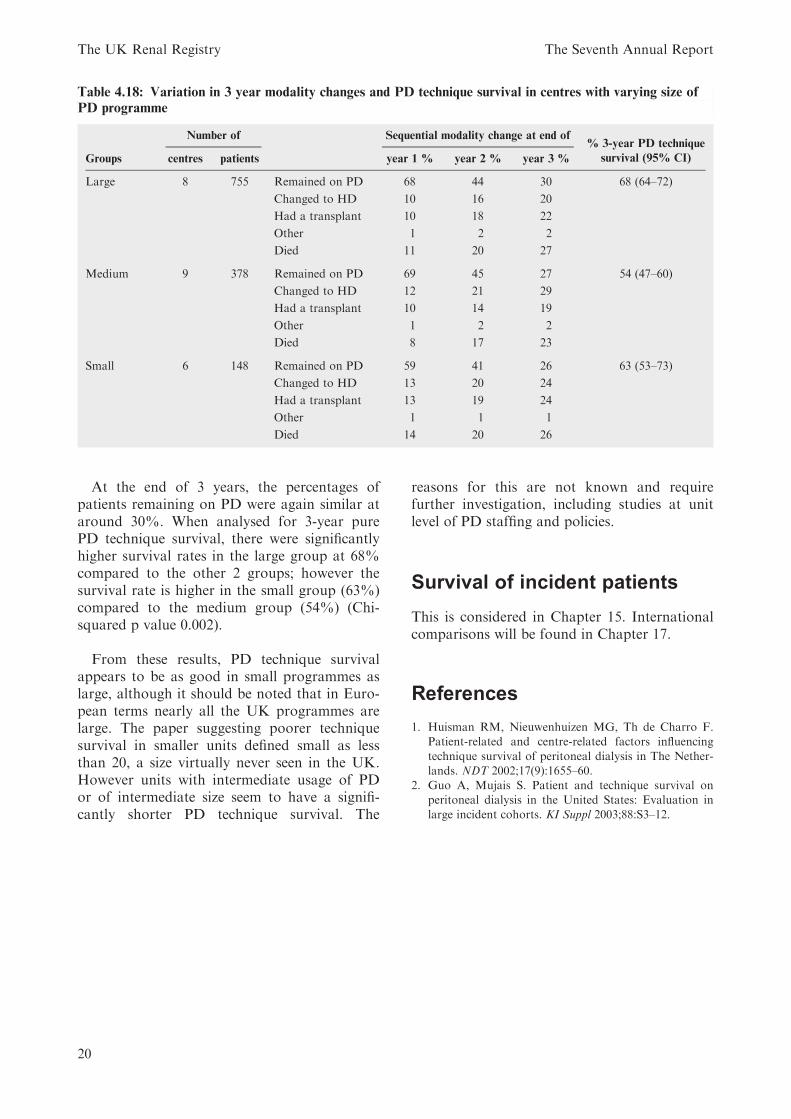
At the end of 3 years, the percentages ofpatients remaining on PD were again similar ataround 30%. When analysed for 3-year purePD technique survival, there were significantlyhigher survival rates in the large group at 68%compared to the other 2 groups; however thesurvival rate is higher in the small group (63%)compared to the medium group (54%) (Chi-squared p value 0.002).
From these results, PD technique survivalappears to be as good in small programmes aslarge, although it should be noted that in Euro-pean terms nearly all the UK programmes arelarge. The paper suggesting poorer techniquesurvival in smaller units defined small as lessthan 20, a size virtually never seen in the UK.However units with intermediate usage of PDor of intermediate size seem to have a signifi-cantly shorter PD technique survival. The
reasons for this are not known and requirefurther investigation, including studies at unitlevel of PD staffing and policies.
Survival of incident patients
This is considered in Chapter 15. Internationalcomparisons will be found in Chapter 17.
References
1. Huisman RM, Nieuwenhuizen MG, Th de Charro F.Patient-related and centre-related factors influencing
technique survival of peritoneal dialysis in The Nether-lands. NDT 2002;17(9):1655–60.
2. Guo A, Mujais S. Patient and technique survival onperitoneal dialysis in the United States: Evaluation in
large incident cohorts. KI Suppl 2003;88:S3–12.
Table 4.18: Variation in 3 year modality changes and PD technique survival in centres with varying size of
PD programme
Number of Sequential modality change at end of% 3-year PD technique
survival (95% CI)Groups centres patients year 1 % year 2 % year 3 %
Large 8 755 Remained on PD 68 44 30 68 (64–72)
Changed to HD 10 16 20
Had a transplant 10 18 22
Other 1 2 2
Died 11 20 27
Medium 9 378 Remained on PD 69 45 27 54 (47–60)
Changed to HD 12 21 29
Had a transplant 10 14 19
Other 1 2 2
Died 8 17 23
Small 6 148 Remained on PD 59 41 26 63 (53–73)
Changed to HD 13 20 24
Had a transplant 13 19 24
Other 1 1 1
Died 14 20 26
The UK Renal Registry The Seventh Annual Report
20