CHAPTER 3 SYSTEM DESIGN: AN OVERVIEW
13
CHAPTER 3 SYSTEM DESIGN: AN OVERVIEW Mark A. Ysusi Montgomery Watson Fresno, CA 3.1 INTRODUCTION The primary purpose of a water distribution system is to deliver water to the individual consumer in the required quantity and at sufficient pressure. Water distribution systems typically carry potable water to residences, institutions, and commercial and industrial establishments. Though a few municipalities have separate distribution systems, such as a high-pressure system for fire fighting or a recycled wastewater system for nonpotable uses, most municipal water distribution systems must be capable of providing water for potable uses and for nonpotable uses, such as fire suppression and irrigation of landscaping. The proper function of a water distribution system is critical to providing sufficient drinking water to consumers as well as providing sufficient water for fire protection. Because these systems must function properly, the principals of their planning, design, and construction need to be understood. This chapter focuses on the critical elements of planning and design of a water distribution system. The information presented primarily discusses typical municipal water distribution systems; however, the hydraulic and design principles presented can be easily modified for the planning and design of other types of pressure distribution systems, such as fire protection and recycled wastewater. 3.1.1 Overview Municipal water systems typically consist of one or more sources of supply, appropriate treatment facilities, and a distribution system. Sources of supply include surface water, such as rivers or lakes; groundwater; and, in some instances, brackish or seawater. The information contained in this chapter is limited to the planning and design of distribution systems and does not address issues related to identifying and securing sources of supply or designing and constructing appropriate water treatment facilities. Water distribution
Transcript of CHAPTER 3 SYSTEM DESIGN: AN OVERVIEW
CHAPTER 3SYSTEM DESIGN:
AN OVERVIEW
Mark A. YsusiMontgomery Watson
Fresno, CA
3.1 INTRODUCTION
The primary purpose of a water distribution system is to deliver water to the individualconsumer in the required quantity and at sufficient pressure. Water distribution systemstypically carry potable water to residences, institutions, and commercial and industrialestablishments. Though a few municipalities have separate distribution systems, such as ahigh-pressure system for fire fighting or a recycled wastewater system for nonpotable uses,most municipal water distribution systems must be capable of providing water for potableuses and for nonpotable uses, such as fire suppression and irrigation of landscaping.
The proper function of a water distribution system is critical to providing sufficientdrinking water to consumers as well as providing sufficient water for fire protection.Because these systems must function properly, the principals of their planning, design,and construction need to be understood. This chapter focuses on the critical elements ofplanning and design of a water distribution system. The information presented primarilydiscusses typical municipal water distribution systems; however, the hydraulic and designprinciples presented can be easily modified for the planning and design of other types ofpressure distribution systems, such as fire protection and recycled wastewater.
3.1.1 Overview
Municipal water systems typically consist of one or more sources of supply, appropriatetreatment facilities, and a distribution system. Sources of supply include surface water,such as rivers or lakes; groundwater; and, in some instances, brackish or seawater. Theinformation contained in this chapter is limited to the planning and design of distributionsystems and does not address issues related to identifying and securing sources of supplyor designing and constructing appropriate water treatment facilities. Water distribution
systems usually consist of a network of interconnected pipes to transport water tothe consumer, storage reservoirs to provide for fluctuations in demand, and pumpingfacilities.
3.1.2 Definitions
Many of the frequently used terms in water distribution system planning and design aredefined here.
Average day demand. The total annual quantity of water production for an agencyor municipality divided by 365.
Maximum day demand. The highest water demand of the year during any 24-h period.Peak hour demand. The highest water demand of the year during any 1-h period.Peaking factors. The increase above average annual demand, experienced during a
specified time period. Peaking factors are customarily used as multipliers of average daydemand to express maximum day and peak hour demands.
Distribution pipeline or main. A smaller diameter water distribution pipeline that servesa relatively small area. Water services to individual consumers are normally placed ondistribution pipelines. Distribution system pipelines are normally between 150 and 400mm (6-16 in.).
Transmission pipeline or main. A larger-diameter pipeline, designed to transport largerquantities of water during peak demand-periods. Water services for small individualconsumers are normally not placed on transmission pipelines. Transmission mains arenormally pipelines larger than 400 mm (16 in.).
3.2 DISTRIBUTIONSYSTEMPLANNING
The basic question to be answered by the water distribution system planner/designer is,"How much water will my system be required to deliver and to where?" The answer tothis question will require the acquisition of basic information about the community,including historical water usage, population trends, planned growth, topography, andexisting system capabilities, to name just a few. This information can then be used to planfor logical extension of the existing system and to determine improvements necessary toprovide sufficient water at appropriate pressure.
3.2.1 Water Demands
The first step in the design of a water distribution system is the determination of thequantity of water that will be required, with provision for the estimated requirements forthe future.
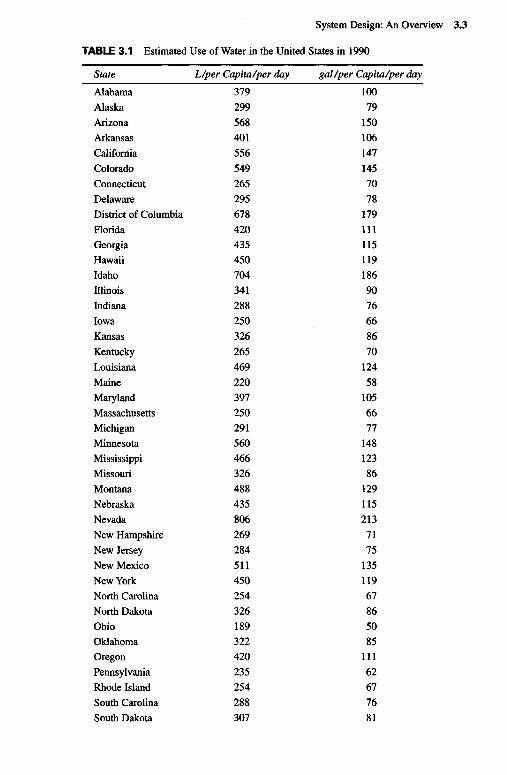
In terms of the total quantity, the water demand in a community is usually estimatedon the basis of per capita demand. According to a study published by the U.S. GeologicalSurvey, the average quantity of water withdrawn for public water supplies in 1990 wasestimated to be about 397 L per day per capita (Lpdc) or 105 gal per day per capita (gpdc).The withdrawals by state are summarized in Table 3.1. The reported water usage shownin Table 3.1 illustrates a wide variation. Per capita water use varies from a low use in
State
AlabamaAlaskaArizonaArkansasCaliforniaColoradoConnecticutDelawareDistrict of ColumbiaFloridaGeorgiaHawaiiIdahoIllinoisIndianaIowaKansasKentuckyLouisianaMaineMarylandMassachusettsMichiganMinnesotaMississippiMissouriMontanaNebraskaNevadaNew HampshireNew JerseyNew MexicoNew YorkNorth CarolinaNorth DakotaOhioOklahomaOregonPennsylvaniaRhode IslandSouth CarolinaSouth Dakota
L/per Capita/per day
379299568401556549265295678420435450704341288250326265469220397250291560466326488435806269284511450254326189322420235254288307
gal/per Capita/per day
10079
1501061471457078
1791111151191869076668670
12458
1056677
14812386
1291152137175
13511967865085
11162677681
TABLE 3.1 Estimated Use of Water in the United States in 1990

Pennsylvania of just over 60 gpcd to over 200 gpcd in Nevada. These variations dependDn geographic location, climate, size of the community, extent of industrialization, andother influencing factors unique to most communities. Because of these variations, theonly reliable way to estimate future water demand is to study each community separately,determining existing water use characteristics and extrapolating future water demandusing population trends.
In terms of how the total water use is distributed within a community throughout theday, perhaps the best indicator is land use. In a metered community, the best way todetermine water demand by land use is to examine actual water usage for the various typesof land uses. The goal of examining actual water usage is to develop water "duties" forthe various types of land uses that can be used for future planning. Water duties arenormally developed for the following land uses:
• Single-family residential (some communities have low, medium, and high-densityzones)
• Multifamily residential
• Commercial (normally divided into office and retail categories)
• Industrial (normally divided into light and heavy categories and separate categories forvery high users
• Public (normally divided into park, or open space, and schools)
Water duties are normally expressed in gallons per acre per day. Table 3.2 showstypical water duties in the western United States. It should be noted that the definitions ofland use terms like "low-density residential," "medium-density residential," and so on,will vary by community and should be examined carefully.
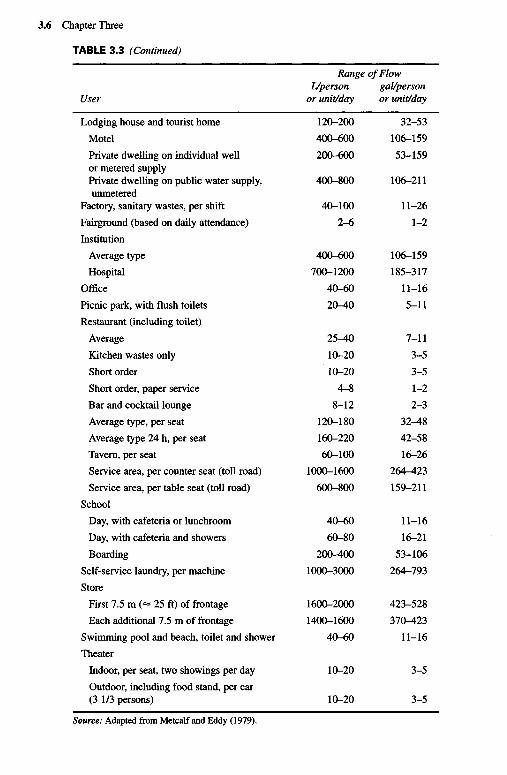
Another method of distributing water demand is to examine the water usage forindividual users. This is particularly the case when an individual customer constitutes asignificant portion of the total system demand. Table 3.3 presents water use for manydifferent establishments. Although the rates vary widely, they are useful in estimating totalwater use for individual users when no other data are available.
TABLE 3.1 (Continued)
State
Tennessee
Texas
Utah
VermontVirginia
Washington
West VirginiaWisconsin
WyomingPuerto RicoVirgin IslandsUnited States total
Source: Solley et al. (1993).
L/per Capita/per day
32254182530328452228019761718287
397
gal/per Capita/per day
85143218
8075
1387452
1634823
105

User
Airport, per passengerAssembly hall, per seatBowling alley, per alley
CampPioneer type
Children's, central toilet and bath
Day, no mealsLuxury, private bath
Labor
Trailer with private toilet and bath,per unit (2 1/2 persons)
Country clubs
Resident typeTransient type serving meals
Dwelling unit, residentialApartment house on individual well
Apartment house on public watersupply, unmetered
BoardinghouseHotel
Range of FlowL/person gal/person
or unit/day or unit/day
10-20 3-56-10 2-3
60-100 16-26
80-120 21-32
160-200 42-53
40-70 11-18
300-400 79-106
140-200 37-53
500-600 132-159
300-600 79-15960-100 16-26
3(XMOO 79-106300-500 79-132
150-220 40-58
200-400 53-106
TABLE 3.3 Typical Rates of Water Use for Various Establishments
TABLE 3.2 Typical Water Duties
Land Use
Low-density residential
Medium-density residential
High-density residential
Single-family residential
Multifamily residential
Office commercial
Retail commercial
Light industrial
Heavy industrial
Parks
Schools
Water Duty, (gal/day/acre)Low High Average
400 3300 1670
900 3800 2610
2300 12000 4160
1300 2900 2300
2600 6600 4160
1100 5100 2030
1100 5100 2040
200 4700 1620
200 4800 2270
400 3100 2020
400 2500 1700
Source: Adapted from Montgomery Watson study of data of 28 western U.S. cities.Note: gal X 3.7854 = L.
User
Lodging house and tourist home
Motel
Private dwelling on individual wellor metered supplyPrivate dwelling on public water supply,unmetered
Factory, sanitary wastes, per shift
Fairground (based on daily attendance)
Institution
Average type
Hospital
Office
Picnic park, with flush toilets
Restaurant (including toilet)
Average
Kitchen wastes only
Short order
Short order, paper service
Bar and cocktail lounge
Average type, per seat
Average type 24 h, per seat
Tavern, per seat
Service area, per counter seat (toll road)
Service area, per table seat (toll road)
School
Day, with cafeteria or lunchroom
Day, with cafeteria and showers
Boarding
Self-service laundry, per machine
Store
First 7.5 m (« 25 ft) of frontage
Each additional 7.5 m of frontage
Swimming pool and beach, toilet and shower
Theater
Indoor, per seat, two showings per day
Outdoor, including food stand, per car(3 1/3 persons)
Source: Adapted from Metcalf and Eddy (1979).
Range of FlowL/person gal/person
or unit/day or unit/day
120-200 32-53
400-600 106-159
200-600 53-159
400-800 106-211
40-100 11-26
2-6 1-2
400-600 106-159
700-1200 185-317
40-60 11-16
20-40 5-11
25^0 7-11
10-20 3-5
10-20 3-5
4-8 1-2
8-12 2-3
120-180 32^8
160-220 42-58
60-100 16-26
1000-1600 264-^23
600-800 159-211
40-60 11-16
60-80 16-21
200-400 53-106
1000-3000 264-793
1600-2000 423-528
1400-1600 370-423
40-60 11-16
10-20 3-5
10-20 3-5
TABLE 3.3 (Continued)
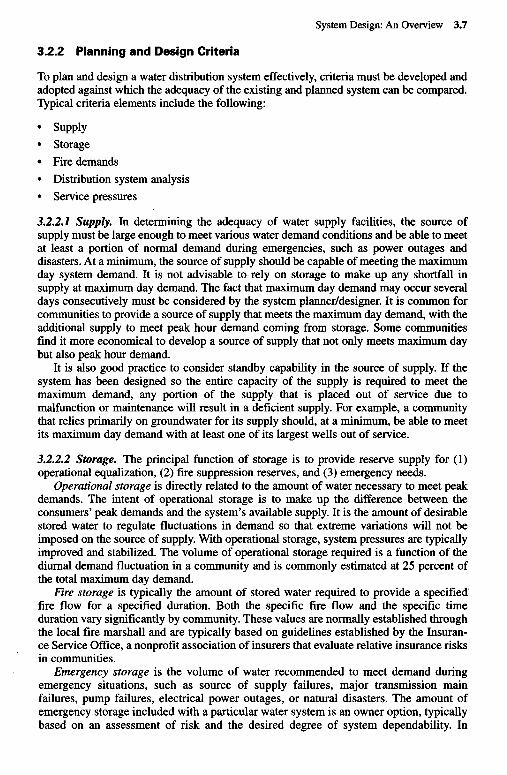
3.2.2 Planning and Design Criteria
To plan and design a water distribution system effectively, criteria must be developed andadopted against which the adequacy of the existing and planned system can be compared.Typical criteria elements include the following:
• Supply• Storage• Fire demands• Distribution system analysis• Service pressures
3.2.2.1 Supply. In determining the adequacy of water supply facilities, the source ofsupply must be large enough to meet various water demand conditions and be able to meetat least a portion of normal demand during emergencies, such as power outages anddisasters. At a minimum, the source of supply should be capable of meeting the maximumday system demand. It is not advisable to rely on storage to make up any shortfall insupply at maximum day demand. The fact that maximum day demand may occur severaldays consecutively must be considered by the system planner/designer. It is common forcommunities to provide a source of supply that meets the maximum day demand, with theadditional supply to meet peak hour demand coming from storage. Some communitiesfind it more economical to develop a source of supply that not only meets maximum daybut also peak hour demand.
It is also good practice to consider standby capability in the source of supply. If thesystem has been designed so the entire capacity of the supply is required to meet themaximum demand, any portion of the supply that is placed out of service due tomalfunction or maintenance will result in a deficient supply. For example, a communitythat relies primarily on groundwater for its supply should, at a minimum, be able to meetits maximum day demand with at least one of its largest wells out of service.
3.2.2.2 Storage. The principal function of storage is to provide reserve supply for (1)operational equalization, (2) fire suppression reserves, and (3) emergency needs.
Operational storage is directly related to the amount of water necessary to meet peakdemands. The intent of operational storage is to make up the difference between theconsumers' peak demands and the system's available supply. It is the amount of desirablestored water to regulate fluctuations in demand so that extreme variations will not beimposed on the source of supply. With operational storage, system pressures are typicallyimproved and stabilized. The volume of operational storage required is a function of thediurnal demand fluctuation in a community and is commonly estimated at 25 percent ofthe total maximum day demand.
Fire storage is typically the amount of stored water required to provide a specifiedfire flow for a specified duration. Both the specific fire flow and the specific timeduration vary significantly by community. These values are normally established throughthe local fire marshall and are typically based on guidelines established by the Insuran-ce Service Office, a nonprofit association of insurers that evaluate relative insurance risksin communities.
Emergency storage is the volume of water recommended to meet demand duringemergency situations, such as source of supply failures, major transmission mainfailures, pump failures, electrical power outages, or natural disasters. The amount ofemergency storage included with a particular water system is an owner option, typicallybased on an assessment of risk and the desired degree of system dependability. In
considering emergency storage, it is not uncommon to evaluate providing significantlyreduced supplies during emergencies. For example, it is not illogical to assume minimaldemand during a natural disaster.
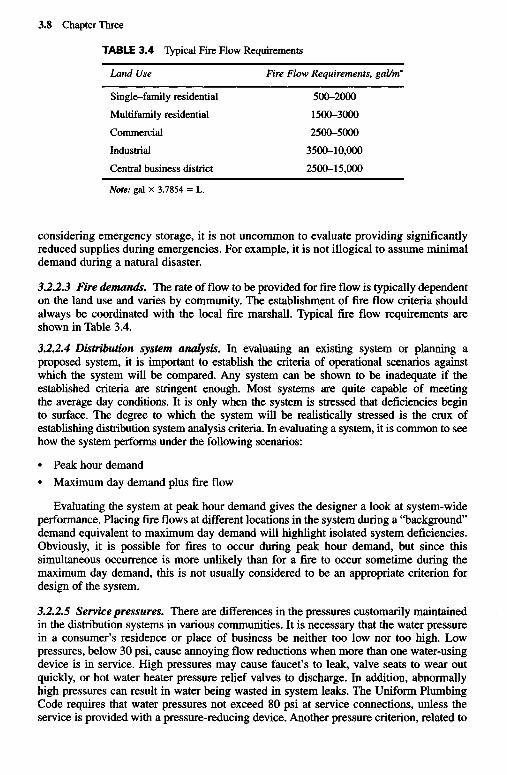
3.2.2.3 Fire demands. The rate of flow to be provided for fire flow is typically dependenton the land use and varies by community. The establishment of fire flow criteria shouldalways be coordinated with the local fire marshall. Typical fire flow requirements areshown in Table 3.4.
3.2.2.4 Distribution system analysis. In evaluating an existing system or planning aproposed system, it is important to establish the criteria of operational scenarios againstwhich the system will be compared. Any system can be shown to be inadequate if theestablished criteria are stringent enough. Most systems are quite capable of meetingthe average day conditions. It is only when the system is stressed that deficiencies beginto surface. The degree to which the system will be realistically stressed is the crux ofestablishing distribution system analysis criteria. In evaluating a system, it is common to seehow the system performs under the following scenarios:
• Peak hour demand• Maximum day demand plus fire flow
Evaluating the system at peak hour demand gives the designer a look at system-wideperformance. Placing fire flows at different locations in the system during a "background"demand equivalent to maximum day demand will highlight isolated system deficiencies.Obviously, it is possible for fires to occur during peak hour demand, but since thissimultaneous occurrence is more unlikely than for a fire to occur sometime during themaximum day demand, this is not usually considered to be an appropriate criterion fordesign of the system.
3.2.2.5 Service pressures. There are differences in the pressures customarily maintainedin the distribution systems in various communities. It is necessary that the water pressurein a consumer's residence or place of business be neither too low nor too high. Lowpressures, below 30 psi, cause annoying flow reductions when more than one water-usingdevice is in service. High pressures may cause faucet's to leak, valve seats to wear outquickly, or hot water heater pressure relief valves to discharge. In addition, abnormallyhigh pressures can result in water being wasted in system leaks. The Uniform PlumbingCode requires that water pressures not exceed 80 psi at service connections, unless theservice is provided with a pressure-reducing device. Another pressure criterion, related to
TABLE 3.4 Typical Fire Flow Requirements
Land Use
Single-family residential
Multifamily residential
Commercial
Industrial
Central business district
Note: gal X 3.7854 = L.
Fire Flow Requirements, gal/m*
500-2000
1500-3000
2500-5000
3500-10,000
2500-15,000
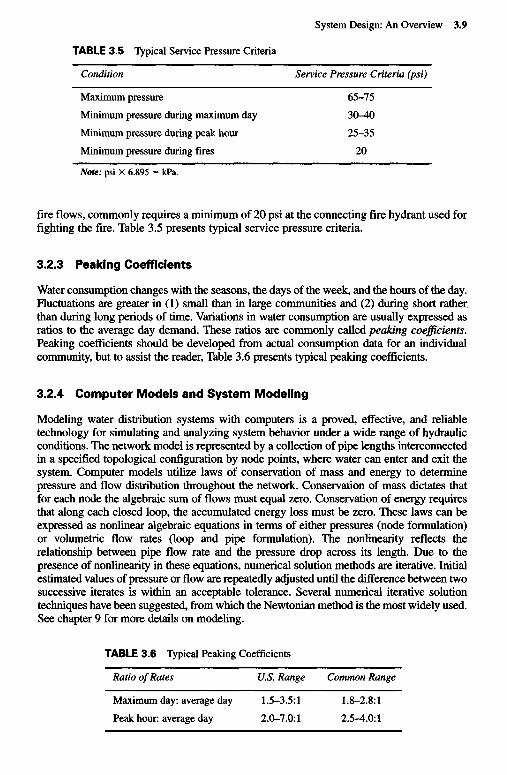
fire flows, commonly requires a minimum of 20 psi at the connecting fire hydrant used forfighting the fire. Table 3.5 presents typical service pressure criteria.
3.2.3 Peaking Coefficients
Water consumption changes with the seasons, the days of the week, and the hours of the day.Fluctuations are greater in (1) small than in large communities and (2) during short ratherthan during long periods of time. Variations in water consumption are usually expressed asratios to the average day demand. These ratios are commonly called peaking coefficients.Peaking coefficients should be developed from actual consumption data for an individualcommunity, but to assist the reader, Table 3.6 presents typical peaking coefficients.
3.2.4 Computer Models and System Modeling
Modeling water distribution systems with computers is a proved, effective, and reliabletechnology for simulating and analyzing system behavior under a wide range of hydraulicconditions. The network model is represented by a collection of pipe lengths interconnectedin a specified topological configuration by node points, where water can enter and exit thesystem. Computer models utilize laws of conservation of mass and energy to determinepressure and flow distribution throughout the network. Conservation of mass dictates thatfor each node the algebraic sum of flows must equal zero. Conservation of energy requiresthat along each closed loop, the accumulated energy loss must be zero. These laws can beexpressed as nonlinear algebraic equations in terms of either pressures (node formulation)or volumetric flow rates (loop and pipe formulation). The nonrmearity reflects therelationship between pipe flow rate and the pressure drop across its length. Due to thepresence of nonlinearity in these equations, numerical solution methods are iterative. Initialestimated values of pressure or flow are repeatedly adjusted until the difference between twosuccessive iterates is within an acceptable tolerance. Several numerical iterative solutiontechniques have been suggested, from which the Newtonian method is the most widely used.See chapter 9 for more details on modeling.
TABLE 3.6 Typical Peaking Coefficients
Ratio of Rates
Maximum day: average day
Peak hour: average day
U.S. Range
1.5-3.5:1
2.0-7.0:1
Common Range
1.8-2.8:1
2.5-4.0:1
TABLE 3.5 Typical Service Pressure Criteria
Condition
Maximum pressure
Minimum pressure during maximum day
Minimum pressure during peak hour
Minimum pressure during fires
Note: psi X 6.895 = kPa.
Service Pressure Criteria (psi)
65-75
3(MO
25-35
20
3.2.4.1 History of computer models. Prior to computerization, tedious, and time-consu-ming manual calculations were required to solve networks for pressure and flowdistribution. These calculations were carried out using the Hardy-Cross numerical methodof analysis for determinate networks. Only simple pipeline systems consisting of a few loopswere modeled and under limited conditions because of the laborious effort required to obtaina solution. The first advent of computers in network modeling was with electric analogues,followed by large mainframe digital computers and smaller microcomputers. The computa-tional power of a laptop computer today is vastly superior to the original computingmachines that would fill several floors in an office building and at a fraction of the cost.
Many of the early computer models did not have interactive on-screen graphics, thuslimiting the ability of engineers to develop and interpret model runs. The user interfacewas very rudimentary and often an afterthought. Input was either by punch cards orformatted American Standard Code for Information Interchange (ASCII) files createdwith a text editor. Errors were commonplace, and just getting a data file that would runcould involve days, if not weeks, of effort, depending on the size and complexity of thenetwork being modeled. Model output was usually a voluminous tabular listing of keynetwork results. Interpretation of the results was time consuming and typically involvedhand plotting of pressure contours on system maps.
Because of the widespread use of microcomputers during the past two decades,network modeling has taken on new dimensions. Engineers today rely on computermodels to solve a variety of hydraulic problems. The use of interactive on-screen graphicsto enter and edit network data and to color code and display network maps, attributes, andanalysis results has become commonplace in the water industry. This makes it much easierfor the engineer to construct, calibrate, and manipulate the model and visualize what ishappening in the network under various situations, such as noncompliance with systemperformance criteria. The engineer is now able to spend more time thinking and evaluatingsystem improvements and less time flipping through voluminous pages of computerprintouts, thus leading to improved operation and design recommendations. The newgeneration of computer models have greatly simplified the formidable task of collectingand organizing network data and comprehending massive results.
3.2.4.2 Software packages. Many of the software packages available offer additionalcapabilities beyond standard hydraulic modeling, such as water quality assessment (bothconservative and reactive species), multiquality source blending, travel time determi-nation, energy and power cost calculation, leakage and pressure management, fire flowmodeling, surge (transient) analysis, system head curve generation, automated networkcalibration, real-time simulation, and network optimization. Some sophisticated modelscan even accommodate the full library of hydraulic network components includingpressure-regulating valves, pressure-sustaining valves, pressure breaker valves, flowcontrol valves, float valves, throttle control valves, fixed-and variable speed pumps,turbines, cylindrical and variable cross-sectional area tanks, variable head reservoirs, andmultiple inlet/outlet tanks and reservoirs. Through their predictive capabilities, computernetwork models provide a powerful tool for making informed decisions to support manyorganizational programs and policies. Modeling is important for gaining a properunderstanding of system dynamic behavior, training operators, optimizing the use ofexisting facilities, reducing operating costs, determining future facility requirements, andaddressing water quality distribution issues.
There is an abundance of network modeling software in the marketplace today. Someare free and others can be purchased at a nominal cost. Costs can vary significantlybetween models, depending on the range of the features and capabilities provided. Thefour major sources of computer models include consulting firms, commercial software
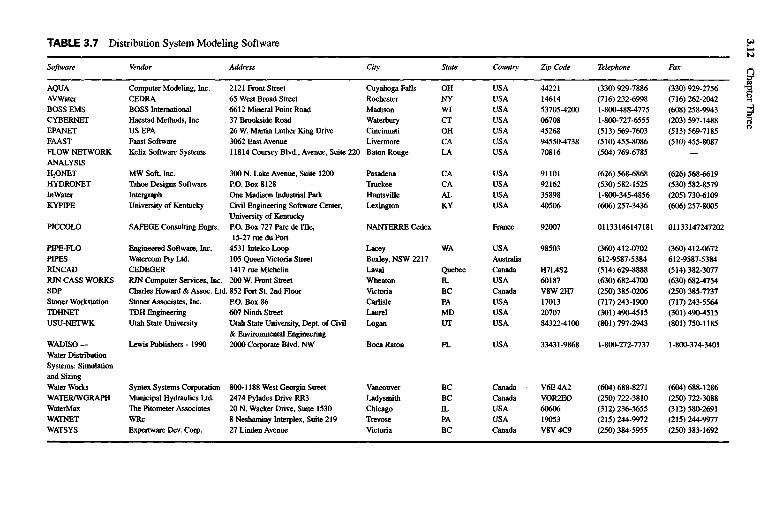
companies, universities, and government agencies. Many of the programs available fromthese sources have been on the market for several years and have established track records.Most of the recent computer models, however, provide very sophisticated and intuitivegraphical user interfaces and results presentation environment, as well as direct linkageswith information management systems, such as relational databases and geographicinformation systems. Table 3.7 lists the names, addresses, and phone numbers of networkmodeling software vendors, along with their primary modeling products.
3.2.4.3 Development of a system model. As was just indicated, the computerized toolsavailable to the engineer today are impressive and powerful. Once appropriate software isselected, data must be then input to the software to develop a computer model of the watersystem under study. Input data include the physical attributes of the system, such as pipesizes and lengths, topography, and reservoir and pump characteristics, as well as theanticipated nodal demands.
Development of the nodal demands normally involves distributing the average dayflow throughout the system in proportion to land use. This is commonly accomplished bydetermining a demand area for each node, measuring the area of each different land usewithin the demand area, multiplying the area of each land use within the demand areaby its respective average day water duty (converted to gal/min or L/sec), and summing thewater duties for each land use within the demand area and applying the sum at the node.In the past this effort required extensive mapping and determining the land use areas byplanimeter or hand measurement. Today, with the advent of graphical information systemsoftware (GIS), the development of nodal demands is normally an activity involvingcomputer-based mapping. The elements of the system, the demand areas, and the landuses are all mapped in separate layers in the GIS software. The GIS software capability of"polygon processing" intersects the different layers and automatically computes the land-use sums with the various demand areas. When the water duties are multiplied by theirrespective land use, the result is the average day system demand, proportioned to eachnode by land use. The water system computer model is then used to apply global peakingfactors as described above.
3.3 PIPELINE PRELIMINARY DESIGN
The purpose of performing the water system planning tasks as outlined above is to developa master plan for correcting system deficiencies and providing for future growth. Normallythe system improvements are prioritized and a schedule or capital improvement program isdeveloped based upon available (now or future) funding. As projects leave the advancedplanning stage, the process of preliminary design begins. During preliminary design, theconsiderations of pipeline routing (alignment), subsurface conflicts, and rights-of-way areconsidered.
3.3.1 Alignment
In deciding upon an appropriate alignment for a pipeline, important considerationsinclude right-of-way (discussed further below), constructability, access for futuremaintenance, and separation from other utilities. Many communities adopt standardizedlocations for utility pipelines (such as that water lines will generally be located 15 ft northand east of the street centerline). Such standards complement alignment considerations.
Fax
(330) 929-2756(716)262-2042(608) 258-9943(203) 597-1488(513) 569-7185(510)455-8087
(626) 568-6619(530) 582-8579(205) 730-6109(606) 257-8005
01133147247202
(360) 412-0672612-9587-5384(514) 382-3077(630) 682-4754(250) 385-7737(717) 243-5564(301) 490-4515(801)750-1185
1-800-374-3401
(604) 688-1286(250) 722-3088(312)580-2691(215) 244-9977(250) 383-1692
Telephone
(330) 929-7886(716) 232-69981-800-488-47751-800-727-6555(513) 569-7603(510)455-8086(504) 769-6785
(626)568-6868(530) 582-15251-800-345-4856(606) 257-3436
01133146147181
(360) 412-0702612-9587-5384(514) 629-8888(630) 682-4700(250) 385-0206(717) 243-1900(301)490-4515(801) 797-2943
1-800-272-7737
(604) 688-8271(250) 722-3810(312) 236-5655(215) 244-9972(250) 384-5955
Zip Code
442211461453705-4200067084526894550-473870816
91101921623589840506
92007
98503
H7L4S260187V8W 2H7170132070784322-4100
33431-9868
V6E4A2VOR2EO6060619053V8V 4C9
Country
USAUSAUSAUSAUSAUSAUSA
USAUSAUSAUSA
France
USAAustraliaCanadaUSACanadaUSAUSAUSA
USA
CanadaCanadaUSAUSACanada
State
OHNYWICTOHCALA
CACAALKY
WA
QuebecILBCPAMDUT
FL
BCBCILPABC
City
Cuyahoga FallsRochesterMadisonWaterburyCincinnatiLivermoreBaton Rouge
PasadenaTruckeeHuntsvilleLexington
NANTERRE Cedex
LaceyBexley, NSW 2217LavalWheatonVictoriaCarlisleLaurelLogan
Boca Raton
VancouverLadysmithChicagoTrevoseVictoria
Address
2121 Front Street65 West Broad Street6612 Mineral Point Road37 Brookside Road26 W. Martin Luther King Drive3062 East Avenue11814 Coursey Blvd., Avenue, Suite 220
300 N. Lake Avenue, Suite 1200P.O. Box 8128One Madison Industrial ParkCivil Engineering Software Center,University of KentuckyP.O. Box 727 Pare de I1IIe,15-27 rue du Port
453 llntelco Loop105 Queen Victoria Street1417 rue Michelin200 W. Front Street852 Fort St. 2nd FloorP.O. Box 86607 Ninth StreetUtah State University, Dept. of Civil& Environmental Engineering2000 Corporate Blvd. NW
800-1 188 West Georgia Street2474 Pylades Drive RR320 N. Wacker Drive, Suite 15308 Neshaminy Interplex, Suite 21927 Linden Avenue
Vendor
Computer Modeling, Inc.CEDRABOSS InternationalHaestad Methods, Inc.USEPAFaast SoftwareKelix Software Systems
MW Soft, Inc.Tahoe Designs SoftwareIntergraphUniversity of Kentucky
SAFEGE Consulting Engrs.
Engineered Software, Inc.Watercom Pty Ltd.CEDEGERRJN Computer Services, Inc.Charles Howard & Assoc. Ltd.Stoner Associates, Inc.TDH EngineeringUtah State University
Lewis Publishers - 1990
Syntex Systems CorporationMunicipal Hydraulics Ltd.The Pitometer AssociatesWRcExpertware Dev. Corp.
Software
AQUAAVWaterBOSS EMSCYBERNETEPANETFAASTFLOW NETWORKANALYSISH2ONETHYDRONETInWaterKYPIPE
PICCOLO
PIPE-FLOPIPESRINCADRJN CASS WORKSSDPStoner WorkstationTDHNETUSU-NETWK
WADISO —Water DistributionSystems: Simulationand SizingWater WorksWATERAVGRAPHWaterMaxWATNETWATSYS
TABLE 3.7 Distribution System Modeling Software
3.3.2 Subsurface Conflicts
A critical element of developing a proposed pipeline alignment is an evaluation ofsubsurface conflicts. To, evaluate subsurface conflicts properly, it will be necessary forthe designer to identify the type, size, and accurate location of all other undergroundutilities along the proposed pipeline alignment. This information must be considered inthe design and accurately placed on the project plans so that the contractor (or whoever isconstructing the line) is completely aware of potential conflicts.
It is good practice to thoroughly investigate potential utility conflicts. For example, itis not enough simply to determine that the proposed pipeline route will cross an electricalconduit. The exact location and dimensions of electrical conduits also need to bedetermined and the proposed water pipeline designed accordingly. What is shown on autility company plat as a single line representing an electrical conduit may turn out to bea major electrical line with several conduits encased in concrete having a cross section2 ft wide and 4 ft deep! Or, what is shown as a buried 3/4-inch telephone line may turnout to be a fiber-optic telecommunications cable that, if severed during construction, willresult in exorbitant fines being levied by the communications utility.
Another water pipeline alignment consideration is the lateral separation of the line fromadjacent sanitary sewer lines. Many state and local health officials require a minimum of 10ft of separation (out-to-out) between potable water and sanitary sewer lines.
3.3.3 Rights-of-Way
The final location of a pipeline can be selected and construction begun only afterappropriate rights-of-way are acquired. Adequate rights-of-way both for construction andfor future access are necessary for a successful installation. Water lines are commonlylocated in streets and roadways dedicated to public use. On occasion, it is necessary toobtain rights-of-way for transmission-type pipelines across private lands. If this is thecase, it is very important to properly evaluate the width of temporary easement that willbe required during construction and the width of permanent easement that will be requiredfor future access. If a pipeline is to be installed across private property, it is also veryimportant for the entity that will own and maintain the pipeline to gain agreements that nopermanent structures will be constructed within the permanent easements and toimplement a program of monitoring construction on the private property to ensure thataccess to the pipeline is maintained. Otherwise, as the property changes hands in thefuture, the pipeline stands a good chance of becoming inaccessible.
3.4 PIPINGMATERIALS
The types of pipe and fittings commonly used for pressurized water distribution systems arediscussed in this section. The types of pipeline materials are presented first and then factorseffecting the types of materials selected by the designer are presented in Sec. 3.4.7. Theemphasis throughout this section is on pipe 100 mm (4 in.) in diameter and larger.
References to a standard or to a specification are given here in abbreviated form—codeletters and numbers only, such as American National Standards Institute (ANSI) B36.10.Double designations, such as ANSI/AWWA CIl 5/A21.15, indicate that American WaterworksAssociation (AWWA) C115 is the same as ANSI A21.15. Most standards are revisedperiodically, so it is advisable for the designer to obtain the latest edition.
Next Page