Chapter 29 - Climate Change - State Water Resources Control ...
36
Bay Delta Conservation Plan/California WaterFix Final EIR/EIS Administrative Final 29-1 2016 ICF 00139.14 Chapter 29 1 Climate Change 2 29.1 Introduction 3 Climate is the average weather over many years, measured most often in terms of temperature, 4 precipitation, and wind. For example, the climate of California’s Central Valley is a Mediterranean 5 climate, which is hot and dry during the summer and cool and damp in winter, with the majority of 6 precipitation falling as rain in the winter months. Climate is unique to a particular location and 7 changes on timescales of decades to centuries or millennia. 8 Climate change generally refers to a “statistically significant variation in either the mean state of the 9 climate or in its variability, persisting for an extended period (typically decades or longer)” (World 10 Meteorological Organization 2013). Although the climate can change, and has changed, in the past in 11 response to natural drivers, recent climate change has been more rapid than previous episodes of 12 climate change and has been unequivocally linked to increasing concentrations of greenhouse gases 13 (GHGs) in Earth’s lower atmosphere and the rapid timescale on which these gases have accumulated 14 (Intergovernmental Panel on Climate Change 2007a). The major causes of this rapid loading of GHGs 15 into the atmosphere include the burning of fossil fuels since the beginning of the industrial 16 revolution, agricultural practices, increases in livestock grazing, and deforestation. More 17 background information on GHG emissions is provided in Chapter 22, Air Quality and Greenhouse 18 Gases, Section 22.1.3. 19 Higher concentrations of heat-trapping GHGs in the atmosphere result in increasing global surface 20 temperatures, a phenomenon commonly referred to as global warming or climate change. Higher 21 global surface temperatures in turn result in changes to the Earth’s climate system, including: the jet 22 stream; El Niño; the Indian monsoon; ocean temperature and acidity; the extent of alpine glaciers, 23 sea ice and polar ice sheets; atmospheric water content; and the extent and health of boreal and 24 tropical forests (Intergovernmental Panel on Climate Change 2007a, b). Some of the above changes 25 will result in specific impacts at the state and local level. 26 29.1.1 Purpose 27 This EIR/EIS analyzes three fundamental questions relating to climate change. Two of them are 28 analyzed in other chapters. The third is analyzed in this chapter. 29 1. What is the impact of the action alternatives on climate change? i.e., how will GHG emissions 30 from construction and operation activities associated with the project alternatives contribute to 31 elevated GHG concentrations in the atmosphere? 32 2. How will the impacts of the action alternatives on the study area for each resource (the area in 33 which impacts may occur) be affected by climate change? i.e., are future changes in climate likely 34 to exacerbate project impacts? 35 3. How will the action alternatives affect the resiliency and adaptability of the Plan Area (the area 36 covered by the project) to the effects of climate change? 37
-
Upload
khangminh22 -
Category
Documents
-
view
1 -
download
0
Transcript of Chapter 29 - Climate Change - State Water Resources Control ...
Bay Delta Conservation Plan/California WaterFix Final EIR/EIS
Administrative Final 29-1
2016 ICF 00139.14
Chapter 29 1
Climate Change 2
29.1 Introduction 3
Climate is the average weather over many years, measured most often in terms of temperature, 4 precipitation, and wind. For example, the climate of California’s Central Valley is a Mediterranean 5 climate, which is hot and dry during the summer and cool and damp in winter, with the majority of 6 precipitation falling as rain in the winter months. Climate is unique to a particular location and 7 changes on timescales of decades to centuries or millennia. 8
Climate change generally refers to a “statistically significant variation in either the mean state of the 9 climate or in its variability, persisting for an extended period (typically decades or longer)” (World 10 Meteorological Organization 2013). Although the climate can change, and has changed, in the past in 11 response to natural drivers, recent climate change has been more rapid than previous episodes of 12 climate change and has been unequivocally linked to increasing concentrations of greenhouse gases 13 (GHGs) in Earth’s lower atmosphere and the rapid timescale on which these gases have accumulated 14 (Intergovernmental Panel on Climate Change 2007a). The major causes of this rapid loading of GHGs 15 into the atmosphere include the burning of fossil fuels since the beginning of the industrial 16 revolution, agricultural practices, increases in livestock grazing, and deforestation. More 17 background information on GHG emissions is provided in Chapter 22, Air Quality and Greenhouse 18 Gases, Section 22.1.3. 19
Higher concentrations of heat-trapping GHGs in the atmosphere result in increasing global surface 20 temperatures, a phenomenon commonly referred to as global warming or climate change. Higher 21 global surface temperatures in turn result in changes to the Earth’s climate system, including: the jet 22 stream; El Niño; the Indian monsoon; ocean temperature and acidity; the extent of alpine glaciers, 23 sea ice and polar ice sheets; atmospheric water content; and the extent and health of boreal and 24 tropical forests (Intergovernmental Panel on Climate Change 2007a, b). Some of the above changes 25 will result in specific impacts at the state and local level. 26
29.1.1 Purpose 27
This EIR/EIS analyzes three fundamental questions relating to climate change. Two of them are 28 analyzed in other chapters. The third is analyzed in this chapter. 29
1. What is the impact of the action alternatives on climate change? i.e., how will GHG emissions 30 from construction and operation activities associated with the project alternatives contribute to 31 elevated GHG concentrations in the atmosphere? 32
2. How will the impacts of the action alternatives on the study area for each resource (the area in 33 which impacts may occur) be affected by climate change? i.e., are future changes in climate likely 34 to exacerbate project impacts? 35
3. How will the action alternatives affect the resiliency and adaptability of the Plan Area (the area 36 covered by the project) to the effects of climate change? 37

Climate Change
Bay Delta Conservation Plan/California WaterFix Final EIR/EIS
Administrative Final 29-2
2016 ICF 00139.14
Question 1 is addressed in Chapter 22, Air Quality and Greenhouse Gases (Impacts AQ-15, AQ-16, and 1 AQ-18), through the calculation of GHG emissions inventories and identification of GHG mitigation 2 opportunities associated with the action alternatives. 3
Question 2 is addressed throughout this document in each of the resource chapters. Under 4 discussion of the No Action Alternative, each resource chapter evaluates how the project would 5 affect the specific resource in question. In each of these analyses, where the effects of the action 6 alternatives are analyzed for 2025 and 2060 conditions, climate change is integrated into the 7 analysis. In these analyses, the action alternatives are evaluated using a projection of future climate 8 that includes changes in temperature, precipitation, humidity, hydrology, and sea level rise. 9 Appendix 5A, BDCP/California WaterFix FEIR/FEIS Modeling Technical Appendix, provides detailed 10 information about the development of the climate change projections. The interrelation between 11 resource topics addressed in this EIS/EIR and potential climate change effects under the No Action 12 Alternative are presented in Table 29-1. An ‘X’ in the table signifies that there is a clear connection 13 between the resource topic and a climate change effect under the No Action Alternative. Readers 14 seeking additional information about a specific climate change effect on a specific resource should 15 reference the resource specific chapter of this EIR/EIS. The potential climate effects under the No 16 Action Alternative listed in Table 29-1 are based on the California Natural Resource Agency’s 17 (CNRA) climate adaptation guidance (California Natural Resources Agency 2009) that was adapted 18 to be specific to the Plan Area. 19
Question 2 also fulfills the requirements for climate change analysis outlined in the Delta Reform Act 20 of 2009 (California Water Code Sections 85000 et seq.). Within the Delta Reform Act, Water Code 21 Section 85320 identifies the contents that the EIR portion of this EIR/EIS must include for the BDCP 22 to be considered for inclusion in the Delta Plan prepared by the Delta Stewardship Council. Section 23 85320(b)(2)(C) of the Water Code directs that the EIR address “[t]he potential effects of climate 24 change, possible sea level rise up to 55 inches [140 centimeters], and possible changes in total 25 precipitation and runoff patterns on the conveyance alternatives and habitat restoration activities 26 considered in the [EIR].” (Italics added.). It should be noted, the California Ocean Protection Council 27 and other scientific bodies have projected that sea level rise will not reach 55 inches (140 28 centimeters) until approximately the year 2100. Sea level rise projections for 2025 and 2060 were 29 developed based on research available during the analysis design and based on the requirements of 30 Water Code Section 85320, which required that BDCP evaluate a sea level rise of 55 inches (well in 31 excess of the expected sea level described by any major study for 2060). 32
This information is provided to discuss the benefits of the action alternatives in the face of expected 33 climate change. 34
This chapter is organized differently from the other resource chapters because analyzing how the 35 action alternatives would improve the Plan Area’s resiliency and adaptability to climate change is a 36 fundamentally different analysis than those presented in other resource chapters. Whereas the 37 other chapters are organized to identify effects of the action alternatives and how to mitigate these 38 impacts, this chapter’s function is to analyze and disclose how the action alternatives affect the Plan 39 Area’s resiliency and adaptability to expected climate change. The study area for this chapter, 40 therefore, is defined as the Plan Area, which is largely formed by the statutory borders of the Delta, 41 along with areas in Suisun Marsh and the Yolo Bypass. 42
This chapter addresses question 3: How will the action alternatives affect the resiliency and 43 adaptability of the Plan Area to the effects of climate change? In this context, resiliency and 44

Climate Change
Bay Delta Conservation Plan/California WaterFix Final EIR/EIS
Administrative Final 29-3
2016 ICF 00139.14
adaptability mean the ability of the Plan Area to remain stable or flexibly change, as the effects of 1 climate change increase, in order to continue providing water supply benefits with sufficient water 2 quality and supporting ecosystem conditions that maintain or enhance aquatic and terrestrial plant 3 and animal species. 4
Table 29-1. Linkages between Resource Areas Addressed in this EIR/EIS and Climate Change 5
Resource Topic
Potential Climate Change Effect
Incr
ease
d ai
r tem
pera
ture
Incr
ease
d w
ater
tem
pera
ture
Incr
ease
d so
il te
mpe
ratu
re
Redu
ced
prec
ipita
tion/
runo
ff vo
lum
es
Shift
from
snow
fall
to ra
infa
ll
Earl
y sn
owm
elt
Chan
ges i
n ev
apot
rans
pira
tion
Incr
ease
d fr
eque
ncy/
seve
rity
of f
lood
eve
nts
Incr
ease
d fr
eque
ncy/
seve
rity
of d
roug
hts
Incr
ease
d fr
eque
ncy
of e
xtre
me
heat
eve
nts
Sea
Leve
l Ris
e
Incr
ease
d sa
linity
intr
usio
n
Chan
ges i
n er
osio
n/se
dim
enta
tion
rate
s
Decr
ease
d sp
ecie
s pop
ulat
ions
and
qua
lity
of
spec
ies h
abita
t
Chan
ges i
n sp
ecie
s geo
grap
hic
rang
e/
dist
ribu
tion
Spre
adin
g of
pes
ts a
nd v
ecto
r-bo
rne
dise
ases
Incr
ease
d fir
e ri
sk
Incr
ease
d at
mos
pher
ic C
O 2 co
ncen
trat
ions
and
ac
idifi
catio
n
Water Supply (Ch. 5) X X X X X X X X X X X X X X Surface Water (Ch. 6) X X X X X X X X X X X X Groundwater (Ch. 7) X X X X X X X X X X X X
Water Quality (Ch. 8) X X X X X X X X X X X X X X X Geology and Seismicity (Ch. 9)
Soils (Ch. 10) X X X X X X X X Fish and Aquatic Resources (Ch. 11) X X X X X X X X X X X X X X X
Terrestrial Biological Resources (Ch. 12) X X X X X X X X X X X X X X X X X Land Use (Ch. 13) X X X X X X
Agricultural Resources (Ch. 14) X X X X X X X X X X X Recreation (Ch. 15) X X X X X X X X X
Socioeconomics (Ch. 16) X X X X X X X X X X Aesthetics and Visual Resources (Ch. 17) X X X X X X Cultural and Historic Resources (Ch. 18) X X X X X X X
Transportation (Ch. 19) X X Public Services and Utilities (Ch. 20) X X X X X X X
Energy (Ch. 21) X X X X X X X Air Quality and Greenhouse Gases (Ch. 22) X X X X X X X
Noise (Ch. 23) Hazards and Hazardous Materials (Ch. 24) X X X X X
Public Health (Ch. 25) X X X X X X X X Mineral Resources (Ch. 26) X X X X X X
Paleontological Resources (Ch. 27) X X X X X X Environmental Justice (Ch. 28) X X X X X X X
6
This resiliency and adaptation analysis focuses on the major impacts of climate change in the Plan 7 Area and the clear and measurable ways that the action alternatives will ameliorate these impacts or 8 add flexibility to the system so that the Plan Area can continue providing water supply benefits with 9 sufficient water quality and supporting ecosystem conditions that maintain or enhance aquatic and 10
Climate Change
Bay Delta Conservation Plan/California WaterFix Final EIR/EIS
Administrative Final 29-4
2016 ICF 00139.14
terrestrial plant and animal species. No single project and indeed none of the action alternatives 1 would be able to completely counteract all of the impacts of climate change; however, as shown 2 below the action alternatives provide important added resilience and adaptability to many of the 3 expected changes. Impacts for which the action alternatives provide no added resiliency or 4 adaptation benefit or for which the benefit is minimal, or not documentable are not discussed in this 5 chapter. 6
While there is a lot of overlap between the analysis provided here and that provided in the resource 7 effects chapters, the main difference is that this chapter focuses on both negative effects and benefits 8 and that it compares a climate changed future without the action alternatives to a climate changed 9 future with the action alternatives. Resource chapters include comparisons to the No Action/No 10 Project Alternative at 2060 (the NEPA point of comparison), which represents the net impact of the 11 project isolated from the effects of climate change. These chapters also compare the action 12 alternatives to Existing Conditions (the CEQA baseline), which represents the net impact of the 13 project combined with the effects of climate change. The differences between these two 14 comparisons allow readers to determine the incremental effects attributable to climate change as 15 distinct from the impacts of the action alternatives. The resource chapters do not, however, 16 specifically contemplate the extent to which action alternatives would contribute to the resiliency 17 and adaptability of the Plan Area to the effects of climate change. Instead, this analysis is included in 18 this chapter. 19
29.1.2 Organization 20
This chapter presents 1) basic background on scientific efforts to evaluate the degree and impacts of 21 future climate changes (a detailed background discussion on climate change is provided in Appendix 22 5A, BDCP California WaterFix FEIR/FEIS Modeling Technical Appendix); 2) a discussion of observed 23 climatological changes over the past several decades, and expected future changes during the rest of 24 this century globally, in California, and for the Plan Area; 3) an evaluation of the resiliency and 25 adaptability of the Plan Area to the major expected impacts of climate change; and 4) an evaluation 26 of the BDCP alternatives’ and non-HCP alternatives’ compatibility with applicable plans and policies 27 designed to adapt to climate change or improve resilience to it. 28
29.1.3 Climate Change Background 29
A vast amount of scientific research on climate change, both its causes and effects, at all geographic 30 scales has been conducted during the last 50 years. The Intergovernmental Panel on Climate Change 31 (IPCC) was established by the United Nations Environment Program and the World Meteorological 32 Organization (WMO) to provide the world with a clear scientific view of the current state of 33 knowledge regarding climate change and its potential environmental and socioeconomic impacts 34 (Intergovernmental Panel on Climate Change 2011). IPCC, an organization of more than 800 35 scientists from around the world, regularly publishes summary documents, which analyze and 36 consolidate all recent peer-reviewed scientific literature, providing a consensus of the state of the 37 science. Thus, IPCC is viewed by governments, policymakers and scientists as the leading 38 international body on the science of climate change and its summaries are considered to be the best 39 available science. IPCC documents address change at the global and super-regional scales. Both IPCC 40 studies and California-specific studies (e.g., California Air Resources Board, California Energy 41 Commission, the California Department of Water Resources [DWR], CNRA, and U.S. Department of 42
Climate Change
Bay Delta Conservation Plan/California WaterFix Final EIR/EIS
Administrative Final 29-5
2016 ICF 00139.14
the Interior, Bureau of Reclamation [Reclamation]) that are based on IPCC data are referenced 1 throughout this chapter. 2
Scientific measurements have shown that changes in the global climate system are already 3 occurring. These include: rising air temperatures; rising ocean temperatures; rising ocean salinity; 4 rising global sea levels; changes in precipitation patterns; and increased intensity and frequency of 5 extreme events such as storms, droughts, and wildfires (Intergovernmental Panel on Climate Change 6 2007b; California Department of Water Resources 2009). 7
29.2 Environmental Setting/Affected Environment 8
The Plan Area has a predominantly Mediterranean climate characterized by hot, dry summers and 9 cool, rainy winters. From 1981–2010, average monthly temperatures in Sacramento ranged from 10 41.0°F (5°C) in December and January to 94.1°F (34.5°C) in July, with average monthly rainfall 11 ranging from a low of 0.02 inches (0.05 centimeters) in July to a high of 3.90 inches (9.9 12 centimeters) in February (Western Regional Climate Center 2012). Average air temperatures in the 13 mountainous regions of the watershed are typically 5–10 degrees lower than the temperature on 14 the valley floor. 15
Although the snow lines vary by storm event, portions of the Sacramento, San Joaquin, Mokelumne, 16 and Cosumnes River watersheds are above the snow line; consequently, much of their respective 17 runoff into the Delta is from snowmelt. Snow in higher elevations serves as an effective type of 18 natural storage because it typically melts gradually during the spring and summer. The snowline is 19 often around the elevation of 5,000 feet (1,524 meters) (U.S. Army Corp of Engineers 2002). 20
Annual precipitation in the Sacramento River watershed ranges from 80 to 90 inches (as liquid 21 water) (203 to 229 centimeters) of primarily snowfall in the mountainous regions, to 41 inches (104 22 centimeters) of rain in Redding and 19 inches (48 centimeters) in Sacramento. Average annual 23 precipitation for the entire watershed is approximately 36 inches (91 centimeters). Most 24 precipitation occurs between November and April, with little or no precipitation falling between 25 May and October (Huber-Lee et al. 2003). Precipitation that falls as rain in the project area can run 26 off into the rivers (and eventually into the Delta), infiltrate into the soils (recharging the 27 groundwater system) or evapotranspirate. Factors such as spring temperatures and the nature of 28 precipitation (rain/snow elevations in storms) during the October to April period play an important 29 role in runoff timing. 30
The primary type of soil in the Plan Area is peat. These soils were developed by the formation of 31 mineral soils near the channels during flood conditions, and by the formation of organic soils on 32 marsh island interiors as plant residues accumulated faster than they could decompose. Prior to the 33 mid-1800s, the Delta was a vast marsh and floodplain, under which peat soils developed to a 34 thickness of up to 30 feet (9 meters) in some areas. In addition to peat, the Delta soils are composed 35 of mineral sediments from rivers (United States Geological Survey 2000). 36
The Plan Area has historically been affected by periodic extreme precipitation events. The majority 37 of these historical events have likely been caused by an atmospheric phenomenon called an 38 atmospheric river (AR) (Dettinger 2011). ARs are narrow corridors of water vapor transported in 39 the lower atmosphere that traverse long swaths of the Earth’s surface (Dettinger and Ralph 2011). 40 These storms can deliver tremendous amounts of precipitation to California in a very short period of 41 time. In addition, these storms tend to be warm (originating in the tropics) which results in higher 42

Climate Change
Bay Delta Conservation Plan/California WaterFix Final EIR/EIS
Administrative Final 29-6
2016 ICF 00139.14
snowlines and larger portions of the watershed contributing to direct runoff. More detailed 1 information on surface water and climate and meteorological conditions in the Plan Area is provided 2 in Chapter 6, Surface Water, and Chapter 22, Air Quality and Greenhouse Gases. 3
Because this chapter discusses how the action alternatives affect the resiliency and adaptability of 4 the Plan Area to the effects of climate change, this section also discusses expected changes to the 5 environmental setting. The following background sections provide brief descriptions of 1) recent 6 trends in key climate metrics such as temperature, precipitation, and sea level, and 2) projections of 7 how the climate will change between now and 2100. Although the year 2100 is approximately 40 8 years after the end of the 2060 time period analyzed in other chapters of this EIR/EIS (reflecting the 9 approximate end date of the 50-year permit term proposed for the BDCP), the year 2100 was chosen 10 in part because of language enacted by the California Legislature in the Sacramento-San Joaquin 11 Delta Reform Act of 2009 (Water Code Sections 85000 et seq.) requiring the EIR to address “[t]he 12 potential effects of climate change, possible sea level rise up to 55 inches [140 centimeters], and 13 possible changes in total precipitation and runoff patterns on the conveyance alternatives and 14 habitat restoration activities considered in the [EIR]” (Water Code Section 85320. Italics added.). It 15 should be noted, the California Ocean Protection Council and other scientific bodies have projected 16 that sea level rise will not reach 55 inches (140 centimeters) until approximately the year 2100. 17
This information is provided at the global scale, at the state level, and for the Plan Area. Projections 18 of future climate change are based on the level of GHGs already in the atmosphere, the current rate 19 at which human activity releases GHGs to the atmosphere, and the future rate of GHG emissions, 20 which in turn relies on predictions of future population, global economic growth, future available 21 energy sources, and regulations. Consequently, future projections of climate are typically displayed 22 as a range, with the lower end representing a minimum amount of estimated change based on past 23 and current GHG emissions and the higher end representing a high degree of global economic 24 growth and the absence of large-scale mitigation of GHG emissions. 25
29.2.1.1 Global Climate Change Effects 26
Recent Trends 27
The IPCC has found that, “[w]arming of the climate system is unequivocal, as is now evident from 28 observations of increases in global average air and ocean temperatures, widespread melting of snow 29 and ice, and rising global average sea level” (Intergovernmental Panel on Climate Change 2007a). 30 Global annual surface temperatures have increased at a rate of 0.13°C (0.23°F) per decade during 31 the period 1950–2000. This rate is double the rate observed during the period 1900–1950. Further, 32 11 of the 12 years during the period 1995–2006 rank among the 12 warmest years in the 33 instrumental record of global surface temperature (since 1850) (Intergovernmental Panel on 34 Climate Change 2007a). 35
Much of the Western United States has experienced warming during the 20th century (roughly 2°F 36 [1.1°C]) and is projected to experience further warming during the 21st century with central 37 estimates varying from roughly 5 to 7°F (2.8°C to 3.8°C), depending on location (Bureau of 38 Reclamation 2011). Historical trends in annual precipitation are less apparent. Future projections 39 suggest that the Northwestern and north-central portions of the United States gradually may 40 become wetter (e.g., Columbia Basin and Missouri River basin) while the Southwestern and south-41 central portions gradually become drier (e.g., San Joaquin, Truckee, and Rio Grande River basins and 42 the Middle to Lower Colorado River Basin). Areas in between have median projected changes closer 43

Climate Change
Bay Delta Conservation Plan/California WaterFix Final EIR/EIS
Administrative Final 29-7
2016 ICF 00139.14
to no change, meaning they have roughly equal chances of becoming wetter or drier (e.g., Klamath 1 and Sacramento basins and the Upper Colorado Basin). These summary statements refer to median 2 projected changes in temperature and precipitation, characterized generally across the Western 3 United States. Projections show that there is significant variability and uncertainty about these 4 projected conditions both geographically and with time (Bureau of Reclamation 2011). 5
Warming trends appear to have led to a shift in cool season precipitation towards more rain and less 6 snow, which has caused increased rainfall-runoff volume during the cool season accompanied by 7 less snowpack accumulation in some Western United States locations (Bureau of Reclamation 2011). 8 Hydrologic analyses-based future climate projections suggest that warming and associated loss of 9 snowpack will persist over much of the Western United States. However, there are some geographic 10 contrasts. Snowpack losses are projected to be greatest where the baseline climate is closer to 11 freezing thresholds (e.g., lower lying valley areas and lower altitude mountain ranges). It also 12 appears that, in high altitude and high latitude areas, there is a chance that cool season snowpack 13 actually could increase during the 21st century (e.g., Columbia headwaters in Canada, Colorado 14 headwaters in Wyoming), because precipitation increases are projected and appear to offset the 15 snow-reduction effects of warming in these locations (Bureau of Reclamation 2011). 16
During the same period over which global temperatures have increased, sea levels have risen on 17 average 0.07 inches (0.18 centimeters) per year with sea level rise during the period 1993–2003 18 rising at a rate of 0.12 inches (0.31 centimeters) per year and increasing overall by about 6.7 inches 19 (17 centimeters) during the twentieth century (Intergovernmental Panel on Climate Change 2007a). 20 Observed trends in sea level rise can be attributed to both thermal expansion of the world’s oceans 21 and the melting of ice sheets (polar and alpine). Also during a similar period (1900–2007) 22 measurements have shown increases in global ocean temperature (since 1961); a decline in the 23 extent of mountain glaciers and global snow cover; increased atmospheric water vapor content; loss 24 in mass of the polar ice sheets; decreased extent of Arctic sea ice; increased precipitation in the 25 eastern portions of North and South America, northern Europe and northern and central Asia; 26 drying conditions in the Sahel region of the Sahara Desert in Africa, the Mediterranean and southern 27 Africa; strengthening in mid-latitude westerly winds (since 1960s); more intense and longer 28 drought conditions in the tropics and sub-tropics (since the 1970s); increased frequency of extreme 29 precipitation events over land areas; higher average night time temperatures; decreased frost days 30 and increased frequency and duration of extreme heat events (since 1950s); and increased tropical 31 cyclone activity in the North Atlantic (Intergovernmental Panel on Climate Change 2007a). There 32 may also be additional synergistic impacts of extreme weather events, such as the sea level rise 33 coupled with high tide and extreme storm surges. The above listed changes are in turn resulting in 34 changes to the climate of California as the regional climate is moderated by sea surface temperature, 35 westerly jet stream wind patterns, the El Niño Southern Oscillation (ENSO), and Pacific storm 36 patterns. 37
Projections to 2100 38
Climate models indicate that global average surface temperature will increase at a rate of 39 approximately 0.4°F (0.2°C) per decade for the period 2000–2020, and will increase by at least that 40 amount per decade during the period 2020–2080. Based on a number of emissions scenarios, the 41 IPCC projected an average increase in surface temperatures of 3.2 to 7.2°F (1.7 to 4°C) by 2100 42 compared to 1980 through 1999 levels, with a likely range of 2.0 to 11.5°F (1.1 to 2.2°C) when 43 accounting for the uncertainty in climate science (Intergovernmental Panel on Climate Change 44 2007a). Approximately half of this warming is the result of past GHG emissions and will occur even 45

Climate Change
Bay Delta Conservation Plan/California WaterFix Final EIR/EIS
Administrative Final 29-8
2016 ICF 00139.14
if GHG emissions were halted at 2000 levels. Some regions of the globe, particularly high latitudes, 1 will experience much larger changes relative to Existing Conditions. Corresponding global average 2 sea level rise levels during the period 2000–2100 are estimated to be between 7 inches (18 3 centimeters) and 23 inches (58 centimeters) (Intergovernmental Panel on Climate Change 2007a). 4 However, recent scientific data now strongly suggests that these sea level rise projections are likely 5 too low and that actual sea level rise may be significantly greater than initially estimated (Rahmstorf 6 2007; National Research Council 2012).1 7
The following additional changes to the global climate system are projected: increased ocean acidity 8 due to increased carbon dioxide uptake by the oceans; reduced global snow cover; increased thaw 9 depth in permafrost regions; decrease in sea ice with potential full disappearance in summer 10 months; increased frequency in heat waves, droughts, and heavy precipitation events; increased 11 intensity of tropical cyclone events; northward movement of extra-tropical storm tracks; increased 12 precipitation at high latitudes and decreased precipitation in tropical and sub-tropical regions; and 13 increased melting of the ice sheets (Intergovernmental Panel on Climate Change 2007a). 14
29.2.1.2 Climate Change Effects on California 15
Recent Trends 16
Scientific measurements and observations indicate that California’s climate is already changing in a 17 manner consistent with what would be expected from global climate change. Since 1920, California’s 18 average temperature has been increasing, although this change, or any climate change impact, is not 19 uniform across California. Nighttime temperatures are rising across California and at a higher rate 20 than day-time temperatures. Furthermore, daytime and nighttime heat wave events throughout 21 California have increased in intensity, particularly the nighttime component (Moser et al. 2009). 22 During the last century, sea level along the California coast has increased approximately 7 inches (18 23 centimeters), with higher rates of increase occurring since 1993 (Cayan et al. 2009). 24
California’s water supply system is dependent on snowpack storage in the Sierra Nevada. 25 Temperatures over the Sierra Nevada have increased during the last 100 years, resulting in less 26 snowfall (and more rainfall) and an earlier snowmelt (Moser et al. 2009). The average early spring 27 snowpack in the Sierra Nevada has decreased by about 10 percent during the last century, a loss of 28 1.5 million acre-feet (MAF) of snowpack storage (California Department of Water Resources 2008). 29 Reductions in water supply can adversely affect hydropower reserves, decreasing hydropower 30 generation in the summer months when peak demand is highest (California Natural Resources 31 Agency 2012). 32
Data also show evidence for the following additional changes to California climate and conditions 33 during the last 50 years: the warming of Lake Tahoe; decreasing chill hours and increased stresses 34 on California agriculture; shifts and disturbances in managed landscapes; increased frequency of 35 wildfire; changes in Santa Ana winds; increases in photochemical smog production in southern 36
1 California agencies including the Bay Conservation and Development Commission (BCDC) and DWR are using the more recent data of Rahmstorf et al. 2007 in their SLR planning efforts in lieu of the estimates as reported by IPCC in the Fourth Assessment Report. As identified above, California Water Code Section 85320 identifies in order to be considered for inclusion in the Delta Plan, the BDCP must assess “[t]he potential effects of climate change, possible sea level rise up to 55 inches [140 centimeters], and possible changes in total precipitation and runoff patterns on the conveyance alternatives and habitat restoration activities.”
Climate Change
Bay Delta Conservation Plan/California WaterFix Final EIR/EIS
Administrative Final 29-9
2016 ICF 00139.14
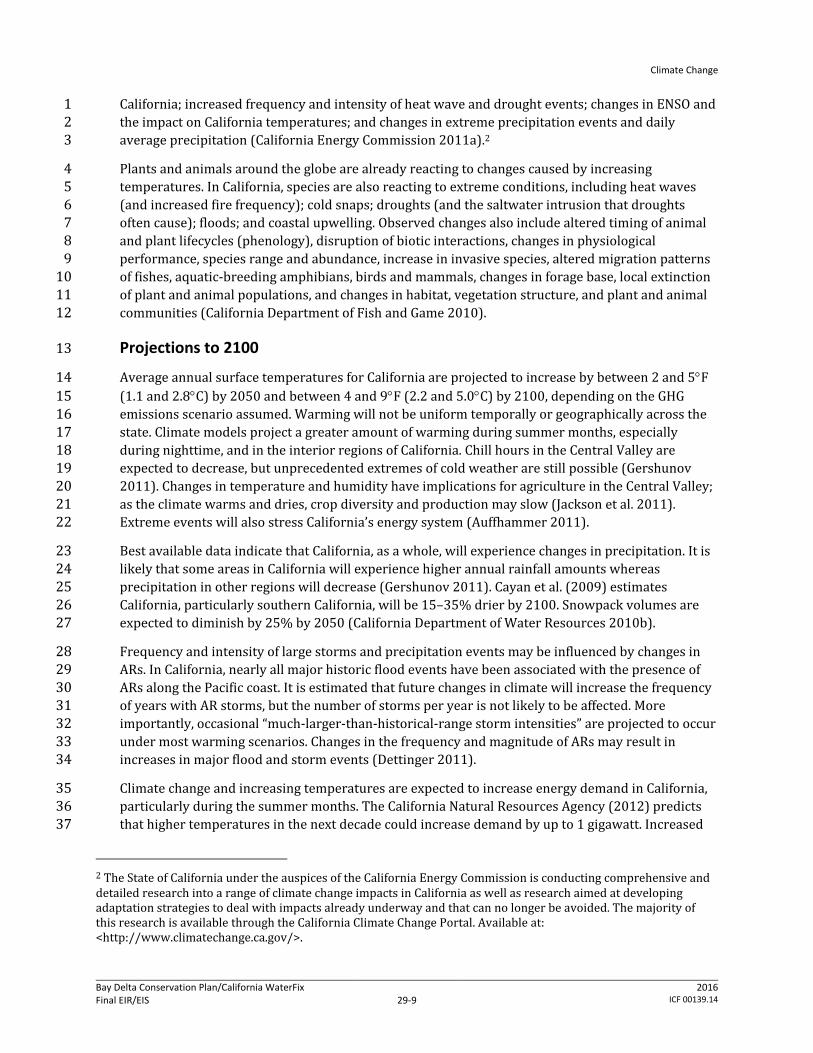
California; increased frequency and intensity of heat wave and drought events; changes in ENSO and 1 the impact on California temperatures; and changes in extreme precipitation events and daily 2 average precipitation (California Energy Commission 2011a).2 3
Plants and animals around the globe are already reacting to changes caused by increasing 4 temperatures. In California, species are also reacting to extreme conditions, including heat waves 5 (and increased fire frequency); cold snaps; droughts (and the saltwater intrusion that droughts 6 often cause); floods; and coastal upwelling. Observed changes also include altered timing of animal 7 and plant lifecycles (phenology), disruption of biotic interactions, changes in physiological 8 performance, species range and abundance, increase in invasive species, altered migration patterns 9 of fishes, aquatic-breeding amphibians, birds and mammals, changes in forage base, local extinction 10 of plant and animal populations, and changes in habitat, vegetation structure, and plant and animal 11 communities (California Department of Fish and Game 2010). 12
Projections to 2100 13
Average annual surface temperatures for California are projected to increase by between 2 and 5°F 14 (1.1 and 2.8°C) by 2050 and between 4 and 9°F (2.2 and 5.0°C) by 2100, depending on the GHG 15 emissions scenario assumed. Warming will not be uniform temporally or geographically across the 16 state. Climate models project a greater amount of warming during summer months, especially 17 during nighttime, and in the interior regions of California. Chill hours in the Central Valley are 18 expected to decrease, but unprecedented extremes of cold weather are still possible (Gershunov 19 2011). Changes in temperature and humidity have implications for agriculture in the Central Valley; 20 as the climate warms and dries, crop diversity and production may slow (Jackson et al. 2011). 21 Extreme events will also stress California’s energy system (Auffhammer 2011). 22
Best available data indicate that California, as a whole, will experience changes in precipitation. It is 23 likely that some areas in California will experience higher annual rainfall amounts whereas 24 precipitation in other regions will decrease (Gershunov 2011). Cayan et al. (2009) estimates 25 California, particularly southern California, will be 15–35% drier by 2100. Snowpack volumes are 26 expected to diminish by 25% by 2050 (California Department of Water Resources 2010b). 27
Frequency and intensity of large storms and precipitation events may be influenced by changes in 28 ARs. In California, nearly all major historic flood events have been associated with the presence of 29 ARs along the Pacific coast. It is estimated that future changes in climate will increase the frequency 30 of years with AR storms, but the number of storms per year is not likely to be affected. More 31 importantly, occasional “much-larger-than-historical-range storm intensities” are projected to occur 32 under most warming scenarios. Changes in the frequency and magnitude of ARs may result in 33 increases in major flood and storm events (Dettinger 2011). 34
Climate change and increasing temperatures are expected to increase energy demand in California, 35 particularly during the summer months. The California Natural Resources Agency (2012) predicts 36 that higher temperatures in the next decade could increase demand by up to 1 gigawatt. Increased 37
2 The State of California under the auspices of the California Energy Commission is conducting comprehensive and detailed research into a range of climate change impacts in California as well as research aimed at developing adaptation strategies to deal with impacts already underway and that can no longer be avoided. The majority of this research is available through the California Climate Change Portal. Available at: <http://www.climatechange.ca.gov/>.

Climate Change
Bay Delta Conservation Plan/California WaterFix Final EIR/EIS
Administrative Final 29-10
2016 ICF 00139.14
energy demand would require additional generation resources or the purchase of costly peak power 1 from external sources. 2
Sea level rise along the California Coast is expected to accelerate during the 21st century. A recent 3 study completed by the National Research Council (NRC) looked at both global (e.g., thermal 4 expansion, land ice melting) and local (e.g., tectonic land movement, localized subsidence) factors 5 effecting sea level relative to land surface. Table 29-2 below shows the projection and the range of 6 uncertainty for expected sea level rise at San Francisco and the Delta at 2030, 2050, and 2100. 7
Table 29-2. Sea Level Rise Projections and Ranges for San Francisco, California 2030, 2050, and 8 2100 9
2030
2050
2100 Projection Range Projection Range Projection Range
Projected Sea Level Rise at San Francisco
cm 14.4 ± 5.0 4.3–29.7 28.0 ± 9.2 12.3–60.8 91.9 ± 25.5 42.4–166.4 in 5.7±2 1.7–11.7 11±3.6 4.84–23.9 36.2±10 16.7–65.5
Source: National Research Council 2012. 10
Sea level rise will continue to threaten coastal lands and infrastructure, increase flooding at the 11 mouths of rivers, place additional stress on levees in the Delta, and will intensify the difficulty of 12 managing the Delta as the heart of the state’s water supply system (California Department of Water 13 Resources 2010a).The effects of sea level rise, combined with large waves generated during El Niño 14 events will have the greatest potential for impacts (Griggs 2011). 15
These changes in temperature, precipitation and sea level may have substantial effects on other 16 resources areas. Potential effects of climate change anticipated in California (and discussed in this 17 document) are listed below (California Natural Resources Agency 2009, 2012). 18
Increased average temperatures (air, water, and soil). 19
Changes in annual precipitation amounts. 20
Change from snowfall (and spring snowmelt) to rainfall. 21
Decreased Sierra snowpack (earlier runoff, reduced maximum storage). 22
Changes in evapotranspiration. 23
Increased frequency and intensity of Pacific storms (flood events). 24
Increased severity of droughts. 25
Increased frequency and severity of extreme heat events. 26
Increased energy demand (particularly during peak summer periods). 27
Increased frequency and severity of wildfire events. 28
Sea level rise (with increased salt water intrusion in the Delta). 29
Changes in species distribution and ranges. 30
Decreased number of species. 31
Increased number of vector-borne diseases and pests (including impacts to agriculture). 32
Climate Change
Bay Delta Conservation Plan/California WaterFix Final EIR/EIS
Administrative Final 29-11
2016 ICF 00139.14
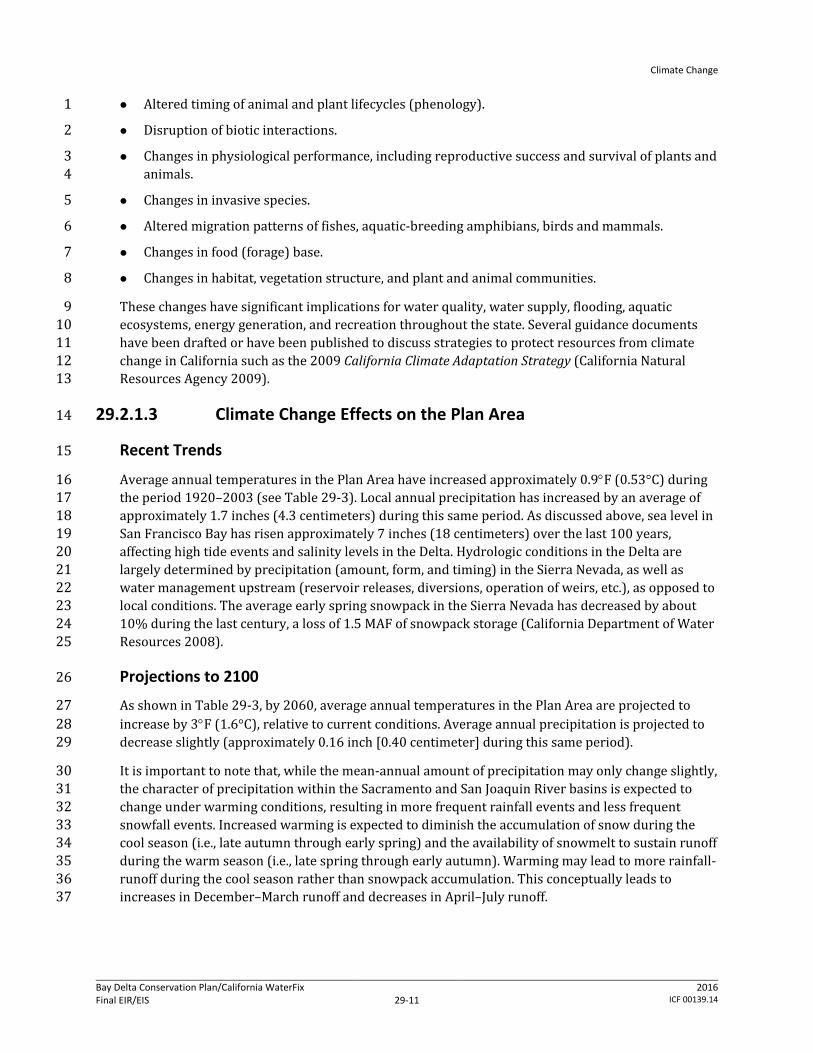
Altered timing of animal and plant lifecycles (phenology). 1
Disruption of biotic interactions. 2
Changes in physiological performance, including reproductive success and survival of plants and 3 animals. 4
Changes in invasive species. 5
Altered migration patterns of fishes, aquatic-breeding amphibians, birds and mammals. 6
Changes in food (forage) base. 7
Changes in habitat, vegetation structure, and plant and animal communities. 8
These changes have significant implications for water quality, water supply, flooding, aquatic 9 ecosystems, energy generation, and recreation throughout the state. Several guidance documents 10 have been drafted or have been published to discuss strategies to protect resources from climate 11 change in California such as the 2009 California Climate Adaptation Strategy (California Natural 12 Resources Agency 2009). 13
29.2.1.3 Climate Change Effects on the Plan Area 14
Recent Trends 15
Average annual temperatures in the Plan Area have increased approximately 0.9°F (0.53°C) during 16 the period 1920–2003 (see Table 29-3). Local annual precipitation has increased by an average of 17 approximately 1.7 inches (4.3 centimeters) during this same period. As discussed above, sea level in 18 San Francisco Bay has risen approximately 7 inches (18 centimeters) over the last 100 years, 19 affecting high tide events and salinity levels in the Delta. Hydrologic conditions in the Delta are 20 largely determined by precipitation (amount, form, and timing) in the Sierra Nevada, as well as 21 water management upstream (reservoir releases, diversions, operation of weirs, etc.), as opposed to 22 local conditions. The average early spring snowpack in the Sierra Nevada has decreased by about 23 10% during the last century, a loss of 1.5 MAF of snowpack storage (California Department of Water 24 Resources 2008). 25
Projections to 2100 26
As shown in Table 29-3, by 2060, average annual temperatures in the Plan Area are projected to 27 increase by 3°F (1.6°C), relative to current conditions. Average annual precipitation is projected to 28 decrease slightly (approximately 0.16 inch [0.40 centimeter] during this same period). 29
It is important to note that, while the mean-annual amount of precipitation may only change slightly, 30 the character of precipitation within the Sacramento and San Joaquin River basins is expected to 31 change under warming conditions, resulting in more frequent rainfall events and less frequent 32 snowfall events. Increased warming is expected to diminish the accumulation of snow during the 33 cool season (i.e., late autumn through early spring) and the availability of snowmelt to sustain runoff 34 during the warm season (i.e., late spring through early autumn). Warming may lead to more rainfall-35 runoff during the cool season rather than snowpack accumulation. This conceptually leads to 36 increases in December–March runoff and decreases in April–July runoff. 37
Climate Change
Bay Delta Conservation Plan/California WaterFix Final EIR/EIS
Administrative Final 29-12
2016 ICF 00139.14
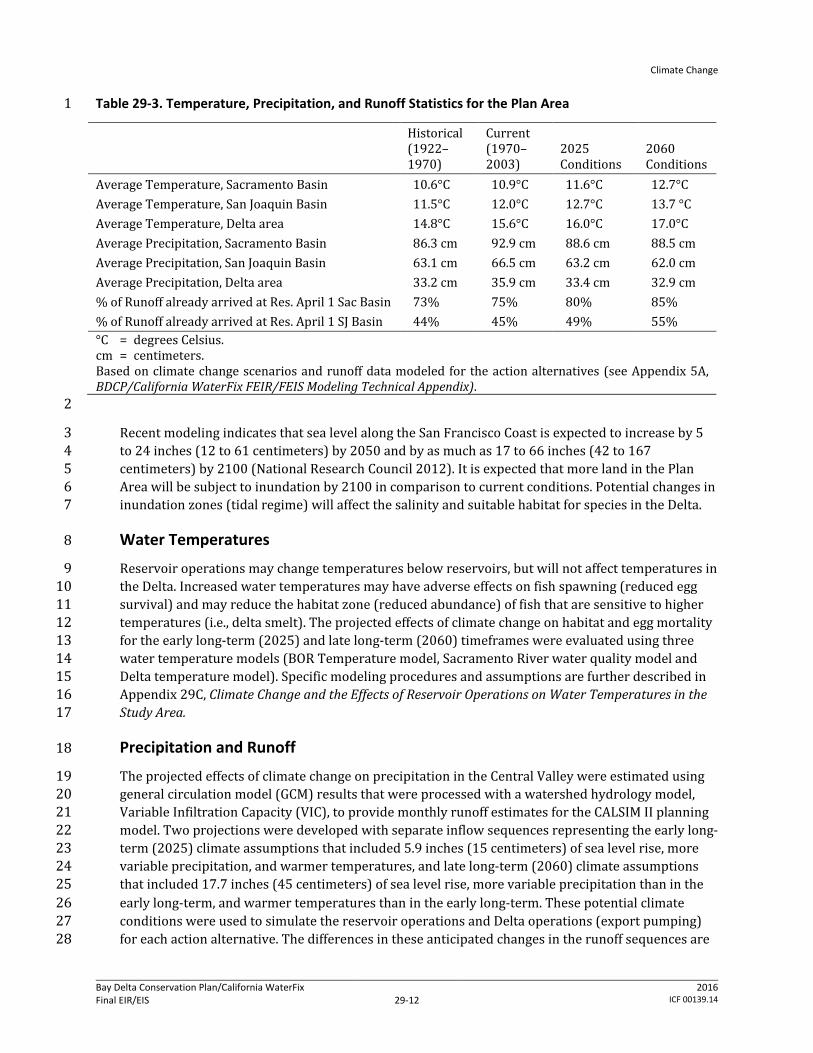
Table 29-3. Temperature, Precipitation, and Runoff Statistics for the Plan Area 1
Historical (1922–1970)
Current (1970–2003)
2025 Conditions
2060 Conditions
Average Temperature, Sacramento Basin 10.6°C 10.9°C 11.6°C 12.7°C Average Temperature, San Joaquin Basin 11.5°C 12.0°C 12.7°C 13.7 °C Average Temperature, Delta area 14.8°C 15.6°C 16.0°C 17.0°C Average Precipitation, Sacramento Basin 86.3 cm 92.9 cm 88.6 cm 88.5 cm Average Precipitation, San Joaquin Basin 63.1 cm 66.5 cm 63.2 cm 62.0 cm Average Precipitation, Delta area 33.2 cm 35.9 cm 33.4 cm 32.9 cm % of Runoff already arrived at Res. April 1 Sac Basin 73% 75% 80% 85% % of Runoff already arrived at Res. April 1 SJ Basin 44% 45% 49% 55% °C = degrees Celsius. cm = centimeters. Based on climate change scenarios and runoff data modeled for the action alternatives (see Appendix 5A, BDCP/California WaterFix FEIR/FEIS Modeling Technical Appendix). 2
Recent modeling indicates that sea level along the San Francisco Coast is expected to increase by 5 3 to 24 inches (12 to 61 centimeters) by 2050 and by as much as 17 to 66 inches (42 to 167 4 centimeters) by 2100 (National Research Council 2012). It is expected that more land in the Plan 5 Area will be subject to inundation by 2100 in comparison to current conditions. Potential changes in 6 inundation zones (tidal regime) will affect the salinity and suitable habitat for species in the Delta. 7
Water Temperatures 8
Reservoir operations may change temperatures below reservoirs, but will not affect temperatures in 9 the Delta. Increased water temperatures may have adverse effects on fish spawning (reduced egg 10 survival) and may reduce the habitat zone (reduced abundance) of fish that are sensitive to higher 11 temperatures (i.e., delta smelt). The projected effects of climate change on habitat and egg mortality 12 for the early long-term (2025) and late long-term (2060) timeframes were evaluated using three 13 water temperature models (BOR Temperature model, Sacramento River water quality model and 14 Delta temperature model). Specific modeling procedures and assumptions are further described in 15 Appendix 29C, Climate Change and the Effects of Reservoir Operations on Water Temperatures in the 16 Study Area. 17
Precipitation and Runoff 18
The projected effects of climate change on precipitation in the Central Valley were estimated using 19 general circulation model (GCM) results that were processed with a watershed hydrology model, 20 Variable Infiltration Capacity (VIC), to provide monthly runoff estimates for the CALSIM II planning 21 model. Two projections were developed with separate inflow sequences representing the early long-22 term (2025) climate assumptions that included 5.9 inches (15 centimeters) of sea level rise, more 23 variable precipitation, and warmer temperatures, and late long-term (2060) climate assumptions 24 that included 17.7 inches (45 centimeters) of sea level rise, more variable precipitation than in the 25 early long-term, and warmer temperatures than in the early long-term. These potential climate 26 conditions were used to simulate the reservoir operations and Delta operations (export pumping) 27 for each action alternative. The differences in these anticipated changes in the runoff sequences are 28

Climate Change
Bay Delta Conservation Plan/California WaterFix Final EIR/EIS
Administrative Final 29-13
2016 ICF 00139.14
fully described in Appendix 29B, Climate Change Effects on Hydrology in the Plan Area Used for 1 CALSIM Modeling Analysis. 2
Sea Level Rise 3
The likely effects of anticipated sea level rise on the Plan Area were evaluated based on detailed 4 modeling simulations. When considering potential sea level rise impacts, special consideration must 5 be given to the following three interrelated elements. 6
Inundation: Changes in sea level have the potential to inundate previously dry areas. The extent 7 of inundation in the Delta is sensitive to the magnitude of sea level rise. As discussed below, 8 Figure 29-1 depicts the changes in inundation at high tide assuming a 55-inch (140-centimeter) 9 sea level rise. 10
Salinity Gradient: The location of the gradient between saline, brackish, and freshwater in the 11 San Francisco estuary will be affected by sea level rise. As sea levels rise, the salinity gradient 12 will shift further upriver. The position of the daily average salinity gradient in the estuary is 13 called “X2”, which is the distance in kilometers upstream of the Golden Gate Bridge of the 2 parts 14 per thousand (ppt) isohaline, (1995 Bay-Delta Water Quality Control Plan [WQCP]). The X2 15 position is highly variable due to daily tidal movement. Outflow objectives identified in the 16 WQCP manage the X2 position to control salinity intrusion into the Delta. The daily average X2 17 position provides a good index of the upstream extent of saltwater intrusion as a consequence of 18 sea level rise. Maintaining the existing X2 position under future sea level rise scenarios will 19 likely require increased outflows from the Delta. 20
Tidal Variations: Changes in sea level will influence natural tidal variations along the California 21 coast and within the San Francisco Bay and Delta. Edge species that rely on existing variations 22 between wet and dry conditions may become permanently inundated or otherwise experience 23 inhospitable environmental changes. 24
Best available information suggests a range of potential sea level rise from 17 to 66 inches (42 to 25 167 centimeters) by 2100 (National Research Council 2012). Given the inherent variability in 26 anticipated future scenarios, a broad range of potential sea level changes (from 6 to 55 inches) was 27 analyzed. The projections from the NRC study were not used directly in the project analysis for two 28 reasons. 1) the study was published in June 2012, well after the modeling analysis for the project 29 had been designed and performed, and 2) the projection years are not directly aligned with the 2025 30 and 2060 analysis periods used for the project. Sea level rise projections for 2025 and 2060 were 31 developed based on research available during the analysis design and based on the requirements of 32 Water Code Section 85320, which required that the project evaluate a sea level rise of 55 inches 33 (well in excess of the expected sea level described by any major study for 2060). The sea level rise 34 projections used in the project analysis at 2025 and 2060 are consistent with the findings of the NRC 35 and fall within the range of expected sea level rise that could be extrapolated from the NRC analyses 36 at each analysis time period. The inclusion of additional analysis for 55 inches (140 centimeters) of 37 sea level rise provides a conservative analysis of potential sea level rise late in the 21st century. 38
As discussed in Appendix 5A, BDCP/California WaterFix FEIR/FEIS Modeling Technical Appendix, 39 several models were used to assess and quantify the effects of sea level rise on the action 40 alternatives. Figure 29-2 identifies the three primary models used in the analysis, as well as how 41 these models interact to predict tidal variations and other corresponding sea level rise effects in the 42 Plan Area. 43
Climate Change
Bay Delta Conservation Plan/California WaterFix Final EIR/EIS
Administrative Final 29-14
2016 ICF 00139.14
Climate and sea level change are global phenomena that can have unique impacts on local systems. 1 As shown in Figure 29-2, the UnTRIM Bay-Delta Model (MacWilliams et al., 2009), a three 2 dimensional hydrodynamics and water quality model, was used to simulate localized impacts on 3 hydrodynamics and salinity transport in the Delta for a range of selected sea-level scenarios (6 to 55 4 inches [15 to 140 centimeters]). The results from the UnTRIM model were used to corroborate 5 (adjust coefficients to match) the RMA Bay-Delta Model (RMA 2005) and Delta Simulation Model 6 (DSM2) to correctly simulate tidal marsh restoration effects with and without sea level rise. Finally, 7 the DWR/Reclamation CALSIM II planning model was adjusted to match the salinity effects from sea 8 level rise to simulate Central Valley Project (CVP) and State Water Project (SWP) operation over the 9 range of projected hydrologic conditions. Higher Delta outflows were calculated to be required to 10 meet the existing salinity objectives. Please refer to Appendix 29A, Effects of Sea-Level Rise on Delta 11 Tidal Flows and Salinity, for additional information on modeling procedures and assumptions. 12
Potential changes in inundation at high tide as a consequence of 55 inches (140 centimeters) of sea 13 level rise are shown in Figure 29-1. Figure 29-1 is based on tidal elevation data developed as part of 14 the Delta Risk Management Strategy, Phase 1 (Phase 1 datasets) (California Department of Water 15 Resources). The Phase 1 datasets are projections of floodplain depths as a function of sea level rise 16 scenarios (including 55 inches [140 centimeters]). Areas shaded in light yellow are at or below the 17 high tide elevation based on the current sea level. Areas shaded in orange are additional areas at or 18 below high tide elevation when a 55-inch (140-centimeter) rise in sea level is considered. Note that 19 the yellow and orange areas are not necessarily inundated due to control structures such as levees. 20 Figure 29-1 provides insight as to which additional areas in the Delta may need to introduce or 21 augment control structures to avoid inundation should mean sea level rise increase by 55 inches 22 (140 centimeters). 23
As shown in Figure 29-1, several communities with elevations greater than 17 feet (e.g., Fairfield, 24 Manteca, Tracy, and Brentwood) (5.2 meters) will likely not be directly affected by a 55-inch (140-25 centimeter) sea level rise. However, some of the Delta islands and other low lying areas may incur 26 additional inundation risk if 55 inches of sea level rise were to occur, especially if levees or other 27 control structures were to fail. 28
29.3 Resiliency and Adaptation Analysis 29
As described in Chapter 2, Project Objectives and Purpose and Need, the action alternatives seek to 30 make physical improvements to the SWP/CVP system which will serve to provide resiliency and 31 adaptability to rising sea levels and other reasonably foreseeable consequences of climate change. 32 The analysis below seeks to describe the manner in which the alternatives would achieve the stated 33 objective of increasing resiliency and adaptability to climate change over the No Action/No Project 34 Alternative. Project components that could affect the resilience and adaptability of the Plan Area to 35 climate changes consist of water diversion and conveyance facilities combined with differing 36 operational scenarios (collectively Conservation Measure [CM]1), measures focused on the 37 protection, restoration, and enhancement of natural communities (CM2—CM11), and measures 38 related to reducing other stressors (CM12—CM21). These conservation measures and the 39 components they comprise are described in detail in Chapter 3, Description of Alternatives. 40 Depending on the alternative, the water facility components would create a new conveyance 41

Climate Change
Bay Delta Conservation Plan/California WaterFix Final EIR/EIS
Administrative Final 29-15
2016 ICF 00139.14
mechanism and operational guidelines to divert water from the north Delta to existing SWP and CVP 1 export facilities in the south Delta to achieve the planning goals outlined in the project.3 2
To the extent possible, detailed project specific analysis done for the project is reported to provide 3 evidence of the expected changes in resiliency and adaptability. Where no detailed project specific 4 analysis was available, references and or qualitative descriptions are included that provide evidence 5 that the described effect would provide a resiliency or adaptation benefit. 6
The discussion on the resiliency and adaptability of the Plan Area to the major expected impacts of 7 climate change is broken into a discussion first about the BDCP alternatives (Alternatives 1A, 1B, 1C, 8 2A, 2B, 2C, 3, 4, 5, 6A, 6B, 6C, 7, 8, and 9) and then the non-HCP alternatives (Alternatives 4A, 2D, 9 and 5A). The analyses are bifurcated to allow for differences in the NEPA point of comparison—No 10 Action Alternative LLT (with sea level rise and climate change that would occur at around Year 11 2060) for the BDCP alternatives, versus a No Action Alternative ELT (with sea level rise and climate 12 change that would occur at around Year 2025) for the non-HCP Alternatives; as well as other 13 modeling assumption differences between the BDCP alternatives and the non-HCP alternatives. 14
29.3.1 BDCP Alternatives 15
29.3.1.1 Resiliency and Adaptability to Sea Level Rise and Hydrology 16 Changes 17
Water Supply Reliability and Aquatic Species in the Delta 18
Impacts 19
Appendix 3E, Potential Seismic and Climate Change Risks to SWP/CVP Water Supplies, describes the 20 existing and future risks to the Plan Area and specifically to the Delta as a result of climate changes 21 described above. The appendix highlights how increased sea level and changes in upstream 22 hydrology will affect the Plan Area. For the project analyses, potential sea level increases of 6 inches 23 (15 centimeters) in 2025 and 18 inches (46 centimeters) in 2060 were evaluated as was a sea level 24 rise of 55 inches (which is not projected to occur until 2099, but is evaluated consistent with the 25 requirements of Water Code Section 85320). Expected changes in precipitation and hydrology were 26 also evaluated including earlier runoff as a result of warmer temperatures causing more 27 precipitation to fall as rain instead of snow and the remaining snow melting earlier. Additional 28 information about the analysis methodology and modeling assumptions can be found in Appendices 29 29A, Effects of Sea-Level Rise on Delta Tidal Flows and Salinity, and 29B, Climate Change Effects on 30 Hydrology in the Study Area Used for CALSIM Modeling Analysis. 31
Modeling results for the 2060 period indicate a shift in runoff from snowmelt months (April–June) 32 to snow/rainfall months (January–March) of about 5–10% for the Sacramento River Basin and of 33 about 5–7% for the San Joaquin River Basin. The total runoff was increased (over historical 34 conditions) slightly (2%) for the Sacramento River Basin and decreased (6–10%) for the San 35 Joaquin River Basin. While these change metrics represent long-term averages, modeling results for 36
3 As described in Chapter 1, Introduction, Section 1.1, the Final EIR/EIS includes the 2013 Draft EIR/EIS, BDCP, 2015 RDEIR/SDEIS, and all associated appendices with these documents; as well as revisions to these documents as contained in this Final EIR/EIS.
Climate Change
Bay Delta Conservation Plan/California WaterFix Final EIR/EIS
Administrative Final 29-16
2016 ICF 00139.14
the 2060 period also indicate that droughts will increase in severity and duration—resulting in 1 periods of critical dryness. 2
All of these climate changes may result in less water flowing into the Delta between March and 3 October. At the same time, higher sea levels, in the absence of intervention, will increase the 4 penetration of salinity into the Delta. This increased Delta salinity would have a myriad of impacts 5 on in-Delta and Delta export water users whose water quality would be diminished. Aquatic species 6 such as Delta smelt would also be affected by these changes as their habitats would shrink or move 7 to less productive areas as discussed in Chapter 11, Fish and Aquatic Resources, Section 11.3.4.1. 8 Interventions that could be taken to counteract additional salinity intrusion would likely include the 9 release of additional water from upstream storage reservoirs. These actions would have 10 corresponding tradeoffs as less water would be left in the reservoirs for other actions. Reduced 11 water available for agricultural, municipal, and industrial water supplies would reduce reliability 12 and have economic costs. Reduced water available for instream and other ecological uses would 13 result in negative effects on upstream aquatic species including cold water pool resources, critical 14 for salmonid rearing. 15
All of the hydrologic changes discussed above will make water management more challenging and 16 more constrained in the future and are expected to result in more years of critical dryness. DWR’s 17 modeling of future conditions suggests that with current management and operations, level of 18 demand, and current climate, major CVP and SWP reservoirs could reach dead storage levels (the 19 level below which water cannot be released) and that the likelihood of these critical conditions will 20 increase substantially as the climate warms. In these instances, there would be critical water 21 shortages leading to potentially extreme impacts to agriculture, municipal, industrial, and ecological 22 water uses. 23
Resilience/Adaptation 24
Alternatives 1A, 1B, 1C, 2A, 2B, 2C, 3, 4, and 5 would provide substantial resiliency and adaptation 25 benefits over the No Action/No Project alternative for dealing with the combined effect of increases 26 in sea level rise and changes in upstream hydrology. Implementation of any of these nine 27 alternatives would result in an increase in Delta exports and total SWP and CVP water deliveries 28 over the No Action Alternative (Table 29-4). These alternatives have dual conveyance facilities, 29 allowing water to be moved through the Delta when conditions permit and allowing water to be 30 diverted from the Sacramento River in the northern Delta when conditions do not permit through 31 Delta conveyance. Diversions at the proposed NDDs [north Delta diversions] would be allowed if 32 Sacramento River inflows are adequate to protect downstream species habitat and water quality 33 conditions. The location of the north Delta diversion facility is further inland making it less 34 vulnerable to salinity intrusion. Even with substantial sea level rise and critically dry upstream 35 conditions, salinity could be repelled from this location. By establishing an alternative diversion 36 point for Delta exports, a great deal of Delta management flexibility is added. Currently, 37 management of the Delta is constrained by requirements to maintain X2 at specific locations during 38 certain times of the year to ensure water diversions have low salinity and to ensure that critical fish 39 populations stay outside of the entrapment zone. Alternatives 1A–2C, 3, 4, and 5 would allow the 40 Delta to be managed in a number of different ways, including maintaining salinity as it is currently 41 managed or allowing salinity to fluctuate more freely in the Delta as it did prior to the development 42 of upstream reservoirs. This added flexibility would allow managers more options for adaptively 43 managing the Delta so that conditions can be optimized to provide the greatest benefits across all 44 Delta water uses and habitat conditions. As shown in Table 29-4, Alternatives 6A through 8 would 45
Deirdre
Highlight
Deirdre
Highlight
Deirdre
Highlight
Deirdre
Highlight
Deirdre
Highlight

Climate Change
Bay Delta Conservation Plan/California WaterFix Final EIR/EIS
Administrative Final 29-17
2016 ICF 00139.14
slightly decrease Delta exports and total SWP and CVP water deliveries over the No Action 1 Alternative. Accordingly, these alternatives may not add resiliency to existing water supplies. 2 However, similar to Alternatives 1A–2C, 3, 4, and 5, Alternatives 7 and 8 would have dual 3 conveyance facilities, which could improve management flexibility. The location of the north Delta 4 diversion facility proposed under these alternatives, as well as under Alternative 6, would also be 5 further inland, making it less vulnerable to salinity intrusion. 6
Table 29-4. Delta Exports and CVP/SWP Deliveries 7
Alternative No Action/ No Project 1 2 3 4 5 6 7 8 9
Delta Exports 4,441 5,456 5,068 5,371 4,945 4,786 3,758 3,754 3,098 4,377
Change in Exports 1,015 627 930 504 345 (683) (687) (1,343) (64)
Total CVP/SWP deliveries
6,553 7,371 7,060 7,321 6,995 6,868 5,902 5,942 5,273 6,496
Change in CVP/SWP deliveries (Alt-NAA)
818 507 767 442 315 (652) (612) (1,281) (57)
8
For the analysis of the action alternatives, operation of the CVP and SWP systems are modeled using 9 current regulatory conditions and a set of operational strategies. While this provides a good 10 reference point for evaluating the potential operational benefits and impacts of the action 11 alternatives, additional infrastructure constructed and ecological restoration implemented as 12 elements of the alternatives could also open up additional operational possibilities that could be 13 explored through the adaptive management process, thus allowing other operational alternatives 14 that could provide potentially larger benefits to Delta resources. There is currently a high level of 15 uncertainty about how different Delta conditions, including salinity, tidal habitat, Delta outflow, 16 water temperature, Delta water quality, and level of Delta exports would affect critical aquatic 17 species, which of these variables has the greatest effect on these species, and what the best 18 combination of management practices would be. Climate change responses add more uncertainty to 19 these variables and tighten the constraints within which the Delta can be managed. Alternatives 1A–20 2C, 3, 4, and 5 would also increase resilience and adaptability to this uncertainty by providing 21 additional management flexibility for in-Delta conditions. 22
In addition to added water management flexibility created by CM1, CM2–CM21 provide for actions 23 that will improve habitat and reduce the effects of other stressors on the Delta ecosystem. By 24 improving and expanding available habitat, the action alternatives increase resilience and 25 adaptability to the climate changes described above by increasing the amount of alternative habitat 26 that is available during periods of high stress such as very high or low freshwater inflow or very 27 high salinity intrusion. By reducing other stressors on the Delta ecosystem, the action alternatives 28 will improve the health of the ecosystem and of individual species populations making them 29 stronger and more resilient to the potential variability and extremes caused by climate change. 30 Below are some of the key ways in which CM2–CM11 improve resiliency and adaptability of aquatic 31 resources in the Delta to climate change. 32
Restoration of wetlands, floodplains, and riparian habitats will restore ecosystem services, 33 including flow regulation, nutrient cycling, and sediment processes that enhance the functioning 34 of aquatic habitats (Mitsch and Gosselink 2000). 35

Climate Change
Bay Delta Conservation Plan/California WaterFix Final EIR/EIS
Administrative Final 29-18
2016 ICF 00139.14
Increased wetland plant biomass, including belowground production, helps to promote 1 accretion and the ability of the marsh to keep pace with sea level rise (Callaway et al. 2011; 2 Parker et al. 2011). 3
A wider and more extensive marsh plain in tidal wetlands and a wider floodplain in river 4 systems increase protection of upland habitat from flooding and storm surges, which are 5 projected to get worse with climate change (Cayan et al. 2008). 6
Improved floodplain connections to rivers will restore the ability of floodplains to absorb flood 7 flows and provide a reservoir of water to help aquatic species withstand droughts. 8
Seasonally inundated floodplains provide more resilience from invasive species by increasing 9 numbers and health of native species and excluding invasive species (Moyle et al. 2007). 10
Restoration supports species diversity by providing a mosaic of habitats that can be used by 11 different species that have evolved to use specific habitats. 12
Wetland restoration will include networks of channels within marshes that are used by fish for 13 foraging, refuge, and movement into and out of the marsh. Currently, such channels are rare 14 (Parker et al. 2011). 15
Terrestrial Habitat and Species 16
Impacts 17
Sea level rise and hydrologic changes will also have potentially detrimental effects on important 18 terrestrial habitat and species in the Delta. In addition to sea level changes, changes in average 19 precipitation, and runoff timing (discussed above), there is one additional hydrologic effect of 20 climate change that could result in impacts to terrestrial species in the Plan Area: increased 21 incidence and magnitude of extreme precipitation events. This additional impact has not been 22 included in the quantitative modeling analysis done for the project because there remains high 23 levels of uncertainty about the scale of the effects and because project hydrologic and operations 24 modeling was not conducted at a time step conducive to evaluating short duration extreme 25 precipitation events.4 Other analyses done for other purposes suggest that extreme precipitation 26 events may become more frequent and larger in the future (Climate Action Team 2010; Dettinger 27 2011). While the effects of more extreme precipitation events are not included in the quantitative 28 analysis, the effects on terrestrial species and potential for the action alternatives to improve or 29 reduce resilience and adaptability to increased frequency and magnitude of extreme precipitation 30 events are described here. 31
The remnant marshes of the Delta are habitat for several species listed under the Federal and State 32 Endangered Species Acts such as California black rail and Mason’s lilaeopsis. The Plan Area lies in a 33 central portion of the Pacific Flyway and continues to provide vital migratory, wintering, and 34
4 The hydrologic modeling done for the project was done on a monthly time step, as is typical for analysis of water management projects in California where flood protection is not a primary objective. However, extreme precipitation events often unfold over much shorter periods of time (usually 2–7 days). At a monthly time step, important details about how streamflows move through the system can be masked. Because flood protection is not a primary objective of the project, analysis at a more detailed time step in order to evaluate these effects in detail is not necessary. Nonetheless, qualitatively, high flow events becoming more frequent or larger in the future could increase the vulnerability of terrestrial species in the Plan Area under the No Action/No Project Alternative and under the action alternatives.

Climate Change
Bay Delta Conservation Plan/California WaterFix Final EIR/EIS
Administrative Final 29-19
2016 ICF 00139.14
breeding habitat for migratory birds, especially in designated wildlife management areas 1 (e.g., Suisun Marsh and Yolo Bypass), where habitat management is optimized for managed species, 2 including waterfowl, shorebirds, and wading birds. Although waterfowl have been reduced in 3 numbers, the Delta still provides habitat for 26 species of wintering waterfowl (Bay Institute 1998). 4 The Pacific Flyway is also particularly important for shorebirds and neotropical migratory birds. 5 Although fragmented, limited riparian habitat remains in the Delta. Remnant patches of tall riparian 6 trees (e.g., Fremont cottonwood, western sycamore, Gooding’s black willow) occur, but the 7 reproduction of these species is greatly impaired by lack of active floodplain habitat and hydrologic 8 modifications. Grasslands with vernal pools support high levels of endemic biodiversity in the 9 Central Valley (Witham et al. 1998). This habitat type occurs in the northeast and southwest areas of 10 the Delta. 11
Higher sea levels will inundate existing low lying terrestrial habitats described above, potentially 12 destroying marshy and tidal habit and increasing species mortality or changes in distributions 13 (California Department of Fish and Game 2010). Current Delta land use patterns, which devote most 14 of the land to agricultural uses, provide habitat value for some species, but provide limited 15 opportunities for migration of low lying terrestrial habitat as sea level rises. Terrestrial habit in the 16 Delta is also likely to face higher risk of inundation or desiccation due to more extreme fluctuations 17 in precipitation. 18
Resilience/Adaptation 19
The BDCP alternatives include measures to restore between 43,000 and 94,000 acres of new 20 seasonally inundated floodplain, tidal wetland, valley/foothill riparian, grassland, vernal pool 21 complex, and nontidal marsh habitat. Additionally, approximately 69,000 acres of natural 22 communities would be protected and 20 or 40 miles of channel margin habitat would be enhanced. 23 While the locations and specific characteristics of each of these restoration, enhancement, and 24 protection activities are not yet fully known, the comprehensive analysis, selection, and 25 implementation of these actions will allow resource managers to plan for habitat migration and 26 transformation, providing greater resilience and adaptability to changing future conditions. 27 Protection and restoration of a variety of natural communities will increase the patch size and 28 connectivity of these habitats. Increasing patch size could increase population sizes of native 29 species, which provides more resilience against a changing climate. Increasing connectivity allows 30 more genetic exchange among populations and movement to more suitable habitats as 31 environmental conditions change. The expansion of habitat will also provide greater resilience and 32 adaptability ensuring that alternate habitats exist if habitats in some locations are destroyed or 33 degraded by expected or unforeseen climate changes or catastrophic events. BDCP measures that 34 restore and protect habitat will also assist in protecting and restoring upland refuges for terrestrial 35 species affected by changes in tidal influence thereby increasing resiliency. These upland refuges 36 may also provide added resiliency and adaptability to more extreme precipitation events such as 37 droughts and floods. The additional habitat will likely provide more possibilities for alternative 38 habitat locations that are less impacted during temporary inundation or desiccation periods. 39 Restoration activities can also provide opportunities to contribute to climate change mitigation by 40 increasing the carbon sequestration potential of these habitats. 41

Climate Change
Bay Delta Conservation Plan/California WaterFix Final EIR/EIS
Administrative Final 29-20
2016 ICF 00139.14
29.3.2 Non-HCP/NCCP Alternatives (Alternatives 4A, 2D, and 1
5A) 2
29.3.2.1 No Action Alternative Early Long-Term 3
Climate change would be anticipated to change the conditions under which alternatives would be 4 implemented. The impact analysis associated with each resource includes an evaluation of how the 5 alternatives would affect the specific resource in question. In each of these analyses, where the 6 effects of the alternatives are analyzed at the ELT (at 2025) and the LLT (at 2060), climate change is 7 integrated into the analysis. In these analyses, the alternatives are evaluated using a projection of 8 future climate that includes changes in temperature, precipitation, humidity, hydrology, and sea 9 level rise. Appendix 5A, BDCP/California WaterFix FEIR/FEIS Modeling Technical Appendix, provides 10 detailed information about the development of the climate change projections. Effects related to 11 climate change would be anticipated to be smaller in magnitude in the ELT timeframe than in the 12 late long-term. 13
29.3.2.2 Alternative 4A—Dual Conveyance with Modified 14 Pipeline/Tunnel and Intakes 2, 3, and 5 (9,000 cfs; Operational 15 Scenario H) 16
This section is organized differently from the other sections above because analyzing how 17 Alternative 4A would affect the Delta’s resiliency and adaptability to climate change is a 18 fundamentally different analysis than those presented in other resource analyses. Whereas the 19 other sections are organized to identify effects of Alternative 4A and how to mitigate any significant 20 impacts, this section’s function is to analyze and disclose how Alternative 4A would affect the Delta’s 21 resiliency and adaptability to expected climate change. While climate change is already ongoing and 22 would occur under the ELT timeframe, effects of Alternative 4A on the resiliency and adaptability 23 would be greater under LLT conditions as climate change effects are expected to be more 24 pronounced.5 Nevertheless, an assessment of conditions under the ELT timeframe is provided 25 below. 26
As described Section 29.3.1, the impact analyses evaluated potential sea level increases of 6 inches 27 (15 centimeters) in 2025, which is relevant to the early long-term timeframe considered for the 28 purposes of Alternative 4A. Expected changes in precipitation and hydrology were also evaluated 29 including earlier runoff as a result of warmer temperatures causing more precipitation to fall as rain 30 instead of snow and the remaining snow melting earlier. These hydrologic changes will make water 31 management more challenging and more constrained in the future and are expected to result in 32 more years of critical dryness. DWR’s modeling of future conditions suggests that with current 33 management and operations, level of demand, and current climate, major CVP and SWP reservoirs 34 could reach dead storage levels (the level below which water cannot be released) and that the 35 likelihood of these critical conditions will increase substantially as the climate warms. In these 36 instances, there would be critical water shortages leading to potentially extreme impacts on 37 agriculture, municipal, industrial, and ecological water uses. 38
5 The ELT timeframe is modeled at 2025. The LLT timeframe is modeled at 2060.

Climate Change
Bay Delta Conservation Plan/California WaterFix Final EIR/EIS
Administrative Final 29-21
2016 ICF 00139.14
Alternative 4A would provide resiliency and adaptation benefits over the No Action/No Project 1 alternative for dealing with the combined effect of increases in sea level rise and changes in 2 upstream hydrology. As shown in Table 5-12 of Chapter 5, Water Supply, implementation of this 3 alternative would result in Delta exports that either remain similar or increase in wetter years and 4 decrease in drier years under Alternative 4A (ELT) as compared to exports under No Action 5 Alternative (ELT) depending on the capability to divert water at the north Delta intakes during 6 winter and spring months. Alternative 4A includes dual conveyance facilities, allowing water to be 7 moved through the Delta when conditions permit and allowing water to be diverted from the 8 Sacramento River in the northern Delta when conditions do not permit through Delta conveyance. 9 Diversions at the proposed north Delta diversions would be allowed if Sacramento River inflows are 10 adequate to protect downstream species habitat and water quality conditions. The location of the 11 north Delta diversion facility is further inland making it less vulnerable to salinity intrusion. Even 12 with substantial sea level rise and critically dry upstream conditions, salinity could be repelled from 13 this location. By establishing an alternative diversion point for Delta exports, a great deal of Delta 14 management flexibility is added. Currently, management of the Delta is constrained by requirements 15 to maintain X2 at specific locations during certain times of the year to ensure water diversions have 16 low salinity and to ensure that critical fish populations stay outside of the entrapment zone. 17 Alternative 4A would allow the Delta to be managed in a number of different ways, including 18 maintaining salinity as it is currently managed or allowing salinity to fluctuate more freely in the 19 Delta as it did prior to the development of upstream reservoirs. This added flexibility would allow 20 managers more options for adaptively managing the Delta so that conditions can be optimized to 21 provide benefits across all Delta water uses and habitat conditions. Alternative 4A would also 22 provide more reliable water supplies, which will provide additional resilience and adaptability to 23 increases in water demand as a result of higher temperatures and increased evapotranspiration and 24 evaporation. 25
In addition to added water management flexibility created by proposed water conveyance facilities, 26 Alternative 4A includes Environmental Commitments 3, 4, 12, 15, and 16 that provide for actions 27 that will improve habitat in certain areas and reduce the effects of stressors, though to a 28 substantially smaller geographic extent than proposed under Alternative 4. By enhancing, restoring, 29 and protecting habitat, Alternative 4A would increase resilience and adaptability to the climate 30 changes described above by increasing the amount of habitat that is available during periods of high 31 stress such as very high or low freshwater inflow or very high salinity intrusion. By creating a wider 32 variety of water management options and restoring habitat, Alternative 4A can also help buffer 33 potential negative effects of increased water temperatures thereby adding resiliency to increased 34 water temperatures. More detail on existing temperature conditions in watersheds within the Delta 35 and water temperature effects on aquatic habitat as well as biological and biochemical processes, 36 and how managed flows influence water temperatures can be found in Chapter 11, Fish and Aquatic 37 Resources. 38
Similarly, in consideration of terrestrial species, protection and restoration of a variety of natural 39 communities will increase the patch size and connectivity of habitats. Increasing patch size could 40 tend to increase population sizes of native species, which provides more resilience against a 41 changing climate. Increasing connectivity allows more genetic exchange among populations and 42 movement to more suitable habitats as environmental conditions change. 43
As described for Alternative 4, Alternative 4A would not be anticipated to add resiliency to existing 44 levees; levee fragility would remain high and increase with time as in the No Action/No Project 45 Alternative. However, Alternative 4A would provide additional adaptability to catastrophic failure of 46
Climate Change
Bay Delta Conservation Plan/California WaterFix Final EIR/EIS
Administrative Final 29-22
2016 ICF 00139.14
Delta levees. By providing an alternate conveyance route around the Delta, this alternative provides 1 a mechanism to continue making water deliveries to SWP/CVP contractors and local and in-Delta 2 water users with conveyance interties even if the Delta were temporarily disrupted by a 3 catastrophic levee failure. 4
Construction and operation of the proposed water conveyance facilities and implementation of 5 Environmental Commitments under Alternative 4A would not affect the ability of agencies to 6 implement plans and proactive measures associated with climate change resiliency. Accordingly, the 7 project would be compatible with these federal and state plans to address climate change. 8
29.3.2.3 Alternative 2D—Dual Conveyance with Modified 9 Pipeline/Tunnel and Intakes 1, 2, 3, 4, and 5 (15,000 cfs; 10 Operational Scenario B) 11
This section is organized differently from the other sections above because analyzing how 12 Alternative 2D would affect the Delta’s resiliency and adaptability to climate change is a 13 fundamentally different analysis than those presented in other resource analyses. Whereas the 14 other sections are organized to identify effects of Alternative 2D and how to mitigate any significant 15 impacts, this section’s function is to analyze and disclose how Alternative 2D would affect the Delta’s 16 resiliency and adaptability to expected climate change. While climate change is already ongoing and 17 would occur under the ELT timeframe, effects of Alternative 2D on the resiliency and adaptability 18 would be greater under LLT conditions as climate change effects are expected to be more 19 pronounced.6 Nevertheless, an assessment of conditions under the ELT timeframe is provided 20 below. 21
Alternative 2D would provide resiliency and adaptation benefits over the No Action/No Project 22 alternative for dealing with the combined effect of increases in sea level rise and changes in 23 upstream hydrology. The benefits would be similar to those anticipated under Alternative 4A and 24 are primarily derived from the alternative’s dual conveyance structure and location of the north 25 Delta facility, which allow for more flexible water movement and protection from potential salinity 26 intrusion. Alternative 2D would also provide more reliable water supplies and increased flexibility 27 to adaptively manage the Delta so that conditions can be optimized across all Delta water uses and 28 habitat conditions. 29
In addition to added water management flexibility, Alternative 2D includes several Environmental 30 Commitments that will improve habitat in certain areas and reduce the effects of stressors. Provided 31 benefits would be similar to those anticipated under Alternative 4A and include expanded habitat 32 options during periods of high or low freshwater inflow, increased habitat connectivity, and 33 potential buffers against rising water temperatures. Alternative 2D would also provide additional 34 adaptability to catastrophic failure of Delta levees. 35
As described for Alternative 4A, Alternative 2D would not be anticipated to add resiliency to existing 36 levees; levee fragility would remain high and increase with time as in the No Action/No Project 37 Alternative. Similarly, construction and operation of the proposed water conveyance facilities and 38 implementation of Environmental Commitments under Alternative 2D would not affect the ability of 39 agencies to implement plans and proactive measures associated with climate change resiliency. 40
6 The ELT timeframe is modeled at 2025. The LLT timeframe is modeled at 2060.

Climate Change
Bay Delta Conservation Plan/California WaterFix Final EIR/EIS
Administrative Final 29-23
2016 ICF 00139.14
Accordingly, the project would be compatible with these federal and state plans to address climate 1 change. 2
29.3.2.4 Alternative 5A—Dual Conveyance with Modified 3 Pipeline/Tunnel and Intake 2 (3,000 cfs; Operational Scenario C) 4
This section is organized differently from the other sections above because analyzing how 5 Alternative 5A would affect the Delta’s resiliency and adaptability to climate change is a 6 fundamentally different analysis than those presented in other resource analyses. Whereas the 7 other sections are organized to identify effects of Alternative 5A and how to mitigate any significant 8 impacts, this section’s function is to analyze and disclose how Alternative 5A would affect the Delta’s 9 resiliency and adaptability to expected climate change. While climate change is already ongoing and 10 would occur under the ELT timeframe, effects of Alternative 5A on the resiliency and adaptability 11 would be greater under LLT conditions as climate change effects are expected to be more 12 pronounced.7 Nevertheless, an assessment of conditions under the ELT timeframe is provided 13 below. 14
Alternative 5A would provide resiliency and adaptation benefits over the No Action/No Project 15 alternative for dealing with the combined effect of increases in sea level rise and changes in 16 upstream hydrology. The benefits would be similar to those anticipated under Alternative 4A and 17 are primarily derived from the alternative’s dual conveyance structure and location of the north 18 Delta facility, which allow for more flexible water movement and protection from potential salinity 19 intrusion. Alternative 5A would also provide more reliable water supplies and increased flexibility 20 to adaptively manage the Delta so that conditions can be optimized across all Delta water uses and 21 habitat conditions. 22
In addition to added water management flexibility, Alternative 5A includes several Environmental 23 Commitments that will improve habitat in certain areas and reduce the effects of stressors. Provided 24 benefits would be similar to those anticipated under Alternative 4A and include expanded habitat 25 options during periods of high or low freshwater inflow, increased habitat connectivity, and 26 potential buffers against rising water temperatures. Alternative 5A would also provide additional 27 adaptability to catastrophic failure of Delta levees. 28
As described for Alternative 4A, Alternative 5A would not be anticipated to add resiliency to existing 29 levees; levee fragility would remain high and increase with time as in the No Action/No Project 30 Alternative. Similarly, construction and operation of the proposed water conveyance facilities and 31 implementation of Environmental Commitments under Alternative 5A would not affect the ability of 32 agencies to implement plans and proactive measures associated with climate change resiliency. 33 Accordingly, the project would be compatible with these federal and state plans to address climate 34 change. 35
29.3.2.5 Delta Levee Stability and Reliability 36
Impacts 37
Whether increased sea levels are counteracted by increased outflows for salinity purposes or not, 38 water levels in the Delta will rise as sea levels rise, placing additional stress on fragile Delta levees. 39
7 The ELT timeframe is modeled at 2025. The LLT timeframe is modeled at 2060.
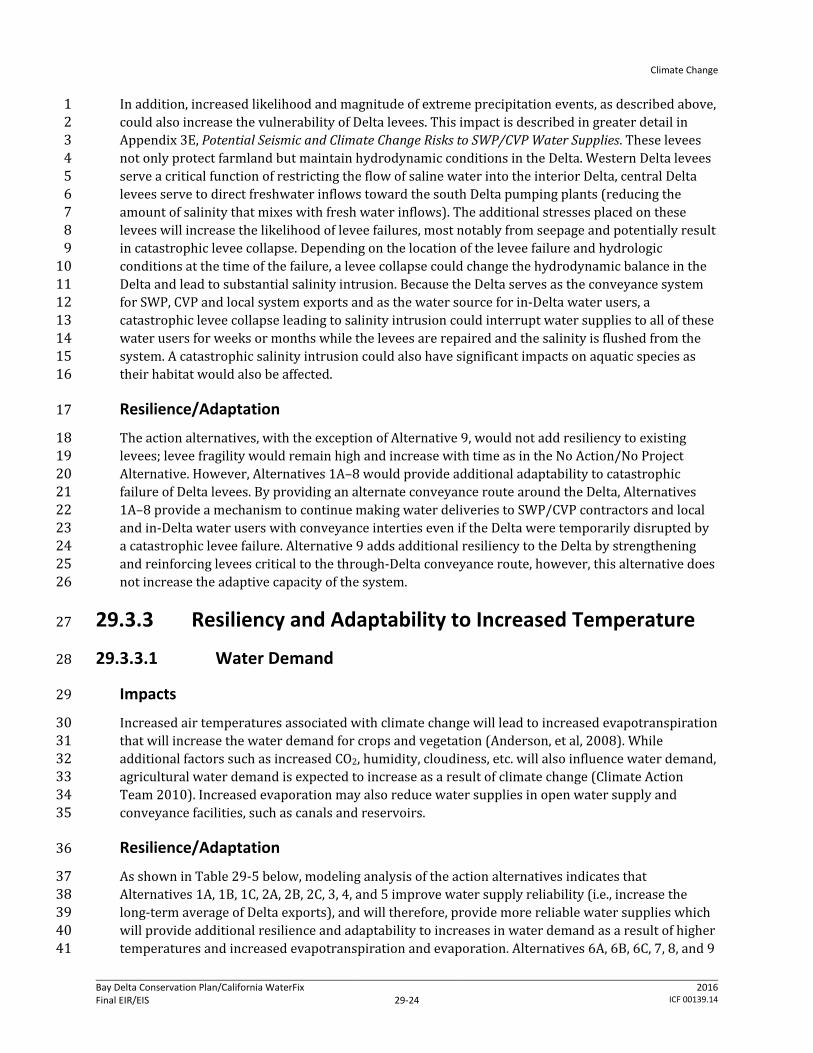
Climate Change
Bay Delta Conservation Plan/California WaterFix Final EIR/EIS
Administrative Final 29-24
2016 ICF 00139.14
In addition, increased likelihood and magnitude of extreme precipitation events, as described above, 1 could also increase the vulnerability of Delta levees. This impact is described in greater detail in 2 Appendix 3E, Potential Seismic and Climate Change Risks to SWP/CVP Water Supplies. These levees 3 not only protect farmland but maintain hydrodynamic conditions in the Delta. Western Delta levees 4 serve a critical function of restricting the flow of saline water into the interior Delta, central Delta 5 levees serve to direct freshwater inflows toward the south Delta pumping plants (reducing the 6 amount of salinity that mixes with fresh water inflows). The additional stresses placed on these 7 levees will increase the likelihood of levee failures, most notably from seepage and potentially result 8 in catastrophic levee collapse. Depending on the location of the levee failure and hydrologic 9 conditions at the time of the failure, a levee collapse could change the hydrodynamic balance in the 10 Delta and lead to substantial salinity intrusion. Because the Delta serves as the conveyance system 11 for SWP, CVP and local system exports and as the water source for in-Delta water users, a 12 catastrophic levee collapse leading to salinity intrusion could interrupt water supplies to all of these 13 water users for weeks or months while the levees are repaired and the salinity is flushed from the 14 system. A catastrophic salinity intrusion could also have significant impacts on aquatic species as 15 their habitat would also be affected. 16
Resilience/Adaptation 17
The action alternatives, with the exception of Alternative 9, would not add resiliency to existing 18 levees; levee fragility would remain high and increase with time as in the No Action/No Project 19 Alternative. However, Alternatives 1A–8 would provide additional adaptability to catastrophic 20 failure of Delta levees. By providing an alternate conveyance route around the Delta, Alternatives 21 1A–8 provide a mechanism to continue making water deliveries to SWP/CVP contractors and local 22 and in-Delta water users with conveyance interties even if the Delta were temporarily disrupted by 23 a catastrophic levee failure. Alternative 9 adds additional resiliency to the Delta by strengthening 24 and reinforcing levees critical to the through-Delta conveyance route, however, this alternative does 25 not increase the adaptive capacity of the system. 26
29.3.3 Resiliency and Adaptability to Increased Temperature 27
29.3.3.1 Water Demand 28
Impacts 29
Increased air temperatures associated with climate change will lead to increased evapotranspiration 30 that will increase the water demand for crops and vegetation (Anderson, et al, 2008). While 31 additional factors such as increased CO2, humidity, cloudiness, etc. will also influence water demand, 32 agricultural water demand is expected to increase as a result of climate change (Climate Action 33 Team 2010). Increased evaporation may also reduce water supplies in open water supply and 34 conveyance facilities, such as canals and reservoirs. 35
Resilience/Adaptation 36
As shown in Table 29-5 below, modeling analysis of the action alternatives indicates that 37 Alternatives 1A, 1B, 1C, 2A, 2B, 2C, 3, 4, and 5 improve water supply reliability (i.e., increase the 38 long-term average of Delta exports), and will therefore, provide more reliable water supplies which 39 will provide additional resilience and adaptability to increases in water demand as a result of higher 40 temperatures and increased evapotranspiration and evaporation. Alternatives 6A, 6B, 6C, 7, 8, and 9 41
Climate Change
Bay Delta Conservation Plan/California WaterFix Final EIR/EIS
Administrative Final 29-25
2016 ICF 00139.14
actually result in reduced water supply reliability and therefore provide reduced resilience and 1 adaptability to the impacts of climate change. 2
Table 29-5. Long-Term Average Exports 3
Alternative Total Delta Exports (thousand acre-feet) No Action/No Project 4,441 Alternatives 1A, 1B, 1C 5,456 Alternatives 2A, 2B, 2C 5,068 Alternative 3 5,371 Alternative 4 – Scenario H1 5,255 Scenario H2 4,710 Scenario H3 4,945 Scenario H4 4,414 Alternative 5 4,786 Alternatives 6A, 6B, 6C 3,758 Alternative 7 3,754 Alternative 8 3,098 Alternative 9 4,377 No Action ELT 4,728 Alternative 4A 4,917 Alternative 2D 5,381 Alternative 5A 5,166
4
29.3.3.2 Water Temperatures 5
Impacts 6
Warmer water temperatures are expected to decrease suitable summer habitat of delta smelt, a 7 federally listed endangered species, because waters in the lower Delta may be too saline and lack 8 food, and fresh water in the upper Delta may be too warm (California Department of Water 9 Resources 2009). Warming of streams and rivers also facilitates colonization by invasive species 10 that will compete for native species’ habitat (Kaushal et al. 2010). 11
Resilience/Adaptation 12
By creating a wider variety of water management options and restoring habitat on a large scale, the 13 project can help buffer potential negative effects of increased water temperatures thereby adding 14 resiliency to increased water temperatures. More detail on existing temperature conditions in 15 watersheds within the Plan Area and water temperature effects on aquatic habitat as well as 16 biological and biochemical processes, and how managed flows influence water temperatures can be 17 found in Chapter 11, Fish and Aquatic Resources. Additional information about the analysis 18 methodology and modeling assumptions used in the analysis can be found in Appendix 29C, Climate 19 Change and the Effects of Reservoir Operations on Water Temperatures in the Study Area. 20
Climate Change
Bay Delta Conservation Plan/California WaterFix Final EIR/EIS
Administrative Final 29-26
2016 ICF 00139.14
29.4 Compatibility with Applicable Plans and Policies 1
This section provides an overview of federal and statewide efforts to prepare for and adapt to 2 climate change. Regulations associated with the mitigation of GHG emissions (e.g., AB-32) are 3 discussed in Chapter 22, Air Quality and Greenhouse Gases, Section 22.2, and are not repeated here. 4
Constructing the proposed water conveyance facilities (CM1) and implementing CM2–CM21 or any of the 5 restoration activities could potentially result in incompatibilities with these plans and policies related to 6 climate change. A number of plans and policies establish plans or guidance for resource protection, 7 adaptation, and enhancement activities related to resources in the study area. This overview of plan and 8 policy compatibility evaluates whether the action alternatives would be compatible or incompatible with 9 such enactments. This analysis is not required by NEPA or CEQA, but is instead performed here to provide full 10 disclosure regarding the potential impacts the proposed project could have on the Plan Area in the future. 11 Note that as discussed in Chapter 13, Land Use, Section 13.2.3, state and federal agencies are not generally 12 subject to local land use regulations; incompatibilities with plans and policies are not, by themselves, physical 13 consequences to the environment. 14
29.4.1 Applicable Plans and Policies 15
29.4.1.1 Federal 16
Council on Environmental Quality 17
CEQ’s Draft NEPA Guidance on Consideration of the Effects of Climate Change and Greenhouse 18 Gas Emissions (2010) 19
On February 19, 2010, the Council on Environmental Quality (CEQ) issued draft NEPA guidance on the 20 consideration of the effects of climate change and GHG emissions. This guidance advises federal 21 agencies that they should consider opportunities to reduce GHG emissions caused by federal actions, 22 adapt their actions to climate change effects throughout the NEPA process, and address these issues in 23 their agency NEPA procedures. Where applicable, the scope of the NEPA analysis should cover the 24 GHG emissions effects of a proposed action and alternative actions, as well as the relationship of 25 climate change effects on a proposed action or alternatives. The CEQ guidance is still considered draft 26 as of the writing of this document and is not an official CEQ policy document (Council on 27 Environmental Quality 2010). 28
National Oceanic and Atmospheric Administration 29
Global Sea Level Rise Scenarios for the United States National Climate Assessment (2012) 30
This report was produced in response to a request from the U.S. National Climate Assessment 31 Development and Advisory Committee. It provides a synthesis of the scientific literature on global 32 sea level rise, and a set of four scenarios of future global sea level rise. The report includes input 33 from national experts in climate science, physical coastal processes, and coastal management. 34

Climate Change
Bay Delta Conservation Plan/California WaterFix Final EIR/EIS
Administrative Final 29-27
2016 ICF 00139.14
U.S. Environmental Protection Agency 1
Climate Ready Estuaries Program (ongoing) 2
U.S. Environmental Protection Agency’s (EPA’s) Climate Ready Estuaries program has four primary 3 objectives related to climate change adaptation: 1) assess climate change vulnerabilities, 2) develop 4 and implement adaptation strategies, 3) engage and educate stakeholders, and 4) share the lessons 5 learned with other coastal managers. The program provides information and tools for managers to 6 develop adaptation plans for estuaries and coastal communities. Resources published by the Climate 7 Ready Estuaries program can provide guidance for adaptively managing estuaries in the Plan Area. 8
U.S. Forest Service 9
Re-Framing Forest and Resource Management Strategies for a Climate Change Context (2008) 10
This report provides a high-level, preliminary framework for developing forest and natural resource 11 management strategies in response to climate change in western mountainous environments. The report 12 summarizes an approach for developing adaptation and mitigation strategies using a “5-R strategy:” 13 increase resistance, promote resilience, enable response, encourage realignment, and implement 14 practices to reduce the human influence on climate. Strategies outlined in the document could provide 15 potential approaches for responding to climate change impacts on forests in the Plan Area. 16
Climate Change Considerations in Project-Level NEPA Analysis (2009) 17
This guidance document provides initial Forest Service guidance on how to consider climate change 18 in project-level NEPA analysis and documentation. This guidance document addresses how Forest 19 Service management may influence climate change mainly through incremental changes to global 20 pools of GHGs. This guidance will be revised as more scientific literature is published, climate 21 change management experience is gained, and government policies are established.8 22
U.S. Department of Agriculture 23
2010–2015 Strategic Plan (2010) 24
The 2010–2015 Strategic Plan outlines future initiatives the U.S. Department of Agriculture will 25 undertake to achieve its overall mission. Four strategic goals are outlined, of which one is to ensure 26 that national forests and private working lands are made more resilient to climate change. 27 Performance measures and strategies for meeting this objective are summarized in the Strategic 28 Plan, and may be applicable to land management in the delta. 29
U.S. Department of the Interior 30
National Fish, Wildlife and Plants Climate Adaptation Strategy (ongoing) 31
The U.S. Fish and Wildlife Service (USFWS), the National Oceanic and Atmospheric Administration, 32 and the New York Division of Fish, Wildlife, & Marine Resources are developing a unified approach 33 to maintaining the key terrestrial, freshwater and marine ecosystems needed to sustain fish, wildlife 34 and plant resources and the services they provide in the face of accelerating climate change. This 35 strategy will provide a unified approach—reflecting shared principles and science-based practices—36
8 Source: http://www.fs.fed.us/emc/nepa/climate_change/includes/cc_nepa_guidance.pdf.

Climate Change
Bay Delta Conservation Plan/California WaterFix Final EIR/EIS
Administrative Final 29-28
2016 ICF 00139.14
for reducing the negative impacts of climate change on fish, wildlife, plants, and the natural systems 1 upon which they depend. 2
WaterSMART (Sustain and Manage America’s Resources for Tomorrow) (ongoing) 3
The WaterSMART program was established in February 2010 following passage of the SECURE 4 Water Act, which authorizes federal water and science agencies to work together with state and 5 local water managers to plan for climate change and the other threats to our water supplies. 6 WaterSMART provides a framework for federal leadership and assistance on efficient water use, 7 integration of water and energy policies, and coordination of water conservation activities. As the 8 Department’s main water management agency, Reclamation plays a key role in implementing the 9 WaterSMART program. Improving water management and supplies through the project is a priority 10 goal for the WaterSMART program. (Bureau of Reclamation 2013) 11
U.S. Fish and Wildlife Service 12
Rising to the Urgent Challenge: Strategic Plan for Responding to Accelerating Climate Change 13 (2010) 14
This report establishes a 5-year framework to analyze fish and wildlife conservation strategies 15 associated with climate change. Adaption, which USFWS defines as “planned, science-based 16 management actions,” forms the core of the Strategic Plan. The primary purpose of the Strategic 17 Plan is to identify adaptive responses to climate change through the strategic conservation of 18 terrestrial, freshwater, and marine habitats. USFWS will implement the Strategic Plan during the 19 next five years. To the extent that USFWS actions target ecosystems in the Delta, climate change 20 resiliency in the Plan Area may be improved. 21
National Fish, Wildlife, and Plants Climate Adaptation Strategy (2013) 22
The overarching goal of the National Fish, Wildlife, and Plants Climate Adaptation Strategy is to 23 “inspire, enable, and increase meaningful action that helps safeguard the nation’s natural resources 24 in a changing climate.” The strategy describes current and expected impacts of climate change on 25 major ecosystems in the United States, and describes steps that can be taken to reduce these 26 impacts. The actions proposed by the strategy address the following seven goals: 1) conserve and 27 connect habitat, 2) manage species and habitats, 3) enhance management capacity, 4) support 28 adaptive management, 5) increase knowledge and information, 6) increase awareness and motive 29 action, and 7) reduce non-climate stressors. 30
U.S. Army Corps of Engineers 31
Climate Change Adaptation Plan and Report (2011) 32
The purpose of this report is to develop practical and cost effective measures to reduce the 33 vulnerability of national water conveyance infrastructure to climate change. Strategies for adaptive 34 planning, design, construction, and maintenance are identified. The document also provides a 35 framework for performing a vulnerability assessment. 36

Climate Change
Bay Delta Conservation Plan/California WaterFix Final EIR/EIS
Administrative Final 29-29
2016 ICF 00139.14
29.4.1.2 State 1
Relevant State Executive Order and California Water Code Section 2
Executive Order S-13-08 3
This Executive Order requests that the National Academy of Sciences (NAS) convene an independent 4 panel to complete the first California Sea Level Rise Assessment Report and initiate an independent 5 sea level rise science and policy committee made up of state, national and international experts. It 6 requires that all state agencies that are planning construction projects in areas vulnerable to future 7 sea level rise shall consider a range of sea level rise scenarios for the years 2050 and 2100 in order 8 to assess project vulnerability and, to the extent feasible, reduce expected risks and increase 9 resiliency to sea level rise. The order does not specify sea level rise scenarios, but it is worth noting 10 that sea level rise projections for California of 16 inches (41 centimeters) by 2050 and 55 inches 11 (140 centimeters) by 2100 have been considered and/or used by multiple state agencies in impacts 12 analyses and policy development. The executive order also tasks the California Natural Resource 13 Agency to coordinate the development of a statewide climate change adaptation strategy which 14 resulted in the 2009 California Climate Adaptation Strategy. 15
California Water Code Section 85320 (b)(2)(C) 16
As noted earlier, Water Code Section 85320 (b)(2)(C) requires that, to be a part of the Delta Plan, the 17 EIR must analyze the potential effects of climate change, possible sea level rise up to 55 inches (140 18 centimeters) (the high end of the projected range in sea level rise), and possible changes in total 19 precipitation and runoff patterns on the conveyance alternatives and habitat restoration activities 20 considered in the Plan Area. 21
California Department of Water Resources 22
Managing an Uncertain Future; Climate Adaptation Strategies for Water (2008) 23
This report summarizes adaptation strategies that can be used by state and local water managers to 24 improve the resiliency of the California water resources. The strategies are organized at the regional 25 and state level and focus on investment planning and decision-making. The report was developed by 26 DWR as part of the process of updating the California Water Plan, and was the basis for the water 27 section of the 2009 California Climate Adaptation Strategy. 28
California Water Plan Update (2009) 29
Chapter 4 of Volume 2 of the California Water Plan (California Department of Water Resources 30 2010c) focuses on the Delta. In this chapter, DWR highlights the need for adaptation strategies to 31 improve the flexibility of water conveyance and storage. Improving water management will enable 32 operators to store large volumes of water during periods of high flow for use during periods of low 33 flow when water supply allocations are more competitive. In addition, streams and channels 34 enlarged for conveyance and flood passage may incorporate riparian habitat improvements that are 35 designed for varying hydrology and water management operations. Delta conveyance 36 improvements incorporate flexibility that allows for increased water supply reliability of Delta 37 supplies in light of climate change. 38

Climate Change
Bay Delta Conservation Plan/California WaterFix Final EIR/EIS
Administrative Final 29-30
2016 ICF 00139.14
Central Valley Flood Protection Plan (2012) 1
Due to recent legislation, DWR is currently implementing the Central Valley Flood Management 2 Program (CVFMP), which involves the preparation of a Central Valley Flood Protection Plan 3 (CVFPP). The CVFPP outlines an approach for addressing climate change considerations for flood 4 management in the Central Valley (California Department of Water Resources 2011). The following 5 are relevant documents developed as part of the 2012 CVFMP that present climate change 6 adaptation strategies for flood management. 7
2012 Central Valley Flood Protection Plan, Climate Change Scope Definition Work Group Summary 8 Report. 9
2012 Central Valley Flood Protection Plan, Climate Change Threshold Analysis Work Plan—Draft 10 Technical Memorandum. 11
Future management measures developed as part of the 2012 CVFMP and associated documents will 12 have direct effects on the hydrology of the Bay-Delta system within the Plan Area. 13
California Department of Fish and Wildlife 14
Unity, Integration, and Action: CDFW’s Vision for Confronting Climate Change in California (2011) 15
The California Department of Fish and Wildlife’s (CDFW’s) framework for addressing climate change 16 adaptation seeks to protect California’s natural resources without compromising the economy. The 17 framework embodies CDFW’s commitment to minimizing negative effects of climate change on the 18 state ecosystems through the development of adaptation measures that provide clear benefits to 19 terrestrial and marine ecosystems. CDFW is acutely aware of the uncertainties associated with 20 emerging climate science and is taking an approach that will allow CDFW to be both proactive and 21 adaptive through the use of a variety of planning tools and strategic initiatives. Specifically, their 22 adaptive management framework will allow for the continual improvement and adjustment of 23 management practices based on new information. 24
California Department of Food and Agriculture 25
California Agricultural Vision: Strategies for Sustainability (2010) 26
California Agricultural Vision (Ag Vision) was created by the California Department of Food and 27 Agriculture (CDFA) and the State Board to address challenges associated with sustainable 28 agriculture. The State Board has endorsed several actions to assure agricultural adaptation to 29 climate change. In particular, research is currently being conducted to determine the most likely 30 impacts of climate change on agriculture, and to propose strategies to help agriculture adapt to and 31 benefit from these changes. Strategies developed as part of Ag Vision’s research may benefit 32 agriculture in the delta. 33
California Department of Public Health 34
Climate Change and Public Health: Building Healthy Communities and a Healthy Planet (ongoing) 35
California Department of Public Health (DPH) has developed a four-part webinar series to educate 36 health professionals on how climate change will impact health across California, especially within 37 vulnerable communities. The webinar provides tools to communicate the need for action at the local 38 level. The webinars also share how cities and counties throughout California are planning for 39

Climate Change
Bay Delta Conservation Plan/California WaterFix Final EIR/EIS
Administrative Final 29-31
2016 ICF 00139.14
climate change and how health and equity can be integrated into those efforts. Assistance provided 1 by DPH may help buffer delta communities from changes in climate. 2
California Natural Resources Agency 3
California Climate Change Adaptation Strategy (2009) and Safeguarding California Plan (2014) 4
In cooperation and partnership with multiple state agencies, the 2009 California Climate Adaptation 5 Strategy summarizes the best known science on climate change and provides recommendations on 6 how to manage against those threats. The report provides an update on the expected climate risks to 7 California, prioritizes solutions to addressing these risks, and develops an implementation plan for 8 minimizing risks. The adaptation strategy will reduce California’s vulnerability to known and 9 projected climate change impacts. The California Natural Resources Agency updated the 2009 10 California Climate Adaptation Strategy with release of the 2014 Safeguarding California Plan. The 11 plan augments previously identified adaption strategies in light of advances in climate science and 12 risk management options 13
California Department of Forestry and Fire Projection 14
CAL FIRE Report on Adaption Strategies for Forestry (2008) 15
This report reviews many of the observed and forecasted impacts to California forests and 16 rangelands as a result of climate change. The document proposes a framework for developing 17 adaptation strategies. More specifically, the report identifies an initial strategy for integrating 18 adaptation into future forest management. Strategies outlined in the document could provide 19 potential approaches for responding to climate change impacts on forests in the Plan Area. 20
CALFED Bay-Delta Program 21
Independent Science Board Memorandum (2007) 22
CALFED Independent Science Board (ISB) is a multidisciplinary panel that provides guidance on 23 climate change and water issues. The CALFED ISB recently prepared a memo recommending 24 appropriate sea level rise projections for ongoing delta planning. In addition, the CALFED Science 25 Program has funded an effort to develop a model-based approach for evaluating plausible future 26 scenarios of the Bay-Delta-River-Watershed system. The outcome is intended to be a strategic 27 planning tool to CALFED agency managers and decision-makers in meeting future delta resource 28 management goals. 29
Delta Protection Commission 30
2006–2011 Strategic Plan (2006) 31
The Delta Protection Commission’s (DPC’s) Strategic Plan is intended to protect and enhance the 32 Delta’s resources. The document summarizes current and future threats to the Delta, including 33 changes in climate. In particular, the document identifies sea level rise as a central threat facing the 34 future integrity of the Delta. 35
Climate Change
Bay Delta Conservation Plan/California WaterFix Final EIR/EIS
Administrative Final 29-32
2016 ICF 00139.14
Ocean Protection Council 1
Sea Level Rise Task Force Interim Guidance Document 2
This document provides guidance for incorporating sea-level rise projections into planning and 3 decision making for projects in California. Its underlying premise is that sea level rise potentially 4 will cause many harmful economic, ecological, physical and social impacts and that incorporating 5 sea level rise into agency decisions can help mitigate some of these potential impacts. For example, 6 sea level rise will threaten water supplies, coastal development, and infrastructure, but early 7 integration of projected sea level rise into project designs will lessen these potential impacts.9 8
California Department of Transportation 9
Climate Change Adaptation Hot Spot Map (ongoing) 10
The Climate Change Adaptation Hot Spot Map is a GIS-based assessment of transportation 11 infrastructure vulnerabilities using available data and studies and to identify critical transportation 12 hotspots. Such hotspots are areas of increased vulnerability to the effects of climate change due to 13 their location near population centers that depend on transportation infrastructure for essential 14 services; are heavily traveled, so a compromise in infrastructure would affect large numbers of 15 individuals; or are particularly situated geographically to be heavily impacted by climate effects 16 (e.g., on the coast in an area that could be inundated by rising sea levels). This research will also 17 result in the development of a climate vulnerability plan that will assess the level and type of 18 transportation infrastructure vulnerability, the adaptation options and strategies, and a framework 19 for prioritizing implementation efforts. California Department of Transportation (Caltrans) will 20 develop a framework for prioritizing implementation efforts throughout the Delta and California. 21
Addressing Climate Change Adaptation in Regional Transportation Plans: A Guide for California 22 MPOs [Metropolitan Planning Organizations] and Regional Transportation Plans Agencies 23 (ongoing) 24
The 2010 Regional Transportation Plans Guidelines currently provide little direction for regions to 25 analyze and address climate change adaptation. This effort will provide the data to develop a clear 26 methodology for regional agencies to address climate change impacts through adaptation of 27 transportation infrastructure. The purpose of this manual is to expand knowledge and develop tools 28 that will assist California MPOs and Regional Transportation Plans. As with incorporating climate 29 change impacts into planning, design, engineering, and operational decisions. The final product will 30 be a literature review of adaptation, best practices for regional agencies, and available adaptation 31 measures for transportation infrastructure. 32
29.4.2 Compatibility Evaluation 33
The USFWS, EPA, U.S. Forest Service, U.S. Department of Agriculture, U.S. Department of the Interior, 34 U.S. Army Corp of Engineers, CVFMP, DWR, CDFW, CDFA, DPH, California Natural Resources Agency, 35 California Department of Forestry and Fire Protection, Delta Protection Commission, and Caltrans 36 have developed frameworks or initiatives to ensure their respective resources are made more 37
9 Source: http://opc.ca.gov/webmaster/ftp/pdf/agenda_items/20110311/12.SLR_Resolution/SLR-Guidance-Document.pdf.
Climate Change
Bay Delta Conservation Plan/California WaterFix Final EIR/EIS
Administrative Final 29-33
2016 ICF 00139.14
resilient to climate change. Construction and operation of the proposed water conveyance facilities 1 and implementation of other conservation measures would not affect the ability of these agencies to 2 implement these plans and proactive measures. Accordingly, the project would be compatible with 3 these federal and state plans to address climate change. 4
The CEQ has prepared draft guidance on how federal agencies should consider the effects of climate 5 change in their evaluation proposals. Consistent with the draft guidance, this chapter evaluates the 6 relationship of climate change effects to the proposed project and alternatives. The project is 7 therefore compatible with the CEQA guidance on climate change. 8
Executive Order S-13-8, California Water Code, Section 85320 (b)(2)(C), CALFED Independent 9 Science Board Memorandum, and the OPC Sea Level Rise Task Force Interim Guidance Document 10 address expected risk and vulnerability to future sea level rise in California. The Water Code 11 specifically requires that, to be a part of the Delta Plan, the EIR must analyze the potential effects of 12 climate change, possible sea level rise up to 55 inches (140 centimeters) (the high end of the 13 projected range in sea level rise), and possible changes in total precipitation and runoff patterns on 14 the conveyance alternatives and habitat restoration activities considered in the Plan Area. Given the 15 inherent variability in anticipated future scenarios, a broad range of potential sea level changes 16 (from 6 to 55 inches [15 to 140 centimeters]) was analyzed (see Appendix 5A, BDCP/California 17 WaterFix FEIR/FEIS Modeling Technical Appendix). Because potential effects of sea level rise on the 18 project were analyzed as part of this analysis, the project is considered compatible with applicable 19 sea level rise guidance documents. 20
29.5 References Cited 21
Anderson, J., F. Chung, M. Anderson, L. Brekke, D. Easton, M. Ejeta, R. Peterson, and R. Snyder, 2008. 22 Progress on Incorporating Climate Change into Management of California’s Water Resources. 23 Climatic Change 89, Supplement 1 (March):91–108. Netherlands: Springer. 24
Auffhammer, M. 2011. Potential Impacts of Extreme Events on Electrical Energy Demand and 25 Infrastructure. In Proceedings from Vulnerability and Adaptation to Extreme Events in California 26 in the Context of a Changing Climate: New Scientific Findings. Scripps Institute of Oceanography. 27 Tuesday, December 13, 2011. 28
Bay Institute. 1998. From the Sierra to the Sea: An Ecological History of the San Francisco Bay-Delta 29 Watershed. Novato, CA: The Bay Institute of San Francisco. 30
Bureau of Reclamation. 2011. SECURE Water Act Section 9503(c) – Reclamation Climate Change and 31 Water 2011. April. Available: <http://www.usbr.gov/climate/SECURE/docs/ 32 SECUREWaterReport.pdf>. Accessed: March 8, 2012>. 33
———. 2013. WaterSMART. Last Revised: June 12, 2013. Available: 34 <http://www.usbr.gov/WaterSMART/index.cfm>. Accessed: July 25, 2013. 35
California Department of Fish and Game. 2010. Climate Change: Confronting the Challenge. Fall. 36 Available at <http://nrm.dfg.ca.gov/FileHandler.ashx?DocumentID=31839&inline=true>. 37 Accessed: March 8, 2012. 38
California Department of Water Resources. 2008. Managing an Uncertain Future. Climate Change 39 Adaptation Strategies for California’s Water. October. 40
Climate Change
Bay Delta Conservation Plan/California WaterFix Final EIR/EIS
Administrative Final 29-34
2016 ICF 00139.14
———. 2009. 2012 Central Valley Flood Protection Plan. Climate Change Scope Definition Work Group 1 Summary Report. Draft. December. 2
———. 2010a. Model CEQA Climate Change Discussion and Impact Analysis Section. Prepared by the 3 California Department of Water Resources CEQA Climate Change Committee. January. 4
———. 2010b. Climate Change Characterization and Analysis in California Water Resources Planning 5 Studies. Final Report. December. 6
———. 2010c. California Water Plan Update 2009. Available: 7 <http://www.waterplan.water.ca.gov/cwpu2009/>. Accessed: March 8, 2012. 8
———.2011. 2012 Central Valley Flood Protection Plan. Executive Summary. Public Draft. December. 9
California Energy Commission. 2011a. California Climate Change Portal. Available: 10 <http://www.climatechange.ca.gov/background/index.html>. Accessed: November 4, 2011. 11 Last Modified: May 2, 2008. 12
California Natural Resources Agency. 2009. 2009 California Climate Adaptation Strategy: A Report to 13 the Governor and Legislature in Response to Executive Order S-13-08. December 2. Available: 14 <http://www.climatechange.ca.gov/adaptation/>. Accessed: March 8, 2012. 15
———. 2013. Our Changing Climate 2012: Vulnerability & Adaptation to increasing Risks from 16 Climate Change in California. Available: <http://www.energy.ca.gov/ 2012publications/CEC-17 500-2012-007/CEC-500-2012-007.pdf>. Accessed: August 1, 2013. 18
Callaway, J. C., V. T. Parker, M. C. Vasey, L. M. Schile, and E. R. Herbert. 2011. Tidal Wetland 19 Restoration in San Francisco Bay: History and Current Issues. San Francisco Estuary and 20 Watershed Science 9(3):1-12. Available: <http://www.escholarship.org/uc/item/5dd3n9x3>. 21
Cayan, D., M. Tyree, M. Dettinger, H. Hidalgo, T. Das, E. Maurer, P. Bromirski, N. Graham and R. Flick. 22 2009. Climate Change Scenarios and SLR Estimates for the California 2008 Climate Change 23 Scenarios Assessment. Prepared by the California Climate Change Center for the California 24 Energy Commission. CEC-500-2009-014-D. Sacramento, CA. Available: 25 <http://www.energy.ca.gov/2009publications/CEC-500-2009-014/CEC-500-2009-014-D.PDF>. 26 Accessed: March 8, 2012. 27
Climate Action Team. 2010. Climate Action Team Biennial Report. April. 28
Dettinger, M. 2011. Climate Change, Atmospheric Rivers, and Floods in California – A Multimodel 29 Analysis of Storm Frequency and Magnitude Changes. Journal of the American Water Resources 30 Association (JAWRA) 47(3):514–523. 31
Dettinger, M. and Ralph, M. 2011. Storms, Floods, and the Science of Atmospheric Rivers. Eos 92(32). 32 August 9. 33
Gershunov, A. 2011. Expected Changes in Key Weather-Related Extreme Events in California. In 34 Proceedings from Vulnerability and Adaptation to Extreme Events in California in the Context of a 35 Changing Climate: New Scientific Findings. Scripps Institute of Oceanography. Tuesday, 36 December 13, 2011. 37

Climate Change
Bay Delta Conservation Plan/California WaterFix Final EIR/EIS
Administrative Final 29-35
2016 ICF 00139.14
Griggs, G. 2011. Coastal Hazards, SLR and Extreme Events. In Proceedings from Vulnerability and 1 Adaptation to Extreme Events in California in the Context of a Changing Climate: New Scientific 2 Findings. Scripps Institute of Oceanography. Tuesday, December 13, 2011. 3
Huber-Lee, A., Yates, D., Purkey, D., Yu, W., and Runkle, B. 2003. Water, Climate, Food, and 4 Environment in the Sacramento Basin. Contribution to the Project ADAPT: Adaptation Strategies 5 to Changing Environments. Available: <http://www.weap21.org/downloads/ 6 adapt_sacramento.pdf>. Accessed: May 21, 2012. 7
Intergovernmental Panel on Climate Change. 2007a. Climate Change 2007: The Physical Science Basis. 8 Contribution of Working Group I to the Fourth Assessment Report of the Intergovernmental Panel 9 on Climate Change. S. Solomon, D. Qin, M. Manning, Z. Chen, M. Marquis, K. B. Averyt, M. Tignor 10 and H. L. Miller (eds.). New York, NY: Cambridge University Press. Available: 11 <http://www.ipcc.ch/publications_and_data/publications_and_data_reports.shtml>. Accessed: 12 March 8, 2012. 13
———. 2007b. Climate Change 2007: Impacts, Adaptation and Vulnerability. Contribution of Working 14 Group II to the Fourth Assessment Report of the Intergovernmental Panel on Climate Change. M. L. 15 Parry, O. F. Canziani, J. P. Palutikof, P. J. van der Linden and C. E. Hanson (eds.). New York, NY: 16 Cambridge University Press. Available: <http://www.ipcc.ch/publications_and_data/ 17 publications_and_data_reports.shtml>. Accessed: March 8, 2012. 18
———. 2011. Organization. Available: <http://www.ipcc.ch/organization/organization.shtml>. 19 Accessed: September 29, 2011. 20
Jackson, L., D. Lobell, C. Field, M. Hanemann, R. Howitt, and A. Gunasekara. 2011. Extreme Events and 21 Agriculture Production in California. In Proceedings from Vulnerability and Adaptation to 22 Extreme Events in California in the Context of a Changing Climate: New Scientific Findings. Scripps 23 Institute of Oceanography. Tuesday, December 13, 2011. 24
Kaushal S. S., G. E. Likens, N. A. Jaworski, M. L. Pace, A. M. Sides, D. Seekell, K. T. Belt, D. H. Secor, and 25 R. L. Wingate. 2010. Rising Stream and River Temperatures in the United States. Frontiers in 26 Ecology and the Environment 8:461–466. 27
MacWilliams, M. L., F. G. Salcedo, and E. S. Gross. 2009. Draft San Francisco Bay-Delta UnTRIM Model 28 Calibration Report, Sacramento and Stockton Deep Water Ship Channel 3-D Hydrodynamic and 29 Salinity Modeling Study. Prepared for US. Army Corps of Engineers, San Francisco District. July. 30
Mitsch, W. J. and J. G. Gosselink. 2000. Wetlands 3. Canada: John Wiley and Sons. 31
Moser, S., G. Franco, S. Pittiglio, W. Chou, and D. Cayan. 2009. The Future is Now: An Update on 32 Climate Change Science Impacts and Response Options for California (Special Report California 33 Climate Change Center). Prepared for the California Energy Commission. CEC-500-2008-071. 34 Sacramento, CA. 35
Moyle, P. B., P. K. Crain, and K. Whitener. 2007. Patterns in the Use of a Restored California 36 Floodplain by Native and Alien Fishes. San Francisco Estuary and Watershed Science 5(3):1–27. 37
National Research Council. 2012. Sea-Level Rise for the Coasts of California, Oregon, and Washington: 38 Past, Present, and Future. National Academies Press. 39

Climate Change
Bay Delta Conservation Plan/California WaterFix Final EIR/EIS
Administrative Final 29-36
2016 ICF 00139.14
Parker, V. T., J. C. Calloway, L. M. Schile, M. C. Vasey, and E. R. Herbert. 2011. Climate Change and San 1 Francisco Bay–Delta Tidal Wetlands. San Francisco Estuary and Watershed Science 9(3). 2
Rahmstorf, S. 2007. A Semi-Empirical Approach to Projecting Future Sea-Level Rise. Science 3 315:368–370. DOI: 10.1126/science.1141283. 4
Resource Management Association, Inc. (RMA). 2005. Flooded Island Pre-feasibility Study: RMA Delta 5 Model Calibration Report. June. 6
San Francisco Bay Conservation and Development Commission. 2009. Living with a Rising Bay: 7 Vulnerability and Adaptation in San Francisco Bay and on the Shoreline. Draft Staff Report. San 8 Francisco, CA. Available: <http://www.bcdc.ca.gov/proposed_bay_plan/bp_amend_1-08.shtml>. 9 Accessed: November 22, 2011. 10
U.S. Army Corps of Engineers. 2002. Comprehensive Study, Sacramento and San Joaquin River Basins. 11 Sacramento, CA. 12
U.S. Geological Survey. 2000. Sacramento–San Joaquin Delta: The Sinking Heart of the State. Prepared 13 by S. E. Ingebritsen, M. E. Ikehara, D. L. Galloway, and D. R. Jones. USGS Fact Sheet 005-00. 14 Available: <http://pubs.usgs.gov/fs/2000/fs00500/>. Accessed: March 8, 2012. 15
Western Regional Climate Center. 2012. Climate Summary. Available: 16 <http://www.wrcc.dri.edu/cgi-bin/cliMAIN.pl?ca7633>. Accessed: June 5, 2012. 17
Witham, C., E. T. Bauder, D. Belk, W. R. Ferren Jr., and R. Ornduff (eds.). Ecology, Conservation, and 18 Management of Vernal Pool Ecosystems. Proceedings from a 1996 Conference. Sacramento, CA: 19 California Native Plant Society. 20