
Chapter 11. Economic Impacts and Jobs - NREL
130
Chapter 11. Economic Impacts and Jobs FINAL REPORT: LA100—The Los Angeles 100% Renewable Energy Study March 2021 maps.nrel.gov/la100
-
Upload
khangminh22 -
Category
Documents
-
view
4 -
download
0
Transcript of Chapter 11. Economic Impacts and Jobs - NREL
Chapter 11. Economic Impacts and Jobs FINAL REPORT: LA100—The Los Angeles 100% Renewable Energy Study
March 2021
maps.nrel.gov/la100
FINAL REPORT: The Los Angeles 100% Renewable Energy Study
Chapter 11. Economic Impacts and Jobs March 2021
Lead Author of Chapter 11: David Keyser1 Computable General Equilibrium Assessment of Net Economic Impacts: Harvey Cutler,2 Adam Rose,3 Dan Wei,3 Martin Shields2
Workforce and Gross Economic Impacts: David Keyser1 1 National Renewable Energy Laboratory 2 Colorado State University 3 University of Southern California
Suggested Citation—Entire Report Cochran, Jaquelin, and Paul Denholm, eds. 2021. The Los Angeles 100% Renewable Energy Study. Golden, CO: National Renewable Energy Laboratory. NREL/TP-6A20-79444. https://maps.nrel.gov/la100/.
Suggested Citation—Chapter 11 Keyser, David, Harvey Cutler, Adam Rose, Dan Wei, and Martin Shields. 2021. “Chapter 11: Economic Impacts and Jobs.” In The Los Angeles 100% Renewable Energy Study, edited by Jaquelin Cochran and Paul Denholm. Golden, CO: National Renewable Energy Laboratory. NREL/TP-6A20-79444-11. https://www.nrel.gov/docs/fy21osti/79444-11.pdf.

Produced under direction of the Los Angeles Department of Water and Power by the National Renewable Energy Laboratory (NREL) under ACT Agreement 18-39, LADWP Ref: 47481.
NOTICE This work was authored, in part, by the National Renewable Energy Laboratory (NREL), operated by Alliance for Sustainable Energy, LLC, for the U.S. Department of Energy (DOE) under Contract No. DE-AC36-08GO28308. Support for the work was provided by the Los Angeles Department of Water and Power under ACT Agreement 18-39, LADWP Ref: 47481. The views expressed in the article do not necessarily represent the views of the DOE or the U.S. Government. The U.S. Government retains and the publisher, by accepting the article for publication, acknowledges that the U.S. Government retains a nonexclusive, paid-up, irrevocable, worldwide license to publish or reproduce the published form of this work, or allow others to do so, for U.S. Government purposes.
This report is available at no cost from the National Renewable Energy Laboratory (NREL) at www.nrel.gov/publications.
U.S. Department of Energy (DOE) reports produced after 1991 and a growing number of pre-1991 documents are available free via www.OSTI.gov.
Cover photo from iStock 596040774.
NREL prints on paper that contains recycled content.

Chapter 11. Economic Impacts and Jobs
LA100: The Los Angeles 100% Renewable Energy Study Chapter 11, page iii
Context The Los Angeles 100% Renewable Energy Study (LA100) is presented as a collection of 12 chapters and an executive summary, each of which is available as an individual download.
• The Executive Summary describes the study and scenarios, explores the high-level findings that span the study, and summarizes key findings from each chapter.
• Chapter 1: Introduction introduces the study and acknowledges those who contributed to it. • Chapter 2: Study Approach describes the study approach, including the modeling framework and
scenarios. • Chapter 3: Electricity Demand Projections explores how electricity is consumed by customers
now, how that might change through 2045, and potential opportunities to better align electricity demand and supply.
• Chapter 4: Customer-Adopted Rooftop Solar and Storage explores the technical and economic potential for rooftop solar in LA, and how much solar and storage might be adopted by customers.
• Chapter 5: Utility Options for Local Solar and Storage identifies and ranks locations for utility-scale solar (ground-mount, parking canopy, and floating) and storage, and associated costs for integrating these assets into the distribution system.
• Chapter 6: Renewable Energy Investments and Operations explores pathways to 100% renewable electricity, describing the types of generation resources added, their costs, and how the systems maintain sufficient resources to serve customer demand, including resource adequacy and transmission reliability.
• Chapter 7: Distribution System Analysis summarizes the growth in distribution-connected energy resources and provides a detailed review of impacts to the distribution grid of growth in customer electricity demand, solar, and storage, as well as required distribution grid upgrades and associated costs.
• Chapter 8: Greenhouse Gas Emissions summarizes greenhouse gas emissions from power, buildings, and transportation sectors, along with the potential costs of those emissions.
• Chapter 9: Air Quality and Public Health summarizes changes to air quality (fine particulate matter and ozone) and public health (premature mortality, emergency room visits due to asthma, and hospital admissions due to cardiovascular diseases), and the potential economic value of public health benefits.
• Chapter 10: Environmental Justice explores implications for environmental justice, including procedural and distributional justice, with an in-depth review of how projections for customer rooftop solar and health benefits vary by census tract.
• Chapter 11: Economic Impacts and Jobs (this chapter) reviews economic impacts, including local net economic impacts and gross workforce impacts.
• Chapter 12: Synthesis reviews high-level findings, costs, benefits, and lessons learned from integrating this diverse suite of models and conducting a high-fidelity 100% renewable energy study.
Chapter 11. Economic Impacts and Jobs
LA100: The Los Angeles 100% Renewable Energy Study Chapter 11, page iv
Table of Contents Key Findings ................................................................................................................................................ 1 1 Introduction ........................................................................................................................................... 7 2 Methodology ......................................................................................................................................... 9
2.1 Net Economic Impact Analysis ................................................................................................... 11 2.2 Jobs Analysis—Input-Output Methodology ............................................................................... 14
2.2.1 Caveats to the Jobs Analysis .......................................................................................... 16 2.2.2 Summary of Assumptions—Net Economic Impacts and Gross Jobs Analysis.............. 16
3 Results and Discussion ..................................................................................................................... 18 3.1 Net Economic Impacts ................................................................................................................ 18
3.1.1 LA100-Specific Electricity Expenditures Used in CGE Analysis ................................. 18 3.1.2 Estimating Annual Commercial and Industrial Electricity Expenditures in LA ............ 19 3.1.3 Input Data from the LA100 Scenarios ........................................................................... 20 3.1.4 Aggregate Impacts.......................................................................................................... 23 3.1.5 Income Distribution Impacts .......................................................................................... 27 3.1.6 Conclusion—Net Economic Impacts ............................................................................. 30
3.2 Jobs and Gross Economic Impact Analysis ................................................................................ 31 3.2.1 Capacity Additions by Scenario Used in Input-Output Analysis ................................... 31 3.2.2 Overview of Scenarios ................................................................................................... 34 3.2.3 SB100 – High Load Electrification ................................................................................ 41 3.2.4 Early & No Biofuels – High Load Electrification .......................................................... 45 3.2.5 Transmission Focus – High Load Electrification ........................................................... 50 3.2.6 Limited New Transmission – High Load Electrification ............................................... 54 3.2.7 Discussion of Jobs Results ............................................................................................. 58 3.2.8 Conclusion—Jobs Analysis ............................................................................................ 61
4 References .......................................................................................................................................... 62 Appendix A. Methodology Detail ...................................................................................................... 64
A.1 I-O Methodology ......................................................................................................................... 64 A.2 JEDI and IMPLAN ...................................................................................................................... 65
Appendix B. Computable General Equilibrium Results ................................................................. 66 B.1 Absolute Impacts of LA100 Scenarios ........................................................................................ 66 B.2 Income Distribution Impacts of LA100 Scenarios Relative to SB100 – Moderate Electrification
68 B.3 Absolute Income Distribution Impacts of LA100 Scenarios ...................................................... 76
Appendix C. Input-Output Results .................................................................................................... 85 C.1 SB100 – Moderate Load Electrification ...................................................................................... 85 C.2 SB100 – Stress Load Electrification ........................................................................................... 92 C.3 Early & No Biofuels – Moderate Load Electrification ............................................................... 99 C.4 Transmission Focus – Moderate Load Electrification............................................................... 106 C.5 Limited New Transmission – Moderate Electrification ............................................................ 113

Chapter 11. Economic Impacts and Jobs
LA100: The Los Angeles 100% Renewable Energy Study Chapter 11, page v
List of Figures Figure 1. Average annual net job changes in each scenario relative to SB100 – Moderate (2026–2045) .... 2 Figure 2. Annual average jobs supported by in- and out-of-basin construction and installation, by scenario
(2026–2045) ............................................................................................................................. 3 Figure 3. Annual average employment supported by both in- and out-of-basin O&M, by scenario (2026–
2045) ........................................................................................................................................ 4 Figure 4. Distribution of employment supported by each technology, averaged across all scenarios .......... 5 Figure 5. Chapter 11 shows how changes in expenditures for LA100 investments in the power system,
provided in Chapter 6 (Renewable Energy Investments and Operations), can affect the economy within LA and the greater LADWP balancing area, including jobs and household income ...................................................................................................................................... 8
Figure 6. Capacity additions by scenario and location for the Moderate and High load projections ......... 11 Figure 7. Computable general equilibrium model structure ....................................................................... 12 Figure 8. In-basin capital expenditures from RPM (2026–2045) ............................................................... 31 Figure 9. Out-of-basin capital expenditures from RPM (2026–2045) ........................................................ 32 Figure 10. In-basin O&M expenditures (2026–2045)................................................................................. 33 Figure 11. Out-of-basin non-capital O&M expenditures (2026–2045) ...................................................... 34 Figure 12. Annual employment due to in-basin construction and installations, by scenario, averaged
across 2026–2045 ................................................................................................................... 35 Figure 13. Average annual employment due to in-basin construction and installation, by scenario (2026–
2045) ...................................................................................................................................... 36 Figure 14. Average annual employment due to out-of-basin construction and installation, by scenario
(2026–2045) ........................................................................................................................... 37 Figure 15. Average annual employment due to out-of-basin construction and installation, by scenario,
2026–2045 .............................................................................................................................. 38 Figure 16. Average annual employment supported by in-basin O&M (2026–2045) ................................. 39 Figure 17. Average annual employment supported by out-of-basin O&M (2026–2045) ........................... 40 Figure 18. SB100 – High average annual employment due to in-basin construction and installation,
by technology (2026–2045) ................................................................................................... 42 Figure 19. SB100 – High average annual employment due to out-of-basin construction and installation,
by technology (2026–2045) ................................................................................................... 43 Figure 20. SB100 – High average annual employment due to in-basin O&M, by technology (2026–2045)
................................................................................................................................................ 44 Figure 21. SB100 – High average annual employment, due to out-of-basin O&M, by technology (2026–
2045) ...................................................................................................................................... 45 Figure 22. Early & No Biofuels – High average annual employment due to in-basin construction and
installation, by technology (2026–2045) ................................................................................ 47 Figure 23. Early & No Biofuels – High average annual employment due to out-of-basin construction and
installation, by technology (2026–2045) ................................................................................ 48 Figure 24. Early & No Biofuels – High average annual employment due to in-basin O&M, by technology
(2026–2045) ........................................................................................................................... 49 Figure 25. Early & No Biofuels – High average annual employment, due to out-of-basin O&M,
by technology (2026–2045) ................................................................................................... 50 Figure 26. Transmission Focus – High average annual employment due to in-basin construction and
installation, by technology (2026–2045) ................................................................................ 51 Figure 27. Transmission Focus – High average annual employment due to out-of-basin construction and
installation, by technology (2026–2045) ................................................................................ 52 Figure 28. Transmission Focus – High average annual employment due to in-basin O&M, by technology
(2026–2045) ........................................................................................................................... 53
Chapter 11. Economic Impacts and Jobs
LA100: The Los Angeles 100% Renewable Energy Study Chapter 11, page vi
Figure 29. Transmission Focus – High average annual employment, due to out-of-basin O&M, by technology (2026–2045) ........................................................................................................ 54
Figure 30. Limited New Transmission – High average annual employment due to in-basin construction and installation, by technology (2026–2045) ......................................................................... 55
Figure 31. Limited New Transmission – High average annual employment due to out-of-basin construction and installation, by technology (2026–2045) .................................................... 56
Figure 32. Limited New Transmission – High average annual employment due to in-basin O&M, by technology (2026–2045) ........................................................................................................ 57
Figure 33. Limited New Transmission – High average annual employment, due to out-of-basin O&M, by technology (2026–2045) ........................................................................................................ 58
Figure 34. Average distribution of jobs, and associated average annual earnings, across all scenarios due to construction and installation .............................................................................................. 59
Figure 35. Average distribution of jobs, and associated annual earnings across all scenarios, due to non-capital O&M .......................................................................................................................... 60
Figure 36. The structure of a SAM ............................................................................................................. 64
List of Tables Table 1. Comparison of Models Used in this Chapter .................................................................................. 9 Table 2. Types of Impacts Included in Both Sets of Analyses (Net Economic Impacts and Jobs) ............ 10 Table 3. Estimated Annual Electricity Expenditures by Household Income Group in LA ........................ 19 Table 4. Average 5-Year RPM-Based Electricity Price Increase Estimates Relative to 2020 ................... 21 Table 5. Scenario Electricity Price Changes Relative to SB100 – Moderate ............................................. 21 Table 6. Scenario O&M Annual Single-Year Expenditures (2019$ million) ............................................. 22 Table 7. Scenario Capital Expenditure Average Over the Five Years Prior and 20-Year Cumulative Total
(2019$ million) ...................................................................................................................... 23 Table 8. Scenario Capital and O&M Annual Average Expenditures (2019$ million) ............................... 23 Table 9. Net Economic Impacts of the LA100 Capacity Expansion Scenarios Relative to SB100 –
Moderate ................................................................................................................................ 25 Table 10. Income Distribution Impact Comparison of Two Time Periods, Early & No Biofuels –
Moderate ................................................................................................................................ 28 Table 11. Gini Coefficients of the Income Distribution Impacts Relative to SB100 – Moderate .............. 29 Table 12. Gini Coefficients of the Absolute Income Impacts Relative to SB100 – Moderate ................... 30 Table 13. Summary of Annual Impacts from In-Basin Construction and Installation, Averaged Across
all Scenarios (2026–2045)...................................................................................................... 34 Table 14. Summary of Annual Impacts from Out-Of-Basin Construction and Installation, Averaged
Across all Scenarios (2026–2045) ......................................................................................... 35 Table 15. Summary of Annual Impacts Due to In-Basin O&M, Averaged Across all Scenarios (2026–
2045) ...................................................................................................................................... 40 Table 16. Summary of Annual Impacts Due to Non-Capital Out-Of-Basin O&M, Averaged Across
all Scenarios (2026–2045)...................................................................................................... 41 Table 17. SB100 – High Average Annual In-Basin Construction and Installation Impacts (2026–2045) . 41 Table 18. SB100 – High Average Annual Out-Of-Basin Construction and Installation Impacts (2026–
2045) ...................................................................................................................................... 42 Table 19. SB100 – High Average Annual In-Basin O&M Impacts (2026–2045) ...................................... 43 Table 20. SB100 – High Average Annual Out-Of-Basin Non-Capital O&M Impacts (2026–2045) ......... 44 Table 21. Early & No Biofuels – High Average In-Basin Annual Construction and Installation Impacts
(2026–2045) ........................................................................................................................... 46 Table 22. Early & No Biofuels – High Average Out-Of-Basin Annual Construction and Installation
Impacts (2026–2045) ............................................................................................................. 46
Chapter 11. Economic Impacts and Jobs
LA100: The Los Angeles 100% Renewable Energy Study Chapter 11, page vii
Table 23. Early & No Biofuels – High Average In-Basin Annual O&M Impacts (2026–2045) ................ 48 Table 24. Early & No Biofuels – High Average Out-Of-Basin O&M Impacts (2026–2045) .................... 48 Table 25. Transmission Focus – High Average In-Basin Annual Construction and Installation Impacts
(2026–2045) ........................................................................................................................... 50 Table 26. Transmission Focus – High Average Out-of-Basin Annual Construction and Installation
Impacts (2026–2045) ............................................................................................................. 51 Table 27. Transmission Focus – High Average In-Basin Annual O&M Impacts (2026–2045) ................. 52 Table 28. Transmission Focus – High Average Out-Of-Basin Annual O&M Impacts (2026–2045) ......... 53 Table 29. Limited New Transmission – High Average In-Basin Annual Construction and Installation
Impacts (2026–2045) ............................................................................................................. 54 Table 30. Limited New Transmission – High Average Out-Of-Basin Annual Construction and Installation
Impacts (2026–2045) ............................................................................................................. 55 Table 31. Limited New Transmission – High Average In-Basin Annual O&M Impacts (2026–2045) ..... 56 Table 32. Limited New Transmission – High Average Out-Of-Basin Annual O&M Impacts (2026–2045)
................................................................................................................................................ 57 Table 33. Results for Limited New Transmission and Early & No Biofuels Scenarios ............................. 66 Table 34. Results for SB100 and Transmission Focus Scenarios ............................................................... 67 Table 35. Limited New Transmission – High Load Electrification ............................................................ 68 Table 36. Limited New Transmission – Moderate Load Electrification..................................................... 69 Table 37. Early & No Biofuels – High Load Electrification ...................................................................... 70 Table 38. Early & No Biofuels – Moderate Load Electrification ............................................................... 71 Table 39. SB100 – High Load Electrification ............................................................................................. 72 Table 40. SB100 – Stress Load Electrification ........................................................................................... 73 Table 41. Transmission Focus – High Load Electrification ....................................................................... 74 Table 42. Transmission Focus – Moderate Load Electrification ................................................................ 75 Table 43. Limited New Transmission – High Load Electrification ............................................................ 76 Table 44. Limited New Transmission – Moderate Load Electrification..................................................... 77 Table 45. Early & No Biofuels – High Load Electrification ...................................................................... 78 Table 46. Early & No Biofuels – Moderate Load Electrification ............................................................... 79 Table 47. SB100 – High Load Electrification ............................................................................................. 80 Table 48. SB100 – Moderate Load Electrification ..................................................................................... 81 Table 49. SB100 – Stress Load Electrification ........................................................................................... 82 Table 50. Transmission Focus – High Load Electrification ....................................................................... 83 Table 51. Transmission Focus – Moderate Load Electrification ................................................................ 84 Table 52. SB100 – Moderate Load Electrification In-Basin Construction and Installation Jobs ............... 85 Table 53. SB100 – Moderate Load Electrification In-Basin Construction and Installation Earnings ........ 85 Table 54. SB100 – Moderate Load Electrification In-Basin Construction and Installation Output ........... 86 Table 55. SB100 – Moderate Load Electrification In-Basin Construction and Installation Value Added . 86 Table 56. SB100 – Moderate Load Electrification In-Basin O&M Jobs .................................................... 86 Table 57. SB100 – Moderate Load Electrification In-Basin O&M Earnings ............................................. 87 Table 58. SB100 – Moderate Load Electrification In-Basin O&M Output ................................................ 87 Table 59. SB100 – Moderate Load Electrification In-Basin O&M Value Added ...................................... 87 Table 60. SB100 – Moderate Load Electrification Out-of-Basin Construction and Installation Jobs ........ 88 Table 61. SB100 – Moderate Load Electrification Out-of-Basin Construction and Installation Earnings . 88 Table 62. SB100 – Moderate Load Electrification Out-of-Basin Construction and Installation Output .... 89 Table 63. SB100 – Moderate Load Electrification Out-of-Basin Construction and Installation Value
Added ..................................................................................................................................... 89 Table 64. SB100 – Moderate Load Electrification Out-of-Basin O&M Jobs ............................................. 90 Table 65. SB100 – Moderate Load Electrification Out-of-Basin O&M Earnings ...................................... 90 Table 66. SB100 – Moderate Load Electrification Out-of-Basin O&M Output ......................................... 91 Table 67. SB100 – Moderate Load Electrification Out-of-Basin O&M Value Added ............................... 91
Chapter 11. Economic Impacts and Jobs
LA100: The Los Angeles 100% Renewable Energy Study Chapter 11, page viii
Table 68. SB100 – Stress Load Electrification In-Basin Construction and Installation Jobs ..................... 92 Table 69. SB100 – Stress Load Electrification In-Basin Construction and Installation Earnings .............. 92 Table 70. SB100 – Stress Load Electrification In-Basin Construction and Installation Output ................. 93 Table 71. SB100 – Stress Load Electrification In-Basin Construction and Installation Value Added ....... 93 Table 72. SB100 – Stress Load Electrification In-Basin O&M Jobs .......................................................... 93 Table 73. SB100 – Stress Load Electrification In-Basin O&M Earnings ................................................... 94 Table 74. SB100 – Stress Load Electrification In-Basin O&M Output ...................................................... 94 Table 75. SB100 – Stress Load Electrification In-Basin O&M Value Added ............................................ 94 Table 76. SB100 – Stress Load Electrification Out-of-Basin Construction and Installation Jobs .............. 95 Table 77. SB100 – Stress Load Electrification Out-of-Basin Construction and Installation Earnings ....... 95 Table 78. SB100 – Stress Load Electrification Out-of-Basin Construction and Installation Output .......... 96 Table 79. SB100 – Stress Load Electrification Out-of-Basin Construction and Installation Value Added 96 Table 80. SB100 – Stress Load Electrification Out-of-Basin O&M Jobs .................................................. 97 Table 81. SB100 – Stress Load Electrification Out-of-Basin O&M Earnings ........................................... 97 Table 82. SB100 – Stress Load Electrification Out-of-Basin O&M Output .............................................. 98 Table 83. SB100 – Stress Load Electrification Out-of-Basin O&M Value Added .................................... 98 Table 84. Early & No Biofuels – Moderate Load Electrification In-Basin Construction and Installation
Jobs ........................................................................................................................................ 99 Table 85. Early & No Biofuels – Moderate Load Electrification In-Basin Construction and Installation
Earnings ................................................................................................................................. 99 Table 86. Early & No Biofuels – Moderate Load Electrification In-Basin Construction and Installation
Output .................................................................................................................................. 100 Table 87. Early & No Biofuels – Moderate Load Electrification In-Basin Construction and Installation
Value Added ........................................................................................................................ 100 Table 88. Early & No Biofuels – Moderate Load Electrification In-Basin O&M Jobs ............................ 100 Table 89. Early & No Biofuels – Moderate Load Electrification In-Basin O&M Earnings ..................... 101 Table 90. Early & No Biofuels – Moderate Load Electrification In-Basin O&M Output ........................ 101 Table 91. Early & No Biofuels – Moderate Load Electrification In-Basin O&M Value Added .............. 101 Table 92. Early & No Biofuels – Moderate Load Electrification Out-of-Basin Construction and
Installation Jobs .................................................................................................................... 102 Table 93. Early & No Biofuels – Moderate Load Electrification Out-of-Basin Construction and
Installation Earnings ............................................................................................................ 102 Table 94. Early & No Biofuels – Moderate Load Electrification Out-of-Basin Construction and
Installation Output ................................................................................................................ 103 Table 95. Early & No Biofuels – Moderate Load Electrification Out-of-Basin Construction and
Installation Value Added ..................................................................................................... 103 Table 96. Early & No Biofuels – Moderate Load Electrification Out-of-Basin O&M Jobs .................... 104 Table 97. Early & No Biofuels – Moderate Load Electrification out-of-Basin O&M Earnings .............. 104 Table 98. Early & No Biofuels – Moderate Load Electrification Out-of-Basin O&M Output ................ 105 Table 99. Early & No Biofuels – Moderate Load Electrification Out-of-Basin O&M Value Added ...... 105 Table 100. Transmission Focus – Moderate Load Electrification In-Basin Construction and Installation
Jobs ...................................................................................................................................... 106 Table 101. Transmission Focus – Moderate Load Electrification In-Basin Construction and Installation
Earnings ............................................................................................................................... 106 Table 102. Transmission Focus – Moderate Load Electrification In-Basin Construction and Installation
Output .................................................................................................................................. 106 Table 103. Transmission Focus – Moderate Load Electrification In-Basin Construction And Installation
Value Added ........................................................................................................................ 107 Table 104. Transmission Focus – Moderate Load Electrification In-Basin O&M Jobs ........................... 107 Table 105. Transmission Focus – Moderate Load Electrification In-Basin O&M Earnings .................... 107 Table 106. Transmission Focus – Moderate Load Electrification In-Basin O&M Output ....................... 108
Chapter 11. Economic Impacts and Jobs
LA100: The Los Angeles 100% Renewable Energy Study Chapter 11, page ix
Table 107. Transmission Focus – Moderate Load Electrification In-Basin O&M Value Added ............. 108 Table 108. Transmission Focus – Moderate Load Electrification Out-of-Basin Construction and
Installation Jobs .................................................................................................................... 109 Table 109. Transmission Focus – Moderate Load Electrification Out-of-Basin Construction and
Installation Earnings ............................................................................................................ 109 Table 110. Transmission Focus – Moderate Load Electrification Out-of-Basin Construction and
Installation Output ................................................................................................................ 110 Table 111. Transmission Focus – Moderate Load Electrification Out-of-Basin Construction and
Installation Value Added ..................................................................................................... 110 Table 112. Transmission Focus – Moderate Load Electrification Out-of-Basin O&M Jobs.................... 111 Table 113. Transmission Focus – Moderate Load Electrification Out-of-Basin O&M Earnings ............ 111 Table 114. Transmission Focus – Moderate Load Electrification Out-of-Basin O&M Output ................ 112 Table 115. Transmission Focus – Moderate Load Electrification Out-of-Basin O&M Value Added ..... 112 Table 116. Limited New Transmission – Moderate Load Electrification In-Basin Construction and
Installation Jobs .................................................................................................................... 113 Table 117. Limited New Transmission – Moderate Load Electrification In-Basin Construction and
Installation Earnings ............................................................................................................ 113 Table 118. Limited New Transmission – Moderate Load Electrification In-Basin Construction and
Installation Output ................................................................................................................ 113 Table 119. Limited New Transmission – Moderate Load Electrification In-Basin Construction and
Installation Value Added ..................................................................................................... 114 Table 120. Limited New Transmission – Moderate Load Electrification In-Basin O&M Jobs ............... 114 Table 121. Limited Transmission – Moderate Load Electrification In-Basin O&M Earnings ................. 114 Table 122. Limited New Transmission – Moderate Load Electrification In-Basin O&M Output ........... 115 Table 123. Limited New Transmission – Moderate Load Electrification In-Basin O&M Value Added . 115 Table 124. Limited New Transmission – Moderate Load Electrification Out-of-Basin Construction and
Installation Jobs .................................................................................................................... 116 Table 125. Limited New Transmission – Moderate Load Electrification Out-of-Basin Construction and
Installation Earnings ............................................................................................................ 116 Table 126. Limited New Transmission – Moderate Load Electrification Out-of-Basin Construction and
Installation Output ................................................................................................................ 117 Table 127. Limited New Transmission – Moderate Load Electrification Out-of-Basin Construction and
Installation Value Added ..................................................................................................... 117 Table 128. Limited New Transmission – Moderate Load Electrification Out-of-Basin O&M Jobs ........ 118 Table 129. Limited New Transmission – Moderate Load Electrification Out-of-Basin O&M Earnings . 118 Table 130. Limited New Transmission – Moderate Load Electrification Out-of-Basin O&M Output .... 119 Table 131. Limited New Transmission – Moderate Load Electrification Out-of-Basin O&M Value Added
.............................................................................................................................................. 119

Chapter 11. Economic Impacts and Jobs
LA100: The Los Angeles 100% Renewable Energy Study Chapter 11, page 1
Key Findings This chapter assesses net economic impacts and gross jobs associated with the LA100 scenarios. In particular, this chapter assesses the net employment, gross domestic product (GDP), and distributional household income impacts within Los Angeles—both positive and negative—as well as workforce needs associated with the development and operation of the power system.
We used a computable general equilibrium (CGE) model to estimate net economic impacts within LA, factoring in both expenditures on construction and operation of infrastructure as well as how this infrastructure may be paid for. These changes can be positive or negative, depending on a number of factors such as how businesses and households change their consumption of different goods and services in response to changes in electricity prices. The model uses changes for all scenarios relative to 2020 prices, although a more accurate representation of changes is to choose a scenario as a reference case and compare other scenarios to this reference. This analysis compares all scenarios with SB100 – Moderate Load Electrification.
Key Findings—Net Economic Impacts 1. Net economic assessment shows that achieving LA100 scenarios will not affect LA’s
economy, on net, in any meaningful manner. While there may be slight positive or negative impacts, these changes are small in relationship to the 3.9 million jobs and $200 billion in annual output in the LA economy as a whole, so they have an almost negligible impact.
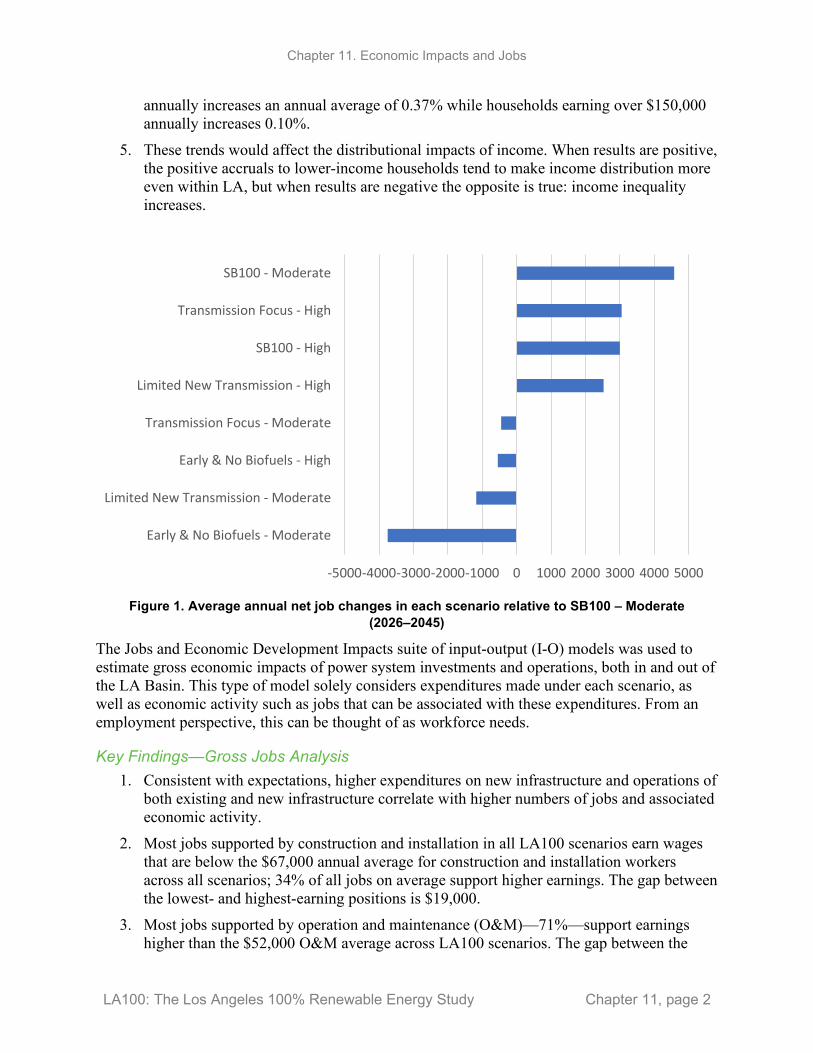
2. Using SB100 – Moderate as a reference scenario, the net economic impacts from 2026 to 2045 within LA range from a low of -3,800 jobs annually under the Early & No Biofuels – Moderate scenario to 4,600 additional jobs under the SB100 – Stress scenario (Figure 1). As a percentage of the 3.9 million employed in Los Angeles in 2019, these reflect changes of -0.10% and 0.12%, respectively.
3. These changes are economy wide and do not differentiate between those within or outside of specific energy technologies or the energy sector. Additionally, the changes do not consider programs such as those that offer retraining or workforce development to facilitate entry into other jobs.
4. Assuming equal distribution of costs across all income levels,1 lower-income households tend to be the most affected regardless of whether results are positive or negative. Under the Early & No Biofuels – Moderate scenario, where impacts are the most negative relative to SB100 – Moderate, average household income changes -0.51% annually for households earning less than $10,0002 annually from 2026 to 2045 compared to changes of 0.09% for households earning more than $150,000 annually. Under SB100 – Stress, where impacts are the most positive, income for households earning below $10,000
1 An equal distribution is used because costs are distributed evenly across households as electricity costs. Households that consume more electricity bear more costs than households that consume less electricity. This assumption is used because the study does not consider whether costs might be distributed differently based on income or tiered based on electricity consumption. These questions are unknown and based on decisions made by those setting rates. 2 All expenditures are in 2019 U.S. dollars.
Chapter 11. Economic Impacts and Jobs
LA100: The Los Angeles 100% Renewable Energy Study Chapter 11, page 2
annually increases an annual average of 0.37% while households earning over $150,000 annually increases 0.10%.
5. These trends would affect the distributional impacts of income. When results are positive, the positive accruals to lower-income households tend to make income distribution more even within LA, but when results are negative the opposite is true: income inequality increases.
Figure 1. Average annual net job changes in each scenario relative to SB100 – Moderate
(2026–2045)
The Jobs and Economic Development Impacts suite of input-output (I-O) models was used to estimate gross economic impacts of power system investments and operations, both in and out of the LA Basin. This type of model solely considers expenditures made under each scenario, as well as economic activity such as jobs that can be associated with these expenditures. From an employment perspective, this can be thought of as workforce needs.
Key Findings—Gross Jobs Analysis 1. Consistent with expectations, higher expenditures on new infrastructure and operations of
both existing and new infrastructure correlate with higher numbers of jobs and associated economic activity.
2. Most jobs supported by construction and installation in all LA100 scenarios earn wages that are below the $67,000 annual average for construction and installation workers across all scenarios; 34% of all jobs on average support higher earnings. The gap between the lowest- and highest-earning positions is $19,000.
3. Most jobs supported by operation and maintenance (O&M)—71%—support earnings higher than the $52,000 O&M average across LA100 scenarios. The gap between the
-5000-4000-3000-2000-1000 0 1000 2000 3000 4000 5000
Early & No Biofuels - Moderate
Limited New Transmission - Moderate
Early & No Biofuels - High
Transmission Focus - Moderate
Limited New Transmission - High
SB100 - High
Transmission Focus - High
SB100 - Moderate
Chapter 11. Economic Impacts and Jobs
LA100: The Los Angeles 100% Renewable Energy Study Chapter 11, page 3
lowest and highest earnings due to O&M within each scenario supported by each technology is $38,000.
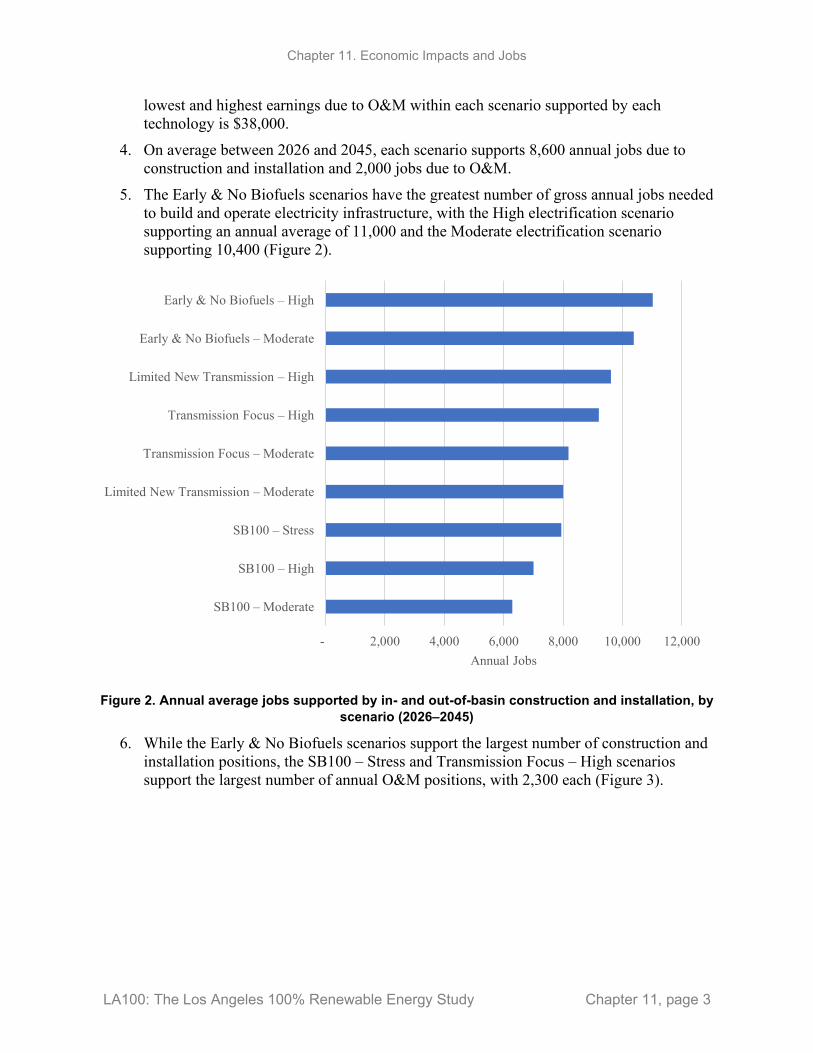
4. On average between 2026 and 2045, each scenario supports 8,600 annual jobs due to construction and installation and 2,000 jobs due to O&M.
5. The Early & No Biofuels scenarios have the greatest number of gross annual jobs needed to build and operate electricity infrastructure, with the High electrification scenario supporting an annual average of 11,000 and the Moderate electrification scenario supporting 10,400 (Figure 2).
Figure 2. Annual average jobs supported by in- and out-of-basin construction and installation, by
scenario (2026–2045)
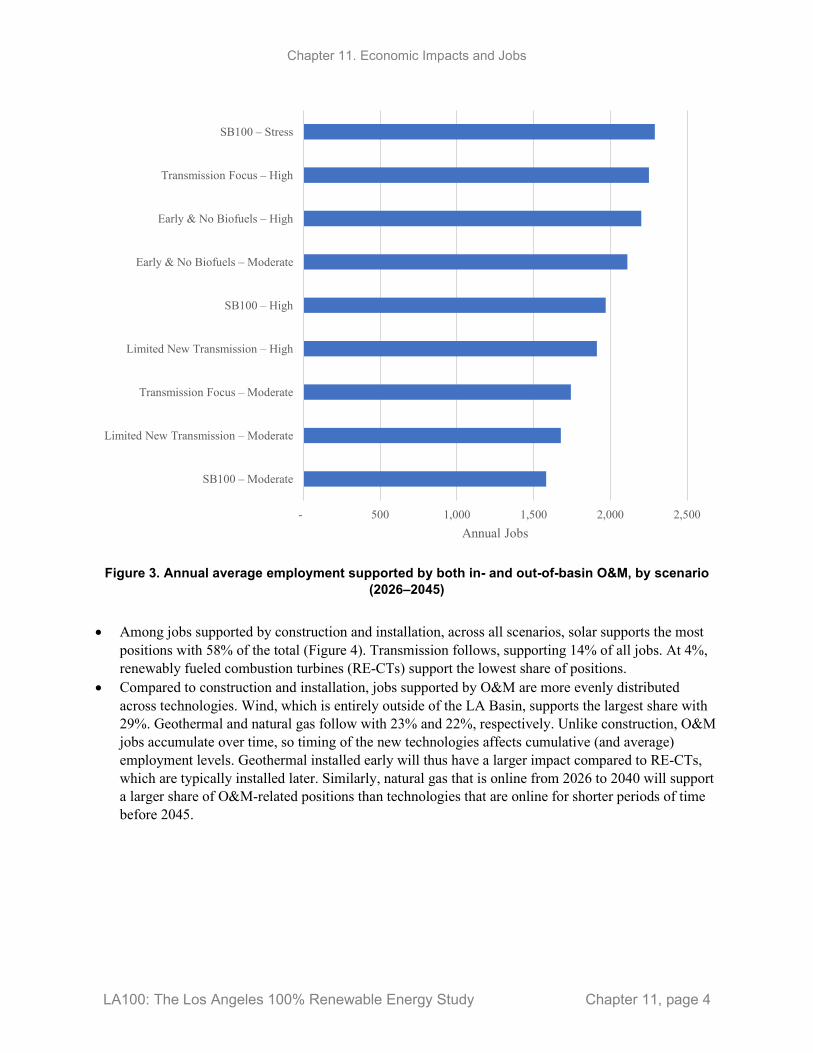
6. While the Early & No Biofuels scenarios support the largest number of construction and installation positions, the SB100 – Stress and Transmission Focus – High scenarios support the largest number of annual O&M positions, with 2,300 each (Figure 3).
- 2,000 4,000 6,000 8,000 10,000 12,000
SB100 – Moderate
SB100 – High
SB100 – Stress
Limited New Transmission – Moderate
Transmission Focus – Moderate
Transmission Focus – High
Limited New Transmission – High
Early & No Biofuels – Moderate
Early & No Biofuels – High
Annual Jobs
Chapter 11. Economic Impacts and Jobs
LA100: The Los Angeles 100% Renewable Energy Study Chapter 11, page 4
Figure 3. Annual average employment supported by both in- and out-of-basin O&M, by scenario
(2026–2045)
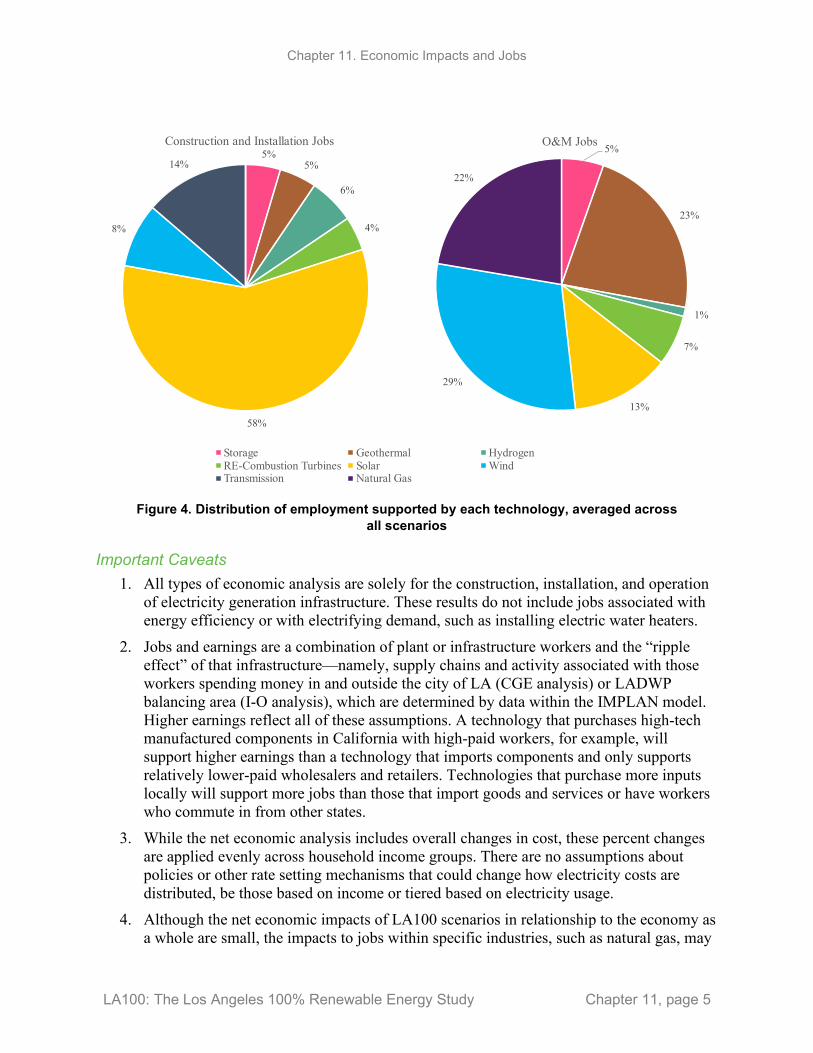
• Among jobs supported by construction and installation, across all scenarios, solar supports the most positions with 58% of the total (Figure 4). Transmission follows, supporting 14% of all jobs. At 4%, renewably fueled combustion turbines (RE-CTs) support the lowest share of positions.
• Compared to construction and installation, jobs supported by O&M are more evenly distributed across technologies. Wind, which is entirely outside of the LA Basin, supports the largest share with 29%. Geothermal and natural gas follow with 23% and 22%, respectively. Unlike construction, O&M jobs accumulate over time, so timing of the new technologies affects cumulative (and average) employment levels. Geothermal installed early will thus have a larger impact compared to RE-CTs, which are typically installed later. Similarly, natural gas that is online from 2026 to 2040 will support a larger share of O&M-related positions than technologies that are online for shorter periods of time before 2045.
- 500 1,000 1,500 2,000 2,500
SB100 – Moderate
Limited New Transmission – Moderate
Transmission Focus – Moderate
Limited New Transmission – High
SB100 – High
Early & No Biofuels – Moderate
Early & No Biofuels – High
Transmission Focus – High
SB100 – Stress
Annual Jobs
Chapter 11. Economic Impacts and Jobs
LA100: The Los Angeles 100% Renewable Energy Study Chapter 11, page 5
Figure 4. Distribution of employment supported by each technology, averaged across
all scenarios
Important Caveats 1. All types of economic analysis are solely for the construction, installation, and operation
of electricity generation infrastructure. These results do not include jobs associated with energy efficiency or with electrifying demand, such as installing electric water heaters.
2. Jobs and earnings are a combination of plant or infrastructure workers and the “ripple effect” of that infrastructure—namely, supply chains and activity associated with those workers spending money in and outside the city of LA (CGE analysis) or LADWP balancing area (I-O analysis), which are determined by data within the IMPLAN model. Higher earnings reflect all of these assumptions. A technology that purchases high-tech manufactured components in California with high-paid workers, for example, will support higher earnings than a technology that imports components and only supports relatively lower-paid wholesalers and retailers. Technologies that purchase more inputs locally will support more jobs than those that import goods and services or have workers who commute in from other states.
3. While the net economic analysis includes overall changes in cost, these percent changes are applied evenly across household income groups. There are no assumptions about policies or other rate setting mechanisms that could change how electricity costs are distributed, be those based on income or tiered based on electricity usage.
4. Although the net economic impacts of LA100 scenarios in relationship to the economy as a whole are small, the impacts to jobs within specific industries, such as natural gas, may
5%5%
6%
4%
58%
8%
14%
Construction and Installation Jobs
Storage Geothermal HydrogenRE-Combustion Turbines Solar WindTransmission Natural Gas
5%
23%
1%
7%
13%
29%
22%
O&M Jobs

Chapter 11. Economic Impacts and Jobs
LA100: The Los Angeles 100% Renewable Energy Study Chapter 11, page 6
be significant. The study does not identify programs to facilitate transitioning workers to new industries.
5. Job estimates are tied to specific energy technologies, while the net economic analysis estimates include all construction and operation in aggregate and are not tied to specific technologies.
6. Jobs analysis can be thought of as identifying overall jobs needed to support construction and operations (including supply chain and induced employment), but the study does not identify how these results could translate to specific occupations (e.g., electricians, engineers, grocery workers).
7. Job estimates do not necessarily translate to opportunities for LA residents, as employers may hire workers from outside of the region. The analysis does distinguish jobs by the location of the economic activity (in versus out of the LA Basin).
8. Jobs by technology include an array of positions that are onsite at generation facilities, throughout the greater supply chain, and those that are supported by workers spending their earnings. Jobs shown for solar, for example, may include a combination of onsite installers, supply chain wholesale workers, hardware manufacturers, and induced retail or health care workers supported by installer and supply chain worker spending.
Chapter 11. Economic Impacts and Jobs
LA100: The Los Angeles 100% Renewable Energy Study Chapter 11, page 7
1 Introduction The LA100 study evaluates pathways to achieving a 100% renewable electricity power system while maintaining the current high degree of reliability. Analysis of system costs (both to LADWP and its customers), local economic impacts, and environmental impacts and benefits are essential elements of the LA100 study. This chapter assesses net economic impacts and jobs associated with the LA100 scenarios.
Achieving a 100% renewable electricity system involves capital investment and changes in O&M outlays. These expenditures will have both immediate and ongoing impacts on the Los Angeles economy, as will any changes in electricity prices necessary in transitioning to the various scenarios.
A computable general equilibrium (CGE) model is a tool that can be used to simulate the regional economic impacts of energy system transitions or policies, such as the transformation of the LADWP power system to a 100% renewable system. CGE models can estimate potential direct and indirect impacts of the aforementioned causal factors on major economic indicators.3
In this chapter, we describe and implement a CGE model built specifically for the city of Los Angeles. We use expenditure outputs that are disaggregated into specific energy technologies as well as estimates of changes in average costs of electricity for each alternative scenario that are derived from the bulk-system analysis (Chapter 6). The modeling framework is geographically specific and allows for the analysis of different combinations of technologies. Our primary indicators of interest are total regional gross output (equivalent to domestic supply or sales revenue), total employment, and total household income. Because lower income households can be especially vulnerable to changes in energy prices, we also look at the impacts on income distribution.
This chapter then investigates jobs associated with the investments in generation, transmission, and storage capacity, as well as ongoing O&M for all technologies, for each of the LA100 scenarios, both inside and outside the LA Basin. Estimates of jobs and other economic impacts can provide valuable information to businesses, governments, utilities, and residents within affected areas. This type of analysis is common, as shown in (Adelaja and Hailu 2008; Bamufleh et al. 2013; Croucher 2012; DOE 2015; Navigant 2013; Slattery et al. 2011; You et al. 2012), and many other studies.
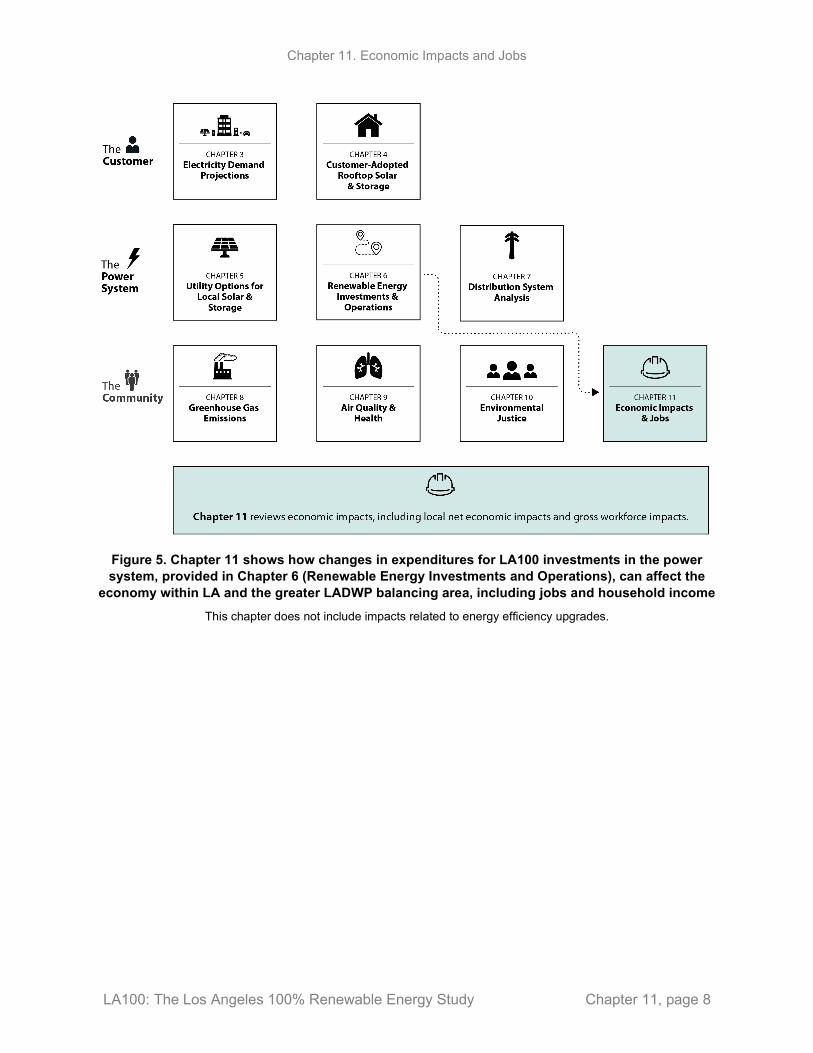
Context within LA100 This chapter is part of the Los Angeles 100% Renewable Energy Study (LA100), a first-of-its-kind power systems analysis to determine what investments could be made to achieve LA’s 100% renewable energy goals. Figure 5 provides a high-level view of how the analysis presented here relates to other components of the study. See Chapter 1 for additional background on LA100, and Chapter 1, Section 1.9, for more detail on the report structure.
3 See Hannum et al. (2017) and Wing and Rose (2020) as examples of CGE analysis.
Chapter 11. Economic Impacts and Jobs
LA100: The Los Angeles 100% Renewable Energy Study Chapter 11, page 8
Figure 5. Chapter 11 shows how changes in expenditures for LA100 investments in the power system, provided in Chapter 6 (Renewable Energy Investments and Operations), can affect the
economy within LA and the greater LADWP balancing area, including jobs and household income This chapter does not include impacts related to energy efficiency upgrades.
Chapter 11. Economic Impacts and Jobs
LA100: The Los Angeles 100% Renewable Energy Study Chapter 11, page 9
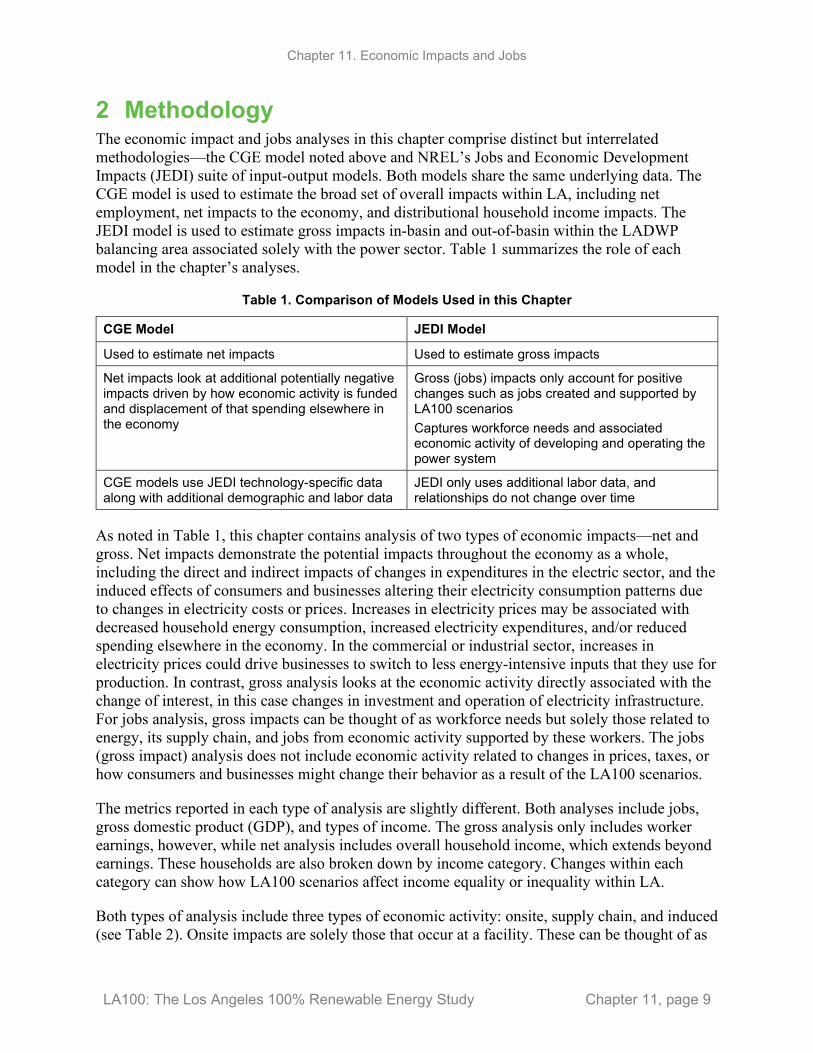
2 Methodology The economic impact and jobs analyses in this chapter comprise distinct but interrelated methodologies—the CGE model noted above and NREL’s Jobs and Economic Development Impacts (JEDI) suite of input-output models. Both models share the same underlying data. The CGE model is used to estimate the broad set of overall impacts within LA, including net employment, net impacts to the economy, and distributional household income impacts. The JEDI model is used to estimate gross impacts in-basin and out-of-basin within the LADWP balancing area associated solely with the power sector. Table 1 summarizes the role of each model in the chapter’s analyses.
Table 1. Comparison of Models Used in this Chapter
CGE Model JEDI Model
Used to estimate net impacts Used to estimate gross impacts
Net impacts look at additional potentially negative impacts driven by how economic activity is funded and displacement of that spending elsewhere in the economy
Gross (jobs) impacts only account for positive changes such as jobs created and supported by LA100 scenarios Captures workforce needs and associated economic activity of developing and operating the power system
CGE models use JEDI technology-specific data along with additional demographic and labor data
JEDI only uses additional labor data, and relationships do not change over time
As noted in Table 1, this chapter contains analysis of two types of economic impacts—net and gross. Net impacts demonstrate the potential impacts throughout the economy as a whole, including the direct and indirect impacts of changes in expenditures in the electric sector, and the induced effects of consumers and businesses altering their electricity consumption patterns due to changes in electricity costs or prices. Increases in electricity prices may be associated with decreased household energy consumption, increased electricity expenditures, and/or reduced spending elsewhere in the economy. In the commercial or industrial sector, increases in electricity prices could drive businesses to switch to less energy-intensive inputs that they use for production. In contrast, gross analysis looks at the economic activity directly associated with the change of interest, in this case changes in investment and operation of electricity infrastructure. For jobs analysis, gross impacts can be thought of as workforce needs but solely those related to energy, its supply chain, and jobs from economic activity supported by these workers. The jobs (gross impact) analysis does not include economic activity related to changes in prices, taxes, or how consumers and businesses might change their behavior as a result of the LA100 scenarios.
The metrics reported in each type of analysis are slightly different. Both analyses include jobs, gross domestic product (GDP), and types of income. The gross analysis only includes worker earnings, however, while net analysis includes overall household income, which extends beyond earnings. These households are also broken down by income category. Changes within each category can show how LA100 scenarios affect income equality or inequality within LA.
Both types of analysis include three types of economic activity: onsite, supply chain, and induced (see Table 2). Onsite impacts are solely those that occur at a facility. These can be thought of as
Chapter 11. Economic Impacts and Jobs
LA100: The Los Angeles 100% Renewable Energy Study Chapter 11, page 10
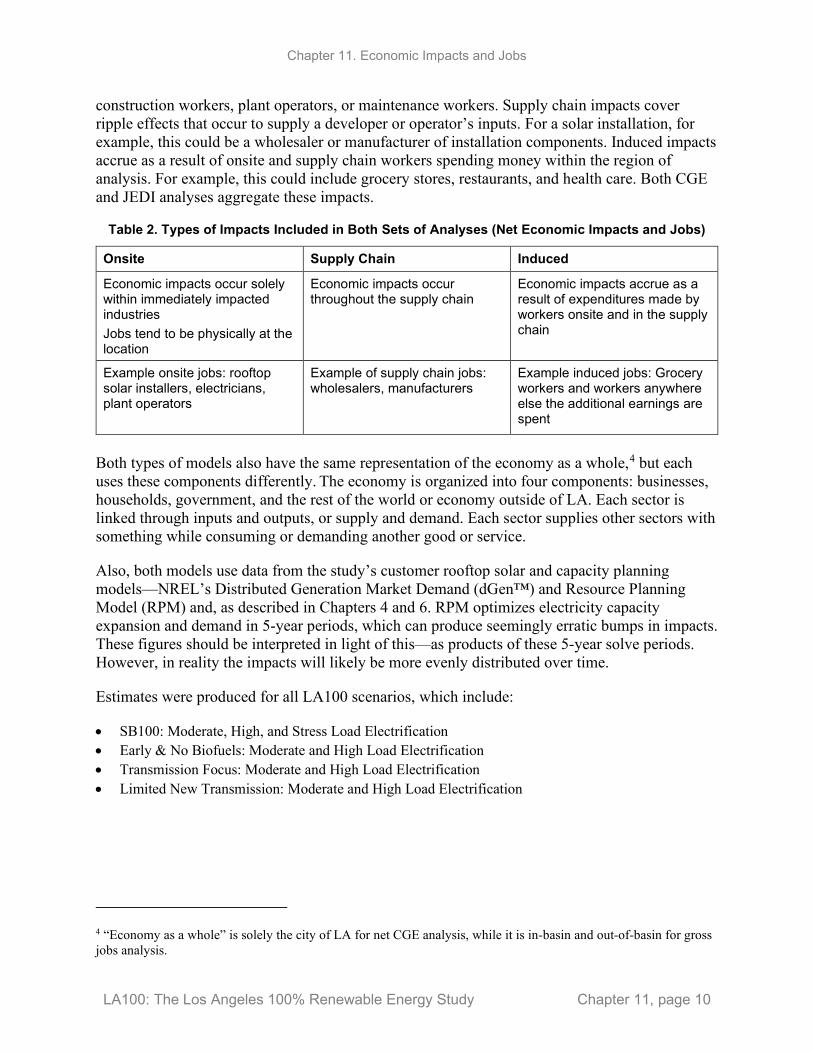
construction workers, plant operators, or maintenance workers. Supply chain impacts cover ripple effects that occur to supply a developer or operator’s inputs. For a solar installation, for example, this could be a wholesaler or manufacturer of installation components. Induced impacts accrue as a result of onsite and supply chain workers spending money within the region of analysis. For example, this could include grocery stores, restaurants, and health care. Both CGE and JEDI analyses aggregate these impacts.
Table 2. Types of Impacts Included in Both Sets of Analyses (Net Economic Impacts and Jobs)
Onsite Supply Chain Induced
Economic impacts occur solely within immediately impacted industries Jobs tend to be physically at the location
Economic impacts occur throughout the supply chain
Economic impacts accrue as a result of expenditures made by workers onsite and in the supply chain
Example onsite jobs: rooftop solar installers, electricians, plant operators
Example of supply chain jobs: wholesalers, manufacturers
Example induced jobs: Grocery workers and workers anywhere else the additional earnings are spent
Both types of models also have the same representation of the economy as a whole,4 but each uses these components differently. The economy is organized into four components: businesses, households, government, and the rest of the world or economy outside of LA. Each sector is linked through inputs and outputs, or supply and demand. Each sector supplies other sectors with something while consuming or demanding another good or service.
Also, both models use data from the study’s customer rooftop solar and capacity planning models—NREL’s Distributed Generation Market Demand (dGen™) and Resource Planning Model (RPM) and, as described in Chapters 4 and 6. RPM optimizes electricity capacity expansion and demand in 5-year periods, which can produce seemingly erratic bumps in impacts. These figures should be interpreted in light of this—as products of these 5-year solve periods. However, in reality the impacts will likely be more evenly distributed over time.
Estimates were produced for all LA100 scenarios, which include:
• SB100: Moderate, High, and Stress Load Electrification • Early & No Biofuels: Moderate and High Load Electrification • Transmission Focus: Moderate and High Load Electrification • Limited New Transmission: Moderate and High Load Electrification
4 “Economy as a whole” is solely the city of LA for net CGE analysis, while it is in-basin and out-of-basin for gross jobs analysis.

Chapter 11. Economic Impacts and Jobs
LA100: The Los Angeles 100% Renewable Energy Study Chapter 11, page 11
Figure 6 shows the capacity additions, by location, for the Moderate and High scenarios derived from RPM, which are used as inputs for the net economic impact and jobs analyses.
Figure 6. Capacity additions by scenario and location for the Moderate and High load projections
For more details, see Chapter 6.
The rest of this section reviews in more detail the methodology for net economic impact analysis followed by the jobs analysis.
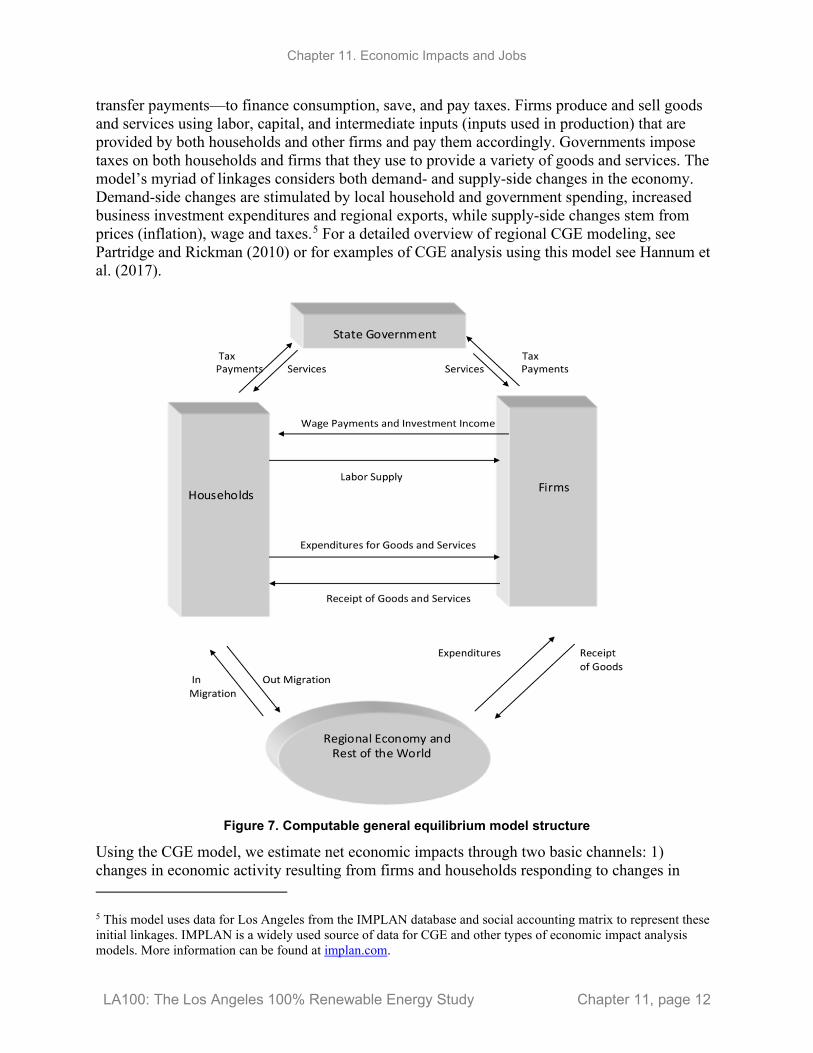
2.1 Net Economic Impact Analysis The net economic impact analysis uses a CGE model to represent economy-wide relationships between the population (i.e., households), businesses and other organizations, government in the study region, and the rest of the world. Figure 7 shows the structure of these relationships in a circular flow diagram. Households supply labor and capital, receiving wages and returns on investments in exchange. They subsequently use this income—in conjunction with government
Chapter 11. Economic Impacts and Jobs
LA100: The Los Angeles 100% Renewable Energy Study Chapter 11, page 12
transfer payments—to finance consumption, save, and pay taxes. Firms produce and sell goods and services using labor, capital, and intermediate inputs (inputs used in production) that are provided by both households and other firms and pay them accordingly. Governments impose taxes on both households and firms that they use to provide a variety of goods and services. The model’s myriad of linkages considers both demand- and supply-side changes in the economy. Demand-side changes are stimulated by local household and government spending, increased business investment expenditures and regional exports, while supply-side changes stem from prices (inflation), wage and taxes.5 For a detailed overview of regional CGE modeling, see Partridge and Rickman (2010) or for examples of CGE analysis using this model see Hannum et al. (2017).
Figure 7. Computable general equilibrium model structure
Using the CGE model, we estimate net economic impacts through two basic channels: 1) changes in economic activity resulting from firms and households responding to changes in
5 This model uses data for Los Angeles from the IMPLAN database and social accounting matrix to represent these initial linkages. IMPLAN is a widely used source of data for CGE and other types of economic impact analysis models. More information can be found at implan.com.
Chapter 11. Economic Impacts and Jobs
LA100: The Los Angeles 100% Renewable Energy Study Chapter 11, page 13
average cost of electricity, and 2) changes in economic activity resulting from changes in direct (power sector) expenditures (investment and operation) required to transition to the 100% renewable power systems simulated. The CGE model employed simultaneously resolves the impacts of changing average electricity prices and the impacts of the new investment to determine the ultimate impact on economic activity.
Generally, changes in electricity costs impact the LA economy through several mechanisms. For example, let us assume that the price changes are positive—i.e., prices increase under a scenario. The first mechanism is an adverse impact on household consumption of locally produced and provided goods and services. Because nearly all households purchase electricity, increases in prices mean people typically have less purchasing power available for other acquisitions, even after they cut back on their electricity demand. These responses consequently lower the demand for other goods and services in the regional economy. For example, if a household spends more money on electricity, it will have less to spend on items of lower necessity such as dining out. This leads to the second mechanism—the restaurant has lower demand for its goods and services. In the language of economic impact analysis, the restaurant experiences an adverse direct substitution effect. This leads to a reduction in the restaurant’s own demand for goods and services from its suppliers and may also reduce its workforce needs. This is only the first round of inter-industry (or “indirect”) effects of this direct substitution effect, which subsequently ripple throughout the economy; the total impact is some multiple of the direct effect, hence the oft-used term multiplier or ripple effect. Further, multiplier losses can be intensified by “induced effects,” which stem from household spending reductions due to direct and indirect declines in employment, and hence income losses.
The effect of higher electricity prices on LA commercial and industrial enterprises is a second impact mechanism. Because utility expenses are an important cost of doing business, it is likely that at least some of the production cost increases caused by electricity price increases will be passed on to customers in the form of higher product prices. By charging higher prices, some local businesses may become less competitive in local, national and global markets, and may see a decline in total sales. This is especially true for businesses that are relatively high users of electricity, such as manufacturing facilities. If a firm’s production declines significantly enough, it may need to lay-off workers. Because of linkages between firms in the Los Angeles region, such changes can generate negative multiplier effects of their own up and down the supply chain. Reduced electricity prices will have the opposite effect.
Overall, the magnitude of the impacts due to the price changes will depend largely on 1) the sensitivity of electricity demand by various user groups to price changes, including their ability to change behavior (for households) and the production process (for businesses) under higher or lower prices, 2) the magnitude of the price change and 3) the interdependence among businesses, which influences the size of the multipliers beyond the direct effects.6
6 Price changes in other areas could be a fourth factor. For example, a price increase in Los Angeles will have less of an impact on the region’s competitive position if electricity prices increase at a similar rate in other places, perhaps due to pursuing similar renewable electricity goals. However, our results assume that LA price changes are relative to unchanged prices in the “rest of the world.”
Chapter 11. Economic Impacts and Jobs
LA100: The Los Angeles 100% Renewable Energy Study Chapter 11, page 14
The combination of quantity and price responses by business and households are often referred to as “general equilibrium effects,” thereby necessitating the use of a CGE model such as the one developed for this study.
2.2 Jobs Analysis—Input-Output Methodology The jobs analysis in this chapter can be more broadly referred to as input-output gross economic impact analysis. The analysis uses the JEDI suite of models, specifically JEDI and IMPLAN, to generate different types of estimates of jobs, earnings, value added, and economic output. JEDI and IMPLAN are input-output (I-O) models, which are structured to show interactions between businesses, households, investors, governments and the rest of the world via imports and exports. Every purchase by one of these groups is considered a sale by another. For example, mounting hardware purchased by a solar installer from a manufacturer is a purchase by the installer and a sale by the manufacturer.7 Construction as well as O&M expenditures are modeled as changes in demand for outputs produced by businesses; these changes in demand produce ripple effects throughout the economy via these linkages due to supply chains, workers earning income, and households spending those earnings.
Because I-O models solely show impacts driven by increased demand for a good or service, these estimates are gross, as opposed to the net impacts estimated using CGE analysis. This can be thought of as the magnitude of workforce needs, not the overall or net number of jobs created or lost shown in the previous section. The jobs analysis does show transitions from one technology to another such as phasing out of natural gas O&M jobs in a transition to wind, but does not include other effects, such as consumer behavior that would occur in response to utility rate changes or how consumption of different inputs such as the mix of electricity and fuel might change business behavior.
This study uses capital payments as well as fixed and variable O&M payments, including fuel, to estimate employment, earnings, value added, and output estimates. Capital payments are modeled as construction, installation, and capital expenditures during the operation of facilities while non-capital payments are assumed to be associated with the ongoing operation, excluding capital payments, of the energy facility. The JEDI suite of models uses these expenditures to produce these estimates.
Unlike CGE analysis, these relationships are fixed in the model; they do not allow substitution or changes in prices or taxes. Because they are fixed they also do not make any assumptions about potential future changes in the structure of the economy, including productivity. Results should be interpreted as if they occur today, and that these economic changes could be swayed by changes in how the economy operates.8
Even though onsite jobs are considered to accrue at a project site and be the most immediately associated with the construction phase of a project, less than 100% of these jobs may necessarily
7 Appendix A contains more information about I-O methodology. 8 Onsite and supply chain impacts differ from direct and indirect, which are commonly used in I-O reports. Appendix A contains more information about these differences.
Chapter 11. Economic Impacts and Jobs
LA100: The Los Angeles 100% Renewable Energy Study Chapter 11, page 15
be considered to occur within the geographic region of analysis. For example, for jobs “supported by in-basin solar installations,” onsite workers may live outside the city.
The metrics covered under these impacts are jobs, earnings, value added, and output:
• Jobs are considered full time equivalent (FTE). One FTE is the equivalent of one person working full time for 1 year. If a worker works 6 months of a year, this would be 0.5 FTE.
• Earnings are all income from work. These include benefits such as health care and employer retirement contributions.
Value added is the equivalent of gross domestic product (GDP) and consists of earnings, property-type income, and net tax payments (payments less subsidies). Property-type income is payments for capital and includes profits or proprietor earnings.
Output is a measure of overall economic activity. It includes value added as well as all payments for inputs. At the business level this can be thought of as revenue. It is not a measure of profitability, but it does show the scale of dollars moving within an economy.
Results are presented in two phases: 1) construction, installation, and capital payments and 2) non-capital O&M. Expenditure estimates are based on RPM generation and transmission capacity expansion results by technology and are for the equivalent of a single year. These do not represent the duration of construction or installation. A single job figure for a project that takes 6 months, for example, would represent two workers over that 6-month period.
Non-capital O&M expenditures are based on when the facility was built or a historical value if they were built before 2010 according to the value assigned by the Western Electricity Coordinating Council Transmission Expansion Planning Policy Committee. These figures are non-capital because they do not include expenditures such as those on the installation or procurement of replacement parts.
This differentiation between ongoing capital expenditures and non-capital O&M is particularly significant for solar, especially residential solar. While there may be significant installations over time, most ongoing activity is related to replacing parts. These replacements are captured as capital, resulting in O&M impacts that may be viewed as low. Non-capital O&M expenditures are higher for utility-scale solar, which incurs ongoing costs unrelated to replacements. Regardless, installation and procurement of replacement parts is an inherently single period rather than ongoing activity, and classifying it as construction, installation, and capital reflects this.
Impact numbers are heavily influenced by the level of expenditures. Because these impacts are gross, as opposed to net, scenarios in which expenditures are greater tend to support more economic activity, while lower expenditures equate to lower activity. Different scenarios do have different workforce needs because they deploy different technologies, however.
Because I-O analysis includes supply chains within a region of analysis, impact results will be larger when the economy being modeled is larger. This is because there are more opportunities for businesses to purchase and supply goods within a larger geographic region of analysis. For example, if a company within LA purchases computer software from San Francisco, the software
Chapter 11. Economic Impacts and Jobs
LA100: The Los Angeles 100% Renewable Energy Study Chapter 11, page 16
developer jobs would not be counted in an analysis of LA but would be counted in an analysis of California as a whole. In-basin I-O and city of LA CGE impact analysis in this chapter are a more limited economic and regional scope compared to out-of-basin impacts which cover the entire LADWP balancing area. Total onsite, supply chain, and induced impacts, then, will generally be larger per dollar spent for out-of-basin impacts when compared with in-basin.
Job estimates do show the approximate location of where the demand of those jobs may accrue but do not show where those workers live, as decisions such as housing or commuting are not factored into the model. In-basin impacts are jobs within LA and out-of-basin impacts are jobs that are within the greater LADWP balancing region, but where workers who fill those jobs live is not estimated.
2.2.1 Caveats to the Jobs Analysis Job impact numbers from JEDI and IMPLAN provide information about the number of workers needed by technology but do not provide information about needs by occupation. Information by occupation would be needed to provide detail about the clean energy workforce, such as the number of needed electricians, technicians, construction workers, scientists, or engineers. These workforce needs could then inform businesses in these areas with knowledge of these occupations of what the needs would be as well as the general public about the number of jobs that may be needed within their community and surrounding areas.
Studies have been conducted for specific technologies, such as Keyser and Tegen (2019) for the wind sector. This study shows, for example, that the largest category of wind workers classified were in trades (14%) followed by engineers (12%). This is significant because approximately 94% of employers surveyed for the study reported difficulty hiring trade workers and between 77% and 84% of employers reported difficulty hiring engineers. The difficulty was significant enough that 24% of respondents reported recruiting internationally to fill positions.
At the same time industries reported difficulty hiring workers, students exiting educational and training programs with wind-specific training were not entering the wind industry. Educational institutions reported only 30% of students with two-year certificates and 20% of students with bachelor’s degrees or higher entering the wind industry upon graduation (Keyser and Tegen 2019).
Employment information generated by the JEDI and IMPLAN models can communicate estimates of future demand to employers to help planning and inform students about future career opportunities. Additional information is needed, however, to link these results directly to educational programs or the need for specific occupations.
2.2.2 Summary of Assumptions—Net Economic Impacts and Gross Jobs Analysis
• A detailed LA-specific CGE model was used to estimate net economic impacts within LA from scenarios with different changes in electricity prices, which allows for response to these prices by businesses and households.
• Economic impacts factor in both changes in economic activity such as purchases of new solar PV panels as well as changes in activity such as from consumers altering spending on retail goods due to changes in expenditures on electricity.
Chapter 11. Economic Impacts and Jobs
LA100: The Los Angeles 100% Renewable Energy Study Chapter 11, page 17
• Gross workforce impacts within and outside of LA—capturing LADWP’s in-basin and out-of-basin renewable energy investments—were estimated using the Jobs and Economic Development Impacts (JEDI) suite of models and IMPLAN. These models take expansion and operations data from the capacity expansion model to estimate gross jobs impacts due to LADWP investments.
• JEDI estimates are gross, not net. They do not factor in wide-ranging impacts such as potential negative economic activity, nor do they account for price changes such as changes in electricity rates or taxes. From a workforce perspective, JEDI estimates show potential employment needs associated with construction of new plants and operation of existing plants.
• Net economic impact analysis beyond the CGE estimates within this chapter can also include monetization of benefits related to reductions in greenhouse gas emissions, mortality, and morbidity, as shown in Chapter 9.
Chapter 11. Economic Impacts and Jobs
LA100: The Los Angeles 100% Renewable Energy Study Chapter 11, page 18
3 Results and Discussion This section reviews results for each set of analyses—Net Economic Impacts (Section 3.1) and Jobs Analysis (Section 3.2).
3.1 Net Economic Impacts Net economic impacts incorporate a wide array of flows between sectors within LA’s economy to provide estimates of how LA100 scenarios could impact jobs, household income, and output. These changes can be positive, negative, or close to zero depending on the combination of expenditures, costs, what technologies are deployed, and when. This does not portray labor needs associated with scenarios—it is an overall change that could occur when both positive and negative impacts are accounted for.
3.1.1 LA100-Specific Electricity Expenditures Used in CGE Analysis A central consideration entails estimating how changing electricity costs affects residential electricity demand and other household spending. In CGE models, household electricity expenditures depend, in part, on the price of electricity, the relative price of any substitutes, and the household’s income. With respect to price changes, the CGE model is used to estimate how much a household with a given income would spend on electricity under different rates. For this analysis, it is essential to know: 1) how spending on electricity varies by household given the current rate, and 2) the sensitivity of electricity demand of each household type to changes in its rate (i.e., the own-price elasticity of demand).
Economists consider electricity a “normal” good, meaning that demand for it increases as household income increases. However, electricity is also a “necessary” good, meaning households need it regardless of their income level. One important implication is that electricity purchases are a relatively larger share of low-income household expenditures than for similarly sized high-income households. Accordingly, lower-income households will likely be more adversely impacted by price increases than higher-income households and would benefit relatively more than higher-income households by price decreases.
The model used in this study captures household income and expenditure differences by categorizing each Los Angeles household (HH) in one of nine income categories, denoted by types HH1 through HH9. Households categorized in HH1 are the lowest income households, with annual income of less than $10,000, while HH9 households are the highest earning households, with income greater than $150,000.9
After categorizing households by income, we model the spending patterns of each household type, especially their spending on electricity. We currently use an average monthly electricity
9 The data we collected from the U.S. Census Bureau produce household data for nine income groups. Disaggregation according to deciles is often used for this type of analysis, but this is only appropriate if the range of the key variable (income in this case) is somewhat similar across deciles. In this case, however, deciles would obscure income receipts in the upper income-categories (i.e., we would not be able to distinguish income brackets such as $75K to $100K, $100K to $150K, and $150K or more if we use deciles).

Chapter 11. Economic Impacts and Jobs
LA100: The Los Angeles 100% Renewable Energy Study Chapter 11, page 19
expenditures for all residential users within Los Angeles (about $75).10 To supplement this, we use data from the U.S. Bureau of Labor Statistics 2017 Consumer Expenditure Survey (CES), which provides detailed information on household spending, including electricity expenditures, by income decile for the western United States. These data allow us to compare how household spending on electricity in each decile compares to the “average” household’s electricity expenditures. These relative ratios are then applied to the average monthly household electricity expenditure and mapped into household “types” in our model to estimate predicted spending for each household income group11 as depicted in Table 3.
Table 3. Estimated Annual Electricity Expenditures by Household Income Group in LA
HH Type HH Income Annual Electricity Spending per HH
Monthly Electricity Spending per HH
Number of HH Total Expenditures
HH1 < $10k $561 $47 103,520 $58,072,000
HH2 10k-25k $566 $47 91,250 $51,590,000
HH3 25k-30k $663 $55 148,040 $98,151,000
HH4 30k-40k $767 $64 121,890 $93,488,000
HH5 40k-60k $850 $71 156,590 $133,102,000
HH6 60k-80k $854 $71 207,560 $177,258,000
HH712 80k-125k $1,025 $85 139,710 $143,206,000
HH8 125k-150k $1,025 $85 166,770 $170,935,000
HH9 > $150k $1,025 $85 179,050 $183,530,000
Total or Weighted Average
$75 1,314,280 $1,179,500,000
3.1.2 Estimating Annual Commercial and Industrial Electricity Expenditures in LA
Electricity purchases in LA are an important business cost, and for some industries they can represent a relatively large share of overall expenses (e.g., some manufacturing facilities and big box retailers). Accordingly, higher electricity prices can adversely impact the economy through
10 Average annual residential electricity expenditures were derived from public reports (LADWP, 2017). Due to variations in public data availability, our data set does not exactly replicate the number of residential consumers served by LADWP. Thus, total monthly household electricity expenditures in our analysis differ slightly from the total residential revenues reported by the utilities. However, because we are most interested in how individual households are impacted, rather than the total impacts on utility revenue, we believe our approach is more informative. Because our total household numbers are quite close to the reported number of residential customers, a more accurate matching of utility revenue and household electricity expenditures would change our results only marginally. 11 A “household” is defined by the U.S. Census Bureau as the number of people residing together. The Census reports that approximately three people per household within the City of LA. 12 HH7, HH8, and HH9 have identical monthly expenditures in Table 1 due to imperfect matches between our household income groups and the deciles reported in BLS-CES.
Chapter 11. Economic Impacts and Jobs
LA100: The Los Angeles 100% Renewable Energy Study Chapter 11, page 20
higher production costs, and lower electricity prices can help stimulate the economy. Economic theory suggests that as per unit production costs increase, for example, businesses will produce less output while its price will increase. This has four economic impacts. First, when businesses reduce their output, they tend to need fewer workers. This is represented by an inward shift in the labor market demand curve, reducing both total employment and real wages. Second, output reductions similarly lower the demand for other primary factors and intermediate inputs of production. If these factors and inputs are produced in LA, local suppliers will feel the indirect effects along the supply chain. This reduced employment results in the third impact, which is reductions in household wages and subsequent reductions in spending. The fourth impact is that despite reductions in demand as a result of income changes, the ability of households to purchase other goods and services could decrease if electricity price increases drive price increases economy wide.
To capture all these effects in a CGE model we need to accurately model commercial and industrial electricity expenditures. To estimate electricity expenditures for each of the 34 production sectors in the CGE model, we turned to IMPLAN, a regional economic modeling software and database (IMPLAN, 2018). IMPLAN is a commonly used model and provides detailed spending profiles for more than 500 industries and is available for the City of Los Angeles (Mulligan et al. 2013). With the IMPLAN data, we determine each industry’s share of total commercial and industrial electricity demand and apply these ratios to the total nonresidential revenue generated by LADWP. This generates estimates of electricity expenditures per industry, which are then entered into the Social Accounting Matrix13 underlying the CGE model.
3.1.3 Input Data from the LA100 Scenarios Electricity payments by firms and households as a proportion of their total expenditures average 4.7% and 1.0%, respectively. Because electricity expenditures represent such a small share of total expenditures, small changes in the price of electricity will only result in small impacts in both sectoral and overall economic activity. To estimate the impacts, we use estimated changes in average electricity prices (from present day) that are based on total changes in system costs from the bulk power system analysis, as described in Chapter 6. Importantly, these estimates do not represent a full analysis of rate impacts and necessarily make a number of simplifying assumptions about costs of financing, existing debt, and costs of energy efficiency and demand response programs, among others.
The inflation-adjusted projected cost increases for the LA100 scenarios are presented in Table 4, and indicate a steady rise over time. It is important to note that these cost increases are relative to a constant Year 2020 base. However, the associated underlying conditions, and thus the projected price in each future year, would change even if LA100 scenarios were not considered. Accordingly, we utilize the SB100 – Moderate scenario as a point of comparison to approximate these otherwise future price trends and compare each of the other scenarios to it in Table 5. In this table, the price trajectories relative to the SB100 – Moderate scenario can be either positive
13 A social accounting matrix, or SAM, is an extension of an input-output table because it includes not only interindustry transactions but also the transactions between industries, households, and various institutions.
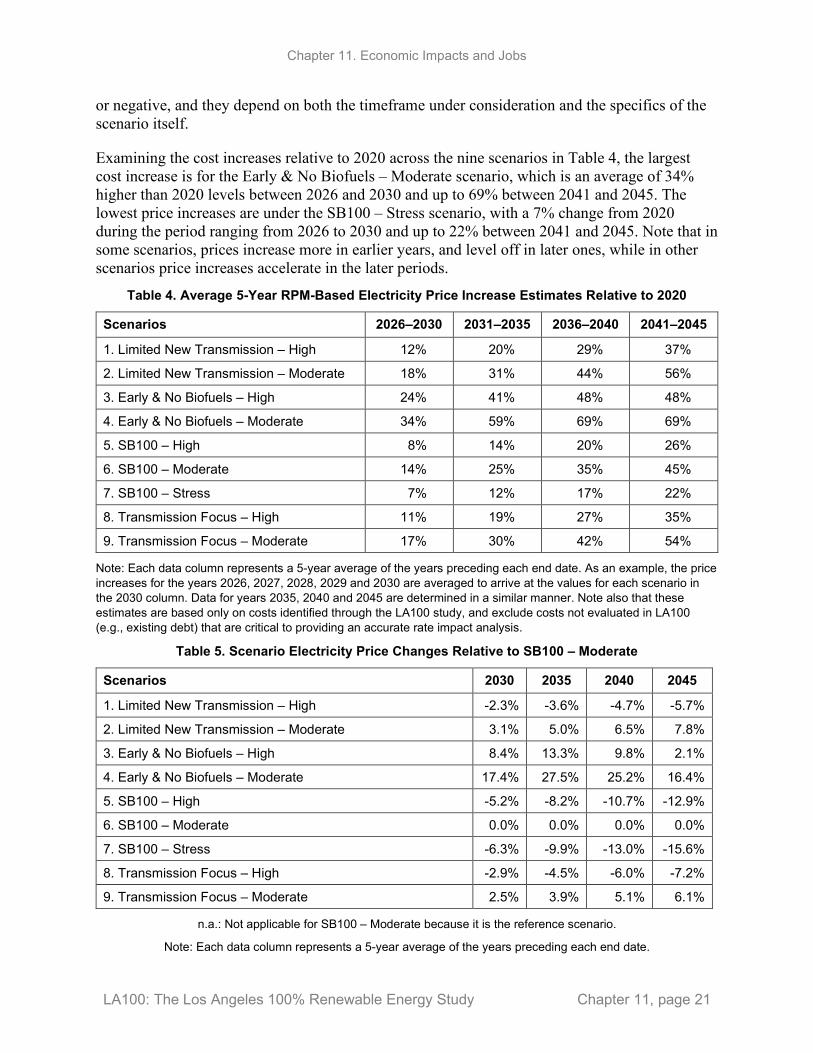
Chapter 11. Economic Impacts and Jobs
LA100: The Los Angeles 100% Renewable Energy Study Chapter 11, page 21
or negative, and they depend on both the timeframe under consideration and the specifics of the scenario itself.
Examining the cost increases relative to 2020 across the nine scenarios in Table 4, the largest cost increase is for the Early & No Biofuels – Moderate scenario, which is an average of 34% higher than 2020 levels between 2026 and 2030 and up to 69% between 2041 and 2045. The lowest price increases are under the SB100 – Stress scenario, with a 7% change from 2020 during the period ranging from 2026 to 2030 and up to 22% between 2041 and 2045. Note that in some scenarios, prices increase more in earlier years, and level off in later ones, while in other scenarios price increases accelerate in the later periods.
Table 4. Average 5-Year RPM-Based Electricity Price Increase Estimates Relative to 2020
Scenarios 2026–2030 2031–2035 2036–2040 2041–2045
1. Limited New Transmission – High 12% 20% 29% 37%
2. Limited New Transmission – Moderate 18% 31% 44% 56%
3. Early & No Biofuels – High 24% 41% 48% 48%
4. Early & No Biofuels – Moderate 34% 59% 69% 69%
5. SB100 – High 8% 14% 20% 26%
6. SB100 – Moderate 14% 25% 35% 45%
7. SB100 – Stress 7% 12% 17% 22%
8. Transmission Focus – High 11% 19% 27% 35%
9. Transmission Focus – Moderate 17% 30% 42% 54%
Note: Each data column represents a 5-year average of the years preceding each end date. As an example, the price increases for the years 2026, 2027, 2028, 2029 and 2030 are averaged to arrive at the values for each scenario in the 2030 column. Data for years 2035, 2040 and 2045 are determined in a similar manner. Note also that these estimates are based only on costs identified through the LA100 study, and exclude costs not evaluated in LA100 (e.g., existing debt) that are critical to providing an accurate rate impact analysis.
Table 5. Scenario Electricity Price Changes Relative to SB100 – Moderate
Scenarios 2030 2035 2040 2045
1. Limited New Transmission – High -2.3% -3.6% -4.7% -5.7%
2. Limited New Transmission – Moderate 3.1% 5.0% 6.5% 7.8%
3. Early & No Biofuels – High 8.4% 13.3% 9.8% 2.1%
4. Early & No Biofuels – Moderate 17.4% 27.5% 25.2% 16.4%
5. SB100 – High -5.2% -8.2% -10.7% -12.9%
6. SB100 – Moderate 0.0% 0.0% 0.0% 0.0%
7. SB100 – Stress -6.3% -9.9% -13.0% -15.6%
8. Transmission Focus – High -2.9% -4.5% -6.0% -7.2%
9. Transmission Focus – Moderate 2.5% 3.9% 5.1% 6.1%
n.a.: Not applicable for SB100 – Moderate because it is the reference scenario.
Note: Each data column represents a 5-year average of the years preceding each end date.
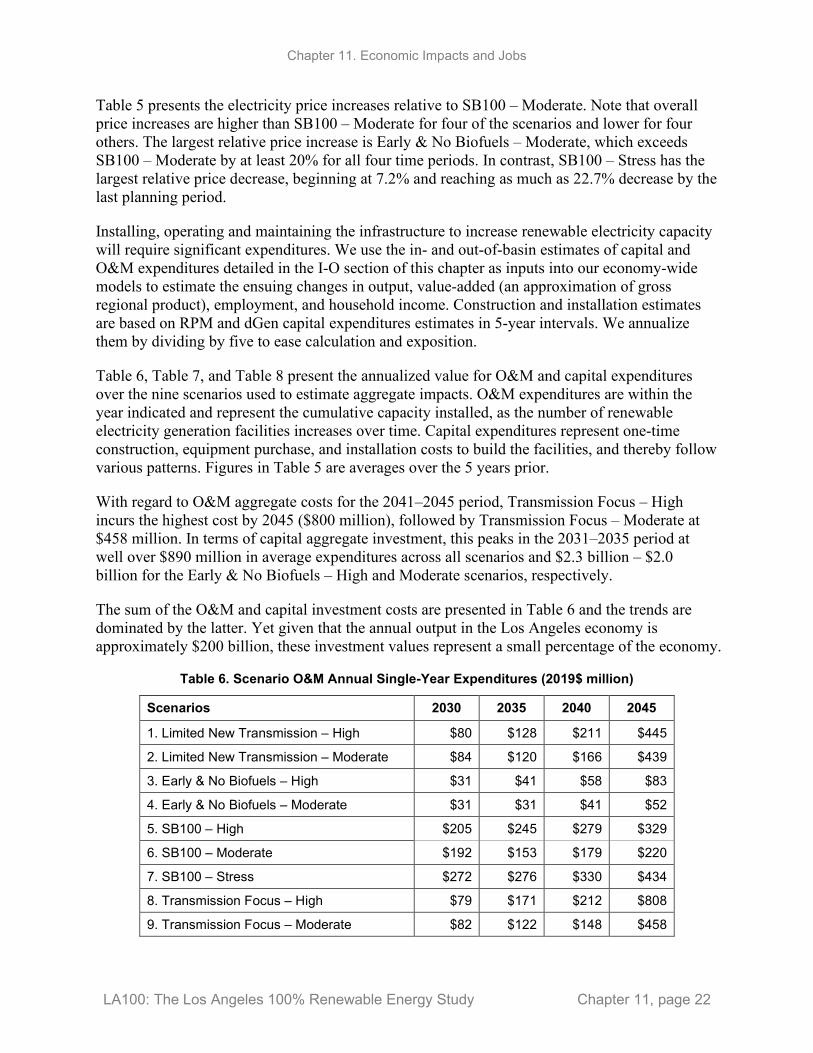
Chapter 11. Economic Impacts and Jobs
LA100: The Los Angeles 100% Renewable Energy Study Chapter 11, page 22
Table 5 presents the electricity price increases relative to SB100 – Moderate. Note that overall price increases are higher than SB100 – Moderate for four of the scenarios and lower for four others. The largest relative price increase is Early & No Biofuels – Moderate, which exceeds SB100 – Moderate by at least 20% for all four time periods. In contrast, SB100 – Stress has the largest relative price decrease, beginning at 7.2% and reaching as much as 22.7% decrease by the last planning period.
Installing, operating and maintaining the infrastructure to increase renewable electricity capacity will require significant expenditures. We use the in- and out-of-basin estimates of capital and O&M expenditures detailed in the I-O section of this chapter as inputs into our economy-wide models to estimate the ensuing changes in output, value-added (an approximation of gross regional product), employment, and household income. Construction and installation estimates are based on RPM and dGen capital expenditures estimates in 5-year intervals. We annualize them by dividing by five to ease calculation and exposition.
Table 6, Table 7, and Table 8 present the annualized value for O&M and capital expenditures over the nine scenarios used to estimate aggregate impacts. O&M expenditures are within the year indicated and represent the cumulative capacity installed, as the number of renewable electricity generation facilities increases over time. Capital expenditures represent one-time construction, equipment purchase, and installation costs to build the facilities, and thereby follow various patterns. Figures in Table 5 are averages over the 5 years prior.
With regard to O&M aggregate costs for the 2041–2045 period, Transmission Focus – High incurs the highest cost by 2045 ($800 million), followed by Transmission Focus – Moderate at $458 million. In terms of capital aggregate investment, this peaks in the 2031–2035 period at well over $890 million in average expenditures across all scenarios and $2.3 billion – $2.0 billion for the Early & No Biofuels – High and Moderate scenarios, respectively.
The sum of the O&M and capital investment costs are presented in Table 6 and the trends are dominated by the latter. Yet given that the annual output in the Los Angeles economy is approximately $200 billion, these investment values represent a small percentage of the economy.
Table 6. Scenario O&M Annual Single-Year Expenditures (2019$ million)
Scenarios 2030 2035 2040 2045
1. Limited New Transmission – High $80 $128 $211 $445
2. Limited New Transmission – Moderate $84 $120 $166 $439
3. Early & No Biofuels – High $31 $41 $58 $83
4. Early & No Biofuels – Moderate $31 $31 $41 $52
5. SB100 – High $205 $245 $279 $329
6. SB100 – Moderate $192 $153 $179 $220
7. SB100 – Stress $272 $276 $330 $434
8. Transmission Focus – High $79 $171 $212 $808
9. Transmission Focus – Moderate $82 $122 $148 $458
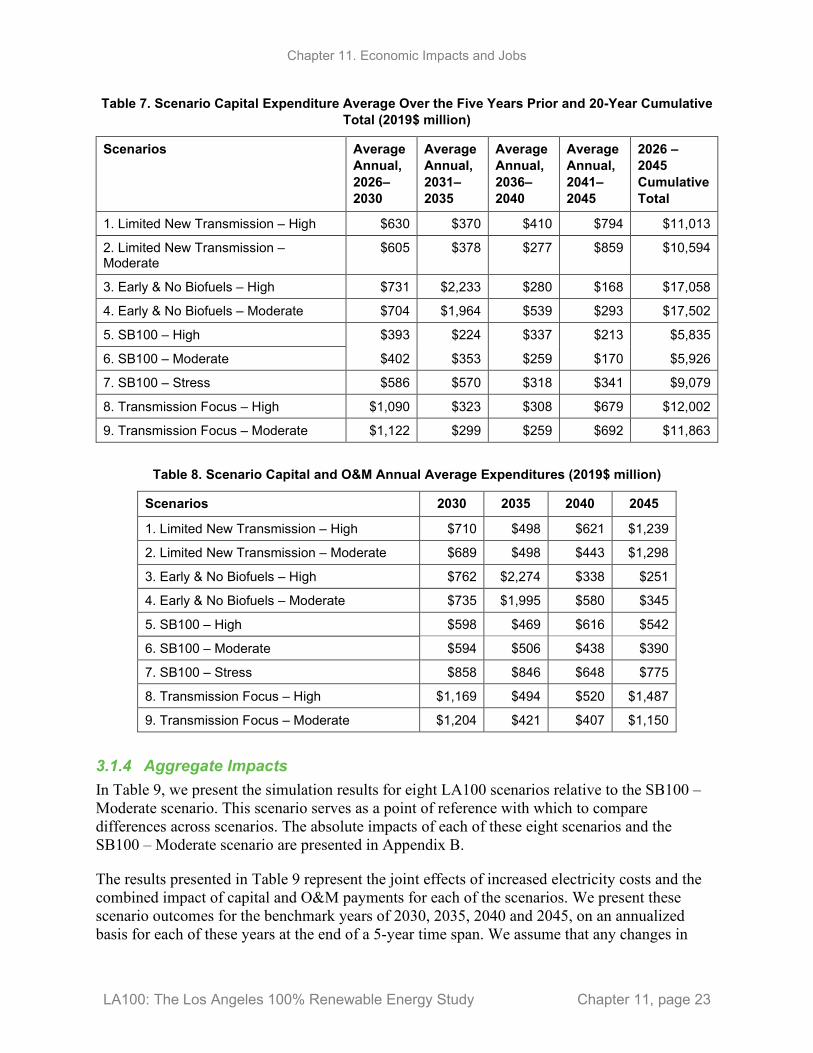
Chapter 11. Economic Impacts and Jobs
LA100: The Los Angeles 100% Renewable Energy Study Chapter 11, page 23
Table 7. Scenario Capital Expenditure Average Over the Five Years Prior and 20-Year Cumulative Total (2019$ million)
Scenarios Average Annual, 2026–2030
Average Annual, 2031–2035
Average Annual, 2036–2040
Average Annual, 2041–2045
2026 – 2045 Cumulative Total
1. Limited New Transmission – High $630 $370 $410 $794 $11,013
2. Limited New Transmission – Moderate
$605 $378 $277 $859 $10,594
3. Early & No Biofuels – High $731 $2,233 $280 $168 $17,058
4. Early & No Biofuels – Moderate $704 $1,964 $539 $293 $17,502
5. SB100 – High $393 $224 $337 $213 $5,835
6. SB100 – Moderate $402 $353 $259 $170 $5,926
7. SB100 – Stress $586 $570 $318 $341 $9,079
8. Transmission Focus – High $1,090 $323 $308 $679 $12,002
9. Transmission Focus – Moderate $1,122 $299 $259 $692 $11,863
Table 8. Scenario Capital and O&M Annual Average Expenditures (2019$ million)
Scenarios 2030 2035 2040 2045
1. Limited New Transmission – High $710 $498 $621 $1,239
2. Limited New Transmission – Moderate $689 $498 $443 $1,298
3. Early & No Biofuels – High $762 $2,274 $338 $251
4. Early & No Biofuels – Moderate $735 $1,995 $580 $345
5. SB100 – High $598 $469 $616 $542
6. SB100 – Moderate $594 $506 $438 $390
7. SB100 – Stress $858 $846 $648 $775
8. Transmission Focus – High $1,169 $494 $520 $1,487
9. Transmission Focus – Moderate $1,204 $421 $407 $1,150
3.1.4 Aggregate Impacts In Table 9, we present the simulation results for eight LA100 scenarios relative to the SB100 – Moderate scenario. This scenario serves as a point of reference with which to compare differences across scenarios. The absolute impacts of each of these eight scenarios and the SB100 – Moderate scenario are presented in Appendix B.
The results presented in Table 9 represent the joint effects of increased electricity costs and the combined impact of capital and O&M payments for each of the scenarios. We present these scenario outcomes for the benchmark years of 2030, 2035, 2040 and 2045, on an annualized basis for each of these years at the end of a 5-year time span. We assume that any changes in
Chapter 11. Economic Impacts and Jobs
LA100: The Los Angeles 100% Renewable Energy Study Chapter 11, page 24
electricity prices reflect changes in total costs of serving load and thus revenue from electricity sales is sufficient to cover any increase in power system costs incurred. As such, we need not make any adjustments in the Los Angeles City budget, such as displacement of other expenditures or tax increases. Overall, capital and O&M expenditures have a positive effect on economic activity, as do price decreases relative to SB100 – Moderate. Conversely, price increases relative to SB100 – Moderate have a dampening effect on economic activity.
To interpret the table, consider the Limited New Transmission – High scenario. For the time span of 2026–2030, the combined impact of the 2.3% decrease in electricity costs from Table 5 and the increase in capital formation and O&M expenditures of $710 million from Table 8, both relative to SB100 – Moderate, the model shows that employment, regional output, and total real household income will rise by 1,700 job-years, $184 million and $3.5 million, respectively, relative to SB100 – Moderate. The percentage changes are relative to the base data for each of these economic indicators collected for the construction of the CGE model. Note that the percentages are all less than 0.1% of their respective bases for this initial time period.
Overall, five of the eight scenarios project positive net impacts on employment and four project positive impacts on output and income in relation to the SB100 – Moderate scenario for the time period 2026–2030, while only four of eight project increases across all three economic indicators for the 2041–2045 period. Transmission Focus – Moderate switches from positive to negative in terms of employment impact by 2035. The switch takes place in part because the cost changes for this scenario are larger than SB100 – Moderate in 2045, which is the largest difference for the four time periods. The higher estimated electricity costs for the Transmission Focus – Moderate scenario in 2045 cause economic activity to fall relative to SB100 – Moderate.
The largest projected employment increases are attained by the SB100 – Stress scenario for the period of 2041–2045: an annual average of 6,200 job-years over that time span. The largest consistent decreases in employment are projected to be for the Early & No Biofuels – Moderate scenario—an annual average decline of 3,700 annual average job years for the period of 2041–2045. Economic output and household income values have analogous relative increases and decreases from the above. For example, gross output impacts range from an increase of $1.2 billion for SB100 – Stress to a decrease of $0.7 billion for Early & No Biofuels – Moderate for the 2041–2045 time period. The time paths of the changes in economic indicators are dictated by a combination of three causal factors, with changes in investments over time being the one that is most variable across scenarios. Although many of the impacts are large in terms of absolute levels, they are relatively small compared to the overall Los Angeles economy; only one of the impacts—economic output for SB100 – Stress—represents more than 0.55% change in economic activity relative to SB100 – Moderate within the city of LA.
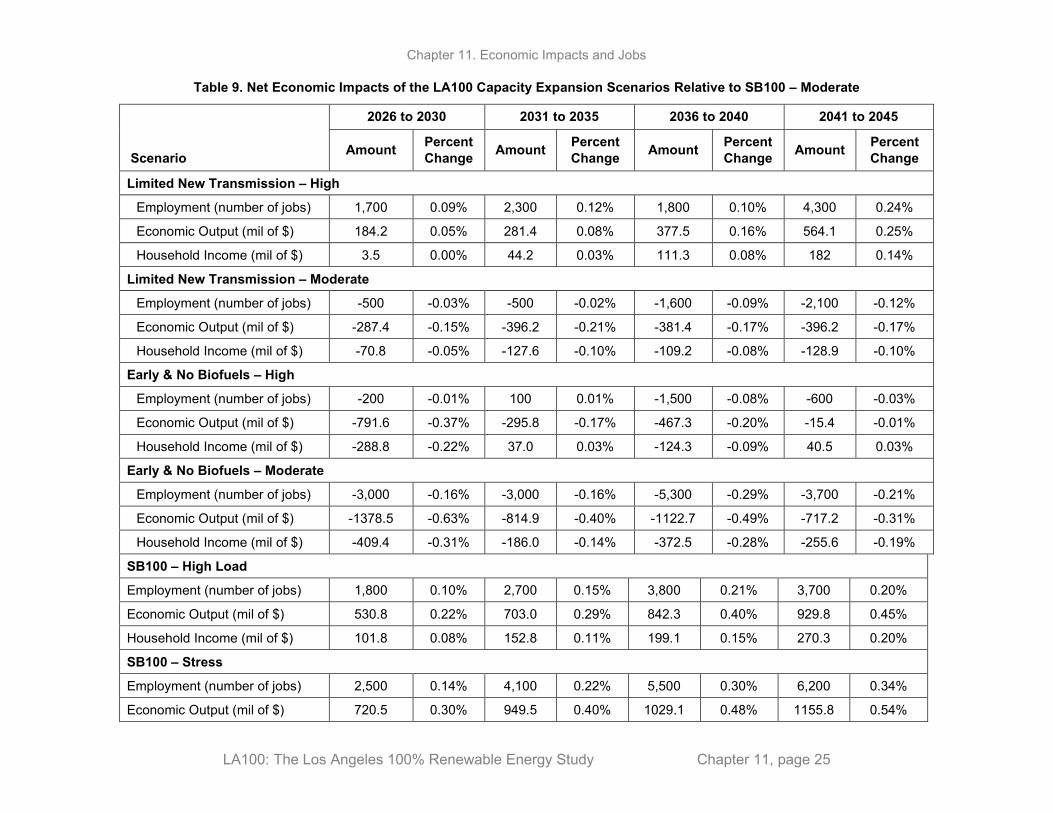
Chapter 11. Economic Impacts and Jobs
LA100: The Los Angeles 100% Renewable Energy Study Chapter 11, page 25
Table 9. Net Economic Impacts of the LA100 Capacity Expansion Scenarios Relative to SB100 – Moderate
2026 to 2030 2031 to 2035 2036 to 2040 2041 to 2045
Scenario Amount Percent Change Amount Percent
Change Amount Percent Change Amount Percent
Change
Limited New Transmission – High
Employment (number of jobs) 1,700 0.09% 2,300 0.12% 1,800 0.10% 4,300 0.24%
Economic Output (mil of $) 184.2 0.05% 281.4 0.08% 377.5 0.16% 564.1 0.25%
Household Income (mil of $) 3.5 0.00% 44.2 0.03% 111.3 0.08% 182 0.14%
Limited New Transmission – Moderate
Employment (number of jobs) -500 -0.03% -500 -0.02% -1,600 -0.09% -2,100 -0.12%
Economic Output (mil of $) -287.4 -0.15% -396.2 -0.21% -381.4 -0.17% -396.2 -0.17%
Household Income (mil of $) -70.8 -0.05% -127.6 -0.10% -109.2 -0.08% -128.9 -0.10%
Early & No Biofuels – High
Employment (number of jobs) -200 -0.01% 100 0.01% -1,500 -0.08% -600 -0.03%
Economic Output (mil of $) -791.6 -0.37% -295.8 -0.17% -467.3 -0.20% -15.4 -0.01%
Household Income (mil of $) -288.8 -0.22% 37.0 0.03% -124.3 -0.09% 40.5 0.03%
Early & No Biofuels – Moderate
Employment (number of jobs) -3,000 -0.16% -3,000 -0.16% -5,300 -0.29% -3,700 -0.21%
Economic Output (mil of $) -1378.5 -0.63% -814.9 -0.40% -1122.7 -0.49% -717.2 -0.31%
Household Income (mil of $) -409.4 -0.31% -186.0 -0.14% -372.5 -0.28% -255.6 -0.19%
SB100 – High Load
Employment (number of jobs) 1,800 0.10% 2,700 0.15% 3,800 0.21% 3,700 0.20%
Economic Output (mil of $) 530.8 0.22% 703.0 0.29% 842.3 0.40% 929.8 0.45%
Household Income (mil of $) 101.8 0.08% 152.8 0.11% 199.1 0.15% 270.3 0.20%
SB100 – Stress
Employment (number of jobs) 2,500 0.14% 4,100 0.22% 5,500 0.30% 6,200 0.34%
Economic Output (mil of $) 720.5 0.30% 949.5 0.40% 1029.1 0.48% 1155.8 0.54%
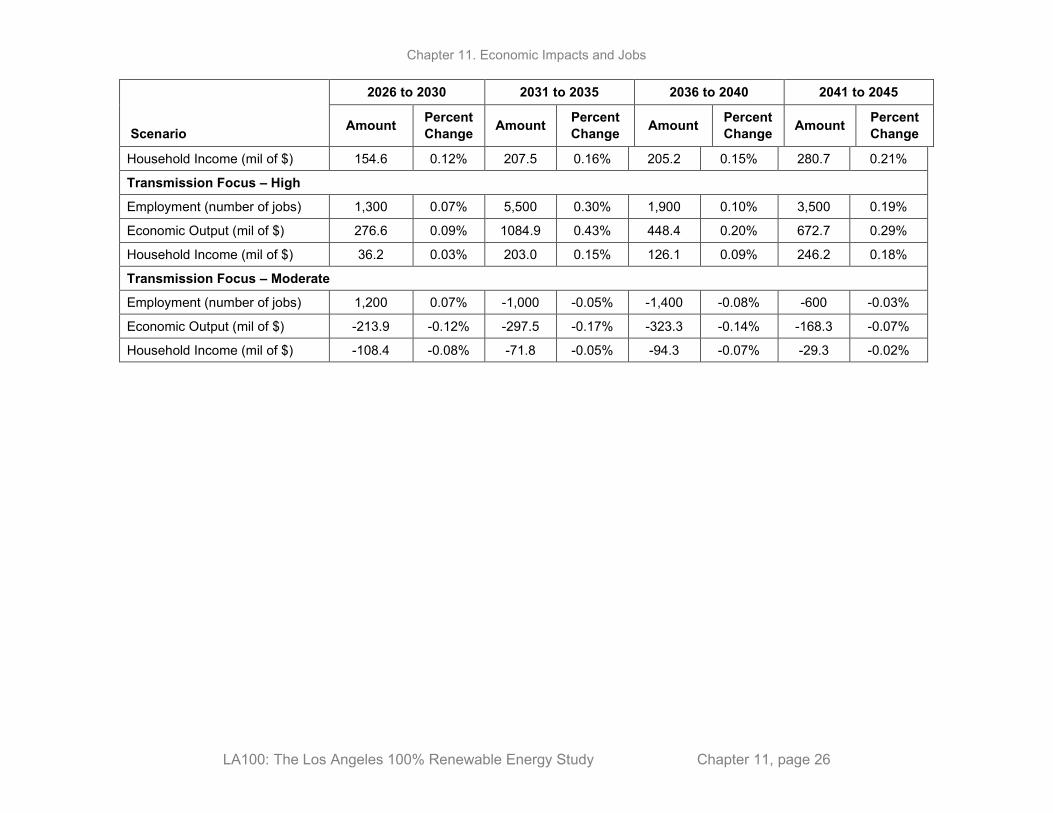
Chapter 11. Economic Impacts and Jobs
LA100: The Los Angeles 100% Renewable Energy Study Chapter 11, page 26
2026 to 2030 2031 to 2035 2036 to 2040 2041 to 2045
Scenario Amount Percent Change Amount Percent
Change Amount Percent Change Amount Percent
Change
Household Income (mil of $) 154.6 0.12% 207.5 0.16% 205.2 0.15% 280.7 0.21%
Transmission Focus – High
Employment (number of jobs) 1,300 0.07% 5,500 0.30% 1,900 0.10% 3,500 0.19%
Economic Output (mil of $) 276.6 0.09% 1084.9 0.43% 448.4 0.20% 672.7 0.29%
Household Income (mil of $) 36.2 0.03% 203.0 0.15% 126.1 0.09% 246.2 0.18%
Transmission Focus – Moderate
Employment (number of jobs) 1,200 0.07% -1,000 -0.05% -1,400 -0.08% -600 -0.03%
Economic Output (mil of $) -213.9 -0.12% -297.5 -0.17% -323.3 -0.14% -168.3 -0.07%
Household Income (mil of $) -108.4 -0.08% -71.8 -0.05% -94.3 -0.07% -29.3 -0.02%
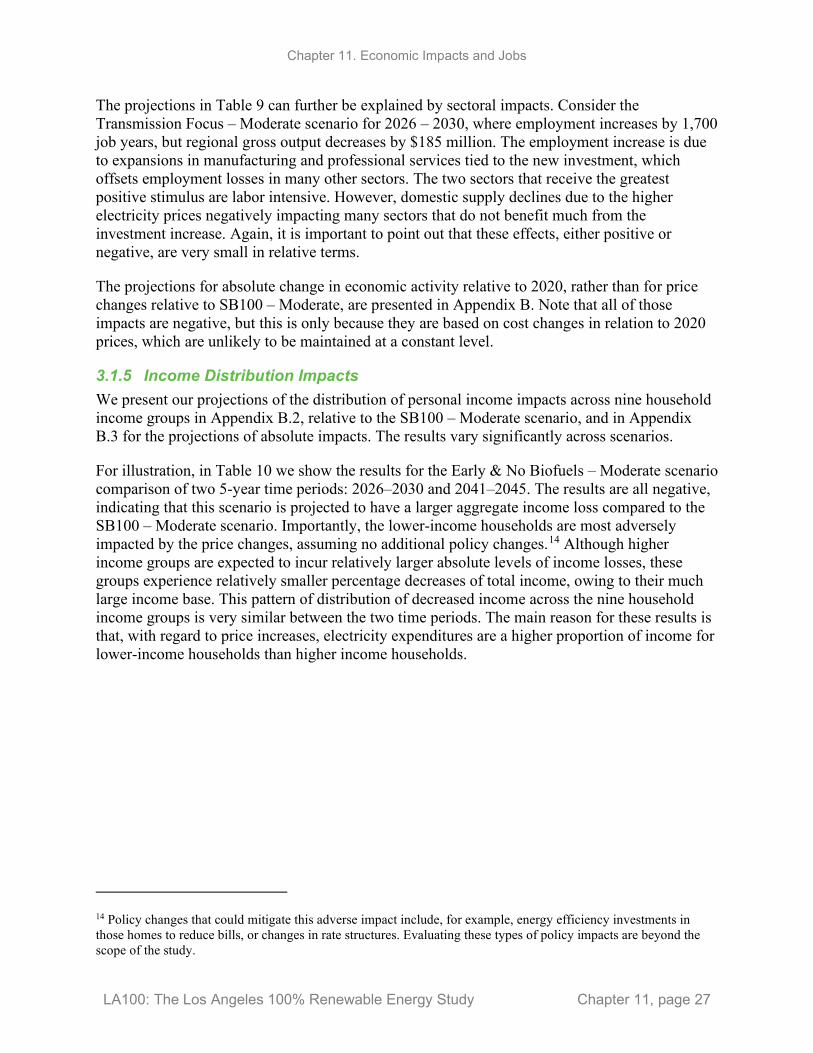
Chapter 11. Economic Impacts and Jobs
LA100: The Los Angeles 100% Renewable Energy Study Chapter 11, page 27
The projections in Table 9 can further be explained by sectoral impacts. Consider the Transmission Focus – Moderate scenario for 2026 – 2030, where employment increases by 1,700 job years, but regional gross output decreases by $185 million. The employment increase is due to expansions in manufacturing and professional services tied to the new investment, which offsets employment losses in many other sectors. The two sectors that receive the greatest positive stimulus are labor intensive. However, domestic supply declines due to the higher electricity prices negatively impacting many sectors that do not benefit much from the investment increase. Again, it is important to point out that these effects, either positive or negative, are very small in relative terms.
The projections for absolute change in economic activity relative to 2020, rather than for price changes relative to SB100 – Moderate, are presented in Appendix B. Note that all of those impacts are negative, but this is only because they are based on cost changes in relation to 2020 prices, which are unlikely to be maintained at a constant level.
3.1.5 Income Distribution Impacts We present our projections of the distribution of personal income impacts across nine household income groups in Appendix B.2, relative to the SB100 – Moderate scenario, and in Appendix B.3 for the projections of absolute impacts. The results vary significantly across scenarios.
For illustration, in Table 10 we show the results for the Early & No Biofuels – Moderate scenario comparison of two 5-year time periods: 2026–2030 and 2041–2045. The results are all negative, indicating that this scenario is projected to have a larger aggregate income loss compared to the SB100 – Moderate scenario. Importantly, the lower-income households are most adversely impacted by the price changes, assuming no additional policy changes.14 Although higher income groups are expected to incur relatively larger absolute levels of income losses, these groups experience relatively smaller percentage decreases of total income, owing to their much large income base. This pattern of distribution of decreased income across the nine household income groups is very similar between the two time periods. The main reason for these results is that, with regard to price increases, electricity expenditures are a higher proportion of income for lower-income households than higher income households.
14 Policy changes that could mitigate this adverse impact include, for example, energy efficiency investments in those homes to reduce bills, or changes in rate structures. Evaluating these types of policy impacts are beyond the scope of the study.
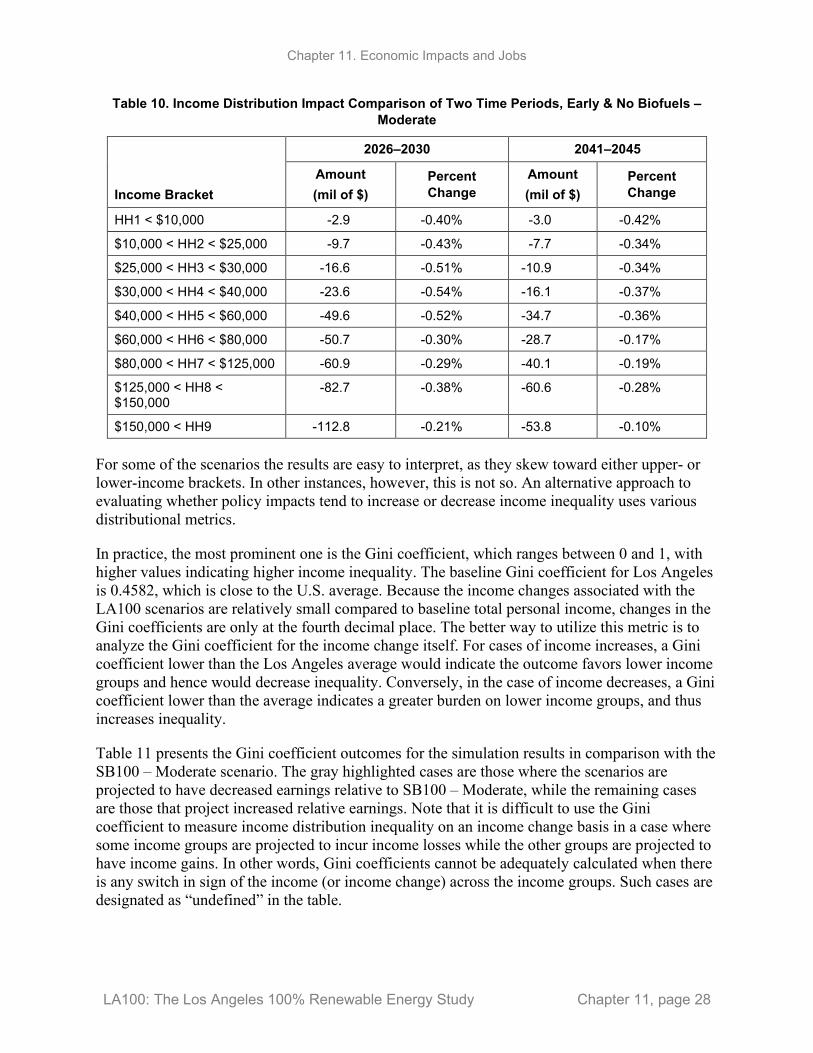
Chapter 11. Economic Impacts and Jobs
LA100: The Los Angeles 100% Renewable Energy Study Chapter 11, page 28
Table 10. Income Distribution Impact Comparison of Two Time Periods, Early & No Biofuels – Moderate
2026–2030 2041–2045
Income Bracket Amount (mil of $)
Percent Change
Amount (mil of $)
Percent Change
HH1 < $10,000 -2.9 -0.40% -3.0 -0.42%
$10,000 < HH2 < $25,000 -9.7 -0.43% -7.7 -0.34%
$25,000 < HH3 < $30,000 -16.6 -0.51% -10.9 -0.34%
$30,000 < HH4 < $40,000 -23.6 -0.54% -16.1 -0.37%
$40,000 < HH5 < $60,000 -49.6 -0.52% -34.7 -0.36%
$60,000 < HH6 < $80,000 -50.7 -0.30% -28.7 -0.17%
$80,000 < HH7 < $125,000 -60.9 -0.29% -40.1 -0.19%
$125,000 < HH8 < $150,000
-82.7 -0.38% -60.6 -0.28%
$150,000 < HH9 -112.8 -0.21% -53.8 -0.10%
For some of the scenarios the results are easy to interpret, as they skew toward either upper- or lower-income brackets. In other instances, however, this is not so. An alternative approach to evaluating whether policy impacts tend to increase or decrease income inequality uses various distributional metrics.
In practice, the most prominent one is the Gini coefficient, which ranges between 0 and 1, with higher values indicating higher income inequality. The baseline Gini coefficient for Los Angeles is 0.4582, which is close to the U.S. average. Because the income changes associated with the LA100 scenarios are relatively small compared to baseline total personal income, changes in the Gini coefficients are only at the fourth decimal place. The better way to utilize this metric is to analyze the Gini coefficient for the income change itself. For cases of income increases, a Gini coefficient lower than the Los Angeles average would indicate the outcome favors lower income groups and hence would decrease inequality. Conversely, in the case of income decreases, a Gini coefficient lower than the average indicates a greater burden on lower income groups, and thus increases inequality.
Table 11 presents the Gini coefficient outcomes for the simulation results in comparison with the SB100 – Moderate scenario. The gray highlighted cases are those where the scenarios are projected to have decreased earnings relative to SB100 – Moderate, while the remaining cases are those that project increased relative earnings. Note that it is difficult to use the Gini coefficient to measure income distribution inequality on an income change basis in a case where some income groups are projected to incur income losses while the other groups are projected to have income gains. In other words, Gini coefficients cannot be adequately calculated when there is any switch in sign of the income (or income change) across the income groups. Such cases are designated as “undefined” in the table.
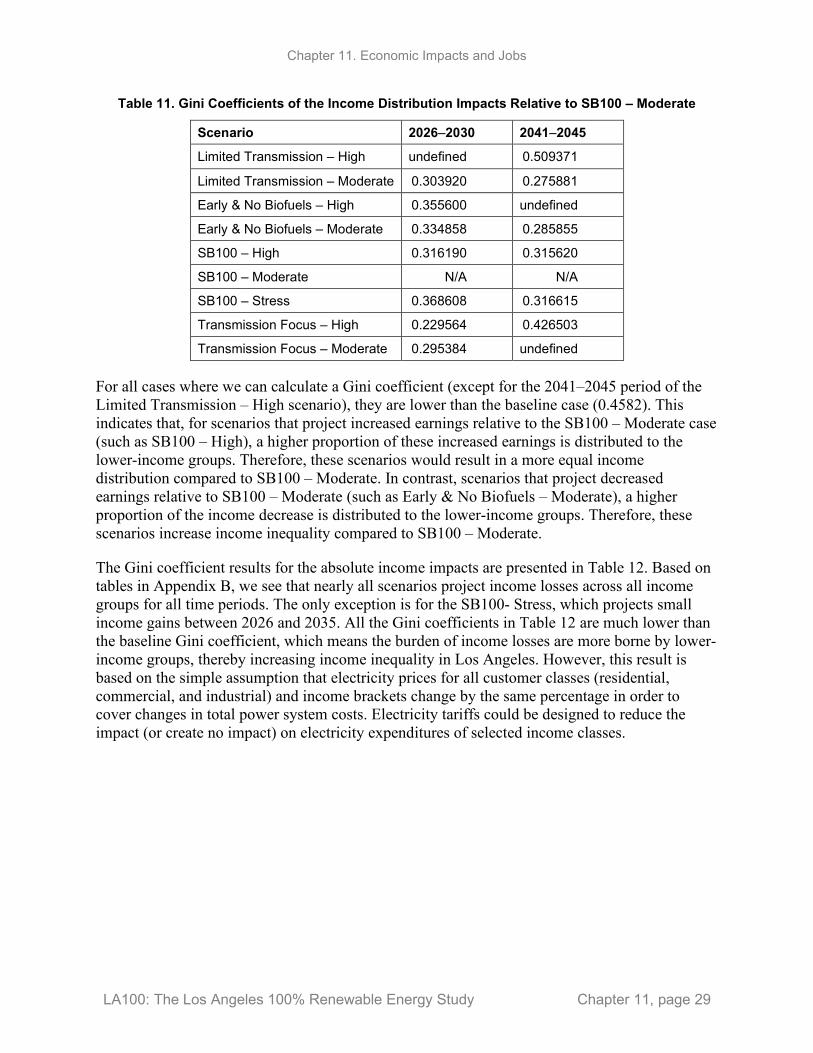
Chapter 11. Economic Impacts and Jobs
LA100: The Los Angeles 100% Renewable Energy Study Chapter 11, page 29
Table 11. Gini Coefficients of the Income Distribution Impacts Relative to SB100 – Moderate
Scenario 2026–2030 2041–2045
Limited Transmission – High undefined 0.509371
Limited Transmission – Moderate 0.303920 0.275881
Early & No Biofuels – High 0.355600 undefined
Early & No Biofuels – Moderate 0.334858 0.285855
SB100 – High 0.316190 0.315620
SB100 – Moderate N/A N/A
SB100 – Stress 0.368608 0.316615
Transmission Focus – High 0.229564 0.426503
Transmission Focus – Moderate 0.295384 undefined
For all cases where we can calculate a Gini coefficient (except for the 2041–2045 period of the Limited Transmission – High scenario), they are lower than the baseline case (0.4582). This indicates that, for scenarios that project increased earnings relative to the SB100 – Moderate case (such as SB100 – High), a higher proportion of these increased earnings is distributed to the lower-income groups. Therefore, these scenarios would result in a more equal income distribution compared to SB100 – Moderate. In contrast, scenarios that project decreased earnings relative to SB100 – Moderate (such as Early & No Biofuels – Moderate), a higher proportion of the income decrease is distributed to the lower-income groups. Therefore, these scenarios increase income inequality compared to SB100 – Moderate.
The Gini coefficient results for the absolute income impacts are presented in Table 12. Based on tables in Appendix B, we see that nearly all scenarios project income losses across all income groups for all time periods. The only exception is for the SB100- Stress, which projects small income gains between 2026 and 2035. All the Gini coefficients in Table 12 are much lower than the baseline Gini coefficient, which means the burden of income losses are more borne by lower-income groups, thereby increasing income inequality in Los Angeles. However, this result is based on the simple assumption that electricity prices for all customer classes (residential, commercial, and industrial) and income brackets change by the same percentage in order to cover changes in total power system costs. Electricity tariffs could be designed to reduce the impact (or create no impact) on electricity expenditures of selected income classes.
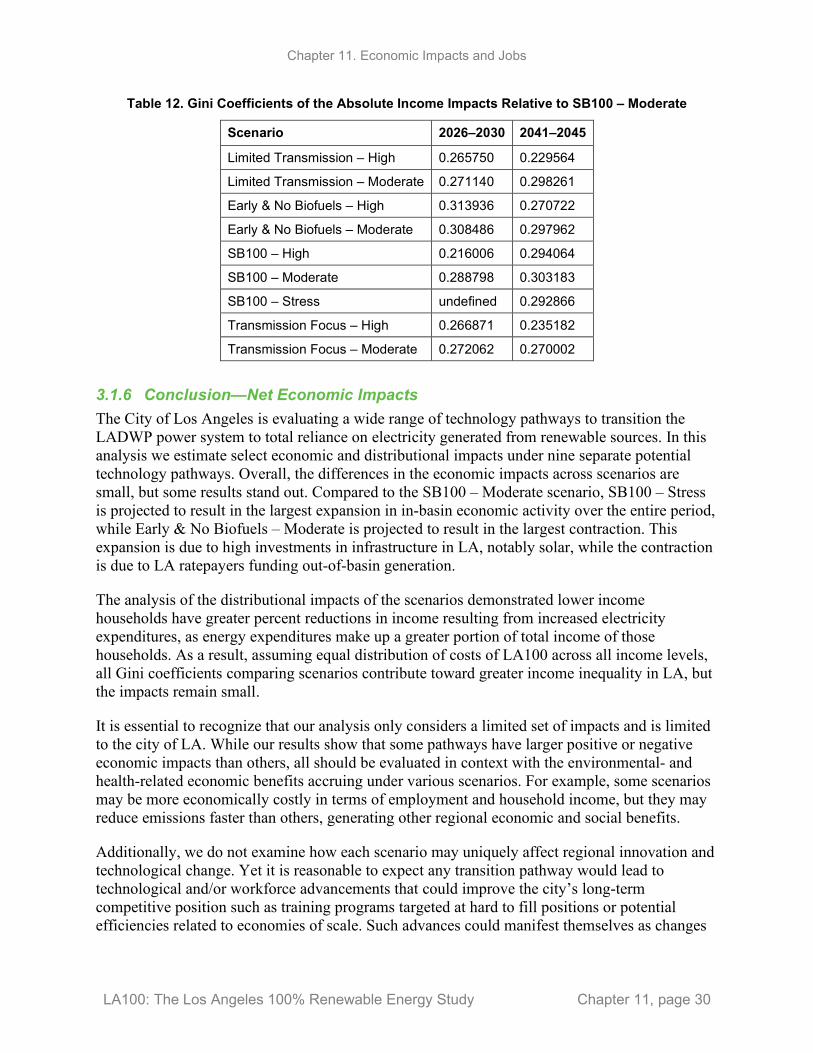
Chapter 11. Economic Impacts and Jobs
LA100: The Los Angeles 100% Renewable Energy Study Chapter 11, page 30
Table 12. Gini Coefficients of the Absolute Income Impacts Relative to SB100 – Moderate
Scenario 2026–2030 2041–2045
Limited Transmission – High 0.265750 0.229564
Limited Transmission – Moderate 0.271140 0.298261
Early & No Biofuels – High 0.313936 0.270722
Early & No Biofuels – Moderate 0.308486 0.297962
SB100 – High 0.216006 0.294064
SB100 – Moderate 0.288798 0.303183
SB100 – Stress undefined 0.292866
Transmission Focus – High 0.266871 0.235182
Transmission Focus – Moderate 0.272062 0.270002
3.1.6 Conclusion—Net Economic Impacts The City of Los Angeles is evaluating a wide range of technology pathways to transition the LADWP power system to total reliance on electricity generated from renewable sources. In this analysis we estimate select economic and distributional impacts under nine separate potential technology pathways. Overall, the differences in the economic impacts across scenarios are small, but some results stand out. Compared to the SB100 – Moderate scenario, SB100 – Stress is projected to result in the largest expansion in in-basin economic activity over the entire period, while Early & No Biofuels – Moderate is projected to result in the largest contraction. This expansion is due to high investments in infrastructure in LA, notably solar, while the contraction is due to LA ratepayers funding out-of-basin generation.
The analysis of the distributional impacts of the scenarios demonstrated lower income households have greater percent reductions in income resulting from increased electricity expenditures, as energy expenditures make up a greater portion of total income of those households. As a result, assuming equal distribution of costs of LA100 across all income levels, all Gini coefficients comparing scenarios contribute toward greater income inequality in LA, but the impacts remain small.
It is essential to recognize that our analysis only considers a limited set of impacts and is limited to the city of LA. While our results show that some pathways have larger positive or negative economic impacts than others, all should be evaluated in context with the environmental- and health-related economic benefits accruing under various scenarios. For example, some scenarios may be more economically costly in terms of employment and household income, but they may reduce emissions faster than others, generating other regional economic and social benefits.
Additionally, we do not examine how each scenario may uniquely affect regional innovation and technological change. Yet it is reasonable to expect any transition pathway would lead to technological and/or workforce advancements that could improve the city’s long-term competitive position such as training programs targeted at hard to fill positions or potential efficiencies related to economies of scale. Such advances could manifest themselves as changes
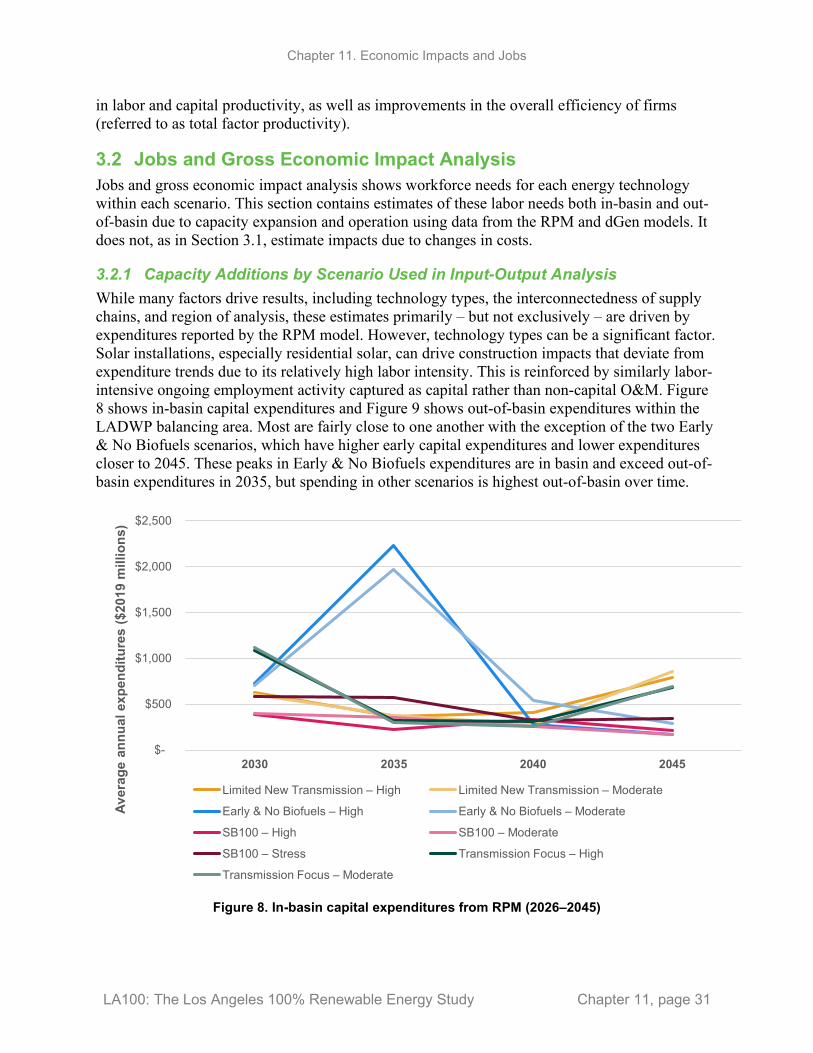
Chapter 11. Economic Impacts and Jobs
LA100: The Los Angeles 100% Renewable Energy Study Chapter 11, page 31
in labor and capital productivity, as well as improvements in the overall efficiency of firms (referred to as total factor productivity).
3.2 Jobs and Gross Economic Impact Analysis Jobs and gross economic impact analysis shows workforce needs for each energy technology within each scenario. This section contains estimates of these labor needs both in-basin and out-of-basin due to capacity expansion and operation using data from the RPM and dGen models. It does not, as in Section 3.1, estimate impacts due to changes in costs.
3.2.1 Capacity Additions by Scenario Used in Input-Output Analysis While many factors drive results, including technology types, the interconnectedness of supply chains, and region of analysis, these estimates primarily – but not exclusively – are driven by expenditures reported by the RPM model. However, technology types can be a significant factor. Solar installations, especially residential solar, can drive construction impacts that deviate from expenditure trends due to its relatively high labor intensity. This is reinforced by similarly labor-intensive ongoing employment activity captured as capital rather than non-capital O&M. Figure 8 shows in-basin capital expenditures and Figure 9 shows out-of-basin expenditures within the LADWP balancing area. Most are fairly close to one another with the exception of the two Early & No Biofuels scenarios, which have higher early capital expenditures and lower expenditures closer to 2045. These peaks in Early & No Biofuels expenditures are in basin and exceed out-of-basin expenditures in 2035, but spending in other scenarios is highest out-of-basin over time.
Figure 8. In-basin capital expenditures from RPM (2026–2045)
$-
$500
$1,000
$1,500
$2,000
$2,500
2030 2035 2040 2045
Aver
age
annu
al e
xpen
ditu
res
($20
19 m
illio
ns)
Limited New Transmission – High Limited New Transmission – Moderate
Early & No Biofuels – High Early & No Biofuels – Moderate
SB100 – High SB100 – Moderate
SB100 – Stress Transmission Focus – High
Transmission Focus – Moderate

Chapter 11. Economic Impacts and Jobs
LA100: The Los Angeles 100% Renewable Energy Study Chapter 11, page 32
Figure 9. Out-of-basin capital expenditures from RPM (2026–2045)
Non-capital O&M expenditures, for the most part, follow installations. The distinction between capital and non-capital O&M is apparent in the relatively low expenditures under the Early & No Biofuels scenarios, which have the lowest in-basin expenditures (Figure 10). These scenarios are in the middle of non-capital O&M expenditures out-of-basin, reflecting the shift from residential to utility solar (Figure 11).15
15 Nuclear O&M is not included in these expenditure figures due to a lack of available I-O data.
$-
$500
$1,000
$1,500
$2,000
$2,500
2030 2035 2040 2045
Aver
age
annu
al e
xpen
ditu
res
($20
19,
mill
ions
)
Limited New Transmission – High Limited New Transmission – Moderate
Early & No Biofuels – High Early & No Biofuels – Moderate
SB100 – High SB100 – Moderate
SB100 – Stress Transmission Focus – High
Transmission Focus – Moderate

Chapter 11. Economic Impacts and Jobs
LA100: The Los Angeles 100% Renewable Energy Study Chapter 11, page 33
Figure 10. In-basin O&M expenditures (2026–2045)
$-
$100
$200
$300
$400
$500
$600
$700
$800
$900
2030 2035 2040 2045
Annu
al e
xpen
ditu
res
($20
19 m
illion
s)
Limited New Transmission – High Limited New Transmission – Moderate
Early & No Biofuels – High Early & No Biofuels – Moderate
SB100 – High SB100 – Moderate
SB100 – Stress Transmission Focus – High
Transmission Focus – Moderate

Chapter 11. Economic Impacts and Jobs
LA100: The Los Angeles 100% Renewable Energy Study Chapter 11, page 34
Figure 11. Out-of-basin non-capital O&M expenditures (2026–2045)
3.2.2 Overview of Scenarios Within the LA Basin, all scenarios separately support an average of approximately 6,300 jobs due to construction and installation annually (exclusive of non-capital O&M), $410 million in earnings, $620 million in value added, and $1.0 billion in gross output. This estimate decreases from an average of 7,400 jobs annually from 2026 to 2030 to a low of 4,300 jobs in 2045 (Table 13). On average, these workers earned $64,000 annually, which is greater than the $60,000 average in LA.16
Table 13. Summary of Annual Impacts from In-Basin Construction and Installation, Averaged Across all Scenarios (2026–2045)
2030 2035 2040 2045 Average
Jobs 7,400 7,600 6,000 4,300 6,300
Earnings ($ mil.) $464 $504 $379 $277 $406
Output ($ mil.) $1,153 $1,233 $929 $686 $1,000
Value Added ($ mil.) $729 $755 $583 $430 $624
16 All data in tables are rounded while calculated data such as sums and average use unrounded original data. As such, data presented in the chapter text, such as average salaries, may not precisely match what is reported in these tables.
$-
$100
$200
$300
$400
$500
$600
$700
$800
$900
2030 2035 2040 2045
Annu
al e
xpen
ditu
res
($20
19, m
illio
ns)
Limited New Transmission – High Limited New Transmission – Moderate
Early & No Biofuels – High Early & No Biofuels – Moderate
SB100 – High SB100 – Moderate
SB100 – Stress Transmission Focus – High
Transmission Focus – Moderate
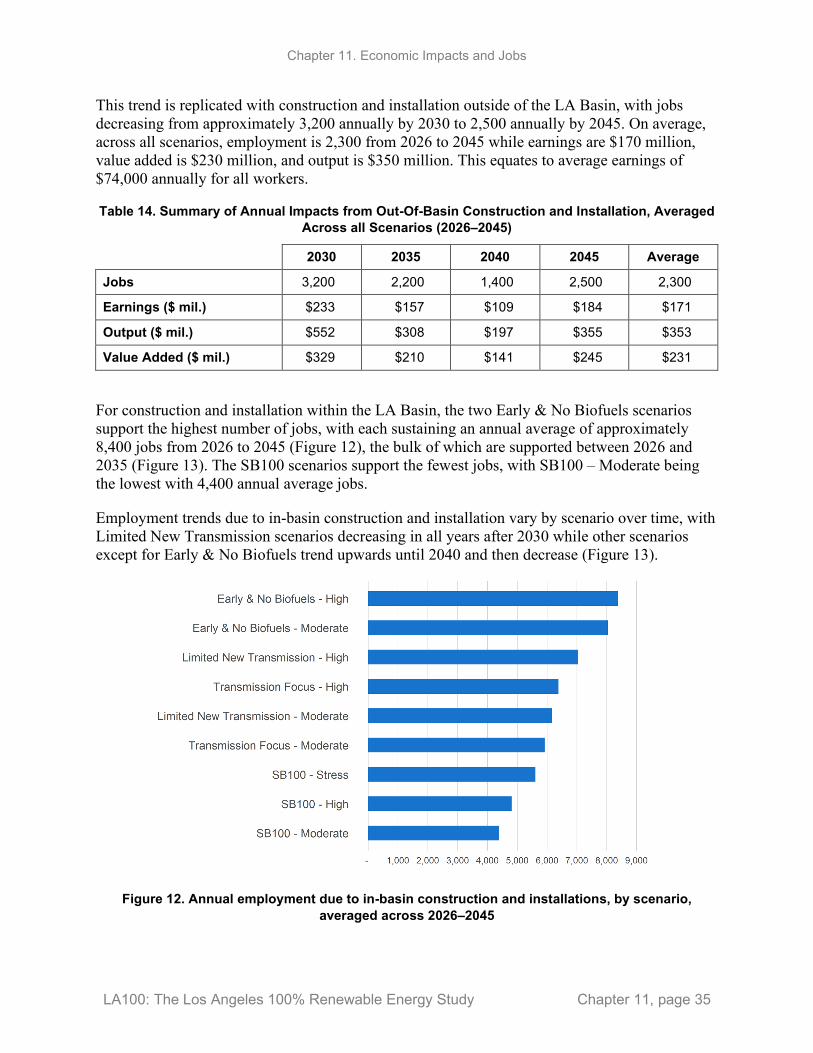
Chapter 11. Economic Impacts and Jobs
LA100: The Los Angeles 100% Renewable Energy Study Chapter 11, page 35
This trend is replicated with construction and installation outside of the LA Basin, with jobs decreasing from approximately 3,200 annually by 2030 to 2,500 annually by 2045. On average, across all scenarios, employment is 2,300 from 2026 to 2045 while earnings are $170 million, value added is $230 million, and output is $350 million. This equates to average earnings of $74,000 annually for all workers.
Table 14. Summary of Annual Impacts from Out-Of-Basin Construction and Installation, Averaged Across all Scenarios (2026–2045)
2030 2035 2040 2045 Average
Jobs 3,200 2,200 1,400 2,500 2,300
Earnings ($ mil.) $233 $157 $109 $184 $171
Output ($ mil.) $552 $308 $197 $355 $353
Value Added ($ mil.) $329 $210 $141 $245 $231
For construction and installation within the LA Basin, the two Early & No Biofuels scenarios support the highest number of jobs, with each sustaining an annual average of approximately 8,400 jobs from 2026 to 2045 (Figure 12), the bulk of which are supported between 2026 and 2035 (Figure 13). The SB100 scenarios support the fewest jobs, with SB100 – Moderate being the lowest with 4,400 annual average jobs.
Employment trends due to in-basin construction and installation vary by scenario over time, with Limited New Transmission scenarios decreasing in all years after 2030 while other scenarios except for Early & No Biofuels trend upwards until 2040 and then decrease (Figure 13).
Figure 12. Annual employment due to in-basin construction and installations, by scenario,
averaged across 2026–2045
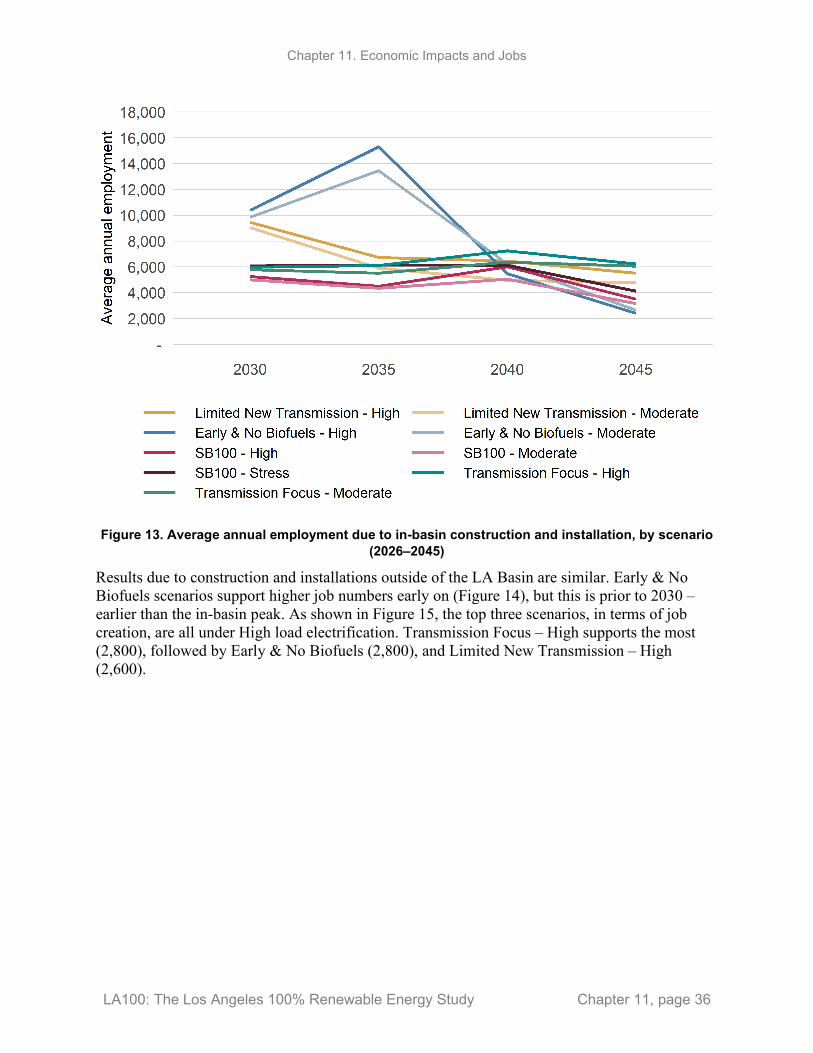
Chapter 11. Economic Impacts and Jobs
LA100: The Los Angeles 100% Renewable Energy Study Chapter 11, page 36
Figure 13. Average annual employment due to in-basin construction and installation, by scenario
(2026–2045)
Results due to construction and installations outside of the LA Basin are similar. Early & No Biofuels scenarios support higher job numbers early on (Figure 14), but this is prior to 2030 – earlier than the in-basin peak. As shown in Figure 15, the top three scenarios, in terms of job creation, are all under High load electrification. Transmission Focus – High supports the most (2,800), followed by Early & No Biofuels (2,800), and Limited New Transmission – High (2,600).

Chapter 11. Economic Impacts and Jobs
LA100: The Los Angeles 100% Renewable Energy Study Chapter 11, page 37
Figure 14. Average annual employment due to out-of-basin construction and installation, by
scenario (2026–2045)
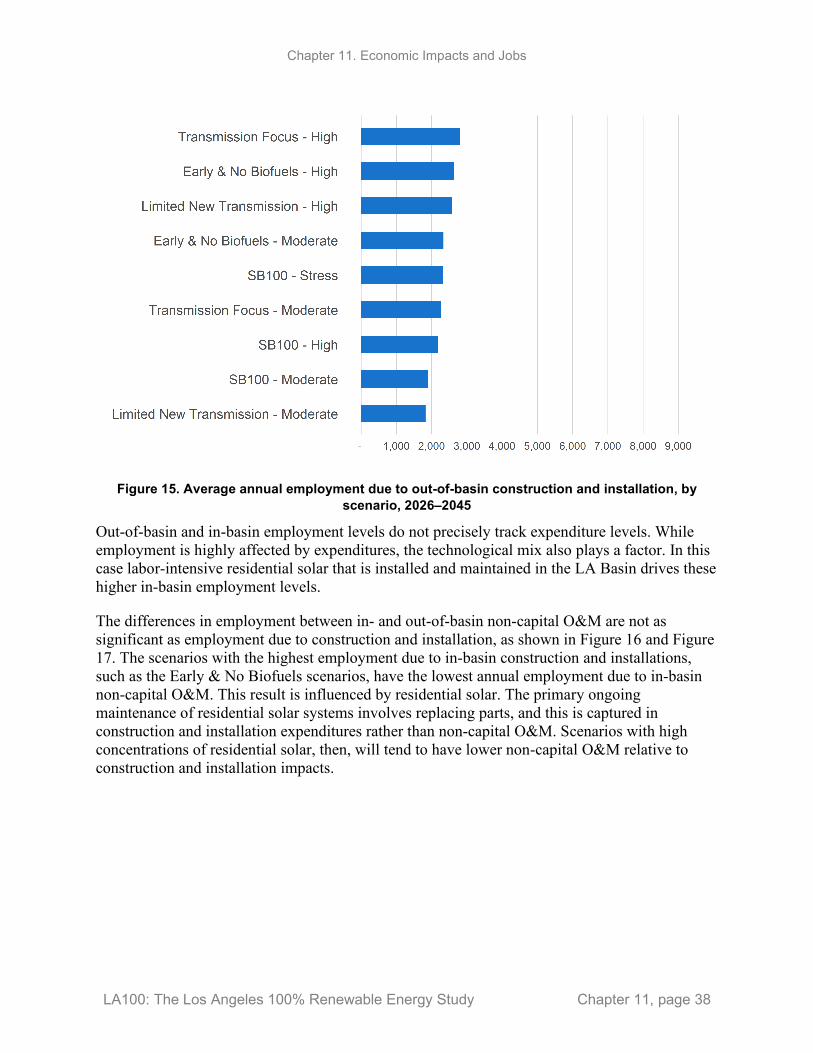
Chapter 11. Economic Impacts and Jobs
LA100: The Los Angeles 100% Renewable Energy Study Chapter 11, page 38
Figure 15. Average annual employment due to out-of-basin construction and installation, by
scenario, 2026–2045
Out-of-basin and in-basin employment levels do not precisely track expenditure levels. While employment is highly affected by expenditures, the technological mix also plays a factor. In this case labor-intensive residential solar that is installed and maintained in the LA Basin drives these higher in-basin employment levels.
The differences in employment between in- and out-of-basin non-capital O&M are not as significant as employment due to construction and installation, as shown in Figure 16 and Figure 17. The scenarios with the highest employment due to in-basin construction and installations, such as the Early & No Biofuels scenarios, have the lowest annual employment due to in-basin non-capital O&M. This result is influenced by residential solar. The primary ongoing maintenance of residential solar systems involves replacing parts, and this is captured in construction and installation expenditures rather than non-capital O&M. Scenarios with high concentrations of residential solar, then, will tend to have lower non-capital O&M relative to construction and installation impacts.
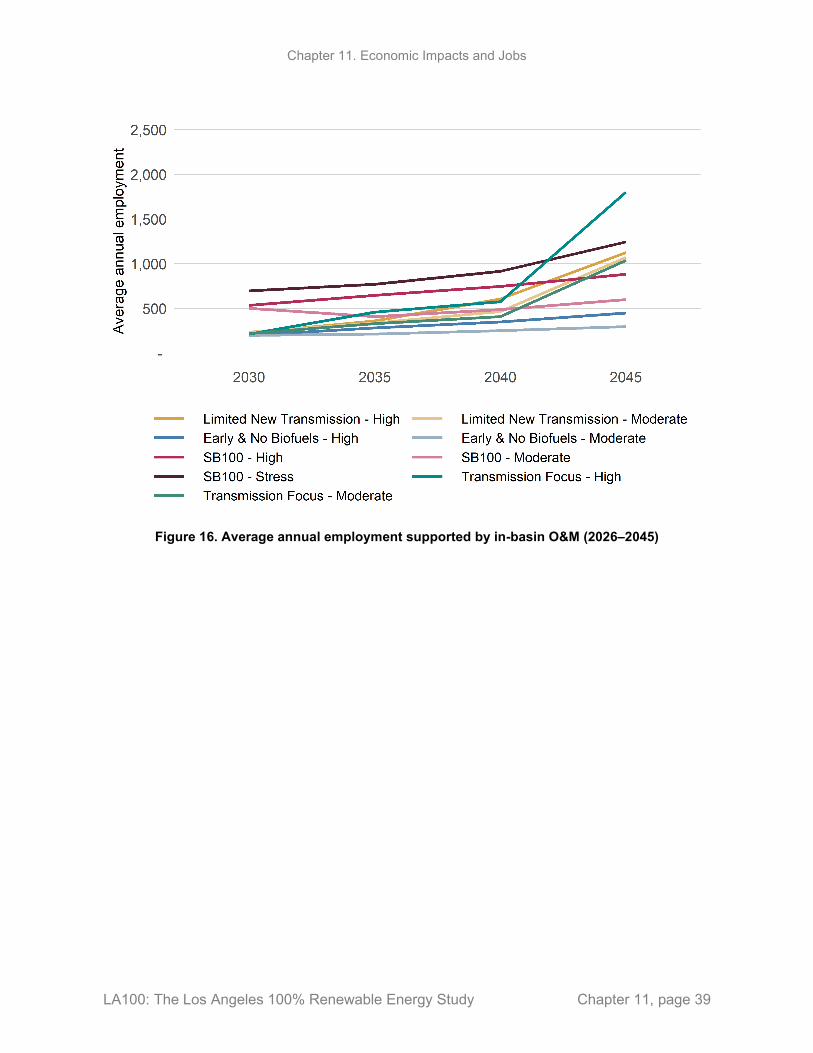
Chapter 11. Economic Impacts and Jobs
LA100: The Los Angeles 100% Renewable Energy Study Chapter 11, page 39
Figure 16. Average annual employment supported by in-basin O&M (2026–2045)

Chapter 11. Economic Impacts and Jobs
LA100: The Los Angeles 100% Renewable Energy Study Chapter 11, page 40
Figure 17. Average annual employment supported by out-of-basin O&M (2026–2045)
Over time, average employment due to in-basin, non-capital O&M increases from just over 300 jobs to 900 ongoing positions by 2045 (Table 15). This level of employment is lower than out-of-basin O&M, which increases from 1,100 annual positions by 2026 to 1,800 ongoing jobs by 2045 (Table 16). In-basin positions earn an average of $54,000 annually while out-of-basin positions, which tend to have higher concentrations in higher-paying technologies, such as wind, earn a higher average of $70,000.
Table 15. Summary of Annual Impacts Due to In-Basin O&M, Averaged Across all Scenarios (2026–2045)
2030 2035 2040 2045 Average
Jobs 300 400 500 900 600
Earnings ($ mil.) $18 $23 $29 $50 $30
Output ($ mil.) $53 $70 $93 $150 $91
Value Added ($ mil.) $33 $43 $56 $94 $57
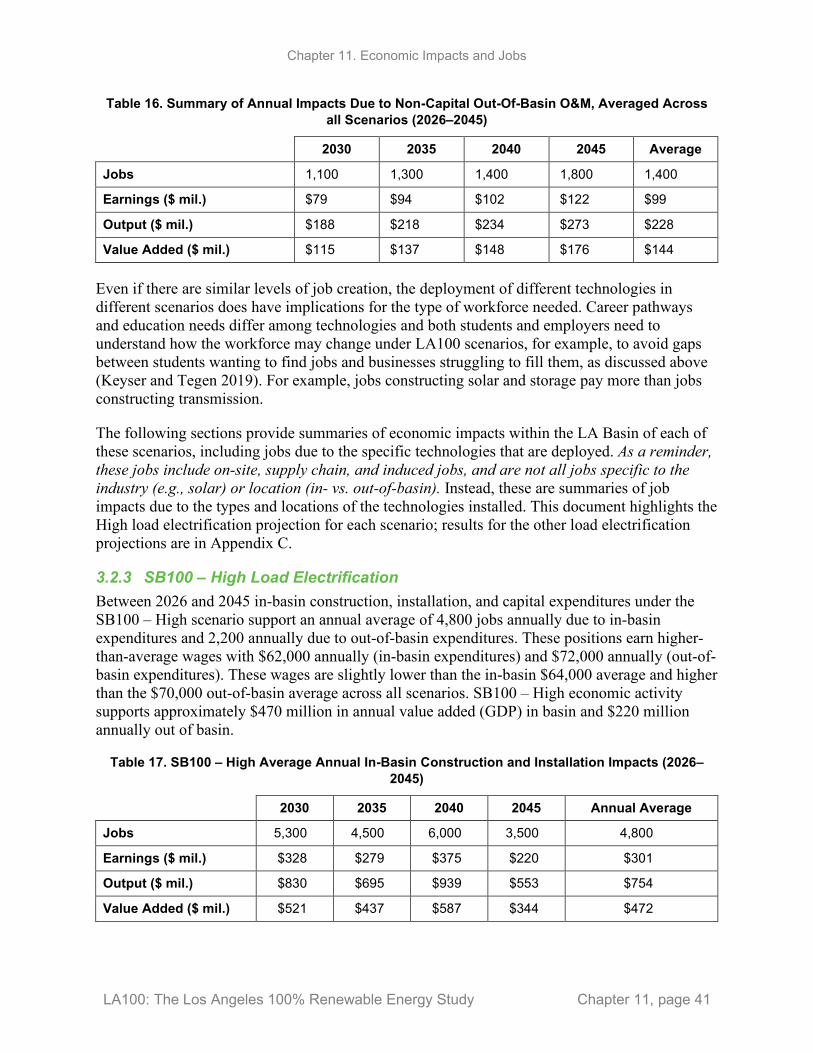
Chapter 11. Economic Impacts and Jobs
LA100: The Los Angeles 100% Renewable Energy Study Chapter 11, page 41
Table 16. Summary of Annual Impacts Due to Non-Capital Out-Of-Basin O&M, Averaged Across all Scenarios (2026–2045)
2030 2035 2040 2045 Average
Jobs 1,100 1,300 1,400 1,800 1,400
Earnings ($ mil.) $79 $94 $102 $122 $99
Output ($ mil.) $188 $218 $234 $273 $228
Value Added ($ mil.) $115 $137 $148 $176 $144
Even if there are similar levels of job creation, the deployment of different technologies in different scenarios does have implications for the type of workforce needed. Career pathways and education needs differ among technologies and both students and employers need to understand how the workforce may change under LA100 scenarios, for example, to avoid gaps between students wanting to find jobs and businesses struggling to fill them, as discussed above (Keyser and Tegen 2019). For example, jobs constructing solar and storage pay more than jobs constructing transmission.
The following sections provide summaries of economic impacts within the LA Basin of each of these scenarios, including jobs due to the specific technologies that are deployed. As a reminder, these jobs include on-site, supply chain, and induced jobs, and are not all jobs specific to the industry (e.g., solar) or location (in- vs. out-of-basin). Instead, these are summaries of job impacts due to the types and locations of the technologies installed. This document highlights the High load electrification projection for each scenario; results for the other load electrification projections are in Appendix C.
3.2.3 SB100 – High Load Electrification Between 2026 and 2045 in-basin construction, installation, and capital expenditures under the SB100 – High scenario support an annual average of 4,800 jobs annually due to in-basin expenditures and 2,200 annually due to out-of-basin expenditures. These positions earn higher-than-average wages with $62,000 annually (in-basin expenditures) and $72,000 annually (out-of-basin expenditures). These wages are slightly lower than the in-basin $64,000 average and higher than the $70,000 out-of-basin average across all scenarios. SB100 – High economic activity supports approximately $470 million in annual value added (GDP) in basin and $220 million annually out of basin.
Table 17. SB100 – High Average Annual In-Basin Construction and Installation Impacts (2026–2045)
2030 2035 2040 2045 Annual Average
Jobs 5,300 4,500 6,000 3,500 4,800
Earnings ($ mil.) $328 $279 $375 $220 $301
Output ($ mil.) $830 $695 $939 $553 $754
Value Added ($ mil.) $521 $437 $587 $344 $472
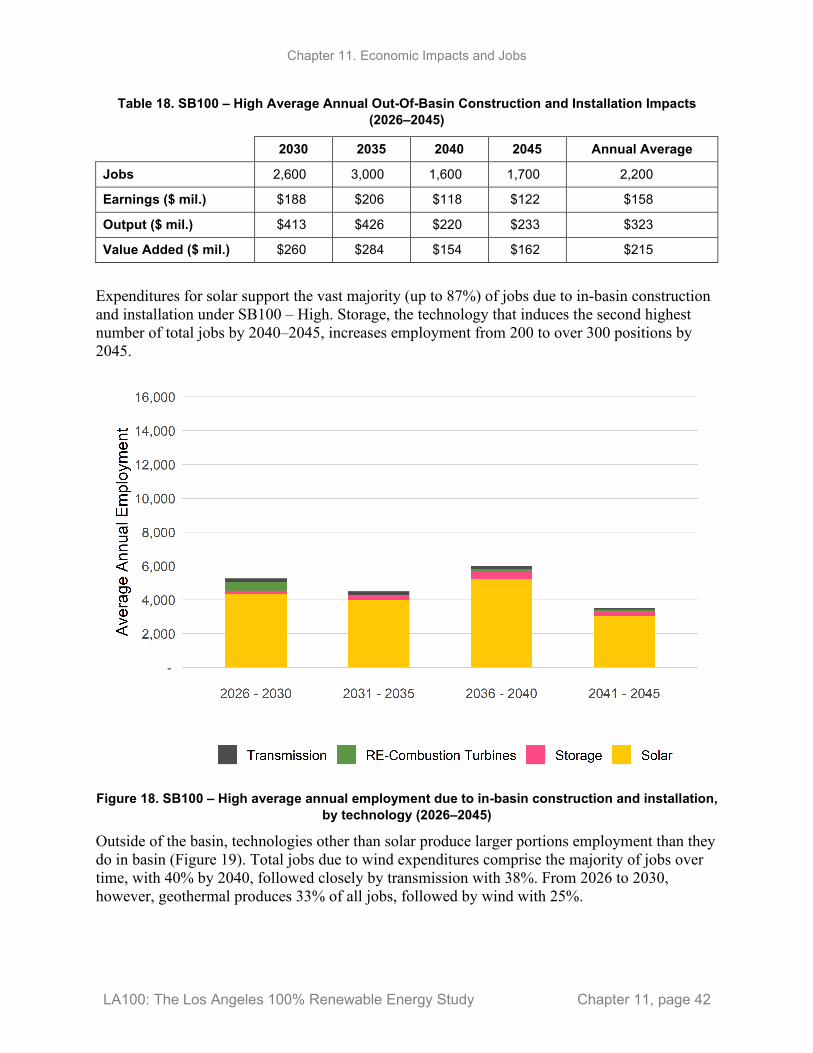
Chapter 11. Economic Impacts and Jobs
LA100: The Los Angeles 100% Renewable Energy Study Chapter 11, page 42
Table 18. SB100 – High Average Annual Out-Of-Basin Construction and Installation Impacts (2026–2045)
2030 2035 2040 2045 Annual Average
Jobs 2,600 3,000 1,600 1,700 2,200
Earnings ($ mil.) $188 $206 $118 $122 $158
Output ($ mil.) $413 $426 $220 $233 $323
Value Added ($ mil.) $260 $284 $154 $162 $215
Expenditures for solar support the vast majority (up to 87%) of jobs due to in-basin construction and installation under SB100 – High. Storage, the technology that induces the second highest number of total jobs by 2040–2045, increases employment from 200 to over 300 positions by 2045.
Figure 18. SB100 – High average annual employment due to in-basin construction and installation,
by technology (2026–2045)
Outside of the basin, technologies other than solar produce larger portions employment than they do in basin (Figure 19). Total jobs due to wind expenditures comprise the majority of jobs over time, with 40% by 2040, followed closely by transmission with 38%. From 2026 to 2030, however, geothermal produces 33% of all jobs, followed by wind with 25%.
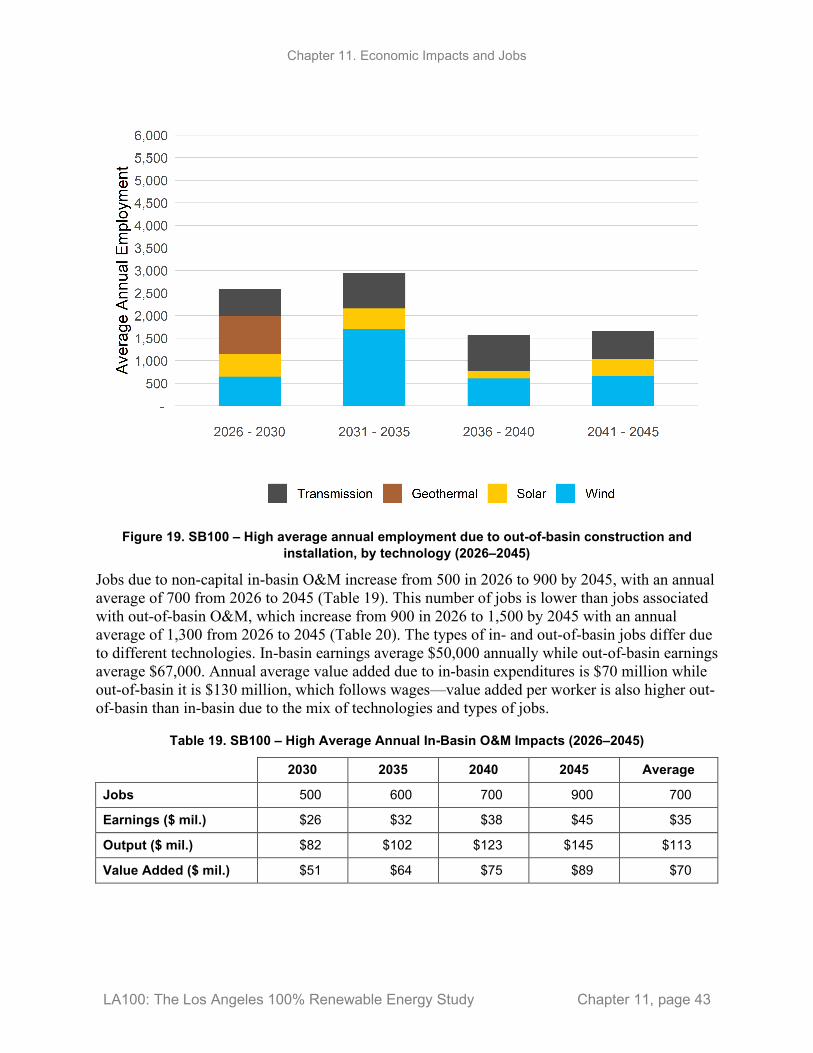
Chapter 11. Economic Impacts and Jobs
LA100: The Los Angeles 100% Renewable Energy Study Chapter 11, page 43
Figure 19. SB100 – High average annual employment due to out-of-basin construction and
installation, by technology (2026–2045)
Jobs due to non-capital in-basin O&M increase from 500 in 2026 to 900 by 2045, with an annual average of 700 from 2026 to 2045 (Table 19). This number of jobs is lower than jobs associated with out-of-basin O&M, which increase from 900 in 2026 to 1,500 by 2045 with an annual average of 1,300 from 2026 to 2045 (Table 20). The types of in- and out-of-basin jobs differ due to different technologies. In-basin earnings average $50,000 annually while out-of-basin earnings average $67,000. Annual average value added due to in-basin expenditures is $70 million while out-of-basin it is $130 million, which follows wages—value added per worker is also higher out-of-basin than in-basin due to the mix of technologies and types of jobs.
Table 19. SB100 – High Average Annual In-Basin O&M Impacts (2026–2045)
2030 2035 2040 2045 Average
Jobs 500 600 700 900 700
Earnings ($ mil.) $26 $32 $38 $45 $35
Output ($ mil.) $82 $102 $123 $145 $113
Value Added ($ mil.) $51 $64 $75 $89 $70
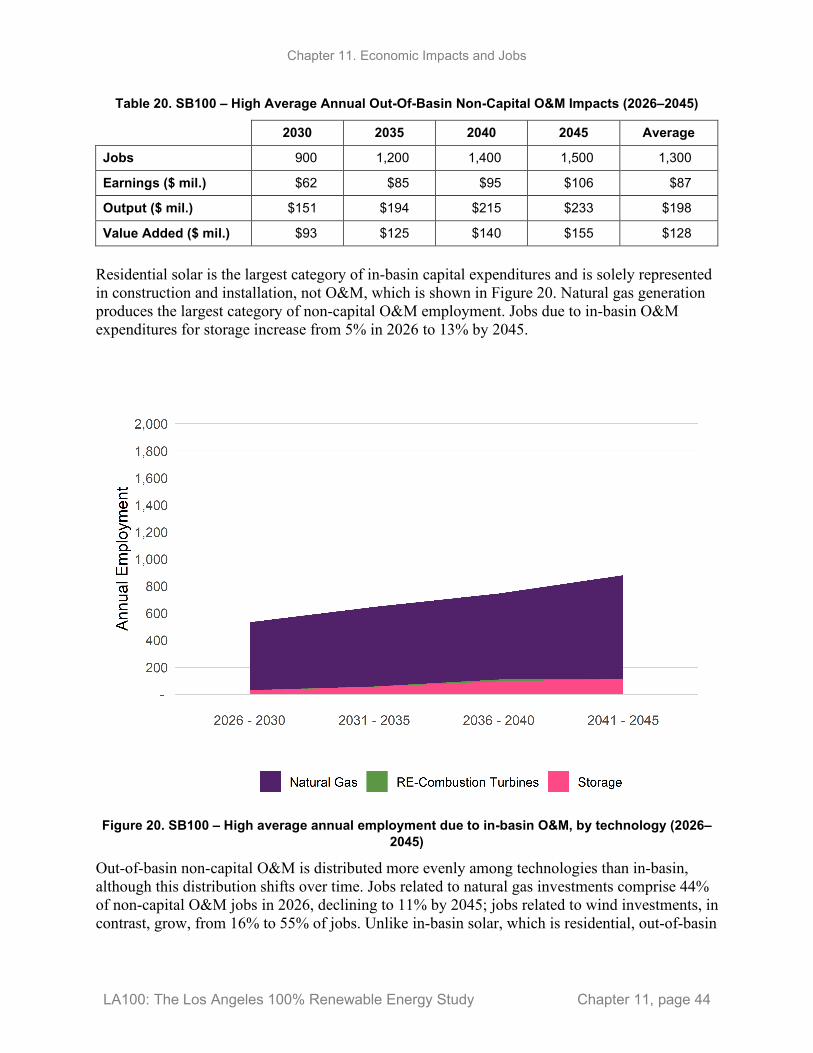
Chapter 11. Economic Impacts and Jobs
LA100: The Los Angeles 100% Renewable Energy Study Chapter 11, page 44
Table 20. SB100 – High Average Annual Out-Of-Basin Non-Capital O&M Impacts (2026–2045)
2030 2035 2040 2045 Average
Jobs 900 1,200 1,400 1,500 1,300
Earnings ($ mil.) $62 $85 $95 $106 $87
Output ($ mil.) $151 $194 $215 $233 $198
Value Added ($ mil.) $93 $125 $140 $155 $128
Residential solar is the largest category of in-basin capital expenditures and is solely represented in construction and installation, not O&M, which is shown in Figure 20. Natural gas generation produces the largest category of non-capital O&M employment. Jobs due to in-basin O&M expenditures for storage increase from 5% in 2026 to 13% by 2045.
Figure 20. SB100 – High average annual employment due to in-basin O&M, by technology (2026–
2045)
Out-of-basin non-capital O&M is distributed more evenly among technologies than in-basin, although this distribution shifts over time. Jobs related to natural gas investments comprise 44% of non-capital O&M jobs in 2026, declining to 11% by 2045; jobs related to wind investments, in contrast, grow, from 16% to 55% of jobs. Unlike in-basin solar, which is residential, out-of-basin
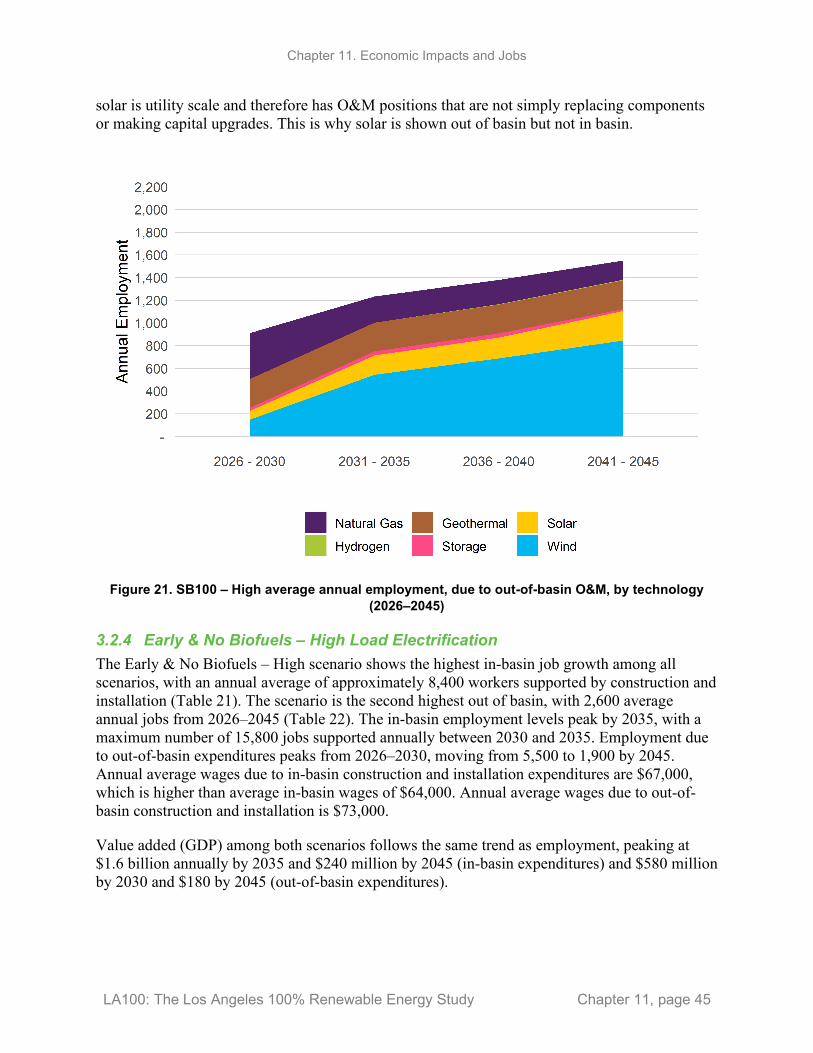
Chapter 11. Economic Impacts and Jobs
LA100: The Los Angeles 100% Renewable Energy Study Chapter 11, page 45
solar is utility scale and therefore has O&M positions that are not simply replacing components or making capital upgrades. This is why solar is shown out of basin but not in basin.
Figure 21. SB100 – High average annual employment, due to out-of-basin O&M, by technology
(2026–2045)
3.2.4 Early & No Biofuels – High Load Electrification The Early & No Biofuels – High scenario shows the highest in-basin job growth among all scenarios, with an annual average of approximately 8,400 workers supported by construction and installation (Table 21). The scenario is the second highest out of basin, with 2,600 average annual jobs from 2026–2045 (Table 22). The in-basin employment levels peak by 2035, with a maximum number of 15,800 jobs supported annually between 2030 and 2035. Employment due to out-of-basin expenditures peaks from 2026–2030, moving from 5,500 to 1,900 by 2045. Annual average wages due to in-basin construction and installation expenditures are $67,000, which is higher than average in-basin wages of $64,000. Annual average wages due to out-of-basin construction and installation is $73,000.
Value added (GDP) among both scenarios follows the same trend as employment, peaking at $1.6 billion annually by 2035 and $240 million by 2045 (in-basin expenditures) and $580 million by 2030 and $180 by 2045 (out-of-basin expenditures).
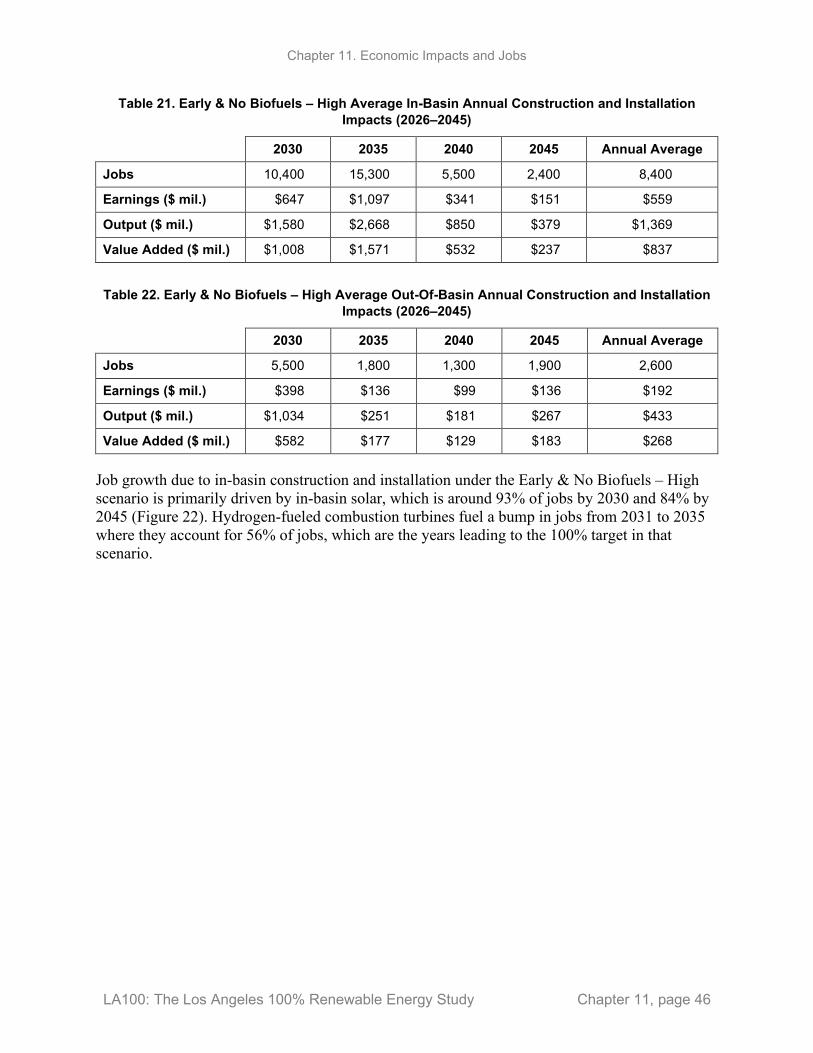
Chapter 11. Economic Impacts and Jobs
LA100: The Los Angeles 100% Renewable Energy Study Chapter 11, page 46
Table 21. Early & No Biofuels – High Average In-Basin Annual Construction and Installation Impacts (2026–2045)
2030 2035 2040 2045 Annual Average
Jobs 10,400 15,300 5,500 2,400 8,400
Earnings ($ mil.) $647 $1,097 $341 $151 $559
Output ($ mil.) $1,580 $2,668 $850 $379 $1,369
Value Added ($ mil.) $1,008 $1,571 $532 $237 $837
Table 22. Early & No Biofuels – High Average Out-Of-Basin Annual Construction and Installation Impacts (2026–2045)
2030 2035 2040 2045 Annual Average
Jobs 5,500 1,800 1,300 1,900 2,600
Earnings ($ mil.) $398 $136 $99 $136 $192
Output ($ mil.) $1,034 $251 $181 $267 $433
Value Added ($ mil.) $582 $177 $129 $183 $268
Job growth due to in-basin construction and installation under the Early & No Biofuels – High scenario is primarily driven by in-basin solar, which is around 93% of jobs by 2030 and 84% by 2045 (Figure 22). Hydrogen-fueled combustion turbines fuel a bump in jobs from 2031 to 2035 where they account for 56% of jobs, which are the years leading to the 100% target in that scenario.
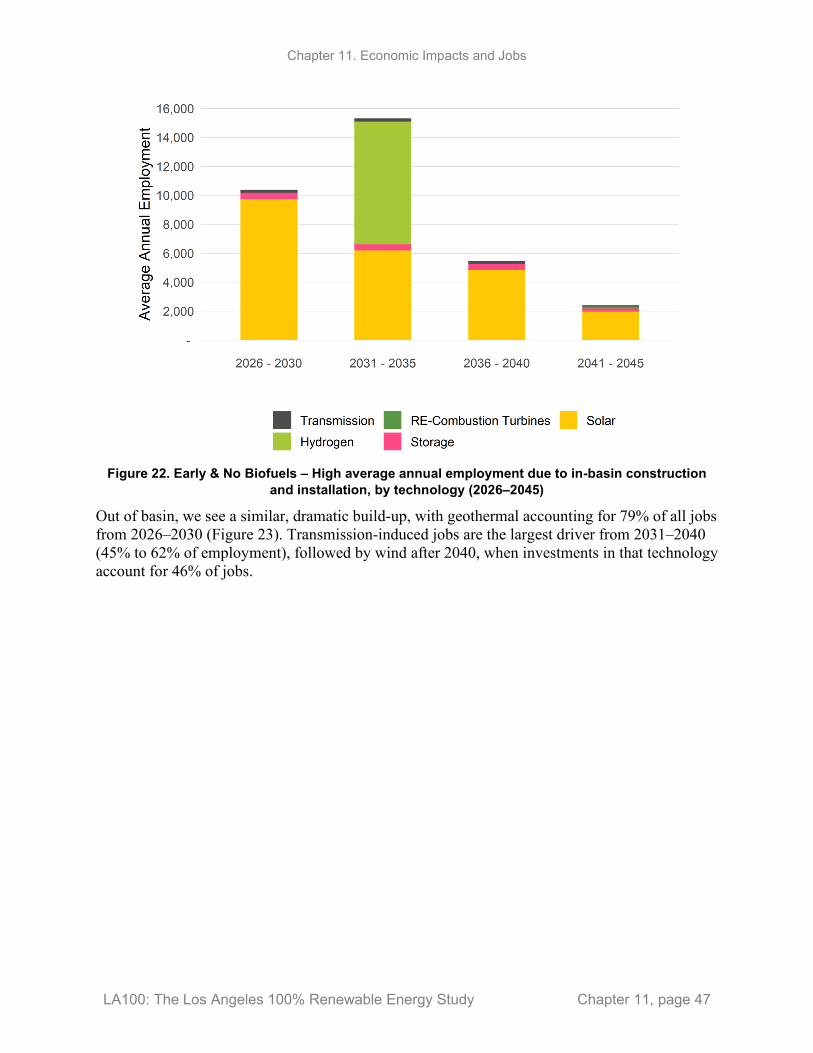
Chapter 11. Economic Impacts and Jobs
LA100: The Los Angeles 100% Renewable Energy Study Chapter 11, page 47
Figure 22. Early & No Biofuels – High average annual employment due to in-basin construction
and installation, by technology (2026–2045)
Out of basin, we see a similar, dramatic build-up, with geothermal accounting for 79% of all jobs from 2026–2030 (Figure 23). Transmission-induced jobs are the largest driver from 2031–2040 (45% to 62% of employment), followed by wind after 2040, when investments in that technology account for 46% of jobs.
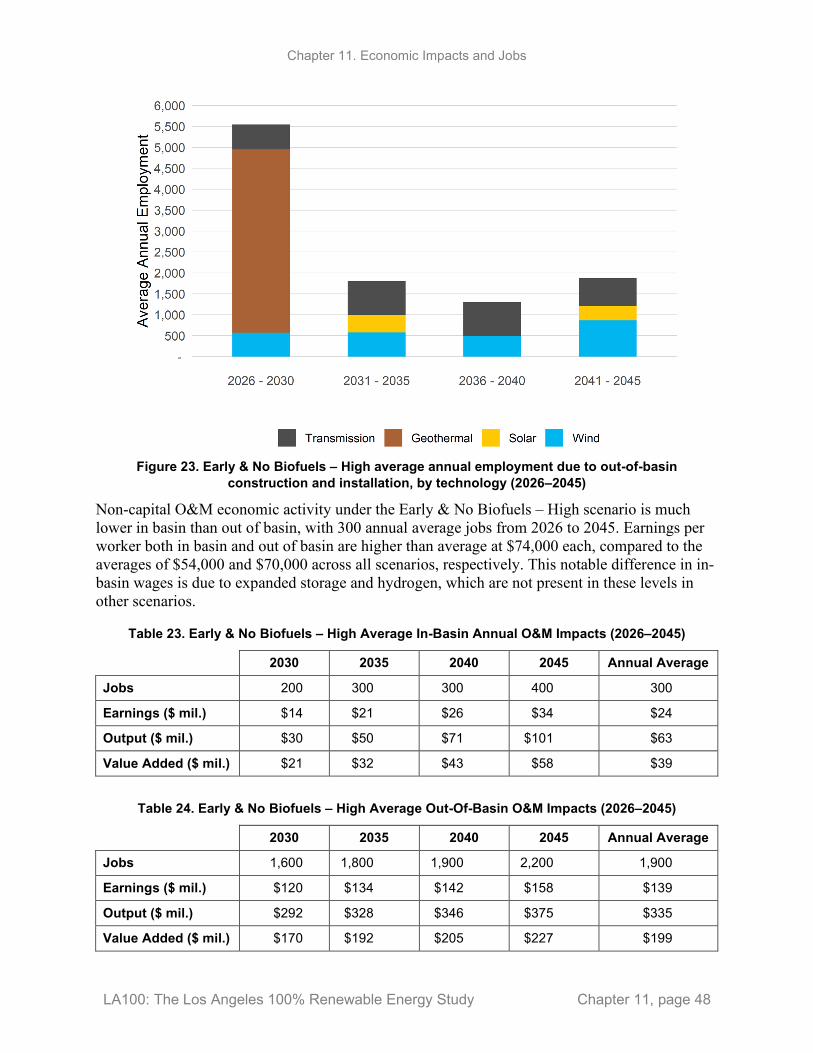
Chapter 11. Economic Impacts and Jobs
LA100: The Los Angeles 100% Renewable Energy Study Chapter 11, page 48
Figure 23. Early & No Biofuels – High average annual employment due to out-of-basin
construction and installation, by technology (2026–2045)
Non-capital O&M economic activity under the Early & No Biofuels – High scenario is much lower in basin than out of basin, with 300 annual average jobs from 2026 to 2045. Earnings per worker both in basin and out of basin are higher than average at $74,000 each, compared to the averages of $54,000 and $70,000 across all scenarios, respectively. This notable difference in in-basin wages is due to expanded storage and hydrogen, which are not present in these levels in other scenarios.
Table 23. Early & No Biofuels – High Average In-Basin Annual O&M Impacts (2026–2045)
2030 2035 2040 2045 Annual Average
Jobs 200 300 300 400 300
Earnings ($ mil.) $14 $21 $26 $34 $24
Output ($ mil.) $30 $50 $71 $101 $63
Value Added ($ mil.) $21 $32 $43 $58 $39
Table 24. Early & No Biofuels – High Average Out-Of-Basin O&M Impacts (2026–2045)
2030 2035 2040 2045 Annual Average
Jobs 1,600 1,800 1,900 2,200 1,900
Earnings ($ mil.) $120 $134 $142 $158 $139
Output ($ mil.) $292 $328 $346 $375 $335
Value Added ($ mil.) $170 $192 $205 $227 $199

Chapter 11. Economic Impacts and Jobs
LA100: The Los Angeles 100% Renewable Energy Study Chapter 11, page 49
Solar is the largest single source of in-basin O&M jobs, although this decreases from 62% by 2030 to 37% by 2045. Natural gas, already the smallest portion of jobs, are phased out by 2035 and replaced with increased job numbers due to storage, solar, and hydrogen technology. By 2045 hydrogen technologies accounts for 35% of all jobs, nearly as much as solar, followed by storage with 29%.
Figure 24. Early & No Biofuels – High average annual employment due to in-basin O&M, by
technology (2026–2045)
Most out-of-basin O&M jobs are in geothermal, which changes from 64% of the total by 2030 to 51% by 2045 (Figure 25). Overall geothermal levels remain fairly steady; the change in proportion is driven primarily by increases in wind, which moves from 26% to 41% of employment impacts. There are slight increases in jobs due to solar and hydrogen O&M, while storage remains steady and natural gas-related employment declines until 2035 and is zero in 2040 and 2045.
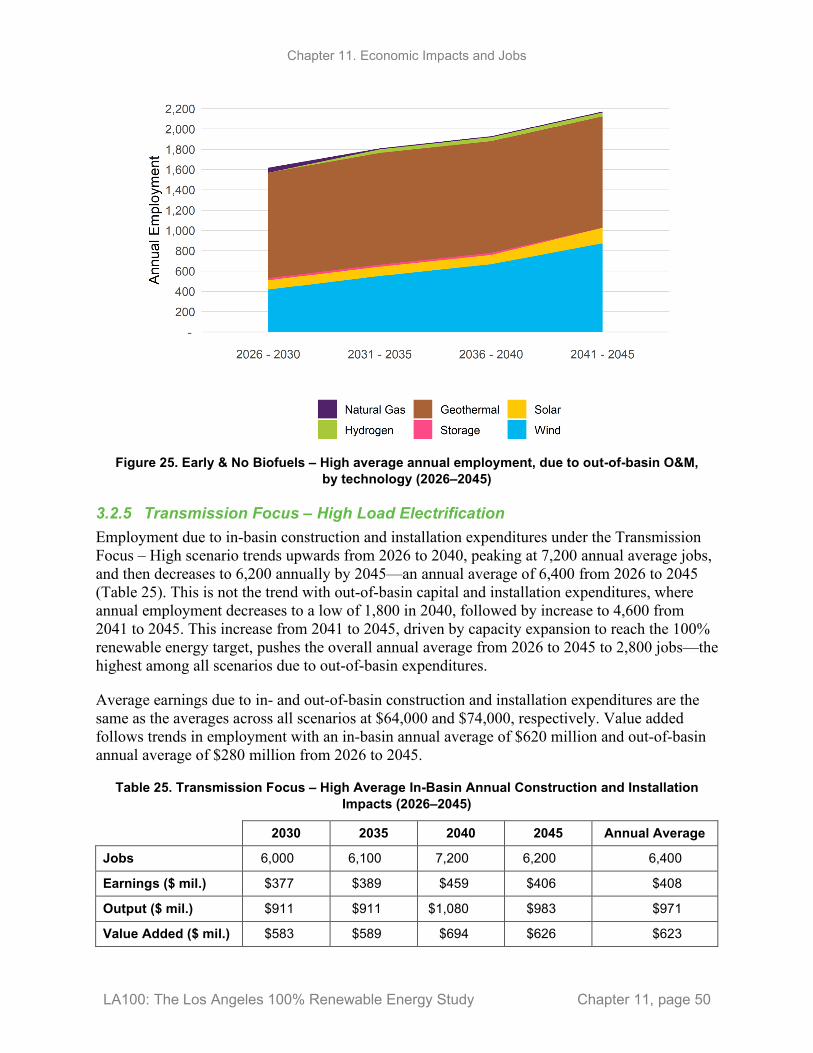
Chapter 11. Economic Impacts and Jobs
LA100: The Los Angeles 100% Renewable Energy Study Chapter 11, page 50
Figure 25. Early & No Biofuels – High average annual employment, due to out-of-basin O&M,
by technology (2026–2045)
3.2.5 Transmission Focus – High Load Electrification Employment due to in-basin construction and installation expenditures under the Transmission Focus – High scenario trends upwards from 2026 to 2040, peaking at 7,200 annual average jobs, and then decreases to 6,200 annually by 2045—an annual average of 6,400 from 2026 to 2045 (Table 25). This is not the trend with out-of-basin capital and installation expenditures, where annual employment decreases to a low of 1,800 in 2040, followed by increase to 4,600 from 2041 to 2045. This increase from 2041 to 2045, driven by capacity expansion to reach the 100% renewable energy target, pushes the overall annual average from 2026 to 2045 to 2,800 jobs—the highest among all scenarios due to out-of-basin expenditures.
Average earnings due to in- and out-of-basin construction and installation expenditures are the same as the averages across all scenarios at $64,000 and $74,000, respectively. Value added follows trends in employment with an in-basin annual average of $620 million and out-of-basin annual average of $280 million from 2026 to 2045.
Table 25. Transmission Focus – High Average In-Basin Annual Construction and Installation Impacts (2026–2045)
2030 2035 2040 2045 Annual Average
Jobs 6,000 6,100 7,200 6,200 6,400
Earnings ($ mil.) $377 $389 $459 $406 $408
Output ($ mil.) $911 $911 $1,080 $983 $971
Value Added ($ mil.) $583 $589 $694 $626 $623
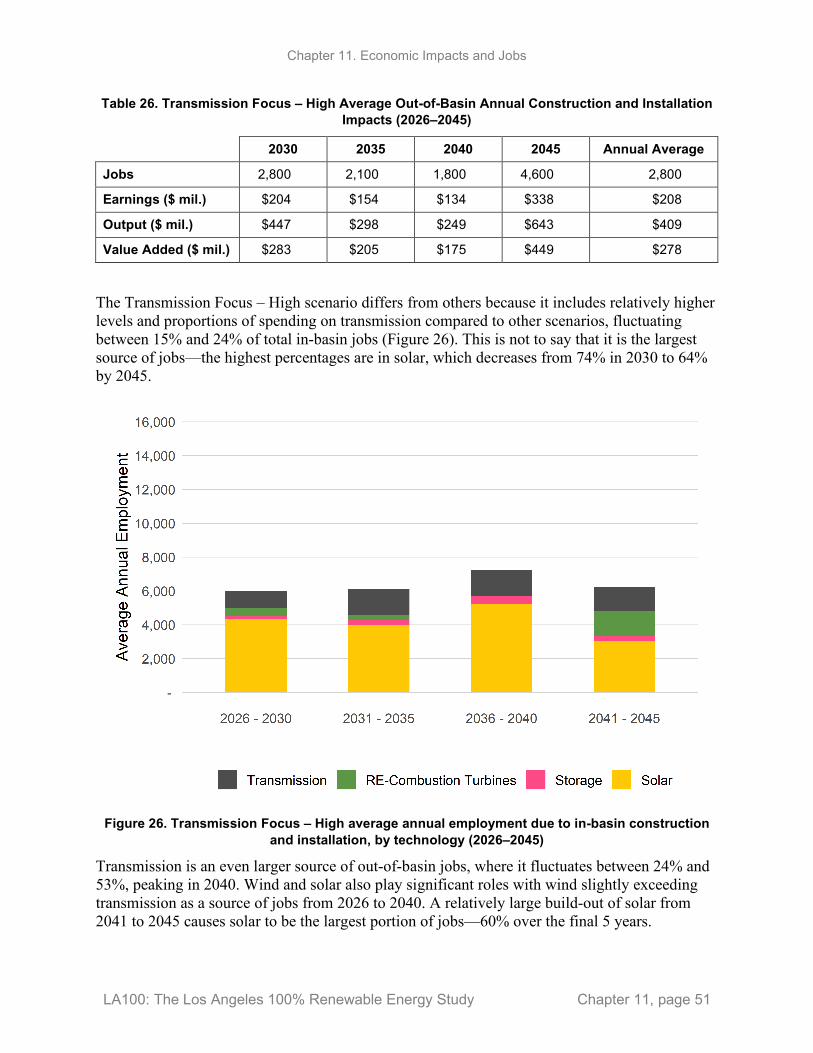
Chapter 11. Economic Impacts and Jobs
LA100: The Los Angeles 100% Renewable Energy Study Chapter 11, page 51
Table 26. Transmission Focus – High Average Out-of-Basin Annual Construction and Installation Impacts (2026–2045)
2030 2035 2040 2045 Annual Average
Jobs 2,800 2,100 1,800 4,600 2,800
Earnings ($ mil.) $204 $154 $134 $338 $208
Output ($ mil.) $447 $298 $249 $643 $409
Value Added ($ mil.) $283 $205 $175 $449 $278
The Transmission Focus – High scenario differs from others because it includes relatively higher levels and proportions of spending on transmission compared to other scenarios, fluctuating between 15% and 24% of total in-basin jobs (Figure 26). This is not to say that it is the largest source of jobs—the highest percentages are in solar, which decreases from 74% in 2030 to 64% by 2045.
Figure 26. Transmission Focus – High average annual employment due to in-basin construction
and installation, by technology (2026–2045)
Transmission is an even larger source of out-of-basin jobs, where it fluctuates between 24% and 53%, peaking in 2040. Wind and solar also play significant roles with wind slightly exceeding transmission as a source of jobs from 2026 to 2040. A relatively large build-out of solar from 2041 to 2045 causes solar to be the largest portion of jobs—60% over the final 5 years.
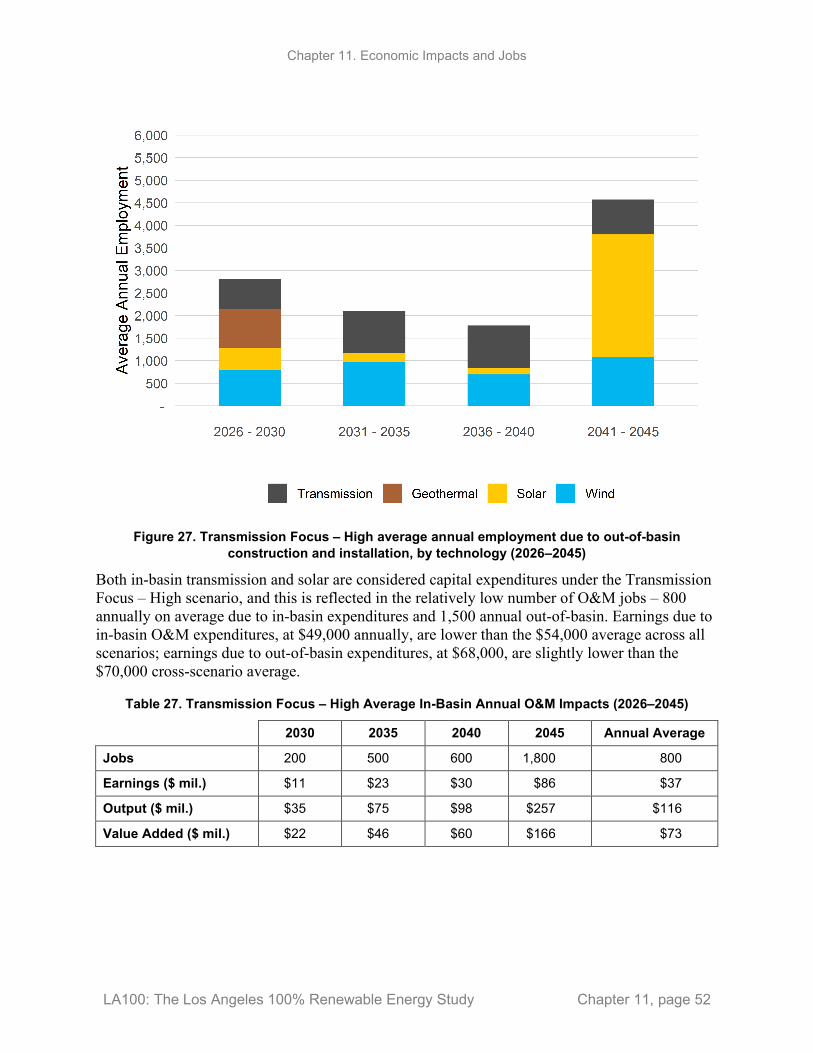
Chapter 11. Economic Impacts and Jobs
LA100: The Los Angeles 100% Renewable Energy Study Chapter 11, page 52
Figure 27. Transmission Focus – High average annual employment due to out-of-basin
construction and installation, by technology (2026–2045)
Both in-basin transmission and solar are considered capital expenditures under the Transmission Focus – High scenario, and this is reflected in the relatively low number of O&M jobs – 800 annually on average due to in-basin expenditures and 1,500 annual out-of-basin. Earnings due to in-basin O&M expenditures, at $49,000 annually, are lower than the $54,000 average across all scenarios; earnings due to out-of-basin expenditures, at $68,000, are slightly lower than the $70,000 cross-scenario average.
Table 27. Transmission Focus – High Average In-Basin Annual O&M Impacts (2026–2045)
2030 2035 2040 2045 Annual Average
Jobs 200 500 600 1,800 800
Earnings ($ mil.) $11 $23 $30 $86 $37
Output ($ mil.) $35 $75 $98 $257 $116
Value Added ($ mil.) $22 $46 $60 $166 $73
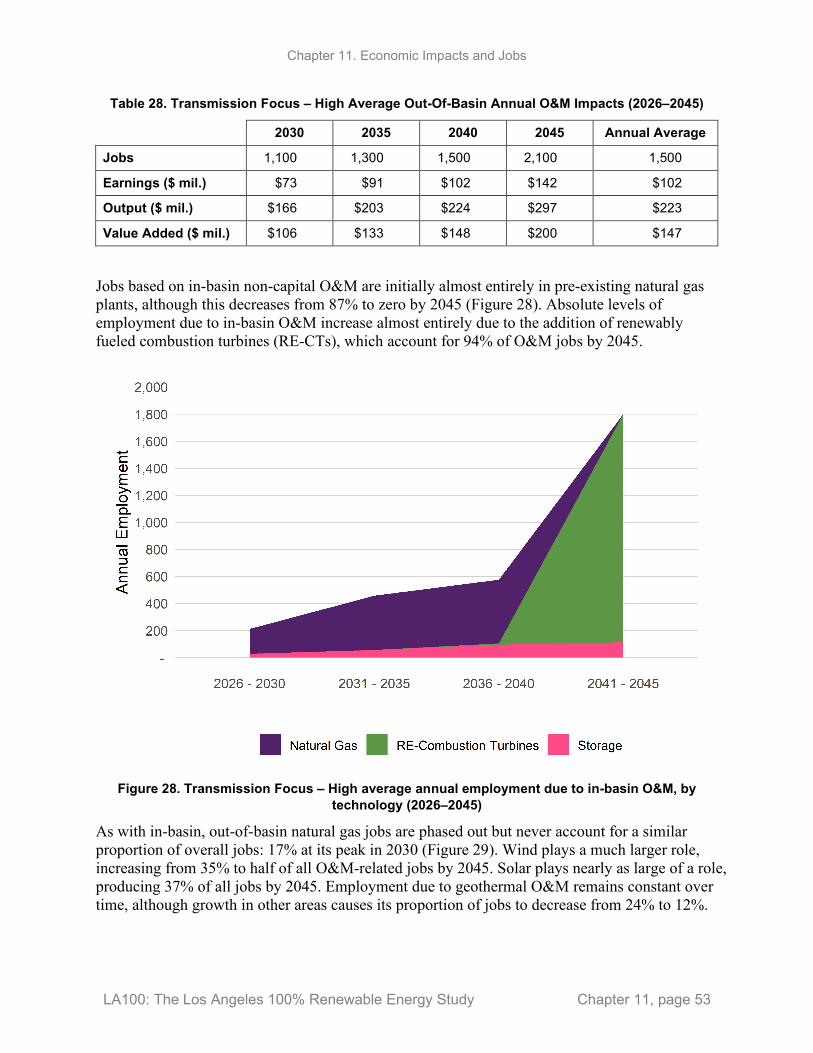
Chapter 11. Economic Impacts and Jobs
LA100: The Los Angeles 100% Renewable Energy Study Chapter 11, page 53
Table 28. Transmission Focus – High Average Out-Of-Basin Annual O&M Impacts (2026–2045)
2030 2035 2040 2045 Annual Average
Jobs 1,100 1,300 1,500 2,100 1,500
Earnings ($ mil.) $73 $91 $102 $142 $102
Output ($ mil.) $166 $203 $224 $297 $223
Value Added ($ mil.) $106 $133 $148 $200 $147
Jobs based on in-basin non-capital O&M are initially almost entirely in pre-existing natural gas plants, although this decreases from 87% to zero by 2045 (Figure 28). Absolute levels of employment due to in-basin O&M increase almost entirely due to the addition of renewably fueled combustion turbines (RE-CTs), which account for 94% of O&M jobs by 2045.
Figure 28. Transmission Focus – High average annual employment due to in-basin O&M, by
technology (2026–2045)
As with in-basin, out-of-basin natural gas jobs are phased out but never account for a similar proportion of overall jobs: 17% at its peak in 2030 (Figure 29). Wind plays a much larger role, increasing from 35% to half of all O&M-related jobs by 2045. Solar plays nearly as large of a role, producing 37% of all jobs by 2045. Employment due to geothermal O&M remains constant over time, although growth in other areas causes its proportion of jobs to decrease from 24% to 12%.
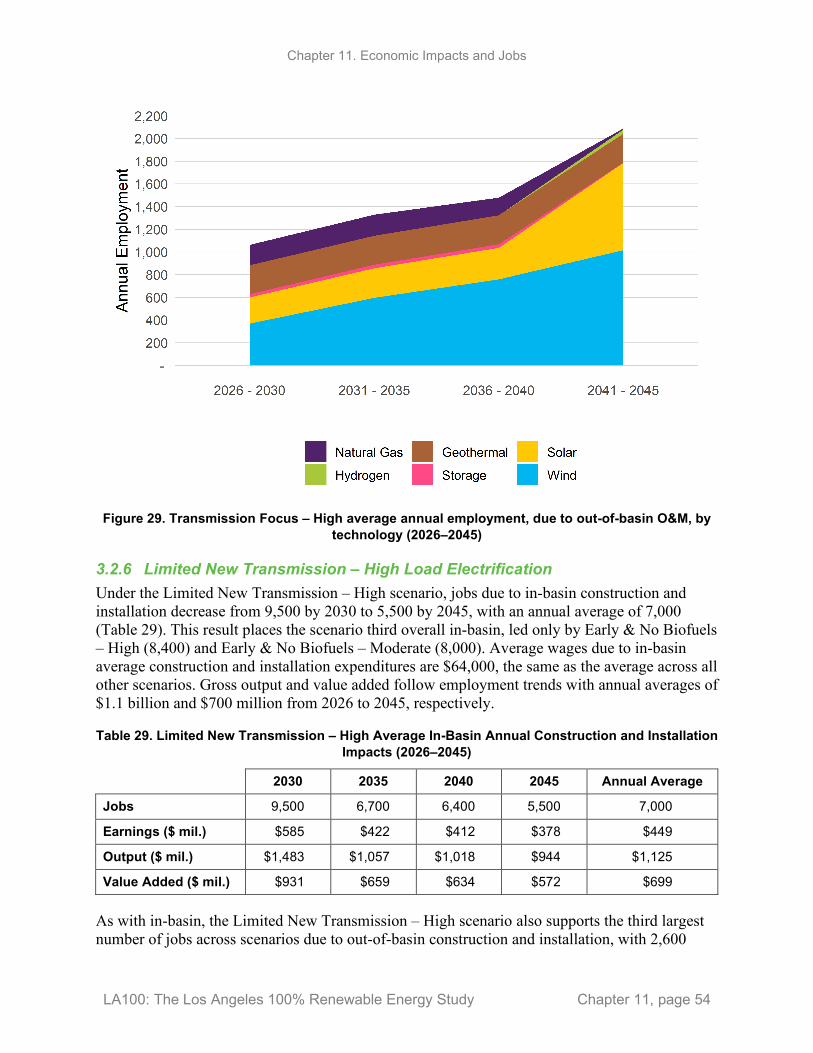
Chapter 11. Economic Impacts and Jobs
LA100: The Los Angeles 100% Renewable Energy Study Chapter 11, page 54
Figure 29. Transmission Focus – High average annual employment, due to out-of-basin O&M, by
technology (2026–2045)
3.2.6 Limited New Transmission – High Load Electrification Under the Limited New Transmission – High scenario, jobs due to in-basin construction and installation decrease from 9,500 by 2030 to 5,500 by 2045, with an annual average of 7,000 (Table 29). This result places the scenario third overall in-basin, led only by Early & No Biofuels – High (8,400) and Early & No Biofuels – Moderate (8,000). Average wages due to in-basin average construction and installation expenditures are $64,000, the same as the average across all other scenarios. Gross output and value added follow employment trends with annual averages of $1.1 billion and $700 million from 2026 to 2045, respectively.
Table 29. Limited New Transmission – High Average In-Basin Annual Construction and Installation Impacts (2026–2045)
2030 2035 2040 2045 Annual Average
Jobs 9,500 6,700 6,400 5,500 7,000
Earnings ($ mil.) $585 $422 $412 $378 $449
Output ($ mil.) $1,483 $1,057 $1,018 $944 $1,125
Value Added ($ mil.) $931 $659 $634 $572 $699
As with in-basin, the Limited New Transmission – High scenario also supports the third largest number of jobs across scenarios due to out-of-basin construction and installation, with 2,600

Chapter 11. Economic Impacts and Jobs
LA100: The Los Angeles 100% Renewable Energy Study Chapter 11, page 55
annually (Table 30). The annual average decreases from 2,600 in 2030 to 1,800 by 2040 and then increases to 3,700 from 2041 to 2045. Similarly, value added decreases from $270 million to $180 million and then increases to $360 million over the last 5-year increment, an annual average of $260 million from 2026 to 2045.
Out-of-basin wages under the Limited New Transmission – High scenario are $74,000, the same as the average across other scenarios.
Table 30. Limited New Transmission – High Average Out-Of-Basin Annual Construction and Installation Impacts (2026–2045)
2030 2035 2040 2045 Annual Average
Jobs 2,600 2,100 1,800 3,700 2,600
Earnings ($ mil.) $193 $160 $143 $270 $191
Output ($ mil.) $444 $321 $274 $539 $394
Value Added ($ mil.) $267 $211 $184 $363 $256
The vast majority of jobs due to in-basin construction and installation are from solar expenditures, although the proportion of jobs due to solar decreases from 2026 to 2045, changing from 88% to 55% (Figure 30). The mix of jobs by technology is fairly constant from 2026 to 2040 when there are larger additions of RE-CTs and, to a lesser extent, hydrogen technologies.
Figure 30. Limited New Transmission – High average annual employment due to in-basin
construction and installation, by technology (2026–2045)
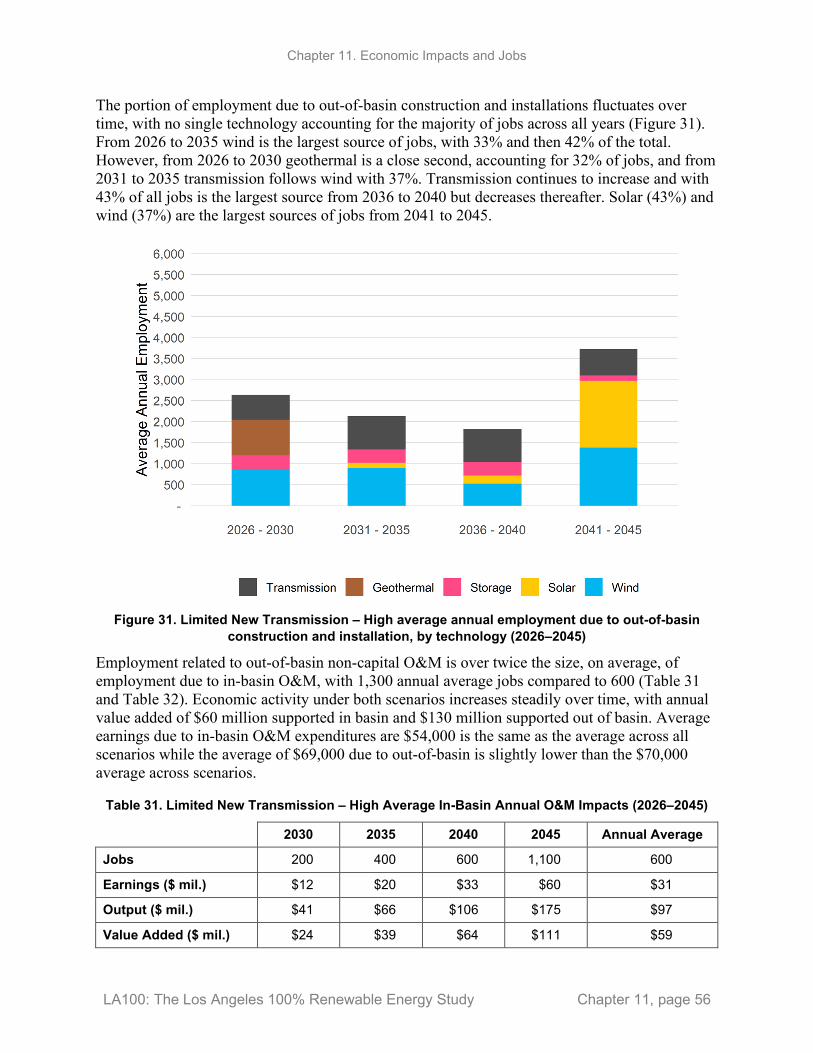
Chapter 11. Economic Impacts and Jobs
LA100: The Los Angeles 100% Renewable Energy Study Chapter 11, page 56
The portion of employment due to out-of-basin construction and installations fluctuates over time, with no single technology accounting for the majority of jobs across all years (Figure 31). From 2026 to 2035 wind is the largest source of jobs, with 33% and then 42% of the total. However, from 2026 to 2030 geothermal is a close second, accounting for 32% of jobs, and from 2031 to 2035 transmission follows wind with 37%. Transmission continues to increase and with 43% of all jobs is the largest source from 2036 to 2040 but decreases thereafter. Solar (43%) and wind (37%) are the largest sources of jobs from 2041 to 2045.
Figure 31. Limited New Transmission – High average annual employment due to out-of-basin
construction and installation, by technology (2026–2045)
Employment related to out-of-basin non-capital O&M is over twice the size, on average, of employment due to in-basin O&M, with 1,300 annual average jobs compared to 600 (Table 31 and Table 32). Economic activity under both scenarios increases steadily over time, with annual value added of $60 million supported in basin and $130 million supported out of basin. Average earnings due to in-basin O&M expenditures are $54,000 is the same as the average across all scenarios while the average of $69,000 due to out-of-basin is slightly lower than the $70,000 average across scenarios.
Table 31. Limited New Transmission – High Average In-Basin Annual O&M Impacts (2026–2045)
2030 2035 2040 2045 Annual Average
Jobs 200 400 600 1,100 600
Earnings ($ mil.) $12 $20 $33 $60 $31
Output ($ mil.) $41 $66 $106 $175 $97
Value Added ($ mil.) $24 $39 $64 $111 $59
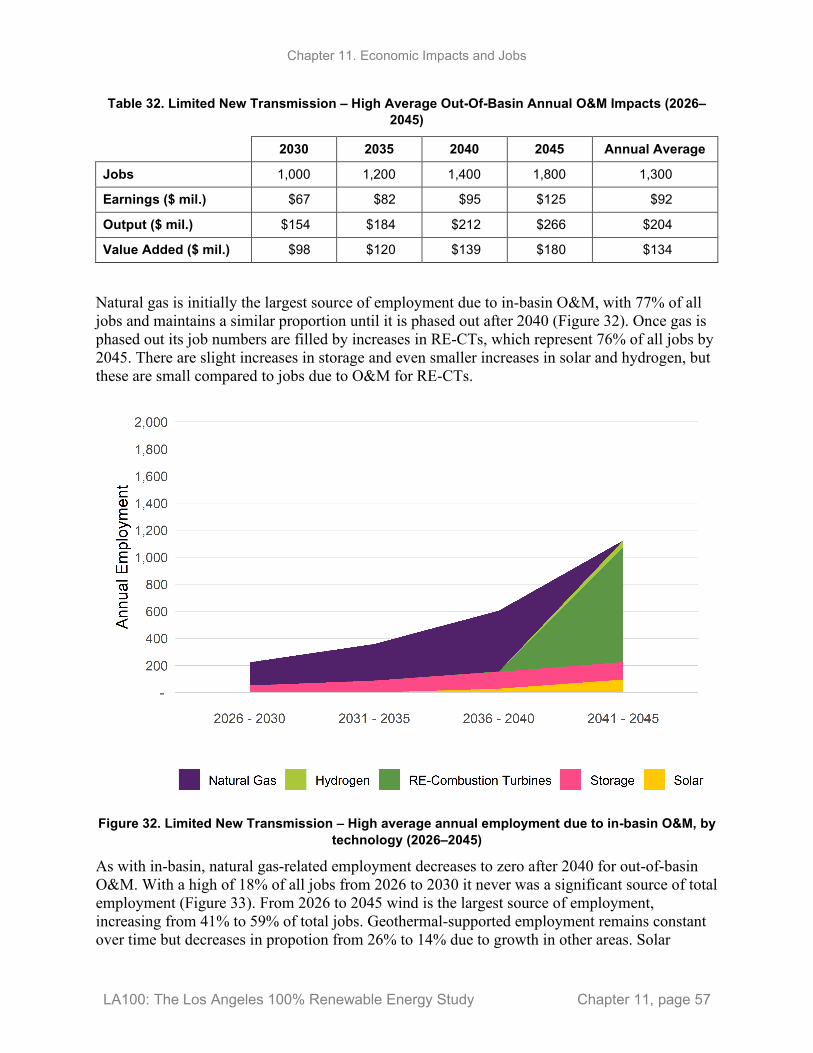
Chapter 11. Economic Impacts and Jobs
LA100: The Los Angeles 100% Renewable Energy Study Chapter 11, page 57
Table 32. Limited New Transmission – High Average Out-Of-Basin Annual O&M Impacts (2026–2045)
2030 2035 2040 2045 Annual Average
Jobs 1,000 1,200 1,400 1,800 1,300
Earnings ($ mil.) $67 $82 $95 $125 $92
Output ($ mil.) $154 $184 $212 $266 $204
Value Added ($ mil.) $98 $120 $139 $180 $134
Natural gas is initially the largest source of employment due to in-basin O&M, with 77% of all jobs and maintains a similar proportion until it is phased out after 2040 (Figure 32). Once gas is phased out its job numbers are filled by increases in RE-CTs, which represent 76% of all jobs by 2045. There are slight increases in storage and even smaller increases in solar and hydrogen, but these are small compared to jobs due to O&M for RE-CTs.
Figure 32. Limited New Transmission – High average annual employment due to in-basin O&M, by
technology (2026–2045)
As with in-basin, natural gas-related employment decreases to zero after 2040 for out-of-basin O&M. With a high of 18% of all jobs from 2026 to 2030 it never was a significant source of total employment (Figure 33). From 2026 to 2045 wind is the largest source of employment, increasing from 41% to 59% of total jobs. Geothermal-supported employment remains constant over time but decreases in propotion from 26% to 14% due to growth in other areas. Solar
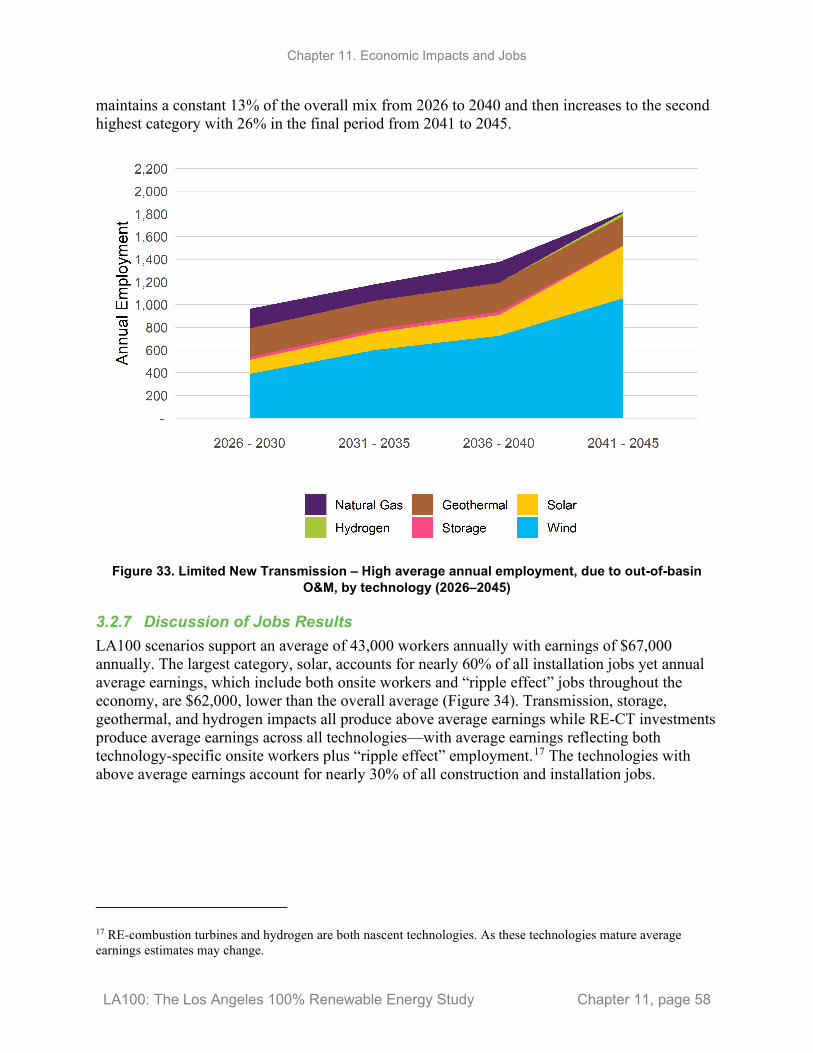
Chapter 11. Economic Impacts and Jobs
LA100: The Los Angeles 100% Renewable Energy Study Chapter 11, page 58
maintains a constant 13% of the overall mix from 2026 to 2040 and then increases to the second highest category with 26% in the final period from 2041 to 2045.
Figure 33. Limited New Transmission – High average annual employment, due to out-of-basin
O&M, by technology (2026–2045)
3.2.7 Discussion of Jobs Results LA100 scenarios support an average of 43,000 workers annually with earnings of $67,000 annually. The largest category, solar, accounts for nearly 60% of all installation jobs yet annual average earnings, which include both onsite workers and “ripple effect” jobs throughout the economy, are $62,000, lower than the overall average (Figure 34). Transmission, storage, geothermal, and hydrogen impacts all produce above average earnings while RE-CT investments produce average earnings across all technologies—with average earnings reflecting both technology-specific onsite workers plus “ripple effect” employment.17 The technologies with above average earnings account for nearly 30% of all construction and installation jobs.
17 RE-combustion turbines and hydrogen are both nascent technologies. As these technologies mature average earnings estimates may change.
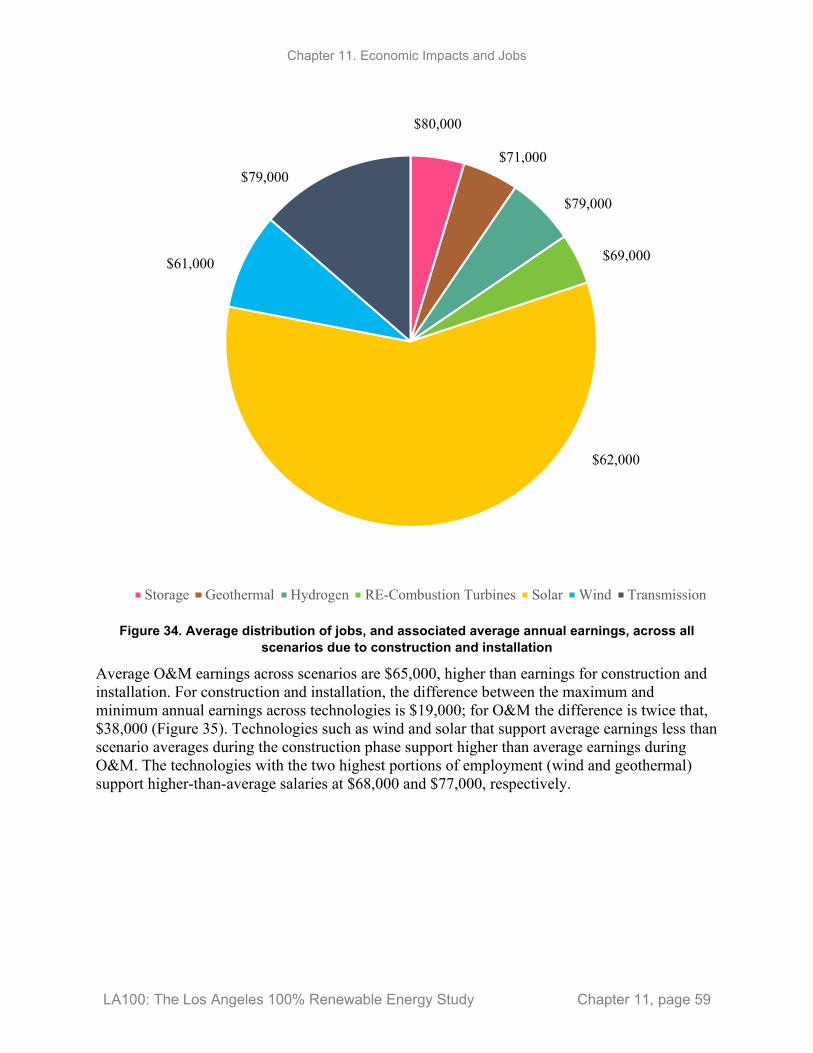
Chapter 11. Economic Impacts and Jobs
LA100: The Los Angeles 100% Renewable Energy Study Chapter 11, page 59
Figure 34. Average distribution of jobs, and associated average annual earnings, across all
scenarios due to construction and installation
Average O&M earnings across scenarios are $65,000, higher than earnings for construction and installation. For construction and installation, the difference between the maximum and minimum annual earnings across technologies is $19,000; for O&M the difference is twice that, $38,000 (Figure 35). Technologies such as wind and solar that support average earnings less than scenario averages during the construction phase support higher than average earnings during O&M. The technologies with the two highest portions of employment (wind and geothermal) support higher-than-average salaries at $68,000 and $77,000, respectively.
Storage Geothermal Hydrogen RE-Combustion Turbines Solar Wind Transmission
$62,000
$69,000
$79,000
$71,000
$61,000
$79,000
$80,000
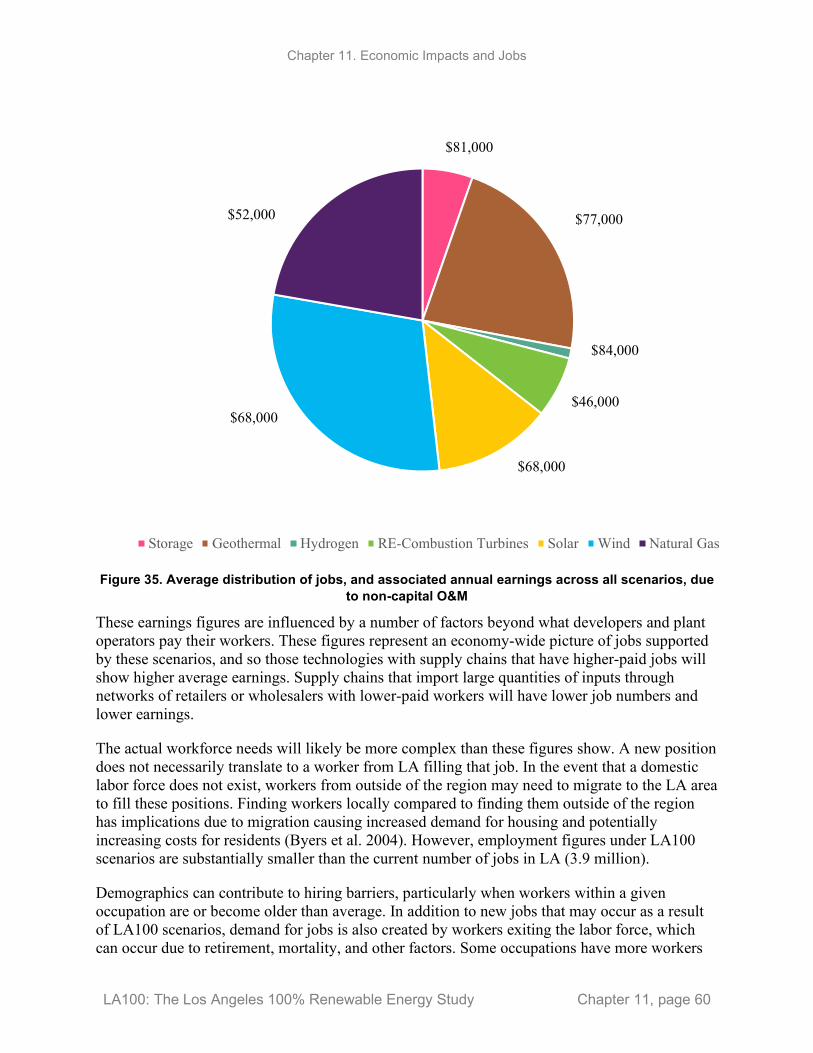
Chapter 11. Economic Impacts and Jobs
LA100: The Los Angeles 100% Renewable Energy Study Chapter 11, page 60
Figure 35. Average distribution of jobs, and associated annual earnings across all scenarios, due
to non-capital O&M
These earnings figures are influenced by a number of factors beyond what developers and plant operators pay their workers. These figures represent an economy-wide picture of jobs supported by these scenarios, and so those technologies with supply chains that have higher-paid jobs will show higher average earnings. Supply chains that import large quantities of inputs through networks of retailers or wholesalers with lower-paid workers will have lower job numbers and lower earnings.
The actual workforce needs will likely be more complex than these figures show. A new position does not necessarily translate to a worker from LA filling that job. In the event that a domestic labor force does not exist, workers from outside of the region may need to migrate to the LA area to fill these positions. Finding workers locally compared to finding them outside of the region has implications due to migration causing increased demand for housing and potentially increasing costs for residents (Byers et al. 2004). However, employment figures under LA100 scenarios are substantially smaller than the current number of jobs in LA (3.9 million).
Demographics can contribute to hiring barriers, particularly when workers within a given occupation are or become older than average. In addition to new jobs that may occur as a result of LA100 scenarios, demand for jobs is also created by workers exiting the labor force, which can occur due to retirement, mortality, and other factors. Some occupations have more workers
Storage Geothermal Hydrogen RE-Combustion Turbines Solar Wind Natural Gas
$52,000
$81,000
$77,000
$68,000
$46,000
$84,000
$68,000

Chapter 11. Economic Impacts and Jobs
LA100: The Los Angeles 100% Renewable Energy Study Chapter 11, page 61
exiting than entering, and demand exists even without demand for workers beyond business as usual. In this case employers would have to recruit outside of LA or even the United States or incur greater expenses to provide resources such as in-house training programs (DOE 2016; Keyser and Tegen 2019).
I-O models also do not incorporate labor productivity changes, and given that this scenario runs from 2026 to 2045, it is likely that the mix of occupations by technology will change over time. Any given level of employment in 2045 will likely have a workforce that looks different from the workforce at the time of this publication in terms of skills, training, education, and demographics.
3.2.8 Conclusion—Jobs Analysis The LA100 scenarios present a wide range of workforce needs and associated economic activity with different mixes of jobs by technology, construction, O&M, and where expenditures accrue. Across all scenarios, solar tends to be the largest source of construction and installation jobs, yet average earnings from economic activity associated with solar are lower than average across the technologies. Jobs with higher-than-LA-average wages account for 30% of all jobs on average.
O&M is more diverse in employment by technology, led by wind and geothermal, which both pay higher-than-average salaries. Both of these technologies also support exclusively out-of-basin jobs. In all cases, declines in natural gas employment are offset by employment in other technologies and annual O&M trends upward over time without any total declines.
The Early & No Biofuels – Moderate and Early & No Biofuels – High scenarios support the highest number of total construction and installation jobs, although these are the top two scenarios only for in-basin jobs. The Transmission Focus – High Electrification scenario supports more out-of-basin jobs, although it falls in the middle of all scenarios when in- and out-of-basin jobs are combined. The SB100 – Moderate scenario supports the fewest total jobs, while the Limited New Transmission – Moderate scenario supports fewer out-of-basin jobs.
Gross economic impacts of O&M are grouped by electrification projections and then scenario. The SB100 – Stress scenario supports the most jobs, followed by Transmission Focus – High and Early & No Biofuels – High. The bottom three scenarios are all under Moderate electrification. Early & No Biofuels – Moderate Electrification is the only Moderate scenario with total job numbers that exceed those of its corresponding High electrification scenario. It leads SB100 – High and Limited New Transmission – High.
There is uncertainty surrounding these workforce needs. Factors such as an available workforce within or outside of California or the LADWP balancing region, changes in productivity, and changes in the occupations, skills, education, and experience needed to fill these jobs will change over time.
Chapter 11. Economic Impacts and Jobs
LA100: The Los Angeles 100% Renewable Energy Study Chapter 11, page 62
4 References Adelaja, Soji, and Yohannes Hailu. 2015. Renewable Energy Development and Implications to Agricultural Viability. http://ageconsearch.unm.edu/bitstream/6132/2/470566.pdf.
Bamufleh, Hishan, Jose Ponce-Ortega, and Mahmoud El-Halwagi. 2013. “Multi-Objective Optimization of Process Cogeneration Systems with Economic Environmental, and Social Tradeoffs.” Clean Technologies and Environmental Policy 15 (1): 185–197. https://doi.org/10.1007/s10098-012-0497-y.
Billman, Lynn, and David Keyser. 2013. Assessment of the Value, Impact, and Validity of the Jobs and Economic Development Impacts (JEDI) Suite of Models. Golden, CO: National Renewable Energy Laboratory. NREL/TP-6A20-56390. https://www.nrel.gov/docs/fy13osti/56390.pdf.
BW Research. 2020 U.S. Energy and Employment Report. 2020. National Association of State Energy Officials.
Byers, Steven, Harvey Cutler, and Stephen Davies. 2004. “Estimating Costs and Benefits of Economic Growth: A CGE-Based Study of Tax Incentives in a Rapidly Growing Region.” Regional Analysis and Policy 34:2 1-20.
Croucher, Matt. 2012. “Which State is Yoda?” Energy Policy 42: 613–615. https://doi.org/10.1016/j.enpol.2011.12.031.
Keyser, David, and Suzanne Tegen. 2019. The Wind Energy Workforce in the United States: Training, Hiring, and Future Needs. Golden, CO: National Renewable Energy Laboratory. NREL/TP-6A20-73908. https://www.nrel.gov/docs/fy19osti/73908.pdf.
Mai, Trieu, Easan Drury, Kelly Eurek, Natalie Bodington, Anthony Lopez, and Andrew Perry. 2013. Resource Planning Model: An Integrated Resource Planning and Dispatch Tool for Regional Electric Systems. Golden, CO: National Renewable Energy Laboratory. NREL/TP-6A20-56723. https://www.nrel.gov/docs/fy13osti/56723.pdf.
Mulligan, Gordon, Randall Jackson, and Amanda Krugh. 2013 “Economic Base Multipliers: A Comparison of ACDS and IMPLAN.” Regional Science Policy and Practice 5 (3): 289–303. https://doi.org/10.1111/rsp3.12010.
BLS (U.S. Bureau of Labor Statistics). 2020. “Quarterly Census of Employment and Wages.” https://www.bls.gov/cew/data.htm.
DOE (U.S. Department of Energy). 2016. Hydropower Vision: A New Chapter for America’s First Renewable Energy Source. DOE/GO-102016-4869. https://www.energy.gov/sites/prod/files/2018/02/f49/Hydropower-Vision-021518.pdf.
Driscoll, William. 2019. “Six Paths to 100% Renewables for Los Angeles,” PV Magazine, January 10, 2019. https://pv-magazine-usa.com/2019/01/10/six-paths-to-100-renewables-for-los-angeles/.
Chapter 11. Economic Impacts and Jobs
LA100: The Los Angeles 100% Renewable Energy Study Chapter 11, page 63
Hannum, Christopher, Harvey Cutler, Terrence Iverson, and David Keyser. 2017. “Estimating the Implied Cost of Carbon in Future Scenarios Using a CGE model: The Case of Colorado.” Energy and Policy 102: 500–511. https://doi.org/10.1016/j.enpol.2016.12.046.
IMPLAN. 2018. “2017 Input-Output Data for City of Los Angeles.” http://implan.com/.
LADWP. 2017. Briefing Book 2017-2018. https://s3-us-west-2.amazonaws.com/ladwp-jtti/wp-content/uploads/sites/3/2017/09/08143247/Briefing-Book-Rolling-PDF.pdf.
Maas, Alexander Maas, Christopher Goemans, Dale T. Manning, Jesse Burkhardt, and Mazdak Arabi. 2020. “Complements of the House: Estimating Demand-side Linkages between Residential Water and Electricity,” Water Resources and Economics 29: 100140. https://doi.org/10.1016/j.wre.2019.02.001 .
Mohammadi, H. and M. Kulkarni. 2017. “Long-Run Relation and Short-Run Dynamics in U.S. Energy Demand: Evidence from Panel Data across Energy Sources and User Ends,” Research Journal of Economics 1:1.
NREL (National Renewable Energy Laboratory). 2018. 100 Percent Renewable Meeting Presentation. Presented in Advisory Group Meeting #7 on November 15, 2018. https://www.ladwp.com/ladwp/faces/ladwp/aboutus/a-power/a-p-cleanenergyfuture/a-p-renewableenergystudy?_adf.ctrl-state=182xiorib9_4&_afrLoop=783075694999101.
———. 2019. LA100 Recap Updates Presentation. Presented in Advisory Group Meeting #8 on June 13, 2019. https://www.ladwp.com/ladwp/faces/ladwp/aboutus/a-power/a-p-cleanenergyfuture/a-p-renewableenergystudy?_adf.ctrl-state=182xiorib9_4&_afrLoop=783075694999101.
Partridge, Mark D., and Dan S. Rickman. 2010. “Computable General Equilibrium (CGE) Modelling for Regional Economic Development Analysis,” Regional Studies 44 (10), 1311–1328. https://doi.org/10.1080/00343400701654236.
Wing, Ian Sue, and Ada, Rose. Forthcoming. “Economic Consequence Analysis of Electric Power Infrastructure Disruptions: An Analytical General Equilibrium Approach,” Energy Economics, forthcoming.
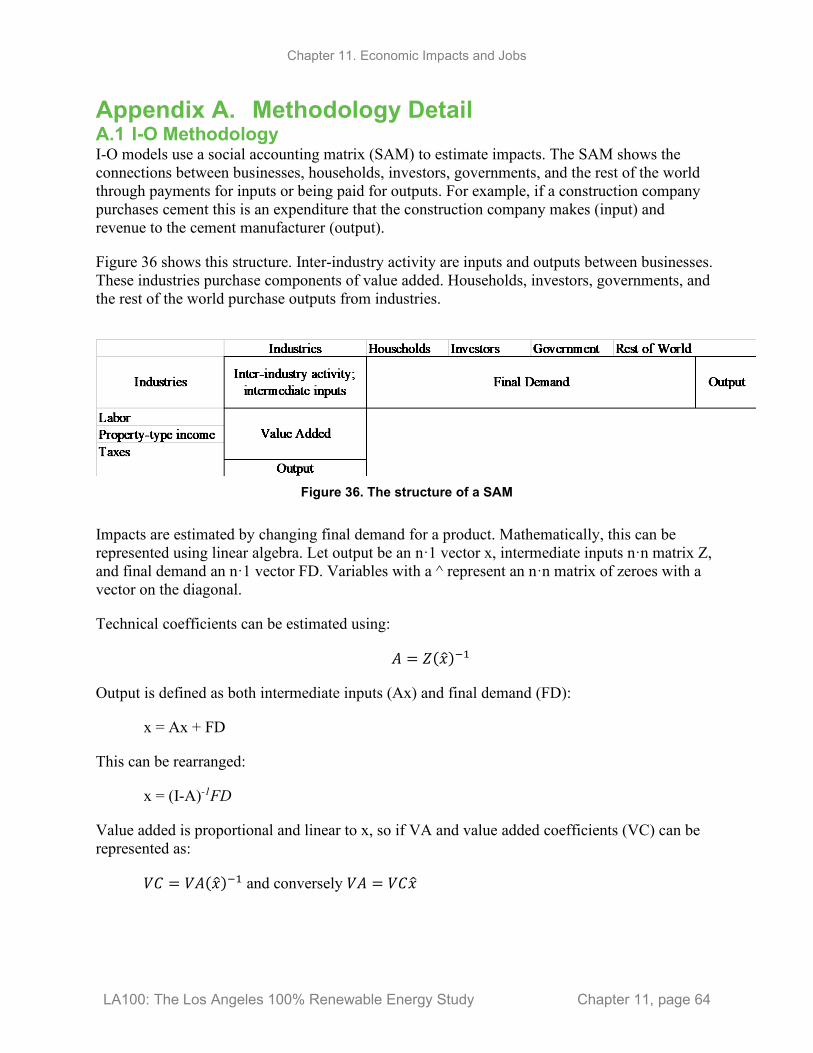
Chapter 11. Economic Impacts and Jobs
LA100: The Los Angeles 100% Renewable Energy Study Chapter 11, page 64
Appendix A. Methodology Detail A.1 I-O Methodology I-O models use a social accounting matrix (SAM) to estimate impacts. The SAM shows the connections between businesses, households, investors, governments, and the rest of the world through payments for inputs or being paid for outputs. For example, if a construction company purchases cement this is an expenditure that the construction company makes (input) and revenue to the cement manufacturer (output).
Figure 36 shows this structure. Inter-industry activity are inputs and outputs between businesses. These industries purchase components of value added. Households, investors, governments, and the rest of the world purchase outputs from industries.
Figure 36. The structure of a SAM
Impacts are estimated by changing final demand for a product. Mathematically, this can be represented using linear algebra. Let output be an n·1 vector x, intermediate inputs n·n matrix Z, and final demand an n·1 vector FD. Variables with a ^ represent an n·n matrix of zeroes with a vector on the diagonal.
Technical coefficients can be estimated using:
𝐴𝐴 = 𝑍𝑍(𝑥𝑥�)−1
Output is defined as both intermediate inputs (Ax) and final demand (FD):
x = Ax + FD
This can be rearranged:
x = (I-A)-1FD
Value added is proportional and linear to x, so if VA and value added coefficients (VC) can be represented as:
𝑉𝑉𝑉𝑉 = 𝑉𝑉𝐴𝐴(𝑥𝑥�)−1 and conversely 𝑉𝑉𝐴𝐴 = 𝑉𝑉𝑉𝑉𝑥𝑥�

Chapter 11. Economic Impacts and Jobs
LA100: The Los Angeles 100% Renewable Energy Study Chapter 11, page 65
A.2 JEDI and IMPLAN JEDI was initially developed in 2004 to assist a wide range of modelers understand the potential impacts of renewables. Renewables are not well represented in I-O models because of data limitations. Even if an analyst knew the cost of a project, the use of an I-O model would depend on their level of expertise.
NREL and MRG & Associates developed information about the costs of construction and O&M of renewable energy technologies and combined these with the IMPLAN I-O model. These costs and where the costs accrue (local content) could be changed by a model user or left as defaults that the two organizations researched and put in the model.
JEDI results have been analyzed and validated using figures reported by developers and operators as well as compared to estimates developed by other modelers, including those in peer-reviewed academic journal articles. (Billman and Keyser 2013).
There is no official JEDI model for storage technologies. To estimate impacts from the deployment and operation of these technologies, the IMPLAN model can be used. This maintains consistency with respect to the economic model, as JEDI uses IMPLAN for its underlying economic data.
Estimates within the storage and hydroelectric model use the same methodology as JEDI to convert direct and indirect estimates into onsite and supply chain.
The local content figures – the level of expenditures within the region of analysis are based on regional purchase coefficients (RPCs). An RPC is a calculation of supply and demand for a commodity within a region. If demand exceeds supply, this indicates that the commodity, which can be a good or service, is imported into a region in order to fulfill demand. IMPLAN calculates RPCs in its trade accounts. IMPLAN data account for imports: goods and services purchased outside of the region of analysis.
Demands for specific commodities that come from the RPM model, then, are adjusted based on what the RPC indicates is produced within a region and what is imported. These imports affect regions outside of the region of analysis and are not calculated or reported.
Input-output data used in this analysis for out-of-basin impacts come from IMPLAN multipliers contained within JEDI. These come from 2016 IMPLAN data. In-basin estimates come from 2017 IMPLAN data. All dollar figures are adjusted to 2019.
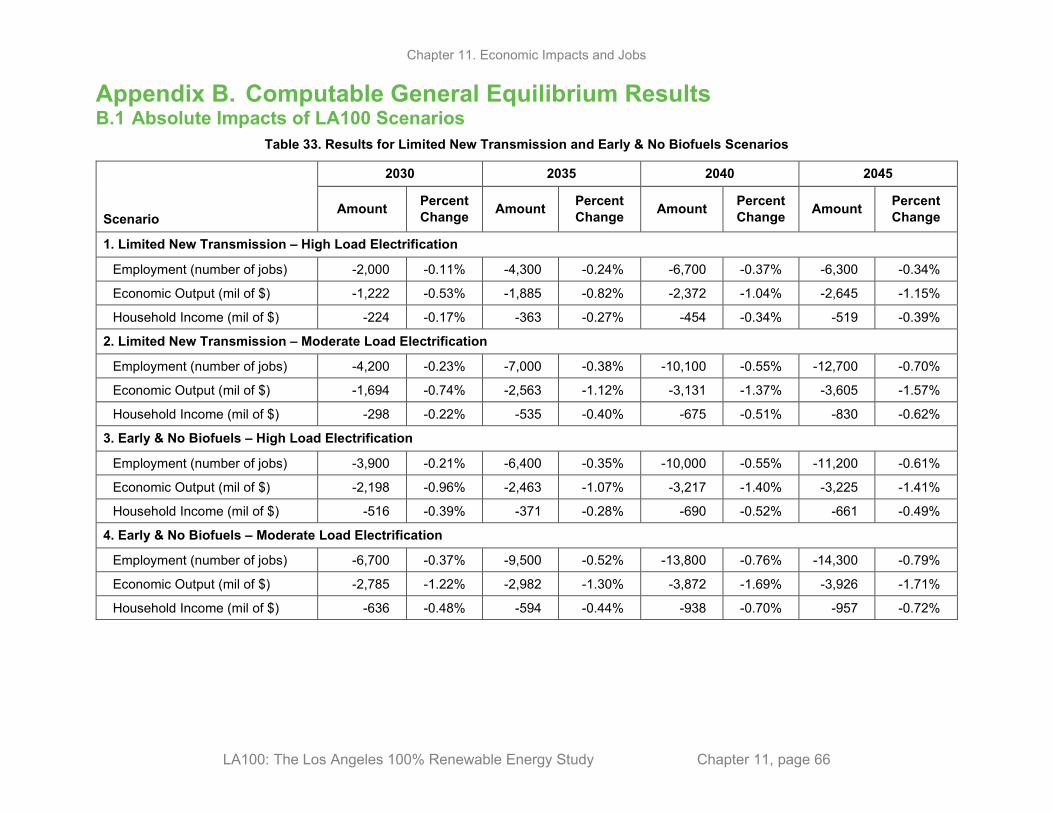
Chapter 11. Economic Impacts and Jobs
LA100: The Los Angeles 100% Renewable Energy Study Chapter 11, page 66
Appendix B. Computable General Equilibrium Results B.1 Absolute Impacts of LA100 Scenarios
Table 33. Results for Limited New Transmission and Early & No Biofuels Scenarios
2030 2035 2040 2045
Scenario
Amount Percent Change Amount Percent
Change Amount Percent Change Amount Percent
Change
1. Limited New Transmission – High Load Electrification
Employment (number of jobs) -2,000 -0.11% -4,300 -0.24% -6,700 -0.37% -6,300 -0.34%
Economic Output (mil of $) -1,222 -0.53% -1,885 -0.82% -2,372 -1.04% -2,645 -1.15%
Household Income (mil of $) -224 -0.17% -363 -0.27% -454 -0.34% -519 -0.39%
2. Limited New Transmission – Moderate Load Electrification
Employment (number of jobs) -4,200 -0.23% -7,000 -0.38% -10,100 -0.55% -12,700 -0.70%
Economic Output (mil of $) -1,694 -0.74% -2,563 -1.12% -3,131 -1.37% -3,605 -1.57%
Household Income (mil of $) -298 -0.22% -535 -0.40% -675 -0.51% -830 -0.62%
3. Early & No Biofuels – High Load Electrification
Employment (number of jobs) -3,900 -0.21% -6,400 -0.35% -10,000 -0.55% -11,200 -0.61%
Economic Output (mil of $) -2,198 -0.96% -2,463 -1.07% -3,217 -1.40% -3,225 -1.41%
Household Income (mil of $) -516 -0.39% -371 -0.28% -690 -0.52% -661 -0.49%
4. Early & No Biofuels – Moderate Load Electrification
Employment (number of jobs) -6,700 -0.37% -9,500 -0.52% -13,800 -0.76% -14,300 -0.79%
Economic Output (mil of $) -2,785 -1.22% -2,982 -1.30% -3,872 -1.69% -3,926 -1.71%
Household Income (mil of $) -636 -0.48% -594 -0.44% -938 -0.70% -957 -0.72%
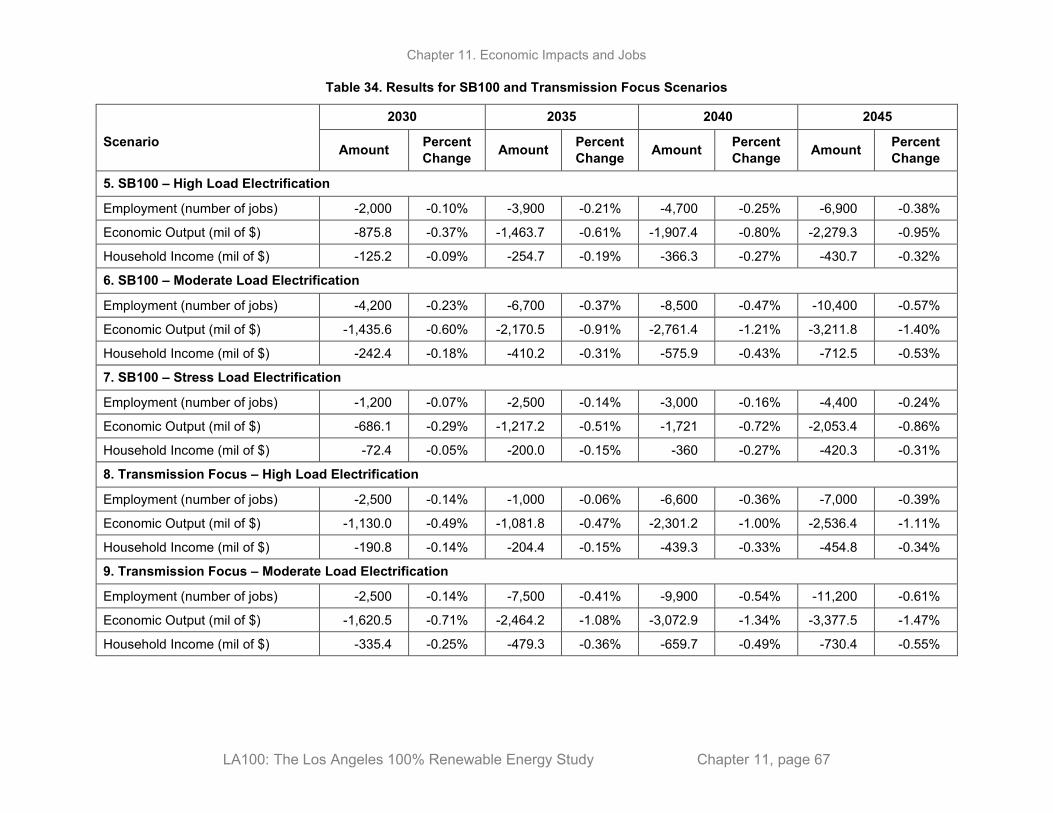
Chapter 11. Economic Impacts and Jobs
LA100: The Los Angeles 100% Renewable Energy Study Chapter 11, page 67
Table 34. Results for SB100 and Transmission Focus Scenarios
2030 2035 2040 2045
Scenario Amount Percent Change Amount Percent
Change Amount Percent Change Amount Percent
Change
5. SB100 – High Load Electrification
Employment (number of jobs) -2,000 -0.10% -3,900 -0.21% -4,700 -0.25% -6,900 -0.38%
Economic Output (mil of $) -875.8 -0.37% -1,463.7 -0.61% -1,907.4 -0.80% -2,279.3 -0.95%
Household Income (mil of $) -125.2 -0.09% -254.7 -0.19% -366.3 -0.27% -430.7 -0.32%
6. SB100 – Moderate Load Electrification
Employment (number of jobs) -4,200 -0.23% -6,700 -0.37% -8,500 -0.47% -10,400 -0.57%
Economic Output (mil of $) -1,435.6 -0.60% -2,170.5 -0.91% -2,761.4 -1.21% -3,211.8 -1.40%
Household Income (mil of $) -242.4 -0.18% -410.2 -0.31% -575.9 -0.43% -712.5 -0.53%
7. SB100 – Stress Load Electrification
Employment (number of jobs) -1,200 -0.07% -2,500 -0.14% -3,000 -0.16% -4,400 -0.24%
Economic Output (mil of $) -686.1 -0.29% -1,217.2 -0.51% -1,721 -0.72% -2,053.4 -0.86%
Household Income (mil of $) -72.4 -0.05% -200.0 -0.15% -360 -0.27% -420.3 -0.31%
8. Transmission Focus – High Load Electrification
Employment (number of jobs) -2,500 -0.14% -1,000 -0.06% -6,600 -0.36% -7,000 -0.39%
Economic Output (mil of $) -1,130.0 -0.49% -1,081.8 -0.47% -2,301.2 -1.00% -2,536.4 -1.11%
Household Income (mil of $) -190.8 -0.14% -204.4 -0.15% -439.3 -0.33% -454.8 -0.34%
9. Transmission Focus – Moderate Load Electrification
Employment (number of jobs) -2,500 -0.14% -7,500 -0.41% -9,900 -0.54% -11,200 -0.61%
Economic Output (mil of $) -1,620.5 -0.71% -2,464.2 -1.08% -3,072.9 -1.34% -3,377.5 -1.47%
Household Income (mil of $) -335.4 -0.25% -479.3 -0.36% -659.7 -0.49% -730.4 -0.55%
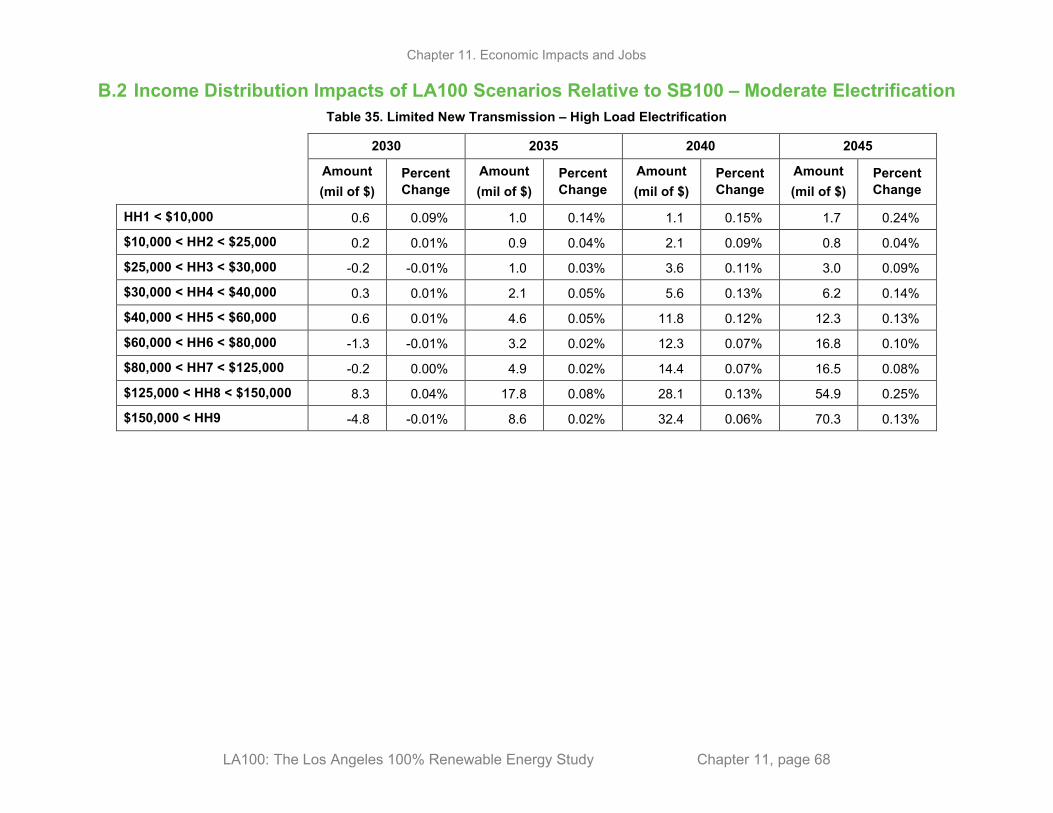
Chapter 11. Economic Impacts and Jobs
LA100: The Los Angeles 100% Renewable Energy Study Chapter 11, page 68
B.2 Income Distribution Impacts of LA100 Scenarios Relative to SB100 – Moderate Electrification Table 35. Limited New Transmission – High Load Electrification
2030 2035 2040 2045
Amount (mil of $)
Percent Change
Amount (mil of $)
Percent Change
Amount (mil of $)
Percent Change
Amount (mil of $)
Percent Change
HH1 < $10,000 0.6 0.09% 1.0 0.14% 1.1 0.15% 1.7 0.24%
$10,000 < HH2 < $25,000 0.2 0.01% 0.9 0.04% 2.1 0.09% 0.8 0.04%
$25,000 < HH3 < $30,000 -0.2 -0.01% 1.0 0.03% 3.6 0.11% 3.0 0.09%
$30,000 < HH4 < $40,000 0.3 0.01% 2.1 0.05% 5.6 0.13% 6.2 0.14%
$40,000 < HH5 < $60,000 0.6 0.01% 4.6 0.05% 11.8 0.12% 12.3 0.13%
$60,000 < HH6 < $80,000 -1.3 -0.01% 3.2 0.02% 12.3 0.07% 16.8 0.10%
$80,000 < HH7 < $125,000 -0.2 0.00% 4.9 0.02% 14.4 0.07% 16.5 0.08%
$125,000 < HH8 < $150,000 8.3 0.04% 17.8 0.08% 28.1 0.13% 54.9 0.25%
$150,000 < HH9 -4.8 -0.01% 8.6 0.02% 32.4 0.06% 70.3 0.13%
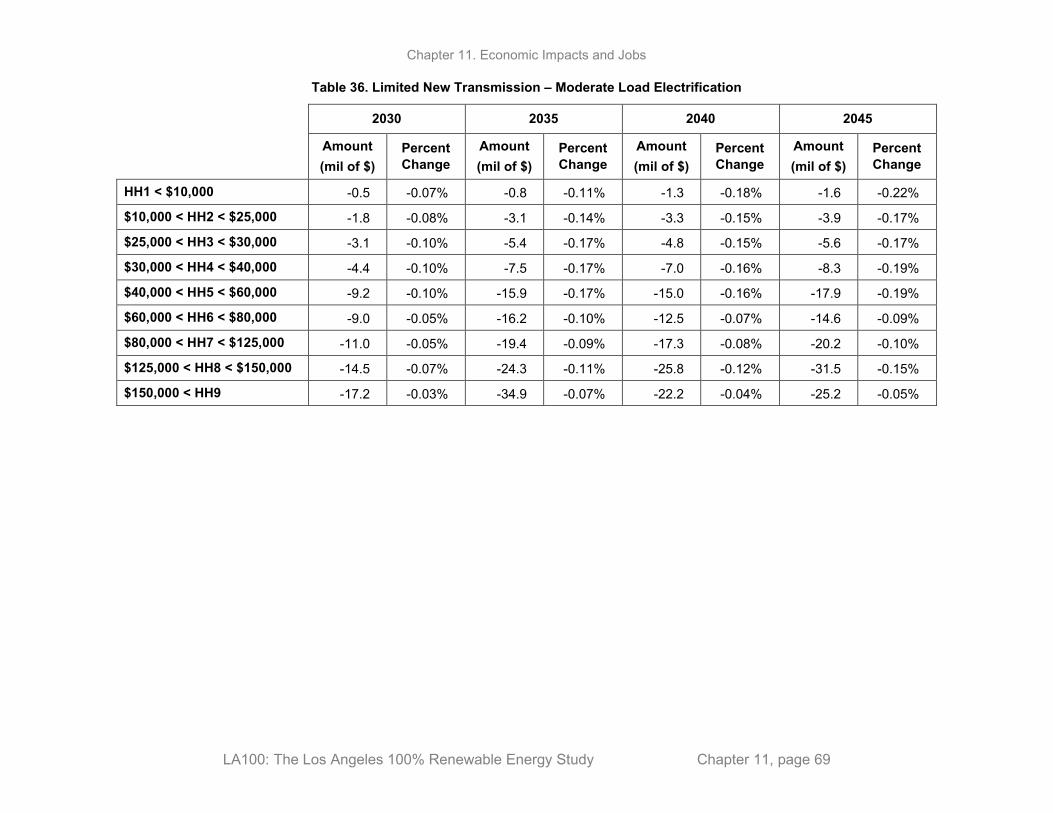
Chapter 11. Economic Impacts and Jobs
LA100: The Los Angeles 100% Renewable Energy Study Chapter 11, page 69
Table 36. Limited New Transmission – Moderate Load Electrification
2030 2035 2040 2045
Amount (mil of $)
Percent Change
Amount (mil of $)
Percent Change
Amount (mil of $)
Percent Change
Amount (mil of $)
Percent Change
HH1 < $10,000 -0.5 -0.07% -0.8 -0.11% -1.3 -0.18% -1.6 -0.22%
$10,000 < HH2 < $25,000 -1.8 -0.08% -3.1 -0.14% -3.3 -0.15% -3.9 -0.17%
$25,000 < HH3 < $30,000 -3.1 -0.10% -5.4 -0.17% -4.8 -0.15% -5.6 -0.17%
$30,000 < HH4 < $40,000 -4.4 -0.10% -7.5 -0.17% -7.0 -0.16% -8.3 -0.19%
$40,000 < HH5 < $60,000 -9.2 -0.10% -15.9 -0.17% -15.0 -0.16% -17.9 -0.19%
$60,000 < HH6 < $80,000 -9.0 -0.05% -16.2 -0.10% -12.5 -0.07% -14.6 -0.09%
$80,000 < HH7 < $125,000 -11.0 -0.05% -19.4 -0.09% -17.3 -0.08% -20.2 -0.10%
$125,000 < HH8 < $150,000 -14.5 -0.07% -24.3 -0.11% -25.8 -0.12% -31.5 -0.15%
$150,000 < HH9 -17.2 -0.03% -34.9 -0.07% -22.2 -0.04% -25.2 -0.05%

Chapter 11. Economic Impacts and Jobs
LA100: The Los Angeles 100% Renewable Energy Study Chapter 11, page 70
Table 37. Early & No Biofuels – High Load Electrification
2030 2035 2040 2045
Amount (mil of $)
Percent Change
Amount (mil of $)
Percent Change
Amount (mil of $)
Percent Change
Amount (mil of $)
Percent Change
HH1 < $10,000 -1.1 -0.16% -1.8 -0.26% -1.8 -0.25% -0.3 -0.04%
$10,000 < HH2 < $25,000 -6.2 -0.28% -8.8 -0.39% -5.8 -0.26% -0.7 -0.03%
$25,000 < HH3 < $30,000 -11.7 -0.36% -8.3 -0.25% -7.9 -0.24% -0.3 -0.01%
$30,000 < HH4 < $40,000 -16.0 -0.37% -9.7 -0.22% -10.8 -0.25% -0.4 -0.01%
$40,000 < HH5 < $60,000 -33.5 -0.35% -22.6 -0.24% -23.5 -0.25% -0.9 -0.01%
$60,000 < HH6 < $80,000 -37.7 -0.22% -1.4 -0.01% -17.4 -0.10% 3.8 0.02%
$80,000 < HH7 < $125,000 -42.8 -0.20% -17.8 -0.08% -25.3 -0.12% 2.2 0.01%
$125,000 < HH8 < $150,000 -48.9 -0.23% 14.8 0.07% -25.5 -0.12% 5.2 0.02%
$150,000 < HH9 -90.9 -0.17% 92.7 0.17% -6.3 -0.01% 32.0 0.06%
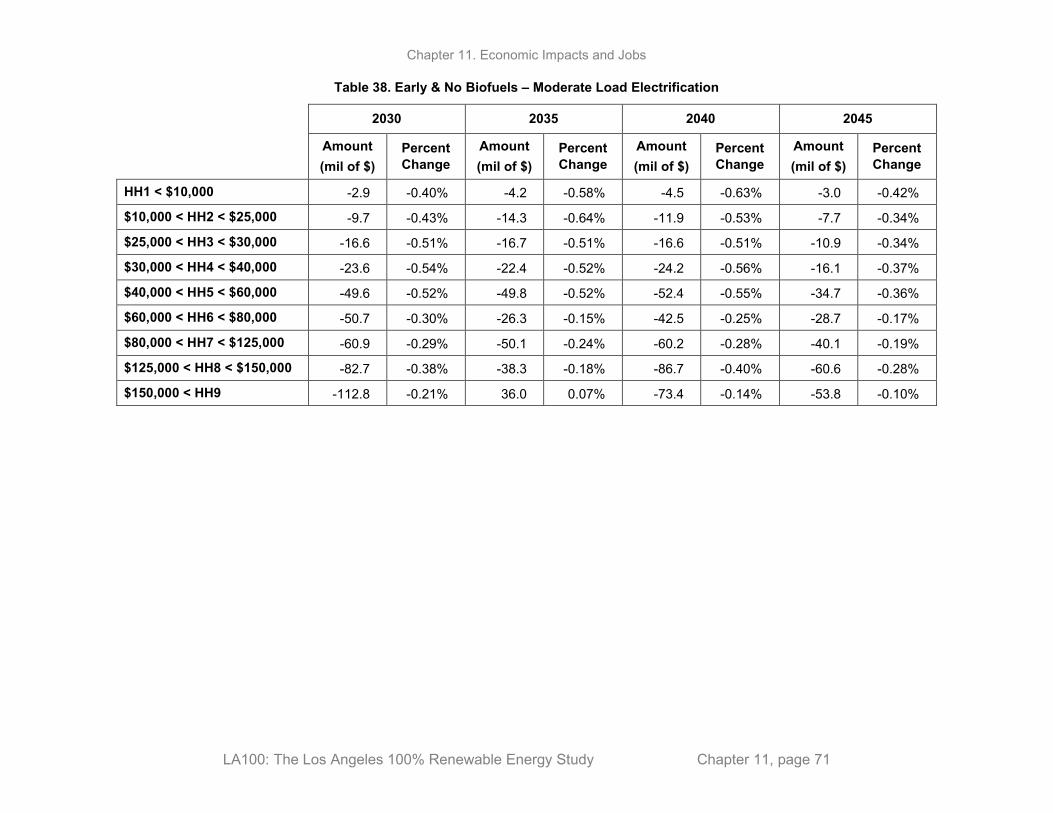
Chapter 11. Economic Impacts and Jobs
LA100: The Los Angeles 100% Renewable Energy Study Chapter 11, page 71
Table 38. Early & No Biofuels – Moderate Load Electrification
2030 2035 2040 2045
Amount (mil of $)
Percent Change
Amount (mil of $)
Percent Change
Amount (mil of $)
Percent Change
Amount (mil of $)
Percent Change
HH1 < $10,000 -2.9 -0.40% -4.2 -0.58% -4.5 -0.63% -3.0 -0.42%
$10,000 < HH2 < $25,000 -9.7 -0.43% -14.3 -0.64% -11.9 -0.53% -7.7 -0.34%
$25,000 < HH3 < $30,000 -16.6 -0.51% -16.7 -0.51% -16.6 -0.51% -10.9 -0.34%
$30,000 < HH4 < $40,000 -23.6 -0.54% -22.4 -0.52% -24.2 -0.56% -16.1 -0.37%
$40,000 < HH5 < $60,000 -49.6 -0.52% -49.8 -0.52% -52.4 -0.55% -34.7 -0.36%
$60,000 < HH6 < $80,000 -50.7 -0.30% -26.3 -0.15% -42.5 -0.25% -28.7 -0.17%
$80,000 < HH7 < $125,000 -60.9 -0.29% -50.1 -0.24% -60.2 -0.28% -40.1 -0.19%
$125,000 < HH8 < $150,000 -82.7 -0.38% -38.3 -0.18% -86.7 -0.40% -60.6 -0.28%
$150,000 < HH9 -112.8 -0.21% 36.0 0.07% -73.4 -0.14% -53.8 -0.10%
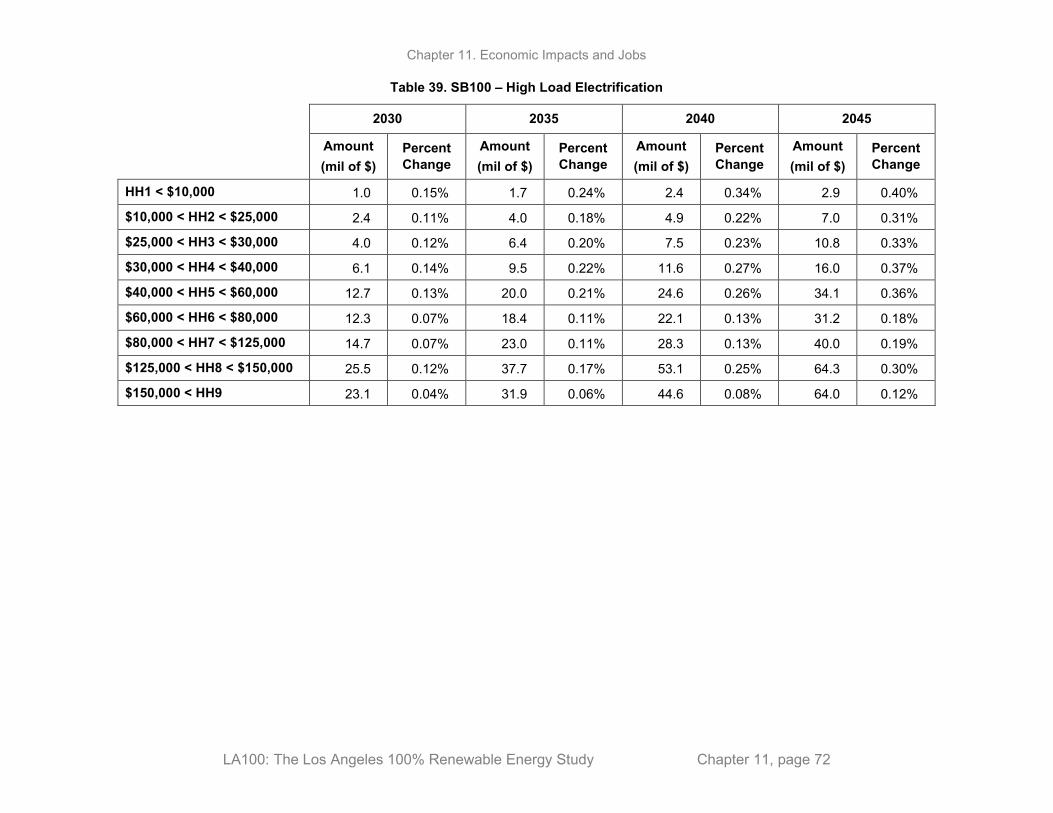
Chapter 11. Economic Impacts and Jobs
LA100: The Los Angeles 100% Renewable Energy Study Chapter 11, page 72
Table 39. SB100 – High Load Electrification
2030 2035 2040 2045
Amount (mil of $)
Percent Change
Amount (mil of $)
Percent Change
Amount (mil of $)
Percent Change
Amount (mil of $)
Percent Change
HH1 < $10,000 1.0 0.15% 1.7 0.24% 2.4 0.34% 2.9 0.40%
$10,000 < HH2 < $25,000 2.4 0.11% 4.0 0.18% 4.9 0.22% 7.0 0.31%
$25,000 < HH3 < $30,000 4.0 0.12% 6.4 0.20% 7.5 0.23% 10.8 0.33%
$30,000 < HH4 < $40,000 6.1 0.14% 9.5 0.22% 11.6 0.27% 16.0 0.37%
$40,000 < HH5 < $60,000 12.7 0.13% 20.0 0.21% 24.6 0.26% 34.1 0.36%
$60,000 < HH6 < $80,000 12.3 0.07% 18.4 0.11% 22.1 0.13% 31.2 0.18%
$80,000 < HH7 < $125,000 14.7 0.07% 23.0 0.11% 28.3 0.13% 40.0 0.19%
$125,000 < HH8 < $150,000 25.5 0.12% 37.7 0.17% 53.1 0.25% 64.3 0.30%
$150,000 < HH9 23.1 0.04% 31.9 0.06% 44.6 0.08% 64.0 0.12%

Chapter 11. Economic Impacts and Jobs
LA100: The Los Angeles 100% Renewable Energy Study Chapter 11, page 73
Table 40. SB100 – Stress Load Electrification
2030 2035 2040 2045
Amount (mil of $)
Percent Change
Amount (mil of $)
Percent Change
Amount (mil of $)
Percent Change
Amount (mil of $)
Percent Change
HH1 < $10,000 1.4 0.19% 2.2 0.31% 3.1 0.44% 3.8 0.53%
$10,000 < HH2 < $25,000 2.8 0.12% 4.3 0.19% 5.2 0.23% 7.0 0.31%
$25,000 < HH3 < $30,000 5.3 0.16% 7.4 0.23% 7.5 0.23% 10.4 0.32%
$30,000 < HH4 < $40,000 8.2 0.19% 11.6 0.27% 12.2 0.28% 16.5 0.38%
$40,000 < HH5 < $60,000 16.8 0.18% 24.1 0.25% 25.8 0.27% 35.0 0.37%
$60,000 < HH6 < $80,000 18.4 0.11% 24.1 0.14% 21.2 0.12% 30.0 0.18%
$80,000 < HH7 < $125,000 20.4 0.10% 28.2 0.13% 28.7 0.13% 39.7 0.19%
$125,000 < HH8 < $150,000 38.4 0.18% 54.6 0.25% 62.4 0.29% 78.7 0.36%
$150,000 < HH9 43.0 0.08% 50.9 0.09% 39.2 0.07% 59.6 0.11%

Chapter 11. Economic Impacts and Jobs
LA100: The Los Angeles 100% Renewable Energy Study Chapter 11, page 74
Table 41. Transmission Focus – High Load Electrification
2030 2035 2040 2045
Amount (mil of $)
Percent Change
Amount (mil of $)
Percent Change
Amount (mil of $)
Percent Change
Amount (mil of $)
Percent Change
HH1 < $10,000 0.6 0.09% 2.6 0.36% 1.2 0.17% 1.6 0.22%
$10,000 < HH2 < $25,000 0.7 0.03% 3.6 0.16% 3.0 0.13% 3.2 0.14%
$25,000 < HH3 < $30,000 1.5 0.05% 6.3 0.19% 5.1 0.16% 7.8 0.24%
$30,000 < HH4 < $40,000 2.7 0.06% 10.7 0.25% 7.6 0.18% 12.0 0.28%
$40,000 < HH5 < $60,000 5.4 0.06% 22.3 0.23% 16.0 0.17% 24.3 0.26%
$60,000 < HH6 < $80,000 5.7 0.03% 22.2 0.13% 15.8 0.09% 30.0 0.18%
$80,000 < HH7 < $125,000 6.4 0.03% 26.6 0.13% 19.1 0.09% 30.6 0.14%
$125,000 < HH8 < $150,000 16.8 0.08% 62.8 0.29% 32.0 0.15% 60.2 0.28%
$150,000 < HH9 11.7 0.02% 48.7 0.09% 36.8 0.07% 88.0 0.16%
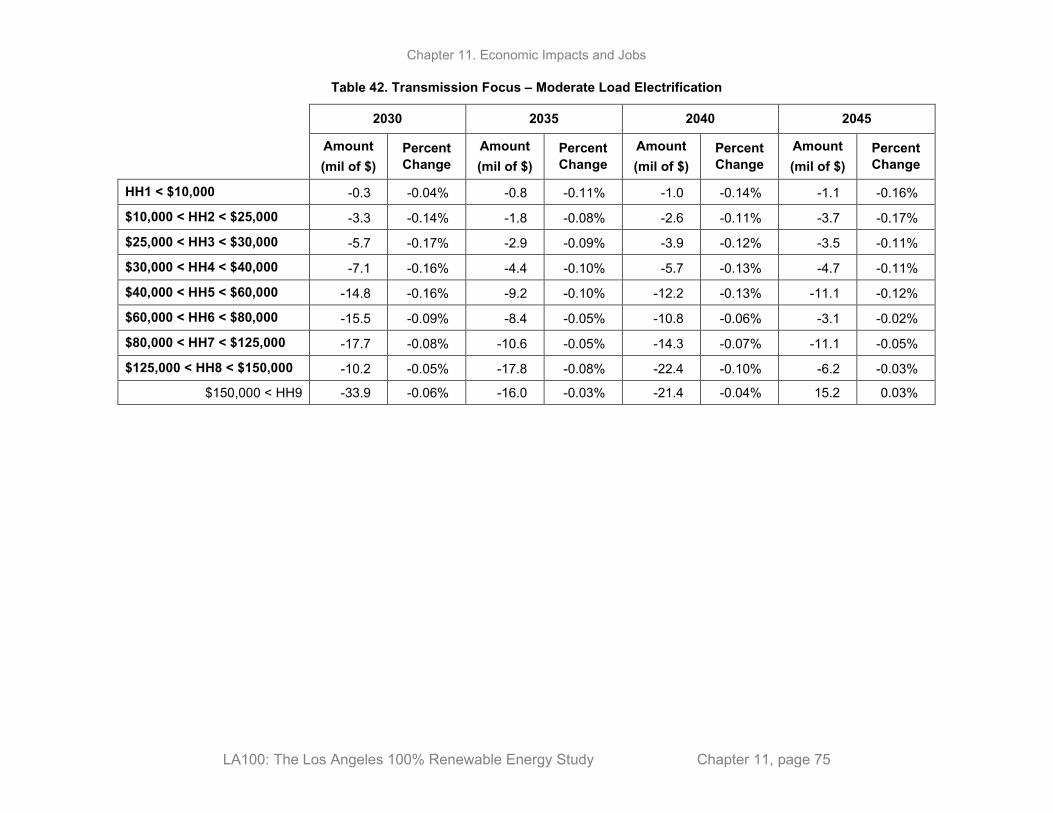
Chapter 11. Economic Impacts and Jobs
LA100: The Los Angeles 100% Renewable Energy Study Chapter 11, page 75
Table 42. Transmission Focus – Moderate Load Electrification
2030 2035 2040 2045
Amount (mil of $)
Percent Change
Amount (mil of $)
Percent Change
Amount (mil of $)
Percent Change
Amount (mil of $)
Percent Change
HH1 < $10,000 -0.3 -0.04% -0.8 -0.11% -1.0 -0.14% -1.1 -0.16%
$10,000 < HH2 < $25,000 -3.3 -0.14% -1.8 -0.08% -2.6 -0.11% -3.7 -0.17%
$25,000 < HH3 < $30,000 -5.7 -0.17% -2.9 -0.09% -3.9 -0.12% -3.5 -0.11%
$30,000 < HH4 < $40,000 -7.1 -0.16% -4.4 -0.10% -5.7 -0.13% -4.7 -0.11%
$40,000 < HH5 < $60,000 -14.8 -0.16% -9.2 -0.10% -12.2 -0.13% -11.1 -0.12%
$60,000 < HH6 < $80,000 -15.5 -0.09% -8.4 -0.05% -10.8 -0.06% -3.1 -0.02%
$80,000 < HH7 < $125,000 -17.7 -0.08% -10.6 -0.05% -14.3 -0.07% -11.1 -0.05%
$125,000 < HH8 < $150,000 -10.2 -0.05% -17.8 -0.08% -22.4 -0.10% -6.2 -0.03%
$150,000 < HH9 -33.9 -0.06% -16.0 -0.03% -21.4 -0.04% 15.2 0.03%
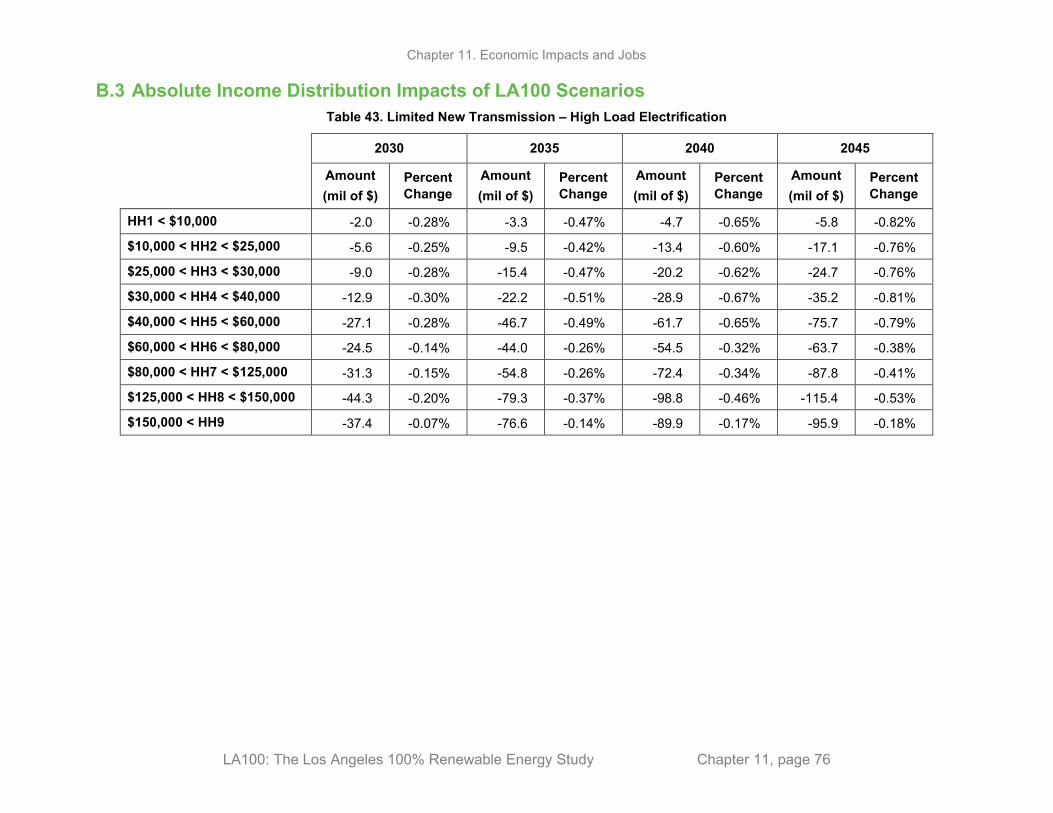
Chapter 11. Economic Impacts and Jobs
LA100: The Los Angeles 100% Renewable Energy Study Chapter 11, page 76
B.3 Absolute Income Distribution Impacts of LA100 Scenarios Table 43. Limited New Transmission – High Load Electrification
2030 2035 2040 2045
Amount (mil of $)
Percent Change
Amount (mil of $)
Percent Change
Amount (mil of $)
Percent Change
Amount (mil of $)
Percent Change
HH1 < $10,000 -2.0 -0.28% -3.3 -0.47% -4.7 -0.65% -5.8 -0.82%
$10,000 < HH2 < $25,000 -5.6 -0.25% -9.5 -0.42% -13.4 -0.60% -17.1 -0.76%
$25,000 < HH3 < $30,000 -9.0 -0.28% -15.4 -0.47% -20.2 -0.62% -24.7 -0.76%
$30,000 < HH4 < $40,000 -12.9 -0.30% -22.2 -0.51% -28.9 -0.67% -35.2 -0.81%
$40,000 < HH5 < $60,000 -27.1 -0.28% -46.7 -0.49% -61.7 -0.65% -75.7 -0.79%
$60,000 < HH6 < $80,000 -24.5 -0.14% -44.0 -0.26% -54.5 -0.32% -63.7 -0.38%
$80,000 < HH7 < $125,000 -31.3 -0.15% -54.8 -0.26% -72.4 -0.34% -87.8 -0.41%
$125,000 < HH8 < $150,000 -44.3 -0.20% -79.3 -0.37% -98.8 -0.46% -115.4 -0.53%
$150,000 < HH9 -37.4 -0.07% -76.6 -0.14% -89.9 -0.17% -95.9 -0.18%
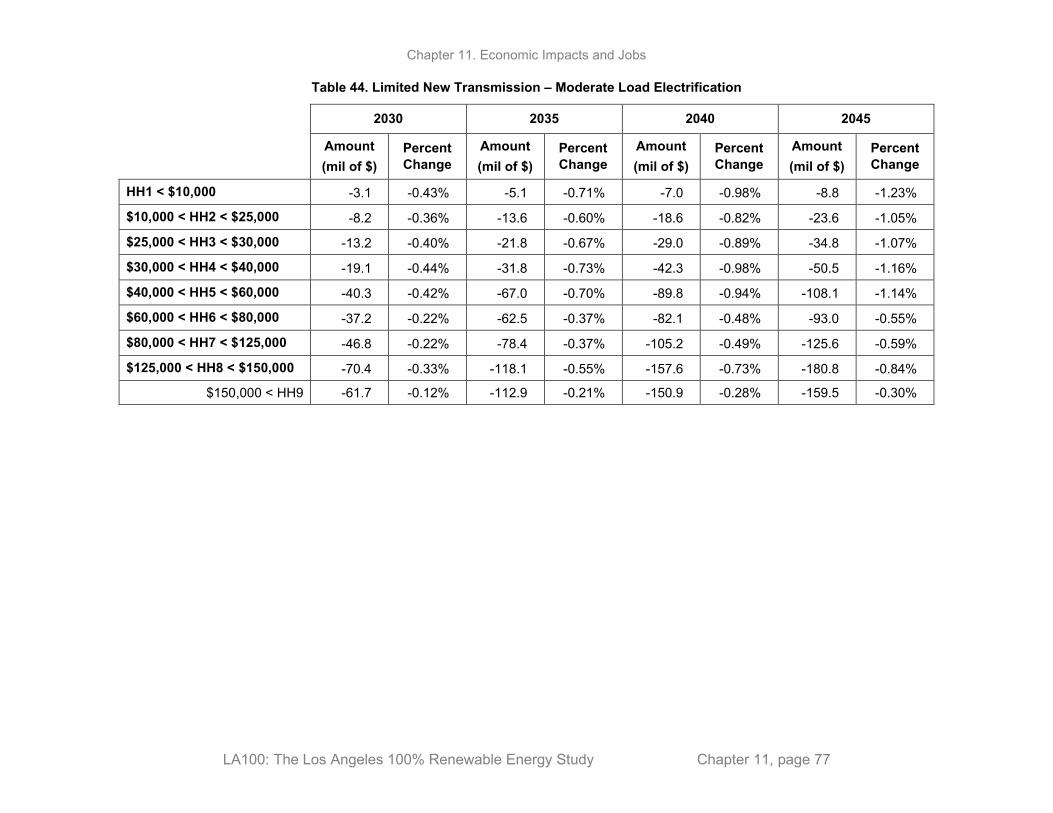
Chapter 11. Economic Impacts and Jobs
LA100: The Los Angeles 100% Renewable Energy Study Chapter 11, page 77
Table 44. Limited New Transmission – Moderate Load Electrification
2030 2035 2040 2045
Amount (mil of $)
Percent Change
Amount (mil of $)
Percent Change
Amount (mil of $)
Percent Change
Amount (mil of $)
Percent Change
HH1 < $10,000 -3.1 -0.43% -5.1 -0.71% -7.0 -0.98% -8.8 -1.23%
$10,000 < HH2 < $25,000 -8.2 -0.36% -13.6 -0.60% -18.6 -0.82% -23.6 -1.05%
$25,000 < HH3 < $30,000 -13.2 -0.40% -21.8 -0.67% -29.0 -0.89% -34.8 -1.07%
$30,000 < HH4 < $40,000 -19.1 -0.44% -31.8 -0.73% -42.3 -0.98% -50.5 -1.16%
$40,000 < HH5 < $60,000 -40.3 -0.42% -67.0 -0.70% -89.8 -0.94% -108.1 -1.14%
$60,000 < HH6 < $80,000 -37.2 -0.22% -62.5 -0.37% -82.1 -0.48% -93.0 -0.55%
$80,000 < HH7 < $125,000 -46.8 -0.22% -78.4 -0.37% -105.2 -0.49% -125.6 -0.59%
$125,000 < HH8 < $150,000 -70.4 -0.33% -118.1 -0.55% -157.6 -0.73% -180.8 -0.84%
$150,000 < HH9 -61.7 -0.12% -112.9 -0.21% -150.9 -0.28% -159.5 -0.30%

Chapter 11. Economic Impacts and Jobs
LA100: The Los Angeles 100% Renewable Energy Study Chapter 11, page 78
Table 45. Early & No Biofuels – High Load Electrification
2030 2035 2040 2045
Amount (mil of $)
Percent Change
Amount (mil of $)
Percent Change
Amount (mil of $)
Percent Change
Amount (mil of $)
Percent Change
HH1 < $10,000 0.04 0.01% 0.37 0.05% -6.9 -0.96% -7.5 -1.05%
$10,000 < HH2 < $25,000 -0.29 -0.01% -1.42 -0.06% -16.3 -0.73% -20.5 -0.91%
$25,000 < HH3 < $30,000 0.11 0.00% 0.58 0.02% -26.7 -0.82% -31.9 -0.98%
$30,000 < HH4 < $40,000 0.45 0.01% 2.19 0.05% -39.9 -0.92% -46.2 -1.07%
$40,000 < HH5 < $60,000 0.75 0.01% 3.43 0.04% -83.8 -0.88% -98.2 -1.03%
$60,000 < HH6 < $80,000 2.55 0.01% 12.33 0.07% -79.7 -0.47% -88.8 -0.52%
$80,000 < HH7 < $125,000 1.87 0.01% 6.28 0.03% -98.0 -0.46% -114.8 -0.54%
$125,000 < HH8 < $150,000 7.87 0.04% 32.46 0.15% -162.4 -0.75% -167.7 -0.77%
$150,000 < HH9 17.27 0.03% 52.54 0.10% -153.2 -0.29% -160.0 -0.30%
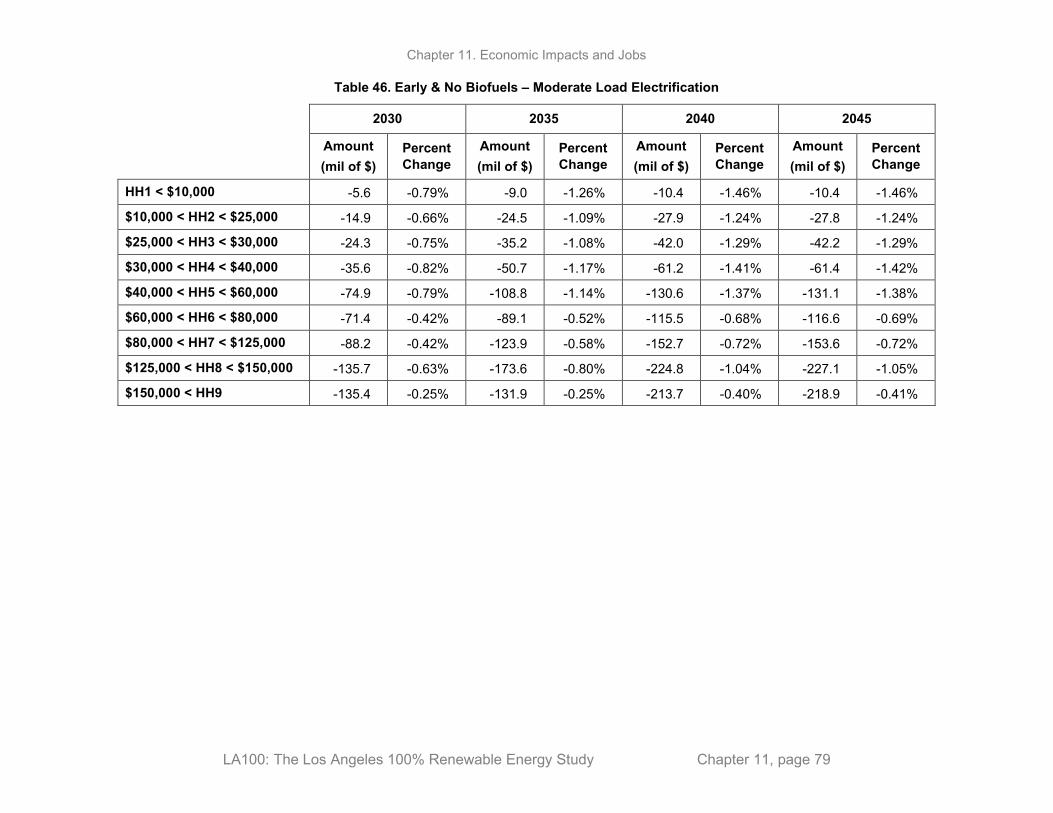
Chapter 11. Economic Impacts and Jobs
LA100: The Los Angeles 100% Renewable Energy Study Chapter 11, page 79
Table 46. Early & No Biofuels – Moderate Load Electrification
2030 2035 2040 2045
Amount (mil of $)
Percent Change
Amount (mil of $)
Percent Change
Amount (mil of $)
Percent Change
Amount (mil of $)
Percent Change
HH1 < $10,000 -5.6 -0.79% -9.0 -1.26% -10.4 -1.46% -10.4 -1.46%
$10,000 < HH2 < $25,000 -14.9 -0.66% -24.5 -1.09% -27.9 -1.24% -27.8 -1.24%
$25,000 < HH3 < $30,000 -24.3 -0.75% -35.2 -1.08% -42.0 -1.29% -42.2 -1.29%
$30,000 < HH4 < $40,000 -35.6 -0.82% -50.7 -1.17% -61.2 -1.41% -61.4 -1.42%
$40,000 < HH5 < $60,000 -74.9 -0.79% -108.8 -1.14% -130.6 -1.37% -131.1 -1.38%
$60,000 < HH6 < $80,000 -71.4 -0.42% -89.1 -0.52% -115.5 -0.68% -116.6 -0.69%
$80,000 < HH7 < $125,000 -88.2 -0.42% -123.9 -0.58% -152.7 -0.72% -153.6 -0.72%
$125,000 < HH8 < $150,000 -135.7 -0.63% -173.6 -0.80% -224.8 -1.04% -227.1 -1.05%
$150,000 < HH9 -135.4 -0.25% -131.9 -0.25% -213.7 -0.40% -218.9 -0.41%

Chapter 11. Economic Impacts and Jobs
LA100: The Los Angeles 100% Renewable Energy Study Chapter 11, page 80
Table 47. SB100 – High Load Electrification
2030 2035 2040 2045
Amount (mil of $)
Percent Change
Amount (mil of $)
Percent Change
Amount (mil of $)
Percent Change
Amount (mil of $)
Percent Change
HH1 < $10,000 -1.4 -0.19% -2.5 -0.35% -3.3 -0.47% -4.5 -0.63%
$10,000 < HH2 < $25,000 -4.3 -0.19% -6.7 -0.30% -9.9 -0.44% -11.5 -0.51%
$25,000 < HH3 < $30,000 -6.5 -0.20% -10.9 -0.34% -16.1 -0.50% -18.3 -0.56%
$30,000 < HH4 < $40,000 -9.1 -0.21% -15.9 -0.37% -23.1 -0.53% -26.8 -0.62%
$40,000 < HH5 < $60,000 -19.4 -0.20% -33.5 -0.35% -48.7 -0.51% -56.6 -0.59%
$60,000 < HH6 < $80,000 -16.4 -0.10% -31.7 -0.19% -46.3 -0.27% -52.5 -0.31%
$80,000 < HH7 < $125,000 -21.9 -0.10% -39.2 -0.18% -57.3 -0.27% -66.0 -0.31%
$125,000 < HH8 < $150,000 -27.9 -0.13% -59.3 -0.27% -80.7 -0.37% -102.5 -0.47%
$150,000 < HH9 -18.3 -0.03% -55.0 -0.10% -80.7 -0.15% -91.9 -0.17%
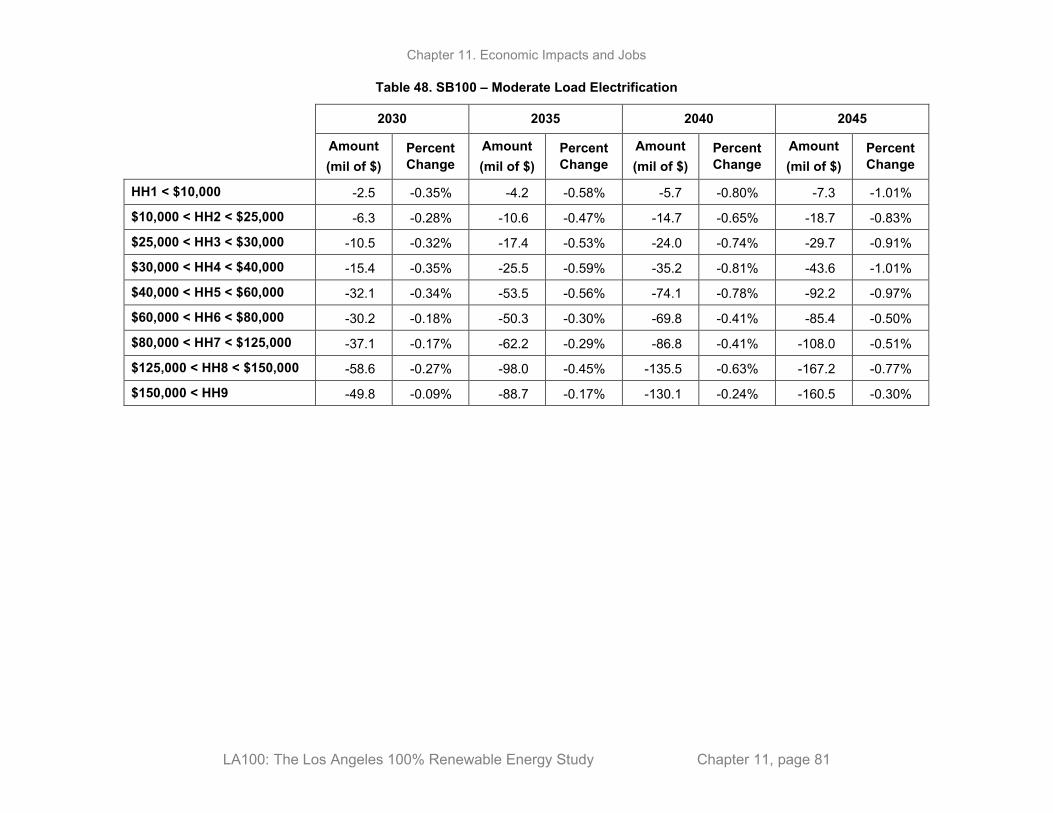
Chapter 11. Economic Impacts and Jobs
LA100: The Los Angeles 100% Renewable Energy Study Chapter 11, page 81
Table 48. SB100 – Moderate Load Electrification
2030 2035 2040 2045
Amount (mil of $)
Percent Change
Amount (mil of $)
Percent Change
Amount (mil of $)
Percent Change
Amount (mil of $)
Percent Change
HH1 < $10,000 -2.5 -0.35% -4.2 -0.58% -5.7 -0.80% -7.3 -1.01%
$10,000 < HH2 < $25,000 -6.3 -0.28% -10.6 -0.47% -14.7 -0.65% -18.7 -0.83%
$25,000 < HH3 < $30,000 -10.5 -0.32% -17.4 -0.53% -24.0 -0.74% -29.7 -0.91%
$30,000 < HH4 < $40,000 -15.4 -0.35% -25.5 -0.59% -35.2 -0.81% -43.6 -1.01%
$40,000 < HH5 < $60,000 -32.1 -0.34% -53.5 -0.56% -74.1 -0.78% -92.2 -0.97%
$60,000 < HH6 < $80,000 -30.2 -0.18% -50.3 -0.30% -69.8 -0.41% -85.4 -0.50%
$80,000 < HH7 < $125,000 -37.1 -0.17% -62.2 -0.29% -86.8 -0.41% -108.0 -0.51%
$125,000 < HH8 < $150,000 -58.6 -0.27% -98.0 -0.45% -135.5 -0.63% -167.2 -0.77%
$150,000 < HH9 -49.8 -0.09% -88.7 -0.17% -130.1 -0.24% -160.5 -0.30%
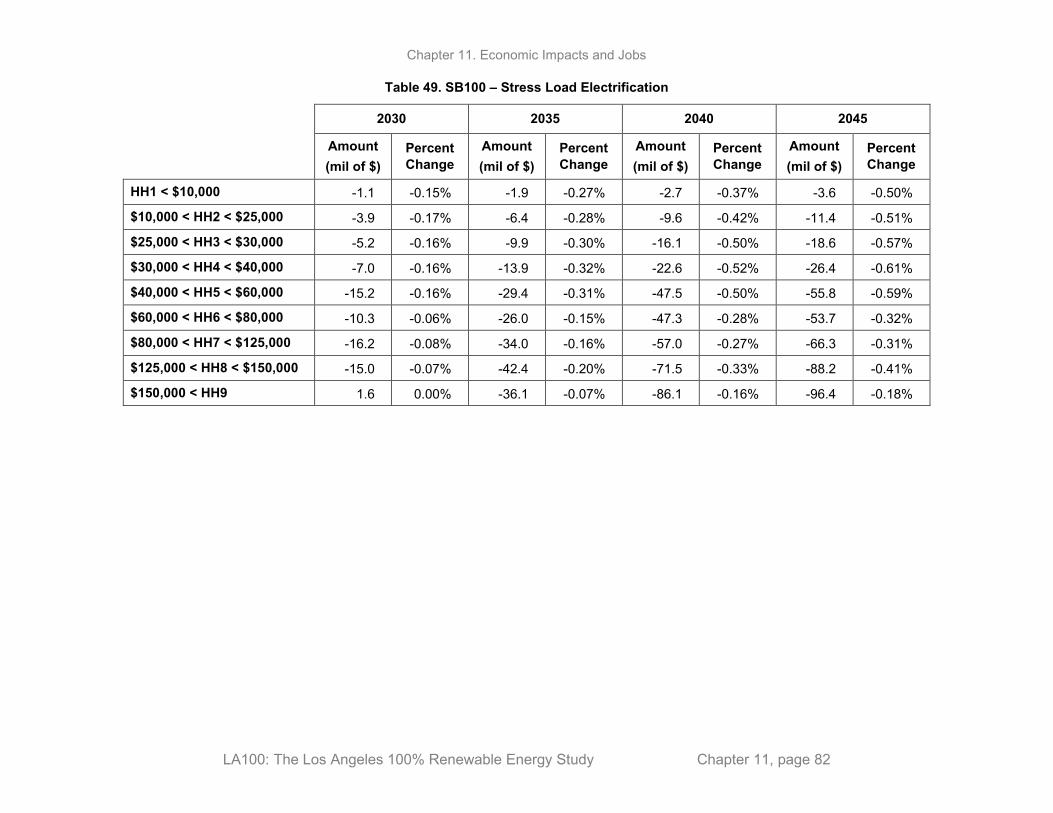
Chapter 11. Economic Impacts and Jobs
LA100: The Los Angeles 100% Renewable Energy Study Chapter 11, page 82
Table 49. SB100 – Stress Load Electrification
2030 2035 2040 2045
Amount (mil of $)
Percent Change
Amount (mil of $)
Percent Change
Amount (mil of $)
Percent Change
Amount (mil of $)
Percent Change
HH1 < $10,000 -1.1 -0.15% -1.9 -0.27% -2.7 -0.37% -3.6 -0.50%
$10,000 < HH2 < $25,000 -3.9 -0.17% -6.4 -0.28% -9.6 -0.42% -11.4 -0.51%
$25,000 < HH3 < $30,000 -5.2 -0.16% -9.9 -0.30% -16.1 -0.50% -18.6 -0.57%
$30,000 < HH4 < $40,000 -7.0 -0.16% -13.9 -0.32% -22.6 -0.52% -26.4 -0.61%
$40,000 < HH5 < $60,000 -15.2 -0.16% -29.4 -0.31% -47.5 -0.50% -55.8 -0.59%
$60,000 < HH6 < $80,000 -10.3 -0.06% -26.0 -0.15% -47.3 -0.28% -53.7 -0.32%
$80,000 < HH7 < $125,000 -16.2 -0.08% -34.0 -0.16% -57.0 -0.27% -66.3 -0.31%
$125,000 < HH8 < $150,000 -15.0 -0.07% -42.4 -0.20% -71.5 -0.33% -88.2 -0.41%
$150,000 < HH9 1.6 0.00% -36.1 -0.07% -86.1 -0.16% -96.4 -0.18%

Chapter 11. Economic Impacts and Jobs
LA100: The Los Angeles 100% Renewable Energy Study Chapter 11, page 83
Table 50. Transmission Focus – High Load Electrification
2030 2035 2040 2045
Amount (mil of $)
Percent Change
Amount (mil of $)
Percent Change
Amount (mil of $)
Percent Change
Amount (mil of $)
Percent Change
HH1 < $10,000 -1.9 -0.26% -1.6 -0.23% -4.5 -0.63% -5.7 -1.9
$10,000 < HH2 < $25,000 -5.6 -0.25% -7.0 -0.31% -11.7 -0.52% -15.5 -5.6
$25,000 < HH3 < $30,000 -8.9 -0.27% -11.0 -0.34% -18.9 -0.58% -21.9 -8.9
$30,000 < HH4 < $40,000 -12.7 -0.29% -14.8 -0.34% -27.6 -0.64% -31.5 -12.7
$40,000 < HH5 < $60,000 -26.7 -0.28% -31.2 -0.33% -58.1 -0.61% -67.9 -26.7
$60,000 < HH6 < $80,000 -24.4 -0.14% -28.1 -0.17% -54.0 -0.32% -55.5 -24.4
$80,000 < HH7 < $125,000 -30.7 -0.14% -35.6 -0.17% -67.7 -0.32% -77.4 -30.7
$125,000 < HH8 < $150,000 -41.7 -0.19% -35.2 -0.16% -103.5 -0.48% -107.0 -41.7
$150,000 < HH9 -38.1 -0.07% -39.9 -0.07% -93.3 -0.17% -72.5 -38.1

Chapter 11. Economic Impacts and Jobs
LA100: The Los Angeles 100% Renewable Energy Study Chapter 11, page 84
Table 51. Transmission Focus – Moderate Load Electrification
2030 2035 2040 2045
Amount (mil of $)
Percent Change
Amount (mil of $)
Percent Change
Amount (mil of $)
Percent Change
Amount (mil of $)
Percent Change
HH1 < $10,000 -2.7 -0.38% -5.0 -0.69% -6.8 -0.95% -8.5 -1.19%
$10,000 < HH2 < $25,000 -9.9 -0.44% -12.5 -0.55% -17.3 -0.77% -22.2 -0.98%
$25,000 < HH3 < $30,000 -16.2 -0.50% -20.2 -0.62% -27.5 -0.84% -32.6 -1.00%
$30,000 < HH4 < $40,000 -22.3 -0.51% -29.8 -0.69% -40.5 -0.93% -47.6 -1.10%
$40,000 < HH5 < $60,000 -46.9 -0.49% -62.7 -0.66% -85.5 -0.90% -101.8 -1.07%
$60,000 < HH6 < $80,000 -44.3 -0.26% -58.5 -0.34% -79.3 -0.47% -86.8 -0.51%
$80,000 < HH7 < $125,000 -54.3 -0.26% -72.8 -0.34% -100.0 -0.47% -117.1 -0.55%
$125,000 < HH8 < $150,000 -63.6 -0.29% -114.8 -0.53% -156.2 -0.72% -173.0 -0.80%
$150,000 < HH9 -75.3 -0.14% -103.0 -0.19% -146.7 -0.27% -140.8 -0.26%
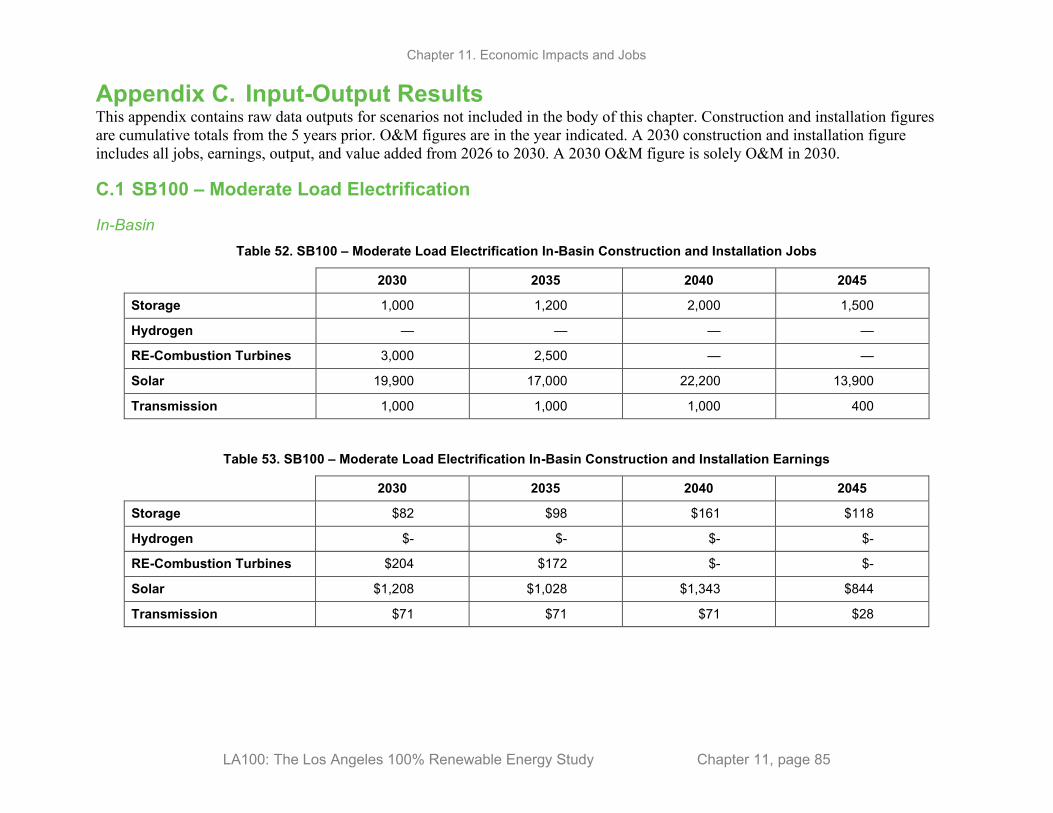
Chapter 11. Economic Impacts and Jobs
LA100: The Los Angeles 100% Renewable Energy Study Chapter 11, page 85
Appendix C. Input-Output Results This appendix contains raw data outputs for scenarios not included in the body of this chapter. Construction and installation figures are cumulative totals from the 5 years prior. O&M figures are in the year indicated. A 2030 construction and installation figure includes all jobs, earnings, output, and value added from 2026 to 2030. A 2030 O&M figure is solely O&M in 2030.
C.1 SB100 – Moderate Load Electrification
In-Basin Table 52. SB100 – Moderate Load Electrification In-Basin Construction and Installation Jobs
2030 2035 2040 2045
Storage 1,000 1,200 2,000 1,500
Hydrogen — — — —
RE-Combustion Turbines 3,000 2,500 — —
Solar 19,900 17,000 22,200 13,900
Transmission 1,000 1,000 1,000 400
Table 53. SB100 – Moderate Load Electrification In-Basin Construction and Installation Earnings
2030 2035 2040 2045
Storage $82 $98 $161 $118
Hydrogen $- $- $- $-
RE-Combustion Turbines $204 $172 $- $-
Solar $1,208 $1,028 $1,343 $844
Transmission $71 $71 $71 $28
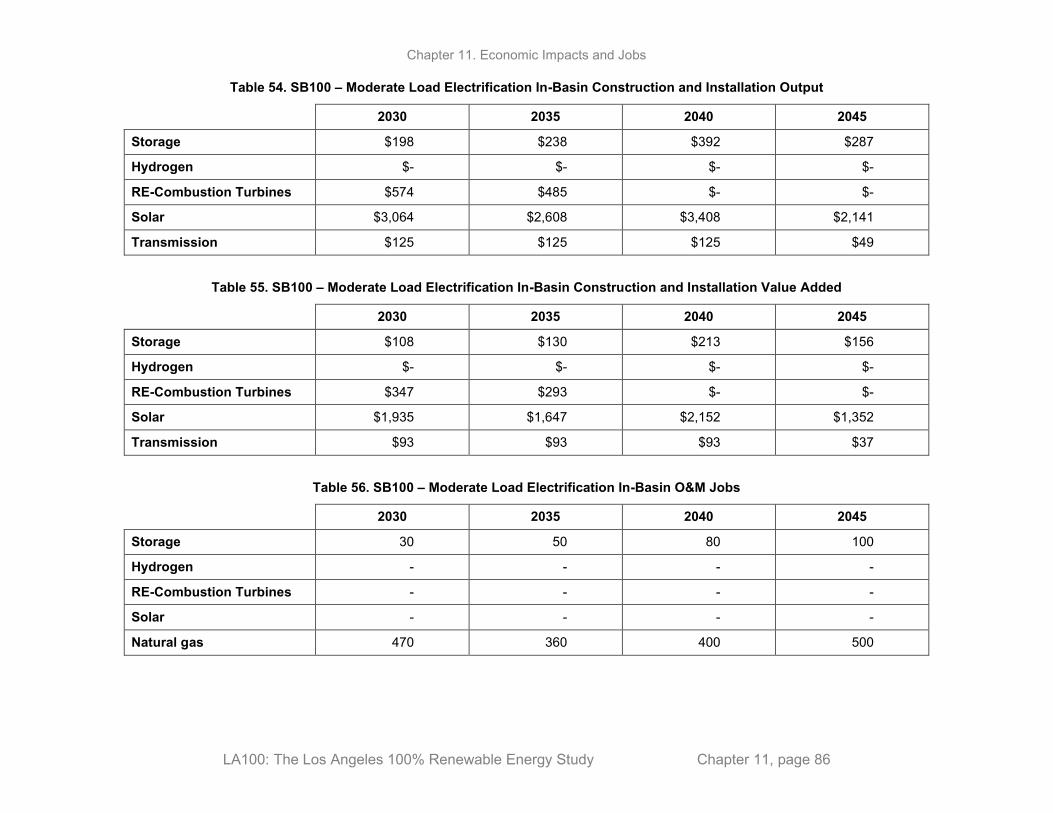
Chapter 11. Economic Impacts and Jobs
LA100: The Los Angeles 100% Renewable Energy Study Chapter 11, page 86
Table 54. SB100 – Moderate Load Electrification In-Basin Construction and Installation Output
2030 2035 2040 2045
Storage $198 $238 $392 $287
Hydrogen $- $- $- $-
RE-Combustion Turbines $574 $485 $- $-
Solar $3,064 $2,608 $3,408 $2,141
Transmission $125 $125 $125 $49
Table 55. SB100 – Moderate Load Electrification In-Basin Construction and Installation Value Added
2030 2035 2040 2045
Storage $108 $130 $213 $156
Hydrogen $- $- $- $-
RE-Combustion Turbines $347 $293 $- $-
Solar $1,935 $1,647 $2,152 $1,352
Transmission $93 $93 $93 $37
Table 56. SB100 – Moderate Load Electrification In-Basin O&M Jobs
2030 2035 2040 2045
Storage 30 50 80 100
Hydrogen - - - -
RE-Combustion Turbines - - - -
Solar - - - -
Natural gas 470 360 400 500
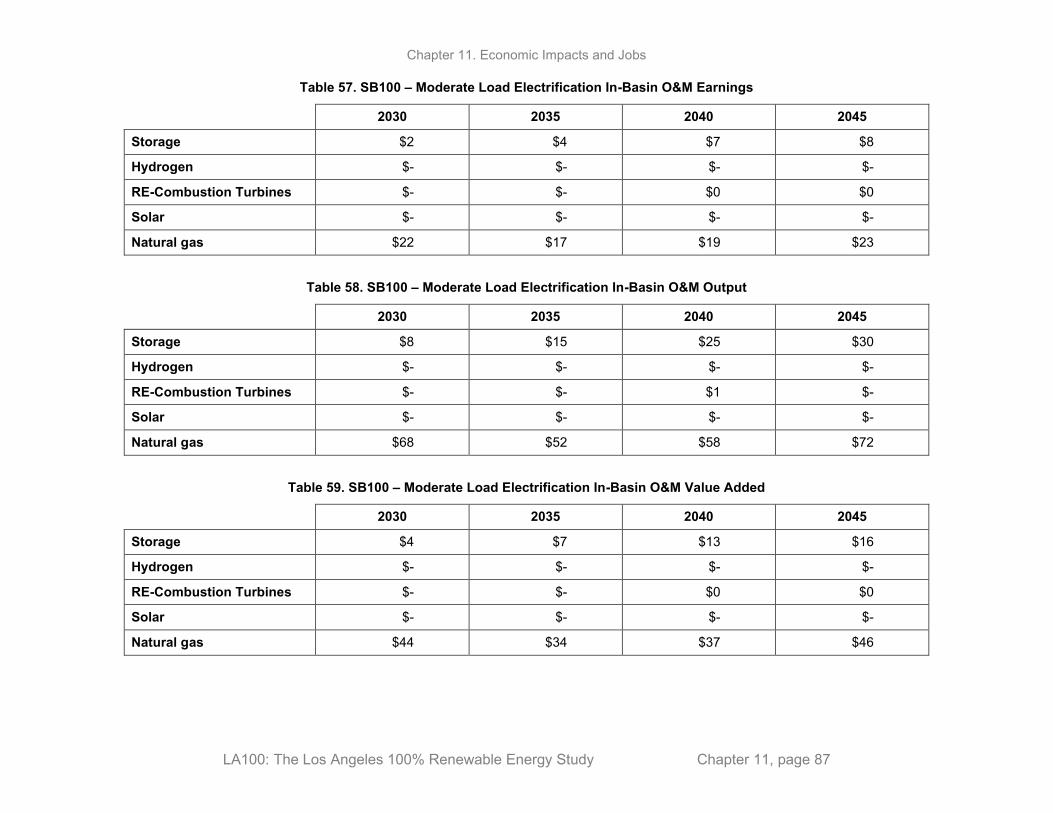
Chapter 11. Economic Impacts and Jobs
LA100: The Los Angeles 100% Renewable Energy Study Chapter 11, page 87
Table 57. SB100 – Moderate Load Electrification In-Basin O&M Earnings
2030 2035 2040 2045
Storage $2 $4 $7 $8
Hydrogen $- $- $- $-
RE-Combustion Turbines $- $- $0 $0
Solar $- $- $- $-
Natural gas $22 $17 $19 $23
Table 58. SB100 – Moderate Load Electrification In-Basin O&M Output
2030 2035 2040 2045
Storage $8 $15 $25 $30
Hydrogen $- $- $- $-
RE-Combustion Turbines $- $- $1 $-
Solar $- $- $- $-
Natural gas $68 $52 $58 $72
Table 59. SB100 – Moderate Load Electrification In-Basin O&M Value Added
2030 2035 2040 2045
Storage $4 $7 $13 $16
Hydrogen $- $- $- $-
RE-Combustion Turbines $- $- $0 $0
Solar $- $- $- $-
Natural gas $44 $34 $37 $46
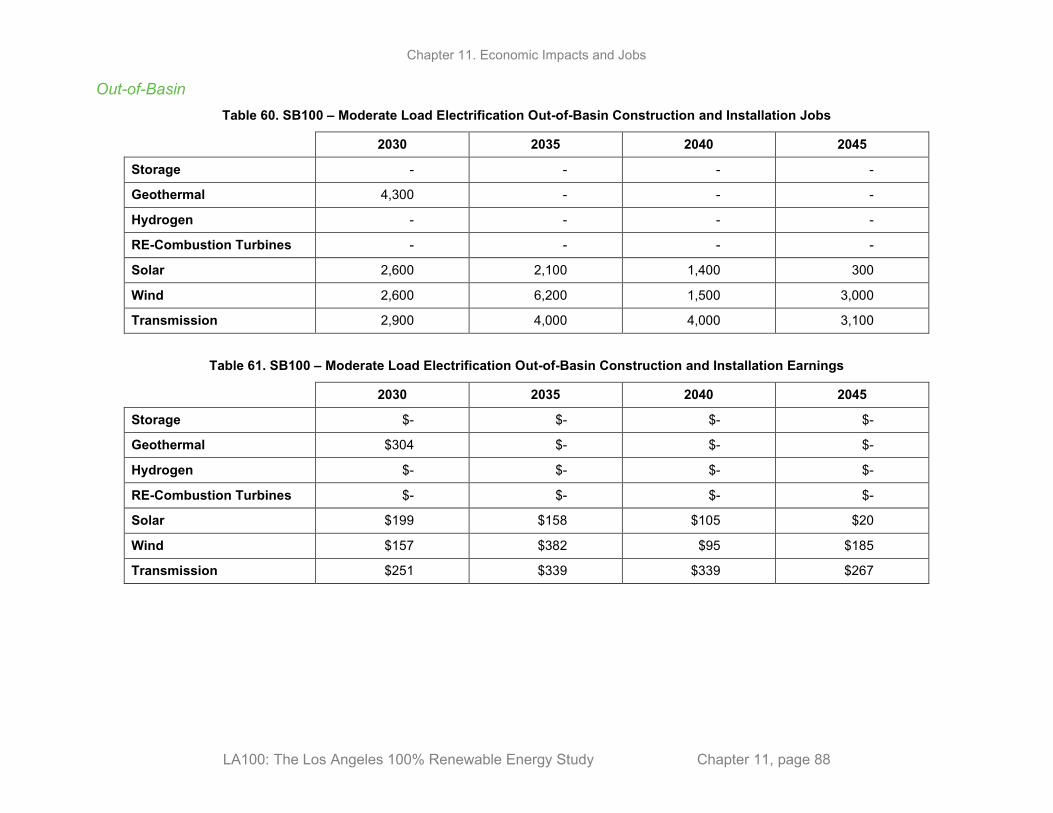
Chapter 11. Economic Impacts and Jobs
LA100: The Los Angeles 100% Renewable Energy Study Chapter 11, page 88
Out-of-Basin Table 60. SB100 – Moderate Load Electrification Out-of-Basin Construction and Installation Jobs
2030 2035 2040 2045
Storage - - - -
Geothermal 4,300 - - -
Hydrogen - - - -
RE-Combustion Turbines - - - -
Solar 2,600 2,100 1,400 300
Wind 2,600 6,200 1,500 3,000
Transmission 2,900 4,000 4,000 3,100
Table 61. SB100 – Moderate Load Electrification Out-of-Basin Construction and Installation Earnings
2030 2035 2040 2045
Storage $- $- $- $-
Geothermal $304 $- $- $-
Hydrogen $- $- $- $-
RE-Combustion Turbines $- $- $- $-
Solar $199 $158 $105 $20
Wind $157 $382 $95 $185
Transmission $251 $339 $339 $267
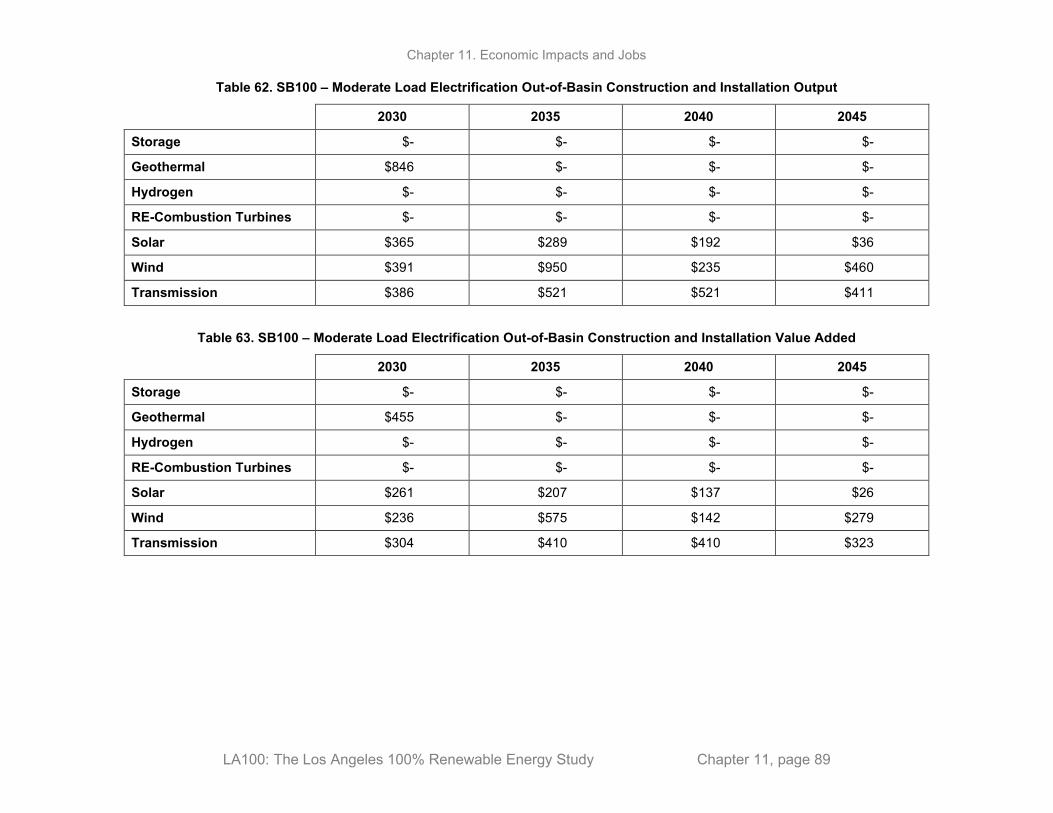
Chapter 11. Economic Impacts and Jobs
LA100: The Los Angeles 100% Renewable Energy Study Chapter 11, page 89
Table 62. SB100 – Moderate Load Electrification Out-of-Basin Construction and Installation Output
2030 2035 2040 2045
Storage $- $- $- $-
Geothermal $846 $- $- $-
Hydrogen $- $- $- $-
RE-Combustion Turbines $- $- $- $-
Solar $365 $289 $192 $36
Wind $391 $950 $235 $460
Transmission $386 $521 $521 $411
Table 63. SB100 – Moderate Load Electrification Out-of-Basin Construction and Installation Value Added
2030 2035 2040 2045
Storage $- $- $- $-
Geothermal $455 $- $- $-
Hydrogen $- $- $- $-
RE-Combustion Turbines $- $- $- $-
Solar $261 $207 $137 $26
Wind $236 $575 $142 $279
Transmission $304 $410 $410 $323
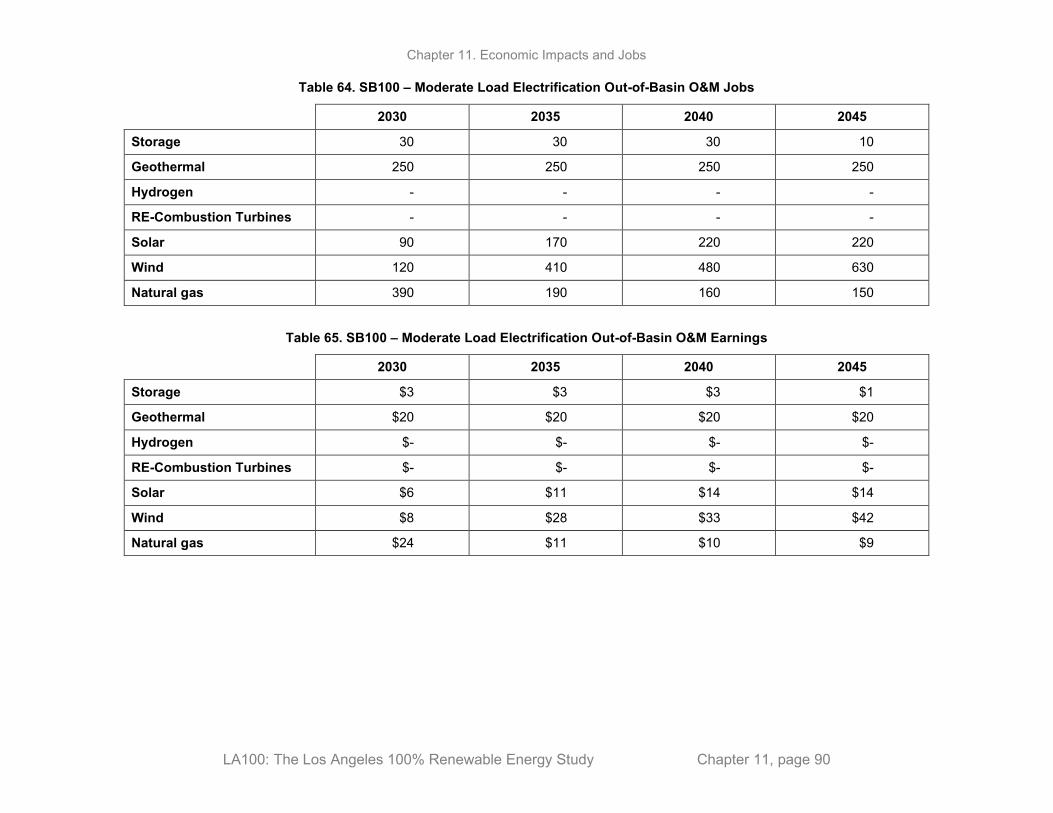
Chapter 11. Economic Impacts and Jobs
LA100: The Los Angeles 100% Renewable Energy Study Chapter 11, page 90
Table 64. SB100 – Moderate Load Electrification Out-of-Basin O&M Jobs
2030 2035 2040 2045
Storage 30 30 30 10
Geothermal 250 250 250 250
Hydrogen - - - -
RE-Combustion Turbines - - - -
Solar 90 170 220 220
Wind 120 410 480 630
Natural gas 390 190 160 150
Table 65. SB100 – Moderate Load Electrification Out-of-Basin O&M Earnings
2030 2035 2040 2045
Storage $3 $3 $3 $1
Geothermal $20 $20 $20 $20
Hydrogen $- $- $- $-
RE-Combustion Turbines $- $- $- $-
Solar $6 $11 $14 $14
Wind $8 $28 $33 $42
Natural gas $24 $11 $10 $9

Chapter 11. Economic Impacts and Jobs
LA100: The Los Angeles 100% Renewable Energy Study Chapter 11, page 91
Table 66. SB100 – Moderate Load Electrification Out-of-Basin O&M Output
2030 2035 2040 2045
Storage $10 $10 $10 $4
Geothermal $51 $51 $51 $51
Hydrogen $- $- $- $-
RE-Combustion Turbines $- $- $- $-
Solar $10 $19 $24 $24
Wind $17 $58 $69 $89
Natural gas $59 $28 $25 $23
Table 67. SB100 – Moderate Load Electrification Out-of-Basin O&M Value Added
2030 2035 2040 2045
Storage $5 $5 $5 $2
Geothermal $27 $27 $27 $27
Hydrogen $- $- $- $-
RE-Combustion Turbines $- $- $- $-
Solar $7 $13 $17 $17
Wind $12 $42 $50 $64
Natural gas $38 $18 $16 $15

Chapter 11. Economic Impacts and Jobs
LA100: The Los Angeles 100% Renewable Energy Study Chapter 11, page 92
C.2 SB100 – Stress Load Electrification
In-Basin Table 68. SB100 – Stress Load Electrification In-Basin Construction and Installation Jobs
2030 2035 2040 2045
Storage 1,200 1,600 2,500 1,600
Hydrogen - - - -
RE-Combustion Turbines 5,300 3,100 - 200
Solar 22,900 24,900 27,100 18,300
Transmission 1,000 1,000 1,000 400
Table 69. SB100 – Stress Load Electrification In-Basin Construction and Installation Earnings
2030 2035 2040 2045
Storage $94 $128 $199 $127
Hydrogen $- $- $- $-
RE-Combustion Turbines $363 $213 $- $15
Solar $1,385 $1,526 $1,643 $1,128
Transmission $71 $71 $71 $28
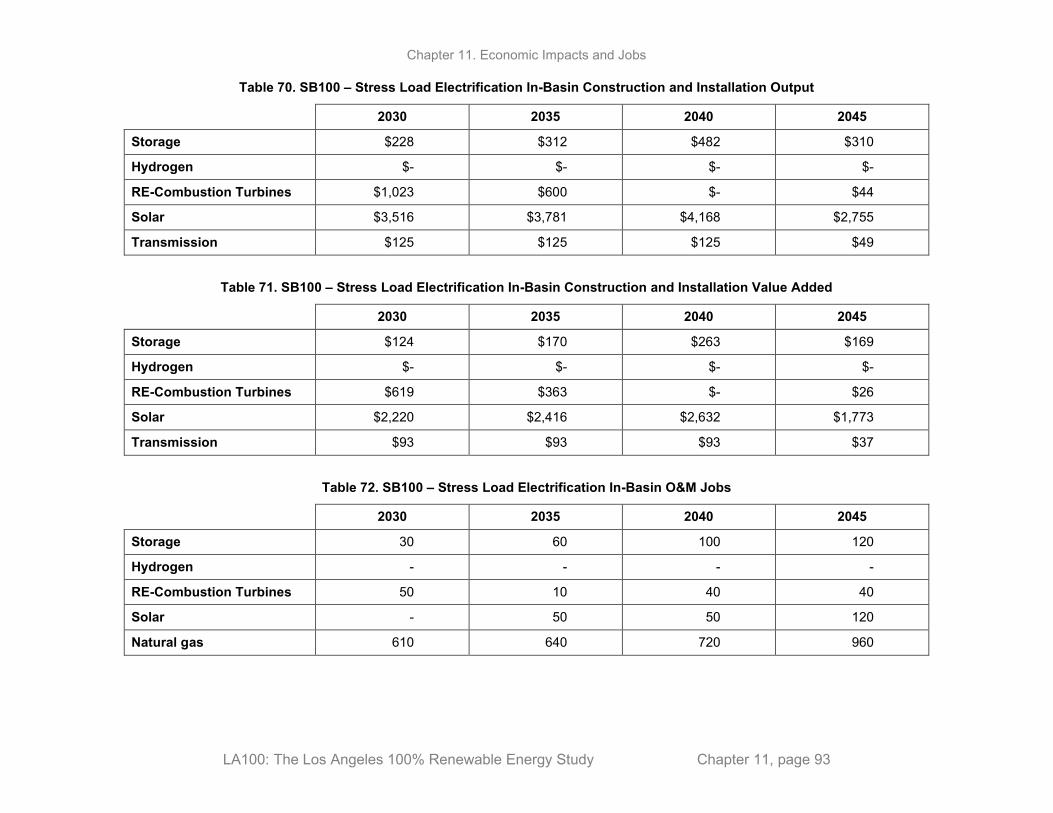
Chapter 11. Economic Impacts and Jobs
LA100: The Los Angeles 100% Renewable Energy Study Chapter 11, page 93
Table 70. SB100 – Stress Load Electrification In-Basin Construction and Installation Output
2030 2035 2040 2045
Storage $228 $312 $482 $310
Hydrogen $- $- $- $-
RE-Combustion Turbines $1,023 $600 $- $44
Solar $3,516 $3,781 $4,168 $2,755
Transmission $125 $125 $125 $49
Table 71. SB100 – Stress Load Electrification In-Basin Construction and Installation Value Added
2030 2035 2040 2045
Storage $124 $170 $263 $169
Hydrogen $- $- $- $-
RE-Combustion Turbines $619 $363 $- $26
Solar $2,220 $2,416 $2,632 $1,773
Transmission $93 $93 $93 $37
Table 72. SB100 – Stress Load Electrification In-Basin O&M Jobs
2030 2035 2040 2045
Storage 30 60 100 120
Hydrogen - - - -
RE-Combustion Turbines 50 10 40 40
Solar - 50 50 120
Natural gas 610 640 720 960
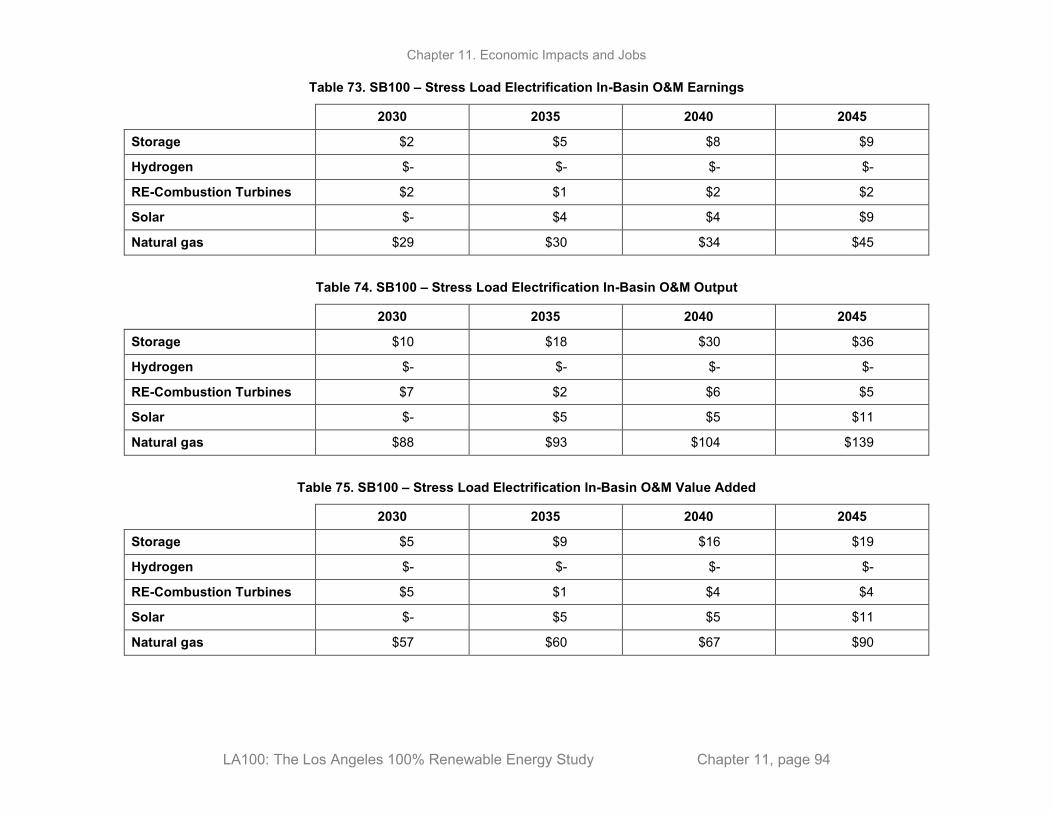
Chapter 11. Economic Impacts and Jobs
LA100: The Los Angeles 100% Renewable Energy Study Chapter 11, page 94
Table 73. SB100 – Stress Load Electrification In-Basin O&M Earnings
2030 2035 2040 2045
Storage $2 $5 $8 $9
Hydrogen $- $- $- $-
RE-Combustion Turbines $2 $1 $2 $2
Solar $- $4 $4 $9
Natural gas $29 $30 $34 $45
Table 74. SB100 – Stress Load Electrification In-Basin O&M Output
2030 2035 2040 2045
Storage $10 $18 $30 $36
Hydrogen $- $- $- $-
RE-Combustion Turbines $7 $2 $6 $5
Solar $- $5 $5 $11
Natural gas $88 $93 $104 $139
Table 75. SB100 – Stress Load Electrification In-Basin O&M Value Added
2030 2035 2040 2045
Storage $5 $9 $16 $19
Hydrogen $- $- $- $-
RE-Combustion Turbines $5 $1 $4 $4
Solar $- $5 $5 $11
Natural gas $57 $60 $67 $90

Chapter 11. Economic Impacts and Jobs
LA100: The Los Angeles 100% Renewable Energy Study Chapter 11, page 95
Out-of-Basin Table 76. SB100 – Stress Load Electrification Out-of-Basin Construction and Installation Jobs
2030 2035 2040 2045
Storage - - - -
Geothermal 4,300 - - -
Hydrogen - - - -
RE-Combustion Turbines - - - -
Solar 3,500 1,900 1,500 1,900
Wind 4,000 9,500 3,100 2,900
Transmission 2,900 4,000 4,000 3,100
Table 77. SB100 – Stress Load Electrification Out-of-Basin Construction and Installation Earnings
2030 2035 2040 2045
Storage $- $- $- $-
Geothermal $304 $- $- $-
Hydrogen $- $- $- $-
RE-Combustion Turbines $- $- $- $-
Solar $269 $141 $115 $141
Wind $245 $581 $191 $175
Transmission $251 $339 $339 $267

Chapter 11. Economic Impacts and Jobs
LA100: The Los Angeles 100% Renewable Energy Study Chapter 11, page 96
Table 78. SB100 – Stress Load Electrification Out-of-Basin Construction and Installation Output
2030 2035 2040 2045
Storage $- $- $- $-
Geothermal $846 $- $- $-
Hydrogen $- $- $- $-
RE-Combustion Turbines $- $- $- $-
Solar $493 $258 $210 $258
Wind $609 $1,443 $475 $435
Transmission $386 $521 $521 $411
Table 79. SB100 – Stress Load Electrification Out-of-Basin Construction and Installation Value Added
2030 2035 2040 2045
Storage $- $- $- $-
Geothermal $455 $- $- $-
Hydrogen $- $- $- $-
RE-Combustion Turbines $- $- $- $-
Solar $353 $185 $150 $185
Wind $368 $873 $287 $263
Transmission $304 $410 $410 $323

Chapter 11. Economic Impacts and Jobs
LA100: The Los Angeles 100% Renewable Energy Study Chapter 11, page 97
Table 80. SB100 – Stress Load Electrification Out-of-Basin O&M Jobs
2030 2035 2040 2045
Storage 30 40 40 20
Geothermal 250 250 250 250
Hydrogen - - - 10
RE-Combustion Turbines - - - -
Solar 120 180 230 310
Wind 180 630 770 910
Natural gas 430 220 210 170
Table 81. SB100 – Stress Load Electrification Out-of-Basin O&M Earnings
2030 2035 2040 2045
Storage $3 $4 $3 $2
Geothermal $20 $20 $20 $20
Hydrogen $0 $0 $0 $1
RE-Combustion Turbines $- $- $- $-
Solar $8 $12 $15 $20
Wind $13 $42 $52 $62
Natural gas $26 $13 $13 $11
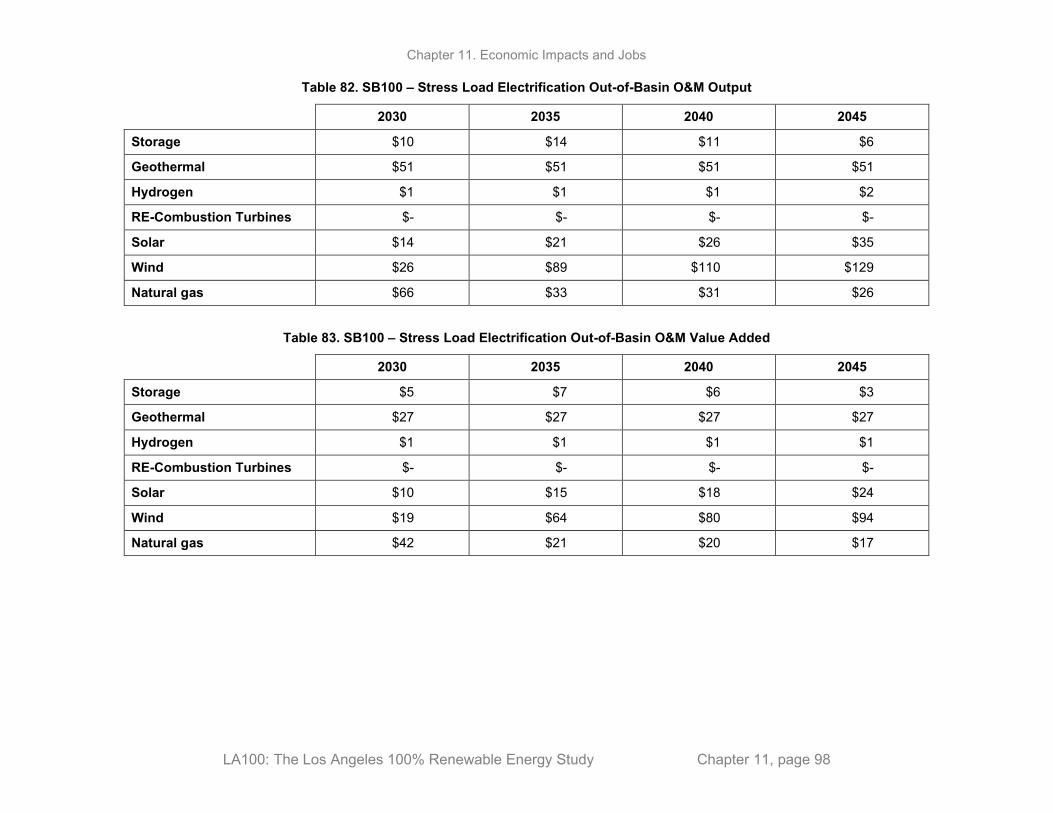
Chapter 11. Economic Impacts and Jobs
LA100: The Los Angeles 100% Renewable Energy Study Chapter 11, page 98
Table 82. SB100 – Stress Load Electrification Out-of-Basin O&M Output
2030 2035 2040 2045
Storage $10 $14 $11 $6
Geothermal $51 $51 $51 $51
Hydrogen $1 $1 $1 $2
RE-Combustion Turbines $- $- $- $-
Solar $14 $21 $26 $35
Wind $26 $89 $110 $129
Natural gas $66 $33 $31 $26
Table 83. SB100 – Stress Load Electrification Out-of-Basin O&M Value Added
2030 2035 2040 2045
Storage $5 $7 $6 $3
Geothermal $27 $27 $27 $27
Hydrogen $1 $1 $1 $1
RE-Combustion Turbines $- $- $- $-
Solar $10 $15 $18 $24
Wind $19 $64 $80 $94
Natural gas $42 $21 $20 $17
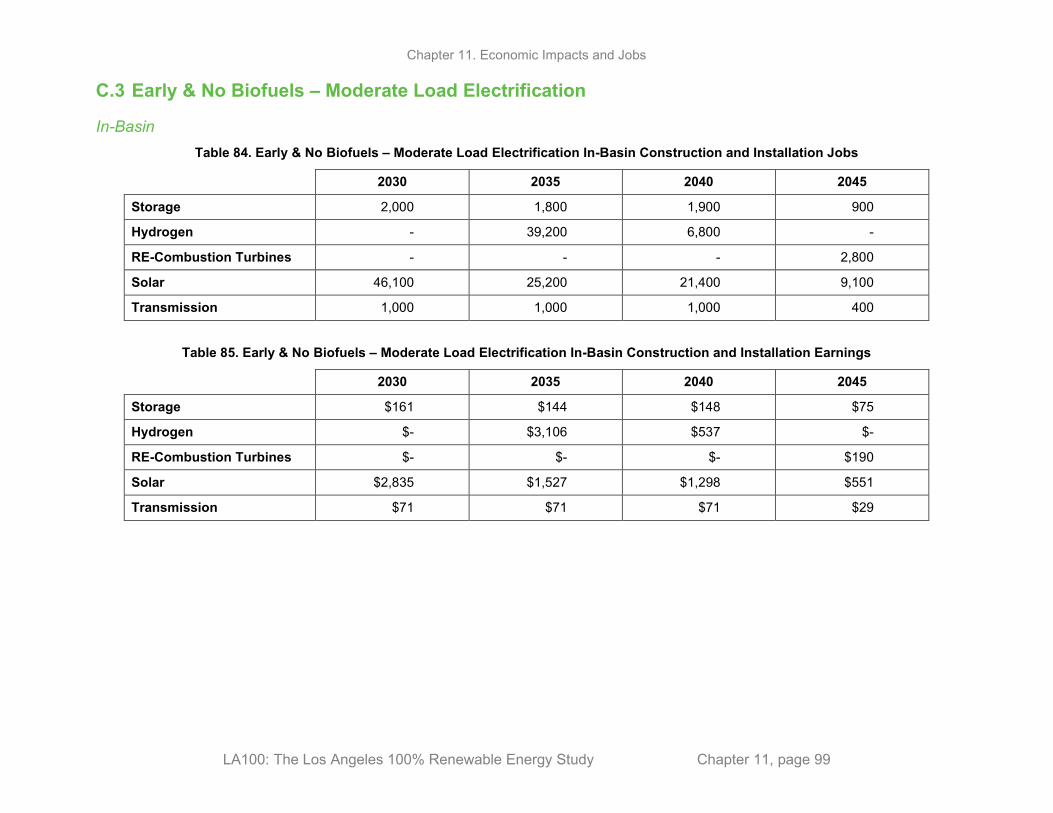
Chapter 11. Economic Impacts and Jobs
LA100: The Los Angeles 100% Renewable Energy Study Chapter 11, page 99
C.3 Early & No Biofuels – Moderate Load Electrification
In-Basin Table 84. Early & No Biofuels – Moderate Load Electrification In-Basin Construction and Installation Jobs
2030 2035 2040 2045
Storage 2,000 1,800 1,900 900
Hydrogen - 39,200 6,800 -
RE-Combustion Turbines - - - 2,800
Solar 46,100 25,200 21,400 9,100
Transmission 1,000 1,000 1,000 400
Table 85. Early & No Biofuels – Moderate Load Electrification In-Basin Construction and Installation Earnings
2030 2035 2040 2045
Storage $161 $144 $148 $75
Hydrogen $- $3,106 $537 $-
RE-Combustion Turbines $- $- $- $190
Solar $2,835 $1,527 $1,298 $551
Transmission $71 $71 $71 $29

Chapter 11. Economic Impacts and Jobs
LA100: The Los Angeles 100% Renewable Energy Study Chapter 11, page 100
Table 86. Early & No Biofuels – Moderate Load Electrification In-Basin Construction and Installation Output
2030 2035 2040 2045
Storage $391 $349 $359 $182
Hydrogen $- $7,480 $1,293 $-
RE-Combustion Turbines $- $- $- $535
Solar $6,966 $3,874 $3,294 $1,398
Transmission $125 $125 $126 $52
Table 87. Early & No Biofuels – Moderate Load Electrification In-Basin Construction and Installation Value Added
2030 2035 2040 2045
Storage $213 $190 $196 $99
Hydrogen $- $4,199 $726 $-
RE-Combustion Turbines $- $- $- $324
Solar $4,469 $2,446 $2,080 $883
Transmission $93 $93 $94 $39
Table 88. Early & No Biofuels – Moderate Load Electrification In-Basin O&M Jobs
2030 2035 2040 2045
Storage 50 80 110 120
Hydrogen - 10 20 60
RE-Combustion Turbines - - - -
Solar 120 120 120 120
Natural gas 20 - - -
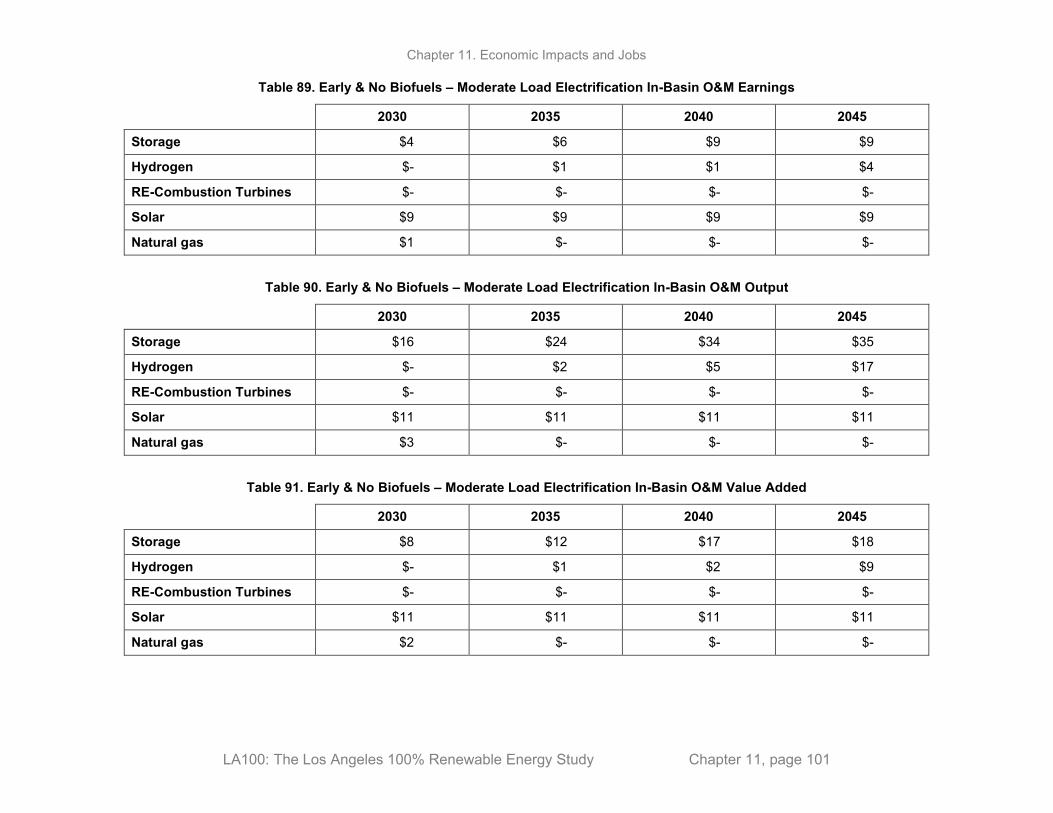
Chapter 11. Economic Impacts and Jobs
LA100: The Los Angeles 100% Renewable Energy Study Chapter 11, page 101
Table 89. Early & No Biofuels – Moderate Load Electrification In-Basin O&M Earnings
2030 2035 2040 2045
Storage $4 $6 $9 $9
Hydrogen $- $1 $1 $4
RE-Combustion Turbines $- $- $- $-
Solar $9 $9 $9 $9
Natural gas $1 $- $- $-
Table 90. Early & No Biofuels – Moderate Load Electrification In-Basin O&M Output
2030 2035 2040 2045
Storage $16 $24 $34 $35
Hydrogen $- $2 $5 $17
RE-Combustion Turbines $- $- $- $-
Solar $11 $11 $11 $11
Natural gas $3 $- $- $-
Table 91. Early & No Biofuels – Moderate Load Electrification In-Basin O&M Value Added
2030 2035 2040 2045
Storage $8 $12 $17 $18
Hydrogen $- $1 $2 $9
RE-Combustion Turbines $- $- $- $-
Solar $11 $11 $11 $11
Natural gas $2 $- $- $-
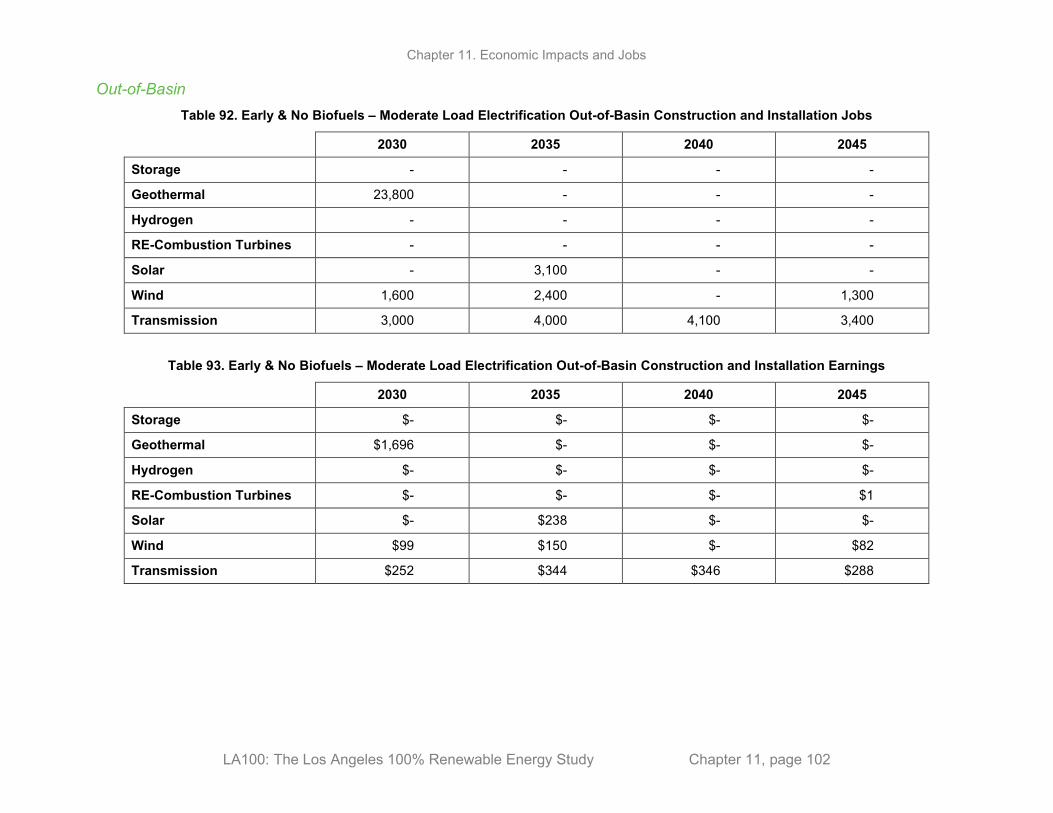
Chapter 11. Economic Impacts and Jobs
LA100: The Los Angeles 100% Renewable Energy Study Chapter 11, page 102
Out-of-Basin Table 92. Early & No Biofuels – Moderate Load Electrification Out-of-Basin Construction and Installation Jobs
2030 2035 2040 2045
Storage - - - -
Geothermal 23,800 - - -
Hydrogen - - - -
RE-Combustion Turbines - - - -
Solar - 3,100 - -
Wind 1,600 2,400 - 1,300
Transmission 3,000 4,000 4,100 3,400
Table 93. Early & No Biofuels – Moderate Load Electrification Out-of-Basin Construction and Installation Earnings
2030 2035 2040 2045
Storage $- $- $- $-
Geothermal $1,696 $- $- $-
Hydrogen $- $- $- $-
RE-Combustion Turbines $- $- $- $1
Solar $- $238 $- $-
Wind $99 $150 $- $82
Transmission $252 $344 $346 $288

Chapter 11. Economic Impacts and Jobs
LA100: The Los Angeles 100% Renewable Energy Study Chapter 11, page 103
Table 94. Early & No Biofuels – Moderate Load Electrification Out-of-Basin Construction and Installation Output
2030 2035 2040 2045
Storage $- $- $- $-
Geothermal $4,718 $- $- $-
Hydrogen $- $- $- $-
RE-Combustion Turbines $- $- $- $2
Solar $- $436 $- $-
Wind $246 $372 $- $203
Transmission $388 $528 $531 $443
Table 95. Early & No Biofuels – Moderate Load Electrification Out-of-Basin Construction and Installation Value Added
2030 2035 2040 2045
Storage $- $- $- $-
Geothermal $2,539 $- $- $-
Hydrogen $- $- $- $-
RE-Combustion Turbines $- $- $- $2
Solar $- $312 $- $-
Wind $149 $225 $- $123
Transmission $305 $416 $418 $348

Chapter 11. Economic Impacts and Jobs
LA100: The Los Angeles 100% Renewable Energy Study Chapter 11, page 104
Table 96. Early & No Biofuels – Moderate Load Electrification Out-of-Basin O&M Jobs
2030 2035 2040 2045
Storage 20 20 20 -
Geothermal 1,110 1,110 1,130 1,170
Hydrogen - 20 20 40
RE-Combustion Turbines - - - -
Solar 90 170 170 170
Wind 440 550 550 620
Natural gas 30 10 0 0
Table 97. Early & No Biofuels – Moderate Load Electrification out-of-Basin O&M Earnings
2030 2035 2040 2045
Storage $2 $2 $2 $-
Geothermal $86 $86 $88 $91
Hydrogen $- $1 $2 $4
RE-Combustion Turbines $- $- $- $-
Solar $6 $11 $11 $11
Wind $30 $37 $37 $42
Natural gas $2 $1 $- $-

Chapter 11. Economic Impacts and Jobs
LA100: The Los Angeles 100% Renewable Energy Study Chapter 11, page 105
Table 98. Early & No Biofuels – Moderate Load Electrification Out-of-Basin O&M Output
2030 2035 2040 2045
Storage $6 $6 $6 $-
Geothermal $222 $222 $227 $235
Hydrogen $- $5 $7 $14
RE-Combustion Turbines $- $- $- $-
Solar $10 $19 $19 $19
Wind $62 $78 $78 $88
Natural gas $5 $2 $- $-
Table 99. Early & No Biofuels – Moderate Load Electrification Out-of-Basin O&M Value Added
2030 2035 2040 2045
Storage $3 $3 $3 $-
Geothermal $119 $119 $122 $126
Hydrogen $- $3 $4 $7
RE-Combustion Turbines $- $- $- $-
Solar $7 $13 $13 $13
Wind $45 $57 $57 $63
Natural gas $3 $1 $- $-

Chapter 11. Economic Impacts and Jobs
LA100: The Los Angeles 100% Renewable Energy Study Chapter 11, page 106
C.4 Transmission Focus – Moderate Load Electrification
In-Basin Table 100. Transmission Focus – Moderate Load Electrification In-Basin Construction and Installation Jobs
2030 2035 2040 2045
Storage 1,000 1,200 2,000 1,500
Hydrogen - - - -
RE-Combustion Turbines 2,900 1,700 - 7,900
Solar 19,900 17,000 22,200 13,900
Transmission 5,000 7,600 7,600 7,000
Table 101. Transmission Focus – Moderate Load Electrification In-Basin Construction and Installation Earnings
2030 2035 2040 2045
Storage $82 $98 $161 $118
Hydrogen $- $- $- $-
RE-Combustion Turbines $202 $116 $- $542
Solar $1,208 $1,028 $1,343 $844
Transmission $339 $518 $518 $475
Table 102. Transmission Focus – Moderate Load Electrification In-Basin Construction and Installation Output
2030 2035 2040 2045
Storage $198 $238 $392 $287
Hydrogen $- $- $- $-
RE-Combustion Turbines $568 $327 $- $1,527
Solar $3,064 $2,608 $3,408 $2,141
Transmission $598 $914 $914 $839
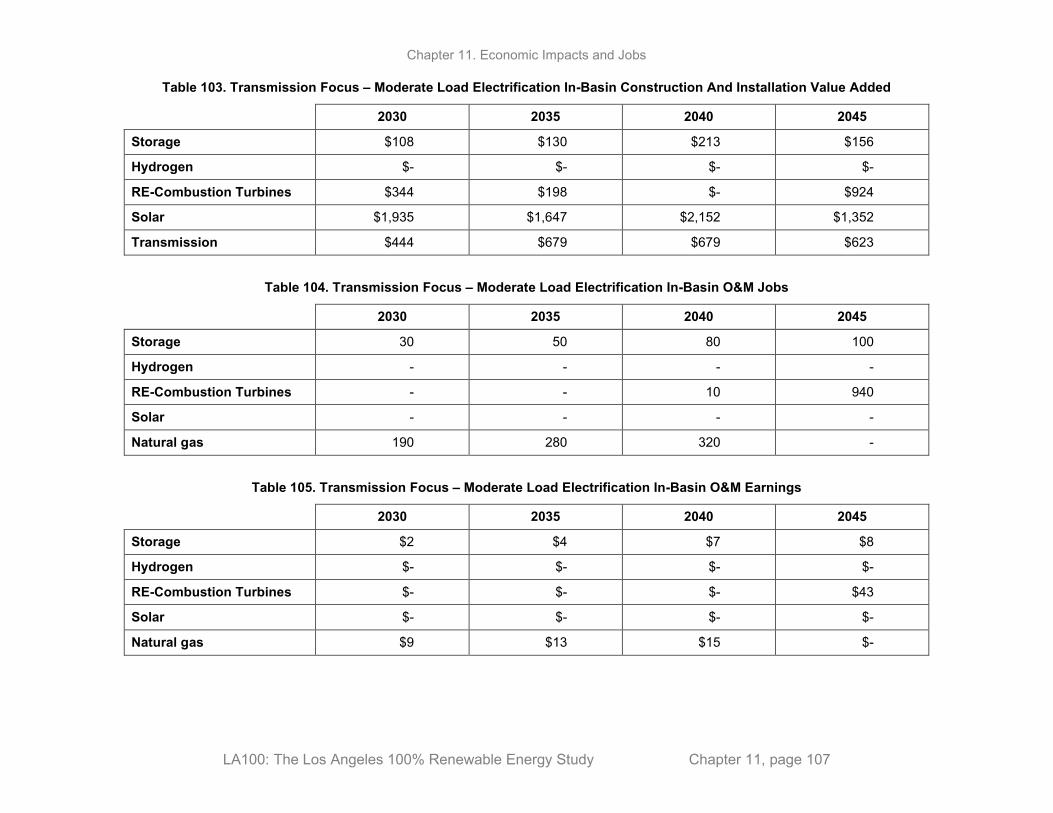
Chapter 11. Economic Impacts and Jobs
LA100: The Los Angeles 100% Renewable Energy Study Chapter 11, page 107
Table 103. Transmission Focus – Moderate Load Electrification In-Basin Construction And Installation Value Added
2030 2035 2040 2045
Storage $108 $130 $213 $156
Hydrogen $- $- $- $-
RE-Combustion Turbines $344 $198 $- $924
Solar $1,935 $1,647 $2,152 $1,352
Transmission $444 $679 $679 $623
Table 104. Transmission Focus – Moderate Load Electrification In-Basin O&M Jobs
2030 2035 2040 2045
Storage 30 50 80 100
Hydrogen - - - -
RE-Combustion Turbines - - 10 940
Solar - - - -
Natural gas 190 280 320 -
Table 105. Transmission Focus – Moderate Load Electrification In-Basin O&M Earnings
2030 2035 2040 2045
Storage $2 $4 $7 $8
Hydrogen $- $- $- $-
RE-Combustion Turbines $- $- $- $43
Solar $- $- $- $-
Natural gas $9 $13 $15 $-

Chapter 11. Economic Impacts and Jobs
LA100: The Los Angeles 100% Renewable Energy Study Chapter 11, page 108
Table 106. Transmission Focus – Moderate Load Electrification In-Basin O&M Output
2030 2035 2040 2045
Storage $8 $15 $25 $30
Hydrogen $- $- $- $-
RE-Combustion Turbines $- $- $1 $124
Solar $- $- $- $-
Natural gas $28 $41 $46 $-
Table 107. Transmission Focus – Moderate Load Electrification In-Basin O&M Value Added
2030 2035 2040 2045
Storage $4 $7 $13 $16
Hydrogen $- $- $- $-
RE-Combustion Turbines $- $- $1 $83
Solar $- $- $- $-
Natural gas $18 $26 $30 $-
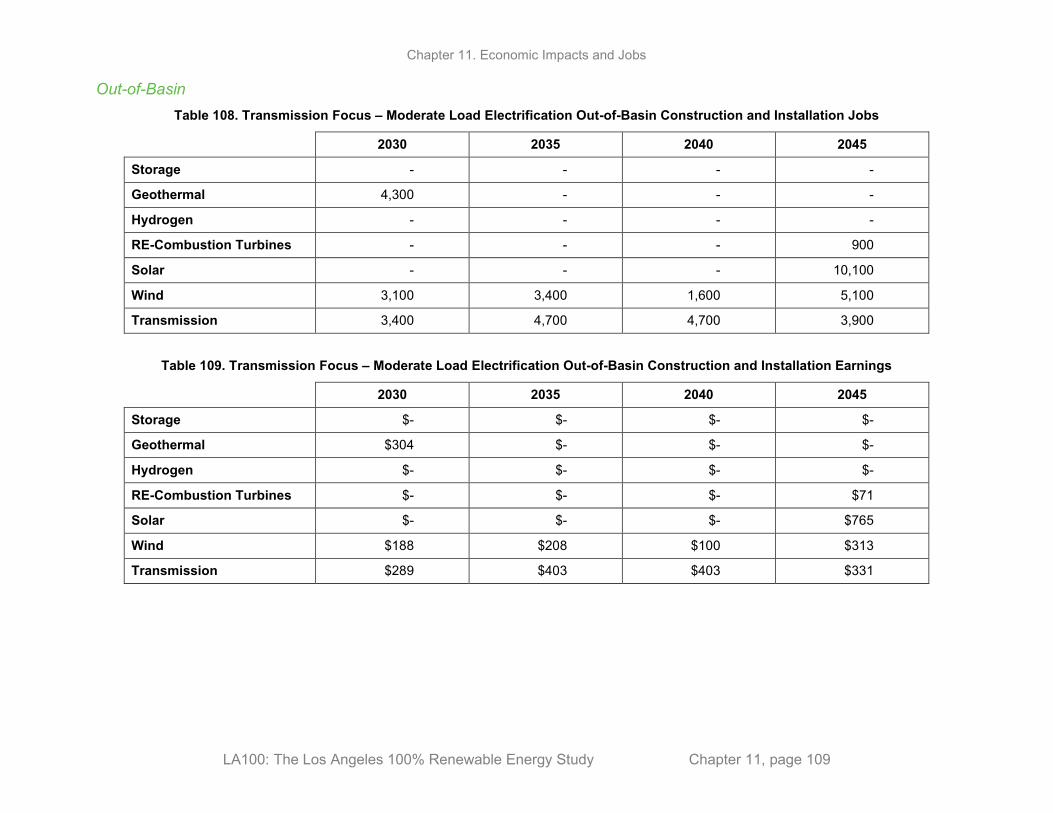
Chapter 11. Economic Impacts and Jobs
LA100: The Los Angeles 100% Renewable Energy Study Chapter 11, page 109
Out-of-Basin Table 108. Transmission Focus – Moderate Load Electrification Out-of-Basin Construction and Installation Jobs
2030 2035 2040 2045
Storage - - - -
Geothermal 4,300 - - -
Hydrogen - - - -
RE-Combustion Turbines - - - 900
Solar - - - 10,100
Wind 3,100 3,400 1,600 5,100
Transmission 3,400 4,700 4,700 3,900
Table 109. Transmission Focus – Moderate Load Electrification Out-of-Basin Construction and Installation Earnings
2030 2035 2040 2045
Storage $- $- $- $-
Geothermal $304 $- $- $-
Hydrogen $- $- $- $-
RE-Combustion Turbines $- $- $- $71
Solar $- $- $- $765
Wind $188 $208 $100 $313
Transmission $289 $403 $403 $331
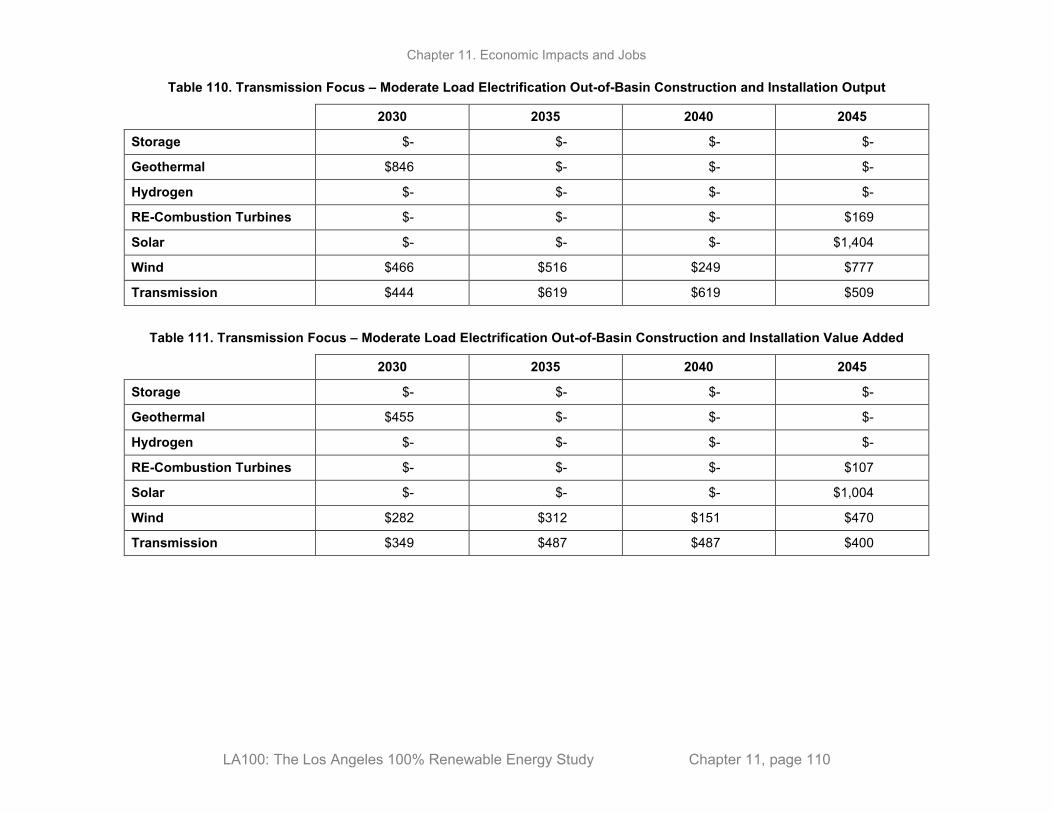
Chapter 11. Economic Impacts and Jobs
LA100: The Los Angeles 100% Renewable Energy Study Chapter 11, page 110
Table 110. Transmission Focus – Moderate Load Electrification Out-of-Basin Construction and Installation Output
2030 2035 2040 2045
Storage $- $- $- $-
Geothermal $846 $- $- $-
Hydrogen $- $- $- $-
RE-Combustion Turbines $- $- $- $169
Solar $- $- $- $1,404
Wind $466 $516 $249 $777
Transmission $444 $619 $619 $509
Table 111. Transmission Focus – Moderate Load Electrification Out-of-Basin Construction and Installation Value Added
2030 2035 2040 2045
Storage $- $- $- $-
Geothermal $455 $- $- $-
Hydrogen $- $- $- $-
RE-Combustion Turbines $- $- $- $107
Solar $- $- $- $1,004
Wind $282 $312 $151 $470
Transmission $349 $487 $487 $400
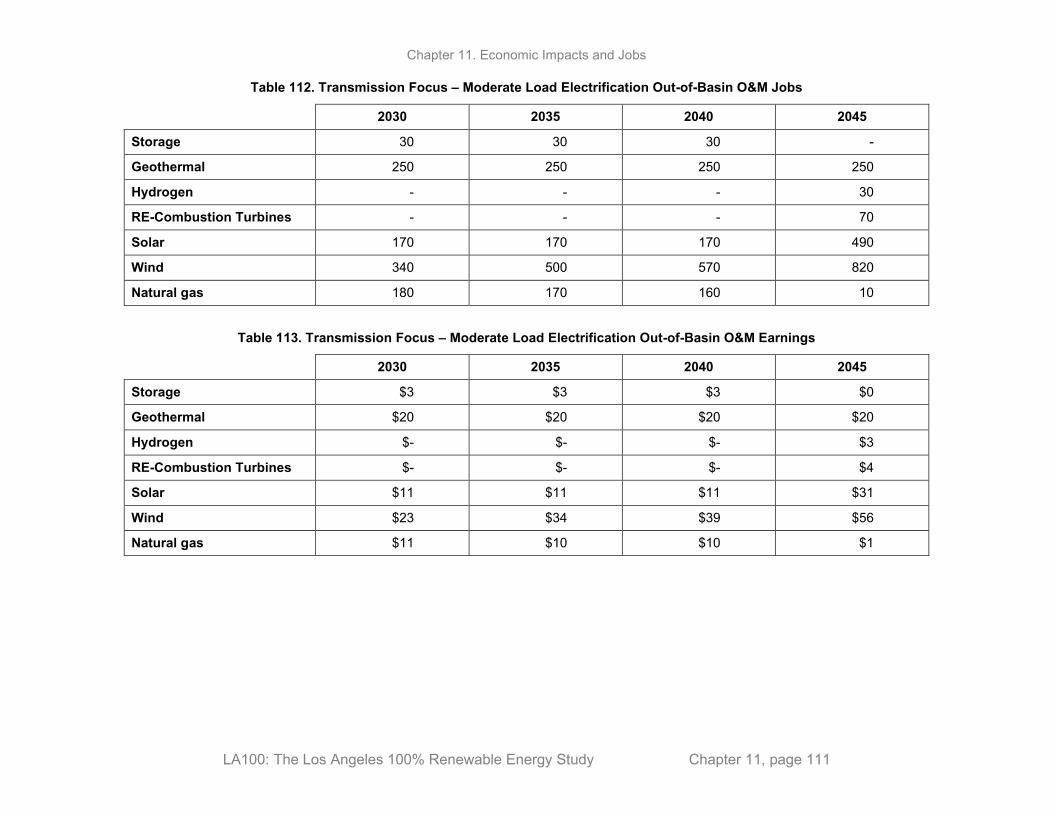
Chapter 11. Economic Impacts and Jobs
LA100: The Los Angeles 100% Renewable Energy Study Chapter 11, page 111
Table 112. Transmission Focus – Moderate Load Electrification Out-of-Basin O&M Jobs
2030 2035 2040 2045
Storage 30 30 30 -
Geothermal 250 250 250 250
Hydrogen - - - 30
RE-Combustion Turbines - - - 70
Solar 170 170 170 490
Wind 340 500 570 820
Natural gas 180 170 160 10
Table 113. Transmission Focus – Moderate Load Electrification Out-of-Basin O&M Earnings
2030 2035 2040 2045
Storage $3 $3 $3 $0
Geothermal $20 $20 $20 $20
Hydrogen $- $- $- $3
RE-Combustion Turbines $- $- $- $4
Solar $11 $11 $11 $31
Wind $23 $34 $39 $56
Natural gas $11 $10 $10 $1

Chapter 11. Economic Impacts and Jobs
LA100: The Los Angeles 100% Renewable Energy Study Chapter 11, page 112
Table 114. Transmission Focus – Moderate Load Electrification Out-of-Basin O&M Output
2030 2035 2040 2045
Storage $10 $9 $10 $1
Geothermal $51 $51 $51 $51
Hydrogen $- $- $- $10
RE-Combustion Turbines $- $- $- $10
Solar $19 $19 $19 $56
Wind $49 $71 $82 $117
Natural gas $28 $26 $24 $2
Table 115. Transmission Focus – Moderate Load Electrification Out-of-Basin O&M Value Added
2030 2035 2040 2045
Storage $5 $4 $5 $1
Geothermal $27 $27 $27 $27
Hydrogen $- $- $- $5
RE-Combustion Turbines $- $- $- $7
Solar $13 $13 $13 $39
Wind $35 $51 $59 $85
Natural gas $18 $17 $15 $1

Chapter 11. Economic Impacts and Jobs
LA100: The Los Angeles 100% Renewable Energy Study Chapter 11, page 113
C.5 Limited New Transmission – Moderate Electrification
In-Basin Table 116. Limited New Transmission – Moderate Load Electrification In-Basin Construction and Installation Jobs
2030 2035 2040 2045
Storage 2,000 1,800 1,900 900
Hydrogen - - - 2,000
RE-Combustion Turbines 3,000 1,500 500 7,400
Solar 39,100 25,200 21,400 13,200
Transmission 1,000 1,000 1,000 400
Table 117. Limited New Transmission – Moderate Load Electrification In-Basin Construction and Installation Earnings
2030 2035 2040 2045
Storage $161 $144 $148 $75
Hydrogen $- $- $- $156
RE-Combustion Turbines $208 $104 $31 $511
Solar $2,368 $1,527 $1,298 $820
Transmission $71 $71 $71 $28
Table 118. Limited New Transmission – Moderate Load Electrification In-Basin Construction and Installation Output
2030 2035 2040 2045
Storage $391 $349 $359 $182
Hydrogen $- $- $- $376
RE-Combustion Turbines $586 $292 $88 $1,438
Solar $6,008 $3,874 $3,294 $1,949
Transmission $125 $125 $125 $50
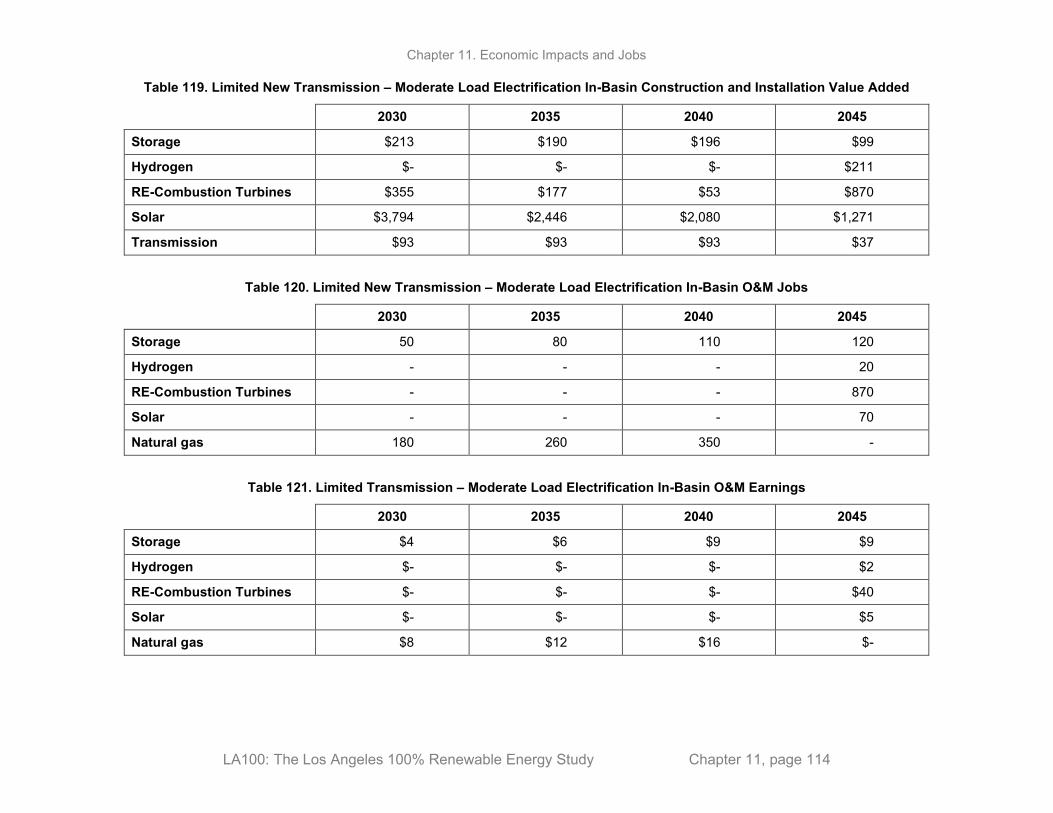
Chapter 11. Economic Impacts and Jobs
LA100: The Los Angeles 100% Renewable Energy Study Chapter 11, page 114
Table 119. Limited New Transmission – Moderate Load Electrification In-Basin Construction and Installation Value Added
2030 2035 2040 2045
Storage $213 $190 $196 $99
Hydrogen $- $- $- $211
RE-Combustion Turbines $355 $177 $53 $870
Solar $3,794 $2,446 $2,080 $1,271
Transmission $93 $93 $93 $37
Table 120. Limited New Transmission – Moderate Load Electrification In-Basin O&M Jobs
2030 2035 2040 2045
Storage 50 80 110 120
Hydrogen - - - 20
RE-Combustion Turbines - - - 870
Solar - - - 70
Natural gas 180 260 350 -
Table 121. Limited Transmission – Moderate Load Electrification In-Basin O&M Earnings
2030 2035 2040 2045
Storage $4 $6 $9 $9
Hydrogen $- $- $- $2
RE-Combustion Turbines $- $- $- $40
Solar $- $- $- $5
Natural gas $8 $12 $16 $-
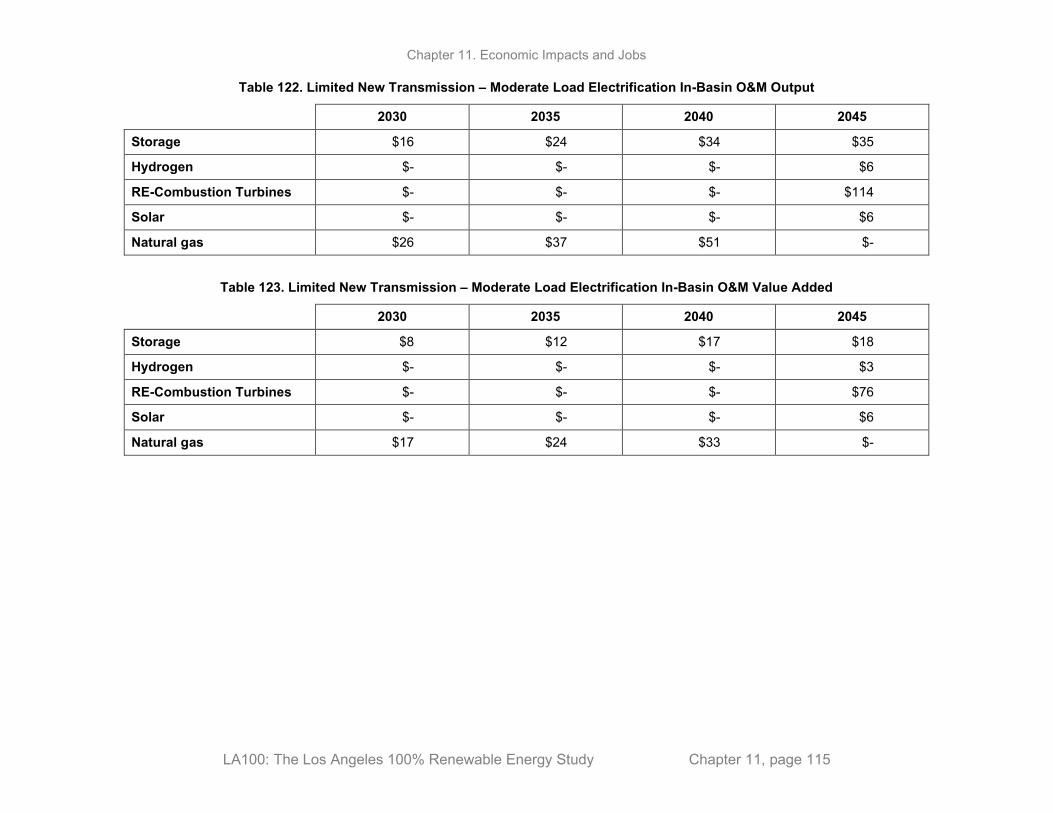
Chapter 11. Economic Impacts and Jobs
LA100: The Los Angeles 100% Renewable Energy Study Chapter 11, page 115
Table 122. Limited New Transmission – Moderate Load Electrification In-Basin O&M Output
2030 2035 2040 2045
Storage $16 $24 $34 $35
Hydrogen $- $- $- $6
RE-Combustion Turbines $- $- $- $114
Solar $- $- $- $6
Natural gas $26 $37 $51 $-
Table 123. Limited New Transmission – Moderate Load Electrification In-Basin O&M Value Added
2030 2035 2040 2045
Storage $8 $12 $17 $18
Hydrogen $- $- $- $3
RE-Combustion Turbines $- $- $- $76
Solar $- $- $- $6
Natural gas $17 $24 $33 $-

Chapter 11. Economic Impacts and Jobs
LA100: The Los Angeles 100% Renewable Energy Study Chapter 11, page 116
Out-of-Basin Table 124. Limited New Transmission – Moderate Load Electrification Out-of-Basin Construction and Installation Jobs
2030 2035 2040 2045
Storage - - - -
Geothermal 4,300 - - -
Hydrogen - - - -
RE-Combustion Turbines - - - -
Solar - - - 5,800
Wind 3,100 2,800 1,200 5,500
Transmission 2,900 4,000 4,000 3,100
Table 125. Limited New Transmission – Moderate Load Electrification Out-of-Basin Construction and Installation Earnings
2030 2035 2040 2045
Storage $- $- $- $-
Geothermal $304 $- $- $-
Hydrogen $- $- $- $-
RE-Combustion Turbines $- $- $- $-
Solar $- $- $- $441
Wind $187 $171 $74 $335
Transmission $251 $339 $339 $267
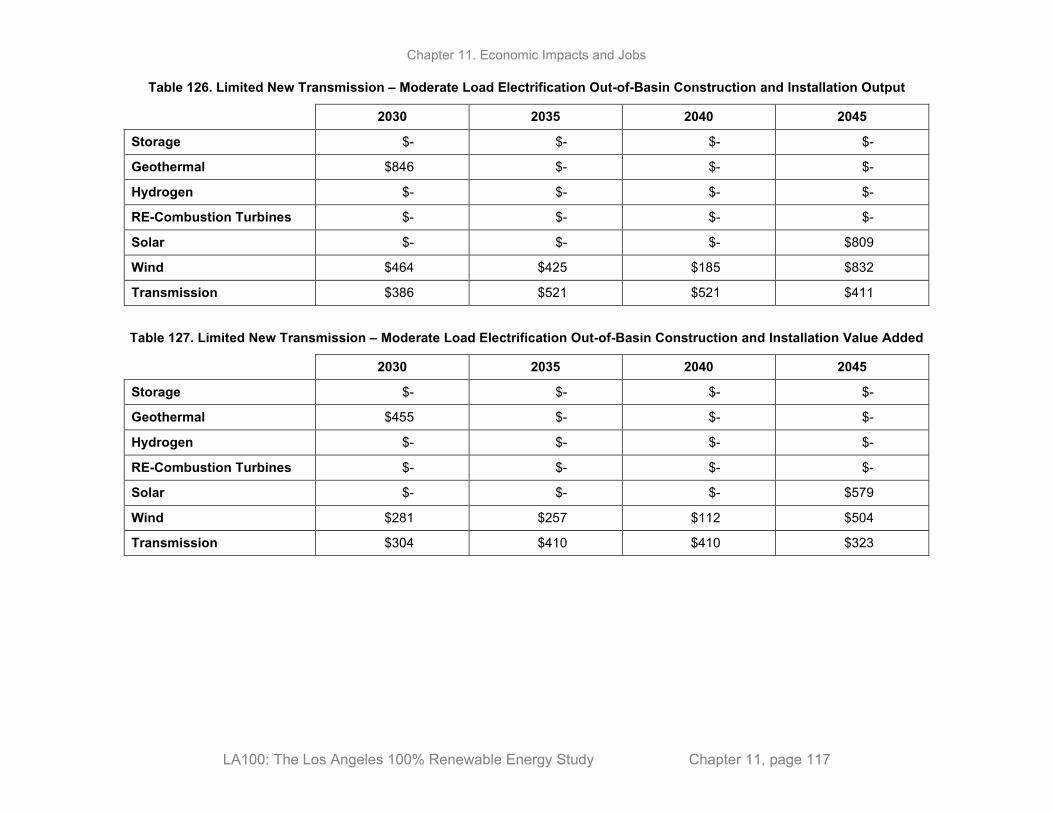
Chapter 11. Economic Impacts and Jobs
LA100: The Los Angeles 100% Renewable Energy Study Chapter 11, page 117
Table 126. Limited New Transmission – Moderate Load Electrification Out-of-Basin Construction and Installation Output
2030 2035 2040 2045
Storage $- $- $- $-
Geothermal $846 $- $- $-
Hydrogen $- $- $- $-
RE-Combustion Turbines $- $- $- $-
Solar $- $- $- $809
Wind $464 $425 $185 $832
Transmission $386 $521 $521 $411
Table 127. Limited New Transmission – Moderate Load Electrification Out-of-Basin Construction and Installation Value Added
2030 2035 2040 2045
Storage $- $- $- $-
Geothermal $455 $- $- $-
Hydrogen $- $- $- $-
RE-Combustion Turbines $- $- $- $-
Solar $- $- $- $579
Wind $281 $257 $112 $504
Transmission $304 $410 $410 $323
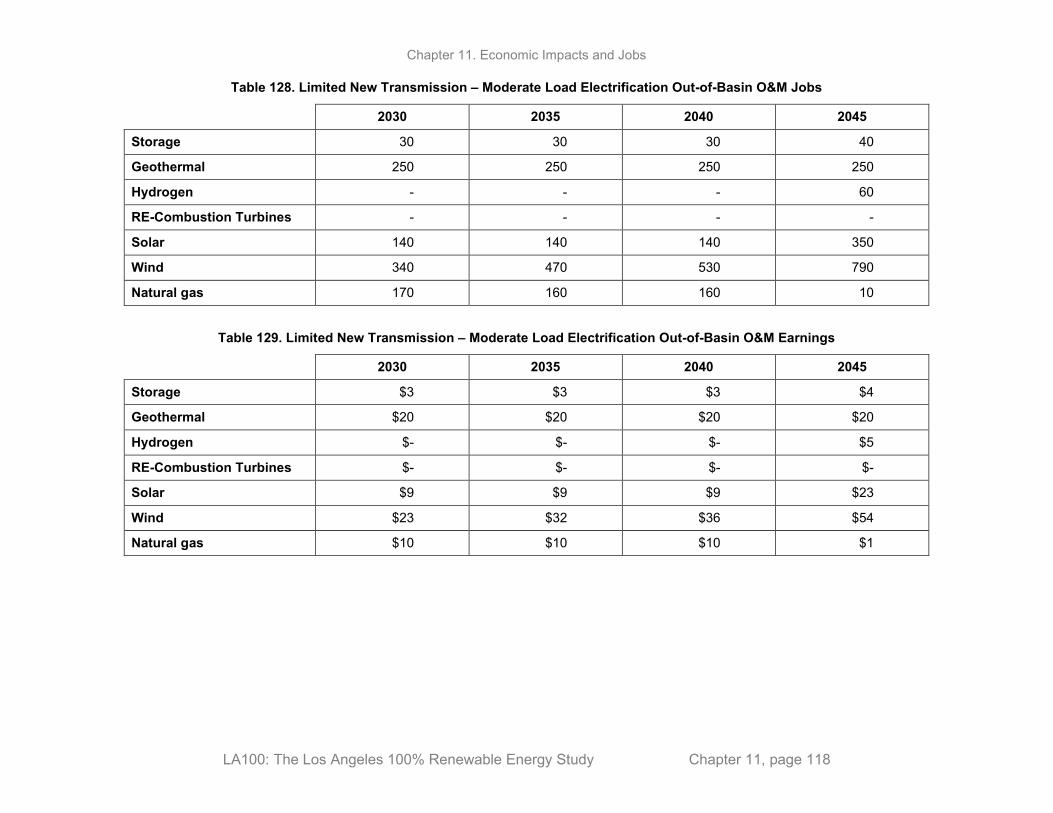
Chapter 11. Economic Impacts and Jobs
LA100: The Los Angeles 100% Renewable Energy Study Chapter 11, page 118
Table 128. Limited New Transmission – Moderate Load Electrification Out-of-Basin O&M Jobs
2030 2035 2040 2045
Storage 30 30 30 40
Geothermal 250 250 250 250
Hydrogen - - - 60
RE-Combustion Turbines - - - -
Solar 140 140 140 350
Wind 340 470 530 790
Natural gas 170 160 160 10
Table 129. Limited New Transmission – Moderate Load Electrification Out-of-Basin O&M Earnings
2030 2035 2040 2045
Storage $3 $3 $3 $4
Geothermal $20 $20 $20 $20
Hydrogen $- $- $- $5
RE-Combustion Turbines $- $- $- $-
Solar $9 $9 $9 $23
Wind $23 $32 $36 $54
Natural gas $10 $10 $10 $1

Chapter 11. Economic Impacts and Jobs
LA100: The Los Angeles 100% Renewable Energy Study Chapter 11, page 119
Table 130. Limited New Transmission – Moderate Load Electrification Out-of-Basin O&M Output
2030 2035 2040 2045
Storage $9 $10 $9 $14
Geothermal $51 $51 $51 $51
Hydrogen $- $- $- $18
RE-Combustion Turbines $- $- $- $-
Solar $16 $16 $16 $40
Wind $49 $67 $75 $113
Natural gas $26 $24 $24 $2
Table 131. Limited New Transmission – Moderate Load Electrification Out-of-Basin O&M Value Added
2030 2035 2040 2045
Storage $4 $5 $4 $7
Geothermal $27 $27 $27 $27
Hydrogen $- $- $- $10
RE-Combustion Turbines $- $- $- $-
Solar $11 $11 $11 $28
Wind $35 $49 $54 $82
Natural gas $16 $15 $15 $1

NREL is a national laboratory of the U.S. Department of Energy Office of Energy Efficiency & Renewable Energy Operated by the Alliance for Sustainable Energy, LLC
This report is available at no cost from the National Renewable Energy Laboratory (NREL) at www.nrel.gov/publications.
Contract No. DE-AC36-08GO28308
Strategic Partnership Project Report NREL/TP-6A20-79444-11 March 2021