CHAPTER 1 - The University of Adelaide
24
“Source to Sink” Sedimentology and Petrology of a Dryland Fluvial System, and Implications for Reservoir Quality, Lake Eyre Basin, Central Australia. Saju Menacherry Bachelor of Science (Geology), University of Calicut, India. Master of Science (Geology), University of Kerala, India. Thesis submitted in fulfilment of the requirements for the degree of Doctor of Philosophy Australian School of Petroleum Faculty of Science The University of Adelaide Australia March 2008
-
Upload
khangminh22 -
Category
Documents
-
view
0 -
download
0
Transcript of CHAPTER 1 - The University of Adelaide

“Source to Sink” Sedimentology and Petrology of a Dryland Fluvial System, and Implications for Reservoir Quality,
Lake Eyre Basin, Central Australia.
Saju Menacherry Bachelor of Science (Geology), University of Calicut, India. Master of Science (Geology), University of Kerala, India.
Thesis submitted in fulfilment of the requirements for the degree of Doctor of Philosophy
Australian School of Petroleum Faculty of Science
The University of Adelaide Australia
March 2008

“Source to Sink” Sedimentology and Petrology Part - 2
Saju Menacherry
PART - 2

“Source to Sink” Sedimentology and Petrology Chapter 5: Modern Sediments
Saju Menacherry - 101 -
CHAPTER 5 MODERN SEDIMENTS
5.1 INTRODUCTION The provenance of a sediment includes all aspects of the drainage area, including source lithology, topographic relief, c limate, t ransport energy, and hydrodynamics of the sedimentary environment (Suttner, 197 4; Basu, 19 85; Johnsson, 19 93). S tudies of m odern s ands c ontribute t o ou r understanding t he processes c ontrolling t he c omposition of s ediment. T his i nformation c an be useful f or i mproved palaeogeographic i nterpretation of anc ient s ource ar eas and bas in s ystems (Dickinson, 1985, 1988; Zuffa, 1987). A petrographic analysis approach permits the development of ac tualistic provenance models i n s ands, their geodynamic i mplications ( Valloni, 1 985; Potter, 1986; DeCelles and Hertel, 198 9; Ingersoll et al., 1 993) an d t heir s ediment s ource l ithologies (Basu, 19 76; M ack, 19 81; M arsaglia, 1993 ; P alomares and A rribas, 19 93). I n addi tion, t he physiographic and c limatic c haracteristics of t he s ource ar ea c an be c orrelated (Grantham an d Velbel, 19 88; Johnsson an d Stallard, 19 89; Ibbeken and Schleyer, 199 1; Nesbitt et al., 1 996; Critelli et al., 1997). Provenance data can play a critical role in the following:
• assessing palaeographic reconstructions
• constraining lateral displacements in orogens
• characterising crust that is no longer exposed
• testing tectonic models for uplift at fault block or orogen scale
• mapping depositional systems
• sub-surface correlations
• predicting reservoir quality (Haughton et al., 1991). The study of modern sands has greatly improved the understanding of the factors that influence sediment c omposition ( Potter, 199 4; Arribas et al., 2000; A rribas an d T ortosa, 20 03). Hig h-resolution petrographic ana lysis of det ritus t ransported and d eposited i n m odern settings allows the d evelopment of ac tualistic pet rogenetic m odels ( Ingersoll, 1 990) t hat c an be used for palaeotectonic an d pal aeogeographic i nterpretation o f anc ient c lastic su ites ( Dickinson, 19 85; Zuffa, 1987).
“Source to Sink” Sedimentology and Petrology Chapter 5: Modern Sediments
Saju Menacherry - 102 -
Sand-sized sediments consist largely of detrital grains, generated from the erosion of parent rocks. Continuous compositional variation of sediments is often attributed to physical mixing of sediments from m ultiple s ources, a factor r ecognised as one of the c entral problems i n s edimentary provenance analysis (Pettijohn et al., 1987). T hus, one of t he ai ms of pr ovenance s tudies i s t o quantify the contribution of each source to the total sediment budget (DeCelles and Hertel, 1989; Weltje, 1995) and the mixing at stream confluences. The tectonic setting is the fundamental control on m ost aspects of the sediment generation and evolution system, par ticularly on t he assemblage of rocks exposed at the surface, f rom which a subsequent s ediment w ill be del ivered ( Heins an d K airo, 20 06). T he provenance l ithotype petrographic as semblages c an t herefore be us ed t o c alculate t he i nferred g enerated gr ain composition i n t he m odern s ediments. T hus, t he petrographic c ompositional analysis of m odern sand-sized detritus is useful to evaluate and compare with the calculated/ inferred generated grain compositions. An understanding of the textural and petrological characteristics of modern sediments is desirable to develop more refined provenance interpretation schemes, to provide a basis for evaluating past environmental conditions, and to evaluate the role of erosion and sedimentation within the tectonic and hydrologic cycles (Noda, 2005). Mixing of detritus from multiple sources can further modify the initial s ediment c haracteristics, es pecially w hen di spersal pat hways are c omplex an d i nvolve recycling of previously deposited sediments (Nesbitt et al., 1996; Critelli et al., 1997; Weltje et al., 1998; Arribas et al., 2000; Cr itelli et al., 2003). The modern sediment QFL (quartz, feldspar and lithics) anal ysis di scusses and em phasises t he r ecognition of t he g enerated s and f rom i ts provenance lithotype. This part of the work describes the diagnostic petrographic and mineralogical signatures of detritus derived f rom t he Peake and D enison I nliers i n t he a djacent Davenport R anges an d other sedimentary deposits, which provide an analogue for intra-cratonic basin provenance adjacent to a basement u plift i n a dr yland s etting (Vezzoli et al., 200 4). I t also pr ovides t he op portunity t o evaluate how the s and-grade c lastic s ediment r ecords t he r ecycling f rom t he older s edimentary rocks. The area w as s elected because i t of fers ex posure of v arious s iliciclastic r ocks, i ncluding Jurassic – Neogene s andstones, s iltstones, m udstones, a nd t he m eta-sedimentary r ocks, i n addition to the well-defined drainage basins producing siliciclastic sands.
“Source to Sink” Sedimentology and Petrology Chapter 5: Modern Sediments
Saju Menacherry - 103 -
Detrital c omposition an d t exture c an c ritically i nfluence t he r eservoir qual ity of s andstones by conditioning the pathways of both physical and chemical diagenesis (Bloch, 1994). Thus, another reason f or obt aining the petrographic at tributes o f t he m odern s and c omposition an d t exture analysis is to provide a basis for the discussion of early diagenetic processes, and to aid prediction of reservoir quality (Haughton et al., 1991; Heins and Kairo, 2007).
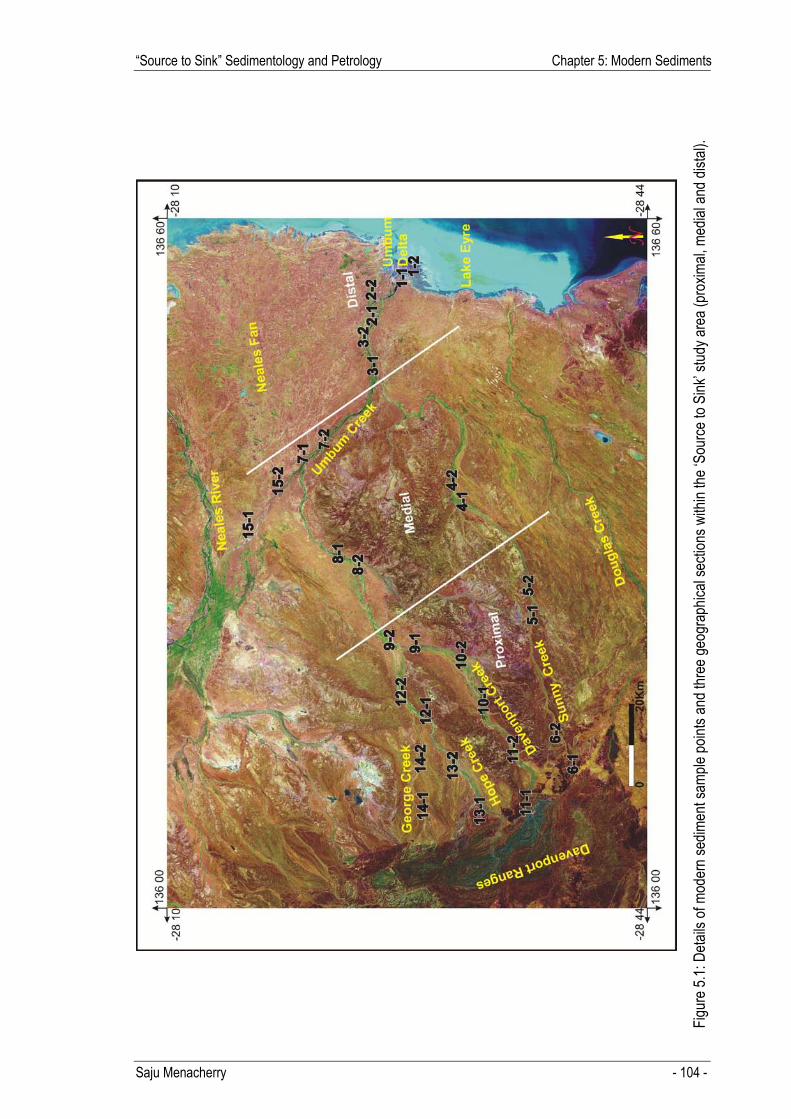
5.2 REVIEW OF REGIONAL SETTING The modern sediment analysis study area covers the Umbum Creek catchment, which is a small river net work s ystem l ocated i n t he w estern s ide of t he L ake Eyre B asin i n Central A ustralia (28:10S, 1 35:50E and 28 :50S, 137:00E) ( Table 1 .1) i n bet ween t he D avenport R anges and western Lake Eyre. The area was selected because it provides exposures of various metamorphic (proterozoic q uartzite, s chists, gnei ss) a nd s edimentary ( clastic r ocks, i ncluding s andstones, conglomerates and mudstones) source lithologies within a well-defined drainage basin generating mixed metamorphic and sedimentary clastic sediment. The Umbum Creek receives supplies from its tributaries: Sunny Creek, Davenport Creek, Hope Creek and George Creek. Sunny Creek is the largest t ributary of Umbum Creek (~ 75 k ms long), other t ributaries (Davenport Creek ~ 40 k ms, Hope C reek ~ 2 0 k ms an d G eorge C reek ~ 18 k ms) ar e c omparatively s mall a nd c onverge t o continue as the Umbum Creek (~70 kms). Sunny Creek joins the Umbum Creek at the distal end of the Umbum Creek network (Fig. 5.1). The total catchment area of Umbum Creek is approximately 5000 km2. The drainage basins in the Umbum Creek catchment are contiguous, showing an elongated shape with an eas t-west t rend. The maximum altitude is about 300 m (along the Davenport Ranges), and the minimum altitude is around –14 m ( Umbum C reek t erminal s play ar ea) ( Bonython, 1955; K otwicki, 1986; Waclawik, 2006). The dryland c limate plays a k ey role in the Umbum Creek catchment area. Lake Eyre is reputed to be the driest locality in Australia (Bonython, 1955) and is largely dominated by desert to marginal desert landscape and vegetation (Linacre and Hobbs, 1977). The ge ology of t he U mbum C reek c omprises m eta-sedimentary and s edimentary pr ovenance zones (Fig. 5.2). The zone of meta-sedimentary rocks mainly encompasses the Davenport Ranges area, w hereas t he s edimentary z one c onstitutes t he r emaining ar eas o f t he U mbum C reek catchment and parts of the Davenport Ranges as remnants of heavily eroded cover successions.
“Source to Sink” Sedimentology and Petrology Chapter 5: Modern Sediments
Saju Menacherry - 104 -
Fig
ure 5
.1: D
etails
of m
oder
n sed
imen
t sam
ple po
ints a
nd th
ree g
eogr
aphic
al se
ction
s with
in the
‘Sou
rce to
Sink
’ stud
y are
a (pr
oxim
al, m
edial
and d
istal)
.

“Source to Sink” Sedimentology and Petrology Chapter 5: Modern Sediments
Figure 5.2 Geological map of Lake Eyre west (part of Neales River, Umbum Creek and Douglas Creek) showing the modern sediment sample points (modified from Drexel and Preiss, 1995).
Saju Menacherry -105-
NOTE: This figure is included on page 105 of the print copy of the
thesis held in the University of Adelaide Library.

“Source to Sink” Sedimentology and Petrology Chapter 5: Modern Sediments
Saju Menacherry - 106 -
The origin of Lake Eyre is predominantly due to a combination of broad subsidence by basement structure, lake sedimentation and aeolian ablation (Callen et al., 1986). The shape of the lake and the orientation o f i nflowing f luvial s ystems ar e c ontrolled by basement l ineaments developed during Neogene neo-tectonic activity (Krieg, 2000; Lang et al., 2004; Waclawik, 2006).
Mean m aximum s ummer temperatures f or t he r egion ar e i n ex cess of 43 °C with i ndividual
maximums reaching 61° C (Callen et al., 1986). Minimum temperatures are below 10° C between
June and September and winter maximum temperatures range f rom 20° to 35°C. Thus, evapo-
transpiration s ignificantly i nfluences t he region. A lmost hal f of t he bas in area receives l ess t han 200 mm of rainfall per year (Callen et al., 1986). Estimates of evaporation in the basin range from 2400 to 3600 mm (Kotwicki, 1986), with the pan coefficient for Lake Eyre ranging from 0.5 to 0.6. The annual precipitation rate for the f illed Lake Eyre is estimated to range f rom 180 to 200 mm. Evaporation is therefore an order of magnitude greater than precipitation (Kotwicki, 1986; Callen et
al., 1995; Krieg, 2000). The depositional environment on the western Lake Eyre system is thus a ephemeral f luvial t erminal-splay-lacustrine d elta i n l ow-accommodation, ar id t o hy per-arid conditions (Krieg, 2000; Lang et al., 2004). The pr esent day hy drography pat terns w ere es tablished i n t he Lak e E yre B asin dur ing t he Palaeogene a nd N eogene ( Callen et al., 198 6; Alley, 1998 ; K rieg, 2 000). T he s ources f or t he modern s ediments i n t he basin c omprise t hree m ajor ar eas: t he D avenport R anges, M esozoic deposits and Cenozoic deposits. The upstream Umbum Creek drains the foothills of the Davenport Ranges (Peake and Denison Inliers), which comprise Palaeo-Proterozoic meta-sedimentary and meta-volcanic s uccessions. T hese s uccessions c omprise gnei ssic, s chistose, quar tzitic a nd granitoid u nits. T he N eo-Proterozoic formations i n t he D avenport R anges i nclude m eta-sedimentary deposits of gneissic, schistose, quartzite, carbonate and clastic rocks associated with minor igneous activity (Table 1.1; Fig. 5.3A); (Ambrose et al., 1981; Drexel et al., 1993). The ‘medial’ catchment zone of the Umbum Creek drains an ar ea of Mesozoic deposits (mainly Eromanga Basin) of sandstone, siltstone, shale and mudstone. These sedimentary deposits were reworked to produce an additional provenance for the modern sand (Table 1.1; Figs 5.3B & 5.4A) (Drexel and Preiss, 1995; Krieg et al., 1995; Krieg, 2000). The downstream zone of the Umbum Creek net work dr ains a n area of C enozoic d eposits ( Lake E yre B asin) c omposed m ostly o f sandstone, siltstone and mudstone (Table 1.1; Fig. 5.4B) (Callen et al., 1986; Callen et al., 1995; Alley, 1998; Krieg, 2000; Krapf and Lang, 2005). T he U mbum C reek s ystem di scharges m ainly
“Source to Sink” Sedimentology and Petrology Chapter 5: Modern Sediments
Saju Menacherry - 107 -
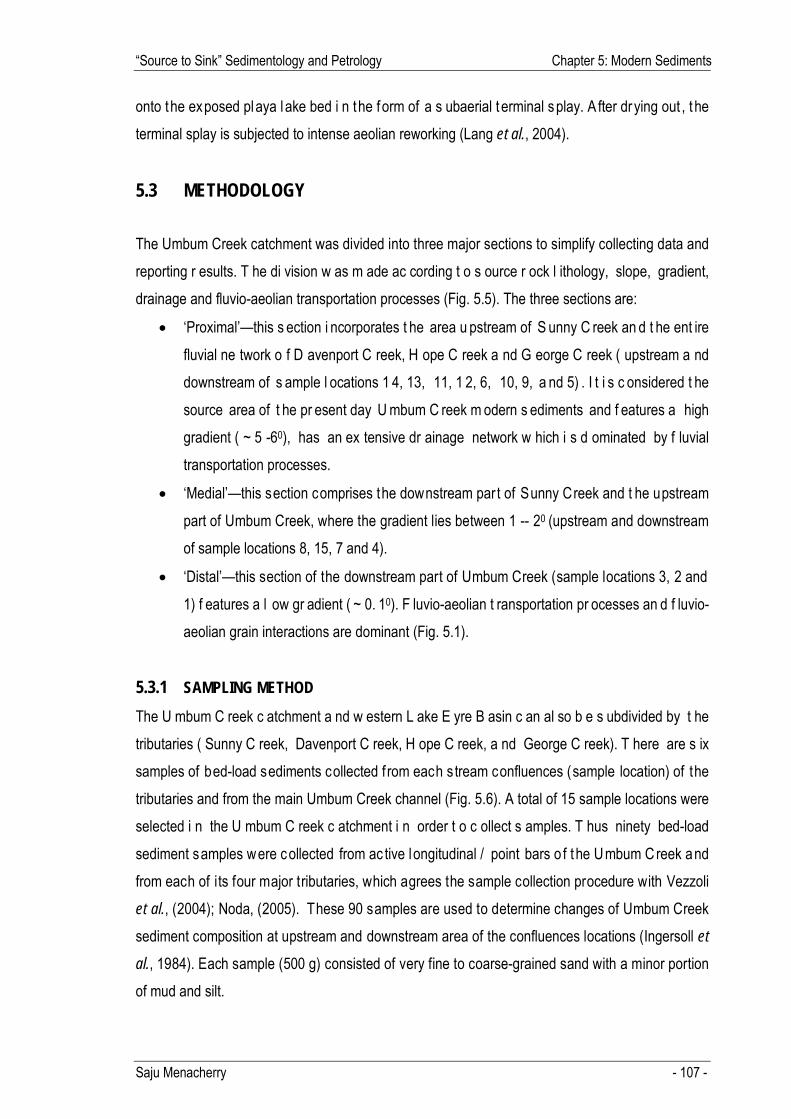
onto the exposed playa lake bed i n the f orm of a s ubaerial t erminal splay. A fter drying out , t he terminal splay is subjected to intense aeolian reworking (Lang et al., 2004).
5.3 METHODOLOGY
The Umbum Creek catchment was divided into three major sections to simplify collecting data and reporting r esults. T he di vision w as m ade ac cording t o s ource r ock l ithology, slope, gradient, drainage and fluvio-aeolian transportation processes (Fig. 5.5). The three sections are:
• ‘Proximal’—this s ection i ncorporates t he area u pstream of S unny C reek an d t he ent ire fluvial ne twork o f D avenport C reek, H ope C reek a nd G eorge C reek ( upstream a nd downstream of s ample l ocations 1 4, 13, 11, 1 2, 6, 10, 9, a nd 5) . I t i s c onsidered t he source area of t he pr esent day U mbum C reek m odern s ediments and f eatures a high gradient ( ~ 5 -60), has an ex tensive dr ainage network w hich i s d ominated by f luvial transportation processes.
• ‘Medial’—this section comprises the downstream part of Sunny Creek and t he upstream part of Umbum Creek, where the gradient lies between 1 -- 20 (upstream and downstream of sample locations 8, 15, 7 and 4).
• ‘Distal’—this section of the downstream part of Umbum Creek (sample locations 3, 2 and 1) f eatures a l ow gr adient ( ~ 0. 10). F luvio-aeolian t ransportation pr ocesses an d f luvio-aeolian grain interactions are dominant (Fig. 5.1).
5.3.1 SAMPLING METHOD
The U mbum C reek c atchment a nd w estern L ake E yre B asin c an al so b e s ubdivided by t he tributaries ( Sunny C reek, Davenport C reek, H ope C reek, a nd George C reek). T here are s ix samples of bed-load sediments collected f rom each stream confluences (sample location) of the tributaries and from the main Umbum Creek channel (Fig. 5.6). A total of 15 sample locations were selected i n the U mbum C reek c atchment i n order t o c ollect s amples. T hus ninety bed-load sediment samples were collected from ac tive longitudinal / point bars o f t he Umbum Creek and from each of its four major tributaries, which agrees the sample collection procedure with Vezzoli et al., (2004); Noda, (2005). These 90 samples are used to determine changes of Umbum Creek sediment composition at upstream and downstream area of the confluences locations (Ingersoll et
al., 1984). Each sample (500 g) consisted of very fine to coarse-grained sand with a minor portion of mud and silt.

“Source to Sink” Sedimentology and Petrology Chapter 5: Modern Sediments
Saju Menacherry - 108 -
Figure 5 .3 ‘Source’ for the modern sands in the Umbum Creek catchment area A. Aerial v iew of Davenport R anges – Palaeo-Neo-Proterozoic m eta-sediments l ooking n orthwest. B. C adna-owie Formation – Eromanga Basin – Early Cretaceous outcrop in Umbum Creek catchment.

“Source to Sink” Sedimentology and Petrology Chapter 5: Modern Sediments
Saju Menacherry - 109 -
Figure 5.4 ‘Source’ for the modern sands A. Outcrop section of Bulldog Shale in Umbum Creek catchment – Eromanga Basin –Cretaceous B. Palaeogene and Neogene outcrop in Umbum Creek catchment – Lake Eyre Basin – Cenozoic.

“Source to Sink” Sedimentology and Petrology Chapter 5: Modern Sediments
Saju Menacherry - 110 -
Fig
ure 5
.5 Ge
ologic
al ma
p (pa
rt of
Neale
s Rive
r and
Umb
um C
reek
list m
ap sh
eet)
drap
ed on
the 3
D DE
M (D
igital
Elev
ation
Map
) of U
mbum
Cre
ek
Ca
tchme
nt sh
owing
the c
hang
e in g
radie
nt fro
m 5-
60 in t
he pr
oxim
al to
1-20 i
n the
med
ial an
d ~0.1
0 in t
he di
stal a
reas
.

“Source to Sink” Sedimentology and Petrology Chapter 5: Modern Sediments
Figure 5.6 Showing the drainage pattern in Umbum Creek catchment with the sediment sample locations. (modified from Reilly, 2007).
Saju Menacherry -111-
NOTE: This figure is included on page 111 of the print copy of the
thesis held in the University of Adelaide Library.

“Source to Sink” Sedimentology and Petrology Chapter 5: Modern Sediments
Saju Menacherry - 112 -
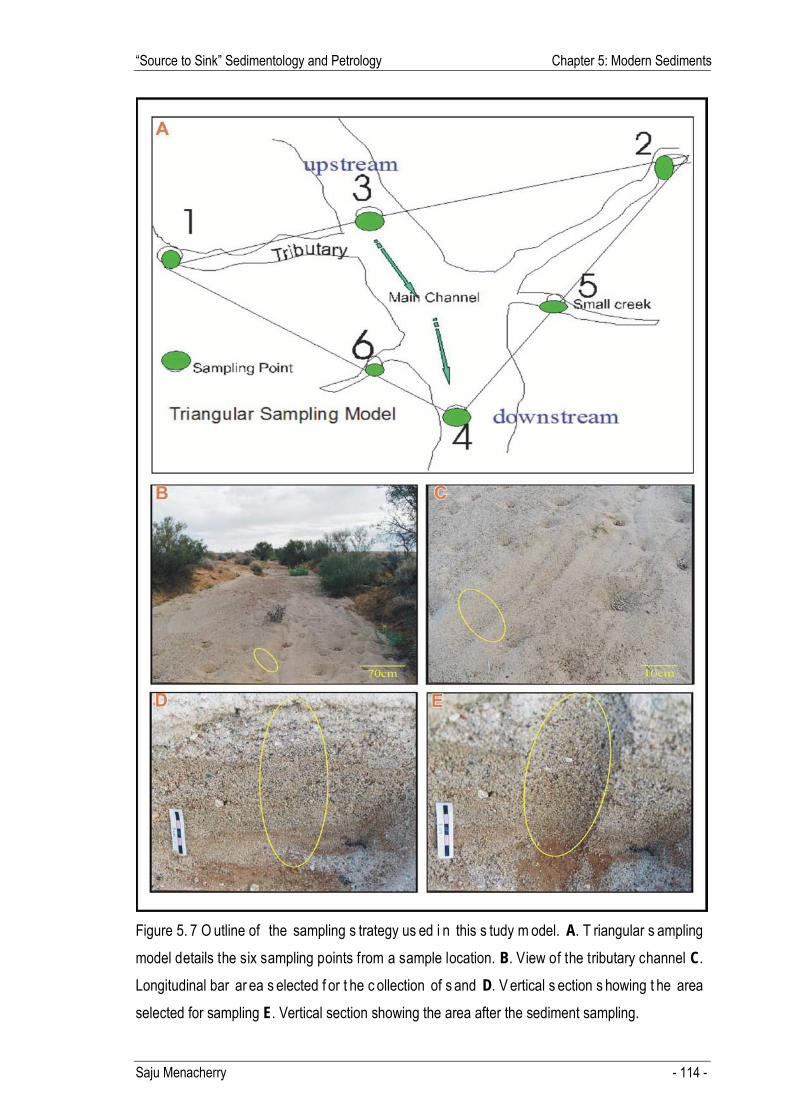
Samples were collected within single-source smaller drainage basins in order to assess the detrital signatures of eac h m ajor geol ogic uni t an d t o a ccess t he i nfluence of t he dr ainage and r elief (Ingersoll et al., 1 993). D ue t o l ong d elayed t ransport f rom ar eas o f l ow r elief and t he dry-hot, windy c limate, s ediment petrography and m ineralogy ar e c onsidered as pr imary and no t significantly modified by chemical weathering or mechanical abrasion (Folk, 1980). Figure 5. 6 s hows two t erminal s play l ocations and 13 u pstream t ributary c onfluence s ample locations along Umbum Creek and i ts t ributaries, where a total of 90 samples were collected for this study. The sediment was collected in plastic containers using a scoop from the top 15—40 cm of active longitudinal / point bars in the main active Umbum Creek channel and tributary channels (just below the top of the bedform to avoid deflationary effects) (Fig. 5.7B-E). It was assumed that these deposits represent the full range of bedload grain sizes and composition in transport at any time along the network (Fig. 5.1). A triangular sampling strategy at each location was selected to appraise the mixing effect and the input of the l ocal s ources on s ediment c omposition. Six s amples w ere c ollected ar ound s tream confluences ( Fig. 5.7A), o ne s ample eac h f rom u pstream and downstream l ocations w ithin t he main c hannel, as w ell as s amples f rom t he a djoining four m inor t ributaries, w hich j oin t he r iver network before the downstream sample location (Fig. 5.7A). Grain-size distribution results showed that samples from the upstream locations are reflected in the downstream location (Figs 5.7 A, 5.8 A, B & C). The samples were oven-dried and mechanically split i nto various proportions f or sieve analysis, thin section preparation, chemical analysis and archive (Fig. 5.9). The processing of the samples is summarised in the workflow chart (Fig. 5.9). Initially, the selected three sample location samples (six samples plus one h omogeneous sample f rom each sample location, total 21 samples) were texturally a nd c ompositionally anal ysed t o d etermine t he i nfluence of t he m ixing effect between upstream and downstream samples. The analysed result suggests that the downstream is totally different f rom the ups tream s tream samples, which is highly represented by the mixing ef fect o f other four minor tributary samples (Figs 5.8A, 5.8B and 5.8C). Instead of adding an additional work load, this s tudy has decided t o c onduct al l t he petrographic w ork using only t he ups tream a nd downstream samples with considering the initial petrographic results. Thus, of the ninety samples from f our t ributaries and t he m ain U mbum C reek, 45 s amples w ere s elected f or s ieve anal ysis (upstream and downstream samples of 12 locations and three locations with six samples and one
“Source to Sink” Sedimentology and Petrology Chapter 5: Modern Sediments
Saju Menacherry - 113 -
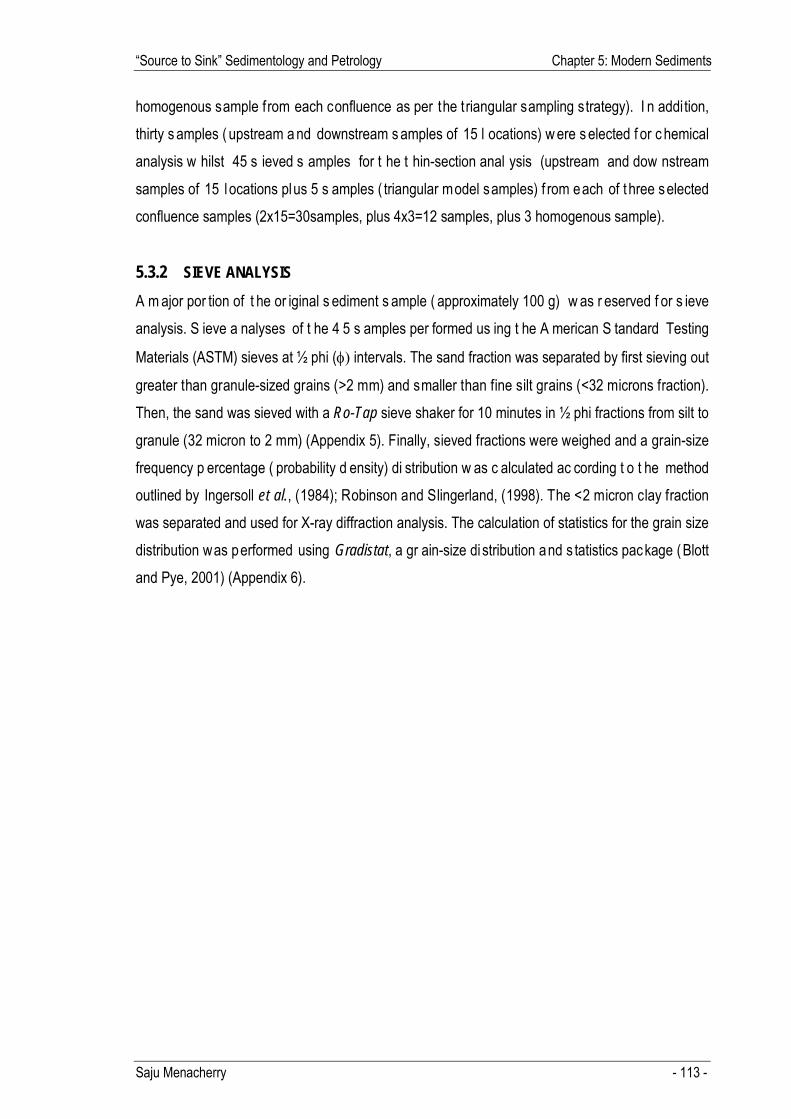
homogenous sample from each confluence as per the triangular sampling strategy). I n addition, thirty s amples ( upstream a nd downstream s amples of 15 l ocations) w ere s elected f or c hemical analysis w hilst 45 s ieved s amples for t he t hin-section anal ysis (upstream and dow nstream samples of 15 l ocations plus 5 s amples ( triangular model samples) f rom each of t hree selected confluence samples (2x15=30samples, plus 4x3=12 samples, plus 3 homogenous sample).
5.3.2 SIEVE ANALYSIS
A m ajor por tion of t he or iginal s ediment s ample ( approximately 100 g) w as r eserved f or s ieve analysis. S ieve a nalyses of t he 4 5 s amples per formed us ing t he A merican S tandard Testing
Materials (ASTM) sieves at ½ phi (φ) intervals. The sand fraction was separated by first sieving out
greater than granule-sized grains (>2 mm) and smaller than fine silt grains (<32 microns fraction). Then, the sand was sieved with a Ro-Tap sieve shaker for 10 minutes in ½ phi fractions from silt to granule (32 micron to 2 mm) (Appendix 5). Finally, sieved fractions were weighed and a grain-size frequency p ercentage ( probability d ensity) di stribution w as c alculated ac cording t o t he method outlined by Ingersoll et al., (1984); Robinson and Slingerland, (1998). The <2 micron clay fraction was separated and used for X-ray diffraction analysis. The calculation of statistics for the grain size distribution was performed using Gradistat, a gr ain-size di stribution and s tatistics package (Blott and Pye, 2001) (Appendix 6).
“Source to Sink” Sedimentology and Petrology Chapter 5: Modern Sediments
Saju Menacherry - 114 -
Figure 5. 7 O utline of the sampling s trategy us ed i n this s tudy m odel. A. T riangular s ampling model details the six sampling points from a sample location. B. View of the tributary channel C. Longitudinal bar ar ea s elected f or t he c ollection of s and D. V ertical s ection s howing t he area selected for sampling E. Vertical section showing the area after the sediment sampling.

“Source to Sink” Sedimentology and Petrology Chapter 5: Modern Sediments
Saju Menacherry - 115 -
Figur
e 5.8A
Gra
ph sh
owing
grain
-size
distr
ibutio
n of 6
samp
les fr
om th
e pro
ximal
area
(loca
tion 1
1) of
Dav
enpo
rt Cr
eek.
Note
that th
e dow
nstre
am
samp
le po
int (s
ample
numb
er 3)
is an
exce
ption
ally r
epre
sente
d the
mixi
ng ef
fect o
f the o
ther f
ive pr
oxim
al sa
mples
farth
er up
strea
m.

“Source to Sink” Sedimentology and Petrology Chapter 5: Modern Sediments
Saju Menacherry - 116 -
Figu
re 5.
8B G
raph
show
ing gr
ain-si
ze di
stribu
tion o
f 6 sa
mples
from
the m
edial
area
(loca
tion 1
5). N
ote th
at the
down
strea
m sa
mple
point
(sa
mple
numb
er 6)
is an
extre
mely
repr
esen
ted th
e mixi
ng ef
fect w
ith th
e othe
r five
med
ial sa
mples
farth
er up
strea
m.

“Source to Sink” Sedimentology and Petrology Chapter 5: Modern Sediments
Saju Menacherry - 117 -
Figur
e 5.8C
Gra
ph sh
owing
grain
-size
distr
ibutio
n of 6
samp
les fr
om th
e dist
al ar
ea (
locati
on 1)
of U
mbum
Cre
ek T
ermi
nal s
play c
omple
x. No
te tha
t the
d
owns
tream
samp
le po
int (s
ample
numb
er 5)
is an
exce
eding
ly re
pres
ented
the m
ixing
effec
t of o
ther d
istal
samp
les fa
rther
upstr
eam.

“Source to Sink” Sedimentology and Petrology Chapter 5: Modern Sediments
Saju Menacherry - 118 -
Figure 5. 9 W ork f low c hart i llustrates s ample pr eparation a nd a nalysis em ployed f or s ieve analysis and chemical analysis in this study.

“Source to Sink” Sedimentology and Petrology Chapter 5: Modern Sediments
Saju Menacherry - 119 -
5.3.3 CHEMICAL ANALYSIS
A s plit s ample of ar ound 50 g of t he s and f raction was us ed f or t he c hemical anal ysis of 3 0 samples. T he p urpose of this c hemical analysis w as t o o btain t he p ercentage di stribution of carbonate, c lay c oatings, and or ganic m aterials i n t he s and f raction. T he c hemical a nalysis results pr ovide i nsight i nto t he c hemical w eathering effects of m odern s ands b ased on c limatic controls (Suttner et al., 1981; Johnsson, 1993). The chemical procedures used followed Krumbein and Pettijohn (1988), where the organic material, carbonate, and clay materials were progressively removed. A brief description of the procedure used in this study follows:
• The split sample of around 50 g was weighed and placed in a beaker. • Oxidation was carried out with 10 ml of 30% H2O2 and demineralised water. The clear
fluid was carefully decanted off without disturbing the remaining solid matter. • The 30 m l of 10% H CL was adde d t o t he r emaining s and m aterial w ith eno ugh
demineralised water to immerse the material in the fluid. The beaker with the material was boi led for at least 5 minutes. More ac id was added for samples w ith s ignificant carbonate content. The walls of the beakers were carefully washed to avoid loss of material.
• The sand material was washed with demineralised water a few times, decanted off as much as possible w ithout l osing m aterial, a nd t hen pl aced i n a drying oven f or 24 hours at 400C.
• The dr ied s and sample w as t hen w eighed. T he di fference of dry w eight before and after t he chemical analysis pr ovided t he t otal w eight of or ganic m aterial, c arbonate, and clay materials removed from the sample.
5.3.4 PETROGRAPHY
Thin-sections w ere prepared f rom e ach ups tream a nd dow nstream m odern s and s ample using blue epoxy resin in order to mount the loose sand grains. In each sample (whole sand fraction), 250 points were counted using the Gazzi-Dickinson point-counting method (Ingersoll et al., 1984). The longest axes of these grains were also measured. A detailed classification scheme (Appendix 3) al lowed t he s tudy t o c ollect f ull quan titative petrographic i nformation on t he sand-sized grain fractions. This included the recognition of 72 provenance lithotype categories and allowed for the calculation of t raditional QFR par ameters f rom t he dat a o btained w hich a grees w ith t he conclusions of Ingersoll et al., (1984; Basu, (1985). This classification scheme provided a detailed
“Source to Sink” Sedimentology and Petrology Chapter 5: Modern Sediments
Saju Menacherry - 120 -
basis t o appraise t he s and gr ains generated f rom t he or iginal pr ovenance l ithotype r ocks (Dickinson and Suczek, 1979). An Olympus BH2-UMA microscope with an at tached Olympus DP11 digital camera was used to point count as well as record photomicrographs. The grain s izes derived f rom the point counting were tabulated for the were grain size distribution calculations and statistics were performed using Gradistat, a gr ain-size di stribution and s tatistics p ackage w hich c onsistent w ith Blott and P ye, (2001).
5.3.5 CATHODOLUMINESCENCE (CL) Cathodoluminescence petrography is a sophisticated technique used to identify l ithology and can thus point to an individual grain’s provenance. The di fferent t ypes of quartz, carbonate, feldspar and h eavy m inerals f rom di fferent s ources ar e a ble t o de tect t hrough c athodoluminescence analysis. Provenance i ndicators o f e ach qu artz gr ain ar e d eveloped t hrough p etrographic examination of polycrystallinity, undulatory extinction (Basu, 1985) and the fabrics of quartz grains (Folk, 1974). These results can be integrated with cathodoluminescence (CL) fabric analysis using quartz colour identification as described by previous works such as Seyedolali et al., (1997; Bernet and Bassett, (2005). The m ain ai m of t he c athodoluminescence a nalysis w as t o c heck an d qua lity c ontrol t he provenance of quartz grains, which are al ready identified through petrographic works. Four thin-section s amples f rom f our di fferent l ocations—1(2), 15(2), 5( 2) a nd 9( 2)—were s tudied u nder cathodoluminescence t o identify the di fferent gr ains a nd their origin. The r esults o f cathodoluminescence analysis together with opt ical petrographic analysis were used to integrate identify and the provenance of quartz grains in the same thin-sections as outlined by Augustsson and Bahlburg, (2003); Richter et al., (2003); Gotte and Richter, (2006). The r emaining 41 s amples w ere pr ovenance i nterpreted us ing p etrographic t echniques and t he conclusion f rom t he i ntegrated a nalysis of c athodoluminescence and p etrography. I ntegrated cathodoluminescence and petrographic analysis was critical in determining sediment provenance correctly. H owever, this s tudy h ad decided to l imit t he c athodoluminescence a nalysis t o four samples rather than performing all 45 samples because the provenance of quartz grains identified using petrography is extremely agrees with the cathodoluminescence analysis results.

“Source to Sink” Sedimentology and Petrology Chapter 5: Modern Sediments
Saju Menacherry - 121 -
A Technosyn Model 8200 Mk II cathodoluminoscope and a Leitz Orthomat E automatic microscope camera were used to examine selected polished sections. Electron gun voltages and beam currents of 25 kV and 200 mA were used while the polished thin-sections were held under vacuums o f b etween 0 .07 and 0. 01 T orr. C L ph otomicrographs w ere t aken a t 3 t o 7 m inute exposure times in integral metering mode with an Olympus DP 11 digital camera.
5.3.6 X-RAY POWDER DIFFRACTION (XRD)
X-ray d iffraction ( XRD) anal yses w ere c arried out o n t he < 2 m icron f raction ( clay f raction) of selected samples 6 (1), 15 (1) and 1 (2). The clay fractions were magnesium and glycol saturated on ceramic plates held under vacuum. The prepared samples were run in a Philips PW 1050 X-ray diffractometer at 50 kV and 35 mA, using Copper Kα radiation, at a speed scan at 20 / m inute. Mineral identification was checked by comparison with the Joint Committee on Powder Diffraction Standards (JCPDS) files using XRDCALC and Traces 5.2 software. This study had decided to perform XRD only on selected samples from proximal, medial and distal regions of the Umbum Creek network system. This is mainly due to time limitations. The intention of t he X RD a nalysis on s elected s amples w as t o achieve t he i nformation of mineralogy a nd composition of c lay s ized particles i n s amples, t he r esults s uggest different s ediment m odifying processes and c lay s ized fraction in dry land environments mainly in proximal, medial and distal parts of t he U mbum C reek catchment. T he s ample s elected f or t he X RD analysis i s w ell represented in the sediments of maximum clay fraction and in the main channel confluences.
5.3.7 SCANNING ELECTRON MICROSCOPY (SEM)
A scanning electron microscope, Philips XL30 FEGSEM, equipped with an energy-dispersive X-ray system ( SEM-EDS) an d electron backscatter di ffraction s ystem w as us ed to study s elected samples follow the initial petrographical and mineralogical studies. Samples were examined both as pol ished t hin-sections a nd as gr ain mounts. S EM w as us ed t o ex amine t he gr ain c oating, cements, overgrowths, and authigenic mineralogy. Selected pol ished thin-sections samples were examined SEM and backscattered electron (BSE) image analysis us ing outlined techniques described in the McBride, (1985); Worden and Morad, (2003).

“Source to Sink” Sedimentology and Petrology Chapter 5: Modern Sediments
Saju Menacherry - 122 -
This s tudy h ad d ecided t o per form S EM onl y o n s elected s amples ( proximal, medial an d di stal samples) because to achieve the information of early diagenetic processes such as grain coating, cements, overgrowths, a nd aut higenic m ineralogy i n different s ediment m odifying env ironments such as in proximal, medial and distal parts of the Umbum Creek catchment.
5.3.8 STEREO- ZOOM BINOCULAR MICROSCOPY
A S tereo-Zoom Binocular m icroscope, Olympus SZX9 was us ed t o s tudy t he s elected s amples with r egards t o s urface texture a nd t he c olour v ariations of f luvio-aeolian grains of s elected samples. An Olympus DP11 digital camera was used to record the photomicrographs. This study had d ecided t o c arry out Stereo-Zoom B inocular m icroscopy on s elected s amples ( medial an d distal samples) because to reach a c lear surface texture information on grains in order to identify the fluvio-aeolian grains interactions in a dryland fluvial environment setting.