Chapter 1 - Foundations of Engineering Economy
28
© 2012 by McGraw-Hill, New York, N.Y All Rights Reserved 1-1 Lecture slides to accompany Engineering Economy 7 th edition Leland Blank Anthony Tarquin Chapter 1 Chapter 1 Foundations Foundations Of Of Engineering Engineering Economy Economy
-
Upload
independent -
Category
Documents
-
view
0 -
download
0
Transcript of Chapter 1 - Foundations of Engineering Economy
© 2012 by McGraw-Hill, New York, N.Y All Rights Reserved1-1
Lecture slides to accompany
Engineering Economy7th edition
Leland BlankAnthony Tarquin
Chapter 1Chapter 1Foundations Foundations
Of Of Engineering Engineering EconomyEconomy
© 2012 by McGraw-Hill, New York, N.Y All Rights Reserved1-2
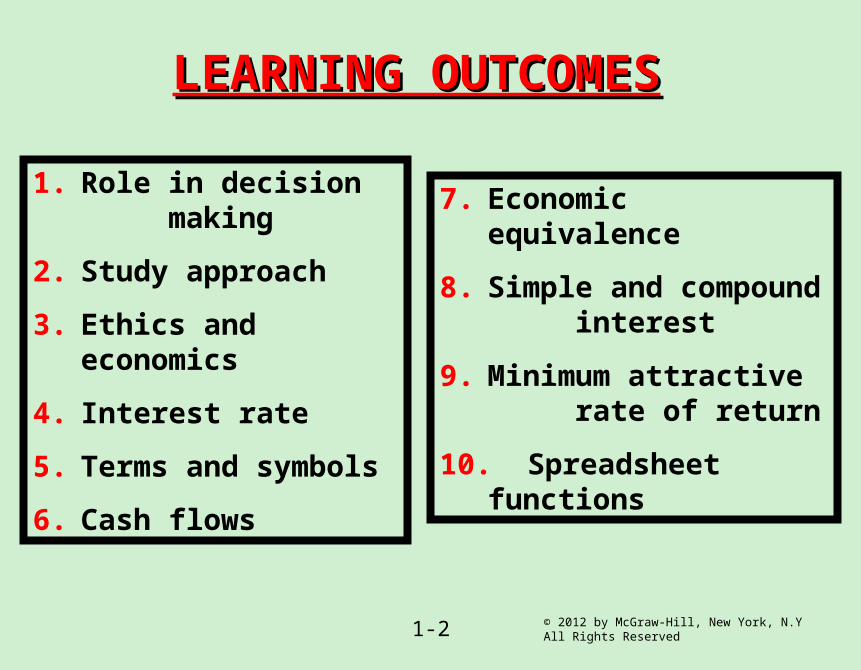
LEARNING OUTCOMESLEARNING OUTCOMES
1. Role in decision making
2. Study approach3. Ethics and
economics4. Interest rate5. Terms and symbols6. Cash flows
7. Economic equivalence
8. Simple and compound interest
9. Minimum attractive rate of return
10. Spreadsheet functions

© 2012 by McGraw-Hill, New York, N.Y All Rights Reserved1-3
Why Engineering Economy is Why Engineering Economy is Important to EngineersImportant to Engineers
Engineers design and create Designing involves economic decisions Engineers must be able to incorporate economic analysis into their creative efforts
Often engineers must select and implement from multiple alternatives
Understanding and applying time value of money, economic equivalence, and cost estimation are vital for engineers
A proper economic analysis for selection and execution is a fundamental task of engineering
© 2012 by McGraw-Hill, New York, N.Y All Rights Reserved1-4
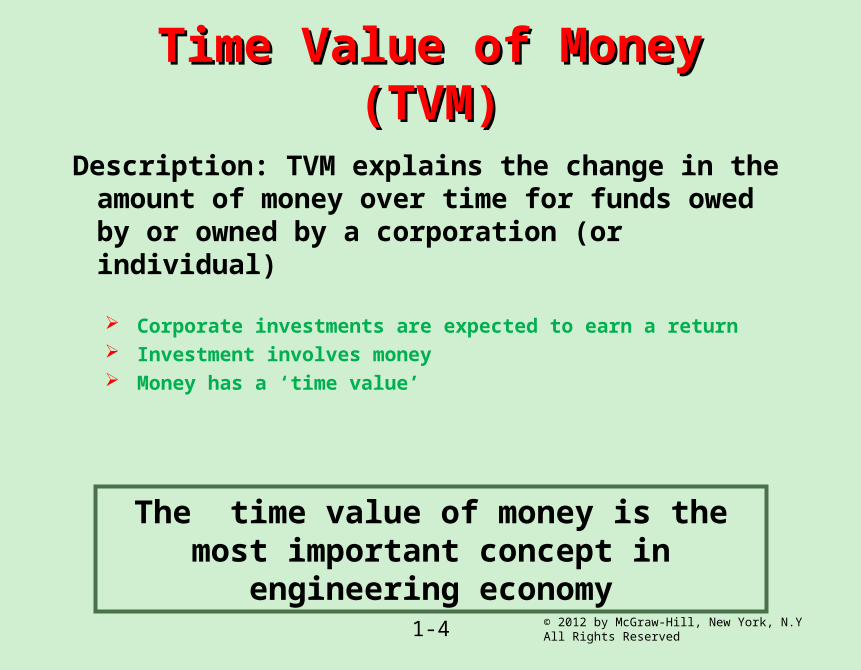
Time Value of Money Time Value of Money (TVM)(TVM)
Description: TVM explains the change in the amount of money over time for funds owed by or owned by a corporation (or individual) Corporate investments are expected to earn a return Investment involves money Money has a ‘time value’
The time value of money is the most important concept in
engineering economy

© 2012 by McGraw-Hill, New York, N.Y All Rights Reserved1-5
Engineering EconomyEngineering Economy Engineering Economy involves
Formulating Estimating, and Evaluating expected economic outcomes of alternatives designed to accomplish a defined purpose
Easy-to-use math techniques simplify the evaluation
Estimates of economic outcomes can be deterministic or stochastic in nature
© 2012 by McGraw-Hill, New York, N.Y All Rights Reserved1-6
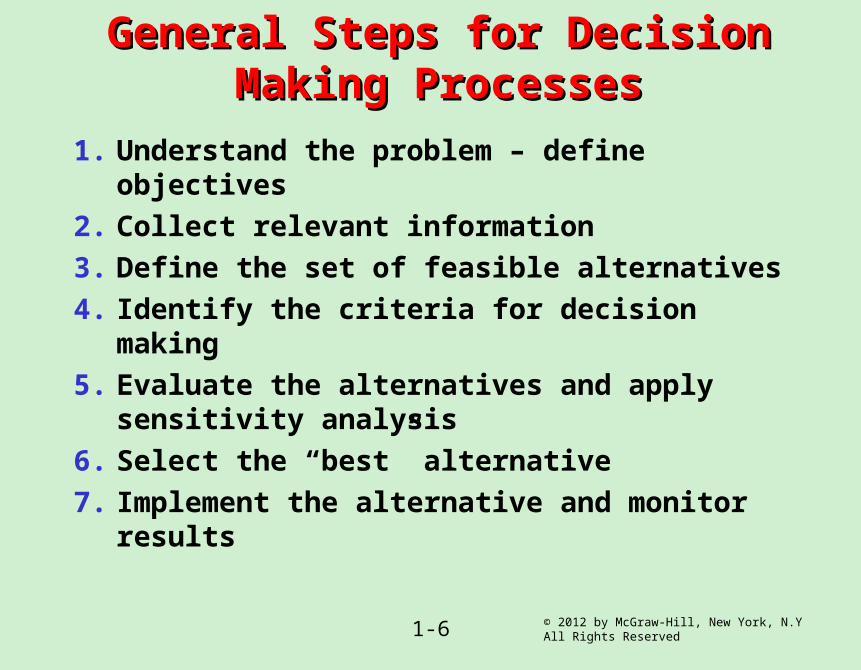
General Steps for Decision General Steps for Decision Making ProcessesMaking Processes
1. Understand the problem – define objectives
2. Collect relevant information3. Define the set of feasible alternatives4. Identify the criteria for decision
making5. Evaluate the alternatives and apply
sensitivity analysis6. Select the “best” alternative7. Implement the alternative and monitor
results
© 2012 by McGraw-Hill, New York, N.Y All Rights Reserved1-7
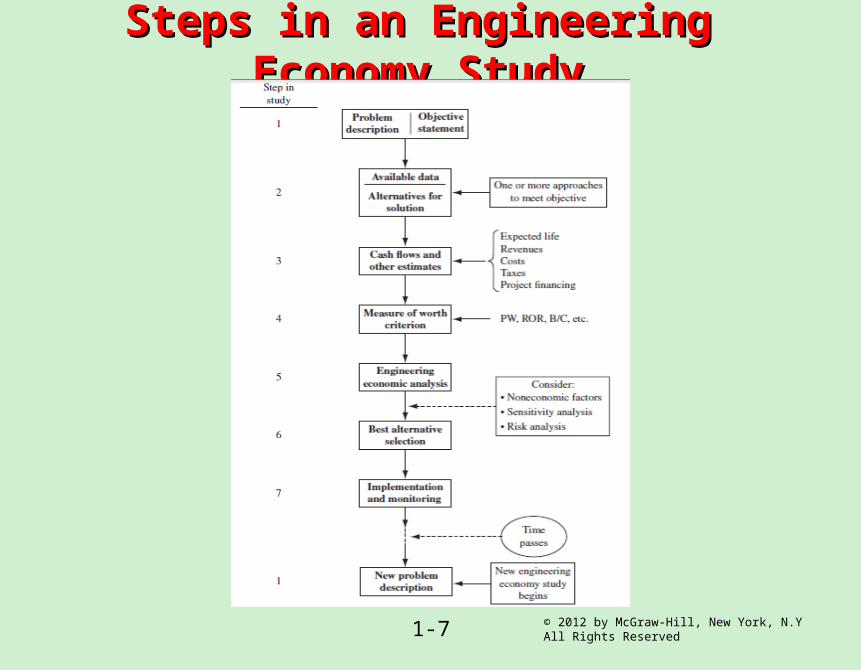
Steps in an Engineering Steps in an Engineering Economy StudyEconomy Study

Ethics – Different Ethics – Different LevelsLevels
Universal morals or ethics – Fundamental beliefs: stealing, lying, harming or murdering another are wrong
Personal morals or ethics – Beliefs that an individual has and maintains over time; how a universal moral is interpreted and used by each person
Professional or engineering ethics – Formal standard or code that guides a person in work activities and decision making
© 2012 by McGraw-Hill, New York, N.Y All Rights Reserved1-8
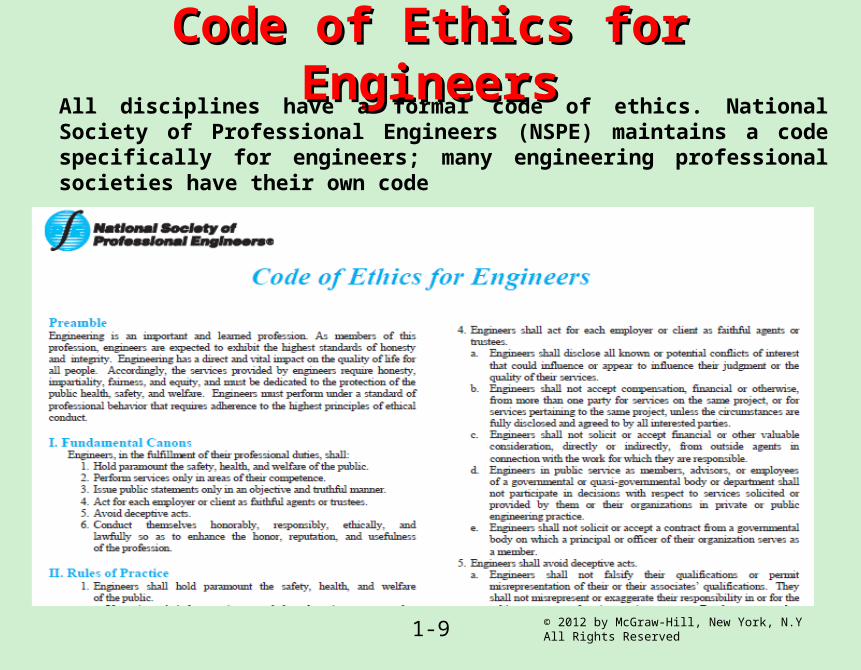
Code of Ethics for Code of Ethics for EngineersEngineersAll disciplines have a formal code of ethics. National
Society of Professional Engineers (NSPE) maintains a code specifically for engineers; many engineering professional societies have their own code
© 2012 by McGraw-Hill, New York, N.Y All Rights Reserved1-9
© 2012 by McGraw-Hill, New York, N.Y All Rights Reserved1-10
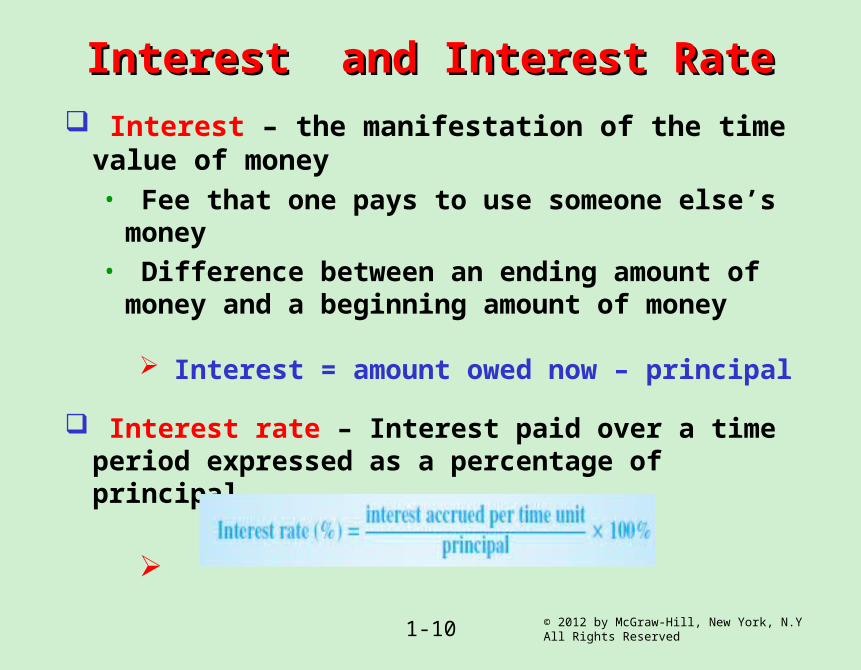
Interest and Interest RateInterest and Interest Rate Interest – the manifestation of the time value of money• Fee that one pays to use someone else’s money
• Difference between an ending amount of money and a beginning amount of money
Interest = amount owed now – principal Interest rate – Interest paid over a time period expressed as a percentage of principal
© 2012 by McGraw-Hill, New York, N.Y All Rights Reserved1-11
Rate of ReturnRate of Return
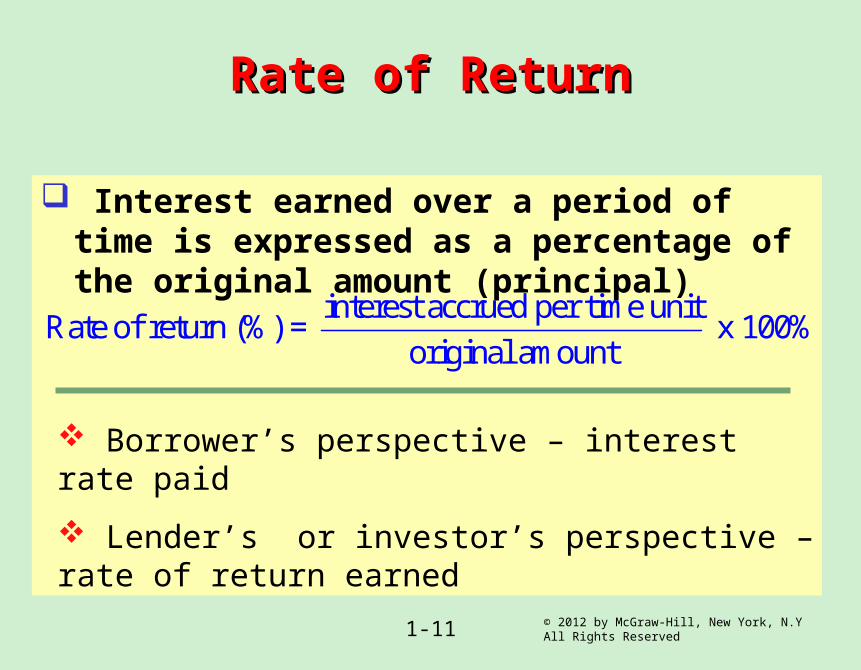
Interest earned over a period of time is expressed as a percentage of the original amount (principal)interest accrued per time unitRate of return (% ) = x 100%original amount
Borrower’s perspective – interest rate paid Lender’s or investor’s perspective – rate of return earned

Interest paidInterest paid Interest earnedInterest earned
© 2012 by McGraw-Hill, New York, N.Y All Rights Reserved1-12
Interest rate Rate of return
© 2012 by McGraw-Hill, New York, N.Y All Rights Reserved1-13
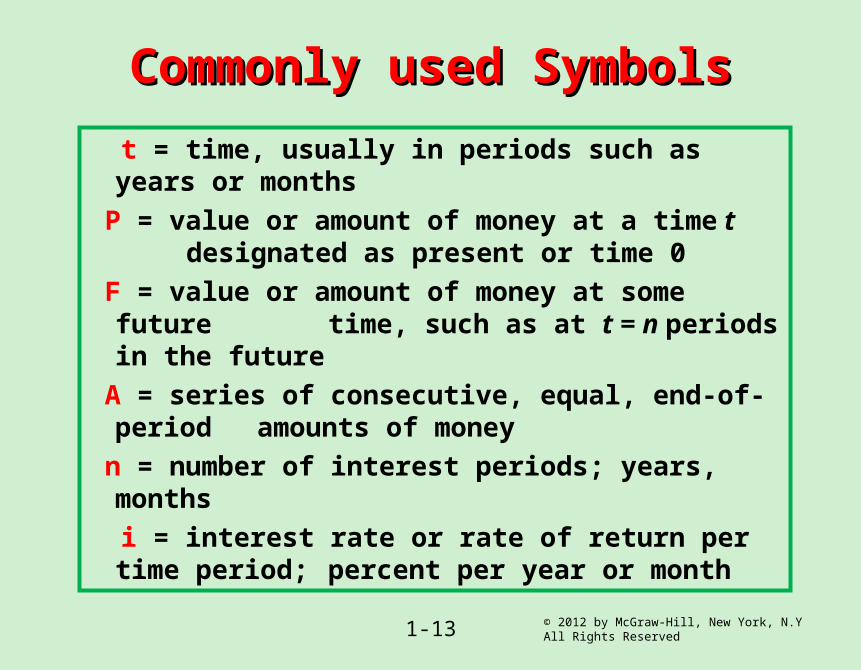
Commonly used SymbolsCommonly used Symbols t = time, usually in periods such as years or months
P = value or amount of money at a time t designated as present or time 0
F = value or amount of money at some future time, such as at t = n periods in the future
A = series of consecutive, equal, end-of-period amounts of money
n = number of interest periods; years, months
i = interest rate or rate of return per time period; percent per year or month
© 2012 by McGraw-Hill, New York, N.Y All Rights Reserved1-14
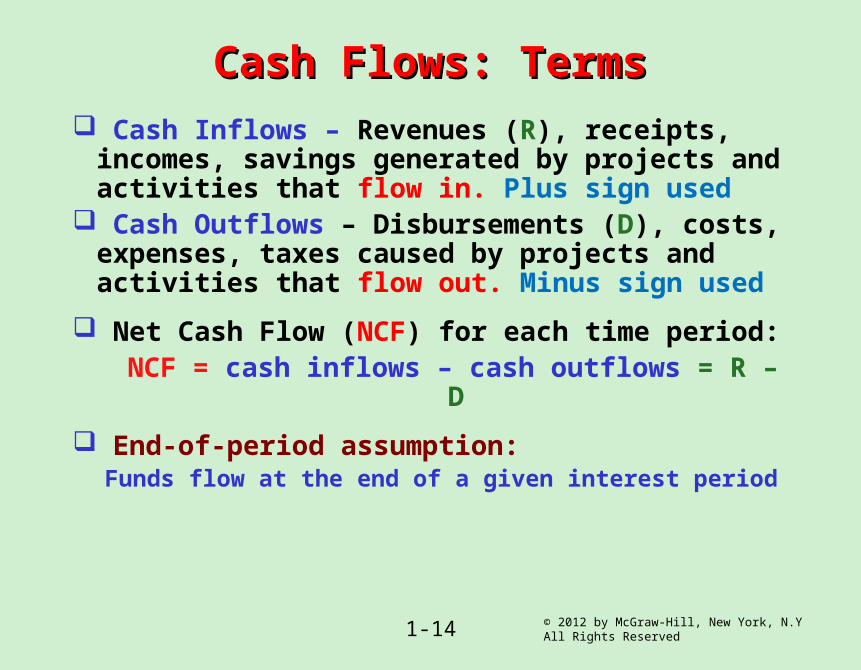
Cash Flows: TermsCash Flows: Terms Cash Inflows – Revenues (R), receipts, incomes, savings generated by projects and activities that flow in. Plus sign used
Cash Outflows – Disbursements (D), costs, expenses, taxes caused by projects and activities that flow out. Minus sign used
Net Cash Flow (NCF) for each time period: NCF = cash inflows – cash outflows = R –
D End-of-period assumption:
Funds flow at the end of a given interest period
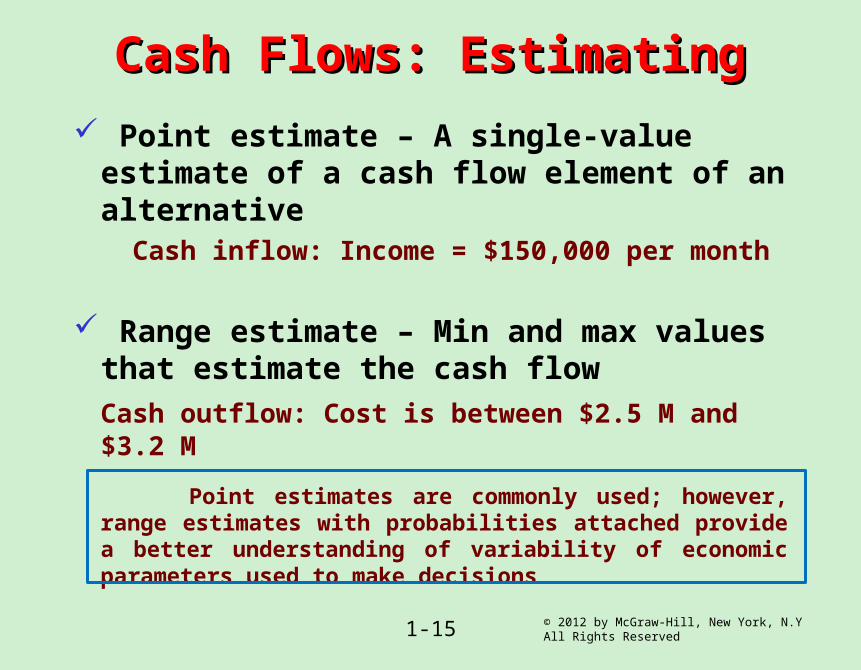
Cash Flows: EstimatingCash Flows: Estimating Point estimate – A single-value estimate of a cash flow element of an alternative
Cash inflow: Income = $150,000 per month
Range estimate – Min and max values that estimate the cash flow Cash outflow: Cost is between $2.5 M and $3.2 M
Point estimates are commonly used; however, range estimates with probabilities attached provide a better understanding of variability of economic parameters used to make decisions
© 2012 by McGraw-Hill, New York, N.Y All Rights Reserved1-15
© 2012 by McGraw-Hill, New York, N.Y All Rights Reserved1-16
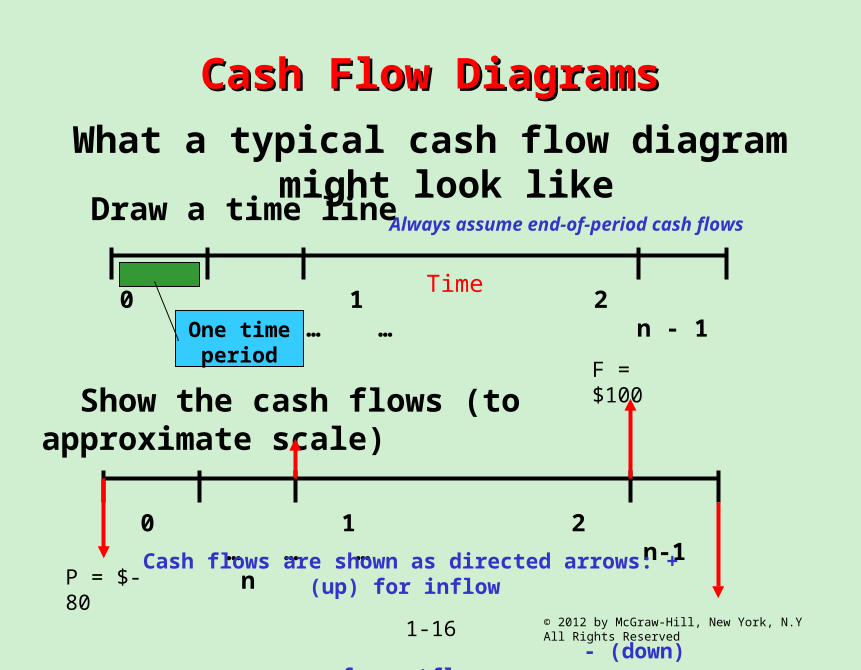
Cash Flow DiagramsCash Flow DiagramsWhat a typical cash flow diagram
might look like
0 1 2 … … … n - 1 n
Draw a time line
One time period
0 1 2 … … … n-1 n
Show the cash flows (to approximate scale)
Cash flows are shown as directed arrows: + (up) for inflow
- (down)
for outflow
Always assume end-of-period cash flows
Time
F = $100
P = $-80
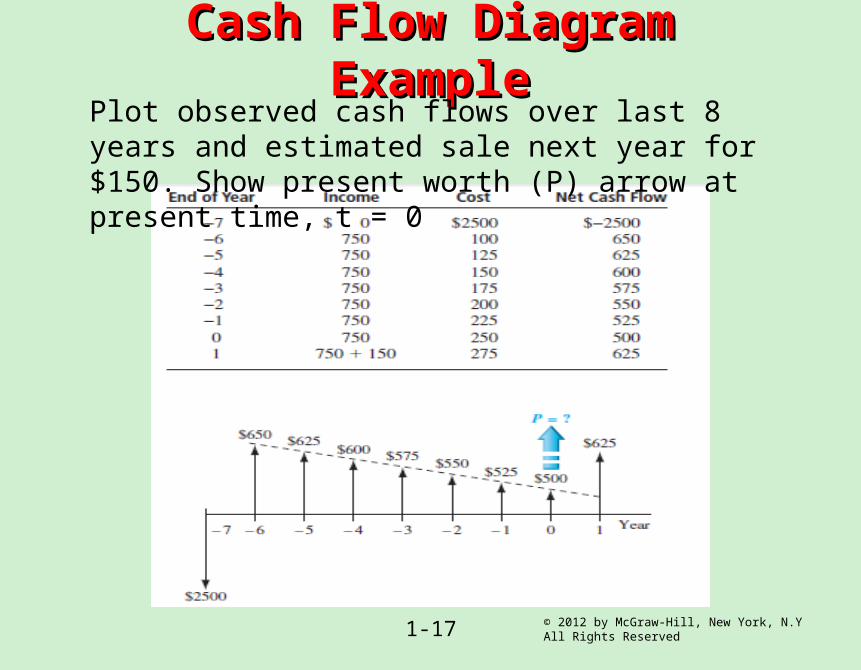
Cash Flow Diagram Cash Flow Diagram ExampleExample
© 2012 by McGraw-Hill, New York, N.Y All Rights Reserved1-17
Plot observed cash flows over last 8 years and estimated sale next year for $150. Show present worth (P) arrow at present time, t = 0
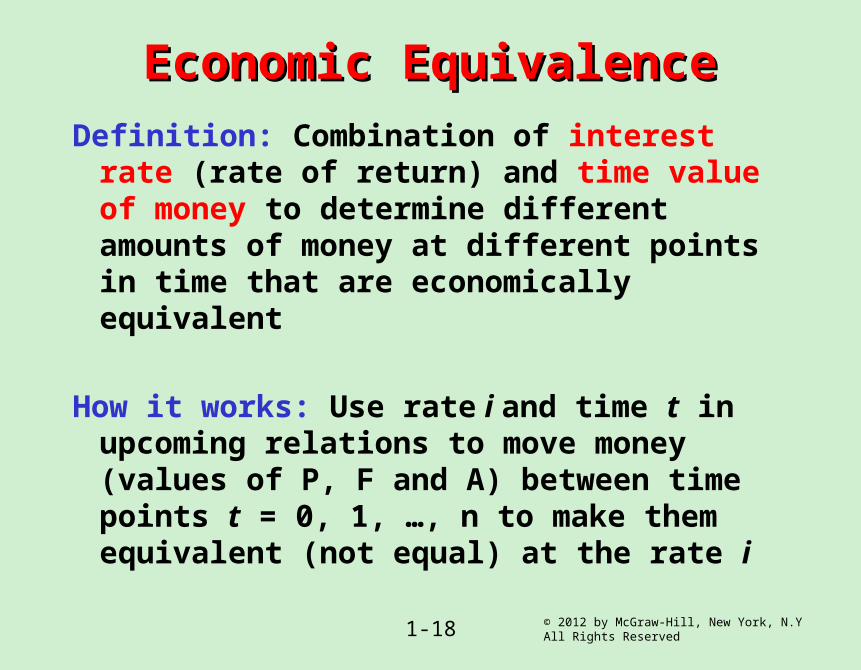
Economic EquivalenceEconomic EquivalenceDefinition: Combination of interest rate (rate of return) and time value of money to determine different amounts of money at different points in time that are economically equivalent
How it works: Use rate i and time t in upcoming relations to move money (values of P, F and A) between time points t = 0, 1, …, n to make them equivalent (not equal) at the rate i
© 2012 by McGraw-Hill, New York, N.Y All Rights Reserved1-18
© 2012 by McGraw-Hill, New York, N.Y All Rights Reserved1-19
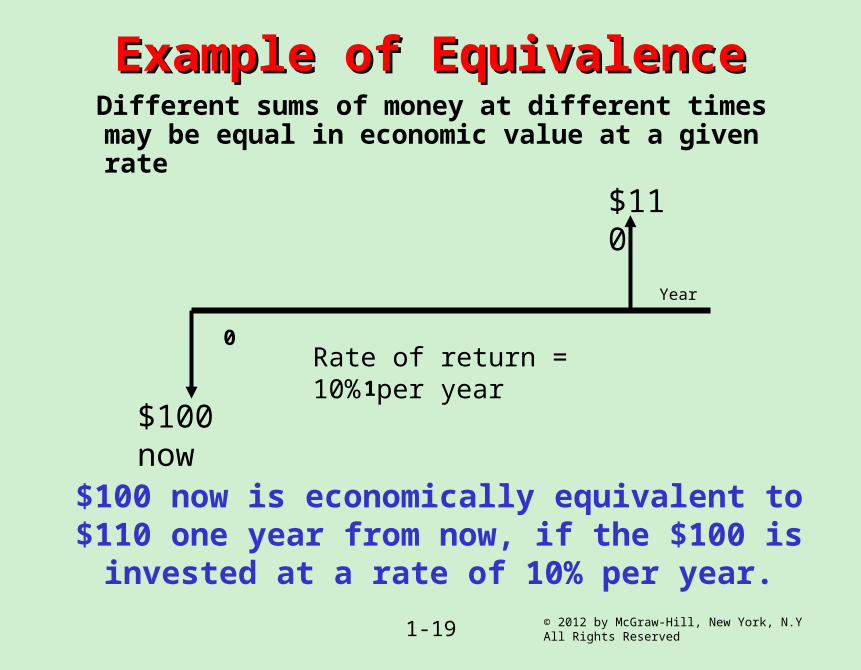
Example of EquivalenceExample of Equivalence Different sums of money at different times may be equal in economic value at a given rate
0 1
$100 now
$110
Rate of return = 10% per year
$100 now is economically equivalent to $110 one year from now, if the $100 is invested at a rate of 10% per year.
Year
© 2012 by McGraw-Hill, New York, N.Y All Rights Reserved1-20
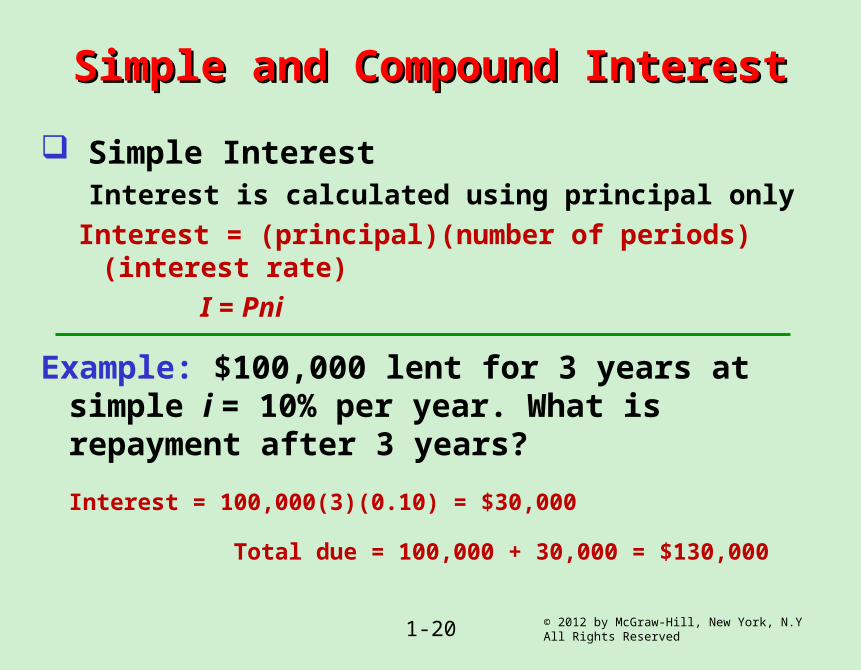
Simple and Compound InterestSimple and Compound Interest Simple Interest
Interest is calculated using principal onlyInterest = (principal)(number of periods)(interest rate) I = Pni
Example: $100,000 lent for 3 years at simple i = 10% per year. What is repayment after 3 years?Interest = 100,000(3)(0.10) = $30,000
Total due = 100,000 + 30,000 = $130,000
Simple and Compound Simple and Compound InterestInterest
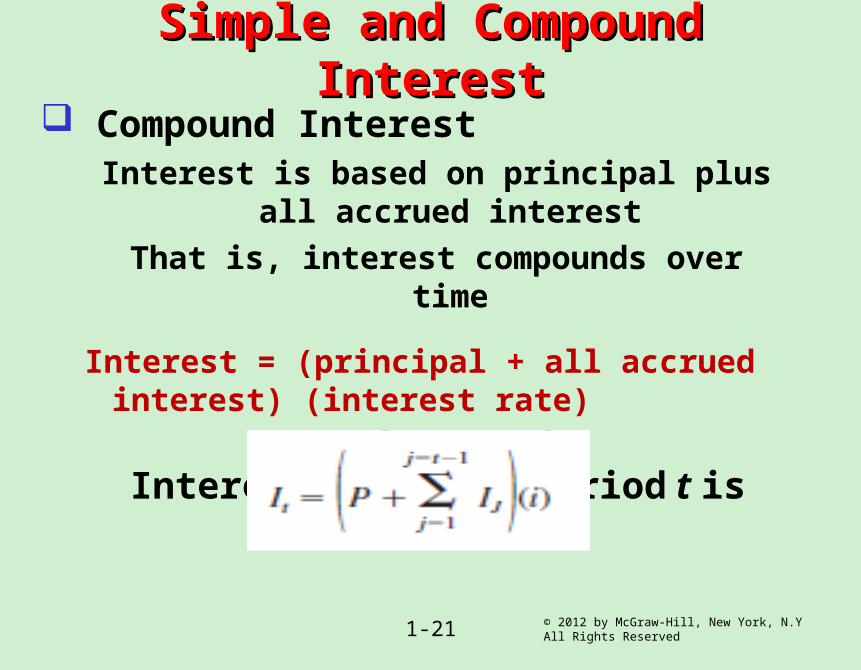
Compound InterestInterest is based on principal plus
all accrued interestThat is, interest compounds over
time
Interest = (principal + all accrued interest) (interest rate)
Interest for time period t is
© 2012 by McGraw-Hill, New York, N.Y All Rights Reserved1-21
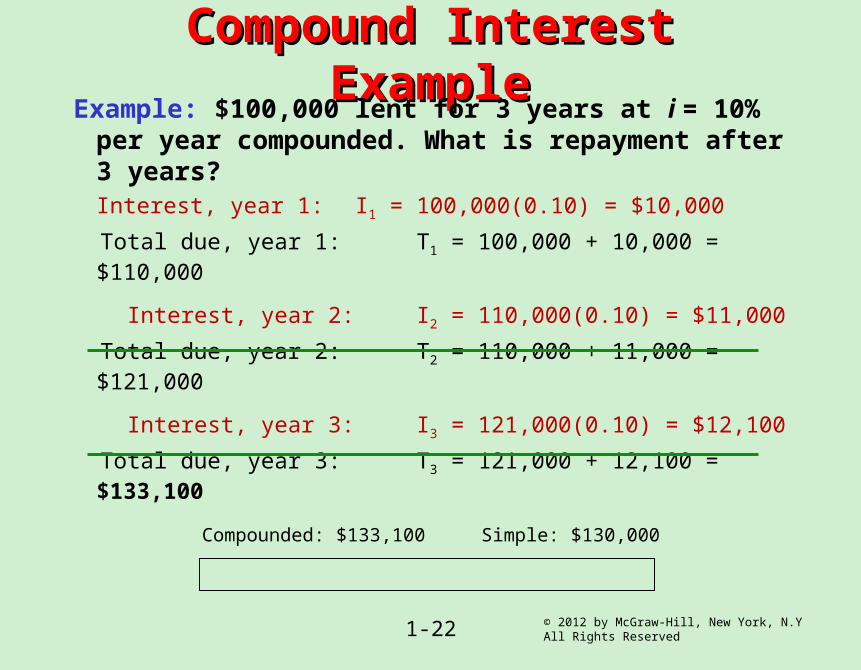
Compound Interest Compound Interest ExampleExampleExample: $100,000 lent for 3 years at i = 10%
per year compounded. What is repayment after 3 years?Interest, year 1: I1 = 100,000(0.10) = $10,000
Total due, year 1: T1 = 100,000 + 10,000 = $110,000
Interest, year 2: I2 = 110,000(0.10) = $11,000 Total due, year 2: T2 = 110,000 + 11,000 = $121,000
Interest, year 3: I3 = 121,000(0.10) = $12,100 Total due, year 3: T3 = 121,000 + 12,100 = $133,100
Compounded: $133,100 Simple: $130,000
© 2012 by McGraw-Hill, New York, N.Y All Rights Reserved1-22

© 2012 by McGraw-Hill, New York, N.Y All Rights Reserved1-23
Minimum Attractive Rate of Minimum Attractive Rate of ReturnReturn
MARR is a reasonable rate of return (percent) established for evaluating and selecting alternatives
An investment is justified economically if it is expected to return at least the MARR
Also termed hurdle rate, benchmark rate and cutoff rate
© 2012 by McGraw-Hill, New York, N.Y All Rights Reserved1-24
MARR CharacteristicsMARR Characteristics MARR is established by the financial managers of the firm
MARR is fundamentally connected to the cost of capital
Both types of capital financing are used to determine the weighted average cost of capital (WACC) and the MARR
MARR usually considers the risk inherent to a project

© 2012 by McGraw-Hill, New York, N.Y All Rights Reserved1-25
Types of FinancingTypes of Financing
Equity Financing –Funds either from retained earnings, new stock issues, or owner’s infusion of money.
Debt Financing –Borrowed funds from outside sources – loans, bonds, mortgages, venture capital pools, etc. Interest is paid to the lender on these funds
For an economically justified project
ROR ≥ MARR > WACC
Opportunity CostOpportunity Cost Definition: Largest rate of return of all projects not accepted (forgone) due to a lack of capital funds
If no MARR is set, the ROR of the first project not undertaken establishes the opportunity cost
Example: Assume MARR = 10%. Project A, not funded due to lack of funds, is projected to have RORA = 13%. Project B has RORB = 15% and is funded because it costs less than A
Opportunity cost is 13%, i.e., the opportunity to make an additional 13% is forgone by not funding project A
© 2012 by McGraw-Hill, New York, N.Y All Rights Reserved1-26
© 2012 by McGraw-Hill, New York, N.Y All Rights Reserved1-27
Introduction to Spreadsheet Introduction to Spreadsheet FunctionsFunctions
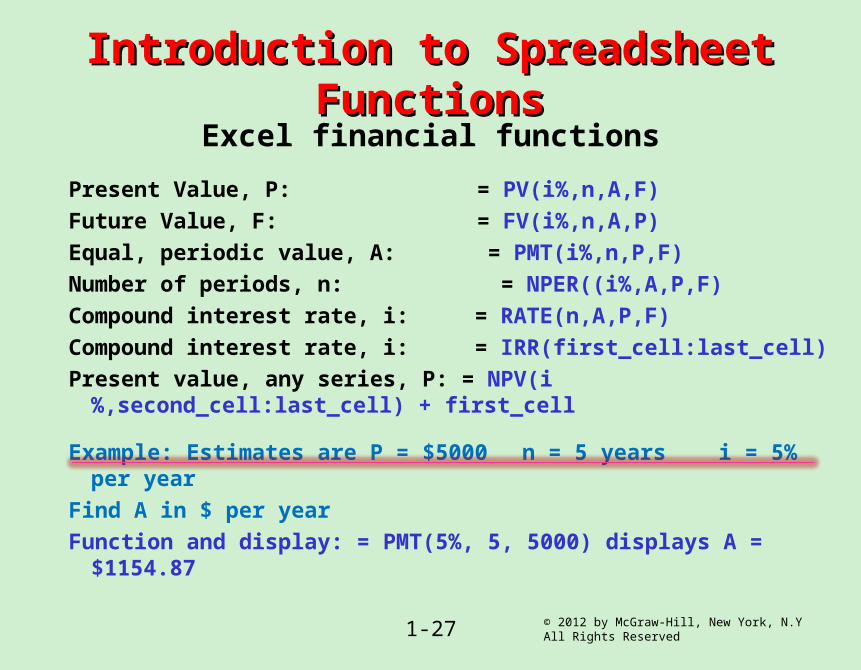
Excel financial functionsPresent Value, P: = PV(i%,n,A,F)Future Value, F: = FV(i%,n,A,P)Equal, periodic value, A: = PMT(i%,n,P,F)Number of periods, n: = NPER((i%,A,P,F)Compound interest rate, i: = RATE(n,A,P,F)Compound interest rate, i: = IRR(first_cell:last_cell)Present value, any series, P: = NPV(i%,second_cell:last_cell) + first_cell
Example: Estimates are P = $5000 n = 5 years i = 5% per year
Find A in $ per yearFunction and display: = PMT(5%, 5, 5000) displays A = $1154.87
© 2012 by McGraw-Hill, New York, N.Y All Rights Reserved1-28
Chapter SummaryChapter Summary Engineering Economy fundamentals
Time value of moneyEconomic equivalenceIntroduction to capital funding and MARRSpreadsheet functions
Interest rate and rate of return Simple and compound interest
Cash flow estimationCash flow diagramsEnd-of-period assumptionNet cash flowPerspectives taken for cash flow estimation
EthicsUniversal morals and personal moralsProfessional and engineering ethics (Code of Ethics)