Changing Land Distribution System in India – A comparative analysis of 48 th and 59 th round By...
14
CASIRJ Volume 5 Issue 1 [Year - 2014] ISSN 2319 – 9202 International Research Journal of Commerce Arts and Science http:www.casirj.com Page 302 Changing Land Distribution System in India – A comparative analysis of 48 th and 59 th round By Gaurav Arya Ph.D.Scholar CSRD/SSS Email: - [email protected] Jawaharlal Nehru University New Delhi-110067 Introduction Agriculture in India holds a pride of place in terms of both income and employment. It is a way of life that penetrates its organisational structure and moulds its value system. In India unequal distribution of property and income forms the basis of agrarian hierarchy. The prevailing value system justifies this existing inequality. Both the privileged and the unprivileged believe that men are born unequal. The respect for higher status runs through every level of the social system. The hierarchical values and un-equal social structures reinforce each other thereby making the change of any status quo very difficult. Indian agriculture comprises multiple social systems each displaying a different process of change. This structure thus provides ample opportunities for research in land systems and reform procedures. Before exploring the inherent complexities of the Indian agrarian sector, we shall trace the process of evolution which contributed to this complex structure. Land distribution and tenancy among the various social groups, especially in rural India is important issue in these days because in rural areas land is major sources of income and employment. But there is very diversification in land distribution in India. These diversification increases the inequality in rural areas. The inequality is very high among different social groups in rural areas because, in rural areas economy is based on agriculture. Some upper society groups have their property right on agricultural land. On the other hand scheduled cast and tribes are the most advantages to the agricultural land.
-
Upload
independent -
Category
Documents
-
view
6 -
download
0
Transcript of Changing Land Distribution System in India – A comparative analysis of 48 th and 59 th round By...

CASIRJ Volume 5 Issue 1 [Year - 2014] ISSN 2319 – 9202
International Research Journal of Commerce Arts and Science http:www.casirj.com Page 302
Changing Land Distribution System in India – A comparative analysis of
48th and 59th round
By Gaurav Arya Ph.D.Scholar
CSRD/SSS
Email: - [email protected]
Jawaharlal Nehru University
New Delhi-110067
Introduction
Agriculture in India holds a pride of place in terms of both income and
employment. It is a way of life that penetrates its organisational structure and moulds its value
system. In India unequal distribution of property and income forms the basis of agrarian
hierarchy. The prevailing value system justifies this existing inequality. Both the privileged and
the unprivileged believe that men are born unequal. The respect for higher status runs through
every level of the social system. The hierarchical values and un-equal social structures reinforce
each other thereby making the change of any status quo very difficult. Indian agriculture
comprises multiple social systems each displaying a different process of change. This structure
thus provides ample opportunities for research in land systems and reform procedures. Before
exploring the inherent complexities of the Indian agrarian sector, we shall trace the process of
evolution which contributed to this complex structure.
Land distribution and tenancy among the various social groups, especially in
rural India is important issue in these days because in rural areas land is major sources of income
and employment. But there is very diversification in land distribution in India. These
diversification increases the inequality in rural areas. The inequality is very high among different
social groups in rural areas because, in rural areas economy is based on agriculture. Some upper
society groups have their property right on agricultural land. On the other hand scheduled cast
and tribes are the most advantages to the agricultural land.
CASIRJ Volume 5 Issue 1 [Year - 2014] ISSN 2319 – 9202
International Research Journal of Commerce Arts and Science http:www.casirj.com Page 303
In India where the agriculture is the prime source of livelihood for a vast
majority of people living in rural and tribal areas, land continues to be the pivotal property in
terms of both income and employment, around which socio-economic privileges and
deprivations revolve. Though the members of scheduled castes and tribes mostly reside in the
countryside and derive their livelihood by working on land, they are the most disadvantaged in
respect to the land. The incidence of landless is more having minuscule holdings or are
sharecroppers or other types of insecure tenants.
In India 10 percent of households are landless in 2003 while eighty percent are
marginal, the areas under them only 23 percent. On the other hand 0.6 percent households having
11.55 percent of owned land. India is a land of small farms, of peasants cultivating their ancestral
lands mainly by family labour. Although farms in India are typically are typically small
throughout the country, the average size holdings by state ranges from about 0.5 hectare in
Kerala and 0.75 hectare in Tamil Nadu to three hectare in Maharashtra and five hectare in
Rajasthan. Factors influencing this range include soils, topography, rainfall, rural population
density, and thoroughness of land redistribution programs in India. This various distribution of
land increases poverty and decreases efficiency of per capita per hectare. In this study we are
analysing the land distribution system in India among major states through a comparative study
between 48th
and 59th
round of NSSO (national sample survey organisation).
Literature review
The land reform (LR) policy was concretised for the first time in the First
Five-Year Plan (1951-56). Agrarian classes were classified into intermediaries, large owners,
small and medium owners, tenants at will and landless workers [Government of India 1951].
Special emphasis was given on the abolition of intermediaries, enactment of radical tenancy laws
and resumption of cultivation based on peasant proprietorship. The need for providing a ceiling
and lower limit to agricultural lands was recommended. The ceiling issue was later given proper
importance in the Agra session of the All India Congress Committee. Later the panel on land
reforms under Gulzarilal Nanda (1955) elaborated the method of imposition of ceiling, the unit
of ceiling fixation and the requisite precautions required to plug the loopholes of the ceiling law.

CASIRJ Volume 5 Issue 1 [Year - 2014] ISSN 2319 – 9202
International Research Journal of Commerce Arts and Science http:www.casirj.com Page 304
The panel also dealt with the question of security of tenure and introduction of co-operation in
the case of non-viable units.
Land reforms have been treated as one of the principal instruments for the
creation of an egalitarian rural society, in tune with socialistic spirit, as provided in the preamble
and under part-4 of the constitution (Directive Principles of state policy). It has also been
included in the ninth schedule to ensure speedy and unhindered implementation of various
legislative measures. However, land reform being a state subject, the legislative as well as the
administrative responsibility devolves on states, and the union government lays down only the
general guidelines. Therefore, the nature of legislative measures and their implementation and
achievement are likely to vary from state to states because they are influenced by the complex
interaction of historical necessities and socio-political and economic forces, which are largely
state or region specific. In such a context, a comprehensive and comparative analysis of the
legislative measures of various states relating to land rights of the schedule groups and their
consequent effects on land distribution is imperative as these are issues of major policy concern.
Though the question of control and use of land among the scheduled castes and tribes has not
been left of the planning commission, 48 per cent of the population of scheduled entirely out of
scientific inquiry, it has received only occasional.
Mohanty B.B. (2001), in recognition of the basic proposition that poor land
ownership position of the scheduled groups accounts largely for their perpetual poverty and
makes them vulnerable to social injustice and exploitation, the government of India has made a
systematic endeavour to protect and promote their rights with regard to control and use of land
through land reforms and allied measures. Land distribution in India closely follows social
hierarchy. While the large landowners invariably belong to the upper castes, the cultivators
belong to the middle castes and the agricultural workers largely to the scheduled castes and tribes
(Beteille 1972).
Land being the important socially valued asset, its un-equal distribution helps
maintain the hierarchical structure and strengthen the basis of dominance of the privileged
groups by perpetuating inequality and deprivation in various socio-economic spheres. Seen from
this point, the idea of fair distribution of land directly strikes at the roots of such social relations.

CASIRJ Volume 5 Issue 1 [Year - 2014] ISSN 2319 – 9202
International Research Journal of Commerce Arts and Science http:www.casirj.com Page 305
Therefore, the upper castes' landed interests have opposed the legislative measures with respect
to land redistribution through various methods (Mohanty, 2001). But when the magnitude of
resistance of the deprived people challenges the existing order or shows signs of potential threat,
the resultant change provokes reform measures. In an insensitive democracy like India, state
action is identified with people's action and people's empowerment rests on their collective
resistance and agitation. The measures to promote and protect the interests of the deprived are
not usually expected without persistent demands and protracted struggles.
Land reforms in India have been launched in response to compelling demands
expressed through agitation, struggle and movements (Dhanagare 1983, Radhakrishnan 1989).
But, land reform policy being fundamentally a political issue, the state passes legislation only to
pacify and neutralise the agrarian tension (Suri and Raghavulu 1996). In order to monitor the
implementation of such measures, the existence of strong social movements is crucial. The
entrenched dominant landowning privileged groups would never like to surrender their power
and privilege without exertion on them of mounting pressure from the deprived people.
According to census of India, (1991) 64 per cent of scheduled castes and 36 per
cent of scheduled tribes mainly workers are agricultural labourers as against 31 per cent of
others. It also reveals that 25 per cent of the scheduled castes and 55 per cent of scheduled tribes
are cultivators compared to 40 per cent of others. The poorest among the poor in the Indian
society are largely from these groups. As per the estimates castes and 51 per cent of scheduled
tribes are below poverty line.
The all India figure according to the millennium study by Chaddha, shows that
the share of scheduled castes in the total rural population, land and incidence of landlessness has
all increased. Land owned by these households has been highest in West Bengal (24 per cent).
On the other hand, for the scheduled tribes it is seen that the share in both population and land
has increased but share for incidence of landlessness has declined. Land owned by these
households has been high in Bihar, Orissa, Andhra Pradesh and west Bengal. While, the share of
non-scheduled castes and tribes has declined for both population and land but have marginally
increased for incidence of landlessness. The incidence of landlessness among the SC households

CASIRJ Volume 5 Issue 1 [Year - 2014] ISSN 2319 – 9202
International Research Journal of Commerce Arts and Science http:www.casirj.com Page 306
stood at 13.34 per cent compared with 10.54 per cent among the non-SC and ST households and
11.50 percent among the ST households.
An understanding of the pattern of ownership and operational holdings of land
is, therefore of central importance to an understanding of the agrarian class structure. Data on
landholdings in India, in particular, on ownership holdings of land have been fraught with
problems. Data from land and livestock surveys conducted decennially by the national sample
survey organisation (NSSO) are the most important source of information on distribution of
landholdings in India. As part of these surveys, detailed data are collected on ownership and
operational tenancy, nature of land use, status of irrigation, and cropping pattern. According to
the 59th
round of the land and livestock surveys, only about 10 per cent households did not own
any land (Sharma 1994, 2007; Chaddha, 2004). Primary data-based studies from most states
report a much higher level of landlessness. Also, NSS surveys themselves report much higher
level of landlessness (of order of about 40 per cent) in terms of operational holdings. Such a
large level of discrepancy between landlessness in terms of ownership holdings and landlessness
in terms of operational holdings cannot be explained by the extent of tenancy.
Framework of the present study
The present study brings out various facts of households ownership holdings
ownership holding of the countries in rural areas. It covers different aspects of ownership
holdings in terms of alternative uses to which land is put, types and terms of lease, and their
variation over size classes of ownership holdings. It also brings out the estimates of area under
household ownership holdings, average size of holding, the number and proportion of landless
households etc. In the present study size distribution, the “broad size classes” are further merged
into six size classes. The first of these, called „nil‟ relates to households that operated no land or
operated a land of area of less than 0.02 hectare during the reference period. The other five size
classes are found along the lines adopted in the agricultural census of India.

CASIRJ Volume 5 Issue 1 [Year - 2014] ISSN 2319 – 9202
International Research Journal of Commerce Arts and Science http:www.casirj.com Page 307
Broad categories of holding
Marginal: 1.000 hectare or less
Small: 1.001 - 2.000 hectare.
Semi-medium: 2.001 - 4.000 hectare.
Medium: 4.001 - 10.000 hectare.
Large: larger than 10.000 hectare.
Objectives
To examine the change in land distribution and area owned pattern among states over five
broad classes in 17 major states for 48th
and for 59th
round.
To estimate the percentage of landless households between 48th
and 59th
round.
To measure the inequality through Gini Coefficient in operational holdings between the
two rounds.
To analyze the effect of some variables on the farm land used for cultivation.
Database and methodology
The whole study is based on the reports of NSSO (national sample survey organisation) of 48th
and 59th
rounds.
Simple correlation and regression technique has been used to measure the effects of some
variables on the farm land used for cultivation.
Y = β0+β1 X1+β2 X2+β3 X3+β4 X4
Where Y is the dependent variable showing the % of farm land used for cultivation, X1 shows the % of male educated farmers, X2 shows the % of
female educated farmers, X3 shows the % irrigated area, and X4 shows the % of farmers using fertiliser on their land.
Analysis
Here, in this study we find a lot change and variation in households and area
owned by different classes of the farmers. The size of distribution of ownership holdings in India
is characterized by predominance of marginal category farmers. During 59th
round, the marginal
holdings constituted about 80% of the rural households but owned only 23% of total area. The

CASIRJ Volume 5 Issue 1 [Year - 2014] ISSN 2319 – 9202
International Research Journal of Commerce Arts and Science http:www.casirj.com Page 308
medium and large holders accounted only 3.6% of the households but had a combined share of
about 35% in the total land owned by all households in 59th
round. The proportion of marginal
households has risen, from 71.88 to 79.9 per cent during 59th
round in all India. In Kerala, it was
92.66 percent in 48th round increased to 95.3% in 59h round and areas increased from 54.5 to
60.72%. Rajasthan reported lowest marginal households in both rounds. On the other hand
decreasing trends in large households it decreases from 0.88 % to 0.66% during 59th
round and
areas decreased from 13.83% to 11.55 in all India. In Andhra Pradesh, there are 0.5% large
households but areas owned are 14.05% in 59th
round but in case of marginal households there is
82.7% having 21.78% areas. In Tamil Nadu there are 90.1% marginal households having only
33.2% area and 2.9% semi medium households having 22.09% area during 59th
round.
Findings
Findings in this study are the change in percentage of households and areas owned
between 48th
and 59th
rounds. We find that the percentage of all type of households is decrease
except marginal households, in marginal households (7.72) it is increasing trends between 48th
round and 59th
rounds at all India level. The owned area is decreasing also except marginal and
small. The percentage of small households (-2.62) is decreasing but percentage of owned area is
increases (1.79). There is decreasing trend also in large households in all states except Andhra
Pradesh and increasing trends in percentage of marginal households in all states. The rate of
growth in percentage is highest in Karnataka (12.28) and lowest in Kerala (2.67) in marginal
households. The percentage of semi medium household is decreasing an all the states, the
percentage of areas owned are also decreasing in all the states except Maharashtra (0.83) and
Orissa (5.34) in the same category. The percentage of medium households and areas owned by
them is decreasing in all states except Karnataka (2.9 acres) and Gujarat (7.13 acres) is increase.

CASIRJ Volume 5 Issue 1 [Year - 2014] ISSN 2319 – 9202
International Research Journal of Commerce Arts and Science http:www.casirj.com Page 309
Table -1 Changes in different categories of households and their respective areas in all major states (in
%)
change in households change in area
states marginal small
semi
medium medium large marginal small
semi
medium medium large
AP 6.29 -3.25 -2.16 -0.78 0.11 0.57 -2.49 -2.99 -1.15 5.99
ASSAM 4.11 -0.62 -2.69 -0.63 -0.08 6.37 5.8 -6.7 -4.21 -1.3
BH 8.84 -4 -3.3 -1.44 -0.1 13.49 1.45 -5.92 -9.12 0.19
GJ 9.97 -3.28 -4.99 -1.12 -0.67 4.05 0.61 -5.82 7.13 -6
HR 18.16 -3.69 -10.49 -3.63 -0.37 5.19 2.4 -8.92 -3.03 4.35
HP 4.53 -0.05 -2.33 -2.08 -0.15 8.81 7.67 -1.8 -12.05 -2.6
J&K 14.1 -8.88 -4.25 -1.18 0.2 10.74 -7.91 -6.3 -4.11 7.58
KT 12.28 -4.17 -6.15 -1.18 -0.78 5.6 1.1 -4.64 2.9 -5
KE 2.64 -1.82 -0.76 -0.04 -0.02 6.21 -3.06 -3.54 0.83 -0.7
MP 9.32 -1.19 -4.1 -3.24 -0.78 4 3.58 0.83 -4.13 -4.3
MH 9.53 -1.09 -3.14 -4.04 -1.25 5.36 4.96 5.34 -6.08 -9.6
OR 10.35 -4.72 -3.64 -1.5 -0.02 15.15 -0.1 -6.27 -8.1 -0.6
PB 6.67 -0.48 -4.31 -2.01 -0.08 1.98 3.28 -4.91 -3.54 3.09
RJ 10.7 -2.03 -3.71 -3.79 -1.27 3.84 1.15 -0.29 -3.15 -1.6
TN 2.97 -2.31 -0.91 0.28 -1.11 -0.07 -3.14 -2.06 8.42 -3
UP 6.6 -2.43 -3.12 -1.16 -0.11 7.47 2.5 -5.08 -3.49 -1.4
WB 6.18 -3.78 -2.54 -0.51 0 16.94 -2.4 -11.1 -3.6 0
All
India 7.72 -2.62 -3.28 -1.54 -0.28 6.12 1.79 -2.6 -2.99 -2.3
Source: Calculated from reports of 48th and 59th rounds of NSSO
Through Gini coefficient we measure the degree of concentration of size
distribution of holdings; it shows a change in 59th
round in many states from the previous 48th
round. In the table the values of Gini coefficient shows a decreasing trend or can say low values
for many states except some agriculturally developed states like Punjab and Haryana, which are
showing a high value from 0.694 to 0.706 and 0.645 to 0.675 respectively for the states in 48th
and 59th
rounds.

CASIRJ Volume 5 Issue 1 [Year - 2014] ISSN 2319 – 9202
International Research Journal of Commerce Arts and Science http:www.casirj.com Page 310
Table-2 Gini Coffecient of selected states
States AP ASSAM BH GJ HR KT KE MP MH OR PB RJ TN UP WB All
India
48th 0.53 0.41 0.53 0.57 0.65 0.58 0.39 0.53 0.57 0.46 0.69 0.59 0.53 0.5 0.43 0.591
59th 0.54 0.37 0.42 0.61 0.68 0.54 0.35 0.53 0.53 0.38 0.71 0.61 0.51 0.45 0.313 0.557
Source: Calculated from reports of 48th and 59th rounds of NSSO
Source: Calculated from reports of 48th and 59th rounds of NSSO
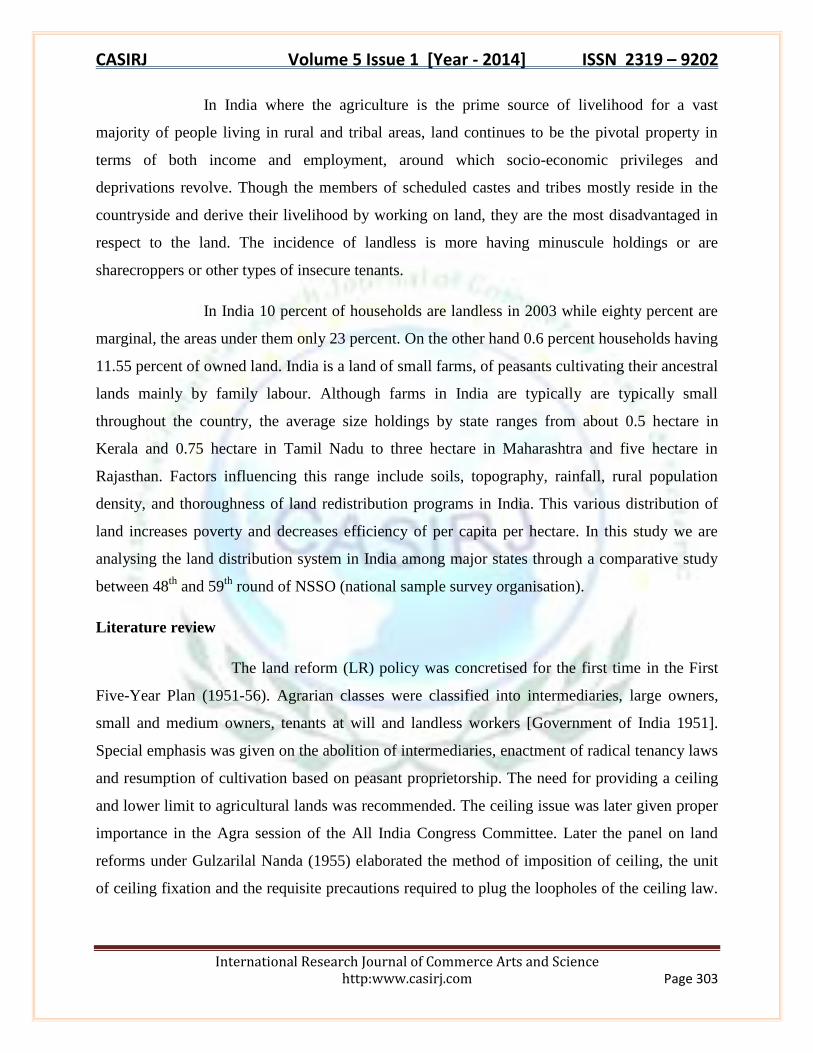
Another finding shows the trends in landless households between 48th
and 59th
rounds. The 59th
round shows that there is decreasing trends in landless households; the
percentage of landless householders has decreased from 11.3% to 10% in 59th
round at India
level. In Assam, Bihar, Gujarat, Kerala, Madhya Pradesh, Orissa, Punjab, Rajasthan, Tamil
Nadu, Uttar Pradesh, and west Bengal, the proportion of landless has decreased in 59th
round.
Andhra Pradesh, Haryana, Jammu Kashmir and Karnataka are the states in which the proportion
of landless households has increased. Haryana (5.5) is the state in which proportion of increasing
trends in landless households is highest followed by the Himachal Pradesh (4.6) and Karnataka
(4.1). In west Bengal (-4.8) there is sharply decreasing trend in landless households.
Table-3 Changes in proportion of landless households
States AP ASSAM BH GJ HR HP J&K KT KE MP MH OR PB RJ TN UP WB
All
India
48th 12 13.4 8.6 16.3 3.7 10.4 2.8 10 8.4 15.2 19.6 13.8 5.9 6.4 17.9 4.9 11 11.3
59th 14 8.1 7.6 13.6 9.2 15 3.3 14.1 4.8 12.1 17.7 9.6 4.6 5.7 16.6 3.8 6.2 10
%
change 2.4 -5.3 -1 -2.7 5.5 4.6 0.5 4.1 -4 -3.1 -1.9 -4.2 -1.3 -0.7 -1.3 -1.1 -4.8 -1.3
Source: Calculated from reports of 48th and 59th rounds of NSSO
0
0.2
0.4
0.6
0.8
Gini cofficient
48th
59th
CASIRJ Volume 5 Issue 1 [Year - 2014] ISSN 2319 – 9202
International Research Journal of Commerce Arts and Science http:www.casirj.com Page 311
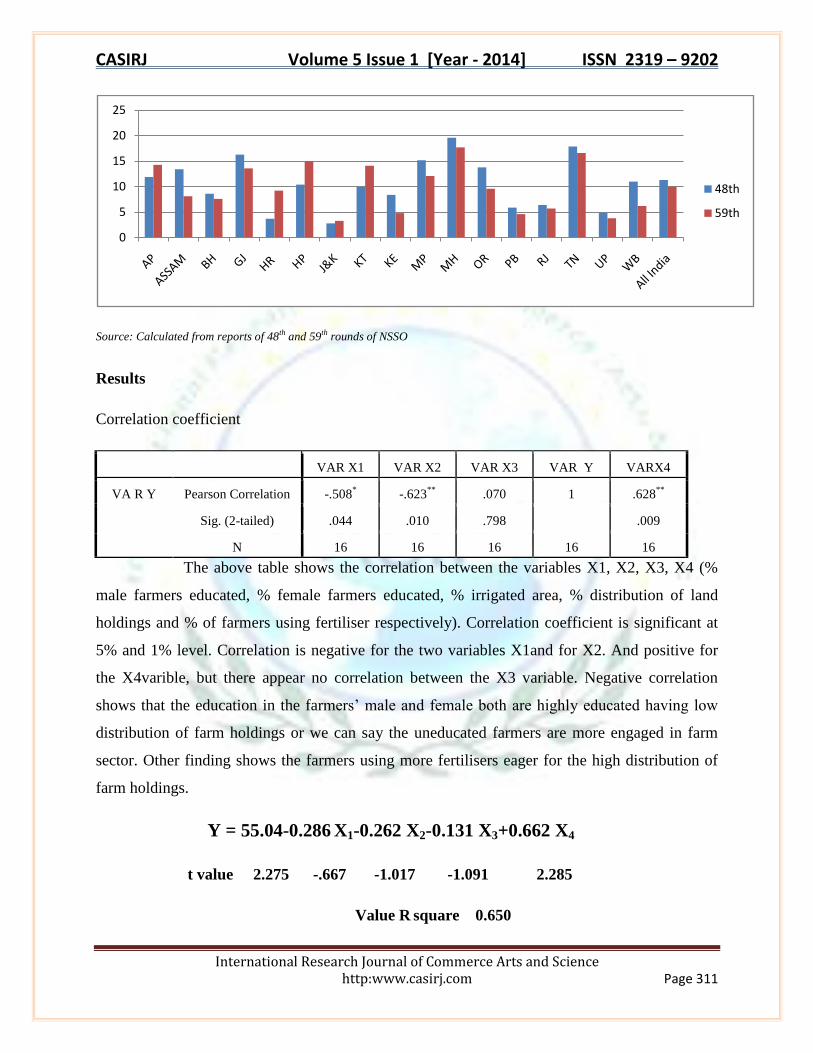
Source: Calculated from reports of 48th and 59th rounds of NSSO
Results
Correlation coefficient
VAR X1 VAR X2 VAR X3 VAR Y VARX4
VA R Y Pearson Correlation -.508* -.623
** .070 1 .628
**
Sig. (2-tailed) .044 .010 .798
.009
N 16 16 16 16 16
The above table shows the correlation between the variables X1, X2, X3, X4 (%
male farmers educated, % female farmers educated, % irrigated area, % distribution of land
holdings and % of farmers using fertiliser respectively). Correlation coefficient is significant at
5% and 1% level. Correlation is negative for the two variables X1and for X2. And positive for
the X4varible, but there appear no correlation between the X3 variable. Negative correlation
shows that the education in the farmers‟ male and female both are highly educated having low
distribution of farm holdings or we can say the uneducated farmers are more engaged in farm
sector. Other finding shows the farmers using more fertilisers eager for the high distribution of
farm holdings.
Y = 55.04-0.286 X1-0.262 X2-0.131 X3+0.662 X4
t value 2.275 -.667 -1.017 -1.091 2.285
Value R square 0.650
0
5
10
15
20
25
48th
59th

CASIRJ Volume 5 Issue 1 [Year - 2014] ISSN 2319 – 9202
International Research Journal of Commerce Arts and Science http:www.casirj.com Page 312
The value of R square shows that explanatory variables are well captured by
dependent variable. This high value shows high association between the dependent and
explanatory or independent variable. But there is negative coefficient for the X1, X2 and X3
variables. So association is negative for the X1, X2, and X3 variables it shows these variables are
affecting negatively to the dependent variable. Only the X4 variable shows the positive
association between the dependent and independent X4 variable.
Major findings
Percentage of marginal, small and semi medium households has decreased in all states.
Percentage of large households has decreased in all states excluding Andhra Pradesh and
Tamil Nadu.
Percentage of marginal areas owned has increased except Tamil Nadu.
Medium area owned has decreased in all states except Gujarat, Kerala, Karnataka, and
Tamil Nadu.
Large areas owned have decreased in all the states except Andhra Pradesh, Bihar,
Haryana, Punjab, and Tamil Nadu.
Values of Gini coefficient also show decreasing trends except some agricultural rich
states like Punjab, Haryana, and few marginal in Gujarat and Rajasthan.
Percentage of landless households has decreased from 11.40 % to 10%.
Coefficient of correlation shows negative values for the % male farmers educated and for
female educated farmers but shows a positive relation between operation farm holdings
and farmers using of fertilisers.
Regression value shows the negative association between the all variables taken under
study except the % of farmers using fertilisers in their farms.
Conclusion
After studying and analysing the major findings we can conclude that farm
percentage of operational households has decreased between two rounds in all India except some
few states. But percentage area holding has decreased for few states in few categories. Gini
coefficient showing concentration also showing a decreasing trend in all India except some farm

CASIRJ Volume 5 Issue 1 [Year - 2014] ISSN 2319 – 9202
International Research Journal of Commerce Arts and Science http:www.casirj.com Page 313
rich states. Correlation and regression shows negative relation which express the distribution of
farm holding is high among the uneducated farmers not in the educated farmers. Still the
agriculture farmers are highly uneducated.
References
Bandyopadhyay D., (1986), “Land Reforms in India: An Analysis”, Economic and Political
Weekly, vol. 21, No. 25/26, pp.A50-A56.
Bandyopadhyay Rekha, (1993), “Land System in India: A Historical Review”, Economic and
Political Weekly, Vol. 28, No. 52, pp. A149-A155.
Beteille, A. (1972), “Inequality and Social Change”, Bombay: Oxford University Press
Chaddha, G.K., S Sen and H.R. Sharma (2004): Land resources: State of Indian Farmer,
Academic Foundation, New Delhi. Economic and Political Weekly, Vol. 36, No. 40, pp. 3857-
3868.
Dhanagare, D.N. (1983). Peasant Movements in India, c.1920-1950, Delhi: Oxford University
Press.
Mohanty B. B., (2001), “Land Distribution among Scheduled Castes and Tribes”.
National Sample Survey Organisation (1992), “Land and Livestock Holding Survey”, Ministry of Statistics and Program Implementation, Government of India.
National Sample Survey Organisation (2003), “Some Aspects of Operational Land Holdings in
India”, Ministry of Statistics and Program Implementation, Government of India.
Prasad Sakti, Padhi and K. N. Nair, (2007), “Dynamics of Land Distribution: An Alternative Approach
and Analysis with Reference to Kerala”, Economic and Political Weekly, Vol. 28, No. 12/13, pp. A29-
A36.
Radhakrishnan, P. (1989). “Peasant Struggles, Land Reforms and Social Change: Malabar
1836-1982”, New Delhi: Sage.
Sharma, H.R., (1994), “Distribution of Land Holdings in Rural India, 1953-54 to 1981-82”,
Economic and Political Weekly, Vol. 29, No. 39, pp. A117-A128.
Suri K.C and C.V Raghavulu (1996), “Agrarian Movements and Land Reforms”. Land Reforms
in India (vol.3): Andhra Pradesh-People’s Pressure and Administrative Innovations. Ed. B.N
Yugandhar. Sage Publication India.

CASIRJ Volume 5 Issue 1 [Year - 2014] ISSN 2319 – 9202
International Research Journal of Commerce Arts and Science http:www.casirj.com Page 314
Appendix
Table-4 Changes in different categories of households and their respective areas in all major states (in %)
PERCENTAGE CHANGE IN HOUSEHOLDS
Percentage change in area
marginal small
semi
medium medium large all marginal small
semi
medium medium large all
AP 2003 82.7 9.1 5.3 2.6 0.5 100 21.9 20 21.2 22.9 14.1 100
1992 76.4 12.4 7.46 3.38 0.39 100 21.3 22.4 24.2 24.1 8.06 100
ASSAM 2003 81.8 14.2 3.6 0.5 0 100 44.4 34.9 16.4 4.32 0 100
1992 77.7 14.8 6.29 1.13 0.08 100 38.1 29.1 23.1 8.53 1.29 100
BH 2003 89.4 7.1 2.7 0.7 0.1 100 42.1 25.3 18.5 9.56 4.63 100
1992 80.6 11.1 6 2.14 0.2 100 28.6 23.8 24.5 18.7 4.44 100
GJ 2003 73.3 11.9 7.2 6.5 1 100 13.6 16.1 19 39.1 12.3 100
1992 63.3 15.2 12.2 7.62 1.67 100 9.55 15.4 24.8 32 18.2 100
HR 2003 77.2 9.8 7.7 4.9 0.4 100 13.2 15.8 24.6 34.1 12.3 100
1992 59 13.5 18.2 8.53 0.77 100 7.96 13.4 33.5 37.2 7.91 100
HP 2003 83.7 11.5 4.1 0.5 0.1 100 43.8 28 19.8 6.45 2.03 100
1992 79.2 11.6 6.43 2.58 0.25 100 35 20.4 21.6 18.5 4.6 100
J&K 2003 77.5 15 5.6 1.7 0.2 100 36.3 25.5 19.5 11.1 7.58 100
1992 63.4 23.9 9.85 2.88 0 100 25.5 33.4 25.8 15.2 0 100
KT 2003 71 14.1 8.8 5.4 0.7 100 16.7 19.5 23.2 29.5 11.2 100
1992 58.7 18.3 15 6.58 1.48 100 11.1 18.4 27.8 26.6 16.2 100
KE 2003 95.3 3.5 0.9 0.3 0 100 60.7 21.1 10.8 7.16 0 100
1992 92.7 5.32 1.66 0.34 0.02 100 54.5 24.2 14.3 6.33 0.66 100
MP 2003 61.7 18 12.1 7.1 1.1 100 11.6 19.1 25.8 31.3 12.3 100
1992 52.4 19.2 16.2 10.3 1.88 100 7.61 15.5 25 35.4 16.6 100
MH 2003 69 13.1 12 5.1 0.8 100 12.4 17.6 30.9 27.4 11.8 100
1992 59.5 14.2 15.1 9.14 2.05 100 7.02 12.6 25.5 33.4 21.4 100
OR 2003 85.5 9.7 3.7 0.9 0.1 100 41.5 27.1 19.7 9.98 1.78 100
1992 75.2 14.4 7.34 2.4 0.12 100 26.4 27.2 26 18.1 2.4 100
PB 2003 76.3 9.5 7.9 5.1 1 100 9.16 15.6 25.3 34.5 15.3 100
1992 69.6 9.98 12.2 7.11 1.08 100 7.18 12.4 30.2 38 12.2 100
RJ 2003 55.2 16.5 14 10.1 4.1 100 9.26 11.2 18.6 28.4 32.5 100
1992 44.5 18.5 17.7 13.9 5.37 100 5.42 10 18.9 31.6 34.1 100
TN 2003 90.1 5.7 2.9 1.2 0 100 33.2 23.1 22.1 20.6 1.23 100
1992 87.1 8.01 3.81 0.92 1.11 100 33.3 26.2 24.2 12.2 4.18 100
UP 2003 81 12.3 4.8 1.6 0.1 100 34.9 27.4 20.7 14.7 2.34 100
1992 74.4 14.7 7.92 2.76 0.21 100 27.4 24.9 25.8 18.1 3.73 100
WB 2003 92.1 5.7 1.4 0.2 0 100 58.2 25.7 11.9 4.02 0 100
1992 85.9 9.48 3.94 0.71 0 100 41.3 28.1 23 7.62 0 100
ALL INDIA 2003 79.6 10.8 6 3 0.6 100 23.1 20.4 22 23.1 11.6 100
1992 71.9 13.4 9.28 4.54 0.88 100 16.9 18.6 24.6 26.1 13.8 100
Source: Calculated from reports of 48th and 59th rounds of NSSO

CASIRJ Volume 5 Issue 1 [Year - 2014] ISSN 2319 – 9202
International Research Journal of Commerce Arts and Science http:www.casirj.com Page 315
Table-5
variables x1 x2 X3 y X4
States
% MALE
farmer
educated
% female
farmer
educated
%
irrigated
area
%distribution of
holdings for
cultivation
% of farmer
households using
fertilisers
AP 47.9 20.7 26.5 61.45 55.5
ASSAM 85.3 71.4 8.5 71.8 57.5
BH 62 15.6 72 81.2 90
GJ 73.1 37.6 30.5 59.7 59.5
HR 73.6 31.3 75 55.6 57.5
J&K 56.3 31.2 21 86.25 86.5
KT 64.6 34.2 21 53.95 60
KE 93.8 85.4 21.5 18.2 55.5
MP 59.3 22.2 33 74.55 55.5
MH 74.2 45.7 25 67.55 61
OR 63.6 22.2 14 61.45 45.5
PB 63.5 48.1 94.5 49.65 54.5
RJ 51.9 15.4 17.5 60.5 47
TN 71.2 43 51 50.45 51
UP 60.4 18.9 73 82.8 83
WB 73.4 13.7 46.5 71.85 80.5