Changes in lipids and their contribution to the taste of migaki-nishin (dried herring fillet) during...
27
Instructions for use Title Changes in lipids and their contribution to the taste of migaki- nishin (dried herring fillet) during drying Author(s) Shah, A. K. M. Azad; Tokunaga, Chikara; Kurihara, Hideyuki; Takahashi, Koretaro Citation Food Chemistry, 115(3): 1011-1018 Issue Date 2009-08-01 Doc URL http://hdl.handle.net/2115/42986 Right Type article (author version) Additional Information Hokkaido University Collection of Scholarly and Academic Papers : HUSCAP
-
Upload
independent -
Category
Documents
-
view
3 -
download
0
Transcript of Changes in lipids and their contribution to the taste of migaki-nishin (dried herring fillet) during...

Instructions for use
Title Changes in lipids and their contribution to the taste of migaki-nishin (dried herring fillet) during drying
Author(s) Shah, A. K. M. Azad; Tokunaga, Chikara; Kurihara, Hideyuki;Takahashi, Koretaro
Citation Food Chemistry, 115(3): 1011-1018
Issue Date 2009-08-01
Doc URL http://hdl.handle.net/2115/42986
Right
Type article (author version)
AdditionalInformation
Hokkaido University Collection of Scholarly and Academic Papers : HUSCAP

1
Changes in lipids and their contribution to the taste of migaki-nishin (dried herring fillet)
during drying
A. K. M. Azad Shah a, *
, Chikara Tokunaga b, Hideyuki Kurihara
a, and Koretaro Takahashi
a
a Division of Marine Life Science, Graduate School of Fisheries Sciences, Hokkaido University, 3-1-1
Minato-cho, Hakodate, Hokkaido 041-8611, Japan
b Food Creation Center, Kyowa Hakko Food Specialties Co. Ltd., 4041, Ami-machi, Inashiki-gun,
Ibaraki 300-0398, Japan
Running title: Changes in lipids and their contribution to the taste of migaki-nishin
*Corresponding author: Tel.: +81-138-40-5562; Fax: +81-138-40-5560
E-mail: [email protected] (A. K. M. Azad Shah)

2
Abstract
This study was conducted to investigate the changes in lipids and their effect on the taste of
migaki-nishin during drying. Lipid was extracted from herring fillets on different drying stages to
measure the degree of lipid oxidation and changes in lipid composition, and fatty acid profile. Peroxide
value, carbonyl value and acid value of the lipids were significantly increased (P < 0.05) during the
drying period. Marked increase in free fatty acids, with decreases in triglyceride and phospholipid
content were observed in proportion to drying time and this result suggested that hydrolysis was
induced by lipases and phospholipases. The decreases in polyunsaturated fatty acids (PUFAs),
especially eicosapentaenoic acid (EPA) and docosahexaenoic acid (DHA), were observed in the total
lipids and phospholipid fraction. In addition, significant increase in PUFAs especially DHA was found
in the free fatty acid fraction. Sensory evaluation showed that an addition of DHA to mentsuyu
significantly (P < 0.05) enhances the intensities of thickness, mouthfulness and continuity. These
results suggest that during drying period lipid oxidation was not only occurred but also lipolysis
predominantly released DHA, which might have a contribution to kokumi enhancement of
migaki-nishin.
Key words: Migaki-nishin; lipid oxidation; lipolysis; phospholipid; DHA; taste; kokumi
1. Introduction
In Asia, particularly Japan, China, Korea, Taiwan and Singapore, there is a high market demand
for dried seafood products, such as horse mackerel, salmon, cod, herring, flounder, scallops, squid,
and skate wings. The consumer preference of these products not only their traditionally desirable
taste and flavour, but also their high content of ω-3 polyunsaturated fatty acids especially in fish lipids.
These fatty acids seem to have various health benefits, such as decreasing the risk of stroke,
reducing serum triacylglycerol levels, reducing blood pressure, and insulin resistance and modulating
the glucose metabolism (Li, Bode, Drummond & Sinclair, 2003). On the other hand, intake of lipid

3
oxidation products are the major causes of many pathological effects such as ageing, heart disease,
cancer, and brain dysfunction (Kinsella, 1987).
Lipid is an important component, determining both functionality and sensory properties of
processed fish products. Depending on the content, composition, and properties, lipids as well as their
fatty acids, contribute to a wide range of quality attributes. The changes in lipid during processing,
such as lipolysis and lipid oxidation in fish muscle are associated with quality deterioration
(Pacheco-Aguilar, Lugo- Sánchez & Robles- Burgueńo, 2000). Moreover, lipolysis induced by lipases
and phospholipases, produces fatty acids that undergo further oxidation to produce low-molecular
weight compounds that are responsible for the rancid off-flavour and taste of fish and fish products
(Toyomizu, Hanaoka & Yamaguchi, 1981). It has been reported that volatile compounds produced by
lipid oxidation, which are primarily responsible for the development of typical flavour during ripening of
anchovy (Triqui & Reineccius, 1995). Much of the literature has concentrated on degradation of lipid
and the effects of storage on fish flavour due to the highly unsaturated nature of fish polyunsaturated
fatty acids (Kawai, 1996; Alasalvar, Anthony Taylor & Shahidi, 2005). However, little is known
regarding the changes in lipids that occurred during drying in fish, which ultimately contribute to the
development of characteristic taste and flavour of the final products.
Fatty fish, especially herring (Clupea harengus) is rich in long-chain polyunsaturated fatty acids,
which make them susceptible to oxidation (Undeland, Hall & Lingnert, 1999). Furthermore, herring
appears to have higher oxidation rates than other fish species, perhaps due to higher activity of
enzymatic oxidation (Hultin, 1988). Consequently, the development of lipid oxidation often limits the
possibilities for storage and processing of this species. In Japan, processing of herring (Clupea
pallasei) fillets are usually carried out by drying under controlled conditions. Dried herring fillets are
also known as migaki-nishin in Japan. It is widely used as an ingredient in savoury dishes including
noodles. Although, the primary purpose of drying is preservation, but, at the same time, the drying
continues, the product develops characteristic taste and flavour (unpublished data). However, the
relationship between lipolysis and lipid oxidation on the development of migaki-nishin taste still

4
remains unclear. Therefore, the aim of this study was to investigate the changes in lipids and their
effect on the characteristic taste and flavour of migaki-nishin during drying.
2. Materials and methods
2.1. Migaki-nishin samples
Migaki-nishin was obtained from Iwasaki Suisan Ltd. Hakodate, Japan. Samples were collected
from different drying stages (2, 4, 6, 8 and 10 days). Frozen herring captured at the coast of
Kamchatka Peninsula, Russia in October 2006, which was subjected to the processing. Herring fillets
were dried by using a huge electric fan. Room temperature and relative humidity were maintained at
approximately 17 °C and 45%, respectively.
2.2. Chemicals
Trimethylsilyl diazomethane was purchased from Aldrich Chemical Co., Inc. USA. Sodium
thiosulfate, potassium hydroxide, 2,4-dinitrophenylhydrazine (2, 4-DNPH) were purchased from Wako
Pure Chemical Industries Ltd., Osaka, Japan. All other chemical solvents were of analytical or HPLC
grade.
2.3. pH value measurement
To determine pH value, 10 g of each sample was homogenized with 10-fold volume of distilled
water and the pH was measured directly by using a pH meter (Beckman Instruments, Inc., Fullerton,
CA, USA).
2.4. Lipid extraction
Total lipids were extracted from migaki-nishin samples with a solvent combination of chloroform:
methanol: distilled water according to the method of Bligh and Dyer (1959) with slight modification

5
making those final ratios 10:5:3, v/v/v. The extracted lipid was redissolved in chloroform and stored
under argon gas in dark at –50 °C until further analysis.
2.5. Peroxide value measurement
Peroxide value of the extracted lipid was measured according to AOAC (1995) and was
expressed as meq/kg of lipid.
2.6. Carbonyl value measurement
Carbonyl value was determined by using a modified method described by Endo et al. (2003). In
brief, 2, 4-DNPH solution was prepared by dissolving 50 mg of 2, 4-DNPH in 100 mL 1-BuOH
containing 3.5 mL concentrated HCl. Lipid sample (20–200 mg) was weighed into a 10 mL volumetric
flask and filled with 1-BuOH. One millilitre of lipid solution was transferred in a 15 mL test tube, and
then mixed with 1 mL of 2, 4-DNPH solution. The test tube was stoppered and incubated at 40°C for
20 min. The test tube was cooled, then 8 mL of 8% KOH in 1-BuOH was added, and centrifuged (5
min, 2000 × g). The absorption of the upper phase was measured at 420 nm with a Hitachi U-2000
spectrophotometer (Hitachi, Ltd. Tokyo, Japan). The concentration of carbonyl compound in the lipid
samples was calculated from a standard calibration curve generated with known amounts of
n-octylaldehyde and the value was expressed as µM/g lipid.
2.7. Measurement of oxidized fatty acid in lipids
Oxidized fatty acid contents in lipids were analyzed according to the method described by Nonaka
(1957). Briefly, 2-3 g of lipid sample was saponified with alcoholic potassium hydroxide following the
standard procedure given in AOAC (1995). After evaporating alcohol, resulting soap was dissolved in
hot water and transferred to a separatory funnel, and then decomposed with HCl. After cooling, the
liquid was shaken with n-hexane and allowed to stand until separated completely into two clear layers.
The insoluble oxidized fatty acid was found to adhere to the side of the funnel or forming sediment in

6
the n-hexane layer. The aqueous layer was poured off first then n-hexane layer was poured off
through filter, and the oxidized fatty acid was washed with n-hexane to remove residual fatty acids.
The oxidized fatty acid was dissolved in warm methanol, evaporated and the residue was then dried
until the weight remains constant.
2.8. Determination of acid value
Acid value was determined according to AOAC (1995). Acid value was analyzed by titration of
approximately 0.5 g of lipid, dissolved in a mixture of 100 mL of ethanol and diethyl ether (1:1; v/v),
with 0.01N potassium hydroxide. Phenolphthalein was used as indicator. The results were expressed
as mg KOH/g lipid.
2.9. Fractionation of total lipids
Polar lipids (PL) and non-polar lipids (NL) were separated from the total lipids by using Sep-Pak
Vac 12cc Silica Cartridges (Waters Corporation, Milford, MA, USA) as described by Juaneda and
Rocquelin (1985). The lipid samples (200 mg of total lipid) were loaded on the top of the cartridges.
Then non-polar and polar lipids were eluted with chloroform and methanol respectively, in sequential
order.
2.10. Lipid class composition analysis
The lipid class compositions of non-polar lipids were determined by using a commercial silica gel
60F254 (Merck KGaA, Darmstadt, Germany) thin-layer chromatograph (TLC) plate using a single step
development system consisting of n-hexane: diethyl ether: acetic acid (80:20:1, v/v/v). The plate was
sprayed with 50% H2SO4 and heated at 150–160 °C for 15 min. Each spot was identified by authentic
lipid standards and then lipid compositions were analyzed by using scanner and Scion Image software
(Scion Corporation, Frederick, Maryland, USA).

7
2.11. Analysis of fatty acid composition
Fatty acid methyl ester (FAME) was derived from the total lipids, triglyceride and phospholipid
fraction of migaki-nishin lipids according to the protocol of Prevot and Mordret (1976). In brief, dried
lipid samples were dissolved in 1 mL n-hexane, and 0.2 mL of methanolic 2N-NaOH solution was
added. The mixture was shaken and kept at 50 °C for 20 seconds and then 0.2 mL of methanolic
2N-HCl solution was added. The n-hexane layer was collected, concentrated and subjected to gas
chromatographic analysis with a Hitachi 163 Gas Chromatograph (Hitachi, Ltd. Tokyo, Japan)
connected with a PEG-20M liquid phase-coated G-300 column (1.2 mm i.d. × 40 m, 0.5 µm;
Chemicals Evaluation and Research Institute, Saitama, Japan) with flame ionization detection. The
temperature of the column, detector and injector were 170, 250 and 240 °C, respectively. The fatty
acids were identified by comparing the peak retention times with authentic standards (GL Sciences
Inc. Tokyo, Japan) and by following the theory of linear relationship between the carbon number unit
or the number of double bonds of fatty acid and logarithm of the corresponding retention times.
Fatty acid methyl ester of free fatty acid (FFA) fraction was prepared by using trimethylsilyl
diazomethane. In brief, dried FFA sample was dissolved in 1 mL of methanol and then trimethylsilyl
diazomethane was added slowly until bubble was disappeared. The solutions were left for 30 min at
room temperature and then evaporated for dryness. The FAME was then dissolved in n-hexane and
subjected to gas chromatographic analysis as described above.
2.12. Sensory evaluation
Sensory evaluation was carried out by adding migaki-nishin lipid or DHA in the mentsuyu (a
Japanese noodle soup) following the modified method of Ueda, Yonemitsu, Tsubuku and Sakaguchi
(1997). Mentsuyu was consisted of 35% soy sauce, 8% “Nishi ki Aji 200” (brewed rice), 3.7% “Sudashi
J-1” (dried bonito and mackerel extract), 5% highly concentrated “Katsuoconku” (dried bonito extract),
0.5% highly concentrated “Kombuekisu” (kelp extract), 2% sugar, 10% F-80 (fructose corn syrup),
1.21% salt and 34.59% water. It was diluted with 6 volumes of distilled water and then subjected to
8
sensory evaluation. Migaki-nishin lipid (2.10%) or DHA (0.10%) (maintaining the same amount of
DHA) was dissolved in mentsuyu and then warmed to 60 °C in a water bath. To dissolve lipid or DHA
homogenously in the mentsuyu, 0.01% ethanol was also added. Sensory evaluation was performed in
separated sensory booths. The panelists were asked to judge the intensities of the test samples using
a scale of 17, where 3 points was given to the control solution. The test samples were awarded
points on the basis of saltiness, umami, thickness, mouthfulness and continuity. The panel was
composed of five trained assessors from the Food Creation Center, Kyowa Hakko Food Specialties
Co. Ltd., Ibaraki, Japan.
2.13. Statistical analysis
All measurements were carried out in triplicate and the results expressed as mean ± standard
deviation. Data were subjected to one-way analysis of variance (ANOVA) followed by Duncan’s
multiple range test to identify differences among the means at P<0.05 using Statgraphics version 7.0
for Windows (StatPoint, Inc., Virginia, USA). The Q value examination was also performed to minimize
the error (Dean & Dixon, 1951). For sensory evaluation analysis, t-test was carried out to determine
significant differences between test samples and control (Steel & Torrie, 1980).
3. Results and discussion
3.1. Changes in pH
Changes in pH of migaki-nishin during drying are shown in Fig. 1. The pH value was slightly
decreased from 6.79 to 6.42 during the drying period, which might be due to increasing of free fatty
acids that were produced by lipolysis. These results are in agreement with those reported by
Nakagawa, Noto, Yasokawa and Kamatani (2007), whom reported that pH was decreased from 6.50
to 6.35 during industrial soft drying of herring fillets. They also stated that decrease in pH correlates
with the production of lactic acids and the largest increase of Staphylococcus, which might improve

9
the quality and by optimizing microorganism growth as well as preventing deterioration of soft dried
migaki-nishin.
3.2. Lipid oxidation
Lipid peroxidation, corresponding to the oxidative deterioration of polyunsaturated fatty acids in
fish muscle, leads to the production of off-flavour and off-odour, thereby shortening the shelf-life of
food (Ramanathan & Das, 1992). Peroxide value of migaki-nishin lipid was increased rapidly from
5.52 to 11.86 meq/kg within 4 days of drying and then gradually increased up to 10 days of drying
(16.07 meq/kg) (Fig. 2A). However, the peroxide values observed in the present study were in
acceptable limits (PV ≤ 20 meq/kg fish lipid) (Connell, 1995). Pacheco-Aguilar et al. (2000) also
observed an increase in peroxide value of Monterey sardine muscle during storage at 0 °C for 15 days.
Moreover, lipid hydroperoxides are readily decomposed into a wide range of carbonyl compounds,
hydrocarbons, ketones, and other materials that contribute to off flavour of foods (Frankel, 1991).
Therefore, the accumulation of secondary oxidation products was measured by determining the
carbonyl compounds. Carbonyl value was varied between 4.66 and 7.27 µM/g lipid, which was initially
decreased within 4 days and then increased significantly up to 10 days of drying (Fig. 2B). The
decrease in carbonyl value at day 4 was probably due to the decomposition of carbonyl compounds or
the interaction with muscle proteins. However, these results are in agreement with those of Takiguchi
(1999), who reported that the carbonyl value in pulverized niboshi increased gradually from 0 to 10
meq/kg lipid during storage at –20 °C for 60 days.
Oxidised fats are undesirable components of human diets. The most potential sources of oxidised
fat in the diet are oily fish and high fat foods that produce during processing or cooking. Oxidised fatty
acid contents of lipids were ranged from 0.56% to 1.13%, which was increased significantly up to 4
days drying then slightly thereafter (Fig. 2C). However, there was no significant increase of oxidised
fatty acid found from 4 days to 10 days lipid. This result indicated that rusting developed in
migaki-nishin during the drying period. Takiguchi (1988) reported that oxidised fatty acid contents

10
were increased during drying with subsequent storage of niboshi and niboshi powder. He also found
that increasing rate of oxidised fatty acid contents in non-smoked control were higher than those of
samples smoked for 60 or 360 min.
In addition to oxidative changes in lipid, acid value was measured to determine the degree of
lipolysis in migaki-nishin. Hydrolysis of glycerol-fatty acid esters is one of the important changes that
occur in fish muscle lipids during postmortem with the release of free fatty acids. This is catalysed by
lipases and phospholipases (Pacheco-Aguilar et al. 2000). Acid value was ranged from 11.20 to 18.94
mg KOH/g of lipid, which was increased significantly (P < 0.05) in various extents during the drying
period (Fig. 2D). An increasing of acid value suggested that free fatty acids might be released by
partial hydrolysis of lipids during drying of migaki-nishin.
3.3. Changes in lipid composition during drying of migaki-nishin
Changes to the lipids during drying of migaki-nishin may greatly influence the characteristic taste
and flavour of the final product. Based on dry weight, total lipid content in migaki-nishin was ranged
between 39.05% and 41.22% (Table 1). The content of total lipids were similar to those reported for
Icelandic herring caught in autumn (Gudmundsdóttir & Stefánsson, 1997). During drying, lipid content
was slightly decreased in the 10 days drying sample. However, no significant changes were observed
in the total lipids throughout the drying period. Aro, Larmo, Backman, Kallio and Tahvonen (2005)
reported that the lipid content of pickled herring decreased significantly from 13.8% to 11.5% during
12 months of storage.
Table 1 shows that triglyceride (TG) is the major lipid class, followed by free fatty acid (FFA),
phospholipids (PL), cholesterol and diglyceride. With the increasing of drying time, triglyceride and
phospholipid content were decreased while FFA content was significantly increased (P < 0.05). This
result suggested that the hydrolysis of TG and PL might take place, caused by lipases or
phospholipases. Hernández-Herrero, Roig-Sagués, López-Sabater, Rodríguez-Jerez and
Mora-Ventura (1999) found that free fatty acid contents increased gradually during the ripening of

11
salted anchovies. They also reported that salting did not inhibit the action of lipases responsible for
the liberation of free fatty acids. However, during separation of neutral lipids and phospholipids by
Sep-Pak Vac Silica Cartridges, a significant amount remained in the cartridges, suggesting that
oxidative degradation of lipid might have occurred in migaki-nishin during drying.
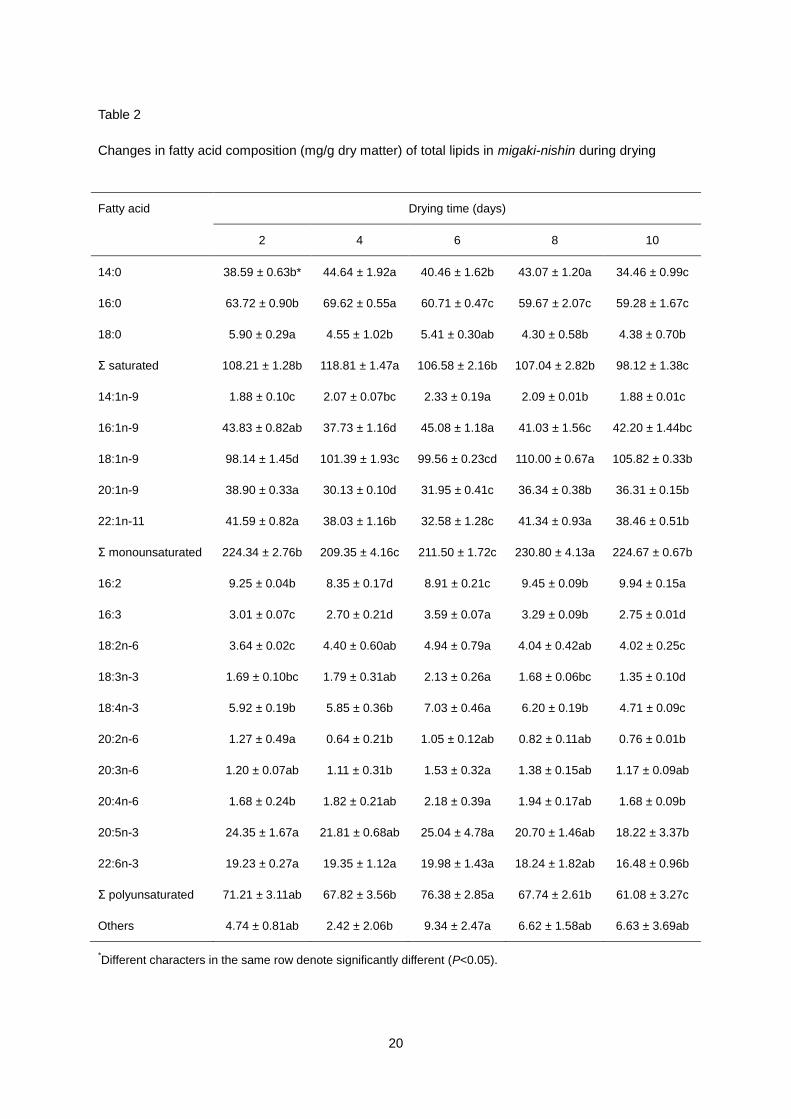
3.4. Changes in fatty acid composition of total lipids
Fatty acid compositions of total lipids in migaki-nishin are depicted in Table 2. The most abundant
fatty acids of total lipids were oleic (18:1n-9), palmitic (16:0), palmitoleic (16:1n-9), and cetoleic
(22:1n-11) acids. Monounsaturated fatty acids clearly constituted the main group ranged from
209.35–230.80 mg/g dry matter of all fatty acids. Fatty acid profiles of the extracted total lipids are in
agreement with the values of Atlantic herring (Aro et al., 2005). The total amount of polyunsaturated
fatty acids (PUFAs) was ranged between 61.08 and 76.38 mg/g dry matter. Within this group the
major fatty acids were eicosapentaenoic acid (EPA, 20:5n-3) and docosahexaenoic acid (DHA,
22:6n-3). However, the total amount of PUFAs was decreased significantly (P < 0.05), which
suggested that the PUFAs might be degraded by oxidation during drying. These results are more or
less similar to those reported in processed herring (Aro et al., 2000, 2005), and in pulverized niboshi
(boiled and dried anchovy) during storage at 25 °C for 60 days (Takiguchi, 1996).
3.5. Changes in fatty acid composition of triglyceride fraction
Table 3 shows the fatty acid composition of triglyceride fraction of migaki-nishin lipid during drying.
Monounsaturated fatty acids were the most abundant (136.84–172.17 mg/g dry matter), followed by
saturated fatty acids (69.56–76.72 mg/g dry matter) and polyunsaturated fatty acids (45.46–49.04
mg/g dry matter). Oleic (18:1n-9) and palmitic (16:0) acids were found to be predominant fatty acids in
the triglyceride fraction. Saturated and monounsaturated fatty acid content were significantly
decreased (P < 0.05), whilst polyunsaturated fatty acid content remained unchanged during the drying

12
period. A similar result was also found in the smoked dried products of anchovy during storage at
35 °C for 30 days (Takiguchi, 1988).
3.6. Changes in fatty acid composition of phospholipid fraction
In the phospholipid fraction, monounsaturated fatty acid content was almost unchanged ranging
from 4.62 to 6.87 mg/g dry matter, whereas polyunsaturated fatty acid content was decreased from
12.90 to 7.73 mg/g dry matter (Table 4). Docosahexaenoic acid was predominant fatty acid and it was
decreased significantly (P < 0.05) throughout the drying period. It is well known that PUFAs are
especially sensitive to oxidation and degradation phenomena both by enzymatic and chemical
oxidation, which produces a great variety of volatile compounds (Coutron-Gambotti & Gandemer,
1999). Oxidative degradation of phospholipids might be one of the reasons for the development of
characteristic taste and flavour of migaki-nishin during drying. Triqui and Reineccius (1995) reported
that lipid oxidation (mainly of n-3 PUFAs) is likely to be responsible for flavour development in
anchovy during ripening. They also stated that increases in the concentration of volatile compounds
are associated with the development of typical flavour after anchovy ripening.
3.7. Changes in fatty acid composition of free fatty acid fraction
Changes in fatty acid composition of free fatty acid fraction during drying in the migaki-nishin lipid
are shown in Table 5. The most abundant fatty acids of free fatty acid fraction were docosahexaenoic
(22:6n-3), palmitic (16:0), oleic (18:1n-9) and eicosapentaenoic (20:5n-3) acids. In this fraction,
saturated and monounsaturated fatty acid content were almost similar, ranging between 13.37 and
19.59 mg/g dry matter, and between 10.22 and 17.96 mg/g dry matter, respectively. Polyunsaturated
fatty acids were the most abundant (17.76–37.72 mg/g dry matter) fatty acids and the content was
significantly increased (P < 0.05) throughout the drying period. In this group, the most abundant fatty
acids were EPA and DHA, and the largest increase was observed in DHA increasing up to 20.34 mg/g
from 9.16 mg/g dry matter during drying. This result suggests that DHA might originate from partial

13
hydrolysis of phospholipids during drying. The changes observed in EPA and DHA contents were in
accordance with those reported by Takiguchi (1988).
3.8. Sensory evaluation
In this study, it was suggested that free fatty acids, especially DHA, should be released by partial
hydrolysis of phospholipids during drying of migaki-nishin. Free fatty acids found in food itself and
those derived from oils by lingual lipase may play an important direct role in taste perception
(Gilbertson, Fontenot, Liu, Zhang & Monroe, 1997). Thus, we speculated that the released DHA
should enhance the characteristic taste and flavour of migaki-nishin. Based on this hypothesis,
sensory evaluation was carried out to determine the effect of migaki-nishin lipid or DHA in mentsuyu.
Sensory evaluation showed that an addition of migaki-nishin lipid to mentsuyu significantly enhances
(P < 0.05) the intensity of mouthfulness (Fig. 3). However, no significant influence was observed on
the intensities of thickness and continuity compared to the control. Furthermore, addition of DHA
significantly (P < 0.05) enhances the intensities of thickness, mouthfulness and continuity, so-called
kokumi (a Japanese term). These results suggested that the intensities of thickness and continuity
was dependent on the total amount of free fatty acids, particularly DHA. The influence of DHA is in
accordance with the migaki-nishin oil specific effects. Koriyama, Wongso, Watanabe and Abe (2002)
reported that an enhancing effect of DHA on the umami when added to the basic tastants (IMP +
MSG). It has also been reported that fat has a taste as well as a viscosity stimulus, which could also
influence perceived flavour (Mattes, 2003).
4. Conclusion
Drying of herring fillets causes large changes in fatty acid composition simultaneously with an
increase in lipid oxidation. It was found that free fatty acids especially DHA content increased
significantly during the drying period, indicating partial hydrolysis of phospholipids. Moreover, sensory
evaluation showed that an addition of DHA to mentsuyu significantly enhances the intensities of
14
thickness, mouthfulness, and continuity. These results suggest that during the drying period lipid
oxidation not only occurred, but also lipolysis predominantly released DHA, which might have a
contribution to kokumi enhancement of migaki-nishin.
Acknowledgements
The first author thanks the Ministry of Education, Culture, Sports, Science and Technology of
Japan for providing him a scholarship. The authors also thank the sensory panel members of Food
Creation Center, Kyowa Hakko Food Specialties Co., Ltd. Ibaraki, Japan, for their sensory
assessments.
References
Alasalvar, C., Anthony Taylor, K. D., & Shahidi, F. (2005). Comparison of volatiles of cultured and wild
sea bream (Sparus aurata) during storage in ice by dynamic headspace analysis/gas
chromatography-mass spectrometry. Journal of Agricultural and Food Chemistry, 53,
2616–2622.
AOAC. (1995). Official methods of analysis (16th ed.). Virginia, USA: Association of Official Analytical
Chemists.
Aro, T. L., Larmo, P. S., Backman, C. H., Kallio, H. P., & Tahvonen, R. L. (2005). Fatty acids and
fat-soluble vitamins in salted herring (Clupea harengus) products. Journal of Agricultural and
Food Chemistry, 53, 1482–1488.
Aro, T., Tahvonen, R., Mattila, T., Nurmi, J., Sivonen, T., & Kallio, H. (2000). Effects of season and
processing on oil content and fatty acids of Baltic herring (Clupea harengus membras). Journal
of Agricultural and Food Chemistry, 48, 6085–6093.
Bligh, E. G., & Dyer, W. J. (1959). A rapid method of total lipid extraction and purification. Canadian
Journal of Physiology and Pharmacology, 37, 911–917.
Connell, J. J. (1995). Control of Fish Quality (4th ed.). Oxford: Fishing News Books.

15
Coutron-Gambotti, C., & Gandemer, G. (1999). Lipolysis and oxidation in subcutaneous adipose
tissue during dry-cured processing. Food Chemistry, 64, 95–101.
Dean, R. B., & Dixon, W. J. (1951). Simplified statistics for small numbers of observations. Analytical
Chemistry, 23, 636–638.
Endo, Y., Tominaga, M., Tagiri-Endo, M., Kumozaki, K., Kouzui, H., Shiramasa, H., & Miyakoshi, K.
(2003). A modified method to estimate total carbonyl compounds in frying oils using 1-BuOH as
a solvent. Journal of Oleo Science, 52, 353–358.
Frankel, E. N. (1991). Review. Recent advances in lipid oxidation. Journal of the Science of Food and
Agriculture, 54, 495–511.
Gilbertson, T. A., Fontenot, D. T., Liu, L., Zhang, H., & Monroe, W. T. (1997). Fatty acid modulation of
K+ channels in taste receptor cells: gustatory cues for dietary fat. American Journal of
Physiology-Cell Physiology, 272, 1203 – 1210.
Gudmundsdóttir, G., & Stefánsson, G. (1997). Sensory and chemical changes in spice-salted herring
as affected by handling. Journal of Food Science, 62, 894–897.
Hernández-Herrero, M., Roig-Sagués, A., López-Sabater, E., Rodríguez-Jerez, J., & Mora-Ventura, M.
(1999). Total volatile basic nitrogen and other physicochemical and microbiological
characteristics as related to ripening of salted anchovies. Journal of Food Science, 64,
344–347.
Hultin, H. O. (1988). Potential lipid oxidation problems in fatty fish processing. In N. Davis, Faty fish
utilization: upgrading from feed to food, proceedings of a national technical conference (pp.
185–233). Raleigh, NC: UNC Sea grant college program.
Juaneda, P., & Rocquelin, G. (1985). Rapid and convenient separation of phospholipids and non
phospholipids from rat heart using silica cartridges. Lipids, 20, 40-41.
Kawai, T. (1996). Fish flavour. Critical Reviews in Food Science and Nutrition, 36, 257–298.
Kinsella, J. E. (1987). Seafood and fish oils in human diseases. New York: Marcel Dekker Inc.

16
Koriyama, T., Wongso, S., Watanabe, K., & Abe, H. (2002). Fatty acid compositions of oil species
affect the 5 basic taste perceptions. Journal of Food Science, 67, 868–873.
Li, D., Bode, O., Drummond, H. & Sinclair, A. J. (2003). Omega-3 (n-3) fatty acids. In F. D. Gunstone,
Lipids for Functional foods and Nutraceuticals, (pp. 225-262). Bridgwater, England: The Oily
Press.
Mattes, R. (2003). Fat: the sixth taste- implications for health. Food Australia, 55, 510–514.
Nakagawa, R., Noto, H., Yasokawa, D., & Kamatani, T. (2007). Microbiological and chemical changes
during the industrial soft-drying process of migaki-nishin herring. Nippon Shokuhin Kagaku
Kogaku Kaishi, 54, 26–32.
Nonaka, J. (1957). Studies on the chemical essentials to the discoloration of fish oil. Journal of the
Tokyo University of Fisheries, 43, 127–165.
Pacheco-Aguilar, R., Lugo-Sánchez, M. E., & Robles-Burgueńo, M. R. (2000). Postmortem
biochemical and functional characteristic of Monterey sardine muscle stored at 0°C. Journal of
Food Science, 65, 40–47.
Prevot, A. F., & Mordret, F. X. (1976). Utilisation des colonnes capillaries de verre pour l`analyse des
corps gras par chromatographie en phase gazeuse. Revue Francaise des Corps Gras, 23,
409–423.
Ramanathan, L., & Das N. P. (1992). Studies on the control of lipid oxidation in ground fish by some
polyphenolic natural products. Journal of Agricultural and Food Chemistry, 40, 17–21.
Steel, R. G. D., & Torrie, J. H. (1980). Principle and procedure of statistics (2nd
ed.). New York:
McGraw-Hill.
Takiguchi, A. (1988). Effects of smoking on lipid oxidation in niboshi and niboshi powder. Nippon
Suisan Gakkaishi, 54, 869–874.
Takiguchi, A. (1996). Changes in free amino acid composition caused by lipid oxidation in pulverized
niboshi (boiled and dried anchovy) during storage. Fisheries Science, 62, 240–245.

17
Takiguchi, A. (1999). The effect of lipid oxidation in frozen pulverized niboshi (boiled and dried
sardine) on color browning and formation of free amino acid. Food Science and Technology
Research, 5, 204–209.
Toyomizu, M., Hanaoka, K., & Yamaguchi, K. (1981). Effect of release of free fatty acids by enzymatic
hydrolysis of phospholipids on lipid oxidation during storage of fish muscle at –5°C. Bulletin of
the Japanese Society of Scientific Fisheries, 47, 605–610.
Triqui, R., & Reineccius, G. A. (1995). Changes in flavor profiles with ripening of anchovy (Engraulis
encrasicholus). Journal of Agricultural and Food Chemistry, 43, 1883–1889.
Ueda, Y., Yonemitsu, M., Tsubuku, T., & Sakaguchi, M. (1997). Flavor characteristics of glutathione in
raw and cooked foodstuffs. Bioscience Biotechnology and Biochemistry, 61, 1977–1980.
Undeland, I., Hall, G., & Lingnert, H. (1999). Lipid oxidation in fillets of herring (Clupea harengus)
during ice storage. Journal of Agricultural and Food Chemistry, 47, 524–532.

18
Figure Captions
Fig. 1. Changes in pH during drying of migaki-nishin.
Fig. 2. Changes in peroxide value (A), carbonyl value (B), oxidized fatty acid (C), and acid value (D) of
migaki-nishin lipid during drying.
Fig. 3. Taste profile of migaki-nishin lipid and DHA in mentsuyu by sensory evaluation. Data are mean
± standard deviation (n = 5). *P < 0.05 vs. control.

19
Table 1
Changes in lipid composition (g/100 g dry matter) during drying of migaki-nishin
Composition Drying time (days)
2 4 6 8 10
Total lipid 40.85 ± 1.67a* 39.84 ± 2.14a 40.38 ± 1.46a 41.22 ± 1.52a 39.05 ± 0.65a
Triglyceride 30.28 ± 0.31a 29.22 ± 0.44ab 28.81 ± 0.75b 28.26 ± 1.23b 26.36 ± 0.74c
Free fatty acid 4.55 ±0.27c 5.12 ± 0.41bc 6.27 ± 0.75ab 6.78 ± 0.91a 6.86 ± 0.67a
Cholesterol 1.07 ± 0.36c 1.12 ± 0.04c 1.30 ± 0.09bc 1.47 ± 0.34ab 1.71 ± 0.12a
Diglyceride 0.053 ± 0.01c 0.058 ± 0.01c 0.071 ± 0.01b 0.080 ± 0.003b 0.092 ± 0.001a
Phospholipids 2.66 ± 0.20bc 2.80 ± 0.18c 2.43 ± 0.25b 2.35 ± 0.16ab 2.03 ± 0.08a
*Different characters in the same row denote significantly different (P<0.05).
20
Table 2
Changes in fatty acid composition (mg/g dry matter) of total lipids in migaki-nishin during drying
Fatty acid Drying time (days)
2 4 6 8 10
14:0 38.59 ± 0.63b* 44.64 ± 1.92a 40.46 ± 1.62b 43.07 ± 1.20a 34.46 ± 0.99c
16:0 63.72 ± 0.90b 69.62 ± 0.55a 60.71 ± 0.47c 59.67 ± 2.07c 59.28 ± 1.67c
18:0 5.90 ± 0.29a 4.55 ± 1.02b 5.41 ± 0.30ab 4.30 ± 0.58b 4.38 ± 0.70b
Σ saturated 108.21 ± 1.28b 118.81 ± 1.47a 106.58 ± 2.16b 107.04 ± 2.82b 98.12 ± 1.38c
14:1n-9 1.88 ± 0.10c 2.07 ± 0.07bc 2.33 ± 0.19a 2.09 ± 0.01b 1.88 ± 0.01c
16:1n-9 43.83 ± 0.82ab 37.73 ± 1.16d 45.08 ± 1.18a 41.03 ± 1.56c 42.20 ± 1.44bc
18:1n-9 98.14 ± 1.45d 101.39 ± 1.93c 99.56 ± 0.23cd 110.00 ± 0.67a 105.82 ± 0.33b
20:1n-9 38.90 ± 0.33a 30.13 ± 0.10d 31.95 ± 0.41c 36.34 ± 0.38b 36.31 ± 0.15b
22:1n-11 41.59 ± 0.82a 38.03 ± 1.16b 32.58 ± 1.28c 41.34 ± 0.93a 38.46 ± 0.51b
Σ monounsaturated 224.34 ± 2.76b 209.35 ± 4.16c 211.50 ± 1.72c 230.80 ± 4.13a 224.67 ± 0.67b
16:2 9.25 ± 0.04b 8.35 ± 0.17d 8.91 ± 0.21c 9.45 ± 0.09b 9.94 ± 0.15a
16:3 3.01 ± 0.07c 2.70 ± 0.21d 3.59 ± 0.07a 3.29 ± 0.09b 2.75 ± 0.01d
18:2n-6 3.64 ± 0.02c 4.40 ± 0.60ab 4.94 ± 0.79a 4.04 ± 0.42ab 4.02 ± 0.25c
18:3n-3 1.69 ± 0.10bc 1.79 ± 0.31ab 2.13 ± 0.26a 1.68 ± 0.06bc 1.35 ± 0.10d
18:4n-3 5.92 ± 0.19b 5.85 ± 0.36b 7.03 ± 0.46a 6.20 ± 0.19b 4.71 ± 0.09c
20:2n-6 1.27 ± 0.49a 0.64 ± 0.21b 1.05 ± 0.12ab 0.82 ± 0.11ab 0.76 ± 0.01b
20:3n-6 1.20 ± 0.07ab 1.11 ± 0.31b 1.53 ± 0.32a 1.38 ± 0.15ab 1.17 ± 0.09ab
20:4n-6 1.68 ± 0.24b 1.82 ± 0.21ab 2.18 ± 0.39a 1.94 ± 0.17ab 1.68 ± 0.09b
20:5n-3 24.35 ± 1.67a 21.81 ± 0.68ab 25.04 ± 4.78a 20.70 ± 1.46ab 18.22 ± 3.37b
22:6n-3 19.23 ± 0.27a 19.35 ± 1.12a 19.98 ± 1.43a 18.24 ± 1.82ab 16.48 ± 0.96b
Σ polyunsaturated 71.21 ± 3.11ab 67.82 ± 3.56b 76.38 ± 2.85a 67.74 ± 2.61b 61.08 ± 3.27c
Others 4.74 ± 0.81ab 2.42 ± 2.06b 9.34 ± 2.47a 6.62 ± 1.58ab 6.63 ± 3.69ab
*Different characters in the same row denote significantly different (P<0.05).

21
Table 3
Changes in fatty acid composition (mg/g dry matter) of triglyceride fraction in migaki-nishin lipid during
drying
Fatty acid Drying time (days)
2 4 6 8 10
14:0 27.66 ± 0.67b* 27.85 ± 0.31b 34.02 ± 0.87a 28.31 ± 0.92b 26.14 ± 0.62c
16:0 44.16 ± 1.02a 43.01 ± 0.48a 40.64 ± 1.58b 40.83 ± 1.15b 40.61 ± 1.08b
18:0 3.19 ± 0.11a 3.14 ± 0.17a 2.06 ± 0.47b 2.65 ± 0.34ab 2.81 ± 0.36a
Σ saturated 75.01 ± 1.60ab 74.00 ± 0.85bc 76.72 ± 1.25a 71.79 ± 1.78cd 69.56 ± 1.52d
14:1n-9 1.37 ± 0.03b 1.60 ± 0.04ab 1.88 ± 0.54a 1.54 ± 0.13ab 1.59 ± 0.28ab
16:1n-9 35.31 ± 0.67a 28.12 ± 0.37b 23.97 ± 0.04d 26.44 ± 1.43c 28.77 ± 0.85b
18:1n-9 76.73 ± 1.36a 77.26 ± 1.11a 62.53 ± 1.77b 75.95 ± 4.83a 66.71 ± 3.28b
20:1n-9 31.03 ± 0.33a 26.74 ± 0.19b 29.84 ± 1.26a 25.81 ± 0.81b 21.05 ± 1.18c
22:1n-11 27.73 ± 3.90b 28.12 ± 0.61b 35.74 ± 2.79a 26.90 ± 3.63b 18.71 ± 3.77c
Σ monounsaturated 172.17 ± 1.72a 161.84 ± 1.27b 153.95 ± 4.52c 156.64 ± 3.34c 136.84 ± 2.10d
14:2 0.89 ± 0.06b 1.11 ± 0.08ab 1.30 ± 0.37a 1.21 ± 0.11ab 1.26 ± 0.26ab
16:2 6.46 ± 0.06a 6.19 ± 0.05a 4.78 ± 0.43d 5.72 ± 0.04b 5.29 ± 0.18c
16:3 1.29 ± 0.05a 1.37 ± 0.04a 1.22 ± 0.39a 1.48 ± 0.13a 1.61 ± 0.29a
18:2n-6 2.12 ± 0.04a 2.53 ± 0.03a 2.69 ± 0.41a 2.21 ± 0.13a 2.41 ± 0.23a
18:3n-3 0.78 ± 0.07b 1.21 ± 0.05a 1.10 ± 0.38ab 0.96 ± 0.12ab 1.17 ± 0.31ab
18:4n-3 2.95 ± 0.05a 2.37 ± 1.63a 2.64 ± 0.41a 2.96 ± 0.19a 3.43 ± 0.17a
20:2n-6 0.38 ± 0.16b 0.62 ± 0.07ab 0.79 ± 0.14a 0.58 ± 0.15ab 0.34 ± 0.38ab
20:4n-6 0.68 ± 0.03a 0.91 ± 0.12a 1.00 ± 0.14a 0.89 ± 0.15ab 0.52 ± 0.46a
20:5n-3 17.82 ± 0.23a 16.33 ± 0.03b 17.44 ± 0.84a 15.67 ± 0.38b 18.20 ± 0.81a
22:5n-6 1.02 ± 0.06b 1.10 ± 0.08ab 1.25 ± 0.04a 1.00 ± 0.15b 0.95 ± 0.10b
22:6n-3 12.97 ± 0.28b 13.29 ± 0.09ab 14.83 ± 0.30a 12.78 ± 0.39b 13.74 ± 1.85ab
Σ polyunsaturated 47.36 ± 0.54ab 47.03 ± 1.12ab 49.04 ± 2.73a 45.46 ± 1.36b 48.92 ± 1.98a
Others 8.26 ± 0.73a 9.33 ± 2.39a 8.38 ± 1.58a 8.71 ± 5.10a 8.29 ± 2.73a
*Different characters in the same row denote significantly different (P<0.05).

22
Table 4
Changes in fatty acid composition (mg/g dry matter) of phospholipid fraction in migaki-nishin lipid
during drying
Fatty acid Drying time (days)
2 4 6 8 10
14:0 0.63 ± 0.02b* 0.66 ± 0.02b 0.78 ± 0.06a 0.82 ± 0.05a 0.65 ± 0.03b
16:0 7.02 ± 0.14b 7.92 ± 0.11a 5.84 ±0.40cd 6.05 ± 0.19c 5.49 ± 0.17d
18:0 1.16 ± 0.01b 1.43 ± 0.03a 0.92 ± 0.09d 1.04 ± 0.04c 0.94 ± 0.01d
Σ saturated 8.81 ± 0.15b 10.01 ± 0.13a 7.54 ± 0.56cd 7.92 ± 0.17c 7.08 ± 0.17d
14:1n-9 0.03 ± 0.01bc 0.08 ± 0.02a 0.02 ± 0.01c 0.05 ± 0.01b 0.04 ± 0.03bc
16:1n-9 0.73 ± 0.01c 0.68 ± 0.05c 1.08 ± 0.05a 0.94 ± 0.06b 1.05 ± 0.04a
18:1n-9 3.12 ± 0.04d 3.50 ± 0.17c 5.07 ± 0.13a 3.99 ± 0.22b 3.81 ± 0.13b
20:1n-9 0.41 ± 0.02a 0.36 ± 0.01b 0.37 ± 0.01ab 0.41 ± 0.01a 0.26 ± 0.04c
22:1n-11 0.33 ± 0.01b 0.32 ± 0.02b 0.33 ± 0.12ab 0.48 ± 0.06a 0.17 ± 0.06c
Σ monounsaturated 4.62 ± 0.04e 4.94 ± 0.24d 6.87 ± 0.05a 5.87 ± 0.25b 5.33 ± 0.04c
14:2 0.06 ± 0.01b 0.11 ± 0.01a 0.05 ± 0.02b 0.06 ± 0.04b 0.07 ± 0.02b
16:2 0.27 ± 0.01c 0.37 ± 0.03b 0.48 ± 0.04a 0.34 ± 0.05b 0.33 ± 0.02b
16:3 0.03 ± 0.01b 0.08 ± 0.01a 0.03 ± 0.01b 0.04 ± 0.01ab 0.07 ± 0.03a
18:2n-6 0.19 ± 0.01a 0.16 ± 0.01a 0.09 ± 0.01b 0.10 ± 0.03b 0.09 ± 0.01b
18:3n-3 0.02 ± 0.00b 0.07 ± 0.01a 0.02 ± 0.01b 0.02 ± 0.00b 0.02 ± 0.01b
18:4n-3 0.04 ± 0.01b 0.08 ± 0.01a tr+ 0.03 ± 0.01c 0.03 ± 0.02c
20:4n-6 0.20 ± 0.02a 0.23 ± 0.01a 0.04 ± 0.01c 0.09 ± 0.01b 0.07 ± 0.03bc
20:5n-3 2.25 ± 0.02a 1.93 ± 0.05b 1.41 ± 0.07c 1.53 ± 0.13c 1.39 ± 0.03c
22:6n-3 9.84 ± 0.06a 9.55 ± 0.29a 7.61 ± 0.53b 7.27 ± 0.33b 5.66 ± 0.21c
Σ polyunsaturated 12.90 ± 0.12a 12.58 ± 0.16a 9.73 ± 0.52b 9.48 ± 0.35b 7.73 ± 0.11c
Others 0.27 ± 0.01b 0.47 ± 0.05a 0.16 ± 0.08bc 0.23 ± 0.02bc 0.16 ± 0.12c
*Different characters in the same row denote significantly different (P<0.05).
+tr: trace

23
Table 5
Changes in fatty acid composition (mg/g dry matter) of free fatty acid fraction in migaki-nishin lipid
during drying
Fatty acid Drying time (days)
2 4 6 8 10
14:0 6.87 ± 0.08a* 4.67 ± 0.17c 8.34 ± 0.06a 7.42 ± 0.62b 3.96 ± 0.19d
16:0 8.61 ± 0.96cd 7.85 ± 0.22d 10.14 ± 0.25ab 10.90 ± 0.05a 9.33 ± 0.36bc
18:0 0.68 ± 0.05d 0.85 ± 0.04bc 1.11 ± 0.06a 0.93 ± 0.01b 0.83 ± 0.05c
Σ saturated 16.16 ± 0.99b 13.37 ± 0.25c 19.59 ± 0.21a 19.25 ± 0.63a 14.12 ± 0.56c
16:1n-9 2.56 ± 0.20d 3.72 ± 0.06c 4.01 ± 0.08b 4.51 ± 0.08a 3.98 ± 0.12b
18:1n-9 6.52 ± 0.44e 7.04 ± 0.03d 8.62 ± 0.09c 11.41 ± 0.16a 9.06 ± 0.23b
20:1n-9 1.02 ± 0.07d 1.46 ± 0.01c 1.41 ± 0.02c 1.89 ± 0.08b 2.02 ± 0.06a
22:1n-11 0.12 ± 0.03a 0.06 ± 0.03a 0.15 ± 0.06a 0.15 ± 0.07a 0.16 ± 0.09a
Σ monounsaturated 10.22 ± 0.74e 12.28 ± 0.10d 14.19 ± 0.22c 17.96 ± 0.18a 15.22 ± 0.24b
14:2 0.65 ± 0.02a 0.39 ± 0.06c 0.55 ± 0.03b 0.42 ± 0.01c 0.43 ± 0.07c
16:3 0.67 ± 0.04c 0.69 ± 0.01c 0.91 ± 0.05a 0.86 ± 0.03a 0.77 ± 0.04b
18:2n-6 0.46 ± 0.04b 0.39 ± 0.03b 0.64 ± 0.09a 0.66 ± 0.04a 0.72 ± 0.03a
18:3n-3 0.26 ± 0.03b 0.23 ± 0.02b 0.37 ± 0.04a 0.36 ± 0.05a 0.40 ± 0.03a
18:4n-3 0.45 ± 0.03e 0.61 ± 0.02d 0.80 ± 0.03c 0.90 ± 0.05b 1.37 ± 0.04a
20:2n-6 0.12 ± 0.01a 0.08 ± 0.01a 0.08 ± 0.01a 0.11 ± 0.03a 0.11 ± 0.06a
20:3n-6 0.30 ± 0.02c 0.35 ± 0.02c 0.48 ± 0.05b 0.42 ± 0.04b 0.58 ± 0.05a
20:4n-6 0.31 ± 0.02c 0.31 ± 0.01c 0.47 ± 0.05b 0.48 ± 0.03b 0.75 ± 0.06a
20:5n-3 5.38 ± 0.26e 8.58 ± 0.15c 8.22 ± 0.08d 9.84 ± 0.18b 12.25 ± 0.18a
22:6n-3 9.16 ± 0.47e 12.81 ± 0.26d 13.73 ± 0.29c 15.09 ± 0.15b 20.34 ± 0.75a
Σ polyunsaturated 17.76 ± 0.67e 24.44 ± 0.25d 26.25 ± 0.05c 29.14 ± 0.33b 37.72 ± 0.91a
Others 1.35 ± 0.58b 1.11 ± 0.07b 2.67 ± 0.09a 1.45 ± 0.25b 1.54 ± 0.29b
*Different characters in the same row denote significantly different (P<0.05).

Fig. 1 (Shah et al.)
6.16.26.36.46.56.66.76.86.9
2 4 6 8 10Drying time (days)
pH

Fig. 2 (Shah et al.)
Drying time (days)
PV (m
eq/k
g lip
id)
0
3
6
9
12
15
18
2 4 6 8 10
(A)
CV
(µM
/g li
pid)
012345678
2 4 6 8 10Drying time (days)
(B)
Oxi
dize
d fa
tty a
cid
(%)
0.0
0.5
1.0
1.5
2.0
2 4 6 8 10Drying time (days)
(C)
6
8
10
12
14
16
18
20
2 4 6 8 10
Aci
d v a
lue
(mg
KO
H/g
lipi
d )
Drying time (days)
(D)

Fig. 3 (Shah et al.)
0
1
2
3
4
5
6
7
salty umami thickness mouthfulness continuity
controlLipidDHA
**
* *
Scor
e