CFA Society Indonesia Universitas Prasetiya Mulya - CFA ...
31
CFA Institute Research Challenge Hosted by CFA Society Indonesia Universitas Prasetiya Mulya The CFA Institute Research Challenge is a global competition that tests the equity research and valuation, investment report writing, and presentation skills of university students. The following report was submitted by a team of university students as part of this annual education initiative and should not be considered a professional report. Disclosures: Ownership and material conflicts of interest: The author(s), or a member of their household, of this report does not hold a financial interest in the securities of this company. The author(s), or a member of their household, of this report does not know of the existence of any conflicts of interest that might bias the content or publication of this report. Receipt of compensation: Compensation of the author(s) of this report is not based on investment banking revenue. Position as a officer or director: The author(s), or a member of their household, does not serve as an officer, director or advisory board member of the subject company. Market making: The author(s) does not act as a market maker in the subject company’s securities. Disclaimer: The information set forth herein has been obtained or derived from sources generally available to the public and believed by the author(s) to be reliable, but the author(s) does not make any representation or warranty, express or implied, as to its accuracy or completeness. The information is not intended to be used as the basis of any investment decisions by any person or entity. This information does not constitute investment advice, nor is it an offer or a solicitation of an offer to buy or sell any security. This report should not be considered to be a recommendation by any individual affiliated with CFA Society Indonesia, CFA Institute or the CFA Institute Research Challenge with regard to this company’s stock.
-
Upload
khangminh22 -
Category
Documents
-
view
6 -
download
0
Transcript of CFA Society Indonesia Universitas Prasetiya Mulya - CFA ...

CFA Institute Research Challenge Hosted by
CFA Society Indonesia
Universitas Prasetiya Mulya
The CFA Institute Research Challenge is a global competition that tests the equity research and valuation, investment report writing, and
presentation skills of university students. The following report was submitted by a team of university students as part of this annual education
initiative and should not be considered a professional report.
Disclosures: Ownership and material conflicts of interest:
The author(s), or a member of their household, of this report does not hold a financial interest in the securities of this company.
The author(s), or a member of their household, of this report does not know of the existence of any conflicts of interest that might bias the
content or publication of this report.
Receipt of compensation:
Compensation of the author(s) of this report is not based on investment banking revenue.
Position as a officer or director:
The author(s), or a member of their household, does not serve as an officer, director or advisory board member of the subject company.
Market making:
The author(s) does not act as a market maker in the subject company’s securities.
Disclaimer:
The information set forth herein has been obtained or derived from sources generally available to the public and believed by the author(s) to be
reliable, but the author(s) does not make any representation or warranty, express or implied, as to its accuracy or completeness. The information
is not intended to be used as the basis of any investment decisions by any person or entity. This information does not constitute investment
advice, nor is it an offer or a solicitation of an offer to buy or sell any security. This report should not be considered to be a recommendation by
any individual affiliated with CFA Society Indonesia, CFA Institute or the CFA Institute Research Challenge with regard to this company’s stock.

1
Universitas Prasetiya Mulya
This report is published for educational purposes only by
students competing in CFA Institute Research Challenge 2018
Date : February 15th, 2019 Current Price : IDR 2,460 Recommendation : BUY
Ticker : PGAS IJ (Bloomberg) Upside Potential : 20.73% Target Price : IDR 2,970
MARKET PROFILE 52-Wk Price Range (IDR) 1,505 – 2,860
Avg. Trading Volume 90,396,068
Shares Outstanding (Bn) 24.24
Free Float 43,04%
Market Cap. (Tn) IDR 59.63
P/E (ttm) 16.35x
P/BV 1.21x
USD/IDR 14,160
Share Price Information (IDR)
Source: Bloomberg
Upside Potential in 2019F
Source: Bloomberg
Time for the Giant to Break-Free Backed by a favourable gas distribution industry outlook, PGAS is well positioned as a market leader to achieve growth and further market penetration. We believe PGAS can overcome insecurity of supply and high capital expenditure, through capital expenditure efficiency and securing gas supply through Pertamina’s gas holding. After considering the investment risks and future growth prospects, we arrived at a BUY recommendation on PGAS with a 12-month target price of IDR2,970/share, reflecting a 20.73% upside potential from its IDR2,460 closing price on 15/02/2019 based on our sum of the parts valuation model. Our recommendation lays on the following key catalysts:
Strong Upcoming Demand from Gas Infrastructure Projects Government have set a target on gas power plant installation of 47.7 GW by 2030 vs current 13.98 GW (growing 9.2% CAGR) (IRENA, 2017). The growing capacity will lead to a growing gas demand. However, inadequate pipeline network is currently a setback as it only provides 20-30% of the needed infrastructure (Ministry of SOE, 2018). Therefore, government is expected to ramp up this figure up to
80-100% by 2030F. Since this government-led plan will involve high expertise to be executed, the
government will turn its favours on PGAS as the government’s leader in the gas sub-holding to deliver this product. On the other hand, PGAS will gain benefits from this, as the government will give incentives for construction in new market area in the form of 20 years monopoly rights (resulting in maximized margins as there will be no margin sharing between distributors) and IRR at 12% in that new market area (Company Presentation, 2019).
Secured Supply from Gas Holding to Fulfil Enormous Potential Demand To fulfil the high potential demand, gas supply comes into the equation. The establishment of the government’s oil and gas holding will align Pertamina’s gas supply chain, securing more supply for PGAS. The oil and gas holding means that Pertamina will turn in PGAS’ favour more as the leader in the gas sub-holding, in terms of transporting and distributing its gas. We expect more secured supply for PGAS to be realized soon. To start with, PGAS will benefit from Pertamina’s 6 gas fields with a total potential of 281 mmscfd which are expected to fully commercialize by 2021 (Ministry of SOE, 2018). We see this holding initiative as a mutualism between Pertamina and PGAS. Pertamina can have more ease at bringing more blocks to the commercialization process due to assurance of distribution through PGAS, while PGAS can benefit from the opportunity in transporting the potential supply.
PGAS-Pertagas Pipeline Integration to Boost Synergic Value With a secure potential supply and huge potential demand, PGAS will need the infrastructure to match the supply and demand’s region. Currently, gas production in Indonesia aggregately is above gas demand (7,453 mmscfd vs 7,318 mmscfd), but lack of infrastructure has created gas supply imbalances in several regions (Ministry of EMR, 2018). This is most evident in Region II and III (Figure 8) which runs a gas supply deficit while Region IV has a gas supply surplus. The acquisition of Pertagas will solve this uneven supply problem. PGAS’ and Pertagas’ pipeline will be integrated, which will connect Region II, III, and IV’s pipeline network with a 576 km pipeline costing US$213.25 mn of CAPEX. The plan, expected to finish by 2020, will bring an additional revenue of US$342.85 mn by 2023F. Revenue synergy along with cost savings from CAPEX duplication avoidance and SG&A savings will bring NPV of total synergic value at US$582.14 mn.
Attractive Valuation with Strong Cash Flow Generator PGAS is trading at an attractive 12.7% 2019F FCF Yield and 5.9x 2019F EV/EBITDA (-1 std of 5-yrs historical average). With a turnaround performance, we believe incremental downside risk remains limited as there will also be lower dependency on upstream oil and gas portfolio post Pertagas acquisition. Therefore, PGAS’ developed infrastructure earnings characteristic will resurface.
Key Financial Highlights 2016A 2017A 2018F 2019F* 2020F Revenue Growth -4.37% 1.19% 11.88% 20.29% 7.41%
Gross Margin 30.22% 26.85% 27.09% 27.29% 27.78%
EBITDA Margin 26.23% 28.12% 26.68% 27.36% 27.62%
EPS (IDR) 182.0 85.6 171.1 179.4 232.2
ROE 9.73% 4.63% 8.65% 9.18% 10.61%
ROA 4.52% 2.35% 4.44% 4.44% 5.25%
Interest Coverage 3.9 2.9 3.2 3.1 3.9
Debt/Equity 0.92 0.75 0.72 0.81 0.74
Source: Company Reports, Team Estimates *Acquisition of Pertagas
1000
1500
2000
2500
3000
3500
Feb
ruar
y-1
6
Jun
e-1
6
Oct
ob
er-1
6
Feb
ruar
y-1
7
Jun
e-1
7
Oct
ob
er-1
7
Feb
ruar
y-1
8
Jun
e-1
8
Oct
ob
er-1
8
Feb
ruar
y-1
9
PGASCurrent PriceTarget Price
2,970
2,460
PT Perusahaan Gas Negara Tbk. Infrastructure, Utilities, Transportation, and Energy Sectors
Indonesia Stock Exchange
0
200
400
600
Feb
ruar
y-1
6
Jun
e-1
6
Oct
ob
er-1
6
Feb
ruar
y-1
7
Jun
e-1
7
Oct
ob
er-1
7
Feb
ruar
y-1
8
Jun
e-1
8
Oct
ob
er-1
8
Feb
ruar
y-1
9
Vo
lum
e (M
illio
n)
1000
2000
3000
4000
5000
6000
7000
IDR
/Sh
are
PGAS JCI
20.73%
2
Figure 1: Revenue Breakdown
Source: Company Presentation 3Q18
Figure 2: Distribution Segment Market Share
Source: Company Report 2017
Figure 3: Distribution Segment Customers
Source: Company Report 2017
Figure 4: PGAS Distribution & Transmission Segment Volume
Source: Company Presentation 3Q18
Figure 5: SAKA Revenue Breakdown
Source: SAKA Energi Report & Presentation 2018
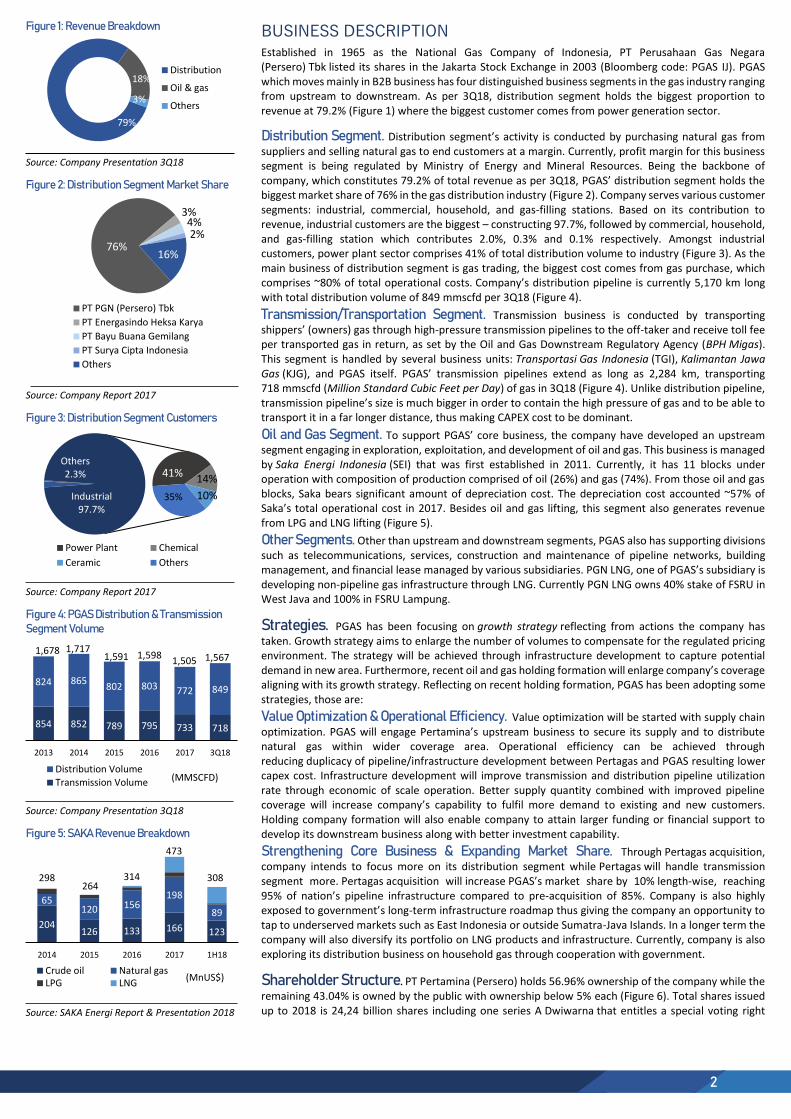
BUSINESS DESCRIPTION Established in 1965 as the National Gas Company of Indonesia, PT Perusahaan Gas Negara (Persero) Tbk listed its shares in the Jakarta Stock Exchange in 2003 (Bloomberg code: PGAS IJ). PGAS which moves mainly in B2B business has four distinguished business segments in the gas industry ranging from upstream to downstream. As per 3Q18, distribution segment holds the biggest proportion to revenue at 79.2% (Figure 1) where the biggest customer comes from power generation sector.
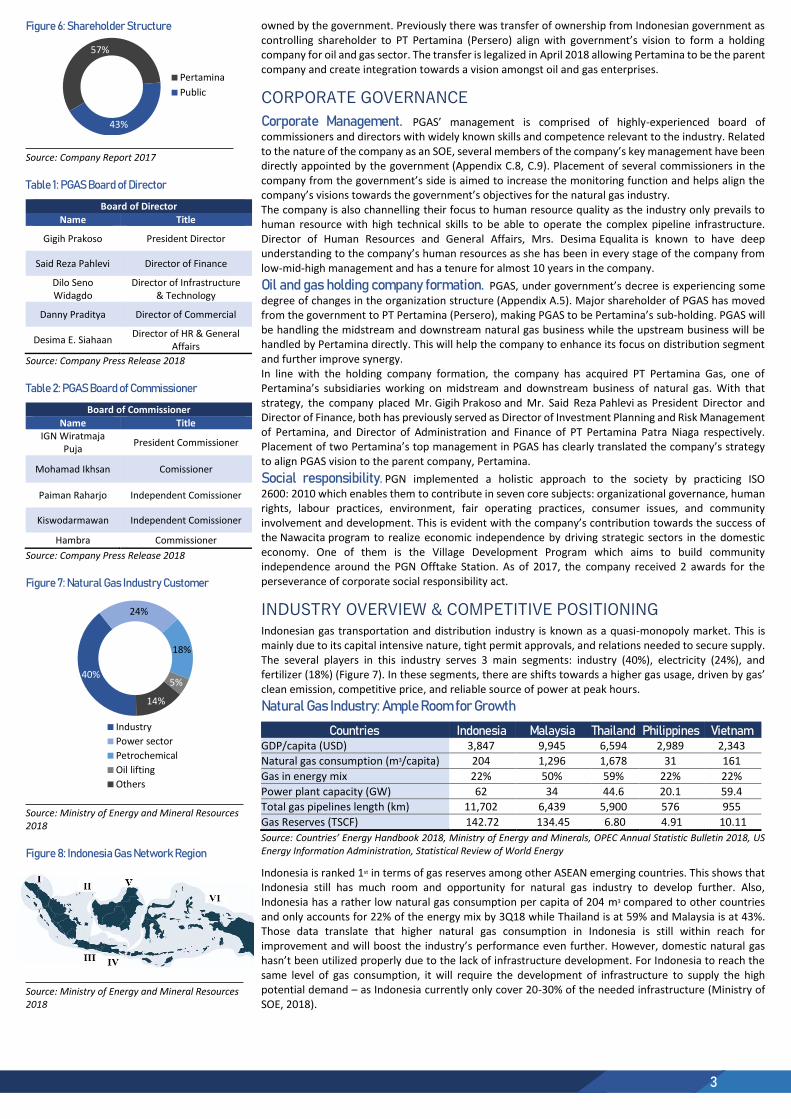
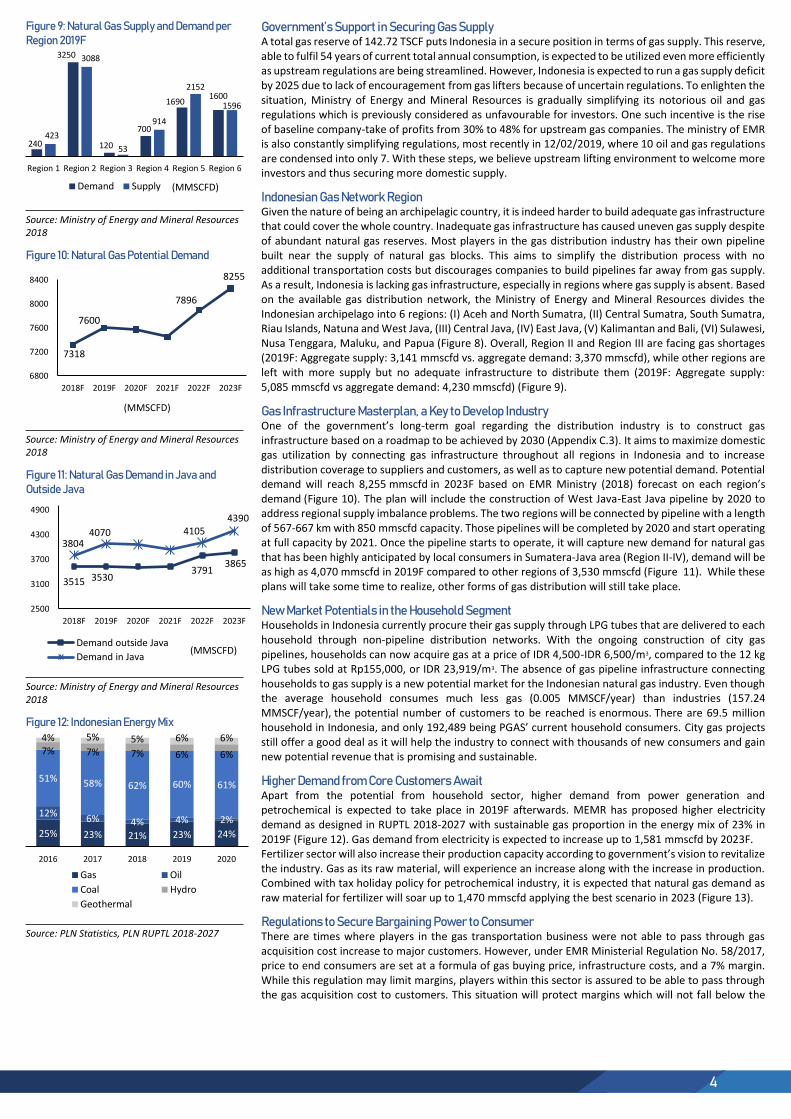
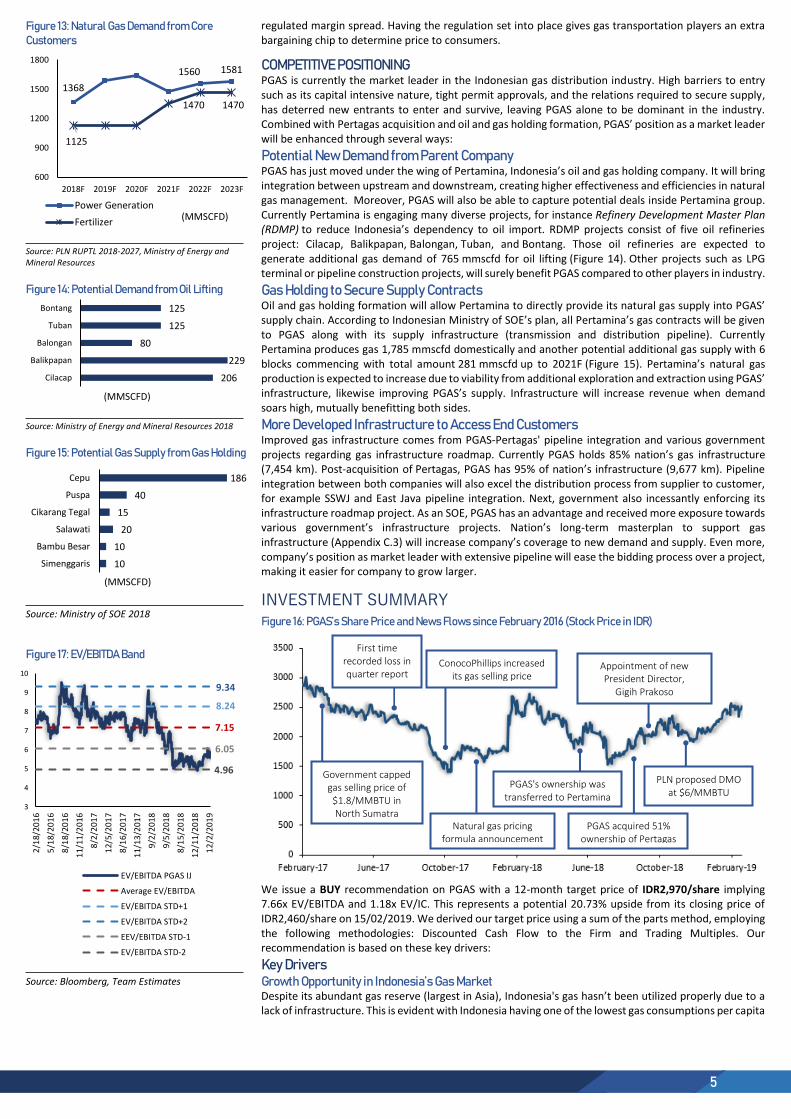
Distribution Segment. Distribution segment’s activity is conducted by purchasing natural gas from suppliers and selling natural gas to end customers at a margin. Currently, profit margin for this business segment is being regulated by Ministry of Energy and Mineral Resources. Being the backbone of company, which constitutes 79.2% of total revenue as per 3Q18, PGAS’ distribution segment holds the biggest market share of 76% in the gas distribution industry (Figure 2). Company serves various customer segments: industrial, commercial, household, and gas-filling stations. Based on its contribution to revenue, industrial customers are the biggest – constructing 97.7%, followed by commercial, household, and gas-filling station which contributes 2.0%, 0.3% and 0.1% respectively. Amongst industrial customers, power plant sector comprises 41% of total distribution volume to industry (Figure 3). As the main business of distribution segment is gas trading, the biggest cost comes from gas purchase, which comprises ~80% of total operational costs. Company’s distribution pipeline is currently 5,170 km long with total distribution volume of 849 mmscfd per 3Q18 (Figure 4).
Transmission/Transportation Segment. Transmission business is conducted by transporting shippers’ (owners) gas through high-pressure transmission pipelines to the off-taker and receive toll fee per transported gas in return, as set by the Oil and Gas Downstream Regulatory Agency (BPH Migas). This segment is handled by several business units: Transportasi Gas Indonesia (TGI), Kalimantan Jawa Gas (KJG), and PGAS itself. PGAS’ transmission pipelines extend as long as 2,284 km, transporting 718 mmscfd (Million Standard Cubic Feet per Day) of gas in 3Q18 (Figure 4). Unlike distribution pipeline, transmission pipeline’s size is much bigger in order to contain the high pressure of gas and to be able to transport it in a far longer distance, thus making CAPEX cost to be dominant.
Oil and Gas Segment. To support PGAS’ core business, the company have developed an upstream segment engaging in exploration, exploitation, and development of oil and gas. This business is managed by Saka Energi Indonesia (SEI) that was first established in 2011. Currently, it has 11 blocks under operation with composition of production comprised of oil (26%) and gas (74%). From those oil and gas blocks, Saka bears significant amount of depreciation cost. The depreciation cost accounted ~57% of Saka’s total operational cost in 2017. Besides oil and gas lifting, this segment also generates revenue from LPG and LNG lifting (Figure 5).
Other Segments. Other than upstream and downstream segments, PGAS also has supporting divisions such as telecommunications, services, construction and maintenance of pipeline networks, building management, and financial lease managed by various subsidiaries. PGN LNG, one of PGAS’s subsidiary is developing non-pipeline gas infrastructure through LNG. Currently PGN LNG owns 40% stake of FSRU in West Java and 100% in FSRU Lampung.
Strategies. PGAS has been focusing on growth strategy reflecting from actions the company has taken. Growth strategy aims to enlarge the number of volumes to compensate for the regulated pricing environment. The strategy will be achieved through infrastructure development to capture potential demand in new area. Furthermore, recent oil and gas holding formation will enlarge company’s coverage aligning with its growth strategy. Reflecting on recent holding formation, PGAS has been adopting some strategies, those are:
Value Optimization & Operational Efficiency. Value optimization will be started with supply chain optimization. PGAS will engage Pertamina’s upstream business to secure its supply and to distribute natural gas within wider coverage area. Operational efficiency can be achieved through reducing duplicacy of pipeline/infrastructure development between Pertagas and PGAS resulting lower capex cost. Infrastructure development will improve transmission and distribution pipeline utilization rate through economic of scale operation. Better supply quantity combined with improved pipeline coverage will increase company’s capability to fulfil more demand to existing and new customers. Holding company formation will also enable company to attain larger funding or financial support to develop its downstream business along with better investment capability.
Strengthening Core Business & Expanding Market Share. Through Pertagas acquisition, company intends to focus more on its distribution segment while Pertagas will handle transmission segment more. Pertagas acquisition will increase PGAS’s market share by 10% length-wise, reaching 95% of nation’s pipeline infrastructure compared to pre-acquisition of 85%. Company is also highly exposed to government’s long-term infrastructure roadmap thus giving the company an opportunity to tap to underserved markets such as East Indonesia or outside Sumatra-Java Islands. In a longer term the company will also diversify its portfolio on LNG products and infrastructure. Currently, company is also exploring its distribution business on household gas through cooperation with government.
Shareholder Structure. PT Pertamina (Persero) holds 56.96% ownership of the company while the remaining 43.04% is owned by the public with ownership below 5% each (Figure 6). Total shares issued up to 2018 is 24,24 billion shares including one series A Dwiwarna that entitles a special voting right
79%
18%
3%
Distribution
Oil & gas
Others
76%
3%4%2%
16%
PT PGN (Persero) Tbk
PT Energasindo Heksa Karya
PT Bayu Buana Gemilang
PT Surya Cipta Indonesia
Others
Others 2.3% 41% 14%
10%35%Industrial97.7%
Power Plant Chemical
Ceramic Others
854 852 789 795 733 718
824 865802 803 772 849
2013 2014 2015 2016 2017 3Q18
(MMSCFD)Distribution VolumeTransmission Volume
1,678 1,7171,591 1,598
1,505 1,567
204126 133 166 123
65120 156
198
89
2014 2015 2016 2017 1H18
(MnUS$)Crude oil Natural gasLPG LNG
298264
314
473
308
3
Figure 6: Shareholder Structure
Source: Company Report 2017
Table 1: PGAS Board of Director
Board of Director
Name Title
Gigih Prakoso President Director
Said Reza Pahlevi Director of Finance
Dilo Seno Widagdo
Director of Infrastructure & Technology
Danny Praditya Director of Commercial
Desima E. Siahaan Director of HR & General
Affairs
Source: Company Press Release 2018
Table 2: PGAS Board of Commissioner
Board of Commissioner
Name Title IGN Wiratmaja
Puja President Commissioner
Mohamad Ikhsan Comissioner
Paiman Raharjo Independent Comissioner
Kiswodarmawan Independent Comissioner
Hambra Commissioner
Source: Company Press Release 2018
Figure 7: Natural Gas Industry Customer
Source: Ministry of Energy and Mineral Resources 2018
Figure 8: Indonesia Gas Network Region
Source: Ministry of Energy and Mineral Resources 2018
owned by the government. Previously there was transfer of ownership from Indonesian government as controlling shareholder to PT Pertamina (Persero) align with government’s vision to form a holding company for oil and gas sector. The transfer is legalized in April 2018 allowing Pertamina to be the parent company and create integration towards a vision amongst oil and gas enterprises.
CORPORATE GOVERNANCE
Corporate Management. PGAS’ management is comprised of highly-experienced board of commissioners and directors with widely known skills and competence relevant to the industry. Related to the nature of the company as an SOE, several members of the company’s key management have been directly appointed by the government (Appendix C.8, C.9). Placement of several commissioners in the company from the government’s side is aimed to increase the monitoring function and helps align the company’s visions towards the government’s objectives for the natural gas industry. The company is also channelling their focus to human resource quality as the industry only prevails to human resource with high technical skills to be able to operate the complex pipeline infrastructure. Director of Human Resources and General Affairs, Mrs. Desima Equalita is known to have deep understanding to the company’s human resources as she has been in every stage of the company from low-mid-high management and has a tenure for almost 10 years in the company.
Oil and gas holding company formation. PGAS, under government’s decree is experiencing some degree of changes in the organization structure (Appendix A.5). Major shareholder of PGAS has moved from the government to PT Pertamina (Persero), making PGAS to be Pertamina’s sub-holding. PGAS will be handling the midstream and downstream natural gas business while the upstream business will be handled by Pertamina directly. This will help the company to enhance its focus on distribution segment and further improve synergy. In line with the holding company formation, the company has acquired PT Pertamina Gas, one of Pertamina’s subsidiaries working on midstream and downstream business of natural gas. With that strategy, the company placed Mr. Gigih Prakoso and Mr. Said Reza Pahlevi as President Director and Director of Finance, both has previously served as Director of Investment Planning and Risk Management of Pertamina, and Director of Administration and Finance of PT Pertamina Patra Niaga respectively. Placement of two Pertamina’s top management in PGAS has clearly translated the company’s strategy to align PGAS vision to the parent company, Pertamina.
Social responsibility. PGN implemented a holistic approach to the society by practicing ISO 2600: 2010 which enables them to contribute in seven core subjects: organizational governance, human rights, labour practices, environment, fair operating practices, consumer issues, and community involvement and development. This is evident with the company’s contribution towards the success of the Nawacita program to realize economic independence by driving strategic sectors in the domestic economy. One of them is the Village Development Program which aims to build community independence around the PGN Offtake Station. As of 2017, the company received 2 awards for the perseverance of corporate social responsibility act.
INDUSTRY OVERVIEW & COMPETITIVE POSITIONING
Indonesian gas transportation and distribution industry is known as a quasi-monopoly market. This is mainly due to its capital intensive nature, tight permit approvals, and relations needed to secure supply. The several players in this industry serves 3 main segments: industry (40%), electricity (24%), and fertilizer (18%) (Figure 7). In these segments, there are shifts towards a higher gas usage, driven by gas’ clean emission, competitive price, and reliable source of power at peak hours.
Natural Gas Industry: Ample Room for Growth
Countries Indonesia Malaysia Thailand Philippines Vietnam GDP/capita (USD) 3,847 9,945 6,594 2,989 2,343 Natural gas consumption (m3/capita) 204 1,296 1,678 31 161 Gas in energy mix 22% 50% 59% 22% 22% Power plant capacity (GW) 62 34 44.6 20.1 59.4 Total gas pipelines length (km) 11,702 6,439 5,900 576 955 Gas Reserves (TSCF) 142.72 134.45 6.80 4.91 10.11
Source: Countries’ Energy Handbook 2018, Ministry of Energy and Minerals, OPEC Annual Statistic Bulletin 2018, US Energy Information Administration, Statistical Review of World Energy
Indonesia is ranked 1st in terms of gas reserves among other ASEAN emerging countries. This shows that Indonesia still has much room and opportunity for natural gas industry to develop further. Also, Indonesia has a rather low natural gas consumption per capita of 204 m3 compared to other countries and only accounts for 22% of the energy mix by 3Q18 while Thailand is at 59% and Malaysia is at 43%. Those data translate that higher natural gas consumption in Indonesia is still within reach for improvement and will boost the industry’s performance even further. However, domestic natural gas hasn’t been utilized properly due to the lack of infrastructure development. For Indonesia to reach the same level of gas consumption, it will require the development of infrastructure to supply the high potential demand – as Indonesia currently only cover 20-30% of the needed infrastructure (Ministry of SOE, 2018).
57%
43%
Pertamina
Public
40%
24%
18%
5%
14%
Industry
Power sector
Petrochemical
Oil lifting
Others
4
Figure 9: Natural Gas Supply and Demand per Region 2019F
Source: Ministry of Energy and Mineral Resources 2018
Figure 10: Natural Gas Potential Demand
Source: Ministry of Energy and Mineral Resources 2018
Figure 11: Natural Gas Demand in Java and Outside Java
Source: Ministry of Energy and Mineral Resources 2018
Figure 12: Indonesian Energy Mix
Source: PLN Statistics, PLN RUPTL 2018-2027
Government’s Support in Securing Gas Supply A total gas reserve of 142.72 TSCF puts Indonesia in a secure position in terms of gas supply. This reserve, able to fulfil 54 years of current total annual consumption, is expected to be utilized even more efficiently as upstream regulations are being streamlined. However, Indonesia is expected to run a gas supply deficit by 2025 due to lack of encouragement from gas lifters because of uncertain regulations. To enlighten the situation, Ministry of Energy and Mineral Resources is gradually simplifying its notorious oil and gas regulations which is previously considered as unfavourable for investors. One such incentive is the rise of baseline company-take of profits from 30% to 48% for upstream gas companies. The ministry of EMR is also constantly simplifying regulations, most recently in 12/02/2019, where 10 oil and gas regulations are condensed into only 7. With these steps, we believe upstream lifting environment to welcome more investors and thus securing more domestic supply.
Indonesian Gas Network Region Given the nature of being an archipelagic country, it is indeed harder to build adequate gas infrastructure that could cover the whole country. Inadequate gas infrastructure has caused uneven gas supply despite of abundant natural gas reserves. Most players in the gas distribution industry has their own pipeline built near the supply of natural gas blocks. This aims to simplify the distribution process with no additional transportation costs but discourages companies to build pipelines far away from gas supply. As a result, Indonesia is lacking gas infrastructure, especially in regions where gas supply is absent. Based on the available gas distribution network, the Ministry of Energy and Mineral Resources divides the Indonesian archipelago into 6 regions: (I) Aceh and North Sumatra, (II) Central Sumatra, South Sumatra, Riau Islands, Natuna and West Java, (III) Central Java, (IV) East Java, (V) Kalimantan and Bali, (VI) Sulawesi, Nusa Tenggara, Maluku, and Papua (Figure 8). Overall, Region II and Region III are facing gas shortages (2019F: Aggregate supply: 3,141 mmscfd vs. aggregate demand: 3,370 mmscfd), while other regions are left with more supply but no adequate infrastructure to distribute them (2019F: Aggregate supply: 5,085 mmscfd vs aggregate demand: 4,230 mmscfd) (Figure 9).
Gas Infrastructure Masterplan, a Key to Develop Industry One of the government’s long-term goal regarding the distribution industry is to construct gas infrastructure based on a roadmap to be achieved by 2030 (Appendix C.3). It aims to maximize domestic gas utilization by connecting gas infrastructure throughout all regions in Indonesia and to increase distribution coverage to suppliers and customers, as well as to capture new potential demand. Potential demand will reach 8,255 mmscfd in 2023F based on EMR Ministry (2018) forecast on each region’s demand (Figure 10). The plan will include the construction of West Java-East Java pipeline by 2020 to address regional supply imbalance problems. The two regions will be connected by pipeline with a length of 567-667 km with 850 mmscfd capacity. Those pipelines will be completed by 2020 and start operating at full capacity by 2021. Once the pipeline starts to operate, it will capture new demand for natural gas that has been highly anticipated by local consumers in Sumatera-Java area (Region II-IV), demand will be as high as 4,070 mmscfd in 2019F compared to other regions of 3,530 mmscfd (Figure 11). While these plans will take some time to realize, other forms of gas distribution will still take place.
New Market Potentials in the Household Segment Households in Indonesia currently procure their gas supply through LPG tubes that are delivered to each household through non-pipeline distribution networks. With the ongoing construction of city gas pipelines, households can now acquire gas at a price of IDR 4,500-IDR 6,500/m3, compared to the 12 kg LPG tubes sold at Rp155,000, or IDR 23,919/m3. The absence of gas pipeline infrastructure connecting households to gas supply is a new potential market for the Indonesian natural gas industry. Even though the average household consumes much less gas (0.005 MMSCF/year) than industries (157.24 MMSCF/year), the potential number of customers to be reached is enormous. There are 69.5 million household in Indonesia, and only 192,489 being PGAS’ current household consumers. City gas projects still offer a good deal as it will help the industry to connect with thousands of new consumers and gain new potential revenue that is promising and sustainable.
Higher Demand from Core Customers Await Apart from the potential from household sector, higher demand from power generation and petrochemical is expected to take place in 2019F afterwards. MEMR has proposed higher electricity demand as designed in RUPTL 2018-2027 with sustainable gas proportion in the energy mix of 23% in 2019F (Figure 12). Gas demand from electricity is expected to increase up to 1,581 mmscfd by 2023F. Fertilizer sector will also increase their production capacity according to government’s vision to revitalize the industry. Gas as its raw material, will experience an increase along with the increase in production. Combined with tax holiday policy for petrochemical industry, it is expected that natural gas demand as raw material for fertilizer will soar up to 1,470 mmscfd applying the best scenario in 2023 (Figure 13).
Regulations to Secure Bargaining Power to Consumer There are times where players in the gas transportation business were not able to pass through gas acquisition cost increase to major customers. However, under EMR Ministerial Regulation No. 58/2017, price to end consumers are set at a formula of gas buying price, infrastructure costs, and a 7% margin. While this regulation may limit margins, players within this sector is assured to be able to pass through the gas acquisition cost to customers. This situation will protect margins which will not fall below the
240
3250
120
700
16901600
423
3088
53
914
2152
1596
Region 1 Region 2 Region 3 Region 4 Region 5 Region 6
(MMSCFD)Demand Supply
7318
7600
7896
8255
6800
7200
7600
8000
8400
2018F 2019F 2020F 2021F 2022F 2023F
(MMSCFD)
3515 35303791
3865
38044070 4105
4390
2500
3100
3700
4300
4900
2018F 2019F 2020F 2021F 2022F 2023F
(MMSCFD)Demand outside Java
Demand in Java
25% 23% 21% 23% 24%
12%6% 4% 4% 2%
51% 58% 62% 60% 61%
7% 7% 7% 6% 6%
4% 5% 5% 6% 6%
2016 2017 2018 2019 2020
Gas Oil
Coal Hydro
Geothermal
5
Figure 13: Natural Gas Demand from Core Customers
Source: PLN RUPTL 2018-2027, Ministry of Energy and Mineral Resources
Figure 14: Potential Demand from Oil Lifting
Source: Ministry of Energy and Mineral Resources 2018
Figure 15: Potential Gas Supply from Gas Holding
Source: Ministry of SOE 2018
Figure 17: EV/EBITDA Band
Source: Bloomberg, Team Estimates
regulated margin spread. Having the regulation set into place gives gas transportation players an extra bargaining chip to determine price to consumers.
COMPETITIVE POSITIONING PGAS is currently the market leader in the Indonesian gas distribution industry. High barriers to entry such as its capital intensive nature, tight permit approvals, and the relations required to secure supply, has deterred new entrants to enter and survive, leaving PGAS alone to be dominant in the industry. Combined with Pertagas acquisition and oil and gas holding formation, PGAS’ position as a market leader will be enhanced through several ways:
Potential New Demand from Parent Company PGAS has just moved under the wing of Pertamina, Indonesia’s oil and gas holding company. It will bring integration between upstream and downstream, creating higher effectiveness and efficiencies in natural gas management. Moreover, PGAS will also be able to capture potential deals inside Pertamina group. Currently Pertamina is engaging many diverse projects, for instance Refinery Development Master Plan (RDMP) to reduce Indonesia’s dependency to oil import. RDMP projects consist of five oil refineries project: Cilacap, Balikpapan, Balongan, Tuban, and Bontang. Those oil refineries are expected to generate additional gas demand of 765 mmscfd for oil lifting (Figure 14). Other projects such as LPG terminal or pipeline construction projects, will surely benefit PGAS compared to other players in industry.
Gas Holding to Secure Supply Contracts Oil and gas holding formation will allow Pertamina to directly provide its natural gas supply into PGAS’ supply chain. According to Indonesian Ministry of SOE’s plan, all Pertamina’s gas contracts will be given to PGAS along with its supply infrastructure (transmission and distribution pipeline). Currently Pertamina produces gas 1,785 mmscfd domestically and another potential additional gas supply with 6 blocks commencing with total amount 281 mmscfd up to 2021F (Figure 15). Pertamina’s natural gas production is expected to increase due to viability from additional exploration and extraction using PGAS’ infrastructure, likewise improving PGAS’s supply. Infrastructure will increase revenue when demand soars high, mutually benefitting both sides.
More Developed Infrastructure to Access End Customers Improved gas infrastructure comes from PGAS-Pertagas' pipeline integration and various government projects regarding gas infrastructure roadmap. Currently PGAS holds 85% nation’s gas infrastructure (7,454 km). Post-acquisition of Pertagas, PGAS has 95% of nation’s infrastructure (9,677 km). Pipeline integration between both companies will also excel the distribution process from supplier to customer, for example SSWJ and East Java pipeline integration. Next, government also incessantly enforcing its infrastructure roadmap project. As an SOE, PGAS has an advantage and received more exposure towards various government’s infrastructure projects. Nation’s long-term masterplan to support gas infrastructure (Appendix C.3) will increase company’s coverage to new demand and supply. Even more, company’s position as market leader with extensive pipeline will ease the bidding process over a project, making it easier for company to grow larger.
INVESTMENT SUMMARY Figure 16: PGAS’s Share Price and News Flows since February 2016 (Stock Price in IDR)
We issue a BUY recommendation on PGAS with a 12-month target price of IDR2,970/share implying 7.66x EV/EBITDA and 1.18x EV/IC. This represents a potential 20.73% upside from its closing price of IDR2,460/share on 15/02/2019. We derived our target price using a sum of the parts method, employing the following methodologies: Discounted Cash Flow to the Firm and Trading Multiples. Our recommendation is based on these key drivers:
Key Drivers Growth Opportunity in Indonesia’s Gas Market Despite its abundant gas reserve (largest in Asia), Indonesia's gas hasn’t been utilized properly due to a lack of infrastructure. This is evident with Indonesia having one of the lowest gas consumptions per capita
1368
1560 1581
1125
1470 1470
600
900
1200
1500
1800
2018F 2019F 2020F 2021F 2022F 2023F
(MMSCFD)Power Generation
Fertilizer
206
229
80
125
125
Cilacap
Balikpapan
Balongan
Tuban
Bontang
(MMSCFD)
10
10
20
15
40
186
Simenggaris
Bambu Besar
Salawati
Cikarang Tegal
Puspa
Cepu
(MMSCFD)
3
4
5
6
7
8
9
10
2/1
8/20
16
5/1
8/20
16
8/1
8/20
16
11/
11
/20
16
8/2
/201
7
12/
5/20
17
8/1
6/20
17
11/
13
/20
17
9/2
/201
8
9/5
/201
8
8/1
5/20
18
12/
11
/20
18
12/
2/20
19
EV/EBITDA PGAS IJ
Average EV/EBITDA
EV/EBITDA STD+1
EV/EBITDA STD+2
EEV/EBITDA STD-1
EV/EBITDA STD-2
9.34
8.24
7.15
6.05
4.96
Appointment of new President Director,
Gigih Prakoso
Natural gas pricing formula announcement
ConocoPhillips increased its gas selling price
Government capped gas selling price of
$1.8/MMBTU in North Sumatra
PLN proposed DMO at $6/MMBTU
PGAS acquired 51% ownership of Pertagas
PGAS's ownership was transferred to Pertamina
First time recorded loss in quarter report
6
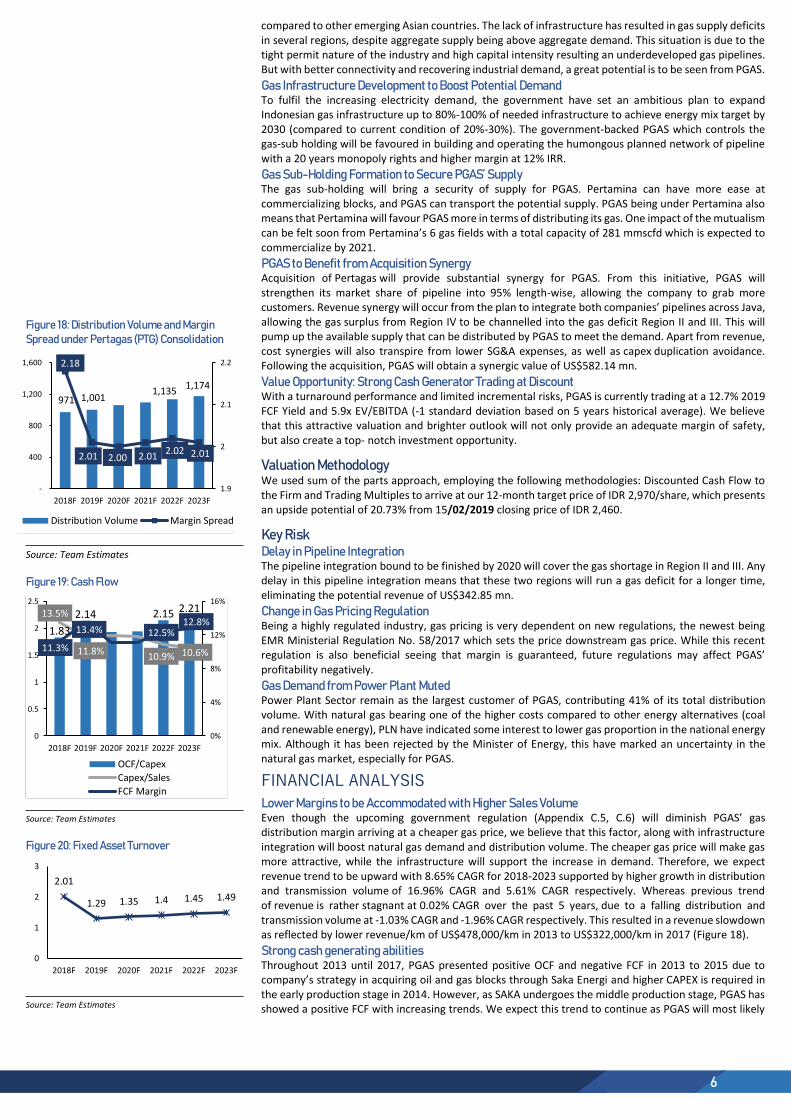
Figure 18: Distribution Volume and Margin Spread under Pertagas (PTG) Consolidation
Source: Team Estimates
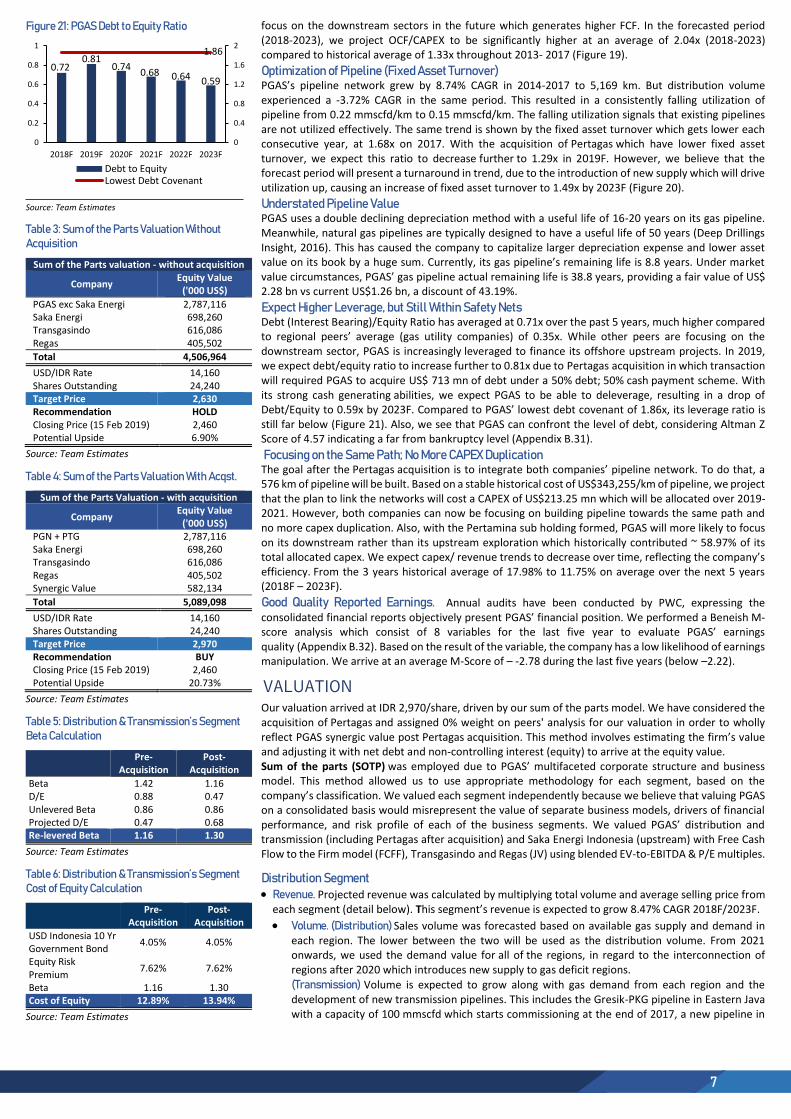
Figure 19: Cash Flow
Source: Team Estimates
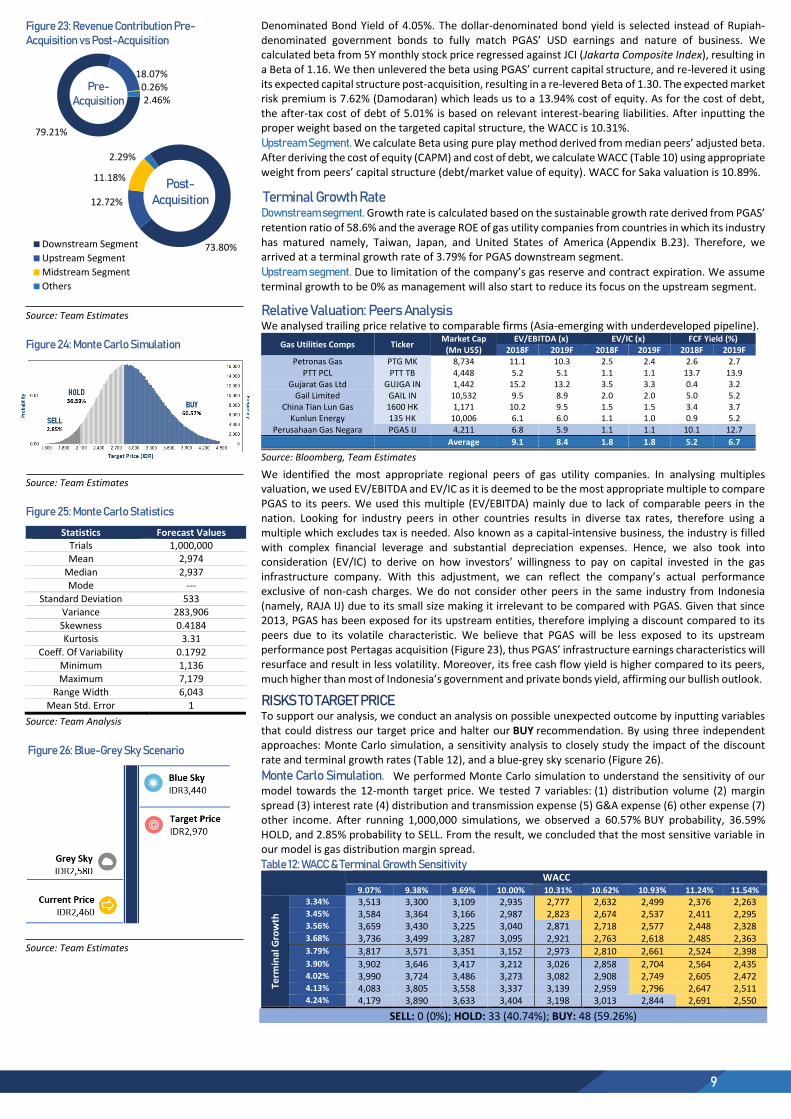
Figure 20: Fixed Asset Turnover
Source: Team Estimates
compared to other emerging Asian countries. The lack of infrastructure has resulted in gas supply deficits in several regions, despite aggregate supply being above aggregate demand. This situation is due to the tight permit nature of the industry and high capital intensity resulting an underdeveloped gas pipelines. But with better connectivity and recovering industrial demand, a great potential is to be seen from PGAS.
Gas Infrastructure Development to Boost Potential Demand To fulfil the increasing electricity demand, the government have set an ambitious plan to expand Indonesian gas infrastructure up to 80%-100% of needed infrastructure to achieve energy mix target by 2030 (compared to current condition of 20%-30%). The government-backed PGAS which controls the gas-sub holding will be favoured in building and operating the humongous planned network of pipeline with a 20 years monopoly rights and higher margin at 12% IRR.
Gas Sub-Holding Formation to Secure PGAS’ Supply The gas sub-holding will bring a security of supply for PGAS. Pertamina can have more ease at commercializing blocks, and PGAS can transport the potential supply. PGAS being under Pertamina also means that Pertamina will favour PGAS more in terms of distributing its gas. One impact of the mutualism can be felt soon from Pertamina’s 6 gas fields with a total capacity of 281 mmscfd which is expected to commercialize by 2021.
PGAS to Benefit from Acquisition Synergy Acquisition of Pertagas will provide substantial synergy for PGAS. From this initiative, PGAS will strengthen its market share of pipeline into 95% length-wise, allowing the company to grab more customers. Revenue synergy will occur from the plan to integrate both companies’ pipelines across Java, allowing the gas surplus from Region IV to be channelled into the gas deficit Region II and III. This will pump up the available supply that can be distributed by PGAS to meet the demand. Apart from revenue, cost synergies will also transpire from lower SG&A expenses, as well as capex duplication avoidance. Following the acquisition, PGAS will obtain a synergic value of US$582.14 mn.
Value Opportunity: Strong Cash Generator Trading at Discount With a turnaround performance and limited incremental risks, PGAS is currently trading at a 12.7% 2019 FCF Yield and 5.9x EV/EBITDA (-1 standard deviation based on 5 years historical average). We believe that this attractive valuation and brighter outlook will not only provide an adequate margin of safety, but also create a top- notch investment opportunity.
Valuation Methodology We used sum of the parts approach, employing the following methodologies: Discounted Cash Flow to the Firm and Trading Multiples to arrive at our 12-month target price of IDR 2,970/share, which presents an upside potential of 20.73% from 15/02/2019 closing price of IDR 2,460.
Key Risk Delay in Pipeline Integration The pipeline integration bound to be finished by 2020 will cover the gas shortage in Region II and III. Any delay in this pipeline integration means that these two regions will run a gas deficit for a longer time, eliminating the potential revenue of US$342.85 mn.
Change in Gas Pricing Regulation Being a highly regulated industry, gas pricing is very dependent on new regulations, the newest being EMR Ministerial Regulation No. 58/2017 which sets the price downstream gas price. While this recent regulation is also beneficial seeing that margin is guaranteed, future regulations may affect PGAS’ profitability negatively.
Gas Demand from Power Plant Muted Power Plant Sector remain as the largest customer of PGAS, contributing 41% of its total distribution volume. With natural gas bearing one of the higher costs compared to other energy alternatives (coal and renewable energy), PLN have indicated some interest to lower gas proportion in the national energy mix. Although it has been rejected by the Minister of Energy, this have marked an uncertainty in the natural gas market, especially for PGAS.
FINANCIAL ANALYSIS
Lower Margins to be Accommodated with Higher Sales Volume Even though the upcoming government regulation (Appendix C.5, C.6) will diminish PGAS’ gas distribution margin arriving at a cheaper gas price, we believe that this factor, along with infrastructure integration will boost natural gas demand and distribution volume. The cheaper gas price will make gas more attractive, while the infrastructure will support the increase in demand. Therefore, we expect revenue trend to be upward with 8.65% CAGR for 2018-2023 supported by higher growth in distribution and transmission volume of 16.96% CAGR and 5.61% CAGR respectively. Whereas previous trend of revenue is rather stagnant at 0.02% CAGR over the past 5 years, due to a falling distribution and transmission volume at -1.03% CAGR and -1.96% CAGR respectively. This resulted in a revenue slowdown as reflected by lower revenue/km of US$478,000/km in 2013 to US$322,000/km in 2017 (Figure 18).
Strong cash generating abilities Throughout 2013 until 2017, PGAS presented positive OCF and negative FCF in 2013 to 2015 due to company’s strategy in acquiring oil and gas blocks through Saka Energi and higher CAPEX is required in the early production stage in 2014. However, as SAKA undergoes the middle production stage, PGAS has showed a positive FCF with increasing trends. We expect this trend to continue as PGAS will most likely
971 1,001 1,135
1,174
2.18
2.01 2.00 2.012.02 2.01
1.9
2
2.1
2.2
-
400
800
1,200
1,600
2018F 2019F 2020F 2021F 2022F 2023F
Distribution Volume Margin Spread
1.83
2.14 2.15 2.2113.5%
11.8%10.9% 10.6%11.3%
13.4% 12.5%12.8%
0%
4%
8%
12%
16%
0
0.5
1
1.5
2
2.5
2018F 2019F 2020F 2021F 2022F 2023F
OCF/Capex
Capex/Sales
FCF Margin
2.01
1.29 1.35 1.4 1.45 1.49
0
1
2
3
2018F 2019F 2020F 2021F 2022F 2023F
7
Figure 21: PGAS Debt to Equity Ratio
Source: Team Estimates
Table 3: Sum of the Parts Valuation Without Acquisition
Sum of the Parts valuation - without acquisition
Company Equity Value
('000 US$)
PGAS exc Saka Energi 2,787,116 Saka Energi 698,260 Transgasindo 616,086 Regas 405,502
Total 4,506,964
USD/IDR Rate 14,160 Shares Outstanding 24,240 Target Price 2,630 Recommendation HOLD Closing Price (15 Feb 2019) 2,460 Potential Upside 6.90%
Source: Team Estimates
Table 4: Sum of the Parts Valuation With Acqst.
Sum of the Parts Valuation - with acquisition
Company Equity Value
('000 US$) PGN + PTG 2,787,116 Saka Energi 698,260 Transgasindo 616,086 Regas 405,502 Synergic Value 582,134
Total 5,089,098
USD/IDR Rate 14,160 Shares Outstanding 24,240 Target Price 2,970 Recommendation BUY Closing Price (15 Feb 2019) 2,460 Potential Upside 20.73%
Source: Team Estimates
Table 5: Distribution & Transmission’s Segment Beta Calculation
Pre-Acquisition
Post-Acquisition
Beta 1.42 1.16 D/E 0.88 0.47 Unlevered Beta 0.86 0.86 Projected D/E 0.47 0.68 Re-levered Beta 1.16 1.30
Source: Team Estimates
Table 6: Distribution & Transmission’s Segment Cost of Equity Calculation
Pre-Acquisition
Post-Acquisition
USD Indonesia 10 Yr Government Bond
4.05% 4.05%
Equity Risk Premium
7.62% 7.62%
Beta 1.16 1.30 Cost of Equity 12.89% 13.94%
Source: Team Estimates
focus on the downstream sectors in the future which generates higher FCF. In the forecasted period (2018-2023), we project OCF/CAPEX to be significantly higher at an average of 2.04x (2018-2023) compared to historical average of 1.33x throughout 2013- 2017 (Figure 19).
Optimization of Pipeline (Fixed Asset Turnover) PGAS’s pipeline network grew by 8.74% CAGR in 2014-2017 to 5,169 km. But distribution volume experienced a -3.72% CAGR in the same period. This resulted in a consistently falling utilization of pipeline from 0.22 mmscfd/km to 0.15 mmscfd/km. The falling utilization signals that existing pipelines are not utilized effectively. The same trend is shown by the fixed asset turnover which gets lower each consecutive year, at 1.68x on 2017. With the acquisition of Pertagas which have lower fixed asset turnover, we expect this ratio to decrease further to 1.29x in 2019F. However, we believe that the forecast period will present a turnaround in trend, due to the introduction of new supply which will drive utilization up, causing an increase of fixed asset turnover to 1.49x by 2023F (Figure 20).
Understated Pipeline Value PGAS uses a double declining depreciation method with a useful life of 16-20 years on its gas pipeline. Meanwhile, natural gas pipelines are typically designed to have a useful life of 50 years (Deep Drillings Insight, 2016). This has caused the company to capitalize larger depreciation expense and lower asset value on its book by a huge sum. Currently, its gas pipeline’s remaining life is 8.8 years. Under market value circumstances, PGAS’ gas pipeline actual remaining life is 38.8 years, providing a fair value of US$ 2.28 bn vs current US$1.26 bn, a discount of 43.19%.
Expect Higher Leverage, but Still Within Safety Nets Debt (Interest Bearing)/Equity Ratio has averaged at 0.71x over the past 5 years, much higher compared to regional peers’ average (gas utility companies) of 0.35x. While other peers are focusing on the downstream sector, PGAS is increasingly leveraged to finance its offshore upstream projects. In 2019, we expect debt/equity ratio to increase further to 0.81x due to Pertagas acquisition in which transaction will required PGAS to acquire US$ 713 mn of debt under a 50% debt; 50% cash payment scheme. With its strong cash generating abilities, we expect PGAS to be able to deleverage, resulting in a drop of Debt/Equity to 0.59x by 2023F. Compared to PGAS’ lowest debt covenant of 1.86x, its leverage ratio is still far below (Figure 21). Also, we see that PGAS can confront the level of debt, considering Altman Z Score of 4.57 indicating a far from bankruptcy level (Appendix B.31).
Focusing on the Same Path; No More CAPEX Duplication The goal after the Pertagas acquisition is to integrate both companies’ pipeline network. To do that, a 576 km of pipeline will be built. Based on a stable historical cost of US$343,255/km of pipeline, we project that the plan to link the networks will cost a CAPEX of US$213.25 mn which will be allocated over 2019-2021. However, both companies can now be focusing on building pipeline towards the same path and no more capex duplication. Also, with the Pertamina sub holding formed, PGAS will more likely to focus on its downstream rather than its upstream exploration which historically contributed ~ 58.97% of its total allocated capex. We expect capex/ revenue trends to decrease over time, reflecting the company’s efficiency. From the 3 years historical average of 17.98% to 11.75% on average over the next 5 years (2018F – 2023F).
Good Quality Reported Earnings. Annual audits have been conducted by PWC, expressing the consolidated financial reports objectively present PGAS’ financial position. We performed a Beneish M-score analysis which consist of 8 variables for the last five year to evaluate PGAS’ earnings quality (Appendix B.32). Based on the result of the variable, the company has a low likelihood of earnings manipulation. We arrive at an average M-Score of – -2.78 during the last five years (below –2.22).
VALUATION Our valuation arrived at IDR 2,970/share, driven by our sum of the parts model. We have considered the acquisition of Pertagas and assigned 0% weight on peers' analysis for our valuation in order to wholly reflect PGAS synergic value post Pertagas acquisition. This method involves estimating the firm’s value and adjusting it with net debt and non-controlling interest (equity) to arrive at the equity value. Sum of the parts (SOTP) was employed due to PGAS’ multifaceted corporate structure and business model. This method allowed us to use appropriate methodology for each segment, based on the company’s classification. We valued each segment independently because we believe that valuing PGAS on a consolidated basis would misrepresent the value of separate business models, drivers of financial performance, and risk profile of each of the business segments. We valued PGAS’ distribution and transmission (including Pertagas after acquisition) and Saka Energi Indonesia (upstream) with Free Cash Flow to the Firm model (FCFF), Transgasindo and Regas (JV) using blended EV-to-EBITDA & P/E multiples.
Distribution Segment Revenue. Projected revenue was calculated by multiplying total volume and average selling price from
each segment (detail below). This segment’s revenue is expected to grow 8.47% CAGR 2018F/2023F.
Volume. (Distribution) Sales volume was forecasted based on available gas supply and demand in each region. The lower between the two will be used as the distribution volume. From 2021 onwards, we used the demand value for all of the regions, in regard to the interconnection of regions after 2020 which introduces new supply to gas deficit regions.
(Transmission) Volume is expected to grow along with gas demand from each region and the development of new transmission pipelines. This includes the Gresik-PKG pipeline in Eastern Java with a capacity of 100 mmscfd which starts commissioning at the end of 2017, a new pipeline in
0.720.81
0.740.68 0.64 0.59
1.86
0
0.4
0.8
1.2
1.6
2
0
0.2
0.4
0.6
0.8
1
2018F 2019F 2020F 2021F 2022F 2023F
Debt to EquityLowest Debt Covenant

8
Table 7: Distribution and Transmission’s Segment Cost of Debt Calculation
Pre-Acquisition
Post-Acquisition
Cost of Debt 5.05% 6.67% After-Tax Cost of Debt 3.79% 5.00%
Source: Team Estimates
Table 8: Distribution and Transmission’s Segment WACC Calculation
Pre-Acquisition
Post-Acquisition
Cost of Equity 12.89% 13.94% Weight of Equity 68% 59% After-Tax Cost of Debt
3.79% 5.00%
Weight of Debt 32% 41% WACC 9.98% 10.31%
Source: Team Estimates
Table 9: Upstream Segment Beta Calculation Oil & Gas peers Beta Debt/MCap Guanghui Energy 1.01 0.11 Medco Energi Internasional
1.71 2.79
Oil and Natural Gas Corp 1.04 0.36 Bharat Petroleum Corp 1.43 0.39 Median 1.24 0.37
Source: Team Estimates
Table 10: Upstream Segment WACC Calculation Cost of Equity – CAPM 13.46% Market Risk Premium 7.62% Risk Free Rate 4.05% Beta 1.24 Cost of Debt 4.01% Target D/E 0.37 WACC 10.89%
Source: Team Estimates
Table 11: Joint Venture Valuation Assumption Peers Valuation
Multiples Computation EV/EBITDA 8.4 P/E 17.2
Transgasindo (TGI) Enterprise Value 1,026,000 Net Debt (145,955) Value from EV/EBITDA (50%) 585,978 Value from P/E (50%) 443,062 Equity Value 1,029,039 Ownerships 59.87% Attributable Equity Value 616,086
Regas Enterprise Value 744,281 Net Debt (146,681) Value from EV/EBITDA (50%) 445,481 Value from P/E (50%) 568,273 Equity Value 1,013,754 Ownership 40% Attributable Equity Value 405,502
Source: Team Estimates
Figure 22: Synergic Value Up To 2023F
Source: Team Estimates
Southern Sumatera transmitting 126 mmscfd for ConocoPhillips is expected to be completed by the end of 2018, and Semarang-Gresik pipeline that will start transmitting 100 mmscfd by 2020. Thus we arrive at a projection of 6.96% and 30.93% CAGR (due to consolidation of Pertagas) from 2018 to 2023 of distribution volume and transmission volume respectively.
Price. (Distribution) To set the selling price, we considered gas pricing formula (Apendix C.9) set by the EMR Ministerial Regulation No. 58/2017 which consists of cost of gas, infrastructure management cost, and trading margin (7% cash cost) for industrial customers. This gas pricing formula will be effectively implied in July 2019. We also consider gas price forecast, which is implied in our cash cost, to administer the selling price used.
(Transmission) Selling Price is forecasted based on average toll fees charged in each region (Northern Sumatera, Southern Sumatera, Western Java, Eastern Java, and Kalimantan). We expect toll fees to be sustained as toll fees are stable for the last 3 years in the nature of it being highly affected by regulations specific for each region.
Cost. Cost is mostly derived from the purchase of gas. We made a projection of purchase of gas price following the movement of global natural gas price as its benchmark. Infrastructure management cost is calculated by the cost of services divided by volume, in which we take several items into account: depreciation expense, general and administrative expenses, repair and maintenance cost, tax and levy, and other operational expenses. Operational cost is expected to increase by 7.80% CAGR 2018- 2023.
Capital Expenditures. In the forecast period, CAPEX will be driven to meet the volume growth and maintenance of assets. We forecast CAPEX with some adjustments after the acquisition takes place in which PGAS’ downstream segment will require additional CAPEX to integrate its pipelines with Pertagas’, which is estimated to be US$213.25 mn over the course of 5 years (2018-2023). Following the acquisition, there will be CAPEX savings from CAPEX duplication avoidance. CAPEX is forecasted with normalized CAPEX to sales ratio ranging between 7.72% to 9.14% for the next 5 years.
Oil and Gas Sales Segment (Upstream) Revenue. Revenue from Saka is calculated by considering the lifting volume and selling price from each
commodity. Revenue from oil and gas sales is expected to grow 6.94% CAGR from 2018F/2023F.
Volume. The growth of volume is forecasted for each block that the company owns, factoring in the capacity utilization level and production stages (and permits). Currently, most of SAKA Energi’s blocks are at an early production stage and 2 blocks (East Kalimantan and Sanga-Sanga) have reached its expiration year. We also estimated Sidayu (under Pangkah) block to commence its operation in the end of 2019 which will contribute 15.7% in oil lifting volume and 28.2% in gas lifting volume. Hence, from the 2018-2023 period, oil lifting volume and gas lifting volume are expected to grow by 4.98% CAGR and 8.72% respectively.
Price. Selling price is set based on the assumptions of commodity forecasts (Appendix B.26) for each type of commodity sold, namely LNG, LPG, Oil, and Natural Gas.
Cost. We estimate cash cost by converting gas and oil to the same units (mmboe). This cost will Increase (decrease) in line in a ratio of 55% with the movement of commodity forecast as contractors will increase its service cost during commodity price hike and decrease its service cost when commodity price fall. Operational cost (including depreciation) is expected to increase by 3.26% CAGR 2018-2023.
Capital Expenditures. CAPEX is required to continue Saka Energi’s exploration and operational activities. In the forecast period, we adjusted based on the blocks’ production stage and its revenues. CAPEX is expected to grow by 3.37% CAGR for the next 5 years with CAPEX/sales ratio between 0.26-0.30.
Joint Ventures (Midstream Segment) – Trading Multiples While accounting classification excludes profit from joint ventures from EBIT, we still acknowledge 2 of PGAS’ JVs contribution to PGAS valuation as it cannot be left out. This is due to their large contribution for the company’s earnings (18.2%) and the nature of operations which are comparable to PGAS’ core business. We derived the target price based on the average gas infrastructure industry’s EV/EBITDA of 8.42x and P/E of 17.3x. In computing the valuation, we equally weight both variables (50%;50%). It was selected since (1) It is a proper metric for gas distribution company in measuring operating performance, by adjusting peers’ tax rate (due to lack of comparison in Indonesia) and depreciation method accounting adjustment (2) the Joint Ventures attribute PGAS based on its earnings, thus earnings performance will affect PGAS’ bottom line. Thereafter, we multiply it by PGAS’ ownership (%) to reflect its value for PGAS.
Synergic Value We foresee PGAS-PTG synergy would take place in the form of additional operating income (Business alignment & optimization and business expansion in gas sub holding) and cost savings. By acquiring Pertagas, PGAS can capture potential deals inside Pertamina group, align Pertagas’ and PGAS’ infrastructure to reach gas supply site and boost sales volume. Also, both companies can avoid pipeline construction duplication and therefore being more efficient on capital expenditure. We then compare the equity value of PGAS with and without the synergy. From this analysis, we conclude that there is a synergic value of US$582 million, which contributes to an upside potential from target price of IDR2,630/share without acquisition into IDR2,970/share with acquisition.
Weighted Average Cost of Capital (WACC) Downstream Segment. The cost of equity is calculated through the Capital Asset Pricing Model adjusted to the country risk premium. As for the risk-free rate, we used the 10Y Indonesia Government Dollar-
2,787 3,3691,425 5821,425
PG
AS
(par
ent
on
ly)
Acq
uis
itio
n C
ost
Per
taga
s
Syn
ergi
c V
alu
e
Tota
l Val
ue
(USD Mn)
9
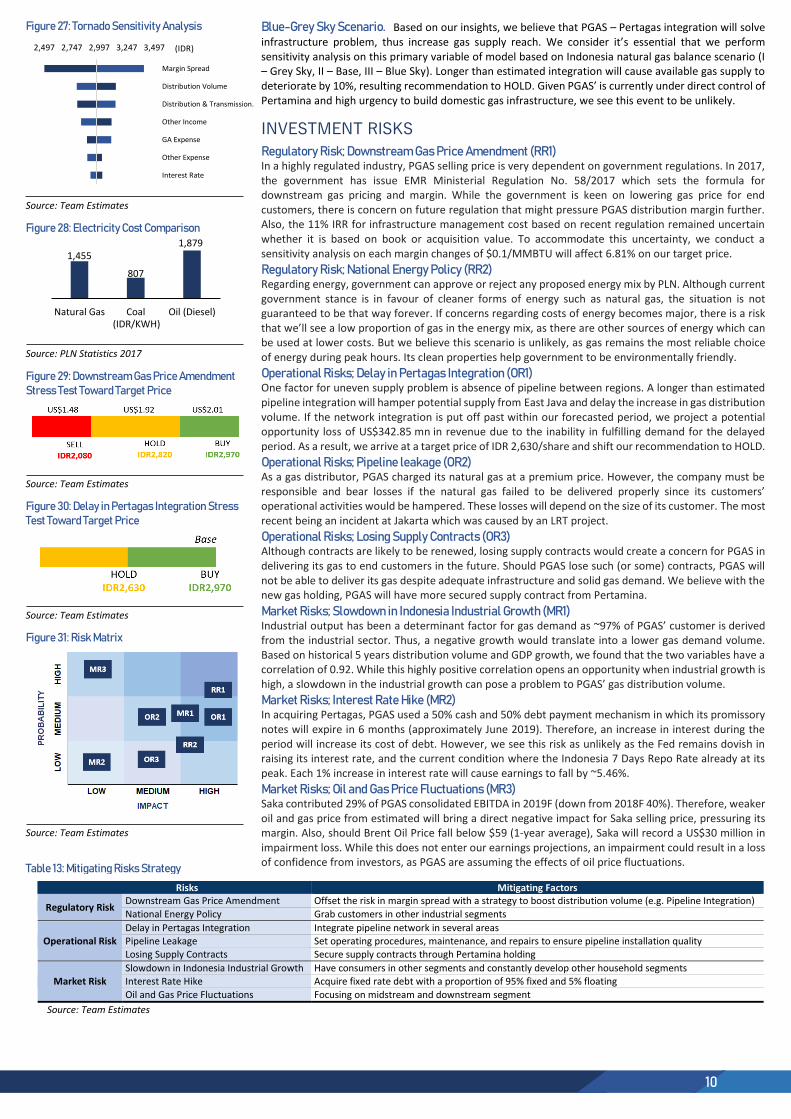
Figure 23: Revenue Contribution Pre-Acquisition vs Post-Acquisition
Source: Team Estimates
Figure 24: Monte Carlo Simulation
Source: Team Estimates
Figure 25: Monte Carlo Statistics
Statistics Forecast Values Trials 1,000,000 Mean 2,974
Median 2,937 Mode ---
Standard Deviation 533 Variance 283,906
Skewness 0.4184 Kurtosis 3.31
Coeff. Of Variability 0.1792 Minimum 1,136
Maximum 7,179 Range Width 6,043
Mean Std. Error 1
Source: Team Analysis
Figure 26: Blue-Grey Sky Scenario
Source: Team Estimates
Denominated Bond Yield of 4.05%. The dollar-denominated bond yield is selected instead of Rupiah-denominated government bonds to fully match PGAS’ USD earnings and nature of business. We calculated beta from 5Y monthly stock price regressed against JCI (Jakarta Composite Index), resulting in a Beta of 1.16. We then unlevered the beta using PGAS’ current capital structure, and re-levered it using its expected capital structure post-acquisition, resulting in a re-levered Beta of 1.30. The expected market risk premium is 7.62% (Damodaran) which leads us to a 13.94% cost of equity. As for the cost of debt, the after-tax cost of debt of 5.01% is based on relevant interest-bearing liabilities. After inputting the proper weight based on the targeted capital structure, the WACC is 10.31%.
Upstream Segment. We calculate Beta using pure play method derived from median peers’ adjusted beta. After deriving the cost of equity (CAPM) and cost of debt, we calculate WACC (Table 10) using appropriate weight from peers’ capital structure (debt/market value of equity). WACC for Saka valuation is 10.89%.
Terminal Growth Rate Downstream segment. Growth rate is calculated based on the sustainable growth rate derived from PGAS’ retention ratio of 58.6% and the average ROE of gas utility companies from countries in which its industry has matured namely, Taiwan, Japan, and United States of America (Appendix B.23). Therefore, we arrived at a terminal growth rate of 3.79% for PGAS downstream segment.
Upstream segment. Due to limitation of the company’s gas reserve and contract expiration. We assume terminal growth to be 0% as management will also start to reduce its focus on the upstream segment.
Relative Valuation: Peers Analysis We analysed trailing price relative to comparable firms (Asia-emerging with underdeveloped pipeline).
Gas Utilities Comps Ticker Market Cap
(Mn US$) EV/EBITDA (x) EV/IC (x) FCF Yield (%)
2018F 2019F 2018F 2019F 2018F 2019F Petronas Gas PTG MK 8,734 11.1 10.3 2.5 2.4 2.6 2.7
PTT PCL PTT TB 4,448 5.2 5.1 1.1 1.1 13.7 13.9 Gujarat Gas Ltd GUJGA IN 1,442 15.2 13.2 3.5 3.3 0.4 3.2
Gail Limited GAIL IN 10,532 9.5 8.9 2.0 2.0 5.0 5.2 China Tian Lun Gas 1600 HK 1,171 10.2 9.5 1.5 1.5 3.4 3.7
Kunlun Energy 135 HK 10,006 6.1 6.0 1.1 1.0 0.9 5.2 Perusahaan Gas Negara PGAS IJ 4,211 6.8 5.9 1.1 1.1 10.1 12.7
Average 9.1 8.4 1.8 1.8 5.2 6.7
Source: Bloomberg, Team Estimates
We identified the most appropriate regional peers of gas utility companies. In analysing multiples valuation, we used EV/EBITDA and EV/IC as it is deemed to be the most appropriate multiple to compare PGAS to its peers. We used this multiple (EV/EBITDA) mainly due to lack of comparable peers in the nation. Looking for industry peers in other countries results in diverse tax rates, therefore using a multiple which excludes tax is needed. Also known as a capital-intensive business, the industry is filled with complex financial leverage and substantial depreciation expenses. Hence, we also took into consideration (EV/IC) to derive on how investors’ willingness to pay on capital invested in the gas infrastructure company. With this adjustment, we can reflect the company’s actual performance exclusive of non-cash charges. We do not consider other peers in the same industry from Indonesia (namely, RAJA IJ) due to its small size making it irrelevant to be compared with PGAS. Given that since 2013, PGAS has been exposed for its upstream entities, therefore implying a discount compared to its peers due to its volatile characteristic. We believe that PGAS will be less exposed to its upstream performance post Pertagas acquisition (Figure 23), thus PGAS’ infrastructure earnings characteristics will resurface and result in less volatility. Moreover, its free cash flow yield is higher compared to its peers, much higher than most of Indonesia’s government and private bonds yield, affirming our bullish outlook.
RISKS TO TARGET PRICE To support our analysis, we conduct an analysis on possible unexpected outcome by inputting variables that could distress our target price and halter our BUY recommendation. By using three independent approaches: Monte Carlo simulation, a sensitivity analysis to closely study the impact of the discount rate and terminal growth rates (Table 12), and a blue-grey sky scenario (Figure 26).
Monte Carlo Simulation. We performed Monte Carlo simulation to understand the sensitivity of our model towards the 12-month target price. We tested 7 variables: (1) distribution volume (2) margin spread (3) interest rate (4) distribution and transmission expense (5) G&A expense (6) other expense (7) other income. After running 1,000,000 simulations, we observed a 60.57% BUY probability, 36.59% HOLD, and 2.85% probability to SELL. From the result, we concluded that the most sensitive variable in our model is gas distribution margin spread.
Table 12: WACC & Terminal Growth Sensitivity
WACC 9.07% 9.38% 9.69% 10.00% 10.31% 10.62% 10.93% 11.24% 11.54%
Term
inal
Gro
wth
3.34% 3,513 3,300 3,109 2,935 2,777 2,632 2,499 2,376 2,263 3.45% 3,584 3,364 3,166 2,987 2,823 2,674 2,537 2,411 2,295 3.56% 3,659 3,430 3,225 3,040 2,871 2,718 2,577 2,448 2,328 3.68% 3,736 3,499 3,287 3,095 2,921 2,763 2,618 2,485 2,363 3.79% 3,817 3,571 3,351 3,152 2,973 2,810 2,661 2,524 2,398 3.90% 3,902 3,646 3,417 3,212 3,026 2,858 2,704 2,564 2,435 4.02% 3,990 3,724 3,486 3,273 3,082 2,908 2,749 2,605 2,472 4.13% 4,083 3,805 3,558 3,337 3,139 2,959 2,796 2,647 2,511 4.24% 4,179 3,890 3,633 3,404 3,198 3,013 2,844 2,691 2,550
SELL: 0 (0%); HOLD: 33 (40.74%); BUY: 48 (59.26%)
79.21%
18.07%0.26%2.46%
Pre-Acquisition
73.80%
12.72%
11.18%
2.29%
Downstream Segment
Upstream Segment
Midstream Segment
Others
Post-Acquisition
10
Risks Mitigating Factors
Regulatory Risk Downstream Gas Price Amendment Offset the risk in margin spread with a strategy to boost distribution volume (e.g. Pipeline Integration)
National Energy Policy Grab customers in other industrial segments
Operational Risk Delay in Pertagas Integration Integrate pipeline network in several areas Pipeline Leakage Set operating procedures, maintenance, and repairs to ensure pipeline installation quality Losing Supply Contracts Secure supply contracts through Pertamina holding
Market Risk Slowdown in Indonesia Industrial Growth Have consumers in other segments and constantly develop other household segments Interest Rate Hike Acquire fixed rate debt with a proportion of 95% fixed and 5% floating
Oil and Gas Price Fluctuations Focusing on midstream and downstream segment
Source: Team Estimates
Figure 27: Tornado Sensitivity Analysis
Source: Team Estimates
Figure 28: Electricity Cost Comparison
Source: PLN Statistics 2017
Figure 29: Downstream Gas Price Amendment Stress Test Toward Target Price
Source: Team Estimates
Figure 30: Delay in Pertagas Integration Stress Test Toward Target Price
Source: Team Estimates
Figure 31: Risk Matrix
Source: Team Estimates
Table 13: Mitigating Risks Strategy
Blue-Grey Sky Scenario. Based on our insights, we believe that PGAS – Pertagas integration will solve infrastructure problem, thus increase gas supply reach. We consider it’s essential that we perform sensitivity analysis on this primary variable of model based on Indonesia natural gas balance scenario (I – Grey Sky, II – Base, III – Blue Sky). Longer than estimated integration will cause available gas supply to deteriorate by 10%, resulting recommendation to HOLD. Given PGAS’ is currently under direct control of Pertamina and high urgency to build domestic gas infrastructure, we see this event to be unlikely.
INVESTMENT RISKS
Regulatory Risk; Downstream Gas Price Amendment (RR1) In a highly regulated industry, PGAS selling price is very dependent on government regulations. In 2017, the government has issue EMR Ministerial Regulation No. 58/2017 which sets the formula for downstream gas pricing and margin. While the government is keen on lowering gas price for end customers, there is concern on future regulation that might pressure PGAS distribution margin further. Also, the 11% IRR for infrastructure management cost based on recent regulation remained uncertain whether it is based on book or acquisition value. To accommodate this uncertainty, we conduct a sensitivity analysis on each margin changes of $0.1/MMBTU will affect 6.81% on our target price.
Regulatory Risk; National Energy Policy (RR2) Regarding energy, government can approve or reject any proposed energy mix by PLN. Although current government stance is in favour of cleaner forms of energy such as natural gas, the situation is not guaranteed to be that way forever. If concerns regarding costs of energy becomes major, there is a risk that we’ll see a low proportion of gas in the energy mix, as there are other sources of energy which can be used at lower costs. But we believe this scenario is unlikely, as gas remains the most reliable choice of energy during peak hours. Its clean properties help government to be environmentally friendly.
Operational Risks; Delay in Pertagas Integration (OR1) One factor for uneven supply problem is absence of pipeline between regions. A longer than estimated pipeline integration will hamper potential supply from East Java and delay the increase in gas distribution volume. If the network integration is put off past within our forecasted period, we project a potential opportunity loss of US$342.85 mn in revenue due to the inability in fulfilling demand for the delayed period. As a result, we arrive at a target price of IDR 2,630/share and shift our recommendation to HOLD.
Operational Risks; Pipeline leakage (OR2) As a gas distributor, PGAS charged its natural gas at a premium price. However, the company must be responsible and bear losses if the natural gas failed to be delivered properly since its customers’ operational activities would be hampered. These losses will depend on the size of its customer. The most recent being an incident at Jakarta which was caused by an LRT project.
Operational Risks; Losing Supply Contracts (OR3) Although contracts are likely to be renewed, losing supply contracts would create a concern for PGAS in delivering its gas to end customers in the future. Should PGAS lose such (or some) contracts, PGAS will not be able to deliver its gas despite adequate infrastructure and solid gas demand. We believe with the new gas holding, PGAS will have more secured supply contract from Pertamina.
Market Risks; Slowdown in Indonesia Industrial Growth (MR1) Industrial output has been a determinant factor for gas demand as ~97% of PGAS’ customer is derived from the industrial sector. Thus, a negative growth would translate into a lower gas demand volume. Based on historical 5 years distribution volume and GDP growth, we found that the two variables have a correlation of 0.92. While this highly positive correlation opens an opportunity when industrial growth is high, a slowdown in the industrial growth can pose a problem to PGAS’ gas distribution volume.
Market Risks; Interest Rate Hike (MR2) In acquiring Pertagas, PGAS used a 50% cash and 50% debt payment mechanism in which its promissory notes will expire in 6 months (approximately June 2019). Therefore, an increase in interest during the period will increase its cost of debt. However, we see this risk as unlikely as the Fed remains dovish in raising its interest rate, and the current condition where the Indonesia 7 Days Repo Rate already at its peak. Each 1% increase in interest rate will cause earnings to fall by ~5.46%.
Market Risks; Oil and Gas Price Fluctuations (MR3) Saka contributed 29% of PGAS consolidated EBITDA in 2019F (down from 2018F 40%). Therefore, weaker oil and gas price from estimated will bring a direct negative impact for Saka selling price, pressuring its margin. Also, should Brent Oil Price fall below $59 (1-year average), Saka will record a US$30 million in impairment loss. While this does not enter our earnings projections, an impairment could result in a loss of confidence from investors, as PGAS are assuming the effects of oil price fluctuations.
2,497 2,747 2,997 3,247 3,497
Margin Spread
Distribution Volume
Distribution & Transmission…
Other Income
GA Expense
Other Expense
Interest Rate
(IDR)
1,455
807
1,879
Natural Gas Coal Oil (Diesel)(IDR/KWH)
11
APPENDICES
SECTION A: BUSINESS OVERVIEW
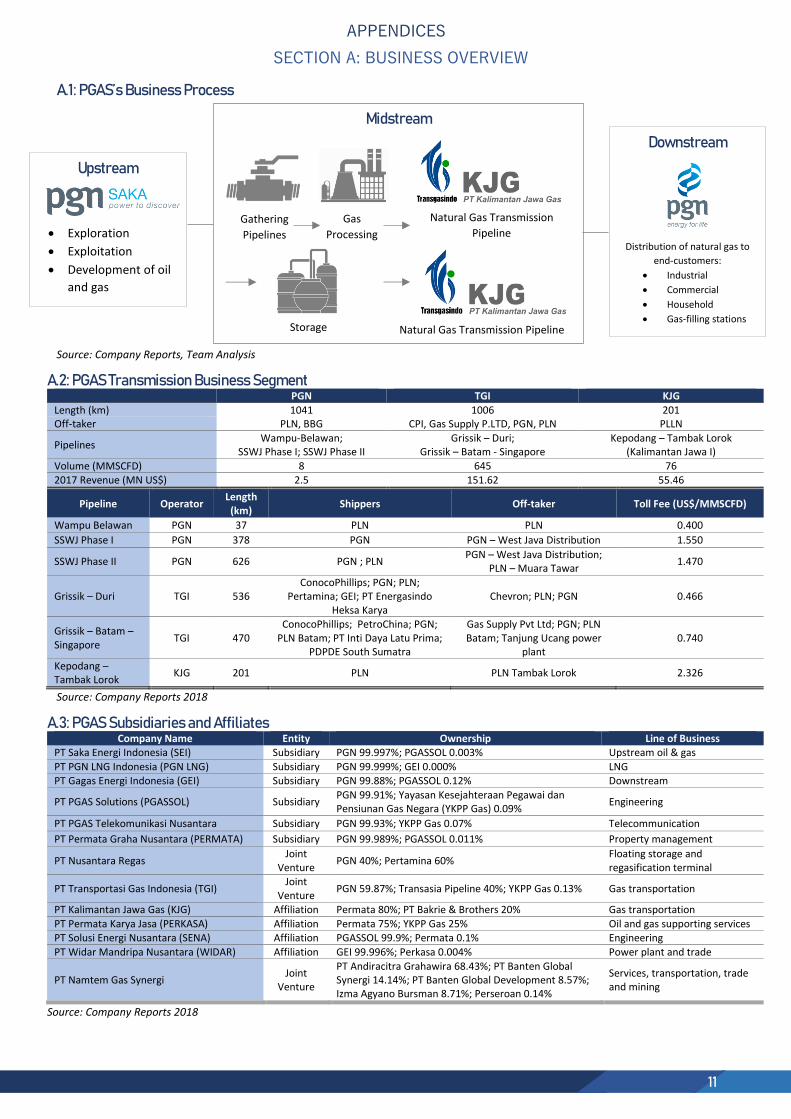
A.1: PGAS’s Business Process
Source: Company Reports, Team Analysis
A.2: PGAS Transmission Business Segment PGN TGI KJG
Length (km) 1041 1006 201 Off-taker PLN, BBG CPI, Gas Supply P.LTD, PGN, PLN PLLN
Pipelines Wampu-Belawan;
SSWJ Phase I; SSWJ Phase II Grissik – Duri;
Grissik – Batam - Singapore Kepodang – Tambak Lorok
(Kalimantan Jawa I)
Volume (MMSCFD) 8 645 76 2017 Revenue (MN US$) 2.5 151.62 55.46
Pipeline Operator Length (km)
Shippers Off-taker Toll Fee (US$/MMSCFD)
Wampu Belawan PGN 37 PLN PLN 0.400
SSWJ Phase I PGN 378 PGN PGN – West Java Distribution 1.550
SSWJ Phase II PGN 626 PGN ; PLN PGN – West Java Distribution;
PLN – Muara Tawar 1.470
Grissik – Duri TGI 536 ConocoPhillips; PGN; PLN;
Pertamina; GEI; PT Energasindo Heksa Karya
Chevron; PLN; PGN 0.466
Grissik – Batam – Singapore
TGI 470 ConocoPhillips; PetroChina; PGN;
PLN Batam; PT Inti Daya Latu Prima; PDPDE South Sumatra
Gas Supply Pvt Ltd; PGN; PLN Batam; Tanjung Ucang power
plant 0.740
Kepodang – Tambak Lorok
KJG 201 PLN PLN Tambak Lorok 2.326
Source: Company Reports 2018
A.3: PGAS Subsidiaries and Affiliates Company Name Entity Ownership Line of Business
PT Saka Energi Indonesia (SEI) Subsidiary PGN 99.997%; PGASSOL 0.003% Upstream oil & gas
PT PGN LNG Indonesia (PGN LNG) Subsidiary PGN 99.999%; GEI 0.000% LNG PT Gagas Energi Indonesia (GEI) Subsidiary PGN 99.88%; PGASSOL 0.12% Downstream
PT PGAS Solutions (PGASSOL) Subsidiary PGN 99.91%; Yayasan Kesejahteraan Pegawai dan Pensiunan Gas Negara (YKPP Gas) 0.09%
Engineering
PT PGAS Telekomunikasi Nusantara Subsidiary PGN 99.93%; YKPP Gas 0.07% Telecommunication
PT Permata Graha Nusantara (PERMATA) Subsidiary PGN 99.989%; PGASSOL 0.011% Property management
PT Nusantara Regas Joint
Venture PGN 40%; Pertamina 60%
Floating storage and regasification terminal
PT Transportasi Gas Indonesia (TGI) Joint
Venture PGN 59.87%; Transasia Pipeline 40%; YKPP Gas 0.13% Gas transportation
PT Kalimantan Jawa Gas (KJG) Affiliation Permata 80%; PT Bakrie & Brothers 20% Gas transportation
PT Permata Karya Jasa (PERKASA) Affiliation Permata 75%; YKPP Gas 25% Oil and gas supporting services PT Solusi Energi Nusantara (SENA) Affiliation PGASSOL 99.9%; Permata 0.1% Engineering
PT Widar Mandripa Nusantara (WIDAR) Affiliation GEI 99.996%; Perkasa 0.004% Power plant and trade
PT Namtem Gas Synergi Joint
Venture
PT Andiracitra Grahawira 68.43%; PT Banten Global Synergi 14.14%; PT Banten Global Development 8.57%; Izma Agyano Bursman 8.71%; Perseroan 0.14%
Services, transportation, trade and mining
Source: Company Reports 2018
Midstream
Gathering
Pipelines
Natural Gas Transmission
Pipeline
Storage Natural Gas Transmission Pipeline
Gas
Processing
Upstream
Exploration
Exploitation
Development of oil
and gas
Downstream
Distribution of natural gas to
end-customers:
Industrial
Commercial
Household
Gas-filling stations
12
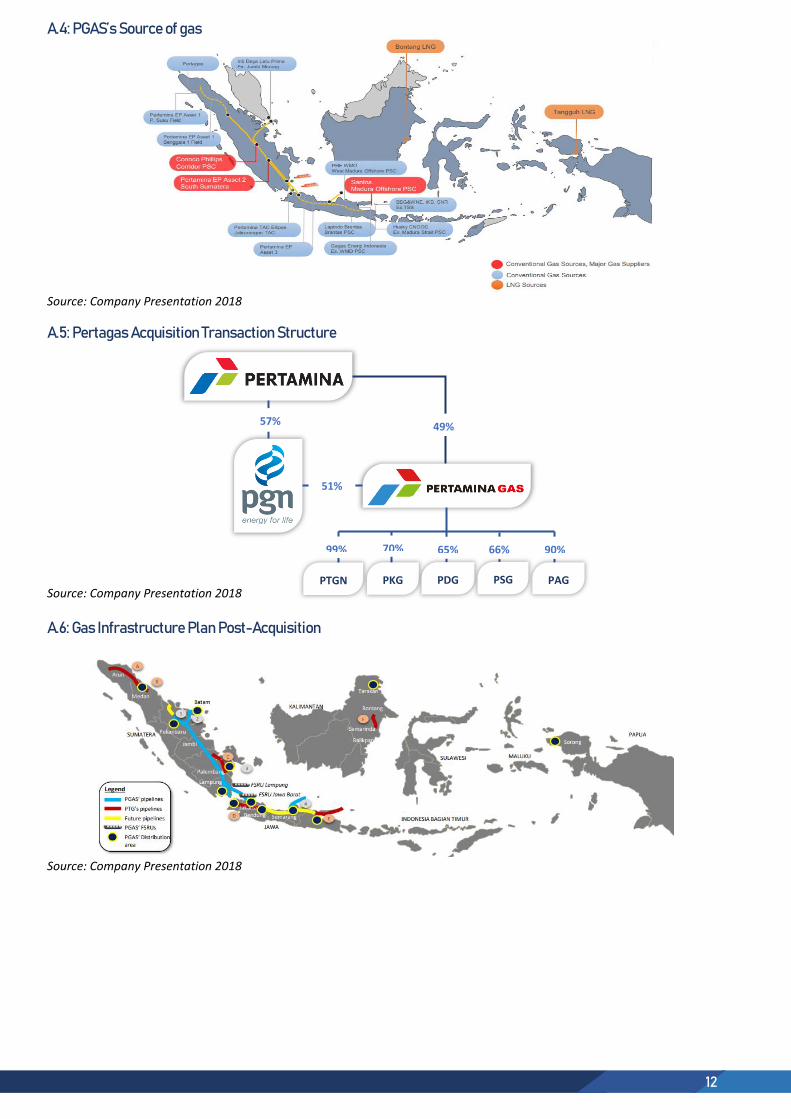
A.4: PGAS’s Source of gas
Source: Company Presentation 2018
A.5: Pertagas Acquisition Transaction Structure Source: Company Presentation 2018
A.6: Gas Infrastructure Plan Post-Acquisition
Source: Company Presentation 2018
57%
51%
99% 70% 65% 66% 90%
PTGN PKG PDG PSG PAG
49%
13
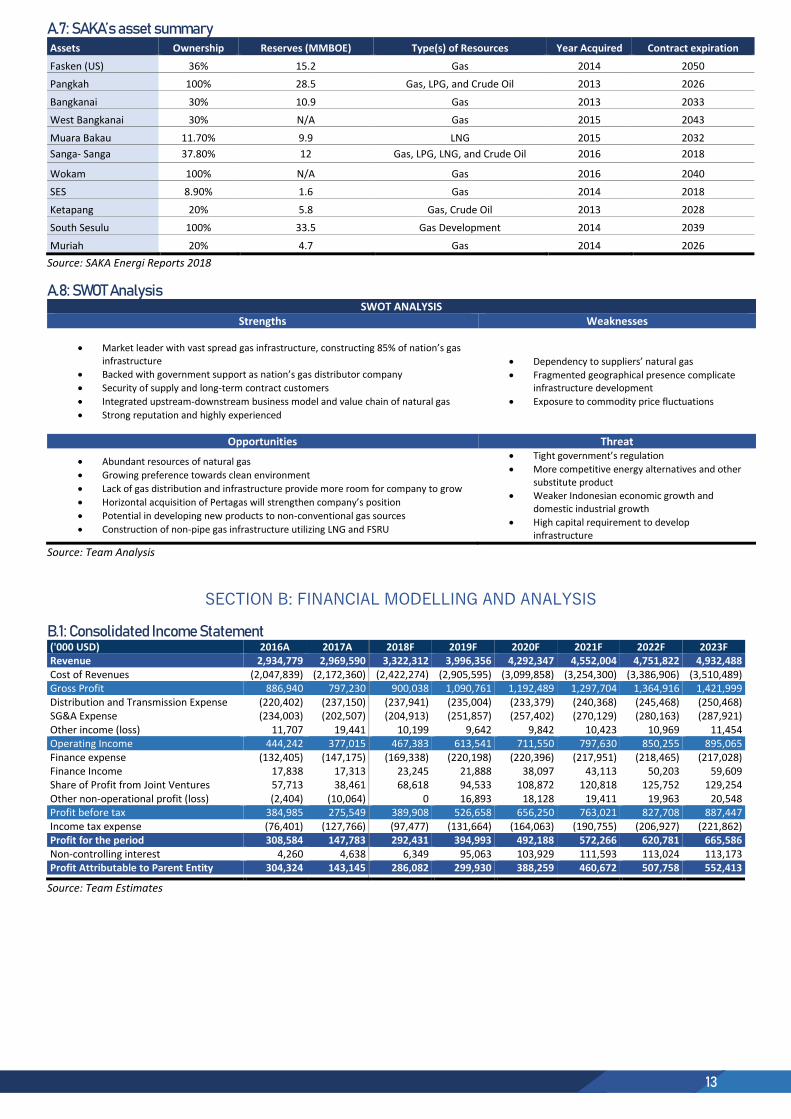
A.7: SAKA’s asset summary Assets Ownership Reserves (MMBOE) Type(s) of Resources Year Acquired Contract expiration
Fasken (US) 36% 15.2 Gas 2014 2050
Pangkah 100% 28.5 Gas, LPG, and Crude Oil 2013 2026
Bangkanai 30% 10.9 Gas 2013 2033
West Bangkanai 30% N/A Gas 2015 2043
Muara Bakau 11.70% 9.9 LNG 2015 2032
Sanga- Sanga 37.80% 12 Gas, LPG, LNG, and Crude Oil 2016 2018
Wokam 100% N/A Gas 2016 2040
SES 8.90% 1.6 Gas 2014 2018
Ketapang 20% 5.8 Gas, Crude Oil 2013 2028
South Sesulu 100% 33.5 Gas Development 2014 2039
Muriah 20% 4.7 Gas 2014 2026
Source: SAKA Energi Reports 2018
A.8: SWOT Analysis SWOT ANALYSIS
Strengths Weaknesses
Market leader with vast spread gas infrastructure, constructing 85% of nation’s gas infrastructure
Backed with government support as nation’s gas distributor company
Security of supply and long-term contract customers
Integrated upstream-downstream business model and value chain of natural gas
Strong reputation and highly experienced
Dependency to suppliers’ natural gas
Fragmented geographical presence complicate infrastructure development
Exposure to commodity price fluctuations
Opportunities Threat
Abundant resources of natural gas
Growing preference towards clean environment
Lack of gas distribution and infrastructure provide more room for company to grow
Horizontal acquisition of Pertagas will strengthen company’s position
Potential in developing new products to non-conventional gas sources
Construction of non-pipe gas infrastructure utilizing LNG and FSRU
Tight government’s regulation
More competitive energy alternatives and other substitute product
Weaker Indonesian economic growth and domestic industrial growth
High capital requirement to develop infrastructure
Source: Team Analysis
SECTION B: FINANCIAL MODELLING AND ANALYSIS
B.1: Consolidated Income Statement
('000 USD) 2016A 2017A 2018F 2019F 2020F 2021F 2022F 2023F Revenue 2,934,779 2,969,590 3,322,312 3,996,356 4,292,347 4,552,004 4,751,822 4,932,488 Cost of Revenues (2,047,839) (2,172,360) (2,422,274) (2,905,595) (3,099,858) (3,254,300) (3,386,906) (3,510,489) Gross Profit 886,940 797,230 900,038 1,090,761 1,192,489 1,297,704 1,364,916 1,421,999 Distribution and Transmission Expense (220,402) (237,150) (237,941) (235,004) (233,379) (240,368) (245,468) (250,468) SG&A Expense (234,003) (202,507) (204,913) (251,857) (257,402) (270,129) (280,163) (287,921) Other income (loss) 11,707 19,441 10,199 9,642 9,842 10,423 10,969 11,454 Operating Income 444,242 377,015 467,383 613,541 711,550 797,630 850,255 895,065 Finance expense (132,405) (147,175) (169,338) (220,198) (220,396) (217,951) (218,465) (217,028) Finance Income 17,838 17,313 23,245 21,888 38,097 43,113 50,203 59,609 Share of Profit from Joint Ventures 57,713 38,461 68,618 94,533 108,872 120,818 125,752 129,254 Other non-operational profit (loss) (2,404) (10,064) 0 16,893 18,128 19,411 19,963 20,548 Profit before tax 384,985 275,549 389,908 526,658 656,250 763,021 827,708 887,447 Income tax expense (76,401) (127,766) (97,477) (131,664) (164,063) (190,755) (206,927) (221,862) Profit for the period 308,584 147,783 292,431 394,993 492,188 572,266 620,781 665,586 Non-controlling interest 4,260 4,638 6,349 95,063 103,929 111,593 113,024 113,173 Profit Attributable to Parent Entity 304,324 143,145 286,082 299,930 388,259 460,672 507,758 552,413
Source: Team Estimates
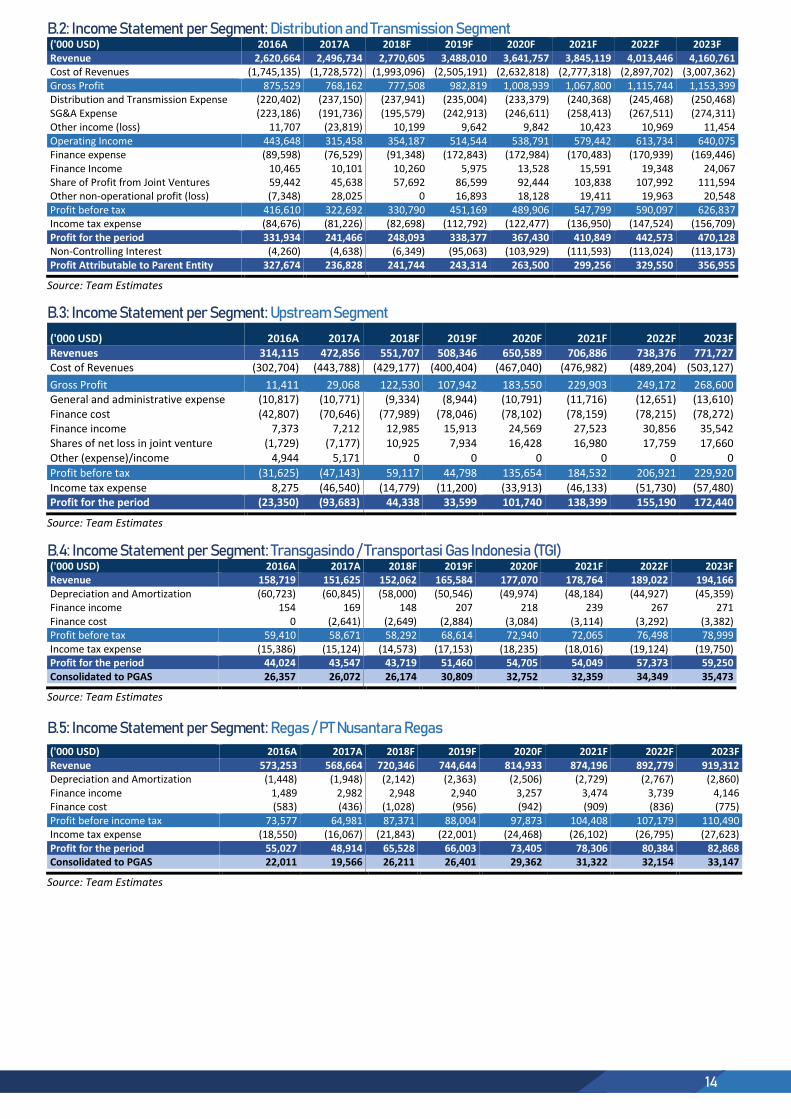
14
B.2: Income Statement per Segment: Distribution and Transmission Segment
('000 USD) 2016A 2017A 2018F 2019F 2020F 2021F 2022F 2023F Revenue 2,620,664 2,496,734 2,770,605 3,488,010 3,641,757 3,845,119 4,013,446 4,160,761 Cost of Revenues (1,745,135) (1,728,572) (1,993,096) (2,505,191) (2,632,818) (2,777,318) (2,897,702) (3,007,362) Gross Profit 875,529 768,162 777,508 982,819 1,008,939 1,067,800 1,115,744 1,153,399 Distribution and Transmission Expense (220,402) (237,150) (237,941) (235,004) (233,379) (240,368) (245,468) (250,468) SG&A Expense (223,186) (191,736) (195,579) (242,913) (246,611) (258,413) (267,511) (274,311) Other income (loss) 11,707 (23,819) 10,199 9,642 9,842 10,423 10,969 11,454 Operating Income 443,648 315,458 354,187 514,544 538,791 579,442 613,734 640,075 Finance expense (89,598) (76,529) (91,348) (172,843) (172,984) (170,483) (170,939) (169,446) Finance Income 10,465 10,101 10,260 5,975 13,528 15,591 19,348 24,067 Share of Profit from Joint Ventures 59,442 45,638 57,692 86,599 92,444 103,838 107,992 111,594 Other non-operational profit (loss) (7,348) 28,025 0 16,893 18,128 19,411 19,963 20,548 Profit before tax 416,610 322,692 330,790 451,169 489,906 547,799 590,097 626,837 Income tax expense (84,676) (81,226) (82,698) (112,792) (122,477) (136,950) (147,524) (156,709) Profit for the period 331,934 241,466 248,093 338,377 367,430 410,849 442,573 470,128 Non-Controlling Interest (4,260) (4,638) (6,349) (95,063) (103,929) (111,593) (113,024) (113,173) Profit Attributable to Parent Entity 327,674 236,828 241,744 243,314 263,500 299,256 329,550 356,955
Source: Team Estimates
B.3: Income Statement per Segment: Upstream Segment
('000 USD) 2016A 2017A 2018F 2019F 2020F 2021F 2022F 2023F Revenues 314,115 472,856 551,707 508,346 650,589 706,886 738,376 771,727 Cost of Revenues (302,704) (443,788) (429,177) (400,404) (467,040) (476,982) (489,204) (503,127)
Gross Profit 11,411 29,068 122,530 107,942 183,550 229,903 249,172 268,600 General and administrative expense (10,817) (10,771) (9,334) (8,944) (10,791) (11,716) (12,651) (13,610) Finance cost (42,807) (70,646) (77,989) (78,046) (78,102) (78,159) (78,215) (78,272) Finance income 7,373 7,212 12,985 15,913 24,569 27,523 30,856 35,542 Shares of net loss in joint venture (1,729) (7,177) 10,925 7,934 16,428 16,980 17,759 17,660 Other (expense)/income 4,944 5,171 0 0 0 0 0 0
Profit before tax (31,625) (47,143) 59,117 44,798 135,654 184,532 206,921 229,920 Income tax expense 8,275 (46,540) (14,779) (11,200) (33,913) (46,133) (51,730) (57,480) Profit for the period (23,350) (93,683) 44,338 33,599 101,740 138,399 155,190 172,440
Source: Team Estimates
B.4: Income Statement per Segment: Transgasindo / Transportasi Gas Indonesia (TGI)
('000 USD) 2016A 2017A 2018F 2019F 2020F 2021F 2022F 2023F Revenue 158,719 151,625 152,062 165,584 177,070 178,764 189,022 194,166 Depreciation and Amortization (60,723) (60,845) (58,000) (50,546) (49,974) (48,184) (44,927) (45,359) Finance income 154 169 148 207 218 239 267 271 Finance cost 0 (2,641) (2,649) (2,884) (3,084) (3,114) (3,292) (3,382) Profit before tax 59,410 58,671 58,292 68,614 72,940 72,065 76,498 78,999 Income tax expense (15,386) (15,124) (14,573) (17,153) (18,235) (18,016) (19,124) (19,750) Profit for the period 44,024 43,547 43,719 51,460 54,705 54,049 57,373 59,250 Consolidated to PGAS 26,357 26,072 26,174 30,809 32,752 32,359 34,349 35,473
Source: Team Estimates
B.5: Income Statement per Segment: Regas / PT Nusantara Regas
('000 USD) 2016A 2017A 2018F 2019F 2020F 2021F 2022F 2023F Revenue 573,253 568,664 720,346 744,644 814,933 874,196 892,779 919,312 Depreciation and Amortization (1,448) (1,948) (2,142) (2,363) (2,506) (2,729) (2,767) (2,860) Finance income 1,489 2,982 2,948 2,940 3,257 3,474 3,739 4,146 Finance cost (583) (436) (1,028) (956) (942) (909) (836) (775) Profit before income tax 73,577 64,981 87,371 88,004 97,873 104,408 107,179 110,490 Income tax expense (18,550) (16,067) (21,843) (22,001) (24,468) (26,102) (26,795) (27,623) Profit for the period 55,027 48,914 65,528 66,003 73,405 78,306 80,384 82,868 Consolidated to PGAS 22,011 19,566 26,211 26,401 29,362 31,322 32,154 33,147
Source: Team Estimates
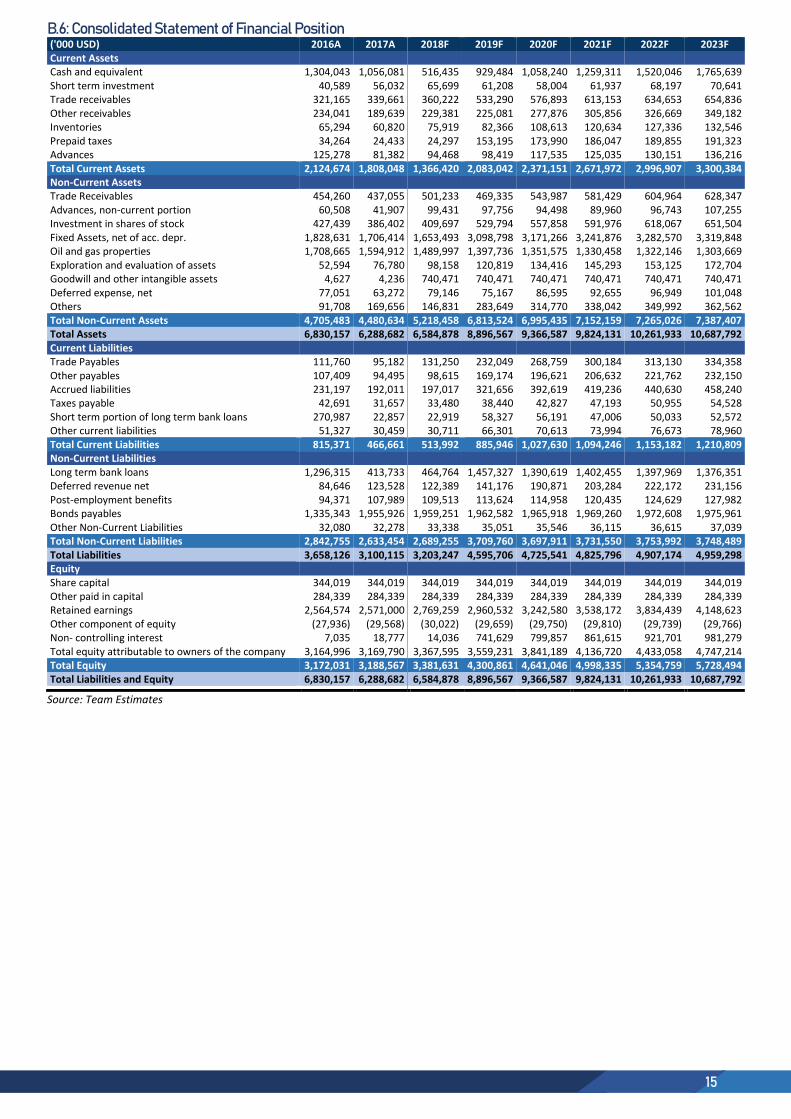
15
B.6: Consolidated Statement of Financial Position ('000 USD) 2016A 2017A 2018F 2019F 2020F 2021F 2022F 2023F Current Assets Cash and equivalent 1,304,043 1,056,081 516,435 929,484 1,058,240 1,259,311 1,520,046 1,765,639 Short term investment 40,589 56,032 65,699 61,208 58,004 61,937 68,197 70,641 Trade receivables 321,165 339,661 360,222 533,290 576,893 613,153 634,653 654,836 Other receivables 234,041 189,639 229,381 225,081 277,876 305,856 326,669 349,182 Inventories 65,294 60,820 75,919 82,366 108,613 120,634 127,336 132,546 Prepaid taxes 34,264 24,433 24,297 153,195 173,990 186,047 189,855 191,323 Advances 125,278 81,382 94,468 98,419 117,535 125,035 130,151 136,216 Total Current Assets 2,124,674 1,808,048 1,366,420 2,083,042 2,371,151 2,671,972 2,996,907 3,300,384 Non-Current Assets
Trade Receivables 454,260 437,055 501,233 469,335 543,987 581,429 604,964 628,347 Advances, non-current portion 60,508 41,907 99,431 97,756 94,498 89,960 96,743 107,255 Investment in shares of stock 427,439 386,402 409,697 529,794 557,858 591,976 618,067 651,504 Fixed Assets, net of acc. depr. 1,828,631 1,706,414 1,653,493 3,098,798 3,171,266 3,241,876 3,282,570 3,319,848 Oil and gas properties 1,708,665 1,594,912 1,489,997 1,397,736 1,351,575 1,330,458 1,322,146 1,303,669 Exploration and evaluation of assets 52,594 76,780 98,158 120,819 134,416 145,293 153,125 172,704 Goodwill and other intangible assets 4,627 4,236 740,471 740,471 740,471 740,471 740,471 740,471 Deferred expense, net 77,051 63,272 79,146 75,167 86,595 92,655 96,949 101,048 Others 91,708 169,656 146,831 283,649 314,770 338,042 349,992 362,562 Total Non-Current Assets 4,705,483 4,480,634 5,218,458 6,813,524 6,995,435 7,152,159 7,265,026 7,387,407 Total Assets 6,830,157 6,288,682 6,584,878 8,896,567 9,366,587 9,824,131 10,261,933 10,687,792 Current Liabilities
Trade Payables 111,760 95,182 131,250 232,049 268,759 300,184 313,130 334,358 Other payables 107,409 94,495 98,615 169,174 196,621 206,632 221,762 232,150 Accrued liabilities 231,197 192,011 197,017 321,656 392,619 419,236 440,630 458,240 Taxes payable 42,691 31,657 33,480 38,440 42,827 47,193 50,955 54,528 Short term portion of long term bank loans 270,987 22,857 22,919 58,327 56,191 47,006 50,033 52,572 Other current liabilities 51,327 30,459 30,711 66,301 70,613 73,994 76,673 78,960 Total Current Liabilities 815,371 466,661 513,992 885,946 1,027,630 1,094,246 1,153,182 1,210,809 Non-Current Liabilities
Long term bank loans 1,296,315 413,733 464,764 1,457,327 1,390,619 1,402,455 1,397,969 1,376,351 Deferred revenue net 84,646 123,528 122,389 141,176 190,871 203,284 222,172 231,156 Post-employment benefits 94,371 107,989 109,513 113,624 114,958 120,435 124,629 127,982 Bonds payables 1,335,343 1,955,926 1,959,251 1,962,582 1,965,918 1,969,260 1,972,608 1,975,961 Other Non-Current Liabilities 32,080 32,278 33,338 35,051 35,546 36,115 36,615 37,039 Total Non-Current Liabilities 2,842,755 2,633,454 2,689,255 3,709,760 3,697,911 3,731,550 3,753,992 3,748,489 Total Liabilities 3,658,126 3,100,115 3,203,247 4,595,706 4,725,541 4,825,796 4,907,174 4,959,298 Equity
Share capital 344,019 344,019 344,019 344,019 344,019 344,019 344,019 344,019 Other paid in capital 284,339 284,339 284,339 284,339 284,339 284,339 284,339 284,339 Retained earnings 2,564,574 2,571,000 2,769,259 2,960,532 3,242,580 3,538,172 3,834,439 4,148,623 Other component of equity (27,936) (29,568) (30,022) (29,659) (29,750) (29,810) (29,739) (29,766) Non- controlling interest 7,035 18,777 14,036 741,629 799,857 861,615 921,701 981,279 Total equity attributable to owners of the company 3,164,996 3,169,790 3,367,595 3,559,231 3,841,189 4,136,720 4,433,058 4,747,214 Total Equity 3,172,031 3,188,567 3,381,631 4,300,861 4,641,046 4,998,335 5,354,759 5,728,494 Total Liabilities and Equity 6,830,157 6,288,682 6,584,878 8,896,567 9,366,587 9,824,131 10,261,933 10,687,792
Source: Team Estimates
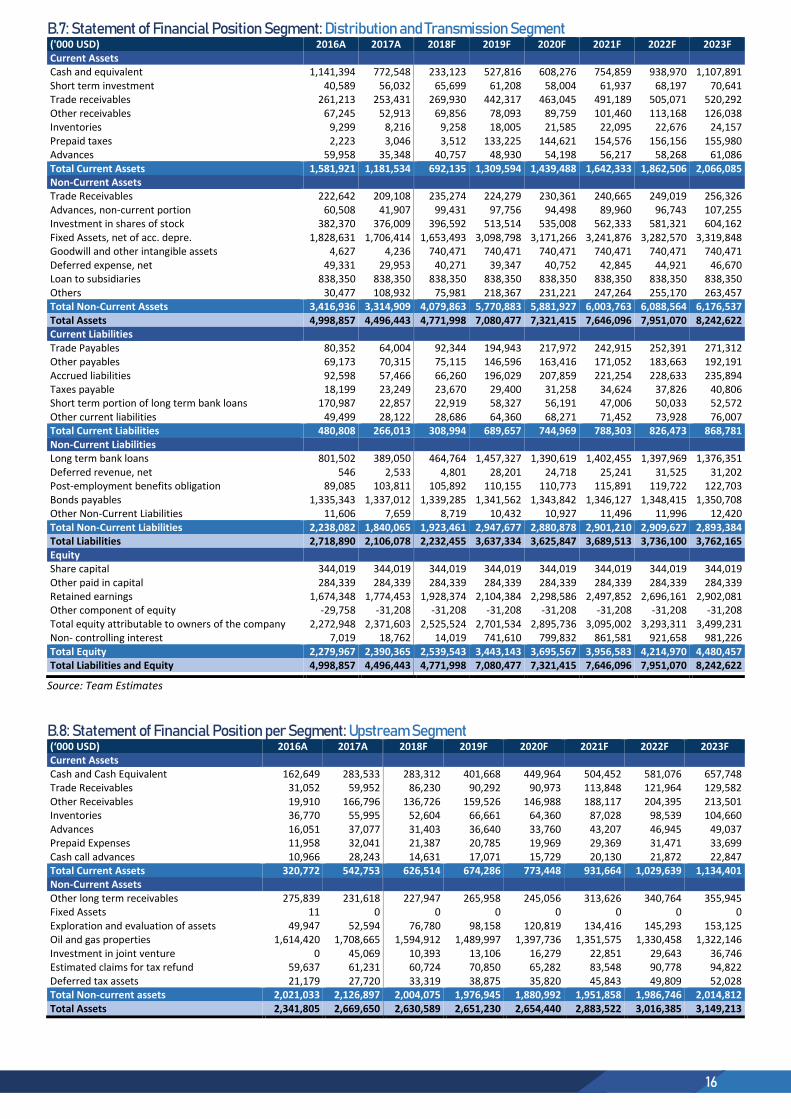
16
B.7: Statement of Financial Position Segment: Distribution and Transmission Segment ('000 USD) 2016A 2017A 2018F 2019F 2020F 2021F 2022F 2023F Current Assets Cash and equivalent 1,141,394 772,548 233,123 527,816 608,276 754,859 938,970 1,107,891 Short term investment 40,589 56,032 65,699 61,208 58,004 61,937 68,197 70,641 Trade receivables 261,213 253,431 269,930 442,317 463,045 491,189 505,071 520,292 Other receivables 67,245 52,913 69,856 78,093 89,759 101,460 113,168 126,038 Inventories 9,299 8,216 9,258 18,005 21,585 22,095 22,676 24,157 Prepaid taxes 2,223 3,046 3,512 133,225 144,621 154,576 156,156 155,980 Advances 59,958 35,348 40,757 48,930 54,198 56,217 58,268 61,086 Total Current Assets 1,581,921 1,181,534 692,135 1,309,594 1,439,488 1,642,333 1,862,506 2,066,085 Non-Current Assets Trade Receivables 222,642 209,108 235,274 224,279 230,361 240,665 249,019 256,326 Advances, non-current portion 60,508 41,907 99,431 97,756 94,498 89,960 96,743 107,255 Investment in shares of stock 382,370 376,009 396,592 513,514 535,008 562,333 581,321 604,162 Fixed Assets, net of acc. depre. 1,828,631 1,706,414 1,653,493 3,098,798 3,171,266 3,241,876 3,282,570 3,319,848 Goodwill and other intangible assets 4,627 4,236 740,471 740,471 740,471 740,471 740,471 740,471 Deferred expense, net 49,331 29,953 40,271 39,347 40,752 42,845 44,921 46,670 Loan to subsidiaries 838,350 838,350 838,350 838,350 838,350 838,350 838,350 838,350 Others 30,477 108,932 75,981 218,367 231,221 247,264 255,170 263,457 Total Non-Current Assets 3,416,936 3,314,909 4,079,863 5,770,883 5,881,927 6,003,763 6,088,564 6,176,537 Total Assets 4,998,857 4,496,443 4,771,998 7,080,477 7,321,415 7,646,096 7,951,070 8,242,622 Current Liabilities Trade Payables 80,352 64,004 92,344 194,943 217,972 242,915 252,391 271,312 Other payables 69,173 70,315 75,115 146,596 163,416 171,052 183,663 192,191 Accrued liabilities 92,598 57,466 66,260 196,029 207,859 221,254 228,633 235,894 Taxes payable 18,199 23,249 23,670 29,400 31,258 34,624 37,826 40,806 Short term portion of long term bank loans 170,987 22,857 22,919 58,327 56,191 47,006 50,033 52,572 Other current liabilities 49,499 28,122 28,686 64,360 68,271 71,452 73,928 76,007 Total Current Liabilities 480,808 266,013 308,994 689,657 744,969 788,303 826,473 868,781 Non-Current Liabilities Long term bank loans 801,502 389,050 464,764 1,457,327 1,390,619 1,402,455 1,397,969 1,376,351 Deferred revenue, net 546 2,533 4,801 28,201 24,718 25,241 31,525 31,202 Post-employment benefits obligation 89,085 103,811 105,892 110,155 110,773 115,891 119,722 122,703 Bonds payables 1,335,343 1,337,012 1,339,285 1,341,562 1,343,842 1,346,127 1,348,415 1,350,708 Other Non-Current Liabilities 11,606 7,659 8,719 10,432 10,927 11,496 11,996 12,420 Total Non-Current Liabilities 2,238,082 1,840,065 1,923,461 2,947,677 2,880,878 2,901,210 2,909,627 2,893,384 Total Liabilities 2,718,890 2,106,078 2,232,455 3,637,334 3,625,847 3,689,513 3,736,100 3,762,165 Equity Share capital 344,019 344,019 344,019 344,019 344,019 344,019 344,019 344,019 Other paid in capital 284,339 284,339 284,339 284,339 284,339 284,339 284,339 284,339 Retained earnings 1,674,348 1,774,453 1,928,374 2,104,384 2,298,586 2,497,852 2,696,161 2,902,081 Other component of equity -29,758 -31,208 -31,208 -31,208 -31,208 -31,208 -31,208 -31,208 Total equity attributable to owners of the company 2,272,948 2,371,603 2,525,524 2,701,534 2,895,736 3,095,002 3,293,311 3,499,231 Non- controlling interest 7,019 18,762 14,019 741,610 799,832 861,581 921,658 981,226 Total Equity 2,279,967 2,390,365 2,539,543 3,443,143 3,695,567 3,956,583 4,214,970 4,480,457 Total Liabilities and Equity 4,998,857 4,496,443 4,771,998 7,080,477 7,321,415 7,646,096 7,951,070 8,242,622
Source: Team Estimates
B.8: Statement of Financial Position per Segment: Upstream Segment (‘000 USD) 2016A 2017A 2018F 2019F 2020F 2021F 2022F 2023F Current Assets Cash and Cash Equivalent 162,649 283,533 283,312 401,668 449,964 504,452 581,076 657,748 Trade Receivables 31,052 59,952 86,230 90,292 90,973 113,848 121,964 129,582 Other Receivables 19,910 166,796 136,726 159,526 146,988 188,117 204,395 213,501 Inventories 36,770 55,995 52,604 66,661 64,360 87,028 98,539 104,660 Advances 16,051 37,077 31,403 36,640 33,760 43,207 46,945 49,037 Prepaid Expenses 11,958 32,041 21,387 20,785 19,969 29,369 31,471 33,699 Cash call advances 10,966 28,243 14,631 17,071 15,729 20,130 21,872 22,847 Total Current Assets 320,772 542,753 626,514 674,286 773,448 931,664 1,029,639 1,134,401 Non-Current Assets Other long term receivables 275,839 231,618 227,947 265,958 245,056 313,626 340,764 355,945 Fixed Assets 11 0 0 0 0 0 0 0 Exploration and evaluation of assets 49,947 52,594 76,780 98,158 120,819 134,416 145,293 153,125 Oil and gas properties 1,614,420 1,708,665 1,594,912 1,489,997 1,397,736 1,351,575 1,330,458 1,322,146 Investment in joint venture 0 45,069 10,393 13,106 16,279 22,851 29,643 36,746 Estimated claims for tax refund 59,637 61,231 60,724 70,850 65,282 83,548 90,778 94,822 Deferred tax assets 21,179 27,720 33,319 38,875 35,820 45,843 49,809 52,028 Total Non-current assets 2,021,033 2,126,897 2,004,075 1,976,945 1,880,992 1,951,858 1,986,746 2,014,812 Total Assets 2,341,805 2,669,650 2,630,589 2,651,230 2,654,440 2,883,522 3,016,385 3,149,213
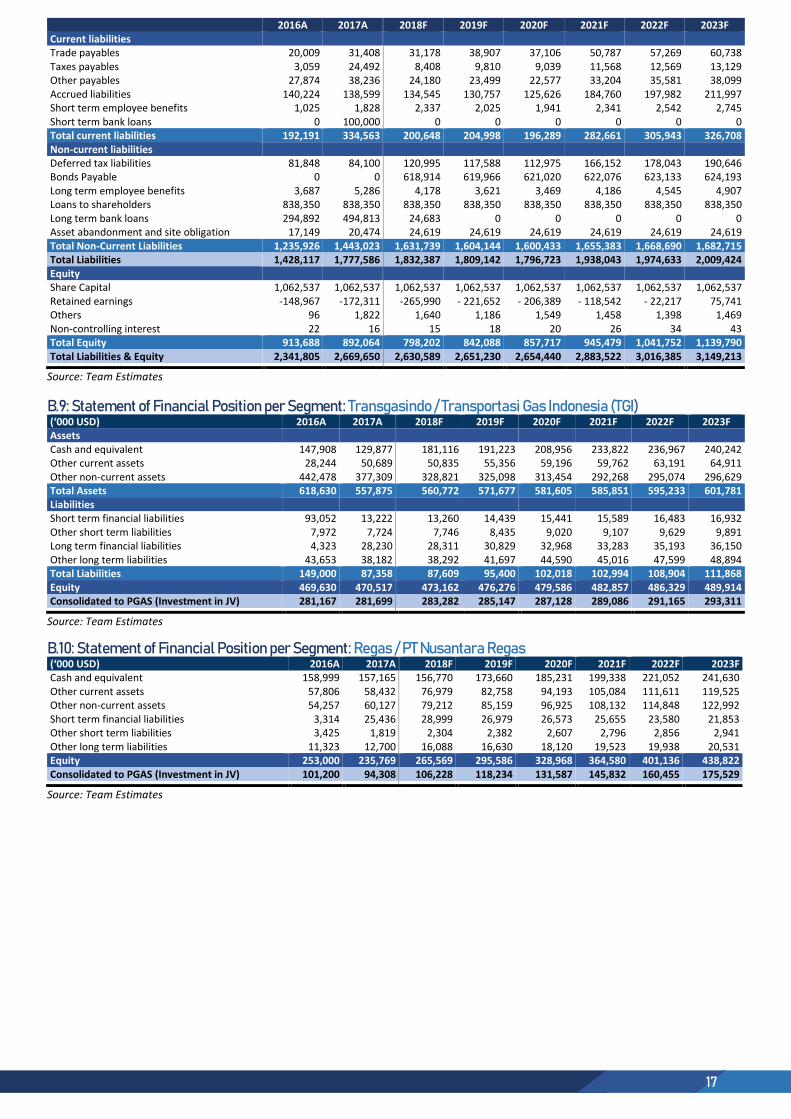
17
2016A 2017A 2018F 2019F 2020F 2021F 2022F 2023F Current liabilities Trade payables 20,009 31,408 31,178 38,907 37,106 50,787 57,269 60,738 Taxes payables 3,059 24,492 8,408 9,810 9,039 11,568 12,569 13,129 Other payables 27,874 38,236 24,180 23,499 22,577 33,204 35,581 38,099 Accrued liabilities 140,224 138,599 134,545 130,757 125,626 184,760 197,982 211,997 Short term employee benefits 1,025 1,828 2,337 2,025 1,941 2,341 2,542 2,745 Short term bank loans 0 100,000 0 0 0 0 0 0 Total current liabilities 192,191 334,563 200,648 204,998 196,289 282,661 305,943 326,708 Non-current liabilities Deferred tax liabilities 81,848 84,100 120,995 117,588 112,975 166,152 178,043 190,646 Bonds Payable 0 0 618,914 619,966 621,020 622,076 623,133 624,193 Long term employee benefits 3,687 5,286 4,178 3,621 3,469 4,186 4,545 4,907 Loans to shareholders 838,350 838,350 838,350 838,350 838,350 838,350 838,350 838,350 Long term bank loans 294,892 494,813 24,683 0 0 0 0 0 Asset abandonment and site obligation 17,149 20,474 24,619 24,619 24,619 24,619 24,619 24,619 Total Non-Current Liabilities 1,235,926 1,443,023 1,631,739 1,604,144 1,600,433 1,655,383 1,668,690 1,682,715 Total Liabilities 1,428,117 1,777,586 1,832,387 1,809,142 1,796,723 1,938,043 1,974,633 2,009,424 Equity Share Capital 1,062,537 1,062,537 1,062,537 1,062,537 1,062,537 1,062,537 1,062,537 1,062,537 Retained earnings -148,967 -172,311 -265,990 - 221,652 - 206,389 - 118,542 - 22,217 75,741 Others 96 1,822 1,640 1,186 1,549 1,458 1,398 1,469 Non-controlling interest 22 16 15 18 20 26 34 43 Total Equity 913,688 892,064 798,202 842,088 857,717 945,479 1,041,752 1,139,790 Total Liabilities & Equity 2,341,805 2,669,650 2,630,589 2,651,230 2,654,440 2,883,522 3,016,385 3,149,213
Source: Team Estimates
B.9: Statement of Financial Position per Segment: Transgasindo / Transportasi Gas Indonesia (TGI) (‘000 USD) 2016A 2017A 2018F 2019F 2020F 2021F 2022F 2023F Assets Cash and equivalent 147,908 129,877 181,116 191,223 208,956 233,822 236,967 240,242 Other current assets 28,244 50,689 50,835 55,356 59,196 59,762 63,191 64,911 Other non-current assets 442,478 377,309 328,821 325,098 313,454 292,268 295,074 296,629 Total Assets 618,630 557,875 560,772 571,677 581,605 585,851 595,233 601,781 Liabilities Short term financial liabilities 93,052 13,222 13,260 14,439 15,441 15,589 16,483 16,932 Other short term liabilities 7,972 7,724 7,746 8,435 9,020 9,107 9,629 9,891 Long term financial liabilities 4,323 28,230 28,311 30,829 32,968 33,283 35,193 36,150 Other long term liabilities 43,653 38,182 38,292 41,697 44,590 45,016 47,599 48,894 Total Liabilities 149,000 87,358 87,609 95,400 102,018 102,994 108,904 111,868 Equity 469,630 470,517 473,162 476,276 479,586 482,857 486,329 489,914 Consolidated to PGAS (Investment in JV) 281,167 281,699 283,282 285,147 287,128 289,086 291,165 293,311
Source: Team Estimates
B.10: Statement of Financial Position per Segment: Regas / PT Nusantara Regas
(‘000 USD) 2016A 2017A 2018F 2019F 2020F 2021F 2022F 2023F Cash and equivalent 158,999 157,165 156,770 173,660 185,231 199,338 221,052 241,630 Other current assets 57,806 58,432 76,979 82,758 94,193 105,084 111,611 119,525 Other non-current assets 54,257 60,127 79,212 85,159 96,925 108,132 114,848 122,992 Short term financial liabilities 3,314 25,436 28,999 26,979 26,573 25,655 23,580 21,853 Other short term liabilities 3,425 1,819 2,304 2,382 2,607 2,796 2,856 2,941 Other long term liabilities 11,323 12,700 16,088 16,630 18,120 19,523 19,938 20,531 Equity 253,000 235,769 265,569 295,586 328,968 364,580 401,136 438,822 Consolidated to PGAS (Investment in JV) 101,200 94,308 106,228 118,234 131,587 145,832 160,455 175,529
Source: Team Estimates
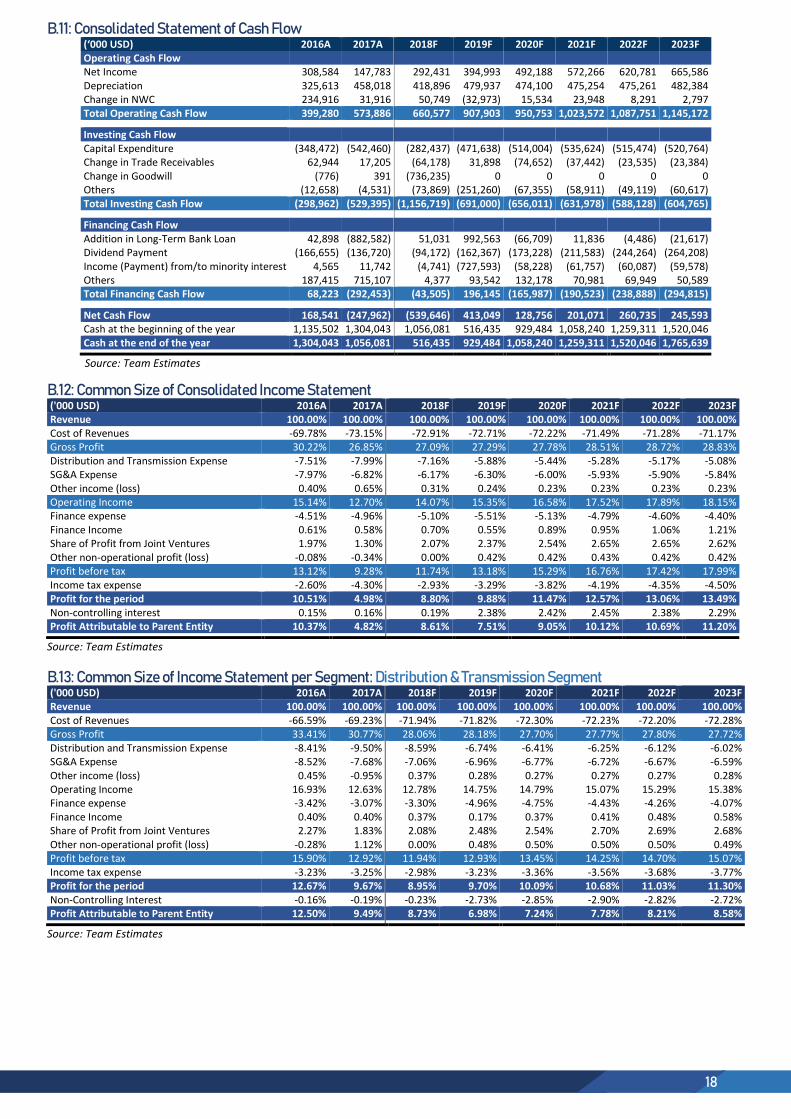
18
B.11: Consolidated Statement of Cash Flow (‘000 USD) 2016A 2017A 2018F 2019F 2020F 2021F 2022F 2023F Operating Cash Flow Net Income 308,584 147,783 292,431 394,993 492,188 572,266 620,781 665,586 Depreciation 325,613 458,018 418,896 479,937 474,100 475,254 475,261 482,384 Change in NWC 234,916 31,916 50,749 (32,973) 15,534 23,948 8,291 2,797 Total Operating Cash Flow 399,280 573,886 660,577 907,903 950,753 1,023,572 1,087,751 1,145,172
Investing Cash Flow Capital Expenditure (348,472) (542,460) (282,437) (471,638) (514,004) (535,624) (515,474) (520,764) Change in Trade Receivables 62,944 17,205 (64,178) 31,898 (74,652) (37,442) (23,535) (23,384) Change in Goodwill (776) 391 (736,235) 0 0 0 0 0 Others (12,658) (4,531) (73,869) (251,260) (67,355) (58,911) (49,119) (60,617) Total Investing Cash Flow (298,962) (529,395) (1,156,719) (691,000) (656,011) (631,978) (588,128) (604,765)
Financing Cash Flow Addition in Long-Term Bank Loan 42,898 (882,582) 51,031 992,563 (66,709) 11,836 (4,486) (21,617) Dividend Payment (166,655) (136,720) (94,172) (162,367) (173,228) (211,583) (244,264) (264,208) Income (Payment) from/to minority interest 4,565 11,742 (4,741) (727,593) (58,228) (61,757) (60,087) (59,578) Others 187,415 715,107 4,377 93,542 132,178 70,981 69,949 50,589 Total Financing Cash Flow 68,223 (292,453) (43,505) 196,145 (165,987) (190,523) (238,888) (294,815)
Net Cash Flow 168,541 (247,962) (539,646) 413,049 128,756 201,071 260,735 245,593 Cash at the beginning of the year 1,135,502 1,304,043 1,056,081 516,435 929,484 1,058,240 1,259,311 1,520,046 Cash at the end of the year 1,304,043 1,056,081 516,435 929,484 1,058,240 1,259,311 1,520,046 1,765,639
Source: Team Estimates
B.12: Common Size of Consolidated Income Statement
('000 USD) 2016A 2017A 2018F 2019F 2020F 2021F 2022F 2023F Revenue 100.00% 100.00% 100.00% 100.00% 100.00% 100.00% 100.00% 100.00% Cost of Revenues -69.78% -73.15% -72.91% -72.71% -72.22% -71.49% -71.28% -71.17% Gross Profit 30.22% 26.85% 27.09% 27.29% 27.78% 28.51% 28.72% 28.83% Distribution and Transmission Expense -7.51% -7.99% -7.16% -5.88% -5.44% -5.28% -5.17% -5.08% SG&A Expense -7.97% -6.82% -6.17% -6.30% -6.00% -5.93% -5.90% -5.84% Other income (loss) 0.40% 0.65% 0.31% 0.24% 0.23% 0.23% 0.23% 0.23% Operating Income 15.14% 12.70% 14.07% 15.35% 16.58% 17.52% 17.89% 18.15% Finance expense -4.51% -4.96% -5.10% -5.51% -5.13% -4.79% -4.60% -4.40% Finance Income 0.61% 0.58% 0.70% 0.55% 0.89% 0.95% 1.06% 1.21% Share of Profit from Joint Ventures 1.97% 1.30% 2.07% 2.37% 2.54% 2.65% 2.65% 2.62% Other non-operational profit (loss) -0.08% -0.34% 0.00% 0.42% 0.42% 0.43% 0.42% 0.42% Profit before tax 13.12% 9.28% 11.74% 13.18% 15.29% 16.76% 17.42% 17.99% Income tax expense -2.60% -4.30% -2.93% -3.29% -3.82% -4.19% -4.35% -4.50% Profit for the period 10.51% 4.98% 8.80% 9.88% 11.47% 12.57% 13.06% 13.49% Non-controlling interest 0.15% 0.16% 0.19% 2.38% 2.42% 2.45% 2.38% 2.29% Profit Attributable to Parent Entity 10.37% 4.82% 8.61% 7.51% 9.05% 10.12% 10.69% 11.20%
Source: Team Estimates
B.13: Common Size of Income Statement per Segment: Distribution & Transmission Segment
('000 USD) 2016A 2017A 2018F 2019F 2020F 2021F 2022F 2023F Revenue 100.00% 100.00% 100.00% 100.00% 100.00% 100.00% 100.00% 100.00% Cost of Revenues -66.59% -69.23% -71.94% -71.82% -72.30% -72.23% -72.20% -72.28% Gross Profit 33.41% 30.77% 28.06% 28.18% 27.70% 27.77% 27.80% 27.72% Distribution and Transmission Expense -8.41% -9.50% -8.59% -6.74% -6.41% -6.25% -6.12% -6.02% SG&A Expense -8.52% -7.68% -7.06% -6.96% -6.77% -6.72% -6.67% -6.59% Other income (loss) 0.45% -0.95% 0.37% 0.28% 0.27% 0.27% 0.27% 0.28% Operating Income 16.93% 12.63% 12.78% 14.75% 14.79% 15.07% 15.29% 15.38% Finance expense -3.42% -3.07% -3.30% -4.96% -4.75% -4.43% -4.26% -4.07% Finance Income 0.40% 0.40% 0.37% 0.17% 0.37% 0.41% 0.48% 0.58% Share of Profit from Joint Ventures 2.27% 1.83% 2.08% 2.48% 2.54% 2.70% 2.69% 2.68% Other non-operational profit (loss) -0.28% 1.12% 0.00% 0.48% 0.50% 0.50% 0.50% 0.49% Profit before tax 15.90% 12.92% 11.94% 12.93% 13.45% 14.25% 14.70% 15.07% Income tax expense -3.23% -3.25% -2.98% -3.23% -3.36% -3.56% -3.68% -3.77% Profit for the period 12.67% 9.67% 8.95% 9.70% 10.09% 10.68% 11.03% 11.30% Non-Controlling Interest -0.16% -0.19% -0.23% -2.73% -2.85% -2.90% -2.82% -2.72% Profit Attributable to Parent Entity 12.50% 9.49% 8.73% 6.98% 7.24% 7.78% 8.21% 8.58%
Source: Team Estimates
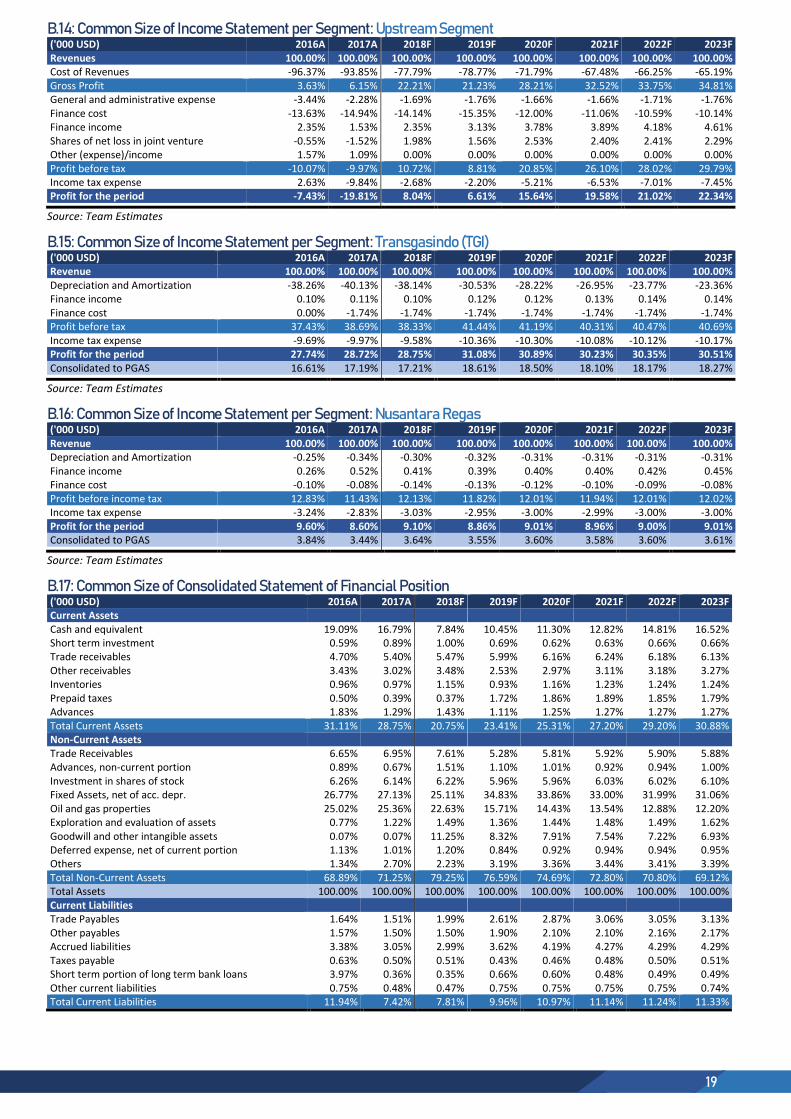
19
B.14: Common Size of Income Statement per Segment: Upstream Segment
('000 USD) 2016A 2017A 2018F 2019F 2020F 2021F 2022F 2023F Revenues 100.00% 100.00% 100.00% 100.00% 100.00% 100.00% 100.00% 100.00% Cost of Revenues -96.37% -93.85% -77.79% -78.77% -71.79% -67.48% -66.25% -65.19% Gross Profit 3.63% 6.15% 22.21% 21.23% 28.21% 32.52% 33.75% 34.81% General and administrative expense -3.44% -2.28% -1.69% -1.76% -1.66% -1.66% -1.71% -1.76% Finance cost -13.63% -14.94% -14.14% -15.35% -12.00% -11.06% -10.59% -10.14% Finance income 2.35% 1.53% 2.35% 3.13% 3.78% 3.89% 4.18% 4.61% Shares of net loss in joint venture -0.55% -1.52% 1.98% 1.56% 2.53% 2.40% 2.41% 2.29% Other (expense)/income 1.57% 1.09% 0.00% 0.00% 0.00% 0.00% 0.00% 0.00% Profit before tax -10.07% -9.97% 10.72% 8.81% 20.85% 26.10% 28.02% 29.79% Income tax expense 2.63% -9.84% -2.68% -2.20% -5.21% -6.53% -7.01% -7.45% Profit for the period -7.43% -19.81% 8.04% 6.61% 15.64% 19.58% 21.02% 22.34%
Source: Team Estimates
B.15: Common Size of Income Statement per Segment: Transgasindo (TGI)
('000 USD) 2016A 2017A 2018F 2019F 2020F 2021F 2022F 2023F Revenue 100.00% 100.00% 100.00% 100.00% 100.00% 100.00% 100.00% 100.00% Depreciation and Amortization -38.26% -40.13% -38.14% -30.53% -28.22% -26.95% -23.77% -23.36% Finance income 0.10% 0.11% 0.10% 0.12% 0.12% 0.13% 0.14% 0.14% Finance cost 0.00% -1.74% -1.74% -1.74% -1.74% -1.74% -1.74% -1.74% Profit before tax 37.43% 38.69% 38.33% 41.44% 41.19% 40.31% 40.47% 40.69% Income tax expense -9.69% -9.97% -9.58% -10.36% -10.30% -10.08% -10.12% -10.17% Profit for the period 27.74% 28.72% 28.75% 31.08% 30.89% 30.23% 30.35% 30.51% Consolidated to PGAS 16.61% 17.19% 17.21% 18.61% 18.50% 18.10% 18.17% 18.27%
Source: Team Estimates
B.16: Common Size of Income Statement per Segment: Nusantara Regas
('000 USD) 2016A 2017A 2018F 2019F 2020F 2021F 2022F 2023F Revenue 100.00% 100.00% 100.00% 100.00% 100.00% 100.00% 100.00% 100.00% Depreciation and Amortization -0.25% -0.34% -0.30% -0.32% -0.31% -0.31% -0.31% -0.31% Finance income 0.26% 0.52% 0.41% 0.39% 0.40% 0.40% 0.42% 0.45% Finance cost -0.10% -0.08% -0.14% -0.13% -0.12% -0.10% -0.09% -0.08% Profit before income tax 12.83% 11.43% 12.13% 11.82% 12.01% 11.94% 12.01% 12.02% Income tax expense -3.24% -2.83% -3.03% -2.95% -3.00% -2.99% -3.00% -3.00% Profit for the period 9.60% 8.60% 9.10% 8.86% 9.01% 8.96% 9.00% 9.01% Consolidated to PGAS 3.84% 3.44% 3.64% 3.55% 3.60% 3.58% 3.60% 3.61%
Source: Team Estimates
B.17: Common Size of Consolidated Statement of Financial Position
('000 USD) 2016A 2017A 2018F 2019F 2020F 2021F 2022F 2023F Current Assets Cash and equivalent 19.09% 16.79% 7.84% 10.45% 11.30% 12.82% 14.81% 16.52% Short term investment 0.59% 0.89% 1.00% 0.69% 0.62% 0.63% 0.66% 0.66% Trade receivables 4.70% 5.40% 5.47% 5.99% 6.16% 6.24% 6.18% 6.13% Other receivables 3.43% 3.02% 3.48% 2.53% 2.97% 3.11% 3.18% 3.27% Inventories 0.96% 0.97% 1.15% 0.93% 1.16% 1.23% 1.24% 1.24% Prepaid taxes 0.50% 0.39% 0.37% 1.72% 1.86% 1.89% 1.85% 1.79% Advances 1.83% 1.29% 1.43% 1.11% 1.25% 1.27% 1.27% 1.27% Total Current Assets 31.11% 28.75% 20.75% 23.41% 25.31% 27.20% 29.20% 30.88% Non-Current Assets Trade Receivables 6.65% 6.95% 7.61% 5.28% 5.81% 5.92% 5.90% 5.88% Advances, non-current portion 0.89% 0.67% 1.51% 1.10% 1.01% 0.92% 0.94% 1.00% Investment in shares of stock 6.26% 6.14% 6.22% 5.96% 5.96% 6.03% 6.02% 6.10% Fixed Assets, net of acc. depr. 26.77% 27.13% 25.11% 34.83% 33.86% 33.00% 31.99% 31.06% Oil and gas properties 25.02% 25.36% 22.63% 15.71% 14.43% 13.54% 12.88% 12.20% Exploration and evaluation of assets 0.77% 1.22% 1.49% 1.36% 1.44% 1.48% 1.49% 1.62% Goodwill and other intangible assets 0.07% 0.07% 11.25% 8.32% 7.91% 7.54% 7.22% 6.93% Deferred expense, net of current portion 1.13% 1.01% 1.20% 0.84% 0.92% 0.94% 0.94% 0.95% Others 1.34% 2.70% 2.23% 3.19% 3.36% 3.44% 3.41% 3.39% Total Non-Current Assets 68.89% 71.25% 79.25% 76.59% 74.69% 72.80% 70.80% 69.12% Total Assets 100.00% 100.00% 100.00% 100.00% 100.00% 100.00% 100.00% 100.00% Current Liabilities Trade Payables 1.64% 1.51% 1.99% 2.61% 2.87% 3.06% 3.05% 3.13% Other payables 1.57% 1.50% 1.50% 1.90% 2.10% 2.10% 2.16% 2.17% Accrued liabilities 3.38% 3.05% 2.99% 3.62% 4.19% 4.27% 4.29% 4.29% Taxes payable 0.63% 0.50% 0.51% 0.43% 0.46% 0.48% 0.50% 0.51% Short term portion of long term bank loans 3.97% 0.36% 0.35% 0.66% 0.60% 0.48% 0.49% 0.49% Other current liabilities 0.75% 0.48% 0.47% 0.75% 0.75% 0.75% 0.75% 0.74% Total Current Liabilities 11.94% 7.42% 7.81% 9.96% 10.97% 11.14% 11.24% 11.33%
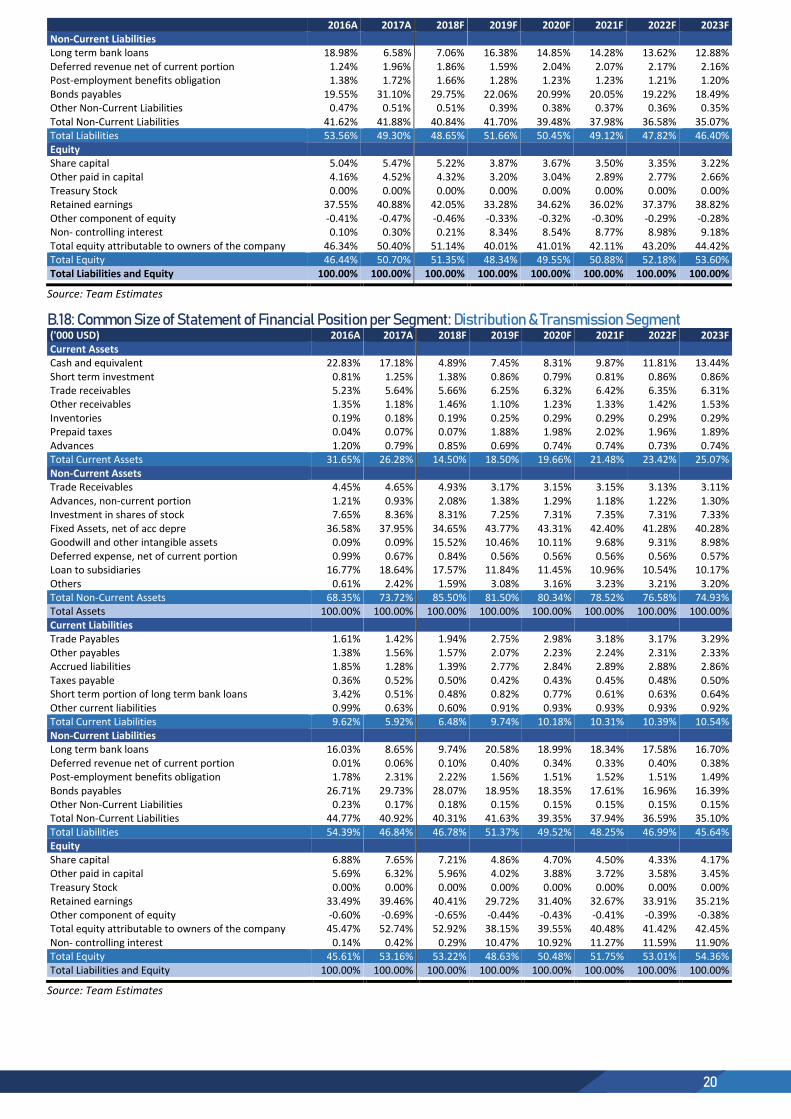
20
2016A 2017A 2018F 2019F 2020F 2021F 2022F 2023F Non-Current Liabilities Long term bank loans 18.98% 6.58% 7.06% 16.38% 14.85% 14.28% 13.62% 12.88% Deferred revenue net of current portion 1.24% 1.96% 1.86% 1.59% 2.04% 2.07% 2.17% 2.16% Post-employment benefits obligation 1.38% 1.72% 1.66% 1.28% 1.23% 1.23% 1.21% 1.20% Bonds payables 19.55% 31.10% 29.75% 22.06% 20.99% 20.05% 19.22% 18.49% Other Non-Current Liabilities 0.47% 0.51% 0.51% 0.39% 0.38% 0.37% 0.36% 0.35% Total Non-Current Liabilities 41.62% 41.88% 40.84% 41.70% 39.48% 37.98% 36.58% 35.07% Total Liabilities 53.56% 49.30% 48.65% 51.66% 50.45% 49.12% 47.82% 46.40% Equity Share capital 5.04% 5.47% 5.22% 3.87% 3.67% 3.50% 3.35% 3.22% Other paid in capital 4.16% 4.52% 4.32% 3.20% 3.04% 2.89% 2.77% 2.66% Treasury Stock 0.00% 0.00% 0.00% 0.00% 0.00% 0.00% 0.00% 0.00% Retained earnings 37.55% 40.88% 42.05% 33.28% 34.62% 36.02% 37.37% 38.82% Other component of equity -0.41% -0.47% -0.46% -0.33% -0.32% -0.30% -0.29% -0.28% Non- controlling interest 0.10% 0.30% 0.21% 8.34% 8.54% 8.77% 8.98% 9.18% Total equity attributable to owners of the company 46.34% 50.40% 51.14% 40.01% 41.01% 42.11% 43.20% 44.42% Total Equity 46.44% 50.70% 51.35% 48.34% 49.55% 50.88% 52.18% 53.60% Total Liabilities and Equity 100.00% 100.00% 100.00% 100.00% 100.00% 100.00% 100.00% 100.00%
Source: Team Estimates
B.18: Common Size of Statement of Financial Position per Segment: Distribution & Transmission Segment ('000 USD) 2016A 2017A 2018F 2019F 2020F 2021F 2022F 2023F Current Assets Cash and equivalent 22.83% 17.18% 4.89% 7.45% 8.31% 9.87% 11.81% 13.44% Short term investment 0.81% 1.25% 1.38% 0.86% 0.79% 0.81% 0.86% 0.86% Trade receivables 5.23% 5.64% 5.66% 6.25% 6.32% 6.42% 6.35% 6.31% Other receivables 1.35% 1.18% 1.46% 1.10% 1.23% 1.33% 1.42% 1.53% Inventories 0.19% 0.18% 0.19% 0.25% 0.29% 0.29% 0.29% 0.29% Prepaid taxes 0.04% 0.07% 0.07% 1.88% 1.98% 2.02% 1.96% 1.89% Advances 1.20% 0.79% 0.85% 0.69% 0.74% 0.74% 0.73% 0.74% Total Current Assets 31.65% 26.28% 14.50% 18.50% 19.66% 21.48% 23.42% 25.07% Non-Current Assets Trade Receivables 4.45% 4.65% 4.93% 3.17% 3.15% 3.15% 3.13% 3.11% Advances, non-current portion 1.21% 0.93% 2.08% 1.38% 1.29% 1.18% 1.22% 1.30% Investment in shares of stock 7.65% 8.36% 8.31% 7.25% 7.31% 7.35% 7.31% 7.33% Fixed Assets, net of acc depre 36.58% 37.95% 34.65% 43.77% 43.31% 42.40% 41.28% 40.28% Goodwill and other intangible assets 0.09% 0.09% 15.52% 10.46% 10.11% 9.68% 9.31% 8.98% Deferred expense, net of current portion 0.99% 0.67% 0.84% 0.56% 0.56% 0.56% 0.56% 0.57% Loan to subsidiaries 16.77% 18.64% 17.57% 11.84% 11.45% 10.96% 10.54% 10.17% Others 0.61% 2.42% 1.59% 3.08% 3.16% 3.23% 3.21% 3.20% Total Non-Current Assets 68.35% 73.72% 85.50% 81.50% 80.34% 78.52% 76.58% 74.93% Total Assets 100.00% 100.00% 100.00% 100.00% 100.00% 100.00% 100.00% 100.00% Current Liabilities Trade Payables 1.61% 1.42% 1.94% 2.75% 2.98% 3.18% 3.17% 3.29% Other payables 1.38% 1.56% 1.57% 2.07% 2.23% 2.24% 2.31% 2.33% Accrued liabilities 1.85% 1.28% 1.39% 2.77% 2.84% 2.89% 2.88% 2.86% Taxes payable 0.36% 0.52% 0.50% 0.42% 0.43% 0.45% 0.48% 0.50% Short term portion of long term bank loans 3.42% 0.51% 0.48% 0.82% 0.77% 0.61% 0.63% 0.64% Other current liabilities 0.99% 0.63% 0.60% 0.91% 0.93% 0.93% 0.93% 0.92% Total Current Liabilities 9.62% 5.92% 6.48% 9.74% 10.18% 10.31% 10.39% 10.54% Non-Current Liabilities Long term bank loans 16.03% 8.65% 9.74% 20.58% 18.99% 18.34% 17.58% 16.70% Deferred revenue net of current portion 0.01% 0.06% 0.10% 0.40% 0.34% 0.33% 0.40% 0.38% Post-employment benefits obligation 1.78% 2.31% 2.22% 1.56% 1.51% 1.52% 1.51% 1.49% Bonds payables 26.71% 29.73% 28.07% 18.95% 18.35% 17.61% 16.96% 16.39% Other Non-Current Liabilities 0.23% 0.17% 0.18% 0.15% 0.15% 0.15% 0.15% 0.15% Total Non-Current Liabilities 44.77% 40.92% 40.31% 41.63% 39.35% 37.94% 36.59% 35.10% Total Liabilities 54.39% 46.84% 46.78% 51.37% 49.52% 48.25% 46.99% 45.64% Equity Share capital 6.88% 7.65% 7.21% 4.86% 4.70% 4.50% 4.33% 4.17% Other paid in capital 5.69% 6.32% 5.96% 4.02% 3.88% 3.72% 3.58% 3.45% Treasury Stock 0.00% 0.00% 0.00% 0.00% 0.00% 0.00% 0.00% 0.00% Retained earnings 33.49% 39.46% 40.41% 29.72% 31.40% 32.67% 33.91% 35.21% Other component of equity -0.60% -0.69% -0.65% -0.44% -0.43% -0.41% -0.39% -0.38% Total equity attributable to owners of the company 45.47% 52.74% 52.92% 38.15% 39.55% 40.48% 41.42% 42.45% Non- controlling interest 0.14% 0.42% 0.29% 10.47% 10.92% 11.27% 11.59% 11.90% Total Equity 45.61% 53.16% 53.22% 48.63% 50.48% 51.75% 53.01% 54.36% Total Liabilities and Equity 100.00% 100.00% 100.00% 100.00% 100.00% 100.00% 100.00% 100.00%
Source: Team Estimates
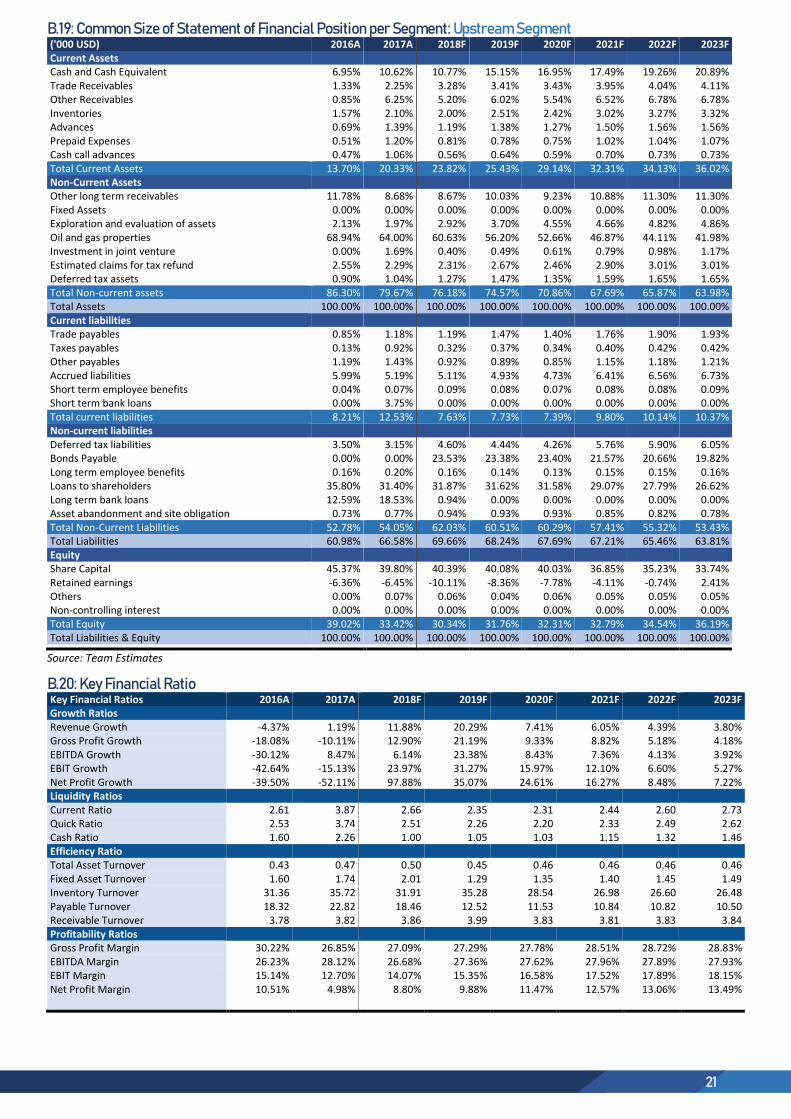
21
B.19: Common Size of Statement of Financial Position per Segment: Upstream Segment ('000 USD) 2016A 2017A 2018F 2019F 2020F 2021F 2022F 2023F Current Assets Cash and Cash Equivalent 6.95% 10.62% 10.77% 15.15% 16.95% 17.49% 19.26% 20.89% Trade Receivables 1.33% 2.25% 3.28% 3.41% 3.43% 3.95% 4.04% 4.11% Other Receivables 0.85% 6.25% 5.20% 6.02% 5.54% 6.52% 6.78% 6.78% Inventories 1.57% 2.10% 2.00% 2.51% 2.42% 3.02% 3.27% 3.32% Advances 0.69% 1.39% 1.19% 1.38% 1.27% 1.50% 1.56% 1.56% Prepaid Expenses 0.51% 1.20% 0.81% 0.78% 0.75% 1.02% 1.04% 1.07% Cash call advances 0.47% 1.06% 0.56% 0.64% 0.59% 0.70% 0.73% 0.73% Total Current Assets 13.70% 20.33% 23.82% 25.43% 29.14% 32.31% 34.13% 36.02% Non-Current Assets Other long term receivables 11.78% 8.68% 8.67% 10.03% 9.23% 10.88% 11.30% 11.30% Fixed Assets 0.00% 0.00% 0.00% 0.00% 0.00% 0.00% 0.00% 0.00% Exploration and evaluation of assets 2.13% 1.97% 2.92% 3.70% 4.55% 4.66% 4.82% 4.86% Oil and gas properties 68.94% 64.00% 60.63% 56.20% 52.66% 46.87% 44.11% 41.98% Investment in joint venture 0.00% 1.69% 0.40% 0.49% 0.61% 0.79% 0.98% 1.17% Estimated claims for tax refund 2.55% 2.29% 2.31% 2.67% 2.46% 2.90% 3.01% 3.01% Deferred tax assets 0.90% 1.04% 1.27% 1.47% 1.35% 1.59% 1.65% 1.65% Total Non-current assets 86.30% 79.67% 76.18% 74.57% 70.86% 67.69% 65.87% 63.98% Total Assets 100.00% 100.00% 100.00% 100.00% 100.00% 100.00% 100.00% 100.00% Current liabilities Trade payables 0.85% 1.18% 1.19% 1.47% 1.40% 1.76% 1.90% 1.93% Taxes payables 0.13% 0.92% 0.32% 0.37% 0.34% 0.40% 0.42% 0.42% Other payables 1.19% 1.43% 0.92% 0.89% 0.85% 1.15% 1.18% 1.21% Accrued liabilities 5.99% 5.19% 5.11% 4.93% 4.73% 6.41% 6.56% 6.73% Short term employee benefits 0.04% 0.07% 0.09% 0.08% 0.07% 0.08% 0.08% 0.09% Short term bank loans 0.00% 3.75% 0.00% 0.00% 0.00% 0.00% 0.00% 0.00% Total current liabilities 8.21% 12.53% 7.63% 7.73% 7.39% 9.80% 10.14% 10.37% Non-current liabilities Deferred tax liabilities 3.50% 3.15% 4.60% 4.44% 4.26% 5.76% 5.90% 6.05% Bonds Payable 0.00% 0.00% 23.53% 23.38% 23.40% 21.57% 20.66% 19.82% Long term employee benefits 0.16% 0.20% 0.16% 0.14% 0.13% 0.15% 0.15% 0.16% Loans to shareholders 35.80% 31.40% 31.87% 31.62% 31.58% 29.07% 27.79% 26.62% Long term bank loans 12.59% 18.53% 0.94% 0.00% 0.00% 0.00% 0.00% 0.00% Asset abandonment and site obligation 0.73% 0.77% 0.94% 0.93% 0.93% 0.85% 0.82% 0.78% Total Non-Current Liabilities 52.78% 54.05% 62.03% 60.51% 60.29% 57.41% 55.32% 53.43% Total Liabilities 60.98% 66.58% 69.66% 68.24% 67.69% 67.21% 65.46% 63.81% Equity Share Capital 45.37% 39.80% 40.39% 40.08% 40.03% 36.85% 35.23% 33.74% Retained earnings -6.36% -6.45% -10.11% -8.36% -7.78% -4.11% -0.74% 2.41% Others 0.00% 0.07% 0.06% 0.04% 0.06% 0.05% 0.05% 0.05% Non-controlling interest 0.00% 0.00% 0.00% 0.00% 0.00% 0.00% 0.00% 0.00% Total Equity 39.02% 33.42% 30.34% 31.76% 32.31% 32.79% 34.54% 36.19% Total Liabilities & Equity 100.00% 100.00% 100.00% 100.00% 100.00% 100.00% 100.00% 100.00%
Source: Team Estimates
B.20: Key Financial Ratio
Key Financial Ratios 2016A 2017A 2018F 2019F 2020F 2021F 2022F 2023F Growth Ratios Revenue Growth -4.37% 1.19% 11.88% 20.29% 7.41% 6.05% 4.39% 3.80% Gross Profit Growth -18.08% -10.11% 12.90% 21.19% 9.33% 8.82% 5.18% 4.18% EBITDA Growth -30.12% 8.47% 6.14% 23.38% 8.43% 7.36% 4.13% 3.92% EBIT Growth -42.64% -15.13% 23.97% 31.27% 15.97% 12.10% 6.60% 5.27% Net Profit Growth -39.50% -52.11% 97.88% 35.07% 24.61% 16.27% 8.48% 7.22% Liquidity Ratios Current Ratio 2.61 3.87 2.66 2.35 2.31 2.44 2.60 2.73 Quick Ratio 2.53 3.74 2.51 2.26 2.20 2.33 2.49 2.62 Cash Ratio 1.60 2.26 1.00 1.05 1.03 1.15 1.32 1.46 Efficiency Ratio Total Asset Turnover 0.43 0.47 0.50 0.45 0.46 0.46 0.46 0.46 Fixed Asset Turnover 1.60 1.74 2.01 1.29 1.35 1.40 1.45 1.49 Inventory Turnover 31.36 35.72 31.91 35.28 28.54 26.98 26.60 26.48 Payable Turnover 18.32 22.82 18.46 12.52 11.53 10.84 10.82 10.50 Receivable Turnover 3.78 3.82 3.86 3.99 3.83 3.81 3.83 3.84 Profitability Ratios Gross Profit Margin 30.22% 26.85% 27.09% 27.29% 27.78% 28.51% 28.72% 28.83% EBITDA Margin 26.23% 28.12% 26.68% 27.36% 27.62% 27.96% 27.89% 27.93% EBIT Margin 15.14% 12.70% 14.07% 15.35% 16.58% 17.52% 17.89% 18.15% Net Profit Margin 10.51% 4.98% 8.80% 9.88% 11.47% 12.57% 13.06% 13.49%
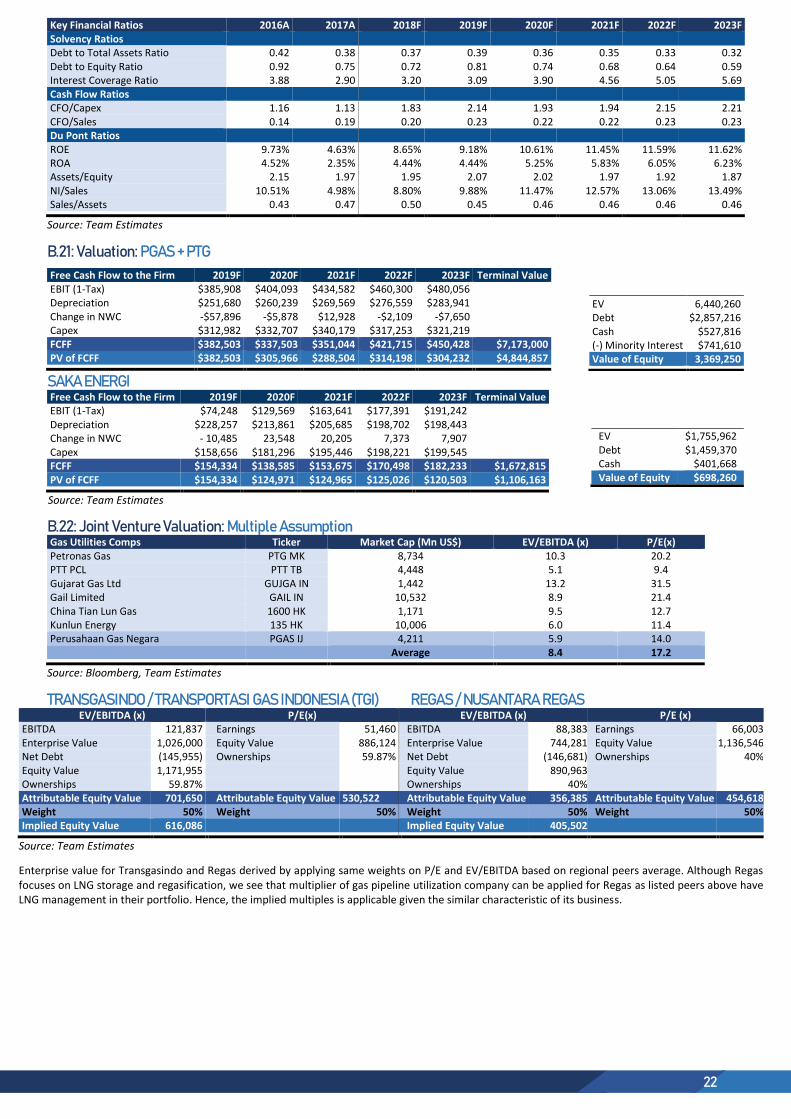
22
Key Financial Ratios 2016A 2017A 2018F 2019F 2020F 2021F 2022F 2023F Solvency Ratios Debt to Total Assets Ratio 0.42 0.38 0.37 0.39 0.36 0.35 0.33 0.32 Debt to Equity Ratio 0.92 0.75 0.72 0.81 0.74 0.68 0.64 0.59 Interest Coverage Ratio 3.88 2.90 3.20 3.09 3.90 4.56 5.05 5.69 Cash Flow Ratios CFO/Capex 1.16 1.13 1.83 2.14 1.93 1.94 2.15 2.21 CFO/Sales 0.14 0.19 0.20 0.23 0.22 0.22 0.23 0.23 Du Pont Ratios ROE 9.73% 4.63% 8.65% 9.18% 10.61% 11.45% 11.59% 11.62% ROA 4.52% 2.35% 4.44% 4.44% 5.25% 5.83% 6.05% 6.23% Assets/Equity 2.15 1.97 1.95 2.07 2.02 1.97 1.92 1.87 NI/Sales 10.51% 4.98% 8.80% 9.88% 11.47% 12.57% 13.06% 13.49% Sales/Assets 0.43 0.47 0.50 0.45 0.46 0.46 0.46 0.46
Source: Team Estimates
B.21: Valuation: PGAS + PTG
Free Cash Flow to the Firm 2019F 2020F 2021F 2022F 2023F Terminal Value EBIT (1-Tax) $385,908 $404,093 $434,582 $460,300 $480,056 Depreciation $251,680 $260,239 $269,569 $276,559 $283,941 Change in NWC -$57,896 -$5,878 $12,928 -$2,109 -$7,650 Capex $312,982 $332,707 $340,179 $317,253 $321,219 FCFF $382,503 $337,503 $351,044 $421,715 $450,428 $7,173,000 PV of FCFF $382,503 $305,966 $288,504 $314,198 $304,232 $4,844,857
SAKA ENERGI
Free Cash Flow to the Firm 2019F 2020F 2021F 2022F 2023F Terminal Value EBIT (1-Tax) $74,248 $129,569 $163,641 $177,391 $191,242 Depreciation $228,257 $213,861 $205,685 $198,702 $198,443 Change in NWC - 10,485 23,548 20,205 7,373 7,907 Capex $158,656 $181,296 $195,446 $198,221 $199,545 FCFF $154,334 $138,585 $153,675 $170,498 $182,233 $1,672,815 PV of FCFF $154,334 $124,971 $124,965 $125,026 $120,503 $1,106,163
Source: Team Estimates
B.22: Joint Venture Valuation: Multiple Assumption
Gas Utilities Comps Ticker Market Cap (Mn US$) EV/EBITDA (x) P/E(x) Petronas Gas PTG MK 8,734 10.3 20.2 PTT PCL PTT TB 4,448 5.1 9.4 Gujarat Gas Ltd GUJGA IN 1,442 13.2 31.5 Gail Limited GAIL IN 10,532 8.9 21.4 China Tian Lun Gas 1600 HK 1,171 9.5 12.7 Kunlun Energy 135 HK 10,006 6.0 11.4 Perusahaan Gas Negara PGAS IJ 4,211 5.9 14.0
Average 8.4 17.2
Source: Bloomberg, Team Estimates
TRANSGASINDO / TRANSPORTASI GAS INDONESIA (TGI) REGAS / NUSANTARA REGAS
EV/EBITDA (x) P/E(x) EV/EBITDA (x) P/E (x) EBITDA 121,837 Earnings 51,460 EBITDA 88,383 Earnings 66,003 Enterprise Value 1,026,000 Equity Value 886,124 Enterprise Value 744,281 Equity Value 1,136,546 Net Debt (145,955) Ownerships 59.87% Net Debt (146,681) Ownerships 40% Equity Value 1,171,955 Equity Value 890,963 Ownerships 59.87% Ownerships 40%
Attributable Equity Value 701,650 Attributable Equity Value 530,522 Attributable Equity Value 356,385 Attributable Equity Value 454,618 Weight 50% Weight 50% Weight 50% Weight 50% Implied Equity Value 616,086 Implied Equity Value 405,502
Source: Team Estimates
Enterprise value for Transgasindo and Regas derived by applying same weights on P/E and EV/EBITDA based on regional peers average. Although Regas focuses on LNG storage and regasification, we see that multiplier of gas pipeline utilization company can be applied for Regas as listed peers above have LNG management in their portfolio. Hence, the implied multiples is applicable given the similar characteristic of its business.
EV 6,440,260 Debt $2,857,216 Cash $527,816 (-) Minority Interest $741,610 Value of Equity 3,369,250
EV $1,755,962 Debt $1,459,370 Cash $401,668 Value of Equity $698,260
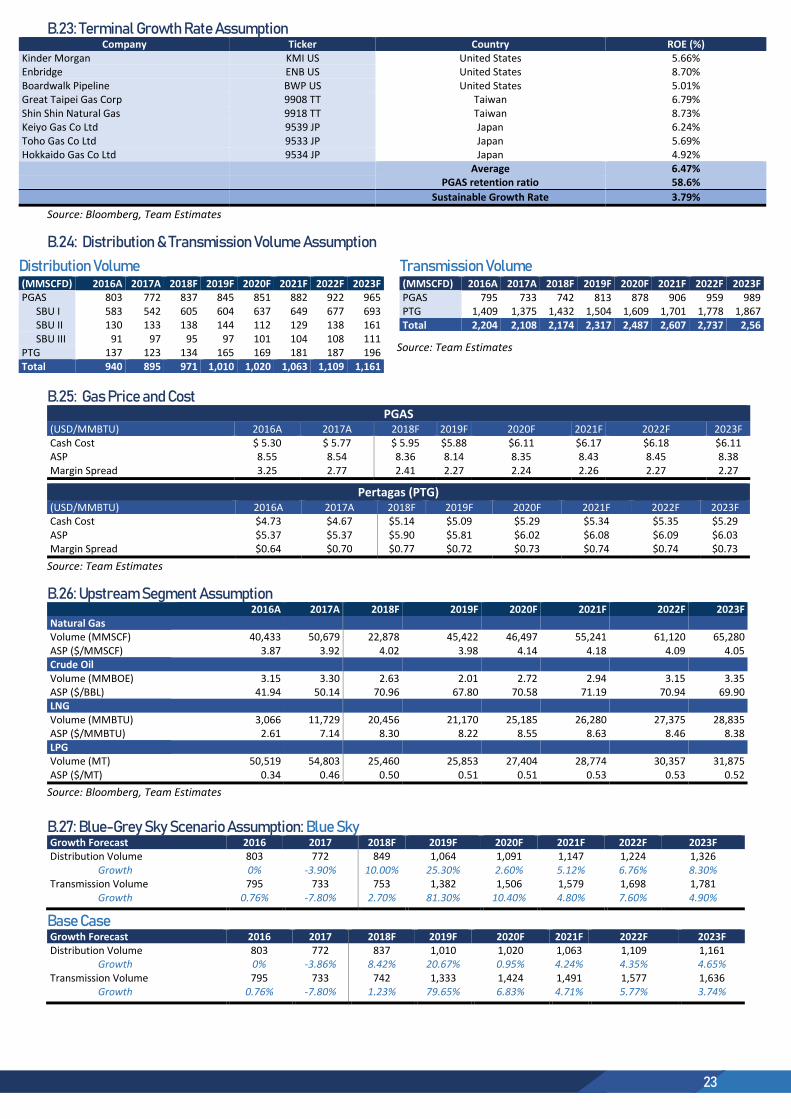
23
B.23: Terminal Growth Rate Assumption Company Ticker Country ROE (%)
Kinder Morgan KMI US United States 5.66% Enbridge ENB US United States 8.70% Boardwalk Pipeline BWP US United States 5.01% Great Taipei Gas Corp 9908 TT Taiwan 6.79% Shin Shin Natural Gas 9918 TT Taiwan 8.73% Keiyo Gas Co Ltd 9539 JP Japan 6.24% Toho Gas Co Ltd 9533 JP Japan 5.69% Hokkaido Gas Co Ltd 9534 JP Japan 4.92%
Average 6.47%
PGAS retention ratio 58.6%
Sustainable Growth Rate 3.79%
Source: Bloomberg, Team Estimates
B.24: Distribution & Transmission Volume Assumption
Distribution Volume Transmission Volume
Source: Team Estimates
B.25: Gas Price and Cost PGAS
(USD/MMBTU) 2016A 2017A 2018F 2019F 2020F 2021F 2022F 2023F Cash Cost $ 5.30 $ 5.77 $ 5.95 $5.88 $6.11 $6.17 $6.18 $6.11 ASP 8.55 8.54 8.36 8.14 8.35 8.43 8.45 8.38 Margin Spread 3.25 2.77 2.41 2.27 2.24 2.26 2.27 2.27
Pertagas (PTG) (USD/MMBTU) 2016A 2017A 2018F 2019F 2020F 2021F 2022F 2023F Cash Cost $4.73 $4.67 $5.14 $5.09 $5.29 $5.34 $5.35 $5.29 ASP $5.37 $5.37 $5.90 $5.81 $6.02 $6.08 $6.09 $6.03 Margin Spread $0.64 $0.70 $0.77 $0.72 $0.73 $0.74 $0.74 $0.73
Source: Team Estimates
B.26: Upstream Segment Assumption
2016A 2017A 2018F 2019F 2020F 2021F 2022F 2023F Natural Gas Volume (MMSCF) 40,433 50,679 22,878 45,422 46,497 55,241 61,120 65,280 ASP ($/MMSCF) 3.87 3.92 4.02 3.98 4.14 4.18 4.09 4.05 Crude Oil Volume (MMBOE) 3.15 3.30 2.63 2.01 2.72 2.94 3.15 3.35 ASP ($/BBL) 41.94 50.14 70.96 67.80 70.58 71.19 70.94 69.90 LNG Volume (MMBTU) 3,066 11,729 20,456 21,170 25,185 26,280 27,375 28,835 ASP ($/MMBTU) 2.61 7.14 8.30 8.22 8.55 8.63 8.46 8.38 LPG Volume (MT) 50,519 54,803 25,460 25,853 27,404 28,774 30,357 31,875 ASP ($/MT) 0.34 0.46 0.50 0.51 0.51 0.53 0.53 0.52
Source: Bloomberg, Team Estimates
B.27: Blue-Grey Sky Scenario Assumption: Blue Sky
Growth Forecast 2016 2017 2018F 2019F 2020F 2021F 2022F 2023F Distribution Volume 803 772 849 1,064 1,091 1,147 1,224 1,326
Growth 0% -3.90% 10.00% 25.30% 2.60% 5.12% 6.76% 8.30% Transmission Volume 795 733 753 1,382 1,506 1,579 1,698 1,781
Growth 0.76% -7.80% 2.70% 81.30% 10.40% 4.80% 7.60% 4.90%
Base Case Growth Forecast 2016 2017 2018F 2019F 2020F 2021F 2022F 2023F Distribution Volume 803 772 837 1,010 1,020 1,063 1,109 1,161
Growth 0% -3.86% 8.42% 20.67% 0.95% 4.24% 4.35% 4.65% Transmission Volume 795 733 742 1,333 1,424 1,491 1,577 1,636
Growth 0.76% -7.80% 1.23% 79.65% 6.83% 4.71% 5.77% 3.74%
(MMSCFD) 2016A 2017A 2018F 2019F 2020F 2021F 2022F 2023F PGAS 803 772 837 845 851 882 922 965
SBU I 583 542 605 604 637 649 677 693 SBU II 130 133 138 144 112 129 138 161 SBU III 91 97 95 97 101 104 108 111
PTG 137 123 134 165 169 181 187 196 Total 940 895 971 1,010 1,020 1,063 1,109 1,161
(MMSCFD) 2016A 2017A 2018F 2019F 2020F 2021F 2022F 2023F PGAS 795 733 742 813 878 906 959 989 PTG 1,409 1,375 1,432 1,504 1,609 1,701 1,778 1,867 Total 2,204 2,108 2,174 2,317 2,487 2,607 2,737 2,56
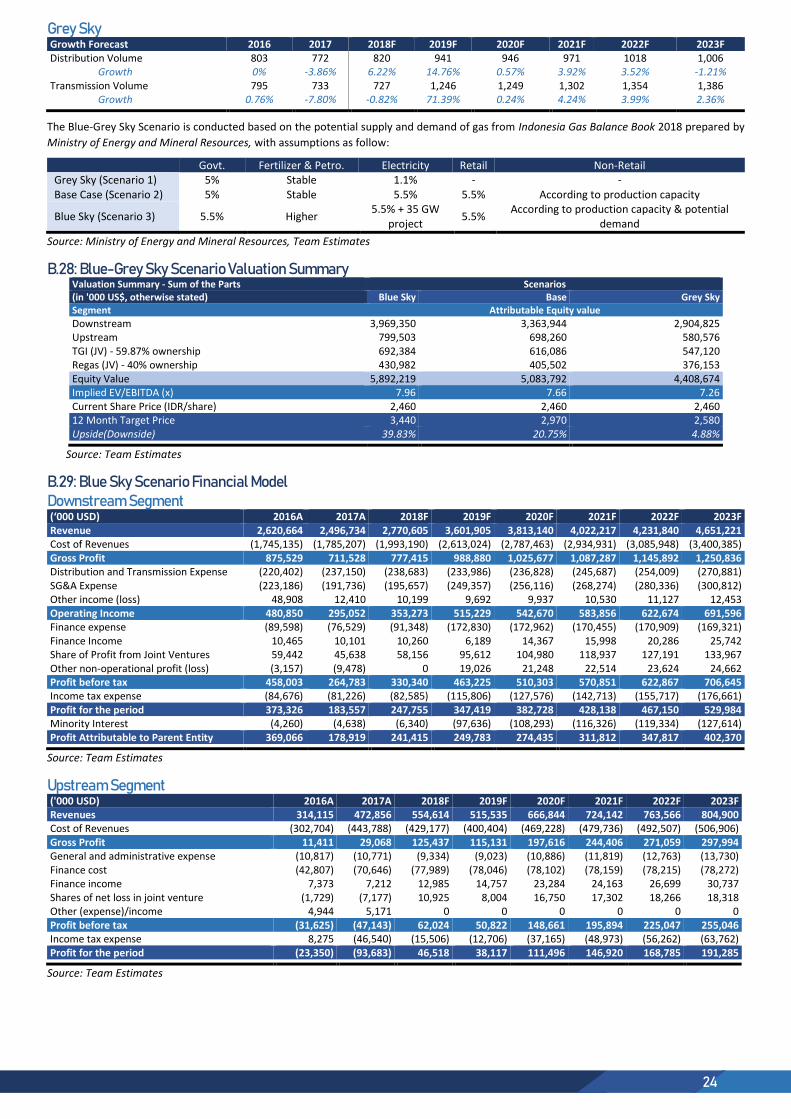
24
Grey Sky
Growth Forecast 2016 2017 2018F 2019F 2020F 2021F 2022F 2023F Distribution Volume 803 772 820 941 946 971 1018 1,006
Growth 0% -3.86% 6.22% 14.76% 0.57% 3.92% 3.52% -1.21% Transmission Volume 795 733 727 1,246 1,249 1,302 1,354 1,386
Growth 0.76% -7.80% -0.82% 71.39% 0.24% 4.24% 3.99% 2.36%
The Blue-Grey Sky Scenario is conducted based on the potential supply and demand of gas from Indonesia Gas Balance Book 2018 prepared by
Ministry of Energy and Mineral Resources, with assumptions as follow:
Govt. Fertilizer & Petro. Electricity Retail Non-Retail Grey Sky (Scenario 1) 5% Stable 1.1% - - Base Case (Scenario 2) 5% Stable 5.5% 5.5% According to production capacity
Blue Sky (Scenario 3) 5.5% Higher 5.5% + 35 GW
project 5.5%
According to production capacity & potential demand
Source: Ministry of Energy and Mineral Resources, Team Estimates
B.28: Blue-Grey Sky Scenario Valuation Summary
Valuation Summary - Sum of the Parts Scenarios (in '000 US$, otherwise stated) Blue Sky Base Grey Sky Segment Attributable Equity value
Downstream 3,969,350 3,363,944 2,904,825 Upstream 799,503 698,260 580,576 TGI (JV) - 59.87% ownership 692,384 616,086 547,120 Regas (JV) - 40% ownership 430,982 405,502 376,153 Equity Value 5,892,219 5,083,792 4,408,674 Implied EV/EBITDA (x) 7.96 7.66 7.26 Current Share Price (IDR/share) 2,460 2,460 2,460 12 Month Target Price 3,440 2,970 2,580 Upside(Downside) 39.83% 20.75% 4.88%
Source: Team Estimates
B.29: Blue Sky Scenario Financial Model Downstream Segment
(‘000 USD) 2016A 2017A 2018F 2019F 2020F 2021F 2022F 2023F Revenue 2,620,664 2,496,734 2,770,605 3,601,905 3,813,140 4,022,217 4,231,840 4,651,221 Cost of Revenues (1,745,135) (1,785,207) (1,993,190) (2,613,024) (2,787,463) (2,934,931) (3,085,948) (3,400,385) Gross Profit 875,529 711,528 777,415 988,880 1,025,677 1,087,287 1,145,892 1,250,836 Distribution and Transmission Expense (220,402) (237,150) (238,683) (233,986) (236,828) (245,687) (254,009) (270,881) SG&A Expense (223,186) (191,736) (195,657) (249,357) (256,116) (268,274) (280,336) (300,812) Other income (loss) 48,908 12,410 10,199 9,692 9,937 10,530 11,127 12,453 Operating Income 480,850 295,052 353,273 515,229 542,670 583,856 622,674 691,596 Finance expense (89,598) (76,529) (91,348) (172,830) (172,962) (170,455) (170,909) (169,321) Finance Income 10,465 10,101 10,260 6,189 14,367 15,998 20,286 25,742 Share of Profit from Joint Ventures 59,442 45,638 58,156 95,612 104,980 118,937 127,191 133,967 Other non-operational profit (loss) (3,157) (9,478) 0 19,026 21,248 22,514 23,624 24,662 Profit before tax 458,003 264,783 330,340 463,225 510,303 570,851 622,867 706,645 Income tax expense (84,676) (81,226) (82,585) (115,806) (127,576) (142,713) (155,717) (176,661) Profit for the period 373,326 183,557 247,755 347,419 382,728 428,138 467,150 529,984 Minority Interest (4,260) (4,638) (6,340) (97,636) (108,293) (116,326) (119,334) (127,614) Profit Attributable to Parent Entity 369,066 178,919 241,415 249,783 274,435 311,812 347,817 402,370
Source: Team Estimates
Upstream Segment
('000 USD) 2016A 2017A 2018F 2019F 2020F 2021F 2022F 2023F Revenues 314,115 472,856 554,614 515,535 666,844 724,142 763,566 804,900 Cost of Revenues (302,704) (443,788) (429,177) (400,404) (469,228) (479,736) (492,507) (506,906) Gross Profit 11,411 29,068 125,437 115,131 197,616 244,406 271,059 297,994 General and administrative expense (10,817) (10,771) (9,334) (9,023) (10,886) (11,819) (12,763) (13,730) Finance cost (42,807) (70,646) (77,989) (78,046) (78,102) (78,159) (78,215) (78,272) Finance income 7,373 7,212 12,985 14,757 23,284 24,163 26,699 30,737 Shares of net loss in joint venture (1,729) (7,177) 10,925 8,004 16,750 17,302 18,266 18,318 Other (expense)/income 4,944 5,171 0 0 0 0 0 0 Profit before tax (31,625) (47,143) 62,024 50,822 148,661 195,894 225,047 255,046 Income tax expense 8,275 (46,540) (15,506) (12,706) (37,165) (48,973) (56,262) (63,762) Profit for the period (23,350) (93,683) 46,518 38,117 111,496 146,920 168,785 191,285
Source: Team Estimates
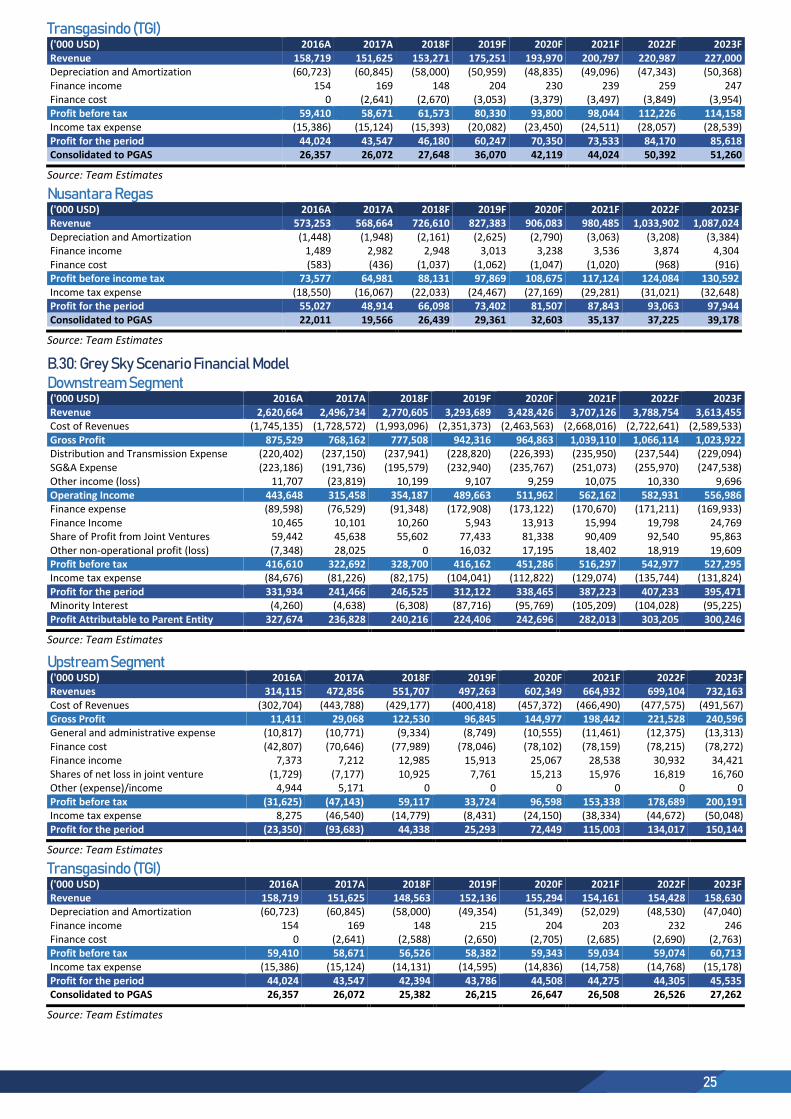
25
Transgasindo (TGI)
('000 USD) 2016A 2017A 2018F 2019F 2020F 2021F 2022F 2023F Revenue 158,719 151,625 153,271 175,251 193,970 200,797 220,987 227,000 Depreciation and Amortization (60,723) (60,845) (58,000) (50,959) (48,835) (49,096) (47,343) (50,368) Finance income 154 169 148 204 230 239 259 247 Finance cost 0 (2,641) (2,670) (3,053) (3,379) (3,497) (3,849) (3,954) Profit before tax 59,410 58,671 61,573 80,330 93,800 98,044 112,226 114,158 Income tax expense (15,386) (15,124) (15,393) (20,082) (23,450) (24,511) (28,057) (28,539) Profit for the period 44,024 43,547 46,180 60,247 70,350 73,533 84,170 85,618 Consolidated to PGAS 26,357 26,072 27,648 36,070 42,119 44,024 50,392 51,260
Source: Team Estimates
Nusantara Regas
('000 USD) 2016A 2017A 2018F 2019F 2020F 2021F 2022F 2023F Revenue 573,253 568,664 726,610 827,383 906,083 980,485 1,033,902 1,087,024 Depreciation and Amortization (1,448) (1,948) (2,161) (2,625) (2,790) (3,063) (3,208) (3,384) Finance income 1,489 2,982 2,948 3,013 3,238 3,536 3,874 4,304 Finance cost (583) (436) (1,037) (1,062) (1,047) (1,020) (968) (916) Profit before income tax 73,577 64,981 88,131 97,869 108,675 117,124 124,084 130,592 Income tax expense (18,550) (16,067) (22,033) (24,467) (27,169) (29,281) (31,021) (32,648) Profit for the period 55,027 48,914 66,098 73,402 81,507 87,843 93,063 97,944 Consolidated to PGAS 22,011 19,566 26,439 29,361 32,603 35,137 37,225 39,178
Source: Team Estimates
B.30: Grey Sky Scenario Financial Model Downstream Segment
('000 USD) 2016A 2017A 2018F 2019F 2020F 2021F 2022F 2023F Revenue 2,620,664 2,496,734 2,770,605 3,293,689 3,428,426 3,707,126 3,788,754 3,613,455 Cost of Revenues (1,745,135) (1,728,572) (1,993,096) (2,351,373) (2,463,563) (2,668,016) (2,722,641) (2,589,533) Gross Profit 875,529 768,162 777,508 942,316 964,863 1,039,110 1,066,114 1,023,922 Distribution and Transmission Expense (220,402) (237,150) (237,941) (228,820) (226,393) (235,950) (237,544) (229,094) SG&A Expense (223,186) (191,736) (195,579) (232,940) (235,767) (251,073) (255,970) (247,538) Other income (loss) 11,707 (23,819) 10,199 9,107 9,259 10,075 10,330 9,696 Operating Income 443,648 315,458 354,187 489,663 511,962 562,162 582,931 556,986 Finance expense (89,598) (76,529) (91,348) (172,908) (173,122) (170,670) (171,211) (169,933) Finance Income 10,465 10,101 10,260 5,943 13,913 15,994 19,798 24,769 Share of Profit from Joint Ventures 59,442 45,638 55,602 77,433 81,338 90,409 92,540 95,863 Other non-operational profit (loss) (7,348) 28,025 0 16,032 17,195 18,402 18,919 19,609 Profit before tax 416,610 322,692 328,700 416,162 451,286 516,297 542,977 527,295 Income tax expense (84,676) (81,226) (82,175) (104,041) (112,822) (129,074) (135,744) (131,824) Profit for the period 331,934 241,466 246,525 312,122 338,465 387,223 407,233 395,471 Minority Interest (4,260) (4,638) (6,308) (87,716) (95,769) (105,209) (104,028) (95,225) Profit Attributable to Parent Entity 327,674 236,828 240,216 224,406 242,696 282,013 303,205 300,246
Source: Team Estimates
Upstream Segment
('000 USD) 2016A 2017A 2018F 2019F 2020F 2021F 2022F 2023F Revenues 314,115 472,856 551,707 497,263 602,349 664,932 699,104 732,163 Cost of Revenues (302,704) (443,788) (429,177) (400,418) (457,372) (466,490) (477,575) (491,567) Gross Profit 11,411 29,068 122,530 96,845 144,977 198,442 221,528 240,596 General and administrative expense (10,817) (10,771) (9,334) (8,749) (10,555) (11,461) (12,375) (13,313) Finance cost (42,807) (70,646) (77,989) (78,046) (78,102) (78,159) (78,215) (78,272) Finance income 7,373 7,212 12,985 15,913 25,067 28,538 30,932 34,421 Shares of net loss in joint venture (1,729) (7,177) 10,925 7,761 15,213 15,976 16,819 16,760 Other (expense)/income 4,944 5,171 0 0 0 0 0 0 Profit before tax (31,625) (47,143) 59,117 33,724 96,598 153,338 178,689 200,191 Income tax expense 8,275 (46,540) (14,779) (8,431) (24,150) (38,334) (44,672) (50,048) Profit for the period (23,350) (93,683) 44,338 25,293 72,449 115,003 134,017 150,144
Source: Team Estimates
Transgasindo (TGI)
('000 USD) 2016A 2017A 2018F 2019F 2020F 2021F 2022F 2023F Revenue 158,719 151,625 148,563 152,136 155,294 154,161 154,428 158,630 Depreciation and Amortization (60,723) (60,845) (58,000) (49,354) (51,349) (52,029) (48,530) (47,040) Finance income 154 169 148 215 204 203 232 246 Finance cost 0 (2,641) (2,588) (2,650) (2,705) (2,685) (2,690) (2,763) Profit before tax 59,410 58,671 56,526 58,382 59,343 59,034 59,074 60,713 Income tax expense (15,386) (15,124) (14,131) (14,595) (14,836) (14,758) (14,768) (15,178) Profit for the period 44,024 43,547 42,394 43,786 44,508 44,275 44,305 45,535 Consolidated to PGAS 26,357 26,072 25,382 26,215 26,647 26,508 26,526 27,262
Source: Team Estimates
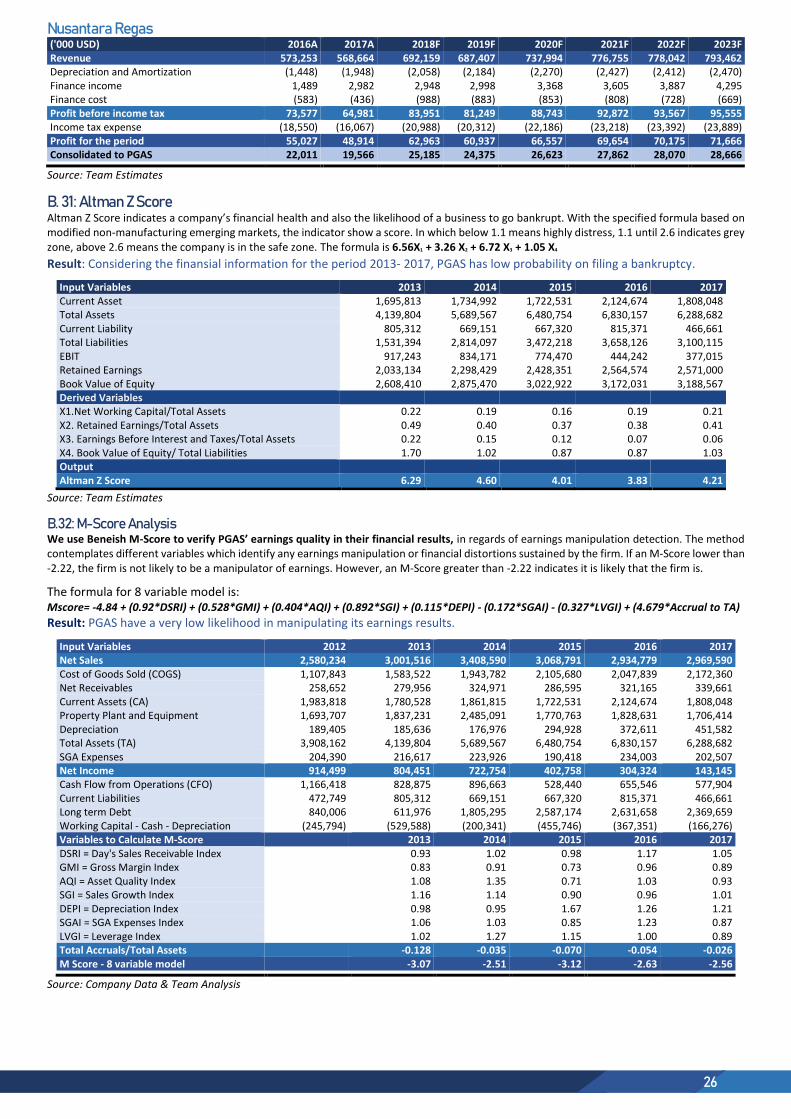
26
Nusantara Regas
('000 USD) 2016A 2017A 2018F 2019F 2020F 2021F 2022F 2023F Revenue 573,253 568,664 692,159 687,407 737,994 776,755 778,042 793,462 Depreciation and Amortization (1,448) (1,948) (2,058) (2,184) (2,270) (2,427) (2,412) (2,470) Finance income 1,489 2,982 2,948 2,998 3,368 3,605 3,887 4,295 Finance cost (583) (436) (988) (883) (853) (808) (728) (669) Profit before income tax 73,577 64,981 83,951 81,249 88,743 92,872 93,567 95,555 Income tax expense (18,550) (16,067) (20,988) (20,312) (22,186) (23,218) (23,392) (23,889) Profit for the period 55,027 48,914 62,963 60,937 66,557 69,654 70,175 71,666 Consolidated to PGAS 22,011 19,566 25,185 24,375 26,623 27,862 28,070 28,666
Source: Team Estimates
B. 31: Altman Z Score Altman Z Score indicates a company’s financial health and also the likelihood of a business to go bankrupt. With the specified formula based on modified non-manufacturing emerging markets, the indicator show a score. In which below 1.1 means highly distress, 1.1 until 2.6 indicates grey zone, above 2.6 means the company is in the safe zone. The formula is 6.56X1 + 3.26 X2 + 6.72 X3 + 1.05 X4
Result: Considering the finansial information for the period 2013- 2017, PGAS has low probability on filing a bankruptcy.
Input Variables 2013 2014 2015 2016 2017 Current Asset 1,695,813 1,734,992 1,722,531 2,124,674 1,808,048 Total Assets 4,139,804 5,689,567 6,480,754 6,830,157 6,288,682 Current Liability 805,312 669,151 667,320 815,371 466,661 Total Liabilities 1,531,394 2,814,097 3,472,218 3,658,126 3,100,115 EBIT 917,243 834,171 774,470 444,242 377,015 Retained Earnings 2,033,134 2,298,429 2,428,351 2,564,574 2,571,000 Book Value of Equity 2,608,410 2,875,470 3,022,922 3,172,031 3,188,567 Derived Variables X1.Net Working Capital/Total Assets 0.22 0.19 0.16 0.19 0.21 X2. Retained Earnings/Total Assets 0.49 0.40 0.37 0.38 0.41 X3. Earnings Before Interest and Taxes/Total Assets 0.22 0.15 0.12 0.07 0.06 X4. Book Value of Equity/ Total Liabilities 1.70 1.02 0.87 0.87 1.03 Output Altman Z Score 6.29 4.60 4.01 3.83 4.21
Source: Team Estimates
B.32: M-Score Analysis We use Beneish M-Score to verify PGAS’ earnings quality in their financial results, in regards of earnings manipulation detection. The method contemplates different variables which identify any earnings manipulation or financial distortions sustained by the firm. If an M-Score lower than -2.22, the firm is not likely to be a manipulator of earnings. However, an M-Score greater than -2.22 indicates it is likely that the firm is.
The formula for 8 variable model is: Mscore= -4.84 + (0.92*DSRI) + (0.528*GMI) + (0.404*AQI) + (0.892*SGI) + (0.115*DEPI) - (0.172*SGAI) - (0.327*LVGI) + (4.679*Accrual to TA)
Result: PGAS have a very low likelihood in manipulating its earnings results.
Input Variables 2012 2013 2014 2015 2016 2017 Net Sales 2,580,234 3,001,516 3,408,590 3,068,791 2,934,779 2,969,590 Cost of Goods Sold (COGS) 1,107,843 1,583,522 1,943,782 2,105,680 2,047,839 2,172,360 Net Receivables 258,652 279,956 324,971 286,595 321,165 339,661 Current Assets (CA) 1,983,818 1,780,528 1,861,815 1,722,531 2,124,674 1,808,048 Property Plant and Equipment 1,693,707 1,837,231 2,485,091 1,770,763 1,828,631 1,706,414 Depreciation 189,405 185,636 176,976 294,928 372,611 451,582 Total Assets (TA) 3,908,162 4,139,804 5,689,567 6,480,754 6,830,157 6,288,682 SGA Expenses 204,390 216,617 223,926 190,418 234,003 202,507 Net Income 914,499 804,451 722,754 402,758 304,324 143,145 Cash Flow from Operations (CFO) 1,166,418 828,875 896,663 528,440 655,546 577,904 Current Liabilities 472,749 805,312 669,151 667,320 815,371 466,661 Long term Debt 840,006 611,976 1,805,295 2,587,174 2,631,658 2,369,659 Working Capital - Cash - Depreciation (245,794) (529,588) (200,341) (455,746) (367,351) (166,276) Variables to Calculate M-Score 2013 2014 2015 2016 2017 DSRI = Day's Sales Receivable Index 0.93 1.02 0.98 1.17 1.05 GMI = Gross Margin Index 0.83 0.91 0.73 0.96 0.89 AQI = Asset Quality Index 1.08 1.35 0.71 1.03 0.93 SGI = Sales Growth Index 1.16 1.14 0.90 0.96 1.01 DEPI = Depreciation Index 0.98 0.95 1.67 1.26 1.21 SGAI = SGA Expenses Index 1.06 1.03 0.85 1.23 0.87 LVGI = Leverage Index 1.02 1.27 1.15 1.00 0.89 Total Accruals/Total Assets -0.128 -0.035 -0.070 -0.054 -0.026 M Score - 8 variable model -3.07 -2.51 -3.12 -2.63 -2.56
Source: Company Data & Team Analysis
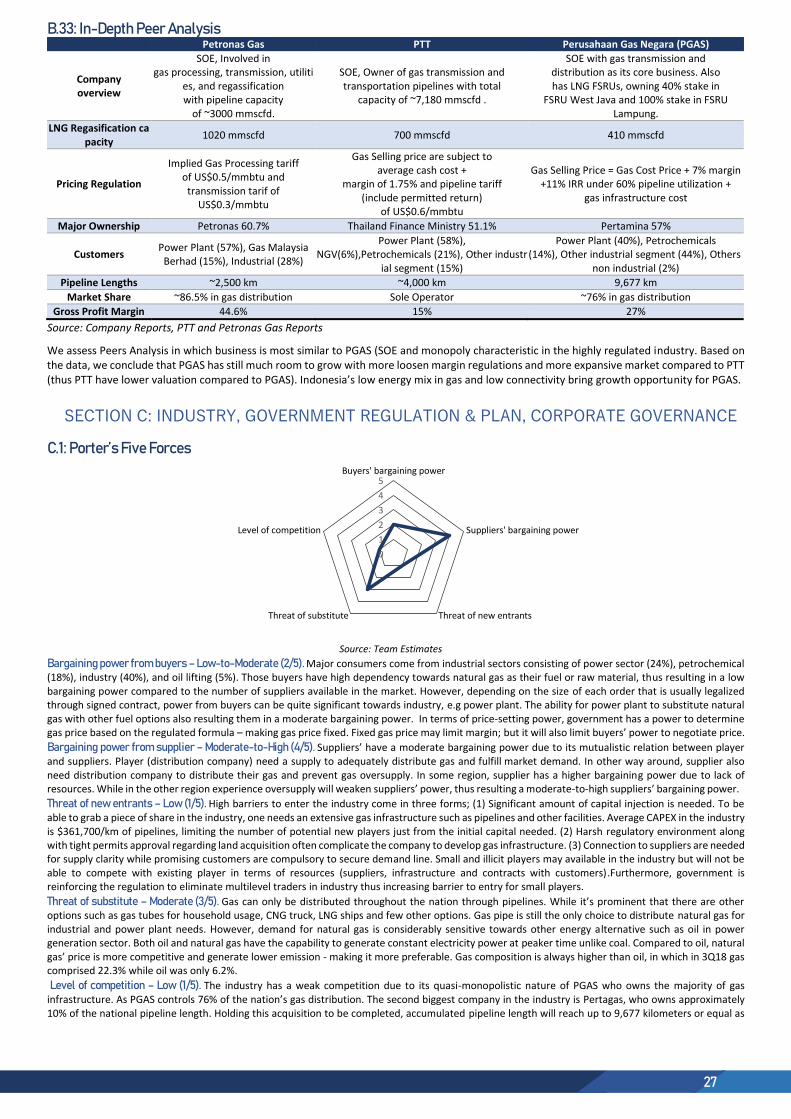
27
B.33: In-Depth Peer Analysis
Petronas Gas PTT Perusahaan Gas Negara (PGAS)
Company overview
SOE, Involved in gas processing, transmission, utiliti
es, and regassification with pipeline capacity
of ~3000 mmscfd.
SOE, Owner of gas transmission and transportation pipelines with total
capacity of ~7,180 mmscfd .
SOE with gas transmission and distribution as its core business. Also has LNG FSRUs, owning 40% stake in
FSRU West Java and 100% stake in FSRU Lampung.
LNG Regasification capacity
1020 mmscfd 700 mmscfd 410 mmscfd
Pricing Regulation
Implied Gas Processing tariff of US$0.5/mmbtu and transmission tarif of
US$0.3/mmbtu
Gas Selling price are subject to average cash cost +
margin of 1.75% and pipeline tariff (include permitted return)
of US$0.6/mmbtu
Gas Selling Price = Gas Cost Price + 7% margin +11% IRR under 60% pipeline utilization +
gas infrastructure cost
Major Ownership Petronas 60.7% Thailand Finance Ministry 51.1% Pertamina 57%
Customers Power Plant (57%), Gas Malaysia
Berhad (15%), Industrial (28%)
Power Plant (58%), NGV(6%),Petrochemicals (21%), Other industr
ial segment (15%)
Power Plant (40%), Petrochemicals (14%), Other industrial segment (44%), Others
non industrial (2%)
Pipeline Lengths ~2,500 km ~4,000 km 9,677 km
Market Share ~86.5% in gas distribution Sole Operator ~76% in gas distribution
Gross Profit Margin 44.6% 15% 27%
Source: Company Reports, PTT and Petronas Gas Reports
We assess Peers Analysis in which business is most similar to PGAS (SOE and monopoly characteristic in the highly regulated industry. Based on the data, we conclude that PGAS has still much room to grow with more loosen margin regulations and more expansive market compared to PTT (thus PTT have lower valuation compared to PGAS). Indonesia’s low energy mix in gas and low connectivity bring growth opportunity for PGAS.
SECTION C: INDUSTRY, GOVERNMENT REGULATION & PLAN, CORPORATE GOVERNANCE
C.1: Porter’s Five Forces
Source: Team Estimates
Bargaining power from buyers – Low-to-Moderate (2/5). Major consumers come from industrial sectors consisting of power sector (24%), petrochemical (18%), industry (40%), and oil lifting (5%). Those buyers have high dependency towards natural gas as their fuel or raw material, thus resulting in a low bargaining power compared to the number of suppliers available in the market. However, depending on the size of each order that is usually legalized through signed contract, power from buyers can be quite significant towards industry, e.g power plant. The ability for power plant to substitute natural gas with other fuel options also resulting them in a moderate bargaining power. In terms of price-setting power, government has a power to determine gas price based on the regulated formula – making gas price fixed. Fixed gas price may limit margin; but it will also limit buyers’ power to negotiate price.
Bargaining power from supplier – Moderate-to-High (4/5). Suppliers’ have a moderate bargaining power due to its mutualistic relation between player and suppliers. Player (distribution company) need a supply to adequately distribute gas and fulfill market demand. In other way around, supplier also need distribution company to distribute their gas and prevent gas oversupply. In some region, supplier has a higher bargaining power due to lack of resources. While in the other region experience oversupply will weaken suppliers’ power, thus resulting a moderate-to-high suppliers’ bargaining power.
Threat of new entrants – Low (1/5). High barriers to enter the industry come in three forms; (1) Significant amount of capital injection is needed. To be able to grab a piece of share in the industry, one needs an extensive gas infrastructure such as pipelines and other facilities. Average CAPEX in the industry is $361,700/km of pipelines, limiting the number of potential new players just from the initial capital needed. (2) Harsh regulatory environment along with tight permits approval regarding land acquisition often complicate the company to develop gas infrastructure. (3) Connection to suppliers are needed for supply clarity while promising customers are compulsory to secure demand line. Small and illicit players may available in the industry but will not be able to compete with existing player in terms of resources (suppliers, infrastructure and contracts with customers).Furthermore, government is reinforcing the regulation to eliminate multilevel traders in industry thus increasing barrier to entry for small players.
Threat of substitute – Moderate (3/5). Gas can only be distributed throughout the nation through pipelines. While it’s prominent that there are other options such as gas tubes for household usage, CNG truck, LNG ships and few other options. Gas pipe is still the only choice to distribute natural gas for industrial and power plant needs. However, demand for natural gas is considerably sensitive towards other energy alternative such as oil in power generation sector. Both oil and natural gas have the capability to generate constant electricity power at peaker time unlike coal. Compared to oil, natural gas’ price is more competitive and generate lower emission - making it more preferable. Gas composition is always higher than oil, in which in 3Q18 gas comprised 22.3% while oil was only 6.2%.
Level of competition – Low (1/5). The industry has a weak competition due to its quasi-monopolistic nature of PGAS who owns the majority of gas infrastructure. As PGAS controls 76% of the nation’s gas distribution. The second biggest company in the industry is Pertagas, who owns approximately 10% of the national pipeline length. Holding this acquisition to be completed, accumulated pipeline length will reach up to 9,677 kilometers or equal as
0
1
2
3
4
5Buyers' bargaining power
Suppliers' bargaining power
Threat of new entrantsThreat of substitute
Level of competition
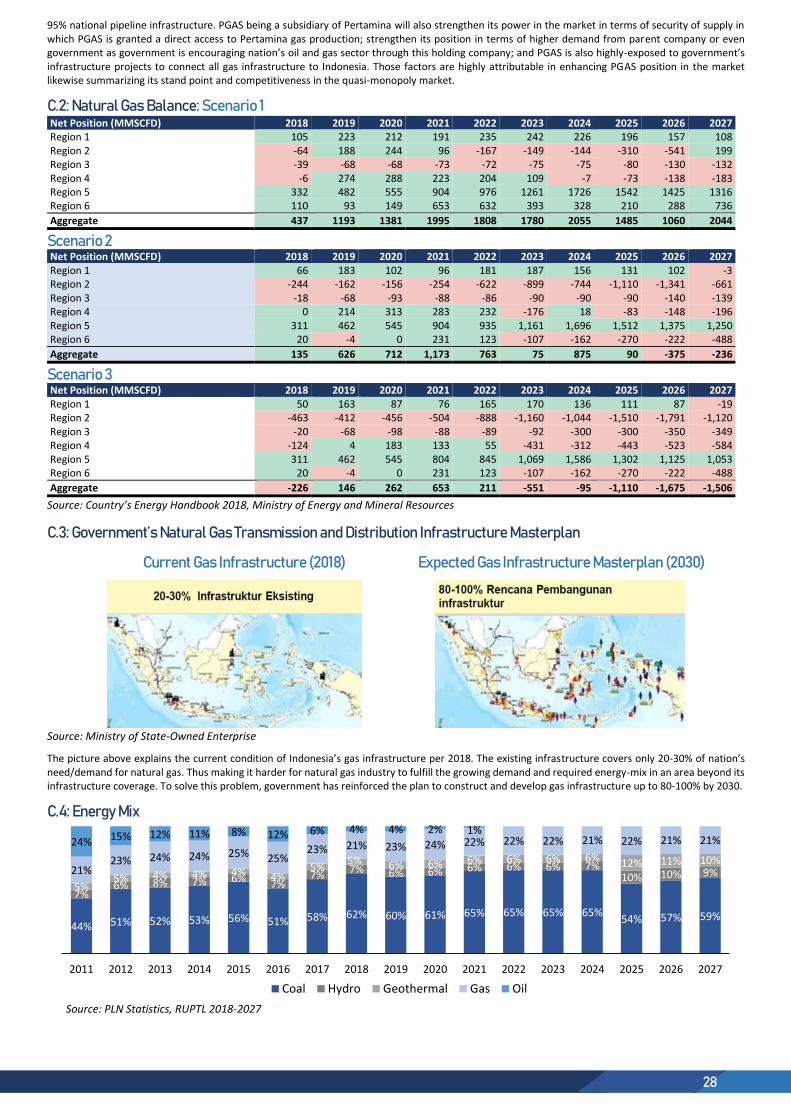
28
95% national pipeline infrastructure. PGAS being a subsidiary of Pertamina will also strengthen its power in the market in terms of security of supply in which PGAS is granted a direct access to Pertamina gas production; strengthen its position in terms of higher demand from parent company or even government as government is encouraging nation’s oil and gas sector through this holding company; and PGAS is also highly-exposed to government’s infrastructure projects to connect all gas infrastructure to Indonesia. Those factors are highly attributable in enhancing PGAS position in the market likewise summarizing its stand point and competitiveness in the quasi-monopoly market.
C.2: Natural Gas Balance: Scenario 1
Net Position (MMSCFD) 2018 2019 2020 2021 2022 2023 2024 2025 2026 2027 Region 1 105 223 212 191 235 242 226 196 157 108 Region 2 -64 188 244 96 -167 -149 -144 -310 -541 199 Region 3 -39 -68 -68 -73 -72 -75 -75 -80 -130 -132 Region 4 -6 274 288 223 204 109 -7 -73 -138 -183 Region 5 332 482 555 904 976 1261 1726 1542 1425 1316 Region 6 110 93 149 653 632 393 328 210 288 736
Aggregate 437 1193 1381 1995 1808 1780 2055 1485 1060 2044
Scenario 2
Net Position (MMSCFD) 2018 2019 2020 2021 2022 2023 2024 2025 2026 2027 Region 1 66 183 102 96 181 187 156 131 102 -3 Region 2 -244 -162 -156 -254 -622 -899 -744 -1,110 -1,341 -661 Region 3 -18 -68 -93 -88 -86 -90 -90 -90 -140 -139 Region 4 0 214 313 283 232 -176 18 -83 -148 -196 Region 5 311 462 545 904 935 1,161 1,696 1,512 1,375 1,250 Region 6 20 -4 0 231 123 -107 -162 -270 -222 -488
Aggregate 135 626 712 1,173 763 75 875 90 -375 -236
Scenario 3 Net Position (MMSCFD) 2018 2019 2020 2021 2022 2023 2024 2025 2026 2027 Region 1 50 163 87 76 165 170 136 111 87 -19 Region 2 -463 -412 -456 -504 -888 -1,160 -1,044 -1,510 -1,791 -1,120 Region 3 -20 -68 -98 -88 -89 -92 -300 -300 -350 -349 Region 4 -124 4 183 133 55 -431 -312 -443 -523 -584 Region 5 311 462 545 804 845 1,069 1,586 1,302 1,125 1,053 Region 6 20 -4 0 231 123 -107 -162 -270 -222 -488
Aggregate -226 146 262 653 211 -551 -95 -1,110 -1,675 -1,506
Source: Country’s Energy Handbook 2018, Ministry of Energy and Mineral Resources
C.3: Government’s Natural Gas Transmission and Distribution Infrastructure Masterplan
Current Gas Infrastructure (2018) Expected Gas Infrastructure Masterplan (2030)
Source: Ministry of State-Owned Enterprise
The picture above explains the current condition of Indonesia’s gas infrastructure per 2018. The existing infrastructure covers only 20-30% of nation’s need/demand for natural gas. Thus making it harder for natural gas industry to fulfill the growing demand and required energy-mix in an area beyond its infrastructure coverage. To solve this problem, government has reinforced the plan to construct and develop gas infrastructure up to 80-100% by 2030.
C.4: Energy Mix
Source: PLN Statistics, RUPTL 2018-2027
44% 51% 52% 53% 56% 51% 58% 62% 60% 61% 65% 65% 65% 65%54% 57% 59%
7%6% 8% 7% 6% 7%
7%7% 6% 6% 6% 6% 6% 7%
10% 10% 9%5%
5% 4% 4% 4% 4%5%
5% 6% 6% 6% 6% 6% 6% 12% 11% 10%21%
23% 24% 24% 25% 25%23% 21% 23% 24% 22% 22% 22% 21% 22% 21% 21%24% 15% 12% 11% 8% 12% 6% 4% 4% 2% 1%
2011 2012 2013 2014 2015 2016 2017 2018 2019 2020 2021 2022 2023 2024 2025 2026 2027
Coal Hydro Geothermal Gas Oil

29
C.5: Indonesia Historical & Upcoming Gas Pricing Policy Issue Date Policy Description
October
2015
Third Economic Policy
Package
Gas price (for gas originating from Indonesia’s new gas fields) is set according to the purchase power of
Fertilizer Industry, which is US$7/MMBTU. The price of gas for other industries (such as petrochemical,
ceramics, etc) will be reduced in accordance with the ability of the ability of their respective industries. Lower
gas prices will come into effect from 1 January 2016.
February
2016
Ministerial Decree of
EDSM No.6/2016
Gas price is determined by considering gas field (upstream) economics, domestic and international gas price as
well as added value of domestic gas usage.
May 2016 Presidential Decree
No.40/2016
7 domestic industries will be allowed to pay a lower gas price. Stipulates lower gas prices by a maximum of
US$2/MMBTU if gas prices are higher than US$6/MMBTU.
June 2016 Decree of ESDM
No.16/2016
Provide supporting regulations for Presidential Decree no.40/2016. It governs gas pricing scheme of 7 specified
strategic industries.
November
2016
Ministerial ESDM
Decree No.40/2016
Government set maximum gas price of $6/MMBTU for 3 specified sectors (steel, fertilizer, and petrochemical)
for direct gas distribution staring January 2017.
February
2017
Minister ESDM Decree
No.434 K/12/MEM
Government will fix maximum gas price in North Sumatra and surrounding areas below US$9/MMBTU by
capping distribution cost below US$1.8/MMBTU.
July 2017 ESDM Regulation
No.45/2017
Power plants can buy natural gas at a maximum price of 14.5% of ICP (Indonesia Crude Price) in US$/MMBTU,
or US$7/MMBTU from domestic suppliers.
July 2017 Minister ESDM Decree
No.5882/12/MEM.M
Allowing ConocoPhillips to increase the selling price of its gas by volume of 27-50 BBTUD from US$2.6/MMBTU
to US$3.5/MMBTU from Gresik block corridor.
December
2017
ESDM Regulation
No.58/2017
Pricing formula for natural gas, i.e gas selling price = gas cost price + gas infrastructure management fee +
trading fee. The gas infrastructure management fee considers a maximum IRR of 11% or 12% applied to the
pipeline business depending on investment in the area. The trading fee is set at a maximum 7% of the gas cost
price. Effective from July 2019.
Source: Company Reports, EDSM, Jakarta Post
C.6: Gas Pricing Formula Ministry of Energy and Mineral Resources (MEMR) Regulation (PERMEN ESDM) No.58/2017
Weighted Average for End Use Price = Cost of Gas + Infrastructure Management Cost + Trading Cost Implementation Infrastructure Management Cost Infrastructure Management Formula Trading Cost
Industry and electricity provider gas price stipulated by MEMR
Prevail for 5 years and open to be evaluated per annum
18 months grace period from date of signatory (Dec 27, 2017)
Toll fee stipulated by regulatory body
Gas distribution setup by: IRR 11%, 60% utilization/gas allocation and project economics
Liquefaction
Compression
Regasification
LNG/CNG storage and transpotation
= Cost of Service/Volume Cost of service are:
Asset value
Operational and maintenance
General and administrative
Gas losses
Insurance
Fee, Tax and levy
Maximum 7% of cost of gas
The maximum percentage should be share B2B in extended supply chain
Source: Company Presentation 2018
C.7: Major Upcoming Pipeline Project in Short-Term Projects Value Commercialization Date
Gresik-Semarang Transmission Pipeline US$221 mn July 2019 Grissik Gas Pipeline US$118 mn February 2019 Duri-Dumai Gas Pipeline US$62 mn February 2019 Gresik Semarang-Pipeline US$179 mn July2019 Regasification Pertagas US$340 mn July 2019 Total US$920 mn
Source: SKK Migas
C.8: Changes in Company’s Board Composition Commissioners As of Dec 31, 2017 As of 9M18 Directors As of Dec 31, 2017 As of 9M18
President commissioners Fajar Sampurno IGN Wiratmaja Puja President director Jobi Triananda Gigih Prakoso Commissioners Hendrika Sinaga Hambra Finance Nusantara Suyono Said Reza Pahlevi
Commissioners Mohamad Ikhsan Mohamad Ikhsan Infrastructure & technology
Dilo Seno Widagdo Dilo Seno Widagdo
Commissioners IGN Wiratmaja Puja - Strategy & business development
Nusantara Suyono -
Independent commissioners Paiman Raharjo Paiman Raharjo Commercial Danny Praditya Danny Praditya Independent commissioners Kiswodarmawan Kiswodarmawan HC & general service Desima Equalita Desima Equalita
Source: Company Report, Team Assessment
30
C.9: PGAS Newly Appointed Key Management Overview Board of
Commissioners Title Career History in PGAS Description
IGN Wiratmaja Puja, 54
President commissioner
President Commissioner, April 2018
Commissioner, Apr 2015 – Apr 2018
Nomination & Remuneration member, Jan 2017 – Apr 2018
He is promoted as President Commissioner of PGAS in 2018 GMS replacing Fajar Harry Sampurno. Previously served as commissioner in the company for three years. He has close relation with former major shareholder of PGAS, Republic of Indonesia through his position as Head of Human Resource Development Agency, Ministry of Energy and Mineral Resources (MEMR). He also has experience as Director General of Oil and Gas in MEMR until August 2017. Highly experience in the industry of oil and gas, Mr Wiratmaja is believed to have the ability to bring the company higher completed with his background as a graduate from Institut Teknologi Bandung & doctorate from University of Kentucky
Hambra, 50 Commissioner Commissioner since April 2018
Hambra is appointed as commissioner of the company though 2018 GMS in April. He is replacing Mrs. Hendrika Nora Osloi Sinaga. Previously he serves as Deputy of Infrastructure Business in Ministry of State-Owned Enterprise. He was a part of Ministry of SOE, along with his background as a doctorate in Universitas Gadjah Mada.
Board of Directors
Title Career History in PGAS Description
Gigih Prakoso President Director
President Director since September 2018
Director of Strategy and Business Development from May 2017 - August 2017
Mr. Gigih Prakoso was appointed as President Director of the company per September 2018 through Extraordinary General Meeting of Shareholder (EGMS). It is a direct order from the holder of Series A Dwiwarna that is entitled with voting right. The appointment aims to strengthen the upcoming corporate action to acquire Pertagas, a subsidiary of Pertamina align with Mr. Gigih previous experience as Director of Investment Planning and Risk Management of Pertamina from August 2017 until September 2018. Prior to its position as one of director in Pertamina, Mr. Gigih served as PGAS’s Director of Strategy and Business Development for four months before the decree from Ministry of SOE moved him to another SOE. Appointment of Mr. Gigih reflects company’s determination in the upcoming integration Pertamina-PGAS-Pertagas as it will be the main key in determining company’s future.
Said Reza Pahlevi
Director of Finance
Director of Finance since April 2015
Mr. Said Reza Pahlevi was appointed as Director of Finance along with appointment of Mr. Gigih Prakoso in 2018 EGMS. His recent experience was Director of Administration and Finance in PT Pertamina Patra Niaga, a subsidiary of Pertamina managing downstream oil and gas business of the company. Supported by his competence in the industry along with experience and knowledge from the previous position will support PGAS performance further and smooth the acquisition transaction.
Source: Company Reports, Team Estimates
REFERENCES
Pages.stern.nyu.edu, (2019). Country Default Spreads and Risk Premiums. [online] Available at: http://pages.stern.nyu.edu/~adamodar/New_Home_Page/datafile/ctryprem.htm [Accessed 4 Feb. 2019]. Handbook of Energi and Economy [online]. Available at: https://www.esdm.go.id/id/publikasi/handbook-of-energy-and-economic [Accessed 20 November 2018]. PLN, RUPTL 2018 [online]. Available at: https://www.esdm.go.id/assets/media/content/content-ringkasan-ruptl-2018-2027.pdf [Accessed 21 November 2018]. PLN, PLN Statistics 2017 [online]. Available at: https://www.pln.co.id/statics/uploads/2018/07/PLN-Statistics-2017-English.pdf [Accessed 21 November 2018]. IRENA, Renewable Energy Prospects: Indonesia [online]. Available at: https://www.irena.org/-/media/IRENA/Agency/Publication/2017/Mar/IRENA_REmap_Indonesia_report_2017.pdf [Accessed 8 February 2018]. PGN Annual Report 2013- 2017 [online]. Available at: http://ir.pgn.co.id/. [Accessed 13 January 2019] Pertagas Annual Report 2013-2017 [online]. Available at: http://www.pertagas.pertamina.com/investors-information. [Accessed 15 January 2019] PGN Business Presentation FY-2013 Update [30 May 2014] PGN Business Presentation FY-2014 Update [05 Mar. 2015] PGN Business Presentation FY-2015 Update [17 Mar. 2016] PGN Business Presentation 12M-2016 [17 Mar. 2017] PGN Business Presentation 12M-2017 [09 Mar. 2018] PGAS Business Update & Prospect [06 Dec. 2018] PGAS Investor Analyst Meeting [11 Jan. 2019] Natural Gas Balance Ministry of Energi and Mineral Resources, (2018). Neraca Gas Bumi Indonesia 2018-2027. [Accessed on 18 January 2019] Master Plan Network of Natural Gas and Transmission [online]. Available at: http://www.bphmigas.go.id/en/master-plan-map-network-of-natural-gas-transmission-and-distribution [Accessed on 21 January 2019] Indonesia Oil and Gas Lifting.(online).Available at: http://lifting.migas.esdm.go.id/lifting/.[Accessed on 22 January 2019] Investment and Taxation Guide Oil and Gas in Indonesia [2018]. Available at: https://www.pwc.com/id/en/energy-utilities-mining/assets/oil-and-gas/oil-and-gas-guide-2018.pdf [Accessed on 24 January 2019] NYMEX WTI $/ BBL. Forecast (Median) of Contributor Composite. Bloomberg Ministry of SOE, Holding BUMN Migas [online]. Available at: https://www.docdroid.net/8dDqWh2/paparan-kbumn-holding-bumn-pwyp.pdf [Accessed on 15 Feb. 2019]