CFA Institute Research Challenge
26
CFA Institute Research Challenge hosted By CFA Society India TEAM NAME: Indian Institute of Management, Trichy (India) The CFA Institute Research Challenge is a global competition that tests the equity research and valuation, investment report writing, and presentation skills of university students. The following report was submitted by a team of university students as part of this annual educational initiative and should not be considered a professional report. Disclosures: Ownership and material conflicts of interest The author(s), or a member of their household, of this report does not hold a financial interest in the securities of this company. The author(s), or a member of their household, of this report does not know of the existence of any conflicts of interest that might bias the content or publication of this report. Receipt of compensation Compensation of the author(s) of this report is not based on investment banking revenue. Position as an officer or a director The author(s), or a member of their household, does not serve as an officer, director, or advisory board member of the subject company. Market making The author(s) does not act as a market maker in the subject company’s securities. Disclaimer The information set forth herein has been obtained or derived from sources generally available to the public and believed by the author(s) to be reliable, but the author(s) does not make any representation or warranty, express or implied, as to its accuracy or completeness. The information is not intended to be used as the basis of any investment decisions by any person or entity. This information does not constitute investment advice, nor is it an offer or a solicitation of an offer to buy or sell any security. This report should not be considered to be a recommendation by any individual affiliated with CFA Society India, CFA Institute, or the CFA Institute Research Challenge with regard to this company’s stock.
-
Upload
khangminh22 -
Category
Documents
-
view
1 -
download
0
Transcript of CFA Institute Research Challenge
1
CFA Institute Research Challenge
hosted By
Local Challenge (e.g., CFA Society India)
TEAM NAME: STRIGES
The CFA Institute Research Challenge is a global competition that tests the equity research and valuation, investment report writing, and presentation skills of university students. The following report was submitted by a team of university students as part of this annual educational initiative and should not be considered a professional report.
Disclosures: Ownership and material conflicts of interest The author(s), or a member of their household, of this report does not hold a financial interest in the securities of this company. The
author(s), or a member of their household, of this report does not know of the existence of any conflicts of interest that might bias the
content or publication of this report. Receipt of compensation Compensation of the author(s) of this report is not based on investment banking revenue. Position as an officer or a director The author(s), or a member of their household, does not serve as an officer, director, or advisory board member of the subject company. Market making The author(s) does not act as a market maker in the subject company’s securities. Disclaimer The information set forth herein has been obtained or derived from sources generally available to the public and believed by the
author(s) to be reliable, but the author(s) does not make any representation or warranty, express or implied, as to its accuracy or
completeness. The information is not intended to be used as the basis of any investment decisions by any person or entity. This
information does not constitute investment advice, nor is it an offer or a solicitation of an offer to buy or sell any security. This report
should not be considered to be a recommendation by any individual affiliated with CFA Society India, CFA Institute, or the CFA
Institute Research Challenge with regard to this company’s stock.
CFA Institute Research Challenge
hosted By
CFA Society India
TEAM NAME: Indian Institute of Management, Trichy (India)
The CFA Institute Research Challenge is a global competition that tests the equity research and valuation, investment report writing, and presentation skills of university students. The following report was submitted by a team of university students as part of this annual educational initiative and should not be considered a professional report.
Disclosures: Ownership and material conflicts of interest The author(s), or a member of their household, of this report does not hold a financial interest in the securities of this company. The
author(s), or a member of their household, of this report does not know of the existence of any conflicts of interest that might bias the content
or publication of this report. Receipt of compensation Compensation of the author(s) of this report is not based on investment banking revenue. Position as an officer or a director The author(s), or a member of their household, does not serve as an officer, director, or advisory board member of the subject company. Market making The author(s) does not act as a market maker in the subject company’s securities. Disclaimer The information set forth herein has been obtained or derived from sources generally available to the public and believed by the author(s)
to be reliable, but the author(s) does not make any representation or warranty, express or implied, as to its accuracy or completeness. The
information is not intended to be used as the basis of any investment decisions by any person or entity. This information does not
constitute investment advice, nor is it an offer or a solicitation of an offer to buy or sell any security. This report should not be considered to
be a recommendation by any individual affiliated with CFA Society India, CFA Institute, or the CFA Institute Research Challenge with regard to this company’s stock.

2
HERO MOTOCORP LTD.
INVESTMENT SUMMARY We issue a BUY recommendation on Hero Motocorp Ltd. with a 12-month target price of
₹ 4417.03 per common share with a projected upside of 17.94% from its 20th October,
2017 closing price of ₹3745. Our target price is calculated based on Discounted Cash-flow
and forward Earnings and EBITDA multiples approach. We have taken average of valuation
from DCF and each of the multiples to arrive at the target price of the stock. The key drivers
for our recommendations are:
INVESTMENT THESIS
RURAL DEMAND TO DRIVE GROWTH: Rural demand is projected to increase due to
increased government focus on rural economy, improving rural road infrastructure and
increased financial penetration. Hero MotoCorp (HMCL) being the dominant player in rural
market is poised to reap benefits from this development.
FOCUS ON TAPPING POTENTIAL MARKETS OVERSEAS: HMCL has ramped up exports to
35+ countries and are strategically expanding their global presence in Asia, Africa, Middle
East and the Americas. Plants like the one in Colombia provide them with opportunities to
further tap exports to potential markets such as U.S. and Mexico.
FOCUS ON DEVELOPING ROBUST OPERATIONS: With the LEAP program, HMCL has been
able to reduce costs significantly. Annual cost reduction through LEAP program was ₹ 1,690
5100
3797
1000
1500
2000
2500
3000
3500
4000
4500
5000
5500 Share Price
Sector: Automobiles
Industry: Two wheeler
Exchange: BSE
Current Price (as of 20th Oct): ₹3745
Target Price (1Year Forward): ₹4417
Upside: 17.94%
Company Name: Hero Motocorp
Ticker: HEROMOTOCO
Recommendation: BUY
1208
14811599 1625 1672 1739
2012 2013 2014 2015 2016 2017
Fig Average MSP Year Wise Trend (INR)
34.6%
38.4%
15.2%
6.4%4.3% 1.2%
Fig Shareholding PatternPROMOTER &PROMOTERGROUP
FPIs
DIIs
RETAIL
FIIs
4419
Source: Bloomberg, Student Research
Source: Bloomberg, Student Research
Source: Bloomberg, Student Research
Source: Economic survey of India, Student Research
Source: Bloomberg, Student Research
Source: Student Research
CLOSING PRICE 3745 MARKET CAP (Mn) 747,800 AVG. DAILY VOL 350,000 52 WEEK HIGH/LOW 2,849/4,091 BETA 1.09
STOCK PROFILE (INR)
FY18P FY19P FY20P FY21P FY22P
38% 39% 41% 39% 41%
53,767.3 62,208.1 76,538.7 81,251.4 99,420.5
15.54% 16.35% 17.76% 16.06% 17.92%
38,165.4 43,636.8 53,477.2 56,130.6 68,586.5
10.88% 11.33% 12.27% 10.99% 12.25%
191.12 218.52 267.79 281.08 343.45
38% 35% 36% 32% 33% ROE
Gross Margin
Key Financials
EBITDA (INR Million)
EBITDA Margin
PAT (INR Million)
PAT Margin
EPS
Valuation Method Value Weight
DCF 4005.94 33.33%
EV/EBITDA 5015.87 33.33%
P/E 4229.28 33.33% Equity Value Per Share 4417 Upside 17.94%
Dividend 95.56 Total Return 20.5%
Valuation Date 20-10-2017

3
million in FY14, 3,290 million in FY15 and ₹ 2,830 million in FY16. Continued improvement
in operational efficiency will support Hero Motocorp’s margins going forward.
AGGRESSIVE PRODUCT LAUNCHES: HMCL is coming up with innovative product launches.
They are planning to launch HX250R in Feb 2018 and Xtreme 200S in December 2017, both
of which are promising launches to gain ground in premium segment. In scooter segment,
Hero is planning to launch LEAP hybrid SES in early 2018 which is an innovative
breakthrough and has great potential is scooter segment
INVESTMENT RISKS
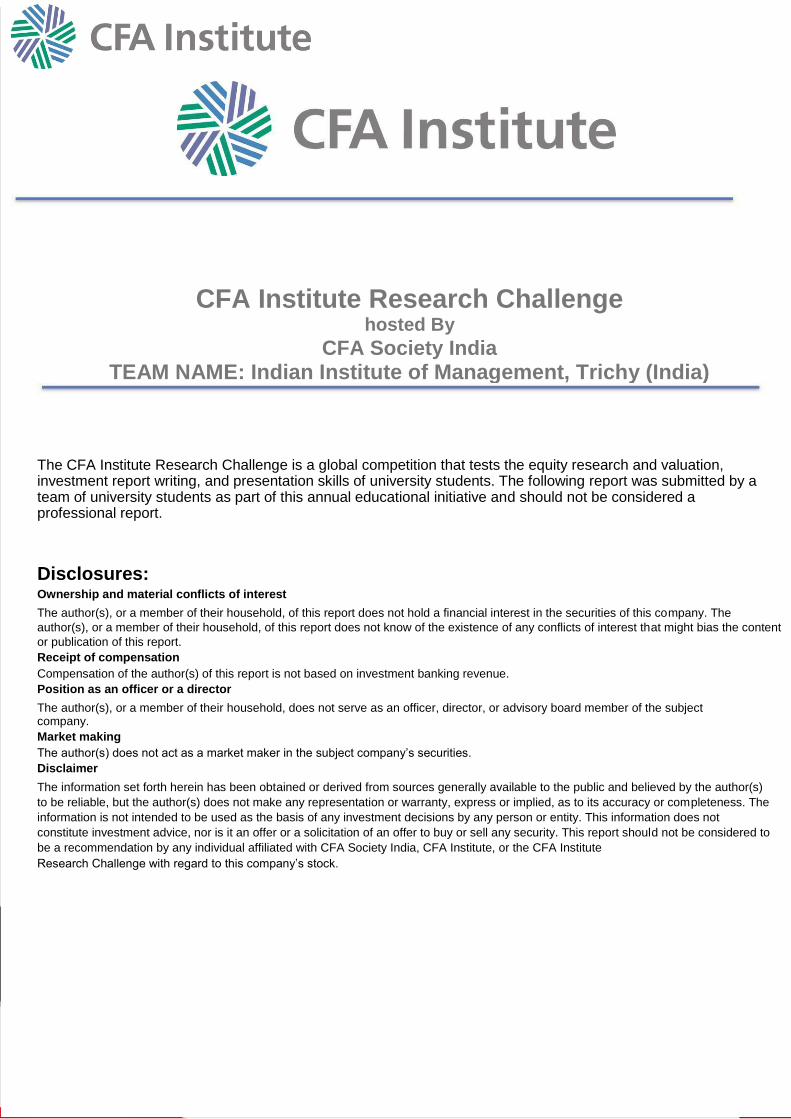
SHIFT TOWARDS PREMIUM SEGMENT: Share of executive segment is declining, whereas,
premium segment is on rise. This trend will lead to reduction in market share as HMCL
holds 70% of the market in executive segment.
POLITICAL INSTABILITY IN THEIR EXPORT MARKETS: The markets of Latin America are
going through a period of unstable political environment which can hurt their economy in
short term. This may translate into lower sales of HMCL from these regions. If these
markets further weaken, then HMCL won’t be able to deliver high growth in exports
segment in short term.
MACROECONOMIC OVERVIEW GLOBAL OVERVIEW After a long period of volatility, we now are witnessing a relatively stable global economy.
As per IMF, global growth is expected to rise to 3.7% in 2017. Developed economies like US
and Europe have shown some momentum in their growth. On the other hand, emerging
markets like China and India have shown increased domestic demands. Below are the
global growth patterns:
LATIN AMERICA: Economy of Latin America fell by 0.7% in 2016. Strong exports and revival in demand allowed the economy to return to positive growth in first quarter of 2017 after eight quarters of decline. Argentina has also shown some positive signs. All these indicators suggest that GDP growth can pick up to 1.5% in 2017 and to 2.5% in 2018.
SUB-SAHARAN AFRICA: Growth in sub-Saharan African countries remains volatile with regional growth touching 1.4%, lowest in past twenty years. With decrease in the price of crude in international markets, almost all of the oil exporting countries are in recession. However, a slight recovery of up to 2.6% is expected in the current year. As the commodity prices will rebalance, an accelerated growth of up to 3.5% can be expected in 2018.
INDIAN ECONOMY
India is one of the fastest growing economies with a GDP growth of 7.1% in 2016-17.
However, recent events like demonetisation have resulted in a dip in growth but the
economy has started gaining momentum. Domestic demand is increasing and structural
changes like GST implementation are expected to boost growths in long term. Also, the
phase of political stability has resulted in increased confidence amongst the businesses in
India. Overall future prospects appear to be optimistic.
Manufacturing sector has seen growth in past year owing to make in India, infrastructural
development and policy reforms.
INDUSTRY OVERVIEW AND COMPETITIVE POSITIONING:
Two-wheeler industry in India highly consolidated with an estimated market size of ~ ₹ 848
billion. Total domestic sales volume for FY17 stood at ~ 17.6 million units registering a
growth of 5.8% as compared to the previous year. It is expected to grow at a rate of 8%
over next three years [1]. Factors that will contribute to the growth are better monsoon
leading to increased crop output, lagging effect of seventh pay commission payouts, model
launches at competitive prices and enhanced reach of dealership network. Lately, the
industry has witnessed some headwinds because of demonetisation and shift from BS III to
BS IV emission norms which created liquidity crunch on demand side and cost pressure on
supply side respectively.
15.716.9
18.5 18.819.9
0.0
5.0
10.0
15.0
20.0
25.0
0.0%
2.0%
4.0%
6.0%
8.0%
10.0%
2012-13 2013-14 2014-15 2015-16 2016-17
Fig 2W Production Annual Growth
Two Wheeler Production Y-o-Y growth GDP growth
Millions
3.53.6
3.4
3.2
3.63.7 3.7
2.9
3
3.1
3.2
3.3
3.4
3.5
3.6
3.7
3.8
2013 2014 2015 2016 2017 2018 E 2019 E
Fig Real GDP growth - World (in %)
103.3106.8
111.1114.9
120.6
90
95
100
105
110
115
120
125
2013 2014 2015 2016 2017
Fig IIP Index(Base Year 2011-12)
109.4 105.896.2
49.940.6
49.8
0.0
20.0
40.0
60.0
80.0
100.0
120.0
2012 2013 2014 2015 2016 2017
Fig Crude Oil Prices(in USD)
24.2 25.3
36.3 36.4
47.4 48.8
2013 2014 2015 2016 2017 2018P
Fig Rural Road Construction(in 000' Kms)
Source: Ministry of Rural Development, Student Research
Source: IMF, Student Research
Source: www.statista.com, Student Research
Source: Ministry of Statistics and Program Implementation
4
SEGMENT WISE SCENARIO: Industry can be divided into three segments – Motorcycle, Scooter & Moped. Motorcycle sales continue to dominate the industry though its share has gradually dropped from 76% in 2010-11 to 63% in 2016-17, whereas share of scooters has consistently increased from 17.5% to 31.6% in the same period [2]. Share of mopeds has more or less remained constant at around 5%. Hero MotoCorp is currently leading the motorcycle segment, whereas Honda is the leader in scooter segment. Moped segment is dominated by TVS Motors.
MOTORCYCLE SEGMENT: Motorcycle segment is further sub-divided into Economy (100-110 CC), Executive (110-125 CC) and Premium (150+ CC) segments. The segment mix is witnessing a change due to higher than industry growth of premium and economy segments and de-growth of executive segment. We expect that premium segment will retain this traction due to increasing urbanisation, enhanced disposable income levels leading to shift in consumer preferences towards aspirational products. Currently, rural sales account for 46% - 48% of total motorcycle sales [data source]. As a result, growth in this segment is highly dependent on monsoon, rural income and development of rural infrastructure.
SCOOTER SEGMENT: Scooter sales continued to witness higher growth in the industry growing at 16.9% CAGR as compared to 5.5% CAGR of two-wheeler industry. We expect demand for ungeared vehicles to rise due to narrowing mileage gap between motorcycles and scooters, increased participation of women in the workforce, launch of new models at competitive prices and aggressive gender-neutral positioning. The improvement in infrastructure in Tier II and Tier III cities will further thrust its sales. HMSI is a market leader in this segment with ~57% market share, followed by TVS at 14.7% and HMCL at 14.1%.
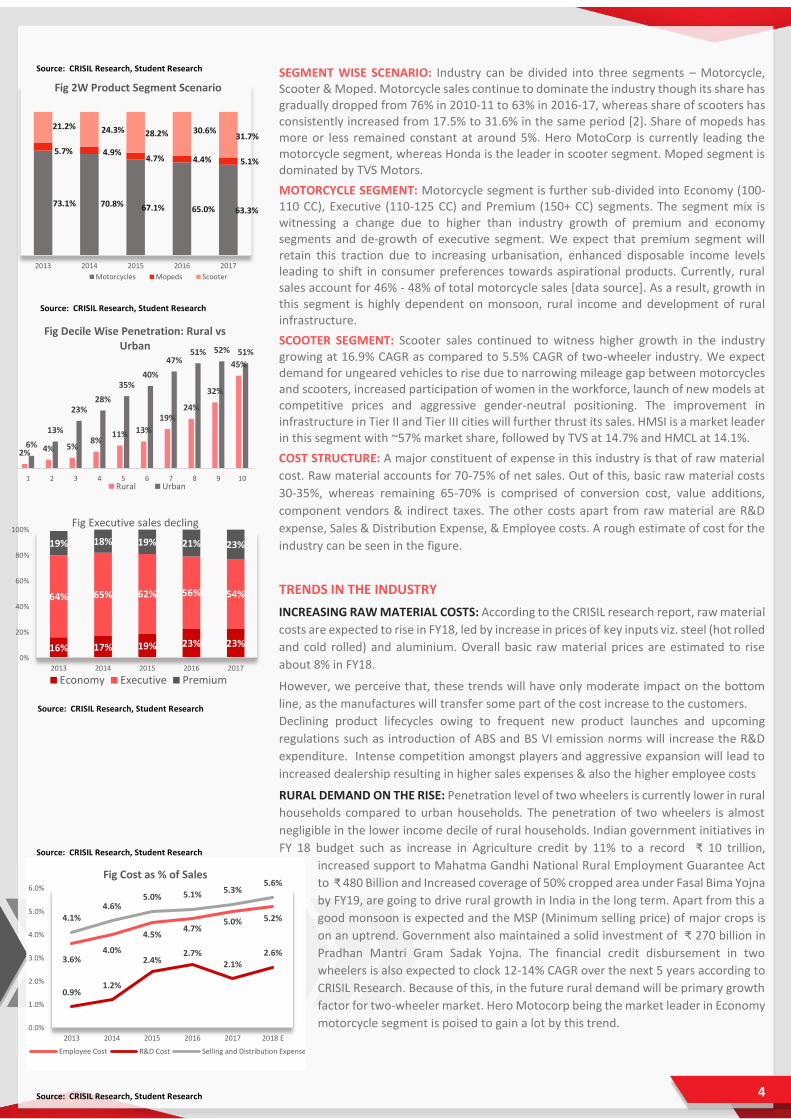
COST STRUCTURE: A major constituent of expense in this industry is that of raw material
cost. Raw material accounts for 70-75% of net sales. Out of this, basic raw material costs
30-35%, whereas remaining 65-70% is comprised of conversion cost, value additions,
component vendors & indirect taxes. The other costs apart from raw material are R&D
expense, Sales & Distribution Expense, & Employee costs. A rough estimate of cost for the
industry can be seen in the figure.
TRENDS IN THE INDUSTRY
INCREASING RAW MATERIAL COSTS: According to the CRISIL research report, raw material
costs are expected to rise in FY18, led by increase in prices of key inputs viz. steel (hot rolled
and cold rolled) and aluminium. Overall basic raw material prices are estimated to rise
about 8% in FY18.
However, we perceive that, these trends will have only moderate impact on the bottom
line, as the manufactures will transfer some part of the cost increase to the customers.
Declining product lifecycles owing to frequent new product launches and upcoming
regulations such as introduction of ABS and BS VI emission norms will increase the R&D
expenditure. Intense competition amongst players and aggressive expansion will lead to
increased dealership resulting in higher sales expenses & also the higher employee costs
RURAL DEMAND ON THE RISE: Penetration level of two wheelers is currently lower in rural
households compared to urban households. The penetration of two wheelers is almost
negligible in the lower income decile of rural households. Indian government initiatives in
FY 18 budget such as increase in Agriculture credit by 11% to a record ₹ 10 trillion,
increased support to Mahatma Gandhi National Rural Employment Guarantee Act
to ₹ 480 Billion and Increased coverage of 50% cropped area under Fasal Bima Yojna
by FY19, are going to drive rural growth in India in the long term. Apart from this a
good monsoon is expected and the MSP (Minimum selling price) of major crops is
on an uptrend. Government also maintained a solid investment of ₹ 270 billion in
Pradhan Mantri Gram Sadak Yojna. The financial credit disbursement in two
wheelers is also expected to clock 12-14% CAGR over the next 5 years according to
CRISIL Research. Because of this, in the future rural demand will be primary growth
factor for two-wheeler market. Hero Motocorp being the market leader in Economy
motorcycle segment is poised to gain a lot by this trend.
73.1% 70.8% 67.1% 65.0% 63.3%
5.7% 4.9%4.7% 4.4% 5.1%
21.2% 24.3% 28.2% 30.6%31.7%
2013 2014 2015 2016 2017
Fig 2W Product Segment Scenario
Motorcycles Mopeds Scooter
3.6%4.0%
4.5%4.7%
5.0% 5.2%
0.9%1.2%
2.4%2.7%
2.1%
2.6%
4.1%
4.6%5.0% 5.1%
5.3%5.6%
0.0%
1.0%
2.0%
3.0%
4.0%
5.0%
6.0%
2013 2014 2015 2016 2017 2018 E
Fig Cost as % of Sales
Employee Cost R&D Cost Selling and Distribution Expense
16% 17% 19% 23% 23%
64% 65% 62% 56% 54%
19% 18% 19% 21% 23%
0%
20%
40%
60%
80%
100%
2013 2014 2015 2016 2017
Fig Executive sales decling
Economy Executive Premium
2% 4% 5%8%
11% 13%
19%24%
32%
45%
6%
13%
23%28%
35%40%
47%51% 52% 51%
1 2 3 4 5 6 7 8 9 10
Fig Decile Wise Penetration: Rural vs Urban
Rural Urban
Source: CRISIL Research, Student Research
Source: CRISIL Research, Student Research
Source: CRISIL Research, Student Research
Source: CRISIL Research, Student Research
Source: CRISIL Research, Student Research

5
• Increase in minimum support price
• Improvement in rural road infrastructure
• Increased financial penetration in rural two-wheeler market.
AGGRESSIVE EXPANSION OF DEALERSHIP NETWORK: Players in the two-wheeler industry are currently looking to expand their dealership network in tier 2 and tier 3 locations to tap the rural demand. Currently, Hero MotoCorp has the advantage in terms of reach through dealership network. Hero currently has 1000+ dealers with 6000+ touchpoints all over India. The second highest in terms of dealers is Bajaj Auto with a dealer network of 675. With aggressive dealership expansion strategy in mind Hero is poised to gain market share in the wake of Rural demand growth.
EASING INFLATION AND HIGHER REAL INCOME: GDP growth in India has been consistently higher compared to CPI Index due to this the real purchasing power of consumers is increasing which will support the growth of Automobile sector.
COMPETITIVE POSITIONING
Two - wheeler is a highly concentrated industry with four major players 7. market. This industry is characterized by strong rivalry and significant capital requirement. The existing players enjoy incumbency advantage independent of their size based on the brand value they have built over the years. They also enjoy supply side economies of scale based on their size, making it difficult for a newer and smaller player to compete in this business.
HMCL is undisputed market leader in Economy and Executive
segments with 55% and 70% market share respectively. On
the supply side HMCL has strong bargaining power with its vendors, it can be seen from
the fact that the company enjoys negative working capital cycle. Hero has a strong brand
name associated with trust and strong presence in rural India with robust distribution
network adds strength to its foundation. Hero has a relatively lower cost of operations as
compared to its competitor which they have achieved through challenging the status quo
and continuous improvement in the existing processes.
BUSINESS DESCRIPTION
Hero MotoCorp is the largest two-wheeler manufacturer in the world with headquarters in New Delhi, India. HMCL was incorporated in year 1984 as a joint venture between Hero Group & Honda Motor. As per the JV agreement, Honda provided technical support for which Hero paid royalty to Honda. However, both of them decided to end the JV in 2010 & Honda exited the JV by selling their entire stake to Hero group.
Legacy of 33 years has helped HMCL to achieve leadership position in economy and
executive segment with strong presence in rural India. HMCL has also expanded its market
to 35 countries across, Asia, Africa and Latin America. It has made strategic investments in
Colombia and Bangladesh to tap the potential markets. HMCL is strategically sponsoring
major sports events across the globe to develop potential markets through increase in the
brand recall.
COMPANY STRATEGY:
EXPLORING NEW GROWTH MARKETS: HMCL is continuously expanding its global footprint. With the entry in Nigerian and Argentinian markets in the last fiscal HMCL has spread its global reach to 35 countries across Asia, Africa and Latin America. They have planned to increase this network to 50 countries by 2020. To pursue the global endeavours, HMCL is looking forward to commence its operation at the manufacturing facility in Bangladesh in FY 2017-18. This expansion will tap the growing demand of Bangladesh. HMCL has planned to increase the capacity of its Colombia plant to 1.5 Million. This plant is strategically placed to act as a selling hub to Andean countries and it will also help them in expanding their footprints to the U.S. and Mexico.
14.2%
23.2%24.9%
11.8% 11.3%
2.9%
7.3% 7.9%
3.0%
6.9%
0.1%
3.9%2.3%
-0.2%
3.7%
2013 2014 2015 2016 2017
Fig Industry Growth Pattern
Growth in Scooters Growth in Two wheeler industry
Growth in Motorcycles
Rivalry
-30.00
-25.00
-20.00
-15.00
-10.00
-5.00
0.00
5.00
10.00
15.00
20.00
2013 2014 2015 2016 2017
Fig Effective Working Capital Management
Cash Conversion Cycles Days Inventory Outstanding
Source: Student Research
Source: Student Research
Source: CRISIL Research, Student Research

6
CONTINUOUS IMPROVEMENT IN OPERATIONAL EFFICIENCY: HMCL has consistently pruned its costs through effective inventory management and thus reducing the working capital requirements. HMCL has also outsourced logistics services which is helping in optimising the loads transported per truck. LEAP project initiated in FY14 helped HMCL to improve their gross margins by enabling design optimisation and cost optimisation across logistics and operations.
SUSTAINED ENVIRONMENT IN R&D, CAPEX AND BRAND BUILDING ACTIVITIES: HMCL commissioned global centre of innovation and technology in FY 16 by investing ₹ 850 million with an aim to provide impetus in R&D. The facility helped them to design and develop new models such as “Achiever 150”, “Splendor iSMART”. On the similar lines the company has deployed ₹ 2.5 billion to expand its manufacturing capacity and for push towards digitisation. To improve its global reach and brand recall, HMCL is strategically sponsoring major sports events across the globe. This will act as a launch platform to enter in new markets.
BUILDING ROBUST PORTFOLIO IN PREMIUM AND SCOOTER SEGMENT: HMCL has planned to launch new products in scooter and premium motorcycle segment with a view to align their product line to the changing customer demand. Planned launches in scooter segment (viz. Leap, Dare, and Duet) and in premium segment (viz. HX250rR, Hastur and Xtreme 200S) are positioned to target specific customer segment. HMCL is expecting to regain their lost market share with the new product launches.
AGGRESSIVELY EXPANDING CUSTOMER REACH: HMCL has consistently expanded its sales and service network. Currently they have over 6000 touch points along with 1000 plus dealership network.
STRATEGIC INVESTMENT IN ELECTRIC VEHICLES: HMCL made an investment of ₹1805 million for 30% stake in Ather Energy to keep themselves future ready for the emerging
disruption in the automotive sector. CAPACITY: HMCL currently operates with six manufacturing facilities at Gurgaon (2.1 Mn units), Dharuhera (2.1 Mn units), Haridwar (2.7 Mn units), Neemrana (1.1 Mn units), Vadodara (1.2 Mn units) and Colombia (.08 units). Vadodara plant has started its operation in 2017 in a phased manner and once fully ramped up its total capacity will be 1.2 Mn units. HMCL’s Colombia plant is strategically placed to cater the needs of Andean countries. HMCL along with ‘Nitol Niloy Group’ has installed a manufacturing facility at Bangladesh (1.5 Mn units) which will start its commercial operation in the year end. The Company has also acquired land in Andhra Pradesh for its seventh plant which is expected to produce 0.5 Mn units by 2018.
CORPORATE GOVERNANCE
The organization has seen a sea of changes in terms of internal restructuring to undertake corporate governance with various independent bodies like Audit, Risk management & stakeholder’s relationship committee. There is a code of conduct for governance defining duties of independent directors, guidelines, corporate business opportunities, roadmap for conflicts of interest removal, fair dealing, insider trading handling & many such issues. The company also has external auditors in the form of statutory, Cost & secretarial auditors. The auditor’s report received no adverse remarks for the year 2017 highlighting the standards of the company. We have used the Institutional shareholder services methodology to identify and assess the risk in corporate governance structure in Hero MotoCorp and we have rated them accordingly.
CORPORATE MANAGEMENT: The company has a variety of board members having rich experience in different domains. Under the leadership of Mr. Pawan Munjal, Hero has become the world’s no. 1 two-wheeler brand (in volume sales). The Board has a mix of representation from automobile, supply chain, manufacturing, project management & legal. Company follows the practice of a yearly review of the performance of board members & new members are elected in a tenure of 3-5 years. Hero roped in Mr. M. Damodaran as an independent director, he works as a consultant for governance and has worked with investment, financial and regulatory bodies. He was involved in the successful restructuring efforts of IDBI and UTI.
SOCIAL RESPONSIBILITY:
Hero has been at the forefront for socio-economic development. They have selected 100
villages in different states in organizing CSR activities to help the locals. They undertook
project AROGYA providing mobile medical vans & organizing health camps. They undertook
Number of Board Members 11
Number of female Members 1
Independent directors 8
1
Non-Executive members 9
Executive members
Score Weight
2/10 25%
3/10 25%
4/10 25%
2/10 25%
2.75Total Corporate Governance
Corporate Governance
Evaluation
Board Structure
Shareholders' Rights
Audit & Risk oversight
Compensation Policies
Source: Student Research
Source: HMCL Annual Report, Student Research
Source: Student Research
7
workshops in the areas of farm management, skill development & animal welfare to make
the locals self-dependent. These projects have imparted job oriented skills to 190 women
(tailoring, beauticians course). They also launched the campaign HAMARI PARI
acknowledged by Facebook for girl child empowerment & launched a digital campaign to
spread awareness on road safety through YouTube, Facebook & Twitter.
ENVIRONMENTAL RESPONSIBILITY: HMCL focuses on developing sustainable and resilient
supply chain through their Green Vendor development initiative. They work with their
vendors to ensure adoption of environment friendly operations and measures across the
supply chain. HMCL runs a “Happy Earth” initiative which promotes optimal use of
environmental resources. This programme includes drives linked to tree plantation,
conservation of wildlife and water bodies. They partner with communities, institutions to
drive tree plantation events. They have planted over 250,000 trees till date and focus on
maintaining higher than 90% survival of these plants. In the last fiscal year, they restored
60,000 litres of water storage capacity of a pond at Neemrana in Rajasthan. i3S technology
which is developed in house in HMCL’s CIT clearly shows that HMCL is always at the
forefront of environment-friendly measures. This technology reduces emissions when the
vehicle is idle, i.e. at traffic stops and is implemented in all its major products.
FINANCIAL ANALYSIS
REVENUE GROWTH: HMCL is a market leader in the economy and executive segments. They have shown consistent growth in revenues over the last five years with 5% CAGR. Although we dominate the executive segment, but it’s share in the industry is on the downward trend. Revenue growth dipped last year owing to demonetisation which affected customer’s expending capability and drove down sales across the industry. over the last few years with a dip in growth last year owing to demonetisation.
Going forward, we expect easing inflation and real income growth supported with strong rural demand to drive up sales in two wheelers.
Our forecast predicts HMCL to register a healthy growth of 11% CAGR in the next five years. New product launches are lined up in the year ahead majorly in the premium and scooter segments which are the fastest growing segments with an annual growth of 13% and 11% respectively. This healthy growth forecast is also attributable to the increase in realisation of vehicles post BS VI which is expected to come into effect from 1st April 2020.
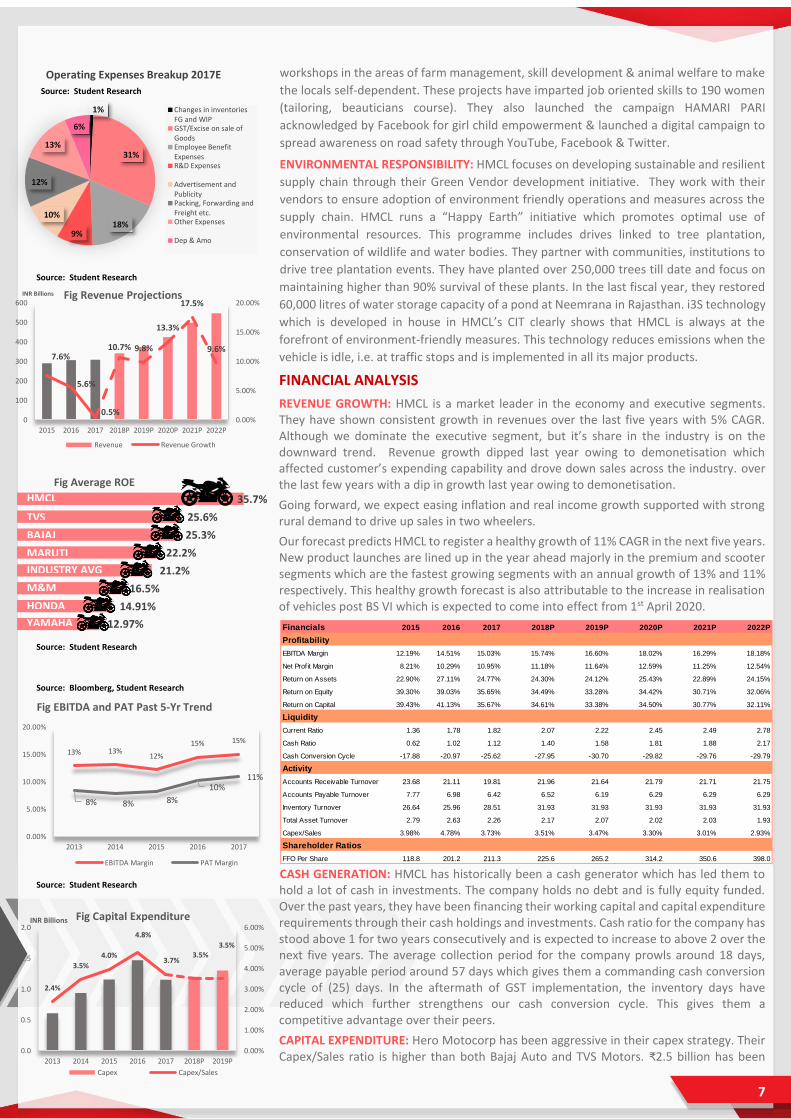
CASH GENERATION: HMCL has historically been a cash generator which has led them to hold a lot of cash in investments. The company holds no debt and is fully equity funded. Over the past years, they have been financing their working capital and capital expenditure requirements through their cash holdings and investments. Cash ratio for the company has stood above 1 for two years consecutively and is expected to increase to above 2 over the next five years. The average collection period for the company prowls around 18 days, average payable period around 57 days which gives them a commanding cash conversion cycle of (25) days. In the aftermath of GST implementation, the inventory days have reduced which further strengthens our cash conversion cycle. This gives them a competitive advantage over their peers.
CAPITAL EXPENDITURE: Hero Motocorp has been aggressive in their capex strategy. Their Capex/Sales ratio is higher than both Bajaj Auto and TVS Motors. ₹2.5 billion has been
12.97%
14.91%
16.5%
21.2%
22.2%
25.3%
25.6%
35.7%
Fig Average ROE
HMCL
TVS
BAJAJ
MARUTI
INDUSTRY AVG
HONDA
YAMAHA
M&M
2.4%
3.5%
4.0%
4.8%
3.7%3.5%
3.5%
0.00%
1.00%
2.00%
3.00%
4.00%
5.00%
6.00%
0.0
0.5
1.0
1.5
2.0
2013 2014 2015 2016 2017 2018P 2019P
Tho
usa
nd
s
Fig Capital Expenditure
Capex Capex/Sales
INR Billions
13% 13%12%
15% 15%
8% 8% 8%
10%11%
0.00%
5.00%
10.00%
15.00%
20.00%
2013 2014 2015 2016 2017
Fig EBITDA and PAT Past 5-Yr Trend
EBITDA Margin PAT Margin
1%
31%
18%9%
10%
12%
13%
6%
Operating Expenses Breakup 2017E
Changes in inventoriesFG and WIPGST/Excise on sale ofGoodsEmployee BenefitExpensesR&D Expenses
Advertisement andPublicityPacking, Forwarding andFreight etc.Other Expenses
Dep & Amo
7.6%
5.6%
0.5%
10.7% 9.8%
13.3%
17.5%
9.6%
0.00%
5.00%
10.00%
15.00%
20.00%
0
100
200
300
400
500
600
2015 2016 2017 2018P 2019P 2020P 2021P 2022P
Hu
nd
red
s
Fig Revenue Projections
Revenue Revenue Growth
Financials 2015 2016 2017 2018P 2019P 2020P 2021P 2022P
Profitability
EBITDA Margin 12.19% 14.51% 15.03% 15.74% 16.60% 18.02% 16.29% 18.18%
Net Profit Margin 8.21% 10.29% 10.95% 11.18% 11.64% 12.59% 11.25% 12.54%
Return on Assets 22.90% 27.11% 24.77% 24.30% 24.12% 25.43% 22.89% 24.15%
Return on Equity 39.30% 39.03% 35.65% 34.49% 33.28% 34.42% 30.71% 32.06%
Return on Capital 39.43% 41.13% 35.67% 34.61% 33.38% 34.50% 30.77% 32.11%
Liquidity
Current Ratio 1.36 1.78 1.82 2.07 2.22 2.45 2.49 2.78
Cash Ratio 0.62 1.02 1.12 1.40 1.58 1.81 1.88 2.17
Cash Conversion Cycle -17.88 -20.97 -25.62 -27.95 -30.70 -29.82 -29.76 -29.79
Activity
Accounts Receivable Turnover 23.68 21.11 19.81 21.96 21.64 21.79 21.71 21.75
Accounts Payable Turnover 7.77 6.98 6.42 6.52 6.19 6.29 6.29 6.29
Inventory Turnover 26.64 25.96 28.51 31.93 31.93 31.93 31.93 31.93
Total Asset Turnover 2.79 2.63 2.26 2.17 2.07 2.02 2.03 1.93
Capex/Sales 3.98% 4.78% 3.73% 3.51% 3.47% 3.30% 3.01% 2.93%
Shareholder Ratios
FFO Per Share 118.8 201.2 211.3 225.6 265.2 314.2 350.6 398.0
Source: Student Research
Source: Student Research
Source: Student Research
Source: Bloomberg, Student Research
Source: Student Research
INR Billions
8
planned as capex over the next two years towards new product development, capacity expansion at their existing plants as well as the upcoming facilities in Bangladesh and Andhra Pradesh. A new facility was also commissioned last year at Vadodra, Gujarat with an annual capacity of 1.2 million units. We expect the firm to continue investing in their capacity and towards new products in the premium and scooter segments since they are currently underrepresented in these segments and they are eyeing this segment for future growth.
R&D EXPENSES: HMCL has continuously increased its R&D expenditures over the years. This is in line with their plans to launch new vehicles in the upcoming years. Their R&D as a proportion of their sales stood at 2.3%, much stronger compared to their rivals, Bajaj Auto and TVS Motors. The new Splendor iSmart 110 and Achiever 150 are two models that have been fully designed and developed by their own Centre of Innovation and Technology (CIT) at Jaipur. We expect HMCL to launch more products in future in the premium segment.
MARGIN: HMCL has consistently improved their EBITDA margin over the last 5 years from 12% to 15% and its PAT margin has also risen from around 8% to 11%. They have achieved this through continuous improvement in their supply chain management activities through outsourcing logistic services, strategic collaborations and LEAP initiative. This ongoing initiative has helped HMCL increase its bottom line by approximately 270 million in the previous year.
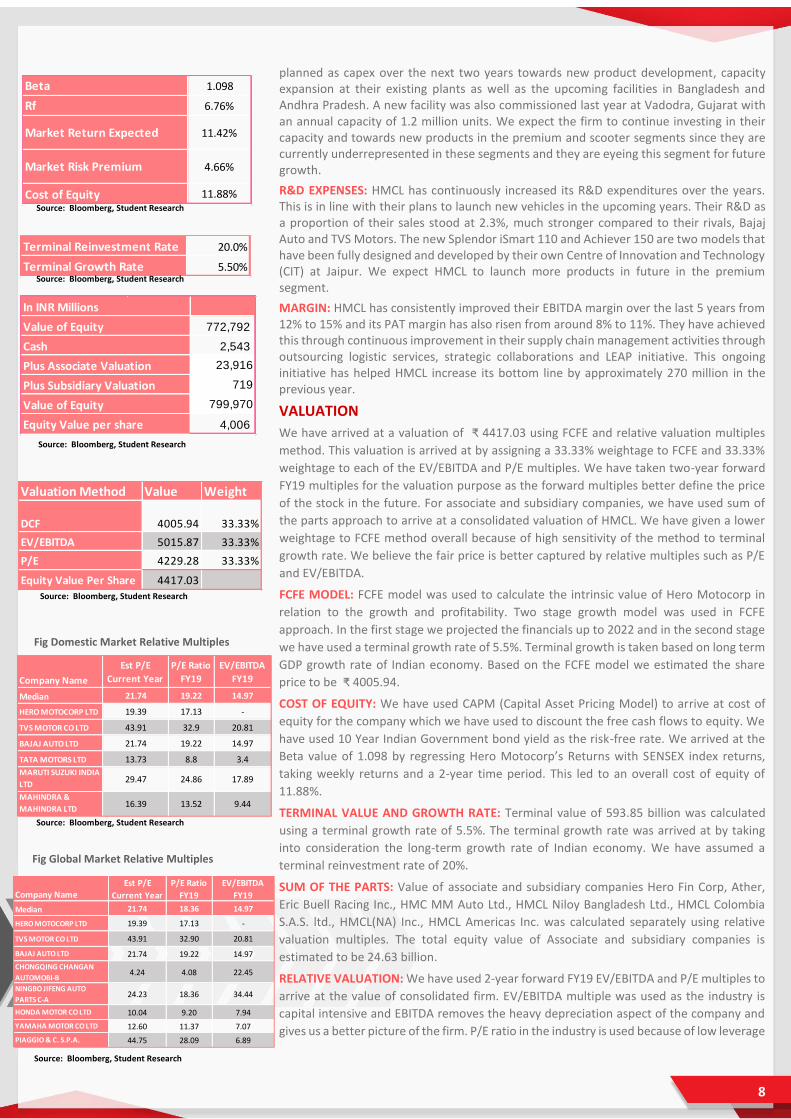
VALUATION
We have arrived at a valuation of ₹ 4417.03 using FCFE and relative valuation multiples
method. This valuation is arrived at by assigning a 33.33% weightage to FCFE and 33.33%
weightage to each of the EV/EBITDA and P/E multiples. We have taken two-year forward
FY19 multiples for the valuation purpose as the forward multiples better define the price
of the stock in the future. For associate and subsidiary companies, we have used sum of
the parts approach to arrive at a consolidated valuation of HMCL. We have given a lower
weightage to FCFE method overall because of high sensitivity of the method to terminal
growth rate. We believe the fair price is better captured by relative multiples such as P/E
and EV/EBITDA.
FCFE MODEL: FCFE model was used to calculate the intrinsic value of Hero Motocorp in
relation to the growth and profitability. Two stage growth model was used in FCFE
approach. In the first stage we projected the financials up to 2022 and in the second stage
we have used a terminal growth rate of 5.5%. Terminal growth is taken based on long term
GDP growth rate of Indian economy. Based on the FCFE model we estimated the share
price to be ₹ 4005.94.
COST OF EQUITY: We have used CAPM (Capital Asset Pricing Model) to arrive at cost of
equity for the company which we have used to discount the free cash flows to equity. We
have used 10 Year Indian Government bond yield as the risk-free rate. We arrived at the
Beta value of 1.098 by regressing Hero Motocorp’s Returns with SENSEX index returns,
taking weekly returns and a 2-year time period. This led to an overall cost of equity of
11.88%.
TERMINAL VALUE AND GROWTH RATE: Terminal value of 593.85 billion was calculated
using a terminal growth rate of 5.5%. The terminal growth rate was arrived at by taking
into consideration the long-term growth rate of Indian economy. We have assumed a
terminal reinvestment rate of 20%.
SUM OF THE PARTS: Value of associate and subsidiary companies Hero Fin Corp, Ather,
Eric Buell Racing Inc., HMC MM Auto Ltd., HMCL Niloy Bangladesh Ltd., HMCL Colombia
S.A.S. ltd., HMCL(NA) Inc., HMCL Americas Inc. was calculated separately using relative
valuation multiples. The total equity value of Associate and subsidiary companies is
estimated to be 24.63 billion.
RELATIVE VALUATION: We have used 2-year forward FY19 EV/EBITDA and P/E multiples to
arrive at the value of consolidated firm. EV/EBITDA multiple was used as the industry is
capital intensive and EBITDA removes the heavy depreciation aspect of the company and
gives us a better picture of the firm. P/E ratio in the industry is used because of low leverage
Fig Global Market Relative Multiples
Company NameEst P/E
Current Year
P/E Ratio
FY19
EV/EBITDA
FY19
Median 21.74 18.36 14.97
HERO MOTOCORP LTD 19.39 17.13 -
TVS MOTOR CO LTD 43.91 32.90 20.81
BAJAJ AUTO LTD 21.74 19.22 14.97
CHONGQING CHANGAN
AUTOMOBI-B4.24 4.08 22.45
NINGBO JIFENG AUTO
PARTS C-A24.23 18.36 34.44
HONDA MOTOR CO LTD 10.04 9.20 7.94
YAMAHA MOTOR CO LTD 12.60 11.37 7.07
PIAGGIO & C. S.P.A. 44.75 28.09 6.89
Fig Domestic Market Relative Multiples
Company Name
Est P/E
Current Year
P/E Ratio
FY19
EV/EBITDA
FY19
Median 21.74 19.22 14.97
HERO MOTOCORP LTD 19.39 17.13 -
TVS MOTOR CO LTD 43.91 32.9 20.81
BAJAJ AUTO LTD 21.74 19.22 14.97
TATA MOTORS LTD 13.73 8.8 3.4
MARUTI SUZUKI INDIA
LTD29.47 24.86 17.89
MAHINDRA &
MAHINDRA LTD16.39 13.52 9.44
Valuation Method Value Weight
DCF 4005.94 33.33%
EV/EBITDA 5015.87 33.33%
P/E 4229.28 33.33%
Equity Value Per Share 4417.03
Beta 1.098
Rf 6.76%
Market Return Expected 11.42%
Market Risk Premium 4.66%
Cost of Equity 11.88%
Terminal Reinvestment Rate 20.0%
Terminal Growth Rate 5.50%Source: Bloomberg, Student Research
Source: Bloomberg, Student Research
Source: Bloomberg, Student Research
Source: Bloomberg, Student Research
Source: Bloomberg, Student Research
Source: Bloomberg, Student Research
772,792
2,543
23,916
719
799,970
4,006
Plus Subsidiary Valuation
Value of Equity
Equity Value per share
Value of Equity
Cash
Plus Associate Valuation
In INR Millions
9
structure of the industry. Most of the players in the industry are heavily equity financed.
Thus, P/E ratio gives us a fair picture of the valuation of the firm.
We have done the relative valuation with respect to global economy and domestic peers.
As the company is increasing its focus on global markets such as Africa, Latin America and
Asia, it is facing tough competition from other global companies from China and Middle
East and Japan. To capture this aspect, we have included Honda Motors, Yamaha Motors
from Japan, Chongquing Changan and Ningbo Jifeng Auto Parts from China in our relative
valuation and peer analysis.
We have used a median P/E multiple of 18.36 with respect to global peers and 19.22 with
respect to domestic peers. Similarly, we have used a median EV/EBITDA of 14.97 with
respect to global peers and 14.97 with respect to domestic peers. We have assigned 50%
weightages to each global and domestic multiple to arrive at a final EV/EBITDA and P/E
valuation. Finally, we estimated a per share value of ₹ 5015.87 using EBITDA multiple and
₹ 4229.28 using Earnings multiple.
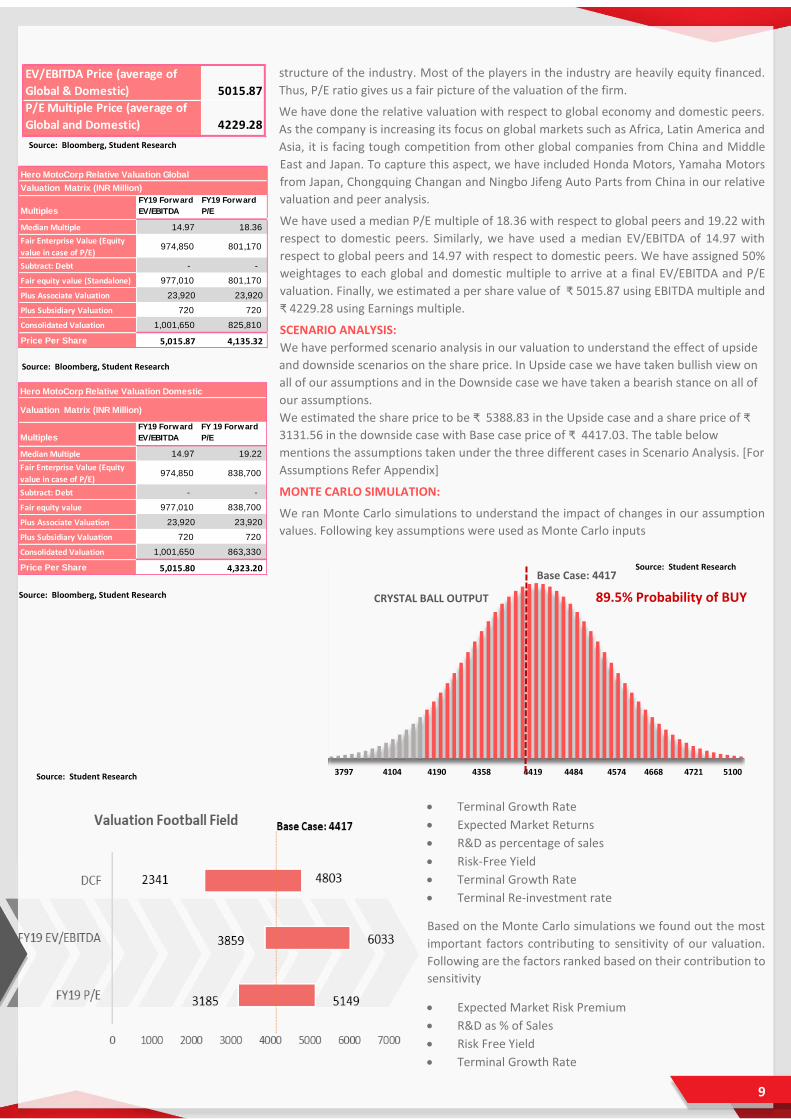
SCENARIO ANALYSIS:
We have performed scenario analysis in our valuation to understand the effect of upside
and downside scenarios on the share price. In Upside case we have taken bullish view on
all of our assumptions and in the Downside case we have taken a bearish stance on all of
our assumptions. We estimated the share price to be ₹ 5388.83 in the Upside case and a share price of ₹
3131.56 in the downside case with Base case price of ₹ 4417.03. The table below
mentions the assumptions taken under the three different cases in Scenario Analysis. [For
Assumptions Refer Appendix]
MONTE CARLO SIMULATION:
We ran Monte Carlo simulations to understand the impact of changes in our assumption
values. Following key assumptions were used as Monte Carlo inputs
• Terminal Growth Rate
• Expected Market Returns
• R&D as percentage of sales
• Risk-Free Yield
• Terminal Growth Rate
• Terminal Re-investment rate
Based on the Monte Carlo simulations we found out the most
important factors contributing to sensitivity of our valuation.
Following are the factors ranked based on their contribution to
sensitivity
• Expected Market Risk Premium
• R&D as % of Sales
• Risk Free Yield
• Terminal Growth Rate
EV/EBITDA Price (average of
Global & Domestic) 5015.87
P/E Multiple Price (average of
Global and Domestic) 4229.28
3797 4104 4190 4358 4419 4484 4574 4668 4721 5100
Base Case: 4417
CRYSTAL BALL OUTPUT 89.5% Probability of BUY
Source: Bloomberg, Student Research
Source: Bloomberg, Student Research
Source: Bloomberg, Student Research
Source: Student Research
Source: Student Research
Multiples
FY19 Forward
EV/EBITDA
FY 19 Forward
P/E
Median Multiple 14.97 19.22
Fair Enterprise Value (Equity
value in case of P/E) 974,850 838,700
Subtract: Debt - -
Fair equity value 977,010 838,700
Plus Associate Valuation 23,920 23,920
Plus Subsidiary Valuation 720 720
Consolidated Valuation 1,001,650 863,330
Price Per Share 5,015.80 4,323.20
Hero MotoCorp Relative Valuation Domestic
Valuation Matrix (INR Million)
Multiples
FY19 Forward
EV/EBITDA
FY19 Forward
P/E
Median Multiple 14.97 18.36
Fair Enterprise Value (Equity
value in case of P/E) 974,850 801,170
Subtract: Debt - -
Fair equity value (Standalone) 977,010 801,170
Plus Associate Valuation 23,920 23,920
Plus Subsidiary Valuation 720 720
Consolidated Valuation 1,001,650 825,810
Price Per Share 5,015.87 4,135.32
Hero MotoCorp Relative Valuation Global
Valuation Matrix (INR Million)
10
Based on 10,000 Monte Carlo simulations we arrived at 89.50% probability of getting a price more than 10% upside compared to
market price as of 20th October, 2017.
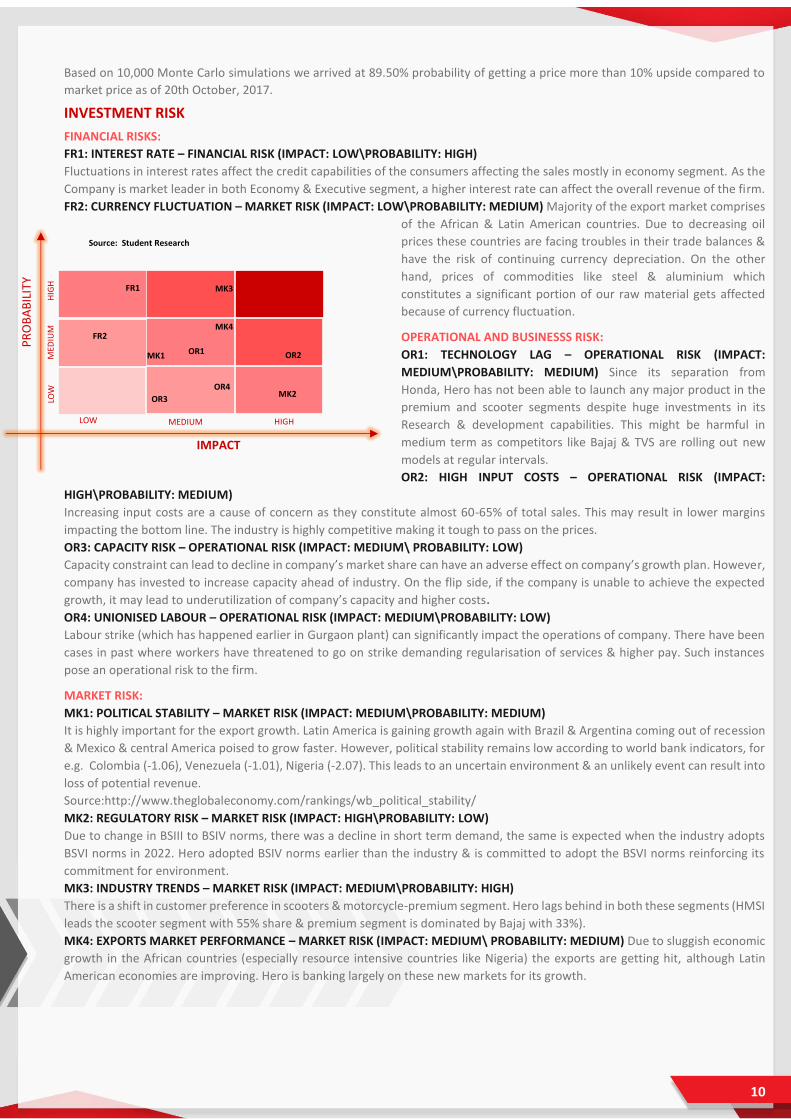
INVESTMENT RISK
FINANCIAL RISKS:
FR1: INTEREST RATE – FINANCIAL RISK (IMPACT: LOW\PROBABILITY: HIGH)
Fluctuations in interest rates affect the credit capabilities of the consumers affecting the sales mostly in economy segment. As the
Company is market leader in both Economy & Executive segment, a higher interest rate can affect the overall revenue of the firm. FR2: CURRENCY FLUCTUATION – MARKET RISK (IMPACT: LOW\PROBABILITY: MEDIUM) Majority of the export market comprises
of the African & Latin American countries. Due to decreasing oil
prices these countries are facing troubles in their trade balances &
have the risk of continuing currency depreciation. On the other
hand, prices of commodities like steel & aluminium which
constitutes a significant portion of our raw material gets affected
because of currency fluctuation.
OPERATIONAL AND BUSINESSS RISK:
OR1: TECHNOLOGY LAG – OPERATIONAL RISK (IMPACT:
MEDIUM\PROBABILITY: MEDIUM) Since its separation from
Honda, Hero has not been able to launch any major product in the
premium and scooter segments despite huge investments in its
Research & development capabilities. This might be harmful in
medium term as competitors like Bajaj & TVS are rolling out new
models at regular intervals.
OR2: HIGH INPUT COSTS – OPERATIONAL RISK (IMPACT:
HIGH\PROBABILITY: MEDIUM)
Increasing input costs are a cause of concern as they constitute almost 60-65% of total sales. This may result in lower margins
impacting the bottom line. The industry is highly competitive making it tough to pass on the prices. OR3: CAPACITY RISK – OPERATIONAL RISK (IMPACT: MEDIUM\ PROBABILITY: LOW)
Capacity constraint can lead to decline in company’s market share can have an adverse effect on company’s growth plan. However,
company has invested to increase capacity ahead of industry. On the flip side, if the company is unable to achieve the expected
growth, it may lead to underutilization of company’s capacity and higher costs.
OR4: UNIONISED LABOUR – OPERATIONAL RISK (IMPACT: MEDIUM\PROBABILITY: LOW)
Labour strike (which has happened earlier in Gurgaon plant) can significantly impact the operations of company. There have been
cases in past where workers have threatened to go on strike demanding regularisation of services & higher pay. Such instances
pose an operational risk to the firm.
MARKET RISK:
MK1: POLITICAL STABILITY – MARKET RISK (IMPACT: MEDIUM\PROBABILITY: MEDIUM)
It is highly important for the export growth. Latin America is gaining growth again with Brazil & Argentina coming out of recession
& Mexico & central America poised to grow faster. However, political stability remains low according to world bank indicators, for
e.g. Colombia (-1.06), Venezuela (-1.01), Nigeria (-2.07). This leads to an uncertain environment & an unlikely event can result into
loss of potential revenue.
Source:http://www.theglobaleconomy.com/rankings/wb_political_stability/
MK2: REGULATORY RISK – MARKET RISK (IMPACT: HIGH\PROBABILITY: LOW) Due to change in BSIII to BSIV norms, there was a decline in short term demand, the same is expected when the industry adopts
BSVI norms in 2022. Hero adopted BSIV norms earlier than the industry & is committed to adopt the BSVI norms reinforcing its
commitment for environment.
MK3: INDUSTRY TRENDS – MARKET RISK (IMPACT: MEDIUM\PROBABILITY: HIGH)
There is a shift in customer preference in scooters & motorcycle-premium segment. Hero lags behind in both these segments (HMSI
leads the scooter segment with 55% share & premium segment is dominated by Bajaj with 33%).
MK4: EXPORTS MARKET PERFORMANCE – MARKET RISK (IMPACT: MEDIUM\ PROBABILITY: MEDIUM) Due to sluggish economic
growth in the African countries (especially resource intensive countries like Nigeria) the exports are getting hit, although Latin
American economies are improving. Hero is banking largely on these new markets for its growth.
IMPACT
PR
OB
AB
ILIT
Y
MK1
MK2
OR2 OR1
MK3
OR3
OR4
MK4
FR1
FR2
LOW MEDIUM HIGH
LOW
M
EDIU
M
HIG
H
Source: Student Research
11
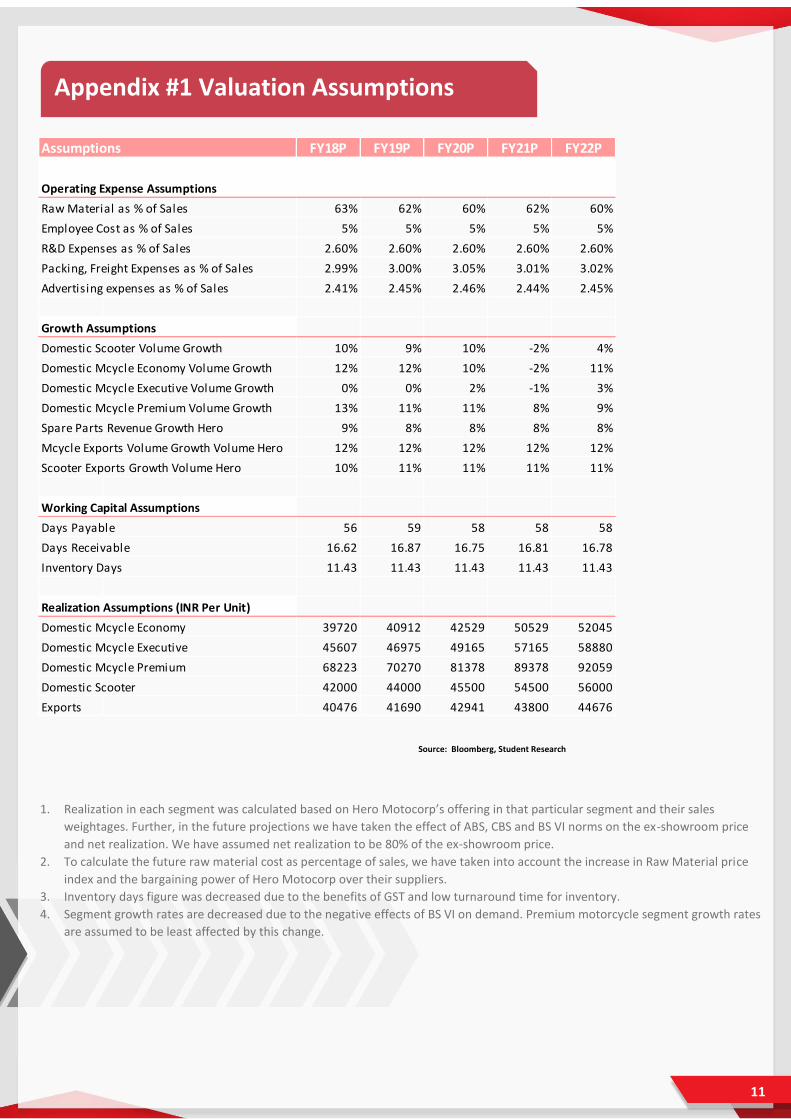
1. Realization in each segment was calculated based on Hero Motocorp’s offering in that particular segment and their sales
weightages. Further, in the future projections we have taken the effect of ABS, CBS and BS VI norms on the ex-showroom price
and net realization. We have assumed net realization to be 80% of the ex-showroom price.
2. To calculate the future raw material cost as percentage of sales, we have taken into account the increase in Raw Material price
index and the bargaining power of Hero Motocorp over their suppliers.
3. Inventory days figure was decreased due to the benefits of GST and low turnaround time for inventory.
4. Segment growth rates are decreased due to the negative effects of BS VI on demand. Premium motorcycle segment growth rates
are assumed to be least affected by this change.
Appendix #1 Valuation Assumptions
Assumptions FY18P FY19P FY20P FY21P FY22P
63% 62% 60% 62% 60%
5% 5% 5% 5% 5%
2.60% 2.60% 2.60% 2.60% 2.60%
2.99% 3.00% 3.05% 3.01% 3.02%
2.41% 2.45% 2.46% 2.44% 2.45%
10% 9% 10% -2% 4%
12% 12% 10% -2% 11%
0% 0% 2% -1% 3%
13% 11% 11% 8% 9%
9% 8% 8% 8% 8%
12% 12% 12% 12% 12%
10% 11% 11% 11% 11%
56 59 58 58 58
16.62 16.87 16.75 16.81 16.78
11.43 11.43 11.43 11.43 11.43
39720 40912 42529 50529 52045
45607 46975 49165 57165 58880
68223 70270 81378 89378 92059
Domestic Scooter 42000 44000 45500 54500 56000
Exports 40476 41690 42941 43800 44676
Domestic Mcycle Executive Volume Growth
Raw Material as % of Sales
Employee Cost as % of Sales
R&D Expenses as % of Sales
Operating Expense Assumptions
Packing, Freight Expenses as % of Sales
Advertising expenses as % of Sales
Growth Assumptions
Domestic Scooter Volume Growth
Domestic Mcycle Economy Volume Growth
Realization Assumptions (INR Per Unit)
Domestic Mcycle Economy
Domestic Mcycle Executive
Domestic Mcycle Premium
Domestic Mcycle Premium Volume Growth
Working Capital Assumptions
Days Payable
Days Receivable
Inventory Days
Spare Parts Revenue Growth Hero
Mcycle Exports Volume Growth Volume Hero
Scooter Exports Growth Volume Hero
Source: Bloomberg, Student Research
12
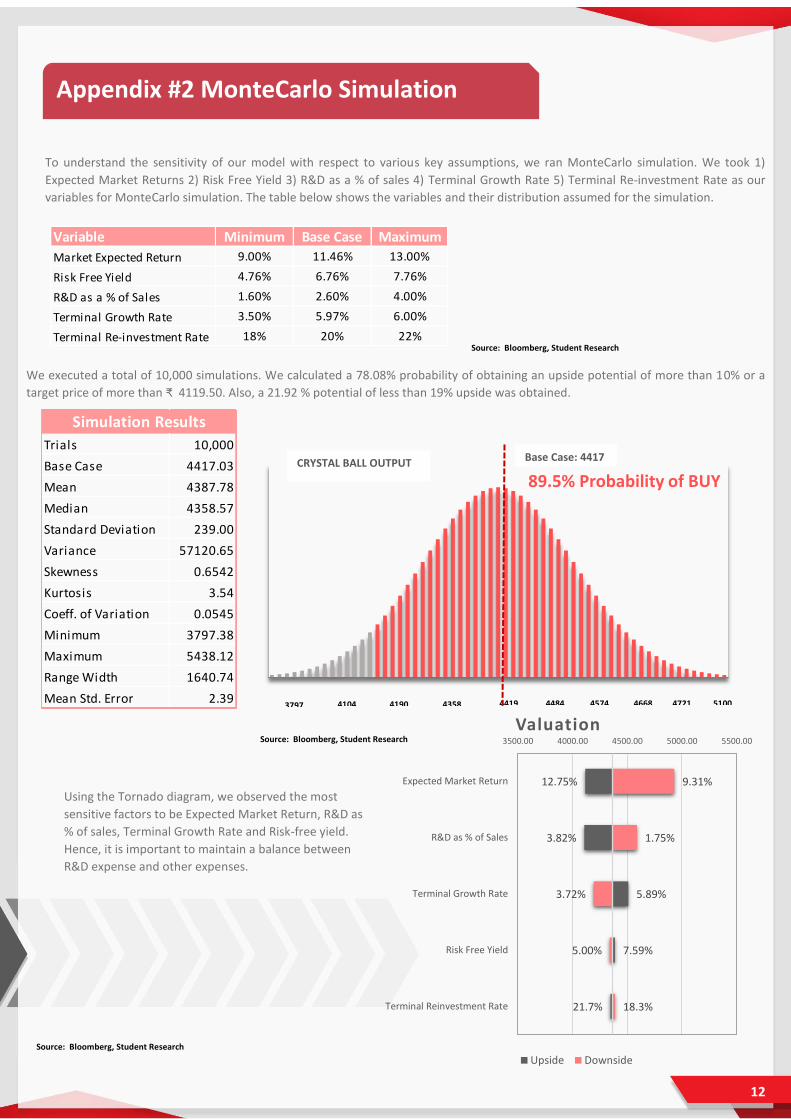
To understand the sensitivity of our model with respect to various key assumptions, we ran MonteCarlo simulation. We took 1)
Expected Market Returns 2) Risk Free Yield 3) R&D as a % of sales 4) Terminal Growth Rate 5) Terminal Re-investment Rate as our
variables for MonteCarlo simulation. The table below shows the variables and their distribution assumed for the simulation.
We executed a total of 10,000 simulations. We calculated a 78.08% probability of obtaining an upside potential of more than 10% or a
target price of more than ₹ 4119.50. Also, a 21.92 % potential of less than 19% upside was obtained.
Using the Tornado diagram, we observed the most
sensitive factors to be Expected Market Return, R&D as
% of sales, Terminal Growth Rate and Risk-free yield.
Hence, it is important to maintain a balance between
R&D expense and other expenses.
Appendix #2 MonteCarlo Simulation
12.75%
3.82%
5.89%
7.59%
21.7%
9.31%
1.75%
3.72%
5.00%
18.3%
3500.00 4000.00 4500.00 5000.00 5500.00
Expected Market Return
R&D as % of Sales
Terminal Growth Rate
Risk Free Yield
Terminal Reinvestment Rate
Valuation
Upside Downside
Trials 10,000
Base Case 4417.03
Mean 4387.78
Median 4358.57
Standard Deviation 239.00
Variance 57120.65
Skewness 0.6542
Kurtosis 3.54
Coeff. of Variation 0.0545
Minimum 3797.38
Maximum 5438.12
Range Width 1640.74
Mean Std. Error 2.39
Simulation Results
Variable Minimum Base Case Maximum
Market Expected Return 9.00% 11.46% 13.00%
Risk Free Yield 4.76% 6.76% 7.76%
R&D as a % of Sales 1.60% 2.60% 4.00%
Terminal Growth Rate 3.50% 5.97% 6.00%
Terminal Re-investment Rate 18% 20% 22%
89.5% Probability of BUY
3797 4104 4190 4358 4419 4484 4574 4668 4721 5100
Base Case: 4417 CRYSTAL BALL OUTPUT
Source: Bloomberg, Student Research
Source: Bloomberg, Student Research
Source: Bloomberg, Student Research

13
We have performed scenario analysis in our valuation to understand the effect of upside and downside scenarios on the share
price. In Upside case we have taken bullish view on all of our assumptions and in the Downside case we have taken a bearish stance
on all of our assumptions.
We estimated the share price to be ₹ 5388.83 in the Upside case and a share price of ₹ 3131.56 in the downside case with Base
case price of ₹ 4417.03. The table below mentions the assumptions taken under the three different cases in Scenario Analysis.
Valuation
Appendix #3 Scenario Analysis
FY18P FY19P FY20P FY21P FY22P
11% 10% 12% 0% 8%
10% 9% 10% -2% 4%
9% 8% 9% -3% 2%
14% 14% 11% -1% 12%
12% 12% 10% -2% 11%
10% 10% 8% -3% 9%
1% 1% 3% 0% 4%
0% 0% 2% -1% 3%
-1% -1% -1% -2% 0%
14% 13% 12% 9% 12%
13% 11% 11% 8% 9%
8% 8% 8% 7% 8%
60% 60% 59% 60% 59%
63% 62% 60% 62% 60%
64% 64% 64% 64% 64%
Downside Case
Assumptions
Scooter Domestic Segment Volume Growth
Upside Case
Base Case
Downside Case
Mcycle Domestic Economy Volume Growth
Upside Case
Base Case
Mcycle Domestic Executive Volume Growth
Upside Case
Base Case
Downside Case
Mcycle Domestic Premium Volume Growth
Upside Case
Base Case
Downside Case
Upside Case
Base Case
Downside Case
Raw Material Cost as % of Sales
Source: Bloomberg, Student Research
14
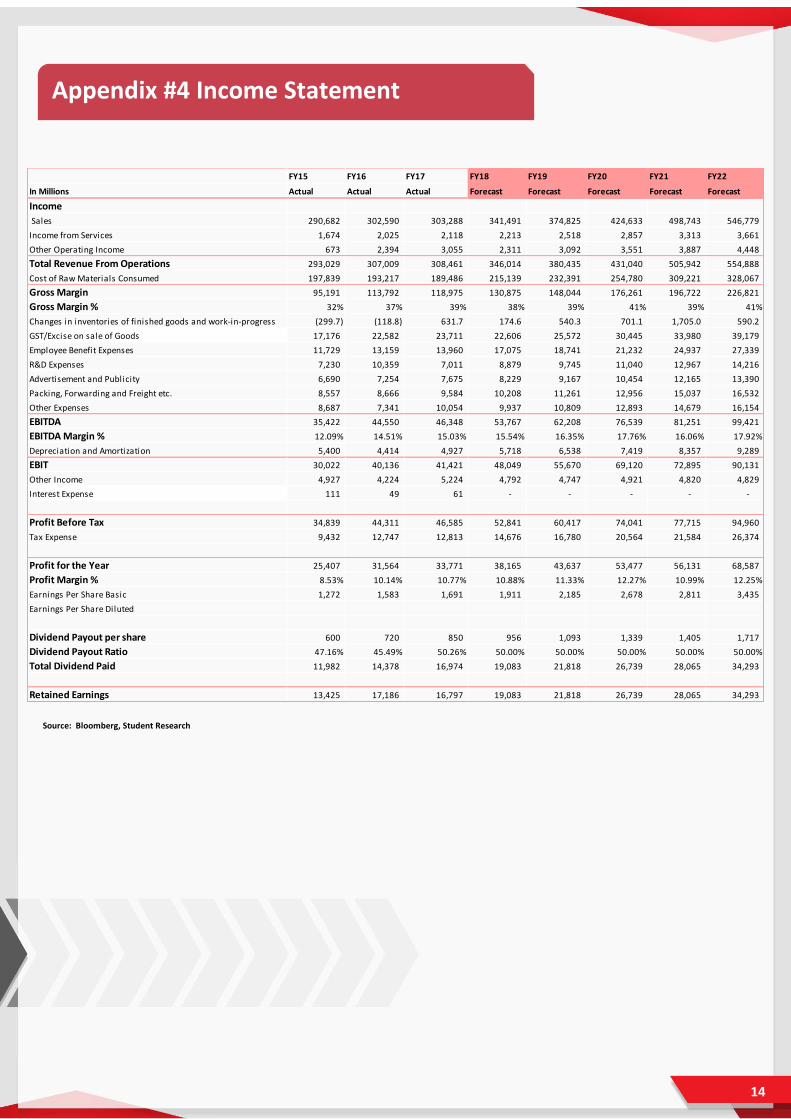
Appendix #4 Income Statement
Source: Bloomberg, Student Research
FY15 FY16 FY17 FY18 FY19 FY20 FY21 FY22
In Millions Actual Actual Actual Forecast Forecast Forecast Forecast Forecast
Income
Sales 290,682 302,590 303,288 341,491 374,825 424,633 498,743 546,779
Income from Services 1,674 2,025 2,118 2,213 2,518 2,857 3,313 3,661
Other Operating Income 673 2,394 3,055 2,311 3,092 3,551 3,887 4,448
Total Revenue From Operations 293,029 307,009 308,461 346,014 380,435 431,040 505,942 554,888
Cost of Raw Materials Consumed 197,839 193,217 189,486 215,139 232,391 254,780 309,221 328,067
Gross Margin 95,191 113,792 118,975 130,875 148,044 176,261 196,722 226,821
Gross Margin % 32% 37% 39% 38% 39% 41% 39% 41%
Changes in inventories of finished goods and work-in-progress (299.7) (118.8) 631.7 174.6 540.3 701.1 1,705.0 590.2
GST/Excise on sale of Goods 17,176 22,582 23,711 22,606 25,572 30,445 33,980 39,179
Employee Benefit Expenses 11,729 13,159 13,960 17,075 18,741 21,232 24,937 27,339
R&D Expenses 7,230 10,359 7,011 8,879 9,745 11,040 12,967 14,216
Advertisement and Publicity 6,690 7,254 7,675 8,229 9,167 10,454 12,165 13,390
Packing, Forwarding and Freight etc. 8,557 8,666 9,584 10,208 11,261 12,956 15,037 16,532
Other Expenses 8,687 7,341 10,054 9,937 10,809 12,893 14,679 16,154
EBITDA 35,422 44,550 46,348 53,767 62,208 76,539 81,251 99,421
EBITDA Margin % 12.09% 14.51% 15.03% 15.54% 16.35% 17.76% 16.06% 17.92%
Depreciation and Amortization 5,400 4,414 4,927 5,718 6,538 7,419 8,357 9,289
EBIT 30,022 40,136 41,421 48,049 55,670 69,120 72,895 90,131
Other Income 4,927 4,224 5,224 4,792 4,747 4,921 4,820 4,829
Interest Expense 111 49 61 - - - - -
Profit Before Tax 34,839 44,311 46,585 52,841 60,417 74,041 77,715 94,960
Tax Expense 9,432 12,747 12,813 14,676 16,780 20,564 21,584 26,374
Profit for the Year 25,407 31,564 33,771 38,165 43,637 53,477 56,131 68,587
Profit Margin % 8.53% 10.14% 10.77% 10.88% 11.33% 12.27% 10.99% 12.25%
Earnings Per Share Basic 1,272 1,583 1,691 1,911 2,185 2,678 2,811 3,435
Earnings Per Share Diluted
Dividend Payout per share 600 720 850 956 1,093 1,339 1,405 1,717
Dividend Payout Ratio 47.16% 45.49% 50.26% 50.00% 50.00% 50.00% 50.00% 50.00%
Total Dividend Paid 11,982 14,378 16,974 19,083 21,818 26,739 28,065 34,293
Retained Earnings 13,425 17,186 16,797 19,083 21,818 26,739 28,065 34,293
15
FY15 FY16 FY17 FY18 FY19 FY20 FY21 FY22
In Crores Actual Actual Actual Forecast Forecast Forecast Forecast Forecast
Income
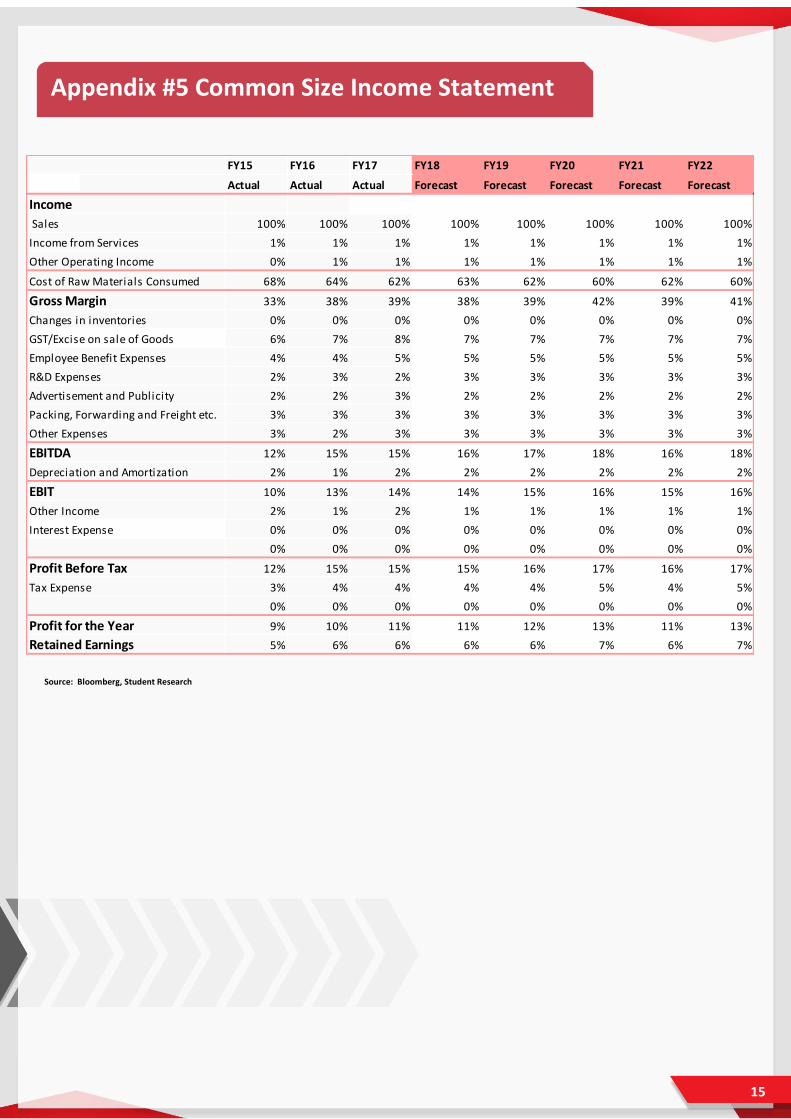
Sales 100% 100% 100% 100% 100% 100% 100% 100%
Income from Services 1% 1% 1% 1% 1% 1% 1% 1%
Other Operating Income 0% 1% 1% 1% 1% 1% 1% 1%
Cost of Raw Materials Consumed 68% 64% 62% 63% 62% 60% 62% 60%
Gross Margin 33% 38% 39% 38% 39% 42% 39% 41%
Changes in inventories 0% 0% 0% 0% 0% 0% 0% 0%
GST/Excise on sale of Goods 6% 7% 8% 7% 7% 7% 7% 7%
Employee Benefit Expenses 4% 4% 5% 5% 5% 5% 5% 5%
R&D Expenses 2% 3% 2% 3% 3% 3% 3% 3%
Advertisement and Publicity 2% 2% 3% 2% 2% 2% 2% 2%
Packing, Forwarding and Freight etc. 3% 3% 3% 3% 3% 3% 3% 3%
Other Expenses 3% 2% 3% 3% 3% 3% 3% 3%
EBITDA 12% 15% 15% 16% 17% 18% 16% 18%
Depreciation and Amortization 2% 1% 2% 2% 2% 2% 2% 2%
EBIT 10% 13% 14% 14% 15% 16% 15% 16%
Other Income 2% 1% 2% 1% 1% 1% 1% 1%
Interest Expense 0% 0% 0% 0% 0% 0% 0% 0%
0% 0% 0% 0% 0% 0% 0% 0%
Profit Before Tax 12% 15% 15% 15% 16% 17% 16% 17%
Tax Expense 3% 4% 4% 4% 4% 5% 4% 5%
0% 0% 0% 0% 0% 0% 0% 0%
Profit for the Year 9% 10% 11% 11% 12% 13% 11% 13%
Retained Earnings 5% 6% 6% 6% 6% 7% 6% 7%
Appendix #5 Common Size Income Statement
Source: Bloomberg, Student Research
16
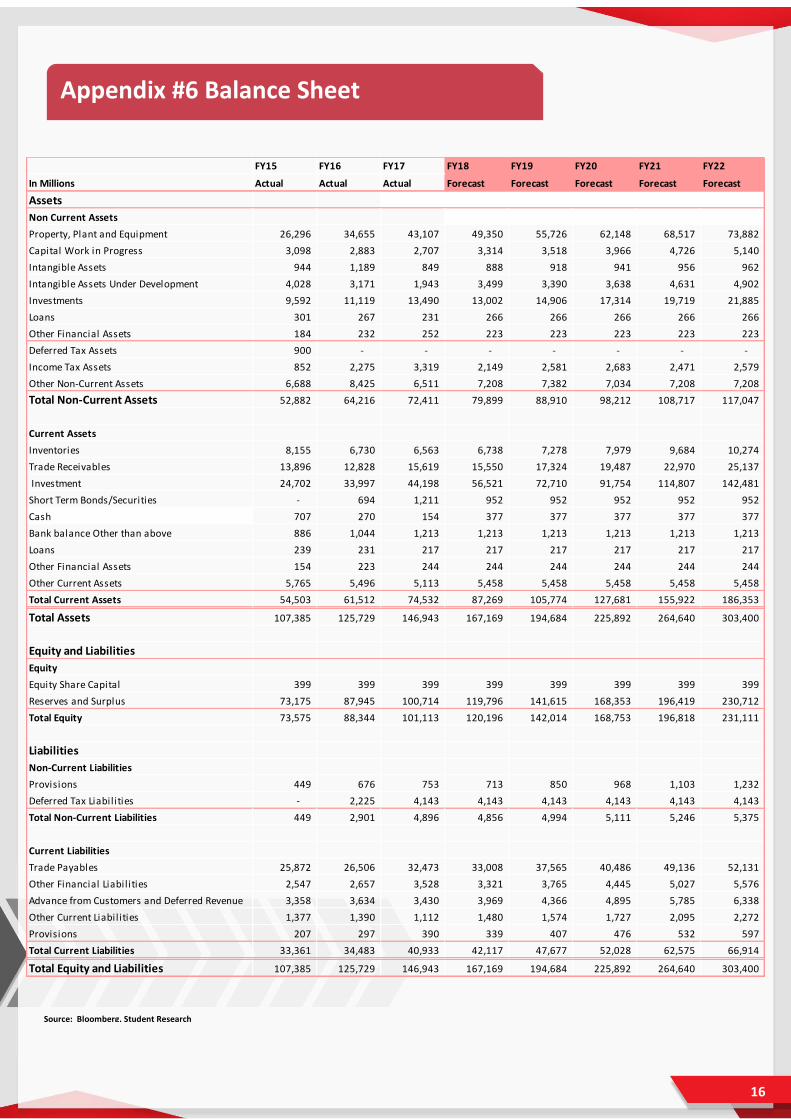
Appendix #6 Balance Sheet
Source: Bloomberg, Student Research
FY15 FY16 FY17 FY18 FY19 FY20 FY21 FY22
In Millions Actual Actual Actual Forecast Forecast Forecast Forecast Forecast
Assets
Non Current Assets
Property, Plant and Equipment 26,296 34,655 43,107 49,350 55,726 62,148 68,517 73,882
Capital Work in Progress 3,098 2,883 2,707 3,314 3,518 3,966 4,726 5,140
Intangible Assets 944 1,189 849 888 918 941 956 962
Intangible Assets Under Development 4,028 3,171 1,943 3,499 3,390 3,638 4,631 4,902
Investments 9,592 11,119 13,490 13,002 14,906 17,314 19,719 21,885
Loans 301 267 231 266 266 266 266 266
Other Financial Assets 184 232 252 223 223 223 223 223
Deferred Tax Assets 900 - - - - - - -
Income Tax Assets 852 2,275 3,319 2,149 2,581 2,683 2,471 2,579
Other Non-Current Assets 6,688 8,425 6,511 7,208 7,382 7,034 7,208 7,208
Total Non-Current Assets 52,882 64,216 72,411 79,899 88,910 98,212 108,717 117,047
Current Assets
Inventories 8,155 6,730 6,563 6,738 7,278 7,979 9,684 10,274
Trade Receivables 13,896 12,828 15,619 15,550 17,324 19,487 22,970 25,137
Investment 24,702 33,997 44,198 56,521 72,710 91,754 114,807 142,481
Short Term Bonds/Securities - 694 1,211 952 952 952 952 952
Cash 707 270 154 377 377 377 377 377
Bank balance Other than above 886 1,044 1,213 1,213 1,213 1,213 1,213 1,213
Loans 239 231 217 217 217 217 217 217
Other Financial Assets 154 223 244 244 244 244 244 244
Other Current Assets 5,765 5,496 5,113 5,458 5,458 5,458 5,458 5,458
Total Current Assets 54,503 61,512 74,532 87,269 105,774 127,681 155,922 186,353
Total Assets 107,385 125,729 146,943 167,169 194,684 225,892 264,640 303,400
Equity and Liabilities
Equity
Equity Share Capital 399 399 399 399 399 399 399 399
Reserves and Surplus 73,175 87,945 100,714 119,796 141,615 168,353 196,419 230,712
Total Equity 73,575 88,344 101,113 120,196 142,014 168,753 196,818 231,111
Liabilities
Non-Current Liabilities
Provisions 449 676 753 713 850 968 1,103 1,232
Deferred Tax Liabilities - 2,225 4,143 4,143 4,143 4,143 4,143 4,143
Total Non-Current Liabilities 449 2,901 4,896 4,856 4,994 5,111 5,246 5,375
Current Liabilities
Trade Payables 25,872 26,506 32,473 33,008 37,565 40,486 49,136 52,131
Other Financial Liabilities 2,547 2,657 3,528 3,321 3,765 4,445 5,027 5,576
Advance from Customers and Deferred Revenue 3,358 3,634 3,430 3,969 4,366 4,895 5,785 6,338
Other Current Liabilities 1,377 1,390 1,112 1,480 1,574 1,727 2,095 2,272
Provisions 207 297 390 339 407 476 532 597
Total Current Liabilities 33,361 34,483 40,933 42,117 47,677 52,028 62,575 66,914
Total Equity and Liabilities 107,385 125,729 146,943 167,169 194,684 225,892 264,640 303,400

17
Appendix #7 Common Size Balance Sheet
FY15 FY16 FY17 FY18 FY19 FY20 FY21 FY22
In Crores Actual Actual Actual Forecast Forecast Forecast Forecast Forecast
Assets
Non Current Assets
Property, Plant and Equipment 24% 28% 29% 30% 29% 28% 26% 24%
Capital Work in Progress 3% 2% 2% 2% 2% 2% 2% 2%
Intangible Assets 1% 1% 1% 1% 0% 0% 0% 0%
Intangible Assets Under Development 4% 3% 1% 2% 2% 2% 2% 2%
Investments 9% 9% 9% 8% 8% 8% 7% 7%
Loans 0% 0% 0% 0% 0% 0% 0% 0%
Other Financial Assets 0% 0% 0% 0% 0% 0% 0% 0%
Deferred Tax Assets 1% 0% 0% 0% 0% 0% 0% 0%
Income Tax Assets 1% 2% 2% 1% 1% 1% 1% 1%
Other Non-Current Assets 6% 7% 4% 4% 4% 3% 3% 2%
Total Non-Current Assets 49% 51% 49% 48% 46% 43% 41% 39%
Current Assets
Inventories 8% 5% 4% 4% 4% 4% 4% 3%
Trade Receivables 13% 10% 11% 9% 9% 9% 9% 8%
Investment in Mutual Funds 23% 27% 30% 34% 37% 41% 43% 47%
Short Term Bonds/Securities 0% 1% 1% 1% 0% 0% 0% 0%
Cash 1% 0% 0% 0% 0% 0% 0% 0%
Bank balance Other than above 1% 1% 1% 1% 1% 1% 0% 0%
Loans 0% 0% 0% 0% 0% 0% 0% 0%
Other Financial Assets 0% 0% 0% 0% 0% 0% 0% 0%
Other Current Assets 5% 4% 3% 3% 3% 2% 2% 2%
Total Current Assets 51% 49% 51% 52% 54% 57% 59% 61%
Total Assets 100% 100% 100% 100% 100% 100% 100% 100%
Equity and Liabilities
Equity
Equity Share Capital 0% 0% 0% 0% 0% 0% 0% 0%
Reserves and Surplus 68% 70% 69% 72% 73% 75% 74% 76%
Total Equity 69% 70% 69% 72% 73% 75% 74% 76%
Liabilities
Non-Current Liabilities
Provisions 0% 1% 1% 0% 0% 0% 0% 0%
Deferred Tax Liabilities 0% 2% 3% 2% 2% 2% 2% 1%
Total Non-Current Liabilities 0% 2% 3% 3% 3% 2% 2% 2%
Current Liabilities
Trade Payables 24% 21% 22% 20% 19% 18% 19% 17%
Other Financial Liabilities 2% 2% 2% 2% 2% 2% 2% 2%
Advance from Customers and Deferred Revenue 3% 3% 2% 2% 2% 2% 2% 2%
Other Current Liabilities 1% 1% 1% 1% 1% 1% 1% 1%
Provisions 0% 0% 0% 0% 0% 0% 0% 0%
Total Current Liabilities 31% 27% 28% 25% 24% 23% 24% 22%
Total Equity and Liabilities 100% 100% 100% 100% 100% 100% 100% 100%
Source: Bloomberg, Student Research
18
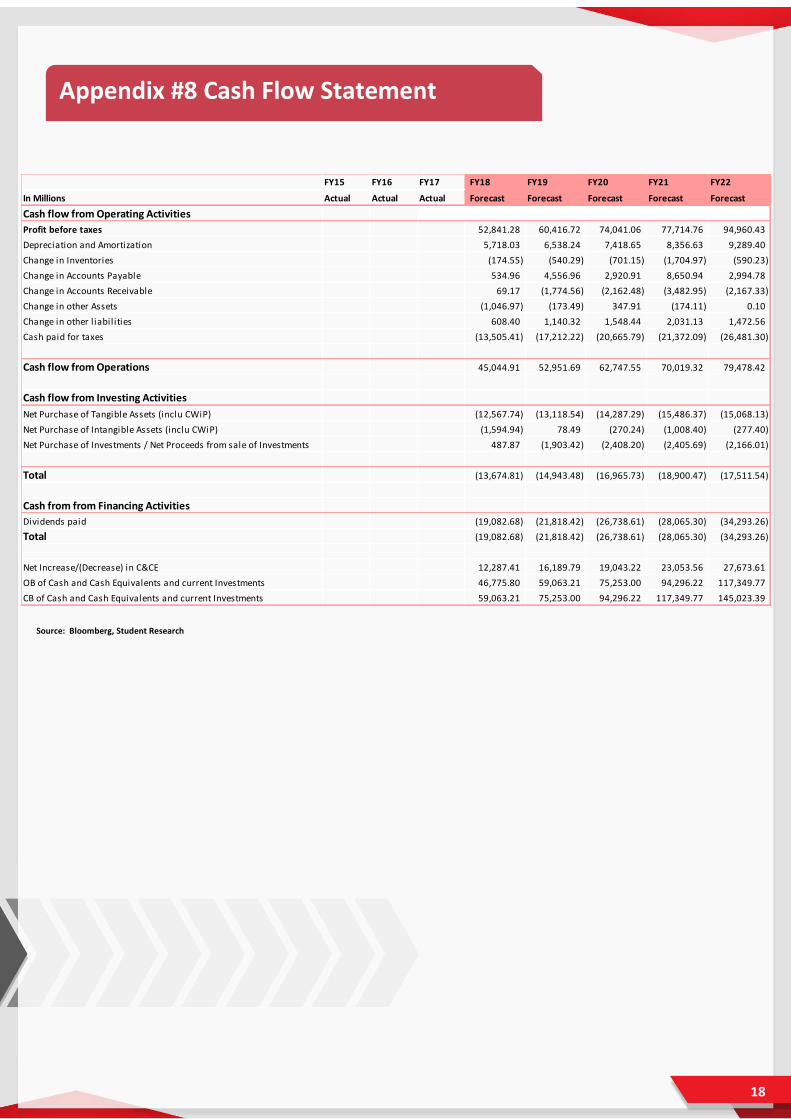
FY15 FY16 FY17 FY18 FY19 FY20 FY21 FY22
In Millions Actual Actual Actual Forecast Forecast Forecast Forecast Forecast
Cash flow from Operating Activities
Profit before taxes 52,841.28 60,416.72 74,041.06 77,714.76 94,960.43
Depreciation and Amortization 5,718.03 6,538.24 7,418.65 8,356.63 9,289.40
Change in Inventories (174.55) (540.29) (701.15) (1,704.97) (590.23)
Change in Accounts Payable 534.96 4,556.96 2,920.91 8,650.94 2,994.78
Change in Accounts Receivable 69.17 (1,774.56) (2,162.48) (3,482.95) (2,167.33)
Change in other Assets (1,046.97) (173.49) 347.91 (174.11) 0.10
Change in other l iabilities 608.40 1,140.32 1,548.44 2,031.13 1,472.56
Cash paid for taxes (13,505.41) (17,212.22) (20,665.79) (21,372.09) (26,481.30)
Cash flow from Operations 45,044.91 52,951.69 62,747.55 70,019.32 79,478.42
Cash flow from Investing Activities
Net Purchase of Tangible Assets (inclu CWiP) (12,567.74) (13,118.54) (14,287.29) (15,486.37) (15,068.13)
Net Purchase of Intangible Assets (inclu CWiP) (1,594.94) 78.49 (270.24) (1,008.40) (277.40)
Net Purchase of Investments / Net Proceeds from sale of Investments 487.87 (1,903.42) (2,408.20) (2,405.69) (2,166.01)
Total (13,674.81) (14,943.48) (16,965.73) (18,900.47) (17,511.54)
Cash from from Financing Activities
Dividends paid (19,082.68) (21,818.42) (26,738.61) (28,065.30) (34,293.26)
Total (19,082.68) (21,818.42) (26,738.61) (28,065.30) (34,293.26)
Net Increase/(Decrease) in C&CE 12,287.41 16,189.79 19,043.22 23,053.56 27,673.61
OB of Cash and Cash Equivalents and current Investments 46,775.80 59,063.21 75,253.00 94,296.22 117,349.77
CB of Cash and Cash Equivalents and current Investments 59,063.21 75,253.00 94,296.22 117,349.77 145,023.39
Appendix #8 Cash Flow Statement
Source: Bloomberg, Student Research
19
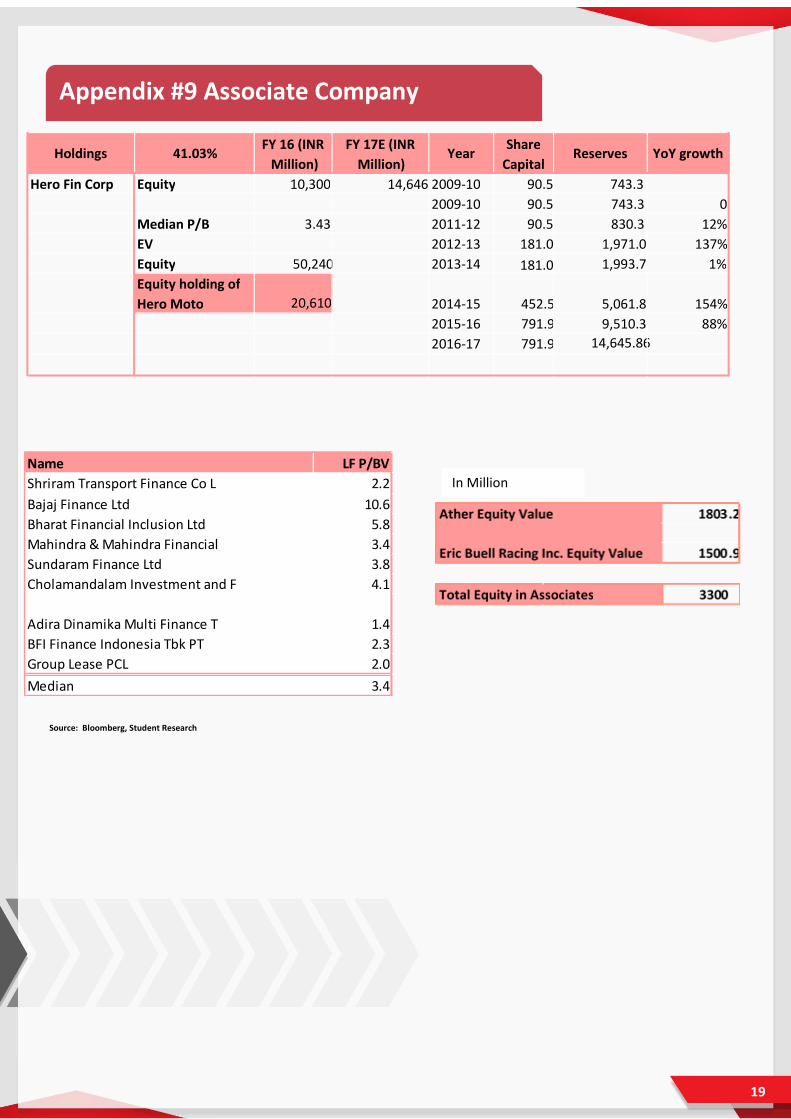
Appendix #9 Associate Company
Valuation
Name LF P/BV
Shriram Transport Finance Co L 2.2
Bajaj Finance Ltd 10.6
Bharat Financial Inclusion Ltd 5.8
Mahindra & Mahindra Financial 3.4
Sundaram Finance Ltd 3.8
Cholamandalam Investment and F 4.1
Adira Dinamika Multi Finance T 1.4
BFI Finance Indonesia Tbk PT 2.3
Group Lease PCL 2.0
Median 3.4
Hero Fin Corp Equity 10,300 14,646 2009-10 90.5 743.3
2009-10 90.5 743.3 0
Median P/B 3.43 2011-12 90.5 830.3 12%
EV 2012-13 181.0 1,971.0 137%
Equity 50,240 2013-14 181.0 1,993.7 1%
Equity holding of
Hero Moto 20,610 2014-15 452.5 5,061.8 154%
2015-16 791.9 9,510.3 88%
2016-17 791.9 14,645.86
Reserves YoY growth Holdings 41.03% Share
Capital
FY 16 (INR
Million)
FY 17E (INR
Million) Year
In Million
Source: Bloomberg, Student Research
20
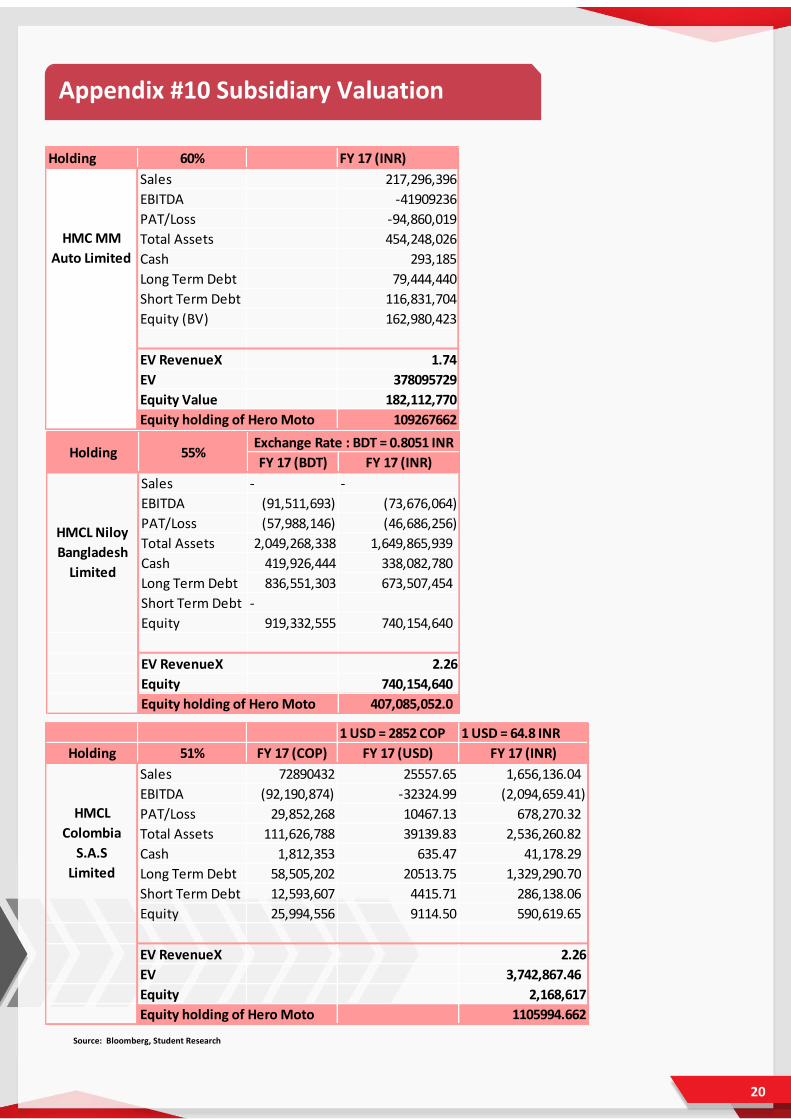
Appendix #10 Subsidiary Valuation
Holding 60% FY 17 (INR)
Sales 217,296,396
EBITDA -41909236
PAT/Loss -94,860,019
Total Assets 454,248,026
Cash 293,185
Long Term Debt 79,444,440
Short Term Debt 116,831,704
Equity (BV) 162,980,423
EV RevenueX 1.74
EV 378095729
Equity Value 182,112,770
Equity holding of Hero Moto 109267662
HMC MM
Auto Limited
FY 17 (BDT) FY 17 (INR)
Sales - -
EBITDA (91,511,693) (73,676,064)
PAT/Loss (57,988,146) (46,686,256)
Total Assets 2,049,268,338 1,649,865,939
Cash 419,926,444 338,082,780
Long Term Debt 836,551,303 673,507,454
Short Term Debt -
Equity 919,332,555 740,154,640
EV RevenueX 2.26
Equity 740,154,640
Equity holding of Hero Moto 407,085,052.0
HMCL Niloy
Bangladesh
Limited
Holding 55%Exchange Rate : BDT = 0.8051 INR
1 USD = 2852 COP 1 USD = 64.8 INR
Holding 51% FY 17 (COP) FY 17 (USD) FY 17 (INR)
Sales 72890432 25557.65 1,656,136.04
EBITDA (92,190,874) -32324.99 (2,094,659.41)
PAT/Loss 29,852,268 10467.13 678,270.32
Total Assets 111,626,788 39139.83 2,536,260.82
Cash 1,812,353 635.47 41,178.29
Long Term Debt 58,505,202 20513.75 1,329,290.70
Short Term Debt 12,593,607 4415.71 286,138.06
Equity 25,994,556 9114.50 590,619.65
EV RevenueX 2.26
EV 3,742,867.46
Equity 2,168,617
Equity holding of Hero Moto 1105994.662
HMCL
Colombia
S.A.S
Limited
Source: Bloomberg, Student Research

21
STRENGTHS:
• Excellent Brand reputation in the economy & executive segment.
• Robust distribution network with more than 1000 dealers and 6000+ customer touch points.
• Excessive capacity is available for the anticipated future demand.
WEAKNESS:
• Existing brand perception of Hero MotoCorp is of economical motorcycle manufacture.
• Overly dependence on economy and executive segment.
• Inability to turnaround losses of subsidiaries.
• Presence of Unionized labour creates an operational risk and can hinder the production capacity.
OPPORTUNITIES:
• Electric Vehicle may disrupt the industry in near future.
• Acquisitions abroad.
• Tap underserved markets.
• Women participation in economy is increasing and Hero can tap the growing demands in scooter segment.
THREATS:
• Industry trend shifting towards scooter and premium motorcycles.
• Executive segment which constitute majority of HMCL’s sale is declining.
• Rise in the cost of raw materials.
• Extremely high competition among the players.
Appendix #11 SWOT Analysis
Source: Bloomberg, Student Research
22
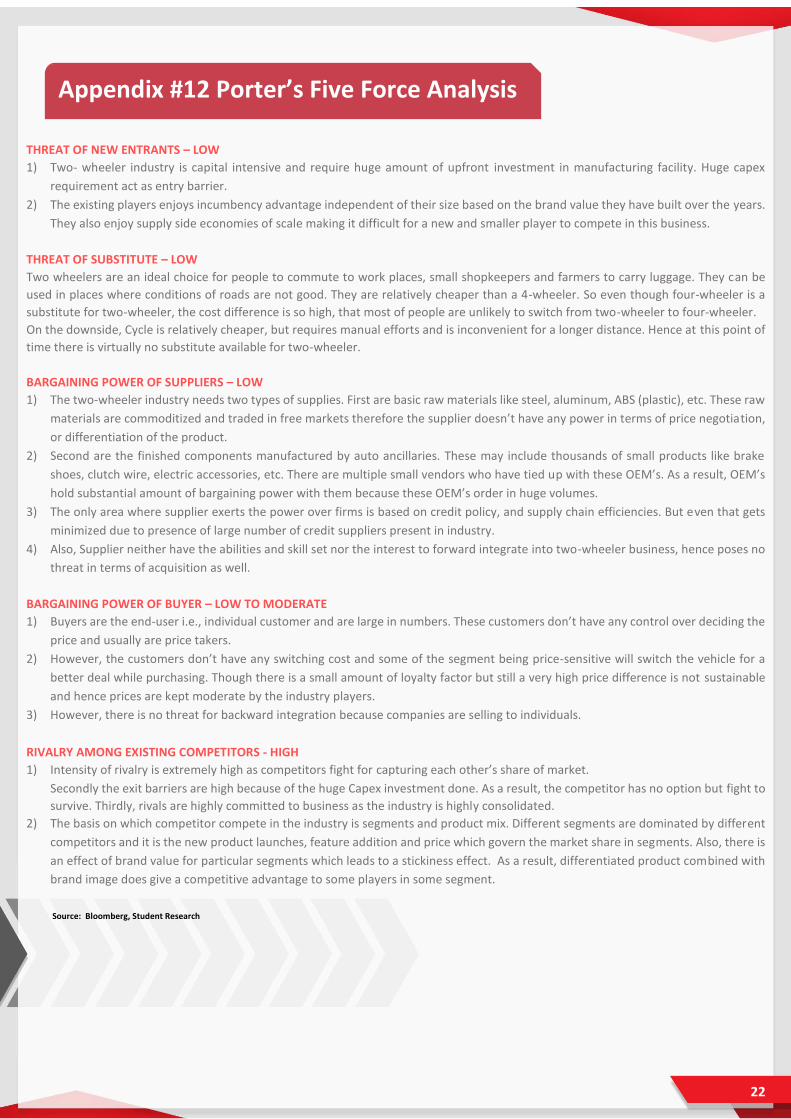
THREAT OF NEW ENTRANTS – LOW
1) Two- wheeler industry is capital intensive and require huge amount of upfront investment in manufacturing facility. Huge capex
requirement act as entry barrier.
2) The existing players enjoys incumbency advantage independent of their size based on the brand value they have built over the years.
They also enjoy supply side economies of scale making it difficult for a new and smaller player to compete in this business.
THREAT OF SUBSTITUTE – LOW
Two wheelers are an ideal choice for people to commute to work places, small shopkeepers and farmers to carry luggage. They can be
used in places where conditions of roads are not good. They are relatively cheaper than a 4-wheeler. So even though four-wheeler is a
substitute for two-wheeler, the cost difference is so high, that most of people are unlikely to switch from two-wheeler to four-wheeler.
On the downside, Cycle is relatively cheaper, but requires manual efforts and is inconvenient for a longer distance. Hence at this point of
time there is virtually no substitute available for two-wheeler.
BARGAINING POWER OF SUPPLIERS – LOW
1) The two-wheeler industry needs two types of supplies. First are basic raw materials like steel, aluminum, ABS (plastic), etc. These raw
materials are commoditized and traded in free markets therefore the supplier doesn’t have any power in terms of price negotiation,
or differentiation of the product.
2) Second are the finished components manufactured by auto ancillaries. These may include thousands of small products like brake
shoes, clutch wire, electric accessories, etc. There are multiple small vendors who have tied up with these OEM’s. As a result, OEM’s
hold substantial amount of bargaining power with them because these OEM’s order in huge volumes.
3) The only area where supplier exerts the power over firms is based on credit policy, and supply chain efficiencies. But even that gets
minimized due to presence of large number of credit suppliers present in industry.
4) Also, Supplier neither have the abilities and skill set nor the interest to forward integrate into two-wheeler business, hence poses no
threat in terms of acquisition as well.
BARGAINING POWER OF BUYER – LOW TO MODERATE
1) Buyers are the end-user i.e., individual customer and are large in numbers. These customers don’t have any control over deciding the
price and usually are price takers.
2) However, the customers don’t have any switching cost and some of the segment being price-sensitive will switch the vehicle for a
better deal while purchasing. Though there is a small amount of loyalty factor but still a very high price difference is not sustainable
and hence prices are kept moderate by the industry players.
3) However, there is no threat for backward integration because companies are selling to individuals.
RIVALRY AMONG EXISTING COMPETITORS - HIGH
1) Intensity of rivalry is extremely high as competitors fight for capturing each other’s share of market.
Secondly the exit barriers are high because of the huge Capex investment done. As a result, the competitor has no option but fight to
survive. Thirdly, rivals are highly committed to business as the industry is highly consolidated.
2) The basis on which competitor compete in the industry is segments and product mix. Different segments are dominated by different
competitors and it is the new product launches, feature addition and price which govern the market share in segments. Also, there is
an effect of brand value for particular segments which leads to a stickiness effect. As a result, differentiated product combined with
brand image does give a competitive advantage to some players in some segment.
Appendix #12 Porter’s Five Force Analysis
Source: Bloomberg, Student Research

23
Key Metrics Hero Bajaj TVS Maruti Suzuki Tata Motors M&M
10.9% 16.9% 4.2% 9.5% -5.1% 8.4%
15.0% 19.5% 6.5% 13.4% 2.5% 10.1%
35.7% 25.3% 25.6% 22.2% -11.3% 16.5%
35.7% 25.3% 19.1% 22.1% -3.2% 15.3%
24.8% 20.5% 10.3% 15.8% -4.3% 10.6%
2.3 1.2 2.4 1.7 0.9 1.3
-25.6 -20.7 -14.0 -29.3 7.0 -25.3Cash
Conversion
Cycle
PAT Margin
EBITDA
Margin
Return on
Equity
Return on
Capital
Employed
Return on
Assets
Asset
Turnover
Appendix #13 Competitive Positioning
Source: Bloomberg, Student Research
24
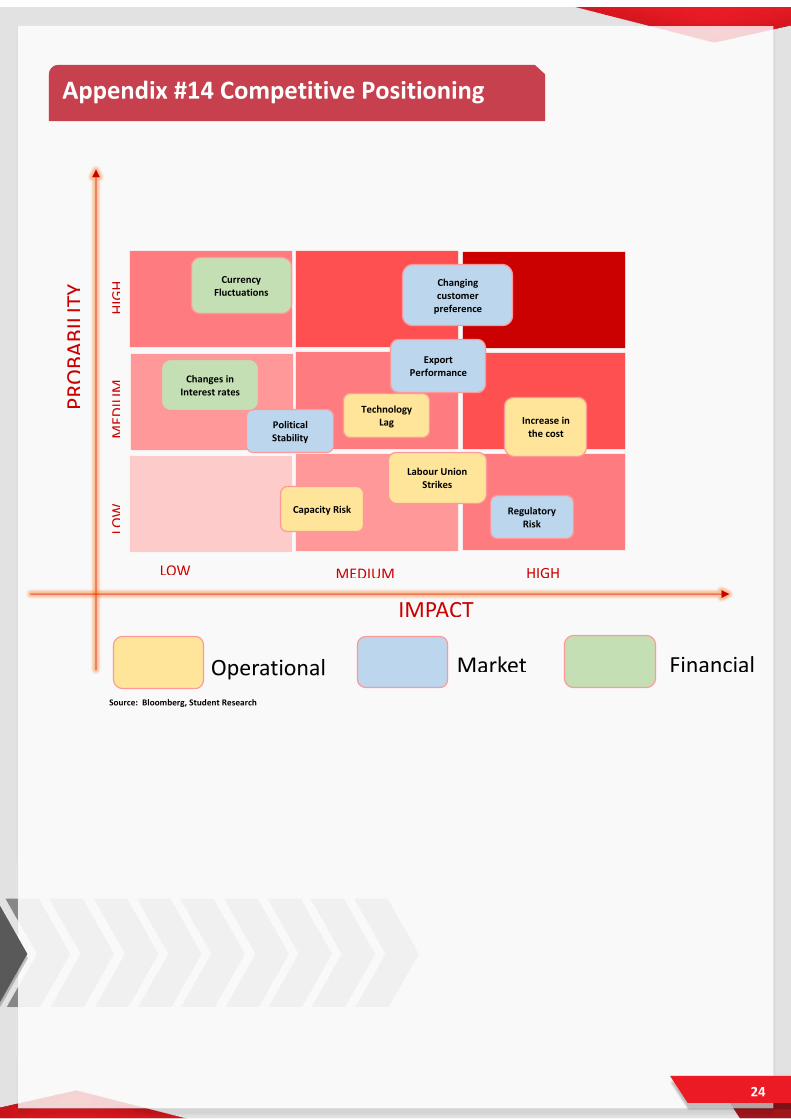
IMPACT
PR
OB
AB
ILIT
Y
Regulatory Risk
Political Stability
Increase in the cost
Technology Lag
Changing customer
preference
Capacity Risk
Labour Union Strikes
Export Performance
Changes in Interest rates
Currency Fluctuations
LOW MEDIUM HIGH
LOW
M
EDIU
M
HIG
H
Operational Risk
Market Risk
Financial Risk
Appendix #14 Competitive Positioning
Source: Bloomberg, Student Research
25
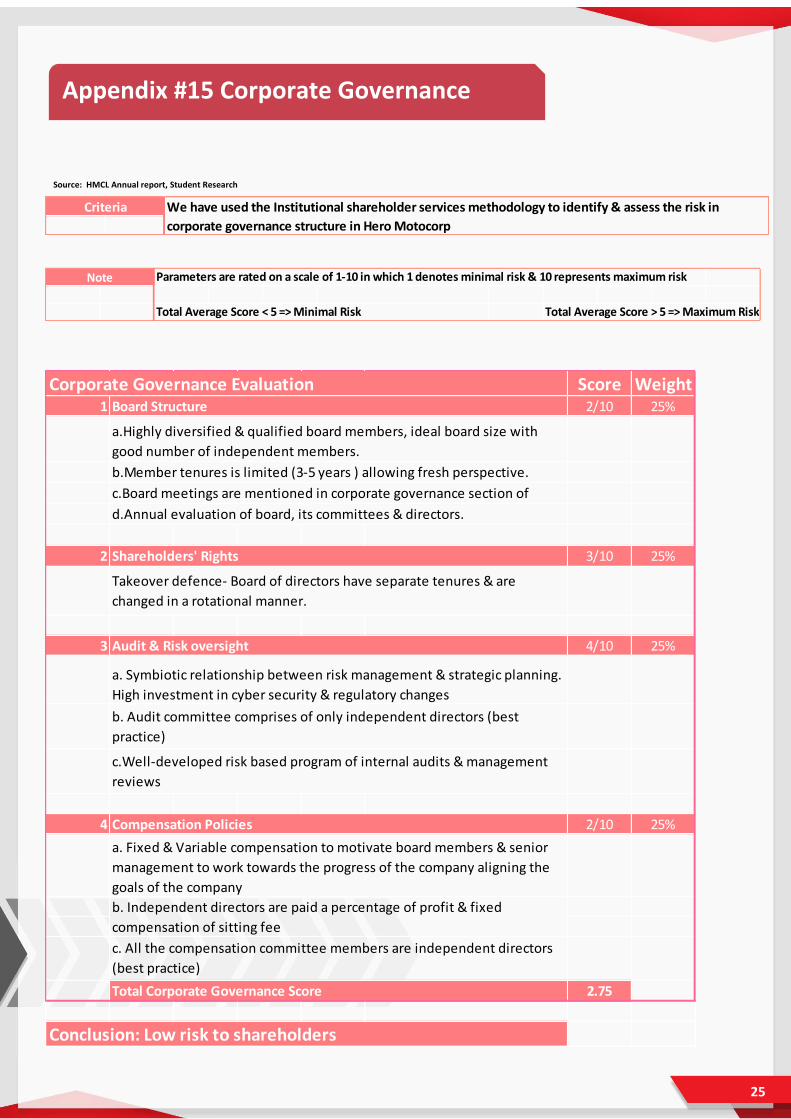
Criteria We have used the Institutional shareholder services methodology to identify & assess the risk in
corporate governance structure in Hero Motocorp
Note Parameters are rated on a scale of 1-10 in which 1 denotes minimal risk & 10 represents maximum risk
Total Average Score < 5 => Minimal Risk Total Average Score > 5 => Maximum Risk
Score Weight1 2/10 25%
2 3/10 25%
3 4/10 25%
4 2/10 25%
2.75
Conclusion: Low risk to shareholders
Shareholders' Rights
Takeover defence- Board of directors have separate tenures & are
changed in a rotational manner.
Audit & Risk oversight
a. Symbiotic relationship between risk management & strategic planning.
High investment in cyber security & regulatory changes
b. Audit committee comprises of only independent directors (best
practice)
c.Well-developed risk based program of internal audits & management
reviews
Compensation Policies
a. Fixed & Variable compensation to motivate board members & senior
management to work towards the progress of the company aligning the
goals of the company
b. Independent directors are paid a percentage of profit & fixed
compensation of sitting fee
c. All the compensation committee members are independent directors
(best practice)
Total Corporate Governance Score
Corporate Governance Evaluation
a.Highly diversified & qualified board members, ideal board size with
good number of independent members.
b.Member tenures is limited (3-5 years ) allowing fresh perspective.
c.Board meetings are mentioned in corporate governance section of
d.Annual evaluation of board, its committees & directors.
Board Structure
Appendix #15 Corporate Governance
Source: HMCL Annual report, Student Research

26
1.Ministry of Statistics and Programme Implementation, New Series of IIP with base 2011-12. Retrieved from: http://mospi.nic.in/new-series-iip-2011-12 2. Ministry of Rural Development, Average Wage Rate per Year data 2017. Retrieved from: http://rural.nic.in/ 3. Indiabudget Economic Survey Statistical Appendix. Retrieved from: http://indiabudget.nic.in/estatvol2.asp 4. IMF Real GDP Growth data, October 2017, Retrieved from: http://www.imf.org/external/datamapper/NGDP_RPCH@WEO/OEMDC/ADVEC/WEOWORLD
5. NDTV, August 14th, 2017 Article “Hero Motocorp to challenge Honda in India with three new Scooter Models”. Retrieved From: https://auto.ndtv.com/news/hero-motocorp-to-challenge-honda-in-india-with-three-new-scooter-models-1737381
6. BSE India Heromotocorp Historical Share price data. Retrieved from http://www.bseindia.com/markets/equity/EQReports/StockPrcHistori.aspx?expandable=7&scripcode=500182&flag=sp&Submit=G
7. Hero Motocorp Annual Report 2016-17 Standalone Financial Statements and Notes to Accounts. 8. Hero Motocorp Quarterly results Q1 Results Apr-Jun 2017. 9. Hero Motocorp 2015-16 CSR Report, CSR Project and activities identified. 10. Hero Motocorp Corporate Governance 2017-18 Report, Composition of Committee. 11. Economic Times Sep 19, 2017 article “Two Wheelers to lead electric vehicle market in India”. Retrieved from:
https://economictimes.indiatimes.com/industry/auto/news/industry/two-wheelers-to-lead-electric-vehicle-market-in-india/articleshow/60739035.cms
12. Indiabudget Union Budget 2016-17, 2017-18 Highlights. Retrieved from: http://indiabudget.nic.in/ub2017-18/bh/bh1.pdf 13. CRISIL Research Two-Wheeler Industry Information 2016-17. 14. CRISIL Research Two-Wheeler Industry Data 2016-17. 15. Moneycontrol Hero Motocorp shareholding data. Retrieved from:
http://www.moneycontrol.com/competition/heromotocorp/comparison/HHM
Appendix #16 References