centre of advanced faculty training in plant pathology
350
CENTRE OF ADVANCED FACULTY TRAINING IN PLANT PATHOLOGY (Indian Council of Agricultural Research, New Delhi) Proceedings of the 24 th Training on “Climate change, precision agriculture and innovative disease control strategies” March 23 to April 12, 2011 D D r r . . J J . . K K u u m m a a r r , , D D i i r r e e c c t t o o r r , , C C A A F F T T D D r r . . R R . . P P . . S S i i n n g g h h , , C C o o u u r r s s e e C C o o o o r r d d i i n n a a t t o o r r G.B. Pant University of Agriculture and Technology Pantnagar- 263 145 (Uttarakhand)
-
Upload
khangminh22 -
Category
Documents
-
view
1 -
download
0
Transcript of centre of advanced faculty training in plant pathology

CCEENNTTRREE OOFF AADDVVAANNCCEEDD FFAACCUULLTTYY TTRRAAIINNIINNGG
IINN PPLLAANNTT PPAATTHHOOLLOOGGYY
((IInnddiiaann CCoouunncciill ooff AAggrriiccuullttuurraall RReesseeaarrcchh,, NNeeww DDeellhhii))
Proceedings of the 24th
Training
on
““CClliimmaattee cchhaannggee,, pprreecciissiioonn aaggrriiccuullttuurree aanndd iinnnnoovvaattiivvee
ddiisseeaassee ccoonnttrrooll ssttrraatteeggiieess””
MMaarrcchh 2233 ttoo AApprriill 1122,, 22001111
DDDrrr... JJJ... KKKuuummmaaarrr,,, DDDiiirrreeeccctttooorrr,,, CCCAAAFFFTTT
DDDrrr... RRR...PPP... SSSiiinnnggghhh,,, CCCooouuurrrssseee CCCoooooorrrdddiiinnnaaatttooorrr
GG..BB.. PPaanntt UUnniivveerrssiittyy ooff AAggrriiccuullttuurree aanndd TTeecchhnnoollooggyy
PPaannttnnaaggaarr-- 226633 114455 ((UUttttaarraakkhhaanndd))

PREFACE
Human sufferings and epidemics of plant diseases have gone hand in hand since the earliest history of
man. History illustrates that plant diseases can have a significant effect on human society. Even today,
catastrophic plant disease exacerbates the current deficit of food supply in which at least 800 million people are
inadequately fed. Indian agriculture, basically characterized as a means of subsistence, is changing fast as per
market demands, both domestic and international. Modern high input mono-cropping based intensive agriculture
has resulted in loss of biodiversity (both flora and fauna), out-breaks of pests and diseases, degradation of soil
and water, which has ultimately led to decline in agricultural production and productivity. Climatic changes are
becoming a major factor in the present scenario.
The importance of plant diseases in terms of causing restrictions to global food production is well
understood. The analysis of the potential impacts of climate change on plant diseases is therefore essential for the
adoption of adaptation measures, as well as for the development of resistant cultivars, new control methods or
adapted techniques, in order to avoid more serious losses. Accelerated climate change affects components of
complex biological interactions differentially, often causing changes that are difficult to predict. Crop yield and
quality are affected by climate change directly, and indirectly, through diseases that themselves will change but
remain important.
The 21-day training under Center of Advanced Faculty Training in Plant Pathology envisaged to address
certain core issues that unravel, address or supplement strategies that are either in demand or are in vogue for
sustaining food productivity in the country taking into account the newer threats posed by changing productions
systems and climatic aberrations. It was also intended to address proactive and responsive communication
strategies to enable effective implementation of both the technologies already on the shelf, and those that will
flow from future research. Excellent response was received from all over India for participation in this training.
Twenty participants representing nine states, who actively participated in the programme, were exposed to the
recent advances made towards Climate change, precision agriculture and innovative disease control strategies
through series of lectures, practical and field visits.
We are grateful to the ICAR for sponsoring this 23rd
advanced training programme in series, and the 2nd
under the banner of the newly created Centre of Advanced Faculty Training in Plant Pathology at Pantnagar .
We are highly grateful to Prof. B.S. Bisht, Vice-Chancellor for his constant support, guidance and encouragement
in making the training a great success. We like to put on record the help and guidance received from Dr. S.K.
Saini, Dean Agriculture and Dr. J.P. Pandey, Director, Experiment Station in the successful conduct of training
programme. We sincerely acknowledge the services of our guest speakers Dr. Rakesh Pandey, CIMAP, Lucknow,
Dr. Y.P. Singh, FRI, Dehradun; Dr. D.K. Chakrabarti, NDUAT, Faizabad, Dr. Roopam Kapoor, Delhi
University, Dr. K.S. Hooda, DMR, Delhi and Dr. S.L. Chaudhary, MPUAT, Udaipur. We would like to place on
record the help and logistic support received from Dr. M.C. Nautiyal, Dean, Hill Campus, Ranichauri and his
team of scientists for delivering lectures during exposure visit of participants. Several scientists from various
departments such as Agronomy, Soil Science, Entomology, Genetics and Plant Breeding, Agriculture
Communication, Agrometeorology, Biological Science, Microbiology, Molecular Biology & Genetic Engineering,
Chemistry, Physics, Environmental Science, Farm Machinery & Power, Irrigation and Drainage Engineering,
Vet. Anatomy and the University library in addition to the Plant Pathology rendered all possible help and
delivered scientific lectures and designed practical exposure to the participants. We acknowledge their
contributions with utmost gratitude and sincerity.
Pantnagar
April 11, 2011
Dr. R.P. Singh
Course Coordinator
Dr. J. Kumar
Director, CAFT

CONTENTS
Sl. No. Title Speaker Page
Welcome Address Dr. J. Kumar i-iii
Inaugural Address Prof. B.S. Bisht i-iii
1. Department of Plant Pathology Dr. J. Kumar 1-23
2. Climate Change and Impacts on Plant Diseases Dr. H.S. Tripathi 24-25
3. Climate Change and Food Security: Enhancing
Adaptation Capabilities as a Response to Global
Warming in Fragile Mountain Ecosystems
Dr. Vir Singh 26-39
4. Disease Management in Precision Farming Dr. V.S. Pundhir 40-42
5. Climate Change and Mitigatory Measures with
Reference to Hill
Dr. Uma Melkania 43-47
6. Climate Change and Plant Diseases Dr. N.S. Murty 48-52
7. Impact of Agricultural Intensification on Carbon
Sequestration and Soil Health
Dr. K.P. Raverkar 53-62
8. Seed Health Testing: Retrospective and
Perspectives
Dr. K. Vishunavat 63-67
9. Communication Skills in Teaching Dr. B. Kumar 68-72
10. Climate Change in Social Perspective Dr. R.P. Singh 73-81
11. Resource Conservation Techniques in Plant Health
and Disease Management: No Till or Reduced Till
Cropping System
Dr. K.P. Singh 82-86
12. Role of Eco-friendly Approaches in Integrated
Pests and Disease Management
Dr. Ruchira Tewari 87-94
13. Advances in Electron Microscopy and application in
Plant Pathology
Dr. Balvinder Singh 95-104
14. Plant Disease Forecasting (Late Blight Forecasting) Dr. V.S. Pundhir 105-110
15. Recent Molecular Biology Tools for Rhizospheric
Community Analysis for Effective Introduction of
Bioagents Application for Organic Agricultural
Practices
Dr. A.K. Gaur 111-115
16. GIS Application in Precision Farming and Plant
Disease Management
Dr. A.K. Agnihotri 116-121
17. Nanotechnology: A Modern Tool for Precision
Farming
Dr. K.P. Singh 122-126
18. Knowledge Transfer: Issues and Expectations Dr. K.P. Singh 127-131
19. Importance of Multitrophic Interactions for
Sucessful Biocontrol of Plant Parasitic Nematodes
with Fungal and Bacterial Antagonists
Dr. Rakesh Pandey 132-137
i

20. Biological Control of Frost Injury: Role of Ice
Nucleating Bacteria
Dr. S.C. Saxena 138-144
21. Characterization of Pathogen Population and
Resistance Management: A Case Study of Rice
Blast Pathosystem
Dr. J. Kumar 145-149
22. Visit to Automatic Weather Station and
Meteorological Observatory at CRC
Dr. H.S. Kushwaha 150-157
23. Toxicological Investigations on the Emerging Pest
Problems in the Important Crops
Dr. S.N. Tiwari 158-160
24. HPLC – An Important Tool for assessment of
Fungicide residues in Crops
Dr. Anjana
Srivastava
161-164
25. Novelties in Mango Malformation Research Dr. D.K. Chakrabarti 165-168
26. Precision Agriculture for Higher Productivity and
Profitability
Dr. Rajeew Kumar 169-175
27. Overcoming Nutritional Deficiencies and Toxicities
in Crop Plants
Dr. P.C. Srivastava 176-177
28. Precision in Soil and Nutrient Management with
Special Reference to Subsoil Health
Dr. T.C. Thakur 178-182
29. Bio-control Strategies for the Management of
Threatening Diseases by Use of Trichoderma spp
Dr. Najam Waris
Zaidi
183-191
30. Environmental Factors Influencing Ascospore
Viability, Conidium Production, Dissemination, and
Germination of V. inaequalis
Dr. K.P. Singh 192-196
31. Carbon Sequestration: Bamboo-Mycorrhizae Dr. Y.P. Singh 197-213
32. Plant Healthcare for Resource Poor Farmers –
Technologies for Disease Management in Low
Input Systems
Dr. J. Kumar 214-220
33. Metagenomics-A Tool for Identification and
Characterization of Uncultivated Microbial Diversity
Dr. Reeta Goel 221-224
34. Effect of Climate Change on Plant-Pathogen
Interactions
Dr. Rupam Kapoor 225-228
35. Soil Solarization and Its Application in Plant
Disease Management
Dr. Yogendra Singh 229-233
36. Precision Farming with Special Relevance to
Irrigation and Fertigation
Dr. P. K. Singh 234-240
37. Induced Systemic Resistance against White Rust of
Mustard by Pre-or Coinoculation with an
Incompatible Isolate
Dr. R.P. Awasthi 241-249
38. Multilines and Cultivar Mixtures for Plant Disease
Management
Dr. P.K. Shrotria
250-257
ii

39. SAS: An Introduction and its Applications Dr. S.B. Singh 258-265
40. Innovations in Agrochemical Formulation
Technology for Safety and Efficacy
Dr. Shishir Tandon
266-275
41. Innovations in Agro-chemical Application
Technology for Safety and Efficacy
Dr. T.P. Singh 276-288
42. Wheat Rusts: New Virulences threatening Global
Wheat Production and Strategies to Manage
Dr. K.P. Singh 289-296
43. Plant Diseases in Changing Climate Dr. K.S. Hooda 297-303
44. Evaluation and Selection of Promising Trichoderma
Isolates For the Management of Soil Borne Fungal
Plant Pathogens
Dr. A.K. Tewari 304-307
45. Major Seed Pieces Transmissible Diseases of
Sugarcane and their Management by Three Tier
Seed Programme
Dr. R.K. Sahu 308-314
46. Biolog: Microbial Identification System Dr. R.P. Singh 315-316
47. Role of Plant Genetic Resources in Plant Disease
Management
Dr. R.K. Khulbe 317-319
48. Disease Management under Protected Cultivation Dr. R.P Singh 320-322
49. Engineering Resistance against Biotic Stress
Affecting Horticultural and Field Crop
Dr. N.K. Singh 323-327
Valedictory Address Vice-Chancellor i-ii
Annexure- I (Committee members) ---
i
Annexure- II (List of Participants) ---
i-iii
Annexure- III (List of Speakers) ---
i-ii
Annexure- IV (Training Course Schedule) ---
i-iv
iii

WELCOME ADDRESS by
Dr. J. Kumar Director CAFT
Prof. & Head, Plant Pathology, College of Agriculture
G.B. Pant University of Agriculture & Technology, Pantnagar- 263 145
on
March 25, 2011
Good morning and welcome to the
Inaugural Session of the 24th CAFT training on
“Climate change, Precision agriculture and
innovative disease control strategies”.
Hon’ble Chief guest, Dr. B. S. Bisht, the
Vice-Chancellor; Dr. J.P. Pandey, Director
Experiment Station and Dr. S.C. Saxena,
honorary professor, Dr. R.P. Singh, Course
Coordinator of the present training, Deans and
Directors, Head of Departments, Senior faculty
members, Colleagues, Staff members, the
trainees from different universities, Students,
Press & Media, Ladies & Gentle men.
At the outset, on behalf of faculty of Plant
Pathology and on my own behalf and also as
officiating Dean, College of Agriculture, it is a
pleasure in welcoming honorable Vice-
Chancellor, Dr. B.S. Bisht, who is known for his
immense energy, strong integrity and
commitment. Dr. Bisht, an alumni of this
University, has had a long distinguished
professional career in various capacities in the
country before joining ICAR where he was
responsible for designing, implementing and
monitoring human resource development
programmes towards academic excellence and
R&D. Dr. Bisht is a big support and source of
inspiration for the pursuance of research and
academics in this Great University as well. You
have consented to grace this occasion despite
your very hectic schedule of work, we are all very
grateful to you, Sir.
It is a pleasure in welcoming Dr. J. P.
Pandey, the Director of Research who has been
very successfully coordinating and leading a very
diverse research prograame in the university. We
all members of Plant Pathology faculty welcome
you.
I would also like to welcome Dr. S.C.
Saxena, the senior most person in the College
and a honorary professor in the Department of
Plant Pathology. Dr. Saxena is the First
Generation Staff in the Department as well as
the College and is an appropriate interface to the
younger generations coming to the Department.
I would also like to welcome my
colleague Dr. R.P. Singh, the Course
Coordinator of this CAFT training.
I welcome all the Deans and Directors
who are present here in the hall. They have
spared their valuable time to grace this occasion.
The Heads and faculty members of
various departments have also responded to our
request and are present in the hall. I welcome all
of you to the function.
The participants of the training from
different universities have traveled a long
distance to reach Pantnagar. At Pantnagar you
may miss the comfort and attractions of big cities
but the warmth of academic that exists at this
i

place and a very exhaustive work that awaits you
should keep you engrossed and compensate for
any logistic inadequacies. I welcome you all and
assure you a comfortable stay within our means.
In the last, but not the least, I welcome all
our students and staff, press and media and
others who are present in the hall and made the
arrangements for this inaugural session.
Ladies and gentlemen, the department of
Plant Pathology was created and accredited by
ICAR in 1961 and ever since the Department has
had a strong commitment to, and history of,
sound education, research and extension in
Plant Pathology. Dr. Y.L.Nene was the first
Head of the Department. Under his capable
leadership, the department expanded to include
many dedicated and extraordinary faculty
members including Dr. R.S. Singh and Dr.
Mukhopadhyay whose programmes made the
Department the recognized leader in the country.
The next generation of faculty members like the
first responded to the changing needs presented
by the modern agriculture. At present the
Department includes 9 professors, one senior
professor as Emeritus Scientist and one as honorary
professor, one honourary professor from INRA,
France, four Associate Professors and one Assistant
Professor with 14 technical and 11 supporting
staffs. The entire staff upholds the Department’s
commitment to education, basic and applied
research and extension.
The Department has a well-knit under
graduate (U.G.) and post graduate (P.G.)
programme with updated and modern course
curricula. It offers six U.G. and 20 P.G. courses.
A broad range of carefully designed courses
complimented by lectures in other Departments
appropriately address the academic needs of the
students. The great diversity in areas of
expertise and interests present in the
Department leads to diversity in thesis titles. So
far about 300 M.Sc. and 160 Ph.D. students
have earned degrees from the Department.
The Department is actively engaged in
the research work on both fundamental and
applied aspects in the domains of ecology of soil
borne plant pathogens, epidemiology and
forecasting, biological control and IPM including
small farms technologies, molecular diagnostics,
pathogen population biology, seed pathology,
fungicides, nematology, phytovirology,
phytobacteriology and biology & technology of
mushroom production.
The distinguished faculty of the
Department has brought in a number of national
and international research grants besides a
series of AICRPS. For a number of AICRPs
such as those of Maize, Oilseeds, Potato, and
Seeds the faculty members of the Department
render services as the Project Coordinators also.
Over the years, the trained and
accomplished faculty members as well as
students while addressing current issues in Plant
Pathology have won over 40 national and
international awards. Individual staff members
with in the department have long been
recognized for their leadership role in the science
of Plant Pathology. By way of their contributions
many faculty members of the Department have
earned International positions. Also a number of
faculty members have served as president, vice
presidents, and zonal president of several
professional societies
The Department has a unique distinction
of producing 56 books published by not only
Indian but also reputed international publishers.
This is besides a series of technical bulletins, lab
manuals, compendia and extension literature
that have also been prepared.
The Department, besides other fields,
has a strong set up in IPM and biocontrol and
has given a number of technologies for both
ii

plains and hills. The biocontrol lab in the
Department has been recognized as the referral
lab by DBT. In the recent past, Government of
India has declared the Biocontrol Lab in the
Department to perform the functions of the
`Central Insecticide Lab’ for biopesticides.
Similarly the Department also holds big strength
in mushroom research and trainings.
In view of quality of teaching, research
and extension work being carried out by the
department, ICAR upgraded the department to
the status of CAS in Plant Pathology in the year
1995 with the major mandate to train scientific
faculty from all over the country in important and
innovative areas of Plant Pathology. So far 23
trainings have been conducted wherein 478
scientists from 24 states have participated.
The topic of the present training under
CAFT is ‘Climate change, Precision agriculture
and innovative disease control strategies’. The
importance of the environment on the
development of plant diseases has been known
for over two thousand years. We know that the
environment can influence host plant growth and
susceptibility; pathogen reproduction, dispersal,
survival and activity; as well as host-pathogen
interaction. The classic disease triangle
establishes the conditions for disease
development, i.e. the interaction of a susceptible
host, a virulent pathogen and a favourable
environment. The intimate relationship between
the environment and diseases suggests that the
observed climate change will definitely cause
modifications in the current agriculture
production and phytosanitary scenario. The
impacts can be positive, negative or neutral,
since there can be a decrease, an increase or no
effect on the different pathosystems.
The importance of plant diseases in
terms of causing restrictions to global food
production is well understood. The analysis of
the potential impacts of climate change on plant
diseases is therefore essential for the adoption of
adaptation measures, as well as for the
development of resistant cultivars, new control
methods or adapted techniques, in order to avoid
more serious losses.
I will not go into the details about the
topic because it would be introduced to you more
appropriately by the Chief Guest.
However, I would like to mention that
Water-limiting environments, pest and diseases,
declining fertility, availability and degradation of
the soil resource are among key constraints to
increasing production and quality of food.
Climate change adds an extra layer of
complexity to an already complex agro-
ecological system. Intensive agriculture has been
a key component of green revolution. However
during last one decade or so, stasis in agriculture
production has been witnessed even after
replication of the same technology in different
regions. It is the time to redefine green revolution
by adding a component of precision agriculture
as well as improvised plant protection strategies
for sustainable agriculture. I would thus like to
extend my appreciations and special gratitude to
the Faculty of Plant Pathology for their
endorsement of the topic for the present CAFT
training.
Finally, I would like to thank our Vice-
Chancellor for allowing us to hold this training.
With these words I welcome you all and
assure a fruitful and comfortable stay to the
participants of this 24th training programme of
CAFT in Plant Pathology.
Thank you very much!
* * * * * * * * *
iii

Chairman’s Remarks by
Prof. B.S. Bisht
Vice-Chancellor
G.B. Pant University of Agriculture & Technology, Pantnagar- 263 145
on
March 25, 2011
I consider it a great privilege to be
called upon to inaugurate the training course
“CLIMATE CHANGE, PRECESION
AGRICULTURE AND INNOVATIVE DISEASE
CONTROL STRATEGIES” being organized by
the Centre of Advanced Faculty Training
(CAFT) in Plant Pathology. I am delighted to
know that as many as 20 scientists from
different SAUs from various parts of the
country are participating in the training course.
I extend my warm welcome to you all.
I hope all of you know that Pantnagar
University has a distinguished record of
producing outstanding Plant Pathologists. The
accomplishments of this Department have been
outlined for you by the Director CAFT. However,
I would like to make a mention of two great plant
pathologists, Dr. Y.L. Nene and Dr. R.S. Singh,
who gave inspiring leadership to the Department
of Plant Pathology soon after the establishment
of the University on November 17, 1960. You
may well be aware that discovery of Khaira
diseases of rice due to zinc deficiency and its
control turned this Tarai into rice bowl of the
country. It is widely acknowledged as one of the
most important plant pathological discovery not
only in India but at the global level that had
maximum impact on farmers. You may also be
aware that Dr. R.S. Singh worked out basic
mechanisms for obtaining the disease control of
soil-borne plant diseases through organic
amendments, which is now becoming a reality
and way of organic farming. His books are
considered to be the milestones for being handy
text books both for under graduate and post
graduate students in Plant Pathology. This
department has to its credit number of research
publications and books that have been published
by some of the most reputed national and
international publishers from the USA and
Europe. The Department was rightly considered
by the ICAR for granting the status of Canter of
Advanced Studies in Plant Pathology in 1995,
and again, after the review, given the status of
Centre of Advanced Faculty Training in 2010. I
am aware that this Department is one of the very
few CAFTs in Plant Pathology in the country,
and thus has an important role not only in
training faculty from the country but also devising
improvised and sustainable methodologies for
plant disease management keeping in view the
alarming issue of food safety and food security in
21st century.
Dear participants, the FAO estimated
that 1.02 billion people went hungry in 2009,
the highest ever level of world hunger, mainly
as a result of declining investment in
agriculture. Land degradation, urban
expansion and conversion of crops and
croplands for non-food production will reduce
i

the total global cropping area by 8–20% by
2050. This fact, combined with water scarcity,
is already posing an alarming challenge to
increase food production by 50% to meet the
projected demand of the world’s population by
2050.
The World Food Summit of 1996
defined food security as existing “when all
people at all times have access to sufficient,
safe, nutritious food to maintain a healthy and
active life”. Therefore total food production
alone does not define food security since food
must be both safe and of appropriate nutritive
value.
Plant diseases are a major impediment
to the production and quality of important food
stuffs, and diseases that affect quality and
food safety. Pest and disease management
has played its role in doubling food production
in the last 40 years, but pathogens still
claim10–16%of the global harvest. In addition
to reducing yield, they are of particular concern
because of their direct impacts on human and
animal health.
Furthermore, food also has social
values. Food must be accessible and
affordable. This is dependent on production,
distribution and trading infrastructure and
mechanisms. All these factors may be affected
by climate change, and some are affected both
directly and indirectly through pest- and
pathogen-mediated changes that occur
because of climate change.
Climate change primarily mediates the
influence of plant diseases to affect
production, quality and safety of food.
Mycotoxins and pesticide residues in food are
among the top food safety concerns
associated with a changing climate.
Climate change and global warming
are the two momentous problems of the
present world. The earth’s climate has always
changed in response to changes in the
atmospheric and interacting factors but human
activities are now increasingly influencing
changes in global climate. Since 1750, global
emissions of radiatively active gases, including
CO2, coming from industry has increased
rapidly as a result of the use of carbon-based
fuels. Over the last 100 years, the global mean
temperature has increased by 0.74 0C and
atmospheric CO2 concentration has increased
from 280 ppm in 1750 to 368 ppm. in year
2000. Temperature is projected to increase by
3.40C and CO2 concentration to increase to
1250 ppm by 2095, accompanied by much
greater variability in climate and more extreme
weather related events.
Meeting this difficult challenge will be
made even harder if climate change melts
portions of the Himalayan glaciers to affect
25% of world cereal production in Asia by
influencing water availability and more frequent
floods affecting lives and livelihoods. These
changes will produce cropping changes which
will have implications for food availability,
directly or indirectly, through, consequent
changes in pathogen and pest incidence and
severity.
Plant pests and diseases could
potentially deprive humanity of up to 82% of
the attainable yield in the case of cotton and
over 50% for other major crops. Each year an
estimated 10–16% of global harvest is lost to
plant diseases. In financial terms, disease
ii

losses cost US $ 220 billion. There are
additional post harvest losses of 6–12%; these
are particularly high in developing tropical
countries that lack infrastructure. Plant
diseases can be far reaching and alter the
course of society and political history as
attested by the devastations from infamous
19th century Irish potato famine or the Bengal
famine.
In common with the past triumphs of
world agriculture that gave us the green
revolution to save millions from starvation, a
major component of the solution will have to
come from improved technology. This is a
timely reminder to all plant protection
specialists that if the goal of increasing the
yield and quality is to be achieved,
communication of research technology must
extend beyond the farm gate to promote
increased awareness among policy makers
and the society at large.
To understand how best to control plant
diseases to improve food security in the
context of climate change, plant protection
professionals must work with societal change,
defining its key processes and influencers to
effect change. More specifically they have a
key role to play in improving food security.
Plant pathologists and other crop
protection professionals develop and deploy
strategies based on well-established principles
to manage plant diseases and many may also
be applicable under climate change when
projected changes, processes and interactions
are factored in. Therefore, research to improve
adaptive capacity of crops by increasing their
resilience to diseases may not involve a totally
new approach. The bulk of any new
investment to improve control of disease in
food crops, therefore, needs only to accelerate
progress of new and existing promising
strategies and approaches and not to ‘re-
invent the wheel’ under the guise of climate-
change research.
It is a matter of great pleasure that the
Centre of Advanced Faculty Training in Plant
Pathology is suitably organizing this advanced
training programme on. It is hoped that the
scientists participating in this course would
effectively utilize the knowledge earned not
only in doing research and teaching but also to
find out ways and means of transferring the
technology to the farmers who are the sole
judge of our R&D efforts.
I have thus pleasure in the declaring
the training course “CLIMATE CHANGE,
PRECESION AGRICULTURE AND
INNOVATIVE DISEASE CONTROL
STRATEGIES” open and I wish the training
course, discussions and deliberations a grand
success.
‘Jai Hind’
* * * * * * * * *
iii

(Climate Change, Precision Agriculture and Innovative Disease Control Strategies)
- 1 -
DEPARTMENT OF PLANT PATHOLOGY
Establishment of University – 1960
Department created and Accredited – 1961
M. Sc. (Ag) Programme – 1963
Ph. D. Programme – 1965
Ist course – Introductory Plant Pathology
Ist Instructor – Dr. Y. L. Nene
Ist HOD – Dr. Y. L. Nene
Courses:
06 UG courses
32 PG courses
Staff position:
09 Professor
02 Honorary Professor
01 Emeritus Scientist
05 Associate Professor
02 Assistant Professor
13 Technical staff
10 Supporting staff
The G.B. Pant University of Agriculture & Technology (earlier known as U.P. Agriculture
University) was established in 1960. Department of Plant pathology was created and accredited by ICAR
in 1961. The postgraduate degree programme leading to M.Sc. (Ag.) Plant Pathology and Ph.D. Plant
Pathology were started in 1963 and 1965, respectively.
Faculty of Plant Pathology is highly qualified and includes 09 professors, 02 Honorary Professor,
01 Emeritus Scientist, 05 Associate Professors and 02 Assistant Professor with 13 technical staff and 10
supporting staffs.
Sl. No. Name of Faculty members Designation Area of specialization
1 Dr. Serge Savary Honorary Professor Epidemiology
2 Dr. S.C. Saxena Honorary Professor Maize Pathology
3 Dr. J. Kumar Professor & Head Plant disease management on small farm, IPM, Biological control, Molecular characterization of Plant Pathogens
4 Dr. H.S. Tripathi Professor Pulse diseases & virology
5 Dr. R.P. Awasthi Professor Oilseed crop disease
6 Dr. K.S. Dubey Professor Soybean diseases

(Climate Change, Precision Agriculture and Innovative Disease Control Strategies)
- 2 -
7 Dr. (Mrs.) K. Vishunavat Professor Seed Pathology
8 Dr. U.S. Singh (on E.O.L.) Professor IPM & Biocontrol
9 Dr. V.S. Pundhir Professor Epidemiology of crop disease
10 Dr. Pradeep Kumar Professor Maize Pathology
11 Dr. R. K. Sahu Professor Sugarcane diseases
12 Dr. Vishwanath Assoc. Professor Soybean Pathology
13 Dr. R.P. Singh Sr. Research Officer Vegetable & maize pathology
14 Dr. Yogendra Singh Sr. Research Officer Sorghum diseases
15 Dr. K.P.S. Kushwaha Sr. Research Officer Mushroom & pulse diseases
17 Dr. A.K. Tewari Sr. Research Officer Oilseed crops diseases
18 Dr. (Mrs.) Deepshikha Jr. Research Officer Wheat diseases
19 Dr. (Mrs.) N.W. Zaidi SMS Bio-control
TEACHING
The department of plant pathology has made immense contribution in the area of teaching,
research and extension. A well-knit UG and PG programme with updated and modern syllabi is
already in operation in the department. The department offers 6 courses for undergraduate
students. There are 20 postgraduate courses leading to M.Sc. (Ag.) and Ph.D. degrees in Plant
Pathology. Since the inception of the department 313 M.Sc. (Ag.) and 176 Ph.D. students have
been awarded degrees.
Under graduate courses:
Sl. No. Course N0. Course name Credit
1. APP-312 Introductory Plant Pathology 3(2-0-3)
2. APP-314 Crop Diseases & their Management 2(1-0-3)
3. APP-330 Diseases of Fruit and Vegetable Crops 2(1-0-3)
4 APP/APE-322 Integrated Pest & Disease Management 2(1-0-3)
5. APP-381 Mushroom Cultivation 1(0-0-1x2)
6. APP-382 Biological Control of Plant Pathgen 2(0-0-2x2)
Post graduate courses:
Sl. No. Course N0. Course name Credit
1. APP-507 Disease of Field and Medicinal Plants 3(2-0-1)
2. APP-508 Disease of Fruits, Plantation and Ornamental Crops
3(2-0-1)
3. APP-509 Disease of Vegetable and Spice Crops 3(2-0-1)
4 APP/ENT- 514 Insects Vector of Plant Viruses and other Pathogens
2(1-0-1)
5. APP-515 Biological Control of Plant Diseases 3(2-0-1)
6. APP-516 Integrated Disease Management 3(2-0-1)
7. APP-517 Mushroom Production Technology 3(2-0-1)
8. APP-519 Post Harvest Disease 3(2-0-1)

(Climate Change, Precision Agriculture and Innovative Disease Control Strategies)
- 3 -
9. APP/ENT-520 Plant Quarantine 2(2-0-0)
10. BBB-599* Mycology 3(2-0-1)
11. APP-600 Master’s Seminar 1(0-0-1)
12. APP-601 Special Problem 1
13. APP-602 Plant Virology 3(2-0-1)
14. APP-603 Plant Bacteriology 3(2-0-1)
15. APP-604 Principles of Plant Pathology 3(3-0-0)
16. APP-606 Principles of Plant Disease Management 3(2-0-1)
17. APP-607 Plant Biosecurity and Biosafety 2(2-0-0)
18. APP-611 Chemicals in Plant Disease Management 3(2-0-1)
19. BBB-615* Advanced Mycology 3(2-0-1)
20. APP-616 Advanced Plant Virology 3(2-0-1)
21. APP-617 Advanced Bacteriology 3(2-0-1)
22. APP-618 Principles and Procedures of Certification 1(1-0-0)
23. APP-622 Techniques in Phytonematology 1(0-0-1)
24. APP-624 Cultural & Chemical Control of Plant Parasitic Nematodes
2(1-0-1)
25. APP-630 Phytonematology 2(1-0-1)
26. APP-690 Master Thesis Research 20
27. APP-704 Molecular Basis of Host Pathogen Interaction 3(2-0-1)
28. APP-710 Seed Health Technology 3(2-0-1)
29. APP-712 Ecology of Soilborne Plant Pathogen 3(2-0-1)
30. APP-713 Disease Resistance in Plants 2(2-0-0)
31. APP-718 Epidemiology and Forecasting of Plant Diseases
3(2-0-1)
32. APP-788 Doctoral Seminar I 1(0-0-1)
33. APP-789 Doctoral Seminar II 1(0-0-1)
34. APP-790 Ph.D. Thesis Research 45
*Course offered by Department of Biological Science, CBSH
Books Published
The department has unique distinction of producing 33 books published by not only Indian
but also reputed international publishers like Elsevier Science (UK), Gordon and Beach (UK),
Prentice Hall (USA), CRC Press (USA), Science Publisher (USA), Lewis Publishers (USA) etc. It
has also produced 13 technical bulletins. A number of text books in Hindi for U.G. students have
been published. The faculty members have written/prepared several laboratory manuals,
reference books, working sheets on diseases, bulletins, extension pamphlets, etc. for the benefit of
U.G. and P.G. students of plant pathology as well as for the farmers.
(A) Hindi – (15) (B) English– (41)
Plant Disease 8th Edition by R.S. Singh
An Introduction to Principles of Plant Pathology 4th Edition by R.S. Singh
Plant Pathogens: The Fungi by R.S. Singh
Plant Pathogens: The Viruses & Viroids by R.S. Singh
Plant Pathogens: The Prokaryotes by R.S. Singh
Integrated Disease Management by R.S. Singh
Diseases of Fruit Crops by R.S. Singh
Fungicides in Plant Disease Control by P.N. Thapliyal and Y.L. Nene

(Climate Change, Precision Agriculture and Innovative Disease Control Strategies)
- 4 -
Diseases of Annual Edible Oilseed Crops Vol.-I by S.J. Kolte
Diseases of Annual Edible Oilseed Crops Vol.-II by S.J. Kolte
Diseases of Annual Edible Oilseed Crops Vol.-III by S.J. Kolte
Diseases of Linseed & Fibre Flex by S.J. Kolte
Castor Diseases & Crop Improvement by S.J. Kolte
Plant Diseases of International Importance Vol.I: Diseases of Cereals & Pulses by
U.S. Singh, A. N. Mukhopadhyay, J. Kumar, and H.S. Chaube
Plant Diseases of International Importance Vol.II: Diseases of Vegetables & Oil Seed
Crops by H.S. Chaube, U.S. Singh, A. N. Mukhopadhyay & J. Kumar
Plant Diseases of International Importance Vol.III: Diseases of Fruit Crops by Drs. J.
Kumar, H.S. Chaube, U. S. Singh & A. N. Mukhopadhyay
Plant Diseases of International Importance Vol.IV: Diseases of Sugar, Forest &
Plantation Crops A. N. Mukhopadhyay, J. Kumar, H.S. Chaube & U.S. Singh
Pathogenesis & Host Specificity in Plant Diseases Vol.I: Prokaryotes by U. S. Singh,
Keisuke Kohmoto and R. P. Singh
Pathogenesis & Host Specificity in Plant Diseases Vol. II: Eukaryotes by Keisuke
Kohmoto, U.S. Singh and R. P. Singh
Pathogenesis & Host Specificity in Plant Diseases Vol. III: Viruses & Viroids by R. P.
Singh, U.S. Singh and Keisuke Kohmoto.
Aromatic Rices by R.K. Singh, U.S. Singh and G. S. Khush
A Treatise on the Scented Rices of India by R.K. Singh and U.S. Singh
Scented Rices of Uttar Pradesh & Uttaranchal by R. K. Singh and U.S. Singh
Plant Disease Management : Principles & practices by H.S. Chaube and U.S. Singh
Molecular Methods in Plant Pathology by R. P. Singh and U.S. Singh
Soil Fungicides Vol.-I by A.P. Sinha and Kishan Singh
Soil Fungicides Vol.-II by A.P. Sinha and Kishan Singh
Experimental & Conceptual Plant Pathology Vol.I: Techniques by R.S. Singh, U. S.
Singh, W.M. Hess & D.J. Weber
Experimental & Conceptual Plant Pathology Vol. II: Pathogenesis and Host
Specificity by R.S. Singh, U. S. Singh, W.M. Hess & D.J. Weber
Experimental & Conceptual Plant Pathology Vol.III: Defense by R.S. Singh, U. S.
Singh, W.M. Hess & D.J. Weber
Seed Pathology, 2 volumes by V.K. Agarwal
Phytopathological Techniques by K. Vishunavat and S.J. Kolte
Crop Diseases & Their Management by H.S. Chaube & V.S. Pundhir
Seed borne diseases of crops & their management by V.K. Agrawal & Y.L. Nene
Plant Pathogens: the Nematodes by R.S. Singh
Disease of vegetables crops by R.S. Singh

(Climate Change, Precision Agriculture and Innovative Disease Control Strategies)
- 5 -
Introductory Plant Pathology by H.S. Chaube & Ram Ji Singh
Seed Health Testing: Principles and Protocols by Karuna Vishunavat
Fundamentals of Seed Pathology by Karuna Vishunavat
Mushroom Production Technology by R.P. Singh & H.S. Chaube
The Elements of Plant Virology: Basic concepts and practical class exercises by S.J.
Kolte & A.K. Tewari
Books in Hindi:
lfCt;ksa ds jksx& th0 ,l0 nwcs] vesfjdk flag ¼1976½
Qlyksa ds jksx &,0,u0 eq[kksik/;k;] vkj0 ,0 flag ¼1976½
Qyksa ds jksx& ih0 ,u0 Fkify;ky] ,l0 ih0 ,l0 csuhoky ¼1976½
ikS/kksa ds jksx &vkj0 ,l0 flag ¼1976½
doduk'kh ,oa ikni jksx fu;a=.k& okbZ0 ,y0 uSu (1976)
Qlyksa ds jksxksa dh jksdFkke& laxeyky ¼1984½
e'k:e mRiknu rduhdh& vkj0 ih0 flag] v”kksd pkS/kjh] iznhi dqekj ¼1997½
feysV ds jksx&,0 ih0 flUgk ,oa ts0 ih0 mik/;k; (1997)
lfCt;ksa ds jksx& ,l0 ,u0 fo”odek Z] ,p0 ,l0 pkSos ,oa ,0ih0 flUgk (2003)
Qyksa ds jksx & ,l0 ,u0 fo”odekZ ¼2006½
lfCt;ksa ds jksxksa dh jksdFkke & ,l0 ,u0 fo'odekZ ¼2000½
cht jksx foKku& oh0 ds0 vxzoky ¼1999½
eDdk ds jksx& laxe yky ¼1993½
/kku ds jksx & vkj0 ,0 flag ,oa ts0 lh0 HkV~V ¼1995½
Qly&lCth&Qy jksx] igpku ,oa izcU/k & ;ksxsUnz flag ,oa vf[kys'k flag
Manuals: Chemicals in Plant Disease Control by Y.L. Nene, R.K. Tripathi, P.N. Thapliyal & S.C.
Saxena (1974)
Management of Soil Borne Plant Diseases by R.S. Singh (1980)
Biocontrol of Fungal Plant Disease by A.N. Mukhopadhyay, H.S. Chaube, U.S. Singh & S.C. Saxena (1994)
Identification of Plant Diseases and their Control by A. N. Tewari (2000)
Epidemiology in Plant Diseases by V.S. Pundhir (2000)
Disease resistance in plants by V.S. Pundhir (2001)

(Climate Change, Precision Agriculture and Innovative Disease Control Strategies)
- 6 -
Seed Pathology: A Practical Manual by K. Vishunavat (2002)
Laboratory Methods in Plant Pathology by Pradeep Kumar, Y.P.S. Rathi, & H.S. Tripathi (2002)
Phytovirology: Laboratory Manual by Y.P.S. Rathi, H.S. Tripathi & Pradeep Kumar (2002)
Diagnosis of Plant Diseases by A.N. Tewari (2002)
Identification of Plant Disease by A.N. Tewari (2003)
Introductory Plant Pathology (UG) by Y.P.S. Rathi, P. Kumar, & H.S. Tripathi (2003)
Diagnosis of Plant Diseases: Laboratory Manual by A.N. Tewari (2004)
Mushroom Cultivation: Laboratory Manual by R.P. Singh (2004)
Crop Diseases and their Management by H.S. Chaube, V.S. Pundhir & S.N. Vishwakarma (2004)
Laboratory Manual of Forest Pathology by K. P.Singh, J. Kumar and P. Srinivas (2007)
Integrated Pest Management by Ruchira Tiwari, S.C.Saxena and Akhilesh Singh (2008)
RESEARCH
Research work in the department began since the inception of the University. With the
addition of new programme and staff strength, the research activities got diversified
encompassing, Ecology of soil borne plant pathogens, Epidemiology and Forecasting, Biological
control and IPM, Molecular Biology and Population Biology, Seed Pathology, Fungicides,
Nematology, Phytovirology, Phytobacteriology and Biology & Technology of Mushroom
Production. The department has several research projects funded by national and international
funding agencies. The department is guiding the research work at the regional station such as
Bharsar, Kashipur, Lohaghat, Majhera and Ranichauri on pathological aspects. The scientists of
the department have won many national and international awards.
The department is actively engaged in the research work on both fundamental and applied
aspects in frontier areas of plant pathology. The plant protection technology developed by the
department is being effectively communicated to the farming community of state of Uttaranchal.
The department has to cater the needs of not only farmers of the plain but also of hills located at
different altitudes. In hills crops, diseases and cropping practices vary a lot depending on altitudes
and they are quite different from plain. This offers a big challenge to the Centre of Advanced
Studies in Plant Pathology.
Significant Contribution
Cause and control of Khaira disease of rice
Development of selective media for isolation and enumeration of Pythium and Fusarium

(Climate Change, Precision Agriculture and Innovative Disease Control Strategies)
- 7 -
Mechanism of biological control in soil amended with organic matters
Biology and characterization of legume viruses
Ecology of soil – borne pathogens (Fusarium, Pythium, Rhizoctonia solani, Sclerotium rofsii)
Mechanism of absorption, translocation and distribution of fungicides in plants
Methods for quantitative estimation of fungicides like metalaxyl, organotin compounds, carbendazim
etc.
Hormonal action of fungicides
Phenolics in Plant disease resistance
Biological control with introduced antagonists
Etiology & management of mango malformation
Etiology and management of shisham wilt.
Epidemiology and Genetics of Karnal bunt fungus
Population biology of rice blast fungus, Magnaporthe grisea
Mechanism of intra-field variability in Rhizoctonia solani
Soil solarization
Mushrooms – Development of strains, and production technologies
Role of Ps. fluorescens in sporophores development of A. bisporus
Compost formulation with Sugarcane baggase + Wheat Straw, 2:1 developed to reduce cost of
cultivation of Agaricus bisporus.
Developed chemical treatment (Formalin 15ml + Bavistin 0.5g/10kg compost) of long method
compost to avoid the moulds in cultivation of A. bisporus.
Recommended supplementation of substrate with 2% mixture of Neem cake + Wheat straw + Rice
bran + Soybean meal for Pleurotus spp. cultivation.
Standardized cultivation of Auricularia polytricha using sterilized wheat straw supplemented with
wheat bran (5%).
Standardized cultivation of Lentinula edodes with substrate
popular sawdust.
Systemic induced resistance in brassicae.
Use of siderophore producing Pseudomonads for early fruiting
and enhanced yield of Agaricus bisporus.
Use of Pseudomonas fluorescens for control of mushroom
diseases caused by Verticillium, Sepedonium, Trichoderma and Fusarium.
Pleurotus sajor-caju and P. florida recommended for commercial cultivation using soybean straw /
Paddy straw / Wheat straw / Mustard straw.
Standardized cultivation technology for Hypsizygus almarius
using wheat straw supplemented with wheat bran.
Standardized cultivation of Calocybe indica using wheat
straw as a substrate with casing of FYM + Spent Compost +
Lentinula edodes

(Climate Change, Precision Agriculture and Innovative Disease Control Strategies)
- 8 -
Sand (2:1:1).
A relay cropping schedule developed for Tarai region of Uttaranchal: two
crops Agaricus bisporus (Sept. - March), four crops Pleurotus spp. (Sept.-
Nov. and Feb.,- April) and three crops of Calocybe indica (March-October).
Developed two strains of Agaricus bisporus, Pant 31 and Pant 52, now included in multilocational
testing under coordinated trials.
Development and commercialization of seven hybrids of oyster mushroom.
Associated with multilocational testing and release of the strains NCS-100, NCS-102, NCH-102 of
A. bisporus.
120 mushroom species from different locations in Uttaranchal
have been collected and preserved in the museum of the
centre.
Of the collected mushrooms five Auricularia, four species of
Pleurotus and two species of Ganoderma have been brought
under cultivation.
Developed / standardized technology for production of traditional
value added mushroom products viz. ‘Sev’, ‘Warian’, ‘Papad’ and ‘Mathri’.
Isolated a high value cater pillar mushroom
Cordyceps sinensis from high altitudes of
Uttaranchal and analysed for antioxidative
properties.
MAJOR ACHIEVEMENTS
Twenty seven wheat lines, combining better agronomic characteristics and resistance to diseases
including Karnal bunt have been identified (Shanghi-4, BW 1052, HUW 318, Lira/Hyan’S’ VUI’S’,
CUMPAS 88, BOBWHITE, SPRW 15/BB/Sn
64/KLRE/3/CHA/4/GB(K)/16/VEE/ GOV/AZ/MU, NI9947, Raj 3666,
UP 1170, HS 265, HD 2590, HS317, PH 130, PH 131, PH 147, PH
148, PH 168, HW 2004, GW 188, MACS 2496, CPAN 3004, K8804,
K8806, ISWYN-29 (Veery”S”) and Annapurna).
Foliar blight of wheat has now been assumed as a problem in Tarai
areas of U.P and foothills of Uttaranchal. Bipolaris sorokiniana -
Dreschlera sorokiniana, was found associated with the disease in
this area. Karnal bunt of wheat caused by Tilletia indica Mitra, is widely distributed in various
Western and Eastern districts of U.P while the North hills and Southern dry areas are free from the
disease.
Multiple disease control in wheat has been obtained by seed treatment with Raxil 2DS @
1.5g/Kg seed + one foliar spray fungicide Folicur 250 EW (Tebuconazole) @ 500ml/ha, which
Ganoderma lucidum
Cordyceps sinensis
Calocybe indica

(Climate Change, Precision Agriculture and Innovative Disease Control Strategies)
- 9 -
controls loose smut, brown rust, yellow rust, powdery mildew and leaf blight disease very
effectively.
The mixture of HD 2329 + WH 542 + UP 2338 produced highest yield recording 11.67 per cent
higher as compared to average yield of their components.
Among new fungicides Raxil 2DS (Tebuconazole) @ 1.0, 1.5, 2.0 and 2.5g/kg seed, Flutriafol
and Dividend @ 2.5g/Kg seed were found highly effective in controlling the disease. Raxil 2DS
@ 1.5g/Kg seed as slurry treatment gave complete control of loose smut.
New techniques for embryo count and seedling count for loose smut, modified partial vacuum
inoculation method of loose smut, creation of artificial epiphytotics of Karnal bunt, NaOH seed
soaked method for Karnal bunt detection and detached leaf technique for screening against
leaf blight using pathogen toxin developed.
The major emphasis has been on the screening of maize germplasms to various diseases with
special reference to brown stripe downy mildew, banded leaf and sheath blight and Erwinia
stalk rot. A sick-plot has been developed to ensure natural source of inoculum. Efficient
techniques for mass multiplication of inoculum and screening of germplasms have been
developed to create epiphytotic conditions. The selected genotypes have been utilized for
evolving agronomically adaptable varieties. Several promising hybrids and composites have
developed and released following interdisciplinary approach.
Studies on estimation of yield losses, epidemiological parameters on various economically
important diseases of maize have been worked out to evolve suitable control measures and
have been recommended to farmers in the region.
Based on the survey and surveillance studies the information on the occurrence of various
diseases in UP and Uttaranchal, a disease map has been prepared and monitored to finalize the
out breaks of one or more diseases in a given area based on weather parameters. It will help the
growers to be prepared to save the crop from recommended plant protection measures.
An repository of >600 isolates of biocontrol agents developed at Pantnagar & Ranichauri.
These isolates are suited for different crops & agro-ecological conditions.
Standard methods developed for testing hyphal and sclerotial colonization.
Isolate of T. virens capable of colonizing sclerotia of Rhizoctonia, Sclerotium and Sclerotinia
isolated for the first time. It may have great potential.
16 new technologies related with mass multiplication and formulation of microbial bio-agents
developed and are in the process of being patented.
Several genotypes including SPV 462, SPV 475, SPV 1685, SPH 1375, SPH 1420, CSV 13,
CSV 15, CSH 14, CSH 16, CSH 18, G-01-03, G-09-03, GMRP 91, RS 629, UTFS 45, UTMC
523 and AKR 150 have been identified with high level of resistance to anthracnose and zonate
leaf spot diseases.
Biocontrol agents T. harzianum and P. fluorescens have been found effective in increasing the
growth of plants and reducing the severity of zonate leaf spot. G. virens and T. viride have

(Climate Change, Precision Agriculture and Innovative Disease Control Strategies)
- 10 -
been found most effective against anthracnose pathogen.
The cause of Khaira as zinc deficiency was established for the first time and zinc sulphate
+slacked lime application schedule was developed for the control of the disease
Inoculation technique was developed to create “Kresek” phase in rice seedlings. Pre-planting root
exposure technique in a suspension of 108cells/ml for 24 hrs gave the maximum “Kresek”. Root
inoculation, in general was found better for development of wilt symptoms than shoot inoculation.
A simple technique has been developed to detect the pathogen in and/or on seeds. The
presence of viable pathogen has been demonstrated from infected seeds stored at room
temperature up to 11 months after harvest.
The disease is sporadic in occurrence often becomes serious in nature. Chemical control trials
showed that the disease can effectively be controlled by giving 2-3 foliar sprays of
streptocycline @ 15 g/ha.
A number of new fungicides along with recommended ones and botanicals were tested against
sheath blight. Foliar sprays with Anvil, Contaf, Opus, Swing and RIL F004 @ 2 ml/l and Tilt @
1 ml/l were found highly effective in controlling sheath blight. Foliar sprays with Neem gold @
20 ml /lit. or Neem azal @ 3ml/lit. was found significantly effective in reducing sheath blight
and increasing grain yield.
Foliar sprays with talc based formulations of the bioagents (Trichoderma harzianum, or
Pseudomonas fluorescence, rice leaf isolates) were found effective in reducing sheath blight
and increasing grain yield. Foliar sprays with the bioagents (T.harzianum) or P. fluorescence)
given 7 days before inoculation with R. solani was highly effective against the disease.
Seed or soil treatment with T. harzianum or P. fluorescence @ 2, 4 or 8 g/kg enhanced root
and shoot growth and fresh and dry weight of rice seedlings.
Seed treatment with fungorene followed by one spray of carbendazim (@ 0.05% at tillering at
diseases appearance) and two sprays of Hinosan @ 0.1% at panicle initiation and 50%
flowering was most effective and economical treatment in reducing the disease intensity and
increasing the yield.
For the first time, true sclerotia were observed in Kumaon and Garhwal regions at an altitude of
900 m above. True sclerotia have a dormancy period of approximately six months. Exposure of
sclerotia to near ultraviolet radiation for an hour breaks the dormancy
and increased germination.
Trichoderma may reduce population of earthworm in vermicomposting
during early days
An repository of >600 isolates of biocontrol agents developed at
Pantnagar & Ranichauri. These isolates are suited for different crops & agro-ecological
conditions.
Isolates of T. virens capable of colonizing sclerotia of Rhizoctonia, Sclerotium and Sclerotinia
isolated for the first time. It may have great potential.

(Climate Change, Precision Agriculture and Innovative Disease Control Strategies)
- 11 -
Standard methods developed for testing hyphal and sclerotial colonization.
16 new technologies related with mass multiplication and formulation of microbial bioagents
developed and are in the process of being patented.
Effect of different physical factors and extracts on the germination of true sclerotia was studied.
Maximum germination was observed at 250 C and at pH 6.0, in fluorescent light. Among the
substratum, maximum germination occurred on moist sand. Soil extract was more favourable
than other extracts. The number of stipes and mature head formation was directly correlated
with the size and weight of the sclerotia.
The viability of the 3 propagules namely; conidia, pseudo and true sclerotia stored under
different conditions showed that conidia remain viable from 2-3 months, pseudo- sclerotia from
4-6 months and true sclerotia up to 11 months at room temperature and under field conditions.
True sclerotia buried at different depth (2.5 to 10 cm) in soil germinated well, but scleroita
buried at 15 cm depth did not germinate and rotted.
Discoloured grains of various types were grouped according to their symptoms. The fungi
responsible for each type of symptoms were identified. Ash grey discolouration of glumes
separated by dark brown band was caused by Alternaria alternata and Nigrospora oryzae.
Spots with dark brown margin and ash grey centre by Curvularia lunata and Alternaria
alternata, light yellow to light brown spots by C. pallescens, Fusarium equiseti and N. oryzae,
Brown to black dot by Phyllosticta oryzae Dark brown to black spot and specks by Drechslera
victoriae, D. rostratum and D. oryzae, light to dark brown glumes by Sarocladium oryzae and
D. oryzae, and light to dark brown spots by D. Australiense.
Rice varieties Manhar, Narendra 80, Saket 7, Ajaya, Bansmati, 385 showed higher incidence
(34.1 to 41.8%) whereas Sarju 52, UPR 1561-6-3, Pusa 44, Jaya, Pant Dhan 10 and improved
Sharbati exhibited lower (18.4-22.3%) incidence of seed discolouration. Bipolaris oyzae
caused highest seed discolouration which is followed by Fusarium moniliforme, curvularia
lunata and Fusarium graminium in all the test varieties.
On the basis of the symptoms pattern and transmissibility of the pathogen through grafting and
eriophyied mite (Aceria cajani), presence of foreign ribonucleic protein and nuclear inclusion
like bodies in the phloem cell indicated the viral (RNA virus) nature of the pathogen of sterility
mosaic of pigeon pea. The vector mite of the pathogen was found on lower surface of leaves
of Canavis sativus and Oxalis circulata weeds in this area. Mild mosaic, ring spot and severe
mosaic symptoms were observed in different as well as same cultivar. This observation reveals
the presence of variation in the pathogen.
Germplasm lines/ cultivars screened viz; ICP 14290, ICP 92059,ICP 8093, KPBR 80-2-2, PL
366, ICPL 371, Bahar, NP (WR) 15.were found resistan against Phytophthora stem blight.
Some resistant donors for mungbean yellow mosaic virus have been identified i.e. UPU-
1,UPU-2,UPU-3, UG-370, PDU-104, NDU-88-8, UG-737, and UG-774. The varieties thus
evolved include PU-19, PU- 30, and PU-35., Manikya, resistant lines/cultivars identified: ML-

(Climate Change, Precision Agriculture and Innovative Disease Control Strategies)
- 12 -
62, ML-65, Pant M-4, Pant M-5, ML-131, NDM 88-14, ML-682, PDM-27, ML- 15, ML-803, ML-
682 and 11/ 395 and for Urdbean leaf crinkle virus, SHU 9504, -9513,-9515, -9516, -9520, -
9522, -9528, KU 96-1, UG 737 and TPU-4.
Seed treatment with carbendazim (0.1%) followed by two prophylactic sprays of carbendazim
(0, 05%) or Dithane M-45 @ 0.25% was found most effective in reducing disease severity of
anthracnose disease. In early sown crop high disease severity was observed while in late
sown crop low disease severity was recorded. Inter cropping with cereals or pulses have no
effect on anthracnose severity.
Propiconazol 0.1%, carbendazim 0.1%, hexaconazol 0.1%, mancozeb 0.25% sprayed plots
have low disease severity and high grain yield against Cercospora leaf spot.
Studies on integrated management of wilt/root rot/collar rot showed that Seed treatment with
fungicide alone or in combination with other fungicides/ bio agents were found effective.
Among the fungicides seed treatment with Bavistin + Thiram (1:2), vitavax + Thiram (1:2),
vitavax, Bavistin, Bayleton, Bio agent Gliocladium virens + Vitavax and Pseudomonas
fluorescence) decreased the seedling mortality, improved germ inability, plant stand and yield.
Eleven thousand germplasm lines/ breeding populations F2,
F3, F4 and F5 generations were screened. Many germplasm/
accessions were found resistant/ tolerant to Botrytis gray
mould viz; ICC 1069, ICC 10302, ICCL 87322, ICC 1599, -
15980, - 8529, ICCV 88510, E100Y (M) BG 256, BG261,
H86-73, IGCP 6 and GNG 146.
Lentil entries evaluated under sick plot for wilt/root rot/ collar
rot diseases. The following lines were found promising viz;
LL 383, PL 81-17, LH 54-8, DPL-58, DPL 14, Jawahar Massor- 3, DPL 112, IPL-114, L 4147
and Pant L 639.
The promising germplasm lines/ cultivars are as follows: DPL 62, PL-406, L 4076, TL 717, E
153, IPL 101, IPL 105, PL- 639, LH 84-8, and Precoz .
The field pea lines were found promising JP 141, Pant P-5, KFPD 24 (swati), HUDP 15, KFPD-
2, HFP-4, P1361, EC-1, P-632, P 108-1, KPMR 444, KF 9412, DPR 48, T-10, KPMRD348,
DDR13, IM9102, KFP 141 and KPMR 467 against powdery mildew and JP 141, Pant P-5, P
10, FP 141, KDMRD 384, HUDP-9, HUP-2 and T-10 were found promising against rust
disease.
Mid-September planting or early October planting of rapeseed-mustard has been found to
escape from Alternaria blight (Alternaria brassicae) downy mildew (Peronospora parasitica)
and white rust (Albugo candida) diseases as against mid and late October planting. In general
high occurrence of the floral infection (staghead phase) of white rust and downy mildew during
flowering period has been found to be associated with reduced period, i.e. 2-6 hours, of bright
sunshine/day concomitant with the mean maximum temperature of 21-250C, the mean

(Climate Change, Precision Agriculture and Innovative Disease Control Strategies)
- 13 -
minimum temperature of 6-100C and higher total rainfall up to 166 mm. Bright sunshine hours
/day has a significant negative correlation whereas total rainfall has a significant positive
correlation with staghead development.
All the three important foliar diseases of rapeseed-mustard could be effectively controlled by
following integrated package of balanced N100 P40K40 application, early October sowing and
treating the seed with Apron 35 SD @ 6g kg-1 seed followed by spray of mixture of metalaxyl +
mancozeb (i.e Ridomil MZ 72 WP @ 0.25%) at flowering stage and by spray of mancozeb or
iprodione @ 0.2% at pod formation stage. In situations where Sclerotinia stem rot and / or
powdery mildew appeared to be important in a particular crop season, a spray of mixture of
carbendazim (0.05%) + mancozeb (0.2%) was found to give excellent cost effective control of
the diseases with significant increase in seed yield of the crop.
Among the botanicals, leaf extracts of Eucalyptus globosus (5%) and Azadirchta indica (5%)
have been proved to exhibit greater antifungal activity against A. brassicae and Albugo
candida and showed significant reduction in the severity of Alternaria blight and white rust
diseases which was rated to be at par with mancozeb fungicide spray.
Some abiotic chemical nutrient salts such as calcium sulphate (1%), zinc sulphate(0.1%) and
borax (0.5%) and biocontrol agents such as Trichoderma harzianum and non-aggressive D
pathotype of A.brassicae have been shown to induce systemic host resistance in mustard
against aggressive “A” pathotype of A. brassicae and virulent race(s) of A. candida.
The staghead phase in B. juncea has been investigated to be due to A. candida and not due P.
parasitica. Tissues at the staghead phase become more susceptible to P. parasitica than
normal tissues of the same plant.
B. juncea genotypes (EC 399296, EC 399299, EC 399301, EC 399313, PAB-9535, Divya
Selection-2 and PAB 9511), B. napus genotypes (EC 338997, BNS-4) and B. carinata (PBC-
9221) have been shown to possess resistance to white rust coupled with high degree of
tolerance to Alternaria blight. Reduced sporulation is identified to be the major component for
slow blighting.
B. juncea (RESJ 836), B. rapa (RESR 219) and B. napus (EC 339000) have been selected for
resistance to downy mildew and for high yield performance. Total 52 genotypes of mustard
representing at least 12 differential resistance sources, 23 lines of yellow sarson representing
6 differential resistance sources and 54 lines of B. napus representing 3 differential resistance
sources to downy mildew have been identified.
A new short duration (95-100 days) short statured (85- 96 cm) plant type of mustard strain
‘DIVYA’ possessing high degree of tolerance to Alternaria blight suitable for intercropping with
autumn sown sugarcane and potato yielding with an average of 15-22 q ha-1 has been
developed. This ‘Mustard DIVYA’ plant type is now recommended as a source for breeding
more and more improved varieties of mustard as it has been proved to have good general
combining ability for short stature characteristics.

(Climate Change, Precision Agriculture and Innovative Disease Control Strategies)
- 14 -
Seed treatment with mancozeb @ 0.2% + thiram @ 0.2% has been found to control seed,
seedling and root rot diseases of groundnut. However seed treatment with thiram @ 0.2% +
vitavax @ 0.2% has been found to control collar rot (Sclerotium rolfsii) of groundnut. Two
sprays of carbendazim @ 0.05% have been found to give excellent control of early and late
leaf spot (tikka disease) of groundnut.
Mid September planting of sunflower was found to escape the occurrence of major diseases
like Sclerotinia wilt and rot, Sclerotium wilt, charcoal rot and toxemia. Severity of Alternaria
blight was found to be negligible and did not cause any reduction in yield. The crop could be
harvested by 15th December. The yield obtained was 16 q/ha.
The average percent loss has been noted in the range of 50.6 to 80.7 percent due to Alternaria
blight disease under Kharif conditions. However, the percent loss in oil has been shown in the
range of 21.6 to 32.3. To control the disease, total 4 sprays of mancozeb @ 0.3% at 10 day
interval have been found effective.
A repository of about 5000 rice blast isolates was made from 30 locations in Indian Himalayas at
Hill Campus, Ranichauri. Blast pathogen population from the region was analyzed using molecular
markers and phenotypic assays. Most locations sampled and analyzed had distinct populations
with some containing one or a few lineages and others were very diverse. Within an
agroecological region migration appeared to be high. The structure of some populations could be
affected to some extent by sexual recombination.
Magnaporthe grisea isolates derived from Eleusine coracana, Setaria italica and Echinochloa
frumentaceum collected from a disease screening nursery were cross compatible. The
chromosome number of each isolate was found to be six or seven. Similarity of karyotypes was
found among isolates with in a lineage though between lineages some variability was noticed. A
remarkable similarity between karyotypes of Eleusine coracana and Setaria italica was observed. All
of these isolates were fertile and mated with each other to produce productive perithecia. The
existing data however showed no evidence of genetic exchange among host-limited M. grisea
populations in Indian Himalayas.
No strong relationship appeared between the number of virulences in a pathotyope and its frequency
of detection. The frequency of virulent phenotype to a cultivar and susceptibility of that cultivar in the
field did not correspond. The number of virulences per isolate was in general less than the number
of virulences per pathotype, which indicated predominance of isolates from pathotypes with fewer
virulences. There was a tendency for the pathotypes to have fewer virulences. The frequency of
virulence among rare pathotypes was higher than common pathotypes against all the differential
NILs, including two-gene pyramids. These rare pathotypes could be the potential source of
resistance breakdown of the novel resistance genes.
Blast resistant gene Pi-2(t) appeared to have the broadest and Pi-1(t) the narrowest resistant
spectra. Compatibility to Pi-2 (t) gene did not appear to limit compatibilities with other resistant

(Climate Change, Precision Agriculture and Innovative Disease Control Strategies)
- 15 -
genes. Loss of avirulence to all the five major gene tested may carry a serious fitness penalty.
Major gene Pi-2 and gene combination Pi-1,2 showed least compatibilities and hold promise
in managing blast in the region. In the overall Himalayan population, gene combinations in
general were effective at most locations. Combination of Pi-1+2 genes was effective at most
locations until the year tested. However, three gene pyramid [Pi-1(t) + Pi-2(t)+Pi-4(t)] resisted
infection at all locations.
It was inferred that the pathotype composition of the blast pathogen composition in the Indian
Himalayas was very complex and diversifying the resistance genes in various rice breeding
programmes should prove to be a useful strategy for disease management.
A common minimum programme under bio-intensive IPM in vegetables in Uttaranchal hills was
designed that is extended to over 2000 farmers from 20 villages in district Tehri Garhwal.
Epidemiological considerations in the apple scab disease management led to the development
of disease prediction models. Relation of degree-day accumulations to maturation of
ascospores, and potential ascospore dose (PAD) were found to be useful for predicting the
total amount of inoculum in an orchard thereby effectively improving apple scab management.
Out of 71 genotypes tested against red rot caused by Colletotrichum falcatum, four genotypes
viz; Co Pant 92226, Co Pant 96216, Co Pant 97222 and CoJ 83 were found resistant and
another 24 exhibited fairly good tolerance.
Seed treatment with Thiram + Carbendazim (2:1) @ 3g/kg seed or Vitavax 0.2% controlled the
seed and seedling rots and improved the seedling emergence without any adverse effect on
the nodulation and invariably yield were increased. Seed treatment with Trichoderma
harizianum, T. viride or Pseudomonas fluorescens @ 10g/kg controlled seed and seedling rots
and increased plant emergence.
Purple seed stain disease can be effectively controlled by seed treatment with thiram +
carbendazim (2:1) @ 3 g/kg seed followed by two sprays of benomyl or Carbendazim @ 0.5
kg/ha.
Rhizoctonia aerial blight can be effectively controlled by two sprays of carbendazim @ 0.5
kg/ha. Seed treatment with T. harzianum or Pseudomonas fluorescens 10g/kg seed + soil
treatment with pant Bioagent-3 mixed with FYM @50q/ha followed by two sprays of T.
harzianum @ 0.25% reduced the disease severity of RAB.
Pod blight and foliar diseases caused by Colletrotichum dematium var truncatum could be
effectively controlled by the use of carbednazim 0.05%, Mancozeb 0.25%, Copperoxychloride
0.3%, Thiophanate methyl 0.05%, Chlorothalonil 0.25%, Hexaconazole 0.1% and
Propiconazole 0.1%. First spray should be given as soon as disease appear and second spray
after 15 days of first spray.

(Climate Change, Precision Agriculture and Innovative Disease Control Strategies)
- 16 -
Rust disease could be effectively controlled with three sprays of Benomyl 0.05%, Mancozeb
0.25% or Zineb 0.25%, at 50, 60 and 70 days after sowing. Varieties Ankur, PK-7139, PK-
7394, PK-7121, PK-7391 were resistant.
Charcoal rot disease can be effectively controlled by seed treatment with Trichoderma
harzianum @ 0.2% + vitavax @ 0.1%.
Pre-mature drying problem Soybean can be minimized by seed treatment with carbendazim +
Thiram (2:1) @ 3g/kg seed followed by two sprays with carbendazim, mancozeb and
Aureofungin. Varieties PSS-1, PS-1042, PK-1162, PK-1242 and PK-1250 were found to be
superior for premature drying problem.
Integrated disease management (IDM) modules based on combined use of cultural practices,
fungicides for fungal disease, insecticide for virus disease and host resistance were evaluated
against RAB and Soybean yellow Mosaic virus diseases.
Bacterial pustules can be successfully controlled by two sprays at 45 and 55 days after
planting with a mixture of Blitox-50 (1.5 kg/ha) + Agrimycin-100 (150g/ha) or streptocycline
(150 g/ha) + copper sulphate (1kg/ha).
Soybean yellow Mosaic can be very effectively controlled by four sprays with oxymethyl
demoton @ 1l/1000 lit/ha at 20, 30, 40 and 50 days after planting. Soil application with Phorate
10G @ 10 kg/ha and Furadan 3G @ 17.5 kg/ha controlled the disease. Varieties PK-1284,
1251, 1259, 1043, 1225, 1303, 1314, 1343, 1347, PS-1042 PS-564, 1364 were identified as
resistant to Soybean yellow Mosaic virus.
EXTENSION The scientists also participate in the farmers contact programme as well as practical
trainings at different levels including those of IAS and PCS officers, Extension workers, Agricultural
officers, Farmers, Defense Personnels etc. The Scientists of the department also actively
participate in the trainings organized under the T&V programme for the benefit of farmers/State
level Agricultural Officers. Two Professors (Extension Pathology) and crop disease specialists are
deputed to “Help Line Service” started recently by the University under Agriculture Technology
Information Centre (ATIC). The telephone number of help line services is 05944-234810 and 1551.
Technology developed by the centre is regularly communicated to the farmers of the 13 districts of
Uttaranchal State through the extension staff (Plant Protection) of both university and state
agriculture and horticulture departments posted in all districts of the state. The radio talks and TV
programme are delivered. Popular articles and disease circulars are published regularly for the
benefit of the farmers.
UP-GRADATION TO CENTRE OF ADVANCED STUDIES
In view of the outstanding quality of teaching, research and extension work being carried out by

(Climate Change, Precision Agriculture and Innovative Disease Control Strategies)
- 17 -
the department, ICAR vide letter No. 1-2/93 (CAS)UNDP dated Feb.02, 1995 upgraded the department
to the status of the centre of advanced studies in plant pathology. Major mandate of the CAS was to train
scientific faculty from all over the country in important and innovative areas of plant pathology. So far
under CAS, 16 trainings have been conducted and 336 scientists from all over the country have been
trained in different areas. Centre of Advanced Studies in Plant Pathology at Pantnagar was awarded a
certificate of Appreciation in commemoration of Golden Jubilee year of independence (1998) for
organizing the programmes for human resource development and developing excellent instructional
material by the education division, ICAR on August 14, 1998. The progress report CAS in Plant
Pathology during X plan is as follows:
Trainings Held
1. Recent advances in biology, epidemiology and management of diseases of major kharif
crops (Sept. 19- Oct. 12, 1996)
2. Recent advances in biology, epidemiology and management of diseases of major rabi crops
(Feb. 25 –March 17, 1997)
3. Ecology and ecofriendly management of soil-borne plant pathogens (Jan 12 – Feb. 02, 1998)
4. Advanced techniques in plant pathology (Oct. 12 – Nov. 02, 1998)
5. Recent advances in detection and management of seed-borne pathogens (March 10-30,
1999)
6. Recent advances etiology and management of root-rot and wilt complexes (Nov. 26 – Dec.
16, 1998)
7. Integrated pest management with particular reference to plant diseases: concept, potential
and application (Nov. 23 –Dec. 13, 2000)
8. Recent advances in research on major diseases of horticultural crops (March 01-30, 2001)
9. Recent advances in plant protection technology for sustainable agriculture (Nov. 19 –Dec.
09, 2001)
10. Plant diseases diagnosis: past, present and future (Feb. 13, - March 05, 2002)
11. Chemicals in plant protection: past, present and future (Jan. 28 – Feb. 17, 2003)

(Climate Change, Precision Agriculture and Innovative Disease Control Strategies)
- 18 -
12. Eco-friendly management of plant diseases of national importance: present status and
research and extension needs (Nov. 10-30, 2003)
13. Ecologically sustainable management of plant diseases: status and strategies (March 22-
April 11, 2004)
14. Disease resistance in field and horticulture crops: key to sustainable agriculture (Dec. 10-30,
2004)
15. Regulatory and cultural practices in plant disease management (Dec. 03-21, 2005)
16. Crop disease management: needs and outlook for transgenics, microbial antagonists and
botanicals (March 21 – April 10, 2006)
17. Soil Health and Crop Disease Management (December 02-22, 2007)
18. Role of Mineral Nutrients and Innovative Eco-friendly Measures in Crop Disease
Management (March 22- April 11, 2007)
19. Plant Disease Management on Small Farms (January 03-23, 2008)
20. Seed Health Management for Better Productivity (March 28 to April 17, 2008)
21. Recent Advances in Plant Disease Management (Dec. 13, 08 to Jan. 02, 09)
22. Recent Advances in Biological Control of Plant Diseases (March 20 - April 09, 2009)
23. Plant Pathology in Practice (March 22 to April 11, 2010)
24. Climate change, precision agriculture and innovative disease control strategies (March 23 to
April 12, 2011)
Sl. No. State Total Sl. No. State Total
1. Andhra Pradesh 13 13. Maharashtra 37
2. Assam 13 14. Manipur 01
3. Bihar 21 15. Meghalaya 01
4. Chattishgarh 07 16. Nagaland 01
5. Gujarat 42 17. Orissa 13
6. Haryana 04 18. Punjab 05
7. Himanchal Pradesh 38 19. Rajasthan 42
8. Jammu & Kashmir 32 20. Sikkim 01
9. Jharkhand 05 21. Tamil Nadu 10
10. Karnataka 22 22. Uttar Pradesh 67
11. Kerla 05 23. Uttarakhand 75
12. Madhya Pradesh 25 24. West Bengal 18
Total = 498

(Climate Change, Precision Agriculture and Innovative Disease Control Strategies)
- 19 -
INFRASTRUCTURE
Wheat Pathology Lab. – General Path, Epidemiology, Toxin, Tissue Culture
Maize Pathology Lab. – General Plant Pathology, Bacteriology
Rice Pathology Lab. – General Plant Pathology
Ecology and Vegetable Pathology Lab. – Ecology, Histopathology, Biocontrol, Nematodes
Soybean Path. Lab.– General Plant Pathology, Fungicides
Oil Seed Path. Lab.– General Pl. Path., Tissue, Culture, Histopathology, Toxins
Pulse Path. Lab. – General Pl. Path., Phytovirology
Seed Path. Lab. – General Path, Seed Borne diseases
Biocontrol Lab. – Biocontrol & IPM
Molecular Pl. Path Lab. – Population biology & host- pathogen interaction
Mushroom Research – Research & training
Glass houses – 3
Polyhouses – 3
UG Practical Lab – 1
PG Lab – 1
Training Hall – 1
Conference Hall – 1
Office – 1
Huts for Mushroom Production

(Climate Change, Precision Agriculture and Innovative Disease Control Strategies)
- 20 -
Research Project (on going)
Large Scale Demonstration of IPM technology through KVKs in Network Mode (HTMM-I)
Promoting IPM through a Common Minimum Programme in Vegetable Cultivation in
Uttarakhand Hills (RKVY, Govt. of India)
Programme Mode Support in Agrobiotechnology (DBT)
Translational Research Centre on Biopesticides (DBT)
AICRP on Biological Control (ICAR)
All India Coordinated Wheat and Barley Improvement Project-Plant Pathology component
(ICAR)

(Climate Change, Precision Agriculture and Innovative Disease Control Strategies)
- 21 -
AIC Chickpea Improvement Project (ICAR)
AIC Pigeonpea Improvement Project (ICAR)
AIC MullaRP Improvement Project (ICAR)
Screening of chickpea germplasms/lines against BGM disease-(NBPGR)
All India Coordinated Soybean Improvement Project (ICAR)
All India Coordinator Research Project on Rapeseed & Mustard (ICAR)
All India Coordinated Rice Improvement Project (ICAR)
Cereal Systems Initiative for South ASIA (CSISA) Objective 3 (IRRI)
AICRP on (NSP) Seed Technology Research (ICAR)
DUS Test Centre for Implementation of PVP-legislation for forage sorghum at Pantnagar
(ICAR)
Seed Production in agriculture crops and fisheries (Mega Seed Project) in Seed
Technology Research (ICAR)
All India Coordinator Potato Improvement Project (ICAR)
All India Coordinated Vegetable Improvement Project (ICAR)
All India coordinated Maize Improvement Project (ICAR)
All India Coordinated Sugarcane Improvement Project (ICAR)
All India Coordinated Sorghum Improvement Project (ICAR)
All India Coordinated Mushroom Improvement Project (ICAR)
Consultancy Project
Evaluation of BAYER fungicides against wheat diseases
Evaluation of SYNGENTA fungicides against wheat diseases
Evaluation of UPL fungicides against wheat diseases
Bio-efficacy of copper hydroxide 46% DF against bacterial leaf blight and false smut
diseases of rice
Phytotoxicity studies on meptyldinocap 35% EC for powdery mildew in pea funded by Dow
Agro Sciences India Pvt. Ltd.
Bio-efficacy of fungicides against blister blight of tea
Bio-efficacy of fungicide Tebuconazole 250 EC (Folicur EC 250) against anthracnose in
Soybean funded by Bayer Crop Science
Total Budget Outlay – > 1000 lakhs
Research Areas – Biological Control, IPM, Shisham wilt, Soil solarization, Population Biology,
Seed pathology, Mushroom etc.
Publication:
1. Books - 56
2. Research Bulletins - 20

(Climate Change, Precision Agriculture and Innovative Disease Control Strategies)
- 22 -
3. Research Papers - >1200
4. Conceptual / Review articles - >130
5. Chapters contributed to book - >150
6. Extension literature - over (200)
(Hindi – English)
Annual Review of Phytopathology - 02
Recognition and Awards:
UNO (Rome) – Dr. Y. L. Nene
Prof. M. J. Narisimhan Academic Award (IPS) 5
Jawahar Lal Nehru Award (ICAR) 2
Pesticide India Award (ISMPP) 7
P. R. Verma Award for best Ph. D. Thesis (ISMPP) 2
Other (Hexamar, MS Pavgi, Rajendra Prasad etc.) >20
Uttaranchal Ratana 2
Education Award 2004-05” for his book “Qyksa ds jksx” 01
by the Ministry of Human Resource Development, GOI
Professional Societies and our Share:
Indian Phytopathological Societies
Presidents – 3
Zonal Presidents – 3
Indian Society of Mycology & Plant Pathology –
Presidents – 3
Vice Presidents – 1
Indian Soc. Seed Technology
Vice Presidents - 3
Science Congress
President (Agriculture Chapter) - 1
National Academy of Agricultural Sciences
Fellows - 3
Future Strategies:
Teaching: Introduction of new courses
Methods in Biological Control
Plant disease and national importance
Integrated plant disease management
Molecular plant pathology
Advances in mushroom production

(Climate Change, Precision Agriculture and Innovative Disease Control Strategies)
- 23 -
Research thrust:
• Biological control & ICM (IPM + INM) in different crops/cropping systems
• Disease management under organic farming
• Microbial ecology
• Green chemicals
• Population biology of pathogens (including use of molecular tools)
• Induced resistance
• Exploitation of indigenous edible and medicinal mushrooms
Human Resource Development
Degree awarded
M.Sc. 313
PhD 176
Trainings organized No. Persons trained
Summer schools (ICAR) 5 136
Summer training (DBT) 1 24
International training (IRRI) 1 11 (8 countries)
Under CAS 24 498
Persons training under SGSY on Mushroom Production 1785
Out of above > 750 persons have started mushroom cultivation
Future Goal:
Ecologically sustainable management of plant diseases to ensure both food security &
safety through education, research & extension

(Climate Change, Precision Agriculture and Innovative Disease Control Strategies)
- 24 -
Climate Change and Impacts on Plant Diseases
H.S. Tripathi & Santosh Kumar Department of Plant Pathology, G.B.P.U.A.&T., Pantnagar- 263 145 (UK)
The rudimentary knowledge about impacts of climate change on plant patho systems, it is
impossible to predict implications for disease management with any certainty. It is prudent to
assume, however, that effects would occur chiefly through influences on host resistance or
chemical and biological control agents. Particular attention is needed to identify cases where the
efficacy of disease management may be reduced under climate change.
Host Resistance
Cultivar resistance to pathogens may become more effective because of increased static
and dynamic defenses from changes in physiology, nutritional status, and water availability.
Durability of resistance may be threatened, however, if the number of infection cycles within a
growing season increases because of one or more of the following factors: increased fecundity,
more pathogen generations per season, or a more suitable microclimate for disease development.
This may lead to more rapid evolution of aggressive pathogen races. In a pilot study, it is
monitored that evolution of Colletotrichum gloeosporioides on S. scabra under elevated CO2 , a
susceptible cultivar was grown in a controlled environment under 1 X or 2 X CO2 and inoculated
with three isolates of the pathogen. For each isolate, conidia collected from infected host tissue
were used to inoculate a second group of plants of the same cultivar. Successive groups of plants
were inoculated with conidia arising from the previous infection cycle to simulate polycyclic
disease development.
Chemical control
Climate change could affect the efficacy of crop protection chemicals in one of two ways.
First changes in temperature and precipitation may alter the dynamics of fungicide residues on the
crop foliage. Globally, climate change models project an increase in the frequency of intense
rainfall events which could result in increased fungicide wash-off and reduced control. The
interactions of precipitation frequency, intensity, and fungicide dynamics are complex, and for
certain fungicides precipitation following application may result in enhanced disease control
because of a redistribution of the active ingredient on the foliage at two intensities (6 and 30 mm h-
1) and found that the higher rate significantly reduced the fungicide residue that could be
measured with a chemical assay, but that there was no difference in disease between the two
treatments when the leaves were challenged in a bioassay with Phytophthora infestans.
Second, morpholigcal or physiological changes in crop plants resulting form growth under
elevated CO2 could uptake, translocation, and metabolism of systemic fungicides. For example,
increased thickness of the epicuticular wax layer on leaves could result in slower and/or reduced
uptake by the host, whereas increased canopy size could negatively affect spray coverage and
lead to a dilution of the active ingredient in the host tissue. Both factors would suggest lowered

(Climate Change, Precision Agriculture and Innovative Disease Control Strategies)
- 25 -
control efficacy at higher concentrations of CO2. Conversely, increased metabolic rates because of
higher temperatures could result in faster uptake by and greater toxicity to the target organism. In
a pilot study with the herbicide chlorotoluron showed that a resistant biotype of the weed
blackgrass (Alopecurus myosuroides) became more sensitive to herbicide application when grown
under elevated CO2. It was hypothesized that this was due to changes in herbicide uptake and
translocation because of altered stomatal physiology. Despite the potential for important
interactions, no similar studies evaluating the impacts of climate change variables on physiological
aspects have been published for fungicides.
Microbial Interactions
Climate change may alter the composition and dynamics of microbial communities in aerial
and soil environments sufficiently to influence the health of plant organs . Changed microbial
population in the phyllosphere and rhizosphere may influence plant disease through natural and
augmented biological control agents. A direct effect of elevated CO2 is unlikely in the soil
environment as the microflora there is regularly exposed to levels 10 to 15 times higher than
atmospheric CO2.
Trees grown in soils of poor nutrient status, especially nitrogen, favor colonization of roots
by arbuscular mycorrhizae is not well understood, and there are conflicting reports on how it may
be influenced by the nutrient status of the plant and soil. If a lower nitrogen status of plant tissue
under increased CO2 results in more mycorrhizal colonization, this could improve plant health
through improved nutrient uptake. Similar confusion exists on the potential role of vesicular
arbuscular mycorrhizae and ectomycorrhizae in the suppression and biological control of plant
pathogens. Mycorrhizae can have positive, negative, or neutral effects on plant disease, and their
role is not well understood despite numerous studies on the subject . Clearly, the influence of
mycorrhizae on plant health under climate change requires further research.
Changes in temperature may have highly nonlinear effects on tri-trophic interactions of
host, pathogen, and bio-control agent. In wheat rise in temperature from 17 to 22°C resulted in an
increase in aphid (Sitobion avenae) reproduction by 10%; a the same time, however, predatory
activity by lady beetle (Coccinelld septempunctata) adults increased by 250%. Aphid damage was
reduced further because of earlier maturity of the crop. Similar data are not available for tri-trophic
interactions involving plant pathogens.
REFERENCE
1. The Hindu Survey of Indian Agriculture 2010. Disaster preparedness in agriculture by M.S. Swaminathan.
2. Coakley, S.M, H. Scherm and S. Chakraborty 1999.Climate change and plant Diseases management. Ann. Rev. Phytopathol. 37:399-426.
3. K.A. Garrett, S.P. Dendy, E. E. Frank, M.N. Rouse, and S. E. Travers 2006.Climatic change effects on Plant disease: Genomes to Ecosystem .Ann. Rev. Phytopathol., 44:489-509.
4. Chakraborty S. Datta S. 2003. How will plant pathogens adapt to host plant resistance at elevated co2 under a changing climate? New Phytol.159:733-742.

(Climate Change, Precision Agriculture and Innovative Disease Control Strategies)
- 26 -
Climate Change and Food Security: Enhancing Adaptation Capabilities as a Response to Global Warming in Fragile Mountain Ecosystems
Vir Singh
Department of Environmental Science, GBPUAT&T, Pantnagar- 263 145 (Uttarakhand)
Climate change is looming large on the globe. Food security is one of the key issues that
inevitably needs to be resolved under the specters of climate change, particularly in the fragile
ecosystems, such as the Himalayan mountains, where climate change is more pronounced than in
the plain areas and where adaptation mechanisms are vocal but need to be promoted, enhanced
and implemented as an appropriate response to the climate change becoming increasingly
phenomenal.
Mountains, especially the Himalayan mountains, constitute one of the most fragile
ecosystems on planet Earth. However, their ecological and environmental functions are vital for
the mainstream world constituted largely of the plains. Biodiversity, one of the most unique
attributes of natural evolution, is a unique characteristic of the mountains. Agriculture, which has
been and continues to be one of the greatest concerns of humanity on Earth since time
immemorial, in a sense, is an art of biodiversity management. Farmers have been manipulating,
managing, enriching, promoting, and utilizing biodiversity for deriving their livelihoods for ages.
This biodiversity, and consequently mountain agriculture, owing to global warming, are under
unprecedented environmental stress these days.
Climate change is affecting – as it is bound to do – life, including human life, throughout the
globe. It is especially evident in the Himalayan mountains. The Himalayas may be referred to as
the Third Pole, for the largest amount of snows and ice is concentrated in the Greater Himalayan
area of these mountains, which is only next to the two poles. Warming in the Himalayan region is
reported to be more than the global average. It is also true that the mountain inhabitants contribute
a little to the global warming, but they are slowly heading towards being the first and perhaps the
worst victims of global warming being followed by adverse climate change. The global warming is
to severely affect water supplies, biodiversity, agricultural production and is also bound to give a
severe blow to several other factors that form the basis of a happy and content life. Severe climate
change impact on Himalayan mountains would be linked with the impending economic blues in the
plains.
What should we do amidst the gloom of climate change? This article attempts to look into
some important adaptation mechanisms that could respond to the on-going spell of climate change
and help avert the impending disaster.
Climate Change and the Himalayas
Climate change is looming large on planet earth and its impacts are being increasingly felt
in all the ecosystems in one way or the other. Its impact in the Himalayan mountains, like in the
poles, is bound to induce phenomenal changes in other ecosystems. Himalayan mountains

(Climate Change, Precision Agriculture and Innovative Disease Control Strategies)
- 27 -
provide origin to perennial river systems in South Asia and therefore climate change repercussions
in the Himalayan Region ought to have profound implications for global climate as well as for
global economies.
Himalayan glaciers cover about three million ha, or, 17% of the global mountain area – the
largest bodies of ice outside the polar caps. Total area of Himalayan glaciers is 35,110 km2. The
total ice reserve of these glaciers is 3,735 km3, which is equivalent to 3250 km3 of fresh water.
Himalayan mountains are the source of the nine giant river systems of Asia: the Indus, Ganga,
Brahmaputra, Irrawaddy, salween, Mekong, Yangtze, Yellow and Tarim. Himalaya serves as the
water lifeline for 500 million inhabitants of the region, or about 10 percent total regional human
population (IPCC 2007).
Spell of global warming on these mountains would lead to declined water flows, drying up
of some of the important rivers, especially the rainfed ones, giving a severe blow to food
production and livelihood security of millions of people. Growing evidence shows that the glaciers
of the Himalayas are receding faster than in any other part of the world. For example, the rate of
retreat of the Gangotri glacier over the last three decades has been more than three times the
rates of the retreat during the preceding two hundred years.
Dynamics of Indian Agriculture
Fate of humanity is intertwined with agriculture, which encompasses cropping, animal
husbandry, horticulture, forestry, fishery, and all other land-related activities. Indian agriculture,
undoubtedly the oldest one in the world, has undergone three phases in its history and has now
ushered in the third phase. These are the following:
1. Primitive agriculture
2. Traditional agriculture
3. Green Revolution agriculture
4. LPG agriculture
The primitive agriculture was largely dependent on uncultivated lands. Natural forests used
to be the sources of a variety of foods. The foods were consumed uncooked. However, man had
learnt to plough the land and cultivate food grains. But there was a perfect ecological balance.
There was no stress whatsoever on nature thanks to anthropogenic activities. People depended
on diversity of foods which was derived from thousands of varieties mostly uncultivated. Primitive
agriculture never knew what venerability was. It was extremely resilient and ecologically
sustainable.
During the millennia-old history of traditional agriculture farmers maintained a balance
between uncultivated lands (forests, grasslands, rangelands, etc.) and cultivated lands. One of the
most striking features of Indian traditional agriculture was that it always embraced wonderful
biodiversity. Traditional farmers during this period developed an art of cultivating, enhancing,
conserving and utilizing biodiversity of nature. This agriculture depended on draught animal power
and organic inputs but maintained an ecological balance. Nutritive value and therapeutic qualities

(Climate Change, Precision Agriculture and Innovative Disease Control Strategies)
- 28 -
of food products were inherent in traditional food production. This agriculture was not dependent
on market to a great extent, but bartering system was very strong.
Then, towards the end of the 1960s, India ushered in the often talked-about Green
Revolution. This agriculture focused merely on high productivity which became possible with high-
yielding varieties of crops, indiscriminate use of chemical fertilizers and pesticides, excessive use
of water, and fossil-fuel powered machinery, like tractors, combine-harvesters, etc. The Green
Revolution through altered agronomic practices was one of the proudest achievements at food
production fronts turning the country from food importer to a robust food exporter. This agriculture
did not have any kind of positive relationship with the environment. Green Revolution also led to a
spurt in industries involved in the manufacture of agri-chemicals, which also contributed to
deteriorate environment.
The agriculture being vigorously pursued these days can be referred to as the
liberalization, privatization and globalization (LPG) agriculture, which, in fact, is an ‘improved’
version of the Green Revolution. The LPG agriculture is biotechnology-driven and is governed by
global market. This is closely allied into global industry and is structured for huge profits by the
corporate sector. New crop cultivars which nature had ‘failed’ to evolve have been created using
genetic engineering. Genetically modified organisms (GMOs) of major crops are on way to occupy
centre-stage of agriculture. After non-food crop of Bt cotton, Bt food crops are in the pipeline. The
LPG agriculture ignores environmental issues. This agriculture is still in its infancy but is all set to
have unending implications for environment and public health.
Vulnerability of Contemporary Agriculture
Never before in the history has Indian agriculture been as vulnerable and uncertainty-
ridden as it is today. A glimpse of the dynamics of Indian agriculture reveals that it has
systematically deviated away from its very base, that is, the environment—the prop that nourishes
all biological resources. Today’s agriculture is valued against the prices it fetches from the market,
especially the global market. Its contribution to human health and welfare, ecological integrity,
resilience of nature, etc. are grossly neglected.
The agriculture had begun going anti-nature since the inception of the Green Revolution,
which was based on the so-called high-yielding varieties, monocultures, indiscriminate applications
of chemical fertilizers and pesticides and over-exploitation of water resources for irrigation. None
of the farming practices associated with the Green Revolution was environment-friendly. The
Green Revolution turned ghastly for small and marginal farmers as well as for the agro-
ecosystems it operated in. It poisoned virtually all components of the environment – biotic as well
as abiotic, and lands, soils, waters and atmosphere. It started poisoning the whole civilization as
well as all living beings.
All kinds of epidemics are virtually linked with agriculture. Healthy food ensures healthy
society. Contaminated food ensures a sick society. A sick society cannot be a sustainable society.
If the very basis of life, i.e. the producers, become poisoned, all the food chains and food webs in

(Climate Change, Precision Agriculture and Innovative Disease Control Strategies)
- 29 -
all ecosystems are inevitable to be poisoned. Thus a wrong agriculture becomes a root cause of
all the ills of a society.
The kind of agriculture being pursued these days (the LPG agriculture) is the climax of
contaminated agriculture. Introduction of alien genes in a plant is a classical example of genetic
pollution. Bt crops are able to save themselves because the introduced Bt genes produce poison
within the plant that is capable of killing insects. But this is the worst possible nature-annihilating
method of pest control. The ecological means of plant protection call for management, not
extermination, of insect pests. If all the insects are wiped out and done to extinction as the
genetically modified crops are set to do, this would be a death knell for nature. The genetically
modified organisms (GMOs) do not make any difference between useful and harmful insects (of
course, there is nothing like harmful in nature). Pollinators, amidst the enormous diversity of
insects, will also be wiped out when large areas of cultivated land are covered by GM crops. This
situation would bring death warrant for humanity, for the extermination of pollinators would mean
failure of crop production to a great extent.
Agriculture has not just been a source of livelihood, human survival, progress and
sustainability, but also a way of life, a potent symbol of a civilization, a culture and a philosophy.
With the retrogression of agriculture, we are also bound to witness crumbling of Indian ethos
reflected in basic Indian philosophy, the agro-ecophilosophy. Making agriculture healthy, vibrant
and sustainable is not only necessary but also an imperative for a healthy, vibrant and sustainable
society. It is also an imperative of our destiny.
Mainstream Agriculture vs Mountain Agriculture
Mountain ecosystems are fragile and witness very high degree of biodiversity. Further,
mountain ecosystems play very crucial role which the mainstream plain areas cannot. Mountain
ecosystems are altogether different from the plains and so is mountain agriculture. Despite
massive agricultural transformations having taken place all over the world, mountain people have
not brought transformation to their agriculture to an appreciable extent. Mountain agriculture,
despite intensive institutional intervention, by and large stays traditional. The cropping
accommodates biodiversity of plants, both at species and genetic level which change according to
the type of agro-ecosystem. Some of the striking characteristics of the mainstream and mountain
characteristics are shown in Table 1.
Table 1: Some features of mainstream and mountain agriculture
Features Mainstream agriculture Mountain agriculture
Fragility Moderate High
Farming system Absent Present
Diversity/ heterogeneity Minimum High to extreme
Complexity Less High to extreme
Vulnerability high Least

(Climate Change, Precision Agriculture and Innovative Disease Control Strategies)
- 30 -
Resilience Low High
Water use efficiency of crops
poor high
Inputs External Internal
Productivity Moderate to high Moderate
Sustainability Poor High
Natural Adaptation Capability in Mountain Agriculture
An agricultural system that embraces features of a sustainable system also carries
characteristics of adaptation capabilities. In other words, a more adapted agricultural system is
more sustainable. And also, a more adaptable agriculture is more sustainable. In order to be
sustainable, agriculture should be:
1. Ecologically sound,
2. Regenerative,
3. Economically viable, and
4. Socially just.
Mountain agriculture, in fact, is characterized by these traits and, therefore, carries traits of
a sustainable agriculture. These have been elaborated in Table 2 and have also been
demonstrated in Fig. 1. All the four traits of a sustainable agriculture are intertwined together. If
one trait misses, the very base of sustainability is shrunk. Each trait of a sustainable agriculture, as
in case of the mountain agriculture, has many indicators of sustainability.
Fig. 1: Traits of sustainable agriculture intertwined into a complex whole – High degree of adaptations

(Climate Change, Precision Agriculture and Innovative Disease Control Strategies)
- 31 -
Table 2: Indicators of sustainability associated with mountain agriculture
Sustainability trait Sustainability Indicators associated with each sustainability trait
Ecologically sound Larger forest-cropland ratio High degree of biodiversity and complexity Living soil Integration with trees and livestock Energy efficient Resilient Cyclic flow of nutrients Organic inputs Resource enhancing and conservation-oriented
Economically viable Linkages with market Remunerative production Value addition
Socially just Accessibility to food resources by all Food and nutrition security for all Recognition and promotion of traditional knowledge systems and people's innovations Good governance
Regenerative Energy saving and conserving Resuscitation and recharging of water sources Enhanced biodiversity Enrichment of soil Increased rate of carbon sequestration Contribution to global warming alleviation and climate change mitigation
Matrix of Mountain Agriculture
A mountain agro-ecosystem comprises uncultivated land (often forest or rangeland),
cropland, livestock and households as its integrated parts (Fig. 2). Uncultivated land serves as a
natural reserve of biodiversity, energy, water and nutrients. This is the largest component of a
mountain agro-ecosystem. Forests are ecologically more stable than the croplands, hence more
resilient and less vulnerable. They do not require an input of nutrients or water. The water received
through natural precipitation is conserved and brought into circulation by the forests. Forests are
rich reserves of nutrients that also nourish croplands. Forests are capable of regeneration. If forest
products are exploited judiciously, they would be capable to regenerate themselves. Higher the
measure of biodiversity in a forest ecosystem, greater would be its role in nourishing the
croplands. In addition to the ecosystem functions vital for the sustainability of an agro-ecosystem,
a forest is also capable of producing very large number of edible food products, such as wild fruits,
buds, flowers, seeds, beans, mushrooms, etc. apart from valuable medicinal plants and several
other plants of economic value.

(Climate Change, Precision Agriculture and Innovative Disease Control Strategies)
- 32 -
Fig. 2: Matrix of a mountain agro-ecosystem
Cropland is the core land serving to produce cultivated foods. This land is constantly
nourished by the nutrient stock in a forest ecosystem, either directly (such as through the input of
mulch) or through livestock (through manure application).
Mountain agriculture is a mixed agriculture and gives prominent place for the livestock.
Livestock play crucial role in transferring nutrients from a forest/ rangeland ecosystem to a
cropland. The latter are more fragile than the forests. They also help in recycling of nutrients into
croplands. Their main contribution is to supply draught power needed for ploughing, leveling,
puddling, inter-culture operations, etc. apart from yielding milk as one of the most important food
items for human beings. In addition, they also serve as crucial part of the local cultures and as a
cushion against socio-economic fluctuations. Livestock role is vital for the very sustainability of
mountain agriculture.
A village is a cluster of households, who are the custodians and managers of an agro-
ecosystem. They are the farmers who have been at the heart of the evolution of Indian agriculture.
Mountain farmers are a rich repository of Indian wisdom. They are equipped with the knowledge
and technologies by means of which nature and its biodiversity are conserved, enhanced and
sustainably utilized. The farmers have never kept their farming systems in static state. They have
changed themselves and their systems as per specific circumstances. They have evolved
strategies as per the local specificities and that can cope up with adverse circumstances.
Food Security Concept in Mountain Context
Just three food crops – wheat, rice, and maize – meet about 75 percent of the total energy

(Climate Change, Precision Agriculture and Innovative Disease Control Strategies)
- 33 -
humanity worldwide needs for sustenance. This perhaps is the most precarious situation relating
to food security on a global scale. Any imbalance in the production of these three food grains –
due to some epidemic or some ominous changes in climate, for example – might pose a serious
threat to the very survival of human race. Some unique food crops endemic to certain regions are
being squeezed out of cultivation practices to give a room for the alien cultivars and some non-
food cash crops having “high” market value.
The concept of food security – the ability of a household to get access to enough food for
all its members, either by producing it or by earning enough to buy it – has been given new
meaning in the food-deficit regions of the Himalayas where farmers are being encouraged to grow
high value cash crops which will contribute to their incomes and thus their food purchasing power.
This “new meaning”, in fact is a bid to amalgamate the local realities with the globalisation
process. This emphasises only the “food purchase power”, a mere political dimension of “food
security” indiscriminately imposing a dependence on market. It has no respect for local cultures
and reverential attitude towards pristine marginal ecosystems like the mountains. “High-value”
cash crops are not the ones mountain farmers have been growing for millennia. These are the
ones that require exploitation of unique ecological niches wantonly to serve the interests of the
global elites in the first place.
There can be no standard approach for food security on a global scale. Food security
without cultural roots is not sustainable. And the current market-linked concept of food security
being debated the world over has no cultural roots; i.e., it has no consideration of specific
ecosystem features and the communities evolved therein. Food situation is tied with local realities.
Local considerations rather than global “standards” would add to the essential cultural dimension
to food security. Mountain farmers are accustomed to grow diversity of food in their habitats, in
harmony with specific ecological niches for specific products and activities. Diversity in sources
providing food is the very essence of the food security of mountain cultures. A community has its
own food habits. As such, there exists an enormous diversity in food habits of peoples in the world.
You cannot ensure food security of a Westerner by plenty of rice for him. A vegetarian cannot be
provided food security through meat. Food security in Uttarakhand would be meaningless without
Dal-Bhaat. A community’s food habits match with the food production system it has evolved in its
habitats. Provision of food as per food habits is a must for one’s physical and mental development
and psychological satisfaction.
Food security of masses in India as of today is tied with just two types of food grains –
wheat and rice – supplied to the vulnerable sections of the society through public distribution
system (PDS). PDS, in fact, appears to have become the only political perception of “food
security”. Inaccessibility- and fragility-ridden mountain areas require altogether a different
approach for acquiring sustainability and food security. Majority of the population in Uttarakhand is
land-based. They are small and marginal farmers depending on a variety of food-providing
sources: the CPRs, the croplands, the livestock, and the water bodies.

(Climate Change, Precision Agriculture and Innovative Disease Control Strategies)
- 34 -
Diversified agriculture is the best bet for reducing risks and enhancing the degree of
security. The marginal farmers exactly do the same. The gains accrued to the small and marginal
farmers through diversified agriculture, however, are limited by the size of the arable land they
own. But, it is not the arable land alone that could serve as the base for food security as is
perceived in the context of the plains. Mountain farmers give equal, rather greater, importance to
the CPRs, other marginal ecosystems (alpine meadows, for example), and water sources.
Availability of water on sustained basis is a prerequisite for sustainable food security. For
water security, fragile mountains obviously require high density of climax vegetation with
enormous diversity of all types of plants – trees, shrubs, herbs, creepers, etc. Such vegetation, in
addition to contribute biomass to cropland so crucial for soil fertility management, also responds to
the problems associated with fragility of the Himalayan mountain ecosystems.
High degree of inaccessibility of the mountain areas calls for decentralised economies.
Dependence on a central market place for agricultural inputs and food grains is not only difficult
and energy consuming but also not conducive to the very philosophy of food security.
Self-sufficiency in food has to be the foremost target to food security in mountain
ecosystems. And for this to achieve, farming system approach of food production involving local
farming cultures should be the focal point of our strategies.
In marginal areas, food self-sufficiency of farming households should be preferred over
food purchase power. Farmers have ample opportunities for raising their incomes through what
their ecological niches can offer. These can range from off-season vegetables, to vegetable seed
production, to floriculture, to medicinal and aromatic plants, and so on. These cash-promising
activities would raise their purchasing power. However, these should be compatible with the food
self-sufficiency in the region.
Adaptation Capabilities of Mountain Agriculture
The farming system the local farmers have developed is characterized by specific
adaptation mechanisms. Farmers through their specific management practices have ensured
maintenance of the sustainability characteristics of a farming system. These are ensured through
energy, nutrient, water and gaseous flows within the ecosystem (Fig. 3). These flows are
indispensable for ecological integrity of the farming system.
Mountain agriculture adaptation capabilities can be counted at two points, viz., resource
base and farmers’ response. Resource base imparting adaptation capability includes common
property resources, landraces, Baranaaja culture, and livestock. The farmers’ response includes
farming system approach, community based farming, on-farm biodiversity conservation, and
farmers’ knowledge, strategies and innovations. These are elaborated in Table 3 and depicted in
Fig. 4.

(Climate Change, Precision Agriculture and Innovative Disease Control Strategies)
- 35 -
Fig. 3. A mountain agro-ecosystem: linkages between components/ subsystems, nutrient and water flows maintain ecological integrity and sustainability of the food production system
Table 3: Mountain agriculture capabilities and their attributes
Mountain agriculture capability
Attributes of the adaptation capability
RESOURCE BASE
Common property resources
Vital for the ecological integrity of an agro-ecosystem
Micro-climate maintenance
Repository of nutrients, energy and water/ moisture
Natural fodder bank for livestock
Wild fruits, nuts, edible flowers, buds, mushrooms, uncultivated vegetables, seeds, pods, beans, medicinal and aromatic plants, honey, etc.
Supply of raw material for house construction, domestic fuel, agricultural implements and tools and cottage industries
Landraces Extremely adapted for the local conditions
High genetic diversity
Nutritive value, specific aroma and taste
Medicinal value of some crops

(Climate Change, Precision Agriculture and Innovative Disease Control Strategies)
- 36 -
Baranaaja culture
Cultivation of biodiversity
Soil fertility management
Insect-pest management
Production of high energy, protein- and nutrient-rich foods (millets, pseudo-cereals, pulses, beans, etc.)
Resistance against drought conditions
Use of degraded, nutrient-poor soils
Spatial and temporal utilization of cultivated land
Livestock Diversification of food resources
Utilisation of high fibrous diet
Mediation for nutrients from ecologically more stable forest ecosystem to fragile croplands
Recycling of nutrients into croplands
Supply of draught power for ploughing, leveling, puddling, inter-culture, etc.
Acting as cushions against economic adversity
FARMERS’ RESPONSE
Farming system approach Ecological stability, reduced vulnerability, enhanced resilience
Diversification of food production
Provision of inputs from within the system
Risk reduction
Sustainability operation
Community based farming Participation of whole community
Democratic decision making in resource management
Availability of precious resources such as seeds at reasonable rates, or free of cost, or through bartering
Free exchange of resources (e.g., ploughshare, germplasm, bullocks, etc.)
More emphasis on innovative approaches to resource management
Involvement of community’s feelings, aspirations and future dreams
Enhancement of social cohesion
On-farm biodiversity conservation
Maintenance of the inherent/ natural characters of germplasm
Minimisation of risks of species’ extinction
Conservation of biodiversity in a natural way
Control of farming community on resource conservation and utilization
Reduced dependence on market/ corporate sector for expensive and often unaffordable germplams
Maintenance of endemic diversity in nature
Farmers’ knowledge, strategies, innovations
Conservation, transfer, articulation and promotion of traditional community knowledge
Articulation of traditional wisdom in land-based activities
Risk minimization tactics of farming
Experimentation according to local site characteristics
Application of world view of agriculture
Applications of community’s own research methodologies and technology testing

(Climate Change, Precision Agriculture and Innovative Disease Control Strategies)
- 37 -
Fig. 4. Adaptation capability of mountain agriculture
The Cycle of Sustainability
There are three principles of sustainability operationalisation—Living soil, biodiversity and
cyclic flow pattern of nutrients. Mountain farmers manage the soil in such a way that it should
continue to be replenished by nutrients through manure, recycling, in-situ fertilization, mixed
cropping, mulching and other management practices. They still adhere to an old adage – don’t
feed the plant, feed the soil which feeds the plant. Farmers cultivate as much agro-biodiversity as
could be possible in a particular area. They also manage the natural biodiversity in uncultivated
areas (forests, grasslands, rangelands, etc.). This biodiversity is a key to sustainability. Higher the
degree of biodiversity, higher the level of sustainability. Farmers also manage cyclic flows of
nutrients. Whatever nutrients are extracted from croplands are cycled into the same soil through
manure. The soil fertility is further enhanced by supplementing the nutrients from forest soil.
Fig. 5. Cycle of sustainability

(Climate Change, Precision Agriculture and Innovative Disease Control Strategies)
- 38 -
This wonderful practice of farming in mountain areas is an example of farmers’
management of sustainability (Fig. 5), which is a natural adaptation capability in the region.
Agro-ecophilosophy and Sustainable Biosphere
Agriculture, in essence, is an articulation of a philosophy we can call agro-ecophilosophy.
Agro-ecophilosophy is a meaningful fusion of agriculture, ecology and philosophy. This philosophy
is life-enhancing and has been at the heart of Indian ethos for millennia and embraces reverential
attitude towards nature, ecosystems, and whole life.
Agro-ecophilosophy provides basis for ecological consciousness which is a pre-requisite of
ecological responsibility. Ecological responsibility prepares a ground for pertinent ecological
actions, which are essentially the life-enhancing actions (biodiversity conservation and
enhancement, for example). Ecological action directs us for ecological justice, which, in turn,
provides an atmosphere of ecological culture. The ecological culture would help create an
ecological balance. And ecological balance is an absolute need for a sustainable biosphere (Fig
6).
Mountain farming communities have been creating eco-philosophies for centuries.
Himalayas’ serenity, environmental sacredness and scenic beauty have been inspiring them to
create and implement eco-philosophies. Mountain agriculture in its traditional form still sings a
song of mountain farmers’ philosophy. The agro-ecophilosophy is potent enough to heal the Earth
and to restore our glorious agriculture even in the era of global warming and climate change.
Ecological balance
Ecological culture
Ecological justice
Ecological action
Ecological responsibility
Ecological consciousness
Agro-ecophilosophy
Fig. 6. Agro-ecophilosophy, agri-culture and sustainable biosphere

(Climate Change, Precision Agriculture and Innovative Disease Control Strategies)
- 39 -
Conclusion
The natural and farmer-evolved adaptation capabilities of mountain agriculture, as
discussed in this paper, serve as a part of our strategy of rising against global warming in our
times. The mountain culture has not undergone as much drastic change as the mainstream
agriculture. With specific characteristics of the mountain resource base and farmers’ traditional
strategies implemented honestly on a massive scale, we would be able to regenerate the
productive potential of the traditional mountain agriculture. We need to capture and absorb basic
philosophical elements of the traditional mountain agriculture, i.e., the agro-ecophilosophy, to
regenerate and restore the kind of agriculture which could produce a variety of plentiful foods to
nourish local communities as well as the people in the distant areas. In this way we would not only
rise against the global warming but would also come out with a glorious victory to restore the
original evolutionary gesture of our nature.

(Climate Change, Precision Agriculture and Innovative Disease Control Strategies)
- 40 -
Disease Management in Precision Farming
V.S. Pundhir
Department of Plant Pathology, G.B.P.U.A.&T., Pantnagar- 263 145 (Uttarakhand)
Precision Farming has emerged as management practice with the potential to increase profits by;
utilizing more precisely agricultural resources.
Precision Farming: the factors are important
Yield potential of variety
Yield capacity of field
Yield potential of variety
Yield capacity of field
Yield potential of variety
Yield capacity of field
Precise Management of following input variables is important:
Cultivar selection
Tillage practices
Irrigation scheduling
Disease / Pest management
Developing database
Options (agents/methods) have been developed to eradicate / reduce the pest populations,
so as they do not cause physical and economic losses to plants that are required for well
being and sustenance of life (human race) on the planet.
Present emphasis is to do the same things more precisely
Following Practices are Adopted in Precision Farming
A. Judicious Use of Pesticides
Disease forecasting
Using ETL for pesticide spray
Management of resistant strains
Adoption of IPM package deal
B. Crop Rotation / Sequence
vegetable crops rotated with rice effective in management of root-knot nematodes in
vegetables
long rotation of potato with cereals & non-host vegetables (cole) helps in bacterial wilt
management
rice crop after cotton reduces Verticillium dahliae
green manuring has dual effects
C. Soil Solarization
Successful Management
Damping-off of seedlings, root rots, stem rots,

(Climate Change, Precision Agriculture and Innovative Disease Control Strategies)
- 41 -
fruit rots, wilts and blights (Pythium, Phytophthora, Fusarium, Sclerotium,
Rhizoctonia,Sclerotinia, Verticillium, Ditylenchus, Globodera, Heterodera, Meloidogyne,
Clavibacter)
WEEDS : Amaranthus spp. Amsickia, Anagallis, Avena, Chenopodium, Convolunalus,
Cynodon, Digitaria, Echinochloacrus, Eleusine, Fumaria, Lactuca, Linum, Montia,
Notabaris, Phalaris, Poa, Portulaca, Sisymbrium, Senecio, Xenthium
D. Precise Crop Culture
Time of planting (late blight)
Method of planting (ridge planting)
Seed rate / population density (wilts)
Seed placement (damping-off)
Host Nutrition: (Balanced)
o deficiencies/toxicities & corrections
o amount & form of Nitrogen (leaf spots)
o P & K imparts resistance (spots/blights/mildews)
E. Water Management
Water is vital for activities of host & pathogens
Soil moisture: damping-off/seed-root rots & wilts
Availability of irrigation affects type of crops grown, thus indirectly affects pathogen
(survival / spread) and resulting diseases
wet soils favour club root of crucifers & silver scurf of potato while dry soils favour white
mold of onion, common scurf of potato and Fussarium wilts
Dry soils suppress zoo-sporic fungi
Irrigation water is potential agent for transport/distribution of inoculum
Time & type of irrigation also influence
F. Organic Amendment of Soil: economic, hazard free and eco-friendly
Decomposable organic matter or green manuring manifold benefits
Soil physical environment (pH, C/N, CO2)
Soil chemical env. (decomposition products)
Soil biological environment: Antagonism (fungistasis, parasitism, predation, antibiosis and
competition etc.)
Induced host resistance / tolerance
G. Precise Practices and Disease Management
Method Pathogen managed Crop
Crop rotation Cephalosporium gramineum G. graminis var. tritici
Wheat Wheat
Crop spacing Sclerotinia sclerotiorum Dry beans
Decoy crop Spongospora subterranea Potato

(Climate Change, Precision Agriculture and Innovative Disease Control Strategies)
- 42 -
Fallow Pseudomonas solanacearum Banana
Fertilizer practices F. oxysporum f. sp. phaseoli Dry bean
Flooding F. oxysporum f. sp. cubense Banana
Monoculture Streptomyces scabies G. graminis var. tritici
Potato Wheat
Organic amendments fungi and nematodes Crops
pH adjustment Plasmodiophora brassicae Streptomyces scabies
Crucifers Potato
Tillage Sclerotium rolfsii Peanut
Time of Planting Fusarium roseum Tilletia controversa
Wheat Wheat
Trap crop Meloidogyne spp. Crops
Water management Phytophthora spp. Macrophomina phaseolina
Walnut, Cherry Sorghum
H. Survey and Surveillance
Survey means “to view the situation comprehensively and extensively at different
periodicity”
Surveillance is “vigilant supervision of a situation” (to keep close and constant watch)
Plant disease surveys are basic guide to disease progress that helps in fixing the priorities
May serve as forewarning for certain actions
It also tells about the impact of the changing CLIMTE , agricultural technology & pd
management tools.
I. Precision in disease forecasting will focus on the following;
1st generation forecast:
based on weather data,
focusing on time of first spray
2nd generation forecast:
Location and magnitude of pathogen
Weather data
Cultivar resistance
Survival of sporangia from out side the fields
Fungicides resistance and micro-processors for
Recording and processing of data.

(Climate Change, Precision Agriculture and Innovative Disease Control Strategies)
- 43 -
Climate Change and Mitigatory Measures with Reference to Hill Agriculture
Uma Melkania
Department of Environmental Science, GBPUA&T, Pantnagar- 263 145 (Uttarakhand)
Background
Global warming refers to warming of the earth resulting from build up of greenhouse gases
of anthropogenic origin in the atmosphere. The impact of climate change due to global warming is
disproportionately higher for developing countries and the poor of all countries due to higher
physical exposure and dependency on natural resources for their livelihood.
Contribution of Greenhouse gases emission in different sectors shows that agriculture contributes
13% of greenhouse gases as compared to other sectors but faces the impact generated by other
sector as well (Fig.1).
Source: ENVIS, NBRI 2010
Impact of Climate Change:
Impact on crop yield: Studies have shown that the climate change will decrease or increase crop
yield in various ways depending on the latitude of the area, altitude of the areas, precipitation
changes evapotranspiration changes and temperature changes. Temperature increase
significantly affects higher photosynthesis, respiration and transpiration rates, triggered flowering
etc. Northward expansion of suitable cropping areas with changes in radiation and temperature is
also expected. The incidences of various diseases have also been observed.
Positive effects of CO2 enrichment on yield and water use efficiency have been observed. It is
recorded that 2-30C temperature rise is good for crop yield but crop yield decreases at higher
temperature. The simulation models studies in India have shown that with increase in temperature,
regardless of CO2 fertilization risk of hunger is a big challenge to be faced (ENVIS 2010). For hill

(Climate Change, Precision Agriculture and Innovative Disease Control Strategies)
- 44 -
agroecosystems the use of lesser known species being grown by inhabitants using their traditional
knowledge can be encouraged. Climate adapted crops such as varieties of major crop resistant to
heat, drought, submergence and salty water could be cultivated. (FAO, 2011)
Threats to Ecosystem services: The mountainous areas serve various types of ecosystem
services in the form of rich forest areas, origin place of many rivers, guarding national boundaries,
watersheds and picturesque landscapes due to the threats of climate change and anthropogenic
pressure. The ecosystem services are also being affected negatively posing threat to ecosystem
health and viability of agroecosystem in hills. Efforts are required for proper valuation of ecosystem
services.
Threats to Biodiversity: The hill ecosystems are the repositories of biodiversity which directly
related with the livelihood of inhabitants in terms of food, medicine, resource for small-scale
industries, mixed crops, underutilized crops, their races and wild relatives and intangible benefit in
terms of ecosystem/environmental stability. Changing climatic conditions may affect the
ecosystem biodiversity through affecting tangible and non-tangible benefits. More efforts are
required to conserve biodiversity in forest and agroecosystem in these hilly areas.
The expected impact of climate change across forest and agriculture sectors mentioned in a report
from Ministry of Environment and Forests (Anonymous 2010) is shown in table 1.
Table 1: Expected impacts of climate change across forestry and agriculture sectors. (Anonymous
2010)
Sector Physical and ecological impacts
Socio-economic impacts
Cross-Cutting issues
Vulnerable areas/Sectors
Forests A study by the Indian Institute of Science shows a large-scale shift in forest types in India under current and future climate scenarios
In India nearly 200,000 villages rely on forests and forest products for their livelihood. The supply of forest products and consequently, the livelihoods of forest-dependent communities
Change in biodiversity (endangered species diversity) and associated implications on ecological balance
Forests
Agriculture In India, it is estimated that a temperature rise of 20C could lower the yields of staple crops such as wheat and rice by 10% and reduce farm revenues
Endangered livelihoods of agriculture-dependent communities and implications on food security
Changes in soil properties and distribution and frequency of infestations by pests, insects and diseases
Farming
With the increasing threat of climate change at world level several measures have been
taken at various levels through adopting policies, acts and rules to combat the effect. One of the
important efforts to deal with this problem was during “Earth Summit” (United Nations Conference
in Environment & Development) held in Rio De Janeiro in the year 1992. As a result of this

(Climate Change, Precision Agriculture and Innovative Disease Control Strategies)
- 45 -
Intergovernmental Panel on climate change (IPCC) was formulated and Kyoto protocol was made
an act on 16th Feb, 2005 including the mechanism of CDM i.e. clean development mechanism.
Under this there is the provision of adaptive and mitigatory measure. The adaptive measures helps
human and natural systems to adjust to climate change such as finding resistant and resilient crop
varieties, tree species with good coppicing capacity, regenerating capacity etc. The mitigatory
measures help to reduce net carbon emission and limit long-term climate changes. Considering
the interconnected of this the mitigatory measures have to be adopted by various sectors as below
i.e.
1. Energy Sector: Under this energy efficiency through improved techniques need to be
achieved.
2. Forestry Sector: The practices of afforestation, avoided deforestation, assisted natural
degradation and environmentally sound forest management have to be addressed.
3. Agriculture Sector: The cropland management has to be adopted through carbon
sequestration, management of nutrients, tillage, residues, soil and agroforestry and water
use efficiency.
Hill Agriculture
Peculiarities
Traditional agriculture in the hills is organic, low in the use of fossil fuel based inputs and,
therefore, results in lower greenhouse gas (GHG) emissions. Himalayan agriculture is based on
traditional approaches exhibiting close interdependence among key resources- land, livestock, and
forests. Agriculture crop diversity, as well as genetic diversity within a single crop, is the key
feature of mountain agricultures. Scientists opine that such biodiversity may also enable
production systems to survive changes in the climate.
There has been an almost total absence of inputs emanating from research on small area and
eco-friendly, high yielding, varieties of rain-fed mountain crops (Anonymous 2010)
The National Action plan on climate change has mentioned that The National Mission for
Sustaining the Himalayan Ecosystem is vital to the ecological security of the Indian landmass,
through providing forest cover, feeding perennial rivers that are the source of drinking water,
irrigation and hydropower, conserving biodiversity, providing a rich base of high value agriculture,
and spectacular landscapes for sustainable tourism. At the same time, climate change may
adversely impact the Himalayan ecosystem through increased temperature, altered precipitation
patterns, and episodes of drought. The National Environment Policy, 2006, interalia provides for
the following relevant measures for conservation of mountain ecosystems:
Adopt appropriate land-use planning and water-shed management practices for
sustainable development of mountain ecosystems.
Adopt “best practice” norms for infrastructure construction in mountain regions to avoid or
minimize damage to sensitive ecosystems and despoiling of landscapes

(Climate Change, Precision Agriculture and Innovative Disease Control Strategies)
- 46 -
Encourage cultivation of traditional varieties of crops and horticulture by promotion of
organic farming enabling farmers to realize a price premium. (National Action Plan on
Climate Change 2010)
Several studies have reported that viability of agroecosystem in hills depend on the viability
of forest ecosystems. The cause has been explained as below due to the peculiarity of hill
agroecosystem in several ways at below:
Mainly rainfed agriculture for subsistence.
Due to topographical aspect cultivation is terrace agriculture, and valley cultivation.
Agricultural productivity alone is not sufficient to fulfil the livelihood feeds of inhabitants.
Their dependency on forest ecosystem is in the form of firewood, fodder and other non-
timber forest produces. Animal husbandry is also the past of hill agriculture as the
mechanization of hill agriculture is not possible due to topographical factors and the
ploughing is being done to cultivate the land. Meanwhile, the farmyard manure is from
livestock is being used in the agriculture to conserve soil and water or for the better health
of ecosystem.
Carbon Sequestration and Agroecosystem
• Carbon sequestration is an important approach for mitigating the greenhouse effect on
climate and terrestrial carbon sequestration is the process through which CO2 from the
atmosphere is absorbed by trees, plants and crops through photosynthesis, and stored as
carbon in biomass (tree trunks, branches, foliage and roots) and soils.
• The largest pool of actively cycling C in terrestrial ecosystems is the soil. Carbon flows
between soil and the atmosphere through the paired process of photosynthesis and
respiration.
• The impact of cultivated land on climate is multiple and significant. First, compared with
forested sites, agricultural land is characterized by a greater albedo, lower soil roughness
and soil humidity variations that influence sensible and latent heat exchanges. Crops
constitute the most important biospheric source of carbon dioxide (CO2), resulting from plant
respiration and soil organic matter decomposition. Changes in agricultural practices are
being considered as possible ways to mitigate climate change by increasing carbon storage
in crop soils.
• The amount of carbon stored in and emitted or removed from the agroecosystem depends
on the crop type, management practices, and soil and climate variables. Annual crops are
harvested each year, and therefore provide no long-term storage of carbon in aboveground
biomass, but soils can sequestrate atmospheric CO2 when large quantities of crop residues
and organic manure are returned to the soil.
• Carbon stocks in agricultural soils can be significant. Changes in stocks can occur in
conjunction with soil properties and management practices, including crop type and rotation,

(Climate Change, Precision Agriculture and Innovative Disease Control Strategies)
- 47 -
tillage, drainage, residue management and organic amendments.
• The carbon budget of agroecosystems is important in the global terrestrial C cycle but has
been difficult to quantify on a larger scale due to spatial and temporal variations in climate,
soils and agricultural practices
• Research during the past few decades has demonstrated the significant contribution that
conservation agricultural systems can have on reducing emission of greenhouse gases, as
well as sequestering carbon in soil as organic matter.
• The soil organic carbon (SOC) content of agricultural ecosystems has been found to depend
on land use, cultural management, fertilizer application, harvest features, residues
management, microclimate and soil tillage.
• The quantity of soil carbon present is controlled by a complex interaction of processes
determined by carbon inputs and decomposition rates. Factors controlling the quantity of
organic matter in soil include temperature, moisture, oxygen, pH, nutrient supply, clay
content and mineralogy.
REFERENCES
1. Anonymous 2010.To look into problems of hill states and hill areas and to suggest ways to ensure that these states and areas do not suffer in any way because of their peculiarities. Planning Commission and G.B.Pant Institute of Himalayan Environment and Development, Kosi Katarmal Almora.
2. Anonymous 2009-2010. Report to the people on Environment and Forests. MOE&F, Govt. of India 2008.
3. National Action Plan on Climate Change, Ministry of Environment MOE&F, Govt. of India 2008.
4. Parsai Gargi, Prepare for long term climate change on food production; FAO.
5. The Hindu 1st April 2011
6. Anonymous 2010. National Botanical Research Institute Lucknow ENVIS (NBRI) MOE&F 6: Newsletter.

(Climate Change, Precision Agriculture and Innovative Disease Control Strategies)
- 48 -
Climate Change and Plant Diseases
N.S. Murty Department of Agrometereology, G.B.P.U.A.&T., Pantnagar- 263 145 (Uttarakhand)
Worldwide concerns have been rising about climatic change and potential changes in crop
yields and production systems. Such concerns include the ability to accommodate these
uncertainities in order to ensure an adequate food supply for ever increasing population. Crop
yields and changes in productivity due to climate change will vary considerably across regions and
among localities, thus changing the patterns of production in general, productivity is projected to
increase in middle to high latitudes, depending on crop type, growing season, changes in
temperature regime, and seasonality of precipitation. Most researchers believe that higher
temperatures and droughts caused by climate change will depress crop yields in many places in
the coming decades.
Impact of Climate Change on Crop Production
In the coming decades, global agriculture faces the prospect of a changing climate as well
as the challenge to feed the world's population, projected to be double its present level by about
the year 2060 .The prospective climate change is global warming (with associated changes in
hydrological regimes and other climatic variables) induced by the increasing concentration of
active greenhouse gases. Despite of technological advances such as improved crop varieties and
irrigation systems, weather and climate are still key factors in agricultural productivity. For
example, weak monsoon rains in 1987 caused large shortfalls in crop production in India,
Bangladesh, and Pakistan, contributing to reverting to wheat imports by India and Pakistan (World
Food Institute, 1988). The 1980s also saw the continuing deterioration of food production in Africa,
caused in part by persistent drought and low production potential, and international relief efforts to
prevent widespread famine. The effects of climate on agriculture in individual countries cannot be
considered in isolation. Agricultural trade has grown dramatically in recent decades and now
provides significant increments of national food supplies to major importing nations and substantial
income for major exporting nations These examples emphasize the close links between agriculture
and climate, the international nature of food trade and food security, and the need to consider the
impacts of climate change in a global context.
Climate change induced by increasing greenhouse gases is likely to affect crop yields differently
from region to region across the globe.
The greenhouse gases CH4, N2O and chlorofluorocarbons (CFCs) have no known direct
effects on plant physiological processes. They only change global temperature and are therefore
not discussed further. Instead, concentration should be on the effects of increased CO2 ,
tropospheric O3, increased UV-B through depleted stratospheric ozone, increased temperatures
and the associated intensification of the hydrological cycle.
In general, higher temperatures are associated with higher radiation and higher water use.

(Climate Change, Precision Agriculture and Innovative Disease Control Strategies)
- 49 -
It is relatively difficult to separate the physiological effects (at the level of plants and plant organs)
of temperatures from the ecological ones. There are both positive and negative impacts at two
levels, and only crop- and site-specific simulation can assess the global 'net' effect of temperature
increases. It is generally agreed that: rising temperatures - now estimated to be 0.2°C per
decade, or 1 °C by 2040 with smallest increase in tropics would diminish the yields of some crops,
especially if night temperatures are increased. Higher cold-season temperatures may lead to
earlier ripening of annual crops, diminishing yield per crop, but would allow for more crops per year
due to lengthening of the growing season.
Effect of increasing temperature: Indian Scenario
Agriculture represents a core part of the Indian economy and provides food and livelihood
activities to much of the Indian population. The agricultural sector represents 35% of India’s Gross
National Product (GNP) and as such plays a crucial role in the country’s development. Food grain
production quadrupled during the post-independence era; this growth is projected to continue. The
impact of climate change on agriculture could result in problems with food security and may
threaten the livelihood activities. Climate change can affect crop yields (both positively and
negatively), as well as the types of crops that can be grown in certain areas, by impacting
agricultural inputs such as water for irrigation, amounts of solar radiation that affect plant growth,
as well as the prevalence of pests. While the magnitude of impact varies greatly by region, climate
change is expected to impact on agricultural productivity and shifting crop patterns. The policy
implications are wide-reaching, as changes in agriculture could affect food security, trade policy,
livelihood activities and water conservation issues, impacting large portions of the population.
According to a recent report of IPCC (2007) Crop productivity will fall, especially in non-
irrigated lands, as temperatures rise for all of South Asia by as much as 1.2 degrees C on
average. Food and Agriculture Organization (FAO) said India could lose as much as 125 million
tones of its rainfed cereal production. In contrast, the industrialized countries are likely to gain in
production potential. On the contrary, at lower latitudes, especially in the seasonally dry tropics,
crop yield potential is likely to decline for even small global temperature rises, which would
increase the risk of hunger. Greater frequency of droughts and floods would affect local production
negatively, especially in subsistence sectors at low latitudes. Rising temperature, due to global
warming, will affect the amount of rainfall and the pattern of monsoon season. Because India’s
economy is heavily based on agriculture, the importance of accurately predicting the timing and
severity of monsoons is extremely important. For example, if monsoon rains do not arrive on time,
farmers will be forced to wait and run the risk of planting their crops late.. If monsoon rains are too
severe, seedlings that were planted could be damaged. A number of recent scientific studies have
acknowledged this risk and have examined the factors which create and influence monsoons in an
attempt to better predict future monsoon seasons.
Effect on Plant diseases:
Coakley et al. concluded that the effects of climate change on plant disease management

(Climate Change, Precision Agriculture and Innovative Disease Control Strategies)
- 50 -
may be less important than changes in land-use patterns, transgenic technologies, and availability
of chemical pesticides. Another general conclusion was that the effects of climate change will tend
to be different for different pathosystems in different locations, so that generalization is a
challenge.
The direct effects of climate change on individual plants and plant communities may occur
in the absence of pathogens, but may also bring about changes in plants that will affect their
interactions with pathogens. Changes in plant architecture may affect microclimate and thus risks
of infection. In general, increased plant density will tend to increase leaf surface wetness and leaf
surface wetness duration, and so make infection by foliar pathogens more likely. Elevated CO2
levels tend to result in changed plant structure. At multiple scales, plant organs may increase in
size: Increased leaf area, increased leaf thickness, higher numbers of leaves, higher total leaf area
per plant, and stems and branches with greater diameter have been observed under elevated
CO2. Enhanced photosynthesis, increased water use efficiency, and reduced damage from ozone
are also reported under elevated CO2. Since many foliar pathogens benefit from denser plant
growth and the resulting humid microclimate, there is the potential for these changes in plant
architecture to increase infection rates.
Also, different populations of the same species may differ in both their genetic structure
and the extent to which climate change will push the species to its physiological limits. As a result
of climate change, the abundance of particular species may change rapidly, as species may lose
their ability to recover from other perturbations such as diseases, insect herbivores, and climatic
extremes within a background of climate changes. Novel plant communities may result with the
increased potential for new patterns of host-sharing by pathogens
The range of many pathogens is limited by climatic requirements for overwintering or
oversummering of the pathogen or vector. For example, higher winter temperatures of −6°C
versus −10°C increase survivorship of overwintering rust fungi (Puccinia graminis) and increase
subsequent disease on Festuca and Lolium. In the case of Phytophthora infestans, the
introduction of multiple mating types, allowing sexual reproduction, increases the ability of the
pathogen to overwinter. For pathogens subject to an Allee effect, or destabilizing density-
dependent reproduction at low population levels, release from overwintering restrictions may have
a much stronger effect than expected. Temperature requirements for infection differ among
pathogen species. For example, wheat rust fungi differ in their requirements from 2°–15°C for
stripe rust, 10°–30°C for leaf rust, and 15°–35°C for stem rust. In a review of the effect of climate
change on insect herbivory, Bale et al. make many points relevant to plant pathogens, whether
insect-vectored or not. They concluded that temperature was the dominant climate factor in terms
of direct effects through effects on overwintering and the potentially important combination of
photoperiod and temperature. In many cases, temperature increases are predicted to lead to the
geographic expansion of pathogen and vector distributions, bringing pathogens into contact with
more potential hosts and providing new opportunities for pathogen hybridization. Increased

(Climate Change, Precision Agriculture and Innovative Disease Control Strategies)
- 51 -
transportation and human movement may act synergistically with temperature changes
Temperature governs the rate of reproduction for many pathogens; for example, spore
germination of the rust fungus Puccinia substriata increases with increasing temperature over a
range of temperatures, and the root rot pathogen Monosporascus cannonballus reproduces more
quickly at higher temperatures. Under climate change, pathogens, like plants, may potentially be
unable to migrate or adapt as rapidly as environmental conditions change. But most pathogens will
have the advantage over plants because of their shorter generation times and, in many cases, the
ability to move readily through wind dispersal.
Disease management strategies may require adjustment under climate change. Strategies
such as delaying planting to avoid a pathogen may become less reliable. And one of the major
problems with applications of biological control for plant disease management in the field has been
the vulnerability of biocontrol agent populations to environmental variation. Simulation models are
based on theoretical relationships and can be used to predict outcomes under a range of
scenarios. Because climate change occurs slowly and variably, it is difficult to study its effects
directly. Temporal variability in climate can be used to draw inference about the potential effects of
climate change through the argument that temporary effects of a year with unusual climatic
features are likely to represent the effects of longer-term changes.environmental extremes.
Models of plant disease have now been developed to incorporate more sophisticated climate
predictions from General Circulation Models.
In the population level, the adaptive potential of plant and pathogen populations may prove
to be one of the most important predictors of the magnitude of climate change effects on plant
disease, since, for many species, populations will not be able to migrate quickly enough to keep
pace with climate change.
Needs for further research
Due to the complex interaction of climate impacts, combined with varying irrigation
techniques, regional factors, and differences in crops, the detailed impacts of these factors need to
be investigated further. Specific recommendations for further research include:
• Precision in climate change prediction with higher resolution on spatial and temporal scales;
• Linking of predictions with agricultural production systems to suggest suitable options for
sustaining agricultural production;
• Preparation of a database on climate change impacts on agriculture; and
• Development of models for pest /diseases population dynamics.
Conclusions
It is evident that the relationship between climate change and agriculture is still very much
a matter of concern with many uncertainties. Predicted changes in average values of global
climate variables (increased temperatures, altered precipitation patterns, increased concentrations
of atmospheric CO2) and changes in the frequency, duration, and degree of extremes (such as
frost, heat, drought, hail, storms, floods) will affect agricultural crops, agroecosystems, and

(Climate Change, Precision Agriculture and Innovative Disease Control Strategies)
- 52 -
agricultural productivity. Forecasts of regional climate changes are still not precise. Overall,
shortage of water will be the predominant factor affecting plant growth. As higher temperatures are
known to enhance plant development and especially the grain-filling duration of cereals, grain yield
losses are possible in a warmer climate. On the other hand, elevated atmospheric CO2
concentrations are known to stimulate photosynthesis and enhance growth and yield ("CO2
fertilization"); concomitantly, leaf transpiration is reduced, resulting in improved water use
efficiency. Elucidating the interactions between positive and negative effects of climate change is
of crucial importance for any prediction of future crop yields. The prediction of the response of
crops to climate on both seasonal and decadal timescales shows promise. The potential benefit of
increasingly accurate prediction is clear: for the season, the mobilization of resources; for the
adaptive measures to minimise the adverse impacts of climate change.
REFERENCES
1. Bale JS, Masters GJ, Hodkinson ID, Awmack C, Bezemer TM, et al. 2002. Herbivory in global climate change research: direct effects of rising temperature on insect herbivores. Glob. Change Biol. 8:1–16
2. Coakley SM, Scherm H, Chakraborty S. 1999. Climate change and plant disease management. Annu. Rev. Phytopathol. 37:399–426
3. FAO. 1995a. World Agriculture: Towards 2010, An FAO Study. N. Alexandratos (ed.). John Wiley, Chichester, UK, and FAO, Rome.
4. FAO, 1995b. FAOCLIM 1.2, Worldwide agroclimatic data. FAO Agrometeorology Working Paper Series No. 11. FAO, Rome.
5. K.A.Garrett, S.P.Dendy, E.E.Frank, M.N.Rouse, and S. E. Travers 2006. Climate Change Effects on Plant Disease: Genomes to Ecosystems. Annu. Rev. Phytopathol. 44: 489-509
6. Masson et al. 2005. Impact of barrier layer on winter-spring variability of the southeastern Arabian Sea. Geophysical Research Letters, VOL. 32, L07703, doi:10.1029/ 2004GL021980.
7. Intergovernmental Panel on Climate Change. (2007). Climate Change 2007: Mitigation - Contribution of Working Group IV to the fourth Assessment Report of the IPCC.
8. Kalra Naveen and Sharma K Subodh,2007. Report on Climate change impact on Agriculture in India. Indian Agricultural Research Institute, Delhi

(Climate Change, Precision Agriculture and Innovative Disease Control Strategies)
- 53 -
Impact of Agricultural Intensification on Carbon Sequestration and Soil Health
K.P. Raverkar
Department of Soil Science, GBPUA&T, Pantnagar- 263 145 (Uttarakhand)
Globally agriculture is a dominant form of land management covering about 40 percent of
terrestrial surface (FAO 2009). The existence and quality of life of human beings depends upon
the agricultural ecosystems as they fulfill the prerequisites of sustenance and wellbeing of human
life by providing food, forage, bio-energy and pharmaceuticals. In recent years, agro ecosystems
are being recognized for their contribution to other types of ecosystem services viz., regulating and
cultural services to human communities besides fulfilling the provisioning services (MEA 2005).
Management practices in agro ecosystems dictates the various services provided which are
supported by the ecosystem processes such as:- pollination, biological pest control, maintenance
of soil structure and fertility, nutrient cycling and hydrological services (Fig. 1). The value of
provisionary, regulatory and cultural services fulfilled by agricultural ecosystems is enormous but
often is not recognized or underappreciated.
Fig. 1. Impacts of farm management and landscape management on the flow of ecosystem
services and disservices to and from agro-ecosystems (Power 2010)
Humans depend on both natural and managed ecosystems for various services including
provisionary and environmental. With the advent of human progress, various agricultural
technologies developed leading to intensification of agriculture to take care of the demand for food,
fibre and feed of ever escalating global population. Agricultural intensification is a set of patterns of
land-use change with the common feature of increased use of the same resources usually
because of a switch from intermittent to continuous cultivation of the same area of land for
enhanced economical production. In the initial era, extensification was adopted to produce the
food. However, only extensification i.e. conversion of natural ecosystem to agricultural ecosystem

(Climate Change, Precision Agriculture and Innovative Disease Control Strategies)
- 54 -
was not able to cope up with the increasing demand to meet the challenge of supplying food to the
escalating population due to limited land. With the time, linearly the gradient developed from being
the shifting cultivation at one end and intensification at the extreme. Along the gradient of
increasing land-use intensification, substitution of manual labour by mechanization, organic inputs
and natural pest management by agrochemicals use is experienced. The management practices
employed while intensification affects soil health.
Soil health in agricultural systems
Soil carbon, soil health and sustainable agriculture are interlinked. Soil carbon is also
termed as a life as it supports the agents involved in continuum of various biogeochemical cycles.
Soil management is fundamental to all agricultural ecosystems; however, there is an evidence for
widespread degradation of agricultural soils in the form of erosion, loss of organic matter,
contamination, compaction, increased salinity etc.
Concept of soil health
The growers looking at the crop health, soil color, intensity of earthworms, visibility of plant
residue etc. judge the soil health. Scientifically it is judged either employing the reductionist or
integrated concept. Reductionist concept advocates an estimation of soil condition using a set of
independent indicators of specific soil properties while integrated concept assumes that the health
of a soil is more than simply the sum of the contributions from a set of specific components. It
recognizes change in emergent properties resulting from the interaction between different
processes and properties.
A healthy agricultural soil is one that is capable of supporting the production of food and
fiber, to a level and with a quality sufficient to meet human requirements together with continued
delivery of other ecosystem services that are essential for maintenance of the quality of life for
humans and the conservation of biodiversity (Kibblewhite et al., 2008). The soil provides the
various services to the community through:
Transformation of carbon through decomposition of plant residues including SOM
Essential ecosystem function
Driver of nutrient cycling
Supports detoxification and
Waste disposal service
C-sequestration: role in regulating emission of GHG e.g. CO2 and CH4
Cycling of nutrients: N, P, K including N2O emissions
Maintenance of structure and fabric of the soil
Soil aggregation
Particle transport
Formation of biostructures
Pore networks
Biological regulation of soil population

(Climate Change, Precision Agriculture and Innovative Disease Control Strategies)
- 55 -
The living system in soil comprising microflora, microfauna and macrofauna governs the
various services provided by the agricultural soils. The relationships between the activities of the
soil biological community and a range of ecosystem goods and services does exist (Fig 2).
Fig.2. Relationships between the activities of the soil biological community and a range of
ecosystem goods and services that society might expect from agricultural soils
(Kibblewhite et al 2008)
Carbon Sequestration
In the terrestrial system, carbon is mainly held in vegetation and soil. Aquatic bodies like
oceans also stocks large volumes of carbon, as does the atmosphere. Soils contain about three
times more C (1500 Pg of C to 1 m and 2500 Pg of C to 2 m depth) than vegetation (650 Pg of C)
and twice as much as that present in the atmosphere (750 Pg of C; USEPA, 1995). Additionally,
fossil fuels e.g., coal, petroleum, and natural gas contain large amounts of carbon that are
released upon combustion.
Fixed carbon is a life of soil and also governs the capacity to provide the nutrients to plants.
All biogeochemical cycles revolve and dictated by the element carbon. Carbon supports the
existence and flourishes the life on the earth. All ecosystems both store and emit carbon back to
the atmosphere at lesser or greater extent as they continuously recycle carbon by photosynthesis
and respiration.
Soil is the biggest reservoir of carbon. Soils can be a source or sink for atmospheric CO2
depending upon the land use and management practices. The conversion of natural habitats to
cropland and pasture, and unsustainable land practices such as excessive tillage frees carbon
from organic matter, releasing it to the atmosphere as CO2 and thus soil acting as a source
whereas the photosynthetic activity, through which the plants convert CO2 into organic forms of
carbon such as sugars, starch and cellulose; as a sink. The soil organic carbon (SOC) pool to 1m
depth ranges from 30 tons/ha in arid climates to 800 tons/ha in organic soils of temperate regions.

(Climate Change, Precision Agriculture and Innovative Disease Control Strategies)
- 56 -
The predominant range of SOC is 50-150 tons/ha. The conversion of natural habitats to
agricultural ecosystems has resulted in depletion of SOC pool by 60 and 75 per cent in soils of
temperate and tropics, respectively. The depletion of SOC pool generally takes place speedily
when the decomposition rates are higher than the rates of carbon added to soil. Severe loss of
SOC leads to deterioration of soil quality, biomass productivity and also affects the water quality.
An overall impact of depletion of SOC levels may be exacerbated by projected global warming
(Lal, 2004). Organic matter plays important role in modulating functions:-
Provision of surface charges (CEC)
Influencing hydrological properties etc.
Soil organic carbon (SOC) pool represents a dynamic equilibrium of gains and losses.
Various practices either contributes or depletes the SOC. Conversion of natural to agricultural
ecosystems causes depletion of SOC pool. Depletion is more in arid/ tropics to the tune of 75
percent or more as compared to temperate regions (60%). The depletion is exacerbated when the
output of C exceeds inputs under the situation of severe soil degradation. Some soils have lost as
much as 20-80 t C/ha, mostly emitted in to the atmosphere.
Soil: Reservoir of C
The carbon from the atmospheric CO2 can be transferred to the long lived stable form in
the soil and plants through the process of sequestration. The process of carbon sequestration
results in the increased SOC and soil inorganic carbon stocks through the judicious
implementation of the land use and friendly/ good management practices. Carbon is referred to be
sequestered if it is converted into a stable form i.e. wood or soil organic carbon. Soils acts as
source as well as sink for atmospheric CO2. The conversion of natural habitat to crop land and/ or
unsustainable land practices lead to source while photosynthesis is the only viable way to trap CO2
from atmosphere and bank in soil.
Soil organic matter comprises of mainly unhumified substances and mummified remains of
plant and animal tissues. Soil being a graveyard for all types of organisms, it may contain all the
biochemical compounds synthesized by the flora, fauna, animals and plants. The soil organic
matter mainly comprises living organisms, fresh residues, and well decomposed residues. These
three parts of soil organic matter can be described as the living, the dead and the very dead.
The dead constituent of the soil organic matter is also referred as the labile pool/ carbon fraction
as it is easily decomposable, susceptible to microbial breakdown and easily oxidizable while the
very dead is resistant to further degradation, microbial breakdown and oxidization. The turnover
time of different fractions of the soil organic matter ranges between 0.1 to 1000 years (Carter,
2002). Therefore, the carbon sequestration in soil depends upon the amount of the carbon put
away in different fractions. More the amount stabilized in the component having the longer
turnover time the more carbon sequestration for longer period.
Loss of SOC
In Asia, India has the lowest average concentration of SOC in agricultural soils (Kyuma,

(Climate Change, Precision Agriculture and Innovative Disease Control Strategies)
- 57 -
1988). The alluvial soils of Indo-Gangetic Plains are inherently fertile and high in K, however
intensive cultivation of rice-wheat; rice-maize and taking away of almost all crop residues lead to
continuous decline in SOC levels (Nambiar, 1994). The Long Term Fertilizer Experiments in India
has indicated that the intensive cropping and imbalance fertilizer use especially fertilizer N alone
resulted in declined SOC concentration irrespective of cropping system and type of the soil
(Swarup, 1998). Accelerated erosion due to wind and water is also a major cause of terrestrial
carbon loss. In India, the extent of soil degradation due to various factors is as below:-
Desertification 68.1 Mha
Water erosion 32.8 Mha
Wind erosion 10.8 Mha
Water logging 08.5 Mha
Salinization 07.0Mha
The emission of C from fossil fuels has increased dramatically since 1970 onwards due to
industrialization, intensive agricultural practices etc. leading to deterioration of soil quality and
enchanced CO2 in atmosphere.
Importance of C sequestration in Soil
Carbon sequestration has a great role in maintenance/ building of soil quality vis-a-vis
sustainability. The importance of carbon sequestration at local/ individual, national and global
scale is depicted in Table 1.
Table 1. Importance of carbon sequestration in soil
Local/ farmer scale National scale Global scale
Improved food security Improved food security Improvements in global climate change
Improved resource base for future generation
Better agricultural sustainability
Reduced CO2 concentration in atmosphere
Reduction in soil degradation and improved soil fertility
Improvement of environmental issues (air and water quality)
Biodiversity build up
Improved crop, timber and livestock yield
Economic returns Economic returns
Improved soil and food quality Social security Social security
Economic returns
Social security
Agricultural intensification: Boon or Bane for C sequestration
With the advent of agriculture, various modern practices and technologies made the
agriculture intensive. Agricultural intensification has been recognized as a source of considerable
emissions with concomitant opportunities for mitigation. However, investment in agricultural
research is rarely considered as mitigation strategy. Burney et al (2010) has analyzed the net
effect of GHG emissions of historical agricultural intensification between 1961-2005. The gist of his
findings is given below:

(Climate Change, Precision Agriculture and Innovative Disease Control Strategies)
- 58 -
Worlds population increased by 111% (3.08 to 6.51 billion)
Crop production rose by 162% (1.8 to 4.8 billion tons)
Agril. production has increased through both extensification and intensification
Gains observed since 1961: largely intensive
Global crop land grew by 27% (960 to 1,208 Mha)
Total crop yield increased by 135% (1.84 to 3.96t/ha) weighted mean across crop
groups
Dramatic increases in cereals and oil seeds were experienced because of:-
Adoption of high yielding varieties
Increased use of pesticides and fertilizers
Improved access to irrigation and mechanization
Direct GHG emissions through agricultural production (2005)
• C emission through Agricultural production: 1.4-1.7 Gt (10-12% of total anthropogenic GHG
emission)
• C emission due land use change: 1.5 Gt
• Agricultural emissions outside land use change
– N2O released from soil related to application of N-fertilizers: 38%
– CH4 : Livestock enteric fermentation and CH4 and N2O from manure management:
38%
– CH4 from rice cultivation: 11%
– CH4 and N2O from burning savannah, forest and agricultural residues: 13%
Indirect GHG emissions through agricultural production (2005)
• Emission in the industrial and energy sectors through production of fertilizers and
pesticides
• Production and operation of farm machinery and
• On farm energy use
Mitigation potential in each area contributing to GHG emission
Each area of agricultural intensification has the mitigation potential to control GHG emission. For
example:-
• Modified rice drainage and straw incorporation practices could reduce global CH4 emission
from rice cultivation: up to 30%
• Precision agriculture and nutrient budgeting facilitates efficient use of fertilizers: reduce
emission associated with excess application
• conservation tillage and potential for sequestration of soil OC in agricultural system: build
fertility and improve yields in degraded soils
• Each of these strategies play role in comprehensive set of crop management guidelines
aimed at simultaneous mitigating agricultural GHG emissions and meeting increased future

(Climate Change, Precision Agriculture and Innovative Disease Control Strategies)
- 59 -
food.
Climatic implications of agricultural intensification
• Burney et al. (2010) calculated agricultural GHG emissions for 1961-2005 as well as two
hypothetical “Alternate World” (AW) scenarios
• In both AW scenarios the growing food needs met by extensification rather than yield
increase (intensification)
• In each case, N2O from agricultural soils, CH4 from rice cultivation, C released from both
biomass and soil by conversion of forest, shrub and grassland to cropland; and N2O, CH4
and CO2 from production and use of N, P and potash fertilizers was considered.
Assumptions
• Alternate World Scenario 1 (AW1)
In this the assumptions were that:
– Population, the global economy and socio-politics evolved exactly as in the Real
World (RW) but agricultural technology and farm practices remained as in 1961
– same crop yield and fertilizer application rates as in 1961 (extensification)
• This hypothetical scenario addresses the question: What it would cost in terms of GHG
impact to replicate current global standard of living in the absence of investment in yield
improvements.
Burney et al (2010) found under such situations as listed above that:
• Additional 1761 Mha of crop land would have needed to achieve same production levels
since 1961 holding yields and fertilizer intensities constant. OR 1514 Mha more cropland
than in RW.
• Potential arable land available in world: 2945 Mha.
• Fertilizer use increase from 31Mt of nutrient to 88Mt of nutrient with constant mean annual
intensity of 32 kg/ha.
• In RW total fertilizer use increased to 136 Kg/ha OR 165 Mt.
• Yield gains in agriculture since 1961 avoided emissions of 161GtC or 3.6 Gt C/year
• Alternate World Scenario 2 (AW2)
In another hypothetical situation it was assumed that:
– A world increased agricultural production is only enough to maintain 1961 standard
of living (in terms of per capita production) through 2005, again through
extensifiction instead of intensification
Under the AW2 situation it was noted that:
Impacts are roughly half than AW1 scenario.
Additional 1111 Mha of cropland would have been needed to maintain per capita
production at 1961 levels while yield and fertilizer intensities holding constant. OR 864 Mha
more cropland than in RW

(Climate Change, Precision Agriculture and Innovative Disease Control Strategies)
- 60 -
Fertilizer use rises from 31Mt of nutrient to 67Mt of nutrient representing same constant
1961 intensity of 32 kg/ha .
Without accounting for any increases in global living standards, yield gains in agriculture
since 1961 have avoided emission of 86.5 Gt C OR an average of 1.9 Gt C/year.
These studies demonstrated that the importance of intensification over extensification to
mitigate the climate change and improve the carbon sequestered in soil vis-a-vis soil
quality. They further suggested that the climatic impacts of historical agricultural
intensification were preferable over a system with lower input with extensification of
cropland to fulfill the demand for food. Continuing improvement of crop yields through
intensification is paramount for agriculture’s future contribution to mitigate climate change.
Further, it has been emphasized that intensification must be coupled with conservation and
development efforts.
Strategies for C sequestration in soil
To mitigate the climate change and global warming the CO2 concentrations in
atmosphere needs to be combated to a level to sustain life on earth and keep
environment clean.
Efficient land use
Diversified cropping
Conservation/reduced/no tillage
Efficient nutrient management
Administered grazing
Aforestation/ agro-forestry
Erosion control
Use of cover crops
Mulching
Rehabilitation of degraded soils etc.
Biostrategies
Afforestation
Ecosystem restoration
Energy plantation
Raising of deep rooted plantation/crops
Growing species with higher content of cellulose and other recalcitrant material
Organic Residue management
Efficient management (mulching/ incorporation) must for enhanced SOC
o Improves infiltration capacity of soil
o Reduce run-off rate
o Reduce soil loss through detachment and transportation
440 Tg plant residue produced in India out of which about 90% is a cereal residue.

(Climate Change, Precision Agriculture and Innovative Disease Control Strategies)
- 61 -
However, it is used as fodder, fuel, construction etc. It is advisable that for the
maintenance/ improvement of soil quality residue should be spared for
incorporation in soil.
Different organic amendments over a long period in various cropping systems
improved the organic carbon status that is a life of soil (Table 2).
Table 2. Impact of different organic amendments on SOC under different cropping sequences
Cropping system Organic amendments Organic carbon (%)
Maize-wheat (25 yrs) Control FYM
0.51 2.49
Cotton-sorghum (45 yrs) Control FYM
0.56 1.14
Ragi-cowpea-maize (3 yrs) Control FYM
0.30 0.64
Rice-rice (10 yrs) Control 50% from inorganic + 50% through green manuring (Sesbania aculeate)
0.43 0.90
Rice -wheat (3 yrs) Control FYM
0.44 0.54
Rice -wheat (7 yrs) Fallow Green Manuring (Sesbania aculeate)
0.23 0.37
Source: Swarup et al., (1999)
Epilogue
o Each dollar investment in agricultural yields resulted in 68 fewer kg C emissions relative to
1961 technology avoiding 3.6GtC per year.
o Yield improvements should be prominent among efforts to reduce future GHG emissions.
o Crop and soil management techniques should be adopted accordingly to enhance potential
of Carbon sequestration
o Good agronomic practices should be followed so that Carbon sequestration can be
increased e.g. reduced tillage.
o To make the farmer aware of the economical benefits of sequestering Carbon.
o Relevant policy consideration that encourage adaptation of various useful practices for
increasing C sequestration.
o All the above stated statements are achievable provided at scientific researches and
policies are implemented with a political will.
o Agril. Intensification should be recognized as GHG emission mitigation strategy at par with
the other strategies.
o Enhanced fund allocation for yield improvements
o Efforts to put away fraction in SOM with high stability and longer turnover time.

(Climate Change, Precision Agriculture and Innovative Disease Control Strategies)
- 62 -
REFERENCES
1. Carter, M.R. (2002). Soil quality for sustainable land management: Organic matter and aggregation interactions that maintain soil functions. Agrnomy Journal 94:38-47.
2. FAO (2009). Food and agriculture organization of United nations statistical database. Available at http://faostat.fao.org/.
3. Kibblewhite, M.G., Ritz, K and Swift, M.J. 2008. Soil health in agricultural systems. Phi. Trans. R. Soc. B. 363: 685-701.
4. Kyuma, K. (1988). Paddy soils of Japan in comparison with those in Tropical Asia. In Proceedings of First International symposium on Paddy Soil Fertility held at Chiagmai, Thailand, December 6-13, 1988. p. 5-19.
5. Lal, R. (2004). Soil carbon sequestration impacts on global climate change and food security. Science 304: 1623-1627.
6. Nambiar, K.K.M. (1994). Soil fertility and crop productivity under long term fertilizer use in India. Indian Council of Agricultural Research, New Delhi.
7. Power, A.G. 2010. Ecosystem services and agriculture: tradeoffs and synergies. Phi. Trans. R. Soc. B. 365:2959-2971.
8. Swarup A. (1998). Emerging soil fertility management issues for sustainable crop productivity in irrigated systems. In Proceedings of a National Workshop on Long-Term Soil Fertility management Integrated Plant Nutrient Supply (Swarup, A., Damodar Reddy, D. and Prasad, R.N.; Eds.). Pp. 54-68.
9. USEPA (1995). Inventory of US greenhouse gas emissions and sinks, 1990–1994. Washington DC.

(Climate Change, Precision Agriculture and Innovative Disease Control Strategies)
- 63 -
Seed Health Testing: Retrospective and Perspectives
Karuna Vishunavat Department of Plant Pathology, GBPUA&T, Pantnagar- 263 145 (Uttarakhand)
For food sufficiency, India underwent introduction of new crops or high yielding varieties of
indigenous planting material, particularly the seed. Of course, it helped India to sustain its food
security via green revolution but at the same time there had been challenges of introduction of
many seed-borne plant pathogens which later established or posed problems time to time for
successful crop production.
Pathogens thus, introduced remained confined to some regions initially, but later spread all
over the country. The diseases which used to be of minor importance became the major diseases
in the regions where pathogen established and disseminated.
There have been the evidences that the infected or contaminated seeds at an early stage
can lead to proliferation of microorganisms through out crop production leading to substantial crop
losses an at times to epidemic proportion
Thus, the seed which is the key input for all crop cultivation has the potential for
transboundary spread of plant diseases and serves as primary source of inoculum for disease
epidemics.Seeds are both the vectors and victims of diseases.
Seed borne diseases vs. Crop production
It is estimated that 30% diseases are of seed borne nature and can be managed through
disease-free seeds. The losses due to seed-borne diseases in developing countries are estimated
to be 60-80% higher than in industrialized countries. Conservatively estimated, seed-borne
diseases cause losses in the order of 50 million ton of food annually.
poor seed healthLeads to poor seed germination to various degrees ,give rise to pre- and post
emergence seedling mortality and progressive disease development in the field and thereby
reduces the yield and quality of the crop,contaminate previously disease-free areas,Spread of the
diseases across national or international boundaries,reduce shelf life of the seed and affects food
safety /mycotoxins /nutritional value
Significance of Seed-borne Pathogens
In worst-case scenario, seed-borne organisms can be disastrous and even life
threatening.
Evidences are there that the consumption of molded grains of wheat, millet, and barley with
Fusarium killed thousands of human beings in the USSR in 1913 after World War II due to toxin
production by the fungus.
Effect of Seed borne diseases in crop production
The major component of losses due to seed borne pathogens are : Quality loss,Cost of
planting restriction,Loss of seed export ,Additional cost of transportation and yield losses.

(Climate Change, Precision Agriculture and Innovative Disease Control Strategies)
- 64 -
Significance of seed-borne pathogens
Few examples which exemplify the significance of seed borne pathogens and their effect
on seed production are mentioned :Blast of rice (Pyricularia oryzae) had been so much so
devastating and was held responsible for famine in Japan in 1930.Yield losses had gone upto
100% due to loose smut in wheat ( Ustilago segatum var. tritici) in Georgia .Brown spot of rice (
Drechslera oryzae) a devastating disease and was held partly responsible for Bengal famine in
1942-43 in India. The fungus is major components of the dirty panicle syndrome of rice. Another
menace to wheat is glume blotch (Septoria nodurum) , known to be present serious in many
European countries , USA and India causing substantial losses in wheat productivity .Losses due
to Karnal bunt of wheat in North western Mexico have been estimated to an average of $7.02
millions/year.Brown spot of rice ( Drechslera oryzae) a devastating disease and was held partly
responsible for Bengal famine in 1942-43 in India. The fungus is major components of the dirty
panicle syndrome of rice. Another menace to wheat is glume blotch (Septoria nodurum) , known
to be present serious in many European countries , USA and India causing substantial losses in
wheat productivity.Losses due to Karnal bunt of wheat in North western Mexico have been
estimated to an average of $7.02 millions/year. Menace to chickpea by Ascochyta blight (
Ascochyta rabiei) in the year 1982-1984 in India and Pakistan. The diseases occurred in serious
proportions and caused substantial yield losses.In severely infected fields no seed setting could
be observed.
Sunflower Downy Mildew unknown in India till 1984, caused by Plasmopara helianthi is
considered to be of North American origin.In 1985, it has been reported to occur in a serious form
in Maharashtra.the disease distributed rapidly by seed trade.
A few examples are bacterial blight in rice( Xanthomonas oryzae),common bacterial
blight of bean ( X.phaseoli ) ,black rot of crucifers ( X.campestris pv. campestris).Bacterial blight of
paddy rice was 1st observed in Mahrashtra (formerly Bombay) State in 1951, when it was reported
in Kolaba District but it was not until 1963 that an outbreak of disease occurred accounting for total
crop failure as happened in Punjab, Haryana and Western Uttar Pradesh States of India in 1979
and 1980. In India, the disease can account for more than 20% rice crop loss, periodically.
Most Seed borne viruses are asymptomatic and transmit efficiently through infected seed
and further disseminated by a number of vectors . Although the losses are attributed to the
environmental conditions and the prevalence of the vector population of that area.For example,
one infected plant will produce 100% infected seed (soybean mosaic virus) such seed will be
viable and germinate well, but the resulting plants will be infected and yields will be significantly
reduced.
All these examples exemplify the significance of seed borne pathogens and their effect on
seed production.
Resurgence of diseases
Spot blotch or Helminthosporium Leaf Blight (HLB) caused by Bipolaris sorokiniana was

(Climate Change, Precision Agriculture and Innovative Disease Control Strategies)
- 65 -
observed way back in 1971 in Canada . The losses attributed due to the diseases have been
equivalent to $42millions in 1971.
The resurgence of the disease was observed in serious proportion during 2008-2009 in
different districts of Sindh and Punjab. The yield reduced from 6.0 tons/ha to a mere yield of 1.6 to
2.2 tons/ha from their potential lands.
With the change in cropping system and the excessive use of chemical pesticides, there is
resurgence of diseases examples are necrosis in sunflower and ground nut that can not be
neglected for crop production and food security .Apart from the threat posed by resurgence, a
large number of diseases are endemic and continue to cause losses in given area example Karnal
Bunt of wheat.
New Challenges
With the new dimensions in Indian agriculture, which is not only confined to the varietal
developments by conventional breeding for crop improvement in yield and quality traits but for
value addition and for food biosecurity, new tools are being used for crop improvement,
(transgenics, or BT crops) by way of biotechnology.
This may change the scenario of the pathogens and plant diseases in agriculture.
Thus, a threat form exotic destructive pests is foremost importance in the era of liberalized
import under WTO. However, the changing conditions the indigenous pests already existing but
having the lower damage level in India are changing their habit and gaining more importance over
the years.
Seed-borne diseases and Seed health: perspective
As a consequence of increased product liability and competitive pressure with in the seed
industry, seed health has also become an important quality trait in market place.
The demand and pressure for seed health testing is however increasing to deliver healthy
seed to farmers and seed producers.SPS (Sanitary and Phytosanitary) issues in WTO are
pressurizing the developing countries to give special attention to seed health testing and to respect
International Phytosanitary Regulations (IPR) issues.
Seed health management needs to be focused on: Estimation of losses attributed to seed-
borne inoculums,Predictive relationships between seed-borne inoculum and disease
incidence,Developing reliable, effective, cheap and rapid detection methods,An understanding of
pathogen tolerance in a seed lot before a technique is an acceptable clinical seed health
test,Establishment of seed health certification schemes,Decisive proper seed processing and seed
treatment.
Advances in Seed Health Testing
The first International Rules for Seed health Testing was published by ISTA in 1928. This
document contained a special section on Sanitary Condition in which special attention was
recommended for Claviceps purpurea, Fusarium, Tilletia, and Ustilago hordei on cereals;
Ascochyta pisi on peas, Colletotrichum lindemuthanium on beans; and Botrytis, Colletotrichum

(Climate Change, Precision Agriculture and Innovative Disease Control Strategies)
- 66 -
linicola, and Aureobasidum lini on flax.
The demand for better seed quality, greater sensitivity and shorter turnaround times for
seed testing is forcing seed health testing laboratories to incorporate new technologies which will
provide the user with a significant level of reliability, sensitivity, and reproducibility of the test.
In last 35 years, several seed health testing procedures, published by International Seed
testing Association (ISTA) are now obsolete and need to be revised or revalidated by newer
technology due to fast pace of technological development
Seed Testing Methodologies:
Many conventional seed health testing methods have been developed such as: agar
plating, blotter test, seedling bioassay, microscopic observation, Direct isolation of pathogens,
growing on test .However, they are multi-stage, and are often slow, cumbersome time consuming,
labour-intensive and subjective.
Recent advances in Seed health testing
Serological Methods
These methods are generally simple to perform, rapid and accurate when used, generally
to detect a number of bacterial and viral pathogens even if present in low level. These methods
are being applied for many seed borne pathogens successfully, for example, indexing seed for
lettuce mosaic virus was started as grow-out assay on several thousand seedlings (30,000).Later
the test was changed to indicator host plant Chenopodium quinoa test . Since 1983, ELISA
(enzyme-linked immunosorbent assay), has been used which not only proved to be more efficient
but very sensitive in detecting low levels of infections that could potentially threaten lettuce
production.
The lack of sensitivity and ambiguity in results and inability to detect all strains of the pathogen
sometimes limits their use.
Indirect Immuno-fluorescence Colony Staining Method
This method is used for detection of seed-borne bacterial pathogens, especially suitable
for seed companies, and quarantine stations which have no facilities for conjugation of primary
antiserum.The assay is easy to perform and quick to be assessed. Choosing the right secondary
conjugate is however, necessary to get best results in the assay.
Nucleic acid based detection methods
Highly sensitive BIO-PCR methods have been developed for several bacterial pathogens
from seeds, including Pseudomonas syringae pv. phaseolicola, Acidovorax avenae ssp. avenae
Xanthomonas oryzae pv. oryzae and X. campestris pv.campestris.
Molecular Methods
Certain laboratories are testing the D-Genos ready-to-use kits to detect certain seed borne
bacterial pathogens (Pseudomonas savastanoi pv. phaseolicola and Xanthomonas axonopodis
pv. phaseoli on bean seeds) . The data obtained are conclusive enough to allow the use of D-
Genos kits for routine testing as an alternative to standard procedures.

(Climate Change, Precision Agriculture and Innovative Disease Control Strategies)
- 67 -
Molecular methods for Seed-borne Fungal Pathogens
Populations of two fungal pathogens of rice - Bipolaris oryzae (Cochliobolus miyabeanus),(
brown spot) and Saracladium oryzae, (sheath rot) - were used as model pathosystems.Methods
were developed to characterise these organisms using polymerase chain reaction (PCR) with both
random amplified polymorphic DNA (RAPD) and simple-sequence repeat SSR oligonucleotides as
primers
Challenges for seed health testing in Seed Industry Seed health testing require greater
emphasis by plant protection authorities on seed health testing. Reliability of tests is
questioned.there should be Harmony in testing procedures and the protocols must be suitable to
test the seed health .
Constraints in seed health testing on routine basis
To date there has been no systematic attempt to evaluate the large number of test
procedures for their appropriateness, whether in terms of cost, ease of use, but even more
importantly their scientific validity.

(Climate Change, Precision Agriculture and Innovative Disease Control Strategies)
- 68 -
Communication Skills in Teaching
Birendra Kumar & S.K.kashyap Department of Agril. Communication ,GBPUAT, Pantnagar- 263 145 (Uttarakhand)
Teaching is a noble profession. It is mission for many people. History is full of prophets and
saints who have embraced the role of teacher to influence others. People take up teaching without
mental preparation or about the gravity of the role. Role of teacher is not only to pass notes or
facts but to stimulate minds to think, analyze and learn.
Teaching is not filling the bucket but lighting the lamp
Students are not empty boxes like buckets. They have experiences, own perception and
ways of learning. Thus, a teacher has to know to approach learners at their and with their
cooperation.
Hundreds of researches have revealed that more effective teachers
Have enthusiasm for teaching; They love to go to class and meet students. They are
emotionally charged and feel happy after teaching.The students also feel pleasure in
attending such classes.
Are interested in learners & subject: : They pay attention to students’ problems, interact
inside and outside of class. They like subject and in turn create an interest for it in students
Have expertise: They have mastery over the content and have comprehensive
understanding of theory and practice
Give praise & maintain positive environment:: They are postive minded and appreciate
good behaviour of students.They always try to create situations in which students perform
well
Are professional in conduct & appearance: They take care of their personality, work and
time. Students fell inspired to meet them and learn from they words and act
Variability: They use variety of methods and aids to create interest and clarify the subject
matter.
Fairness/quality of exams: They are not only good teachers but good in evaluating
learning. Their examinations are quite balanced in content and testing abilities. They are
fair in assessment.
Preparation: He plans systematically and manages time efficiently. He is up to date about
latest in the subject and resources. Democratic: He allows students to actively participate
in class room activities. He may even delegate some roles to them.
Effective communication skills: He has command over language. He listens to students
and tries to encourage discussion
Teaching is not covering syllabus or passing information. Teachers are hired to influence
the minds of the learners. It is indeed quite challenging to motivate and enhance learning among
students. It is not enough for the teachers to know and understand the subject t. He has to find

(Climate Change, Precision Agriculture and Innovative Disease Control Strategies)
- 69 -
ways and means to make the learners know and understand what he has mastered already. This
is quite challenging and calls for more than subject matter knowledge. An effective teacher must
master the craft of communication. It is learners who have tol learn at the end of teaching? How
can they learn it during the given time? What approach should I select to achieve my outcome?
Learners are not empty pots. They have their own experiences and ideas. A teacher must begin
where the learner is and take them to the goal. Human mind is like parachute. It works best when
it opens. The teacher must do s something to open it. Thus, a teacher must learn a number of
skills as described below:
1. Entry behaviour
All the verbal and non-verbal commutation behaviour of teachers communicates something
to the students. Teachers must watch out their entry in the classroom. Do you enter carelessly
looking at walls, notes and blackboards? Do you consciously smile, look at the students and make
a few positive remarks. Be conscious and do not forget to look at your clients and greet them
enthusiastically. This builds positive atmosphere.
2. Opening remarks
Students come to your class from hostel or a last class with entirely different subject or an
hourly examination. Take time to draw their attention towards the lesson of your class. You may
ask one or more students to recapitulate the gist of the least class. How do you open your lecture?
Do you start the lesson of the day straight away by writing the topic? Start the class with relevant
questions. Giving personal experience and interesting cases relevant to the topic may catch
attention of the students. Alternately, students may be asked to recall the last lesson should be
clearly spelt out and even written on the board to act as road amp for the students. Let students
know exactly what is to be learnt, to prepare them for it.
Various techniques to begin:
Recall the last class
Stress importance of today’s lesson
Share a case/personal experience related with the lesson
Ask them to share something they have known or experienced about the topic
Discuss a current news item related with topic
It is believed that mostly student are not able to understand the major theme, if teacher has
not clearly specified the purpose. So let them know before hand what 4 or5 things they are going
to learn today, give them a little overview to crate interest. This will make students attentive and
alert about what is to be covered.
3. Designing Lesson
An old German maxim states
“All that is said not listened
All that is listened is not understood
All that is understood is not accepted

(Climate Change, Precision Agriculture and Innovative Disease Control Strategies)
- 70 -
All that is accepted is not done”
So there is a large gap between what they hear, understand and do. So the impact of
lecture is less in spite of the efforts People understand things better that are logically organized.
Logical organization demands organization from simple to complex, empirical to rational, contract
to abstract, know to unknown…………..
A well-designed lecture should consider the obstacles in communication from learners’
point of view. As a seasoned teacher, you may know their levels of understanding. Ability to
organize subject matter logically and in sequence is essential. A teacher must divide his topic into
three or four major parts. The parts should be organized in an easily understandable sequence.
Each part should be dealt with appropriate introduction, explanation and conclusion so that
learners can make sense of it.
Explanation
Explanation is an essential skill that a teacher must have to elaborate,exemplify and make
learning easy. Students may not understand terms or processdue to lack of pre-requisite
knowledge or awareness about the technical term or a process.A teacher mustask him/herself
these questions:.
Did you explain the new terms?
Did you make sure that students know the background information/
Are you sure that the language you are easy to understand for students.
If the answer to these questions is yes,then what strategy do you have to expand the content ?
Ability to explain requires explain a difficult term or phenomenon in many alternative ways. Use of
examples, evidences and visuals enhance understanding of new concepts.You amy relate with
something already known by students.
Use of audiovisual aids
Speaking alone is not enough. What you speak is lost in the air but what you write on the
board stays. Plan your board work in advance to put basic essential points on board. Planning
visual aids like charts, transparencies or power points beforehand helps to concentrate on
explanation. Besides teachers do not have pressure to remember everything. Take care to stand
aside and point out the exact on visual.
Use of verbal communication
Speak clearly and loud enough for everyone in the class to hear. Mind your pace of
speaking not too fast, not too slow. In fact, follow the same speed as in normal conservation.
Become aware if you are in the habit of repeating some words like I mean, you see, let me tell.
Avoid such vocal virus or else you will become a laughing.
Use of non-verbal communication
People perceive message mostly through non-verbal communication. Position yourself in
full view of the students. Look evenly at both sides; move a little towards students from time to
time. Use limited gestures. Use facial expressions to express emotion consistent with the dialogue.

(Climate Change, Precision Agriculture and Innovative Disease Control Strategies)
- 71 -
Student’s participation
Do students sit passively in your class? Are they taking notes all the time and listen
passively to what you speak? It is better to turn the table and their inputs. Sometimes, you may
ask the class to summarize what you have spoken in ten minutes. Encourage question answer
session at the end of the lecture to clarify doubts.
Use of questions
Questions are important stimulant for learners. Questions make them think different types
of questions can be asked for different purpose, as below:
To Check Awareness: Easy questions can be asked in between lecture to check deftness
of the students. Many students may volunteer to respond and thus, a positive atmosphere is
related. It breaks boredom of one way communication.
To Test Knowledge: Carefully worded questions may be raised to check understanding.
To Help In Application: Practical problems may be given to solve by using relevant theory.
To Develop Critical Thinking Ability: Question of high order may check analytical ability of
students.
Thus, questions may very form low level to high level depending upon the need. However,
it is also important to determine who should be asked.
Ask To The Class: Address the question in general to the whole class to see how many people
volumes to speak.
Ask To A Group: Question may be addressed to a group at the bask, front or side who may be
engaged in side-conversation or other diversion.
Ask A Person: Question may be addressed to a person to check his, her perform in particular
normally questions are addressed to the class.
Handling Students’ Questions
Students seldom raise questions but when they do it must be attended to properly.
Student’s questions are a prize to the teachers. They indicate that the student is attentive and
evolved. Teacher may return the question to the class to see of someone knows already. He may
rephrase the questions and give class for answer. In the end he may answer himself. Though it is
not necessary to respond himself.
Handling Students’ Response
Listening is key to responding the response of students should be listened carefully. He,
she should be complemented for the part of the response which is right. Student should be given
correct answer should be told with explanation. Thus, questioning handling response are important
skills to be used purposively.
Ask different types of questions to know the students’ progress. Sometimes you may ask
simple question to encourage response by many. You can raise the level of question to know the
dept of learning. Direct your question to all the students. Do not always ask a particular group only
to respond.

(Climate Change, Precision Agriculture and Innovative Disease Control Strategies)
- 72 -
Closure
Do not leave the class abruptly Like the opening, closure has a purpose. It must be planned
and linked to the overall lecture. Unfortunatly many teachers stop abruptly at the end of fifty
minutes or stretch till the nest teacher knocks. The actives to be performed at the close of the
lecture are as follow.
1. Pull out ideas from the lectures.
You any ask students to recall what has been presented today. Help them in recalling
important materials.
2. Help in application of the material.
It is desirable that students in higher education get to know the practical implications of the
materials covered in the class. Problem related with the topic may be discussed.
3. Achievement of adjectives.
You may intricate to the class the facts discussed in the light of the objectives.
4. Forward planning.
In order to prepare students for the next assignment to be completed. You may give a
preview of next class and ask students to bring some observations to get them ready.
Pull the key points and important explanations together and lead to meaningful
conclusion.
Ask them to recall key points
Tell them the appropriate reference to be consulted and question they think about.
You may ask them to come ready for the next lesson.
If possible tell them about the next clasd
Teaching should be planned and purposeful. A teacher must show positive orientation
towards students through verbal and non-verbal communication. Clearly of expression, simple
postures and controlled movement are helpful in conveying meaning.

(Climate Change, Precision Agriculture and Innovative Disease Control Strategies)
- 73 -
Climate Change in Social Perspective
R.P. Singh Directorate of Extension Education, GBPUA&T, Pantnagar- 263 145 (Uttarakhand)
Our lives on this planet depend on nature’s provision of stability and resources. Current
rates of human-engendered environmental destruction threaten those resources and leave death
and misery in their wake. But we can avoid this. To do so, we must act in concert and with a sense
of urgency to make the structural and policy changes needed to maintain ecosystems and their
services, control water and air pollution, and reverse the trends leading to global warming. This
must be done if we are to achieve the level of environmental sustainability necessary to meet the
reduction of poverty, illiteracy, hunger, discrimination against women, unsafe drinking water, and
environmental degradation. By environmental sustainability we mean meeting current human
needs without undermining the capacity of the environment to provide for those needs over the
long term. Achieving environmental sustainability requires carefully balancing human development
activities while maintaining a stable environment that predictably and regularly provides resources
such as freshwater, food, clean air, wood, fisheries, and productive soils and that protects people
from floods, droughts, pest infestations, and disease.
Drivers for environmental change
In every region of the world, human actions have affected the natural environment,
resulting in rapidly diminishing the forest and increased consumption of scarce water and energy
resources, desertification, loss of biodiversity and increasing effect of global climate change. There
are two kinds of driver; direct and indirect drivers affect on climate change. Most significant direct
drivers of environmental degradation are-
Change in land cover; resulting from logging, urbanization, conversion to agriculture, road
construction and human habitation, among other factors, can impair the delivery of vital
ecosystem services, such as water retention and flood attenuation.
Pollution of air, soil and water by chemical and organic waste affects human health,
reduces agricultural production and damages ecosystems.
Invasive alien species are non native organisms that become established and spread in
new environments.
Over appropriation or inappropriate exploitation of natural resources can reduce
even the stock of renewable resources below sustainable levels.
Climate change may be the single greatest driver of environmental change on a broad
scale. It has such diverse effects as altered precipitation patterns, greater frequency of
extreme weather events, rising sea levels, increased ranges for some disease vectors and
changes in ecological systems.
Most influential indirect drivers which leads to environmental degradations of ecosystems
and pollution of our air, water and land are-

(Climate Change, Precision Agriculture and Innovative Disease Control Strategies)
- 74 -
Sociopolitical factors. Differences in social behaviour yield varying consumption and
production patterns and social change can produce unpredictable shifts in resource uses.
Demographic Change. Population growth, rural to urban migration and shift in house hold
economic status have important implications for the environment because they tend to
increase pressure on environment.
Economic factors. Economic growth intensifies resource consumption, drives land cover
change and generate waste. Extreme poverty can drive environmental degradation, in turn
enforcing poverty.
Scientific and technological change. Some new technologies can enable more effective
pollution abatement, whereas other technologies might drive overexploitation by increasing
resource extraction efficiency.
Market failures and distortions. Environmentally damaging subsidies can encourage
overproduction or overexploitation of resources such as fisheries and forest. Failure to
account for resource depletion may result in a misleading picture of economic conditions.
Environment and poverty
For too many of the worlds’ people, environmental degradation eclipses the hopes of
meeting even the most basic human needs. In developing countries, one person in five lakhs
access the safe water, 1.0 billion people live in dry lands and 1.2 billions live in less than Rs.50.0
per day. While consumption pattern of the rich drive overexploitation of the natural resources, poor
families, in their daily struggle for survival often lack the resources required to avoid degrading
their local environment. Their fragile resources, often poorly defined poverty rights, and limited
access to credit. With few alternative sources of income they rely extensively on the natural
resources and ecosystem services to supply such basic human needs as food, fuel and drinking
water. However, over extraction of resources disrupt the environment, causing many to loose
access to the ecosystem services on which their survival depends.
Reducing poverty and achieving environmental sustainability, then require charting a new
path for development between extremes of resource degradation on one hand and unsustainable
production and consumption on the other. Doing so will require a clear, ambitious set of objectives
and strategies with creative forward thinking leadership in each nation.
Environment and food security
Food security is integrally linked to environmental sustainability, as all food ultimately
derives from ecosystem services. More than two billion poor people rely directly on agriculture for
subsistence and commercial food production. The ecosystem services are critical for production
includes provision for freshwater for crop irrigation, maintenance of soil fertility through nutrient
cycle, provision of crop genetic diversity; crop pollinators, pest control and climate regulation.
Environmental degradation and biodiversity loss are urgent, fundamental problems that
threaten the achievement of goal like

(Climate Change, Precision Agriculture and Innovative Disease Control Strategies)
- 75 -
Where people lack access to modern agricultural technologies.
The condition of the local ecosystem determines agricultural productivity and food supply.
Thus sustainable management of terrestrial and marine ecosystem is a prerequisite to
global food security. Over the past century, 75 percent of crop diversity has been lost, leaving
crops and varieties vulnerable to emerging and spreading disease, pest and changing
environmental conditions. Land degradation continues as a result of inappropriate, intensive
agricultural techniques and land conversion related to agriculture extensification. Inappropriate
intensification causes salinization of irrigated areas, nutrient and pesticides leaching and pesticide
resistance while extensification destroys natural vegetation cover and leads to soil erosion and
loss of soil fertility, increased withdrawals of groundwater and surface water and increased
agrochemical loads (Wood, Sebastian and Scherr, 2000). These form of environmental
degradation decrease food availability, sometimes irreversibly, complicating efforts to fight hunger.
Environment and health
Environmental degradation adversely affects human health through exposure to bacteria,
parasites and disease vectors, chemical agents (such as heavy metals, pesticides in water, food,
air and soils), and physical and safety hazards (such as fire, radiation and natural disasters) (Bojo
and others 2001). Pollution and contamination of air and water are major sources of human illness.
Diarrhea strongly linked with unsafe water and inadequate sanitation, is the leading killer of
children under five. In most developing countries 90-95 percent of all sewage and 70 percent of
industrial waste are dumped untreated into surface water (UNFPA 2001). Acute and chronic
respiratory infections are related to ambient air conditions influenced by the incidence of wild fires,
vehicle pollution, and industrial discharge. Indoor air pollution from the use of biomass fuels in
poorly ventilated houses has been linked to 1.6 million deaths worldwide (Warwick and Doig
2004).
Many of the diseases, such as malaria, dengue and encephalitis are on the rise because of
human disruption of natural ecosystems. To the extent that the risk mechanisms are understood,
the potential for protecting or reducing the risk of certain diseases can be achieved through
incorporating sustainable conservation measures into development plans.
Demographic change
Demographic trends with key implications for the environment include population growth,
rural to urban migration and shift in household economic status. UN population division forecasts a
population increase of 2.6 billion people between 2003 and 2050, yielding a global population of
8.9 billion people, 86 percent of whom will live in developing countries (UNDESA Population
Division 2004). Fertility is highest in the poorest countries and among the poorest people in poor
and middle income societies. These countries have the highest levels of unmet needs for family
planning and reproductive health services; in concert with other health, education and gender
equality issues. At the same time, many developing countries are experiencing significant rural to
urban migration. By 2030, 60 percent of the worlds’ population is expected to live in urban areas.

(Climate Change, Precision Agriculture and Innovative Disease Control Strategies)
- 76 -
Urban population is increasing by 0.86 percent per year as rural populations post a similar decline
(UNDESA Population Division 2004).
These demographic shifts have key implications for resource use. Population growth
increases the demand for such essential goods and services as food, shelter and energy. It also
drives the production of greenhouse gases and airborne particulates, which cause human health
and environmental problems. Increased food demand can encourage agricultural intensification,
which can reduce pressure to convert natural habitat or extensification of agriculture. As
populations expand in countries that possess reservoirs of biodiversity, human pressures on
ecosystems and environment will grow. Indeed, population growth around biodiversity zones often
exceeds national aggregate growth rates (Cincotta and Engelman 2000). Rural to urban migration
is causing rapid expansion of cities with potentially adverse environmental consequences.
Economic change
Economic factors drive environmental change in at least six important ways. Economic
growth increases consumption and production, which intensifies resource exploitation; It drives
changes in land cover, its use and generates waste. Economic factors associated in rising
incomes are sometimes associated with investment in environmental improvement, cleaner
technologies and more robust environmental policies. Extreme poverty can be powerful driver of
environmental degradation and unsustainable exploitation results in the loss of important
environmental services, which can reinforce poverty. Fourth economic driver of environmental
change is environmentally damaging subsidies, such as those affecting the fisheries and forestry
sector. Other market failures include ownership problems associated with the tragedy of the
commons, externalities and distorting taxes. In addition, failure to account for resource depletion
may provide a misleading picture of economic conditions (Sachs and others 2004). Fifth,
increased international trade and financial flows shift consumption and production patterns as well
as patterns of resource use. And lastly exogenous shift in consumer preferences such as
emerging consumer demand for environmentally friendly goods and services may yield positive
environmental outcomes.
Sociopolitical factors
Sociopolitical factors influence the resource use patterns and affect countries’ willingness
and ability to invest in environmental protection. Differences in culture and social behaviour yield
varying consumption and production patterns and social change can produce unpredictable shifts
in resource use. Social conflict within countries causes and results form environmental
degradation. Environmental degradation can limit resource availability, strain social systems and
intensify latent social tensions. At the same time, countries in conflict, especially in the limiting
case of war, are unlikely to invest in environmental protection or other public goods.
Institutional gaps
Institutions develop shared norms and expectations for behaviour through such
arrangements as property rights and rule of law. Weak enforcement regimes fail to deter damaging

(Climate Change, Precision Agriculture and Innovative Disease Control Strategies)
- 77 -
forms of extraction such as poaching or illegal logging. Limited participation of key stakeholders in
planning and management of sustainable resource use reduces the legitimacy and effectiveness
of institutions, policy design and implementation.
Controlling the drivers of environmental change
The drivers of climate change are influenced by decision makers’ choices at all geographic
and political scales (Millennium Ecosystem Assessment 2004b, ch.7). Direct drivers of
environmental change are often endogenous to individual actions, while indirect drivers are usually
exogenous determinants of individual choices reflecting political, economic or social patterns at a
much larger scale. There are six key elements responsible for environmental change:
Forest
Freshwater resources and ecosystems
Agriculture production systems
Fisheries and marine ecosystems
Air and water pollution
Global climate change
The condition of these elements affects human health and economic wellbeing, biodiversity
conservation and environmental sustainability. These six elements provide the frame work for
environmental management.
Forest
Recent estimates suggest that forests provide more than 1.5 billion cubic meters of timber
and 1.8 billion meters of fuel (Wood or charcoals) every year (Matthews and others 2000). The
earths’ 3.4 billion hectares of forest directly contribute to the livelihoods of 90 percent of the worlds’
1.2 billion people living in extreme poverty and many others, in both developed and developing
countries by providing food, fuel, shelter, freshwater, fibers and genetic resources (Scherr and
others 2003). Extraction and processing of an array of forest resources- timber, medicine, fruits
and other nontimber forest products, forms the basis of many local economies. They also stabilize
natural ecosystems, storing carbon, controlling soil erosion and regulating movement of water
through the ecosystem. Clear cutting eliminates these services and can exacerbate the
consequences of natural disasters.
Fresh water resources and ecosystems
Freshwater resources are critical to human survival and environmental sustainability. They
provide the fundamental societal functions for human life support, food production and energy
production and a transport medium. Freshwater system support fisheries and other aquatic
biodiversity. Water uses of ecosystem functions and societal needs are interlinked because the
often depend on the same watershed. The integrated management of resources, which consider
the effects of one use upon others, is critical to coordinate supply to the multiplicity of end users.

(Climate Change, Precision Agriculture and Innovative Disease Control Strategies)
- 78 -
Agricultural production systems
Sustainable land based production is directly tied to the health and wellbeing of the world’s
populations, livelihoods and survival of world’s poorest people. Land based production system –
crops, orchard, plantation, graze land and freshwater aquaculture claims one third of the worlds’
terrestrial surface. Production systems are carved out of natural ecosystems where, a wide range
of services were provided. These include providing natural habitat for the worlds’ biodiversity,
including the inordinately large soil biota, the health of which is fundamental to maintaining soil
fertility. Land productivity depends on soil fertility and water availability. Good soil fertility plays an
important role in determining the current state of ecosystems and their future productivity.
There are three primary direct drivers of environmental change related to agriculture
production systems. Firstly land covers changes; agricultural extensification converts and
ultimately degrades natural habitat and marginal lands. Habitat degradation not only threatens
biodiversity, it also disrupts the soils’ natural regulatory functions resulting in soil erosion, reduced
water holding capacity and nutrient depletion, as well as desertification and other forms of soil
degradation. Secondly, over appropriation or inappropriate exploitation of natural resources;
inappropriate agricultural practices degrade soil, introduce pollutants, and contribute to salinization
or desertification. Misuse of fertilizers and modern agro techniques has contributed to chemical
degradation. In addition, inappropriate irrigation has produced depleted ground water resources.
Third driver is Climate change; it may dramatically alter rainfall patterns, leading to more frequent
droughts and flooding.
Demographic change is indirect driver. Population growth drives the need for more food
and productive employment. Land conversion is also driven by economic distortion. People living
in extreme poverty often lack sufficient resources to invest in maintenance of soil fertility. Poverty
can also drive people to strip the land without regard for long-term sustainability, even though
environmental degradation ultimately reinforces poverty. Finally, technology and information gaps;
such as inadequate trainings of crop production, perpetuate damaging, insufficient practices.
Fisheries and marine ecosystems
Ocean covers 70 percent of the planets’ surface and is by far the largest habitat for life on
earth. They supply billions of people with food and mineral resources. Marine biodiversity provides
critical global ecosystem services; climate control, carbon sequestration and oxygen generation. A
recent study that linked overfishing with climate change showed that sardines play an important
role in regulating upwelling ocean ecosystems by devouring large amounts of phytoplankton,
which would otherwise cause toxic gas plumes and dead zones upon decay on the ocean floor
(Bakun and weeks, 2004). Finally, coastal water provides cultural and environmental services,
frequently supporting tourism and recreation. As the interface between terrestrial and ocean
ecosystems, however, coastal systems are inappropriately affected by human activity.
Air and water pollution
Clean air and water are preconditions for human life and healthy ecosystems. The range of

(Climate Change, Precision Agriculture and Innovative Disease Control Strategies)
- 79 -
human activities that emit chemical, biological and particulate pollutants adversely affect human
health. Air and water pollution threaten marine and inland water resources, soils and forest. They
endanger biodiversity by destroying habitat, causing reproductive impairment and generating other
population level effects. There are two direct drivers of environmental change related to air and
water pollution; land cover change and over appropriation or in appropriate exploitation of natural
resources. And major indirect drivers are demographic change, economic factors, institutional
gaps and sociopolitical factors. Attempts to improve both air and water quality have been
frustrated by week regulatory and enforcement regimes.
Global climate change
Climate affects weather patterns and events, agricultural and marine productivity,
distribution and population health of species and energy consumption. In a complex feedback
system, the climate both drives and is driven by the interactions among components of
environment. Regional weather patterns are strongly influenced by vegetation cover, reflection of
solar radiation, air flow and the water cycle.
Evidence suggests that low lying small Iceland developing states and deltaic regions of
developing countries of South Asia and Indian Ocean could eventually be submerged. Crop
production could significantly decrease in Africa, Latin America and developing countries. Fresh
water could become scarcer in many areas that already face shortage (IPCC 2001).
The Solution
Achieving environmental sustainability requires dramatic changes in the ways societies and
citizens manage their biodiversity, wastes and byproducts of production and consumption process,
and consumption patterns. Improving environmental management also requires addressing the
direct and indirect drivers, the underlying causes of environmental problems. These structural
changes must complement and occur in parallel with the technical solutions. Few of these
solutions are:
1. Structural changes for environmental sustainability;
The following structural changes must be implemented in order for countries to effectively
integrate environmental concerns into all development plans and sector policies.
Train, recruit and retain environment experts.
Secure sufficient funding for environmental institutions.
Reform government institutions and improve interagency coordination
Improve governance and gender equality.
Account for the cost of environmental degradation in national accounts.
Introduce payment systems for ecosystem services and tax reform.
Phase out environment damaging subsidies.
Improve national and international regulatory framework.

(Climate Change, Precision Agriculture and Innovative Disease Control Strategies)
- 80 -
Establish mechanisms for science and technology advices.
Train decision makers for environmental management.
Provide public access to information.
Improve extension, training and services.
Science and technology must be at the center of any strategy for environmental
sustainability.
Universities and other institutions of higher learning should apply themselves
directly to sustainability goals.
2. Investing on environmental management;
To integrate environmental sustainability into national developmental strategies, we have to
take an ecosystem based approach to guide the planning of interventions in environmental
management. This management approach is a strategy for the integrated management for the
land, water and living resources that consider the connectivity of different landscape elements. To
fulfill these following recommendations may be considered-
Increase use of sustainable agriculture techniques to preserve natural assets;
protect and improve soils, use water sustainably, maintain agro diversity, mobilize
local knowledge and experiences, adopt prevention strategies to protect dry land,
mobilize information and technology, rationalize land use planning, minimize
fertilizer and pesticide use,
Increase real income of informal forest sector of atleast 200 percent by 2015.
Achieving this goal is requiring out reach to informal users, rationalization of
institutional and regulatory frameworks and incentives for conservation and
sustainable management.
Protection and restoration of ecologically viable representative areas of all major
forest, shrub land and pasture vegetation types and their biodiversity.
Slowing fresh water degradation requires reducing demand, especially in cropping
systems; controlling pollution; and protecting aquatic environments.
Increasing demand for marine products and services are resulting irreversible
losses, which requires managing fisheries at sustainable levels, rebuilding depleted
fish populations to healthy levels and establishing a network of representative, fully
protected reserves.
Action should be taken to reduce exposure to toxic chemicals and child mortality
caused by indoor air pollution and water born diseases.
Limiting the long term increase in global mean surface temperature to 2 degree
Celsius target requires investment in cost effective and environmentally sustainable
energy, climate friendly carbon and technology markets and adaptation measures.
Since environmental challenges act at local, national, regional and global scales,

(Climate Change, Precision Agriculture and Innovative Disease Control Strategies)
- 81 -
corresponding implementation mechanism must be developed. Only if all levels of government-
from local authorities to national governments, integrate the principle of environmentally
sustainable development into their policies and investment strategies can occur at the right scale.
This does not mean however, that civil society and private sector do not have critical role to play;
the contribution of both parties are critical for environmental sustainability to be achieved.
REFERENCES
1. Bakun, Andrew and Scarla J. Weeks. 2004.”Greenhouse gas buildup, Sardines, Submarine Eruptions and the Possibility of Abrupt Degradation of Intense Marine Upwelling Ecosystems” Ecology Letters 7 (11) : 1015-23.
2. Bojo, Jan, J. Bucknall, K. Hamilton, N. Kishor, C. Kraus and P. Pillai. 2001. “Environment” In The Poverty Reduction Strategy Sourcebook. Volume 1. Washington, D. C. Worldbank.
3. Cincotta, R. P. and R. Engelman. 2000. “Nature’s Place: Human Population and the Futures of Biological Diversity. Washington, D. C.: Population Action International. (www.populationaction.org).
4. IPCC (Intergovernmental Panel on Climate Change). 2001. Climate Change 2001: Synthesis Report. Geneva.
5. Matthews, Emily, Rechard Payne, Mark Rohweder and Siobhan Murray. 2000. Pilot Analysis of Global Ecosystems: Forest Ecosystems. Washington, D. C.: World Resources Institute.
6. Millennium Ecosystem Assessment.2004b. Scenarios Report.2nd
Review Draft. Published in 2005 by Island Press. Washington, D. C.
7. Sachs, J. D., J. McArthur, G. Schmidt- Traub, M. Kruk, C. Bahadur, M. Faye and G. McCord. 2004. “Ending Africa’s Poverty Trap.” Brookings papers on Economic Activity 2: 117-216.
8. Scherr, Sara J., Andy White and Devid Kaimowitz. 2003. A New Agenda for Forest Conservation and Poverty Alleviation: Making Markets work for low income producers. Forest Trends and the Center for International Forestry Research, Washington, D. C.
9. UNDESA (United Nations Department of Economic and Social Affairs) Population Division. 2004. Urban and Rural Areas 2003. New York.
10. UNFPA (United Nations Population Fund). 2001. The State of World Population 2001, Footnotes and Milestones: Population and Environmental Change. New York. (www.unfpa.org/swp/2001/english).
11. Warwick, Hugh and Alison Doig. 2004. Smoke: The Killer in the Kitchen: Indoor Air Pollution in Developing Countries. London: ITDG Publishing.
12. Wood, S., K. Sebastian and S. Scherr. 2000. Pilot Analysis of Global Ecosystems: Agroecosystems. Washington, D. C.: World Resource Institute and International food Policy Research Institute.

(Climate Change, Precision Agriculture and Innovative Disease Control Strategies)
- 82 -
Resource Conservation Techniques in Plant Health and Disease Management: No Till or Reduced Till Cropping System
K.P. Singh
Department of Plant Pathology, GBPUA&T, Pantnagar- 263 145 (Uttarakhand)
No-till is one of the biggest breakthroughs in resource conservation agricultural technology.
It gives meaning to the term "sustainable agriculture", because it is practical, profitable, maintains
production targets, and protects soil and water quality on and off the farm. In the past 30 years,
innovative farmers have turned their attention to soil conservation.
The key benefit of no-till production is the ability to plant in a more timely way with less
investment in time and machinery costs. The other important benefit of no-till is that it allows
growers to establish a full no-till cropping system. The best chance of increasing soil organic
matter and improving soil structure over the long term occurs when all crops in the rotation are
planted using no-till practices.
No-till Defined
In a no-till crop production system:
The field is left virtually undisturbed from harvest to planting, except for nutrient injection
Fields are no longer ploughed, and plant residues remain on the soil to offer protection
from erosion
A narrow seedbed is prepared by the planter or drill during the planting operation, to allow
adequate seed and fertilizer placement
o alternatively, the row strip may be pre-tilled during a separate pass
Weed control is accomplished primarily with herbicides, but shallow inter-row cultivation
may still be used for emergency weed control.
of
Ind
ia

(Climate Change, Precision Agriculture and Innovative Disease Control Strategies)
- 83 -
Effect of no-till on soil properties
The effect of continuous no-till and conventional tillage in wheat on soil physico-chemical
properties was studied by Malik et al., 2004 at six long-term tillage sites under rice wheat cropping
system. These permanent sites had tropical arid brown soils. The bulk density (BD) of 0-7.5 cm
soil depth was greater in no till as compared to the conventional tillage in the first year (BD 0.12-
0.46 t/m3 higher) and third year (0.08-0.26 t/m3 higher). There was no detrimental effect of
increased bulk density on wheat germination and plant growth. Furthermore, the difference in BD
between the two tillage systems tended to diminish with time. The initial and basic water intake
rates were higher in conventional tillage (initial rate 6 – 48 mm/ha higher, basic rate 0.41 - 2.11
mm/ha higher) as compared to no-till. Slower water intake in no-till may be a reflection of the
destructive influence of puddling in the rice phase. The moisture retention, defined as the moisture
content in the 0-15 cm layer of soil at 7 days after first irrigation, was higher in no-till (up to 13.6%
higher) as compared to the conventional tillage system. Four years after the start of this multi-site
study, organic carbon (%) and available K in the 0-15 cm soil depth were higher in no-till (OC 0.09-
0.24% higher, and available K 8-36 kg/ha higher) as compared to conventional tillage. The soil pH,
electrical conductivity (1:2 soil: water) and available P were not affected by the tillage treatments.
The P contents (%) in wheat plants were higher in no-till (0.05 - 0.1 % higher) as compared to the
conventional tillage and this may be related to greater root growth under no-till. Savings in
irrigation water use are also an important feature of no-till systems.
The RW Consortium in collaboration with HAU undertook a detailed investigation of the
savings in irrigation water use under no till (Gupta, 2003). Fields under no-till and conventional
tillage systems were selected along an irrigation channel in Haryana to determine irrigation water
use. Studies showed that irrigation water used was 13- 33% lower in the fields under no-till, which
was attributed to lower water infiltration rate under no-till. The overall assessment of irrigation
water use by 4 villages in this irrigation scheme showed about 10% saving in water due to the
adoption of no-till. Average water use efficiency (kg grain produced/mm water used) was
estimated to be 18.3 kg/ha/mm in no-till fields as compared to 12 kg/ha/mm in the conventional
tillage fields, an increase of 35%. This improvement in water use efficiency is likely to be related to
avoidance of transient water-logging after the first irrigation which is a common feature of wheat
crops grown with conventional tillage in rice-wheat rotation. Savings in irrigation water can also
arise in some seasons when soil moisture content after rice harvest is adequate to sow wheat
without any pre-sowing irrigation.
Managing soils for no-till production
Well-drained, silt loam and clay soils are best suited to no-till production. Sandy soils have
been less successful, and poorly drained soils are not suited for no-till small grains. Growers with
sandy, coastal plain soils with more than 12 inches to clay often find that no-till cropping systems,
where no tillage occurs in any of the rotation crops, increases soil compaction. In such cases,
some deep tillage during one of the crop rotations may be required. On poorly drained soils, land

(Climate Change, Precision Agriculture and Innovative Disease Control Strategies)
- 84 -
leveling and/or the installation of tile drainage is necessary. One should examine soil classification
and drainage class for each field to determine how to manage soils for no-till production
Effect of tillage practice on soil microbes and diseases
Interest in no-tillage and conservation tillage systems is increasing due to scarcity and
increasing cost of fossil fuels, periodic food shortages, inclement weather conditions, and
concerns over soil erosion. Changing the tillage practice can lead to changes in the physical and
chemical properties of soil which in turn is likely to influence the occurrence of plant diseases. Key
factors in the occurrence of plant diseases include the survival and activity levels of pathogens,
host susceptibility, and the population of other soil microorganisms. Reduced tillage can favour
pathogens by lowering soil temperatures, increasing soil moisture, changing root growth, changing
nutrient uptake, and changing the population of plant pathogen vectors. The decomposition of rice
plant residues may release phytotoxins and stimulate toxin producing microorganisms, thereby
predisposing plants more to pathogen attack (Sturz et al., 1997). However, relatively high soil
microbial activity can lead to competition effects that may affect pathogen activity and survival and
thus reduce harmful pathogen inoculum pressures. This microbial antagonism in the root zone can
be beneficial for farmers by leading to the formation of disease suppressive soils. Thus, on the one
hand leaving plant debris on the surface or partially buried may allow pathogens to survive to the
next crop, but on the other, it may also make conditions more favourable for the biological control
of plant pathogens (Sumner et al., 1981).
Any major shift in farming practices, such as reducing or eliminating tillage, may inevitably
affect the micro-environment in which crops are grown. This in turn may alter the microbial
community in the soil. These communities include both plant pathogens and the microorganisms
that are natural antagonists of these pathogens. Many soil borne plant pathogens survive in the
soil via the previous years’ crop residues. However, no information is available on the effect of
zero tillage on the population dynamics of soil antagonists and the relationship between
populations of soil antagonists and soil-borne plant pathogens. (Varshney et al., 2002)
The rice-wheat cropping systems of the Indo-Gangetic plains face several productivity and
sustainability problems. These include late wheat sowing, low water and nutrient use efficiency,
groundwater depletion, water logging, poor water control, salinity and the build-up of weeds, pests
and diseases. The adoption of reduced and zero tillage cultivation of rice and wheat can address
some of these problems. It can improve the timeliness of sowing and help farmers cope with many
productivity and sustainability constraints (Harrington, 2000).
Many plant pathogens have been reported to increase to damaging levels under no-till
conditions and become constraints to efficient, profitable farming. Wheat pathogens have been
reported to be either favoured or controlled by zero tillage. The fungal pathogens Fusarium
graminearum, Pyrenophora tritici-repentis, Septoria tritici and Pythium spp. are reportedly favoured
by zero tillage whereas Bipolaris sorokiniana, Fusarium culmorum are reduced under no till
conditions (Bockus and Shroyer, 1998).

(Climate Change, Precision Agriculture and Innovative Disease Control Strategies)
- 85 -
Minimum-till or no-till cultivation may also lead to increased disease severity by pathogens
that survive better when infested crop debris remain on or near the soil surface (Garbeva et al.,
2004). For example, root rot and bare patch disease of wheat caused by R. solani AG8 are
favoured by reduced or no-till treatments in the U.S. Pacific Northwest and in Australia. Abawi &
Crosier (1992) demonstrated the influence of the reduced tillage practices on root rot severity and
yield of snap beans, as beans grown in rototilled and chisel-plowed plots had significantly higher
root rot severity than those grown in the conventionally plowed plots.
Under survey for build up of pests in zero tillage in selected farms, four sites in zero tillage
conditions along with conventional tillage plots under rice-wheat cropping system were monitored
for insect pests and diseases in wheat crop (Singh, 2004). In general, the incidence of yellow rust,
foliar blight and aphids was higher in zero tillage plots as compared to the conventional ones. In
rice crop also the observations indicated higher incidence of insect pests and diseases in zero
tillage plots as compared to the conventional tillage plots. Under evaluation of newly emerging
tillage practices FIRBS was found marginally superior to flat bed conventional tillage as it had
numerically less pest and disease incidence and higher yield.
Singh et al., (2002) indicated that the population of soil fungi was greater in conventional
than no-till fields in Haryana at the Crown Root Initiation (CRI) and dough stage of wheat, while no
consistent trend was observed in paddy. Fusarium species, Drechslera rostrata and Penicillium
species were predominant fungi in the rhizosphere of wheat and rice. The population of F.
moniliforme was greater in conventionally sown wheat fields than under no-till. F. moniliforme, F.
pallidoroseum, D. oryzae and D. rostrata were found to be pathogenic in paddy and Alternaria
triticina and Bipolaris sorokiniana on wheat. There was no significant difference between the tillage
systems in the incidence and severity of major diseases of rice-wheat sequence in Haryana.
Reduced tillage practices enhance species diversity and support larger microbial
populations in the upper layers of soil. Cultivation redistributes the microorganisms throughout the
upper and lower soil layers (Doran, 1980; Kennedy and Smith, 1995). In the wheat phase of
different cropping rotations, soil microbial biomass and bacterial diversity was greater in reduced
tillage systems (Lupwayi et al., 1998, 1999). Ergosterol content (an indicator of fungal biomass) is
greater with no tillage (Monreal et al., 2000). However, increases in microbial biomass may include
increases in both beneficial and pathogenic microorganisms but has a positive effects overall on
plant health and disease.
Soil organisms can protect plants from diseases and pests in several ways:
Healthy populations of microbes compete with pathogens for nutrients and can suppress
the severity of plant disease.
There are predatory organisms that will keep pest species such as nematodes and fungi in
check; protozoa engulf fungi and bacteria, while predatory nematodes eat root-feeding
nematodes.
Beneficial fungi provide a physical barrier to root-feeding pests by wrapping the roots in a

(Climate Change, Precision Agriculture and Innovative Disease Control Strategies)
- 86 -
network of threads (hyphae).
Other soil organisms secrete chemicals that ‘hide’ plant roots from their attackers.
Many agricultural practices can harm the organisms that live in the soil. There are
management actions that can be employed to minimize harmful practices:
Using rotations provide a more diverse food source and thus a more diverse group of soil
organisms. It can also break an existing pest/disease cycle.
Reducing tillage minimize habitat disturbance, maintain soil structure and increase organic
matter (food) for soil organisms and encourage a more diverse group of soil organisms.
Liming to keep the soil pH in a range favoured by plants benefit soil organisms.
Retaining stubble provides organic matter for soil organisms and encourages diversity. The
fungi that benefit from stubble left on the soil surface prey on nematodes. Incorporating
stubble increases its breakdown and reduce habitat for some pathogens.
The non-target effect of various agricultural chemicals is hard to determine, as there have
been very few studies on the organisms that live in the soil. Obviously fungi, including
beneficial ones like VAM, are susceptible to fungicides, and there is growing concern over
the effects of copper-based products on soil organisms such as earthworms.
REFERENCES
1. Bockus, W.W. and Shroyer, J.P. 1998. The impact of reduced tillage on soilborne plant pathogens. Ann. Rev. Phytopathol.36: 485- 500.
2. Doran, J.W. 1980. Soil microbial and biochemical changes associated with reduced tillage. Soil Sci. Soc. Am. J. 44:765–771.
3. Harrington, L. 2000. Synthesis of systems diagnosis: Is the sustainability of rice wheat cropping system threatened? - an epilogue. Journal of Crop Production. 3:2, 119-132.
4. Lupwayi, N.Z., Rice, W.A and Clayton, G.W. 1999. Soil microbial biomass and carbon dioxide flux under wheat as influenced by tillage and crop rotation. Can. J. Soil Sci. 79:273–280.
5. Monreal, M.A., Derksen D.A, Watson, P.R and Monreal, C.M. 2000. Effect of crop management practices on soil microbial communities. p. 216–228. In Proc. Annu. Manitoba Soc. of Soil Sci. Meet., 43rd, Winnipeg, MB, Canada. 25–26 Jan. 2000.
6. Singh, K.P. (2004). IPM in rice wheat cropping system. Research Bulletin No.132. Directorate of Experiment Station, Pantnagar, 2004. p. 16-18.
7. Singh, R., Malik, R.K., Singh, S., Yadav, A. and Duveiller, E. 2002. Influence of zero tillage in wheat on population dynamics of soil fungi and diseases of rice-wheat system. Proceedings of International Workshop on Herbicide Resistance Management and zero tillage in rice-wheat cropping system, Hisar, Haryana, India, pp.177-181.
8. Sturz, A.V., Crater, M.R and Johnston, H.W. 1997. A review of plant disease-pathogen interactions and microbial antagonism under conservation tillage in temperate, humid agriculture. Soil Tillage Res. 41: 169-189.
9. Sumner, D.R., Doupnik, B.L. Jr. and Boosalis, M.G. 1981. Effects of reduced tillage and multiple cropping on plant diseases. Annu. Rev. Phytopathol. 19: 167 -187.
10. Varshney, S., Duveiller, E., Bridge, J., Rutherford, M., Mishra, R., Ambdekar1, S.J. and Singh1 U.S. 2002. Effect of Tillage Practices on Population Dynamics of Soilborne Antagonists in Uttaranchal State, India. In E. Duveiller J. Bridge M. Rutherford and S. Keeling eds. Soil Health and Sustainability of the Rice Wheat- Systems of the Indo-Gangetic Plains. Pp. 25-28.

(Climate Change, Precision Agriculture and Innovative Disease Control Strategies)
- 87 -
Role of Eco-friendly Approaches in Integrated Pests and Disease Management
Ruchira Tiwari
Department of Entomology, GBPUA&T, Pantnagar-263145 ( Uttarakhand)
What is Integrated Pest Management (IPM)
Integrated Pest Management (IPM) is a system designed to provide long-term management
of pests, instead of temporarily eradicating hem. It is the coordinated use of pest and
environmental information with available economic pest control methods to prevent unacceptable
levels of pest damage which is least hazardous to human being, property, and the environment.
Practicing IPM can reduce the use of chemical pesticides entering the environment and can save
money. IPM is based on taking preventive measures, monitoring the crop, assessing the pest
damage, and choosing appropriate measures. Many different tactics are used in IPM, including
cultural practices, biological control agents, chemical pesticides, pest-resistant varieties, physical
barriers etc.
IPM means a pest management system that in the context of the associate environment
and the population dynamics of the pest species, utilizes all suitable techniques and methods in an
compatible manner as possible to maintain the pest population at levels below those causing
economically unacceptable damage or loss. FAO (1967).
IPM based on the following assessments:
Thresholds levels: Thresholds are the levels of pest population at which pest management action
should be initiated/ undertaken to prevent the pests from causing an acceptable damage. The
threshold often is set at the level where the economic losses caused by pest damage would be
greater than the cost of controlling the pests which sometimes are called ‘Economic Thresholds’
(ET). Populations above these thresholds can reach the Economic Injury Level (EIL), where
they cause enough damage for the grower to lose money. At the economic injury level, the cost of
control is equal to the loss of yield or quality that would result otherwise.
Economic-Injury Level (EIL): (Stern et al., 1959): “The lowest population density of a pest that
will cause economic damage; or the amount of pest injury which will justify the cost of control.”
The eco-friendly approaches which are least disruptive to beneficial insect populations are
as follows:
(1) Cultural practices- It means adjustment of agronomic procedures to reduce pest abundance

(Climate Change, Precision Agriculture and Innovative Disease Control Strategies)
- 88 -
or it is a manipulation of the environment to make it less favourable to insect pests. It needs the
basic studies of the life history and habits of the insects, its plants and animal hosts.
(a) Sanitation- It includes ploughing under infested plants after the harvest of the crop. It includes
destruction and pruning of twigs and branches infested with pests , gathering of plant debris which
harbor overwintering infestations or infections.
(b)Tillage- The cultivation of soil in and around crop plants to destroy numerous crop pests either
through mechanical injury or exposure to sunlight or predators e.g. larvae and pupae of cutworm,
gram pod borer, grass hopper etc.
(c)Alterations in sowing time- The early spring planted sugarcane crop is less attacked by early
shoot borer. In tarai region, if spring maize is planted before 15 February the attack of sorghum
shoot fly would be less. The early sowing of chick pea crop on 15th October was least infested
with H. armigera with maximum seed yield in comparison to crop sown on 24th December.(1) Early
sowing is practicable, cheap and environment friendly option to avoid pod borer infestation.
(d)Nutritional disorder-Proper dose of NPK make the crop healthy and less prone to insect and
disease attack.
(e)Improved storage structures – Plastic woven sacks for food grains packages were found
highly effective to control high moisture content.(2)
(f)Crop rotation Adopting of legume crop after a cereal crop reduces attack of white grub on
legumes.
To control nematode, Meloidogyne incognita in french bean, crop rotation like french bean- rice-
sesamum- french bean found effective in reducing the soil population, root galls and egg masses
of nematode and increase in the field of French bean.(3)
(g)Trap crops-Grow okra along with cotton to attract red cotton bug and jassids
Grow pigeon pea along with cotton to attract grey weevil
Sorghum as trap crop in cotton for increasing paratising efficiency of Trichogramma chilonis
against bollworm when grown after 5 rows of cotton.(4)
Dhaincha (Sesbenia bispinosa) was found economical when 4 lines of dhaincha was sown with
the host crop, soybean on the periphery of the field preferred by the females of girdle beetle. (5)
(h) Mixed cropping- The sowing of Wheat+ gram+ mustard crops in mixed form found effective
against termite, gram caterpillar and aphid on their respective host plants.
(i)Intercropping Inter cropping of tomato crop with crucifer crops suppresses pest population of
H. armigera in tomato due to glocosinolate allelochemicals.
cotton with sesame showed control of bollworm complex.
Groundnut crop intercropped with pigeon pea showed lowest incidence as well as % damage of
Spilractia obliqua in ground nut. (6)
(j)Use of resistant plant varieties: Biotechnology (Genetically Modified (GM) or transgenic
crops)- It refers to the crops which express foreign genes isolated from any biological system. On
the basis of three factors which are responsible for the resistance mechanism in plants are :

(Climate Change, Precision Agriculture and Innovative Disease Control Strategies)
- 89 -
Antibiosis, Non-preference and Tolerance for insect pest resistance, a number of genes have been
used for production of GM crops. Bt Cry proteins, tripsin inhibitors, Alpha amylase inhibitors,
potato proteinase inhibitor II (pinII), lectins, cholesterol oxidase, polyphenol oxidase have been
reported to provide insect pest resistance. Bt transgenic crops are potato, tomato, cotton Bt cotton
(bollguard) and tobacco American variety of grapes against Phylloxera, Winter majetin variety of
apple against wooly aphid were found effective.
(2) Mechanical practices-
These are the methods employing manual devices and machines and give immediate
results.
1) Hand picking- For large sized insects ( caterpillars, beetles bugs etc.)
2) Shaking and beating of branches-To dislodge the insects.
3) Banding- The application of sticky bands( alkathene bands) around the tree trunks
to prevent the movement of the insect pests e.g. for mealy bugs
4) Wire gauge screens- The stems or fruits could be surrounded by wire gauge
screens to prevent the attack of borers
5) Trench digging- This is good for trapping the grasshoppers and locusts which
move in bands and afterwards kill them with insecticides.
6) Trapping – The light traps, pheromone traps, baits are being used to lure the insect
pests to get early warning of increasing pest population. The adhesive traps for
catching alate (flying) mustard aphids were evaluated by making a glass jars
painted with mustard yellow colour and then smeared with transparent grease on its
outer surface to get the flying aphids stuck on the surface of the jar. (7)
(3)Biorational approaches-The utilization of naturally produced chemicals that affect insect
behavior, growth or reproduction and suppress the insect population without affecting the
environment. It includes biological control, use of sex pheromones in mating disruption, hormones
that is use to inhibit a biologically active system of living process like chitin synthase inhibitors,
mating disruption hormones and various types of baits used for mass trapping.
(a)Semiochemicals- These are the chemicals that are able to modify the behavior of the
perceiving organism at sub micro and nanogram level.
Pheromones – It is a chemical or a mixture of chemicals that is released to the exterior by an
organism and that causes one or more specific reactions in a receiving organism of the same
species.
Sex pheromones- These can be employed in IPM for three ways- monitoring / survey, mass
trapping and mating disruption of the pests. Insect population can be estimated and new areas
of infestation detected at very early stage. It is used to give warning regarding the outbreak of
the insect pests and determine economic threshold level to decide about the timing of insecticide
applications. An economical sex pheromone, polystyrene trap was fabricated having females of H.
armigera instead of synthetic septum for monitoring Helicoverpa armigera showed good results in

(Climate Change, Precision Agriculture and Innovative Disease Control Strategies)
- 90 -
capturing more number of males in comparison to synthetic septum used.(8)
(b)Botanicals- The plant products and their active constituents played an important role in plant
disease control by combating growth and development of pathogens and inducing resistance in
host plants. Spore germination of Erysiphi pisi (powdery mildew of pea)was affected by 80% by
applying 500ppm of extract of ocimium sanctum, zingiber officinale rhizome and madhuca indica
leaves.(11). The 15% extract of datura, 20% of Azadirachta indica controls bacterial blight of rice
Xanthomonas oryzae var. oryzae. (12). Neem, tulsi and mint are antihelminthic in action. Plant
extracts such as leaf extracts at 10% concentration of Mint, tulsi ,abutilon indicum were found
effective against storage fungi
(Helminthosporium oryzae, Sarocladium oryzae Aspergillus niger, A. flavus) of paddy They
inhibited the fungal mycelia growth aswell as biomass production and spore germination of
pathogen. Garlic bulb extract (40%) water extract was checked against the growth of Aspergillus
niger and A. flavus( stored fungi) showed total inhibition of the growth of fungi. (13). Neem leaves,
neem seed kernel extract, neem oil were found very effective against the larvae of lepidopteran,
coleopteran and dipteran insects.(9,10).
(C) Insect growth regulators ( IGRs) –
(1)Juvenile hormones- The juvenoids like methoprene, hydroprene, fenoxycarb, pyriproxyfen,and
antijuvenoids such as Precocene I and II, ecdysoids (anti moulting hormones and chitin synthetic
inhibitors ( Dimilin) are being employed for the control of insect pests. New insect growth
regulators like flufenoxuron 0.25% and Lufenuron (0.25% ) were found effective caused 80-85%
mortality of 3rd instar larvae of S. obliqua after 96 hrs of treatment. (14,15,) .Anti juvenile hormones
isolated from Plant Ageratum houstonianumis Precocene I and II induced precocious
metamorphosis in the milkweed bug.
(2)Moulting hormones(MHs) represented by ecdysone, ecdysterone and other ecdysteroids
secreted by prothoracic glands are responsible for normal moulting and growth and maturation of
insects. Phyto ecdysterone isolated from dried parts of Ajuga reptans strongly influenced the
metamorphosis of Epilachna beetle .
The exogenous application of this ecdysone at wrong time cause death of insects.
(3) Chitin synthesis inhibitor- A new class of insecticide is Bnzoyl Phenyl Urea (BPU)
analogues that is diflubenzuron, which is commercialized under the name of Dimilin. It inhibited the
last stage of formation of chitin and cent percent mortality was observed in 15 days old larvae of
Spilarctia oblique at 0.1 % concentration after 10 days of treatment. (16). Others are BAY SIR
8514 and IKI 7899, (chlorfluazuron), teflubenzuron, buprofezin. Plumbagin is a naturally occurring
chitin synthesis inhibitor present in the roots of medicinal shrub, Plumbago capensis.
(d)Biological control agents-
To save the natural enemies and pollinators it is required to have idea of the weakest stage
of insect which is transparent as well, is to be targeted for borers moth emergence and larval
hatching period is most preferred time for biocontrol. Most vulnerable stage of insect pest is

(Climate Change, Precision Agriculture and Innovative Disease Control Strategies)
- 91 -
important. Apply insecticide after or before application of biocontrol agents.
(1) Microbials (Pathogens) – When microbial organisms or their products (toxins) are employed
for the control of insects, animals and plants in a particular area is referred as microbial control.
Principal groups of pathogens are —Bacteria Bt, NPV, fungi and nematodes
Bacteria- Entomogenous sporeforming bacteria are more promosing in insect control. The toxic
crystal producing bacteria is Bacillus thuriengensis which is marketed under different commercial
names dipel, centari, thuricide, biosporine, parasporine etc. like Bt kurstaki, Bt aizawai, Bt
thuriengiensis,. The bacteria causes septicemia (multiplication of the bacterial spores) in the
haemocoel of insects.
Viruses- The entomogenous viruses fall in two categories inclusion viruses and non-
inclusion viruses which produce inclusion bodies in the insect body. NPV
NucleoPolyhedrosis Viruses, Cytoplasmic Polyhedrosis Viruses (CPV) and Granulosis
Viruses (GV). NPV affects insect by producing polyhedral bodies which dissolves by the
alkaline gut of the insect midgut and cause death. The insect stops feeding becomes
sluggish and integument becomes fragile. The infected insect climbs to the higher positions
and the dead larvae usually hang by their prolegs (head downwards) and dry down to dark
brown and black
Fungi - Entomopathogenic fungi Beauveria bassiana and Mettarrhizium anisopliae causes
muscardine disease in insects. Biological control of Meliodogyne incognita by the
application of soil fungus, Paecilomyces lilacinus 2g/pot reduced the egg number by
forming mycilia around the eggs and breakdown the female by entering through their
vulva. Seed treatment of cowpea with fungus P. lilacinus together with the application of
organic matter ( leaves of Leuceana leucocephala) into the nematode infested soil one
week prior to the sowing was found to be more effective in reducing root knot nematodes
incidence and increasing the yield of cowpea .(17)
Nematodes- Infective juvenile of Steinernema carpocapsae and Heterorhabditis
transmits bacteria which are lethal to their hosts. They have a wide host range. Infective
juveniles can easily be cultured and stored for extended periods. Different nematode
formulations are available- liquid, granular and foam incorporated.
(2)Macrobial agents like predators and parasitoids are employed for the control of insects. The
4th instar grub of Coccinella beetle is a potential predator of wheat aphid complex. The
consumption of beetle increases with increase in the age of the grubs.(18).
Biological control of weeds:
A leaf beetle, Zygogramma bicolorata , introduced from Mexico for biocontrol of
Parthenium weed. Inoculative release of this beetle (100 pairs of adults/ acre) may be an
important component of Integrated Parthenium weed management.(19).
Animal originated products
Cow urine, cow dung, buffalo urine, biogas are in use, nowadays, to control the insect pest

(Climate Change, Precision Agriculture and Innovative Disease Control Strategies)
- 92 -
infestation and diseases. Biogas (methane and carbondioxide) was successfully used in the
control of stored grain insect pests such as Rhizopertha dominica, Sitotroga cerealella, Corcyra
cephalonica infesting paddy which was carried out in 100 kg capacity of PVC bins over a period of
8 months. It was observed that it had no any adverse effect on seed germination of paddy.(20).
Cold and hot water extracts of urine of buffalo and bullock and milk of goat completely
inhibited mycelia growth of Macrophomina phaseolina causing dry rot in cotton. The cotton seed
germination was also found higher with vigorous growth of seedlings. It has been observed that
buffalo urine retained total toxicity after autoclaving when tested against tomato fusarial wilt
pathogen. (21)
Baffalo urine at 40% concentration (hot water extract, water extract and autoclaved) totally
inhibited the growth of Aspergillus spp. (13). Cow urine alone and in addition with Allium sativum
bulb powder, neem oil and tea leaves was found effective against snails, Lymnaea acuminata.(22).
Neem leaves and cow urine decoction was found promising to control S. Obliqua (23 , 25) and
had negative effect on the larval weight and feeding preference of S. litura (26).
Cow urine against honeybee diseases— A novel approach (Dr. Ruchira Tiwari ) (24)
The effectiveness and feasibility of using an eco-friendly measure, cow urine were
assessed for the first time in preventing and management of bacterial infections of European foul
brood disease (EFB), a wide spread and serious menace of honeybee, Apis mellifera. Application
of cow urine (25 to 100%) as spray twice at weekly interval on infected combs and terramycin
sugar syrup (125 mg/l) as food and spray showed that cow urine at 75 and 100% concentrations
proved most effective and reduced disease infection to below detectable limit in 8-10 days,
respectively as against 20 days in terramycin syrup fed bees. Cow urine treated infected combs
not only showed rapid recovery in disease infection but also promotion of growth of brood whereas
in terramycin fed colonies the queen stops laying eggs for certain period. Re-occurrence of
disease in the cow urine treated combs was also not observed. Other beneficial effects of cow
urine on robbing, aggressiveness, egg laying and adult activities are discussed. The studies
revealed that cow urine can serve as a potential eco-friendly measure for management of EFB in
honeybees.
What is Pest Risk Analysis (PRA)
Pest Risk analysis is a process of investigation, evaluation of information and decision
making with respect to a certain pest, that starts once it is known or determined that this pest is a
quarantine pest. Subsequently, an evaluation of the potential of introduction of the pest into the
country is done along with its economic, social and environmental consequences. With
identification, determination and evaluation done, the process culminates with decision making to
avoid or reduce the probability of entrance or establishment of the pest into the country.
There are generally three initiation points for PRA:
The identification of a pathway, usually an imported commodity, that may allow the

(Climate Change, Precision Agriculture and Innovative Disease Control Strategies)
- 93 -
introduction and/or spread of quarantine pests
The identification of a pest that may qualify as a quarantine pest
The review or revision of phytosanitary policies and priorities.
The PRA process as described in the International Standards For Phytosanitary Measures
(ISPM) is divided into four phases –Pest risk initiation, Pest risk assessment, Pest risk
management and Pest risk communication/documentation.
On the basis of above mentioned eco-friendly approaches, pre-planting discussions,
reviewing activities undertaken during the year and post harvest discussion and interpretation of
results with transfer of new technologies to the farmers and others related with plant protection
makes a sophisticated IPM programme.
REFERENCES
1. Chakravorty, S. and Nath, P. 2006. Effect of time of sowing on the incidence of pod borer, Helicoverpa armigera in chickpea. Indian Journal of Applied Entomology, 20,1 28-32.
2. Khanna, S.C.,Chaurasia, V. and Sundria, M.M. 2004. Suitability of plastic woven sacks for foodgrain packaging-moisture permeability. Annals of Plant Protection Sciences. 12, 1 210-211.
3. Ahmed, J.A. and Chaudhary, B.N. 2004. Management of Meloidogyne incognita in french bean through crop rotation. Annals of Plant Protection Sciences. 12,1, 118-120.
4. Khosa Jaspreet,Virk, J.S. and Brar, K.S. 2008. Role of sorghum as trap crop for increasing parasitizing efficiency of Trichogramma chiolnis against cotton bollworms. Journal of Insect Science. 21,1 , 79-83.
5. Chaudhary, H.R. and Girdhar Gopal. 2006 .Effect of Dhaincha sesbania bispinosa as a trap crop against girdle beetle in soybean. Indian Journal of Applied Entomology, 20,1 80-81.
6. Nath, P. and Singh, A.K. 2004. Effect of intercropping on the population of Bihar hairy caterpillar and leaf damage in groundnut. Annals of Plant Protection Sciences. 12,1, 32-36.
7. Prasad, S. K. 2004. Modified telescopic adhesive trap for catching alate mustard aphids. Annals of Plant Protection Sciences. 12,1 211-213.
8. Krishna Kant and Kanaujia, K.R. 2008. Low cost sex pheromone trap design for monitoring Helicoverpa armigera (Hubner). Journal of Insect Science. 21,1 61-66.
9. Mishra, P.K., Singh, D.P. and Srivastava, J.S. 2007. Bio-efficacy of neemazal, a product of azadirachtin against sclerotial development of Sclerotinia sclerotiorum and Sclerotinia rolfsii. Journal of Eco-friendly Agriculture, 2,2, 175-177.
10. Mallapur, C.P. and Lingappa, S. 2005. Management of chilli pests through indigenous materials. Karnataka Journal of Agricultural Sciences.18 (2): 389-392.
11. Maurya, S. Singh, D.P. Srivastava, J.S. and Singh, U.P. Effect of some plant extracts on pea powdery mildew ( Erysiphe pisi).2004. Annals of Plant Protection Sciences. 12,2, 296-300.
12. Meena, C. and Gopalakrishnan, Jayshree. 2004. Efficacy of plant extracts against bacterial blight ( Xanthomonas oryzae var. oryzae) of rice. Annals of Plant Protection Sciences. 12,2, 344-346
13. Wani, M.A. and Kurucheva,V. 2004. Effect of garlic bulb extract and buffalo urine on the growth of Aspergillus niger and Aspergillus flavus. Annals of Plant Protection Sciences, 12 (1), 221-222.
14. Ramesh Chander and Bhargava, M.C. 2005. Effect of methoprene on the reproductive potential of tobacco caterpillar, Spodoptera litura (Fabricius). Journal of Insect Science, 18 (2), 25-28.
15. Ramesh Chander, Bhargava, M.C and Choudhary, R.K. 2008. Effect of fenoxycarb on adults of

(Climate Change, Precision Agriculture and Innovative Disease Control Strategies)
- 94 -
Spodoptera litura.(Fabricius). Journal of Insect Science, 21 (1), 24-27.
16. Singh , Y.R. Singh, I.S. and Varatharajan, R. 2004. Bioefficacy of IGRs against caterpillars of Spilarctia obliqua. Annals of Plant Protection Sciences,12, (1), 198-201.
17. Hasan, N. 2004. Evaluation of native strain of Paecilomyces lilacinus against Meloidogyne incognita in cowpea followed by Lucerne. Annals of Plant Protection Sciences. 12,2, 121-124.
18. Soni, R. Deol, G.S. and Brar, K.S. 2005. Feeding potential of Coccinella septempunctata (Linn.) on wheat aphid complex in response to level/intensity of food. Journal of Insect Science, 21, (1) 90-92.
19. Kaur, P. and Shenhmar, M. 2006. Seasonal abundance of Zygogramma bicolorata on Parthenium hysterophorus in Punjab. Journal of Insect Science. 19, 129-133.
20. Yadav, S. and Mahla, J.C. 2005. Bioefficacy of carbondioxide concentrations and exposure periods against lesser grain borer, Rhyzopertha dominica, (Fab.) in stored wheat. Journal of Insect Science,18 (2) 84-89.
21. Raja, V. and Kurucheve, V. 1997. Antifungal properties of some animal products against Macrophomina phaseolina causing dry root rot of cotton. Plant Disease Research, 12,1 11-14.
22. Tripathi, R. Singh, V.K. and Singh, D.K. 2006. Freeze dried powder of cow urine reduces the viability of the snail, Lymnaea acuminata. Journal of Pest Science, 79,(3) 143-148.
23. Purwar, J.P. and Yadav, Sri Ram. 2004. Evaluation of age related response of Spilarctia obliqua to biorationals insecticides. Annals of Plant Protection Sciences. 12,2, 271-273.
24. Tiwari, R. and Mall, P. 2007. Efficacy of cow urine for management of European foulbrood disease of honey bee, Apis mellifera (L) at Pantnagar. Journal of Eco-friendly Agriculture, 2,2, 201-203.
25. Aakash Chand and Tiwari R. 2010. Effect of cow urine and some indigenous plant extracts on feeding preference of Spilarctia obliqua (Walker). Journal of Applied Entomology. 24(1), 43-46
26. Aakash Chand and Tiwari R. 2010. Influence of cow urine and indigenous plant leaf extracts on feeding potential and larval weight of Spodoptera litura (Fabricius) (Noctuidae : Lepidoptera). Journal of Insect Science. 23 (3)313-317

(Climate Change, Precision Agriculture and Innovative Disease Control Strategies)
- 95 -
Advances in Electron Microscopy and application in Plant Pathology
Balwinder Singh Dhote Department of Anatomy, G.B.P.U.A.&T., Pantnagar - 263145 (Uttarakhand)
Introduction
One of the most important tasks in the education of a pathologist is learning to distinguish
normal from abnormal tissues. Typically, training
programs provide an adequate background for the
examination and interpretation of tissues at the
gross and light microscopic (lm) levels, leaving the
student pathologist to his/her own devices to
develop necessary skills at the ultrastructural level.
The purpose of this presentation is to facilitate
development of these skills in ultrastructural
examination/interpretation of tissues, by providing a
starting point, some tools for study, direction, and
finally, a goal at which to aim. Since it would be
unrealistic to attempt to go into depth in the short
time allotted, the presentation will concentrate on
an approach to interpretation of ultrastructural
cases while providing a broad overview of some
commonly examined tissues.
A human eye can distinguish two points 0.2mm apart. Man’s quest to see the unseen and
beyond what can be seen with the naked eye led to the discovery of simple magnifying glass that
produces an enlarged image of an object. Further improvement led to development of light
microscopes that use a combination of magnifying glasses/lenses. Dr.Ernst Ruska at the
University of Berlin built the first Electron Microscope (a Transmission Electron Microscope) in
1931 and could get a resolution of 100nm using two magnetic lenses. Today using 5-7 magnetic
lenses in the imaging system a resolution of 0.2nm can be achieved. The introduction of the
electron microscope as a tool for the biologist brought about a complete reappraisal of the micro-
anatomy of biological tissues, organisms and cells. In the early days of its application to biological
materials, it was the tool of anatomists and histologists, and many previously unimagined
structures in cells were revealed. More recent developments in biological specimen preparation
have come from biochemists and physicists who have used the electron microscope to examine
cells and tissue in many different ways.
The two most common types of electron microscopes available commercially are the
TRANSMISSION ELECTRON MICROSCOPE (TEM) and the SCANNING ELECTRON
MICROSCOPE (SEM). In the SEM, the specimen is scanned with a focused beam of electrons

(Climate Change, Precision Agriculture and Innovative Disease Control Strategies)
- 96 -
which produce "secondary" electrons as the beam hits the specimen. These are detected and
converted into an image on a television screen, and a three-dimensional image of the surface of
the specimen is produced. Specimens in the TEM are examined by passing the electron beam
through them, revealing more information of the internal structure of specimens.
The Transmission Electron Microscope (TEM)
The TEM is an evacuated metal cylinder (the column) about 1 to 2 meters high with the
source of illumination, a tungsten filament (the cathode), at the top. If the filament is heated and a
high voltage (the accelerating voltage) of between 40,000 to 100,000 volts is passed between it
and the anode, the filament will emit electrons. These negatively charged electrons are
accelerated to an anode (positive charge) placed just below the filament, some of which pass
through a tiny hole in the anode, to form an electron beam which passes down the column. The
speed at which they are accelerated to the anode depends on the amount of accelerating voltage
present.
Electro-magnets, placed at intervals down the column, focus the electrons, mimicking the
glass lenses on the light microscope. The double condenser lenses focus the electron beam onto
the specimen which is clamped into the removable specimen stage, usually on a specimen grid.
As the electron beam passes through the specimen, some electrons are scattered whilst
the remainder are focused by the objective lens either onto a phosphorescent screen or
photographic film to form an image. Unfocussed electrons are blocked out by the objective
aperture, resulting in an enhancement of the image contrast. The contrast of the image can be
increased by reducing the size of this aperture. The remaining lenses on the TEM are the
intermediate lens and the projector lens. The intermediate lens is used to control magnification.
The projector lens corresponds to the ocular lens of the light microscope and forms a real image
on the fluorescent screen at the base of the microscope column.

(Climate Change, Precision Agriculture and Innovative Disease Control Strategies)
- 97 -
Resolving Power
The human eye can recognize two objects if they are 0.2mm apart at a normal viewing
distance of 25 cm. This ability to optically separate two objects is called resolving power. Any finer
detail than this can be resolved by the eye only if the object is enlarged. This enlargement can be
achieved by the use of optical instruments such as hand lenses, compound light microscopes and
electron microscopes.
Resolution in the light microscope
In the light microscope, the quality of the objective lens plays a major role in determining
the resolving power of the apparatus. The ability to make fine structural detail distinct is expressed
in terms of numerical aperture (NA). The numerical aperture can be expressed as n sinα where n
is the refractive index for the medium through which the light passes (n air =1.00; n water = 1.33; n
oil = 1.4), and α is the angle of one half of the angular aperture of the lens. Light microscope
objective and condenser lenses are usually designated by this NA value.
In a light microscope, a beam of light is directed through a thin object and a combination of
glass lenses provide an image, which can be viewed by our eyes through an eye piece. The image
formed is realistic, because it uses visible multicolor light. Visible light has wave like nature with a
wavelength (λ) of 400-800 nm. Since the resolution cannot be less than half the wavelength (λ),
the ultimate resolution attainable by using the light microscope is 200nm. This corresponds to a
magnification of 1000 times as compared to an eye. Any magnification higher than this will not
resolve more detail but will only give “empty magnification”.
( 1mm = 1000 µm; 1 µm = 1000nm; 1nm = 10 A0 )
Changes in resolution with wavelength (light microscope)
Light source Green Blue Ultraviolet
Wavelength (nm) 546 436 365
Resolution (nm) 190 160 130
Resolution improves with shorter wavelengths of light
It can be seen from the above table that resolving power improves as the wavelength of the
illuminating light decreases. To explain this more fully, the resolving power of the optical system
can be expressed as
where
R is the distance between distinguishable points (in nm),
is the wavelength of the illumination source (in nm),
NA is the numerical aperture of the objective lens.

(Climate Change, Precision Agriculture and Innovative Disease Control Strategies)
- 98 -
The optimal resolving power for a light microscope is obtained with ultraviolet illumination
( = 365) if a system with the optimal NA is used (1.4).
In this example
R = 130.4 nm
In the visible region of the spectrum, blue light has the next shortest wavelength, then
green and finally red. If white light is used for illumination then the applicable wavelength is that for
green. This is in the middle range of the visible spectrum and the region of highest visible
sharpness.
Improvement of resolving power
Due to this limitation of resolving power by light microscopy, other sources of illumination,
with shorter wavelengths than visible light, have been investigated. Early experiments using X-rays
of extremely short wavelength were not pursued further because of the inability to focus these
rays. The first breakthrough in the development of the electron microscope came when Louis de
Broglie advanced his theory that the electron had a dual nature, with characteristics of a particle or
a wave. The demonstration, in 1923 by Busch, that a beam of electrons could be focused by
magnetic or electric fields opened the way for the development of the first electron microscope, in
1932, by Knoll and Ruska. Although the initial development of the electron microscope, in
Germany, was followed by technical improvements in America, the first commercially available
apparatus was marketed by Seimens.
Specimen preparation for TEM
The greatest obstacle to examining biological material with the electron microscope is the
unphysiological conditions to which specimens must be exposed.
Since the material must be exposed to a very high vacuum ( to Torr) when being
examined, it must be dried at some stage in its preparation. The biological specimen must be
stabilized (or fixed) so that its ultrastructure is as close to that in the living material when exposed
to the vacuum.
The limited penetrating power of electrons means that the specimens must be very thin or
must be sliced into thin sections (50 - 100 nm) to allow electrons to pass through.
Contrast in the TEM depends on the atomic number of the atoms in the specimen; the
higher the atomic number, the more electrons are scattered and the greater the contrast.
Biological molecules are composed of atoms of very low atomic number (carbon, hydrogen,
nitrogen, phosphorus and sulphur). Thin sections of biological material are made visible by
selective staining. This is achieved by exposure to salts of heavy metals such as uranium, lead
and osmium, which are electron opaque.
Fixatives are used to prevent autolysis, change in volume and shape and preserve various
chemical constituents of the cell.

(Climate Change, Precision Agriculture and Innovative Disease Control Strategies)
- 99 -
Aims of Fixation
To preserve the structure of cells and tissues with minimum or least alteration from the
living state.
To protect them against alterations during embedding and sectioning.
To prepare them for subsequent treatments such as staining and exposure to the electron
beam
Commonly used Fixatives
Glutaraldehyde
Paraformaldehyde Primary fixative
Acrolein
Karnovsky’s Fixative (Glutaraldehyde + Paraformaldehyde)
Osmium tetroxide Secondary fixative
Some other compounds are also there which have the ability to partially fix or stain the
cellular constituents e.g. Chromium salts, Uranium salts, lead compounds and Phosphotungstic
acid (PTA).
Procedure of Fixation and Block Making
Primary fixation
1-2mm sq thick samples + 2.5% glutaraldehyde made
in 0.1M sodium phosphate buffer (pH 7.4) 2-24 hours at 4°C
Washing
Rinse thoroughly with 0.1 M sodium phosphate buffer (pH 7.4) to wash away excess fixative
Secondary fixation
Osmium tetroxide (1% solution) is commonly used, acts as electron dense stain reacts principally
with lipids.
Washing
Rinse thoroughly with 0.1 M sodium phosphate buffer (pH 7.4) to wash away excess fixative
Dehydration
Ethanol or Dry acetone is used to completely dehydrate the tissue.
Clearing
Xylene, Toluene or epoxy propane is commonly used.
Infiltration
Infiltration is done by gradually decreasing the concentration of clearing agent and proportionately
increasing the concentration of embedding medium.
Infiltration is carried out with liquid resins.
Embedding
Embedding is done in the embedding medium using a gelatin or beam capsule

(Climate Change, Precision Agriculture and Innovative Disease Control Strategies)
- 100 -
Polymerization
Keep the specimen at 40-50°C for overnight for better penetration of the resin and then increase
the temperature to 60°C for 24-48 hrs so that the resin gets hardened.
Removing the Blocks from the mould
After polymerization the blocks can be easily removed.
ULTRAMICROTOMY
Glass knife is used for cutting ultrathin sections. Ultrathin sections show interference colors while
floating on the liquid of the trough. This makes it possible to determine the thickness of the
sections.
Gray-60 nm (600A0 ); optimal for high resolution work.
Silver- 60-90 nm; ideal for most of the purposes.
Gold- 90-150 nm; useful for low magnification and autoradiography.
Purple ,blue,green and yellow- range from 150-320nm; very thick sections and not suitable for
transmission microscopy.
He sections are picked on to the grids to be observed in the TEM
Tem Observations
One of the most important tasks is learning to distinguish normal from abnormal tissues. In
order to successfully interpret an electron microscopic (EM) case, you need some of basic tools
such as a working knowledge of normal. To describe a micrograph:
Begin by stating which tissue(s) is (are) present
Brief description of normal landmarks present
Describe pathologic changes
Have good vocabulary of EM terms - appendix I in the 2nd edition of cell pathology by
Cheville has a glossary of EM terms; this is a good starting point.
Morphologic diagnosis
Same rules apply as for LM cases
Be concise
Example: hepatocyte: degeneration, diffuse, moderate with intranuclear virions.
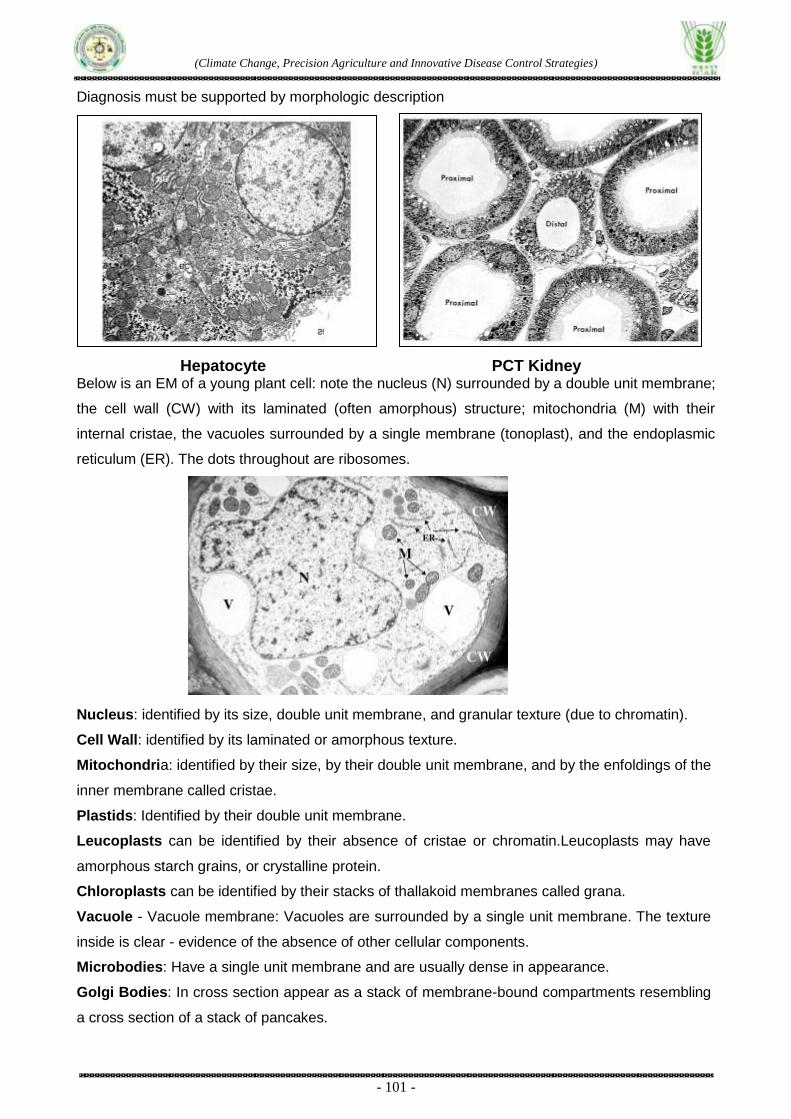
(Climate Change, Precision Agriculture and Innovative Disease Control Strategies)
- 101 -
Diagnosis must be supported by morphologic description
Hepatocyte PCT Kidney Below is an EM of a young plant cell: note the nucleus (N) surrounded by a double unit membrane;
the cell wall (CW) with its laminated (often amorphous) structure; mitochondria (M) with their
internal cristae, the vacuoles surrounded by a single membrane (tonoplast), and the endoplasmic
reticulum (ER). The dots throughout are ribosomes.
Nucleus: identified by its size, double unit membrane, and granular texture (due to chromatin).
Cell Wall: identified by its laminated or amorphous texture.
Mitochondria: identified by their size, by their double unit membrane, and by the enfoldings of the
inner membrane called cristae.
Plastids: Identified by their double unit membrane.
Leucoplasts can be identified by their absence of cristae or chromatin.Leucoplasts may have
amorphous starch grains, or crystalline protein.
Chloroplasts can be identified by their stacks of thallakoid membranes called grana.
Vacuole - Vacuole membrane: Vacuoles are surrounded by a single unit membrane. The texture
inside is clear - evidence of the absence of other cellular components.
Microbodies: Have a single unit membrane and are usually dense in appearance.
Golgi Bodies: In cross section appear as a stack of membrane-bound compartments resembling
a cross section of a stack of pancakes.

(Climate Change, Precision Agriculture and Innovative Disease Control Strategies)
- 102 -
Endoplasmic Reticulum: Membranes that pervade the cell, seemingly not associated with any of
the structures listed above. If ribosomes are clustered along these membranes is called rough ER.
Ribosomes: dot-like structures often associated with endoplasmic reticulum.
Meristematic cells in roots parenchyma Chloroplast in Leaf Material from Glycine hispida (10000X)
Thicker ascospore walls (TEM) fungus TEM of phytoplasma colonizing the phloem of an infected stem.
Infectious Agent
A complete treatise of ultrastructural detail of infectious agents is beyond the scope of this
presentation. Generally speaking, it is easy to get carried away describing these organisms in any
detail, especially protozoa. It is better to describe the essentials, interpret and continue.
Viral
In describing viruses, describe size if a scale marker is present, shape, encapsulated or
not, appearance of nucleoid, and where virus is present (intranuclear, budding from cell
membranes/ walls, within er, extracellular, etc.).Some viruses are more easily identified
ultrastructurally than others:
Poxviruses- relatively large viruses (200-300 nm), replication in the cytosol unlike most
DNA viruses, substantial capsule and dumbbell-shaped nucleoid.
Adenoviruses- characteristic intranuclear paracrystalline array.
Herpesviruses- replication in nucleus where immature nucleocapsids are present, envelope
by budding through a membrane (often nuclear, sometimes er or plasma membrane).
Bacterial
Be familiar with general ultrastructural morphology of a bacterium. Knowing the species of
plant / animal, the tissue involved, and occasionally some other features, you can make an

(Climate Change, Precision Agriculture and Innovative Disease Control Strategies)
- 103 -
educated guess as to the bacteria with which you are dealing. Describe size if a scale is given,
shape (coccus, rod, pleomorphic) and where bacteria are located (i.e. At microvillar tips, closely-
adhered to cell membrane / wall, intracytoplasmic and if so, within phagolysosome or free).
Pseudomonas putida under solute stress Pseudomonas putida with no stress Examples:
Bordetella- bacteria enmeshed in tracheal cilia; animal affected may be dog, turkey,
etc.Car bacillus- bacteria enmeshed in cilia of airway, but more likely in a rat.
These Helicobacter pylori Bacteria (formerly named Campylobacter) on human stomach
epithelial cells can cause certain types of stomach ulcers and gastritis. Peptic ulcers are holes or
sores in the stomach or duodenum and most are caused by this pathogen. With antibiotics, the
infection can be cured in a few weeks. TEM X40,000
Protozoal
Be familiar with some of the terminology used in describing protozoa, such as conoid,
micronemes and rhoptries. Note whether zoites are contained within a parasitophorous vacuole or
free in the cytoplasm. If in a bradycyst, is wall thick or thin? Some familiar examples include:
Giardia- elongated, attached along microvillar surface
Cryptosporidium- trophozoites attached to apical cell surface by feeder organelle, microvilli
are effaced only at the site of attachment. The trophozoites develop into schizonts.
Journals relating to Electron Microscopy
Journal of Electron Microscopy (Japanese)
Journal of Electron Microscopy Techniques

(Climate Change, Precision Agriculture and Innovative Disease Control Strategies)
- 104 -
Journal of Microscopy
Biology of Cell (French)
Journal of Ultra-structural Pathology
Scanning Electron Microscopy
Ultramicroscopy
Developmental Dynamics
Anatomical Record
Journal of Cell Biology
Tissue and Cell
Electron Microscopy Reviews
Journal of Ultra structure and Molecular Structure Research
Cell and Tissue Research

(Climate Change, Precision Agriculture and Innovative Disease Control Strategies)
- 105 -
Plant Disease Forecasting (Late Blight Forecasting)
V. S. Pundhir Department of Plant Pathology, GBPUA&T, Pantnagar- 263 145 (Uttarakhand)
Diseases vary in consistency of occurrence and severity, thus epidemics are irregular
feature. The growers are often faced with the dilemma: whether to spray or to wait? Agrios (1997)
very aptly described epidemics “they resemble hurricanes”. They come, devastate and vanish.
Pathologists have been successful in understanding the factors responsible for initiation, buildup
and demise of epidemics. Fortunately epidemics follow a predictable course. The understanding
about interactions of four elements of epidemics has been exploited for prediction of
disease/epidemics. Our ability to predict diseases is an indicative of developments in science of
plant pathology. Disease forecasting or warning systems are boon to the growers as it encourages
judicious use (need based) of pesticides. This not only saves the money and energy of the
growers, without risking crop health, but also avoids the environmental pollution.
Miller and O’ Brien (1952) proposed a descriptive definition of disease forecasting that
stands valid even today. They stated, “Forecasting involves all the activities in ascertaining and
notifying the growers of community that conditions are sufficiently favorable for certain diseases,
that application of control measures will result in economic gain, or on the other hand, and just as
important that the amount expected is unlikely to be enough to justify the expenditure of time,
energy and money for control”. The above statement made explicit distinction between positive
forecast and negative forecast and both have value for growers as well as society in general.
Pre-requisites for Developing a Forecast System
Disease forecasting is a complicated, expensive and risky venture, as several biotic and
abiotic factors influence appearance and development of plant disease. The advancements in
science and technology have made ‘Disease warning System’ a working proposition, it requires lot
of expenditure in terms of time, money and technical personnel, following points should be
considered before starting a project on “disease forecasting”:
a. The crop must be a cash crop (economic value)
b. The disease must have potential to cause damage (yield losses)
c. The disease should not be a regular feature (uncertainty)
d. Effective and economic control known (options to growers)
e. Reliable means of communication with farmers, and
f. Farmer should be adaptive and have purchase power.
Disease forecasting systems
Based on the method of development of forecasting system the models may be of two
types. Empirical models are usually based on experience of growers, the scientists or both. Dutch
rules (Van Everdingen, 1926) were developed for late blight forecast based on experience.

(Climate Change, Precision Agriculture and Innovative Disease Control Strategies)
- 106 -
Fundamental Models involve research and experimentation for establishing fruitful relationships,
identifying ‘critical factor(s)’ and relating them with appearance (time and amount) of disease. An
empirical model can be further refined or modified by experimentation. Forecasting systems may
aim on two aspects: Infection forecasting, which is prediction of initial appearance of disease. It is
generally based on amount of primary inoculum and prevailing environmental conditions. In
disease forecasting the emphasis is on further development of disease. Amount of secondary
inoculum and number of infection cycles are important.
The appearance and buildup of plant disease epidemic depends on suitable crop growth
stage (canopy: microclimate) and the establishment of pathogen in the crop. This combination
determines the zero date before which disease outbreaks are rare or of little significance, and
therefore, warrants no control measures. Royle (1993) discussed approaches towards
understanding and predicting epidemics by selecting four fungal pathosystems.
Criterion Used for Disease Forecasting
Every plant disease is a unique ‘story’ and interactions of four variable elements make
every situation ‘a case’. First disease forecasting system in plant pathology was developed for vine
downy mildew (Plasmopara viticola) in 1913 (Muller’s incubation calendar; Germany). For
prediction of plant diseases the criteria used are related with survival of inoculum, production and
dispersal of primary and secondary inoculum and role of vector population. Following criteria are
used for predicting plant diseases:
(a) Weather conditions during non-crop period: The amount of primary inoculum depends on
survivability of pathogenic propagules during non-crop period. This relationship has been exploited
to predict the Stewart’s corn wilt (Stevens, 1934) : The pathogen (Erwinia stewartii) overwinters in
the body of vector, corn flea beetle (Chaetocnema pulecaria). Severe winters (low temperature) kill
vector population, thereby reducing the initial inoculum for the next season. Forecasting of
stewart’s corn wilt can be made based on cumulative winter temperature index (CWTI), is the sum
of mean temperatures of December, January and February months. Following Table gives the
relationship between CWTI and different phases (wilt phase in early stage and leaf blight phase in
mature plant) of the disease.
Relationship of cumulative winter temperature index and different phases of Stewart’s corn wilt.
CWTI (0F) 80 or below 80-85 85-90 90-100 >100
Wilt phase Absent Absent Absent/rare Light/severe Destructive
Leaf blight phase
Only trace Light to moderate
Moderate / severe
Severe Severe
The severity of blue mold of tobacco (Peronospora tabacina) in southern U.S. is predicted
based on winter temperature (January). Above normal temperature means severe and early
appearance of disease. Blue mould warning service has been operative in North America by
Tobacco Disease Council, which keeps the growers and industry aware of location and time of

(Climate Change, Precision Agriculture and Innovative Disease Control Strategies)
- 107 -
appearance and speed of blue mould to help with the timing and intensity of control.
(b). Amount of initial inoculum: This criterion is more important for monocyclic diseases where
the secondary infection does not take place and amount of primary inoculum is related to disease
severity and damage. Amount of primary inoculum present in seed, soil or vector can be estimated
and disease prediction can be made, without much problem. It is being used in case of loose smut
of wheat (Ustilago tritici), potato tuber borne inoculum (bacterial & viral pathogens) and soil borne
inoculum of Sclerotium, Verticillium, Rhizoctonia, nematodes can be estimated and disease can be
forecast. Pea root rot (Aphanomyces euteiches), can be predicted by conducting winter grow out
test in glasshouse. In North America Blue Mold Warning System is operative since 1980s where
based on January temperature the threat to seedbeds is forewarned.
Apple scab forecasting: Apple scab (Venturia inaequalis) is one of the most important diseases
of quality apples. Plants are exposed to attack by the fungal spores for very long period (bud
breaking to fruit maturity). Apple – V. inaequalis system was a fit case for development of
forecasting system to guide the growers for first (prophylactic spray) and further need based
sprays to reduce pesticide usage. Three main criteria were used : (a) quantity of primary inoculum,
measured as ascospore dose / ascospore discharge, (b) phenological stage of apple trees, time of
bud breaking, and (c) infection periods (Mills criteria, discussed in chapter 2) depends on
prevailing weather (temperature, Rh, leaf wetness and rain fall). Apple scab warning services are
operating in Germany, Netherlands, England (CEEFAX: computerized programme managed by
BBC by subscription) and India (Himachal Pradesh). Thakur and Khosla (1999) tested relevance
of Mills infection periods to apple scab prediction and rescheduling fungicide application in
Himachal Pradesh (India). They found that at least three sprays could be saved to control the scab
disease below the economic threshold. Following systems of apple scab forecasting have helped
the growers.
(c) Weather conditions during crop season: Prevailing weather conditions have become major
criteria for diseases forecasting for polycyclic diseases where in addition to amount of primary
inoculum, the multiplication and dispersal of secondary inoculum are weather dependent.
Forecasting of early and late blight of potato, anthracnose and Septoira leaf spot of tomato, wheat
rusts, apple scab, powdery mildew of cucurbits and downy mildew of grapes are made considering
the prevailing weather conditions which determine the amount of disease and damage to the crop.
Jhorar et al. (1992) developed a bio-meteorological model for forecasting Karnal bunt disease of
wheat (N. indica) based on weather conditions in late crop season (heading and anthesis stage).
Humidity thermal index (HTI), having highest correlation was used in forecasting model.
Forecasting late blight of potato: Late blight of potato had been instrumental in development of
various fundamental concepts in plant pathology, and disease forecasting is no exception. The
potato growers in Europe were wise enough to recognize blight weather (Moderate temperature
and lots of moisture: rain, dew or humidity) much earlier than van Everdingen postulated Dutch
rules in 1926. Following are four conditions related with ‘weather’ that could foretell about

(Climate Change, Precision Agriculture and Innovative Disease Control Strategies)
- 108 -
‘appearance’ of late blight in Netherlands.
The Dutch Rules:
Night temperature below dew point for at least 4 hrs,
Minimum temperature of 10 c or slightly above,
Clouds on the next day, and
Rainfall during next 24 hrs of at least 0.1 mm.
NOTABLE CONTRIBUTIONS IN LATE BLIGHT FORECASTING
a. van Everdingen postulated “Dutch rules” in 1926
b. Cook (1947) 7-day moving graph.
c. Hyre (1954) Blight favorable days.
d. Wallin (1962) Severity values
e. Bhattacharya et al. (1970) 7 day moving precipitation
f. Krause et al. (1975) BLITECAST
g. Mac Hardy (1979) Non-computerized model
h. Singh et al. (1980) “JHULSACAST” for Indo-Gangetic plains.
i. Fry and Apple (1983) Integrated host resistance and fungicide weathering in
BLITECAST.
j. Dommermuth (1998) Phytoprog I. late blight warning service
k. Runno and Kopple (2002) NEGFRY
l. Grunwald (2002) Modified and validated SIMCAST
Major breakthrough in late blight forecasting came when Krause et al (1975) with a genius
stroke designed an adjustable matrix using Hyre’s (1947) concept of “blight favorable days” and
Wallen’s (1962) “severity values”. The output of BLITECAST was in the form of recommendations
for the grower, tailor made to his own conditions. The growers of Pennsylvania State could send
the weather data recorded in potato fields to a computer through a telephone at forecasting centre
and get the recommendations. The recommendations to the growers were main attraction of this
centralized disease forecasting system.
BLITECAST and after: BLITECAST was a success story. Mac Hardy (1979) developed a non-
computerized method and Fry and Apple (1983) incorporated factors like host resistance and
fungicide withering in BLITECAST. Several computer based decision systems have been
developed. Hijmans et al. (2000) estimated the global severity of potato late blight with geographic
information system (GIS) – linked disease forecast models. They used Blitecast and Simcast along
with climate database in GIS. They identified zones of high late blight severity, which included the
tropical highlands, Western Europe, the east cost of Canada, northern USA, south-eastern Brazil,
and central-southern China. Major production zones with low late blight severity include the

(Climate Change, Precision Agriculture and Innovative Disease Control Strategies)
- 109 -
western plains of India, north-central China, and the north-western USA. Grunwald et al. (2000)
evaluated TOM-CAST, BLITECAST and SIM-CAST for potato late blight management in Toluca
Valley (Maxico). They found that SIM-CAST was superior over other two systems compared. They
also reported that SIM-CAST accurately allocated fungicide application for susceptible potato
cultivars but needed modifications for resistant cultivars. In 2002 these workers reported field
validation of modified SIM-CAST for potato cultivars with high field resistance. There was
significant reduction in fungicides required on resistant cultivars, without risking crop health. Runno
and Koppel (2002) reported NEGFRY – a computer based programme for control of potato late
blight. NEGFRY is based on two existing models: (a) model for forecasting risk of primary attack
(first spray) and (b) model for timing of subsequent fungicide applications. Hansen et al. (2000)
reported decision support system (PlanteInfo) for the control of late blight via PC-NgFry and
internet based information. The success of this system may be due to its regional character.
The Prognosis is another term used in literature to describe forecasting or warning of
diseases, pests, weeds etc (the noxious organisms). Prognosis is characterized as the prediction
of the outbreak, development and outcome of disease. The objective is to decide in advance
whether expected damage is threatening and whether control measures are to be taken (would be
economically justified). Prognosis has been attempted at two levels: (a) Date prognosis and (b)
Loss prognosis.
Late blight forecasting in India: Early work on late blight forecasting was initiated by Chaudhury
and coworkers in Darjeeling where they developed a 7 day moving graph for predicting late blight
appearance in the area. Later Bhattacharya and coworkers at CPRI, Shimla carried further work.
The precipitation was taken as major criteria, as temperature is generally favorable. The model
developed had two stages of blight forecast in Himachal hills. Singh and co-workers in 1980
developed two-component model for blight forecast in plains (Singh et al. 1999).
Long-range vs. Short-term Forecast
The disease forecasts being made are solely depending on prevailing weather conditions.
Our ability to foretell weather is very limited, so the present day disease forecasts are ‘short term
forecasts’. The farmers get little or no time to protect the crops before the infection sets in (most of
conventional fungicides have only protective function). There is urgent need to predict
‘meteorological events’ in coming days, weeks or months. This may be feasible in future by use of
synoptic weather charts, remote sensing devices and satellite gathered data. This may result in
long term weather forecast as well as long term disease forecasts. The growers will have more
sophisticated and commercially useful forecast and sufficient time to modify the agricultural
practices that may be more economically acceptable.
REFERENCES
1. Bhattocharya, S. K., et al. 1983, Forecasting late blight of Potato in Indian hills. In: BBNagaich et al. (Ed) Potato in developing countries Indian Potato Assoc. CPRI Shimla 20p.
2. Cook, H. T. 1947, Forecasting tomato late blight. Plant Dis Reptr. 31: 245.

(Climate Change, Precision Agriculture and Innovative Disease Control Strategies)
- 110 -
3. Cox, A. and Large E. C. 1960, Potato blight epidemics throughout the world. U. S. Dept. Agric, Agric. Handb. 174, p230.
4. Eversmeyer, J. G., Burleigh, J. R., and Roelfs, A. P., 1973. Equation for predicting wheat stem rust development. Phytopathology 63, 348-351.
5. Horsfall J. G. and Cowling, 1978, How Disease Develops in Populations. In Plant Disease, An Advanced Treatise Vol. Ii. Horsfall and Cowling E. B. Academic Press New York.
6. Horsfall, J. G. and Barrat R. W., 1945. An improved growing system for measuring plant disease. Phytopathol. 35: 655.
7. Hyre, R. A. 1954, Progress in forecasting late blight of potato and tomato. Plant Dis. Rep. 38, 245
8. Krause, R.A. and Massie, L.B. 1975. Predictive systems: Modern approaches to disease control. Annu. Rev. Phytopathol. 13: 31-47.
9. Krause, R.A., Massie, L.B. and Hyre, R.A. 1975. Blightcast: A computerized forecast of potato late blight. Plant Dis. Rep. 59: 95-98.
10. Main, C. E., 1977. Crop destruction-the raison d’etre of plant pathology, In “Plant Disease: An Advanced Treatise” (J.G.Horsfall and E.B. Cowling, eds.), Vol. 1, pp. 55-78. Academic Press, New York.
11. Padmanabhan, S. Y. 1973. The great Bengal Famine. Ann. Rev. Phytopathol. 11:11.
12. Singh, B. P., Singh P. H. and Bhattacharya S. K., 1999, Epidemiology. In: Potato Late Blight in Inia CPRI Tech. Bull. No 27.
13. Stevens, N.E., 1934. Stewart’s disease in relation to winter temperatures. Plant Dis. Rep. 12, 141-149.
14. Waggoner, P.E., 1960. Forecasting epidemics. In “Plant Pathology: An Advanced Treatise” (J.G. Horsfall and A.E.Dimond, eds.) Vol. 3, pp. 291-312. Academic Press, New York.
15. Wallin, J. R. 1962, Summary of recent progress in Predicting late blight epidemics in limited states and Canada. Amer Pot. J. 39: 306
16. Yarwood, CE, 1959. Predisposition. In “Plant Pathology: An Advanced Treatise” (J.G. Horsfall and A.D.Dimore) eds., Vol. 1, pp-512-562. Academic Press. New York

(Climate Change, Precision Agriculture and Innovative Disease Control Strategies)
- 111 -
Recent Molecular Biology Tools for Rhizospheric Community Analysis for Effective Introduction of Bioagents Application for Organic
Agricultural Practices
A.K. Gaur Department of Molecular Biology & Genetic Engineering, G.B.P.U.A.&T., Pantnagar- 263 145 (UK)
Rhizosphere and plant interactions have been realized of utmost importance by virtue of
natural selection of microbial communities most suited its growth. Since rare plants of medicinal
importance and aesthetic values are required to be adopted in different climatic zones for
sustainable harvest, therefore, it becomes necessary job to characterize these rhizospheric
communities more precisely adopting new and advance molecular biology and other specified
tools. Such microbial diversity characterization shall also provide good application approaches of
biofertilizers/ biocontrol agents in organic farming practices. Many of the time culturing practices of
rhizospheric microbes are difficult and as a result denaturing gel electrophoresis, temperature
gradient gel electrophoresis, single strand conformation polymorphism, gene polymorphism,
amplified ribosomal DNA restriction analysis, terminal RFLP, etc techniques could successfully
adopted for microbial characterizations.
Global human population and urbanization in southeast Asian countries posed once again
a major challenge of productivity and food production with an additional issue of at least
sustainable environment adopting ecofreindly practices. While studying biodiversity an important
issue of conserving natural resources and their sustainable harvest has also been emerged.
Products of aesthetic values from rare plants lead toward organic pharming/farming for atleast
nutraceutical development. Therefore, understanding of microbial ecology precisely through
utilizing present day advance tools for better understanding of soil biology at molecular level of
various natural habitat which in turn will help protecting biodiversity at different level.
Introduction
Biofertilizers and biocontrol agents represent broad range of soil microbes, their
introduction in different soils need carefull characterization in terms of composition and structure
with the help of advance technology available such as 16s ribosomal DNA for phylotyping and
redox potential of carbon sources for phenotyping by sequence/ microarray analyses tools which
will allow right type of introduction of agents as bioferilizers/biocontrols in different agroclimatic
zones with special reference to cultivation of medicinal plants.The concept and compilation of
detailed methodology for said applications will be discussed. Biolog
Inc. developed a screening technology,”Phenotype MicroArray” it ia an integrated system of
cellular assays, instrumentation, and bioinformatics software for high-throughput screening of
cells, available for fungal and bacterial cells .Testing process and the technology were
reconfigures a diverse range of phenotypic tests into sets of arrays. Wells are prepared for a total
of 1,920 conditions, hence each well is designed to test a different phenotype in the array. The

(Climate Change, Precision Agriculture and Innovative Disease Control Strategies)
- 112 -
OmniLog® monitored simultaneously thousands of phenotypes and upto 450,000 data points
generated in one 24 h run. Much of known aspects of the cell, directly or indirectly can be
monitored by PM. Recently researcher demonstrated the global effect of the CbrAB and NtrBC
two-component systems of carbon and nitrogen utilization in Pseudomonas aeruginosa which was
characterized by phenotype microarray analyses with single and double mutants and the isogenic
parent strain.
The gene common to all organisms identify by the use of PCR, that allows the identification
of these previously unknown organisms. Genes commonly amplified for this purpose codes for the
RNA sequence of the small subunit (SSU) of the ribosome. Different bacterial genomes were
estimated per gram of soil to occur in terrestrial environments . Extensive diversity of the soil could
be competed by even comprehensive culture collection. In the whole world, many culture-
independent surveys of the microbial diversity in soil had been performed e.g. DGGE, TGGE,
TRFLP, ARDRA. All were based principally on the PCR amplification of the small-subunit rDNA
from directly extracted soil DNA with universal primers. Comprehensive SSU rDNA clone libraries
are subsequently generated by using these amplicons, allowing subsequent sequencing analyses.
Unfortunately, all the studies used different studies used different cell lysis methods and primer
sets. Comparability is thus limited, all these sequence provide the first indication of microbial
diversity based on “real environment” 16S rDNA data. The presence of hitherto unidentified
bacteria demonstrated by the analysis of such 16S rDNA clone libraries, that were remotely
related to known strains. Only a minority of sequences retrieved from directly isolated soil DNA
could be closely related to cultured organisms.
Materials and Methods
Biofilm quantification assay. Biofilm formation assaye by the ability of the cells to adhere to the
wells of microtitre plates made of polystyrene. Bacterial supernatants discarded after incubation ,
and loosely adherent bacteria removed by three washes with phosphate-buffered saline (pH 7.2).
The microtiter plates then inverted and allowed to dry before each well filled with 25µl 0.1% (w/v)
crystal violet (CV) solution and incubated at room temperature for 30 minutes. Unbound CV
removed by three washes with water, and the plates inverted to dry. Cell-bound CV then released
from bacterial cell by the addition of 200µl 95% ethanol and, after incubation at room temperature
for 30 minutes on a rotary shaker, the concentration of CV in each solution determined by the
optical density reading at 590nm (Tecan Infinite 200 Microplate Reader, Ma nnedorf, Switzerland).
Similarly, wells containing only NB but no bacteria were used as negative controls.
EPS quantification assay. Cell suspension of O.D. about 1.0 (600 nm), centrifuge the cell
suspension at 10,000 rpm for 10 min. The sedimented material is used for the total carbohydrate
assay. To 0.5 ml sample grown in NB/LB, add ml phenol (5% w/v) then add 1ml sulphuric acid,
incubate it for 1h in dark. Dilute the resultant solution by adding equal volume of water to the
material. Incubate for 60 min in dark and measure absorbance at 490 nm.
Alginate quantification assay. Grown bacterial culture in 40 ml of NB for 48 h centrifuged using

(Climate Change, Precision Agriculture and Innovative Disease Control Strategies)
- 113 -
Sorvall RC 5C at 10,000 rpm for 10 min at 4°C. Supernatant was collected in a fresh vessel;
alginate was precipitated by the equal volume of isopropanol by keeping it for one day in static
conditions.Again centrifuge at 10,000 rpm for 10 min and collect the pellet, wash with 70% ethanol
followed by 96% ethanol then dry by keeping at 37°C for 15 min. Dissolve pellet in 500 µl of sterile
DW. 100 µl was used for quantification, dilute it 1:10 fold by adding 900 µl sterile DW to make it 1
ml. Add equal volume of Borate sulfuric acid (10mM H3BO3 in Conc. H2SO4), then 30 µl of
Carbazole reagent (0.1% in ethanol) added. Distinguishable purple colour develops; absorbance
of the mixture has been taken at 500 nm. Alginate can be calculated in terms of mg/g wet
biomass using alginate from sea weed as a standard.
Characterization of clones
Restriction mapping. In order to construct the restriction map of the recombinant positive clone
digestion is required with a number of respriction enzymes. The restriction enzymes selected form
the multiple cloning sites usually common amongst them are Eco RI, Xho I and Hind III. Digestion
with restriction endonucleases generally carried out as per the conditions recommended by the
manufacture(s) of the restriction endonucleases. The restriction digestion pattern analyzed on
0.8% agarose gel along with λ DNA Eco RI + Hind III double digest as marker for fragment size
determinations. After electrophoresis, the gel was stained with ethidium bromide and visualized in
UV light.
Sequencing of cloned fragment. The nucleotide sequence of the cloned DNA requires to be
determind on DNA sequencer. Initially universal sequencing primers were used subsequent
sequencing was accomplished by primer walking.
Analysis of sequences. Nucleotide sequences of the plasmid analysis manually performed to
find the insert DNA sequence. Sequences beyond the matched sequences of vector treated as
insert sequences. Insert sequences matched for nucleotide-nucleotide homology by using the
BLAST search (www.ncbi.nlm.nih.gov) and hosted tools of website www.justbio.com used to
create inverse complementary sequences, sequences oriented in same frame then aligned
manually to get a complete sequence in same orientation.
Phenotype microarray
Phenotypic microarray analysis is a recently developed analytical tool to determine the
phenotype of an organism. This technique can be useful to understand the growth changes of an
organism when changing medium, temperature, or adding a stressor, or when testing mutant
strains. The plates, which are commercially available from Biolog (Hayward, CA), consist of array
of 20 plates, The first eight plates test a variety of metabolic agents, including electron donors,
acceptors, and amion acids. Plates 9 and 10 cover a pH and osmotic stressors, while plates 11-20
contain a variety of inhibitors, including toxic agents and antibiotics. The layouts of the 2,000 PM
tests, PM 1-8 test the main catabolic pathways in cells for carbon, nitrogen, phosphorus and
sulphur, as well as biosynthetic pathways. PM9 tests osmotic and ion effects on the cell. PM10
primarily tests pH growth range and pH regulation.

(Climate Change, Precision Agriculture and Innovative Disease Control Strategies)
- 114 -
Community profiling on biochemical basis
Substrate utilization from rhizosphere of a plant under different treatment could be
determined using (Biolog Inc., Hayward, California, USA). The rate of utilization is indicated by
tetrazolium reduction with the help of dye, on the basis of colour change. Suitable aliquots were
used into microplate wells, after incubation of these plate at 30°C. The absorbancy was measured
using visible microplate reader as per Garland (1996). Diversity indices and related were
calculated using formula described by Derry et al.(1998).
Results and Discussion
It is inferred that in the environment the bacterial communities were composed mainly of
uncultured species. The production of clone libraries, however limits the number of samples and
time-consuming that can be analyzed and compared with each other. The number of samples that
can be analyzed may be a critical factor for many ecological studies, because the natural
variability of a community needs to be differentiated from effects that were triggered by a changing
environmental condition. Since, to promote the circulation of plant nutrients and reduce the need
for chemical fertilizers microorganisms are most important, therefore, rhizosphere bacterial
communities could be explored for reasonably correct identification by use of culture-dependent
and culture-independent methods, in relation to variables such as the host plant species and soil
properties. Rhizosphere bacterial communities characterization methods involved soil sampling
followed by bacterial community assessment, as well as the magnitude of interactions that can
result from different plant/soil/environmental systems for biopharming practices.
REFERENCES
1. Bochner BR (1989) Sleuthing out bacterial identities. Nature339, 157-158.
2. Bochner BR (2003) New technologies to assess genotype-phenotype relationships. Nat Rev Genet 4, 309-314.
3. Bochner BR, Gadzinski P and Panomitros E (2001) Phenotype microarray for high throughput phenotypic testing and assay of gene function. Genome Res 11,1246-1255.
4. Derry AM, Staddon WJ and Trevors JT (1998) Functional diversity and community structure of microorganisms in uncontaminated and creosote-contaminated soils as determined by sole-carbon-source-utilization, World J Microbiol Biotechnol 14, 571-578.
5. Garland JL (1996) patterns of potential C source utilization by rhizosphere communities. Soil Biol Biochem 28 223-230.
6. Marshall MM, Amos RN, Henrich VC and Rublee PA (2008) Developing SSU rDNA metagenomic profiles of aquatic microbial communities for environmental assessments. Ecological Indicators 8, 442-453.
7. Schmalenberger A and Tebbe GC (2003) Bacterial diversity in maize rhizospheres conclusion on the use of genetic profiles based on PCR-amplified partial small subunit rRNA genes in ecological studies. Mol Ecol 12, 251-262.
8. Torsvik V, Goksǿyrn J and Daae FL (1990) High diversity in DNA of soil bacteria. Appl Environ Microbiol 56, 782-787.
9. Von Eiff C, McNamara P, Becker K, Bates D, Lei X-,Ziman M, Bochner BR, Petres G and Proctor RA (2006) Phenotype Microarray profiling of Staphylococcus aureus mend and hemB mutantwith the Small-Colony-variant phenotype. J Bacteriol 188, 688-693.

(Climate Change, Precision Agriculture and Innovative Disease Control Strategies)
- 115 -
10. Wang M, Chen J-K, Li B (2007) Characterization of bacterial community structure and diversity in rhizosphere soils of three plants in rapidly changing salt marshes using 16s rDNA. Pedosphere 17, 545-556.
11. Zhang W, Ki J-S and Qian P-Y (2008) Microbial diversity in polluted harbor sediments I: Bacterial community assessment based on four clone libraries of 16s rDNA. Estuarine Coastal and Shelf Science 76, 668-681.
12. Zhang XX and Rainey PB (2008) Dual involvement of CbrAB and NtrBC in the regulation of histidine utilization in Pseudomonas fluorescens SBW25. Genetics 178, 185-195.

(Climate Change, Precision Agriculture and Innovative Disease Control Strategies)
- 116 -
GIS Application in Precision Farming and Plant Disease Management
A.K. Agnihotri Department of Soil Science, GBPUA&T, Pantnagar- 263 145 (Uttarakhand)
Introduction to GIS
Definition
Definitions of GIS (short for "Geographic Information Systems") vary considerably.
One such definition is as follows.
GIS is a computer-based information management technology used by people for handling
spatial/geographic data or geographically-referenced data.
There are two important aspects in the definition of GIS:
Components of GIS
There are four basic components of a GIS - i.e., people managing data by formulating
tasks using software running on hardware.
Functions of GIS
With these basic components, GIS can be used to perform the following functions:
Data handling (i.e. capturing, organizing, storing)
Data manipulation (i.e. processing, analyzing)
Data output (i.e. displaying)
GIS Applications
GIS as an information management tool can be used over a spectrum of developmental
stages from the most basic to the most sophisticated. GIS techniques can be applied to a wide
variety of problem-solving situations in practically any field of human endeavor where maps or
geographical information are used.
Three basic types of GIS applications that represent the stages of development (with
increasing sophistication) in the use of GIS technology are
1 inventory applications,
2 analysis applications, and
3 management applications.
At its most basic level, GIS is used as an information management tool - a method of
integrating spatial data (e.g., maps and satellite images) and textual/tabular data (e.g., census,
soils, and climate) within a single, retrievable data base. At the advanced level, GIS can be used
as a tool for modeling and testing hypotheses, such as on land/resource use scenarios, ecosystem
change and evaluation of technology suitability .
Inventory Applications
Often the first step in developing a GIS application is making an inventory of the subjects
you want to study for a given geographic area, e.g. soils, land cover/land use, human settlements,
infrastructure, etc. These subjects are represented in the GIS as layers or themes of data. At this

(Climate Change, Precision Agriculture and Innovative Disease Control Strategies)
- 117 -
basic level, the GIS is used as an information handling tool --- a method of integrating spatial data
( e.g., maps and satellite images) and textual/tabular data ( e.g., census, soils, and climate) within
a data base whereby the component layers may be retrieved, displayed, printed out and updated.
Analysis Applications
Once the GIS data base is set up, you would usually want to get value-added information
from the data. This can range from carrying out simple to complex queries involving multiple data
layers to more complex analysis on the data layers. Most GIS have a variety of spatial analysis
tools to manipulate map layers and their associated data.
Management Applications
More advanced spatial analysis and modeling techniques are needed to address real world
problems. At this stage of application, GIS, on its own or linked with other tools, may be used to
help managers and policy makers in making decisions based on a rational use of a sound
knowledge base.
What you can do with a GIS?
Identifying Features
With a GIS, you can ask questions about the data sets created. There are two main kinds
of questions that the GIS can answer:
I. Querying - what exists at a particular location?
You specify the object/feature for which you want information by
o pointing at an object or region of a displayed map
o typing the identifier for the object you select
o typing in a geographical coordinate location
After specifying the object/feature or location, you can obtain a list of
o all of its characteristics some of its characteristics
o some of its’ characteristics
2. Locating by specifying conditions - where are the objects/features which satisfy a
particular set of conditions?
You can specify one condition or a set of conditions by stringing them up in logical
expressions.
Performing Geographical Analyses
You can analyze data to obtain.
o answers to a particular question
o solutions to a particular problem
GIS can carry out many different types of spatial operations on the data stored in the GIS data
base, or on data from other software which are linked to the GIS data sets.
Spatial operations may be applied to.
o existing map(s)
o attribute data associated with existing map(s)

(Climate Change, Precision Agriculture and Innovative Disease Control Strategies)
- 118 -
The result of spatial operations may be.
o new map(s)
o tabular data
o graphics, e.g. line graphs, bar charts, etc..
When spatial operations are performed on two or more map layers, we refer to the
operations as map overlays. Spatial operations performed on multiple map layers may be thought
of as map algebra. The map algebra concept is an extension of the algebra operation on
numbers.
Instead of operating on single numbers, the spatial operator acts on whole map layers. In the
raster mode, the operator acts on the geographically equivalent cells of the map layers.
By stringing together various spatial operations, the GIS can be used to solve complex problems
using geographically-referenced data.
Concept of Map Overlays
Vector mode Raster mode

(Climate Change, Precision Agriculture and Innovative Disease Control Strategies)
- 119 -
THE NATURE AND REPRESENTATION OF GEOGRAPHIC DATA
THE NATURE OF GEOGRAPHIC DATA
The world is infinitely complex and full of variation; the closer one looks, the more detail is
seen, ad infinitum. It would therefore take an infinitely large data base to represent the real world
accurately. Therefore data must somehow be reduced to a finite and manageable quantity by
abstraction and generalization. Real-world entities must be represented by discrete objects with
associated attributes and geographical data must give information about
a. position
b. attribute
c. possible topological relationships
Spatial objects representing real-world entities with finite area. The real-world entities
which are represented as areas also depend on the scale of the map ( e.g., on a large scale map,
streams are represented by areas, although slim, elongated areas while on a small scale map,
streams are represented by lines). Boundaries may be natural or man-made.
Representation of geographic objects in computerised GIS
In computerized GIS, map information that we normally see in paper maps would need to
be converted to digital form.
Analog Representation
This is more familiar to ordinary users of maps. Points, lines, and areas are drawn with a
certain amount of locational accuracy on a 2-D surface like a piece of paper, and referenced to
locations on the earth's surface by using some standard system of coordinates, e.g. national grid,
or an internationally-accepted map projection. Objects drawn on the map may be stylized and
symbolized or color-coded, attributes may also be directly labeled onto objects or is shown in a
legend. Topological relationships are inferred visually by the map reader. A map sheet can contain
a. single entity type or theme, i.e., thematic map, such as soil map
b. Several entity types e.g., topographic maps have contours, rivers, cultural features such
as towns, bridges, etc.
Digital Representation
A map, in the paper form that we are familiar with, cannot exist in the computer. While the
human eye (and brain) is adept at recognizing shapes and inferring spatial relationships among
objects, the computer needs to be instructed specifically how spatial patterns should be recorded,
handled and displayed. The locational, attribute, and topological information inherent in spatial
data must be represented or encoded into the spatial data base. The manner in which the
information is represented is defined by the spatial data base model, there are two main kinds of
spatial data models, i.e., raster and vector models. In simple terms,
a. A raster model tells what occurs everywhere, at each place/cell in the entire study area.
b. A vector model tells where everything occurs, i.e., by giving a location to every object

(Climate Change, Precision Agriculture and Innovative Disease Control Strategies)
- 120 -
which one intends to map
Whichever the model, spatial data for a study area are organized into a set of layers
(coverages or themes ), each layer may represent a single entity type. However, it is not usual for
distinctly different entity types to be combined in a layer, such as is normally seen in an analog
topographic map. Generally, separation of the complex, realworld features by layers makes spatial
data more easily handled in the GIS. The user cannot "see" the digital spatial data base directly for
it would not make much sense; in order to convert the digital data to comprehensible display would
require certain software commands to retrieve data from the data base and display them on some
output device.
Vector data structure
The Data Model
The objects of a map are defined by tracing its boundaries or locations in relation to a
geographic reference frame. The fundamental primitive is a point, objects are created by
connecting points with straight lines or with splines. The vector data file is therefore a list of points
making up arcs, arcs making up areas, with explicit documentation of membership and topology
and with associated attribute usually kept in a separate file.
Raster data structure
The Data Model
Raster model divides the entire study area into a regular grid of cells arranged neatly in
rows. Each cell contains a single value; the value given to a cell depends on the type of entity
being encoded, and the type allowable by the GIS software; it can be:
Precision Farming Terminology
Precision farming is a comprehensive approach to farm management and has the following
goals and outcomes: increased profitability and sustainability, improved product quality, effective
and efficient pest management, energy, water and soil conservation, and surface and ground
water protection.. These terms may be confusing at first, but you will soon become familiar with the
language of PF.
Precision Farming vs. Traditional Agriculture
In PF, the farm field is broken into "management zones" based on soil pH, yield rates, pest
infestation, and other factors that affect crop production. Management decisions are based on the
requirements of each zone and PF tools (e.g. GPS/GIS) are used to control zone inputs. In
contrast, traditional farming methods have used a "whole field" approach where the field is treated
as a homogeneous area. Decisions are based on field averages and inputs are applied uniformly
across a field in traditional farming. The advantage of PF is that management zones with a higher
potential for economic return receive more inputs, if needed, than less productive areas.
Therefore, the maximum economic return can be achieved for each input.
Information, Technology, and Decision Support
PF relies on three main elements: information, technology, and decision support
(management).

(Climate Change, Precision Agriculture and Innovative Disease Control Strategies)
- 121 -
Information
Timely and accurate information is the modern farmer's most valuable resource. This
information should include data on crop characteristics, hybrid responses, soil properties, fertility
requirements, weather predictions, weed and pest populations, plant growth responses, harvest
yield, post harvest processing, and marketing projections. Precision farmers must find, analyze,
and use the available information at each step in the crop system. An enormous database is
available on the internet. This data is both accessible and quickly updated.
Technology
Precision farmers must assess how new technologies can be adapted to their operations.
For example, the personal computer (PC) can be used to effectively organize, analyze, and
manage data. Record keeping is easy on a PC and information from past years can be easily
accessed. Computer software including spreadsheets, databases, geographic information systems
(GIS), and other types of application software are readily available and most are easy to use.
Another technology that precision farmers use is the global positioning system (GPS). GPS
allows producers and agricultural consultants to locate specific field positions within a few feet of
accuracy. As a result, numerous observations and measurements can be taken at a specific
position. Global information systems (GIS) can be used to create field maps based on GPS data to
record and assess the impact of farm management decisions. Data sensors used to monitor soil
properties, crop stress, growth conditions, yields, or post harvest processing are either available or
under development. These sensors provide the precision farmer with instant (real-time)
information that can be used to adjust or control operational inputs.
Precision farming uses three general technologies or sets of tools: crop, soil, and
positioning sensors - these include both remote and vehicle-mounted, "on-the-go" sensors that
detect soil texture, soil moisture levels, crop stress, and disease and weed infestations;
Machine controls - these are used to guide field equipment and can vary the rate, mix, and
location of water, seeds, nutrients, or chemical applications;
Computer-based systems - these include GIS maps and databases that use sensor
information to "prescribe" specific machine controls.
Decision support combines traditional management skills with precision farming tools to
help precision farmers make the best management choices or "prescriptions" for their crop
production system Unfortunately, decision support has many times been either unreliable or
difficult to understand. Building databases based on the relationships between input and potential
yields, refining analytical tools, and increasing agronomic knowledge at the local level are yet to be
accomplished. Most agricultural researchers agree that decision support remains the least
developed area of PF. Diagnostic and database development will eventually replace technologies
as the real benefit of PF.
It would be easy to predict the incidence of the plant disease if weather conditions are
recorded properly and an effective data base is prepared for precise decision support. It would be
easier to handle the plant disease if farmers are fore-warned and chemicals are made available in
time to farmers.

(Climate Change, Precision Agriculture and Innovative Disease Control Strategies)
- 122 -
Nanotechnology: A Modern Tool for Precision Farming
K. P. Singh Department of Biophysics & Nanotechnology, GBPUA&T, Pantnagar- 263 145 (Uttarakhand)
1. What is Nanotechnology?
Nanotechnology is the manipulation or self-assembly of individual atoms, molecules, or
molecular clusters into structures to create materials and devices with new or vastly different
properties. Nanotechnology can work from the top down (which means reducing the size of the
smallest structures to the nanoscale e.g. photonics applications in nanoelectronics and
nanoengineering) or the bottom up (which involves manipulating individual atoms and molecules
into nanostructures and more closely resembles chemistry or biology).
The definition of nanotechnology is based on the prefix “nano” which is from the Greek
word meaning “dwarf”. In more technical terms, the word “nano” means 10-9, or one billionth of
something. For comparison, a virus is roughly 100 nanometres (nm) in size. The word
nanotechnology is generally used when referring to materials with the size of 0.1 to 100
nanometres, however it is also inherent that these materials should display different properties
from bulk (or micrometric and larger) materials as a result of their size. These differences include
physical strength, chemical reactivity, electrical conductance, magnetism, and optical effects.
Nanotechnology allows scientists to create materials and structures at the molecular level. These
nanomaterials have following important characteristics.
1. Chemical and physical properties can become size dependent at the nanoscale.
2. Physical forces have different relative importance at the nanoscale than at macroscopic
length scale.
3. Some physical laws don’t hold at the nanoscale.
4. Fairly complex nanostructures can be constructed by selfassembly. They can build
themselves!
5. Seemingly small changes in structure at the nanoscale can lead to big changes in chemical
or physical properties.
Due to these specific characteristics there are plenty of applications of these nanomaterials
in various fields like biomedical, molecular diagnostics, engineering, Nanobiotechnology etc. In the
food industry, nanotechnology is being used to create better packaging and healthier foods. For
example, researchers are working on creating food packages embedded with tiny materials
specifically designed to alert consumers that a product is no longer safe to eat. Food scientists
also are creating nanomaterials whose small size gives the ability to deliver powerful nutrients to
human cells where they previously could not reach. In addition, scientists believe nanomaterials
can be designed to block certain substances in food, such as harmful cholesterol or food
allergens, from reaching certain parts of the body.
Farm applications of nanotechnology are also commanding attention. Nanomaterials are

(Climate Change, Precision Agriculture and Innovative Disease Control Strategies)
- 123 -
being developed that offer the opportunity to more efficiently and safely administer pesticides,
herbicides, and fertilizers by controlling precisely when and where they are released. For example,
an environmentally friendly pesticide is in development that uses nanomaterials to release its
pestkilling properties only when it is inside the targeted insect. For livestock, the ability of certain
nanomaterials to control dosage could reduce the amount of growth hormones needed to boost
livestock production. There also are nanomaterials in the late stages of development that can
detect and neutralize animal pathogens in livestock before they reach consumers. These
nanosensors are being started to be used in precision farming through Ethernet or wireless
attachments.
1.1 Nanotechnology in Agriculture
Nanotechnology has the potential to revolutionize the agricultural and food industry with
new tools for the molecular treatment of diseases, rapid disease detection, enhancing the ability of
plants to absorb nutrients etc. Smart sensors and smart delivery systems will help the agricultural
industry combat viruses and other crop pathogens. In the near future nanostructured catalysts will
be available which will increase the efficiency of pesticides and herbicides, allowing lower doses to
be used.
Nanotechnology will also protect the environment indirectly through the use of alternative
(renewable) energy supplies, and filters or catalysts to reduce pollution and clean-up existing
pollutants. An agricultural methodology widely used in the USA, Europe and Japan less used in
India, which efficiently utilises modern technology for crop management, is called Controlled
Environment Agriculture (CEA). CEA is an advanced and intensive form of hydroponically-based
agriculture. Plants are grown within a controlled environment so that horticultural practices can be
optimized. The computerized system monitors and regulates localised environments such as fields
of crops. CEA technology, as it exists today, provides an excellent platform for the introduction of
nanotechnology to agriculture. With many of the monitoring and control systems already in place,
nanotechnological devices for CEA that provide “scouting” capabilities could tremendously
improve the grower’s ability to determine the best time of harvest for the crop, the vitality of the
crop, and food security issues, such as microbial or chemical contamination.
1.2 Nano market
Nanotechnology has been described as the new industrial revolution and both developed
and developing countries are investing in this technology to secure a market share. At present the
USA leads with a 4 year, 3.7 billion USD investments through its National Nanotechnology
Initiative (NNI). The USA is followed by Japan and the European Union, which have both
committed substantial funds (750 million and 1.2 billion, including individual country contributions,
respectively per year). The level of funding in developing countries may be comparatively lower,
however this has not lessened the impact of some countries on the global stage. For example,
China's share of academic publications in nanoscale science and engineering topics rose from
7.5% in 1995 to 18.3% in 2004, taking the country from fifth to second in the world. Others such as

(Climate Change, Precision Agriculture and Innovative Disease Control Strategies)
- 124 -
India, South Korea, Iran, and Thailand are also catching up with a focus on applications specific to
the economic growth and needs of their countries. Iran for example has a focused programme in
nanotechnology for the agricultural and food industry. The report suggests that with more than
50% of the world population, the largest market for Nanofood in 2010 will be Asia lead by China.
2. What is Precision Farming?
“Precision farming,” also known as site-specific management, describes a bundle of new
information technologies applied to the management of large-scale, commercial agriculture.
Precision farming technologies include, for example: personal computers, satellite-positioning
systems, geographic information systems, automated machine guidance, remote sensing devices
and telecommunications.
2.1 A Brief Case Study of Precision Farming
“It is 5 a.m. A farmer sips coffee in front of a computer. Up-to-the-minute satellite images
show a weed problem in a field on the north-west corner of the farm. At 6:30 a.m., the farmer
drives to the exact location to apply a precise amount of herbicide.” – A Laboratory for Agricultural
Remote Sensing press release.
2.2 How Does Precision Farming Work?
Precision farming relies upon intensive sensing of environmental conditions and computer
processing of the resulting data to inform decision-making and control farm machinery. Precision
farming technologies typically connect global positioning systems (GPS) with satellite imaging of
fields to remotely sense crop pests or evidence of drought, and then automatically adjust levels of
irrigation or pesticide applications as the tractor moves around the field. Yield monitors fitted to
combine harvesters measure the amount and moisture levels of grains as they are harvested on
different parts of a field, generating computer models that will guide decisions about application or
timing of inputs.
2.3 What are the Benefits of Precision Agriculture?
Precision agriculture promises higher yields and lower input costs by streamlining
agricultural management and thereby reducing waste and labour costs. It also offers the potential
to employ less skilled, and therefore cheaper, farm machinery operators since, theoretically, such
systems can simplify and centralize decision-making. In the future, precision farming will resemble
robotic farming as farm machinery is designed to operate autonomously, continuously adapting to
incoming data.
2.4 The Role of Networks of Wireless Nanosensors in Precision Farming
If they function as designed, ubiquitous wireless sensors will become an essential tool for
bringing this vision of precision farming to maturity. When scattered on fields, networked sensors
are expected to provide detailed data on crop and soil conditions and relay that information in real
time to a remote location so that crop scouting will no longer require the farmer to get their boots
dirty. Since many of the conditions that a farmer may want to monitor (e.g., the presence of plant
viruses or the level of soil nutrients) operate at the nano-scale, and because surfaces can be

(Climate Change, Precision Agriculture and Innovative Disease Control Strategies)
- 125 -
altered at the nano-scale to bind selectively with particular biological proteins, sensors with nano-
scale sensitivity will be particularly important in realizing this vision.
2.5 Smart Fields’ Monitored by Wireless Nanosensors
Agricultural nanosensors development is one of their most important research priorities of
most of the advanced research group worldwide. They are working to promote and develop a total
“Smart Field System” that automatically detects, locates, reports and applies water, fertilisers and
pesticides - going beyond sensing to automatic application.
2.6 What is ‘Smart Dust’?
The idea that thousands of tiny sensors could be scattered like invisible eyes, ears and
noses across farm fields and battlefields sounds like science fiction. Scientists are in a way to
develop autonomous sensors that would each be the size of a match head. Using silicon-etching
technology, these motes (“smart dust” sensors) would feature an onboard power supply,
computation abilities and the ability to detect and then communicate with other motes in the
vicinity. In this way the individual motes would self-organize into ad hoc computer networks
capable of relaying data using wireless (i.e., radio) technology.
3. Membrane Made from Organic Waste Matter Could Help Crops Conserve Water
Researchers have developed a nanoporous membrane made from organic waste
materials, such as seaweed, fish bones, and manure that can prevent water loss from soil and
plant roots and regulate soil temperature in regions that are excessively arid, hot, or cold. Tests
performed on the membrane in the desert soils indicated that the technology reduced the need for
irrigation by 30 to 50 percent. Different pigments can also be added to the membranes to increase
or decrease sun reflection, depending on whether the soil requires heating or cooling.
4. Conclusion
Precision farming has been a long-desired goal to maximise output (i.e. crop yields) while
minimising input (i.e. fertilisers, pesticides, herbicides, etc) through monitoring environmental
variables and applying targeted action. Precision farming makes use of computers, global satellite
positioning systems, and remote sensing devices to measure highly localised environmental
conditions thus determining whether crops are growing at maximum efficiency or precisely
identifying the nature and location of problems. By using centralised data to determine soil
conditions and plant development, seeding, fertilizer, chemical and water use can be fine-tuned to
lower production costs and potentially increase production- all benefiting the farmer. Precision
farming can also help to reduce agricultural waste and thus keep environmental pollution to a
minimum. Although not fully implemented yet, tiny sensors/nanosensors and monitoring systems
enabled by nanotechnology or its oriented applications will have a large impact on future precision
farming methodologies. One of the major roles for nanotechnology-enabled devices will be the
increased use of autonomous sensors/nanosensors linked into a GPS system for real-time
monitoring. These nanosensors could be distributed throughout the field where they can monitor
soil conditions and crop growth. These nanosensors can also play a pivotal role in mobile testing,

(Climate Change, Precision Agriculture and Innovative Disease Control Strategies)
- 126 -
referral and analysis laboratory for rapid screening of physical chemical and pathogenic entities.
5. Further Reading
The interested reader is directed to the following sources which offer a more detailed
analysis of nanotechnology applications in the agricultural and food industries than could be
provided in this manuscript:
1. Down on the Farm” – published by the ETC Group (2004)
www.etcgroup.org/documents/ETC_DOTFarm2004.pdf
2. Nanoscale Science and Engineering for Agriculture and Food Systems” – a report from the
USDA workshop (2003) www.nseafs.cornell.edu/web.roadmap.pdf
3. The Woodrow Wilson International Center for Scholars “Project on Emerging
Nanotechnologies” www.nanotechproject.org
4. A review of potential implications of nanotechnologies for regulations and risk
assessment in relation to food” – published by the Food Standards Agency (2006)
www.food.gov.uk/multimedia/pdfs/nanotech.pdf
5. The Institute of Food Science & Technology statement on Nanotechnology
www.ifst.org/uploadedfiles/cms/store/ATTACHMENTS/Nanotechnology.pdf
6. The European Technology Platform “Food for Life”
http://etp.ciaa.be/asp/about_etp/welcome.asp
7. NANOFOREST - A nanotechnology roadmap for the forest products industry” – published
by STFI-Packforsk (2005) www.stfi-ackforsk.se/upload/3352/Finalroadhem.pdf
8. Science for Agricultural Development - Changing contexts, new opportunities” – published
by the Science Council of the Consultative Group on International Agricultural Research
www.cgiar.org/enews/december2005/scienceforagrdev.pdf
9. Nanotechnology and the Developing World” - Fabio Salamanca-Buentello, Deepa L.
Persad, Erin B. Court, Douglas K. Martin, Abdallah S. Daar, Peter A. Singer (2005). PLoS
Med 2(4): e97. www.utoronto.ca/jcb/home/documents/PLoS_nanotech.pdf
10. Nanotechnology and the Poor: Opportunities and Risks” – published by the Meridian
Institute (2005) www.meridian-nano.org/gdnp/NanoandPoor.pdf

(Climate Change, Precision Agriculture and Innovative Disease Control Strategies)
- 127 -
Knowledge Transfer: Issues and Expectations
K.P. Singh Department of Plant Pathology, G.B.P.U.A.&T., Pantnagar- 263 145 (Uttarakhand)
India was most successful in gaining from ‘Green Revolution”, the term applied to
successful agricultural experiments in many Third World Countries. There were four basic
elements of Green Revolution in India.
1. Introduction of high yielding crop varieties
2. Move to go for extensive irrigation
3. Extensive use of fertilizers and agro-chemicals and
4. Adoption of intensive cultivation practices.
But Green Revolution has certain limitations as indicated below:
1. The Green Revolution, however impressive, has not succeeded in making India totally and
permanently sufficient in food as even to-day India agricultural output sometimes falls
short of demand.
2. India has failed do extend the concept of availability of quality seed and other planting
material of high yielding varieties to all crops and/ or all regions.
3. It is disturbing to note that there are places like Kalahandi (Orissa) where famine like
conditions have been existing for many years and where starvation deaths have also been
reported.
4. Since early nineties deceleration in total factor productivity, over stress on natural
resources and squeeze in net income of the farmers have been reported. This has
caused discontentment among farming community. One of the important reasons of not
reaching the fruit of Green Revolution to all especially at lower ladder of the society was
failure of conventional development approaches in meeting the needs of resource-poor
people.
Limitation of Traditional Knowledge Transfer Methods:
Expensive: it s very costly to train a chain of extension personnel at district, sub division, block to
village level extension worker, prints extension messages brochures, to understand the new
technology and to answer the possible queries form farmers.
Time consuming process: it takes many actors to understand the message form university/
Zonal Research Station (ZRS)/ Krishi Vigyan Kendra (KVK)/ and deliver it to next layer then to
pass onto farmer.
Erosion in quality of message: student of Training and Visit (T&V) system indicate that the
quality of extension messages gets heavily eroded b the time it reaches the farmers.
Poor Communication Capacity: the flow of the information from research to extension tends to
be to-down, rather than a two-way, interactive process aimed at identifying and solving serious
problems. Also, there is little use of up-to- date communications technology, the capacity of

(Climate Change, Precision Agriculture and Innovative Disease Control Strategies)
- 128 -
traditional extension system is very limited, and the challenge in terms of reaching all the villages
and all the farmers is becoming more and more difficult to meet.
How to improve?
Before we decide the strategies for improvement, it is important to discuss the factors
affecting efficiency of extension:
Better the technology, faster the adoption
Economic viability of the new technology
Infrastructure in terms of available consolidation of holding, availability of farm
machinery, market, irrigation etc. has signigicant influence on the adoption of new
technology.
Input distribution backup
Present Challenges faced by Extension system
Indian extension worker-operating in tough socio-economic environment: The extension
worker has to understand the technical, social, economic, educational and cultural environment he
has to operate in. For this, it is very important that he or she appreciates the multifaceted
problems faced by Indian farmers, viz.
Small and fragmented land holdings,
Inferior per hectare yields as compared to international standards,
Inferior quality of produce,
Sub-standard market facilities,
Poor post harvest and seasonal dependence
Multiple produce in small quantities (lack of specialization) leading to wastages,
Poor storage facilities,
Problem in availability of adequate and timely credit,
Distress sale of produce by farmers,
Poor bargaining power of farmers,
Inefficient markt intelligence,
Exploitation of farmer by commission agents.
Our research and extension systems need to address the changed paradigm like:
Complex and changing consumer demand
Increasing impact of international market
Inadequate information with farmers connect with the market.
Research system should have greater connect with the market.
Critical need to build competitiveness to face imports and to increase share in exports will
be heightened liberalized trade regime.
Need to optimize the use of water resources.
Logistics and transport cost are becoming extremely important.

(Climate Change, Precision Agriculture and Innovative Disease Control Strategies)
- 129 -
Factors Required for Agricultural Development
Research which acts as source of innovations, discoveries, inventions and continuous
improvements.
Extension system which is capable of disseminating useful information to farmers as well
as training and educating them on the utilization of technologies.
Farmers who are willing to improve their productivity and make use of opportunities.
Efficient market channels for ensuring farmer’s benefits.
How Research is Being Done?
Conducted by highly trained researcher
In highly controlled environment
With high inputs
With plenty of labour
Result…? Invariably not adapted by the farmers……!
Reason?
Technology generated is:
Not economically viable;
Not operationally feasible;
Not stable;
Not matching with the farmer’s needs; and
Not compatible with the farmer’s system
Research should address these questions
Will it increase the productivity and by how much?
Will it decrease the coast and by how much?
Will it improve the quality and to what extent?
Will it spare, farmer’s time and resources and by how much?
Whether the farmer needs this piece of time and resources to allocate them to another
activity?
Traditional Top-Down Model of Technology Transfer
Research
Extension
Farmer
Steps in Technology Transfer
Generation
Testing
Adaptation
Integration
Dissemination
Adoption and Diffusion

(Climate Change, Precision Agriculture and Innovative Disease Control Strategies)
- 130 -
Missing Links in Technology Transfer
Education
Training
Participation, and
Motivation
Farmers
Representing the greatest human resources in agriculture
Can be extremely effective, if well involved, motivated and rewarded,
With clear strategies and policies.
Bottom-Up Model of Technology Transfer
Bottom up Model
More emphasis
on
Farmer’s knowledge
Farming situations
and
Farmer’s involvement
at
Every steps
of
Technology
Steps in Technology Generation through Farmer’s Participation
Diagnosis of the situation
Identification of the problem
Development of alternative solution
Experimentation
Evaluation, and
Finally, diffusion of Technology
Expectations from farmer’s end:
Flow of Information for backward linkages and taking care of product for forward
linkages will be of utmost necessity. These issues can be satisfactorily addressed by proper
technology penetration through the use of more and more demonstrations ,providing information
and training.
Participation of farmers at planning stage itself not only to identify himself with the
problem and problem solving processes, but also to own it. Follow up after technology transfer
and feed back from farmers goes a long way in refining the technology and therefore, enhancing
it’s sustainability. Weather and disease forecasting system should be given due attention to reach
to the farmers very timely helping to reduce sudden field losses.

(Climate Change, Precision Agriculture and Innovative Disease Control Strategies)
- 131 -
Some successful models of technology transfer in Plant Protection
IPM modules for major crops and cropping systems e.g. cotton, sugarcane, rice, wheat, pigeon
pea, chickpea etc and IPM for rice- wheat cropping system, sugarcane based cropping system,
pulse based cropping system, cotton based cropping system etc.. has been developed and
successfully transferred .
To have a successful transfer of technology there are certain necessary questions that needs to
be answered which helps in popularizing IPM technology or for that matter any technology :
What to do ?
When to do ?
Why to do ?
How to do ?
What not to do ?
Why not to do ?
The points can be discussed by taking an example, e.g. management of mealy bug in
cotton under IPM:
What to do ? Grow pigeon pea, bajra or maize as border crop.
When to do ? At the time of planting of cotton.
Why to do ? These crops offer least support for the growth and multiplication of mealy bug.
How to do ? Growing two rows of any of these crops on border or as inter crop.
What not to do ? Avoid growing Malvaceous or Solanaceous crops in or in the vicinity of the field.
Why not to do ? Malvaceous and Solanaceous crops are good hosts of mealy bugs.
Therefore, the strategy for improved way of knowledge transfer should be by involving
farmer as co-researcher and educating, considering him the most important human resource in
whole business from very beginning and not believing that the farmer is only to here and do what
ever is said to be done..

(Climate Change, Precision Agriculture and Innovative Disease Control Strategies)
- 132 -
Importance of Multitrophic Interactions for Sucessful Biocontrol of Plant Parasitic Nematodes with Fungal and Bacterial Antagonists
Rakesh Pandey
Central Institute of medicinal and Aromatic Plants (CIMAP-CSIR), P.O. CIMAP, Lucknow – 2260 15,
Soil is a major reservoir of variety of plant pathogens mainly bacteria, fungi and
nematodes, which creates major economic problems in various crops all around the world. Among
different pathogens, plant parasitic nematodes are the most serious pest due to their interaction
with variety of pathogens. Since early times the major economically important agricultural crops
have been plagued by these noxious microscopic organisms that feed on plant root, bud, stem,
crown, leaf, seed, rhizome, sucker, seedling, tuber etc. The damage caused by these nematode
pests to a particular plant depends on crop and cultivars, nematode species, level of nematode
inoculum in soil and their environment. The most severe damage generally occurs, when
susceptible host plants are planted in fields with high levels of nematode inoculums. This results in
low crop production / yield and poor quality. The major crops affected by these noxious pests are,
vegetables, fruits, sugar, cotton, oil seed, pulses, tobacco, tea, coffee, cereals, spices, medicinal
and aromatic plants.
The major symptoms caused by plant parasitic nematodes may be observed on shoots and
roots. The above ground symptoms caused by plant parasitic nematodes are stunting, uneven
plant growth, chlorosis, drying of leaves and wilting etc. Root symptoms caused by nematodes are
distributed very widely due to different kind of plant parasitic nematodes. The most common
symptoms are: root lesions, root pruning, root galling, and cessation of plant roots. Roots
damaged by nematodes can not efficiently use the water moisture and nutrients available in the
soil.
Some kinds of nematodes cause damage to tissues on which they feed (for instance root-
knot and some foliar nematodes); some prevent the growth of the roots; others kill the cells on
which they feed, leaving patches of dead tissue as they move on. Depending on the kinds of
nematodes involved, damage may include galls, stunting, and decay of roots. Nematode infested
roots are often darker in color than healthy roots. Large number plant viruses are transmitted by
variety of ectoparasitic nematode species like Longidorus, Trichodorus, Paratrichodorus and
Xiphinema. There are various estimates of the economic loss caused by nematode. The precise
value can not be determined. Because of its “ small size and hidden way of life” and lack of exact
information on their occurrence and pathogenicity. Estimated overall average annual yield loss on
world major crops due to plant parasitic nematodes is more than 12%. Losses for the 40 crops in
developed nations average 8.8% compared with 14.6% for developing nations. Global crop loss
due to nematode on 21 crops, 15 of which are life sustaining were estimated at $ 85 billion
annually. These figures are staggering, and the real figure, when all crops throughout the world
are considered probably exceeds more than $ 100billion annually.

(Climate Change, Precision Agriculture and Innovative Disease Control Strategies)
- 133 -
Among different plant parasitic nematodes, root-knot nematodes (Meloidogyne spp.) are by
far the most important. Their easily recognized galls on the roots make their presence obvious.
Galls result from growth of plant tissues around juvenile nematode, which feed near the center of
the root. Root-knot gall tissue is firm without a hollow center, and is an integral part of the root;
removing a root-knot gall from a root tears root tissue. Nodules formed on roots of many legumes
because of beneficial Rhizobium spp. (nitrogen-fixing bacteria) and most other natural nodules or
bumps are loosely attached to the root and have hollow centers. Active Rhizobium nodules have a
milky fluid in their centers. The problem of root-knot nematode becomes many folds when the
nematode interacts with other microorganisms dwelling in the same niche. The effect is generally
synergistic resulting in several fold damages to host plant. The major fungi that form the
synergistic effect in association with root-knot nematode are Fusarium, Rhizoctonia, Pythium,
Sclerotium, Curvularia, Phomosis, Aspergillus, Verticillium etc. Root-knot nematode interacts with
different viruses and phytoplasma. and causes more damage to the crops.
To manage various plant parasitic nematodes the chemical nematicides were the major
option but it’s use is now being reappraised due to environment, human health, availability and
cost. Sometimes nematode develop resistance due to its repeated use. Nowadays most of the
effective chemical nematicides have been phase out from the world market and in country like
India we don’t have any major chemical nematicides. Increasing social awareness on
environmental and health concerns associated with the use of synthetic chemicals for nematode
management, urged to search an alternative with biosafety for better and economic management
of nematodes. For sustainable crop production the biological management of plant parasitic
nematodes through use of fungal and bacterial antagonists in cultivated crops becomes a major
tool of interest. Several experiments were carried out to manage root-knot nematode population
through the use of microorganisms. Major emphasis was given on nematophagus fungi, egg
parasitic fungi, nematode parasitic bacteria, PGPR, and AM fungi to manage the root-knot
nematode problem in agricultural crops. Though, several non-chemical management tactics like
fallow, flooding, changes in time of sowing / planting material, tillage practices, crop rotations, use
of antagonistic crop, trap crop/ cover crop, use of nematode free planting materials or seeds,
solarization, organic amendment and biological control are available. Recently efforts are directed
towards the use of microbes to minimize the plant parasitic nematode population and to make soil
more suppressive to nematode diseases. Working with microbial agent the candidate organism
should posses following characteristics in the nematode management. The microbes should be
Host specific
Parasitism is always lethal
Easily manipulated in laboratory
Can be mass produced
Easily disseminated with standard equipment

(Climate Change, Precision Agriculture and Innovative Disease Control Strategies)
- 134 -
Potential for establishment & recycling
Provides control for extended period
Not harmful to environment
Shelf-life of at least one year
Rhizospheres are complex environment where several microorganisms interact with each
other. Nematophagus or nematode destroying fungi are important component of rhizosphere and
they parasitizes the nematode/ egg/ female and use them as their source of growth and
development. On the basis of the infection to nematode these fungi are known as nematode
trapping fungi , endoparasitic fungi , egg and female parasitic fungi etc. Adhesive compounds are
secreted by nematode trapping fungi over the entire surface fungal trapping structure which helps
to dissolve the nematode cuticle. The major fungal anatagonists to phytonematodes are :
Arthobotrys amerospora, A. brochropaga, A. conoides, A. dactyloides, A. musiformis, A.
oligospora, A. pravicovia, A. robusta, A. superb, Catenaria anguileulae, auxillaris, C. vermicola,
Monacrosporium cionopagum, M. ellipsosporum, M. lysipagum, M. thaumasia, Hirsutella
heteroderae, H. rhossilensis, Nematoctonus concurrens, N. haptocladus, Drechmeria coniospora,
Harposporium anguillulae, H. subliforme, Catenaria auxialiaris, Dactylella candida, D.
oviparasitica, Nematopthora gynophila, Paecilomyces lilacinus, P. nostocoides, , Verticillium
chalamydosporium (Pochonia chlamydosporium), Verticillium balanoides V. lamellicola, V.
leptobactrum, V. suchlasporium, Trichodrma harzianum, T.virens, T. atroviride etc.
The association of AM fungi with roots brings several changes in the plants as these fungal
organism absorb nutrients which makes plants more healthy and induces resistance against
several plant diseases. The AMF colonize the root system and make a thick fungal mat around the
root therefore alter other pathogen to infest the colonized root system. These fungi may change
the physiology of the root system or compete with other organisms for root colonization. There are
several groups of fungi associated with plant root system but in agriculture it is the arbuscular
mycorrhizal fungi (AMF) of the Phylum Glomeromycota that is the most important. AMF actively
associated with a large number of plants except plant families of Brassicae and Chenopodiaceae.
Generally the AM fungus consists of two phases as one part of fungus i.e. mycelium is inside the
root and other part is distributed in soil to form the hyphal net, which absorbs the nutrients like
soluble phosphorus, iron, and provide these to plant for its health. The arbuscular mycorrhizal
fungi generally increase uptake of immobile phosphate ion and in return the AM fungi gets carbon
from the plants. The mycorrhiza and plant parasitic nematodes occupy root system and
mycorrhizae are useful to plants, whereas phytonematodes are detrimental to plant. Nowadays
mycorrhizal fungi have becomes a useful tool to manage nematode infestation in plants resulting
in an enhanced crop production and yield. Phytonematodes and arbuscular mycorrhizal fungi both
are associated with plant root for their food and space. The major interest in such an association is
to provide an increased plant resistance against phytonematodes. Symbiotic association of

(Climate Change, Precision Agriculture and Innovative Disease Control Strategies)
- 135 -
mycorrhizal fungi with plants provides a range of beneficial effects like enhanced micro and macro
nutrient availability provides resistance to plants against different biotic and abiotic factors and
makes the soil healthy.
Nowadays researcher are more inclined for organic farming due to adverse effect of
chemical nematicides on environment and human health. But in such farming system we have to
take a lot of precaution to maintain the rich population of useful organism in the soil to make soil
more suppressive to plant diseases. Normally the organic farming is recommended but due to low
yield, it is difficult to satisfy farmers for their product price. In developed nations farmers are getting
good price but in country like India farmers are hesitating to opt organic technology. CIMAP is
leading in this direction and trying to satisfy the farmers for such cultivation of medicinal and
aromatic plants and having great price for their organic products. The organic farming also affects
the mycorrhizal population and other pathogen population in soil.
Various types of bacteria are involved in decreasing the nematode population in soil. On
the basis of their mode of action these bacteria may be considered as obligate parasite,
opportunistic, rhizospheric, cry protein forming, endophytic and symbiotic bacteria as few are
parasite to nematode and others are indirectly involved to reduce the nematode infestation to
plants. Few bacteria like Bacillus spp. and Pseudomonas spp. are among the dominant
population in the root rhizosphere which antagonize the phytonematode population. Similarly
Pseudomonas spp. also exhibit nematode suppressive effect against variety of nematode species
through production of antibiotic, induction of systemic resistance. Several genera of other
rhizobacteria has shown the antagonistic activities against plant parasitic nematodes are
Actinomycetes, Agrobacterium, Arthobactor, Alcaligenes, Aureobacterium, Azotobacter,
Beijerinckia, Burkholderia, Chromobacterium, Clavibacter, Clostridium, Comamonas,
Corynebacterium, Curtobacterium, Desulforibtio, Enterobacter, Flavobacterium, Gluconobacter,
Hydrogenophaga, Klebsiella, Methylobacterium, Phyllobacterium, Phingobacterium, Rhizobium,
Serratia, Stenotrotrophomonas and Variovorax . The different ways by which rhizobacteria
antagonize the plant parasitic nematode populations are:
Disrupts the nematode-host recognition and thus regulate the nematode behavior.
They compete with nematode for nutrients for there living.
Rhizobacteria promote plant growth and therefore nematode could not attack the healthy
roots easily.
Antibiotics produced by the rhizobacteria directly or indirectly induce resistance and hence
reduce nematode population
Different microbes have been exploited in this lab to reduce the population of plant
parasitic nematodes below the economic threshold level and could play a significant role either
singly or can be integrated with other practices to develop integrated nematode management
practices (INMP). Studies conducted at CIMAP, Lucknow so far indicate that microbial agents may

(Climate Change, Precision Agriculture and Innovative Disease Control Strategies)
- 136 -
play a significant role in limiting plant parasitic nematode population. The results of the studies
carried out on major medicinal plants like Artemisia annua, Withania somnifera, Rauvolfia
serpentina, Bacopa monnieri and aromatic plants like Abelmoschus moschatus, Artemisia pallens,
Mentha arvensis, Rosa damascena, Lavandula officinalis and Pogostemon cablin (syn= patchouli)
have proven the efficacy of microbial agents (Paecilomyces lilacinus, Glomus aggregatum,
Trichoderma harzianum, Glomus fasciculatum, Glomus mosseae, Pseudomonas fluorescens etc.)
and organic farming too in the management of nematode and for sustainable growth and yield of
medicinal and aromatic plants.
SELECTED READINGS
1. Barbosa, P, Kirschik,L & Jones, E. (eds.) 1990. Multitrophic Level Interactions among microorganisms, plants, and insects. New York: John Wiley.
2. Bagyaraj, DJ; Manjunath, A. & Reddy, DDR. 1979. Interaction of vesicular arbuscular Mycorrhizae with root-knot nematode in tomato. Plant and Soil 51: 397-407.
3. Bird, AF, and Bird J. 1991. The Structure of Nematodes. 2nd edition. 71pp. San Diego: CA Academic Press.
4. Brown, RH and Kerry, BR. 1987. Principles and Practice of nematode control in crops. Academic Press New York, 447pp.
5. Davies, KG, Kerry, BR & Flynn, CA. 1988. Observations on the pathogenicity of Pasteuria penetrans, a parasite of root-knot nematodes. Annals of Applied Biology 112, 1491–1501.
6. Elsen, A, Gervacio, D, Swennen, R and Wacle D.De. 2008. AMF-induced Biocontrol against plant parasitic nematodes in Musa sp. : a systemic approach. Mycrrhiza 18: 251-256.
7. Gupta,A. & Pandey, R. 2009. Mycorrhiza: The saviour of plants from Phytonematodes in Microbes , Applications and effects (Edited by Dr. P. C. Trivedi, Professor Department of Botany, University Of Rajasthan , Jaipur) :143-157
8. Hallmann J, Quadt-Hallmann A, Miller WG, Sikora RA & Lindow SE 2001. Endophytic colonization of plants by the biocontrol agent Rhizobium etli G12 in relation to Meloidogyne incognita infection. Phytopathol 91: 415–422.
9. Kloepper JW, Rodriguez-Kábana R, McInroy JA & Young RW . 1992. Rhizosphere bacteria antagonistic to soybean cyst (Heterodera glycines) and root-knot (Meloidogyne incognita) nematodes: identification by fatty acid analysis and frequency of biocontrol activity. Plant Soil 139, 75–84.
10. Koshy, PK, Pandey,R & Eapen, SJ. 2005. Nematode Parasites of Spices, Condiments and Medicinal Plants in Plant Parasitic Nematodes in Subtropical and Tropical Agriculture 2
nd Edition (Eds. M. Luc, ORSTOM, France, Sikora, RA, University of Bonn, Germany,
J. Bridge, CABI, Bioscience, Egham, Surrey, U.K.) : 751-791.
11. Luc, M., Sikora, RA & Bridge.J.2005. Plant Parasitic Nematodes in Subtropical and Tropical Agriculture 2
nd, 871pp., CABI, Bioscience, Egham, Surrey, U.K.
12. Pandey, R. 1998. Phytopathological impact of root-knot nematode on some medicinal and aromatic plants - Journal of Medicinal And Aromatic Crop Sciences 20: 67-84.
13. Pandey, R. 2003. Mint Nematology- Current Status and Future Needs in Advances in Nematology (Eds. P.C.Trivedi Professor, Department of Botany, University Of Rajsthan, and Jaipur): 155-166.
14. Pandey R. 2005. Field application of bio-organics in the management of Meloidogyne incognita in Mentha arvensis. Nematologia Medit. 33 (1): 51-54.
15. Price, PW., Bouton, CE., Gross, P, McPheron, BA.Thompson, J.N., and Weis, A.E.1980.
Interactions among three trophic levels: influence of plants on interactions
between herbivores and natural enemies. Annual Review of Ecology and

(Climate Change, Precision Agriculture and Innovative Disease Control Strategies)
- 137 -
Systematics 11: 41–65.
16. Sikora, RA 1992. Management of the antagonistic potential in agricultural ecosystem for the biological control of plant parasitic nematodes. Ann. Rev. Phytopathol. 30: 245-270.
17. Sturz AV & Kimpinski J .2004. Endoroot bacteria derived from marigolds (Tagetes spp.) can decrease soil population densities of root-lesion nematodes in the potato root zone. Plant Soil 262: 241–249.
18. Tian BY, Yang JK, Lian LH, Wang CY & Zhang KQ .2007. Role of neutral protease from Brevibacillus laterosporus in pathogenesis of nematode. Appl Microbiol Biotechnol 74: 372–380.
19. Willamson, VM. 1998. Root knot nematode resistance genes in tomato and their potential for future use. Annual review of Phytopathology 36: 277-293.
20. Whitehead, AG. 1998. Plant Nematode control. CAB International Wallingford, U.K. 384pp.

(Climate Change, Precision Agriculture and Innovative Disease Control Strategies)
- 138 -
Biological Control of Frost Injury: Role of Ice Nucleating Bacteria
S.C. Saxena Department of Plant Pathology, GBPUA&T, Pantnagar- 263 145 (Uttarakhand)
The science of plant pathology is largely a study of the mechanisms, quantification, and
alleviation of plant stresses due to biological agents. Of obvious importance are the stresses to
plants directly caused by various plant pathogenic fungi, bacteria, viruses, nematodes, insects,
etc. In such cases, plant stress is due either to direct damage to plant tissue or to an alteration in
normal plant metabolism. Some biological agents, such as the fungi that form mycorrhizae with
plant roots, may even reduce plant stress in certain situations and increase stress in others.
Plants may also be stressed directly and indirectly by various physical factors such as high
or low temperatures or air pollutants. Physical stresses such as temperature or air pollutants may
also influence the subsequent damage of plants incited by certain plant pathogens. Root infecting
plant pathogens, can make plants more susceptible to damage due to high temperatures or
drought.
Many more subtle interactions between microorganisms and plants have also been
reported. Bacteria living on the surfaces of healthy leaves and roots have been reported to
increase plant growth, possibly by production of one or more plant growth regulators. Conversely,
some bacteria isolated from root surfaces have been shown to be detrimental to root and plant
growth.
Frost injury is a serious abiotic disease of plants. Losses in plant production in the United
States due to frost injury are estimated at over one billion dollars yearly. Frost injury has been
described as one of the main limiting factors to crop production in many locations in the temperate
zone. Little attention has been paid to the mechanism of frost injury to frost-sensitive agricultural
plants that are damaged at temperatures warmer than -50C. Frost injury was considered an
unavoidable result of physical stress (low temperatures) to these plants.
Some plant frost recently has been shown to involve an interaction of certain leaf surface
bacterial as well as low temperature stress. Some bacteria cause the frost-sensitive plants on
which they reside to become more susceptible to freezing damage by initiating the formation of ice
that is required for frost injury.
In this talk, the importance of some epiphytic bacterial that initiate ice formation on plants
(ice nucleation active bacteria) are discussed in reference to their significance to the frost
sensitivity of many plants, and to initiation of disease. Some aspects of plant physiology and
physics relevant to frost damage in frost-sensitive plants are discussed to elucidate further the
unique role that ice although indirectly, the world’s most destructive abiotic disease.
Bacterial Ice Nucleation in Plant Disease
Many pathogenic strains of P. syringae have been reported to survive in large numbers as
epiphytes on a variety of symptomless host plants, including stone fruits, olive, bean and soybean.

(Climate Change, Precision Agriculture and Innovative Disease Control Strategies)
- 139 -
Since infection by P. syringae often occurs after injury to a host plant, this observation may attest
to the ubiquitous presence of this bacterium as an epiphyte.
In fact, frost injury has been reported as a predisposing factor for infection of some plants
by P. syringae. It has been reported that pear blossoms supercooled to approximately –20C. If
flowers were sprayed with a bacterial suspension after freezing, infection by P. syringae pv.
syringae was severe, whereas infection of inoculated unfrozen flowers was minimal. P. syringae
pv. syringae was found to occur in large numbers on flowers from branches from field sources but
was not found on greenhouse-grown tree.
Therefore, frozen field-grown flowers which were sprayed with water after freezing
sustained severe infection by P. syringae, whereas greenhouse-grown flowers did not. Frost injury
has also been implicated in outbreaks of bacterial blight of pea (Pisum sativum L.) incited by
P. syringae pisi in South Africa.
Freezing injury has also found to aid in the development of bacterial canker of poplar
(Poplar spp.) caused by P. syringae pv. syringae, and an unidentified pathogen of barley. A strong
relationship between frost injury to apricot (Prunus armenica L.) and development of bacterial
canker incited by P. syringae pv. Syringae was recorded.
The ice nucleation activity of P. syringae pv. syringae strains was well correlated with
development of cankers on inoculated peach seedlings frozen at –100C. The scientists suggested
that ice nucleation activity by P. syringae pv. syringae was important in the development of
bacterial canker of peach. The use of an ice nucleation-deficient mutant of P. syringae in this
study, however, would help clarify the role of ice nucleation in canker development.
Mechanism of Plant Frost Injury
Frost-sensitive plants are distinguished from frost-hardy plants by their relative inability to
tolerate ice formation within their tissues. Examples of frost-sensitive plants tissues include
herbaceous annual plants, flowers of deciduous fruit trees, fruit of many plant species, and shoots
and stems of certain forest trees such as Eucalyptus. Ice former in or on frost-sensitive plants
spreads rapidly both intercellular and intracellularly, causing mechanical disruption of cell
membranes. This disruption is usually manifested as a flaccidity and/or discoloration upon
rewarming of the plant. Thus, most frost-sensitive plants have no significant mechanisms of frost
tolerance and must avoid ice formation to avoid frost injury.
Two general types of ice nuclei exist: heterogeneous and homogeneous. Homogeneous
ice nuclei are of primary importance at low temperatures whereas hetrogeneous nuclei are more
importance at temperatures approaching 00C. Small volumes of pure water can be supercooled to
approximately -400C before the spontaneous homogeneous catalysis of ice formation occurs.
Even relatively large quantities of water readily supercool to -100C to -200C.
Catalysis of ice formation in water involves a transient ordering of water molecules into a
lattice resembling ice. The number of water molecules that must be ordered to trigger macroscopic
ice formation in super-cooled water is governed by thermodynamic and geometric considerations

(Climate Change, Precision Agriculture and Innovative Disease Control Strategies)
- 140 -
and decreases with decreasing temperature. At very low temperatures (approaching –400C),
random grouping of water molecules can efficiently trigger homogeneous ice formation within short
time intervals.
At warmer temperatures, nonaqueous catalysts for ice formation known as heterogeneous
ice nuclei are required for the water-ice phase transition. The mechanism of ice nucleation of all
heterogeneous ice nuclei is due to ordering of water molecules into an ice-like lattice, perhaps in
the case of inorganic salts, by aggregation of water molecules onto the face of fractured crystals
with lattice structures similar to ice. The efficiency of heterogeneous ice nuclei presumably
increases with increasing numbers of water molecules oriented in a rigid ice-like array.
Non-biological Sources of Heterogeneous Ice Nuclei
The most common and the most thoroughly studied source of heterogeneous ice nuclei are
mineral particles, particularly silver iodide. These mineral particles efficiently nucleate ice only at
temperatures lower than -8°C to -15°C. Most organic and inorganic materials such as dust
particles nucleate ice only at temperatures lower than -10°C to -15°C. Dust particles, particularly
certain mineral clays have long been considered as primary sources of ice nuclei. Mineral particles
of meteoric origin (are also considered abundant atmospheric ice nuclei. These minerals are active
as ice nuclei primarily at temperature colder than –150C, therefore are quite unlikely to account for
ice nucleation at relatively warm subfreezing temperatures.
Kaolinite is among the most active minerals ice nucleus sources, but it is active in ice
nucleation only at temperatures below about -9°C. Silver iodide, used in weather modification
studies as a cloud seeding agent, is active in ice nucleation only at temperatures warmer than -
8°C. Its abundance in nature is also very low.
Crystals of a number of inorganic compounds, however, are ice nuclei at temperature
warmer than -10°C. Crystals of several organic compounds also have ice-nucleation activity,
including steroids, amino acids, proteins, terpenes, metaldehyde, phenazine, and others. Although
these organic compounds are active in ice nucleation at relatively warm temperatures (warmer
than -5°C), they are active as ice nuclei only in a crystalline form. When solubilized, these
compounds lose ice nucleation activity .The natural occurrence of the crystalline form of these
organic compounds .is likely to be small.
ICE Nucleation on Plant Surfaces
• The supercooling of plant tissues is limited by the heterogeneous ice nucleus that is active
at the warmest temperature. Therefore, the number and activity of heterogeneous ice
nuclei in or on plants can be determined by analysis of the supercooling points of plant
tissue.
• The ability of many frost-sensitive plants to supercool has been recognized for some time.
It has been shown that flowers of small fruit trees supercool to only -2°C before ice
formation occurs. Extensive supercooling has been reported for lemon, grapefruit, and
other Citrus species. Wheat leaves have been reported to supercool to -4.5°C to -5.0°C.

(Climate Change, Precision Agriculture and Innovative Disease Control Strategies)
- 141 -
Several recent reports also indicate variability in the degree of supercooling, which ranged
from -2°C to -14°C for a large number of even green different plant species.
Bacterial Ice Nuclei
• Recent research has focused on the search for biological sources of ice nuclei. The
concentration of ice nuclei in the atmosphere at a given location was observed to increase
with increasing organic matter content of the soil. Decaying vegetation is a source of
abundant ice nuclei. The bacterium P. syringae, associated with decaying leaf material,
was shown to be an active ice nucleating agent.
• Recently, three species of bacteria commonly only found as epiphytes on leaf surfaces
have been shown to be catalysts for Ice formation. Many pathovars of P. syringae are
active in ice nucleation and are generally the most common ice nucleation active bacteria
found on plants in the United States. Certain strains of both E. herbicola, and P.
fluorescens are also active in ice nucleation.
• Other scientists have reported that certain strains of other Pseudomonas and stewartii are
active in ice nucleation, but these reports have not yet been verified. Approximately 50% of
the many pathovars of P. syringae examined, including P. syringae pv. coronafaciens, P.
syringae pv. pisi, and P. syringae pv. lachrymans are active in ice nucleation.
• The strains of P. syringae and E. herbicola studied to date are the most active naturally
occurring ice nuclei. These bacteria catalyze ice formation at temperatures as warm as -
1°C. Not every cell of P. syringae, E. herbicola, or P. fluorescens is active as an ice
nucleus at a given time. The fraction of cells that are active as ice nuclei increases rapidly
with decreasing temperatures below -10C.
• The strains of P. syringae and E. herbicola studied to date are the most active naturally
occurring ice nuclei yet discovered. These bacteria catalyze ice formation at temperatures
as warm as -1°C. Not every cell of P. syringae, E. herbicola, or P. fluorescens is active as
an ice nucleus at a given time. The fraction of cells that are active as ice nuclei increases
rapidly with decreasing temperatures below -10C.
Measurement of Bacterial Ice Nuclei
The study of the ecological role of bacterial ice nuclei has been facilitated by the
development of a number of rapid quantitative assays for their presence and qualitative activity.
Measurements of the cumulative number of ice nuclei active above a given temperature are
reported by several scientists A droplet freezing assay developed, has been the basis for most
measurements of bacterial ice nuclei which yields an estimate of the number of freezing nuclei,
defined as those heterogeneous ice nuclei that are active when suspended in water.
A modification of this method in which aqueous suspensions of bacteria are placed in calibrated
capillary tubes has been reported to increase slightly the accuracy of determination of ice
nucleation temperatures. The activity of bacteria as contact ice nuclei, in which dry bacterial cells
contact and nucleate supercooled water droplets suspended in an isothermal cloud chamber, .has

(Climate Change, Precision Agriculture and Innovative Disease Control Strategies)
- 142 -
also been reported.
Ice Nucleation Active Bacteria on Plants
Most field-grown plants are colonized by large epiphytic populations of one or more
species of ice nucleation active bacteria. Nearly all of 95 species of agricultural and native plants
sampled from several locations in North America, with the exception of conifers and smooth
leaved crucifers, harbored detectable populations of epiphytic ice nucleation active bacteria. Ice
nucleation active bacteria on plants have also recently been reported from Israel and Japan.
The numbers of ice nucleation active bacteria on plant surfaces vary among species as
well as temporally on a given species. The maximum populations of ice nucleation active bacteria
ranged from approximately 100 cells/g fresh weight of valencia and navel orange (Citrus sp.) leaf
tissue to over 107 cells/g fresh weight on leaves of English walnut or almond.
Many more plant pathologists have studied leaf surface populations of phytopathogenic
bacteria or their antagonists., including species now known to nucleate ice. Populations of P.
Syringae. and E. herbicola have been reported on a variety of plants throughout the world and are
ubiquitous epiphytes on nearly all plants studied. The occurrence of ice nucleation activity among
strains of E. herbicola is as yet largely unknown, but is probably low.
However, the observation that at least half of the pathovars of P. syringae are active as ice
nuclei indicates that ice nucleation active bacteria have a worldwide distribution. Similarly, strains
of P. fluorescens are common sol! and water Inhabitants. Even if a low percentage of P.
fluorescens strains are active in ice nucleation, this species may also be an important source of ice
nuclei.
Bacterial Ice Nucleation and Frost Injury
A single ice nucleus is currently thought to be sufficient to initiate ice formation and
subsequent frost injury to an entire leaf, fruit, flower, or even groups of leaves or flowers,
depending on the degree of restriction of ice propagation within a plant. Since frost-sensitive plants
must avoid ice formation to avoid frost damage, frost injury to these plants might best be
considered a quantal response – either a plant part escapes ice formation or it does not.
The extent of frost damage at a given temperature increases with increasing populations of ice
nucleation active bacteria on that plant. Frost injury at a given temperature is more directly related
to the numbers of actual bacterial ice nuclei on the plant at the time of freezing than to the
population of ice nucleation active bacteria.
Current Practices for Management of Plant Frost Injury
• involve physical warming of plant tissue to at least 00C to avoid internal ice
formation or
• By planting frost-sensitive plants in sites which do not have a history of cold
temperatures.
• Physical methods of frost prevention
• use of stationary wind machines

(Climate Change, Precision Agriculture and Innovative Disease Control Strategies)
- 143 -
• helicopters to mix the cold layer of air nearest the ground with warmer air aloft
• Heaters have been employed to heat the air in the vicinity of plants in need of
protection.
• Radiational cooling of plants
• Radiative heat losses can be reduced by the application of artificially generated
fogs or foam-like insulation to cover plants
• Application of water directly to plant parts during periods of freezing temperatures.
Application of water directly to plant parts during periods of freezing temperatures.
Although ice may from during such a process, it is limited to the exterior of the plant. Frost damage
does not result so long as additional water is applied to ice-covered plant parts during the entire
period the air temperature is below 00C. The latent heat of fusion, released when water freezes to
form ice, warms the ice-water mixture on leaves to 00C. This mixture will remain at 00C as long as
water is continuously available to freeze on plant surface. Since all plants contain dissolved salts
and other soluble components, the freezing point of the plant tissue is slightly lower than 00C. Ice
held at 00C on the surface of the plant will not penetrate and disrupt plant tissues.
Bactericides
One new alternative method of frost management has included the use of commercially
available bactericides to reduce populations of ice nucleation active bacteria on plants. Large
(100- to l000-fold) reductions in populations of epiphytic ice nucleation active bacterial are
observed following protectant bactericide applications when compared with untreated plants. The
numbers of ice nuclei on bactericide-treated plants was also significantly lower than on untreated
plants, thereby reducing the chances of frost injury to a given plant part at temperatures above -
5°C.
Antagonistic Bacteria
Only about 0.1% to 10.0% of the total bacteria found on plant surfaces are active as ice
nuclei and are therefore involved directly in frost injury. Competition or other form(s) of antagonism
between these and other epiphytic bacteria and other microorganisms on leaf surfaces appears
likely based on studies of other ecological niches.
The degree of nature competition among epiphytic microorganisms is insufficient to prohibit
buildup of significant of epiphytic ice nucleation active bacteria on most plants. However, this
natural antagonism may be augmented by altering the leaf surface microbial ecology so as to favor
increased populations of non-ice nucleation active bacteria competitors. These bacterial
competitors may then occupy a niche on the plant that might otherwise be colonized by ice
nucleation active bacteria.
Integrated Management
Integrated management of fire blight and frost injury of pear have recently been reported.
An antagonistic non-ice nucleation active bacterium applied at 10% bloom to pear trees colonized
pear flowers and leaves for over three months and reduced significantly the epiphytic populations

(Climate Change, Precision Agriculture and Innovative Disease Control Strategies)
- 144 -
of P. syringae and Erwinia amylovora.
The incidence of both frost injury, and, later, fire Blight, was reduced significantly compared
to untreated trees. The control of frost injury and fire blight from a single application of antagonistic
bacteria was nearly as good as from weekly applications of a mixture of streptomycin and
oxytetracycline or cupric hydroxide.
Frost Injury with Non-Nucleation Active Bacteria
Control of frost injury with non-nucleation active bacteria is a good model system with
which to study biological control processes for a number of Reasons:
1. Frost injury is an important, worldwide problem;
2. The target Microorganism are well known and can be well quantified based on their
Phenotype of ice nucleation activity;
3. Subtle microbial interactions on leaves may be expressed and therefore quantified
as altered ice nucleation activity of bacteria on leaves; and,
4. Even in the absence of frost injury, information gained on the ecology and control of
ice nucleation active pathovars of p. syringae could be exploited to achieve
management of the disease initiated by these and other bacteria by reduction of
epiphytic inoculums sources on host plants.
Ice Nucleation Inhibitors
Chemicals that quickly inactivate the ice nucleus associated with ice nucleation active
bacteria without necessarily killing bacterial cells have been termed “bacterial ice nucleation
inhibitors”. Laboratory tests have shown that the ice nucleation site associated with ice nucleation
active bacteria is sensitive to various physical and chemical stresses such as extremes of pH,
specific heavy metal ions in a soluble state (including copper and zinc), and certain cationic
detergents (unlike most commercial anionic surfactants used in agriculture).

(Climate Change, Precision Agriculture and Innovative Disease Control Strategies)
- 145 -
Characterization of Pathogen Population and Resistance Management: A Case Study of Rice Blast Pathosystem
J. Kumar
Department of Plant Pathology, GBPUA&T, Pantnagar- 263 145 (Uttarakhand)
Rice (Oryza sativa L.) is a staple food for over 2 billion people, providing 20% of human
food calories. “Blast”, caused by the heterothallic ascomycete Magnaporthe grisea (Hebert) Barr.
(anamorphe : Pyricularia grisea Sacc.) is the most important disease of rice and can cause severe
losses in most rice-growing environments . Although only known to reproduce asexually in nature,
the pathogen is notorious for its pathotypic diversity. Disease resistant rice cultivars are the
preferred means of blast management, considering that most rice farmers are poor and that
effective fungicides are quite costly. However, resistance in such cultivars is frequently short-lived.
Typically, a variety released as blast-resistant shows signs of susceptibility after only very few
seasons of cultivation in blast-prone environments.
Resistance “breakdown” is usually ascribed to extreme diversity and/or virulence variability in
the pathogen. In the case of extreme diversity, it has been proposed that much of the observed
resistance breakdown resulted from simple “escape” due to inadequate challenge in screening
nurseries. That is, either because conditions are not suitable for disease development, or if some
pathotypes are so rare as to not encounter a compatible line, lines may be incorrectly interpreted to
be `resistant'. As a breeding line is multiplied for release and eventually planted over large areas,
chances increase for encounter between compatible pathotypes and the new variety. With a large
host population the previously rare pathotype reproduces rapidly, and the observed `new'
susceptibility of the cultivar is interpreted as a resistance `breakdown'.
There is some evidence for escape being an important phenomenon in the lack of durability of
blast resistance. By conducting a blast resistance breeding program in a site with a highly diverse
pathogen population and an environment that supports continuous blast epidemics, durably resistant
cultivars could be developed. One such cultivar, Oryzica Llanos 5, has been grown continuously over
thousands of hectares for over 15 seasons in a severely blast-prone environment. Furthermore, it
has been evaluated in a number of countries across the world and found to be highly resistant in all
sites.
The question of pathotypic variation has long been controversial. At one extreme the
pathogen was described as hypervariable, with the capacity to generate a seemingly endless array
of new pathotypes from a single asexual spore. Thus, varieties evaluated for resistance to a single
pathotype would be exposed to an infinite range of pathogenic variation once released into the
field. A variety stood little chance of surviving under the onslaught of such variation, and the
reasonable conclusion was that race-specific resistance to the pathogen could not yield durable
resistance. This led to a major effort to develop race non-specific, or partial, resistance. At the
other extreme, the pathogen was described as completely stable, with no new races generated

(Climate Change, Precision Agriculture and Innovative Disease Control Strategies)
- 146 -
even after years of culture in the laboratory. It is noteworthy that the proponents of hypervariability
worked with isolates from Asia (the center of origin of rice), recently recovered from the field, while
proponents of stability worked largely with isolates from the US (where rice was introduced only a
few hundred years earlier) and that had been in culture for a number of years.
Blast populations are very diverse, regardless of the mechanisms (genetic or otherwise)
that generated the diversity, and the design of most breeding programs is such that a blast-
resistant variety is simply not exposed to pathogenic variants that it would likely encounter under
production conditions. In other words, real-world rice varieties would be exposed to populations of
the pathogen, not just one or two races.
Virulence variation in pathogen populations
Plant pathologists and plant breeders have long understood the importance of pathogen
variation to the effectiveness and durability of host resistance. Pathogen genotypes can interact
with specific host genotypes leading to the "breakdown" of resistance within very short periods of
time. Detection of pathogen variation has traditionally relied upon the identification of virulence
variation (races) in the pathogen population by inoculating a sample of pathogen isolates on a
series of hosts with defined resistance genes (differentials) and observing the resulting compatible
or incompatible disease phenotype. This approach to monitoring pathogen populations has been
tremendously valuable in the development and deployment of host resistance, and has provided
important insights into the evolution of pathogen populations in response to selection by host
resistance genes. Pathotype monitoring is still used extensively in many pathosystems today and
continues to provide timely information about the structure of pathogen populations that is relevant
to breeding programs and resistance deployment.
Limitations on the use of virulence phenotype
Despite the obvious value of pathotype data, the use of virulence phenotypes to assess
genetic variation in plant pathogens has several important limitations. Host differential lines used in
virulence assays are often poorly defined genetically. A common set of differentials must be used
among labs to obtain comparable data, and assays are subject to environmental variation. A more
important limitation is that virulence variation in plant pathogens is almost always determined in
terms of virulence phenotype rather than genotype, which means that frequencies of virulence
genes cannot be estimated from these assays. This lack of genetic information coupled with the
fact that virulence phenotypes are subject to strong selection by the host limits the value of
virulence markers as population genetics tools.
Molecular markers in pathogen population analysis
Lately, plant pathologists interested in genetic variation in pathogen populations have
adopted the use of molecular markers as population genetics tools. Motivating this shift has been
the availability of a myriad of molecular techniques which makes the quantification of genetic
variation a relatively straightforward endeavor. Molecular markers such as allozymes , restriction
fragment length polymorphisms (RFLP) and random amplified polymorphic DNA (RAPD) have

(Climate Change, Precision Agriculture and Innovative Disease Control Strategies)
- 147 -
been extensively used to characterize pathogen populations. More recently, amplified fragment
length polymorphisms (AFLP) have proven to be highly polymorphic and robust markers and will
likely be used extensively with plant pathogenic fungi in the future. In contrast to virulence and
fungicide resistance markers, molecular markers are presumed to be selectively neutral and
therefore may be used to study evolutionary processes in addition to selection.
The discovery of a neutral repetitive DNA sequence, MGR (for Magnaporthe grisea repeat)
in the rice blast pathogen in the late 1980s provided a means of analyzing populations
independently of the pathogenicity of the constituent isolates. The similarity of the MGR
"fingerprints" generated by analyzing the DNA of different isolates permitted an estimate of their
relatedness. Initial analysis of archival US P. grisea isolates revealed a direct relationship between
fingerprint type (subsequently referred to as lineages) and pathogenic races . Application of this
analytical tool to the Santa Rosa population yielded a less direct, but intriguing, relationship
between lineage and race: Sets of closely related races fall within a single lineage and the race
constitution of lineages differed. Furthermore, in what had been described as an extremely race-
diverse population, all isolates could be grouped into only six lineages. This led to the suggestion
that rice breeding could focus on selecting for cultivars that combined resistance that was effective
against the virulence spectrum of all lineages in a target population.
Lineage exclusion
This breeding approach, referred to as "lineage exclusion", assumes that P. grisea
populations are comprised of a few number of discrete lineages and that these lineages have
different and stable virulence spectra. These assumptions were tested in two populations from
blast resistance screening nurseries in the Philippines. It was found that , as in Colombia, there
were relatively few lineages comprising the populations . Analysis of lineage virulence spectra (i.e.,
the virulence of isolates on sets of isolates with known and different resistance) revealed that they
were indeed different. "Composite pathotypes" could be created for a lineage by considering any
compatibility within a lineage as reflecting the virulence capacity of that lineage. Comparing the
composite pathotypes of all the lineages of a population could predict what combination of
resistance would be effective across the entire population. In the case of the Philippines, a
combination of resistance genes Pi-1 and Pi Z5 (Pi-2) should yield resistance effective across all
lineages.
A similar analysis in Santa Rosa (Colombia) also predicted that the same two genes should
yield broad-spectrum resistance. This was tested by crossing two sources of resistance and then
evaluating the progeny in the field (exposing them to a diverse, well-characterized population) and
in the greenhouse (exposing them to isolates representing the full virulence spectrum in all
lineages in the population). As expected, progeny resulted with full spectrum resistance in both
greenhouse and field evaluations. Based on this positive result, parents in crosses for blast
resistance in Santa Rosa have been selected to combine complementary resistance. This has
yielded an significant increase in the efficiency of the breeding programs.

(Climate Change, Precision Agriculture and Innovative Disease Control Strategies)
- 148 -
How effective can lineage exclusion be as a breeding tool for obtaining durable blast
resistance world-wide? A few critical issues suggest that with present technology, all areas may
not be suitable for its adoption. The situations in the Philippines and Santa Rosa may be
somewhat atypical in that these populations are from areas where modern varieties have been
grown and, because of a bottleneck effect of earlier deployed blast resistance, the pathogen
population may be much simpler than those populations in other rice-growing regions. i.e. if
populations are very complex it could be practically impossible to characterize the virulence
spectra of all lineages. Furthermore, for lineage exclusion to yield durable resistance, lineages
should be genetically isolated from one another so that virulence genes cannot be exchanged
among lineages.
A population analysis of P. grisea from a traditional rice-growing area of northeast Thailand
revealed a very complex population: 49 lineages were identified from 527 isolates, and most were
represented by only one or a few isolates . No obvious relationships between pathotype and
lineage was discerned within these samples using either lines near-isogenic for resistance genes
or cultivars with known resistance. Very high lineage diversity was also observed in the Indian
Himalayas and very high pathotypic diversity was observed in the Himalayan Kingdom of Bhutan,
although the corresponding lineage data are sketchy. It would be impossible to determine the
virulence spectrum of lineages comprising these populations. The problems however
notwithstanding, the analysis of the NE Thailand population revealed the same complementary
effectiveness of resistance genes Pi 1 and Pi z5.
An important assumption of the lineage exclusion approach is that there is no gene flow
across or genetic recombination among lineages. Several lines of evidence suggest that this may
not be the case in some areas. Reports of sexually fertile field isolates from India , China , and
Thailand indicate that the capacity for sexual recombination exists in nature. Population structure
and dynamics of Indian Himalayan populations are consistent with sexual recombination having
influenced populations there . There is also the possibility that horizontal flow of genes, including
those mediating resistance to entire lineages, can occur across lineages via non-sexual, or
parasexual, means .
Despite indications that there may be very large areas over which a population analysis-
based lineage exclusion breeding strategies may not be appropriate, there is ample evidence that
population analyses can yield valuable dividends. First, in most cases examination of the virulence
spectra of the most common lineages should indicate to breeders which crosses are unlikely to
yield durable blast resistance, thus increasing their efficiency. Second, the repeated conclusion
that the gene combination Pi 1 and Pi z5 is effective across very different populations suggests
there is something fundamentally limiting to P. grisea carrying compatibility to both genes
simultaneously. As more blast resistance genes are identified and placed in near-isogenic
backgrounds population analyses will enable us to identify other broadly effective gene
combinations. Finally, there are large and important rice growing areas where P. grisea

(Climate Change, Precision Agriculture and Innovative Disease Control Strategies)
- 149 -
populations are relatively simple. These may be where rice has only recently been introduced, or
where very large areas have been planted to a few varieties carrying several major resistance
genes. Breeding strategies for these areas should be adjusted accordingly.
REFERENCES
1. Correa-Victoria, F.J., Zeigler, R.S. 1995. Stability of partial and complete resistance in Rice to Pyricularia grisea under rainfed upland conditions in eastern Colombia. Phytopathology 85:977-982.
2. Correa-Victoria, F.J., and Zeigler, R.S. 1993. Pathogenic variability in Pyricularia grisea at a rice blast "hot spot" breeding site in eastern Columbia. Plant Disease 77:1029-1035.
3. Kumar, J., Nelson, R. J., and Zeigler R. S., 1996. Population structure of Magnaporthe grisea in the traditional Himalayan rice system. In: Rice Genetics III. IRRI-CABI, Los Banos, Philippines, pp 963- 969.
4. Kumar, J., Nelson, R.J., and Zeigler, R.S. 1999. Population structure and dynamics of Magnaporthe grisea in the Indian Himalayas. Genetics 152:971-984.
5. Kumar, J. and Zeigler, R.S. 2000.Genetic diversity and evidence for recombination in
6. Himalayan populations of Magnaporthe grisea. In: Proceedings of the International
7. Conference on Integrated Plant Disease Management for Sustainable Agriculture. Vol. I.
8. Indian Phytopathology Society, IARI New Delhi., pp. 127-134.
9. Leung, H., R. J. Nelson, and J. E. Leach. 1993. Population structure of plant pathogenic fungi and bacteria. Advances in Plant Pathology 10:157-205.
10. Milgroom, M. G., and W. E. Fry. 1997. Contributions of population genetics to plant disease epidemiology and management. Advances in Botanical Research 24:1-30.
11. Zeigler, R.S. 1998. Recombination in Magnaprthe grisea. Annual Review of Phytopathology 36:249-276.
12. Zeigler, R.S., Scott, R.P., Leung, H., Bordeos, A.A., Kumar, J., and Nelson, R.J. 1997. Evidence of parasexual exchange of DNA in the rice blast fungus challenges its exclusive clonality. Phytopathology 87:284-294.
13. Zeigler, R.S., Tohme, J., Nelson, R. J., Levy, M., Correa, F. J. 1994. Lineage exclusion: A proposal for linking blast population analysis to resistance breeding. pp. 267-292 in Rice Blast Disease, R. S. Zeigler, P.S. Teng, S. A. Leong (eds.) Commonwealth Agricultural Bureaux, Walllingford, UK.

(Climate Change, Precision Agriculture and Innovative Disease Control Strategies)
- 150 -
Visit to Automatic Weather Station and Meteorological Observatory at CRC
H.S. Kushwaha
Department of Soil Science, GBPUA&T, Pantnagar- 263 145 (Uttarakhand)
Introduction
Since the meteorological instruments in the meteorological observatories are exposed
over the short cut grass, apparently the values of some of the important weather variables
especially the air temperature, relative humidity, leaf wetness and the wind in particular may
differ significantly from those observed in a cropped field. The major meteorological instruments
available at meteorological observatory included Stevension screen to house maximum
thermometer, minimum thermometer, dry bulb thermometer and wet bulb thermometer, three soil
thermometers each at 5, 10 and 20 cm soil depth, USWB Class A open Pan evaporimeter,
Ordinary & self recording rain gauges, Anemometer, Wind vane, Bright Sunshine recorder, dew
gauge etc. The data is recorded daily twice a day at 0712 hrs and at 1412 hrs at Pantnagar by
IMD trained meteorological observers and record is maintained in pocket registers supplied by
IMD. However, the validity of such weather data recorded at meteorological observatory at a
location from a field experiment will decrease with the distance from the meteorological
observatory. Keeping in view this constraint, for disease-weather relation studies it is,
recommended & advised to monitor these important weather variables over and within the crops
under natural field conditions. These fields have variability in terms of crops their type and
stage, soil moisture, ground water table, tillage operations for soil manipulation etc. as compared
with the meteorological observatory field. Also detailed and reliable weather information is also not
available in many locations in the country due to non-availabilty of meteorological observatories.
For this purpose, a Scientific Automatic Weather Station (AWS) attached with micrologger and
Computer will be very useful for recording of weather parameters within and over the crops
accurately and then correlate them with crop observations for understanding the real crop -
weather relationships in general and disease - weather relationships in particular for major crops
of the area. There is a close relationship between crop diseases and weather variables and,
therefore, under prevailing weather conditions, the incidence of several diseases may occur in an
area and the application of chemicals in these crops will depend on the intensity and durability of
the weather conditions prevailing at particular & sensitive crop stage. The details of observations
are discussed under following heads.
A. Meteorological observatory :
A plain area of 55 m (N-W) x 36 m (E-W) size with short cut grasses free from all
obstacles including highway, high building, big trees, canals, rivers and wild animals provides a
good exposure for installing all the meteorological instruments in the observatory. If a person
stands at the gate facing the observatory plot, he will find the tall instruments in the back row and
shorter instruments in the front rows. In general the instruments are separated at a distance of 9 m

(Climate Change, Precision Agriculture and Innovative Disease Control Strategies)
- 151 -
from each within rows of 12 m apart Fig.1.). All observations are taken manually by
meteorological observer daily twice a day.
The method of measurement of the important meteorological variables :
1). Maximum and Minimum Temperatures:
The maximum and minimum air temperatures (oC) are measured by maximum and
minimum thermometers, respectively. They are housed in a single Stevenson in approximate
horizontal position at about 4 feet height from the ground. The screen is erected on 4 wooden
posts supplied with the screen with its door opening to the north and the bottom at 4 feet
approximately above the ground level.
2). Relative Humidity:
The relative humidity (%) is measured indirectly by the readings of dry and wet bulb
temperatures. The dry and wet bulb temperatures are measured by Dry and wet bulb
thermometers which are placed in the above Stevenson screen perfectly in the vertical positions.
The height of the bulbs of dry and wet thermometers should be from 4' 3" to 4' 6" above the
ground, respectively for correct measurements. From the readings of dry and wet bulb
temperatures the relative humidity is computed using Hygrometric Tables prepared by India
Meteorological Department (IMD), Pune, based on the values of Atmospheric Pressure of the
observatory locations throughout the Country. At Pantnagar the Hygrometric Table of 1000 mb is
used.
3). Soil Temperature:
The soil temperatures (oC) in the observatory are measured by specially designed Soil
Thermometers at 5, 10 and 15 cm soil depths. The plot where these thermometers are exposed
should not receive any shadow from the neighboring instruments or objects. The bulbs should be
at a vertical depth of 5 cm, 10 cm and 20 cm below the soil surface and the slant of the stem of the
thermometer should be towards north, i.e. the observer should be able to read the instruments by
sitting to the south of the instruments.
4). Rainfall:
The rainfall is measured by Raingauge. The ordinary Raingauge is erected on a masonry
or concrete foundation of 3' x 3' x 3' size and sunk into the ground. Into this foundation the base of
the gauge is cemented so that the rim of the Raingauge is exactly one foot above the ground level
and 10" above the concrete structure, i.e. the concrete structure will project 2" above the ground
surface. While getting the gauge, great care is taken to ensure that the rim is perfectly level.
However, the continuous recording of rainfall in the observatory is done by Self Recording Rain
Gauge on Charts.
5). Bright Sunshine Hours:
The recording of the number of bright sunshine hours (hrs) is done by Campbell Stoke’s
type Sunshine Recorder. This instrument is exposed on the terrace of the roof or on a pillar in the
'open' where the horizon is clearly visible between North - East and South - East on the Eastern

(Climate Change, Precision Agriculture and Innovative Disease Control Strategies)
- 152 -
side and between North - West and South - West on the Western side. The instrument should be
placed on a solid masonry pillar of any suitable height of 5' or 10' above ground depending upon
the exposure on eastern and western sides and rigidly fixed to it after proper adjustment is made.
The number of burns on the sunshine cards are counted to compute the duration of bright
sunshine hours (hrs) in a day on daily basis. However, no burning on cards takes place on cloudy
days.
6). Solar Radiation:
The quantity and intensity of solar radiation is measured by Pyranometer. This instrument
is placed in the same way as the sunshine recorder. The output in terms of solar radiation is
expressed in W m-2 or Cal.cm-2 day-1 units.
7). Wind Speed and Wind Direction:
Wind speed (km hr-1) is measured by Anemometer while its direction (in terms of Compass
points) is measured by Wind vane. These wind instruments are erected at a height of 10 feet from
the ground on wooden posts. The site for these instruments must be as open as possible and
there must not be any object loftier than the instrument for a long distance (as far as possible)
around. Long trees and building in the neighborhood are always objectionable. Even if there are
not lofty enough to screen the instruments, they serve to cause eddies or swirls which act on the
wind vane from a direction different from that of a general air current in the neighborhood.
Such obstructions do not also allow winds from all directions to strike the anemometer cups with
equal force. The standard exposure of wind instruments over open level ground in the observatory
plot should be 10 ft. above the ground. The distance between the wind instruments and any
obstruction should be at least 10 times the height of the obstruction.
8). Dew:
Dew (mm) is measured by Dew Gauges which are exposed at four heights on a stand and
the appearance of dew drops is compared with the standard photographs to quantify the dew in
terms of mm of dew fall on daily basis.
9). Recording Instruments:
i). Air Temperature:
The continuous recording of air temperature (oC) is done by the Thermograph or Thermo-
hygrograph. They are placed in the observatory area inside the double Stevenson screen. In the
same screen, a standard thermometer is also placed for comparison with its bulb at the level of the
thermal element and at a horizontal distance of about 5" from it.
ii). Relative Humidity:
The continuous recording of the relative humidity (%) of free air in the observatory is done
by Hair Hygrograph or Thermo-hygrograph. They are exposed in the observatory in the same
above double Stevenson screen. The Stevenson screen should be located in a place where the
surrounding air is not polluted by excessive smoke or dust particles or is surcharged with brine or
oil vapour, since these instruments have a deleterious effect upon the hygroscopic properties of

(Climate Change, Precision Agriculture and Innovative Disease Control Strategies)
- 153 -
the hair.
B. Automatic weather station (AWS) :
A Campbell Scientific Automatic Weather Station has been designed and developed to a
very high standard for reliable measurement and recording of wide range of important
micrometeorological variables in and above the crops The station is soundly engineered and
based Campbell,s proven 21X micrologger whose comprehensive specification enables the user
to undertake virtually any monitoring task F.g.2.). The main and important features of the system
are described as below ::
1. Wide range of sensors : A maximum of 20 sensors can be a attached to this at a time.
2. Flexible data storage : It has Internal memory to store 19, 200 data points i.e. hourly data
for continuous 40 days at a time can be stored.
3. Versatile data transfer : Software package is available for automatic routine collection of data
at pre determined time interval which can be modified as per the need and requirement.
4. Fully protected : It has a weather proof enclosure to protect data logger and peripheral against
dust and moisture. The logger can operate over the range from - 25oC to + 50 oC without any
error.
5. Integral data processing : The processing includes the averages of maximum and minimum
averages of all weather variables, standard deviations, wind vector integration etc.
6. Robust construction : Tripod and mast are build from thick walled, galvanished steel tubing
with nickle-plated fittings. The mast is 3 metre in height with adjustable cross-arm supports for
sensors. The mast can be positoned precisely by independently adjusting tripod legs. Each leg is
provided with a flat foot with 12 mm hole which allows anchorage to the ground by stake or to
concrete. A lightning conductor and earth spike are also included to save the sensors and
datalogger from destructive effects of Thunderstorm and Lightning as and when experienced in the
area. For measurement of weather parameters in and over the Horticutural crops, a mast of 30
metre height (existing in the nearby site in the same field) can be used for sitting the sensors at
desired heights depending upon the height of horticultural crops as per the need and requirement.
7. Minimum maintenance : Once errected, the station requires very little routine attension.
8. Recording device :
It has a 21 X Micrologger as recording device. It is a rugged field-proven datalogger
suitable for any application requiring data acquisition, on line data processing or electronic control.
It is compact and powerfull battery-powered device which effectively combines the functions of
micro-computer, clock, calibrator, scanner, frequency counter and controller with one smaller
enclosure. The 12 volt Nickle-Cadmium battery is chargeable by solar pannel. The micrologger is
programmed to handle almost any task including signal averaging, exite and delay, totaling,
maximum and minimum, standard deviation, scaling, 5th order polynomial processing, low-pass
filtering and wind vector calculation which are fully supported by simple program statements,
together with a histogram command for direct calculation of frequency distributions. Software

(Climate Change, Precision Agriculture and Innovative Disease Control Strategies)
- 154 -
support is available to simplify more complex programming tasks and to avoid inspection and
processing of stored data.
STRUCTURE, FUNCTIONING AND SITTING OF VARIOUS MICRO -METEOROLOGICAL
SENSORS ON AUTOMATIC WEATHER STATION
This Automatic Weather Station (AWS) is composed (Fig.1.) with various
micrometeorological instruments / sensors for monitoring the micrometeorological weather
variables such as Air temperature (oC), Relative humidity (%), Wind speed (m s-1), Wind direction
(degrees from North), Leaf temperature (oC), Leaf wetness ( % of total wet), Solar radiation (W
m-2), Net radiation (W m-2), Rainfall (mm) , Soil temperature (oC) etc. within and above the crop
canopy. A brief description of sensors measuring these weather variables is given under the
following subheads :
1. Air temperature and relative humidity
The air temperature and relative humidity in and above crop canopy are measured by
HMP 35 AC Temperature and Relative Humidity (RH) probes (two sensors). The probe contains a
Vaisala capacitive relative humidity sensor and a precision thermistor. The probe is designed to
be housed in a 41004-5 or URSI radiation shield and is attached with a 3 m long lead wire
and a connector. The length of lead wire can be increased as per the requirement.
2. Wind speed
Wind speed in and above crop canopy is measured by A100R Switching Anemometer
(two sensors) in which a magnet rotates with the rotor spindle. The varying field forces a mercury
wetted reed switch to make contact once per resolution. This instrument is a precision
instrument which is easily interfaced with Datalogger to give accurate measurements of wind run
or mean wind speed in m/s. This instrument is constructed from anodised aluminium alloy,
stainless steels and weather resisting plastics. A stainless steel shaft runs in two precision,
corrosion-resistant ball races. The bearings are protected from the entry of moisture droplets
and dust, resulting the instrument suitable for permanent exposure to the weather. Its sensitivity
is 0.80 revolutions per metre with an overall accuracy of 2 % + 0.1 m s-1.
3. Wind Direction
The wind direction at 3 m height is measured by W200P Potentiometer Wind Vane (one
sensor). This instrument is manufactured by Vector Instruments Ltd. and measures the wind
direction directly in degrees from North. The windvane incorporates a 358 degree micro - torque
potentiomter (wire wound type). The 2 degree gap is filled to ensure operation and a long service
life. The precision ball - bearing races are corrosion - resistant and are protected against the
entry of moisture and dust.
4. Leaf Temperature
The temperature (oC) of leave is measured by K-Type Thermocouples (two sensors).
Copper and constantan thermocouple wires were twisted to form the sensors and are connected
to the leaves of the plants. There is provision of adding two more leaf temperature sensors.

(Climate Change, Precision Agriculture and Innovative Disease Control Strategies)
- 155 -
5. Soil Temperature
The soil temperature (oC) at 10 and 20 cms soil depths are measured by 107 Thermister
Probes (two sensors). These probes incorporate a precision thermistor in a water resistant probe
with a standard 3 m long cable.
6. Leaf Wetness Period
The duration of leaf wetness at crop surface is measured by 237 Wetness Sensing grid.
This grid is suitable for a range of Scientific and Industrial wetness sensing applications. It
provides a simple measure of the degree of wetness of the surface to which they are attached /
exposed and they can also be used to measure the percentage of time for which the surface is
wet or dry. The sensor consists of a rigid epoxy circuit board (75 mm x 60 mm) with interlacing
gold - plated fingers. Condensation or rain on the sensor lowers the resistance between the
fingers which is measured by the datalogger.
7. Solar Radiation
The Solar or Global radiation at 3 m height is being measured by SP1110 Pyranometer
sensor (one sensor). This is a compact high - output thermally stable solar radiation sensor. The
cosine- errected head contains a special high grade Silicon Photocell sensitive to short-wave
radiation with wavelength between 350 and 1100 nm. The head is completely sealed and can be
left indefinitely in exposed conditions. A levelling mount is also available which enables the
pyranometer to be accurately positioned. The output is 10 mv / 1000 W m-2 with excellent
linearity.
8. Net Radiation
The net radiation which is the difference between the incomming solar radiation and the
outgoing radiation received on the crop surface is being measured by Q -7 Net Radiometer (one
sensor). This instrument is high - output thermopile sensor which measures the algebraic sum of
incoming and outgoing all - wave radiation (i.e. short- and long - wave components). Incoming
radiation consists of direct (beam) and diffuse plus long wave irradiance from the sky. Outgoing
radiation consists of reflected solar radiation plus the terrestroal long-wave components. It
consists 60 - junction thermopile with low electrical resistance. The top and bottom surfaces are
painted black and are protected from convective cooling by hemispherial heavy duty
polyethelene windshileds.
9. Rainfall
The rainfall is measured by ARG 100 Aerodynamic Tipping Bucket Raingauge (one
sensor). It is a well designed tipping bucket raingauge which combines durable construction
with very reasonable cost. The gauge offers less resistance to air flow and helps to reduce the
sampling errors that inevitably occur during wind - driven rain. This instrument is constructed from
UV - resistant, vaccum - moulded plastic and consists of a base and an upper collecting funnel.
The base splits into two parts, the inner section supporting the tipping - bucket mechanism and
the outer providing protection and allowing the unit to be bolded firmly to a suitable mounting

(Climate Change, Precision Agriculture and Innovative Disease Control Strategies)
- 156 -
plinth or concrete slab. The gauge resolution is 0.2 mm / tip. the funnel diameter is 25.5 cms.
10. Micrologger enclosure
All the sensors and the logging equipment are supported on a sturly tripod and mast. A
fiberglass housing with lock and key provides as excellent environmental protection for the
datalogger and ancillary equipment. Glass fitted nylon water proof connectors are fitted to the base
of the enclosure and sensors may be removed or replaced with minimum disturbance to the
weather station.
C. Recording & data logger programming in automatic weather station
All these above sensors have been hooked into the 21X Micrologger (Datalogger) which
runs through a chargeable battery charged with Solarex Solar Panels. In order to record the
output of these sensors, a datalogger programme has been prepared in the Computer
depending upon the number of the sensors attached with different channels in the datalogger and
also the frequency and time of observations. This has been done with the help of micro -
programmes developed in the Computer, and the output is converted into the desired units for
each weather variable. Each variable is sensed after each minute and an integrated value
over a period of five minutes is calculated. Twelves such values of each data point is totalled
or averaged over a period of say one hour and is stored in the memory of the datalogger at an
appropriate location at each hour of the day. The data is also averaged or totalled from each
day called Julian day (i.e. the day of a year from Ist January) from the date of planting / sowing
of the crop in the field. In the present study the recording of micrometeorological weather
variables by AWS were started one month before the first sowing of potato crop and continued till
the end of the Potato crop season. The crop var. Kufri Bahar which is sensitive to Late Blight of
Potato was planted in three dates viz. D1 (20 - 10 - 2010, D2 (30 - 10-2010) and D3 (10 -11 –
2010-) under four irrigation treatments viz. one irrigation, two irrigations, three irrigations and four
irrigations. The observations on micro-meteorological variables in crop field since October 01,
2010 and continued till harvesting of crop of all planting dates depending upon the maturity of
crop in March 2011. The incidence of Late Blight of Potato is monitored on day by day basis and
will continue till maturity of crop in all plots. The recording of micro- meteorological data
observations is also continuing till date. The current data of this hour can be noted on the provided
sheet. At a time, the micro-meteorological data of last 40 days can stored in this datalogger and it
can be seen on hourly basis on liquid crystal display (LCD) of the datalogger.
From this data logger each week the micro-meteorological data thus stored in its memory
is transferred into the SM 192 Storage Module by connecting it to the 9 - pin serial I / O port. This
Storage Module is taken to the laboratory and connected to the Computer. From SM -192 using
SC – 532, 9 - pin Peripheral to RS - 232 interface, the data is then transferred into the Computer
in ASCII form using SMCOM programmes developed for this purpose in the form of a Computer
file. From this file the data is then splitted into the hourly as well as into daily values using splitting
programmes like SPLIT 03. PAR and SPLIT 04. PAR, respectively, which have also been

(Climate Change, Precision Agriculture and Innovative Disease Control Strategies)
- 157 -
development on Computer. The data will then be used for identification of micro-meteorological
weather conditions conducive for the occurrence of late blight of potato during the 2009-10
season.
Data sheet for recording of current observations of micro-meteorological variables in the potato field at CRC using automatic weather station The current micro-meteorological weather variables are being recorded by Automatic
Weather Station (AWS) in the field from 01-10-2010 and the date of planting of Potato crop var.
Kufri Bahar in plot is 20-10-2010 during this Rabi season of 2010 - 11 at Crop Research Centre
of the University. The current data can be read on Liquid Crystal Display (LCD) of the Datalogger
of the AWS in the table given below in the specific sequence of attached sensors :
1. Name of the crop : Potato 2. Date of Ist planting of crop : 20-10-2010
3. Stage of the crop : - 4. Julian day : 90
5. Date of observation : 31-03-2011 6. Time of observation : 1600 hrs
-----------------------------------------------------------------------------------------------------------------------------------
S.No. LOCATION NO. WEATHER VARIABLE HEIGHT UNITS
-----------------------------------------------------------------------------------------------------------------------------------
1. 1 Relative Humidity 1 3m %
2. 2 Air Temperature 1 3m oC
3. 3 Relative Humidity 2 crop %
4. 4 Air Temperature 2 crop oC
5. 5 Net Radiation crop W m-2
6. 6 Solar Radiation 3m W m-2
7. 7 Soil Temperature 1 10 cm depth oC
8. 8 Soil Temperature 2 20 cm depth oC
9. 9 Leaf Wetness crop %
10. 10 Wind Direction 3m Degrees
11. 11 Wind Speed 1 3m m s-1
12. 12 Wind Speed 2 crop m s-1
13. 13 Rainfall crop mm
14. 14 Leaf Temperature 1 crop oC
15. 15 Leaf Temperature 2 crop oC

(Climate Change, Precision Agriculture and Innovative Disease Control Strategies)
- 158 -
Toxicological Investigations on the Emerging Pest Problems in the Important Crops
S.N. Tiwari
Department of Entomology, GBPUA&T, Pantnagar- 263 145 (Uttarakhand)
Toxicological investigations have played very important role in increasing food production
in most of the countries. About 10,000 species of insects are known to damage different crops
most of which were unprotected till 1940 when first synthetic organic insecticide DDT belonging to
organochlorine was investigated. This insecticide along with many more active ingredients
protected so many crops for longer duration. However, due to various reasons only a few are
permitted at present in agriculture. In the past so many years many new active ingredients
belonging to organophosphate, carbamate and pyrethroids have also been investigated and used
extensively in different crops. But due to investigation of some new group such as spinosyns,
oxadiazine, pyrezole, nicotinoid, diamide, neristoxine, growth regulator, thiourea and antibiotic
which are highly effective at low dosages and comparatively safe, the plant protection scenario
have changed drastically in many countries including India. At present following active ingredients
are being used in India in different crops for its protection against insect infestation:
Chemical Group / Active Ingredients / Formulations of insecticides
Trade Name of Insecticides
Organochlorine
Endosulfan 35 EC Thiodan (B), Parrysulfan (C), Thiokill (U)
Endosulfan 4 DP Endosulfan (GP)
Lindane 1.3 DP (R) Kanodane (K)
Lindane 6.5 WP (R) Kanodane (K)
Organophosphorus
Acephate 75 SP Twinguard (G), Tamaron Gold (B), Ortain (C), Lancer (U)
Chlorpyrifos 20 EC Chlorguard (G), Trishul(C), Chlorban (U)
Chlorpyrifos 20 TC Navigator (G)
Dichlorvos 76 SC Nuvan (S), Doom (U), MarvexSuper (C)
Dimethoate 30 EC Rogor (B), Nugor (U)
Ethion 50 EC Mitoff (G)
Fenitrothion 40 WDP
Fenitrothion 50 EC Folithion
Fenitrothion 82.5 EC Folithion
Fenthion 82.5 EC
Malathion 50 EC Cythion (C)
Malathion 5 DP Malathion (GP)
Methyl Parathion 50 EC(R) Parahit
Monocrotophos 36 SL Guardian (G), Parryphos(C), Phoskill (U)
Oxydemeton-methyl 25 EC Metasystox (B)
Phenthoate 50 EC Phendal (C)
Phosphamidon 40 SL Sumidon (SC)
Phosphamidon 50 SL Kinadon (U)
Phorate 10 CG Thimet, Umet (U)
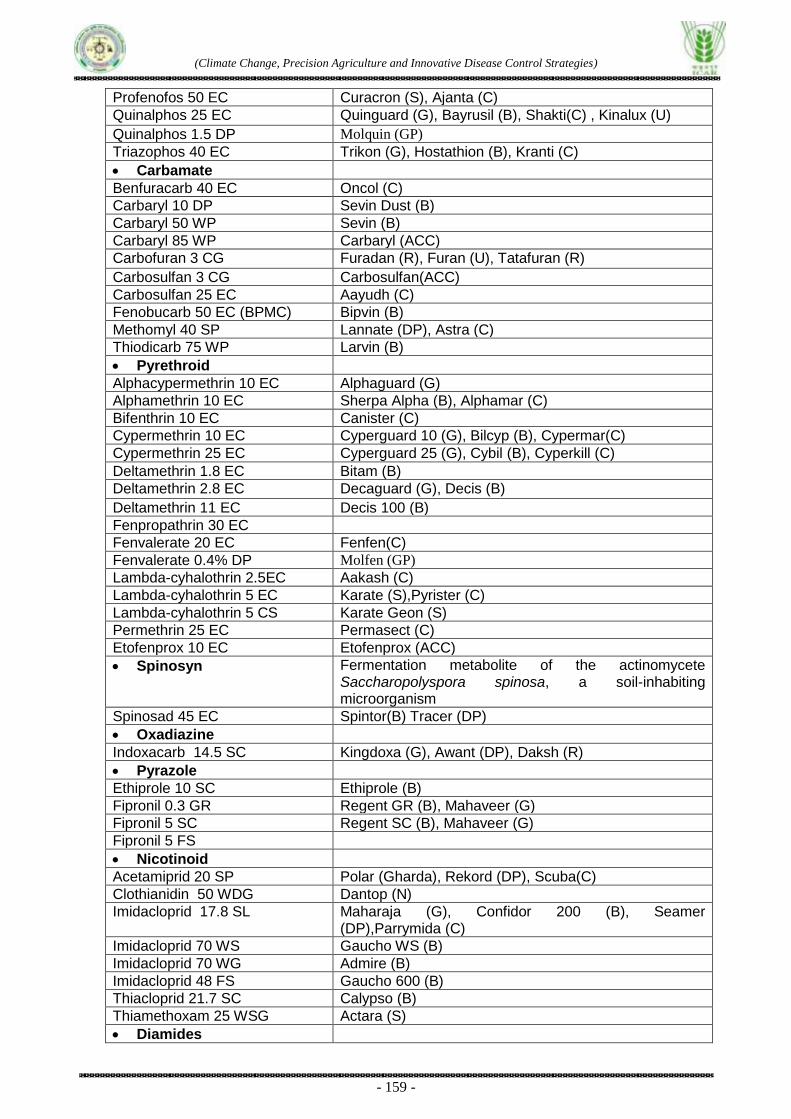
(Climate Change, Precision Agriculture and Innovative Disease Control Strategies)
- 159 -
Profenofos 50 EC Curacron (S), Ajanta (C)
Quinalphos 25 EC Quinguard (G), Bayrusil (B), Shakti(C) , Kinalux (U)
Quinalphos 1.5 DP Molquin (GP)
Triazophos 40 EC Trikon (G), Hostathion (B), Kranti (C)
Carbamate
Benfuracarb 40 EC Oncol (C)
Carbaryl 10 DP Sevin Dust (B)
Carbaryl 50 WP Sevin (B)
Carbaryl 85 WP Carbaryl (ACC)
Carbofuran 3 CG Furadan (R), Furan (U), Tatafuran (R)
Carbosulfan 3 CG Carbosulfan(ACC)
Carbosulfan 25 EC Aayudh (C)
Fenobucarb 50 EC (BPMC) Bipvin (B)
Methomyl 40 SP Lannate (DP), Astra (C)
Thiodicarb 75 WP Larvin (B)
Pyrethroid
Alphacypermethrin 10 EC Alphaguard (G)
Alphamethrin 10 EC Sherpa Alpha (B), Alphamar (C)
Bifenthrin 10 EC Canister (C)
Cypermethrin 10 EC Cyperguard 10 (G), Bilcyp (B), Cypermar(C)
Cypermethrin 25 EC Cyperguard 25 (G), Cybil (B), Cyperkill (C)
Deltamethrin 1.8 EC Bitam (B)
Deltamethrin 2.8 EC Decaguard (G), Decis (B)
Deltamethrin 11 EC Decis 100 (B)
Fenpropathrin 30 EC
Fenvalerate 20 EC Fenfen(C)
Fenvalerate 0.4% DP Molfen (GP)
Lambda-cyhalothrin 2.5EC Aakash (C)
Lambda-cyhalothrin 5 EC Karate (S),Pyrister (C)
Lambda-cyhalothrin 5 CS Karate Geon (S)
Permethrin 25 EC Permasect (C)
Etofenprox 10 EC Etofenprox (ACC)
Spinosyn Fermentation metabolite of the actinomycete Saccharopolyspora spinosa, a soil-inhabiting microorganism
Spinosad 45 EC Spintor(B) Tracer (DP)
Oxadiazine
Indoxacarb 14.5 SC Kingdoxa (G), Awant (DP), Daksh (R)
Pyrazole
Ethiprole 10 SC Ethiprole (B)
Fipronil 0.3 GR Regent GR (B), Mahaveer (G)
Fipronil 5 SC Regent SC (B), Mahaveer (G)
Fipronil 5 FS
Nicotinoid
Acetamiprid 20 SP Polar (Gharda), Rekord (DP), Scuba(C)
Clothianidin 50 WDG Dantop (N)
Imidacloprid 17.8 SL Maharaja (G), Confidor 200 (B), Seamer (DP),Parrymida (C)
Imidacloprid 70 WS Gaucho WS (B)
Imidacloprid 70 WG Admire (B)
Imidacloprid 48 FS Gaucho 600 (B)
Thiacloprid 21.7 SC Calypso (B)
Thiamethoxam 25 WSG Actara (S)
Diamides

(Climate Change, Precision Agriculture and Innovative Disease Control Strategies)
- 160 -
Chlorantraniliprole 20SC Coragen (DP), Rynaxypyre (DP)
Flubendiamide 480SC Fame (B)
Nereistoxin Isolated from a marine annelid, Lumbrineris heteropoda
Cartap 4 GR Kraft (G), Parry Ratna (C), Sanvex (N)
Cartap 50 SP Josh(C), Sanvex (N), Cartox (R)
Growth regulators
Buprofezin 25 SC Applaud (R)
Diflubenzuron 25 WP Dimilin
Flufenoxuron 10 DC Cascade
Lufenuron 5 EC Cigna (S)
Novaluron 10 EC Caesar (DP)
Thiourea
Diafenthiuron 50 WP Pegasus (S)
Antibiotic
Emamectin benzoate 5 SG Proclaim (S)
Fumigant
Aluminium Phosphide 56% Tablet (R)
Celphos (E), Quickphos (U)
Aluminium Phosphide 15% Tablet (R)
Quickphos (U)
Aluminium Phosphide 56% Powder (R)
Celphos (E),Fumino (U)
Ready to use mixtures
Chlorpyrifos 50% + Cypermethrin 5% EC
Hamala 550 (G), Catch (C)
Triazophos 35% + Deltamethrin 1% EC
Spark (B)
Deltamethrin 0.72% + Buprofezin 5.65 % EC
Dadeci 5.625 (B)
Profenofos 40% + Cypermethrin 4% EC
Polytrin (S)
Quinalphos 20% + Cypermethrin 3% EC
Prachand (C)
Acaricide
Abamectin 1.9 EC Vertimec (S)
Dicofol 18.5 EC Delcofol , Tiktok (U)
Ethion 50% EC Coromit
Fenazaquin 10% EC Magister (DP)
Rodenticide
Bromadiolone 0.005 % RB Roban (P)
Zinc Phosphide Ratol (U)
Molluscicide
Metaldehyde Snailkill (PIL)
(R)- Restricted – To be used under technical supervision
G- Gharda Chemicals Limited, B- Bayer CropScience Limited, S- Syngenta India Limited,
C- Coromandal Fertilizers Limited, U-United Phosphorus Limited, E-Excel Crop Care Limited, GP-
Gujrat Pesticides, K-Kanoria Chemicals, CA-Cynamid Agro, DP-DuPont, M-Mansanto, SC-
Sudarshan Chemicals, R-Rallis, P-PCI, H-Hindustan Antibiotic Limited, I-Indofil, B-BASF, A-Amvac
Rasayan, SK-Shivalik, N-Nagarjuna ; DK-Dhanuka, PIL-Pesticide India Limited

(Climate Change, Precision Agriculture and Innovative Disease Control Strategies)
- 161 -
HPLC – An Important Tool for assessment of Fungicide residues in Crops
Anjana Srivastava
Department of Chemistry, GBPUA&T, Pantnagar- 263 145 (Uttarakhand)
High-performance liquid chromatography (HPLC) is a form of liquid chromatography to
separate compounds that are dissolved in solution.
Compounds are separated by injecting a plug of the sample mixture onto the column. The
different components in the mixture pass through the column at different rates due to differences in
their partitioning behavior between the mobile liquid phase and the stationary phase.
Functional description of the HPLC instrument Mobile phase reservoir, filtering
Pump
Injector
Column
Detector
Data system
The choice of appropriate mobile phase and column play a very important role in optimizing
conditions for HPLC analysis. The mobile phase is less polar than the stationary phase in normal
phase HPLC but in RP-HPLC it is more polar than the stationary phase. Solvents must be
degassed to eliminate formation of bubbles. The pumps provide a steady high pressure with no
pulsating, and can be programmed to vary the composition of the solvent during the course of the
separation.
The heart of the system is the column where separation occurs. Since the stationary phase
is composed of micrometre size porous particles, a high pressure pump is required to move the
mobile phase through the column.
The chromatographic process begins by injecting the solute onto the top of the column.

(Climate Change, Precision Agriculture and Innovative Disease Control Strategies)
- 162 -
Separation of components occur as the analytes and mobile phase are pumped through the
column. Eventually, each component elutes from the column as a narrow band (or peak) which is
detected on the recorder.
Detection of the eluting components is important, and this can be either selective or
universal, depending upon the detector used. The response of the detector to each component is
displayed on a chart recorder or computer screen and is known as a chromatogram. To collect,
store and analyse the chromatographic data, computer, integrator, and other data processing
equipment are frequently used.
Quantitative analysis by HPLC
A calibration curve is created using the standard sample The area of a peak is proportional
to the concentration of the corresponding component. The concentration of the compound of
interest can be determined from the peak area of the detected compound
Attention should be given to the fact that a qualitative analysis includes many uncertainties.
Other components may also elute together with the target component. LC and GC systems are
good at determining the content of a certain component in a sample, rather than the types of the
components of a sample.
Use of HPLC in pesticide / fungicide residue analysis
Due to the indiscriminate use of pesticides for different applications, important
environmental problems are emerging that are a risk to plant, animal, and human health.
Pesticide residue in crops refers to the pesticides insecticides, fungicides, herbicides etc.) that
may remain on or in food after they are applied to food crops. The levels of these residues in foods
is often stipulated by regulatory bodies in many countries.
Pesticide residue analysis is defined as both the qualitative and quantitative analysis of the
representative samples drawn from agricultural field, market and environment for pesticides and
their toxic metabolites.
The European Union issues new and revised Maximum Residue Limits (MRLs) from time
to time for the different pesticides used across the world. The revision is intended to simplify the
previous system, under which certain pesticide residues are regulated by the Commission.
Fungicides are one group of these pesticides that are used primarily to control spoilage of crops as

(Climate Change, Precision Agriculture and Innovative Disease Control Strategies)
- 163 -
a result of fungal attack. Fungicides in general represent approximately 20 to 25 percent of all
pesticides used.
HPLC method development for fungicides
The 3 critical components considered for developing an HPLC method for fungicide
residues are: sample preparation / extraction, HPLC analysis and standardization (calculations).
1. Sample preparation / extraction and cleanup
A comprehensive literature search of the chemical and physical properties of the analytes
(and other structurally related compounds) is essential to ensure the success of the method.
Most sample preparations involve the use of organic-aqueous and acid-base extraction
techniques. Therefore, literature survey is very helpful to understand the solubility and pKa of the
analytes.
Solubility in different organic or aqueous solvents determines the best composition of the
sample solvent. pKa determines the pH in which the analyte will exist as a neutral or ionic species.
This information will facilitate an efficient sample extraction scheme and determine the optimum
pH in mobile phase to achieve good separations.
2. HPLC analysis
The LC analysis of these substances can be challenging. After suitable selection of solvent
for extraction, a proper choice of column and mobile phase is also essential. for example,
Thiabendazole,shows significant tailing on most silica based LC columns, particularly if the
analysis is performed at acid pH, but both thiabendazole and carbendazim show excellent
retention and good peak shape when analyzed at pH 10 on C18 columns.
Fungicide analysis is carried out mostly on C-8 and C-18 columns with UV, Fluorescence
detectors after appropriate extraction and clean up steps. Post column derivatization has also
been reported. A number of multiresidue determination by C-18 HPLC and UV detector have been
reported for ex. Vinclozolin, iprodione, procymidone while some like thiabendazole, biphenyl, o-
phenylphenol and diphenylamine by fluorimetric determination.
The data is obtained in the form of peaks and for recording the data high speed computers
are used. Recorded data can further be manipulated on the basis of comparison for identification
of the compound of interest.
3. Calculations / Data analysis
The data should always be in triplicate so that it can be subjected to stastistical analysis.
The primary data alongwith S.D or C.V are usually reported in tabular form. They show the spread
of the data and are a measure of precision.
The residue data can also be presented in graphical form as a persistence or dissipation
curve and with the help of these curves the half life values of pesticides / fungicides can be
calculated.
Estimation of Carbendazim fungicide in vegetable samples by HPLC
Carbendazim is a broad spectrum benzimidazole group of systemic fungicides, used for

(Climate Change, Precision Agriculture and Innovative Disease Control Strategies)
- 164 -
controlling several plant diseases. It is basic in nature having high solubility in aqueous organic
solvents.It can remain in solution form in acidic aqueous solutions. When this acidic aqueous
solution is partitioned with organic solvents, most of the coextractives are partitioned with the
solvent whereas carbendazim remains in the aqueous phase.
Extraction from vegetables 25gm vegetable sample
׀Extract with CH3OH (2x50ml)
׀Extract with CH3OH (2x50ml)
׀Partition with CH2Cl2
׀Clean up on a column packed with silica gel and NaCl and activated charcoal
׀Elute with CH2Cl2 + C2H5COOCH3
׀
Evaporate the eluate to dryness and dissolve the residue in HPLC grade CH3OH
HPLC conditions:
Stationary phase : C18 column (25cmx4.6mm i.d)
Mobile phase : CH3OH : H2O (80:20)
Detection : UV 280nm
Estimation of Pyroquilon fungicide in soil, paddy and straw
Pyroquilon, an unclassified group of fungicide used for controlling rice blast disease in rice
plants by seed treatment. It is highly soluble in polar organic solvents.
Extraction from soil, paddy and straw
50g soil/ 25g grain/ 25g straw ׀
Extract with CH3COCH3 : 0.1N HCL (80:20) Filter ׀
Neutralize extract with Na2CO3 and evaporate to dryness ׀
Partition with CH2Cl2: H2O ׀
Dry over MgSO4 and filter ׀
Concentrate the eluent to 1ml and pass through SPE cartridge loaded with silica ׀
Elute with 5ml solvent ׀
Evaporate the solvent under a stream of N2
׀Dissolve residue in 1ml mobile phase
HPLC conditions:
Stationary phase : C18 column (25cmx4.6mm i.d)
Mobile phase : CH3CN : H2O (30:70)
Detection : UV 254nm

(Climate Change, Precision Agriculture and Innovative Disease Control Strategies)
- 165 -
Novelties in Mango Malformation Research
D.K. Chakrabarti N. D. University of Agriculture and Technology, Faizabad (UP)
In recent years no other plant disease has drawn so much attention from scientists of
various disciplines and generated such high-pitched animated debate as mango malformation.
The sequence of events that unraveled the confusion in understanding its cause and thereafter
stepwise revelation of different aspects of the disease leading to a common agreement about
nature of its causal organism and developing integrated management practices makes a
fascinating story. Here attempts have been made to trace the course of research of mango
malformation since its first report in 1891 till date. The publications that have mooted new ideas
and directed the course of the investigations have been specially mentioned.
In the initial years i.e. upto the fifties, the research was limited to the visual observations and
reporting the disease symptoms and severity; attempts were also made to speculate the probable
cause and possible remedies. During this period erophyid mites were the prime suspects as
causal organism. Besides the hypothesis of virus origin of the disease was mooted, both
vegetative and floral malformation were envisaged as the manifestations of the same disease and
attempts were made to reduce the disease incidence through eradication of malformed plant parts.
Some of the important findings during this period are:
Initially the malformation was reported as abnormal manifestations on inflorescences. But
during this time manifestation of the disease on branches of grown up trees and top of the
young seedlings were recorded.
The term “Bunchy top” was first time used to denote seedling malformation; thus
distinguishing it from vegetative malformation.
The association of the eriophyid mite Aceria mangifera with malformation was a significant
report.
The idea that the disease is caused by a virus was also mooted which took long years to
clear off.
The research in the sixties are marked by systemic approach to identify the cause of the
disease. Attempts were made to prove Koch’s postulates for the first time both with eriophyid mites
and a fungus Fusarium moniliforme, the two major suspected causal organisms. The important
research findings during this period are:
Disturbed C/N ratio was implicated to contribute in the disease symptoms.
F. moniliforme was found to be associated with the malformed tissues and malformation
symptoms were reproduced by artificial inoculation with the isolated fungus.
On the other hand, a group of scientists reproduced malformed shoots and panicles by
inoculating just sprouting buds with mites taken from malformed twigs.
The role of temperature in the disease manifestation that has become a favourite aspect in

(Climate Change, Precision Agriculture and Innovative Disease Control Strategies)
- 166 -
later years was initiated this time.
A remarkable discovery of this time was control of mango malformation by removing
malformed shoots and panicles.
The research in seventies witnessed an intensive investigation on the biochemical and
physiological alteration in malformed plants. The horticulturists and plant physiologists interpreted
the changes as the cause of the malady while the plant pathologists viewed them as the resultant
of the pathogenic invasion (F. moniliforme) or physiology of pathogenesis. The important
observations are:
A control measure consisting of deblossoming and naphthyl acetic acid (NAA) spray which
is till date the favourite recommendation for horticulturists and plant physiologists was
suggested.
Differences in growth hormone gibberellins, and protein and DNA contents between
healthy and malformed tissues were determined and speculated that these qualitative and
quantitative changes of the biochemical components induced the disease symptoms.
In seventies a substantial changes in perspectives were recorded. To confirm or disprove
the contention of horticulturists and plant physiologists that the aberrant biochemical constituents
of the host cause the malady, plant pathologists first inoculated the healthy plants with the
pathogen and subsequently reproduced the similar biochemical changes. Thus convinced that the
abnormal biochemical constituents were not the cause of the disease; on the contrary, these were
the results of the pathogenic invasion.
Artificially inoculating the healthy host tissues, biochemical changes in protein and nitrogen
content, cell wall components and oxidative enzymes activity similar to that of naturally
malformed plants were reproduced.
F. moniliforme was renamed as F. moniliforme var. subglutinans.
Primary indications towards host-specificity of the pathogen and its dependence on
external wounding agencies, biotic or abiotic, to enter the host came into the fore.
The presence of toxins of F. moniliforme var. subglutinans was detected in malformed
cells; the chemical nature of the toxins and their role in producing the disease symptoms
was established.
First experimental proof of micronutrient deficiency in malformed tissues was produced.
The idea of implementation of quarantine rule to prevent distant spread of the disease was
mooted.
In the eighties, most of the research publications directly or indirectly substantiated the
pathogenic origin of the disease. In addition to the estimation of growth hormones in malformed
tissues, interest in the disease epidemiology was also become apparent.
Elaborate authentic experimentation conclusively disproved the virus origin of the disease.
Further information in support of the involvement of the fusarial toxins in the disease

(Climate Change, Precision Agriculture and Innovative Disease Control Strategies)
- 167 -
manifestation was made available. In thiscontext, a toxic compound Malformin, usually
secreted by Aspergillus niger is to be mentioned especially.
The disease specific GA and cytokinins produced by the pathogen both in vitro and vivo
were identified.
However, in depth study on the physiology of pathogenesis strongly supported the
contention that the disease manifestation is the combined effects of the aberrant host
metabolites (toxic principles, TP) or (mangiferin, zoosterols, abnormal GA or cytokinins)
and the fusarial toxins (malformation inducing principles, MIP) or (trichothecenes, T-2
toxins, zearalenone, abscisic acid).
Despite the strong evidence supporting F. moniliforme var. subglutinans as the causal
organism of the disease, some publications cast doubt on the fact that the fungus is responsible
for mango malformation. Hence, to provide unequivocal evidence, a series of studies using
molecular diagnostic tools were undertaken in nineties. This period also witnessed large number of
publications on the epidemiology that was so far poorly understood. Besides, some disease
forecasting models were proposed.
Improved technologies such as vegetative compatibility (VCG) and use of GUS reporter
gene further confirmed F. moniliforme var. subglutinans as the causal organism of the
disease.
Biochemical evidence were put forward to establish it as a physiological race of F.
moniliforme var. subglutinas and was proposed to name it as F. moniliforme var.
subglutinans f. sp. mangiferae. The mechanism of transformation of the fungus into a
physiologic race was also reported.
Various epidemiological aspects viz. structure of the epidemic, seasonal variation of the
pathogen vis-à-vis the disease incidence in relation to environmental parameters,
mangiferin content and flushing of the host, synergistic role of a new group of
mycophagus mite with the pathogen, disease dissemination and variation in symptom
expression and virulence of the pathogen under adverse agro-climatic conditions were
reported.
Role of ethylene in malformation was intensively investigated.
Mathematical models forecasting the disease outbreak and for assessment in yield loss
were proposed.
A single step control measure was replaced with integrated management strategy. The
IPM strategy was formulated keeping the disease epidemiology in view.
In the past few years, also a plethora of convincing experimental evidence supporting F.
moniliforme var. subglutinanas as the causal organism have been generated. Its taxonomic
position was reviewed and nomenclature of F. moniliforme var. subglutinanas from mango has
been revised. Subsequently many new aspects of epidemiology have been focused.

(Climate Change, Precision Agriculture and Innovative Disease Control Strategies)
- 168 -
Improved inoculation technique has been developed which has made possible to
reproduce both vegetative and floral malformation symptoms consistently and easily.
Chromosomal anomalies during microsporogenesis in malformed flowers resulting into
abortive pollens were reported.
The PR protein that imparts resistance in the host plant against the pathogen was
identified.
Studies using different molecular tools such as nuclear and mitochondrial DNA sequences
and isozymes and tests for mating types and compatibility concluded that Fusarium isolate
from malformed mango tissues represented a new species of G. fujikuroi complex and a
discrete taxon. It was described as F. mangiferae.
The studies on population genetics conducted with the F. mangiferae showed very little
variations among isolates from different region of the world. F. mangifeae in different
geographical areas was most probably introduced from India. It was also assumed that the
pathogen have originated in India.
A computerized expert system has been developed to predict the disease incidence in any
state of India and to suggest appropriate an IPM strategy.
But we have “miles to go” to completely unwind the mystery of malformation and find out an
easy and a single stroke solution. In view of the current enthusiasm among the new generation of
scientists and their improved techniques, it may be hoped that it is not far away when the stride to
tame the devastating malady will trump the success of century old efforts.
However, once India was the epicenter of mango malformation research. But now-a-days
hardly any scientist in India venture to work on this problem. On the contrary, a number of
scientists in USA, Israel, South Africa, Australia are vigorously and constantly pursuing the
research on malformation. Perhaps we are looking towards these countries to come with
technologies that will save our mango orchards from the tentacles of malformation!

(Climate Change, Precision Agriculture and Innovative Disease Control Strategies)
- 169 -
Precision Agriculture for Higher Productivity and Profitability
Rajeew Kumar and Vineeta Department of Agronomy, GBPUA&T, Pantnagar- 263 145 (Uttarakhand)
Traditional agriculture provides goods required by the farming family usually without any
significant surplus or sale. But burgeoning population compel us to go for more food, which
resulted unstable farming system. The traditional agriculture is an important reserve and source of
biodiversity. Food demand laid the birth of modern agriculture where more crops can be grown on
less land. Modern agriculture is dependent on fossil fuels, mostly for mechanized agriculture. The
goal of modern agriculture practices is to help farmers provide an affordable supply of food to meet
the demands of a growing population. The challenge for the future is how to increase yields in
traditional systems while retaining a certain measure of their integrity. Future agriculture requires
to produce more food per unit land simultaneously consider the threat of deterioration of natural
resources as well as environment. Modern agriculture is based on uniform recommendation
technique. However, this is need of hour to take care of individual site/plant to enhance their
productivity. Under such circumstances precision agriculture is only alternative.
1. Precision agriculture
Precision agriculture (PA) – also known as precision farming, prescription farming, variable
rate technology (VRT) and site specific agriculture – is a current buzz word among the agricultural
circles and considered as the agricultural system of the 21st century, as it symbolizes a better
balance between reliance on traditional knowledge and information – and management – intensive
technologies. It is an integrated agricultural management strategy where farmers can adjust input
use and cultivation methods – including seed, fertilizer, pesticide, and water application, varietal
selection, planting, tillage, harvesting – according to varying soil, crop and other field conditions. In
brief, precision agriculture refers to tailoring crop and soil management practices according to
variation in crop and soil conditions within each field. PF differs from conventional farming that is
based on uniform treatments across a field. A key difference between conventional management
and precision agriculture is the application of modern information technologies can be viewed as
technologies that improves the efficiency of inputs applied but requires higher investment capital
and labor than traditional technology. It involves mapping and analyzing within field variability and
linking spatial relationships to management decisions, thereby helping farmers to look at their
farms, crops and practice from and entirely new perspective. PA thus provides a framework of
information with farmers can make both production and management decisions.
PA promises to revolutionize form management as it offers a variety of potential benefits in
profitability, productivity, sustainability, crop quality, environmental protection, on – farm quality of
life, food safety, and rural economic development. Studies in USA, Canada, Europe and Australia
have shown that PF permits reductions in input application rates without sacrificing crop yields.
Refinement and wider application of PA technologies in India can help in lowering production

(Climate Change, Precision Agriculture and Innovative Disease Control Strategies)
- 170 -
costs, enhancing higher productivity and environmental benefits, and better utilization of natural
resources. For example, site – specific application of irrigation in wheat of Punjab and Haryana,
pesticides in cotton and fertilizers applications in plantations of oil palm in South India and coffee
and tea garden of Eastern India can greatly reduce production costs and decrease environmental
loading of chemicals.
When PA technologies judiciously implemented, farmers could be benefited in many ways.
In the short term, growers can use forecast based on remote sensing and alleviate problems such
as water stress, nutrient deficiency and pests/diseases more effectivity. Database – building
benefits will be in the form of accurate farm document keeping for effective management of inputs,
property, machinery and labor, and efficient monitoring of environmental quality through recording
the amounts and location of input through applying at exact locations that produce maximum profit
margins. PF technologies also increase opportunities for skilled employment in farming, and
provide new tools for evaluating multifunctional character (including non – market functions) or
agriculture and land.
2. Integrated technology components
Precision agriculture technologies provide three basic requirements for precise and
sustainable agricultural management. These are: Ability to identify precise location of field, 2.
Ability to gather and analysis information on spatio – temporal variability of soil and crop conditions
at field level, and 3. Ability to adjust input use and farming practices to maximize benefits from
each field location. Precision farming involves integrated technologies such as (GPS), (GIS),
Remote Sensing, Variable Rate Technology (VRT), Crop models, yield monitors and precision
irrigation. Various configurations of these technologies are suitable for different PF operations.
Information technology such as the Internet is good means for some agri – business companies to
deliver their services and products.
2.1 GPS
More recently farmer in USA have gained access to site – specific technology through use
of GPS. Currently a constellation of 27 satellites developed by the US Department of Defense –
provides geospatial accuracy to farm practices and enables farmers to identify and compare
characteristic of each field site (location of soil sample or pest data are collection and compared to
soil and crop vigor map, respectively). A minimum of four satellites is required to get good position
information. If a GPS receiver is used along with a ground reference station (Differential GPS), any
location on earth can be identified to within one square meter. The value of knowing a precise
location within inches is that 1) locations of soil samples and the laboratory results can be
compared to a soil map, 2) fertilizer and pesticides can be prescribed to fit soil properties (clay and
organic matter content) and soil conditions (relief and drainage), 3) tillage adjustments can be
made as one finds various conditions across the field, and 4) one can monitor and record yield
date as one goes across the field.

(Climate Change, Precision Agriculture and Innovative Disease Control Strategies)
- 171 -
2.2 GIS
Geographic information system is a computerized data base management and retrieval
system, which offers spatial solutions to many problems relating crop productivity and agronomic
management. It can integrate all types of spatial and non spatial information collected form
different sources and interface with other decision support tools such as crop models. GIS can
display analyzed information in maps that allow (a) better understanding of interactions among
crop vigor, yield, nutrients status, pests & disease stress, weeds and other factors, and (b)
decision-making based on such spatial relationships. Recently, many types of commercial and
user specific GIS software with varying functionality are now available. For example, AGROMA
from PCI, AGRIMAPPER, DSSAT v 3.5 with Arc/View interface from IBSNAT A comprehensive
farm GIS contains base maps such as topography, soil type, N, P, K and other nutrient levels, soil
moisture, pH, etc. data on crop rotations, tillage, nutrient and pesticide applications, yields, etc.
can also be stored. GIS is useful to create fertility, weed and pest intensity maps, which can then
be used for making maps that show recommended application rate of nutrients or pesticides.
2.3 Remote Sensing
Satellite has inherent quality of providing information on spatial variability in crops caused
by natural and agronomic practices. Some farmers have already received benefits from satellite
data. Remotely sensed images from LANDSAT, SPOT and IRS LISS III have been used to
distinguish crop species and locate crop stress areas. Commercial satellites to be launched in
future are expected to have ideal sensors specifications for Precision farming such as 3-day
repeat coverage, 1 to 4 meter spatial resolution and image delivery to users within 15 minutes
after acquisition. At present, IKONOS satellite from Imaging has capability to provide multi-spectral
data with 1 to 4 meters spatial resolution for India which make it possible to have information on
actual state of crop in the field. IKONOS is clearly paving the way toward making agricultural
monitoring a reality so that farmers are able to reach their management and planning goals.
Moreover, merged of LISS III + PAN from current IRS series satellites can also shows all crop
fields and thereby helps in field boundary detection and updating of cadastral information along
with cultural and management details. Remotely sensed images can show all fields in a village or
block and spot problems sooner than ground survey, thereby allowing remedial treatments to be
taken up before the stress spreads to other parts of the field. In a field survey, GPS can be used to
pinpoint the stressed area for a detailed examination. Crop vitality indicators can also be
determined using images acquired at different times during a season. Such data when use with
crop, models through calibration of re-initialization of model, can be useful in predicting crop yields.
2.4. Variable rate technology
One method of controlling variability within field is VRT. VRT allows grower to apply the
quantity of crop inputs needed at a precise location in the field based on the individual
characteristics of that location. Typical VRT system includes a computer controller, GPS receiver,
and GIS map databases. Computer controller adjusts the equipment application rate of the crop

(Climate Change, Precision Agriculture and Innovative Disease Control Strategies)
- 172 -
input applied. The computer controller is integrated with the GIS database, which contains the flow
rate instructions for the application equipment. The computer controller uses the location
coordinates from the GPS unit to find the equipment location on the map provided by the GIS unit.
The computer controller reads the instructions from the GIS system and varies the rate of the crop
input being applied as the equipment crosses the field. The computer controller will record the
actual rates applied at each location in the field and store the information in the GIS system, thus
maintaining precise field maps of materials applied.
3. Role of precision agriculture
The real value of precision agriculture for the farmer is that he can adjust seeding rates,
plan more accurate crop protection programs, perform more timely tillage and know the yield
variation within a field. These benefits will enhance the overall cost effectiveness of his crop
production.
3.1. Seeding
Hybrid seeds perform best when placed at spacing that allows the plants to obtain such
benefits as maximum sunlight and moisture. This is best accomplished by varying the seeding rate
according to the soil conditions such as texture, organic matter and available soil moisture. One
would plant fewer seeds in sandy soil as compared to silt loam soils because of less available
moisture. The lower seed population usually has larger heads (ears) of harvested seeds providing
for a maximum yield. Since soils vary even across an individual farm field, the ability to change
seeding rates as one goes across the field allows the farmer to maximize this seeding rate
according to the soil conditions. A computerized soil map of a field on a computer fitted on the
tractor along with a GPS can tell farmers where they are in the field allowing the opportunity to
adjust this seeding rate as they go across their fields.
3.2. Crop Protection
The application of chemicals and fertilizers in proper proportions are of environmental and
economic concern to the farmers. Environmental regulations are calling for the discontinuance of
certain pesticide applications within 100 feet of a stream or water body or well or within 60 feet of
an intermittent stream. Using a GPS along with a digital drainage map, the farmer is able to apply
these pesticides in a safer manner. In fact, the spraying equipment can be preprogrammed to
automatically turn off when it reaches the distance limitation or zone of the drainage feature.
Additionally, farmers can preprogram the rate of pesticide of fertilize to be applied so that only the
amount needed determined by the soil condition is applied varying this rate from one area of the
field to another. This saves money and allows for safer use of these materials.
3.3 Tillage
The ability to vary the depth of tillage along with soil conditions is very important to proper
seedbed preparation, control of weeds and fuel consumption and therefore cost to the farmer.
Most farmers are using conservation tillage which means leaving residues on the soil surface for
erosion control. The use of GPS in making equipment adjustments as one goes across the

(Climate Change, Precision Agriculture and Innovative Disease Control Strategies)
- 173 -
different soil types would mean higher yields and safer production at lower costs. This part of
precision farming is in its infancy. The equipment companies will be announcing tillage equipment
with GPS and selected controls tailored to precision farming in the near future.
3.4 Harvesting
The proof in the use of variable rate technology (adjusting seed, pesticide, fertilizer and
tillage) as one goes across the field is in knowing the precise yields. Combines and other
harvesting equipment can be equipped with weighing devices that are coupled to a GPS. One
literally measures yields on the go. With appropriate software, a yield map is produced showing
the yield variation throughout the field. This allows farmers to inspect the precise location of the
highest and the lowest yielding areas of the field and determine what caused the yield difference. It
allows one to program cost and yield to determine the most profitable practices and rates that
apply to each field location. In my opinion, the use of yield monitors is a good place to start if one
wants to get started in precision farming. Yield data from the same field over 3 + years would
define the weak spots in the field and narrow down the probability of what is causing a log yield.
4. Role of remote sensing in precision agriculture
4.1 Management Zone and Soil Maps
Soil maps are also sometimes used to determine management zones. Soil maps are
becoming part of the GIS database. Except for semi detailed country soil surveys, remote sensing
has not gained wide acceptance as a mapping tool for soil characteristics. This is because “the
reflectance characteristics of the desired soil properties (e.g., organic matter, texture, iron content)
are often confused by variability in soil moisture content, surface roughness, climate factors, solar
zenith angle, and view angle”.
4.2 Monitor Crop Health
Remote sensing data and images provide farmers with the ability to monitor the health and
condition of crops. Stressed plants reflect various wavelengths of light that are different from
healthy plants. Healthy plants reflect more infrared energy from the spongy mesophyll plant leaf
tissue than stressed plants. By being able to detect areas of plant stress before its becomes
visible, farmers will have additional time to analyze the problem area and apply a treatment.
4.3 Water Stress
The use of remote sensors to directly measure soil moisture has had very limited success.
Synthetic Aperture Radar (“SAR”) sensors are sensitive to soil moisture and they have been used
to directly measure soil moisture. SAR data requires extensive use of processing to remove
surface induced noise such as soil surface roughness, revelation, and topography. A crop evapo-
transpiration rate decrease is an indicator of crop water stress or other crop problems such as
plant infestation. Remote sensing images have been combined with a crop water stress index
(“CWSI”) model to measure field variations.
4.4 Weed Management
Aerial remote sensing has not yet proved to be very useful in monitoring and locating

(Climate Change, Precision Agriculture and Innovative Disease Control Strategies)
- 174 -
dispersed weed populations. Some difficulties encountered are that weeds often will be dispersed
throughout a crop that is spectrally similar, and very large-scale high resolution images will be
needed for detection and identification.
4.5 Insect Detection
Aerial or satellite remote sensing has not been successfully used to identify and locate
insects directly. Indirect detection of insects though the detection of plant stress has generally not
been used in annual crops. The economic injury level for treatment is usually exceeded by the
time plant stress is detected by remote sending.
4.6 Nutrient Stress
Plant nitrogen stress areas can be located in the field using high-resolution color infrared
aerial images. The reflectance of near infrared, visible red and visible green wavelengths have a
high correlation to the amount of applied nitrogen in the field. Canopy reflectance of red provides a
good estimate of actual crop yields.
4.7 Yield Forecasting
For crops such as wheat, grain sorghum, production yields, leaf area index (“LAI”), crop
height and biomass have been correlated with NDVI data obtained from multispectral images. In
order to get reasonably accurate yield predictions this data must be combined with input from crop
growth and weather models during the growing season.
5. Scope of precision agriculture in India
Precision farming technologies is a suite of many high-tech tools but there is no need to
adopt all PF technologies at once to start benefiting from them. Many farmers can begin by using
only a part of the technology, as even partial use can bring many benefits. In fact, applying the
entire range of technologies is not profitable in several cases, particularly for technologies that are
not scale-neutral. For example, small farmers in India cannot afford on their own, but some private
sector support is needed for the advancement of data acquisition and analysis methods, including
sensing technologies, sampling methods, data base systems, and geospatial methods. Some of
the agribusiness companies like Nagarjun Fertilizers Company Limited, BAYER India Ltd. and
Mahyco Seeds Pvt. Limited should come forward and get actively involved in extending the
services on precision farming technologies to the farmers someway. There are many companies
have involved in these extension activities and helping to the farmers.
Precision farming technologies is likely to provide a greater profitability advantage for (a)
high-value crops, (b) areas where input costs are high, and (c) areas where production conditions
are very heterogeneous. The implementation of precision agriculture technologies in India should
have two different strategies – one for the low input subsistence agriculture and the other for input-
intensive profit-making agriculture. In case of former, the increase in productivity is the prime
concern. Here, the system has to be converted to information-based agriculture, where farmer has
spatial information about the soil and crop. This information can be used for efficient input
application. Since the field size are small in this situation individually bunded field or a group of

(Climate Change, Precision Agriculture and Innovative Disease Control Strategies)
- 175 -
field can be considered as a unit for variable rate application. However, for the latter case, such as
rice and wheat of Indo-Gangetic belt and the horticultural crops like grape (Maharashtra), potato
(Punjab), tea (Assam) where the field size arer large and farmers are rich, input use efficiency is
prime concern. Here, remote sensing data can be used to identify the spatial and temporal
variability and necessary actions can be adopted using sophisticated equipments like variable rate
technology. Adoption of PF techniques aimed at irrigation management, nutrient management and
integrated pest management will obviously be a priority for such crops.
6. Limitations for adoption of precision agriculture in India
There are many limitations in adopting this high-tech precision farming technology in India.
Some of them include:
High cost of obtaining site-specific satellite data
Lack of willingness to share spatial data among various organizations
Complexity of tools and techniques requiring new skills
Culture, attitude and perceptions of farmers including resistance to adoption of new
techniques and lack of awareness of agro-environmental problems
Farmers inability to afford High-tech farm equipments
Small farms, heterogeneity of cropping systems, and land tenure/ownership restrictions
Infrastructure and institutional constraints including market imperfections
Lack of success stories of PE adoption and lack of demonstrated impacts on yields
Lack of local technical expertise
Uncertainty on returns from investments to be made on new equipment and information
management system
Lack of transformation of technical know –how to farmers in local language, and
Knowledge and technological gaps including
Inadequate understanding of agronomic factors and their interaction.
Lack of understanding of the geostatistics necessary for displaying spatial variability
of crops and soils using current mapping software, and
Limited ability to integrate information from diverse sources with varying resolutions
and intensities.

(Climate Change, Precision Agriculture and Innovative Disease Control Strategies)
- 176 -
Overcoming Nutritional Deficiencies and Toxicities in Crop Plants
P.C. Srivastava Department of Soil Science, GBPUA&T, Pantnagar- 263 145 (Uttarakhand)
The growth of crop plants depends upon a number of soil, climatic and management
factors. Nutrient supply to plants play very important role in plant growth and ultimate crop yield
and quality of produce. When crops fail to absorb any nutrient in sufficient quantities, the metabo-
lism disturbances occur and crops exhibit specific hunger signs. These hunger signs are called
deficiency symptoms, which appear depending upon the mobility of nutrient in plants. Deficiency
symptoms of nitrogen, phosphorus, potassium, magnesium, molybdenum and zinc appear first on
older leaves. The deficiency symptoms of calcium, boron, manganese iron and sulphur appear first
on new leaves and buds. On the other hand, if some of these nutrients are present in excess they
produce toxicity symptoms and require immediate adoption of corrective measures.
Management of nutrient deficiencies in the field requires a thorough knowledge of the
symptoms produced as a result of deficiency or toxicity of the specific nutrient. For the
amelioration of deficiency, corrective measures need to be adopted based on the principles of
integrated nutrient supply system.
Nutrient toxicities especially, in respect of micronutrients are important in certain
geographical regions and can be best managed by using tolerant varieties and chemical
amendments.
Components of nutrient supply system:
In agricultural ecosystem, major sources of plant nutrients are:
Soil
Mineral fertilizers
Organic manures/matter
Amendments
Biofertilizers.
The main aim is to tap all possible sources in a judicious way and ensure their efficient use.
A. Soil source:
In order to enhance the supply of nutrients from soil, the following measures need to be
adopted.
Adoption of appropriate soil management and conservation practices to reduce nutrient
loss.
Amelioration of problem soils to mobilize unavailable nutrients
Maximum utilization of available soil nutrients using appropriate crop variety, cultural
practices and cropping system
Microbiological methods to mobilize unavailable soil nutrients using vesicular-
arbuscular mycorrhizae and Psuedomonas spp.
B. Chemical fertilizers:
More efficient use of chemical fertilizers in the production system is intended. In a country

(Climate Change, Precision Agriculture and Innovative Disease Control Strategies)
- 177 -
like India where the problems of low and unbalanced fertilizer use and food requirement of an ever
increasing population coexist, any approach to further reduce the fertilizer application and
supplementation through alternative sources should be advocated with great caution depending
upon the current level of fertilizer use in the system. The direction should be to maximize
production/unit area/unit time by optimizing fertilizer use efficiency through complementary use of
organics and other alternative sources of plant nutrients. Any additional nutrient applied through
other sources must be taken into account for making up the gap between the recommended and
actual level of fertilizer application.
Higher fertilizer use efficiency can be achieved through:
Use of appropriate fertilizer product
Minimization of nutrient loss by using correct method and time of application
Elimination of all nutritional limiting factors such as primary a- and secondary-nutrients
and improvement in other production factors
Scheduling of fertilizer recommendations
C. Organic manures:
Organic manure/matter is valuable bye-product of farming and allied industries. The
nutrient recycling is possible either by their composting or direct application or mulching. Some of
such sources are-
Farmyard manure, poultry litter, sheep and goat droppings.
Crop residues.
Municipal wastes (Night soil, urine, sewage, sludge)
Slaughter house (blood, bones) and fishery wastes
Bye-products of agro-industries (oil cakes, fruit and vegetable processing wastes,
press-mud rice-husk, bran)
Forest litter, marine algae, sea weeds, water hyacinth, tank silt etc.
D. Biofertilizers:
Suitable microbial culture should be used to tap unavailable soil nutrients. Besides
improving the availability of N to plants, green manuring/leguminous tree leaf manuring and use of
symbiotic and asymbiotic microorganisms also alter the supply of micronutrients. This involves use
of vesicular-arbuscular mycorrhizae and suitable strains of Psuedomonas spp. Microbes capable
of producing growth promoting, antifungal and antibacterial substances can also be used. A
combined inoculation strategy can be adopted to partly reduce the dependence on chemical
fertilizers. This involves an integration of a combination of inoculants with reduced doses of
mineral fertilizers to meet the complete requirement of the crop under a given agro-climatic
condition. The strategy has important relevance in organic farming.
REFERENCES
1. Tisdale, S.L.; Nelson, W.L.; Beaton, J.D. and Havlin, J.L. 1997. Soil Fertility and Fertilizer. 5th ed.
Prentice hall of India.
2. Srivastava, P.C. and Gupta, U.C. 1996. Trace elements in crop production. Oxford. IBH publishing.

(Climate Change, Precision Agriculture and Innovative Disease Control Strategies)
- 178 -
Precision in Soil and Nutrient Management with Special Reference to Subsoil Health
T.C. Thakur
Department of Farm Machinery and Power Engg., GBPUA&T, Pantnagar- 263 145 (Uttarakhand)
India witnessed a remarkable growth on agricultural front particularly during 1970s and 80s
which enabled the country to become self-sufficient in food grain production. The growth in food
grain production started declining during 1990s and presently, it is almost stagnant, forcing the
country to import food grains once again. As the increase in production will come from shrinking
land and water resources, the country is left with no other option but only through improvement in
crop productivity. Soil health degradation has emerged as a major issue responsible for stagnation
in agricultural productivity. In near future, high capacity machines would be required for tillage and
sowing operations, often in a single pass to make the best use of available soil moisture. Subsoiling
and deep tillage after harvest in dry soil conditions will be needed to prevent run-off after the rain
and for enhancing the ‘green water’ storage. Seeding and fertilizer placement in deep furrows
would be required, if the soil moisture recedes beyond the normal seeding depth.
The soil cultivation in India changed over the years as per availability of farm power
sources. During 1960s, the soil cultivation was limited to around 10-12 cm depth with dominant
animate power sources. Although tractors upto 80 h.p. are now available in the country, the soil
management practices have not changed appreciably and confined to shallow depths of 10-15 cm
with rigid tine cultivators and harrows which manage soil almost similar to a country plough.
However, some of the farmers also opt for deep tillage upto 20 cm depth occasionally with mould
board/disc ploughs. It can, therefore, be postulated that the Indian subsoil (>25 cm depth) have
not been cultivated due to lack of tractor power in the past. The current decade, however, has
witnessed a definite shift to high h.p. (>50h.p.) tractors with a share of 8-10% out of over 0.42
million tractors produced annually in the country.
Subsoil compaction and hard pan formation is caused either by natural soil forming
processes or by man made activities such as use of heavy weight machinery, repeated cultivation,
indiscriminate movement of machineries, soil cultivation under wet land condition (paddy field),
slipping wheels in furrows during operation of heavy equipment and so on. The heavy equipment
such as combine harvesters, sugarcane harvesters and other specialized machineries have been /
are being introduced on Indian farms. The weight of self-propelled combines in India ranges from
about 6 t (KS-513 TD) to 7.5 t (Standard self-propelled C-514) while the sugarcane harvesters
with weight of 9 to 12 t may compact soil upto 30-40 cm depths, particularly when working under
moist soil condition. This calls for introduction of matching subsoil cultivation equipment with high
h.p. tractors on Indian farms.
For food security in India, the fertilizer security is of paramount importance. But at
present a huge amount of fertilizers is imported every year to meet the domestic demand which
(c)

(Climate Change, Precision Agriculture and Innovative Disease Control Strategies)
- 179 -
puts heavy pressure on Indian economy and drain of foreign exchange. Here again, the
fertilizer application technology has not changed resulting in poor nutrient utilization efficiency
and consequent low productivity. The application of fertilizers is generally accomplished either
through broadcasting and mixing in upper soil layers or furrow/band placement or drilling along
the seeds during sowing. Broadcasting of fertilizers, especially P and K, results in fixation
problems due to more soil contact while applied N is lost due to volatilization. It has been
reported that only 40-50% of N and 20-30% of P and K fertilizers are used effectively by crops
and the remaining get lost through numerous ways. Even in case of existing seed-cum-fertilizer
drills, the seeds and fertilizers are placed side-by-side in the top 4-6 cm depth, thus resulting in
very poor nutrient utilization efficiency. This is because of the fact that fertilizer remains in the
upper dry zone of soil profile for most part of the cropping period.
Yet another dimension of the present problem is that the soil management and fertilizer
application practices do not match with the crop roots requirement which has been very poorly
investigated in our country. The root length and density of different crops vary dramatically with
variety, soil type and condition, moisture and nutrient status as well as biotic and abiotic stress
conditions. The maximum root length of different crops, viz. wheat (1.6 m), rice (0.7 m), maize
(1.83 m), sugarbeet (0.9 m), soybean (1.8 m), cotton (1.83 m), barely (1.4 m), potato (1.0 m) carrot
(3.0 m) and so on has been reported by Van-Noordwijk and Brouwer (1991). In case of rice
(Var.: Saket 4) about 92% and in case of wheat (Var.: UP 2338) about 60.4% roots have been
found in upper 20 cm depth (Pandey and Singh, 2003). In case of sugarcane more than 50%
roots up to 20 cm depth and 85% roots upto 60 cm are generally noticed but could go deeper
even upto 6 m (Lee, 1926). For soybean about 47% roots upto 18 cm depth have been found
(Sanders and Brown, 1978). These facts call for developing tillage equipment for deep
placement of fertilizers directly into the root zone of crops as per their root density for enhanced
nutrients utilization efficiency. By increasing the uptake efficiency, the same amount of yield can
be obtained with less amount of fertilizer. At Pantnagar, over 20% saving of fertilizers has been
found incase of potato and sugarcane for the same yield as that of conventional practices in the
field experiments conducted on deep and differential placement of fertilizers under the ICAR
National Professor Scheme.
Further, a precisely levelled field is pre-requisite for an efficient surface irrigation system,
in-situ conservation of rain water and introduction of Resource Conservation Technologies (RCTs)
such as zero tillage, raised bed planting etc. The laser aided precision land smoothening
equipment have been in use for decades in many developed countries but were imported in India
in the year 2002, the first one by the Pantnagar University from Pakistan through Rice-Wheat
Consortium. Since then, their number has increased year after year. According to an estimate,
over 3000 units of laser land levellers are available in India which have levelled over 1 Mha of land
mainly in the States of Punjab, Haryana, U.P. and Uttarakhand (RWC, 2009). Results of several
hundreds participatory field trials in these States have brought out several benefits of this

(Climate Change, Precision Agriculture and Innovative Disease Control Strategies)
- 180 -
technology which include water saving of 15-30%, increased nutrient utilization efficiency by 10-
15%, enhanced field efficiency of farm equipment by over 10%, increased net cultivable area by
reduction of bunds/ridges and irrigation channels by 2-5%, and yield advantage of 15 to 30% in
different crops (Jat et al., 2006). The area under laser levelling is increasing at an exponential rate
but for tillage operations in these fields, the same old equipment i.e. mould board/disc ploughs,
harrow, cultivator etc. are being used which cause frequent changes in the level of fields.
Therefore, there is an urgent need to develop and introduce such tillage equipment which could
cultivate not only the top soil but also the subsoil without soil inversion so that the biomass in
different soil layers are maintained in the same zone and at the same time, level of the field is
disturbed to a bare minimum. Some of the subsoil health management technologies / equipment
developed under the ICAR National Professor Scheme are briefly described below :
1. Pant-ICAR Subsoiler-cum-Differential Rate Fertilizer Applicator
This machine has been designed by adopting the soil mechanics principle for maximum
soil disturbance with least resistance. It consisted of a rectangular frame with a pair of adjustable
depth control wheels, main subsoiling winged tine mounted at the centre of rear beam of the frame
for soil disturbance upto 50 cm depth, two shallow leading adjustable winged tines mounted on the
front beam of frame at a spacing of about 2 times the full working depth of main subsoiling tine i.e.
about 1 m and operate at a depth of 20-25 cm, a specially designed fertilizer box with adjustments
for vertical movement for varying application rate, three positive feed metering rollers, a floating
armed ground drive wheel to transmit power to the fertilizer metering shaft and a three point
Category-II hitching system (Fig. 1). It can meter and deliver the recommended doze of fertilizers
either in equal amount through three tines or 75-80% fertilizers by two leading tines and remaining
20-25% fertilizers by the main subsoiling tine at two depths. The metered fertilizer drops onto
inverted-V shape deflector plates mounted underneath the extended wing cover and deposits in
bands of about 22 cm width. The technology has been well adopted by the farming community
and research workers, and has been extended to over 250 ha area. Efforts are being made to get
this machine manufactured and supply to different regions of the country particularly in heavy soils
and rainfed areas for adoption in different cropping systems.
2. Pant-ICAR Deep Soil Volume Loosener-cum-Fertilizer Applicator
It consisted of a rectangular frame, two scientifically designed V-shaped tines, four
inverted-T openers tines, two floating type spiked clod crushers, two fertilizer boxes with metering
system, a floating ground drive wheel for power transmission and other accessories (Fig. 1). This
machine is being extensively used for sugarcane ratoon management as Sugarcane Ratoon
Manager and has covered an area of over 175 ha during 2009-11. It cuts the old roots of plant
sugarcane crop after harvesting by upto 30 cm depth with the help of two V-shaped tines
positioned exactly behind the tractor rear wheels and places fertilizers in bands along both sides of
rows at 20±5 cm depth and at the same time pulverizes the clods and consolidates the loose soil
for moisture conservation. This machine leaves a completely levelled field surface after operation

(Climate Change, Precision Agriculture and Innovative Disease Control Strategies)
- 181 -
and therefore, it is the most suitable machine for soil cultivation in laser levelled fields.
3. Pant-ICAR Subsoiler-cum-Vermicompost and Soil Amendments Applicator
It consisted of a subsoiling unit with wings for soil disturbance upto 40 cm depth and a
fertilizer placement unit driven by the tractor PTO for metering and placement of organic manures
(vermicompost, pressmud, FYM), inorganic fertilizers and soil amendments such as gypsum, lime,
rice husk, cement etc. at different depths. The research trials on application of vermicompost and
NPK at different depths upto 40 cm depth have shown substantial increase in yield of mustard
(Var. Kranti) by over 25% in comparison to conventional method of broadcasting and mixing
fertilizers in top 10 cm soil.
4. Pant-ICAR Conservation Tillage Combine
It consisted of a soil working unit with five winged chisel tines positioned at 450 V- angle on
three frames i.e. one tine at the centre of front beam, two tines at V-angle on middle beam and
another two tines at V-angle on rear beam, fertilizer placement unit and a floating spiked clod
crusher unit (Fig. 1). The initial field trial of Pant-ICAR Conservation Tillage Combine has revealed
that it can till soil to the depth of 20-25 cm without soil inversion and with retention of crop residues
at the surface needed for conversation agriculture, place fertilizers in bands at the tillage depth,
pulverize and consolidate the soil for moisture conservation, all in a single pass. Since all the four
wheels of the tractor move on the levelled field surface (in contrast to one side of tractor wheels
operating in the furrow and compacting / smearing the furrow bottom, thereby farming hard tillage
pan incase of conventional mould board / disc ploughing), formation of hard tillage pan could be all
together retarded. Also, there was no need felt for the levelling of field after operation of the
machine, therefore, it is the best suited for soil cultivation in laser levelled fields. The machine can
be operated with a 50-55 h.p. tractor while tilling a depth of 20 cm and cover a width of 1.6 m as
against a mold board / disc plough which covers a width of about 1.25 m only with 3-bottoms
pulled by the same h.p. range tractor and changes the field surface configuration which requires
additional levelling operation. This machine has, therefore, been developed with an ultimate
objective to replace the M.B. plough / disc plough and to solve the associated problems, as it is
capable of providing complete tillage solution.
5. Pant-ICAR Chiseler-cum-Fertilizer Applicator
This machine was developed for soil cultivation upto 20-25 cm depth and simultaneous
application of fertilizers at tillage depth. It consisted of three winged chisel tines mounted on a
rectangular frame in a V-shape i.e. one winged tine at the centre of front beam and two winged
tines mounted on the rear beam at 450 V-line w.r.t. front tine and a fertilizer box with metering and
ground drive wheel with accessories. The evaluation of the machine on potato for deep and
differential placement of fertilizers i.e. 80% of recommended dose at 15 cm and remaining 20% at
25% depth has resulted in the yield increase of more than 24% over conventional practice. It has
been designed for 35-45 hp tractor range.
The adoption of deep subsoil health management technologies developed in the ICAR

(Climate Change, Precision Agriculture and Innovative Disease Control Strategies)
- 182 -
National Professor Scheme has resulted in reduction of rhizomatous and some other kinds of
weeds, destruction of termite’s colonies and less incidence of stem borer in direct seeded rice
which need to be validated through further research. In the past, one of the reasons for failure of
soybean crop in the Tarai region was due to attack of yellow mosaic grown in comparatively wet
soil conditions. There is a need to carry out research with different tillage options such as raised
bed planter, Pant-ICAR subsoiler-cum-differential rate fertilizer applicator and other deep soil
management equipment to have a cap on high soil moisture regime and related pathological
menace.
Pant-ICAR Subsoiler-cum-Differential Rate
Fertilizer Applicator
b. Pant-ICAR Deep Soil Volume Loosener-
cum-Fertilizer Applicator (Sugarcane Ratoon
Manager)
Pant-ICAR Subsoiler-cum-Vermicompost and Soil Amendments Applicator
Pant-ICAR Conversation Tillage Combine
Fig. 1 Subsoil Health Management Technologies Developed at Pantnagar under ICAR National Professor Scheme

(Climate Change, Precision Agriculture and Innovative Disease Control Strategies)
- 183 -
Bio-control Strategies for the Management of Threatening Diseases by Use of Trichoderma spp
Najam Waris Zaidi
Department of Plant Pathology, GBPUA&T, Pantnagar-263 145 (Uttarakhand)
Trichoderma species are free-living fungi that are common in soil and root ecosystems
throughout the world. They are highly interactive in root, soil and foliar environment. They are
presently in nearly all types of soils and other natural habitats especially those containing high
organic matter. This fungus is a secondary colonizer and is frequently isolated from well
decomposed organic matter. Trichoderma species have also been isolated from root surfaces of
various plants, from decaying barks and from sclerotia and propagules of other fungi. Trichoderma
species have the ability to utilize a wide range of compounds as sole carbon and nitrogen sources
and can utilize monosaccharides, disaccharides, polysaccharides etc. for carbon with ammonia
being the most preferred source of nitrogen. The members of Trichoderma are generally
considered to be aggressive competitors although this trait has also been found to be species
dependent.
Trichoderma species are best friends of higher plants. They not only protect them by killing
or antagonizing their enemies but also improve their overall health including toning up of their
ability to tolerate diseases and pests. They act as symbiont and may colonize epidermal and
cortical cells. This colonization results in improved root growth, which in turn improves overall plant
health. Trichoderma species also make micro- and macro-nutrients available to the plants by
enhancing their availability in soil. They decompose soil organic matter which helps in plant
growth. Trichoderma spp are highly efficient producer of many extra cellular enzymes like
cellulases, chitinases, glucanases, proteases etc. They are being exploited in variety of ways like
source of cellulases (used in foods and textiles and also in poultry feed and chitinases (generating
disease resistant transgenic), in plant disease control (through their anti-fungal and anti-nematode
and plant defense inducing activities), improvement of plant growth and organic matter/compost
decomposition.
General characteristics
More than two hundred years ago, when it was first described by Persoon in 1794,
mycologists mistook Trichoderma Pers.: Fr. for a gasteromycetes. At present Trichoderma is a
readily exploitable source and how this source can be fully utilized for economic gains depends on
a clear understanding of the biology, systematics and biocontrol and other characteristics of this
genus.
Trichoderma: Biology
Most species of Trichoderma are photosensitive, sporulating readily on many natural and
artificial substrates in a concentric pattern in response to diurnal alternation of light and darkness
with conidia being produced during the light period. Trichoderma cultures exhibit “replacement wall

(Climate Change, Precision Agriculture and Innovative Disease Control Strategies)
- 184 -
building type” of conidiogenesis. Another interesting property of Trichoderma spp. is their ability to
produce chlamydospores. These resting structures also have the potential to be exploited for
biological control (Papavizas, 1985).
Most Trichoderma strains are not encountered in nature in association with their perfect
stages and are considered to be strictly mitotic, clonal fungi. This apparent lack of sexuality is also
a barrier to understanding relationships within and among Trichoderma species. Sexual
reproduction is known in Trichoderma in the sense that the only known teleomorphs of
Trichoderma are species of Hypocrea Fr. and closely related genera (Samuels, 1996).
About 35 species of Trichoderma are currently recognized on the basis of morphological
and molecular data. However, T. harzianum, T. virens and T. viride are the three most cited
species of Trichoderma for biological control of plant diseases. A detailed description of these
three species as given by Bisset is as follows:
Trichoderma: as a bio-control agent
Weindling in 1932, for the first time implicated the role of Trichoderma lignorum in the
biological control of citrus seedling disease caused by Rhizoctonia solani. Since this pioneering
work, several reports on successful biocontrol by Trichoderma spp. have accumulated. T.
harzianum, T. viride and T. virens are the most widely used/cited for biological control. They are
reported effective in controlling root rots /wilt complexes and foliar diseases in several crops and
are reported to inhibit a number of soil borne fungi like Rhizoctonia, Pythium, Sclerotinia,
Sclerotium, Fusarium spp., Macrophomina etc. and recently root knot nematode, Meloidogyne
spp.
One of the most interesting aspects of studies on Trichoderma is the varied mechanisms
employed by Trichoderma species to affect disease control. In addition to being parasite of other
fungi recent studies shows that they are opportunistic plant symbionts. They produce or release a
variety of compounds that induce localized or systemic resistance responses. Biocontrol activity of
Trichoderma is due to combination of its ability to serve as antagonist, plant growth promoter, plant
defense inducer, rhizosphere colonizer and neutralizer of pathogen’s activity favouring infection.
I. Trichoderma as a fungal antagonist
As an antagonist, Trichoderma may directly kill the pathogen by mycoparasitism and/or
antibiosis. Also, it may adversely affect the growth and development of the pathogen either by
antibiosis or by competing for the nutrient, oxygen or space. Indirectly, it may contribute by
promoting plant growth which manifests itself as increased root and shoot growth, resistance to
biotic and abiotic stresses and changes in the nutritional status of the plant.
1. Host selectivity
Although Trichoderma spp. has got a very wide host range, there is fairly good degree of
host selectivity at the level of strains/ isolates. Many soil borne fungal pathogens like Rhizoctonia,
Sclerotinia, Sclerotium, Macrophomina etc. form hard resting structure called sclerotia. These
sclerotia play vital role in long term survival of these pathogens in soil. It is difficult to kill these

(Climate Change, Precision Agriculture and Innovative Disease Control Strategies)
- 185 -
sclerotia using fungicides. In general T. virens colonizes and kill these sclerotia, whereas T.
harzianum primarily attack hyphae.
2. Mechanism of antifungal action
Against fungal pathogens, Trichoderma species rely on three major mechanisms viz.
mycoparasitism/ hyperparasitism, antibiosis and competition.
i. Mycoparasitism/ Hyperparasitism
One of the most salient characters of the genus Trichoderma is its ability to parasitize other
fungi. Weindling in 1932 for the first time described the biocontrol of R. solani (causing citrus
seedling disease) by Trichoderma lignorum to mycoparasitism. Mycoparasitism is a complex
process involving tropic growth of the biocontrol agent towards the target organism, coiling and
finally dissolution of the target organism’s cell wall/cell membrane by the activity of enzymes.
(Rather than coiling, hyphae of Trichoderma may grow attached with hyphae of R. solani, form
haustoria, which may penetrate host fungal cell to draw nutrients. Same isolate of Trichoderma
harzianum, against R. solani, may show both coiling and haustoria formation, however, one or
other mechanism may dominate depending upon isolate of the antagonist. Is there any effect of
host fungus on type of structure formed by antagonist is yet to be explored?
Studies on the molecular and cellular aspects of the process of mycoparasitism indicate
that it is an extremely complex process involving several steps and numerous separate genes and
gene products. Trichoderma can detect its host from a distance and on detection it starts
branching in an atypical way towards the fungus. This process is probably induced by nutrient
gradients arising from the host
ii). Enzymes
Most of the pathogenic fungi contain chitin and -glucans in their cell walls. Dissolution or
damage of these structural polymers has adverse effects on the growth of these fungi. Recent
research work has implicated a major role of enzymes in biological control by Trichoderma species
and the secretion of enzymes is reported to be an integral step of the mycoparasitic process of
Trichoderma. Trichoderma species secrete a number of hydrolytic enzymes, which includes
chitinases, proteases, cellulases, glucanases and xylanases. Lorito (1998) listed 10 separate
chitinolytic enzymes alone. Similar levels of diversity are reported to exist for -1,3 glucanases.
Elad et al. (1982) tested the secretion of chitinases and -1,3 glucanases by T. harzianum and
observed that the enzymes degraded hyphae of S. rolfsii. Harman et al. (1989) studied the
involvement of “chitinase and -1,3-glucanase” in Trichoderma mediated biological control.
Geremia et al. (1993) purified and biochemically characterized a serine protease enzyme. Elad
and Kapat (1999) suggested the role of proteases in biocontrol of B. cineria by T. harzianum. For
mycoparasitism of Pythiaceous fungi, -1,4-glucanases may play an important role (Thrane et
al.,1997). Ait-Lahsen (2001) isolated and characterized an exo--1,3- glucanase (AGN 13.1)
enzyme from T. harzianum that degrade - glycosidic linkages of polysaccharides of cell wall of

(Climate Change, Precision Agriculture and Innovative Disease Control Strategies)
- 186 -
fungi. The reactions between T. harzianum strains and various fungal hosts were based on
different mechanisms. This, again, indicates that factors other than chitinase activity are important
to the biocontrol process.
iii) Antibiosis
This is the second major mechanism implicated in the biocontrol of pathogens by
Trichoderma. Two years after reporting the involvement of mycoparasitism in Trichoderma- host
fungus interactions, Weindling in 1934 reported that a strain of T. lignorum produced a “lethal
principle” that was excreted into the surrounding medium. He characterized it and demonstrated
that it was toxic to both R. solani and Sclerotinia americana and named it “gliotoxin”. Later in 1983,
Howell and Stipanovic isolated and described a new antibiotic “gliovirin”, from Gliocladium virens
that was strongly inhibitory to Pythium ultimum and Phytophthora but was ineffective against R.
solani, Theilaviopsis basicola, Rhizopus arrhizus, Bacillus thuringensis and Pseudomonas
fluorescens (Howell et al.,1993). Lifshitz et al. (1986) attributed the control of Pythium species on
peas by T. harzianum to the production of an antibiotic. Similarly, suppressive activity of T. virens
to damping off of Zinnias was correlated to production of antibiotic gliotoxin by the bioagent
(Lumsden et al., 1992). Mutation studies with Trichoderma strains have revealed that mutants
deficient for antibiotic production often lack the ability to control Pythium damping off disease
(Wilhite et al., 1994). At present Trichoderma species are reported to produce a number of
antibiotics. These include gliotoxin and glioviridin from T. virens, viridin, alkyl pyrones, isonitriles,
polyketides, peptaibols, diketopiperazines, sesquiterpenes and some steroids from other
Trichoderma species (Howell, 1998).
iv). Competition and rhizosphere competence
Competition is considered as a ‘classical’ mechanism of biological control. It involves
competition between antagonist and plant pathogen for space and nutrients (Chet, 1987). The idea
of the involvement of this mechanism in biocontrol by Trichoderma has gained popularity in recent
years. It is assumed that the mechanism of competition is involved in biocontrol, if no evidence for
mycoparasitism or antibiosis is found in a particular Trichoderma-host fungus interaction. Howell
(2003) used ultraviolet light irradiation to produce mutants of T. virens, deficient for both
mycoparasitism and antibiotic production. However, the mutants still retained biocontrol efficacy
equal to that of the parent strain against both P. ultimum and R. solani causing cotton seedling
disease. This indicated that neither mycoparsitism nor antibiosis is the principal mechanisms
involved in the biocontrol of seedling disease in cotton.
The omnipresence of Trichoderma in agricultural and natural soils throughout the world
proves that it must be an excellent competitor. In studies conducted by Elad and Kapat (1999)
presented information regarding biocontrol of B. cineria by T. harzianum strain T-39. B. cineria
conidia require external nutrients for germination and infection. When conidia of T-39 were applied
to leaves, germination of conidia of the pathogen was slowed, an effect attributed in part to
competition (Elad, 2000). The competitive ability of Trichoderma and therefore its biocontrol

(Climate Change, Precision Agriculture and Innovative Disease Control Strategies)
- 187 -
potential is affected by soil properties.
v). Signal transduction
The ability of Trichoderma to sense and respond to different environmental conditions,
including the presence of a potential host, is essential for successful colonization of soil, organic
material, and developing plant roots. Sensing of such environmental conditions may occur through
a variety of transduction pathways, which determine the adequate cellular response. Mitogen-
activated protein kinase (MAPK) cascades and G-protein subunits transduce a large variety of
signals, including those associated with pathogenesis.
Mukherjee et al. (2003) investigated role of signaling pathway, mitogen-activated protein
kinase (MAPK) cascades, in parasitism of T. virens. Through single- and double-crossover
recombination, they obtained tmkA loss-of-function mutants. The TmkA transcript was not
detectable in these mutants. Against Rhizoctonia solani hyphae, the knockout mutants exhibited
mycoparasitic coiling and lyses of host hyphae similar to that of the wild type. The mutants,
however, were less effective in colonizing the sclerotia of R. solani. On Sclerotium rolfsii, the
MAPK loss-of-function mutants had reduced antagonistic properties and failed to parasitize the
sclerotia. TmkA-dependent and -independent pathways are thus involved in antagonism against
different hosts. Contrary to this Mendoza-Mendoza et al. (2003) observed that MAPK mutant (tvk1
null mutant) was more virulent against R. solani. These mutants showed a clear increase in the
level of the expression of mycoparasitism-related genes under simulated mycoparasitism and
during direct confrontation with the plant pathogen R. solani. The null mutants displayed an
increased protein secretion phenotype as measured by the production of lytic enzymes in culture
supernatant compared to the wild type. Consistently, biocontrol assays demonstrated that the null
mutants were considerably more effective in disease control than the wild-type strain or a chemical
fungicide. In addition, tvk1 gene disruptant strains sporulated abundantly in submerged cultures, a
condition that is not conducive to sporulation in the wild type. These data suggest that Tvk1 acts as
a negative modulator during host sensing and sporulation in T. virens. They concluded that that the
deletion of a MAPK gene generates a more aggressive parasite and, consequently, a better
biocontrol agent. They further suggested that Trichoderma uses different mechanisms to control
different hosts.
G-protein subunits are involved in transmission of signals for development, pathogenicity,
and secondary metabolism in plant pathogenic and saprophytic fungi. Mukherjee et al. (2004)
cloned two G-protein subunit genes, tgaA and tgaB, from the biocontrol fungus Trichoderma
virens. They compared loss-of-function mutants of tgaA and tgaB with the wild type for their ability
to overgrow colonies of Rhizoctonia solani and Sclerotium rolfsii, and the ability to colonize the
sclerotia of these pathogens in soil. Both mutants grew as well as the wild type and sporulated
normally. Both tgaA and tgaB mutants and the wild type overgrew, coiled, and lysed the mycelia of
R. solani, but tgaA mutants had reduced ability to colonize S. rolfsii colonies. Both mutants

(Climate Change, Precision Agriculture and Innovative Disease Control Strategies)
- 188 -
parasitized the sclerotia of R. solani, but tgaA mutants were unable to parasitize the sclerotia of S.
rolfsii. Thus, tgaA is involved in antagonism against S. rolfsii, but neither G protein subunit is
involved in antagonism against R. solani. T. virens, which has a wide host range, thus employs a
G-protein pathway in a host-specific manner.
II. Trichoderma as an antagonist of nematodes
In recent years Trichoderma spp., have been attributed with the ability to control diseases
caused by nematodes. Root dipping in antagonists suspension not only reduced root knot severity
caused by Meloidogyne but also enhances seedling growth in tomato, brinjal, chili and capsicum
Root dipping of rice seedlings in suspension of T. harzianum reduced severity of root lesion
nematode and improved seedling growth (U.S. Singh, unpublished information). Culture filtrate of
T. harzianum and T. virens suppressed hatching and release of second stage juveniles of
Meloidogyne. Trichoderma harzianum formed loops and trapped second stage juveniles of M.
incognita. Trichoderma penetrated nematode body by forming haustoria like structures and
colonized internally replacing all internal organs with fungal mycelia resulting in death of the
nematode. Egg masses are also penetrated and colonized by T. harzianum. Hyphae of T.
harzianum were attracted towards nematode body in Anguina tritici. This chemotactic response
was not recorded against second stage juveniles of Meloidogyne. This may be because of rapid
motility of juveniles in suspension or on agar medium. Protease production by T. harzianum has
been associated with the reduction in root galling. However, field experiments are still required to
prove the potential of Trichoderma as an effective antagonist against nematodes.
III. Trichoderma as a biofertilizers & plant growth promoter
Apart from the direct inhibition of plant pathogens, Trichoderma spp. are reported to
improve crop health by promotion of plant growth (both root and shoot). It is reported to enhance
growth in a number of plant species like rice, wheat, sorghum, tomato, brinjal, soybean, chickpea,
pea, rajma, chilli, capsicum etc. However, this growth promotary effect was not only dependent on
isolate of Trichoderma but also on plant species cultivar involved. When applied as seed treatment
maximum shoot growth promotion in tomato, brinjal, chilli and pea was caused by T. harzianum
isolates PBAT-13, PBAT-41, PBAT-14 and PBAT-33, respectively. Similarly when T. harzianum
isolate PBAT-43 was applied as seed treatment it resulted in different degree of growth promotion
in different cultivars of rice.
Plant growth promotion is one of the indirect mechanisms employed by Trichoderma spp.
which plays a role in the biocontrol of various plant pathogens and in improvement of plant health.
Treatment with Trichoderma generally increases root and shoot growth, reduces the activity of
deleterious microorganisms in the rhizosphere of plants and improves the nutrient status of the
plant. Growth enhancement by Trichoderma spp. has been observed even in the absence of any
detectable disease and in sterile soil and is not considered to be a side effect of suppression of
disease or minor plant pathogens. Secretion of hormone-like metabolites and release of nutrients
from soil or organic matter, have been proposed as the mechanisms involved in plant growth

(Climate Change, Precision Agriculture and Innovative Disease Control Strategies)
- 189 -
IV. Trichoderma as a symbiont and defense inducer
Till recently the interaction between the bioagent and the host plant was given little
attention. Recent discoveries have shown that in addition to being parasites of other fungi,
Trichoderma act as opportunistic, avirulent plant symbionts. At least some strains establish robust
and long-lasting colonization of root surfaces and penetrate into the epidermis and a few cortical
cells below. They produce or release a variety of compounds that induce localized or systemic
resistance responses. This restricts further advance of the Trichoderma and make the plants
resistant to other diseases. These root–microorganism associations cause substantial changes to
the plant proteome and metabolism. Plants are protected from numerous classes of plant
pathogen by responses that are similar to systemic acquired resistance and rhizobacteria-induced
systemic resistance. Root colonization by Trichoderma spp. also frequently enhances root growth
and development, crop productivity, resistance to abiotic stresses and the uptake and use of
nutrients.
Symbiotic colonization of roots by Trichoderma enhanced root growth, which may be
responsible for increased tolerance of plans to biotic and abiotic stresses. Wheat plants raised
from Trichoderma treated seeds tolerate drought (water stress) better under field condition.
Similarly applications of T. harzianum to roots through colonized compost or by root dip helped in
better establishment and growth of plants in Usar soil
Several studies revealed that some biocontrol agents including Trichoderma spp. are also
able to reduce disease through a plant-mediated mechanism that is phenotypically similar to SAR,
since the resistance is systemically activated and extends to above-ground plant parts. This type
of induced resistance, which is activated by biocontrol agents, is often referred to as induced
systemic resistance (ISR). In one of the first comprehensive studies on induction of resistance by
Trichoderma spp. and the accompanying changes in the host plant, Yedidia et al. (2003)
demonstrated that inoculating roots of 7 day old cucumber seedlings in an aseptic hydroponic
system with T. harzianum T-203 spores initiated plant defense responses in both the roots and
leaves of treated plants. They observed that T. harzianum penetrated the epidermis and outer
cortex of the cucumber roots and the treated plants were more developed compared to the
untreated plants throughout the experiment. The plant response was marked by an increase in the
peroxidase and chitinase activity and by the deposition of callose and cellulose enriched wall
appositions on the inner surface of cell walls even in areas beyond the site of fungal penetration.
The induction of defense response in plants by Trichoderma spp is often associated with
accumulation of various antimicrobial compounds like phytoalexins, PR proteins along with the
strengthening of cell walls and other barriers in the plant cells. Howell et. al. (2000) demonstrated
that seed treatment of cotton with biocontrol preparations of T. virens or application of T. virens
culture filtrate to cotton seedling radicles induced synthesis of terpenoids desoxyhemigossypol,
hemigossypol and gossypol in developing roots in very high concentration and also led to
increased peroxidase activity as compared to that of control. These compounds were inhibitory to

(Climate Change, Precision Agriculture and Innovative Disease Control Strategies)
- 190 -
the cotton seedling pathogen R. solani at quite low concentrations.
Induced-resistance systems in plants are complex. There are three generally recognized
pathways of induced resistance in plants. Two of these pathways involve the direct production of
pathogenesis-related (PR) proteins; in one pathway, the production of PR proteins is generally the
result of attack by pathogenic microorganisms, and in the other pathway, PR proteins are
generally produced as a result of wounding, or necrosis-inducing plant pathogens —for example,
herbivory by insects — although both pathways can be induced by other mechanisms. Typically,
the pathogen-induced pathway relies on salicylic acid produced by the plant as a signaling
molecule, whereas the herbivory-induced pathway relies on jasmonic acid as the signaling
molecule. These compounds, and their analogues, induce similar responses when they are
applied exogenously, and there is considerable crosstalk between the pathways. The jasmonate-
induced pathway is designated as induced systemic resistance. The jasmonate- and salicylate-
induced pathways are characterized by the production of a cascade of PR proteins. These include
antifungal chitinases, glucanases and thaumatins, and oxidative enzymes, such as peroxidases,
polyphenol oxidases and lipoxygenases. Low-molecular-weight compounds with antimicrobial
properties (phytoalexins) can also accumulate. The triggering molecules in the Trichoderma
responses are unknown. The third type of induced resistance has been best-described as being
induced by non-pathogenic, root-associated bacteria, and is termed as rhizobacteria-induced
systemic resistance (RISR). It is phenotypically similar to the jasmonate- and salicylate-induced
systems, as it results in systemic resistance to plant diseases. However, it is functionally very
different, as the PR proteins and phytoalexins are not induced by root colonization by the
rhizobacteria in the absence of attack by plant-pathogenic microorganisms. However, once
pathogen attack occurs, the magnitude of the plant response to attack is increased and disease is
reduced. Thus, RISR results in a potentiation of plant defense responses in the absence of the
cascade of proteins that is typical of the jasmonate- or salicylate-induced systems. Treatment with
an inhibitor of ethylene action strongly inhibited the protective effect of Trichoderma on plants thus
indicating that ethylene signal is required for ISR. Moreover, application of jasmonic acid
production inhibitor completely abolished the protective effect of Trichoderma on plants. These
experiments confirmed that like in case of rhizospheric bacteria, induction of resistance by
Trichoderma also occurs through the jasmonic acid/ ethylene signaling pathway.
The role of a mitogen activated protein kinase TmkA in inducing systemic resistance in
cucumber against a bacterial pathogen Pseudomonas syringae pv. lacrymans was investigated by
Viterbo et. al. (2005) using tmkA loss-of function mutants of Trichoderma virens. They observed
that the mutants were able to colonize the plant roots as effectively as the wild type strain, but
failed to induce a full systemic resistance against the leaf pathogen. Interactions with the plant
roots enhanced the level of tmkA transcript in T. virens and its homologue in T. asperellum. At the
protein level activation of two forms reacting to the phospho-p44/42 MAPK antibody were
detected. They further demonstrated that the tmkA mutants retained their biocontrol potential in

(Climate Change, Precision Agriculture and Innovative Disease Control Strategies)
- 191 -
soil against Rhizoctonia solani, but were not effective in reducing disease incidence against
Sclerotium rolfsii. They concluded that unlike in many plant-pathogen interactions, Trichoderma
TmkA MAPK is not involved in limited root colonization. Trichoderma, however, needs MAPK
signaling in order to induce full systemic resistance in the plant. Regardless of the exact
mechanism responsible, this study demonstrates that a conserved fungal signal transduction
pathway is involved in the three-way interaction between biocontrol fungus, plant pathogen, and
plant and that different signals control mycoparasitic activity and ability to induce plant systemic
resistance.
Therefore it may be concluded that the interactions of Trichoderma with its host fungi are
very complex often influenced by the particular strain of Trichoderma involved, the host fungus in
question and maybe several other ecological factors.
V. Trichoderma as a compost colonizer
Trichoderma can colonize and decompose dead organic matter. Recent studies have
revealed that it enhances the decomposition of organic composts like cow dung, poultry manure
and press mud. Trichoderma harzianum enhances the decomposition of compost. It changes the
colour of fresh cow dung in five days.
Trichoderma is capable of colonizing cow dung / farmyard manure (FYM) that serves as an
excellent substrate for its multiplication. It multiplies very well on cow dung /FYM not only under
laboratory condition but also at farmers’ level in their compost pits. The population of T. harzianum
on colonized cow dung may go as high as 2.46 x 10¹² cfu.g-1 air-dried sample at 30% moisture
level and 320C temperature and two weeks of incubation. Exponential multiplication of
Trichoderma in cow dung is probably due to its versatile nature for carbon nutrient and major and
minor nutrients available during decomposition. Analysis of colonized compost showed that both
total and water soluble content of a number of macro and micronutrients like P, K, S, Zn, Cu and
Fe were significantly higher in T. harzianum colonized FYM as compared to non-colonized FYM.
There was almost 6 folds increase in water-soluble humic matter content in colonized FYM as
compared to non-colonized. Since humic matter is reported to have got growth promoting effect, in
addition to better availability of macro and micronutrients, higher humic matter content might also
be responsible for the better plant growth in Trichoderma harzianum colonized FYM.
Conclusion
When introduced to soil environment Trichoderma faces tough competition from other
microbes like fluorescent pseudomonads etc. Therefore, in order to fully harness its potential for
benefit of agriculture, there is need to support it even after application. One of the most effective
methods for the delivery of Trichoderma in soil is through colonized compost like FYM, cow dung;
poultry manure etc.

(Climate Change, Precision Agriculture and Innovative Disease Control Strategies)
- 192 -
Environmental Factors Influencing Ascospore Viability, Conidium Production, Dissemination, and Germination of V. inaequalis
K .P. Singh and J. Kumar
College of Forestry & Hill Agriculture, Ranichauri-249 199 (Uttarakhand)
Uttarakhand is predominantly a Horticultural State of India, since the economy of its
growers and orchardists largely depends upon the cultivation of fruits and vegetables. Ageo-
climatic conditions of the state are well suited for the production of different types of fruits ranging
from temperate to sub-tropical fruits. Apple cultivation in temperate fruit region of India has taken
an important position in fruit production. It rank 5th, first being mango followed by banana, citrus
and guava. In India, its cultivation of apple is mainly confined to the Western Himalayas covering
an area of 2,38,000 hectares with production of 1,320,590 metric tonnes. Kashmir valley has about
60,000 ha, Himachal Pradesh 47000 ha, Uttarakhand 32254 ha, Sikkim 800 ha and Arunachal
Pradesh 1802 ha under apple, beside unrecorded area in other hill regions. The main apple
varieties are ‘Royal Delicious, Golden Delicious, Red Gold, Tydeman’s-Early-Worcester, Red
Delicious, Rich-a-Red, Starkrimson Delicious, Top Red, Red Chief, William Favourite, Summer
Queen, Mcintosh, Red Fuji, Oregon spur, Crab apples, and Jonathan. The production, quality and
usage of the fruit are greatly influenced by the insect, pests and diseases. The diseases inflicting
injury partly or wholly to an apple tree are several. The most prominent among these are Apple
scab, Powdery mildew, Phytophthora root, Collar rot, Apple blotch, Canker, White root rot, Fly
speck, Sooty blotch, and Replant problem (Singh et. al. 2007). All the diseases combined did not
discourage the fruit growers to the extent as the one scavenger disease called “SCAB” did in a
couple of years. In Uttarakhand, control of apple scab is achieved primarily through a protectant
fungicides spray program. In a protectant program for primary scab control, fungicides are
generally applied after every 10 days of new growth. Applications are made regardless of whether
infection periods have occurred. In wet growing seasons, Gangotri fruit belt growers make up to
10-12 fungicides applications for scab control (Singh and Kumar 2005). To improve spraying
efficiency, with reduced fungicide use, more reliable scab warnings are needed. GBPUAT
established the effectiveness of the scab predictor for scheduling several EBI fungicides that have
post-infection control activity against apple scab. We have started experiments to study some of
the relevant epidemiologic questions related to apple scab management.
Installing an apple scab forcasting and monitoring system at Harsil, Purola-Naugaon, Koti-
Kanasar, Gwaldam and Joshimath and recorded weather parameters. A model to predict
ascospore maturity for use in Uttarakhand orchards. These model are designed to identify earliest
date of ascospores are matured and discharged. In Garhwal Himalayas, scabbed infected apple
leaves from unsprayed orchards of Red Delicious cultivars were collected periodically between 1st
week of March to June each year from 1995 to 2010. The ascospore maturity started around 2nd
week of March and continued upto last week of May at different place of Uttaranchal Himalayas.

(Climate Change, Precision Agriculture and Innovative Disease Control Strategies)
- 193 -
The ascospores can germinate and cause infection only when they are kept wet over a certain
minimum period of time, temperature ranging from 6-26°C. Production of conidia takes place over
a wide range of temperature from 4-28°C, sporulation peaks at 16-20°C. The conidia germinate at
temperature widely ranging from a minimum of 0°C to a maximum 32°C. Temperature during
spring favour pseudothecial development, maturity and discharge of ascospores, process of spore
germination and establishment of primary infection in the spring season. Intermittent wet and dry
periods are congenial for perithecial maturity and discharge of ascospores than the continuous wet
weather in early spring.
The dispersal of primary and secondary spores largely depends on air movement, during
the rainy periods in spring as well as throughout the growing season. Singh and Kumar (2010)
has revealed the wind dissemination of conidia in Gangotri valley and concluded that ascospores
discharge varied greatly with the prevailing meteorological condition. The trapped conidia of V.
inaequalis at 2500 m. asl. Height and postulated that air-borne spores were important
epidemiologically in establishing disease in scab free orchards. He also suggested that large
numbers of ascospores of V. inaequalis are discharged during afternoon than early morning. The
wetting of perithecia during light is more effective than in darkness, and more ascospores are
released from perithecia in warm and humid atmosphere. The conidial stage ordinarily remains
viable for not more than 15 days and direct sunshine even for 48 h is lethal for its survival. The
mycelia stromatic pad or cushion underneath the conidial stage appears to remain viable and can
initiate new infections with the onset of favourable weather. The summer spores are spread by
washing action of rain and not by the air current. Weather and climate influence the epidemic
development either by interacting with the pathogen or altering the host physiology. A good deal of
work has been done all over the world and also by this University through several sustained trials
at Ranichauri and elsewhere to understand the impact of this single factor. The mention of the role
of changing weather conditions in relation to epidemics influencing the two distinct stages of the
pathogen will perhaps be more appropriate for a better understanding of the scab disease
On examination of the primary infection period of 15 years data from Gangothri fruit belt,
some differences were observed between our results and Mills table developed by Mills (1944)
and Mills and La Plante (1951) for ascospores infection. Our result shows 5 to 8 light infection
periods occurred during each year in the month of March, April and May which could initiate the
primary infection and time required for symptom expression was 9 to14 days under prevailing
temperature condition. Whichever the infection time was more than precticted (1 to 4 days) as
mentioned in Mills table. Six to eight moderate infection periods were recorded in each month
during 1990-2010 and almost all indicated delay by a day in symptom expiration (1-3 days) in
orchard conditions. The third criteria as described by Mills was severe infection period, 2 to 5
infection periods were observed in most of the month at an average temperature (11.4 to 15.2 ºC)
and leaf wetness (23.4 to 27.2 hr) period and indicated 1 to 2 days delay in symptom expression.
This observation revealed 2 day (light infection), 1 day (moderate infection) and 1 day (severe

(Climate Change, Precision Agriculture and Innovative Disease Control Strategies)
- 194 -
infection) delay in symptom expression under orchard conditions. The regression analysis was
used to describe relationship between Mills infection criteria and our light, moderate and severe
infection period data of Uttarakhand for symptom appearance. In all the cases, the total variation
was high in low moderate and severe, infection curves.
The prevailing microclimatic conditions, topography and apple cultivars might be the
possible reasons for the delay of ascospore release and symptom development in Uttarakhand
Himalayas. Ascospore maturation data of ten consecutive years were pooled and plotted against
Celsius degree day accumulation from the date of first ascospore discharge of Garhwal hills.
Based on the results, two linear lines were developed, one for the use when the cumulative degree
days from 1 February to 15 May was < 657 and another for use when the cumulative degree-days
for these dates was > 657. Our results showed that 50 and 95 per cent ascospores matured after
418 and 792 cumulative degree days, respectively for the orchards situated at 1900-2200 m asl
(villages Auli, Syori, Koti-kanasar, Talwadi and Gwaldam) while for orchards situated at higher
elevation (i.e. > 2200 m; e.g. villages Harsil, Dharali, Jhalla, Sukhi and Auli) the cumulative
degree-days was > 1182 (95% ascospore maturity). The duration of ascospore discharge in the
field appeared to be longer and varied from place to place.
The scab development was monitored over 15 years in farmers’ fields from 1994 through
2010, the PAD varied from 2872 to 7, 26,852. All the variables showed highly positive correlation
with each others. PAD was high and there was no adverse effect of delaying the first spray till 14 th
day after the petal fall stage. At this time, the proportion of ascospore that was mature was very
low and the amount of foliage infection was also low. Two-three spray of EBI fungicide at the end
of primary infection inoculum season had no effect on scab development. As is evident in figure 3,
PAD was low, the first Mills infection period for the season occurred 13 days after petal fall. Fifteen
to eighteen infection period were recorded from last week of May to September, three sprays
during this period gave good control of disease compared to the unsprayed, and just one spray
reduced scab on the leaves to a great extent, and eliminated scab on the fruits during 1999 to
2001. The reason for this was probably due to winter and early springs are more mild and rainy in
the Himalayan range of Uttaranchal hills. The susceptible cultivars (Red, Royal and Golden
Delicious) also served as one of the reason for increase of inoculum under favoruable conditions.
However, the overall results of this study and of Holb and Heijne (2002) and MacHardy et al.
(1993) indicated that, the fungicide applications against apple scab can be omitted at the
beginning of the season and could be a good strategy for saving cost in integrated orchards if PAD
values are lower than 600 ascospores/ m2. Estimates of PAD are useful when comparing
management strategies or control treatments in several orchards. However, the results clearly
indicated that the PAD was not uniformly distributed in farmer’s apple orchard or other
management practice was applicable in one orchard but not in another orchard subjected to the
same weather conditions. Thus more reliable data would be obtained from managed orchard

(Climate Change, Precision Agriculture and Innovative Disease Control Strategies)
- 195 -
whether sanitation practices can be used effectively to lower the PAD and, as a consequence,
lower the fungicide dose. For this reason, reduction of primary inoculum sources could have a play
very important role in the improvement of effectiveness scab management of apple in Uttaranchal
Himalayas.
Scab predictive and warning service in Uttarakhand hills: Apple scab forewarning service
carried out under NATP, ICAR, UCOST and NAIP project is being followed in Uttarakhand hills.
Such forecasting, which usually begins in the early spring, predicts the time when initial disease
may develop and when the threat of primary scab is over, and helps the orchardists in efficient use
of spray chemicals. Ascospores emanating from the pseudothecia on the overwintered leaves in
the spring from the main primary inoculums in most of the apple growing regions of the world. The
maturity and discharge of these spores usually coincide with the pink bud to petal fall stage of the
tree. Ascospore dose measures the actual inoculums concentration in the orchard air at different
stages of host phenology and this is dependent on, (i) ascospore productivity and, (ii) factors that
influence spore release i.e. air temperature, light, time of days, climatic date, and leaf wetting by
rain/dew. Numbers of traps are available for monitoring of ascospores dose in the air. The
percentage of coloured spores increased week by week until about bloom to early petal fall stage
of ‘Delicious, cultivar and then diminished in Uttarakhand hills. Looking into 20 years data on tree
phenology at Garhwal hills, is confident of utilizing tree phonological stages in developing a
predictive equation for improving chemical control strategy.
In Uttarakhand, apple scab predictor and µMETOS were able to predict infection periods
correctly as tagged leaves showed new scab lesion accordingly. The Revised Mill’s Table indicate
the minimum number of hours of continuous wetting periods required for primary infection of apple
leaves by ascospores of Venturia inaequalis.. Some ascospores are discharged at night or rain
begins after sunset, so hours of leaf wetting should be computed from sunrise. For all other
events, times should be computed from start of rain (Singh, et. al. 2010).
Singh and Kumar (2009) developed a linear statistical model based on the accumulated
degree days from the maturation of ascospore and PAD. The development and computation of
mathematical models or predictive equations, and automatic monitoring of weather data for apple
scab, majority of the orchardists in Garhwal hills and several other places of India still rely on
initiating the first spray at green tip to early petal fall stage in spring, and following a 10 day spray
schedule thereafter till the primary scab season is over. The above information collected from
experimental sites on the infection period is passed on to the orchardists by blowing a
characteristic signaling, telephonic communication, SMS, local news paper, Govt. organization and
through personal contacts or messages flashed 4-5 times through “All India Radio, Nazibabad” on
the urgent need to undertake immediate spray or to reschedule already recommended spray
programme. Such forewarning has benefited the grower in minimizing damages due to scab and

(Climate Change, Precision Agriculture and Innovative Disease Control Strategies)
- 196 -
also reduce fungicide usage.
REFERENCES
1. Holb, I. and Heijne, B. 2002. Comparative study of Dutch and Hungarian environmentally friendly apple orchards on potential ascospore dose of apple scab. Journal of Agricultural Science 12: 31-6.
2. MacHardy, W.E., Gadoury, D.M. and Rosenberger, D.A. 1993. Delaying the onset of fungicide programs for control of apple scab in orchards of low potential ascospore dose of Venturia inaequalis. Plant Disease 77: 373-375
3. Mac Hardy, W.E. 1996. Apple Scab: Biology, Epidemiology and Management. 545 pp. Academic Press, APS St Paul Minnesota.
4. Singh, K.P. and Kumar, J. (2005). IPM of apple diseases. Techanical Bulletin, GBPUAT, CFHA 6: 1-48
5. Singh, K.P. and Kumar, J. (2008). Disease warning system for scab of apple: A field study. GBPUAT, CFHA 22: 1-18
6. Singh, K.P. and Kumar, J. (1999). Studies on ascospore maturity of Venturia inaequalis, the apple scab pathogen, in Central Himalayas of India. Journal of Mycology and Plant Pathology 29: 408 – 15.
7. Singh, K.P. and Kumar, J. (1999). Efficacy of different fungicidal spray schedules in combating apple scab severity in Uttar Pradesh Himalayas. Indian Phytopathology 52: 142 – 7.
8. Singh, K.P., Kumar, J. and Singh, H.B. (2001). Curative and protective action of ergosterol-biosynthesis inhibiting fungicides in relation to infection periods against apple scab in Uttaranchal Himalayas. Indian Journal of Plant Pathology 19: 34 - 38
9. Singh, K.P., and Kumar, J. (2009). Potential ascospore dose of apple scab fungus, Venturia inaequalis, from Indian Himalayas. Indian Journal of Agricultural Sciences 79: 184 - 189
10. Singh, K.P., Kumar, J. and Kumar, B. (2010). GBPUAT and apple disease research in the Gangotri valley region of India. In: Microbial diversity and plant disease management, 625p., Singh, K.P. and Shahi, D.K. (eds). VDM Verlag Dr. Muller GmbH & Co. KG, Germany/ USA/ U.K., pp 276-301.

(Climate Change, Precision Agriculture and Innovative Disease Control Strategies)
- 197 -
Carbon Sequestration: Bamboo-Mycorrhizae
A. Garg*, S. Das#, Y. P. Singh#, S. P. S. Rawat$ *Department of Environment Management, Forest Research Institute, University, Dehradun- 248 006
#Department of Forest Pathology, Forest Research Institute, Dehradun $Climate Change and Forest Influences Division, Forest Research Institute, Dehradun
Introduction
Copenhagen meet on climate change in 2009 brought out three key issues: 1) It raised
climate change to the highest level of government; 2) The Copenhagen Accord reflects a political
consensus on the long-term, global response to climate change; 3) The negotiations brought an
almost full set of decisions to implement rapid climate action near to completion (UNFCCC).
Current climate situation is bringing urgent issue of global climate change to the centre stage.
Climate warming or global warming is the increase in the average temperature of the earth's near-
surface air and oceans since the mid-20th century and its projected continuation. Global surface
temperature increased 0.74 ± 0.18 °C during the last century (IPCC, 2007). The term global
warming was coined in 1896 by the Swedish chemist, Svante August Arrhenius. The urban heat
island effect is estimated to account for about 0.002 °C of warming per decade since 1900
(Trenberth et al., 2007). An increase in global temperature will cause sea levels to rise and will
change the amount and pattern of precipitation, probably including expansion of subtropical
deserts (Reichler et al., 2007). The continuing retreat of glaciers, permafrost and sea ice is
expected, with warming being strongest in the Arctic. Other likely effects include increases in the
intensity of extreme weather events, species extinctions and changes in agricultural yields, more
virulent attacks of diseases and insect pests and vanishing habitats of plants and animals.
Now the question arises that what causes this climate change? One of the major reasons
for this climate change is the increase in the concentration of green house gases (GHG) in the
atmosphere. GHG are responsible for Green House Effect. The greenhouse effect is the process
by which absorption and emission of infrared radiation by gases in the atmosphere warm a
planet's lower atmosphere and surface. Naturally occurring greenhouse gases have a mean
warming effect of about 33 °C (IPCC, 2007). The major greenhouse gases are water vapour,
which causes about 36–70 percent of the greenhouse effect; carbon dioxide (CO2), which causes
9–26 percent; methane (CH4), which causes 4–9 percent; and ozone (O3), which causes 3–7
percent (Kiehl and Trenberth, 1997; Schmidt, 2005) and Nitrous oxide (N2O). Human activity since
the Industrial Revolution has increased the amount of greenhouse gases in the atmosphere
leading to increased radiative forcing from CO2, methane, tropospheric ozone, CFCs and nitrous
oxide. The concentrations of CO2 and CH4 have increased by 36 and 148 percent respectively
since the mid-1700s (EPA, 2008). Carbon dioxide concentrations are continuing to rise due to
burning of fossil fuels and land-use change. About three-quarters of the increase in CO2 from
human activity have been produced by fossil fuel burning over the past 20 years. Most of the rest
is due to land-use change, particularly deforestation (IPCC, 2001).

(Climate Change, Precision Agriculture and Innovative Disease Control Strategies)
- 198 -
Through successively improved versions of general circulation models (GCMs), the
currently accepted estimate of the warming trend was about 3 ± 1.5 °C, for a 2 x CO2 scenario,
with regional temperature increases at mid- to high-latitudes possibly exceeding 10 °C (Overpeck,
1991). The IPCC Special Report on Emissions Scenarios gives a wide range of future CO2
scenarios, ranging from 541 to 970 ppm by the year 2100 (Prentice et al., 2001). New ice core
records show that the earth system has not experienced current atmospheric concentrations of
CO2, or indeed of CH4, for at least 650 kyr – six glacial-interglacial cycles. During that period the
atmospheric CO2 concentration remained between 180 ppm (glacial maxima) and 300 ppm (warm
interglacial periods; Siegenthaler et al., 2005). It is generally accepted that during glacial maxima,
the CO2 removed from the atmosphere was stored in the ocean. Several causal mechanisms have
been identified that connect astronomical changes, climate, CO2 and other greenhouse gases,
ocean circulation and temperature, biological productivity and nutrient supply and interaction with
ocean sediments.
As the population is swelling, its social, political and economical areas are expanding
accordingly and invading the very constant sphere of ecosystem. Human-induced climate change
has become a central theme and needs immediate response from each individual. Hence,
mitigation of green house gases has become a priority. The potential of nature to tackle elevated
CO2 cannot be ignored or underestimated. Exploring out the hidden mysteries of nature to mitigate
the carbon has become an essential need in today’s scientific world. Such a concept inspires us to
review and investigate the potential of Bamboo-Mycorrhiza as an efficient candidate in
sequestering the elevated carbon-dioxide.
Carbon Sequestration
Mitigation of global warming can be attained through reductions in the rate of
anthropogenic greenhouse gas release. To a great extent, mitigation of climate change is a matter
of understanding and manipulating the carbon cycle. Prior to the industrial revolution, the carbon
that is now floating in the atmosphere was locked permanently in large underground pools
(Schroeder and Ladd, 1991; Rubin et al., 1992). Presently, over 8 billion tons of C are added
annually to atmosphere. While retrieval of the extra C from the atmosphere is feasible, it may not
remain locked for too long in biomass. Instead, it will be passed through a chain of temporary
storage, finally returning to atmosphere. Current estimates are that, all together, plants retain
annually about 600 GtC (gigatons of carbon), with another 1600 GtC in soil (Herzog et al., 2000).
Under the Kyoto Protocol, industrialized countries have promised to reduce their carbon emission
to below their 1990 emission levels over the period 2008-2012. To fulfill their commitment, some
countries have proposed the inclusion of three broad land management activities pursuant to
Article 3.4 of the Protocol, including forest, cropland and grazing land management. These
activities can reduce atmospheric carbon stock by sequestering, or removing, carbon from the
atmosphere and storing it in soil or biomass (Feng et al., 2000). Carbon sequestration contributes
to offset the greenhouse effect and thus, reduce the pace of global warming. Models suggest that

(Climate Change, Precision Agriculture and Innovative Disease Control Strategies)
- 199 -
mitigation can quickly begin to slow global warming, but that temperatures will appreciably
decrease only after several centuries (Lowe et al., 2009).
Carbon sequestration is the long term storage of carbon in oceans, soils, vegetation
(especially forests) and geologic formations (Ecological Society of America, 2000). The first large-
scale CO2 sequestration project (1996) is called Sleipner, and is located in the North Sea where
Norway's state oil hydro removes carbon dioxide from natural gas with amine solvents and
disposes this carbon dioxide in a deep saline aquifer. In 2000, a coal-fueled synthetic natural gas
plant in Beulah, North Dakota, became the world's first coal using plant to capture and store
carbon dioxide (Petroleum Technology Research Centre, 2009). Ocean processes regulate the
uptake, storage and release of CO2 to the atmosphere. Seawater can, through inorganic
processes, absorb large amounts of CO2 from the atmosphere, because CO2 is a weakly acidic
gas and the minerals dissolved in the ocean have over geologic time created a slightly alkaline
ocean. Carbon dioxide sequestration in geologic formations includes use of site such as depleted
oil and gas reservoirs, shale formations with high organic content, unmineable coal seams and
underground saline formations. Immense quantity (about 65 × 106 GtC) of carbon stored as
carbonate rocks.
Fig.1. Simplified representation of the Global Carbon Cycle. (Source: IPCC, 2001).
Carbon sequestration in terrestrial ecosystems is either the net removal of CO2 from the
atmosphere, or the prevention of CO2 emissions from the terrestrial ecosystems into the
atmosphere (Fig.1). Two, among the most important sinks for C in the terrestrial ecosystem, are
the biosphere and the pedosphere. The potential of the pedosphere to sequester C can play an

(Climate Change, Precision Agriculture and Innovative Disease Control Strategies)
- 200 -
important role in the overall management of C (Schlesinger, 1990; Goudriaan, 1995; Paul et al.,
1997; Potter and Klooster, 1997; Trumbore, 1997; Lal et al., 1998; Lal, 1999; Marland and
Schlamadinger, 1999; Rosenberg et al., 1999; Rosenzweig and Hillel, 2000). The C in soil is a
balance of inputs and outputs. Increasing inputs (i.e. increasing plant growth) or decreasing
outputs or losses of C result in increasing soil C, called soil C sequestration or building C ‘sinks’.
The amount of C that is stored in soils is a function of climate, precipitation and temperature and
soil properties, principally clay content (Rice et al., 2007).
Plants and Carbon Sequestration
In terrestrial carbon sequestration, vegetation plays a major role. Plants remove CO2 from
the air and convert it into sugars that are used to produce substances needed to sustain their
growth and development. Many of these CO2-derived products, particularly lignin and cellulose,
are present in large quantities within the woody tissues of trees and shrubs. Hence, as long as
these plants are alive and growing, they actively remove carbon from the air around them. Even
after their biological activities cease, trees continue to retain the carbon they sequestered during
their lifetimes within their woody tissues. Thus, trees and other woody plants, aided by human
ingenuity, possess an enormous potential to sequester vast amounts of carbon for very long
periods of time (Chambers et al., 1998). The ability to remove CO2 by trees from the air grow
stronger as the air's CO2 content continues to rise, due to the well-known aerial fertilization effect
of atmospheric CO2 enrichment.
Plants assimilate carbon through the process of photosynthesis and return some of it to the
atmosphere through respiration. The carbon is added to the soil as litter when plants die and
decompose. Litter from plants grown at elevated CO2 concentrations often decomposes at a
slower rate, or to a lesser degree, than litter from plants grown at the air's current CO2
concentration. This phenomenon results in greater carbon retention times within decaying litter;
and it provides greater time for more of the litter's carbon to become incorporated into more stable
compounds that can be sequestered for longer periods of time within soils. And, of course, it
leaves a greater amount of carbon to be thus sequestered. For example, atmospheric CO2
enrichment significantly reduced litter decomposition rates in an alpine grassland species (Hirschel
et al., 1997), in seedlings of yellow poplar (Scherzel et al., 1998) and in sorghum and soybeans
(Torbert et al., 1998). Likewise, Van Ginkel and Gorissen (1998) grew this same perennial
ryegrass at 700 ppm CO2 and noted a 42 percent increase in both root and soil microbial biomass,
while root decomposition rates dropped by 13 percent relative to those measured at 350 ppm CO2.
The carbon is stored in the soil is as soil organic matter (SOM, 57% by weight). SOM is a complex
mixture of carbon compounds consisting of decomposing plant and animal tissue, microbes
(protozoa, nematodes, fungi and bacteria) and carbon associated with soil minerals. There is a
good correlation between soil aggregate stability and soil organic matter content across a wide
range of soil types, suggesting that whatever enhances soil stability will enhance the likelihood that
carbon delivered to the soil as a consequence of plant growth and decay will stay sequestered

(Climate Change, Precision Agriculture and Innovative Disease Control Strategies)
- 201 -
there for the longest time possible (Swift, 2001). Bamboo forest biomass stores a large quantity of
carbon. With a carbon percentage of 40-45 per cent, nearly half of the total biomass is carbon.
This makes them an efficient candidate in carbon sequestration.
Role of Bamboo in Carbon Sequestration
Bamboo is woody grass belonging to the sub-family Bambusoideae of the family Poacae.
There are approximately 1,500 spp. under 87 genera of bamboo worldwide (Ohrnberger, 1999; Li
and Kobayashi, 2004). Bamboo is known to be one of the fastest growing plants in the world, with
a growth rate ranging from 30-100 cm per day in growing season. Bamboo is naturally distributed
in the tropical and subtropical belt between approximately 46° north and 47° south latitude, and is
commonly found in Africa, Asia and Central and South America. Some species may also grow
successfully in mild temperate zones in Europe and North America. Bamboo is an extremely
diverse plant, which easily adapts to different climatic and soil conditions. Dwarf bamboo species
grow to only a few centimeters (cm), while medium-sized bamboo species may reach a few meters
(m) and giant bamboo species grow to about 30 m with a diameter of up to 30 cm. Bamboo stems
are generally hard and vigorous, and the plant can survive and recover after severe calamities,
catastrophes and damage. Bamboo can form a closely woven mat of roots and rhizomes
underground, which are effective in holding soil. The soil around bamboo plants is permeated by a
mass of intertwining roots (Ben-zhi et al., 2005). Bamboos have the advantage of fixing carbon in
rhizomes, which do not die at harvest, as tree roots do—which means that the below-ground
biomass sequestration is stable and must not be subtracted after harvest. Furthermore, some
species may fix much more carbon in their culms at harvestable age than in the leaf or branch
biomass of tree species.
In the terrestrial ecosystem, forest is the largest carbon inventory and it deposits 1,146 x
1015 g carbon that occupies 56 percent of the carbon inventory of the total terrestrial ecosystem.
Bamboo ecosystem is an important part of forest ecosystem and an important carbon source and
carbon sinks on the earth. Bamboo accumulates biomass quickly and offers the opportunity to
maintain and increase carbon stocks through carbon sequestration (one hectare of bamboo forest
can absorb 17 metric tons of carbon/year). In this system, bamboo biomass, bamboo litter and
bamboo soil are carbon sinks on the earth. In bamboo ecosystem, through the mechanism of
photosynthesis, bamboo, turn carbon dioxide into organic carbon and stores it as their structures.
Part of organic carbon will store in the litters and forest soil and part of which will gradually
decompose, rot and return to the atmosphere (Rh). The Net Primary Production (NPP) of bamboo
forest may be formulated as: NPP = Gp - Ra – Rh. Gross of plant (Gp) and respiration of plant
(Ra) will emit part of its carbon. In the natural situation, the Net Primary Production of bamboo
forest is positive, but due to the disturbance by human beings, NPP is negative. So, we must take
measures to protect the bamboo forest from being a carbon source and to mitigate the
greenhouse effects through carbon storage and emission from bamboo stands, litters, bamboo
forest soil and bamboo products. The bamboo ecosystem participates in the carbon cycle between

(Climate Change, Precision Agriculture and Innovative Disease Control Strategies)
- 202 -
bamboo forest and atmosphere. Bamboo forest biomass stores a large quantity of carbon. With a
carbon percentage of 40 – 45 percent, nearly half of the total biomass is carbon. Bamboo
represents one of the world’s greatest natural and renewable resources. Moreover, bamboos are
mycotrophic (dependent on mycorrhiza) due to their fast rate of growth and shallow root system
(Rawat, 2005). The dynamic role of microbes in C cycle in soil of bamboo can’t be underestimated.
Microbes and Carbon Sequestration
In soil, there is a great role of microorganisms in carbon sequestration. Microbes are
responsible for transforming many of earth’s most abundant compounds and cannot be ignored in
the search for scientific solutions to adverse global changes both the ubiquity of microbes and the
delicacy of environmental balances contribute to the planet’s sensitivity to disturbances in the
microbial world.
Microbes, cycle immense volumes of carbon in the process of recycling most of earth’s
biomass: They can fix CO2 by light driven (photoautotrophy) and geochemically driven
(lithoautotrophy) reactions, generate methane, produce CO2 as they decompose organic matter,
precipitate carbonate minerals and catalyze the polymerization of plant polymers into recalcitrant
pools of carbon in soil (Fig.2). Some microbial populations influence carbon storage in plants by
enhancing their growth through interactions with organic compounds around the root
(rhizosphere), by providing nutrients such as phosphorous and nitrogen or by suppressing plant
pathogens in the soil. Other microbial communities exert neutral or even harmful effects.
Fig.2. Carbon transformation and transport in soil (Source: The U.S. Climate Change Science Program: Vision for the Program and Highlights of the Scientific Strategic Plan, 2003).

(Climate Change, Precision Agriculture and Innovative Disease Control Strategies)
- 203 -
Soils have a finite capacity to sequester organic carbon (OC) that is determined by soil
texture and aggregation. SOC levels increase with silt + clay content and the maximum level is
achieved when soils are most highly aggregated, i.e. when they are not tilled (Duxbury, 2005).
Worldwide, SOC in the top 1 meter of soil comprises about 3/4 of the earth's terrestrial carbon
(Umadevi & Thiyagarajan, 2007). Soil organic and inorganic carbon (C) is by far the largest
terrestrial C pool, storing more than double the quantity of C in vegetation or the atmosphere
(Batjes, 1996; Eswaran et al., 2000). Changes in soil organic and inorganic C content could have a
great effect on the global C budget. Historically, the soil C pool has been a major source of
atmospheric abundance of CO2, contributing as much as 78 ± 12 Pg of C, and likely more. Such a
transfer of soil C to the atmospheric pool has created a C deficit in world soils, the so-called ‘C
sink.’ The process of transfer of atmospheric CO2 into the soil C pool, either through humification
of photosynthetic biomass or formation of secondary carbonates, is termed soil C sequestration.
The rate of soil C sequestration ranges from about 100 to 1,000 kg ha−1 yr−1 for soil organic C and
5 to 15 kg ha−1 yr−1 for soil inorganic C, depending on land use, soil properties, landscape position,
climate and cropping/farming systems. Total global C sink capacity, approximately equal to the
historic C loss of 78 ± 12 Pg, can be filled at the potential maximum rate of about 1 Pg C yr−1 (Lal
& Follett, 2009). Moreover, a potential increase in the C storage capacity of soil is a recognized
option for mitigating the buildup of atmospheric CO2 in the future (Watson et al., 2000; Lal and
Kimble, 2000).
Role of Bamboo-Mycorrhizae in Carbon Sequestration
In the terrestrial ecosystem, forest is the largest carbon inventory and it deposits 1146 x
1015 g carbon, which occupies 56 percent of the carbon inventory of the total terrestrial ecosystem.
And also bamboo forest biomass stores a large quantity of carbon with a carbon percentage of 40
-45 per cent, nearly half of the total biomass is carbon. Bamboo ecosystem is an important part of
forest ecosystem and act as an important carbon source and carbon sinks on the earth. In this
system, bamboo biomass, bamboo litter and bamboo soil are the major part in carbon sinks
(www.bamboocarboncredits.com, 2009) Moreover, plants with high growth rate and shallow root
system may be more mycotrophic like bamboos.
As a general trend, a large proportion of the additionally fixed carbon in terrestrial
ecosystems is channeled below ground, to roots (Rogers et al., 1994) and soil (Jones et al., 1998).
Soil micro-organisms, especially arbuscular mycorrhizal fungi (AMF) in addition to ectomycorrhizal
fungi (ECM) and ericoid mycorrhizal fungi (ERM) have well-recognized roles in terrestrial
ecosystems (Zhu and Miller 2003; Read et al., 2004; Rillig, 2004; Rillig and Mummey, 2006).
Arbuscular mycorrhizae (AM), ubiquitous mutualistic symbioses between the roots of the vast
majority of land plants (80%; Allen, 1991) and fungi in the Glomeromycota, are an important factor
to consider in attempts to understand the effects of elevated atmospheric CO2 on plants and
ecosystems (Hodge, 1996; Rillig and Allen, 1999; Fitter et al., 2000; Treseder and Allen, 2000;
Rillig et al., 2002).

(Climate Change, Precision Agriculture and Innovative Disease Control Strategies)
- 204 -
The arbuscular mycorrhizal symbiosis is ideal for two main reasons. First, AMF are
affected indirectly by elevated atmospheric [CO2], responding to changes in plant physiology and
growth (Staddon et al., 1998; Rillig et al., 2002; Treseder, 2004). These fungi are obligate
biotrophs that are intimately associated with plant roots and depend directly on plant
photosynthate as a source of carbon (Allen, 1991; Smith & Read, 1997). Increasing atmospheric
CO2 often results in increased allocation of carbon to roots. This increased carbon availability can
influence microbial interactions in the rhizosphere and the structure of the AMF community
(Klironomos et al., 1998; Wolf et al., 2003). Second, AMF and many of their plant hosts grow and
reproduce quickly. This allows us to study the responses of several generations over a reasonably
short period of time. AM is not always best represented as a ‘dual organism’ that can be studied as
an entity, but as a suite of plants and fungi whose organization is spatiotemporally complex,
transient and extensive (Rillig & Allen, 1999).
Fig.3. Framework for the discussion of arbuscular mycorrhizal (AM) fungal contributions to
responses to elevated atmospheric CO2 at the levels of individual host plant, plant
population, plant community and the ecosystem. ‘Ecosystem’ as defined here belongs to the
process-functional branch, and ‘community’ to the ‘population-community’ branch of the hierarchy
(see text). The bold arrows signify the different ways in which AM fungi can influence CO2
responses at the respective levels (Rillig & Allen, 1999).
The ways in which mycorrhizal fungi can potentially influence responses to CO2 at the
various levels include: (a) influencing the homeostatic adjustment of individual host plants to
elevated CO2, (b) altering the variability of responses to CO2 within a plant population, (c)
differentially responding and providing feedbacks to different plant species within a plant
community and to different plant functional assemblages in an ecosystem, (d) providing an

(Climate Change, Precision Agriculture and Innovative Disease Control Strategies)
- 205 -
increased ecosystem sink of carbon in the soil, and influencing nutrient cycling patterns. For
example, because ‘community’ and ‘ecosystem’ belong to different hierarchies, it follows that
changes in plant community composition mediated by AM fungi do not necessarily have to lead to
ecosystem changes and vice versa. It is necessary to consider which response variables are most
meaningful at each level of organization (MacMahon et al., 1978; Fig.3). For example, percent root
infection by AM fungi may yield desirable information for studying P uptake in an individual plant
(Smith & Read, 1997). However, percent infection may be a less important measure of ecosystem
soil carbon storage, for which AM extraradical hyphal length, biomass or glomalin turnover may be
more crucial. AM fungi can constitute a physiologically important carbon sink (Wright et al., 1998).
Roots with AM fungi receive about 4–20 percent more photosynthate than comparable non-
mycorrhizal (NM) roots (Smith and Read, 1997). Jakobsen and Rosendahl (1990) estimated that
AM fungi could use up to 20 percent of the total fixed CO2 in young plants. The importance of this
sink to plants grown in elevated CO2 has been recognized (Jongen et al., 1996).
It has been hypothesized that AM fungi can take up host extra carbon before it is
rhizodeposited and available to all rhizosphere inhabitants (Diaz et al., 1993; Diaz, 1996). AM
fungal inoculum potential (Koide and Mooney, 1987; Allen, 1991) and AM fungal species are non-
uniformly distributed in the environment, even on a local scale of a few square meters (Bever et
al., 1996). This means that plants from the same population can have quantitatively (percent
infection) and qualitatively (subset of the AM fungal community) different AM fungal root
colonization.
AM hyphae are not involved in litter decomposition processes, but they take up nutrients
(including nitrogen) and translocate them to the plant root. High AM fungus biomass may
therefore, impose nutrient limitations on decomposer fungi in nutrient-limited ecosystems (Allen,
1991). So far, only ectomycorrhizal fungi have been postulated to suppress decomposition by this
mechanism (Gadgil and Gadgil, 1971; Zhu and Ehrenfeld, 1996). It is not known whether AM fungi
can inhibit decomposition in similar ways, and whether this effect can be magnified by elevated
CO2. In case AM fungi prove to be important in this context, they would modify carbon cycling and
retard the release of CO2 back to the atmosphere, thereby, increasing the system carbon sink.
Among the fungi, arbuscular mycorrhizal fungi (AMF) appear to be the most important
mediators of soil aggregation for three reasons. The extraradical hyphae of AMF represent a
substantial often dominant component of soil microbial biomass (Allen, 1991; Miller et al., 1995;
Rillig et al., 1999). By directly tapping into carbon resources of the plant, they are independent of
the limiting carbon supply in bulk soil on which saprobic fungi depend (Smith and Read, 1997).
Additionally, since grazers prefer saprobic hyphae over AMF hyphae (Klironomos and Kendrick,
1996), AMF hyphae appear to have a longer residence time in soil, allowing for a less transient
contribution to soil aggregate stabilization than saprobic hyphae.
At the ecosystem scale, AMF become important through their effects on soil aggregation in
soils in which organic matter is the main binding agent. Soil aggregation, in turn, has important

(Climate Change, Precision Agriculture and Innovative Disease Control Strategies)
- 206 -
consequences for soil carbon storage (for example, via physical protection of carbon inside of
aggregates; Jastrow, 1996; Six et al., 2000). Soil organic matter is of great significance in
determining or influencing numerous aspects of soil quality, including nutrient storage capacity and
water-holding capacity (Paul and Clark, 1989). Thus, AMF are not only a factor but also key
determinants of soil quality.
Glomalin: Link between AMF and Carbon Sequestration
Recently, a new factor of presumably great importance in soil aggregation was discovered:
glomalin (Wright and Upadhyaya, 1996). Glomalin is a glycoprotein produced by AMF and its
concentration in aggregates (Wright and Upadhyaya, 1998) and soil (Rillig et al., 2001 a&b)
correlates with the percentage of water-stable aggregates (WSA). Glomalin accounts for a large
amount (about 15 to 20%) of the organic carbon in undisturbed soils. The study of glomalin started
out with a monoclonal antibody (MAb32B11) raised against an unknown epitope on crushed
spores of the AMF species Glomus intraradices Schenck & Smith (Wright and Upadhyaya 1996;
Wright et al., 1996). This monoclonal antibody reaction has been used to operationally define
glomalin (Fig.4).
Fig.4. Various lines of evidence suggest that GRSP in soil is of arbuscular mycorrhizal fungal
origin (Source: Rillig, 2004).
There is increasing circumstantial evidence accumulating from decomposition studies that
Glomalin Related Soil Protein (GRSP) is of AMF origin. When AMF growth is eliminated, e.g., by
incubating soil without host plants, it was observed that GRSP concentrations decline, along with
AMF hyphae (Steinberg and Rillig, 2003).
Glomalin is an important molecule in aggregate stabilization. When aggregates are not
stabilized, they break apart with rainfall. Organic matter and nutrients within disrupted aggregates
may be lost to rain and wind erosion. The chemistry of glomalin makes it an ideal stabilizing coat.
The aggregation reduces wind and water erosion, increases water infiltration, increases water
retention near roots, improves nutrient cycling, and improves root penetration by reducing

(Climate Change, Precision Agriculture and Innovative Disease Control Strategies)
- 207 -
compaction along with soil carbon and/or nitrogen storage.
Consequences of Increased Levels of CO2 for Microbial Communities in the Rhizosphere
Soil microorganisms are commonly C-limited. Therefore, increased C availability due to
enhance rhizodeposition, resulting from increased level of atmospheric CO2 concentrations, might
stimulate microbial growth and activity. However, studies examining effects of elevated CO2
concentrations on microbial biomass, particularly in the rhizosphere, have yielded mixed results.
Alterations in carbon supply have been shown to decrease (Diaz et al., 1993; Ebersberger et al.,
2004), increase (Zak et al., 1993) or not affect (Randlett et al., 1996; Kandeler et al., 1998) on the
growth and activities (e.g. decomposition and nutrient cycling) of soil-borne communities (Jones et
al., 1998; Hu et al., 1999).
Under elevated CO2, increased photosynthate supply stimulated mycorrhizae growth and it
could enhance plant growth in the way of increased nutrient supply. Compared with non-
mycorrhizal plants, there is more carbon translocated to root in mycorrhizal plants. Elevated CO2
stimulated photosynthetic carbon fixation and allocation of carbon to nodule may also increase.
Elevated CO2 may affect allocation of carbon in soil and ecosystems through changing
carbohydrates amount and composition in plants. Root morphological and physiological
characteristics were changed under CO2 enrichment. Since CO2 concentration in soil is about 50
times higher than that in atmosphere, effect of CO2 elevation on rhizosphere soil processes may
not be direct. However, if rhizodeposition increased with elevated CO2, it is possible that the
structure and composition of microbial community will change. This includes changes of microbial
amount and activity, population dynamic, etc. Any change in size and composition of soil microbial
community will probably affect soil evolvement and nutrients availability of plant and its symbionts.
Analyses of variation partitioning for bacterial, fungal and nematode community profiles
revealed that the bacterial community structure was the most affected by elevated CO2, with fungal
and nematode communities being influenced to a somewhat lesser extent. The factors most
influencing fungal community structures were soil origin and plant species. Moreover, the
response of the rhizosphere communities to elevated CO2 depended on the plant species. The
mycorrhizal plant, Festuca rubra, showed a strong increase in AMF infection under elevated CO2
and a more pronounced effect of elevated CO2 on the structure of the rhizosphere microbial
community. This suggests that mycelial products, potentially coupled with altered root exudation
patterns, may have an important impact on the size and structure of the soil microbial community
in response to elevated CO2.
Limitations of Terrestrial Carbon Sequestration
Soil C loss occurs through biological (soil respiration) as well as physical (leaching and soil
erosion) processes. On a global basis, soil respiration is believed to be the main C loss pathway.
The microbial biomass that plays a major role in transforming inputs of organic matter also controls
C loss. The field measurements of soil respiration in dryland agroecosystems show wide variations
due to seasons as well as types of soil amendments. Thus, apart from the controlling effect of

(Climate Change, Precision Agriculture and Innovative Disease Control Strategies)
- 208 -
environmental variables (principally temperature and soil moisture), the rates of soil respiration are
strongly affected by various management practices. It is important to understand the processes
controlling soil respiration rates in order to devise strategies for effective C sequestration.
Appropriate land management can contribute significantly to soil C sequestration by
manipulating agroecosystems, forestry and agriculture practices to generate greater biological
inputs of C than losses. Farming practices since ancient days have improvised procedures that
enhance soil fertility by increasing the input of plant materials (e.g. shifting cultivation where
cultivation is alternated with forest regeneration and growth). Precise estimates of C input and loss
from soil provide the capability to quantify in short terms changes in soil organic C storage
resulting from a specific land use change; such critical methodology may become increasingly
important in relative assessment of the different land use change options with respect to C
sequestration. Quantifying the effects of management practices and their combinations on C
sequestration is vital for improving the potential of farming systems to sequester C (Singh and
Ghoshal, 2007).
The capacity of the land-based sink is progressively decreasing in proportion to total emissions
(Canadell et al., 2007), probably due to gradual increase in extent and severity of soil degradation. Incidents
like forest fire, soil erosion, felling of trees, forest land disturbances due to constructions of dams, roads, etc.
often make the land fragile to sequester carbon for longer duration. Such disturbance also affects the soil
microbial diversity, which indirectly reduces the ability of soil to act as carbon sink.
Not all environmental effects of bamboo are beneficial or benign. Monopodial bamboos can
be invasive to the extent that tough root barriers are needed to prevent undesirable spreading.
Bamboos have caused slope failures due to dense root mats in upper soil horizons (Dura and
Hiura, 2006; Lu et al., 2007). They may emit methane or isoprene and contribute directly or
indirectly to warming.
To mitigate atmospheric carbon-dioxide is becoming an essential requirement at present
scenario. Implementation of new policies in the area of forest management, afforestration, land
management and soil conservation will boost the terrestrial carbon sequestration. The ability of soil
microbes and their role in carbon sequestration needs further research. The role of glomalin
produced by arbuscular mycorrhizal fungi in soil aggregation and ability of phytoliths (plant
stones) produced by bamboo to trap soil carbon for longer period in soils needed special attention
to enhance the capacity of terrestrial carbon sequestration (Parr and Sullivan, 2004).
Conclusion
No matter what has happened to the Kyoto Protocol, may be Copenhagen meet was highly
criticized, Himalayan glaciers won’t melt by 2035 or IPCC report might be challenged, all these
issues will never allow us to close our eyes from the harsh realities of climate change. We need to
believe that our atmosphere is changing- uneven climate patterns will draw us to the cliff of
alarming situation of global warming. GHG have to be mitigated to the possible extent by strict
actions. Our functional role should involve implementation of new approaches to improve carbon

(Climate Change, Precision Agriculture and Innovative Disease Control Strategies)
- 209 -
absorption of vegetation and soil, to reduce the emission of carbon, to enhance the Soil Organic
Matter (SOC) and to extend the storage time of carbon in soil.
Quick biomass accumulating nature of bamboos enables to trap carbon for longer period
and after death bamboos leave behind phytoliths or plant-stones in soil, which hold carbon in silica
crystals for very long period. Mycotrophic nature of bamboos helps in maintaining the soil carbon
and their glomalin plays a very important role in soil aggregation that traps the carbon in it. Also,
the efficient role of soil microbes in carbon cycle cannot be neglected. The amount of
sequestration depends on land-management practices, edaphic factors, climate and the amount
and quality of plant and microbial inputs. These situations provide valuable tools for addressing
many issues related to carbon sequestration in both natural and agricultural soils. Carbon
sequestration, in turn, will contribute in reducing atmospheric CO2 concentration and mitigate
drought, salinity stress and desertification. Thus, synergistic role of bamboo-mycorrhizae will
certainly be the one of the viable approaches towards sustainable forestry.
REFERENCES
1. Allen, M. F. 1991. The ecology of mycorrhizae, Cambridge. Cambridge University Press. 184p.
2. Bamboo Ecosystem And Carbon Dioxide Sequestration. [Available at: www.bamboocarboncredits.com; 22 January, 2009.]
3. Batjes, N. H. 1996. Total carbon and nitrogen in soils of world. Eur. J. Soil Sci., 47: 151–163.
4. Ben-zhi, Z.; Mao-yi, F.; Jin-zhong, X.; Xiao-sheng, Y. and Zheng-cai, L. 2005. Ecological functions of bamboo forest: research and application. Journal of Forestry Research, 16 (2): 143-147.
5. Bever, J. D.; Morton, J. B.; Antonovics, J. and Schultz, P. A. 1996. Host-dependent sporulation and species diversity of arbuscular mycorrhizal fungi in a mown grassland. J. Ecol., 84: 71–82.
6. Canadell, J. G.; Pataki, D.; Gifford, R.; Houghton, R. A.; Lou, Y.; Raupach, M. R.; Smith, P. and Steffen, W. 2007. Terrestrial ecosystems in a changing world. International Geosphere–Biosphere Programme Series. pp 59–78.
7. Chambers, J. Q.; Higuchi, N. and Schimel, J. P. 1998. Ancient trees in Amazonia. Nature, 391: 135-136.
8. Diaz, S.; Grime, J. P.; Harris J. and McPherson E. 1993. Evidence of a feedback mechanism limiting plant response to elevated carbon dioxide. Nature, 364: 616-617.
9. Díaz, S. 1996. Effects of elevated CO2 at the community level mediated by root symbionts. Plant Soil., 187: 309–320.
10. Dura, D. B. and Hiura, H. 2006. Expansion characteristics of bamboo stand and sediment disaster in South Western Japan. Pakistan Journal of Biological Sciences, 9 (4): 622-631.
11. Duxbury, J. M. 2005. Reducing greenhouse warming potential by carbon sequestration in soils:
12. Opportunites, limits and tradeoffs. In: R. Lal et al., Climate change and global food security. pp.
13. 435-450.
14. Ebersberger, D.; Wermbter, N.; Niklaus, P. A. and Kandeler, E. 2004. Effects of long term CO2 enrichment on microbial community structure in calcareous grassland. Plant and Soil, 264: 313-323.
15. Ecological Society of America. 2000, Carbon sequestration in soils. 1707 H Street, NW, Suite 400, Washington, DC 20006. 202-833-8773. [Available at: http://www.esa.org, accessed on 23
rd June, 2009]

(Climate Change, Precision Agriculture and Innovative Disease Control Strategies)
- 210 -
16. EPA. 2008. Recent climate change: Atmosphere changes. Climate Change Science Program. United States environmental protection agency. [Available at: http://www.epa.gov/climatechange/science/recentac.html, accessed on 30
th
August, 2009]
17. Eswaran, H.; Reich, P. F.; Kimble, J. M.; Beinroth, F. H.; Padmanabhan, E. and Moncharoen, P. 2000. Global carbon stocks. In: Lal. R.; Kimble, J. M.; Eswaran, H.; Stewart, B. A. (Eds.), Global change and pedogenic carbonate. Boca Raton, CRC Press. pp. 15–25.
18. Feng, H.; Jhao, J. and Kling, C. 2000. Carbon sequestration in agriculture: Value and implementation. Working Paper 00-WP 256. Center for Agricultural and Rural Development Iowa State University. 33p.
19. Fitter, A. H.; Heinemeyer, A. and Staddon, P. L. 2000. The impact of elevated CO2 and global climate change on arbuscular mycorrhizas: A mycocentric approach. New Phytol., 147: 179–187.
20. Gadgil, R. L. and Gadgil, P. D. 1971. Mycorrhiza and litter decomposition. Nature, 233: 133.
21. Ginkel, J. H. V. and Gorissen, A. 1998. In situ decomposition of grass roots as affected by elevated atmospheric carbon dioxide. Soil Science Society of America Journal, 62: 951-958.
22. Goudriaan, J. 1995. Global carbon cycle and carbon sequestration. NATO ASI Series 1, 30: 3-18.
23. Herzog, H.; Eliasson, B. and Kaarstad, O. 2000. Capturing greenhouse gases. Scientific American, 282 (2): 72-79.
24. Hirschel, G.; Korner, C. and Arnone III, J. A. 1997. Will rising atmospheric CO2 affect leaf litter quality and in situ decomposition rates in native plant communities? Oecologia 110: 387-392.
25. Hodge, A. 1996. Impact of elevated CO2 on mycorrhizal associations and implications for plant growth. Biology Fert. Soils, 23: 388– 398.
26. Hu, S.; Firestone, M. and Chapin, F. I. 1999. Soil microbial feedbacks to atmospheric CO2 enrichment. Trends in Ecology and Evolution, 14: 433-437.
27. IPCC. 2001. ‘Summary for policymakers’. Climate Change 2001: The Scientific Basis. Contribution of Working Group I to the Third Assessment Report of the Intergovernmental Panel on Climate Change. 34p.
28. IPCC. 2007. "Chapter 1: Historical overview of climate change science". IPCC WG1 AR4 Report. 36p.
29. Jakobsen, I. and Rosendahl, L. 1990. Carbon flow into soil and external hyphae from roots of mycorrhizal cucumber plants. New Phytol., 115: 77–83.
30. Jastrow, J. D. 1996. Soil aggregate formation and the accrual of particulate and mineral-associated organic matter. Soil Biol. Biochem., 28: 665–676.
31. Jones, T. H.; Thompson, L. J.; Lawton, J. H.; Bezemer, T. M.; Bardgett, R. D.; Blackburn, T. M., Bruce, K. D.; Canon, P. F.; Hall, G. S.; Harley, S. E.; Howson, G.; Hones, C. G.; Kampichler, C.; Kandler, E. and Richie, D. A. 1998. Impacts of rising atmospheric carbon dioxide on model terrestrial ecosystems. Science, 280: 441–443.
32. Jongen, M.; Fay, P. and Jones, M. B. 1996. Effects of elevated carbon dioxide and arbuscular mycorrhizal infecton on Trifolium repens. New Phytol., 132: 413–423.
33. Kandeler, E.; Tscherko, D.; Bardgett, R. D.; Hobbs, P. J.; Kampichler, C. and Jones, T. H. 1998. The response of soil microorganisms and roots to elevated CO2 and temperature in a terrestrial model ecosystem. Plant and Soil, 202: 251-262.
34. Kiehl, J. T. and Trenberth, K. E. 1997. Earth’s annual global mean energy budget. Bulletin of the American Meteorological Society, 78 (2): 197–208.
35. Klironomos, J. N. and Kendrick, W. B. 1996. Palatability of microfungi to soil arthropods in relation to the functioning of arbuscular mycorrhizae. Biol. Fertil. Soils., 21: 43–52.
36. Klironomos, J.; Ursic, M.; Rillig, M. and Allen, M. 1998. Interspecific differences in the response of arbuscular mycorrhizal fungi to Artemisia tridentata grown under elevated

(Climate Change, Precision Agriculture and Innovative Disease Control Strategies)
- 211 -
atmospheric CO2. New Phytol., 138: 599–605.
37. Koide, R. T. and Mooney, H. A. 1987. Spatial variation in inoculum potential of vesicular-arbuscular mycorrhizal fungi caused by formation of gopher mounds. New Phytol., 107: 173–182.
38. Lal, R.; Kimble, J. M.; Follett, R. F. and Cole, C. V. 1998. The potential of U.S. cropland to sequester carbon and mitigate the greenhouse effect. Chelsea, MI. Ann Arbor Press, 128p.
39. Lal, R. 1999. Soil management and restoration for C sequestration to mitigate the accelerated greenhouse effect. Prog. Environ. Sci., 1: 307-326.
40. Lal, R. J. and Kimble, J. M., 2000. Pedogenic carbonates and the global carbon cycle. In: Lal, R.; Kimble, J. M.; Eswaran, H. and Stewart, B. A. (Eds.), Global change and pedogenic carbonate. Boca Raton, FL. CRC Press, pp. 1–14.
41. Lal, R. and Follett, R. F. 2009. Soil Carbon Sequestration and the Greenhouse Effect. Second Edition. Madison, WI. Soil Science Society of America, 410p.
42. Li, Z. H. and Kobayashi, M. 2004. Plantation future of bamboo in China. Journal of Forestry Research, 15: 233–242.
43. Lowe, J. A.; Huntingford, C.; Raper, S. C. B.; Jones, C. D.; Liddicoat, S. K. and Gohar, L. K. 2009. How difficult is it to recover from dangerous levels of global warming?. Environmental Research Letters, 4: 014012.
44. Lu, S. Y.; Liu, C. P.; Hwang, L. S. and Wang, C. H. 2007. Hydrological characteristics of a makino bamboo woodland in Central Taiwan. Taiwan Journal of Forest Science, 22 (1): 81-93.
45. MacMahon, J. A.; Phillips, D. L.; Robinson, J. V. and Schimpf, D. J. 1978. Levels of biological organization: an organism-centered approach. BioScience, 28: 700–704.
46. Marland, G. and Schlamadinger, B. 1999. Carbon sequestered, carbon displaced and the Kyoto context. Proc. TAPPI Int. Environ. Conf., 1: 283-289.
47. Miller, R. M.; Reinhardt, D. R. and Jastrow, J. D. 1995. External hyphal production of vesicular-arbuscular mycorrhizal fungi in pasture and tallgrass prairie communities. Oecologia.,103: 17–23.
48. Ohrnberger, D. 1999. The bamboos of the world. Amsterdam, Elsevier, 6p.
49. Overpeck, J. T., 1991. Century- to millennium-scale climatic variability during the late Quaternary. In: R.
Bradley, (Ed.), Global changes of the past, UCAR/Office for Interdisciplinary Earth
Studies, Boulder, CO, pp.139-173.
50. Parr, J. F. and Sullivan, L. A. 2004. Soil carbon sequestration in phytoliths. Soil Biology & Biochemistry, 37: 117–124.
51. Paul, E. A. and Clark, F. E. 1989. Soil biology and biochemistry. San Diego, Academic Press, CA, pp. 625-632.
52. Paul, E. A.; Paustian K.; Eliott E. T. and Cole C. V., (Eds.). 1997. Soil Organic matter in temperate agroecosystems: Long term experiments in North America. Boca Raton, FL, CRC Press, pp. 430.
53. Petroleum Technology Research Centre. Weyburn-Midale CO2 Project, World’s first CO2 measuring, monitoring and verification initiative. [Available at: http://www.ptrc.ca/weyburn_overview.php, accessed on 25
th July, 2009].
54. Potter, C. S. and Klooster, S. A. 1997. Global model estimates of carbon and nitrogen storage in litter and soil pools: Response to changes in vegetation quality and biomass allocation. Tellus, Ser. B. 49B: 1-17.
55. Prentice, I. C.; Farquhr, G. D. and Fasham, M. J. R. 2001. The carbon cycle and atmospheric carbon dioxide. In: Houghton, J. T.; Ding, Y. and Griggs, D. J. (Eds). IPCC, climate change 2001: the scientific basis. Cambridge, UK: Cambridge University Press. pp. 183–237.
56. Randlett, D. L.; Zak, D. R.; Pregitzer, K. S. and Curtis, P. S. 1996. Elevated atmospheric carbon dioxide and leaf litter chemistry: Influences on microbial respiration and net

(Climate Change, Precision Agriculture and Innovative Disease Control Strategies)
- 212 -
nitrogen mineralization. Soil Sci. Soc. Am. J., 60: 1571–1577.
57. Rawat, S. 2005. Bamboo-Endomycorrhizae: Ecology, growth and macroproliferation. PhD thesis submitted to Forest Research Institute University, Dehradun. 200p.
58. Read, D. J.; Leake, J. R. and Perez-Moreno, J. 2004. Mycorrhizal fungi as drivers of ecosystem processes in heathland and boreal forest biomes. Can. J. Bot., 82: 1243–1263.
59. Reichler, T. J.; Lu, J. and Vecchi, G. 2007. Expansion of the Hadley cell under global warming.
Geophysical Research Letters, 34 (6): L06805.
60. Rice, C. W.; Fabrizzi, K. P. and White, P. M., Jr. 2007. Benefits of soil organic carbon to physical, chemical and biological properties of soil. In Kimble, J. M.; Rice, C. W.; Reed, D; Mooney, S.; Follett, R. F. and Lal, R. 2007. Soil carbon management: Economic, environmental and societal benefits. Taylor and Francis. pp. 155-162.
61. Rillig, M. C.; Field, C. B. and Allen, M. F. 1999. Soil biota responses to long-term atmospheric CO2 enrichment in two California annual grasslands. Oecologia, 119: 572–577.
62. Rillig, M. C. and Allen, M. F. 1999. What is the role of arbuscular mycorrhizal fungi in plant-to-ecosystem responses to elevated atmospheric CO2? Mycorrhiza, 9: 1–8.
63. Rillig, M. C.; Wright, S. F.; Nichols, K. A.; Schmidt, W. F. and Torn, M. S. 2001a. Large contribution of arbuscular mycorrhizal fungi to soil carbon pools in tropical forest soils. Plant and Soil, 233: 167–177.
64. Rillig, M. C.; Wright, S. F.; Kimball, B. A. and Leavitt, S. W. 2001b. Elevated carbon dioxide and irrigation effects on water stable aggregates in a sorghum field: A possible role for arbuscular mycorrhizal fungi. Global Change Biol., 7: 333–337.
65. Rillig, M. C.; Treseder, K. K. and Allen, M. F. 2002. Global change and mycorrhizal fungi. In Mycorrhizal ecology. (Eds.) Van Der Heijden, M. G. A. and Sanders, I. Springer Verlag, Berlin. Ecological Studies, 157: 135–160.
66. Rillig, M. C. 2004. Arbuscular mycorrhizae and terrestrial ecosystem processes. Ecol Lett., 7: 740–754.
67. Rillig, M. C. and Mummey, D. L. 2006. Mycorrhizas and soil structure. New Phytol., 171: 41–53.
68. Rogers, H. H.; Runion, G. B. and Krupa, S. V. 1994. Plant responses to atmospheric CO2 enrichment with emphasis on roots and the rhizosphere. Environmental Pollution, 83: 155–189.
69. Rosenberg, N. J.; Izaurralde, R. C. and Malone, E. L., (Eds.) 1999. Carbon sequestration in soils: Science, monitoring and beyond. Columbus, OH. Battelle Press. 199p.
70. Rosenzweig, C. and Hillel, D. 2000. Soils and global climate change: Challenges and opportunities. Soil Sci., 165: 47-56.
71. Rubin, E. S.; Lave, L. B., and Morgan, M. G. 1992. Keeping climate research relevant. Issues in Science
and Technology, Winter 1991-92: 47-55.
72. Scherzel, A. J.; Rebbeck, J. and Boerner, R. E. J. 1998. Foliar nitrogen dynamics and decomposition of yellow-poplar and eastern white pine during four seasons of exposure to elevated ozone and carbon dioxide. Forest Ecology and Management, 109: 355-366.
73. Schlesinger, M. J. 1990. Heat shock proteins. J. Biol. Chem., 265 (21): 12111-12114.
74. Schmidt, G. 2005. Water vapour: Feedback or forcing? Real Climate.142p.
75. Schroeder, P. and Ladd, L. 1991. Slowing the increase of atmospheric carbon dioxide: A biological approach. Climatic Change, 19: 283-290.
76. Siegenthaler, U.; Stocker, T.; Monnin, E.; Luthi, D.; Schwander, J.; Stauffer, B.; Raynaud, D.; Barnola, J.
M.; Fischer, H.; Masson-Delmotte, V. and Jouzel, J. 2005. Stable carbon cycle-climate
relationship during the late Pleistocene. Science, 310: 1313-1317.
77. Singh, K. P.; Ghoshal, N. 2007. Soil carbon in agroecosystems: Issues and challenges. International Society of Environmental Botanists,13: 4.
78. Six, J.; Elliott, E. T. and Paustian, K. 2000. Soil macroaggregate turnover and microaggregate formation: A mechanism for C sequestration under no tillage agriculture. Soil Biol.

(Climate Change, Precision Agriculture and Innovative Disease Control Strategies)
- 213 -
Biochem.., 32: 2099–2103.
79. Smith, S. E. and Read, D. J. 1997. Mycorrhizal Symbiosis. San Diego, CA, Academic Press. 71p.
80. Staddon, P. L.; Graves, J. D. and Fitter, A. H. 1998. Effect of enhanced atmospheric CO2 on mycorrhizal colonization by Glomus mosseae in Plantago lanceolata and Trifolium repens. New Phytol., 139: 571–580.
81. Steinberg, P. D. and Rillig, M. C. 2003. Differential decomposition of arbuscular mycorrhizal fungal hyphae and glomalin. Soil Biol. Biochem., 35: 191–194.
82. Swift, R. S. 2001. Sequestration of carbon by soil. Soil Science, 166: 858-871.
83. Torbert, H. A.; Prior, S. A.; Rogers, H. H. and Runion, G. B. 1998. Crop residue decomposition as affected by growth under elevated atmospheric CO2. Soil Science, 163: 412-419.
84. Trenberth, K. E.; Jones, P. D.; Ambenje, P.; Bojariu, R.; Easterling, D.; Tank, A. K.; Parker, D.;
Rahimzadeh, F.; Renwick, J. A.; Rusticucci, M.; Soden, B. and Zhai, P. 2007.
Observations: surface and atmospheric climate change. In Climate Change 2007: The
Physical Science Basis, edited by Solomon, S.; Qin, D.; Manning, M.; Chen, Z.; Marquis,
M.; Averyt, K. B.; Tignor, M. and Miller, H. L. Cambridge, United Kingdom and New
York, N.Y., USA: Cambridge University Press. pp. 236-336.
85. Treseder, K. K. and Allen, M. F. 2000. Mycorrhizal fungi have a potential role in soil carbon storage under elevated CO2 and nitrogen deposition. New Phytol., 147: 189–200.
86. Treseder, K. K. 2004. A meta-analysis of mycorrhizal responses to nitrogen, phosphorus, and atmospheric CO2 in field studies. New Phytol., 164: 347–355.
87. Trumbore, S. E. 1997. Potential responses of soil organic carbon to global environmental change. Proc. Natl. Acad. Sci., 94 (16): 8284-8291.
88. Umadevi, R and Thiyagrajan, G. 2007. Soil carbon sequestration. Science Tech. Entrepreneur. 5p.
89. Wolf, J.; Johnson, N. C.; Rowland, D. L. and Reich, P. B. 2003. Elevated CO2 and plant species richness impact arbuscular mycorrhizal fungal spore communities. New Phytol., 157: 579–588.
90. Wright, S. F.; Franke-Snyder, M.; Morton, J. B. and Upadhyaya, A. 1996. Time-course study and partial characterization of a protein on hyphae of arbuscular mycorrhizal fungi during active colonization of roots. Plant and Soil, 181: 193–203.
91. Wright, S. F. and Upadhyaya, A. 1996. Extraction of an abundant and unusual protein from soil and comparison with hyphal protein of arbuscular mycorrhizal fungi. Soil Sci., 161: 575–586.
92. Wright, S. F. and Upadhyaya, A. 1998. A survey of soils for aggregate stability and glomalin, a glycoprotein produced by hyphae of arbuscular mycorrhizal fungi. Plant and Soil, 198: 97–107.
93. Wright, D. P.; Scholes, J. D. and Read, D. J. 1998. Effects of VA mycorrhizal colonization on photosynthesis and biomass production of Trifolium repens L. Plant Cell Environ., 21: 209–216.
94. Zak, D. R.; Pregitzer, K. S.; Curtis, P. S.; Teeri, J. A.; Fogel, R. and Randlett, D. L. 1993. Elevated atmospheric CO2 and feedback between carbon and nitrogen cycles. Plant and Soil, 151: 105–117.
95. Zhu, W. X. and Ehrenfeld, J. G. 1996. The effects of mycorrhizal roots on litter decomposition, soil biota, and nutrients in a spodosolic soil. Plant and Soil., 179: 109–118.
96. Zhu, Y. G. and Miller, R. M. 2003. Carbon cycling by arbuscular mycorrhizal fungi in soil–plant systems. Trends Plant Sci., 8: 407–409.

(Climate Change, Precision Agriculture and Innovative Disease Control Strategies)
- 214 -
Plant Healthcare for Resource Poor Farmers – Technologies for Disease Management in Low Input Systems
J. Kumar
Department of Plant Pathology, GBPUA&T, Pantnagar-263 145 (Uttarakhand)
Since recorded history, the impact of pests on different crops has been important as a
result of which many practices of “traditional” and “modern” agriculture have evolved. During the
last century high input based intensification of agricultural production and less diversified farming
systems has caused crop protection problems to multiply. As a result an impressive array of crop
protection technologies such as pest-resistant plants, cultural controls, biological controls,
pesticides, behavior-modifying substances, quarantine laws, and pest eradication programs have
evolved. Ancient farmers developed sustainable agriculture practices, which allowed them to
produce food and fibre for thousand of years with few outside inputs. Most of such practices were
developed empirically through millennia of trial and errors, natural selection, and keen
observations. Some of these practices which often conserve energy, maintain natural resources
and reduce chemical use, deserve examination. Today, perhaps over half the world’s arable land
is farmed by traditional farmers. Many of their techniques are unknown or poorly understood, but
have allowed them to produce crops and animals with minimal or no purchased inputs. The
striking diversity existing in the traditional farming systems gives them a high degree of stability,
resilience and efficiency especially on marginal lands.
Efforts to intensify agriculture production will continue as a result of the need for food
security among rapidly growing population. But changes in agricultural systems and in the intensity
of land use have impacts on pest problems. Growing food demand must be met primarily by
increasing production on land already under cultivation (productive and marginal lands) and by
reducing losses due to diseases and pests. Attention, therefore, must go to small and marginal
farmers, who till nearly 65% of world’s arable land, to increase farm productivity. Crop protection
aspects must accordingly be incorporated as an integral part of sustainable efforts to intensify
production.
Plant protection in hill agriculture
Rainfed farming and intensive cultivation on small and fragmented lands is characteristic of
hill agriculture. Less land per person requires more high yielding agriculture and often the
response is high levels of chemical inputs, reduced rotations and extensive monocultures. The
search for greater and ever-cheaper production with increased intensification reduces the
biodiversity of the system itself and makes it vulnerable (Box 1).

(Climate Change, Precision Agriculture and Innovative Disease Control Strategies)
- 215 -
Decreased biodiversity tends to result in agroecosystems that are unstable and prone to
recurrent pest outbreaks and many other problems. In a recent study¥ (Singh and Singh, 2005)
carried out in four hill districts of Uttarakhand, viz., Bageshwar (Kumaon), Nainital (Kumaon),
Uttarkashi (Garhwal) and Pauri Garhwal (Garhwal), it was found that the per hectare
agrochemical usage in the vegetable crops was quite high as compared to cereal crops. The
highest per ha consumption was recorded in tomato, which stood at 406 kg/ha of fertilizers and an
average five sprays of pesticides. Similarly in other vegetables, the agrochemical (including
pesticides) consumption has dramatically increased and will continue in future as well.
High pesticide use does not guarantee pest control. Unaware of the problems arising from
pesticide resistance and the destruction of natural enemies, farmers often respond to pest
outbreaks by applying more pesticide, which merely aggravate the problem, a situation known as
‘the pesticide treadmill’. Once on the treadmill, the farmers find himself or herself facing spiraling
pesticide input costs, potentially increased pest problems and lower yields, leading to increasingly
smaller returns on investment. To increase yield from existing land requires good crop protection
against losses before and after harvesting, which, must be achieved within the framework of
Integrated Pest Management (IPM). However, the underlying, well taken theme--that an IPM
approach can lead to reduced reliance on pesticides--has to compete with constraints such as
intensive agriculture on small and scattered holdings, poor risk bearing capacity of the farmers,
inherent susceptibility of vegetable varieties in use to a spectrum of diseases and pests and
natural calamities (like draught or incessant rains).
Integrated Pest Management
Integrated pest management (IPM) is a concept of crop production incorporating effective,
ChallengesSmall and fragmented holding; women based hill agricultureSmall and fragmented holding; women based hill agriculture
Tremendous pressure to make living from the landTremendous pressure to make living from the land
Intensive Intensive agricultureagriculture
Reduced Reduced rotationsrotations
Extensive Extensive monoculturemonoculture
ReducedReducedBiodiversity of Biodiversity of
systemsystem
Box 1

(Climate Change, Precision Agriculture and Innovative Disease Control Strategies)
- 216 -
stable, long-lasting crop protection components that minimize the negative side effects of current
pest control actions. IPM recognizes that farmers' knowledge - and not just the technology - is the
key to success. It thus takes its place in a broad school of sustainable approaches, ranging from
organic agriculture to low external-input practices. In the traditional sense, IPM has been thought
of to be the use of multiple tactics to optimize control, but slowly that vision has changed to
accommodate the integration of all pest management tactics for a crop (Box 2). Pesticides are the
option of last resort in IPM programs because of their potential negative impacts on the
environment. If chemical pesticides must be used, it is to the grower’s advantage to choose the
least-toxic pesticide that will control the pest but not harm non-target organisms such as birds, fish,
and mammals. Pesticides that are short-lived or act on one or a few specific organisms are
included in this category. More recently, a larger portion of strategies utilized in agriculture have
been biological control practices progressing towards biointenssive IPM (Box 3). The goal is to
increase farmers’ income and to ensure that it can be sustained over time, and to reduce
environmental and health risks.
IPM is especially well suited to small scale farming because it makes use of on-farm labour
and farmers’ knowledge instead of purchased inputs. If deliberate attempts are made to
strengthen the natural defenses of the ecosystem, it is likely that there will be little or no need of
chemical inputs to manage pests. Promoting improved and promising IPM strategies that can be
easily understood and implemented by small scale farmers thus remains the major objective under
two situations: one involving traditional cultivation system and subsistence crops where pests
regularly cause considerable crop losses and the other involving pesticide induced crises caused
by high-input biased intensification, where farmers are continually forced to increase the amount of
pesticides they use in order to maintain yield levels. Both the situations need to be targeted in
order to implement an IPM programme in Uttarakhand hills.
A Common Minimum Programme under IPM : a case study in Uttarakhand hills
Off-season vegetable cultivation plays a unique role in the hill farming system in
Box-2
IPM Interventions
Pesticides Biological control Physical/mechanical control
Cultural/ sanitation practices
IPM Continuum Biointensive
Biologically based control
Prevention
Reduced risk pesticides
Economic thresholds
Monitoring
Chemically intensive
Box-3

(Climate Change, Precision Agriculture and Innovative Disease Control Strategies)
- 217 -
Uttarakhand. Being low volume and high value crops they are rated to be potential cash earners.
Unfortunately, however, all these cash crops suffer recurrent chronic losses due to a variety of
seed and soil borne diseases and impact of insects like, white grub and cutworm. Farmers suffer
from limited choice of improved cultivars and have poor access to healthy seeds and propagation
material. These problems result in an injudicious use of pesticides to solve pest problems causing
a number of problems related to heavy use of pesticides, like residues in soil, ground water and
harvested produce, intoxication of farmers and development of pesticide resistance.
The problems faced by the farmers in the region are consistent with mandate of IPM. The
challenge is to apply research to issues that lead to insecurity amongst small and marginal farmers
as regards crop management and protection. While threats with regard to biotic and abiotic
causes vary from region to region, there is a range of common challenges such as recurrent
losses (over 70%) to vegetable cultivation due to seed and soil borne pathogens and pests that
warrant a regional approach of integrated management (Box 4).
The cost of soil borne pathogens and pests to society and the environment far exceeds the
direct costs to growers and consumers. Long term chemical applications may permanently alter
the microbial community structure to an extent that sustainable agriculture may be impossible.
The opportunity therefore exists to address the issues relating to IPM across ecosystems through
a Common Minimum Programme¥. Other specific problems could be addressed through
supplementary intervention(s).
The key elements of the Common Minimum Programme that provide the frame work for a
regional approach include soil solarization, vermicompsoting, use of bioagents, and value
addition of vermicompost. Each element has a strong ecological base and operates through
COMMON THREATS TO VEGETABLES IN UTTARAKHAND HILLS
Crop Threat
Potato Late blight, bacterial wilt, brown rot, cut worm, white grub
Pea Seed rot, Root rot complex, Ascochyta blight, cut worm
Bean Seed rot, Root rot complex, anthracnose, angular leaf spot
Cabbage Seed rot, Root rot complex, collar rot, black rot, head rot
Cauliflower Root rot complex, collar rot, black rot, head rot
Capsicum Root rot complex, fruit rot, Cercospora leaf spot, dieback
Tomato Seed rot, Root rot complex, early blight, fruit rot, wilt, fruit borer
Cucumber Root rot complex, Bacterial wilt
Common threats indicated in italics are those that either seed or soil borne in nature and cause
over 70 % losses to crops each season in mid and high hills.
Common crops in bold are those that are raised through nurseries and harbour severe damage
due to pre-and post emergence damping off and root rot complex in the nursery itself causing
severe losses to the farmers due to high seed costs.
Strategies that can mitigate losses (of over 70%) due to seed and soil borne causative can
enhance production by the same proportion
Box 4

(Climate Change, Precision Agriculture and Innovative Disease Control Strategies)
- 218 -
maintaining and increasing biological diversity in the soil.
1. Soil solarization:
The use of clear polythene film to cover moistened soil and trap lethal amounts of heat
from solar radiation, termed as soil solarization. The pesticidial activity of soil solarization has
been found to stem from a combination of physical, chemical and biological effects. For most
vegetables, nursery is raised from the seeds and transplanted in the field. In the nursery, the seed
and the emerging seedlings encounter a plethora of soil pathogens and insects. As a result,
substantial portion of the nursery is lost due to seed rot, damping off, root rot, collar rot, stem rot
and insect damage. The left over seedlings are usually infected and poor in growth, and carry
infection to the field. Soil solarization is a low-cost technique to reduce losses due to insect pests
and diseases. Under the technique, nursery beds are prepared 5-8 weeks in advance of seed
sowing and are irrigated. Subsequently, they are covered with a transparent polythene sheet (50-
100 μ thick) in such a manner that there is no leakage of air from any point in the nursery.
Polythene sheet is removed 3-4 days ahead of the seed sowing time. The polythene sheet gives a
green-house effect whereby sun rays are trapped underneath. As a result, temperature of the soil
increases to a level that it becomes injurious to the soil microorganisms. Besides, it reduces weed
population, improved physical and chemical properties of the soil and increases population of
useful (friendly) micro flora in the soil. Since, plant pathogens are weakened through the effect of
solarization; they are over powered by the bioagents. In order to get maximum benefit from soil
solarization, it is necessary to perform the practice for about 5-8 weeks during hottest months of
the year using a transparent polythene sheet. Nursery beds must be irrigated before being
covered by polythene sheet and organic compost must be incorporated.
2. Preparation and use of vermicompost: Traditionally farmers use undecomposed farm yard
manure, which is deficient in nutrients and does more harm than good to the crop. Undecomposed
FYM promotes diseases, insects and pests and weed populations in the soil. On the other hand,
vermicompost is more nutritious and gets ready in lesser time. For its preparation, dung, crop
residue, green manure and other wastes are used by the earthworms to convert these to nutritious
compost. Vermicompost is balanced natural compost for vegetables, fruits and cereal crops. Use
of vermicompost reduces the cost of production, increases plant’s health and resistance against
biotic and abiotic causes and fertility and water holding capacity of the soil. Since the waste
material consumed by the earthworms passes through their guts, where it is acted upon by
enzymes and hence becomes nutritious for the crops. Of other species of earthworms, Eisenia
foetida has been found to be efficient in compost making.
3. Use of bioagents : Biological control is the sum total of harmful activities, which an organism
(biological control agent, abbreviated synonym “bioagent”) inflicts on the other. The term biological
control has been used in different fields of biology, more commonly in entomology and plant
pathology. In entomology, it has been used to describe the live predatory insects,
entomopathogenic nematodes, or microbial pathogens to suppress populations of different pest

(Climate Change, Precision Agriculture and Innovative Disease Control Strategies)
- 219 -
insects. In plant pathology, the term applies to the use of microbial antagonists to suppress
diseases as well as the use of host specific pathogens to control weed populations Continuous
use of pesticide results into the development of resistance in the pests, therefore use of bioagents
is a better alternative. More so because they are environment friendly and improve soil ecology
and health. During last two decades many bioagents have become commercially available in the
market of which Trichoderma and Pseudomonas spp. are quite popular for management of plant
diseases. Bioagents (microbial antagonists) could be used as seed treatment , rhizome
treatment , seedling treatment, compost treatment , spray or drench.
Use of bioagents offers several advantages: (i) it reduces cost of cultivation, (ii) it is
ecofriendly and does not affect the health of humans and animals, (iii) through its use pathogens
do not develop resistance and (iv) use of biaogents promotes seed germination and plant growth.
4. Value addition of vermi compost/ biocompost : Vermicompost/ biocompost should be
supplemented with bioagents (@ 250 g/q). This increases the nutritive value of the compost as
well as provides opportunity to the bioagant to grow faster on the compost so that it can compete
well with plant pathogens in the soil. Further, it facilitates rapid spread of bioagent in the soil.
Bioagent colonized compost acts as both biofertlizer and biopesticide because of its nutritional
superiority. Bioagent application through colonized compost is least expensive and the best
delivery system for biocontrol agents. Colonized compost also serves as inoculum for fresh
compost.
Through adoption CMP losses through seed and soil borne diseases could be severely
minimized. The ultimate aim is to raise healthy plant, which can resist/ withstand attacks of biotic
and abiotic aganets. This is achieved through maintaining microbial diversity in the soil, creating
conditions suitable for their growth and development through providing habitats for their growth.
The CMP tends to fulfill these objectives. Through the adoption of CMP farmers can reduce cost
of production, minimize losses due to pests and diseases, increase benefit-cost ratio and raise
value added crop. CMP has been extended¥ to over 3500 farmers from over 95 villages in
Uttarakhand hills through 124 trainings (farmers’ field schools).
Field observations revealed marked differences between the farmers who were adopting
IPM practices and conventional practices. This was a yardstick, showing how far the ‘older’
farmers have come. Importantly, they are applying the results to the bulk of their crops.
Management was a crucial element in producing healthy crops. For instance, crops failed where
farmers were busy with off-farm work. By comparison, committed farmers in disease prone areas
were visiting their crops weekly – in some places daily despite heavy rains – checking for disease,
roguing plants, and applying suggested measures. Diligence was seen to be a crucial factor in
pest and disease control. Seed quality and vagaries of weather were crucial to the
implementation of technology.
Experience of farmers adopting CMP nevertheless revealed that intensive vegetable
cultivation without complete reliance on pesticides and synthetic fertilizers is perfectly possible.

(Climate Change, Precision Agriculture and Innovative Disease Control Strategies)
- 220 -
The low-cost technology while on one hand offers a solution to recurrent disease and pest
problems, on the other falls with in the frame work of organic farming, which is the state policy.
CMP has a sound basis. The enthusiasm amongst people suggested that it would have wide
acceptability.
Although there is still a long way to go for local vegetable farmers to implement IPM
perfectly, the programme has contributed a lot to local vegetable production and to the upward
changes of farmers’ idea, habits and practice in pest management activities. However, certain
guidelines, such as the following, may lead the future course of action in sustaining vegetable
cultivation in the region through adoption of IPM: i). Initiating the establishment of a regional
network for the development and application of IPM in vegetables, ii). Establishing a databank on
IPM practices of vegetable cultivation and to make the information widely available, iii).
Strengthening the capacity for extension and training in IPM in vegetables and to develop
strategies to support IPM activities at various levels of the agricultural society, iv). Extending and
multiplying the pilot-stage training of lead farmers in vegetable IPM down to village/farmer level as
widely as possible, v). Strengthening and encouraging adaptive research for the development of
farmers' adoptable IPM packages, vi). Promoting supply of certified seeds of high yielding and
pest tolerant/resistant vegetable cultivars, vii). Minimizing pesticide use and promote safe and
judicious use of chemical pest control methods, viii). Developing a monitoring and surveillance
program for major pests of vegetables, ix). Ensuring sustained supply of quality bioagents and
biopescticides and x). Strengthening quality control units.
IPM techniques still are used by only a small number of farmers, primarily in pilot initiatives.
Government adoption of IPM as a part of its agriculture policy will move IPM from the level of
individual projects to increase the take-up, and bring benefits to the State. Farmers are largely
unaware of the benefits of adopting IPM practices but use cultural mechanical and crude botanical
pesticides, as well as indigenous and traditional knowledge for pest control. Encouraging farmers
to expand and adopt these pest management strategies, creating greater awareness of the
environmental benefits of IPM practices through education and training of extension agents and
farmers, and establishing mechanisms for recognition for farmers, who successfully adopt IPM
practices would not only facilitate the implementation of the IPM programme but also significantly
minimize the identified risks associated with pesticide dependent pest control strategies.
Certification of crops raised according to IPM or some other ecology-based standards may
give growers a marketing advantage as public concerns about health and environmental safety
increase. One goal of the program, in addition to being a marketing vehicle, would be to educate
consumers about agriculture and the food system. While the other goal would be to keep all
growers moving along the “IPM Continuum.”

(Climate Change, Precision Agriculture and Innovative Disease Control Strategies)
- 221 -
Metagenomics-A Tool for Identification and Characterization of Uncultivated Microbial Diversity
Ravindra Soni, Deep Chandra Suyal and Reeta Goel
Department of Microbiology, GBPUA&T, Pantnagar-263145 (Uttarakhand)
Microorganisms constitute two third of the Earth’s biological diversity. They can be
accessed primarily by a classical approach, involving culturing the microorganism by preparing a
solid or liquid growth medium containing appropriate carbon, energy and electron acceptor
sources depending on the physiological conditions under which the organism is to be isolated.
However, general routine conditions provided in the laboratory tend to impose selective pressure,
thereby preventing the growth of large number of microorganisms, but studies have shown that
only 1–15% of microbial genomes are cultivable under laboratory conditions and more than 85%
have never studied. Further, simple morphological and physiological traits of microbes can
provide few identification clues. This problem can be rectified by the use of phylogenetically
directed isolation strategies. Therefore,culture-independent methods are required to understand
the genetic diversity, population structure and ecological roles of the majority of microorganisms.
What is Metagenomics?
Microscope can visualized only culturable bacteria and still a large variety of microbes are
invisible. There are 1.9 x10⁶ species of microorganisms (Hammond 1995) but less than 105
species of bacteria and fungi are documented (Bull 1992). In the case of bacteria a small fraction
form observable colonies on culture media and there is no clear cut evidence that cultivable
bacterial play a significant role in their environment because enrichment cultures are for those
adapted to grow in media and selective for fast growing microbes (Torsvik and Ovreas, 2002). As
Studies reveals that 99% are unculturable in laboratory conditions (Amann 1995) showing the
biasness of cultivation based technologies. Available literature support that(Kaeberlein 2002),
one of the important reasons for bacterial unculturability is the prerequisite for cellular signals from
organisms in coculture. Therefore, to unreveal the complete microbial community an approach
should be there which provide an easy way to explore those invisible magicians.
The concept of cloning DNA directly from environmental samples was proposed by
Norman R. Pace, in 1991 wherein, a phage vector was reported for such cloning. Modification by
Delong group in direct DNA cloning from seawater provided the landmark for this field (Stein et al,
1996). After these initiative steps several other groups used this idea for the exploration of
unculturable microbial flora. Therein, new modifications and methodologies have been developed
to find out the unseen prokaryotic diversity of different environments.

(Climate Change, Precision Agriculture and Innovative Disease Control Strategies)
- 222 -
Figure 1: Basic steps of Metagenomic library construction
Approaches & techniques of Metagenomics
Two different analyses have been used to obtain information from metagenomic
libraries: a function-driven approach, in which metagenomic libraries are initially screened for
an expressed trait, and a sequence-driven approach, in which libraries are initially screened
for particular DNA sequences (fig.2).
Realizing the potential for discovery from metagenomics is dependent
on the
advancement of methods that are central to library construction and analysis. For sequence-
based approaches, the speed and cost of nucleotide sequencing will be a barrier of rapidly
diminishing significance as sequencing technology continues to improve.
Moreover, sequence-
based assignment of function will also benefit from advances in detection of homology, which
will increasingly rely on the tertiary structures of predicted proteins rather than
simply on
primary sequences. Advances that will facilitate the management and analysis of large
libraries include bioinformatics tools to analyze vast sequence databases and reassemble
multiple genomes rapidly and affordable gene chips for library profiling
(Sebat 2003) or that
readily distinguish clones that are expressing genes from those clones that are silent. On the
other hand, Functional approach will require more innovation in method development. Most
important
among these are strategies to improve heterologous gene expression
and
approaches for efficient screening of large libraries.

(Climate Change, Precision Agriculture and Innovative Disease Control Strategies)
- 223 -
Molecular
Tools used in
Metagenomics
Figure 2: Two different Metagenomic approaches: Sequenced based and function based.
Our On-going efforts
To explore the unculturable microbial diversity of Uttarakhand Himalayan region, efforts are
underway at different fronts: one is direct quantification of bacterial rRNA gene (Soni et al.
2010)to know the bacterial load on soil and the other is isolation of functional gene like bacterial
cold shock genes (csp) (Lata et al 2009) and nifH gene (Singh et al. 2010) etc. The metagenomic
Csp library was constructed from the temperate and glacier soils. Homology search of cloned
sequence revealed their identity with the Csp genes of Pseudomonas fluorescens,
Psychrobacter cryohalolentis K5 and Shewanella sp.MR-4. Further, analysis of amino
acid sequence of Csp recombinants revealed the sequence similarity with several cold stress
induced protein like rbfA, IF2, DEAD-boxhelicase, cold acclimation protein (EFTs) and temperature
induced proteins (SRP1/TIP1). This study highlights the prevalence of Csp gene(s) from cold
Himalayan environments which can be explored for tailored made crop as per the need of that
region in future.
Besides 16s rRNA gene library was constructed and sequenced from metagenome
isolated from six places i.e. Pantnagar (29.00 N, 243.8 mts), Chamoli (30. 51°N, 79.4°E,
1300mts), Ranichauri (78°30'E, 30°15'N, 1600 mts), Pithoragarh (80°2' E, 29° 47'N, 1967 mts),
Badrinath (30.440N, 790E, 3110mts) and Mana Glacier (30.440N, 790E, 3, 133m) of Uttarakhand.
More than 30 finally selected clones were sequenced and analyzed. Most of the clones are
showing homology with free living like Nostoc sp. symbiotic: Azorhizobium, Mesorhizobium

(Climate Change, Precision Agriculture and Innovative Disease Control Strategies)
- 224 -
nitrogen fixing and others related to nitrogen fixation process Nitrobacter sp., Nitrosococcus etc.
community like. It would be interesting to further screen them completely in view of their 100%
exploitations (Soni & Goel 2010).
REFERENCES
1. Amann, R.I., Ludwig, W., Schleifer, K.H., (1995). Phylogenetic identification and in situ detection of individual microbial cells without cultivation. Microbiol. Rev. 59, 143–169.
2. Bull A.T., Goodfellow M. and Slater J.H. (1992). Biodiversity as asource of innovation in biotechnology. Annu Rev Microbio. l46:219.
3. Hammond, P.M. (1995). Described and estimated species numbers:an objective assessment of current knowledge. In: Microbial 5 diversity and ecosystem function: proceedings of the IUBS/IUMS workshop, Egham, UK. University Press, Cambridge, UK, p 2.
4. Kaeberlein, T., Lewis, K. and Epstein, S.S., (2002). Isolating ‘Uncultivable’ microorganisms in pure culture by a simulated natural environment. Science, 296, 1127–1129.
5. Latha P. K., Soni R., Khan M., Marla S. S. Goel R. (2009) Exploration of Csp gene(s)from temperate and glacier soils of Indian Himalaya and in silico analysis of encoding proteins. Current Microbiology.58:343–348
6. Sebat, J.L. (2003). Metagenomic profiling: Microarray analysis of an environmental genomic library. Applied and Environmental Microbiology 69: 4927-34.
7. Singh C., Soni R., Jain S., Roy S. and Goel R. (2010)Study of nitrogen fixing bacterial community using nifH gene as a biomarker in different geographical soils of Western Indian Himalayas. Journal of Environmental Biology.31:553-556.
8. Soni R. Shaluja B.and Goel R. (2010) Bacterial community analysis using temporal gradient gel Electrophoresis of 16 S rDNA PCR products of soil metagenomes. Ekologija..56:3&4.
9. Soni R. and Goel R. (2010) Triphasic Approach for Assessment of Bacterial Population in Different Soil Systems. Ekologija.56:3&4.
10. Stein J.L.; Marsh T.L. wu K.Y., Shizuya H, Delong E.F. (1996). Characterisation of uncultivated prokaryotes :isolation and analysis of a 40 kilobase-pair genome fragment front a planktonic marine archaeon. J. Bacteriol. 178:591-599.
11. Torsvik, V. and Ovreas, L. (2002). Microbial diversity and function in soil: from genes to ecosystems. Curr. Opin. Microbiol. 5, 240-245.

(Climate Change, Precision Agriculture and Innovative Disease Control Strategies)
- 225 -
Effect of Climate Change on Plant-Pathogen Interactions
Rupam Kapoor Department of Botany, University of Delhi, Delhi
The science of climate change has matured considerably during the past decade, both
relative to the strength of the evidence documenting the ongoing anthropogenic climate change
and in terms of the quality of climate models projecting future changes in climate. The fourth
assessment report of the Intergovernmental Panel on Climate Change (2007) projects rising levels
of greenhouse gas and global temperature. The emerging body of knowledge strongly suggests
that climate change, especially changes in precipitation events, temperature and atmospheric
composition, will significantly add to the complex interactions in influencing plant diseases.
Pathogens drastically reduce plant growth in agricultural and natural ecosystems worldwide. The
makeup and functioning of natural ecosystems can also change dramatically because of
pathogens. Despite the paramount importance of plant disease to agricultural and natural
ecosystems, little is known of how disease will be affected by global climate change.Even the most
recent commentaries on food security advocating the priorities for climate change adaptation
needs continue to ignore impacts of pest and diseases on agricultural production and quality.
Process based models linking key elements of pathogen/disease cycle to crop models would be
more appropriate in projecting climate change impacts.
Given the integral role of environmental conditions in disease expression, altered
atmospheric composition is expected to modify plant disease expression and pathogen load
indirectly through changes in host plants (Chakraborty et al., 2008; Garrett et al.,
2006).Undoubtedly the nature of host (e.g. annual vs. perennial, C3 vs. C4) and pathogen (e.g.
root-infecting vs. shoot-infecting, biotroph vs. necrotroph) population and climate (e.g.asymmetric
temperature shifts will have different effects from changes in both maxima and minima) will
determine how the impacts of climate change will be felt. Consequently, climate change will
reduce, increase orhave no effect on a disease.
Structural, physiological, and chemical changes are common to many plants grown under
elevated CO2conditions and could also alter interactions with microbial pathogens (Coakley et al.,
1999; Karnosky et al., 2001). Many of these changes in host physiology can potentially enhance
host resistance. Significant increase in rates of net photosynthesis allows increased mobilization of
resources into host resistance at elevated CO2(Hibberd et al., 1996a). Other changes, including
production of papillae and accumulation of silicon at sites of appressorial penetration (Hibberd et
al., 1996a); greater accumulation of carbohydrates in leaves; more waxes, extra layers of
epidermal cells and increased fiber content (Owensby, 2006); lowered nutrient concentration,
leading to partitioning of nitrogen from photosynthetic proteins to metabolism that is limiting to
plant growth (Baxter et al., 1994); and greater number of mesophyll cells (Bowes, 1993) can all
influence host resistance.

(Climate Change, Precision Agriculture and Innovative Disease Control Strategies)
- 226 -
Reduced pathogen penetration results from a reduction in stomatal density (Chakraborty et
al., 1999) and stomatal conductance at high CO2(Hibberd et al., 1996b). Because many plant
pathogens infect leaves through the stomata (Agrios, 1997), any changes in stomatal structure
and function induced by elevated CO2may affect the infection process (Coakley et al., 1999). For
example, reductions in stomatal density (SD) and aperture could provide pathogens with fewer
and smaller points of entry, respectively. In addition, once infection occurs, changes in leaf
chemistry induced by elevated CO2 may alter the severity of infection.Whether changes in host
physiology would equally influence susceptible and resistant cultivars or resistance in both
traditionally bred and transgenic cultivars is not well known.
Though potential effects of climate change on crops have been investigated in detail,
knowledge about the impact on plant pathogens is still lacking (Runion, 2003). In fact, pathogens
could adapt to climate changes more rapidly than their hosts, because their multiple generations
give more opportunity for adaptation than the single generation per year of the crop plants
(Coakley, 1999). In particular, changes in temperature and rainfall patterns could directly affect
survival, development and reproduction of pathogens. With regard to temperature, warmer winter
conditions could favour pathogen overwintering (Manning & Tiedemann, 1995). The higher rate of
survival during winter could lead to an increase of the amount of initial inoculum and by contrast,
the dryer summer conditions of continental areas could reduce the incidence of those pathogens
that require free water on leaf or saturated soil for infection to occur (Coakleyet al., 1999).
The biggest threat to the durability of host resistance would come from accelerated
pathogen evolution. Changes will occur at all stages in the pathogen life cycle under elevated CO2.
Despite initial delays and reduction in host penetration, established colonies grow faster inside
host tissues at elevated CO2(Hibberd et al., 1996a).A combination of increased fecundity and a
favorable microclimate within enlarged canopies will provide more opportunities for infection.
There is evidence of adaptation for increased aggressiveness in some pathogens within three
sexualgenerations and controlled crossing has shown that aggressiveness is heritable and may be
polygenically controlled (Caten et al., 1984). For sexually reproducing pathogen populations with
broad genetic diversity,increased population size and the number of generationsin favorable
microclimates would increase the probability of more damaging pathotypes evolving more rapidly.
Warming will generally cause a pole-ward shift of the agroclimatic zones and crops that
grow in these zones. Pathogens will follow migrating host plants and their dispersal and survival
between seasons and changes in host physiology and ecology in the new environment would
largely determine how rapidly the pathogens establish in the new environment.More aggressive
strains of pathogens with broad host range, such as Rhizoctonia, Sclerotinia, Sclerotium, and
other necrotrophic pathogens may migrate from agricultural crops to natural plant communities.
Similarly, pathogens that are normally less aggressive in natural plant communities could
devastate crop monocultures growing in close proximity. Pathogens, in particular unspecialized
necrotrophs, may extend their host range to cause new disease problems in migrating

(Climate Change, Precision Agriculture and Innovative Disease Control Strategies)
- 227 -
crops.Expansion of host range may even occur in specialized biotrophs, as geographical proximity
is as important as phylogenetic relatedness in influencing the host range of some rusts (Savile and
Urban, 1982). As plants in both natural and agricultural communities can be symptomless carriers
of pathogens, any early predictions of impending damage will be difficult.
Most studies considering the effect of elevated CO2have been performed in greenhouses,
controlled environment chambers, transparent field enclosures or open top chambers. Data
derived from such work may not represent all aspects of natural systems (Long et al., 2004)
because of the exclusion of contributing abiotic and biotic factors. Open Top Chambers (OTCs)
have long been known to modify the environment by altering light intensity, relative humidity, wind
speed and direction, and other environmental factors. This is particularly disconcerting for studies
of disease occurrence when the chambers may interfere with the dispersal of natural inoculum or
alter the plant’s susceptibility to a given pathogen. If host plant resistance is to remain at the
frontline of the battle against devastating diseases like rusts, strategic experimental studies must
be made in environments that mimic future climate and atmospheric composition. Implementation
of Free Air gas Concentration Enrichment (FACE) systems has allowed researchers to expose
study plants to altered atmospheric composition in agricultural and natural ecosystems with
minimal impact on microclimate and without limiting the movement of biological organisms (e.g.
insects and pathogens). Realistic assessments of climate change impacts on host–pathogen
interactions are still scarce and there are only a handful of FACE studies. One of the most
important challenges for FACE research will be incorporating results of necessarily small-scale
experiments in larger scale predictions.
The global climate change will not only effect plant-pathogeninteractions, but also disease
management will be influenced due to altered efficacy of biological and chemical control
options.The shortage of such critical data on individual plant diseases needs to be addressed
using experimental approaches. Field-based research examining the influence of a combination of
interacting factors would be needed to provide a more realistic appraisal of impacts. Outcomes
from this research will have important implications for decisions on amelioration and management
strategies. Various gaps in knowledge and challenges related to study on impact of climate
change on plant-pathogen interactionswould be discussed.
REFERENCES
1. Agrios GN. 1997 Plant Pathology, 4th edn. San Diego, USA: Academic Press. 2. Baxter R, Ashenden TW, Sparks TH, Farrar JF. 1994 Effects of elevated CO2 on three montane
grass species. I. Growth and dry matter partitioning. Journal of Experimental Botany 45: 305-315.
3. Bowes G. 1993Facing the inevitable: plants and increasing atmospheric CO2. Annual Review of Plant Physiology and Plant Molecular Biology 44: 309-332.
4. Caten CE, Person C, Groth JV,Dhali SJ. 1984. The genetics of pathogenic aggressiveness in three dikaryons of Ustilagohordei. Canadian Journal of Botany.62: 1209-1219.
5. Chakraborty S. 2005 Potential impact of climate change on plant pathogen interactions. Australasian Plant Pathology 34:443- 448.
6. ChakrabortyS , Luck J , Hollaway G , Freeman A, Norton R, Garrett A, Percy K , Hopkins A, Davis

(Climate Change, Precision Agriculture and Innovative Disease Control Strategies)
- 228 -
C and Karnosky DF. 2008 CAB Reviews: Perspectives in Agriculture, Veterinary Science, Nutrition and Natural Resources3,No. 054
7. Chakraborty S, Tiedemann AV, Teng PS. 2000 Climate change: potential impact on plant diseases. Environmental Pollution 108:317–26.
8. Coakley SM, Scherm H, Chakraborty S. 1999 Climate change and plant disease management.Annual. Review of Phytopathology37:399–426.
9. Coakley SM. 1999 Biospheric change: will it matter in plant pathology? Canadian Journal of Plant Pathology 17, 147- 151.
10. Coakley, SM, Scherm, H. 1996 Plant disease in a changing global environment. Aspects of Applied Biology 45: 227-237.
11. Garrett KA, Dendy SP, Frank EE, Rouse MN, Travers SE. 2006 Climate change effects on plant disease: genomes to ecosystems. Annual Review of Phytopathology44: 490–509.
12. Hibberd JM, Whitbread R, Farrar JF. 1996a Effect of elevated concentrations of CO2 on infection of barley by Erysiphegraminis. Physiological and Molecular Plant Pathology 48: 37 - 53.
13. Hibberd JM, Whitbread R, Farrar JF. 1996b Effect of 700 mmol per mol CO2 and infection of powdery mildew on the growth and partitioning of barley. New Phytologist 1348: 309-345.
14. IPCC. 2007. Climate change 2007: the physical science basis. Contribution of Working Group I to the 4th Assessment Report of the IPCC. UK: Cambridge University Press.
15. Karnosky DF, Gielen G, Ceulemans R, Schlesinger WH, Norby RJ, Oksanen E, et al. 2001 Face systems for studying the impacts of greenhouse gases on forest ecosystems. In: Karnosky DF, ScarasciaMugnozza G, CeulemansR,Innes J, (Eds.), The Impact of Carbon Dioxide and Other Greenhouse Gases on Forest Ecosystems. CABI Publishing: New York, NY, USApp.297-324.
16. Kimball BA. Adaptation of vegetation and management practices to a higher carbon dioxide world. In: Strain BR, Cure JD, (Eds.), Direct Effects of Increasing Carbon Dioxide on Vegetation, 1985. US Department of Energy, Washington, pp. 185-204.
17. Long SP, Ainsworth EA, Rogers A, Ort DR.2004 Rising atmospheric carbon dioxide: Plants FACE the future. Annual Review of Plant Biology 55:591-628.
18. Owensby CE. 2006 Climate change and grasslands: ecosystem-level responses to elevated carbon dioxide. In: Proceedings of XVII International Grassland Congress, 1119-1124.
19. Pangga IB, Chakraborty S, Yates D. 2004 Canopy size and induced resistance in Stylosanthesscabradetermine anthracnose severity at high CO2. Phytopathology94:221–27.
20. Runion GB, Curl EA, Rogers HH, Backman PA, Rodriguez-Kabana R, Helms BE.1994 Effects of free-air CO2 enrichment on microbial populations in the rhizosphere and phyllosphere of cotton. Agricultural and ForestMeteorology 117-130.
21. Savile DBO, Urban Z. 1984 Evolution and ecology of Pucciniagraminis.Preslia54: 97- 104.

(Climate Change, Precision Agriculture and Innovative Disease Control Strategies)
- 229 -
Soil Solarization and Its Application in Plant Disease Management
Y. Singh Department of Plant Pathology, GBPUA&T, Pantnagar- 263 145 (Uttarakhand)
There are several methods for the management of plant diseases which include fungicidal
application, breeding for disease resistance, sanitation, crop rotation, biological control and soil
disinfestations. However, usually none of them is perfect nor can any one be used under all
circumstances. Moreover, the life cycles of pathogens may vary in different crop systems, thus
requiring different management strategies. Therefore, any new method of disease management is
of value since it adds to our rather limited arsenal of control methods.
The concept of managing soil borne pathogens has now changed. In past, control of these
pathogens concentrated on eradication. Later it has been realized that effective control could be
achieved by interrupting the disease cycle, plant resistance or the microbial balance leading to
disease reduction below the economic injury level, rather than absolute control. The integrated
pest management concept encompasses many elements. In this context soil solarization can play
a significant role.
In Israel, extension workers and growers suggested that the intensive heating that occurs
in mulched soil might be used for disease control. By mulching the soil with transparent
polyethylene sheets in the hot season prior to planting, a team of Israeli workers developed a solar
heating approach for soil disinfestation (Katan, 1995). Soil solarization is a method of controlling
soil borne pests and pathogens by raising the temperature of the soil through application of
transparent polyethylene sheet to a moist soil surface. With solarization vast possibilities for
disease control are possible.
Terms used to describe the method- solar heating, soil solarization, plastic or polyethylene
tarping, polyethylene or plastic mulching of soil, solar pasteurization.
Principles
Heat is used as a lethal agent for pest control through the use of transparent polyethylene
soil mulches (tarps) for capturing solar energy.
Recommendations:
Transparent not black polyethylene should be used since it transmits most of the solar
radiation that heats the soil. Black polyethylene, though it is greatly heated by itself, is less
efficient in heating the soil than transparent sheet.
Soil mulching should be carried out during the period of high temperatures and intense
solar irradiation.
Soil should be kept wet during mulching to increase thermal sensitivity of resting structures
and improve heat conduction.
The thinnest possible polyethylene tarp (25-30 µm) is recommended, since it is both
cheaper and more effective in heating, due to better radiation transmittance, than the

(Climate Change, Precision Agriculture and Innovative Disease Control Strategies)
- 230 -
thicker one. Polyethylene reduces heat convection and water evaporation from the soil to
the atmosphere. As a result of the formation of water droplets on the inner surface of the
polythene film, its transmissivity to long wave radiation is highly reduced, resulting in better
heating due to an increase in its greenhouse effect. An ideal plastic mulch is that which is
100% transparent to solar radiation and completely opaque to long wave radiation. This
ideal mulch can increase soil temp. by 6-80c over ordinary polyethylene.
Since temperatures at the deeper soil layers are lower than at the upper ones, the
mulching period should be sufficiently extended, usually 4 weeks or longer, in order to
achieve pathogen control at all desired depths.
The solar heating method for disease control is similar, in principle, to that of artificial soil
heating by steam or other means. There are, however, important biological and technological
differences:
With soil solarization there is no need to transport the heat from its source to the field.
Solar heating is carried out at relatively low temps. as compared to artificial heating; thus
its effects on living and nonliving components are likely to be less drastic. Negative side
effects observed with soil steaming such as phytotoxicity due to release of manganese or
other toxic products and a rapid soil reinfestation due to the creation of a biological vacuum
have not been reported so far with solar heating.
Mechanism of disease control
Reduction in disease incidence in solarized soils results from the effects on host, pathogen,
and soil microbiota as well as the physical and chemical environment which, in turn affects the
activity and interrelationships of the organisms. Although these processes occur primarily during
solarization, they may continue after the removal of the polyethylene sheets and planting. The
most pronounced effect of soil mulching with polyethylene is a physical one, i.e. an increase in soil
temperatures, for several hours of the day. However, other accompanying processes such as
shifts in microbial populations, changes in chemical composition and physical structure of the soil,
high moisture levels maintained by the mulch, and changes in gas composition of the soil, should
also be considered while analyzing mechanisms of disease control. The following equation proposed
by Baker (1968), for relating the various factors involved in biological control, should be adopted for this
analysis:
Disease severity =inoculum potential x disease potential, where inoculum potential is the energy
available for colonization of a substrate (infection court) at the surface and disease potential is the ability
of the host to contract disease. More specifically the equation becomes:
Disease severity = (inoculum density x capacity) x (proneness x susceptibility), where capacity is
the effect of the environment on energy for colonization, and proneness is the effect of the environment
on the host. Of these four components, inoculum density (ID) is the one most affected by solarization
either through the direct physical effect of the heat or by microbial processes induced in the soil. The

(Climate Change, Precision Agriculture and Innovative Disease Control Strategies)
- 231 -
other components, however (except for susceptibility which is genetically determined) might also be
affected.
The Physical effect of heat: Whenever organisms are subjected to moist heat, at temps. exceeding the
max. for growth, their viability is reduced. The thermal death rate of a population of an organism depends
on both the temperature level and exposure time, which are inversely related. The response of a
population of a particular organism to elevated temp. depends on its physiological condition eg.
Propagule type, age, and on environmental factors. Moisture level is a crucial factor since
microorganisms are much more resistant to heat under dry conditions. The effect of water can be
explained by the dependence of heat stability of proteins on hydration. In the presence of water less
energy is required to unfold the peptide chain of proteins resulting in a decreased heat resistance.
Heating dry soil is therefore not effective in pathogen control. In arid zones, summer temperatures in the
upper layers of bare soils naturally reach similar to those recorded in solarized ones. Apparently this
heating is ineffective in disease control since the soil remains dry in summer in those areas. It is
worthwhile to examine the possibility that merely keeping the soil moist during the summer in those
regions may result in disease control. The most obvious and easily measured effect of high temp. on
pathogens is their mortality and the consequent reduction in ID calculated by estimating the number of
surviving organisms. The surviving individuals may, however, be also affected. They may be weakened
or partially damaged by heat. Weakened propagules may possess lower inoculum potential and shorter
longevity due to slower germination or growth, reduced number and length of mycelia germinating from a
multicellular propagule, reduced capacity to produce enzymes, ruptures in cell membranes and leakage
of nutrients from cells. Moreover, a weakened propagule may become more vulnerable to antagonistic
action in the soil.
Biological control: Microbial processes, induced in the soil by solarization, may contribute to disease
control, since the impact of any lethal agent in the soil extends beyond the target organisms. Induced by
solarization, biological control may affect the pathogen by increasing its vulnerability to soil
microorganisms or increasing the activity of soil microorganisms toward pathogen or plant, which will
finally lead to a reduction in disease incidence, pathogen survivability, or both. Thus both short and long
term effects might be expected. The mechanisms of biological control, which may be created or
stimulated by solarization are summarized as follows:
I. The effect on the inoculum existing in the soil.
A. Reduction in ID (in the dormant stage or during host penetration) through
1. microbial killing of the pathogen, already weakened by sublethal heat;
2. Partial or complete annulment of fungistasis and subsequent lysis of the
germinating propagule;
3. Parasitism or lysis by antagonists stimulated by solarization.
B. Reduced inoculum potential (IP) due to competition or antibiosis induced by
solarization.
C. Diminished competitive saprophytic ability of the pathogen, in the absence of the

(Climate Change, Precision Agriculture and Innovative Disease Control Strategies)
- 232 -
host, due to antibiosis or competition.
II. Preventing reinfestation through activities of microorganisms possessing mechanisms A2,
A3, B, and C
III. The effect on the host due to cross protection
Combining solarization with other methods such as pesticides or biocontrol agents
improves disease control. Whenever a pathogen is weakened by heating, even reduced dosages
might suffice for improved control combining with biocontrol agents, organic amendments, etc.
Volatiles and other mechanisms
Volatiles in the soil are involved in key processes, such as fungistasis and biological
control. Ammonia has been found involved in the suppression of Fusarium by oilseed
amendments. Permeability of polyethylene to many gases is very low. It is possible, therefore, that
certain volatiles, accumulated to high amounts and heated under the mulch, play a role in
pathogen control. If this is the case, then solar heating can be improved by adding suitable OM to
the mulched soil or by using mulch that is less permeable to volatiles.
Control of Weeds and other pests: Solarization results in an effective weed control lasting in
many cases for a whole yr. or even longer. The possible mechanism of weed control: direct killing
of weed seeds by heat; indirect microbial killing of seeds weakened by sublethal heating; killing of
seeds stimulated to germinate in the moistened mulched soil; killing of germinating seeds whose
dormancy is broken in the heated soil. Volatiles may also play a role in weed control.
Increased Growth Response: Different mechanisms, not related to pathogen control, have been
suggested for explaining IGR in disinfested soils: increased micro and macro elements in the soil
solution; elimination of minor pathogens or parasites; destruction of phytotoxic substances in the
soil; release of growth regulator like substances; and stimulation of mycorrhizae or other beneficial
microorganisms.
Advantages
Soil solarization as a disinfestations method, has potential advantages. It is a non chemical
method which is not hazardous to the user and does not involve substances toxic to the consumer, to
the host plant or to other organisms. In the right perspective it is less expensive than other methods.
This technology can easily be transmitted to the ordinary farmers and can be applied in large areas
manually and mechanically. Thus, it is suitable for both developed and developing countries. It may
have a long term effect, since effective disease control lasts for more than one season. This method
has the characteristics of an integrated control, since physical, chemical and biological mechanisms
are involved and because the control of varieties of pests is achieved.
Limitations
Solarization involves limitations, difficulties and potential negative side effects. It can only be
used in regions where the climate is suitable (hot) and the soil is free of crops for about one month or
more at a time of tarping with PE sheets.

(Climate Change, Precision Agriculture and Innovative Disease Control Strategies)
- 233 -
It is too expensive for some crops and ineffective in the control of certain diseases
Heat tolerant pathogens might develop after repeated application, though selection for
tolerance to lethal agents is not likely to develop with disinfestation methods which are not
target specific
Another possibility would be an increase in pathogen population due to a harmful effect on its
antagonists
Problem of degradation of plastic
Lines of Research
Cost Reduction: Possibilities for reducing the cost of mulching: (a) Used polyethylene (e.g. from
plastic tunnels) may be as effective as the new, thus reducing the cost to nearly zero (b) Reusing
the polyethylene, providing it is durable (c) If required during the growing season, durable sheets
may be used for both solarization and mulch (d) The production of thinner polythene sheets (of an
adequate strength) will reduce the amount needed per hectare.
Other Uses: Application of solarization for controlling root diseases of existing trees in orchards
should be examined.
Combining with other methods: Combining pesticides or biocontrol agents with solarization
improves disease control. Whenever a pathogen is weakened by heating, a synergistic effect is
expected; thus reduced dosages might suffice for improved control. Combining with biocontrol
agents might be especially effective in preventing reinfestation and in extending the effectiveness
of disease control.
Plastic Technology: 1) Biodegradable plastic 2) Polyethylene recycling processes should be
further developed 3)Developing economic, novel plastic or other materials more efficient than
polythene in trapping solar energy, thus reducing our dependence on climate and making this
available to cooler regions 4) Possibility of plastic material that can be sprayed on the soil, instead
of polyethylene mulching, should be explored.
Biodegradable Plastic (Manufacturers and Suppliers)
Jaipur Polymers, Jaipur
Symphony Polymers Pvt. Ltd., Pune
Om Bioplast Pvt. Ltd., Pune
Bio-D Plastics, Gurgaon
Seazell International, New Delhi
Bio Bags, India, Chennai
Sachdeva Plastics, New Delhi
Juneja Plastic Industries, New Delhi

(Climate Change, Precision Agriculture and Innovative Disease Control Strategies)
- 234 -
Precision Farming with Special Relevance to Irrigation and Fertigation
P. K. Singh Department of Irrigation & Drainage Engineering, GBPUA&T, Pantnagar- 263 145 (Uttarakhand)
Introduction
Applications of agricultural inputs at uniform rates across the field without due regard to in-
field variations in soil fertility and crop conditions does not yield desirable results in terms of crop
yield. The management of in-field variability in soil moisture, fertility and crop conditions for
improving the crop production and minimizing the environmental impact is the crux of precision
farming. It's about doing the right thing, in the right place, in the right way, at the right time. It
requires the use of new technologies, such as global positioning (GPS), sensors, satellites or
aerial images, and information management tools (GIS) to assess and understand variations.
Precision farming may be used to improve a field or a farm management from several
perspectives. Better irrigation (Precision Irrigation) is one of the engineering perspectives of
precision farming.
We first need to establish common under standing to clarify or explain the term precision
irrigation. The traditional meaning of precision irrigation has been that of given in the literature, is
referred to as irrigation scheduling. That is scheduling based on environmental data, whether that
data comes from local field sensors or from more global sources such as regional meteorological
information at precise locations (within the soil profile) or at precise times. Perhaps good example
of this traditional definition of drip irrigation, which is generally accepted as a very precise irrigation
technique because water can be precisely controlled with regard to application rate, timing and
location with respect to the plant. This definition continued to be used today in many countries
except in USA and western world where more than 60% irrigated area is under sprinkler irrigation
(centre pivot system). However, in this paper we define precision irrigation as site specific irrigation
water management , specifically the application of water to a given site ( right place) in a given
volume (right amount) at right time (when) in a right manner (irrigation method) needed for
optimum crop production, profitability and other management objectives at the specific site. This is
in contrast with a simultaneous application of single amount of water to entire area of the irrigation
system / methods. During nineties in USA precision irrigation concept have been initiated at few
locations (Camp et al. 2006) mostly concerning to the hardware development and only a few
concerning to the site specific irrigation (Lu et al. 2004(a), Lu et al. 2004(b) and Lu et al. 2005).
This method of water management continues to be more or less a research issues. Development
of hardware is mostly in the area of variable rate applicators (sprinkler nozzles, control valves,
pumps, sensors etc.), and software to operate the system. However, exiting commercial self-
propelled system such as centre-pivot and lateral-move machines are particularly amenable to site
specific approaches because of their central level of automation and large area of coverage with a
single pipe lateral. This is reflected in some commercial irrigation systems that have recently been

(Climate Change, Precision Agriculture and Innovative Disease Control Strategies)
- 235 -
modified for precision irrigation. In addition to irrigation these machine offer an outstanding
platform for mounting sensors that can provide real time monitoring of plant and soil conditions
and serve as a transport device for nutrients and other agro-chemical application system. Adoption
of micro (drip / trickle) irrigation and fertigation systems are at an accelerated rate in the developed
and developing world for the wide spared horticultural and row crops. This system also offers a
site specific management of water and nutrients in precise manner with the application of
controllers and sensors. The development of efficient and cost effective hardware and software
shall be able to accelerate the adoption of a complete precision irrigation system by the all
category growers.
Advantages and Limitations
Applying precision irrigation practices offers significant potential for saving water, energy,
and money. Further, it has the potential to increases crop yield. There is an additional positive
environmental impact from precision irrigation in that farm runoff, a major source of water pollution,
can be reduced. The major limitation associated with precision irrigation are limited application of
self propelled centre-pivot sprinklers for small land holdings, high initial cost, operation and
maintenance need skilled work force.
Irrigation Application System
In conventional types of irrigation valves, emission devices, sprinkler nozzles, application
rates have been altered by manual operations. Similarly, the movement of lateral line, travel speed
were also controlled/ adjusted manually. In newer systems use of controller and software has
made these jobs automatically in dynamic mode as per the requirement of the crop and field i.e.
site specific.
Sprinkler Irrigation: Numerous innovative technologies have been developed to apply the
irrigation water in dynamic mode (variable rate) to meet anticipated whole-field management
needs in precision irrigation primarily with centre-pivot and lateral-move irrigation systems. In
general, the operation criteria for these systems include case of retrofit to existing commercial
irrigation system, good water application uniformity within and between management zone, robust
electronics, compatibility with existing irrigation system equipment, by-directional communication,
and flexible expansion for future development and functional requirement. In addition,
management of precision water application must include the interactions between individual
sprinkler wetted diameters, the start / stop movement of towers, and solenoid valve cycling. These
new precision water application technologies generally can be classified as either (1) a multiple of
discrete fixed-rate application devices operated in combination to provide a range of application
depths, (2) flow interruption to fixed-rate devices to provide a range of application depths that
depend upon pulse frequency, or (3) a variable aperture sprinkler with time proportional control.
Multiple sprinklers, pulsing sprinklers and variable-orifice sprinklers have been developed in
different part of the world for the precision application of water to the crops.
Micro Irrigation: In low pressure irrigation system (drip, micro sprinkler, micro jet etc.) constant

(Climate Change, Precision Agriculture and Innovative Disease Control Strategies)
- 236 -
and variable discharge emitters have been developed by manufacturers to provide variable flow
rate at the specific site in the field. In micro irrigation there may be single or multiple emitters at a
point, the operation of one or more than one emitters could be possible with the precision irrigation
system. The operation time of emitters / lateral is possible through automatic hydraulic valves
controlled by the micro processor/ controller.
System Control
Various form of control systems have been developed for the surface, sprinkler and micro
irrigation system for the control of the self propelled sprinklers, emitters on the basis of time,
volume and real time feed back. The control system generally consists of a micro processor /
controller, communication system (wire / wireless), control valve and sensors. For example,
Remote Irrigation Monitoring and Control System (RIMCS) have been developed for continuous
move irrigation systems that integrate localized wireless sensor networks for monitoring soil
moisture and weather and provide control for individual or groups of nozzles with wireless access
to the Internet to enable remote monitoring and control. The RIMCS uses a Single Board
Computer (SBC) using the Linux operating system to control solenoids connected to individual or
groups of nozzles based on prescribed application maps. The main control box houses the SBC
connected to a sensor network radio, a GPS unit, and an Ethernet radio creating a wireless
connection to a remote server. A C-software control program resides on the SBC to control the
on/off time for each nozzle group using a “time on” application map developed remotely. The SBC
also interfaces with the sensor network radio to record measurements from sensors on the
irrigation system and in the field that monitor performance and soil and crop conditions. The SBC
automatically populates a remote database on the server in real time and provides software
applications to monitor and control the irrigation system from the Internet. Another example of
irrigation control system is EIT irrigation control system is a data collection and SCADA based
control system which utilizes EIT data telemetry products as well as third party supplied soil
sensors for monitoring and scheduling irrigation activities. The system is designed for flexibility
and ease of use. The Human Machine Interface (HMI) provides easy to use functions for setting a
selecting irrigation modes and soil moisture set points. The system comprises of three main
components. These are the central PC, sensor for monitoring soil moisture and telemetry for data
collection, valve and pump control.
Sensors
Sensors are the most important component of a precision irrigation control system which
provide the desired information for the control of the sprinkler nozzels / emitters, control valve etc.
Field Environmental Sensors Soil moisture sensors are the most common type of environmental
sensor employed for determining a crop’s water requirements. However, sensors for ambient
temperature and humidity in the crop’s field are also common. As stated above, full weather
stations may even be included in local sensors. Sensors are strategically located at a number of
points within a crop’s field in a way that covers variations in soil type and climate. Pressure

(Climate Change, Precision Agriculture and Innovative Disease Control Strategies)
- 237 -
transducers may also be employed in the field for monitoring the water pressure of irrigation
zones. For crops that require continuous flood conditions, such as rice, water level sensors at
various points in the field may be used. They may be used as direct real-time feedback for
automatic controls (discussed below) and/or data collection and logging. Sensor Data Collection
Sensors may be queried manually or automatically by a data collection system. Automatic data
collection systems will query at regular intervals (generally every 5-15 minutes or so) and then log
the data into a database for subsequent reference. Also, automatic data collection systems
generally require a wireless communications network of very low power data collection nodes with
solar cells and rechargeable batteries. Any node within the network may have one to several
sensors attached. Some nodes may be used only as a communication relay within the wireless
network. In addition to the wireless nodes, the network may also include switching hubs, routers,
and gateways. Viewing of real-time data as well as data in the database archive may be limited to
a local network on the farm or may be accessible from the Internet.
Auxiliary System Components
Location and alignment
The control system for most site-specific application systems use some form of spatiality
indexed data to determine the appropriate application rate for specific sites. The basis for these
spatially indexed data is typically a widely accepted georeference system, such as latitude and
longitude. Consequently, it is necessary to know the precise location of all elements of the
application system at all times during operation if accurate site specific applications are expected.
Various approaches have been used, but the greatest challenge is cost. Although it is often
desirable to have multiple location sensors along the truss length of a moving irrigation system,
cost would be prohibitive. A general solution has been to use one or two sensors to locate one or
both ends of the moving system and to calculate the location intermediate points. Because moving
irrigation systems consist of multiple segments or spans, with each end of the span moving
independently but within confined limits, the truss is not always linear. This is not a significant
problem for small systems, but misalignment can be significant for large system. Fortunately, in
many cases, the shape of the truss is consistent, predictable, and describable for specific
operational conditions.
The determination of precise locations for lateral move system is similar to that of centre
pivot systems concept that is more difficult because both ends move. Laser alignment system is
also used for such system. Although the travel path is constrained by the guidance system, some
variation usually exists in repeatability. The issues of tissue misalignment are similar for lateral
move and centre-pivot systems. In general, more sensors are required for determining locations in
lateral move systems than in centre pivot systems. Most lateral move precision irrigation systems
have used one or more GPS sensor to determine location.
Management database and decision support
Any information to be used in the precision management application must be indexed by its

(Climate Change, Precision Agriculture and Innovative Disease Control Strategies)
- 238 -
geographical location and stored in an electronic format that can be readily accessed by a
computer or computer based controller. As such, it operates as special purpose GIS. This
management database houses the data with which the control system operates the irrigation
machines, records the actual application amounts for later use or documentation, and provides the
framework on which a decision support system can operate. Data that may be stored could include
user-entered soil characteristics, cultural operations, or application maps. It could also include
historical geo-referenced data such as yield maps, past application maps, or cultural histories.
Spatial arrays of sensors either mounted on the system or in the field could potentially feed
information directly into the management database.
Variable water supply
Most conventional moving irrigation systems are designed for and operate with a constant
water flow rate and pressure to the system in which all sprinklers operate most of the time. With
precision irrigation, in which variable flow rates are required for several management zones within
the total system, water must be applied to the system at constant pressure but at a variable flow
rate. The magnitude of the flow rate variance depends upon the system design and operation
characteristics, but in extreme cases it can vary from full design flow rate to almost zero.
Nutrient application methods
In all known applications, variable rate application of nutrients has been accomplished by
maintaining a constant concentration of the nutrient in the water supply and using the variable rate
application capabilities of the irrigation machine to vary the amount of water applied. This requires
knowledge of the water flow rate: either by direct measurement or by calculation using the design
(or individually measured) flow rates of the segments that are operating at a given time. With that
information the controller must signal the nutrient pump to inject the nutrient solution at a flow rate
that is proportional to the system water flow rate.
Because site specific applications of fertilizers are often applied in less water than normally applied
during a single irrigation application, water deficits may occur in some areas within the system,
especially for arid climates in which irrigation machines must operate most of time. Furthermore,
multiple site specific fertilizer application during the growing season could further exacerbate this
problem. Conversely, site specific fertilizer applications could cause excess water application in
some areas, causing surface accumulation or possible leaching of nutrients.
Precision Irrigation and Aerial Remote Sensing
To reduce the cost of making objective precision management decision, another approach
would be to spread out the cost of information from each point over the biggest area possible
(www.precirieg.net). Borrowing on ACMG’s experience in the treatment of nears infra-red imaging
from the air, ISA and especially IMIDA, specialized in the treatment of data from space, have set
up an experiment to test this principle on the ground. They have selected in an orchard some trees
with a variable irrigation management to express symptoms that the reflectance in the visible and
near infra-red would be capable of detect.

(Climate Change, Precision Agriculture and Innovative Disease Control Strategies)
- 239 -
Major work to finely and precisely measure the water status of citrus trees has been carried
out. A pressure vessel has been used for the base leaf potential and, in the middle of the day, the
gas exchange have been measured at the level of leaves to calculate the photosynthesis rate, the
transpiration rate and stomatal conductance of the capacitative probes tom establish the soil’s
water status. After have provoked progressive water stress over a period of 50 days, the
reflectance values and vegetation indices were compared with that precise information.
They concluded that the visible band alone is not enough to establish a reliable relationship
between the real state of stress and the image observed. In contrast, the infra red canal is rather
highly correlated with stomal conductance and the transpiration rate. This allows for seriously
entertaining the possibility of using the satellite or aerial sensing using localized and quite
expensive information collection to assess water status of vast zones.
Cost-Benefit
The cost-benefit issues are certainly not the same throughout the world. The issues vary
with size of enterprise, type and size of irrigation system, crops produced, prevailing crop prices
and subsidies and production costs. Therefore, these issues will be discussed for two broad
categories-automated irrigation on medium to large sized farm and manually controlled irrigation
on smaller farms.
Large farms: Because commercially produced precision water management systems and crop
production functions needed for optimization are not yet available, it is difficult to develop accurate
cost-benefit scenarios. A critical factor is that water, fertilizer and pesticide applications should all
be included in the precision management system. Depending on crop, savings can be substantial
for pesticides applications, especially if custom applications such as aerial applications can be
avoided. Some savings may accrue from less water, fertilizer and pesticide use from selective and
improved accuracy of pesticide applications and from better utilization of manpower. Also, future
environment regulations may greatly change the feasibility of precision irrigation systems because
they may be able to accomplish applications with less environmental impact.
Smaller farms: Although the popular concept is that precision agriculture technology is
appropriate only for large, mechanized farms, primarily because of equipment cost and location
positioning systems, it is probably not true. Certainly the scale and type of equipment and possibly,
the technology will not the same for the two cases. However the basic concept of precision
agriculture, that of optimizing the management of each crop unit for maximum profit (or other
objectives) applies equally to both production scales.
Conclusions
For the profitable adoption of site specific water, nutrient and agrochemical application
systems, crop response information is needed for optimum management of these systems.
Existing control systems are generally adequate for maintaining site specific application of water,
fertilizer and pesticides if the basis for management can be represented by a digital map or file of
spatially referenced data. Although certain combinations of cost and availability of water may

(Climate Change, Precision Agriculture and Innovative Disease Control Strategies)
- 240 -
justify precision application of water alone, precision water application system must usually
incorporate fertilizer and pesticide applications to be cost effective. Initially this technology will
probably be used predominantly on higher value crops, such as vegetables but will cascade to
other crops as the cost decreases.
REFERENCES
1. Lu Y C, Camp C R and Sadler E J. 2004a. Efficient allocation of irrigation water and nitrogen fertilizer in corn production. Journal of Sustainable Agriculture, 24(4):97-111.
2. Lu Y C, Camp C R and Sadler E J. 2004b. Optimal levels of irrigation in corn production in the southeast coastal plains. Journal of Sustainable Agriculture, 24(1):95-106.
3. Lu Y C, Sadler E J and Camp C R. 2005. Economic feasibility study of variable irrigation of corn production in southeast coastal plains. Journal of Sustainable Agriculture, 26(3):69-81.
4. Camp C R, Sadler E J and Evans R G. 2006. Precision water management: current realities, possibilities and trends In: Hand Book of Precision Agriculture, Haworth pp 153-185.
5. www.precirieg.net Precision irrigation to make the best use of water resources.21p

(Climate Change, Precision Agriculture and Innovative Disease Control Strategies)
- 241 -
Induced Systemic Resistance against White Rust of Mustard by Pre-or Coinoculation with an Incompatible Isolate
R.P. Awasthi
Department of Plant Pathology, GBPUA&T, Pantnagar- 263 145 (Uttarakhand))
White rust, caused by the biotrophic oomycete pathogen Albugo candida (Pers. ex Hook)
Kunze, is an important disease of Brassica juncea (L.) Czern & Coss and B. rapa L. The pathogen
can infect all aboveground parts of the plant, producing characteristic white blisters (sori). Severe
infection culminates in systemic “staghead” infection of the inflorescence (often in association with
Peronospora parasitica), which is the main cause of yield loss in susceptible cultivars (2, 3, 16).
A candida exhibits specialization on different cruciferous species and cultivars within
species (16). The North American population of the pathogen has been categorized into races that
cause the most of severe disease on their respective homologous hosts, although some also are
capable of infecting heterologous hosts (13, 17).
In some host-pathogen systems, prior inoculation with an incompatible isolate can protect
plants against subsequent infection by a compatible isolate. There has been much interest in this
type of induced resistance, because it suggests the possibility of “immunizing” crops against
disease (10,18). Little work has been done on the interactions among isolates of pathogens
differing in virulence on the interactions among isolates of pathogens differing in virulence on
Brasica hosts, although Mahuku et al., (12) recently demonstrated that highly and weakly virulent
isolates of Leptosphaeria maculans can coexist in lesions on B. napus and described how isolates
can interact during disease development. The aim of our study was to determine the interaction
between incompatible (IN) and compatible (CO) isolates of A. candida on B. juncea. We measured
isolated interaction in terms of symptom expression and did preliminary investigations of physical
(competition for infection sites among zoospores) and host-mediated (defense-related enzymes)
factors associated with the interaction.
Fungal isolates:
Two single-pustule isolates of A. candida, originally collected by N.I. Nashaat at Pantnagar
in northern India during January 1995 (MAFF import license PHF 1307C/1253/114), were used.
The incompatible (with B. juncea) isolate (IA01A) was collected from toria (B. rapa); the compatible
isolate (IA102A) was collected from mustard (B. juncea). The isolates were maintained separately
on seedlings of accessions of the hosts from which they were originally colleted: PT-303 (B. rapa)
and Kranti (B. juncea).
Plant material:
A B. juncea accession (PPBJ-1) was used as the host throughout the experiments.
Seedlings were raised from untreated seed, either in 8-cm-diameter plastic pots or in 5-cm2 card
board jiffy pots (Nursery Trades (Lee Valley) Ltd., Cheshunt, UK.). Seeds were sown = 1cm deep
in a soilless peat-based compost mix (Petersfield Products, Cosby, U.K.). Seedlings that emerged

(Climate Change, Precision Agriculture and Innovative Disease Control Strategies)
- 242 -
were thinned to seven per pot. Compost was kept moist by placing pots in propagator trays
(35.5×21×18cm), each containing a layer of water = 1 cm deep. All plant material was raised in
1×2.5×1.3-m controlled environment (CE) cabinets set at 18/150C day/night temperatures and 16-
h photoperiod, with a photosynthetic photon flux (measured at seedling height) ranging from 70 to
110µ mol quanta sec-1 m-2. Seedlings were first inoculated 6 to 7 days after sowing, when
cotyledons were fully expanded but true leaves were still developing (i.e., growth stage (GS) 1.0,
as described by Sylvester-Bradley (21). Inoculation of first and second true leaves usually was
done 10 (GS 1.1) or 12 (GS 1.2) days after sowing. After inoculation, seedlings were returned to
the incubation chamber under the same conditions, except for a transparent propagator lid that
was placed over them to provide the high humidity required for successful infection.
Preparation of zoosporangia suspensions, inoculation, and disease assessment:
Inoculum (zoosporangia suspensions) was prepared by shaking excised cotyledons
supporting abundant sporulations in sterile distilled water (SDW) in a glass vial. Extraneous matter
was removed from the resulting suspension by filtering through several layers of muslin. Before
inoculation, zoosporangial suspensions were adjusted to the required concentration with a
hemacytometer slide and appropriate dilution with SDW. In preliminary tests, zoosporangial
germination was high (>90%) and similar at each of the inoculum concentrations used in the
experiments. Inoculation was done within 15 min of preparing zoosporangial suspensions.
Prior to inoculation, seedlings were sprayed with SDW to remove compost debris from their
surface and left to dry for 30 min. Inoculum was applied either by pipetting inoculum droplets onto
cotyledons or by spraying seedlings to runoff with an atomizer. When droplets were used, a total of
10µl was applied surface of each half of a cotyledon. Droplets of this size were used, rather larger
ones, because they were never observed to run off the inoculated cotyledon. To test the local
interaction between the IN and CO isolates, the isolates were applied either together as mixed
inoculum or separately in succession as close as possible to the same site on the cotyledons. To
test systemic interactions, various combinations of isolates were applied to opposite cotyledons.
True leaves each received a total of 25µl of inoculum in similarly sized droplets pipetted onto their
adaxial surfaces. Inoculum was agitated during application. Unless otherwise specifed, inoculum
concentrations of 1×10⁵ (IN isolate) and 5×10⁴ (CO isolate) zoosporangia per ml were used. In
experiments that involved different treatments to opposite cotyledons, the position of each
treatment was marked with a marker pen.
Disease reaction was assessed 7 days after inoculation, using a 0 to 9 scale (modified
from Williams (26) for both cotyledons and true leaves: 0=no symptoms or signs of A. candida
infection; 1=pinpoint necrotic flecks at inoculation site, no sporulation; 4=6to10% of leaf area
covered with pustules; 5=11 to 20% leaf area covered with pustules; 6=21 to 30% leaf area
covered with pustules; 7=31 to 50% leaf area covered with pustules; 8=51 to 75% leaf area
covered with pustules; and 9=>75% leaf area covered with pustules. At least seven seedlings
were scored for each replication of a treatment combination.

(Climate Change, Precision Agriculture and Innovative Disease Control Strategies)
- 243 -
All experiments involved three replications of each treatment, and propagator trays
receiving different treatments were arranged randomly within CE cabinets. All experiments were
repeated at least once. Mean disease severity was calculated for ach tray, and the values were
used in analysis of variance. F tests were used to assess the significance of treatment main
effects and interactions. Treatment means were differentiated using Fisher’s least significant
difference test (LSD). All analyses were done using the Genstat statistical package (Lawes
Agricultural Trust, Hertfordshire, U.K.).
Local and systemic induction of resistance:
In a preliminary experiment, batches of seedlings were either spray-inoculated with the IN
isolate or sprayed with SDW; 4 h later all seedlings were spray-inoculated with the CO isolate. In a
second experiment, seedlings were droplet-inoculated on one cotyledon (treatment A) with SDW
or the IN isolate followed by CO isolate and then inoculated on the other cotyledon (treatment B)
with either the CO or IN isolate. The possibility of systemic protection of true leaves was
investigated in a third experiment: both cotyledons of a seedling were spray-inoculated with the IN
isolate or with SDW as a control before the emergence of true leaves; 5 days later newly emerged
true leaves were droplet-inoculated with the CO isolate.
Effect of IN inoculum concentration on CO infection:
The CO isolate was droplet-inoculated either alone or in mixed suspension with increasing
concentrations of the IN isolate (0, 5×10³, 1×10⁴, 5 × 10⁴, 1×10⁵ zoosporangia per ml) on one
cotyledon per seedling from different seedling batches; the opposite cotyledons of all seedlings
received the CO isolate alone (1 × 10⁵ zoosporangia per ml). Mixed suspensions were prepared in
such a way that the inoculum concentration of the CO isolate remained constant.
Importance of timing and sequence in IN and CO inoculations:
Both cotyledons of each seedling in a batch received droplet-inoculations with both the IN
and CO isolates, but the inoculations, were different time intervals between the applications of
each isolate. Both IN followed by CO and CO followed by IN combinations were tested in four
experiments. (i) In-tervals of 4 h between initial application of the CO or IN isolate or H2O followed
by application of the CO or IN isolate or H2O compared with simultaneous application of the CO
and IN isolates. (ii) Cotyledons were first inoculated with H2O or the IN isolate and subsequently
inoculated with the CO isolates 0, 1, 3, 5, or 7 days later. In similar experiments, true leaves 1 and
2 were inoculated with the CO isolate 5 or 7 days and 7 days, respectively, after initial inoculation
of cotyledons with H2O or the IN isolate. Results for cotyledons and true leaves 1 and 2 were
analyzed separately. (iii) Cotyledon 1 was inoculated initially with H2O or the IN isolates, and both
cotyledons were inoculated with the CO isolate after 0, 1, or 3 days. (iv) Cotyledons were initially
inoculated with the CO isolate and then with the IN isolate after 0, 1, 3 or 5 days. Cotyledons of
control seedlings were inoculated a second time with H2O. In all cases, disease reaction was

(Climate Change, Precision Agriculture and Innovative Disease Control Strategies)
- 244 -
scored 7 days after last inoculation.
Microscope observation of zoospore distribution:
A sub sample of four cotyledons was collected 4 h after droplet-inoculation with the IN
isolate alone. Cotyledons were washed thoroughly three times in SDW in a glass vial and mounted
in a 0.1% aqueous solution of Calcofluor on microscope slides. The location of zoospores in
relation to stomata was investigated with a fluorescence microscope (Leitz, Wetzlar, Germany)
fitted with a 380 to 440 nm exciter filter and a 475-nm barrier filter (22). The extent of zoospore
lodging over stomata was estimated by counting the number of zoospores over, or away from, 100
stomata under the site of the inoculum droplet on each replicate cotyledon.
Phenylalanine ammonia lyase and total soluble peroxidase as says:
Sub samples of cotyledons were collected at the time of droplet inoculation with the IN or
CO isolate and 1, 3, and 5 days after inoculation. SDW treated cotyledons were sampled at the
same times for the control. For each treatment combination, a 2-g sample was homogenized in 20
ml of homogenization buffer (0.1 M potassium phosphate, 50 mM sodium metabisulphite, 1 mM
phenylmethyl-sulphonyl fluoride, and 250 mM sucrose, pH 7.0). The homogenate was mixed with
2.5g of polyvinylpoypyrrolidone (standard grade, Sigma Chemical Co., St. Louis) and 1.25g of
Amberlite XAD-4 (standard grade, Sigma) ion-exchange resin for 2 min, filtered through two layer
s of muslin cloth, and centrifuged at 100,000 × g at 40C for 30 min. A 1-ml aliquot of supernatant
was purified further and desalted by centrifugation through a 2-ml Sepharose G25 mini-column
(3000 rpm for 5 min at 40C). The G25 column removes excess salt simple organic acids that might
interfere with both the phenylalanine ammonia lyase (PAL) and total soluble peroxidase (POS)
assays. PAL and POX activities were assayed by procedures modified from those reported by
Strack and Mock (20). For PAL, 50µl of supernatant was mixed with 950 µl of substrate butter
(10mM L-phenylalanine in 100mM potassium borate, pH 8.8), and the formation of trans-cinnamic
acid was measured at 290nm after 2 h of incubation at 300C. PAL activity was expressed as
nanomoles trans-cinnamic acid per gram fresh weight per hour. For POX, 50µl of supernatant was
mixed with 950µl of substrate buffer (4.5 mM guaiacol [50µl], 2.2 mM hydrogen peroxide [25µl of
30% stock], and 200 mM potassium phosphate, pH 5.8). The formation of tetraguaiacol was
recorded spectrophotometrically at 300C for 2 min, and a rate was determined. POX activity was
expressed as nanomoles tetraguaiacol formed per gram fresh weight per hour. Six assays for both
PAL and POX were performed for each sample.
Local and systemic induction of resistance:
A preliminary experiment indicated that pretreatment by spraying with the IN isolate
protected seedlings from the CO isolate (disease reaction = 3.92 versus 7.06 for the control;
standard error of difference between means = 0.326; F significant at P = 0.0006). The relative
virulence of each isolate of B. juncea accession PPBJ-1 and the local and systemic induction of
resistance to the CO isolate by the IN isolate are shown in Figure 1. Within the time (6 to 7 days) it
took the CO isolate to produce abundant white pustules on the lower surfaces of cotyledons the IN

(Climate Change, Precision Agriculture and Innovative Disease Control Strategies)
- 245 -
isolate produced few systems. Occasionally, IN-inoculated cotyledons became slightly curled, but
they had a disease reaction of only 0 or 1. Coinoculation with the IN and CO isolates
simultaneously on one cotyledon decreased disease reaction on the cotyledon, as well as on the
opposite cotyledon inoculated with the CO isolate alone. However, systemic protection (on the
opposite cotyledon) was not as great as local protection. If the opposite cotyledon was inoculated
instead with the IN isolate after the first simultaneous IN and Co inoculation, there was no change
in disease reaction on the cotyledon. There was no evidence that coinoculation with the two
isolates encouraged infection by the IN isolate.
Inoculating cotyledons with the IN isolate also protected subsequently emerging true
leaves against the CO isolate (P<0.001). The first and second true leaves were protected to a
similar extent.
Effect of IN inoculum concentration on CO infection:
The degrees of both local and systemic protection of cotyledons against the CO isolate
increased as the concentration of the IN isolate used in mixed inoculation increased (P<0.001).
Local protection was greater than systemic protection (P<0.001; Fig. 3). The pattern of protection
differed between local and systemic (P<0.001). Systemic protection was greatest at = 5 × 10 4
zoosporangia per ml, whereas, local protection continued to increase upto the highest
concentration of IN isolate applied sporangia per ml.
Importance of timing and sequence of IN and CO inoculation:
The local protection given by inoculation with the IN isolate increased when there was a
delay of as little as 4h before challenge inoculation with the CO isolate. Disease severity was
reduced compared with cotyledons inoculated with the CO isolate after 4 h of inoculations with
H2O, whether inoculation with the IN isolate took place before or after inoculation with the CO
isolate (P>0.001). However, inoculation with the IN isolate 4 h before the CO isolate gave the
greatest protection; protection was weaker with simultaneous inoculation with the CO IN isolates
and weakest with inoculation with the IN isolate 4 h after inoculation with the CO isolate.
Ther was clear evidence of both local protection of cotyledons and systemic protection of
true leaves induced by initial inoculation of cotyledons with the IN isolate (P<0.001), but there
appeared to be a decline in the systemic protection of true leaves, relative to control, when the
interval was extended from 5 to 7 days. However, the difference in disease severity between the
control and IN inoculation decreased as the delay until inoculation with the CO isolate increased
(P=0.001).
There also was evidence of both local and systemic protection of cotyledons induced by
the IN inoculation (P<0.001), but systemic protection was lower (P<0.001). Disease severity in
general decreased as the delay until inoculation with the CO isolate increased, but there was no
evidence of any change in this pattern as the length of the delay increased (P>0.35 for all
interactions with delayed inoculation with the CO isolates).
In another experiment, disease severity was reduced by = 50% when cotyledons were

(Climate Change, Precision Agriculture and Innovative Disease Control Strategies)
- 246 -
simultaneously inoculated with the CO and IN isolates compared with those inoculated
simultaneously with the CO isolate and H2O, but the difference became minimal as the delay until
inoculation with the IN isolate increased to 5 days.
Zoospore distribution on inoculated cotyledon surfaces:
At the zoosporangia concentration used for the IN isolate (1×10⁵ zoosporangia per ml),
almost all (>97%) stomata under the inoculum droplet were occupied by encysted zoospores.
PAL and POX activities in inoculated tissues:
PAL and POX activities declined in uninoculated cotyledons during the course of the
assays, but inoculated cotyledons showed net increases in the activities of both enzymes, and the
difference from the control increased with time after inoculation (P<0.001). The activities of both
enzymes were consistently higher in IN-than in CO-inoculated cotyledons; the rate of increase in
POX activity was similar for the two isolates, but the rate of increase in PAL activity was greater
with the IN isolate. Cotyledons and true leaves that had been coinoculated with IN and CO isolates
simultaneously were not assessed.
Attempted infection of cotyledons by an IN isolate of A. candida provided various degrees
of protection of B. juncea seedlings, both local and systemic, against an CO isolate. The degree of
protection depended on the zoosporangia concentration of IN isolate applied, sequence of
inoculations, and interval between inoculations with the IN and CO isolates. However, the CO
isolate only produced symptoms comparable with an IN reaction when a very high concentration of
inducing (IN) inoculum was used. The protective effect was also greatest locally and appeared to
decline in usues remote from the point of IN isolate inoculation.
This interaction probably was not due to direct antagonism between zoospores of the two
isolates. A more likely explanation is a combination of two effects: competition between the
isolates for infection sites and inhibition of the CO isolate by host resistance responses induced by
the IN isolate.
Competition for infection sites is likely to have contributed to local protection conferred by
the IN isolate, at least in treatments involving IN isolate inoculation before the CO isolate. A.
candida zoospores must lodge over a stoma to initiate infection, and they must do so in an
orientation that allows the emerging germ tube to grow directly into the stomatal chamber.
Zoospores of the two isolates used in our study germinate from zoosporangia, encyst, and send
germ tubes into stomatal chambers at a similar rate. More than one zoospore can lodge over a
stoma, but once the stoma is occupied, the presence of one zoospore appears to reduce the
likelihood that subsequent zoospores will lodge and penetrate successfully (U.S. Singh, K.J.
Doughty, N.I. Nashaat, G.Ross, and S.J. Kolte, unpublished data). When the IN and CO isolates
were inoculated together, the IN isolate is likely to have prevented a significant proportion of the
CO isolate zoospores from penetrating successfully, particularly when a high IN zoosporangia
concentration was applied. The fact that local protection was greater when the IN isolate
inoculaum preceded the CO isolate inoculum by as little as 4h and less when the IN isolate

(Climate Change, Precision Agriculture and Innovative Disease Control Strategies)
- 247 -
followed the CO isolate than when the two isolates were inoculated together is consistent with this
hypothesis. Four hours between successive inoculations with the IN and CO isolates is long
enough to allow zoospores of the IN isolate to deny the CO isolate a proportion of stomatal
infection sites by blocking them. Also, increasing the delay between inducting (IN) and challenge
(CO) inoculations did not greatly increase the extent of local protection, and there was no
significant “curative” effect when the IN isolate was applied more than 1 day after the Co isolate.
Systemic protection against the CO isolate conferred by the IN isolate was host-mediated.
Local protection conferred by In isolate probably also was host-mediated, at least in part. For
example, treatments that involved inoculating a cotyledon with the CO isolate and then the IN
isolate (precluding the possibility of denial of infection sites by the IN isolate) also decreased the
extent of local symptom development. However, local symptom development was much less when
the isolates were inoculated at the same time or when the IN isolates was inoculated first. It is
difficult to estimate the relative contributions of competition for infection sites and induced
resistance to the local interaction between the two isolates.
Induced (IN) responses were likely to be relatively rapid ones, coinciding perhaps with
inhibition of haustorial development in the mesophyll, which appears to be the first indication of an
IN interaction (11, 23). The IN isolate probably was recognized by the host relatively early, and its
attempt to infect may have led to the release of elictors that condition the expression of plant
resistance genes-the products of which may inhibit infection by the CO isolate. This is consistent
with the earlier an greater increase in PAL activity and the slightly greater increase in POX activity
after inoculation with the IN isolate than with the CO isolate. Visible symptoms of hypersensitive
reactions of fungal infection commonly occur between 3 and 5 days after inoculation. However,
there are clearly other defense-related events that occur much earlier in resistance and
hypersensitive plants, including insolubilization of cell wall proteins and induction of various
enzymes and crucifer in-dole phytozalexins (15, 19). Both PAL and POX are associated with
induced resistance in various species and have various functions, including control of key stages
in biosynthesis of lignin precursors (PAL), strengthening of cell walls against pathogen invasion
(PAL and POX), and biosynthesis of indolylglucosinolates and in-dole phytoalexins (POX) (4, 7,
25). Dahiya and Woods (5) reported that infection by A. candida induced production of fungitoxic
phytoalexins in rapeseed (species unspecified). It is possible that increased PAL and POX
activities may contribute to protection of B. juncea against the CO isolate conferred by the IN
isolate. However, Brassica species also are capable of other biochemical responses to infection
that are not measured here, including production of pathogenesis-related proteins and
glucosinolates (6, 8, 19). Further studies need to be completed before the precise biochemical
mechanism(s) of the IN isolate-induced resistance can be identified.
The greater local and systemic protection resulting from increased inducing (IN) inoculum
corresponds with other studies (14). However, when increasing inoculum concentrations of the IN
isolate were applied to one cotyledon, there appeared to be a limit to the extent of protection of

(Climate Change, Precision Agriculture and Innovative Disease Control Strategies)
- 248 -
opposite cotyledons inoculated with the CO isolate, such that the response (and presumably the
signaling mechanism that invokes it) were greatest at relatively low inducing zoosporangia
concentrations.
The pattern of interactions between the CO and IN isolates of A. candida on B. juncea
corresponded, to some extent, to those found between highly virulent (HV) and weakly virulent
(WV) isolates of LEptosphaeria maculans on B. napus (12). However, in contrast to A. candida,
the optimum interval between WV and HV L. maculans inoculations was 24h, and it was possible
to achieve a curative effect up to 48h after HV inoculation.
Out controlled-environment studies suggest there are likely interactions in the field among
pathotypes of A. candida expressing different host specificities. In similar work, Voorrips (24)
concluded that induction of host resistance was a better explanation for interactions between
Plasmodiophora brassicae isolates deferring in virulence on B. oleracea than competition for
infection sites. In the A. candida B. juncea system, both competition and induced resistance may
be involved, although the relative importance of each in nature is determined by the amount of a
virulent inoculum present. In western Canada, where both B. rapa and B. juncea are grown, there
is a predominance of isolates that infect only B. rapa (13), and these might be expected to
interfere with infection by isolates specific to B. juncea. The scale and significance of these
interactions in crops depends not only on the virulence composition of the local pathogen
population, but also on the relative timing and proximity of cultivation of respective hosts and on
the likelihood that A. candida races differing in virulence coexist at infection sites, as is the case of
the L. maculans-B. napus (12) and other (1) systems. In our study the optimum local protection
that occurred after preinoculation with the IN isolate alone approached a response comparable to
an IN interaction when a high zoosporangia concentration (2 × 10⁵ ml-1-) was used. The importance
of the timing and sequence of IN and CO inoculations to the induction of resistance to A. candida
in B. juncea suggests that major effects in the field are less likely than for L. maculans, for which
induced resistance appears to be more flexible (12).
Based on the results presented in out paper, biological control of A. candida based on
intervention with IN isolates appears difficult to achieve. The use of antagonistic or resistance-
inducing bacterial inoculants for control may be a more promising approach (9). However, the A.
Candida-B. juncea interactions described here may provide a useful model for identifying the
systemic biochemical responses that determine incompatibility.
Induce system resistance against white rust was demonstrated in an investigation of the
interaction between two isolates of Albugo candida that were compatible (CO) and incompatible
(IN) on a Brassica juncea accession, the IN isolate induced both local and systemic protection of
cotyledons and true leaves against the CO isolate. The extent of the protection was proportional to
the zoosporangia concentration used in the inducing (IN) inoculation. Protection was greatest
locally on cotyledons and least on true leaves (the most remote tissue from the point of the
inducing inoculation). Protection occurred when the two isolates were inoculated together but was
(Climate Change, Precision Agriculture and Innovative Disease Control Strategies)
- 249 -
greater when the interval between the IN and CO isolate inoculations was longer. The IN isolates
induced only slight protection when it was inoculated after the CO isolate. No induced
susceptibility to the In isolate occurred with any treatment. There was some evidence of
competition between Co and IN zoospores for infection sites (stomata). The occurrence of
systemic protection and changes detected in phyenylalanine ammona lyase and total soluble
peroxidase activities in inoculated cotyledons, particularly after the inducing (IN) inoculation,
suggested that host-mediated factors also may be involved in the interaction between the two
isolates.
REFERENCES
1. Awasthi, R.P., Nashaat, N.I., Heran, A., Kolte, S.J., and Singh, U.S. 1997. The effect of Albugo candida on the resistance to Peronospora parasitica and vice versa in rapeseed-mustard. Page 49 in: Abstr. ISHS symp. Brassicas; 10
th Crucifer Genet. Workshop.
ENSAR-INRA, Rennes, France.
2. Bisht, I.S., Agrawal, R.C., and Singh, R. 1994. White rust (A. candida). Severity in mustard (B. juncea) and its effect on seed yield. Plant Var. & Seeds 7: 85-89.
3. Dhaiya, J.S., and Woods, D.L. 1987. Phytoalexin accumulation in rapeseed leaves challenged with white rust (A. candida). (Abstr.) Can. J. Plant. Pathol. 9: 276.
4. Dixelius, C. 1994. Presence of pathogenesis-related proteins 2, Q and S in stressed B. napus and B. nigra plantets. Physiol. Mol. Plant Pathol. 44:1-8.
5. Doughty, K.J., Porter, A.J.R., Morton, A.M. Kiddle, G., Bock, C.H., and Wallsgrove, R.M. 1991. Variation in the glucosinolates content of oilseed rape (B. napus L.) leaves. II. Response to infection by Alternaria brassicae (Brek). Sacc. Ann. Appl. Biol. 118: 469-477.
6. Goyal, B.K., Verma, P.R., and Reddy, M.S. 1995. Suppression of white rust of mustard by foliar and seed application of microbial inoculants. (Abstr.) Can. J. Palnt Pathol. 17: 357.
7. Liu, Q., Rimmer, S.R., and Scarth, R. 1989. Histopathology of compatibility and incompatibility between noilseed rape and A. candida. Plant Pathol. 38: 176-182.
8. Mahuku, G.S., Hall, R., and Goodwin, P.H. 1996. Co-infection and induction of systemic acquired resistance by weakly and highly virulent isolates of Leptosphaeria maculans in oilseed rape. Physiol. Mol. Plant Pathol. 49: 61-72.
9. Mathur, S., Wu, C.R. and Rimmer, S.R. 1995. Pathogenic variation among A. candida isolates from Western Canada. (Abstr.) Phytopathology 85: 1175.
10. Petrie, G.A. 1988. Races of A. candida (white rust and staghead) on cultivated Cruciferac in Saskatchewan. Can. J. Plant. Pathol. 10: 142-150.
11. Pidskalny, R.S., and Rimmer, S.R. 1985. Virulence of A. candida from turnip rape (B. campestris) and mustard (B. juncea) on various crucifers. Can. J. Plant Pathol. 7: 283-286.

(Climate Change, Precision Agriculture and Innovative Disease Control Strategies)
- 250 -
Multilines and Cultivar Mixtures for Plant Disease Management
P.K. Shrotria Department of Genetics and Plant Breeding, GBPUA&T, Pantnagar- 263 145 (Uttarakhand)
Introduction
Cultivation of resistant varieties is considered as most effective and economical method of
disease management. Resistance breeding involves management of two biological entities viz.
host plant and pathogen. In view of dynamic nature of pathogen the resistance gene(s) fall
susceptible after few years and therefore the resistance breeding programme is a continuating
approach. Breeding for disease resistance involve several methods like selection, line breeding,
poly cross breeding, hybrid and synthetic variety development and hybridization followed by
pedigree/bulk pedigree or back cross breeding. However for management of disease up to the
level where it is not able to cause the economic loss is important aspect of resistance breeding.
Since the mode of inheritance of resistance in host may be race specific (vertical) and/or non race
specific (horizontal) therefore, depending on the mode of inheritance several methods have been
proposed for better utilization of resistance gene(s) for disease management.
Management of Disease
Management of vertical resistance genes
Important factors for management of VR genes
VR can only reduce the outside inoculum or exodemic
VR is achieved by manipulating the host population for maximum disadvantage to
pathogen population
For management of vertical resistance genes following approaches may be useful
Recycling and sequential release of resistance genes: Varieties are replaced frequently
with each increase in new races of pathogen such that release of one gene with resistance
and wait until it become ineffective and then release second gene and so on.
Pyramiding of resistance genes: Simultaneous introduction of diverse genes for resistance
into cultivars such that the variety offer more than one physiological barrier against pathogen
and also prevent stepwise development of races virulent to varieties possessing different but
single genes for resistance.
Regional deployment of resistance gene: Resistant varieties with different resistance genes
are developed and recommended for different geographical regions of the country where the
crop covers sizable area. This type of gene deployment is essentially a geographical multiline
eg. control of Puccinia recondita of Wheat.
Chromosome or genome substitution: If genes for resistance are not available in the
cultivated species, it is some times transferred from related species/genera through inter
specific/inter genetic recombination. Whole genome/whole chromosome/chromosome
segment of recurrent parent is substituted by genome of donor parent with resistance genes.

(Climate Change, Precision Agriculture and Innovative Disease Control Strategies)
- 251 -
e.g. transfer of resistance to Clubroot disease (Plasmodeophera brassicae) from B .
campestris to B napus
Multiline Cultivar
A multiline cultivar is a population of plants that is agronomically uniform but heterogeneous
for genes that condition resistance to a disease organism. The concept of multiline is based on two
philosophies for disease management (Marshall 1977)
Clean crop approach: In this approach all component lines of the mixture will be resistant to all
prevalent races of the pathogens to be controlled. The objective of this approach is to keep the
crop as free of disease as possible and at the same time reduce the threat of disease losses due
to shift of racial composition of pathogen population.
Dirty crop approach: It is on the concept that each line in the mixture carries a different single
gene for resistance however none of the line is resistant to all known races of pathogen.
Such multiline protects the crop in two ways (Frey et al 1973). First by stabilizing the race
structure of pathogen population, thus ensuring that simple races carrying single gene for virulence
dominate in the pathogen population, and second by stabilizing each component of multiline so
that it is attacked by only one race (dominant in pathogen population) while remaining line (except
for the line to which race has virulent gene) will act as spore traps thereby reducing the rate of
spread of disease. In this way multiline cultivars would have an effect similar to the polygenic non
race specific or synthesized horizontal resistance in delaying the intercrop buildup of the
pathogen.
How the two approaches differ
Component lines of multilines in dirty crop approach require to confer resistance to only
part of the pathogen population and this will extent the useful life of strong resistance
genes present in component lines which even with moderate level of resistance is able to
control disease. Because of moderate level of resistance of component lines breeder will
have greater choice for selection of other good characters like yield, maturity etc.
With less risk of breaking down the resistance, breeder would also free/less bothered from
difficult task of continuously searching and incorporating new sources of resistant.
Moreover in both the approaches, 6-15 phenotypically similar lines differing for
gene for resistance are required.
Mechanism of action of multilines
The mechanism by which the multiline cultivars buffer against diseases is the reduction of
initial inoculum (X0) and rate of increase (r)
A component line of the multiline being selectively resistant to specific race population of
pathogen, reduces. X0 but had no effect on r whereas all component lines being resistant to all
prevalent races of pathogen does not reduce X0 but reduce r. Therefore by reducing both r and X0
the multiline matures with less damage due to less initial inoculums and reduced rate of epiphytotic

(Climate Change, Precision Agriculture and Innovative Disease Control Strategies)
- 252 -
development.
Another mechanism of action of multiline to buffer against disease can be explained on the
basis of reduced X0 and r due to spore trap. A component line of multiline has high race specific
resistance therefore reduce initial inoculum (X0) but at the same time a component line will be
completely susceptible to certain other races. However when series of such resistant genes are
placed in the multiline the population of plants serve as the spore trap which keep under control
the potential parental spore of pathogen to contribute off spring for future cycle thus reducing rate
of infection.
Vertical and horizontal resistance concept of mechanism
Vander plank (1962) introduced these terms. A variety with vertical resistance is resistant
to certain/few races of pathogen while with that of horizontal resistance the resistance is evenly
spread against all races of pathogen
Epidemy of VR and HR
Epidemiologically, VR act by decreasing the effect of oxogenous (incoming) inoculum but
doses not effect the rate increase of virulent races whereas due to HR the rate of increase in
reduced for all race
Effect of VR & HR separately and in combination on disease progress (Van der Plank
1968)
Concept of Multiline
The two programme viz. New York Programme (Jenson 1952) and Rockefeller Foundation
Programme (Borlang and Gibler 1953), introduced the concept of multilines. From the later
programme the first multiline viz. Miramer 63 of wheat having resistance to stripe rust and stem
rust, was released for commercial cultivation. From the Indian Programme, multiline viz. KSML-1,
KSML-3, KSML-4 of Kalyan Sona and PVML-1, PVML-2, PVML-4 of PV-18 having better
resistance to leaf rust as compare to their parents were developed .
Crop heterogeneity for disease management and Cultivars Mixture
Dependence on monoculture has continued to spread rapidly despites serious setback as
well as evidences that alternate methods are also feasible. In traditional agriculture, cultivation of
mixtures within and between plant species help protect crops against stresses. Report of rice
mixture containing two to five component lines matching for maturity and quality but otherwise
heterogeneous has been available. Even in the recent and modern agriculture system mixtures

(Climate Change, Precision Agriculture and Innovative Disease Control Strategies)
- 253 -
are being cultivated commonly e.g. Barley-Oat mixture, Wheat-Barley, Wheat-Gram etc.
The earliest record of value of crop heterogeneity for disease control is from eighteen
century (Groenewegen & Zadokas, 1979) where reduction in rust infection in mixtures of Wheat
and Oat has been reported. In the recent time the concept of multiline approach (Jensen, 1952) is
the example of scope of crop heterogeneity for disease control. The common theme is to have
crop heterogeneous for disease resistance character to be achieved by multilines or variety
mixtures.
Potential of mixture for disease restriction
To under stand this we have to analyze the fundamental difference in ability of mixture to
cope with abiotic and disease stress. While abiotic stress occur as single event e.g. frost, drought
etc. Neither of which are influenced either by pure variety or mixture. The mixture can survive
better through compensation between each other but will not never effect the abiotic stress. On
the other hand for biotic stress like disease/ pest, pure variety or mixture can influence
disease/insect progress directly by controlling the degree of stress. Therefore, potential of gains
from using mixture are greater for disease control/insect control (biotic stress) as compare to
protection against drought/frost etc. (abiotic stress).
Mechanism of disease restriction by mixtures
Mixture may restrict the disease spread relatively more to the mean of their components
provided that component differ in the degree of susceptibility. With appropriate mixture of spring
barley, reduction of up to 80% in powdery mildew infection compared with mean disease level of
components grown as pure stand has been reported.
Effect on out side inoculums
Mixtures affect the inoculum that comes from out side the crop differently from that
generated within the crop by providing diversification of host resistance. The amount of infection
caused by an exogenous spore shower landing on a mixture equals the mean infection of the
component lines. On the product of initial infection, mixture has its effect on restricting the spread
of pathogen population. The mechanism operates in three principal ways (Trenbath 1984, Burdon
& Chilvers 1976 & 1982 and Burdon & Shattock, 1980)
Through decrease in the spatial density of susceptible plant thus limiting the amount of
susceptible tissue in a given area, reducing survival of spores and reducing possibility of
them reaching to neighboring susceptible plant. Spore density is declined due to reduction
in plant density and smaller effect of dispersal. e.g .Due to shallow dispersal gradient,
Powdery mildew (Erysiphe graminis spread is restricted by mixtures).
Through barrier effect provided by resistant plant that fill the space between susceptible
plants. To work this mechanism, susceptible plants should be as small possible to minimize
the number of spores available to blow in to the barrier.
Through the resistance induced by non pathogenic spores such that normally pathogenic

(Climate Change, Precision Agriculture and Innovative Disease Control Strategies)
- 254 -
spores that land is same area are prevented from infecting or are limited in their
productivity. The phenomenon is cumulative at least by reducing the amount of inoculum in
each pathogen generation and can account for a considerable proportion of the disease
restriction noted in the mixtures. It should also be systemic which should increase the
cumulative effect.
Working of mechanism in epidemic conditions
As result of initiation of epidemic by exogenous inoculum, the duration of disease spread in
the mixture changes in relation to that in pure stand. The stage of disease restriction may
depend on constitution of mixture, quality and amount of exogenous inoculum at the
beginning of epidemic and number of pathogen generation during active development of the
epidemic. Infection may increase upto disease carrying capacity of pure line as it does not
reach the same level in the mixtures. The host continues to grow until it is harvested.
The amount of disease restriction varies depending on the structure of the mixture and
quality and quantity of exogenous inoculum. Based on the monitoring of the air borne
inoculum and its movement, theoretically it is possible to construct mixtures to give high
level of disease restriction.
In case of soil borne pathogen where the spread of pathogen is by spores or mycelium or
by splash dispersal, the mixture will have little or no effect on disease. Moreover the plants
resistant to soil borne pathogen will provide compensation for damage to susceptible plants
in a mixture. The value of such compensation will be determined by the distribution of initial
inoculum in the soil such that if patchy, then even un infected susceptible plants in the pure
stand may compensate for damage plants (e.g. restriction of spared of Helmithosparium
victoriae in oats- Ayanru & Browning 1977).
Adaptation of Pathogen to Mixtures
The rate at which the pathogen adapts to the mixtures, if able to do so, depends on the
selection coefficient of the phenotype with different combinations of pathogenity genes and relative
distribution of pathogen propagules within or between plants of the mixtures. It will also depend on
the quality of matching pathogenity genes. Therefore, it is always desirable to use host resistance
gene either that can not be matched by the pathogen or those which can be matched only by
pathogenity genes that carry severe penalty for survival of the pathogen. Unit area of host
genotype need to be as small as possible to maximize the restriction of disease spread.
Durability of Mixture
The potential durability of mixtures depends not only on the quality of pathogenity gene in
pathogen population but also on the number needed to overcome host mixture. The potential
durability of mixture will be much improved by increasing the number of different components or
by increasing the complexity of resistant genes (oligogenic /polygenic).
The components of variety mixture possess many differences among genes of greater as

(Climate Change, Precision Agriculture and Innovative Disease Control Strategies)
- 255 -
well as lesser effect on resistance. Due to this complexity of gene, the evolutionary process in the
pathogen in relation to resistance gene, pathogenesis will therefore slowdown and chances of
emerging out super race to overcome the resistance of mixtures may be least. Further, the
evolution of new race of pathogen reached different limits of infection on different varieties.
Therefore, if a particular mixture were to be used continuously it is desirable to provide
diversification among mixture and minimize difference in resistance between component.
Yield advantage in variety mixture for disease resistances
Mixtures with genetic variation may be expected to yield more than component mean in
variable environments. The yield advantage is achieved through restriction of disease spread
(White 1982). The gain obtained is equal to what expected through single average fungicide
treatment. Some time yield advantage may not be obtained because the restriction of infection is
not sufficient to limit the damage or because other than disease, some other stress is also
predominant.
Number & type of mixture components
The number of component should be kept to minimum with reasonable restriction of
disease progress. Dynamic use of all permutation of a small number of components will provide
greater durability. Another constraint with number is in matching the components for harvest
maturity and yield. Small number makes it easy to harvest them at the same time. While the
component varieties with similar yield help to obtain mixture yields as high or higher than that of the
best component.
Besides resistance and yield, the components should have ability to produce better quality
when in mixture with other components or better than mean of component lines (e.g. Barley
mixture have comparable mating quality).
Management of Horizontal Resistance
HR is evenly spread against all races of pathogen
It is stability is due to its polygenic inheritance
It reduce the apparent infection rate
Reduces the area of lesion progress of disease curve, sporulation capacity,
infection efficiency
Increase latent period and incubation period
e.g. Slowing down of Wheat Powdery mildew of Wheat and slow rusting of Oat of
Wheat
Multigenic variety
The Concept has been given by Watson and Singh (1982). These are true breeding
varieties/lines possessing two or more diverse genes conferring resistance to a predominant race
or spectrum of predominant races of pathogen
Genetics basis

(Climate Change, Precision Agriculture and Innovative Disease Control Strategies)
- 256 -
If a variety has two genes at locus A and B, the probability of single mutation will be 10-6
however, probability of simultaneous mutation at both loci A and B will be 10-12 therefore the
multigenic variety will have longer life.
How to develop
Select two varieties having diverse gene for resistance to same or different pathogen
Combine both the genes in one variety provided that
o Two genes should be linked
o Have different level of resistance
o Have lower level of resistance individually as compared to combination
Multilines, Line Mixtures vs. Cultivar Mixture
In multiline the component lines differ only by identified resistance genes while the line
mixtures developed from lines selected from hybridization of common parent. However in case of
variety mixtures, components may differ for many characters including disease resistance
therefore varietal mixture provides greater potential for practical application (Wolf & Berect 1980).
With varietal mixture the choice is extended to all available varieties. Besides, there is also greater
potential of mixing with resistant to a range of diseases alongwith abiotic stress each with many
qualitative and quantitative differences. Due to greater flexibility, better performance and problem
in registering multilines under Plant Breeder Right (European Economic Community), intension is
now shifted from multiline to heterogeneous crop or cultivar mixture.
Other related strategies for disease management
Growing of range of varieties, randomly dispersed in each season
Pyramiding resistance genes
o Using particular set of resistance genes in pyramid form and none of the
component gene are released for cultivation in simpler combination or alone.
Integration of different strategies to maximize effectiveness of disease control
o Diversification of variety mixture
o Combining qualitative and quantitative resistance in component lines
o Integrating use of fungicide with variety mixtures
o Dynamic use of mixtures by changing their composition in space and time to delay
the buildup of new race of major pathogens
Cultivar Mixtures: SWOT Analysis
Strength
Control of endemic for air borne foliar disease of cereals
Reduction in yield loss
Least possibility of emergence of super race
Better guarantee of high yield as compare to best variety
Inexpensively and simple strategy of disease management which can be added to

(Climate Change, Precision Agriculture and Innovative Disease Control Strategies)
- 257 -
or integrated with other strategies
Help to improve the efficiency and reduce fungicide use
Mixed seed can be provided to the farmers
Weaknesses
Problem in gaining acceptance of concept
Not acceptable to industrial agriculture which is market oriented
Compatibility of cultivars to be mixed- in terms of maturity, height, quality etc.
Opportunities
Mixtures can be grown as the seed crops
Opportunities for change of component
Opportunity to combine a range of positive characters not achievable in single crop
genotype.
Reduced dependency on mono culture
REFERENCES
1. Ayanru, D.K. G., Browning, J.A. 1977. Effect of heterogeneous oat populations on the epithytotic development of Victoria blight. New Phytol. 79:613-23.
2. Borlaug NE, Gibler JW (1953) The use of flexible composite wheat varieties to control the constantly changing stem rust pathogen. Agron Abstr p 81.
3. Burdon, J.J., Chilvers, G.A. 1976. Controlled environment experiments on epidemics of barley mildew in different density host stands. Oecologia 26:61-72.
4. Burdon, J.J., Shattock, R.C. 1980. Disease in plant communities. Appl. Biol. 5:145-219.
5. Frey KJ, Browning JA, Simons MD (1973) Management of host resistance genes to control disease. Z Pflanzenkrankh Pflanzensch 80: 160-180.
6. Groenewegen, L.J.M., Zodoks, J.C. 1979. Exploiting within-field diversity as a defense against cereal diseases: A plea for ‘poly-genotype’ varieties. Indian J. Genet. Plant Breed. 39:81-94.
7. Gupta S.K. (2008) Plant Beeding: Theory and Techniques. AGROBIOS (INDIA) Jodhpur. Pp 314-349.
8. Jensen, N.F. 1952. Intra-varietal diversification in oat breeding. Agron. J. 44:30-34.
9. Marshall, D.R. 1977. The advantages and hazards of genetic homogeneity. Ann. NY Acad. Sci. 287:1-20.
10. Singh D.P. and Arti Singh (2005) Disease and Insect Resistance in Plants. Oxford & IBH Publishing Co. Pvt. Ltd. New Delhi . pp 233-272.
11. Trenbath, B.R. 1984. Gene introduction strategies for the control of crop diseases. In Pest and Pathogen Control: Strategic, Tactical and Policy Models, Ed: G.R. Conway, pp. 142-68. Chichester: Wiley. 488pp.
12. Van der Plank J.E. (1968) Disease Resistance in Plants. Academic Press, London New York, pp 206.
13. Watson, I.A. and Singh. D. (1982). The future of rust resistant wheat in Australia. J. Aust. Inst. Agric. Sci. 28:190-197.
14. White, E.M. 1982. The effects of mixing barley cultivars on incidence of powdery mildew (Erysiphe graminis) and on yield in Northern Ireland. Ann. Appl. Biol. 101:539-45.
15. Wolfe, M.S., Barrett, J.A. 1980. Can we lead the pathogen astray? Plant Dis. 64:148-55.

(Climate Change, Precision Agriculture and Innovative Disease Control Strategies)
- 258 -
SAS: An Introduction and its Applications
S. B. Singh & R. S. Rajput Deptt. of Mathematics, Statistics and Computer Science, GBPUA&T, Pantnagar- 263 145 (Uttarakhand)
Introduction
Statistical analysis is an important tool to extract as much information as possible from the
given data. Statistical computing methods enable to answer quantitative biological questions from
research data and help to plan new experiments in a way that the amount of information generated
from each experiment is maximized. Widespread use of computers and specialized high and
statistical software package have helped and greatly improved the ability of researchers to analyze
and interpret voluminous data. Developments in computerized statistical analysis have enhanced
the ability of researchers to come up with better conclusions. The statistical computing support
would be useful in improving the quality of agricultural research and make it globally competitive
and acceptable by way of publications in international refereed journals. SAS is a software that
strengthen high end computing environment for the scientists and faculty members.
What Is SAS?
The Statistical Analysis System (SAS) is a Computer Software for performing statistical
analysis of data.
SAS is a set of solutions for enterprise-wide business users and provides a powerful fourth-
generation programming language for performing tasks such as these:
data entry, retrieval, and management
report writing and graphics
statistical and mathematical analysis
business planning, forecasting, and decision support
operations research and project management
quality improvement
applications development
NAIP Project: Strengthening of Statistical Computing
Availability of SAS Software to SAU/ICAR institutes
Training programme for SAS

(Climate Change, Precision Agriculture and Innovative Disease Control Strategies)
- 259 -
Working of SAS Program
Overview of Base SAS Software
The core of the SAS System is Base SAS software, which consists of the following:
DATA step a programming language that you use to manipulate and manage your
data.
SAS procedures software tools for data analysis and reporting.
SAS Libraries
A SAS library is a folder where your SAS files are stored. After a library is created, SAS
has access to the files in that library.
A SAS library is a logical location of SAS Data.
Some Procedures
PROC CONTENTS
The contents procedure displays the descriptor portion of a SAS Data set
PROC PRINT
The print procedure displays the data portion (browsing) of a SAS Dataset
PROC FREQ
The freq procedure one-way to n-way frequency table
PROC MEANS
The Means procedure produces summary reports that display descriptive statistics.
Means, STDDEV, MIN, MAX
Some Procedures
PROC UNIVARIATE
The Univariate procedure produces summary reports that display descriptive
statistics. Moments, Basic Statistics measures, Quintiles, Extreme Observation,
PROC TABULATE
Viewing records tabulate form
Raw data
Data other
format,-Excel,
SPSS, text,
Oracle RDBM
Set
SAS
format SAS Proc Results
SAS Data step

(Climate Change, Precision Agriculture and Innovative Disease Control Strategies)
- 260 -
PROC REG
Performing Regression analysis
PROC CORR
Performing correlation analysis
Some Procedures
PROC GLM
Analysis of Variance, one way ANOVA,ANOVA with RBD,2-Way ANOVA
PROC TTEST
T-Test
PROC IML
Performing matrix algebra
PROC LOGISTIC
Analysis of Logistics Regression
Some Solution Tools
Time Series Forecasting System
The Time Series Forecasting system forecasts future values of time series
variables by extrapolating trends and patterns in the past values of the series or by
extrapolating the effect of other variables on the series.
Enterprise Miner
Analysis of data using some data mining techniques:-Decision tree, Artificial Neural
Network, Association rule, Clustering etc.
Experiment 1 - Create SAS data library & export data from excel sheet to your SAS data
Library.
Step-1 Create an Excel Work sheet that contains your data.
Step-2 On the Base SAS, Select File-> New->Library->fill your Library Name, select Engine (in
present case select Excel) and give path of Excel worksheet.
Step-3 Click OK button, your library with your excel data is created.
Step-4 Check your Library & Data.
Experiment 2-Explore sample data
Step-1 Go to explorer Tab, Click Libraries icon, Display-all active libraries.
Step-2 Click Sashelp library, Display-Contains of Sashelp Library, find Heart Data table.
Step-3 Click Heart (data table) icon, Display-Contains of table Heart
Experiment 3-Working with Proc Contents
The CONTENTS procedure displays the descriptor portion of SAS data set. General form of the
CONTAINS procedure
Proc contents data=SAS-DATA-SET;
Run;
Example

(Climate Change, Precision Agriculture and Innovative Disease Control Strategies)
- 261 -
Proc contents data=Sashelp.heart;
Run;
Experiment 4- Working with Proc Print
The PRINT procedure displays the data portion (browsing) of a SAS dataset. General Form of the
PRINT procedure
Proc print data=SAS-DATA-SET;
Run;
Example
Proc print data=Sashelp.heart;
Run;
Proc print data=Sashelp.heart;
Var Height;
Run;
Experiment 5- Working with Proc Freq
The FREQ procedure produces one-way to n-way frequency tables. General Form of FREQ
procedure
Proc Freq Data=SAS-DATA-SET<NLEVELS>;
Tables variable(s);
Run;
Example
Proc Freq data=Sashelp.heart;
Tables Weight cholesterol;
Run;
Proc Freq data=Sashelp.heart nlevel;
Tables Weight cholesterol;
Run;
Experiment 6- Working with Proc Means
The MEANS procedure produces summary report that displays descriptive statistics. General
Form of MEANS procedure
Proc means data=SAS-DATA-SET<statistics>;
Var variable(s);
Run;
Example
Proc means data=Sashelp.heart;
Var cholesterol;
Run;
Proc means data=Sashelp.heart n mean median mode std var q1 q3 nmiss max min;
Var cholesterol;

(Climate Change, Precision Agriculture and Innovative Disease Control Strategies)
- 262 -
Run;
Experiment 7-Working with Proc Univariate
The UNIVARIATE procedure produces summary reports that display descriptive statistics. The
general form of univariate procedure
Proc univariate data=SAS-DATA-SET;
Var variable(s);
Run;
The UNIVARIATE procedure produces the following section of output
Moments, Basic Statistics measures, Test for locations, Quantiles, Extreme Observations, Missing
values
Example
Proc univariate data =Sashelp.heart;
Var cholesterol;
Run;
Experiment 8-Working with Proc Tabulate
The TABULATE procedure displays descriptive statistics in tabular format. General Form of
tabulate procedure
Proc tabulate data=SAS-DATA-SET;
Class Classification –variable(s);
Var analysis variable(s);
Table page-expression, row- expression, column-expression;
Run;
Example
proc tabulate data=Sashelp.heart;
class weight height smoking;
var cholesterol ;
table weight all ,height all ,smoking all;
run;
Experiment 9 –Working with ttest proc
The TTEST analyse difference between two population means. General Form of Proc TTest
Proc TTEST data=SAS-DATA-SET;
Class Variable;
Var Variable;
Run;
Example
proc ttest data=Sashelp.heart;
class sex;
var cholesterol ;

(Climate Change, Precision Agriculture and Innovative Disease Control Strategies)
- 263 -
run;
Experiment 10 Working with Corr Proc
The CORR procedure to produce correlation statistics and scatter plots. General Form of Corr
Procedure
Proc corr data=SAS-DATA-SET<option>;
Var Variable(s);
With Variables;
Run;
Example
Proc Corr data=Sashelp.heart;
Var cholesterol;
With weight;
Run;
Proc Corr data=Sashelp.heart;
Run;
PROC corr data=Sashelp.heart nosimple plots=matrix(nvar=all histogram);
VAR cholesterol systolic smoking height weight ;
RUN;
Experiment 11 Working with Proc GLM
The GLM procedure use to analyse differences between population means. General form of GLM
procedure
Proc GLM Data=SAS-DATA-SET;
Class Variable;
Model Dependents=Independents
Run;
Quit;
Example
One way ANOVA
proc glm data=sashelp.heart plots(only)=diagnostics(unpack);
class bp_status;
model cholesterol=bp_status;
run;
quit;
ANOVA with randomized Block Design
proc glm data=sashelp.heart plots(only)=diagnostics(unpack);
class bp_status weight_status;
model cholesterol=bp_status weight_status;
run;

(Climate Change, Precision Agriculture and Innovative Disease Control Strategies)
- 264 -
quit;
Two way ANOVA
proc glm data= Sashelp.heart plots(only)=diagnostics(unpack);
class bp_status smoking_status;
model cholesterol= bp_status bp_status*smoking_status;
run;
Experiment 12-Working with REG Proc
The REG procedure enables to fit regression model to data. General Form of the REG procedure
Proc REG data=SAS-DATA-SET<option>;
Model dependent(s)= Regressor(s);
Run;
Quit;
Example
proc reg data= Sashelp.heart ;
model cholesterol=weight height;
run;
quit;
Experiment 13: Working with SAS/IML (IML: Interactive Matrix Language)
General Form of IML procedure
Proc IML;
IML statements;
Quit;
Writing a Matrix & display elements
Proc iml;
X={2 5 6, 12 23 45, 5 6 4}; /* create 3X3 order matrix */
Print X; /* display matrix */
Print X[ ,2]; /* display 2nd column */
Print X[2, ]; /* display 2nd row */
Print X[1,1,}; /* display [1,1]th element */
Quit;
Basic Operations on Matrixes
Proc iml;
a={ 1 2 3,2 4 5, 6 7 8}; /* cerate 3X3 order matrix a */
b={ 1 3 2,4 5 6, 7 6 8}; /* cerate 3X3 order matrix b */
c= a**3; /* matrix exponentiation */
d= a##3; /* element wise exponentiation */
e= a+b; /* element wise addition */

(Climate Change, Precision Agriculture and Innovative Disease Control Strategies)
- 265 -
f= a-b; /* element wise subtraction */
g= a*b; /* matrix multiplication */
h= a/b; /* element wise division */
i= a#b; /* element wise multiplication */
j= inv(a); /* calculate matrix inverse */
k= det(a); /* calculate determinant value */
l= diag(a); /* diagonal matrix */
print c,d,e,f,g,h,I,j,k,l; /* display results */
Quit;

(Climate Change, Precision Agriculture and Innovative Disease Control Strategies)
- 266 -
Innovations in Agrochemical Formulation Technology for Safety and Efficacy
Shishir Tandon
Department of Chemistry (Division of Agricultural Chemicals), GBPUA&T, Pantnagar- 263 145 (Uttarakhand)
Formulations
A pesticide product consists of two parts: active and inert ingredients. Active ingredients
are chemicals which actually control the pest. Inert ingredients are primarily solvents and carriers
that help deliver the active ingredients to the target pest; they serve to enhance the utility of the
product. Inert ingredients may be liquids into which the active ingredient is dissolved, chemicals
that keep the product from separating or settling, and even compounds that help secure the
pesticide to its target after application.
The combination of an active ingredient with a compatible inert ingredient is referred to as a
formulation.
Types of Formulations
1. On the basis of Use
Depending upon the intended use of pesticides there are different types of formulations
2. On the basis of state
Solids Liquids Gases
Dust or powders, Granules,
Pellets, Tablets Particulates or
Baits, Dry flowables, Wettable
powders, Ear tag/ Vapour
strips, Seed treatment, WDGs
Suspensions Concentrate (Flowables),
Solutions, Emulsifiable concentrates,
Gels, Aerosol, Ultra low volume
concentrates, Microemulsions,
Suspoemulsions
Fumigants,
sold as
liquids or
solids

(Climate Change, Precision Agriculture and Innovative Disease Control Strategies)
- 267 -
Factors Responsible for different types of formulations
• Chemistry of the active ingredient
• Toxicology of active ingredient
• Effectivity of the product against the pest
• Effectivity of the product on the plant, animal or surface
• Effectivity of the product on the environment
• Method of application and equipment used
• Rate of application
Choosing a Formulation
A single pesticide is often sold in different formulations. Different formulations of the same
active ingredient often behave differently. For example, some types of formulation may mix in
water better, while others may increase the chance of crop injury. Choose the formulation that is
suitable for the job. Things to consider include:
1. Percent of active ingredient.
2. Ease in handling and mixing.
3. Personal safety risk.
4. Type of environment (agriculture, forest, urban, etc.).
5. Effectiveness against the pest.
6. Habits of the pest or pest biology.
7. The crop to be protected.
8. Surface to be protected
9. Type of application machinery.
10. Danger of drift or runoff.
11. Possible injury to crop.
12. Cost.
Individual Formulations
1. Aerosols (A): Aerosols (pressurized cans, "bug bombs") very low concentrate solutions i.e.
contains a small amount of pesticide, or a combination of pesticides in the same formulation that
are driven through a fine opening as a fine spray or mist by a chemically inactive gas under
pressure, when the nozzle of can is triggered. Usually they are small, and the percentage of active
ingredients is very low.
Advantages: Aerosols are very convenient in that they are always ready to use. They are also a
convenient way to buy small quantities of a pesticide. They are easily stored and the pesticides do
not lose their strength (potency, activity) while in the can during their normal period of use.
Disadvantages: Aerosols are only practical for use in small areas. There is not much active
ingredient in any one can. Because of this, it is an expensive way to buy pesticides. Unfortunately,
they are also attractive playthings for small children and, if left within reach, are a hazard. Aerosols
can be dangerous if punctured or overheated. They may explode and injure someone. Don't ever

(Climate Change, Precision Agriculture and Innovative Disease Control Strategies)
- 268 -
try to burn aerosol cans.
2. Dusts (D): A prepared dust is a finely ground, dry mixture combining a low concentration of the
pesticide with an inert carrier such as fine powder or talc, clay, or volcanic ash or powdered nut
hulls, or other such materials. There is a wide range in size of the dust particles in any one
formulation. They are used dry; never mix them with water. The percentage of active ingredient is
usually quite low.
Advantages: Dusts are ready to use as purchased and require no mixing. They can be applied
with simple, lightweight equipment even in commercial use. Active ingredients that may harm a
crop if applied as an EC can be applied without harm as a dust.
Disadvantages: Because dust particles are finely ground, they may drift long distances from the
treated area and may contaminate off target areas. While drifting they are highly visible and may
cause public criticism. When used outside, they are easily dislodged from the treated surface by
wind and rain and soon become inactive. Never apply dust formulations on a windy day.
3. Poisonous Baits: Poisonous bait is a food or other attractive substance mixed with a active
ingredient or pesticide that will attract and be eaten by pests and eventually cause their death. The
percentage of active ingredient is low compared to EC’s and other formulations.
Advantages: Baits are useful for controlling pests such as flies, rats, etc., that range over a large
area. Often the whole area need not be covered, just those spots where the pests gather. Baits
may be carefully placed in homes, gardens, granaries, and other agricultural buildings so that they
do not contaminate food or feed, and can be removed after use. Usually only small amounts of
pesticide are used in comparison to the total area treated, so potential environmental pollution is
minimized.
Disadvantages: Within the home, baits are often attractive and dangerous to children or pets and
therefore must be used with care. Outside, they may kill domestic animals and wildlife as well as
the pest. Often the pest will prefer the protected crop or food rather than the bait, so the bait may
be ineffective. When larger pests are killed by baits, the bodies must be disposed of. If not, they
may cause an odor and/or sanitation problem. Unfortunately, other animals feeding on the
poisoned pests can also be poisoned.
4. Granules (G): Granular formulations are made by adding the active ingredient to coarse and
porous particles (granules) of inert material like fired clay particles or corn cobs or walnut shells.
Like dusts, pesticide granules are dry, ready-to-use, low concentrate mixtures of pesticide(s) and
inert carriers. The percentage of active ingredient is lower than in an EC but usually higher than
that of a dust formulation. However, unlike dusts, almost all of the particles in a granular
formulation are about the same size and are larger than those making up a dust. A fine granular
pesticide pours like ordinary salt or sugar.
Advantages: Granules are ready to use as purchased, with no further mixing necessary. Because
the particles are large, relatively heavy, and more or less the same size, granulars drift less than
most other formulations. There is little toxic dust to drift up to the operator's face and be inhaled by

(Climate Change, Precision Agriculture and Innovative Disease Control Strategies)
- 269 -
him. They are usually safer to apply than ECs or dusts. They can be applied with simple, often
multi -purpose equipment such as seeders or fertilizer spreaders. They also will work their way
through dense foliage to a target underneath.
Disadvantages: With a few exceptions, granulars are not suitable for treating foliage because
they will not stick to it.
5. Low concentrate liquids or oil solutions (S) or Ready-To-Use (RTU): These formulations
are premixed, ready to use. These preparations are usually solutions in highly refined oils that
contain low concentrations of the pesticide. They are generally used as purchased with no further
dilution.
Advantages: Low concentrate solutions are designed to be sprayed as purchased. Because of
this, no mixing is necessary and this lessens the chances for making mistakes. Household
formulations have no unpleasant odors and usually the liquid carrier evaporates quickly and does
not stain fabrics, furniture, etc.
Disadvantages: Low concentrate formulations are usually fairly expensive for the amount of
actual pesticide bought and the uses for such materials are few and specialized.
6. Emulsifiable Concentrates (EC or E): These preparations are usually solutions containing a
high concentration of the pesticide. The active ingredient is mixed with an oil base (often listed as
petroleum derivatives) and contain wetting agents, stickers, and other additives and forms an
emulsion which is diluted with water or oil for application
Advantages: These formulations contain a high concentration of pesticide, so the price per pound
of active ingredient is rather low. Only moderate agitation is required in the tank, so they are
especially suitable for low -pressure, low-volume weed sprayers, mist blowers, and small home
ground sprayers. They are not abrasive and do not settle out when the sprayer is not running.
There is little visible residue, which generally allows their use in populated areas. Because of the
high pesticide content, the applicator is not required to store, transport, or handle a large bulk of
chemical for a particular job.
Disadvantages: It is easy to under dose or overdose because of the high concentration of
pesticide, if directions for mixing are not carefully followed. Mixtures of emulsifiable concentrates
may be phytotoxic. Also, because of the high concentration and liquid form, which is usually easily
absorbed through the skin, there may be hazard to the applicator. The hazard of improperly stored
concentrates can also be high. Because of their solvents, most liquid concentrates cause rubber
hoses, gaskets, and pump parts to deteriorate rapidly unless they are made of neoprene rubber.
Some formulations cause pitting in car finishes. They can cause a minor surface bronzing of light
colored fruit. They should be protected from freezing temperatures which can break down the
emulsifier.
7. High Concentrate Liquids, Spray Concentrates, and Ultra Low Volume (ULV)
Concentrates: They may be thought of as special EC formulations. They usually contain a very
high concentration of the active ingredient, as much as eight or more pounds per gallon. Most are

(Climate Change, Precision Agriculture and Innovative Disease Control Strategies)
- 270 -
made to be mixed with water or oil. ULV concentrates are made to be used directly without
dilution; they contain little but the pesticide itself.
8. Flowable Liquids (F or L): Some pesticides can be manufactured only as solid materials, not
as liquids as the active ingredients does not dissolve well in water or oil. Often these pesticides are
formulated as flowables. Flowables are made from very finely ground solid materials, which are
suspended in a liquid along with suspending agents, adjuvants, and other ingredients. In this form,
they can be mixed with water to form a suspension in a spray tank and applied. Flowables are
similar to emulsifiable concentrates and are used in the same way.
Advantages: Flowables do not usually clog nozzles and require only moderate agitation. They are
as easy to handle
9. Wettable or Soluble Powders (WP or SP): Wettable powders and soluble powders are dry
preparations containing a relatively high concentration of pesticides. Wettable powder formulations
are made by combining the active ingredient with a fine powder. Wettable powders do not form a
true solution and when mixed with water they form suspensions. Soluble powders formulation is
made from an active ingredient in powder form that dissolve in water completely to form solutions.
The percentage of active ingredient is usually high in SPs compared to ECs and WPs. The amount
of pesticide in these powders varies from 15% to 95%.
Advantages: As is true with liquid concentrates, the pesticides in wettable powders are relatively
low in cost and easy to store, transport, and handle. They are safer to use on tender foliage and
usually do not absorb through the skin as rapidly as liquid concentrates. They are easily measured
and mixed when preparing spray suspensions. WPs are less likely than ECs to damage sensitive
plants. In Soluble powder once in solution is prepared, agitation is not needed
Disadvantages: Wettable powders may be hazardous to the applicator if he inhales their
concentrated dust while mixing. They require good agitation (usually mechanical) in the sprayer
tank and will settle quickly if the sprayer is turned off. They cause some pumps to wear out quickly.
Their residues are more subject to weathering than liquid concentrates, and being more visible
may soil cars, windows, and other finished surfaces. Wettable powder formulations are abrasive to
pumps and nozzles. Not many SP formulations are available.
10. Dry flowables or Water Dispersible Granules (WDG): It look like granules, but are used in the
same way as wettable powders. They contain very high concentrations of active ingredient.
Advantages: They have several advantages over WPs: they can be poured from their container
and measured by volume like a liquid; they are safer to handle because there is little dust in the air
when they are measured and mixed.
11. Pressure-liquefied gases and Fumigants: Fumigants are pesticides in the form of poisonous
gases that kill when absorbed or inhaled. They are often stored under pressure. These
formulations may be injected into the soil, released under tarps, or released into a grain storage
elevator. Some liquid formulations not stored under pressure turn to gases or vapors after they
have been applied to the soil or crop.

(Climate Change, Precision Agriculture and Innovative Disease Control Strategies)
- 271 -
Advantages: A single fumigant may be toxic to many different forms and types of pests.
Therefore, a single treatment with one fumigant may kill insects, weed seeds, nematodes, and
fungi. Fumigants penetrate into cracks, crevices, burrows, partitions, soil, and other areas that are
not gastight and expose hidden pests to the killing action of the pesticide.
Disadvantages: The area to be fumigated almost always must be enclosed. Even in outdoor
treatments the area must be covered by a tarp or the fumigant incorporated into the soil, so that it
doesn't escape. Fumigants pose a serious safety risk because they are highly toxic and easily
inhaled. Proper techniques and all recommended protective gear must be used when applying
them. Most fumigants can also burn the skin.
12. Solutions and Water Soluble Concentrates (S): These are liquids in their original state and
are completely soluble in water or other organic solvents.
Advantages: Properly prepared solutions do not leave unsightly residues. They do not clog spray
equipment.
Disadvantage: some Solutions and water soluble concentrates can damage crops.
13. Encapsulated pesticides: They are a fairly new type of formulation. The active ingredient is
contained in an extremely small capsule. The capsules are suspended in a liquid. This formulation
is mixed with water and applied with conventional sprayers.
Advantages: It is relatively easy and safe to use.
Disadvantages: It can cause significant hazard for bees because the bees may take the capsules
back to the hive with pollen.
14. Invert Emulsions: It contain a water-soluble pesticide dispersed in an oil carrier. They require
a special kind of emulsifier that allows the pesticide to be mixed with a large volume of oil, usually
a fuel oil. When applied, invert emulsions form large droplets which do not drift easily. Invert
emulsions are most often used along rights-of-way where there is a problem of pesticide drift on
non-target plants.
Advantages: Does not drift easily
Disadvantages: Special kind of emulsifier and large volume of oil is required
Catalogue of Pesticide Formulations types and International Coding System
AB Grain Bait
AE Aerosol dispenser
AF Aqueous flowable
AI Active ingredient
AL Other liquids to be applied undiluted
AP Any other powder
AS Aqueous suspension
BB Block bait
BR Briquette

(Climate Change, Precision Agriculture and Innovative Disease Control Strategies)
- 272 -
CB Bait concentrate
CF Capsule Suspension for Seed Treatment
CG Encapsulated granule
CL Contact liquid or gel (insecticidal or rodenticidal)
CP or TP Contact powder/ Tracking powder
CS Capsule suspension
DC Dispersible concentrate
DL Driftless formulation
DP or D Dustable powder or Dispersible powder/ Dust
DS Powder for dry seed treatment
EC or E Emulsifiable concentrate
ED Electrochargeable liquid
EG Emulsifiable granule
EO Emulsion, water in oil
ES Emulsion for seed treatment (Emulsifiable solution)
EW Emulsion, oil in water
FD Smoke tin
FG Fine granule
FK Smoke candle
FL or F Flowable
FP Smoke cartridge
FR Smoke rodlet
FS Flowable concentrate for seed treatment
FT Smoke tablet
FU Smoke generator
FW Smoke pellet
GA Gas
GB Granular bait
GE Gas generating product
GF Gel for Seed Treatment
GG Macrogranule
GL Emulsifiable gel
GP Flo-dust
GR or G Granule
GS Grease
GW Water soluble gel
HN Hot fogging concentrate

(Climate Change, Precision Agriculture and Innovative Disease Control Strategies)
- 273 -
KK Combi-pack solid/liquid
KL Combi-pack liquid/liquid
KN Cold fogging concentrate
KP Combi-pack solid/solid
LA Lacquer
LO Live Organism
LS Solution for seed treatment
LV Liquid vaporiser
MC Mosquito coil
ME Micro-emulsion
MG Microgranule
MV Vaporising mat
OD Oil dispersion
OF Oil miscible flowable concentrate (Oil miscible suspension)
OL Oil miscible liquid
OP Oil dispersible powder
PA Paste
PB Plate bait
PC Gel or paste concentrate
PO Pour-on
PR Plant rodlet
PS or P Seed coated with a pesticide (Pelleted)
RB Bait (ready for use)
S Solution
SA Spot-on
SB Scrap bait
SC or FC Suspension concentrate (=flowable concentrate)
SD Suspension concentrate for direct application
SE Suspo-emulsion
SG Water soluble granules (Sand granules)
SL Soluble concentrate (Slurry)
SN Active Solution
SO Spreading oil
SP Water soluble powder (Soluble powder)
SS Water soluble powder for seed treatment
ST Water soluble tablet

(Climate Change, Precision Agriculture and Innovative Disease Control Strategies)
- 274 -
SU Ultra-low volume (ULV) suspension
TB Tablet
TC Technical material
TK Technical concentrate
UL or ULV Ultra-low volume (ULV) liquid concentrate
VP Vapour releasing product
WG or WDG or DF Water dispersible granules (Dry flowable)
WP or W Wettable powder (= Water dispersible powder)
WSB Water soluble bag
WSP Water soluble pack or packet
WS Water dispersible powder for slurry treatment
WT Water dispersible tablet
XX Others
ZC A mixed formulation of CS and SC
ZE A mixed heterogeneous formulation of CS and SE
ZW A mixed heterogeneous formulation CS and EW
Test Parameters
In order to ensure the right quality of the pesticide, besides testing for the active ingredient,
it is also necessary to test other parameters give in the list below :
Type of Materials /
Formulations
Test parameters
Technical grade
pesticides
Moisture content, melting point, setting point, isomeric ratio,
relative density, acidity / alkalinity
Water dispersible powder Sieving test, suspensibility, wettability, acidity / alkalinity
Dusting powder Sieving test for particle size, bulk density after compacting,
acidity / alkalinity
Granules Encapsulation i.e. Attrition test and water run-off test, sieving
test for granule size, sieving test for dust, moisture, acidity/
alkalinity.
Emulsifiable concentrates,
Soluble liquids
Emulsion stability, cold test, acidity/alkalinity, flash point.
Combination Formulations:
Sometimes various pesticides are combined. Some pesticides are registered for use in
combination with a liquid fertilizer. If pesticides may be combined safely and effectively, they are
called compatible. If not, they are called incompatible. Incompatibility can be physical or chemical.

(Climate Change, Precision Agriculture and Innovative Disease Control Strategies)
- 275 -
Physical incompatibility means that the chemicals cannot physically be mixed together. Solid
materials may become deposited at the bottom of the spray tank or the ingredients may become
separated into two or more layers following agitation. In some cases, separate parts may come
together or foaming or curdling may occur. If chemicals are physically incompatible, the mixture
may not be sprayable or the concentrations may vary.
Chemical incompatibility: Even if some chemicals can be mixed together physically, there may
be other kinds of incompatibility that may reduce effectiveness or cause injury to the plant.
Summary
Pesticides come in various formulations. Some are easier to use than others. Some are
more effective than others in certain situations. The most commonly used formulations are
emulsifiable concentrates and wettable powders, but there are many other types available. It is
important to know which type of formulation is the safest and most effective for the crop and pest
you wish to treat. Do not combine pesticides that are physically or chemically incompatible.

(Climate Change, Precision Agriculture and Innovative Disease Control Strategies)
- 276 -
Innovations in Agro-chemical Application Technology for Safety and Efficacy
T.P. Singh
Department of Farm Machinery and Power Engineering, GBPUA&T, Pantnagar- 263 145 (Uttarakhand)
India is an agriculture based country where more than 60% of its population still depends
upon agriculture for their daily need. The country’s economy depends on the agricultural sector to
a substantial extent. Mechanization in agriculture has enhanced production and productivity of
major food grains, vegetables and fruits though timeliness of operations, better management of
inputs, improved quality of work and reduction in post harvest loses. Insects and pests cause
considerable damage to crops. According to an estimate India loses nearly 30% of its potential
crop due to insects, weeds and rodent attacks. The timely and proper application of pesticide not
only saves the crop from complete damage but its effective application may enhance the
productivity by over 30 percent. Therefore the importance of plant protection equipments can not
be undermined in agricultural production system not only for the control of insects, pests but also
for the survival of mankind.
The Pesticides industry plays a crucial role in protecting crops against possible damage by
weeds, pests, insects and fungus, both before and after harvest. India’s pesticide industry is the
largest in Asia and twelfth largest in the world. Pesticides, also referred to as agrochemicals, are
chemical compounds used for crop protection. Two main types of products being produced by
pesticide industry namely are Technical Grade Pesticides (the basic concentrated chemical
compound) and Formulations from these technical grade pesticides (the usable form of
pesticides). Agricultural usage of pesticide in India commenced in 1949 with the application of
BHC for locust control. With timely application of chemicals, according to an estimate, the crop
yield may increase between 50 to 500 percent.
Farmers use a large quantity of pesticides than actually required. During impaction and
deposition, some of the spray solution roles-off the crop and get wasted. According to a research
only about 20% of the spray volume and 1 to 3% of chemical pesticide reach the target plant
(Bowen et al., 1952). This results into losses of pesticides requiring its repeated / frequent
application. Therefore, it becomes necessary to learn about the various types of pesticide
application equipment as well as the application technique for effective control of insects, pests,
weeds etc without wasting these chemicals and also saving man and environment from its
hazardous effect.
Types of Pesticides
i) Based on type of use
Pesticides are available in various forms that are used for very specific purposes. The uses of
pesticides are listed as under:
• Insecticides that are used against insects

(Climate Change, Precision Agriculture and Innovative Disease Control Strategies)
- 277 -
• Fungicides are used for preventing fungus
• Herbicides are used for removing weeds
• Rodenticides are useful against rodents
• Nemanticides are used for killing pests in the plant root
• Regulants are used for nourishing plants
• Acaricides are used for mites, spider and ticks
ii) Based on toxicity
a) Reduced-risk Pesticides
Since 1993, EPA (Environmental Protection Agency, US) has expedited the registration of
conventional pesticides with characteristics such as very low toxicity to humans and non-target
organisms including fish and birds, low risk of groundwater contamination or runoff, low potential
for pesticide resistance, demonstrated efficacy, and compatibility with IPM. Materials meeting
these criteria are referred to by EPA as “reduced-risk.”
b) Minimum-risk Pesticides
Minimum-risk pesticides are certain products that are exempted from EPA registration and
therefore have no EPA registration number. They contain only active ingredients and inert
ingredients
c) Bio-pesticides
Bio-pesticides or biological pesticides, as defined by EPA, are certain types of pesticides
derived from natural materials such as animals, plants, bacteria, and certain minerals. These
include microbial pesticides, plant-pesticides and biochemical pesticides comprised of naturally
occurring substances that control pests by nontoxic mechanisms.
Methods of Pesticide Application
The pesticide application requires knowledge of biology of pest in order to determine that at
what stage it will cause maximum destruction. This will help in applying the pesticide at correct
place, in correct amount and in a correct method. The various application methods used for
controlling different types of pests are explained as under:
1. Pre-sowing Soil/Foliage Treatment - In this method the pesticide (Herbicide/weedicide) is
applied before sowing.
2. Pre-emergence Soil/Foliage Treatment – In this case the pesticide (Herbicide/weedicide) is
applied just after sowing but before the germination of seed.
3. Post-emergence Soil/foliage Treatment - Pesticides (Herbicide/weedicide) is applied after
the seed has emerged and may be only a few centimeters tall.
4. Foliar Application - Pesticide is applied on the leaves of plant for control of pests.
5. Directed application- Pesticide is directed on the weeds in the vicinity of plant.
6. Band soil application - Application of pesticide to a band or strip of soil where the crop will
be grown.
7. Band application - Pesticide is applied on a continuous restricted area of crop only.

(Climate Change, Precision Agriculture and Innovative Disease Control Strategies)
- 278 -
8. Soil injection - Fumigants are applied under the soil.
9. Spot treatment - Pesticide application on a particular portion of the plant.
Spray Techniques
Spray techniques are generally classified on the basis of volume of spray material to be
applied on the plant. These are high volume, low volume, ultra low volume, foam spraying and
dusting.
i) High volume spraying
High volume spraying is generally preferred for complex pest and disease management
under wide range of conditions. This method is quite expensive and both time and labor intensive.
Usually the volume of spray material to be handled is more than 400 lit/ha for cereal crops and for
orchards it is over 1000 lit/ha. Hydraulic sprayers are used to handle this large amount of solution.
ii) Low volume spraying
In this technique the volume of spray material is between 5 to 400 liters/ha. It utilizes air
stream as pesticide carrier with small quantities of liquid thus saving the material and labor. In this
case same effect can be achieved with 25 percent less spray material when compared with high
volume spraying.
iii) Ultra Low volume spraying
Spray volume to be handled is less than 5 liters/ha in this technique. The chemical is
undiluted form or formulated in oil. Ultra volume spraying technique is usually utilized in arial
spraying by aircraft as well as in hand held battery operated spinning disc sprayers.
iv) Foam spraying
In foam spraying technique foaming agent (chemical additive) is added to the spray
solution and with the help of a special nozzle (air aspirating nozzle) the spray solution is converted
into foam. The foam helps the operator to see the volume of spray material and location being
applied. This system is quite economical.
v) Dusting
In this case the chemical is applied in dust form which is carried up to the target mainly by
air stream as a carrier. Air stream is created through a fan or turbine blower. Normally chemical
application in dust form is done when the weather is calm and plants surface is wet with dew or
rain.
vi) Wet dusting
Wet dusting is suitable for the crops in semi-arid or drought area. Chemical dust and water
is discharged simultaneously which gets mixed just before the target. Higher chemical deposition
is achieved due to better adhering property.
vii) Formulated capsules
• Insecticides formulated in the form of granules is placed precisely into the developing root
zone
• Pesticide is released slowly from the pellets. This does not harm to:

(Climate Change, Precision Agriculture and Innovative Disease Control Strategies)
- 279 -
– Operator
– Animals and
– Beneficial insects
Principles of spray atomization
These are of following types:
i) Pressure or hydraulic atomization – In this case, the liquid under pressure breaks due its
inherent instability as it comes out of the nozzle.
ii) Gas Atomization – Liquid chemical is introduced into high velocity air stream which helps in
breaking of droplets.
iii) Centrifugal atomization – Liquid under low pressure is fed on a high speed rotating disc
and centrifugal force causes split of liquid into fine droplets.
Spray Quality
The spray quality is defined in terms of droplet size i.e. fine, medium or coarse. With
conventional spraying system, a large portion of the spray is often lost by airborne drifts of droplets
known as Exodrifts. Small droplets of pesticides have higher chemical effectiveness than larger
droplets. Droplets in the 120 to 300 um range has been found most efficacious.
Coarse droplets are much heavier than fine droplets and are less likely to be affected by
drift. However if the crop canopy is heavy and has a high percentage of ground cover then
medium-fine droplets are required to achieve better penetration, retention and coverage. Flat fan
nozzles do not provide good coverage and therefore the operator increase the pressure beyond
the recommended range (2-4 bar) to produce a finer droplet. These fine droplets may drift and are
less effective in penetrating the canopy.
To improve crop coverage twinjet nozzle can be used in place of flat fan nozzle which
produce the same volume of spray through two separate openings. These openings are situated at
the front and rear of the nozzle and increase the potential to hit the target by producing a finer
spray quality at a lower pressure.
Plant Protection Equipment
Plant protection equipment falls into two major categories which are:
i) Spraying equipment
These equipments are used for the dispersal of insecticide in liquid form and are commonly
known as sprayers.
ii) Dusting equipment
These are used for the dispersal of insecticide in powder form and are commonly known as
dusters.
Types of Plant Protection Equipment
The various types of plant protection equipment that are available in market can be classified as:

(Climate Change, Precision Agriculture and Innovative Disease Control Strategies)
- 280 -
i) Based on form of energy used
a) Hydraulic energy sprayer
This type of sprayer includes Hand Sprayers, Telescopic Lance Sprayer, Stirrup Pump
Sprayers, knapsack Sprayers, Rocking Sprayer, Foot Sprayer, hand Compression Sprayer, Power
sprayers and Tractor PTO Operated Sprayers.
b) Gaseous energy sprayers
This includes Knapsack Sprayer cum Duster (mist Blower), Power Operated Sprayer,
Tractor PTO Shaft Operated Sprayers and ULV Sprayers
c) Centrifugal energy sprayers
This includes Spinning Disc Sprayer where the pesticide in liquid form is dropped on the a disc
spinning at very high speed. The liquid is then broken into smaller droplets (mist) because of the
action of centrifugal force.
ii) Based on volume of spray
a) High volume sprayer- Hydraulic energy sprayers
b) Low volume sprayers- Gaseous/Centrifugal energy sprayers
c) Ultra low volume sprayers - Gaseous/Centrifugal energy sprayers
iii) Based on power source
a) Manually operated
1) Portable (Equipment carried by one person) - Hydraulic/Gaseous/Centrifugal energy sprayers,
Shoulder/belly mounted dusters, granule applicator
2) Movable (Equipment carried on wheels or lifted by two or more persons) - Hydraulic/Gaseous
energy sprayers, power dusters
b) Power operated equipment
1) Portable - Hydraulic/Gaseous/Centrifugal energy sprayers, Dusters, Granule applicators
operated by Petrol engine /tractor PTO /electric motor and self propelled
2) Movable - Hydraulic/Gaseous/Centrifugal energy sprayers, Dusters, Granule applicators
operated by Petrol engine /tractor PTO /electric motor and self propelled
iv) Based on droplet size (VMD)
i) Less than 50 micron - Rotary atomizer, Thermal Fogger, Aerosol Generator
ii) 50-100 micron - Gaseous and Centrifugal energy sprayers (mist Blowers, ULV sprayers)
iii) 100-150 micron - Gaseous/Centrifugal energy sprayers (Rotary Atomizers), ULV Sprayers,
Spinning disc sprayers, Dusters
iv) 200-400 micron - Hydraulic energy sprayers
v) 400-800 microns - Hydraulic energy sprayers
vi) Greater than 800 micron - Hydraulic energy sprayers

(Climate Change, Precision Agriculture and Innovative Disease Control Strategies)
- 281 -
Table: Volume of spray application
Sl No.
Terminology Application rate, l/ha
Field crops Trees and bushes
1 2 3 4 5
High volume Medium volume Low volume Very low volume Ultra low volume
> 600 200-600 50-200 50 < 5
> 1000 500-1000 200-500 50-200 <50
(Shahare, PU and Dave, AK 2010)
Sprayer
Sprayer is a machine which applies chemicals in liquid form mainly in the form of droplets.
Uses of Sprayers
The sprayers can be used for the following purposes.
• Application of herbicides to remove weeds.
• Application of fungicides to minimize fungal diseases.
• Application of insecticides to control insect and pests.
• Application of micronutrients on the plants.
Functions of Sprayer
The main functions of a sprayer are:-
• To break the liquid into droplet of effective size.
• To distribute them uniformly over the plants.
• To regulate the amount of liquid to avoid excessive application.
Types of commercial sprayers
Based on the power source it can be classified as:
1. Manually operated
• Hand sprayer
• Stirrup type
• Knapsack sprayer
• Foot sprayer
• Rocking sprayer
2. Power operated
• Engine operated
• Tractor operated
• Aircraft
Hand sprayer
It is also known as hand atomizer or garden sprayer. It is a small, light weight (gross weight
approximately 1.5 kg) and compact unit. The working capacity may vary between 500-1000 ml. It
works at very low pressure in the range of 0.15 to 0.35 kg/cm2. It is generally used for small
spraying jobs in small nurseries, kitchen gardens, homes, offices etc

(Climate Change, Precision Agriculture and Innovative Disease Control Strategies)
- 282 -
Hand Compression Sprayer
It has a cylindrical container of 500 to 3500 ml for holding the chemical solution with a
handle, spray lance, nozzle, cut-off device and built in air pump. The commercial size of this
sprayer varies between 12 and 14 liter. The air pump develops pressure in the range of 0.15-0.35
kg/cm2. The weight of the sprayer is approximately 6-7 kg. This sprayer is most suitable for
chemical application in kitchen gardens, animal treatments, timber treatments, preservatives,
solvents, disinfectants, liquid fertilizers and application in cereal crops etc.
Stirrup Sprayer
It is designed to pump the spray fluid directly from an open container, usually a bucket. The
hydraulic pump is put inside the bucket and held properly with the help of a foot rest. It has either
single or double barrel. As the plunger is continuously operated, pressure is built in the pressure
chamber and the delivery hose. As soon as the required pressure is built up, the spraying can be
done. It is most ideal for public health jobs like anti-malarial spraying as well as small scale
agricultural use. The sprayer weighs about 4-5 kg and provides a minimum discharge rate of 550
ml/min. The average working pressure, for public health use, is 1.8-2.5 kg/cm2 and 7 – 10 kg/cm2
for agricultural use.
Foot Sprayer
The foot sprayer consists of plunger assembly, stand, suction hose, delivery hose and
extension rod with spray nozzle. It does not have any built in tank for chemical. The pump has a
pump barrel and a pressure chamber. The plunger moves up and down when operated by foot
pedal. A ball valve is provided in the plunger assembly to allow the fluid to cross the plunger and
getting pressurized in the pressure vessel. One end of the suction hose is fitted with strainer and
the other end has flexible coupling. Similarly one end of the delivery hose is fitted with cut-off valve
and the other end with flexible coupling. The gross weight of the sprayer is about 8 kg and
provides a minimum discharge of 1200 ml/min. The working pressure is about 17-21 kg/cm2 and
can spray up to a maximum height of 6 meter. The sprayer is ideally suitable for spraying in
plantations, field crops in hilly terrain, field crops, orchards, tea, coffee, rubber, coconut, apple and
also on tall trees.
Rocker Sprayer
The rocker sprayer has a pump assembly, fixed on a wooden platform with an operating
lever, a valve assembly with two ball valves, a pressure chamber, suction hose with strainer and
delivery hose with spray lance. It is operated with a hand lever. The forward angular movement of
lever is about 15 deg where as backward angular movement is about 30 deg. By operating the
hand lever pressure is built in pressure chamber. The gross weight of the sprayer is about 10 kg
and provides a discharge rate of 1200 ml/min at a working pressure of 17-21 kg/cm2. The
maximum pressure generated is about 36 kg/cm2. This high pressure makes this sprayer more
suitable for chemical application on tall field crops, orchards and tree up to 5 meter tall.

(Climate Change, Precision Agriculture and Innovative Disease Control Strategies)
- 283 -
Ultra low volume sprayer
The sprayer has a motor powered by 6 or 12 volt battery. A spinning disc is attached to the
motor, having grooves or teeth which rotate at a very high speed (4000-9000 rpm). The disc
receives the concentrated chemical from a plastic container having a capacity of about 1 liter.
Average droplet size varies between 35-100 micron. It produces uniform droplet size with a narrow
range. The spray volume reduces to 10 % compared to a knapsack sprayer. The amount of spray
volume required to be handled is between 1-10 lit/ha.
Power Knapsack Sprayers
It is capable of applying chemicals in liquid, powder and granule form economically and
effectively. It utilizes a light weight engine (2-stroke petrol driven air cooled, 1.2 hp, 5500 rpm, 12.5
kg) to produce air stream with the help of a blower having a capacity of about 6 m3/min. The spray
liquid is discharged into air stream through an adjustable nozzle. Additional dusting attachment is
provided to convert the sprayer into a duster. The commercial unit has a chemical tank capacity of
about 11.5 liters with a small fuel tank of 1.25 liter. The discharge volume is in the range of 0.3-1.5
lit/min. It can spray up to a height of approximately 10 meters. The field capacity for manually
operated sprayer is approximately 10 hrs/ha with a spray volume in the range
of 100 to 200 lit /ha. It is suitable for spraying and dusting on field crops, orchards, tea and coffee
plantation, glass houses and tall trees up to 10 meter. The effective swath width is 4-5 meter.
Electrodyn Sprayers
The operation of an electro-dynamic type of sprayer is based on the droplet emerging from
the delivery gun with an electric charge. As each droplet has the same charge, the droplets repel
each other causing them to form a reasonably wide spray. In these oil is used as a chemical
carrier. The total volume of liquid to be sprayed over a hectare is only a litre or less than this.
Electrostatic Sprayers
Electrostatics means that the droplets are electrically charged. Electrical charging causes
an attraction force between the spray drops and the plant. Because they are charged, the droplets
do not drift away or fall on the ground. By using air-assistance in
combination with electrostatics the amount of spray material
reaching the plant is significantly increased. Under leaf coverage
has been shown to be increased by more than 70 fold. The water
is used as chemical carrier in electrostatic sprayers. A stream of
air is used to transport the droplet in air-assisted electrostatic
spraying. The deposition efficiency is more than twice than that of
hydraulic sprayers and non-electrostatic types of air-assisted
sprayers.
Air Assisted Sprayers
These can give a number of advantages: -
i) Increased penetration in dense crops

(Climate Change, Precision Agriculture and Innovative Disease Control Strategies)
- 284 -
ii) Improved work rates through the use of lower spray volume rates (lit/ha)
iii) 50-90% reduction in drift
iv) Being able to control the deposition of spray on the target location.
Types of Air Assisted Sprayers
The main types are:
i) Sleeve Boom Sprayers - A hydraulically driven fan blows air into an air sleeve of flexible
material with specially designed air outlets.
ii) Twin Fluid Atomizers (Air Jet Sprayers) - Air is fed from a high volume/ low-pressure
compressor mounted on the sprayer while the liquid is fed from a conventional pump. A
unique swirl chamber within the nozzle mixes the air and spraymix and the spray emerges
in a flat fan pattern.
Tractor operated Mist Sprayers
It is also known as aero blast sprayers and is a viable alternative to hydraulic sprayer. It
helps in chemical application on targets far from the sprayer. It uses air stream to carry the spray
liquid onto the plant canopy. In order to generate sufficient air stream a blower is provided which
gets its drive from tractor PTO through suitable drive. Turbulence of the out coming air blast
causes thorough mixing of spray fluid and air. The spray laden air proceeds from the sprayer to
displace original air in the plant canopy. Air blast distributes the chemical uniformly in the swath
The major portion of swath is covered by main spout where as the supplementary nozzle covers
the area nearer to tractor. The effective working width is about 13 meter. The effective field
capacity of such sprayers range from 2-2.5 ha/h for cereal crops and 4-4.5 ha for orchards at an
average speed of operation of 1.8 to 2.2 km/h. Aero blast sprayers have been designed for
economic and effective application of chemicals in orchards, grape gardens, vegetables and
cotton crops.
Tractor operated Air Sleeve Boom Sprayer
The control of pest can be achieved effectively if pesticides are properly applied at the
correct rate, at right time and on the target by appropriate equipment. In field crops like cotton the
pest attacks on the lower side of the leaves and mostly at the time of boll formation. The sprays
with conventional sprayer do not enter at the bottom position of the plant canopy and on the upper
and lower side of the leaves. For this purpose tractor operated air sleeve boom sprayers have
been designed for chemical application in cotton crop. The principle of working of this sprayer is
totally based on the replacement of air within the canopy of plant with spray laden air. In this
sprayer, the spray boom having hydraulic nozzles is fitted along a flexible air sleeve having series
of holes to deliver air at high velocity (28 -32 m/s) from behind the nozzles. The major components
in air sleeve boom sprayer are blower, spray boom, air sleeve, spray pump and accessories. The
length of boom is about 8.1m with 18 nozzles spaced at 45 cm. The number of orifice is 44 with 4
m long sleeve on each side. The tank capacity is 450 litres. It produces droplet size of 270- 193

(Climate Change, Precision Agriculture and Innovative Disease Control Strategies)
- 285 -
micron at 28 m/s and 187-169 micron at 32m/s with droplet density as 24-11 and 26-11
numbers/sq cm respectively. The laboratory tests have shown that the recommended value of
droplet density and droplet size could be obtained at air velocity of 26 m/s, air sleeve angle 30°,
nozzle angle 35° and height of boom 70 cm. The air velocity and air sleeve angle was observed
more effective as compared to nozzle angle and height of boom. The field capacity of the sprayer
has been found 12 ha/h. The comparative performance of air sleeve boom sprayer with tractor
operated aero blast, boom sprayer and hand compression sprayer has been found very effective
for the control of aphids, jassids, whitefly and thrips in cotton crop. This sprayer is also useful for
wide row crops.
Table: Technical specification of a commercial Air Sleeve Boom Sprayer
Sl No.
Parameters Specification
1 Length of boom, mm 7200
2 Number of atomizers 18
3 Spacing between atomizers, mm 440
4 Blower speed, rpm 3800
5 Type of pump Piston type ( 3 Numbers)
6 Tank capacity, lit 400
7 Pump capacity, lit/min 36
8 Tank material HD Polyethylene
Table: Comparative performance of air assisted and air sleeve boom sprayer
Sl No.
Test Parameters Air assisted sprayer
Air sleeve boom sprayer
1 Speed of operation, km/h 2.50 2.5-3.0
2 Effective swath width, m 13 8.8
3 Field capacity, ha/h 1.15-1.16 1.70-2.0
4 Tank filling time, min 25-27 25-27
5 Fuel consumption, l/h 3-4 3-4
Air-carrier sprayers (aero-blast sprayers)
Air-carrier sprayers are used for spray application in orchards and vineyards where the
target is far away from the sprayer. The air as carrier serves for transport of the liquid droplets
from the sprayer to the target foliage, penetration of the foliar canopy and deposition of droplets. A
blower is used to create a stream of air which carries the droplets to the required distance/ height.
The blower must have the sufficient discharge to replace the volume of plant canopy during
stipulated period for one tree. It is used for application of same quantity of chemical in 1/10th
volume compared to a hydraulic sprayer
Arial spraying
Arial spraying is done mostly with the use of an aircraft using ULV technique. It produces
very fine droplets less than 70 micron. It is used for controlling insects, pests and diseases as well
as for large scale spraying. Arial spraying is more common in developed countries where large

(Climate Change, Precision Agriculture and Innovative Disease Control Strategies)
- 286 -
sizes of farms are available with almost negligible agricultural laborers.
Hand Rotary Duster
It consists of a blower complete with a gear box and a hopper. Blower is operated by
rotating the crank at about 35-40 rpm. The blower sucks the dust or powder from the hopper and
pushes it out forcefully to achieve efficient dispersal. The operator carries the duster by means of
one or two shoulder straps and holds the lance in his left hand cranking the handle with his right
hand. The air output is about 0.3 -0.85 m³/min. A feed control lever is provided by which the
operator slide it to control the aperture at the bottom of the hopper and thereby controls control the
amount of feed. The hopper capacity is generally 5-6 litre and the weight of the duster is about 4-6
kg. Hand rotary duster is useful for continuous application of pesticide on cereals, pulses,
groundnut, cotton, tobacco, potato and other vegetable crops.
Common types of Spray Nozzles
i) Hollow cone nozzle (Disc and core type)
It is used primarily where plant foliage penetration is essential and where drift is not a
major consideration. It produces fine droplets. The spray angle is adjustable between 30-120 deg.
It is mainly used for insecticide application with knapsack sprayer
ii) Solid cone nozzle
The solid cone nozzle has 3 cores. The centre core fills the hollow cone produce by two
side cores. It produces large droplets at low pressure. The spray angle is between 20-30 deg.
Solid cone nozzles are used mainly for high volume spraying of chemical.
iii) Flood Jet nozzles
Flood jet nozzle produces wide, flat spray with large droplet size. The liquid discharged
from orifice strikes a curved deflector providing spray angle is between 70-160 deg. It is used for
fertilizer and post-emergence herbicides
iv) Flat fan nozzles
It produces medium size droplets providing even coverage. The spray angle is narrow to
medium. It is used for all type of fertilizer and insecticide application. Largely used for herbicide
application
v) Adjustable nozzles
It is a nozzle which is capable of producing a solid cone, hollow cone and jet spray pattern.
It can also produce spray pattern with different spray angles.
vi) Double swivel nozzles
This has two swivel nozzles instead of one, capable of independent movement. It is used
for high volume spraying in two different directions at a time.
Sprayer Maintenance
Sprayer should be well maintained during the spraying season.
Sprayer should be checked well before the beginning of the season.

(Climate Change, Precision Agriculture and Innovative Disease Control Strategies)
- 287 -
It should be cleaned from inside and outside after each day's work.
all moving parts should be lubricated thoroughly and regularly
Worn out, broken and damaged parts should be replaced.
Parts that are likely to be needed should be kept in stock.
Sprayer should be cleaned thoroughly before it is kept in the store to avoid corrosion
from residual chemical
Filters and Nozzles should also be cleaned thoroughly.
The pump should be greased and operating / moving parts should be well oiled.
Safety Precautions
Before spraying
Identify the pest and ascertain the damage done
Use recommended pesticide with less toxicity only if it has exceeded the Economical
Injury Level.
Read instructions manual of the pesticide and equipment.
Check the spraying equipment and accessories which are to be used.
Ascertain that all components are clean, especially filling and suction strainer, sprayer
tank, cut off device and nozzle.
Replace worn out parts such as 'O' ring, seal, gasket, worn out nozzle tip, hose clamps
and valves.
Test the sprayer and ascertain whether it pumps the required output at rated pressure.
Check the nozzle spray pattern and discharge rate
Make sure that appropriate protective clothing is available and is used.
Ensure that soap, towel and plenty of water is available
During spraying
Take only sufficient pesticide for the day's application.
Make sure pesticides are mixed in the correct quantities
Liquid formulation should be poured carefully to avoid splashing.
Selecting proper direction of spraying to avoid drift
Hold nozzle and boom at a proper height to avoid drift.
Wear appropriate clothing.
Avoid contamination of the skin especially eyes and mouth.
Follow correct spray technique.
Operate sprayer at correct speed and correct pressure.
DO NOT transfer pesticides from original container and packing into another container.
Do not spray in high wind, high temperature and rain.
Never eat, drink or smoke when mixing or applying pesticides.
NEVER blow out clogged nozzles or hoses with your mouth.

(Climate Change, Precision Agriculture and Innovative Disease Control Strategies)
- 288 -
Never allow children to be nearby during mixing.
NEVER leave pesticides unattended in the field.
Never spray if the wind is blowing towards grazing livestock or pastures regularly used
or habitat.
After spraying
Remaining pesticides left in the tank after spraying should be emptied and disposed off in
pits dug on wasteland.
Never empty the tank into irrigation canals or ponds.
Never leave unused pesticides in sprayers. Always clean equipment properly. After use, oil
it and then keep away in store room.
Do not use empty pesticide containers for any purpose.
Crush and bury the containers preferably in a land filled dump.
Clean buckets, sticks, measuring jars, etc. used in preparing the spray solution.

(Climate Change, Precision Agriculture and Innovative Disease Control Strategies)
- 289 -
Wheat Rusts: New Virulences threatening Global Wheat Production and Strategies to Manage
K.P. Singh
Department of Plant Pathology, G.B.P.U.A.&T., Pantnagar- 263 145 (Uttarakhand)
Introduction
Stem or black rust of wheat, caused by fungus Puccinia graminis Pers. F. sp. tritici Eriks. &
E. Henn., was at one time the most feared disease of wheat worldwide. It was not until the
beginning of the 20th century and soon after the rediscovery of Mendel’s laws, that Biffen in 1905
demonstrated that inheritance of resistance to wheat yellow rust, caused by Puccinia striiformis,
followed Mendel’s laws. After two devastating stem rust epidemics in North America in 1904 and
1916, another important finding came from the work of Stakman and Piemeisel 1917 who showed
that stem rust pathogen had various forms or races. These races varied in their ability to infect
different wheat varieties which later were found to carry distinct resistance genes or combinations
thereof. Strong emphases to identify resistance to stem rust and breed resistant wheat cultivars
were given in the USA, Canada, Australia and Europe. A simultaneous effort was also made to
understand rust epidemiology and evolution, which led to the barberry eradication programme in
North America and Europe and formulation of genetic control strategies. Efforts to find a solution to
stem rust also initiated global collaboration among wheat scientists who grew and evaluated wheat
germplasm for resistance to stem rust.
Table 1. Originating genus and species and usefulness of designated Sr genes in conferring
seedling and/or adult plant resistance to Ug99 race of stem rust pathogen P. graminis f. sp. tritici
Origin of Sr genes Stem rust resistant (Sr) genes
Infective Effective
Triticum aestivum 5, 6, 7a, 7b, 8a, 8b, 9a, 9b, 9f, 10, 15, 16, 18, 19, 20, 23, 30, 41, 42, Wld-1
281, 292, Tmp
Triticum turgidum 9d, 9e, 9g, 11, 12, 17 22, 1312, 141
Triticum monococcum 21 22, 35
Triticum timopheevi 361, 37
Triticum speltoides 32, 39
Triticum tauschii 332, 45
Triticum comosum 34
Triticum ventricosum 38
Triticum araraticum 40
Thinopyrum elongatum 241, 25, 26, 43
Thinopyrum intermedium 44
Secale cereale 31 271, 1A, 1R
Almost 50 different stem resistance genes are now catalogued (5), several of which are
incorporated in wheat from alien relatives of wheat (Table 1). All but one of 50 resistance genes
are race-specific, and are expressed in both seedling and adult plants. Race specificity derives
from the gene-for-gene relationship between the host plant resistance gene and corresponding
virulence genes in the pathogen. Gene Sr2, transferred to wheat from ‘Yaroslav emmer’ by

(Climate Change, Precision Agriculture and Innovative Disease Control Strategies)
- 290 -
McFadden 1930, is the only catalogued gene that is not race-specific. Sr2 can confer slow rusting
resistance of adult-plant nature. Resistance gene Sr2, in addition to other unknown minor genes
derived from cultivar Hope and commonly known as ‘Sr2-Complex’, provided the foundation for
durable resistance to stem rust in germplasm from university of Minnesota in the USA, Sydney
University in Australia, and the spring wheat germplasm developed by Dr. N.E. Borlaug as part of
a programme sponsored by the Mexican Government and the Rockefeller Foundation.
The importance of stem rust declined worldwide with the deployment of various other alien
resistance genes such as Sr 24, Sr 26, Sr 31 and more recently Sr 38. Translocations carrying
these genes, except that with Sr 26, also carried additional genes that conferred resistance to
some other important diseases such as leaf rust, yellow rust or powdery mildew.
Susceptibility of Global Wheat Germplasm to P. graminis tritici Race Ug 99 Present in East
Africa
Race Ug 99, first identified in Uganda during 1999, is the only known race of P. graminis
tritici that has virulence for gene Sr 31 from rye (Secale cereale). Later this race was designated
as TTKS by Wanyera et al. (2006) using the North American nomenclauture system.
Unfortunately, race Ug 99 not only carries virulence to gene Sr 31 but also this unique virulence is
present together with virulences for most of the genes of wheat origin and virulence for gene Sr 38
introduced in wheat from Triticum ventricosum that is present in several European and Australian
cultivars and a small portion of new CIMMYT germplasm (Table 1).
Predicted patterns of movement of airborne pathogens are filled with uncertainty, although
advances in air-borne modeling and prediction are offering some interesting new insights.
Typically, most spores will be deposited close to the source, however long-distance dispersal is
well documented, with three principal modes of dispersal known to occur.
The first mode of dispersal is single event, extremely long-distance (typically cross-continent)
dispersal that results in pathogen colonization of new regions. Dispersion of this type is rare under
natural conditions and by nature inherently unpredictable.
Assisted long-distance dispersal, typically on traveller’s clothing or infected plant material,
is another increasingly important is another increasingly important element in the colonization of
new areas by pathogens. Despite strict phytosanitary regulations, increasing globalization and air
travel both increase the risk of pathogen spread.
The second major mode of dispersal for pathogens like rusts is step-wise range expansion.
This typically occurs over shorter distances, within country or region, and has a much higher
probability than the first described dispersal mode. This probably represents the most common or
normal mode of dispersal for rust pathogens. A good example of this type of dispersal mechanism
would include the spread of yellow rust by a Yr9-virulent race of P. striiformis that evolved in
eastern Africa and migrated to South Asia through the Middle East and West Asia in a step-wise
manner over about 10 years, and caused severe epidemics in its path.
The third mode of dispersal, extinction and re-colonization, could perhaps be considered a

(Climate Change, Precision Agriculture and Innovative Disease Control Strategies)
- 291 -
sub-mechanism of step-wise range expansion. This mechanism occurs in areas that have
unsuitable conditions of year round survival.
Race Ug99 was first detected in Uganda in 1999. Following its detection, inverstigations in
neighbouring countries in East Africa revealed that the same race may have migrated to sites in
the Rift Valley province of central Kenya by 1998/1999, with subsequent advancement to site in
Eastern Kenya by 2001. In 2003, race Ug 99 was detected in Ethiopia with 2005 reports from at
least six dispersed site locations. Available evidence suggests that Ug99 is now established in the
eastern African highlands and spreading.
The East African highlands are a known ‘hot-spot’ for the evolution of new rust races. The
favourable environmental conditions, plus the presence of host plants year-round all favour the
buildup of pathogen populations. Available evidence emerging from the East African countries
indicates that Ug99 has exhibited a gradual step-wise range expansion, following the predominant
west-east airflows.
A major concern is that a significant proportion of global wheat germplasm is potentially at
risk from race Ug99. Reynolds and Borlaug estimated that this area might amount to 50 million ha
of wheat grown globally i.e., about 25% of the world’s wheat area. Germplasm with resistance to
Ug 99 is available, but for many parts of the world, material of this type is not present in varieties
grown in farmers’ fields. Major questions that now arise are: how likely is it that Ug 99 might
spread, where Ug99 might spread to, and what the likely consequences of any movement are.
Potential Migration Paths for Race Ug99
Most evidence, albeit circumstantial, indicate that Ug 99 is likely to spread beyond the
borders of the three East African countries in which it is currently present. The sheer mobility of
rust spores led an international panel of rust experts to conclude that it is only a matter of time until
Ug99 reaches across the Saudi Arabian Peninsula and into the Middle East, South Asia, and
eventually, East Asia and the Americas’. In addition, there is documented evidence connecting
East Africa with West and South Asia for migration of rust races of East African origin.
Strategies to Mitigate the Risks of Losses From Epidemics Caused by Race Ug 99
The best control strategy is to identify resistant wheat genotypes that can adapt to the
prevalent environments in these countries, and release them after proper testing while
simultaneously producing the seed. An aggressive strategy to promote these resistant cultivars in
farmer’s fields is the only viable option as resource-poor farmers in most of East Africa, except
some commercial farmers in Kenya, can not afford to use chemical control. A reduction in disease
pressure in East Africa will also reduce chances of migration beyond the region.
Reducing the area planted to susceptible cultivars in the Arabian Peninsula, North Africa,
Middle East and West and South Asia is also the best strategy if major losses are to be avoided
when race Ug99 migrates to these areas. The ‘Global Rust Initiative’, launched during 2005 and
led by CIMMYT in partnership with ICARDA and various National and Advanced Research
Institutions, is using the following strategies to reduce the possibilities of major epidemics:

(Climate Change, Precision Agriculture and Innovative Disease Control Strategies)
- 292 -
1) monitoring the spread of race Ug 99 beyond eastern Africa
2) screening of released cultivars and germplasm for resistance
3) distributing sources of resistance worldwide for either direct use as cultivars or for
breeding, and
4) targeted breeding to incorporate diverse resistance genes and adult plant resistance into
high-yielding adapted cultivars and germplsm (www.globalrust.org).
Table 2: Frequency of wheat cultivars and advanced breeding lines of different origins for
their field response to Ug99 race of the stem rust pathogen at Njoro, Kenya during 2006
Country/Institution Response and frequency Total
Resistant Moderately resistant
Moderately susceptible and susceptible
Bangladesh 0 3 81 84
China 1 1 116 118
Egypt 3 0 146 149
India 16 7 79 102
Iran 1 1 98 100
Khazakstan 2 1 83 86
Nepal 1 1 103 105
Pakistan 0 6 99 105
Russia 0 1 34 35
Turkey 14 2 69 85
CIMMYT-Irrigated4 94 56 400 550
CIMMYT-Semiarid4 50 9 161 220
CIMMYT-High Rainfall4 11 6 99 116
Race-specific Resistance Genes
A large portion of the highly resistant germplsm from South America, Australia and
CIMMYT possess Sr 24. There are three distinct Sr24-carrying translocations: the original one
linked to a gene for re grain colour, the shorter segment with white grain, and a third segment
where a very small segment has been retranslocated onto chromosome 1BS. In all three
segments both Sr24 and Lr 24 are present together. Therefore, selection for Lr24 with avirulent
leaf rust isolates can be used as an indirect selection strategy. This gene would look like an
attractive candidate for future breeding efforts; however it must be used in combination with other
effective resistance genes because virulence to Sr 24 is already known in South Africa and India.
Gene Sr 36 derived from Triticum timopheevi, exhibits an immunity (no symptoms) to race
Ug99 at both seedling and adult plant stages. The gene occurs in a high frequency in US soft
winter wheat. Although races with virulence for Sr 36 are common, it could be used effectively as a
component for Ug99 resistance breeding.
Breeding strategies for resistance to P. graminis tritici Race Ug99
The fastest way to reduce the susceptibility of important wheat cultivars and the best new
germplasm is to systematically incorporate diverse sources of resistance into them through limited
or repeated backcrossing. To transfer two or more effective resistance genes into an adapted
cultivar the better crossing strategy would be to first cross the resistance sources and then cross

(Climate Change, Precision Agriculture and Innovative Disease Control Strategies)
- 293 -
the F1 plants with the adapted cultivar. Molecular markers can then be used to select top-cross
plants that have desirable agronomic features and carry the targeted resistance genes.
The strategy adopted at CIMMYT is to transfer the adult-plant resistance from Pavon 76,
and a few other wheats identified so far, to a range of important CIMMYT wheat germplasm by
using the ‘single-backcross selected-bulk’ breeding approach. In this strategy the resistance
sources are crossed with the adapted high-yielding wheats and then a single backcross is made
with the recurrent parent to obtain about 400 BC1 seeds. BC1 plants were then selected for desired
agronomic features and resistance to leaf and yellow rusts, and harvested as bulk. Large F2
populations of about 2500 plants will be grown and plants will be selected in Mexico for agronomic
traits and resistance to other diseases and harvested as bulk. A similar selection will be practiced
in the F3 generation to obtain F4 populations. At this stage we will try to select for adult-plant
resistance by growing densely sown F4-buld population is Kenya or Ethiopia, under high stem rust
pressure created by inoculating with Ug99 race. Populations will be bulk harvested and plumper
grains selected to grow F5 generation in Mexico. Because stem rust affects grain filling, we expect
that plants with insufficient resistance will have shriveled grains. Moreover, by F4 generation
enough homozygosity is achieved for the selection of additive resistance genes. Individual plants
with desired agronomic features and resistance to other diseases will be selected in the F5
generation and those with good grain characteristics will be grown in F6 as hill plots or short rows
in Kenya or Ethiopia as well as small plots in Mexico for final selection. Finally, the resistant F6
plots will be harvested for conducting yield trials in the following crop season. The same
methodology is also proposed to transfer resistance from old, tall Kenyan cultivars into adapted
semidwarf wheats. The proposed approach is expected to rebuild the durable resistance in
modern wheat germplasm. Genetic analyses will be necessary to understand the number and type
of resistance genes involved in sources contributing the adult plant resistance. Genomic locations
of minor, additive resistance genes will be determined through molecular mapping. Such
information will be useful to establish and enhance genetic diversity for minor genes.
Rapid Seed Multiplication
Once UG99 resistant wheat varieties are nationally or regionally registered and ready for
release, a national strategy should be in place for the seed multiplication and distribution of quality
seed of rust resistant varieties to replace rust susceptible varieties in high areas or hot spots. As a
stating point, the initial target for rapid seed multiplication is 10% of the wheat production area. In
most countries this can be accomplished in 3-4 generations (see Table 2). The actual targets for
rapid seed multiplication will depend on the actual and potential threat of UG99 that will be
elaborated as part of the contingency planning and surveillance system.
Table 1: Planting rate of 100kg/ha with varying yields (3T/ha, 4T/ha and 6T/ha)
Generation Qty of seed produced in Tons with different Seed Multiplication Ratio
1:30 1:40 1:60
Initial seed Qty 0.05 0.05 0.05
First 1.5 (0.5 ha) 2.0 (0.5 ha) 3.0 (0.5 ha)
Second 45 (15 ha) 80 (20 ha) 180 (30 ha)

(Climate Change, Precision Agriculture and Innovative Disease Control Strategies)
- 294 -
Third 1,350 (450 ha) 3,200 (800 ha) 10,800 (1800 ha)
Fourth 40,500 (13,500 ha) 128,000 (32,000 ha) 348,000 (108,000 ha)
Fifth 1,215,000 (405,000 ha)
5,120,000 (128,0000 ha)
38,880,000 (648,0000 ha)
To provide an idea of the number of generations, area needed for seed multiplication and
area the seed can cover at various multiplication factors, the above tables will provide some basic
information of a seed multiplication system starting with 50kg of nucleus seed.
S. No. Country Area under Wheat
cultivartion 2007
10% of the
wheat area
% Area that will be covered after 4 generations with following
Multiplication Factor
1:30 1:40 1:60
1. Afghanistan 2,190,000 219,000 18.4 58.4 100
2. Algeria 1,785,000 178,500 22.6 71.7 100
3. Armenia 113,300 11,330 100 - -
4. Azerbaijan 486,990 48,699 83.4 100 -
5. Bangladesh 805,000 80,500 50.3 100 -
6. China 30,000,000 3,000,000 1.4 4.3 21.6
7. Eqypt 1,139,000 113,900 35.6 100 -
8. Ethiopoia 1,351,000 135,100 29.9 94.7 100
9. Georgia 61,000 6,100 100 - -
10. India 28,035,000 2,803,500 1.4 4.6 23.1
11. Iran 6,400,000 640,000 6.3 20.0 100
12. Iraq 531,210 53,121 76.2 100 -
13. Jordan 30,000 3,000 100 - -
14. Kenya 150,000 15,000 100 - -
15. Kyrgyzstan 354,500 35,450 100 - -
16. Lebanon 48,000 4,800 100 - -
17. Libya 257,000 25,700 100 - -
18. Morocco 1500,000 150,000 27.0 85.3 -
19. Nepal 472,000 47,200 85.8 100 -
20. Oman 275 27.5 100 - -
21. Pakistan 8,494,000 849,400 4.8 15.1 76.3
22. Saudi Arabia
462,000 46,200 87.7 100 -
23. Sudan 250,000 25,000 100 - -
24. Syria 1,850,000 185,000 21.9 69.18 100
25. Tajikistan 330,000 33,000 100 - -
26. Tunisia 974,000 97,400 41.6 100 -
27. Turkey 8,600,000 860,000 4.7 14.9 75.3
28. Uganda 11,000 1,100 100 - -
29. Uzbekistan 1400,000 140,000 28.9 91.4 100
30. Yemen 114,030 11,403 100
This second table focuses on providing an idea of indicative quantities of seed that may be
needed in each country. A tentative target of seed to cover 10% of the total area in wheat is
included. In addition the percentage of the area that can be covered by 4 generation of seed
production a multiplication factor of 30, 40 and 60 demonstrates the need to undertaken intensive

(Climate Change, Precision Agriculture and Innovative Disease Control Strategies)
- 295 -
wheat seed production in order to reduce the time to reach the target quantities.
Gene Deployment: Indian Experience
Gene deployment is the strategic usage of resistance genes over a large area to
reduce the threat of epidemics.
Gene deployment schemes with aim to prevent large-scale build up of wheat rusts
were also proposed in India.
In order for the gene deployment to be effective, information on some of key areas
- Pathogenicity survey in the country,
- Information on virulence of exogenous pathotypes
- Epidemiological studies must be acquired and made available.
In order for the gene deployment to be effective, it is very essential that role of
exogenous inoculum is ascertained. Breakdown of Kalyansona, Sonalika and Yr9
resistance against stripe rust was traced to Eastern Africa, Turkey, Syria, Iran and
Pakistan. Another challenge now is that similar route of migration has also been predicted
for Ug99.
A successful, though unintentional, deployment for stem rust resistance is the large scale
cultivation of HD2189 in Peninsular India. Presently, this cultivar is resistant to Indian stem
rust pathogen. Another Sr31- cultivar (DWR162) being cultivated in Karnataka or Nilgiris is
not able to multiply as it lands on the resistant gene. Consequently, three popular cultivars
of Central Zone namely Lok-1, Sujata and WH147, though susceptible but are protected
against any transported inoculum.
Chemical and Cultural Management of TTSK (Ug99) of Wheat Stem Rust Pathogen in
Kenya
While resistant is the most effective method of controlling stem rust, there are no
commercial varieties in Kenya with adequate resistance. Therefore, fungicides as foliar or
seed treatments will play a role in the integrated management of the disease until new
varieties with improved resistance are released.
Stem rust epidemics are causing grain losses of up to 70% in experimental plots
and over 70% in farmer’s fields. This is yield of sprayed vs. unsprayed wheat crop.
Spraying only reduces but does not eliminate the disease. It is therefore possible to get
yield losses higher than this when relative to a clean crop. In the year 2007, farmers who
never controlled the disease at all, lost 100% of their crop regardless of the variety.
Short term control of stem rust can be achieved with standard application of
fungicides, provided the infection is not severe. Some of the foliar fungicides
recommended for the control of yellow and leaf rusts can also be used to reduce/suppress
the stem rust disease. Because most farmers are not able to identify the rust, it is
recommended to apply to apply two sprays, 60 days and 75-78 days respectively, after
planting.

(Climate Change, Precision Agriculture and Innovative Disease Control Strategies)
- 296 -
REFERENCES
1. Mclntosh R.A. The role of specific genes in breeding for durable stem rust resistance in wheat and triticale. In: symonds NW, Rajaram S(eds) “Breeding strategies for resistance to the rust of wheat” CIMMY, Mexico 1988 p 101-08.
2. Ravi P. Singh et al Current status, likely migration and strategies to mitigate the threat to wheat production from Race Ug 99 of stem rust. CAB Rev. 2006, 1, no. 054.
3. Singh R.P. et al Wheat rust in Asia: meeting the challenges with old and new technologies. Proc. 4
th International Sciences Congress, Brisbane, Australia 26 Sept-1 Oct. 2004.
4. S.S. Xu et al Evaluation and characterization of seedling resistance to stem rust Ug 99 races in wheat alien species derivatives. Published online Oct 2009. Crop Science.
5. Wanyera R.; Kinyua M.G.; Jin, Y; Singh, R.P. The spread of stem rust with virulence on Sr 31 in wheat in Eastern Africa. Plant Diseases 2006: 90-113

(Climate Change, Precision Agriculture and Innovative Disease Control Strategies)
- 297 -
Plant Diseases in Changing Climate
K.S. Hooda, Kedar Nath, Shikha Sharma, Meena Shekhar and Sangit Kumar Directorate of Maize Research, Indian Council of Agriculture Research, Pusa Campus, New Delhi 12
Introduction
Greenhouse gas concentrations in the atmosphere are being altered by human activities,
thus causing global climate change. These activities, intensified after the Industrial Revolution at
the end of the eighteenth century, result from the use of natural resources such as burning of fossil
fuel, deforestation and other land use changes. The atmospheric concentration of carbon dioxide
(CO2) has reached levels significantly higher than in the last 650 thousand years (Siegenthaler et.
al., 2005). Similar trends have been observed for methane (CH4), nitrous oxide (N2O), and other
greenhouse gases (Spahni et. al., 2005; IPCC, 2007). The average global surface temperature
has increased by 0.2°C per decade in the past 30 years (Hansen et. al., 2006). Theophrastus
(370-286 B.C.) observed that cereals cultivated in higher altitude regions exposed to the wind had
lower disease incidence than cereals cultivated in lower altitude areas. Agrios (2004) estimated
that annual losses by diseases cost US$ 220 billion.
Geographical distribution of plant pathogenic prokaryotes, like other pathogens occurring in
plants, is predominantly influenced by several factors such as: local climate, distribution of host
plants, dispersal ability of pathogens, presence of animal vectors, and adaptability of pathogens to
local conditions, the ability of pathogens to infect new host plants, and resistance of local cultivars
(Garrett et. al., 2006).
There is consensus among climatologists that global warming is occurring and refers to the
gradual increase in global average surface temperature, as one of the consequence of radiative
forcing caused by anthropogenic (created by people or caused by human activity) emissions.
However, confidence in attributing some observed climate change phenomena to anthropogenic or
natural processes is limited by uncertainties in radiative forcing, as well as by uncertainty in
processes and observations (Bater et. al., 2008).
Climate Change in Agriculture Sector
Agriculture sector is particularly sensitive to climate change. From an agricultural
perspective, macroclimate can be defined as the climate above or .outside a plant canopy, in
contrast to microclimate, the climate within the plant canopy. While many events in plant disease
cycles occur within the plant canopy, the macroenvironment often exerts a major influence on
disease occurrence and pathogen dissemination (Gleaseon 2000).
Role of Environment in Causing Plant Diseases
Plant Disease Triangle:

(Climate Change, Precision Agriculture and Innovative Disease Control Strategies)
- 298 -
The three legs of the triangle – host, pathogen, and environment – must be present and
interact appropriately for plant disease to result. If any of the 3 factors is altered, changes in the
progression of a disease epidemic can occur.
Nowadays, the environment can influence host plant growth and susceptibility; pathogen
reproduction, dispersal, survival and activity; as well as host-pathogen interaction (Gaumann,
1950).
Impact of Rising Temperatures on Diseases
Temperature has potential impacts on plant diseases through both the host crop plants and
the pathogens. Research has shown that host plants such as wheat and oats become more
susceptible to rust diseases with increased temperature; but some forage species become more
resistant to fungi with increased temperature (Coakley et. al., 1999). Generally, fungi that cause
plant disease grow best in moderate temperature ranges. For example, predictive models for
potato and tomato late blight (Phytophthora infestans) show that the fungus infects and
reproduces most successfully during periods of high moisture that occur when temperatures are
between 7.2°C - 26.8°C (Wallin et. al., 1950).
Bergot et. al., 2004 have used a GCM to simulate the potential impacts of climate change
on the expansion of Phytophthora cinnamomi in oak, by modeling phloem temperature of infected
trees to evaluate overwintering probabilities. For the downy mildew of grape, caused
by Plasmopara viticola. Salinari et. al., 2006 used GCM to evaluate disease pressure.
Impact of Rising CO2 levels on Diseases
Increased CO2 levels can impact both the host and the pathogen in multiple ways.
Researchers have shown that higher growth rates of leaves and stems observed for plants grown
under high CO2 concentrations may result in denser canopies with higher humidity that favor
pathogens. Lower plant decomposition rates observed in high CO2 situations could increase the
crop residue on which disease organisms can overwinter, resulting in higher inoculum levels at the
beginning of the growing season, and earlier and faster disease epidemics. High
CO2 concentration results in benefits for plant growth, although there might be differences among
species. CO2 enrichment promotes changes in plant metabolism, growth and physiological
processes. There is a significant increase in the photosynthetic rate and a decrease in the
transpiration rate per unit leaf area, while total plant transpiration sometimes increases, due to the
larger leaf area (Jwa & Walling, 2001; Li et. al., 2003).
Karnosky et. al., 2002 also observed that the effects of O3 on leaf surface properties
resulted in increased incidence of this rust. Osswald et. al., 2006 investigated whether elevation of
CO2 (400 up to 700 ppm) and/or ozone (ambient or two-fold ambient) resulted in a change in
susceptibility of potato plants infected with Phytophthora infestans.
Using mathematical models, Carter et. al., 1996 simulated climate change in Finland and
concluded that warming will expand the cropping area for cereals by 2050 (100 to 150 linear km
per Celsius degree increase in mean annual temperature); furthermore, higher yields are expected

(Climate Change, Precision Agriculture and Innovative Disease Control Strategies)
- 299 -
with higher CO2 concentration. In this scenario, potato cropping will also be benefited with an
estimated 20 to 30% increase in yield. However, a new distribution of the potato cyst nematode
(Globodera rostochiensis) is also predicted.
Manning and Tiedemann, 1995 observed an upward trend in diseases. They analyzed the
potential effects of higher CO2 concentration on plant diseases, based on the plant responses to
this new environment. Increased carbohydrate contents can stimulate the development of sugar-
dependent pathogens, such as rusts and powdery mildews. Increases in canopy density and plant
size can promote higher growth, sporulation and spread of leaf infecting fungi, which require high
air humidity, but not rain, as rusts, powdery mildews and leaf necrotrophs. The reduction in
stomatal opening can inhibit stomata- invading pathogens, such as rusts, downy mildews and
some necrotrophs.
Drought stress and disease stress may have additive effects on plants, as observed for
infection by Maize dwarf mosaic virus (Mayek-Perez et. al., 2002 and Macrophomina phaseolina
(Olson et. al., 1990), may cause more deleterious effects on their hosts under drought conditions,
though it is unclear whether this is because of increased infection rates under drought or because
of increased impacts per infection event.
Mayek-Perez et. al., 2002 suggest that the concentration of carbohydrates in host tissues
as a result of drought stress may benefit pathogens such as M. phaseolina that can survive in
extremely dry soils. High CO2 concentration results in benefits for plant growth, although there
might be differences among species. Several authors reached the same conclusions with different
crops, natural ecosystems and forest species.
Impact of Moisture on Plant Diseases
Moisture can impact both host plants and pathogen organisms in various ways. Some
pathogens such as apple scab, late blight, and several vegetable root pathogens are more likely to
infect plants with increased moisture. Other pathogens like the powdery mildew species tend to
thrive in conditions with lower (but not low) moisture (Coakley et. al., 1999).
Major Taxonomic Groups of Pathogens Causing Plant Emerging Infectious Diseases (EID)
Viruses, fungi and bacteria are the major pathogens causing plant EIDs. Viruses cause just
under half (47%) of the reported plant EIDs which is a similar percentage to that for human (44%
[Taylor et. al., 2001]) and wildlife (43%) EIDs (Dobson et. al., 2001). However, bacteria cause a
lower proportion (16%) of plant EIDs compared with human (30% [Taylor et. al., 2001 ]) or wildlife
(w30% [Dobson and Foufopoulos (2001) ]) EIDs and fungi represent a higher proportion (30%) of
plant EID pathogens when compared with those of humans (9% [Taylor et. al., 2001]) or wildlife
(!10% [Dobson et. al., 2001]).
Climate Change as a Driver of Emerging Infectious Diseases of Plants
Range expansion of the grey leaf blight of corn, caused by the fungus Cercospora zeae-
maydis, was first noticed during the 1970s, and, in the past two decades, has become the major
cause of corn yield loss in the USA. Aflatoxin, a compound that lowers corn quality and which is a

(Climate Change, Precision Agriculture and Innovative Disease Control Strategies)
- 300 -
health risk to humans, is related to drought conditions and its concentration is raised during crop-
water deficits, which favour the growth of the fungus Aspergillus flavus.
Plant Diseases in Relation to Climate Change
It was emphasised by Coakley et. al., 1999 that most of what has been said about plant
disease in relation to climate change is based on qualitative, rule-based reasoning. For example, it
seems plausible but not sure that (i) increased air temperature would result in a poleward
expansion of the geographical range of pathogens and in more generations per year; (ii) elevated
winter temperatures would increase survival and hence the amount of initial inoculum in many
pathosystems; (iii) and that greater continental dryness during summer would reduce risk of
infection by pathogens that require leaf wetness or saturated soils for infection. In case of vector-
borne diseases, climate influences the spatial distribution, intensity of transmission, and
seasonality of diseases transmitted by vectors. Climate change can have positive, negative or
neutral impact on individual plant-bacterial pathogen interactions.
Anonymous (2008) reported that Rhizoctonia solani produced symptoms in the form of
scattered lesions after 3 days of inoculation at temperature range 26.0- 33.30C and relative
humidity 84- 86 per cent as compared to temperature range 8.8-200C and relative humidity 86-92
per cent after 20 days of inoculation.
According to Chakraborty et. al., 2000a, more aggressive strains of pathogen with broad
host range, such as Rhizoctonia, Sclerotinia, Sclerotium and other necrotrophic pathogens can
migrate from agroecosystems to natural vegetation, and less aggressive pathogens from natural
plant communities can start causing damage in monocultures of nearby regions.
Gioria et. al., 2008 showed a prediction for the main tomato diseases and argued that
climate change will not be favorable for the occurrence of late blight (Phytophthora infestans),
verticillium wilt (Verticillium albo-atrum), and white mold (Sclerotinia sclerotiorum); and will not alter
the importance of the tomato mosaic caused by the tomato mosaic virus (ToMV) and the septoria
leaf spot (Septoria lycopersici). In contrast to those diseases, the importance of powdery mildew
(Leveilula taurica) will increase in all tomato production regions across the country, just as the
importance of early blight (Alternaria solani), fusarium wilt (Fusarium oxysporum f.sp.lycopersici),
bacterial wilt (Ralstonia solanacearum), tomato spotted wilt virus - TSWV, tomato chlorotic spot
virus - TCSV, groundnut ring spot virus - GRSV, Chrysanthemum stem necrosis virus - CSNV and
yellow leaf curl virus (Geminivirus).
Emergence of Heat-loving bacteria
Most heat-loving plant pathogenic bacteria that have emerged as serious problem
worldwide belong following bacterial plant pathogens: Ralstonia solanacearum, Acidovorax
avenae subsp. aveane, and Burkholderia glumea.
Climate Change and Plant Health Care System
The predicted changes in future climate may affect growth of crop plants and their
interaction with plant pathogens. Climate change is likely to be a gradual process that will give

(Climate Change, Precision Agriculture and Innovative Disease Control Strategies)
- 301 -
researchers, plant breeders, plant health care practitioners, managers and farmers some
opportunity to adapt. Both predicted (and unpredicted) disease consequence of climate change on
plant health can most likely be minimised by such manners as follows: (i) to build a solid
knowledge base on the impact a consequence of climate change for various parts of the world; (ii)
to determine the potential for adaptation under potential changes in pathogen pressure due to
climate change (or other factors); (iii) to maintain a high index of suspicion for changes in the plant
pathosystem; (iv) to monitor systematically occurrence of diseases and animal pests in each field
and region and keep records of severity, frequency over time; (v) to develop new varieties adapted
to changed climate through traditional or transgenic methods; (vi) the farm advisory system could
be used not only to disseminate knowledge but also to adopt and introduce the new integrated
control of organisms injurious to plants.
Conclusions
1. The precise impacts of climate change on insects and pathogens is somewhat uncertain
because some climate changes may favor pathogens and insects while others may inhibit a
few insects and pathogens.
2. The preponderance of evidence indicates that there will be an overall increase in the number
of outbreaks of a wider variety of insects and pathogens.
3. The possible increased use of fungicides and insecticides resulting from an increase in pest
outbreaks will likely have negative environmental and economic impacts for agriculture.
4. The best economic strategy for farmers to follow is to use integrated pest management
practices to closely monitor insect and disease occurrence. Keeping pest and crop
management records over time will allow farmers to evaluate the economics and
environmental impact of pest control and determine the feasibility of using certain pest
management strategies or growing particular crops.
5. Global climate change affect humans, livestock and wildlife as plant diseases impact
negatively on human wellbeing through agricultural and economic loss, and also have
consequences for biodiversity conservation.
6. The analysis of the potential impacts of climate change on plant diseases is essential for the
adoption of adaptation measures, as well as for the development of resistant cultivars, new
control methods or adapted techniques, in order to avoid more serious losses.
Future Thrust
The impacts on abiotic diseases associated with the occurrence of extreme values of
environmental variables need to be discussed, in spite of an expected increase in their incidence
so it could be study.
REFERENCES
1. Agrios, G. N. (2004). Plant Pathology. 5 ed. London: Elsevier, p. 922.
2. Anonymous (2008). Annual report on assessment of vulnerability of crop yield to pest damage in global climate change, Directorate of Maize Research, Pusa, New Delhi.

(Climate Change, Precision Agriculture and Innovative Disease Control Strategies)
- 302 -
3. Bater B.C.; Kunderzewitz Z. W.; Wu, S. and Palutikof, J. (eds) (2008). Climate Change and Water. Paper of the Intergovernmental Panel on Climate Change, IPCC Secretariat, Geneva.
4. Bergot, M.; Cloppet, E.; Perarnaud, V.; Deque, M.; Marcais, B. and Desprez-Loustau, M. L. (2004). Simulation of potential range expansion of oak disease caused by Phytophthora cinnamomi under climate change. Global Change Biology. 10, p.1539-
1552.
5. Carter, T.R.; Saarikko, R.A. and Niemi, K .J. (1996). Assessing the risks and uncertainties of regional crop potential under a changing climate in Finland. Agricultural and Food Science in Finland. 5, p.329-350.
6. Chakraborty, S.; Tiedemann, A.V.; Teng, P.S. (2000a). Climate change: potential impact on plant diseases. Environmental Pollution. 108, p.317-326.
7. .Coakley, S.M.; Scherm, H. and Chakraborty. S. (1999). Climate Change and Disease Management. Ann. Rev. Phyto. 37, p.399-426.
8. Dobson, A. and Foufopoulos, J. (2001.) Emerging infectious pathogens of wildlife. Philos. Trans.
R. Soc. Lond. Ser. 356, p. 1001–1012.
9. Garrett, K.A.; Dendy, S.P.; Frank, E.E.; Rouse, M.N. and Travers, S.E. (2006). Climate change effects on plant disease: genomes to ecosystems. Annual Review of Phytopathology. 44, p .489-509.
10. Gaumann, E.(1950). Principles of plant infection. London: Crosby Lockwood, p.543
11. Gioria, R.; Brunelli, K.R.; Kobori, R.F. (2008). Impacto potencial das mudanças climáticas sobre as doenças de hortaliças: tomate, um estudo de caso. Summa Phytopathologica. 34,
p.121-S122.
12. Gleaseon M.L. (2000): Macroenvironment. In: Maloy O.C., Murray T.D. (eds): Encyclopedia of Plant Pathology. 2. John Wiley & Sons Inc., New York. p.627–628.
13. Hansen, J.; Sato, M.; Ruedy, R.; Lo, K.; Lea, D.W.; Medinaelizade, M. (2006).Global temperature change. Proceedings of the National Academy of Sciences. 103, p.14288-14293.
14. IPCC (2007). Climate change: the physical science basis. Geneva: IPCC, p.996. (Assessment Report, 4).
15. Jwa, N.S. and Walling, L.L. (2001). Influence of elevated CO2 concentration on disease development in tomato. New Phytologist. 149, p.509-518.
16. Karnosky, D.F.; Percy, K.E.; Xiang, B.X.; Callan, B.;Noormets, A.; Mankovska, B.; Hopkin, A.; Sober, J.; Jones, W.; Dickson, R.E.; Isebrands, J.G. 2002.Interacting elevated CO2 and tropospheric O3 predisposes aspen (Populus tremuloides Michx.) to infection by rust (Melampsora medusa f. sp tremuloidae). Global Change Biology. 8, p.329-338.
17. Li, F.; Kang, S.; Zhang, J.; Cohen, S. (2003). Effects of atmospheric CO2 enrichment, water status and applied nitrogen on water and nitrogen-use efficiencies of wheat. Plant and Soil. 254, p.279-289.
18. Manning, W.J. and Tiedemann, A.V. (1995). Climate change: potential effects of increased atmospheric carbon dioxide (CO2), ozone (O3), and ultraviolet-B (UV-B) radiation on plant diseases. Environmental Pollution. 88, p.219-245.
19. Mayek-Perez N, Garcia-Espinosa R, Lopez-Castaneda C, Acosta-Gallegos JA, Simpson J. ( 2002). Water relations, histopathology and growth of common bean (Phaseolus vulgaris L.) during pathogenesis of Macrophomina phaseolina under drought stress. Physiol. Mol. Plant Pathol. 60, p.185–95.
20. Olson A. J.; Pataky J. K.; D’Arcy, C.J. and Ford, R. E. (1990). Effects of drought stress and infection by maize dwarf mosaic virus in sweet corn. Plant Dis. 74, p.147–51
21. Osswald, W.F.; Fleischmann, F.; heiser, I. 2006Investigations on the effect of ozone, elevated CO2 and nitrogen fertilization on host-parasite interactions. Summa Phytopathologica, 32S, S111-S113.
22. Salinari, F.; Giosue, S.; Tubiello, F.N.; Rettori, A.; Rossi, V.; Spanna, F.; Rosenzweig, C. and

(Climate Change, Precision Agriculture and Innovative Disease Control Strategies)
- 303 -
Gullino, M.L. , 2006 Downy mildew (Plasmopara viticola) epidemics on grapevine under climate change. Global Change Biology. 12, p.1299- 1307.
23. Schaad N.W. (2008): Emerging plant pathogenic bacteria and global warming. In: Fatmi M.B., Collmer A., Iacobellis N.S., Masfield J.W., Murillo J., Schaad N.W., Ulrich M. (eds): Pseudomonas syringae Pathovars and Related Pathogens – Identification
Epidemiology and Genomics. Springer, Dordrecht: 369–370.
24. Siegenthaler, U.; Stocker, T.F.; Monnin, E.; Luthi, D.; Schwander, J.; Stauffer, B.; Raynaud, D.; Barnola, J. M.; Fischer, H.; Masson-Delmotte, V. and Jouzel, J. (2005). Stable carbon cycle-climate relationship during the late pleistocene. Science. 310, p.1313-1317.
25. Spahni, R.; Chappellaz, J.; Stocker, T. J.; Loulergue, L.; Hausammann, G.; Kawamura, K.; Fluckiger, J.; Schwander, J.; Raynaud, D.; Masson-Delmotte, V. and Jouzel, J. (2005). Atmospheric methane and nitrous oxide of the late Pleistocene from Antarctic ice cores. Science. 310, p.1317- 1321.
26. Taylor, L.H. et al. (2001) Risk factors for human disease emergence.Philos. Trans. R. Soc. Lond. Ser. 356, p. 983–989.
27. Wallin, J. R. and Waggoner, P. E. 1950. The influence of climate on the development and spread of Phytophthora infestans in artificially inoculated potato plots. Plant Dis. Reptr. Suppl. 190, p. 19-33.

(Climate Change, Precision Agriculture and Innovative Disease Control Strategies)
- 304 -
Evaluation and Selection of Promising Trichoderma Isolates For the Management of Soil Borne Fungal Plant Pathogens
A.K. Tewari
Department of Plant Pathology, GBPUA&T, Pantnagar- 263 145 (Uttarakhand)
Dual culture Method: This method is used for testing mycoparasitic activity of antagonist. Pour
15-20ml sterile PDA in sterile plates amended with Chloromphenicol (100 mg/lit.) or streptomycin
(100mg/lit). Place the bits (5mm) of the test pathogen as well as antagonist on the PDA plates
opposite to each other from 1.0 cm from the periphery of plates (if both are fast growing) or place it
2-3cm apart (if both are slow growing). Incubate the plates at 25+10C for desired duration.
Observe the plates regularly.
I. In-vitro evaluation and selection
(A). Mycoparasitism:
In mycoparasitism the pathogen stops growing upon contact with the antagonist and its
mycelium begin to lyse backwards and the antagonist continue to grow over the test fungal
pathogen.
Observations
First observation should be taken just after contact and measure the growth of the
pathogen in dual culture.
After contact, observations should be taken regularly at 3 day interval until the antagonist
completely parasitizes the test pathogen or antagonist stops growing over the test pathogen.
Calculate the percent inhibition (parasitized growth) of the test pathogen by comparing the growth
of the pathogen (after parasitization) with its initial growth (just after contact). To see the hyphal
interaction small bits of mycelium can be taken from interaction zone and observe under
microscope.
Mycoparasitism of Sclerotial plant pathogens
Collect freshly non-dried sclerotia , surface disinfested and wash in sterile distilled water.
Immerse these sclerotia in an aqueous spore or mycelial suspension of the antagonist for 1-5 min.
Place these sclerotia in culture plates containing sterile moist sand. Incubate it for 1-4 week at 25-
280C. After desired period of time observe colonization of antagonist on decayed sclerotia
B). Antibiosis:
The antagonists that has antibiosis effect (formation of zone of inhibition) in dual culture
must be further tested using cellophane membrane and cell free culture filtrates
Non Volatile compounds:
1. Cellophane membrane method
Place sterilized disk (90mm) of a cellophane membrane on culture medium. An agar disk of
antagonistic fungus is placed at the centre of the cellophane membrane. 3-4 days after incubation,
remove the cellophane membrane along with the growth of antagonist. An agar disk from culture

(Climate Change, Precision Agriculture and Innovative Disease Control Strategies)
- 305 -
of actively growing test pathogen is transfer to the position previously occupied by the antagonist.
Test pathogen grown on PDA plates serves as check. The radial growth of the test pathogen is
recorded 3-4 days after incubation and compare with check. The reduction in radial growth of the
test pathogen shows production of non-volatile compounds by the antagonist.
2. Cell free culture filtrate
The antagonist is grown on potato broth medium either in stationary or in shake culture.
After sufficient mycelium growth the mycelium and other cells are removed by filtration through
filter paper and then sterilized by passing through G1,G3 and G5 sintered glass filter. The cell free
sterile culture filtrate is tested for efficacy of antagonist against the fungal pathogens by following
ways.
a. Assay in solid medium
i. Food Poison technique
ii. Filter paper disc method
iii. Agar well method
b. Assay in liquid medium
c. Spore germination test
a. Assay in solid medium
i. Food Poison technique
Mix sterile cell free culture filtrate in sterilized PDA flasks (various concentrations)
and pour in Petri dishes. Inoculate the test pathogen at the centre of the PDA plates. Pathogen
on PDA plates without culture filtrate serves as control. Incubate at 25+10C for desired
duration. Per cent inhibition was calculated by measuring the radial growth of the test fungus in
amended medium and compare with check.
ii. Filter paper disc method
Pour 15ml of a PDA in sterile Petri plates. After solidification uniformly spread 4ml of 1.5%
water agar, seeded with 104 spores/ml of the test pathogen. 4-6 filter paper dics (1-2 cm dia,
autoclaved and dried) soaked in culture filtrate and dried, are place on the seeded agar medium
from 1-1.5cm periphery of the plates. After incubation measure the zones of inhibition around the
filter paper .
iii. Agar-well Method
Prepare PDA plates as above. Remove Agar plugs at a distance of 1-2 cm from the
periphery of the PDA plate with the help of cork borer of 1-2 cm dia. Fill the wells with a known
concentration and standard quantity of the cell free culture filtrate. After incubation, measure the
zones of inhibition around the wells.
b. Assay in liquid medium
Add sterile culture filtrate at desired concentration in a known volume of potato broth and
mix well. The flasks containing medium is inoculated with a 5 mm discs (2 no.) of the test
pathogen. Incubate until sufficient growth has occurred in check (medium without culture filtrate)

(Climate Change, Precision Agriculture and Innovative Disease Control Strategies)
- 306 -
flask. Measure fresh and dry weight of the test pathogen growth and calculate per cent inhibition
c. Spore germination test
Place 0.2-0.5ml of the desired concentration of the cell free culture filtrate in the wells of a
cavity slide and dry at room temp. The same amount (0.2-0.5ml) of spore suspension of the test
pathogen (5X10³ spores/ml) is added over the dried culture filtrate and mix well with help of a
glass rod. Incubate it in a humid chamber at 25-280C. Spore germination and characteristics of the
germ tube is recorded at 12 hr interval and compare with check (cavity slides without culture
filtrate) and calculate per cent inhibition.
Volatile compounds:
Grow antagonist on PDA plates. 3-4 days after incubation, inoculate the test pathogen in
separate PDA plates. Place inoculated test pathogen (upper) on the 3-4 days old antagonistic
plates (lower) by removing lids of both the plates. Make pair by binding both the plates opposite to
each other with parafilm. Incubate the paired plates until full growth has occurred in check plates
(inoculated with test pathogen alone). Calculate the per cent growth inhibition by measuring the
growth of the test pathogen and comparing it with check plates. The reduction in radial growth of
the test pathogen shows production of volatile compounds.
C. Compatibility of fungal antagonist with commonly used chemicals:
‘Food Poison Technique’ is used to test the compatibility of fungal antagonist fungicides,
insecticides, herbicides and other chemicals to be commonly used for plant health.
II. Evaluation and selection of promising Trichoderma isolates in glasshouse
1. Disease Management
A. Seed treatment
B. Seedling dip treatment
C. Soil application
D. Soil drenching
Observations
i. Disease incidence / Disease severity
ii. Population dynamics (CFU /g soil at 7 days interval)
2. Systemic induced resistance
A. Seed treatment
B. Seedling dip treatment
C. pre-spraying
Observations:
a. Peroxidase,
b. Phenyl alanine ammmonia lyase
c. Polyphenol oxidase
d. H2O2 content
e. Phenol content

(Climate Change, Precision Agriculture and Innovative Disease Control Strategies)
- 307 -
f. Superoxide dismutase
g. Lypoxygenase
h. Chlorophyll content
i. Membrane stability index
3. Plant growth promoter
Observations:
a. Biomass of plant
b. Root length & weight
c. Shoot length & weigh
III. Qualitative parameters for formulation
a. Spore concentration
b. Shelf life (Viability)
c. Food for initial establishment
IV. Field Testing
V. Maintenance of culture
Selection of promising Trichoderma isolates for commercialization
i. Select broad spectrum isolate.
ii. Evaluate performance under the range of environmental conditions.
iii. Evaluate formulations.
iv. Evaluate application methods.

(Climate Change, Precision Agriculture and Innovative Disease Control Strategies)
- 308 -
Major Seed Pieces Transmissible Diseases of Sugarcane and their Management by Three Tier Seed Programme
R.K. Sahu
Department of Plant Pathology, G.B.P.U.A.&T., Pantnagar- 263 145 (Uttarakhand)
Sugarcane is one of the most energy rich plant and most efficient converters of solar
energy in to not only in sugars (Sucrose) but also in other renewable forms of energy. Basically, it
is an tropical region crop but grown very successfully in subtropical regions under diverse agro
ecological situation for various agro industrial purposes through out the country.
Out of total sugarcane produced, it is estimated that 70% is used in sugar industry whereas
18% is used for the production of Gur (Jaggery), Khandsari, Rav and Juice and 12% is used as
seed. In beginning the plant was domesticated only for its sweet stem but later on it was used for
various other purposes. Now a days the by products of sugar industry are of much significant.
Products like Bagasse, Molasses, Filter press cake or press mud which are generated during
sugar production are used as raw material for the production of paper, different types of boards
making, rayan, liquir, alcohal, gasohol and other derivatives of alcohal and chemicals, animal feed,
antibiotic, biofertilizer and raw material for generating electricity. Due to crisis and limited
availability of the mineral oil/crude oil, it is a hope for future ecofriendly fuel and may be a
substitute. Among several countries Brajil is one where use as fuel in transportation has
tremendously increased. Govt. of India in 2009 has also decided to mix 5% Alcohal in petrol.
It was estimated that in a typical sugar mill 100(t) of sugarcane, on an average produce 10
ton of sugar (sucrose), 4(t) of molasses from which ethanal is produced, 3(t) of press mud which is
converted in to biofertilizer, 30(t) of bagasse used for co-generation of power to yield 1,500 Kw
electricity and for manufacturing of paper. About 30(t) of cane tops and leaves are generally left in
the field which again has multifold use like animal fodder. Dry leaves are used in thaching the huts
and several other means and remaining is used for recycling in the field (mulch). Sugarcane thus
play a major role in the economy of sugarcane growing areas in particular and nation as whole and
hence increasing sugarcane production will certainly bring the smiles in the face of farmers and
other stake holders associated with this crop directly or indirectly.
The cane area estimated during 2006 were 48.32 lakh ha and 51.54 lakh ha in 2007. In
2005-06 sugar production was 19.32 MT whereas in 2006-07 it was 28.36 MT and in 07-08 it was
26.35 MT. As the population is increasingly increasing day by day and is expected to be in
between 1237 to 1262 million in the year 2011 and in between 1504 to 1690 million in year 2025.
Correspondingly the land resources, what we are having are condensing day by day because of
several uses especially in industries, infrastructure facility creation and residential purposes. To
cater the need of this growing population, we have the only way out to increase the productivity of
the crop hence forth. Productivity of southern & Maharashtra is 90-110 t/ha whereas in the major
sugarcane producing Northern states (Uttar Pradesh, Uttarakhand, Punjab and Haryana which

(Climate Change, Precision Agriculture and Innovative Disease Control Strategies)
- 309 -
accounts for 67% area of the country) the productivity of these states is ranging some where 43-60
t/ha than the national average 67 t/ha which in lower and is of major concern.
As the vagarics of agroclimatic condition and many biotic & abiotic stress sugarcane crop is
suffering. Among serval biotic stresses and constraints responsible for low cane production &
productivity, diseases are one of the major constraints causing 19-20% losses. If we can minimize
this loss, then it will help a lot for sugrpool.
More than 240 disease caused by Fungi, bacteria, Virus, Phytoplasma, Nematodes etc
have been reported from various parts of the world causing low to severe looses every year. Out
of these a dozen are important in our country which are occurring year after year. Among these
only 7disease (major) which are seed /sett borne are more prevalent and causing moderate to
severe loss depending on the severity and agroclimatic condition, cropping pattern and the
susceptibility of the host.
The diseases of sugarcane which are sett/ seed borne and exerting huge losses are Red
rot, Smut, Wilt, GSD, Mosaic, Ratoon Stunting & Leaf scaled. A short account of these diseases
are given as:
1. Red rot
In India the disease was first recorded in the Godawari Delta of Andhra Pradesh by
Barber in 1901. Presently this disease is of wide occurrence in varying degree where ever the
sugarcane crop is under cultivation in the country & particularly rampant in eastern U.P. &
Northern Bihar making these places as ‘hot spots’. This disease because of its most devastating
nature has made several promising sugarcane varieties obsolete.
The disease is caused by a fungus Colletotrichum falcatum Went. The initial symptoms
appear as third fourth leaves from the top start drying from margin inwards & ultimately entire
leave dry. Mid-rib lesions become conspicuous during monsoon. The lesions usually start as
minute red spots on the upper surface of the mid-rib & further develop forming long lesions. During
later stage, the canes become shriveled and lighter in weight. When the canes are split open
longitudinally, the pith is found reddened accompanied by white transverse patches at right angles.
In advance stage of the disease the red colour may be replaced by dirty brown & white bands look
hazy or unclear. These dried canes often emit sour odour & juice does not set well on boiling.
Diseased seed setts are the main source of survival & spread of the pathogen.
2. Smut
The disease is world-wide in occurrence except Australia, among 121 sugarcane
producing countries. During 1942-43, it assumed devastating epidemic form in Bihar affecting 66%
of the cane area. The causal organism of this disease is Ustilago scitaminea (syn. Sporosorium
scitaminea) which gets transmitted through infected seed setts and can also survive through the
spores fallen on the ground.
Affected plants are characterized by the production of long, whip like structure with black

(Climate Change, Precision Agriculture and Innovative Disease Control Strategies)
- 310 -
dusty mass of spores at apex. During early stage this structure is straight & becomes curved,
several feet in length. Subsequently, the whip remains covered with a bright whitish membrane.
On bursting of membrane the spores come out & healthy plants get infected by air. Such structure
can be observed in flushes: first during the months of May- June and secondly during October-
November. Infected plants often have slender & thin canes (look likes “Narkul” a wild grass) and
become lighter in weight due to drying of canes & sometimes many tillers develop.
3. Wilt
Earlier wilt disease was confined to northern belt of sugarcane particularly Bihar state from
where it spread to U.P., Punjab & Haryana. In Tamilnadu, during 1955-56, the disease caused
considerable damage with 5-80 percent incidence. Similarly during 1959-60 it assumed severe
proportion in Andhra Pradesh where incidence was as high as 100% in cultivar like Co 775.
The disease is caused by a fungus Cephalosporium sachari and is transmitted mainly through
infected seed setts. The fungus can also survive in the soil. This disease commonly occurs with
the infection of red rot & poor crop is more prone to wilt infection. Disease intensity largely
depends upon faulty drainage & prevailing draught or in sufficient moisture conditions in the field.
The most striking symptoms of the disease become apparent late in the season which are
yellowing accompanied by drooping of the top when the crop is ready for harvest, the growth of
plants is held up & the affected canes dry rapidly. In the initial stage of the disease when the canes
are split open, the tissues, particularly of the lowest internodes have a brick-red / dirty red colour in
the form of conical shaped spots. This reddening may be confined to a few internodes or extended
to the entire length of the cane. Such canes dry up, become hollow & there is considerable
reduction in the quality of juice. Disease canes produce characteristic foul odour.
4. Mosaic (Sugarcane mosaic)
In India the disease was first observed in 1927. Subsequently its appearance has been
reported from different sugarcane growing areas in the country. The casual virus belongs to the
potato virus ‘Y’ group and known as Sugarcane mosaic virus (Marmar Sacchri). Infection of this
disease occurs through infected seed setts. In India Rhopalosiphum maidis is the main vector
though Toxoptera graminum. (Schizaphis graminum) has also been demonstrated to be a vector
of SCMV. The virus is also sap transmissible. In India disease losses have been estimated
between 10-20 percent. The disease symptoms characteristically appear on basal portion of
foliage than on the older leaves prominently in the form of yellowish or chlorotic stripes alternate
with green space of the leaf- a mosaic pattern. Considerable increase in chloratic area over the
normal green & appearance of symptoms on the leaf sheath become common features during
advance severe infection yellow stripes also appear on the rind of the internodes & stalks finally
dry up forming ‘sunken’ areas called as canker stage of mosaic. The disease affects both in
quantity of sugar & Jaggery as well as their quality also.
5. Grassy shoot disease (GSD)
The GSD was first observed in 1919 by Barber and reported by Vasudeva in 1955 from

(Climate Change, Precision Agriculture and Innovative Disease Control Strategies)
- 311 -
Belapur, Maharastra. The disease has been recorded in most of the sugarcane growing belt in
India. But since then the incidence is being particularly high in Maharastra and is caused by
Phytoplasma.
The disease is characterized by proliferation of auxiliary buds from base of the cane giving
rise to profuse/ crowded bunch of tillers bearing narrow leaves which exhibit varying degrees of
loss of cholorophyll, ranging from total green to white (albinism). Cane formation rarely takes place
in affected clumps & if formed they are thin with short internodes giving plant a bushy appearance.
According to reports diseased clumps were observed at average. 6%, 16%,24%, 28%, 24% & 2%
in June, July, August, September, October & November, respectively.
The primary transmission of disease is through infected cane setts while the secondary
transmission is through insect vectors i.e. aphids Rhopalosiphum maidis, Melanaphis sacchari & M
indosachari. Transmission through infected knife & dodder (Cuscuta campestris) may also occur
from diseased to healthy plants.
6. Ratoon Stunting Disease (RSD)
In India the disease was first reported by Prof. Chilton from Gola Gokarannath of
Lakheempur Kheeri distt. of U.P. in 1956 in a cultivar CoS 510. Leifsonia xyli sub sp. xyli a
bacteriaum, is responsible for causing this disease in sugarcane which spreads through diseased
cane setts.
Yellowish leaves, reduced tillering, short internodes & thin stalks are the characteristic symptoms
of RSD. The infected canes when split open longitudinally orange-red vascular bundles in shads of
pink, red & reddish brown or yellow-orange at the nodes can be seen. Well defined symptoms
appear in the crop deficit in moisture, nutrients etc.
7. Leaf- Scaled
This disease is caused by Xanthomonas albileneans and is favoured by wet seasons,
water stress, water logging and low temperature. Symptoms appear in two phases one is “chronic”
and other is “acute”.
In chronic phase “white pencil line” extending in entire length of lamina reaching the margin
of young leaves and stripes diffuse resulting leaf etiolation. Since drying starts tip onwards
therefore a scaled appearence is seen and therefore the name “scaled” has been given, chlorosis
varies from total albinism to interveinal chlorosis in young leaves with bussy appearence in
standing cane if the stalk is cut, then dark colour vascular strands, & prominent streaks al node
may be seen.
In “Acute phase” the symptoms appear suddenly and die without major leaf symptoms. The
masking of symptoms are more common during monsoon and symptoms may appear suddenly
any time during crop growth.
Disease management in Sugarcane
Depending upon mode of survival of the pathogen, its transmission and source of primary
inoculum infection, various diseases occurring in sugarcane, are being managed. For instance.

(Climate Change, Precision Agriculture and Innovative Disease Control Strategies)
- 312 -
Diseases like SCMV & GSD which are primarily transmitted through diseased seed setts &
subsequently aphid vectors play crucial role in transmission of inoculum from a diseased plant to a
healthy plant. The best way to control/ manage the said maladies would be treatment of cane setts
through Moist Hot Air method at 54°C for 4 hours coupled with spray of aphidicides like Methyl-o-
demeton 25 E.C. or Dimethoate 30 E.C. at 0.1 percent concentration for the control of vectors.
Similarly, different aspects of management are taken up for the control of various diseases. When
more than one disease occur together in a crop season or locality the management of each one of
them separately would involve higher cost, more labour & would also consume more time. To over
come with such problems comfortably and effectively use of resistance varieties recommended for
the particular zone followed by the quality and healthy cane seed coupled with due thermotherapy,
chemotherapy and recommended cultural practices are the best way to manage the sett borne
diseases because, sugarcane being a vegetatively propagated crop has a low 1:6 to1:8 seed
multiplication rate and therefore, non-availability of quality seed material is one of the major draw
back faced by the farmers. Further, the bulkey, cane cuttings used for planting as seed harbor
many pest & diseases, thereby decreasing cane yield and quality drastically. Infact poor quality
seed is a major constrant in sugarcane production and disease management as well.
Three tier seed production programme in Sugarcane
As a poor quality seed increases the cost which result in poor germination and
consequently less number of malleable cane & poor production and productivity and more
incidence of disease and pest it is therefore adesible to go for three tier seed production
programme which will not only meet most of the problem but also helpful to minimise the incidence
of the seed borne diseases as mentioned above.
The three tier seed production programme includes the following:
1. Nucleus seed/Breeder seed/ Primary seed: it is genetically 100% pure and free from all kinds
of disease and insect pests. This seed is raised by the breeders of originating centers and used for
foundation seed productions.
2. Foundation seed/ Secondary seed: It is also 100% genetically pure and free from pests and
diseases. It is raised from breeder seed in supervision of Scientist/Breeders. Before planting for
foundation seed, seed material should be treated with hot water or moist hot air. During crop
period five times supervision is required.
3. Certified seed/ Commercial seed: This type of seed is raised without hot water/air treatment.
This type of seed can be raised in farmers plot of the reserve area of the factory or factory farms in
consultation with technician/ technical person. Three inspections or supervisions are required
during crop period in which 100% clumps are examined in first visit and 25% in second and third
visit.
Seed cane standards: There is no certification of seed by any agency so far as sugarcane is
concerned. Recently the seed cane standards for sugarcane have been worked out and the
approved sugarcane seed cane standards for tropical and subtropical India is as under.

(Climate Change, Precision Agriculture and Innovative Disease Control Strategies)
- 313 -
Age of the seed cane at harvest for seed purpose shall be 6-8 months and 8-10 months for
sowing in tropics and subtropical respectively. Buds of seed cane material should be undamaged
and clean. Each node of seed cane shall bear one bud. The number of nodes without sound bud
shall not exceed 5% of total number of buds for seed cane. The number of buds which have
swollen up or have projected beyond one centimeter from the rind surface shall not exceed 5% of
total number of buds.
I. Application and amplification of general seed cane certification standards.
The certified classes shall be produced from the seed canes/or mericlones where sources and
identity be assured and approved by the certification agency.
II. Land requirements
a. A seed crop of sugarcane shall not eligible for certification if planted on land on which
sugarcane was grown in the pervious season.
b. Land/seed crop shall be kept free from sugarcane residues and drainage from other
sugarcane fields.
c. Foundation stage seed should be raised through hot water/ moist hot air treatment
(MHAT).
III. Field inspection:
Seed type Date of inspection after planting (days)
First Second Third Fourth Fifth
Foundation 45-60 120-130
150 250 15 days before harvest
Certified seed or commercial seed
120 200 15 days before harvest
- -
IV. Field standards:
a. General requirement like isolation.
The sugarcane seed production fields shall be isolated from other fields with a minimum
distance of 5 meters to avoid mechanical mixtures of others varieties
b. At the time of final inspection, tolerance limit of diseases and insect pests should be as
under.
Sl. No.
Disease and insect- pests Affected clumps (%)
Breeder seed
Foundation seed
Certified or commercial seed
1. Red rot, Smut, Wilt, Grassey shoot, Leaf scaled.
0 0 0
2. Scale insects 0 5 5
3. Plassey/Gurdaspur borers 0 0 0
4. Other borers 10 20 20
Important points for quality seed production:
1. All off types and diseased plants shall be rogued out along with roots and destroyed.

(Climate Change, Precision Agriculture and Innovative Disease Control Strategies)
- 314 -
2. Maximum permissible limit for detrashing of dry foliage shall be 2.0%
3. The crop should not have more than 10% lodged canes.
4. Seed cane should not have nodal roots. In waterlogged areas, relaxation may be given
upto a maximum of 5%
5. Moisture in seed cane should not be less than 65% on wet basis.
6. Germinability of buds should not be less than 85%
7. Physical purity of seed should be 98%
8. Genetic purity of seed should be 100%
REFERENCES
1. Agnihotri, V.P. 1990. Diseases of sugarcane and sugarbeet. Oxford & IBH Publishing Co. (P) Ltd., New Delhi.
2. Annonymous, 2009. Souvenir on “Group meeting of AICRP on Sugarcane”. Held at RAU, PUSA (Bihar), Nov. 6-8.
3. Current Trends in Sugarcane Pathology (Prof. K.S. Bhargava Fetscrift). 1994. Eds. G.P. Rao et. al International Books and Periodicals Supply Service, Pitampura. Delhi.
4. Nagarjan, R. 2007. Breeder seed production and slandered, whinter school on sugarcane breedring and genetics in retrospect & prospects, S.B.I, Coimbatore. Oct 3-23, pp 116-118.
5. Rao, G.P.; Singh, Ashutosh; Singh, H.B. and Sharma, S.R., 2005. Phytoplasma Diseases of Sugarcane: Characterization, Diagnosis and Management. Indian J. Plant Pathology. 23(1&2): 1-21.
6. Singh, R.S. 1998. Plant Diseaes (7th ed.) Oxford & IBH Pub. Co. Pvt. Ltd., New Delhi.

(Climate Change, Precision Agriculture and Innovative Disease Control Strategies)
- 315 -
Biolog: Microbial Identification System
R.P. Singh, J. Kumar and Laxmi Rawat Department of Plant Pathology, GBPUA&T, Pantnagar- 263 145 (Uttarakhand)
Biolog microbial identification system (Micro Station ID System) is a versatile system, with
the ability to identify and characterize a wide range of environmental and pathogenic organisms
across diverse fields of microbiology. Using all Biolog databases, over 2650 species of bacteria,
yeast and filamentous fungi can be identified with in few hours. Biolog Microbial Identification
System is based on metabolic phenotypes i.e. the principle that a species of microorganism
develops a unique metabolic finger-print on a set of carbon sources and biochemicals. The
cultured bacteria are tested for utilization of different carbon sources and biochemicals, which are
pre-filled and dried into a 96 well test plate. Cells utilizing nutrient, respire and release energy
which reduces proprietary Tetrazolium dye to form a distinct purple colour. Biolog data collection
software is used to record the unique metabolic profile into the computer which can be compared
with thousands of profiles (corresponding to thousands of species) stored in the Biolog databases.
If the profile is matched, computer displays the identified species. Biolog has designed proprietary
microplates for identification of a wide range of microorganisms up to species level, such as Gen
III plate (for gram negative and gram positive aerobic bacteria), AN plate (for anaerobic bacteria),
YT plate (for yeast) and FF plate (for filamentous fungi).
Just prepare a cell suspension and inoculate the appropriate MicroPlate. After inoculation
and incubation, the MicroPlate is placed into the MicroStation Reader for analysis. The unique
metabolic pattern generated by the organism is recorded and compared to hundreds of
identification profiles in a corresponding Biolog Database. The versatile plate reader uses dual
wavelength readings to quantify color reactions in the MicroPlate wells, adding consistency and
accuracy when reading the reaction patterns. Biolog’s patented redox chemistry makes use of
different carbon compounds including sugars, carboxylic acids, amino acids and peptides to
provide an unparalleled wealth of discriminating biochemical characterizations. This diverse set of
tests enables our systems to identify microorganisms that other kit-based methods misidentify or
fail to identify. The MicroStation System, as well as the OmniLog System, has extensive
applications also for microbial community analysis in soil, water, biofilms and other environments.
Procedure
1. Isolate a pure culture on agar media
2. Prepare inoculum at specified cell density
3. Inoculate the Biolog MicroPlate
4. Incubate the plate, observe and enter the reaction pattern to obtain ID result

(Climate Change, Precision Agriculture and Innovative Disease Control Strategies)
- 316 -
Isolate Prepare Inoculate Incubate & read
Phenotype Micro Array Technology
Phenotype MicroArray technology uses the same chemistry and format, but tests a much
larger and more diverse set of cellular properties. It enables researchers to evaluate nearly 2000
phenotypes of a microbial cell in a single experiment. With automated instrumentation, phenotypic
properties can be measured quantitatively and kinetically, and then recorded automatically into
electronic records. The rough comprehensive and precise quantitation of phenotypes, researchers
are able to obtain an unbiased perspective of the effect on cells of genetic differences,
environmental change, and exposure to drugs and other chemicals. They can correlate genotypes
with phenotypes, determine a cell’s metabolic and chemical sensitivity properties, discover new
targets for antimicrobial compounds, optimize cell lines and culture conditions in bioprocess
development, characterize cell phenotypes for taxonomic or epidemiological studies, and more.
Advantages
Robust and straightway technology
Automated incubation and data collection
Complementary to genomic and proteomic technologies
Rigid or flexible experimental designs are possible
Applications
Cell-line validation and fingerprinting
Understanding metabolism in cells for basic research
Target validation and lead optimization in drug discovery
Inferring mechanism of action of new compounds

(Climate Change, Precision Agriculture and Innovative Disease Control Strategies)
- 317 -
Role of Plant Genetic Resources in Plant Disease Management
R. K. Khulbe Department of Genetics and Plant Breeding, GBPUA&T, Pantnagar- 263 145 (Uttarakhand)
Plant Genetic Resources (PGR) are the genetic material of plants which are of value for
present and future generations of human kind. Often used as a synonym to plant germplasm PGR
can be defined as seed, a plant or plant part including cell cultures, genes and DNA sequences
that are held in a repository or collected from wild as the case may be and that is useful in crop
breeding, research or conservation because of genetic attributes. PGR have proved immensely
valuable in combating the real and potential threats from the ever-evolving plant pathogens and
will continue to do so in the future as well. The realization of actual importance of PGR in crop
improvement owes much to the massive crop failures such as that caused by southern corn blight
in 1970 that led to renewed efforts at the international level towards ex situ and in situ
conservation of plant genetic resources. PGR have not contributed as much to an area of crop
improvement as disease resistance breeding, be it the incorporation of resistance genes for late
blight in potato or blight and blast in rice or the more recent for stem rust race Ug99 in wheat
In spite of the vastness of germplasm accessions in genebanks world wide (> 7.4 million
accessions), the representation of CWR (Crop Wild Relatives) is only 2-18% (FAO, 2010). Less
than 30 per cent of the accessions are estimated to be distinct. Utilization in crop improvement is
less than 5 per cent. The non-availability of low-cost tools to identity similarities and differences
among the accessions makes elimination of duplicates difficult and the limitation of resources to
extensively evaluate the accessions for various abiotic and biotic stresses restricts their utilization.
For enhancing utilization of variability in genebanks the development of core and minicore
collections has been proposed. A core collection is a subset of accessions from the entire
collection that capture most of the available genetic diversity of the species (Brown, 1989).
Generally, 10% of the crop accessions constitute the core collection representing the variability of
the entire collection. The aim is to reduce the collection to a number manageable for conducting
comprehensive phenotypic and molecular evaluation. The core collection, if large, as in wheat and
rice, may be further narrowed down to mini core collections (Upadhyaya and Ortiz, 2001), which
are 1/100th of the original collection or 1/10th of the core collection, or reference sets of between
300-400 most geographically and genetically diverse genotypes, including those of wild and weedy
relatives. Mini core collections and reference sets are developed by using the qualitative
parameters to develop trait-specific subsets and by characterizing the genetic diversity of each
core sample using molecular markers to reveal the structure of its diversity.Core/mini
core/reference sets of many crops have been developed at various national and international crop
institutes.
Core/minicore collections and reference sets are being increasingly used for assessment of
natural diversity and identification of accessions promising for various traits, for discovering allelic

(Climate Change, Precision Agriculture and Innovative Disease Control Strategies)
- 318 -
variants for important agronomic traits (allele mining) and for establishment of marker-trait
associations (association mapping). Screening/evaluation of these collections have yielded
sources of resistance to black rot in Brassica rapa; eyespot disease in tetraploid wheat; powdery
mildew, scald, leaf rust, net blotch, BYDV and BaMMV in barley; white rust in Brassica oleracea;
leaf rust, powdery mildew and stem rust in wheat; fusarium wilt, dry root rot and botrytis grey mold
in chickpea; and late blight in potato.
Association Mapping
Quantitative trait loci (QTL) for a number of traits in many species have been identified so
far by linkage analysis using populations derived from bi-parental crosses. However, the limited
number of recombination events occurring during the construction of such mapping populations
and the limited number of segregating alleles often result in poor resolution of these QTL. In
addition, the parental genotypes are often not representatives of the germplasm pool that is
actively used in breeding programmes. Hence, there is a substantial time-lag between QTL
discovery and marker assisted crop improvement practices, due to the need to confirm the stability
of the QTL in different genetic backgrounds.
As a new alternative to traditional linkage analysis, association mapping offers three
advantages, (i) increased mapping resolution, (ii) reduced research time, and (iii) greater allele
number (Yu and Buckler, 2006). Association mapping (AM) is a method that exploits the variation
in a collection of genetically diverse materials to uncover a significant association between a trait
and a gene or a molecular marker on the basis of linkage disequilibrium. AM resolves complex trait
variation down to the sequence level by exploiting historical and evolutionary recombination events
at the population level. Association mapping based on PGR collections has yielded some very
valuable marker-trait associations in the recent times. Some of these include markers for glume
blotch and fusarium head blight and spot blotch in barley; stem canker in Brassica napus; stem
rust in wheat; and dieback in lettuce.
Allele Mining
The conventional method of discovering allelic variants for a gene relies upon the
segregation pattern of progeny of two parents supposedly carrying variant alleles. Confounding of
the phenotypic effects and masking effect of stronger alleles severely limit the effectiveness of the
conventional method. Besides, the underlying base sequence variation is not revealed. Allele
mining is a promising approach to dissect naturally occurring allelic variation at candidate genes
controlling key agronomic traits which has potential applications in crop improvement programs
(Kumar et al. 2010). Identification of allelic variants from germplasm collections not only provides
new germplasm for delivering novel alleles to targeted trait improvement but also categorizes the
germplasm entries for their conservation. Allele mining has led to the discovery of numerous allelic
variants for powdery mildew of wheat; stem rust (Ug99) of wheat; leaf blast of rice; late blight of
potato; and many other important diseases in various crops.

(Climate Change, Precision Agriculture and Innovative Disease Control Strategies)
- 319 -
Pre-breeding
Pre-breeding is the preliminary phase in plant breeding that involves transfer of genes for
desirable traits from agronomically unadpted backgrounds to adapted genetic backgrounds to
facilitate utilization of such genes in crop improvement programmes. Pre-breeding makes use of
conventional plant breeding procedures such as back-crossing and pedigree methods. The advent
of Marker-Aided-Selection (MAS) procedures has greatly facilitated pre-breeding. In pre-breeding,
alternative approaches such as somatic hybridization, bridge species and irradiations etc., also are
used for introgression of desirable genes from sexually incompatible species. The most recent
examples of pre-breeding include transfer of stem rust (Ug99) resistance into cultivated wheat
from its diploid, tetraploid and wild relatives.
Future thrusts
The utilization of PGR in plant disease management may be enhanced by augmenting
diversity and reduction in size of genebank collections and development of core/minicore
collections and disease-specific ‘reference sets’ to enable comprehensive evaluation of the
accessions. Special thrust needs to be laid on collection, conservation, evaluation and utilization of
CWR (Crop Wild Resources), which are reservoirs of disease-resistance genes. The utilization
may be further enhanced by developing low-cost molecular tools for discovery of new genes and
alleles for disease resistance, which could be used to develop cultivars with broad-based disease
resistance using molecular marker-aided breeding procedures.
REFERENCES
1. Brown AHD. 1989b. Core collections: a practical approach to genetic resources management. Genome 31: 818-824.
2. FAO 2010. The Second Report on the State of the World’s Plant Genetic Resources for Food and Agriculture. Rome
3. Kumar GR et al. (2010) Allele mining in crops: prospects and potentials. Biotechnol. Adv. 28, 451–461
4. Upadhyaya HD and Oritz R. 2001. A mini core subset for capturing diversity and promoting utilization of chickpea genetic resources in crop improvement. Theor. Appl. Genet. 102:1292–98.
5. Yu J and Buckler Iv ES. 2006. Genetic association mapping and genome organization of maize. Current Opinion in Biotechnology 17:155-160

(Climate Change, Precision Agriculture and Innovative Disease Control Strategies)
- 320 -
Disease Management under Protected Cultivation
R. P. Singh and Mamta Mathpal Department of Plant Pathology, GBPUA&T, Pantnagar- 263 145 (Uttarakhand)
Protected cultivation is a cropping technique in which the micro climate, surrounding the
plants is controlled partially or fully as per the requirement of the plant species grown, during their
period of growth. With the advancement in agriculture various types of protected cultivation
practices suitable for a specific type of agro-climatic zone have emerged. Among these green
house, glass/poly house, Trench Planting, Low tunnel, High tunnel and Rain shelter are common
techniques. Under controlled environment crops could be grown under the inclement climatic
conditions when it would not be otherwise possible to grow crops under the open field conditions.
The crop yields are at the maximum level per unit area, per unit volume and per unit input basis
with high quality produce which could fetch the export markets. It can not only be used to generate
self employment for the educated rural youth in the farm sector, but income from the small and the
marginal land holdings can also increased by growing off season crops.
Though greenhouse technology is more than 200 years old, but in India, the technology is
still in its infancy stage. The area under green house cultivation as reported to be about 500 ha in
India. This figure is quite non significant when compared with the total area under green house in
the world, but the face is changing and trend is encouraging. Now a day, much needed vegetables
are being grown throughout the year in these hostile climates. Production of brinjal, capsicum,
tomato and other cucurbits is taken in the summer months on a large scale, whereas the green
leafy vegetables are being grown in the long frozen winter months when the average temperature
reaches- 30.20C. Underground greenhouses and soil trenches are also being used on a large
scale in these remote areas. Ornamental crops like gerbera, carnation and roses are being grown
for cut flowers under poly houses on large scale. Farmers are also utilizing low and medium cost
greenhouses for raising potted plants and seedlings in the nursery. In the Northern Gangetic plains
the farmers are using this technology to raise healthy seedlings of high yielding crop varieties so
that they can be transplanted early in the fields during the onset of the spring season so as to
capture the early markets and thus reap higher returns. There is a vast scope for expansion of
green house technology in India.
The incidence of pest problem under protected conditions is higher than in the open. The
green house climate is ideal for the development of plant diseases. While creating favorable
environment in the greenhouse for growing high value crops; we also create a favorable habitat for
their insect, pests and diseases. Under greenhouse conditions, natural forces which keep pest
population below threshold level are under controlled. Direct sun, ultraviolet light, and the constant
changes in temperature also play an important role in overall natural pest control often obtained
under open conditions. The greenhouse literally protects its plants and consequently their
respective pests from these environmental conditions. High day time temperatures and relative

(Climate Change, Precision Agriculture and Innovative Disease Control Strategies)
- 321 -
humidity, poor ventilation and plant hygienic condition provide ideal conditions for the introduction
and rapid multiplication of insects, as well as fungal, bacterial and viral pathogens. Inadequate soil
disinfection and absence of adequate fallow and rotations also provide ideal conditions for the
multiplication of soil borne plant pathogens. Due to high value of crops under such conditions, an
economic threshold level of most insects and disease problem are lower and requires more
monitoring and care. Right from nursery raising and seedling plantations to harvesting, crop need
very well planned disease and pest management strategies.
The planning for the protected cultivation system should include Greenhouse construction
design (especially height, heating, insect screens, and ventilation components), an irrigation
system that minimizes leaf wetness and humidity at the plant canopy level, selection of available
pest resistant varieties, pest-free and healthy transplants that minimize introduction of plant
pathogens, nematodes, and insects. Apart from this, optimum fertilizer programs that result in
healthy growth as opposed to maximum growth, scouting for diseases, nematodes and insects
during the growing season, sanitation practices that minimize microorganism movement from
diseased plants to healthy ones, including removal of all plant materials after final harvest, and
shipping practices. Such practices maximize product quality and application of such integrated
practices will ensure good quality and environmentally safe products to the consumers at the same
time, enhancing economic returns to the growers.
Disease management in poly houses may have two approaches: 1) those aimed at the root
environment, and 2) those aimed at the aerial environment.
Management of Root Environment :
Soil disinfection is an important part of control of soil-borne plant pathogens when raising
vegetables by the ground culture method or when soil-based potting mixes are used. Soil-borne
diseases include damping-off (Pythium and Rhizoctonia), root rots (Sclerotinia), and wilts caused
by Fusarium and Phytophthera. Potting mixes based on compost, peat moss, vermiculite, perlite,
and bark are typically pathogen-free and do not require prior sterilization.
Chemical biocides, electrical heat, steam heat, and soil solarization are the primary methods of
soil disinfection in greenhouse production. Another method of disease suppression is biological
control. Soil fumigation with formaldehyde is also practiced, of course, restricted in organic
production. Steam pasteurization and soil solarization are the two most viable options for sterilizing
greenhouse soils or large volumes of soil-based mixes. Biological control is complementary to
these two methods.
Management of Aerial Environment
Foliar and stem diseases include gray mold (Botrytis), powdery mildew (Erysiphe spp.),
early blight (Alternaria spp.), soft rot (Erwinia spp.), and several other fungal and viral diseases
caused by Xanthomonas, Fusarium, and Psuedomonas.
Greenhouse climates are warm, humid, and wind-free-an ideal environment for the development of
many foliar and stem diseases. For the majority of pathogenic fungi and bacteria, infection usually

(Climate Change, Precision Agriculture and Innovative Disease Control Strategies)
- 322 -
occurs when a film or drop of water on the plant surface persists. Unless temperature, humidity,
and ventilation are well regulated, this surface water can remain in the greenhouse until infection
becomes assured.
Integrated disease management, therefore, is based on climate control for disease
infection and optimum crop yield and quality. It eliminates inoculum through high standards of
hygiene (sterilizing soil or using soilless media, obtaining disease-free planting material, chlorine
bleach rinses of footwear & equipment, vegetative-free floors, etc.), cultural practices for limiting
disease spread, biological and pesticidal control, and, most important, is use of resistant varieties.
Management of Environment:
Temperature and humidity regulation, ventilation, vapor pressure, and structure-are
increasingly becoming computerized. Expert software that reduces disease-infective conditions
while promoting crop growth is available in the developed countries but its use in India is still very
limited.
Points to be considered during pest management programme:
The planning stage for the production system should include the following considerations:
a. Greenhouse construction design (especially height, insect screens, and ventilation
components) and an irrigation system that minimizes leaf wetness and humidity.
b. Use of available resistant varieties
c. Healthy and disease free transplants that minimize introduction of plant pathogens and
nematodes.
d. Optimum fertilizer programs that result in healthy growth.
e. Scouting for diseases, nematodes and insects pests incidence during the growing season.
f. Sanitation practices that minimize movement of inoculums from diseased plants to healthy
ones, including removal of plant residues after harvest.
g. Harvesting, packaging and transportation practices that maximize produce quality.
Problems in disease management under protected cultivaton:
1. Lack of available chemical control measures for the greenhouse:
2. Problem of frequent harvests over a long period of time:
3. Non availability of equipments to apply pesticides efficiently:
Conclusion
An integration of cultural practices, environmental control and natural control products is
required to manage insect pests and diseases under green house conditions and to prevent wide
spread outbreak. Integrated practices can only ensure economically and environmentally
acceptable greenhouse crops to the society.

(Climate Change, Precision Agriculture and Innovative Disease Control Strategies)
- 323 -
Engineering Resistance against Biotic Stress Affecting Horticultural and Field Crop
N.K. Singh
Department of Genetics and Plant Breeding, GBPUA&T, Pantnagar- 263 145 (Uttarkhand)
The crop yield decline due to pathogens and pets is still substantial despite of availability
and use of sophisticated and intensive crop-protection measures. Varieties bred using the
classical approach of Genetics and Plant Breeding have been used alone or in combination with
chemical or biological control measures to minimize the loss incurred due to biotic factors.
Molecular breeding has been added as another tool to manipulate the resistance gene (s).
However, classical and molecular breeding approaches rely on vertical variability only.
Advancement in science, more specifically in the areas of Molecular Biology and Genetic
Engineering, has enabled scientists to exploit horizontal variability for engineering tolerance to
biotic factors. Commercialization of Bt gene based crops is an excellent example of engineering
plants using horizontal variability. Over the past two decades, crops with intrinsic pest and
pathogen resistance have been developed using genetic transformation. Plants transformed with
insect-control-protein genes are resistant to insect pests, and new proteins from any genera or
species with novel modes of action will further provide broad spectrum resistance to pests.
Resistance to a range of fungal and bacterial pathogens has been conferred by expression of a
variety of genes, and viral-pathogen-derived genes have been used to produce crops immune to
viral infections. These advances form the basis of a ‘environmentally sound’ and economically
viable approach to pest and disease control in field as well as horticultural crops.
Insect pests and diseases caused by fungal, viral and bacterial pathogens are responsible
for substantial losses in crop yields worldwide. Thus, one of the challenges confronting scientists
worldwide is to develop new and sustainable ways of protecting crops from pests and diseases.
Controlling biotic stress and producing crops with special agronomic traits is therefore of
paramount importance for reducing the threat to crop productivity, farmers’ net income, the food
supply, and by extension, the economies of rural areas.
To combat losses caused by biotic stress, various crop husbandry techniques have been
adopted, and the most widely used management strategy is the application of agrochemicals.
However, chemical protection against bacterial pathogens has not evolved as quickly as that
against fungi, and is not applicable to viruses. The intensive use of agrochemicals has led to the
development of resistance in various pest and pathogen populations and in some cases the
chemicals are no longer used because of their high toxicity to non-target species. Nowadays, the
focus is on strategies that allow for crop production with minimal use of agrochemicals and the
most effective strategy involves breeding resistant crop cultivars. However, there are many
pathogens for which no effective sources of disease resistance have been identified.
Although enhanced resistance has been introduced into crops by traditional plant breeding

(Climate Change, Precision Agriculture and Innovative Disease Control Strategies)
- 324 -
programs with some success, effective resistance against several destructive insect pests and
pathogens is still lacking. This is evident in the commercial use of a large number of chemical, and
few biological, pesticides for crop protection. However, effective and durable resistance genes to
control many viral and bacterial diseases have not been identified in plants, and there is a need for
new sources of resistance in many crops. Recently molecular breeding approach has resulted in
transfer as well pyramiding of genes in many crop plants. In wheat, the leaf rust resistance genes
Lr24 and Lr28 were the first two genes pyramided through MAS in India in 2003-04 in the variety
HD 2329, which has been followed up with PBW 343 pyramided with the same two genes at IARI,
New Delhi. Now there are large number of combinations in different trials having components of
Lr24, Lr28, Lr9, Lr19 and adult plant resistance genes like Lr48. The genes Lr24, Lr28 and Lr9,
Lr37 have been pyramided in the genetic background of popular cultivar WH147 in various
combinations using validated molecular markers for these genes. Pyramided lines with gene
combinations Lr24+Lr28,Lr24+Lr37,Lr28+Lr37 in the genetic background of WH147 and gene
combinations Lr24+Lr28+Yr15 in the background of high yielding cultivar HD2687 have been
produced using molecular markers. In rice, MAS has been successfully exploited for pyramiding
different genes for bacterial leaf blight and blast diseases. ‘Pusa 1460’, is a new version of ‘Pusa
Basmati 1’ developed by Indian Agricultural Research Institute. This variety developed by
pyramiding bacterial leaf blight (BLB) resistance genes (xa13 & Xa21) in the background of ‘Pusa
Basmati 1’ through marker assisted backcross breeding. Similarly another variety namely ‘RP BIO
226’ developed by Directorate of Rice Research using MAS. ‘RP BIO 226’ is developed by marker
assisted pyramiding of three BLB resistance genes (Xa21, xa13 and xa5) in the genetic
background of an elite fine grained rice variety, Samba Mahsuri. Two high yielding BLB
susceptible indica rice cultivars ADT43 and ASD16, popular among farmers and consumers
across South India were introgressed with the three BLB resistance genes xa5, xa13 and Xa21
using functional markers. Thirty pyramided genotypes with two or three resistance genes
exhibited high levels of resistance against two predominant Xanthomonas oryzae isolates of South
India. Twelve pyramided genotypes (xa5 + xa13 + Xa21) were found to be significantly high
yielding with desirable agronomic characteristics and the selection efficiency of the present
markers was hundred percent. Three rice blast resistance genes, namely Pi1, Piz5 and Pita have
been pyramided in a susceptible rice variety, CO39 using RFLP and PCR-based markers for
durable blast resistance.
Genetic engineering or recombinant DNA technology, together with plant transformation
and tissue culture techniques, has facilitated the precise manipulation of desirable gene (s)
bypassing the cross incompatibility barrier and development of transgenic plant cultivars with
enhanced arthropod pest and disease resistance. In contrast to conventional breeding, which
involves the random mixing of tens of thousands of genes present in both the resistant and
susceptible plant, recombinant DNA technology allows the transfer of only the resistance gene to
the susceptible plant and the preservation of valuable economic traits. Moreover, the genetic

(Climate Change, Precision Agriculture and Innovative Disease Control Strategies)
- 325 -
sources for disease resistance are not limited to closely related plant species. Genetic engineering
work requires a gene to be transferred, systems to transfer gene in plant parts and a well
established regeneration system so that transformed cell/tissue could be regenerated into whole
plant. There are different approaches used for transfer of gene. These approaches are based on
Agrobacterium-a plant pathogenic agent, Liposome encapsulation, Electroporation, Microinjection,
DNA injection into intact plants, Incubation of seeds with DNA, Pollen tube pathway, Laser
microbeam, Silicon carbide fibre and Particle bombardment. However, Agrobacterium and particle
bombardment or gene gun mediated gene transfer approach has been most successful in transfer
and stable integration of gene in most of the plant species and all the transgenic plants are
transformed using either Agrobacterium or particle bombardment approach.
The first genetically engineered tomato plant (FlavrSavr TM) engineered for delayed
ripening was released for commercial cultivation in 1994. Since then, many crops have been
introgressed with various gene (s) from different sources and adopted for cultivation across the
Continents. The present area under the genetically engineered crops are 148 m ha where the pre-
dominant crop is soybean followed maize, cotton and canola, and the pre-dominant trait is
herbicide tolerance followed by herbicide+ insect tolerance and insect tolerance. Several crop
varieties with agronomically useful levels of resistance to insects and viral pathogens have been
generated through gene transfer, and these are rapidly moving towards commercialization.
The engineering of crops for insect tolerance has been moved quite ahead probably
because of necessity as well as availability of efficient genetic system (e.g. Bt gene). In addition to
Bt gene, many other genes from different sources such as cholesterol oxidase, lectin, β-
glucosidase gene, proteinase inhibitor, amylase inhibitors, vegetative insecticidal proteins etc have
also been used for insect tolerance. In India, cotton is the only crop where genetically engineered
crop is grown. Cotton varieties engineered with cry1Ac gene (Bollgard-I : MECH 12 Bt , MECH 162
Bt and MECH 184 Bt) was permitted first time for commercial cultivation in the year 2002.
Bollgard II technology was introduced in 2006 where two transgenes namely Cry1Ac gene and
Cry2Ab gene were stacked together to provide better control of three types of bollworms along
with Spodoptera and army worm.
The genetic engineering of virus-resistant plants has exploited new genes derived from
viruses themselves in a concept referred to as ‘pathogen-derived resistance’ (PDR). The first
transgenic tobacco plants with increased resistance to tobacco mosaic virus (TMV) resulted from
the expression of a coat protein (CP) gene. This resistance was referred to as coat-protein-
mediated resistance (CP-MR). CP-MR has been found to be effective against almost all classes
of viruses in many different plants, including melon, rice, papaya, potato and sugar beet. As was
the case for CP-MR control of TMV, plants showed resistance to the virus from which the gene for
the CP was derived, but not to other unrelated viruses. A post-transcriptional mechanism involving
homology-dependent gene silencing has been deployed in development of a variety of yellow
squash, called Freedom II. Potatoes expressing U-length PVY or potato leafroll virus (PLRV)

(Climate Change, Precision Agriculture and Innovative Disease Control Strategies)
- 326 -
replicase genes are highly resistant to all strains and isolates that have been tested so far. It has
been proposed that the replicase-mediated resistance to PVX may be due to an RNA-based
mechanism that depends on homology-dependent gene silencing. A durable and broad-spectrum
resistance to viral pathogens may be engineered through a combination of PDR strategies in
transgenic plants, or through the combination of genetically engineered resistance with resistance
achieved through classical plant breeding.
The development of transgenic crops that are resistant to fungal diseases has lagged
behind that of virus- and insect-resistant varieties. A few examples of transgenic plants exhibiting
high levels of resistance to fungal pathogens however showed prospects for engineering tolerance
to fungal diseases. Moreover, several new advances in the field further showed an optimistic
outlook for the development of fungus-resistant crops. First, several antifungal proteins with strong
in vitro antifungal activity have been identified and cloned. Second, the long awaited cloning of
fungal-disease resistance genes has now been accomplished. Third, there has been an enormous
increase in our understanding of the molecular events underlying plant-pathogen interactions,
which will hopefully aid our attempts to develop agronomically useful and durable resistance to
fungal pathogens in transgenic crops. Strategies for the production of fungus resistant transgenics
can be basically classified into two categories namely (i) production of transgenic plants with
antifungal molecules like proteins and toxins, and (ii) generation of a hypersensitive response
through R genes or by manipulating genes of the SAR pathway.
Progress in the development of bacterial-pathogen resistant crops has also lagged behind
that in the development of insect- and virus-resistant crops. However, advances in the cloning of
several new bacterial-resistance genes, such as the Arabidopsis Rps2 gene and the tomato Pto
gene, may provide insights into our understanding of plant-bacterial interactions at the molecular
level. Attempts to express antibacterial magainins or cecropins in plants for bacterial resistance
have met with little success. Some success was observed with a bacteriophage T4 lysozyme. The
expression of a bacteriophage T4 lysozyme in transgenie potato tubers led to increased resistance
to Enviniu curotovora subsp. atroseptica. The plant proteins, thionins, often display toxicity in vitro
to plant pathogens. The expression of a barley a-thionin gene significantly enhanced the
resistance of transgenic tobacco to the bacterial pathogens Pseudomonas syringae pv. tabaci.
Nonhost specific toxins are the major virulence determinants of bacterial pathogens, in particular
the pathovars of Pseudomonas syringae. Expressing a toxin inactivating enzyme has been
successfully used to engineer resistance to a bacterial pathogen. The expression of a toxin-
resistant OCTase gene in transgenic tobacco and bean plants led to agronomically useful levels of
resistance to the bacterial pathogen; evidence for this was the induction of a hypersensitive
response (HR) to infection by P. syringae pv. pkaseolicola.
Genetic engineering of crops will be a valuable option to increase and stabilize yields in a
world with a changing climate and a growing human population. It will also help in minimizing the
chemical pollutions in environment. However, GE tools must not be used in isolation rather it

(Climate Change, Precision Agriculture and Innovative Disease Control Strategies)
- 327 -
should be integrated with classical as well as molecular plant breeding to address the problems of
biotic stresses and stabilize the crop yield in eco-friendly manner. A few virus resistant and many
insect resistant GM cultivars have been on the market for more than a decade and their number
are likely to expand in the future. However, for the economically far more important fungal
diseases, more fundamental research, particularly for potential resistance mechanisms and their
durability, is still needed. Specifically, an important move would be to exploit the potential and
proven durability of natural resistance through introgression between species. In addition, the
major challenge remains in molding public opinion on the potential on the potential of diseases
resistant GM crops to reduce the need for pesticides. Despite these precautions, GM crops have
already contributed significantly in world agriculture and we strongly believe that disease resistant
crops have a role to play in future strategies for plant disease control.

VALEDICTORY ADDRESS by
Vice-Chancellor
G.B. Pant University of Agriculture & Technology, Pantnagar- 263 145
on
April 11, 2011
It is a pleasure having to deliver the
valedictory address on the successful completion of
the 24th
CAFT training on “Climate change,
Precision agriculture and innovative disease control
strategies”. I am sure that you all have enjoyed the
scientific interaction during your stay at Pantnagar
as well as exposure trip to Ranichauri during course
of the training.
You may be aware that the world’s
population is anticipated to increase from 5.7 billion
in 1995 to 7.7 billion in 2020 with 80 per cent of the
population living in developing countries, where the
population increases by 1.9 per cent per year. Most
poor people live in areas where the land is marginal
and ecosystems are fragile. Global food production
is 5 billion tons per annum and at least 10 per cent
of global food production is lost to plant disease.
Plant pathologists cannot ignore the juxtaposition of
these figures for food shortage and the damage to
food production caused by plant pathogens.
To feed the ever growing population and
ensuring food security, the Green Revolution model
of agriculture though successfully ensured the food
security, yet there are a host of environmental and
health consequences, widely documented, and
which have implications for food consumption and
nutrition. From the pathologist’s point of view, the
most critical effect of the Green Revolution has
been the increased use of pesticides and chemical
fertilizers. As a result lots of negative effects
occurred including land degradation and genetic
erosion, which resulted in explosive growth of pests
and diseases in the crops.
Although plant breeders continue to breed high-
yielding varieties most of which have been grown
under irrigation conditions. With the addition of
fertilizer and under monocropping, ideal
environment is created for pest and weed growth.
Data suggest that pesticide use rose to over half a
billion tons in the developing world by the 1980s,
accounting for 1/5th of global production, with a
much higher rate of insecticides, which are more
toxic to humans and other organisms. In addition to
the obvious human health implications, excessive
pesticide use increases pest outbreaks by
increasing resistance to pest populations while
eliminating natural pest predators. All of these
effects have implications for food consumption and
nutrition, through complex and inter-related
pathways.
The impact of pests, diseases and weeds
on food supply is as high that they reduce
production by at least one-third, and that diseases
alone reduce production by more than 10 per cent
despite the use of pesticides worth $32 billion.
History illustrates that plant diseases can have a
significant effect on human society.
Chemical pesticides have reduced crop
losses in many situations, but even with a very
substantial increase in pesticide use, the overall
proportion of crop losses and the absolute value of
these losses from pests appear to have increased
over time. Despite this perverse relationship, a
marginal increase in pesticide use still appears to be
profitable.
Keeping in view these facts about the use
and misuse of pesticides and its long lasting effects
on agriculture, newer technological approaches to
improving pest management that do not necessarily
depend on chemical pesticides have come forward.
i

These include plant breeding, the use of biological
control agents, and biotechnology, although
elements of all these technologies are often used
together frequently with chemical pesticides.
There is clear evidence that climate change
is altering the distribution, incidence and intensity of
plant pests and diseases such as those pests
whose distribution is shifting most likely due to
climatic factors. Plant pests and diseases are not
evenly distributed over the globe, often because
they are limited by physical barriers such as
mountains, seas and deserts. The increase in
movement of people, animals, plants, goods and
conveyances has accelerated the redistribution of
plant pests and diseases and climate change will
create new ecological niches allowing for the
establishment and spread of pests and diseases
into new geographical areas and from one region to
another.
In addition, unforeseen emergence of “new”
diseases and pests has been very common.
Change in climate resulting in changes in species
composition and interactions will augment the
emergence of unexpected events, including the
emergence of new diseases and pests.
Overall climate change will result in a higher
volatility and, therefore, is likely to cause additional
crises in local agricultural production with different
consequences for socio-economic groups and
genders. Plant pests/pathogens and changes in
pest/pathogens incidence and intensity may result
in additional and inappropriate pesticide use.
Changes in rainfall, temperature and relative
humidity may favour the growth of fungi that
produce mycotoxins and thus may make food such
as groundnuts, wheat, maize, rice and coffee
unsuitable for human and animal consumption.
Plant pathologists can help identify disease
problems and help disseminate information to both
private and government organizations for use in
education and in planning actions to reduce world
hunger. Plant pathologists can also help maximize
agricultural production by assisting in crop
improvements, reducing input requirements, and
through better assessment of disease problems.
Long term solutions may be found through
sustainable agriculture and integrated pest
management (IPM). By combining knowledge and
resources, plant pathologists can work together
toward increasing food security and reducing world
hunger. The new technologies, through appropriate
policies, can be made accessible to small-scale
farmers. Instead of rejecting the solutions offered by
science, policies may be changed to ensure that the
solutions benefit the poor. A good approach would
be to integrate all the advances made in genetics,
agronomy, pathology, technology, economy and
sociology into a single system. Improved diagnosis
of diseases and pests, as well as of water, soil and
air quality remains another research challenge
because a lot of time and money is lost on
identifying the problems. One of the important ways
of enhancing food security is to support small scale
farming. It will not only increase agricultural
productivity, but will also help small farmers out of
poverty, as they could sell over-production and
reinvest gains in diversifying their production.
I am delighted to know that all such points
were appropriately addressed in this particular
training course, which I am sure was very well
designed and appropriately conducted.
It is hoped that you would use the
knowledge gained through the training in teaching,
research and extension activities at your respective
institution/university. You are now in a way alumini
of this university and I am sure that you will maintain
this linkage in a dynamic manner for our mutual
benefit in the pursuance of science of Plant
Pathology, especially in the area of plant health
management.
I wish you a safe and comfortable journey
back home and fruitful professional career ahead.
Jai Hind
ii

ANNEXURE-I
CENTRE OF ADVANCED FACULTY TRAINING IN PLANT PATHOLOGY
College of Agriculture, Pantnagar-263 145 (Uttarakhand)
Following committees have been constituted for smooth conduct of the training programme
on “Climate change, precision agriculture and innovative disease control strategies”
scheduled on March 23 to April 12, 2011.
1. Overall Supervision
Dr. J. Kumar, Director CAFTPP
Dr. R.P. Singh, Course Coordinator
Dr. H.S. Tripathi
Dr. R.P. Awasthi
Dr. V.S. Pundhir
Dr. (Mrs.) K. Vishunavat
2. Invitation, Inaugural and Closing Function Committee
Dr. H.S. Tripathi– Chairman
Mr. Narender Singh
Mr. S.P. Yadav
Mr. Mani Ram
3. Inaugural Session, Intersession Tea and valedictory function Committee
Dr. K.P.S. Kushwaha – Chairman
Dr. (Mrs.) Deepshikha
Mr. S. P. Yadav
Mr. Jagannath
4. Budget Committee
Dr. R. P. Awasthi – Chairman
Dr. Yogendra Singh
Mr. K. S. Bhatnagar (Account Officer)
Mr. A. B. Joshi
Mr. Praveen Kumar
Mr. Het Ram
5. Transport and Reception Committee
Dr. Pradeep Kumar – Chairman
Mr. Prakash Joshi
Mr. P.C. Khulbe
Mr. Bhupesh Kabadwal
6. Boarding & Loading Committee
Dr. V.S. Pundhir – Chairman
Dr. R.K. Bansal
Mr. S. P. Yadav
7. Registration Committee
Dr. (Mrs) K. Vishunavat – Chairperson
Dr. (Mrs.) Kanak Srivastava
Dr. (Mrs.) Renu Singh
8. Session Arrangement Committee
Dr. S.C. Saxean – Chairman
Dr. A.K. Tewari
Mr. Prakash Joshi
Mr. Vikram Prasad
9. Field / Excursion Trip Committee
Dr. R.K. Sahu – Chairman
Dr. Vishwanath
Mr. M.K. Sharma
Mr. K. S. Bisht
Mr. R. B. Sachan
10. Audiovisual Aid & Publicity Committee
Dr. A.K. Tewari-Chairman
Mr. R.C. Singh
Mr. Bupesh Kabdwal
11. Committee for typing correspondence work
Dr. K.S. Dubey, Chairman
Smt. Meena Singh
Mr. Rakesh Tewari
Mr. Mehboob
i

ANNEXURE-II
LIST OF PARTICIPANTS
Sl. No.
Name and Address Phone/E-mail
1. Shri. D.B. Patel
Assistant Research Scientist
Department of Plant Pathology
Centre of Excellence for Res. on Pulses
S.D. Agricultural University
Sardarkrushinagar- 385 506 (Gujarat)
(O): 02748-278158 (Mb.): 9913721465 E-mail: [email protected]
2. Dr. Rajesh Chandra Verma
Asstt. Prof./SMS (Plant Protection)
Krishi Vigyan Kendra, Hastinapur
(SVPUAT, Modipuram)
Hastinapur- 250 404 (U.P.)
(O): 01233-280605 (Mb.): 09411320383 E-mail: [email protected]
3. Dr. Rudra Pratap Singh
SMS-Plant Protection
Krishi Vigyan Kendra
N.D. Univ. of Agric. & Tech, Faizabad
Kotwa, Azamgarh- 276 001 (U.P.)
(O): 0546-2243179 (R): 0546-1226428 (Mb.): 09415720507 E-mail: [email protected] [email protected]
4. Dr. Virendra Singh
SMS/Asstt. Prof. (Plant Protection)
SVPUA&T, KVK, Cotton Research Farm
, Bulandshahr- 203 001 (UP)
(O): 05732-223103 (R): 09456841516 (Mb.): 09411477003 E-mail: [email protected]
5. Dr. Chet Ram Prajapati
SMS/Assistant Professor
Deptt. of Pl. Protection
K.V.K., Khekra, Baghpat- 250 609 (UP)
(Mb.): 09450129403 E-mail: [email protected]
6. Shri. Ram Kumar Singh
Asstt. Professor
NARP-Daleepnagar, Directorate of A.E.S.
C.S.A. Univ. of Agric. & Tech.
Kanpur- 208 002 (U.P.)
(O): 0512-2534128 (R): 0512-2583343 (Mb.): 09450174634 E-mail: [email protected]
7. Dr. Mehraj-Ul-Din Shah
Assistant Professor-cum-Jr. Scientist
Division of Plant Pathology
SKUAST- Kashmir
Shalimar, Srinagar- 191 121 (J&K)
(Mb.): 09419088345 (R): 0194-2106305 E-mail: [email protected] [email protected]
i

8. Dr. (Mrs.) Magar Sunita Janardhanrao
Assistant Professor
Department of Plant Pathology
College of Agriculture, Latur
Marathwada Agricultural University
Parbhani (MS)
(O): 02382-256128 (R): 02382-225972 (Mb.): 09404957355 E-mail: [email protected] [email protected]
9. Shri. S.S. Karande
Associate Professor & I/C Principal
Lokmangal Agriculture College
A/P-Wadala, Tal-N. Solapur
Distt. Solapur- 413 222 (M.S.)
(O): 0217-2735521 9923404691 9860704554 E-mail: [email protected]
10. Dr. S.D. Somwanshi
Assistant Professor
Department of Plant Pathology
College of Agriculture, Udgir
Marathwada Agril. University
Parbhani (MS)
(O): 02385-251026 (R): 02382-225972 (Mb.): 09404957356 E-mail: [email protected]
11. Dr. (Ms.) Shiwani Bhatnagar
Assistant Professor (Agriculture)
Deptt. of Education in Sci. and Mathematics
Regional Institute of Education (NCERT)
Shyamla Hills, Bhopal- 462 013 (M.P.)
(Mb.): 08827712718 E-mail: [email protected]
12. Dr. Ashish Kumar Tripathi
SMS (Plant Pathology)
Krishi Vigyan Kendra (JNKVV)
Nowgong, Chhatarpur- 471 201 (M.P.)
(Mb.): 09826241232 E-mail: [email protected]
13. Shri. Moti Singh Rathore
SMS (Agronomy)
Vidya Bhawan Krishi Vigyan Kendra
Badgaon, Udaipur- 313 011 (Rajasthan)
(O): 0294-2451313 (Mb.): 09414290217 E-mail: [email protected]
14. Mrs. Poly Saha
Assistant Professor (Plant Pathology)
Orissa University of Agric. & Tech.
Bhubaneswar-3 (Orissa)
(O): 06753-211210 (R): 08895173687 (Mb.): 08895173677 E-mail: [email protected]
15. Dr. Rupesh Kumar Arora
SMS (Plant Protection)
Krishi Vigyan Kendra, Tepla
Ambala- 133 104 (Haryana)
(O): 0171-2822522 (R): 05944-233261 (Mb.): 09541403563 E-mail: [email protected] [email protected]
ii

16. Dr. Tejbir Singh
SMS/Asstt Prof. (Plant Protection)
Krishi Vigyan Kendra
Jeolikote, Nainital- 263 127 (UK)
(O): 05942-224615 (Mb.): 9412120608 E-mail: [email protected]
17. Dr. (Mrs.) Shailbala
Jr. Research Officer (Plant Pathology)
Sugarcane Research Centre
Kashipur- 244 713 (UK)
(O): 05947262281 (Mb.): 9456678706 E-mail: [email protected]
18. Dr. (Mrs.) Gohar Taj
Assistant Professor,Department of MBGE
College of Basic Sciences & Humanities
GBPUA&T, Pantnagar- 263 145 (UK)
(O): 05944-233898 (Mb.): 9411851713 E-mail: [email protected]
19. Dr. (Mrs.) Nirmala Bhatt
SMS/Asstt. Professor (Plant Protection)
Krishi Vigyan Kendra, Gaina-Aincholi
Pithoragarh- 262 530 (Uttarakhand)
(O): 05964 -252175 (R): 05964-264006 (Mb.) 9412044788 E-mail: [email protected]
20. Dr. Dharmendra Singh Rawat
Assistant Professor
Department of Biological Science
College of Basic Sciences & Humanities
GBPUA&T, Pantnagar- 263 145 (UK)
(O): 05944-233309 (R): 05944-233092 (Mb.): 09412965072 E-mail: [email protected]
S U M M A R Y
Sl. No. State No. of participants
1 Gujarat 01
2 Haryana 01
3 Jammu & Kashmir 01
4 Madhya Pradesh 02
5 Maharashtra 03
6 Orissa 01
7 Rajasthan 01
8 Uttara Pradesh 05
9 Uttarakhand 05
Total Participants 20
iii

ANNEXURE-III
TRAINING
ON
CLIMATE CHANGE, PRECISION AGRICULTURE AND INNOVATIVE DISEASE CONTROL STRATEGIES
(March 23 to April 12, 2011)
Venue Committee Room, Department of Plant Pathology
Sponsored by Centre of Advance Faculty Training in Plant Pathology (ICAR, New Delhi)
GUEST SPEAKERS/CONTRIBUTORS Dr. Rakesh Pandey Scientist, Central Institute of Medicinal &Aromatic Plants
(CIMAP), Near Kukrail Picnic Spot, Lucknow (UP)
Dr. D.K. Chakrabarty Professor Plant Pathology, Department of Horticulture, NDUAT, Kumarganj, Faizabad (UP)
Dr. S.L. Chaudhary Asian Agri-History Foundation Rajasthan Chapter , Udaipur (Rajasthan)
Dr. Rupam Kapoor Associate Professor, Department of Botany, University of Delhi, New Delhi
Dr K. S. Hooda Principal Scientist, Plant Pathology, Directorate of Maize, Research, Pusa Campus, New Delhi
Dr. Y.P. Singh Principal Scientist, Forest Pathology Division, Forest Research Institute, Dehradun
LOCAL SPEAKERS
Dr. S.K. Saini Dean, College of Agriculture
Dr. M.C. Nautiyal Dean, Hill Campus Ranichauri
Dr. J. Kumar Professor and Head-cum-Director CAFT Plant Pathology
Dr. S.C. Saxena Honorary Professor, Plant Pathology
Dr. K.P. Singh Emeritus Scientist, Plant Pathology
Dr. H.S. Tripathi Professor, Plant Pathology
Dr. R.P. Awasthi Professor, Plant Pathology
Dr. (Mrs.) K. Vishunavat Professor, Plant Pathology
Dr. V.S. Pundhir Professor, Plant Pathology
Dr. R.K. Sahu Professor, Plant Pathology
Dr. Vishwanath Assoc. Prof., Plant Pathology
Dr. R.P. Singh Assoc. Prof., Plant Pathology
Dr. K.P.S. Kushwaha SRO, Plant Pathology
Dr. Y. Singh SRO, Plant Pathology
Dr. A.K. Tewari SRO, Plant Pathology
Dr. N.W. Zaidi SMS, Plant Pathology
i

Dr. S.N. Tewari Professor, Entomology
Dr. Ruchira Tewari Assistant Professor, Entomology
Dr. H.S. Kushwaha Professor, Soil Science
Dr. A.K. Agnihotri Professor, Soil Science
Dr. K.P. Raverkar Assoc. Professor, Soil Science
Dr. P.C. Srivastava Professor, Soil Science
Dr. Rajeev Kumar Shukla Asstt. Professor, Agronomy
Dr. H.S. Chawla Prof. & Head, Genetics and Plant Breeding
Dr. D. Roy Professor, Genetics and Plant Breeding
Dr. P.K. Shrotia Professor, Genetics and Plant Breeding
Dr. N.K .Singh SRO, Genetics and Plant Breeding
Dr. R.K. Khulbe JRO, Genetics and Plant Breeding
Dr. B. Kumar Professor & Head, Agriculture Communication
Dr. Shivendra Kashyap Assoc. Professor, Agriculture Communication
Dr. N.S. Murty Prof. & Head, Agrometereology
Dr. A.S. Nain Asstt. Professor, Agrometereology
Dr. Anil Kumar Professor and Head, MBGE
Dr. A.K. Gaur Professor, MBGE
Dr. Reeta Goel Professor & Head, Microbiology
Dr. K.P. Singh Assoc. Professor, Physics
Dr. Anil Sharma Assoc. Prof., Biological Science
Dr. Uma Melkania Prof. & Head, Environmental Science
Dr. Veer Singh Professor, Environmental Science
Dr. A.K. Pant Professor & Head, Chemistry
Dr. Shishir Pant Asstt. Professor, Chemistry
Dr. Anjana Srivastava Asstt. Professor, Chemistry
Dr. S.B. Singh Assoc. Professor, Mathematics
Dr. R.S. Rajput Asstt. Professor, Computer Science
Dr. Balwinder Singh Assoc. Prof., Vet. Anatomy
Dr. T.C. Thakur National Professor, Farm Machinery & Power Engineering
Dr. T.P. Singh Professor, Farm Machinery & Power Engineering
Dr. Samant Ray Professor, Computer Engineering
Dr. P.K. Singh SRO, Irrigation and Drainage Engineering
Dr. R.P. Singh Associate Director, Directorate of Extension Education
Dr. K.P. Singh Professor, Plant Pathology, Hill Campus Ranichauri
ii

ANNEXURE-IV
CENTRE OF ADVANCED FACULTY TRAINING IN PLANT PATHOLOGY G.B. Pant University of Agric. & Tech., Pantnagar-263 145 (UK)
Course Schedule (March 23 to April 12, 2011)
“Climate change, precision agriculture and innovative disease control strategies”
Venue : PG Lab- Department of Plant Pathology
Day & Date Time Topic ( Lecture/ Lab) Speaker/Contact
Wednesday
March 23
09:30-10:30 hrs Registration & Introduction with Plant Pathology Faculty Venue: PG Lab, Plant Pathology
Registration Committee
10:30-11:30 hrs Department of Plant Pathology and CAFT activities at Pantnagar
Dr. J. Kumar, Director, CAFT
11:30-11:45 hrs Tea Break
11:45-13:00 hrs T.A. claims & settlement Dr. R.P. Awasthi
13:00-14:30 hrs Lunch
14:30-17:00 hrs Visit of different research centre of the university Dr. Vishwanath
Thursday
March 24
09:30-10:30 hrs College of Agriculture at a Glance Dean Agriculture
10:30-11:30 hrs Climate change and Plant Disease Dr. H.S. Tripathi
11:30-11:45 hrs Tea Break
11:45-13:00 hrs Visit to Plant Pathology Labs and MRTC Dr. R.P. Singh/ Y. Singh
13:00-14:30 hrs Lunch
14:30-15:30 hrs Climate change and food security Dr. Veer Singh
15:30-15:45 hrs Tea Break
15:45-17:00 hrs Disease Prediction and precision agriculture Dr. V.S. Pundhir
Friday
March 25
10:00-11:00 hrs Inaugural Function
Venue: Conference Hall, Agriculture College
11:00-11:30 hrs Tea Break
11:30-13:00 hrs Climate change and mitigatory measures with reference to hill agriculture
Dr. Uma Melkania
13:00-14:30 hrs Lunch
14:30-17:00 hrs Visit to Univ. Library & KNSCCF Dr. R.K. Sahu
Saturday
March 26
09:30-10:30 hrs Weather and plant disease forecasting Dr. N.S. Murty
10:30-11:30 hrs Impact of agricultural intensification on carbon sequestration, soil health and nutritional quality
Dr. K.P. Raverkar
11:30-11:45 hrs Tea Break
11:45-13:00 hrs Seed health testing: retrospect and prospect Dr. K. Vishunavat
13:00-14:30 hrs Lunch
14:30-15:30 hrs Communication skills for teaching professionals Drs. B. Kumar & Shiven Kashyap
15:30-15:45 hrs Tea Break
15:45-17:00 hrs Communication skills for teaching professionals Drs. B. Kumar & Shiven Kashyap
Sunday
March 27
09:30-17:00 hrs Visit of Indo-dutch project, Chafi, Bhimtal/Research Centre Patuwadangar/ARIS Nainital
Dr. Vishwanath
Monday
March 28
09:30-10:30 hrs Climate change in social perspective Dr. R.P. Singh, DEE
10.30-11.30 hrs Resource conservation techniques in plant health disease and management
Dr K. P. Singh
i

11:30-11:45 hrs Tea Break
11:45-13:00 hrs Role of eco-friendly approaches in integrated pest and disease management
Dr. Ruchira Tewari
13:00-14:30 hrs Lunch
14:30-15:30 hrs Advances in electron microspy and application in plant pathology
Dr. Balvinder Singh
15:30-15:45 hrs Tea Break
15:45-17:00 hrs Visit of EM Lab Dr. Balvinder Singh
Tuesday
March 29
09:30-10:30 hrs IPR issues in agriculture Dr. H.S. Chawla
10.30-11.30 hrs Plant disease management in precision farming Dr. V.S. Pundhir
11:30-11:45 hrs Tea Break
11:45-13:00 hrs Microarray applications of rhizospheric community analysis for introducing bioagents in organic farming
Dr. A.K. Gaur
13:00-14:30 hrs Lunch
14:30-15:30 hrs GIS application in precision farming Dr. A.K. Agnihotri
15:30-15:45 hrs Tea Break
15:45-17:00 hrs Visit of GIS Lab Dr. A.K. Agnihotri
Wednesday
March 30
09:30-10:30 hrs Innovations in plant disease management through microbes
Dr. Anil Sharma
10:30-11:30 hrs Nano-technology: A modern technological tool for precision agriculture.
Dr. K.P. Singh, CBSH
11:30-11:45 hrs Tea Break
11:45-13:00 hrs Knowledge transfer issues and successes in relation to plant pathology
Dr. K.P. Singh
13:00-14:30 hrs Lunch
14:30-17:00 hrs Visit to University Library
Thursday
March 31
09:30-10:30 hrs Management of key nematode pests of field and horticultural crops
Dr. Rakesh Pandey
10:30-11:30 hrs Biological Control of Frost Injury: Role of Ice Nucleating Bacteria
Dr. S.C. Saxena
11:30-11:45 hrs Tea Break
11:45-13:00 hrs Plant Pathology & Food Security Dr. J. Kumar
13:00-14:30 hrs Lunch
14:30-17:00 hrs Visit of Automatic weather station and observatory at CRC Dr. H.S. Kushwaha
Friday
April 01
09:30-10:30 hrs Toxicological investigations on the emerging pest problems in the important crops
Dr S.N. Tiwari
10:30-11:30 hrs HPLC: An important tool for assessment of pesticides residue in crops
Dr. Anjana Srivastava
11:30-11:45 hrs Tea Break 11:45-13:00 hrs Novelties in mango malformation research Dr. D.K.
Chakrabarty 13:00-14:30 hrs Lunch 14:30-15:30 hrs Precision farming for higher productivity and
profitability Dr. Rajeev Kumar
15:30-15:45 hrs Tea Break
15:45-17:00 hrs Overcoming nutritional deficiencies and toxicities in crop plants
Dr. P.C. Srivastava
Saturday
April 02
09:30-10:30 hrs Current status of forecasting of late blight of potato Dr. V.S. Pundhir
10:30-11:30 hrs Use of variable rate farm machinery in precision farming
Dr. T.C. Thakur
11:30-11:45 hrs Tea Break
11:45-13:00 hrs Bio-control strategy for the management of threatening diseases
Dr. N.W. Zaidi
ii

13:00-14:30 hrs Lunch
14:30-15:30 hrs Presentation by Participants
15:30-15:45 hrs Tea Break
15:45-17:00 hrs Presentation by Participants
Sunday
April 03
09:00 hrs. Departure to Ranichauri
Monday
April 04
09:00-10:00 hrs Visit of Green House Gas Monitoring Station Dr. Vijendra Kumar/IMD Scientist
10:00-11:00 hrs Academic activities of Hill Campus Dr M C Nautiyal
11.00-12.00 hrs Forecasting of apple scab Dr. K.P. Singh
12.00-13:00 hrs Climate change in mid Himalayan reason Dr. R.K. Singh
13:00-14:00 hrs Lunch
14:00-17:00 hrs Visit of IPM Demonstrations at Farmers field. Dr. K. P. Singh/
Dr. Vijendra Kumar
Tuesday
April 05
08:00 hrs Departure to Forest Research Institute, Dehradun
11:00 hrs Arrival in Forest Research Institute, Dehradun
11:00-12:00 hrs Mycorhizae, bamboo and carbon sequestration Dr Y.P. Singh, FRI
12.00-13.00 hrs Visit of Forest Pathology Museum Dr. Amit Pandey
13:00-14:00 hrs Lunch
14:00-15:30 hrs Visit of Forest Research Institute
15:30 hrs. Departure to Pantnagar
Wednesday
April 06
09:15-09:30 hrs Group photograph
09:30-10:30 hrs Plant Healthcare for Resource Poor Farmers – Technologies for Disease Management in Low Input Systems
Dr. J. Kumar
10:30-11:30 hrs Metagenomics-A tool for identification and characterization of uncultivable microbial diversity
Dr. Reeta Goel
11:30-11:45 hrs Tea Break
11:45-13:00 hrs Impact of Climate change on plant pathogen interaction
Dr. Rupam Kapoor
13:00-14:30 hrs Lunch
14:30-15:30 hrs Soil solarization and its application in plant disease management
Dr. Y. Singh
15:30-15:45 hrs Tea Break
15:45-17:00 hrs Drip irrigation for precision farming Dr. P.K. Singh
Thursday
April 07
09:30-10:30 hrs Ancient crop protection practices: relevance as on now
Dr. S.L. Chaudhary
10:30-11:30 hrs Induced systemic resistance against white rust of rapeseed & Mustard
Dr. R.P. Awasthi
11:30-11:45 hrs Tea Break
11:45-13:00 hrs Cultivar mixtures in plant disease management Dr. P.K. Shrotia
13:00-14:30 hrs Lunch
14:30-15:30 hrs Application of SAS in Biological Sciences Drs. S.B. Singh/ R.S. Rajput
15:30-15:45 hrs Tea Break
15:45-17:00 hrs Application of SAS in Biological Sciences Drs. S.B. Singh/ R.S. Rajput
Friday
April 08
09:30-10:30 hrs Future prospects of immunological assays for the detection of plant pathogens
Dr. Anil Kumar
10:30-11:30 hrs ICT applications in agricultural research and knowledge management
Dr. Samant Ray
iii

11:30-11:45 hrs Tea Break
11:45-13:00 hrs Evaluation and application of promising Trichoderma isolates for the management of soil borne plant pathogen
Dr. A.K. Tewari
13:00-14:30 hrs Lunch
14:30-15:30 hrs Chaemo-prospecting for agrochemicals form nature: design and development of novel products.
Dr A.K. Pant
15:30-15:45 hrs Tea Break
15:45-17:00 hrs Innovations in agrochemical formulation technology for safety and efficacy
Dr. Shishir Tandan
Saturday
April 09
09:30-10:30 hrs Innovations in agrochemical application technology for safety and efficacy
Dr. T. P. Singh, PCT
10:30-11:30 hrs Wheat rust and its impact on global wheat production Dr K. P. Singh
11:30-11:45 hrs Tea Break
11:45-13:00 hrs Scenario of maize diseases in changing climate Dr K. S. Hooda
13:00-14:30 hrs Lunch
14:30-15:30 hrs Application of remote sensing in plant disease management
Dr. A.S. Nain
15:30-15:45 hrs Tea Break
15:45-17:00 hrs Visit of remote sensing Dr. A.S. Nain
Sunday
April 10
09:30-10:30 hrs Role of plant genetic resources in plant disease management
Dr. R.K. Khulbe
10:30-11:30 hrs Demonstration of Biology microbial identification Dr R.P. Singh/
Laxmi Rawat
11:30-11:45 hrs Tea Break
11:45-13:00 hrs Visit of rhizosphere biology lab Drs. Anil Kumar & Anil Sharma
13:00-14:30 hrs Lunch
14:30-15:30 hrs Presentation by Participants
15:30-15:45 hrs Tea Break
15:45-16:45 hrs Presentation by Participants
16:45-17:15 hrs Observation of Biolog microbial identification Dr Laxmi Rawat
Monday
April 11
09:30-10:30 hrs Characterization of race profile and resistance to pathogens
Dr. J. Kumar
10:30-11:30 hrs Seed pieces transmissible diseases of sugarcane and three tier seed production programme
Dr. R.K. Sahu
11:30-11:45 hrs Tea Break
11:45 12:45 hrs Managing disease through host resistance Dr. D. Roy
12:45-14:00 hrs Lunch
14:00-15:00 hrs Disease management in Protected Cultivation Dr R P Singh
15:00-16:00 hrs Engineering resistance against biotic stress affecting horticultural and field crops
Dr. N.K. Singh
16:00-17:00 hrs Closing function
Tuesday
April 12
09:30-10:30 hrs Climate change and its implication on disease dynamics in rice, wheat and legumes
Dr. S.C. Saxena
10:30-11:30 hrs Presentation by Participants
11:30-11:45 hrs Tea Break
11:45-13:00 hrs Presentation by Participants
13:00-14:30 hrs Lunch
14:30-17:00 hrs Discussion and wrap-up session
iv