
Centre for Forensic Science - STAX - University of Strathclyde
348
A comprehensive chemical examination of methylamphetamine produced from pseudoephedrine extracted from cold medication By Saravana Kumar Jayaram Centre for Forensic Science Department of Pure and Applied Chemistry University of Strathclyde A thesis presented in fulfilment of the requirements for the degree of Doctor of Philosophy 2012
-
Upload
khangminh22 -
Category
Documents
-
view
0 -
download
0
Transcript of Centre for Forensic Science - STAX - University of Strathclyde

A comprehensive chemical examination of
methylamphetamine produced from
pseudoephedrine extracted from cold medication
By
Saravana Kumar Jayaram
Centre for Forensic Science
Department of Pure and Applied Chemistry
University of Strathclyde
A thesis presented in fulfilment of the requirements for the
degree of Doctor of Philosophy
2012

ii
This thesis is the result of the author’s original research. It has been
composed by the author and has not been previously submitted for
examination which has led to the award to the degree. The copyright of this
thesis belongs to the author under the terms of the United Kingdom
Copyright Acts as qualified by University of Strathclyde Regulations 3.50.
Due acknowledgements must be always made of the use of any material
contained in, or derived from, this thesis.

iii
Abstract
This research evaluates the ability of gas chromatography mass spectrometry (GCMS),
isotope ratio mass spectrometry (IRMS) and inductively coupled plasma mass
spectrometry (ICPMS) to characterize methylamphetamine hydrochloride synthesised
from precursors extracted from proprietary cold medication using three different
extraction solvents. Two clandestine routes were utilized in the synthetic phase of the
research, (i) Moscow route and (ii) Hypophoshorous route (Hypo). Repetitive batches of
samples were prepared and analysed by each analytical technique to provide a robust
sample set for data interpretation.
Organic impurity analysis was undertaken using a developed and validated GCMS
impurity profiling method. The GCMS method discriminated the samples by synthetic
route based on the presence of specific target impurities. Carbon, nitrogen and hydrogen
stable isotope ratios facilitated the differentiation of samples by route, and precursor
source with nitrogen and hydrogen isotopes providing the best results. Inorganic
impurities present in the samples were analysed using inductively coupled plasma mass
spectrometry (ICPMS). This technique provided meaningful discrimination according to
the route and precursor utilized in the synthetic phase.
Pattern recognition techniques were applied to the generated data (raw and pre
processed) from each of the analytical technique both individually and in combination.
Pearson’s correlation coefficient, hierarchical cluster analysis, principal component
analysis and artificial neural networks (self organizing feature maps) were used to
investigate the separation of samples to the individual routes and precursor extracted
from the individual solvent systems. The mathematical tools demonstrated that
methylamphetamine profiling linking precursors sourced from proprietary grade
materials extracted from different solvent systems and synthetic route employed was
achievable.

iv
Acknowledgements
I would first like to thank my supervisor Prof. Niamh Nic Daeid for her support and
patience. Thank you for all the encouragements and motivations you gave me
throughout the duration of my PhD. To my co-supervisor, Prof. Billy Kerr for the
advice and suggestions given during the synthetic phase of this project. I’ve learned a
great deal from both of you which has made me a better person than I was yesterday.
Special thanks also go to the Malaysian Government for the sponsorship and the
opportunity to allow me to pursue one of my life long dreams.
I would like to take this opportunity to thank Prof. Wolfram Meier-Augenstein and Dr.
Helen Kemp from The James Hutton Institute for their assistance in the IRMS analysis
of methylamphetamine samples. Dr. Dzulkiflee Ismail for his help and advice in the
understanding of pattern recognition , theory and application of the software which
allowed me to carry out all my data analysis smoothly. This project could not have been
a success without all of you.
To all the FFBs past and present namely, The Chiefs, Ice, Four, Kevin and Anika, thank
you for those countless gaming nights, dinners, movies and outings that helped cure the
week’s stresses.
A special thank you also goes to all the staff at the Centre for Forensic Science,
academic and technical, who have helped me throughout these 3 and half years: Georgie
and Jim Christie who have helped me with the instrument maintenance and
procurements of various laboratory reagents.
I would also like to thank my family for being there for me. Your encouragements and
belief in me has kept me going through those tough times
Most importantly, I would like thank my wife, Yuva, for the unconditional support and
unwavering patience. You believed in me when I doubted myself, and for that I am
sincerely thankful. This PhD is yours too.

v
Oral and Poster Presentations
Influence of precursor chemicals of the chemical profiling of methylamphetamine (Oral
presentation).American Academy of Forensic Sciences(AAFS), 21-25th Feb, 2012
Atlanta, Georgia, United States of America.
S.Jayaram, N.Nic Daeid, W.J.Kerr, Influence of precursor chemicals of the chemical
profiling of methylamphetamine (Poster presentation). University of Strathclyde,
Research Day 2010, 10-17th
July, 2010 Glasgow, United Kingdom.
S.Jayaram, N.Nic Daeid, W.J.Kerr, W.Meier-Augenstein, H.Kemp, IRMS analysis of
methylamphetamine synthesized via the Hypophosphorous and Moscow routes using
cold medication as a precursor source (Poster presentation). European Geosciences
Union General Assembly 2012, 22-27th
April, 2012, Vienna, Austria.
S.Jayaram, W.J.Kerr, N.NicDaeid, Profiling methylamphetamine synthesized using
precursors extracted from proprietary cold medication via the "Hypo and Moscow" route
– part 1 GC-MS (Poster presentation). European Academy of Forensic Sciences(EAFS),
20-24th
August, The Hague, Netherlands.
S.Jayaram,N.NicDaeid,W.J.Kerr,W.Meier-Augenstein,H.Kemp,Profiling
methylamphetamine synthesized using precursors extracted from proprietary cold
medication via the "Hypo and Moscow" route – part 2 Isotope ratio mass spectroscopy
(Poster presentation). European Academy of Forensic Sciences(EAFS), 20-24th
August,
The Hague, Netherlands.
S.Jayaram, W.J.Kerr, N.NicDaeid, Profiling methylamphetamine synthesized using
precursors extracted from proprietary cold medication via the "Hypo and Moscow" route
– part 3 Inductively coupled plasma mass spectrometry (Poster presentation). European
Academy of Forensic Sciences(EAFS), 20-24th
August, The Hague, Netherlands
D.Ismail, S.Jayaram, N.NicDaeid, Unsupervised pattern recognition analysis of
methylamphetamine synthesised from precursors extracted from proprietary cold
medication via “Hypo and Moscow” routes using three different analytical techniques
(Poster presentation). European Academy of Forensic Sciences(EAFS), 20-24th
August,
The Hague, Netherlands.

vi
List of abbreviations
BMK Benzyl methyl ketone
BSIA Bulk Stable Isotope Analysis
CHM Commission on Human Medicines
CDTA Chemical Diversion and Trafficking Act
CHAMP Collaborative Harmonisation of Amphetamine Method Profiling
CI Chemical Ionisation
CSIA Compound Specific Isotope Analysis
DCDA Domestic Chemical Diversion Act
DI IRMS Dual Inlet Isotope Ratio Mass Spectrometry
DWG Drugs Working Group
EA/IRMS Elemental Analyser Isotope Ratio Mass Spectrometry
EI Electron Impact
ENFSI European Network of Forensic Sciences
EtOH Ethanol
FTIR Fourier Transform infra Red
GCMS Gas Chromatograph Mass Spectrometry
HCA Hierarchical Cluster Analysis
Hypo Hypophosphorous
ICPMS Inductively Coupled Plasma Mass Spectrometry
IRMS Isotope Ratio Mass Spectrometry
LSD Lysergic Acid Diethylamide
MCA Methylamphetamine Control act
MDA Methylenedioxyamphetamine
MDMA Methylenedioxymethamphetamine
MDR Misuse of Drugs regulations
mg miligram
mL millilitres
MtOH Methanol
NMR Nuclear Magnetic Resonance
PCA Principal Component Analysis
P2P Phenyl-2-Propanone
RSD Relative standard Deviation
SOFM Self Organising Feature Maps
Std dev Standard Deviation
TC/EA
IRMS Temperature Conversion/Elemental Analyser Isotope ratio Mass spectrometer
UNODC United Nations Office on Drugs and Crime

vii
Table of contents
Chapter 1 Introduction ............................................................................................ 1
1.1 Historical Overview of Amphetamine type stimulants ....................................... 1
1.2 The global methylamphetamine situation ........................................................... 5
1.3 Global methylamphetamine and precursor seizures and trends .......................... 6
1.4 Amphetamine and methylamphetamine and MDMA use in the United
Kingdom – A brief overview ......................................................................................... 7
1.5 Law and legislation ............................................................................................. 8
1.5.1 United Kingdom Legislation ........................................................................ 9
1.5.2 The Misuse Of Drugs Act 1971 .................................................................. 9
1.5.3 The Misuse Of Drugs Regulations 2001 .................................................... 9
1.5.4 Legislation relating to precursors ............................................................... 10
1.6 Types of Methylamphetamine ........................................................................... 10
1.6.1 Physical morphology .................................................................................. 10
1.6.2 Chemical structure ..................................................................................... 11
1.7 Illicit Manufacture of Methylamphetamine....................................................... 12
1.7.1 Trends in Illicit manufacture of Methylamphetamine in the United
Kingdom ................................................................................................................... 17
1.7.2 Trends in Illicit manufacture of Methylamphetamine in other parts of the
world 18
1.8 Drug Profiling .................................................................................................... 19
1.8.1 Methylamphetamine profiling with gas chromatography mass
spectrometry ............................................................................................................. 21
1.8.2 Route specific impurities in methylamphetamine samples ........................ 23
1.8.3 Methylamphetamine profiling using isotope ratio mass spectrometry ...... 30
1.8.4 Drug profiling with Inductively Coupled Plasma Mass Spectrometry ...... 40
1.9 References ......................................................................................................... 42
Chapter 2 Analytical Techniques ....................................................................... 48
2.1 Introduction ....................................................................................................... 48

viii
2.2 Melting point ..................................................................................................... 48
2.3 Optical rotation .................................................................................................. 49
2.4 Fourier Transform Infrared Spectroscopy (FTIR) ............................................. 49
2.5 Nuclear Magnetic Resonance (NMR) ............................................................... 52
2.6 Microanalysis (Elemental Microanalysis) ......................................................... 52
2.7 Powdered diffraction technique (XRD) ............................................................ 53
2.8 Chromatography ................................................................................................ 55
2.8.1 Introduction to Gas Chromatography ........................................................ 56
2.8.2 Chromatographic Separation in gas chromatography ................................ 61
2.8.3 The Basic Parts of a Gas Chromatograph .................................................. 62
2.8.4 Mass spectrometry as a detection system in chromatographic analysis .... 64
2.8.5 Quadrupole mass analyzer ......................................................................... 64
2.9 Isotope Ratio Mass Spectrometry (IRMS) ........................................................ 66
2.9.1 Isotope ratios .............................................................................................. 66
2.9.2 Delta notation ............................................................................................. 67
2.9.3 Fractionation Effects .................................................................................. 68
2.9.4 Isotope ratio Mass Spectrometer ................................................................ 70
2.10 Inductively Coupled Plasma Mass Spectrometry .......................................... 76
2.11 Conclusion ..................................................................................................... 77
2.12 References ...................................................................................................... 78
Chapter 3 Clandestine Synthesis of Methylamphetamine ......................... 81
3.1 Introduction ....................................................................................................... 81
3.2 Synthetic Routes ................................................................................................ 82
3.2.1 Commercial production of Ephedrine/pseudoephedrine ............................ 83
3.2.2 Methylamphetamine synthesis using Ephedrine/Pseudoephedrine as the
precursor chemical ................................................................................................... 85
3.2.3 Extraction and preparation of pseudoephedrine from commercially
available cold medication. ........................................................................................ 93
3.2.4 Materials and Methods ............................................................................... 93
3.2.5 Extraction of pseudoephedrine from pharmaceutical tablets ..................... 94

ix
3.2.6 Extraction of essential chemicals ............................................................... 95
3.2.7 Synthesis of methylamphetamine using the Moscow Route ..................... 95
3.2.8 Synthesis of methylamphetamine using Hypophoshorous Route. ............. 96
3.3 Result and discussions ....................................................................................... 97
3.3.1 Extraction of Sudafed tablets using various solvents ................................. 97
3.3.2 Extraction of Panadol and Allerpid tablets using acid/base extraction .... 102
3.3.3 Extraction of essential chemicals ............................................................. 108
3.3.4 Synthesis of Methylamphetamine using the Moscow and
Hypophosphorous routes ........................................................................................ 110
3.4 Conclusion ....................................................................................................... 117
3.5 References ....................................................................................................... 118
Chapter 4 Validation of organic impurity extraction and gas
chromatography mass spectrometry (GCMS) ............................................. 121
4.1 Introduction ..................................................................................................... 121
4.2 Experimental Methods .................................................................................... 122
4.3 Instrumental Parameters .................................................................................. 122
4.4 Preparation and Analysis of Grob Mixture ..................................................... 123
4.4.1 Preparation of phosphate buffer ............................................................... 124
4.4.2 Sample preparation................................................................................... 124
4.5 Results and Discussion .................................................................................... 124
4.5.1 Peak symmetry and repeatability of analysis ........................................... 124
4.5.2 Impurity extraction ................................................................................... 127
4.5.3 Homogeneity of Samples studies ............................................................. 135
4.5.4 Reproducibility of the Extraction Analytical Method .............................. 137
4.6 Conclusions ..................................................................................................... 140
4.7 References ....................................................................................................... 140
Chapter 5 Organic impurity profiling of methylamphetamine using gas
chromatography mass spectrometry (GCMS) ............................................. 142
5.1 Introduction ..................................................................................................... 142
5.2 Experimental methods ..................................................................................... 144

x
5.2.1 Within batch variation .............................................................................. 144
5.2.2 Between batch variation ........................................................................... 144
5.3 Results and Discussion .................................................................................... 144
5.3.1 Within batch variation of methylamphetamine synthesized via Moscow
route using laboratory grade pseudoephedrine ...................................................... 145
5.3.2 Between batch variation of methylamphetamine synthesized via Moscow
route using laboratory grade pseudoephedrine ..................................................... 147
5.3.3 Overview of variation of methylamphetamine impurity profiles
synthesized via the Moscow route using pseudoephedrine extracted from
proprietary cold medication (Sudafed- UK) using the three different solvent
systems.............. ..................................................................................................... 149
5.3.4 Within batch variation of methylamphetamine synthesized via the Moscow
route using pseudoephedrine hydrochloride extracted from proprietary cold
medication (Sudafed-UK) using ethanol. ............................................................... 150
5.3.5 Between batch variation of methylamphetamine synthesized via Moscow
route using pseudoephedrine hydrochloride extracted from proprietary cold
medication using ethanol........................................................................................ 152
5.3.6 Within batch variation of methylamphetamine synthesized via Moscow
route using pseudoephedrine hydrochloride extracted from proprietary cold
medication using ethanol:methanol (90:10% vol/vols) as the extraction solvent. . 154
5.3.7 Between batch variation of methylamphetamine synthesized via Moscow
route using pseudoephedrine hydrochloride extracted from proprietary cold
medication using ethanol:methanol (90:10% vol/vol ) as the extraction solvent. . 156
5.3.8 Within batch variation of methylamphetamine synthesized via Moscow
route using pseudoephedrine hydrochloride extracted from proprietary cold
medication using commercial methylated spirit as the extraction solvent. ............ 159
5.3.9 Between batch variation of methylamphetamine synthesized via Moscow
route using pseudoephedrine hydrochloride extracted from proprietary cold
medication using commercial methylated spirit as the extraction solvent. ............ 161
5.3.10 Unknown impurity peaks of methylamphetamine synthesized via the
Moscow route using the various precursor materials. ........................................... 164
5.3.11 Within batch variation of methylamphetamine synthesized via Hypo route
using laboratory grade pseudoephedrine ............................................................... 166
5.3.12 Between batch variation of methylamphetamine synthesized via Hypo
route using laboratory grade pseudoephedrine ..................................................... 167
5.3.13 Overview of interbatch variation of methylamphetamine synthesized via
Hypo route using pseudoephedrine extracted from proprietary cold
medication(Sudafed- UK) using the three different solvent systems..................... 170

xi
5.3.14 Within batch variation of methylamphetamine synthesized via Hypo route
using pseudoephedrine hydrochloride extracted from proprietary cold medication
(Sudafed-UK) using ethanol as the extraction solvent ........................................... 171
5.3.15 Between batch variation of methylamphetamine synthesized via Hypo
route using pseudoephedrine hydrochloride extracted from proprietary cold
medication (Sudafed-UK) using ethanol as the extraction solvent ........................ 173
5.3.16 Within batch variation of methylamphetamine synthesized via Hypo route
using pseudoephedrine hydrochloride extracted from proprietary cold medication
(Sudafed-UK) using ethanol:methanol (90:10)% vol/vols as the extraction
solvent........... ......................................................................................................... 176
5.3.17 Between batch variation of methylamphetamine synthesized via Hypo
route using pseudoephedrine hydrochloride extracted from proprietary cold
medication (Sudafed-UK) using ethanol:methanol (90:10)% vol/vols as the
extraction solvent ................................................................................................... 178
5.3.18 Within batch variation of methylamphetamine synthesized via Hypo route
using pseudoephedrine hydrochloride extracted from proprietary cold medication
(Sudafed-UK) using commercial methylated spirit as the extraction solvent........ 181
5.3.19 Between batch variation of methylamphetamine synthesized via Hypo
route using pseudoephedrine hydrochloride extracted from proprietary cold
medication (Sudafed-UK) using commercial methylated spirit as the extraction
solvent.......... .......................................................................................................... 183
5.3.20 Unknown impurity peaks of the methylamphetamine synthesized from the
Hypo route ............................................................................................................. 186
5.4 Methylamphetamine synthesized from precursors sourced from Malaysia .... 188
5.4.1 Methylamphetamine synthesized via Hypo route using pseudoephedrine
extracted from proprietary cold medication (Allerpid-Malaysia) using acid base
extractions .............................................................................................................. 188
5.4.2 Methylamphetamine synthesized via Hypo route using pseudoephedrine
extracted from proprietary cold medication (Panadol-Malaysia) using acid base
extractions .............................................................................................................. 190
5.4.3 Methylamphetamine synthesized via Moscow route using
pseudoephedrine extracted from proprietary cold medication (Allerpid-Malaysia)
using acid base extractions ..................................................................................... 192
5.5 Comparison of the chromatographic profiles of methylamphetamine
synthesized using precursors (pseudoephedrine) extracted from Sudafed tablets using
the three different solvent systems using the Pearson Correlation matrix approach . 194
5.5.1 Pearson Correlation Coefficient ............................................................... 195
5.5.2 Data Pre-Treatment Methods ................................................................... 196
5.5.3 Results of Pearson Correlation Coefficient analysis ................................ 198

xii
5.6 Conclusion ....................................................................................................... 202
5.7 References ....................................................................................................... 203
Chapter 6 Inorganic impurity profiling of precursors, essential
chemicals and methylamphetamine synthesized via the Moscow and
Hypophosphorous routes using inductively coupled plasma mass
spectrometry (ICP-MS). ....................................................................................... 205
6.1 Introduction ..................................................................................................... 205
6.2 Experimental Methods .................................................................................... 206
6.2.1 Reagents and Standards............................................................................ 206
6.2.2 Sample Preparation .................................................................................. 206
6.2.3 ICPMS Instrument Parameters ................................................................. 207
6.3 Results and Discussion .................................................................................... 208
6.3.1 Analysis of precursor chemicals .............................................................. 208
6.3.2 Laboratory grade chemicals ..................................................................... 210
6.3.3 The analysis of proprietary medication and the effect of solvent extraction
..................................................................................................................211
6.3.4 The analysis of proprietary medication extracted using different solvents.
..................................................................................................................213
6.3.5 Iodine extraction....................................................................................... 216
6.3.6 Red phosphorous extraction from matchboxes ........................................ 217
6.3.7 Analysis of methylamphetamine synthesised via the Moscow and
Hypophosphorous routes. ....................................................................................... 218
6.4 Conclusions ..................................................................................................... 236
6.5 Reference ......................................................................................................... 237
Chapter 7 Investigation of precursor source, synthetic routes and
regiospecificity of methylamphetamine samples using stable isotope
ratio mass spectrometry (IRMS).......... ............................................................. 239
7.1 Introduction ..................................................................................................... 239
7.2 Experimental Methods .................................................................................... 239
7.2.1 13C and
15N Isotope analysis by EA-IRMS .............................................. 239
7.2.2 2H Isotope analysis by TC/EA-IRMS ...................................................... 240

xiii
7.2.3 IRMS Sample preparation ........................................................................ 241
7.2.4 Solvent and drying studies of pseudoephedrine hydrochloride extracted
from Sudafed tablets. ............................................................................................. 241
7.3 Results and discussion ..................................................................................... 242
7.3.1 Pseudoephedrine HCl extracted from Sudafed tablets............................. 242
7.3.2 Pseudoephedrine HCl extracted from Allerpid and Panadol tablets ........ 248
7.3.3 IRMS analysis of methylamphetamine .................................................... 250
7.3.4 IRMS analysis of methylamphetamine synthesized from the Hypo and
Moscow routes using laboratory grade pseudoephedrine ...................................... 252
7.3.5 IRMS analysis of methylamphetamine synthesized pseudoephedrine
extracted from pharmaceutical tablets ................................................................... 255
7.4 Conclusion ....................................................................................................... 265
7.5 References ....................................................................................................... 266
Chapter 8 Chemometric analysis...................................................................... 268
8.1 Introduction ..................................................................................................... 268
8.2 Hierarchical Cluster Analysis (HCA) .............................................................. 271
8.2.1 HCA experimental ................................................................................... 273
8.2.2 HCA results and discussion ..................................................................... 273
8.2.3 HCA conclusions ..................................................................................... 280
8.3 Principal Component Analysis (PCA) ............................................................ 281
8.3.1 PCA experimental .................................................................................... 282
8.3.2 PCA results and discussion ...................................................................... 283
8.3.3 PCA conclusion ........................................................................................ 289
8.4 Artificial Neural Networks .............................................................................. 290
8.5 Self Organising Feature Maps (SOFM) .......................................................... 290
8.5.1 SOFM Algorithm ..................................................................................... 291
8.5.2 SOFM Visualisation ................................................................................. 292
8.5.3 Limitations of SOFM ............................................................................... 292
8.5.4 SOFM experimental ................................................................................. 293
8.5.5 SOFM Results and Discussion ................................................................. 293

xiv
8.5.6 SOFM conclusion ................................................................................... 299
8.6 Conclusion ....................................................................................................... 300
8.7 References ....................................................................................................... 301
Chapter 9 Conclusions and Future Work ..................................................... 304
9.1 Research conclusions ...................................................................................... 304
9.2 Recommendations of Future Work ................................................................. 306

xv
List of Tables
Table 1.1. Route specific impurities synthesised via reductive amination and Leuckart
route.................................................................................................................................. 24
Table 1.2. Impurities identified from methylamphetamine synthesised via emde route .25
Table 1.3. Impurities identified in methylamphetamine synthesised via Rosenmund route
. ......................................................................................................................................... 26
Table 1.4. Impurities identified in methylamphetamine synthesised via birch route . .... 27
Table 1.5. Impurities found by Windahl et al., Tanaka et al.and Kunalan et al. in their
synthesis of methylamphetamine by the Nagai route. ..................................................... 28
Table 1.6. Impurities identified from methylamphetamine synthesised via Moscow route
. ......................................................................................................................................... 29
Table 1.7. The δ13
C and δ15
N values of ephedrine used as precursors of
methylamphetamine synthesis and methylamphetamine synthesized from the ephedrine
.......................................................................................................................................... 34
Table 1.8. Comparisons of δ 13
C and δ 15
N of precursor and methamphetamine. .......... 35
Table 1.9. δ13
C, δ15
N and δ2H values for ephedrine and pseudoephedrine of known
provenance ....................................................................................................................... 36
Table 1.10. δ13
C, δ15
N and δ2H values for methylamphetamine synthesised from
ephedrine and pseudoephedrine of known provenance . ................................................. 37
Table 2.1. Typical wavelength of functional groups ....................................................... 51
Table 2.2. Relative abundances of naturally occurring isotope elements analysed by the
isotope ratio mass spectrometer . ..................................................................................... 67
Table 3.1. Extraction of pseudoephedrine from Sudafed tablets (with and without
coating) with ethanol – shaking by hand. ........................................................................ 98
Table 3.2. Extraction of pseudoephedrine from Sudafed tablets (with and without
coating) with ethanol – using a mechanical agitator. ....................................................... 99
Table 3.3. Extraction of pseudoephedrine from Sudafed tablets (with and without
coating) with ethanol – using a vortex. .......................................................................... 100
Table 3.4. Repeatability of extraction using various solvents (15 mL) with mechanical
agitation (15 minutes) ................................................................................................... 101
Table 3.5. Summary of precursor yields obtained from Sudafed using each solvent. ... 102
Table 3.6. Summary of precursor yields obtained from Panadol and Allerpid tablets
using each acid/base extraction. ..................................................................................... 102
Table 3.7. CHN and melting point data of pseudoephedrine HCl extracted from Sudafed
tablets. ............................................................................................................................ 103
Table 3.8. Yield of iodine extracted from iodine tinctures. ........................................... 109
Table 3.9. Yield of red phosphorous from matchboxes striker pads. ............................ 109
Table 3.10. Methylamphetamine yields obtained from Moscow route synthesis. ......... 111

xvi
Table 3.11. Methylamphetamine yields obtained from Hypophosphorous route synthesis.
........................................................................................................................................ 111
Table 3.12. Results of CHN analysis of methylamphetamine synthesized via Moscow
and Hypophosphorous routes ......................................................................................... 112
Table 4.1. Peak Symmetry of the individual Grob mixture components. ...................... 126
Table 4.2. Relative standard deviation (RSD) of the Grob Mixture over 6 repeat
injections. ....................................................................................................................... 126
Table 4.3. RSD and normalized (to the internal standard [IS] and total peak area [TPA])
RSD values of the varying mass of methylamphetamine for impurity profiling analysis
using ethyl acetate as extraction solvent at pH 10.5. ..................................................... 129
Table 4.4. RSD and normalized (to the internal standard[IS] and total peak area[TPA])
RSD values of the varying mass of methylamphetamine for impurity profiling analysis
using toluene as extraction solvent at pH 10.5. .............................................................. 131
Table 4.5. RSD and normalized (to the internal standard[IS] and total peak area[TPA])
RSD values of the varying mass of methylamphetamine for impurity profiling analysis
using hexane as extraction solvent at pH 10.5. .............................................................. 134
Table 4.6. Results of unnormalised values unhomogenised and homogenised batches of
methylamphetamine. ...................................................................................................... 135
Table 4.7. Results of normalized values to internal standard(IS) of unhomogenised and
homogenised batches of methylamphetamine. .............................................................. 136
Table 4.8. Results of normalized to total peak area (TPA) values unhomogenised and
homogenised batches of methylamphetamine. .............................................................. 136
Table 4.9. Results of within day reproducibility studies. ............................................... 137
Table 5.1. Nagai Impurities identified by Windahl et al., Tanaka et al.and Kunalan et al.
. ....................................................................................................................................... 143
Table 5.2. Moscow Impurities identified by Kunalan ................................................... 143
Table 5.3. Table of impurity peaks identified in methylamphetamine synthesized via the
Moscow route using laboratory grade pseudoephedrine hydrochloride. ....................... 146
Table 5.4. Impurity peaks identified methylamphetamine synthesized via the Moscow
route using laboratory grade pseudoephedrine hydrochloride. ...................................... 148
Table 5.5. Impurity peaks identified in methylamphetamine synthesized via the Moscow
route using using pseudoephedrine hydrochloride extracted from proprietary cold
medication (Sudafed) with ethanol. ............................................................................... 151
Table 5.6. Impurity peaks identified methylamphetamine synthesized via the Moscow
route using pseudoephedrine hydrochloride extracted from proprietary cold medication
using ethanol as the extraction solvent........................................................................... 153
Table 5.7. Table of impurity peaks identified in methylamphetamine synthesized via the
Moscow route using pseudoephedrine hydrochloride extracted from proprietary cold

xvii
medication (Sudafed-UK) using ethanol:methanol (90:10)% vol/vols as the extraction
solvent. ........................................................................................................................... 155
Table 5.8. Impurity peaks identified methylamphetamine synthesized via the Moscow
route using pseudoephedrine hydrochloride extracted from proprietary cold medication
using ethanol:methanol (90:10% vol/vol) as the extracting solvent. ............................. 157
Table 5.9. Impurity peaks identified in methylamphetamine synthesized via the Moscow
route using pseudoephedrine hydrochloride extracted from proprietary cold medication
(Sudafed-UK) using commercial methylated spirit as the extraction solvent................ 160
Table 5.10. Impurity peaks identified methylamphetamine synthesized via the Moscow
route using pseudoephedrine hydrochloride extracted from proprietary cold medication
using commercial methylated spirits as the extracting solvent. ..................................... 162
Table 5.11. Summary of the unknown peaks for the Moscow route ............................. 164
Table 5.12. Table of impurity peaks identified in methylamphetamine synthesized via
the Hypo route using laboratory grade pseudoephedrine hydrochloride. ...................... 167
Table 5.13. Impurity peaks identified methylamphetamine synthesized via the Hypo
route using laboratory grade pseudoephedrine hydrochloride. ...................................... 169
Table 5.14. Table of impurity peaks identified in methylamphetamine synthesized via
the Hypo route using using pseudoephedrine hydrochloride extracted from proprietary
cold medication (Sudafed) with ethanol. ....................................................................... 172
Table 5.15. Impurity peaks identified methylamphetamine synthesized via the Hypo
route using pseudoephedrine hydrochloride extracted from proprietary cold medication
using ethanol as the extracting solvent........................................................................... 174
Table 5.16. Impurity peaks identified in methylamphetamine synthesized via the Hypo
route using using pseudoephedrine hydrochloride extracted from proprietary cold
medication (Sudafed) with ethanol:methanol (90:10)% vol/vols. ................................. 177
Table 5.17. Impurity peaks identified methylamphetamine synthesized via the Hypo
route using pseudoephedrine hydrochloride extracted from proprietary cold medication
using ethanol:methanol (90:10)% vol/vols as the extracting solvent............................. 179
Table 5.18. Impurity peaks identified in methylamphetamine synthesized via the Hypo
route using using pseudoephedrine hydrochloride extracted from proprietary cold
medication (Sudafed) with commercial methylated spirit. ............................................ 182
Table 5.19. Impurity peaks identified methylamphetamine synthesized via the Hypo
route using pseudoephedrine hydrochloride extracted from proprietary cold medication
using commercial methylated spirit as the extracting solvent. ...................................... 184
Table 5.20. Summary of the unknown peaks for the Hypophosphorous route. ............. 186
Table 5.21. List of some of the impurities of methylamphetamine synthesized via
Hypophosphorous route using pseudoephedrine hydrochloride extracted from (Allerpid-
Malaysia) ....................................................................................................................... 189

xviii
Table 5.22. List of some of the impurities of methylamphetamine synthesized via
Hypophosphorous route using pseudoephedrine hydrochloride extracted from (Panadol-
Malaysia) . ...................................................................................................................... 191
Table 5.23. List of some of the impurities of methylamphetamine synthesized via
Moscow route using pseudoephedrine hydrochloride extracted from (Allerpid-Malaysia)
........................................................................................................................................ 193
Table 5.24. The effects of square root, fourth root and sixteen root data pre-treatments
on a set of randomly generated data. .............................................................................. 196
Table 5.25. Pearson correlation coefficients for every pair of samples in the 48 batches
synthesised by two synthetic routes using normalized to the sum of targets and pre-
treated with square root method. .................................................................................... 198
Table 5.26. Pearson correlation coefficients for every pair of samples in the 48 batches
synthesised by two synthetic routes using normalized to the sum of targets and pre-
treated with fourth root method...................................................................................... 199
Table 5.27. Pearson correlation coefficients for every pair of samples in the 48 batches
synthesised by two synthetic routes using normalized to the sum of targets and pre-
treated with sixteenth root method. ................................................................................ 200
Table 6.1.ICPMS analysis of elements detected in ppm for 6 samples of ethanol. ....... 209
Table 6.2.ICPMS analysis of elements detected in ppm for 6 samples of ethanol:
methanol (90:10) % vol/vol. .......................................................................................... 209
Table 6.3.ICPMS analysis of elements detected in ppm for 6 samples of commercial
methylated spirit. ............................................................................................................ 210
Table 6.4.ICP-MS analysis of elements detected in ppm for 6 batches of laboratory
grade pseudoephedrine hydrochloride. .......................................................................... 211
Table 6.5. ICPMS analysis of elements detected in ppm for 6 batches of Sudafed tablets
purchased from pharmacies............................................................................................ 212
Table 6.6. ICP-MS analysis of elements detected in ppm for 6 batches of; .................. 215
Table 6.7.ICP-MS analysis of elements detected in ppm for 6 batches of iodine extracted
from iodine tinctures. ..................................................................................................... 216
Table 6.8.ICP-MS analysis of elements detected in ppm for six batches of red
phosphorous extracted from matchboxes. ...................................................................... 218
Table 6.9.ICP-MS analysis of elements detected in ppm for six batches of
methylamphetamine synthesized via Moscow route from: ............................................ 221
Table 6.10.ICP-MS analysis of elements detected in ppm for six batches
methylamphetamine synthesized via Hypo route from:................................................. 225
Table 6.11.Various elements detected in batches of methylamphetamine, precursors and
essential chemicals. ........................................................................................................ 227
Table 7.1. δ13
C, δ15
N and δ2H values for the precursor samples. ................................. 242

xix
Table 7.2. δ13
C, δ15
N and δ2H values of methylamphetamine synthesised from the Hypo
and Moscow routes. ....................................................................................................... 250
Table 8.1. List of datasets used in multivariate and chemometric analysis (HCA, PCA
and SOFM). .................................................................................................................... 269
Table 8.2. List of datasets used in multivariate and chemometric analysis (HCA, PCA
and SOFM) continued. ................................................................................................... 270

xx
List of Figures
Figure 1.1. Total number of ATS laboratory incidents, 1999-2009 by World Drug Report
2011 ................................................................................................................................... 2
Figure 1.2. Distribution of ATS seizures by region by World Drug Report 2011. ............ 3
Figure 1.3. Notable locations of manufacture and main trafficking routes of ATS. .......... 4
Figure 1.4. Global seizures of ephedrine and pseudoephedrine, 2005-2009 ..................... 7
Figure 1.5. S(+)Methylamphetamine ............................................................................... 11
Figure 1.6. R (-) Methylamphetamine.............................................................................. 11
Figure 1.7. Outline of the synthetic routes used in the manufacture of
methylamphetamine. ........................................................................................................ 13
Figure 1.8. Gas chromatogram of a impurity profile of methylamphetamine tablet . ..... 22
Figure 1.9. Production schemes of ephedrine . ................................................................ 30
Figure 1.10. Two dimensional plot of carbon and nitrogen isotope ratios of ephedrine
and pseudoephedrine samples .......................................................................................... 31
Figure 1.11. Graphical two dimensional plot of carbon and nitrogen isotope ratios of l-
ephedrine and d-pseudoephedrine samples: biosynthetic, synthetic, semi-synthetic from
molasses and semi-synthetic from pyruvic acid............................................................... 32
Figure 1.12. 2H values of l-ephedrine and d-pseudoephedrine samples: biosynthetic,
synthetic, semi-synthetic from molasses and semi synthetic from pyruvic acid.. ........... 33
Figure 1.13. Carbon and nitrogen isotope ratios of methylamphetamine samples .......... 35
Figure 1.14. Methylamphetamine carbon and nitrogen isotope ratios . ........................... 39
Figure 2.1. Schematic illustration of FTIR spectrophotometer ....................................... 50
Figure 2.2. Schematic diagram of CHN analyser. ........................................................... 53
Figure 2.3. Schematic diagram of XRD . ......................................................................... 54
Figure 2.4. Theoretical plate model of chromatography .................................................. 58
Figure 2.5. Van Deemter plot .......................................................................................... 59
Figure 2.6. Diagram of gas chromatography mass spectrometry (GCMS) ..................... 62
Figure 2.7. A Schematic diagram quadrupole mass spectrometer . ................................. 65
Figure 2.8. General layout of an Isotope Ratio Mass spectrometer. ................................ 71

xxi
Figure 2.9. General layout of an EA-IRMS system for the measurement of carbon and
nitrogen bulk stable isotope ratios.. ................................................................................. 73
Figure 2.10. General layout of an TC/EA-IRMS system for the measurement of
hydrogen and oxygen bulk stable isotope ratios. . ........................................................... 74
Figure 2.11. General GC-C/IRMS layout for the measurements of carbon and nitrogen
isotope ratios by CSIA. .................................................................................................... 75
Figure 2.12. General GC-C/IRMS layout for the measurements of hydrogen and oxygen
isotope ratios by CSIA.. ................................................................................................... 75
Figure 2.13. Schematic diagram of the inductively coupled plasma mass spectrometry .
.......................................................................................................................................... 76
Figure 3.1. l-ephedrine ..................................................................................................... 83
Figure 3.2. d-pseudoephedrine ......................................................................................... 83
Figure 3.3. Red phosphorous involvement in a catalytic cycle for generation of
hydroiodic acid in anhydrous media . .............................................................................. 89
Figure 3.4. Hypophosphorous acid involvement in a catalytic cycle for generation of
hydroiodic acid in aqueous media ................................................................................... 90
Figure 3.5. X ray Powder diffraction of Pseudoephedrine HCl extracted from Sudafed
using ethanol as extraction solvent. ............................................................................... 103
Figure 3.6. X ray Powder diffraction of Pseudoephedrine HCl extracted from Sudafed
using ethanol:methanol(90:10) vol/vol as extraction solvent ........................................ 104
Figure 3.7. X ray Powder diffraction of Pseudoephedrine HCl extracted from Sudafed
using commercial methylated spirit as extraction solvent ............................................. 104
Figure 3.8. X ray Powder diffraction of Laboratory grade pseudoephedrine HCl. ....... 105
Figure 3.9. FTIR spectra of Pseudoephedrine HCl extracted from Sudafed using ethanol
as extraction solvent. ...................................................................................................... 106
Figure 3.10. FTIR spectra of Pseudoephedrine HCl extracted from Sudafed using
ethanol:methanol(90:10) vol/vol as the extraction solvent ............................................ 106
Figure 3.11. FTIR spectra of Pseudoephedrine HCl extracted from Sudafed using
commercial methylated spirits as the extraction solvent................................................ 107

xxii
Figure 3.12. FTIR spectra of Pseudoephedrine HCl extracted from Panadol using acid
base extraction. ............................................................................................................... 107
Figure 3.13. FTIR spectra of Pseudoephedrine HCl extracted from Allerpid using acid
base extraction. ............................................................................................................... 108
Figure 3.14. FTIR spectra of methylamphetamine synthesised via the Moscow route
utilising pseudoephedrine HCl extracted from Sudafed using ethanol as extraction
solvent. ........................................................................................................................... 113
Figure 3.15. FTIR spectra of methylamphetamine synthesised via the Moscow route
utlising pseudoephedrine HCl extracted from Sudafed using ethanol/methanol(90:10)%
vol/vol as extraction solvent........................................................................................... 113
Figure 3.16. FTIR spectra of methylamphetamine synthesised via the Moscow route
utlising pseudoephedrine HCl extracted from Sudafed using commercial methylated
spirit as extraction solvent. ............................................................................................. 114
Figure 3.17. FTIR spectra of methylamphetamine synthesised via the Hypo route
utlising pseudoephedrine HCl extracted from Sudafed using ethanol as extraction
solvent. ........................................................................................................................... 114
Figure 3.18. FTIR spectra of methylamphetamine synthesised via the Hypo route
utlising pseudoephedrine HCl extracted from Sudafed using ethanol/methanol(90:10)%
vol/vol as extraction solvent........................................................................................... 115
Figure 3.19. FTIR spectra of methylamphetamine synthesised via the Hypo route
utlising pseudoephedrine HCl extracted from Sudafed using commercial methylated
spirit as extraction solvent. ............................................................................................. 115
Figure 3.20. FTIR spectra of methylamphetamine synthesised via the Hypo route
utlising pseudoephedrine HCl extracted from Panadol using acid base as extraction. . 116
Figure 3.21. FTIR spectra of methylamphetamine synthesised via the Hypo route
utlising pseudoephedrine HCl extracted from Allerpid using acid base extraction. ...... 116
Figure 4.1. Chromatogram of the Grob mixture used. ................................................... 125
Figure 4.2. Impurity profile of 50 mg of methylamphetamine extracted at pH 10.5 with
ethyl acetate as extraction solvent. ................................................................................. 128

xxiii
Figure 4.3. Impurity profile of 100 mg of methylamphetamine extracted at pH 10.5 with
ethyl acetate as extraction solvent. ................................................................................. 128
Figure 4.4. Impurity profile of 150 mg of methylamphetamine at pH 10.5 with ethyl
acetate as extraction solvent. .......................................................................................... 129
Figure 4.5. Impurity profile of 50 mg of methylamphetamine extracted at pH 10.5 with
toluene as extraction solvent. ......................................................................................... 130
Figure 4.6. Impurity profile of 100 mg of methylamphetamine extracted at pH 10.5 with
toluene as extraction solvent. ......................................................................................... 131
Figure 4.7. Impurity profile of 150 mg of methylamphetamine extracted at pH 10.5 with
toluene as extraction solvent. ......................................................................................... 131
Figure 4.8. Impurity profile of 50 mg of methylamphetamine extracted at pH 10.5 with
hexane as extraction solvent........................................................................................... 133
Figure 4.9. Impurity profile of 100 mg of methylamphetamine extracted at pH 10.5 with
hexane as extraction solvent........................................................................................... 133
Figure 4.10. Impurity profile of 150 mg of methylamphetamine extracted at pH 10.5
with hexane as extraction solvent. ................................................................................. 134
Figure 4.11. Methylamphetamine extract stability (pH 10.5) over three days stored at
room temperature (20oC)................................................................................................ 138
Figure 4.12. Methylamphetamine extract stability (pH 10.5) over three days stored at
5oC. ................................................................................................................................. 139
Figure 5.1. Impurity profiles illustrating within batch variation of 6 sub batches of
methylamphetamine synthesized via the Moscow route (ML1). ................................... 146
Figure 5.2. Impurity profiles of between batch variation of ML 1 to 6 of
methylamphetamine synthesized via the Moscow route using laboratory grade
pseudoephedrine. ............................................................................................................ 147
Figure 5.3. Chromatograms of methylamphetamine synthesized via the Moscow route
(a) laboratory grade precursors and precursors extracted from ‘Sudafed’ using (b)
ethanol, (c) ethanol/methanol (90:10) % vol/vol and (d)methylated spirits. ................ 149

xxiv
Figure 5.4. Impurity profiles illustrating within batch variation of 6 sub batches of
methylamphetamine synthesized via the Moscow route (ME 1) using pseudoephedrine
hydrochloride extracted from proprietary cold medication (Sudafed) with ethanol. ..... 150
Figure 5.5. Impurity profiles of between batch variation of ME 1 to 6 of
methylamphetamine synthesized via the Moscow route using pseudoephedrine
hydrochloride extracted from proprietary cold medication using ethanol. .................... 152
Figure 5.6. Impurity profiles illustrating within batch variation of 6 sub batches of
methylamphetamine synthesized via the Moscow route (MDA1) pseudoephedrine
hydrochloride extracted from proprietary cold medication using ethanol:methanol (90:10
% vol/vol) as the extraction solvent. .............................................................................. 154
Figure 5.7. Impurity profiles of between batch variation of MDA 1 to 6 of
methylamphetamine synthesized via the Moscow route using pseudoephedrine
hydrochloride extracted from proprietary cold medication (Sudafed-UK) using
ethanol:methanol (90:10)% vol/vols as the extraction solvent. ..................................... 156
Figure 5.8. Impurity profiles illustrating within batch variation of 6 sub batches of
methylamphetamine synthesized via the Moscow route (MMS1) using
pseudoephedrine hydrochloride extracted from proprietary cold medication (Sudafed-
UK) using commercial methylated spirit as the extraction solvent. .............................. 159
Figure 5.9. Impurity profiles of between batch variation of MMS 1 to 6 of
methylamphetamine synthesized via the Moscow route using pseudoephedrine
hydrochloride extracted from proprietary cold medication (Sudafed-UK) using
commercial methylated spirit as the extraction solvent. ................................................ 161
Figure 5.10. Chromatograms of methylamphetamine synthesized via the Moscow route
precursors extracted from ‘Sudafed’ using (a) ethanol, (b) ethanol/methanol (90:10) %
vol/vol and (c) methylated spirits .................................................................................. 165
Figure 5.11. Impurity profiles of within batch variation of 6 sub batches of [HL 1]
methylamphetamine synthesized via the Hypo route using laboratory grade
pseudoephedrine. ............................................................................................................ 166

xxv
Figure 5.12. Impurity profiles of between batch variation of HL 1 to 6 of
methylamphetamine synthesized via the Moscow route using laboratory grade
pseudoephedrine. ............................................................................................................ 168
Figure 5.13. Chromatograms of methylamphetamine synthesized via the Hypo route (a)
laboratory grade precursors and precursors extracted from ‘sudafed’ using (b)ethanol, (c)
mthanol/methanol(10:90) and (d)methylated spirits. .................................................... 170
Figure 5.14. Impurity profiles illustrating within batch variation of 6 sub batches of
methylamphetamine synthesized via the Hypo route (HE 1) using pseudoephedrine
hydrochloride extracted from proprietary cold medication (Sudafed) with ethanol. ..... 171
Figure 5.15. Impurity profiles of between batch variation of HE 1 to 6 of
methylamphetamine synthesized via the Hypo route using pseudoephedrine
hydrochloride extracted from proprietary cold medication using ethanol. .................... 173
Figure 5.16. Impurity profiles illustrating within batch variation of 6 sub batches of
methylamphetamine synthesized via the Hypo route (HDA1) pseudoephedrine
hydrochloride extracted from proprietary cold medication using ethanol:methanol (90:10
% vol/vol) as the extraction solvent. .............................................................................. 176
Figure 5.17. Impurity profiles of between batch variation of HDA 1 to 6 of
methylamphetamine synthesized via the Hypo route using pseudoephedrine
hydrochloride extracted from proprietary cold medication (Sudafed-UK) using
ethanol:methanol (90:10)% vol/vols as the extraction solvent ...................................... 178
Figure 5.18. Impurity profiles illustrating within batch variation of 6 sub batches of
methylamphetamine synthesized via the Hypo route (HMS1) using pseudoephedrine
hydrochloride extracted from proprietary cold medication (Sudafed-UK) using
commercial methylated spirit as the extraction solvent ................................................. 181
Figure 5.19. Impurity profiles of between batch variation of HMS 1 to 6 of
methylamphetamine synthesized via the Hypo route using pseudoephedrine
hydrochloride extracted from proprietary cold medication (Sudafed-UK) using
commercial methylated spirit as the extraction solvent ................................................. 183
Figure 5.20. Impurity profiles of interbatch variation of 2 batches (AllepH 1 to Allep
H2) ................................................................................................................................ 188

xxvi
Figure 5.21. Impurity profile of methylamphetamine synthesized via the
Hypophosphorous route using pseudoephedrine hydrochloride (Panadol-Malaysia) ... 190
Figure 5.22. Impurity profiles of interbatch variation of 2 batches(AllepM 1 to Allep
M2) of methylamphetamine synthesized via the hypoHypophosphorous route .......... 192
Figure 5.23. Illustration of the effect of square, fourth and sixteen root pre-treatment on
a random set of data. ...................................................................................................... 197
Figure 6.1 Graph of ICPMS analysis of 6 samples of ethanol. ...................................... 208
Figure 6.2. Graph of ICPMS analysis of 6 samples of ethanol :methanol (90:10)%
vol/vol. ........................................................................................................................... 209
Figure 6.3. Graph of ICPMS analysis of 6 samples of commercial methylated spirits. 210
Figure 6.4. Graph of ICPMS analysis of 6 batches of laboratory grade pseudoephedrine.
........................................................................................................................................ 211
Figure 6.5. Graph of ICPMS analysis of 6 batches of Sudafed tablets (UK). ............... 212
Figure 6.6. Boxplot analysis of the elemental variation present in the 6 batches of
Sudafed tablets (UK). ..................................................................................................... 213
Figure 6.7. Graph of ICPMS analysis of 6 batches of pseudoephedrine extracted from
Sudafed tablets using ethanol as the extraction solvent. ................................................ 213
Figure 6.8. Graph of ICPMS analysis of 6 batches of pseudoephedrine extracted from
Sudafed tablets using ethanol:methanol (90:10) % vol/vol as the extraction solvent. .. 214
Figure 6.9. Graph of ICPMS analysis of 6 batches of pseudoephedrine extracted from
Sudafed tablets using commercial methylated spirit as the extraction solvent. ............. 214
Figure 6.10. ICPMS analysis of iodine extracted from iodine tinctures. ....................... 216
Figure 6.11. Graph of ICPMS analysis of red phosphorous extracted from matchboxes.
........................................................................................................................................ 217
Figure 6.12. ICPMS analysis of methylamphetamine via Moscow Route using
laboratory grade pseudoephedrine HCl. ......................................................................... 219
Figure 6.13. ICPMS analysis of methylamphetamine via Moscow Route using
pseudoephedrine extracted from Sudafed using ethanol. ............................................... 219
Figure 6.14. ICPMS analysis of methylamphetamine via Moscow Route using
pseudoephedrine extracted from Sudafed using ethanol:methanol (90:10)% vol/vol. .. 220

xxvii
Figure 6.15. ICPMS analysis of methylamphetamine via Moscow Route using
pseudoephedrine extracted from Sudafed using commercial methylated spirits. .......... 220
Figure 6.16. Iodine analysis of methylamphetamine batches synthesized using the
Moscow route using pseudoephedrine extracted from Sudafed using the three solvents.
........................................................................................................................................ 221
Figure 6.17. ICPMS analysis of methylamphetamine via Hypo Route using lab grade
pseudoephedrine HCl. .................................................................................................... 223
Figure 6.18. ICPMS analysis of methylamphetamine via Hypo Route using
pseudoephedrine extracted from Sudafed using ethanol:methanol (90:10)% vol/vol. .. 223
Figure 6.19. ICPMS analysis of methylamphetamine via Hypo Route using
pseudoephedrine extracted from Sudafed using ethanol. ............................................... 224
Figure 6.20. ICPMS analysis of methylamphetamine via Hypo Route using
pseudoephedrine extracted from Sudafed using commercial methylated spirits. .......... 224
Figure 6.21. Iodine analysis of methylamphetamine batches synthesized via the Hypo
route using pseudoephedrine extracted from Sudafed using the three solvents............. 225
Figure 6.22. Sodium concentrations of methylamphetamine synthesized from both routes
using laboratory grade and extracted precursors. ........................................................... 229
Figure 6.23. Sulfur concentrations of methylamphetamine synthesized from both routes
using laboratory grade and extracted precursors. ........................................................... 230
Figure 6.24. Potassium concentrations of methylamphetamine synthesized from both
routes using laboratory grade and extracted precursors HL/ML=hypo/moscow route
using laboratory grade chemicals. .................................................................................. 231
Figure 6.25. Phosphorous concentrations of methylamphetamine synthesized from both
routes using laboratory grade and extracted precursors ................................................. 232
Figure 6.26. Iodine concentrations of methylamphetamine synthesized from both routes
using laboratory grade and extracted precursors ............................................................ 233
Figure 6.27. Iron concentrations of methylamphetamine synthesized from both routes
using laboratory grade and extracted precursors . .......................................................... 234
Figure 6.28. Zinc concentrations of methylamphetamine synthesized from both routes
using laboratory grade and extracted precursors ............................................................ 235

xxviii
Figure 7.1. Scatter plot of δ13
C and δ15
H values of batches of pseudoephedrine dried in a
desiccator and at room temperature. .............................................................................. 245
Figure 7.2. Scatter plot of δ15
N and δ13
C values of batches of pseudoephedrine dried in a
desiccator and at room temperature. .............................................................................. 246
Figure 7.3. Scatter plot of δ15
N and δ2H values of batches of pseudoephedrine dried in a
desiccator and at room temperature. .............................................................................. 246
Figure 7.4. 3D scatter plot of δ13
C, δ2H and δ
15N analysis of desiccated and non-
desiccated pseudoephedrine samples extracted from Sudafed tablets. .......................... 247
Figure 7.5. 3D scatter plot of mean values δ13
C, δ2H and δ
15N analysis of
pseudoephedrine samples extracted from laboratory and pharmaceutical grades
(Sudafed, Allerpid and Panadol). ................................................................................... 249
Figure 7.6. The methylamphetamine HCl molecule with numbered atoms. ................. 251
Figure 7.7. The origin of hydrogen atoms on an Methylamphetamine molecule
synthesised by the Hypo and Moscow routes.. .............................................................. 252
Figure 7.8. Scatter plot of δ13
C and δ15
H values of batches of methylamphetamine
synthesized from the hypo (HL) and moscow (ML) routes using laboratory grade
pseudoephedrine. ............................................................................................................ 253
Figure 7.9. Scatter plot of δ13
C and δ2H values of batches of methylamphetamine
synthesized from the hypo (HL) and moscow (ML) routes using laboratory grade
pseudoephedrine. ............................................................................................................ 253
Figure 7.10. Scatter plot of δ15
N and δ2H values of batches of methylamphetamine
synthesized from the hypo (HL) and moscow (ML) routes using laboratory grade
pseudoephedrine. ............................................................................................................ 254
Figure 7.11. 3D scatter plot of δ13
C, δ2H and δ
15N for methylamphetamine synthesized
from the from the hypo (HL) and moscow (ML) routes using laboratory grade
pseudoephedrine. ............................................................................................................ 254
Figure 7.12. Scatter plot of δ2H and δ
13C values of batches of methylamphetamine
synthesized from the Hypo and Moscow routes using pseudoephedrine extracted from
proprietary cold medication. .......................................................................................... 255

xxix
Figure 7.13. Scatter plot of δ15
N and δ13
C values of batches of methylamphetamine
synthesized from the hypo and moscow routes using pseudoephedrine extracted from
proprietary cold medication. .......................................................................................... 256
Figure 7.14. Scatter plot of δ15
N and δ2H values of batches of methylamphetamine
synthesized from the hypo and Moscow routes using pseudoephedrine extracted from
proprietary cold medication. .......................................................................................... 256
Figure 7.15. 3D scatter plot of δ13
C, δ2H and δ
15N for methylamphetamine synthesized
from the from the hypo and Moscow routes using laboratory grade pseudoephedrine. 258
Figure 7.16. Isotopic variation of δ13C of batches of methylamphetamine synthesised
via the Hypo and Moscow routes. .................................................................................. 259
Figure 7.17. Isotopic variation of δ15N of batches of methylamphetamine synthesised
via the Hypo and Moscow routes. .................................................................................. 260
Figure 7.18. Red phosphorous involvement in a catalytic cycle for generation of
hydroiodic acid in anhydrous media for the Moscow route . ......................................... 262
Figure 7.19. Hypophosphorous acid involvement in a catalytic cycle for generation of
hydroiodic acid in aqueous media for the Hypophoshorous route . ............................... 262
Figure 7.20. Isotopic variation δ2H of batches of methylamphetamine synthesised via
the Hypo and Moscow routes. ........................................................................................ 264
Figure 8.1. Distance, d, between clusters A and B as defined by the nearest neighbour
method ........................................................................................................................... 271
Figure 8.2. Distance, d, between clusters A and B as defined by the furthest neighbour
method . .......................................................................................................................... 272
Figure 8.3. Hierarchical clustering of chromatographic profiles of batches of
methylamphetamine synthesised via the Hypo and Moscow routes using raw GCMS
data.. ............................................................................................................................... 273
Figure 8.4. Hierarchical clustering of chromatographic profiles of batches of
methylamphetamine synthesised via the Hypo and Moscow routes using row scaled
GCMS data pre processed using the square root. . ....................................................... 274

xxx
Figure 8.5. Hierarchical clustering of chromatographic profiles of batches of
methylamphetamine synthesised via the Hypo and Moscow routes using row scaled
GCMS data pre processed using the fourth root. . ......................................................... 275
Figure 8.6. Hierarchical clustering of chromatographic profiles of batches of
methylamphetamine synthesised via the Hypo and Moscow routes using row scaled
GCMS data pre processed using the sixteenth root. .................................................... 276
Figure 8.7. Hierarchical clustering of batches of methylamphetamine synthesised via the
Hypo and Moscow routes using C, N and H isotopic ratios. ......................................... 277
Figure 8.8. Hierarchical clustering of batches of methylamphetamine synthesised via the
Hypo and Moscow routes using ICPMS data.. .............................................................. 278
Figure 8.9. Hierarchical clustering of batches of methylamphetamine synthesised via the
Hypo and Moscow routes using ICPMS and IRMS data. .............................................. 279
Figure 8.10. Hierarchical clustering of batches of methylamphetamine synthesised via
the Hypo and Moscow routes using the combined GCMS , ICPMS and IRMS data. ... 280
Figure 8.11. Score plots of chromatographic profiles of batches of methylamphetamine
synthesised via the Hypo and Moscow routes. ............................................................. 283
Figure 8.12. Score plots of chromatographic profiles of batches of methylamphetamine
synthesised via the Hypo and Moscow routes using row scaled GCMS data pre
processed using the square root. .................................................................................... 284
Figure 8.13. Score plots of chromatographic profiles of batches of methylamphetamine
synthesised via the Hypo and Moscow routes using row scaled GCMS data pre
processed using the fourth root. ..................................................................................... 285
Figure 8.14. Score plots of chromatographic profiles of batches of methylamphetamine
synthesised via the Hypo and Moscow routes using row scaled GCMS data pre
processed using the sixteenth root.................................................................................. 285
Figure 8.15. Score plot of batches of methylamphetamine synthesised via the Hypo and
Moscow routes using average C, N and H isotopic ratios. ............................................ 286
Figure 8.16. Score plot of batches of methylamphetamine synthesised via the Hypo and
Moscow routes using average elemental profiles. . ....................................................... 287

xxxi
Figure 8.17. Score plot of batches of methylamphetamine synthesised via the Hypo and
Moscow routes using average elemental and isotopic profiles. ..................................... 288
Figure 8.18. Score plots of batches of methylamphetamine synthesised via the Hypo and
Moscow routes using the combined GCMS , ICPMS and IRMS data. ......................... 289
Figure 8.19. Two layer structure of SOFM neural network. Each input variable is
connected to all neurons on the platform.. ..................................................................... 291
Figure 8.20. SOFM output maps of the GCMS data. .................................................... 294
Figure 8.21. SOFM output maps of the IRMS data. ...................................................... 296
Figure 8.22. SOFM output maps of the ICPMS data. .................................................... 297
Figure 8.23. SOFM output maps of the ICPMS and IRMS data. .................................. 298
Figure 8.24. SOFM output maps of the GCMS, ICPMS and ICPMS data.
.............................................................................................................. 299

xxxii
Research objectives
Many studies in organic impurity profiling of methylamphetamine have focused on
samples synthesised from laboratory grade precursor chemicals via known methods.
This provides valuable information relating to the determination of route specific
markers, however, does not fully mimic the true clandestine nature of the synthesis
where, in many cases proprietary over the counter medications and household items may
be used as precursor sources.
In this work, repetitive batches of methylamphetamine were synthesised using the
Moscow and Hypophosphorous (‘Hypo’) synthetic routes following the clandestine and
published literature. The starting compound in each case was pseudoephedrine extracted
from ‘Sudafed’ cold medication tablets using a variety of different solvents. Red
phosphorous and iodine were also extracted from locally sourced matchbooks and
tinctures respectively. The same synthesis was preformed repetitively using laboratory
grade starting compounds as control samples.
Pseudoephedrine hydrochloride was extracted from cold medication using existing
clandestine extraction methods. In total, three different solvents were used in the
extraction process, ethanol, ethanol/methanol and commercial methylated spirits. 24
samples were prepared by each synthetic route, 18 of which were produced by precursor
extracted from cold medication purchased in Glasgow. In addition 5 batches of
methylamphetamine were synthesised from cold medication purchased in Kuala
Lumpur, Malaysia. Following the synthesis of the methylamphetamine samples the
objectives of this work were as follows:
Using an existing GCMS profiling method, a full exploration of the range of
route specific impurities produced in the synthesis of methylamphetamine was
undertaken using precursors extracted from cold medication. The effect of the
specific extracting solvents was also explored.

xxxiii
The comparison of known provenance methylamphetamine samples using IRMS
analysis to investigate linkage to precursors extracted using the three solvent
systems. The sample set produced would allow the inter-synthesis variation
(batch to batch variation) to also be assessed.
An investigation of the ability of IRMS to identify methylamphetamine samples
prepared from precursors from two different regions, United Kingdom and
Malaysia.
Elemental analysis of known provenance methylamphetamine samples and
precursor samples extracted from cold medication using ICPMS.
The final objective of this work was to assess the ability of different data analysis
techniques to provide meaningful discrimination of the methylamphetamine data
sets generated by the analytical techniques employed. Hierarchical cluster
analysis, principal component analysis and self organizing feature maps (SOFM)
were applied to the GCMS data on its own, the IRMS data on its own, ICPMS
data on its own and combinations of data from all of the techniques. Various data
pretreatment methods were also investigated.

xxxiv
Thesis Overview
The analytical techniques used in the identification of synthesised methylamphetamine
and extracted pseudoephedrine are discussed in chapter 2. Nuclear magnetic resonance
(NMR), Fourier transform infra red spectroscopy (FTIR), melting point and CHN
analysis which were used for the confirmation of extracted and synthesised products are
addressed briefly. GCMS, IRMS and ICPMS are discussed in greater detail as they were
the main analytical techniques used in the project.
The synthesis of methylamphetamine by both synthetic routes and the development of
an efficient precursor/essential chemical (i.e. iodine and red phosphorous) extraction
methodology is described in chapter 3. A discussion of the mechanism and chemistry
which contributes to the final methylamphetamine molecule is explained in this chapter.
Chapters 4 and 5 outline in detail the GCMS profiling work. The method validation is
presented in chapter 4. This includes preliminary work used to test column performance
to ensure repeatability of the chromatography and method validation for the extraction
procedure and GCMS conditions. The results of the analysis of the synthesised
methylamphetamine are discussed and a list of target impurities is presented in chapter
5. The results were analysed using Pearson correlation matrix to evaluate the degree of
similarity between samples based on the types and quantity of impurities present in each
batch.
In Chapter 6, the results of ICPMS analysis of the synthesised methylamphetamine and
pseudoephedrine extracted from the proprietary cold medication samples are presented.
The concentration of each inorganic element is assessed and evaluated within the
context of the synthetic route used.
In Chapter 7, the results of the IRMS analysis of the 53 batches of synthesised
methylamphetamine samples and batches of pseudoephedrine extracted from the three
different solvent systems are presented and discussed. The discrimination by precursor

xxxv
source and synthetic route by one, two and three-dimensional plots of the isotope data is
addressed.
Multivariate and artificial neural network analysis of the analytical data sets produced
from the various techniques employed is discussed in chapter 8. This data were
subjected to HCA, PCA and SOFM in order to assess which data analysis techniques
including preprocessing techniques afford meaningful discrimination of the samples.
The overall conclusions of this work are presented in Chapter 9, together with the
suggestions for future work in order to advance the field of methylamphetamine
profiling.

1
Chapter 1 Introduction
1.1 Historical Overview of Amphetamine type stimulants
Records indicate that since the 1st century
AD, Chinese herbalists have been prescribing
“Ma Huang” to treat asthma, a material obtained from the dried stem of the Ephedra
Vulgaris plant [1-8]. The plant has the ability to dilate bronchial passages and provides
relief for mild asthmatic attack, bronchial congestion and catarrh. In the 20th
century, a
moderately potent stimulant, ephedrine, was extracted from Ephedra Vulgaris and used
for these ailments [1-9]. As it was difficult to obtain the plant, pharmaceutical
companies sought to produce a synthetic substitute, and in 1887 the German chemist
called Leuckart first synthesised amphetamine [9]. In 1919, Nagai, a Japanese chemist
synthesised methylamphetamine from ephedrine using hydroidic acid and red
phosphorous [10]. In 1927, Alles, an American chemist, suggested that amphetamines
could be used as a cheap alternative to ephedrine [10].
Amphetamines were used to treat various disorders such as narcolepsy, attention deficit
disorder, depression and obesity. However, amphetamines were also found to have
undesirable long term effects such as hypertension, depression, dependence and
psychiatric disturbance. One of earliest non medical use of amphetamines was reported
when students at the University of Minnesota used Benzedrine inhalers as a performance
aid to study for examinations [10].
During World War II it has been estimated that over 200 million amphetamine and
methylamphetamine tablets were distributed to American troops and over 27 million
similar tablets given to the British service men as performance enhancers [10]. From
1942 onwards, similar tablets were also given to the Japanese forces. Post war misuse of
amphetamine and methylamphetamine was observed by several countries, including the
United States, Japan and Sweden a factor of which was attributed to the growing
dependence on the drug by ex-servicemen [10]. Stringent controls were put in place in
these countries to restrict the sale of amphetamine and methylamphetamine. However

2
such controls on the availability of the compounds contributed to a developing black
market created to meet the growing demand for the drugs [11].
The United Nations Office on Drugs and Crime, (UNODC), World Drug Report 2011
estimates that between 149 and 272 million people or 3.3% to 6.1% of the Global
population aged 15-64 had abused illicit substances at least once in the previous year [1].
In terms of drugs of abuse, cannabis is by far the most widely abused illicit drug type
followed by the amphetamine-type stimulants (ATS), mainly methylamphetamine,
amphetamine and 3,4-methylenedioxymethylamphetamine (generally referred to as
ecstasy), the opioids (including opium, diamorphine (heroin) and prescription opioids)
and finally cocaine [1]. The World Drug Report 2011 further concluded that due to lack
of information regarding the illicit use of ATS, particularly in China and India but also
in emerging markets in Africa, there was considerable uncertainty when estimating the
global number of users [1]. Seizures of ATS have seen an increase between 2008 and
2009 of 26% to 10,600, though this figure was still 46% lower than in the peak year of
2004 as illustrated in Figure 1.1 [1].
Figure 1.1. Total number of ATS laboratory incidents, 1999-2009 by World Drug Report 2011 [1].
In North America, Asia and Oceania methylamphetamine and ecstasy production
dominate within the ATS drug classification as illustrated in Figure 1.2.

3
Figure 1.2. Distribution of ATS seizures by region by World Drug Report 2011 [1].
In relative terms the esctasy seizures remained important in Central, South America and
the Carribean although majority of the reported seizures consisted of amphetamines [1].
The seizures in Oceania remained diversied with majority of the seizures reported were
methylamphetamine and the other types of ATS [1]. In the African continent
methylamphetamine seizures have been reported in Nigeria and South Africa. Notable
locations of manufacture and main trafficking routes of ATS is shown in the figure 1.3
shown below [1].
In Europe, including the United Kingdom, 3,4-methylenedioxymethylamphetamine
(MDMA) remains the most popular illicit synthetic drug [1] where as in Japan and the
United States and more recently Australia, methylamphetamine is much more prevalent.
On a global scale, methylamphetamine is the most popular produced illicit synthetic
drug. It is firmly established in a number of countries such as United States, Australia,
Japan, Thailand and a majority of nations in the East and Far East [12].

4
Figure 1.3. Notable locations of manufacture and main trafficking routes of ATS [1].

5
1.2 The global methylamphetamine situation
On a global scale, the consumption of amphetamine type of stimulants (ATS) has been
reported as being stabilised in some parts of the world (North America and the European
Union) but worsened in others such as China, the Middle East region and East, South
East and Middle East Asia [13]. Currently, these countries largely lack the facilities to
combat the increase in ATS abuse due to various factors such as ineffective information
gathering and a poor regulatory framework coupled with corrupt law enforcement
officials [1]. According to the UNODC, the number of people who regularly abuse ATS
drugs at least once in the previous 12 month period now exceed those taking cocaine and
heroin combined [13].
Amphetamine type of stimulants produce a high profit return for major illicit drug
syndicates and can be synthesised from readily available precursors and pre-precursors
using a variety of methods. There are no geographical limitations (as there are with plant
based drugs such as heroin and cocaine) and clandestine laboratories can be situated
both in close proximity and remotely from areas of consumption. The manufacture of
the drugs does not require advanced knowledge of chemistry [13].
Since 2001 a number of specific developments in the synthesis of ATS drugs occurred
which can be summarised as follows [13]:
(a) Regional shifts and a rapid spread to new markets: supply driven increases in the
Near and Middle East and demand driven increases in MDMA manufacture in North
America and South East Asia.
(b) Increases in size and sophistication of clandestine operations: The emergence of
very large scale ATS clandestine laboratories;
Zamboanga City (Philippines): monthly production capacity of 1 metric tonnes of
crystalline methylamphetamine.
Klang (Malaysia): 60 kg batch of crystalline methylamphetamine.

6
Kulim (Malaysia): Theoretical production cycle of 1.4-1.7 metric tonnes of
crystalline methylamphetamine (laboratory did not operate at full capacity).
Semenyih (Malaysia): estimated output 1 metric tonne of crystalline
methylamphetamine.
Cikande, Indonesia : 75 kg of crystalline methylamphetamine.
(c) Diversification of ATS products to contain an increasing variety of substances
both controlled and non-controlled depending on the region were the compounds are
being abused.
(d) Vulnerability within developing countries to cope with the sudden increase of ATS
manufacture ,trafficking and use within and across their national boundaries.
1.3 Global methylamphetamine and precursor seizures and trends
Ephedrine and pseudoephedrine are the main precursors employed in the manufacture of
methylamphetamine and both substances are controlled by the 1988 United Nations
Convention Against Illicit Traffic in Narcotic Drugs and Psychotropic Substances.
Seizures of these precursors can provide some indications about manufacturing trends
[1]. In 2009, 41.9 metric tonnes of ephedrine and 7.2 metric tonnes of pseudoephedrine
were seized, shown in Figure 1.4. In 2008, 18.2 metric tonnes of ephedrine and 5.1
metric tonnes of pseudoephedrine were seized. It was reported in the world drug report
2011 that there has been a shift from bulk substances to pharmacuetical preparations
used in the illicit manufacture of methylamphetamine [1].

7
Figure 1.4. Global seizures of ephedrine and pseudoephedrine, 2005-2009 [1].
1.4 Amphetamine and methylamphetamine and MDMA use in the United
Kingdom – A brief overview
Amphetamine was first prescribed in the United Kingdom in the 1920’s and 40’s under
the brand name Drinamyl and Dexdrine and sold under prescription. A surge of black
market supply of amphetamine in the 60’s forced the government to ban the importation
and legally controlled the possession of the drug [14]. Prior to 1968, there were very few
reported cases of methylamphetamine use in London. In 1968, the intravenous abuse of
methylamphetamine increased dramatically and incidents of methylamphetamine related
psychosis were reported at medical and social gatherings [14]. This increase was also
due in part to private doctors prescribing methylamphetamine (“Methdrine ampoules”)
as substitutes to cocaine addicts [14]. This increase was short lived and in late 1968 a
voluntary agreement between the manufacturers, the Ministry of Health and the Council
of the Pharmaceutical Society immediately stopped the sale of methylamphetamine to
retail pharmacists. After 1968, the only source of methylamphetamine was from limited
supplies which were diverted or stolen from hospitals or pharmacies [14].

8
From 1970 to 1980, there is limited information available relating to the abuse of
amphetamine and methylamphetamine in the United Kingdom as long term research
efforts focused on other drugs such as heroin and opiates [14]. During the 1980s and
1990s an increase in MDMA and methylamphetamine abuse was associated with the
developments of ‘rave culture’ and nightclub scenes at punk rock and ‘northern soul’
dance events [14]. Most of the ATS drugs which were imported into the United
Kingdom were manufactured in Belgium and the Netherlands and manifested as
amphetamine sulfate powder or MDMA tablets [14].
1.5 Law and legislation
In the early twentieth century, the Chinese opium epidemic spurred various international
responses in particular, the 1961 Single Convention on Narcotic Drugs, the 1971
Convention on Psychotropic Substances and the 1988 Convention against the Illicit
Traffic in Narcotic Drugs and Psychotropic Substances [2].
The 1961 Single Convention on Narcotic Drugs was created to combine legislation
emerging from different nations into a primary instrument. Its sole purpose is to limit
manufacture, possession and use of drugs to scientific study and medicine. Signatory
countries of the convention provide annual statistical data and estimates for the use, and
need for drugs covered by this convention to the United Nations Office on Drugs and
Crime (UNODC) [2].
The 1971 Convention on Psychotropic Substances was the second major treaty created
to combat the widening range of drugs of abuse. The sole purpose of this convention is
to control the use of psychotropic substances which includes many synthetic drugs [3].
Finally, the 1988 Convention Against the Illicit Traffic in Narcotic Drugs and
Psychotropic Substances was developed to deal with the growing problem in drug
trafficking. The main aim of this treaty is to provide extradition of drug traffickers and it
offers provision against money laundering and the divergence of precursors [4].

9
1.5.1 United Kingdom Legislation
The two main pieces of legislation regulate the use of controlled drugs in the United
Kingdom. The Misuse of Drugs Act 1971 (MDA 1971) follows the United Nations
conventions and lists what is prohibited in terms of the use of listed substances. The
Misuse of Drugs Regulations 2001 (MDR 2001) explains what can be done with the
listed substances [5].
1.5.2 The Misuse Of Drugs Act 1971
This piece of legislation covers drugs and categorises these into three classes, A,B and
C, in order of known toxicity where class A drugs are the most harmful. The legistlation
controls possession, supply and manufacture of the listed substances as well as
extablishing the Misuse of Drugs Advisory Board [6].
1.5.3 The Misuse Of Drugs Regulations 2001
The Misuse of Drugs Regulations 2001 defines permitted use of the substances
controlled under the misuse of drugs act 1971. Substances are divided into five
schedules according to their medicinal value as follows [6]:
Schedule 1: includes drugs such as cannabis that are not, conventionally, used for
medical purposes. Possession and supply are prohibited without specific Home Office
approval.
Schedule 2: includes morphine and diamorphine, amphetamine and methylamphetamine
that, because of their potential harm, are subject to special requirements relating to their
safe custody, prescription, and the need to maintain registers relating to their acquisition
and use.
Schedule 3: includes the barbiturates and are subject to special prescription, though not
safe custody, requirements.

10
Schedule 4: includes the benzodiazepines and are subject to special prescription, though
not safe custody, requirements.
Schedule 5: includes preparations that, because of their strength, are exempt from most
of the controlled drug requirements.
1.5.4 Legislation relating to precursors
In the United Kingdom, the manufacture and the placing on the market of the precursor
chemicals is regulated by the Controlled Drugs (Substances Useful for Manufacture)
(Intra Community Trade) Regulations 1993. This legislation monitors precusors and
requires that all import, exports and intermediary activities involving drug precusors are
clearly defined and documented [7].
The scheduled precusors are defined into 3 categories. Category 1 contains true
precusors which form the core structure of a controlled substance. Category 2 includes
essential chemicals for the synthesis of the controlled substance and secondary precusors
which can be modified to produce Category 1 precusors. Category 3 precusors include
acids, bases and solvents required for final product synthesis [7].
1.6 Types of Methylamphetamine
1.6.1 Physical morphology
Illicit methylamphetamine is commonly encountered in one of four forms; tablet,
powder, free base and crystal. Tablets normally contain methylamphetamine
hydrochloride and caffeine. This formulation is more commonly known as ‘yaba’ which
means ‘crazy day’ in Thai [12, 14]. In the United States, methylamphetamine tablets are
encountered in different colours and shapes which can be flavoured, scented and
stamped with various logos in a similar fashion to conventional ecstasy tablets. The
tablets can be taken orally or smoked (commonly be enhaling the crushed tablet heated
in foil) [12, 14].

11
The powder form of methylamphetamine is commonly known as ‘ice’, ‘crank’, ‘crystal’,
‘nazi crystal’ [12, 14]. It is bitter to taste and water soluble. The colour of the powder
ranges from off white to reddish brown depending on the chemicals used in the
manufacturing process. It can be taken orally, snorted and injected intravenously [12,
14].
A more uncommon form of methylamphetamine is the free base. This has a waxy or oily
apperance and has been reported in Australia where it is usually ingested orally or
injected intarvenously. This is thought to be made by clandestine chemists who are not
skilled in their training to convert the methylamphetamine base to its hydrchloride salt
[12, 14].
Crystalline methylamphetamine is usually obtained by re-crystallizing the hydrochloride
powder using isopropyl alcohol or water. Crystalline methylamphetamine is usually
smoked or snorted using a variety of pipes or smoking devices. This form of
methylamphetamine has the highest purity compared to other forms [12, 14].
1.6.2 Chemical structure
Methylamphetamine has two stereoisomers, the S (d- or (+) methylamphetamine) shown
in
Figure 1.5 and R (l- or (-) methylamphetamine) shown in Figure 1.6.
Figure 1.5. S(+)Methylamphetamine
Figure 1.6. R (-) Methylamphetamine

12
There are three types of methylamphetamine chemical mixtures obtained through
synthesis, each of which is identified by the balance of the d- or l- isomers, and are given
below [14]:
• l-Methylamphetamine (levo-methylamphetamine). In terms of central nervous
system activity, l-methylamphetamine is the least potent type of methylamphetamine. It
is primarily active in the periphery systems (e.g. the cardiovascular system) [14].
• dl-methylamphetamine (dextro-levo-methamphetylamine) is the racemate (an
equimolar mixture of the two enantiomeric isomers) form of methylamphetamine
containing equal proportions of (l-) and (d-) stereoisomer [14].
• d-methylamphetamine (dextro-methylamphetamine). In terms of central nervous
system activity d-methylamphetamine is the most potent, and widely abused form, of
methylamphetamine [14].
1.7 Illicit Manufacture of Methylamphetamine
There are eight synthetic methods generally used in the illicit manufacture of
methylamphetamine hydrochloride and these are presented in Figure 1.7. These methods
are easily accessible through the Internet, the scientific literature, patents and books.

13
Figure 1.7. Outline of the synthetic routes used in the manufacture of methylamphetamine.
The method used to synthesize methylamphetamine depends on various factors such as
availability of precursors, essential chemicals, complexity of the process, equipment and
the chemical hazards presented [14]. With increasing internet usage, many clandestine
chemists can purchase the required supplies using internet auction sites such as eBay
[15].
Three categories of chemicals are used in the synthesis of methylamphetamine;
precursors, reagents and general purpose chemicals. Precursors are essentially the
‘building blocks’ or basic chemicals needed in the synthesis of methylamphetamine. The
molecular structure of the precursor is generally quite similar to that of the final product.
The purpose of reagents in the synthesis is to chemically modify or combine precursors
in a chemical reaction. General purpose chemicals are used to facilitate the reaction and
isolate the products [14] of which examples include solvents, alkalis and acids. In many

14
countries, including the United Kingdom, the sale of these chemicals are placed under
strict control and regulated by the individual legislation of the countries involved.
Besides chemicals, another important tool required in the clandestine manufacture of
methylamphetamine is appropriate glassware and these can be obtained either from
chemical supply companies or made out of household items [14].
In general, methylamphetamine is synthesized from one of two different types of known
precursors; l-ephedrine or d-pseudoephedrine and phenyl-2-propanone (P2P) also known
as benzylmethylketone (BMK), phenylacetone and phenylpropanone. In the United
Kingdom, these precursor chemicals are placed under the Controlled Drugs (Substances
Useful for Manufacture) (Intra-Community Trade) Regulations 1993 and the exportation
to other European Union Countries is regulated by Controlled Drugs (Substances Useful
for Manufacture) Regulations 1991 and Amendment 1992 [14]. These regulations do not
apply to medical or pharmaceutical products. The precursor chemical phenyl-2-
propanone is not readily available in the United Kingdom but can be imported or
manufactured from other less restricted chemicals which are not controlled under the
regulations mentioned. Ephedrine and pseudoephedrine are used commonly in cold
medication and sold as over the counter medication in the United Kingdom and
elsewhere [14]. To combat the isolation of ephedrine and pseudoephedrine from
medication, manufacturers increasingly add various inhibitors such as aminoalkyl
methacrylate copolymer (Eudragit-E), ferrous gluconate, lactose, ethylcellulose and
hydroxypropyl cellulose which interferes with the conversion of ephedrines or
pseudoephedrines to methylamphetamine [14].
Besides extracting ephedrine and pseudoephedrine from cold medication, clandestine
chemists also isolate the compounds from Ephedra plant based products. The stem and
leaves of the Asiatic and Mediterranean species of Ephedra contain ephedrine and
pseudoephedrine as well as other alkaloids such as norephedrine, norpseudoephedrine,
methylephedrine, and methylpseudoephedrine [15]. An in-depth explanation of the
reaction mechanisms for the precursor and final product synthesis is presented in
Chapter 3.

15
In the United States, the earliest detection of clandestine methylamphetamine
manufacturing was reported in the late 1960s. The total number of clandestine
laboratories detected in 1969 was 21. Since then, there has been a dramatic increase of
clandestine laboratories manufacturing methylamphetamine and in 2011 a total of 9,153
laboratories were reported according to the Drug Enforcement Agency [14]. The
clandestine laboratories seized in the United States have varied in sophistication from
well equipped laboratories to those with very crude operations. The laboratories seized
were mainly small scale with ounce or multi ounce production capacity. The bulk of
methylamphetamine sold are produced by laboratories which have a production cycle of
in the order of 4 or 5 kilograms, so called ‘super labs’. A total of 142 ‘super labs’ were
seized in the United States in 2009 [1, 14].
In February 1980, phenyl-2-propanone was reclassified as a Schedule II controlled
substance in the United States. Most clandestine chemists in the United States started to
synthesise phenyl-2-propanone from phenylacetic acid and also began synthesising
methylamphetamine from other precursors such as ephedrine and benzylchloride. The
preferred route to manufacture methylamphetamine was the reduction of ephedrine
using hydroiodic acid and red phosphorous. In 1989 the Birch route was reported as the
synthetic route most encountered in the clandestine manufacture of methylamphetamine,
involving the reduction of ephedrine using lithium in ammonia. That year, a total of 652
clandestine laboratories were detected and 53% of these laboratories employed an
ephedrine reduction method using hydroiodic acid and red phosphorous. To combat the
sale of the precursors involved, the US Drug Enforcement Agency embarked on a broad
chemical control program based on the Chemical Diversion and Trafficking Act
(CDTA) of 1988. As a result of this, the supply of ephedrine and phenyl-2-propanone
became more difficult. Clandestine operators begun using over the counter
pharmaceutical preparations as alternatives to ephedrine or pseudoephedrine which were
exempted from CDTA act [10, 14].

16
In 1993, the Drug Enforcement Agency seized 193 clandestine laboratories, 81% of the
laboratories were manufacturing methylamphetamine using the ephedrine reduction
method and the rest were utilising phenyl-2-propanone as the precursor. The domestic
chemical control act was further strengthened with an enactment of Domestic Chemical
Diversion Control Act (DCDCA), which added a registration requirement for List I
chemical handlers and established record keeping and reporting requirements for
transactions in single-entity ephedrine products. In the same year, hydroiodic acid was
placed under List 1 chemicals and became virtually unavailable in the United States.
Reduction of ephedrine with hydrogen iodide (hydriodic acid) or with hydrochloric acid
and zinc or tinfoil was also reported. The next most popular method (less than 10%)
involved the reaction of benzylchloride with magnesium to produce a Gringard reagent
which, was then reacted with the product of an acetaldehyde/methylamine reaction [14].
Due to stricter controls on hydroiodic acid, clandestine chemists resorted to manufacture
their own hydroiodic acid from in-situ reactions using red phosphorous, iodine and
water. Another recipe emerged from Australia where the hydroiodic acid could be
produced from reacting hypophosphorous acid with iodine [10, 14].
When stricter control of ephedrine was regulated under the DCDCA, clandestine
chemists turned to the ephedrine’s stereoisomer pseudoephedrine. There were also
reports of using phenylpropanolamine to produce amphetamine rather than
methylamphetamine using the red phosphorus method. In 1995 an increase from 1.5% to
38% was reported in the usage of pseudoephedrine as the main precursor in clandestine
manufacture of methylamphetamine [14].
The Comprehensive Methamphetamine Control Act of 1996 (MCA) was introduced and
expanded regulatory control of lawfully marketed drug products containing ephedrine,
pseudoephedrine and phenylpropanolamine. Iodine also became a List II Chemical, with
a 400 gram threshold [14, 15]. From 1997 to 2004, due to stricter regulatory control on
the sale of hydroiodic acid, red phosphorous and iodine, there was a reported increase of
the usage of hypophosphorous acid in the clandestine manufacture of

17
methylamphetamine in California [14]. The DEA also reported several cases where
phosphorous acid has been used as an alternative to hypophosphorous acid [15].
Between 2004 and 2009, North America accounted for the 44% of global seizures of
methylamphetamine. A sharp increase in methylamphetamine seizures in Mexico which
reached 6.1 metric tonnes was also reported in 2009 [1]. According to the UNODC, in
recent years the availability of methylamphetamine seems to be directly linked to large
scale methylamphetamine production in Mexico [1]. The increase reported is due to the
number of small scale laboratories which has shifted their production from Mexico to
the United States particularly in California. In recent years, stricter controls over the
availability of ephedrine and pseudoephedrine has lead to an increase in the use of P2P
or its pre-precursor phenylacetic acid (PAA) in methylamphetamine production,
particularly in the United States [1].
1.7.1 Trends in Illicit manufacture of Methylamphetamine in the United
Kingdom
The first reported methylamphetamine laboratory in the UK was in 1981, where the
route employed was an ephedrine reduction using hydroiodic acid with red phosphorous.
Between 1981 and 1989 there was a steady increase of reported clandestine manufacture
of methylamphetamines but towards the end of 1989, the drug was disappearing from
the United Kingdom market [14]. Since the early 1990s a total of 15 laboratories were
seized in the UK [14]. Most of the laboratories seized involved the illicit manufacture of
amphetamines using phenyl-2-propanone and ammonium formate. Between 1992 and
1999 there was a general decline in clandestine amphetamine laboratories and most
laboratories seized in that period were mainly small-scale with a manufacturing
capability of less than 100 kilograms. In 2002, a large illicit amphetamine laboratory
was detected in a specially converted outbuilding on a farm in East Essex. The pre-
precursor, benzyl cyanide was being converted to phenyl-2-propanone via an
intermediate α-acetyl-phenylacetonitrile. Phenyl-2-propanone was then being converted
to amphetamine via the Leuckart method. The potential yield of the laboratory was

18
calculated to be 200 kilograms of high purity amphetamine sulfate, equivalent to 2
tonnes of ‘street level’ amphetamine powder at 10% purity [14]. Another illicit
laboratory was reported in 2004, used for the illicit manufacture of tryptamines and ring
substituted phenethylamines related to ‘ecstasy’ [14].
1.7.2 Trends in Illicit manufacture of Methylamphetamine in other parts of the
world
Over the last decade notably in 2009, Mexico has become an important manufacturing
location. In 2009, Mexican authorities reported dismantled 191 laboratories the upward
trend has been continuing and another 63 laboratories has been dismantled since May
2010 [1]. The Mexican laboratory operators tend to manufacture large quantities of end
products compared to their North American counterparts who appear to manufacture the
substance on a much smaller scale [1]. The Mexican clandestine operators tend to use
the P2P method to prepare the less potent racemic d/l methylamphetamine [1].
A significant number of clandestine methylamphetamine laboratories have been
dismantled over recent years in East and South East Asia. China reported 391 seizures of
clandestine synthetic drug laboratories in 2009 mainly in the Guangdong, Sichuan and
Hubei provinces and these were primarily for the manufacture of crystalline
methylamphetamine [1]. Since 2008, a total of 244 laboratories have been dismantled in
China [1].
Indonesian authorities seized 35 clandestine methylamphetamine laboratories since 2009
including 25 large scale and 10 small scale laboratories [1]. Since 2010, 11 clandestine
laboratories manufacturing methylamphetamine have been seized in Malaysia in various
parts of the country including Kuala Lumpur and Southern Malaysia. The manufacturing
of crystalline methylamphetamine has also been reported in the Philippines with 9
manufacturing laboratories detected in 2010 [1].
The Islamic republic of Iran has reported increased seizures of quantities of
methylamphetamine since 2005 [1]. In the first nine months of 2010 Iranian authorities

19
reported seizures of 883 kilograms of methylamphetamine compared to 271 in 2009 [1].
The precursor used in the clandestine synthesis in the Middle, East and South East Asia
has been the precursor pseudoephedrine [1]. Methylamphetamine manufacture in Africa
is rare and was reported only in South Africa and in Egypt [1].
In Oceania, methylamphetamine manufacture has been reported in Australia and New
Zealand and the Australian authorities reported dismantling 316 clandestine laboratories
since 2009 where most of the laboratories were involved in the manufacture of
amphetamine and methylamphetamine [1]. New Zealand authorities reported a total of
135 laboratories having been dismantled in 2010 [1].
Compared to the other parts of the world, illicit manufacture of methylamphetamine in
Europe is fairly low [1]. Until recently, methylamphetamine manufacture in this region
has been mainly restricted to the Czech Republic where 300-400 kitchen laboratories
have been dismantled since 2009 [1]. Seizures also have been reported in neighboring
countries such as Slovakia, Germany, Poland and Austria. An emerging second region
for the clandestine synthesis of methylamphetamine is in the Baltic countries particularly
Lithuania and Estonia [1].
1.8 Drug Profiling
Recognising an urgent need for the development of drug profiling strategies and its
importance in the field of drug analysis, the Commission on Narcotic Drugs, in
resolution 1 (XXXIX) of 24 April 1996, requested the Executive Director of the United
Nations International Drug Control Programme (UNDCP) to develop standard methods
for the profiling/signature analysis of key narcotic drugs and psychotropic substances.
This was an important tool in developing harmonised methods for the characterisation
and impurity profiling of illicit drugs [1, 18]. The United Nations Office on Drugs and
Crime (UNODC) impurity profiling methods which have been used extensively in
Thailand, Japan, Australia, United States and the Philippines [1, 18].

20
Due to the prevalence of the clandestine manufacture of synthetic drugs, trafficking and
involvement of organised criminal groups in drug related activity, the ability to provide
information related to synthesis and supply chains is of interest to law enforcement
communities. Clandestine manufacture, trafficking and abuse of methylamphetamine
appear to be increasing in different parts of the world, particularly in the East and South
East Asia and the Middle East. Law enforcement authorities are faced with challenges to
identify the sources of supply and establish trafficking routes and distribution patterns
for these materials. A potential means of achieving this is through chemical
characterisation of the illicit drugs [1]. The characterisation of synthetic reaction
impurities and by products is increasing in its role as a valuable component in
clandestine drug investigation and it is suggested that such derived data can potentially
provide information relating to the following [1, 18]:
chemical links between samples
origin of samples
identification of trafficking patterns and distribution networks
output from illicit laboratories
common methods of synthesis
precursor trends
Organic impurities extracted from illicit methylamphetamine have been studied and
profiled by researchers around the world based on seized illicit street samples. Detailed
studies of impurity profiling of methylamphetamine have been reported on samples
seized in countries such as Japan, Thailand, China and the Philippines where
methylamphetamine abuse poses serious potential for harm [18]. The most important
tool to date that aids researchers in the impurity profiling of methylamphetamine is gas
chromatography mass spectrometry (GCMS), although the chromatographic results,
rather than the mass spectral data is predominantly used.
In 2005, collaboration between seven laboratories in Europe funded through the
European Union (SMT-CT98-2277) resulted in a ‘harmonised’ GCMS amphetamine

21
profiling method [19] and resultant published literature suggested that harmonized
methods would allow the exchange of data and intelligence information [19]. This
project was extended into the “Collaborative Harmonisation of Methods for Profiling of
Amphetamine Type Stimulants (CHAMP)” and funded by the sixth framework
programme of the European Commission in 2008 [19]. In 2006, an agreed definition for
drug profiling has been presented by the European Network of Forensic Science
Institutes (ENFSI) drug working group as :
“The use of methods to define the chemical and/or physical properties of a drug seizure
for comparing seizures for intelligence and evidential purposes” [16].
Besides GCMS profiling, Isotope Ratio Mass Spectrometry (IRMS) and Inductively
Coupled Plasma Mass Spectrometry (ICPMS) both offer potential as additional
techniques for methylamphetamine profiling. Research conducted and developments in
this area are discussed in detail in sections 1.8.3 and 1.8.4.
1.8.1 Methylamphetamine profiling with gas chromatography mass spectrometry
Methylamphetamine is synthesised predominantly using the eight synthetic routes
previously mentioned and the derived drug profiles can contain impurities which arise
due to a number of factors. These include the nature of the precursor and precursor
synthesis/extraction, incomplete reactions, inadequate purification of intermediates, and
reagents/solvents that are carried over to the final product. Knowledge of impurities
formed is useful for several reasons [20-23]. The impurities detected may reveal the
synthetic method employed and essential chemicals used in the manufacture. Gas
chromatography mass spectrometry (GCMS) is an important tool that can provide
information relating to the identification of the molecules contained within a reaction
mixture [22, 23]. A typical GCMS impurity profile is presented in Figure 1.8.

22
Figure 1.8. Gas chromatogram of a impurity profile of methylamphetamine tablet [18]. Selected
impurities: (1) benzaldehyde, (2) cis-1,2-dimethyl-3-phenylazridne, (3) amphetamine, (4) 3,4-
dimethyl-5-phenyl-oxazolidine, (5) ethyl vanillin (colouring agent), (6) N-methyl-ephedrine, (7) N-
formylmethamphetamine, (8) N-acetylmethamphetamine, (9) N-acetylephedrine and
(10) methylamphetamine dimer [18].
Normally, only the synthetic byproducts or impurities are utilised in subsequent data
comparisons [22-34]. Various factors need to be considered before the synthetic route
can be attributed and these include the frequency of occurrence of molecules in multiple
samples, the presence of artifacts or co-eluting peaks as a consequence of the GCMS
method and the repeatability of both the extraction method and analytical method [24].
The extraction method and analytical column used may affect both the nature and
amount of impurities presented in the final chromatogram. Acidic or basic pH buffers
are commonly used in liquid-liquid extractions of the sample. Impurities may be
preferentially extracted at each pH and some analytical columns may have better
specificity and selectivity for these molecules. The balance between extraction pH and
analytical column can thus alter the final appearance of the impurity profile [23, 24].

23
1.8.2 Route specific impurities in methylamphetamine samples
The clandestine synthesis of methylamphetamine generally involves either phenyl-2-
propanone or ephedrine/pseudoephedrine as the precursor chemicals [14, 18]. These
precursors themselves can be extracted from other innocuous materials such as over the
counter medications or increasingly produced clandestinely [14, 18]. When the materials
are utilised in the various synthetic reactions, they produce a collection of reaction and
partial reaction impurities which may identify the type of precursor molecule used as
well as present a series of molecules which may be considered as specific to the
particular synthetic route.
To date the most comprehensive known study of route specific impurities of
methylamphetamine samples was conducted by Kunalan [32]. Here, she repetitively
synthesised over 20 batches of methylamphetamine via seven of the eight synthetic
routes and characterized all of the route specific impurities within each route. This has
either confirmed or clarified much of the previous literature in the area.
Methylamphetamine produced from P-2-P: Leuckart and reductive amination routes
In the 70’s scientific literature began to report route specific impurities arising from the
Leuckart synthesis of methylamphetamine using phenyl-2-propanone as the precursor.
Kram and Kruegel [35] suggested that methylamphetamine synthesized via this route
might be contaminated by methylamine or methylformamide and identified α-benzyl-N-
methylpheneethylamine, dibenzylketone, and N-methyldipheneethylamine as possible
route specific impurities. Barron et al. [36] also identified α,α’-
dimethyldiphenethylamine and N,α,α’-trimethyldiphenethylamine as impurities present
in the Leuckart route. Barron et al. and Bailey et al. [36, 37] reported that N-
formylmethylamphetamine as a route specific impurity of methylamphetamine
synthesized via Leuckart route. However Qi et al. [34] suggested that this molecule was
also present in samples believed to be manufactured via the ephedrine based routes [34].
Kunalan confirmed α,α’-dimethyldiphenethylamine and N,α,α’-
trimethyldiphenethylamine as route specific impurities for the Leuckart route.

24
Verweij suggested that 1-phenyl-2-propanol was a route specific impurity of
methylamphetamine synthesized via the reductive amination route of synthesis [38] and
this was confirmed by Kunalan et al. [38] who suggested it was the only route specific
impurity for this synthesis [38]. These route specific impurities are summarised in Table
1.1.
Table 1.1. Route specific impurities synthesised via reductive amination and Leuckart route.
Name Major Ions Origin Chemical Structure
1-Phenyl-2-Propanol 92,91,45 Intermediate (reductive
amination route)
dibenzylketone 91,65,119 Route specific impurity of
the leuckart route
N,α,α’-
trimethyldiphenethylamine
176,91,58 Route specific impurity of
the leuckart route
α,α’-
dimethyldiphenethylamine
91,162,119 Route specific impurity of
the leuckart route
Methylamphetamine produced from ephedrine or pseudoephedrine: Emde,
Rosenmund, Birch, Nagai and Moscow routes
As with the Leuckart and reductive amination synthesis, a number of studies have been
undertaken purporting to identify route specific impurities for the
ephedrine/pseudoephedrine routes. In many cases confusion arose within the literature
until the clarifying work of Kunalan resolved a number of conflicting reports [29].

25
Emde Synthesis
Salouros et al. [33] isolated and identified N,N’-dimethyl-3,4-diphenylhexane-2,5-
diamine (two stereoisomers) from Emde synthesised samples while N-methyl-1-{4-[2-
(methylamino)propyl]}-1-phenylpropan-2-amine was observed in Emde, Moscow and
Hypophosphorous samples and is thus not route specific [33]. Both of these impurities
had been previously listed as unknown compounds. Qi et al. [34] reported various
compounds within the profile of Emde samples all or which had also been observed in
Leuckart synthesised samples. One impurity however was route specific to the Emde
method and that was the presence of chloroephedrine. Listed in the Table 1.2 below are
full the list impurities identified by studies conducted by Kunalan [32]. Impurity
highlighted in italics is the route specific impurity of the Emde route.
Table 1.2. Impurities identified from methylamphetamine synthesised via emde route [32].
Name Peak m/z (base peak in bold)
Cis-1,2-dimethyl-3-phenylazridine 146, 105, 132, 91
N-(1-methyl-2-phenylethylidene)methenamine 56, 91, 65, 39, 77
Dimethylamphetamine(DMA) 72, 91, 56, 42
Ephedrone 58, 77, 105
Chloroephedrine 58, 77, 91, 146, 166
Ephedrine 58, 77, 117, 132, 146
3,4-Dimethyl-5-phenyloxazolidine 71, 56, 91
N-formylmethamphetamine 86, 58, 118
N-acetylmethamphetamine 58, 100
Benzylmethamphetamine 91, 160, 119, 65, 77, 207
N-β-(phenylisopropyl)benzylmethylketimine 91, 160, 119, 65, 77, 207
3,4-Dimethyl-2,5-diphenyl-oxazolidine 146, 147, 105, 132
Methylamphetamine dimer 238, 91, 120, 148

26
Rosenmund synthesis
Studies conducted by Kunalan [32] identified three route specific impurities,
ethylamphetamine and two unknown compounds which were present in the batches of
samples synthesized via the Rosenmund route [32]. A full list of impurities synthesised
by methylamphetamine via the Rosenmund route identified by Kunalan is shown in the
Table 1.3 below. Impurities highlighted in italics are the route specific impurities of the
Rosenmund route.
Table 1.3. Impurities identified in methylamphetamine synthesised via Rosenmund route [32].
Name Peak m/z (base peak in bold)
Dimethylamphetamine(DMA) 72, 91, 56, 42
Ephedrone 58, 77, 105
Ephedrine 58, 77, 117, 132, 148
Ethylamphetamine 72, 44, 58, 91
N-formylamphetamine 44, 118, 72, 91, 58
N-formylmethylamphetamine 86, 58, 118
N-acetylmethylamphetamine 58, 100
Cis 3,4-Diphenyl-3-buten-2-one 179, 178, 222, 221
Trans 3,4-Diphenyl-3-buten-2-one 179, 178, 222, 221
Unknown 1 58, 91, 118, 239
Unknown 2 58, 263, 248
Birch reduction
Research conducted by Person et al. [31] reported 1-(1,4-cyclohexadienyl)-2-
methylaminopropane (CMP) as a route specific impurity for the Birch reduction route
[31]. This was confirmed by Kunalan [32], a full list of impurities synthesised by
methylamphetamine via the birch route identified by Kunalan is shown in the Table 1.4
below [32]. Impurities highlighted in bold is the route specific impurity of the birch
route.

27
Table 1.4. Impurities identified in methylamphetamine synthesised via birch route [32].
Name Peak m/z (base peak in bold)
Benzaldehyde 105, 107, 77, 51
CMP 58, 56, 91, 77, 152
Dimethylamphetamine (DMA) 72, 91, 56, 42
Ephedrone 58, 77, 105
Ephedrine 58, 77, 117, 132, 148
Unknown 1 58, 77
N-formylmethamphetamine 86, 58, 118
N-acetylmethamphetamine 58, 100
N-formylephedrine 86, 87, 58, 77, 100
N-acetylephedrine 58, 77, 100
3,4-Dimethyl-2,5-diphenyl-oxazolidine 146, 147, 105, 132
Nagai synthesis
Cis or trans azridines presented within impurity profiles associated with the Nagai route
may undergo a ring opening process producing phenyl-2-propanone (P2P) [23]. Two
molecules of P2P can undergo a self-condensation process followed by dehydration to
form 1-benzyl-3-methyl-naphtalene and 1,3-dimethyl-2-phenylnaphtalene impurities
[25]. Windahl et al. [25] reported that the azridine species may not always be present in
Nagai samples (and thus could not be a route specific impurity), and carried out a
systematic study of reaction times concluding that the reaction time was key factor in
determining the amount of azridines and napthalenes present in the final product. As the
reaction time increased, the aziridines decreased and naphthalenes increased. This study
also suggested two new impurities, N-methyl-N-(α-methylphenethyl)amino-1-phenyl-2-
propanone and (Z)-N-methyl-N-(α-methylphenethyl)-3-phenylpropenamide [25]. Other
researchers reported the presence of a methylamphetamine dimer [26] formed via
condensation of 1,2-dimethyl-3-phenylazridine and methylamphetamine. This was
demonstrated by the successful synthesis of the methylamphetamine dimer with the two

28
mentioned compounds. They also reported the presence of aziridines impurity as a route
specific impurity of the ephedrine route [26]. Analysis of seized samples of Nagai
synthesised samples reported the presence of all three specific impurities [27, 28]. The
literature was finally clarified by Kunalan et al. [29] and the formation of all specific
impurities clarified as a function of synthetic conditions and are presented in Table 1.5.
Table 1.5. Impurities found by Windahl et al. [25], Tanaka et al. [26] and Kunalan et al. [29] in their
synthesis of methylamphetamine by the Nagai route.
Impurities Windahl Tanaka Kunalan
Cis-1,2-dimethyl-3-phenylaziridine √ √ (1/2, 2, 4 hr)
Trans-1,2-dimethyl-3-phenylaziridine √ √ (1/2, 2, 4 hr)
Methylamphetamine dimer √ √ (1/2, 2 hr)
1,3-dimethyl-2-phenylnapthalene √ √ (2, 4, 24 hr)
Isomers of N-methyl-N-(α-
methylphenylethyl)amino-1-phenyl-2-
propanone
√ √ (2, 4, 24 hr)
(z)-N-methyl-N-(α-methylphenethyl)-3-
phenylpropenamide
√ √ (2, 4, 24 hr)
Moscow synthesis
Studies conducted by Kunalan [32] identified three route specific impurities which were
identified in the Nagai samples were also observed in the samples synthesised via the
Moscow route [32]. A full list of impurities synthesised by methylamphetamine via the
Moscow route identified by Kunalan is shown in Table 1.6 below. Impurities
highlighted in italics are the route specific impurity of the Moscow route.

29
Table 1.6. Impurities identified from methylamphetamine synthesised via Moscow route [32].
Name Peak m/z (base peak in bold)
N-(1-methyl-2-phenylethylidene)methenanmine 56, 91, 65, 39, 77
Dimethylamphetamine(DMA) 72, 91, 56, 42
Z(1-phenylpropan-2-one oxime) 91, 149, 116, 131
E((1-phenylpropan-2-one oxime) 91, 131, 116, 149
3,4-Dimethyl-5-phenyloxazolidine 71, 56, 91
3,4-Dimethyl-5-phenyloxazolidine 71, 56, 91
N-formylamphetamine 118, 72, 44, 91
Bibenzyl 91, 182
N-formylmethylamphetamine 86, 58, 118
N-acetylmethylamphetamine 58, 100
Cis-3,4-Diphenyl-3-buten-2-one 179, 178, 222, 221
Trans-3,4-Diphenyl-3-buten-2-one 179, 178, 222, 221
Benzylmethamphetamine 91, 148, 65, 105
N-β-(phenylisopropyl)benzylmethylketimine 91, 160, 119, 65, 77, 207
Dimethylphenylnapthalene 232, 217, 202, 77
N-benzoylamphetamine 105, 77, 148, 91, 118
Benzylmethnapthalene 232, 217, 202, 58
N-methyl-N-(α-methylphenethyl)amino-1-phenyl-2-
propanone
238, 91, 105, 190, 120
N-benzoylmethylamphetamine 105, 62, 77, 91
N,N-di-(β-phenylisopropyl)formamide 190, 91, 58, 119, 77, 105
(Z)-N-methyl-N-(α-methylphenethyl)-3-
phenylpropenamide
131, 91, 58, 103, 188, 77

30
1.8.3 Methylamphetamine profiling using isotope ratio mass spectrometry
The application of Isotope Ratio Mass Spectrometry (IRMS) in determining the
geographic origin, source and/or discriminating between batches of various types of
drug compounds has been applied over the years [39-43]. Kurashima et al. [43]
investigated the possibility of determining the geographic origin of ephedrine on the
basis of δ13
C and δ15
N values. Ephedrine is one of the precursors of methylamphetamine
and it can be manufactured by three routes shown in Figure 1.9 below, where (a) full
chemical synthesis; (b) semi-synthesis from sugar; and (c) extraction from the ephedra
plant [43]. Kurashima et al. [43] reported that combining δ13
C and δ15
N values obtained
allowed the discrimination of all three forms of ephedrine shown in the figure below,
confirming the importance of nitrogen isotope values for greater sample discrimination
compared to carbon alone.
Figure 1.9. Production schemes of ephedrine [43].
Studies conducted by Makino et al. [44] in 2005 confirmed the work of Kurashima et al.
[43] and suggested the potential for IRMS to reveal the geographic origin that had been
used as a precursor [44]. The authors investigated the isotopic ratios for carbon and
nitrogen for ephedrine samples produced from the three different synthetic methods

31
shown in Figure 1.9 and together with pseudoephedrine of known origin sourced from
six different manufacturers shown in Figure 1.10 [44].
Figure 1.10. Two dimensional plot of carbon and nitrogen isotope ratios of ephedrine and
pseudoephedrine samples [44].
The authors concluded that the lower (δ15
N) value for d-pseudoephedrine was a direct
result of nitrogen isotope fractionation during the isomerization process. The (δ15
N) and
(δ13
C) values shown for manufacturer C were much lower compared to semi-synthetic
ephedrine [44]. The information provided to the authors from manufacturer C suggested
that it was imported from Europe. The lower (δ13
C) values were attributed to
manufacturer C using sugar beet (C3) instead of sugar cane (C4) is a possible explanation
of lower (δ13
C) value seen in the figure above [44]. The lower (δ15
N) values obtained
were probably due to nitrogen fractionation during the isomerization process. The
authors of this study also reported that pseudoephedrine from manufacturer B was
synthesized from natural ephedrine and from manufacturer F was synthesized
chemically [44]. The pseudoephedrine from manufacturers D and E were reagent grade.

32
The authors also suggested that pseudoephedrine from manufacturer C, D and E were all
manufactured from European semi-synthetic ephedrine because of their proximity [44].
In 2009, Kurashima et al. [45] analysed 27 precursor samples and discussed identified
that semi-synthetic ephedrines synthesized from pyruvic acid could be discriminated
from natural and synthetic ephedrines based on δ2H values. The authors noted that using
δ13
C and δ15
N values alone did not discriminate ephedrine synthesised from the three
different manufacturing processes. Figure 1.11 illustrates a two dimensional plot of δ15
N
values versus δ13
C values of l-ephedrine and d-pseudoephedrine samples manufactured
from synthetic, semi-synthethic (molasses and pyruvic acid) and biosynthetic processes
[45].
Figure 1.11. Graphical two dimensional plot of carbon and nitrogen isotope ratios of l-ephedrine
and d-pseudoephedrine samples: biosynthetic, synthetic, semi-synthetic from molasses and semi-
synthetic from pyruvic acid. Open symbols indicate d-pseudoephedrine samples. The biosynthetic
group is indicated as I, the synthetic group as ‘II’, the semi-synthetic group from molasses as ‘III’
and the semi-synthetic group from pyruvic acid as ‘IV’ [45].

33
Kurashima et al. [45] suggested that δ2H values of naturally synthesized ephedrine (
2H:
-193% to -151%) facilitated clear discrimination from synthetic ephedrines (2H: -73% to
-30%), semi-synthetic ephedrines derived from pyruvic acid (2H: +75% to +148%) and
semi-synthetic ephedrines derived from molasses (2H: -74% to +243%) [45].
Furthermore, the authors suggested that using δ13
C and δ15
N values it was possible to
distinguish apparently similar methylamphetamine samples seized on different
occasions. Their results are illustrated in Figure 1.12.
Figure 1.12. 2H values of l-ephedrine and d-pseudoephedrine samples: biosynthetic, synthetic, semi-
synthetic from molasses and semi synthetic from pyruvic acid. Open symbols indicate d-
pseudoephedrine samples. I-IV are the same as Figure 1.11 [45].

34
Kurashima et al. [43] noted that the origins of ephedrine could be discriminated by δ13
C
and δ15
N values and these were similar in value to methylamphetamine samples
synthesized using these specific precursors and the authors demonstrated a relationship
between ephedrine and methylamphetamine using δ13
C and δ15
N values shown below in
Table 1.7 [43].
Table 1.7. The δ13
C and δ15
N values of ephedrine used as precursors of methylamphetamine
synthesis and methylamphetamine synthesized from the ephedrine [43].
In the second part of their study, authors demonstrated the ability of IRMS to distinguish
between methylamphetamine prepared from natural, semi synthetic or synthetic
ephedrine the results of which are shown in Table 1.7 where Figure 1.9 illustrates the
reaction pathways used to derive the various precursors [43]. The data obtained indicates
that the IRMS is indeed a useful instrumental technique to link precursors to illicit
substance [43]. This is shown in Table 1.8 and Figure 1.13.

35
Table 1.8. Comparisons of δ 13
C and δ 15
N of precursor and methamphetamine [43].
SAMPLE/PRECURSOR δ 13
C (0/00) δ
15 N(
0/00)
Natural ephedrine -29.2 +4.2
Methamphetamine from natural ephedrine -29.5 +3.9
Semi-synthetic ephedrine -23.1 +6.2
Methamphetamine from semi-synthetic ephedrine -23.1 +5.8
Synthetic ephedrine -29.2 -10.5
Methamphetamine from synthetic ephedrine -29.2 -11.1
Figure 1.13. Carbon and nitrogen isotope ratios of methylamphetamine samples: seized, synthesized
from natural ephedrine, synthesized from synthetic ephedrine, synthesized from semi-synthetic
ephedrine and commercial methylamphetamine. Dotted circles indicate samples that were seized on
the same occasion [43].

36
In a similar study conducted in 2008, Collins et al. [46] synthesised methylamphetamine
using ephedrine and pseudoephedrine of different synthetic provenance (synthetic, semi-
synthetic and natural) via four different clandestine routes (Nagai, Hypophosphorous,
Emde and Moscow). This is presented in Table 1.9.
Table 1.9. δ13
C, δ15
N and δ2H values for ephedrine and pseudoephedrine of known provenance
(values reported as the mean of three consecutive measurements) [46].
Precursor source δ13
CVPDB(o/oo) δ
15Nair(
o/oo) δ
2HVSMOW(
o/oo)
Pseudoephedrine (I)
Sigma Aldrich (USA)/semi synthetic origin -23.3 +5.1 +168
Ephedrine (II)
Fluka product -26.8 +6.8 -135
Pseudoephedrine (III)
Sigma Aldrich/semi synthetic origin -26.2 +3.6 +159
Pseudoephedrine (IV)
Extracted from Sudafed tablets/Wellcome -26.5 +0.6 +78
Ephedrine (V)
Sigma Aldrich Product(India)/semi
synthetic
-25.6 -0.1 +171
It was observed that methylamphetamine synthesized from semi-synthetic ephedrine and
pseudoephedrine had positive δ2H values and methylamphetamine synthesized prepared
from natural material had negative δ2H values [46]. The authors concluded from their
findings that the positive values of δ2H ephedrine and pseudoephedrine from semi-
synthetic source was attributed to the synthetic benzaldehyde used as a starting material
in the manufacture of these precursors shown in Table 1.10. The study demonstrated that
besides using IRMS analysis of δ13
C and δ15
N values, the δ2H value also provided a
viable option to distinguish batches of methylamphetamine synthesized from different
routes to its precursor from different origins [46].

37
Table 1.10. δ13
C, δ15
N and δ2H values for methylamphetamine synthesised from ephedrine and
pseudoephedrine of known provenance (values reported as the mean of three consecutive
measurements) [46].
Methylamphetamine product
Precursor Reaction Purity(0/oo) δ
13CVPDB(
o/oo) δ
15Nair(
o/oo) δ
2HVSMOW(
o/oo)
Pseudo
ephedrine (I)
Nagai(1)
Nagai(2)
Nagai(1)
Nagai(2)
Hypo (1)
Hypo (2)
Hypo (3)
Emde
Moscow
96
95
93
94
93
93
90
89
95
-23.2
-23.1
-22.9
-23.0
-23.8
-23.2
-23.1
-22.8
-23.4
+5.2
+5.3
+5.2
+5.1
+4.1
+4.3
+4.7
+5.6
+4.7
+134
+111
+131
+128
+124
+120
+114
+145
+127
Ephedrine (II) Emde(1)
Emde(2)
Emde(3)
Hypo (1)
94
94
93
93
-27.2
-27.4
-27.3
-27.7
+6.6
+6.5
+6.5
+6.3
-134
-133
-131
-132
Pseudo
ephedrine (III) Nagai 94 -26.2 +4.3 +120
Pseudo
ephedrine(IV)
Nagai(1)
Nagai(2)
Emde(1)
Emde(2)
Emde(3)
90
93
95
94
90
-25.9
-26.1
-25.7
-25.9
-25.6
+2.7
+2.4
+1.7
+1.9
+1.6
+65
+65
+79
+81
+77
Ephedrine (V) Emde
Nagai
Moscow
Hypo
87
95
95
94
-25.5
-25.6
-25.4
-25.0
-0.1
-0.4
-0.3
-0.2
+166
+133
+142
+140

38
Kurashima et al. [45] observed a substitution of exchangeable hydrogen atoms during
the synthetic process of seven batches of methylamphetamine synthesized by the Nagai
or Emde routes. To study this substitution, the batches of methylamphetamine were
synthesised using untreated (treated with water) and treated with Milli-Q-water [45].
The authors suggested the difference in δ2H values of methylamphetamine obtained
were due to various experimental conditions during the synthetic process including the
drying process, solvent used and humidity [45].
Makino et al. [44] applied IRMS profiling to seized crystalline methylamphetamine
samples where the reported source of methylamphetamine was (i) various locations of
seizures of methylamphetamine in different parts of Japan, (ii) samples smuggled in
from Malaysia, Hong Kong, Philippines, Canada and (iii) samples seized in different
locations, Australia, Korea, United States [44]. Using carbon and nitrogen isotope ratios,
the authors suggested that the precursor used in all of the seized methylamphetamine
were natural or semi-synthetic and not synthetic ephedrine. They reported that from
IRMS analysis (specifically δ13
C and δ15
N values) of samples from Canada and
Malaysia suggested a semi-synthetic ephedrine precursor source. The
methylamphetamine from Australia and United States were suggested to have been
synthesised from semi-synthetic pseudoephedrine. The samples found in different parts
of Japan and from Philippines were suggested to have been synthesized from natural
ephedrine as were the samples from Korea. The findings of the IRMS analysis are
shown in Figure 1.14 [44].

39
Figure 1.14. Methylamphetamine carbon and nitrogen isotope ratios [44].
Studies conducted by Kunalan et al. [32] reported stable isotope ratios of carbon (δ13
C),
nitrogen (δ15
N) and hydrogen (δ2H) of methylamphetamine prepared using seven
synthetic routes using two different precursors, phenyl-2-propanone and
ephedrine/pseudoephedrine. The synthesized methylamphetamine batches could be
discriminated using the isotopic data by precursor. The δ13
C values offered the best
discrimination which was to be expected as all of the carbon atoms on the final
methylamphetamine molecule are contributed by the precursor. It was reported also that
δ2H values could discriminate whether the methylamphetamine prepared was from either
a phenyl-2-propanone (P2P) or an ephedrine pseudoephedrine pathway and the 15
δN
data appeared to be most sensitive to inadvertent differences in preparative methods
[32].
In 2010, David et al. [47] reported in their study that δ2H and δ
15N were found to
fractionate during the precipitation of methylamphetamine as the hydrochloric salt. This
was similar to δ15
N values during the fractionation of cocaine hydrochloride salt [47]. It
was also reported that successive fractions of precipitate were found to be depleted in
heavy isotopes with more negative δ values [47]. However mixing the different fractions
of precipitate together and homogenizing them eventually minimized the effects of the

40
fractionation. In the authors opinion, in a clandestine situation samples would not be
fully precipitated or mixed this fractionation could create greater than expected variation
between illicit samples for δ2H and δ
15N even when synthesized from the same batch of
precursor [47].
1.8.4 Drug profiling with Inductively Coupled Plasma Mass Spectrometry
Few studies involving amphetamine type stimulants have been reported using
Inductively coupled Plasma mass Spectrometry (ICPMS) in comparison with other
techniques and, generally speaking, this may be as a result of the less specific nature of
the results obtained in terms of route or precursor specificity.
Waddell et al. [49] reported on ICPMS analysis data of seized ecstasy tablets and their
potential in seizure to seizure comparison. The study utilized chemometric methods and
artificial neural networks to analyse the resultant data. The authors reported that
principal component analysis (PCA) and hierarchical cluster analysis (HCA) failed to
differentiate tablets from different seizures adequately [49]. The limitations were due to
significant variation in the intensity of metals present within each seizure which still
impacted the cluster analysis despite data pre processing. The authors also noted
significant improvements in the classification of the tablets to the original seizures by
applying neural network algorithms.
Marumo et al. [51] analysed seized samples of methylamphetamine using ICPMS and
atomic absorption spectrometry (AAS). The authors identified seven elements (barium
(Ba), antimony (Sb), palladium (Pd), strontium (Sr), bromine (Br), zinc (Zn) and copper
(Cu)) and concluded a possible classification of the samples into five groups, however
given the unknown provenance of the samples, no route identification was possible [51].
Suzuki et al. [52] reported a number of inorganic impurities identified in
methylamphetamine samples using anion exchange ICPMS analysis. The authors
reported inorganic impurities of seized crystalline methylamphetamine using ICPMS
and ion chromatography. The authors also observed large variations of the target

41
elements within the same crystal and concluded that several parts of the crystal should
be analysed.
Kishi et al. [48] reported sodium (Na), bromine (Br), palladium (Pd), barium (Ba) and
iodine (I) in Emde synthesised samples and iodine, bromine and sodium apparent in
Nagai synthesised methylamphetamine samples [48]. Similarly Suh et al. [50] analysed
51 seized methylamphetamine samples using ICPMS and identified iodine (I) in the
majority of samples known to have been prepared via the Nagai route and palladium
(Pd) and barium (ba) in samples known to have been prepared via the Emde route.
Bromine (Br) was also detected in samples identified as being prepared via Nagai or
Emde synthesis.
Kunalan [32] also used ICPMS to interrogate methylamphetamine samples prepared via
seven different synthetic routes. This work highlighted the non specific nature of the
technique in relation to sample of this type where clusters of elements were associated
with more than one synthetic method: mercury (Hg) and lithium (Li) were associated
with both the reductive amination and birch routes, phosphorous (P) and iodine (I) were
associated with the Nagai and Moscow routes, paladium (Pd) and barium (Ba) were
associated with the Rosenmund and Emde routes [32].

42
1.9 References
1. United Nations Office on Drugs and Crime, World Drug Report; 2011.
2. United Nations, Single Convention on Narcotics Drugs, 1961. Available at:
http://www.incb.org/pdf/e/conv/convention_1961_en.pdf. Last accessed on
12/05/09.
3. United Nations, Single Convention on Narcotics Drugs, 1971. Available at:
http://www.incb.org/pdf/e/conv/convention_1971_en.pdf. Last accessed on
12/05/09.
4. United Nations, Convention Against the Illicit Traffic in Narcotic Drugs and
Psychotropic Substances, 1988. Available at:
http://www.incb.org/pdf/e/conv/convention_1988_en.pdf. Last accessed on
12/05/09.
5. King, L.; The Misuse of Drugs Act- A Guide for Forensic Scientists. RCS:
Cambridge, 2003.
6. The Evidence Base for the Classification of Drugs, 2010. Available at:
http://www.rand.org. Last accessed on 10/12/10.
7. Controlled Drugs (Substances Useful Manufacture) (Intra Community Trade)
Regulations 1993. Available at:
http://www.uk-legislation.hmso.gov.uk/si/si1993/Uksi_19932166_en_1.html.
8. Abouashed, A.E.; El-Alfy A.T.; Khan, I.A.; Walker, L.; Ephedra in Perspective- A
Current Review. Phytotherapy Research 2003, 17, 703-712.
9. Eric Lock. PhD thesis. University of Lausanne 2005, pp 8-9.
10. A Brief History of Methamphetamine. Available at:
http://www.helathvermont.gov/adap/meth/brief_history.aspx. Last accessed on
12/11/1.
11. Forensic Science Service, Drugs Intelligence Laboratory, Drugs Abuse Trends
1999. Available at: http://www.homeoffice.gov.uk. Last accessed on 10/05/09.
12. Forensic Science Service, Drugs Intelligence Laboratory, Drug Abuse Trends
2000. Available at: http://www.homeoffice.gov.uk. Last accessed on 10/05/09.

43
13. Forensic Science Service, Drugs Intelligence Laboratory, Drug Abuse Trends
2001. Available at: http://www.homeoffice.gov.uk/acmd1/ACMD-meth-annex-
November-2005. Last accessed on 10/05/09.
14. Forensic Science Service, Methamphetamine: Chemistry, Seizure Statistics,
Analysis,Synthetic Routes and History of Illicit Manufacture in UK and USA,
2004. Available at: http://www.homeoffice.gov.uk/acmd1/ACMD-meth-annex-
November-2005. Last accessed on 10/05/09.
15. Massetti, J., Recent laboratory seizures and activity in California clandestine
methamphetamine laboratories. Journal of the Clandestine Laboratory
Investigating Chemists 1996, 6(4), 13-14.
16. European Network of Forensic Science Institute, Definition of Drug Profiling In
Drugs Working Group Annual Meeting, Krakow, Poland, 2006.
17. Efficient amphetamine profiling by use of Harmonised Method and Common
Database. Available at: http://www.enfsi.org/agenda/cheddar. Last Accessed on
10/07/12.
18. United Nations International Drug Control Programme, Drug
Characterization/Impurity Profiling: Background and Concepts; Vienna 2001.
19. Andersson, K.; Lock, E.; Jalava, K.; Huizer, H.; Jonson, S.; Kaa, E.; Lopes, A.;
Poortman, A.; Sippola, E.; Dujourdy, L.; Dahle’n, J., Development of a
harmonized method for profiling of amphetamines VI Evaluation of methods for
comparison of amphetamine. Forensic Science International 2007, 169, 86-99.
20. United Nations International Drug Control Programme. A practical guide to
Methamphetamine Characterization/Impurity Profiling; Vienna 2000.
21. Puthaviriyakorn, V.; Siriviriyasomboon, N.; Phorachata, J.; Pan, W.; Sasaki, T.;
Tanaka, K., Identification of impurities and statistical classification of
methamphetamine tablets (Ya-Ba) seized in Thailand. Journal of Forensic Science
International 2002, 126, 105-113.
22. Dayrit, F.M.; Dumlao, M.C., Impurity profiling of methamphetamine
hydrochloride drugs seized in Philippines. Forensic Science International 2004,
144, 29-36.

44
23. Skinner, H.F, Methamphetamine Synthesis via HI/Red Phosphorous Reduction
Of Ephedrine. Forensic Science International 1990, 48,128-134.
24. Tanaka, K.; Ohmori, T.; Inoue, T., Analysis of Impurities in illicit
methamphetamine. Forensic Science International 1992, 56(2), 157-165.
25. Windahl, K.L.; McTigue, M.J.; Pearson, J.R.; Pratt, S.J.; Rowe, J. E; Sear, E.M.,
Investigation of the impurities found in methamphetamine synthesized from
pseudoephedrine by reduction with hydroiodic acid and red phosphorous.
Forensic International 1995, 76, 97-114.
26. Tanaka, K.; Ohmort, T.; Inoue, T.; Seta, S., Impurity profiling analysis of Illicit
Methamphetamine by Capillary Gas Chromatography. Journal of Forensic
Sciences 1994, 39(2), 500-511.
27. Lee, J.S.; Han, E.Y.; Lee, S.Y.; Kim, E.M.; Park, Y.H.; Lim, M.A; Chung, H.S.;
Park, J.H., Analysis of the impurities in the methamphetamine synthesized by
three different methods from ephedrine and pseudoephedrine. Forensic Science
International 2006, 161(2-3), 209-215.
28. Ko, B.J.; Suh, S.; Suh, Y.J.; In, M.K.; Kim, S.H., The impurity characteristics of
methamphetamine synthesized by emde and nagai method. Forensic Science
International 2007, 170(1), 142-147.
29. Kunalan,V.; W.J.Kerr.; N.NicDaeid., Investigation of the reaction impurities
associated with methylamphetamine synthesized using the nagai method.
Analytical Chemistry 2012, 84, 5744-5752.
30. Inoue, H.; Kanamori, T.; Iwata, Y.T; Ohmae, Y.; Tsujikawa, K.; Saitoh, S.; Kishi,
T., Methamphetamine impurity profiling using a 0.32 mm i.d. nonpolar capillary
column. Forensic Science International, 2003,135(1), 42-47.
31. Person, E.C.; Meyer, J.A.; Vyvan, J.R., Structural determination of the Principal
byproduct of the Lithium-Ammonia Reduction Method of Methamphetamine
Manufacture. Journal of Forensic Sciences 2005, 50 (1) 9.
32. Vanitha Kunalan. PhD thesis. University of Strathclyde 2010.,pp 30-285

45
33. Salourous, H.; Collins,H.; George.A.V; Davies, S., Isolation and Identification of
Three By-products found in Methylamphetamine synthesized by the Emde Route.
Journal of Forensic Sciences 2010, 5,605-615.
34. Qi, Y.; Evans, I.D.; McCluskey, A., New impurity profiles of recent Australian
imported ‘ice’: Methamphetamine impurity profiling and the identification of
(pseudo)ephedrine and Leuckart specific marker compounds. Forensic Science
International 2007,169, 173-180.
35. Kram, T.C.; Kruegel, A.V., The identification of Impurities in Illicit
Methamphetamine Exhibits by Gas Chromatography/Mass Spectrometry and
Nuclear Magnetic Resonance Spectroscopy. Journal of Forensic Sciences 1977,
22(1), 40-52.
36. Barron, R.P.; Kruegel, A.V.; Moore, J.M.; Kram, T.C., Identification of Impurities
in Illicit Methamphetamine Samples. Journal of the Association of Official
Analytical Chemists, 1974,57(5), 1147-1158.
37. Bailey, K.; Boulanger, J.G.;Legault, D.;Taillefer, S.L., Identification and synthesis
of Di-(1-phenylisopropyl)methylamine, an impurity in illicit methamphetamine.
Journal of Pharmaceutical Sciences, 1974,63(10),1575-1578.
38. Kunalan, V.; NicDaeid, N.; Kerr, W.J.;Buchanan, H.A.S.; McPherson, A.R.,
Characterization of Route Specific impurities found in Methamphetamine
synthesized by the Leuckart Route and Reductive Amination Methods. Analytical
Chemistry,2009,81(17), 7342-7348.
39. Carter, J.F.; Titterton, E.L.; Grantc, H.; Sleeman, R., Isotopic changes during the
synthesis of amphetamines. Chemical Communications 2002, (21) 2590-2591.
40. Palhol, F.;Lamoureux, C.;Chabrillat, M.;Naulet, N.,15N/14N isotopic ratio and
statistical analysis: an efficient way of linking seized Ecstasy tablets.Analytical
Chimica Acta 2004, 510(1), 1-8.
41. Buchanan,H.A.S.;NicDaeid N.;Meier-Augenstein, W.;Kemp,H.F.;Kerr,W.J.;
Middleditch, M.,Emerging use of Isotope ratio mass spectrometry as a too for
discrimination of 3,4-methylenedioxymethamphetamine by synthetic route.
Analytical Chemistry 2008, 80(9), 3350-3356.
42. Mas, F.; Beemsterboera, B.; Veltkamp, A.C.; Verweij, A.M.A., Determination of
‘common-batch’ members in a set of confiscated 3,4-(methyllendioxy)-

46
methamphetamine samples by measuring the natural isotope abundances: a
preliminary study. Forensic Science International 1995, 71, 225-231.
43. Kurashima, N.; Makino, Y.; Sekita, S.; Urano, Y.; Nagano, T., Determination of
Origin of Ephedrine Used as Precursor for Illicit Methamphetamine by Carbon and
Nitrogen Stable Isotope Ratio Analysis. Analytical Chemistry 2004, 76(14), 4233-
236.
44. Makino,Y.;Urano,Y.;Nagano,T., Investigation of the origin of ephedrine and
methamphetamine by stable isotope ratio mass spectrometry: a Japanese
experience. Bulletin on Narcotics 2005, 57, 63-68.
45. Kurashima,N.;Makino,Y.;Urano,Y;Sanuki,K.;Ikehara,Y.;Nagano,T.,Use of stable
isotope ratios for profiling of industrial ephedrine samples: Application of
hydrogen isotope ratios in combination with carbon and nitrogen. Forensic
Science International 2009, 14-18.
46. Collins, M.; Cawley, A.T.; Heagney, A.C.; Kissane, L.; Robertson, J.; Salourous,
H., δ13C, δ15N and δ2H isotope ratio mass spectrometry of ephedrine and
pseudoephedrine:application to methylamphetamine profiling. Rapid
Communications in Mass Spectrometry 2009, 23, 2003-2010.
47. David, G.E.; Coxon, A.; Frew, R.D.; Hayman, A.R., Isotope fractionation during
precipitation of methamphetamine HCl and discrimination of seized forensic
samples. Forensic Science International, 2010,200,123-129.
48. T.Kishi,J.Res.Natl.Bur.Stand (U.S.A) 93 (1988) 469-471.
49. Waddell, R.J.H.;NicDaeid.N.; Littlejohn, D.,Classification of ecstasy tablets using
trace metal analysis with chemometrics procedures and artificial neural network
algorithms .Analyst, 2004,129, 235-240.
50. Suh, S.;Ko, B.J.;Suh, Y.J.; In, M. K.; Kim, S. H.,Analysis of inorganic impurities
in illicit methamphetamine using Inductively Coupled Plasma Mass Spectrometry
(ICP-MS). Poster, The International Association of Forensic Toxicologists
(TIAFT), 2006.
51. Marumo, Y.; Inoue, T.; Seta, S., Analysis of inorganic impurities in seized
methamphetamine samples. Forensic science International 1994, 69(1), 89-95.

47
52. Suzuki, H.I.; Tsuchihashi, H.; Nakajima, K.; Matsushita, A.; Nagao, T., Analysis
of impurities in methamphetamine by Inductively coupled plasma-mass
spectrometry and ion chromatography. Journal of Chromatography 1988, 437,322.
53. Andrews, K.M., Ephedra’s Role as a precursor in the Clandestine Manufacture of
Methamphetamine. Journal of Forensic Sciences 1995, 40(4), 551-560.
54. Frank, R.S., The Clandestine Drug Laboratory Situation in the United States.
Journal of Forensic Science 1983, 28(1), 18-31.
55. King, L.A.; Glasgow, S., Clandestine Laboratories in the UK. Journal of the
Clandestine Laboratory Investigating Chemists 1994, 4(1), 19-20.
56. Massetti, J., Hypophosphorous acid use increase at California clandestine
methamphetamine laboratories. Journal of the Clandestine Laboratory
Investigating Chemists 1997, 7(3), 6.
57. Uncle Fester, Secrets of Methamphetamine Manufacture. Vol.9th
Edition,
Loompanics Unlimited: Port Townsend, Washington, 2009.

48
Chapter 2 Analytical Techniques
2.1 Introduction
The identity of the extracted precursor, essential chemicals and target compound
synthesised for this study was confirmed by a variety of analytical techniques and
comparison of the results obtained was made against literature values. This chapter
provides a brief description of each of these instruments together with a summary of the
background theory upon which each is based.
Melting point analysis, optical rotation, Fourier transform infrared spectroscopy (FTIR)
and nuclear magnetic resonance (NMR) were used to confirm the synthetic products and
extracted precursors. Microanalysis and X-ray powdered diffraction (XRD) were used to
determine the purity of the extracted precursor from the proprietary medication. Gas
chromatography mass spectroscopy (GCMS) was used to analyse the synthesised
samples to indicating organic impurities present. Inorganic impurities (elemental
profiles) were obtained for synthetic products, precursor, extracted essential chemicals
and extracting solvents using inductively coupled plasma mass spectrometry (ICPMS).
All of the synthesised samples and extracted precursors were subjected analysis using
stable isotope ratio mass spectrometry (IRMS) at the Stable Isotope Unit, The James
Hutton Institute, Invergowrie, Dundee, Scotland.
2.2 Melting point
The melting point of a solid is a temperature range over which the material changes state
from a solid to a liquid. This range is shorter for pure solids and as such melting points
measurements are often used as indicators for purity as well as identification of an
organic compound [1]. Solid to liquid transition is precise for pure solids and melting
point can be measured at 0.1oC and a pure solid has a higher melting point compared to
a less pure compound of the same material [1].

49
2.3 Optical rotation
A known number of solids, liquids, crystals and vapours rotate the electric vector of
linearly polarized light that passes through them. This property is known as optical
activity. The rotation is proportional to the thickness of the medium traversed where
clockwise rotations are defined as dextrorotatory (positive) and anticlockwise rotations
defined as laevorotatory (negative) [2]. The specific rotation of solid is defined as ‘the
optical rotation in degrees produced by a 1 mm thickness of the solid’ and is given by
the following equation:
Where:
α is the measured rotation (degrees)
d the path of length in solution (mm)
c the concentration (g/100 cm3)
2.4 Fourier Transform Infrared Spectroscopy (FTIR)
Infrared (IR) Spectroscopy is used as a means to confirm the molecular structure of pure
compounds and has particular uses in the differentiation of stereoisomers such as
ephedrine and pseudoephedrine [9,10,11]. The basic components of an FTIR instrument
include (i) a beam splitter (ii) a stationary mirror and (iii) a moveable mirror. Figure 2.1
represents a schematic diagram of the FTIR.
Equation 2.1

50
Figure 2.1. Schematic illustration of FTIR spectrophotometer [12].
Half of the infra red light is reflected from the beam splitter to the fixed mirror and back
to the detector, while the other half is passed through to a moveable mirror and then
back to the beam splitter, where the beam is again split and half of the light from the
reflected beam is passed to the detector. Using an infrared source, the moveable mirror
is moved so that the two light beams interact constructively. The detector records the
sum of the sine waves of the light and hence all the wavelengths of interest are collected.
A sample is introduced into a sample compartment where the light beam will absorb
some wavelengths but not others. Hence some wavelengths will be detected more
strongly than others and an interferogram is produced. These signals are transformed
into an infra red (IR) spectrum using a mathematical function called a Fourier Transform
[9-11].
A molecule absorbs infrared radiation when the vibration of the atoms in the molecule
produces an oscillating electric field with the same frequency as the incident infrared
light. This absorption of light causes an energy transition in the form of vibrational

51
excitation of bonds in the molecule. There are two types of molecular vibrations and
these results in the stretching and the bending of bonds. After the light as passed through
the sample, the frequencies which have been absorbed are detected and intensities are
recorded in the resultant spectrum. Light of wavelength λ will only be absorbed if there
is an energy transition, according to the following equation:
Where:
h is Planck’s constant (6.6 X 10⁻³⁴
Js),
c is the speed of the light (3.0 X 10⁸ m/s),
λ is the wavelength of light in metres.[9,10,11].
Some typical wavelengths of functional groups are presented in Table 2.1.
Table 2.1. Typical wavelength of functional groups [13].
Organic Compounds Wavelength (cm-1
)
Carbonyl Compounds 1670-1780
Alkenes (non terminal) 1640-1680
Amines 3300-3500
(C-N) 1030-1250
The 1450-600 cm-1
is described as the ‘fingerprint region’ due to the complexity of the
infrared spectra in that region [13]. Absorption bands in the 4000 to 1450 cm-1
region
are usually due to stretching vibrations of diatomic units and this is sometimes called the
group frequency region or functional group region [13].
Equation 2.2

52
2.5 Nuclear Magnetic Resonance (NMR)
Nuclear magnetic resonance (NMR) spectroscopy facilitates structural characterisation
of molecules. The principle behind NMR analysis relies on the fact that nuclei (such as
1H or
13C) with an odd number of protons, neutrons or both, will have an intrinsic
nuclear angular momentum or nuclear spin. When a nucleus with a non-zero spin is
placed in a magnetic field, the nuclear spin can align in either the same direction or in
the opposite direction to the external magnetic field. A nucleus that has its spin aligned
with the external field will have a lower energy than when its spin is aligned in the
opposite direction to the field [14]. The circulation of electrons about the proton itself
which generates a magnetic field opposed to the applied field. The field felt by the
proton itself is thus diminished and the proton is said to be shielded. If the induced field
reinforces the applied field, then the field felt by the proton is enhanced the proton is
said to be deshielded. The resonance frequencies of different nuclei in an atom are
described by a relative shift (chemical shift, δ (ppm)) compared to the frequency of a
standard which for 1H and
13C NMR spectroscopy the reference compound is
tetramethylsilane, Si(CH3) or TMS [14].
2.6 Microanalysis (Elemental Microanalysis)
The samples to be analysed are held in a tin container and placed inside an autosampler
drum [3]. Samples are dropped into a vertical quartz tube maintained in a furnace at high
temperature under a continuous flow of helium. In the quartz tube, the helium stream is
temporarily enriched with pure oxygen and both the sample and container melt (flash
combustion). Quantitative combustion is achieved when the mixture of gases formed is
passed over a layer of copper catalyst which removes oxygen and reduces nitrogen
oxides to elemental nitrogen. The mixture is passed through a chromatographic column
where it is separated into nitrogen (N2), carbon dioxide (CO2) and water (H2O) using a
thermal conductivity detector (TCD). A known standard is used to calibrate the

53
instrument [3, 4]. A general diagram of the instrumental set up is presented in Figure
2.2.
Figure 2.2. Schematic diagram of CHN analyser [5].
2.7 Powdered diffraction technique (XRD)
X-ray powder diffraction (XRD) is commonly used for identification of single phase
materials such as minerals, chemical compounds, ceramics or other engineered products.
This analytical technique is used extensively in the determination of crystal structures as
well as recognition of amorphous materials in partially formed crystalline mixtures [6,
7]. Figure 2.3 illustrates a typical XRD instrument.

54
Θ: Glancing angle; 2θ: Diffraction angle; α: Aperture angle
Figure 2.3. Schematic diagram of XRD [8].
A coherent beam of monochromatic x-rays of a known wavelength are produced when
an anode of a particular metal is struck with a beam of high energy electrons in a sealed
vacuum tube. The X-ray generated is influenced by the choice of metal anodes and
energy of the accelerated electrons. Usually copper (Cu), chromium (Cr), iron (Fe),
cobalt (Co) or molybdenum (Mo) tubes are used. Radiation is produced as Kα1, Kα2 and
Kβ radiation. Kα is commonly used for X-ray diffraction analysis and other X-rays are
removed by a filter or a monochromator [6, 7].
The X-ray is collimated and directed to the powdered sample. To create the parallel
beams most diffractometers have a series of parallel plates that are arranged
perpendicular to the diffractometer circle that are used to beam the X-rays to the
samples. Filters are located at the generator or detector side of the diffractometer to
remove the Kα2 and Kβ radiation [6, 7]. Recent instruments have optical systems in place
that produce tightly controlled and focused incident beams of X-ray [6, 7].

55
The intensity of the deflected (diffracted) X-ray is recorded and sent to a microprocessor
which converts the signal to a count rate. The distances between the planes of the atom
are calculated using Bragg’s Law [6, 7].
Where:
Integer n, is the order of the diffracted beam
λ is the wavelength of X-ray beam in nm
d is the distance between the adjacent planes of atoms (d-spacings)
θ is the angle of incidence of the X-ray beam in degrees
A typical X-ray scan provides a unique ‘fingerprint’ of the mineral or crystal lattice of
the target and the interpretation process involves comparison to known standards or
reference compounds [6, 7].
2.8 Chromatography
The International Union of Pure and Applied Chemistry (IUPAC) definition of
chromatography is [15-17]:
“a physical method of separation in which the components to be separated are
distributed between two phases, one of which is stationary (stationary phase) while the
other (mobile phase) moves in a definite direction. Elution chromatography is a
procedure in which the mobile phase is continually passed through or along the
chromatographic bed and the sample is fed into the system in a definite slug.”
In chromatography, the separation of components in a mixture occurs as a result of their
relative interaction with a mobile phase and a stationary phase. The components can be
separated as a result of differences in molecular charge, size or mass, polarity, redox
potential, ionization constants or structural differences such as isomeric structures or
chirality [15]. The sample is generally dissolved or distributed within the mobile phase
Equation 2.3

56
(gas, liquid or supercritical liquid) and the mobile phase is forced through a stationary
phase. The distribution of the sample between the mobile and stationary phases
determines the rate at which it will travel through the stationary phase [15].
Migration rates of individual molecules differ due to partition differences with the
mobile and stationary phases. The various components are hindered by interaction
(sorption) with the stationary phase. The sorption-desorption process occurs many times
as the analyte flows through the chromatographic system and the time required to reach
the detector (retention time) is dependent on the retention of the individual analytes by
the stationary phase. This type of chromatographic separation is called zonal or batch
chromatography because the sample is applied to the chromatographic system in one
narrow zone or band.
Besides adsorption, other factors that influence chromatographic separations include
properties of the analytes that can influence the intermolecular forces which it can
experience between the stationary and mobile phases. Some of these properties include,
ionization potential, electron affinity, electronegativity, molar volume, ionic radius,
ionic potential, dipole moment, dielectric constant, polarity, boiling point and solubility
[15, 16].
2.8.1 Introduction to Gas Chromatography
2.8.1.1 Distribution of analytes between phases
An analyte is in equilibrium between two phases according to its equilibrium constant
(partition constant), Kc presented in Equation 2.4
[15, 16]:
Where:
[A]s is the equilibrium concentration of analyte A in the stationary phase.
[A]m is the equilibrium concentration of analyte A in the mobile phase.
Equation 2.4

57
The equilibrium constant equation can also be used to express the relationship between
retention, column diameter and stationary phase as shown in Equation 2.5 [16]:
Where:
k = retention factor
r = column radius (µm)
β = phase ratio
df = column film thickness (µm).
The phase ratio, β, is a unitless value that depends on the diameter and thickness of the
column and reflects the impact of the column diameter and film thickness on retention.
The phase ratio is described in Equation 2.6 [15]:
The retention factor (k), also referred to as the partition ratio or capacity factor, can be
calculated using Equation 2.7:
Where:
tr = retention time (seconds).
tm= retention time of a non-retained compound (peak) (seconds).
Equation 2.5
Equation 2.6
Equation 2.7

58
2.8.1.2 Theoretical Plate Model of Chromatography
The theoretical plate model of chromatography suggests that the chromatographic
column consists of a large number of separate layers called ‘theoretical plates’ as shown
in Figure 2.4.
Figure 2.4. Theoretical plate model of chromatography
Equilibrium occurs separately at each individual plate between the stationary and mobile
phase. This model can be used in the measurement of column efficiency by calculating
the Height Equivalent to a Theoretical Plate (HETP), where N and H are inverse to each
other and the number of theoretical plates in the column (N) using Equation 2.8 and
Equation 2.9 respectively [16, 17].
Where:
L is the total length of the column (cm or mm).
H is the length of a column that contains one plate.
N is the number of theoretical plates in the column.
Where:
w ½ is peak width at half height (cm or mm).
tR is the retention time (seconds).
Equation 2.8
Equation 2.9

59
The plate number provides a measure of the relative peak broadening (w½) which has
occurred when the analyte passes through the system in time tR.
The plate theory explaining chromatographic separation is useful for providing some
information in relation to column efficiency but has been largely replaced by rate theory
concepts. This describes band broadening of the chromatographic peak using the Van
Deemter plot, represented in Figure 2.5 and the Van Deemter equation [15-17].
Figure 2.5. Van Deemter plot [15]
A Van Deemter plot is a representation of the plate height with respect to the average
linear velocity of the mobile phase. The Van Deemter plot is used to determine the
optimum mobile phase flow rate. The minimum point of the curve represents the
optimum velocity that provides the highest efficiency and smallest plate height. The Van
Deemter plot can be manipulated to obtain the best performance in a given analysis time
[15-17].

60
Van Deemter and co workers identified three factors that effected band broadening in
packed gas chromatography columns [15] which were expressed in the Van Deemter
equation:
Where:
A relates to eddy diffusion (metres, m).
B relates to longitudinal molecular diffusion (m2s
-1 ).
C relates to the mass transfer in stationary liquid phase (seconds, sec).
H is the height of a theoretical plate (metres, m).
u is average gas velocity (cm/s).
Eddy Diffusion
The A term in the Van Deemter equation is given in Equation 2.11 [15, 16]:
Where:
dp , represents the diameter of the particles packed in the column (µm)
λ is the packing factor.
To minimize A, small tightly packed particles are used to form the matrix of the
stationary phase to achieve maximum column efficiency.
Molecular Diffusion
The B term in the Van Deemter equation is given by Equation 2.12 [15, 16]:
Where:
DM is the diffusion coefficient for the solute in the mobile phase.
ψ is the obstruction factor that allows for the nature of packed beds.
Equation 2.10
Equation 2.11
Equation 2.12

61
A low diffusion coefficient is desirable and is achieved in gas chromatography by using
carrier gasses which have larger masses such as nitrogen and argon. Larger mobile phase
velocities will minimize the B value by ensuring that the solute resides for shorter times
in the column [15].
Mass Transfer
The C term in the Van Deemter equation is given in Equation 2.13 [15,16]:
Where:
df2 is average film thickness of the stationary phase in µm.
Ds is the diffusion coefficient of the solute in the stationary phase.
k is the capacity factor
In order to minimize mass transfer resistance, the film thickness of the column needs to
be small and the diffusion coefficient large [15, 16].
2.8.2 Chromatographic Separation in gas chromatography
Gas chromatographic separation relies on samples being volatile, thermally stable and
that the separation of mixtures of analytes is affected by their relative size, shape and
functionality which dictate their interaction with the chemical coating of the
chromatographic column [15-17].
In the chromatographic column, the analyte molecules are repetitively distributed
between the mobile phase (carrier gas) and the stationary phase, where molecules with a
greater affinity for the stationary phase are retarded. In general small molecules travel
through the column more quickly than larger molecules. The overall rate of movement
of the molecule down the column depends on the distribution of the molecules in
stationary and mobile phases respectively. The number of molecules in the mobile phase
and the rate at which they travel through the column are reflected by the size of the
Equation 2.13

62
corresponding peak in the chromatogram and the retention time of the analyte
respectively. Separation between two molecules occurs when their distribution between
the mobile and stationary phases are different. If they are similar, co-elution occurs. The
length, width, temperature of the column and thickness of the stationary phase also play
an important role in the chromatographic separation [15-17]. Identification of
chromatographic peaks is accomplished by a comparison with known standards.
2.8.3 The Basic Parts of a Gas Chromatograph
A gas chromatography instrument, presented in Figure 2.6, is comprised of six major
components: the gas supply and flow controllers, injector, detector, oven, column and a
data system [19].
Figure 2.6. Diagram of gas chromatography mass spectrometry (GCMS) [18].
Gas Supply and Flow Controllers: High purity gases are regulated by pressure
regulators which control the gas flow into the instrument. Further pressure regulators
deliver the carrier gas to the injector at precisely controlled rates. The carrier gas flows
through the injector to the column and exits through the detector [19, 20]. The main
purpose of carrier gas is to carry the sample through the column [19, 20]. It acts as an
inter mobile phase and provides a suitable matrix for the detector to measure sample

63
components [19, 20]. Helium is the most popular carried gas used particularly with
GCMS instruments although it can be expensive. Hydrogen is also commonly used,
though poses greater fire and explosion hazard and nitrogen provides slightly more
sensitivity but a slower analysis time than helium [19, 20].
Injector: The function of the injector is to introduce the sample into the column. It is
made from a hollow, metal cylinder normally containing a glass liner or insert. The
column is inserted into the bottom of the injector so that the column end resides in the
lower region of the glass liner. The usual temperature of the injector is between 100-
300oC, to ensure that any volatile sample is vaporised. The carrier gas is mixed with the
vaporised sample and swept into the column [19, 20].
Capillary Column and Oven: The column is housed in an oven whose temperature can
be accurately controlled. The interior wall of the column is coated with a thin film of
polymeric material which forms the stationary phase. Interactions occur between the
analytes and the stationary phase to impede the movement of different analytes to
different degrees. Compound retention is affected by various factors such as, length and
diameter of the column, the chemical structure and thickness of stationary phase and
column temperature [19, 20].
Detector: When an analyte exits the column it enters the detector which records the
analyte based on its physical and/or chemical properties. The detector response
corresponds to the amount of the analyte present [19, 20].
Data System: The recording device, normally a computerized system, plots the detector
signal against the time elapsed since the sample introduction into the injector to produce
the chromatogram. Computer operated data systems are very versatile and offer various
plotting, reporting and storage options [19, 20].

64
2.8.4 Mass spectrometry as a detection system in chromatographic analysis
The mass spectrometer is kept under vacuum of between 10-4
to 10-6
torr using either a
diffusion or turbomolecular pump. The mass spectrometer consists of three zones, (i)
Ionizer (ii) Mass Analyzer (iii) Detector. Ion production in the spectrometer occurs using
one of two methods, chemical ionization (CI) or electron ionization (EI). In the case of
chemical ionization, methane is ionized creating a radical which in turn ionizes the
sample molecule to produce (M + H)+ molecular ions. The CI process is a less energetic
way of ionizing a molecule and less fragmentation occurs compared electron ionization
[19, 20].
For electron ionization, a beam of electrons ionize the sample molecules emerging from
the chromatographic column resulting in the loss of one electron. Usually the ionization
source is heated to 150-300oC, to prevent condensation of the sample. The electrons are
supplied by a filament and enter through a small hole directed by a negatively charged
shield behind the filament. The electrons are focused into a narrow beam by magnets.
The energized electrons enter the source and collide with the molecules exiting from the
column. This creates a molecular ion, represented by M+ (a radical cation). From the
collision, energy is released from the molecules and accumulates in a single bond or
group of bonds which dissociate to produce smaller positive ionic fragments (daughter)
ions with characteristic relative abundance that provide a ‘fingerprint’ for that molecular
structure [19, 20].
2.8.5 Quadrupole mass analyzer
The mass analyzer separates the positively charged ions according to various mass
related properties depending upon the analyser used. Several types of analyser exist:
quadrupoles, ion traps, magnetic sector, time of flight, radio frequency and cyclotron
resonance. [19, 20] A simplified schematic diagram of a quadrupole mass spectrometer
is shown in Figure 2.7.

65
Figure 2.7. A Schematic diagram quadrupole mass spectrometer [21].
Positive ions are ejected from the source by a repeller held at a slightly positive
potential. The ions produced move through a series of focusing plates which accelerate
and focus the ions into a narrow beam before they pass into the quadrupole analyzer. A
negatively charged detector at the other end of the quadrupole array attracts the ions.
The quadrupole consists of four accurately machined rods set in a square array. In the
array a complex field is generated by the electrical potentials supplied to the rods. The
field is maintained at 2-4 scans per second, allowing the quadrupole to act as a mass
filter. The ion fragments oscillate through the quadrupole array and ions with specific
mass-to-charge (m/z) ratio pass completely through to the detector without colliding
with any one of the four rods [19, 20]. The signal resulting from the impact of ions on
the detector is amplified by an electron multiplier in the detector. The intensity or
abundance of the ions detected are plotted against time to produce a total ion
chromatogram (TIC) [19, 20].

66
2.9 Isotope Ratio Mass Spectrometry (IRMS)
Isotope ratio mass spectrometry provides an ‘isotope fingerprint’ of a chemical molecule
which may facilitate the identification of a sample. Stable isotope ratio mass
spectrometry (IRMS) has been used for the analysis of both licit and illicit drugs for the
purpose of determining geographic origin and to determine the potential for
discrimination between batches and manufacturing routes. The results obtained have
been promising for the technique, however the data remains limited due to the difficulty
in acquiring a sufficient number of samples of know origin and history, though
continued research is addressing this issue [21-23].
2.9.1 Isotope ratios
Isotopes are defined as atoms of the one element that differ in the number of neutrons
present in the nuclei, i.e. have different mass numbers. All but 12 elements exist as
mixtures of isotopes [24, 25]. For example, hydrogen usually has one proton in its
nucleus (written as 1H), but an isotopic form exists in which the nucleus contains one
proton and one neutron (2H, deuterium). Each element has a dominant light isotope, for
example 12
C (carbon), 14
N (nitrogen), 16
O (oxygen), 32
S (sulphur) and 1H (hydrogen),
and one or more heavy isotopes (e.g. 13
C, 15
N, 17
O, 18
O, 33
S, 34
S and 2H) [25, 26]. Table
2.2 below illustrates the relative abundances of common naturally occurring isotopes
[25, 26].
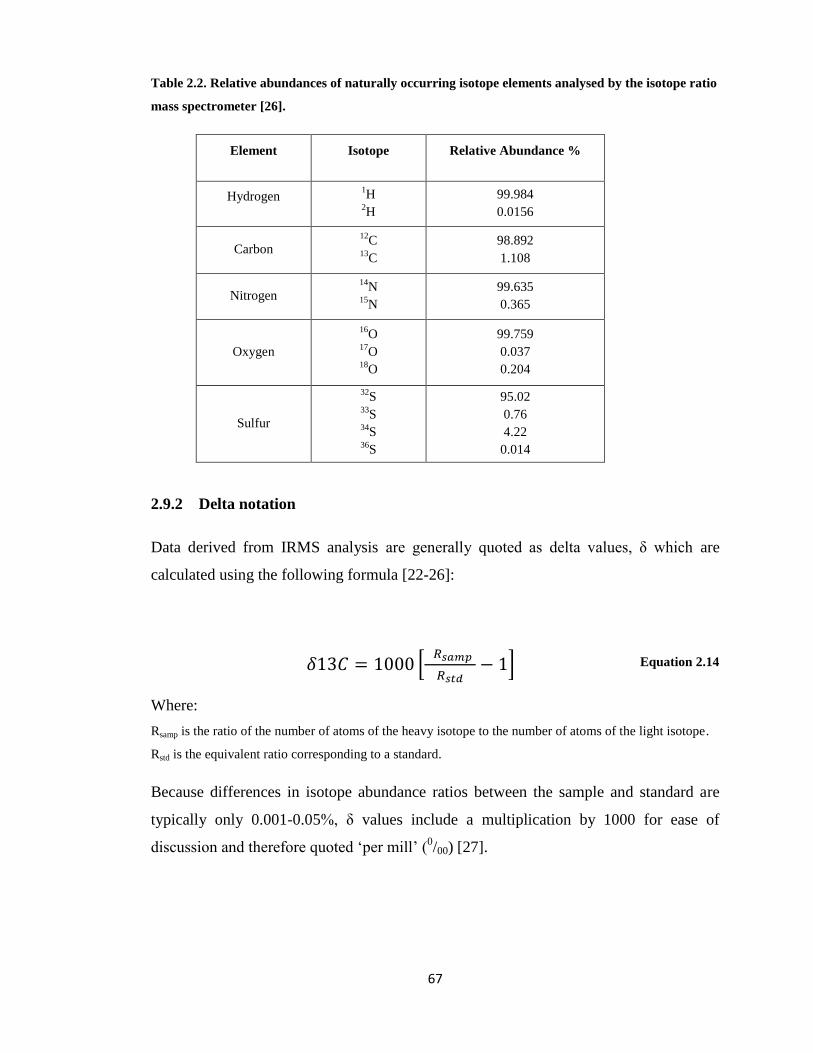
67
Table 2.2. Relative abundances of naturally occurring isotope elements analysed by the isotope ratio
mass spectrometer [26].
Element Isotope Relative Abundance %
Hydrogen 1H
2H
99.984
0.0156
Carbon 12
C 13
C
98.892
1.108
Nitrogen 14
N 15
N
99.635
0.365
Oxygen
16O
17O
18O
99.759
0.037
0.204
Sulfur
32S
33S
34S
36S
95.02
0.76
4.22
0.014
2.9.2 Delta notation
Data derived from IRMS analysis are generally quoted as delta values, δ which are
calculated using the following formula [22-26]:
Where:
Rsamp is the ratio of the number of atoms of the heavy isotope to the number of atoms of the light isotope.
Rstd is the equivalent ratio corresponding to a standard.
Because differences in isotope abundance ratios between the sample and standard are
typically only 0.001-0.05%, δ values include a multiplication by 1000 for ease of
discussion and therefore quoted ‘per mill’ (0/00) [27].
Equation 2.14

68
The isotope ratio is a relative measurement usually made against laboratory reference
material. These working standards are calibrated against international standards
arbitrarily set to 00/00. The International Atomic Energy Agency and the National
Institute of Standards and Technology (NIST) both supply a range of standards [39]. A
negative value delta indicates that the sample is light or depleted in the heavy isotope
relative to the standard. A positive value indicates that the sample is enriched in the
heavy isotope relative to the standard [22-27].
In natural abundance isotope analysis, the emphasis is on the relative difference between
samples analysed under the same conditions, as opposed to exact values obtained. One
of the main advantages of this relative measurement approach is higher precision [22-
24].
2.9.3 Fractionation Effects
Isotope fractionation is a process that changes the relative abundance of stable isotopes
of an element. The atmosphere and all living things, have various elements of stable
isotopes which occur naturally. Lighter elements are more prone to natural variation of
their isotopic composition and this variation is caused by fractionation effects. This
results in the creation of specific isotope values that are characteristic of the origin and
purity of the sample. In general, only the lighter element seems to be effected by isotope
fractionation. Increased precision of the modern isotope ratio mass spectrometer has
enabled researchers to identify natural variation as a result of isotopic fractionation in
heavier elements also [22-24,].
Isotopic fractionation arises from chemical, physical and biological processes and occurs
via two main mechanisms; (a) a kinetic isotope effect which is produced by differences
in reaction rates and (b) a thermodynamic effect which relate to the energy state of the
system [22-27].

69
Kinetic Isotope Effects
Kinetic isotope effects occur during reaction processes where different isotopes have
different reaction rates in a bond due to differences in their bond strength. This effect
represents changes in chemical bonding between the ground state and transition state of
the reaction where, according to statistical models, the lighter isotopes in an element
form a weaker bond. Primary isotopic effects occur when a bond which contains the
atom or isotope is broken or formed during the rate determining step of the reaction. A
secondary isotope effect occurs in reactions where the isotopic atom is situated next to
the reactive bond [22-24].
Kinetic isotope effects can be defined as a ratio of rate of constants of compounds which
contains light versus heavy isotopes at reactive sites, illustrated in [22-27]:
If the ratio is greater than one, the isotope effect is referred to as normal, and occurs
when light isotopes react faster and as a consequence the substrate becomes enriched by
heavy isotopes. If the ratio is less than one, the isotope effect is inverted and the
substrate becomes enriched by the light isotope. Fractionations that arise from chemical
reactions such as evaporation and condensation produce substrates that are isotopically
lighter (contains less heavy isotopes) than their starting material. These can be seen in
lighter elements such as hydrogen and deuterium because their isotopes show larger
differences in mass compared to heavier elements such as carbon or nitrogen [27, 28].
The selective incorporation of 12
C into organic matter during photosynthesis is another
vital kinetic isotope effect. The amount of metabolic carbon available in the plants
depends on numerous factors such as carbon fixation and the rate of diffusion of carbon
dioxide in the plant. The composition of ambient carbon dioxide will also vary
according to the temperature and photosynthetic process taking place (whether over land
or ocean) [22-27].
Equation 2.15

70
Most plants consume carbon dioxide via a C3 (Calvin), C4 (Hatch-Slack) or CAM
(Crassulacean Acid Metabolism) photosynthetic cycle. It is reported that 85% of plant
species follow the C3 pathway including wheat, rye and cotton whereas plants such as
sugar cane, tropical grasses and desert plants follow the C4 pathway [22-27]. The
photosynthetic pathway is also dependent on the isotopic composition of the plant which
is affected by environmental conditions including humidity, temperature, and the
isotopic composition of the soil [22-24, 27].
Thermodynamic Isotope Effects
The second most common isotopic fractionation is the thermodynamic isotope effect due
to free energy changes brought about when one atom in a compound is replaced by its
isotope. A heavier isotope has a smaller reserve of free energy compared to the same
molecule containing a lighter isotope. Differences in physical-chemical properties (such
as infrared absorption, molar volume, vapour pressure, boiling point and melting point,
all related to vibrational energy levels) are generally associated with thermodynamic
isotopic effects [22, 23, 27].
2.9.4 Isotope ratio Mass Spectrometer
Isotope ratio mass spectrometers (IRMS) are specialised mass spectrometers that
produce precise and accurate measurements of the variations in the natural isotopic
abundance of light stable isotopes. IRMS instruments are different from conventional
mass spectrometers, in that they do not scan a mass range of characteristic fragment ions
in order to provide structural information on the sample being analysed [25, 26, 27].
The mass spectrometers used for isotopic analysis, illustrated in Figure 2.8, are divided
into three main sections; (i) an ion source (IS), (ii) a mass analyser (EM) and (iii) an ion
collection assembly (FCC) [27].

71
Figure 2.8. General layout of an Isotope Ratio Mass spectrometer [27].
Gaseous samples for analysis enter the ionization chamber of the mass spectrometer. A
focused electron beam within a high vacuum environment interacts with the sample and
results in the loss of electrons from molecules, producing positive ions [22, 27]. These
ions are accelerated through a flight tube between the poles of an electromagnet, where
they are separated according to their mass to charge ratios (m/z). The ions are collected
by a collector array generally consisting of three (or sometimes up to eight) Faraday cup
(FC) collectors [27]. The Faraday cups are positioned so that the major ion currents
simultaneously strike at the middle of the entrance of the silt of the respective cups.
Each incoming ion contributes one charge. No stray ions or electrons can enter the cup
and no secondary particles formed from the impact with the inner walls of the cups exit
the cup. The ion currents are continuously monitored and then amplified, digitised using
a voltage to frequency converter (VFC) [27].
Sample size needed for routine, high precision isotope ratio analyses of an illicit drug is
1-2 mg. The sample is placed in a tin and combusted in an elemental analyzer coupled to
the mass spectrometer. Oxidizing and reducing columns ensure that all carbon and
nitrogen are converted to CO2 and N2 respectively. A gas chromatograph is positioned

72
following the elemental analyzer and before the mass spectrometer to separate CO2 and
N2 gas. The carbon and nitrogen isotope ratios of a sample can be determined on a single
analysis. Additionally, the C and N peaks are integrated as the gases pass through the
GC, so that precise C/N ratio can be determined facilitating the calculation of sample
purity [27]. The analysis of the isotopes must be performed on a simple gas which is
isotopically representative of the sample. For instance, the isotope ratio measurement of
2H/
1H is achieved on H2 gas,
13C/
12C on CO2,
15N/
14N on N2 and
18O/
16O on CO [27].
The continuous flow (CF) IRMS introduces the sample into the ion source of the IRMS
via a helium carrier gas. This system is connected to a range of automated sample
preparation devices such as (a) bulk stable isotope analysis (BSIA) and (b) compound
specific isotope analysis (CSIA). CF-IRMS is commonly used in forensic science
research due on-line sample preparation, smaller sample size needed, faster analysis
time, increased cost effectiveness and the possibility of interfacing with GC and LC
systems.
Bulk Stable Isotope Analysis (BSIA)
In bulk stable isotope analysis (BSIA) all of the sample interest is converted into simple
gases for IRMS analysis producing values reflecting the isotopic composition of all the
components in the sample. The setup of the instrument consists of an elemental analyser
coupled to the isotope ratio mass spectrometer (EA/IRMS) [27, 28]. Sample preparation
for BSIA involves weighing the samples into capsules, usually tin then loading these
onto an autosampler. Samples are then purged with helium to prevent the introduction of
water, oxygen and nitrogen. There are two instruments presented in Figure 2.9 and
Figure 2.10, which are involved in the preparation of samples for bulk stable isotope
analysis, (a) quantitative high temperature combustion and (b) quantitative high
temperature conversion. The quantitative high temperature combustion for bulk samples
is generally used for the analysis nitrogen and carbon [27].

73
Figure 2.9. General layout of an EA-IRMS system for the measurement of carbon and nitrogen bulk
stable isotope ratios. Diagram based on Benson et al. [28].
High temperature conversion elemental analysers (TC/EA) are used for the analysis of
hydrogen and oxygen isotope ratios of bulk samples. The samples are converted to H2
and CO gases, separated on a packed GC column and enter the IRMS via an open split
interface. Hydrogen and oxygen isotope ratios are measured from a single analysis [27,
28].
IRMS
Sample
introduction
Water trap
Gas chromatograph
Reduction tube

74
Figure 2.10. General layout of an TC/EA-IRMS system for the measurement of hydrogen and
oxygen bulk stable isotope ratios. Diagram based on Benson et al. [28].
Compound Specific Isotope Analysis (CSIA)
A capillary gas chromatographic column is used to achieve baseline separation of
complex mixtures of analytes prior to isotopic analysis. A splitter at the end of the gas
chromatographic column diverts most of the sample to a combustion or pyrolysis tube.
The remainder is sent to an optional flame ionization detector (FID), ion trap mass
spectrometer or is vented to the atmosphere [27, 28]. Diagrams of the typical
instrumental set up are presented in Figure 2.11 and Figure 2.12 [27, 28]. In order to
determine nitrogen and carbon isotope ratios, the eluting compounds are passed into a
combustion tube which contains an oxidation catalyst and other materials. The function
of the tube is to quantify carbon dioxide (CO2), water (H2O) and nitrogen. After the
combustion tube the products pass to a reduction tube to reduce NOx to nitrogen (N2)
and remove excess oxygen (O2). The sample finally passes through a trap to remove
water (H2O) and onwards to the IRMS [27, 28]. When nitrogen isotope ratios are
IRMS
Water trap
Gas chromatograph
pyrolysis
Sample
introduction

75
measured, the carbon dioxide formed is removed by cryogenic trapping as the ions
formed will interfere with the nitrogen isotope measurements. Hydrogen and oxygen
isotope ratios are quantitatively measures by converting the elements in the samples to
hydrogen gas or carbon monoxide [27, 28].
Figure 2.11. General GC-C/IRMS layout for the measurements of carbon and nitrogen isotope
ratios by CSIA. Diagram based Benson et al. [28].
Figure 2.12. General GC-C/IRMS layout for the measurements of hydrogen and oxygen isotope
ratios by CSIA. Diagram based on Benson et al. [28].
IRMS
Gas
chromatograph
Combustion tube Reduction tube
Water trap
Gas chromatograph
IRMS
Gas chromatograph
Water trap Pyrolysis
tube
Gas chromatograph
Sample
Introduction

76
2.10 Inductively Coupled Plasma Mass Spectrometry
Inductively coupled plasma mass spectrometry (ICP-MS) is a combination of two
analytical techniques, (a) inductively coupled plasma and (b) mass spectrometry [29]. A
typical instrumental set up is illustrated in Figure 2.13.
Figure 2.13. Schematic diagram of the inductively coupled plasma mass spectrometry [31].
General sample preparation for the ICP-MS analysis requires 1 or 2 mL of sample to be
diluted with nitric acid (generally 2% w/v) [29, 30]. The minimum sample volume
required for analysis is 5 mL with the total dissolved solids less than 0.1 wt % and no
suspended solids. A peristaltic pump and a nebuliser are used to create a fine aerosol of
sample within a spray chamber which is then transported into the sample injector of the
plasma torch using a flow of argon gas. The aerosol is directed into the inductively
coupled plasma (ICP) ion source. Plasma formation occurs as a result of the application
of a high voltage spark to the flow of argon gas stripping electrons from the argon atoms
[29, 30]. The electrons generated from this process are accelerated into a magnetic field
formed by the application of a radio frequency (RF) energy applied to a coil surrounding
the plasma torch. A chain reaction occurs between the newly formed electrons causing
an ICP discharge due to collision induced ionization. The temperatures in the ICP reach
between 6000 to 8000K [29, 30].

77
An interface consisting of an assembly of two cones (skimmer and sampler cone) is
needed to maintain a series of pressured differentials to facilitate an efficient sampling of
the plasma gases. This is because, the ions travelling in the argon stream which are at
atmospheric pressure (1-2 torr) need to transition into the low pressure region of the
mass spectrometer (< 1 X 10⁻⁵
torr). The sampler and skimmer cones are basically metal
disks with a small hole in the centre. These cones sample the center portion of the ion
beam coming from the plasma torch. The ions emerging from the ICP source via the
cones are focused into the mass spectrometer (MS) by a series of positively charged
electrostatic lenses or ion optics. The ions are then separated according to their mass to
charge (m/z) ratios [29, 30].
2.11 Conclusion
Structural determination of the extracted and synthesised compounds was determined
using nuclear magnetic resonance (NMR) and fourier transform infrared (FTIR).
Determination of the identity and purity of the compounds were facilitated using melting
point and optical rotation analysis. Microanalysis and XRD analysis was undertaken to
determine the purity of the extracted and synthesised compounds.
Organic impurity profiling of the synthesised methylamphetamine was undertaken using
gas chromatography mass spectrometry. The determination of inorganic profiling or
elemental profile for the batches precursors extracted from proprietary cold medication,
essential chemicals such as iodine and red phosphorous extracted from matchboxes and
tinctures and methylamphetamine synthesised was performed using inductively coupled
mass spectrometry (ICPMS). The investigation of isotopic variation of
methylamphetamine and the precursors used in the synthetic phase were analysed using
isotope ratio mass spectrometry (IRMS).

78
2.12 References
1. J.G.Speight.,Lange’s Handbook of Chemistry,16th
edition.;McGraw-Hill,1996.
2. Mohrig, J.R.; Hammond, C.N.; Schatz, P.F., Techniques in organic chemistry,3rd
edition.;W.H Freeman Company,2001.
3. CHN analyser. Available at:
http://www.ucl.ac.uk/pharmacy/services/analyticalservices/CHN. Last accessed on
5/03/12
4. Elemental analysis pathways. Available at:
http://www.uochb.cz/web/documents/cms_library. Last accessed 11/07/2012.
5. CHN image. Available at: http://www.rsic.iitb.ac.in/Chn.html. Last accessed on
5/03/12.
6. Ewald, P.P.; Fifty years of X-Ray diffraction. 3rd
edition.;International Union of
Crystallography, 1999.
7. Powdered diffraction theory. Available at:
http://serc.carleton.edu/research_education/geochemsheets/techniques/XRD.html.
Last accessed on 5/03/12.
8. Powdered diffraction instrument. Available at:
http://epswww.unm.edu/xrd/xrdclass/01-XRD-Intro.pdf. Last accessed on
11/03/12.
9. Kemp, W., Organic Spectroscopy. 2nd
edition.; Macmillan Publishers Ltd:
London, 1987.
10. Willard, H. H.; Merritt Jr., L. L.; Dean, J.A.; Settle Jr., F.A., Instrumental Methods
of Analysis. 7th
edition; Wadsworth Publishers USA:1988
11. Bell, S.E.J., Forensic Chemistry, 3rd
edition.;Pearson Education, Inc: Upper Saddle
River, NJ, 2006.
12. Fourier transform infrared spectroscopy instrument. Available at:
http://nanotechno-webnode.com. Last accessed on 1/07/12.
13. Clayden, J.; Greeves, N.; Warren, S.; Wothers, P., Organic Chemistry, 1st edition.;
Oxford University Press;Oxford, 2004.

79
14. Harwood, L.M.; Claridge, T.D.W., Introduction to Organic Spectrscopy, 2nd
edition; Oxford University Press: Oxford 1997.
15. McNair, H.M.; Miller, J.M., Peak Shape. In Basic Gas Chromatography, 5th
edition; John Wiley & Sons, Inc.; New York, 1998.
16. Robinson, K.; Robinson, J., Contemporary Instrumental Analysis, 3rd
edition;
Prentice Hall Publishing, 2000.
17. Dean, R., The Troubleshooting and Maintenance Guide for Gas
Chromatographers, 4th
edition.; Wiley-Vch publishing,2007.
18. Gas chromatography mass spectrometery image. Available at:
http://www.chromacademy.com/resolver-
november2010_Understanding_GCMS_part1. Last accessed on 11/07/2012.
19. Braithwaite, A.; Smith, F.J., Chromatographic Methods, 5th
edition.; Blackie
Academic & Professional: Glasgow, 1996.
20. McNair, H.M.; Bonelli, E.J., Sample Injection: In Basic Gas Chromatography, 5th
edition.; Consolidated Printers: Berkeley ,1969.
21. Mass spectrometer image. Available at: http://www.files.chem.vt.edu. Last
accessed on 11/07/2012.
22. Mas, F.;Beemsterboer, B.; Veltkamp, A.C.; Verweij, A.M.A., Determination of
common-batch members in a set of confiscated 3,4-
(methylendioxy)methylamphetamine samples by measuring the natural isotope
abundances-a preliminary study. Forensic Science International 1995, 71(3), 225-
231.
23. Carter, J.F.; Titterton, E.L.;Grant, H.;Sleeman, R., Isotopic changes during the
synthesis of amphetamines. Chemical Communications 2002, (21), 2590-2591.
24. Meier-Augenstein, W.,Liu, R.H.,Forensic Applications of Isotope Ratio Mass
Spectrometry. In Advances in Forensic Applications of Mass Spectrometry, Yinon,
J.,Ed. CRC Press: Boca Raton, 2004; pp 149-180.

80
25. Palhol, F.;Lamoureux, C.;Chabrillat, M.;Naulet, N.,15
N/14
N isotopic ratio and
statistical analysis: an efficient way of linking seized Ecstasy tablets. Analytical
Chimica Acta 2004, 510(1), 1-8.
26. Buchanan, H.A.S.; NicDaeid N.; Meier-Augenstein, W.; Kemp,H.F.; Kerr,W.J.;
Middleditch, M., Emerging use of Isotope ratio mass spectrometry as a tool for
discrimination of 3,4-methylenedioxymethamphetamine by synthetic route.
Analytical Chemistry 2008, 80(9), 3350-3356.
27. Wolfram Meier-Augenstein., Stable Isotope Forensics, 1st edition; John Wiley &
Sons Ltd: England, 2010.
28. Benson, S.; Lennard, C.P.; Roux, C., Forensic applications of isotope ratio mass
spectrometry-A review. Forensic Science International 2006, 157(1), 1-22.
29. Thomas, R.,Practical Guide to ICP-MS.Taylor &Francis Ltd:New York, 2005.
30. Brouwers, E.E.M.; Tibben, M.; Rosing, H.; Schellens, J.H.M.; Beijnen, J.H.,The
application of Inductively Coupled Plasma Mass Spectrometry in Clinical
Pharmacological Oncology Research. Mass Spectrometry Reviews,2008, 27,67-
100.
31. ICPMS image. Available at: http://www.eecelabs.seas.wustl.edu. Last accessed on
11/07/2012.

81
Chapter 3 Clandestine Synthesis of Methylamphetamine
3.1 Introduction
Illicit drugs manufactured from clandestine laboratories are often impure due to poor
laboratory conditions, variations in synthesis and impure starting materials (precursors
and essential chemicals) extracted either from common household products or
pharmaceutical grade chemicals [1, 2, 3]. As a consequence, chemical impurity profiles
can be derived from illicit drugs synthesized within these clandestine laboratories.
Chemical analysis, in particular, using gas chromatography mass spectrometry (GCMS)
can provide useful information on the materials, methods and synthetic route involved in
manufacture of the drugs [1, 2, 3].
Information relating to the clandestine manufacture of methylamphetamine and
amphetamine is widely available on the internet and various websites have been
dedicated to the clandestine manufacture of these compounds [1, 2, 3]. One well known
text widely available (‘The Secrets of Methamphetamine Manufacture’ by Uncle Fester)
is designed for novices with little or no knowledge in organic chemistry [4]. The book
gives details on using common household products to make methylamphetamine [4].
Many precursors and essential chemicals used in the clandestine manufacture of
methylamphetamine can be purchased in pharmacies and local hardware stores. For
example pseudoephedrine hydrochloride, a known precursor for methylamphetamine
can be easily extracted (using methylated spirits or other commonly available solvents)
from cold medication widely available as over the counter pharmaceuticals [4]. Essential
chemicals such as iodine and red phosphorous are also readily available and can be
extracted from iodine tinctures and matchboxes respectively [4].

82
3.2 Synthetic Routes
Most clandestine laboratories produce methylamphetamine hydrochloride using one or
other of eight synthetic pathways presented in Scheme 3.1.
Scheme 3.1. Pathways of methylamphetamine manufacture.
Rosenmund

83
The synthetic routes can be simply separated into two groups based on the precursor
chemical. The Leuckart and reductive amination synthesis both use phenyl-2-propanone
(P2P) and are popular in North American clandestine laboratories. All the other routes
(Birch, Nagai, Rosenmund, Emde, Moscow and Hypophosphorous) use ephedrine or
pseudoephedrine base or hydrochloride as the starting material and are favoured
elsewhere in the world mainly because of the precursor availability. In general the
synthetic routes are named after the individual who first reported the reactions [5-11].
Methylamphetamine synthesized from phenyl-2-propanone yields a racemic mixture,
regardless of the synthetic route. Manufacture via d-pseudoephedrine or l-ephedrine
yields the more potent d-methylamphetamine [9, 10, 11].
3.2.1 Commercial production of Ephedrine/pseudoephedrine
Ephedrine and pseudoephedrine shown in Figure 3.1 and Figure 3.2, are used in many
cough and nasal remedies to treat congestion caused by the common cold, sinusitis and
hay fever.
Figure 3.1. l-ephedrine
Figure 3.2. d-pseudoephedrine
Both ephedrine and pseudoephedrine are under international control in bulk form.
Restrictions on the supply of ephedrine and pseudoephedrine pharmaceutical products
have been imposed by the Medicines and Healthcare products Regulatory Agency
(MHRA) in the United Kingdom. However, medication containing both of these
compounds (ephedrine and pseudoephedrine) remain available in the UK and elsewhere
as over the counter products. Due to concern that pseudoephedrine and ephedrine can be
extracted from cold medication, MHRA held a public consultation in 2007 on whether to
reclassify pseudoephedrine, ephedrine from OTC (sold over the counter) to POM

84
(prescription only medicines). Following the consultation, The Commission on Human
Medicines (CHM), an independent body which gives advice to government ministers
about safety and quality and efficacy of medicines, advised that number of measures
should be introduced to control the supply of pseudoephedrine and ephedrine. The
measures include reducing the pack size for OTC containing ephedrine,
pseudoephedrine and a restriction on sale to one pack per transaction, which is the
current situation [12, 13]. Various brands names for medication containing
pseudoephedrine hydrochloride include Sudafed (Johnson and Johnson formerly Pfizer),
Actifed (Burroughs Wellcome) and Contac (GlaxoSmithKline) [12, 13].
Commercial ephedrine and Pseudoephedrine are produced via the three processes
(a) extraction from the ephedra plant (b) full chemical synthesis or (c) semi synthesis
and these are presented in Scheme 3.2.
Scheme 3.2. (I) Preparation of ephedrine from the ephedra plant; (II)Semi-synthetic synthesis of
ephedrine from fermentation of sugar and (III) fully synthetic route to ephedrine [14].
85
Ephedrine and pseudoephedrine can be readily extracted from the ephedra plant. The
stems and leaves of the Mediterranean and Asiatic species of the plant contain both
ephedrine and pseudoephedrine alkaloids [14, 15]. This process is typically employed
for ephedrine manufacture in China. Preparation of Ephedra alkaloids from the crude
plant material involves an acid/base extraction procedure. The powdered plant material
is first made alkaline. The base is extracted using chloroform and distilled. The residue
obtained is dissolved in dilute acid and filtered using decolorising carbon. The filtrate is
alkalinised and the alkaloids obtained are re-extracted with diethyl ether or chloroform.
Finally, the residue obtained is recrystallised from hot water and the solvent evaporated
to yield pure ephedrine crystals.
The most economical and popular method for large scale production of pharmaceutical
ephedrine is through the fermentation of a mixture of benzaldehyde and molasses
followed by a reductive amination of the resulting carbinol. Ephedrine is crystallized as
the hydrochloric salt. Pseudoephedrine hydrochloride is also produced from ephedrine
hydrochloride via an acetylation/deacetylation procedure [14, 15]. This process is known
to be used in India.
The semisynthetic process ephedrine is produced by fermentation of sugar followed by
amination. Acetaldehyde is generated by sugar fermentation is condensed with
benzaldehyde to form phenylacetylcarbinol (PAC). PAC reacts with methylamine over a
catalyst to produce ephedrine [14, 15, 16].
3.2.2 Methylamphetamine synthesis using Ephedrine/Pseudoephedrine as the
precursor chemical
Six synthetic routes are documented for the preparation of methylamphetamine using
ephedrine or pseudoephedrine as the starting material. The Moscow and
Hypophosphorous routes are both variations of the Nagai route and all three are
described in more detail in the next section.

86
3.2.2.1 Nagai Route
The clandestine manufacture of methylamphetamine using the Nagai route is a benzylic
alcohol reduction with typical methylamphetamine hydrochloride yields of between 54%
and 82% [10]. A mixture of ephedrine/pseudoephedrine hydrochloride, red phosphorous
and hydroiodic acid is heated, filtered and basified, extracted and crystallised as the
hydrochloric salt from ether/acetone with hydrochloric acid or hydrogen chloride gas
[10, 16]. The reaction involves a cyclic oxidation of the iodide anion to iodine and
reduction of iodine back to the anion by the red phosphorous, the latter being converted
to phosphorous or phosphoric acid. The diastereoisomers, (-) ephedrine and
(+) pseudoephedrine are reduced to (+) methylamphetamine and a (+,-) mixture of
ephedrine reduces to racemic methylamphetamine. The enantiomer or diastereoisomer
of ephedrine selected as precursor thus dictates which isomer of methylamphetamine
will be produced.
The reaction mechanism for the reduction of ephedrine with hydroiodic acid/red
phosphorus is presented in Scheme 3.3 and summarised as follows:
ephedrine/pseudoephedrine reacts with hydroiodic acid to form iodoephedrine which is
predominantly reduced to methylamphetamine. Iodoephedrine can also undergo ring
closure to form aziridines as a reaction by product [10].

87
Scheme 3.3. Methylamphetamine manufacture using Nagai route [16].
This is a popular clandestine synthesis due to its simple process and ease of use in large
scale production. There are two variations in the Nagai route, (a) the Moscow route and
(b) the Hypophosphorous route (known as the ‘Hypo route’) [11]. In both of these
methods, hydroiodic acid is made in situ during the reaction process. These
modifications are most likely to have occurred as a result of the difficulty in obtaining
hydroiodic acid regulated by the Controlled Drugs (Substances Useful for Manufacture)
Regulations 1983 in the United Kingdon and is listed in List 1 of Domestic Chemical
Diversion Control Act (DCDCA) in the United States [2, 3].

88
3.2.2.2 Moscow and Hypophosphorous routes
The Moscow route is presented in Scheme 3.4. Hydroiodic acid is formed in situ by
adding red phosphorous, iodine and water together which is reacted with the precursor
either, ephedrine or pseudoephedrine hydrochloride.
Scheme 3.4. Moscow Route synthesis.
Within the Moscow synthesis, HI is produced by reacting red phosphorus and iodine in
the presence of water. The catalytic cycle is presented in Figure 3.3 shown below. In
anhydrous media the oxidation of red phosphorous by iodine allows the equilibrium to
shift in favour of the generation of hydrogen by removal of iodine as P2I4 which
decomposes in the presence of water to phosphoric acid and phosphonium iodide which
affords under heating, the hydroiodic acid and phosphine PH3. Oxidation of PH3 by the
liberated iodine in the presence of water gives H3PO2 [10, 17, 18, 19].

89
Figure 3.3. Red phosphorous involvement in a catalytic cycle for generation of hydroiodic acid in
anhydrous media [19].
The Hypophosphorus (hypo) route has become an established synthetic route employed
by clandestine laboratories [17] and differs from the Moscow route in terms of the
phosphorus source. The Hypophosphorus approach uses commercially available
hypophosphorus (phosphinic) acid, which, upon reacting with iodine, generates
hydroiodic acid in-situ [18].
This method does not require any red phosphorous as the hypophosphorous acid
(commercially available in 50%, 30-32% and 10%) acts as the reducing agent
[11, 17, 18]. The reaction can effectively be carried out in one reaction vessel and is
much faster than that of the Moscow route with typical yields of 70-80 %. The reaction
is presented in Scheme 3.5.

90
Scheme 3.5. Methylamphetamine manufactured using the Hypo Method [11].
For the hypophosphorous route, the hydroiodic acid is generated from the reaction
between hypophosphorous acid and iodine and is illustrated in Figure 3.4 [19].
Figure 3.4. Hypophosphorous acid involvement in a catalytic cycle for generation of hydroiodic acid
in aqueous media [19].

91
For both catalytic cycles, hydroiodic is regenerated using a dissociative mechanism
which affords hydrogen and iodine. Both of these are consumed by the individual
phosphorous source (red phosphorous for the Moscow route and hypophosphorous acid
for the hypo route) [19]. The in-situ generated hydroiodic acid protonates the hydroxyl
group of ephedrine or pseudoephedrine, which is removed from the compound. This is
most likely facilitated by the secondary amine which is capable of forming an aziridine
intermediate. The introduction of iodide in place of the hydroxyl group is then followed
by reduction of this new functionality to yield methylamphetamine [10, 19]. The
reaction mechanism is presented in Scheme 3.6.

92
Scheme 3.6. Moscow and Hypophosphorous mechanism

93
3.2.3 Extraction and preparation of pseudoephedrine from commercially
available cold medication.
Initial studies optimised the extraction of the precursor pseudoephedrine from
pharmaceutical products and iodine and red phosphorous from commonly available
materials. The extracted materials were then used to systematically synthesise
methylamphetamine as the hydrochloride salt using both the Moscow and
Hypophosphorous routes.
3.2.4 Materials and Methods
Toluene, diethyl ether, methanol, absolute ethanol and chloroform were all purchased
from Fischer Scientific. Hydrochloric Acid (37%), sulfuric acid (95-97%) and
hypophosphorous acid (40%) were purchased from Sigma Aldrich. Sodium chloride and
sodium hydroxide pellets were purchased from GPR (Poole, England). d-
pseudoephedrine hydrochloride was purchased from Sigma Aldrich. Methylated Spirits
was purchased from B&Q. Apparatus used were a Philips PW9421 pH meter, a Fisons
Whirlmixer vortex, an American Beauty S/70 sonicator and an Edmund Buhler Swip
KS-10 rotative shaker. Distilled water was obtained from an in house water purification
system.
Sudafed, a non drowsy decongestant, containing pseudoephedrine hydrochloride (60 mg
per tablet), was purchased from pharmacies in Glasgow, Scotland. Other components of
the tablets included lactose, microcrystalline cellulose, maize starch, silica, magnesium
stearate, hypermellose, polyethylene glycol and red iron oxide (E172). Panadol and
Allerpid tablets were purchased from various pharmacies in Kuala Lumpur, Malaysia.
The Panadol brand tablets contained pseudoephedrine hydrochloride (30 mg per tablet).
Other active components included paracetamol (500 mg per tablet) and chlorphenramine
(5 mg per tablet). The Allerpid brand tablets contained pseudoephedrine hydrochloride
(120 mg per tablet) and loratadine (5 mg per tablet).

94
3.2.5 Extraction of pseudoephedrine from pharmaceutical tablets
Sudafed tablets: Initial studies were undertaken to determine the volume of solvent,
time and method of agitation which facilitated the optimal conditions for the extraction
of pseudoephedrine from the Sudafed tablets. The tablets were coated with a red iron
oxide (E172) and optimisation studies also included exploring whether this coating
needed to be removed prior to extraction. The iron oxide coating was removed by
repetitive washing with acetone (10 mL in total) until all the red colour had disappeared.
The following general method of sample extraction was undertaken [4].
One Sudafed tablet was crushed using a mortar and pestle and the crushed tablet placed
in a beaker. A measured volume of solvent was added to the beaker which was then
covered with aluminium foil and agitated for a fixed period of time. The sample was left
to settle for one hour at room temperature and then filtered using gravity filtration. The
solvent was evaporated and the resultant solid collected and analysed using NMR and
FTIR.
Panadol/Allerpid tablets: A different approach was required for the extraction of
pseudoephedrine from the Panadol and Allerpid tablets. This was because both tablets
also contained relatively large amounts of paracetamol. The extraction methodology
followed was originally suggested by the US Drug Enforcement Administration (DEA)
[20]. 10 tablets (one strip) were crushed using a mortar and pestle and placed in a beaker
(250 mL) together with 100 mL of hot water (90oC) and stirred. The pH of the mixture
was adjusted to pH 1 using hydrochloric acid (4% vol/vol). The mixture was washed
three times using a total of 100 mL of diethyl ether. The pH of the mixture was further
adjusted to pH 12 using sodium hydroxide (10%) and extracted three times using a total
of 100 mL of diethyl ether and the washings retained. The collected diethyl ether
washings were further washed with 50 mL of distilled water and the solvent was left to
evaporate and resultant solid collected [20].

95
3.2.6 Extraction of essential chemicals
3.2.6.1 Iodine from iodine tinctures
Iodine tincture (7 mL of 2.5%) and distilled water (7 mL) were combined together and
mixed with swirling. Concentrated hydrochloric acid (1 mL) was added drop wise with
swirling, followed by hydrogen peroxide (7 mL, 6% 20 vols). The mixture was poured
into a beaker containing distilled water (50 mL) and left to stand for 20 minutes [4]. The
mixture was subsequently filtered using gravity filtration to reveal the iodine crystals. In
total 214.6 g of iodine was produced.
3.2.6.2 Red phosphorous from matchboxes
Matchbook strikers from locally purchased K TWO safety matchboxes were cut off the
boxes and soaked in acetone (10 mL). After 30 minutes the red phosphorous was
scraped from the strikers and the paper discarded. The extracted red phosphorous was
washed with distilled water and left to dry completely. The dry red phosphorous was
placed in a beaker and sodium hydroxide solution (20% wt/vol, 20 mL) was added and
placed on a low heat for 2 hours. The final product was filtered, washed with distilled
water and left to dry [4]. In total, 23.4 g of red phosphorous was extracted from 360
matchboxes.
3.2.7 Synthesis of methylamphetamine using the Moscow Route
Pseudoephedrine hydrochloride (2.0 g) was mixed in a round bottom flask (100 mL)
together with red phosphorous (0.6 g), iodine (4.0 g) and distilled water (2 mL) and a
condenser attached. The mixture was refluxed for 24 hours and then allowed to cool.
Once cool, the mixture was diluted with an equal volume of water and the red
phosphorus filtered out. A few grams of sodium thiosulfate were placed into a beaker,
and sodium hydroxide solution (25% wt/vol, 8 mL) added. This was then added to the
filtered reaction mixture, and swirled to reveal methylamphetamine free base as an oil
which floated to the top of the aqueous solution. Toluene (20 mL) was added to extract
the methylamphetamine free base. The toluene extract was clear to pale yellow.
96
Anhydrous hydrogen chloride gas was bubbled through to reveal a white precipitate,
which was washed with toluene. The solid was dried under high vacuum. Structural
conformation of the product was achieved using nuclear magnetic resonance (NMR) and
typical values obtained were 1H NMR (400 MHz, D2O): δH 1.23 (d, 3H, J=8.0 Hz,
CH3), 2.66 (s, 3H, CH3), 2.87(dd, 1H, J=24.0, 8.0 Hz, CH), 3.04 (dd, 1H, J=20.0, 8.0
Hz, CH), 3.48-3.53 (m, 1H, CH), 7.24-7.39 (m, 5H, C6H5). This data is confirmed by
work published by Kram et al. [21]. A sample spectra is attached in Appendix A.
IR vmax (KBr)/cm-1
: 3419(N-H), 2972, 2731, 2461(C-C), 1605(N-C). This is in
agreement with published data for IR [22]. A sample spectra is attached in Appendix B.
The synthesis was repeated six times each for laboratory grade pseudoephedrine and
pseudoephedrine extracted from Sudafed tablets using ethanol, ethanol:methanol
(90:10% vol/vol) and commercial methylated spirits. In these cases essential chemicals
(iodine and phosphorous) extracted from tinctures and matchboxes were also used. Two
samples were prepared from the pseudoephedrine extracted using Allerpid tablets
extracted using the acid base extraction.
3.2.8 Synthesis of methylamphetamine using Hypophoshorous Route.
Pseudoephedrine hydrochloride (2.0 g) was placed into a round bottom flask (100 mL)
and mixed with iodine (4.0 g) and hypophosphorus acid (3.6 mL) and a condenser
attached. The mixture was refluxed for 8 hours then allowed to cool. Once cool, the
mixture was diluted with an equal volume of water. A few grams of thiosulfate was
placed into a beaker, and 25% sodium hydroxide solution (24 mL) was added to extract
the methylamphetamine free base. Extraction and precipitation of the salt was as
previously described. Structural conformation of the product was achieved using nuclear
magnetic resonance (NMR) and typical values obtained were 1H NMR (400 MHz, D2O):
δH 1.20 (d, 3H, J=8.0 Hz, CH3), 2.62 (s, 3H, CH3), 2.85(dd, 1H, J=24.0, 8.0 Hz, CH),
3.01(dd, 1H, J=20.0, 8.0 Hz, CH), 3.42-3.50 (m, 1H, CH), 7.23-7.36 (m, 5H, C6H5).
This data is confirmed by work published by Kram et al. [21]. A sample spectra is
attached in Appendix C.

97
IR vmax (KBr)/cm-1
: 3419(N-H), 2972, 2731, 2461(C-C), 1605(N-C). This is in
agreement with published data for IR [22]. A sample spectra is attached in Appendix D.
The synthesis was repeated six times each for laboratory grade pseudoephedrine and
pseudoephedrine extracted from Sudafed tablets using ethanol, ethanol:methanol
(90:10% vol/vol) and commercial methylated spirits. In these cases essential chemicals
(iodine and phosphorous) extracted from tinctures and matchboxes were also used.
Three batches of methylamphetamine in total were also prepared from the
pseudoephedrine extracted from Panadol (1 batch) and Allerpid (2 batches) tablets
extracted using the acid base extraction.
3.3 Result and discussions
3.3.1 Extraction of Sudafed tablets using various solvents
Pseudoephedrine was extracted from commercially available Sudafed tablets. Each
tablet was coated in red iron oxide (E172) and contained 60 mg of the target drug per
tablet. Three solvents were chosen with reference to the literature (ethanol,
ethanol:methanol (90:10 vol/vol) and methylated spirits). A systematic study was
undertaken using ethanol as the extracting solvent to determine the optimum extraction
conditions. The optimised conditions were subsequently used for each solvent to prepare
the desired weight of precursor. During the optimisation experiments, three different
agitation methods were examined where the volume of solvent and time of agitation was
systematically varied. Both coated and non coated tablets were used. The yields of
pseudoephedrine recovered for each set of extracting conditions are presented in Table
3.1, Table 3.2 and Table 3.3 where the highest yielding method is highlighted in each
case.

98
Table 3.1. Extraction of pseudoephedrine from Sudafed tablets (with and without coating) with
ethanol – shaking by hand.
Sample Method Coating Time (mins) Volume (mL) Yield (%)
SC-1 Hand shaking Yes 10 5 7.5
SC-2 Hand shaking Yes 10 10 8.0
SC-3 Hand shaking Yes 10 15 8.5
SC-4 Hand shaking Yes 15 5 8.0
SC-5 Hand shaking Yes 15 10 14.0
SC-7 Hand shaking Yes 15 15 13.9
SC-8 Hand shaking Yes 20 5 9.1
SC-9 Hand shaking Yes 20 10 13.7
SC-10 Hand shaking Yes 20 15 13.9
S-11 Hand shaking No 10 5 2.1
S-12 Hand shaking No 10 10 3.0
S-13 Hand shaking No 10 15 5.8
S-14 Hand shaking No 15 5 2.5
S-15 Hand shaking No 15 10 3.8
S-16 Hand shaking No 15 15 3.8
S-17 Hand shaking No 20 5 4.0
S-18 Hand shaking No 20 10 5.6
S-19 Hand shaking No 20 15 7.0

99
Table 3.2. Extraction of pseudoephedrine from Sudafed tablets (with and without coating) with
ethanol – using a mechanical agitator.
Sample Method Coating Time (mins)
(mins)
Volume (mL) Yield (%)
SC-20 Agitator Yes 10 5 1.4
SC-21 Agitator Yes 10 10 15.0
SC-22 Agitator Yes 10 15 15.3
SC-23 Agitator Yes 15 5 10.9
SC-24 Agitator Yes 15 10 15.5
SC-25 Agitator Yes 15 15 18.9
SC-26 Agitator Yes 20 5 6.4
SC-27 Agitator Yes 20 10 10.1
SC-28 Agitator Yes 20 15 16.7
S-29 Agitator No 10 5 3.6
S-30 Agitator No 10 10 12.3
S-31 Agitator No 10 15 3.7
S-32 Agitator No 15 5 5.9
S-33 Agitator No 15 10 3.3
S-34 Agitator No 15 15 11.3
S-35 Agitator No 20 5 3.2
S-36 Agitator No 20 10 3.9
S-37 Agitator No 20 15 6.2

100
Table 3.3. Extraction of pseudoephedrine from Sudafed tablets (with and without coating) with
ethanol – using a vortex.
Sample Method Coating Time (mins)
(mins)
Volume (mL) Yield (%)
SC-38 Vortex Yes 10 5 10.5
SC-39 Vortex Yes 10 10 10.5
SC-40 Vortex Yes 10 15 10.0
SC-41 Vortex Yes 15 5 14.5
SC-42 Vortex Yes 15 10 11.9
SC-43 Vortex Yes 15 15 10.2
SC-44 Vortex Yes 20 5 6.6
SC-45 Vortex Yes 20 10 10.7
SC-46 Vortex Yes 20 15 11.8
S-47 Vortex No 10 5 4.6
S-48 Vortex No 10 10 14.9
S-49 Vortex No 10 15 6.0
S-50 Vortex No 15 5 4.6
S-51 Vortex No 15 10 11.5
S-52 Vortex No 15 15 13.0
S-53 Vortex No 20 5 12.1
S-54 Vortex No 20 10 13.7
S-55 Vortex No 20 15 14.0
The general trend observed in the data suggests that better yields are obtained with
tablets where the coating hasn’t been removed and the best results were obtained using
15 mL of ethanol with mechanical agitation for 15 minutes. Repeatability of this
extraction method was explored for each solvent used (ethanol, ethanol:methanol
(90:10% vol/vol) and commercial methylated spirits) the results of which are presented
in Table 3.4. The total weight of precursor material extracted from Sudafed using each
solvent is presented in Table 3.5.

101
Table 3.4. Repeatability of extraction using various solvents (15 mL) with mechanical agitation (15
minutes) SE = ethanol, SLMS = ethanol:methanol (90:10% vol/vol), SMS – commercial methylated
spirits.
Sample Weight (mg) Yield (%)
Ethanol extraction
SE 25C-1 254.8 18.70
SE 25C-2 254.7 18.90
SE 25C-3 256.4 18.70
SE 25C-4 256.6 18.50
SE 25C-5 255.3 18.40
SE 25C-6 256.6 17.90
%RSD 1.88
Ethanol:Methanol (90:10% vol/vol) extraction
Weight(mg)
Yield(%)
SLMS 25C-1 256.0 17.78
SLMS 25C-2 252.1 18.90
SLMS 25C-3 256.8 18.30
SLMS 25C-4 254.0 18.26
SLMS 25C-5 260.2 17.60
SLMS 25C-6 252.5 17.90
% RSD 2.58
Commercial methylated spirits extraction
SMS 25C-1 254.6 16.78
SMS 25C-2 255.7 16.90
SMS 25C-3 253.5 16.30
SMS 25C-4 257.0 16.26
SMS 25C-5 254.1 16.60
SMS 25C-6 259.6 16.90
% RSD 1.73

102
Table 3.5. Summary of precursor yields obtained from Sudafed using each solvent.
Precursor extraction solvent Yields (grams) from 840 tablets (70
boxes)
Average
yield (%)
Ethanol 34.50 18.51
Ethanol:methanol (90:10) vol/vol 34.00 18.12
Commercial methylated spirits 32.00 16.62
3.3.2 Extraction of Panadol and Allerpid tablets using acid/base extraction
The availability of Panadol and Allerpid tablets was more limited as these were sourced
from Malaysia. The yields of pseudoephedrine hydrochloride obtained from the acid
base extraction of these samples are provided in Table 3.6. The lower amounts of these
materials restricted the number of repetitive synthesis of methylamphetamine possible
with these precursors.
Table 3.6. Summary of precursor yields obtained from Panadol and Allerpid tablets using each
acid/base extraction.
Precursor acid base extraction Yield (grams) Yield (%)
Panadol tablets 300pills - 3.00 g 5.80
Allerpid tablets 50 pills - 9.25 15.90
Confirmational analysis of each of the extracted pseudoephedrine samples was
undertaken using melting point, microanalysis, FTIR and X-ray powdered diffraction
(XRD) and examples of the results presented in Table 3.7 and Figure 3.5Figure 3.6to
Figure 3.13.

103
Table 3.7. CHN and melting point data of pseudoephedrine HCl extracted from Sudafed tablets.
Sample C % H % N % Melting point
(0C)
Laboratory grade pseudoephedrine 59.40 7.86 6.96 185-189
Sudafed extracted using Ethanol 58.74 7.81 6.50 185-188
Sudafed extracted using
Ethanol:methanol (90:10 %vol/vol) 58.60 7.89 6.38 184-187
Sudafed extracted using commercial
methylated spirits 59.11 8.07 5.99 185-186
Panadol tablets extracted using acid
base extraction
values
58.40 7.90 6.90 185-187
Allerpid tablets extracted using acid
base extraction 59.20 7.80 6.78 186-187
Theoretical value 59.55 7.94 6.94 186-187
Figure 3.5. X ray Powder diffraction of Pseudoephedrine HCl extracted from Sudafed using ethanol
as extraction solvent.
Lin
(Cou
nts)
0
1000
2000
3000
4000
5000
6000
7000
8000
9000
10000
11000
12000
13000
14000
2-Theta - Scale
4 10 20 30

104
Figure 3.6. X ray Powder diffraction of Pseudoephedrine HCl extracted from Sudafed using
ethanol:methanol(90:10) vol/vol as extraction solvent
Figure 3.7. X ray Powder diffraction of Pseudoephedrine HCl extracted from Sudafed using
commercial methylated spirit as extraction solvent
Lin
(Cou
nts)
0
1000
2000
3000
4000
5000
6000
7000
8000
9000
10000
11000
12000
13000
14000
2-Theta - Scale
4 10 20 30
Lin
(C
ou
nts
)
0
1000
2000
3000
4000
5000
6000
7000
8000
9000
10000
11000
12000
13000
14000
2-Theta - Scale
4 10 20 30

105
X-ray powder diffraction analysis confirmed that pseudoephedrine hydrochloride
extracted from the three solvent systems were all of the same crystalline phase. The
pattern is consistent with that of the single crystal structure of laboratory grade
pseudoephedrine hydrochloride presented in Figure 3.8 and was in agreement with
previous studies [23, 24]. Interestingly, the powdered sample extracted from Sudafed
using methylated spirits was purple, the colour deriving from the violet colour dye
present in the solvent. The dye was not crystalline and did not contribute to the
diffraction pattern.
Figure 3.8. X ray Powder diffraction of Laboratory grade pseudoephedrine HCl.
The FTIR spectra of the extracted precursor samples are presented in Figure 3.9 to
Figure 3.13 and demonstrate consistency across all extracted samples.
Lin
(C
ou
nts
)
0
1000
2000
3000
4000
5000
6000
7000
8000
9000
10000
11000
12000
13000
14000
2-Theta - Scale
4 10 20 30

106
Figure 3.9. FTIR spectra of Pseudoephedrine HCl extracted from Sudafed using ethanol as
extraction solvent.
Figure 3.10. FTIR spectra of Pseudoephedrine HCl extracted from Sudafed using
ethanol:methanol(90:10) vol/vol as the extraction solvent

107
Figure 3.11. FTIR spectra of Pseudoephedrine HCl extracted from Sudafed using commercial
methylated spirits as the extraction solvent.
Figure 3.12. FTIR spectra of Pseudoephedrine HCl extracted from Panadol using acid base
extraction.

108
Figure 3.13. FTIR spectra of Pseudoephedrine HCl extracted from Allerpid using acid base
extraction.
3.3.3 Extraction of essential chemicals
Both iodine and red phosphorous are essential chemicals in the Moscow and
Hypophosphorous synthetic routes. The extraction of these chemicals from household
materials is straightforward and easily accomplished from iodine tinctures or
matchboxes. Table 3.8 and 3.9 provide the yields of iodine and phosphorous
respectively recovered using the methods described in section 3.2.3.

109
Table 3.8. Yield of iodine extracted from iodine tinctures.
Bottles of Tincture (250 mL) Yield (g)
10 bottles 8.70
10 bottles 15.20
10 bottles 14.79
10 bottles 15.00
10 bottles 14.63
10 bottles 13.69
10 bottles 14.20
10 bottles 14.00
10 bottles 14.78
10 bottles 14.65
10 bottles 14.34
10 bottles 15.17
10 bottles 15.28
10 bottles 15.89
10 bottles 14.32
Overall yield obtained (gram) 214.64
Table 3.9. Yield of red phosphorous from matchboxes striker pads.
Amount of striker pads from
matchboxes
Yield (g)
15 strips 2.07
15 strips 1.78
20 strips 2.66
10 strips 1.24
10 strips 1.25
10 strips 1.13
10 strips 2.67
15 strips 2.11
15 strips 1.94
10 strips 1.17
10 strips 1.78
15 strips 2.26
10 strips 1.34
Overall yield (grams) 23.40

110
3.3.4 Synthesis of Methylamphetamine using the Moscow and Hypophosphorous
routes
Six samples of methylamphetamine hydrochloride were prepared using laboratory grade
precursor and essential chemicals for both the Moscow and Hypophosphorous synthetic
routes. These samples were prepared as a set of control samples.
Six repetitive samples of methylamphetamine hydrochloride were produced for both
synthetic routes using the precursor extracted from Sudafed and the extracted iodine and
red phosphorous. In total 36 samples were prepared with typical yields obtained of 22%-
31% and 48%-86% for the Moscow and Hypophosphorous routes respectively
In the case of the Panadol and Allerpid tablets, an acid/base extraction was used to
recover pseudoephedrine from the tables which resulted in much lower yields of the
precursor restricting the number of repeat samples of methylamphetamine which could
be produced as a consequence. In total two repeat samples using each synthetic method
were prepared from the precursor extracted from the Allerpid tablets with typical yields
obtained of 11% and 13.5% for the Moscow and Hypophosphorous routes respectively.
A single methylamphetamine sample was synthesised using the Hypophosphorous route
from the precursor extracted from the Panadol tablets (yield 12.5%).
The yields of methylamphetamine obtained for each synthetic route are presented in
Table 3.11 and Table 3.12. Confirmation of each methylamphetamine sample was
undertaken using melting point, microanalysis, FTIR and examples of the results are
presented in Table 3.12 and in Figure 3.14 to Figure 3.21.

111
Table 3.10. Methylamphetamine yields obtained from Moscow route synthesis.
Reagent grade chemicals Pseudoephedrine
extracted with ethanol
Pseudoephedrine
extracted with
ethanol/methanol
Pseudoephedrine
extracted with
Methylated spirits
Pseudoephedrine
extracted from Allerpid
Sample ID Yield (g) Sample ID Yield (g) Sample ID Yield (g) Sample ID Yield (g) Sample ID Yield (g)
ML1 0.46 ME1 0.47 MD1 0.40 MMS1 0.32 Allep-M1 0.20
ML2 0.40 ME2 0.60 MD2 0.34 MMS2 0.55 Allep M2 0.25
ML3 0.51 ME3 0.62 MD3 0.38 MMS3 0.30
ML4 0.50 ME4 0.31 MD4 0.37 MMS4 0.42
ML5 0.42 ME5 0.41 MD5 0.70 MMS5 0.45
ML6 0.38 ME6 0.43 MD6 0.40 MMS6 0.41
Mean 0.44 Mean 0.47 Mean 0.43 Mean 0.44 Mean 0.22
RSD 12.3% RSD 25.02% RSD 30.9% RSD 22.3% RSD 15.71%
Table 3.11. Methylamphetamine yields obtained from Hypophosphorous route synthesis.
Reagent grade
chemicals
Pseudoephedrine
extracted with
ethanol
Pseudoephedrine
extracted with
ethanol/methanol
Pseudoephedrine
extracted with
Methylated spirits
Pseudoephedrine
extracted from
Panadol
Pseudoephedrine
extracted from
Allerpid
Sample ID Yield (g) Sample ID Yield (g) Sample ID Yield (g) Sample ID Yield (g) Sample
ID
Yield (g) Sample
ID
Yield (g)
HL1 1.42 HE1 1.04 HD1 0.98 HMS1 1.20 PND-H 0.25 Allep-H1 0.30
HL2 1.30 HE2 0.85 HD2 1.15 HMS2 1.08 Allep-H2 0.25
HL3 1.73 HE3 1.11 HD3 0.85 HMS3 1.07
ML4 1.72 HE4 1.02 HD4 0.70 HMS4 0.83
HL5 1.50 HE5 1.30 HD5 0.91 HMS5 0.93
HL6 1.57 HE6 1.40 HD6 1.24 HMS6 1.00
Mean 1.54 Mean 1.12 Mean 0.97 Mean 1.01 Mean Mean 0.27
RSD 11.0% RSD 17.92% RSD 20.4% RSD 12.7% RSD RSD 12.85%

112
Table 3.12. Results of CHN analysis of methylamphetamine synthesized via Moscow and
Hypophosphorous routes
Sample C %
H % N % Melting
point(0C)
Theoretical / Literature Values 64.6 8.62 7.54 169-172
ML-methylamphetamine synthesized using laboratory grade
pseudoephedrine via Moscow route
63.60 8.55 7.68 170-172
ME-methylamphetamine synthesized using pseudoephedrine via
Moscow route extracted from Sudafed tablets using ethanol
62.87 8.45 7.60 170-172
MD-methylamphetamine synthesized using pseudoephedrine via
Moscow route extracted from Sudafed tablets using
ethanol:methanol (90:10) % vol/vol
62.93 8.41 7.44 169-173
MMS-methylamphetamine synthesized using pseudoephedrine
via Moscow route extracted from Sudafed tablets using
commercial methylated spirit
61.85 8.34 7.50 170-173
HL-methylamphetamine synthesized using laboratory grade
pseudoephedrine via Hypo route
64.40 8.58 7.52 170-172
HE-methylamphetamine synthesized using pseudoephedrine via
Hypo route extracted from Sudafed tablets using ethanol
63.57 8.45 7.44 169-172
HDA-methylamphetamine synthesized using pseudoephedrine via
Hypo route extracted from Sudafed tablets using
ethanol:methanol (90:10) % vol/vols
63.22 8.45 7.36 168-170
HMS-methylamphetamine synthesized using pseudoephedrine via
Hypo route extracted from Sudafed tablets using commercial
methylated spirit
61.93 8.24 7.30 170-173
Allep-Moscow- methylamphetamine synthesized using
pseudoephedrine via Moscow route extracted from Allerpid
tablets using acid base extraction
64.22 8.45 7.31 169-172
Allep-Hypo- methylamphetamine synthesized using
pseudoephedrine via Hypo route extracted from Allepid tablets
using acid base extraction
61.80 8.44 7.40 170-172
PND-Hypo- methylamphetamine synthesized using
pseudoephedrine via Hypo route extracted from Panadol tablets
using acid base extraction
63.40 8.30 7.50 170-173

113
The carbon (C), hydrogen (H) and nitrogen (N) values obtained fro the synthesised
samples were within ± 5% of the theoretical values obtained for methylamphetamine.
Figure 3.14. FTIR spectra of methylamphetamine synthesised via the Moscow route utilising
pseudoephedrine HCl extracted from Sudafed using ethanol as extraction solvent.
Figure 3.15. FTIR spectra of methylamphetamine synthesised via the Moscow route utlising
pseudoephedrine HCl extracted from Sudafed using ethanol/methanol(90:10)% vol/vol as extraction
solvent.

114
Figure 3.16. FTIR spectra of methylamphetamine synthesised via the Moscow route utlising
pseudoephedrine HCl extracted from Sudafed using commercial methylated spirit as extraction
solvent.
Figure 3.17. FTIR spectra of methylamphetamine synthesised via the Hypo route utlising
pseudoephedrine HCl extracted from Sudafed using ethanol as extraction solvent.

115
Figure 3.18. FTIR spectra of methylamphetamine synthesised via the Hypo route utlising
pseudoephedrine HCl extracted from Sudafed using ethanol/methanol(90:10)% vol/vol as extraction
solvent.
Figure 3.19. FTIR spectra of methylamphetamine synthesised via the Hypo route utlising
pseudoephedrine HCl extracted from Sudafed using commercial methylated spirit as extraction
solvent.

116
Figure 3.20. FTIR spectra of methylamphetamine synthesised via the Hypo route utlising
pseudoephedrine HCl extracted from Panadol using acid base as extraction.
Figure 3.21. FTIR spectra of methylamphetamine synthesised via the Hypo route utlising
pseudoephedrine HCl extracted from Allerpid using acid base extraction.

117
3.4 Conclusion
Pseudoephedrine hydrochloride was successfully extracted from commercially available
medications using various solvents suggested in the clandestine literature (ethanol,
ethanol:methanol and commercial methylated spirit). A total of 36 batches of
methylamphetamine was synthesised from this precursor for each of the
Hypophosphorous and Moscow synthetic routes using extracted iodine and red
phosphorous. For comparison purposes, six batches of methylamphetamine were
synthesised using each route using laboratory grade chemicals.
A total of five batches of methylamphetamine were prepared using pseudoephedrine
hydrochloride extracted from Panadol and Allerpid brand tablets from Malaysia and
extracted iodine and red phosphorous. Three samples were prepared using the
Hypophosphorous method (one from Panadol and two from Allerpid tablets) and the
remaining two samples were prepared from Allerpid samples using the Moscow
synthetic route.

118
3.5 References
1. United Nations Office on Drugs and Crime, 2011 World Drug Report; 2011.
2. Forensic Science Service., Methamphetamine: Chemistry, Seizure Statistics,
Analysis, Synthetic Routes and History of Illicit Manufacture in UK and USA,
2004.
3. The UNODC Synthetics Monitoring 2011. Available at:
http://www.unodc.org/documents/scientific/GLOBAL_SMART_update_6.pdf.
Last accessed on 01/05/12.
4. Uncle Fester., Secrets of Methamphetamine Manufacture. Vol.9th
edition;
Loompanics Unlimited: Port Townsend, Washington, 2009.
5. Kunalan,V.; W.J.Kerr.; N.NicDaeid., Investigation of the reaction impurities
associated with methylamphetamine synthesized using the nagai method.
Analytical Chemistry 2012, 84, 5744-5752.
6. Andrews, K.M., Ephedra’s Role as a precursor in the Clandestine Manufacture of
Methamphetamine. Journal of Forensic Sciences 1995, 40(4), 551-560.
7. Allen, A.C.; Kiser, W.O., Methamphetamine From Ephedrine: I. Chloroephedrines
and Aziridines. Journal of Forensic Sciences 1987, 32, 953-962.
8. Person, E.C.; Meyer, J.A.; Vyvan, J.R., Structural determination of the principal
by product of the Lithium-Ammonia reduction method of methamphetamine
manufacture. Journal of Forensic Sciences 2005, 50 (1), 9.
9. Ko, B.J.; Suh, S.; Suh, Y.J.; In, K.M.; Kim,S-Hong.; Kim, J-Han., (1S,2S)-1-
Methylamino-1-phenyl-2-chloropropane: Route specific marker impurity of
methamphetamine synthesised from ephedrine via chloroephedrine. Forensic
Science International, 2012, 212, 92-97.
10. Skinner, H.F., Methamphetamine Synthesis via HI/Red Phosphorous Reduction
Of Ephedrine. Forensic Science International 1990, 48, 128-134.
11. Windahl, K.L.; McTigue, M.J.; Pearson, J.R.; Pratt, S.J.; Rowe, J. E; Sear, E.M.,
Investigation of the impurities found in methamphetamine synthesized from
pseudoephedrine by reduction with hydroiodic acid and red phosphorous.
Forensic Science International 1995, 76, 97-114.

119
12. Pseudoephedrine and ephedrine: Controlling the risk of misuse of medicines.
Available at: http://www.mhra.gov.uk. Last accessed on 3/08/2012.
13. Precursor control at a glance 2010. Available at:
http://www.unodc.org/documents/easasiaandpasific/Publications/ROSA/_Precurso
r_Subba.pdf. Last accessed on 3/08/12.
14. Kurashima, N.; Makino, Y.; Sekita, S.; Urano, Y.; Nagano, T.,Determination of
Origin of Ephedrine Used as Precursor for Illicit Methamphetamine by Carbon and
Nitrogen Stable Isotope Ratio Analysis. Journal Analytical Chemistry 2004,
76(14), 4233-236.
15. Collins,M.;Cawley,A.T.;Heagney,A.C.;Kissane,L.;Robertson,J.;Salouros,H.,δ13
C,
δ15
N, and δ2H isotope ratio mass spectrometry of ephedrine and
pseudoephedrine:application to methylamphetamine profiling. Rapid
Communications in Mass Spectrometry 2009, 23, 2003-2010.
16 Kurashima,N.;Makino,Y.;Urano,Y;Sanuki,K.;Ikehara,Y.;Nagano,T., Use of
stable isotope ratios for profiling of industrial ephedrine samples: Application of
hydrogen isotope ratios in combination with carbon and nitrogen. Forensic
Science International 2009, 14-18.
17. Massetti, J., Hypophosphorous acid use increase at California clandestine
methamphetamine laboratories. Journal of the Clandestine Laboratory
Investigating Chemists 1997, 7(3), 6.
18. Massetti, J., Recent laboratory seizures and activity in California clandestine
methamphetamine laboratories. Journal of the Clandestine Laboratory
Investigating Chemists 1996, 6(4), 13-14.
19. D.Albouy.;G.E.Moghadam.;M.Vinatoru.;M.Koeni.,Regenerative role of the red
phosphorus in the couple’HI aq/P red’.Journal of Organometallic Chemistry, 1997,
529, 295-299.
20. Extraction of Methamphetamine Precursor Material from Medicinal Preparations
and Methamphetamine Profiling results. Available at:
http://www.cicad.oas.org/apps/Document. Last accessed on 21/10/10.

120
21. Kram, T.C.;Kruegel, A.V., The identification of Impurities in Illicit
Methamphetamine Exhibits by Gas Chromatography/Mass Spectrometry and
Nuclear Magnetic Resonance Spectroscopy. Journal of Forensic Sciences 1977,
22(1), 40-52.
22. United Nations Office on Drugs and Crime, Recommended methods for the
identification and analysis of Amphetamine, Methamphetamine and their Ring-
Substituted Analogues in seized materials; 2006.
23. Catriona Morrison. PhD Thesis. University of Strathclyde, 2011.
24. Matthew, M.; Palenik, G.J., The crystal and molecular structures of (+)-
pseudoephedrine and (+)-pseudoephedrine hydrochloride. Acta Crystallography
and Crystal Chemistry, 1977, B33, 1016-1022.

121
Chapter 4 Validation of organic impurity extraction and gas chromatography
mass spectrometry (GCMS)
4.1 Introduction
Optimised impurity extraction and gas chromatography mass spectrometry (GCMS)
methods are essential to the chromatographic profiling of route specific impurities
inherent within clandestinely produced methylamphetamine samples. The aim is to
identify a method that efficiently and reproducibly extracts the maximum number of
impurities and GCMS conditions that will produce chromatograms with well resolved
peaks.
Validation of extraction systems and chromatographic systems can be undertaken in a
number of ways. These can include the development and validation of new methods
suited for a particular purpose, or the adaptation of existing methods and assuring that
they achieve the requirements for validation for a particular analysis. The latter approach
is used here and partial validation of an existing GCMS analysis is described. Of
importance is the identification of impurities rather than the quantification of samples
and, as such, certain aspects normally associated with validation such as limit of
detection or limit of quantification are not addressed.
Currently, two of the most common GCMS methods used in the organic impurity
profiling of methylamphetamine are the CHAMP method and the method proposed by
Tanaka et al. [1] and Inoue et al. [2] and confirmed by Kunalan et al. [3]. Studies
conducted by Kunalan et al. [3] identified that all route specific impurities for
methylamphetamine synthesized from seven different routes could be elucidated through
a basic extraction of the synthesised sample followed by GCMS analysis using a DB-5
column, equivalent to a HP5-MS column. This was a considerable improvement on
previous work which reported that both an acidic and basic extraction were required [4].
As a consequence the GCMS method used by Kunalan et al. [3] has been adopted for
this work [3].

122
The quality and performance or deterioration of a GC column can be monitored during
use using a Grob mixture [5, 6]. A mixture of acids, bases, alcohols, hydrocarbons and
neutral compounds was suggested by Grob et al. [5] as a single test mixture for capillary
columns.
4.2 Experimental Methods
The chemicals used were reagent grade unless stated otherwise. Manufacturers were as
follows: hexane by Rathburn; methyl decanoate ester, 1-octanol, potassium phosphate
monobasic (KH2PO4), sodium phosphate dibasic dehydrate (Na2HPO4.2H2O) from
Fluka; ethyl acetate, dicyclohexylamine, 2,6-dimethylaniline, 2,6-dimethylphenol,
dodecanoate, eicosane, methyl undecanoate ester, tetracosane and tridecanoate from
Sigma Aldrich; glacial acetic acid from Riedel de Haen. Tridecane was decanted from
stock within the university and the manufacturer was not available.
Other apparatus used were a Philips PW9421 pH meter, a Fisons Whirlmixer vortex, an
American Beauty S/70 sonicator, an Edmund Buhler Swip KS-10 rotative shaker, and a
Jouan centrifuge. Distilled water was obtained from an in house water purification
system.
Glassware was washed with Teepol and then rinsed with acetone and dried. Samples
prepared for gas chromatography mass spectrometry analysis were transferred to 250 µL
silanised microvial inserts (Agilent part no.5181-8872) inside non-deactivated vials with
PFTE/silicone septa screw caps (Agilent part no:5183-4428).
4.3 Instrumental Parameters
The analysis was carried out using an Agilent 6850 gas chromatograph (GC) coupled to
a 5975C VL MSD (Triple –Axis Detector). A HP-5MS column (30 m length x 0.25 mm
internal diameter, 0.25 mm µm film thickness) was used. Analysis was undertaken with
the oven temperature programmed as follows: 60oC for 1 minute, 10
oC/minute to 300
oC
and then held at 300oC for 10 minutes. The injector and detector temperatures were set

123
at 250oC and 300
oC respectively [3]. Helium was used as the carrier gas at a constant
flow rate of 1.0 mL/minute. Injection of 1µL of sample was made in the splitless mode
(purge on time; 1.0 minutes). Data were acquired at a rate of 20 Hz and a peak width of
0.05 minutes. Hewlett Packard HP3365 Chemstation software was used for controlling
the GCMS system, data acquisition and integration of the gas chromatograms.
The mass spectrometer (MS) was tuned weekly using the tuning compound
Perfluorotributylamine (PFTBA) and an air and water check was performed daily,
column performance was monitored using a Grob mixture over approximately six
weekly cycles, and solvent blanks were run between sample injections (unless indicated
otherwise). Peaks were integrated using the total ion chromatogram.
4.4 Preparation and Analysis of Grob Mixture
A modified Grob test mixture was prepared to test column performance using the
following components:
1. 1-octanol
2. 2,6-dimethylphenol
3. 2,6-dimethylaniline
4. dodecane, C12
5. tridecane, C13
6. methyl decanoate ester
7. methyl undecanoate ester
8. dicyclohexylamine
9. eicosane, C20
10. tetracosane,C24
Each compound was weighed (40 mg) into clean 5 mL volumetric flasks and filled to the
mark with hexane to give a stock solution of concentration 8 mg/mL. A volume of each
stock solution (5 µL) was removed and combined in one 5 mL volumetric flask which
was filled to the mark with hexane. This resulted in a Grob mixture of ten components,
each at a concentration of 8 µg/mL. This concentration was used so that, theoretically, a

124
1 µL injection would result in 8 ng of analyte on column [5, 6]. Six repeat injections
were performed to establish instrument repeatability and peak symmetry.
4.4.1 Preparation of phosphate buffer
0.1 M of phosphate buffer was prepared by combining KH2PO4 (1.36 g) and
Na2HPO4.2H2O (1.78 g) in a 100 mL volumetric flask and filling to the mark with
distilled water. This solution was made to pH 10.5 by adding sodium carbonate [7].
4.4.2 Sample preparation
Varying amounts of homogenised and unhomogenised methylamphetamine
hydrochloride (50 mg, 100 mg and 150 mg) were placed in separate centrifugation tubes
and dissolved in phosphate buffer (2.0 mL). The mixture was sonicated for 5 minutes
and vortexed for 1 minute. 400 µL of extraction solvent (ethyl acetate, hexane or
toluene) containing eicosane as an internal standard (0.05 mg/mL) was added and the
sample centrifuged for a further 5 minutes. The organic layer was transferred to a gas
chromatograph vial insert for analysis [3, 4, 8]. The stability of the extracts in each of
these solvents over a period of 0, 1 and 2 days were also investigated. Extracts were
stored at room temperature and in the refrigerator (5oC) and repetitively analysed to
assess any alterations in peak area.
4.5 Results and Discussion
4.5.1 Peak symmetry and repeatability of analysis
The Grob sample was used to assess the repeatability of the GCMS in the analysis of
similar samples to those expected in the target impurity profiles. This sample was also
used to assess the peak symmetry. Peak symmetry is used in determining column
efficiency. The asymmetry factor, A, can be calculated according to Equation 4.1:

125
Where:
a and b are the left and right halves of the peak width at 10% peak height.
If A is greater than one, the peak is said to be tailing, if this occurs, components are
strongly retained on the stationary phase and lag behind the main body of the component
band. When A is less than one, peak fronting occurs. This happens when components are
retained to a lesser extent and elute before the main body of the component band.
A typical chromatogram of the Grob mixture is presented in Figure 4.1. The
measurement for peak symmetry for the components in the Grob mixture was made by
hand and are presented in Table 4.1.
Figure 4.1. Chromatogram of the Grob mixture used.
8.00 10.00 12.00 14.00 16.00 18.00 20.00
1000000 2000000 3000000 4000000 5000000 6000000 7000000 8000000 9000000 1e+07
1.1e+07 1.2e+07 1.3e+07 1.4e+07 1.5e+07 1.6e+07 1.7e+07 1.8e+07 1.9e+07
Time-->
Abundance
TIC: 10072012.D\data.ms
6.867
7.442
8.363
8.780
10.179
10.511
11.813
18.182 21.719
Equation 4.1

126
Table 4.1. Peak Symmetry of the individual Grob mixture components.
Peak Components Asymmetry Factor
1 1-Octanol 1.33
2 2,6-dimethylphenol 1.00
3 2,6-dimethylaniline 1.00
4 Dodecane,C12 1.23
5 Tridecane, C13 1.11
6 Methyl decanoate ester 1.43
7 Methyl undecanoate ester 1.00
8 Dicyclohexylamine 1.00
9 Eicosane, C20 1.00
10 Tetracosane, C24 1.00
The analysis of the Grob mixture was also used to assess repeatability. The results
obtained across six repetitive analysis of the same Grob sample were compared and the
relative standard deviation (RSD) of the peak areas calculated. For repeatability, a value
of less than 5% was chosen to indicate the reliability of the analysis. The results are
provided in Table 4.2.
Table 4.2. Relative standard deviation (RSD) of the Grob Mixture over 6 repeat injections.
Peak Components RSD (Peak Area)
1 1-Octanol 3.31%
2 2,6-dimethylphenol 3.40%
3 2,6-dimethylaniline 3.59%
4 Dodecane,C12 3.54%
5 Tridecane, C13 2.63%
6 Methyl decanoate ester 3.74%
7 Methyl undecanoate ester 1.80%
8 Dicyclohexylamine 2.27%
9 Eicosane, C20 0.88%
10 Tetracosane, C24 2.89%
127
4.5.2 Impurity extraction
Sample extraction plays an important role in impurity profiling analysis and is pH
dependent. pH buffers used are selected for their ability to ‘push’ the impurities of the
methylamphetamine sample out of the aqueous phase and into an organic phase [3, 7].
Two common buffers, a phosphate buffer and an acetate buffer have been used for the
majority of methylamphetamine profiling [1, 2, 3, 7]. In this study, the impurity
extraction of methylamphetamine has been carried out using the phosphate buffer (pH
10.5) only, following the work of Kunalan et al. [3, 7].
Three specific issues arise during impurity extraction. Firstly the ability of a given
solvent to extract sufficient quantity of the impurities with good repeatability and
reproducibility, secondly the weight of sample required and finally the nature of the
sample (homogenised or unhomogenised). The pH used for this work was pH 10.5 as
reported by Kunalan et al. [3]. Three solvents (ethyl acetate, toluene and hexane) and
three weights of sample (50 mg, 100 mg and 150 mg) were evaluated based upon
previous study. Exemplars of the chromatograms obtained for each solvent-weight
combination are presented in Figure 4.2 to Figure 4.10. Table 4.3 to Table 4.6 indicate
the impurity profiles produced in each case. The tables show the data for the first 10
peaks in the impurity profile and indicate the total number of peaks present in the overall
profile.

128
5 . 0 0 1 0 . 0 0 1 5 . 0 0 2 0 . 0 0 2 5 . 0 0 3 0 . 0 00
2 0 0 0 0 0
4 0 0 0 0 0
6 0 0 0 0 0
8 0 0 0 0 0
1 0 0 0 0 0 0
1 2 0 0 0 0 0
1 4 0 0 0 0 0
1 6 0 0 0 0 0
1 8 0 0 0 0 0
2 0 0 0 0 0 0
T i m e - - >
A b u n d a n c e
T I C : 1 1 1 1 0 1 . D \ d a t a . m s
1 . 9 4 2
3 . 0 3 9
9 . 2 2 8
Figure 4.2. Impurity profile of 50 mg of methylamphetamine extracted at pH 10.5 with ethyl acetate
as extraction solvent.
5 . 0 0 1 0 . 0 0 1 5 . 0 0 2 0 . 0 0 2 5 . 0 0 3 0 . 0 00
2 0 0 0 0 0
4 0 0 0 0 0
6 0 0 0 0 0
8 0 0 0 0 0
1 0 0 0 0 0 0
1 2 0 0 0 0 0
1 4 0 0 0 0 0
1 6 0 0 0 0 0
1 8 0 0 0 0 0
2 0 0 0 0 0 0
2 2 0 0 0 0 0
2 4 0 0 0 0 0
2 6 0 0 0 0 0
2 8 0 0 0 0 0
T i m e - - >
A b u n d a n c e
T I C : 1 1 1 1 0 2 . D \ d a t a . m s
1 . 9 3 4
3 . 0 3 6
9 . 3 6 1
Figure 4.3. Impurity profile of 100 mg of methylamphetamine extracted at pH 10.5 with ethyl
acetate as extraction solvent.
Methylamphetamine peak
Methylamphetamine peak
ISTD Peak
ISTD Peak

129
5 . 0 0 1 0 . 0 0 1 5 . 0 0 2 0 . 0 0 2 5 . 0 0 3 0 . 0 00
2 0 0 0 0 0
4 0 0 0 0 0
6 0 0 0 0 0
8 0 0 0 0 0
1 0 0 0 0 0 0
1 2 0 0 0 0 0
1 4 0 0 0 0 0
1 6 0 0 0 0 0
1 8 0 0 0 0 0
2 0 0 0 0 0 0
2 2 0 0 0 0 0
2 4 0 0 0 0 0
2 6 0 0 0 0 0
2 8 0 0 0 0 0
3 0 0 0 0 0 0
3 2 0 0 0 0 0
T i m e - - >
A b u n d a n c e
T I C : 1 1 1 1 0 3 . D \ d a t a . m s
1 . 9 4 0
3 . 0 3 5
9 . 4 4 2
Figure 4.4. Impurity profile of 150 mg of methylamphetamine at pH 10.5 with ethyl acetate as
extraction solvent.
Table 4.3. RSD and normalized (to the internal standard [IS] and total peak area [TPA]) RSD
values of the varying mass of methylamphetamine for impurity profiling analysis using ethyl acetate
as extraction solvent at pH 10.5.
50 mg 100 mg 150 mg
Peak %
RSD
% RSD
(IS)
% RSD
(TPA)
%
RSD
% RSD
(IS)
% RSD
(TPA)
%
RSD
% RSD
(IS)
% RSD
(TPA)
1 4.3 3.8 1.30 2.4 8.2 2.4 25.7 27.1 21.7
2 19.3 18.2 16.9 18.1 18.6 17.7 29.0 14.2 10.7
3 16.6 14.4 11.1 2.5 1.7 2.9 78.2 4.0 60.5
4 7.9 4.2 3.6 4.0 3.9 4.3 97.5 94.1 91.0
5 10.4 4.1 4.3 5.0 3.4 3.3 41.5 30.8 17.7
6 19.8 17.8 18.2 1.2 0.9 0.3 27.6 15.7 24.8
7 156.3 124.4 123.4 24.9 23.0 24.1
40.9 35.6 2.7
8 3.0 3.0 3.0 5.7 7.2 7.5
58.9 48.8 31.5
9 16.7 11.1 13.5 15.7 12.4 13.8
29.0 27.1 23.3
10 18.0 12.7 3.4 5.5 1.8 5.0
15.8 14.1
14.8
Ave 27.2 3.8 19.9 8.5 8.1 8.1 44.4 37.2 29.9
Total Peaks 45 75 85
Methylamphetamine peak
ISTD Peak

130
The 100 mg methylamphetamine sample was found to produce the best peak shape and
the greatest number of detectable impurities with reasonable reproducibility based on the
average RSD peak area values obtained compared to the other sample weights.
5 . 0 0 1 0 . 0 0 1 5 . 0 0 2 0 . 0 0 2 5 . 0 0 3 0 . 0 00
5 0 0 0 0 0
1 0 0 0 0 0 0
1 5 0 0 0 0 0
2 0 0 0 0 0 0
2 5 0 0 0 0 0
3 0 0 0 0 0 0
3 5 0 0 0 0 0
4 0 0 0 0 0 0
T i m e - - >
A b u n d a n c e
T I C : 1 2 0 1 0 1 0 . D \ d a t a . m s 3 . 2 9 7
9 . 2 3 3
Figure 4.5. Impurity profile of 50 mg of methylamphetamine extracted at pH 10.5 with toluene as
extraction solvent.
Methylamphetamine peak
ISTD Peak
Toluene peak
ene peak

131
5 . 0 0 1 0 . 0 0 1 5 . 0 0 2 0 . 0 0 2 5 . 0 0 3 0 . 0 00
5 0 0 0 0 0
1 0 0 0 0 0 0
1 5 0 0 0 0 0
2 0 0 0 0 0 0
2 5 0 0 0 0 0
3 0 0 0 0 0 0
T im e - - >
A b u n d a n c e
T I C : 1 2 0 1 0 1 1 . D \ d a t a . m s 3 . 3 2 1 3 . 4 2 1
9 . 3 5 3
Figure 4.6. Impurity profile of 100 mg of methylamphetamine extracted at pH 10.5 with toluene as
extraction solvent.
5 . 0 0 1 0 . 0 0 1 5 . 0 0 2 0 . 0 0 2 5 . 0 0 3 0 . 0 00
2 0 0 0 0 0
4 0 0 0 0 0
6 0 0 0 0 0
8 0 0 0 0 0
1 0 0 0 0 0 0
1 2 0 0 0 0 0
1 4 0 0 0 0 0
1 6 0 0 0 0 0
1 8 0 0 0 0 0
2 0 0 0 0 0 0
2 2 0 0 0 0 0
2 4 0 0 0 0 0
2 6 0 0 0 0 0
2 8 0 0 0 0 0
3 0 0 0 0 0 0
3 2 0 0 0 0 0
T i m e - - >
A b u n d a n c e
T I C : 1 2 0 1 0 1 2 . D \ d a t a . m s 3 . 4 0 2
9 . 4 0 9
Figure 4.7. Impurity profile of 150 mg of methylamphetamine extracted at pH 10.5 with toluene as
extraction solvent.
Table 4.4. RSD and normalized (to the internal standard[IS] and total peak area[TPA]) RSD values
of the varying mass of methylamphetamine for impurity profiling analysis using toluene as
extraction solvent at pH 10.5.
Methylamphetamine peak
Methylamphetamine peak
ISTD Peak
ISTD Peak
Toluene peak
ene peak
Toluene peak
ene peak

132
50 mg 100 mg 150 mg
Peak %
RSD
% RSD
(IS)
% RSD
(TPA)
%
RSD
% RSD
(IS)
% RSD
(TPA)
%
RSD
% RSD
(IS)
%
RSD
(TPA)
1 24.9 24.1 38.0 112.5 111.5 110.4 143.3 125.1 123.5
2 48.9 46.2 36.3 175.4 145.5 145.5 110.3 110.7 141.9
3 82.1 73.4 60.1 116.2 112.4 113.8 16.7 14.8 14.7
4 44.9 31.6 28.9 167.2 13.6 12.2 103.0 100.1 116.2
5 41.2 40.0 32.9 15.2 7.9 9.8 244.9 240.7 236.7
6 10.7 7.05 6.3 24.9 24.2 23.5 104.2 94.9 92.8
7 78.9 68.8 60.9 156.5 124.4 122.5 211.6 193.7 184.1
8 5.6 5.0 4.8 44.9 42.6 39.9 9.3 2.6 3.3
9 17.8 16.7 15.7 14.5 12.5 14.9 5.9 7.4 5.7
10 25.7 21.8 20.5 44.7 42.2 43.3 5.3 4.9 6.1
Ave 38.1 33.5 30.5 87.2 63.7 63.6 95.4 89.5 92.4
Total Peaks 25 60 55
The 50 mg methylamphetamine sample extracted with toluene was found to produce the
best peak shape and the greatest number of detectable impurities with reasonable
reproducibility.

133
5 . 0 0 1 0 . 0 0 1 5 . 0 0 2 0 . 0 0 2 5 . 0 0 3 0 . 0 00
2 0 0 0 0 0
4 0 0 0 0 0
6 0 0 0 0 0
8 0 0 0 0 0
1 0 0 0 0 0 0
1 2 0 0 0 0 0
1 4 0 0 0 0 0
1 6 0 0 0 0 0
1 8 0 0 0 0 0
2 0 0 0 0 0 0
2 2 0 0 0 0 0
T i m e - - >
A b u n d a n c e
T I C : 1 2 0 1 0 4 . D \ d a t a . m s 1 . 7 8 6
1 . 9 5 0
2 . 1 3 5
2 . 3 5 0
2 . 9 7 9
9 . 2 0 0
Figure 4.8. Impurity profile of 50 mg of methylamphetamine extracted at pH 10.5 with hexane as
extraction solvent.
5 . 0 0 1 0 . 0 0 1 5 . 0 0 2 0 . 0 0 2 5 . 0 0 3 0 . 0 00
2 0 0 0 0 0
4 0 0 0 0 0
6 0 0 0 0 0
8 0 0 0 0 0
1 0 0 0 0 0 0
1 2 0 0 0 0 0
1 4 0 0 0 0 0
1 6 0 0 0 0 0
1 8 0 0 0 0 0
2 0 0 0 0 0 0
2 2 0 0 0 0 0
2 4 0 0 0 0 0
2 6 0 0 0 0 0
T i m e - - >
A b u n d a n c e
T I C : 1 2 0 1 0 5 . D \ d a t a . m s
1 . 7 8 8
1 . 9 4 7
2 . 1 3 3
2 . 9 7 8
9 . 2 8 7
Figure 4.9. Impurity profile of 100 mg of methylamphetamine extracted at pH 10.5 with hexane as
extraction solvent.
Methylamphetamine peak
Methylamphetamine peak
ISTD Peak
ISTD Peak

134
5 . 0 0 1 0 . 0 0 1 5 . 0 0 2 0 . 0 0 2 5 . 0 0 3 0 . 0 00
2 0 0 0 0 0
4 0 0 0 0 0
6 0 0 0 0 0
8 0 0 0 0 0
1 0 0 0 0 0 0
1 2 0 0 0 0 0
1 4 0 0 0 0 0
1 6 0 0 0 0 0
1 8 0 0 0 0 0
2 0 0 0 0 0 0
2 2 0 0 0 0 0
2 4 0 0 0 0 0
2 6 0 0 0 0 0
2 8 0 0 0 0 0
T i m e - - >
A b u n d a n c e
T I C : 1 2 0 1 0 6 . D \ d a t a . m s
1 . 7 8 6
1 . 9 4 9
2 . 1 3 4
2 . 3 4 9
2 . 9 8 1
9 . 3 3 2
Figure 4.10. Impurity profile of 150 mg of methylamphetamine extracted at pH 10.5 with hexane as
extraction solvent.
Table 4.5. RSD and normalized (to the internal standard[IS] and total peak area[TPA]) RSD values
of the varying mass of methylamphetamine for impurity profiling analysis using hexane as
extraction solvent at pH 10.5.
50 mg 100 mg 150 mg
Peak %
RSD
% RSD
(IS)
% RSD
(TPA)
%
RSD
% RSD
(IS)
% RSD
(TPA)
%
RSD
% RSD
(IS)
%
RSD
(TPA)
1 28.0 18.1 16.3 19.6 19.1 12.9 27.2 26.8 24.2
2 25.5 22.4 23.8 16.8 9.7 8.7 45.1 43.3 44.4
3 35.3 31.4 32.2 25.8 15.5 13.0 56.1 54.5 51.5
4 45.7 40.2 43.3 11.6 13.5 18.8 7.5 4.1 3.4
5 19.0 17.2 9.7 17.3 11.2 14.2 8.4 8.5 6.8
6 29.9 28.5 24.8 25.2 17.7 9.9 13.2 12.7 11.6
7 29.3 27.0 16.2 23.6 10.9 18.2 29.2 26.5 23.2
8 27.6 27.4 10.8 21.5 24.5 31.5 8.0 5.3 4.8
9 28.8 22.8 22.4 18.7 9.4 10.6 27.4 28.1 24.3
10 17.3 13.6 13.9 24.0 16.7 14.8 38.4 35.6 32.3
Ave 28.6 24.8 21.3 20.4 14.7 15.2 26.0 24.5 22.6
Total Peaks 30 60 80
Methylamphetamine peak
ISTD Peak

135
The 100 mg methylamphetamine sample extracted in hexane was found to produce the
best peak shape and the greatest number of detectable impurities with reasonable
reproducibility.
From results obtained and shown in Table 4.3 to Table 4.6 the 100 mg
methylamphetamine sample using ethyl acetate has effectively extracted a greatest
number of impurity peaks, while maintaining a relatively low relative standard deviation
(75 impurity peaks and %RSD of 8.5 for the first ten impurities).
4.5.3 Homogeneity of Samples studies
Homogenised and non homogenised 100 mg samples of methylamphetamine were
extracted using ethyl acetate. The impurity profile data for the ten peaks in the
chromatorgam is presented in Table 4.6 to Table 4.8 clearly demonstrates better relative
standard deviations for the homogenized samples.
Table 4.6. Results of unnormalised values unhomogenised and homogenised batches of
methylamphetamine.
Unhomogenised methylamphetamine Homogenised methylamphetamine
Peak RSD Area Peak RSD Area
1 76.2 1 25.6
2 110.5 2 18.9
3 45.4 3 8.2
4 118.9 4 27.4
5 68.9 5 11.4
6 23.6 6 17.5
7 38.9 7 6.6
8 11.8 8 7.8
9 28.9 9 10.9
10 6.7 10 3.4
Average Values 52.92 Average Values 13.82

136
Table 4.7. Results of normalized values to internal standard(IS) of unhomogenised and homogenised
batches of methylamphetamine.
Unhomogenised methylamphetamine Homogenised methylamphetamine
Peak RSD Area Peak RSD Area
1 73.3 1 20.1
2 108.8 2 12.1
3 40.8 3 6.9
4 112.7 4 22.1
5 64.7 5 10.1
6 21.8 6 13.7
7 32.7 7 5.6
8 9.8 8 7.7
9 24.9 9 9.8
10 4.7 10 2.4
Average Values 49.4 Average Values 11.9
Table 4.8. Results of normalized to total peak area (TPA) values unhomogenised and homogenised
batches of methylamphetamine.
Unhomogenised methylamphetamine Homogenised methylamphetamine
Peak RSD Area Peak RSD Area
1 70.7 1 21.7
2 111.8 2 13.7
3 41.9 3 6.5
4 110.8 4 23.0
5 63.7 5 10.7
6 20.8 6 14.8
7 30.6 7 5.7
8 8.8 8 7.5
9 23.6 9 10.3
10 4.2 10 3.3
Average Values 48.7 Average Values 11.7

137
4.5.4 Reproducibility of the Extraction Analytical Method
4.5.4.1 Within Day Reproducibility
The within day reproducibility of the analysis was evaluated by preparing, in parallel,
six separate extractions from six homogenized sub samples of 100 mg each from the
same batch of methylamphetamine. Extractions and analysis were undertaken on the
same day and the data is presented in Table 4.9 for 10 prominent impurity peaks within
each sample.
Table 4.9. Results of within day reproducibility studies.
Peak % RSD
% RSD
(Normalised to
int. standard)
% RSD
(Normalised to
total peak area)
1 21.2 21.4 21.6
2 26.4 26.7 27.2
3 16.2 12.9 14.7
4 20.9 19.3 16.8
5 25.4 25.4 25.3
6 4.5 3.1 5.0
7 12.9 11.7 11.1
8 24.4 20.0 21.6
9 18.9 17.1 16.0
10 3.4 2.9 2.8
Ave Value 17.4 16.1 16.2
The data obtained for a within a day reproducibility takes into account the instrumental
precision. The best average RSDs obtained for the within day reproducibility study of
methylamphetamine was 16.1 and is in line with the published literature for similar
samples [8, 9, 10].

138
4.5.4.2 Reproducibility of the Analysis over time
External environmental conditions such as humidity and temperature can have adverse
effects on the extraction process of methylamphetamine samples, thus the
reproducibility of the analysis over time was also investigated. The stability of the
extract over three days was assessed by preparing two extracts from the same
homogenised batch of methylamphetamine and analyzing the samples over a period of
three days. The extracts were stored under different conditions (one at room temperature
in the dark and a second at 5oC) and the peak areas for the ten components were plotted
against time. The results are shown in Figure 4.11 and Figure 4.12.
Day 3Day 2Day 1Day 0
50
40
30
20
10
0
RS
D v
alu
es (
Norm
ali
sed t
o I
S)
10
1
2
3
4
5
6
7
8
9
Peak
Extract Stability Studies in Room temperature( Day 0, Day 1, Day 2, Day 3 )
Figure 4.11. Methylamphetamine extract stability (pH 10.5) over three days stored at room
temperature (20oC).

139
Day 3Day 2Day 1Day 0
35
30
25
20
15
10
5
0
RS
D v
alu
es (
Norm
ali
sed t
o I
S)
10
1
2
3
4
5
6
7
8
9
Peak
Extract Stability at 5 C( Day 0, Day 1, Day 2, Day 3 )
Figure 4.12. Methylamphetamine extract stability (pH 10.5) over three days stored at 5oC.
It can be seen that the concentrations of the selected components vary from each other
even after one day. For instance, peaks 2, 5, 4 and 10 change dramatically over the time
frame studied. There were also differences apparent within the sample extracts stored at
5oC. This further illustrates that storing the extract at a cooler temperature does not
increase extract stability. As a consequence extracts were analysed on the same day of
preparation.

140
4.6 Conclusions
The impurity extraction method was evaluated and best results were obtained using
100 mg of a homogenized sample extracted using a phosphate buffer (pH 10.5) with
ethyl acetate as the extraction solvent. Samples were extracted and analysed on the same
day using a HP5-MS column; the oven temperature started at 50oC for 1 minute and then
increased at 10oC/min until 300
oC, where it was held for 10 minutes; the injector and
detector temperatures were set at 250oC and 300
oC respectively; helium was used as
carrier gas at a constant flow rate of 1 mL/min; 1µL of extract was injected in the
splitless mode.
4.7 References
1. Inoue, H.; Kanamori, T.; Iwata, Y.T.; Ohmae, Y.; Tsujikawa, K.; Saitoh, S.; Kishi,
T., Methamphetamine impurity profiling using a 0.32 mm i.d. nonpolar capillary
column. Forensic Science International 2003, 135(1), 42-47.
2. Tanaka, K.; Ohmort, T.; Inoue, T.; Seta, S., Impurity Profiling Analysis of Illicit
Methamphetamine by Capillary Gas Chromatography. Journal of Forensic
Sciences 1994, 39(2), 500-511.
3. Kunalan,V.; W.J.Kerr.; N.NicDaeid., Investigation of the reaction impurities
associated with methylamphetamine synthesized using the nagai method.
Analytical Chemistry 2012, 84, 5744-5752.
4. Vanitha Kunalan. PhD thesis, University of Strathclyde 2010.,pp 30-285.
5. Grob Jr, K.; Grob, K., Evaluation of capillary columns by separation number of
plate Number. Journal of Chromatography A 1981, 207, 291-297.
6. Grob Jr,K.; Grob, G.; Grob, K., Comprehensive, standardized quality test for glass
capillary columns. Journal of Chromatography A 1978, 156, 1-20.
7. Remberg, B.and A.H. Stead. Drug characterization/impurity profiling, with
special focus on methamphetamine: Recent work of the United Nations
International Drug Control Programme. Bulletin on Narcotics 1999 (Volume LI
Nos.1 and 2), Available at: http://www.unodc.org/unodc/en/data-and-
analysis/bulletin/bulletin-1999-01-01_1_page008.html. Last Accessed on
17/01/2010.

141
8. Ballany, J.; Caddy, B.; Cole, M.; Finnon, Y.; Aalberg, L.; Janhunen, K.; Sippola,
E.; Andersson, K.; Bertler, C.; Dahle n, J.; Kopp, I.; Dujourdy, L.; Lock, E.;
Margot, P.; Huizer, H.; Poortman, A.; Kaa, E.; Lopes, A, A., Development of a
harmonized pan-European method for the profiling of Amphetamines. Science and
Justice 2001, 41(3), 193-196.
9. Aalberg, L.; Andersson, K.; Bertler, C.; Cole, M.D.; Finnon, Y.; Huizer, H.;
Jalava, K.; Kaa, E.; Lock, E.; Lopes, A.; Poortman, A.; Sippola, E.; Dahlen,
J.Aalberg, L., Development of a harmonized method for the profiling of
amphetamines II. Stability of impurities in organic solvents. Forensic Science
International 2005, 149, 231-241.
10. Lock, E.; Aalberg, L.; Andersson, K.; Dahlen, J.; Cole, M.D.; Finnon, Y.; Huizer,
H.; Jalava, K.; Kaa, E.; Lopes, A.; Poortman, A.; Sippola, Erkki L., Development
of a harmonized method for the profiling of amphetamines V: Determination of
the variability of the optimised method. Forensic Science International 2007, 169,
77-85.

142
Chapter 5 Organic impurity profiling of methylamphetamine using gas
chromatography mass spectrometry (GCMS)
5.1 Introduction
Both the Moscow and Hypophosphorous (Hypo) synthetic routes are linked to the Nagai
route through the mechanism of synthesis. The difference between the three methods is
the means by which the essential chemicals iodine and red phosphorous are introduced.
As a consequence of this interconnectivity it is reasonable to assume that there will be
some considerable overlap of the impurity profile generated from samples of each route.
Some limited literature exists relating to the organic route specific impurities of both the
Nagai and Moscow routes but no published papers relate to route specific impurities
from the Hypophosphorous route.
Windahl et al. [1] reported that the length of time that the Nagai reaction proceeded,had
an effect on the levels of aziridines and napthalenes present in the final synthesised
methylamphetamine. The authors concluded that as the reaction time increased, the
concentration of aziridines and napthalenes decreased [1]. Tanaka et al. [2] reported the
presence of a methylamphetamine dimer formed via the condensation of
methylamphetamine and aziridine, however neither the aziridines nor the
methylamphetamine dimer are route specific compounds [2]. Ko et al. [3] identified the
presence of napthalenes and isomers of propanone and propenamide as having potential
route specificity for the Nagai synthesis [3]. Extensive research conducted by Kunalan
[4] which involved the repetitive synthesis of methylamphetamine using seven methods
(Leuckart, Reductive Amination, Nagai, Birch, Moscow, Rosenmund and Emde) has
provided clarity in relation to the literature surrounding the Nagai synthesis confirming
the impurities suggested by Ko et al. as those linked to Nagai synthesised samples, and
these results are presented in Table 5.1 [5]. However, Kunalan et al. also reported that
impurities apparent within repetitive Moscow synthesised samples, were the same as
those though to be Nagai specific together with an additional two impurities of unknown
identity and these results are presented in Table 5.2. This is hardly surprising given the

143
closeness of the synthetic methods, however it does suggest that there are no impurities
specific to the Nagai synthesis alone.
Table 5.1. Nagai Impurities identified by Windahl et al. [1], Tanaka et al. [2] and Kunalan et al. [5].
Samples in red were suggested as route specific.
Impurities Windahl.[1] Tanaka[2] Kunalan [5]
cis-1,2-dimethyl-3-phenylazridine √ √
trans-1,2-dimethyl-3-phenylazridine √ √
Methylamphetamine dimer √ √
1,3-dimethyl-2-phenylnaphthalene √ √
1-benzyl -3-methylnaphthalene √ √
Isomers of N-methyl-N-(α-methylphenylethyl)amino-1-
phenyl-2-propanone
√ √
Isomers of N-methyl-N-(α-methylphenylethyl)-3-
phenylpropenamide
√ √
.
Table 5.2. Moscow Impurities identified by Kunalan [1].
Compound Peak m/z(base peak in bold)
Unknown 5 43, 125, 89, 168, 105, 91, 63
Unknown 6 91, 145, 262
1,3-dimethyl-2-phenylnaphthalene 232, 217, 202, 77
1-benzyl -3-methylnaphthalene 232, 217, 202, 58
Isomers of N-methyl-N-(α-methylphenethyl) amino-1-
phenyl-2-propanone
238, 91, 105, 190, 120
Isomers of (Z)-N-methyl-N-(α-methylphenethyl)-3-
phenylpropenamide
131, 91, 58, 103, 188, 77

144
5.2 Experimental methods
Sub samples of each batch of synthesised methylamphetamine were extracted and
analysed by GCMS according to the methods outlined in Chapter 4. The impurity
profiles were scrutinized using the data analysis software associated with the GCMS
instrument (HPChemstation Hewlett Packard HP3365) and the compounds were
identified using the available literature, previous studies and the NIST library (version
2.0). In each chromatogram presented the main peak at 9 mins is methylamphetamine
and the peak at 18.4 mins is the internal standard, eicosane.
5.2.1 Within batch variation
Within batch variation is observed when a single batch of methylamphetamine sample is
homogenized, divided into subsamples, analysed and the results compared. Within batch
results can be used to assess the extraction method and the variation of selected target
impurities within a synthetic batch. The relative standard deviation (RSD) of the
normalized peak area of each impurity was calculated using the six sub batches.
5.2.2 Between batch variation
The between batch variation relates to the variation in the impurity profile observed
when six batches of sample produced from six repetitive synthesis using the exact same
conditions and apparatus. The relative standard deviation (RSD) of the normalized peak
area of each impurity was calculated using the six separate batches.
5.3 Results and Discussion
A phosphate buffer (pH 10.5) extract was used to expose the organic impurity profiles
obtained from the samples produced using the Moscow and Hypo routes. The organic
impurity profiles are presented for samples produced using laboratory grade chemicals
initially and these are compared with previous the literature and existing research data.
Secondly, the impurity profiles obtained from samples derived from precursors and
essential chemicals extracted from Sudafed, iodine tinctures and matchbooks were

145
compared to each other and to the samples produced using the laboratory precursor
chemicals.
There are differences in the impurity profiles of methylamphetamine synthesized from
both routes which is evident and expected. Some significant between batch variation
were also very evident despite careful repetitive synthesis using the same conditions ,
equipment and chemicals.
Sections 5.3.1 and 5.3.11 present the within and between batch variations and the route
specific impurities obtained for both the Moscow and Hypophosphorous synthetic routes
using laboratory grade chemicals as precursors. Sections 5.3.3-5.3.11 and 5.3.13-5.3.20
present the chromatograms derived from samples of methylamphetamine synthesized
using the Moscow and Hypophosphorous routes respectively using pseudoephedrine
extracted from cold medication using ethanol, ethanol/methanol (90:10 % vol:vol) and
commercial methylated spirits respectively. In each case iodine and red phosphorous
were used in the synthetic phase. Regions of variability in the impurity profiles are
highlighted.
5.3.1 Within batch variation of methylamphetamine synthesized via Moscow
route using laboratory grade pseudoephedrine
The chromatographic impurity profiles for each of 6 sub samples of one batches of
methylamphetamine (ML 1 (i-iv)) synthesized via the Moscow route using laboratory
grade pseudoephedrine hydrochloride is presented in Figure 5.1 and the within batch
RSD (%) values of the derived impurities are presented in Table 5.3. Good
reproducibility was demonstrated for the extraction method with relatively low relative
standard deviations obtained across the range of impurities obtained (11 out of 16 peaks
having %RSD of 10 or less) which was in keeping with other reported RSD values in
similar studies [6]. Four of the six suggested Nagai/Moscow specific impurities
identified by Kunalan [4], were apparent in the samples and these included the
unidentified impurity MLUK 1 (unknown 6 in Kunalan’s work) [4]. These are
highlighted red in the table.

146
Figure 5.1. Impurity profiles illustrating within batch variation of 6 sub batches of
methylamphetamine synthesized via the Moscow route (ML1).
Table 5.3. Table of impurity peaks identified in methylamphetamine synthesized via the Moscow
route using laboratory grade pseudoephedrine hydrochloride.
Retention
Time (RT)
Impurity Peak RSD(%) of normalized
to IS values
5.484 Benzaldehyde 10
7.984 Benzyl-methyl-ketone(BMK) 27
10.067 Dimethylamphetamine(DMA) 5
10.785 Z(1-phenylpropan-2-one oxime) 35
11.576 N-Methylbenzamide 7
13.876 N-formylmethamphetamine 19
14.254 Methamphetamine acetylated 2
16.172 Amphetaminil 1
17.084 3,4-Diphenyl-3-buten-2-one 30
17.775 N-β-(phenylisopropyl)benzylmethyl ketimine 2
18.727 MLUK 1 24
19.057 Benzylmethnaphtalene 10
19.389 N-methyl-N-(α-methylphenyl)amino-1-phenyl-2-propanone 5
19.577 benzoylmethylamphetamine 8
19.796 N,N-di-(β-phenylisopropyl) formamide 9
21.623 (z)-N-methyl-N-(α-methyphenethyl)-3-phenylpropenamide 4
5.00 10.00 15.00 20.00 25.00 30.00 0
Time-->
Abundance
Methylamphetamine
Peak
ISTD peak
ML1-vi
ML1-v
ML1-iv
ML1-iii
ML1-ii
ML1-i

147
5.3.2 Between batch variation of methylamphetamine synthesized via Moscow
route using laboratory grade pseudoephedrine
The chromatographic impurity profiles for each of six repetitively synthesized batches of
methylamphetamine via the Moscow route using laboratory grade pseudoephedrine
hydrochloride are presented in Figure 5.2. Visual comparison of the impurity profiles
illustrates clear differences between sample profiles particularly within the 15-25 minute
range. Methylamphetamine synthesized using the Moscow route exhibits a large benzyl-
methyl-ketone (BMK) peak, shown in Figure 5.2. These differences are apparent in the
high %RSD values presented in Table 5.4. The previous identified Nagai and Moscow
route specific impurities (in red in the table) are still apparent within the samples.
Figure 5.2. Impurity profiles of between batch variation of ML 1 to 6 of methylamphetamine
synthesized via the Moscow route using laboratory grade pseudoephedrine.
5.00 10.00 15.00 20.00 25.00 30.00 Time-->
Abundance
ML 1
ML 2
ML 3
ML 4
ML 5
ML 6
ISTD peak
Methylamphetamine
Peak

148
Table 5.4. Impurity peaks identified methylamphetamine synthesized via the Moscow route using laboratory grade pseudoephedrine
hydrochloride.
Retention
Time
(RT)
Impurity Peak RSD(%) RSD(%)
normalized
to IS
RSD(%)
normalized
to TPA
Semi quant
values
mg/mL
m/z (base peak in
bold)
5.484 Benzaldehyde 70 81 76 0.002 105,77,51,63
7.984 Benzyl-methyl-ketone(BMK) 192 192 187 0.012 91,134,65,77,51
10.067 Dimethylamphetamine(DMA) 24 16 17 0.008 72,58,65,77,91
10.785 Z(1-phenylpropan-2-one oxime) 51 46 45 0.002 91,149,116,131
11.576 N-Methylbenzamide 85 75 84 0.001 105,77,58,134,91
13.876 N-formylmethamphetamine 76 76 76 0.009 86,58,118
14.254 Methamphetamine acetylated 49 44 49 0.004 58,100
16.172 Amphetaminil 63 64 59 0.008 132,105,91,77,65
17.084 3,4-Diphenyl-3-buten-2-one 105 88 107 0.005 179,178,222,221
17.775 N-β-(phenylisopropyl)benzylmethyl ketimine 85 87 82 0.011 91,160,119,65,77,207
18.727 MLUK 1 71 72 66 0.002 91,142,262
19.057 Benzylmethnaphtalene 28 25 25 0.001 232,217,202,58
19.389 N-methyl-N-(α-methylphenyl)amino-1-
phenyl-2-propanone
86
88 89 0.016 238,91,105,190,120
19.577 benzoylmethylamphetamine 83 84 86 0.015 105,162,77,91
19.796 N,N-di-(β-phenylisopropyl) formamide 48 58 55 0.005 190,91,58,119,77,105
21.623 (z)-N-methyl-N-(α-methyphenethyl)-3-
phenylpropenamide
188
188 190 0.017 131,91,58,103,188
RSD values are presented for raw data and peak areas normalized to the peak area of the internal standard (IS) and to the total peak area (TPA).
Impurities were semi-quantified to the internal standard using a single point estimate.
Three of the four route specific impurities observed witin the Moscow prepared samples have also been previously reported as
impurities in Nagai route samples. (N-methyl-N-(α-methyphenethyl)-3-phenylpropenamide, N-methyl-N-(α-
methylphenyl)amino-1-phenyl-2-propanone and benzylmethnaphtalene (1-benzyl-3-methylnaphthalene). The unknown
compound (MLUK 1) may be route specific for the Moscow synthesis, corroborating the previous work by Kunalan in this
regard.

149
5.3.3 Overview of variation of methylamphetamine impurity profiles synthesized
via the Moscow route using pseudoephedrine extracted from proprietary
cold medication (Sudafed- UK) using the three different solvent systems
The preparation of methylamphetamine using non laboratory precursor materials
represents a more realistic scenario of some clandestine synthesis, particularly small
scale synthesis. The mechanisms of extraction of the precursor chemical from available
over the counter cold medication (Sudafed) has been previously described and is
relatively straight forward. The effect of using different precursor extracting solvents on
the final methylamphetamine product is currently unknown with no reports addressing
this in the literature. Figure 5.3 represents on overlay comparing of batches of
methylamphetamine synthesised using laboratory precursor and precursors extracted
from proprietary cold medication using the three different solvent systems and exposes
significant differences within the resultant impurity profiles which appear to be solvent
dependent. The rest of the work discussed in this section explores these differences in
greater depth.
Figure 5.3. Chromatograms of methylamphetamine synthesized via the Moscow route (a) laboratory
grade precursors and precursors extracted from ‘Sudafed’ using (b) ethanol, (c) ethanol/methanol
(90:10) % vol/vol and (d)methylated spirits.
5.00 10.00 15.00 20.00 25.00 30.00 0 Time-->
Abundance
Methylamphetamine
Peak
(d)
(b)
(c)
(a)

150
5.3.4 Within batch variation of methylamphetamine synthesized via the Moscow
route using pseudoephedrine hydrochloride extracted from proprietary
cold medication (Sudafed-UK) using ethanol.
The chromatographic impurity profiles and related data for six subsamples of
methylamphetamine produced via the Moscow synthesis from precursor extracted from
Sudafed using ethanol are presented in Figure 5.4 and Table 5.5. Ten of the 28 peaks
presenting within the impurity profile display an RSD value of 10% of less while no
peak has a variation greater than 28% and again this is in accordance with previous
literature values for similar studies [6].
Figure 5.4. Impurity profiles illustrating within batch variation of 6 sub batches of
methylamphetamine synthesized via the Moscow route (ME 1) using pseudoephedrine
hydrochloride extracted from proprietary cold medication (Sudafed) with ethanol.
5.00 10.00 15.00 20.00 25.00 30.00 0
Time-->
Abundance
ME 1-i
ME 1-ii
ME 1-iiii
ME 1-iv
ME 1-v
ME 1-vi
Methylamphetamine
peak

151
Table 5.5. Impurity peaks identified in methylamphetamine synthesized via the Moscow route using
using pseudoephedrine hydrochloride extracted from proprietary cold medication (Sudafed) with
ethanol.
Retention
Time
(RT)
Impurity Peak RSD(%) of
normalized
to IS values
6.436 2-propenyl benzene 28
6.737 N-(phenylmethylene methanamine 26
8.356 Benzyl Methyl Ketone(BMK) 15
10.881 N-Methyl-1-phenylethanamine 18
13.333 Bibenzyl 12
13.677 MEUK 1 16
14.265 Acetylated methylamphetamine 7
14.855 MEUK 2 17
15.240 MEUK 3 8
15.465 MEUK 4 9
15.783 1,2-diphenyl-ethanone, 17
16.065 N-Acetylpseudoephedrine 23
16.168 2 phenyl-morpholine-3-methyl, 24
17.116 3,4-diphenyl trans 3-buten-2-one 15
17.480 n-β-phenylisopropylbenzyl methyl ketimine 20
18.170 1,2-dimethyl 1,3-phenyl azridine, 14
18.893 MEUK 5 10
19.047 N,N’-dimethyl-3,4-diphenylhexane-2,5-diamine 27
19.184 N-benzoylamphetamine 15
19.300 MEUK 6 5
19.694 MEUK 7 35
20.089 MEUK 8 19
20.236 MEUK 9 1
20.568 MEUK 10 2
20.726 MEUK 11 11
20.964 N-methyl-1-{4-[2-(methylamino)propyl]phenyl}-1-phenylpropa-2-
amine
24
21.044 N-methyl-1-{4-[2-(methylamino)propyl]phenyl}-1-phenylpropa-2-
amine
10
22.021 MEUK 12 3
It is immediately evident that the impurity profile is more complex than that observed
when laboratory grade materials were used. This is not unexpected as the purity of the
chemicals will be different. Furthermore, a greater number (12) of unidentified
compounds are present within the profiles. Interestingly an impurity previously
identified as a route specific impurity for the Emde route was found present in the
batches of methylamphetamine, the impurity was N-methyl-1-{4-[2-
(methylamino)propyl]phenyl}-1-phenylpropa-2-amine.

152
5.3.5 Between batch variation of methylamphetamine synthesized via Moscow
route using pseudoephedrine hydrochloride extracted from proprietary cold
medication using ethanol
The chromatographic impurity profiles for each of the 6 batches synthesized via the
Moscow route using pseudoephedrine hydrochloride extracted from Sudafed tablets
using ethanol and associated data are presented in Figure 5.5 and Table 5.6. Visual
comparison of the impurity profiles illustrates considerable differences between sample
profiles particularly within the 14-24 minute range. The large benzyl-methyl-ketone
(BMK) peak, present in the previous samples is also evident.
Figure 5.5. Impurity profiles of between batch variation of ME 1 to 6 of methylamphetamine
synthesized via the Moscow route using pseudoephedrine hydrochloride extracted from
proprietary cold medication using ethanol.
5.00 10.00 15.00 20.00 25.00 30.00 0
Time-->
Abundance
ME 5
ME 4
ME 3
ME 2
ME 1
ME 6
Methylamphetamine peak

153
Table 5.6. Impurity peaks identified methylamphetamine synthesized via the Moscow route using pseudoephedrine hydrochloride extracted
from proprietary cold medication using ethanol as the extraction solvent.
Retention
Time (RT)
Impurity Peak RSD
(%)
RSD(%)
normalized
to IS
RSD(%)
normalized
to TPA
Semi quant
values
mg/mL
m/z(base peak in bold)
6.436 2-propenyl benzene 64 63 57 0.001 117,91,103,77,60,51
6.737 N-(phenylmethylene methanamine 86 78 69 0.002 118,77,91,63,51
8.356 Benzyl Methyl Ketone(BMK) 59 52 42 0.015 91,134,65,77,51
10.881 N-Methyl-1-phenylethanamine 52 57 51 0.002 120,58,77,91,105,134
13.333 Bibenzyl 80 67 55 0.001 91,58,65,77,182
13.677 MEUK 1 33 36 35 0.005 148,176,133,91,113,58,77
14.265 Acetylated methylamphetamine 123 106 83 0.007 58,100
14.855 MEUK 2 57 64 65 0.001 118,147,58,77,91,105,191,176
15.240 MEUK 3 82 88 79 0.002 118,147,58,77,91,105,191,176
15.465 MEUK 4 153 136 118 0.009 105,190,77,86,176,51
15.783 1,2-diphenyl-ethanone, 188 176 166 0.009 105,77,91,51,65,115,128
16.065 N-Acetylpseudoephedrine 76 82 73 0.000 58,77,100,86,117
16.168 2 phenyl-morpholine-3-methyl, 187 166 155 0.008 132,105,91,77,65,51
17.116 3,4-diphenyl trans 3-buten-2-one 179 166 150 0.115 179,221,207,152,105,77
17.480 n-β-phenylisopropylbenzyl methyl ketimine 72 54 39 0.002 91,160,119,58,77
18.170 1,2-dimethyl 1,3-phenyl azridine 101 95 88 0.029 146,132,105,117,91,77,65
18.893 MEUK 5 93 76 60 0.002 131,148,190,103,91,77,58
19.047 N,N’-dimethyl-3,4-diphenylhexane-2,5-diamine 98 103 96 0.005 58,118,141,193,238
19.184 N-benzoylamphetamine 170 167 134 0.003 105,77,148,91,118
19.300 MEUK 6 214 205 194 0.012 148,190,91,117,105,77,58
19.694 MEUK 7 104 88 72 0.007 148,190,91,117,105,77,58
20.089 MEUK 8 134 116 96 0.004 203,91,148,188,58
20.236 MEUK 9 156 140 117 0.003 58,77,91,105,118,148,176,188,247
20.568 MEUK 10 164 149 126 0.002 259,115,58,91,176,105,77
20.726 MEUK 11 156 140 121 0.003 176,148,91,117,133,58
20.964 N-methyl-1-{4-[2-(methylamino)propyl]phenyl}-1-
phenylpropa-2-amine
42 48 51
0.004 58,208,239,195
21.044 N-methyl-1-{4-[2-(methylamino)propyl]phenyl}-1-
phenylpropa-2-amine
57
62 54
0.015 58,208,239,195
22.021 MEUK 12 146 129 107 0.002 105,91,77,58,118,262
RSD values are presented for raw data and peak areas normalized to the peak area of the internal standard (IS) and to the total peak area (TPA).
Impurities were semi-quantified to the internal standard using a single point estimate.

154
5.3.6 Within batch variation of methylamphetamine synthesized via Moscow
route using pseudoephedrine hydrochloride extracted from proprietary
cold medication using ethanol:methanol (90:10% vol/vol) as the
extraction solvent.
The chromatographic impurity profiles and related data for six subsamples of
methylamphetamine produced via the Moscow synthesis from pseudoephedrine
hydrochloride extracted from Sudafed tablets using ethanol:methanol (90:10%
vol/vol) as the extraction solvent is Figure 5.6 and Table 5.7. Ten of the 28 peaks
presenting within the impurity profile display an RSD value of 10% of less while no
peak has a variation greater than 28% and again this is in accordance with previous
literature values for similar studies [6].
Figure 5.6. Impurity profiles illustrating within batch variation of 6 sub batches of
methylamphetamine synthesized via the Moscow route (MDA1) pseudoephedrine
hydrochloride extracted from proprietary cold medication using ethanol:methanol (90:10 %
vol/vol) as the extraction solvent.
5.00 10.00 15.00 20.00 25.00 30.00 0
Time-->
Abundance
Methylamphetamine peak
MDA 1-i
MDA 1-ii
MDA 1-iii
MDA 1-iv
MDA 1-v
MDA 1-vi

155
Table 5.7. Table of impurity peaks identified in methylamphetamine synthesized via the
Moscow route using pseudoephedrine hydrochloride extracted from proprietary cold
medication (Sudafed-UK) using ethanol:methanol (90:10)% vol/vols as the extraction solvent.
Retention
Time (RT)
Impurity Peak RSD(%)
normalize
d to IS
5.481 Benzaldehyde 30
6.432 MDUK 1 20
6.734 N(phenylmethylene) methanamine , 22
7.872 1,2-dimethyl-3-phenyl aziridine, 12
7.977 Benzylmethylketone (BMK) 28
10.563 N,α-dimethyl -benzenemethanamine, 5
12.374 MDUK 2 6
12.758 Pseudoephedrine 5
13.095 MDUK 3 10
13.247 MDUK 4 15
13.354 Bibenzyl 5
13.584 N,N-dimethyl -benzenepropanamine, 12
13.692 MDUK 5 7
14.248 Methamphetamine acetylated 20
15.209 2,6-Diisopropylnaphthalene 4
15.457 3-Benzoyl-2-t-butyl-oxazolidin-5-one 16
15.771 N-benzoylamphetamine 3
15.906 MDUK 6 15
16.042 N-Acetylephedrine 12
16.654 Bibenzoyl 8
17.361 4,4-diphenyl-3-buten-2-one, 10
17.923 1,2-diphenyl-2-propen-1-one, 5
18.152 Aziridine, 1,2-dimethyl-3-phenyl-, trans 19
19.042 N,N’-dimethyl-3,4-diphenylhexane-2,5-diamine 10
19.378 MDUK 7 23
21.236 benzoylmethamphetamine 10
21.556 Acetylephedrine 23
22.706 E-N-methyl-N-(α-methylpheneethyl)-3-phenylpropenamide 13
23.169 MDUK 8 21
As with the ethanol extracted precursor samples, the impurity profiles are more
complex than those observed when laboratory grade materials were used. In this case
eight unidentified compounds are present within the profiles, and only the E-N-
methyl-N-(α-methylpheneethyl)-3-phenylpropenamide impurity from the Nagai
specific group is present.

156
5.3.7 Between batch variation of methylamphetamine synthesized via Moscow
route using pseudoephedrine hydrochloride extracted from proprietary
cold medication using ethanol:methanol (90:10% vol/vol ) as the
extraction solvent.
The chromatographic impurity profiles for each of the 6 batches synthesized via the
Moscow route using pseudoephedrine hydrochloride extracted from Sudafed tablets
using ethanol:methanol (90:10 % vol/vol) and associated data are presented in Figure
5.7 and Table 5.8. As before visual comparison of the impurity profiles illustrate
considerable differences between sample profiles particularly within the 14-22
minute range and the large benzyl-methyl-ketone (BMK) peak, present in the
previous samples is also evident.
Figure 5.7. Impurity profiles of between batch variation of MDA 1 to 6 of methylamphetamine
synthesized via the Moscow route using pseudoephedrine hydrochloride extracted from
proprietary cold medication (Sudafed) using ethanol:methanol (90:10 % vol/vol) as the
extraction solvent.
5.00 10.00 15.00 20.00 25.00 30.00 0
Time-->
Abundance
MDA 1
MDA 2
MDA 3
MDA 4
MDA 5
MDA 6
Methylamphetamine peak

157
Table 5.8. Impurity peaks identified methylamphetamine synthesized via the Moscow route using pseudoephedrine hydrochloride extracted from proprietary
cold medication using ethanol:methanol (90:10% vol/vol) as the extracting solvent.
Retention
Time
(RT)
Impurity Peak RSD(%)
RSD(%)
normalized
to IS
RSD(%)
normalized
to TPA
Semi quant
values
mg/mL
m/z (base peak in bold)
5.481 Benzaldehyde 50 46 46 0.021 106,77,51,63,74
6.432 MDUK 1 68 78 71 0.001 60,117,91,103,51
6.734 N(phenylmethylene) methanamine , 7 77 71 0.004 118,77,91,103,63,51
7.872 1,2-dimethyl-3-phenyl aziridine, 17 170 170 0.008 146,105,132,117,91,77
7.977 Benzylmethylketone(BMK) 118 107 108 0.022 91,134,65,77,105,115
10.563 N,α-dimethyl benzenemethanamine, 81 73 72 0.006 120,58,77,91,105,63,71
12.374 MDUK 2 75 67 67 0.001 105,77,58,51,163
12.758 Pseudoephedrine 44 35 40 0.003 58,77,62,70,105,117
13.095 MDUK 3 47 47 43 0.001 58,118,72,91,77,65,105
13.247 MDUK 4 52 41 44 0.000 58,71,91,117,176,105,158
13.354 benzyl 49 38 40 0.000 91,58,65,77,182
13.584 N,N-dimethyl benzenepropanamine 49 55 49 0.000 58,91,163,118
13.692 MDUK 5 61 57 63 0.004 148,176,58,91,113,133
14.248 Methamphetamine acetylated 77 83 77 0.005 58,100,91,77,65
15.209 2,6-Diisopropylnaphthalene 107 98 98 0.002 105,77,86,190,51,65,212
15.457 3-Benzoyl-2-t-butyl-oxazolidin-5-one 5 60 63 0.005 105,77,86,190,51,65
15.771 N-benzoylamphetamine 179 187 182 0.002 105,77,148,91,118
15.906 MDUK 6 43 45 44 0.001 230,58,86,77,105,177,188,245
16.042 N-Acetylephedrine 104 96 94 0.001 58,100,77,86,70
16.654 Bibenzoyl 191 195 192 0.005 105, 77,51, 61, 86
17.361 4,4-diphenyl-3-buten-2-one, 84 90 84 0.003 179,222,152,207,186
17.923 1,2-diphenyl-2-propen-1-one, 82 88 80 0.000 105,77,51,91
18.152 Trans 1,2-dimethyl-3-phenyl- aziridine 9 86 86 0.026 146,105,132,91,77,65
19.042 N,N’-dimethyl-3,4-diphenylhexane-2,5-diamine 67 98 75 0.007 58,208,239
19.378 MDUK 7 46 45 50 0.107 58,118,149,133,91,77
21.236 benzoylmethamphetamine 139 150 142 0.005 105,162,77,91
21.556 Acetylephedrine 60 61 56 0.032 58,100,77,86,70

158
Retention
Time
(RT)
Impurity Peak RSD(%)
RSD(%)
normalized
to IS
RSD(%)
normalized
to TPA
Semi quant
values
mg/mL
m/z (base peak in bold)
22.706 E-N-methyl-N-(α-methylpheneethyl)-3-
phenylpropenamide
52
89 50 0.003 131,91,58,103,188
23.169 MDUK 8 48 56 50 0.001 105,204,91,77,58,118,149,178
RSD values are presented for raw data and peak areas normalized to the peak area of the internal standard (IS) and to the total peak area (TPA). Impurities
were semi-quantified to the internal standard using a single point estimate.
One of the four specific impurities observed for the Nagai route (N-methyl-N-(α-methyphenethyl)-3-phenylpropenamide) was also
observed in all batches of methylamphetamine synthesised via the moscow route using pseudoephedrine hydrochloride extracted using
ethanol/methanol (90:10 % vol/vol)

159
5.3.8 Within batch variation of methylamphetamine synthesized via Moscow
route using pseudoephedrine hydrochloride extracted from proprietary
cold medication using commercial methylated spirit as the extraction
solvent.
The chromatographic impurity profiles for each of within 6 sub batches of MMS 1
synthesized via the Moscow route using pseudoephedrine hydrochloride extracted
from proprietary cold medication (Sudafed) using commercial methylated spirit as
the extraction solvent is presented in Figure 5.8 shown below. The RSD (%) values
of list of impurities identified in within sub batch of MMS 1 is presented in Table 5.9
shown below.
Figure 5.8. Impurity profiles illustrating within batch variation of 6 sub batches of
methylamphetamine synthesized via the Moscow route (MMS1) using pseudoephedrine
hydrochloride extracted from proprietary cold medication (Sudafed) using commercial
methylated spirit as the extraction solvent.
5.00 10.00 15.00 20.00 25.00 30.00 0
Time-->
Abundance
MMS 1-i
MMS 1-ii
MMS 1-iii
MMS 1-iv
MMS 1-v
MMS 1-vi
Methylamphetamine peak

160
Table 5.9. Impurity peaks identified in methylamphetamine synthesized via the Moscow route
using pseudoephedrine hydrochloride extracted from proprietary cold medication (Sudafed)
using commercial methylated spirit as the extraction solvent.
Retention
Time
(RT)
Impurity Peak RSD(%)
normalized
to IS
5.261 2,4 dimethyl pyridine 10
6.443 2-propenyl benzene, 10
6.744 N-(phenylmethylene) methanamine 11
8.089 Benzyl methyl ketone(BMK) 18
10.373 2-Chloro-acetophenone 6
10.848 1-phenyl- oxime-2-propanone 20
11.285 1-2-methylaziridine 28
12.744 Pseudoephedrine 40
13.086 MMUK 1 28
13.201 1-methyl-2-phenylhexahydropyrimidine 18
13.661 MMUK 2 20
15.229 MMUK 3 15
15.785 1,2-diphenylethanone 10
16.163 Amphetaminil 2
16.398 MMUK 4 2
16.659 Bibenzoyl 2
17.000 4,4-diphenyl-3-buten-2-one 10
17.392 4,4,diphenyl-3-buten-2-one 8
17.792 MMUK 5 20
18.166 Trans 1,2 dimethyl-3-phenyl azridine 15
19.182 MMUK 6 23
19.266 MMUK 7 17
19.596 Benzoylmethamphetamine 12
19.672 MMUK 8 13
20.157 MMUK 9 8
20.235 MMUK 10 5
20.374 MMUK 11 7
20.467 MMUK 12 19
21.061 N-methyl-1-{4-[2-(methylamino)propyl]phenyl}-1-
phenylpropa-2-amine
20
21.217 N-methyl-1-{4-[2-(methylamino)propyl]phenyl}-1-
phenylpropa-2-amine
24
22.491 MMUK 13 6
23.030 MMUK 14 21
23.388 MMUK 15 10
23.868 MMUK16 11
As with the previous two Sudafed prepared sets of methylamphetamine samples, the
impurity profile is more complex than that observed when laboratory grade materials
were used. The largest number of unidentified compounds (16) in comparison to all
other Moscow prepared samples are present within the profiles, and both isomers of
the impurity compound associated with the Emde route was found present in this
batches of methylamphetamine similar to the batches of methylamphetamine
synthesised using pseudoephedrine HCl extracted using ethanol, the mentioned

161
impurity N-methyl-1-{4-[2-(methylamino)propyl]phenyl}-1-phenylpropa-2-amine
were present.
5.3.9 Between batch variation of methylamphetamine synthesized via Moscow
route using pseudoephedrine hydrochloride extracted from proprietary
cold medication using commercial methylated spirit as the extraction
solvent.
The chromatographic impurity profiles for each of the 6 batches synthesized via the
Moscow route using pseudoephedrine hydrochloride extracted from Sudafed tablets
using commercial methylated spirits and associated data are presented in Figure 5.9
and Table 5.10. As before visual comparison of the impurity profiles illustrate
considerable differences between sample profiles particularly within the 14-22
minute range and the large benzyl-methyl-ketone (BMK) peak, present in the
previous samples is also evident.
Figure 5.9. Impurity profiles of between batch variation of MMS 1 to 6 of methylamphetamine
synthesized via the Moscow route using pseudoephedrine hydrochloride extracted from proprietary cold
medication (Sudafed) using commercial methylated spirit as the extraction solvent.
5.00 10.00 15.00 20.00 25.00 30.00 0
Time-->
Abundance
MMS 1
MMS 2
MMS 3
MMS 4
MMS 5
MMS 6
Methylamphetamine peak

162
Table 5.10. Impurity peaks identified methylamphetamine synthesized via the Moscow route using pseudoephedrine hydrochloride extracted from
proprietary cold medication using commercial methylated spirits as the extracting solvent.
Retention
Time (RT)
Impurity Peak RSD
(%)
RSD(%)
normalized
to IS
RSD(%)
normalized
to TPA
Semi
quant mg/mL
m/z (base peak in bold)
5.261 2,4 dimethyl pyridine, 94 87 77 0.042 107,79,92,65,51,115
6.443 2-propenyl benzene, 75 69 65 0.001 117,91,103,77,60,51
6.744 N-(phenylmethylene) methanamine 86 79 68 0.001 118,77,91,103,63,51
8.089 Benzyl methyl ketone(BMK) 99 91 79 0.013 91,134,65,77,105,115
10.373 2-Chloro-acetophenone 63 58 61 0.006 105,77,51,58,91,154
10.848 1-phenyl-oxime-2-Propanone 58 49 35 0.002 91,58,77,105,119,130
11.285 1-2-methylaziridine 78 70 60 0.009 56,63,77,54,91,105,115
12.744 Pseudoephedrine 107 99 83 0.003 58,77,62,70,105,117
13.086 MMUK 1 34 31 25 0.001 118,58,72,91,171,105
13.201 1-methyl-2-phenylhexahydropyrimidine 44 45 46 0.000 58,118,146,175,189
13.661 MMUK 2 64 62 46 0.001 148,176,58,91,113,133,77
15.229 MMUK 3 115 123 113 0.001 111,91,58,77,176,129
15.785 1,2-diphenylethanone 181 177 160 0.008 105,77,91,58,196
16.163 Amphetaminil 81 80 86 0.007 132,105,117,91,77,65,51
16.398 MMUK 4 69 61 49 0.000 180,77,58,91,51
16.659 Bibenzoyl 117 110 93 0.002 105,77,51,210
17.000 4,4-diphenyl-3-buten-2-one, 91 89 95 0.039 179,222,152,207,186
17.392 4,4-diphenyl-3-buten-2-one 131 123 100 0.009 179,222,152,207,186
17.792 MMUK 5 91 83 64 0.004 91,119,222,104
18.166 Trans 1,2 dimethyl-3-phenyl azridine 60 63 50 0.008 146,105,132,117,91,77
19.182 MMUK 6 76 69 66 0.001 105,186,58,77,91,170,144,118,
160
19.266 MMUK 7 87 81 72 0.004 179,207,256,58,114,152
19.596 Benzoylmethamphetamine 96 90 90 0.026 105,162,77,91
19.672 MMUK 8 75 66 46 0.010 193,165,250,89,148
20.157 MMUK 9 50 43 30 0.005 58,160,91,179,251
20.235
MMUK 10 91 83 69 0.002 188,247,91,105,58,77,148,176

163
Retention
Time (RT)
Impurity Peak
RSD
(%)
RSD(%)
normalized
to IS
RSD(%)
normalized
to TPA
Semi
quant
mg/m
L
m/z (base peak in bold)
20.374 MMUK 11 82 73 56 0.003 118,56,162,279,239,186,105,91
20.467 MMUK 12 46 39 34 0.002 71,58,91,115,236,251,179
21.061 N-methyl-1-{4-[2-(methylamino)propyl]phenyl}-1-phenylpropa-2-
amine
97 100 91 0.017 58,208,239,195
21.217 N-methyl-1-{4-[2-(methylamino)propyl]phenyl}-1-phenylpropa-2-
amine
82 76 71 0.007 58,208,239,195
22.491 MMUK 13 80 72 60 0.002 91,131,176,202,264,58,77,105,
118
23.030 MMUK 14 89 88 77 0.001 58,190,105,91,77
23.388 MMUK 15 108 103 105 0.002 105,120,77,198,275,289,91,51
23.868 MMUK16 126 122 125 0.005 247,162,91,119,70,56
RSD values are presented for raw data and peak areas normalized to the peak area of the internal standard (IS) and to the total peak area (TPA). Impurities
were semi-quantified to the internal standard using a single point estimate.

164
5.3.10 Unknown impurity peaks of methylamphetamine synthesized via the
Moscow route using the various precursor materials.
Besides known impurities listed in the above sections, a number of unknown
impurities for methylamphetamine synthesized via the Moscow route for each of the
different precursor samples prepared from Sudafed have been exposed and are
summarised in Table 5.12. Some of these peaks have been mentioned previously in
the literature relating to Moscow synthesised samples.
Table 5.11. Summary of the unknown peaks for the Moscow route
Sample
Mass ions for identification Retention Time of GC-MS
MLUK 1 105,77,58,134,91 11.576
MLUK 2 91,119,104,222,71 17.775 Kunalan [4]
MLUK 3 58,91,165,178,77 18.727
MLUK 4 174,91,56,115,148,265 19.796 (FSI 160 (2006) 1-10)[7]
MEUK 1 148,176,133,91,113,58,77 13.677
MEUK 2 118,147,58,77,91,105,191,176 14.855 (FSI 164(2006)210-
210)[8]
MEUK 3 118,147,58,77,91,105,191,176 15.240 (FSI 164(2006)210-
210)[8]
MEUK 4 105,190,77,86,176,51 15.465
MEUK 5 131,148,190,103,91,77,58 18.893
MEUK 6 148,190,91,117,105,77,58 19.300
MEUK 7 148,190,91,117,105,77,58 19.694
MEUK 8 203,91,148,188,58 20.089
MEUK 9 58,77,91,105,118,148,176,188,247 20.236
MEUK 10 259,115,58,91,176,105,77 20.568
MEUK 11 176,148,91,117,133,58 20.726
MEUK 12 105,91,77,58,118,262 22.021 (FSI 160(2006) 1-10)[7]
MDUK 1 60,117,91,103,51 6.432
MDUK 2 105,77,58,51,163 12.374 (FSI164(2006) 201-
210)[8]
MDUK 3 58,118,72,91,77,65,105 13.095
MDUK 4 58,71,91,117,176,105,158 13.247
MDUK 5 148,176,58,91,113,133 13.692
MDUK 6 230,58,86,77,105,177,188,245 15.906
MDUK 7 105,204,91,77,58,118,149,178 23.169
MMUK 1 118,58,72,91,171,105 13.086
MMUK 2 148,176,58,91,113,133,77 13.661
MMUK 3 111,91,58,77,176,129 15.229 (FSI 164(2006) 201-
210)[8]
MMUK 4 180,77,58,91,51 16.398
MMUK 5 91,119,222,104 17.792 Kunalan [4]
MMUK 6 105,186,58,77,91,170,144,118,160 19.182
MMUK 7 179,207,256,58,114,152 19.266
MMUK 8 193,165,250,89,148 19.672
MMUK 9 58,160,91,179,251 20.157
MMUK 10 188,247,91,105,58,77,148,176 20.235
MMUK 11 118,56,162,279,239,186,105,91 20.374
MMUK 12 71,58,91,115,236,251,179 20.467 (FSI 161(2006) 209)[9]

165
Sample
Mass ions for identification Retention Time of GC-
MS MMUK 13 91,131,176,202,264,58,77,105,118 22.491
MMUK 14 58,190,105,91,77 23.030
MMUK 15 105,120,77,198,275,289,91,51 23.388
MMUK 16 247,162,91,119,70,56 23.868
One unknown impurity appears across all of the synthetic routes where the precursor
was extracted from Sudafed. This peak has been labeled MEUK1, MDUK5 and
MMUK2 shown in Figure 5.10 below. The suggested route specific impurity
previously identified by Kunalan [4] has also been identified in both the laboratory
grade preparation and in the samples prepared from pseudoephedrine extracted using
commercial methylated spirits, however it was absent from both of the other sets of
samples and as such cannot be described as route specific.
Figure 5.10. Chromatograms of methylamphetamine synthesized via the Moscow route
precursors extracted from ‘Sudafed’ using (a) ethanol, (b) ethanol/methanol (90:10) % vol/vol
and (c) methylated spirits
9.00 10.00 11.00 12.00 13.00 14.00 15.00 16.00 17.00 18.00 19.00 20.00 21.00 22.00 0
Time-->
Abundance
Unknown impurities
MEUK1, MDUK5
and MMUK2
Methylamphetamine peak
(a)
(b)
(c)

166
5.3.11 Within batch variation of methylamphetamine synthesized via Hypo
route using laboratory grade pseudoephedrine
The chromatographic impurity profiles for each of 6 sub samples of one batches of
methylamphetamine (HL 1 i-vi) synthesized via the Hypo route using laboratory
grade pseudoephedrine hydrochloride is presented in Figure 5.11 and the within
batch RSD (%) values of the derived impurities are presented in Table 5.13. Impurity
peaks identified methylamphetamine synthesized via the Hypo route using laboratory
grade pseudoephedrine hydrochloride. Good reproducibility was demonstrated for
the extraction method with relatively low relative standard deviations obtained across
the range of impurities obtained (7 out of 16 peaks having %RSD of 10 or less)
which was in keeping with other reported RSD values in similar studies [6]. One of
the six suggested Nagai specific impurities identified by Kunalan were apparent in
the samples[ 4, 5].
Figure 5.11. Impurity profiles of within batch variation of 6 sub batches of [HL 1]
methylamphetamine synthesized via the Hypo route using laboratory grade pseudoephedrine.
4.00 6.00 8.00 10.00 12.00 14.00 16.00 18.00 20.00 0
Time-->
Abundance
Methylamphetamine
Peak
HL1-vi
HL1-v
HL1-iv
HL1-iii
HL1-ii
HL1-i

167
Table 5.12. Table of impurity peaks identified in methylamphetamine synthesized via the Hypo
route using laboratory grade pseudoephedrine hydrochloride.
Retention
Time(RT)
Impurity Peak RSD(%) of
normalized
to IS values
6.687 Acetic Acid 2%
7.787 Trans 1,2-dimethyl-3-phenyl azridine, 10%
10.062 Dimethylamphetamine(DMA) 8%
11.556 3-methyl-2-phenyl morpholine 20%
11.635 HLUK 1 10%
13.881 N-formylmethamphetamine 15%
14.257 Methylamphetamine acetylated 6%
16.093 Benzeneethanamine, α-methyl-N-phenylmethylene)- 20%
17.088 Benzylamphetamine 10%
17.484 N-β-(phenylisopropyl)benzylmethylketimine 14%
18.003 HLUK 2 4%
18.159 1,2-dimethyl-3-phenyl-aziridine, 20%
19.391 N-methyl-N-(α-methylphenethyl)amino-1-phenyl-2-
propanone
18%
19.577 Benzoylmethylamphetamine 20%
19.831 HLUK 3 17%
20.405 HLUK 4 4%
5.3.12 Between batch variation of methylamphetamine synthesized via Hypo
route using laboratory grade pseudoephedrine
The chromatographic impurity profiles for each of six repetitively synthesized
batches of methylamphetamine via the Hypo route using laboratory grade
pseudoephedrine hydrochloride are presented in Figure 5.12. Visual comparison of
the impurity profiles illustrate clear differences between sample profiles particularly
within the 15-25 minute range. These differences are apparent in the high %RSD
values presented in Table 5.13. The previous identified Nagai route specific
impurities (in red in the table) are still apparent within the samples.

168
Figure 5.12. Impurity profiles of between batch variation of HL 1 to 6 of methylamphetamine
synthesized via the Moscow route using laboratory grade pseudoephedrine.
5.00 10.00 15.00 20.00 25.00 30.00 0
Time-->
Abundance
HL 1
HL 2
HL3
HL4
HL 5
HL 6
Methylamphetamine peak

169
Table 5.13. Impurity peaks identified methylamphetamine synthesized via the Hypo route using laboratory grade pseudoephedrine hydrochloride.
RSD values are presented for raw data and peak areas normalized to the peak area of the internal standard (IS) and to the total peak area (TPA). Impurities were semi-
quantified to the internal standard using a single point estimate.
Retention
Time
(RT)
Impurity Peak RSD(%) RSD(%)
normalized to
IS
RSD(%)
normalized
to TPA
Semi quant
values
mg/mL
m/z (base peak in
bold)
6.687 Acetic Acid 16 14 24 0.002 60,76,91,117,133
7.787 Trans 1,2-dimethyl-3-phenyl azridine, 78 80 77 0.007 146,105,132,117,91,77
10.062 Dimethylamphetamine(DMA) 27 27 36 0.021 72,58,91,65,115,134
11.556 3-methyl-2-phenyl morpholine 55 56 64 0.009 71,56,77,91,105
11.635 HLUK 1 61 52 68 0.008 85,148,70,58,117,133
13.881 N-formylmethamphetamine 71 70 73 0.004 86,58,65,77,91,118,132
14.257 Methylamphetamine acetylated 97 100 111 0.002 58,100
16.093 α-methyl-N-phenylmethylene- benzeneethanamine 55 53 46 0.002 132,71,91,105,117,165
17.088 Benzylamphetamine 50 51 61 0.001 91,148,179,222,58,77
17.484 N-β-(phenylisopropyl)benzylmethylketimine 49 51 60 0.002 91,160,119,58,77
18.003 HLUK 2 41 39 50 0.000 172,91,131,58,77,103,
65
18.159 1,2-dimethyl-3-phenyl-aziridine, 116 115 107 0.003 146,105,132,117,91,77
19.577 Benzoylmethylamphetamine 57 59 68 0.003 105,162,77,91
19.831 HLUK 3 46 44 56 0.020 174,91,56,115,148,65,
77,265
20.405 HLUK 4 26 23 24 0.001 186,91,105,128,58,77,
115,162
One of the four route specific impurities observed for the Nagai route were also observed for the batches of methylamphetamine synthesised via
the Hypo route using laboratory grade pseudoephedrine hydrochloride. The mentioned route specific impuritiesobserved were, N-methyl-N-(α-
methylphenyl)amino-1-phenyl-2-propanone [1].

170
5.3.13 Overview of variation of methylamphetamine synthesized via Hypo route
using pseudoephedrine extracted from proprietary cold
medication(Sudafed) using the three different solvent systems
Figure 5.13 represents on overlay of batches of methylamphetamine synthesised
using laboratory precursor and precursors extracted from proprietary cold medication
using the three different solvent systems and exposes significant differences within
the resultant impurity profiles which appear to be solvent dependent. The rest of the
work discussed in this section explores these differences in greater depth.
Figure 5.13. Chromatograms of methylamphetamine synthesized via the Hypo route (a)
laboratory grade precursors and precursors extracted from ‘sudafed’ using (b)ethanol, (c)
mthanol/methanol(10:90) and (d)methylated spirits.
5.00 10.00 15.00 20.00 25.00 30.00 0
Time-->
Abundance
Methylamphetamine
Peak
(a)
(b)
(c)
(d)

171
5.3.14 Within batch variation of methylamphetamine synthesized via Hypo
route using pseudoephedrine hydrochloride extracted from proprietary
cold medication (Sudafed) using ethanol as the extraction solvent
The chromatographic impurity profiles and related data for six subsamples of
methylamphetamine produced via the Hypo synthesis from precursor extracted from
Sudafed using ethanol are presented in Figure 5.14 and Table 5.14. Four of the 29
peaks presenting within the impurity profile display an RSD value of 10% of less
while again this is in accordance with previous literature values for similar studies
[6].
Figure 5.14. Impurity profiles illustrating within batch variation of 6 sub batches of
methylamphetamine synthesized via the Hypo route (HE 1) using pseudoephedrine
hydrochloride extracted from proprietary cold medication (Sudafed) with ethanol.
5.00 10.00 15.00 20.00 25.00 30.00 0
Time-->
Abundance
HE 1-i
HE 1-ii
HE 1-iii
HE 1-iv
HE 1-v
HE 1-vi
Methylamphetamine peak

172
Table 5.14. Table of impurity peaks identified in methylamphetamine synthesized via the Hypo
route using using pseudoephedrine hydrochloride extracted from proprietary cold medication
(Sudafed) with ethanol.
Retention
Time
(RT)
Impurity Peak RSD(%) of
normalized
to IS values
5.649 Benzaldehyde 26
5.918 2-methyl- benzeneethanol, 10
6.421 2-propenyl benzene, 27
7.864 Trans 1,2-dimethyl-3-phenyl- azridine, 23
11.244 1-(2-phenylethyl) azridine 20
13.357 Bibenzyl 20
13.688 HEUK 1 9
13.885 Ethyl-methamphetamine 21
14.258 N-Acetylmethamphetamine 12
14.859 HEUK 2 28
15.247 HEUK 3 34
15.846 N-formylephedrine 30
16.081 HEUK 4 14
16.170 Amphetaminil 20
16.412 Pseudoephedrine 22
17.508 N-β-(phenylisopropyl)benzylmethylketimine 7
17.757 HEUK 5 10
18.161 1,2dimethyl-3-phenyl azridine 11
19.287 HEUK 6 31
19.464 N,N’-dimethyl-3,4-diphenylhexane-2,5-diamine 16
19.519 HEUK 7 13
19.590 Benzoylmethylamphetamine 20
19.940 HEUK 8 18
20.128 N,N’-dimethyl-3,4-diphenylhexane-2,5-diamine 16
20.234 HEUK 9 19
20.370 HEUK 10 13
20.567 HEUK 11 25
21.031 N-methyl-1-{4-[2-(methylamino)propyl]phenyl}-1-
phenylpropan-2-amine
24
21.519 HEUK 12 33

173
5.3.15 Between batch variation of methylamphetamine synthesized via Hypo
route using pseudoephedrine hydrochloride extracted from proprietary
cold medication (Sudafed) using ethanol as the extraction solvent
The chromatographic impurity profiles for each of the 6 batches synthesized via the
Hypo route using pseudoephedrine hydrochloride extracted from Sudafed tablets
using ethanol and associated data are presented in Figure 5.15 and Table 5.15.
Visual comparison of the impurity profiles illustrate considerable differences
between sample profiles particularly within the 14-24 minute range. These
differences are apparent in the high %RSD values presented in Table 5.15.
Figure 5.15. Impurity profiles of between batch variation of HE 1 to 6 of methylamphetamine
synthesized via the Hypo route using pseudoephedrine hydrochloride extracted from
proprietary cold medication using ethanol.
5.00 10.00 15.00 20.00 25.00 30.00 0
Time-->
Abundance
HE 1
HE 2
HE 3
HE 4
HE 5
HE 6
Methylamphetamine peak

174
Table 5.15. Impurity peaks identified methylamphetamine synthesized via the Hypo route using pseudoephedrine hydrochloride extracted from proprietary
cold medication using ethanol as the extracting solvent.
Retention
Time
(RT)
Impurity Peak RSD(%) RSD(%)
normalized
to IS
RSD(%)
normalized
to TPA
Semi quant
values
mg/mL
m/z (base peak in bold)
5.649 Benzaldehyde 115
116 113 0.007 106,77,51
5.918 2-methyl- benzeneethanol, 60 59 53 0.004 105,77,91,51,63
6.421 2-propenyl benzene, 88 86 84 0.002 117,60,91,103,77,51
7.864 Trans 1,2-dimethyl-3-phenyl- azridine, 91
91 87
0.234 146,105,132,117,91,77,65
11.244 1-(2-phenylethyl) azridine 70 69 67 0.001 56,65,77,91,104,117,146
13.357 Bibenzyl 92 91 89 0.000 91,58,77,105,146,182
13.688 HEUK 1 53 52 51 0.005 148,176,113,91,58
13.885 Ethyl-methamphetamine 44 43 52 0.001 86,58,65,77,91,97,118
14.258 N-Acetylmethamphetamine 30 32 36 0.001 58,100,65,77,91,117
14.859 HEUK 2 146 148 134 0.008 118,147,191,77,91,105,
191(2 isomers)
15.247 HEUK 3 114 114 100 0.020 118,147,191,77,91,105,
191
15.846 N-formylephedrine 125 126 110 0.004 57,65,77,91,105,117,132
16.081 HEUK 4 168 169 156 0.014 176,58,91,115,77
16.170 Amphetaminil 63 62 62 0.002 132,58,71,77,91,105,117
16.412 Pseudoephedrine 61 69 75 0.000 58,77,91,105
17.508 N-β-(phenylisopropyl)benzylmethylketimine 69
73 75
0.003 91,160,119,146,168,206,6
5,77
17.757 HEUK 5 53 52 40 0.000 85,58,70,91,105,146,178
18.161 1,2dimethyl-3-phenyl azridine 89
89 85 0.024 146,132,105,91,77,65
19.287 HEUK 6 64 67 67 0.002 58,148,190,91,77,105,118

175
The impurity compound associated with the Emde route was found present in this batches of methylamphetamine similar to the batches of
methylamphetamine synthesised using pseudoephedrine HCl extracted using ethanol, the mentioned impurity N-methyl-1-{4-[2-
(methylamino)propyl]phenyl}-1-phenylpropa-2-amine were present.
Retention
Time
(RT)
Impurity Peak RSD(%) RSD(%)
normalized
to IS
RSD(%)
normalized
to TPA
Semi quant
values
mg/mL
m/z (base peak in bold)
19.464 N,N’-dimethyl-3,4-diphenylhexane-2,5-
diamine
66
56 64 0.005 58,118,141,193,238
19.519 HEUK 7 81 81 63 0.004 58,118,203,49,77,91
19.590 Benzoylmethylamphetamine 58 59 42 0.002 105,162,77,91
19.940 HEUK 8 87 88 71 0.005 58,118,179,91,105
20.128 N,N’-dimethyl-3,4-diphenylhexane-2,5-
diamine
26
22 29 0.006 58,118,141,193,238
20.234 HEUK 9 118 119 104 0.010 118,237,91,58,77,146
20.370 HEUK 10 46 47 36 0.000 118,56,148,162,91,77,105,
132,239
20.567 HEUK 11 52 51 47 0.001 259,115,58,77,91,105
21.031 N-methyl-1-{4-[2-
(methylamino)propyl]phenyl}-1-
phenylpropan-2-amine
60
59 65 0.049 58,239,208,193,165
21.519 HEUK 12 87 87 70 0.000 58,190,91,105,118,132,
146,77,65

176
5.3.16 Within batch variation of methylamphetamine synthesized via Hypo
route using pseudoephedrine hydrochloride extracted from proprietary
cold medication (Sudafed) using ethanol:methanol (90:10)% vol/vols as
the extraction solvent
The chromatographic impurity profiles and related data for six subsamples of
methylamphetamine produced via the Hypo synthesis from precursor extracted from
Sudafed using ethanol:methanol (90:10)% vol/vols are presented in Figure 5.16 and
Table 5.16. Thirteen of the 27 peaks presenting within the impurity profile display
and RSD value of 10% of less and again this is in accordance with previous
literature values for similar studies [6].
Figure 5.16. Impurity profiles illustrating within batch variation of 6 sub batches of
methylamphetamine synthesized via the Hypo route (HDA1) pseudoephedrine hydrochloride
extracted from proprietary cold medication using ethanol:methanol (90:10 % vol/vol) as the
extraction solvent.
5.00 10.00 15.00 20.00 25.00 30.00 0
Time-->
Abundance
HDA 1-i
HDA 1-ii
HDA 1-iii
HDA 1-iv
HDA 1-v
HDA 1-vi
Methylamphetamine peak

177
Table 5.16. Impurity peaks identified in methylamphetamine synthesized via the Hypo route
using using pseudoephedrine hydrochloride extracted from proprietary cold medication
(Sudafed) with ethanol:methanol (90:10)% vol/vols.
Retention
Time (RT) Impurity Peak
RSD(%) of
normalized
to IS values
5.584 Benzaldehyde 24%
6.441 2-propenyl benzene 20%
11.805 Pseudoephedrine 2%
13.365 Bibenzyl 2%
13.683 HDUK 1 30%
14.248 Methamphetamine acetylated 22%
15.238 HDUK 2 12%
16.074 Acetylephedrine 28%
16.652 HDUK 3 5%
17.501 N-β-(phenylisopropyl)benzylmethyl ketimine 21%
17.758 HDUK 4 6%
18.154 1,2-dimethyl-3-phenyl azridine 5%
19.042 N,N’-dimethyl-3,4-diphenylhexane-2,5-diamine 10%
19.386 HDUK 5 5%
19.466 N,N’-dimethyl-3,4-diphenylhexane-2,5-diamine 18%
19.593 Benzoylmethylamphetamine 7%
19.662 HDUK 6 7%
19.824 HDUK 7 4%
19.942 HDUK 8 16%
19.996 N-methyl-N-(α-methylphenethyl)amino-1-phenyl-2-
propanone 3%
20.368 HDUK 9 12%
20.563 HDUK 10 20%
20.881 HDUK 11 8%
20.961 N-methyl-1-{4-[2-(methylamino)propyl]phenyl}-
1phenylpropa-2-amine 4%
21.028 N-methyl-1-{4-[2-(methylamino)propyl]phenyl}-1-
phenylpropa-2-amine 10%
21.517 HDUK 12 5%
21.807 HDUK 13 19%

178
5.3.17 Between batch variation of methylamphetamine synthesized via Hypo
route using pseudoephedrine hydrochloride extracted from proprietary
cold medication (Sudafed-UK) using ethanol:methanol (90:10)% vol/vols
as the extraction solvent
The chromatographic impurity profiles for each of the 6 batches synthesized via the
Moscow route using pseudoephedrine hydrochloride extracted from Sudafed tablets
using ethanol :methanol (90:10)% vol/vols and associated data are presented in
Figure 5.17 and Table 5.17. Visual comparison of the impurity profiles illustrate
considerable differences between sample profiles particularly within the 14-22
minute range.
Figure 5.17. Impurity profiles of between batch variation of HDA 1 to 6 of methylamphetamine
synthesized via the Hypo route using pseudoephedrine hydrochloride extracted from proprietary cold
medication (Sudafed-UK) using ethanol:methanol (90:10)% vol/vols as the extraction solvent
5.00 10.00 15.00 20.00 25.00 30.00 0
Time-->
Abundance
HDA 1
HDA 2
HDA 3
HDA 4
HDA 5
HDA 6
Methylamphetamine peak

179
Retention
Time (RT) Impurity Peak
RSD (%)
RSD(%)
normalized to
IS
RSD(%)
normalized
to TPA
Semi
quant
mg/mL
m/z (base peak in bold)
5.584 Benzaldehyde 93 92 98 0.014 106,77,51
6.441 2-propenyl benzene 69 66 71 0.002 117,60,91,103,77,51
11.805 Pseudoephedrine 62 60 71 0.480 58,77,91,105
13.365 Bibenzyl 73 73 68 0.001 91,58,77,105,146,182
13.683 HDUK 1 32 31 39 0.008 148,176,58,91,113,133,
84,77,98
14.248 Methamphetamine acetylated 90 90 74 0.001 58,100,65,77,91,117
15.238 HDUK 2 38 40 34 0.025 118,147,191,77,91,105
16.074 Acetylephedrine 81 80 84 0.006 58,77,86,100,117,207
16.652 HDUK 3 35 36 18 0.000 91,134,58,77,105
17.501 N-β-(phenylisopropyl)benzylmethyl ketimine 54 56 40
0.002
91,160,119,146,168,206,
65,77
17.758 HDUK 4 54 56 39 0.000 85,58,70,77,91,117,250
18.154 1,2-dimethyl-3-phenyl azridine 79 77 97 0.046 146,132,105,91,77,65
19.042 N,N’-dimethyl-3,4-diphenylhexane-2,5-diamine 57 56 59 0.009 58,118,141,193,238
19.386 HDUK 5 20 18 21 0.107 118,58,149,91,133,71
19.466 N,N’-dimethyl-3,4-diphenylhexane-2,5-diamine 52 52 55 0.108 58,118,141,193,238
19.593 Benzoylmethylamphetamine 37 38 20 0.002 105,162,77,91
19.662 HDUK 6 50 48 52 0.005 148,190,203,118,105,91,
77,58,265
19.824 HDUK 7 49 49 40 0.008 174,105,252,91,77,56,14
8,265
19.942 HDUK 8 67 71 52 0.005 58,118,237,91,179
19.996 N-methyl-N-(α-methylphenethyl)amino-1-phenyl-2-
propanone 34 33 36 0.031
238,190,148,120,105,91
20.368
HDUK 9 28 27 38 0.000
118,148,162,58,105,91,
77,132
20.563 HDUK 10 38 39 29 0.000 259,146,115,58,77,91,
105
20.881 HDUK 11 37 38 26 0.000 58,146,241,91,77,105,
117
Table 5.17. Impurity peaks identified methylamphetamine synthesized via the Hypo route using pseudoephedrine hydrochloride extracted from
proprietary cold medication using ethanol:methanol (90:10)% vol/vols as the extracting solvent.

180
One of the four route specific impurities observed for the Nagai route were also observed for the batches of methylamphetamine
synthesised via the Hypo route using laboratory grade pseudoephedrine hydrochloride. The mentioned route specific impurities observed
were, N-methyl-N-(α-methylphenyl)amino-1-phenyl-2-propanone [1]. the impurity compound associated with the Emde route was found
present in this batches of methylamphetamine the mentioned impurity N-methyl-1-{4-[2-(methylamino)propyl]phenyl}-1-phenylpropa-2-
amine were present.
Retention
Time (RT) Impurity Peak
RSD (%)
RSD(%)
normalized to
IS
RSD(%)
normalized
to TPA
Semi
quant
mg/mL
m/z (base peak in bold)
20.961 N-methyl-1-{4-[2-(methylamino)propyl]phenyl}-
1phenylpropa-2-amine 32 31 35 0.015
58,239,208,193,165
21.028 N-methyl-1-{4-[2-(methylamino)propyl]phenyl}-1-
phenylpropa-2-amine 23 23 26 0.047
58,239,208,193,165
21.517 HDUK 12 52 52 46 0.000 58,190,91,105,118,132,1
46,160
21.807 HDUK 13 160 160 155 0.003 254,148,120,58,91,105,1
32

181
5.3.18 Within batch variation of methylamphetamine synthesized via Hypo
route using pseudoephedrine hydrochloride extracted from proprietary
cold medication (Sudafed) using commercial methylated spirit as the
extraction solvent
The chromatographic impurity profiles and related data for six subsamples of
methylamphetamine produced via the Hypo synthesis from precursor extracted from
Sudafed using commercial methylated spirit are presented in Figure 5.18 and Table
5.18
Figure 5.18. Impurity profiles illustrating within batch variation of 6 sub batches of
methylamphetamine synthesized via the Hypo route (HMS1) using pseudoephedrine
hydrochloride extracted from proprietary cold medication (Sudafed) using commercial
methylated spirit as the extraction solvent
5.00 10.00 15.00 20.00 25.00 30.00
Time-->
Abundance
HMS 1-i
HMS 1-ii
HMS 1-iii
HMS 1-iv
HMS 1-v
HMS 1-vi
Methylamphetamine peak

182
Table 5.18. Impurity peaks identified in methylamphetamine synthesized via the Hypo route
using using pseudoephedrine hydrochloride extracted from proprietary cold medication
(Sudafed) with commercial methylated spirit.
Retention
Time (RT)
Impurity Peak RSD(%) of
normalized to
IS values
5.467 Benzaldehyde 27%
6.420 2-propenyl benzene, 25%
10.163 p-Chloro-N-methylamphetamine 18%
10.270 HMUK 1 20%
10.945 HMUK 2 25%
12.063 HMUK 3 20%
13.696 HMUK 4 7%
13.818 HMUK 5 17%
13.874 Ethyl methamphetamine 16%
14.250 N-acetyl methamphetamine 16%
15.837 Dimethylphenyloxazolidone 4%
16.094 HMUK 6 19%
16.410 HMUK 7 18%
17.093 Benzylamphetamine 6%
18.001 HMUK 8 21%
18.148 1,2 dimethyl-3-phenyl azridine, 9%
19.355 HMUK 9 7%
19.452 N,N’-dimethyl-3,4-diphenylhexane-2,5-diamine 12%
19.507 HMUK 10 5%
19.657 HMUK 11 6%
19.987 N-methyl-N-(α-methylphenethyl)amino-1-phenyl-
2-propanone
8%
20.223 HMUK 12 10%
20.448 HMUK 13 11%
21.013 N-methyl-1-{4-[2-(methylamino)propyl]phenyl}-1-
phenylpropa-2-amine
15%
21.224 N-benzoylmethylamphetamine 20%
21.517 HMUK 14 28%
22.146 HMUK 15 17%
30.46 Leucocrystal Violet 18%

183
5.3.19 Between batch variation of methylamphetamine synthesized via Hypo
route using pseudoephedrine hydrochloride extracted from proprietary
cold medication (Sudafed-UK) using commercial methylated spirit as the
extraction solvent
The chromatographic impurity profiles for each of the 6 batches synthesized via the
Hypo route using pseudoephedrine hydrochloride extracted from Sudafed tablets
using commercial methylated spirit and associated data are presented in Figure 5.19
and Table 5.19. Visual comparison of the impurity profiles illustrate considerable
differences between sample profiles particularly within the 14-20 minute range.
Figure 5.19. Impurity profiles of between batch variation of HMS 1 to 6 of
methylamphetamine synthesized via the Hypo route using pseudoephedrine hydrochloride
extracted from proprietary cold medication (Sudafed-UK) using commercial methylated spirit
as the extraction solvent
5.00 10.00 15.00 20.00 25.00 30.00
Time-->
Abundance
HMS 1
HMS 2
HMS 3
HMS 4
HMS 5
HMS 6
Methylamphetamine peak

184
Table 5.19. Impurity peaks identified methylamphetamine synthesized via the Hypo route using pseudoephedrine hydrochloride extracted from proprietary
cold medication using commercial methylated spirit as the extracting solvent.
Retention
Time (RT) Impurity Peak
RSD
(%)
RSD(%)
normalized
to IS
RSD(%)
normalized
to TPA
Semi
quant
mg/mL
m/z (base peak in bold)
5.467 Benzaldehyde 85 80 63 0.016 106,77,51
6.420 2-propenyl benzene, 91 84 70 0.001 117,60,91,103,77,51
10.163 p-Chloro-N-methylamphetamine 35 31 30 0.005 58,91,125,63,77,105
10.270 HMUK 1 68 61 53 0.008 58,117,90,144,104,130,77,65
10.945 HMUK 2 105 105 91 0.005 120,58,77,91
12.063 HMUK 3 45 43 37 0.001 138,58,181,91,82,100,110,152
13.696 HMUK 4 33 31 33 0.004 148,176,58,91,113,133,84,98,
77
13.818 HMUK 5 57 55 51 0.002 148,176,113,91,84,58,77,105,
133
13.874 Ethyl methamphetamine 41 37 42 0.002 86,58,65,77,91,97,118
14.250 N-acetyl methamphetamine 42 44 53 0.001 58,100,65,77,91,117
15.837 Dimethylphenyloxazolidone 90 86 72 0.006 57,77,91,105,117,191
16.094 HMUK 6 87 85 75 0.003 58,100,77,91,86,176
16.410 HMUK 7 86 97 99 0.001 58,91,105,115,146
17.093 Benzylamphetamine 31 35 37 0.011 91,148,65,77,102,116,130
18.001 HMUK 8 60 72 76 0.000 58,91,219,176,119,77,105,146,
234
18.148 1,2 dimethyl-3-phenyl azridine 105 101 90 0.017 146,132,105,91,77,65
19.355 HMUK 9 55 50 37 0.106 58,118,149,91,77,133
19.452 N,N’-dimethyl-3,4-diphenylhexane-2,5-diamine
80 74 60 0.009 58,118,141,193,238

185
Retention
Time (RT) Impurity Peak
RSD
(%)
RSD(%)
normalized
to IS
RSD(%)
normalized
to TPA
Semi
quant
mg/mL
m/z (base peak in bold)
19.507 HMUK 10 62 62 65 0.007 58,91,118,238,190,149,133,105
72
19.657 HMUK 11 99 97 82 0.004 148,190,58,77,91,105,133
19.987 N-methyl-N-(α-methylphenethyl)amino-1-phenyl-2-propanone 70 73 80 0.009 238,190,148,120,105,91
20.223 HMUK 12 72 66 54 0.007 188,118,105,91,58,77,247
20.448 HMUK 13 46 52 57 0.002 71,56,91,115,78,236,251
21.013 N-methyl-1-{4-[2-(methylamino)propyl]phenyl}-1-phenylpropa-2-
amine 67 61 52 0.057 58,239,208,193,165
21.224 N-benzoylmethylamphetamine 95 93 75 0.002 105,162,77,91,58
21.517 HMUK 14 96 87 73 0.003 58,190,91,105,118
22.146 HMUK 15 59 56 39 0.000 58,146,105,91,77,132,176,202
30.46 Leucocrystal Violet 52 45 31 0.011 253,373,359,329,126,165,208
One of the four route specific impurities observed for the Nagai route were also observed for the batches of methylamphetamine
synthesised via the Hypo route using laboratory grade pseudoephedrine hydrochloride. The mentioned route specific impurities observed
were, N-methyl-N-(α-methylphenyl)amino-1-phenyl-2-propanone [1]. The impurity compound associated with the Emde route was found
present in this batches of methylamphetamine the mentioned impurity N-methyl-1-{4-[2-(methylamino)propyl]phenyl}-1-phenylpropa-2-
amine were present.

186
5.3.20 Unknown impurity peaks of the methylamphetamine synthesized from
the Hypo route
Besides known impurities listed in the above sections, this research also has
identified a number of unknown impurities for methylamphetamine synthesized via
the Hypo route. The unknown impurities are listed in Table 5.20. Some of the peaks
presented in the table below were listed as unknowns in literature.
Table 5.20. Summary of the unknown peaks for the Hypophosphorous route.
HUK (Hypo
unknown impurity
peaks)
Mass ions for identification(base peak
in bold)
Retention Time of GC-
MS(unknowns reported in
other citations)
HLUK 1 85,148,70,58,117,133,105 11.635(FSI 164(2006)201-
210)[8]
HLUK 2 172,91,131,58,77,103,65 18.003
HLUK 3 174,91,56,115,148,65,77,265 19.831 (FSI 160(2006))[7]
HLUK 4 186,91,105,128,58,77,115,162 20.405
HEUK 1 148,176,113,91,58 13.688
HEUK 2 118,147,191,77,91,105,191(2 isomers) 14.859 (FSI 164(2006) 201-
210)[8]
HEUK 3 118,147,191,77,91,105,191 15.247 (FSI 164(2006) 201-
210)[8]
HEUK 4 176,58,91,115,77 16.081
HEUK 5 85,58,70,91,105,146,178 17.757
HEUK 6 58,148,190,91,77,105,118 19.287
HEUK 7 58,118,203,49,77,91 19.519
HEUK 8 58,118,179,91,105 19.940
HEUK 9 118,237,91,58,77,146 20.234 (FSI 160 (2006) 1-
103)[7]
HEUK 10 118,56,148,162,91,77,105,132,239 20.370 ( FSI 160 (2006) 1-
10)[7]
HEUK 11 259,115,58,77,91,105 20.567
HEUK 12 58,190,91,105,118,132,146,77,65 21.519
HDUK 2 148,176,58,91,113,133,84,77,98 13.683
HDUK 3 118,147,191,77,91,105 15.238 (FSI 164 (2006)
201-210)[8]
HDUK 4 91,134,58,77,105 16.652
HDUK 5 85,58,70,77,91,117,250 17.758
HDUK 6 118,58,149,91,133,71 19.386
HDUK 7 148,190,203,118,105,91,77,58,265 19.662
HDUK 8 174,105,252,91,77,56,148,265 19.824 (FSI 160(2006) 1-
10)[7]
HDUK 9 58,118,237,91,179 19.942 (FSI 160(2006) 1-
10)[7]
HDUK 10 118,148,162,58,105,91,77,132 20.368
HDUK 11 259,146,115,58,77,91,105 20.563
HDUK 12 58,146,241,91,77,105,117 20.881
HDUK 13 58,190,91,105,118,132,146,160 21.517
HDUK 14 254,148,120,58,91,105,132 21.807(FSI 160(2006) 1-
10)[7]
HMUK 1 58,117,90,144,104,130,77,65
10.270

187
HUK (Hypo
unknown impurity
peaks)
Mass ions for identification(base peak
in bold)
Retention Time of GC-
MS(unknowns reported in
other citations)
HMUK 2 120,58,77,91 10.945 (Analytica Chimica
acta 619 (2008) 20-25)[10]
HMUK 3 138,58,181,91,82,100,110,152 12.063
HMUK 4 148,176,58,91,113,133,84,98,77 13.696
HMUK 5 148,176,113,91,84,58,77,105,133 13.818
HMUK 6 58,100,77,91,86,176 16.094
HMUK 7 58,91,105,115,146 16.410
HMUK 8 58,91,219,176,119,77,105,146,234 18.001
HMUK 9 58,118,149,91,77,133 19.355
HMUK 10 58,91,118,238,190,149,133,105,72 19.507
HMUK 11 148,190,58,77,91,105,133 19.657
HMUK 12 188,118,105,91,58,77,247 20.223
HMUK 13 71,56,91,115,78,236,251 20.448 (FSI 161 (2006)
209-215)[6]
HMUK 14 58,190,91,105,118 21.517
HMUK 15 58,146,105,91,77,132,176,202 22.146
A number of common impurities were observed across the unknown impurities
within the Hypo samples. In each of the clandestine mimicked sample set, the
impurity previously associated with the clandestine mimicked Moscow samples was
present at approximately 13.6 minutes. This is identified as HEUK1, HDUK2 and
HMUK4. Again these did not appear in the samples produced using laboratory grade
chemicals.
Each of the clandestine mimicked Hypo samples produced one common impurity at
approximately 21.5 minutes (HEUK12, HDUK13, HMUK14) which was not present
in the samples prepared from laboratory grade materials. Finally the impurity at
approximately 20.5 minutes (HEUK11, HDUK13) was common across the ethanol
and ethanol:methanol extracted precursor samples but did not appear in the
methylated spirit extracted precursor samples. This also appeared to be the same
impurity as MEUK10 in the Moscow prepared samples.

188
5.4 Methylamphetamine synthesized from precursors sourced from Malaysia
5.4.1 Methylamphetamine synthesized via Hypo route using pseudoephedrine
extracted from proprietary cold medication (Allerpid-Malaysia) using
acid base extractions
Two batches of methylamphetamine hydrochloride were synthesized via Hypo
route using pseudoephedrine hydrochloride extracted from proprietary cold
medication (Allerpid-Malaysia) shown below in Figure 5.20 and Table 5.21 using
acid base extraction as detailed in Chapter 3. The impurity profiles of these samples
are presented in figure 5.20 and the table of extracted peaks presented in table 5.21.
Figure 5.20. Impurity profiles of different batches (AllepH 1 to Allep H2) of
methylamphetamine synthesized via the Hypophosphorous route using pseudoephedrine
hydrochloride (Allerpid-Malaysia) extracted using acid base extraction
5.00 10.00 15.00 20.00 25.00 30.00
Time-->
Abundance
Methylamphetamine peak

189
Table 5.21. List of some of the impurities of methylamphetamine synthesized via
Hypophosphorous route using pseudoephedrine hydrochloride extracted from (Allerpid-
Malaysia) using acid base extraction.
No RT Peak m/z fragments(base peak in
bold)
1. 5.329 Benzaldehyde 106,77,51,60,85
2. 7.674 1,2 dimethyl-3-phenylazridine 146,105,132,117,91,77,65
3. 10.803 Methcathinone 58,73,77,86,92,105,115
4. 11.282 3-methyl-2-phenylmorpholine 71,56,77,91,117,148,176
5. 16.632 Unknown 162,91,119,154,56,71
6. 17.102 Unknown 156,99,91,58,70,78
7. 18.641 Unknown 114,171,203,58,91,99,81
8. 18.918 Unknown 229,214,194,170,179,58
9. 19.157 N-methyl-N(-α-methylpheneethyl)amino-
1-phenyl-2-propanone
238,190,91,120,105,133,146
10. 19.359 Unknown 162,190,91,119,154,56,71
11. 21.001 Triprolidine 208,58,193,181,167,117
12. 23.916 Desloratadine 280,324,216,245,70,96,115
One of the four route specific impurities (N-methyl-N-(α-methylphenyl)amino-1-
phenyl-2-propanone [1]), observed for the Nagai route was also observed within
these samples

190
5.4.2 Methylamphetamine synthesized via Hypo route using pseudoephedrine
extracted from proprietary cold medication (Panadol-Malaysia) using
acid base extractions
A single batch of methylamphetamine hydrochloride were synthesized via Moscow
route using pseudoephedrine hydrochloride extracted from Panadol sourced from
Malaysia using acid base extraction as detailed in Chapter 3 shown in Figure 5.21
and Table 5.22. The impurity profile and associated data is presented in figure 5.21
and table 5.22.
Figure 5.21. Impurity profile of methylamphetamine synthesized via the Hypophosphorous
route using pseudoephedrine hydrochloride (Panadol-Malaysia) extracted using acid base
extraction.
5.00 10.00 15.00 20.00 25.00 30.00
2000000 4000000 6000000 8000000
1e+07 1.2e+07 1.4e+07 1.6e+07 1.8e+07
2e+07 2.2e+07 2.4e+07 2.6e+07 2.8e+07
3e+07 3.2e+07 3.4e+07 3.6e+07 3.8e+07
4e+07 4.2e+07 4.4e+07 4.6e+07 4.8e+07
5e+07 5.2e+07 5.4e+07
Time-->
Abundance
Methylamphetamine
peak

191
Table 5.22. List of some of the impurities of methylamphetamine synthesized via
Hypophosphorous route using pseudoephedrine hydrochloride extracted from (Panadol-
Malaysia) using acid base extraction.
No RT Peak m/z fragments(base peak in
bold)
1. 7.69 1,2 –Dimethyl-3-phenylazridine 146,105,132,117,91,77
2. 10.672 N-methyl-1-phenylethanamine 120,146,77,91,105,63,51
3. 10.819 Methcathinone 58,77,105,50,91,160
4. 11.188 1,2-dimethyl-3-phenylazridine 58,146,132,117,105,91
5. 11.287 3-methyl-2-phenylmorpholine 71,58,91,105,117,132,146
6. 13.867 3,5-Dimethyl-2-phenylpyridine 82,167,58,77,90,105,115
7. 15.013 2H-Indol-2-one, 1,3-dihydro-1-methyl 118,147,191,77,91,105
8. 15.617 2H-Quinoline-1-carboxylic acid,3,4-
dihydro-methylester
57,191,176,163,77,91,105
9. 16.25 2-methylphenyl-2-pyridinyl methanone 119,169,91,196,182,65,51
10. 18.559 5-Methyl-2-phenylindolizine 207,191,102,110,97
11. 18.702 Chlorphenamine 203,167,58,72,139
12. 19.123 Unknown 118,58,203,134,149,91,77
13. 19.757 Methylamphetamine dimer 238,91,120,148
14. 20.406 Unknown 183,167,98,84,196
15. 21.206 Triprolidine 208,58,193,181,167,117
16. 22.52 Unknown 272,256,244,128,136
17. 23.33 Unknown 286,271,207,143,258
18. 23.436 Unknown 224,207,183,276,294,117
19. 23.612 Unknown 276,247,219,205,117,102
20. 23.921 Desloratadine 280,266,310,254,245,230
One of the Nagai route impurities (methylamphetamine dimer [1].) was in this
sample. The samples prepared from the Malaysian pharmaceutical samples
produced, in general, much cleaner impurity profiles than those prepared using
Sudafed tablets. This may be in part because of the extraction methodology used for
prepare the precursor chemical

192
5.4.3 Methylamphetamine synthesized via Moscow route using
pseudoephedrine extracted from proprietary cold medication (Allerpid-
Malaysia) using acid base extractions
A total of 2 batches of independent samples of methylamphetamine hydrochloride
were synthesized via Moscow route using pseudoephedrine hydrochloride extracted
from proprietary cold medication (Allerpid-Malaysia) using acid base extraction as
detailed in Chapter 3 shown in Figure 5.22 and Table 5.23 below.
Figure 5.22. Impurity profiles of interbatch variation of 2 batches(AllepM 1 to Allep M2) of
methylamphetamine synthesized via the hypoHypophosphorous route using pseudoephedrine
hydrochloride (Allerpid-Malaysia) extracted using acid base extraction
5.00 10.00 15.00 20.00 25.00 30.00 0
Time-->
Abundance
Methylamphetamine peak

193
Table 5.23. List of some of the impurities of methylamphetamine synthesized via Moscow route
using pseudoephedrine hydrochloride extracted from (Allerpid-Malaysia) using acid base
extraction.
No RT Peak m/z fragments(base peak in
bold)
1. 5.332 Benzaldehyde 105,77,51,61,85
2. 7.672 1,2-Dimethyl-3-phenylazridine 146,105,117,132,91,77
3. 7.812 Benzyl methyl ketone 91,134,65,77,84,51,57
4. 9.05 1,2-dimethyl-3-phenylazridine 146,105,117,132,91,77
5. 10.791 Methcathinone 58,73,77,86,92,105,115
6. 11.278 Pseudoephedrine 58,71,79,91,105,117,132
7. 15.23 Unknown 105,190,77,51,64,86,131
8. 16.858 4,4-diphenyl-3-buten-2-one, 179,222,207,152,115,77,51
9. 19.119 Unknown 118,58,149,91,133,77,105
10. 19.908 Unknown 160,91,144,131,117,103,77
11. 20.773 Unknown 58,208,239,193,165,178
12. 21.274 Unknown 58,91,105,190,77,118
13. 24.189 Desloratadine 280,266,310,254,245,230

194
5.5 Comparison of the chromatographic profiles of methylamphetamine
synthesized using precursors (pseudoephedrine) extracted from Sudafed
tablets using the three different solvent systems using the Pearson
Correlation matrix approach
The impurity profiles were compared with each other using a Pearson correlation
coefficient matrix where the linkages threshold defined the goodness of fit for
samples within their synthetic group. In total, three data pre treatment refinements of
the various GCMS data sets were investigated in an effort to gain the most accurate
mathematical discrimination of the samples using Pearson correlation matrix. The
data pretreatment methods were selected based on those suggested by the CHAMP
authors [11](i.e. normalization, square root and fourth root). In this study a further
pretreatment method, the sixteen root was also included. The three refinements were
as follows:
1. Target impurities from this study normalized to the sum of targets and pre-
treated with square root method.
2. Target impurities from this study normalized to the sum of targets and pre-
treated with fourth root method.
3. Target impurities from this study normalized to the sum of targets and pre-
treated with sixteenth root method.
The success of the GCMS profiling method was assessed by its ability to produce
Pearson correlation coefficients which would facilitate the correct allocation of
individual drug batches to their synthetic route, while not permitting the batches
between synthetic routes to be deemed similar [11].Before discussing the results, a
discussion of the calculation of Pearson correlation coefficients and effect of the data
pre-treatment methods is undertaken in the sections below.

195
5.5.1 Pearson Correlation Coefficient
Pearson correlation coefficient, r, is a measure of the correlation between two
variables. The values usually ranges from -1 to +1 (with +1 indicating a positive
linear relationship, -1 indicating a negative linear relationship , and 0 indicating no
linear relationship between the two variables), although the coefficients may be
scaled over a different range for ease of use if required [11, 12, 13]. The coefficient
can be calculated using the following equation 5.1:
where x and y represent the two samples under the comparison and n is the number of variables per
sample [11,12].
An Excel macro, which allows convenient calculation of Pearson correlation
coefficients for data input by the user, has been developed by the European Network
of Forensic Institutes (ENFSI) drug working group and was used in this
study.[11,12] The coefficients are scaled such that a maximum positive correlation
corresponds to a value of +100, maximum negative correlation corresponds to a
value of -100, and no correlation corresponds to a value of 0. For the purpose of
comparing chromatograms, a value of +100 represents maximum similarity between
profiles[11,12,13 ].
While Pearson correlation coefficients conveniently qualify the relative similarity
between impurity profiles in a data set, it is up to the user to evaluate the meaning of
the value of r. Application of this statistic to a data set of samples of which the origin
(i.e. similarity) is known will allow the threshold value to be set such that all of the
known samples within each synthetic route are grouped together [11, 12, 13 ].
Equation 5.1

196
5.5.2 Data Pre-Treatment Methods
In order to reduce the influence of larger peak areas in, for example, a
chromatogram, data can be pre-treated, or transformed, before statistical analysis.
Two pre-treatment methods investigated by the CHAMP authors were the square
root and fourth root methods [11]. When pre-treating the data with the square root
method, each data point is replaced by its square root. Similarly, the fourth root and
sixteenth roots require replacing each data point by its fourth root and sixteenth roots
respectively. These types of pretreatment effectively reduce the range over which
data points are spread by reducing the magnitude of the larger data points (or
increasing the magnitude of the smaller points for values between 0 and 1) [14,15]
This effect is presented in Table 5.24 in which a Hypothetical set of 10 randomly
generated data points is pre-treated using both methods.
Table 5.24. The effects of square root, fourth root and sixteen root data pre-treatments on a set
of randomly generated data.
Random Raw Data After Square Root
Pre-treatment
After Fourth Root
Pre-treatment
After Sixteen Root
Pre-treatment
9.78 3.12 1.76 1.15
3.33 1.82 1.35 1.07
7.10 2.66 1.63 1.13
0.96 0.97 0.98 0.99
6.80 2.60 1.61 1.12
8.72 2.95 1.71 1.14
4.67 2.16 1.47 1.10
1.27 1.12 1.06 1.01
5.44 2.33 1.52 1.11
2.45 1.56 1.25 1.05
From data shown the Table 5.24 (above), the apparent spread of raw data originally
from 0.96 through to 9.78, is reduced to a range of 0.97 to 3.12 after the square root
pre-treatment and further reduced to 0.98 to 1.76 and 0.99 to 1.15 after pre-treating

197
with fourth and sixteenth root techniques respectively. The graphical representation
of the figures in the table above is shown in Figure 5.23 below.
Figure 5.23. Illustration of the effect of square, fourth and sixteen root pre-treatment on a
random set of data.
The square root method and, to a lesser extend, the fourth and sixteen root methods
are accepted and used relatively widely as data transformation methods [14, 15]
similar to the common log transformation [14,15]. The square, fourth and sixteenth
roots methods are more suitable than the log transformation when the data set has
many zeroes (as in the case with drug profiling data in which some of the target
impurities are not present)[14,15].
The Pearson correlation coefficient matrices are presented in tables 5.25 to 5.27

198
5.5.3 Results of Pearson Correlation Coefficient analysis
ME1 100.00
2.00 86.05 100.00
3.00 86.45 88.44 100.00
4.00 89.43 84.84 88.93 100.00
5.00 69.73 68.33 84.88 81.63 100.00
6.00 72.26 74.38 86.90 78.89 77.21 100.00
MDA7 41.87 40.70 61.05 62.04 49.85 71.29 100.00
8.00 31.85 38.08 48.40 50.25 30.79 61.11 91.86 100.00
9.00 32.41 34.21 40.40 47.28 17.53 50.29 86.76 92.57 100.00
10.00 30.70 30.06 47.63 51.75 44.60 58.04 89.69 91.28 77.87 100.00
11.00 31.69 38.36 60.50 54.62 56.23 69.03 94.02 85.73 74.00 88.78 100.00
12.00 36.04 39.32 49.57 53.26 28.87 60.08 92.24 98.11 95.46 88.33 83.88 100.00
MMS 13 26.44 7.64 24.93 37.69 36.80 27.26 39.78 33.92 24.94 49.53 37.55 33.04 100.00
14.00 24.02 16.66 29.11 37.57 47.29 36.56 36.87 37.38 20.85 54.54 37.91 31.06 57.17 100.00
15.00 30.21 15.53 35.17 47.73 54.06 43.09 50.53 44.94 28.81 64.49 48.96 40.14 67.10 93.83 100.00
16.00 34.24 23.55 33.47 46.91 47.87 40.13 43.10 41.65 26.02 58.92 39.70 36.70 63.68 90.15 94.54 100.00
17.00 28.24 14.43 34.28 45.06 52.06 41.26 47.46 43.98 26.30 62.74 46.49 38.63 80.34 87.91 94.64 91.05 100.00
18.00 35.50 23.00 39.11 44.79 45.47 42.53 51.79 48.34 35.22 63.35 50.35 44.98 89.23 72.85 79.62 78.62 89.08 100.00
ML19 47.38 48.81 59.27 57.93 58.39 62.26 68.85 54.81 57.99 56.55 64.78 54.46 37.02 29.23 36.52 35.69 36.63 46.01 100.00
20.00 48.14 48.14 59.59 57.87 56.05 63.75 71.17 57.43 62.46 56.55 65.04 58.15 33.48 24.40 32.15 30.37 30.97 39.97 98.24 100.00
21.00 53.92 49.48 59.00 51.66 55.39 57.31 50.30 34.84 39.27 38.09 45.75 35.69 30.92 18.40 24.15 27.17 23.78 36.88 90.78 90.19 100.00
22.00 54.40 60.64 58.27 68.32 56.09 57.46 58.79 49.23 56.96 46.14 52.13 50.67 30.79 19.56 25.92 28.12 25.81 32.27 91.08 90.59 79.30 100.00
23.00 77.44 81.61 83.57 84.49 66.84 70.16 56.23 44.28 41.14 44.76 49.48 46.59 20.15 16.78 24.99 26.52 23.51 30.58 62.80 63.13 60.06 67.86 100.00
24.00 58.97 59.87 65.74 61.57 56.26 63.56 61.47 49.15 55.26 46.95 55.16 50.85 28.92 19.26 24.88 27.27 24.45 37.70 96.18 95.50 95.11 89.77 69.02 100.00
HE25 -5.55 -8.44 -15.48 -12.94 -5.41 -7.56 -6.98 -6.94 4.80 -6.43 -2.00 -7.18 14.39 -5.17 -9.94 -8.36 -6.68 4.93 38.75 35.63 40.57 36.00 -18.15 37.08 100.00
26.00 59.98 60.14 42.53 55.36 38.37 29.36 -1.59 -6.96 -0.04 -6.93 -1.11 -4.45 11.58 -5.31 -4.55 -0.84 -4.77 2.58 27.96 25.99 31.36 50.28 49.74 35.76 36.43 100.00
27.00 32.45 31.62 17.42 24.90 21.64 16.33 -7.98 -8.48 1.90 -11.45 -7.20 -8.93 12.26 -5.44 -8.41 -1.40 -3.62 2.68 37.80 34.41 41.26 50.93 11.86 41.45 75.07 73.35 100.00
28.00 43.87 44.17 26.41 36.78 27.09 15.70 -6.20 -8.15 0.65 -7.78 -3.40 -6.79 13.28 -9.57 -11.37 -5.27 -8.05 2.17 32.34 28.35 34.78 50.43 26.69 37.43 67.85 86.99 89.53 100.00
29.00 24.28 26.16 8.66 19.21 8.94 -0.22 -10.87 -6.97 -1.98 -3.82 -6.10 -6.75 13.60 -9.84 -13.28 -9.18 -9.45 1.99 19.16 15.54 18.53 33.66 20.36 21.17 65.96 71.76 70.32 87.30 100.00
30.00 48.52 49.17 31.77 42.48 28.57 15.86 -5.93 -6.79 -1.94 -3.80 -2.07 -4.44 10.02 -10.50 -11.02 -7.63 -9.51 0.93 15.36 12.43 16.71 35.50 36.68 20.92 44.55 87.17 67.42 90.40 90.88 100.00
HDA31 82.86 84.84 77.72 80.83 58.17 61.98 41.40 38.29 36.38 37.30 34.15 39.15 13.56 28.00 25.34 28.68 21.95 25.93 45.78 44.73 43.11 55.35 82.76 53.57 -8.20 61.94 27.07 45.24 36.91 55.13 100.00
32.00 67.56 62.75 56.73 59.84 34.74 37.70 22.00 17.16 24.13 13.14 9.39 20.91 1.15 -0.22 -2.35 -0.85 -1.83 3.18 31.90 33.98 31.56 42.57 69.99 40.64 -5.14 54.80 22.81 42.31 40.02 53.92 87.23 100.00
33.00 73.15 63.88 63.75 66.51 44.04 48.52 35.29 28.24 31.09 28.45 22.49 30.20 14.56 16.62 16.60 17.36 16.82 21.39 40.32 41.55 39.69 44.19 73.63 46.55 -6.65 50.18 20.48 36.48 33.56 46.78 90.42 96.17 100.00
34.00 62.76 52.88 53.75 50.49 25.92 37.40 27.28 20.30 29.90 12.77 12.05 25.37 1.08 -8.01 -8.20 -8.96 -7.19 2.19 35.04 39.75 38.76 38.10 65.16 45.20 -2.37 40.53 14.25 30.28 29.71 39.12 76.51 94.65 92.69 100.00
35.00 86.00 79.37 75.59 77.88 47.86 60.31 43.46 41.20 42.55 37.20 30.73 44.52 18.71 22.23 22.85 26.45 21.76 30.11 43.22 43.34 44.81 48.65 79.06 54.22 -8.98 53.73 22.52 37.36 30.60 46.76 94.85 86.25 90.93 81.76 100.00
36.00 76.22 66.81 66.95 66.71 42.28 50.57 38.79 33.38 36.05 32.47 25.93 35.71 16.40 17.64 17.70 19.87 18.11 26.42 41.23 42.17 42.19 42.22 74.47 49.09 -6.07 48.43 19.54 34.92 31.84 45.40 90.84 93.16 98.32 90.82 93.81 100.00
HMS 37 34.93 48.14 30.19 43.48 25.48 24.77 11.78 15.43 11.67 11.74 9.75 15.95 5.40 -4.62 0.53 5.09 1.67 9.77 5.68 3.61 -1.04 20.47 38.12 9.01 -14.54 35.83 13.98 29.25 23.74 36.41 39.70 29.82 28.58 20.43 34.91 26.61 100.00
38.00 32.96 35.93 29.99 26.93 20.89 23.08 12.87 10.29 13.21 7.53 12.66 14.03 0.40 -13.70 -9.46 -5.10 -8.90 7.04 22.95 20.48 30.24 18.57 25.19 32.43 15.13 21.75 23.43 27.86 15.52 20.78 23.99 18.57 19.58 22.18 29.00 22.83 73.24 100.00
39.00 12.02 16.47 7.98 8.38 6.29 0.89 -8.68 -8.71 -6.52 -7.63 -4.15 -4.78 -8.70 -18.02 -15.93 -12.54 -14.83 -6.22 1.90 -1.93 5.91 2.35 8.03 8.15 9.89 16.45 18.24 24.57 20.54 22.55 8.44 6.09 2.86 5.00 9.02 2.93 70.79 86.43 100.00
40.00 31.58 33.13 28.81 23.84 19.79 19.26 7.27 6.63 9.03 7.44 11.84 11.50 2.82 -11.48 -8.03 -4.26 -6.06 8.31 22.85 18.67 29.28 20.01 21.55 31.81 24.07 26.46 30.84 37.69 31.79 33.93 22.39 16.71 15.49 18.56 26.36 18.60 60.90 87.39 91.64 100.00
41.00 42.39 40.91 34.96 32.46 23.28 27.93 12.50 10.90 13.40 8.93 11.84 15.27 5.79 -10.63 -5.16 -1.07 -4.08 13.48 24.84 21.94 32.39 21.25 29.52 34.88 18.23 29.06 28.48 35.17 25.19 30.81 31.00 24.12 25.95 27.40 37.52 29.73 73.44 95.89 87.19 92.96 100.00
42.00 52.19 52.78 45.83 41.59 32.01 37.43 15.43 15.20 16.77 11.48 14.21 18.81 12.57 -8.16 -4.25 -0.18 -1.45 17.90 27.90 25.87 37.70 28.21 34.34 40.72 24.25 40.55 34.39 42.66 31.35 40.44 38.32 34.66 34.41 36.91 46.14 38.94 50.00 71.12 41.03 61.85 72.45 100.00
HL43 54.46 57.62 54.86 58.99 49.93 53.46 44.76 35.45 36.02 35.12 39.93 35.78 28.94 21.10 28.40 33.71 28.35 40.37 59.02 54.75 58.45 53.54 54.60 62.60 21.05 37.87 32.41 32.21 15.37 21.83 47.05 28.32 39.12 28.05 49.82 44.08 45.23 59.57 22.50 34.05 53.23 66.63 100.00
44.00 43.58 41.42 44.41 51.87 51.22 47.40 42.19 28.56 32.67 31.17 38.33 29.64 36.20 19.14 29.39 30.72 30.79 39.02 66.01 62.24 63.78 60.35 41.86 65.72 38.00 35.20 41.94 37.17 17.61 19.26 29.57 15.90 25.08 17.41 31.63 27.13 37.81 58.41 25.62 35.79 51.22 60.58 93.49 100.00
45.00 50.26 51.45 53.99 60.90 53.02 55.75 54.22 44.67 40.49 48.94 49.72 43.94 39.81 35.07 44.64 48.06 44.55 52.47 57.50 52.84 53.48 49.45 55.13 57.66 10.14 26.80 18.74 18.42 5.48 11.15 44.22 21.08 35.63 19.94 46.92 40.79 41.44 50.22 14.91 24.50 43.81 55.37 96.70 89.55 100.00
46.00 48.87 59.56 50.47 51.59 30.30 48.57 42.82 40.44 46.30 26.30 33.59 43.27 8.25 -1.87 2.93 9.72 3.70 18.66 47.55 47.64 46.48 47.48 53.83 55.78 10.85 31.02 21.65 23.40 9.79 16.51 45.67 35.07 39.82 39.38 51.66 45.04 50.65 61.73 23.90 33.07 53.85 67.93 90.88 80.70 84.60 100.00
47.00 47.90 49.60 53.53 59.46 52.44 55.36 54.18 43.99 40.91 46.10 49.33 43.89 38.15 29.14 39.50 41.46 40.72 48.52 55.60 52.25 51.08 48.03 53.01 55.59 9.27 24.28 16.77 16.35 3.23 9.11 39.93 20.54 33.73 21.26 43.40 38.29 41.73 50.82 13.88 22.93 42.99 58.01 96.45 91.13 98.78 87.59 100.00
48.00 59.08 55.40 58.67 67.78 57.76 58.22 50.27 36.85 39.17 36.68 43.09 39.32 35.27 19.04 31.73 32.26 31.68 38.88 58.65 57.04 56.50 57.25 56.30 60.99 17.03 39.80 31.19 32.51 13.52 23.16 44.09 29.99 39.03 30.93 47.66 41.27 47.34 57.71 21.85 32.62 51.59 66.58 94.93 95.01 92.27 87.11 94.89 100.00
Table 5.25. Pearson correlation coefficients for every pair of samples in the 48 batches synthesised by two synthetic routes using normalized to the sum of targets and pre-treated with square root method. Red numbers corresponds to the
coefficients greater than a threshold of 70.26. The coefficients inside each box should be high as they denote the comparison of samples from within a synthetic route (Hypo is green and Moscow is blue).

199
ME1 100.00
2.00 79.30 100.00
3.00 76.45 79.81 100.00
4.00 85.82 77.11 91.86 100.00
5.00 79.59 76.05 93.65 94.97 100.00
6.00 76.41 72.41 74.87 73.48 75.30 100.00
MDA7 29.77 34.55 58.53 52.37 59.88 29.51 100.00
8.00 25.18 27.19 50.39 47.18 55.58 26.30 90.17 100.00
9.00 15.95 42.31 35.95 28.89 35.70 13.02 74.45 76.03 100.00
10.00 15.80 25.64 49.29 40.93 52.30 22.68 88.97 93.28 73.20 100.00
11.00 27.32 25.40 54.54 51.42 60.16 28.48 92.48 85.55 58.27 82.22 100.00
12.00 29.93 31.82 54.53 52.32 59.24 27.25 91.80 97.70 77.87 91.45 86.20 100.00
MMS 13 13.21 9.62 26.64 26.55 26.17 26.31 29.17 21.27 5.23 23.87 29.22 21.29 100.00
14.00 12.68 6.52 32.87 33.74 39.67 26.86 33.21 31.08 -3.84 30.65 49.50 26.70 55.91 100.00
15.00 3.19 -2.02 26.69 23.32 30.26 15.11 23.21 18.31 -19.18 24.53 39.82 14.81 58.60 89.01 100.00
16.00 1.97 -9.13 22.02 22.90 23.62 8.34 27.86 23.41 -4.50 22.50 37.63 21.58 66.95 80.52 84.31 100.00
17.00 22.11 16.50 43.87 44.78 51.44 32.96 44.13 38.01 6.30 42.02 52.46 37.06 60.07 84.42 80.98 74.63 100.00
18.00 34.68 24.76 51.88 55.48 55.05 38.38 47.80 36.31 7.26 37.46 54.03 36.97 79.40 76.05 73.98 71.61 78.21 100.00
ML19 57.16 50.01 65.27 65.55 63.39 51.57 53.32 42.86 36.71 31.48 43.84 45.11 27.42 11.90 6.64 19.23 23.90 38.59 100.00
20.00 55.93 50.25 62.55 61.23 61.77 53.63 51.45 40.59 36.57 29.70 41.36 42.97 25.18 9.96 3.28 13.80 21.19 33.69 98.41 100.00
21.00 59.46 48.82 58.45 60.82 60.96 55.05 48.38 36.12 29.54 24.19 38.96 38.45 25.19 8.54 2.26 10.38 19.99 33.93 93.86 95.62 100.00
22.00 50.51 41.58 55.22 55.85 55.81 46.99 48.65 37.02 30.06 25.88 40.38 38.17 25.10 10.62 4.47 15.39 20.16 34.86 96.75 97.13 94.04 100.00
23.00 48.04 40.87 49.56 52.52 50.90 42.25 43.06 33.18 28.46 21.26 34.25 34.86 20.04 4.40 -0.88 9.95 17.70 28.87 93.11 93.07 91.84 95.48 100.00
24.00 56.46 46.57 59.23 62.07 61.51 51.66 51.04 40.29 32.30 28.62 42.52 42.14 25.64 10.39 4.19 15.20 23.10 35.87 97.60 98.02 96.31 98.38 95.76 100.00
HE25 15.01 12.49 5.80 8.81 16.06 20.73 -0.36 -3.40 1.62 -9.22 4.61 -5.42 -9.86 -1.18 -6.63 -0.73 -8.51 -7.74 45.84 49.68 45.96 51.12 48.10 50.82 100.00
26.00 19.05 18.97 19.57 18.35 26.49 23.20 3.83 1.16 1.48 -5.16 6.87 -1.62 -19.94 -3.18 -8.98 -5.73 -8.90 -12.93 49.60 53.33 49.56 52.54 50.36 52.59 90.65 100.00
27.00 12.54 16.75 10.61 12.40 21.77 17.32 7.00 2.85 9.44 -1.49 12.01 1.52 -9.39 -2.96 -9.21 -8.29 -8.21 -7.40 40.10 44.42 41.99 44.97 40.22 44.28 90.03 87.03 100.00
28.00 11.40 10.47 5.01 7.89 15.91 18.91 -0.81 -4.53 -1.08 -9.20 6.38 -6.34 -9.39 1.99 -3.71 -0.05 -5.23 -6.57 39.38 42.71 40.06 43.60 39.58 43.60 97.66 90.29 92.44 100.00
29.00 18.75 11.20 9.11 14.44 17.26 22.55 -4.65 -3.18 -4.86 -10.39 4.25 -4.05 -6.23 5.63 -3.04 4.22 -2.53 -1.67 43.49 45.28 41.06 44.09 43.86 44.85 91.49 85.48 80.62 92.12 100.00
30.00 14.06 11.71 9.85 11.60 17.66 24.05 -4.81 -4.38 -7.01 -9.14 5.06 -5.98 -11.38 7.10 1.08 4.66 -1.91 -4.77 37.04 39.71 36.14 37.70 37.94 38.92 91.09 89.41 79.39 92.31 96.16 100.00
HDA31 73.70 74.25 67.79 69.01 66.51 58.76 42.46 36.80 33.71 30.06 33.23 43.54 -3.86 -7.44 -14.83 -16.98 5.10 13.24 47.63 47.64 52.65 39.60 40.67 47.54 12.32 18.83 18.56 10.71 10.90 11.69 100.00
32.00 57.17 58.37 46.24 47.30 42.62 34.94 35.18 32.33 34.70 23.46 28.34 37.77 -18.91 -19.47 -29.35 -28.04 -20.18 -2.64 34.54 34.05 37.96 29.27 31.55 34.35 12.94 13.46 17.73 9.50 11.72 10.35 88.44 100.00
33.00 65.18 56.15 53.37 56.16 51.39 43.44 40.06 38.48 29.99 27.25 35.06 43.76 -8.10 -11.50 -20.21 -16.62 -9.50 9.65 41.22 39.47 44.86 35.78 36.94 41.34 12.51 13.93 17.64 9.51 12.97 10.45 90.65 95.66 100.00
34.00 55.21 54.54 47.33 44.75 40.87 32.44 41.00 37.17 37.87 28.31 32.13 42.27 -13.53 -17.84 -26.22 -20.10 -17.63 2.58 38.79 38.15 40.29 33.91 34.20 37.83 15.82 15.20 18.10 11.04 15.02 12.46 85.43 95.82 95.06 100.00
35.00 73.68 64.70 60.02 63.75 57.09 50.72 37.47 34.36 30.53 23.44 29.64 41.22 -8.96 -11.70 -23.09 -16.98 -7.59 9.76 44.23 43.40 46.94 36.30 36.31 42.80 12.21 16.36 14.40 9.40 14.64 12.77 93.42 91.77 94.57 90.82 100.00
36.00 66.03 59.05 54.39 54.74 49.50 44.56 37.30 33.87 31.62 22.27 31.68 39.90 -7.46 -14.37 -23.71 -18.26 -12.15 7.63 41.93 40.62 44.76 35.54 35.67 40.41 11.44 12.22 17.02 8.68 12.54 8.89 89.45 95.39 98.33 94.60 94.62 100.00
HMS 37 6.50 6.58 0.23 7.77 1.06 2.60 -2.66 -6.10 -1.81 -15.94 -2.38 -8.37 1.58 -0.72 -5.38 1.96 -6.87 8.17 16.00 12.67 7.47 20.99 23.76 16.05 9.17 4.77 12.13 8.36 4.65 -1.72 -1.26 -5.38 -0.60 0.06 1.20 -1.12 100.00
38.00 -1.82 0.87 1.16 4.68 1.15 -1.35 12.41 3.22 7.09 0.40 10.01 3.31 0.65 -8.90 -8.02 -0.28 2.03 10.53 9.53 6.47 0.85 11.18 13.75 10.67 1.60 -0.80 3.72 4.26 -2.01 -3.66 0.36 -9.90 -4.37 -1.58 0.93 -5.26 81.55 100.00
39.00 -15.04 -3.89 -1.67 -4.16 -7.61 -9.77 9.17 5.51 10.84 3.72 7.83 6.07 2.42 -10.73 -9.70 2.25 -2.67 6.32 -5.15 -8.97 -14.44 -5.14 -1.64 -6.60 -7.58 -4.02 -3.34 -3.98 -3.90 -3.51 -6.26 -11.42 -6.56 -0.92 -2.83 -5.90 62.81 84.51 100.00
40.00 -9.25 -0.50 -1.36 -1.48 -7.17 -9.32 5.54 0.54 9.09 -2.47 4.31 1.80 -3.65 -11.48 -10.80 1.07 -4.38 5.44 -0.99 -5.05 -12.95 -0.33 0.67 -3.15 -1.36 -1.94 -1.56 -1.18 -1.37 -2.08 -8.57 -10.74 -7.49 -0.28 -0.93 -5.78 63.70 82.08 94.26 100.00
41.00 -8.36 -4.53 -6.07 -0.49 -5.90 -11.05 2.30 -2.43 1.20 -8.57 4.00 -3.43 -0.83 -0.86 -0.61 7.49 3.45 9.74 3.98 -0.05 -6.46 5.78 8.07 3.40 4.15 1.41 4.57 5.27 0.97 -1.64 -11.93 -19.67 -14.80 -11.82 -8.76 -14.68 84.05 90.70 84.68 89.21 100.00
42.00 -8.05 -3.67 -13.64 -8.24 -14.31 -6.44 -10.35 -12.74 -4.08 -18.29 -10.98 -15.45 -9.03 -12.64 -14.32 -4.79 -11.90 -4.54 -0.12 -2.33 -8.99 3.34 6.86 0.73 8.20 5.62 5.77 8.19 4.37 2.99 -13.16 -18.73 -16.81 -11.28 -9.93 -16.68 86.50 91.08 81.29 82.94 93.88 100.00
HL43 51.50 37.62 56.62 60.11 55.68 42.28 47.06 34.90 21.76 23.24 41.62 36.77 24.96 12.51 8.13 20.64 21.56 39.09 90.18 88.18 83.13 93.44 89.60 90.69 39.44 42.98 37.63 32.32 32.45 26.25 37.71 28.71 36.73 33.07 37.73 35.92 35.56 24.95 9.47 15.26 20.90 17.69 100.00
44.00 43.12 34.57 49.46 51.07 49.13 37.38 44.78 31.36 24.92 21.31 37.96 32.50 19.74 5.41 2.55 15.08 13.13 30.74 88.94 87.74 82.48 93.22 89.77 90.46 50.25 51.40 47.93 43.12 39.24 34.30 33.01 26.65 31.90 30.67 32.63 31.30 36.95 27.98 10.55 16.80 22.78 21.29 97.41 100.00
45.00 48.19 31.74 55.79 59.35 55.51 41.09 47.54 36.41 18.62 24.66 42.73 38.02 25.49 15.10 9.88 22.88 24.36 40.47 88.62 86.22 82.38 92.09 88.49 89.28 39.50 45.36 38.33 33.72 34.36 28.81 35.02 25.30 34.47 29.65 35.12 33.21 31.34 22.27 9.89 13.73 18.25 14.72 98.77 95.83 100.00
46.00 45.64 40.59 56.16 55.92 52.04 39.10 50.36 38.37 32.93 26.84 40.12 40.30 19.92 4.94 -3.66 12.60 14.84 31.20 89.31 87.71 82.21 91.85 89.37 88.69 38.91 46.13 39.58 33.04 33.13 27.97 40.66 33.53 38.79 38.19 40.70 39.35 33.74 25.23 16.20 19.34 20.72 19.08 96.64 95.53 96.78 100.00
47.00 46.02 34.05 56.37 56.93 54.32 42.95 48.68 38.41 23.11 26.12 43.27 39.04 26.75 14.38 8.22 21.37 21.73 38.60 89.59 87.47 83.58 93.30 89.15 90.00 40.02 45.98 38.91 33.88 34.15 29.19 34.16 26.90 35.10 30.76 34.47 34.78 27.67 17.83 8.53 12.92 14.79 11.26 97.60 96.03 98.60 97.21 100.00
48.00 51.96 43.11 57.50 59.49 54.39 42.59 45.68 33.87 26.59 21.63 37.81 35.71 22.32 5.83 1.06 15.86 15.89 34.24 91.16 88.91 83.81 93.76 90.38 91.30 39.95 43.67 37.41 32.26 32.42 26.65 41.10 33.43 39.82 37.75 41.25 39.89 34.59 24.60 11.48 18.14 21.09 18.59 98.73 97.49 96.93 97.56 97.55 100.00
Table 5.26. Pearson correlation coefficients for every pair of samples in the 48 batches synthesised by two synthetic routes using normalized to the sum of targets and pre-treated with fourth root method. Red numbers corresponds to the
coefficients greater than a threshold of 71.26. The coefficients inside each box should be high as they denote the comparison of samples from within a synthetic route (Hypo is green and Moscow is blue).

200
ME1 100
2 98.89 100
3 91.27 93.32 100
4 98.5 99.56 93.73 100
5 98.37 99.35 93.68 99.52 100
6 97.98 98.21 91.15 97.3 97.18 100
MDA7 12.66 18.58 28.51 19.39 20.08 14.82 100
8 13.71 20.3 29.63 19.52 22.06 17.46 83.09 100
9 18.16 24.94 32.53 25.49 27.17 19.1 72.81 84.99 100
10 4.045 10.94 19.87 11.26 13.55 8.961 76.4 87.52 72.98 100
11 2.637 8.777 18.67 9.753 10.64 4.526 86.2 74.4 66.36 67.56 100
12 12.11 18.71 28.68 18.33 20.31 14.49 82.2 95.12 86.73 84.52 77.03 100
MMS 13 -6.139 -2.507 6.968 -1.689 -1.907 -7.295 26.34 12.95 13.89 9.285 21.06 21.04 100
14 1.528 5.053 6.068 5.31 2.634 5.037 15.86 -0.814 0.563 13.47 6.536 2.729 38.65 100
15 -5.436 0.599 9.846 3.218 2.293 -2.56 39.34 23.05 21.86 34.01 25.8 27.98 68.81 59.47 100
16 -2.134 1.701 9.577 3.331 2.725 0.42 26.94 13.48 9.605 23.97 19.82 19.44 66.65 48.1 86.68 100
17 4.154 5.816 7.049 6.939 6.902 2.709 12.93 -0.735 2.061 12.27 -0.951 6.281 27.2 21.95 40.37 26.97 100
18 5.351 9.826 20.59 13.01 11.78 3.071 41.43 25.03 31.85 26.84 30.33 33.39 79.64 49.31 84.14 72.04 36.24 100
ML19 54.28 56.33 48.13 56.68 55.97 51.81 21.18 19.44 35.07 9.075 17.36 19.59 -15.2 -6.165 -3.213 -0.386 -6.414 1.288 100
20 54.19 56.35 48.27 56.68 56.01 51.97 19.3 17.8 33.21 7.748 16.13 17.83 -17.48 -7.309 -4.483 -1.93 -5.382 -0.92 99.79 100
21 53.83 55.79 47.69 56.14 55.66 51.46 17.15 15.48 31.39 6.36 14.33 14.98 -19.05 -4.854 -3.536 -1.546 -4.598 -1.469 99.3 99.61 100
22 54.13 56.37 48.02 56.63 56.13 51.65 18.33 17.45 34.16 7.124 16.01 17.35 -16.19 -8.577 -5.153 -2.355 -5.932 -0.78 99.69 99.78 99.42 100
23 52.36 54.26 47.18 54.77 54.59 50.65 13.98 14.32 33.43 11.03 12.43 16.06 -23.8 -8.17 -6.838 -5.825 -5.149 -7.452 92.12 92.59 92.3 92.38 100
24 54.45 56.53 48.21 56.86 56.26 51.99 19.25 17.21 33.46 7.046 16.36 17.15 -16.66 -6.51 -4.418 -2.515 -4.394 -0.545 99.68 99.83 99.65 99.81 92.54 100
HE25 79.96 79.52 72.15 78.62 79.15 82.62 2.719 8.89 16.18 -1.666 0.396 3.506 -19.92 -9.326 -16.02 -10.79 -15.91 -12.85 62.36 62.6 62.51 62.94 60.45 62.53 100
26 77.96 77.65 70.15 76.94 77.72 78.98 0.415 4.885 10.45 0.628 -1.462 0.946 -14.65 -4.467 -11.8 -4.723 -10.74 -8.204 66.87 67.11 67.04 67.24 64.94 67 93.74 100
27 80.25 79.52 72 78.87 79.52 82.36 2.492 9.03 18.26 -1.332 -1.623 3.174 -19.95 -10.35 -15.62 -11.46 -13.5 -10.17 61.52 61.74 61.86 61.98 59.91 61.62 98.65 92.91 100
28 79.44 78.53 71.2 77.8 78.44 81.83 1.755 6.856 14.53 -3.455 -1.366 1.05 -20.98 -9.555 -16.72 -11.41 -16.2 -13.79 60.54 60.75 60.84 60.96 59.17 60.65 99.68 93.5 98.97 100
29 65.75 62.22 54.89 61.25 62.24 68.16 -14 -8.944 -8.931 -14.45 -12.57 -13.81 -34.52 -11.3 -29.91 -21.39 -25.51 -29.22 45.02 45.16 46.18 45.44 44.6 45.11 88.26 81.22 86.72 88.61 100
30 79.23 78.71 72.17 78.08 78.5 81.99 2.525 7.289 14.54 -1.246 -1.447 2.094 -22.03 -5.569 -15.97 -11.61 -16.71 -13.39 59.67 59.92 59.9 59.97 59.46 59.8 99.04 93.92 97.56 99.02 89.09 100
HDA31 83.91 84.42 77.86 84.36 84.87 83.51 15.1 21.77 32.92 13.68 18.07 22.91 -18.22 -4.734 -10.82 -7.93 -0.933 1.326 52.97 52.94 52.92 53.35 53.03 53.26 73.89 72.82 74.2 72.81 60.99 72.67 100
32 78.25 79.04 72.87 79 79.8 78.04 17.61 25.12 37 17.73 23.44 26.37 -18.51 -3.994 -13.84 -10.78 -11 0.181 49.65 49.36 49.44 49.91 50.38 49.93 69.85 69.31 70.31 69.05 56.89 68.97 98.15 100
33 80.88 81.7 76.17 81.87 82.28 80.5 15.24 22.49 34.81 16.46 19.95 23.54 -19.07 -2.032 -12.6 -9.712 -9.014 0.695 50.87 50.63 50.89 51.11 52.62 51.15 72.47 71.82 72.91 71.67 59.45 71.64 98.49 99.32 100
34 78.32 79.43 73.75 79.59 79.97 77.72 18.15 24.52 36.28 16.69 22.93 25.59 -16.8 -2.944 -12.09 -9.166 -11.2 2.328 51.01 50.68 50.68 51.2 51.73 51.27 70.02 70.19 70.57 69.12 55.54 69.14 97.7 99.44 99.31 100
35 82.08 82.26 75.82 82.13 82.61 81.42 11.62 19.04 31.56 11.27 15.6 20.05 -18.23 -5.035 -13.3 -10.31 -5.507 -0.032 49.16 49 49.18 49.47 49.87 49.45 72.65 71.27 73.08 71.8 58.53 71.42 98.99 98.69 99.01 98.59 100
36 81.39 81.72 76.07 81.89 82.2 80.65 14.92 22.03 33.89 15.48 19.49 22.67 -20.39 -3.97 -14.63 -11.48 -10.42 -0.865 50.23 49.97 50.2 50.59 51.65 50.6 72.3 71.43 72.47 71.43 60 71.51 98.4 99.12 99.7 99.03 98.88 100
HMS 37 6.572 6.835 0.996 7.579 6.368 6.055 -13.43 1.658 8.534 -3.522 1.11 8.83 1.213 16.4 3.352 4.332 -11.43 4.978 12.34 12.04 13.57 11.06 12.87 12.44 15.45 11.6 14.22 14.42 18.74 16.44 10.92 11.16 12.63 10.51 11.17 10.6 100
38 12.6 12.25 16.93 13.62 12.43 14.22 -6.289 12.69 17.41 8.649 -6.379 16.81 9.575 12.86 14.75 8.86 2.899 20.24 2.295 1.668 2.775 0.555 4.719 1.923 13.63 8.069 14.86 12.16 15.46 16.31 23.22 20.91 22.32 20.96 22.95 20.94 73.41 100
39 2.714 1.011 9.48 1.403 1.187 5.352 -5.758 11.63 8.654 6.607 -8.585 12.52 2.664 13.38 8.2 1.783 -13.37 10.42 -4.939 -5.478 -4.21 -7.13 -1.41 -5.347 10.97 9.681 12.5 10.51 18.93 15.83 13.17 12.83 13.51 13.39 13.7 12.81 57.91 87.87 100
40 -4.396 -6.874 0.985 -6.238 -5.712 -3.551 -12.85 5.538 3.296 -0.075 -10.89 6.998 9.674 14.27 9.908 5.279 -11.49 13.56 -11.95 -12.41 -10.29 -13.41 -9.946 -12.03 4.655 4.507 6.018 4.793 14.61 8.607 8.421 8.588 8.914 8.674 9.153 8.202 60.39 84.14 95.22 100
41 -0.169 -1.618 2.722 -0.048 -0.621 0.038 -13.02 3.528 6.786 -3.008 -2.213 6.649 5.807 12.42 7.578 2.899 -6.562 12.12 -4.769 -4.932 -2.739 -6.069 -2.952 -4.301 6.788 5.721 7.338 6.702 12.46 10.09 14.36 14.47 14.63 14.1 15.55 13.78 79.87 88.74 85.24 88.91 100
42 0.207 -2.145 -2.577 -1.992 -1.98 1.807 -31.72 -11.65 -11.96 -17.3 -24.33 -8.516 -3.751 10.77 -0.925 -0.668 -9.919 -1.703 -6.63 -6.156 -3.598 -7.788 -1.154 -6.043 6.604 1.396 7.691 6.684 19.28 9.568 8.909 8.062 8.7 7.081 9.754 7.126 79.87 86.03 79.83 82.26 90.11 100
HL43 50 51.33 44.69 51.61 51.54 47.25 29.87 22.62 35.55 5.547 27.9 22.59 0.392 -10.46 -0.569 5.593 -4.503 7.274 88.66 87.7 86.51 88.43 80.93 88.81 55.73 59.3 53.5 53.68 36.67 52.78 48.51 45.98 45.14 47.93 44.83 45.48 9.908 1.549 -5.391 -11.49 -1.696 -6.892 100
44 49.34 50.48 43.99 50.72 50.82 46.72 28.31 21.33 34.61 5.207 26.94 20.71 -2.554 -11.16 -3.325 4.17 -8.358 3.568 88.53 87.5 86.51 88.38 81.29 88.69 56.48 59.93 54.01 54.63 39.04 53.76 48.15 46.13 45.35 47.86 44.59 45.76 9.662 0.167 -5.805 -11.49 -2.011 -6.863 99.67 100
45 50.15 51.62 45.02 51.72 51.74 47.79 30.46 23.2 35.25 6.845 27.96 23.05 0.659 -10.15 -0.273 6.372 -3.998 6.55 88.45 87.5 86.35 88.21 80.81 88.59 55.7 59.49 53.26 53.56 36.51 52.78 48.39 45.84 45.03 47.7 44.63 45.36 8.491 0.636 -6.111 -12.56 -3.276 -7.615 99.82 99.6 100
46 50.4 51.49 44.88 51.66 51.55 47.69 29.54 21.6 33.32 5.665 27.31 21.29 -0.434 -10.35 -1.698 5.426 -5.485 5.458 88.48 87.49 86.42 88.24 80.91 88.57 55.94 59.64 53.42 53.89 38.43 53.16 47.98 45.28 44.63 47.05 44.04 45.17 8.85 0.505 -6.044 -12.17 -2.762 -6.96 99.63 99.63 99.82 100
47 49.7 51.15 44.68 51.15 51.33 47.21 29.98 22.84 35.33 6.506 27.63 21.75 0.051 -9.862 -0.604 6.312 -6.772 5.769 88.55 87.56 86.57 88.43 80.66 88.6 56.14 59.93 53.68 54.1 37.49 53.27 48.23 45.81 44.9 47.55 44.58 45.33 6.548 -1.767 -7.908 -13.86 -4.55 -9.152 99.55 99.59 99.72 99.7 100
48 49.9 51.14 44.48 51.43 51.28 47.02 28.68 21.02 34.26 4.515 26.95 20.38 -0.881 -10.22 -1.331 5.385 -6.064 5.619 88.73 87.77 86.69 88.61 80.89 88.86 56.05 59.51 53.58 54.06 37.49 53.07 48.38 45.75 45.03 47.71 44.75 45.47 8.337 -0.523 -7.348 -13.01 -2.84 -8.347 99.8 99.76 99.62 99.62 99.7 100
Table 5.27. Pearson correlation coefficients for every pair of samples in the 48 batches synthesised by two synthetic routes using normalized to the sum of targets and pre-treated with sixteenth root method. Red numbers corresponds to
the coefficients greater than a threshold of 69.26. The coefficients inside each box should be high as they denote the comparison of samples from within a synthetic route (Hypo is green and Moscow is blue).

201
5.5.3.1 Discussion on the Pearson Correlation Coefficient analysis
The Pearson correlation coefficients were calculated for each pair of samples using the
three data sets discussed previously shown in Table 5.25, Table 5.26 and Table 5.27.
Since the ‘true’ relationships of the samples were known, a threshold value for the
calculated coefficients was sought such that values above the threshold indicated the
related samples and values below the threshold indicated unrelated samples.
The most accurate discrimination by synthetic route of the 48 batches of
methylamphetamine was achieved using the impurities normalized to the sum of targets
and pre-treated with the fourth root shown in table 5.26. The lowest coefficient
calculated for a pair of samples from within a synthetic route was 71.26; thus this was
the maximum threshold that would allow the six samples within each route to be deemed
similar. The red numbers in table 5.26 indicate coefficients greater than 71.26, and it is
clear that the set of Moscow route batches are deemed similar to one another, as are the
Hypo route batches within their respective sets.
The best linkages were observed for the methylamphetamine synthesised from
laboratory grade chemicals for both of the Hypo and Moscow routes. While
discrimination between the Hypo and Moscow routes using laboratory grade chemicals
is encouraging, it is unfortunate that the precursors extracted using different solvents
from proprietary cold medication using the two mentioned routes could not be
completely resolved correctly.
Batches of methylamphetamine synthesised from the pseudoephedrine extracted from
proprietary cold medication using ethanol/methanol and commercial methylated spirit as
extraction solvent via the Moscow route consistently had the lowest Pearson correlation
coefficient, indicating that these samples were the most difficult to link together using
the data pre-treatment methods and reflects the observed variation in the six
chromatographic profiles of batches of methylamphetamine synthesised from these
precursors. The same observation was observed in batches of methylamphetamine
synthesised via the Hypo route.

202
5.6 Conclusion
Organic impurity profiling of methylamphetamine hydrochloride synthesized from
proprietary cold medication using gas chromatography mass spectrometry (GCMS) is
one of the major objectives of this research. From the results presented the variation of
the impurity profiles generated from between batches synthesized from the same chemist
showed greater differences. Potential route specific impurities identified from the
individual batches demonstrated a possible link between the batches of
methylamphetamine synthesized.
The aim of the study was to synthesize methylamphetamine in an analogous manner to
that employed by clandestine laboratories [16]. The impurity profiles related to batches
of methylamphetamine synthesized from laboratory grade materials have been
contrasted with those associated with material extracted from cold medication. To our
knowledge this is the first time a comparison of this nature has been reported.
Existing impurities suggested to be route specific impurities in the Emde preparative
route were identified within methylamphetamine synthesized using the Moscow and
Hypo routes following clandestine methods, (N-methyl-1-{4-[2-
(methylamino)propyl]phenyl}-1-phenylpropa-2-amine (2 isomers) and N,N’-dimethyl-
3,4-diphenylhexane-2,5-diamine) [17].
The new impurities identified in the methylamphetamine synthesized from proprietary
cold medication sourced from United Kingdom was not present in methylamphetamine
synthesized from proprietary cold medication sourced from Malaysia. The different
tablet formulation of the brands from sourced from Malaysia compared to the cold
medication sourced from United Kingdom, coupled with different precursor extraction
methods may account for these differences. A number of common impurities were
associated with the Moscow and Hypophosphorous synthesis were identified some of
which were also associated with the Nagai route [1-4 ]. A number of unknown
impurities were also identified some of which appeared only in the clandestine
mimicked samples and some which may be specific to each route.

203
5.7 References
1. Windahl, K.L.; McTigue, M.J.; Pearson, J.R.; Pratt, S.J.; Rowe, J. E; Sear, E.M.,
Investigation of the impurities found in methamphetamine synthesized from
pseudoephedrine by reduction with hydroiodic acid and red phosphorous.
Journal of Forensic International 1995, 76, 97-114.
2. Tanaka, K.; Ohmort, T.; Inoue, T.; Seta, S., Impurity profiling analysis of Illicit
Methamphetamine by Capillary Gas Chromatography. Journal of Forensic
Sciences 1994, 39(2), 500-511.
3. Ko, B.J.; Suh, S.; Suh, Y.J.; In, M.K.; Kim, S.H., The impurity characteristics of
methamphetamine synthesized by emde and nagai method. Journal of Forensic
Science International 2007, 170(1), 142-147.
4. Vanitha Kunalan. Phd thesis.University of Strathclyde 2010.,pp 30-285.
5. Kunalan,V.; W.J.Kerr.; N.N.Daeid., Investigation of the reaction impurities
associated with methylamphetamine synthesized using the nagai method.
Analytical Chemistry 2012, 84, 5744-5752.
6. Weyermann, C.; Marquis, R.; Delaporte, C.; Esseiva, P.; Lock, E.; Aalberg, L.;
Bozenko, S.J.; Dieckmann, S.; Dujourdy, L.; Zrcek, F., Drug Intelligence based
on MDMA tablets data: Organic impurities profiling. Forensic Science
International 2008, 177 (1), 11-16.
7. Lee, J.S.; Han, E.Y.; Lee, S.Y.; Kim, E.M.; Park, Y.H.; Lim, M.A; Chung, H.S.;
Park, J.H., Analysis of the impurities in the methamphetamine synthesized by
three different methods from ephedrine and pseudoephedrine. Journal of Forensic
Science International 2006, 161(2-3), 209-215.
8. Sasaki, T.; Makino, Y., Effective injection in pulsed splitless mode for impurity
profiling of methamphetamine crystal by GC or GC/MS. Journal of Forensic
Science International 2006, 160(1), 1-10.
9. Qi, Y.,Evans, I.D and McCluskey, A.,Australian federal Police seizures of illicit
crystalline methamphetamine(ice) 1998-2002: Impurity analysis. Journal of
Forensic Science International 2006, 164(2-3), 201-210.
10. Lee, J.S.; Chung, H.S.; Kuwayama, K.; Inoue, H.; Lee, M.Y.; Park, J.H.,
Determination of impurities in illicit methamphetamine seized in Korea and
Japan, Analytical Chimica Acta 2008, 619(1), 20-25.

204
11. Dujourdy, L., Dufey, V.; Besacier, F.; Miano, N.; Marquis, R.; Lock, E.;
Aalberg, L.; Dieckmann, S.; Zreck, F.; Bozenko, J.S., Drug intelligence based on
organic impurities in Illicit MA samples. Forensic Science International 2008,
177, 153-161.
12. Pearson’s Correlation Coefficient. Available at
http://www.vias.org/tmdatanaleng/cc_corr_coeff.html.Last accessed on 24/05/12.
13. Buchanan, H.A.S., PhD Thesis in Department of Pure and Applied and Applied
Chemistry, University of Strathclyde:Glasgow,2009.
14. Altman, D.G., Why Transform Data? In Pratical Statistics for Medical Research.
Chapman & Hall/CRC:Boca Raton, Florida, 1999,143-149.
15. Bland, M., The Use of Transformations. In An Introduction to Medical Statistics.
3rd
ed.; Oxford University Press: New York, 2005, 164-167.
16. Uncle Fester., Secrets of Methamphetamine Manufacture. Vol.9th
Edition,
Loompanics Unlimited: Port Townsend, Washington, 2009.
17. Salourous,H.;Collins,H.;A.V.George.;S.Davies., Isolation and Identification of
Three By-products found in Methylamphetamine synthesized by the Emde Route.
Journal of Forensic Sciences 2010, 5,605-615.

205
Chapter 6 Inorganic impurity profiling of precursors, essential chemicals and
methylamphetamine synthesized via the Moscow and Hypophosphorous routes
using inductively coupled plasma mass spectrometry (ICP-MS).
6.1 Introduction
Inorganic profiling or elemental analysis was expected to reveal information relating to
the catalyst (red phosphorous extracted from matchboxes), essential chemicals (iodine
extracted from iodine tinctures), precursor chemical and extracting solvents used in the
synthesis of methylamphetamine. In total 48 batches of methylamphetamine were
analysed using inductively coupled plasma mass spectrometry (ICPMS) and included all
of the samples prepared from Sudafed, iodine tinctures and red phosphorous from match
books together with six repetitive samples of each method prepared from laboratory
grade chemicals as a control set. The batches of methylamphetamine synthesised from
the cold medication sourced from Malaysia (Panadol and Allerpid tablets) were not
analysed using ICPMS due to limited amount of sample.
Previous ICPMS work has reported that elemental profiles could contribute information
supporting linkage of methylenedioxymethylamphetamine (MDMA) and other illcit
drug samples [1-11]. ICPMS has also been reported to provide information relating to
diluents added into MDMA powder during the tableting process. C.Koper et al. [12]
reported that elemental profiles suggested information about the synthetic phase and
production stage of MDMA [12].
Suh et al. [13] analysed 51 seized methylamphetamine samples using ICPMS and
identified iodine (I) in the majority of samples known to have been prepared via the
Nagai route, and palladium (Pd) and barium (Ba) in samples known to have been
prepared via the Emde route. Bromine (Br) was also detected in samples identified as
Nagai, Emde and one other undetermined route [13]. Marumo et al. [5] analysed seized
samples of methylamphetamine using ICPMS and atomic absorption spectrometry
(AAS) and identified seven elements (barium (Ba), antimony (Sb), palladium (Pd),

206
strontium (Sr), bromine (Br), zinc (Zn) and copper (Cu)) and suggested that samples
could be classified into five groups, however no route identification was possible [5].
Other studies examining natural or semi-synthetic drugs such as cannabis, cocaine and
heroin have also suggested the potential for elemental analysis to provide useful
information in relation to sample linkages [6-11].
6.2 Experimental Methods
6.2.1 Reagents and Standards
Trace metal grade nitric acid (65%, w/w) and laboratory grade tetramethylammonium
hydroxide (TMAH) (25%, v/v) were both obtained from Sigma Aldrich (UK). Potassium
iodide was obtained from Fluka. Ultrapure water was used throughout. Regenerated
cellulose syringe filters (brown code) were purchased from Spec and Burke Analytical
(Scotland). Multi element standards were obtained from Merck (Germany) and CPI
international (USA). Calibration solutions were prepared from a Spex “CertiPrep”
certified standard diluted as required with 2% Fischer Trace Metal grade nitric acid.
6.2.2 Sample Preparation
Multi element analysis
100 mg of sample was weighed into a 10 mL polypropylene tube and 1% HNO3 (4 mL)
was added. The tubes were placed on an Edmund Buhler Swip KS-10 rotative shaker
overnight. The solution was filtered with a regenerated cellulose syringe filter (25 mm
and diameter 0.45 µm pore size). The following elements were analysed in multi
element analysis with ICP-MS (isotopic abundances): Li (7), Be (9), B (11) , Na (23), Al
(27) , Si (28), P (31), S (34), K (39), Ca (42), Sc (45), Ti (47), V (51), Cr (52), Mn (55),
Fe (56), Co (59), Ni (60), Cu (63), Zn (66), Ga (69), Ge (72), As (75), Se (78), Br (79),
Rb (85), Ru (101), Rh (103), Pd (105), Ag (107), Cd (111), Sn (118), Sb (121), I (127),
Ba (137), Pt (195), Au (197), Hg (202), Pb (208), Bi (209), U (238).

207
Iodine Analysis
Batches of synthesized methylamphetamine were subjected to separate iodine analysis.
This is because at low pH, iodide is easily oxidized to volatile molecular iodine via
dissolved oxygen. Iodine is not a stable element in dilute nitric acid and carry over can
result even with nitric acid washes between samples. Due to iodine’s volatility and
complex redox chemistry, the sample was prepared in an alkaline media to avoid the
oxidation of iodine. The presence of strong alkali conditions leads to the conservation of
iodine as iodide or iodate which can then be determined by ICPMS analysis.
Approximately 100 mg of a sample was weighed into a 10 mL polypropylene tube; 1%
tetramethylammonium hydroxide (4 mL) was added and the procedure outlined
previously was followed. A series of iodine calibration standards were prepared from
potassium iodide [14].
6.2.3 ICPMS Instrument Parameters
An Agilent 7700 quadrupole instrument was used with a Cetac ASX-520 autosampler.
The instrument was operated with a Peltier cooled conical single-pass spray chamber
with impact bead and has an integral peristaltic pump for sample uptake from the
autosampler. A hexapole for CCT ED (Collision Cell Technology with Energy
Discrimination) mode was used to remove polyatomic interferences.
Instrumental operating conditions used were 1400 W RF forward power; 13 L/min
plasma flow; 1.0 L/min nebulizer flow and 0.8 L/min auxiliary flow, respectively. For
the ICPMS a sample flush time of 60 s, a wash time of 90 s and peak hopping scan mode
was used with a dwell time per isotope of 10 ms.
A solution of 1% HNO3 was used as the wash solution for Li, Pd and Hg analysis and
1% TMAH was used as the wash solution for iodine as discussed previously.

208
6.3 Results and Discussion
The analysis of the precursor and essential chemicals used in the preparation of
methylamphetamine by both synthetic routes are presented. The effect of the different
solvent extractions on the extraction of pseudoephedrine is discussed and the influences
of the synthetic processes are exposed.
6.3.1 Analysis of precursor chemicals
6.3.1.1 Solvent analysis:
Six separate samples of each of the extracting solvents (ethanol, ethanol:methanol
(90:10)% vol/vol and commercial methylated spirits) were analysed using ICPMS as
described previously and the results presented in Figure 6.1 to Figure 6.3 and Table 6.1
to Table 6.3. Visual comparison of the elemental profiles indicate high concentrations of
silicone in all samples and additional high concentrations of potassium in the
ethanol:methanol (90:10)% vol/vol samples and sulfur, potassium, zinc and sodium in
the commercial methylated spirit samples. The relative standard deviations obtained for
the concentrations of these elements were also quite high demonstrating some variability
across aliquots of the samples.
Figure 6.1 Graph of ICPMS analysis of 6 samples of ethanol.

209
Table 6.1. ICPMS analysis of elements detected in ppm for 6 samples of ethanol.
Element/
ppm ETH-1 ETH-2 ETH-3 ETH-4 ETH-5 ETH-6 Mean
Std
Dev
RSD
(%)
Mg 0.001 0.002 0.002 0.002 0.001 0.002 0.002 0.000 18.88
Al 0.006 0.005 0.006 0.006 0.006 0.007 0.006 0.000 8.82
Si 0.522 0.601 0.643 0.633 0.624 0.674 0.616 0.051 8.41
Ca 0.025 0.043 0.039 0.050 0.004 0.025 0.031 0.016 52.58
Fe 0.005 0.004 0.004 0.005 0.005 0.006 0.005 0.000 13.94
Cu 0.020 0.019 0.020 0.020 0.023 0.021 0.021 0.001 6.81
Zn 0.022 0.023 0.023 0.021 0.022 0.026 0.023 0.001 7.41
Figure 6.2. Graph of ICPMS analysis of 6 samples of ethanol :methanol (90:10)% vol/vol.
Table 6.2. ICPMS analysis of elements detected in ppm for 6 samples of ethanol: methanol
(90:10) % vol/vol.
Element
/ ppm DA-1 DA-2 DA-3 DA-4 DA-5 DA-6 Mean
Std
Dev
RSD
(%)
Al 0.002 0.002 0.001 0.002 0.002 0.003 0.002 0.000 29.54
Si 0.501 0.582 0.606 0.634 0.628 0.613 0.594 0.048 8.241
Fe 0.002 0.002 0.002 0.002 0.002 0.005 0.003 0.001 34.548
Cu 0.013 0.014 0.013 0.013 0.013 0.017 0.014 0.001 9.488
K 0.200 0.220 0.200 0.200 0.190 0.420 0.238 0.089 37.425

210
Figure 6.3. Graph of ICPMS analysis of 6 samples of commercial methylated spirits.
Table 6.3. ICPMS analysis of elements detected in ppm for 6 samples of commercial methylated
spirit.
Element/
ppm MS-1 MS-2 MS-3 MS-4 MS-5 MS-6 Mean
Std
Dev
RSD
(%)
Na 0.043 0.010 0.012 0.025 0.007 0.128 0.037 0.046 122.09
Al 0.002 0.001 0.001 0.001 0.001 0.004 0.002 0.001 58.80
Si 0.463 0.515 0.547 0.569 0.537 0.610 0.540 0.049 9.20
K 0.046 0.028 0.022 0.028 0.030 0.192 0.058 0.066 114.08
Ca 0.022 0.024 0.009 0.033 0.009 0.032 0.022 0.010 47.97
Fe 0.004 0.004 0.003 0.003 0.003 0.007 0.004 0.001 30.45
Cu 0.004 0.004 0.004 0.004 0.004 0.009 0.005 0.001 34.94
Zn 0.025 0.024 0.020 0.021 0.022 0.074 0.031 0.021 68.70
I 0.002 0.002 0.002 0.002 0.002 0.003 0.002 0.000 16.78
S 0.208 0.297 0.081 0.029 0.238 0.014 0.145 0.118 81.63
6.3.2 Laboratory grade chemicals
Six samples of laboratory grade pseudoephedrine were analysed using ICPMS as
described previously and the results presented in Figure 6.4 and Table 6.4. Visual
comparison of the elemental profiles demonstrate consistency in the concentration of
potassium and silicone with very good relative standard deviations expected because
of the nature of the material (commercially synthesised).

211
Figure 6.4. Graph of ICPMS analysis of 6 batches of laboratory grade pseudoephedrine.
Table 6.4. ICP-MS analysis of elements detected in ppm for 6 batches of laboratory grade
pseudoephedrine hydrochloride.
Element/ppm L-1 L-2 L-3 L-4 L-5 L-6 Mean Std Dev RSD(%)
K 2.71 2.29 2.08 2.30 2.53 2.46 2.40 0.22 9.1
Si 0.89 0.92 0.94 0.90 0.94 0.93 0.92 0.02 2.0
A possible explanation for the potassium concentration in the laboratory grade
pseudoephedrine may be due to acid-base extractions [15], when the
pseudoephedrine is extracted from the plant Ephedra. Potassium carbonate is a
common base used in the acid base extractions. The presence of silicone may be due
to artefacts from the manufacturing process and/or contaminants from glassware and
was also observed in some of the extracted samples.
6.3.3 The analysis of proprietary medication and the effect of solvent
extraction
Pseudoephedrine was extracted from Sudafed tablets using the three different solvent
systems. Initially six Sudafed tablets were analysed using ICPMS to gain an
understanding of the background inorganic profiles which may be present within the
pharmaceutical preparations and these are presented in Figure 6.5 and Table 6.5.

212
Figure 6.5. Graph of ICPMS analysis of 6 batches of Sudafed tablets (UK).
Table 6.5. ICPMS analysis of elements detected in ppm for 6 batches of Sudafed tablets
purchased from pharmacies.
Element
ppm SUD 1 SUD2 SUD 3 SUD 4 SUD 5 SUD 6 Mean
Std
Dev
RSD
(%)
Na 0.62 0.79 0.97 1.14 1.06 0.94 0.92 0.18 20.22
Mg 4.05 4.36 4.72 4.82 4.86 4.68 4.58 0.31 6.85
Si 3.00 7.79 10.07 10.57 10.46 12.86 9.12 3.40 37.29
Fe 2.95 12.81 30.43 39.89 35.61 28.50 25.03 14.21 56.79
The Sudafed tablets consistently contained four main elements, sodium, magnesium,
silicon and iron. The tablets were red in colour and were coated with red iron oxide
(E172). Magnesium stearate was also added as a binder and both of these elements
are reflected in the ICPMS profiles. Visual comparison of the elemental profiles
shown in Figure 6.6 reveals some variation within the concentration of the dominant
four elements present in the tablets. The presence of silicone may be due to coatings
present on the tablets and/or contaminants from glassware. Figure 6.6 illustrates the
degree of variation present across these elements for the six samples analysed. In
general more iron is present in the Sudafed tablets than the other three elements and
this is reflected in the elemental variation presented in the boxplot below.

213
FeSiMgNa
40
30
20
10
0
Co
nce
ntr
ati
on
(p
pm
)
Elemental variation in Sudafed tablets
Figure 6.6. Boxplot analysis of the elemental variation present in the 6 batches of Sudafed
tablets (UK).
6.3.4 The analysis of proprietary medication extracted using different
solvents.
Six samples of pseudoephedrine extracted using each of the solvent systems were
analysed by ICPMS and are presented in Figure 6.7 to Figure 6.9.
Figure 6.7. Graph of ICPMS analysis of 6 batches of pseudoephedrine extracted from Sudafed
tablets using ethanol as the extraction solvent.

214
Figure 6.8. Graph of ICPMS analysis of 6 batches of pseudoephedrine extracted from Sudafed
tablets using ethanol:methanol (90:10) % vol/vol as the extraction solvent.
Figure 6.9. Graph of ICPMS analysis of 6 batches of pseudoephedrine extracted from Sudafed
tablets using commercial methylated spirit as the extraction solvent.

215
Table 6.6. ICP-MS analysis of elements detected in ppm for 6 batches of;
(a) pseudoephedrine hydrochloride extracted from ethanol.
Element/
ppm
PSE-
E-1
PSE-
E-2
PSE-
E-3
PSE-
E-4
PSE-
E-5
PSE-
E-6 Mean
Std
Dev
RSD
(%)
Na 1.86 1.97 2.06 2.14 2.27 2.43 2.12 0.20 9.78
Mg 10.22 11.09 11.24 11.41 10.60 10.80 10.89 0.43 4.00
(b) pseudoephedrine hydrochloride extracted from ethanol:methanol (90:10 % vol/vol).
Element/
ppm
PSE-
DA-1
PSE-
DA-2
PSE-
DA-3
PSE-
DA-4
PSE-
DA-5
PSE-
DA-6 Mean
Std
Dev
RSD
(%)
Na 1.08 1.08 1.10 1.10 1.09 1.10 1.09 0.00 0.82
Mg 7.97 8.24 5.48 5.48 5.59 5.71 6.41 1.31 20.50
Si 1.26 1.31 1.25 1.23 1.26 1.24 1.26 0.02 2.20
K 3.46 3.14 3.34 2.76 3.15 3.29 3.19 0.24 7.59
(c) pseudoephedrine hydrochloride extracted from commercial methylated spirits.
Element/
ppm
PSE-
MS-1
PSE-
MS-2
PSE-
MS-3
PSE-
MS-4
PSE-
MS-5
PSE-
MS-6 Mean
Std
Dev
RSD
(%)
Na 6.37 6.03 5.88 5.51 5.59 5.67 5.84 0.32 5.51
Mg 12.21 11.83 11.69 11.32 11.39 10.83 11.54 0.47 4.12
Si 1.33 1.29 1.26 1.18 1.22 1.26 1.26 0.05 4.22
S 1.15 1.09 1.01 1.04 1.01 0.99 1.05 0.05 5.58
K 3.74 3.34 3.45 3.01 3.85 3.17 3.43 0.32 9.43
Distinct elemental variations were observed for the precursors extracted from the
different solvent systems. Iron was absent in the extracted precursor samples
reflecting the removal of the red iron oxide colouration as part of the extraction
process. In general, a greater concentration of magnesium and sodium was present in
the extracted samples when compared with the Sudafed samples. The introduction of
methanol to the extraction solvent appears to have facilitated the extraction of both
potassium and silicon and/or the transference of these elements from the solvents
themselves to the extracted product. When commercial methylated spirits was used
to extract the samples, sulfur was also present in the resultant extracts reflecting its
presence within the solvent and its transference to the final extracted product. As a
consequence of the elemental analysis it was possible to distinguish between the
extraction solvents used to prepare pseudoephedrine from the cold medication.

216
6.3.5 Iodine extraction
Six batches of iodine extracted from different iodine tinctures (as previously
described in section 3.2.3) was analysed by ICPMS and the results presented in
Figure 6.10 and Table 6.7. In total eight elements were consistently present in the
samples and a visual comparison of the elemental profiles reveal the variation,
particularly in iodine content where two samples contained significantly greater
amounts of iodine than the remaining four samples. These variations are reflected in
the high relative standard deviation values for iodine.
Figure 6.10. ICPMS analysis of iodine extracted from iodine tinctures.
Table 6.7. ICP-MS analysis of elements detected in ppm for 6 batches of iodine extracted from
iodine tinctures.
Element/
ppm IT 1 IT 2 IT 3 IT 4 IT 5 IT 6 Mean
Std
Dev
RSD
(%)
C 17.53 22.57 23.32 21.72 18.68 25.61 21.57 3.00 13.92
Cl 41.84 35.20 34.44 33.35 51.72 32.41 38.16 7.43 19.47
K 33.05 26.31 28.38 23.34 48.37 28.91 31.39 8.91 28.38
Cr 10.28 3.52 4.18 1.18 8.91 0.45 4.75 4.02 84.57
Fe 32.23 11.71 13.39 4.13 30.36 1.85 15.61 12.92 82.74
Ni 4.60 1.62 1.82 0.54 4.18 0.22 2.16 1.836 84.64
Cu 1.29 0.47 0.56 0.14 1.26 0.06 0.63 0.53 84.00
I 549.69 134.80 128.99 78.94 517.90 99.02 251.56 219.79 87.37

217
6.3.6 Red phosphorous extraction from matchboxes
Six samples of red phosphorous extracted from the striking pad of six different
matchboxes (as described previously in section 3.2.36.2) were analysed using
ICPMS and the results are presented in Figure 6.11 and Table 6.8. In total, fourteen
elements were present across all six samples with phosphorous and sulfur
dominating. The striking pad typically contains, 50% red phosphorous, 5%
neutralizer, 4% carbon black and 16% binder together with a coat of adhesive that
glues the above mentioned compounds to the striker pads of the matchboxes [16].
Figure 6.11. Graph of ICPMS analysis of red phosphorous extracted from matchboxes.

218
Table 6.8. ICP-MS analysis of elements detected in ppm for six batches of red phosphorous
extracted from matchboxes.
Element/
ppm MB 1 MB 2 MB 3 MB 4 MB 5 MB 6 Mean
Std
Dev
RSD
(%)
C 46.42 41.99 141.90 46.42 41.99 141.90 76.77 50.48 65.75
Na 7.06 6.70 4.20 7.06 6.70 4.20 5.99 1.39 23.22
Mg 3.32 3.14 1.61 3.32 3.14 1.61 2.69 0.84 31.23
Al 3.28 3.09 1.89 3.28 3.09 1.89 2.75 0.67 24.32
S 115.89 107.71 66.39 115.89 107.71 66.39 96.67 23.73 24.55
P 150.52 137.82 81.19 150.52 137.82 81.19 123.18 33.01 26.80
Cl 13.78 9.82 10.06 13.78 9.82 10.06 11.22 1.98 17.69
K 43.63 41.28 26.80 43.63 41.28 26.80 37.28 8.15 21.89
Ca 70.30 62.68 32.44 70.30 62.68 32.44 55.14 17.90 32.47
Zn 24.64 23.17 14.14 24.64 23.17 14.14 20.65 5.08 24.62
Cr 23.77 22.88 14.61 23.77 22.88 14.61 20.42 4.52 22.13
Mn 5.99 5.65 3.25 5.99 5.65 3.25 4.96 1.33 26.81
Fe 89.29 90.76 40.99 89.29 90.76 40.99 73.68 25.33 34.37
Pb 10.82 7.56 12.32 10.82 7.56 12.32 10.23 2.179 21.28
6.3.7 Analysis of methylamphetamine synthesised via the Moscow and
Hypophosphorous routes.
Six batches of methylamphetamine synthesized using (a) laboratory grade precursor,
iodine and red phosphorous and (b) extracted precursor and extracted iodine and red
phosphorous were analysed using ICPMS and the results are presented in Figure 6.12
to Figure 6.16 and Table 6.9.

219
Figure 6.12. ICPMS analysis of methylamphetamine via Moscow Route using laboratory grade
pseudoephedrine HCl.
Figure 6.13. ICPMS analysis of methylamphetamine via Moscow Route using pseudoephedrine
extracted from Sudafed using ethanol.

220
Figure 6.14. ICPMS analysis of methylamphetamine via Moscow Route using pseudoephedrine
extracted from Sudafed using ethanol:methanol (90:10)% vol/vol.
Figure 6.15. ICPMS analysis of methylamphetamine via Moscow Route using pseudoephedrine
extracted from Sudafed using commercial methylated spirits.

221
Figure 6.16. Iodine analysis of methylamphetamine batches synthesized using the Moscow route
using pseudoephedrine extracted from Sudafed using the three solvents.
Table 6.9. ICP-MS analysis of elements detected in ppm for six batches of methylamphetamine
synthesized via Moscow route from:
(a) laboratory grade pseudoephedrine.
Element ML 13 ML 17 ML 21 ML 22 ML 23 ML 24 Mean Std
Dev
RSD
(%)
Na 13.21 7.87 117.10 7.74 24.25 6.44 29.43 43.44 147.58
Si 1.02 0.99 1.02 1.04 0.99 0.96 1.00 0.027 2.72
P 2.07 0.98 1.07 0.63 1.58 1.19 1.25 0.50 39.97
S 8.02 6.59 81.97 5.22 14.21 3.79 19.97 30.58 153.14
K 2.55 2.90 3.44 2.59 2.72 2.58 2.80 0.34 12.15
Fe 2.02 4.14 1.26 1.40 3.58 1.88 2.38 1.19 50.11

222
(b) pseudoephedrine extracted ethanol.
Element ME 5 ME 6 ME 7 ME 8 ME 9 ME 10 Mean Std
Dev
RSD
(%)
Na 30.26 7.25 5.92 22.07 9.50 11.26 14.38 9.66 67.21
Al 0.04 0.29 0.12 0.055 1.10 0.05 0.27 0.41 148.14
P 0.20 0.17 0.76 1.19 0.49 0.12 0.49 0.41 85.02
S 21.35 5.38 3.56 16.22 6.43 8.08 10.17 7.02 68.99
K 2.58 3.08 2.41 2.49 2.36 2.12 2.51 0.32 12.81
Zn 0.19 0.10 0.10 0.43 0.55 0.37 0.29 0.18 63.92
(c) pseudoephedrine extracted ethanol : methanol (90:10) vol/vol.
Element MDA 3 MDA 4 MDA 5 MDA 8 MDA 9 MDA
10 Mean
Std
Dev
RSD
(%)
Na 10.19 26.53 16.13 28.70 9.38 15.32 17.71 8.15 46.05
S 7.21 8.97 11.57 19.75 6.29 10.13 10.66 4.84 45.47
K 2.45 2.20 1.25 0.97 0.87 0.81 1.42 0.71 50.31
Cr 0.44 0.88 0.44 1.18 0.77 0.40 0.68 0.31 45.49
Fe 2.14 4.13 2.98 4.52 2.67 1.71 3.03 1.10 36.43
Ni 0.46 1.36 0.61 1.04 0.48 0.25 0.70 0.41 59.29
Zn 0.25 0.81 0.80 1.02 0.37 0.87 0.69 0.30 43.75
P 0.82 0.39 0.22 0.64 0.58 0.22 0.48 0.24 50.42
(d) pseudoephedrine extracted commercial methylated spirit
Element MMS
3
MMS
4
MMS
7
MMS
8
MMS
9
MMS
10 Mean
Std
Dev
RSD
(%)
Na 28.70 11.48 34.51 12.64 31.29 37.48 26.02 11.21 43.09
S 19.37 7.14 22.65 7.50 20.31 24.84 16.97 7.71 45.42
K 2.41 2.39 2.51 2.64 2.50 2.87 2.55 0.18 7.07
Cr 1.47 1.04 2.37 0.90 0.57 0.53 1.15 0.69 60.07
Fe 5.55 3.92 8.58 3.35 2.22 2.20 4.30 2.43 56.54
Ni 0.95 0.62 1.19 1.10 0.56 0.28 0.78 0.35 44.91
Zn 1.18 0.39 3.90 4.50 3.38 2.25 2.60 1.60 61.67
P 1.08 0.35 0.87 0.77 0.60 0.46 0.69 0.27 39.39

223
Six batches of methylamphetamine synthesized via the Hypo route using (a)
laboratory grade precursor, iodine and red phosphorous and (b) extracted precursor
and extracted iodine and red phosphorous were analysed using ICPMS and the
results are presented in Figure 6.17 to Figure 6.21 and Table 6.10.
Figure 6.17. ICPMS analysis of methylamphetamine via Hypo Route using lab grade
pseudoephedrine HCl.
Figure 6.18. ICPMS analysis of methylamphetamine via Hypo Route using pseudoephedrine
extracted from Sudafed using ethanol:methanol (90:10)% vol/vol.

224
Figure 6.19. ICPMS analysis of methylamphetamine via Hypo Route using pseudoephedrine
extracted from Sudafed using ethanol.
Figure 6.20. ICPMS analysis of methylamphetamine via Hypo Route using pseudoephedrine
extracted from Sudafed using commercial methylated spirits.

225
Figure 6.21. Iodine analysis of methylamphetamine batches synthesized via the Hypo route
using pseudoephedrine extracted from Sudafed using the three solvents.
Table 6.10. ICP-MS analysis of elements detected in ppm for six batches methylamphetamine
synthesized via Hypo route from:
(a) laboratory grade pseudoephedrine.
Elements HL10 HL7 HL8 HL11 HL6 HL9 Mean Std
Dev
RSD
(%)
Na 10.82 15.31 10.70 45.76 11.32 3.71 16.27 14.92 91.69
Si 0.82 1.05 0.86 0.86 1.03 0.98 0.93 0.09 10.51
P 1.48 2.60 1.29 1.64 1.44 2.32 1.79 0.53 29.79
S 8.16 11.93 8.58 35.93 8.84 2.85 12.72 11.74 92.31
K 2.79 2.93 2.82 2.287 2.28 2.54 2.61 0.28 10.90
Fe 0.40 0.68 0.63 1.071 1.63 0.54 0.82 0.45 54.85
Zn 1.08 1.03 1.19 1.253 1.62 0.87 1.180 0.25 21.69

226
(b) pseudoephedrine extracted ethanol : methanol (90:10) vol/vol.
c) pseudoephedrine extracted from ethanol.
Elements HE1 HE2 HE3 HE4 HE5 HE6 Mean Std
Dev
RSD
(%)
Na 4.98 29.89 64.72 41.27 24.60 29.25 32.45 19.75 60.87
Si 1.12 1.08 1.08 1.07 1.05 1.01 1.071 0.03 3.47
P 4.20 7.13 4.65 1.19 3.85 5.71 4.46 1.99 44.67
S 4.58 15.10 42.64 26.35 15.48 17.26 20.23 12.97 64.13
K 2.67 2.69 3.29 2.90 2.64 2.80 2.83 0.24 8.53
Fe 1.38 1.38 1.42 0.45 2.53 1.10 1.38 0.67 48.85
Zn 1.01 2.53 2.97 4.67 2.73 1.51 2.57 1.27 49.60
(d) pseudoephedrine extracted from commercial methylated spirit.
Elements HMS
1
HMS
2
HMS
3
HMS
4
HMS
5
HMS
6 Mean
Std
Dev
RSD
(%)
Na 101.72 125.53 33.17 43.22 40.26 84.67 71.43 38.08 53.31
Si 1.50 1.51 1.54 1.49 1.45 1.30 1.47 0.08 5.76
P 16.62 20.83 7.26 14.59 15.12 6.51 13.49 5.56 41.27
S 65.85 81.50 19.48 23.91 20.93 55.26 44.49 26.63 59.85
K 4.53 3.76 3.89 3.24 3.78 3.07 3.71 0.51 13.91
Fe 1.74 3.36 3.71 5.77 1.92 2.17 3.11 1.52 49.11
Zn 2.37 2.97 1.23 1.50 2.71 1.92 2.12 0.68 32.34
Elements HDA
1
HDA
2
HDA
3
HDA
4
HDA
5
HDA
6 Mean
Std
Dev
RSD
(%)
Na 51.36 67.18 108.80 111.58 72.75 79.98 81.94 23.83 29.09
Si 1.31 1.25 1.27 1.24 1.18 1.13 1.23 0.06 5.24
P 3.22 9.24 3.25 10.41 7.70 11.84 7.61 3.65 47.98
S 34.63 41.44 73.82 69.81 48.01 46.49 52.37 15.82 30.21
K 3.38 2.63 2.80 3.03 2.70 3.05 2.93 0.27 9.52
Fe 2.74 1.12 1.91 1.92 1.65 0.56 1.65 0.74 45.31
Zn 2.49 2.40 4.05 3.28 1.97 4.65 3.14 1.04 33.23

227
The various elements detected within each sample and route are summarised in Table
6.11.
Table 6.11. Various elements detected in batches of methylamphetamine, precursors and essential
chemicals.
Precursor source Pseudo-
ephedrine Moscow route
Hypo
route
Laboratory chemicals
P
Si
Na
S
K
I
P
Fe
Na
S
K
I
P
Zn
Ethanol extraction Na
Mg
Na
S
K
I
P
Zn
Al
Na
S
K
I
P
Zn
Fe
Ethanol/Methanol
(90:10% vol/vol)
Na
Mg
K
Si
Na
S
K
I
P
Zn
Fe
Cr
Ni
Na
S
K
I
P
Zn
Fe
Commercial methylated
spirits
Na
S
K
Si
Mg
Na
S
K
I
P
Zn
Fe
Cr
Ni
Na
S
K
I
P
Zn
Fe
Iodine tincture C, Cl, K, Cr, Fe, I
Matchbook stripe pad C, Cl, K, Cr, Fe, Na, Mg, S, P, Zn, Mn, Pb

228
Various elements were present across the range of samples analysed. Specific
combinations of elements were also present in the extracting solvents and iodine and red
phosphorous which appeared to carry through to the final products. Five elements,
(sodium, sulfur, potassium, iodine and phosphorous), were present in all synthesised
samples, all be it, in variable quantities. Zinc was also present in all samples synthesised
from the extracted precursor chemicals and may be present due to its presence in red
phosphorous prepared from matchbook stripe pads.
Sodium (presented in Figure 6.22) was present in all extracted pseudoephedrine samples
and presumably carried through to the final synthetic product although the presence of
this element as an environmental contaminant cannot be ruled out. The synthetic process
itself may also introduce sodium and sulphur as a consequence of the basification of
methylamphetamine from the oil where sodium hydroxide and sulphuric acid are used.
The generation of gaseous hydrochloric acid occurs via a reaction between sodium
chloride and sulphuric acid introduced to the methylamphetamine base via a cannula
providing another potential sodium source [17]. Methylamphetamine samples
synthesized from the Hypo route generally had increased concentrations and a wider
spread of sodium compared to methylamphetamine synthesized from the Moscow route.
This may be as a consequence of further sodium being introduced with
hypophosphorous acid used in the synthesis which itself is prepared industrially via a
two step process involving lithium, sodium or potassium hypophosphite salts [18,19].

229
Figure 6.22. Sodium concentrations of methylamphetamine synthesized from both routes using
laboratory grade and extracted precursors; HL/ML=hypo/moscow route using laboratory grade
chemicals, HE/ME=Hypo/Moscow route using pseudoephedrine extracted using ethanol,
HDA/MDA= Hypo/Moscow route using pseudoephedrine extracted using ethanol:methanol (90:10%
vo/vol), HMS/MMS=Hypo route/Moscow route using pseudoephedrine extracted using commercial
methylated sprits.
ppm

230
The values for sulphur within each group of samples is presented in Figure 6.23.
Figure 6.23. Sulfur concentrations of methylamphetamine synthesized from both routes using
laboratory grade and extracted precursors HL/ML=hypo/moscow route using laboratory grade
chemicals, HE/ME=Hypo/Moscow route using pseudoephedrine extracted using ethanol,
HDA/MDA=Hypo/Moscow route using pseudoephedrine extracted using ethanol:methanol (90:10%
vo/vol), HMS/MMS=Hypo route/Moscow route using pseudoephedrine extracted using commercial
methylated sprits.
Potassium was most probably due to the presence of the element in the extracted
pseudoephedrine, iodine and red phosphorous samples. The distribution of potassium is
presented in Figure 6.24 and is reasonably evenly distributed across the samples.
ppm

231
Figure 6.24. Potassium concentrations of methylamphetamine synthesized from both routes using
laboratory grade and extracted precursors HL/ML=hypo/moscow route using laboratory grade
chemicals, HE/ME=Hypo/Moscow route using pseudoephedrine extracted using ethanol,
HDA/MDA=Hypo/Moscow route using pseudoephedrine extracted using ethanol:methanol (90:10%
vo/vol), HMS/MMS=Hypo route/Moscow route using pseudoephedrine extracted using commercial
methylated.
Methylamphetamine synthesized from the Hypo route have a higher concentration of
phosphorous compared to methylamphetamine synthesized from the Moscow route
when compared across each of the specific precursor sources. The highest concentration
of phosphorous was detected within batches of methylamphetamine synthesized using
precursors extracted from proprietary cold medication using commercial methylated
spirit (HMS).
The distribution of phosphorous within the samples is presented in Figure 6.25
ppm

232
Figure 6.25. Phosphorous concentrations of methylamphetamine synthesized from both routes using
laboratory grade and extracted precursors HL/ML=hypo/moscow route using laboratory grade
chemicals, HE/ME=Hypo/Moscow route using pseudoephedrine extracted using ethanol,
HDA/MDA=Hypo/Moscow route using pseudoephedrine extracted using ethanol:methanol (90:10%
vo/vol), HMS/MMS=Hypo route/Moscow route using pseudoephedrine extracted using commercial
methylated.
The source of phosphorous was different for each synthetic route. In the Hypo route in
situ synthesised hypophosphorous acid was used while red phosphorous was directly
used in the Moscow route and this no doubt also contributed to the elemental
distribution between routes.
The iodine source is obviously the tinctures used in the synthesis for both routes. Apart
from the Moscow route samples where commercial methylated spirit was used as the
extracting solvent for Sudafed, the concentrations of iodine did not vary significantly
between the various batches of samples, with the Hypo samples having slightly higher
concentrations and a wider spread of values than the Moscow samples as illustrated in
Figure 6.26.
ppm

233
Figure 6.26. Iodine concentrations of methylamphetamine synthesized from both routes using
laboratory grade and extracted precursors HL/ML=hypo/moscow route using laboratory grade
chemicals, HE/ME=Hypo/Moscow route using pseudoephedrine extracted using ethanol,
HDA/MDA=Hypo/Moscow route using pseudoephedrine extracted using ethanol:methanol (90:10%
vo/vol), HMS/MMS=Hypo route/Moscow route using pseudoephedrine extracted using commercial
methylated.
Methylamphetamine synthesized from the Moscow route have a higher concentration of
iron compared to methylamphetamine synthesized from the Moscow route when
compared across each of the specific precursor sources. The only exception to this was
Hypo samples synthesised from the precursor extracted using commercial methylated
spirit. The highest concentration of iron was detected within batches of
methylamphetamine synthesized using precursors extracted using commercial
methylated spirit (MMS) which also provided the widest range of values in both the
Moscow and Hypo routes. Iron was also detected in the iodine tinctures, phosphorous
extracted from the matchboxes and from the Sudafed tablets themselves. The
distribution of iron within the samples is presented in Figure 6.27.
ppm

234
Figure 6.27. Iron concentrations of methylamphetamine synthesized from both routes using
laboratory grade and extracted precursors HL/ML=hypo/moscow route using laboratory grade
chemicals, HE/ME=Hypo/Moscow route using pseudoephedrine extracted using ethanol,
HDA/MDA=Hypo/Moscow route using pseudoephedrine extracted using ethanol:methanol (90:10%
vo/vol), HMS/MMS=Hypo route/Moscow route using pseudoephedrine extracted using commercial
methylated.
The zinc detected may be as a result of zinc present within the phosphorous extracted
from matchboxes. The distribution of zinc within the samples is presented in Figure
6.28. Methylamphetamine synthesized from the Hypo route had, generally speaking,
higher concentrations of zinc compared to samples prepared using the Moscow route
with the exception of the methylated spirit extracted Moscow synthesised sample.
ppm

235
Figure 6.28. Zinc concentrations of methylamphetamine synthesized from both routes using
laboratory grade and extracted precursors HL/ML=hypo/moscow route using laboratory grade
chemicals, HE/ME=Hypo/Moscow route using pseudoephedrine extracted using ethanol,
HDA/MDA=Hypo/Moscow route using pseudoephedrine extracted using ethanol:methanol (90:10%
vo/vol), HMS/MMS=Hypo route/Moscow route using pseudoephedrine extracted using commercial
methylated.
ppm

236
6.4 Conclusions
Inductively coupled plasma mass spectrometry (ICP-MS) analysis is potentially useful
in the comparison and discrimination between batches of precursor produced via
different extracting solvents and subsequent methylamphetamine produced for each
route. Generally speaking, the elemental concentrations within the Hypo samples were
higher than those within the Moscow samples.
The elemental analysis of the extracted pseudoephedrine distinguished between the
extraction solvents used to prepare the precursor from the cold medication. To our
knowledge this is the first time that this discrimination had been exposed.
Methylamphetamine synthesized from precursors sourced from cold medication and
essential chemicals extracted from tinctures and matchboxes also demonstrated different
elemental profiles from the laboratory grade precursors by constantly exhibiting the
presence of zinc in all samples. Of the lab grade synthesised samples, zinc was present
only in the Hypo samples. Both zinc and iron were present in the elemental profiles of
red phosphorous from matchbook strips, with iron also present consistently in the
elemental profiles of iodine from iodine tinctures and the Sudafed tablets themselves.
The elemental variation of phosphorous observed within methylamphetamine
synthesised via the Hypo and Moscow routes were also different presumably due to the
different phosphorous sources used in the synthetic methods.
A trend was also observed in the concentrations of sodium and sulphur within the
various samples which may be directly linked to the salting out process used.

237
6.5 References
1. van de Boom, C.P.H.; van Duersen, M.M.; Block, A.; Dobney, W.; de Joode, P.;
van der Perjil, G.J.Q., XTC characterization using ICP-MS. Forensic Science
International, 2003, 136,98-99.
2. Wadell, R.J.H.;NicDaeid, N.; Littlejohn, D.,Classification of ecstasy tablets using
trace metal analysis with chemometrics procedures and artificial neural network
algorithms. Analyst, 2004, 129, 235-240.
3. Suzuki, S.I.;Nakajima, K.;Matsushita, A.;Nagao, T.,Analyses of impurities in
methamphetamine by ICPMS and ion chromatography. Journal Chromatography,
1988, 437, 322-327.
4. Comment, S.; Lock, E.; Zingg, C.; Jakob, A., The analysis of ecstasy tablets by
ICP-MS and ICP-AES. Probl. Forensic Science 2001, 131-146.
5. Marumo, Y.; Inoue, T.;Seta, S., Analyses of inorganic impurities in seized
methamphetamine samples. Forensic Science International 1994, 69,89-95.
6. Watling, R.J., Sourcing the provenance of cannabis crops using inter-element
association patterns ‘fingerprinting’ and LA-ICPMS. Journal of Analytical Atomic
Spectrometry, 1998, 13, 917-926.
7. Myors, R.; Wells, R.J.; Skopec, S.V.;Crisp, P.;Iavetz,R.;Skopec, Z.;Ekangaki, A.;
Roberston, J., Preliminary investigation of heroin fingerprinting using trace
element concentration. Analytical Communication, 1998, 35, 403-410.
8. Violante, N.;Quaglia, M.G.;Lopex, A.;Corrolini, S., Characterisation of cocaine
and heroin samples as a function of their trace element concentration, an
analytical pilot study. Journal of Microchemistry, 1992, 45, 78-89.
9. Wells, R.J.;Skopec, S.V.;Iavetz, R.;Robertson, J., Trace element analysis of heroin
by ICPMS. Australian Chemistry, 1995, 14-15.
10. Wijesekara, A.R.L.;Henry, K.D.;Ranasinghe, P., The detection of and estimation
of arsenic in opium and strychnine in opium and heroin, as a means of
identification of their respective sources. Forensic Science International, 1988, 36,
193-209.
11. Bora,T.;Merdivian, M.;Hammci, C.,Levels of trace and major elements in illicit
heroin. Journal of Forensic Sciences, 2002, 47,1-5.

238
12. Koper,C.; van den Boom, C.; Wiarda, W.; Schrader, M.; de Joode, P.; van der
Peijl, G.; Bolck, A., Elemental analysis of 3,4-methylenedioxymethamphetamine
(MDMA): A tool to determine the synthesis methods and trace links. Forensic
Science International 2007, 171, 171-179.
13. Suh, S.;Ko, B.J.;Suh, Y.J.; In, M. K.; Kim, S. H.,Analysis of inorganic impurities
in illicit methamphetamine using Inductively Coupled Plasma Mass Spectrometry
(ICP-MS). Poster, The International Association of Forensic Toxicologists
(TIAFT), 2006.
14. Vanitha Kunalan. PhD thesis.University of Strathclyde 2010.,pp 30-320.
15. Makino,Y.;Urano,Y.;Nagano,T; Investigation of the origin of ephedrine and
methamphetamine by stable isotope ratio mass spectrometry: a Japanese
experience. Bulletin on Narcotics 2005, 57,63-68.
16. Oliver, Thomas; Industrial disease due to certain poisonous fumes or gases.
Manchester University press.1-21.
17. Uncle Fester, Secrets of Methamphetamine Manufacture. Vol.9th
Edition,
Loompanics Unlimited: Port Townsend, Washington, 2009.
18. Cotton.F.Alberthttp://en.wikipedia.org/wiki/F._Albert_Cotton; Wilkinson G;
Murillo, Carlos A.; Bochmann, Manfred (1999), Advanced Inorganic
Chemistry (6th ed.), New York: Wiley-Interscience, pp 1-120.
19. Popik, V.V; Wright, A.G; Khan, T.A; Murphy, J.A, "Hypophosphorous Acid" in
Encyclopedia of Reagents for Organic Synthesis (Ed: L. Paquette) 2004, J. Wiley
& Sons, New York. pp 30-170.
239
Chapter 7 Investigation of precursor source, synthetic routes and regiospecificity
of methylamphetamine samples using stable isotope ratio mass spectrometry
(IRMS)
7.1 Introduction
The investigation of carbon, nitrogen and hydrogen stable isotopic ratios are presented
for each batch of methylamphetamine prepared via the Hypophosphorous and Moscow
routes using the various precursor samples. Six samples were prepared using each
synthetic method using laboratory precursors and the various extracted precursors,
giving 48 samples in total. This facilitated the investigation of the influence of the
extracting solvent on any resultant data. Secondly, 5 batches of methylamphetamine
synthesized from precursors extracted from Allerpid and Panadol tablets sourced from
Malaysia were also analysed. All IRMS analysis was conducted at the James Hutton
Institute, Dundee.
7.2 Experimental Methods
7.2.1 13C and
15N Isotope analysis by EA-IRMS
Carbon and nitrogen isotope abundances analyses were carried out using an automated
nitrogen-carbon analyzer (ANCA) coupled to an automated breath analyzer (ABCA)
isotope ratio mass spectrometer (SerCon Ltd, Crewe, United Kingdom). Typically
0.4 mg of sample material was weighed into tin capsules (Elemental microanalysis,
Devon, United Kingdom) and introduced via a solid Costech Zero-Blank autosampler
(Pelican Scientific Limited, Alford, United Kingdom). The elemental analyzer (EA)
reactor tubes were comprised of two quartz glass tubes filled with chromium (III)
oxide/copper oxide and reduced copper, held at 1020oC and 620
oC for combustion and
reduction respectively. A water trap filled with magnesium perchlorate was used to
remove water from combustion gases thus generated, and post reactor gas
chromatograpy (GC) column was kept at 65oC for separation of evolved N2 and CO2.
Data were processed using proprietary software (SerCon Limited, Crewe, United

240
Kingdom). Measured isotope ratios are expressed in the δ notation [o/oo] relative to the
appropriate international standard material anchoring the isotope scale (e.g., VPDB for
13C or VSMOW for
2H).
Each batch of samples was bracketed by two blanks (empty tin capsules) and two sets of
laboratory certified standards of known isotopic composition (Iso-Analytical, Crewe,
United Kingdom). This standard was leucine (δ13
CVPDB= -30.52 o/oo, δ
15NAIR= +10.77
o/oo).
7.2.2 2H Isotope analysis by TC/EA-IRMS
A DeltaPlus
-XP isotope ratio mass spectrometer (IRMS) coupled to a high-temperature
conversion/elemental analyzer (TC/EA; both Thermo-Fischer Corporation, Bremen,
Germany) was used for 2H/
1H isotope ratio measurement of synthesized
methylamphetamine samples. Typically, 0.2 mg of solid sample was weighed into a
silver capsule and placed in a desiccator for one week before the samples were
introduced into the TC/EA by means of a solid Costech Zero-Blank solid autosampler
(Pelican Scientific Ltd, Alford, United Kingdom). The reactor tube was self packed and
comprised of an Alsint ceramic tube, containing a glassy carbon tube filled with glassy
carbon granulate, silver and quartz wool (SerCon, Crewe, Cheshire). The reactor
temperature was set at 1425oC while the postreactor gas chromatograph column was
maintained at 85oC. Helium (99.99% purity, Air Products plc, Crewe, Cheshire) pressure
was set at 1.45 bar. The run time per analysis was 350s. Measured 2H/
1H isotope ratios
are expressed as δ values in o/oo relative to VSMOW.
The working reference gas, H2 (BOC, Guilford, Surrey, United Kingdom), was
calibrated against VSMOW (δ2H=0.00
o/oo) and checked against international reference
material (IRM), IAEA-CH-7 polyethylene (δ2HVSMOW= -100.3
o/oo; IAEA, Vienna,
Austria). Cross checking the δ2HVSMOW-value obtained for the working reference gas H2
against a further international reference material (IRM) for H2 isotope analysis, GISP,
yielded a measured δ2HVSMOW-value for GISP of -194.6
o/oo (accepted δ
2HVSMOW=
-189.73 o
/oo; IAEA, Vienna Austria). A typical batch analysis compised of 10 samples

241
run in triplicate, preceded and followed by a set of standards as reported previously [1].
This consisted of in-house standards (coumarin, δ2HVSMOW= +62.56
o/oo) and one IRM
(IAEA-CH-7) as calibration controls at the beginning and end of the set. Each batch was
preceded and followed by a blank silver capsule. Precision of 2H isotope analysis as
monitored by the IRMs and lab standards was ±1.15 o/oo or better.
7.2.3 IRMS Sample preparation
Aliquots sufficient for stable isotope analysis were weighed out and dried in a desiccator
to remove any traces of moisture (in vacuo over P4O10). To prepare samples for isotope
analysis, drug aliquots were removed from the desiccator and approximately 0.2 and
0.4 mg samples were weighed out in triplicate into silver and tin capsules (SerCon
Limited, Crewe, United Kingdom) for analysis by TC/EA-IRMS and EA-IRMS
respectively. Capsules were subsequently crimped and placed into 96 well-plates already
prepared with blanks and appropriate reference materials. Batch run ready well-plates
were placed into another desiccator, where they were kept in vacuo over P4O10 until
analysis.
7.2.4 Solvent and drying studies of pseudoephedrine hydrochloride extracted
from Sudafed tablets.
A precursor drying and extraction solvent study was undertaken to determine the effects
on isotopic variation that may have occurred when pseudoephedrine hydrochloride was
extracted from the Sudafed tablets.
Two sets of the precursor were prepared by extraction from Sudafed samples using
solvents sourced from different suppliers. The tablets were extracted according to the
method detailed in section 3.2.2. Ethanol and methanol were supplied by Sigma Aldrich
and Fluka, commercial methylated Spirits were sourced from two different batches of
Home brand purchased locally in Glasgow at B&Q.

242
Secondly, a set of extracted precursors were split into two batches to explore the effect
of drying. In each case, one half of the sample was dried at room temperature in a fume
hood and the second half dried in vacuo over P4O10 for one week prior to analysis.
7.3 Results and discussion
7.3.1 Pseudoephedrine HCl extracted from Sudafed tablets
Methylamphetamine hydrochloride was prepared via both synthetic routes using
laboratory grade pseudoephedrine hydrochloride purchased from Sigma Aldrich. One set
of precursors obtained were split and dried either at room temperature in a fume hood or
in a desiccator. δ13
C, δ15
N and δ2H values for the precursor samples are presented in the
table below. Sudafed tablets extracted using ethanol and methanol purchased from Fluka
was initially used in the extraction process of pseudoephedrine. These are highlighted in
italics table shown below. Single batches of the samples was analysed initially to
determine the δ13
C, δ15
N and δ2H isotopic values. The results obtained for δ
13C, δ
15N
and δ2H represents the average of triplicate analysis δ
13C, δ
15N and δ
2H values for the
precursor samples are presented in Table 7.1.
Table 7.1. δ13
C, δ15
N and δ2H values for the precursor samples.
Precursor Source δ13
C δ15
N δ2H
Pseudoephedrine from Sigma Aldrich -24.99 3.72 -82.50
Samples dried at room temperature
Sudafed tablets extracted using ethanol (Fluka) -24.97 -3.00 -20.10
Sudafed tablets extracted using ethanol:methanol(90:10)%vol/vol (both
Fluka) -26.78 -2.91 55.30
Sudafed tablets extracted using commercial methylated spirit (home brand
B&Q 1) -25.28 -2.88 -2.00
Sudafed tablets extracted using ethanol (Sigma Aldrich)
PSE-E-1
PSE-E-2
PSE-E-3
PSE-E-4
PSE-E-5
PSE-E-6
-26.57
-26.51
-26.60
-26.61
-26.65
-26.55
-26.50
-2.48
-2.43
-2.45
-2.46
-2.52
-2.56
-2.46
-34.88
-35.1
-33.0
-34.3
-35.4
-35.9
-35.6

243
Sudafed tablets extracted using ethanol:methanol(90:10)%vol/vol (both
Sigma Aldrich)
PSE-DA-1
PSE-DA-2
PSE-DA-3
PSE-DA-4
PSE-DA-5
PSE-DA-6
-26.71
-26.69
-26.83
-26.70
-26.67
-26.73
-26.65
-2.16
-2.09
-2.19
-2.14
-2.21
-2.13
-2.20
-50.73
-50.7
-51.3
-50.9
-49.1
-52.8
-49.6
Sudafed tablets extracted using commercial methylated spirit (home brand
B&Q 2)
PSE-MMS-1
PSE-MMS-2
PSE-MMS-3
PSE-MMS-4
PSE-MMS-5
PSE-MMS-6
-27.12
-27.09
-27.15
-27.11
-27.15
-27.12
-27.10
-2.09
-2.06
-2.06
-2.12
-2.10
-2.14
-2.08
-58.87
-60.7
-58.0
-60.4
-58.0
-58.3
-57.8
Samples dried in vacuo over P4O10
Sudafed tablets extracted using ethanol (Sigma Aldrich)
D-PSE-E-1
D-PSE-E-2
D-PSE-E-3
D-PSE-E-4
D-PSE-E-5
D-PSE-E-6
-27.12
-27.09
-27.15
-27.11
-27.15
-27.12
-27.11
-2.09
-2.06
-2.06
-2.12
-2.10
-2.14
-2.08
-30.75
-32.1
-30.9
-31.0
-30.3
-30.5
-29.7
Sudafed tablets extracted using ethanol:methanol(90:10)%vol/vol (both
Sigma Aldrich)
D-PSE-DA-1
D-PSE-DA-2
D-PSE-DA-3
D-PSE-DA-4
D-PSE-DA-5
D-PSE-DA-6
-27.12
-27.09
-27.15
-27.11
-27.15
-27.12
-27.11
-2.09
-2.06
-2.06
-2.12
-2.10
-2.14
-2.08
-45.40
-45.4
-45.7
-44.2
-43.8
-44.3
-49.0
Sudafed tablets extracted using commercial methylated spirit (home brand
B&Q batch 2)
D-PSE-MMS-1
D-PSE-MMS-2
D-PSE-MMS-3
D-PSE-MMS-4
D-PSE-MMS-5
D-PSE-MMS-6
-27.12
-27.09
-27.15
-27.11
-27.15
-27.12
-27.11
-2.09
-2.06
-2.06
-2.12
-2.10
-2.14
-2.08
-52.28
-53.2
-52.2
-51.9
-51.9
-52.0
-52.5

244
Solvent effects
Significant variations are observed within the data for δ15
N values between laboratory
grade pseudoephedrine and extracted pseudoephedrine hydrochloride. The precursor
extracted from Sudafed tablets demonstrate between them a spread of ± 0.91o/oo
compared with a difference of over 5.81o/oo between the nearest sample and the
laboratory grade sample. Positive δ15
N values can be used as an indicator of the
manufacturing method for the laboratory grade chemical and is indicative of a semi-
synthetic route using molasses as the pre precursor [1, 2]. Negative δ15
N values indicate
that pseudoephedrine extracted from the Sudafed tablets could have been manufactured
from pyruvic acid as the pre precursor and are in agreement of work published by
Kurashima et al. [2].
Variation in δ2H values were observed of pseudoephedrine extracted from Sudafed
tablets using solvents sourced from different manufactures. This variation was also
observed in precursor samples extracted with the two batches of commercial methylated
spirit and is in agreement with similar work done by Benson et al. relating to explosive
analysis [6].
The effect of drying
Variations in δ2H values can be due to a variety of external factors such as, the drying
process, the kind of solvent used and ambient humidity [2]. The variations observed for
δ2H values for the pseudoephedrine hydrochloride extracted from Sudafed tablets using
the different drying conditions appeared to also be influenced by the extraction solvent
with larger variations observed for the ethanol:methanol extracted samples commercial
methylated spirit when compared to ethanol extracted samples. The influence of
methanol may be because it is more hygroscopic compared to ethanol, and as such has a
greater tendency to absorb moisture from the atmosphere [3]. The hydrogen atoms
contained in the hydroxyl group are classed as exchangeable hydrogen, available for
exchange with atmospheric hydrogen and as such differences in the moisture content

245
within the environment of the sample can affect the δ2H isotopic value. This was further
confirmed by studies conducted by Carter et al. [5].
Thirty six batches of pseudoephedrine hydrochloride extracted from the Sudafed tablets
using the three solvent systems were dried at room temperature and in a desiccator. The
δ13
C, δ2H and δ
15N data are presented in Figure 7.1 to Figure 7.4.
-26.5-26.6-26.7-26.8-26.9-27.0-27.1-27.2
-30
-35
-40
-45
-50
-55
-60
C
H
D-PSE-E
D-PSE DA
D-PSE MMS
PSE-E
PSE DA
PSE MMS
Precursor
Scatterplot of H vs C
Figure 7.1. Scatter plot of δ
13C and δ
15H values of batches of pseudoephedrine dried in a desiccator
and at room temperature.

246
-26.5-26.6-26.7-26.8-26.9-27.0-27.1-27.2
-2.0
-2.1
-2.2
-2.3
-2.4
-2.5
-2.6
C
N
D-PSE-E
D-PSE DA
D-PSE MMS
PSE-E
PSE DA
PSE MMS
Precursor
Scatterplot of N vs C
Figure 7.2. Scatter plot of δ
15N and δ
13 C values of batches of pseudoephedrine dried in a desiccator
and at room temperature.
-30-35-40-45-50-55-60
-2.0
-2.1
-2.2
-2.3
-2.4
-2.5
-2.6
H
N
D-PSE-E
D-PSE DA
D-PSE MMS
PSE-E
PSE DA
PSE MMS
Precursor
Scatterplot of N vs H
Figure 7.3. Scatter plot of δ
15N and δ
2H values of batches of pseudoephedrine dried in a desiccator
and at room temperature.

247
-30
-40-2.6
-2.4
-2.2
-50-27.2
-2.0
-27.0 -60-26.8-26.6
N
H
C
D-PSE-E
D-PSE DA
D-PSE MMS
PSE-E
PSE DA
PSE MMS
Precursor
3D Scatterplot of N vs H vs C
Figure 7.4. 3D scatter plot of δ
13C, δ
2H and δ
15N analysis of desiccated and non-desiccated
pseudoephedrine samples extracted from Sudafed tablets.
Pseudoephedrine hydrochloride extracted using the three different solvents and dried
under two different conditions formed some distinct clusters across the different isotopic
combinations, however only the carbon and hydrogen isotopic values used in tandem
provided sufficient differences to facilitate full discrimination of all the samples. The
precursor extracted using ethanol and the ethanol:methanol mixture could be easily
discriminated from each other and as a function of drying, specifically on the carbon
isotopic values and this may be indicative of the evolution of solvent as the sample
dried. Samples extracted using commercial methylated spirits were discriminated from
the other precursor samples but the large differences observed in the ethanol and
ethanol:methanol extracted samples in relation to the drying of the sample were not
apparent in this case. Plotting all three isotopic ratio values against each other reflected
the differences observed within the hydrogen and carbon isotopic values. Thus IRMS
has been demonstrated as a potential tool for precursor specificity both by extraction
Batches of
pseudoephedrine
HCl dried at room
temperature
Batches of
pseudoephedrine
HCl dried in
desiccator

248
solvent but also as an indicator of some of the synthetic processes which may be
involved such as solvent drying.
7.3.2 Pseudoephedrine HCl extracted from Allerpid and Panadol tablets
The combination of δ13
C, δ15
N and δ2H data in a 3D plot of all stable isotopes was also
used to investigate the potential of the technique to discriminate batches of
pseudoephedrine extracted from the Malaysian sourced Allerpid and Panadol tablets
from the precursor prepared from Sudafed. Figure 7.5 illustrates that this geographical
discrimination is possible based largely on the nitrogen isotopic values.

249
4
2-26.5
0
-26.0
-25.5
-25.0
-100 -2-50
050
dC13
dN15
dH2
PSE-Allep
PSE-DA
PSE-E
PSE-L
PSE-MMS
PSE-PND
PSE
3D Scatterplot of dC13 vs dN15 vs dH2 of pseudoephedrine HCl
Figure 7.5. 3D scatter plot of mean values δ13
C, δ2H and δ
15N analysis of pseudoephedrine samples extracted from laboratory and pharmaceutical
grades (Sudafed, Allerpid and Panadol).
Laboratory grade
Pseudoephedrine HCl
Pseudoephedrine HCl
extracted from
proprietary cold
medication from
Malaysia (Allerpid &
Panadol) using
acid/base extractions.
Pseudoephedrine HCl extracted from
proprietary cold medication from
United Kingdom (Sudafed) using
the three solvent systems and
laboratory grade pseudoephedrine.

250
7.3.3 IRMS analysis of methylamphetamine
A total of 53 batches of methylamphetamine were prepared from the various
pseudoephedrine precursor samples (6 batches from each precursor) and are presented in
Table 7.2.
Table 7.2. δ13
C, δ15
N and δ2H values of methylamphetamine synthesised from the Hypo and Moscow
routes.
Precursor Route δ13
CVPDB(0/00) δ
15NAir(
0/00)
δ2HVSMOW
(0/00)
Pseudoephedrine HCl
(99%) (Sigma Aldrich)
Moscow(M)
ML 24
ML 22
ML 17
ML 21
ML 23
ML 13
Hypo(H)
HL 6
HL 7
HL 8
HL 9
HL 10
HL 11
-27.13
-27.12
-27.35
-27.22
-26.78
-27.29
-25.16
-25.10
-25.07
-25.10
-25.12
-25.16
5.50
5.59
5.61
6.59
6.10
5.77
4.75
8.20
5.28
4.57
5.33
4.11
63.8
62.4
61.8
63.0
66.2
60.7
-150.8
-142.9
-150.8
-152.5
-152.8
-154.4
Pseudoephedrine HCl
extracted from Sudafed
tablets using ethanol as the
solvent (Fluka)
Moscow(M)
ME 5
ME 6
ME 7
ME 8
ME 9
ME 10
Hypo(H)
HE 1
HE 2
HE 3
HE 4
HE 5
HE 6
-27.27
-26.82
-27.15
-26.85
-26.64
-26.77
-26.48
-26.26
-27.09
-26.52
-26.18
-24.85
-1.96
-1.65
-2.35
-3.12
-2.57
-2.27
-0.48
-1.39
-3.09
-1.84
-2.58
-1.96
48.3
46.0
43.5
43.3
60.3
35.0
19.0
-3.9
25.7
21.1
-0.2
-37.6
Pseudoephedrine HCl
extracted from Sudafed
tablets using
ethanol:methanol
(90:10)% vol/vol as the
solvent (Fluka)
Moscow(M)
MDA 3
MDA 4
MDA 5
MDA 8
MDA 9
MDA 10
Hypo(H)
HDA 1
HDA 2
HDA 3
-27.06
-27.15
-27.31
-27.03
-26.73
-26.75
-26.10
-25.99
-24.21
-1.56
-3.24
-0.61
-2.35
-2.41
0.11
-1.00
-1.84
-1.31
41.4
44.0
32.9
47.7
35.1
37.2
35.4
-4.3
18.3

251
HDA 4
HDA 5
HDA 6
-25.23
-25.53
-25.16
0.19
-2.42
-2.04
-22.5
-13.9
-25.8
Pseudoephedrine HCl
extracted from Sudafed
tablets using commercial
methylated spirit as the
solvent
Moscow(M)
MMS 3
MMS 4
MMS 6
MMS 7
MMS 8
MMS 10
Hypo(H)
HMS 1
HMS 2
HMS 3
HMS 4
HMS 5
HMS 6
-27.31
-27.13
-26.79
-26.92
-26.88
-26.61
-25.22
-24.91
-24.97
-25.22
-25.31
-24.98
-1.93
-2.52
0.88
-1.51
-1.22
0.23
-1.79
-2.83
-2.95
-2.04
-2.70
-2.36
49.7
39.6
38.6
49.0
37.4
38.0
-27.6
-29.6
-36.6
-27.0
-19.8
-39.7
Pseudoephedrine HCl
extracted from Allerpid
tablets using acid base
extractions
Moscow(M)
Allep-Moscow 1
Allep-Moscow 2
Hypo(H)
Allep-Hypo 1
Allep-Hypo 2
-24.10
-23.73
-23.89
-24.10
6.87
6.92
5.26
6.86
56.08
55.74
34.26
37.90
Pseudoephedrine HCl
extracted from Panadol
tablets using acid base
extractions
Hypo(H)
Panadol-Hypo
-24.66
3.32
-23.65
In order to discuss the origins of the atoms on a methylamphetamine hydrochloride
molecule prepared by each of the two synthetic routes investigated, it is useful to refer to
the numbered molecule shown in Figure 7.6. The nitrogen in the molecule is also
contributed by the starting material pseudoephedrine HCl.
Figure 7.6. The methylamphetamine HCl molecule with numbered atoms.

252
All of the carbon atoms (1-10) on the methylamphetamine hydrochloride are from the
pseudoephedrine HCl used as the starting material or precursor [1, 2], and as such one
would have an expectation of a close carbon isotopic link between precursor and final
product. One of the hydrogen atoms on the methylamphetamine molecule originate from
the formation of hydroiodic acid generated during the reaction process which protonates
the hydroxyl group of ephedrine or pseudoephedrine [7, 8]. The origin of hydrogen atom
on the nitrogen is from hydrogen gas, formed from the HCl solution used to convert
methylamphetamine base to its hydrochloride salt. Proton exchange will also occur
during the reaction.
Figure 7.7. The origin of hydrogen atoms on an Methylamphetamine molecule synthesised by the
Hypo and Moscow routes. *elimination of hydroxyl group from pseudoephedrine HCl replaced by a
hydrogen atom. * Proton source from hydrogen gas.
7.3.4 IRMS analysis of methylamphetamine synthesized from the Hypo and
Moscow routes using laboratory grade pseudoephedrine
Twelve batches of methylamphetamine hydrochloride were synthesized using laboratory
grade pseudoephedrine hydrochloride, iodine and red phosphorous. The δ13
C, δ2H and
δ15
N data are presented for these samples in Figure 7.8 to Figure 7.11. Visual
discrimination of the methylamphetamine synthesized via the two different routes using
the same batch of pseudoephedrine hydrochloride was evident. Methylamphetamine
synthesized using the Hypo route produced more negative values for δ2H compared to
the products from the Moscow synthesis possibly due to influence of the hydrogen donor
in the benzylic position which, in the case of Moscow synthetic route, is influenced by
the addition of water to aid in the formation of hydroiodic acid in-situ [9].
Differentiation on the basis of carbon isotopic ratios was also clearly evident. This is

253
more likely to be connected to the reaction conditions for each synthetic route given that
all carbon atoms of the product derive from the precursor.
-25.0-25.5-26.0-26.5-27.0-27.5
8
7
6
5
4
dC13
dN
15
HL 6
HL 10
HL 7
HL 8
HL 11 HL 9
ML 13
ML 23
ML 21
ML17
ML22
ML24
Scatterplot of dN15 vs dC13 methylamphetamine(laboratory grade)
Figure 7.8. Scatter plot of δ13
C and δ15
H values of batches of methylamphetamine synthesized from
the hypo (HL) and moscow (ML) routes using laboratory grade pseudoephedrine.
-25.0-25.5-26.0-26.5-27.0-27.5
50
0
-50
-100
-150
dC13
dH
2
HL 6HL 10 HL 7
HL 8HL 11
HL 9
ML 13 ML 23
ML 21ML17
ML22
ML24
Scatterplot of dH2 vs dC13 of methylamphetamine (laboratory grade)
Figure 7.9. Scatter plot of δ13
C and δ2H values of batches of methylamphetamine synthesized from
the hypo (HL) and moscow (ML) routes using laboratory grade pseudoephedrine.

254
87654
50
0
-50
-100
-150
dN15
dH
2
HL 6 HL 10HL 7
HL 8HL 11 HL 9
ML 13ML 23 ML 21ML17
ML22
ML24
Scatterplot of dH2 vs dN15 of methylamphetamine(laboratory grade)
Figure 7.10. Scatter plot of δ15
N and δ2H values of batches of methylamphetamine synthesized
from the hypo (HL) and moscow (ML) routes using laboratory grade pseudoephedrine.
8-27
6
-26
-160
-25
-8040
80
dC13
dN15
dH2
3D Scatterplot of dC13 vs dN15 vs dH2 of methylamphetamine(lab grade)
Figure 7.11. 3D scatter plot of δ13
C, δ2H and δ
15N for methylamphetamine synthesized from the
from the hypo (HL) and moscow (ML) routes using laboratory grade pseudoephedrine.
Batches of
methylamphetamine (HL)
synthesized from lab grade
materials via Hypo Route
Batches of methylamphetamine
(ML) synthesized from lab grade
materials via Moscow Route

255
7.3.5 IRMS analysis of methylamphetamine synthesized pseudoephedrine
extracted from pharmaceutical tablets
A total of 41 batches of methylamphetamine hydrochloride were synthesized using
pseudoephedrine hydrochloride extracted from pharmaceutical tablets and iodine and red
phosphorous extracted from tinctures and matchboxes respectively. The δ13
C, δ2H and
δ15
N data are presented for these samples in Figure 7.12 to Figure 7.15.
-24.0-24.5-25.0-25.5-26.0-26.5-27.0-27.5
75
50
25
0
-25
-50
C
H
Allep-Hy
Allep-M
HDA
HE
HMS
MDA
ME
MMS
Pnd-Hy
Meth
Scatterplot of H vs C
Figure 7.12. Scatter plot of δ
2H and δ
13C values of batches of methylamphetamine synthesized from
the Hypo and Moscow routes using pseudoephedrine extracted from proprietary cold medication.

256
-24.0-24.5-25.0-25.5-26.0-26.5-27.0-27.5
8
6
4
2
0
-2
-4
C
N
Allep-Hy
Allep-M
HDA
HE
HMS
MDA
ME
MMS
Pnd-Hy
Meth
Scatterplot of N vs C
Figure 7.13. Scatter plot of δ
15N and δ
13C values of batches of methylamphetamine synthesized from
the hypo and moscow routes using pseudoephedrine extracted from proprietary cold medication.
7550250-25-50
8
6
4
2
0
-2
-4
H
N
Allep-Hy
Allep-M
HDA
HE
HMS
MDA
ME
MMS
Pnd-Hy
Meth
Scatterplot of N vs H
Figure 7.14. Scatter plot of δ
15N and δ
2H values of batches of methylamphetamine synthesized from
the hypo and Moscow routes using pseudoephedrine extracted from proprietary cold medication.
Convolution of the samples occurs except when hydrogen or carbon and nitrogen
isotopes are plotted against each other (with the exception of one or two samples). In
this case the samples synthesised from the Malaysian sourced precursor are clearly
separated both from each other by tablet source and also by synthetic route. Separation

257
occurs both on the nitrogen isotopic values as well as the hydrogen isotopic values.
Furthermore, the Sudafed precursor samples are separated from the Malaysian precursor
samples specifically by the nitrogen isotopic values with the latter having a more
negative value. The samples are also separated according to synthetic route where the
Moscow samples have generally more positive hydrogen and negative carbon isotopic
values. This suggests that the nitrogen isotopes are presenting a geographical specificity,
(given the nitrogen atom in the product comes directly from the precursor) and route
specificity presented by the carbon or hydrogen isotope variations. The source
specificity for the laboratory precursor samples appears to be more related to differences
in the carbon isotope values rather than those of the nitrogen isotopes.

258
8
4-27
-26
-25
0-160
-24
-800
80
dC13
dN15
dH2
MMS
PND-Hy
Allep-H
Allep-M
HDA
HE
HL
HMS
MDA
ME
ML
Meth
3D Scatterplot of dC13 vs dN15 vs dH2 of methylamphetamine
Figure 7.15. 3D scatter plot of δ13
C, δ2H and δ
15N for methylamphetamine synthesized from the from the hypo and Moscow routes using
laboratory grade pseudoephedrine.
Methylamphetamine synthesised via
Moscow Route using laboratory
grade Pseudoephedrine HCl
Methylamphetamine synthesised via
Hypo Route using laboratory grade
Pseudoephedrine HCl
Methylamphetamine synthesised via
Hypo and Moscow Routes from
Pseudoephedrine HCl extracted from
proprietary cold medication from
Malaysia (Allerpid and Panadol)
Batches of
methylamphetamine
synthesised from via Hypo
and Moscow routes from
Pseudoephedrine HCl
extracted from Sudafed
tablets (UK) using three
different solvents

259
Carbon results
10 of the 11 carbon atoms on the final methylamphetamine molecule are contributed by
the pseudoephedrine starting material [1, 2]. Small variations were observed within the
carbon values and presented in Figure 7.16 indicate that while fractionation occurs
within the synthetic process the reproducibility by the same chemist using the same
method and materials is relatively good [10]. Within route variation was more obvious
for the Hypo synthesised samples and this route was hardest to replicate as the
temperature of the exothermic reaction was difficult to control during the preparation of
hydroiodic acid when iodine was added into the hypophoshorus acid. The Moscow
prepared samples involved a more controlled temperature reaction where the precursor,
essential chemicals and water are added together in flask and refluxed. Such differences
in preparative method have been confirmed as potential causes of carbon isotopic
variation by Carter et al. [10, 11] and Buchanan et al. [12]. It can be observed that the
Moscow samples have more negative carbon isotope values in all cases.
MMSMLMEMDAHMSHLHEHDA
-24.0
-24.5
-25.0
-25.5
-26.0
-26.5
-27.0
-27.5
Batch
C1
3
Isotopic variation of C13 of methylamphetamine synthesised via the Hypo and Moscow routes
Figure 7.16. Isotopic variation of δ13C of batches of methylamphetamine synthesised via the Hypo
and Moscow routes.

260
Nitrogen results
Variations were observed in δ15
N values across all of the samples and when compared
with the nitrogen values of the individual precursor chemicals some general trends are
observed and presented in Figure 7.17. The nitrogen atom on the methylamphetamine
hydrochloride molecule is contributed exclusively by the precursor molecule [1, 2]. For
the laboratory grade precursors, positive values for the nitrogen isotopic values in the
precursor chemicals are reflected in the methylamine products for both synthetic routes.
Negative isotopic values between -2.88 and -3.00 were obtained . All other Sudafed
derived samples produced negative nitrogen isotopic values while the
methylamphetamine prepared from medication sourced from Malaysia produced
positive nitrogen isotope values.
MMSMLMEMDAHMSHLHEHDA
8
6
4
2
0
-2
-4
Batch
N1
5
Isotopic variation of N15 of methylamphetamine synthesised via Hypo and Moscow routes
Figure 7.17. Isotopic variation of δ15N of batches of methylamphetamine synthesised via the Hypo
and Moscow routes.

261
This variation observed is most likely due to isotopic fractionation and kinetic isotope
effects during the reaction phase of methylamphetamine [9, 10, 11]. The isotopic
fractionation that occurs during the synthetic process was also reported in the studies
conducted by Buchanan et al. [12] and by Carter et al. [10] who suggested that during
the synthesis of methylamphetamine, seemingly innocuous differences in the synthetic
method could result in different δ15
N values of the target compound. The large
variability of the δ15
N between the precursors and product was greater than observed by
studies conducted by Collins et al. [13] and Kurashima et al. [2]. This variability may be
due to fractionation that occurs during the precipitation of the product as the HCl salt
[9, 13, 14].
Hydrogen results
The δ2H data values of methylamphetamine synthesized for the Hypo and Moscow
routes using the pseudoephedrine extracted from Sudafed batches followed the same
trend observed with the samples prepared using the laboratory precursor. This re-
emphasises that the variations observed between routes are potentially due to the
synthetic phase of the reaction and the nature of different essential chemicals used in the
individual routes. This is best explained by the catalytic cycle shown in Figure 7.18 and
Figure 7.19 [15].

262
Figure 7.18. Red phosphorous involvement in a catalytic cycle for generation of hydroiodic acid in
anhydrous media for the Moscow route [15].
Figure 7.19. Hypophosphorous acid involvement in a catalytic cycle for generation of hydroiodic
acid in aqueous media for the Hypophoshorous route [15].
The generation of hydroiodic acid in the Moscow route occurs in-situ in the reaction
process where higher temperatures are needed when compared to the Hypo route
[15, 16] where involvement of hypophosphorous acid in the catalytic cycle for the
generation of hydroiodic acid in aqueous media is involved.

263
A contributing factor for hydrogen isotopic variation is the anhydrous nature of the
catalytic cycle in the generation hydroiodic acid in situ during the reaction of the
Moscow route and aqueous nature of hydroiodic acid generation of the Hypo route.
Mass differences arising from the different nature of the respective catalytic routes can
give rise to fractionation during the synthetic phase whereby a bond containing the atom
or isotope is broken or formed in the rate determining step of the reaction process [17].
Molecules consisting of lighter isotopes moving from the liquid to the vapour phase
faster than molecules consisting of heavier isotopes [17]. As more energy is needed to
break bonds in anhydrous media compared to aqueous media a difference in the isotopic
values between routes is expected.
The formation of the final hydrochloride salt may also have some influence on the final
isotopic values for hydrogen [9, 13, 14, 18-21]. During salt formation the nitrogen gains
a proton to become positively charged. The deuterium species forms a stronger bond to
the nitrogen than hydrogen [9, 13, 14, 18-21]. This proton gain is in rapid equilibrium
and the formation of deuterium-nitrogen species will be present for a longer time in a
solution than the hydrogen-nitrogen species [9, 13, 14, 18, 19]. The deuterium-nitrogen
species thus, have a greater chance of associating with the chloride ions to form the
methylamphetamine salt and precipitate from the solution [9, 13, 14, 18, 19].
Figure 7.20 illustrates the isotopic variation observed for hydrogen between the batches
of methylamphetamine synthesised via the Hypo and Moscow routes. It can be observed
that the Moscow samples have more positive hydrogen isotope values in all cases.

264
MMSMLMEMDAHMSHLHEHDA
50
0
-50
-100
-150
Batch
2H
Isotopic varaition of 2H of methylamphetamine synthesised via the Hypo and Moscow routes
Figure 7.20. Isotopic variation δ2H of batches of methylamphetamine synthesised via the Hypo and
Moscow routes.

265
7.4 Conclusion
53 batches of methylamphetamine synthesized from the two routes using the
pseudoephedrine extracted from laboratory grade and cold medication sourced from
different regions were analysed to present a comprehensive data set of clandestine
synthesised samples. The combination of δ13
C, δ2H and δ
15N data facilitated the
discrimination of the samples into four major groups according to routes and precursor
origin. This is in agreement with studies conducted by Collins et al.[13] where δ13
C,
δ2H and δ
15N values provided a viable means of distinguishing batches of
methylamphetamine synthesised from different routes to precursors from different
origins. Samples synthesized from laboratory grade pseudoephedrine via the Moscow
and Hypo routes could be clearly resolved from each other and all other samples
specifically by hydrogen isotopic values. The methylamphetamine synthesized from
precursor extracted from Sudafed tablets using the three solvent systems forms one
elongated cluster with two further groups consisting of methylamphetamine synthesized
from precursor extracted from Panadol and Allerpid tablets.
Sample discrimination according to geographical region was best illustrated using
nitrogen isotopic values particularly when plotted against hydrogen values. Carbon and
hydrogen isotopic values were more successful at discriminating samples by synthetic
route and clear distinctions could be made. IRMS was not capable of discriminating
methylamphetamine samples according to the extraction solvent used to prepare the
precursor chemical eventhough this was possible for the precursors themselves.

266
7.5 References
1. Kurashima, N.; Makino, Y.; Sekita, S.; Uranob, Y.; Naganao, T., Determination of
Origin of Ephedrine Used as Precursor for Illicit Methamphetamine by Carbon and
Nitrogen Stable Isotope Ratio Analysis. Analytical Chemistry 2004, 76(14), 4233-
4236.
2. Kurashima, N.; Makino, Y.; Urano, Y.; Sanuki, K.; Ikehara, Y.; Nagano, T., Use
of stable isotope ratios for profiling of industrial ephedrine samples: Application
of hydrogen isotope ratios in combination with carbon and nitrogen. Forensic
Science Intenational 2009, 189, 14-18.
3. Speight, G.J., Lange’s Handbook in Chemistry. 70th
Edition; McGraw-Hill, 2005.
4. Meier-Augenstein, W., Stable Isotope Forensics: An Introduction to the Forensic
Application of Stable Isotope Analysis. First edition; Wiley-Blackwell, 2010.
5. Carter, J.F.; Hill, J.C.; Doyle, S.; Lock, C., Results of four inter-laboratory
comparisons provided by the Forensic Isotope Ratio Mass Spectrometry (FIRMS)
network. Science and Justice 2009, 49, 127-137.
6. Benson, S.J.; Lennard, C.J.; Maynard, P.; Hill, D.M.; Andrew, A.S.; Roux, C.,
Forensic Analysis of explosives using isotope ratio mass spectrometry (IRMS)-
preliminary study on TATP and PETN. Science and Justice 2009, 49, 73-80.
7. Skinner, H.F.,Methamphetamine Synthesis via HI/Red Phosphorous Reduction Of
Ephedrine. Forensic Science International 1990,48,128-134.
8. Andrews, K.M., Ephedra’s Role as a precursor in the Clandestine Manufacture of
Methamphetamine. Journal of Forensic Sciences 1995, 40(4), 551-560.
9. David, G.E.; Brynn, H.D.; Frew,F.D.; Hayman, R.A., Significant Determinants of
Isotope Composition during HI/Pred synthesis of Methamphetamine. Australian
Journal of Chemistry 2010, 63, 22-29.
10. Carter, J.F.; Titterton, E.L.; Grant, H.; Sleeman, R., Isotopic changes during the
synthesis of amphetamines. Chemical Communications 2002, (21) 2590-2591.
11. Carter, J.F.; Titterton, E.L.; Murray, M.; Sleeman, R., Isotopic characterization of
3,4-methylenedioxyamphetamine and 3,4-methylenedioxymethylamphetamine
(ecstasy). Analyst 2002, 127, 830-833.

267
12. Buchanan, H.A.S.; Nic Daeid, N.; Augenstein, W.M.; Kemp, H.F.; Kerr, W.J.;
Middletich, M., Emerging Use of Isotope Ratio Mass Spectrometry as a Tool for
Discrimination of 3,4-Methylenedioxymethamphetamine by Synthetic Route.
Analytical Chemistry 2008, 80(9), 3350-3356.
13. Collins,M.; Cawley,A.T.; Heagney,A.C.; Kissane,L.; Robertson,J.; Salouros,H.,
δ13
C, δ15
N and δ2H isotope ratio mass spectrometry of ephedrine and
pseudoephedrine:application to methylamphetamine profiling. Rapid
Communications in Mass Spectrometry 2009, 23, 2003-2010.
14. David,G.E.; Coxon,A.; Frew,D.R.; Hayman,R.A., Isotope fractionation during
precipitation of methamphetamine HCl and discrimination of seized forensic
samples. Forensic Science International, 2010, 200,123-129.
15. Albouy, D.; Moghadam, G.E.; Vinatoru, M.; Koeni, M., Regenerative role of the
red phosphorus in the couple ’HI aq/P red.Journal of Organometallic Chemistry,
1997, 529, 295-299.
16. Uncle Fester, Secrets of Methamphetamine Manufacture. Vol.9th
Edition,
Loompanics Unlimited: Port Townsend, Washington, 2009.
17. Hilary Buchanan. PhD thesis. University of Strathclyde 2009.pp 140-204.
18. Armelin,S.;Brenna,E.;Frigoli,S.; Fronza, G.; Fuganti, C.; Mussida, D.,
Determination of the synthetic origin of methamphetamine samples by 2H NMR
spectroscopy. Analytical Chemistry 2006, 78, 3113.
19. Matsumoto, T.; Urano, Y.; Makino, Y.; Kikura-Hanajiri, R.; Kawahara, N.; Goda,
Y.; Nagano, T., Evaluation of characteristics deuterium distribution of ephedrine
and methamphetamine by NMR spectroscopy for drug profiling. Analytical
Chemistry 2008, 80, 1176.
20. Iwata, Y.T.; Kuwayama, K.; Tsujikawa, K.; Miyaguchi, H.; Kanamori, T.; Inoue,
H., Evaluation method of linking methamphetamine seizures using stable carbon
and nitrogen isotopic compositions: a complementary study with impurity
profiling. Rapid Communication Mass Spectrometry 2008, 22, 3816.
21. Gabrielle David. PhD thesis. University of Otago 2008. p 314.

268
Chapter 8 Chemometric analysis
8.1 Introduction
PCA and HCA are the two most conventional pattern recognition techniques applied in
the analysis of data of forensic science interest whilst SOFM, which is based on an
artificial neural network (ANN) learning scheme is relatively new in its application to
forensic science problems [1, 2, 3]. SOFM has, however been successfully applied in the
data derived from the analysis of wax based products, ink dyes and ignitable liquids for
articulating and displaying elusive clusters within datasets where PCA and HCA had
failed to do so [1, 2, 3].
This part of the research provides insight to the application of unsupervised pattern
recognition techniques for data derived from the analysis of the various
methylamphetamine samples prepared. Given the way in which the synthesized samples
were produced, discrimination could occur on a number of levels, (a) by starting
material (laboratory grade materials, Sudafed decongestant tablets, Allerpid or Panadol
tablets) (b) by extracting solvent/method (c) by synthetic route or (d) by a combination
of starting material, extraction solvent and synthetic route (referred to as ‘lab output’).
The data generated from each of the analytical techniques, were subjected to
unsupervised pattern recognition analysis using hierarchical cluster analysis (HCA),
principal component analysis (PCA) and self organising feature maps (SOFM). This
facilitated the identification of clusters that could be used to objectively interpret the
respective data sets. The data derived from the three analytical techniques were either
analysed on their own or combined with one another. The GCMS data was also pre-
processing where the peak areas of the target impurities were normalised to either the
internal standard or the sum of the total peak area [4]. The square, fourth and sixteenth
root data pre-treatment methods were also investigated using HCA, PCA and SOFM
analysis. The summary of the datasets used in the multivariate and SOFM analysis are
presented in Table 8.1 and Table 8.2.

269
Table 8.1. List of datasets used in multivariate and chemometric analysis (HCA, PCA and SOFM).
No Sample class Data description Data pre-processing
1 ML GCMS data
(methylamphetamine synthesised
via Moscow route using laboratory
grade materials
Target impurities
identified in this study
with acceptable RSD
values
Raw data
Normalised to total peak area
(TPA), square root
Normalised to total peak area
(TPA), fourth root
Normalised to total peak area
(TPA), sixteenth root
2 ME GCMS data
(methylamphetamine synthesised
via Moscow route using precursors
extracted from proprietary cold med
using ethanol as the extraction
solvent)
Target impurities
identified in this study
with acceptable RSD
values
Raw data
Normalised to total peak area
(TPA), square root
Normalised to total peak area
(TPA), fourth root
Normalised to total peak area
(TPA), sixteenth root
3 MDA GCMS data
(methylamphetamine synthesised
via Moscow route using precursors
extracted from proprietary cold med
using ethanol/methanol (10:90 %
vol/vol) as the extraction solvent)
Target impurities
identified in this study
with acceptable RSD
values
Raw data
Normalised to total peak area
(TPA), square root
Normalised to total peak area
(TPA), fourth root
Normalised to total peak area
(TPA), sixteenth root
4 MMS GCMS data
(methylamphetamine synthesised
via Moscow route using precursors
extracted from proprietary cold med
using commercial methylated spirit
as the extraction solvent)
Target impurities
identified in this study
with acceptable RSD
values
Raw data
Normalised to total peak area
(TPA), square root
Normalised to total peak area
(TPA), fourth root
Normalised to total peak area
(TPA), sixteenth root
5 HL GCMS data
(methylamphetamine synthesised
via Hypo route using laboratory
grade materials
Target impurities
identified in this study
with acceptable RSD
values
Raw data
Normalised to total peak area
(TPA), square root
Normalised to total peak area
(TPA), fourth root
Normalised to total peak area
(TPA), sixteenth root
6 HE GCMS data
(methylamphetamine synthesised
via Hypo route using precursors
extracted from proprietary cold med
using ethanol as the extraction
solvent)
Target impurities
identified in this study
with acceptable RSD
values
Raw data
Normalised to total peak area
(TPA), square root
Normalised to total peak area
(TPA), fourth root
Normalised to total peak area
(TPA), sixteenth root

270
Table 8.2. List of datasets used in multivariate and chemometric analysis (HCA, PCA and SOFM)
continued.
No Sample class Data description Data pre-processing
7 HDA GCMS data
(methylamphetamine synthesised
via Hypo route using precursors
extracted from proprietary cold med
using ethanol/methanol (10:90 %
vol/vol) as the extraction solvent)
Target impurities
identified in this study
with acceptable RSD
values
Raw data
Normalised to total peak area
(TPA), square root
Normalised to total peak area
(TPA), fourth root
Normalised to total peak area
(TPA), sixteenth root
8 HMS GCMS data
(methylamphetamine synthesised
via Hypo route using precursors
extracted from proprietary cold med
using commercial methylated spirit
as the extraction solvent)
Target impurities
identified in this study
with acceptable RSD
values
Raw data
Normalised to total peak area
(TPA), square root
Normalised to total peak area
(TPA), fourth root
Normalised to total peak area
(TPA), sixteenth root
9 Isotopic values of batches of
methylamphetamine via Moscow
and Hypo routes using laboratory
grade precursors and precursors
extracted from proprietary cold
medication using IRMS analysis
δC13
, δN15
, δH2
isotopic values
Raw data
10 Elemental values of batches of
methylamphetamine via Moscow
and Hypo routes using laboratory
grade precursors and precursors
extracted from proprietary cold
medication
Elemental
concentration in ppm
and ppb Raw data
11 Combination of GCMS, IRMS and
ICPMS analysis batches of
methylamphetamine via Moscow
and Hypo routes using laboratory
grade precursors and precursors
extracted from proprietary cold
medication
Target impurities in
this study with
acceptable RSD
values, isotopic and
elemental values
Raw data for the ICPMS and
IRMS. Normalised to total
peak area (TPA) and treated
with fourth root for GCMS
data for HCA and PCA
analysis
Raw data for the ICPMS and
IRMS. Normalised to total
peak area (TPA) and treated
with sixteenth root for GCMS
data for SOFM analysis

271
8.2 Hierarchical Cluster Analysis (HCA)
Hierarchical Cluster Analysis (HCA) is an unsupervised pattern recognition technique in
which a set of data is clustered to produce a dendogram, or a graphical representation of
the similarities between the elements in the data set [5, 6]. Dendograms are similar to
tree diagrams in that individual elements or clusters are linked to other elements and
clusters until finally, all the elements are linked together [5, 6]. Dendograms can be
either agglomerative or divisive [5, 6, 7]. The agglomerative method is more popular
and involves examination of the data points in a sequential way until the entire data set
is linked together. The divisive method begins with one large group and breaks this
down until only clusters consisting of one element remain [5, 6, 7]. A number of
methods also exist for determining how clusters should be combined, such as single,
complete, group-average, centroid, median and Ward clustering [5, 6, 7]. Two common
linkages are the nearest neighbour (single linkage) and furthest neighbour (complete
linkage) methods [5, 6, 7]. For the nearest neighbour linkage (simplest procedure) the
distance between the two clusters is defined as the smallest distance between the two
elements, one from each cluster, shown in figure 8.1 [5, 6, 7]. The disadvantage of this
particular linkage is ‘space contracting’ or ‘chaining’ [5, 6, 7], which in turn will result
in poorly separated clusters [5, 6, 7].
Figure 8.1. Distance, d, between clusters A and B as defined by the nearest neighbour method [5,6].
d
Cluster A
Cluster B

272
As implied by the name, the furthest neighbour clustering method is the opposite of
nearest neighbour. With this method, the distance between the two clusters is defined by
the greatest distance between two objects, one from each cluster [5, 6,]. Figure 8.2
illustrates this concept. The furthest neighbour method can have result in ‘space dilating’
creating many small clusters and is the opposite of space contracting effect [5, 6].
Figure 8.2. Distance, d, between clusters A and B as defined by the furthest neighbour method [5,6].
A method of measuring the distance between clusters must also be selected for
hierarchical cluster analysis. Two options to measure the interval are a simple Euclidean
distance, in which the straight line distance between the two points is calculated and the
squared Euclidean distance, which is the same distance but squared[5,6,7]. Equation 8.1
presents the relationship used for the Euclidean.
Cluster B
Cluster A
d
Equation 8.1 [7]

273
8.2.1 HCA experimental
HCA was performed using Minitab (version 15) on the data sets mentioned previously in
table 8.1. Euclidean distance measurements using single, average and complete linkage
strategies were used to reveal the best clustering regime which in each case was using
complete linkage with Euclidian distance as the measurement.
8.2.2 HCA results and discussion
8.2.2.1 GCMS data
The dendrogram generated from HCA analysis of the raw GCMS data of the target
impurities is presented in Figure 8.3 and illustrate some correct linkages for batches of
samples (HMS, MMS and HDA) but many misclassifications.
HD
A34
HD
A36
HD
A33
HD
A32
HD
A35
HD
A31
HL4
5H
L47
HL4
3H
L46
HL4
8M
L23
HL4
4M
L22
MD
A12
MD
A9
MD
A8
MD
A7
MD
A11
MD
A10
ML2
4M
L21
HE28
HE27
HE25
ME6
MM
S15
MM
S18
MM
S17
MM
S14
MM
S16
MM
S13
HM
S40
HM
S39
HM
S42
HM
S41
HM
S38
HM
S37
HE30
HE29
HE26
ME5
ML2
0M
L19
ME3
ME4
ME2
ME1
0.00
33.33
66.67
100.00
Observations
Sim
ilari
ty
Dendrogram GCMS Raw AllComplete Linkage, Euclidean Distance
Figure 8.3. Hierarchical clustering of chromatographic profiles of batches of methylamphetamine
synthesised via the Hypo and Moscow routes using raw GCMS data. The sample codes provided in
Table 8.1 identify each sample type and the numbers refer to a particular synthetic batch number.

274
Dendrograms derived from row scaled GCMS data (normalised to total peak area) and
pre processed using the square root, fourth root and sixteenth root power transformations
of the target impurities identified are presented in Figure 8.4, Figure 8.5 and Figure 8.6
respectively. HCA progressively improved in its ability to classify the batches of
samples together depending on extraction solvent and all batches were successfully
grouped with fourth and sixteenth root pre processing. However the samples could not
be successfully grouped by synthetic route (that is Moscow synthesised samples were
grouped more readily with Hypo synthesised samples in some cases) irrespective of the
level of pre processing.
HL4
6H
L48
HL4
4H
L47
HL4
5H
L43
ML2
2M
L24
ML2
1M
L20
ML1
9M
DA
9M
DA
12M
DA
8M
DA
10M
DA
11M
DA
7H
MS39
HM
S41
HM
S40
HM
S38
HM
S42
HM
S37
HE28
HE27
HE30
HE29
HE26
HE25
MM
S16
MM
S17
MM
S15
MM
S14
MM
S18
MM
S13
HD
A34
HD
A36
HD
A33
HD
A32
HD
A35
HD
A31
ML2
3M
E6
ME5
ME4
ME3
ME2
ME1
0.00
33.33
66.67
100.00
Observations
Sim
ilari
ty
Dendrogram GCMS SQRT AllComplete Linkage, Euclidean Distance
Figure 8.4. Hierarchical clustering of chromatographic profiles of batches of methylamphetamine
synthesised via the Hypo and Moscow routes using row scaled GCMS data pre processed using the
square root. The sample codes provided in Table 8.1 identify each sample type and the numbers
refer to a particular synthetic batch number.

275
HL4
4H
L48
HL4
6H
L47
HL4
5H
L43
ML2
3M
L21
ML2
4M
L22
ML2
0M
L19
HE27
HE26
HE30
HE29
HE28
HE25
HM
S40
HM
S39
HM
S42
HM
S41
HM
S38
HM
S37
MM
S17
MM
S16
MM
S15
MM
S14
MM
S18
MM
S13
MD
A9
MD
A10
MD
A12
MD
A8
MD
A11
MD
A7
HD
A34
HD
A36
HD
A33
HD
A32
HD
A35
HD
A31
ME6
ME5
ME4
ME3
ME2
ME1
0.00
33.33
66.67
100.00
Observations
Sim
ilari
ty
Dendrogram GCMS FQRT AllComplete Linkage, Euclidean Distance
Figure 8.5. Hierarchical clustering of chromatographic profiles of batches of methylamphetamine
synthesised via the Hypo and Moscow routes using row scaled GCMS data pre processed using the
fourth root. The sample codes provided in table 8.1 identify each sample type and the numbers refer
to a particular synthetic batch number. All samples were correctly grouped depending on extracting
solvent.

276
MM
S17
MM
S14
MM
S16
MM
S15
MM
S18
MM
S13
MD
A9
MD
A10
MD
A12
MD
A8
MD
A11
MD
A7
HL4
7H
L46
HL4
5H
L44
HL4
8H
L43
ML2
3M
L21
ML2
4M
L22
ML2
0M
L19
HM
S42
HM
S41
HM
S40
HM
S39
HM
S38
HM
S37
HE29
HE26
HE27
HE30
HE28
HE25
HD
A36
HD
A33
HD
A34
HD
A32
HD
A35
HD
A31
ME3
ME6
ME5
ME4
ME2
ME1
0.00
33.33
66.67
100.00
Observations
Sim
ilari
ty
Dendrogram GCMS SXRT AllComplete Linkage, Euclidean Distance
Figure 8.6. Hierarchical clustering of chromatographic profiles of batches of methylamphetamine
synthesised via the Hypo and Moscow routes using row scaled GCMS data pre processed using the
sixteenth root. The sample codes provided in table 8.1 identify each sample type and the numbers
refer to a particular synthetic batch number. All samples were correctly grouped depending on
extracting solvent.
The fourth and sixteenth root pre processed data provided discrimination between the
methylamphetamine prepared from the laboratory grade chemicals (however both
synthetic routes were linked together) and the extracted precursor products.
8.2.2.2 IRMS data
IRMS data for the six repetitive samples of each synthetic batch were averaged and
subjected to HCA. The resultant dendrogram is presented in Figure 8.7.

277
MMSMDAMEMLHMSHDAHEHL
0.00
33.33
66.67
100.00
Observations
Sim
ilari
ty
Dendrogram IRMSComplete Linkage, Euclidean Distance
Figure 8.7. Hierarchical clustering of batches of methylamphetamine synthesised via the Hypo and
Moscow routes using C, N and H isotopic ratios. The sample codes provided in table 8.1 identify
each sample type and the numbers refer to a particular synthetic batch number.
In each case the samples were readily separated by the solvent used to extract the
precursor chemical. All of the Moscow samples were linked together irrespective of
precursor, while the Hypo samples prepared from the laboratory precursor were split
away from all other samples.
8.2.2.3 ICPMS analysis
The ICPMS data for the six repetitive samples of each synthetic batch were averaged
and subjected to HCA and the resultant dendrogram is presented in Figure 8.8.

278
MMSMDAMEMLHDAHEHMSHL
0.00
33.33
66.67
100.00
Observations
Sim
ilari
ty
Dendrogram ICPMSComplete Linkage, Euclidean Distance
Figure 8.8. Hierarchical clustering of batches of methylamphetamine synthesised via the Hypo and
Moscow routes using ICPMS data. The sample codes provided in table 8.1 identify each sample type
and the numbers refer to a particular synthetic batch number.
As with the IRMS data, the samples were readily separated by the solvent used to extract
the precursor chemical. The laboratory prepared samples were successfully separated
from each other by route. All of the Moscow samples were linked together by route
whilst the Hypo samples were split into two separate groups where similarities were
suggested between the samples prepared from the laboratory precursor and the precursor
extracted by commercial methylated spirits.
8.2.2.4 Combination of IRMS and ICPMS data
A combination ICPMS and IRMS datasets produced a dendrogram shown in Figure 8.9
which was essentially the same as that for ICPMS suggesting that the data derived from
this technique dominated and little added value was obtained from combining the IRMS
and ICPMS results.

279
MMSMDAMEMLHDAHEHMSHL
0.00
33.33
66.67
100.00
Observations
Sim
ilari
ty
Dendrogram ICPIRMSComplete Linkage, Euclidean Distance
Figure 8.9. Hierarchical clustering of batches of methylamphetamine synthesised via the Hypo and
Moscow routes using ICPMS and IRMS data. The sample codes provided in table 8.1 identify each
sample type and the numbers refer to a particular synthetic batch number.
8.2.2.5 Combination of GCMS, ICPMS and IRMS data
A combination of each of the best performing data sets (GCMS using row scaled fourth
root pre processed data, ICPMS and IRMS) produced a dendrogram presented in Figure
8.10 which demonstrated discrimination of all samples by precursor but did not provide
any significant route discrimination.

280
HDAHEMMSMDMEMLHMSHL
0.00
33.33
66.67
100.00
Observations
Sim
ilari
ty
Dendrogram GCICPIRMSComplete Linkage, Euclidean Distance
Figure 8.10. Hierarchical clustering of batches of methylamphetamine synthesised via the Hypo and
Moscow routes using the combined GCMS (row scaled and fourth root pre processed) ICPMS and
IRMS data. The sample codes provided in table 8.1 identify each sample type and the numbers refer
to a particular synthetic batch number.
8.2.3 HCA conclusions
HCA analysis of the various batches of methylamphetamine samples proved successful
in discriminating the samples by precursor when using any of the normalised and pre
treated GCMS data (above the square root) or either the IRMS and ICPMS data sets
alone or in combination. No complete route discrimination was possible using any of the
data sets although the ICPMS and IRMS did provide some linkages between Moscow
prepared samples.

281
8.3 Principal Component Analysis (PCA)
Principal component analysis (PCA), changes the dimensionality of data by the
combination, or transformation, of the original variables into new variables, each of
which accounts for more variance than the corresponding original variables [8, 9, 10].
PCA seeks to find linear combinations of the original variables, each weighted
appropriately, such that the greatest degree of variance is explained by the fewest
number of new variables, or principal components (PCs) [8, 9, 10]. Once the first PC is
found, a second linear combination is sought to explain the remaining variance. Each
principal component is constructed so that it is orthogonal (or uncorrelated) with others.
When multivariate data sets contain more than two or three variables, graphical
representation of the data becomes complicated, thus rendering the identification of
similarities and differences between samples difficult. If two or three PCs can be
identified which account for the majority of the variation in the data set, then graphical
representation is simplified and it may be possible to visually identify clusters among the
samples [11, 12, 13]. The first PC is defined by equation 8.2:
Where:
α1X represents the weights or loadings for each of the original variables (X1 to Xp) in PC1.
Large absolute values of these loadings indicate a strong contribution of the
corresponding original variable, and loadings near zero indicate a weak contribution
[11, 12]. PC’s may be created until 100% of the variance in the data is explained
however, it is common to select a subset of the PC’s such that the dimensionality of the
original data set is reduced while very little information is lost overall [11, 12, 13].
Normal practise dictates accepting those PC’s which cumulatively account for 80-90%
for the overall variance of the data [11, 12, 13]. The PC ‘scores’ are the elements of the
new variables (PC1, PC2, etc) which are derived from the loadings and the original
Equation 8.2

282
variables and represent the projection of the original data points onto the new axes
[11, 12, 13].
The interpretability of PC’s can be improved through rotation. Rotation maximizes the
loading of each variable on one of the extracted PC whilst minimizing the loading on all
other PC’s and works through changing the absolute values of the variables whilst
keeping their differential values constant [11, 12, 13]. There are two methods of rotation,
orthogonal and oblique rotation. Orthogonal rotation assumes that the factors are at right
angles to each other usually described as uncorrelated [12, 13]. For example, if factor
loadings are plotted on a two dimensional axes, the variables that load on one factor
would lie along one axis, the variables that load on the other factor would lie along the
other [12, 13]. Oblique rotations relaxes the assumption that factors must be orthogonal.
In this method one set of variables may lie along the axis while the other may lie along a
45 degree angle to the axes [12, 13].
8.3.1 PCA experimental
PCA was performed using Minitab software (version 15) on the data sets described at
the beginning of the chapter. The first two principal components (PCs) of each analysis
were extracted and plotted to assess which data sets, if any, afforded any discrimination
of the samples. The data sets which facilitated clustering of the samples using a plot of
the first two PCs were than examined further to identity the variables which loaded most
highly on PC1 and PC2. The variable loadings are a measure of the correlation between
the variable and the principal component, and strength of this relationship is indicated by
the magnitude of the loading (either positive or negative), where -1 indicates maximum
negative correlation and + 1 indicates maximum positive correlation.

283
8.3.2 PCA results and discussion
8.3.2.1 GCMS data
PCA is highly susceptible to variations in the magnitude of variables and the data
generally needs to be pre processed in order that the PC’s provide meaningful data. As
such it was unsurprising that convoluted data clusters were obtained when the raw
GCMS data was examined and these results are presented in Figure 8.11.
Notwithstanding this, clustering of the Moscow synthesised methylamphetamine from
pseudoephedrine extracted from Sudafed using ethanol:methanol (90:10 % vol/vol) and
the Hypo and Moscow samples produced from pseudoephedrine extracted from Sudafed
using commercial methylated spirits was observed. Furthermore, the data appears to be
conditioned on PC1according to the methanol content of the extracting solvent with non
methanol containing solvent having negative PC1 values and methanol containing
solvents having progressively more positive PC1 values.
12.510.07.55.02.50.0-2.5-5.0
4
2
0
-2
-4
-6
-8
First Component
Seco
nd C
ompo
nent
HL48HL47
HL46HL45HL44
HL43
HMS42
HMS41
HMS40
HMS39HMS38
HMS37
HDA36HDA35
HDA34
HDA33HDA32HDA31HE30
HE29HE28HE27HE26HE25
ML24
ML23
ML22ML21
ML20
ML19
MMS18
MMS17
MMS16
MMS15MMS14
MMS13
MDA12MDA11MDA10MDA9
MDA8MDA7
ME6
ME5ME4
ME3ME2ME1
GCMS Raw All
Figure 8.11. Score plots of chromatographic profiles of batches of methylamphetamine synthesised
via the Hypo and Moscow routes. The sample codes provided in table 8.1 identify each sample type
and the numbers refer to a particular synthetic batch number.

284
The score plots for the principal components generated from the dataset for the row
scaled pre processed data are presented in Figure 8.12 (square root transformation),
Figure 8.13 (fourth root transformation) and Figure 8.14 (sixteenth root transformation).
While each dataset provides some deconvolution of the samples, in no case are all of the
samples discriminated according to either their precursors (laboratory grade or
extracting solvent) or synthetic route. The same general trend was noted with the
samples which involved precursor extraction with methanol containing solvents tending
to be discriminated better by PC1, this is particularly the case for the fourth and
sixteenth root transformed data.
10.07.55.02.50.0-2.5-5.0
5.0
2.5
0.0
-2.5
-5.0
First Component
Se
con
d C
om
po
ne
nt
HL48
HL47
HL46
HL45HL44
HL43
HMS42HMS41 HMS40HMS39HMS38HMS37
HDA36HDA35
HDA34
HDA33
HDA32
HDA31
HE30HE29HE28
HE27
HE26
HE25
ML24
ML23
ML22ML21
ML20
ML19
MMS18MMS17MMS16MMS15
MMS14 MMS13
MDA12
MDA11MDA10
MDA9
MDA8MDA7
ME6ME5ME4ME3
ME2ME1
GCMS SQRT All
Figure 8.12. Score plots of chromatographic profiles of batches of methylamphetamine synthesised
via the Hypo and Moscow routes using row scaled GCMS data pre processed using the square root.
The sample codes provided in table 8.1 identify each sample type and the numbers refer to a
particular synthetic batch number.

285
7.55.02.50.0-2.5-5.0
7.5
5.0
2.5
0.0
-2.5
-5.0
First Component
Seco
nd C
ompo
nent
HL48
HL47HL46HL45HL44
HL43
HMS42HMS41HMS40HMS39HMS38
HMS37HDA36HDA35HDA34HDA33HDA32HDA31HE30
HE29HE28
HE27HE26
HE25
ML24ML23
ML22ML21
ML20ML19
MMS18MMS17
MMS16MMS15MMS14MMS13
MDA12
MDA11MDA10
MDA9
MDA8MDA7
ME6
ME5ME4
ME3
ME2ME1
GCMS FQRT All
Figure 8.13. Score plots of chromatographic profiles of batches of methylamphetamine synthesised
via the Hypo and Moscow routes using row scaled GCMS data pre processed using the fourth root.
The sample codes provided in table 8.1 identify each sample type and the numbers refer to a
particular synthetic batch number.
7.55.02.50.0-2.5-5.0
5.0
2.5
0.0
-2.5
-5.0
First Component
Seco
nd C
ompo
nent
HL48HL47HL46HL45
HL44HL43
HMS42
HMS41HMS40HMS39HMS38HMS37HDA36
HDA35HDA34HDA33HDA32HDA31
HE30
HE29
HE28HE27
HE26
HE25
ML24
ML23
ML22
ML21ML20ML19
MMS18MMS17MMS16
MMS15
MMS14MMS13
MDA12MDA11MDA10
MDA9MDA8
MDA7
ME6
ME5ME4ME3ME2
ME1
GCMS SXRT All
Figure 8.14. Score plots of chromatographic profiles of batches of methylamphetamine synthesised
via the Hypo and Moscow routes using row scaled GCMS data pre processed using the sixteenth
root. The sample codes provided in table 8.1 identify each sample type and the numbers refer to a
particular synthetic batch number.

286
8.3.2.2 IRMS data
The PCA score plot shown in Figure 8.16 clearly illustrates that the batches of samples
are discriminated by both precursor and synthetic route.
3210-1
2.0
1.5
1.0
0.5
0.0
-0.5
-1.0
First Component
Seco
nd C
ompo
nent
MMS
MDA
ME
ML
HMS
HDA
HE
HL
Score Plot for IRMS
Figure 8.15. Score plot of batches of methylamphetamine synthesised via the Hypo and Moscow
routes using average C, N and H isotopic ratios. The sample codes provided in Table 8.1 identify
each sample type and the numbers refer to a particular synthetic batch number.
The products of the laboratory grade precursor have been influenced by both PC 1 and
PC2 providing a very clear separation between the two synthetic methods. The extracted
precursor samples demonstrate a more negative influence on PC 2 in comparison to the
laboratory grade precursors. Furthermore, all of the Hypo synthesised samples are more
heavily influenced by PC1 which has spread these samples to towards more positive
values of this PC. This provides a distinct delineation between the two synthetic routes
and provides a full ‘lab output’ discrimination of the samples.

287
8.3.2.3 ICPMS data
Similar to the IRMS data analysis, the PCA score plot shown in Figure 8.16 for the
elemental analysis by ICPMS presented as average results for each precursor type has
separated all of the samples by precursor. However the same trends are not observed in
relation to route specificity and while all of the Moscow synthesised samples have more
positive values of PC2 this is also the case for the lab precursor Hypo synthesised
samples thus affording no overall route specificity using the ICPMS data.
10.07.55.02.50.0-2.5-5.0
5.0
2.5
0.0
-2.5
-5.0
First Component
Se
con
d C
om
po
ne
nt
MMS
MDA
ME
ML
HMS
HDA
HE
HL
Score Plot for ICPMS
Figure 8.16. Score plot of batches of methylamphetamine synthesised via the Hypo and Moscow
routes using average elemental profiles. The sample codes provided in table 8.1 identify each sample
type and the numbers refer to a particular synthetic batch number.

288
8.3.2.4 Combination of IRMS and ICPMS data
The PCA score plot of the combined ICPMS and IRMS is shown in Figure 8.17. Little
difference is seen from the result presented by ICPMS data alone, again corroborating
the dominance of this technique over IRMS that was observed in HCA.
10.07.55.02.50.0-2.5-5.0
5.0
2.5
0.0
-2.5
-5.0
First Component
Se
con
d C
om
po
ne
nt
MMS
MDA
ME
ML
HMS
HDA
HE
HL
Score Plot for ICPIRMS
Figure 8.17. Score plot of batches of methylamphetamine synthesised via the Hypo and Moscow
routes using average elemental and isotopic profiles. The sample codes provided in table 8.1 identify
each sample type and the numbers refer to a particular synthetic batch number.
8.3.2.5 Combination of GCMS, IRMS and ICPMS data.
When the results of the row scaled and pre processed with fourth root transformation
GCMS data, IRMS and ICPMS data are combined all of the Hypo synthesised samples
show strong positive correlations with both PC 1 and 2 providing clear discrimination of
this group. The Moscow samples prepared using the precursor extracted from Sudafed
are less influenced by PC 1 and group together while the laboratory grade precursor is

289
clearly more heavily influenced by PC1 and is convincingly separated from the other
Moscow synthesised samples.
5.02.50.0-2.5-5.0-7.5
5.0
2.5
0.0
-2.5
-5.0
-7.5
-10.0
First Component
Se
con
d C
om
po
ne
nt
MMS
MD
ME
ML
HMS
HDA
HE
HL
Score Plot for GCICPIRMS
Figure 8.18. Score plots of batches of methylamphetamine synthesised via the Hypo and Moscow
routes using the combined GCMS (row scaled and pre processed with fourth root transformation)
ICPMS and IRMS data. The sample codes provided in table 8.1 identify each sample type and the
numbers refer to a particular synthetic batch number.
8.3.3 PCA conclusion
Only PCA analysis performed on IRMS data provided complete discrimination of the
samples based on both the precursor (including the extraction method) and synthetic
route. All other data produced either convoluted clusters of did not provide clear route
discrimination based on the PC’s presented.

290
8.4 Artificial Neural Networks
Artificial Neural Networks (ANN) is a powerful technique that mimics the basic
function of the human brain [14, 15, 16, 17, 18]. In their early stages, ANN’s were
developed thirty years ago using electrical circuits however, with the emergence of
computer technology, suitable functions and codes using computer programming
software such as Visual Basic, C++ and Pascal were developed [14]. ANN’s are used
widely in scientific disciplines such as engineering, business, ecology and medicine
although their application to forensic science has been much more recent [14].
There are two types of learning schemes are available for ANN’s classified as
supervised and unsupervised learning mechanisms. In supervised learning, both the
input and output signals are required in the learning process and the output signals act as
target outcomes. With unsupervised learning schemes only input signals are required in
the learning process [14]. An example of an ANN based on a supervised learning
scheme is the Multi Layer Perceptron (MLP) or back propagation network, and an
example of ANN based on an unsupervised learning scheme is the Self Organising
Feature Maps (SOFM) or Kohonen network [14].
8.5 Self Organising Feature Maps (SOFM)
The Self Organising Feature Maps (SOFM) neural network was first introduced by
Kohonen in 1982 [14, 18, 19, 20, 21] and represents perhaps the most popular
unsupervised pattern recognition ANN [14-20, 22-24] SOFM does not require a prior
knowledge of the output patterns and uses only the input patterns (vectors) to devise
variable (or class) membership [14]. In doing so, two basic assumptions are made, firstly
the membership of each variable is defined by the user and shares common features and
secondly, the network will be able to identify these common features across the range of
the input vectors [14, 15].

291
8.5.1 SOFM Algorithm
SOFM is arranged in a two-layer format consisting of an input and an output layer. The
input layer represents the ‘input neurons’ which are the variables from the dataset. The
output layer is described as a two-dimensional platform equipped with a number of map
units (neurons or pixels) for the input patterns to be mapped onto. The typical
architecture of SOFM is shown in the Figure 8.19 [14, 25, 26].
Figure 8.19. Two layer structure of SOFM neural network. Each input variable is connected to all
neurons on the platform. Adapted from [26].
The mapping process starts with initialisation of the model where each unit or node on
the output layer is given a random weighting. The next stage is the training or the
learning process. At this stage, input neurons are introduced to the network iteratively so
that all the neurons will be stimulated by the input vectors until the best matching unit
(BMU) is identified. The BMU is chosen based on the similarity of the output neurons to
the input neurons whereby similarities between the two are measured using Euclidean
distances [14, 20, 25, 26].
The weights of the BMU’s are corrected so that they become closer to the input neurons
in the next iteration of the algorithm. The neighbouring neurons of the BMU undergo
weight adjustment in proportion to their distance to the BMU such that the further they

292
are, the less the adjustment is made. As the iterative process continues, the SOFM
organises into a state whereby similar input neurons are mapped onto similar neurons on
the output layer [14, 20, 25, 26]. When the process ends, the output neuron is labelled
according to the input or object that has been mapped onto it to reveal if clustering has
emerged from the training [14, 25, 26]. The SOFM matrix is trained to correctly classify
the members of the chosen training set. Once trained, the ability of the specific SOFM
algorithm to correctly classify novel samples can be revealed and validated by using a
test set of known data [14, 20, 26].
8.5.2 SOFM Visualisation
The output layer or output map is a powerful means of visualising complex
multidimensional data using spatial arrangements and colour coding that presents
general clustering inherent within the dataset [20, 26]. Apart from the output map, there
are other multiple visualisation methods offered depending on the information acquired,
for example, various types of distance matrix maps, and two and three dimensional
projections of hit histograms [20, 26]. Multiple visualisation techniques allow the
analyst to view the results from a variety of perspectives increasing the interpretative
value of the data [20, 26]. Individual component maps (associated with each input
variable) can be particularly useful as they facilitate the examination of the
characteristics of the clusters and explore the association between the variables within
the dataset [20, 26].
8.5.3 Limitations of SOFM
SOFM is proposed as a mathematical technique which can complement HCA and PCA.
Despite its proven performance, the method is computationally complex and remains to
be universally accepted in the interpretation of forensic science data [25, 26]. A major
obstacle in the application of SOFM, is that it requires extra computation time as the
network learns and becomes optimised. Parameters such as the numbers of nodes and
the numbers of iterations in the learning process are carried out largely by trial and error

293
[26]. In some cases PCA and HCA can be used to condition data sets providing a
reduced variable set for subsequent SOFM analysis.
8.5.4 SOFM experimental
SOFM artificial neural network analysis was performed using ViscoveryRSOMine
(version 5.0.2, Viscovery Software GmbH). Dataset learning was carried out using the
optimum specification set by the software whereby the number of iterations (epochs) in
each case was 40 with 2000 maps units (neurons).
In order to test both the predictive nature of the SOFM approach as well as provide
reassurance that unknown samples would indeed cluster within their source group, cross
validation was performed where the overall dataset were split into two; a training and a
test set. The training set was used to model the data while the test set was used to test the
quality and predictive ability of the model. SOFM analysis was applied to the datasets of
the three different analytical techniques presented earlier in the chapter.
8.5.5 SOFM Results and Discussion
8.5.5.1 GCMS Data
The SOFM output maps of raw and row scaled pre processed GCMS data (using the
square, fourth and sixteenth root transformations respectively) are presented in Figure
8.20.
Analysis of the raw GCMS data resulted in some misclassification. All samples were
correctly classified by precursor for all row scaled and power transformed data however
none of the GCMS datasets correctly grouped all samples correctly by synthetic route.
The sixteenth root power transformation provided the best classification grouping
together all of the Moscow synthesised samples but the Hypo synthesised samples
remained split with the laboratory precursor samples being removed from the remaining
Hypo samples.

294
A B
B
C D
Figure 8.20. SOFM output maps of the GCMS data. A,B,C and D represent the maps of, raw data
row scaled and pre processed using the square root transformation, row scaled and pre processed
using the fourth root transformation, row scaled and pre processed using the sixteenth root
transformation. The sample codes provided in table 8.1 identify each sample type and the numbers
refer to a particular synthetic batch number.
HDA36 HDA31HE30
HE29 HMS42 HMS39
HDA35HMS40
HDA33 HE26
HMS37 HMS41
HMS38
HDA32
HDA34
HE28
HE27 HE25
ML23MMS14
MMS18
ME6
ME1 MMS13ML21
MMS15
MMS16
ML22 ME2
ML20 MMS17MDA9
ML24
ML19ME4 ME5 MDA11
MDA8HL43
HL47MDA7
HL46 ME3 MDA12HL44HL48
HL45 MDA10
HDA32 HE29 HE27
MMS14HDA34 HE25 MMS16
MMS15
HE30 HE28 MMS17HDA33
MMS13
HMS37 MMS18HDA31
HDA36 HE26
HMS38HDA35
HMS41HMS42
ME2ME6
ME4 HMS39
HMS40
ME1ME3
MDA11
ML23ME5
MDA10ML24
ML19 MDA7HL45
HL43MDA9
ML20HL44 MDA8
HL47ML21
ML22 HL48 HL46 MDA12
ML20 ML21
MMS13 MDA11 MDA12MDA7
ML23ML22 MDA8
MMS18 MDA10
ML19
MDA9ML24
MMS14
HL47MMS15 MMS16
HMS39HL44
HL48MMS17
HMS41HL46 HMS40
HMS37
HL43ME5
HMS38HMS42HL45
ME4
HE26 ME3HDA31 HDA35
HDA34
HE30 ME2
HE28 HDA33
ME1HE29 HDA32
HE25 HE27
ME6
HDA36
HMS39 HMS38
ME6
HDA33HDA34HMS40
HMS41 HDA35 HDA32HMS42 HMS37 HDA36
MMS14MMS17
HDA31HE25
HE29MMS15 HL48
HL45MMS16
HE27 HE28
MMS13 HL44HE30
HL46HL43
HE26
MMS18
MDA10
ML24 ME5
HL47
ML19
MDA12 ML22
MDA7ML20 ME1
MDA9 ML21
ME2MDA11 MDA8
ML23ME3 ME4

295
8.5.5.2 IRMS data
The SOFM output for the average values for the isotopic ratios of all the samples are
presented in Figure 8.21 and illustrate a clear and distinctive grouping of the batches of
methylamphetamine synthesised from the two routes using the precursors from the
various sources. Furthermore, the samples were discriminated by synthetic route with
the Hypo samples being placed predominantly to the left of the SOFM output map and
the Moscow samples on the right hand side of the map. The samples prepared from
laboratory grade precursors were placed side by side indicating a similarity between
these products and a distinction from the other samples while at the same time
maintaining their synthetic route distinction. The results also suggest that, even though
there have been some substantial isotopic changes during the precursor extraction and
synthetic process, the samples synthesised from the same route share sufficient features
to facilitate being clustered together.

296
Figure 8.21. SOFM output maps of the IRMS data. The sample codes provided in table 8.1 identify
each sample type and the numbers refer to a particular synthetic batch number.
8.5.5.3 ICPMS data
The SOFM output for the average values for the elemental profiles of all the samples are
presented in Figure 8.22 and these also illustrate a clear and distinctive grouping of the
batches of methylamphetamine synthesised from the two routes using the precursors
from the various sources. Again, the Hypo and Moscow samples have been separated.
The elemental profiles suggest a linkage both within route but also a connectivity across
routes through the nature of the precursors and the extraction solvents used. The output
map is much more symmetrical than that obtained for the IRMS data, with the
methylated spirit and ethanol:methanol (90:10 % vol/vol) samples placed next to each
other. In further contrast to the IRMS results, the methylamphetamine produced from
laboratory grade precursors are separated completely by the synthetic method.
HL MDA
ML
HMS
MMS HE
HDA ME

297
Figure 8.22. SOFM output maps of the ICPMS data. The sample codes provided in table 8.1 identify
each sample type and the numbers refer to a particular synthetic batch number.
8.5.5.4 Combination of IRMS and ICPMS data
The SOFM obtained from combining the two different datasets together is presented in
Figure 8.23. The SOFM map, again illustrate a clear and distinctive grouping of the
batches of methylamphetamine synthesised from the two routes using the precursors
from the various sources. The dominant trend observed in the ICPMS analysis is again
reflected in the combination of IRMS and ICPMS datasets where the
methylamphetamine produced from laboratory grade precursors are separated
completely by the synthetic method.
ML MDA
MMS
HMS ME
HE
HDA
HL

298
Figure 8.23. SOFM output maps of the ICPMS and IRMS data. The sample codes provided in table
8.1 identify each sample type and the numbers refer to a particular synthetic batch number
8.5.5.5 Combination of GCMS, IRMS and ICPMS data
The SOFM obtained from combining all three data sets together is presented in Figure
8.24. Again complete discrimination of the samples has been achieved by precursor and
synthetic method. The influence of the elemental and isotopic profiles appear to have
combined to produce a map with the laboratory grade precursors aligning and the
samples prepared from the precursor chemicals extracted with greater volumes of
methanol present within the extracting solvents being separated further from each other.
HDA HL
HE
ME HMS
MMS
ML MDA

299
Figure 8.24. SOFM output maps of the GCMS (row scaled and pre processed with sixteenth root
transformation)ICPMS and ICPMS data. The sample codes provided in table 8.1 identify each
sample type and the numbers refer to a particular synthetic batch number.
8.5.6 SOFM conclusion
SOFM accurately classified batches of methylamphetamine synthesised using two
different routes and each of the different source of precursor (laboratory grade and
precursors extracted from pharmaceutical products using different solvents). Both the
IRMS and ICPMS provided complete discrimination of the samples.
HMS HDA
ME
HE
MDA
ML
MMS
HL

300
8.6 Conclusion
The HCA had limited success in discriminating samples at ‘laboratory output’ level that
is by both precursor source and synthetic route. The HCA of IRMS and ICPMS data on
their own readily discriminated the samples by precursor but not by synthetic method
and even the combination of the various data sets did not present route specificity.
PCA analysis performed on samples had similar success as compared to HCA analysis
with the exception of PCA analysis performed on the IRMS dataset. In this case
complete laboratory output discrimination was achieved. PC loading suggested some
influence on the level of methanol present within the extracting solvent may be
contributing to the discrimination of samples at the precursor level.
The SOFM successfully discriminated the batches of methylamphetamine by laboratory
output using ICPMS, IRMS, the combination of these techniques with each other and
with the GCMS results.
The IRMS data set provided the best performance overall indicating full route and
precursor specificity using both PCA and the more sophisticated SOFM analysis. This is
a different result to that obtained in previous studies where GCMS data has been better
at discriminating between synthetic routes and has most likely arisen because of the
similarity in the organic impurity profiles of the Moscow and Hypophosphorous
samples.

301
8.7 References
1. Mat Desa, Wan.N.S.;Ismail, D.;Nic Daeid, N., Classfication and Source
Determination of Medium Petroleum Distillates by Chemometric and Artificial
Neural Networks: A Self Organizing Feature Approach. Analytical Chemistry
2011, 83(20), 7745-7754.
2. Mat Desa, Wan.N.S,;Nic Daeid, N.;Ismail, D.;Savage, K., Application of
Unsupervised Chemometric Analysis and Self-organizing Feature Map (SOFM)
for the Classification of Lighter Fuels. Analytical Chemistry 2010, 82(15), 6395-
6400.
3. Dzukiflee, I.;Nic Daeid, N.,Comparison of smears of wax based products using
Thin Layer Chromatography (TLC) and microspectrophotometric (MSP)
detection. Journal of Forensic Identification 2011, 61(2), 136-162.
4. Dujourdy, L.;Dufey, V.;Besacier, F.;Miano, N.; Marquis, R.; Lock,E.;Aalberg,
L.;Dieckmann, S.;Zreck, F.;Bozenko, J.S., Drug intelligence based on organic
impurities in illicit MA samples. Forensic Science International 2008, 177, 154-
161.
5. Massart, D.L.; Kaufman, L. The interpretation of Analytical Chemical Data by the
Use of Cluster Analysis. John Wiley & Sons: New York, 1983.
6. Everitt, B.S., Cluster Analysis, 3rd
ed.; Arnold (a member of the Hodder Headline
Group): London, 1993.
7. Software, I.O. Euclidean and Euclidean Squared. Available at:
http://www.improvedoutcomes.com/docs/WebsiteDocs/Clustering/ClusteringPara
meters/Euclidean_and_Euclidean_Squarred_Distance_Metrics.htm. Last accessed
on 07/05/12.
8. Adams, M.J., Chemometrics in Analytical Spectroscopy, 2nd
ed.; The Royal
Society of Chemistry: Melbourne, Australia, 2004.
9. Kline, P., An Easy Guide to Factor Analysis. Routledge: London, 1994.
10. Miller, J.N.; Miller, J.C., Statistic and Chemometrics for Analytical Chemistry. 4th
ed.;Pearson Education Limited: U.K., 2000.
11. Kunalan, V., PhD Thesis, Department of Pure and Applied Chemistry, University
of Strathclyde:Glasgow,2010, 291-307.

302
12. Gorsuch, R.L., Factor Analysis. W.B.Saunders Company: Philadephia ,1974.
13. Gardiner, W.P., Statistical Analysis Methods for Chemists: A Software-based
Approach. The Royal Society of Chemistry: Glasgow, Scotland, 1997.
14. Ismail, D., PhD Thesis Department of Pure and Applied Chemistry, University of
Strathclyde: Glasgow, 2010, 21-40.
15. Kingston, C., Neural Networks in Forensic Science. Journal of Forensic Sciences,
1992, 37(1):252-264.
16. Wasserman, P.D., Neural Computing Theory and Practice. 1989, New York: Von
Nostrand Reinhold.
17. Cartwright, H.M., Applications of Artificial Intelligence in chemistry. 1993,
Oxford: Oxford Science Publications.
18. Patterson, D.W., Artificial Neural Networks-Theory and Applications. 1996,
London: Prentice Hall.
19. Kustrin, S.A. and Beresford, R., Basic Concepts of Artificial Neural Network
(ANN) Modeling and its Application in Pharmaceutical Research. Journal of
Pharmaceutical and Biomedical Analysis, 2000, 22: 717-727.
20. Kohonen, T., Self Organising Maps. 1991,Berlin: Springer-Verlag.
21. Zupan, J., and Gasteiger, G., Neural Networks in Chemistry and Drug
Designs.1999, Weinheim: Wiley-VCH.
22. Zupan, J., Novic, M. And Ruisanchez, I., Kohonen and Counterpropagation
Artificial Neural Networks in Analytical Chemistry. Chemometrics and
Intelligence Laboratory Systems, 1997.37:1-23.
23. Hong, Y.S.T., Rosen, M.R. and Bhamidimarri, R., Analysis of Municipal
Wastewater Treatment Plant using a Neural Network-Based Pattern Analysis.
Water Research,2003.37:1608-1618.
24. Marini, F., Bucci, R., Magri, A.L. and Magri, A.D., Artificial Neural Networks in
Chemometrics: History, Examples and Prespectives. Microchemical Journal,
2008.88:178-185.
25. Mat Desa, W.N.S., PhD Thesis, Department of Pure and Applied Chemistry,
University of Strathclyde: Glasgow, 2012, 142-150.

303
26. Self Organising Feature Maps (Kohonen Maps); Available at:
http://www.codeproject.com/KB/recipes/sofm.aspx?msg=2142943. Accessed on
29/06/2012]

304
Chapter 9 Conclusions and Future Work
9.1 Research conclusions
Batches of methylamphetamine were synthesised using two popular synthetic routes
frequently employed by clandestine chemists. Both the Moscow and Hypophosphorous
routes are variations of the Nagai route utilising iodine and red phosphorous in the
synthetic phase. To mimic exact clandestine conditions, batches of pseudoephedrine HCl
were extracted from proprietary cold medication sourced from United Kingdom and
Malaysia. Three different solvent systems and acid-base extractions used extensively in
clandestine laboratories in the extraction of pseudoephedrine HCl were utilised.
Essential chemicals such as iodine and red phosphorous were extracted from tinctures
and matchboxes using clandestine literature methods.
In total 53 batches of methylamphetamine HCl were prepared from laboratory and
pharmaceutical grade pseudoephedrine HCl. These samples were analysed using GCMS,
IRMS and ICPMS. The data generated from the different techniques were assessed using
four different mathematical data processing methods (HCA, PCA, SOFM and Pearson
correlation analysis).
For the organic impurity profiling, impurities were extracted and analysed using GCMS.
For this study, extraction of impurities from the samples was performed using a single
basic extraction process using a basic buffer and was analysed using a HP-5MS column.
The impurity profiles generated were compared mathematically using Pearson
correlation coefficients calculated for each pair of samples. A list of target impurities
were generated from the chromatographic results and peak areas normalized and various
data pre-treatments assessed. The selected target impurities normalized and pretreated to
the fourth root provided complete discrimination of the samples allocating all samples to
their appropriate synthetic route and particular precursor extracting solvent.
IRMS has been used to identify geographic origin and synthetic pathways of illicit
drugs. The combination of carbon, nitrogen and hydrogen isotopic values discriminated

305
the samples into four groups according to routes and precursor origin. The hydrogen
isotopic values discriminated the methylamphetamine samples synthesised via the Hypo
and Moscow routes using laboratory grade precursors. Sample discrimination by
geographic origin or regio-specificity was best illustrated using nitrogen isotopic values
plotted against hydrogen isotopic values. Carbon and hydrogen isotopic values
discriminated the samples according to synthetic route.
This study has identified the potential applicability of the ICPMS analysis for
methylamphetamine profiling. Results obtained for ICPMS identified the possibility of
comparison and discrimination between batches of precursor produced via different
extracting solvents and subsequent methylamphetamine produced for each route.
Elemental variation was observed for the methylamphetamine samples synthesised from
precursors extracted from proprietary cold medication compared to the
methylamphetamine synthesised from laboratory grade chemicals.
HCA, PCA and SOFM were used in the discrimination of the GCMS, IRMS and ICPMS
datasets. SOFM proved to be the best chemometric technique compared to the HCA and
PCA and successfully discriminated the batches of methylamphetamine by laboratory
output using ICPMS, IRMS, the combination of these techniques with each other and
with the GCMS results.
HCA had limited success in discriminating samples by both precursor and synthetic
route however the samples were readily discriminated by precursor but not by synthetic
route. PCA analysis produced similar results to the HCA analysis.

306
9.2 Recommendations of Future Work
Future work on methylamphetamine profiling could proceed in a number of areas.
Firstly, repetitive synthesis methylamphetamine via other synthetic routes should be
carried on precursors (pseudoephedrine) extracted from cold medication using the three
solvent systems. Further studies based on precursor sources from different regions such
as the United States, Australia and Asia would be most useful to explore geographical
origins, particularly in relation to IRMS analysis.
Besides using pseudoephedrine extracted from cold medication it is also possible to
extract the precursor from the Ephedra plant. The repetitive synthesis of
methylamphetamine using the precursors extracted from the Ephedra plant would be a
useful addition to the research literature. The effect of a natural precursor source rather
than a synthetic or semi-synthetic source would be of significant interest.
The batches of methylamphetamine synthesized in this study were from precursors
sourced from cold medication and extracted using three different solvent systems and
dried at room temperature. Isotopic variations were observed from drying experiments
undertaken of the precursors. Further studies investigating the effect of drying on the
isotopic variations would be advantageous. An extension of this work could also explore
the effect of different batches and grades of precursor extracting solvent.

307
Appendix A
H NMR Spectra: Methylamphetamine HCl synthesised via the Moscow route using laboratory grade materials

308
Appendix B
FTIR Spectra: Methylamphetamine HCl synthesised via the Moscow route using laboratory grade materials

309
Appendix C
H NMR Spectra: Methylamphetamine HCl synthesised via the Hypo route using laboratory grade materials

310
Appendix D
FTIR Spectra: Methylamphetamine HCl synthesised via the Hypo route using laboratory grade materials

311
Appendix E
Structures of impurities identified in this study using HP5-MS column
N-acetylmethamphetamine
N-Benzoylmethamphetamine
- N-Benzoylamphetamine
Phenyl-2-Propanone
1,2-dimethyl-3-phenylaziridine
Dimethylamphetamine(DMA)
N-methyl-N(α-
methylphenethyl)-3-
phenylpropenamide
N-formylmethamphetamine

312
N-β-
(phenylisopropyl)benzylmethylketimine
Ethyl-methamphetamine
N-methyl-1-{4-[2-
(methylamino)propyl]phenyl}-1-
phenylpropa-2-amine
N, N’ –dimethyl-3,4-
diphenylhexane-2,5-diamine
N-Benzoylmethamphetamine N,N,di β-phenylisopropylformamide
3,4-Diphenyl-3-buten-2-
one
N-
acetylmethamphetamine

313
N-methyl-N-(α-
methylphenethyl)amino-1-
phenyl-2-propane
1-benzyl-3-methyl-naphthalene