Cell surface hydrophobicity (CSH) of Escherichia coli, Staphylococcus aureus...
11
Journal of American Science 2010;6(7) http://www.americanscience.org [email protected] 78 Cell surface hydrophobicity (CSH) of Escherichia coli, Staphylococcus aureus and Aspergillus niger and the biodegradation of Diethyl Phthalate (DEP) via Microcalorimetry. Alhaji Brima Gogra a,d , Jun Yao a, *, Edward H. Sandy a , ShiXue Zheng b , Gyula Zaray c , Bashiru M. Koroma d , Zheng Hui b a State Key Laboratory of Biogeology and Environmental Geology of Chinese Ministry of Education, School of Environmental Studies and SinoHungarian Joint Laboratory of Environmental Science and Health, China University of Geosciences, 430074 Wuhan, PR China. b State key Laboratory of Agricultural Microbiology, College of Life Science and Technology, Huazhong Agricultural University, 430070 Wuhan, PR China. c Department of Chemical Technology and Environmental Chemistry, Eötvös University, H1518 Budapest, P.O. Box 32, Hungary. d Department of Chemistry, School of Environmental Sciences, Njala University, Sierra Leone. * Corresponding author. Email address: [email protected] (J. Yao) or [email protected] (A. B. Gogra) Abstract: This work was focused on investigating the occurrence of cell surface hydrophobic (CSH) character among diethyl phthalate (DEP)degrading microbes (Escherichia coli, Staphylococcus aureus, and Aspergillus niger) by evaluating the effect of DEP on microbial cell surface hydrophobicity and to investigate any relationship between cell surface hydrophobicity and the ability of such microbes to degrade DEP using microcalorimetry and other methods. In this study, a TAM III multichannel microcalorimeter, at 28 o C, was used to measure the minimum inhibitory concentration (MIC) of DEP and the DEP biodegradation efficiency by fitting the thermogenic curves and integrating the area limited by these curves, respectively. Using MATHS (microbial adhesion to hydrocarbons) assay, CSH of the microbial cells was determined as a measure of their adherence to the hydrophobic noctane. From the experimental data, S. aureus was found to be the most efficient DEP degrader and E. coli the least and that S. aureus showed high, whilst E. coli and A. niger showed moderate hydrophobicity and autoaggregation abilities. There were positive correlations between microbial cell surface hydrophobicity and autoaggregation ability, DEP biodegradability, IC 50 values for the tested strains. [Journal of American Science 2010;6(7):7888]. (ISSN: 15451003). Keywords: Hydrophobicity, Escherichia coli, Staphylococcus aureus, Aspergillus niger, Microcalorimetry, Diethyl phthalate, Autoaggregation, IC 50 . 1. Introduction To satisfactorily define hydrophobicity has not been very easy, though this effect has been investigated for so many decades ago. Many researchers have tried to proffer its definition: the thermodynamists defined it from a thermodynamic view (Edsall, 1992) and the microbiologists defined it from a phenomenological view (Kauzmann, 1959; Doyle, 2000). Breslow (1991) observed that, hydrophobicity is the tendency of apolar species to aggregate in aqueous medium so as to decrease the hydrocarbonwater/oilwater interfacial area. The inability of nonpolar compounds like phthalic acid esters (PAEs) to dissolve in aqueous medium has been associated with the hydrophobicity of these compounds, in fact, making the term misleading; the London dispersion interactions between molecules of water and nonpolar compounds are favourable and quite substantial. Reviews by Doyle (2000) and Karplus (1997) attempted to throw light on hydrophobicity in terms of both biology and chemistry. Adherence of a microorganism to a surface may occur through hydrophobic effect provided the associating sites have sufficiently high densities of nonpolar areas. Microorganisms, including bacteria and fungi have adopted ways to use the hydrophobic effect to adhere to surfaces. Hydrophobic microorganisms, in particular, are capable of adhering to the oilwater interface, and of utilizing oil components as a source of energy for growth and metabolism (Marshall, 1991). Duncan Hewitt, (1990) observed that, there exist compelling rationales to believe that the hydrophobic effect (attributed to cell wall proteins and lipids) may be the driving force for the adhesion of most microbes. Miyoshi (1895) was the first to describe the ability of microorganisms to consume organic compounds as sole carbon source, by reporting the microbial utilization of paraffins. A great diversity of different microbes (bacteria, fungi, yeast and moulds) capable of degrading organic compounds (such as PAEs, and other oilyliquids) in the environment
Transcript of Cell surface hydrophobicity (CSH) of Escherichia coli, Staphylococcus aureus...

Journal of American Science 2010;6(7)
http://www.americanscience.org [email protected] 78
Cell surface hydrophobicity (CSH) of Escherichia coli, Staphylococcus aureus and Aspergillus niger and the biodegradation
of Diethyl Phthalate (DEP) via Microcalorimetry. Alhaji Brima Gogra a,d , Jun Yao a, *, Edward H. Sandy a , ShiXue Zheng b , Gyula Zaray c , Bashiru M. Koroma d ,
Zheng Hui b a State Key Laboratory of Biogeology and Environmental Geology of Chinese Ministry of Education, School of Environmental Studies and SinoHungarian Joint Laboratory of Environmental Science and Health, China
University of Geosciences, 430074 Wuhan, PR China. b State key Laboratory of Agricultural Microbiology, College of Life Science and Technology, Huazhong
Agricultural University, 430070 Wuhan, PR China. c Department of Chemical Technology and Environmental Chemistry, Eötvös University, H1518 Budapest, P.O.
Box 32, Hungary. d Department of Chemistry, School of Environmental Sciences, Njala University, Sierra Leone.
* Corresponding author. Email address: [email protected] (J. Yao) or [email protected] (A. B. Gogra)
Abstract: This work was focused on investigating the occurrence of cell surface hydrophobic (CSH) character among diethyl phthalate (DEP)degrading microbes (Escherichia coli, Staphylococcus aureus, and Aspergillus niger) by evaluating the effect of DEP on microbial cell surface hydrophobicity and to investigate any relationship between cell surface hydrophobicity and the ability of such microbes to degrade DEP using microcalorimetry and other methods. In this study, a TAM III multichannel microcalorimeter, at 28 o C, was used to measure the minimum inhibitory concentration (MIC) of DEP and the DEP biodegradation efficiency by fitting the thermogenic curves and integrating the area limited by these curves, respectively. Using MATHS (microbial adhesion to hydrocarbons) assay, CSH of the microbial cells was determined as a measure of their adherence to the hydrophobic noctane. From the experimental data, S. aureus was found to be the most efficient DEP degrader and E. coli the least and that S. aureus showed high, whilst E. coli and A. niger showed moderate hydrophobicity and autoaggregation abilities. There were positive correlations between microbial cell surface hydrophobicity and autoaggregation ability, DEP biodegradability, IC50 values for the tested strains. [Journal of American Science 2010;6(7):7888]. (ISSN: 15451003).
Keywords: Hydrophobicity, Escherichia coli, Staphylococcus aureus, Aspergillus niger, Microcalorimetry, Diethyl phthalate, Autoaggregation, IC50.
1. Introduction To satisfactorily define hydrophobicity has not
been very easy, though this effect has been investigated for so many decades ago. Many researchers have tried to proffer its definition: the thermodynamists defined it from a thermodynamic view (Edsall, 1992) and the microbiologists defined it from a phenomenological view (Kauzmann, 1959; Doyle, 2000). Breslow (1991) observed that, hydrophobicity is the tendency of apolar species to aggregate in aqueous medium so as to decrease the hydrocarbonwater/oilwater interfacial area. The inability of nonpolar compounds like phthalic acid esters (PAEs) to dissolve in aqueous medium has been associated with the hydrophobicity of these compounds, in fact, making the term misleading; the London dispersion interactions between molecules of water and nonpolar compounds are favourable and quite substantial. Reviews by Doyle (2000) and Karplus (1997) attempted to throw light on hydrophobicity in terms of both biology and
chemistry. Adherence of a microorganism to a surface may occur through hydrophobic effect provided the associating sites have sufficiently high densities of nonpolar areas. Microorganisms, including bacteria and fungi have adopted ways to use the hydrophobic effect to adhere to surfaces. Hydrophobic microorganisms, in particular, are capable of adhering to the oilwater interface, and of utilizing oil components as a source of energy for growth and metabolism (Marshall, 1991). Duncan Hewitt, (1990) observed that, there exist compelling rationales to believe that the hydrophobic effect (attributed to cell wall proteins and lipids) may be the driving force for the adhesion of most microbes.
Miyoshi (1895) was the first to describe the ability of microorganisms to consume organic compounds as sole carbon source, by reporting the microbial utilization of paraffins. A great diversity of different microbes (bacteria, fungi, yeast and moulds) capable of degrading organic compounds (such as PAEs, and other oilyliquids) in the environment
Journal of American Science 2010;6(7)
http://www.americanscience.org [email protected] 79
occurs. Bacteria belong to a group of the ‘best bio degraders’ of organic compounds (Olivera et al., 2003; Chao et al., 2006) including oilyliquids and other hydrocarbons; in this study, diethyl phthalate, DEP, and noctane. Unfortunately, little or no information is available on the simultaneous degradation of both pollutants and without focusing on the relationship between extent of degradation achieved and cell surface hydrophobicity (CSH), which seems to be an avoided topic especially in systems containing more than one carbon source.
CSH influences the direct contact of cell with hydrocarbon droplets and is hence, one of the major factors affecting the degradation of hydrophobic compounds (Chao et al., 2006; Prabhu and Phale, 2003; AlTahhan et al., 2000). This factor is of paramount importance for cell survival, as it controls the process of association between the cells and other surfaces. The rate of biodegradation of organic compounds is dependent upon several other physicochemical and biological parameters. For instance, PAEs with shorter alkylchains (like diethyl phthalate, DEP; dibutyl phthalate, DBP) are relatively easily biodegraded than phthalate esters with longer alkylchains, such as di(2ethylhexyl) phthalate (DEHP) (Chang et al., 2004; Chao et al., 2006). So it’s expected that DEP is more easily biodegraded than DBP. The poor solubility of PAEs in water is potentially one of the commonest physicochemical properties which hinders their rates of biodegradation in the environment, which effect makes PAEs poorly bioavailable, and thus hampers their microbial degradation (Rosenberg et al., 1992; Bouchez et al., 1995; Efroymson and Alexander, 1995; Churchill et al., 1999). Bioavailability of hydrophobic organic compounds, a physicochemical parameter critical in the overall rate of compound degradation, is a function of phase solubility and solution transport processes. For chemical and physical compatibility between and/or among the organisms and the hydrophobic DEP and noctane substrates, the microbes must possess cell surface hydrophobicity, hence, leading to enhanced mutual interactions between and/or among them (Busscher et al., 1995), which consequently, would lead to increased dispersion and greater bioavailability of DEP substrates, and enhanced utilization. Therefore, the ubiquitous occurrence of hydrophobic cell surface property among strains of DEPdegrading population of microorganisms will be a favourable feature for DEP contamination bioremediation activity in any environmental matrix. Potentially, the ratelimiting step in biodegradation of hydrophobic compounds is the ability of the compounds to be solubilized and transported into microbial cells capable of metabolizing them. Though there exist among
microorganisms, direct contact and DEP solubilization mechanisms for substrate uptake but their relative contribution in a population of DEP degraders is yet unknown. Therefore, the aim of this study was to investigate the effect of microbial CSH on the degradation of DEP by exploring any existing relationship between CSH and the ability of such microbes (two bacterial strains, Escherichia coli and Staphylococcus aureus; and a fungal strain, Aspergillus niger) to degrade this compound by monitoring their growth on media amended with DEP, using a combination of microcalorimetry and other methods.
2. Materials and Methods 2.1 Microorganisms
The DEPdegrading microorganisms employed in this study were wild strains of Escherichia coli (a Gramnegative, facultative anaerobic and nonsporulating bacterium), Staphylococcus aureus (a Grampositive, facultative anaerobic coccus), and Aspergillus niger (a filamentous ascomycete fungus) and were all provided by the National Key Laboratory of Agromicrobiology, Huazhong Agricultural University (Wuhan, PR China).
2.2 Media preparations Peptone culture medium (commonly known as
Luria Broth, LB, culture medium) was used to incubate the bacteria, E. coli and S. aureus and was prepared by adding 10.0g Peptone and 5.0g sodium chloride (NaCl) to a 1000mL measuring cylinder containing 5.0g Beef Extract and was made to the mark with distilled water. The medium, at pH 7.2, was then sterilized in highpressure steam in an autoclave at 121 o C for 30 minutes.
Potato sucrose medium (PSM), used to incubate the fungus, A. niger, was prepared by adding 20.0mg DGlucose to a filtrate, obtained by boiling 200.0mg peeled potato slices in 1000mL distilled water for 30 minutes. The volume of the medium was adjusted to 1000mL with distilled water, with no pH adjustment; and was also sterilized in highpressure steam in an autoclave at 121 o C for 30 minutes.
2.3 Preparation of microbial cell suspensions For inoculum preparations, a loop full of
each of the microorganisms was subcultured by inoculating them into 10 mL each of their respective sterile medium and incubated on a horizontal orbital shaker (FM FUMA, PR China) at 37 o C with orbital shaking 200 rev min −1 (rpm) for 12–18 hours, prior each measurement. The culture was then used as a source of inoculum for the experiments carried out in this work.
Journal of American Science 2010;6(7)
http://www.americanscience.org [email protected] 80
2.4 Reagents and their preparations noctane (obtained from Sinopharm
Chemical Reagent Company Limited, PR China) and diethyl phthalate (DEP); obtained from Tianjin Standard Science and Technology Company Limited, PR China] were used in this work. A 5mL stock solution of 5000 µg mL 1 of an analytical grade 99.0% DEP was prepared by thoroughly mixing 0.0223mL DEP with 4.978mL ethanol (95%±5) and stored in the refrigerator. Ethanol was used as solvent because of the low solubility of DEP in water and that it has been widely used as a depolymerizing agent catalyzing the depolymerization of compounds of the DEP family. All chemicals were used as received without further purification. In each microcalorimetric determination, five concentrations (So) of DEP (0, 50, 100, 200 and 300 μg mL 1 ) were prepared as standards from the stock DEP solutions and pipetted into separate conical flasks and/or test ampoules (whereupon most of the added ethanol was removed through 15 minutes volatilization with the aid of HDL APPARATUS clean bench).
2.5 Minimum Inhibitory concentration (MIC) of DEP
The MIC of DEP (defined as the minimum concentration of DEP at which microbial growth was inhibited) for each of the three microbial cultures was separately determined from the half inhibitory concentration, IC50, values (inhibitory concentrations of causing a 50% decrease of microbial growth rate) obtained microcalorimetrically (see Section 2.6) by inoculating a series of 4 mL test ampoules each containing 2 mL air, 2 mL of each respective medium and various concentrations (0 – 300 µg mL 1 ) of DEP with individual culture prepared as above. The IC50 value is determined at 50% of the growth inhibitory ratio (I) obtained by
I = [(k0 – kC)/k0] x 100%, (1) where k0 and kC are the rate constants of the blank/control (0 µg mL 1 ) and the DEPcontaining sample of dose C, respectively. DEP at 25 % of the MIC concentrations was used to determine its effect on cell surface hydrophobicity (CSH) and autoaggregation of the three microbial cultures, and DEP degradation.
2.6 Calorimetry and analytical methods Enthalpy changes of microbial growth processes
can be computed through microcalorimetry, quantifying continuously the exchange of heat between the growth system and the environment. In this study, a TAM III (the third generation thermal activity monitor) multichannel microcalorimeter
(Thermometric AB, Järfälla, Sweden), in the isothermal (constant temperature) mode, was employed to measure continuously the heat production rate from microbial respiration (which is measured as microbial activity) or thermal activities of the wide variety of processes taking place in the test sample (mixture of culture medium and varied concentrations of the compound) contained in the cleaned and sterilized 4mL stainless steel ampoules placed in the instrument in terms of heat, heat flow and heat capacity (Wadsö, 1997; Yao et al., 2008) at 28 o C. Each of the hermetically closed (by teflon sealing discs) sample ampoules contained 2mL of nutrient medium, varied doses of DEP, a loop of cell suspension and 2mL of headspace (air). The aim of the ampoule closure was to ensure the control of evaporation yet allowing oxygen and carbondioxide transfer (Critter and Airoldi, 2001). The cell concentration of inoculums for bacteria and fungus was controlled to be equal for the purpose of comparison. The culture medium (i.e., 2mL nutrient medium plus microorganisms) in the reference ampoule serves as blank/control in all the determinations. The performance and details of the instrument’s construction are described in its users’ manual.
The values of the total heat generated or total thermal effect (QT), peakheat output power (PMax), and peaktime (tMax, related to the maximum position in the PT curves, Figure 1(a)(c),) of the growth process for each experiment (from the start of the growthprocess until data collection was ended) was computed by integrating the area limited by the PT curves (Prado and Airoldi, 2000; Critter et al., 2002); also computed from the curves were the value of the microbial growth rate constant (k) and the generation time (tG). The quantification procedures for these parameters are well established in Hashimoto and Takahashi (1982). The thermogenic (PT) curves generated from all the experiments illustrate typical patterns of all the phases of the exponential microbial growthprocess reactions in environmental matrices (Kimura and Takahashi, 1985; Nuñez et al., 1994): lag, exponential/log growth (exponential increase of the heat evolution rate), stationary and death phases (decline of the P–T curve due to the microbial death) and hence obey the firstorder thermokinetic relation (Equation 2) at the log phase of growth,
St = So. exp (kt) (2) where t is the time period, k is the growth rate constant, So and St represent concentrations of DEP at times 0 and t, respectively. The biodegradation kinetics of organic compounds has been described by so many models and the firstorder kinetics has been utilized often to describe their biodegradation process
Journal of American Science 2010;6(7)
http://www.americanscience.org [email protected] 81
at low dosages (Zeng et al., 2004). The degradation rate of the DEP by the strains, expressed as relative rate of degradation (δ), could be determined using St and S0 [Equation (2)] via Equation (3) as the DEP dose utilized divided by the original DEP dose, multiplied by 100.
% DEP degradation (δ) = [1(St/S0)] x 100% = (∆S/S0) x 100%, (3)
2.7 DEP treatment and preparations of blanks and samples.
In order to investigate the extent to which 50 μg mL 1 (i.e., about 25 % of the MIC concentrations) of DEP could be used as a source of carbon and energy for the microbes under aerobic growth conditions, shake flask experiments were performed. Each culture was grown individually in 150 mL of respective medium in 250 mL Erlenmeyer flasks on the same shaker used for inoculum preparation, with and without 50 μg mL 1 DEP for the evaluation of the effect of these compounds on growth, dissolved oxygen (DO), and autoaggregation. At the end of the 24 hours’ incubation of the flasks in dark at 28 o C, flasks were taken in turn at predetermined times and assayed for cell autoaggregation ability, and DO concentration as described Section 2.8 and the remaining culture medium was centrifuged, using TGL–16M (PR China), at 5000 rpm for 20 minutes to obtain cell pellet, which was used to evaluate the effect of DEP on microbial cell surface hydrophobicity (CSH), as described in Section 2.9.
2.8 Cells autoaggregation assay. The microbial strains were inoculated in 250
mL Erlenmeyer flasks containing 150 mL each of either LB (for the bacteria) or PSM (for the fungus) culture and initial concentration of DEP made at 50 μg mL 1 . Absorbance of the cultured media of the microbial cells, grown with (as test samples) or without (as controls or blanks) 50 µg mL 1 DEP, was monitored as described below to observe the effect of DEP on autoaggregation ability. After 24hour incubation at 28 o C in the dark, the cultured medium was vortexed for 15s and allowed to stand at room temperature for 120 minutes, and changes in absorbance were monitored, by taking 3.5 mL inoculated culture medium into quartz cuvette cell at 660 nm using the Spectrumlab 725s Spectrophotometer (Lingguang Ltd., Shanghai, PR China). Autoaggregation ability was determined as percent autoaggregation (%AAg) using the formula (Equation 4)
%AAg = [1(A/Ao) x 100, (4)
where Ao and A are the absorbances of the cultured media at 0 and 120 minute intervals, respectively. Strains with % AAg ≥70%, between 50 and 70% and <50% can arbitrarily been designated as highly, moderately and low autoaggregating, respectively.
2.9 Microbial cell surface hydrophobicity (CSH) assay
Hydrophobicity of the microbial cell suspensions prepared as above was determined, using MATHS (microbial adhesion to hydrocarbons) assay, as a measure of their adherence to the hydrophobic hydrocarbon (noctane) following the procedure described previously by Rosenberg et al., (1983). After 24h incubation, microbial cells were concentrated and harvested during the exponential growth phase by centrifugation (5000 x rpm for 20 minutes, TGL–16M, PR China); washed twice with phosphate buffered saline (PBS: 7.6g NaCl, 1.9g Na2HPO4.7H2O, 0.7g NaH2PO4.2H2O per liter, pH 7.2, which is a hydrophilic solution), resuspended in the same buffer and the absorbance measured at 660 nm (A1). Five milliliters (5 mL) of microbial suspension and 1 mL noctane (i.e., the assay mixture) were mixed for 120s by vortexing to ensure thorough mixing and then incubated for 1h without shaking to insure that the two solutions had separated into biphasic state. The absorbance of the lower hydrophilic (aqueous) layer was measured again (A2) by recording the changes in absorbance of microbial suspensions due to microbial adhesion to noctane at 660 nm using the Spectrumlab 725s Spectrophotometer. Microbial cell surface hydrophobicity was expressed as percentage adherence (%Adh) and calculated using the formula (Equation 5)
%Adh = [1(A2/A1)] x 100, (5) Strains with %Adh ≥70%, between 50 and 70% and <50% can arbitrarily been classified as highly, moderately and low hydrophobic, respectively.
2.10 Statistical analyses Experimental values were obtained through
three parallel experiments. Means and standard deviations of generated triplicate data were determined using Originlab Scientific Graphing and Analysis software (OriginPro 7.5). This tool was also used to evaluate the differences between cultures, and the effect of DEP by statistically determining the significance at the P<0.0001 level of difference between treatments and the correlation coefficient (R>0.99).
3. Results and Discussions
Journal of American Science 2010;6(7)
http://www.americanscience.org [email protected] 82
In this study, the minimum inhibitory concentration (MIC) for the three microbial cultures, ranging between 127.84 and 197.37 µg mL 1 (Table 1), is considered as the least concentration of DEP at which microbial growth was inhibited. Twentyfive percent (25%) of the highest MIC value (i.e., sub inhibitory dose) was approximated to 50 µg mL 1 .
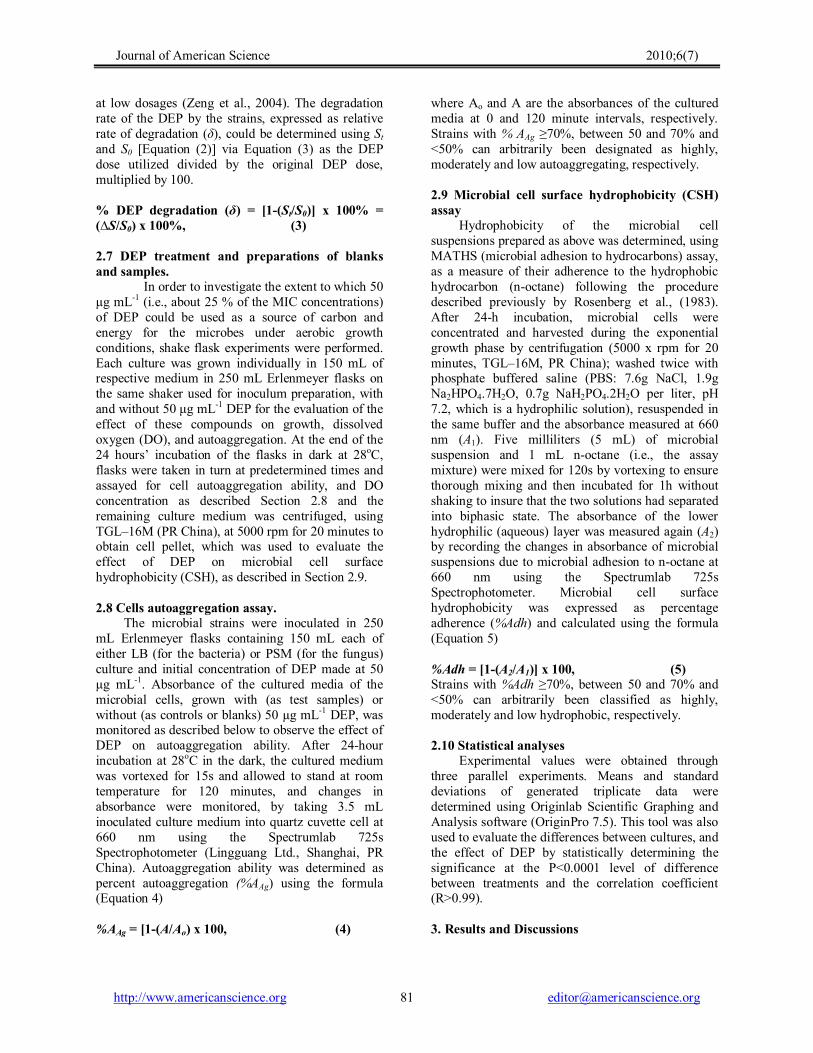
3.1 Microcalorimetry; the growth thermogenic (powertime, PT) curves at varied doses of DEP at 28 o C.
The third generation multichanneled thermal activity monitor (TAM) III (Thermometric AB, Järfälla, Sweden) in the isothermal mode, was employed to generate the IC50 values from the metabolism of DEP by the three strains by continuously measuring the heat production rate, from the microbial respiration or thermal activities of the wide variety of processes taking place in the test sample, in terms of heat, heat flow and heat capacity at 28 o C. The PT curves for the growth of these strains in the presence of different doses of DEP (used as the sole carbon and energy source) were shown in Figure 1; all of them depicting, more or less, lag, exponential, stationary and death phases. From these curves, important parameters, including k (the microbial growth rate constant), were computed (Table 1). From Figure 1, it can be seen that DEP has an obvious inhibitory action on the growth of these strains. The IC50 value (regarded as the inhibiting dose capable of causing a 50% decrease of the growth rate) was determined at 50% of the inhibitory ratio (I) obtained via Equation 1 and by extrapolating C versus I plot (linear relationship). The sub inhibitory DEP dose (50 µg mL 1 ) used to investigate the hydrophobicity and autoaggregation ability of the strains was determined by considering the maximum of 25% of the three sought IC50 values. The k, I and IC50 values were presented in Table 1, with correlation coefficients (R) greater than 0.99. The k values, decreasing with increase in the DEP doses, show that DEP has potential antimicrobial activity even though it was almost completely biodegraded in these experiments (see δ values in Table 1). The IC50 values (E. coli, 197.37 µg mL 1 ; S. aureus, 154.43 µg mL 1 ; and A. niger, 127.84 µg mL 1 ) indicated that A. niger and E. coli are, respectively, the most sensitive and most tolerant microbes to DEP. The DEP degradation efficiencies (δ) recorded for E. coli, S. aureus, and A. niger ranged between 51.9 93.5, 91.9 – 99.8 and 59.8 – 99.9%, respectively; making S. aureus (mean DEP Degradation, δ, = 96.18%) the most efficient DEP degrader and E. coli (mean DEP Degradation, δ, = 83.83%) the least.
With increasing DEP doses the time for the appearance of the peaks on each curve (tmax values,
Table 1) increased and their heights (Pmax and QT values, Table 1) decreased correspondingly; with little or diminishing peaks on curves for DEP doses of 200 and 300 μg mL 1 . These trends suggest that DEP has inhibitory effect (with increasing dose) on the strains as a consequence of the increased maintenance requirements due to irreparable harm to the cellular envelope (Tiehm, 1994; Chen et al., 2000). The growth curves of these strains have two characteristic peaks; which may suggest that these strains might have adopted two ways of metabolism. The presence or absence of oxygen (O2) is very significant for microbial growth, hence influencing the ways of microbial metabolism. In this experiment, the volume of O2 (the headspace) in the test ampoule is approximately 2.0 mL and this is only a limited amount of O2 to be consumed by the strain in the system. The strains adopted one way of metabolism (aerobic) at the start of the experiment and when the O2 is used up, the microbes may have adjusted themselves and adopted another metabolic way (anaerobic); which may explain the presence of two peaks. It’s worthy to note that the heights of the second peaks increased greater than the first at lower and medium DEP doses and little or shrinking peaks on curves for higher DEP doses (200 and 300 μg mL 1 ). Therefore, we may conclude that the first way of metabolism has been greatly influenced than the second way and that in the second way of metabolism, these facultative strains must have consumed DEP or/and subsequently its related degradation intermediates (monoethyl phthalate, MEP; phthalic acid, PA; and Protocatechuic acid) that may have accumulated during the primary degradation of DEP, as sources of carbon and energy needed for their continued growth for a definite time. Biodegradation of DEP (Kurane et al., 1978) follows the proposed degradative pathway [Equation (6)].
DEP → MEP→ PA → Protocatechuic acid →→ CO2 + H2O (through TCA Cycle) (6) which entails systematic cleavage of the ester bond to produce the phthalate monoester and then phthalic acid which is further metabolized and goes through the tricarboxylic acid (TCA) cycle to produce carbon dioxide (CO2) and water (H2O) (Wang et al., 1995).
3.2 Microbial cell surface hydrophobicity and autoaggregation of the investigated strains.
For computing microbial CSH, a quantitative method base on adherence to liquid hydrocarbon was recently illustrated. The ease of this technique lends itself to the rapid screening of numerous microbial samples. Three microbial strains were investigated for the effect of DEP on their
Journal of American Science 2010;6(7)
http://www.americanscience.org [email protected] 83
Table 1. Enumerative microcalorimetric experimental results of the effects of increasing doses of DEP on the growth of the three microbial strains at 28 o C.
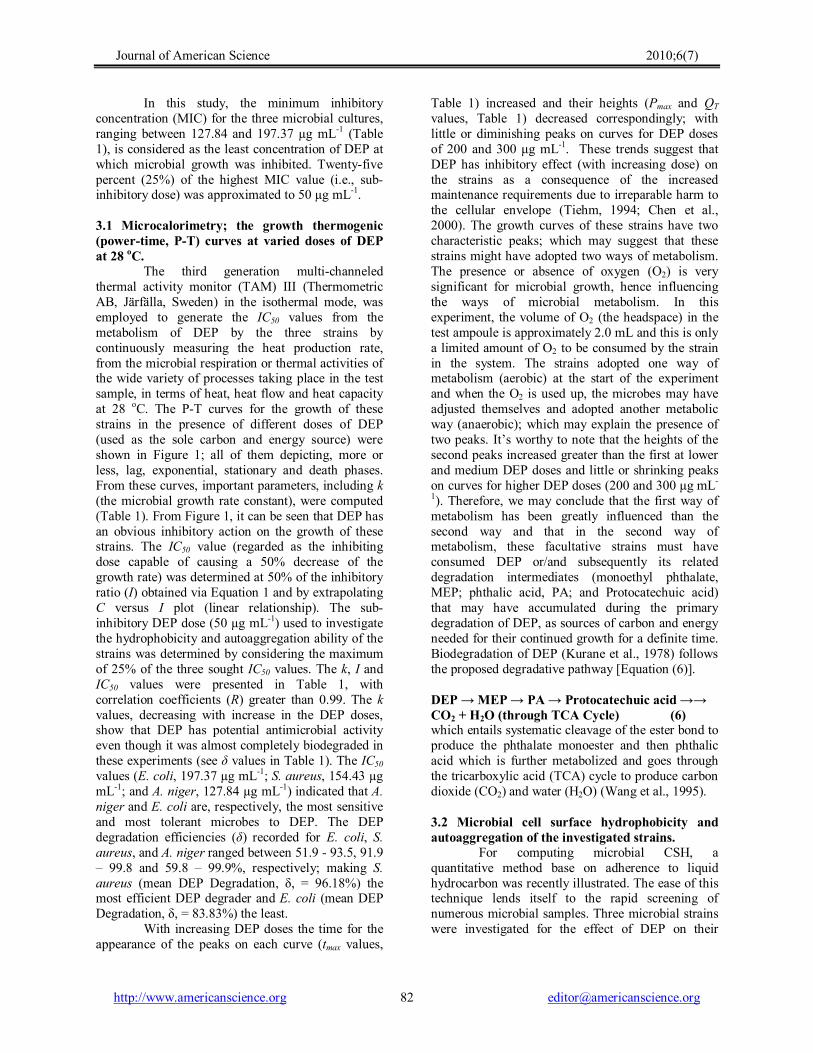
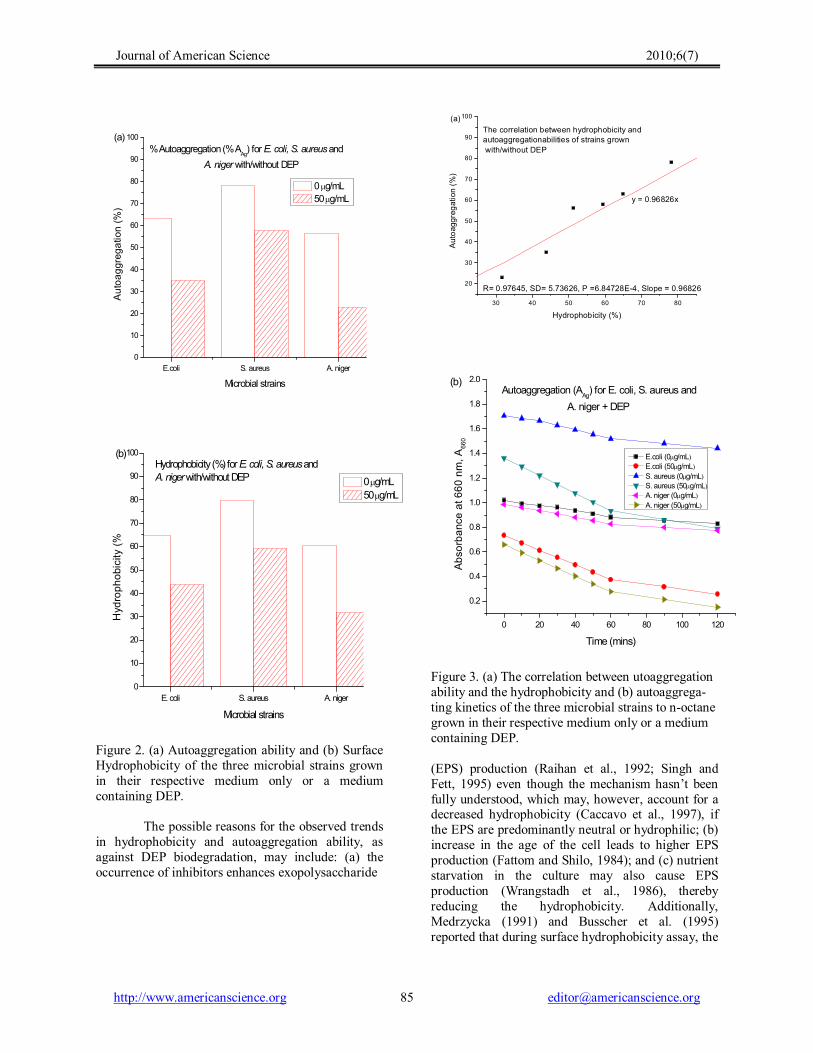
hydrophobicity (CSH) by measuring microbial adhesion to noctane [Figure 2 (b)]; and on their autoaggregation abilities [Figure 2 (a)]. There were significant differences in the means of CSH (E. coli, 64.90%; S. aureus, 78.25%; and A. niger, 51.30%) and of the autoaggregation abilities (E. coli, 63.00%; S. aureus, 78.25%; and A. niger, 56.25%) amongst the strains without DEP treatment. Without DEP treatment, S. aureus showed high (Ljungh et al., 1985), whilst E. coli (Ljungh and Wadström, 1983) and A. niger (Wessels, 1997) showed moderate hydrophobicity and autoaggregation abilities. The fungal stain (A. niger) showed a lower CSH and autoaggregation values than those of the bacterial strains (E. coli and S. aureus), illustrating that remarkable differences might exist due to bacterial and fungal surface composition and structure (strain specific characteristics). The effects of adding DEP to the respective medium on autoaggregating ability and CSH include decreased autoaggregation ability
(E. coli, 35.00%; S. aureus, 58.00%; and A. niger, 23.00%) and a corresponding decrease in CSH of the strains (E. coli, 43.85%; S. aureus, 59.40%; and A. niger, 31.70%) [Figure 2 (a) and (b)]. When compared with the blank (0 µg mL 1 ), the two moderately hydrophobic strains recorded significant reductions in autoaggregation ability (E. coli, 44.44%; S. aureus, 25.88%; and A. niger, 59.11%) than the strongly hydrophobic strain and similar re duction in hydrophobicity of all strains (E. coli, 32.90%; S. aureus, 24.09%; and A. niger, 19.64%). Such reductions made the strains less hydrophobic and less autoaggregating. These observed decreases are hard to explain as little is known about the effect of metabolic inhibitor compound (like DEP) on microbial cell surface hydrophobicity; however, Teo et al. (1998) proposed that disappearance of cell clusters can cause inhibition of proton translocation across the microbial cell surface, resulting in reduced
Strains Dose (µg mL 1 ) (C)
moles DEP (So) (10 4 mol) L 1
Pmax (µW)
tmax (min)
QT (J) k(10 3 min 1 )
R tG (min)
Moles DEP (∆S) (10 4 mol) L 1
DEP Degrada tion (δ) (%)
I (%) IC50 (µg mL 1 )
E. coli 0 50100 200 300
0.00 2.25 4.50 9.00 13.50
193.23 186.73 159.37 161.29 12.00
1944 1808 2090 2574 600
10.50 10.07 10.29 14.41 0.20
1.62 1.51 1.26 1.38 1.22
0.9965 0.9928 0.9983 0.9983 0.9960
428 459 550 502 568
0.00 2.10 4.18 8.74 7.01
0.0 93.5 92.8 97.1 51.9
0.00 6.79 22.22 14.81 24.69
197.37
S. aureus 0 50100 200 300
0.00 2.25 4.50 9.00 13.50
145.28 203.81 191.48 134.10 39.27
1439 1198 1751 3686 4106
9.76 12.97 12.77 27.51 7.52
2.61 2.07 1.68 1.15 1.51
0.9990 0.9913 0.9991 0.9905 0.9987
266 335 413 603 459
0.00 2.06 4.26 8.87 13.47
0.0 91.6 94.7 98.6 99.8
0.00 20.69 35.63 55.94 42.15
154.43
A. niger 0 50100 200 300
0.00 2.25 4.50 9.00 13.50
224.25 277.01 239.08 32.06
224 2247 1914 1627
13.03 12.05 11.90 2.33
4.24 3.35 1.33 0.56
0.9959 0.9986 0.9982 0.9978
164 207 521 1238
0.00 2.249 4.15 5.38
0.0 99.9 92.2 59.8
0.00 20.99 68.63 86.79 100.00
127.84
Journal of American Science 2010;6(7)
http://www.americanscience.org [email protected] 84
0 500 1000 1500 2000 2500 3000 3500 0
50
100
150
200
0 1000 2000 3000 4000 5000 0
50
100
150
200
0 1000 2000 3000 4000
0
50
100
150
200
250
300
Heat O
utput (
µW)
Time (min)
DEP + E. coli
300µg/mL
200µg/mL
100µg/mL
50µg/mL
0µg/mL
(a)
Heat O
utput (
µW)
Time (min)
100µg/mL
50µg/mL
0µg/mL
200µg/mL
300µg/mL
DEP + S. aureus
(b)
Heat O
utput (
µW)
Time (min)
50µg/mL
100µg/mL
0µg/mL
200µg/mL
300µg/mL
DEP + A. niger
(c)
Figure 1. The growth thermogenic (powertime, PT) curves of (a) E. coli in Luria Broth (LB) medium, (b) S. aureus in LB medium and (c) A. niger in potato sucrose medium (PSM) affected by varied doses of DEP at 28 o C.
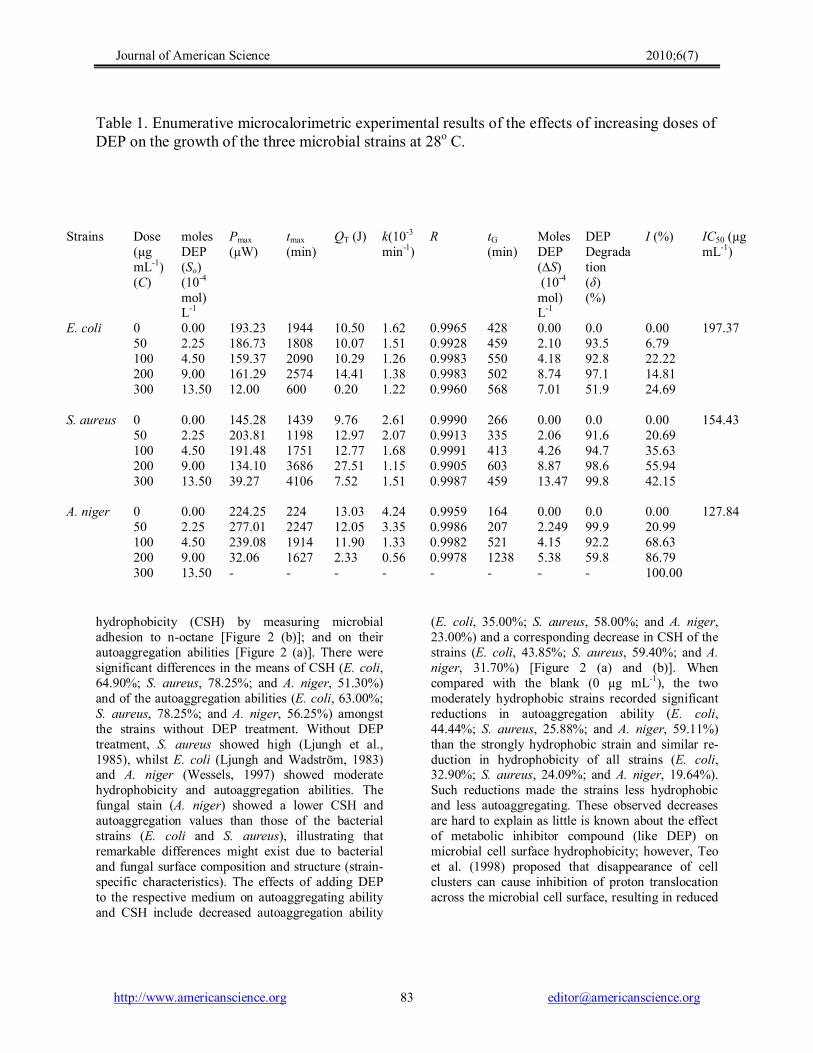
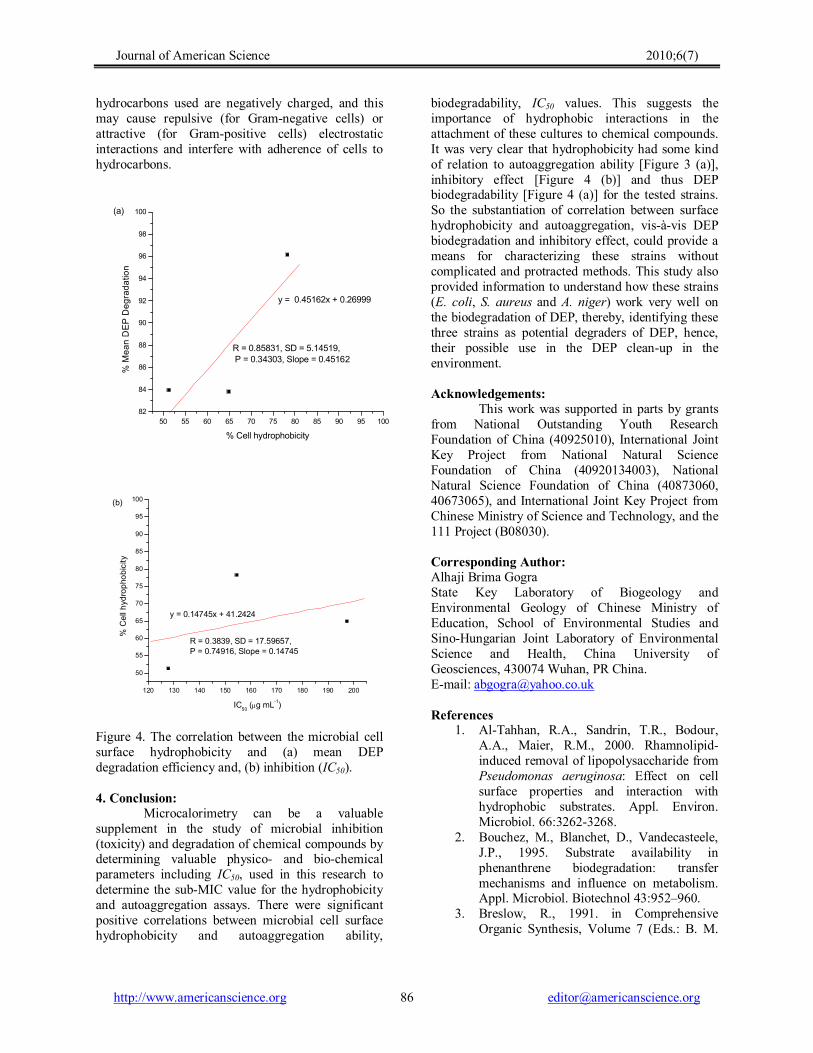
dehydration of cell surface and subsequently leading to decreased hydrophobicity. This may be the likely explanation for the observed decreased in the hydrophobicity and/or adherence, thus decreasing the autoaggregation ability of the three strains. Furthermore, a possible reason for such differences could be attributed to the different compositions and origins of strains studied and the different compositions of nutrient medium; and that the surface physicochemical characteristics of the strains are speciesspecific and probably decided by differences in chemical composition in the cell membrane (Christophe et al., 1997). A thorough understanding of all the significant factors, which influence the whole process, is of immense desire. Different methods to determine hydrophobicity may lead to differences to some extent. Figure 3 (b) shows the kinetics of autoaggregation followed by changes in the absorbance of the cultured medium with/without DEP. No significant decrease in absorbance was observed in all the strains. The distributions of CSH and autoaggregation values (Figures 2 and 3) shared much similarity. Regression analysis showed a significant positive linear correlation between hydrophobicity of microbial
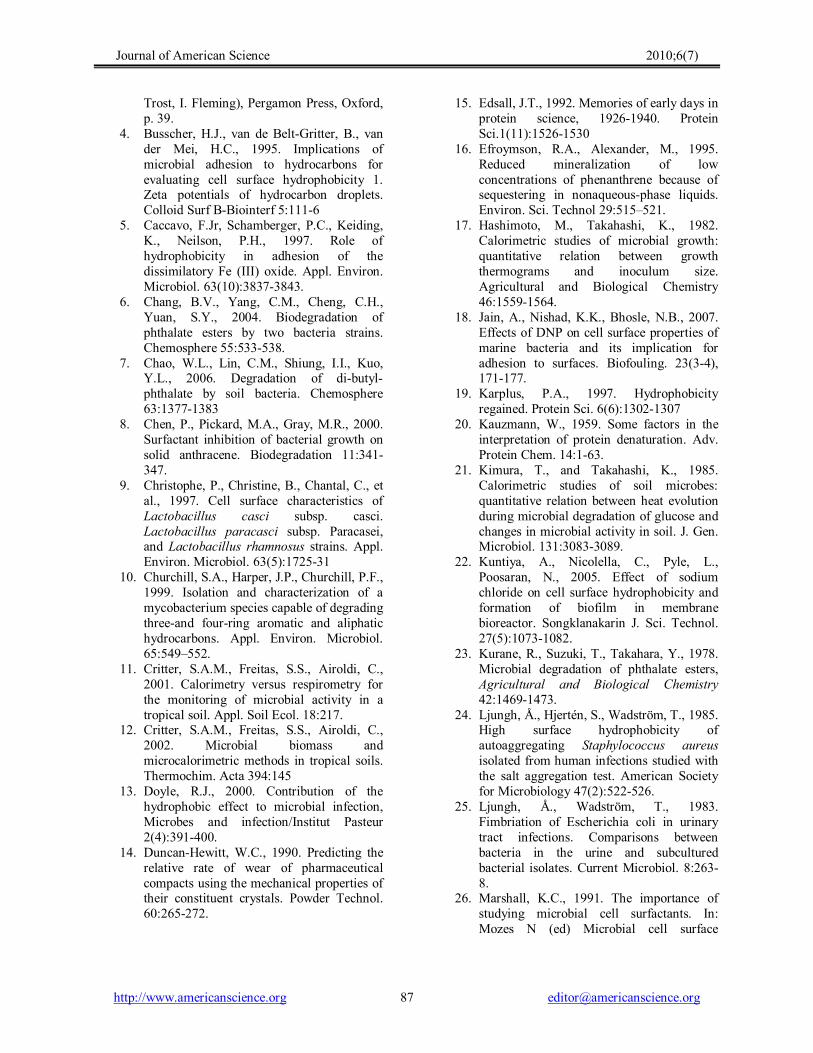
cultures and autoaggregation abilities of the strains [Figure 3 (a)], with correlation coefficient, R = 0.96826. This idea has been supported by other researchers including Jain et al. (2007). Generally, non parametric statistical analysis showed significant qualitative correlation between classes of hydrophobicity (i.e., high, moderate and low) and antibiotic resistance (IC50 values) at P = 0.74916, and from the regression analysis [Figure 4 (b)] we also found some kind of relationship, though a non significant positive linear one (R = 0.3839), between CSH and the half inhibition dose (IC50 ), which contradicted the finding of Tahmourespour et al. (2008) but supportive of those of Pan et al. (2006) and Kuntiya et al. (2005). The correlation between CSH and the DEP microbial degradation was also observed by AlTahhan et al. (2000) and Prabhu and Phale (2003), who observed that, as the cell surface becomes more hydrophobic, the association of the cell with the hydrophobic substrate becomes stronger, resulting in an increase in the degradation rate; but was contrary to Chao et al. (2006), who failed to observe any relationship between CSH and phthalate degradation potentials. This dichotomy, therefore, provides some information for further studies.
Journal of American Science 2010;6(7)
http://www.americanscience.org [email protected] 85
E.coli S. aureus A. niger 0
10
20
30
40
50
60
70
80
90
100
0µg/mL 50µg/mL
Autoaggregation (%
)
Microbial strains
% Autoaggregation (% A Ag ) forE. coli, S. aureusand
A. nigerwith/without DEP
(a)
E. coli S. aureus A. niger 0
10
20
30
40
50
60
70
80
90
100
0µg/mL 50µg/mL
Hydrophobicity (%
Microbial strains
Hydrophobicity (%) forE. coli, S. aureusand A. nigerwith/without DEP
(b)
Figure 2. (a) Autoaggregation ability and (b) Surface Hydrophobicity of the three microbial strains grown in their respective medium only or a medium containing DEP.
The possible reasons for the observed trends in hydrophobicity and autoaggregation ability, as against DEP biodegradation, may include: (a) the occurrence of inhibitors enhances exopolysaccharide
30 40 50 60 70 80
20
30
40
50
60
70
80
90
100
The correlation between hydrophobicity and autoaggregationabilities of strains grown with/without DEP
y = 0.96826x
R= 0.97645, SD= 5.73626, P =6.84728E4, Slope = 0.96826
Autoaggregation (%
)
Hydrophobicity (%)
(a)
0 20 40 60 80 100 120
0.2
0.4
0.6
0.8
1.0
1.2
1.4
1.6
1.8
2.0
E.coli (0µg/mL) E.coli (50µg/mL) S. aureus (0µg/mL) S. aureus (50µg/mL) A. niger (0µg/mL) A. niger (50µg/mL)
Absorbance at 660 nm, A
660
Time (mins)
Autoaggregation (A Ag ) for E. coli, S. aureus and A. niger + DEP
(b)
Figure 3. (a) The correlation between utoaggregation ability and the hydrophobicity and (b) autoaggrega ting kinetics of the three microbial strains to noctane grown in their respective medium only or a medium containing DEP.
(EPS) production (Raihan et al., 1992; Singh and Fett, 1995) even though the mechanism hasn’t been fully understood, which may, however, account for a decreased hydrophobicity (Caccavo et al., 1997), if the EPS are predominantly neutral or hydrophilic; (b) increase in the age of the cell leads to higher EPS production (Fattom and Shilo, 1984); and (c) nutrient starvation in the culture may also cause EPS production (Wrangstadh et al., 1986), thereby reducing the hydrophobicity. Additionally, Medrzycka (1991) and Busscher et al. (1995) reported that during surface hydrophobicity assay, the
Journal of American Science 2010;6(7)
http://www.americanscience.org [email protected] 86
hydrocarbons used are negatively charged, and this may cause repulsive (for Gramnegative cells) or attractive (for Grampositive cells) electrostatic interactions and interfere with adherence of cells to hydrocarbons.
50 55 60 65 70 75 80 85 90 95 100 82
84
86
88
90
92
94
96
98
100
% Mean DEP Degradation
% Cell hydrophobicity
y = 0.45162x + 0.26999
R = 0.85831, SD = 5.14519, P = 0.34303, Slope = 0.45162
(a)
120 130 140 150 160 170 180 190 200
50
55
60
65
70
75
80
85
90
95
100
% Cell hydrophobicity
IC 50 (µg mL 1 )
R = 0.3839, SD = 17.59657, P = 0.74916, Slope = 0.14745
y = 0.14745x + 41.2424
(b)
Figure 4. The correlation between the microbial cell surface hydrophobicity and (a) mean DEP degradation efficiency and, (b) inhibition (IC50).
4. Conclusion: Microcalorimetry can be a valuable
supplement in the study of microbial inhibition (toxicity) and degradation of chemical compounds by determining valuable physico and biochemical parameters including IC50, used in this research to determine the subMIC value for the hydrophobicity and autoaggregation assays. There were significant positive correlations between microbial cell surface hydrophobicity and autoaggregation ability,
biodegradability, IC50 values. This suggests the importance of hydrophobic interactions in the attachment of these cultures to chemical compounds. It was very clear that hydrophobicity had some kind of relation to autoaggregation ability [Figure 3 (a)], inhibitory effect [Figure 4 (b)] and thus DEP biodegradability [Figure 4 (a)] for the tested strains. So the substantiation of correlation between surface hydrophobicity and autoaggregation, visàvis DEP biodegradation and inhibitory effect, could provide a means for characterizing these strains without complicated and protracted methods. This study also provided information to understand how these strains (E. coli, S. aureus and A. niger) work very well on the biodegradation of DEP, thereby, identifying these three strains as potential degraders of DEP, hence, their possible use in the DEP cleanup in the environment.
Acknowledgements: This work was supported in parts by grants
from National Outstanding Youth Research Foundation of China (40925010), International Joint Key Project from National Natural Science Foundation of China (40920134003), National Natural Science Foundation of China (40873060, 40673065), and International Joint Key Project from Chinese Ministry of Science and Technology, and the 111 Project (B08030).
Corresponding Author: Alhaji Brima Gogra State Key Laboratory of Biogeology and Environmental Geology of Chinese Ministry of Education, School of Environmental Studies and SinoHungarian Joint Laboratory of Environmental Science and Health, China University of Geosciences, 430074 Wuhan, PR China. Email: [email protected]
References 1. AlTahhan, R.A., Sandrin, T.R., Bodour,
A.A., Maier, R.M., 2000. Rhamnolipid induced removal of lipopolysaccharide from Pseudomonas aeruginosa: Effect on cell surface properties and interaction with hydrophobic substrates. Appl. Environ. Microbiol. 66:32623268.
2. Bouchez, M., Blanchet, D., Vandecasteele, J.P., 1995. Substrate availability in phenanthrene biodegradation: transfer mechanisms and influence on metabolism. Appl. Microbiol. Biotechnol 43:952–960.
3. Breslow, R., 1991. in Comprehensive Organic Synthesis, Volume 7 (Eds.: B. M.
Journal of American Science 2010;6(7)
http://www.americanscience.org [email protected] 87
Trost, I. Fleming), Pergamon Press, Oxford, p. 39.
4. Busscher, H.J., van de BeltGritter, B., van der Mei, H.C., 1995. Implications of microbial adhesion to hydrocarbons for evaluating cell surface hydrophobicity 1. Zeta potentials of hydrocarbon droplets. Colloid Surf BBiointerf 5:1116
5. Caccavo, F.Jr, Schamberger, P.C., Keiding, K., Neilson, P.H., 1997. Role of hydrophobicity in adhesion of the dissimilatory Fe (III) oxide. Appl. Environ. Microbiol. 63(10):38373843.
6. Chang, B.V., Yang, C.M., Cheng, C.H., Yuan, S.Y., 2004. Biodegradation of phthalate esters by two bacteria strains. Chemosphere 55:533538.
7. Chao, W.L., Lin, C.M., Shiung, I.I., Kuo, Y.L., 2006. Degradation of dibutyl phthalate by soil bacteria. Chemosphere 63:13771383
8. Chen, P., Pickard, M.A., Gray, M.R., 2000. Surfactant inhibition of bacterial growth on solid anthracene. Biodegradation 11:341 347.
9. Christophe, P., Christine, B., Chantal, C., et al., 1997. Cell surface characteristics of Lactobacillus casci subsp. casci. Lactobacillus paracasci subsp. Paracasei, and Lactobacillus rhamnosus strains. Appl. Environ. Microbiol. 63(5):172531
10. Churchill, S.A., Harper, J.P., Churchill, P.F., 1999. Isolation and characterization of a mycobacterium species capable of degrading threeand fourring aromatic and aliphatic hydrocarbons. Appl. Environ. Microbiol. 65:549–552.
11. Critter, S.A.M., Freitas, S.S., Airoldi, C., 2001. Calorimetry versus respirometry for the monitoring of microbial activity in a tropical soil. Appl. Soil Ecol. 18:217.
12. Critter, S.A.M., Freitas, S.S., Airoldi, C., 2002. Microbial biomass and microcalorimetric methods in tropical soils. Thermochim. Acta 394:145
13. Doyle, R.J., 2000. Contribution of the hydrophobic effect to microbial infection, Microbes and infection/Institut Pasteur 2(4):391400.
14. DuncanHewitt, W.C., 1990. Predicting the relative rate of wear of pharmaceutical compacts using the mechanical properties of their constituent crystals. Powder Technol. 60:265272.
15. Edsall, J.T., 1992. Memories of early days in protein science, 19261940. Protein Sci.1(11):15261530
16. Efroymson, R.A., Alexander, M., 1995. Reduced mineralization of low concentrations of phenanthrene because of sequestering in nonaqueousphase liquids. Environ. Sci. Technol 29:515–521.
17. Hashimoto, M., Takahashi, K., 1982. Calorimetric studies of microbial growth: quantitative relation between growth thermograms and inoculum size. Agricultural and Biological Chemistry 46:15591564.
18. Jain, A., Nishad, K.K., Bhosle, N.B., 2007. Effects of DNP on cell surface properties of marine bacteria and its implication for adhesion to surfaces. Biofouling. 23(34), 171177.
19. Karplus, P.A., 1997. Hydrophobicity regained. Protein Sci. 6(6):13021307
20. Kauzmann, W., 1959. Some factors in the interpretation of protein denaturation. Adv. Protein Chem. 14:163.
21. Kimura, T., and Takahashi, K., 1985. Calorimetric studies of soil microbes: quantitative relation between heat evolution during microbial degradation of glucose and changes in microbial activity in soil. J. Gen. Microbiol. 131:30833089.
22. Kuntiya, A., Nicolella, C., Pyle, L., Poosaran, N., 2005. Effect of sodium chloride on cell surface hydrophobicity and formation of biofilm in membrane bioreactor. Songklanakarin J. Sci. Technol. 27(5):10731082.
23. Kurane, R., Suzuki, T., Takahara, Y., 1978. Microbial degradation of phthalate esters, Agricultural and Biological Chemistry 42:14691473.
24. Ljungh, Å., Hjertén, S., Wadström, T., 1985. High surface hydrophobicity of autoaggregating Staphylococcus aureus isolated from human infections studied with the salt aggregation test. American Society for Microbiology 47(2):522526.
25. Ljungh, Å., Wadström, T., 1983. Fimbriation of Escherichia coli in urinary tract infections. Comparisons between bacteria in the urine and subcultured bacterial isolates. Current Microbiol. 8:263 8.
26. Marshall, K.C., 1991. The importance of studying microbial cell surfactants. In: Mozes N (ed) Microbial cell surface
Journal of American Science 2010;6(7)
http://www.americanscience.org [email protected] 88
analysis, 1st edn. WileyVCH Publishers, New York.
27. Medrzycka, K.B., 1991. The effect of particle concentration in extremely dilute solutions. Prog Colloid Polym Sci. 269:85 – 90
28. Miyoshi, M., 1895. Die durchbohrung von membranen durch pilzfäden. Jahrb Wiss Bot 28:269–289.
29. Nuñez, L., Barros, N., Barja, I., 1994. Thermochim. Acta 237:7381.
30. Olivera, N.L., Commendatore, M.G., Delgado, O., Esteves, JL., 2003. Microbial characterization and hydrocarbon biodegradation potential of natural bilge waste microflora. J Ind Microbiol Biotechnol 30:542–548
31. Pan, W.H., Li, P.L., Liu, Z., 2006. The correlation between surface hydrophoicity and adherence of Bifidobacterium strains from centenarians’ faeces. Food microbiology. Anaerobes 12:148152.
32. Prabhu, Y., Phale, P.S., 2003. Biodegradation of phenanthrene by Pseudomonas sp. strain PP2: Novel metabolic pathway, role of biosurfactant and cell surface hydrophobicity in hydrocarbon assimilation. Appl. Microbiol. Biotechnol. 61:342351.
33. Prado, A.G.S., Airoldi, C., 2000. Effects of the pesticide 2,4D on microbial activity of the soil monitored by microcalorimetry. Thermochim. Acta 349:1722.
34. Raihan, S., Ahmed, N., Ali, R., Khan, N., Eshaq, A., 1992. Production of exopolysaccharide by an indigenous soil isolates. JIAS. 5(4). http://www.medicaljournaliasorg/5 4/Raihan.html
35. Rosenberg, E., Kaplan, N., Pines, O., Rosenberg, M., Gutnick, D., 1983. Capsular polysaccharides interfere with adherence of Acinetobacter calcoaceticus to hydrocarbon. FEMS Microbiol. Lett. 17(13):157160.
36. Rosenberg, E., Legmann, R., Kushmaro, A., Taube, R., Adler, E., Ron, E.Z., 1992. Petroleum bioremediation – a multiphase problem. Biodegradation 3:337–350.
37. Singh, S., Fett, W.F. 1995. Stimulation of exopolysaccharide production by fluorescent pseudomonads in sucrose media due to dehydration and increased osmolarity. FEMS Microbiol. Lett. 130(23):301306.
38. Tahmourespour, A., Kermanshahi, R.K., Salehi, R., Nabinejad., A., 2008. The relationship between cell surface hydrophobicity and antibiotic resistance of Streptococcal strains isolated from dental plaque and caries. Iranian Journal of basic medical sciences 10(4):251255.
39. Teo, K.C., Xu H.L., Tay, J.H., 1998. Molecular mechanism of granulation. II: Proton translocation activity. J. Environ Eng 126:411 418
40. Tiehm, A., 1994. Degradation of polycyclic aromatic hydrocarbons in the presence of synthetic surfactants. Appl. Environ. Microbiol. 60:258263.
41. Wadsö, I., 1997. Isothermal microcalorimetry near ambient temperature: An overview and discussion. Thermochim. Acta 294:111.
42. Wang, J, Liu, P., Qian, Y., 1995. Microbial degradation of dinbutly phthalate. Chemosphere. 31(9):40514056.
43. Wessels, J.G.H., 1997. Hydrophobins: proteins that change the nature of a fungal surface. Adv Microb Physiol. 38:145.
44. Wrangstadh, M., Conway, P.L., Kjellberg, S., 1986. The production and release of an extracellular polysaccharide during starvation of a marine Pseudomonas sp. and the effect thereof on adhesion. Arch. Microbiol. 145(3):220227.
45. Yao, J., Tian, L., Wang, Y., Djah, A., Wang, F., Chen, H.L., Su, C.L., Zhuang, R., Zhou, Y., Choi, M.M.F., Bramanti, E., 2008. Microcalorimetric study of the toxic effect of hexavalent chromium on microbial activity of Wuhan brown sandy soil: An in vitro approach. Ecotoxicology and Environmental safety 69:289295.
46. Zeng, F., Cui, K., Li, X., Fu, J., Sheng, G., 2004. Biodegradation kinetics of phthalate esters by Pseudomonas fluorescens FS1. Process Biochemistry 39, 1125–1129
03/12/2010


![Diethyl 4,4′-dihydroxy-3,3′-{[(3a RS ,7a RS )-2,3,3a,4,5,6,7,7a-octahydro-1 H -1,3-benzimidazole-1,3-diyl]bis(methylene)}dibenzoate](https://static.fdokumen.com/doc/165x107/63258a10584e51a9ab0ba0e1/diethyl-44-dihydroxy-33-3a-rs-7a-rs-233a45677a-octahydro-1.jpg)