CellAdvisor JD720C User's Manual - AD INSTRUMENTS
193
CellAdvisor JD720C Series Cable and Antenna Analyzers JD723C JD724C JD725C JD726C User’s Manual
-
Upload
khangminh22 -
Category
Documents
-
view
3 -
download
0
Transcript of CellAdvisor JD720C User's Manual - AD INSTRUMENTS
CellAdvisor JD720C Series Cable and Antenna Analyzers
JD723C JD724C JD725C JD726C
User’s Manual
Network and Service Enablement
20250 Century Boulevard
Germantown, Maryland 20874 USA
Toll Free 1-855-ASK-JDSU • Tel +1-301-353-1560 • Fax +1-240-404-1996
www.jdsu.com
CellAdvisor JD720C Series Cable and Antenna Analyzers
JD723C JD724C JD725C JD726C
User’s Manual
CellAdvisor JD720C User's Manual 3
Notice
Every effort was made to ensure that the information in this manual was accurate at the time of release. However, information is subject to change without notice, and JDS Uniphase reserves the right to provide an addendum to this manual with information not available at the time that this manual was created.
Copyright
© Copyright 2015 JDS Uniphase Corporation. All rights reserved. JDSU, Network and Service Enablement, and its logo are trademarks of JDS Uniphase Corporation (“JDS Uniphase”). All other trademarks and registered trademarks are the property of their respective owners. No part of this document may be reproduced or transmitted electronically or otherwise without written permission of the publisher.
Copyright release
Reproduction and distribution of this document is authorized for Government purposes only.
Trademarks
JDSU, CellAdvisor, and StrataSync are trademarks or registered trademarks of JDSU in the United States and/or other countries.
Bluetooth is a trademark or a registered trademark of Bluetooth Special Interest Group (SIG) Inc. in the United States and/or other countries.
Android is a trademark or a registered trademark of Google in the United States and/or other countries.
iOS is a trademark or a registered trademark of Apple Inc. in the United States and/or other countries.
Windows and Windows 7 are either trademarks or registered trademarks of Microsoft Corporation in the United States and/or other countries.
Specifications, terms, and conditions are subject to change without notice. All trademarks and registered trademarks are the property of their respective companies.
Acknowledgement
This product incorporates open source software entitled “zlib”. The zlib is the compression library written by Jean-loup Gailly and Mark Adler, who granted permission to use this software for any purpose, including commercial applications.
This product includes open source software developed by the Apache Software Foundation (http://www.apache.org/).
4 CellAdvisor JD720C User's Manual
This product used free library for JPEG image compression written and distributed by Independent JPEG Group or IJG (http://www.ijg.org/).
See “Appendix H – OSS licensing” on page 182 for more information.
Ordering information
This manual is a product of JDSU, issued as part of the JD720C Series analyzers. The catalog number for a published manual is JD720C362 - printed. The catalog number for an electronic manual on CD-ROM is JD72050561 - electronic.
Terms and conditions
Specifications, terms, and conditions are subject to change without notice. The provision of hardware, services, and/or software is subject to JDSU’s standard terms and conditions, available at www.jdsu.com/terms.
NRTL compliance
This product was tested according to UL 61010-1:2012 and CAN/CSA C22.2 No. 61010-1-12. Conformity with these requirements is based upon compliance with the standard IEC 61010-1. A copy of the Declaration of Conformity is provided upon your request.
Ce produit a été testé selon la norme UL 61010-1 : 2012 et CAN / CSA C22.2
No. 61010-1-12. La conformité à ces exigences est fondée sur la conformité à la norme CEI 61010-1. Une copie de la déclaration de conformité est disponible sur demande.
EMC directive compliance
JD723C and JD724C
This product was tested and conforms to the EMC Directive, 2004/108/EC and its amending directives for electromagnetic compatibility. Conformity with this directive is based upon compliance with the harmonized European standard: EN61326-1. A copy of the Declaration of Conformity is provided upon your request.
JD725C and JD726C
This product was tested and conforms to the EMC Directive, 2004/108/EC and its amending directives for electromagnetic compatibility. Conformity with this directive is based upon compliance with the harmonized European standards: EN61326-1 and EN61326-2-3. A copy of the Declaration of Conformity is provided upon your request.
Low voltage directive compliance
JD725C and JD726C
This product was tested and conforms to the Low Voltage Directive, 2006/95/EC and its amending directives. Conformity with this directive is based upon compliance with the harmonized European standard EN61010-1. A copy of the Declaration of Conformity is provided upon your request.

CellAdvisor JD720C Series User’s Manual 5
WEEE and battery directive compliance
JDSU has established processes in compliance with the Waste Electrical and Electronic Equipment (WEEE) Directive, 2002/96/EC, and the Battery Directive, 2006/66/EC.
This product, and the batteries used to power the product, should not be disposed of as unsorted municipal waste and should be collected separately and disposed of according to your national regulations. In the European Union, all equipment and batteries purchased from JDSU after 2005-08-13 can be returned for disposal at the end of its useful life. JDSU will ensure that all waste equipment and batteries returned are reused, recycled, or disposed of in an environmentally friendly manner, and in compliance with all applicable national and international waste legislation.
It is the responsibility of the equipment owner to return equipment and batteries to JDSU for appropriate disposal. If the equipment or battery was imported by a reseller whose name or logo is marked on the equipment or battery, then the owner should return the equipment or battery directly to the reseller.
Instructions for returning waste equipment and batteries to JDSU can be found in the Environmental section of JDSU’s web site at www.jdsu.com. If you have questions concerning disposal of your equipment or batteries, contact JDSU’s WEEE Program Management team at [email protected].
6 CellAdvisor JD720C User's Manual
Table of Contents Chapter 1 About This Guide ............................................................................................................................... 12
Purpose and scope ............................................................................................................................................................. 13 Assumptions........................................................................................................................................................................ 13 Safety and compliance information ..................................................................................................................................... 13
Safety consideration .................................................................................................................................................... 13 Conventions ........................................................................................................................................................................ 14 Technical assistance ........................................................................................................................................................... 16
Chapter 2 JD720C Series Overview ................................................................................................................... 17
About the JD720C series .................................................................................................................................................... 18 Features and capabilities .................................................................................................................................................... 18
Features ....................................................................................................................................................................... 18 Capabilities .................................................................................................................................................................. 19
Options ................................................................................................................................................................................ 19 Specifications ...................................................................................................................................................................... 19
AC power ..................................................................................................................................................................... 19 Physical specifications ................................................................................................................................................. 20
Chapter 3 Getting Started ................................................................................................................................... 21
Unpacking the JD720C series ............................................................................................................................................. 22 Exploring the JD720C series ............................................................................................................................................... 22
Front panel ................................................................................................................................................................... 22 Top panel ..................................................................................................................................................................... 25 Display screen ............................................................................................................................................................. 27
Installing battery pack ......................................................................................................................................................... 30 Starting up your JD720C series .......................................................................................................................................... 31 Changing date and time ...................................................................................................................................................... 31
Chapter 4 Performing Calibration ...................................................................................................................... 33
Understanding calibration ................................................................................................................................................... 34 Calibration tools ........................................................................................................................................................... 34 Calibration status indicators ......................................................................................................................................... 34
Performing 1-port calibration ............................................................................................................................................... 35 O-S-L calibration using mechanical Y-Cal kit ............................................................................................................... 35 O-S-L calibration using electronic EZ-Cal kit................................................................................................................ 37 Quick calibration .......................................................................................................................................................... 39
Performing 2-port calibration ............................................................................................................................................... 40 O-S-L-Thru calibration using mechanical Y-Cal kit ...................................................................................................... 40
Table of Contents
CellAdvisor JD720C Series User’s Manual 7
O-S-L-Thru calibration using electronic EZ-Cal kit ....................................................................................................... 41
Chapter 5 Reflection Testing .............................................................................................................................. 42
Introducing reflection measurements .................................................................................................................................. 43 VSWR .......................................................................................................................................................................... 43 Return loss ................................................................................................................................................................... 43 Display screen ............................................................................................................................................................. 44
Preparing for a measurement ............................................................................................................................................. 45 Selecting measurement mode ..................................................................................................................................... 45 Setting parameters ....................................................................................................................................................... 45 Performing calibration .................................................................................................................................................. 48
Making a measurement ....................................................................................................................................................... 48 Measurement examples ............................................................................................................................................... 49
Analyzing measurement results .......................................................................................................................................... 51
Chapter 6 DTF Testing ........................................................................................................................................ 52
Introducing DTF measurements .......................................................................................................................................... 53 Display screen ............................................................................................................................................................. 53
Preparing for a measurement ............................................................................................................................................. 54 Selecting measurement mode ..................................................................................................................................... 54 Setting parameters ....................................................................................................................................................... 54 Defining cable .............................................................................................................................................................. 58 Performing calibration .................................................................................................................................................. 59
Making a measurement ....................................................................................................................................................... 59 Measurement examples ............................................................................................................................................... 60
Analyzing measurement results .......................................................................................................................................... 62
Chapter 7 1-Port Cable Loss Testing ................................................................................................................. 63
Introducing 1-port cable loss measurements ...................................................................................................................... 64 Display screen ............................................................................................................................................................. 64
Preparing for a measurement ............................................................................................................................................. 65 Selecting measurement mode ..................................................................................................................................... 65 Setting parameters ....................................................................................................................................................... 65 Performing calibration .................................................................................................................................................. 68
Making a measurement ....................................................................................................................................................... 68 Measurement examples ............................................................................................................................................... 69
Analyzing measurement results .......................................................................................................................................... 70
Chapter 8 1-Port Phase Testing ......................................................................................................................... 71
Introducing 1-port phase measurements ............................................................................................................................. 72 Display screen ............................................................................................................................................................. 72
Preparing for a measurement ............................................................................................................................................. 73 Selecting measurement mode ..................................................................................................................................... 73 Setting parameters ....................................................................................................................................................... 73 Performing calibration .................................................................................................................................................. 76
Making a measurement ....................................................................................................................................................... 76 Measurement examples ............................................................................................................................................... 77
Analyzing measurement results .......................................................................................................................................... 77
Table of Contents
8 CellAdvisor JD720C User's Manual
Chapter 9 Smith Chart Testing ........................................................................................................................... 78
Introducing Smith chart measurements ............................................................................................................................... 79 Display screen ............................................................................................................................................................. 79
Preparing for a measurement ............................................................................................................................................. 80 Selecting measurement mode ..................................................................................................................................... 80 Setting parameters ....................................................................................................................................................... 80 Performing calibration .................................................................................................................................................. 82
Making a measurement ....................................................................................................................................................... 82 Measurement examples ............................................................................................................................................... 83
Analyzing measurement results .......................................................................................................................................... 84
Chapter 10 2-Port Transmission Testing ............................................................................................................. 85
Introducing 2-port transmission measurements .................................................................................................................. 86 Gain ............................................................................................................................................................................. 86 Insertion loss ................................................................................................................................................................ 86 Display screen ............................................................................................................................................................. 86
Preparing for a measurement ............................................................................................................................................. 87 Selecting measurement mode ..................................................................................................................................... 87 Setting parameters ....................................................................................................................................................... 88 Performing calibration .................................................................................................................................................. 91
Making a measurement ....................................................................................................................................................... 91 Measurement examples ............................................................................................................................................... 92
Analyzing measurement results .......................................................................................................................................... 92
Chapter 11 2-Port Phase Testing ......................................................................................................................... 93
Introducing 2-port phase measurements ............................................................................................................................. 94 Display screen ............................................................................................................................................................. 94
Preparing for a measurement ............................................................................................................................................. 95 Selecting measurement mode ..................................................................................................................................... 95 Setting parameters ....................................................................................................................................................... 95 Performing calibration .................................................................................................................................................. 98
Making a measurement ....................................................................................................................................................... 98 Measurement examples ............................................................................................................................................... 99
Analyzing measurement results .......................................................................................................................................... 99
Chapter 12 High Power CW Signal Generating ................................................................................................. 100
Introducing RF source ....................................................................................................................................................... 101 Display screen ........................................................................................................................................................... 101
Using RF source ............................................................................................................................................................... 101 Selecting measurement mode ................................................................................................................................... 101 Turing on RF source .................................................................................................................................................. 102
Chapter 13 RF Power Testing ............................................................................................................................. 103
Introducing RF power measurements ............................................................................................................................... 104 Display screen ........................................................................................................................................................... 104
Preparing for a measurement ........................................................................................................................................... 105 Selecting measurement mode ................................................................................................................................... 105
Table of Contents
CellAdvisor JD720C Series User’s Manual 9
Connecting a power sensor ....................................................................................................................................... 105 Setting parameters ..................................................................................................................................................... 106 Setting display ............................................................................................................................................................ 107
Making a measurement ..................................................................................................................................................... 107 Measurement example .............................................................................................................................................. 108
Analyzing measurement results ........................................................................................................................................ 109 Holding a measurement ............................................................................................................................................. 109 Setting limits ............................................................................................................................................................... 109
Chapter 14 Optical Power Testing ..................................................................................................................... 110
Introducing optical power measurements .......................................................................................................................... 111 Display screen ........................................................................................................................................................... 111
Preparing for a measurement ........................................................................................................................................... 112 Selecting measurement mode ................................................................................................................................... 112 Connecting a power meter ......................................................................................................................................... 112 Setting parameters ..................................................................................................................................................... 113
Making a measurement ..................................................................................................................................................... 114 Measurement example .............................................................................................................................................. 115
Analyzing measurement results ........................................................................................................................................ 115 Holding a measurement ............................................................................................................................................. 115 Viewing a relative power ............................................................................................................................................ 116 Storing power readings .............................................................................................................................................. 116
Chapter 15 Fiber Testing ..................................................................................................................................... 117
Introducing fiber inspection ............................................................................................................................................... 118 Display screen ........................................................................................................................................................... 118
Preparing for fiber inspection ............................................................................................................................................ 119 Connecting a fiber microscope ................................................................................................................................... 119 Selecting measurement mode ................................................................................................................................... 119 Setting parameters ..................................................................................................................................................... 119
Performing fiber inspection ............................................................................................................................................... 121 Capturing fiber image ................................................................................................................................................. 121 Testing a fiber ............................................................................................................................................................ 121
Chapter 16 Analysis ............................................................................................................................................ 125
Using zoom zones ............................................................................................................................................................. 126 Setting sub-band frequency ....................................................................................................................................... 126 Example of zoom zones ............................................................................................................................................. 127 Changing sub-band frequency ................................................................................................................................... 127 Tips for zoom zones ................................................................................................................................................... 127
Using alternate DTF band ................................................................................................................................................. 128 Setting alternate DTF band ........................................................................................................................................ 128 Example of alternate DTF band ................................................................................................................................. 129
Using markers ................................................................................................................................................................... 129 Setting a marker ......................................................................................................................................................... 130 Moving, hiding, and clearing a marker ....................................................................................................................... 131
Searching for peak or valley .............................................................................................................................................. 131 Finding a peak or valley ............................................................................................................................................. 131
Table of Contents
10 CellAdvisor JD720C User's Manual
Performing more searches ......................................................................................................................................... 132 Finding a peak or valley in zoom zones ..................................................................................................................... 132
Displaying traces ............................................................................................................................................................... 132 Adding a trace ............................................................................................................................................................ 133 Performing trace math ............................................................................................................................................... 134 Loading a saved trace ................................................................................................................................................ 134
Setting test limits ............................................................................................................................................................... 134 Setting a limit line ....................................................................................................................................................... 135 Setting a multi-segment limit line ............................................................................................................................... 135 Setting a limit window ................................................................................................................................................ 137
Holding a measurement .................................................................................................................................................... 138
Chapter 17 Operation .......................................................................................................................................... 139
Performing save ................................................................................................................................................................ 140 Using save/load key ................................................................................................................................................... 140 Using favorite key ...................................................................................................................................................... 141 Using quick save key ................................................................................................................................................. 142 Using save on event .................................................................................................................................................. 143
Performing load ................................................................................................................................................................. 144 Using save/load key ................................................................................................................................................... 144 Using favorite key ...................................................................................................................................................... 145
Managing files ................................................................................................................................................................... 146 Using on-screen keyboard ................................................................................................................................................ 147
Typing in and deleting letters ..................................................................................................................................... 147 Editing keywords ........................................................................................................................................................ 148 Adding keywords ........................................................................................................................................................ 150
Changing display layout .................................................................................................................................................... 152 Changing display layout ............................................................................................................................................. 152 Single layout .............................................................................................................................................................. 152 Horizontal layout ........................................................................................................................................................ 153 Vertical layout ............................................................................................................................................................ 153
Connecting GPS receiver .................................................................................................................................................. 154 Connecting GPS receiver........................................................................................................................................... 154 GPS connection status indicators .............................................................................................................................. 154
Chapter 18 System Settings and Maintenance ................................................................................................. 155
Checking system information ............................................................................................................................................ 156 Setting preferences ........................................................................................................................................................... 156 Installing options ............................................................................................................................................................... 158 Configuring network .......................................................................................................................................................... 158
Wireline LAN .............................................................................................................................................................. 158 Wireless LAN ............................................................................................................................................................. 159
Upgrading firmware ........................................................................................................................................................... 161 Performing service diagnostic ........................................................................................................................................... 162
Running self-test ........................................................................................................................................................ 163 Viewing system log .................................................................................................................................................... 163 Reverting to factory setting ........................................................................................................................................ 164 Re-aligning touch screen ........................................................................................................................................... 164
Table of Contents
CellAdvisor JD720C Series User’s Manual 11
Activating StrataSync ........................................................................................................................................................ 164 Setting up Internet connection ................................................................................................................................... 165 Establishing a connection to StrataSync .................................................................................................................... 166 StrataSync status indicators....................................................................................................................................... 167
Enabling Web-based remote control ................................................................................................................................. 167
Appendix ........................................................................................................................................................... 170
Appendix A – Product general information ........................................................................................................................ 171 Appendix B – Ordering information ................................................................................................................................... 173
Basic Model ............................................................................................................................................................... 173 Options with license ................................................................................................................................................... 173 Standard accessories ................................................................................................................................................ 173 Optional accessories .................................................................................................................................................. 174
Appendix C – Cable listing ................................................................................................................................................ 177 Appendix D – Band listing ................................................................................................................................................. 178 Appendix E – VSWR-Return loss conversion table ........................................................................................................... 180 Appendix F – Device driver installation ............................................................................................................................. 181 Appendix G – Bluetooth connection .................................................................................................................................. 182
Connecting Bluetooth through BlueSoleil program .................................................................................................... 183 Connecting Bluetooth directly from your computer .................................................................................................... 185 Setting up communication in JDSU application.......................................................................................................... 187 Connecting JD720C series from Android-based smartphone over Bluetooth ............................................................ 188 Turning Bluetooth mode on/off manually ................................................................................................................... 188
Appendix H – OSS licensing ............................................................................................................................................. 190 Appendix I – RoHS information ......................................................................................................................................... 191
JD723C and JD724C ................................................................................................................................................. 191 JD725C and JD726C ................................................................................................................................................. 192
1
12 CellAdvisor JD720C User's Manual
Chapter 1 About This Guide
Topics discussed in this chapter include the following:
Purpose and scope .............................................................................................................. 13
Assumptions ......................................................................................................................... 13
Safety and compliance information ...................................................................................... 13
Conventions ......................................................................................................................... 14
Technical assistance ............................................................................................................ 16
Sections “Safety and compliance information” and “Conventions” in this chapter contain information in French as well.
Chapter 1 About This Guide
CellAdvisor JD720C Series User’s Manual 13
Purpose and scope
The purpose of this manual is to help you successfully operate the JD720C series (firmware version 1.053 and after) and use its features and capabilities. It includes instructions that describe how to operate, set up, configure, and use the JD720C series cable and antenna analyzers, consisting of JD723C, JD724C, JD725C, and JD726C.
Objectif et champ d'application
Le but de ce manuel est de vous aider à exploiter avec succès la série de JD720C (version du firmware 1.053 et après) et utilisez ses fonctionnalités et capacités. Il comprend des instructions qui décrivent comment utiliser, créer, configurer et utiliser le câble série de JD720C et analyseurs d'antenne, composée de JD723C et JD724C, JD725C et JD726C.
Assumptions
This manual is intended for novice, intermediate, and experienced users who want to use the JD720C series effectively and efficiently. We are assuming that you have basic operation experience and are familiar with basic mobile communication concepts and terminology.
Hypothèses
Ce manuel est destiné aux débutants, intermédiaires et aux utilisateurs expérimentés qui veulent utiliser la série de JD720C efficace et efficiente. Nous supposons que vous avez une expérience de base de fonctionnement et êtes familier avec les concepts de communication mobile de base et la terminologie.
Safety and compliance information
Safety and compliance information for the instrument are provided upon your request.
Informations de sécurité et de conformité
Informations sur la sécurité et la conformité de l'instrument sont fournies sur demande.
Safety consideration
It is mandatory to permanently connect this product to the protective earth.
When powering this instrument externally, always use an AC power cable that includes an earth (safety) ground connection, which is shipped with your instrument.
Considération de la sécurité
Il est obligatoire de se connecter en permanence ce produit à la terre de protection. Lors de la mise de cet appareil, utilisez toujours un câble d'alimentation qui comprend une terre (la sécurité) à la terre.
WARNING
Do not attempt to service this product yourself, as opening or removing covers may expose you to dangerous voltage and other hazards. Refer all servicing to qualified JDSU service personnel.
Chapter 1 About This Guide
14 CellAdvisor JD720C User's Manual
AVERTISSEMENT Ne pas tenter de réparer ce produit vous-même, car l'ouverture ou le retrait des capots peut vous exposer à des tensions dangereuses et autres risques. Confiez toute réparation à un personnel qualifié de service JDSU.
CAUTION
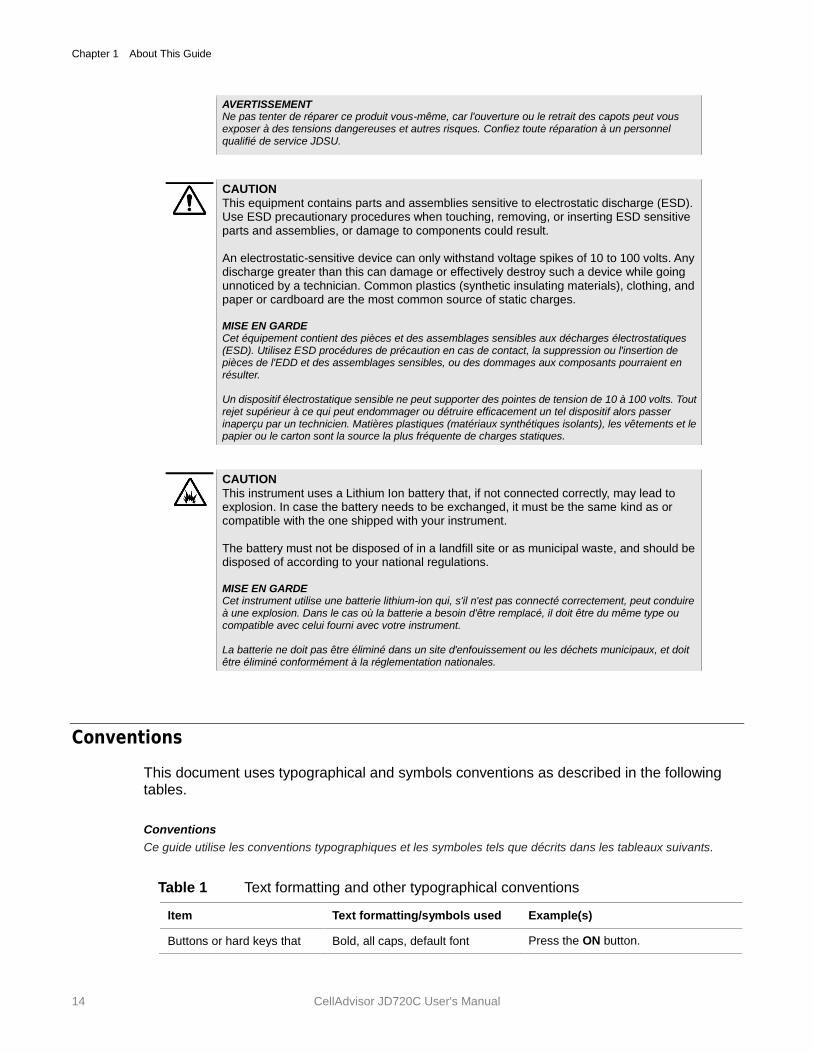
This equipment contains parts and assemblies sensitive to electrostatic discharge (ESD). Use ESD precautionary procedures when touching, removing, or inserting ESD sensitive parts and assemblies, or damage to components could result. An electrostatic-sensitive device can only withstand voltage spikes of 10 to 100 volts. Any discharge greater than this can damage or effectively destroy such a device while going unnoticed by a technician. Common plastics (synthetic insulating materials), clothing, and paper or cardboard are the most common source of static charges. MISE EN GARDE Cet équipement contient des pièces et des assemblages sensibles aux décharges électrostatiques (ESD). Utilisez ESD procédures de précaution en cas de contact, la suppression ou l'insertion de pièces de l'EDD et des assemblages sensibles, ou des dommages aux composants pourraient en résulter. Un dispositif électrostatique sensible ne peut supporter des pointes de tension de 10 à 100 volts. Tout rejet supérieur à ce qui peut endommager ou détruire efficacement un tel dispositif alors passer inaperçu par un technicien. Matières plastiques (matériaux synthétiques isolants), les vêtements et le papier ou le carton sont la source la plus fréquente de charges statiques.
CAUTION
This instrument uses a Lithium Ion battery that, if not connected correctly, may lead to explosion. In case the battery needs to be exchanged, it must be the same kind as or compatible with the one shipped with your instrument. The battery must not be disposed of in a landfill site or as municipal waste, and should be disposed of according to your national regulations. MISE EN GARDE Cet instrument utilise une batterie lithium-ion qui, s'il n'est pas connecté correctement, peut conduire à une explosion. Dans le cas où la batterie a besoin d'être remplacé, il doit être du même type ou compatible avec celui fourni avec votre instrument. La batterie ne doit pas être éliminé dans un site d'enfouissement ou les déchets municipaux, et doit être éliminé conformément à la réglementation nationales.
Conventions
This document uses typographical and symbols conventions as described in the following tables.
Conventions
Ce guide utilise les conventions typographiques et les symboles tels que décrits dans les tableaux suivants.
Table 1 Text formatting and other typographical conventions
Item Text formatting/symbols used Example(s)
Buttons or hard keys that Bold, all caps, default font Press the ON button.
Chapter 1 About This Guide
CellAdvisor JD720C Series User’s Manual 15
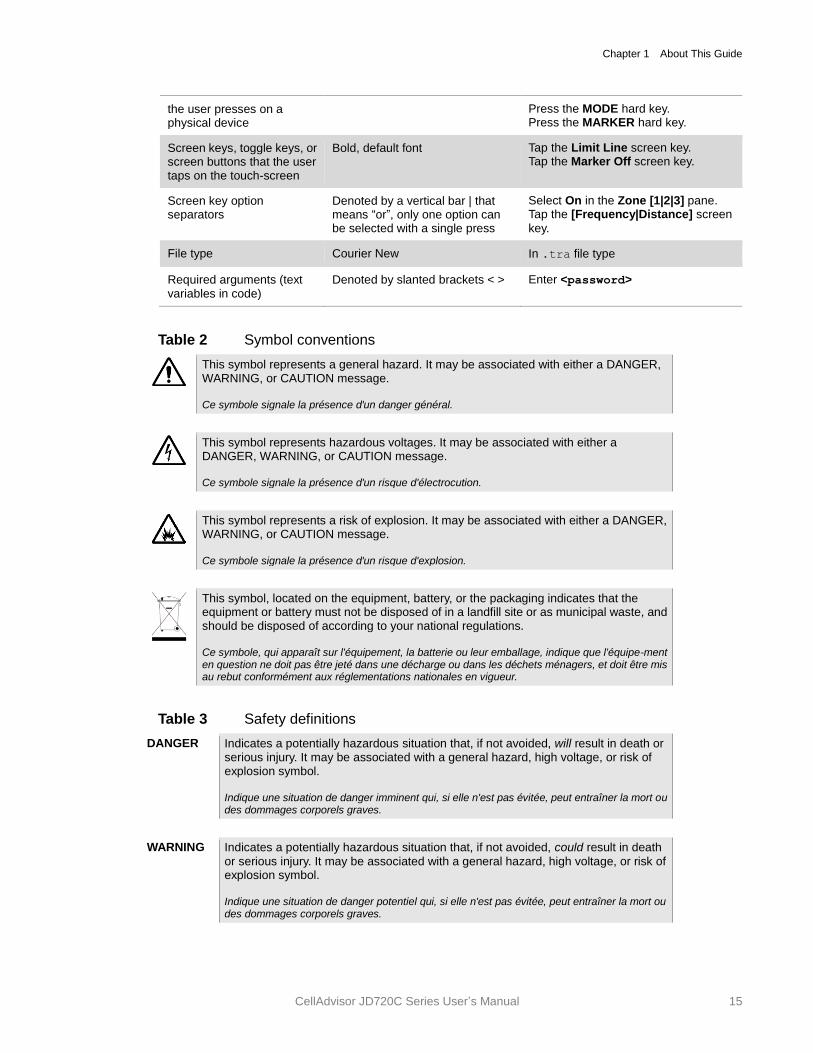
the user presses on a physical device
Press the MODE hard key. Press the MARKER hard key.
Screen keys, toggle keys, or screen buttons that the user taps on the touch-screen
Bold, default font Tap the Limit Line screen key. Tap the Marker Off screen key.
Screen key option separators
Denoted by a vertical bar | that means “or”, only one option can be selected with a single press
Select On in the Zone [1|2|3] pane. Tap the [Frequency|Distance] screen
key.
File type Courier New In .tra file type
Required arguments (text variables in code)
Denoted by slanted brackets < > Enter <password>
Table 2 Symbol conventions
This symbol represents a general hazard. It may be associated with either a DANGER, WARNING, or CAUTION message. Ce symbole signale la présence d'un danger général.
This symbol represents hazardous voltages. It may be associated with either a DANGER, WARNING, or CAUTION message. Ce symbole signale la présence d'un risque d'électrocution.
This symbol represents a risk of explosion. It may be associated with either a DANGER, WARNING, or CAUTION message. Ce symbole signale la présence d'un risque d'explosion.
This symbol, located on the equipment, battery, or the packaging indicates that the equipment or battery must not be disposed of in a landfill site or as municipal waste, and should be disposed of according to your national regulations. Ce symbole, qui apparaît sur l'équipement, la batterie ou leur emballage, indique que l'équipe-ment en question ne doit pas être jeté dans une décharge ou dans les déchets ménagers, et doit être mis au rebut conformément aux réglementations nationales en vigueur.
Table 3 Safety definitions
DANGER Indicates a potentially hazardous situation that, if not avoided, will result in death or serious injury. It may be associated with a general hazard, high voltage, or risk of explosion symbol. Indique une situation de danger imminent qui, si elle n'est pas évitée, peut entraîner la mort ou des dommages corporels graves.
WARNING Indicates a potentially hazardous situation that, if not avoided, could result in death
or serious injury. It may be associated with a general hazard, high voltage, or risk of explosion symbol. Indique une situation de danger potentiel qui, si elle n'est pas évitée, peut entraîner la mort ou des dommages corporels graves.
Chapter 1 About This Guide
16 CellAdvisor JD720C User's Manual
CAUTION
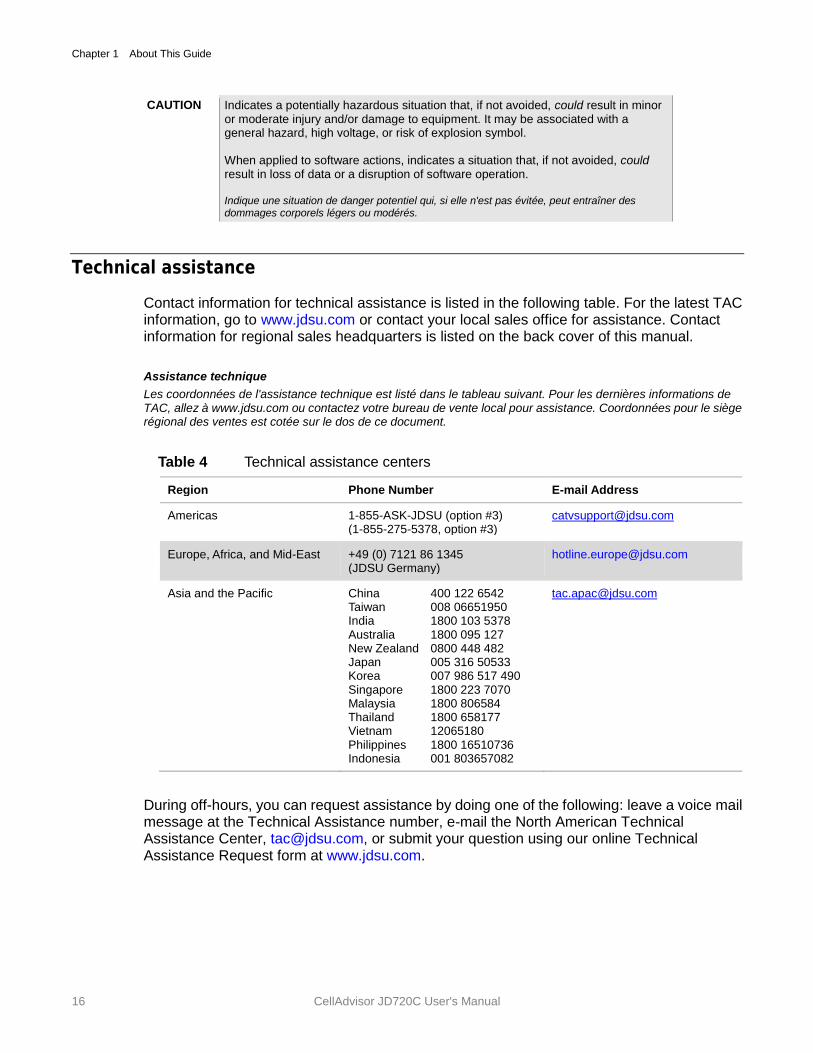
Indicates a potentially hazardous situation that, if not avoided, could result in minor or moderate injury and/or damage to equipment. It may be associated with a general hazard, high voltage, or risk of explosion symbol. When applied to software actions, indicates a situation that, if not avoided, could result in loss of data or a disruption of software operation. Indique une situation de danger potentiel qui, si elle n'est pas évitée, peut entraîner des dommages corporels légers ou modérés.
Technical assistance
Contact information for technical assistance is listed in the following table. For the latest TAC information, go to www.jdsu.com or contact your local sales office for assistance. Contact information for regional sales headquarters is listed on the back cover of this manual.
Assistance technique
Les coordonnées de l'assistance technique est listé dans le tableau suivant. Pour les dernières informations de TAC, allez à www.jdsu.com ou contactez votre bureau de vente local pour assistance. Coordonnées pour le siège régional des ventes est cotée sur le dos de ce document.
Table 4 Technical assistance centers
Region Phone Number E-mail Address
Americas 1-855-ASK-JDSU (option #3) (1-855-275-5378, option #3)
Europe, Africa, and Mid-East +49 (0) 7121 86 1345 (JDSU Germany)
Asia and the Pacific China 400 122 6542 Taiwan 008 06651950 India 1800 103 5378 Australia 1800 095 127 New Zealand 0800 448 482 Japan 005 316 50533 Korea 007 986 517 490 Singapore 1800 223 7070 Malaysia 1800 806584 Thailand 1800 658177 Vietnam 12065180 Philippines 1800 16510736 Indonesia 001 803657082
During off-hours, you can request assistance by doing one of the following: leave a voice mail message at the Technical Assistance number, e-mail the North American Technical Assistance Center, [email protected], or submit your question using our online Technical Assistance Request form at www.jdsu.com.
2
CellAdvisor JD720C User's Manual
Chapter 2 JD720C Series Overview
This chapter provides a general description of the JD720C series. Topics discussed in this chapter include the following:
About the JD720C series ..................................................................................................... 18
Features and capabilities ..................................................................................................... 18
Options ................................................................................................................................. 19
Specifications ....................................................................................................................... 19
Chapter 2 JD720C Series Overview
18 CellAdvisor JD720C User's Manual
About the JD720C series
The majority of problems in mobile networks occur at the base station infrastructure that is consisted of the antenna system, cables, and connectors. It is essential to have the optimal instrument for properly servicing or installing cell sites.
The JD720C series analyzers are the optimal test solution to characterize cell site’s infrastructure due to its light-weight handheld design, ease of use, and rich functionality.
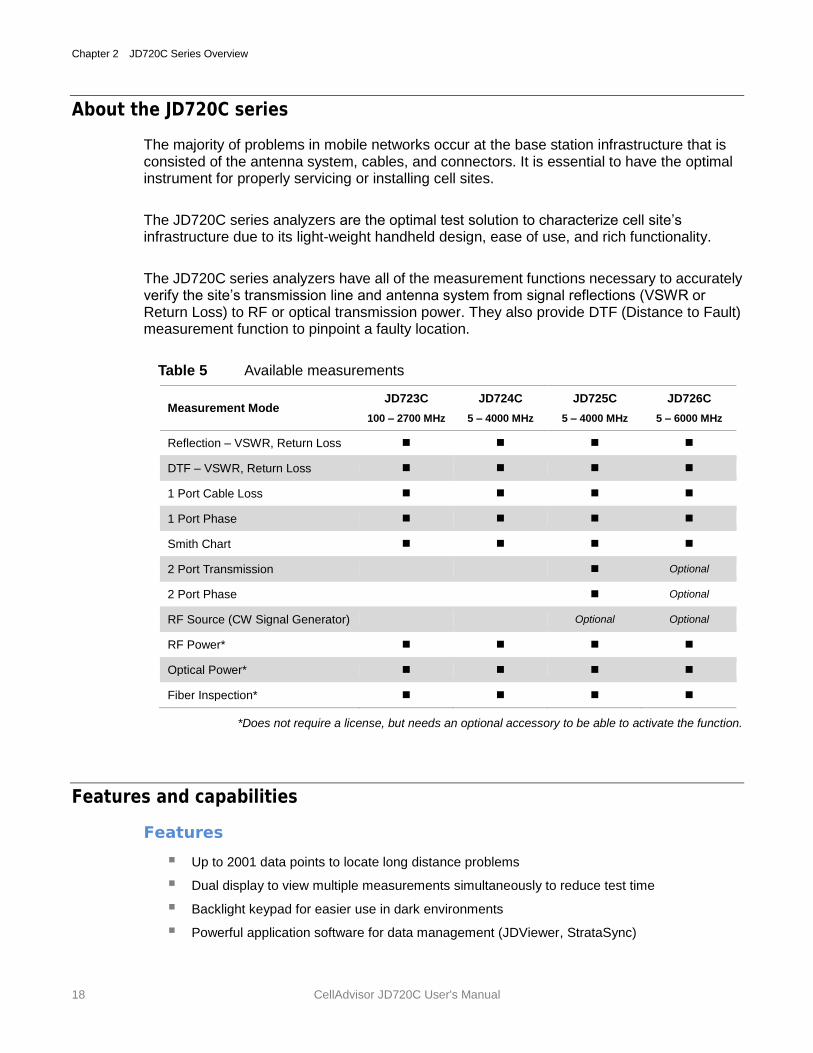
The JD720C series analyzers have all of the measurement functions necessary to accurately verify the site’s transmission line and antenna system from signal reflections (VSWR or Return Loss) to RF or optical transmission power. They also provide DTF (Distance to Fault) measurement function to pinpoint a faulty location.
Table 5 Available measurements
Measurement Mode JD723C
100 – 2700 MHz
JD724C
5 – 4000 MHz
JD725C
5 – 4000 MHz
JD726C
5 – 6000 MHz
Reflection – VSWR, Return Loss
DTF – VSWR, Return Loss
1 Port Cable Loss
1 Port Phase
Smith Chart
2 Port Transmission Optional
2 Port Phase Optional
RF Source (CW Signal Generator) Optional Optional
RF Power*
Optical Power*
Fiber Inspection*
*Does not require a license, but needs an optional accessory to be able to activate the function.
Features and capabilities
Features
Up to 2001 data points to locate long distance problems
Dual display to view multiple measurements simultaneously to reduce test time
Backlight keypad for easier use in dark environments
Powerful application software for data management (JDViewer, StrataSync)
Chapter 2 JD720C Series Overview
CellAdvisor JD720C Series User’s Manual 19
Full remote control of the instrument from JDRemote on a Windows-based computer or from web browsers on computers and mobile devices
Rechargeable and field replaceable Lithium Ion battery with more than 7 hours or 5 hours of operation time depending on model
RF power protection of output
Capabilities
All JD720C series
Reflection measurement in VSWR, Return Loss, or Smith Chart
DTF (Distance to Fault) measurement in VSWR or Return Loss
1 Port Cable Loss measurement
1 Port Phase measurement
RF Power Meter with an external RF power sensor
Optical Power Meter with an external optical power meter
Fiber inspection with a fiber microscope P5000i
StrataSync supportability for cloud-based asset inventory and test data managements and centralized configuration sharing
GPS supportability with an optional USB GPS receiver for a record of test position information
Bluetooth supportability with an optional USB Bluetooth adapter for FTP/OPP and PAN connection with your computer or smartphone
Wi-Fi connectivity with a USB Wi-Fi LAN card
Report generation in PDF and HTML file types directly from the instrument
JD725C and JD726C models
2 Port Transmission (gain/insertion loss) measurement
2 Port Phase measurement
Bias Tee
High power CW signal generator
Options
This instrument is provided with various options that are available to be ordered. See “Appendix B – Ordering information” on page 173 for more information.
Specifications
AC power
Input voltage is automatically selected within the instrument’s tolerable input line voltage from 100 to 240 VAC. This instrument does not have a separate line protection fuse.
Chapter 2 JD720C Series Overview
20 CellAdvisor JD720C User's Manual
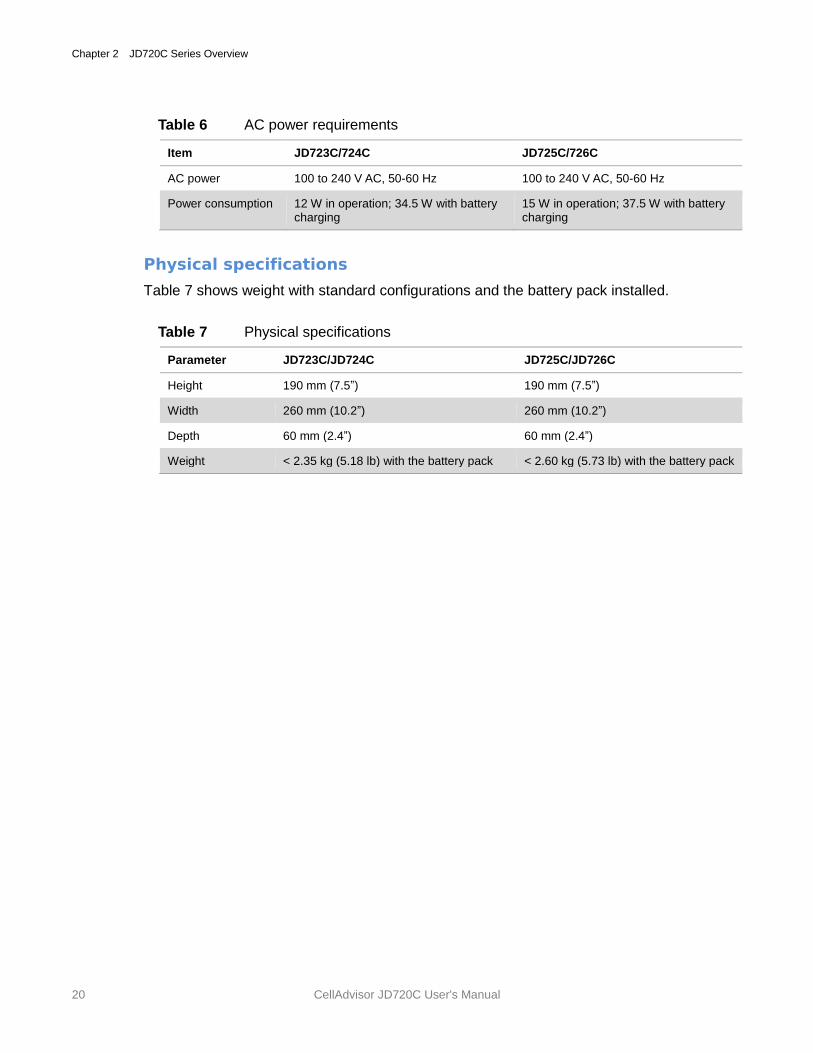
Table 6 AC power requirements
Item JD723C/724C JD725C/726C
AC power 100 to 240 V AC, 50-60 Hz 100 to 240 V AC, 50-60 Hz
Power consumption 12 W in operation; 34.5 W with battery charging
15 W in operation; 37.5 W with battery charging
Physical specifications
Table 7 shows weight with standard configurations and the battery pack installed.
Table 7 Physical specifications
Parameter JD723C/JD724C JD725C/JD726C
Height 190 mm (7.5”) 190 mm (7.5”)
Width 260 mm (10.2”) 260 mm (10.2”)
Depth 60 mm (2.4”) 60 mm (2.4”)
Weight < 2.35 kg (5.18 lb) with the battery pack < 2.60 kg (5.73 lb) with the battery pack
3
CellAdvisor JD720C User's Manual
Chapter 3 Getting Started
This chapter describes how to get started with the JD720C series instrument. Topics discussed in this chapter are as follows:
Unpacking the JD720C series ............................................................................................. 22
Exploring the JD720C series ............................................................................................... 22
Installing battery pack .......................................................................................................... 30
Starting up your JD720C series ........................................................................................... 31
Changing date and time ....................................................................................................... 31
Chapter 3 Getting Started
22 CellAdvisor JD720C User's Manual
Unpacking the JD720C series
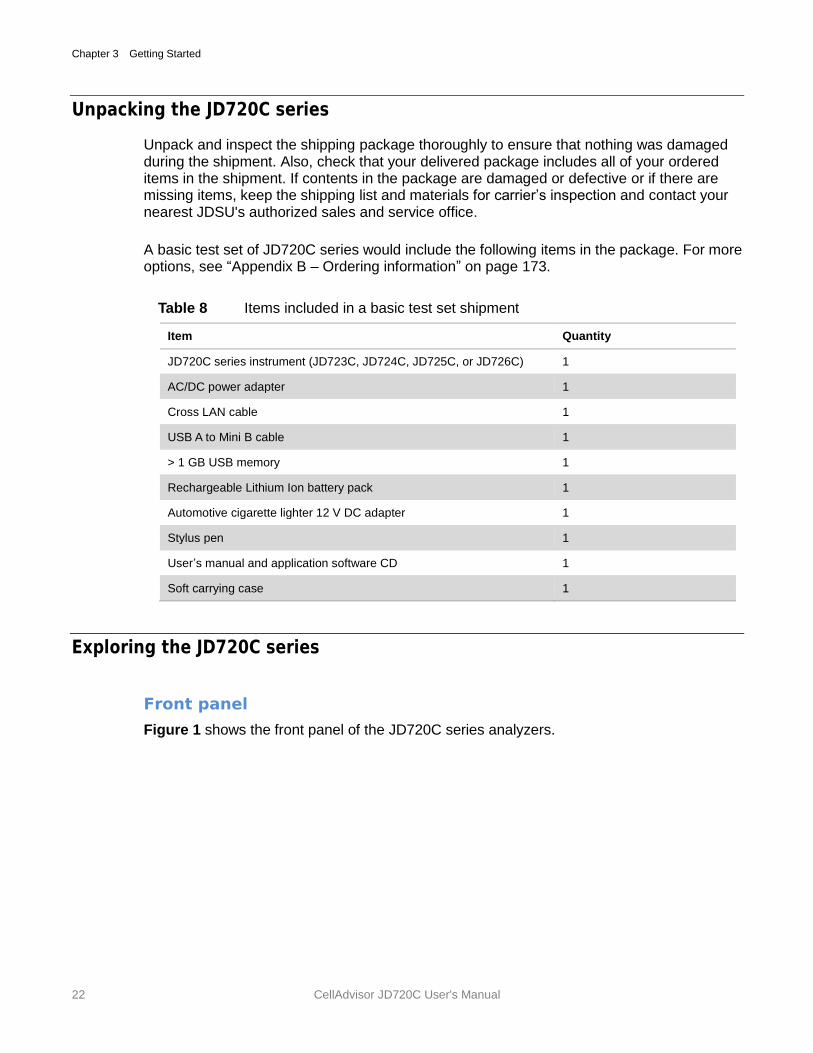
Unpack and inspect the shipping package thoroughly to ensure that nothing was damaged during the shipment. Also, check that your delivered package includes all of your ordered items in the shipment. If contents in the package are damaged or defective or if there are missing items, keep the shipping list and materials for carrier’s inspection and contact your nearest JDSU's authorized sales and service office.
A basic test set of JD720C series would include the following items in the package. For more options, see “Appendix B – Ordering information” on page 173.
Table 8 Items included in a basic test set shipment
Item Quantity
JD720C series instrument (JD723C, JD724C, JD725C, or JD726C) 1
AC/DC power adapter 1
Cross LAN cable 1
USB A to Mini B cable 1
> 1 GB USB memory 1
Rechargeable Lithium Ion battery pack 1
Automotive cigarette lighter 12 V DC adapter 1
Stylus pen 1
User’s manual and application software CD 1
Soft carrying case 1
Exploring the JD720C series
Front panel
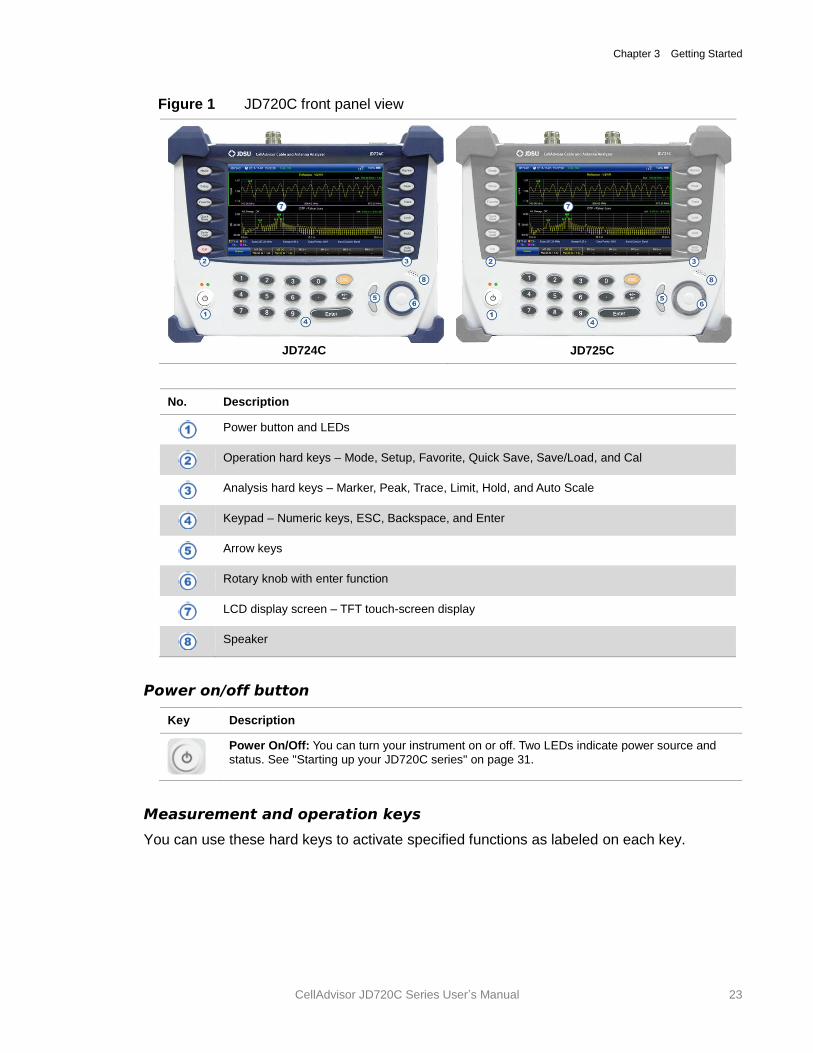
Figure 1 shows the front panel of the JD720C series analyzers.
Chapter 3 Getting Started
CellAdvisor JD720C Series User’s Manual 23
Figure 1 JD720C front panel view
JD724C
JD725C
No. Description
Power button and LEDs
Operation hard keys – Mode, Setup, Favorite, Quick Save, Save/Load, and Cal
Analysis hard keys – Marker, Peak, Trace, Limit, Hold, and Auto Scale
Keypad – Numeric keys, ESC, Backspace, and Enter
Arrow keys
Rotary knob with enter function
LCD display screen – TFT touch-screen display
Speaker
Power on/off button
Key Description
Power On/Off: You can turn your instrument on or off. Two LEDs indicate power source and
status. See "Starting up your JD720C series" on page 31.
Measurement and operation keys
You can use these hard keys to activate specified functions as labeled on each key.
Chapter 3 Getting Started
24 CellAdvisor JD720C User's Manual
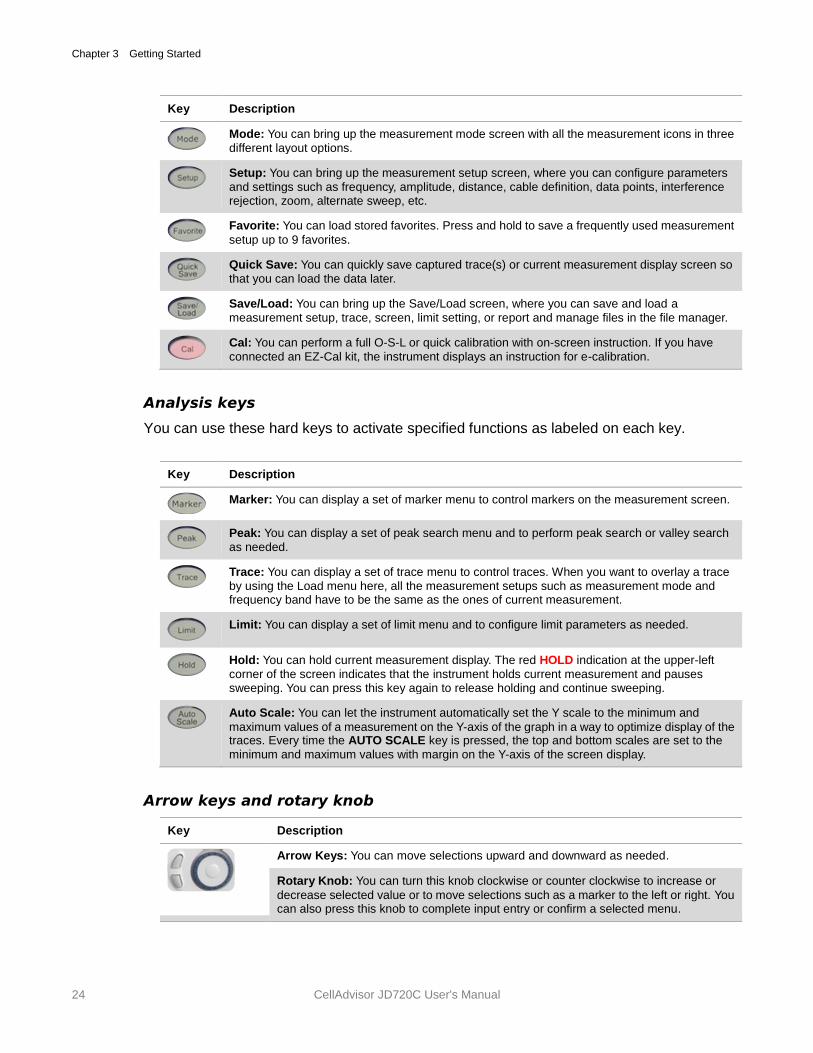
Key Description
Mode: You can bring up the measurement mode screen with all the measurement icons in three
different layout options.
Setup: You can bring up the measurement setup screen, where you can configure parameters
and settings such as frequency, amplitude, distance, cable definition, data points, interference rejection, zoom, alternate sweep, etc.
Favorite: You can load stored favorites. Press and hold to save a frequently used measurement
setup up to 9 favorites.
Quick Save: You can quickly save captured trace(s) or current measurement display screen so
that you can load the data later.
Save/Load: You can bring up the Save/Load screen, where you can save and load a
measurement setup, trace, screen, limit setting, or report and manage files in the file manager.
Cal: You can perform a full O-S-L or quick calibration with on-screen instruction. If you have
connected an EZ-Cal kit, the instrument displays an instruction for e-calibration.
Analysis keys
You can use these hard keys to activate specified functions as labeled on each key.
Key Description
Marker: You can display a set of marker menu to control markers on the measurement screen.
Peak: You can display a set of peak search menu and to perform peak search or valley search
as needed.
Trace: You can display a set of trace menu to control traces. When you want to overlay a trace
by using the Load menu here, all the measurement setups such as measurement mode and frequency band have to be the same as the ones of current measurement.
Limit: You can display a set of limit menu and to configure limit parameters as needed.
Hold: You can hold current measurement display. The red HOLD indication at the upper-left
corner of the screen indicates that the instrument holds current measurement and pauses sweeping. You can press this key again to release holding and continue sweeping.
Auto Scale: You can let the instrument automatically set the Y scale to the minimum and
maximum values of a measurement on the Y-axis of the graph in a way to optimize display of the traces. Every time the AUTO SCALE key is pressed, the top and bottom scales are set to the
minimum and maximum values with margin on the Y-axis of the screen display.
Arrow keys and rotary knob
Key Description
Arrow Keys: You can move selections upward and downward as needed.
Rotary Knob: You can turn this knob clockwise or counter clockwise to increase or
decrease selected value or to move selections such as a marker to the left or right. You can also press this knob to complete input entry or confirm a selected menu.
Chapter 3 Getting Started
CellAdvisor JD720C Series User’s Manual 25
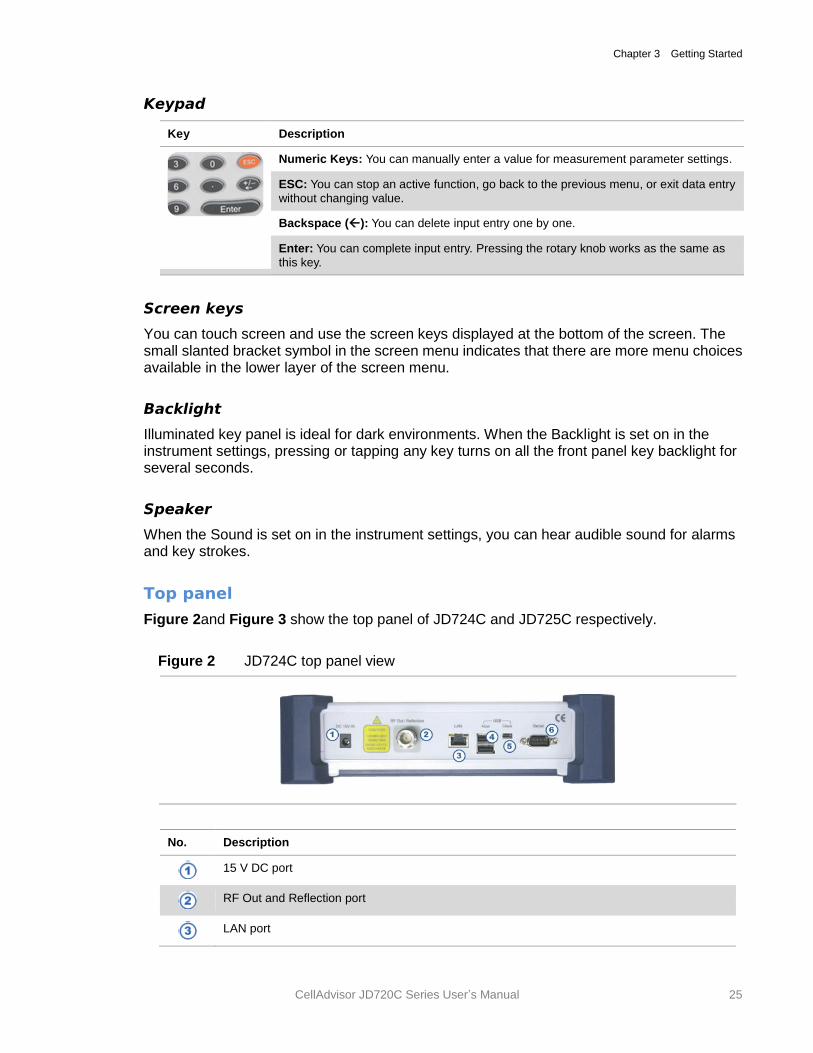
Keypad
Key Description
Numeric Keys: You can manually enter a value for measurement parameter settings.
ESC: You can stop an active function, go back to the previous menu, or exit data entry
without changing value.
Backspace (): You can delete input entry one by one.
Enter: You can complete input entry. Pressing the rotary knob works as the same as
this key.
Screen keys
You can touch screen and use the screen keys displayed at the bottom of the screen. The small slanted bracket symbol in the screen menu indicates that there are more menu choices available in the lower layer of the screen menu.
Backlight
Illuminated key panel is ideal for dark environments. When the Backlight is set on in the instrument settings, pressing or tapping any key turns on all the front panel key backlight for several seconds.
Speaker
When the Sound is set on in the instrument settings, you can hear audible sound for alarms and key strokes.
Top panel
Figure 2and Figure 3 show the top panel of JD724C and JD725C respectively.
Figure 2 JD724C top panel view
No. Description
15 V DC port
RF Out and Reflection port
LAN port
Chapter 3 Getting Started
26 CellAdvisor JD720C User's Manual
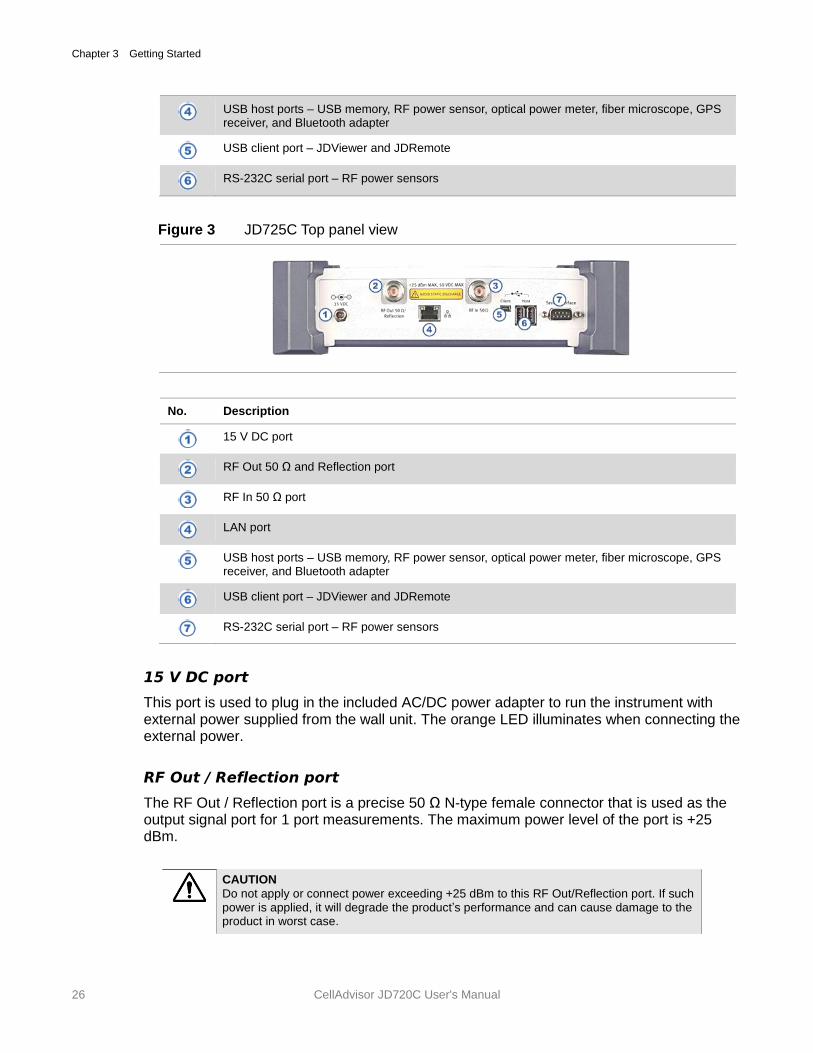
USB host ports – USB memory, RF power sensor, optical power meter, fiber microscope, GPS receiver, and Bluetooth adapter
USB client port – JDViewer and JDRemote
RS-232C serial port – RF power sensors
Figure 3 JD725C Top panel view
No. Description
15 V DC port
RF Out 50 Ω and Reflection port
RF In 50 Ω port
LAN port
USB host ports – USB memory, RF power sensor, optical power meter, fiber microscope, GPS receiver, and Bluetooth adapter
USB client port – JDViewer and JDRemote
RS-232C serial port – RF power sensors
15 V DC port
This port is used to plug in the included AC/DC power adapter to run the instrument with external power supplied from the wall unit. The orange LED illuminates when connecting the external power.
RF Out / Reflection port
The RF Out / Reflection port is a precise 50 Ω N-type female connector that is used as the output signal port for 1 port measurements. The maximum power level of the port is +25 dBm.
CAUTION
Do not apply or connect power exceeding +25 dBm to this RF Out/Reflection port. If such power is applied, it will degrade the product’s performance and can cause damage to the product in worst case.
Chapter 3 Getting Started
CellAdvisor JD720C Series User’s Manual 27
RF In
The RF In port is a precise 50 Ω N-type female connector that is used as the input signal port for 2 port transmission measurements with JD725C and JD726C. The maximum power level of the port is +25 dBm. This port is not available in JD723C and JD724C.
CAUTION
Do not apply or connect power exceeding +25 dBm to this RF In port. If such power is applied, it will degrade the product’s performance and can cause damage to the product in worst case.
LAN port
You can use this Ethernet communication port to connect your instrument and your PC using the application software JDViewer or JDRemote, if needed. Two LEDs indicate data transfer activity and link status.
ACTIVITY: The yellow LED is illuminated during data transfer.
LINK: The green LED is illuminated when there is a valid communication connection.
USB host ports
You can use these USB 2.0 ports to plug in an external USB memory to extend storage capacity or to upgrade the instrument's firmware. It supports most USB memory devices with 32-bit file system. You can also use these ports to connect an external RF power sensor, optical power meter, Bluetooth USB adapter, USB Wi-Fi LAN card, or fiber microscope P5000i. See “Appendix G – Bluetooth connection" on page 182 for more information.
USB client port
You can use this communication port to connect your instrument and your PC with application software JDViewer or JDRemote. You must install driver software for the instrument on to the computer. See “Appendix F – Device driver installation" on page 181 for more information.
Serial port
You can use the RS-232C serial port for power sensors such as JD72450551 and JD72450552. The instrument does not recognize these power sensors automatically. You can also connect your instrument and other application software via RS-232C connection.
Display screen
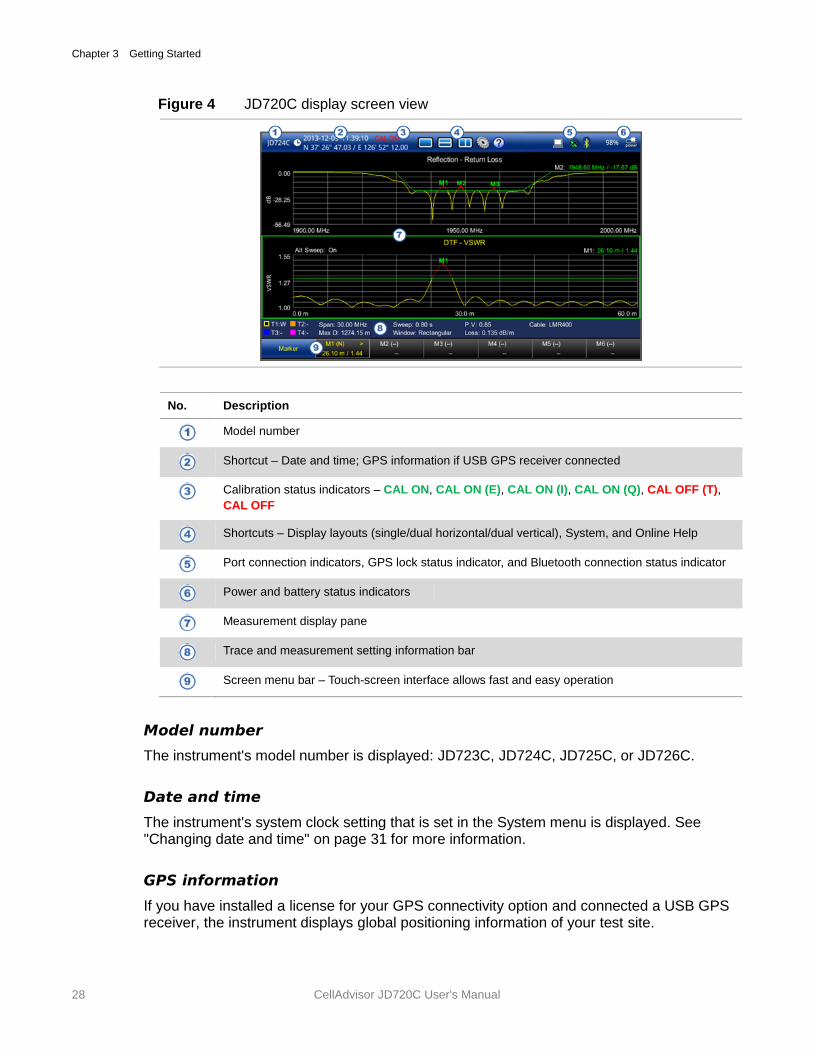
Figure 4 shows the display screen view of the JD720C series analyzers. The indicators and icons in the status bar at the top of the screen give information about the instrument.
In dual display mode, the measurement display pane with outside borders indicates that it is selected and active for operation and analysis. You can simply touch the other measurement display pane on the screen to change the selection of active measurement.
Chapter 3 Getting Started
28 CellAdvisor JD720C User's Manual
Figure 4 JD720C display screen view
No. Description
Model number
Shortcut – Date and time; GPS information if USB GPS receiver connected
Calibration status indicators – CAL ON, CAL ON (E), CAL ON (I), CAL ON (Q), CAL OFF (T),
CAL OFF
Shortcuts – Display layouts (single/dual horizontal/dual vertical), System, and Online Help
Port connection indicators, GPS lock status indicator, and Bluetooth connection status indicator
Power and battery status indicators
Measurement display pane
Trace and measurement setting information bar
Screen menu bar – Touch-screen interface allows fast and easy operation
Model number
The instrument's model number is displayed: JD723C, JD724C, JD725C, or JD726C.
Date and time
The instrument's system clock setting that is set in the System menu is displayed. See "Changing date and time" on page 31 for more information.
GPS information
If you have installed a license for your GPS connectivity option and connected a USB GPS receiver, the instrument displays global positioning information of your test site.
Chapter 3 Getting Started
CellAdvisor JD720C Series User’s Manual 29
Calibration status indicators
The calibration status indicators are important to get reliable measurement results. They include CAL ON, CAL ON (E), CAL ON (I), CAL ON (Q), CAL OFF (T), and CAL OFF. See “Understanding calibration” on page 34 for more information.
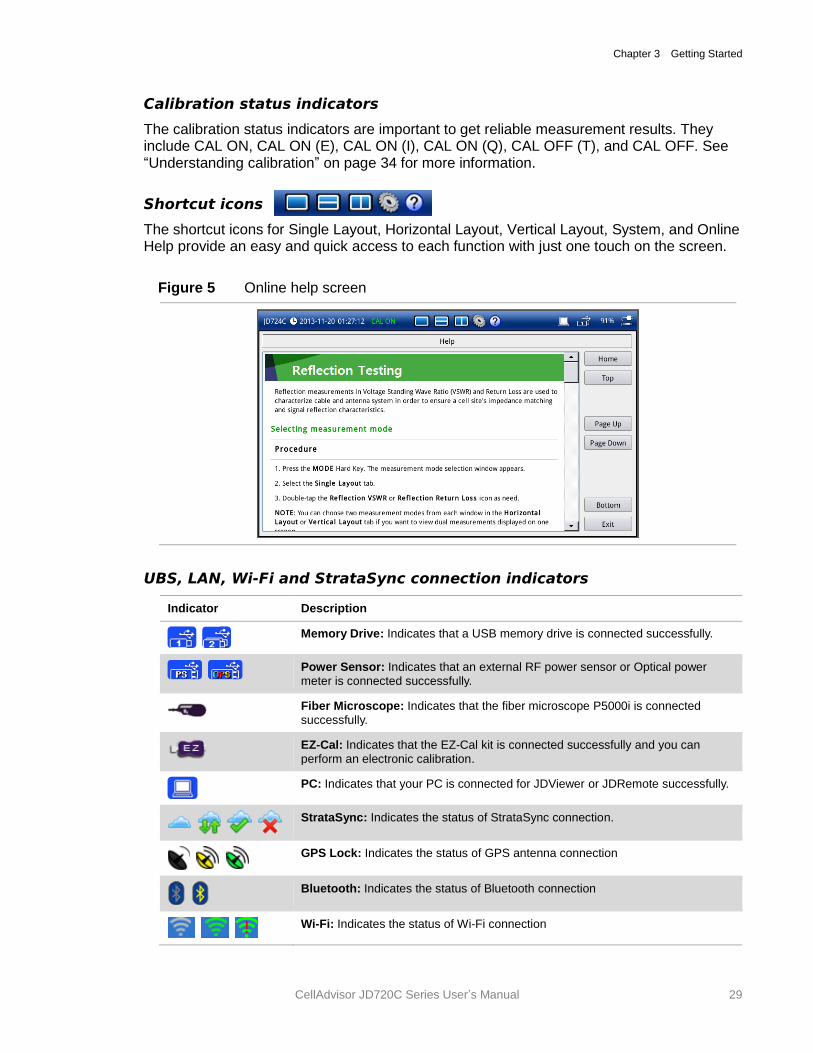
Shortcut icons
The shortcut icons for Single Layout, Horizontal Layout, Vertical Layout, System, and Online Help provide an easy and quick access to each function with just one touch on the screen.
Figure 5 Online help screen
UBS, LAN, Wi-Fi and StrataSync connection indicators
Indicator Description
Memory Drive: Indicates that a USB memory drive is connected successfully.
Power Sensor: Indicates that an external RF power sensor or Optical power
meter is connected successfully.
Fiber Microscope: Indicates that the fiber microscope P5000i is connected
successfully.
EZ-Cal: Indicates that the EZ-Cal kit is connected successfully and you can
perform an electronic calibration.
PC: Indicates that your PC is connected for JDViewer or JDRemote successfully.
StrataSync: Indicates the status of StrataSync connection.
GPS Lock: Indicates the status of GPS antenna connection
Bluetooth: Indicates the status of Bluetooth connection
Wi-Fi: Indicates the status of Wi-Fi connection
Chapter 3 Getting Started
30 CellAdvisor JD720C User's Manual
Power and battery indicators
Indicator Description
DC Supply: Indicates that external power is supplied to the instrument. The installed battery is
charged when the external power supply is connected.
Battery: Indicates that the instrument has a battery pack in it and shows the remaining battery
level or charging status in percentage.
Measurement display pane
There are three display layouts available: single, dual horizontal and dual vertical. For the dual layout modes, the screen displays two measurement panes horizontally or vertically.
Trace and measurement setting information bar
This bar shows information about traces and measurement settings for the displayed measurement.
Screen menu bar
The screen menu bar displays a set of screen keys at the bottom of the screen when you press the MARKER, PEAK, TRACE, or LIMIT hard key. You can tap a screen key to execute its function as needed.
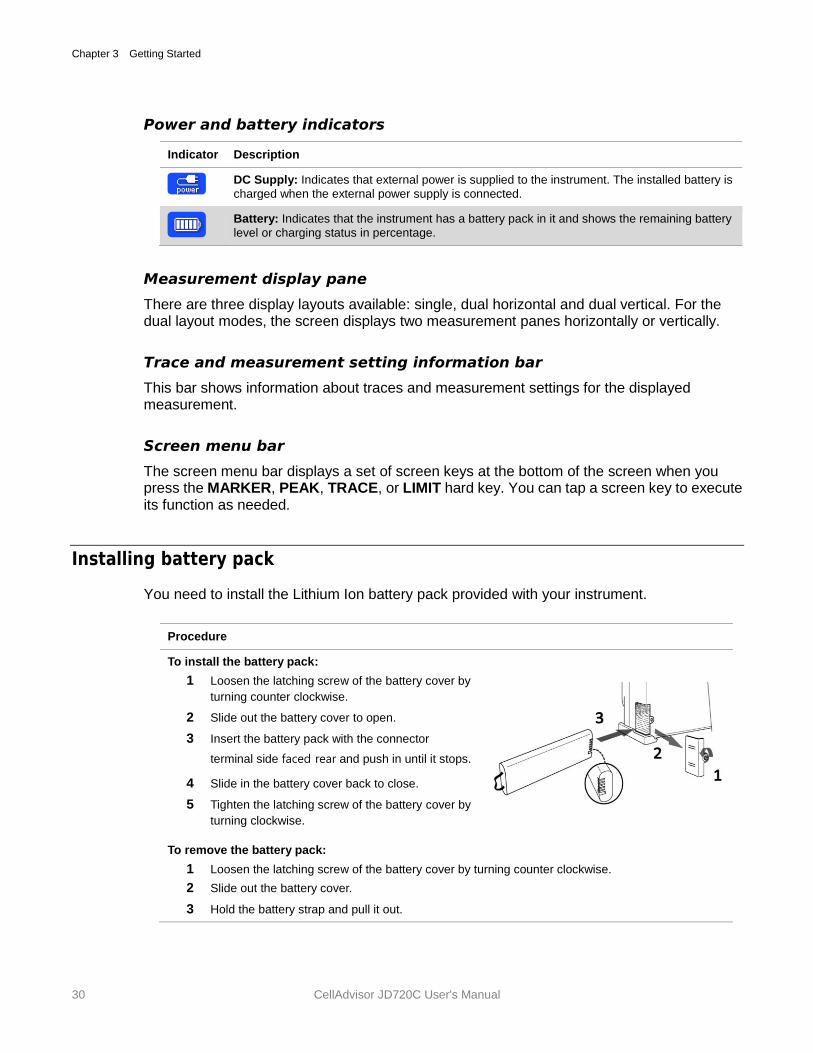
Installing battery pack
You need to install the Lithium Ion battery pack provided with your instrument.
Procedure
To install the battery pack:
1 Loosen the latching screw of the battery cover by
turning counter clockwise.
2 Slide out the battery cover to open.
3 Insert the battery pack with the connector
terminal side faced rear and push in until it stops.
4 Slide in the battery cover back to close.
5 Tighten the latching screw of the battery cover by
turning clockwise.
To remove the battery pack:
1 Loosen the latching screw of the battery cover by turning counter clockwise.
2 Slide out the battery cover.
3 Hold the battery strap and pull it out.
Chapter 3 Getting Started
CellAdvisor JD720C Series User’s Manual 31
CAUTION
The battery pack that came with your instrument is Lithium Ion and it may, if not connected correctly, lead to explosion. In case you need to replace the battery, you must use one of the same kinds or compatible ones. You must dispose a battery according to your local safety and environmental regulations.
NOTE
It is recommended that you turn off the instrument to replace the battery. However, if you do not want to interrupt the current test, you can leave the module turned on with the AC power adapter plugged in.
Starting up your JD720C series
Use the power button to turn your instrument on or off. When the external power is supplied via the AC/DC adapter, the left orange LED is illuminated.
Procedure
To turn on:
1 Press and hold the POWER button for a few seconds until the right green LED indicator is
illuminated.
2 Release the button and wait for a few seconds while booting up. To turn off:
1 Press and hold the POWER button for a few seconds until the right green LED indicator
goes out.
2 Release the button.
Changing date and time
The instrument provides real time clock powered up by a separate internal battery to maintain the timing information even when the Lithium-Ion battery is fully discharged or the system power is disconnected. The system clock is preset for the time zone of South Korea in the format of YYMMDD.
Procedure
1 Press the MODE hard key and then tap the System button. You can also directly touch the date
and time information displayed at the top of the screen.
The System window appears.
2 Touch the Instrument Settings tab.
The Instrument Settings window appears.
3 Tap the bar for the Date/Time.
The Date and Time pane appears.
4 Tap the drop-down list button for the Standard Time Zone and then select your time zone.
5 Select the Date Format option from the choices: YYMMDD, MMDDYY, and DDMMYY.
6 To set the date and time manually, complete the following steps:

Chapter 3 Getting Started
32 CellAdvisor JD720C User's Manual
a Select the Date input box for year, month, or day.
b Enter a number by using the numeric keys or the rotary knob.
c Select the Time input box for hour, minute, or second.
d Enter a number by using the numeric keys or the rotary knob.
e Tap the Apply button in the Date and Time pane to save the change(s).
7 Tap the Apply or Exit button in the lower-right corner of the Instrument Settings window to return
to the measurement screen.
4
CellAdvisor JD720C User's Manual
Chapter 4 Performing Calibration
This chapter provides instructions on how to perform calibration properly in order to obtain accurate measurement results. Topics discussed in this chapter are as follows:
Understanding calibration .................................................................................................... 34
Performing 1-port calibration ................................................................................................ 35
Performing 2-port calibration ................................................................................................ 40
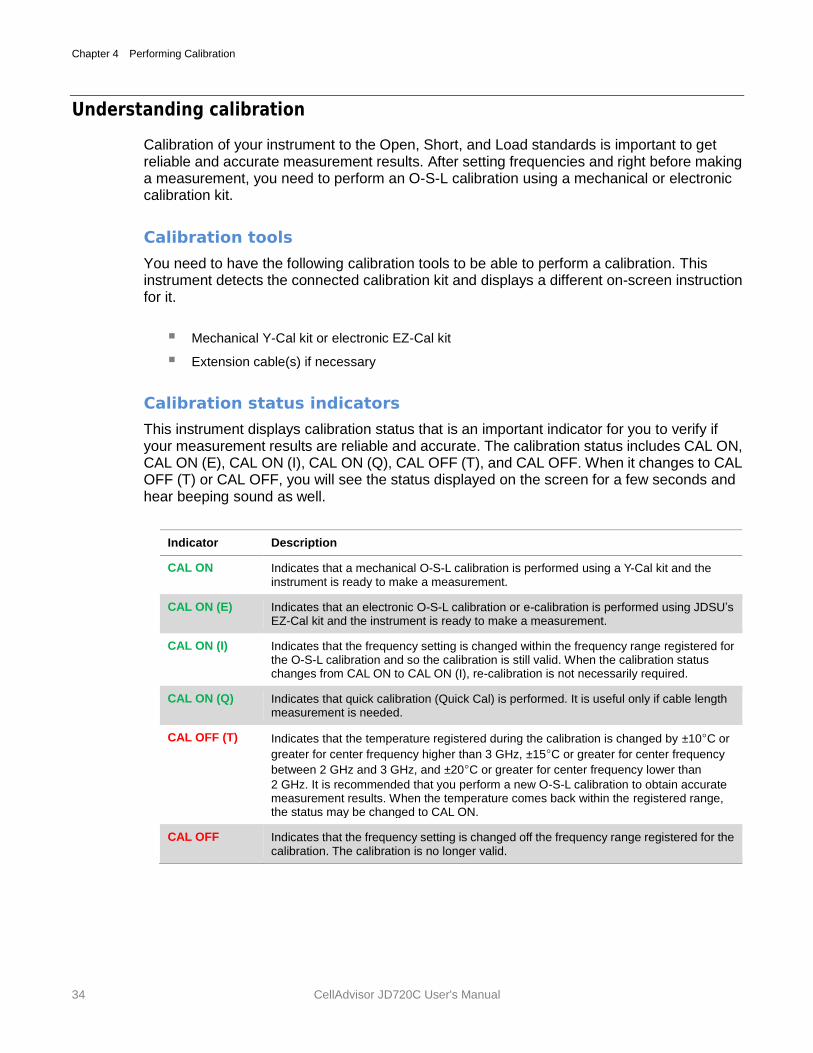
Chapter 4 Performing Calibration
34 CellAdvisor JD720C User's Manual
Understanding calibration
Calibration of your instrument to the Open, Short, and Load standards is important to get reliable and accurate measurement results. After setting frequencies and right before making a measurement, you need to perform an O-S-L calibration using a mechanical or electronic calibration kit.
Calibration tools
You need to have the following calibration tools to be able to perform a calibration. This instrument detects the connected calibration kit and displays a different on-screen instruction for it.
Mechanical Y-Cal kit or electronic EZ-Cal kit
Extension cable(s) if necessary
Calibration status indicators
This instrument displays calibration status that is an important indicator for you to verify if your measurement results are reliable and accurate. The calibration status includes CAL ON, CAL ON (E), CAL ON (I), CAL ON (Q), CAL OFF (T), and CAL OFF. When it changes to CAL OFF (T) or CAL OFF, you will see the status displayed on the screen for a few seconds and hear beeping sound as well.
Indicator Description
CAL ON Indicates that a mechanical O-S-L calibration is performed using a Y-Cal kit and the instrument is ready to make a measurement.
CAL ON (E) Indicates that an electronic O-S-L calibration or e-calibration is performed using JDSU’s EZ-Cal kit and the instrument is ready to make a measurement.
CAL ON (I) Indicates that the frequency setting is changed within the frequency range registered for the O-S-L calibration and so the calibration is still valid. When the calibration status changes from CAL ON to CAL ON (I), re-calibration is not necessarily required.
CAL ON (Q) Indicates that quick calibration (Quick Cal) is performed. It is useful only if cable length measurement is needed.
CAL OFF (T) Indicates that the temperature registered during the calibration is changed by ±10°C or
greater for center frequency higher than 3 GHz, ±15°C or greater for center frequency
between 2 GHz and 3 GHz, and ±20°C or greater for center frequency lower than
2 GHz. It is recommended that you perform a new O-S-L calibration to obtain accurate measurement results. When the temperature comes back within the registered range, the status may be changed to CAL ON.
CAL OFF Indicates that the frequency setting is changed off the frequency range registered for the calibration. The calibration is no longer valid.
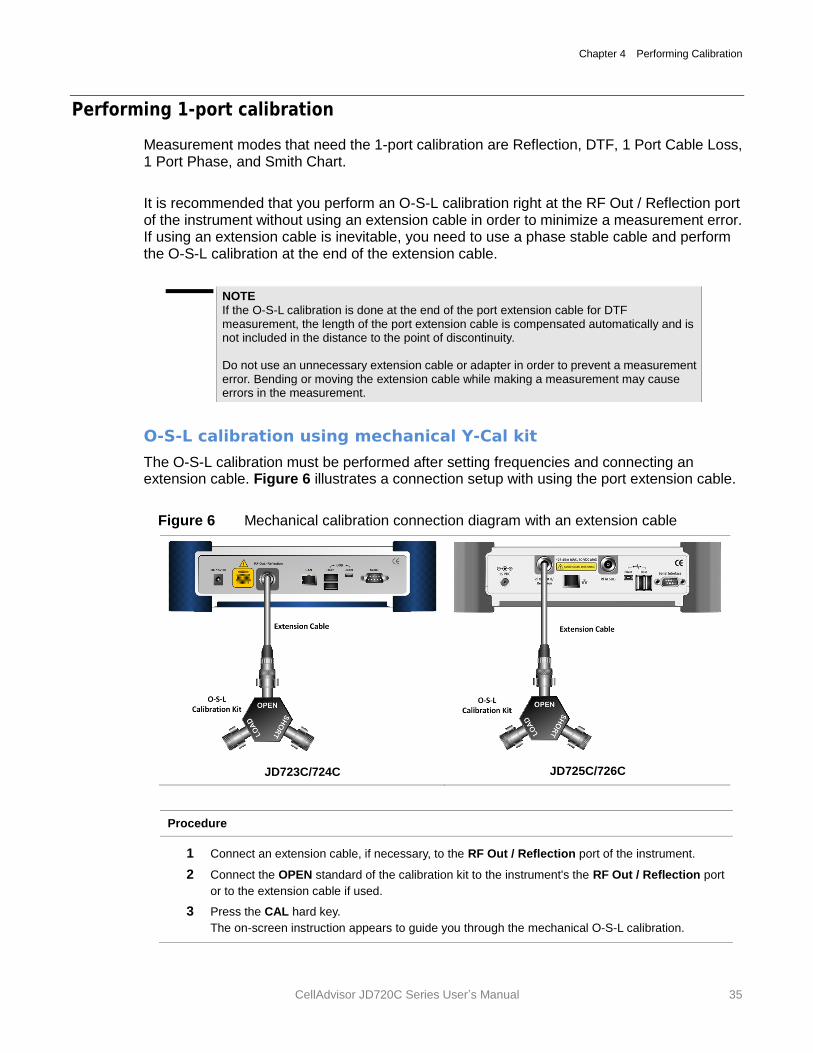
Chapter 4 Performing Calibration
CellAdvisor JD720C Series User’s Manual 35
Performing 1-port calibration
Measurement modes that need the 1-port calibration are Reflection, DTF, 1 Port Cable Loss, 1 Port Phase, and Smith Chart.
It is recommended that you perform an O-S-L calibration right at the RF Out / Reflection port of the instrument without using an extension cable in order to minimize a measurement error. If using an extension cable is inevitable, you need to use a phase stable cable and perform the O-S-L calibration at the end of the extension cable.
NOTE
If the O-S-L calibration is done at the end of the port extension cable for DTF measurement, the length of the port extension cable is compensated automatically and is not included in the distance to the point of discontinuity. Do not use an unnecessary extension cable or adapter in order to prevent a measurement error. Bending or moving the extension cable while making a measurement may cause errors in the measurement.
O-S-L calibration using mechanical Y-Cal kit
The O-S-L calibration must be performed after setting frequencies and connecting an extension cable. Figure 6 illustrates a connection setup with using the port extension cable.
Figure 6 Mechanical calibration connection diagram with an extension cable
JD723C/724C
JD725C/726C
Procedure
1 Connect an extension cable, if necessary, to the RF Out / Reflection port of the instrument.
2 Connect the OPEN standard of the calibration kit to the instrument's the RF Out / Reflection port
or to the extension cable if used.
3 Press the CAL hard key.
The on-screen instruction appears to guide you through the mechanical O-S-L calibration.
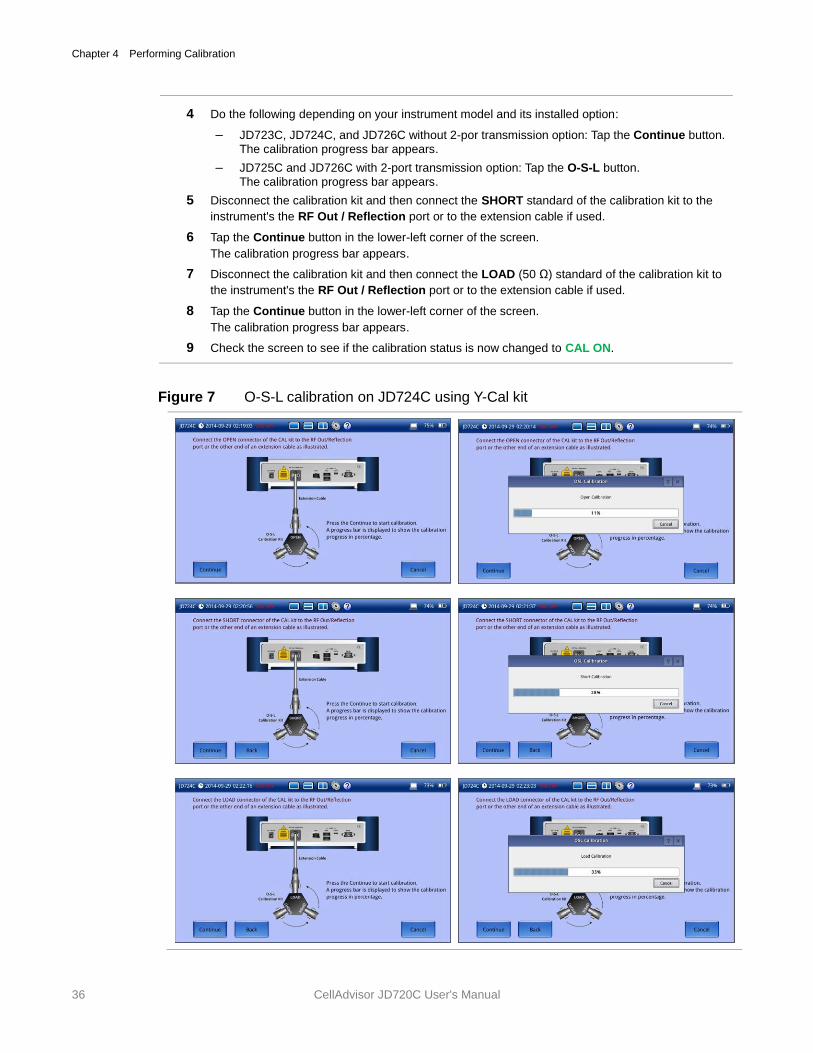
Chapter 4 Performing Calibration
36 CellAdvisor JD720C User's Manual
4 Do the following depending on your instrument model and its installed option:
– JD723C, JD724C, and JD726C without 2-por transmission option: Tap the Continue button.
The calibration progress bar appears.
– JD725C and JD726C with 2-port transmission option: Tap the O-S-L button.
The calibration progress bar appears.
5 Disconnect the calibration kit and then connect the SHORT standard of the calibration kit to the
instrument's the RF Out / Reflection port or to the extension cable if used.
6 Tap the Continue button in the lower-left corner of the screen.
The calibration progress bar appears.
7 Disconnect the calibration kit and then connect the LOAD (50 Ω) standard of the calibration kit to
the instrument's the RF Out / Reflection port or to the extension cable if used.
8 Tap the Continue button in the lower-left corner of the screen.
The calibration progress bar appears.
9 Check the screen to see if the calibration status is now changed to CAL ON.
Figure 7 O-S-L calibration on JD724C using Y-Cal kit
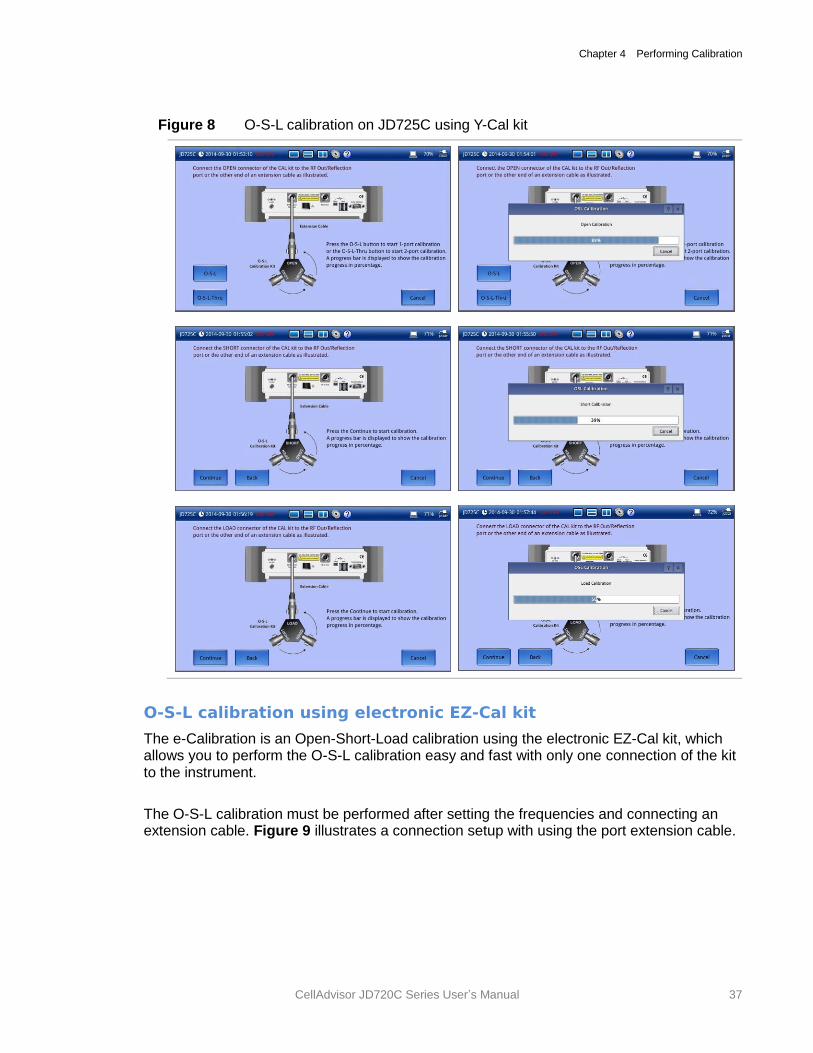
Chapter 4 Performing Calibration
CellAdvisor JD720C Series User’s Manual 37
Figure 8 O-S-L calibration on JD725C using Y-Cal kit
O-S-L calibration using electronic EZ-Cal kit
The e-Calibration is an Open-Short-Load calibration using the electronic EZ-Cal kit, which allows you to perform the O-S-L calibration easy and fast with only one connection of the kit to the instrument.
The O-S-L calibration must be performed after setting the frequencies and connecting an extension cable. Figure 9 illustrates a connection setup with using the port extension cable.
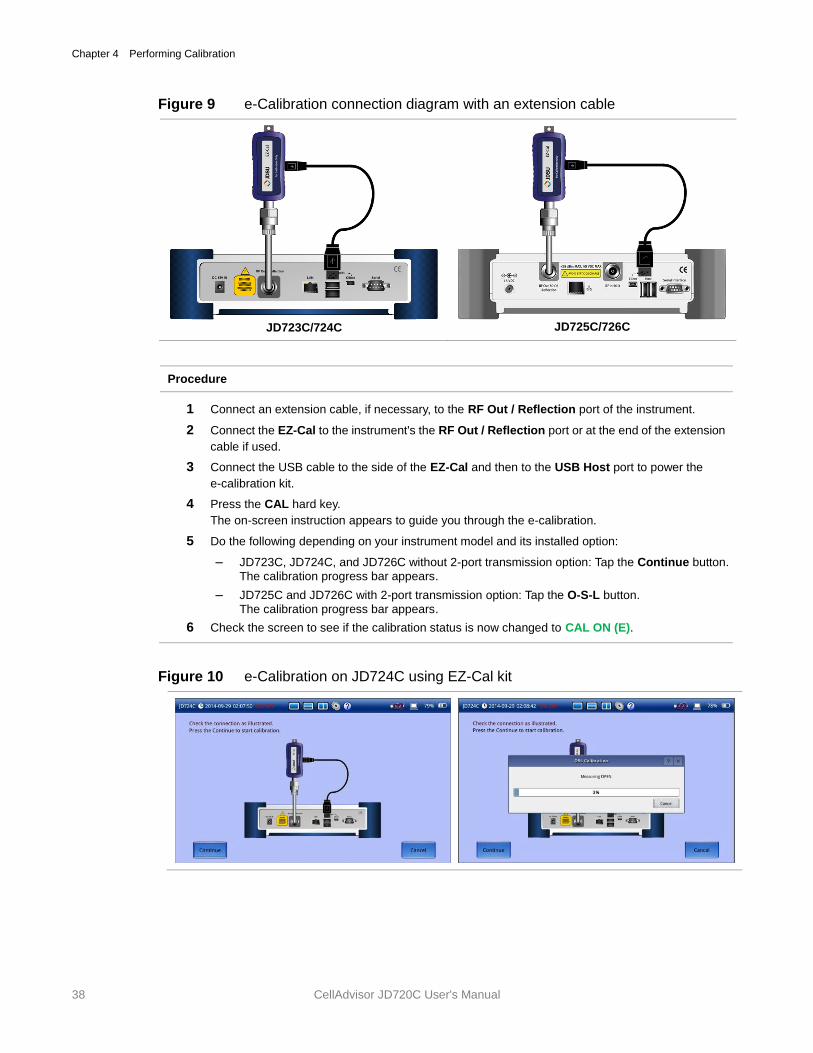
Chapter 4 Performing Calibration
38 CellAdvisor JD720C User's Manual
Figure 9 e-Calibration connection diagram with an extension cable
JD723C/724C
JD725C/726C
Procedure
1 Connect an extension cable, if necessary, to the RF Out / Reflection port of the instrument.
2 Connect the EZ-Cal to the instrument's the RF Out / Reflection port or at the end of the extension
cable if used.
3 Connect the USB cable to the side of the EZ-Cal and then to the USB Host port to power the
e-calibration kit.
4 Press the CAL hard key.
The on-screen instruction appears to guide you through the e-calibration.
5 Do the following depending on your instrument model and its installed option:
– JD723C, JD724C, and JD726C without 2-port transmission option: Tap the Continue button.
The calibration progress bar appears.
– JD725C and JD726C with 2-port transmission option: Tap the O-S-L button.
The calibration progress bar appears.
6 Check the screen to see if the calibration status is now changed to CAL ON (E).
Figure 10 e-Calibration on JD724C using EZ-Cal kit
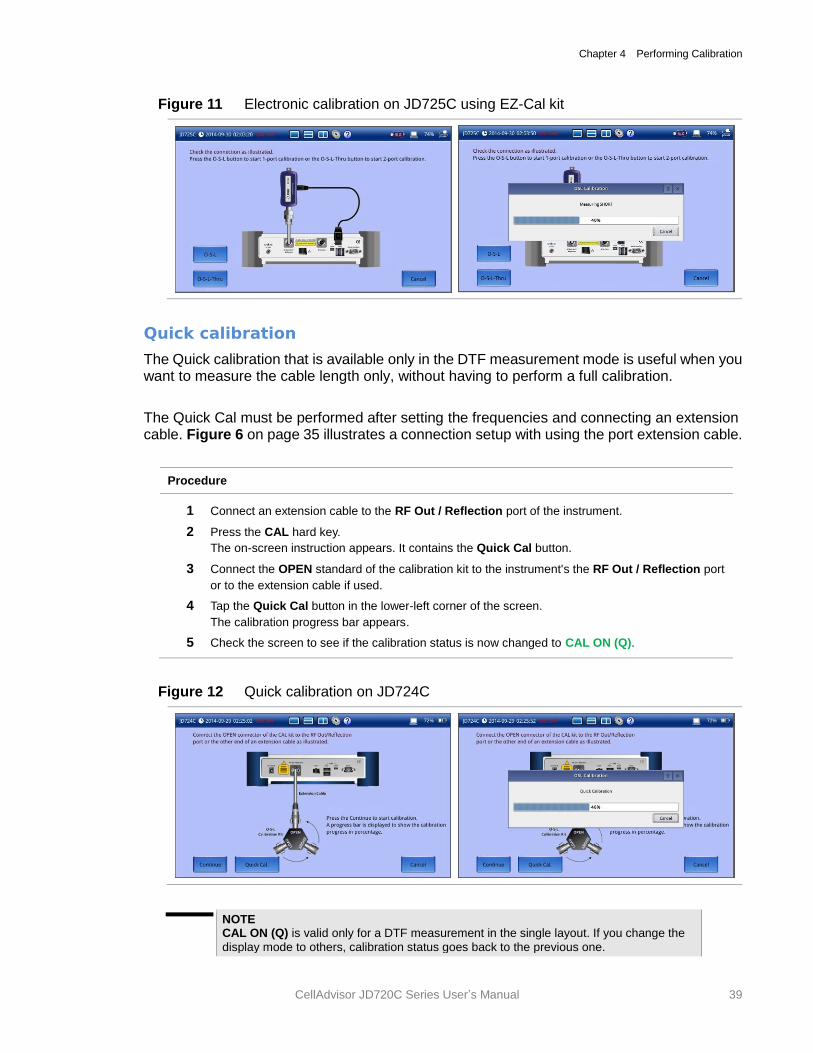
Chapter 4 Performing Calibration
CellAdvisor JD720C Series User’s Manual 39
Figure 11 Electronic calibration on JD725C using EZ-Cal kit
Quick calibration
The Quick calibration that is available only in the DTF measurement mode is useful when you want to measure the cable length only, without having to perform a full calibration.
The Quick Cal must be performed after setting the frequencies and connecting an extension cable. Figure 6 on page 35 illustrates a connection setup with using the port extension cable.
Procedure
1 Connect an extension cable to the RF Out / Reflection port of the instrument.
2 Press the CAL hard key.
The on-screen instruction appears. It contains the Quick Cal button.
3 Connect the OPEN standard of the calibration kit to the instrument's the RF Out / Reflection port
or to the extension cable if used.
4 Tap the Quick Cal button in the lower-left corner of the screen.
The calibration progress bar appears.
5 Check the screen to see if the calibration status is now changed to CAL ON (Q).
Figure 12 Quick calibration on JD724C
NOTE CAL ON (Q) is valid only for a DTF measurement in the single layout. If you change the
display mode to others, calibration status goes back to the previous one.
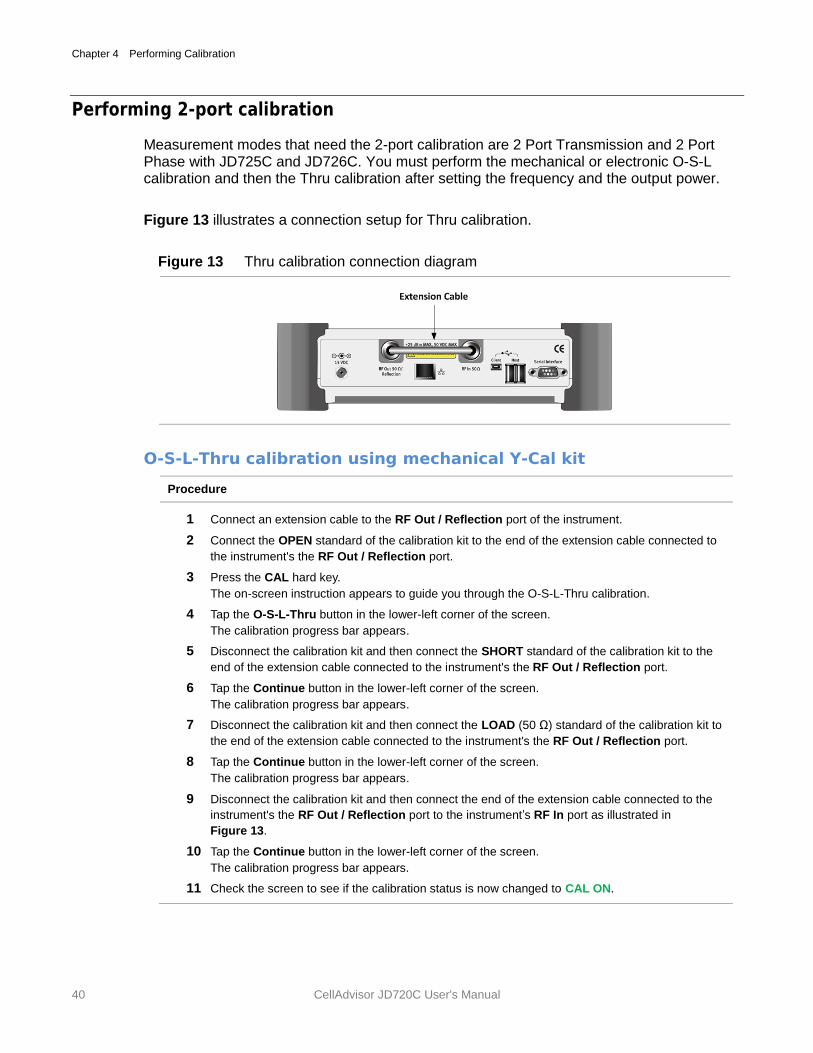
Chapter 4 Performing Calibration
40 CellAdvisor JD720C User's Manual
Performing 2-port calibration
Measurement modes that need the 2-port calibration are 2 Port Transmission and 2 Port Phase with JD725C and JD726C. You must perform the mechanical or electronic O-S-L calibration and then the Thru calibration after setting the frequency and the output power.
Figure 13 illustrates a connection setup for Thru calibration.
Figure 13 Thru calibration connection diagram
O-S-L-Thru calibration using mechanical Y-Cal kit
Procedure
1 Connect an extension cable to the RF Out / Reflection port of the instrument.
2 Connect the OPEN standard of the calibration kit to the end of the extension cable connected to
the instrument's the RF Out / Reflection port.
3 Press the CAL hard key.
The on-screen instruction appears to guide you through the O-S-L-Thru calibration.
4 Tap the O-S-L-Thru button in the lower-left corner of the screen.
The calibration progress bar appears.
5 Disconnect the calibration kit and then connect the SHORT standard of the calibration kit to the
end of the extension cable connected to the instrument's the RF Out / Reflection port.
6 Tap the Continue button in the lower-left corner of the screen.
The calibration progress bar appears.
7 Disconnect the calibration kit and then connect the LOAD (50 Ω) standard of the calibration kit to
the end of the extension cable connected to the instrument's the RF Out / Reflection port.
8 Tap the Continue button in the lower-left corner of the screen.
The calibration progress bar appears.
9 Disconnect the calibration kit and then connect the end of the extension cable connected to the
instrument's the RF Out / Reflection port to the instrument’s RF In port as illustrated in
Figure 13.
10 Tap the Continue button in the lower-left corner of the screen.
The calibration progress bar appears.
11 Check the screen to see if the calibration status is now changed to CAL ON.
Chapter 4 Performing Calibration
CellAdvisor JD720C Series User’s Manual 41
O-S-L-Thru calibration using electronic EZ-Cal kit
Procedure
1 Connect an extension cable, to the RF Out / Reflection port of the instrument.
2 Connect the EZ-Cal to the end of the extension cable connected to the instrument's the RF Out /
Reflection port.
3 Connect the USB cable to the side of the EZ-Cal and then to the USB Host port to power the
e-calibration kit.
4 Press the CAL hard key.
The on-screen instruction appears to guide you through the e-calibration.
5 Tap the O-S-L-Thru button in the lower-left corner of the screen.
The calibration progress bar appears.
6 Disconnect the EZ-Cal kit and then connect the end of the extension cable connected to the
instrument’s RF Out / Reflection port to the instrument’s RF In port as illustrated in
Figure 13.
7 Tap the Continue button in the lower-left corner of the screen.
The calibration progress bar appears.
8 Check the screen to see if the calibration status is now changed to CAL ON (E).

5
CellAdvisor JD720C User's Manual
Chapter 5 Reflection Testing
This chapter provides instructions on how to perform Reflection measurements in VSWR or Return Loss. Topics discussed in this chapter are as follows:
Introducing reflection measurements ................................................................................... 43
Preparing for a measurement .............................................................................................. 45
Making a measurement ....................................................................................................... 48
Analyzing measurement results ........................................................................................... 51
Chapter 5 Reflection Testing
CellAdvisor JD720C Series User’s Manual 43
Introducing reflection measurements
Reflection measurements in VSWR or Return Loss are used to characterize cable and antenna system in order to ensure a cell site's impedance matching and signal reflection characteristics.
A proper RF emission in cell sites is achieved with a maximum power transfer from the transmitter to the antenna, where all the transmission media should have an impedance match. A mismatch at the antenna system produces a reflective 'traveling wave’ that goes in the opposite direction from the incident wave. As the two traveling waves cross each other in opposite direction, it is produce an interference pattern called a "standing wave". VSWR is the ratio between the power that is sent forward to the cable and/or antenna and the amount of the power that is reflected back to the transmitter.
Some of the consequences of having a high VSWR condition in cellular services are dropped calls, poor reception, and an overall unacceptable performance in the cell (or section of cell) coverage covered by the base station antenna. Therefore, the VSWR of the antenna system including the feed line is one of the most critical factors in the service and maintenance of the RF transmitter systems.
VSWR
In telecommunications, standing wave ratio (SWR) is the ratio of the amplitude of a partial standing wave at its maximum amplitude and at its minimum, in an electrical transmission line. The SWR is usually defined as a voltage ratio called the VSWR, for voltage standing wave ratio. For example, the VSWR value 1.2:1 denotes the maximum standing wave amplitude that is 1.2 times greater than the minimum standing wave value.
Return loss
In telecommunications, return loss is a measure of power reflected from imperfections in an electrical or optical communication link. The ratio (PR / PT), represents the wave power reflected from the imperfection (PR) to that of the incident, or transmitted, wave, (PT). For maximum transmitted power, the return loss should be as small as possible, meaning the ratio PR / PT should be as small as possible.
Return loss is usually expressed in dB and the return loss value describes the reduction in the amplitude of the reflected energy, as compared to the forward energy. It will always be a loss and therefore a negative dB. However, you can write -3 dB simply as 3 dB of loss, dropping the negative sign and adding loss. For example, if a device has 15 dB of return loss, the reflected energy from that device (PR), is always 15 dB lower than the transmitted energy (PT). When expressed in dB, larger (in magnitude) negative numbers represent larger return losses and thus smaller reflected power (PR).
In electrical systems, return losses often occur at junctions between transmission lines and terminating impedances. It is a measure of the dissimilarity between impedances in metallic transmission lines and loads. For devices that are not perfect transmission lines or purely resistive loads, the return loss value varies with the frequency of the transmitted signal.
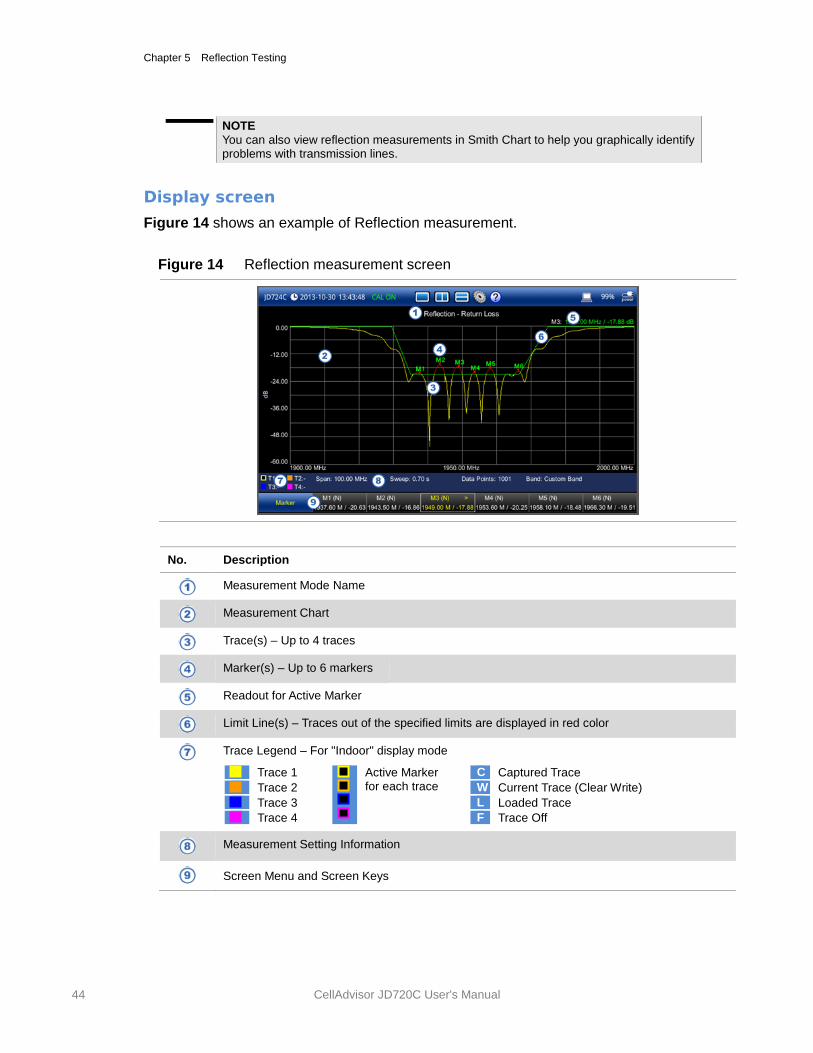
Chapter 5 Reflection Testing
44 CellAdvisor JD720C User's Manual
NOTE
You can also view reflection measurements in Smith Chart to help you graphically identify problems with transmission lines.
Display screen
Figure 14 shows an example of Reflection measurement.
Figure 14 Reflection measurement screen
No. Description
Measurement Mode Name
Measurement Chart
Trace(s) – Up to 4 traces
Marker(s) – Up to 6 markers
Readout for Active Marker
Limit Line(s) – Traces out of the specified limits are displayed in red color
Trace Legend – For "Indoor" display mode
Trace 1
Active Marker for each trace
C Captured Trace
Trace 2 W Current Trace (Clear Write)
Trace 3 L Loaded Trace
Trace 4 F Trace Off
Measurement Setting Information
Screen Menu and Screen Keys
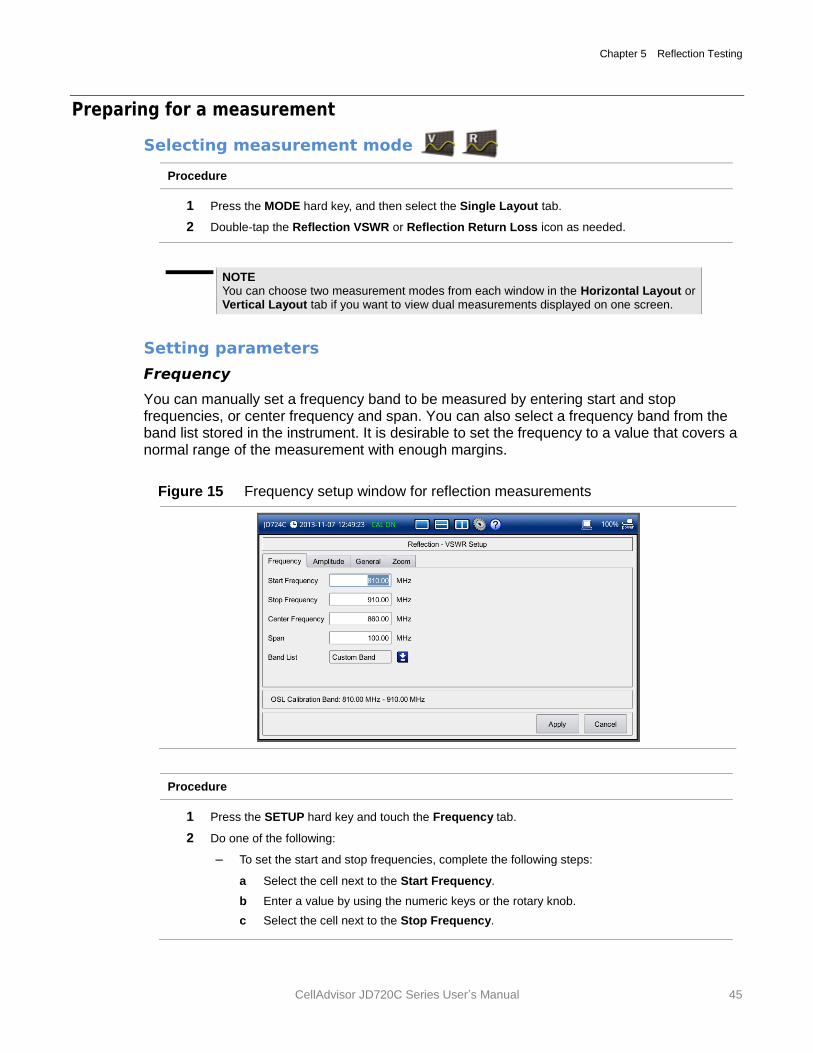
Chapter 5 Reflection Testing
CellAdvisor JD720C Series User’s Manual 45
Preparing for a measurement
Selecting measurement mode
Procedure
1 Press the MODE hard key, and then select the Single Layout tab.
2 Double-tap the Reflection VSWR or Reflection Return Loss icon as needed.
NOTE You can choose two measurement modes from each window in the Horizontal Layout or Vertical Layout tab if you want to view dual measurements displayed on one screen.
Setting parameters
Frequency
You can manually set a frequency band to be measured by entering start and stop frequencies, or center frequency and span. You can also select a frequency band from the band list stored in the instrument. It is desirable to set the frequency to a value that covers a normal range of the measurement with enough margins.
Figure 15 Frequency setup window for reflection measurements
Procedure
1 Press the SETUP hard key and touch the Frequency tab.
2 Do one of the following:
– To set the start and stop frequencies, complete the following steps:
a Select the cell next to the Start Frequency.
b Enter a value by using the numeric keys or the rotary knob.
c Select the cell next to the Stop Frequency.
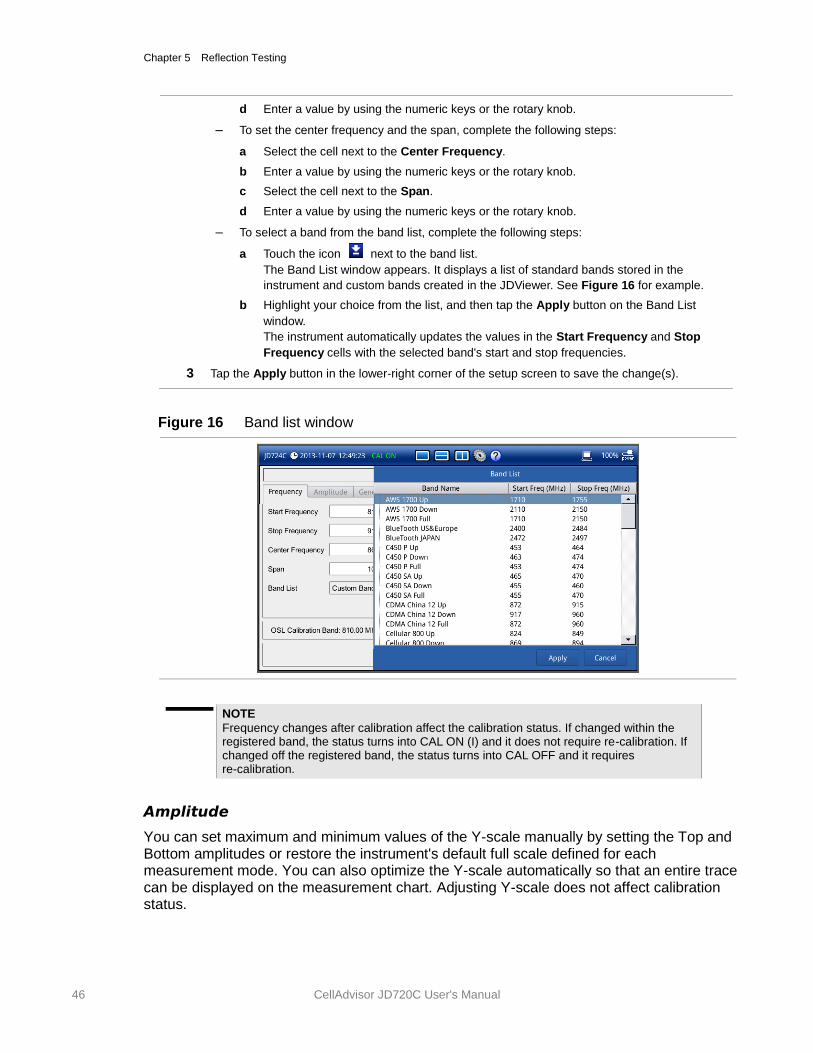
Chapter 5 Reflection Testing
46 CellAdvisor JD720C User's Manual
d Enter a value by using the numeric keys or the rotary knob.
– To set the center frequency and the span, complete the following steps:
a Select the cell next to the Center Frequency.
b Enter a value by using the numeric keys or the rotary knob.
c Select the cell next to the Span.
d Enter a value by using the numeric keys or the rotary knob.
– To select a band from the band list, complete the following steps:
a Touch the icon next to the band list.
The Band List window appears. It displays a list of standard bands stored in the
instrument and custom bands created in the JDViewer. See Figure 16 for example.
b Highlight your choice from the list, and then tap the Apply button on the Band List
window.
The instrument automatically updates the values in the Start Frequency and Stop
Frequency cells with the selected band's start and stop frequencies.
3 Tap the Apply button in the lower-right corner of the setup screen to save the change(s).
Figure 16 Band list window
NOTE
Frequency changes after calibration affect the calibration status. If changed within the registered band, the status turns into CAL ON (I) and it does not require re-calibration. If changed off the registered band, the status turns into CAL OFF and it requires re-calibration.
Amplitude
You can set maximum and minimum values of the Y-scale manually by setting the Top and Bottom amplitudes or restore the instrument's default full scale defined for each measurement mode. You can also optimize the Y-scale automatically so that an entire trace can be displayed on the measurement chart. Adjusting Y-scale does not affect calibration status.
Chapter 5 Reflection Testing
CellAdvisor JD720C Series User’s Manual 47
Procedure
1 Press the SETUP hard key and touch the Amplitude tab.
2 Do one of the following:
– To set the Top and Bottom amplitudes manually, complete the following steps:
a Select the cell next to the Top.
b Enter a value by using the numeric keys or the rotary knob.
The entered value becomes the maximum value for the Y-scale.
c Select the cell next to the Bottom.
d Enter a value by using the numeric keys or the rotary knob.
The entered value becomes the minimum value for the Y-scale.
– To restore the instrument’s default range for the Y-scale, tap the Full Scale button. The amplitude range for the Reflection mode is 1 to 65 in VSWR and -60 to 0 dB in Return Loss.
3 Tap the Apply button in the lower-right corner of the setup screen to save the change(s).
NOTE
You can also press the AUTO SCALE hard key any time you need to view the
entire trace on the measurement chart. The instrument automatically optimizes the maximum and minimum values of the Y-scale to display the entire trace.
General parameters
You can select options for Data Points and Interference Rejection. For JD725C and JD726, you can also set the Bias Tee option if you have purchased the option 001 Bias Tee.
Procedure
1 Press the SETUP hard key and touch the General tab.
2 To set the measurement resolution, select the Data Points option from the choices: 126, 251,
501, 1001, and 2001.
NOTE Default setting is 1001. It is recommended that you select high resolution data points
only for an instance of measuring wide frequency bands or requiring precise measurement data. The larger number you choose, the higher resolution you get and the longer the instrument takes to sweep and display results. For example, selecting 501 data points provides twice as many measurement points as 251, but it may take twice longer to sweep and display the trace than choosing 251 data points. Changing data points does not affect calibration status.
3 To enable the Interference Rejection feature, select On.
NOTE Default setting is Off. It is recommended to use this feature only when you suspect
interfering signals in the area as it slows down measurement.
4 For JD725C and JD726C users with the option 001 Bias Tee installed. To use the Bias Tee,
complete the following steps:
Chapter 5 Reflection Testing
48 CellAdvisor JD720C User's Manual
a Select On for the Bias Tee.
b Enter a value between 12 and 32 with 1 V step, as you desire.
NOTE If you have set this Bias Tee to On, the instrument will supply a DC bias of set level (12 – 32 V) from the RF In port to an active device, such as Tower Mounted Amplifier
(TMA) or Low Noise Amplifier (LNA), through the transmission line, eliminating the need of an external power supply.
5 Tap the Apply button in the lower-right corner of the setup screen to save the change(s).
Performing calibration
Perform the mechanical or electronic O-S-L Calibration by pressing the CAL hard key. The instrument displays on-screen instructions for you to follow through. See “Performing Calibration” on page 33 for more information.
Making a measurement
Once the O-S-L calibration is done, the instrument is now ready to make a reflection measurement in VSWR or Return Loss.
Procedure
1 Disconnect the calibration kit from the calibration point.
2 Connect an antenna or feed line to the calibration point, where is usually at the extension cable
end if used. See Figure 17 for the cable connection diagram.
3 Your measurement result is displayed on the screen in real time.
CAUTION Do not apply or connect power exceeding +25 dBm to the RF Out / Reflection port. When
the input signal power is greater than +25 dBm, the input power protection is triggered to protect the instrument and a measurement comes to stop automatically.
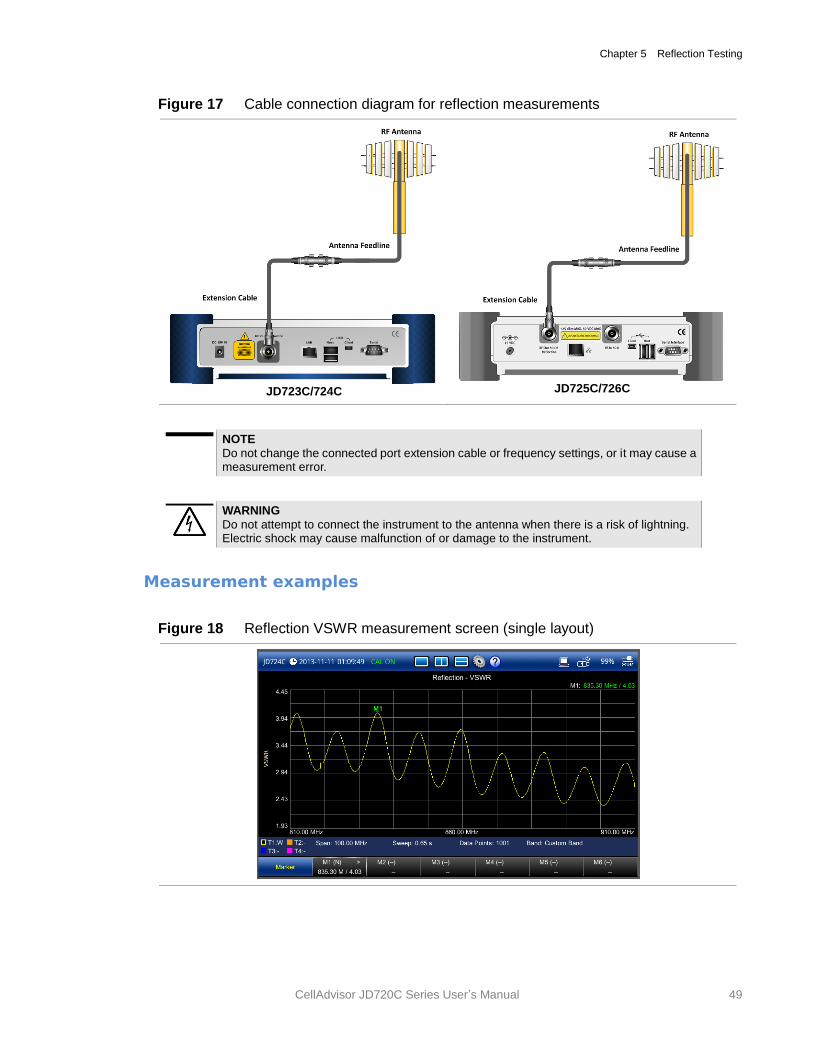
Chapter 5 Reflection Testing
CellAdvisor JD720C Series User’s Manual 49
Figure 17 Cable connection diagram for reflection measurements
JD723C/724C
JD725C/726C
NOTE
Do not change the connected port extension cable or frequency settings, or it may cause a measurement error.
WARNING
Do not attempt to connect the instrument to the antenna when there is a risk of lightning. Electric shock may cause malfunction of or damage to the instrument.
Measurement examples
Figure 18 Reflection VSWR measurement screen (single layout)
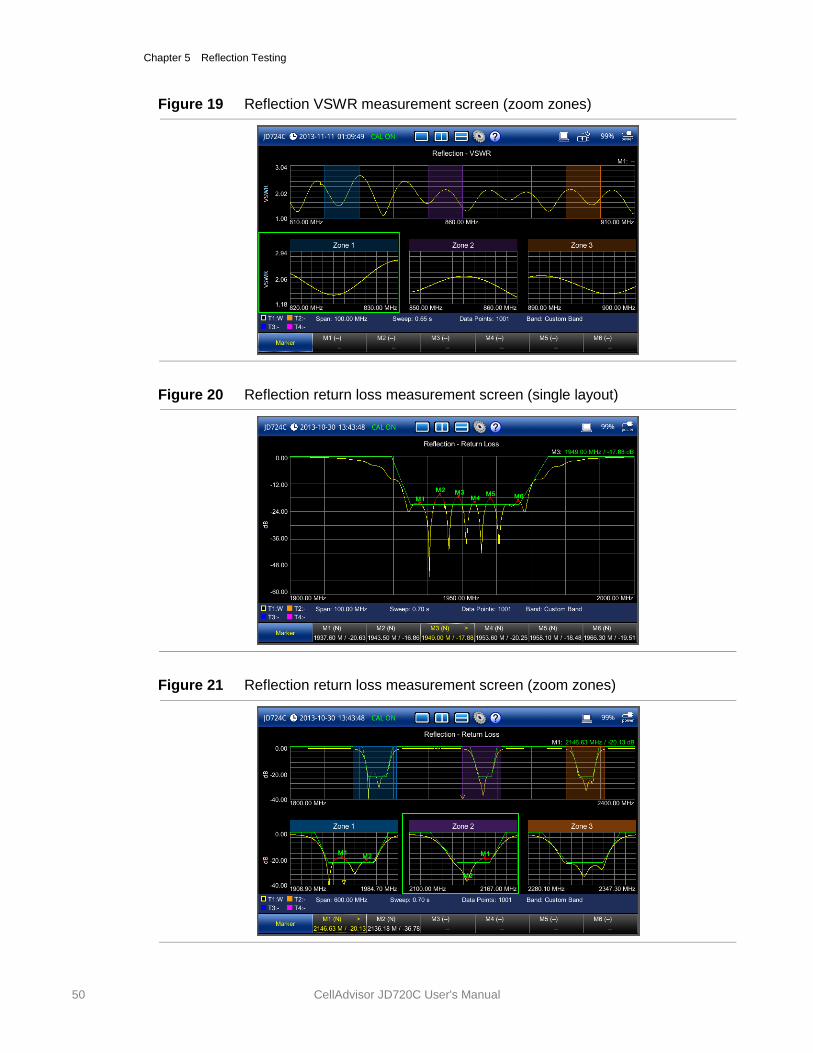
Chapter 5 Reflection Testing
50 CellAdvisor JD720C User's Manual
Figure 19 Reflection VSWR measurement screen (zoom zones)
Figure 20 Reflection return loss measurement screen (single layout)
Figure 21 Reflection return loss measurement screen (zoom zones)
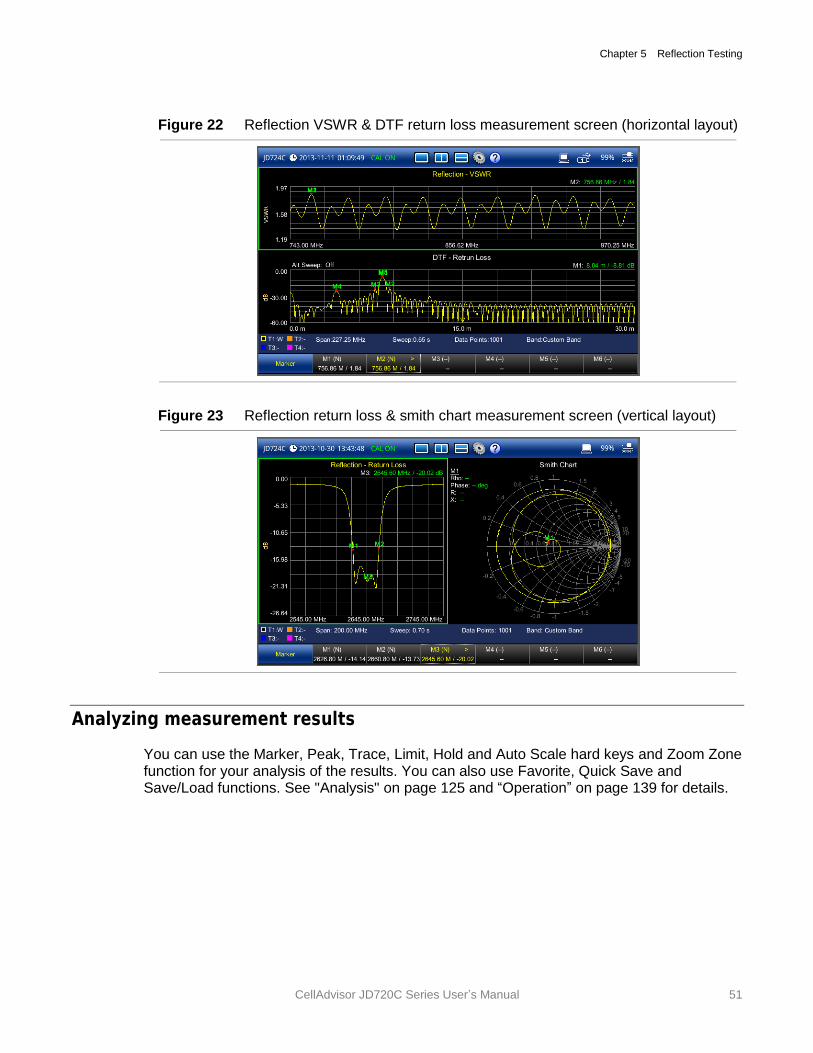
Chapter 5 Reflection Testing
CellAdvisor JD720C Series User’s Manual 51
Figure 22 Reflection VSWR & DTF return loss measurement screen (horizontal layout)
Figure 23 Reflection return loss & smith chart measurement screen (vertical layout)
Analyzing measurement results
You can use the Marker, Peak, Trace, Limit, Hold and Auto Scale hard keys and Zoom Zone function for your analysis of the results. You can also use Favorite, Quick Save and Save/Load functions. See "Analysis" on page 125 and “Operation” on page 139 for details.

6
CellAdvisor JD720C User's Manual
Chapter 6 DTF Testing
This chapter provides instructions on how to perform DTF (Distance to Fault) measurements in VSWR or Return Loss. Topics discussed in this chapter are as follows:
Introducing DTF measurements .......................................................................................... 53
Preparing for a measurement .............................................................................................. 54
Making a measurement ....................................................................................................... 59
Analyzing measurement results ........................................................................................... 62
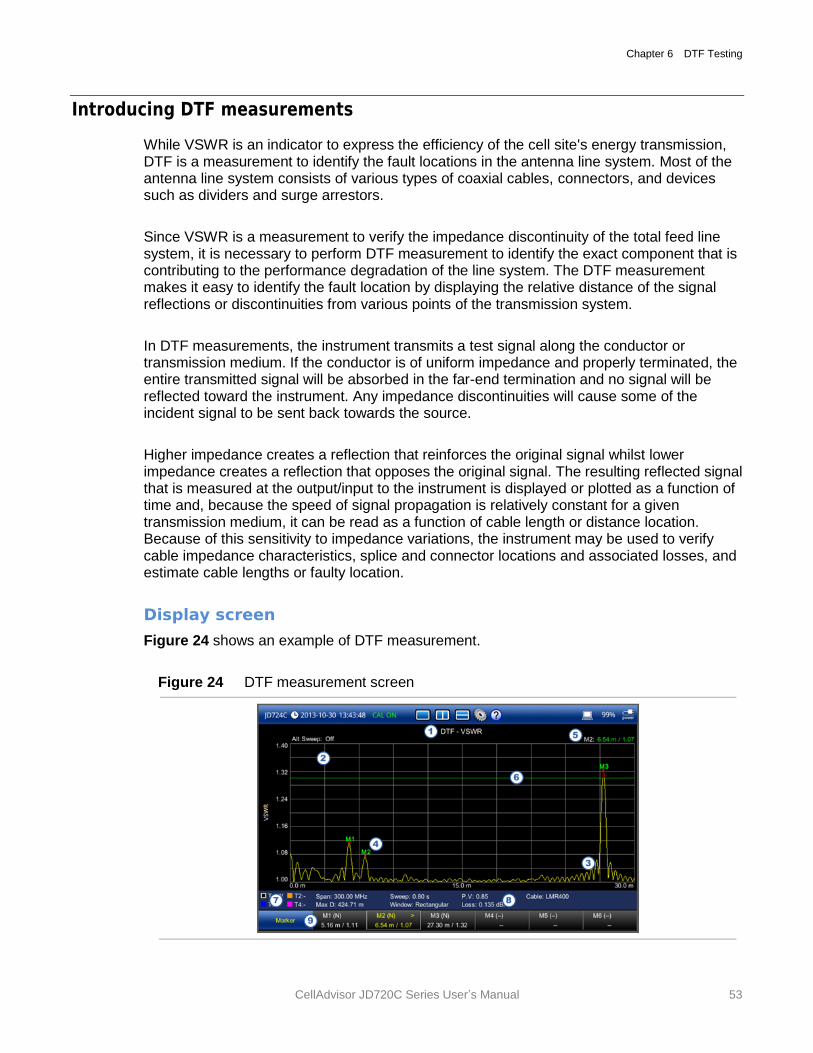
Chapter 6 DTF Testing
CellAdvisor JD720C Series User’s Manual 53
Introducing DTF measurements
While VSWR is an indicator to express the efficiency of the cell site's energy transmission, DTF is a measurement to identify the fault locations in the antenna line system. Most of the antenna line system consists of various types of coaxial cables, connectors, and devices such as dividers and surge arrestors.
Since VSWR is a measurement to verify the impedance discontinuity of the total feed line system, it is necessary to perform DTF measurement to identify the exact component that is contributing to the performance degradation of the line system. The DTF measurement makes it easy to identify the fault location by displaying the relative distance of the signal reflections or discontinuities from various points of the transmission system.
In DTF measurements, the instrument transmits a test signal along the conductor or transmission medium. If the conductor is of uniform impedance and properly terminated, the entire transmitted signal will be absorbed in the far-end termination and no signal will be reflected toward the instrument. Any impedance discontinuities will cause some of the incident signal to be sent back towards the source.
Higher impedance creates a reflection that reinforces the original signal whilst lower impedance creates a reflection that opposes the original signal. The resulting reflected signal that is measured at the output/input to the instrument is displayed or plotted as a function of time and, because the speed of signal propagation is relatively constant for a given transmission medium, it can be read as a function of cable length or distance location. Because of this sensitivity to impedance variations, the instrument may be used to verify cable impedance characteristics, splice and connector locations and associated losses, and estimate cable lengths or faulty location.
Display screen
Figure 24 shows an example of DTF measurement.
Figure 24 DTF measurement screen
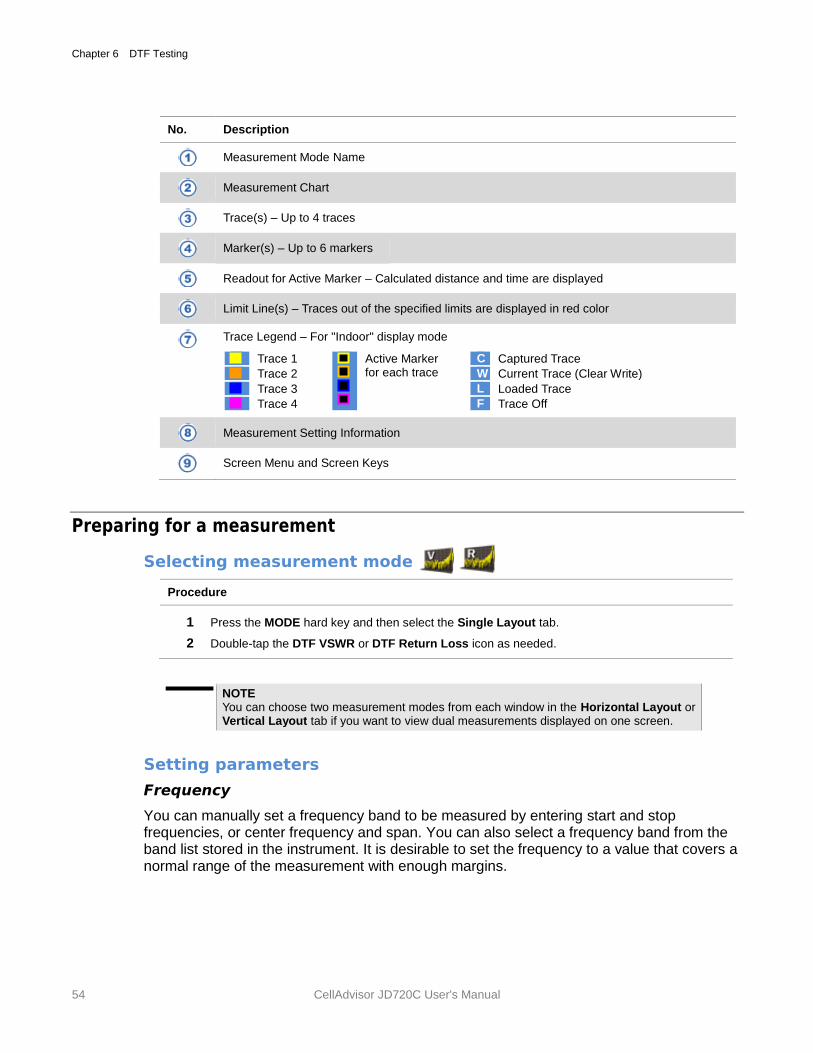
Chapter 6 DTF Testing
54 CellAdvisor JD720C User's Manual
No. Description
Measurement Mode Name
Measurement Chart
Trace(s) – Up to 4 traces
Marker(s) – Up to 6 markers
Readout for Active Marker – Calculated distance and time are displayed
Limit Line(s) – Traces out of the specified limits are displayed in red color
Trace Legend – For "Indoor" display mode
Trace 1
Active Marker for each trace
C Captured Trace
Trace 2 W Current Trace (Clear Write)
Trace 3 L Loaded Trace
Trace 4 F Trace Off
Measurement Setting Information
Screen Menu and Screen Keys
Preparing for a measurement
Selecting measurement mode
Procedure
1 Press the MODE hard key and then select the Single Layout tab.
2 Double-tap the DTF VSWR or DTF Return Loss icon as needed.
NOTE You can choose two measurement modes from each window in the Horizontal Layout or Vertical Layout tab if you want to view dual measurements displayed on one screen.
Setting parameters
Frequency
You can manually set a frequency band to be measured by entering start and stop frequencies, or center frequency and span. You can also select a frequency band from the band list stored in the instrument. It is desirable to set the frequency to a value that covers a normal range of the measurement with enough margins.
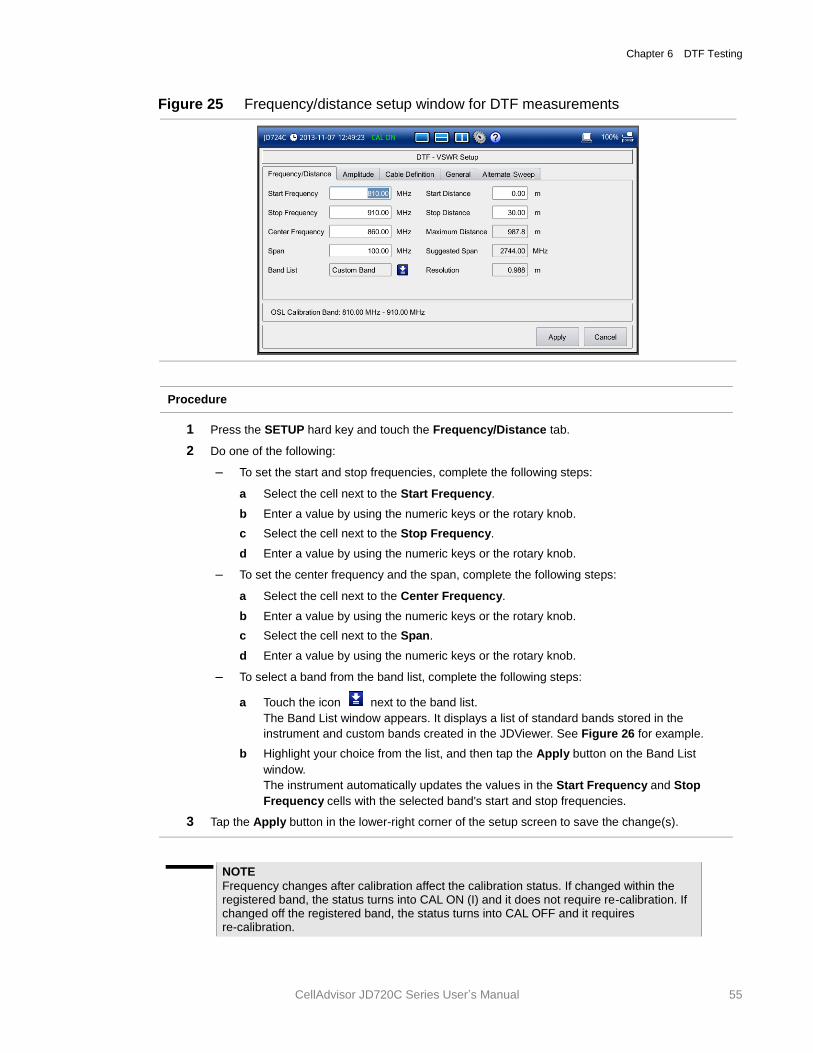
Chapter 6 DTF Testing
CellAdvisor JD720C Series User’s Manual 55
Figure 25 Frequency/distance setup window for DTF measurements
Procedure
1 Press the SETUP hard key and touch the Frequency/Distance tab.
2 Do one of the following:
– To set the start and stop frequencies, complete the following steps:
a Select the cell next to the Start Frequency.
b Enter a value by using the numeric keys or the rotary knob.
c Select the cell next to the Stop Frequency.
d Enter a value by using the numeric keys or the rotary knob.
– To set the center frequency and the span, complete the following steps:
a Select the cell next to the Center Frequency.
b Enter a value by using the numeric keys or the rotary knob.
c Select the cell next to the Span.
d Enter a value by using the numeric keys or the rotary knob.
– To select a band from the band list, complete the following steps:
a Touch the icon next to the band list.
The Band List window appears. It displays a list of standard bands stored in the
instrument and custom bands created in the JDViewer. See Figure 26 for example.
b Highlight your choice from the list, and then tap the Apply button on the Band List
window.
The instrument automatically updates the values in the Start Frequency and Stop
Frequency cells with the selected band's start and stop frequencies.
3 Tap the Apply button in the lower-right corner of the setup screen to save the change(s).
NOTE
Frequency changes after calibration affect the calibration status. If changed within the registered band, the status turns into CAL ON (I) and it does not require re-calibration. If changed off the registered band, the status turns into CAL OFF and it requires re-calibration.
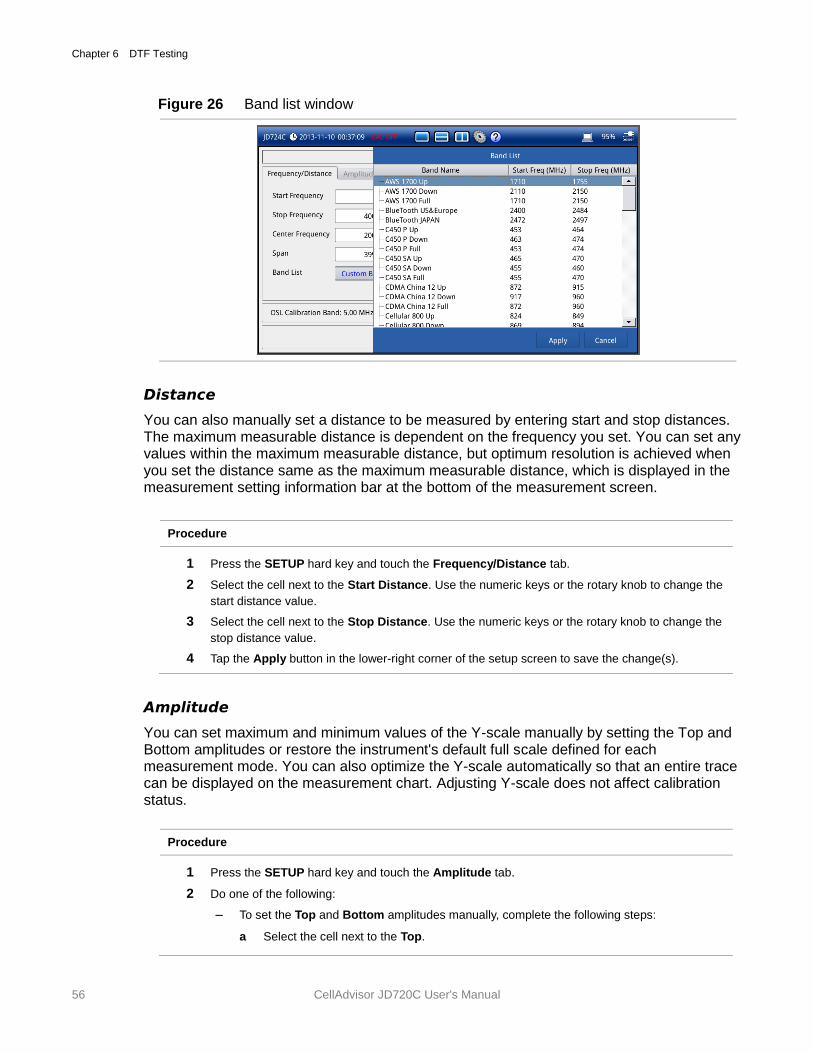
Chapter 6 DTF Testing
56 CellAdvisor JD720C User's Manual
Figure 26 Band list window
Distance
You can also manually set a distance to be measured by entering start and stop distances. The maximum measurable distance is dependent on the frequency you set. You can set any values within the maximum measurable distance, but optimum resolution is achieved when you set the distance same as the maximum measurable distance, which is displayed in the measurement setting information bar at the bottom of the measurement screen.
Procedure
1 Press the SETUP hard key and touch the Frequency/Distance tab.
2 Select the cell next to the Start Distance. Use the numeric keys or the rotary knob to change the
start distance value.
3 Select the cell next to the Stop Distance. Use the numeric keys or the rotary knob to change the
stop distance value.
4 Tap the Apply button in the lower-right corner of the setup screen to save the change(s).
Amplitude
You can set maximum and minimum values of the Y-scale manually by setting the Top and Bottom amplitudes or restore the instrument's default full scale defined for each measurement mode. You can also optimize the Y-scale automatically so that an entire trace can be displayed on the measurement chart. Adjusting Y-scale does not affect calibration status.
Procedure
1 Press the SETUP hard key and touch the Amplitude tab.
2 Do one of the following:
– To set the Top and Bottom amplitudes manually, complete the following steps:
a Select the cell next to the Top.
Chapter 6 DTF Testing
CellAdvisor JD720C Series User’s Manual 57
b Enter a value by using the numeric keys or the rotary knob.
The entered value becomes the maximum value for the Y-scale.
c Select the cell next to the Bottom.
d Enter a value by using the numeric keys or the rotary knob.
The entered value becomes the minimum value for the Y-scale.
– To restore the instrument’s default range for the Y-scale, tap the Full Scale button. The amplitude range for the DTF mode is 1 to 65 in VSWR and -60 to 0 dB in Return Loss.
3 Tap the Apply button in the lower-right corner of the setup screen to save the change(s).
NOTE
You can also press the AUTO SCALE hard key any time you need to view the
entire trace on the measurement chart. The instrument automatically optimizes the maximum and minimum values of the Y-scale to display the entire trace.
General parameters
You can select options for Windowing, Data Points, Distance Unit, and Interference Rejection.
Procedure
1 Press the SETUP hard key and touch the General tab.
2 To set the method of video filtering to display the trace, select the Windowing option from the
following choices:
– Rectangular
– Blackman
– NSL (Nominal Side Lobe)
– LSL (Low Side Lobe)
– MSL (Minimum Side Lobe)
NOTE
If the video filtering is activated by selecting a different type of Windowing filters, Rectangular or Blackman, the overshoots of the trace are reduced by smoothing out the sharp transitions so that you can easily discriminate noises and peaks. For example, if you select the Blackman, noises around peaks are reduced and it helps you verify a DTF location clearly.
3 To set the measurement resolution, select the Data Points option from the choices: 126, 251,
501, 1001, and 2001.
NOTE Default setting is 1001. The larger number you choose, the lower resolution you get
even though you can have longer Max Distance to measure. Changing data points does not affect calibration status.
4 To change the display unit for distance, select the Units option from the choices: Meter and Foot.
NOTE
Setting your city and time zone automatically changes not only the date and time but also the distance unit in the DTF settings accordingly to Meter or Foot.
Chapter 6 DTF Testing
58 CellAdvisor JD720C User's Manual
5 To enable the Interference Rejection feature, select On.
NOTE Default setting is Off. It is recommended to use this feature only when you suspect
interfering signals in the area as it slows down measurement.
6 For JD725C and JD726C users with the option 001 Bias Tee installed. To use the Bias Tee,
complete the following steps:
a Select On for the Bias Tee.
b Enter a value between 12 and 32 with 1 V step, as you desire.
NOTE If you have set this Bias Tee to On, the instrument will supply a DC bias of set level (12 – 32 V) from the RF In port to an active device, such as Tower Mounted Amplifier
(TMA) or Low Noise Amplifier (LNA), through the transmission line, eliminating the need of an external power supply.
7 Tap the Apply button in the lower-right corner of the setup screen to save the change(s).
Defining cable
You can select a cable from the list of cable names stored in the instrument or define a cable as custom cable by setting the propagation velocity and cable loss parameters.
Procedure
1 Press the SETUP hard key and touch the Cable Definition tab.
2 Touch the icon next to the Cable Name field.
The Cable List window appears, displaying standard cables stored in the instrument and custom
cables created in the JDViewer.
3 Select a cable to choose from the list and then tap the Apply button on the Cable List window.
The instrument automatically changes the Propagation Velocity and Cable Loss values
correspondent to the selected cable's propagation velocity and cable loss. Default setting is
HFC-12D (1/2").
4 If you want to define a new cable, complete the following steps:
a Select the Propagation Velocity field, and then enter the propagation velocity of the cable
by using the numeric keys or the rotary knob.
NOTE
You can set this relative propagation delay of the cable to be defined. It affects the calculation of distance in DTF measurements.
b Select the Cable Loss field, and then enter the cable loss value of the cable by using the
numeric keys or the rotary knob.
NOTE
You can set this cable loss of the cable, for which you like to define. It affects the peak level of discontinuity in DTF measurements. If you select a cable from the list, the cable loss value is displayed as "@ 1 GHz". If you define a cable manually, its value is displayed as "@ Custom Frequency".
The text “Custom Cable” appears in the Cable Name field.
5 Tap the Apply button in the lower-right corner of the setup screen to save the change(s).

Chapter 6 DTF Testing
CellAdvisor JD720C Series User’s Manual 59
Performing calibration
Perform an O-S-L or Quick calibration by pressing the CAL hard key. The instrument displays on-screen instructions for you to follow through. See “Performing Calibration” on page 33 for more information.
Making a measurement
Once the O-S-L or Quick calibration is done, the instrument is now ready to make a DTF measurement in VSWR or Return Loss. If you like to not only measure the DTF cable length but also get highly accurate and reliable data, you need to perform a full O-S-L calibration.
Procedure
1 Disconnect the calibration kit from the calibration point.
2 Connect an antenna or feed line to the calibration point, where is usually at the extension cable
end if used. See Figure 27 for the cable connection diagram.
3 Your measurement result is displayed on the screen in real time.
NOTE
If O-S-L or Quick calibration has been done at the end of the port extension cable for DTF measurement, the length of the port extension cable is compensated automatically and is not included in the distance to the point of discontinuity.
CAUTION Do not apply or connect power exceeding +25 dBm to the RF Out / Reflection port. When
the input signal power is greater than +25 dBm, the input power protection is triggered to protect the instrument and a measurement comes to stop automatically.
Figure 27 Cable connection diagram for DTF measurements
JD723C/724C
JD725C/726C
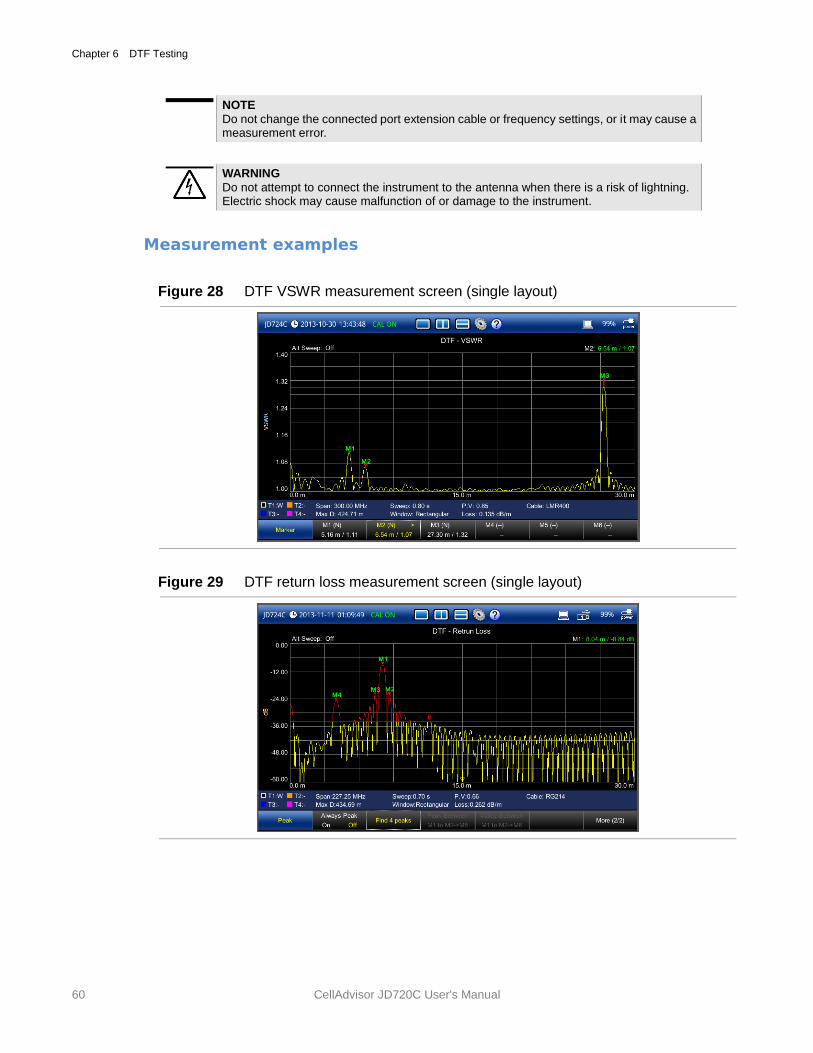
Chapter 6 DTF Testing
60 CellAdvisor JD720C User's Manual
NOTE
Do not change the connected port extension cable or frequency settings, or it may cause a measurement error.
WARNING
Do not attempt to connect the instrument to the antenna when there is a risk of lightning. Electric shock may cause malfunction of or damage to the instrument.
Measurement examples
Figure 28 DTF VSWR measurement screen (single layout)
Figure 29 DTF return loss measurement screen (single layout)
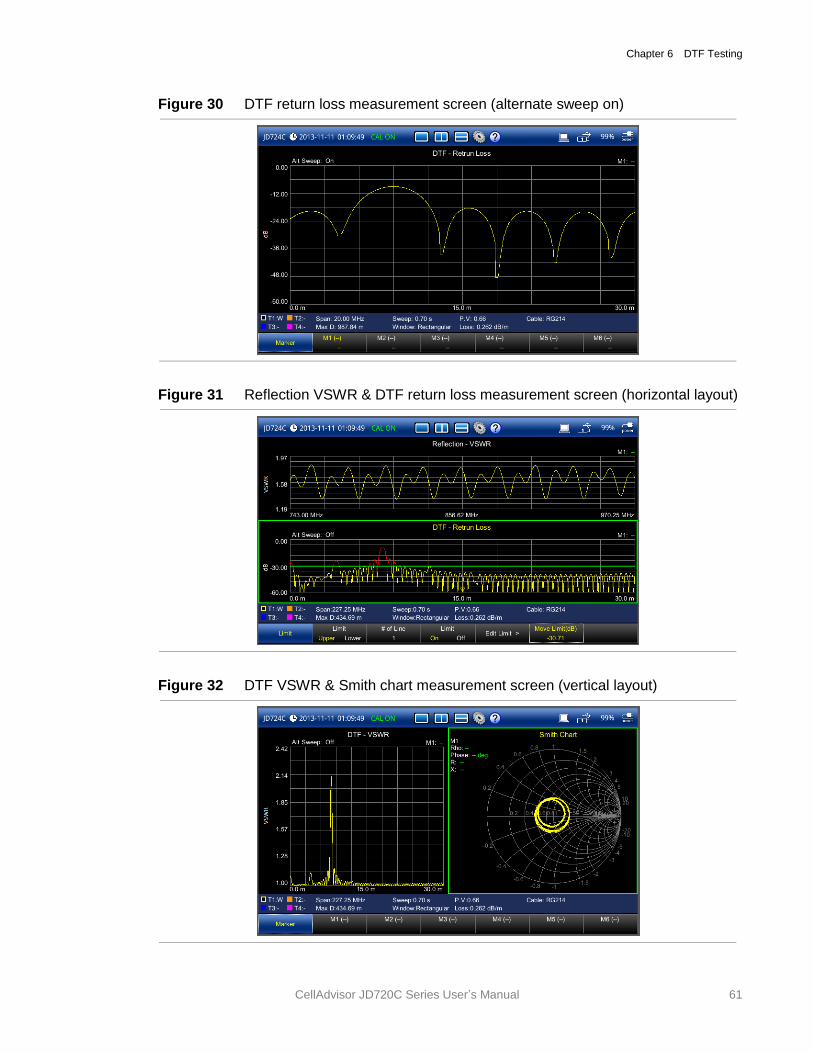
Chapter 6 DTF Testing
CellAdvisor JD720C Series User’s Manual 61
Figure 30 DTF return loss measurement screen (alternate sweep on)
Figure 31 Reflection VSWR & DTF return loss measurement screen (horizontal layout)
Figure 32 DTF VSWR & Smith chart measurement screen (vertical layout)

Chapter 6 DTF Testing
62 CellAdvisor JD720C User's Manual
Analyzing measurement results
You can use the Marker, Peak, Trace, Limit, Hold and Auto Scale hard keys and Alternate Sweep function for your analysis of the results. You can also use Favorite, Quick Save and Save/Load functions. See "Analysis" on page 125 and “Operation” on page 139 for details.
7
CellAdvisor JD720C User's Manual
Chapter 7 1-Port Cable Loss Testing
This chapter provides instructions on how to perform 1 Port Cable Loss measurements that are used to quantify signal loss in a cable or other device without connecting both ends of the cable or device to the instrument. Topics discussed in this chapter are as follows:
Introducing 1-port cable loss measurements ....................................................................... 64
Preparing for a measurement .............................................................................................. 65
Making a measurement ....................................................................................................... 68
Analyzing measurement results ........................................................................................... 70
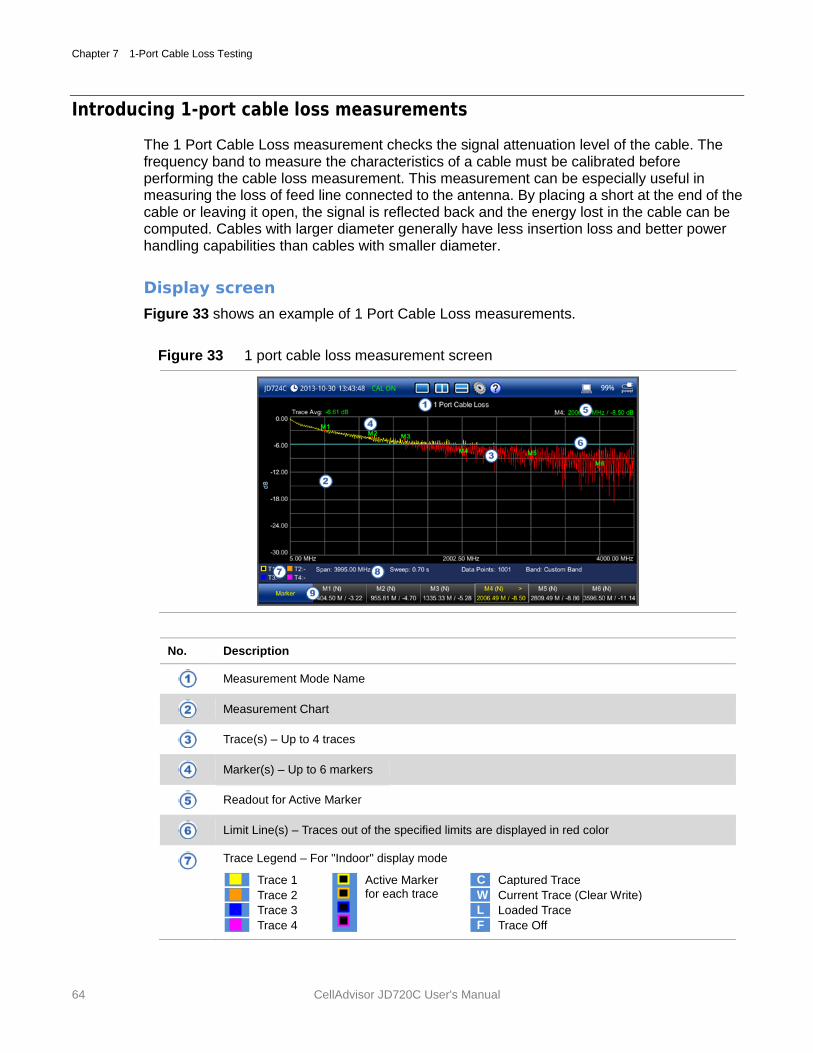
Chapter 7 1-Port Cable Loss Testing
64 CellAdvisor JD720C User's Manual
Introducing 1-port cable loss measurements
The 1 Port Cable Loss measurement checks the signal attenuation level of the cable. The frequency band to measure the characteristics of a cable must be calibrated before performing the cable loss measurement. This measurement can be especially useful in measuring the loss of feed line connected to the antenna. By placing a short at the end of the cable or leaving it open, the signal is reflected back and the energy lost in the cable can be computed. Cables with larger diameter generally have less insertion loss and better power handling capabilities than cables with smaller diameter.
Display screen
Figure 33 shows an example of 1 Port Cable Loss measurements.
Figure 33 1 port cable loss measurement screen
No. Description
Measurement Mode Name
Measurement Chart
Trace(s) – Up to 4 traces
Marker(s) – Up to 6 markers
Readout for Active Marker
Limit Line(s) – Traces out of the specified limits are displayed in red color
Trace Legend – For "Indoor" display mode
Trace 1
Active Marker for each trace
C Captured Trace
Trace 2 W Current Trace (Clear Write)
Trace 3 L Loaded Trace
Trace 4 F Trace Off
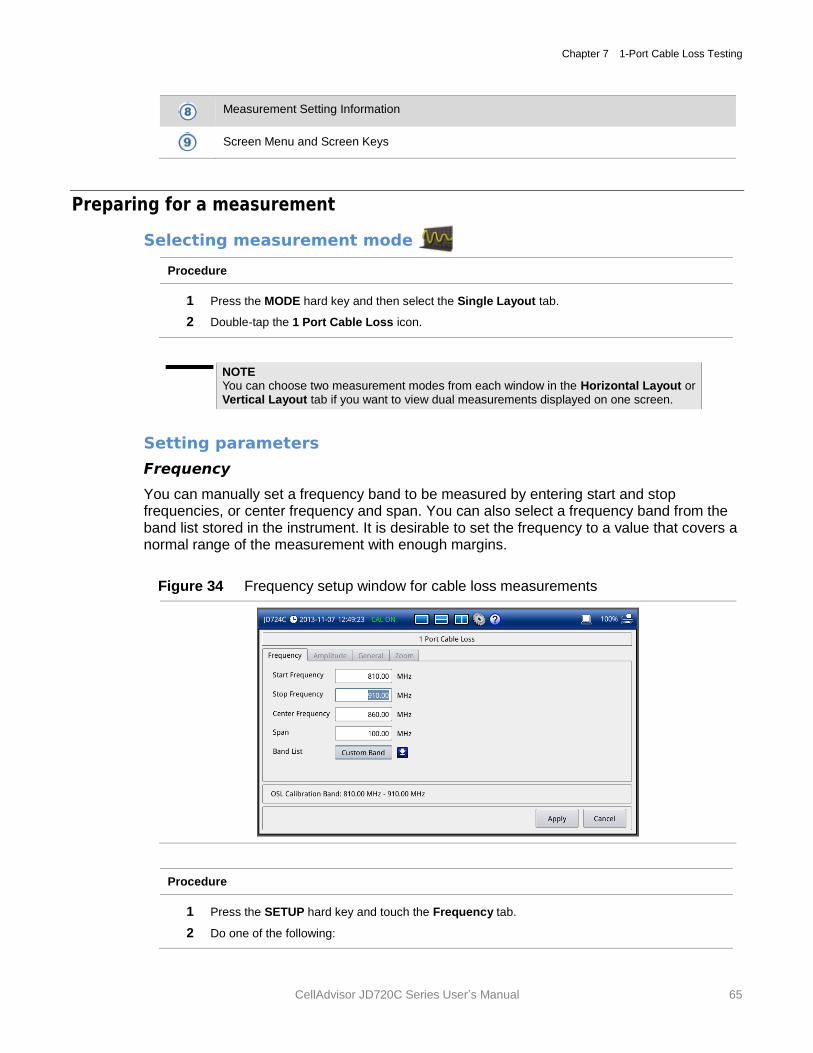
Chapter 7 1-Port Cable Loss Testing
CellAdvisor JD720C Series User’s Manual 65
Measurement Setting Information
Screen Menu and Screen Keys
Preparing for a measurement
Selecting measurement mode
Procedure
1 Press the MODE hard key and then select the Single Layout tab.
2 Double-tap the 1 Port Cable Loss icon.
NOTE You can choose two measurement modes from each window in the Horizontal Layout or Vertical Layout tab if you want to view dual measurements displayed on one screen.
Setting parameters
Frequency
You can manually set a frequency band to be measured by entering start and stop frequencies, or center frequency and span. You can also select a frequency band from the band list stored in the instrument. It is desirable to set the frequency to a value that covers a normal range of the measurement with enough margins.
Figure 34 Frequency setup window for cable loss measurements
Procedure
1 Press the SETUP hard key and touch the Frequency tab.
2 Do one of the following:
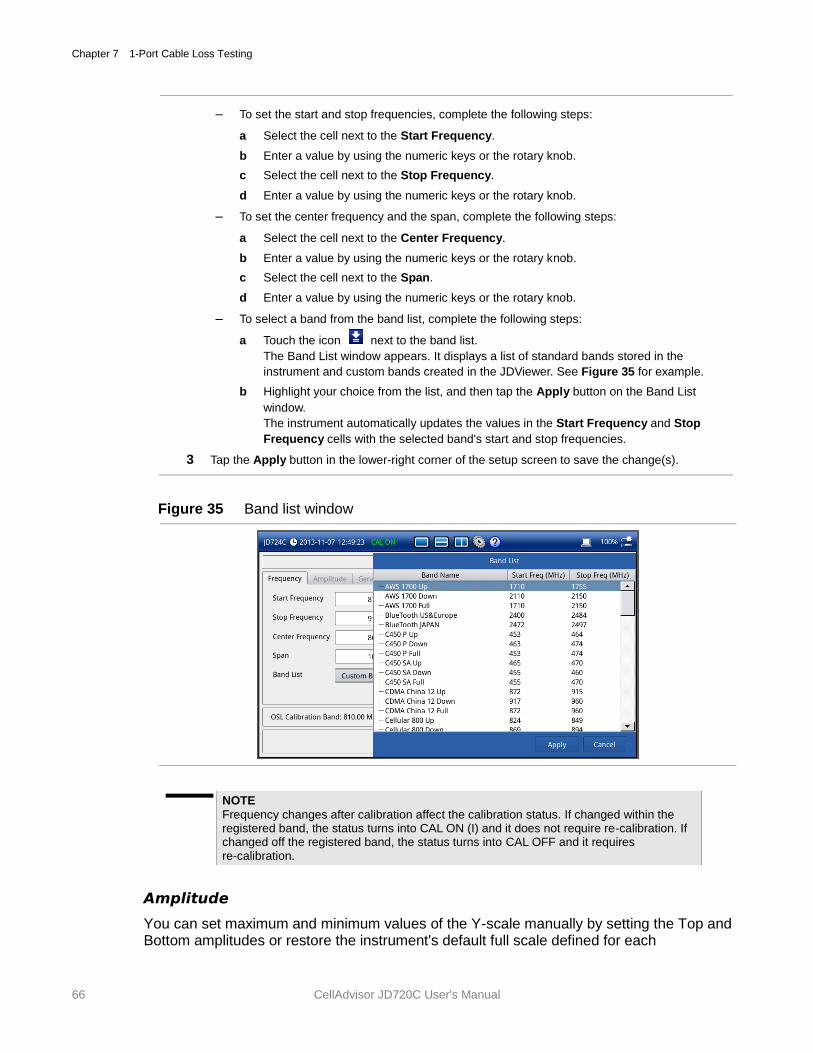
Chapter 7 1-Port Cable Loss Testing
66 CellAdvisor JD720C User's Manual
– To set the start and stop frequencies, complete the following steps:
a Select the cell next to the Start Frequency.
b Enter a value by using the numeric keys or the rotary knob.
c Select the cell next to the Stop Frequency.
d Enter a value by using the numeric keys or the rotary knob.
– To set the center frequency and the span, complete the following steps:
a Select the cell next to the Center Frequency.
b Enter a value by using the numeric keys or the rotary knob.
c Select the cell next to the Span.
d Enter a value by using the numeric keys or the rotary knob.
– To select a band from the band list, complete the following steps:
a Touch the icon next to the band list.
The Band List window appears. It displays a list of standard bands stored in the
instrument and custom bands created in the JDViewer. See Figure 35 for example.
b Highlight your choice from the list, and then tap the Apply button on the Band List
window.
The instrument automatically updates the values in the Start Frequency and Stop
Frequency cells with the selected band's start and stop frequencies.
3 Tap the Apply button in the lower-right corner of the setup screen to save the change(s).
Figure 35 Band list window
NOTE
Frequency changes after calibration affect the calibration status. If changed within the registered band, the status turns into CAL ON (I) and it does not require re-calibration. If changed off the registered band, the status turns into CAL OFF and it requires re-calibration.
Amplitude
You can set maximum and minimum values of the Y-scale manually by setting the Top and Bottom amplitudes or restore the instrument's default full scale defined for each
Chapter 7 1-Port Cable Loss Testing
CellAdvisor JD720C Series User’s Manual 67
measurement mode. You can also optimize the Y-scale automatically so that an entire trace can be displayed on the measurement chart. Adjusting Y-scale does not affect calibration status.
Procedure
1 Press the SETUP hard key and touch the Amplitude tab.
2 Do one of the following:
– To set the Top and Bottom amplitudes manually, complete the following steps:
a Select the cell next to the Top.
b Enter a value by using the numeric keys or the rotary knob.
The entered value becomes the maximum value for the Y-scale.
c Select the cell next to the Bottom.
d Enter a value by using the numeric keys or the rotary knob.
The entered value becomes the minimum value for the Y-scale.
– To restore the instrument’s default range for the Y-scale, tap the Full Scale button. The amplitude range for this measurement mode is 0 to 30 dB.
3 Tap the Apply button in the lower-right corner of the setup screen to save the change(s).
NOTE
You can also press the AUTO SCALE hard key any time you need to view the
entire trace on the measurement chart. The instrument automatically optimizes the maximum and minimum values of the Y-scale to display the entire trace and the limit.
General parameters
You can select options for Data Points and Interference Rejection.
Procedure
1 Press the SETUP hard key and touch the General tab.
2 To set the measurement resolution, select the Data Points option from the choices: 126, 251,
501, 1001, and 2001.
NOTE Default setting is 1001. It is recommended that you select high resolution data points
only for an instance of measuring wide frequency bands or requiring precise measurement data. The larger number you choose, the higher resolution you get and the longer the instrument takes to sweep and display results. For example, selecting 501 data points provides twice as many measurement points as 251, but it may take twice longer to sweep and display the trace than choosing 251 data points. Changing data points does not affect calibration status.
3 To enable the Interference Rejection feature, select On.
NOTE Default setting is Off. It is recommended to use this feature only when you suspect
interfering signals in the area as it slows down measurement.
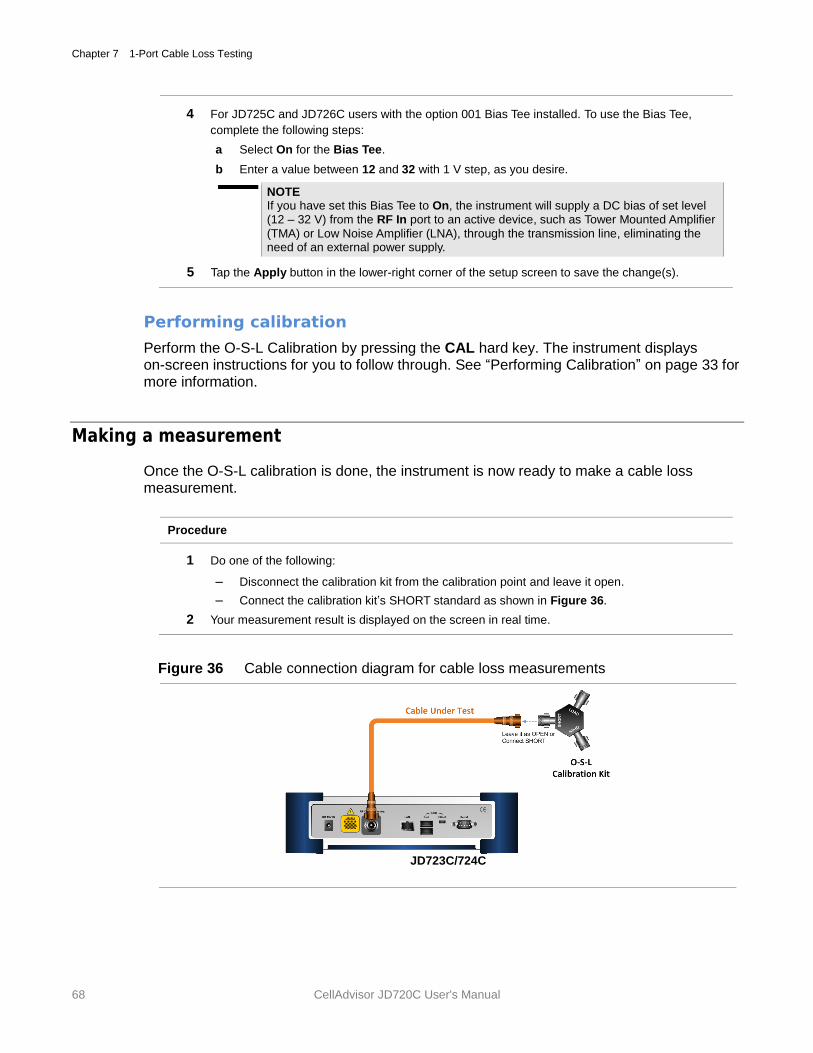
Chapter 7 1-Port Cable Loss Testing
68 CellAdvisor JD720C User's Manual
4 For JD725C and JD726C users with the option 001 Bias Tee installed. To use the Bias Tee,
complete the following steps:
a Select On for the Bias Tee.
b Enter a value between 12 and 32 with 1 V step, as you desire.
NOTE If you have set this Bias Tee to On, the instrument will supply a DC bias of set level (12 – 32 V) from the RF In port to an active device, such as Tower Mounted Amplifier
(TMA) or Low Noise Amplifier (LNA), through the transmission line, eliminating the need of an external power supply.
5 Tap the Apply button in the lower-right corner of the setup screen to save the change(s).
Performing calibration
Perform the O-S-L Calibration by pressing the CAL hard key. The instrument displays on-screen instructions for you to follow through. See “Performing Calibration” on page 33 for more information.
Making a measurement
Once the O-S-L calibration is done, the instrument is now ready to make a cable loss measurement.
Procedure
1 Do one of the following:
– Disconnect the calibration kit from the calibration point and leave it open.
– Connect the calibration kit’s SHORT standard as shown in Figure 36.
2 Your measurement result is displayed on the screen in real time.
Figure 36 Cable connection diagram for cable loss measurements
JD723C/724C
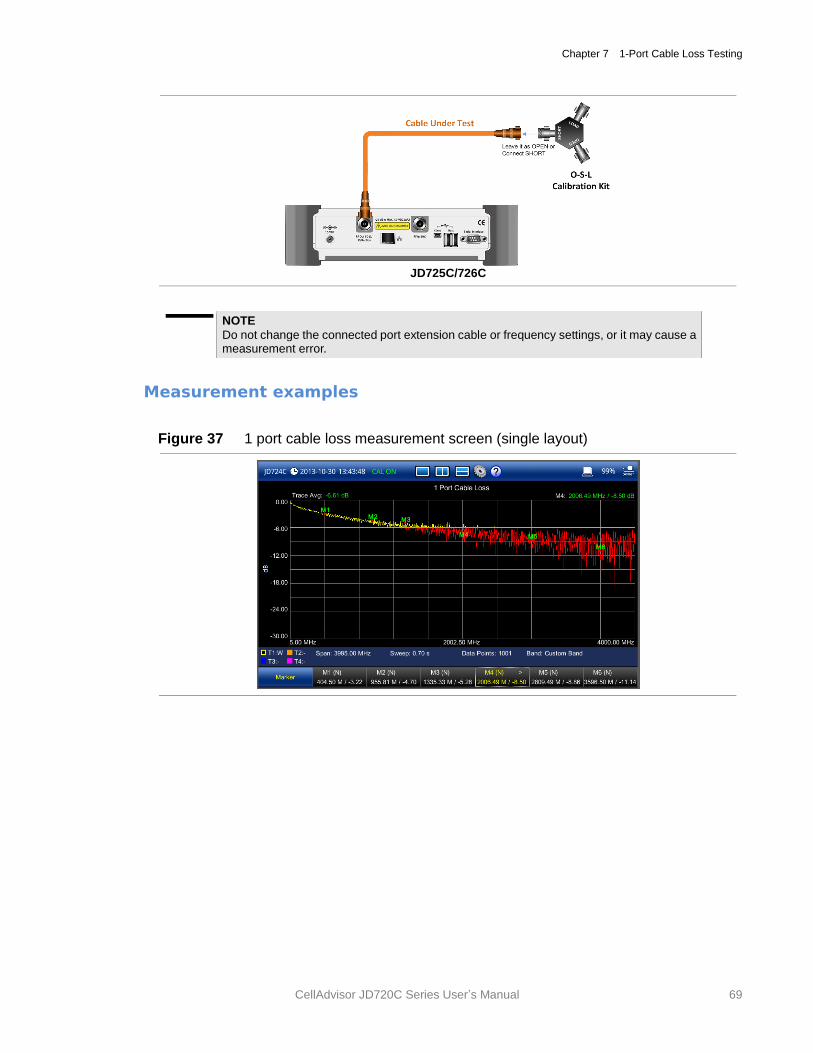
Chapter 7 1-Port Cable Loss Testing
CellAdvisor JD720C Series User’s Manual 69
JD725C/726C
NOTE
Do not change the connected port extension cable or frequency settings, or it may cause a measurement error.
Measurement examples
Figure 37 1 port cable loss measurement screen (single layout)
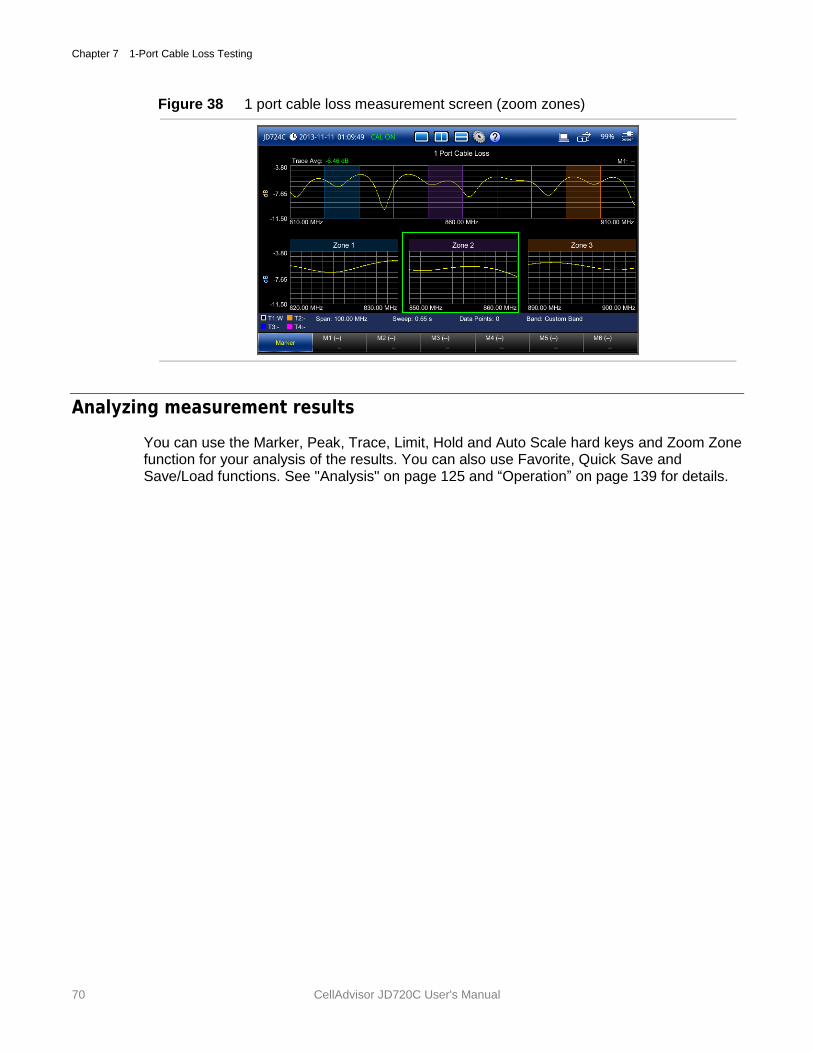
Chapter 7 1-Port Cable Loss Testing
70 CellAdvisor JD720C User's Manual
Figure 38 1 port cable loss measurement screen (zoom zones)
Analyzing measurement results
You can use the Marker, Peak, Trace, Limit, Hold and Auto Scale hard keys and Zoom Zone function for your analysis of the results. You can also use Favorite, Quick Save and Save/Load functions. See "Analysis" on page 125 and “Operation” on page 139 for details.
8
CellAdvisor JD720C User's Manual
Chapter 8 1-Port Phase Testing
This chapter provides instructions on how to perform 1 Port Phase measurements to tune DUT’s impedance matching and phase match cables. Topics discussed in this chapter are as follows:
Introducing 1-port phase measurements ............................................................................. 72
Preparing for a measurement .............................................................................................. 73
Making a measurement ....................................................................................................... 76
Analyzing measurement results ........................................................................................... 77
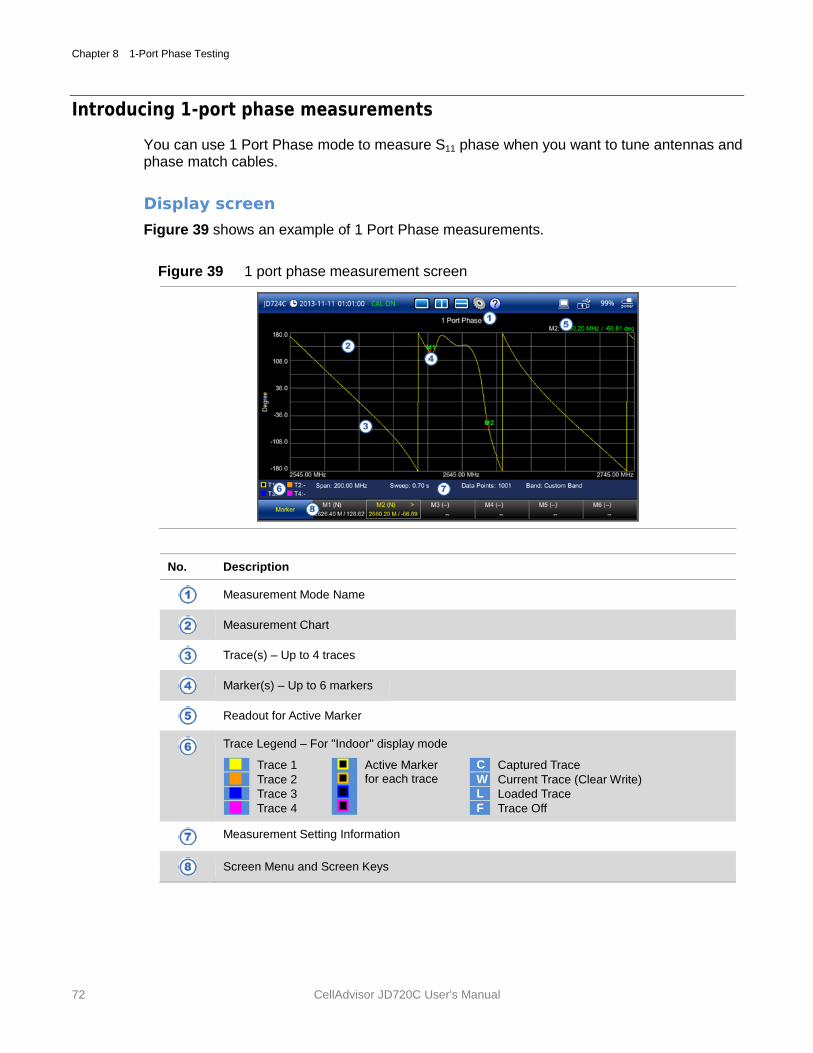
Chapter 8 1-Port Phase Testing
72 CellAdvisor JD720C User's Manual
Introducing 1-port phase measurements
You can use 1 Port Phase mode to measure S11 phase when you want to tune antennas and phase match cables.
Display screen
Figure 39 shows an example of 1 Port Phase measurements.
Figure 39 1 port phase measurement screen
No. Description
Measurement Mode Name
Measurement Chart
Trace(s) – Up to 4 traces
Marker(s) – Up to 6 markers
Readout for Active Marker
Trace Legend – For "Indoor" display mode
Trace 1
Active Marker for each trace
C Captured Trace
Trace 2 W Current Trace (Clear Write)
Trace 3 L Loaded Trace
Trace 4 F Trace Off
Measurement Setting Information
Screen Menu and Screen Keys
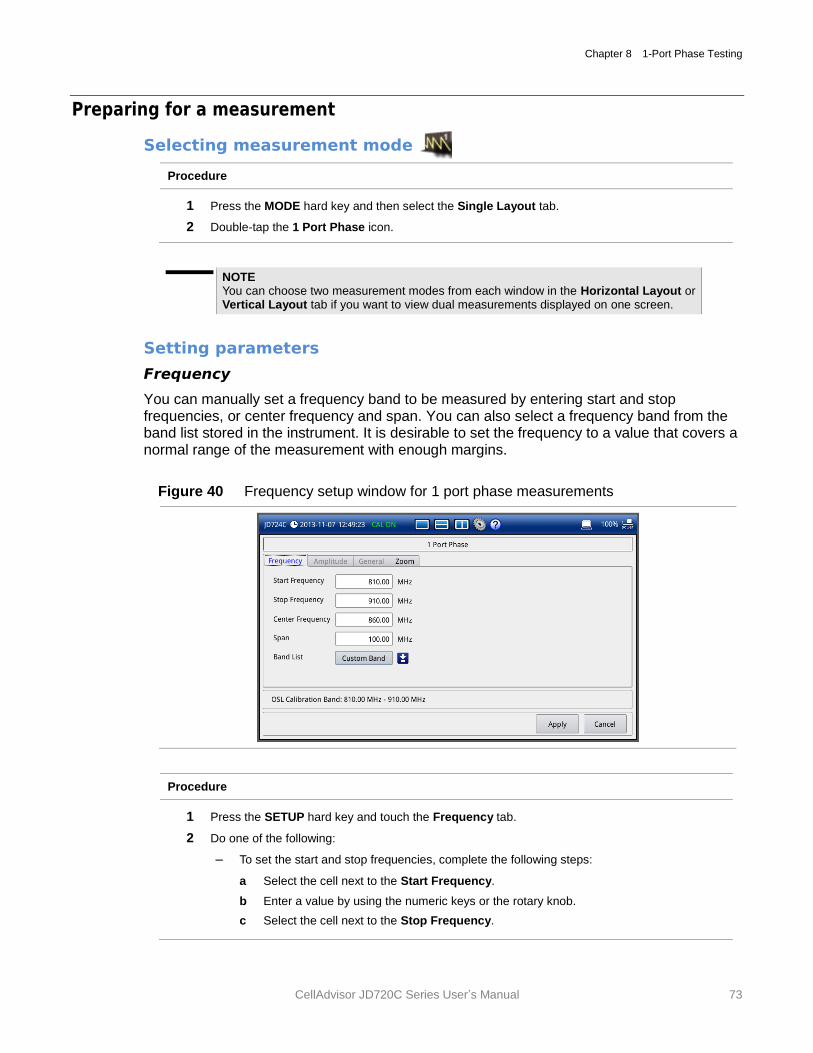
Chapter 8 1-Port Phase Testing
CellAdvisor JD720C Series User’s Manual 73
Preparing for a measurement
Selecting measurement mode
Procedure
1 Press the MODE hard key and then select the Single Layout tab.
2 Double-tap the 1 Port Phase icon.
NOTE You can choose two measurement modes from each window in the Horizontal Layout or Vertical Layout tab if you want to view dual measurements displayed on one screen.
Setting parameters
Frequency
You can manually set a frequency band to be measured by entering start and stop frequencies, or center frequency and span. You can also select a frequency band from the band list stored in the instrument. It is desirable to set the frequency to a value that covers a normal range of the measurement with enough margins.
Figure 40 Frequency setup window for 1 port phase measurements
Procedure
1 Press the SETUP hard key and touch the Frequency tab.
2 Do one of the following:
– To set the start and stop frequencies, complete the following steps:
a Select the cell next to the Start Frequency.
b Enter a value by using the numeric keys or the rotary knob.
c Select the cell next to the Stop Frequency.

Chapter 8 1-Port Phase Testing
74 CellAdvisor JD720C User's Manual
d Enter a value by using the numeric keys or the rotary knob.
– To set the center frequency and the span, complete the following steps:
a Select the cell next to the Center Frequency.
b Enter a value by using the numeric keys or the rotary knob.
c Select the cell next to the Span.
d Enter a value by using the numeric keys or the rotary knob.
– To select a band from the band list, complete the following steps:
a Touch the icon next to the band list.
The Band List window appears. It displays a list of standard bands stored in the
instrument and custom bands created in the JDViewer. See Figure 41 for example.
b Highlight your choice from the list, and then tap the Apply button on the Band List
window.
The instrument automatically updates the values in the Start Frequency and Stop
Frequency cells with the selected band's start and stop frequencies.
3 Tap the Apply button in the lower-right corner of the setup screen to save the change(s).
Figure 41 Band list window
NOTE
Frequency changes after calibration affect the calibration status. If changed within the registered band, the status turns into CAL ON (I) and it does not require re-calibration. If changed off the registered band, the status turns into CAL OFF and it requires re-calibration.
Amplitude
You can set maximum and minimum values of the Y-scale manually by setting the Top and Bottom amplitudes or restore the instrument's default full scale defined for each measurement mode. You can also optimize the Y-scale automatically so that an entire trace can be displayed on the measurement chart. Adjusting Y-scale does not affect calibration status.
Chapter 8 1-Port Phase Testing
CellAdvisor JD720C Series User’s Manual 75
Procedure
1 Press the SETUP hard key and touch the Amplitude tab.
2 Do one of the following:
– To set the Top and Bottom amplitudes manually, complete the following steps:
a Select the cell next to the Top.
b Enter a value by using the numeric keys or the rotary knob.
The entered value becomes the maximum value for the Y-scale.
c Select the cell next to the Bottom.
d Enter a value by using the numeric keys or the rotary knob.
The entered value becomes the minimum value for the Y-scale.
– To restore the instrument’s default range for the Y-scale, tap the Full Scale button. The amplitude range for this measurement mode is -180 to 180 Degree.
3 Tap the Apply button in the lower-right corner of the setup screen to save the change(s).
NOTE
You can also press the AUTO SCALE hard key any time you need to view the
entire trace on the measurement chart. The instrument automatically optimizes the maximum and minimum values of the Y-scale to display the entire trace.
General parameters
You can select options for Data Points and Interference Rejection.
Procedure
1 Press the SETUP hard key and touch the General tab.
2 To set the measurement resolution, select the Data Points option from the choices: 126, 251,
501, 1001, and 2001.
NOTE Default setting is 1001. It is recommended that you select high resolution data points
only for an instance of measuring wide frequency bands or requiring precise measurement data. The larger number you choose, the higher resolution you get and the longer the instrument takes to sweep and display results. For example, selecting 501 data points provides twice as many measurement points as 251, but it may take twice longer to sweep and display the trace than choosing 251 data points. Changing data points does not affect calibration status.
3 To enable the Interference Rejection feature, select On.
NOTE Default setting is Off. It is recommended to use this feature only when you suspect
interfering signals in the area as it slows down measurement.
4 For JD725C and JD726C users with the option 001 Bias Tee installed. To use the Bias Tee,
complete the following steps:
a Select On for the Bias Tee.
Chapter 8 1-Port Phase Testing
76 CellAdvisor JD720C User's Manual
b Enter a value between 12 and 32 with 1 V step, as you desire.
NOTE If you have set this Bias Tee to On, the instrument will supply a DC bias of set level (12 – 32 V) from the RF In port to an active device, such as Tower Mounted Amplifier
(TMA) or Low Noise Amplifier (LNA), through the transmission line, eliminating the need of an external power supply.
5 Tap the Apply button in the lower-right corner of the setup screen to save the change(s).
Performing calibration
Perform the O-S-L Calibration by pressing the CAL hard key. The instrument displays on-screen instructions for you to follow through. See “Performing Calibration” on page 33 for more information.
Making a measurement
Once the O-S-L calibration is done, the instrument is now ready to make a measurement.
Procedure
1 Disconnect the calibration kit from the calibration point.
2 Connect an antenna or feed line to the calibration point, where is usually at the extension cable
end if used. See Figure 42 for the cable connection diagram.
3 Your measurement result is displayed on the screen in real time.
CAUTION Do not apply or connect power exceeding +25 dBm to the RF Out / Reflection port. When
the input signal power is greater than +25 dBm, the input power protection is triggered to protect the instrument and a measurement comes to stop automatically.
NOTE
Do not change the connected port extension cable or frequency settings, or it may cause a measurement error.
WARNING
Do not attempt to connect the instrument to the antenna when there is a risk of lightning. Electric shock may cause malfunction of or damage to the instrument.
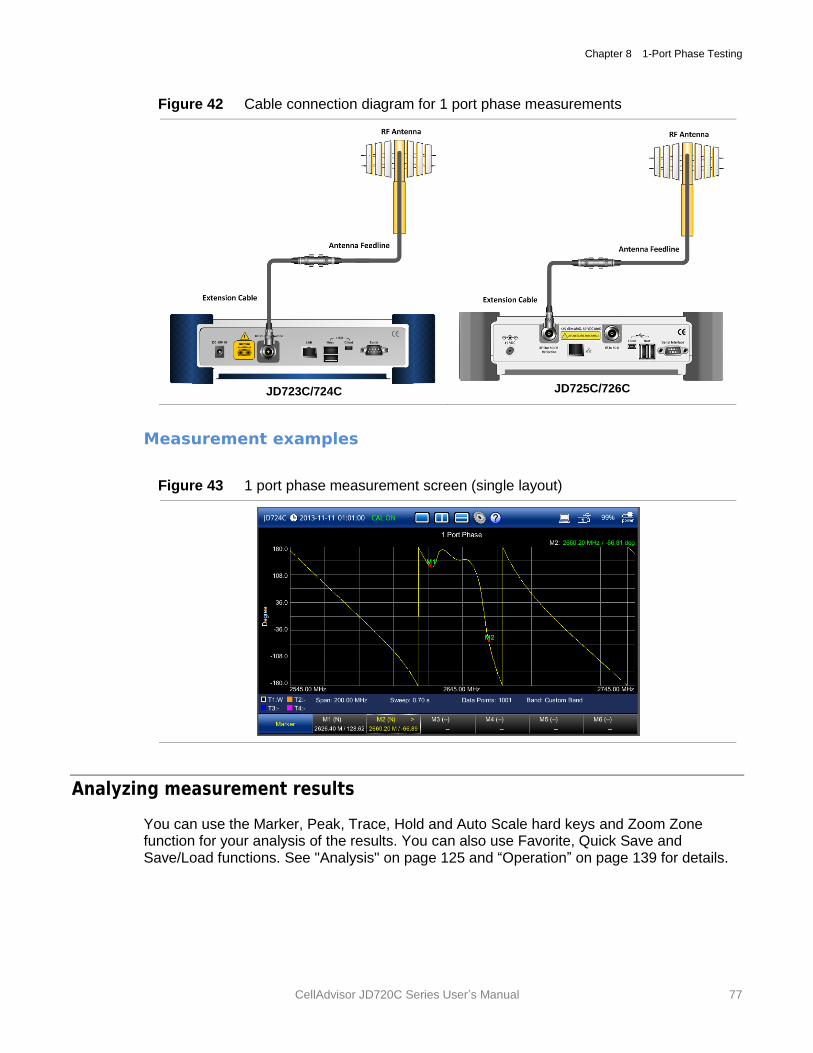
Chapter 8 1-Port Phase Testing
CellAdvisor JD720C Series User’s Manual 77
Figure 42 Cable connection diagram for 1 port phase measurements
JD723C/724C
JD725C/726C
Measurement examples
Figure 43 1 port phase measurement screen (single layout)
Analyzing measurement results
You can use the Marker, Peak, Trace, Hold and Auto Scale hard keys and Zoom Zone function for your analysis of the results. You can also use Favorite, Quick Save and Save/Load functions. See "Analysis" on page 125 and “Operation” on page 139 for details.

9
CellAdvisor JD720C User's Manual
Chapter 9 Smith Chart Testing
This chapter provides instructions on how to perform reflection measurements in Smith Chart. Topics discussed in this chapter are as follows:
Introducing Smith chart measurements ............................................................................... 79
Preparing for a measurement .............................................................................................. 80
Making a measurement ....................................................................................................... 82
Analyzing measurement results ........................................................................................... 84
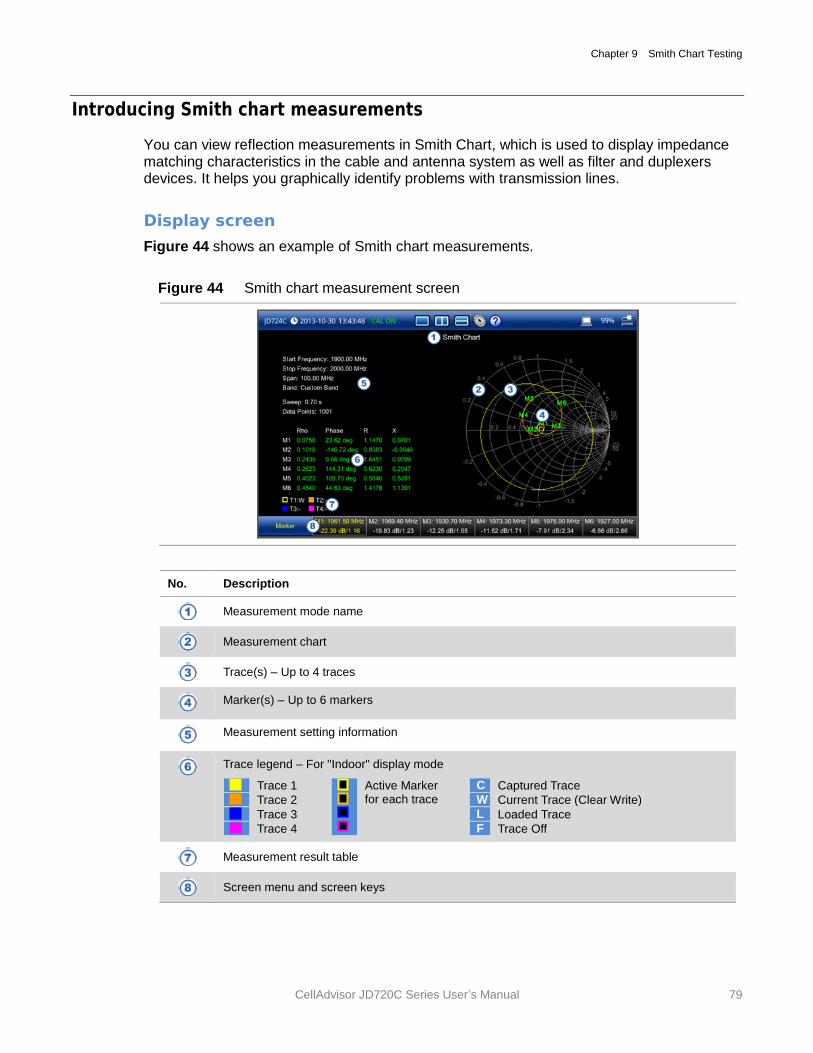
Chapter 9 Smith Chart Testing
CellAdvisor JD720C Series User’s Manual 79
Introducing Smith chart measurements
You can view reflection measurements in Smith Chart, which is used to display impedance matching characteristics in the cable and antenna system as well as filter and duplexers devices. It helps you graphically identify problems with transmission lines.
Display screen
Figure 44 shows an example of Smith chart measurements.
Figure 44 Smith chart measurement screen
No. Description
Measurement mode name
Measurement chart
Trace(s) – Up to 4 traces
Marker(s) – Up to 6 markers
Measurement setting information
Trace legend – For "Indoor" display mode
Trace 1
Active Marker for each trace
C Captured Trace
Trace 2 W Current Trace (Clear Write)
Trace 3 L Loaded Trace
Trace 4 F Trace Off
Measurement result table
Screen menu and screen keys
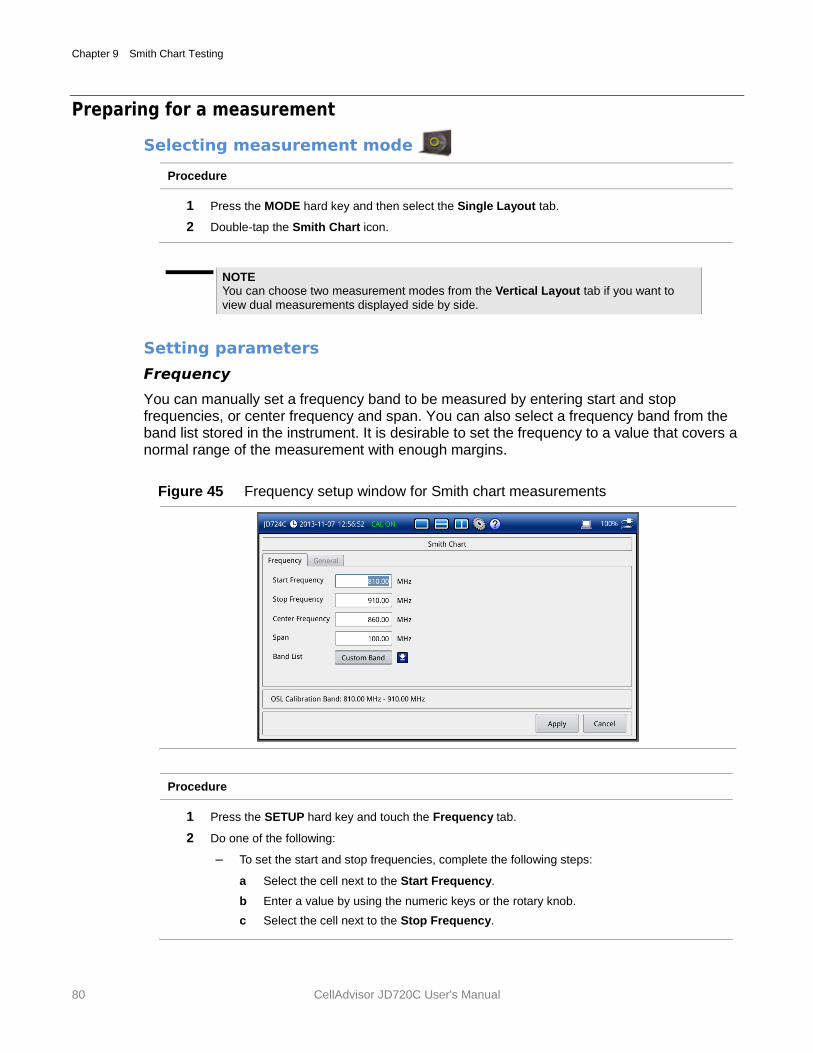
Chapter 9 Smith Chart Testing
80 CellAdvisor JD720C User's Manual
Preparing for a measurement
Selecting measurement mode
Procedure
1 Press the MODE hard key and then select the Single Layout tab.
2 Double-tap the Smith Chart icon.
NOTE You can choose two measurement modes from the Vertical Layout tab if you want to
view dual measurements displayed side by side.
Setting parameters
Frequency
You can manually set a frequency band to be measured by entering start and stop frequencies, or center frequency and span. You can also select a frequency band from the band list stored in the instrument. It is desirable to set the frequency to a value that covers a normal range of the measurement with enough margins.
Figure 45 Frequency setup window for Smith chart measurements
Procedure
1 Press the SETUP hard key and touch the Frequency tab.
2 Do one of the following:
– To set the start and stop frequencies, complete the following steps:
a Select the cell next to the Start Frequency.
b Enter a value by using the numeric keys or the rotary knob.
c Select the cell next to the Stop Frequency.
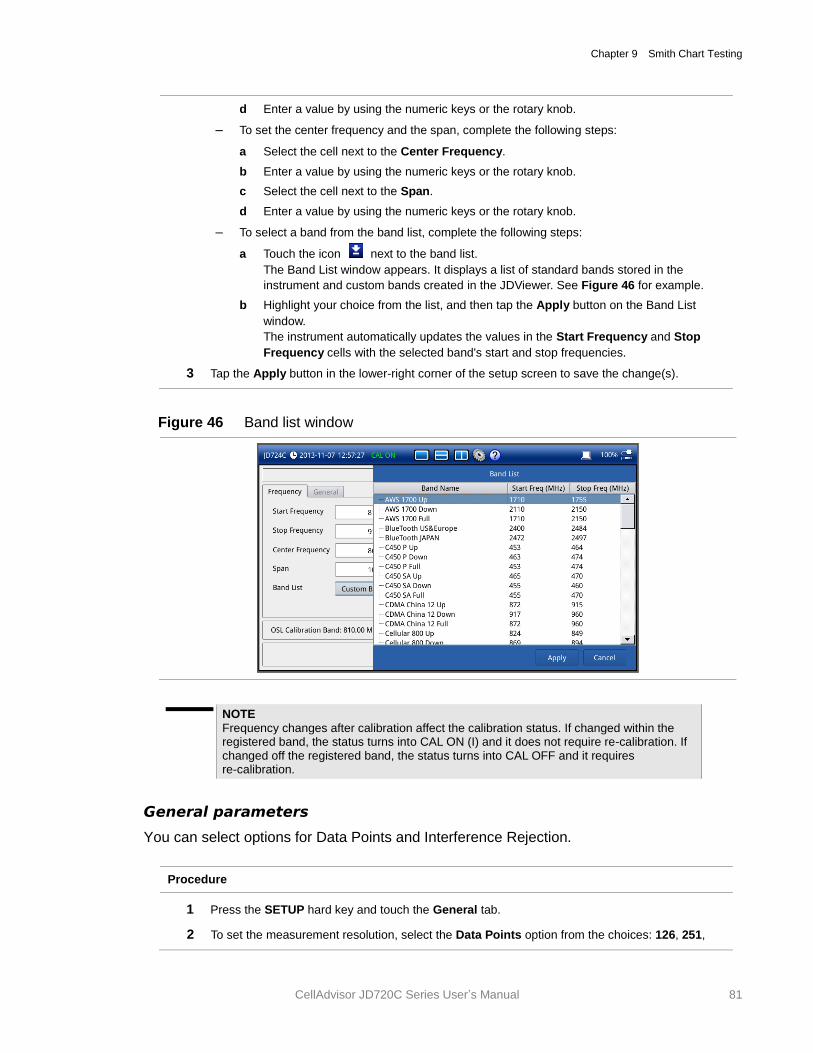
Chapter 9 Smith Chart Testing
CellAdvisor JD720C Series User’s Manual 81
d Enter a value by using the numeric keys or the rotary knob.
– To set the center frequency and the span, complete the following steps:
a Select the cell next to the Center Frequency.
b Enter a value by using the numeric keys or the rotary knob.
c Select the cell next to the Span.
d Enter a value by using the numeric keys or the rotary knob.
– To select a band from the band list, complete the following steps:
a Touch the icon next to the band list.
The Band List window appears. It displays a list of standard bands stored in the
instrument and custom bands created in the JDViewer. See Figure 46 for example.
b Highlight your choice from the list, and then tap the Apply button on the Band List
window.
The instrument automatically updates the values in the Start Frequency and Stop
Frequency cells with the selected band's start and stop frequencies.
3 Tap the Apply button in the lower-right corner of the setup screen to save the change(s).
Figure 46 Band list window
NOTE
Frequency changes after calibration affect the calibration status. If changed within the registered band, the status turns into CAL ON (I) and it does not require re-calibration. If changed off the registered band, the status turns into CAL OFF and it requires re-calibration.
General parameters
You can select options for Data Points and Interference Rejection.
Procedure
1 Press the SETUP hard key and touch the General tab.
2 To set the measurement resolution, select the Data Points option from the choices: 126, 251,
Chapter 9 Smith Chart Testing
82 CellAdvisor JD720C User's Manual
501, 1001, and 2001.
NOTE Default setting is 1001. It is recommended that you select high resolution data points
only for an instance of measuring wide frequency bands or requiring precise measurement data. The larger number you choose, the higher resolution you get and the longer the instrument takes to sweep and display results. For example, selecting 501 data points provides twice as many measurement points as 251, but it may take twice longer to sweep and display the trace than choosing 251 data points. Changing data points does not affect calibration status.
3 To enable the Interference Rejection feature, select On.
NOTE Default setting is Off. It is recommended to use this feature only when you suspect
interfering signals in the area as it slows down measurement.
4 For JD725C and JD726C users with the option 001 Bias Tee installed. To use the Bias Tee,
complete the following steps:
a Select On for the Bias Tee.
b Enter a value between 12 and 32 with 1 V step, as you desire.
NOTE If you have set this Bias Tee to On, the instrument will supply a DC bias of set level (12 – 32 V) from the RF In port to an active device, such as Tower Mounted Amplifier
(TMA) or Low Noise Amplifier (LNA), through the transmission line, eliminating the need of an external power supply.
5 Tap the Apply button in the lower-right corner of the setup screen to save the change(s).
Performing calibration
Perform the O-S-L Calibration by pressing the CAL hard key. The instrument displays on-screen instructions for you to follow through. See “Performing Calibration” on page 33 for more information.
Making a measurement
Once the O-S-L calibration is done, the instrument is now ready to make a measurement.
Procedure
1 Disconnect the calibration kit from the calibration point.
2 Connect an antenna or feed line to the calibration point, where is usually at the extension cable
end if used. See Figure 47 for the cable connection diagram.
3 Your measurement result is displayed on the screen in real time.
CAUTION Do not apply or connect power exceeding +25 dBm to the RF Out / Reflection port. When
the input signal power is greater than +25 dBm, the input power protection is triggered to protect the instrument and a measurement comes to stop automatically.
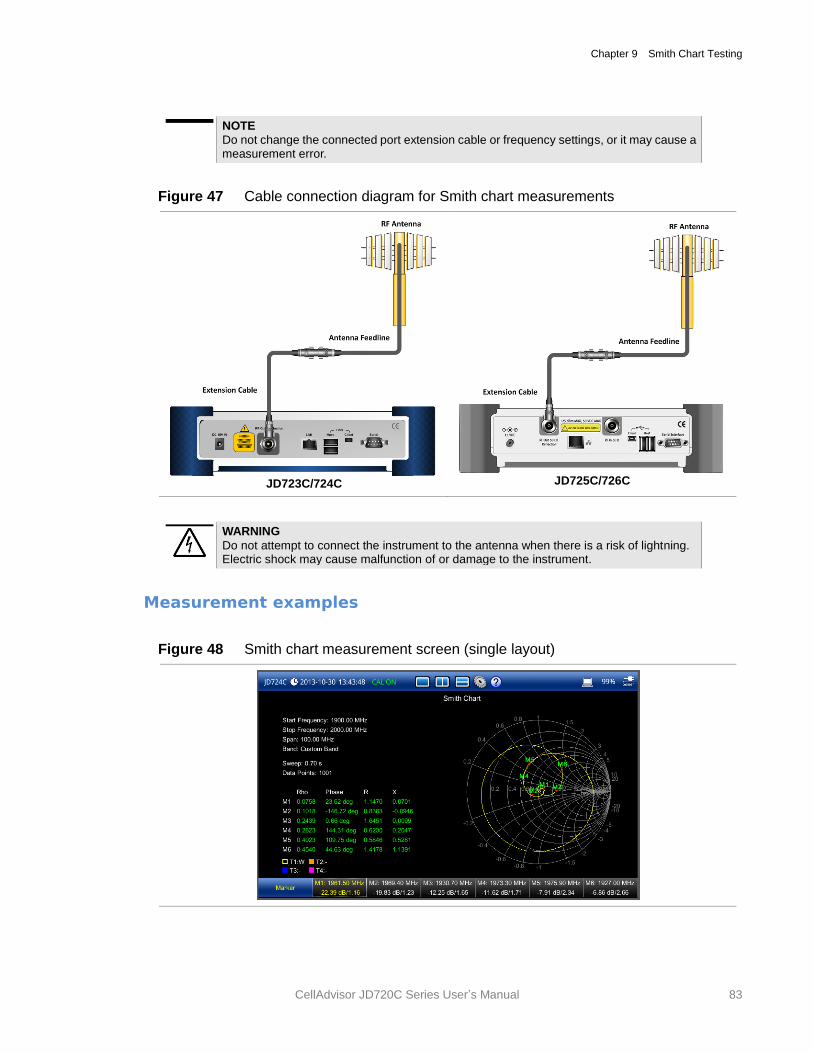
Chapter 9 Smith Chart Testing
CellAdvisor JD720C Series User’s Manual 83
NOTE
Do not change the connected port extension cable or frequency settings, or it may cause a measurement error.
Figure 47 Cable connection diagram for Smith chart measurements
JD723C/724C
JD725C/726C
WARNING
Do not attempt to connect the instrument to the antenna when there is a risk of lightning. Electric shock may cause malfunction of or damage to the instrument.
Measurement examples
Figure 48 Smith chart measurement screen (single layout)
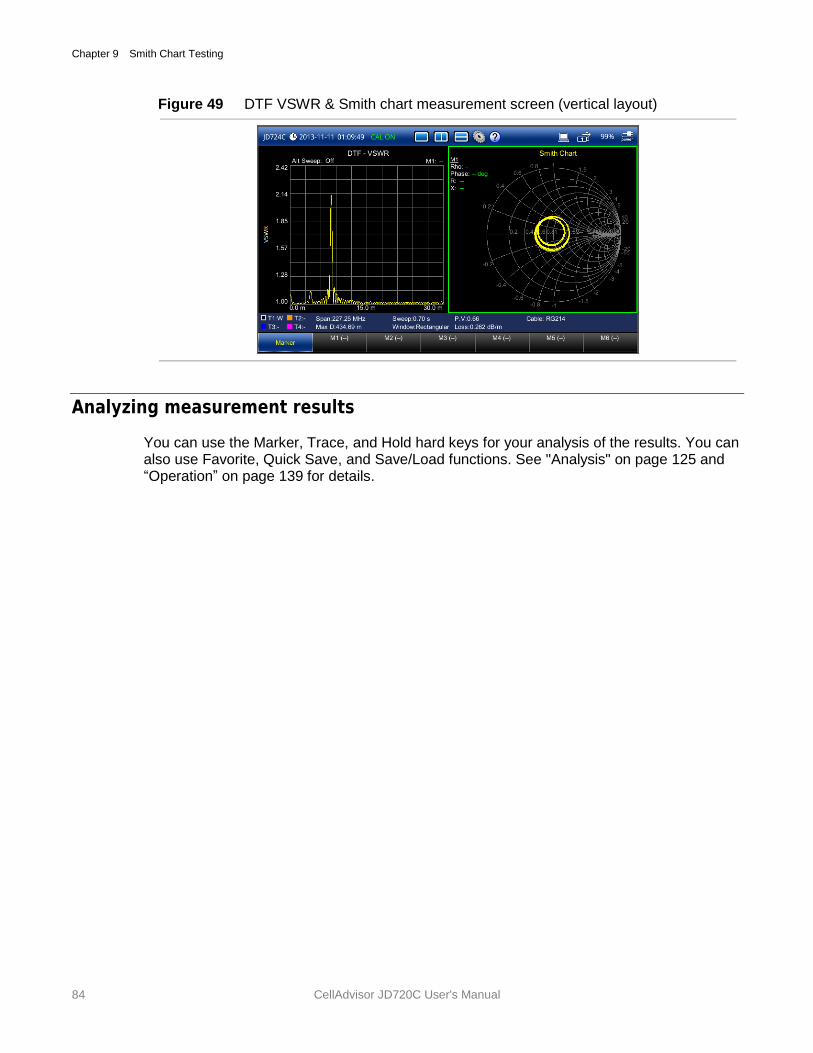
Chapter 9 Smith Chart Testing
84 CellAdvisor JD720C User's Manual
Figure 49 DTF VSWR & Smith chart measurement screen (vertical layout)
Analyzing measurement results
You can use the Marker, Trace, and Hold hard keys for your analysis of the results. You can also use Favorite, Quick Save, and Save/Load functions. See "Analysis" on page 125 and “Operation” on page 139 for details.
10
CellAdvisor JD720C User's Manual
Chapter 10 2-Port Transmission Testing
This chapter provides instructions on how to perform the 2-Port Transmission measurement that is a standard feature for JD725C and an option (002) for JD726C. It is used to quantify signal gain or loss in a cable or other devices with connecting both ends of the cable or device to the instrument. Topics discussed in this chapter are as follows:
Introducing 2-port transmission measurements ................................................................... 86
Preparing for a measurement .............................................................................................. 87
Making a measurement ....................................................................................................... 91
Analyzing measurement results ........................................................................................... 92
Chapter 10 2-Port Transmission Testing
86 CellAdvisor JD720C User's Manual
Introducing 2-port transmission measurements
The 2 Port Transmission measures the level of the signal attenuation of passive RF elements such as cables and filters, or the level of gains of active RF elements such as amplifiers. The frequency band to measure the characteristics of a cable must be calibrated before performing the insertion loss/gain measurement.
Gain
The gain is the gain resulting from the insertion of a device in a transmission line, expressed as the ratio of the signal power delivered to that part of the line following the device to the signal power delivered to that same part before insertion.
Insertion loss
The insertion loss is the loss of the transmitted signal power resulting from the insertion of a device in a transmission line. It is usually expressed relative to the signal power delivered to that same part before insertion. In most systems, insertion loss is introduced by things such as connectors, splitters, or couplers.
The insertion loss of a device (which may be a whole line) may also be referred to as attenuation. Line terminations play an important part in the insertion loss because they reflect some of the power. Apart from this, it is clear that not all of the power that is sent in to the line at one end appears at the other. This is because of radiation losses, resistive losses in the conductor as well as losses in the surrounding dielectric. The loss resulted from inserting a transmission line between a source and a load is called the insertion loss of the line.
If the power transmitted by the source is PT and the power received by the load is PR, then the insertion loss is given by PR divided by PT. For maximum power transfer the insertion loss should be as small as possible. In other words, the ratio PR/PT should be as close to one as possible, which in decibels means as close to 0 dB as possible.
Display screen
Figure 50 shows an example of 2 Port Transmission measurements.
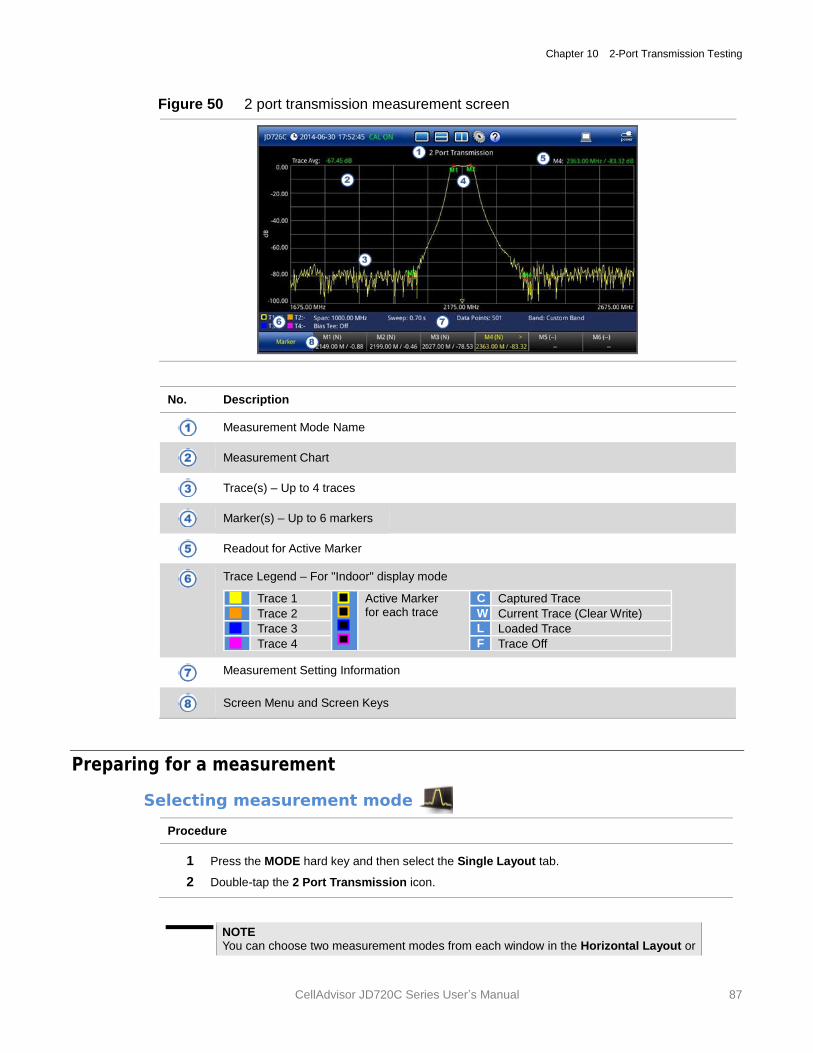
Chapter 10 2-Port Transmission Testing
CellAdvisor JD720C Series User’s Manual 87
Figure 50 2 port transmission measurement screen
No. Description
Measurement Mode Name
Measurement Chart
Trace(s) – Up to 4 traces
Marker(s) – Up to 6 markers
Readout for Active Marker
Trace Legend – For "Indoor" display mode
Trace 1
Active Marker for each trace
C Captured Trace
Trace 2 W Current Trace (Clear Write)
Trace 3 L Loaded Trace
Trace 4 F Trace Off
Measurement Setting Information
Screen Menu and Screen Keys
Preparing for a measurement
Selecting measurement mode
Procedure
1 Press the MODE hard key and then select the Single Layout tab.
2 Double-tap the 2 Port Transmission icon.
NOTE You can choose two measurement modes from each window in the Horizontal Layout or
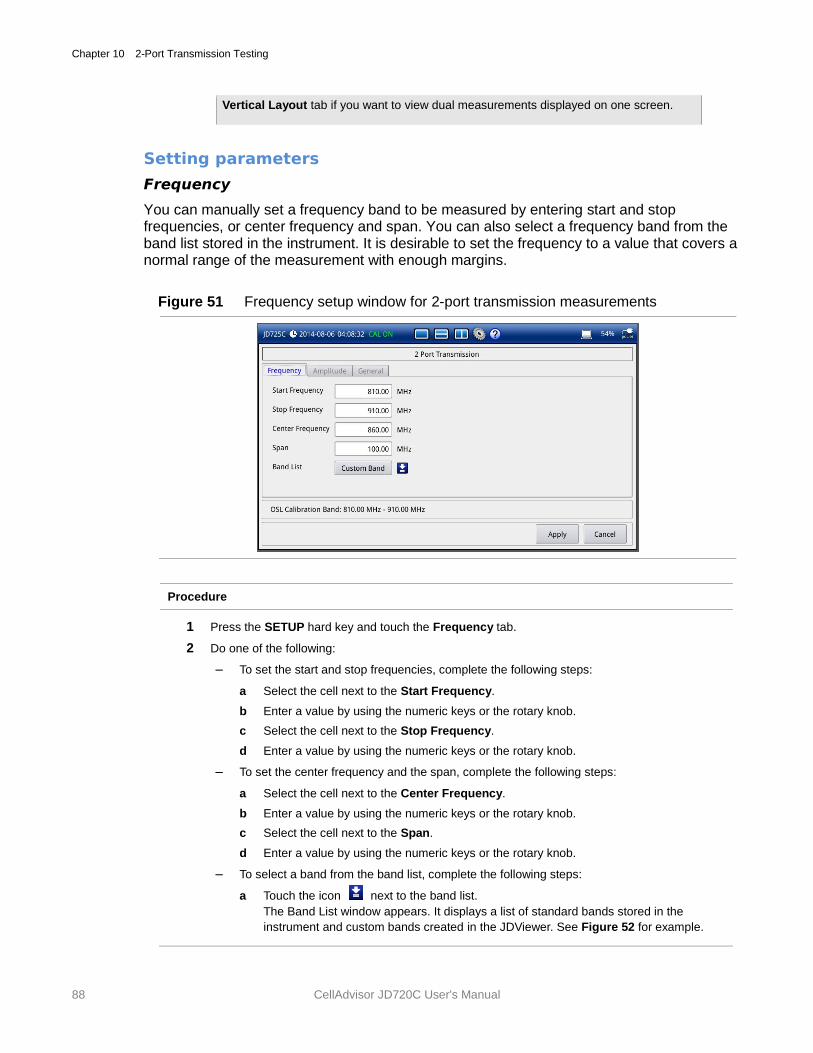
Chapter 10 2-Port Transmission Testing
88 CellAdvisor JD720C User's Manual
Vertical Layout tab if you want to view dual measurements displayed on one screen.
Setting parameters
Frequency
You can manually set a frequency band to be measured by entering start and stop frequencies, or center frequency and span. You can also select a frequency band from the band list stored in the instrument. It is desirable to set the frequency to a value that covers a normal range of the measurement with enough margins.
Figure 51 Frequency setup window for 2-port transmission measurements
Procedure
1 Press the SETUP hard key and touch the Frequency tab.
2 Do one of the following:
– To set the start and stop frequencies, complete the following steps:
a Select the cell next to the Start Frequency.
b Enter a value by using the numeric keys or the rotary knob.
c Select the cell next to the Stop Frequency.
d Enter a value by using the numeric keys or the rotary knob.
– To set the center frequency and the span, complete the following steps:
a Select the cell next to the Center Frequency.
b Enter a value by using the numeric keys or the rotary knob.
c Select the cell next to the Span.
d Enter a value by using the numeric keys or the rotary knob.
– To select a band from the band list, complete the following steps:
a Touch the icon next to the band list.
The Band List window appears. It displays a list of standard bands stored in the
instrument and custom bands created in the JDViewer. See Figure 52 for example.
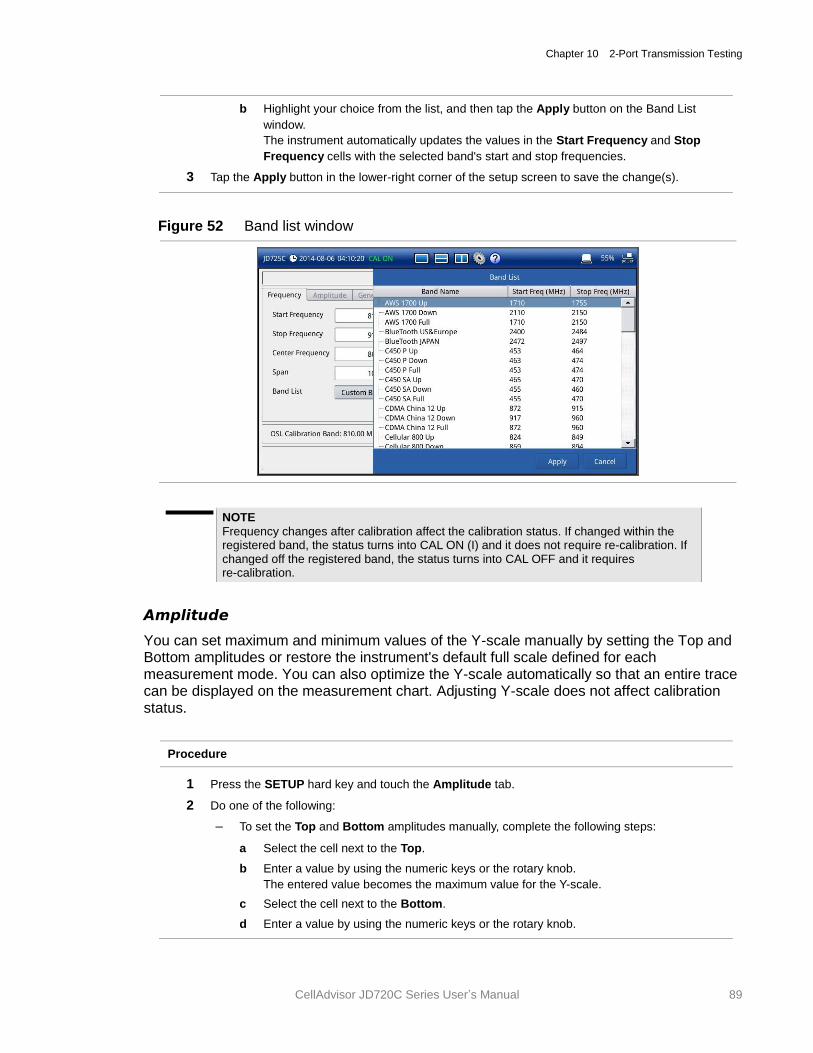
Chapter 10 2-Port Transmission Testing
CellAdvisor JD720C Series User’s Manual 89
b Highlight your choice from the list, and then tap the Apply button on the Band List
window.
The instrument automatically updates the values in the Start Frequency and Stop
Frequency cells with the selected band's start and stop frequencies.
3 Tap the Apply button in the lower-right corner of the setup screen to save the change(s).
Figure 52 Band list window
NOTE
Frequency changes after calibration affect the calibration status. If changed within the registered band, the status turns into CAL ON (I) and it does not require re-calibration. If changed off the registered band, the status turns into CAL OFF and it requires re-calibration.
Amplitude
You can set maximum and minimum values of the Y-scale manually by setting the Top and Bottom amplitudes or restore the instrument's default full scale defined for each measurement mode. You can also optimize the Y-scale automatically so that an entire trace can be displayed on the measurement chart. Adjusting Y-scale does not affect calibration status.
Procedure
1 Press the SETUP hard key and touch the Amplitude tab.
2 Do one of the following:
– To set the Top and Bottom amplitudes manually, complete the following steps:
a Select the cell next to the Top.
b Enter a value by using the numeric keys or the rotary knob.
The entered value becomes the maximum value for the Y-scale.
c Select the cell next to the Bottom.
d Enter a value by using the numeric keys or the rotary knob.
Chapter 10 2-Port Transmission Testing
90 CellAdvisor JD720C User's Manual
The entered value becomes the minimum value for the Y-scale.
– To restore the instrument’s default range for the Y-scale, tap the Full Scale button. The amplitude range for this measurement mode is -120 to 100 dB.
3 Tap the Apply button in the lower-right corner of the setup screen to save the change(s).
NOTE
You can also press the AUTO SCALE hard key any time you need to view the
entire trace on the measurement chart. The instrument automatically optimizes the maximum and minimum values of the Y-scale to display the entire trace and the limit.
General parameters
You can set parameters for Data Points, Interference Rejection, Bias Tee, Output Power, and Average.
Procedure
1 Press the SETUP hard key and touch the General tab.
2 To set the measurement resolution, select the Data Points option from the choices: 126, 251,
501, 1001, and 2001.
NOTE Default setting is 1001. It is recommended that you select high resolution data points
only for an instance of measuring wide frequency bands or requiring precise measurement data. The larger number you choose, the higher resolution you get and the longer the instrument takes to sweep and display results. For example, selecting 501 data points provides twice as many measurement points as 251, but it may take twice longer to sweep and display the trace than choosing 251 data points. Changing data points does not affect calibration status.
3 To set the level of the output power to be inserted, select the Output Power option from the
following choices:
– 0 dBm: To test your DUT’s loss if it a passive RF device such as cable or filter.
– -30 dBm: To test your DUT’s gain if it is an active RF device such as amplifier.
NOTE
Changing the output power level after calibration affects the calibration status and it requires you to perform a new calibration.
4 To set the number of measurements to be averaged, complete the following steps:
a Select the input box next to the Average.
b Enter a value between one and five.
5 To enable the Interference Rejection feature, select On.
NOTE Default setting is Off. It is recommended to use this feature only when you suspect
interfering signals in the area as it slows down measurement.
6 For JD725C and JD726C users with the option 001 Bias Tee installed. To use the Bias Tee,
complete the following steps:
a Select On for the Bias Tee.
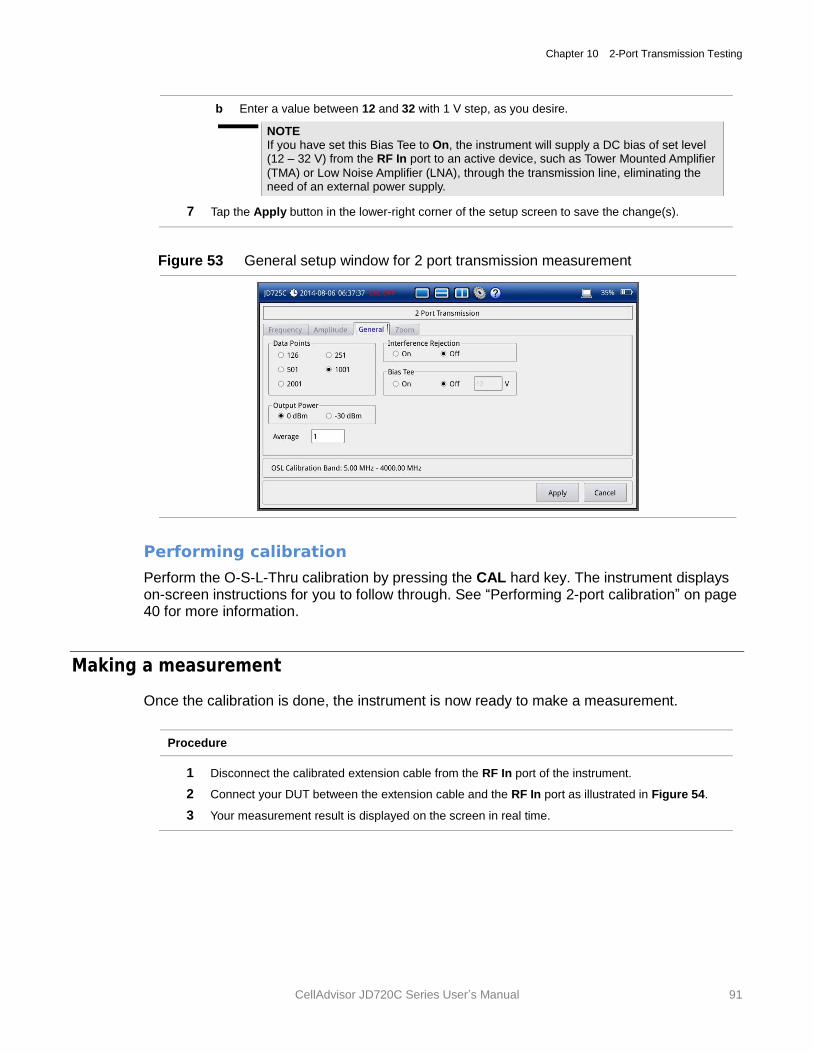
Chapter 10 2-Port Transmission Testing
CellAdvisor JD720C Series User’s Manual 91
b Enter a value between 12 and 32 with 1 V step, as you desire.
NOTE If you have set this Bias Tee to On, the instrument will supply a DC bias of set level (12 – 32 V) from the RF In port to an active device, such as Tower Mounted Amplifier
(TMA) or Low Noise Amplifier (LNA), through the transmission line, eliminating the need of an external power supply.
7 Tap the Apply button in the lower-right corner of the setup screen to save the change(s).
Figure 53 General setup window for 2 port transmission measurement
Performing calibration
Perform the O-S-L-Thru calibration by pressing the CAL hard key. The instrument displays on-screen instructions for you to follow through. See “Performing 2-port calibration” on page 40 for more information.
Making a measurement
Once the calibration is done, the instrument is now ready to make a measurement.
Procedure
1 Disconnect the calibrated extension cable from the RF In port of the instrument.
2 Connect your DUT between the extension cable and the RF In port as illustrated in Figure 54.
3 Your measurement result is displayed on the screen in real time.
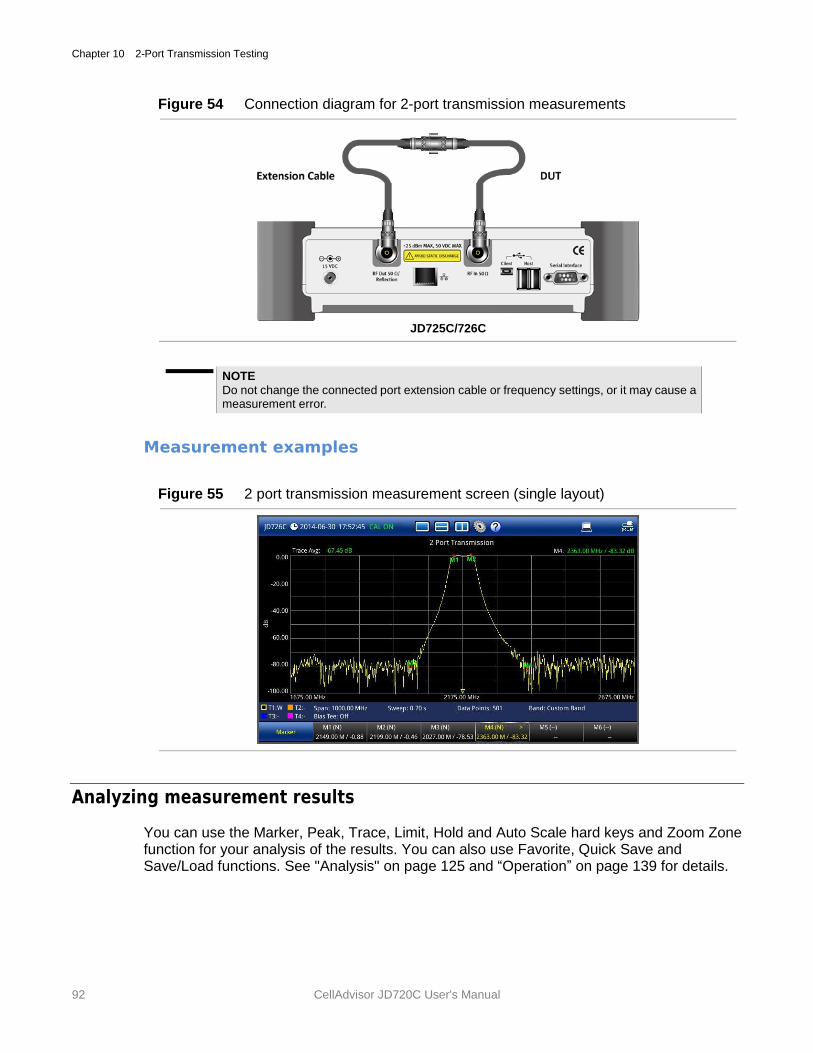
Chapter 10 2-Port Transmission Testing
92 CellAdvisor JD720C User's Manual
Figure 54 Connection diagram for 2-port transmission measurements
JD725C/726C
NOTE
Do not change the connected port extension cable or frequency settings, or it may cause a measurement error.
Measurement examples
Figure 55 2 port transmission measurement screen (single layout)
Analyzing measurement results
You can use the Marker, Peak, Trace, Limit, Hold and Auto Scale hard keys and Zoom Zone function for your analysis of the results. You can also use Favorite, Quick Save and Save/Load functions. See "Analysis" on page 125 and “Operation” on page 139 for details.
11
CellAdvisor JD720C User's Manual
Chapter 11 2-Port Phase Testing
This chapter provides instructions on how to perform the 2 Port Phase measurement that is a standard feature for JD725C and an option (002) for JD726C. Topics discussed in this chapter are as follows:
Introducing 2-port phase measurements ............................................................................. 94
Preparing for a measurement .............................................................................................. 95
Making a measurement ....................................................................................................... 98
Analyzing measurement results ........................................................................................... 99
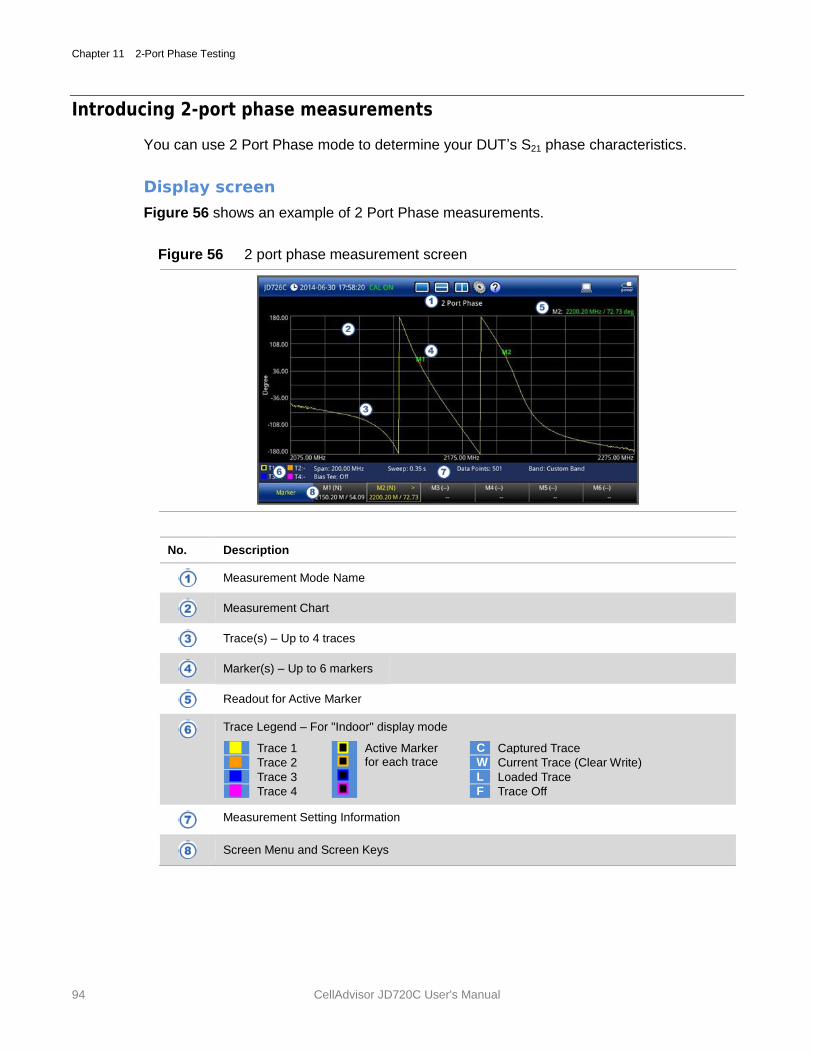
Chapter 11 2-Port Phase Testing
94 CellAdvisor JD720C User's Manual
Introducing 2-port phase measurements
You can use 2 Port Phase mode to determine your DUT’s S21 phase characteristics.
Display screen
Figure 56 shows an example of 2 Port Phase measurements.
Figure 56 2 port phase measurement screen
No. Description
Measurement Mode Name
Measurement Chart
Trace(s) – Up to 4 traces
Marker(s) – Up to 6 markers
Readout for Active Marker
Trace Legend – For "Indoor" display mode
Trace 1
Active Marker for each trace
C Captured Trace
Trace 2 W Current Trace (Clear Write)
Trace 3 L Loaded Trace
Trace 4 F Trace Off
Measurement Setting Information
Screen Menu and Screen Keys
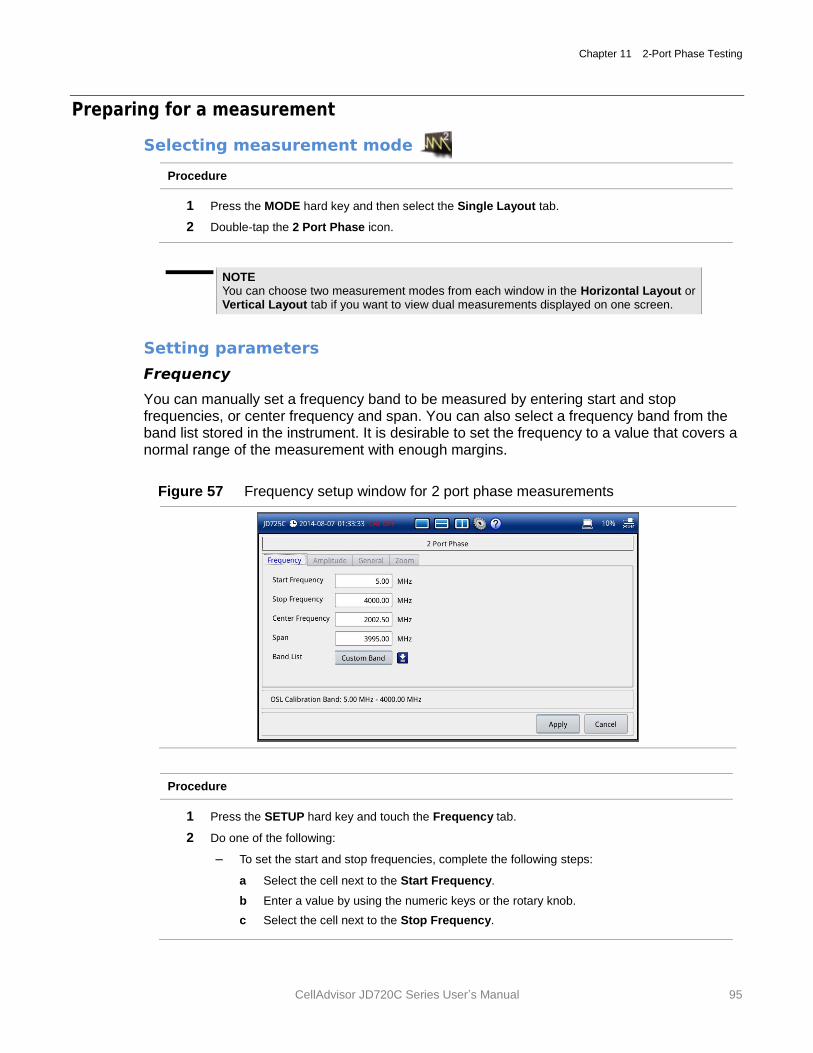
Chapter 11 2-Port Phase Testing
CellAdvisor JD720C Series User’s Manual 95
Preparing for a measurement
Selecting measurement mode
Procedure
1 Press the MODE hard key and then select the Single Layout tab.
2 Double-tap the 2 Port Phase icon.
NOTE You can choose two measurement modes from each window in the Horizontal Layout or Vertical Layout tab if you want to view dual measurements displayed on one screen.
Setting parameters
Frequency
You can manually set a frequency band to be measured by entering start and stop frequencies, or center frequency and span. You can also select a frequency band from the band list stored in the instrument. It is desirable to set the frequency to a value that covers a normal range of the measurement with enough margins.
Figure 57 Frequency setup window for 2 port phase measurements
Procedure
1 Press the SETUP hard key and touch the Frequency tab.
2 Do one of the following:
– To set the start and stop frequencies, complete the following steps:
a Select the cell next to the Start Frequency.
b Enter a value by using the numeric keys or the rotary knob.
c Select the cell next to the Stop Frequency.
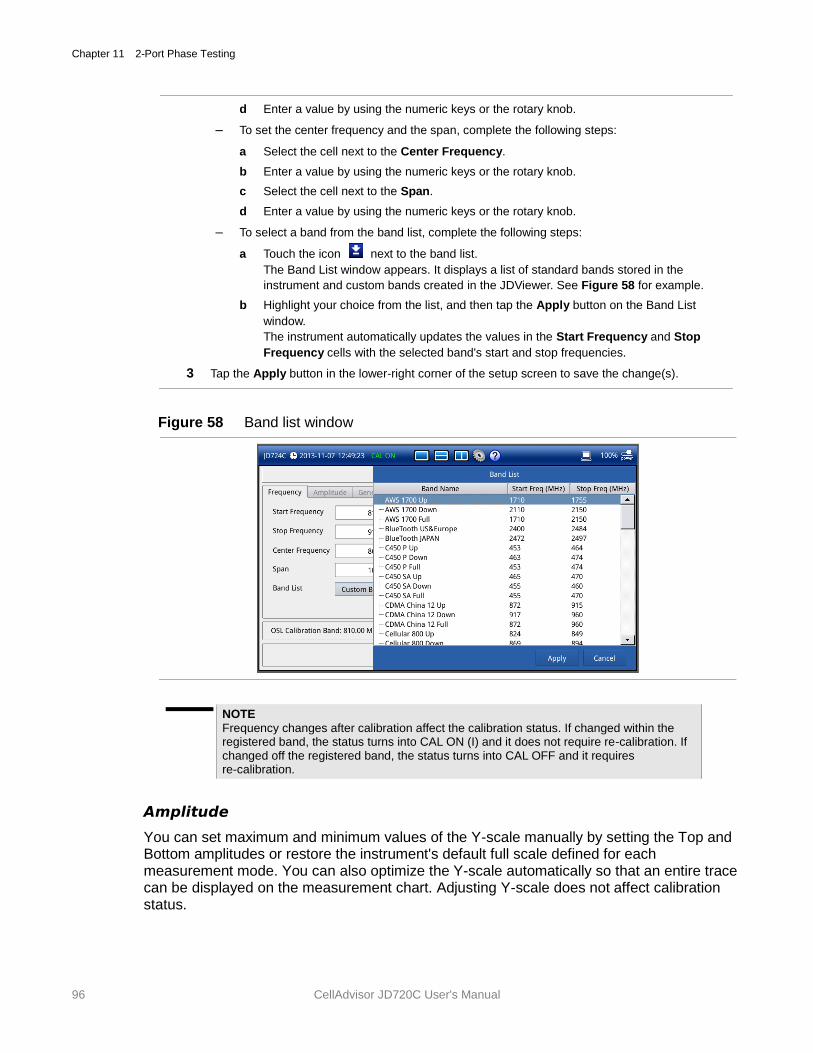
Chapter 11 2-Port Phase Testing
96 CellAdvisor JD720C User's Manual
d Enter a value by using the numeric keys or the rotary knob.
– To set the center frequency and the span, complete the following steps:
a Select the cell next to the Center Frequency.
b Enter a value by using the numeric keys or the rotary knob.
c Select the cell next to the Span.
d Enter a value by using the numeric keys or the rotary knob.
– To select a band from the band list, complete the following steps:
a Touch the icon next to the band list.
The Band List window appears. It displays a list of standard bands stored in the
instrument and custom bands created in the JDViewer. See Figure 58 for example.
b Highlight your choice from the list, and then tap the Apply button on the Band List
window.
The instrument automatically updates the values in the Start Frequency and Stop
Frequency cells with the selected band's start and stop frequencies.
3 Tap the Apply button in the lower-right corner of the setup screen to save the change(s).
Figure 58 Band list window
NOTE
Frequency changes after calibration affect the calibration status. If changed within the registered band, the status turns into CAL ON (I) and it does not require re-calibration. If changed off the registered band, the status turns into CAL OFF and it requires re-calibration.
Amplitude
You can set maximum and minimum values of the Y-scale manually by setting the Top and Bottom amplitudes or restore the instrument's default full scale defined for each measurement mode. You can also optimize the Y-scale automatically so that an entire trace can be displayed on the measurement chart. Adjusting Y-scale does not affect calibration status.
Chapter 11 2-Port Phase Testing
CellAdvisor JD720C Series User’s Manual 97
Procedure
1 Press the SETUP hard key and touch the Amplitude tab.
2 Do one of the following:
– To set the Top and Bottom amplitudes manually, complete the following steps:
a Select the cell next to the Top.
b Enter a value by using the numeric keys or the rotary knob.
The entered value becomes the maximum value for the Y-scale.
c Select the cell next to the Bottom.
d Enter a value by using the numeric keys or the rotary knob.
The entered value becomes the minimum value for the Y-scale.
– To restore the instrument’s default range for the Y-scale, tap the Full Scale button. The amplitude range for this measurement mode is -180 to 180 Degree.
3 Tap the Apply button in the lower-right corner of the setup screen to save the change(s).
NOTE
You can also press the AUTO SCALE hard key any time you need to view the
entire trace on the measurement chart. The instrument automatically optimizes the maximum and minimum values of the Y-scale to display the entire trace.
General parameters
You can select options for Data Points and Interference Rejection.
Procedure
1 Press the SETUP hard key and touch the General tab.
2 To set the measurement resolution, select the Data Points option from the choices: 126, 251,
501, 1001, and 2001.
NOTE Default setting is 1001. It is recommended that you select high resolution data points
only for an instance of measuring wide frequency bands or requiring precise measurement data. The larger number you choose, the higher resolution you get and the longer the instrument takes to sweep and display results. For example, selecting 501 data points provides twice as many measurement points as 251, but it may take twice longer to sweep and display the trace than choosing 251 data points. Changing data points does not affect calibration status.
3 To set the level of the output power to be inserted, select the Output Power option from the
following choices:
– 0 dBm: To test your DUT’s loss if it is a passive RF device such as cable or filter.
– -30 dBm: To test your DUT’s gain if it is an active RF device such as amplifier.
NOTE
Changing the output power level after calibration affects the calibration status and it requires you to perform a new calibration.
4 To set the number of measurements to be averaged, complete the following steps:
Chapter 11 2-Port Phase Testing
98 CellAdvisor JD720C User's Manual
a Select the input box next to the Average.
b Enter a value between one and five.
5 To enable the Interference Rejection feature, select On.
NOTE Default setting is Off. It is recommended to use this feature only when you suspect
interfering signals in the area as it slows down measurement.
6 For JD725C and JD726C users with the option 001 Bias Tee installed. To use the Bias Tee,
complete the following steps:
a Select On for the Bias Tee.
b Enter a value between 12 and 32 with 1 V step, as you desire.
NOTE If you have set this Bias Tee to On, the instrument will supply a DC bias of set level (12 – 32 V) from the RF In port to an active device, such as Tower Mounted Amplifier
(TMA) or Low Noise Amplifier (LNA), through the transmission line, eliminating the need of an external power supply.
7 Tap the Apply button in the lower-right corner of the setup screen to save the change(s).
Performing calibration
Perform the O-S-L-Thru Calibration by pressing the CAL hard key. The instrument displays on-screen instructions for you to follow through. See “Performing 2-port calibration” on page 40 for more information.
Making a measurement
Once the calibration is done, the instrument is now ready to make a measurement.
Procedure
1 Disconnect the calibrated extension cable from the RF In port of the instrument.
2 Connect your DUT between the extension cable and the RF In port as illustrated in Figure 59.
3 Your measurement result is displayed on the screen in real time.
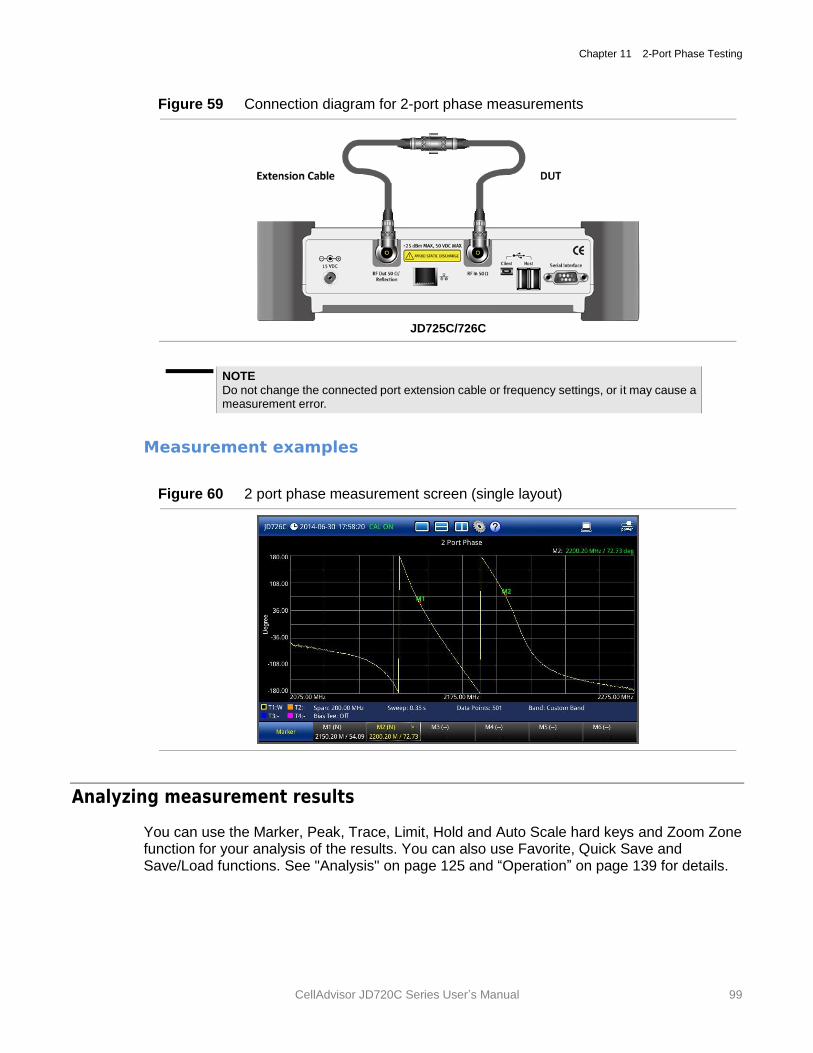
Chapter 11 2-Port Phase Testing
CellAdvisor JD720C Series User’s Manual 99
Figure 59 Connection diagram for 2-port phase measurements
JD725C/726C
NOTE
Do not change the connected port extension cable or frequency settings, or it may cause a measurement error.
Measurement examples
Figure 60 2 port phase measurement screen (single layout)
Analyzing measurement results
You can use the Marker, Peak, Trace, Limit, Hold and Auto Scale hard keys and Zoom Zone function for your analysis of the results. You can also use Favorite, Quick Save and Save/Load functions. See "Analysis" on page 125 and “Operation” on page 139 for details.
12
CellAdvisor JD720C User's Manual
Chapter 12 High Power CW Signal Generating
This chapter provides instructions on how to use the CW Signal Generator function (option 005) with JD275C and JD726C. Topics discussed in this chapter are as follows:
Introducing RF source ........................................................................................................ 101
Using RF source ................................................................................................................ 101
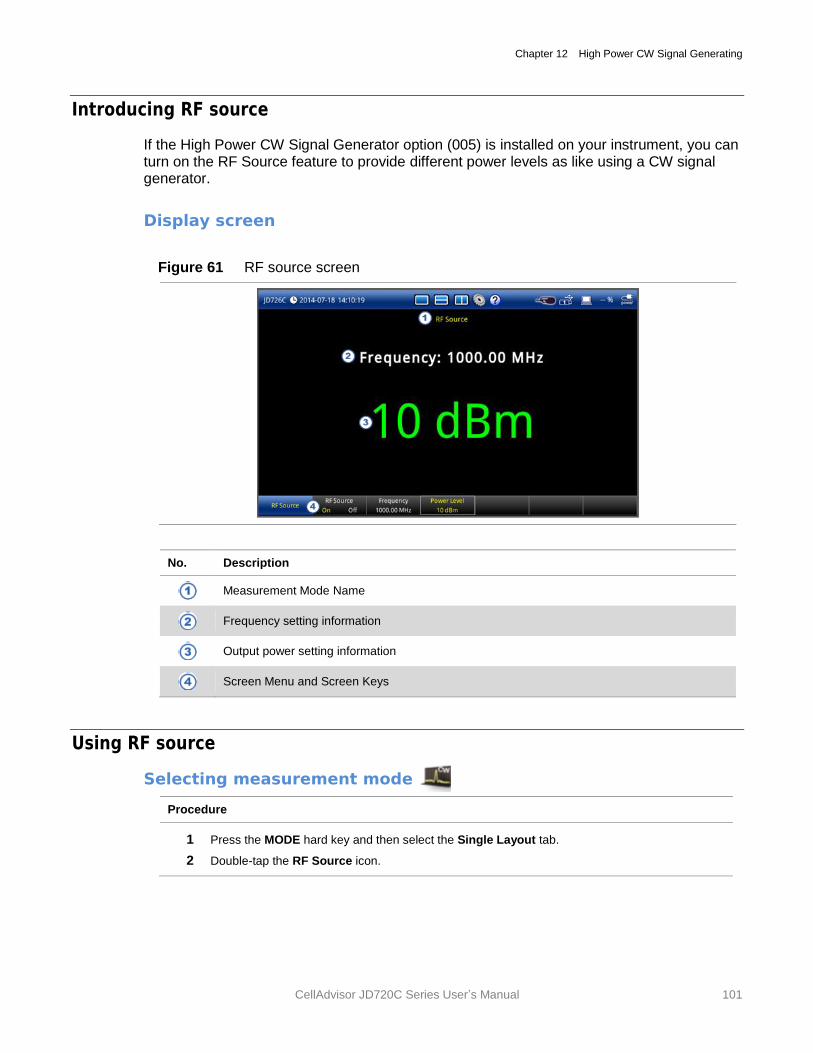
Chapter 12 High Power CW Signal Generating
CellAdvisor JD720C Series User’s Manual 101
Introducing RF source
If the High Power CW Signal Generator option (005) is installed on your instrument, you can turn on the RF Source feature to provide different power levels as like using a CW signal generator.
Display screen
Figure 61 RF source screen
No. Description
Measurement Mode Name
Frequency setting information
Output power setting information
Screen Menu and Screen Keys
Using RF source
Selecting measurement mode
Procedure
1 Press the MODE hard key and then select the Single Layout tab.
2 Double-tap the RF Source icon.
Chapter 12 High Power CW Signal Generating
102 CellAdvisor JD720C User's Manual
Turing on RF source
Procedure
1 To set the frequency of the signal, complete the following steps:
a Tap the Frequency screen key.
b Enter a value within the frequency range of your instrument by using the numeric keys,
and then press the ENTER hard key. You can also use the rotary knob.
2 To set the output level of the signal, complete following steps:
a Tap the Power Level screen key.
b Enter a value between -30 dBm and 10 dBm for JD725C or -30 dBm and 5 dBm for
JD726C by using the numeric keys, and then press the ENTER hard key. You can also use
the rotary knob.
3 To start generating the set signal, toggle the RF Source screen key, and then select On.
4 To stop generating the signal, toggle the RF Source screen key, and then select Off.

13
CellAdvisor JD720C User's Manual
Chapter 13 RF Power Testing
This chapter provides instructions on how to use the RF Power Meter function. Topics discussed in this chapter are as follows:
Introducing RF power measurements ................................................................................ 104
Preparing for a measurement ............................................................................................ 105
Making a measurement ..................................................................................................... 107
Analyzing measurement results ......................................................................................... 109
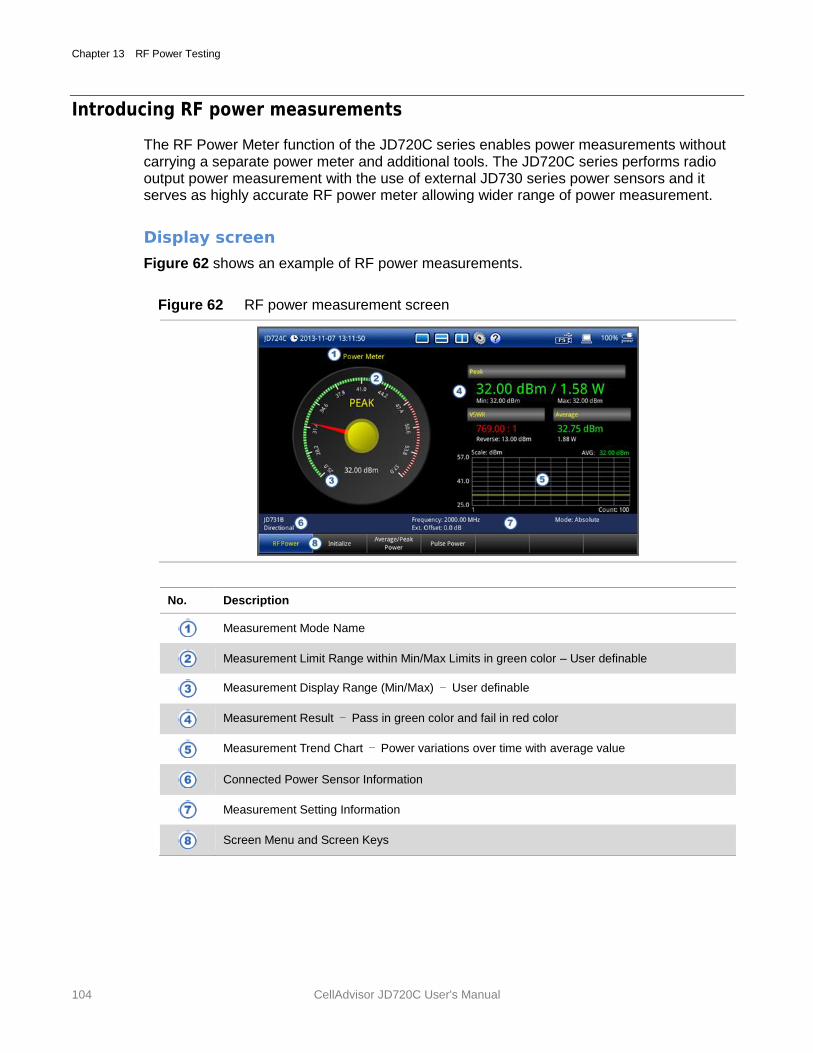
Chapter 13 RF Power Testing
104 CellAdvisor JD720C User's Manual
Introducing RF power measurements
The RF Power Meter function of the JD720C series enables power measurements without carrying a separate power meter and additional tools. The JD720C series performs radio output power measurement with the use of external JD730 series power sensors and it serves as highly accurate RF power meter allowing wider range of power measurement.
Display screen
Figure 62 shows an example of RF power measurements.
Figure 62 RF power measurement screen
No. Description
Measurement Mode Name
Measurement Limit Range within Min/Max Limits in green color – User definable
Measurement Display Range (Min/Max) – User definable
Measurement Result – Pass in green color and fail in red color
Measurement Trend Chart – Power variations over time with average value
Connected Power Sensor Information
Measurement Setting Information
Screen Menu and Screen Keys
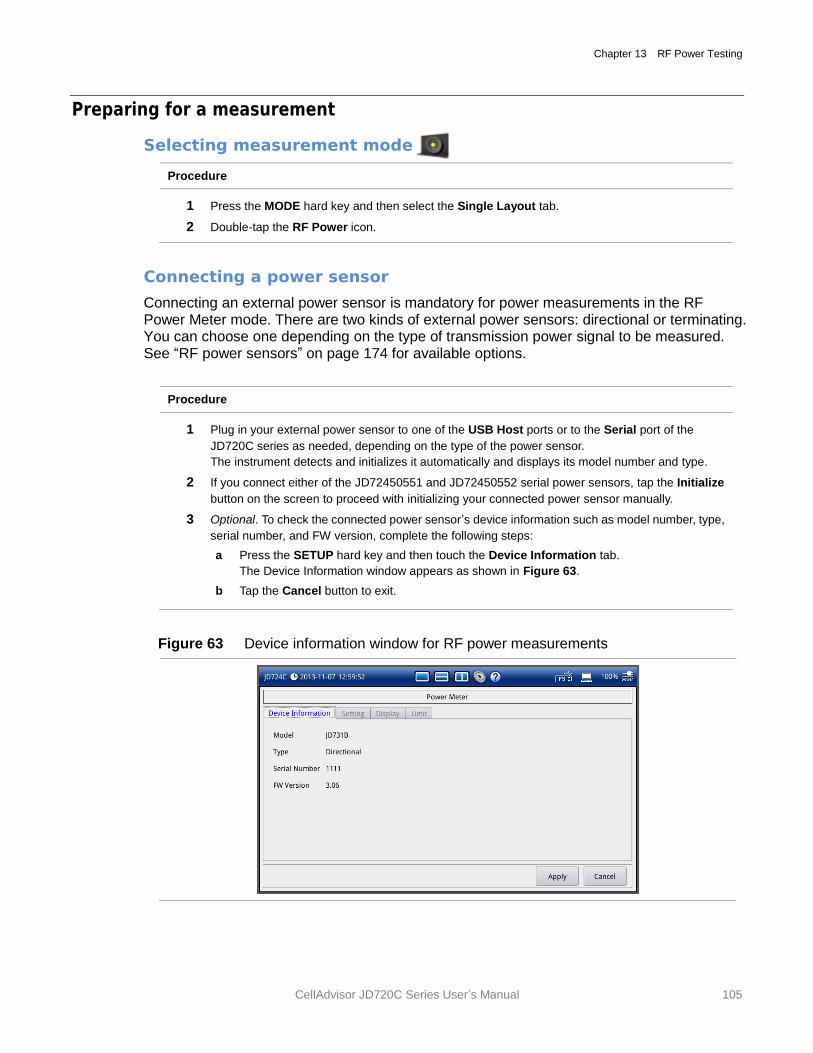
Chapter 13 RF Power Testing
CellAdvisor JD720C Series User’s Manual 105
Preparing for a measurement
Selecting measurement mode
Procedure
1 Press the MODE hard key and then select the Single Layout tab.
2 Double-tap the RF Power icon.
Connecting a power sensor
Connecting an external power sensor is mandatory for power measurements in the RF Power Meter mode. There are two kinds of external power sensors: directional or terminating. You can choose one depending on the type of transmission power signal to be measured. See “RF power sensors” on page 174 for available options.
Procedure
1 Plug in your external power sensor to one of the USB Host ports or to the Serial port of the
JD720C series as needed, depending on the type of the power sensor.
The instrument detects and initializes it automatically and displays its model number and type.
2 If you connect either of the JD72450551 and JD72450552 serial power sensors, tap the Initialize
button on the screen to proceed with initializing your connected power sensor manually.
3 Optional. To check the connected power sensor’s device information such as model number, type,
serial number, and FW version, complete the following steps:
a Press the SETUP hard key and then touch the Device Information tab.
The Device Information window appears as shown in Figure 63.
b Tap the Cancel button to exit.
Figure 63 Device information window for RF power measurements
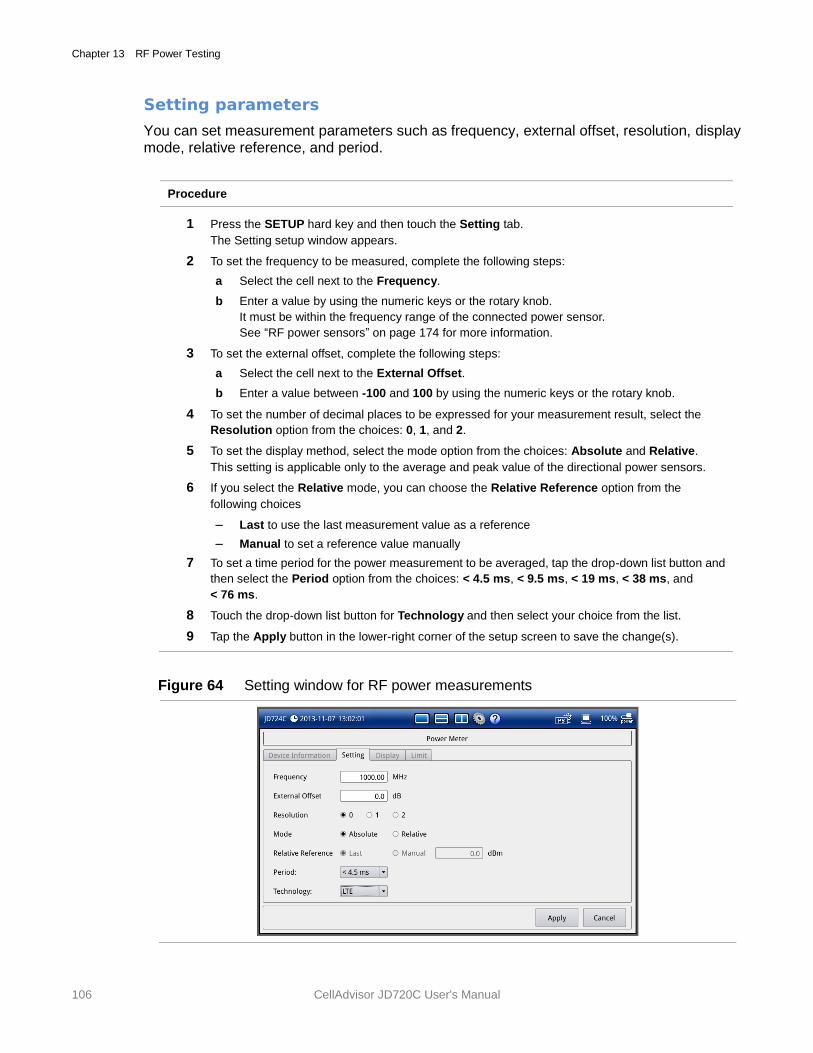
Chapter 13 RF Power Testing
106 CellAdvisor JD720C User's Manual
Setting parameters
You can set measurement parameters such as frequency, external offset, resolution, display mode, relative reference, and period.
Procedure
1 Press the SETUP hard key and then touch the Setting tab.
The Setting setup window appears.
2 To set the frequency to be measured, complete the following steps:
a Select the cell next to the Frequency.
b Enter a value by using the numeric keys or the rotary knob.
It must be within the frequency range of the connected power sensor.
See “RF power sensors” on page 174 for more information.
3 To set the external offset, complete the following steps:
a Select the cell next to the External Offset.
b Enter a value between -100 and 100 by using the numeric keys or the rotary knob.
4 To set the number of decimal places to be expressed for your measurement result, select the
Resolution option from the choices: 0, 1, and 2.
5 To set the display method, select the mode option from the choices: Absolute and Relative.
This setting is applicable only to the average and peak value of the directional power sensors.
6 If you select the Relative mode, you can choose the Relative Reference option from the
following choices
– Last to use the last measurement value as a reference
– Manual to set a reference value manually
7 To set a time period for the power measurement to be averaged, tap the drop-down list button and
then select the Period option from the choices: < 4.5 ms, < 9.5 ms, < 19 ms, < 38 ms, and
< 76 ms.
8 Touch the drop-down list button for Technology and then select your choice from the list.
9 Tap the Apply button in the lower-right corner of the setup screen to save the change(s).
Figure 64 Setting window for RF power measurements
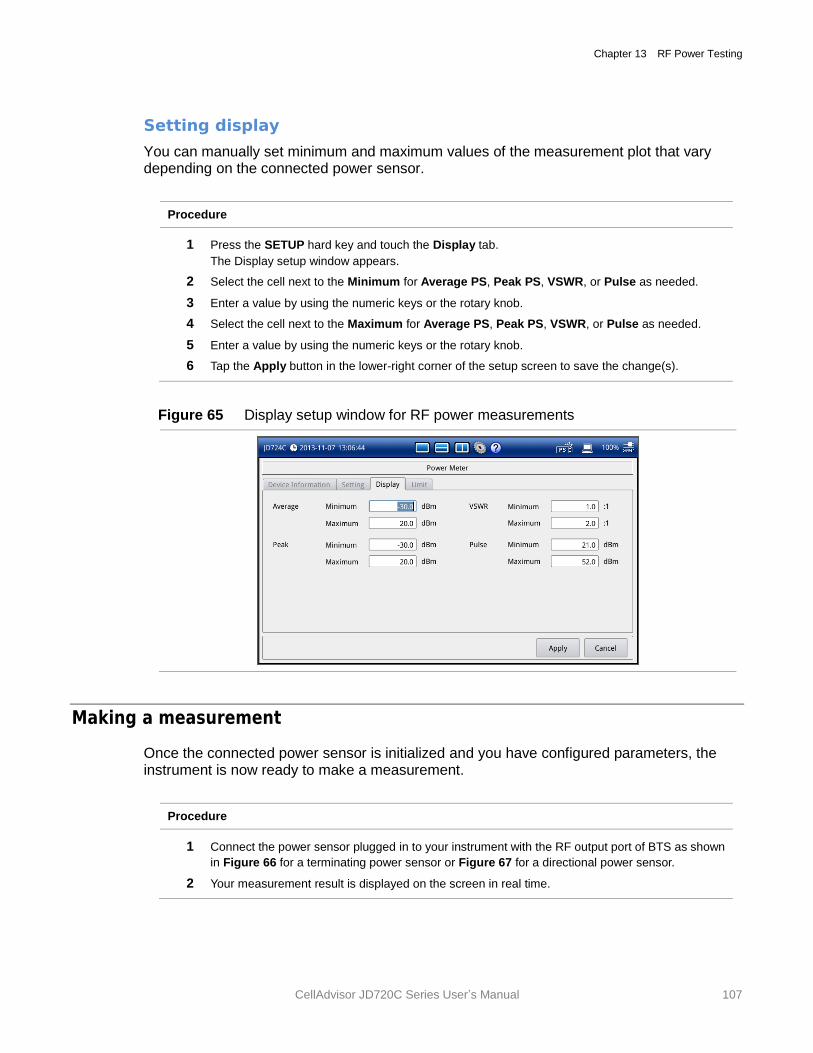
Chapter 13 RF Power Testing
CellAdvisor JD720C Series User’s Manual 107
Setting display
You can manually set minimum and maximum values of the measurement plot that vary depending on the connected power sensor.
Procedure
1 Press the SETUP hard key and touch the Display tab.
The Display setup window appears.
2 Select the cell next to the Minimum for Average PS, Peak PS, VSWR, or Pulse as needed.
3 Enter a value by using the numeric keys or the rotary knob.
4 Select the cell next to the Maximum for Average PS, Peak PS, VSWR, or Pulse as needed.
5 Enter a value by using the numeric keys or the rotary knob.
6 Tap the Apply button in the lower-right corner of the setup screen to save the change(s).
Figure 65 Display setup window for RF power measurements
Making a measurement
Once the connected power sensor is initialized and you have configured parameters, the instrument is now ready to make a measurement.
Procedure
1 Connect the power sensor plugged in to your instrument with the RF output port of BTS as shown
in Figure 66 for a terminating power sensor or Figure 67 for a directional power sensor.
2 Your measurement result is displayed on the screen in real time.
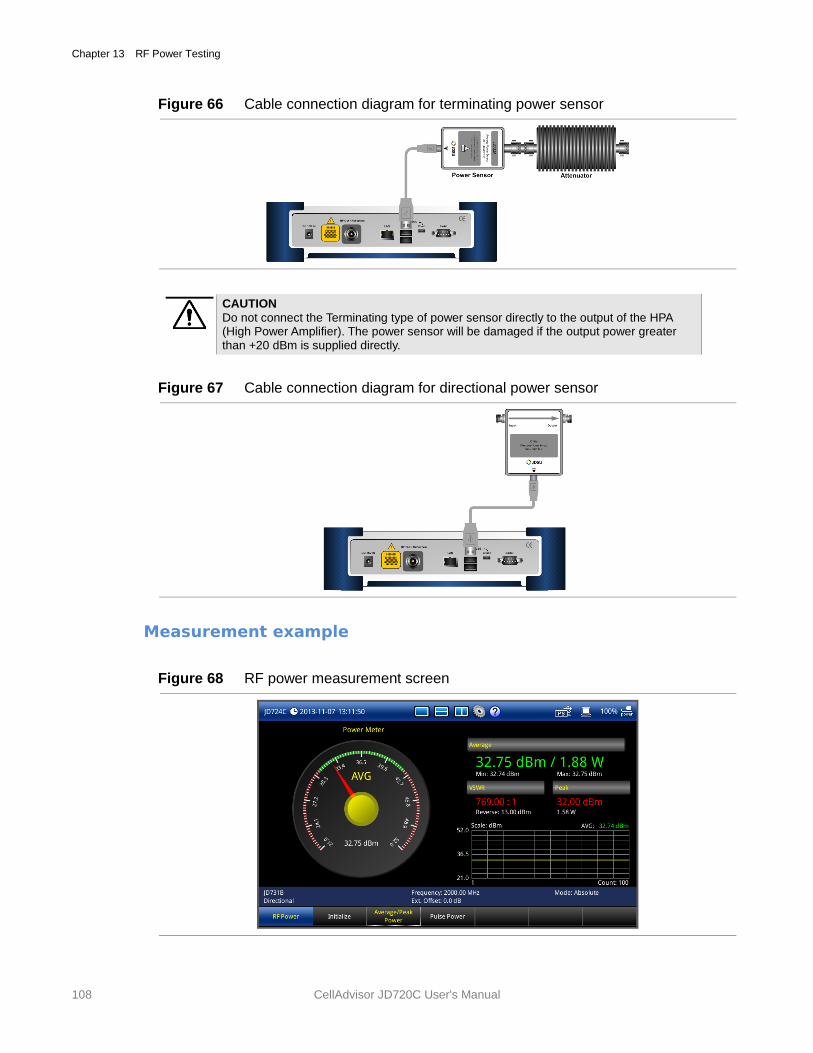
Chapter 13 RF Power Testing
108 CellAdvisor JD720C User's Manual
Figure 66 Cable connection diagram for terminating power sensor
CAUTION
Do not connect the Terminating type of power sensor directly to the output of the HPA (High Power Amplifier). The power sensor will be damaged if the output power greater than +20 dBm is supplied directly.
Figure 67 Cable connection diagram for directional power sensor
Measurement example
Figure 68 RF power measurement screen
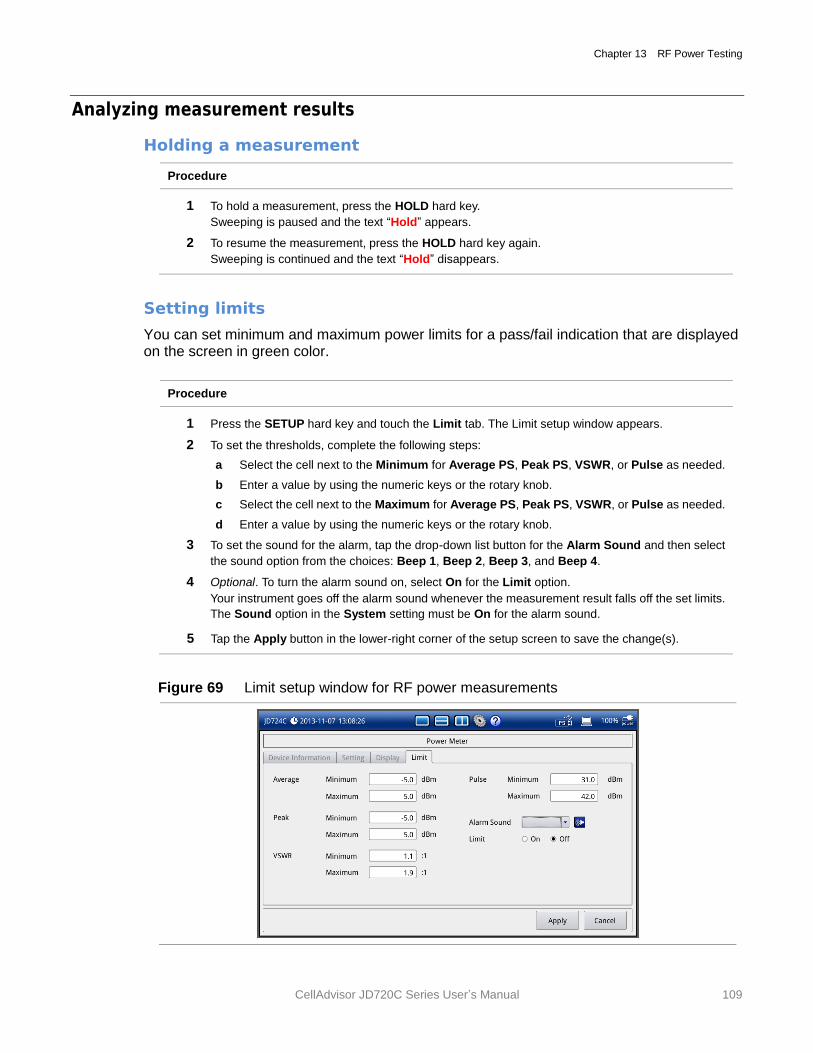
Chapter 13 RF Power Testing
CellAdvisor JD720C Series User’s Manual 109
Analyzing measurement results
Holding a measurement
Procedure
1 To hold a measurement, press the HOLD hard key.
Sweeping is paused and the text “Hold” appears.
2 To resume the measurement, press the HOLD hard key again.
Sweeping is continued and the text “Hold” disappears.
Setting limits
You can set minimum and maximum power limits for a pass/fail indication that are displayed on the screen in green color.
Procedure
1 Press the SETUP hard key and touch the Limit tab. The Limit setup window appears.
2 To set the thresholds, complete the following steps:
a Select the cell next to the Minimum for Average PS, Peak PS, VSWR, or Pulse as needed.
b Enter a value by using the numeric keys or the rotary knob.
c Select the cell next to the Maximum for Average PS, Peak PS, VSWR, or Pulse as needed.
d Enter a value by using the numeric keys or the rotary knob.
3 To set the sound for the alarm, tap the drop-down list button for the Alarm Sound and then select
the sound option from the choices: Beep 1, Beep 2, Beep 3, and Beep 4.
4 Optional. To turn the alarm sound on, select On for the Limit option.
Your instrument goes off the alarm sound whenever the measurement result falls off the set limits.
The Sound option in the System setting must be On for the alarm sound.
5 Tap the Apply button in the lower-right corner of the setup screen to save the change(s).
Figure 69 Limit setup window for RF power measurements
14
CellAdvisor JD720C User's Manual
Chapter 14 Optical Power Testing
This chapter provides instructions on how to use the Optical Power Meter function. Topics discussed in this chapter are as follows:
Introducing optical power measurements .......................................................................... 111
Preparing for a measurement ............................................................................................ 112
Making a measurement ..................................................................................................... 114
Analyzing measurement results ......................................................................................... 115
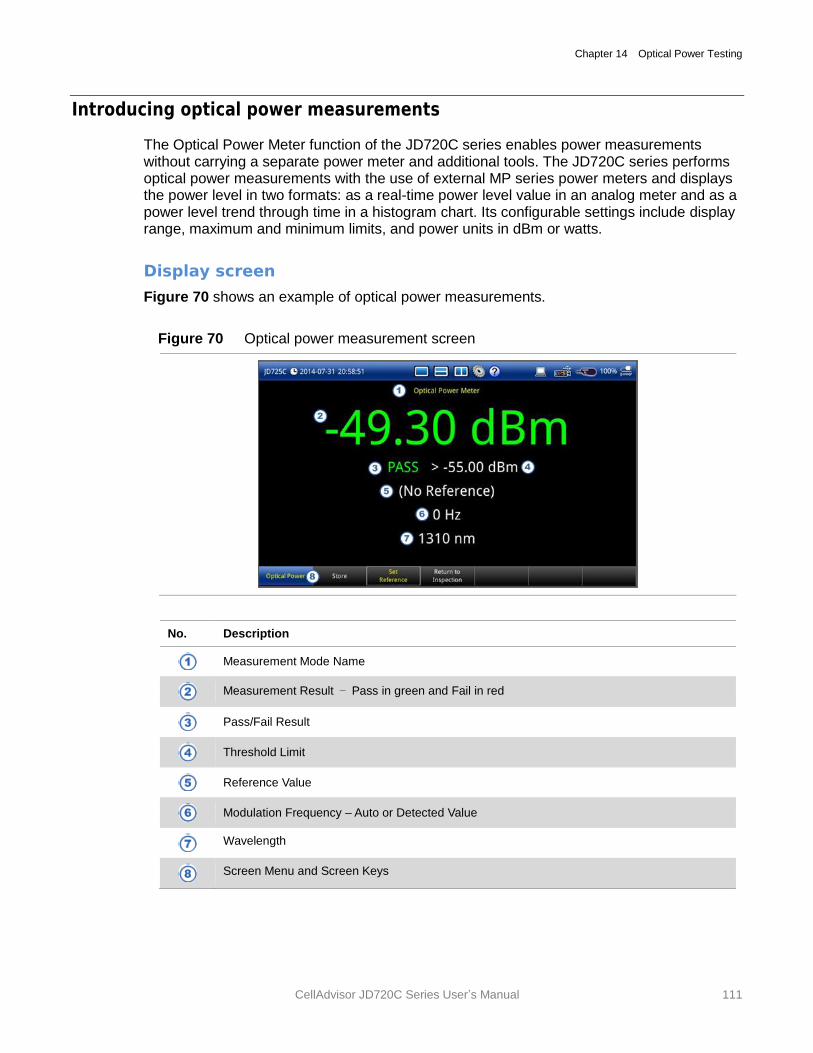
Chapter 14 Optical Power Testing
CellAdvisor JD720C Series User’s Manual 111
Introducing optical power measurements
The Optical Power Meter function of the JD720C series enables power measurements without carrying a separate power meter and additional tools. The JD720C series performs optical power measurements with the use of external MP series power meters and displays the power level in two formats: as a real-time power level value in an analog meter and as a power level trend through time in a histogram chart. Its configurable settings include display range, maximum and minimum limits, and power units in dBm or watts.
Display screen
Figure 70 shows an example of optical power measurements.
Figure 70 Optical power measurement screen
No. Description
Measurement Mode Name
Measurement Result – Pass in green and Fail in red
Pass/Fail Result
Threshold Limit
Reference Value
Modulation Frequency – Auto or Detected Value
Wavelength
Screen Menu and Screen Keys
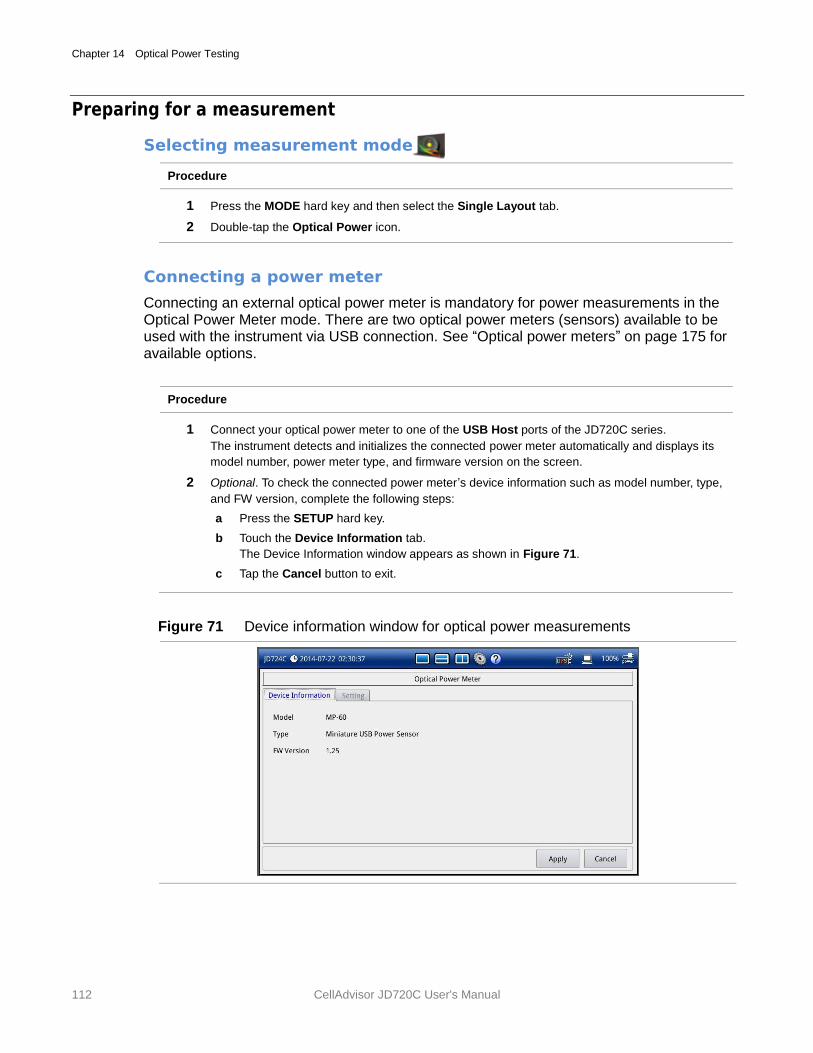
Chapter 14 Optical Power Testing
112 CellAdvisor JD720C User's Manual
Preparing for a measurement
Selecting measurement mode
Procedure
1 Press the MODE hard key and then select the Single Layout tab.
2 Double-tap the Optical Power icon.
Connecting a power meter
Connecting an external optical power meter is mandatory for power measurements in the Optical Power Meter mode. There are two optical power meters (sensors) available to be used with the instrument via USB connection. See “Optical power meters” on page 175 for available options.
Procedure
1 Connect your optical power meter to one of the USB Host ports of the JD720C series.
The instrument detects and initializes the connected power meter automatically and displays its
model number, power meter type, and firmware version on the screen.
2 Optional. To check the connected power meter’s device information such as model number, type,
and FW version, complete the following steps:
a Press the SETUP hard key.
b Touch the Device Information tab.
The Device Information window appears as shown in Figure 71.
c Tap the Cancel button to exit.
Figure 71 Device information window for optical power measurements
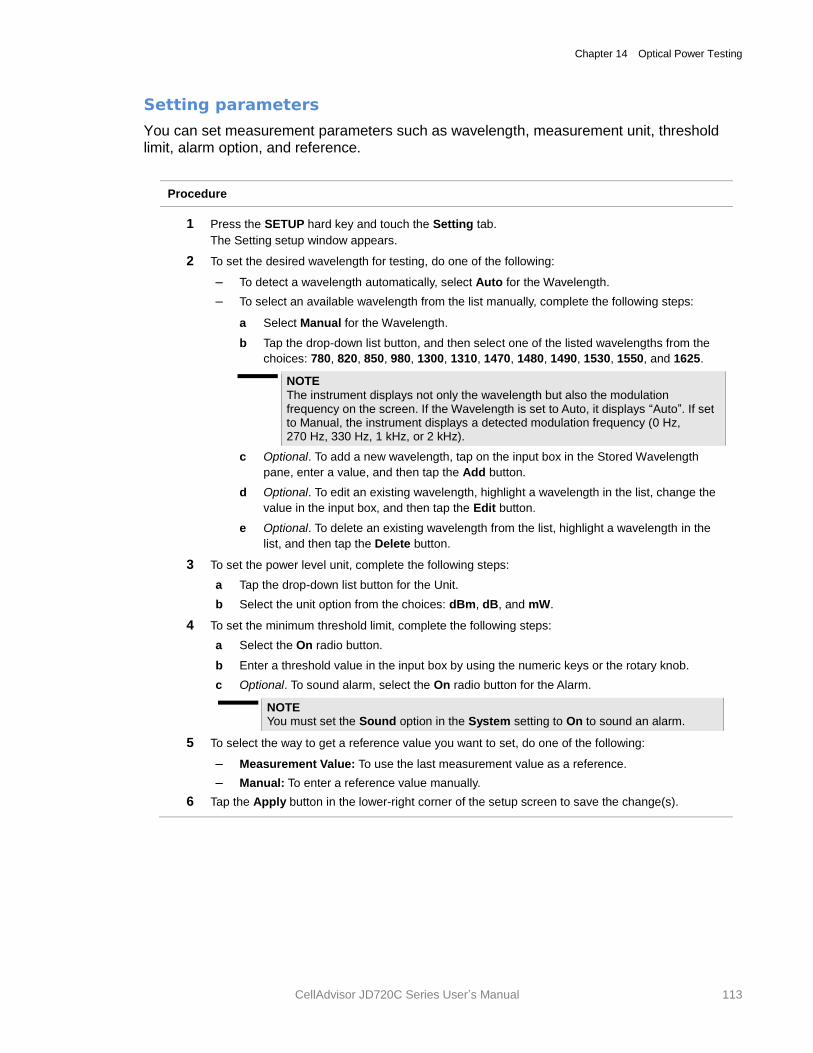
Chapter 14 Optical Power Testing
CellAdvisor JD720C Series User’s Manual 113
Setting parameters
You can set measurement parameters such as wavelength, measurement unit, threshold limit, alarm option, and reference.
Procedure
1 Press the SETUP hard key and touch the Setting tab.
The Setting setup window appears.
2 To set the desired wavelength for testing, do one of the following:
– To detect a wavelength automatically, select Auto for the Wavelength.
– To select an available wavelength from the list manually, complete the following steps:
a Select Manual for the Wavelength.
b Tap the drop-down list button, and then select one of the listed wavelengths from the
choices: 780, 820, 850, 980, 1300, 1310, 1470, 1480, 1490, 1530, 1550, and 1625.
NOTE
The instrument displays not only the wavelength but also the modulation frequency on the screen. If the Wavelength is set to Auto, it displays “Auto”. If set to Manual, the instrument displays a detected modulation frequency (0 Hz, 270 Hz, 330 Hz, 1 kHz, or 2 kHz).
c Optional. To add a new wavelength, tap on the input box in the Stored Wavelength
pane, enter a value, and then tap the Add button.
d Optional. To edit an existing wavelength, highlight a wavelength in the list, change the
value in the input box, and then tap the Edit button.
e Optional. To delete an existing wavelength from the list, highlight a wavelength in the
list, and then tap the Delete button.
3 To set the power level unit, complete the following steps:
a Tap the drop-down list button for the Unit.
b Select the unit option from the choices: dBm, dB, and mW.
4 To set the minimum threshold limit, complete the following steps:
a Select the On radio button.
b Enter a threshold value in the input box by using the numeric keys or the rotary knob.
c Optional. To sound alarm, select the On radio button for the Alarm.
NOTE You must set the Sound option in the System setting to On to sound an alarm.
5 To select the way to get a reference value you want to set, do one of the following:
– Measurement Value: To use the last measurement value as a reference.
– Manual: To enter a reference value manually.
6 Tap the Apply button in the lower-right corner of the setup screen to save the change(s).
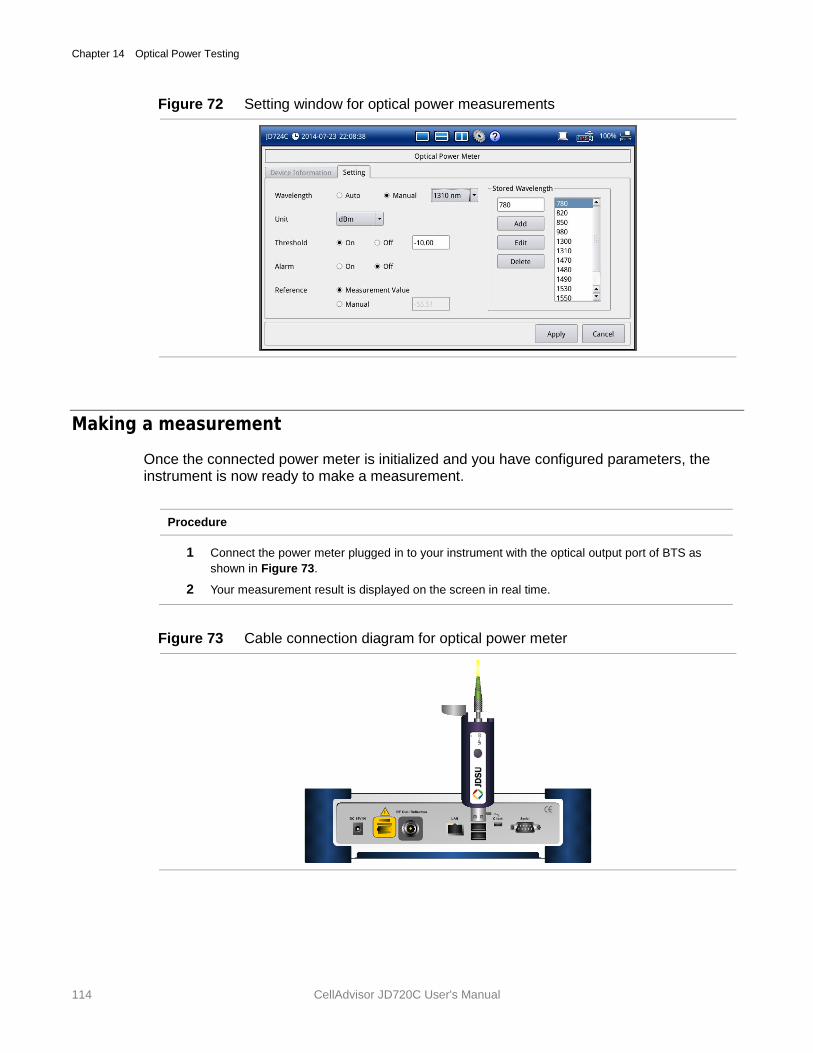
Chapter 14 Optical Power Testing
114 CellAdvisor JD720C User's Manual
Figure 72 Setting window for optical power measurements
Making a measurement
Once the connected power meter is initialized and you have configured parameters, the instrument is now ready to make a measurement.
Procedure
1 Connect the power meter plugged in to your instrument with the optical output port of BTS as
shown in Figure 73.
2 Your measurement result is displayed on the screen in real time.
Figure 73 Cable connection diagram for optical power meter
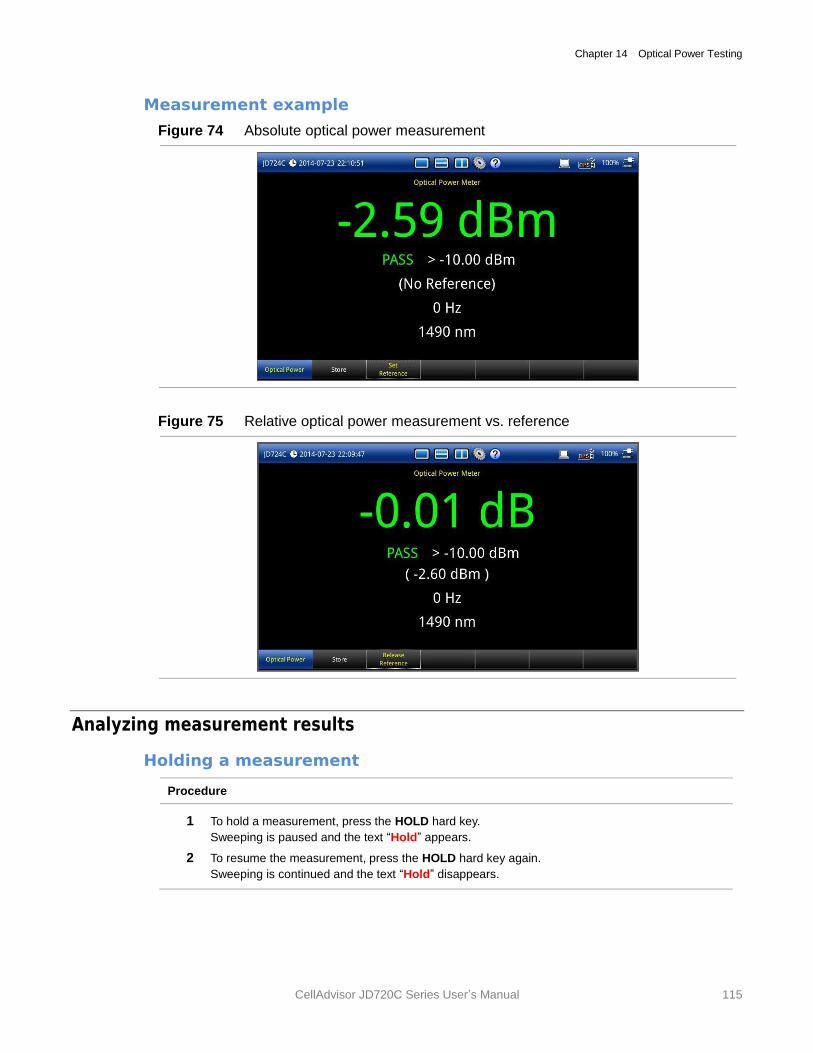
Chapter 14 Optical Power Testing
CellAdvisor JD720C Series User’s Manual 115
Measurement example
Figure 74 Absolute optical power measurement
Figure 75 Relative optical power measurement vs. reference
Analyzing measurement results
Holding a measurement
Procedure
1 To hold a measurement, press the HOLD hard key.
Sweeping is paused and the text “Hold” appears.
2 To resume the measurement, press the HOLD hard key again.
Sweeping is continued and the text “Hold” disappears.
Chapter 14 Optical Power Testing
116 CellAdvisor JD720C User's Manual
Viewing a relative power
You can view a relative power in dB by setting a reference value.
Procedure
1 Tap the Set Reference screen key. You can also press and hold the physical round button on the
plugged MP-series device for 3 seconds until you hear a beep sound.
A delta value in dB appears on the screen.
2 To view an absolute power measurement again, tap the Release Reference screen key. You can
also press and hold the physical round button on the plugged MP-series device for 3 seconds until
you hear a beep sound.
Storing power readings
You can store power measurement readings in a .csv log file.
Procedure
1 Tap the Store screen key.
Each time that you tap this key the instrument adds a power meter reading to the .csv log file
that is created in the root directory of the instrument’s internal memory.
NOTE If you have checked the option called “Link OPM readings with fiber analysis” in
the Fiber Inspection > Setup and then come to the Optical Power Meter mode to store power meter readings, the instrument integrates the captured readings into a fiber inspection report in the Fiber Inspection mode.
15
CellAdvisor JD720C User's Manual
Chapter 15 Fiber Testing
This chapter provides instructions on how to use the Fiber Inspection function. Topics discussed in this chapter are as follows:
Introducing fiber inspection ................................................................................................ 118
Preparing for fiber inspection ............................................................................................. 119
Performing fiber inspection ................................................................................................ 121
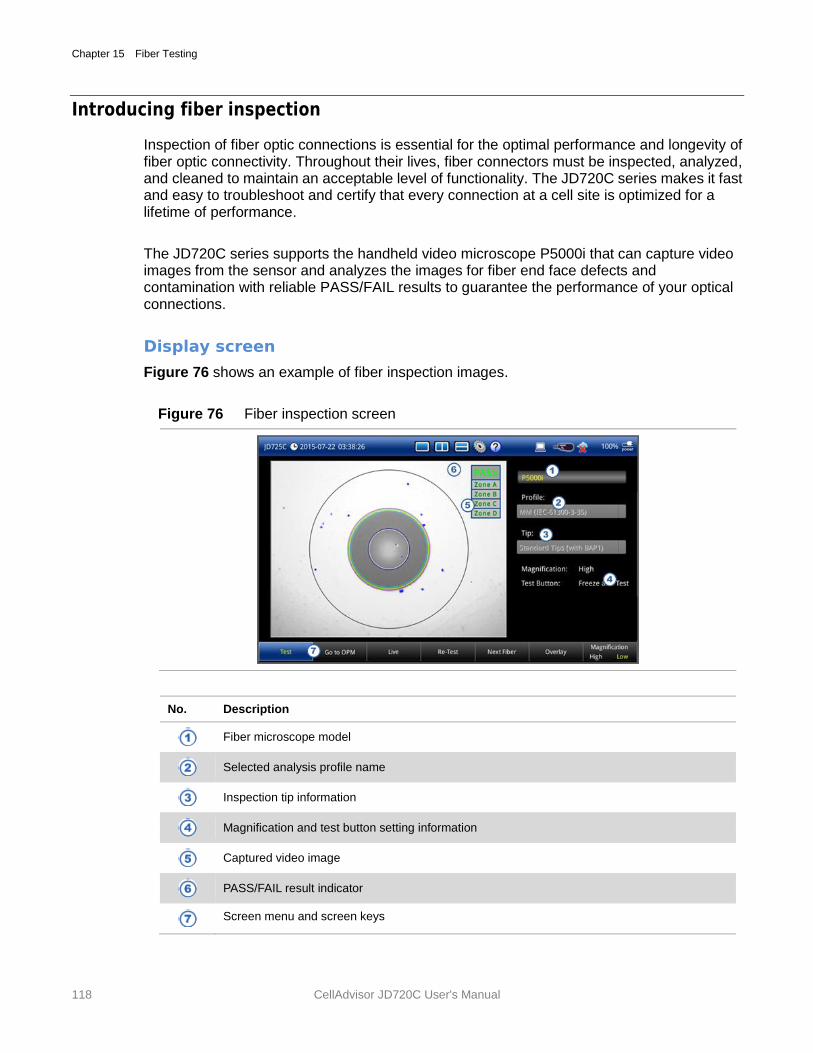
Chapter 15 Fiber Testing
118 CellAdvisor JD720C User's Manual
Introducing fiber inspection
Inspection of fiber optic connections is essential for the optimal performance and longevity of fiber optic connectivity. Throughout their lives, fiber connectors must be inspected, analyzed, and cleaned to maintain an acceptable level of functionality. The JD720C series makes it fast and easy to troubleshoot and certify that every connection at a cell site is optimized for a lifetime of performance.
The JD720C series supports the handheld video microscope P5000i that can capture video images from the sensor and analyzes the images for fiber end face defects and contamination with reliable PASS/FAIL results to guarantee the performance of your optical connections.
Display screen
Figure 76 shows an example of fiber inspection images.
Figure 76 Fiber inspection screen
No. Description
Fiber microscope model
Selected analysis profile name
Inspection tip information
Magnification and test button setting information
Captured video image
PASS/FAIL result indicator
Screen menu and screen keys
Chapter 15 Fiber Testing
CellAdvisor JD720C Series User’s Manual 119
Preparing for fiber inspection
Connecting a fiber microscope
Connecting an optional fiber microscope P5000i is mandatory for fiber inspection and analysis. See “Fiber microscope kits” on page 175 for available options.
Procedure
1 Connect your fiber microscope P5000i to one of the USB Host ports of the JD720C series.
The instrument detects the connected video microscope automatically.
The Fiber Inspection icon and name appears on the measurement mode screen.
Selecting measurement mode
Procedure
1 Press the MODE hard key and then select the Single Layout tab.
2 Double-tap the Fiber Inspection icon.
3 Optional. To check the connected fiber microscope such as model number, version, and serial
number, complete the following steps:
a Press the SETUP hard key and then touch the Info/Setting tab.
The information and setting window appears.
b Tap the Cancel button to exit.
Setting parameters
You can set testing parameters such as analysis profile, tip, test button, and auto center. You can also select the profile and the tip from the drop-down lists activated on the Live screen.
Procedure
1 Press the SETUP hard key and touch the Info/Setting tab.
The information and setting window appears.
2 To select one of the pre-configured analysis profiles that match the PASS/FAIL criteria in the IEC
visual inspection standard, complete the following steps:
a Tap the drop-down list button for the Profile.
b Select the profile that you want to use, from the following choices:
– MM (IEC-61300-3-35)
– Ribbon, MM (IEC-61300-3-35)
– Ribbon, SM APC (IEC-61300-3-35)
– SM APC (IEC-61300-3-35)
– SM PC (IEC-61300-3-35)
– SM UPC (IEC-61300-3-35)
NOTE
All of the profiles are factory set and cannot be edited or removed.
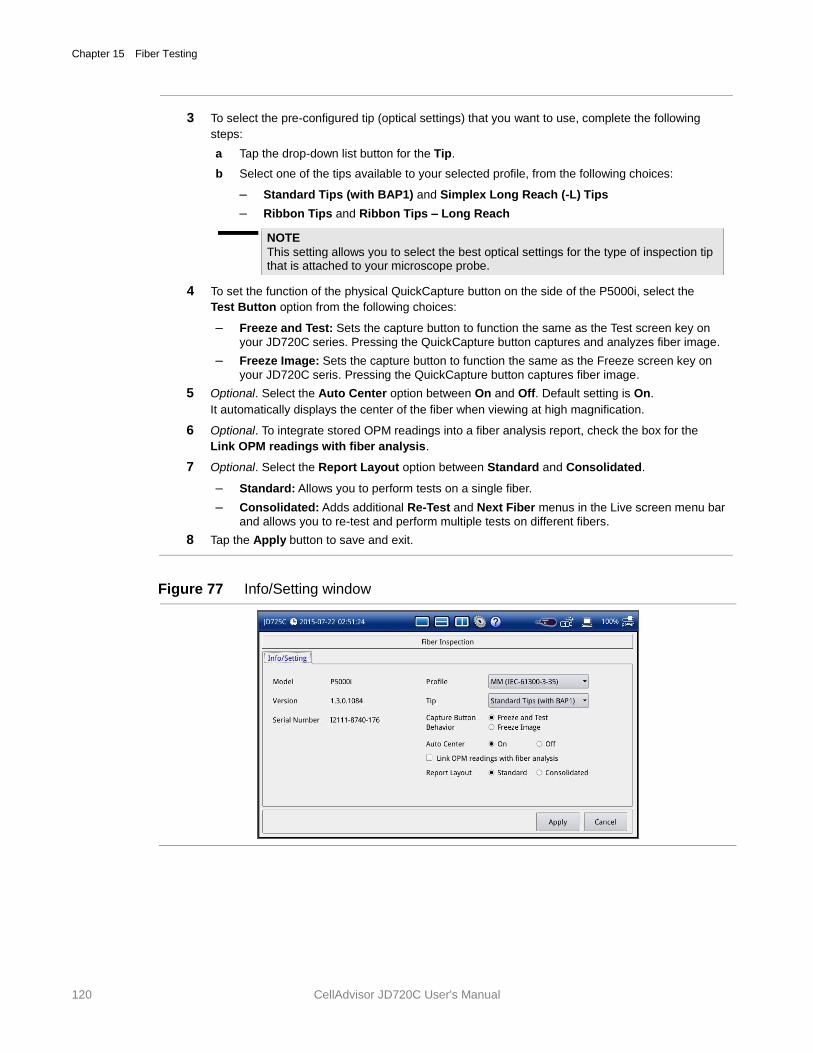
Chapter 15 Fiber Testing
120 CellAdvisor JD720C User's Manual
3 To select the pre-configured tip (optical settings) that you want to use, complete the following
steps:
a Tap the drop-down list button for the Tip.
b Select one of the tips available to your selected profile, from the following choices:
– Standard Tips (with BAP1) and Simplex Long Reach (-L) Tips
– Ribbon Tips and Ribbon Tips – Long Reach
NOTE
This setting allows you to select the best optical settings for the type of inspection tip that is attached to your microscope probe.
4 To set the function of the physical QuickCapture button on the side of the P5000i, select the
Test Button option from the following choices:
– Freeze and Test: Sets the capture button to function the same as the Test screen key on
your JD720C series. Pressing the QuickCapture button captures and analyzes fiber image.
– Freeze Image: Sets the capture button to function the same as the Freeze screen key on
your JD720C seris. Pressing the QuickCapture button captures fiber image.
5 Optional. Select the Auto Center option between On and Off. Default setting is On.
It automatically displays the center of the fiber when viewing at high magnification.
6 Optional. To integrate stored OPM readings into a fiber analysis report, check the box for the
Link OPM readings with fiber analysis.
7 Optional. Select the Report Layout option between Standard and Consolidated.
– Standard: Allows you to perform tests on a single fiber.
– Consolidated: Adds additional Re-Test and Next Fiber menus in the Live screen menu bar
and allows you to re-test and perform multiple tests on different fibers.
8 Tap the Apply button to save and exit.
Figure 77 Info/Setting window
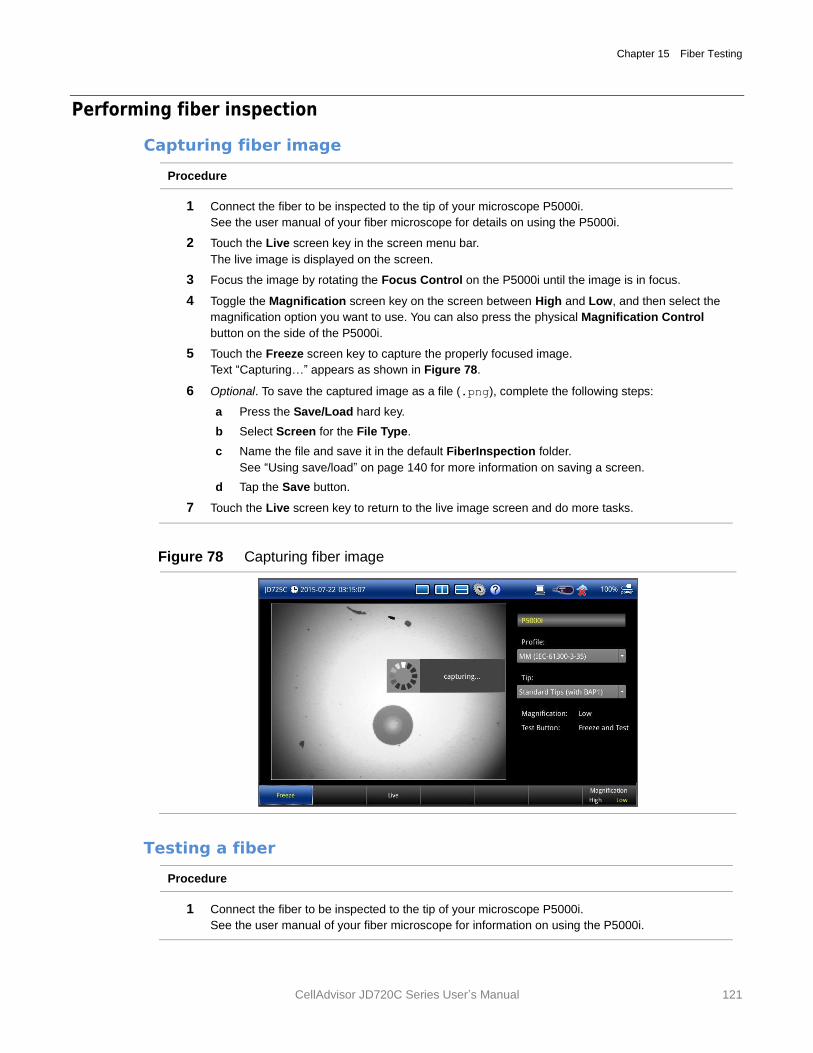
Chapter 15 Fiber Testing
CellAdvisor JD720C Series User’s Manual 121
Performing fiber inspection
Capturing fiber image
Procedure
1 Connect the fiber to be inspected to the tip of your microscope P5000i.
See the user manual of your fiber microscope for details on using the P5000i.
2 Touch the Live screen key in the screen menu bar.
The live image is displayed on the screen.
3 Focus the image by rotating the Focus Control on the P5000i until the image is in focus.
4 Toggle the Magnification screen key on the screen between High and Low, and then select the
magnification option you want to use. You can also press the physical Magnification Control
button on the side of the P5000i.
5 Touch the Freeze screen key to capture the properly focused image.
Text “Capturing…” appears as shown in Figure 78.
6 Optional. To save the captured image as a file (.png), complete the following steps:
a Press the Save/Load hard key.
b Select Screen for the File Type.
c Name the file and save it in the default FiberInspection folder.
See “Using save/load” on page 140 for more information on saving a screen.
d Tap the Save button.
7 Touch the Live screen key to return to the live image screen and do more tasks.
Figure 78 Capturing fiber image
Testing a fiber
Procedure
1 Connect the fiber to be inspected to the tip of your microscope P5000i.
See the user manual of your fiber microscope for information on using the P5000i.
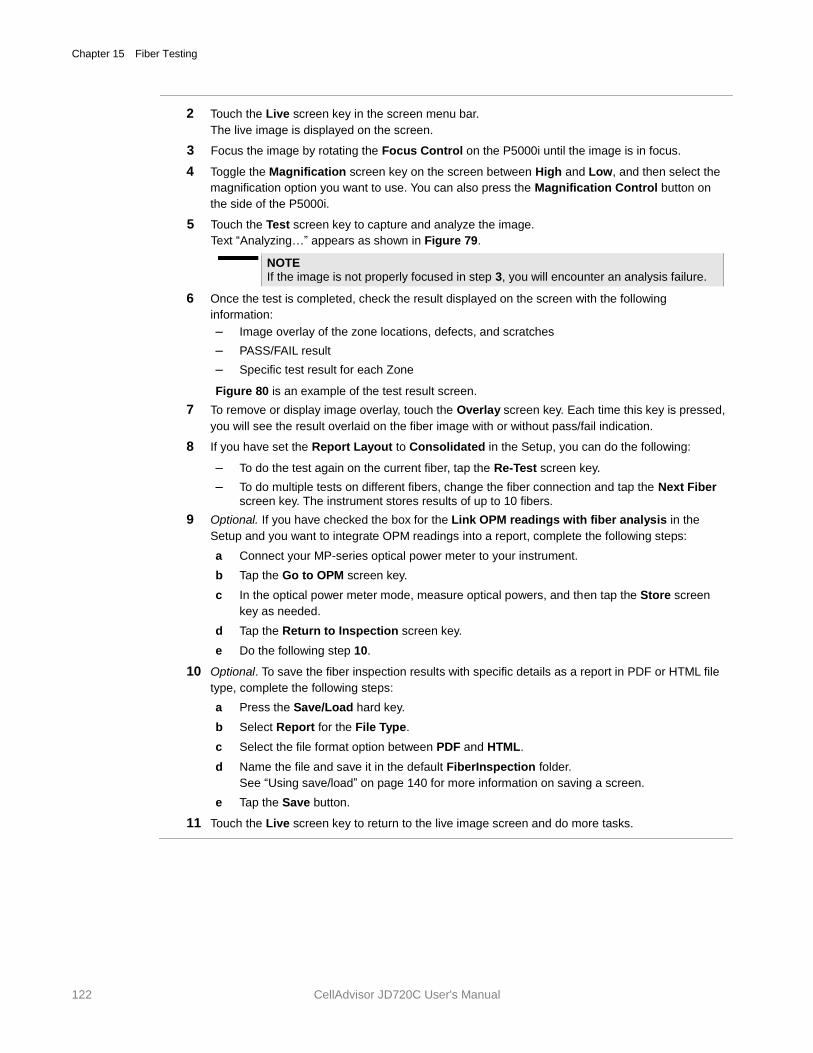
Chapter 15 Fiber Testing
122 CellAdvisor JD720C User's Manual
2 Touch the Live screen key in the screen menu bar.
The live image is displayed on the screen.
3 Focus the image by rotating the Focus Control on the P5000i until the image is in focus.
4 Toggle the Magnification screen key on the screen between High and Low, and then select the
magnification option you want to use. You can also press the Magnification Control button on
the side of the P5000i.
5 Touch the Test screen key to capture and analyze the image.
Text “Analyzing…” appears as shown in Figure 79.
NOTE If the image is not properly focused in step 3, you will encounter an analysis failure.
6 Once the test is completed, check the result displayed on the screen with the following
information:
– Image overlay of the zone locations, defects, and scratches
– PASS/FAIL result
– Specific test result for each Zone
Figure 80 is an example of the test result screen.
7 To remove or display image overlay, touch the Overlay screen key. Each time this key is pressed,
you will see the result overlaid on the fiber image with or without pass/fail indication.
8 If you have set the Report Layout to Consolidated in the Setup, you can do the following:
– To do the test again on the current fiber, tap the Re-Test screen key.
– To do multiple tests on different fibers, change the fiber connection and tap the Next Fiber
screen key. The instrument stores results of up to 10 fibers.
9 Optional. If you have checked the box for the Link OPM readings with fiber analysis in the
Setup and you want to integrate OPM readings into a report, complete the following steps:
a Connect your MP-series optical power meter to your instrument.
b Tap the Go to OPM screen key.
c In the optical power meter mode, measure optical powers, and then tap the Store screen
key as needed.
d Tap the Return to Inspection screen key.
e Do the following step 10.
10 Optional. To save the fiber inspection results with specific details as a report in PDF or HTML file
type, complete the following steps:
a Press the Save/Load hard key.
b Select Report for the File Type.
c Select the file format option between PDF and HTML.
d Name the file and save it in the default FiberInspection folder.
See “Using save/load” on page 140 for more information on saving a screen.
e Tap the Save button.
11 Touch the Live screen key to return to the live image screen and do more tasks.
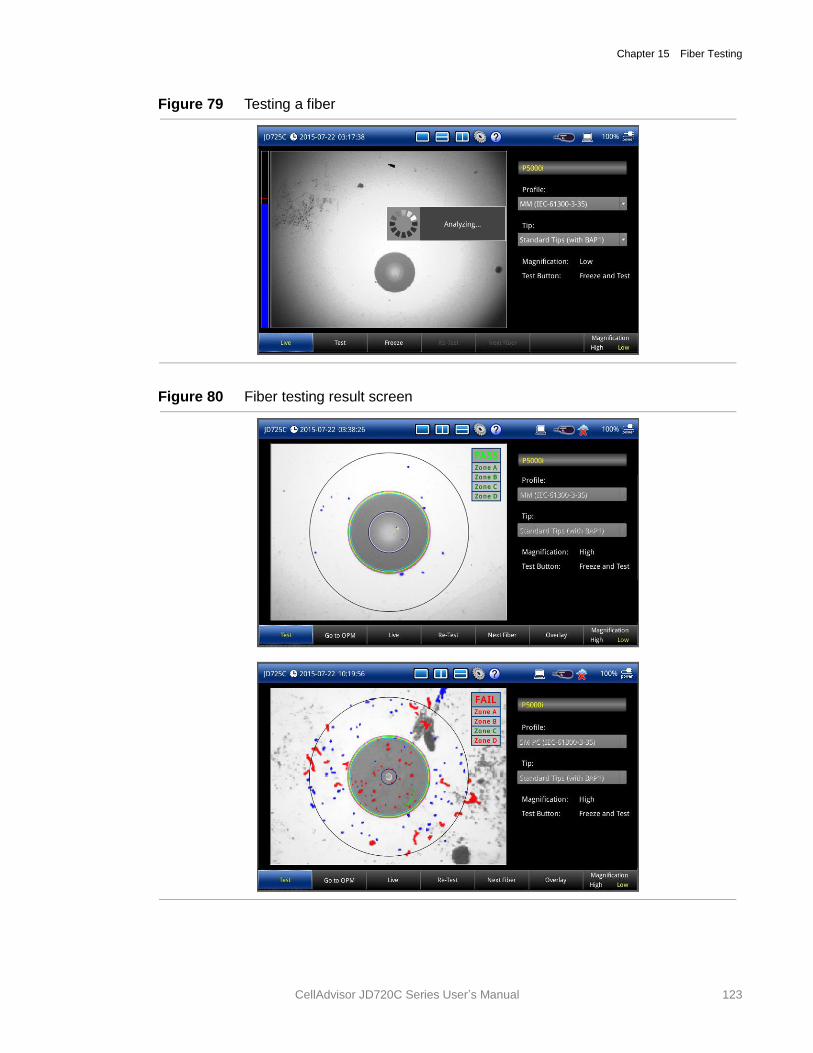
Chapter 15 Fiber Testing
CellAdvisor JD720C Series User’s Manual 123
Figure 79 Testing a fiber
Figure 80 Fiber testing result screen
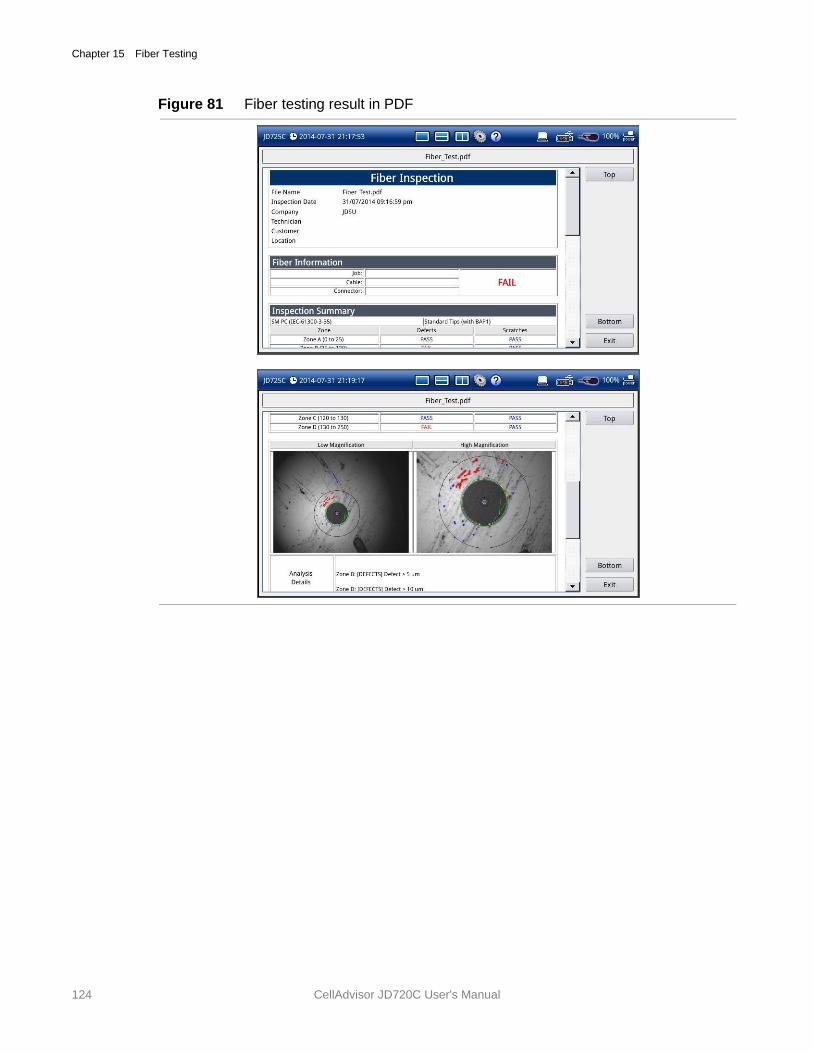
Chapter 15 Fiber Testing
124 CellAdvisor JD720C User's Manual
Figure 81 Fiber testing result in PDF
16
CellAdvisor JD720C User's Manual
Chapter 16 Analysis
This chapter provides instructions to analyze measurement results. Topics discussed in this chapter are as follows:
Using zoom zones.............................................................................................................. 126
Using alternate DTF band .................................................................................................. 128
Using markers .................................................................................................................... 129
Searching for peak or valley .............................................................................................. 131
Displaying traces ................................................................................................................ 132
Setting test limits ................................................................................................................ 134
Holding a measurement ..................................................................................................... 138
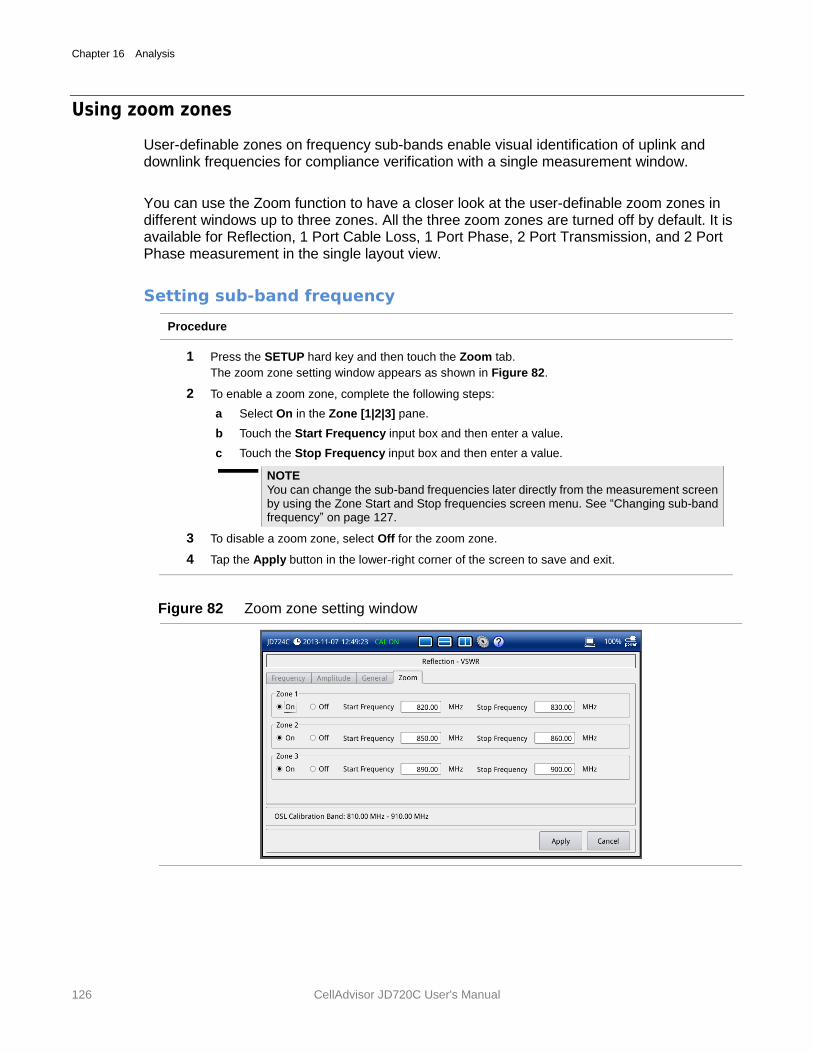
Chapter 16 Analysis
126 CellAdvisor JD720C User's Manual
Using zoom zones
User-definable zones on frequency sub-bands enable visual identification of uplink and downlink frequencies for compliance verification with a single measurement window.
You can use the Zoom function to have a closer look at the user-definable zoom zones in different windows up to three zones. All the three zoom zones are turned off by default. It is available for Reflection, 1 Port Cable Loss, 1 Port Phase, 2 Port Transmission, and 2 Port Phase measurement in the single layout view.
Setting sub-band frequency
Procedure
1 Press the SETUP hard key and then touch the Zoom tab.
The zoom zone setting window appears as shown in Figure 82.
2 To enable a zoom zone, complete the following steps:
a Select On in the Zone [1|2|3] pane.
b Touch the Start Frequency input box and then enter a value.
c Touch the Stop Frequency input box and then enter a value.
NOTE
You can change the sub-band frequencies later directly from the measurement screen by using the Zone Start and Stop frequencies screen menu. See “Changing sub-band frequency” on page 127.
3 To disable a zoom zone, select Off for the zoom zone.
4 Tap the Apply button in the lower-right corner of the screen to save and exit.
Figure 82 Zoom zone setting window
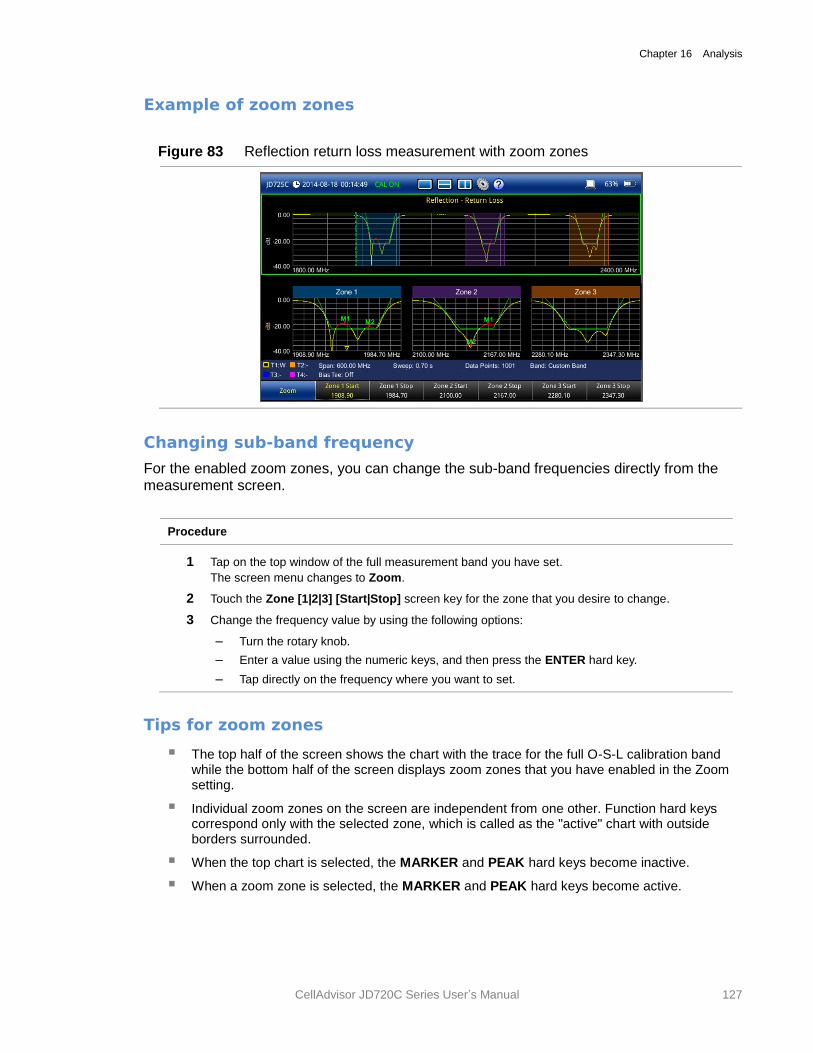
Chapter 16 Analysis
CellAdvisor JD720C Series User’s Manual 127
Example of zoom zones
Figure 83 Reflection return loss measurement with zoom zones
Changing sub-band frequency
For the enabled zoom zones, you can change the sub-band frequencies directly from the measurement screen.
Procedure
1 Tap on the top window of the full measurement band you have set.
The screen menu changes to Zoom.
2 Touch the Zone [1|2|3] [Start|Stop] screen key for the zone that you desire to change.
3 Change the frequency value by using the following options:
– Turn the rotary knob.
– Enter a value using the numeric keys, and then press the ENTER hard key.
– Tap directly on the frequency where you want to set.
Tips for zoom zones
The top half of the screen shows the chart with the trace for the full O-S-L calibration band while the bottom half of the screen displays zoom zones that you have enabled in the Zoom setting.
Individual zoom zones on the screen are independent from one other. Function hard keys correspond only with the selected zone, which is called as the "active" chart with outside borders surrounded.
When the top chart is selected, the MARKER and PEAK hard keys become inactive.
When a zoom zone is selected, the MARKER and PEAK hard keys become active.
Chapter 16 Analysis
128 CellAdvisor JD720C User's Manual
Using alternate DTF band
You can use the Alt DTF Band that is available only in DTF measurements after a calibration to scale down of a specific sub-band without a need of an additional calibration.
Two independent sweeps can be performed, for example, one Reflection measurement and the other DTF measurement.
Setting alternate DTF band
Procedure
1 Press the SETUP hard key and touch the Alt DTF Band tab. If you have dual displays on the
screen, make sure to select a DTF measurement display for which you like to set.
The alternate DTF band setting window appears as shown in Figure 84.
2 Select On for the Alt DTF Band to enable or Off to disable.
3 To set the frequency to be measured, do one of the following:
– To set the alternate start and stop frequencies, complete the following steps:
a Select the input box for Alternate Start Frequency and then enter a value.
b Select the input box for Alternate Stop Frequency and then enter a value.
– To set the alternate center frequency and span, complete the following steps:
a Select the input box for Alternate Center Frequency and then enter a value.
b Select the input box for Alternate Span and then enter a value.
NOTE
Minimum value for the Alternate Span is 2% of what you have set for the Span in the Frequency/Distance tab.
4 To set the distance, complete the following steps:
a Select the input box for Start Distance and then enter a value.
b Select the input box for Stop Distance and then enter a value.
5 Tap the Apply button in the lower-right corner of the setup screen to save and exit.
The text "Alt DTF Band: On" appears at the top left corner of the DTF measurement plot.
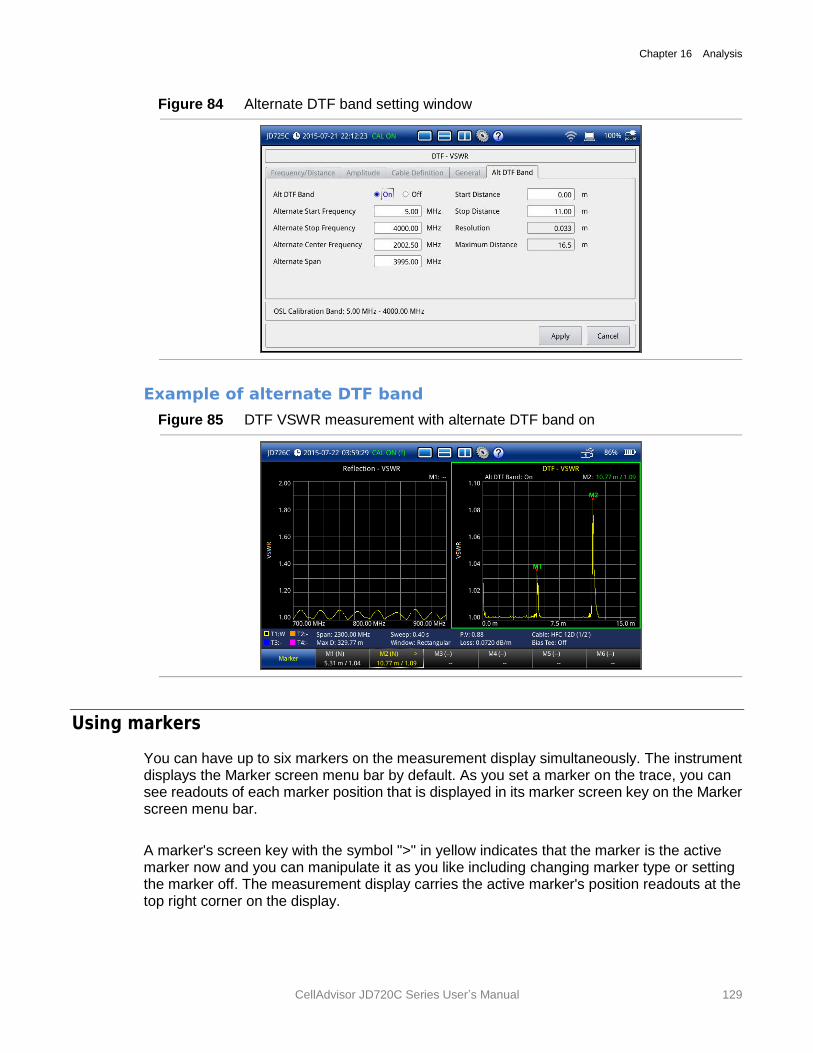
Chapter 16 Analysis
CellAdvisor JD720C Series User’s Manual 129
Figure 84 Alternate DTF band setting window
Example of alternate DTF band
Figure 85 DTF VSWR measurement with alternate DTF band on
Using markers
You can have up to six markers on the measurement display simultaneously. The instrument displays the Marker screen menu bar by default. As you set a marker on the trace, you can see readouts of each marker position that is displayed in its marker screen key on the Marker screen menu bar.
A marker's screen key with the symbol ">" in yellow indicates that the marker is the active marker now and you can manipulate it as you like including changing marker type or setting the marker off. The measurement display carries the active marker's position readouts at the top right corner on the display.
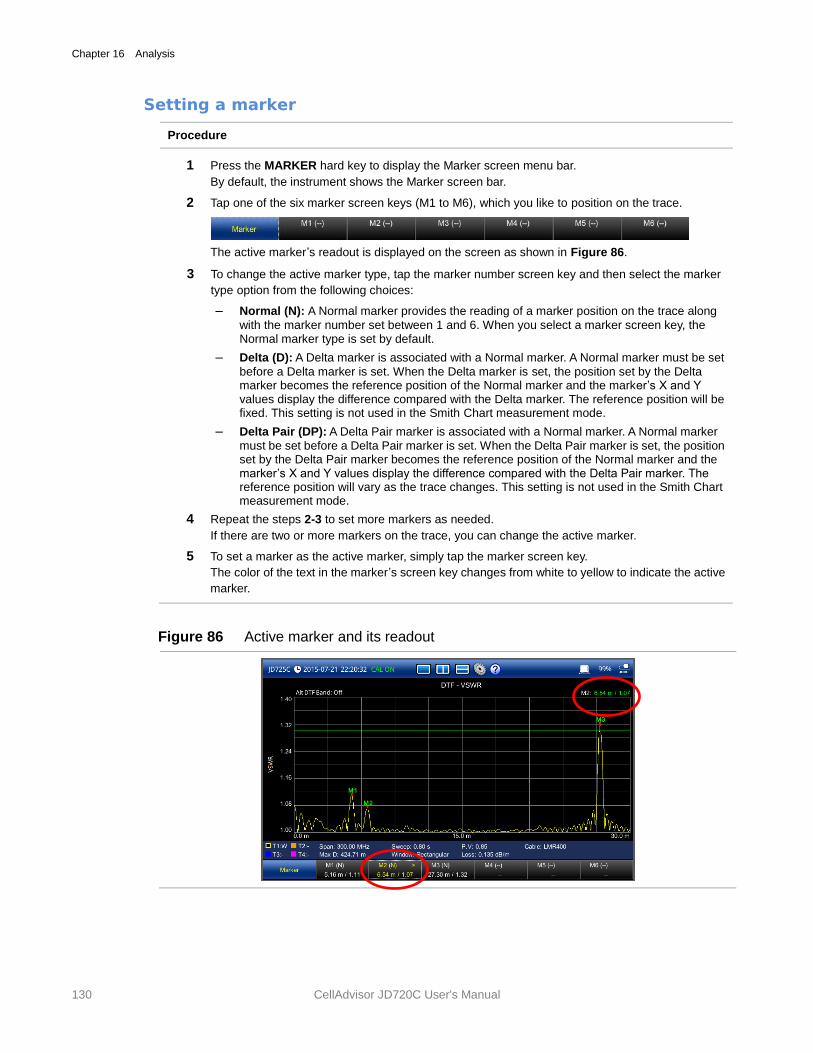
Chapter 16 Analysis
130 CellAdvisor JD720C User's Manual
Setting a marker
Procedure
1 Press the MARKER hard key to display the Marker screen menu bar.
By default, the instrument shows the Marker screen bar.
2 Tap one of the six marker screen keys (M1 to M6), which you like to position on the trace.
The active marker’s readout is displayed on the screen as shown in Figure 86.
3 To change the active marker type, tap the marker number screen key and then select the marker
type option from the following choices:
– Normal (N): A Normal marker provides the reading of a marker position on the trace along
with the marker number set between 1 and 6. When you select a marker screen key, the Normal marker type is set by default.
– Delta (D): A Delta marker is associated with a Normal marker. A Normal marker must be set
before a Delta marker is set. When the Delta marker is set, the position set by the Delta marker becomes the reference position of the Normal marker and the marker’s X and Y values display the difference compared with the Delta marker. The reference position will be fixed. This setting is not used in the Smith Chart measurement mode.
– Delta Pair (DP): A Delta Pair marker is associated with a Normal marker. A Normal marker
must be set before a Delta Pair marker is set. When the Delta Pair marker is set, the position set by the Delta Pair marker becomes the reference position of the Normal marker and the marker’s X and Y values display the difference compared with the Delta Pair marker. The reference position will vary as the trace changes. This setting is not used in the Smith Chart measurement mode.
4 Repeat the steps 2-3 to set more markers as needed.
If there are two or more markers on the trace, you can change the active marker.
5 To set a marker as the active marker, simply tap the marker screen key.
The color of the text in the marker’s screen key changes from white to yellow to indicate the active
marker.
Figure 86 Active marker and its readout
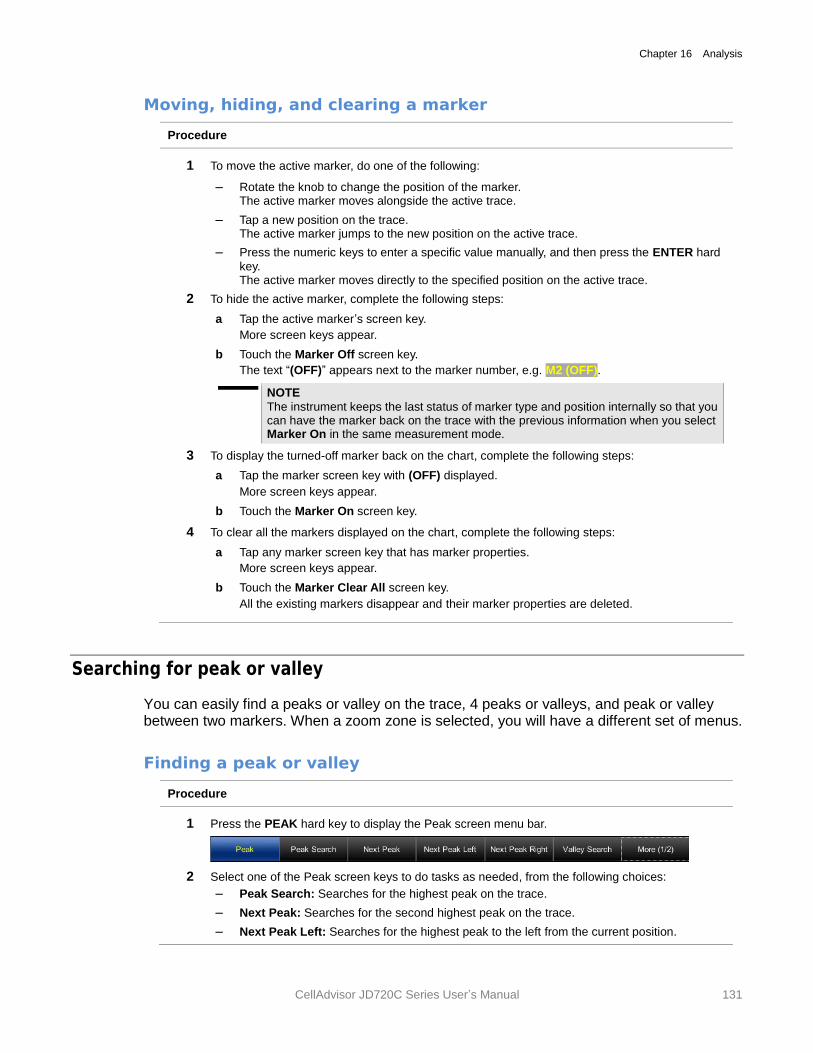
Chapter 16 Analysis
CellAdvisor JD720C Series User’s Manual 131
Moving, hiding, and clearing a marker
Procedure
1 To move the active marker, do one of the following:
– Rotate the knob to change the position of the marker. The active marker moves alongside the active trace.
– Tap a new position on the trace. The active marker jumps to the new position on the active trace.
– Press the numeric keys to enter a specific value manually, and then press the ENTER hard
key. The active marker moves directly to the specified position on the active trace.
2 To hide the active marker, complete the following steps:
a Tap the active marker’s screen key.
More screen keys appear.
b Touch the Marker Off screen key.
The text “(OFF)” appears next to the marker number, e.g. M2 (OFF).
NOTE
The instrument keeps the last status of marker type and position internally so that you can have the marker back on the trace with the previous information when you select Marker On in the same measurement mode.
3 To display the turned-off marker back on the chart, complete the following steps:
a Tap the marker screen key with (OFF) displayed.
More screen keys appear.
b Touch the Marker On screen key.
4 To clear all the markers displayed on the chart, complete the following steps:
a Tap any marker screen key that has marker properties.
More screen keys appear.
b Touch the Marker Clear All screen key.
All the existing markers disappear and their marker properties are deleted.
Searching for peak or valley
You can easily find a peaks or valley on the trace, 4 peaks or valleys, and peak or valley between two markers. When a zoom zone is selected, you will have a different set of menus.
Finding a peak or valley
Procedure
1 Press the PEAK hard key to display the Peak screen menu bar.
2 Select one of the Peak screen keys to do tasks as needed, from the following choices:
– Peak Search: Searches for the highest peak on the trace.
– Next Peak: Searches for the second highest peak on the trace.
– Next Peak Left: Searches for the highest peak to the left from the current position.
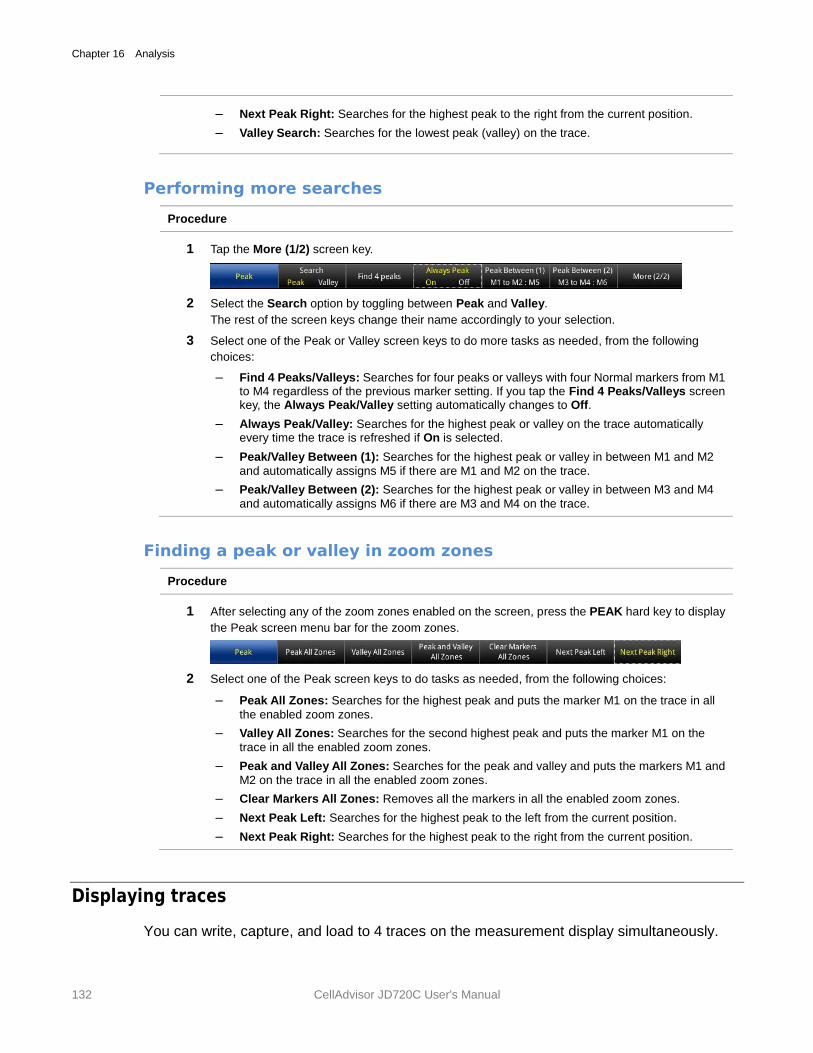
Chapter 16 Analysis
132 CellAdvisor JD720C User's Manual
– Next Peak Right: Searches for the highest peak to the right from the current position.
– Valley Search: Searches for the lowest peak (valley) on the trace.
Performing more searches
Procedure
1 Tap the More (1/2) screen key.
2 Select the Search option by toggling between Peak and Valley.
The rest of the screen keys change their name accordingly to your selection.
3 Select one of the Peak or Valley screen keys to do more tasks as needed, from the following
choices:
– Find 4 Peaks/Valleys: Searches for four peaks or valleys with four Normal markers from M1 to M4 regardless of the previous marker setting. If you tap the Find 4 Peaks/Valleys screen key, the Always Peak/Valley setting automatically changes to Off.
– Always Peak/Valley: Searches for the highest peak or valley on the trace automatically every time the trace is refreshed if On is selected.
– Peak/Valley Between (1): Searches for the highest peak or valley in between M1 and M2
and automatically assigns M5 if there are M1 and M2 on the trace.
– Peak/Valley Between (2): Searches for the highest peak or valley in between M3 and M4
and automatically assigns M6 if there are M3 and M4 on the trace.
Finding a peak or valley in zoom zones
Procedure
1 After selecting any of the zoom zones enabled on the screen, press the PEAK hard key to display
the Peak screen menu bar for the zoom zones.
2 Select one of the Peak screen keys to do tasks as needed, from the following choices:
– Peak All Zones: Searches for the highest peak and puts the marker M1 on the trace in all
the enabled zoom zones.
– Valley All Zones: Searches for the second highest peak and puts the marker M1 on the
trace in all the enabled zoom zones.
– Peak and Valley All Zones: Searches for the peak and valley and puts the markers M1 and
M2 on the trace in all the enabled zoom zones.
– Clear Markers All Zones: Removes all the markers in all the enabled zoom zones.
– Next Peak Left: Searches for the highest peak to the left from the current position.
– Next Peak Right: Searches for the highest peak to the right from the current position.
Displaying traces
You can write, capture, and load to 4 traces on the measurement display simultaneously.
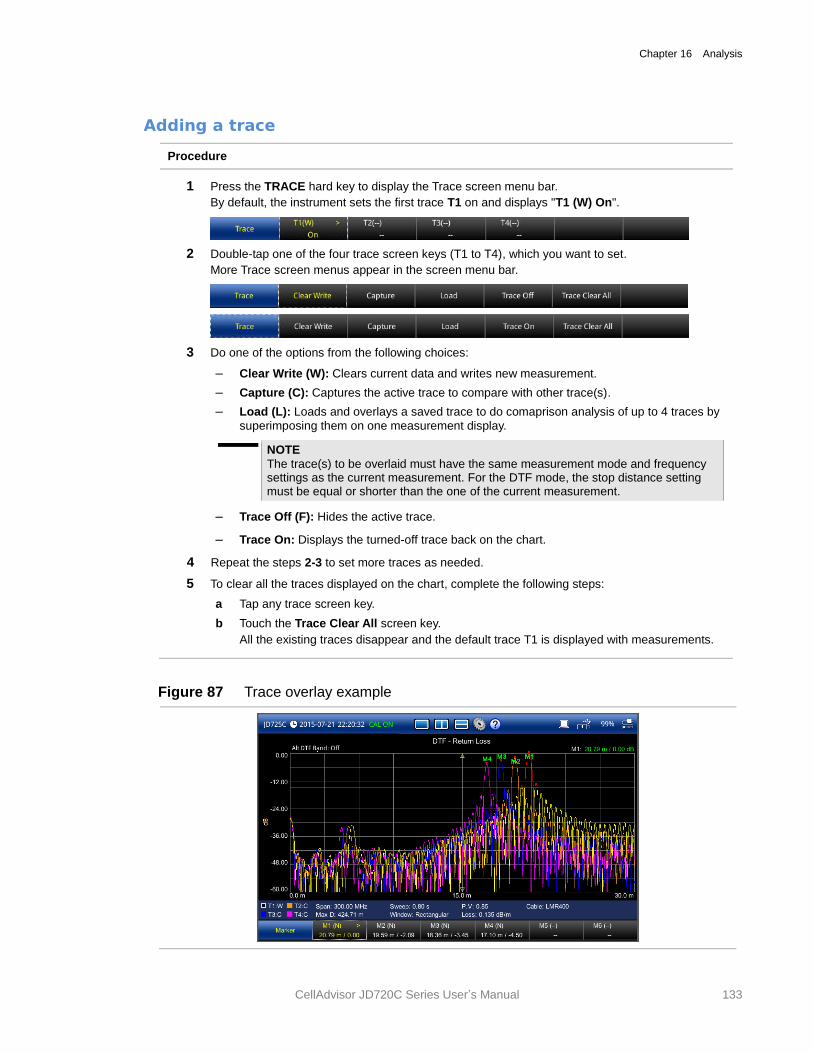
Chapter 16 Analysis
CellAdvisor JD720C Series User’s Manual 133
Adding a trace
Procedure
1 Press the TRACE hard key to display the Trace screen menu bar.
By default, the instrument sets the first trace T1 on and displays "T1 (W) On".
2 Double-tap one of the four trace screen keys (T1 to T4), which you want to set.
More Trace screen menus appear in the screen menu bar.
3 Do one of the options from the following choices:
– Clear Write (W): Clears current data and writes new measurement.
– Capture (C): Captures the active trace to compare with other trace(s).
– Load (L): Loads and overlays a saved trace to do comaprison analysis of up to 4 traces by
superimposing them on one measurement display.
NOTE
The trace(s) to be overlaid must have the same measurement mode and frequency settings as the current measurement. For the DTF mode, the stop distance setting must be equal or shorter than the one of the current measurement.
– Trace Off (F): Hides the active trace.
– Trace On: Displays the turned-off trace back on the chart.
4 Repeat the steps 2-3 to set more traces as needed.
5 To clear all the traces displayed on the chart, complete the following steps:
a Tap any trace screen key.
b Touch the Trace Clear All screen key.
All the existing traces disappear and the default trace T1 is displayed with measurements.
Figure 87 Trace overlay example
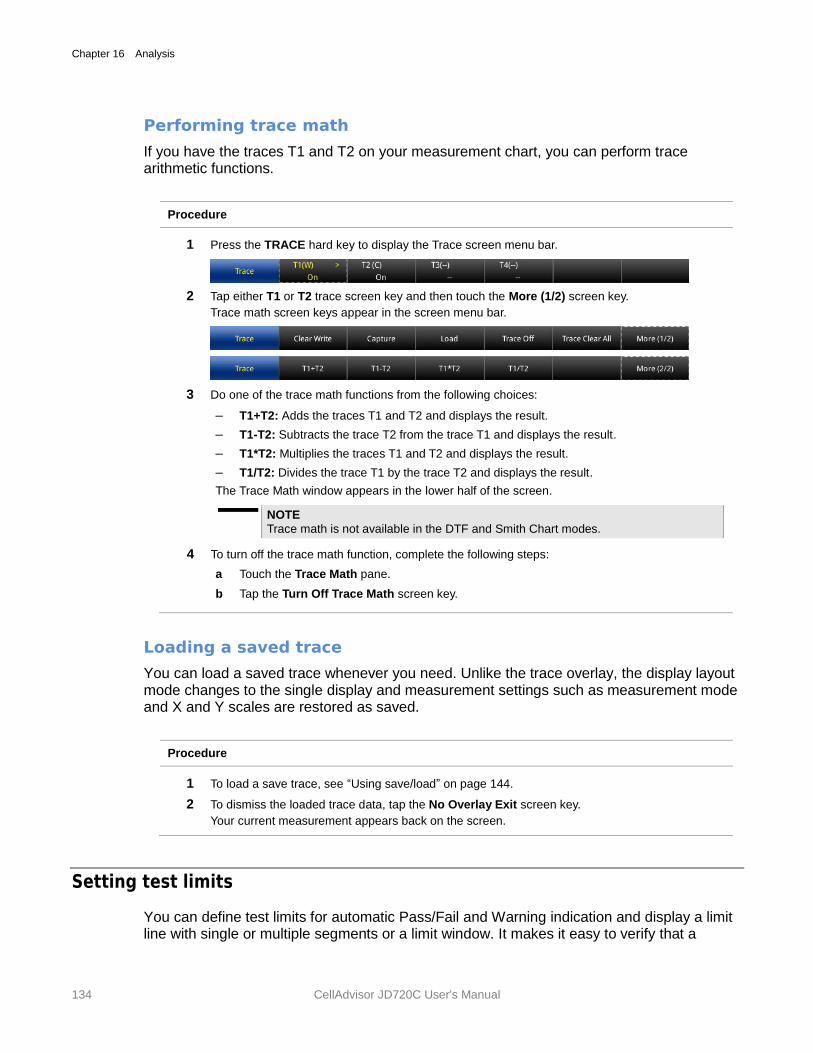
Chapter 16 Analysis
134 CellAdvisor JD720C User's Manual
Performing trace math
If you have the traces T1 and T2 on your measurement chart, you can perform trace arithmetic functions.
Procedure
1 Press the TRACE hard key to display the Trace screen menu bar.
2 Tap either T1 or T2 trace screen key and then touch the More (1/2) screen key.
Trace math screen keys appear in the screen menu bar.
3 Do one of the trace math functions from the following choices:
– T1+T2: Adds the traces T1 and T2 and displays the result.
– T1-T2: Subtracts the trace T2 from the trace T1 and displays the result.
– T1*T2: Multiplies the traces T1 and T2 and displays the result.
– T1/T2: Divides the trace T1 by the trace T2 and displays the result.
The Trace Math window appears in the lower half of the screen.
NOTE
Trace math is not available in the DTF and Smith Chart modes.
4 To turn off the trace math function, complete the following steps:
a Touch the Trace Math pane.
b Tap the Turn Off Trace Math screen key.
Loading a saved trace
You can load a saved trace whenever you need. Unlike the trace overlay, the display layout mode changes to the single display and measurement settings such as measurement mode and X and Y scales are restored as saved.
Procedure
1 To load a save trace, see “Using save/load” on page 144.
2 To dismiss the loaded trace data, tap the No Overlay Exit screen key.
Your current measurement appears back on the screen.
Setting test limits
You can define test limits for automatic Pass/Fail and Warning indication and display a limit line with single or multiple segments or a limit window. It makes it easy to verify that a
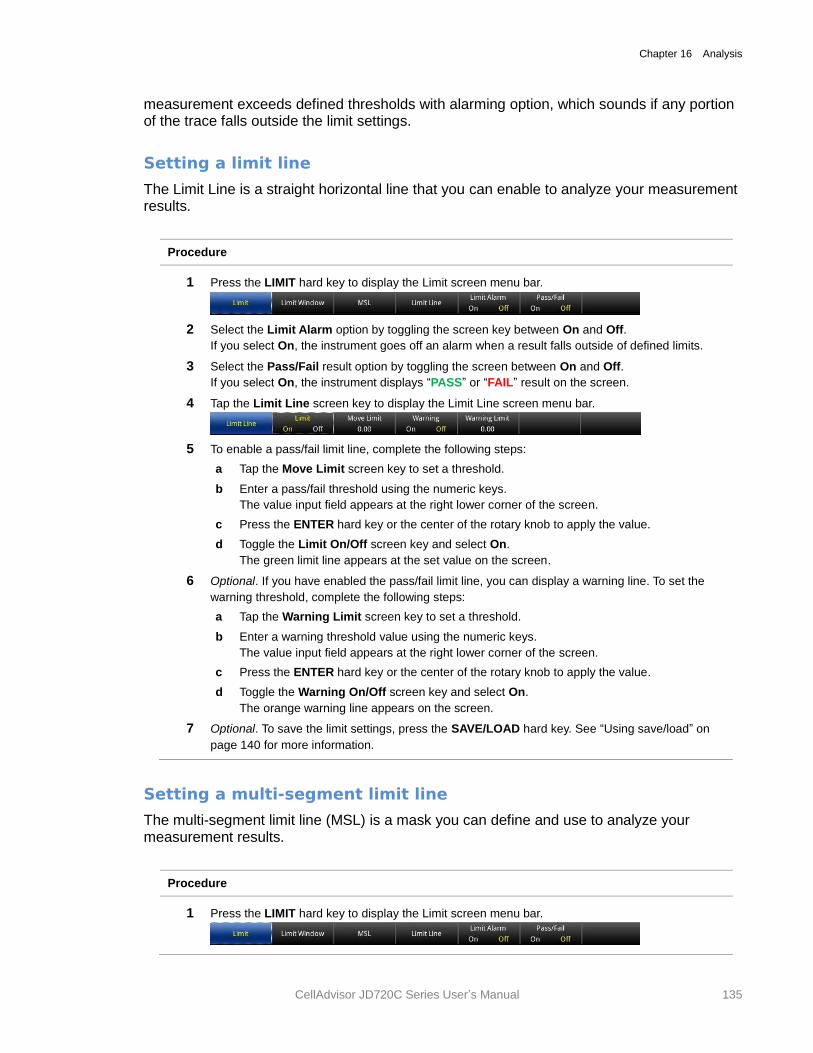
Chapter 16 Analysis
CellAdvisor JD720C Series User’s Manual 135
measurement exceeds defined thresholds with alarming option, which sounds if any portion of the trace falls outside the limit settings.
Setting a limit line
The Limit Line is a straight horizontal line that you can enable to analyze your measurement results.
Procedure
1 Press the LIMIT hard key to display the Limit screen menu bar.
2 Select the Limit Alarm option by toggling the screen key between On and Off.
If you select On, the instrument goes off an alarm when a result falls outside of defined limits.
3 Select the Pass/Fail result option by toggling the screen between On and Off.
If you select On, the instrument displays “PASS” or “FAIL” result on the screen.
4 Tap the Limit Line screen key to display the Limit Line screen menu bar.
5 To enable a pass/fail limit line, complete the following steps:
a Tap the Move Limit screen key to set a threshold.
b Enter a pass/fail threshold using the numeric keys.
The value input field appears at the right lower corner of the screen.
c Press the ENTER hard key or the center of the rotary knob to apply the value.
d Toggle the Limit On/Off screen key and select On.
The green limit line appears at the set value on the screen.
6 Optional. If you have enabled the pass/fail limit line, you can display a warning line. To set the
warning threshold, complete the following steps:
a Tap the Warning Limit screen key to set a threshold.
b Enter a warning threshold value using the numeric keys.
The value input field appears at the right lower corner of the screen.
c Press the ENTER hard key or the center of the rotary knob to apply the value.
d Toggle the Warning On/Off screen key and select On.
The orange warning line appears on the screen.
7 Optional. To save the limit settings, press the SAVE/LOAD hard key. See “Using save/load” on
page 140 for more information.
Setting a multi-segment limit line
The multi-segment limit line (MSL) is a mask you can define and use to analyze your measurement results.
Procedure
1 Press the LIMIT hard key to display the Limit screen menu bar.
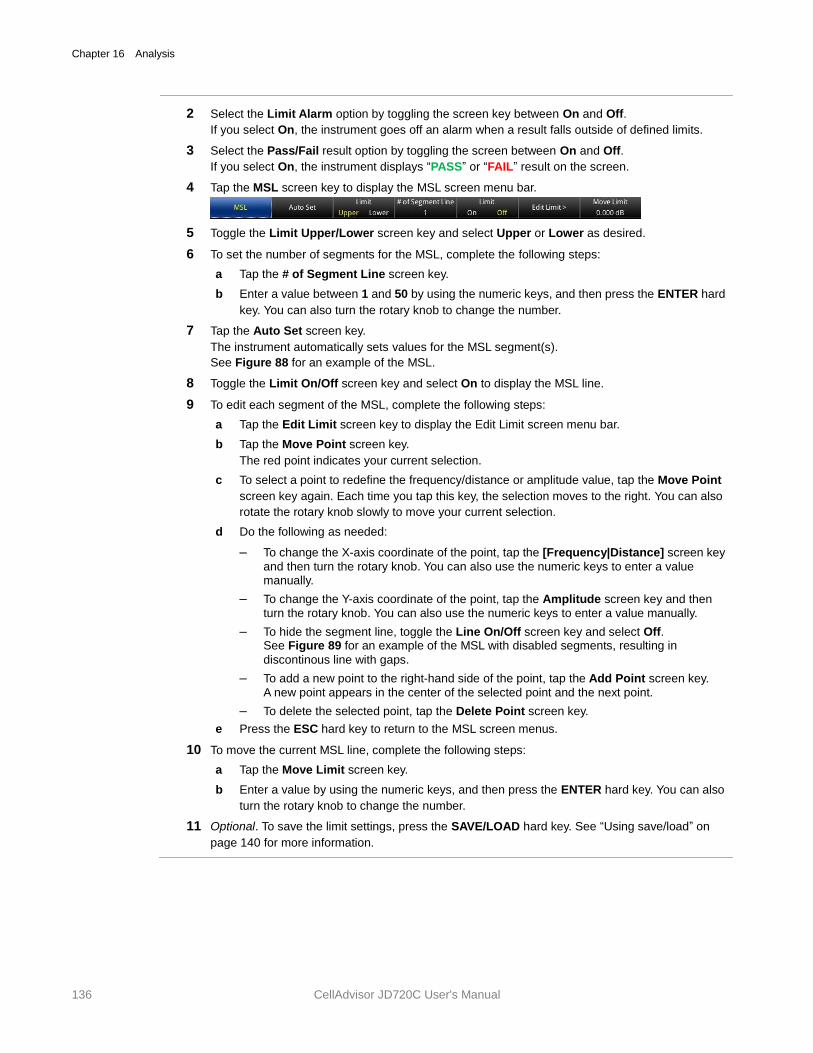
Chapter 16 Analysis
136 CellAdvisor JD720C User's Manual
2 Select the Limit Alarm option by toggling the screen key between On and Off.
If you select On, the instrument goes off an alarm when a result falls outside of defined limits.
3 Select the Pass/Fail result option by toggling the screen between On and Off.
If you select On, the instrument displays “PASS” or “FAIL” result on the screen.
4 Tap the MSL screen key to display the MSL screen menu bar.
5 Toggle the Limit Upper/Lower screen key and select Upper or Lower as desired.
6 To set the number of segments for the MSL, complete the following steps:
a Tap the # of Segment Line screen key.
b Enter a value between 1 and 50 by using the numeric keys, and then press the ENTER hard
key. You can also turn the rotary knob to change the number.
7 Tap the Auto Set screen key.
The instrument automatically sets values for the MSL segment(s).
See Figure 88 for an example of the MSL.
8 Toggle the Limit On/Off screen key and select On to display the MSL line.
9 To edit each segment of the MSL, complete the following steps:
a Tap the Edit Limit screen key to display the Edit Limit screen menu bar.
b Tap the Move Point screen key.
The red point indicates your current selection.
c To select a point to redefine the frequency/distance or amplitude value, tap the Move Point
screen key again. Each time you tap this key, the selection moves to the right. You can also
rotate the rotary knob slowly to move your current selection.
d Do the following as needed:
– To change the X-axis coordinate of the point, tap the [Frequency|Distance] screen key
and then turn the rotary knob. You can also use the numeric keys to enter a value manually.
– To change the Y-axis coordinate of the point, tap the Amplitude screen key and then
turn the rotary knob. You can also use the numeric keys to enter a value manually.
– To hide the segment line, toggle the Line On/Off screen key and select Off. See Figure 89 for an example of the MSL with disabled segments, resulting in
discontinous line with gaps.
– To add a new point to the right-hand side of the point, tap the Add Point screen key.
A new point appears in the center of the selected point and the next point.
– To delete the selected point, tap the Delete Point screen key.
e Press the ESC hard key to return to the MSL screen menus.
10 To move the current MSL line, complete the following steps:
a Tap the Move Limit screen key.
b Enter a value by using the numeric keys, and then press the ENTER hard key. You can also
turn the rotary knob to change the number.
11 Optional. To save the limit settings, press the SAVE/LOAD hard key. See “Using save/load” on
page 140 for more information.
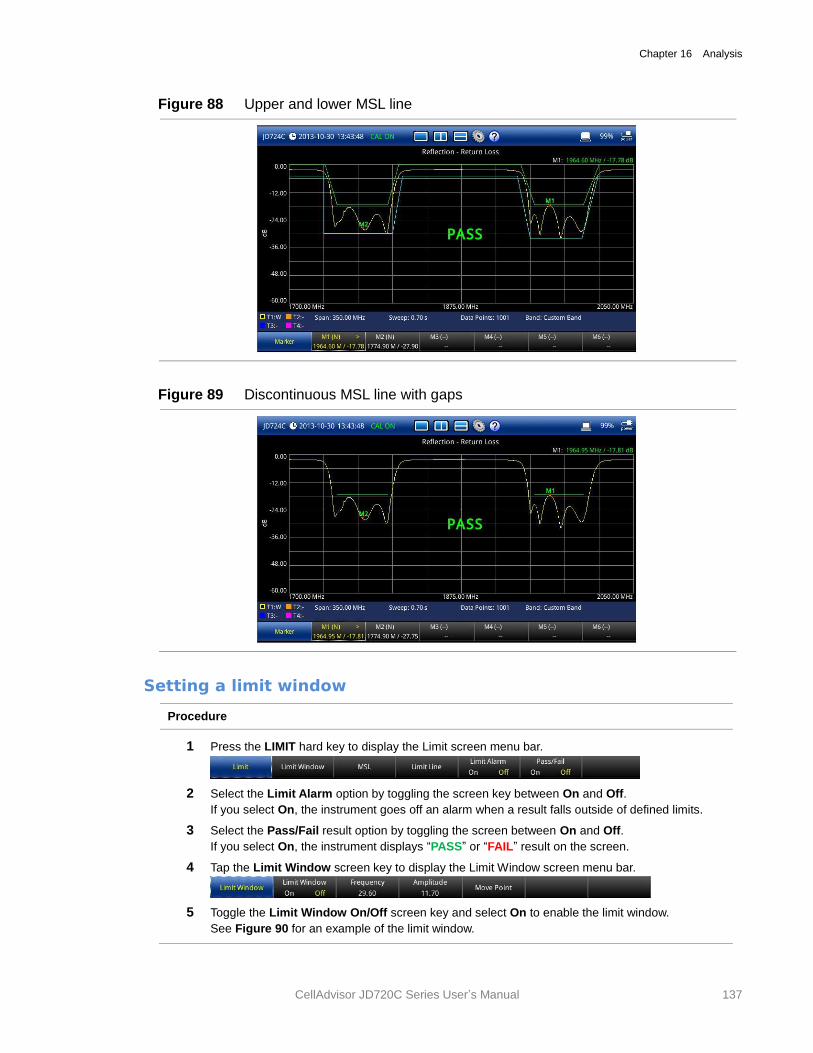
Chapter 16 Analysis
CellAdvisor JD720C Series User’s Manual 137
Figure 88 Upper and lower MSL line
Figure 89 Discontinuous MSL line with gaps
Setting a limit window
Procedure
1 Press the LIMIT hard key to display the Limit screen menu bar.
2 Select the Limit Alarm option by toggling the screen key between On and Off.
If you select On, the instrument goes off an alarm when a result falls outside of defined limits.
3 Select the Pass/Fail result option by toggling the screen between On and Off.
If you select On, the instrument displays “PASS” or “FAIL” result on the screen.
4 Tap the Limit Window screen key to display the Limit Window screen menu bar.
5 Toggle the Limit Window On/Off screen key and select On to enable the limit window.
See Figure 90 for an example of the limit window.
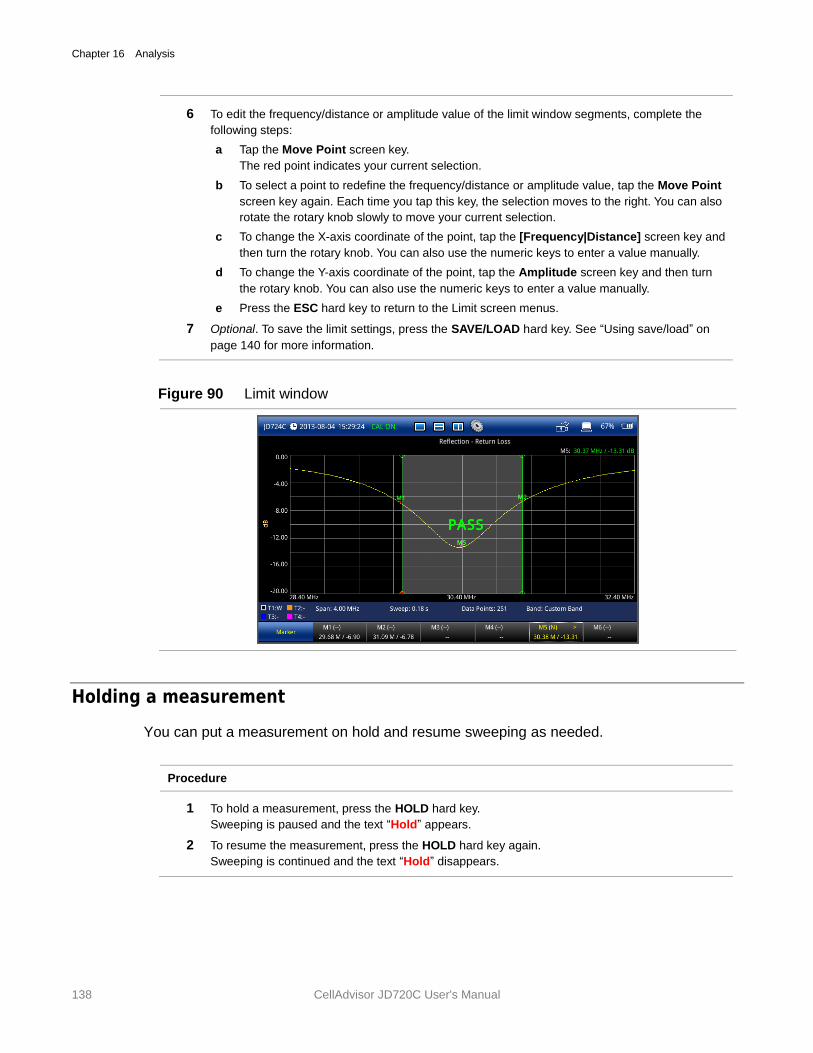
Chapter 16 Analysis
138 CellAdvisor JD720C User's Manual
6 To edit the frequency/distance or amplitude value of the limit window segments, complete the
following steps:
a Tap the Move Point screen key.
The red point indicates your current selection.
b To select a point to redefine the frequency/distance or amplitude value, tap the Move Point
screen key again. Each time you tap this key, the selection moves to the right. You can also
rotate the rotary knob slowly to move your current selection.
c To change the X-axis coordinate of the point, tap the [Frequency|Distance] screen key and
then turn the rotary knob. You can also use the numeric keys to enter a value manually.
d To change the Y-axis coordinate of the point, tap the Amplitude screen key and then turn
the rotary knob. You can also use the numeric keys to enter a value manually.
e Press the ESC hard key to return to the Limit screen menus.
7 Optional. To save the limit settings, press the SAVE/LOAD hard key. See “Using save/load” on
page 140 for more information.
Figure 90 Limit window
Holding a measurement
You can put a measurement on hold and resume sweeping as needed.
Procedure
1 To hold a measurement, press the HOLD hard key.
Sweeping is paused and the text “Hold” appears.
2 To resume the measurement, press the HOLD hard key again.
Sweeping is continued and the text “Hold” disappears.
17
CellAdvisor JD720C User's Manual
Chapter 17 Operation
This chapter provides instructions to perform operational tasks with the JD720C series. Topics discussed in this chapter are as follows:
Performing save ................................................................................................................. 140
Performing load .................................................................................................................. 144
Managing files .................................................................................................................... 146
Using on-screen keyboard ................................................................................................. 147
Changing display layout ..................................................................................................... 152
Connecting GPS receiver .................................................................................................. 154
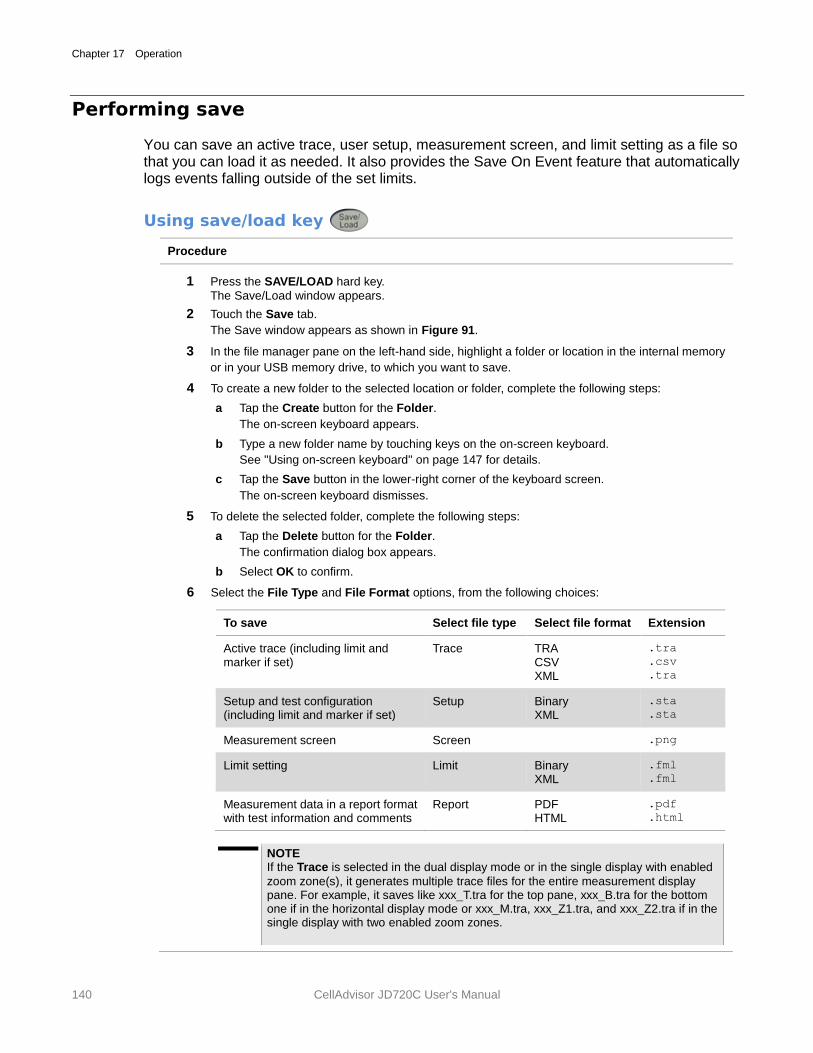
Chapter 17 Operation
140 CellAdvisor JD720C User's Manual
Performing save
You can save an active trace, user setup, measurement screen, and limit setting as a file so that you can load it as needed. It also provides the Save On Event feature that automatically logs events falling outside of the set limits.
Using save/load key
Procedure
1 Press the SAVE/LOAD hard key.
The Save/Load window appears.
2 Touch the Save tab.
The Save window appears as shown in Figure 91.
3 In the file manager pane on the left-hand side, highlight a folder or location in the internal memory
or in your USB memory drive, to which you want to save.
4 To create a new folder to the selected location or folder, complete the following steps:
a Tap the Create button for the Folder.
The on-screen keyboard appears.
b Type a new folder name by touching keys on the on-screen keyboard.
See "Using on-screen keyboard" on page 147 for details.
c Tap the Save button in the lower-right corner of the keyboard screen.
The on-screen keyboard dismisses.
5 To delete the selected folder, complete the following steps:
a Tap the Delete button for the Folder.
The confirmation dialog box appears.
b Select OK to confirm.
6 Select the File Type and File Format options, from the following choices:
To save Select file type Select file format Extension
Active trace (including limit and marker if set)
Trace TRA CSV XML
.tra
.csv
.tra
Setup and test configuration (including limit and marker if set)
Setup Binary XML
.sta
.sta
Measurement screen Screen .png
Limit setting Limit Binary XML
.fml
.fml
Measurement data in a report format with test information and comments
Report PDF HTML
.html
NOTE If the Trace is selected in the dual display mode or in the single display with enabled
zoom zone(s), it generates multiple trace files for the entire measurement display pane. For example, it saves like xxx_T.tra for the top pane, xxx_B.tra for the bottom one if in the horizontal display mode or xxx_M.tra, xxx_Z1.tra, and xxx_Z2.tra if in the single display with two enabled zoom zones.
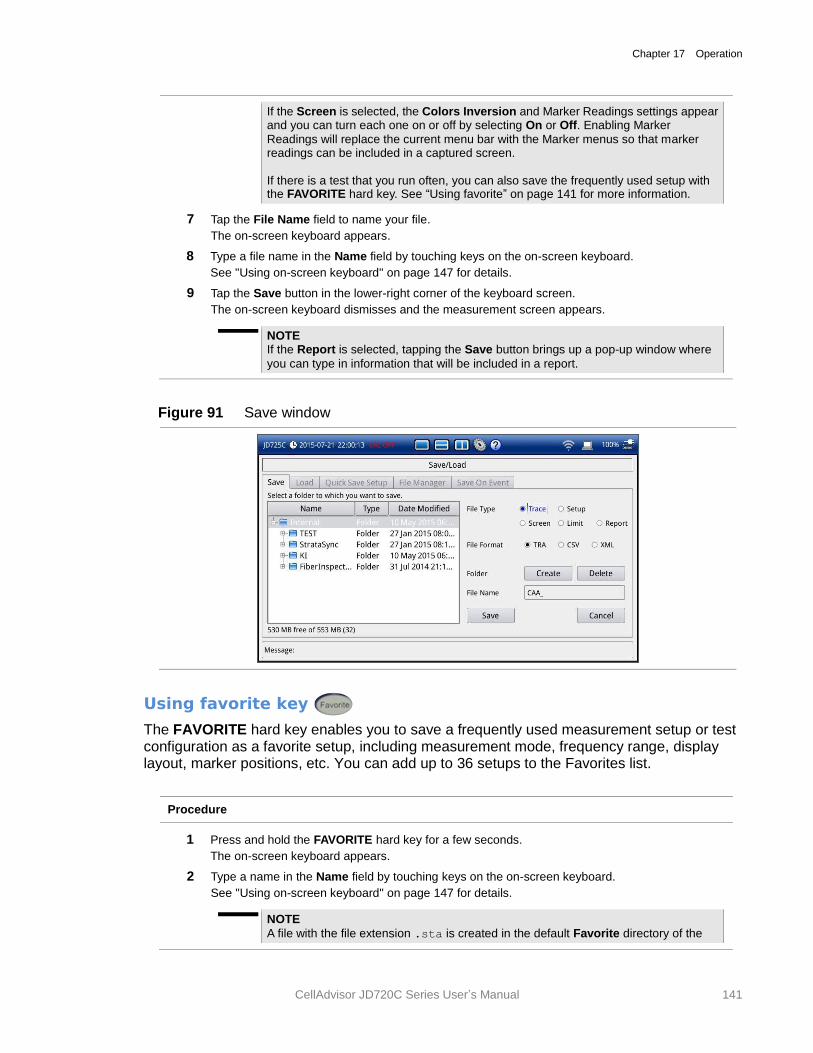
Chapter 17 Operation
CellAdvisor JD720C Series User’s Manual 141
If the Screen is selected, the Colors Inversion and Marker Readings settings appear and you can turn each one on or off by selecting On or Off. Enabling Marker
Readings will replace the current menu bar with the Marker menus so that marker readings can be included in a captured screen. If there is a test that you run often, you can also save the frequently used setup with the FAVORITE hard key. See “Using favorite” on page 141 for more information.
7 Tap the File Name field to name your file.
The on-screen keyboard appears.
8 Type a file name in the Name field by touching keys on the on-screen keyboard.
See "Using on-screen keyboard" on page 147 for details.
9 Tap the Save button in the lower-right corner of the keyboard screen.
The on-screen keyboard dismisses and the measurement screen appears.
NOTE If the Report is selected, tapping the Save button brings up a pop-up window where
you can type in information that will be included in a report.
Figure 91 Save window
Using favorite key
The FAVORITE hard key enables you to save a frequently used measurement setup or test configuration as a favorite setup, including measurement mode, frequency range, display layout, marker positions, etc. You can add up to 36 setups to the Favorites list.
Procedure
1 Press and hold the FAVORITE hard key for a few seconds.
The on-screen keyboard appears.
2 Type a name in the Name field by touching keys on the on-screen keyboard.
See "Using on-screen keyboard" on page 147 for details.
NOTE
A file with the file extension .sta is created in the default Favorite directory of the
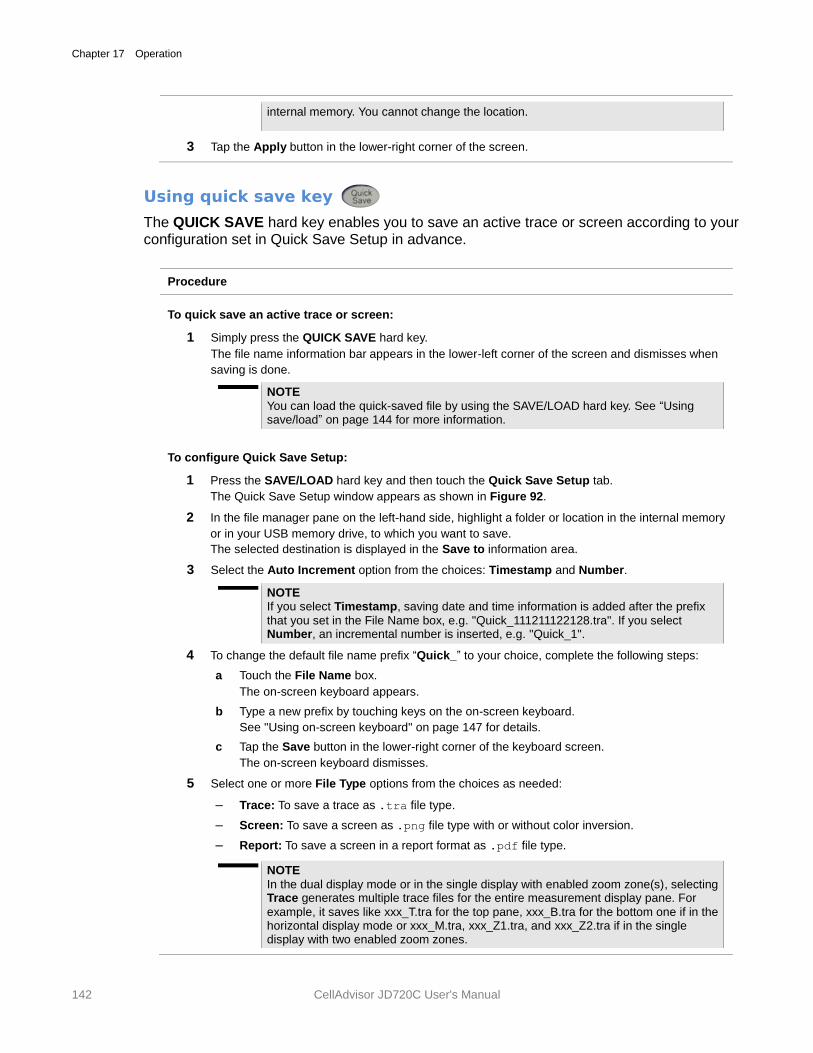
Chapter 17 Operation
142 CellAdvisor JD720C User's Manual
internal memory. You cannot change the location.
3 Tap the Apply button in the lower-right corner of the screen.
Using quick save key
The QUICK SAVE hard key enables you to save an active trace or screen according to your configuration set in Quick Save Setup in advance.
Procedure
To quick save an active trace or screen:
1 Simply press the QUICK SAVE hard key.
The file name information bar appears in the lower-left corner of the screen and dismisses when
saving is done.
NOTE
You can load the quick-saved file by using the SAVE/LOAD hard key. See “Using save/load” on page 144 for more information.
To configure Quick Save Setup:
1 Press the SAVE/LOAD hard key and then touch the Quick Save Setup tab.
The Quick Save Setup window appears as shown in Figure 92.
2 In the file manager pane on the left-hand side, highlight a folder or location in the internal memory
or in your USB memory drive, to which you want to save.
The selected destination is displayed in the Save to information area.
3 Select the Auto Increment option from the choices: Timestamp and Number.
NOTE If you select Timestamp, saving date and time information is added after the prefix
that you set in the File Name box, e.g. "Quick_111211122128.tra". If you select Number, an incremental number is inserted, e.g. "Quick_1".
4 To change the default file name prefix “Quick_” to your choice, complete the following steps:
a Touch the File Name box.
The on-screen keyboard appears.
b Type a new prefix by touching keys on the on-screen keyboard.
See "Using on-screen keyboard" on page 147 for details.
c Tap the Save button in the lower-right corner of the keyboard screen.
The on-screen keyboard dismisses.
5 Select one or more File Type options from the choices as needed:
– Trace: To save a trace as .tra file type.
– Screen: To save a screen as .png file type with or without color inversion.
– Report: To save a screen in a report format as .pdf file type.
NOTE
In the dual display mode or in the single display with enabled zoom zone(s), selecting Trace generates multiple trace files for the entire measurement display pane. For
example, it saves like xxx_T.tra for the top pane, xxx_B.tra for the bottom one if in the horizontal display mode or xxx_M.tra, xxx_Z1.tra, and xxx_Z2.tra if in the single display with two enabled zoom zones.
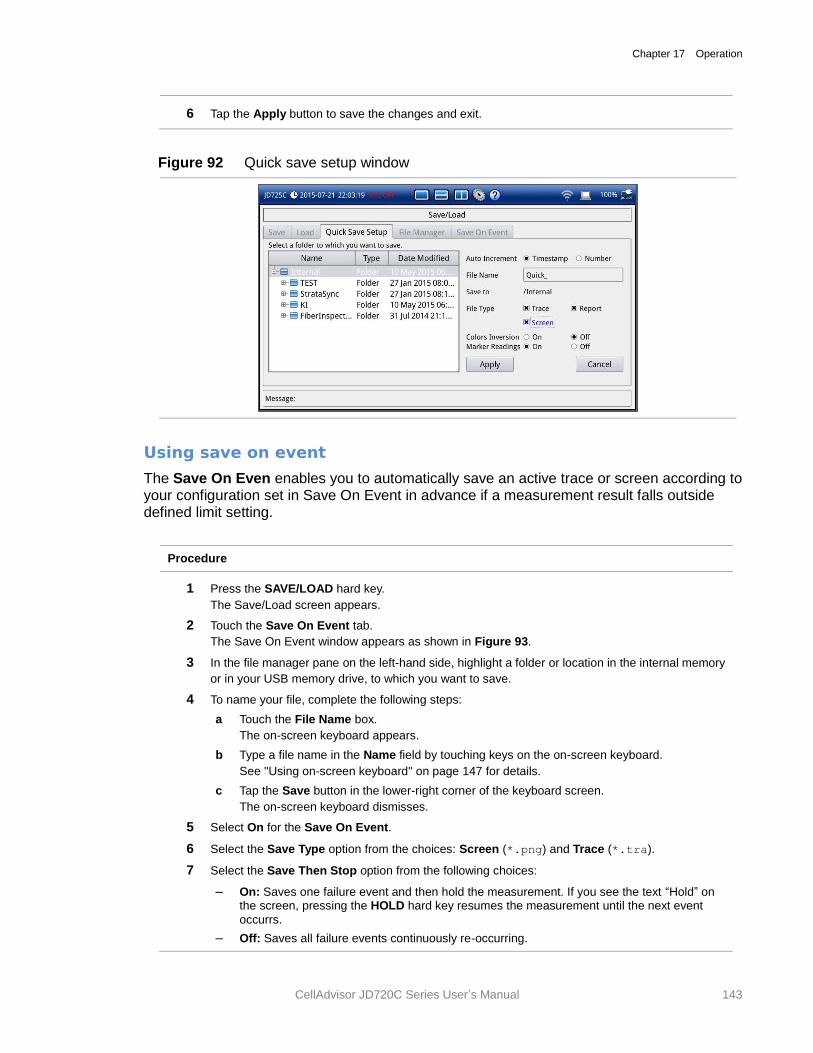
Chapter 17 Operation
CellAdvisor JD720C Series User’s Manual 143
6 Tap the Apply button to save the changes and exit.
Figure 92 Quick save setup window
Using save on event
The Save On Even enables you to automatically save an active trace or screen according to your configuration set in Save On Event in advance if a measurement result falls outside defined limit setting.
Procedure
1 Press the SAVE/LOAD hard key.
The Save/Load screen appears.
2 Touch the Save On Event tab.
The Save On Event window appears as shown in Figure 93.
3 In the file manager pane on the left-hand side, highlight a folder or location in the internal memory
or in your USB memory drive, to which you want to save.
4 To name your file, complete the following steps:
a Touch the File Name box.
The on-screen keyboard appears.
b Type a file name in the Name field by touching keys on the on-screen keyboard.
See "Using on-screen keyboard" on page 147 for details.
c Tap the Save button in the lower-right corner of the keyboard screen.
The on-screen keyboard dismisses.
5 Select On for the Save On Event.
6 Select the Save Type option from the choices: Screen (*.png) and Trace (*.tra).
7 Select the Save Then Stop option from the following choices:
– On: Saves one failure event and then hold the measurement. If you see the text “Hold” on the screen, pressing the HOLD hard key resumes the measurement until the next event
occurrs.
– Off: Saves all failure events continuously re-occurring.
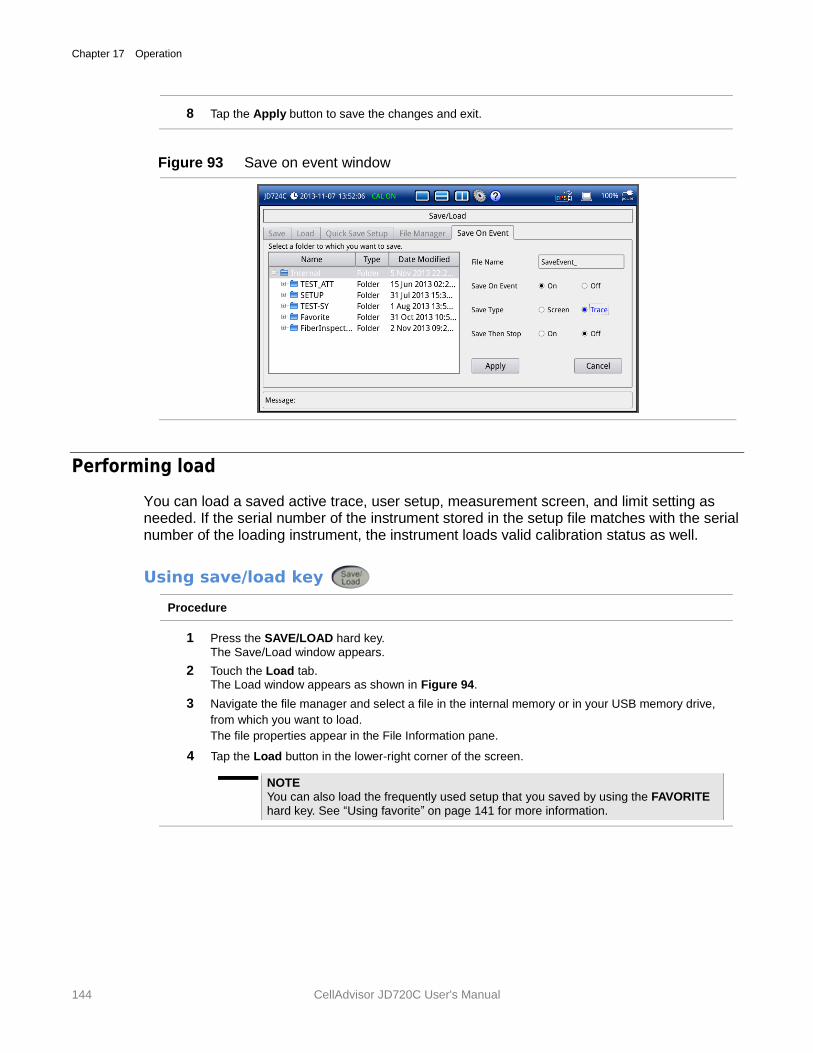
Chapter 17 Operation
144 CellAdvisor JD720C User's Manual
8 Tap the Apply button to save the changes and exit.
Figure 93 Save on event window
Performing load
You can load a saved active trace, user setup, measurement screen, and limit setting as needed. If the serial number of the instrument stored in the setup file matches with the serial number of the loading instrument, the instrument loads valid calibration status as well.
Using save/load key
Procedure
1 Press the SAVE/LOAD hard key.
The Save/Load window appears.
2 Touch the Load tab. The Load window appears as shown in Figure 94.
3 Navigate the file manager and select a file in the internal memory or in your USB memory drive,
from which you want to load.
The file properties appear in the File Information pane.
4 Tap the Load button in the lower-right corner of the screen.
NOTE You can also load the frequently used setup that you saved by using the FAVORITE
hard key. See “Using favorite” on page 141 for more information.
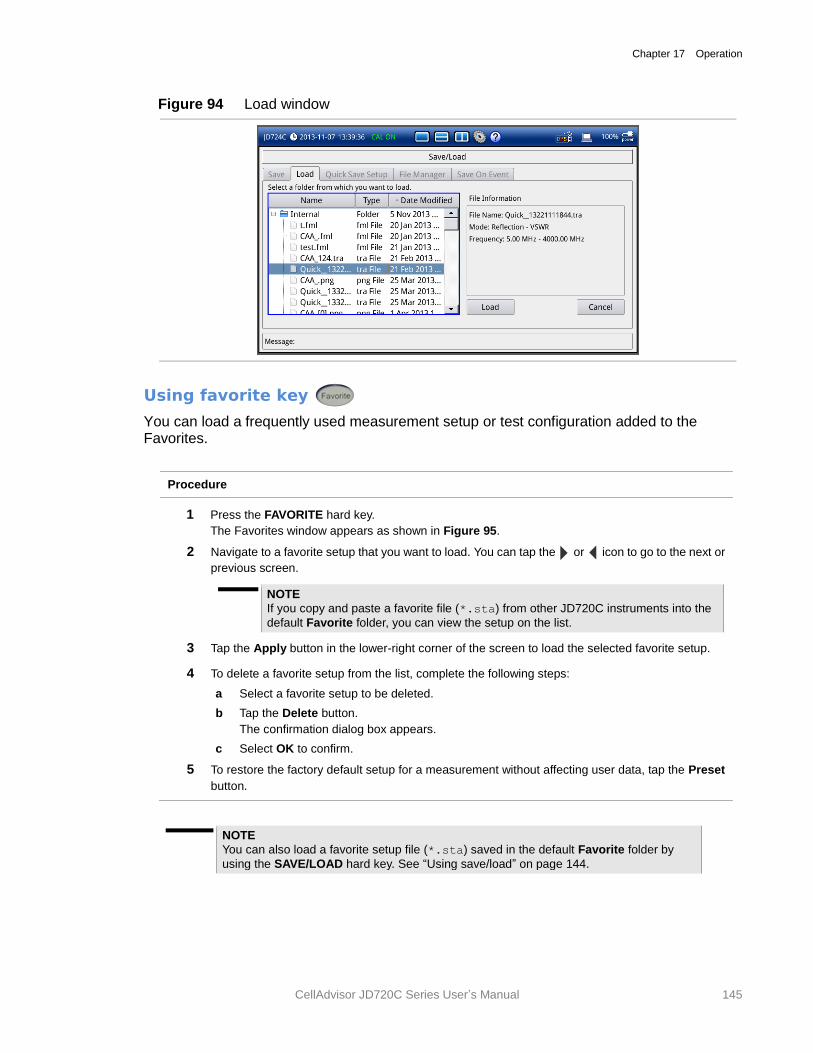
Chapter 17 Operation
CellAdvisor JD720C Series User’s Manual 145
Figure 94 Load window
Using favorite key
You can load a frequently used measurement setup or test configuration added to the Favorites.
Procedure
1 Press the FAVORITE hard key.
The Favorites window appears as shown in Figure 95.
2 Navigate to a favorite setup that you want to load. You can tap the or icon to go to the next or
previous screen.
NOTE
If you copy and paste a favorite file (*.sta) from other JD720C instruments into the
default Favorite folder, you can view the setup on the list.
3 Tap the Apply button in the lower-right corner of the screen to load the selected favorite setup.
4 To delete a favorite setup from the list, complete the following steps:
a Select a favorite setup to be deleted.
b Tap the Delete button.
The confirmation dialog box appears.
c Select OK to confirm.
5 To restore the factory default setup for a measurement without affecting user data, tap the Preset
button.
NOTE
You can also load a favorite setup file (*.sta) saved in the default Favorite folder by
using the SAVE/LOAD hard key. See “Using save/load” on page 144.
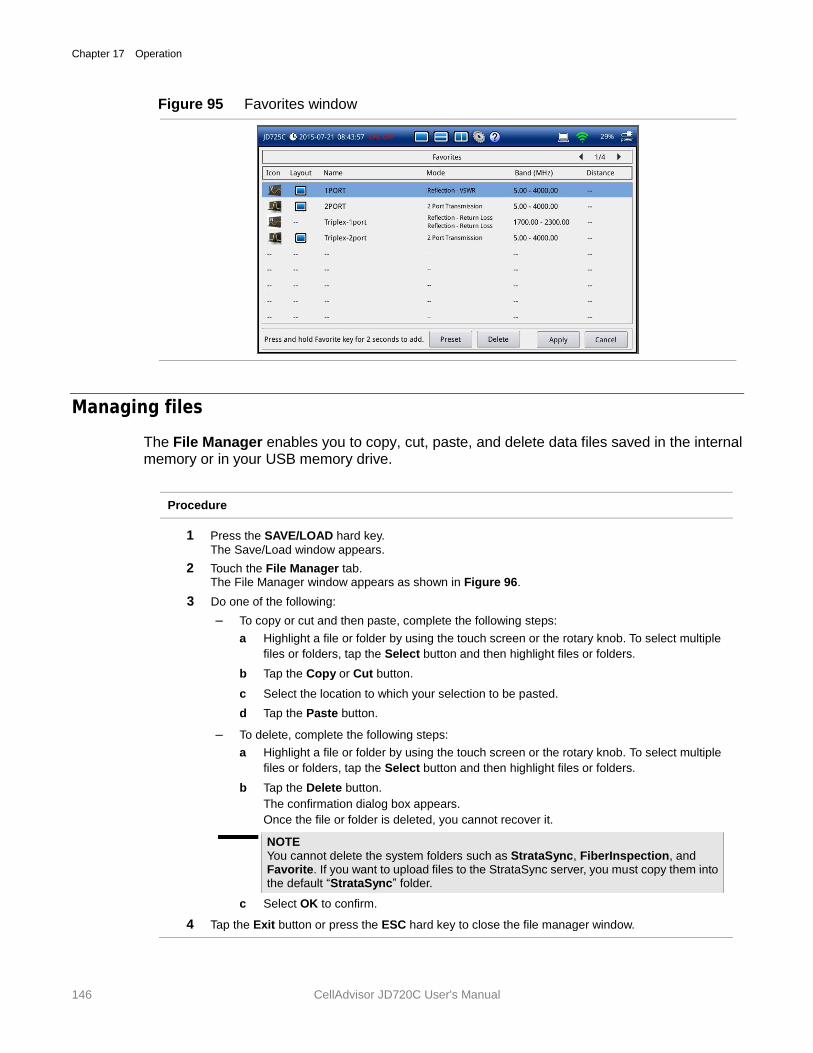
Chapter 17 Operation
146 CellAdvisor JD720C User's Manual
Figure 95 Favorites window
Managing files
The File Manager enables you to copy, cut, paste, and delete data files saved in the internal memory or in your USB memory drive.
Procedure
1 Press the SAVE/LOAD hard key.
The Save/Load window appears.
2 Touch the File Manager tab. The File Manager window appears as shown in Figure 96.
3 Do one of the following:
– To copy or cut and then paste, complete the following steps:
a Highlight a file or folder by using the touch screen or the rotary knob. To select multiple
files or folders, tap the Select button and then highlight files or folders.
b Tap the Copy or Cut button.
c Select the location to which your selection to be pasted.
d Tap the Paste button.
– To delete, complete the following steps:
a Highlight a file or folder by using the touch screen or the rotary knob. To select multiple
files or folders, tap the Select button and then highlight files or folders.
b Tap the Delete button.
The confirmation dialog box appears.
Once the file or folder is deleted, you cannot recover it.
NOTE You cannot delete the system folders such as StrataSync, FiberInspection, and Favorite. If you want to upload files to the StrataSync server, you must copy them into the default “StrataSync” folder.
c Select OK to confirm.
4 Tap the Exit button or press the ESC hard key to close the file manager window.
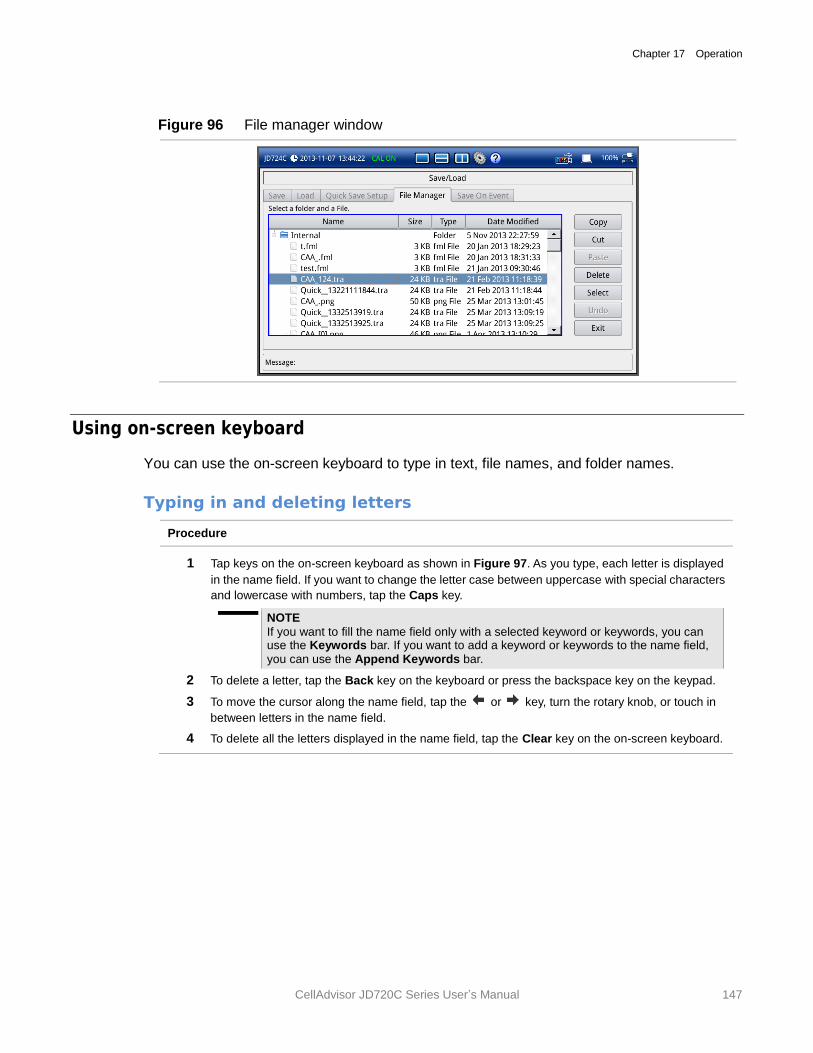
Chapter 17 Operation
CellAdvisor JD720C Series User’s Manual 147
Figure 96 File manager window
Using on-screen keyboard
You can use the on-screen keyboard to type in text, file names, and folder names.
Typing in and deleting letters
Procedure
1 Tap keys on the on-screen keyboard as shown in Figure 97. As you type, each letter is displayed
in the name field. If you want to change the letter case between uppercase with special characters
and lowercase with numbers, tap the Caps key.
NOTE
If you want to fill the name field only with a selected keyword or keywords, you can use the Keywords bar. If you want to add a keyword or keywords to the name field, you can use the Append Keywords bar.
2 To delete a letter, tap the Back key on the keyboard or press the backspace key on the keypad.
3 To move the cursor along the name field, tap the or key, turn the rotary knob, or touch in
between letters in the name field.
4 To delete all the letters displayed in the name field, tap the Clear key on the on-screen keyboard.
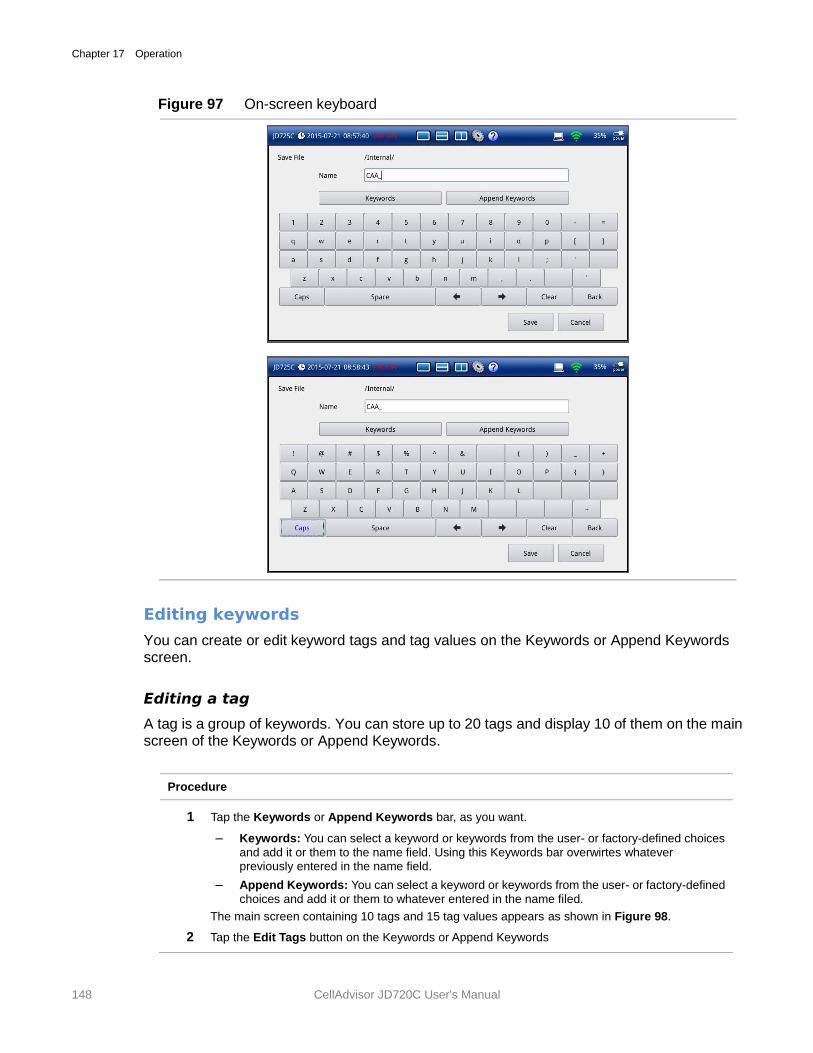
Chapter 17 Operation
148 CellAdvisor JD720C User's Manual
Figure 97 On-screen keyboard
Editing keywords
You can create or edit keyword tags and tag values on the Keywords or Append Keywords screen.
Editing a tag
A tag is a group of keywords. You can store up to 20 tags and display 10 of them on the main screen of the Keywords or Append Keywords.
Procedure
1 Tap the Keywords or Append Keywords bar, as you want.
– Keywords: You can select a keyword or keywords from the user- or factory-defined choices
and add it or them to the name field. Using this Keywords bar overwirtes whatever previously entered in the name field.
– Append Keywords: You can select a keyword or keywords from the user- or factory-defined
choices and add it or them to whatever entered in the name filed.
The main screen containing 10 tags and 15 tag values appears as shown in Figure 98.
2 Tap the Edit Tags button on the Keywords or Append Keywords
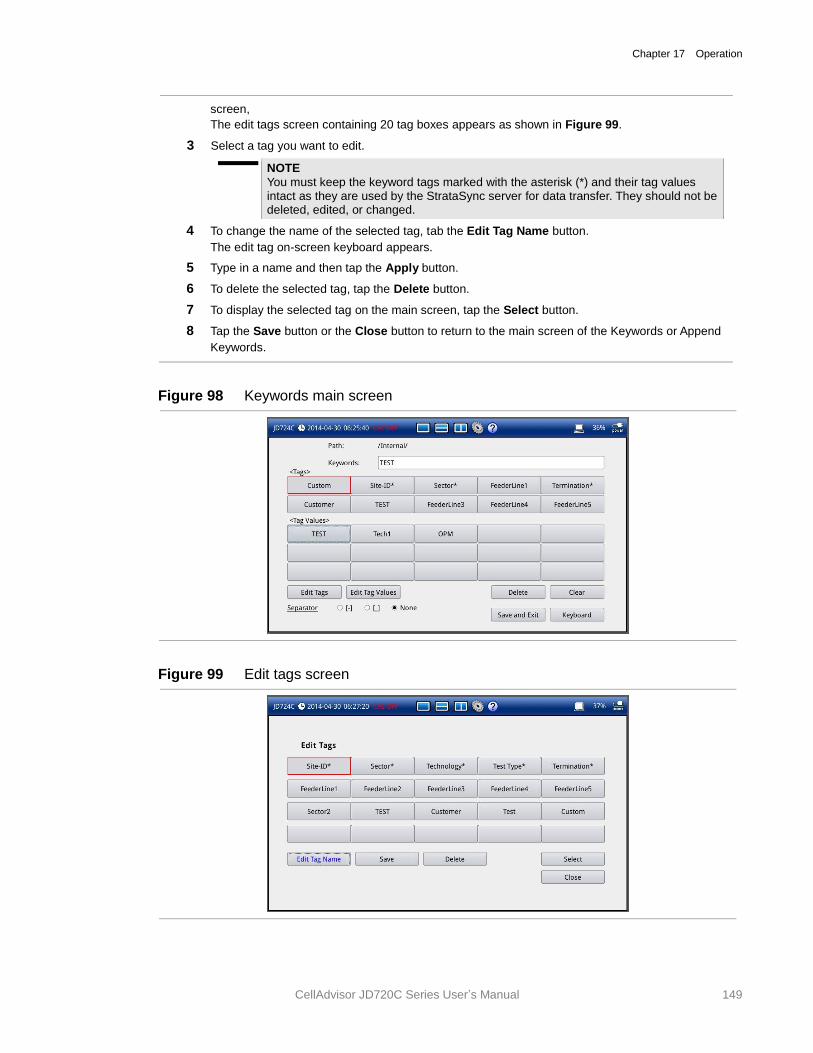
Chapter 17 Operation
CellAdvisor JD720C Series User’s Manual 149
screen,
The edit tags screen containing 20 tag boxes appears as shown in Figure 99.
3 Select a tag you want to edit.
NOTE
You must keep the keyword tags marked with the asterisk (*) and their tag values intact as they are used by the StrataSync server for data transfer. They should not be deleted, edited, or changed.
4 To change the name of the selected tag, tab the Edit Tag Name button.
The edit tag on-screen keyboard appears.
5 Type in a name and then tap the Apply button.
6 To delete the selected tag, tap the Delete button.
7 To display the selected tag on the main screen, tap the Select button.
8 Tap the Save button or the Close button to return to the main screen of the Keywords or Append
Keywords.
Figure 98 Keywords main screen
Figure 99 Edit tags screen
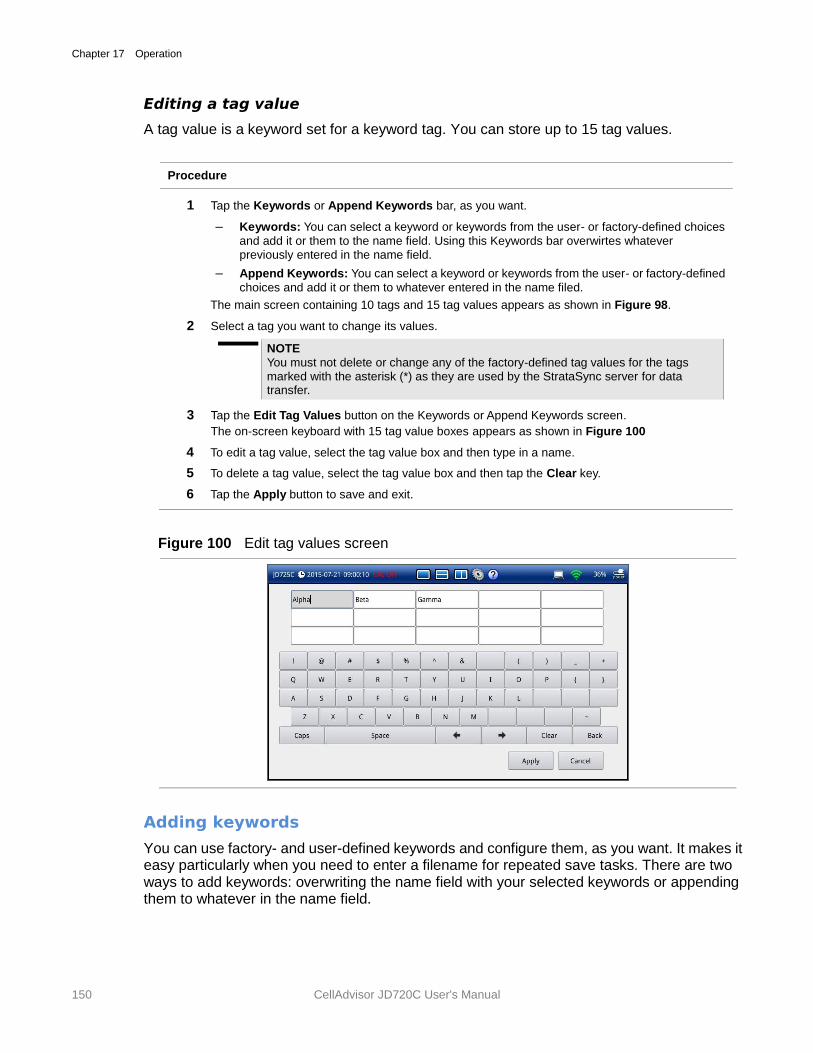
Chapter 17 Operation
150 CellAdvisor JD720C User's Manual
Editing a tag value
A tag value is a keyword set for a keyword tag. You can store up to 15 tag values.
Procedure
1 Tap the Keywords or Append Keywords bar, as you want.
– Keywords: You can select a keyword or keywords from the user- or factory-defined choices
and add it or them to the name field. Using this Keywords bar overwirtes whatever previously entered in the name field.
– Append Keywords: You can select a keyword or keywords from the user- or factory-defined
choices and add it or them to whatever entered in the name filed.
The main screen containing 10 tags and 15 tag values appears as shown in Figure 98.
2 Select a tag you want to change its values.
NOTE
You must not delete or change any of the factory-defined tag values for the tags marked with the asterisk (*) as they are used by the StrataSync server for data transfer.
3 Tap the Edit Tag Values button on the Keywords or Append Keywords screen.
The on-screen keyboard with 15 tag value boxes appears as shown in Figure 100
4 To edit a tag value, select the tag value box and then type in a name.
5 To delete a tag value, select the tag value box and then tap the Clear key.
6 Tap the Apply button to save and exit.
Figure 100 Edit tag values screen
Adding keywords
You can use factory- and user-defined keywords and configure them, as you want. It makes it easy particularly when you need to enter a filename for repeated save tasks. There are two ways to add keywords: overwriting the name field with your selected keywords or appending them to whatever in the name field.
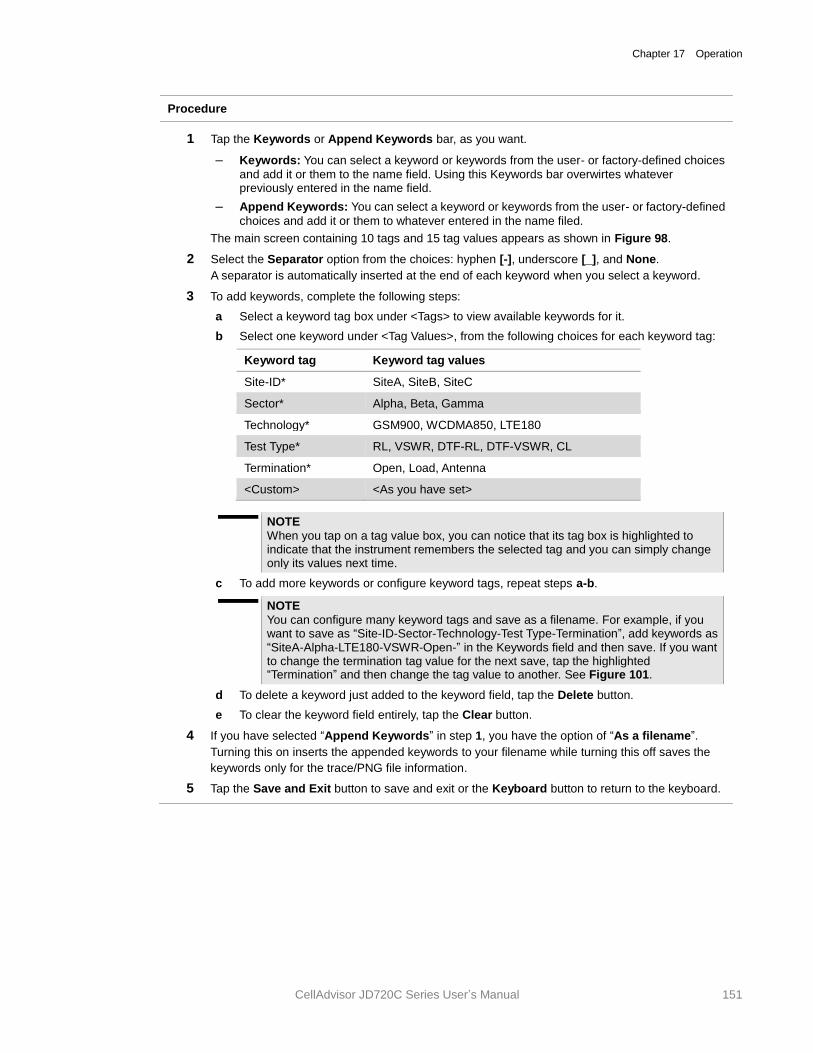
Chapter 17 Operation
CellAdvisor JD720C Series User’s Manual 151
Procedure
1 Tap the Keywords or Append Keywords bar, as you want.
– Keywords: You can select a keyword or keywords from the user- or factory-defined choices
and add it or them to the name field. Using this Keywords bar overwirtes whatever previously entered in the name field.
– Append Keywords: You can select a keyword or keywords from the user- or factory-defined
choices and add it or them to whatever entered in the name filed.
The main screen containing 10 tags and 15 tag values appears as shown in Figure 98.
2 Select the Separator option from the choices: hyphen [-], underscore [_], and None.
A separator is automatically inserted at the end of each keyword when you select a keyword.
3 To add keywords, complete the following steps:
a Select a keyword tag box under <Tags> to view available keywords for it.
b Select one keyword under <Tag Values>, from the following choices for each keyword tag:
Keyword tag Keyword tag values
Site-ID* SiteA, SiteB, SiteC
Sector* Alpha, Beta, Gamma
Technology* GSM900, WCDMA850, LTE180
Test Type* RL, VSWR, DTF-RL, DTF-VSWR, CL
Termination* Open, Load, Antenna
<Custom> <As you have set>
NOTE
When you tap on a tag value box, you can notice that its tag box is highlighted to indicate that the instrument remembers the selected tag and you can simply change only its values next time.
c To add more keywords or configure keyword tags, repeat steps a-b.
NOTE
You can configure many keyword tags and save as a filename. For example, if you want to save as “Site-ID-Sector-Technology-Test Type-Termination”, add keywords as “SiteA-Alpha-LTE180-VSWR-Open-” in the Keywords field and then save. If you want to change the termination tag value for the next save, tap the highlighted “Termination” and then change the tag value to another. See Figure 101.
d To delete a keyword just added to the keyword field, tap the Delete button.
e To clear the keyword field entirely, tap the Clear button.
4 If you have selected “Append Keywords” in step 1, you have the option of “As a filename”.
Turning this on inserts the appended keywords to your filename while turning this off saves the
keywords only for the trace/PNG file information.
5 Tap the Save and Exit button to save and exit or the Keyboard button to return to the keyboard.
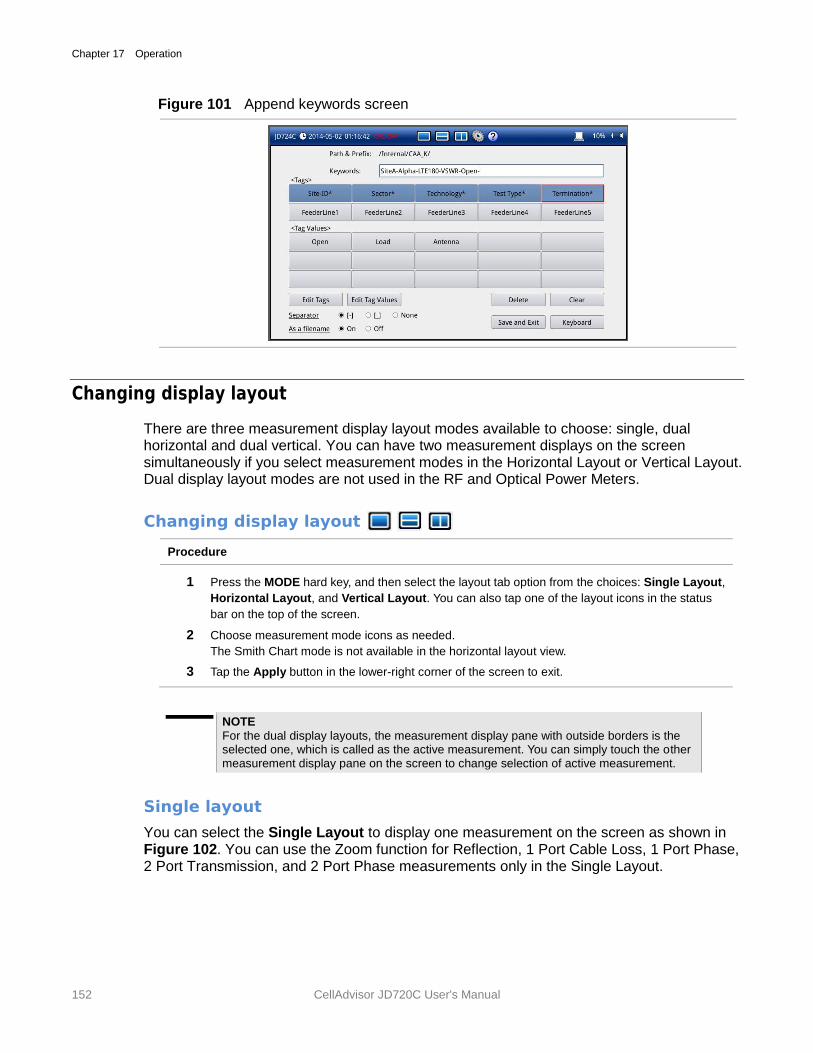
Chapter 17 Operation
152 CellAdvisor JD720C User's Manual
Figure 101 Append keywords screen
Changing display layout
There are three measurement display layout modes available to choose: single, dual horizontal and dual vertical. You can have two measurement displays on the screen simultaneously if you select measurement modes in the Horizontal Layout or Vertical Layout. Dual display layout modes are not used in the RF and Optical Power Meters.
Changing display layout
Procedure
1 Press the MODE hard key, and then select the layout tab option from the choices: Single Layout,
Horizontal Layout, and Vertical Layout. You can also tap one of the layout icons in the status
bar on the top of the screen.
2 Choose measurement mode icons as needed.
The Smith Chart mode is not available in the horizontal layout view.
3 Tap the Apply button in the lower-right corner of the screen to exit.
NOTE
For the dual display layouts, the measurement display pane with outside borders is the selected one, which is called as the active measurement. You can simply touch the other measurement display pane on the screen to change selection of active measurement.
Single layout
You can select the Single Layout to display one measurement on the screen as shown in Figure 102. You can use the Zoom function for Reflection, 1 Port Cable Loss, 1 Port Phase, 2 Port Transmission, and 2 Port Phase measurements only in the Single Layout.
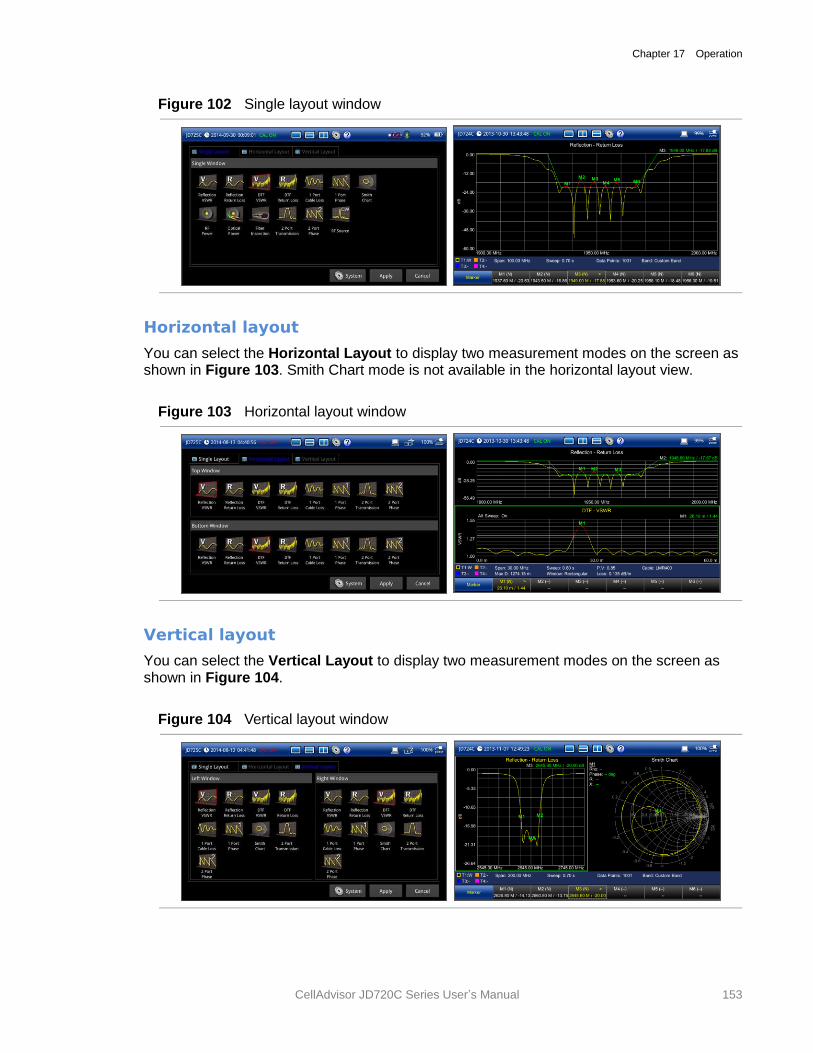
Chapter 17 Operation
CellAdvisor JD720C Series User’s Manual 153
Figure 102 Single layout window
Horizontal layout
You can select the Horizontal Layout to display two measurement modes on the screen as shown in Figure 103. Smith Chart mode is not available in the horizontal layout view.
Figure 103 Horizontal layout window
Vertical layout
You can select the Vertical Layout to display two measurement modes on the screen as shown in Figure 104.
Figure 104 Vertical layout window
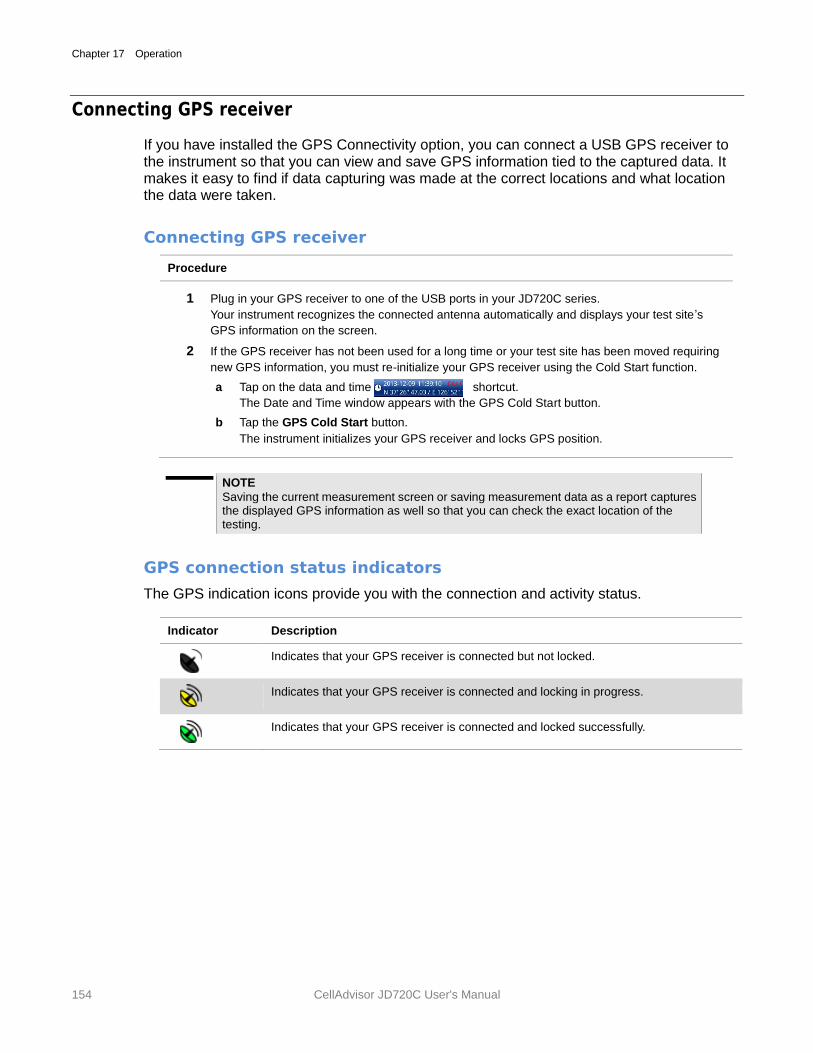
Chapter 17 Operation
154 CellAdvisor JD720C User's Manual
Connecting GPS receiver
If you have installed the GPS Connectivity option, you can connect a USB GPS receiver to the instrument so that you can view and save GPS information tied to the captured data. It makes it easy to find if data capturing was made at the correct locations and what location the data were taken.
Connecting GPS receiver
Procedure
1 Plug in your GPS receiver to one of the USB ports in your JD720C series.
Your instrument recognizes the connected antenna automatically and displays your test site’s
GPS information on the screen.
2 If the GPS receiver has not been used for a long time or your test site has been moved requiring
new GPS information, you must re-initialize your GPS receiver using the Cold Start function.
a Tap on the data and time shortcut.
The Date and Time window appears with the GPS Cold Start button.
b Tap the GPS Cold Start button.
The instrument initializes your GPS receiver and locks GPS position.
NOTE
Saving the current measurement screen or saving measurement data as a report captures the displayed GPS information as well so that you can check the exact location of the testing.
GPS connection status indicators
The GPS indication icons provide you with the connection and activity status.
Indicator Description
Indicates that your GPS receiver is connected but not locked.
Indicates that your GPS receiver is connected and locking in progress.
Indicates that your GPS receiver is connected and locked successfully.
18
CellAdvisor JD720C User's Manual
Chapter 18 System Settings and Maintenance
This chapter describes how to set up your system preferences and properties and maintain your instrument. Topics discussed in this chapter are as follows:
Checking system information ............................................................................................. 156
Setting preferences ............................................................................................................ 156
Installing options ................................................................................................................ 158
Configuring network ........................................................................................................... 158
Upgrading firmware ............................................................................................................ 161
Performing service diagnostic ............................................................................................ 162
Activating StrataSync ......................................................................................................... 164
Enabling Web-based remote control.................................................................................. 167
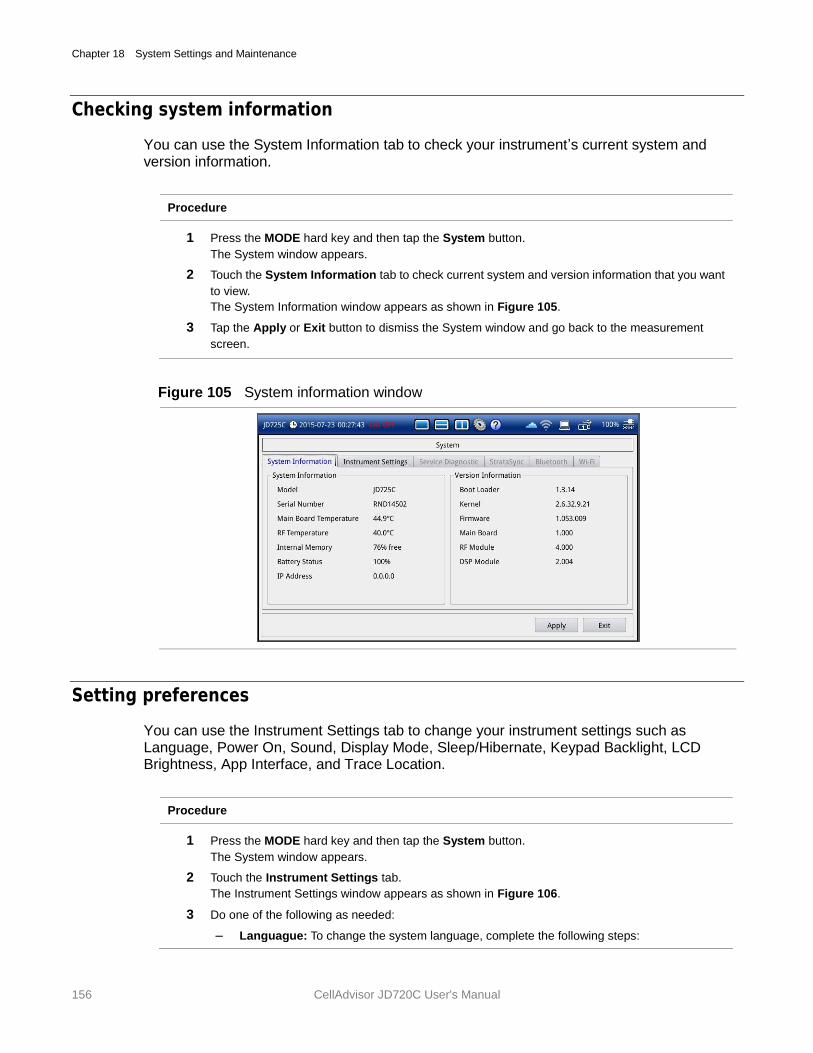
Chapter 18 System Settings and Maintenance
156 CellAdvisor JD720C User's Manual
Checking system information
You can use the System Information tab to check your instrument’s current system and version information.
Procedure
1 Press the MODE hard key and then tap the System button.
The System window appears.
2 Touch the System Information tab to check current system and version information that you want
to view.
The System Information window appears as shown in Figure 105.
3 Tap the Apply or Exit button to dismiss the System window and go back to the measurement
screen.
Figure 105 System information window
Setting preferences
You can use the Instrument Settings tab to change your instrument settings such as Language, Power On, Sound, Display Mode, Sleep/Hibernate, Keypad Backlight, LCD Brightness, App Interface, and Trace Location.
Procedure
1 Press the MODE hard key and then tap the System button.
The System window appears.
2 Touch the Instrument Settings tab.
The Instrument Settings window appears as shown in Figure 106.
3 Do one of the following as needed:
– Languague: To change the system language, complete the following steps:
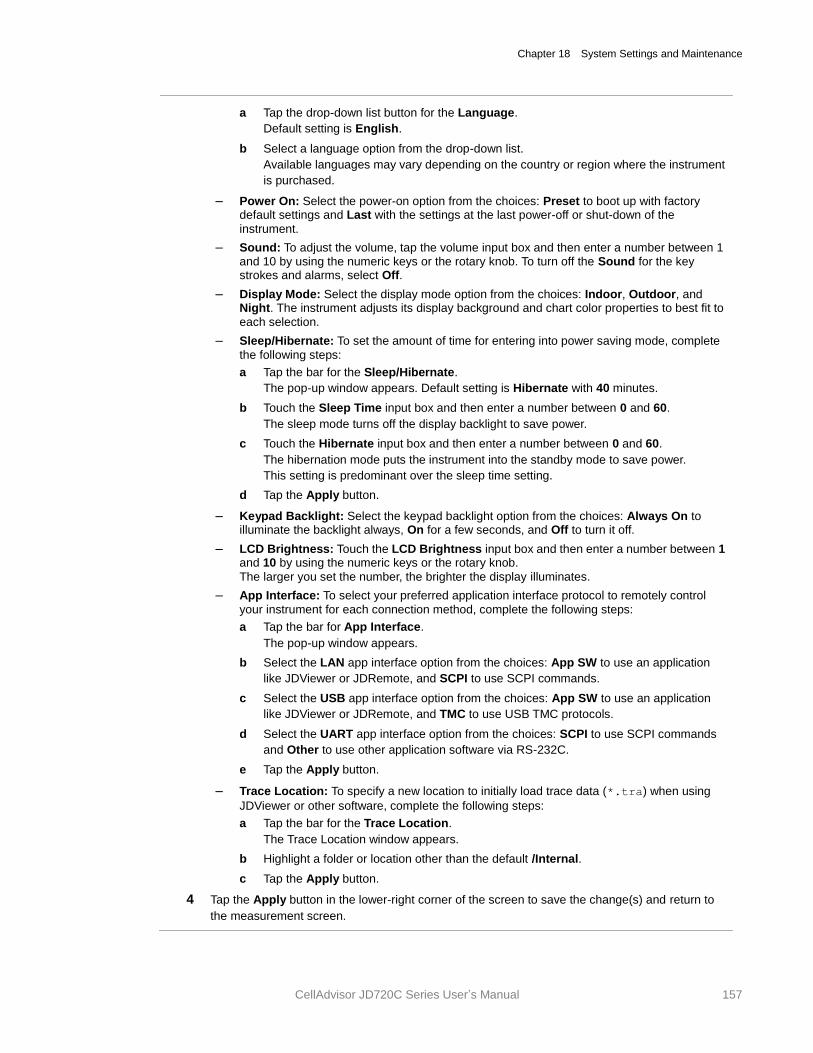
Chapter 18 System Settings and Maintenance
CellAdvisor JD720C Series User’s Manual 157
a Tap the drop-down list button for the Language.
Default setting is English.
b Select a language option from the drop-down list.
Available languages may vary depending on the country or region where the instrument
is purchased.
– Power On: Select the power-on option from the choices: Preset to boot up with factory default settings and Last with the settings at the last power-off or shut-down of the
instrument.
– Sound: To adjust the volume, tap the volume input box and then enter a number between 1 and 10 by using the numeric keys or the rotary knob. To turn off the Sound for the key strokes and alarms, select Off.
– Display Mode: Select the display mode option from the choices: Indoor, Outdoor, and Night. The instrument adjusts its display background and chart color properties to best fit to
each selection.
– Sleep/Hibernate: To set the amount of time for entering into power saving mode, complete
the following steps:
a Tap the bar for the Sleep/Hibernate.
The pop-up window appears. Default setting is Hibernate with 40 minutes.
b Touch the Sleep Time input box and then enter a number between 0 and 60.
The sleep mode turns off the display backlight to save power.
c Touch the Hibernate input box and then enter a number between 0 and 60.
The hibernation mode puts the instrument into the standby mode to save power.
This setting is predominant over the sleep time setting.
d Tap the Apply button.
– Keypad Backlight: Select the keypad backlight option from the choices: Always On to illuminate the backlight always, On for a few seconds, and Off to turn it off.
– LCD Brightness: Touch the LCD Brightness input box and then enter a number between 1 and 10 by using the numeric keys or the rotary knob.
The larger you set the number, the brighter the display illuminates.
– App Interface: To select your preferred application interface protocol to remotely control
your instrument for each connection method, complete the following steps:
a Tap the bar for App Interface.
The pop-up window appears.
b Select the LAN app interface option from the choices: App SW to use an application
like JDViewer or JDRemote, and SCPI to use SCPI commands.
c Select the USB app interface option from the choices: App SW to use an application
like JDViewer or JDRemote, and TMC to use USB TMC protocols.
d Select the UART app interface option from the choices: SCPI to use SCPI commands
and Other to use other application software via RS-232C.
e Tap the Apply button.
– Trace Location: To specify a new location to initially load trace data (*.tra) when using
JDViewer or other software, complete the following steps:
a Tap the bar for the Trace Location.
The Trace Location window appears.
b Highlight a folder or location other than the default /Internal.
c Tap the Apply button.
4 Tap the Apply button in the lower-right corner of the screen to save the change(s) and return to
the measurement screen.
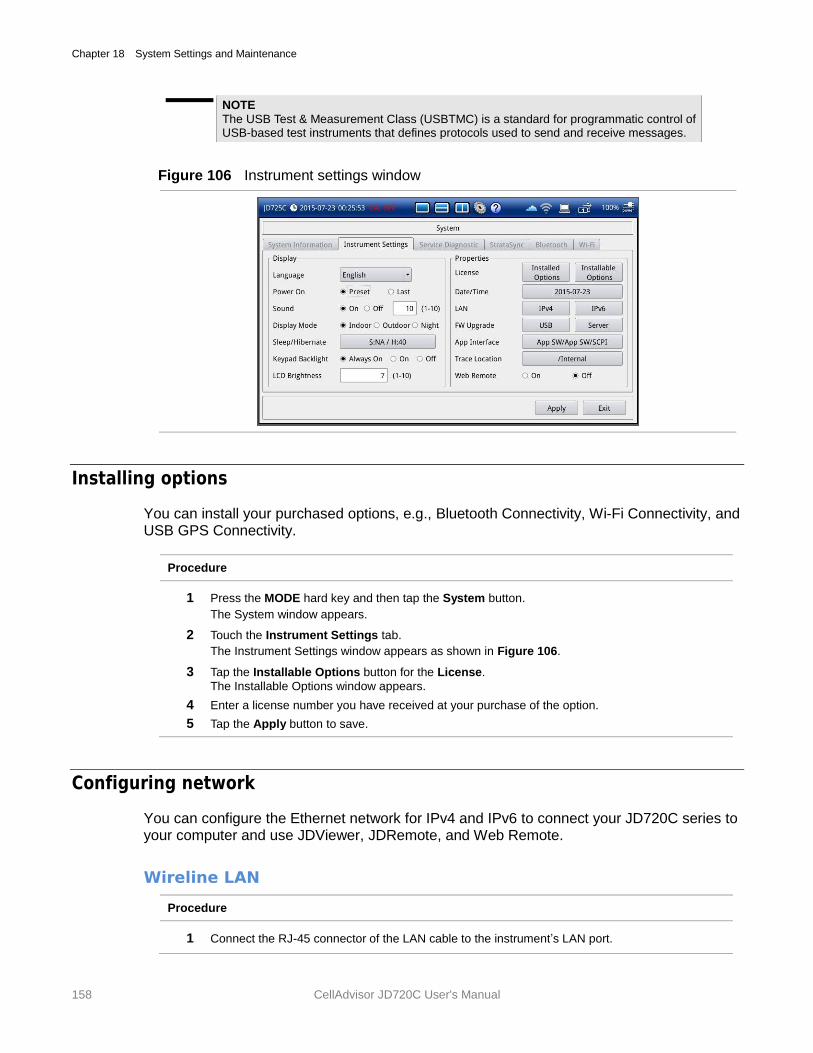
Chapter 18 System Settings and Maintenance
158 CellAdvisor JD720C User's Manual
NOTE
The USB Test & Measurement Class (USBTMC) is a standard for programmatic control of USB-based test instruments that defines protocols used to send and receive messages.
Figure 106 Instrument settings window
Installing options
You can install your purchased options, e.g., Bluetooth Connectivity, Wi-Fi Connectivity, and USB GPS Connectivity.
Procedure
1 Press the MODE hard key and then tap the System button.
The System window appears.
2 Touch the Instrument Settings tab.
The Instrument Settings window appears as shown in Figure 106.
3 Tap the Installable Options button for the License.
The Installable Options window appears.
4 Enter a license number you have received at your purchase of the option.
5 Tap the Apply button to save.
Configuring network
You can configure the Ethernet network for IPv4 and IPv6 to connect your JD720C series to your computer and use JDViewer, JDRemote, and Web Remote.
Wireline LAN
Procedure
1 Connect the RJ-45 connector of the LAN cable to the instrument’s LAN port.
Chapter 18 System Settings and Maintenance
CellAdvisor JD720C Series User’s Manual 159
2 Press the MODE hard key and then tap the System button.
The System window appears.
3 Touch the Instrument Settings tab.
The Instrument Settings window appears as shown in Figure 106.
4 To set IPv4 addresses, tap the IPv4 button, and then do one of the following:
– To enable automatic IP addressing, select the DHCP mode and tap the Apply button.
– To manually assign fixed IP addresses, complete the following steps:
a Select the Static mode.
b Enter an address for the IP Address.
c Enter an address for the Net Mask.
d Enter an address for the Gateway.
e Enter an address for the DNS.
f Tap the Apply button.
5 To set IPv6 addresses, tap the IPv6 button, and then do one of the following:
– To enable automatic IP addressing, select the Auto mode and tap the Apply button.
– To manually assign fixed IP addresses, complete the following steps:
a Select the Static mode.
b Enter an address for the IP Address.
c Enter an address for the Subnet Prefix Length.
d Enter an address for the Gateway.
e Enter an address for the DNS.
f Tap the Apply button.
– If you do not want to use the IPv6 protocol, select the Off mode and tap the Apply button.
Wireless LAN
If you have installed your purchased license for the Wi-Fi connectivity option on your JD720C series, the Wi-Fi tab appears in the System so that you can join a wireless network from the instrument to have access to StrataSync or operate the instrument from the Web-based remote control on your computer.
Procedure
1 Plug in the USB Wi-Fi LAN card that came with the Wi-Fi connectivity option to the USB Host port
of the JD720C series.
The Wi-Fi LAN card is detected and the white Wi-Fi indicator appears in the system status bar.
2 Press the MODE hard key, and then tap the System button. You can also touch the System
shortcut icon in the top system status bar.
The System window appears.
3 Touch the Wi-Fi tab that is enabled with an installed license.
The Wi-Fi connection window appears with a list of searched wireless network.
4 The Wi-Fi mode turned on automatically. If not, select On next to the Wi-Fi Mode.
5 To select a network to join, complete the following steps:
a To refresh the networks list, tap the Scan button.
The instrument displays all detected networks as Detected and previously connected ones
Chapter 18 System Settings and Maintenance
160 CellAdvisor JD720C User's Manual
as Saved.
b Highlight a network to join by using the Up/Down keys or rotary knob.
c Press the Select button.
The Wi-Fi connection window appears for entries.
6 To enter a user identity and a password for the network, complete the following steps:
a Tap on the input box for Identity, if required.
The on-screen keyboard appears.
b Type your identity, and then tap the Apply button.
c Tap on the input box for Password, if required.
The on-screen keyboard appears.
d Type a correct password that must be at least eight characters long.
e Tap the Apply button.
f To view the password exactly as entered, tap the checkbox for Show Password to enable it.
7 To configure IP network settings, complete the following steps:
a Select the TCP/IP protocol option from the choices: IPv4 and IPv6.
Sub-selection options change according to your selection. If the selected network supports
IPv6, you can configure IP settings for it.
b Do one of the following:
– To enable automatic IP addressing, select DHCP for IPv4 or Auto for IPv6.
It is recommended that you select DHCP unless otherwise you know static IP addresses.
– To manually assign fixed IP addresses, select Static, and then enter addresses as
required for IPv4 or IPv6. If you do not have required information, contact your network administrator.
– To disable the IPv6 protocol, select Off.
8 Tap the Connect button.
Once connected, the Wi-Fi indicator turns green and the Wi-Fi connection window is updated with
information about the connected network including SSID, status, authentication type, encryption
method, BSSID, and assigned IP address(es). If you have selected Auto for IPv6 in step 7, you
will have Link-Local, Stateless, and Stateful instead of IP Address. If you see the green Wi-Fi
indication with a red exclamation mark in the center, it means that an IP address has not been
assigned.
NOTE
It is important to record the IP address(es) or Stateless and Stateful addresses if you want to use the Web Remote on your computer.
9 To disconnect the currently connected network, select the network and then tap the Disconnect
button.
10 To forget the selected network and delete it permanently from the list, tap the Remove button.
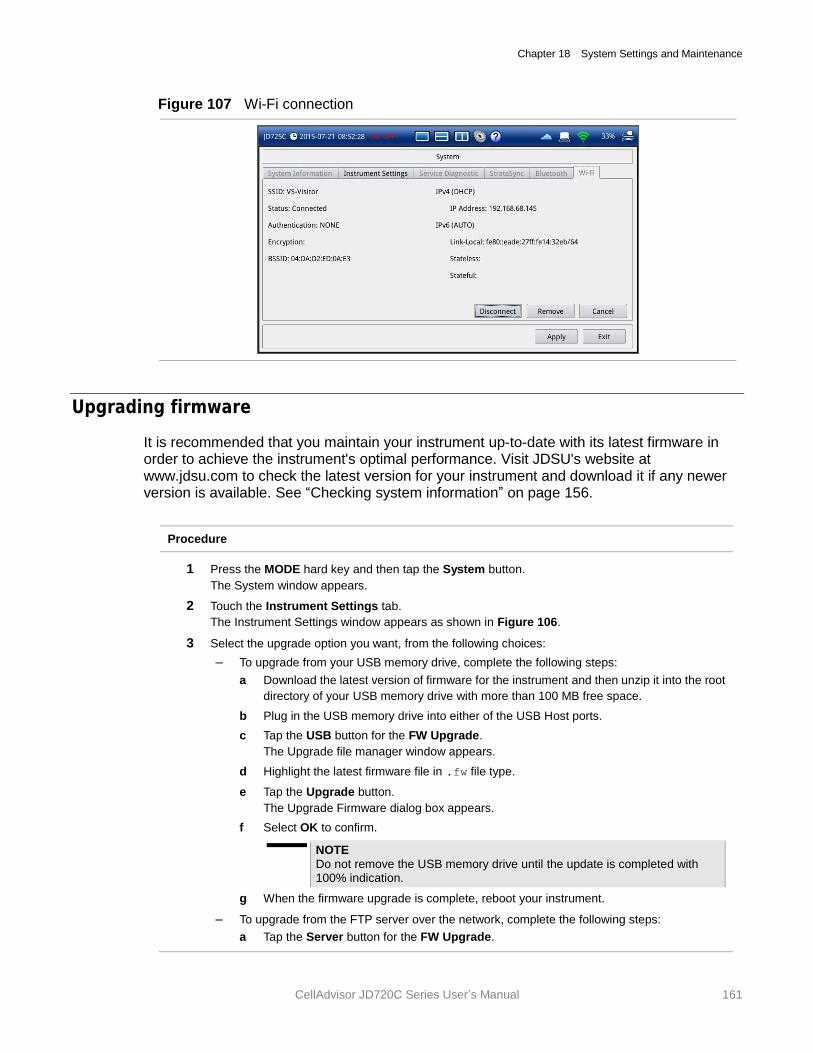
Chapter 18 System Settings and Maintenance
CellAdvisor JD720C Series User’s Manual 161
Figure 107 Wi-Fi connection
Upgrading firmware
It is recommended that you maintain your instrument up-to-date with its latest firmware in order to achieve the instrument's optimal performance. Visit JDSU's website at www.jdsu.com to check the latest version for your instrument and download it if any newer version is available. See “Checking system information” on page 156.
Procedure
1 Press the MODE hard key and then tap the System button.
The System window appears.
2 Touch the Instrument Settings tab.
The Instrument Settings window appears as shown in Figure 106.
3 Select the upgrade option you want, from the following choices:
– To upgrade from your USB memory drive, complete the following steps:
a Download the latest version of firmware for the instrument and then unzip it into the root
directory of your USB memory drive with more than 100 MB free space.
b Plug in the USB memory drive into either of the USB Host ports.
c Tap the USB button for the FW Upgrade.
The Upgrade file manager window appears.
d Highlight the latest firmware file in .fw file type.
e Tap the Upgrade button.
The Upgrade Firmware dialog box appears.
f Select OK to confirm.
NOTE
Do not remove the USB memory drive until the update is completed with 100% indication.
g When the firmware upgrade is complete, reboot your instrument.
– To upgrade from the FTP server over the network, complete the following steps:
a Tap the Server button for the FW Upgrade.
Chapter 18 System Settings and Maintenance
162 CellAdvisor JD720C User's Manual
The upgrade server dialog box appears.
NOTE Older version of firmware does not have the Server option. It is recommended that you update your firmware with the USB option first.
b Enter ftp2.jdsu.com in the server address field.
c Enter your proxy server address in the proxy server field, if necessary.
Contact your system administrator for your proxy server information.
d Tap the Check button to check.
e If the installed firmware version is the latest one, the message “Your firmware is up to
date.” is displayed. If not, the instrument displays the latest firmware version information
and you can install it by touching the Install button.
NOTE
If the instrument encounters power down during the upgrade, it may not operate properly. Do not interrupt power supply until the upgrade is done.
Performing service diagnostic
The Service Diagnostic enables you to view system log, run self-testing, revert to factory settings, and perform touch-screen alignment.
Procedure
1 Press the MODE hard key and then tap the System button.
The System window appears.
2 Touch the Service Diagnostic tab.
The Service Diagnostic window appears as shown in Figure 108.
3 Use the following action buttons as needed:
– Run Self Test
– System Logging
– Factory Reset
– Touch Alignment
See the sections below for details of each task.
4 Tap the Apply button in the lower-right corner of the screen.
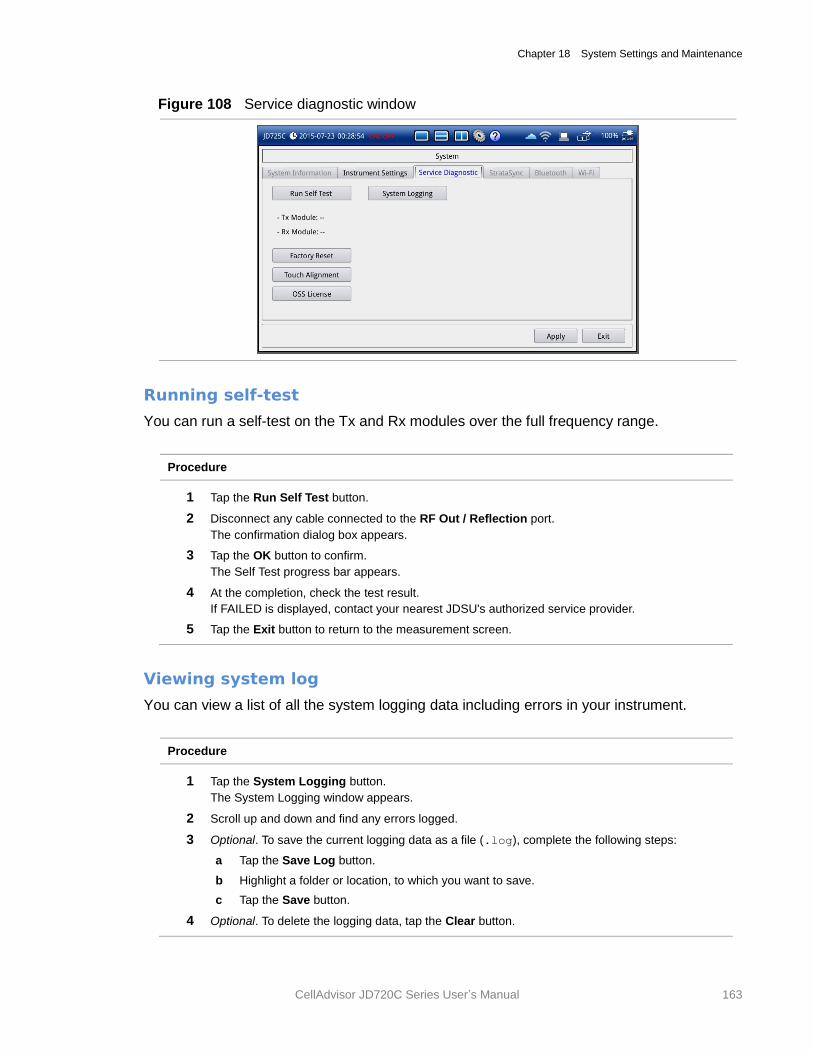
Chapter 18 System Settings and Maintenance
CellAdvisor JD720C Series User’s Manual 163
Figure 108 Service diagnostic window
Running self-test
You can run a self-test on the Tx and Rx modules over the full frequency range.
Procedure
1 Tap the Run Self Test button.
2 Disconnect any cable connected to the RF Out / Reflection port.
The confirmation dialog box appears.
3 Tap the OK button to confirm.
The Self Test progress bar appears.
4 At the completion, check the test result.
If FAILED is displayed, contact your nearest JDSU's authorized service provider.
5 Tap the Exit button to return to the measurement screen.
Viewing system log
You can view a list of all the system logging data including errors in your instrument.
Procedure
1 Tap the System Logging button.
The System Logging window appears.
2 Scroll up and down and find any errors logged.
3 Optional. To save the current logging data as a file (.log), complete the following steps:
a Tap the Save Log button.
b Highlight a folder or location, to which you want to save.
c Tap the Save button.
4 Optional. To delete the logging data, tap the Clear button.
Chapter 18 System Settings and Maintenance
164 CellAdvisor JD720C User's Manual
5 Tap the Exit button to return to the measurement screen.
Reverting to factory setting
You should use the Factory Reset only when you need to return to the instrument's factory state as it purges all the user settings and data stored in the system, including traces, setups, screens, and limits. Once deleted, they cannot be recovered.
Procedure
1 Tap the Factory Reset button.
The confirmation dialog box appears.
2 Read the factory reset message carefully.
3 Select OK to confirm. Otherwise, select No.
NOTE
It is recommended that you copy your setup or result data to an external USB memory drive so that you can restore them later.
Re-aligning touch screen
When you consistently experience of the instrument responding improperly to your touch on the screen, you may need to perform this touch-screen alignment.
Procedure
1 Tap the Touch Alignment button. You can also press and hold the CAL hard key.
The white screen with a plus sign (+) in the upper-left corner appears.
2 Touch the plus sign (+) properly and repeat it until you see the System window back.
3 Tap the Apply button to return to the measurement screen.
Activating StrataSync
StrataSync is a cloud-based solution that provides asset, configuration, and test data management for JDSU instruments. StrataSync manages and tracks test instruments, collects and analyzes results from the entire network, and informs and trains the workforce.
The JD720C series is compatible with the JDSU StrataSync cloud. This optional capability allows you to manage your instrument inventory ensuring you know where all your valuable equipment is and which engineer is using it. In addition, it allows you to keep your instruments current through the remote upgrade capability that ensures all instruments have the latest firmware. It also enables the centralized distribution of configuration settings to ensure all your engineers use the same instrument settings resulting in consistent measurements.
Chapter 18 System Settings and Maintenance
CellAdvisor JD720C Series User’s Manual 165
Once testing is completed, the trace files can be uploaded onto StrataSync for secure storage and sharing. This sharing capability allows engineers who have a problem they cannot resolve to request help from an expert who can analyze the trace file via StrataSync using the JDViewer application from anywhere without having to be at the instrument, helping resolve problems even faster.
Setting up Internet connection
Your JD720C series must have an access to the Internet to be able to connect to the StrataSync. You can connect the Ethernet network to the RJ45 port of your instrument. You can also use your mobile device’s data network such as the Bluetooth tethering on an Android-based smartphone and the Personal Hotspot on an iOS-based smartphone. If you want to share your mobile’s data network, you need to connect your instrument and your mobile device.
Procedure
1 Connect one of the Parani-UD100 Bluetooth adapters to the USB port of your JD720C series.
2 Turn on Bluetooth on your mobile device, and then activate its tethering or hotspot.
– On Android mobile devices:
a Go to Settings > Connections > Bluetooth.
b Check the box for Visible to all nearby Bluetooth devices to make your mobile device
discoverable by your JD720C series.
c Go to Settings > More networks > Tethering and portable hotspot.
d Check the box for Bluetooth tethering to enable sharing your mobile device’s Internet
connection with your instrument.
– On iOS mobile devices:
a Go to Settings > Bluetooth.
b Turn on Bluetooth.
c Go to Settings > Personal Hotspot.
d Turn on Personal Hotspot to make your mobile device discoverable by your JD720C
series and enable sharing your mobile device’s Internet connection with your
instrument.
3 On your JD720C series instrument, press the MODE hard key, and then tap the System button.
The System window appears.
4 Touch the Bluetooth tab.
The Bluetooth setting window appears.
5 Tap the Start Scan button to discover your shared mobile device.
You will find your mobile device from the list in the Bluetooth Devices pane.
6 Highlight your mobile device name, and then tap the Select button.
A dialog box appears.
7 Tap the Connect button to pair and connect.
8 On your mobile device, enter 0000 in the PIN field, and then tap the OK button or Pair.
If the connection is successful, you mobile device is displayed under the Connected Device in the
Connection Information pane.
Chapter 18 System Settings and Maintenance
166 CellAdvisor JD720C User's Manual
Establishing a connection to StrataSync
If you have set up the Internet connection in your JD720C series, you can establish a connection to StrataSync.
Procedure
1 Press the MODE hard key and then tap the System button.
2 Touch the StrataSync tab.
The StrataSync setting window appears as shown in Figure 109.
3 Enter <server address> in the Server Address field for StrataSync. The server address at present is “stratasync.jdsu.com”, which may change.
NOTE
JDSU provides you with the information required to access StrataSync at your purchase of StrataSync, including the Server Address, Account ID, and Port number. See “StrataSync subscription” on page 176 for more information on available options.
4 Enter <account number> in the Account ID field.
5 Enter <technician number> in the Technician ID field.
6 To set the port number and proxy server address, complete the following steps:
a Tap the Detail Settings button.
The input dialog box appears.
b Enter <port number> in the Port field.
c Enter <proxy server address> in the Proxy Server address, if necessary.
Contact your system administrator for your proxy server information.
d Tap the Apply button to save and exit.
7 Tap the Start Sync button.
Files are downloaded from the StrataSync server into your instrument’s “Internal/StrataSync”
folder and then uploaded from the “Internal/StrataSync” folder to the StrataSync server. Once
successfully synchronized, the text “Successfully synchronized with server” appears and the
StrataSync status icon changes.
8 Tap the Apply button to exit.
NOTE
o If you have encountered a failure to synchronize with the server, reboot your instrument and then start it from the setting up the Internet connection.
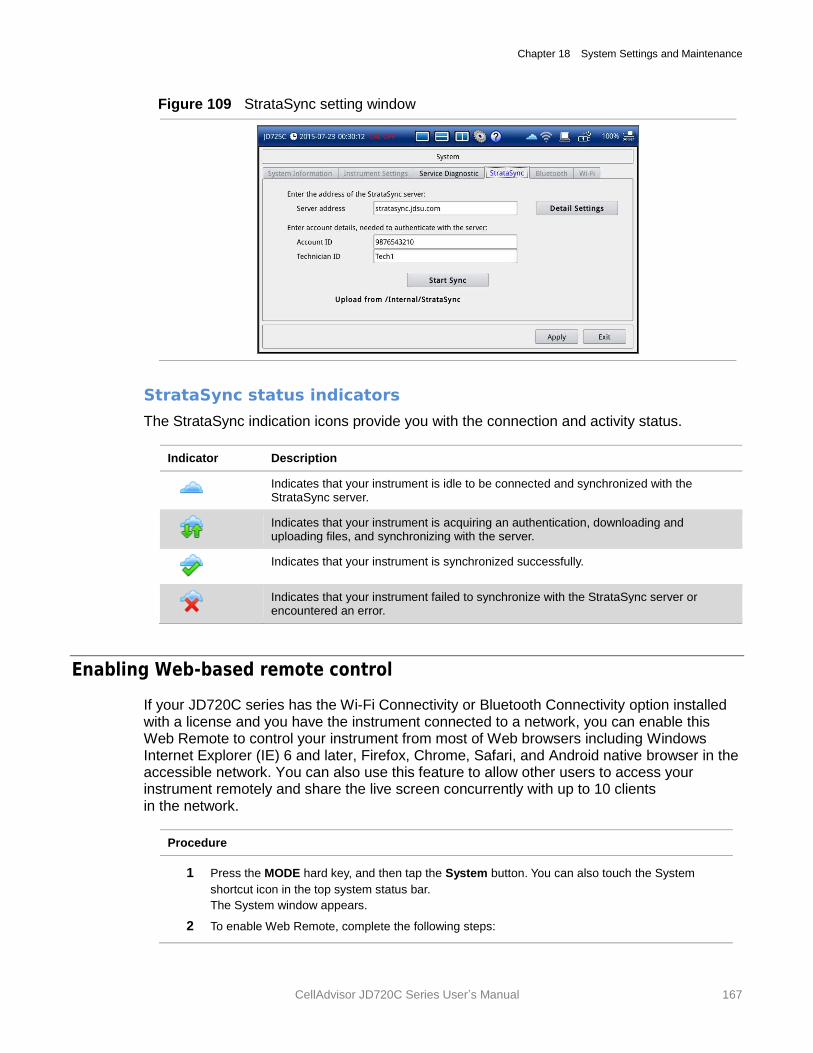
Chapter 18 System Settings and Maintenance
CellAdvisor JD720C Series User’s Manual 167
Figure 109 StrataSync setting window
StrataSync status indicators
The StrataSync indication icons provide you with the connection and activity status.
Indicator Description
Indicates that your instrument is idle to be connected and synchronized with the StrataSync server.
Indicates that your instrument is acquiring an authentication, downloading and uploading files, and synchronizing with the server.
Indicates that your instrument is synchronized successfully.
Indicates that your instrument failed to synchronize with the StrataSync server or encountered an error.
Enabling Web-based remote control
If your JD720C series has the Wi-Fi Connectivity or Bluetooth Connectivity option installed with a license and you have the instrument connected to a network, you can enable this Web Remote to control your instrument from most of Web browsers including Windows Internet Explorer (IE) 6 and later, Firefox, Chrome, Safari, and Android native browser in the accessible network. You can also use this feature to allow other users to access your instrument remotely and share the live screen concurrently with up to 10 clients in the network.
Procedure
1 Press the MODE hard key, and then tap the System button. You can also touch the System
shortcut icon in the top system status bar.
The System window appears.
2 To enable Web Remote, complete the following steps:
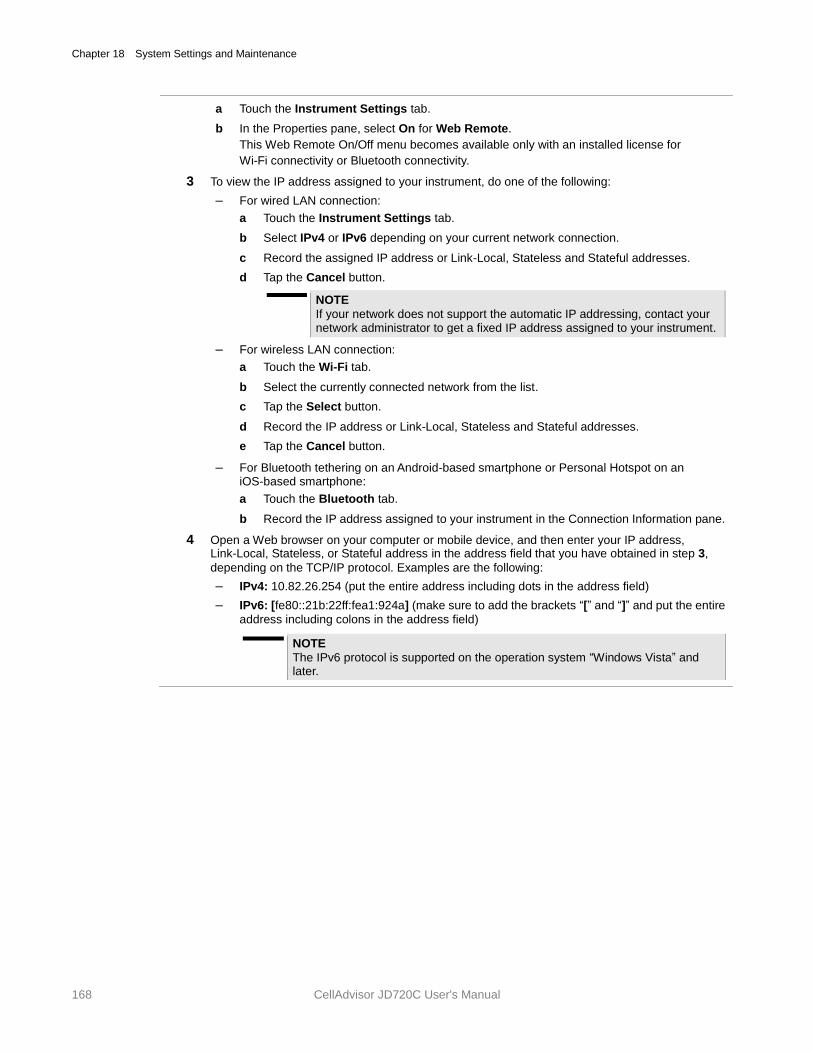
Chapter 18 System Settings and Maintenance
168 CellAdvisor JD720C User's Manual
a Touch the Instrument Settings tab.
b In the Properties pane, select On for Web Remote.
This Web Remote On/Off menu becomes available only with an installed license for
Wi-Fi connectivity or Bluetooth connectivity.
3 To view the IP address assigned to your instrument, do one of the following:
– For wired LAN connection:
a Touch the Instrument Settings tab.
b Select IPv4 or IPv6 depending on your current network connection.
c Record the assigned IP address or Link-Local, Stateless and Stateful addresses.
d Tap the Cancel button.
NOTE
If your network does not support the automatic IP addressing, contact your network administrator to get a fixed IP address assigned to your instrument.
– For wireless LAN connection:
a Touch the Wi-Fi tab.
b Select the currently connected network from the list.
c Tap the Select button.
d Record the IP address or Link-Local, Stateless and Stateful addresses.
e Tap the Cancel button.
– For Bluetooth tethering on an Android-based smartphone or Personal Hotspot on an iOS-based smartphone:
a Touch the Bluetooth tab.
b Record the IP address assigned to your instrument in the Connection Information pane.
4 Open a Web browser on your computer or mobile device, and then enter your IP address, Link-Local, Stateless, or Stateful address in the address field that you have obtained in step 3,
depending on the TCP/IP protocol. Examples are the following:
– IPv4: 10.82.26.254 (put the entire address including dots in the address field)
– IPv6: [fe80::21b:22ff:fea1:924a] (make sure to add the brackets “[” and “]” and put the entire
address including colons in the address field)
NOTE
The IPv6 protocol is supported on the operation system “Windows Vista” and later.
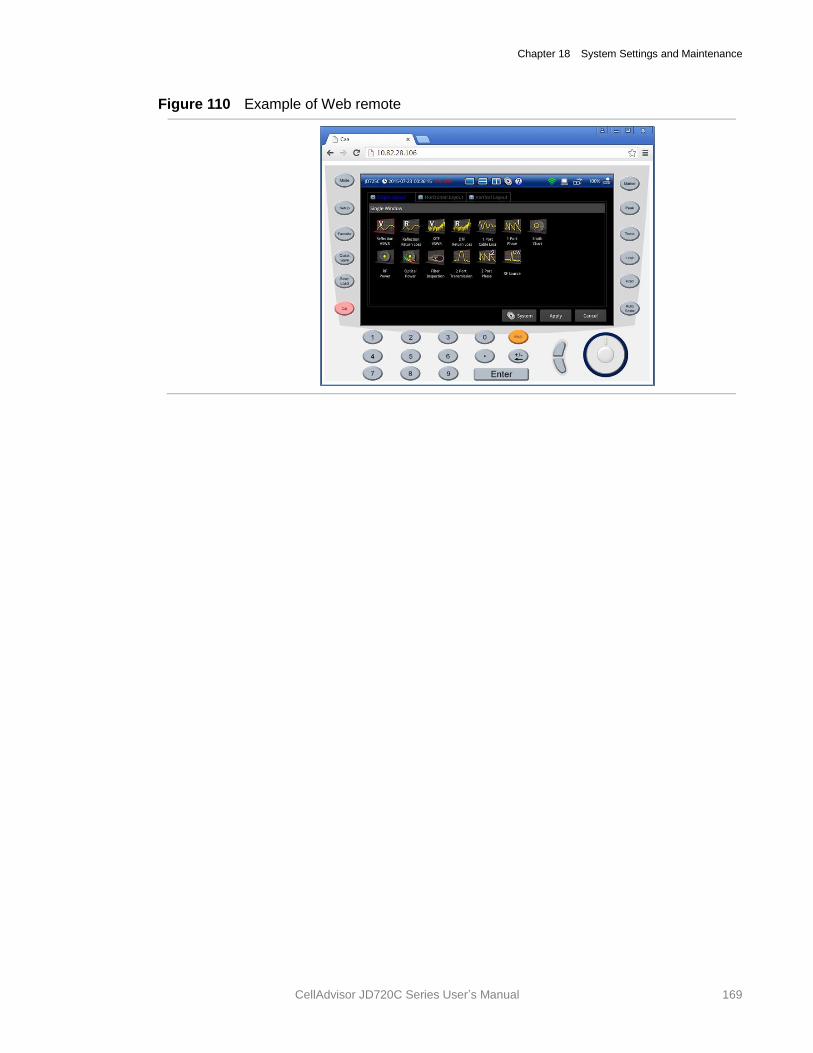
Chapter 18 System Settings and Maintenance
CellAdvisor JD720C Series User’s Manual 169
Figure 110 Example of Web remote
CellAdvisor JD720C User's Manual
Appendix
Topics discussed in this appendix are as follows:
Appendix A – Product general information ........................................................................ 171
Appendix B – Ordering information .................................................................................... 173
Appendix C – Cable listing ................................................................................................. 177
Appendix D – Band listing .................................................................................................. 178
Appendix E – VSWR-Return loss conversion table ........................................................... 180
Appendix F – Device driver installation .............................................................................. 181
Appendix G – Bluetooth connection ................................................................................... 182
Appendix H – OSS licensing .............................................................................................. 190
Appendix I – RoHS information .......................................................................................... 191
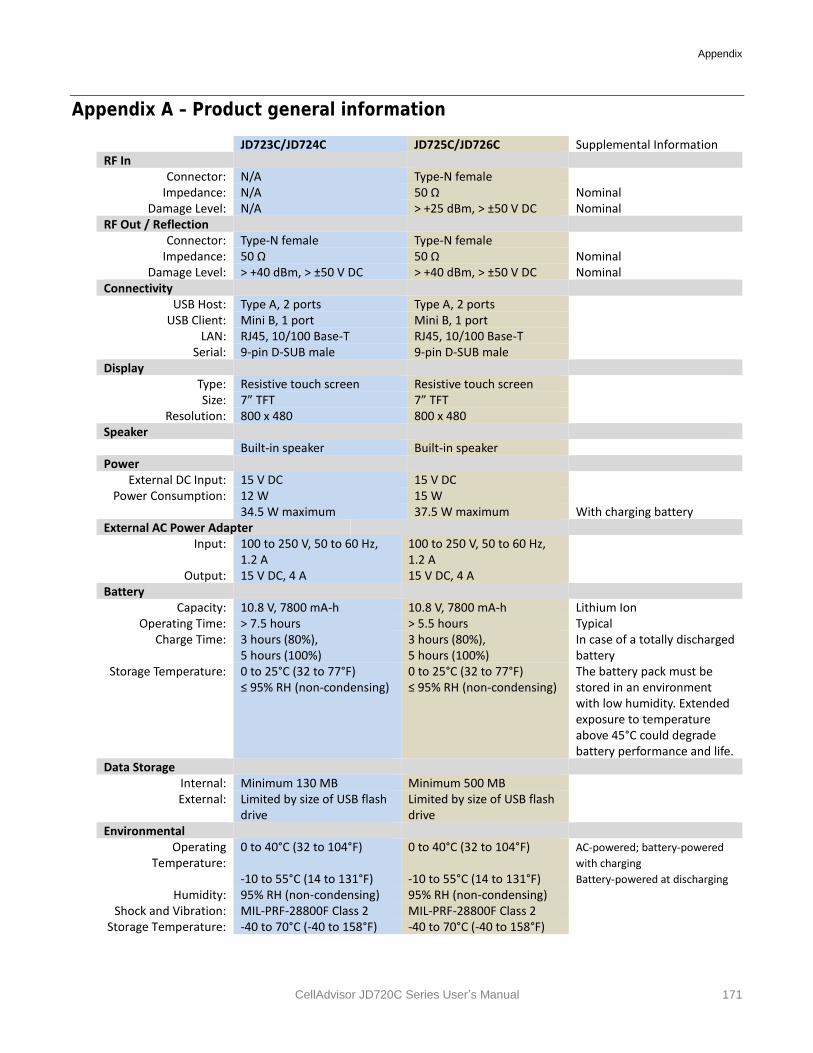
Appendix
CellAdvisor JD720C Series User’s Manual 171
Appendix A – Product general information
JD723C/JD724C JD725C/JD726C Supplemental Information RF In
Connector: N/A Type-N female Impedance: N/A 50 Ω Nominal
Damage Level: N/A > +25 dBm, > ±50 V DC Nominal RF Out / Reflection
Connector: Type-N female Type-N female Impedance: 50 Ω 50 Ω Nominal
Damage Level: > +40 dBm, > ±50 V DC > +40 dBm, > ±50 V DC Nominal Connectivity
USB Host: Type A, 2 ports Type A, 2 ports USB Client: Mini B, 1 port Mini B, 1 port
LAN: RJ45, 10/100 Base-T RJ45, 10/100 Base-T Serial: 9-pin D-SUB male 9-pin D-SUB male
Display Type: Resistive touch screen Resistive touch screen Size: 7” TFT 7” TFT
Resolution: 800 x 480 800 x 480 Speaker
Built-in speaker Built-in speaker Power
External DC Input: 15 V DC 15 V DC Power Consumption: 12 W 15 W
34.5 W maximum 37.5 W maximum With charging battery External AC Power Adapter
Input: 100 to 250 V, 50 to 60 Hz, 1.2 A
100 to 250 V, 50 to 60 Hz, 1.2 A
Output: 15 V DC, 4 A 15 V DC, 4 A Battery
Capacity: 10.8 V, 7800 mA-h 10.8 V, 7800 mA-h Lithium Ion Operating Time: > 7.5 hours > 5.5 hours Typical
Charge Time: 3 hours (80%), 5 hours (100%)
3 hours (80%), 5 hours (100%)
In case of a totally discharged battery
Storage Temperature: 0 to 25°C (32 to 77°F) ≤ 95% RH (non-condensing)
0 to 25°C (32 to 77°F) ≤ 95% RH (non-condensing)
The battery pack must be stored in an environment with low humidity. Extended exposure to temperature above 45°C could degrade battery performance and life.
Data Storage Internal: Minimum 130 MB Minimum 500 MB External: Limited by size of USB flash
drive Limited by size of USB flash drive
Environmental Operating
Temperature: 0 to 40°C (32 to 104°F) -10 to 55°C (14 to 131°F)
0 to 40°C (32 to 104°F) -10 to 55°C (14 to 131°F)
AC-powered; battery-powered
with charging
Battery-powered at discharging Humidity: 95% RH (non-condensing) 95% RH (non-condensing)
Shock and Vibration: MIL-PRF-28800F Class 2 MIL-PRF-28800F Class 2 Storage Temperature: -40 to 70°C (-40 to 158°F) -40 to 70°C (-40 to 158°F)
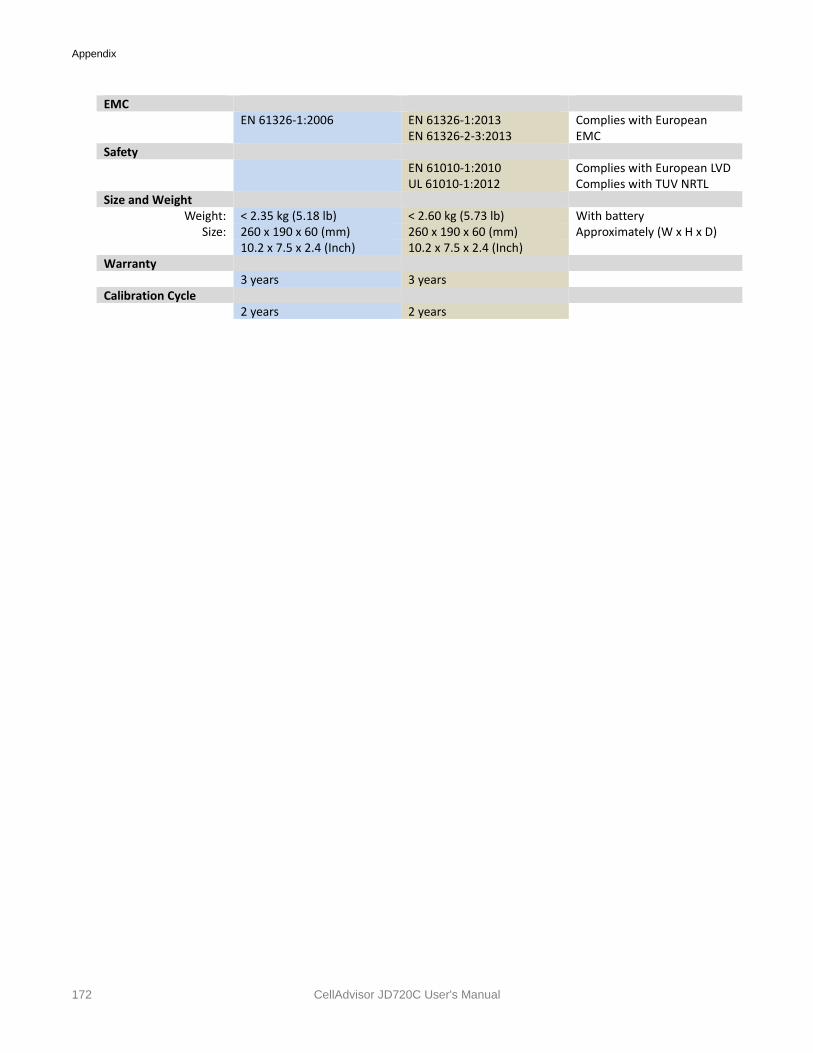
Appendix
172 CellAdvisor JD720C User's Manual
EMC EN 61326-1:2006 EN 61326-1:2013
EN 61326-2-3:2013 Complies with European EMC
Safety EN 61010-1:2010
UL 61010-1:2012 Complies with European LVD Complies with TUV NRTL
Size and Weight Weight: < 2.35 kg (5.18 lb) < 2.60 kg (5.73 lb) With battery
Size: 260 x 190 x 60 (mm) 260 x 190 x 60 (mm) Approximately (W x H x D) 10.2 x 7.5 x 2.4 (Inch) 10.2 x 7.5 x 2.4 (Inch)
Warranty 3 years 3 years Calibration Cycle 2 years 2 years
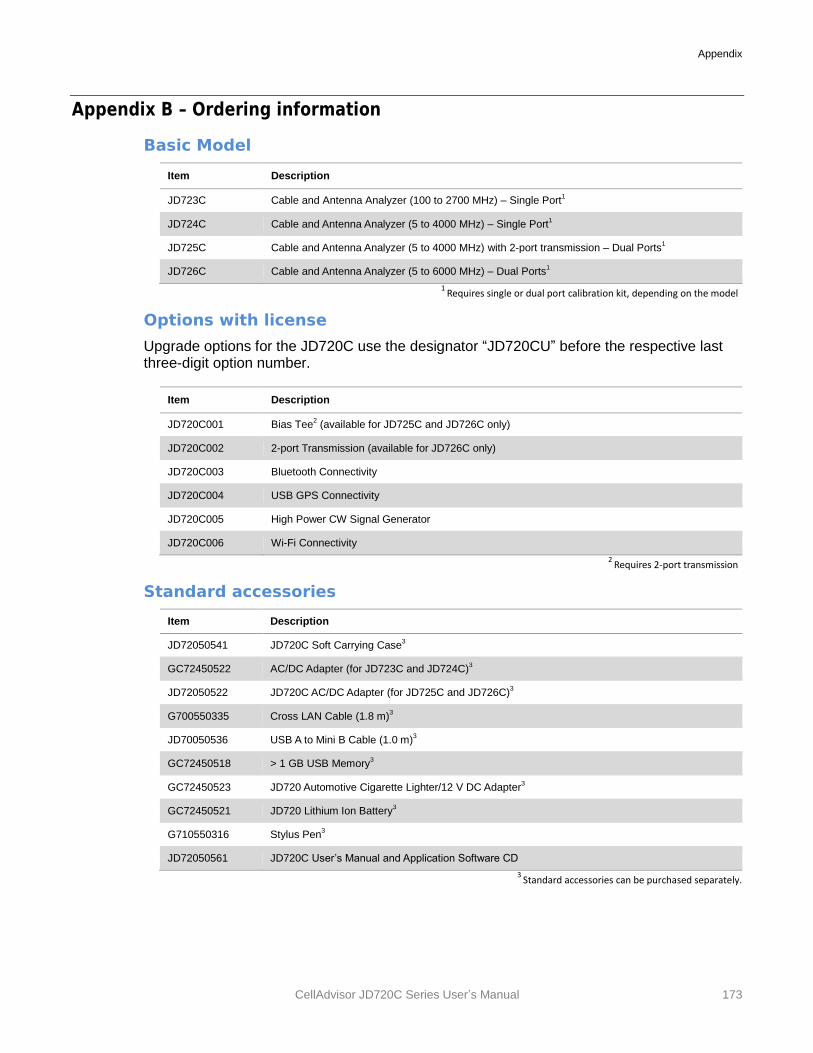
Appendix
CellAdvisor JD720C Series User’s Manual 173
Appendix B – Ordering information
Basic Model
Item Description
JD723C Cable and Antenna Analyzer (100 to 2700 MHz) – Single Port1
JD724C Cable and Antenna Analyzer (5 to 4000 MHz) – Single Port1
JD725C Cable and Antenna Analyzer (5 to 4000 MHz) with 2-port transmission – Dual Ports1
JD726C Cable and Antenna Analyzer (5 to 6000 MHz) – Dual Ports1
1 Requires single or dual port calibration kit, depending on the model
Options with license
Upgrade options for the JD720C use the designator “JD720CU” before the respective last three-digit option number.
Item Description
JD720C001 Bias Tee2 (available for JD725C and JD726C only)
JD720C002 2-port Transmission (available for JD726C only)
JD720C003 Bluetooth Connectivity
JD720C004 USB GPS Connectivity
JD720C005 High Power CW Signal Generator
JD720C006 Wi-Fi Connectivity
2 Requires 2-port transmission
Standard accessories
Item Description
JD72050541 JD720C Soft Carrying Case3
GC72450522 AC/DC Adapter (for JD723C and JD724C)3
JD72050522 JD720C AC/DC Adapter (for JD725C and JD726C)3
G700550335 Cross LAN Cable (1.8 m)3
JD70050536 USB A to Mini B Cable (1.0 m)3
GC72450518 > 1 GB USB Memory3
GC72450523 JD720 Automotive Cigarette Lighter/12 V DC Adapter3
GC72450521 JD720 Lithium Ion Battery3
G710550316 Stylus Pen3
JD72050561 JD720C User’s Manual and Application Software CD
3 Standard accessories can be purchased separately.
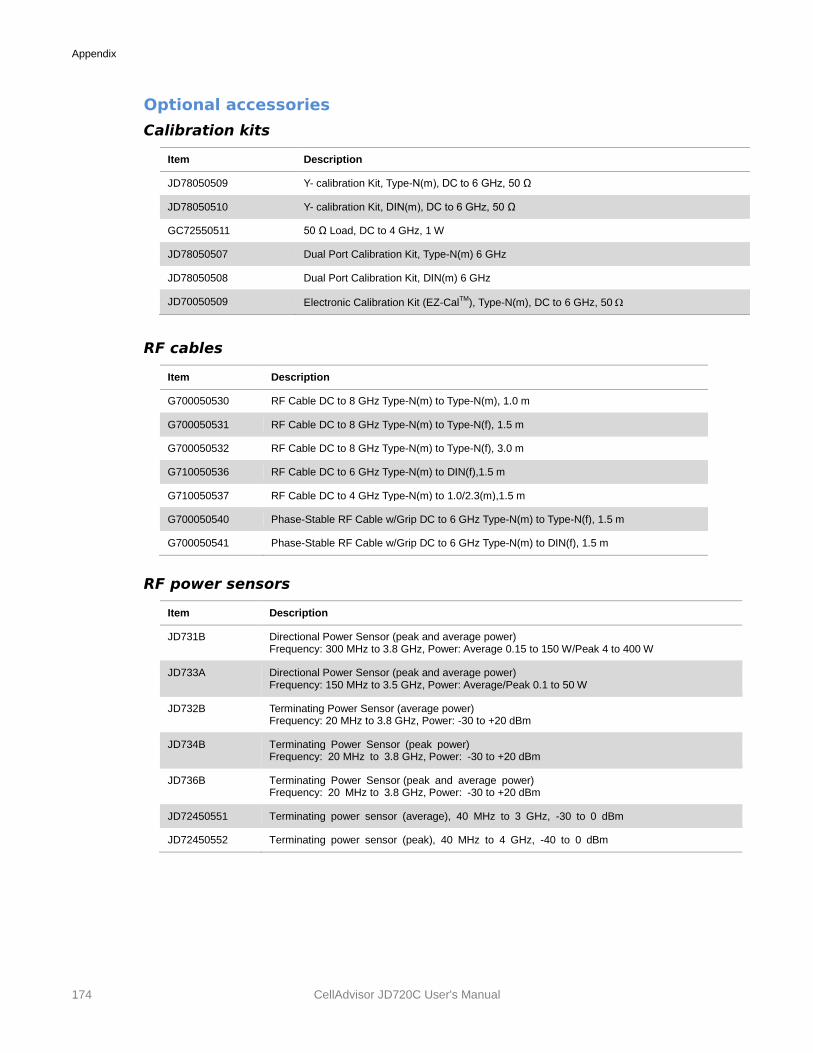
Appendix
174 CellAdvisor JD720C User's Manual
Optional accessories
Calibration kits
Item Description
JD78050509 Y- calibration Kit, Type-N(m), DC to 6 GHz, 50 Ω
JD78050510 Y- calibration Kit, DIN(m), DC to 6 GHz, 50 Ω
GC72550511 50 Ω Load, DC to 4 GHz, 1 W
JD78050507 Dual Port Calibration Kit, Type-N(m) 6 GHz
JD78050508 Dual Port Calibration Kit, DIN(m) 6 GHz
JD70050509 Electronic Calibration Kit (EZ-CalTM
), Type-N(m), DC to 6 GHz, 50
RF cables
Item Description
G700050530 RF Cable DC to 8 GHz Type-N(m) to Type-N(m), 1.0 m
G700050531 RF Cable DC to 8 GHz Type-N(m) to Type-N(f), 1.5 m
G700050532 RF Cable DC to 8 GHz Type-N(m) to Type-N(f), 3.0 m
G710050536 RF Cable DC to 6 GHz Type-N(m) to DIN(f),1.5 m
G710050537 RF Cable DC to 4 GHz Type-N(m) to 1.0/2.3(m),1.5 m
G700050540 Phase-Stable RF Cable w/Grip DC to 6 GHz Type-N(m) to Type-N(f), 1.5 m
G700050541 Phase-Stable RF Cable w/Grip DC to 6 GHz Type-N(m) to DIN(f), 1.5 m
RF power sensors
Item Description
JD731B Directional Power Sensor (peak and average power) Frequency: 300 MHz to 3.8 GHz, Power: Average 0.15 to 150 W/Peak 4 to 400 W
JD733A Directional Power Sensor (peak and average power) Frequency: 150 MHz to 3.5 GHz, Power: Average/Peak 0.1 to 50 W
JD732B Terminating Power Sensor (average power) Frequency: 20 MHz to 3.8 GHz, Power: -30 to +20 dBm
JD734B Terminating Power Sensor (peak power) Frequency: 20 MHz to 3.8 GHz, Power: -30 to +20 dBm
JD736B Terminating Power Sensor (peak and average power) Frequency: 20 MHz to 3.8 GHz, Power: -30 to +20 dBm
JD72450551 Terminating power sensor (average), 40 MHz to 3 GHz, -30 to 0 dBm
JD72450552 Terminating power sensor (peak), 40 MHz to 4 GHz, -40 to 0 dBm
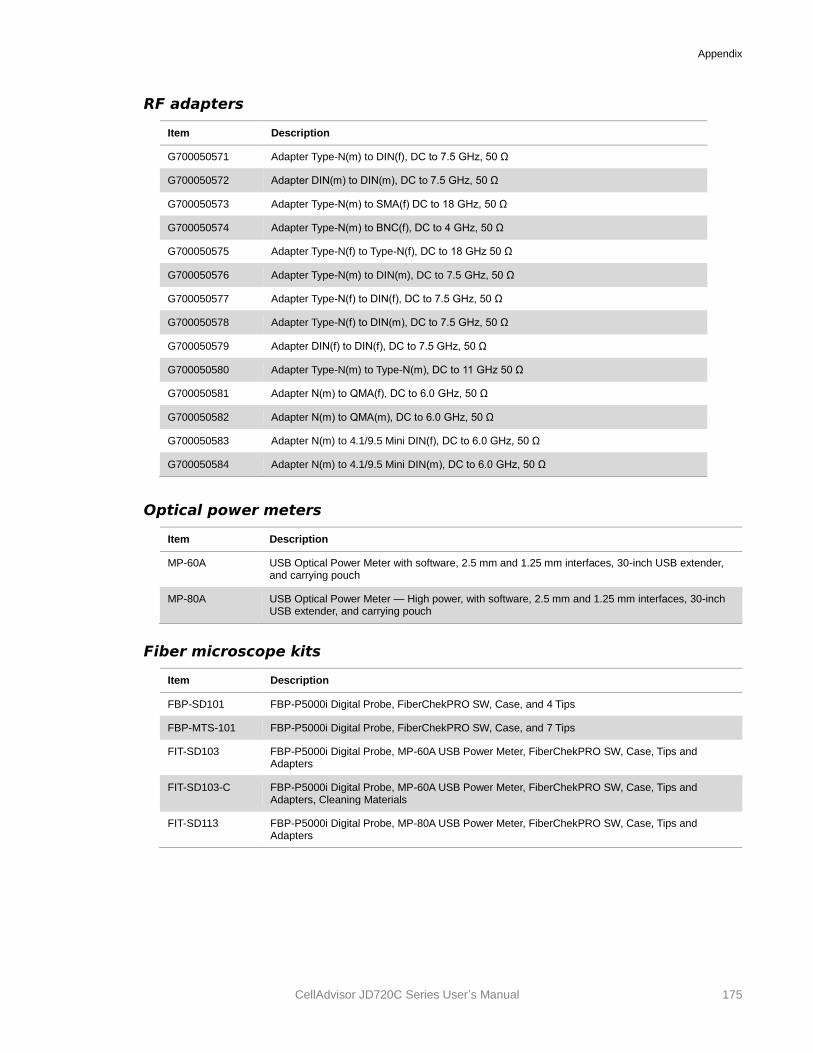
Appendix
CellAdvisor JD720C Series User’s Manual 175
RF adapters
Item Description
G700050571 Adapter Type-N(m) to DIN(f), DC to 7.5 GHz, 50 Ω
G700050572 Adapter DIN(m) to DIN(m), DC to 7.5 GHz, 50 Ω
G700050573 Adapter Type-N(m) to SMA(f) DC to 18 GHz, 50 Ω
G700050574 Adapter Type-N(m) to BNC(f), DC to 4 GHz, 50 Ω
G700050575 Adapter Type-N(f) to Type-N(f), DC to 18 GHz 50 Ω
G700050576 Adapter Type-N(m) to DIN(m), DC to 7.5 GHz, 50 Ω
G700050577 Adapter Type-N(f) to DIN(f), DC to 7.5 GHz, 50 Ω
G700050578 Adapter Type-N(f) to DIN(m), DC to 7.5 GHz, 50 Ω
G700050579 Adapter DIN(f) to DIN(f), DC to 7.5 GHz, 50 Ω
G700050580 Adapter Type-N(m) to Type-N(m), DC to 11 GHz 50 Ω
G700050581 Adapter N(m) to QMA(f), DC to 6.0 GHz, 50 Ω
G700050582 Adapter N(m) to QMA(m), DC to 6.0 GHz, 50 Ω
G700050583 Adapter N(m) to 4.1/9.5 Mini DIN(f), DC to 6.0 GHz, 50 Ω
G700050584 Adapter N(m) to 4.1/9.5 Mini DIN(m), DC to 6.0 GHz, 50 Ω
Optical power meters
Item Description
MP-60A USB Optical Power Meter with software, 2.5 mm and 1.25 mm interfaces, 30-inch USB extender, and carrying pouch
MP-80A USB Optical Power Meter — High power, with software, 2.5 mm and 1.25 mm interfaces, 30-inch USB extender, and carrying pouch
Fiber microscope kits
Item Description
FBP-SD101 FBP-P5000i Digital Probe, FiberChekPRO SW, Case, and 4 Tips
FBP-MTS-101 FBP-P5000i Digital Probe, FiberChekPRO SW, Case, and 7 Tips
FIT-SD103 FBP-P5000i Digital Probe, MP-60A USB Power Meter, FiberChekPRO SW, Case, Tips and Adapters
FIT-SD103-C FBP-P5000i Digital Probe, MP-60A USB Power Meter, FiberChekPRO SW, Case, Tips and Adapters, Cleaning Materials
FIT-SD113 FBP-P5000i Digital Probe, MP-80A USB Power Meter, FiberChekPRO SW, Case, Tips and Adapters
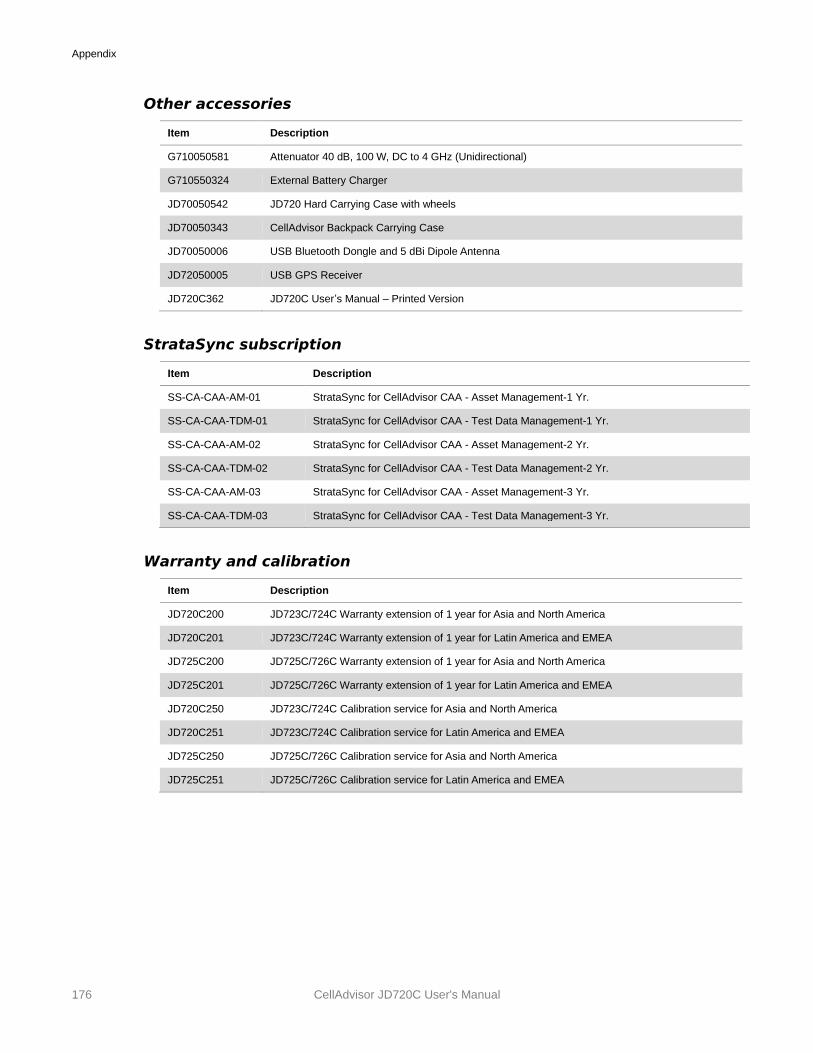
Appendix
176 CellAdvisor JD720C User's Manual
Other accessories
Item Description
G710050581 Attenuator 40 dB, 100 W, DC to 4 GHz (Unidirectional)
G710550324 External Battery Charger
JD70050542 JD720 Hard Carrying Case with wheels
JD70050343 CellAdvisor Backpack Carrying Case
JD70050006 USB Bluetooth Dongle and 5 dBi Dipole Antenna
JD72050005 USB GPS Receiver
JD720C362 JD720C User’s Manual – Printed Version
StrataSync subscription
Item Description
SS-CA-CAA-AM-01 StrataSync for CellAdvisor CAA - Asset Management-1 Yr.
SS-CA-CAA-TDM-01 StrataSync for CellAdvisor CAA - Test Data Management-1 Yr.
SS-CA-CAA-AM-02 StrataSync for CellAdvisor CAA - Asset Management-2 Yr.
SS-CA-CAA-TDM-02 StrataSync for CellAdvisor CAA - Test Data Management-2 Yr.
SS-CA-CAA-AM-03 StrataSync for CellAdvisor CAA - Asset Management-3 Yr.
SS-CA-CAA-TDM-03 StrataSync for CellAdvisor CAA - Test Data Management-3 Yr.
Warranty and calibration
Item Description
JD720C200 JD723C/724C Warranty extension of 1 year for Asia and North America
JD720C201 JD723C/724C Warranty extension of 1 year for Latin America and EMEA
JD725C200 JD725C/726C Warranty extension of 1 year for Asia and North America
JD725C201 JD725C/726C Warranty extension of 1 year for Latin America and EMEA
JD720C250 JD723C/724C Calibration service for Asia and North America
JD720C251 JD723C/724C Calibration service for Latin America and EMEA
JD725C250 JD725C/726C Calibration service for Asia and North America
JD725C251 JD725C/726C Calibration service for Latin America and EMEA
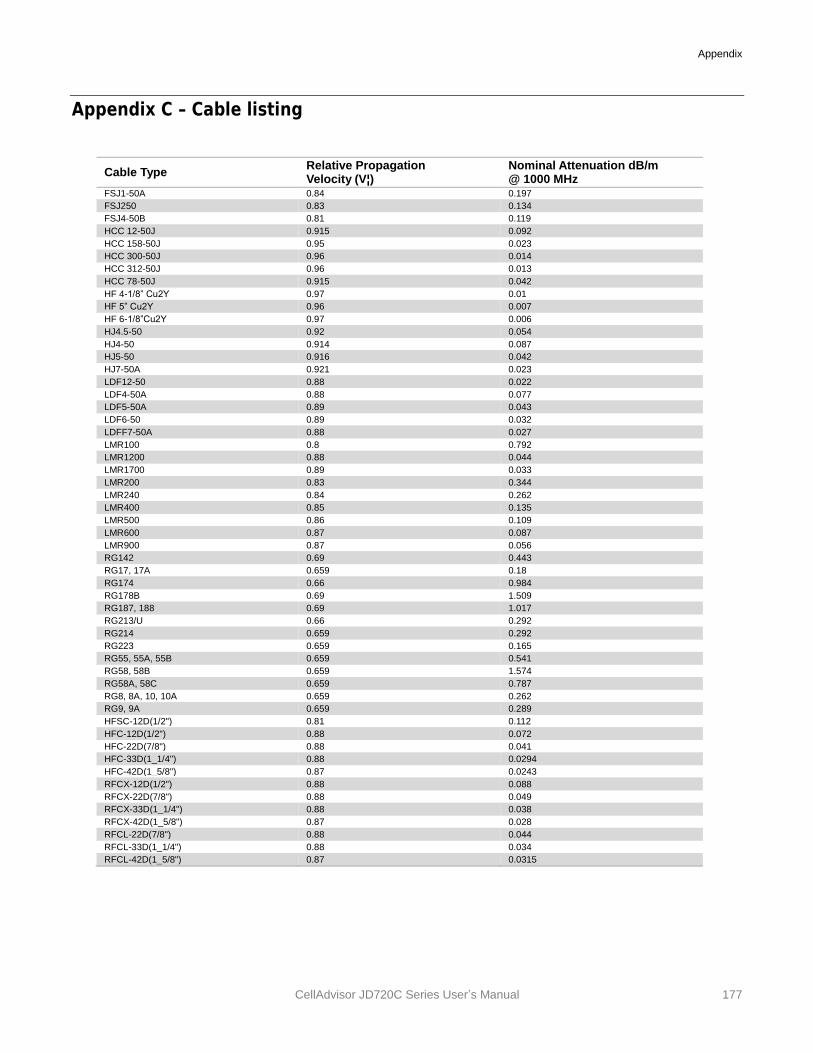
Appendix
CellAdvisor JD720C Series User’s Manual 177
Appendix C – Cable listing
Cable Type Relative Propagation Velocity (V¦)
Nominal Attenuation dB/m @ 1000 MHz
FSJ1-50A 0.84 0.197
FSJ250 0.83 0.134
FSJ4-50B 0.81 0.119
HCC 12-50J 0.915 0.092
HCC 158-50J 0.95 0.023
HCC 300-50J 0.96 0.014
HCC 312-50J 0.96 0.013
HCC 78-50J 0.915 0.042
HF 4-1/8” Cu2Y 0.97 0.01
HF 5” Cu2Y 0.96 0.007
HF 6-1/8”Cu2Y 0.97 0.006
HJ4.5-50 0.92 0.054
HJ4-50 0.914 0.087
HJ5-50 0.916 0.042
HJ7-50A 0.921 0.023
LDF12-50 0.88 0.022
LDF4-50A 0.88 0.077
LDF5-50A 0.89 0.043
LDF6-50 0.89 0.032
LDFF7-50A 0.88 0.027
LMR100 0.8 0.792
LMR1200 0.88 0.044
LMR1700 0.89 0.033
LMR200 0.83 0.344
LMR240 0.84 0.262
LMR400 0.85 0.135
LMR500 0.86 0.109
LMR600 0.87 0.087
LMR900 0.87 0.056
RG142 0.69 0.443
RG17, 17A 0.659 0.18
RG174 0.66 0.984
RG178B 0.69 1.509
RG187, 188 0.69 1.017
RG213/U 0.66 0.292
RG214 0.659 0.292
RG223 0.659 0.165
RG55, 55A, 55B 0.659 0.541
RG58, 58B 0.659 1.574
RG58A, 58C 0.659 0.787
RG8, 8A, 10, 10A 0.659 0.262
RG9, 9A 0.659 0.289
HFSC-12D(1/2") 0.81 0.112
HFC-12D(1/2") 0.88 0.072
HFC-22D(7/8") 0.88 0.041
HFC-33D(1_1/4") 0.88 0.0294
HFC-42D(1_5/8") 0.87 0.0243
RFCX-12D(1/2") 0.88 0.088
RFCX-22D(7/8") 0.88 0.049
RFCX-33D(1_1/4") 0.88 0.038
RFCX-42D(1_5/8") 0.87 0.028
RFCL-22D(7/8") 0.88 0.044
RFCL-33D(1_1/4") 0.88 0.034
RFCL-42D(1_5/8") 0.87 0.0315
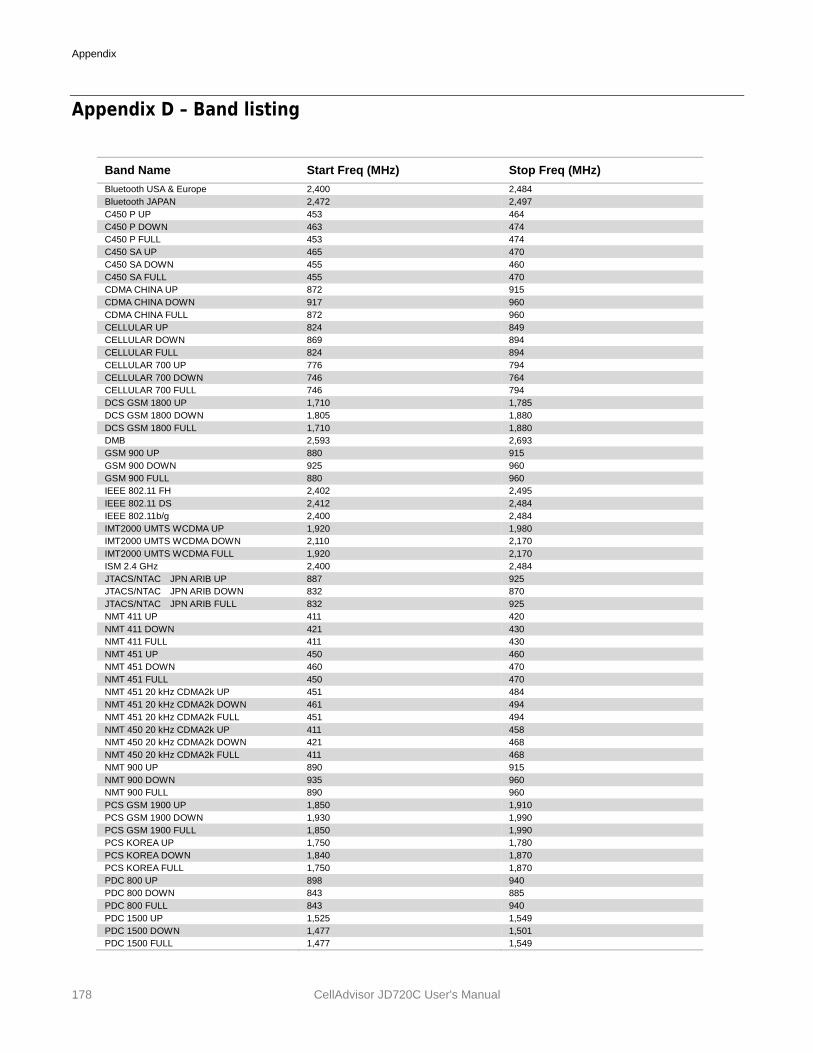
Appendix
178 CellAdvisor JD720C User's Manual
Appendix D – Band listing
Band Name Start Freq (MHz) Stop Freq (MHz)
Bluetooth USA & Europe 2,400 2,484
Bluetooth JAPAN 2,472 2,497
C450 P UP 453 464
C450 P DOWN 463 474
C450 P FULL 453 474
C450 SA UP 465 470
C450 SA DOWN 455 460
C450 SA FULL 455 470
CDMA CHINA UP 872 915
CDMA CHINA DOWN 917 960
CDMA CHINA FULL 872 960
CELLULAR UP 824 849
CELLULAR DOWN 869 894
CELLULAR FULL 824 894
CELLULAR 700 UP 776 794
CELLULAR 700 DOWN 746 764
CELLULAR 700 FULL 746 794
DCS GSM 1800 UP 1,710 1,785
DCS GSM 1800 DOWN 1,805 1,880
DCS GSM 1800 FULL 1,710 1,880
DMB 2,593 2,693
GSM 900 UP 880 915
GSM 900 DOWN 925 960
GSM 900 FULL 880 960
IEEE 802.11 FH 2,402 2,495
IEEE 802.11 DS 2,412 2,484
IEEE 802.11b/g 2,400 2,484
IMT2000 UMTS WCDMA UP 1,920 1,980
IMT2000 UMTS WCDMA DOWN 2,110 2,170
IMT2000 UMTS WCDMA FULL 1,920 2,170
ISM 2.4 GHz 2,400 2,484
JTACS/NTAC JPN ARIB UP 887 925
JTACS/NTAC JPN ARIB DOWN 832 870
JTACS/NTAC JPN ARIB FULL 832 925
NMT 411 UP 411 420
NMT 411 DOWN 421 430
NMT 411 FULL 411 430
NMT 451 UP 450 460
NMT 451 DOWN 460 470
NMT 451 FULL 450 470
NMT 451 20 kHz CDMA2k UP 451 484
NMT 451 20 kHz CDMA2k DOWN 461 494
NMT 451 20 kHz CDMA2k FULL 451 494
NMT 450 20 kHz CDMA2k UP 411 458
NMT 450 20 kHz CDMA2k DOWN 421 468
NMT 450 20 kHz CDMA2k FULL 411 468
NMT 900 UP 890 915
NMT 900 DOWN 935 960
NMT 900 FULL 890 960
PCS GSM 1900 UP 1,850 1,910
PCS GSM 1900 DOWN 1,930 1,990
PCS GSM 1900 FULL 1,850 1,990
PCS KOREA UP 1,750 1,780
PCS KOREA DOWN 1,840 1,870
PCS KOREA FULL 1,750 1,870
PDC 800 UP 898 940
PDC 800 DOWN 843 885
PDC 800 FULL 843 940
PDC 1500 UP 1,525 1,549
PDC 1500 DOWN 1,477 1,501
PDC 1500 FULL 1,477 1,549

Appendix
CellAdvisor JD720C Series User’s Manual 179
PHS 1,895 1,918
SMR 800 UP 806 821
SMR 800 DOWN 851 866
SMR 800 FULL 806 866
SMR 1500 UP 1,453 1,465
SMR 1500 DOWN 1,501 1,513
SMR 1500 FULL 1,453 1,513
TACS/ETACS UP 872 915
TACS/ETACS DOWN 917 960
TACS/ETACS FULL 872 960
Tetra 380 430
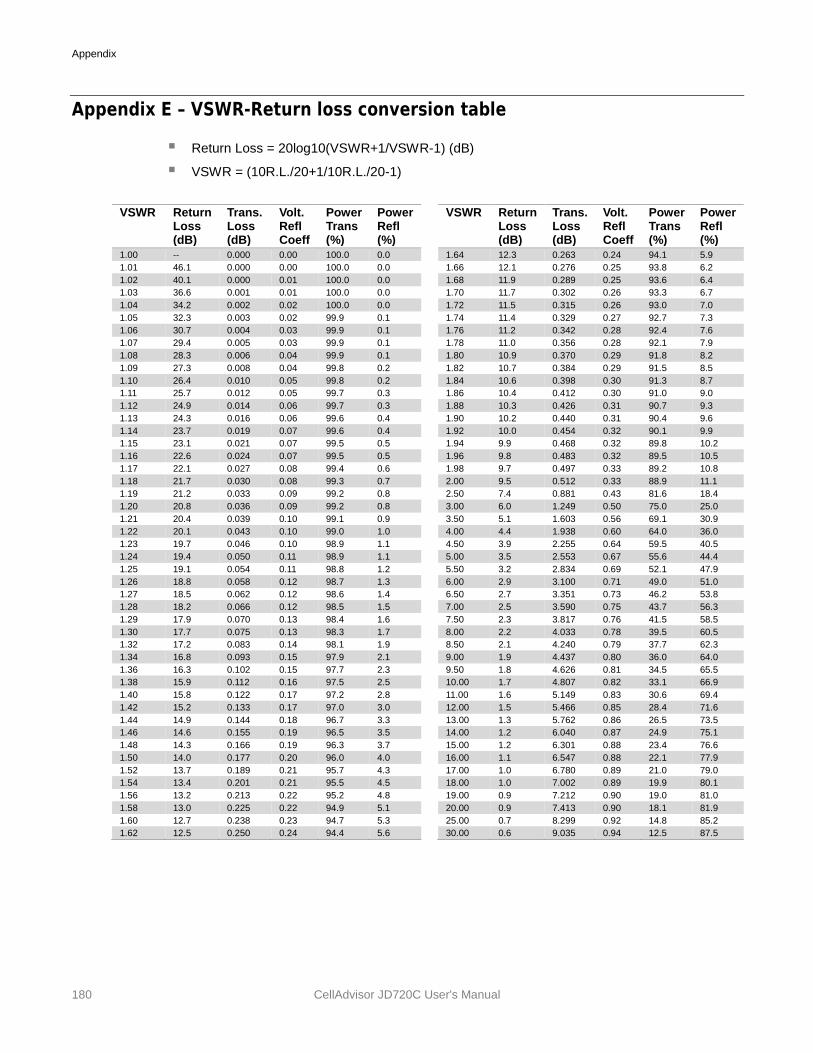
Appendix
180 CellAdvisor JD720C User's Manual
Appendix E – VSWR-Return loss conversion table
Return Loss = 20log10(VSWR+1/VSWR-1) (dB)
VSWR = (10R.L./20+1/10R.L./20-1)
VSWR Return Loss (dB)
Trans. Loss (dB)
Volt. Refl Coeff
Power Trans (%)
Power Refl (%)
VSWR Return Loss (dB)
Trans. Loss (dB)
Volt. Refl Coeff
Power Trans (%)
Power Refl (%)
1.00 -- 0.000 0.00 100.0 0.0 1.64 12.3 0.263 0.24 94.1 5.9
1.01 46.1 0.000 0.00 100.0 0.0 1.66 12.1 0.276 0.25 93.8 6.2
1.02 40.1 0.000 0.01 100.0 0.0 1.68 11.9 0.289 0.25 93.6 6.4
1.03 36.6 0.001 0.01 100.0 0.0 1.70 11.7 0.302 0.26 93.3 6.7
1.04 34.2 0.002 0.02 100.0 0.0 1.72 11.5 0.315 0.26 93.0 7.0
1.05 32.3 0.003 0.02 99.9 0.1 1.74 11.4 0.329 0.27 92.7 7.3
1.06 30.7 0.004 0.03 99.9 0.1 1.76 11.2 0.342 0.28 92.4 7.6
1.07 29.4 0.005 0.03 99.9 0.1 1.78 11.0 0.356 0.28 92.1 7.9
1.08 28.3 0.006 0.04 99.9 0.1 1.80 10.9 0.370 0.29 91.8 8.2
1.09 27.3 0.008 0.04 99.8 0.2 1.82 10.7 0.384 0.29 91.5 8.5
1.10 26.4 0.010 0.05 99.8 0.2 1.84 10.6 0.398 0.30 91.3 8.7
1.11 25.7 0.012 0.05 99.7 0.3 1.86 10.4 0.412 0.30 91.0 9.0
1.12 24.9 0.014 0.06 99.7 0.3 1.88 10.3 0.426 0.31 90.7 9.3
1.13 24.3 0.016 0.06 99.6 0.4 1.90 10.2 0.440 0.31 90.4 9.6
1.14 23.7 0.019 0.07 99.6 0.4 1.92 10.0 0.454 0.32 90.1 9.9
1.15 23.1 0.021 0.07 99.5 0.5 1.94 9.9 0.468 0.32 89.8 10.2
1.16 22.6 0.024 0.07 99.5 0.5 1.96 9.8 0.483 0.32 89.5 10.5
1.17 22.1 0.027 0.08 99.4 0.6 1.98 9.7 0.497 0.33 89.2 10.8
1.18 21.7 0.030 0.08 99.3 0.7 2.00 9.5 0.512 0.33 88.9 11.1
1.19 21.2 0.033 0.09 99.2 0.8 2.50 7.4 0.881 0.43 81.6 18.4
1.20 20.8 0.036 0.09 99.2 0.8 3.00 6.0 1.249 0.50 75.0 25.0
1.21 20.4 0.039 0.10 99.1 0.9 3.50 5.1 1.603 0.56 69.1 30.9
1.22 20.1 0.043 0.10 99.0 1.0 4.00 4.4 1.938 0.60 64.0 36.0
1.23 19.7 0.046 0.10 98.9 1.1 4.50 3.9 2.255 0.64 59.5 40.5
1.24 19.4 0.050 0.11 98.9 1.1 5.00 3.5 2.553 0.67 55.6 44.4
1.25 19.1 0.054 0.11 98.8 1.2 5.50 3.2 2.834 0.69 52.1 47.9
1.26 18.8 0.058 0.12 98.7 1.3 6.00 2.9 3.100 0.71 49.0 51.0
1.27 18.5 0.062 0.12 98.6 1.4 6.50 2.7 3.351 0.73 46.2 53.8
1.28 18.2 0.066 0.12 98.5 1.5 7.00 2.5 3.590 0.75 43.7 56.3
1.29 17.9 0.070 0.13 98.4 1.6 7.50 2.3 3.817 0.76 41.5 58.5
1.30 17.7 0.075 0.13 98.3 1.7 8.00 2.2 4.033 0.78 39.5 60.5
1.32 17.2 0.083 0.14 98.1 1.9 8.50 2.1 4.240 0.79 37.7 62.3
1.34 16.8 0.093 0.15 97.9 2.1 9.00 1.9 4.437 0.80 36.0 64.0
1.36 16.3 0.102 0.15 97.7 2.3 9.50 1.8 4.626 0.81 34.5 65.5
1.38 15.9 0.112 0.16 97.5 2.5 10.00 1.7 4.807 0.82 33.1 66.9
1.40 15.8 0.122 0.17 97.2 2.8 11.00 1.6 5.149 0.83 30.6 69.4
1.42 15.2 0.133 0.17 97.0 3.0 12.00 1.5 5.466 0.85 28.4 71.6
1.44 14.9 0.144 0.18 96.7 3.3 13.00 1.3 5.762 0.86 26.5 73.5
1.46 14.6 0.155 0.19 96.5 3.5 14.00 1.2 6.040 0.87 24.9 75.1
1.48 14.3 0.166 0.19 96.3 3.7 15.00 1.2 6.301 0.88 23.4 76.6
1.50 14.0 0.177 0.20 96.0 4.0 16.00 1.1 6.547 0.88 22.1 77.9
1.52 13.7 0.189 0.21 95.7 4.3 17.00 1.0 6.780 0.89 21.0 79.0
1.54 13.4 0.201 0.21 95.5 4.5 18.00 1.0 7.002 0.89 19.9 80.1
1.56 13.2 0.213 0.22 95.2 4.8 19.00 0.9 7.212 0.90 19.0 81.0
1.58 13.0 0.225 0.22 94.9 5.1 20.00 0.9 7.413 0.90 18.1 81.9
1.60 12.7 0.238 0.23 94.7 5.3 25.00 0.7 8.299 0.92 14.8 85.2
1.62 12.5 0.250 0.24 94.4 5.6 30.00 0.6 9.035 0.94 12.5 87.5
Appendix
CellAdvisor JD720C Series User’s Manual 181
Appendix F – Device driver installation
The JD720C series can be controlled from the application software JDViewer or JDRemote installed on your computer. You must install driver software for the instrument on to your computer if USB Client connection is used for communication. Following is an example of procedure done with Windows 7.
Procedure
1 Connect the USB Client port of JD720C and your computer with a USB cable.
2 On your computer, go to Control Panel > System > Device Manager.
The Device Manager window appears.
3 Right-click the Unknown Device under the Other Devices, and then click the Update Driver Software. The Update Driver Software – Unknown Device window appears as shown in Figure 111.
4 Select the Browse my computer for driver software, and then click the Browse button to
search for the location where the driver software is. The Browse For Folder window appears.
5 Search for the JDRemote folder, and then select the driver folder for the installed OS.
For example, OSDisk (C:) > Program Files (x86) > JDRemote > Driver > Win7 > 64bit.
6 Click the OK button.
The Browse For Folder window dismisses.
7 Click the Next button to start installation. If the Windows Security window appears, select the Install this driver software anyway.
Installing driver software starts.
8 Click the Close button at the end of the installation.
If you have encountered a problem with installing the driver with connecting your computer connected to JD720C, you can install the driver without the USB connection.
Procedure
1 Connect the USB Client port of JD720C and your computer with a USB cable.
2 On your computer, go to Control Panel > System > Device Manager.
The Device Manager window appears.
3 Right-click the Unknown Device under the Other Devices, and then click the Update Driver Software. The Update Driver Software – Unknown Device window appears as shown in Figure 111.
4 Select the Browse my computer for driver software, and then click the Browse button to
search for the location where the driver software is. The Browse For Folder window appears.
5 Search for the JDRemote folder, and then select the driver folder for the installed OS.
For example, OSDisk (C:) > Program Files (x86) > JDRemote > Driver > Win7 > 64bit.
6 Click the OK button.
The Browse For Folder window dismisses.
7 Click the Next button to start installation.
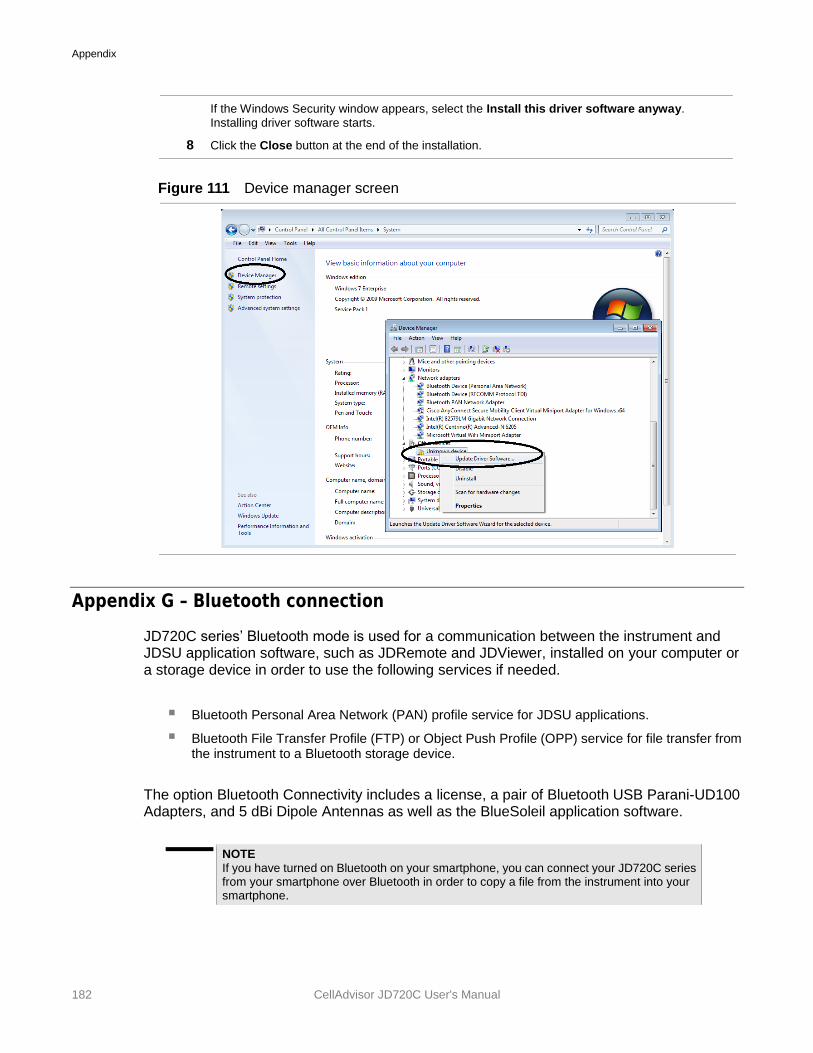
Appendix
182 CellAdvisor JD720C User's Manual
If the Windows Security window appears, select the Install this driver software anyway.
Installing driver software starts.
8 Click the Close button at the end of the installation.
Figure 111 Device manager screen
Appendix G – Bluetooth connection
JD720C series’ Bluetooth mode is used for a communication between the instrument and JDSU application software, such as JDRemote and JDViewer, installed on your computer or a storage device in order to use the following services if needed.
Bluetooth Personal Area Network (PAN) profile service for JDSU applications.
Bluetooth File Transfer Profile (FTP) or Object Push Profile (OPP) service for file transfer from the instrument to a Bluetooth storage device.
The option Bluetooth Connectivity includes a license, a pair of Bluetooth USB Parani-UD100 Adapters, and 5 dBi Dipole Antennas as well as the BlueSoleil application software.
NOTE
If you have turned on Bluetooth on your smartphone, you can connect your JD720C series from your smartphone over Bluetooth in order to copy a file from the instrument into your smartphone.
Appendix
CellAdvisor JD720C Series User’s Manual 183
There are two ways to make a Bluetooth connection between your instrument and your computer. One is connecting through the BlueSoleil program, using both of the Parani-UD100 Bluetooth adapters connected with the 5-dBi Dipole antennas for a communication up to 100 meters. The other one is connecting directly from the Control Panel of your computer’s network setting, using one of the Parani-UD100 adapters and your computer’s built-in Bluetooth adapter without having to use BlueSoleil for the communication within a few meters.
NOTE
It is recommended that you use the BlueSoleil program if the distance between your instrument and your computer is longer than a few meters. Doing so, however, disables your computer’s Bluetooth service and you will have to manually enable and start the service on your computer again to connect a Bluetooth device other than the CellAdvisor.
Connecting Bluetooth through BlueSoleil program
Installing and Setting up Bluetooth software
After installing the software, you must disable DHCP Server option in order to use the PAN Service properly.
Procedure
1 Insert the provided CD-ROM into your computer and install the software as instructed.
The BlueSoleil Space shortcut icon appears on the desktop.
NOTE
For more information on installation, refer to the Quick Start Guide or the User Guide provided with the adapter.
2 Double-click the BlueSoleil Space shortcut icon on your computer desktop to launch the appli-
cation. The BlueSoleil program window appears.
3 Right-click the My Device icon (the orange ball) in the center of the window, and then click
Properties > Services tab.
The My Device Properties window appears.
4 Select the Bluetooth Personal Area Network from the list, and then click the Properties button.
The Bluetooth Personal Area Network Properties window appears.
5 Click the Options tab, and then uncheck the Enable DHCP Server option.
The Enable DHCP Server option is checked by default.
NOTE
You must disable this option in order to eliminate any Network Connection setting as the Enable DHCP Server option is checked by default.
6 Click the OK button.
The Bluetooth Personal Area Network Properties window dismisses.
7 Click the OK button.
The My Device Properties window dismisses.
Establishing Bluetooth connection
The JD720C series detects a plugged-in Parani-UD100 USB Bluetooth Adapter automatically.
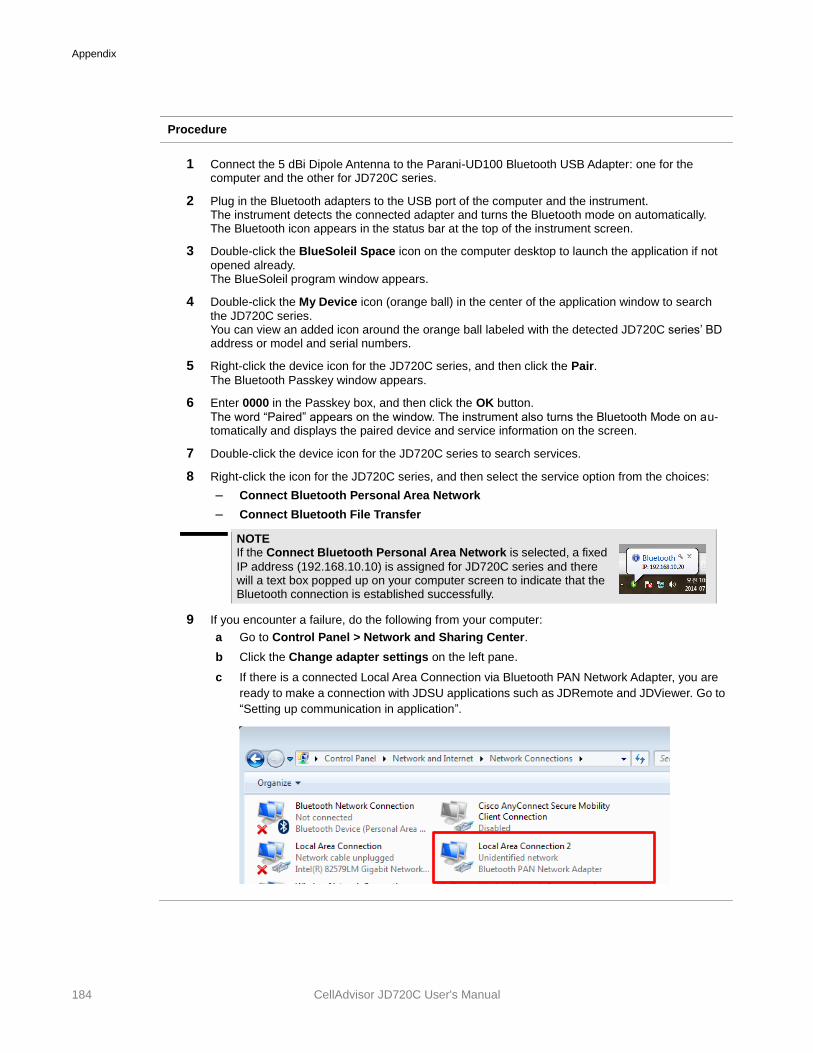
Appendix
184 CellAdvisor JD720C User's Manual
Procedure
1 Connect the 5 dBi Dipole Antenna to the Parani-UD100 Bluetooth USB Adapter: one for the computer and the other for JD720C series.
2 Plug in the Bluetooth adapters to the USB port of the computer and the instrument. The instrument detects the connected adapter and turns the Bluetooth mode on automatically. The Bluetooth icon appears in the status bar at the top of the instrument screen.
3 Double-click the BlueSoleil Space icon on the computer desktop to launch the application if not
opened already. The BlueSoleil program window appears.
4 Double-click the My Device icon (orange ball) in the center of the application window to search
the JD720C series. You can view an added icon around the orange ball labeled with the detected JD720C series’ BD address or model and serial numbers.
5 Right-click the device icon for the JD720C series, and then click the Pair.
The Bluetooth Passkey window appears.
6 Enter 0000 in the Passkey box, and then click the OK button.
The word “Paired” appears on the window. The instrument also turns the Bluetooth Mode on au-tomatically and displays the paired device and service information on the screen.
7 Double-click the device icon for the JD720C series to search services.
8 Right-click the icon for the JD720C series, and then select the service option from the choices:
– Connect Bluetooth Personal Area Network
– Connect Bluetooth File Transfer
NOTE If the Connect Bluetooth Personal Area Network is selected, a fixed
IP address (192.168.10.10) is assigned for JD720C series and there will a text box popped up on your computer screen to indicate that the Bluetooth connection is established successfully.
9 If you encounter a failure, do the following from your computer:
a Go to Control Panel > Network and Sharing Center.
b Click the Change adapter settings on the left pane.
c If there is a connected Local Area Connection via Bluetooth PAN Network Adapter, you are
ready to make a connection with JDSU applications such as JDRemote and JDViewer. Go to
“Setting up communication in application”.
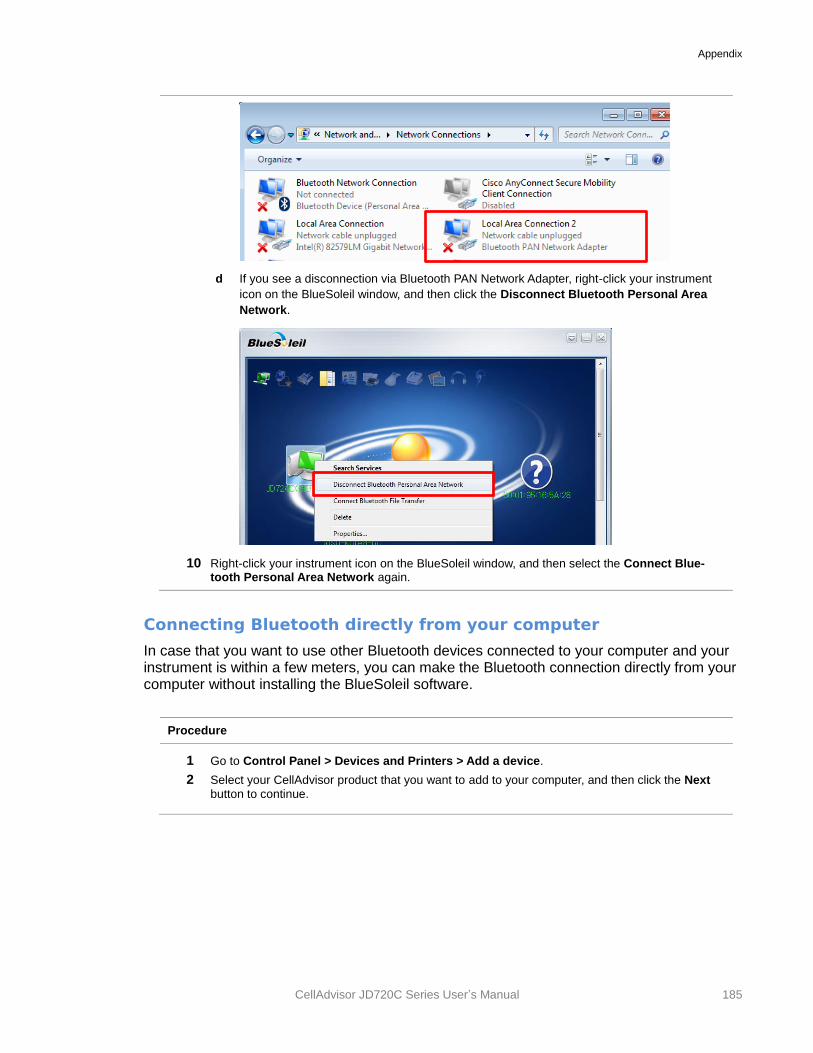
Appendix
CellAdvisor JD720C Series User’s Manual 185
d If you see a disconnection via Bluetooth PAN Network Adapter, right-click your instrument
icon on the BlueSoleil window, and then click the Disconnect Bluetooth Personal Area
Network.
10 Right-click your instrument icon on the BlueSoleil window, and then select the Connect Blue-tooth Personal Area Network again.
Connecting Bluetooth directly from your computer
In case that you want to use other Bluetooth devices connected to your computer and your instrument is within a few meters, you can make the Bluetooth connection directly from your computer without installing the BlueSoleil software.
Procedure
1 Go to Control Panel > Devices and Printers > Add a device.
2 Select your CellAdvisor product that you want to add to your computer, and then click the Next
button to continue.
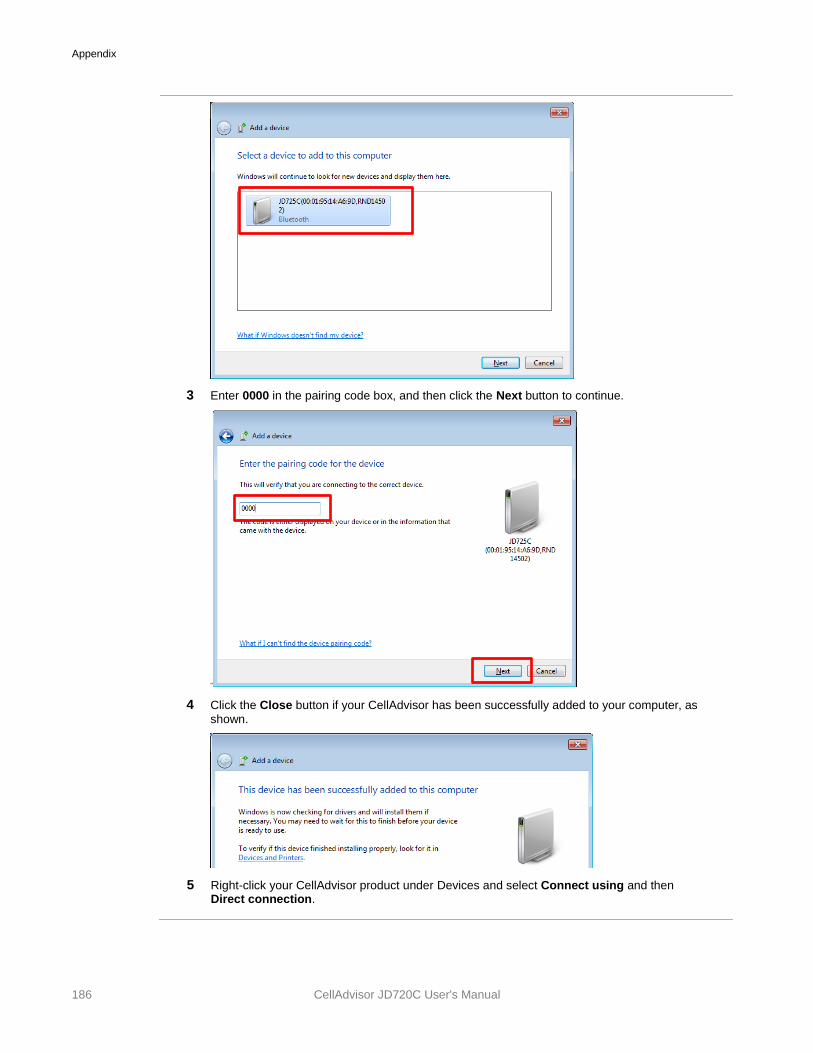
Appendix
186 CellAdvisor JD720C User's Manual
3 Enter 0000 in the pairing code box, and then click the Next button to continue.
"
4 Click the Close button if your CellAdvisor has been successfully added to your computer, as
shown.
5 Right-click your CellAdvisor product under Devices and select Connect using and then Direct connection.
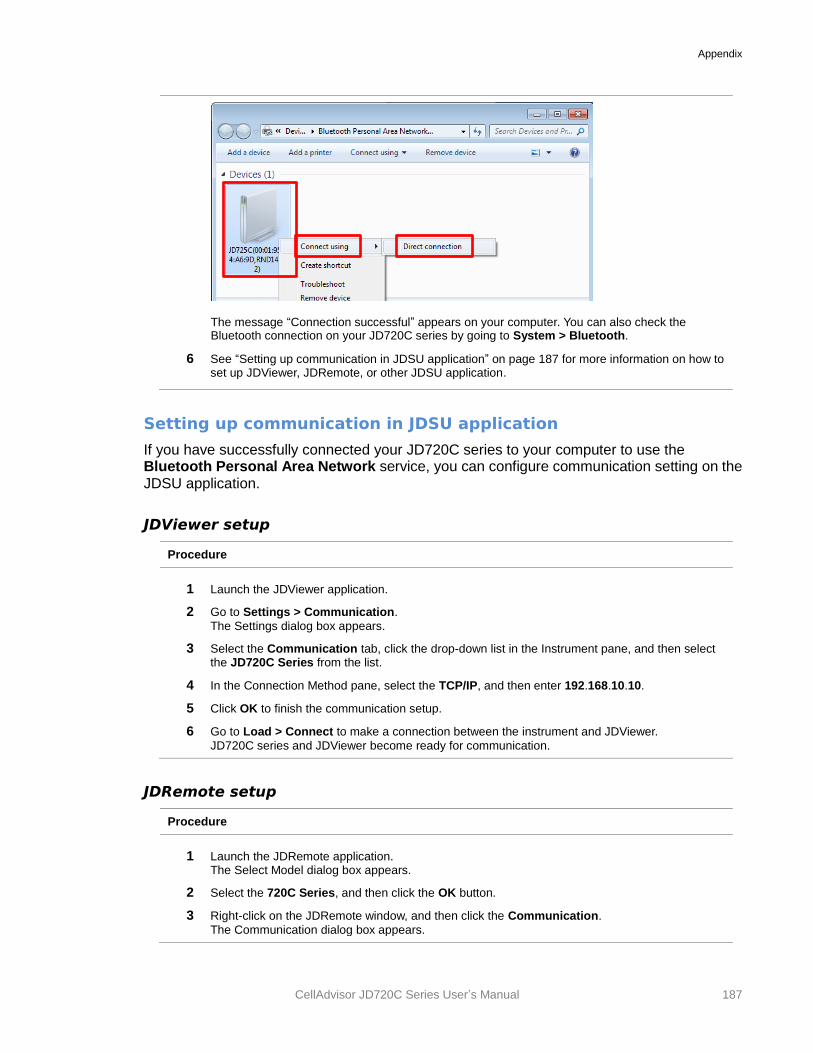
Appendix
CellAdvisor JD720C Series User’s Manual 187
The message “Connection successful” appears on your computer. You can also check the Bluetooth connection on your JD720C series by going to System > Bluetooth.
6 See “Setting up communication in JDSU application” on page 187 for more information on how to set up JDViewer, JDRemote, or other JDSU application.
Setting up communication in JDSU application
If you have successfully connected your JD720C series to your computer to use the Bluetooth Personal Area Network service, you can configure communication setting on the JDSU application.
JDViewer setup
Procedure
1 Launch the JDViewer application.
2 Go to Settings > Communication.
The Settings dialog box appears.
3 Select the Communication tab, click the drop-down list in the Instrument pane, and then select the JD720C Series from the list.
4 In the Connection Method pane, select the TCP/IP, and then enter 192.168.10.10.
5 Click OK to finish the communication setup.
6 Go to Load > Connect to make a connection between the instrument and JDViewer.
JD720C series and JDViewer become ready for communication.
JDRemote setup
Procedure
1 Launch the JDRemote application. The Select Model dialog box appears.
2 Select the 720C Series, and then click the OK button.
3 Right-click on the JDRemote window, and then click the Communication.
The Communication dialog box appears.
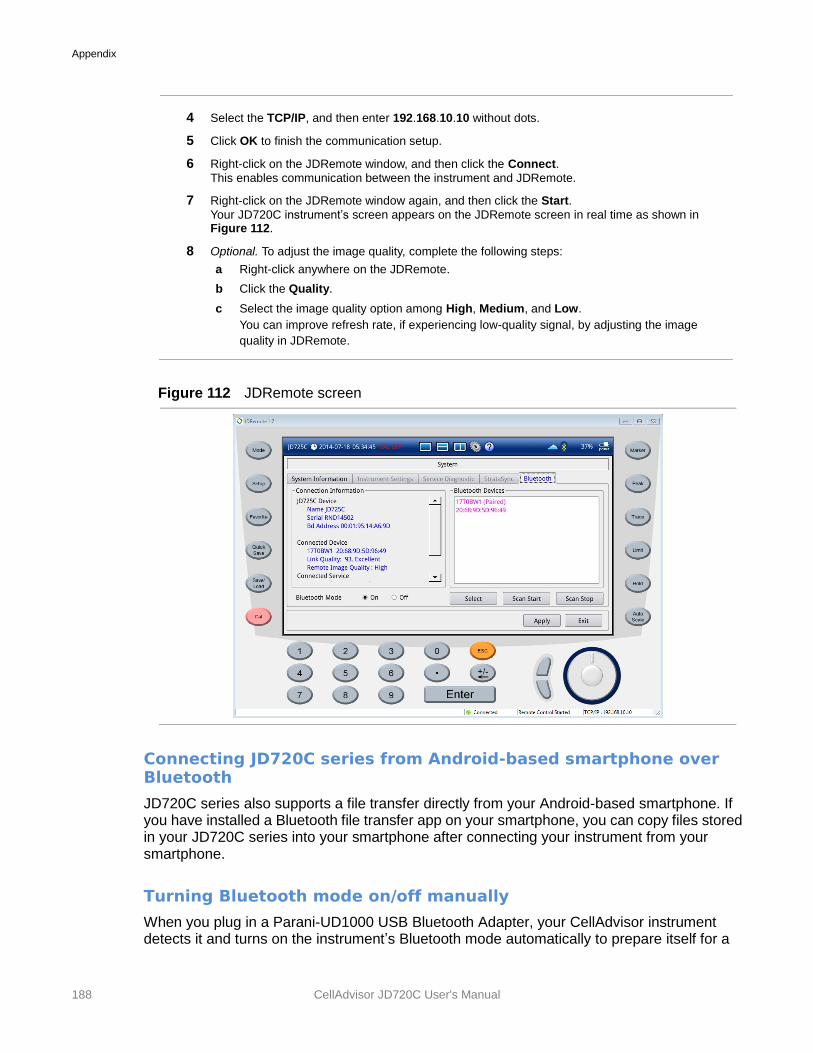
Appendix
188 CellAdvisor JD720C User's Manual
4 Select the TCP/IP, and then enter 192.168.10.10 without dots.
5 Click OK to finish the communication setup.
6 Right-click on the JDRemote window, and then click the Connect.
This enables communication between the instrument and JDRemote.
7 Right-click on the JDRemote window again, and then click the Start.
Your JD720C instrument’s screen appears on the JDRemote screen in real time as shown in Figure 112.
8 Optional. To adjust the image quality, complete the following steps:
a Right-click anywhere on the JDRemote.
b Click the Quality.
c Select the image quality option among High, Medium, and Low.
You can improve refresh rate, if experiencing low-quality signal, by adjusting the image
quality in JDRemote.
Figure 112 JDRemote screen
Connecting JD720C series from Android-based smartphone over Bluetooth
JD720C series also supports a file transfer directly from your Android-based smartphone. If you have installed a Bluetooth file transfer app on your smartphone, you can copy files stored in your JD720C series into your smartphone after connecting your instrument from your smartphone.
Turning Bluetooth mode on/off manually
When you plug in a Parani-UD1000 USB Bluetooth Adapter, your CellAdvisor instrument detects it and turns on the instrument’s Bluetooth mode automatically to prepare itself for a
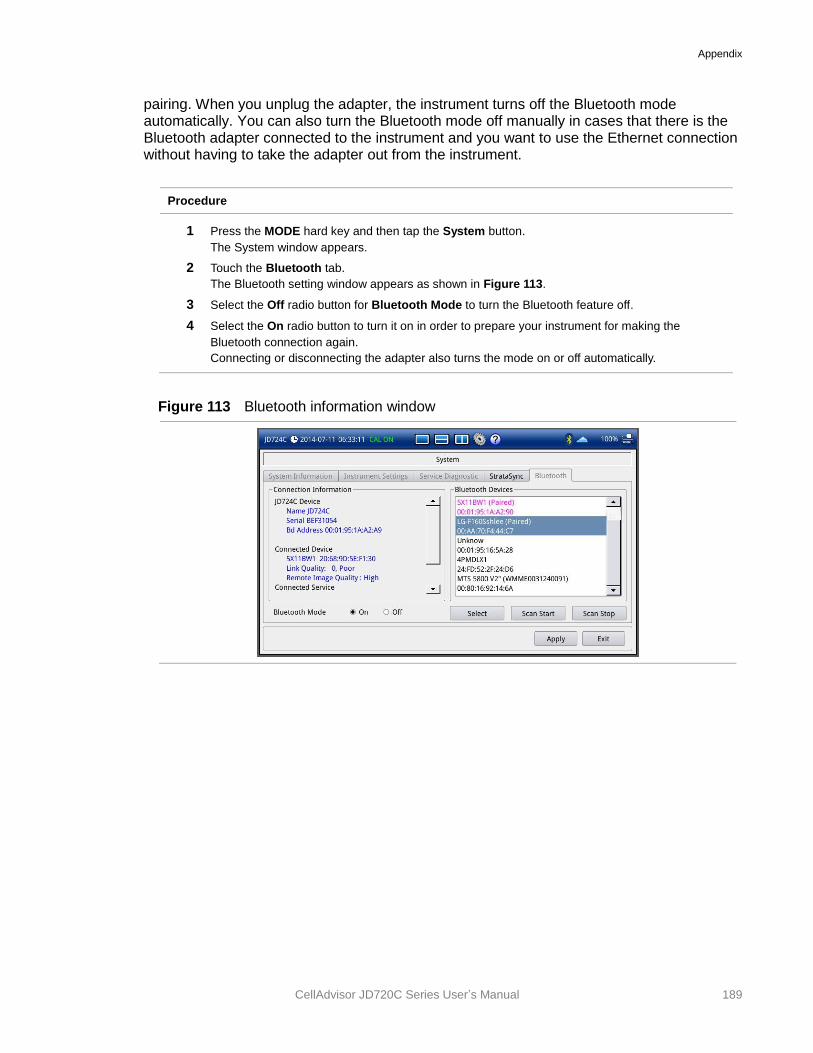
Appendix
CellAdvisor JD720C Series User’s Manual 189
pairing. When you unplug the adapter, the instrument turns off the Bluetooth mode automatically. You can also turn the Bluetooth mode off manually in cases that there is the Bluetooth adapter connected to the instrument and you want to use the Ethernet connection without having to take the adapter out from the instrument.
Procedure
1 Press the MODE hard key and then tap the System button.
The System window appears.
2 Touch the Bluetooth tab.
The Bluetooth setting window appears as shown in Figure 113.
3 Select the Off radio button for Bluetooth Mode to turn the Bluetooth feature off.
4 Select the On radio button to turn it on in order to prepare your instrument for making the
Bluetooth connection again.
Connecting or disconnecting the adapter also turns the mode on or off automatically.
Figure 113 Bluetooth information window
Appendix
190 CellAdvisor JD720C User's Manual
Appendix H – OSS licensing
The JD720C series incorporates software that is covered by either the GNU General Public license or GNU Lesser General Public License. You can view the OSS license notification and distribution in details.
Procedure
1 Press the MODE hard key.
The measurement mode window appears.
2 Tap the System button.
The System window appears.
3 Touch the Service Diagnostic tab.
4 Tap the OSS License button.
The Open Source Code Notification & Distribution window appears.
5 Touch the Exit button or press the ESC hard key to exit.
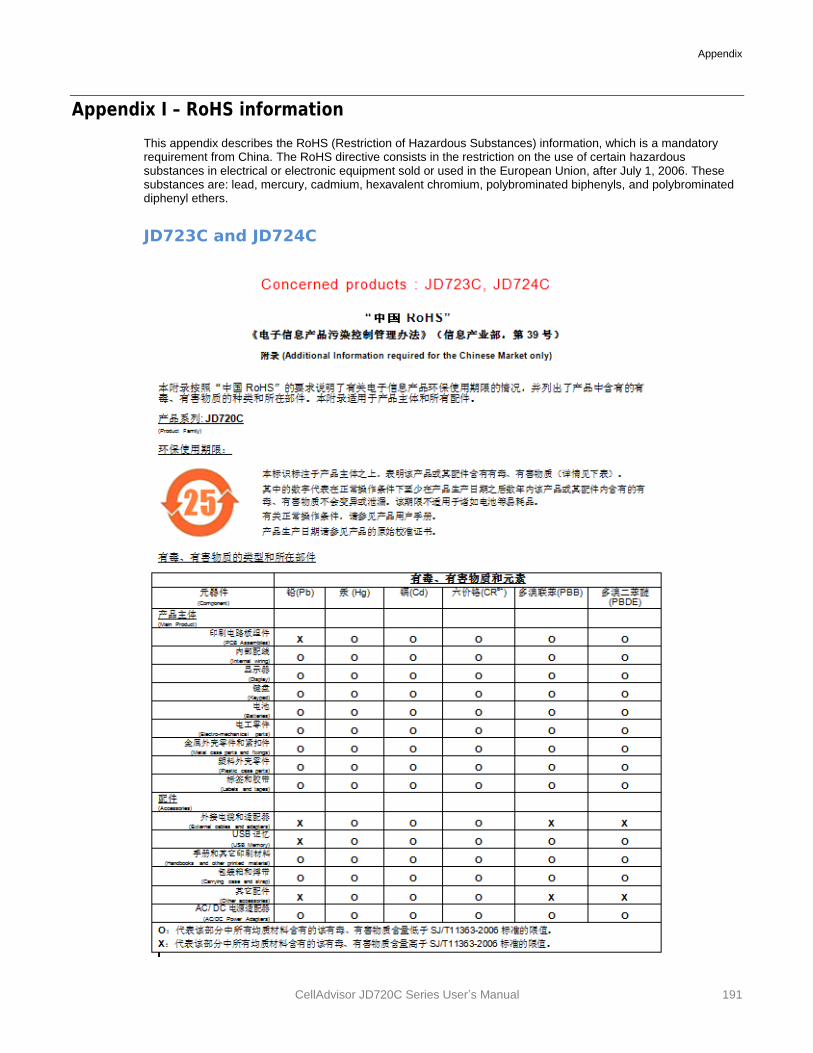
Appendix
CellAdvisor JD720C Series User’s Manual 191
Appendix I – RoHS information
This appendix describes the RoHS (Restriction of Hazardous Substances) information, which is a mandatory requirement from China. The RoHS directive consists in the restriction on the use of certain hazardous substances in electrical or electronic equipment sold or used in the European Union, after July 1, 2006. These substances are: lead, mercury, cadmium, hexavalent chromium, polybrominated biphenyls, and polybrominated diphenyl ethers.
JD723C and JD724C
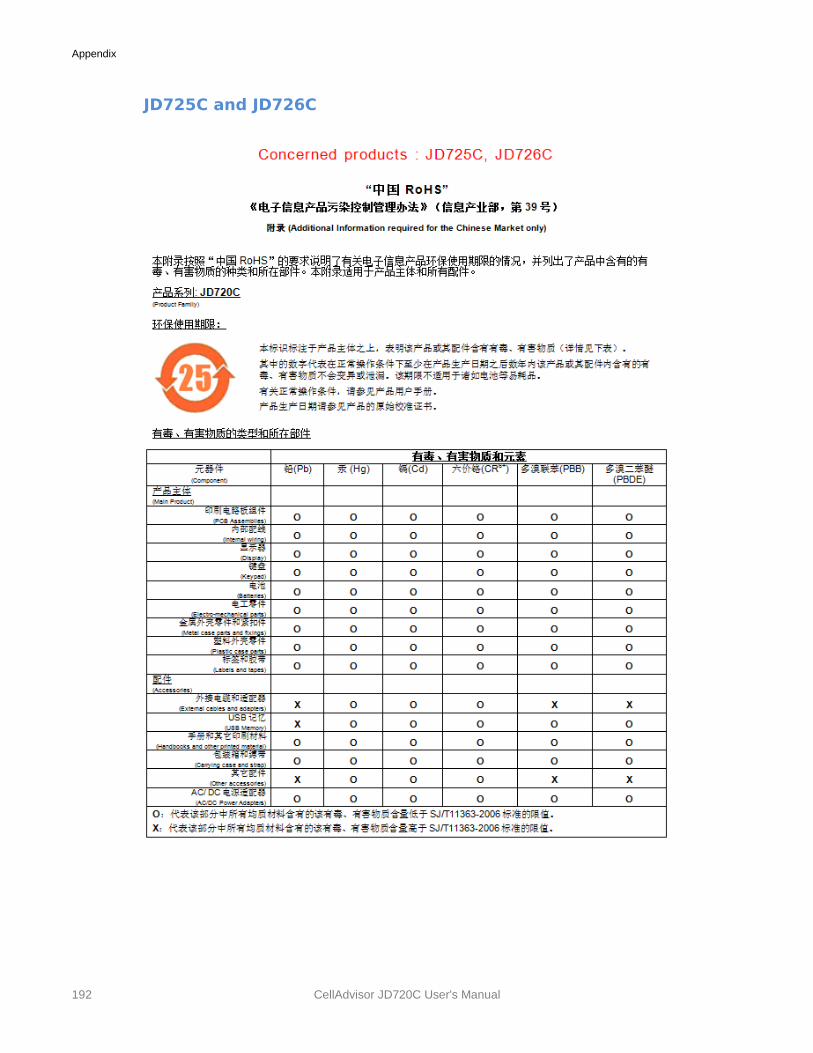
Appendix
192 CellAdvisor JD720C User's Manual
JD725C and JD726C

Network and Service Enablement Regional Sales
North America
Toll Free: 1 855 ASK JDSU
Latin America
Tel: +55 11 5503 3800
Asia Pacific
Tel: +852 2892 0990
EMEA
Tel: +49 7121 86 2222 www.jdsu.com
Doc Part No. 22080035
Rev. 5.1, July 2015