CCMPCS Annual Performance Targets -2016-2017-FINAL ...
15
CARROLL CREEK MONTESSORI PUBLIC CHARTER SCHOOL ANNUAL PERFORMANCE TARGETS REPORT: FALL 2016 EDUCATIONAL PERFORMANCE Focus Area: Federal Accountability Focus Area Indicator Standard/Criteria Sources of Evidence Federal Accountability PARCC ELA/Literacy The school will meet systemic annual performance targets that will increase student performance by 50% for high performing groups and by 75% for low performing groups over a five year period. MSDE PARCC Results (see below) PARCC Mathematics The school will meet systemic annual performance targets that will increase student performance by 50% for high performing groups and by 75% for low performing groups over a five year period. Student-group(s) achievement The school will meet systemic annual performance targets that will increase student performance by 50% for high performing groups and by 75% for low performing groups over a five year period. Evidence: All targets were surpassed with the exception of two groups in Language Arts. Neither of the groups who did not meet the target growth included the accepted number of students (n=10) to “count” for statistical validity. Language Arts overall increase from last year was 9.3% (target was 3.9% for 2016-17; Table 1). Math overall increase from last year was 11.4% (target was 6.4% for 2016-17; Table 2). See next page for Tables.
-
Upload
khangminh22 -
Category
Documents
-
view
1 -
download
0
Transcript of CCMPCS Annual Performance Targets -2016-2017-FINAL ...

CARROLL CREEK MONTESSORI PUBLIC CHARTER SCHOOL ANNUAL PERFORMANCE TARGETS REPORT: FALL 2016
EDUCATIONAL PERFORMANCE
Focus Area: Federal Accountability Focus Area Indicator Standard/Criteria Sources of Evidence
Federal Accountability
PARCC ELA/Literacy
The school will meet systemic annual performance targets that will increase student performance by 50% for high performing groups and by 75% for low performing groups over a five year period.
MSDE PARCC Results (see below)
PARCC Mathematics
The school will meet systemic annual performance targets that will increase student performance by 50% for high performing groups and by 75% for low performing groups over a five year period.
Student-group(s) achievement
The school will meet systemic annual performance targets that will increase student performance by 50% for high performing groups and by 75% for low performing groups over a five year period.
Evidence: All targets were surpassed with the exception of two groups in Language Arts. Neither of the groups who did not meet the target growth included the accepted number of students (n=10) to “count” for statistical validity. Language Arts overall increase from last year was 9.3% (target was 3.9% for 2016-17; Table 1). Math overall increase from last year was 11.4% (target was 6.4% for 2016-17; Table 2). See next page for Tables.

2
Table 1. Language Arts PARCC Benchmarks and Results Proficiency Level: 3-5
2015/16 Baseline (%)
Increase goal per yr (%)
2016 goal
2016 actual
% Increase Notes
All Students 60.6 3.9 64.5 69.9 9.3 Asian 100 0 100 100 0 Black 33.3 10 43.3 75 41.7 LEP 25 11.3 36.3 0 0 N/A (1) Spec Ed 45.5 8.2 53.7 37.5 -8 N/A (8) Farms 35.7 9.7 45.4 52.6 16.9 Hispanic 30 10.5 40.5 57.1 27.1 2 or more races 50 5 55 25.0 -25 N/A (4) White 67.5 3.3 70.8 72.9 5.4
Table 2. Math PARCC Benchmarks and Results Proficiency Level: 3-5
2015/16 Baseline (%)
Increase goal per yr (%)
2016 goal
2016 actual
% Increase Notes
All Students 36.4 6.4 42.8 47.8 11.4 Asian 60 4 64 66.7 6.7 Black 33.3 10 43.3 62.5 29.2 LEP 25 11.3 36.3 0 0 N/A (1) Spec Ed 18.2 12.3 30.5 37.5 19.3 N/A (8) Farms 28.6 10.7 39.3 44.4 15.8 Hispanic 10 13.5 23.5 38.5 28.5 2 or more races 50 5 55 50 0 N/A (4) White 40 6 46 47.5 7.5
3
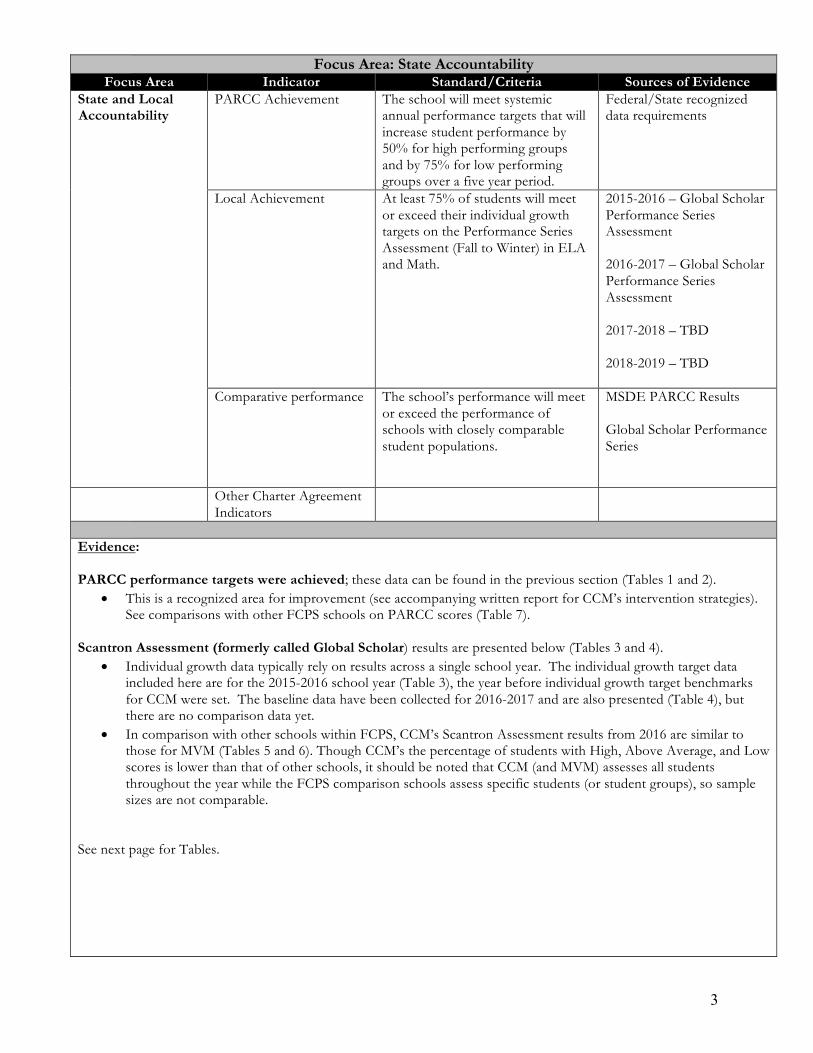
Focus Area: State Accountability Focus Area Indicator Standard/Criteria Sources of Evidence
State and Local Accountability
PARCC Achievement
The school will meet systemic annual performance targets that will increase student performance by 50% for high performing groups and by 75% for low performing groups over a five year period.
Federal/State recognized data requirements
Local Achievement At least 75% of students will meet or exceed their individual growth targets on the Performance Series Assessment (Fall to Winter) in ELA and Math.
2015-2016 – Global Scholar Performance Series Assessment 2016-2017 – Global Scholar Performance Series Assessment 2017-2018 – TBD 2018-2019 – TBD
Comparative performance The school’s performance will meet or exceed the performance of schools with closely comparable student populations.
MSDE PARCC Results Global Scholar Performance Series
Other Charter Agreement Indicators
Evidence: PARCC performance targets were achieved; these data can be found in the previous section (Tables 1 and 2).
• This is a recognized area for improvement (see accompanying written report for CCM’s intervention strategies). See comparisons with other FCPS schools on PARCC scores (Table 7).
Scantron Assessment (formerly called Global Scholar) results are presented below (Tables 3 and 4). • Individual growth data typically rely on results across a single school year. The individual growth target data
included here are for the 2015-2016 school year (Table 3), the year before individual growth target benchmarks for CCM were set. The baseline data have been collected for 2016-2017 and are also presented (Table 4), but there are no comparison data yet.
• In comparison with other schools within FCPS, CCM’s Scantron Assessment results from 2016 are similar to those for MVM (Tables 5 and 6). Though CCM’s the percentage of students with High, Above Average, and Low scores is lower than that of other schools, it should be noted that CCM (and MVM) assesses all students throughout the year while the FCPS comparison schools assess specific students (or student groups), so sample sizes are not comparable.
See next page for Tables.

4
Table 3. Scantron Assessment Results from Spring 2016 – Individual Growth
% of students reaching individual growth target in Reading
% of students reaching individual growth target in Math
All Students 49 36 Black 40 20 White 52 42 Hispanic 55 16 Multiracial 33 50 Special Education 57 22
Table 4. Baseline Scantron Assessment Results from Fall 2016
% of students with Average (Includes High, Above and Low)
Reading
% of students with Average (Includes High, Above and Low)
Math All Students 84 88 Black 86 95 White 89 90 Hispanic 67 72 Multiracial 75 87 Special Education 62 64
Table 5. Scantron Assessment Results Comparison from Spring 2016 (Reading)
% of students with Average (Includes High, Above and Low) Number of students assessed
Carroll Creek 83.2 120 Centerville 100 <10 Frederick Classical 100 <10 MVM 85.7 124 Urbana 96.4 53 Yellow Springs 100 <10
Table 6. Scantron Assessment Results Comparison from Spring 2016 (Math)
% of students with Average (Includes High, Above and Low) Number of students assessed
Carroll Creek 82.4 120 Centerville 100 <10 Frederick Classical 0 <10 MVM 80.8 194 Urbana 100 <10 Yellow Springs 100 <10

5
Table 7. PARCC Results Comparison from 2016
% of students achieving level 3, 4, 5 in Reading
% of students achieving level 3, 4, 5 in Math
All FCPS 74.6 74.8 Carroll Creek (266 total students) 69.7 47.7 Centerville (1000 total students) 93.6 96.9 Frederick Classical (357 total students) 82.5 80.6 MVM (298 total students) 86.6 66.4 Urbana (719 total students) 87.8 86.3 Yellow Springs (487 total students) 76.6 84.2
Focus Area: Mission-Specific Accountability Focus Area Indicator Standard/Criteria Sources of Evidence
Mission-Specific Accountability
Spanish Program
The school’s Spanish curriculum will be fully developed by September 2016.
Elementary and Middle School Spanish curriculum
Spanish Program 80% of 8th Grade students who have been enrolled in CCM for at least 5 years, will receive high school credit for Spanish II.
FCPS CRES Assessment
80% of students who have been enrolled in CCM for at least 5 years, will demonstrate proficiency in Spanish by the end of their 3rd and 6th Grade school years as measured by an agreed upon research-based instrument.
Avant Standards-based Measurement of Proficiency (STAMP) Assessment
Montessori Training and Certification for instructional staff
The percentage of trained Montessori teachers will increase each year from baseline data. 100% of all teachers will be trained by the end of 2018-2019 school year.
2015-2016 – 75% 2016-2017 – 85% 2017-2018 – 95% 2018-2019 – 100%
The percentage of (lead) classroom teachers who have obtained or are working towards Montessori certification will increase from 67% to 75% by the end of the 2018-2019 school year.
Annual increases from the baseline of 67% to 75% by the end of the 2018-2019 school year.
Middle School Program The middle school program will fully reflect a Montessori model with the use of Montessori middle school curriculum, grading, and assessment by the beginning of the 2016-2017 school year.
Observation Review of artifacts

6
Evidence: Spanish CCM’s Spanish Curricular Lead developed a Schoolwide Spanish curriculum over the summer of 2016 (Appendix A). Assessment Levels: Students are being assessed at the end of each cluster (kindergarten, 3rd and 6th grades).
• Kindergarten: The kindergarten assessment is an “in-house” developed assessment due to no national assessment being available at that level. Kindergarten students showed significant improvements in Spanish reception, expression, and literacy from Winter 2015 to Spring 2016 (Graph 1).
• Grades 3 and 6:
Students in grades 3 and 6 are assessed twice annually using the AVANT STAMP Spanish assessment. The majority of 3rd graders scored in the Novice-Low to Novice-Mid range for writing, speaking, reading, and listening, while the majority of 6th graders scored in the Novice-Mid range or higher for these areas (Key: Chart 1, Graphs 2-9).
Graph 1 Kindergarten Spanish Assessment Results for 2015-16
25
6
40
16
52
12
3019
33 37
22
3545
75
27
47
26
53
0102030405060708090100
Winter Spring Winter Spring Winter Spring
Receptive Expressive Literacy
In-HouseSpanishAssessment%ofKindergartenStudentsatEachLevel
2015-16SchoolYear
Introduced Approaching Mastered

7
Chart 1 AVANT Spanish Test Scoring Categories
Graphs 2-5 AVANT Spanish Baseline Test Results (3rd Grade)
0 0 0 0 0 4 0
25
71
00
1020304050607080
9 8 7 6 5 4 3 2 1 NR
3rdGradeListening%
0 0 0 0 0 0 0
43
57
00
10
20
30
40
50
60
70
80
9 8 7 6 5 4 3 2 1 NR
3rdGrade3Reading%
0 0 0 0 0 0
12
2331 34
0
10
20
30
40
50
60
70
80
9 8 7 6 5 4 3 2 1 NR
3rdGradeWriting%
0 0 0 0 04
11
30 30 29
0
10
20
30
40
50
60
70
80
9 8 7 6 5 4 3 2 1 NR
3rdGradeSpeaking%

8
Graphs 6-9 AVANT Spanish Baseline Test Results (6th Grade)
Montessori Training/Certification
• 100% of classroom lead teachers have been trained in Montessori philosophy. • As of August 2016 91% of all classroom lead teachers hold Montessori certificates from a MACTE
(Montessori Accreditation Council for Teacher Education – the national accreditation agency) accredited teacher training center or are currently in a MACTE accredited program.
Middle School Program The middle school program at CCM reflects the Montessori model in curriculum, grading and assessment. Grading for Spanish 1 and math courses reflects connection to the FCPS model to enable students to receive high school credit when appropriate.
0 0 0 08 8
17 17
50
00
1020304050607080
9 8 7 6 5 4 3 2 1 NR
6thGradeListening%
0 0 08
08
0
42 42
001020304050607080
9 8 7 6 5 4 3 2 1 NR
6thGradeReading%
0 0 0 0 0
1725 25
8
25
0
10
20
30
40
50
60
70
80
9 8 7 6 5 4 3 2 1 NR
6thGradeWriting%
0 0 0 0 08 8
50
17 17
0
10
20
30
40
50
60
70
80
9 8 7 6 5 4 3 2 1 NR
6thGradeSpeaking%

9
Focus Area: Educational Program Implementation Focus Area Indicator Standard/Criteria Sources of Evidence
Educational Program Implementation
Implementation of Spanish Program
Students’ instructional program and schedules reflect Spanish instruction as indicated in revised charter.
As defined in the school’s contract
Implementation of Montessori Program
Montessori instruction is provided in all classrooms.
Observation Review of artifacts
Montessori Training and Certification for instructional staff
The percentage of trained Montessori teachers will increase by the beginning of each year from baseline data. 100% of all teachers will be trained by the end of 2018-2019 school year.
2015-2016 – 75% 2016-2017 – 85% 2017-2018 – 95% 2018-2019 – 100%
The percentage of (lead) classroom teachers who have obtained or are working towards Montessori certification will increase from 67% to 75% by the end of the 2018-2019 school year.
Annual increases from the baseline of 67% in Spring 2016 to 75% by the end of the 2018-2019 school year.
Student/Staff Ratio The student/staff ratio will be 15:1 during a minimum of 50% of the core curriculum instructional day. The ratio will not exceed 30:1 as outlined in the charter agreement.
Primary – 100% Lower Elem. – 100% Upper Elem. – 50% Middle School – 50%
Implementation of Middle School Program
The middle school program will fully reflect a Montessori model with the use of Montessori middle school curriculum, grading, and assessment by the beginning of the 2016-2017 school year.
Observation Review of artifacts
Evidence: Spanish
• A licensed Spanish teacher provides Spanish instruction to all students. • Multiple staff members are native or fluent Spanish speakers who model the Spanish language in daily routines
and instruction. • The Spanish curriculum follows Maryland State World Languages objectives (Appendix A) while achieving our
Spanish Program goals (see written report). Montessori Implementation/Training/Certification
• CCM has begun the American Montessori Society Pathway to Continuous Improvement process for accreditation. The school currently stands at a 7 out of 10. This number will increase as we add our 8th grade (all levels must be multi-age) and the one remaining lead teacher starts her training (both expected by Fall 2017). This process will also include an on-site visit from a team of Montessori expert reviewers.
• 100% of classroom lead teachers have been trained in Montessori philosophy. • As of August 2016 91% of all classroom lead teachers hold Montessori certificates from a MACTE
accredited teacher training center or are currently in a MACTE accredited program. Student/Staff Ratio Staff to student ratios are consistent with the standard set in the charter agreement.

10
Middle School Program The middle school program at CCM reflects the Montessori model in curriculum, grading and assessment. Grading for Spanish 1 and math courses reflects connection to the FCPS model to enable students to receive high school credit when appropriate.
FINANCIAL PERFORMANCE
Focus Area: Financial Management Focus Area Indicator Standard Sources of Evidence
Financial Management
Demonstration of professional competence and sound systems in managing the schools financial operations
The school implements an effective system of internal controls over revenues, expenses, and fixed assets, and exercises good business practices.
Annual budgets, financial reports, annual financial audits, financial corrective action plans, onsite evaluation MMCI FY16 Audit Report (Submitted to FCPS and BOE September 14, 2016) FY17 Budget submitted to FCPS August 29, 2016
Adherence to generally accepted accounting principles
The school adheres to generally accepted accounting principles
Financial Reporting Requirements
The school submits timely and accurate financial information adhering to its financial reporting requirements as defined in the school’s contract.
Evidence:
• MMCI meets all contractual requirements for accurate financial reporting and adheres to generally accepted accounting principles, financial management requirements, and auditing requirements as evidenced by our FY2016 audit results submitted in September 2016.
• The school finance committee chair reports to the MMCI Finance Committee and participates in financial strategic planning for the the organization
• School budgets are reviewed and approved by the MMCI BOT after Governing Council and community input. The approved annual school budget is formally submitted to FCPS once the final PPA is provided in August.
Focus Area: Financial Viability Focus Area Indicator Standard/Criteria Sources of Evidence
Financial Viability
Budgeting
The school maintains balanced budgets and a positive cash flow.
Annual budgets, financial reports, annual financial audits, onsite evaluation SY2015-16 Budget to Actual Report 5 Year Draft Budget Projection
Financial obligations
The school’s financial obligations are in good standing.
Long-term financial planning
The school has a sound and sustainable long-term financial plan.

11
Evidence: Budgeting and Financial Process
• Monthly and “As Needed” meetings of the School Finance Committee are held to address any financial or procedural concerns and to develop/implement specific plans to address them.
• Monthly review of year-to-date and future expenses as compared to the approved budget is conducted by the School Finance Committee and presented to the Governing Council.
• A budget planning process for the next academic year begins in February to develop an estimated school budget based on estimated PPA. The impact of the following is considered when creating the budget:
• Forecasted changes to PPA • Expected increases or decreases in staff salary/benefits • Changes in maintenance (utility, infrastructure, taxes) • Changes in Federal, state, or county mandates that affect the core curriculum • Needs for new instructional supplies • Supplemental academic programs that support the Montessori pedagogy • New areas of interest identified by the Strategic Plan.
• Currently, CCM’s financial obligations are in good standing and a 5-year budget projection has been prepared. SY2015-16 Budget to Actual Report

12
5 Year Draft Budget Projection
ORGANIZATIONAL PERFORMANCE
Focus Area: Student Enrollment and Conduct Focus Area Indicator Standard/Criteria Sources of Evidence
Student Enrollment and Conduct
Student enrollment trends
All available enrollment slots will be filled based on the official September 30 enrollment counts.
Official student enrollment reports on September 30 of each year.
The overall attendance for all students and student groups will increase annually to 96% or greater.
2015-2016 – 94% 2016-2017 – 95% 2017-2018 – 95.5% 2018-2019 – 96% or greater
Racial/ethnic composition of the student body (Pending BOE Approval of the Lottery Waiver)
The percentage of native Spanish speakers enrolled will increase based on revised charter agreement.
Lottery Waiver Denied by MD State BOE on 10/26/2016.
School environment
The school maintains a safe and secure environment.
Discipline reporting; onsite evaluation
Suspension rates for all students and student groups will be 3% or less.
2015-2016- 3% or less 2016-2017- 3% or less 2017-2018- 3% or less 2018-2019-3% or less
Health and safety
The school complies with applicable health and safety laws.
Fire and health inspections, fire drill reports, evacuation plans, onsite evaluation

13
Evidence: 2016 Enrollment 268 with Preschool Students 220 without Preschool Students Attendance Final attendance for 2015-2016 was 94.9%, exceeding the benchmark for the year. Racial/Ethnic Composition In an effort to boost the percentage of native Spanish-speaking students at our school, we are active in outreach programs each year including the FCC Latino Festival, FCPS’ World Language Day, and targeted community outreach and interactions. School Environment/Health and Safety
• CCM continues to be a safe, secure, peaceful learning environment with less than 3% student suspensions. • All appropriate emergency drills are held, as are inspections. Evacuation plans are posted in each classroom.
There is an emergency binder located in the office that maintains pertinent information.
Enrollment Modification Request (Submitted October 4, 2016) – Under Review When the charter renewal was passed, an oversight occurred whereby the language was not altered from the original charter agreement, which accommodated up to 190 students in the first four years, and no additional language was added referring to the 4-year period of the renewed charter. As a result, CCM’s PPA student counts remained unchanged from the projections included in the original charter. These numbers were based on the continuance of the dual-track Spanish program (dual language and enrichment) which has been eliminated via the BOE-approved amendment to the charter. Since the dual-track program is no longer in practice,

14
we propose amending the charter agreement to include the following new schedule which would bring our enrollment to final capacity one year earlier than stated in the original charter application. Since our request in October, we have decided to reduce the requested SY18 Middle School number by 5 students for a total of 45 to better reflect projected enrollment.
Focus Area: Facilities Focus Area Indicator Standard/Criteria Sources of Evidence
Facilities Facility compliance The school’s facilities comply with applicable laws and codes.
Occupancy permits, health, safety and fire reports, onsite evaluation
Evidence: Facility Compliance All occupancy permits and appropriate documentation are in place and can be made available upon request. Update on the Buildout Project
• The agreed upon current lease includes our budgeted financial responsibilities for our current occupied space as well as the additional space that will be completed to house the growth of our school.
• The original goal for completion for expansion space was by the end of Summer 2016. Due to delays in the permitting and bidding process, as well as budget finalization discussions with the landlord, construction on the space did not begin when hoped.
• Occupancy of the expansion space is now slated for Spring 2017.
Focus Area: Governance, Staff and Parents Focus Area Indicator Standard/Criteria Sources of Evidence
Governance, Staff and Parents
Governance structure The school implements the governance structure as defined in the school’s contract.
Governing board meeting agendas and minutes, onsite evaluation
Compliance with Maryland and federal laws
The school complies with relevant Maryland and federal laws and laws governing public records.
Qualifications of instructional staff
All instructional staff will be MSDE certified.
100% of instructional staff will be MSDE Certified annually.
15
Parental Involvement The school is effectively involving parents in its programs as defined in the school’s contract.
Onsite evaluation, parental surveys
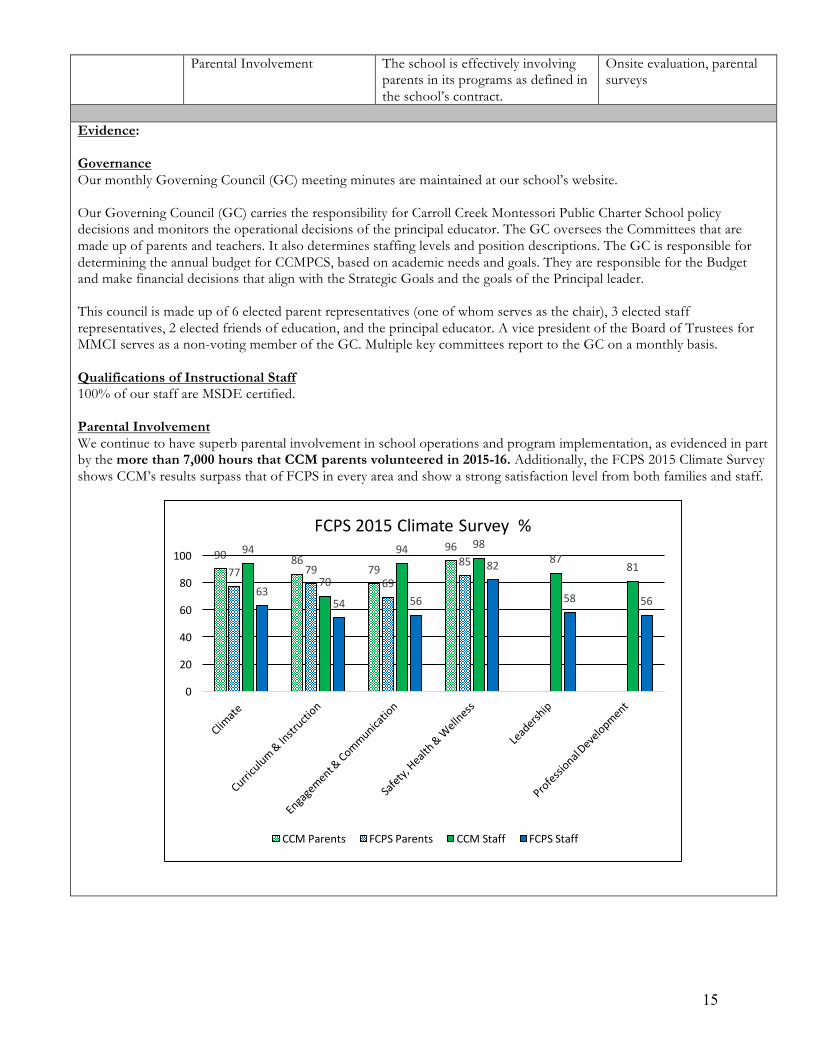
Evidence: Governance Our monthly Governing Council (GC) meeting minutes are maintained at our school’s website. Our Governing Council (GC) carries the responsibility for Carroll Creek Montessori Public Charter School policy decisions and monitors the operational decisions of the principal educator. The GC oversees the Committees that are made up of parents and teachers. It also determines staffing levels and position descriptions. The GC is responsible for determining the annual budget for CCMPCS, based on academic needs and goals. They are responsible for the Budget and make financial decisions that align with the Strategic Goals and the goals of the Principal leader. This council is made up of 6 elected parent representatives (one of whom serves as the chair), 3 elected staff representatives, 2 elected friends of education, and the principal educator. A vice president of the Board of Trustees for MMCI serves as a non-voting member of the GC. Multiple key committees report to the GC on a monthly basis. Qualifications of Instructional Staff 100% of our staff are MSDE certified. Parental Involvement We continue to have superb parental involvement in school operations and program implementation, as evidenced in part by the more than 7,000 hours that CCM parents volunteered in 2015-16. Additionally, the FCPS 2015 Climate Survey shows CCM’s results surpass that of FCPS in every area and show a strong satisfaction level from both families and staff.
90 8679
96
77 7969
8594
70
94 9887
81
6354 56
82
58 56
0
20
40
60
80
100
FCPS2015ClimateSurvey%
CCMParents FCPSParents CCMStaff FCPSStaff