Cbesta1 Paper
21
A SURVEY ON COFFEE SHOPS AROUND DE LA SALLE UNIVERSITY – MANILA CBESTA1 PROJECT PAPER PRESENTED BY Eala, Veronica Garalde, Maria Ramirez, Francesca San Ignacio, Danica Yatco, Jethro PRESENTED TO Prof. Erlinda Pangan August 22, 2012
-
Upload
independent -
Category
Documents
-
view
0 -
download
0
Transcript of Cbesta1 Paper
A SURVEY ON COFFEE SHOPS AROUND DE LA SALLE UNIVERSITY – MANILA
CBESTA1 PROJECT PAPER
PRESENTED BY Eala, Veronica Garalde, Maria
Ramirez, Francesca San Ignacio, Danica
Yatco, Jethro
PRESENTED TO Prof. Erlinda Pangan
August 22, 2012
This paper transpired from the question: Which is the most preferred coffee shop by Lasallian students and what are the qualities that these students look for a coffee shop? The group suddenly came about asking this question not just because of curiosity but also of their aspiration to figure out what catches a market specifically asking the question how do coffee shops catch the attention and loyalty of their valued customers, which we may apply in Entrepreneurship and Marketing. To be able to arrive to a conclusion in the limited given time, only 50 respondents were chosen. These respondents are students from De La Salle University-Manila, have an ID number of 111 and are currently taking up courses under the College of Business. These respondents were chosen randomly, but should importantly match the characteristics of the population stated above. Each respondent was given a questionnaire sheet, which can be found attached in this document. The questionnaire intends to answer questions like how often do the respondent visit a coffee shop, what are the reasons why they visit a coffee shop and which qualities of a coffee shop do they personally find important.
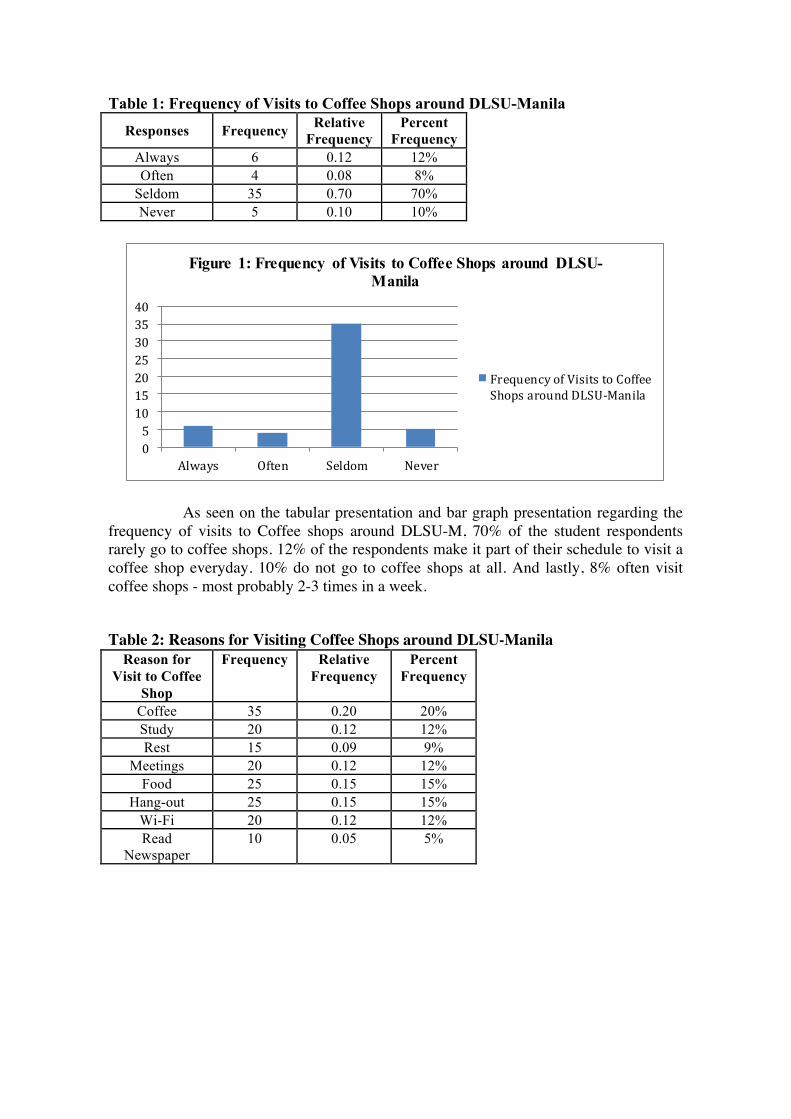
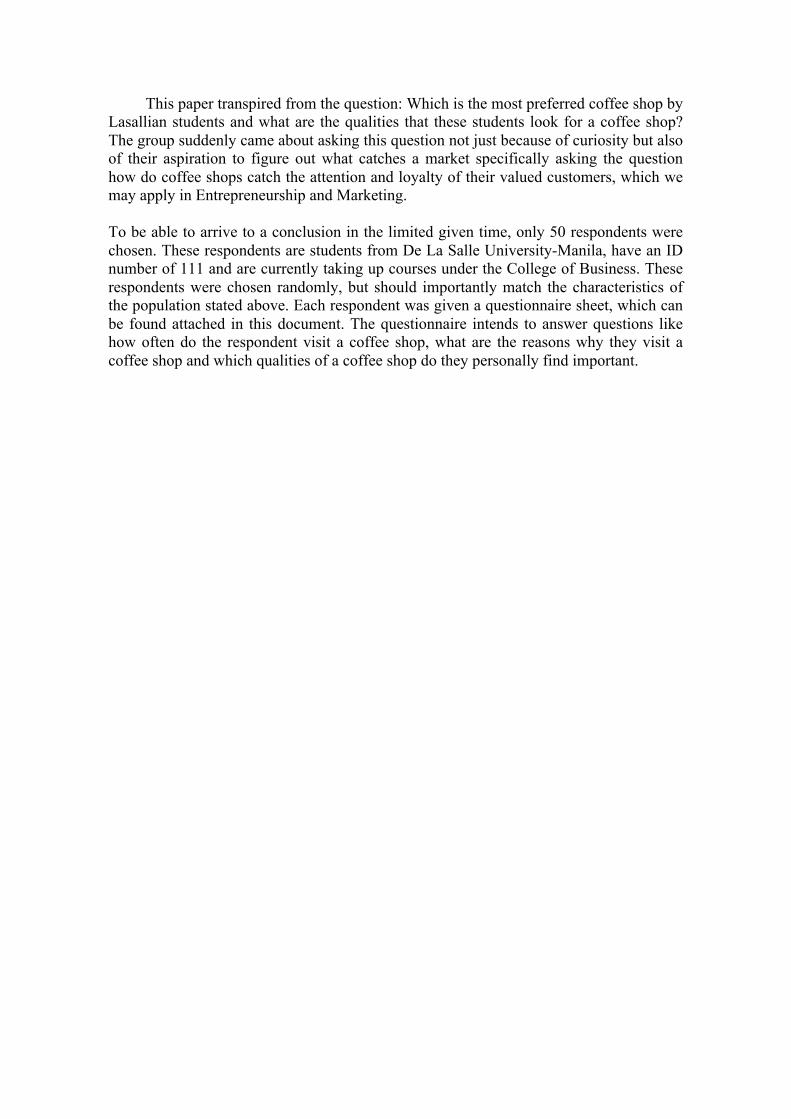
Table 1: Frequency of Visits to Coffee Shops around DLSU-Manila
Responses Frequency Relative Frequency
Percent Frequency
Always 6 0.12 12% Often 4 0.08 8%
Seldom 35 0.70 70% Never 5 0.10 10%
0510152025303540
Always Often Seldom Never
Figure 1: Frequency of Visits to Coffee Shops around DLSU-Manila
Frequency of Visits to CoffeeShops around DLSU-‐Manila
As seen on the tabular presentation and bar graph presentation regarding the frequency of visits to Coffee shops around DLSU-M, 70% of the student respondents rarely go to coffee shops. 12% of the respondents make it part of their schedule to visit a coffee shop everyday. 10% do not go to coffee shops at all. And lastly, 8% often visit coffee shops - most probably 2-3 times in a week. Table 2: Reasons for Visiting Coffee Shops around DLSU-Manila
Reason for Visit to Coffee
Shop
Frequency Relative Frequency
Percent Frequency
Coffee 35 0.20 20% Study 20 0.12 12% Rest 15 0.09 9%
Meetings 20 0.12 12% Food 25 0.15 15%
Hang-out 25 0.15 15% Wi-Fi 20 0.12 12% Read
Newspaper 10 0.05 5%

Figure 2 is a pie chart presentation of the reasons why the respondents visit coffee shops. According to the tabular presentation, 20% of the respondents go to coffee shops mainly to buy coffee. 30% of the respondents go to coffee shops to have a meal and/or hangout with their friends. 36% of the respondents either: study, have meetings, or just go to coffee shops to make use of the Wi-Fi. Only a few as 9% of students visit coffee shops to be able to relax and take a break. And, a very small percentage of 5% read newspapers in the coffee shops. Table 3: Most Frequented Coffee Shops around DLSU-Manila
Coffee Shops Visited
Frequency Relative Frequency
Percent Frequency
Starbucks 38 0.31 31% Coffee Bean &
Tea Leaf 22 0.18 18%
Holly’s 24 0.19 19% Seattle’s Best 6 0.05 5% Cafe Noriter 18 0.15 15% Beanhoppers 15 0.12 12%
As seen on the tabular and line graph presentations for the coffee shops around DLSU-M that are visited by the students, 31% go to Starbucks (at the back of Andrew building) more often. Secondly, 19% of the respondents frequent Holly’s Coffee in One Archer’s Place. Coffee Bean & Tea Leaf places 3rd on the coffee shops that are most visited by the students. Cafe Noriter, along Estrada St., is visited by 15% of the respondents. Beanhoppers Coffee, along Taft Avenue on the other side of DLSU-M, is frequented by 12% of the students. Only 5% of the respondents go to Seattle’s Best, near DLSU-CSB - most probably because of the distance. Table 4: Hours Spent in a Coffee Shop Hours Spent in
the Coffee Shop
Frequency Relative Frequency
Percent Frequency
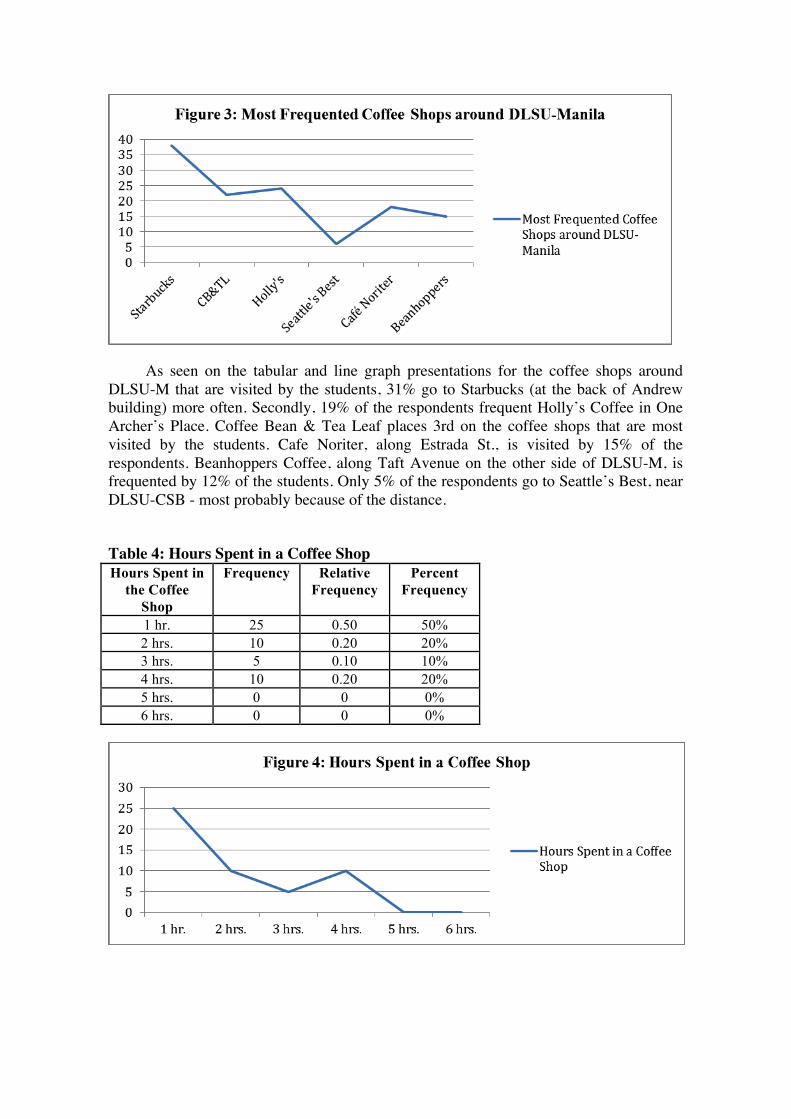
1 hr. 25 0.50 50% 2 hrs. 10 0.20 20% 3 hrs. 5 0.10 10% 4 hrs. 10 0.20 20% 5 hrs. 0 0 0% 6 hrs. 0 0 0%
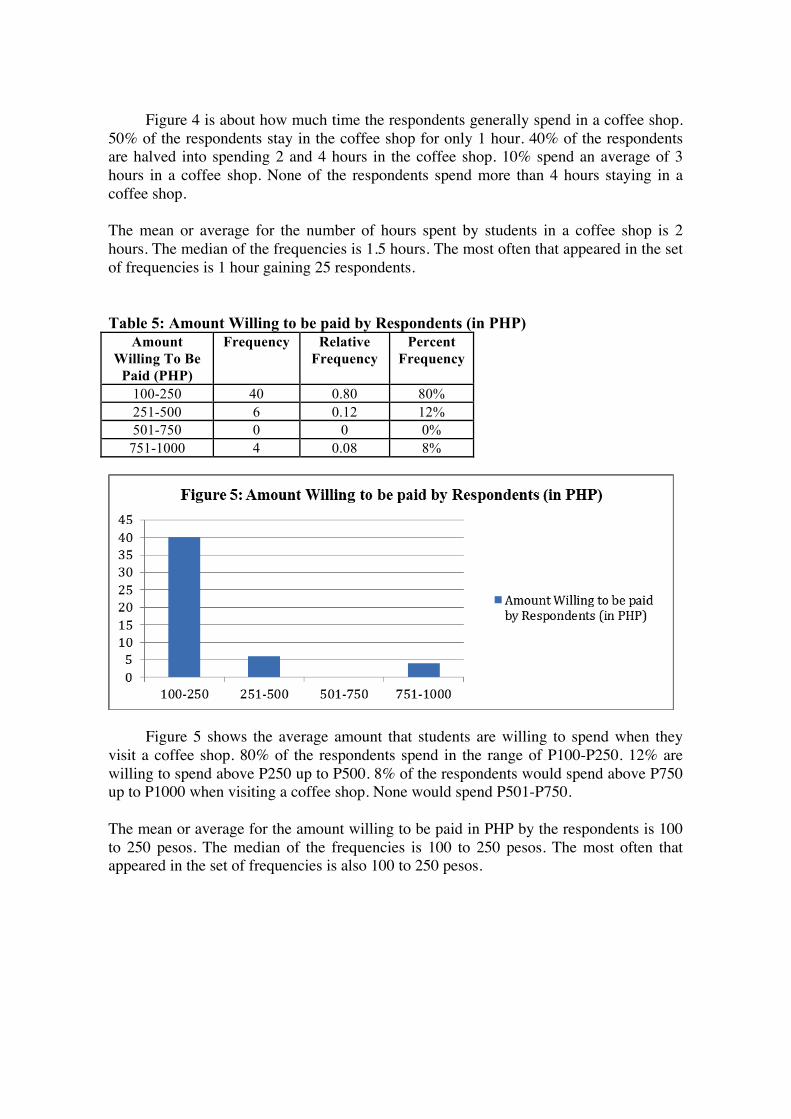
Figure 4 is about how much time the respondents generally spend in a coffee shop. 50% of the respondents stay in the coffee shop for only 1 hour. 40% of the respondents are halved into spending 2 and 4 hours in the coffee shop. 10% spend an average of 3 hours in a coffee shop. None of the respondents spend more than 4 hours staying in a coffee shop. The mean or average for the number of hours spent by students in a coffee shop is 2 hours. The median of the frequencies is 1.5 hours. The most often that appeared in the set of frequencies is 1 hour gaining 25 respondents. Table 5: Amount Willing to be paid by Respondents (in PHP)
Amount Willing To Be
Paid (PHP)
Frequency Relative Frequency
Percent Frequency
100-250 40 0.80 80% 251-500 6 0.12 12% 501-750 0 0 0%
751-1000 4 0.08 8%
Figure 5 shows the average amount that students are willing to spend when they visit a coffee shop. 80% of the respondents spend in the range of P100-P250. 12% are willing to spend above P250 up to P500. 8% of the respondents would spend above P750 up to P1000 when visiting a coffee shop. None would spend P501-P750. The mean or average for the amount willing to be paid in PHP by the respondents is 100 to 250 pesos. The median of the frequencies is 100 to 250 pesos. The most often that appeared in the set of frequencies is also 100 to 250 pesos.
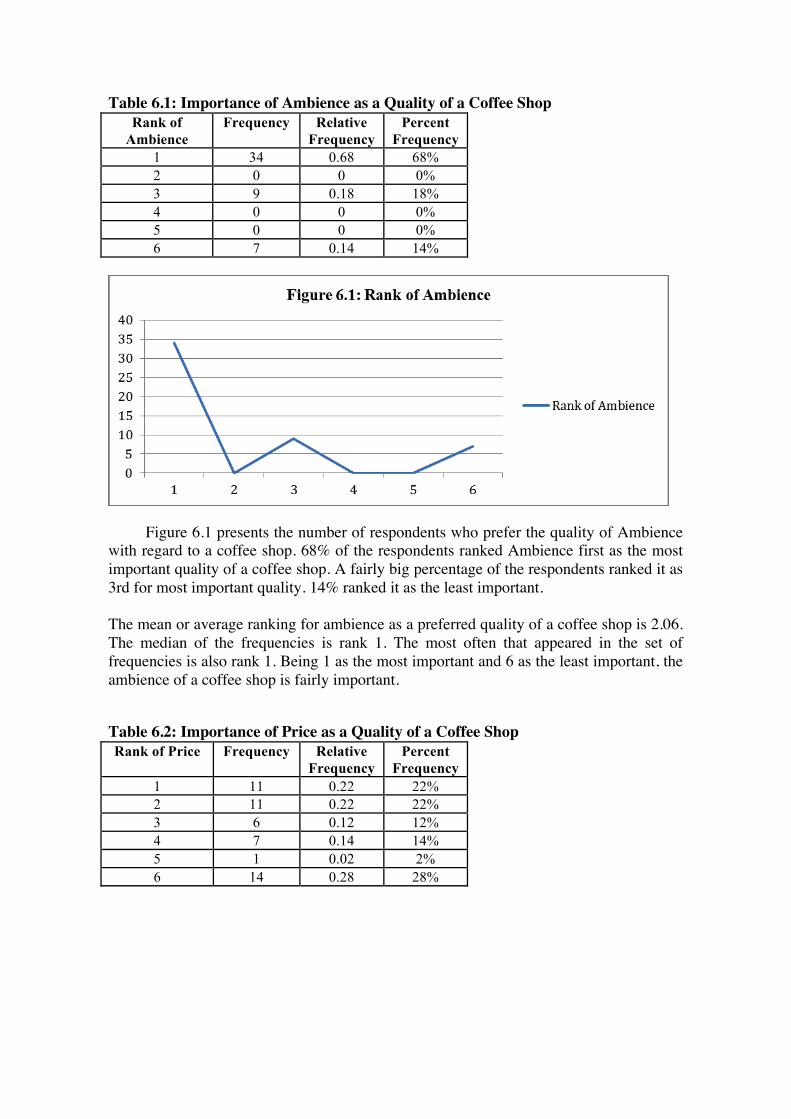
Table 6.1: Importance of Ambience as a Quality of a Coffee Shop Rank of
Ambience Frequency Relative
Frequency Percent
Frequency 1 34 0.68 68% 2 0 0 0% 3 9 0.18 18% 4 0 0 0% 5 0 0 0% 6 7 0.14 14%
Figure 6.1 presents the number of respondents who prefer the quality of Ambience with regard to a coffee shop. 68% of the respondents ranked Ambience first as the most important quality of a coffee shop. A fairly big percentage of the respondents ranked it as 3rd for most important quality. 14% ranked it as the least important. The mean or average ranking for ambience as a preferred quality of a coffee shop is 2.06. The median of the frequencies is rank 1. The most often that appeared in the set of frequencies is also rank 1. Being 1 as the most important and 6 as the least important, the ambience of a coffee shop is fairly important. Table 6.2: Importance of Price as a Quality of a Coffee Shop Rank of Price Frequency Relative
Frequency Percent
Frequency 1 11 0.22 22% 2 11 0.22 22% 3 6 0.12 12% 4 7 0.14 14% 5 1 0.02 2% 6 14 0.28 28%
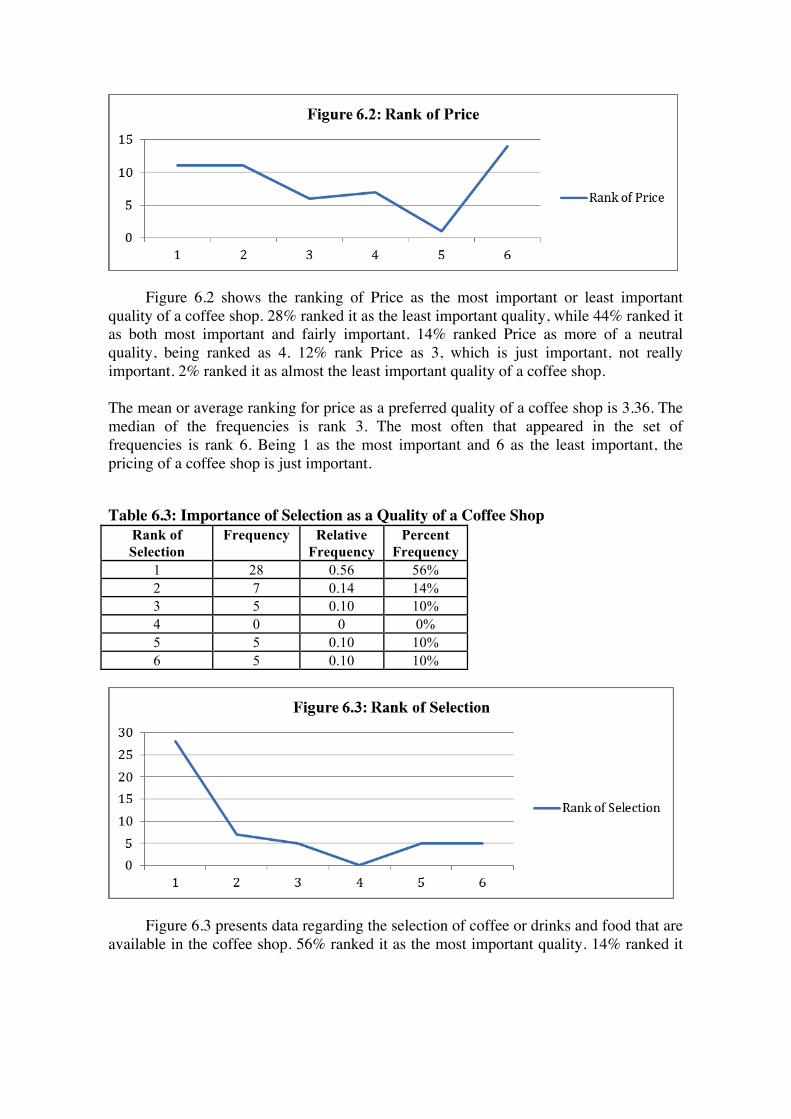
Figure 6.2 shows the ranking of Price as the most important or least important quality of a coffee shop. 28% ranked it as the least important quality, while 44% ranked it as both most important and fairly important. 14% ranked Price as more of a neutral quality, being ranked as 4. 12% rank Price as 3, which is just important, not really important. 2% ranked it as almost the least important quality of a coffee shop. The mean or average ranking for price as a preferred quality of a coffee shop is 3.36. The median of the frequencies is rank 3. The most often that appeared in the set of frequencies is rank 6. Being 1 as the most important and 6 as the least important, the pricing of a coffee shop is just important. Table 6.3: Importance of Selection as a Quality of a Coffee Shop
Rank of Selection
Frequency Relative Frequency
Percent Frequency
1 28 0.56 56% 2 7 0.14 14% 3 5 0.10 10% 4 0 0 0% 5 5 0.10 10% 6 5 0.10 10%
Figure 6.3 presents data regarding the selection of coffee or drinks and food that are available in the coffee shop. 56% ranked it as the most important quality. 14% ranked it
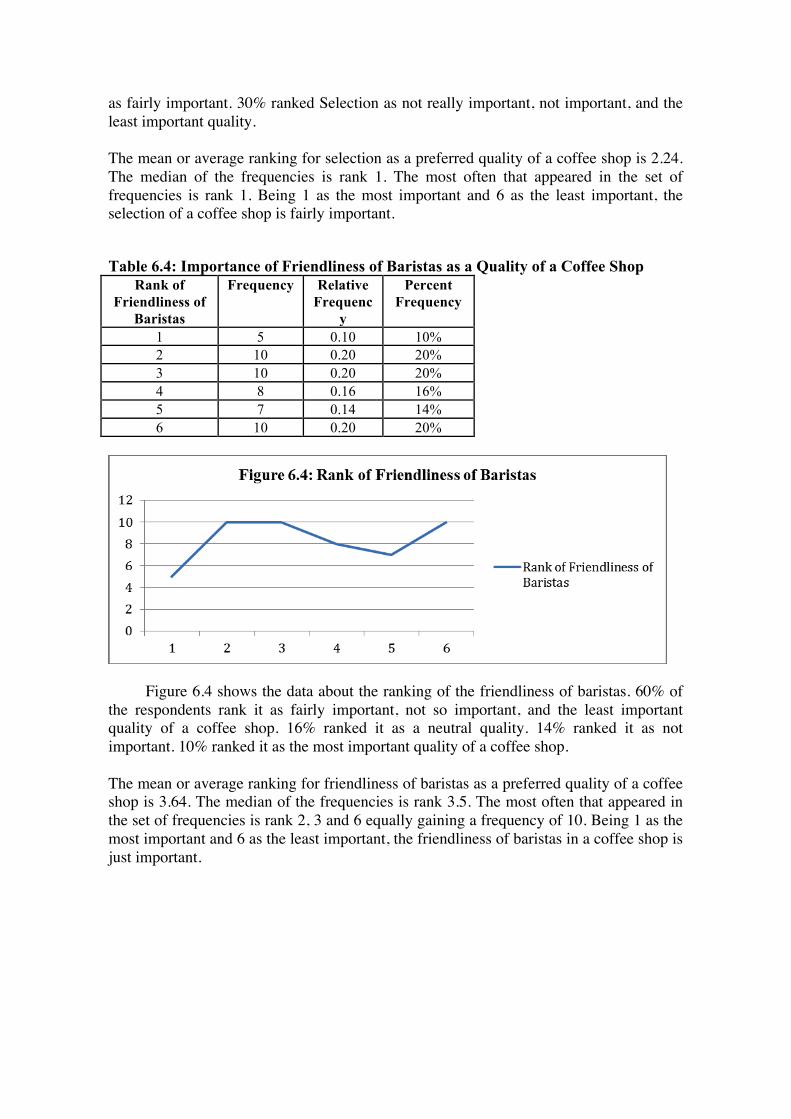
as fairly important. 30% ranked Selection as not really important, not important, and the least important quality. The mean or average ranking for selection as a preferred quality of a coffee shop is 2.24. The median of the frequencies is rank 1. The most often that appeared in the set of frequencies is rank 1. Being 1 as the most important and 6 as the least important, the selection of a coffee shop is fairly important. Table 6.4: Importance of Friendliness of Baristas as a Quality of a Coffee Shop
Rank of Friendliness of
Baristas
Frequency Relative Frequenc
y
Percent Frequency
1 5 0.10 10% 2 10 0.20 20% 3 10 0.20 20% 4 8 0.16 16% 5 7 0.14 14% 6 10 0.20 20%
Figure 6.4 shows the data about the ranking of the friendliness of baristas. 60% of the respondents rank it as fairly important, not so important, and the least important quality of a coffee shop. 16% ranked it as a neutral quality. 14% ranked it as not important. 10% ranked it as the most important quality of a coffee shop. The mean or average ranking for friendliness of baristas as a preferred quality of a coffee shop is 3.64. The median of the frequencies is rank 3.5. The most often that appeared in the set of frequencies is rank 2, 3 and 6 equally gaining a frequency of 10. Being 1 as the most important and 6 as the least important, the friendliness of baristas in a coffee shop is just important.
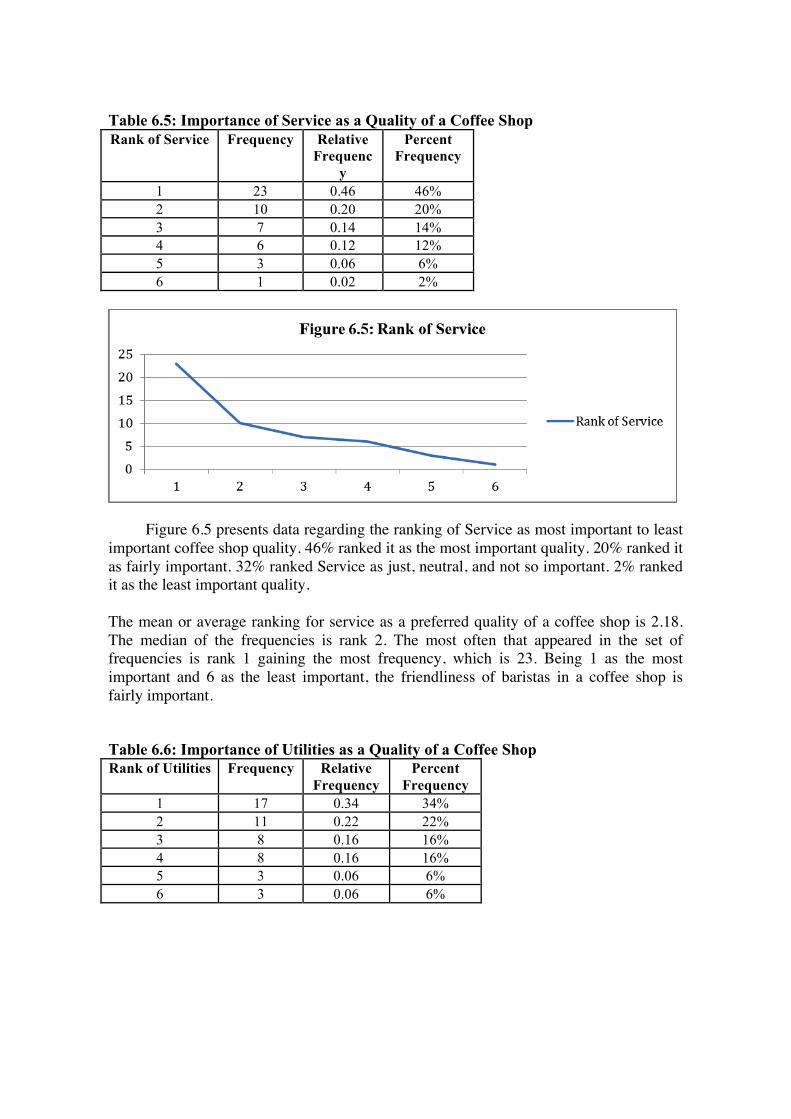
Table 6.5: Importance of Service as a Quality of a Coffee Shop Rank of Service Frequency Relative
Frequency
Percent Frequency
1 23 0.46 46% 2 10 0.20 20% 3 7 0.14 14% 4 6 0.12 12% 5 3 0.06 6% 6 1 0.02 2%
Figure 6.5 presents data regarding the ranking of Service as most important to least important coffee shop quality. 46% ranked it as the most important quality. 20% ranked it as fairly important. 32% ranked Service as just, neutral, and not so important. 2% ranked it as the least important quality. The mean or average ranking for service as a preferred quality of a coffee shop is 2.18. The median of the frequencies is rank 2. The most often that appeared in the set of frequencies is rank 1 gaining the most frequency, which is 23. Being 1 as the most important and 6 as the least important, the friendliness of baristas in a coffee shop is fairly important. Table 6.6: Importance of Utilities as a Quality of a Coffee Shop Rank of Utilities Frequency Relative
Frequency Percent
Frequency 1 17 0.34 34% 2 11 0.22 22% 3 8 0.16 16% 4 8 0.16 16% 5 3 0.06 6% 6 3 0.06 6%
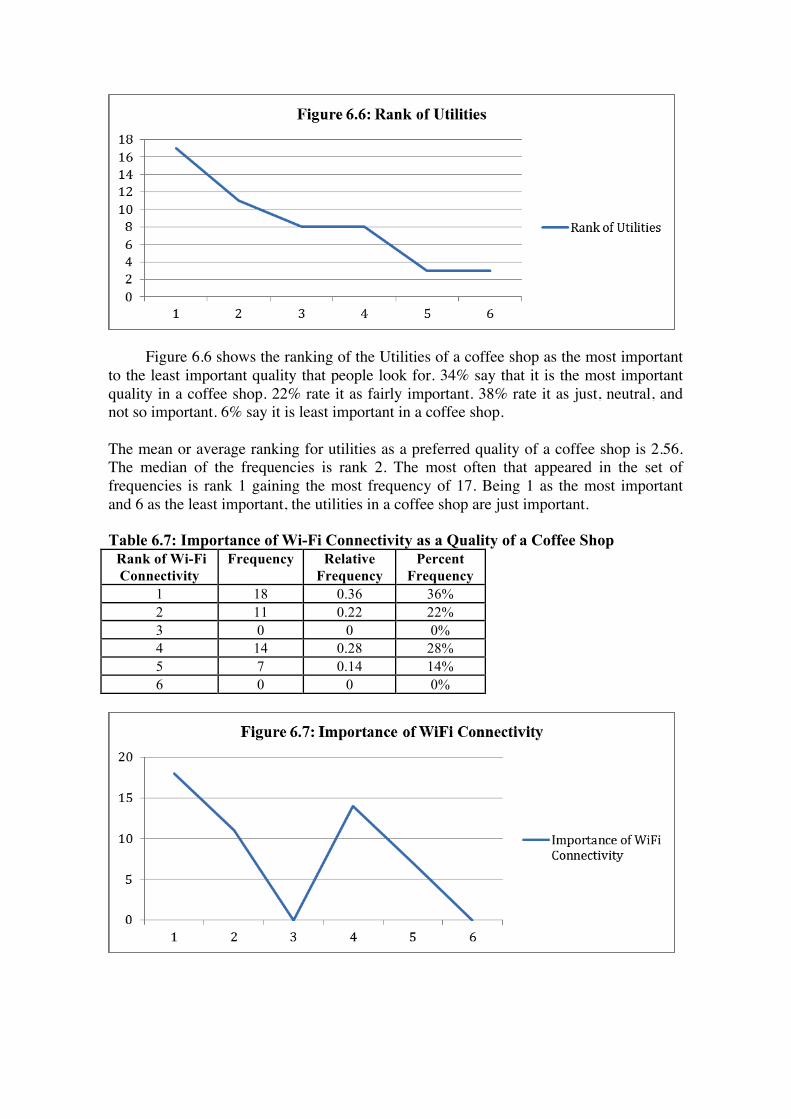
Figure 6.6 shows the ranking of the Utilities of a coffee shop as the most important to the least important quality that people look for. 34% say that it is the most important quality in a coffee shop. 22% rate it as fairly important. 38% rate it as just, neutral, and not so important. 6% say it is least important in a coffee shop. The mean or average ranking for utilities as a preferred quality of a coffee shop is 2.56. The median of the frequencies is rank 2. The most often that appeared in the set of frequencies is rank 1 gaining the most frequency of 17. Being 1 as the most important and 6 as the least important, the utilities in a coffee shop are just important. Table 6.7: Importance of Wi-Fi Connectivity as a Quality of a Coffee Shop Rank of Wi-Fi Connectivity
Frequency Relative Frequency
Percent Frequency
1 18 0.36 36% 2 11 0.22 22% 3 0 0 0% 4 14 0.28 28% 5 7 0.14 14% 6 0 0 0%
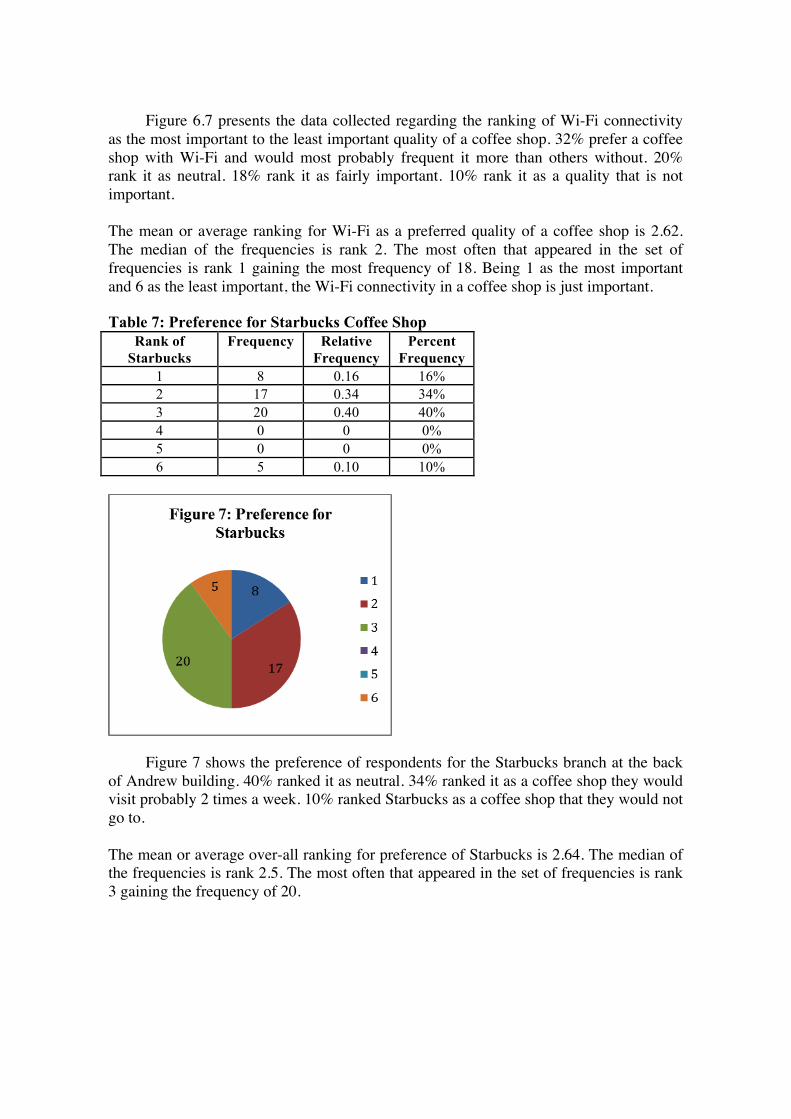
Figure 6.7 presents the data collected regarding the ranking of Wi-Fi connectivity as the most important to the least important quality of a coffee shop. 32% prefer a coffee shop with Wi-Fi and would most probably frequent it more than others without. 20% rank it as neutral. 18% rank it as fairly important. 10% rank it as a quality that is not important. The mean or average ranking for Wi-Fi as a preferred quality of a coffee shop is 2.62. The median of the frequencies is rank 2. The most often that appeared in the set of frequencies is rank 1 gaining the most frequency of 18. Being 1 as the most important and 6 as the least important, the Wi-Fi connectivity in a coffee shop is just important. Table 7: Preference for Starbucks Coffee Shop
Rank of Starbucks
Frequency Relative Frequency
Percent Frequency
1 8 0.16 16% 2 17 0.34 34% 3 20 0.40 40% 4 0 0 0% 5 0 0 0% 6 5 0.10 10%
Figure 7 shows the preference of respondents for the Starbucks branch at the back of Andrew building. 40% ranked it as neutral. 34% ranked it as a coffee shop they would visit probably 2 times a week. 10% ranked Starbucks as a coffee shop that they would not go to. The mean or average over-all ranking for preference of Starbucks is 2.64. The median of the frequencies is rank 2.5. The most often that appeared in the set of frequencies is rank 3 gaining the frequency of 20.
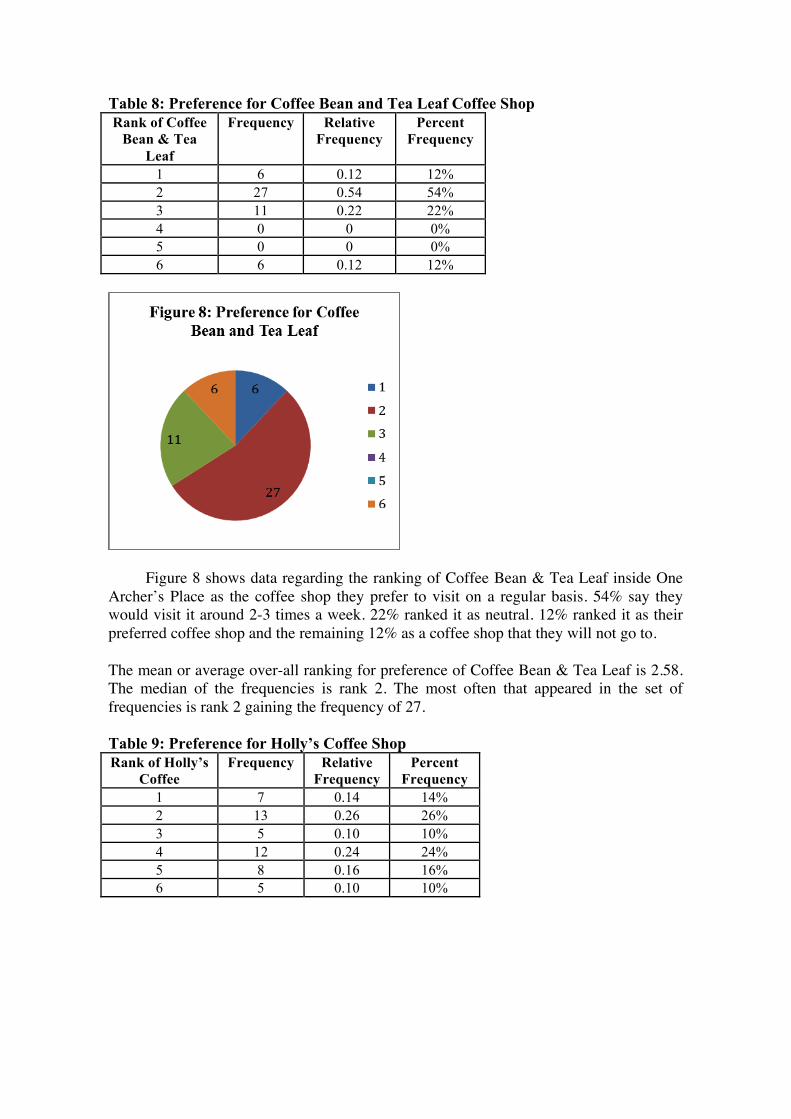
Table 8: Preference for Coffee Bean and Tea Leaf Coffee Shop Rank of Coffee
Bean & Tea Leaf
Frequency Relative Frequency
Percent Frequency
1 6 0.12 12% 2 27 0.54 54% 3 11 0.22 22% 4 0 0 0% 5 0 0 0% 6 6 0.12 12%
Figure 8 shows data regarding the ranking of Coffee Bean & Tea Leaf inside One Archer’s Place as the coffee shop they prefer to visit on a regular basis. 54% say they would visit it around 2-3 times a week. 22% ranked it as neutral. 12% ranked it as their preferred coffee shop and the remaining 12% as a coffee shop that they will not go to. The mean or average over-all ranking for preference of Coffee Bean & Tea Leaf is 2.58. The median of the frequencies is rank 2. The most often that appeared in the set of frequencies is rank 2 gaining the frequency of 27. Table 9: Preference for Holly’s Coffee Shop Rank of Holly’s
Coffee Frequency Relative
Frequency Percent
Frequency 1 7 0.14 14% 2 13 0.26 26% 3 5 0.10 10% 4 12 0.24 24% 5 8 0.16 16% 6 5 0.10 10%
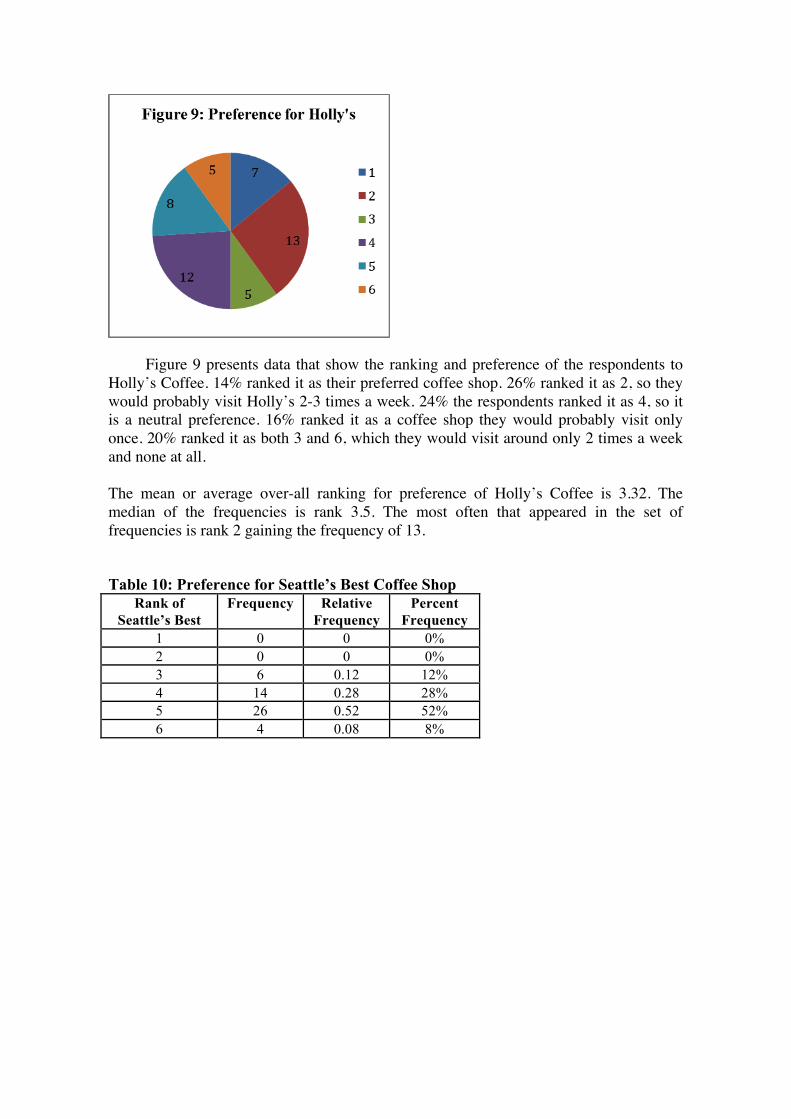
Figure 9 presents data that show the ranking and preference of the respondents to Holly’s Coffee. 14% ranked it as their preferred coffee shop. 26% ranked it as 2, so they would probably visit Holly’s 2-3 times a week. 24% the respondents ranked it as 4, so it is a neutral preference. 16% ranked it as a coffee shop they would probably visit only once. 20% ranked it as both 3 and 6, which they would visit around only 2 times a week and none at all. The mean or average over-all ranking for preference of Holly’s Coffee is 3.32. The median of the frequencies is rank 3.5. The most often that appeared in the set of frequencies is rank 2 gaining the frequency of 13. Table 10: Preference for Seattle’s Best Coffee Shop
Rank of Seattle’s Best
Frequency Relative Frequency
Percent Frequency
1 0 0 0% 2 0 0 0% 3 6 0.12 12% 4 14 0.28 28% 5 26 0.52 52% 6 4 0.08 8%
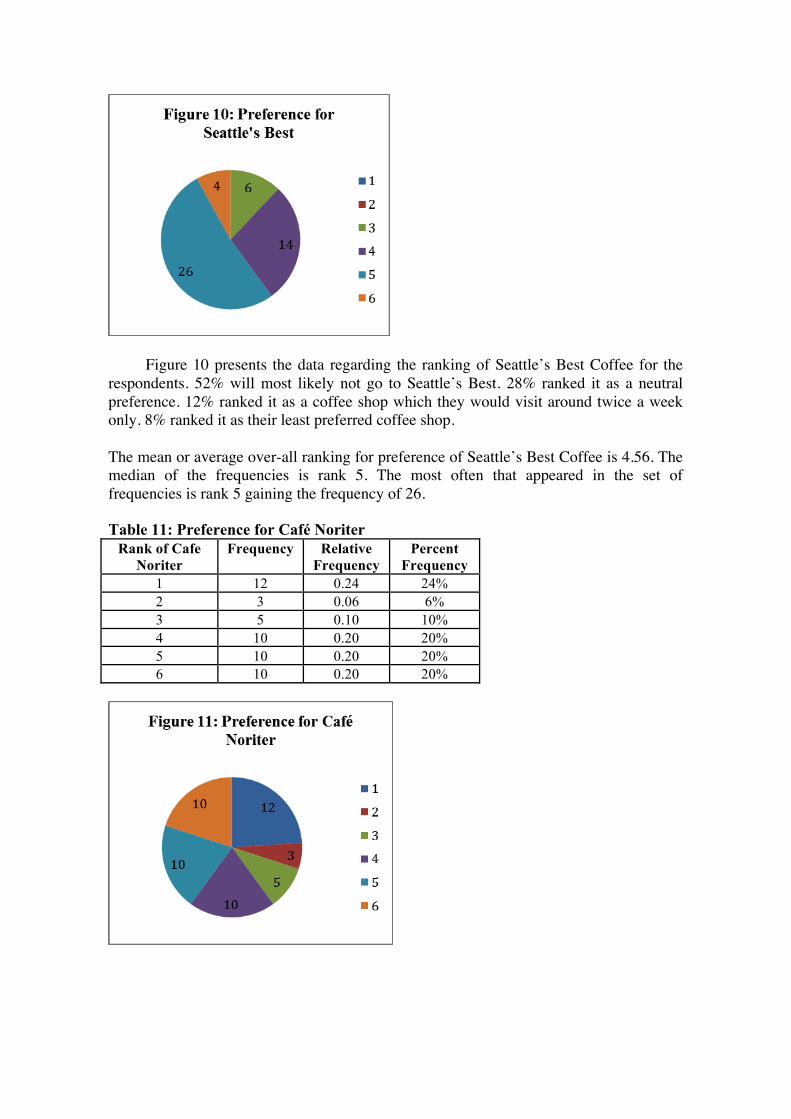
Figure 10 presents the data regarding the ranking of Seattle’s Best Coffee for the respondents. 52% will most likely not go to Seattle’s Best. 28% ranked it as a neutral preference. 12% ranked it as a coffee shop which they would visit around twice a week only. 8% ranked it as their least preferred coffee shop. The mean or average over-all ranking for preference of Seattle’s Best Coffee is 4.56. The median of the frequencies is rank 5. The most often that appeared in the set of frequencies is rank 5 gaining the frequency of 26. Table 11: Preference for Café Noriter
Rank of Cafe Noriter
Frequency Relative Frequency
Percent Frequency
1 12 0.24 24% 2 3 0.06 6% 3 5 0.10 10% 4 10 0.20 20% 5 10 0.20 20% 6 10 0.20 20%
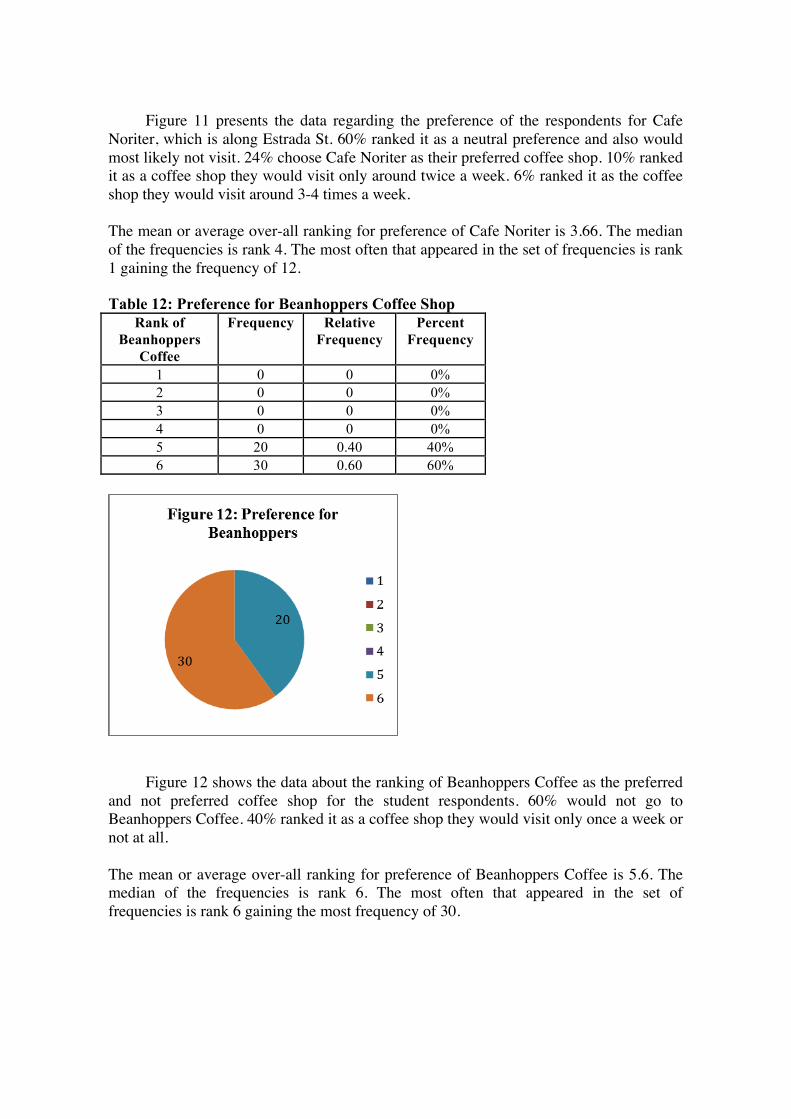
Figure 11 presents the data regarding the preference of the respondents for Cafe Noriter, which is along Estrada St. 60% ranked it as a neutral preference and also would most likely not visit. 24% choose Cafe Noriter as their preferred coffee shop. 10% ranked it as a coffee shop they would visit only around twice a week. 6% ranked it as the coffee shop they would visit around 3-4 times a week. The mean or average over-all ranking for preference of Cafe Noriter is 3.66. The median of the frequencies is rank 4. The most often that appeared in the set of frequencies is rank 1 gaining the frequency of 12. Table 12: Preference for Beanhoppers Coffee Shop
Rank of Beanhoppers
Coffee
Frequency Relative Frequency
Percent Frequency
1 0 0 0% 2 0 0 0% 3 0 0 0% 4 0 0 0% 5 20 0.40 40% 6 30 0.60 60%
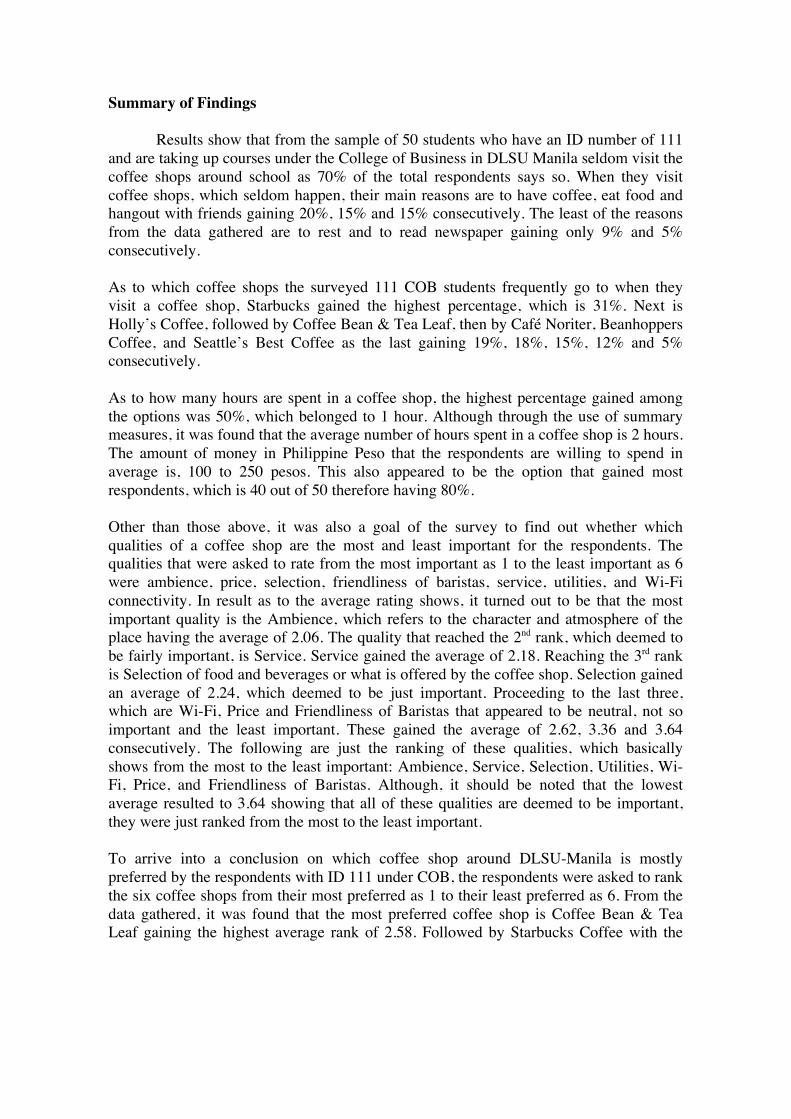
Figure 12 shows the data about the ranking of Beanhoppers Coffee as the preferred and not preferred coffee shop for the student respondents. 60% would not go to Beanhoppers Coffee. 40% ranked it as a coffee shop they would visit only once a week or not at all. The mean or average over-all ranking for preference of Beanhoppers Coffee is 5.6. The median of the frequencies is rank 6. The most often that appeared in the set of frequencies is rank 6 gaining the most frequency of 30.
Summary of Findings
Results show that from the sample of 50 students who have an ID number of 111 and are taking up courses under the College of Business in DLSU Manila seldom visit the coffee shops around school as 70% of the total respondents says so. When they visit coffee shops, which seldom happen, their main reasons are to have coffee, eat food and hangout with friends gaining 20%, 15% and 15% consecutively. The least of the reasons from the data gathered are to rest and to read newspaper gaining only 9% and 5% consecutively. As to which coffee shops the surveyed 111 COB students frequently go to when they visit a coffee shop, Starbucks gained the highest percentage, which is 31%. Next is Holly’s Coffee, followed by Coffee Bean & Tea Leaf, then by Café Noriter, Beanhoppers Coffee, and Seattle’s Best Coffee as the last gaining 19%, 18%, 15%, 12% and 5% consecutively. As to how many hours are spent in a coffee shop, the highest percentage gained among the options was 50%, which belonged to 1 hour. Although through the use of summary measures, it was found that the average number of hours spent in a coffee shop is 2 hours. The amount of money in Philippine Peso that the respondents are willing to spend in average is, 100 to 250 pesos. This also appeared to be the option that gained most respondents, which is 40 out of 50 therefore having 80%. Other than those above, it was also a goal of the survey to find out whether which qualities of a coffee shop are the most and least important for the respondents. The qualities that were asked to rate from the most important as 1 to the least important as 6 were ambience, price, selection, friendliness of baristas, service, utilities, and Wi-Fi connectivity. In result as to the average rating shows, it turned out to be that the most important quality is the Ambience, which refers to the character and atmosphere of the place having the average of 2.06. The quality that reached the 2nd rank, which deemed to be fairly important, is Service. Service gained the average of 2.18. Reaching the 3rd rank is Selection of food and beverages or what is offered by the coffee shop. Selection gained an average of 2.24, which deemed to be just important. Proceeding to the last three, which are Wi-Fi, Price and Friendliness of Baristas that appeared to be neutral, not so important and the least important. These gained the average of 2.62, 3.36 and 3.64 consecutively. The following are just the ranking of these qualities, which basically shows from the most to the least important: Ambience, Service, Selection, Utilities, Wi-Fi, Price, and Friendliness of Baristas. Although, it should be noted that the lowest average resulted to 3.64 showing that all of these qualities are deemed to be important, they were just ranked from the most to the least important. To arrive into a conclusion on which coffee shop around DLSU-Manila is mostly preferred by the respondents with ID 111 under COB, the respondents were asked to rank the six coffee shops from their most preferred as 1 to their least preferred as 6. From the data gathered, it was found that the most preferred coffee shop is Coffee Bean & Tea Leaf gaining the highest average rank of 2.58. Followed by Starbucks Coffee with the
average rank of 2.64, then by Holly’s Coffee with 3.32, Café Noriter with 3.66, Seattle’s Best Coffee with 4.56 and lastly Beanhoppers Coffee gaining the least ranking of 5.6 therefore being the least preferred.
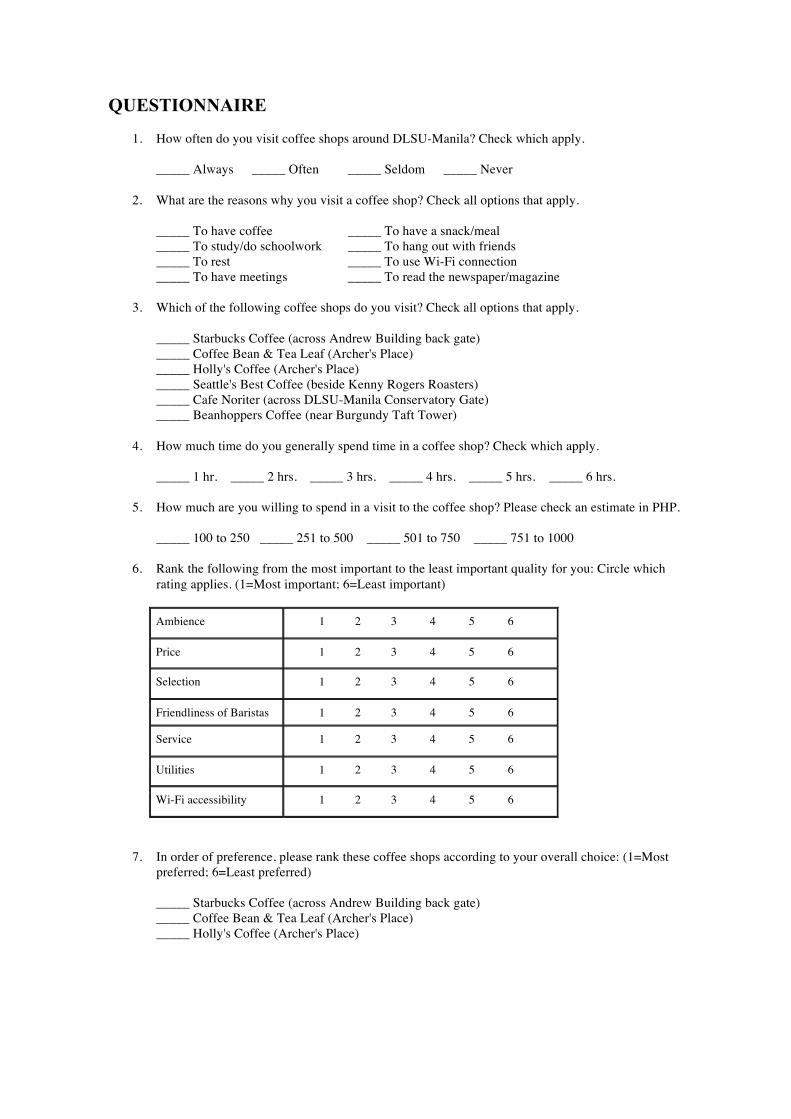
QUESTIONNAIRE
1. How often do you visit coffee shops around DLSU-Manila? Check which apply. _____ Always _____ Often _____ Seldom _____ Never
2. What are the reasons why you visit a coffee shop? Check all options that apply. _____ To have coffee _____ To have a snack/meal _____ To study/do schoolwork _____ To hang out with friends _____ To rest _____ To use Wi-Fi connection _____ To have meetings _____ To read the newspaper/magazine
3. Which of the following coffee shops do you visit? Check all options that apply. _____ Starbucks Coffee (across Andrew Building back gate) _____ Coffee Bean & Tea Leaf (Archer's Place) _____ Holly's Coffee (Archer's Place) _____ Seattle's Best Coffee (beside Kenny Rogers Roasters) _____ Cafe Noriter (across DLSU-Manila Conservatory Gate) _____ Beanhoppers Coffee (near Burgundy Taft Tower)
4. How much time do you generally spend time in a coffee shop? Check which apply. _____ 1 hr. _____ 2 hrs. _____ 3 hrs. _____ 4 hrs. _____ 5 hrs. _____ 6 hrs.
5. How much are you willing to spend in a visit to the coffee shop? Please check an estimate in PHP. _____ 100 to 250 _____ 251 to 500 _____ 501 to 750 _____ 751 to 1000
6. Rank the following from the most important to the least important quality for you: Circle which rating applies. (1=Most important; 6=Least important) Ambience 1 2 3 4 5 6
Price 1 2 3 4 5 6
Selection 1 2 3 4 5 6
Friendliness of Baristas 1 2 3 4 5 6
Service 1 2 3 4 5 6
Utilities 1 2 3 4 5 6
Wi-Fi accessibility 1 2 3 4 5 6
7. In order of preference, please rank these coffee shops according to your overall choice: (1=Most preferred; 6=Least preferred) _____ Starbucks Coffee (across Andrew Building back gate) _____ Coffee Bean & Tea Leaf (Archer's Place) _____ Holly's Coffee (Archer's Place)
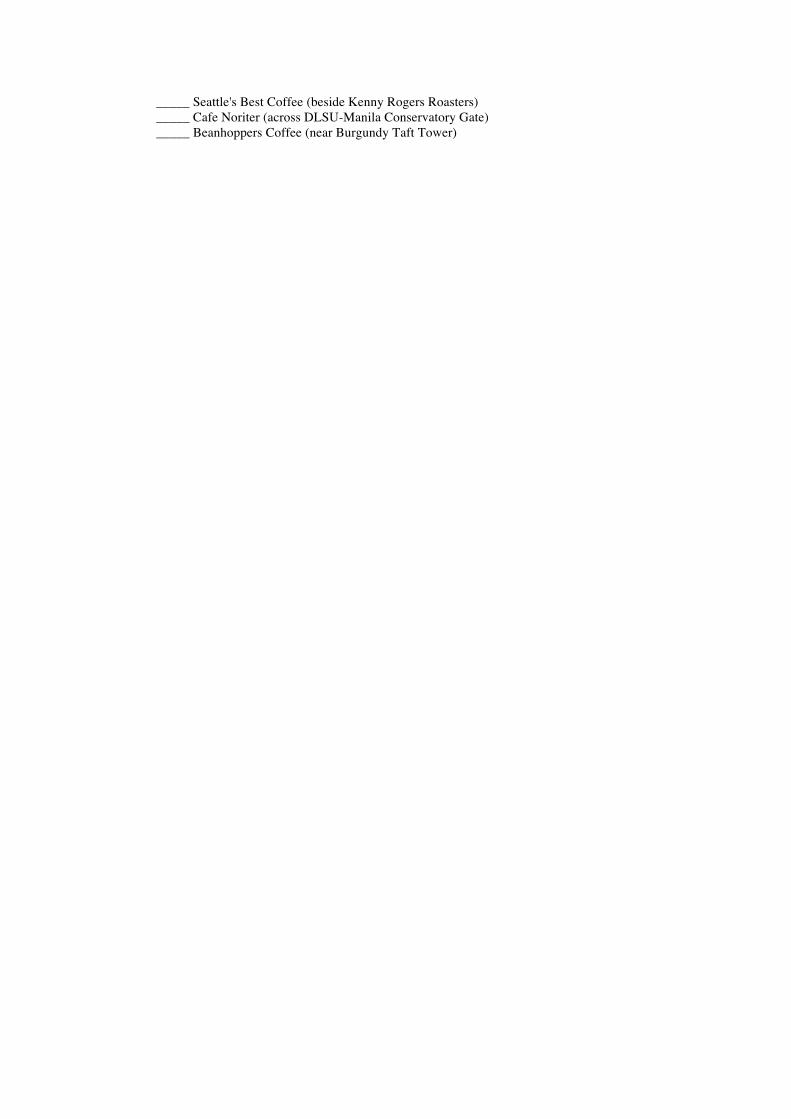
_____ Seattle's Best Coffee (beside Kenny Rogers Roasters) _____ Cafe Noriter (across DLSU-Manila Conservatory Gate) _____ Beanhoppers Coffee (near Burgundy Taft Tower)
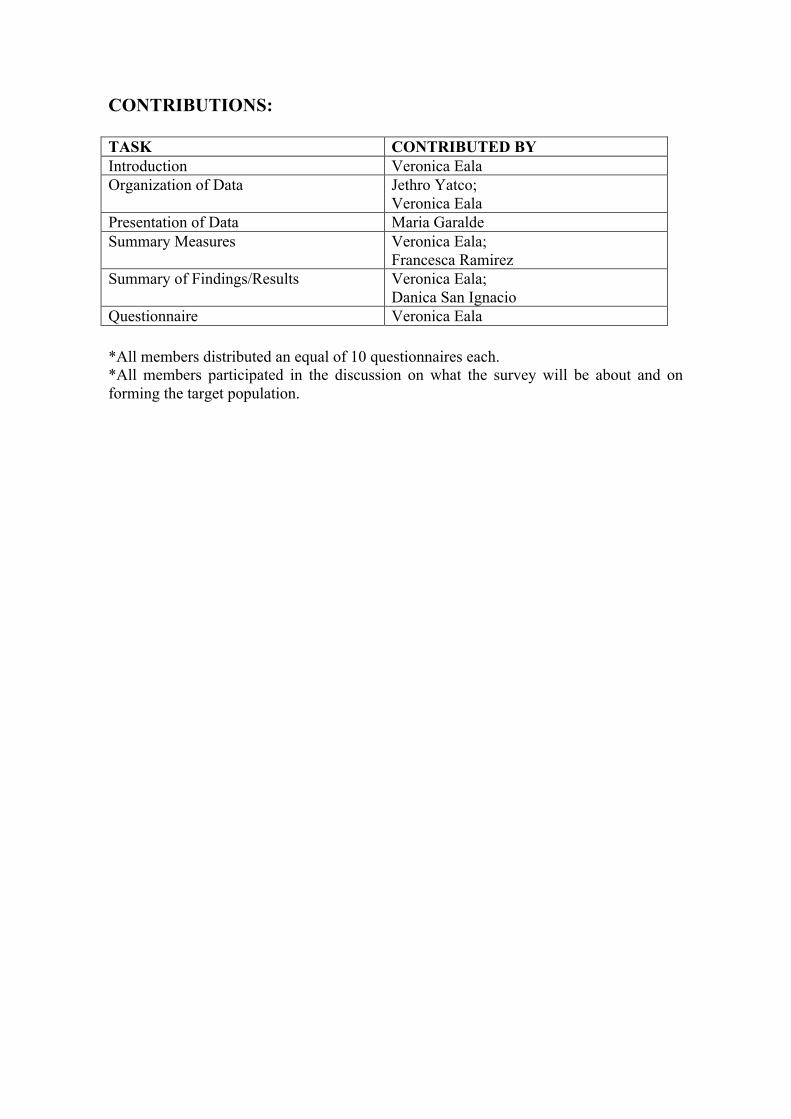
CONTRIBUTIONS: TASK CONTRIBUTED BY Introduction Veronica Eala Organization of Data Jethro Yatco;
Veronica Eala Presentation of Data Maria Garalde Summary Measures Veronica Eala;
Francesca Ramirez Summary of Findings/Results Veronica Eala;
Danica San Ignacio Questionnaire Veronica Eala *All members distributed an equal of 10 questionnaires each. *All members participated in the discussion on what the survey will be about and on forming the target population.