Cautious on 2019 Domestic TV Sales Performance ...
9
See the last page for disclaimer Page 1 of 9 Equity Research Equity Research Report Company Report 股 票 研 究 公 司 报 告 证 券 研 究 报 告 工 业 制 造 行 业 Manufacturing Sector 创 维 数 码 Skyworth Digital (00751 HK) Company Report: Skyworth Digital (00751 HK) Andrew Song 宋涛 (852) 2509 5313 公司报告:创维数码 (00751 HK) [email protected] 3 April 2019 Cautious on 2019 Domestic TV Sales Performance, Downgrade to "Accumulate" 对2019年国内彩电表现保持谨慎,下调至“收集” Skyworth’s profit after taxation recorded RMB839 million in 2018. Total revenue slightly increased 0.1% YoY to RMB38,978 million, of which domestic TV sales dropped 3.8% YoY and overseas TV sales declined 27.4% YoY. Gross margin improved by 1.6 ppts YoY to 18.5%, mainly due to raw material costs drop and product mix upgrade. For nine months ended Dec. 31, 2018, revenue recorded RMB30,192 million and shareholders’ profit was RMB420 million. Expect still challenging domestic TV market in 2019. In 2018, total TV sales volume growth in China was largely flat but sales revenue dropped by high single digit percentage, mainly due to declining panel price and price war conducted by internet brands. In 2019, we expect the competition trend to continue. However, we believe that leading TV manufacturers will outperform the industry leveraging on technology advantages and economies of scale, leading to more concentrated market share. Downgrade investment rating to "Accumulate" but revise up target price to HK$3.08. We value TVs as an important interface in smart appliances systems but remain cautious on the short-term performance. New TP represents 8.0x 2019 PER and 6.3x 2020 PER, respectively. Main downside risks include continuing price war and lower-than-expected margin. 创维 2018 年税后利润为人民币 839 百万元。 收入同比微增 0.1%至人民币 38,978 百万元, 其中国内电视销售同比下降 3.8%,海外电视销售同比下滑 27.4%。毛利率同比提升 1.6 个百分点至 18.5%,主要由于原材料价格下降以及产品结构升级。截止 2018 年 12 月 31 日九个月,收入录得人民币 30,192 百万元,股东净利为人民币 420 百万元。 预期 2019 年国内彩电市场仍然有挑战。2018 年,中国彩电总销量大致持平但销售收入 录得高单位数下跌,主要由于面板价格下降以及互联网品牌发起的价格战。我们认为 2019 年竞争趋势仍将持续。然而,我们认为领先的电视制造企业将会凭借其技术优势和 规模效应跑赢行业,使得市场份额更加集中。 下调投资评级至“收集”,但上调目标价至 3.08 港元。我们看重电视作为智能家电系统 中重要的交互界面作用,但对短期表现表示谨慎。新目标价分别对应 8.0 倍 2019 年市盈 率以及 6.3 倍 2020 年市盈率。主要下行风险包括持续的价格战以及低于预期的利润率。 Rating: Accumulate Downgraded 评级: 收集 (下调) 6-18m TP 目标价: HK$3.08 Revised from 原目标价: HK$2.62 Share price 股价: HK$2.620 Stock performance 股价表现 [Table_PriceChange] Change in Share Price 股价变动 1 M 1 个月 3 M 3 个月 1 Y 1 年 Abs. % 绝对变动 % 4.8 60.7 (25.8) Rel. % to HS Index 相对恒指变动 % 0.7 41.1 (25.1) Avg. Share price(HK$) 平均股价(港元) 2.7 2.4 2.7 Source: Bloomberg, Guotai Junan International. [Table_ Year End Turnover Net Profit EPS EPS PER BPS PBR DPS Yield ROE 年结 收入 股东净利 每股净利 每股净利变动 市盈率 每股净资产 市净率 每股股息 股息率 净资产收益率 12/31 (RMB m) (RMB m) (RMB) (△ %) (x) (RMB) (x) (RMB) (%) (%) 2017A 39,271 459 0.152 (59.1) 14.3 5.481 0.4 0.043 2.0 3.2 2018A 30,192 420 0.139 (8.6) 16.6 5.724 0.4 0.052 2.3 2.8 2019F 40,613 992 0.327 135.3 6.8 7.101 0.3 0.143 6.4 5.8 2020F 44,067 1,253 0.413 26.3 5.4 7.449 0.3 0.181 8.1 6.4 2021F 47,503 1,528 0.504 22.0 4.4 7.866 0.3 0.220 9.9 7.4 Shares in issue (m) 总股数 (m) 3,032.2 Major shareholder 大股东 Wei Ping Lin 40.1% Market cap. (HK$ m) 市值 (HK$ m) 7,944.4 Free float (%) 自由流通比率 (%) 59.2 3 month average vol. 3 个月平均成交股数 (‘000) 34,774.0 FY19 Net gearing (%) FY19 净负债/股东资金 (%) Net cash 52 Weeks high/low (HK$) 52 周高/低 (HK$) 4.190 / 1.620 FY19 Est. NAV (HK$) FY19 每股估值(港元) 3.5 Source: the Company, Guotai Junan International. Note: 2018A represents the period of nine months ended December 31, 2019. (60.0) (50.0) (40.0) (30.0) (20.0) (10.0) 0. 0 10.0 20.0 Apr-18 Jul-18 Sep-18 Dec-18 Mar-19 % of return HSI index SKYWORTH DIGITAL
-
Upload
khangminh22 -
Category
Documents
-
view
0 -
download
0
Transcript of Cautious on 2019 Domestic TV Sales Performance ...
See the last page for disclaimer Page 1 of 9
Eq
uit
y R
ese
arc
h
Eq
uit
y R
ese
arc
h R
ep
ort
证
券 研
究 报
告
Co
mp
an
y R
ep
ort
股
票
研
究
公
司
报
告
证
券
研
究
报
告
[Tab
le_I
nfo1
] 工
业
制
造
行
业
Ma
nu
fac
turi
ng
Se
cto
r
[Tab
le_I
nfo2
]
创
维
数
码
Sk
yw
ort
h D
igit
al (0
075
1 H
K)
[Table_Title] Company Report: Skyworth Digital (00751 HK)
Andrew Song 宋涛
(852) 2509 5313
公司报告: 创维数码 (00751 HK) [email protected]
3 April 2019
[Table_Summary] Cautious on 2019 Domestic TV Sales Performance,
Downgrade to "Accumulate" 对2019年国内彩电表现保持谨慎,下调至“收集”
Skyworth’s profit after taxation recorded RMB839 million in 2018. Total
revenue slightly increased 0.1% YoY to RMB38,978 million, of which
domestic TV sales dropped 3.8% YoY and overseas TV sales declined
27.4% YoY. Gross margin improved by 1.6 ppts YoY to 18.5%, mainly due
to raw material costs drop and product mix upgrade. For nine months ended
Dec. 31, 2018, revenue recorded RMB30,192 million and shareholders’
profit was RMB420 million.
Expect still challenging domestic TV market in 2019. In 2018, total TV
sales volume growth in China was largely flat but sales revenue dropped by
high single digit percentage, mainly due to declining panel price and price
war conducted by internet brands. In 2019, we expect the competition trend
to continue. However, we believe that leading TV manufacturers will
outperform the industry leveraging on technology advantages and
economies of scale, leading to more concentrated market share.
Downgrade investment rating to "Accumulate" but revise up target
price to HK$3.08. We value TVs as an important interface in smart
appliances systems but remain cautious on the short-term performance.
New TP represents 8.0x 2019 PER and 6.3x 2020 PER, respectively. Main
downside risks include continuing price war and lower-than-expected
margin.
创维 2018 年税后利润为人民币 839 百万元。收入同比微增 0.1%至人民币 38,978 百万元,
其中国内电视销售同比下降 3.8%,海外电视销售同比下滑 27.4%。毛利率同比提升 1.6
个百分点至 18.5%,主要由于原材料价格下降以及产品结构升级。截止 2018 年 12 月 31
日九个月,收入录得人民币 30,192 百万元,股东净利为人民币 420 百万元。
预期 2019 年国内彩电市场仍然有挑战。2018 年,中国彩电总销量大致持平但销售收入
录得高单位数下跌,主要由于面板价格下降以及互联网品牌发起的价格战。我们认为
2019 年竞争趋势仍将持续。然而,我们认为领先的电视制造企业将会凭借其技术优势和
规模效应跑赢行业,使得市场份额更加集中。
下调投资评级至“收集”,但上调目标价至 3.08 港元。我们看重电视作为智能家电系统
中重要的交互界面作用,但对短期表现表示谨慎。新目标价分别对应 8.0 倍 2019 年市盈
率以及 6.3 倍 2020 年市盈率。主要下行风险包括持续的价格战以及低于预期的利润率。
[Table_Rank] Rating: Accumulate
Downgraded
评级: 收集 (下调)
[Table_Price] 6-18m TP 目标价: HK$3.08
Revised from 原目标价: HK$2.62
Share price 股价: HK$2.620
Stock performance
股价表现
[Table_QuotePic]
[Table_PriceChange] Change in Share Price
股价变动
1 M
1 个月
3 M
3 个月
1 Y
1 年
Abs. %
绝对变动 % 4.8 60.7 (25.8)
Rel. % to HS Index
相对恒指变动 % 0.7 41.1 (25.1)
Avg. Share price(HK$)
平均股价(港元) 2.7 2.4 2.7
Source: Bloomberg, Guotai Junan International.
[Table_Profit] Year End Turnover Net Profit EPS EPS PER BPS PBR DPS Yield ROE
年结 收入 股东净利 每股净利 每股净利变动 市盈率 每股净资产 市净率 每股股息 股息率 净资产收益率
12/31 (RMB m) (RMB m) (RMB) (△ %) (x) (RMB) (x) (RMB) (%) (%)
2017A 39,271 459 0.152 (59.1) 14.3 5.481 0.4 0.043 2.0 3.2
2018A 30,192 420 0.139 (8.6) 16.6 5.724 0.4 0.052 2.3 2.8
2019F 40,613 992 0.327 135.3 6.8 7.101 0.3 0.143 6.4 5.8
2020F 44,067 1,253 0.413 26.3 5.4 7.449 0.3 0.181 8.1 6.4
2021F 47,503 1,528 0.504 22.0 4.4 7.866 0.3 0.220 9.9 7.4
[Table_BaseData] Shares in issue (m) 总股数 (m) 3,032.2 Major shareholder 大股东 Wei Ping Lin 40.1%
Market cap. (HK$ m) 市值 (HK$ m) 7,944.4 Free float (%) 自由流通比率 (%) 59.2
3 month average vol. 3 个月平均成交股数 (‘000) 34,774.0 FY19 Net gearing (%) FY19 净负债/股东资金 (%) Net cash
52 Weeks high/low (HK$) 52 周高/低 (HK$) 4.190 / 1.620 FY19 Est. NAV (HK$) FY19 每股估值(港元) 3.5
Source: the Company, Guotai Junan International. Note: 2018A represents the period of nine months ended December 31, 2019.
(60.0)
(50.0)
(40.0)
(30.0)
(20.0)
(10.0)
0.0
10.0
20.0
Apr-18 Jul-18 Sep-18 Dec-18 Mar-19
% of return
HSI index SKYWORTH DIGITAL
Co
mp
an
y R
ep
ort
See the last page for disclaimer Page 2 of 9
[Table_RightMar1]
3 A
pri
l 2
01
9
[Table_RightMar2]
Skyw
ort
h D
igita
l 创
维数
码 (0
07
51
HK
)
[Table_PageHeader] Skyworth Digital (00751 HK)
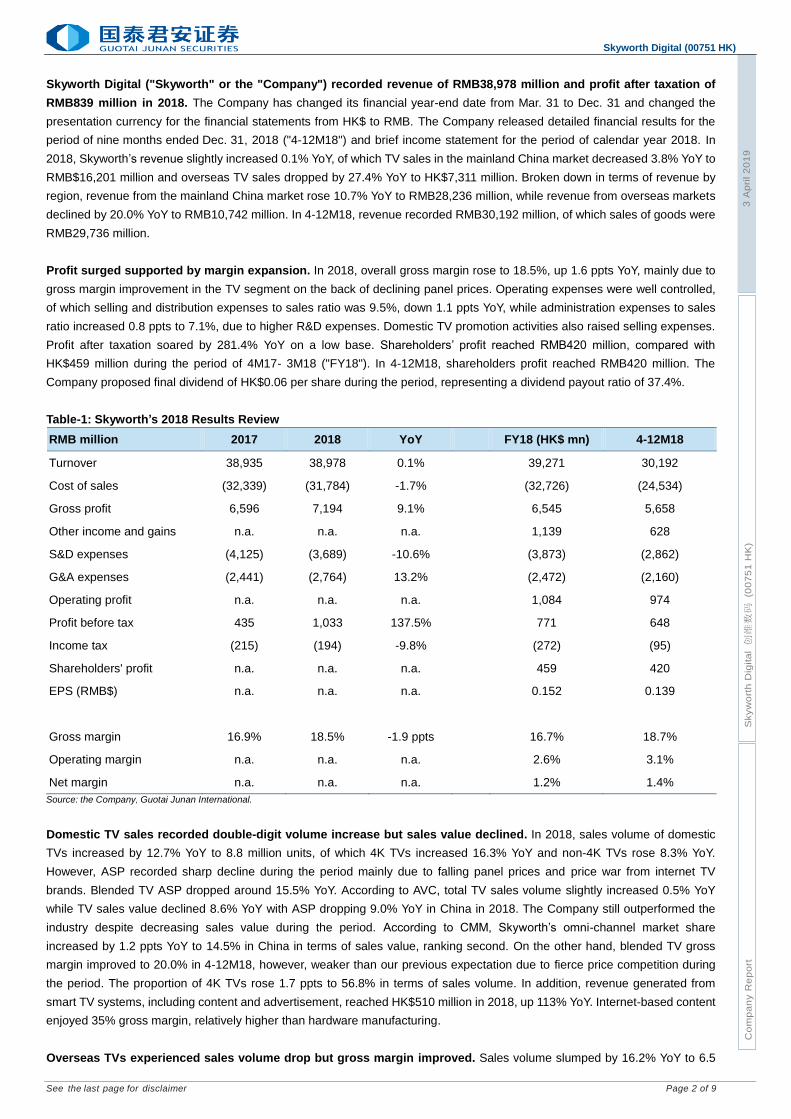
Skyworth Digital ("Skyworth" or the "Company") recorded revenue of RMB38,978 million and profit after taxation of
RMB839 million in 2018. The Company has changed its financial year-end date from Mar. 31 to Dec. 31 and changed the
presentation currency for the financial statements from HK$ to RMB. The Company released detailed financial results for the
period of nine months ended Dec. 31, 2018 ("4-12M18") and brief income statement for the period of calendar year 2018. In
2018, Skyworth’s revenue slightly increased 0.1% YoY, of which TV sales in the mainland China market decreased 3.8% YoY to
RMB$16,201 million and overseas TV sales dropped by 27.4% YoY to HK$7,311 million. Broken down in terms of revenue by
region, revenue from the mainland China market rose 10.7% YoY to RMB28,236 million, while revenue from overseas markets
declined by 20.0% YoY to RMB10,742 million. In 4-12M18, revenue recorded RMB30,192 million, of which sales of goods were
RMB29,736 million.
Profit surged supported by margin expansion. In 2018, overall gross margin rose to 18.5%, up 1.6 ppts YoY, mainly due to
gross margin improvement in the TV segment on the back of declining panel prices. Operating expenses were well controlled,
of which selling and distribution expenses to sales ratio was 9.5%, down 1.1 ppts YoY, while administration expenses to sales
ratio increased 0.8 ppts to 7.1%, due to higher R&D expenses. Domestic TV promotion activities also raised selling expenses.
Profit after taxation soared by 281.4% YoY on a low base. Shareholders’ profit reached RMB420 million, compared with
HK$459 million during the period of 4M17- 3M18 ("FY18"). In 4-12M18, shareholders profit reached RMB420 million. The
Company proposed final dividend of HK$0.06 per share during the period, representing a dividend payout ratio of 37.4%.
Table-1: Skyworth’s 2018 Results Review
RMB million 2017 2018 YoY FY18 (HK$ mn) 4-12M18
Turnover 38,935 38,978 0.1% 39,271 30,192
Cost of sales (32,339) (31,784) -1.7% (32,726) (24,534)
Gross profit 6,596 7,194 9.1% 6,545 5,658
Other income and gains n.a. n.a. n.a. 1,139 628
S&D expenses (4,125) (3,689) -10.6% (3,873) (2,862)
G&A expenses (2,441) (2,764) 13.2% (2,472) (2,160)
Operating profit n.a. n.a. n.a. 1,084 974
Profit before tax 435 1,033 137.5% 771 648
Income tax (215) (194) -9.8% (272) (95)
Shareholders' profit n.a. n.a. n.a. 459 420
EPS (RMB$) n.a. n.a. n.a. 0.152 0.139
Gross margin 16.9% 18.5% -1.9 ppts 16.7% 18.7%
Operating margin n.a. n.a. n.a. 2.6% 3.1%
Net margin n.a. n.a. n.a. 1.2% 1.4%
Source: the Company, Guotai Junan International.
Domestic TV sales recorded double-digit volume increase but sales value declined. In 2018, sales volume of domestic
TVs increased by 12.7% YoY to 8.8 million units, of which 4K TVs increased 16.3% YoY and non-4K TVs rose 8.3% YoY.
However, ASP recorded sharp decline during the period mainly due to falling panel prices and price war from internet TV
brands. Blended TV ASP dropped around 15.5% YoY. According to AVC, total TV sales volume slightly increased 0.5% YoY
while TV sales value declined 8.6% YoY with ASP dropping 9.0% YoY in China in 2018. The Company still outperformed the
industry despite decreasing sales value during the period. According to CMM, Skyworth’s omni-channel market share
increased by 1.2 ppts YoY to 14.5% in China in terms of sales value, ranking second. On the other hand, blended TV gross
margin improved to 20.0% in 4-12M18, however, weaker than our previous expectation due to fierce price competition during
the period. The proportion of 4K TVs rose 1.7 ppts to 56.8% in terms of sales volume. In addition, revenue generated from
smart TV systems, including content and advertisement, reached HK$510 million in 2018, up 113% YoY. Internet-based content
enjoyed 35% gross margin, relatively higher than hardware manufacturing.
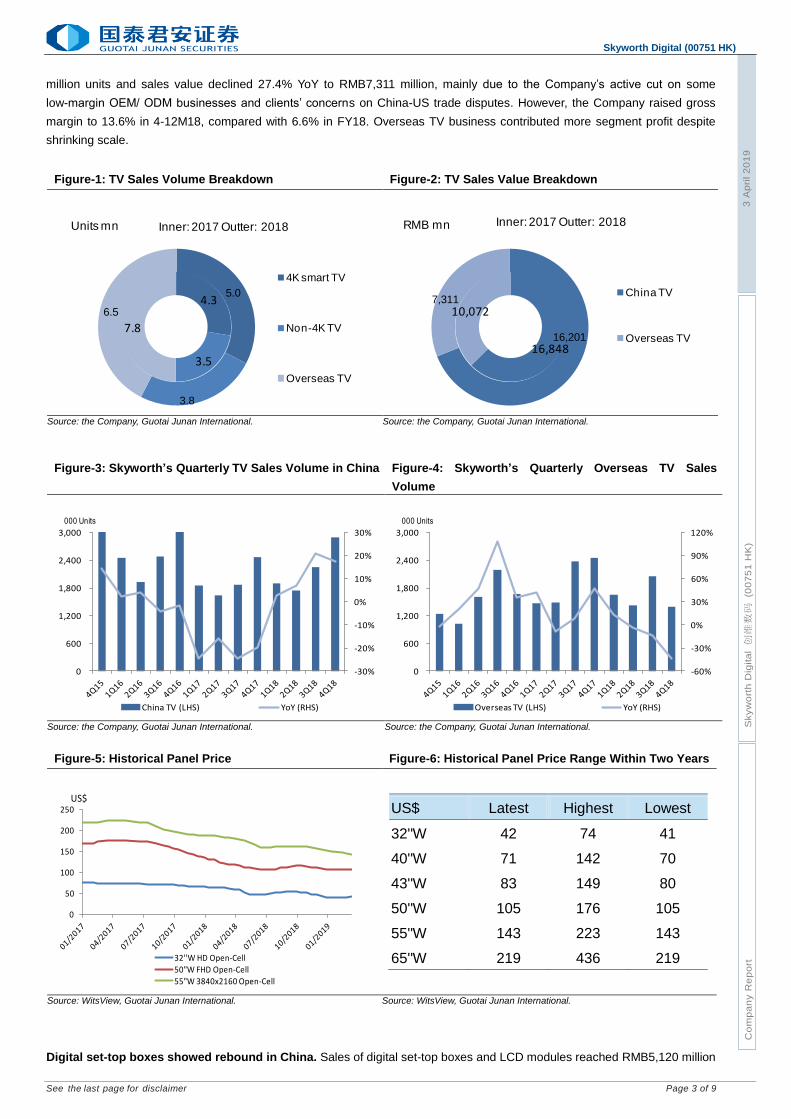
Overseas TVs experienced sales volume drop but gross margin improved. Sales volume slumped by 16.2% YoY to 6.5
Co
mp
an
y R
ep
ort
See the last page for disclaimer Page 3 of 9
[Table_RightMar1]
3 A
pri
l 2
01
9
[Table_RightMar2]
Skyw
ort
h D
igita
l 创
维数
码 (0
07
51
HK
)
[Table_PageHeader] Skyworth Digital (00751 HK)
million units and sales value declined 27.4% YoY to RMB7,311 million, mainly due to the Company’s active cut on some
low-margin OEM/ ODM businesses and clients’ concerns on China-US trade disputes. However, the Company raised gross
margin to 13.6% in 4-12M18, compared with 6.6% in FY18. Overseas TV business contributed more segment profit despite
shrinking scale.
Figure-1: TV Sales Volume Breakdown Figure-2: TV Sales Value Breakdown
Source: the Company, Guotai Junan International. Source: the Company, Guotai Junan International.
Figure-3: Skyworth’s Quarterly TV Sales Volume in China Figure-4: Skyworth’s Quarterly Overseas TV Sales
Volume
Source: the Company, Guotai Junan International. Source: the Company, Guotai Junan International.
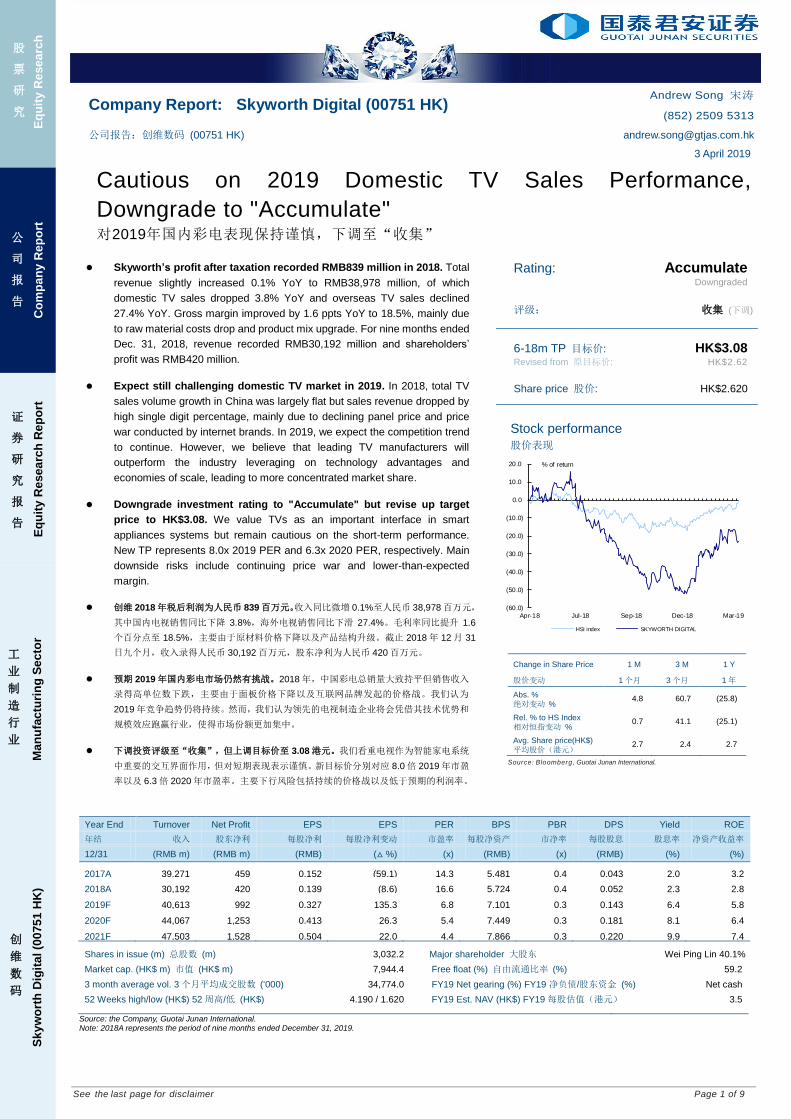
Figure-5: Historical Panel Price Figure-6: Historical Panel Price Range Within Two Years
US$ Latest Highest Lowest
32''W 42 74 41
40''W 71 142 70
43''W 83 149 80
50''W 105 176 105
55''W 143 223 143
65''W 219 436 219
Source: WitsView, Guotai Junan International. Source: WitsView, Guotai Junan International.
Digital set-top boxes showed rebound in China. Sales of digital set-top boxes and LCD modules reached RMB5,120 million
4.3
3.5
7.8
5.0
3.8
6.5
4K smart TV
Non-4K TV
Overseas TV
Units mn Inner: 2017 Outter: 2018
16,848
10,072
16,201
7,311 China TV
Overseas TV
RMB mn Inner: 2017 Outter: 2018
-30%
-20%
-10%
0%
10%
20%
30%
0
600
1,200
1,800
2,400
3,000
China TV (LHS) YoY (RHS)
000 Units
-60%
-30%
0%
30%
60%
90%
120%
0
600
1,200
1,800
2,400
3,000
Overseas TV (LHS) YoY (RHS)
000 Units
0
50
100
150
200
250
32''W HD Open-Cell
50"W FHD Open-Cell
55"W 3840x2160 Open-Cell
US$
Co
mp
an
y R
ep
ort
See the last page for disclaimer Page 4 of 9
[Table_RightMar1]
3 A
pri
l 2
01
9
[Table_RightMar2]
Skyw
ort
h D
igita
l 创
维数
码 (0
07
51
HK
)
[Table_PageHeader] Skyworth Digital (00751 HK)
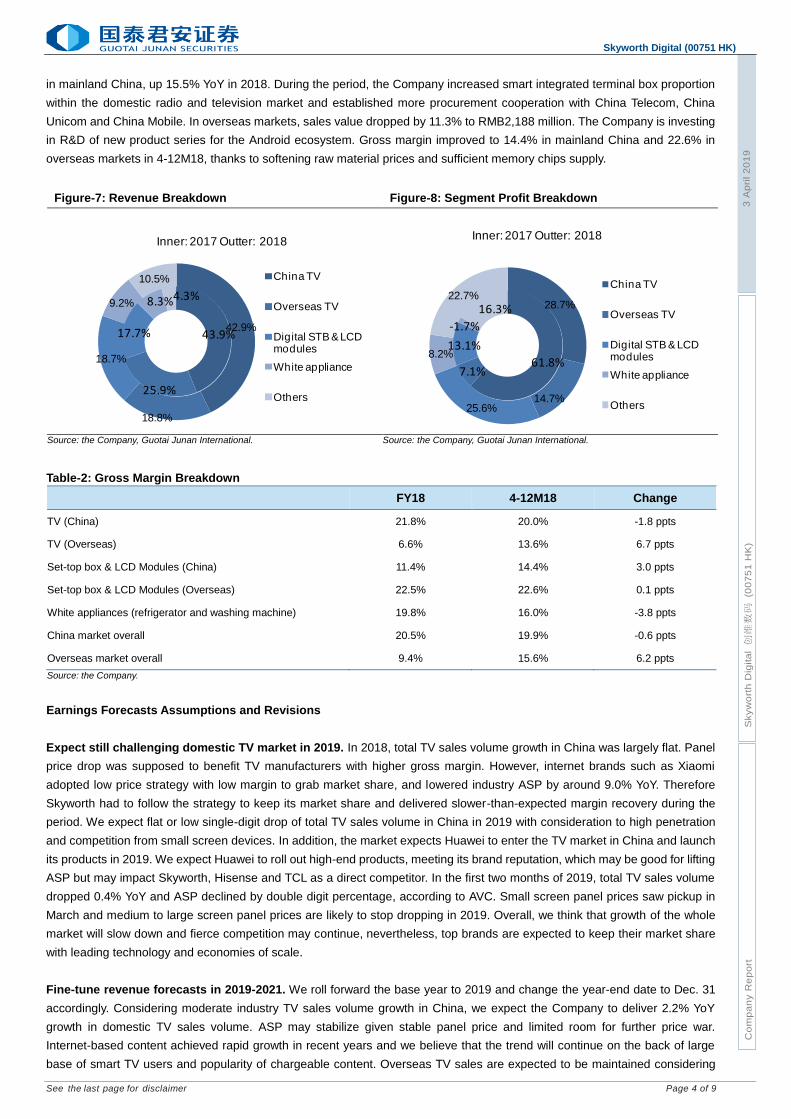
in mainland China, up 15.5% YoY in 2018. During the period, the Company increased smart integrated terminal box proportion
within the domestic radio and television market and established more procurement cooperation with China Telecom, China
Unicom and China Mobile. In overseas markets, sales value dropped by 11.3% to RMB2,188 million. The Company is investing
in R&D of new product series for the Android ecosystem. Gross margin improved to 14.4% in mainland China and 22.6% in
overseas markets in 4-12M18, thanks to softening raw material prices and sufficient memory chips supply.
Figure-7: Revenue Breakdown Figure-8: Segment Profit Breakdown
Source: the Company, Guotai Junan International. Source: the Company, Guotai Junan International.
Table-2: Gross Margin Breakdown
FY18 4-12M18 Change
TV (China) 21.8% 20.0% -1.8 ppts
TV (Overseas) 6.6% 13.6% 6.7 ppts
Set-top box & LCD Modules (China) 11.4% 14.4% 3.0 ppts
Set-top box & LCD Modules (Overseas) 22.5% 22.6% 0.1 ppts
White appliances (refrigerator and washing machine) 19.8% 16.0% -3.8 ppts
China market overall 20.5% 19.9% -0.6 ppts
Overseas market overall 9.4% 15.6% 6.2 ppts
Source: the Company.
Earnings Forecasts Assumptions and Revisions
Expect still challenging domestic TV market in 2019. In 2018, total TV sales volume growth in China was largely flat. Panel
price drop was supposed to benefit TV manufacturers with higher gross margin. However, internet brands such as Xiaomi
adopted low price strategy with low margin to grab market share, and lowered industry ASP by around 9.0% YoY. Therefore
Skyworth had to follow the strategy to keep its market share and delivered slower-than-expected margin recovery during the
period. We expect flat or low single-digit drop of total TV sales volume in China in 2019 with consideration to high penetration
and competition from small screen devices. In addition, the market expects Huawei to enter the TV market in China and launch
its products in 2019. We expect Huawei to roll out high-end products, meeting its brand reputation, which may be good for lifting
ASP but may impact Skyworth, Hisense and TCL as a direct competitor. In the first two months of 2019, total TV sales volume
dropped 0.4% YoY and ASP declined by double digit percentage, according to AVC. Small screen panel prices saw pickup in
March and medium to large screen panel prices are likely to stop dropping in 2019. Overall, we think that growth of the whole
market will slow down and fierce competition may continue, nevertheless, top brands are expected to keep their market share
with leading technology and economies of scale.
Fine-tune revenue forecasts in 2019-2021. We roll forward the base year to 2019 and change the year-end date to Dec. 31
accordingly. Considering moderate industry TV sales volume growth in China, we expect the Company to deliver 2.2% YoY
growth in domestic TV sales volume. ASP may stabilize given stable panel price and limited room for further price war.
Internet-based content achieved rapid growth in recent years and we believe that the trend will continue on the back of large
base of smart TV users and popularity of chargeable content. Overseas TV sales are expected to be maintained considering
43.9%
25.9%
17.7%
8.3%4.3%
42.9%
18.8%
18.7%
9.2%
10.5% China TV
Overseas TV
Digital STB & LCD modules
White appliance
Others
Inner: 2017 Outter: 2018
61.8%7.1%
13.1%
-1.7%
16.3% 28.7%
14.7%25.6%
8.2%
22.7%China TV
Overseas TV
Digital STB & LCD modules
White appliance
Others
Inner: 2017 Outter: 2018
Co
mp
an
y R
ep
ort
See the last page for disclaimer Page 5 of 9
[Table_RightMar1]
3 A
pri
l 2
01
9
[Table_RightMar2]
Skyw
ort
h D
igita
l 创
维数
码 (0
07
51
HK
)
[Table_PageHeader] Skyworth Digital (00751 HK)
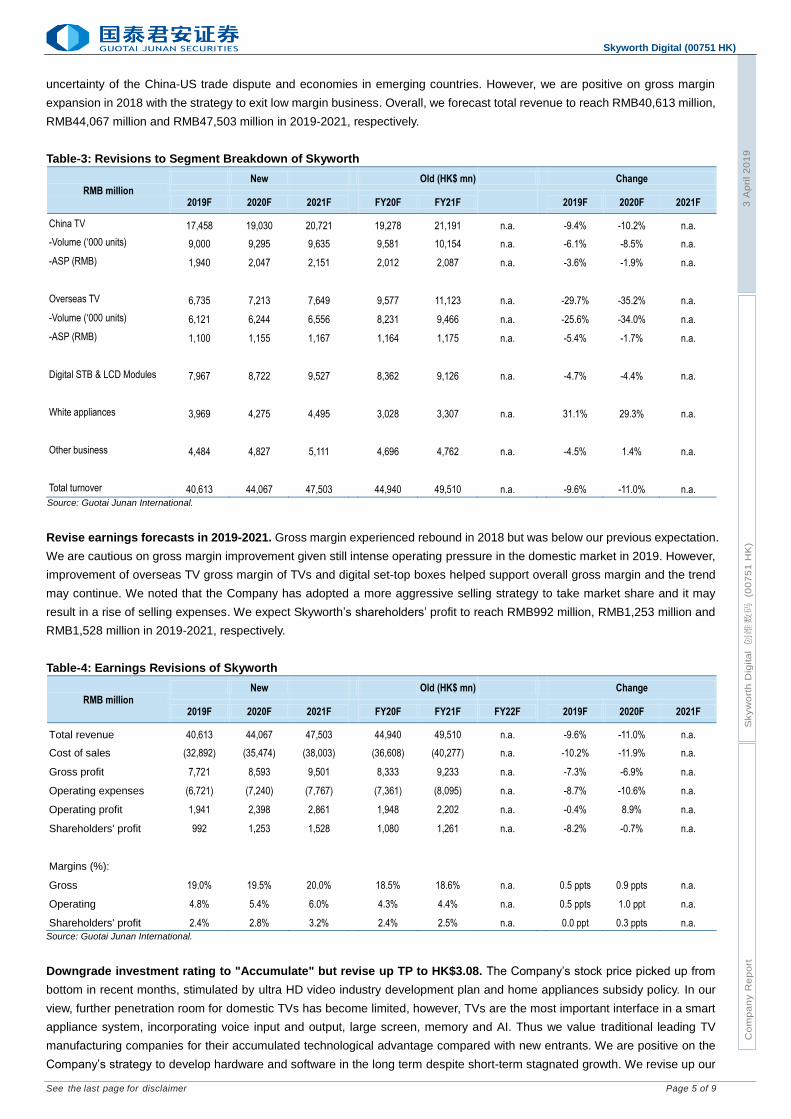
uncertainty of the China-US trade dispute and economies in emerging countries. However, we are positive on gross margin
expansion in 2018 with the strategy to exit low margin business. Overall, we forecast total revenue to reach RMB40,613 million,
RMB44,067 million and RMB47,503 million in 2019-2021, respectively.
Table-3: Revisions to Segment Breakdown of Skyworth
RMB million New Old (HK$ mn) Change
2019F 2020F 2021F
FY20F FY21F
2019F 2020F 2021F
China TV 17,458 19,030 20,721
19,278 21,191 n.a.
-9.4% -10.2% n.a.
-Volume (‘000 units) 9,000 9,295 9,635
9,581 10,154 n.a.
-6.1% -8.5% n.a.
-ASP (RMB) 1,940 2,047 2,151
2,012 2,087 n.a.
-3.6% -1.9% n.a.
Overseas TV 6,735 7,213 7,649
9,577 11,123 n.a.
-29.7% -35.2% n.a.
-Volume (‘000 units) 6,121 6,244 6,556
8,231 9,466 n.a.
-25.6% -34.0% n.a.
-ASP (RMB) 1,100 1,155 1,167
1,164 1,175 n.a.
-5.4% -1.7% n.a.
Digital STB & LCD Modules 7,967 8,722 9,527
8,362 9,126 n.a.
-4.7% -4.4% n.a.
White appliances 3,969 4,275 4,495
3,028 3,307 n.a.
31.1% 29.3% n.a.
Other business 4,484 4,827 5,111
4,696 4,762 n.a.
-4.5% 1.4% n.a.
Total turnover 40,613 44,067 47,503
44,940 49,510 n.a.
-9.6% -11.0% n.a.
Source: Guotai Junan International.
Revise earnings forecasts in 2019-2021. Gross margin experienced rebound in 2018 but was below our previous expectation.
We are cautious on gross margin improvement given still intense operating pressure in the domestic market in 2019. However,
improvement of overseas TV gross margin of TVs and digital set-top boxes helped support overall gross margin and the trend
may continue. We noted that the Company has adopted a more aggressive selling strategy to take market share and it may
result in a rise of selling expenses. We expect Skyworth’s shareholders’ profit to reach RMB992 million, RMB1,253 million and
RMB1,528 million in 2019-2021, respectively.
Table-4: Earnings Revisions of Skyworth
RMB million New Old (HK$ mn) Change
2019F 2020F 2021F
FY20F FY21F FY22F
2019F 2020F 2021F
Total revenue 40,613 44,067 47,503
44,940 49,510 n.a.
-9.6% -11.0% n.a.
Cost of sales (32,892) (35,474) (38,003)
(36,608) (40,277) n.a.
-10.2% -11.9% n.a.
Gross profit 7,721 8,593 9,501
8,333 9,233 n.a.
-7.3% -6.9% n.a.
Operating expenses (6,721) (7,240) (7,767)
(7,361) (8,095) n.a.
-8.7% -10.6% n.a.
Operating profit 1,941 2,398 2,861
1,948 2,202 n.a.
-0.4% 8.9% n.a.
Shareholders' profit 992 1,253 1,528
1,080 1,261 n.a.
-8.2% -0.7% n.a.
Margins (%):
Gross 19.0% 19.5% 20.0%
18.5% 18.6% n.a.
0.5 ppts 0.9 ppts n.a.
Operating 4.8% 5.4% 6.0%
4.3% 4.4% n.a.
0.5 ppts 1.0 ppt n.a.
Shareholders' profit 2.4% 2.8% 3.2%
2.4% 2.5% n.a.
0.0 ppt 0.3 ppts n.a.
Source: Guotai Junan International.
Downgrade investment rating to "Accumulate" but revise up TP to HK$3.08. The Company’s stock price picked up from
bottom in recent months, stimulated by ultra HD video industry development plan and home appliances subsidy policy. In our
view, further penetration room for domestic TVs has become limited, however, TVs are the most important interface in a smart
appliance system, incorporating voice input and output, large screen, memory and AI. Thus we value traditional leading TV
manufacturing companies for their accumulated technological advantage compared with new entrants. We are positive on the
Company’s strategy to develop hardware and software in the long term despite short-term stagnated growth. We revise up our
Co
mp
an
y R
ep
ort
See the last page for disclaimer Page 6 of 9
[Table_RightMar1]
3 A
pri
l 2
01
9
[Table_RightMar2]
Skyw
ort
h D
igita
l 创
维数
码 (0
07
51
HK
)
[Table_PageHeader] Skyworth Digital (00751 HK)
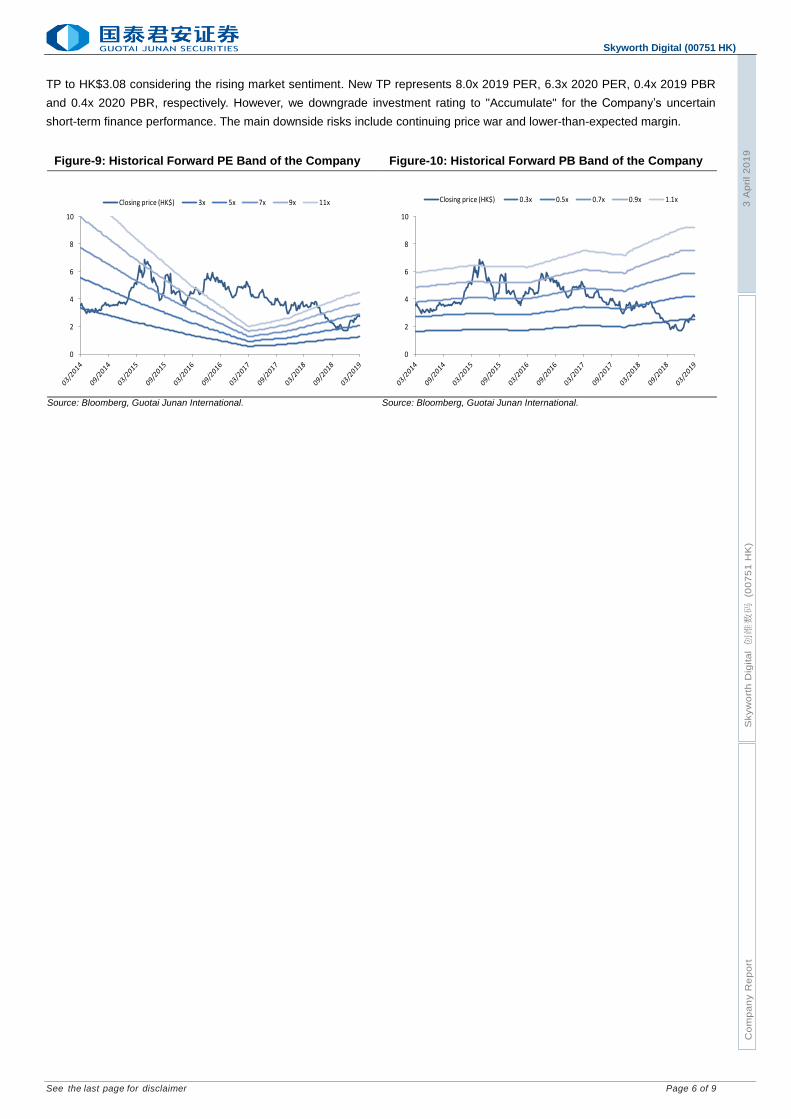
TP to HK$3.08 considering the rising market sentiment. New TP represents 8.0x 2019 PER, 6.3x 2020 PER, 0.4x 2019 PBR
and 0.4x 2020 PBR, respectively. However, we downgrade investment rating to "Accumulate" for the Company’s uncertain
short-term finance performance. The main downside risks include continuing price war and lower-than-expected margin.
Figure-9: Historical Forward PE Band of the Company Figure-10: Historical Forward PB Band of the Company
Source: Bloomberg, Guotai Junan International. Source: Bloomberg, Guotai Junan International.
0
2
4
6
8
10
Closing price (HK$) 3x 5x 7x 9x 11x
68.6%
10.8%
1.8%5.3%
13.6%
73.3%
11.2%
1.8%5.8%
8.0% China TV
Overseas TV
Digital STB & LCD modules
White appliance
Others
Inner: 1HFY17 Outter: 1HFY18
0
2
4
6
8
10
Closing price (HK$) 0.3x 0.5x 0.7x 0.9x 1.1x
Co
mp
an
y R
ep
ort
See the last page for disclaimer Page 7 of 9
[Table_RightMar1]
3 A
pri
l 2
01
9
[Table_RightMar2]
Skyw
ort
h D
igita
l 创
维数
码 (0
07
51
HK
)
[Table_PageHeader] Skyworth Digital (00751 HK)
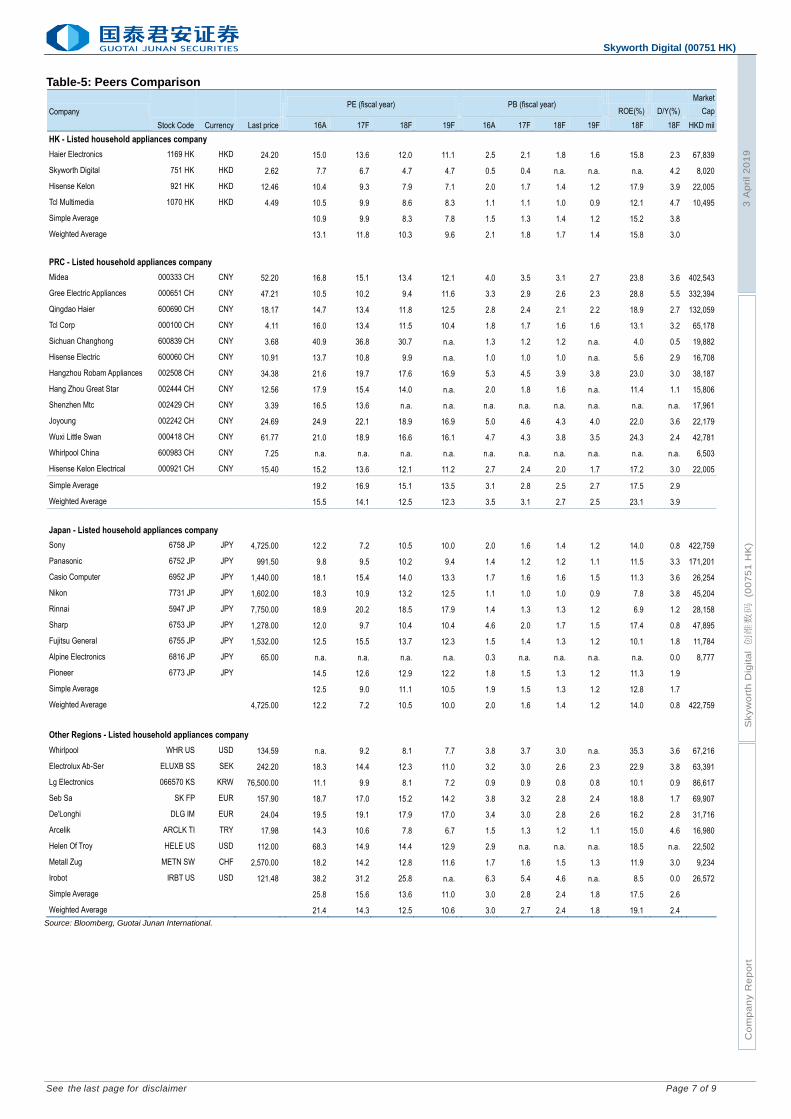
Table-5: Peers Comparison
Company
Stock Code Currency Last price
PE (fiscal year)
PB (fiscal year)
ROE(%)
D/Y(%)
Market
Cap
16A 17F 18F 19F 16A 17F 18F 19F 18F 18F HKD mil
HK - Listed household appliances company
Haier Electronics 1169 HK HKD 24.20
15.0 13.6 12.0 11.1
2.5 2.1 1.8 1.6
15.8
2.3
67,839
Skyworth Digital 751 HK HKD 2.62
7.7 6.7 4.7 4.7
0.5 0.4 n.a. n.a.
n.a.
4.2
8,020
Hisense Kelon 921 HK HKD 12.46
10.4 9.3 7.9 7.1
2.0 1.7 1.4 1.2
17.9
3.9
22,005
Tcl Multimedia 1070 HK HKD 4.49
10.5 9.9 8.6 8.3
1.1 1.1 1.0 0.9
12.1
4.7
10,495
Simple Average 10.9 9.9 8.3 7.8 1.5 1.3 1.4 1.2 15.2 3.8
Weighted Average 13.1 11.8 10.3 9.6 2.1 1.8 1.7 1.4 15.8 3.0
PRC - Listed household appliances company
Midea 000333 CH CNY 52.20
16.8 15.1 13.4 12.1
4.0 3.5 3.1 2.7
23.8
3.6
402,543
Gree Electric Appliances 000651 CH CNY 47.21
10.5 10.2 9.4 11.6
3.3 2.9 2.6 2.3
28.8
5.5 332,394
Qingdao Haier 600690 CH CNY 18.17
14.7 13.4 11.8 12.5
2.8 2.4 2.1 2.2
18.9
2.7 132,059
Tcl Corp 000100 CH CNY 4.11
16.0 13.4 11.5 10.4
1.8 1.7 1.6 1.6
13.1
3.2
65,178
Sichuan Changhong 600839 CH CNY 3.68
40.9 36.8 30.7 n.a.
1.3 1.2 1.2 n.a.
4.0
0.5
19,882
Hisense Electric 600060 CH CNY 10.91
13.7 10.8 9.9 n.a.
1.0 1.0 1.0 n.a.
5.6
2.9
16,708
Hangzhou Robam Appliances 002508 CH CNY 34.38
21.6 19.7 17.6 16.9
5.3 4.5 3.9 3.8
23.0
3.0
38,187
Hang Zhou Great Star 002444 CH CNY 12.56
17.9 15.4 14.0 n.a.
2.0 1.8 1.6 n.a.
11.4
1.1
15,806
Shenzhen Mtc 002429 CH CNY 3.39
16.5 13.6 n.a. n.a.
n.a. n.a. n.a. n.a.
n.a.
n.a.
17,961
Joyoung 002242 CH CNY 24.69
24.9 22.1 18.9 16.9
5.0 4.6 4.3 4.0
22.0
3.6
22,179
Wuxi Little Swan 000418 CH CNY 61.77
21.0 18.9 16.6 16.1
4.7 4.3 3.8 3.5
24.3
2.4
42,781
Whirlpool China 600983 CH CNY 7.25
n.a. n.a. n.a. n.a.
n.a. n.a. n.a. n.a.
n.a.
n.a.
6,503
Hisense Kelon Electrical 000921 CH CNY 15.40
15.2 13.6 12.1 11.2
2.7 2.4 2.0 1.7
17.2
3.0
22,005
Simple Average 19.2 16.9 15.1 13.5 3.1 2.8 2.5 2.7 17.5 2.9
Weighted Average 15.5 14.1 12.5 12.3 3.5 3.1 2.7 2.5 23.1 3.9
Japan - Listed household appliances company
Sony 6758 JP JPY 4,725.00
12.2 7.2 10.5 10.0
2.0 1.6 1.4 1.2
14.0
0.8
422,759
Panasonic 6752 JP JPY 991.50
9.8 9.5 10.2 9.4
1.4 1.2 1.2 1.1
11.5
3.3 171,201
Casio Computer 6952 JP JPY 1,440.00
18.1 15.4 14.0 13.3
1.7 1.6 1.6 1.5
11.3
3.6
26,254
Nikon 7731 JP JPY 1,602.00
18.3 10.9 13.2 12.5
1.1 1.0 1.0 0.9
7.8
3.8
45,204
Rinnai 5947 JP JPY 7,750.00
18.9 20.2 18.5 17.9
1.4 1.3 1.3 1.2
6.9
1.2
28,158
Sharp 6753 JP JPY 1,278.00
12.0 9.7 10.4 10.4
4.6 2.0 1.7 1.5
17.4
0.8
47,895
Fujitsu General 6755 JP JPY 1,532.00
12.5 15.5 13.7 12.3
1.5 1.4 1.3 1.2
10.1
1.8
11,784
Alpine Electronics 6816 JP JPY 65.00
n.a. n.a. n.a. n.a.
0.3 n.a. n.a. n.a.
n.a.
0.0
8,777
Pioneer 6773 JP JPY 14.5 12.6 12.9 12.2 1.8 1.5 1.3 1.2 11.3 1.9
Simple Average 12.5 9.0 11.1 10.5 1.9 1.5 1.3 1.2 12.8 1.7
Weighted Average 4,725.00
12.2 7.2 10.5 10.0
2.0 1.6 1.4 1.2
14.0
0.8 422,759
Other Regions - Listed household appliances company
Whirlpool WHR US USD 134.59
n.a. 9.2 8.1 7.7
3.8 3.7 3.0 n.a.
35.3
3.6
67,216
Electrolux Ab-Ser ELUXB SS SEK 242.20
18.3 14.4 12.3 11.0
3.2 3.0 2.6 2.3
22.9
3.8
63,391
Lg Electronics 066570 KS KRW 76,500.00
11.1 9.9 8.1 7.2
0.9 0.9 0.8 0.8
10.1
0.9
86,617
Seb Sa SK FP EUR 157.90
18.7 17.0 15.2 14.2
3.8 3.2 2.8 2.4
18.8
1.7
69,907
De'Longhi DLG IM EUR 24.04
19.5 19.1 17.9 17.0
3.4 3.0 2.8 2.6
16.2
2.8
31,716
Arcelik ARCLK TI TRY 17.98
14.3 10.6 7.8 6.7
1.5 1.3 1.2 1.1
15.0
4.6
16,980
Helen Of Troy HELE US USD 112.00
68.3 14.9 14.4 12.9
2.9 n.a. n.a. n.a.
18.5
n.a.
22,502
Metall Zug METN SW CHF 2,570.00
18.2 14.2 12.8 11.6
1.7 1.6 1.5 1.3
11.9
3.0
9,234
Irobot IRBT US USD 121.48
38.2 31.2 25.8 n.a.
6.3 5.4 4.6 n.a.
8.5
0.0
26,572
Simple Average 25.8 15.6 13.6 11.0 3.0 2.8 2.4 1.8 17.5 2.6
Weighted Average 21.4 14.3 12.5 10.6 3.0 2.7 2.4 1.8 19.1 2.4
Source: Bloomberg, Guotai Junan International.
Co
mp
an
y R
ep
ort
See the last page for disclaimer Page 8 of 9
[Table_RightMar1]
3 A
pri
l 2
01
9
[Table_RightMar2]
Skyw
ort
h D
igita
l 创
维数
码 (0
07
51
HK
)
[Table_PageHeader] Skyworth Digital (00751 HK)
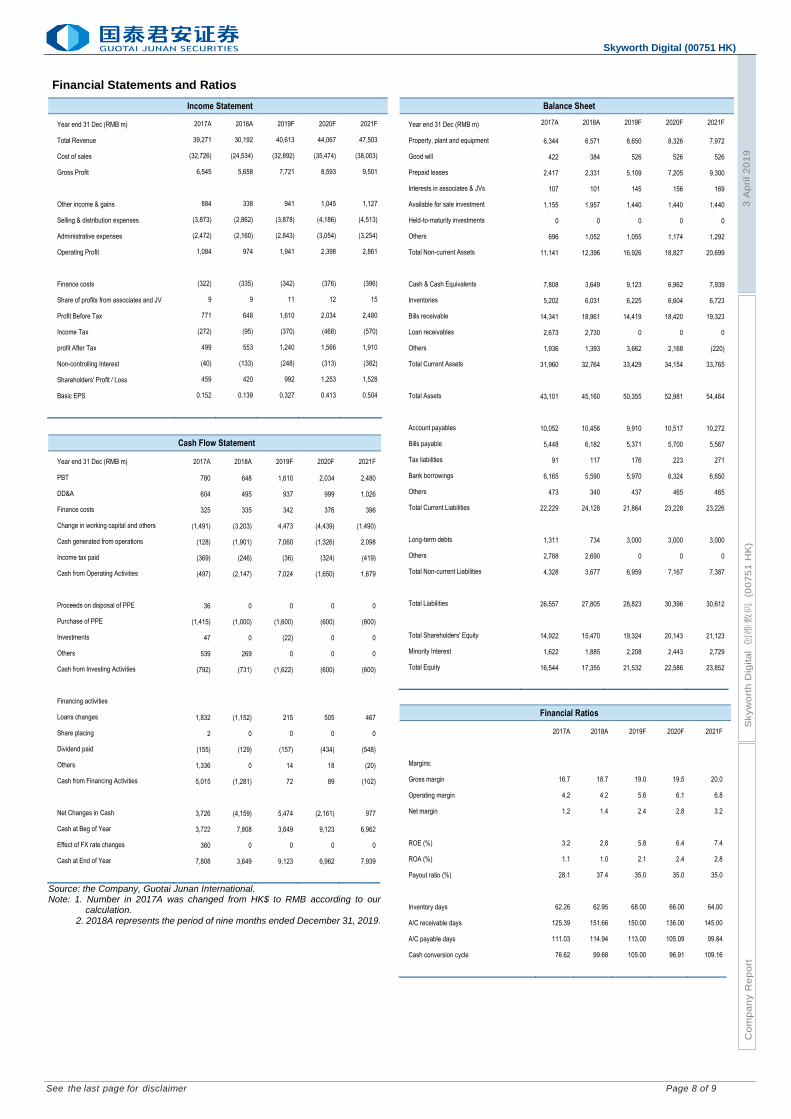
Financial Statements and Ratios
[Table_IncomeStatement] Income Statement
Year end 31 Dec (RMB m) 2017A 2018A 2019F 2020F 2021F
Total Revenue 39,271 30,192 40,613 44,067 47,503
Cost of sales (32,726) (24,534) (32,892) (35,474) (38,003)
Gross Profit 6,545 5,658 7,721 8,593 9,501
Other income & gains 884 338 941 1,045 1,127
Selling & distribution expenses (3,873) (2,862) (3,878) (4,186) (4,513)
Administrative expenses (2,472) (2,160) (2,843) (3,054) (3,254)
Operating Profit 1,084 974 1,941 2,398 2,861
Finance costs (322) (335) (342) (376) (396)
Share of profits from associates and JV 9 9 11 12 15
Profit Before Tax 771 648 1,610 2,034 2,480
Income Tax (272) (95) (370) (468) (570)
profit After Tax 499 553 1,240 1,566 1,910
Non-controlling Interest (40) (133) (248) (313) (382)
Shareholders' Profit / Loss 459 420 992 1,253 1,528
Basic EPS 0.152 0.139 0.327 0.413 0.504
[Table_CashFlowStatement] Cash Flow Statement
Year end 31 Dec (RMB m) 2017A 2018A 2019F 2020F 2021F
PBT 780 648 1,610 2,034 2,480
DD&A 604 495 937 999 1,026
Finance costs 325 335 342 376 396
Change in working capital and others (1,491) (3,203) 4,473 (4,439) (1,490)
Cash generated from operations (128) (1,901) 7,060 (1,326) 2,098
Income tax paid (369) (246) (36) (324) (419)
Cash from Operating Activities (497) (2,147) 7,024 (1,650) 1,679
Proceeds on disposal of PPE 36 0 0 0 0
Purchase of PPE (1,415) (1,000) (1,600) (600) (600)
Investments 47 0 (22) 0 0
Others 539 269 0 0 0
Cash from Investing Activities (792) (731) (1,622) (600) (600)
Financing activities
Loans changes 1,832 (1,152) 215 505 467
Share placing 2 0 0 0 0
Dividend paid (155) (129) (157) (434) (548)
Others 1,336 0 14 18 (20)
Cash from Financing Activities 5,015 (1,281) 72 89 (102)
Net Changes in Cash 3,726 (4,159) 5,474 (2,161) 977
Cash at Beg of Year 3,722 7,808 3,649 9,123 6,962
Effect of FX rate changes 360 0 0 0 0
Cash at End of Year 7,808 3,649 9,123 6,962 7,939
Source: the Company, Guotai Junan International. Note: 1. Number in 2017A was changed from HK$ to RMB according to our
calculation. 2. 2018A represents the period of nine months ended December 31, 2019.
[Table_BalanceSheet] Balance Sheet
Year end 31 Dec (RMB m) 2017A 2018A 2019F 2020F 2021F
Property, plant and equipment 6,344 6,571 8,650 8,326 7,972
Good will 422 384 526 526 526
Prepaid leases 2,417 2,331 5,109 7,205 9,300
Interests in associates & JVs 107 101 145 156 169
Available for sale investment 1,155 1,957 1,440 1,440 1,440
Held-to-maturity investments 0 0 0 0 0
Others 696 1,052 1,055 1,174 1,292
Total Non-current Assets 11,141 12,396 16,926 18,827 20,699
Cash & Cash Equivalents 7,808 3,649 9,123 6,962 7,939
Inventories 5,202 6,031 6,225 6,604 6,723
Bills receivable 14,341 18,961 14,419 18,420 19,323
Loan receivables 2,673 2,730 0 0 0
Others 1,936 1,393 3,662 2,168 (220)
Total Current Assets 31,960 32,764 33,429 34,154 33,765
Total Assets 43,101 45,160 50,355 52,981 54,464
Account payables 10,052 10,456 9,910 10,517 10,272
Bills payable 5,448 6,182 5,371 5,700 5,567
Tax liabilities 91 117 176 223 271
Bank borrowings 6,165 5,590 5,970 6,324 6,650
Others 473 340 437 465 465
Total Current Liabilities 22,229 24,128 21,864 23,228 23,226
Long-term debts 1,311 734 3,000 3,000 3,000
Others 2,788 2,690 0 0 0
Total Non-current Liabilities 4,328 3,677 6,959 7,167 7,387
Total Liabilities 26,557 27,805 28,823 30,396 30,612
Total Shareholders' Equity 14,922 15,470 19,324 20,143 21,123
Minority Interest 1,622 1,885 2,208 2,443 2,729
Total Equity 16,544 17,355 21,532 22,586 23,852
[Table_FinancialRatio] Financial Ratios
2017A 2018A 2019F 2020F 2021F
Margins:
Gross margin 16.7 18.7 19.0 19.5 20.0
Operating margin 4.2 4.2 5.6 6.1 6.8
Net margin 1.2 1.4 2.4 2.8 3.2
ROE (%) 3.2 2.8 5.8 6.4 7.4
ROA (%) 1.1 1.0 2.1 2.4 2.8
Payout ratio (%) 28.1 37.4 35.0 35.0 35.0
Inventory days 62.26 62.95 68.00 66.00 64.00
A/C receivable days 125.39 151.66 150.00 136.00 145.00
A/C payable days 111.03 114.94 113.00 105.09 99.84
Cash conversion cycle 76.62 99.68 105.00 96.91 109.16
Co
mp
an
y R
ep
ort
See the last page for disclaimer Page 9 of 9
[Table_RightMar1]
3 A
pri
l 2
01
9
[Table_RightMar2]
Skyw
ort
h D
igita
l 创
维数
码 (0
07
51
HK
)
[Table_PageHeader] Skyworth Digital (00751 HK)
[Table_CompanyRatingDefinition] Company Rating Definition
The Benchmark: Hong Kong Hang Seng Index
Time Horizon: 6 to 18 months
Rating Definition
Buy 买入 Relative Performance>15%; or the fundamental outlook of the company or sector is favorable.
Accumulate 收集 Relative Performance is 5% to 15%; or the fundamental outlook of the company or sector is favorable.
Neutral 中性 Relative Performance is -5% to 5%; or the fundamental outlook of the company or sector is neutral.
Reduce 减持 Relative Performance is -5% to -15%; or the fundamental outlook of the company or sector is unfavorable.
Sell 卖出 Relative Performance <-15%; or the fundamental outlook of the company or sector is unfavorable.
[Table_IndustryRatingDefinition] Sector Rating Definition
The Benchmark: Hong Kong Hang Seng Index
Time Horizon: 6 to 18 months
Rating Definition
Outperform 跑赢大市 Relative Performance>5%; or the fundamental outlook of the sector is favorable.
Neutral 中性 Relative Performance is -5% to 5%; or the fundamental outlook of the sector is neutral.
Underperform 跑输大市 Relative Performance<-5%; Or the fundamental outlook of the sector is unfavorable.
[Table_DISCLOSUREOFINTERESTS] DISCLOSURE OF INTERESTS
(1) The Analysts and their associates do not serve as an officer of the issuer mentioned in this Research Report. (2) The Analysts and their associates do not have any financial interests in relation to the issuer mentioned in this Research Report. (3) Except for KAISA GROUP (01638 HK),GUOTAI JUNAN I (01788 HK),BANK OF GANSU (02139 HK),BINHAI INVESTMENT (02886
HK),VALUE A SHARE (03095 HK),CAM SCSMALLCAP (03157 HK),HAITIANTIAN (08227 HK),CSOP MSCI-R (CNY) (83149 HK),Guotai Junan and its group companies do not hold equal to or more than 1% of the market capitalization of the issuer mentioned in this Research Report.
(4) Guotai Junan and its group companies have not had investment banking relationships with the issuer mentioned in this Research Report within the preceding 12 months.
(5) Guotai Junan and its group companies are not making a market in the securities in respect of the issuer mentioned in this Research Report.
(6) Guotai Junan and its group companies have not employed an individual serving as an officer of the issuer mentioned in this Research Report. There is no officer of the issuer mentioned in this Research Report associated with Guotai Junan and its group companies.
DISCLAIMER This Research Report does not constitute an invitation or offer to acquire, purchase or subscribe for securities by Guotai Junan Securities (Hong Kong) Limited ("Guotai Junan"). Guotai Junan and its group companies may do business that relates to companies covered in research reports, including investment banking, investment services, etc. (for example, the placing agent, lead manager, sponsor, underwriter or invest proprietarily). Any opinions expressed in this report may differ or be contrary to opinions or investment strategies expressed orally or in written form by sales persons, dealers and other professional executives of Guotai Junan group of companies. Any opinions expressed in this report may differ or be contrary to opinions or investment decisions made by the asset management and investment banking groups of Guotai Junan. Though best effort has been made to ensure the accuracy of the information and data contained in this Research Report, Guotai Junan does not guarantee the accuracy and completeness of the information and data herein. This Research Report may contain some forward-looking estimates and forecasts derived from the assumptions of the future political and economic conditions with inherently unpredictable and mutable situation, so uncertainty may contain. Investors should understand and comprehend the investment objectives and its related risks, and where necessary consult their own financial advisers prior to any investment decision. This Research Report is not directed at, or intended for distribution to or use by, any person or entity who is a citizen or resident of or located in any jurisdiction where such distribution, publication, availability or use would be contrary to applicable law or regulation or which would subject Guotai Junan and its group companies to any registration or licensing requirement within such jurisdiction. © 2019 Guotai Junan Securities (Hong Kong) Limited. All Rights Reserved. 27/F., Low Block, Grand Millennium Plaza, 181 Queen’s Road Central, Hong Kong. Tel.: (852) 2509-9118 Fax: (852) 2509-7793 Website: www.gtja.com.hk