Catch Me if You Can: Effectiveness and Consequences of ...
51
Catch Me if You Can Effectiveness and Consequences of Online Copyright Enforcement Aguiar, Luis; Claussen, Jörg; Peukert, Christian Document Version Accepted author manuscript Published in: Information Systems Research DOI: 10.1287/isre.2018.0778 Publication date: 2018 License Unspecified Citation for published version (APA): Aguiar, L., Claussen, J., & Peukert, C. (2018). Catch Me if You Can: Effectiveness and Consequences of Online Copyright Enforcement. Information Systems Research, 29(3), 656–678. https://doi.org/10.1287/isre.2018.0778 Link to publication in CBS Research Portal General rights Copyright and moral rights for the publications made accessible in the public portal are retained by the authors and/or other copyright owners and it is a condition of accessing publications that users recognise and abide by the legal requirements associated with these rights. Take down policy If you believe that this document breaches copyright please contact us ([email protected]) providing details, and we will remove access to the work immediately and investigate your claim. Download date: 17. Jan. 2022
-
Upload
khangminh22 -
Category
Documents
-
view
2 -
download
0
Transcript of Catch Me if You Can: Effectiveness and Consequences of ...

Catch Me if You CanEffectiveness and Consequences of Online Copyright EnforcementAguiar, Luis; Claussen, Jörg; Peukert, Christian
Document VersionAccepted author manuscript
Published in:Information Systems Research
DOI:10.1287/isre.2018.0778
Publication date:2018
LicenseUnspecified
Citation for published version (APA):Aguiar, L., Claussen, J., & Peukert, C. (2018). Catch Me if You Can: Effectiveness and Consequences of OnlineCopyright Enforcement. Information Systems Research, 29(3), 656–678. https://doi.org/10.1287/isre.2018.0778
Link to publication in CBS Research Portal
General rightsCopyright and moral rights for the publications made accessible in the public portal are retained by the authors and/or other copyright ownersand it is a condition of accessing publications that users recognise and abide by the legal requirements associated with these rights.
Take down policyIf you believe that this document breaches copyright please contact us ([email protected]) providing details, and we will remove access tothe work immediately and investigate your claim.
Download date: 17. Jan. 2022
Catch Me if You Can: Effectiveness and Consequences of Online Copyright Enforcement
Luis Aguiar, Jörg Claussen, and Christian Peukert
Journal article (Accepted manuscript*)
Please cite this article as: Aguiar, L., Claussen, J., & Peukert, C. (2018). Catch Me if You Can: Effectiveness and Consequences of Online
Copyright Enforcement. Information Systems Research, 29(3), 656–678. DOI: 10.1287/isre.2018.0778
DOI: 10.1287/isre.2018.0778
* This version of the article has been accepted for publication and undergone full peer review but has not been through the copyediting, typesetting, pagination and proofreading process, which may
lead to differences between this version and the publisher’s final version AKA Version of Record.
Uploaded to CBS Research Portal: February 2019

Catch Me if You Can:
Effectiveness and Consequences of
Online Copyright Enforcement∗
Luis Aguiar1 Jorg Claussen2,3 Christian Peukert4
1European Commission - Joint Research Center - Digital Economy Unit, [email protected] Munich - Institute for Strategy, Technology and Organization, [email protected] Business School - Department of Innovation and Organizational Economics
4UCP - Catolica Lisbon School of Business and Economics, [email protected], corresponding author.
Accepted version, January 17, 2018
Abstract
We evaluate the unexpected shutdown of kino.to, a major platform for unlicensed video stream-ing in the German market. Using highly disaggregated clickstream data in a difference-in-differences setting, we compare the web behavior of 20,000 consumers in Germany and threecontrol countries. We find that this intervention was not very effective in reducing unlicensedconsumption or encouraging licensed consumption, mainly because users quickly switch to alter-native unlicensed sites. We highlight that the shutdown additionally had important unintendedexternalities. Individuals who never visited kino.to and who additionally clicked on news ar-ticles that covered the shutdown increased their visits to piracy websites substantially. Weshow that this effect largely comes from articles that explicitly mention alternative websites orsuggest that users do not have to fear legal consequences from unlicensed streaming. Finally,we document that the unlicensed video streaming market is much more fragmented after theshutdown, potentially affecting future interventions, at least in the short run. We argue thatour results can be helpful to understand why online piracy rates are still high, despite a plethoraof enforcement efforts.
Keywords: Anti-Piracy Policy, Copyright, Movie Industry, Clickstream, Natural Experiment
JEL classification: K42, L82, O34, O38
∗Disclaimer: The views expressed are those of the authors and may not in any circumstances be regarded asstating an official position of the European Commission, the EC Joint Research Center or the IPTS. We thankTobias Kretschmer, Ulrich Kaiser, and the senior editor, the associate editor, and three anonymous reviewers fortheir valuable comments and ideas. The paper has benefited from feedback of conference participants at NBERSummer Institute, IIOC Boston, EARIE Munich, Media Economics Workshop Stellenbosch, ZEW ICT Conference,ICT Workshop Evora, Media Workshop Florence, Munich Summer Institute, Digital Economy Workshop Liege,Verein fur Socialpolitik Augsburg, Swiss Society of Economics and Statistics Basel and seminar presentations atCopenhagen Business School, IPTS Seville, DICE Dusseldorf, Telecom ParisTech, University of Zurich, ETH Zurichand Max Planck Institute Munich. We acknowledge the support from FCT – Portuguese Foundation of Science andTechnology for the project UID/GES/00407/2013.

1 Introduction
With the advent of file-sharing networks and, more recently, unlicensed online streaming, copyright
infringing content has become easily available to consumers. This raises concerns about sales
displacement, continued investment in entertainment products, and overall welfare. Governments
have reacted with different actions to enforce copyright on the Internet, such as stricter legislation,
DNS blocking, and crackdowns of platforms that host or provide access to infringing content.
Despite the many enforcement efforts carried out in the last decade or so, online piracy rates are
still substantially high (UK Intellectual Property Office, 2016) and have even increased regarding
video content (Poort and Weda, 2015). Additionally, the available evidence on the effectiveness
of individual policies is mixed. Studies suggest that announcements and introduction of stricter
laws did not have a lasting effect on box office movie revenues in the US, France, New Zealand,
South Korea, Taiwan, and the UK (Orme, 2014; McKenzie, 2017). In the context of digital music,
new laws in France and Sweden led to an increase in sales of about 25%, but this effect diminished
after 6 months (Adermon and Liang, 2014; Danaher et al., 2014). Studies that look at the effect of
DNS blocking find limited reductions in overall piracy consumption (Poort et al., 2014; Danaher
et al., 2015b). Finally, the shutdown of the major hosting platform Megaupload was associated with
an average increase in licensed digital and theatrical revenues of movie content of less than 10%
(Danaher and Smith, 2014). Box office revenues of narrow-release movies even declined, probably
due to word-of-mouth effects of piracy (Peukert et al., 2017).
The fact that online copyright enforcement policies have been rather unsuccessful in lowering piracy
rates or increasing producer surplus remains a puzzle. Drawing on a large body of work across
disciplines, we argue that the deterrence effect of online copyright enforcement efforts is likely to be
challenged by adaptive behavior on both the demand and the supply side. In addition, we highlight
that unintended externalities can be an important factor in policy implementations. Despite their
importance for policy and management, the empirical significance of these effects has not yet been
documented.1 Our paper is the first to provide individual-level evidence on the effects of a copyright
enforcement intervention on consumer behavior.
1Theoretical work highlights strategic reasons why too strong enforcement may be suboptimal for the firm (e.g.Conner and Rumelt, 1991; Peitz and Waelbroeck, 2006; Jain, 2008; Tunca and Wu, 2013).
1

The literature shows that increased enforcement efforts can deter unlawful or unethical behavior,
both directly and indirectly (Levitt, 1997; Ayres and Levitt, 1998; DiTella and Schargrodsky, 2004;
Draca et al., 2011; Bertoni et al., 2013). Shutting down one supplier of infringing content could
convince other piracy websites to voluntarily step down and deter new entry.2 Because consumers’
intentions to pirate and willingness to pay for licensed content are correlated with the perceived
risk of prosecution (Chiou et al., 2005; Chiang and Assane, 2009; Liao et al., 2010), one could
similarly expect enforcement efforts, either targeted at consumers or suppliers, to have some kind
of externalities. On the other hand, theoretical insights from the economics of crime literature sug-
gest that the effectiveness of law enforcement may be undermined by displacement effects, adaptive
behavior, and the industry’s supply behavior (Cameron, 1988). Stronger enforcement sometimes
simply shifts criminal activity to a different time or place (Angrist and Kugler, 2008; Adda et al.,
2014; Dobkin et al., 2014), or even induces market entry after crackdowns have weakened incumbent
criminals (Dell, 2015). Recent evidence shows that international cooperation in law enforcement
can reduce cybercrime, but also diverts hacker attacks to non-enforcing countries (Hui et al., forth-
coming). Similarly, studies suggest that consumers simply switch the modus operandi of accessing
and distributing unlicensed content as a response to stricter enforcement (Lauinger et al., 2013;
Arnold et al., 2014; Poort et al., 2014). Such results are in line with the literature on search and
switching costs on the Internet (Chen and Hitt, 2002; Goldfarb, 2006a,b). For example, Goldfarb
(2006b) shows that consumers easily switch to a competing website when their preferred website is
temporarily unavailable because of denial of service attacks.
An important source of (intended or unintended) externalities could result from the fact that
piracy and copyright enforcement actions regularly trigger substantial media coverage.3 Authors
have frequently articulated the idea that media coverage may reinforce the intended effects of
enforcement, leading consumers to reduce piracy consumption and switch to licensed offerings (Al-
Rafee and Cronan, 2006; Hennig-Thurau et al., 2007; Sinha and Mandel, 2008; Danaher et al., 2010;
2A few days after Megaupload was closed down, its competitors Filesonic and Fileserve restricted downloads tothe person who uploaded the file, rendering the platform useless for the distribution of pirated content. Many othercompetitors followed subsequently. See http://tinyurl.com/75of8j6.
3A keyword search for prominent examples in the news database Factiva lists 37,597 articles related to “Napster”(period 1999–2002), 13,301 articles related to “Pirate Bay” (2003–2016), 13,760 articles related to “Megaupload”(2007–2013), 11,362 articles related to “HADOPI” (2009–2013), 6,277 articles related to “PIPA” and “SOPA”.
2

Cox and Collins, 2014).4 However, not all news articles contain a clear-cut anti-piracy message.
Zamoon and Curley (2008) study the contents of US newspaper articles about software piracy,
and document that around the same number of articles condemn and condone piracy. Further, in
situations where the legal status of downloading and streaming is ambiguous, news articles may
provide legal information – for example by citing lawyers – that can affect consumption choices
in different ways.5 Indeed, there is some evidence that consumers use arguments put forward in
the mass media to rationalize their piracy behavior (Vida et al., 2012). Regardless of their tone,
news articles may also simply inform consumers about the existence of unlicensed content on the
Internet. This information can facilitate switching to alternative unlicensed offerings for consumers
already in the market, and it may lead previously uninformed consumers to start pirating following
news reports.
While we are not aware of any systematical evidence of media-induced externalities of copyright
enforcement, findings from a variety of empirical contexts show that information in mass media can
have direct and indirect effects on individuals’ behavior. For example, Goh et al. (2011) show that
newspaper reports affected how many consumers opt-in for a consumer protection policy. Media
coverage of suicides is also known to be related to subsequent increases in suicide rates (Gould,
2001), and there is robust evidence of a link between media and violent behavior against others.
For example, Yanagizawa-Drott (2014) and Adena et al. (2015) show that radio broadcasts in-
creased participation in violence in the Rwandan genocide and Nazi Germany. Esser and Brosius
(1996) document that the number of right-wing violent offenses increases with the intensity of TV
news coverage of previous right-wing violent offenses. Finally, exposure to public health campaigns
aiming at establishing social norms for issues such as smoking, drinking, unsafe sex, and cancer pre-
4For example, Al-Rafee and Cronan (2006, p. 247) state that “one approach [to reduce piracy] would be to expandthe media coverage on [...] digital piracy busts.” Cox and Collins (2014, p. 75) conclude that “public awarenesscampaigns may prove a more worthwhile investment of time and resources for the movie industry.” Hennig-Thurauet al. (2007, p. 15) argue that “stressing the unethical element of appropriating copyrighted content [...] in marketingcampaigns could increase the moral costs of illegal file sharing and lower file-sharing activities” and Danaher et al.(2010, p. 1150) speculate that “large part of antipiracy efforts in the future may need to rely on the consumer’s‘moral’ cost associated with piracy”. Experimental evidence in Sinha and Mandel (2008) shows that reading (made-up) news articles about piracy lawsuits can affect the perceived risk of getting caught and increase the willingness topay for licensed content.
5In representative surveys among 10,000 Germans, only 39% stated that they find it easy to judge whether movieand TV content offerings on the Internet are legal or illegal. 86% stated that they know about legal consequencesof up-and downloads of copyrighted material from news reports. See DCN-Studie 2013, available at https://drive.google.com/open?id=0Bxe11iVXrXgsd0dKeFExWU9vWlE.
3

vention, can be negatively correlated to people’s attitudes and intentions of use (Cho and Salmon,
2007).
We examine the extent of the intended and unintended consequences of online copyright enforcement
using URL-level clickstream data that allow us to observe all web browsing of 5,000 individuals
each in Germany, France, Italy, and the UK throughout 2011. We exploit the exogenous timing
of the shutdown of the then dominant German streaming website kino.to in June 2011 as a
natural experiment. In a difference-in-differences setting, we compare licensed and unlicensed video
consumption of consumers in Germany to a control group of consumers in three other countries,
before and after the shutdown.
Our aggregate results show that the effectiveness of the shutdown of kino.to was limited, confirm-
ing previous findings regarding other copyright enforcement cases and different data. Comparing
German users to international users, we see a moderate reduction in visits to piracy sites of 4.5%.
We also fail to find much evidence for substitution into consumption of licensed video content as
German users do not differentially change their visits to movie theaters’ websites, licensed online
video services (such as Maxdome, Lovefilm, and iTunes), or DVD/Blu-ray-related pages on Amazon.
Our individual-level data allow us to go far beyond a simple aggregate analysis. Distinguishing
different types of users, we find that individuals who were using kino.to before its shutdown
decreased their piracy consumption by about 27%. Because consumers substitute towards existing
and newly entering alternative unlicensed websites, this decrease is, however, much lower than
what could have been expected given kino.to’s 79% market share. Most interestingly, we find
evidence of unintended externalities. On average, individuals who never visited kino.to increased
their visits to other piracy websites by 0.8%. We show that this effect is driven by individuals who
clicked on news articles that discussed the shutdown of kino.to. Those users increase their visits
to piracy websites by about 35%. Looking at the content of these news articles, we find that this
effect mainly comes from articles that directly mention alternative piracy websites, or indicate that
consumers do not have to fear prosecution when using streaming sites.
Finally, we assess the post-shutdown structure of the market for unlicensed video streaming in
Germany. While the market was initially largely dominated by kino.to, it ends up being much
4

more fragmented after its shutdown. In the observed six-month period after the shutdown, the
market was evenly split between movie2k.to (the second largest player at the time of the shutdown),
kinoX.to (a new entrant), and a remainder of 17 websites which cumulatively accounted for one
third of the market. Future interventions in the German market may therefore be potentially more
costly and potentially less effective after the shutdown of kino.to, at least in the short run.
Our paper makes an important contribution to an emerging literature documenting the importance
of public policy externalities for both policy and management (e.g. Goh et al., 2015). Our key
contribution to the piracy literature is to highlight that not only direct, but also indirect effects
need to be taken into account when evaluating the effectiveness and consequences of copyright
enforcement efforts. This can help understand why we still observe high piracy rates despite the
abundance of enforcement efforts that have been carried out in the past.
Our results generate at least two important and novel implications. First, we provide evidence that
consumers find it easy to switch to alternative unlicensed services, which substantially reduces the
effectiveness of the enforcement effort. Second, an enforcement effort that creates publicity can
backfire if some consumers that were previously uninformed start using unlicensed offerings. This
challenges the idea – often put forward in the piracy literature, but never tested in observational data
– that the media can be helpful in educating consumers about possible consequences of unlicensed
consumption, and in persuading them to stop pirating and switch to licensed offerings. With this in
mind, we discuss implications for future anti-piracy policy. From a managerial perspective, opening
the “black box” of consumer behavior can be helpful to design private copyright enforcement
strategies, as well as to understand the competition between licensed and unlicensed services.
We recognize that while our analysis provides rich insights, it remains a case study with context-
specific results. Based on a careful discussion of the available evidence and established results in
the literature, we conclude that it is unlikely that a similar experiment in a different institutional
and geographic setting would yield very different results. The historical context, however, is likely
to affect our results on substitution towards licensed consumption. We speculate that better avail-
ability and lower prices of licensed content can convince consumers to switch to licensed offerings
(Danaher et al., 2010, 2015a; Poort and Weda, 2015; Aguiar and Waldfogel, forthcoming).
5

2 Movie Piracy and the Shutdown of kino.to
Consumption patterns of entertainment products have drastically changed since the beginning of
the 21st century. Ever since the advent of Napster in 1999 and the creation of subsequent file-
sharing networks, individuals are able to freely share and access vast amounts of digital media files.
The primary mode of access to unlicensed content in recent times is the system of cyberlockers
and linking sites.6 In their simplest form, cyberlockers are online services that allow Internet users
to upload and store large files. While this type of service can be used to back up any type of
personal data, it can also be used to share copyright protected files such as movies and episodes
of TV series (Antoniades et al., 2009; Liu et al., 2013). Once a file is uploaded, the uploader
receives a download URL, which can be shared with other individuals, e.g. by posting the link on a
website where anyone can get direct access. These linking sites, or sometimes called streaming sites,
would typically do more than simply providing access to these links, as they would also categorize
content, make it searchable, and provide meta-information (such as credits and ratings).7 Like
many licensed services, this ecosystem essentially runs on advertising revenues.8 The more visits a
cyberlocker gets, the higher the advertising revenue. In order to generate traffic to its website, a
cyberlocker would sometimes pay uploaders a share of the advertising revenue generated by their
uploaded content. Linking sites also show third-party ads to final consumers, generating revenue
for their owner. Therefore, an individual who visits the linking website and clicks on the link enjoys
free content and generates revenue for the cyberlocker, the initial uploader, and the linking site. Of
course, the content creator or rightsholder is usually not compensated at all. This is why we refer
to this type of consumption as “unlicensed” throughout the paper. Overall, this whole process has
enabled cyberlockers to store huge amounts of movies, episodes of TV series, e-books, and recorded
music. Linking websites play a crucial role in the unlawful sharing of copyright protected content
by acting as platforms for uploaders and final consumers.
6According to a representative survey among German consumers conducted in 2011, 80% of the consumersthat use unlicensed services for movie and TV series consumption do so mainly via cyberlockers and streamingsites. Only 2% use mainly BitTorrent. See DCN-Studie 2011, available at https://drive.google.com/open?id=
0Bxe11iVXrXgsSjBGRFpqR2txVFk.7The name streaming site relates to the fact that the links provided on the websites often allow for the immediate
consumption of the movie, without having to download the complete file. We will use the terms linking and streaminginterchangeably in the remainder of the text.
8According to a joint report of the music and advertising industry in 2012, more than two thirds of infringingwebsites are predominately financed by advertising. See Google and PRS, available at https://docs.google.com/
file/d/0Bw8Krj_Q8UaENDhEOG1LVFRhVkU/view.
6

The German market for unlicensed video content had a substantial size in 2010, with at least
one million people (more than 1% of Germany’s entire population) using cyberlockers and linking
sites to stream or download 54 million movies and 23 million TV show episodes (GfK et al., 2011,
p. 17).9 While a significant number of linking sites were active in the German market, kino.to
was – as will be detailed below – the dominant platform providing access to unlicensed video
streaming in 2011. Following a complaint filed by movie industry representatives, a joint raid
involving police, computer specialists, and tax officers led to the seizure of kino.to on June 8,
2011, effectively removing access to copyright infringing content. In the couple of months following
the intervention, visitors of www.kino.to were shown a police notice stating that the domain had
been seized, owners had been arrested, and users that had created or distributed unlawful copies
of copyrighted material may be facing prosecution. As a result of various court decisions between
December 2011 and June 2012, 6 members of kino.to’s management team were sentenced to prison
for up to four and a half years (Spiegel Online, 2012).
Given the massive popularity of kino.to, its shutdown generated tremendous media attention,
published in all kinds of outlets, including major ones such as Bild (Germany’s largest tabloid) or
Suddeutsche Zeitung (Germany’s largest national daily newspaper). As we detail below, we observe
1,835 distinct URLs of news articles or blog posts covering or following up on the shutdown, collected
using several databases including Google News, Factiva and LexisNexis.
A verdict from a German court sheds some light on the contents of kino.to and the revenues it
generated (Amtsgericht Leipzig, 2011). Users of kino.to had clicked 1.74 billion times on links to
movies and TV episodes between September 1, 2010 and June 8, 2011 alone, an average of some
7 million clicks per day. The district court considered that the website offered at least 1.3 million
links to some 21,000 motion pictures, 7,000 documentaries, and 106,000 TV episodes. Kino.to
provided about ten alternative links for each movie, about two for each documentary and about
eight for each TV episode. Content was not directly hosted by kino.to, but mostly by external
9A total of 4.3 million consumers accessed movies and 5.8 million accessed TV episodes online in 2010. Mostcommonly (47%), survey participants indicated that legal streaming sites (such as MyVideo) and TV station websites(many German TV stations have large online archives) were the primary source to consume TV episodes. However,only 22% considered those services as the primary source of movie consumption. The majority of consumers (38%)reported cyberlockers and streaming sites (such as kino.to) as their main source of movie consumption, while 18%indicated that they mainly used cyberlockers and streaming sites for consuming TV episodes. For movies, 17% ofthe consumers mainly used paid download services, while only 9% mainly used such services for TV episodes.
7

cyberlockers. Interestingly enough, kino.to owned some of these cyberlockers (freeload.to and
ebays.to). The district court considered that at least 12,970 links (less than 1% of the total
number of links) pointed to content hosted on vertically integrated cyberlockers. The owners of
kino.to assumed an active role in obtaining links to video files, setting incentives for uploaders, and
enforcing minimum quality standards. Monthly advertising revenues are estimated at AC150,000,
which amounts to almost AC6 million over the period from March 2008 to June 2011. During the
same period, revenues from integrated cyberlockers were some additional AC634,000.
3 Data and Methodology
3.1 Data Source and Structure
We have access to clickstream data from Nielsen’s Internet audience measurement service NetView.
This service monitors the online activity of a large number of Internet users by recording all of their
URL visits via an application that is installed on the consumer’s device (desktop PC or Mac) and
operates in the background. Consumers are incentivized to take part and stay in the panel by a
rewards program, in which they can exchange credit points for retail and travel vouchers. Con-
sumers earn a fixed amount of credit points every month, and take part in a lottery every quarter.10
Upon signing up, Nielsen requires participants to fill out a survey about basic demographics, such
as household size, net household income, age, gender, education, and employment status.11
Our sample consists of the browsing history of 5,000 individuals each in Germany, France, Italy
and the UK throughout 2011, totaling 20,000 users. We observe the URL of every website an
individual has visited together with a timestamp, the referral URL, and the amount of time spent
on that URL.12 The URL information lets us distinguish different kinds of online activities. Most
importantly, it allows us to identify visits to webpages linking to copyright infringing content – such
as unlicensed video streaming – as well as domains related to licensed video consumption. The great
10See https://digitalvoice.nielsen.com/us/en/home.html.11To check whether our sample is representative of the population of Internet users, we compare key demographic
variables to a representative sample of Internet users in Germany, which we construct using data from the repre-sentative German Socioeconomic Panel (SOEP, Wagner et al., 2007). We find that differences in household income,education, and age are significantly different from zero, but small in size. We note, however, that representative-ness is not crucial for the purpose of our study, because we are interested in across- and within-group comparisonsin the same sample. In an analysis not detailed here, we investigate whether the effects found below differ acrossdemographic groups. Results don’t provide much evidence that this is the case.
12Nielsen measures time spent on a given URL while it is in focus (tab and browser window), see http://en-us.
nielsen.com/sitelets/cls/digital/Online-NetView-FAQ.pdf.
8

level of detail in this data even allows us to go beyond the website level. For example, we distinguish
different product categories users are browsing on Amazon, or identify whether users are accessing
news articles related to the shutdown of kino.to. We aggregate the data from the clickstream level
to the user-week-level, so that the unit of observation for most of our analyses is the weekly sum
of clicks per user in a specific content category, e.g. unlicensed video streaming websites. With 52
weeks, 5,000 users per country, and four countries, we have 1,040,000 observations.
3.2 Variables
All variables are defined briefly in Table 1 and introduced in more detail below. Descriptive statistics
are reported in Table 2.
3.2.1 Piracy Consumption
Measuring the consumption of unlicensed video content requires the identification of websites pro-
viding access to such content. We both manually went through the top-1000 domains classified
by Nielsen as entertainment-related websites and used available lists of piracy websites in 2011.13
This led us to a total of 20 websites offering unlicensed video streaming content, which defines
our unlicensed video streaming market in Germany. By far, the most popular site in this set is
kino.to, which was visited around 6,000 times per week between January and June 2011 in our
sample. This is more than 8 times the traffic received by the second most visited website in our
data, movie2K.to, which had an average of 730 weekly visits over the same period of time. The
20th and last website included in the definition of the German movie streaming piracy market,
streams.to, received an average of less than 1 weekly click between January and June 2011. With
a weekly average of 79% market share, kino.to was clearly the dominant unlicensed movie stream-
ing platform in the German market at the time of its shutdown. We perform a similar exercise to
define the corresponding unlicensed video streaming markets in Italy, France, and the UK.
Piracy: Visits Our preferred measure of piracy usage is the weekly number of visits to the piracy
websites described above.
13See for example http://tinyurl.com/lvaunh6 and http://repat.de/2011/06/alternativen-zu-kino-to.
9
One may be worried that visits to those types of sites do not provide a perfect measure of video
content consumption. Before being able to stream a movie, a user would need to make a number
of navigational clicks, for instance searching or browsing through content, or selecting a server that
provides the video stream. A potential concern would therefore be that the unlicensed websites in
our sample differ in their design. This may, for example, lead to a smaller number of necessary
clicks to consume content on kino.to compared to alternative websites. It may be possible that
some websites do not offer the desired content, and that the observed clicks to that domain only
reflect search as opposed to consumption. To address these issues we re-run our regressions using
three alternative measures of unlicensed video consumption, which we present below.
Piracy: Streams We exploit the fact that a website like kino.to doesn’t directly host video
content, but only provides links to cyberlockers (external servers that operate under a different
domain name, e.g. megavideo.com). Using historical information available online, we compile a
list of 34 cyberlocker services. In our raw clickstream data, we flag a streaming session whenever
we observe a click to a linking site that is directly followed by a click to a cyberlocker site, or clicks
to cyberlocker sites where a linking site is listed as the referral.
Piracy: Days This is a measure of the extensive margin of piracy consumption, making use of
daily variation within users. We count the number of days on which a given individual uses an
unlicensed video streaming website in a given week. A piracy day is flagged as such if we observe
at least one visit to a unlicensed website. In this way, we address the concern that some platforms
may require more clicks than others to reach content.
Piracy: Duration Our third alternative measure is provided by Nielsen and gives the time
spent on each URL (in seconds). While video consumption should result in much higher values
compared to navigational clicks, a few practical issues challenge the accuracy. For example, Nielsen
only records time spent on pages in focus and time stops being recorded once the user switches to
another tab. While this implies that the duration provided by Nielsen will potentially underestimate
10

the time spent on each URL, this measure is still strongly correlated with the true time spent on
each URL.14
3.2.2 Licensed Consumption
Our data provide us with good proxies for several licensed video consumption channels. In partic-
ular, we can observe visits to websites related to movie theaters, licensed online video services, and
DVD/Blu-ray purchases.
Licensed: Cinema We proxy for movie theater visits by measuring clicks on the main movie
portals that include showing times (e.g. kino.de, mymovies.it) as well as the websites of the
major movie theater companies in a given country.15
Licensed: Online We track visits to paid licensed video services. While European consumers
could not subscribe to flat-rate services that were already popular in the U.S. (e.g. Netflix ) and
the number of digital pay-per-view services was limited in 2011, we are still able to measure the
visits to platforms such as Canalplay, Mediaset Premium, CinemaNow, Lovefilm, and iTunes.16
Licensed: DVD We proxy for DVD and Blu-ray sales by measuring visits to pages in the DVD
and Blu-ray categories on Amazon.17 The home video market was dominated by DVD and Blu-ray
in 2011, with a market share of more than 96%, leaving less than 4% to digital channels in Germany
(GfK and Bundesverband Audiovisuelle Medien, 2013), similarly so in other European countries.18
14We randomly selected 500,000 URLs on youtube.com that were visited by users in our data and collectedinformation about the duration of according videos via the YouTube API. The correlation between Nielsen’s measureof visit duration and the actual video duration is 0.79 (and 0.91 for YouTube videos shorter than 120 seconds, whichare more likely to be watched completely).
15A representative survey among 8,639 German consumers estimates that 16.21 million people have bought cinema,concerts or theater tickets online in 2011. Around 30.5 million Germans went to a movie theater in 2011. This impliesthat almost every second cinema visitor purchased tickets online. See http://tinyurl.com/nhur74u and GfK andGerman Federal Film Board (2012).
16We cannot observe purchases on iTunes, because the Nielsen NetView application only captures traffic withinthe browser and iTunes is a standalone software. We are therefore only able to observe the visits to the iTuneswebpage, which is a proxy of individuals signing up of the service and downloading the iTunes application to makepurchases later. Market shares for 2011 are not available, but data in the first half of 2014 show that Maxdomedominates the German market with a share of 35%, followed by iTunes with 18%, Lovefilm (12%) and Videoload(10%). See http://tinyurl.com/qb3jjsw.
17We did this by crawling all Amazon URLs in our data to check the product category of items. Amazon is by farthe dominant online retailer in the German market with a revenue of AC4.8 billion in 2012. The second biggest onlineretailer is Otto with AC1.7 billion in revenues. Amazon’s market position is similarly dominant in other Europeancountries. See http://tinyurl.com/pq9vyvf and http://tinyurl.com/jwvhbpo.
18See http://tinyurl.com/lzu6488 and http://tinyurl.com/guqwkya.
11

3.2.3 User Types
Because individuals may be affected differently by the shutdown of kino.to, it is useful to define
groups according to their characteristics. In the German sample, 16.9% of the users have visited the
kino.to website at least once between January 1st and June 8th 2011. We refer to these individuals
as the Kino users, and to the individuals who never visited kino.to before its shutdown as Non-
Kino users. We observe effectively zero visits to kino.to from users located in other countries.
For an additional analysis, we also construct a more granular distinction of user types. We distin-
guish between users of kino.to that did not visit any other piracy websites before the shutdown
(Kino: Singlehoming) and those that did (Kino: Multihoming). Similarly, we distinguish
between non-users of kino.to who visited unlicensed streaming sites before the shutdown (Non-
Kino: Pirate) and those who did not (Non-Kino: Non-Pirate). Finally, for the purpose of
analyzing aggregate effects, we group all German users in a variable named Germany.
3.2.4 News Consumption
To measure news readership, we collected news articles and blog posts covering or following up on
the shutdown of kino.to. We pulled search results for the term “kino.to” from Google, Google
News, and the proprietary news databases Factiva and LexisNexis and went through all 112.7
million URLs accessed by German users in our data to identify those that included some version
of “kino.to.”19 After careful manual cleaning, we arrived at 1,835 distinct URLs of news articles.
When matching these URLs back to our clickstream data, we obtained 170 news articles that were
actually visited by the individuals in our sample. We then created the dummy variable News that
turns one once a user clicks a corresponding URL for the first time.
In a next step, we classified the content of news articles (Zamoon and Curley, 2008; Goh et al.,
2011) into one the four following categories: Background, Illegal, Legal and Alternative Websites.
About a third of the articles cover topics in multiple categories. Examples of background stories
(News: Background, 44%) include “Polizei schaltet kino.to ab (Police takes down kino.to)” in
Zeit Online and “Millionenkonten bei kino.to entdeckt (Millions found in kino.to bank accounts)” in
19See e.g. http://www.zeit.de/digital/internet/2011-06/kinotto-razzia-streaming.
12

Suddeutsche Zeitung, which summarize key facts about kino.to and the procedure and surrounding
events of the takedown.20 Articles like “Millionen Nutzer haben Angst (Millions of users fear legal
action)” and “Kino.to: GVU will Nutzer verfolgen und bestrafen (GVU wants to prosecute and
punish users)” quote industry representatives or lawyers saying that consumers may face criminal
and civil prosecution. We include articles featuring such claims in the category News: Illegal
(11%).21 Typical claims in the News: Legal (7%) category are that streaming may not count
as copying in the sense of German copyright law, and consumers therefore do not need to fear
legal consequences.22 The last category of media coverage – referring to unlicensed alternative
websites (News: Alternatives, 46% of the articles) – includes stories such as “Kino.to-Nachfolger
bereits online: Video2k.tv (Kino.to successor already online)” in Gulli, and “Illegales Filmportal ist
zuruck – Kino.to-Piraten verhohnen Ermittler (Illegal movieportal is back – Kino.to-pirates mock
investigators)” in Bild.23
The different types of stories published in news outlets following the shutdown of kino.to illustrate
the idea that media coverage may generate externalities going in several directions. On the one
hand, coverage may deter consumers from using alternative websites out of fear of legal action.
On the other hand, media coverage may inform users of the seized platform about the existence
of alternative websites and therefore lower search and entry costs. Similarly, it may also inform
individuals who were initially unaware of the existence of such websites, causing them to start
consuming unlicensed content online.
3.3 Estimation Strategy
3.3.1 The Shutdown of kino.to as a Natural Experiment
The main goal of this paper is contribute to the understanding of the effectiveness and consequences
of online copyright enforcement. The richness of our highly disaggregated data allows us to not
only investigate direct effects, but also provide evidence for potentially confounding or reinforcing
indirect effects. Like many recent studies that are interested in evaluating anti-piracy or cybercrime
enforcement policy (e.g. Adermon and Liang, 2014; Danaher and Smith, 2014; Reimers, 2016;
20See http://tinyurl.com/6bjxxo2 and http://tinyurl.com/mam4sx9.21See http://tinyurl.com/3mfm9tq and http://tinyurl.com/635vgcl.22See http://tinyurl.com/6ad5dus and http://tinyurl.com/lhx8ub8.23See http://tinyurl.com/kkj3bbb and http://tinyurl.com/5usgxsu.
13
Peukert et al., 2017; Hui et al., forthcoming; Zhang, forthcoming), we focus on a specific empirical
setting, and interpret the shutdown of kino.to as a natural experiment that removes an important
option from the consumers’ entertainment choice set, suddenly and unexpectedly.
A number of facts indicate that the timing of the shutdown was indeed exogenous to all parties
involved – the movie industry, consumers, and the owners of kino.to. First, the management team
did not seem to know about the intervention of kino.to as they did not relocate to a third country
before their arrest.24 We therefore do not expect them to have carried out any type of strategic
action, e.g. removing links, in anticipation of a crackdown. Second, our data shows no evidence
of consumers changing their visits to kino.to shortly before the domain went offline. Finally,
although industry representatives were seemingly involved in the investigations, it is very unlikely
that they could have affected the exact timing of the operation in a way that would affect the
dependent variables in our analysis. We could not find any evidence that movie theaters, or offline
or online retailers (including licensed video platforms) strategically changed contents or prices –
neither in anticipation of the precise date of the shutdown, nor afterwards.
3.3.2 Econometric Model
Following the policy evaluation literature (e.g. Card and Krueger, 1994), we use a difference-in-
differences approach, in which we compare the behavior of consumers that were affected by the
policy to the behavior of consumers that remained unaffected. Under some moderate assumptions,
this allows to establish a plausibly causal estimate of the impact of the shutdown of kino.to on
the consumption of both unlicensed and licensed video content.
Individuals located outside of the German-speaking countries constitute a good control group be-
cause they are very unlikely to be affected by the shutdown of kino.to, neither directly nor indi-
rectly. First, we observe essentially zero clicks to kino.to from users located in Italy, France, and
the UK. Second, media coverage of the shutdown was almost exclusively limited to news articles
in German outlets and written in German.25 Because we are interested in testing for externalities
24According to news articles, 13 suspects were immediately arrested. See for example http://www.spiegel.de/
netzwelt/netzpolitik/kino-to-ermittler-verhaften-mutmassliche-betreiber-von-raubkopie-seite-a-767375.
html.25Less than 2.5% of the news articles and blog posts covering and following up on the shutdown of kino.to we
observe are written in English, 85% of the URLs have the German top-level domain .de.
14

caused by the intervention, we distinguish between two different treatment groups within Germany.
The first group, which includes individuals that visited kino.to before its shutdown (Kino users),
was directly affected by the intervention. The second group of consumers includes German indi-
viduals that never visited kino.to (Non-Kino users). By definition, these individuals could only
have been indirectly affected by the shutdown.
The identifying assumption in any difference-in-differences setting is that the dependent variable
would have followed a similar trend in the treatment and control groups had the policy shock
not happened. A necessary condition for this assumption to hold is that trends of treatment and
control groups do not differ before the intervention. Using the long time dimension of our data, we
provide some statistical insights that support this assumption, and therefore address the concern
that changes in the dependent variable would have occurred in the absence of the policy shock.
The baseline specification of our difference-in-differences model is defined as follows:
ln(Clicksit + 1) = α+ δ1 (Aftert ×Kinoi) + δ2 (Aftert × Non-Kinoi) +∑c
βc(t× Cc)
+ β1 (t×Kinoi) + β2 (t× Non-Kinoi) + wt + µi + εit, (1)
where Clicksit refers to the number of visits to either unlicensed or licensed video consumption
websites of individual i in week t, t is a linear time trend, Kinoi and Non-Kinoi indicate whether
individual i is a Kino user or a German Non-User of Kino, Aftert is a dummy variable equal to
one during the weeks after the shutdown, the β coefficients capture country- and group-specific
time trends and εit is an individual-time specific error term. The δ coefficients correspond to the
effects of the shutdown on the two treatment groups. Specification (1) also includes week fixed
effects and individual fixed effects, which allow us to control for any unobserved week-specific and
cross-sectional-invariant factors as well as individual-specific and time-invariant factors. Note that
the terms corresponding to Aftert, Kinoi, and Non-Kinoi are not included in the specification as
they are implicitly controlled for by the week and individual fixed effects. Following the literature,
we estimate equation (1) using OLS and cluster standard errors at the individual level (Bertrand
15
et al., 2004). As the individual-level data tends to be dispersed and as we are interested in relative
changes, we use the logarithm of the number of clicks as a dependent variable.26
4 Results
In what follows, we first show how the shutdown affected the consumption of unlicensed video
content, both directly and indirectly. We then provide evidence that exposure to news articles
that discuss the shutdown can explain the externalities we observe and show how this varies across
categories of news articles. We go on to examine how the shutdown affected the consumption of
licensed alternatives. We provide additional evidence that indirect effects and externalities are
driven by how much knowledge individuals have about unlicensed alternatives, by distinguishing
between single and multihoming users. We then “zoom out” and discuss what our results imply
on the aggregate and speculate about welfare effects. Finally, we discuss the changes in the overall
structure of the market for unlicensed video consumption after the enforcement effort. Throughout,
we present a range of robustness checks regarding the identifying assumption of the difference-in-
differences model and potential measurement error in the dependent variable.
4.1 Effects on Unlicensed Video Consumption
4.1.1 Descriptive Evidence and Parallel Trends
We start our analysis with a descriptive look at how the consumption of unlicensed content changed
with the shutdown. The plot of average overall piracy levels in Figure 1 shows that the overall
number of visits to unlicensed video streaming sites declined substantially right after kino.to was
removed from the market. However, this decline is clearly not as strong as the decline in visits to
kino.to. Furthermore, visits to piracy websites quickly increase again following the 5th week after
the shutdown and almost return to pre-intervention levels towards the end of the observed period.
Figure 2 plots the average total clicks to piracy websites separately for Kino users, Non-Kino users
and users in France, Italy and the UK (termed “international users” in the remainder of the text).
For Kino users, we observe a strong decline in piracy consumption directly after the shutdown,
which quickly recovers and then stagnates from the 5th week after the shutdown onwards. The post-
26As we have many zeros in the dependent variable and want to avoid losing those observations, we follow the priorliterature and take the log over Clicksit + 1. We show below that results remain robust when we exclude outliers.
16

shutdown levels of Kino users stay below the pre-shutdown levels for the entire period of observation.
Looking at Non-Kino users, we first observe that their average piracy levels are substantially lower
than the piracy levels of Kino users. However, we see a sharp increase directly after the shutdown,
which still remains much lower than the piracy levels of Kino users. The group of international users
shows fairly stable levels of piracy consumption throughout the observed period. Most importantly,
Figure 2 provides evidence that the necessary condition of the parallel trends assumption seems
to hold. Average piracy levels of Kino users, Non-Kino users and international users follow very
similar trends before the shutdown. Furthermore, the fact that overall piracy levels of international
users remain stable throughout the entire year, and especially do not markedly change with the
shutdown, strongly suggests that these individuals constitute a valid control group.
We now go beyond this simple visual inspection and provide more detailed evidence supporting the
validity of our parallel trends assumption. We estimate the following specification to test, week by
week, whether the number of visits to piracy websites of Kino and Non-Kino users differ from the
number of visits to piracy websites of international users:
ln(Clicksit + 1) = α+∑t
βt0wt +∑t
βt1 (wt ×Kinoi) +∑t
βt2 (wt × Non-Kino) + µi + εit. (2)
We define the week before the shutdown as the left-out reference week. Testing that βt1 = 0 and
βt2 = 0 (no difference between treatment group users and international users) for all t in pre-
shutdown period therefore provides a more direct test in support of our parallel trends assumption.
Estimates of βt1 and βt2 for all t, along with 90% confidence bands are reported in Figure 3. Overall,
most of the pre-shutdown coefficients appear to be statistically indistinguishable from zero prior to
the intervention and we do not observe a systematic trend.27
27An alternative way of checking for the validity of our identification assumption is to perform a placebo test, wherewe focus on the pre-shutdown period only and define a “placebo” shutdown at the middle point of that time period.Estimating our difference-in-differences model (1) on this subset of the data should provide statistically insignificantresults if the identification assumption is valid. Performing such an exercise indeed leads to non-significant estimatesfor the corresponding coefficients δ1 (coeff= −0.044, s.e.= 0.032) and δ2 (coeff= −0.002, s.e.= 0.004) in equation (1).One might also be worried that some of the pre-shutdown coefficients are significantly different from zero (see Figure3). If we exclude those weeks from the sample, the results, which are not presented here but available upon request,are again very similar to our main results presented below.
17

4.1.2 Econometric Evidence
We now turn to the results of estimating equation (1). Those baseline results are reported in column
(1) of Table 3. The estimate for the average effect of the intervention on Kino users is significant
and equal to -0.317 (s.e.= 0.033), indicating that the intervention was successful in reducing piracy
consumption levels by 27.2%.28 If we put these results in relation to the average 79% market share
of kino.to in the pre-shutdown period, the decline is much smaller than what we would expect
if consumers did not switch to alternative piracy websites. Instead of only distinguishing between
two time periods (before and after the shutdown) with the Aftert interactions in equation (1),
we can also look at the post-shutdown coefficients from the regression of equation (2) in Figure 3.
Confirming what we already saw in the descriptive statistics, we find the strongest decline in piracy
levels for Kino users in the first five weeks after the shutdown, with some uptake afterwards. This
result indicates that the existence of alternative unlicensed platforms challenged the effectiveness
of kino.to’s shutdown in deterring consumers from online piracy.
The estimated coefficient on the After × Non-Kino variable in column (1) of Table 3 is positive
and significant at the 10% level.29 This indicates that shutting down kino.to did not only affect
Kino users directly, but also individuals that never visited kino.to. On average, those individuals
increase their visits to piracy websites by 0.8%. Again, estimates for the post-shutdown period
from the flexible form regression in equation (2), reported in Figure 3, show how the effect of the
shutdown changed over time. We find that the effects on Non-Kino users did not immediately
materialize, but became pronounced following the first five weeks after the shutdown. Note that
this timing is symmetric to the timing of the increase in piracy usage we find for Kino users.
Before exploring the mechanism behind this externality in more detail, we report results of various
additional specifications that provide further support to our identification strategy and address
concerns regarding a potential measurement error in the dependent variable.
As a first robustness check, we construct an alternative control group by means of a propensity score
matching based on observables, i.e. gender, age, income, education and overall news consumption.
28Point estimates are transformed to percentage values as follows: PercentageChange = (exp(Coefficient)−1)∗100.29As shown in Table 4 and discussed below, the net effect is driven by two opposing effects. This explains that
the coefficient is small in magnitude and relatively imprecisely estimated.
18

For each individual in the treatment group, we find a control individual using one-to-one matching
without replacement. Following Lechner (2002), we use binary probit models to estimate propensity
scores for the two treatment groups Kino users and Non-Kino users. The results in column (2) are
very similar to those results obtained with the control group of international users in Table 3.
As a second robustness check, we consider three alternative measures of piracy. We first proxy
for the number of streams of unlicensed content by measuring subsequent visits to cyberlockers.
A second alternative measure involves the weekly number of days an individual visited websites
offering unlicensed content. The third proxy measures the weekly duration spent on piracy websites.
Results are reported in columns (3), (4) and (5) of Table 3 and are in line with our preferred
specification. This alleviates the concern that our baseline results could be driven by measurement
error, for example caused by differences in the design of alternative piracy websites that would
make more clicks necessary to search for and consume content compared to kino.to.
Finally, because of the dispersed distribution of the dependent variable, a concern could be that
our results are driven by outliers. We check the robustness of our results to outliers by dropping
observations with the 1% smallest and largest residuals and 1% smallest and largest predicted values
after running the baseline regression. Re-running the regression on this new sample generates the
results presented in column (6), which remain similar to column (1).
4.2 Externalities from News Coverage
Our results above indicate that Non-Kino users increased their consumption of unlicensed content
following the intervention. We now test if the media coverage surrounding the shutdown of kino.to
can explain these unintended externalities.
Using visits to URLs of news articles and blog posts that cover and follow up on the shutdown
of kino.to, we define the dummy variable Newsit equal to one starting in the week where we
observe the individual’s first visit to one of those URLs. To test whether the shutdown effect varies
19
conditional on reading news about kino.to, we add the following interactions to our baseline model
in equation (1): Aftert ×Kinoi ×Newsit and Aftert × Non-Kinoi ×Newsit.30
The results are reported in Table 4.31 To ease comparison with our baseline results, column (1) of
Table 3 is included in the first column of the table. Column (2) reports estimates of the augmented
model with three-way interaction terms comparing users that have read news about kino.to to
those that did not. While there is no significant difference for Kino users, we observe a large and
significant difference for Non-Kino users: their consumption of pirated consumption increases 35%
more than the insignificant baseline increase of 0.5%. We observe 100 Non-Kino users that read
news, which represents 2.4% of the total number of Non-Kino users, and 11.9% of the total number
of Kino users, making this an effect of substantial economic significance.
In column (3), we further distinguish the content of the news articles to identify possible mech-
anisms. As before, we do not find any significant difference within Kino users. For Non-Kino
users, we see that the strong positive effect of reading about the shutdown on piracy consumption
is driven mainly by reading news articles that conclude that using streaming services would not
lead to legal consequences for consumers, but also by reading news articles that mention unlicensed
alternatives to kino.to. Much in line with theory, the effect of reading articles that conclude that
using unlicensed streaming sites would be illegal is negative, yet not significant (p-value 0.104).
4.3 Effects on Licensed Video Consumption
While we have shown that shutting down kino.to led to a decrease in overall piracy levels, it could
only have benefited content creators and copyright holders if consumption of licensed content also
increased as a result from the intervention. We analyze the effects of the shutdown on licensed
video consumption proxied by clicks on movie theater websites, licensed video streaming services,
and DVD/Blu-ray pages on Amazon.
30We also add group-specific time trends of the News variable. Note that we cannot separately identify coefficientsfor lower-order interaction variables in this model. By definition, users cannot read news about the shutdown beforeit happened, and therefore Newsit = 0 if Aftert = 0. This makes Aftert and Newsit collinear, and therefore alsoany interaction with each.
31In results not reported here, but available upon request, we can show that the effects are very similar when we usea control group generated from a propensity score model that matches individuals based on observable characteristics.
20

The identifying assumption here is again that clicks to licensed content of treatment and control
groups would have followed similar trends had the shutdown not happened. We can again partially
test this assumption by looking at cross-group differences in trends prior to the intervention. Figures
4, 5, and 6 plot the interactions of week dummies and user type from a regression of equation (2).32
Results are reported in Table 5.33 Columns (1), (3), and (5) report the overall effects on Kino and
Non-Kino users. These specifications present no evidence of Kino users substituting into any of the
licensed alternatives. For Non-Kino users, we observe a slight reduction in paid licensed streaming
services of 0.6%.
When we again include the news interactions in columns (2), (4) and (6), we get positive and
significant coefficients for the news interactions regarding visits to cinema websites. The News
interactions are significant for both the Kino and Non-Kino users, suggesting that both groups
increase their visits to movie theaters after they read news about the shutdown. The decrease in
consuming streamed licensed content for Non-Kino users that we observed for the overall effects is
not significantly moderated by reading news about the shutdown.
4.4 Effects on Different Levels of Aggregation
We now assess the effect of the shutdown on alternative levels of aggregation. Speculating somewhat
beyond what our analysis allows us to show in a causal manner, we first provide suggestive evidence
that indirect effects and externalities are driven by the amount of knowledge individuals have
about unlicensed alternatives. We then run a country-level analysis to assess the overall effect and
speculate about the size of welfare effects.
32As discussed in footnote 27, we can also conduct placebo tests to check for the validity of our identificationassumption. Performing such exercise for our different dependent variables leads to non-significant estimates for thecorresponding coefficients δ1 and δ2 in equation (1) for all but one case (the δ2 coefficient when using clicks on AmazonDVD pages as a dependent variable, which turns out to be marginally significant: coeff= −0.007, s.e.= 0.004). Weadditionally perform our estimations by focusing on a shorter time window around the shutdown, which essentiallyremoves weeks that are significantly different from zero (see Figures 3-6). Those results, which are not presented butavailable upon request, are again very similar to our main results presented in Table 5.
33The effects reported in Table 5 can be replicated to a large extent by using an alternative control group generatedfrom a propensity score model that matches individuals based on observable characteristics. The results, which are notreported here but available on request, show a small positive coefficients (significant at the 10% level) for After×Kinoand After×Non−Kino regarding visits to movie theaters. All other coefficients are very similar to those in Table5.
21

4.4.1 The Effect of Knowing about Unlicensed Alternatives
Our definition of Kino users includes users that only visit kino.to and no other unlicensed video
streaming website (Kino: Singlehoming, 57%), as well as users that visit kino.to along with other
services (Kino: Multihoming, 43%). Similarly, our definition of Non-Kino users includes users that
did visit other piracy websites before the shutdown (Non-Kino: Pirate, 6%) as well as those that
did not visit any piracy websites before the shutdown (Non-Kino: Non-Pirate, 94%). We split
each of the two treatment groups into two subgroups to get a more nuanced view of how existing
knowledge about other piracy sites could influence the reaction to the shutdown.34 Knowing about
unlicensed alternatives could play out in two ways. First, because Kino multihomers already knew
about alternative unlicensed video streaming websites before the removal of kino.to, they should
perhaps find it easier to switch to those websites (Chen and Hitt, 2002; Goldfarb, 2006a,b). Second,
because Non-Kino pirates were already exclusively using alternative platforms before the shutdown
of kino.to, we should not expect their usage of alternative piracy websites to be affected by the
intervention.
We estimate our difference-in-differences model using visits to alternative unlicensed video stream-
ing websites (i.e. visits to all unlicensed streaming websites except kino.to) as well as visits to
licensed video consumption as the dependent variable. Results are presented in Table 6. Column
(1) shows that Kino users that visited alternative piracy websites before (multihomers) increase
their visits to those sites more than singlehomers. Additionally, we observe no significant effect for
the Non-Kino users that visited alternative piracy websites before the shutdown (Non-Kino Pirate).
Taken together, these results provide evidence that prior knowledge about unlicensed alternatives
triggers switching, not an unobserved trend that makes those sites more attractive per se. The
effect for users that never visited piracy websites is positive and significant. This provides some
additional evidence of unintended externalities and supports the results discussed above.
Regarding licensed consumption, we first find that singlehoming Kino users increase their visits to
movie theater websites in column (2). The effect size is 2.6%. This suggest that the intervention was
34Note that any measure of prior knowledge about alternative piracy websites, including the multihoming statuswe use below, may be correlated to unobservables. For example, young and tech-savvy Internet users may be moreinterested in consuming contents online, and therefore also in multihoming on different piracy websites. The followingresults therefore need to be interpreted with caution.
22

at least somewhat effective in convincing some individuals to substitute towards licensed offerings.
Intuitively, it makes sense to see this uptake only for singlehoming users since they do not readily
know about alternative unlicensed websites. Regarding licensed online video content in column
(3), we observe no effect for Kino users and find that users that never pirated before the shutdown
decrease their clicks to licensed offerings. Again, this provides further supporting evidence of our
main results. The unintended externalities only affect users that never pirated before the shutdown.
Finally, we do not observe any effects when it comes to visiting DVD/Blu-Ray pages on Amazon
in column (4).
4.4.2 The Aggregate Effect and Implications for Welfare
A necessary condition for the enforcement effort to be welfare enhancing – net of any enforcement
costs – is that the resulting producer surplus exceeds the reduction in consumer surplus that results
from lower piracy levels. To speculate about the welfare implications of the shutdown of kino.to,
we assess the aggregate effect of the intervention by combining Kino users and Non-Kino users into
a single treatment group, labeled Germany. The results of this analysis are presented in Table 7.
Compared to France, Italy and the UK, we find an overall reduction in piracy levels in the German
market of 4.5%, but do not observe any significant changes in any type of licensed consumption.
We conclude that the shutdown reduced overall welfare as consumer surplus is reduced and there
is no evidence of an uptake in licensed consumption.35
We try to quantify the welfare loss in a back-of-the-envelope calculation. A 4.5% decrease in clicks
to piracy sites is equivalent to 0.17 streams per capita (using our Piracy Streams measure).
Based on estimates of sales displacement rates in the literature (Hui and Png, 2003; Rob and
Waldfogel, 2006, 2007; Bai and Waldfogel, 2012; Danaher et al., 2010), we can assume that the
monetary equivalent of the utility of streaming a movie via an unlicensed websites is somewhere
between 3.5–20% of the price of the licensed version. The average price on iTunes in Germany
is 3.00 Euro for rentals and 7.99 Euro for purchases, the average movie ticket price in 2011 in
35One should also take into account the potential effect of the intervention on prices. As mentioned in section3.3.1, we do not find any evidence that movie theaters or offline and online retailers changed their content or pricesas a result of the kino.to shutdown.
23

Germany is 7.39 Euro, and the average price of DVDs and Blu-rays at Amazon is 16.57 Euro.36
Let’s consider one scenario where consumers displace sales at the lowest displacement rate and
always prefer the cheapest option (iTunes rentals) and another scenario where consumers have the
highest displacement rate and prefer the most expensive option (DVD/Blu-ray). The resulting
estimate of per capita change in consumer surplus is in the range of 2–56 cents.37 Using census
and ITU data for the number of Internet users in Germany (65.21 million in 2011), our estimate of
total loss in consumer surplus (and therefore overall welfare) is somewhere between 1.16 and 36.74
million Euro per week.38
4.5 Post-Shutdown Market Structure
We now turn to the analysis of the overall structure of the market for unlicensed video streaming
following the shutdown of kino.to. The raid on June 8, 2011 involved the seizure of servers,
databases of the linking site itself, and integrated cyberlocker services. However, the shutdown
only resulted in a shock to part of the whole piracy ecosystem. Because content hosted on other
cyberlockers remained online, it was relatively easy for existing competitors or even new entrants to
supply similar content as the one initially offered by kino.to. Shutting down the major platform
may therefore simply result in some existing or new website capturing most of the market. However,
it is a priori not clear whether a new dominant platform would emerge to take kino.to’s place, or
if a more fragmented market should be expected as a result of the intervention.
We look at the evolution of unlicensed platforms’ weekly market shares to assess how the streaming
piracy market was affected by the shutdown of kino.to. Figure 7 presents the evolution of market
shares for the different platforms defining our market, distinguishing between kino.to, kinoX.to,
movie2k.to, and the 17 remaining websites included in our market definition. The figure shows
remarkable changes in the structure of the streaming piracy market after the intervention. Before
the shutdown, kino.to (dashed blue line) clearly dominated the market with an average market
share of about 80%. The second largest player movie2k.to had a market share of about 10%, and
36Price information about purchase and rental prices on iTunes comes from the meta search site werstreamt.es
(in 2014), cinema ticket prices from the German Federal Film Board (FFA), and we calculate average DVD/Blu-rayprices directly from the Amazon pages that individuals visited in our data.
370.17 ∗ 0.035 ∗ 3 ∗ 100 = 1.79 and 0.17 ∗ 0.20 ∗ 16.57 ∗ 100 = 56.3438If we were to take the enforcement costs into consideration, which are probably largely borne by tax-payers, the
estimated loss in consumer surplus would of course be higher.
24

the remaining websites jointly accounted for an average market share of 10%. During the first four
weeks after the intervention, movie2k.to’s market share increased to about 55%, and the market
share of all other streaming sites increased to about 45%. After four weeks kinoX.to entered and
immediately gained 20% market share, while movie2k.to’s market share decreased to about 30%.39
Eight weeks after the shutdown, the market shares changed to about one third each.
The changes in market shares imply changes in market concentration. Figure 8 shows the weekly
evolution of the Herfindahl-Hirschman Index (HHI) of the unlicensed video streaming market.40
This adds additional insights since we do not aggregate the “long tail” of websites in the HHI
measure. Before the shutdown of kino.to, the HHI was around 6,500. It decreased sharply to
3,000 during the week of the shutdown, but immediately increased to about 4,000 after two weeks.
After four weeks, and following the entry of kinoX.to, the HHI decreased again sharply to about
2,000, where it remains for six weeks before increasing slightly to about 3,000 at the end of the
year.
While the shutdown of kino.to had important effects on the market structure of the German piracy
market, it is important to note that these effects are also likely to be context-specific. One should
therefore interpret and generalize our results with caution. First, we only observe six months of data
after the shutdown of kino.to and therefore cannot test whether the observed market structure
will remain stable in the longer run. For instance, it is possible for one of the remaining platforms
to increase its market share to the point of having a market structure similar to the one preceding
the intervention. Second, market-specific characteristics could influence the impact of the shutdown
on the structure of the piracy market.41
We note that these changes in market structure, while context-specific, can have important policy
implications. In the case of the German market for unlicensed video streaming, our results suggest
39Note that the decrease in movie2k.to’s market share is not due to a decrease in traffic to the platform, but byan expansion of the overall piracy market driven by the entry of kinoX.to.
40The HHI is calculated by summing up the squared market shares of all active unlicensed platforms. Usingpercentages to express market shares leads to values of the HHI ranging from 0 to 10,000, the latter correspondingto the case where a single platform has a market share of 100%.
41For instance, the initial level of market concentration, the substitutability of content across existing sites, oreven the severity of the punishment imposed on the platform’s owners, could all affect the impact of the shutdownon the structure of the market. Such market specificities may also influence the entry decision of a new platform,which may in turn affect the effects of such intervention on the structure of the piracy market.
25

that the shutdown of kino.to made, in the short term at least, future interventions potentially more
costly – as there would not be a single dominant platform to shutdown anymore – and potentially
less effective if only a single website is targeted by the intervention.
5 Discussion
The robustness checks detailed above have helped to address concerns regarding the internal validity
of our findings, discussing the choice of measures and control group. External validity of our
results may nevertheless remain a concern. While our analysis provides insightful results, it is
essentially a case study, with certain limits to generalizability. In particular, one may wonder
whether similar results could be expected from a similar enforcement carried out in a different
country or at a different point in time. Guided by the literature on threats to external validity in
quasi-experimental research (Cook and Campbell, 1979; Howell, 2005) and the available evidence,
we carefully discuss the boundaries of our research regarding its geographic, institutional, and
historical context. Finally, we discuss alternative private and public enforcement policies and their
potential to reduce piracy levels and increase licensed consumption.
5.1 External Validity Regarding Geography
A first concern is related to a potential interaction of setting and treatment, i.e. that the effect
may differ across institutional and geographic settings.
How representative are German consumers? Evidence suggests that cross-country differ-
ences in piracy rates can be explained by the strength of enforcement and aggregate demographics
such as income and education (van Kranenburg and Hogenbirk, 2005; Proserpio et al., 2005; Walls,
2008). Reflecting such differences, the piracy rate in Germany in 2011 is lower than in other Euro-
pean countries, but higher than in the US.42 The per-capita propensity to pirate alone, however,
is not enough to draw conclusions about potential cross-country differences regarding the displace-
ment of licensed content. Although willingness to pay is clearly correlated with intentions to pirate
(see the extensive review in Watson et al., 2015), we are not aware of systematic evidence showing
that the willingness to pay for licensed content varies across countries.
42Germany’s piracy rate in 2011 is about two-thirds of a standard deviation below the European average, and 40%above the piracy rate of the US. Calculations are based on data from Table 1 in Danaher and Smith (2014) and page9 in Business Software Alliance (2012).
26

How representative is the German market for unlicensed video streaming? A concern
could be that our results crucially depend on the structure of the piracy market and the relative
quality of different unlicensed streaming options. Consider a scenario where, after the shutdown of
a high appeal website, consumers can only access low appeal alternatives. Licensed options may
consequently gain in relative attractiveness. Evidence suggests that such a scenario is probably not
very realistic. Lauinger et al. (2013) show that it is fairly easy to replicate the content of a linking
site, because the underlying video files are stored elsewhere, and multiple copies exist.43 As a
consequence, what we document in the German case – that other websites (including new entrants)
quickly gain traffic – is likely to happen in other markets as well. Anecdotal evidence from recent
examples is consistent with this idea. Within a few weeks following the shutdown of the hugely
popular unlicensed sites kat.cr (global Alexa rank 69) and zone-telechargement.com (French
Alexa rank 11) by legal authorities in late 2016, multiple new platforms entered the market.44 In
general, Germany is no exception when it comes to anti-piracy interventions. A variety of other
countries have introduced policies targeted at consumers and suppliers of unlicensed content, some
of which are thoroughly documented in the literature (Danaher et al., 2014; Adermon and Liang,
2014; Danaher and Smith, 2014; Poort et al., 2014; Peukert et al., 2017; McKenzie, 2017).
How representative is the German market for licensed video consumption? A growing
literature shows that availability of licensed content can reduce piracy (Danaher et al., 2010, 2013;
Aguiar and Waldfogel, forthcoming). Accordingly, a potential explanation for why we don’t observe
more substitution towards licensed consumption may be found in the relative quality of licensed
online alternatives in the German market in 2011 (Poort and Weda, 2015).45 Compared to other
(European) countries, there is not much reason to believe that Germany was an exception when
it comes to the availability and attractiveness of licensed content, neither online nor offline. To
date, in 2017, Apple doesn’t offer movies in 45 (24%) and TV shows in 149 (79%) of 189 markets
43Looking at all links listed on rlslog.net, a linking site that is very similar to kino.to, Lauinger et al. (2013)show that the median number of alternative links to the same content (hosted on a variety of cyberlockers) is 48.
44see https://venturebeat.com/2016/07/31/kickasstorrents-mirrors-go-down-but-new-kat-sites-quickly-spring-up/and http://www.lemonde.fr/pixels/article/2016/12/15/zone-telechargement-est-il-vraiment-de-retour_
5049581_4408996.html.45We do not have access to reliable data on the catalogues of licensed services in 2011. However, according to the
comparison website www.werstreamt.es, still in November 2014, the licensed German market offers less content thankino.to, with 11,600 movies on iTunes, 8,500 on Maxdome, 5,800 on Videoload, and 1,000 on Netflix compared to20,000 movies on kino.to.
27

where they operate an iTunes Store.46 Data from 2013 suggests that the vast majority of movies in
a country-specific iTunes Store in Europe are only available in one language (Gomez-Herrera and
Martens, 2015). The streaming service Netflix had not started to roll out in Europe before 2012,
arriving in Germany and France in 2014 and in Italy in 2015.
In addition, it also seems that prices of licensed offerings in Germany were not very different
compared to other countries. Gomez-Herrera and Martens (2015) show that cross-country price
differences of digital content can be largely explained by overall price levels, which is essentially
the same regarding cinema ticket prices.47 Finally, in a study that looks at an entirely different
experiment, analyzing very different data from the US, Danaher et al. (2010) arrive at results very
similar to ours. After the removal of content on iTunes, piracy rates for the same content increased,
yet there is no effect on sales of respective DVDs at Amazon.
5.2 External Validity Regarding History
We now discuss the potential concern that the effects identified in our analysis may differ across
time periods.
How will digital piracy and licensed offerings change? According to a joint report of
the music and advertising industry in 2012, infringing websites are predominately financed by
advertising or subscription models.48 Hence, as long as there is demand for unlicensed content
that can be monetized, the incentives to operate large-scale piracy websites are likely to remain
strong. An emerging literature suggests that the appeal of piracy may decrease over time, mainly
due to improvements in licensed alternatives. Theoretical work shows that content services where
consumers can choose between fee based or free and ad-supported subscriptions (a model that is
mostly offered in the music market, much less in the video market) can reduce the demand for
piracy (Thomes, 2013). Recent evidence in Aguiar and Waldfogel (forthcoming) suggests that
the licensed streaming platform Spotify – which operates a freemium business model – has had
a negative and significant impact on recorded music piracy. Data from the Netherlands in Poort
46See https://en.wikipedia.org/wiki/ITunes_Store.47To look into this, we collected yearly average cinema ticket prices for Germany (FFA), Italy (SIAE), France
(CNC) and the UK (UK Cinema Association) and consumer price index data (OECD) for 2010–2014. Regressingconsumer price index data on an index of cinema ticket prices (both base 2010) yields a coefficient of 0.9
48Google and PRS (2012), “The six business models for copyright infringement”, https://docs.google.com/
file/d/0Bw8Krj_Q8UaENDhEOG1LVFRhVkU/view.
28
and Weda (2015) shows that piracy levels of music have declined from 35% to 23% between 2008
and 2012, while piracy levels of video content increased from 11% to 18% during the same time.
Relying on survey data, the authors conclude that this difference can be explained by differences
in how consumers perceive availability and price of licensed music vs. video offers. The idea that
consumers do not switch to licensed platforms because their preferred content is not available can
be partly tested with our data. Looking at the URLs of visited pages on kino.to, we see whether
users were watching movies or TV shows. This allows us to categorize users based on their content
preferences. Distinguishing between the effects of the shutdown on users who mainly watched TV
series on kino.to and users who mainly watched movies, shows that the former group reacted to
the shutdown to a larger extent. Usage of alternative piracy websites is similar for both types
of users before the shutdown, and increased 50% more for users that mainly watched TV shows
thereafter.49 This suggests that it is mainly a preference for TV shows that convinces consumers
to switch to alternative websites. An implication could be that firms might be able to strategically
react to differences in user preferences and offer specialized products. However – in line with the
results above – we do not find evidence that either type of Kino user increases visits to licensed
video streaming services.
In conclusion, if availability and pricing of licensed offerings becomes more attractive, it is likely
that more consumers switch to licensed offerings.50 Yet, according to anecdotal evidence, the most
significant changes towards full digital availability of movies are yet to come – more than five
years after the enforcement effort we study. Recent news reports suggest that movie studios are
negotiating with cinema owners about reducing the window between theatrical release and video
on-demand in exchange for a share of streaming revenues.51 Reportedly, movies would become
available for streaming three weekends after the theatrical release at a price of $30–50 per movie.
5.3 Alternative Policy Levers
Based on suggestive evidence and established results in the literature, we conclude that the effects
we document are not very likely to differ across institutional and geographic settings. However, we
49Results are not reported here but are available upon request.50Note, however, that the mere availability of licensed offerings may not be enough to curtail piracy. Godinho de
Matos et al. (forthcoming) show that reducing piracy also requires offering licensed content much earlier and at muchlower prices than those currently offered in the marketplace.
51See http://tinyurl.com/lm8r5vt.
29

have reasons to speculate that our findings are specific to the historical timing of the shutdown.
Better availability and lower prices of licensed consumption options introduced in the recent years
could help to convince more consumers to use legitimate offerings if further developed. Looking
ahead, we discuss whether alternative policy levers could be more effective.
Public enforcement There are reasons to expect stronger effects from greater enforcement ef-
forts on the supply-side. In the model of Dey et al. (2016), stronger supply-side enforcement leads
to higher entry costs for unlicensed websites, which in turn reduces the content available for con-
sumers. The authors show that supply-side enforcement can lead to desirable welfare outcomes
(which is similar to the result in Tsai and Chiou, 2012). In the light of this model, an interpre-
tation of our results could be that the enforcement intensity was not high enough, in particular
because the intervention affected only one unlicensed website. The implication could be that shut-
ting down multiple websites at a time would be more effective at decreasing piracy levels and
increasing welfare.52 Nevertheless, from a practical perspective, achieving a level of enforcement
that is sufficiently broad to be sustainable in the long run seems very hard. For example, evidence
shows that the rate of new cyberlockers entering the market increased after the shutdown of Megau-
pload (Lauinger et al., 2013) and consumers use VPN services to circumvent the blocking of the
PirateBay and a number of similar websites (Danaher et al., 2015b). Putting aside country-specific
legal issues – which may make a large scale international raid difficult – the associated costs of
physically raiding multiple websites hosted on geographically dispersed servers would also have to
be taken into account. This could naturally reduce the welfare enhancing effect of supply-side
enforcement (Tsai and Chiou, 2012; Dey et al., 2016). A relatively recent regulatory approach is to
reduce the advertising revenues that piracy websites receive. Initiatives towards a self-regulation
of the online advertising industry have been implemented in 2013 the UK and are on the agenda
of the European Commission since 2015.53 Although economically appealing, except for a recent
52A recent working paper by Danaher et al. (2015b) looks at this question and uses highly aggregated clickstreamdata to compare the effects of two policy experiments in the UK – court decisions that ordered Internet serviceproviders to block one piracy website versus the blocking multiple piracy websites. While they don’t find evidenceof an increase in visits to paid streaming services when one website is blocked, they find a positive effect in the caseof the wide blockade. For both interventions, their analysis suggests that a change in the number of clicks to othertorrent sites or cyberlockers is small or not significant, but the results also show that consumers increase clicks toVPN services that allow to circumvent the blockade.
53See http://ec.europa.eu/growth/tools-databases/newsroom/cf/itemdetail.cfm?item_id=8974
30

working paper by Batikas et al. (2017), we are not aware of an academic literature that provides
evidence on the overall effectiveness of such efforts.
Taxes and subsidies Theoretical work in Becker et al. (2006), using a model that is applied to
illegal drugs, shows that a tax on legalized production is better able to reduce the quantity of drugs
in the market than quantity-restricting enforcement efforts. This is in line with what Chen and Png
(2003) find in their theoretical analysis of digital piracy. They compare the welfare implications
of government policies and conclude that taxing copying is superior to fining on consumers, and
that a subsidy for legal producers is optimal. Evidence from a discrete choice experiment carried
out in the Netherlands shows that a tax of less than two Euro on Internet subscriptions would
keep revenues of music rights holders at the current level while simultaneously increasing consumer
surplus (Handke et al., 2016).
Private enforcement Theory suggests that firms find it optimal to invest in private enforcement
to deter piracy when public enforcement is too weak (Banerjee, 2003; Sundararajan, 2004; Kiema,
2008; Ahn and Shin, 2010; Lu and Poddar, 2012). This is backed by evidence showing that pri-
vate enforcement can be effective in settling infringement cases regarding digital images (Luo and
Mortimer, 2016), and increase sales of e-books (Reimers, 2016). However, when copy protection
reduces consumer utility, private enforcement can have negative implications for firm profits and
social welfare (Ahn and Shin, 2010). This idea is mirrored in evidence showing that music sales
increase due to the removal of digital rights management technology (Zhang, forthcoming).
6 Conclusion
In this paper we address the puzzle that online piracy rates remain high, despite an abundance
of enforcement efforts that involve large amounts of public resources. We study the unexpected
shutdown of kino.to, the largest unlicensed video streaming site in the German market in 2011,
using highly disaggregated clickstream data for a set of 20,000 Internet users in Germany, Italy,
France and the UK to provide detailed evidence on the effects of this intervention on consumer
behavior and on the structure of the unlicensed video streaming market.
31
We show that the shutdown was rather ineffective in reducing unlicensed consumption and moving
consumers to licensed offerings. We highlight that indirect effects – consumers quickly switching
to alternative unlicensed websites – and unintended externalities that operate via the type of
story news articles tell about piracy, are important factors driving our results. The latter is quite
surprising in light of the previous literature. Awareness about legal consequences of online piracy –
in the form of the anticipation of stricter laws – has been causally linked to higher sales of licensed
content (Adermon and Liang, 2014; Danaher et al., 2014) and media and press coverage has often
been presented as a potential mechanism to raise awareness about the negative consequences of
piracy (Al-Rafee and Cronan, 2006; Hennig-Thurau et al., 2007; Sinha and Mandel, 2008; Danaher
et al., 2010; Cox and Collins, 2014). Our study shows that media coverage of copyright enforcement
– which has happened regularly in the past – implies a trade-off for content creators and copyright
holders, depending on the content of news articles. In the case of kino.to, only about 11% of
news articles that individuals in our data read were discussing legal aspects that could have had
deterring effects. Our results suggest that if that fraction had been higher, we would have seen less
switching to alternative piracy websites and fewer consumers entering the market. In other settings,
the introduction of journalistic standards have been shown to be effective in reducing unintended
effects of news coverage. For example, Etzersdorfer and Sonneck (1998) show that the number of
copycat suicides (or suicide attempts) decreased after newspapers adopted specific guidelines for
journalists. From a policy perspective, it goes without saying that benefits from such efforts must
be traded off against freedom of the press.
We also show that the structure of the piracy market changed after the shutdown of kino.to in
a way that may make future interventions more costly and potentially even less effective, at least
in the short run. An interesting avenue for future research could be to evaluate whether broader
public enforcement efforts, targeting multiple websites at the same time, or reducing the monetary
incentives from advertising revenues could be more effective. From a managerial perspective, we get
important insights into consumer behavior that can be helpful to design effective private copyright
enforcement strategies, as well as to understand competition between licensed and unlicensed ser-
vices. Although our study is specific to its historical context, we speculate that better availability
and lower prices of licensed content can convince consumers to switch to licensed offerings.
32

References
Adda, J., McConnell, B., and Rasul, I. (2014). “Crime and the depenalization of cannabis posses-sion: Evidence from a policing experiment.” Journal of Political Economy, 122 (5), 1130–1199.
Adena, M., Enikolopov, R., Petrova, M., Santarosa, V., and Zhuravskaya, E. (2015). “Radio andthe rise of the nazis in prewar germany.” Quartely Journal of Economics, 130 (4), 1885–1939.
Adermon, A., and Liang, C.-Y. (2014). “Piracy and Music Sales: The Effects of an Anti-PiracyLaw.” Journal of Economic Behavior & Organization, 105, 90–106.
Aguiar, L., and Waldfogel, J. (forthcoming). “As Streaming Reaches Flood Stage, Does it Stimulateor Depress Music Sales?” International Journal of Industrial Organization.
Ahn, I., and Shin, I. (2010). “On the optimal level of protection in drm.” Information Economicsand Policy, 22 (4), 341–353.
Al-Rafee, S., and Cronan, T. P. (2006). “Digital Piracy: Factors that Influence Attitude TowardBehavior.” Journal of Business Ethics, 63, 237–259.
Amtsgericht Leipzig (2011). “Urteil zum Verfahren KINO.TO.” District Court Leipzig, Verdict200 Ls 390 Js 184/11, December 21, 1–16, http://www.justiz.sachsen.de/lentschweb/
document.phtml?id=978.
Angrist, J. D., and Kugler, A. D. (2008). “Rural Windfall or a New Resource Curse? Coca, Income,and Civil Conflict in Colombia.” Review of Economics and Statistics, 90 (2), 191–215.
Antoniades, D., Markatos, E. P., and Dovrolis, C. (2009). “One-Click Hosting Services: A File-Sharing Hideout.” In Proceedings of the 9th ACM SIGCOMM Conference on Internet Measure-ment Conference, IMC ’09, 223–234, New York, NY, USA: ACM.
Arnold, M., Darmon, E., Dejean, S., and Penard, T. (2014). “Graduated Response Policy and theBehavior of Digital Pirates: Evidence from the French Three-strike (Hadopi) Law.” WorkingPaper.
Ayres, I., and Levitt, S. D. (1998). “Measuring positive externalities from unobservable victimprecaution: An empirical analysis of lojack.” Quarterly Journal of Economics, 113 (1), 43–77.
Bai, J., and Waldfogel, J. (2012). “Movie Piracy and Sales Displacement in Two Samples of ChineseConsumers.” Information Economics and Policy, 24 (3), 187–196.
Banerjee, D. S. (2003). “Software piracy: a strategic analysis and policy instruments.” InternationalJournal of Industrial Organization, 21 (1), 97–127.
Batikas, M., Claussen, J., and Peukert, C. (2017). “Follow the money: Piracy and online advertis-ing.” Working Paper.
Becker, G. S., Murphy, K. M., and Grossman, M. (2006). “The Market for Illegal Goods: The Caseof Drugs.” Journal of Political Economy, 114 (1), 38–60.
Bertoni, M., Brunello, G., and Rocco, L. (2013). “When the cat is near, the mice won’t play: Theeffect of external examiners in italian schools.” Journal of Public Economics, 104, 65–77.
33
Bertrand, M., Duflo, E., and Mullainathan, S. (2004). “How Much Should We Trust Differences-In-Differences Estimates?” Quarterly Journal of Economics, 119 (1), 249–275.
Business Software Alliance (2012). “Shadow Market.” 2011 Global Software Piracy Study.
Cameron, S. (1988). “The Economics of Crime Deterrence: A Survey of Theory and Evidence.”Kyklos, 41 (2), 301–323.
Card, D., and Krueger, A. B. (1994). “Minimum wages and employment: A case study of the fast-food industry in new jersey and pennsylvania.” American Economic Review, 84 (4), 772–793.
Chen, P., and Hitt, L. M. (2002). “Measuring Switching Costs and the Determinants of CustomerRetention in Internet-Enabled Businesses: A Study of the Online Brokerage Industry.” Informa-tion Systems Research, 13 (3), 255–274.
Chen, Y., and Png, I. (2003). “Information Goods Pricing and Copyright Enforcement: WelfareAnalysis.” Information Systems Research, 14 (1), 107–123.
Chiang, E. P., and Assane, D. (2009). “Estimating the willingness to pay for digital music.” Con-temporary Economic Policy, 27 (4), 512–522.
Chiou, J.-S., Huang, C.-y., and Lee, H.-h. (2005). “The antecedents of music piracy attitudes andintentions.” Journal of Business Ethics, 57 (2), 161–174.
Cho, H., and Salmon, C. T. (2007). “Unintended Effects of Health Communication Campaigns.”Journal of Communication, 57, 293–317.
Conner, K. R., and Rumelt, R. P. (1991). “Software Piracy: An Analysis of Protection Strategies.”Management Science, 37 (2), 125–139.
Cook, T., and Campbell, D. (1979). Quasi-experimentation: Design & Analysis Issues for FieldSettings. Houghton Mifflin Boston.
Cox, J., and Collins, A. (2014). “Sailing in the same ship? differences in factors motivating piracyof music and movie content.” Journal of Behavioral and Experimental Economics, 50, 70–76.
Danaher, B., Dhanasobhon, S., Smith, M. D., and Telang, R. (2010). “Converting Pirates WithoutCannibalizing Purchasers: The Impact of Digital Distribution on Physical Sales and InternetPiracy.” Marketing Science, 29 (6), 1138–1151.
Danaher, B., Dhanasobhon, S., Smith, M. D., and Telang, R. (2015a). “Understanding MediaMarkets in the Digital Age: Economics and Methodology.” In Greenstein, Goldfarb, and Tucker(Eds.), Economic Analysis of the Digital Economy, chap. 13, 385–406, University of ChicagoPress, Chicago, IL.
Danaher, B., and Smith, M. D. (2014). “Gone in 60 Seconds: The Impact of the MegauploadShutdown on Movie Sales.” International Journal of Industrial Organization, 33 (0), 1 – 8.
Danaher, B., Smith, M. D., and Telang, R. (2013). “Piracy and Copyright Enforcement Mecha-nisms.” In Innovation Policy and the Economy, Volume 14, NBER Chapters, 25–61, NationalBureau of Economic Research, Inc.
Danaher, B., Smith, M. D., and Telang, R. (2015b). “The Effect of Piracy Website Blocking onConsumer Behavior.” Working Paper.
34

Danaher, B., Smith, M. D., Telang, R., and Chen, S. (2014). “The Effect of Graduated ResponseAnti-Piracy Laws on Music Sales: Evidence from an Event Study in France.” Journal of IndustrialEconomics, LXII (3), 541–553.
Dell, M. (2015). “Trafficking Networks and the Mexican Drug War.” American Economic Review,105 (6), 1738–1779.
Dey, D., Kim, A., and Lahiri, A. (2016). “Online Piracy and the “’Longer Arm” of Enforcement.”Working Paper.
DiTella, R., and Schargrodsky, E. (2004). “Do Police Reduce Crime? Estimates Using the Alloca-tion of Police Forces after a Terrorist Attack.” American Economic Review, 94 (1), 115–133.
Dobkin, C., Nicosia, N., and Weinberg, M. (2014). “Are supply-side drug control efforts effective?evaluating otc regulations targeting methamphetamine precursors.” Journal of Public Economics,120, 48–61.
Draca, M., Machin, S., and Witt, R. (2011). “Panic on the Streets of London: Police, Crime, andthe July 2005 Terror Attacks.” American Economic Review, 101 (5), 2157–2181.
Esser, F., and Brosius, H. B. (1996). “Television as arsonist? the spread of right-wing violence ingermany.” European Journal of Communication, 11 (2), 235–260.
Etzersdorfer, E., and Sonneck, G. (1998). “Preventing suicide by influencing mass-media reporting.the viennese experience 1980–1996.” Archives of Suicide Research, 4 (1), 67–74.
GfK, and Bundesverband Audiovisuelle Medien (2013). “Der Videomarkt 2013 – GfK ConsumerPanel.” http://www.bvv-medien.de/jwb_pdfs/JWB2013.pdf.
GfK, and German Federal Film Board (2012). “Der Kinobesucher 2011 – Strukturen undEntwicklungen auf Basis des GfK Panels.” http://www.ffa.de/start/download.php?file=
publikationen/kinobesucher_2011.pdf.
GfK, Gesellschaft zur Verfolgung von Urheberrechtsverletzungen, and Borsenverein des DeutschenBuchhandels (2011). “Studie zur digitalen Content-Nutzung (DCN Studie).” http://www.
musikindustrie.de/uploads/media/DCN-Studie_2011_Presseversion_FINAL_02.pdf.
Godinho de Matos, M., Ferreira, P., and Smith, M. D. (forthcoming). “The effect of video-on-demand on piracy: Evidence from a household level randomized experiment.” Management Sci-ence.
Goh, K.-Y., Hui, K.-L., and Png, I. P. L. (2011). “Newspaper reports and consumer choice: Evi-dence from the do not call registry.” Management Science, 57 (9), 1640–1654.
Goh, K.-Y., Hui, K.-L., and Png, I. P. L. (2015). “Privacy and marketing externalities: Evidencefrom do not call.” Management Science, 61 (12), 2982–3000.
Goldfarb, A. (2006a). “State dependence at internet portals.” Journal of Economics & ManagementStrategy, 15 (2), 317–352.
Goldfarb, A. (2006b). “The medium-term effects of unavailability.” Quantitative Marketing andEconomics, 4, 143–171.
35

Gomez-Herrera, E., and Martens, B. (2015). “Language, Copyright and Geographic Segmentationin the EU Digital Single Market for Music and Film.” IPTS Working Paper.
Gould, M. S. (2001). “Suicide and the Media.” Annals New York Academy of Sciences, 932 (1),200–224.
Handke, C., Balazs, B., and Vallbe, J.-J. (2016). “Going means trouble and staying makes it double:the value of licensing recorded music online.” Journal of Cultural Economics, 40 (3), 227–259.
Hennig-Thurau, T., V., H., and Sattler, H. (2007). “Consumer file sharing of motion pictures.”Journal of Marketing, 71, 1–18.
Howell, D. C. (2005). “External Validity.” In B. S. Everitt, and D. C. Howell (Eds.), Encyclopediaof Statistics in Behavioral Science, vol. 2, 588–591, John Wiley & Sons, Ltd.
Hui, K.-L., Kim, S.-H., and Wang, Q.-H. (forthcoming). “Cybercrime deterrence and internationallegislation: Evidence from distributed denial of service attacks.” Management Information Sys-tems Quartely.
Hui, K.-L., and Png, I. (2003). “Piracy and the legitimate demand for recorded music.” The B.E.Journal of Economic Analysis & Policy, (1), 11.
Jain, S. (2008). “Digital Piracy: A Competitive Analysis.” Marketing Science, 27 (4), 610–626.
Kiema, I. (2008). “Commercial piracy and intellectual property policy.” Journal of Economic Be-havior & Organization, 68 (1), 304–318.
Lauinger, T., Szydlowski, M., Onarlioglu, K., Wondracek, G., Kirda, E., and Kruegel, C. (2013).“Clickonomics: Determining the effect of anti-piracy measures for one-click hosting.” Proceedingsof NDSS Symposium 2013, San Diego, CA.
Lechner, M. (2002). “Program heterogeneity and propensity score matching: An application to theevaluation of active labor market policies.” Review of Economics and Statistics, 84 (2), 205–220.
Levitt, S. D. (1997). “Using Electoral Cycles in Police Hiring to Estimate the Effect of Police onCrime.” American Economic Review, 87 (3), 270–290.
Liao, C., Lin, H.-N., and Liu, Y.-P. (2010). “Predicting the use of pirated software: A contingencymodel integrating perceived risk with the theory of planned behavior.” Journal of BusinessEthics, 91 (2), 237–252.
Liu, M., Zhang, Z., Hui, P., Qin, Y., and Kulkarni, S. (2013). “Measurement and understanding ofCyberlocker URL-sharing sites: Focus on Movie Files.” In Advances in Social Networks Analysisand Mining (ASONAM), 2013 IEEE/ACM International Conference, 902–909.
Lu, Y., and Poddar, S. (2012). “Accommodation or deterrence in the face of commercial piracy:the impact of intellectual property rights protection.” Oxford Economic Papers, 64 (3), 518–538.
Luo, H., and Mortimer, J. H. (2016). “Copyright infringement in the market for digital images.”American Economic Review Papers and Proceedings, 106 (5), 140–145.
McKenzie, J. (2017). “Graduated response policies to digital piracy: Do they increase box officerevenues of movies?” Information Economics and Policy, 38, 1–11.
36

Orme, T. (2014). “The short- and long-term effectiveness of anti-piracy laws and enforcementactions.” Journal of Cultural Economics, 38, 351–368.
Peitz, M., and Waelbroeck, P. (2006). “Piracy of digital products: A critical review of the theoreticalliterature.” Information Economics and Policy, 18, 449–476.
Peukert, C., Claussen, J., and Kretschmer, T. (2017). “Piracy and Box Office Movie Revenues:Evidence from Megaupload.” International Journal of Industrial Organization, 52, 188–215.
Poort, J., Leenheer, J., van der Ham, J., and Dumitru, C. (2014). “Baywatch: Two approachesto measure the effects of blocking access to The Pirate Bay.” Telecommunications Policy, 38,383–392.
Poort, J., and Weda, J. (2015). “Elvis is returning to the building: Understanding a decline inunauthorized file sharing.” Journal of Media Economics, 28 (2), 63–83.
Proserpio, L., Salvemini, S., and Ghiringhelli, V. (2005). “Entertainment pirates: Determinants ofpiracy in the software, music and movie industries.” International Journal of Arts Management,8 (1), 33–47.
Reimers, I. (2016). “Can Private Copyright Protection be Effective? Evidence from Book Publish-ing.” Journal of Law and Economics, 59 (2), 411–440.
Rob, R., and Waldfogel, J. (2006). “Piracy on the high c’s: Music downloading, sales displacement,and social welfare in a sample of college students.” Journal of Law and Economics, 49 (1), 29–62.
Rob, R., and Waldfogel, J. (2007). “Piracy on the Silver Screen.” Journal of Industrial Economics,55 (3), 379–395.
Sinha, R., and Mandel, N. (2008). “Preventing digital music piracy: The carrot or the stick?”Journal of Marketing, 72, 1–15.
Spiegel Online (2012). “kino.to: Angeklagte und Urteile im Uberblick.” June 14, http://www.
spiegel.de/netzwelt/web/kino-to-angeklagte-und-urteile-im-ueberblick-a-838822.
html.
Sundararajan, A. (2004). “Managing digital piracy: Pricing and protection.” Information SystemsResearch, 15 (3), 287–308.
Thomes, T. P. (2013). “An economic analysis of online streaming music services.” InformationEconomics and Policy, 25 (2), 81–91.
Tsai, M.-F., and Chiou, J.-R. (2012). “Counterfeiting, enforcement and social welfare.” Journal ofEconomics, 107 (1), 1–21.
Tunca, T., and Wu, Q. (2013). “Fighting Fire with Fire: Commercial Piracy and the Role ofFile Sharing on Copyright Protection for Digital Goods.” Information Systems Research, 24 (2),436–453.
UK Intellectual Property Office (2016). “Online copyright infringement tracker – latest wave ofresearch mar 16 – may 16.” Policy report.
van Kranenburg, H., and Hogenbirk, A. (2005). “Multimedia, entertainment, and business softwarecopyright piracy: A cross-national study.” Journal of Media Economics, 18 (2), 109–129.
37

Vida, I., Kos Koklic, M., Kukar-Kinney, M., and Penz, E. (2012). “Predicting consumer digitalpiracy behavior the role of rationalization and perceived consequences.” Journal of Research inInteractive Marketing, 6 (4), 298–313.
Wagner, G. G., Frick, J. R., and Schupp, J. (2007). “The German Socio-Economic Panel Study(SOEP)-Evolution, Scope and Enhancements.” Schmollers Jahrbuch, 127 (1), 139–169.
Walls, W. (2008). “Cross-country analysis of movie piracy.” Applied Economics, 40 (5), 625–632.
Watson, S., Zizzo, D., and Fleming, P. (2015). “Determinants of unlawful file sharing: a scopingreview.” PLoS ONE, 10 (6), e0127921.
Yanagizawa-Drott, D. (2014). “Propaganda and conflict: Evidence from the rwandan genocide.”Quartely Journal of Economics, 129 (4), 1947–1994.
Zamoon, S., and Curley, S. P. (2008). “Ripped from the headlines: What can the popular pressteach us about software piracy?” Journal of Business Ethics, 83 (3), 515–533.
Zhang, L. (forthcoming). “Intellectual Property Strategy and the Long Tail: Evidence from theRecorded Music Industry.” Management Science.
38

Tab
le1:
Var
iab
leD
efin
itio
n
Var
iab
leD
efin
itio
n
Dep
enden
tV
ari
abl
esP
irac
y(l
n+
1)
Wee
kly
vis
its
top
irac
yw
ebsi
tes
Pir
acy:
Str
eam
(ln
+1)
Wee
kly
num
ber
ofd
own
load
sfr
omp
irac
yw
ebsi
tes
Pir
acy:
Day
s(l
n+
1)W
eekly
nu
mb
erof
wee
kd
ays
wh
ere
the
use
rvis
ited
pir
acy
web
site
sP
irac
y:
Du
rati
on
(ln
+1)
Wee
kly
du
rati
onof
vis
itin
gp
irac
yw
ebsi
tes
Alt
.P
irac
y(l
n+
1)W
eekly
vis
its
toal
tern
ativ
ep
irac
yw
ebsi
tes,
i.e.
all
site
sex
clu
din
gkin
o.to
Lic
ense
d:
Cin
ema
(ln
+1)
Wee
kly
vis
its
toci
nem
aw
ebsi
tes
Lic
ense
d:
On
lin
e(l
n+
1)
Wee
kly
vis
its
toli
cen
sed
stre
amin
gw
ebsi
tes
Lic
ense
d:
DV
D(l
n+
1)W
eekly
vis
its
toth
eD
VD
sect
ion
ofA
maz
on
Indep
enden
tV
ari
abl
esA
fter
(0/1)
On
eaf
ter
the
shu
tdow
nof
kin
o.to
inw
eek
23of
2011
Kin
o(0
/1)
On
eif
aG
erm
anu
ser
vis
ited
kin
o.to
bef
ore
the
shu
tdow
nN
on
-Kin
o(0
/1)
On
eif
aG
erm
anu
ser
nev
ervis
ited
kin
o.to
New
s(0
/1)
On
eaft
era
Ger
man
use
rre
adn
ews
abou
tth
esh
utd
own
ofkin
o.to
New
s:B
ack
gro
un
d(0
/1)
On
eaft
era
Ger
man
use
rre
adn
ews
onth
ekin
o.to
shu
tdow
nth
atin
clu
des
ab
ackgr
oun
dre
por
tN
ews:
Alt
ern
ati
ves
(0/1)
On
eaft
era
Ger
man
use
rre
adn
ews
onth
ekin
o.to
shu
tdow
nth
atm
enti
ons
ille
gal
alte
rnat
ives
New
s:L
egal
(0/1)
On
eaft
era
Ger
man
use
rre
adn
ews
onth
ekin
o.to
shu
tdow
nth
atco
nsi
der
sst
ream
ing
from
kin
o.to
asle
gal
New
s:Il
lega
l(0
/1)
On
eaft
era
Ger
man
use
rre
adn
ews
onth
ekin
o.to
shu
tdow
nth
atco
nsi
der
sst
ream
ing
from
kin
o.to
asille
gal
Kin
o:S
ingl
ehom
ing
On
eif
aG
erm
anu
ser
vis
ited
kin
o.to
and
vis
ited
no
oth
erp
irac
yw
ebsi
tes
bef
ore
the
shu
tdow
nK
ino:
Mu
ltih
om
ing
On
eif
aG
erm
anu
ser
vis
ited
kin
o.to
and
atle
ast
one
oth
erp
irac
yw
ebsi
teb
efor
eth
esh
utd
own
Non
-Kin
o:P
irat
eO
ne
ifa
Ger
man
use
rn
ever
vis
ited
kin
o.to
and
vis
ited
atle
ast
one
oth
erp
irac
yw
ebsi
teb
efor
eth
esh
utd
own
Non
-Kin
o:N
on
-Pir
ate
On
eif
aG
erm
anu
ser
nev
ervis
ited
kin
o.to
and
vis
ited
no
oth
erp
irac
yw
ebsi
tes
bef
ore
the
shutd
own
Ger
many
On
efo
rG
erm
anu
sers
39

Tab
le2:
Des
crip
tive
Sta
tist
ics
Kin
o(N
=84
3),
Non
-Kin
o(N
=41
57),
Con
trol
(N=
1500
0)K
ino
Bef
ore
Kin
oA
fter
Non
-Kin
oB
efor
eN
on-K
ino
Aft
erC
ontr
olB
efor
eC
ontr
olA
fter
Mea
nS
DM
ean
SD
Mea
nSD
Mea
nS
DM
ean
SD
Mea
nS
D
Pir
acy
8.56
626
.327
7.80
535
.030
0.10
52.
898
0.38
39.
164
0.91
59.
225
1.05
314
.487
Ln
(Pir
acy
+1)
0.7
981.4
000.
604
1.29
60.
014
0.18
90.
035
0.31
90.
103
0.53
50.
108
0.55
8P
irac
y:
Str
eam
s0.9
864.4
580.
687
4.38
90.
004
0.15
00.
022
0.71
10.
172
1.90
00.
195
2.67
9P
irac
y:
Ln
(Str
eam
s+
1)
0.2
550.6
540.
169
0.54
90.
001
0.04
50.
007
0.10
50.
043
0.28
90.
044
0.29
9P
irac
y:
Day
s0.
697
1.44
50.
530
1.31
40.
012
0.17
90.
027
0.27
40.
096
0.55
70.
099
0.57
2P
irac
y:
Ln
(Day
s+
1)
0.3
22
0.56
20.
241
0.51
20.
006
0.08
30.
015
0.12
40.
047
0.23
40.
048
0.23
8P
irac
y:
Du
rati
on
143.8
02
447
.674
152.
198
835.
740
2.57
868
.715
9.85
227
2.95
231
.950
364.
358
27.6
2937
1.70
5P
irac
y:
Ln
(Du
rati
on
+1)
1.5
672.5
671.
185
2.38
30.
033
0.41
30.
079
0.65
60.
240
1.16
10.
237
1.14
0L
icen
sed
:C
inem
a0.5
05
3.05
00.
426
3.09
50.
194
2.01
30.
190
1.98
60.
599
6.41
60.
539
4.45
9L
icen
sed
:L
n(C
inem
a+
1)0.1
22
0.49
10.
100
0.45
10.
044
0.30
70.
043
0.30
30.
121
0.50
30.
114
0.48
5L
icen
sed
:O
nli
ne
0.46
84.
899
0.47
04.
957
0.27
64.
636
0.22
43.
213
0.11
12.
541
0.13
62.
786
Lic
ense
d:
Ln
(On
lin
e+
1)0.
079
0.42
10.
074
0.41
70.
044
0.31
60.
041
0.30
10.
022
0.21
60.
025
0.23
3L
icen
sed
:D
VD
0.4
253.6
440.
484
4.80
00.
215
2.53
70.
255
3.23
00.
124
1.98
90.
172
2.98
1L
icen
sed
:L
n(D
VD
+1)
0.09
50.
427
0.09
30.
435
0.05
20.
312
0.05
90.
335
0.03
00.
238
0.03
70.
269
40
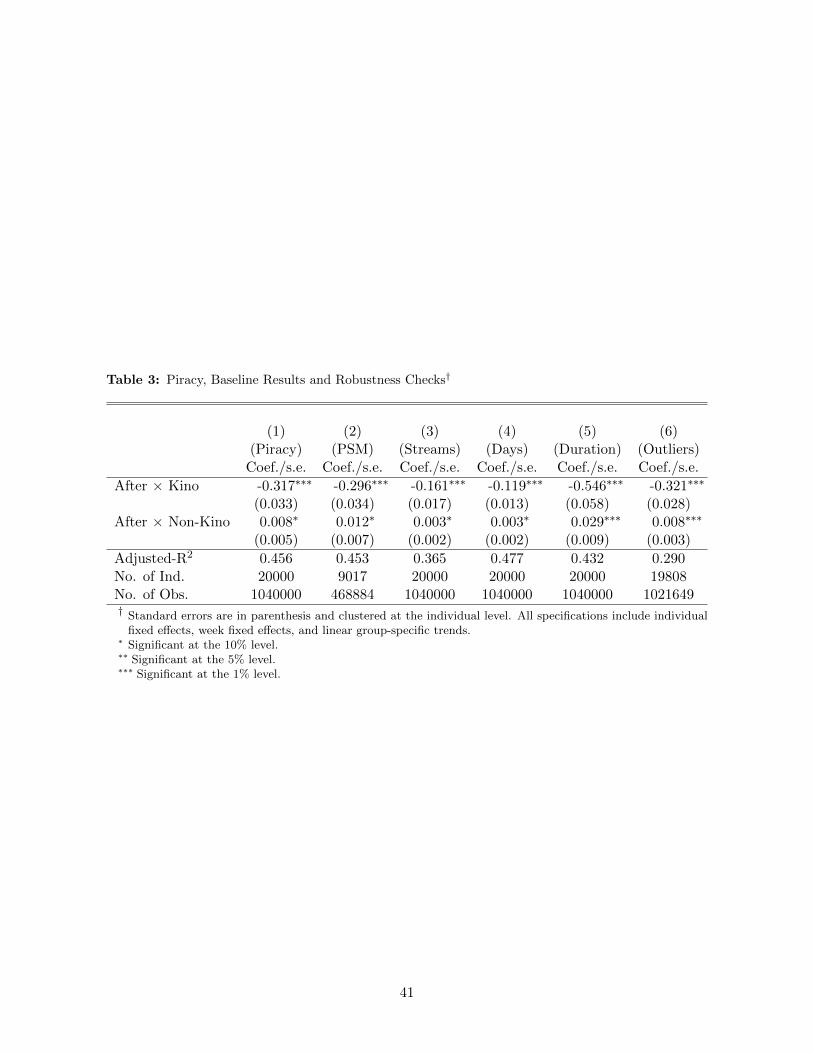
Table 3: Piracy, Baseline Results and Robustness Checks†
(1) (2) (3) (4) (5) (6)(Piracy) (PSM) (Streams) (Days) (Duration) (Outliers)
Coef./s.e. Coef./s.e. Coef./s.e. Coef./s.e. Coef./s.e. Coef./s.e.
After × Kino -0.317∗∗∗ -0.296∗∗∗ -0.161∗∗∗ -0.119∗∗∗ -0.546∗∗∗ -0.321∗∗∗
(0.033) (0.034) (0.017) (0.013) (0.058) (0.028)After × Non-Kino 0.008∗ 0.012∗ 0.003∗ 0.003∗ 0.029∗∗∗ 0.008∗∗∗
(0.005) (0.007) (0.002) (0.002) (0.009) (0.003)
Adjusted-R2 0.456 0.453 0.365 0.477 0.432 0.290No. of Ind. 20000 9017 20000 20000 20000 19808No. of Obs. 1040000 468884 1040000 1040000 1040000 1021649† Standard errors are in parenthesis and clustered at the individual level. All specifications include individual
fixed effects, week fixed effects, and linear group-specific trends.∗ Significant at the 10% level.∗∗ Significant at the 5% level.∗∗∗ Significant at the 1% level.
41

Table 4: Piracy, Externalities†
(1) (2) (3)Coef./s.e. Coef./s.e. Coef./s.e.
After × Kino -0.317∗∗∗ -0.317∗∗∗ -0.318∗∗∗
(0.033) (0.033) (0.033)After × Non-Kino 0.008∗ 0.005 0.007
(0.005) (0.005) (0.005)After × Kino × News -0.013
(0.203)After × Non-Kino × News 0.300∗∗∗
(0.107)After × Kino × News: Background -0.054
(0.181)After × Kino × News: Alternatives 0.084
(0.165)After × Kino × News: Legal -0.095
(0.209)After × Kino × News: Illegal 0.205
(0.218)After × Non-Kino × News: Background 0.004
(0.064)After × Non-Kino × News: Alternatives 0.163∗
(0.086)After × Non-Kino × News: Legal 0.283∗∗
(0.115)After × Non-Kino × News: Illegal -0.185
(0.114)
Adjusted-R2 0.456 0.456 0.457No. of Ind. 20000 20000 20000No. of Obs. 1040000 1040000 1040000† Standard errors are in parenthesis and clustered at the individual level. All specifications
include individual fixed effects, week fixed effects, and linear group-specific trends.∗ Significant at the 10% level.∗∗ Significant at the 5% level.∗∗∗ Significant at the 1% level.
42

Table 5: Licensed Alternatives†
(1) (2) (3) (4) (5) (6)(Cinema) (Cinema) (Online) (Online) (DVD) (DVD)Coef./s.e. Coef./s.e. Coef./s.e. Coef./s.e. Coef./s.e. Coef./s.e.
After × Kino 0.004 -0.004 0.012 0.014 -0.002 -0.002(0.010) (0.010) (0.009) (0.009) (0.008) (0.008)
After × Non-Kino 0.005 0.004 -0.006∗∗ -0.005∗ -0.004 -0.004(0.004) (0.004) (0.003) (0.003) (0.003) (0.003)
After × Kino × News 0.134∗∗ -0.043 0.006(0.059) (0.049) (0.057)
After × Non-Kino × News 0.123∗∗ -0.045 -0.038(0.056) (0.071) (0.057)
Adjusted-R2 0.284 0.284 0.261 0.261 0.316 0.316No. of Ind. 20000 20000 20000 20000 20000 20000No. of Obs. 1040000 1040000 1040000 1040000 1040000 1040000† Standard errors are in parenthesis and clustered at the individual level. All specifications include individual fixed
effects, week fixed effects, and linear group-specific trends.∗ Significant at the 10% level.∗∗ Significant at the 5% level.∗∗∗ Significant at the 1% level.
Table 6: Knowing About Unlicensed Alternatives†
(1) (2) (3) (4)(Alt. Piracy) (Cinema) (Online) (DVD)
Coef./s.e. Coef./s.e. Coef./s.e. Coef./s.e.
After × Kino: Singlehoming 0.215∗∗∗ 0.026∗∗ 0.015 -0.003(0.028) (0.012) (0.011) (0.010)
After × Kino: Multihoming 0.395∗∗∗ -0.026 0.009 0.001(0.060) (0.018) (0.013) (0.013)
After × Non-Kino: Pirate 0.000 0.007 -0.020 -0.004(0.041) (0.018) (0.014) (0.017)
After × Non-Kino: Non-Pirate 0.009∗∗ 0.005 -0.005∗ -0.004(0.004) (0.003) (0.003) (0.003)
Adjusted-R2 0.430 0.284 0.261 0.316No. of Ind. 20000 20000 20000 20000No. of Obs. 1040000 1040000 1040000 1040000† Standard errors are in parenthesis and clustered at the individual level. All specifications include
individual fixed effects, week fixed effects, and linear group-specific trends.∗ Significant at the 10% level.∗∗ Significant at the 5% level.∗∗∗ Significant at the 1% level.
43

Table 7: Aggregate†
(1) (2) (3) (4)(Piracy) (Cinema) (Online) (DVD)
Coef./s.e. Coef./s.e. Coef./s.e. Coef./s.e.
After × Germany -0.046∗∗∗ 0.005 -0.003 -0.004(0.007) (0.004) (0.003) (0.003)
Adjusted-R2 0.455 0.284 0.261 0.316No. of Ind. 20000 20000 20000 20000No. of Obs. 1040000 1040000 1040000 1040000† Standard errors are in parenthesis and clustered at the individual level. All
specifications include individual fixed effects, week fixed effects, and lineargroup-specific trends.
∗ Significant at the 10% level.∗∗ Significant at the 5% level.∗∗∗ Significant at the 1% level.
44

Figure 1: Evolution of Online Movie Streaming Piracy
0
.02
.04
.06
.08
.1
.12
.14
.16
Ave
rag
e log
(clic
ks)
1 3 5 7 9 11 13 15 17 19 21 23 25 27 29 31 33 35 37 39 41 43 45 47 49 51
Week
Total Piracy Kino.to
Evolution of Online Movie Streaming Piracy
Vertical axis: Average log weekly clicks per user. Horizontal axis: Calendar weeks in 2011.Solid blue: Average log weekly clicks per user on all unlicensed streaming websites.Dashed red: Average log weekly clicks per user on kino.to.
Figure 2: Evolution of Online Movie Streaming Piracy, by Group
.01
.05
.1.2
.4.6
.81
1 4 7 10 13 16 19 22 25 28 31 34 37 40 43 46 49 52
Vertical axis: Average log weekly clicks per group. Horizontal axis: Calendar weeks in 2011.Solid blue: Kino users. Dashed blue: Non-Kino users.Solid red: International users (control group).
45

Figure 3: Group difference: Overall piracy
Kino vs. international
−.6
−.4
−.2
0.2
.4.6
1 4 7 10 13 16 19 22 25 28 31 34 37 40 43 46 49 52
Non-Kino vs. international
−.0
6−
.04
−.0
20
.02
.04
.06
1 4 7 10 13 16 19 22 25 28 31 34 37 40 43 46 49 52
Vertical axis: OLS coefficients. Horizontal axis: Calendar weeks in 2011.Weekly differences between the treatment group (Kino/Non-Kino) and the control group (users in FR, IT, UK).Solid blue: OLS estimates of the βt
1wt (left panel) and βt2wt (right panel) coefficients obtained from a regression of:
ln(Clicksit + 1) = α+∑
t βt0wt +
∑t β
t1 (wt ×Kinoi) +
∑t β
t2 (wt × Non-Kino) + µi + εit.
Bars indicate 90% confidence bands.
Figure 4: Group difference: Cinema
Kino vs. international
−.1
2−
.1−
.08
−.0
6−
.04
−.0
20
.02
.04
.06
.08
.1
1 4 7 10 13 16 19 22 25 28 31 34 37 40 43 46 49 52
Non-Kino vs. international
−.1
2−
.1−
.08
−.0
6−
.04
−.0
20
.02
.04
.06
.08
.1
1 4 7 10 13 16 19 22 25 28 31 34 37 40 43 46 49 52
Vertical axis: OLS coefficients. Horizontal axis: Calendar weeks in 2011.Weekly differences between the treatment group (Kino/Non-Kino) and the control group (users in FR, IT, UK).Solid blue: OLS estimates of the βt
1wt (left panel) and βt2wt (right panel) coefficients obtained from a regression of:
ln(Clicksit + 1) = α+∑
t βt0wt +
∑t β
t1 (wt ×Kinoi) +
∑t β
t2 (wt × Non-Kino) + µi + εit.
Bars indicate 90% confidence bands.
46

Figure 5: Group difference: Online
Kino vs. International
−.0
5−
.03
−.0
1.0
1.0
3.0
5.0
7.0
9
1 4 7 10 13 16 19 22 25 28 31 34 37 40 43 46 49 52
Non-Kino vs. International
−.0
5−
.03
−.0
1.0
1.0
3.0
5.0
7.0
9
1 4 7 10 13 16 19 22 25 28 31 34 37 40 43 46 49 52
Vertical axis: OLS coefficients. Horizontal axis: Calendar weeks in 2011.Weekly differences between the treatment group (Kino/Non-Kino) and the control group (users in FR, IT, UK).Solid blue: OLS estimates of the βt
1wt (left panel) and βt2wt (right panel) coefficients obtained from a regression of:
ln(Clicksit + 1) = α+∑
t βt0wt +
∑t β
t1 (wt ×Kinoi) +
∑t β
t2 (wt × Non-Kino) + µi + εit.
Bars indicate 90% confidence bands.
Figure 6: Group difference: DVD
Kino vs. International
−.0
5−
.03
−.0
1.0
1.0
3.0
5.0
7.0
9
1 4 7 10 13 16 19 22 25 28 31 34 37 40 43 46 49 52
Non-Kino vs. International
−.0
5−
.03
−.0
1.0
1.0
3.0
5.0
7.0
9
1 4 7 10 13 16 19 22 25 28 31 34 37 40 43 46 49 52
Vertical axis: OLS coefficients. Horizontal axis: Calendar weeks in 2011.Weekly differences between the treatment group (Kino/Non-Kino) and the control group (users in FR, IT, UK).Solid blue: OLS estimates of the βt
1wt (left panel) and βt2wt (right panel) coefficients obtained from a regression of:
ln(Clicksit + 1) = α+∑
t βt0wt +
∑t β
t1 (wt ×Kinoi) +
∑t β
t2 (wt × Non-Kino) + µi + εit.
Bars indicate 90% confidence bands.
47
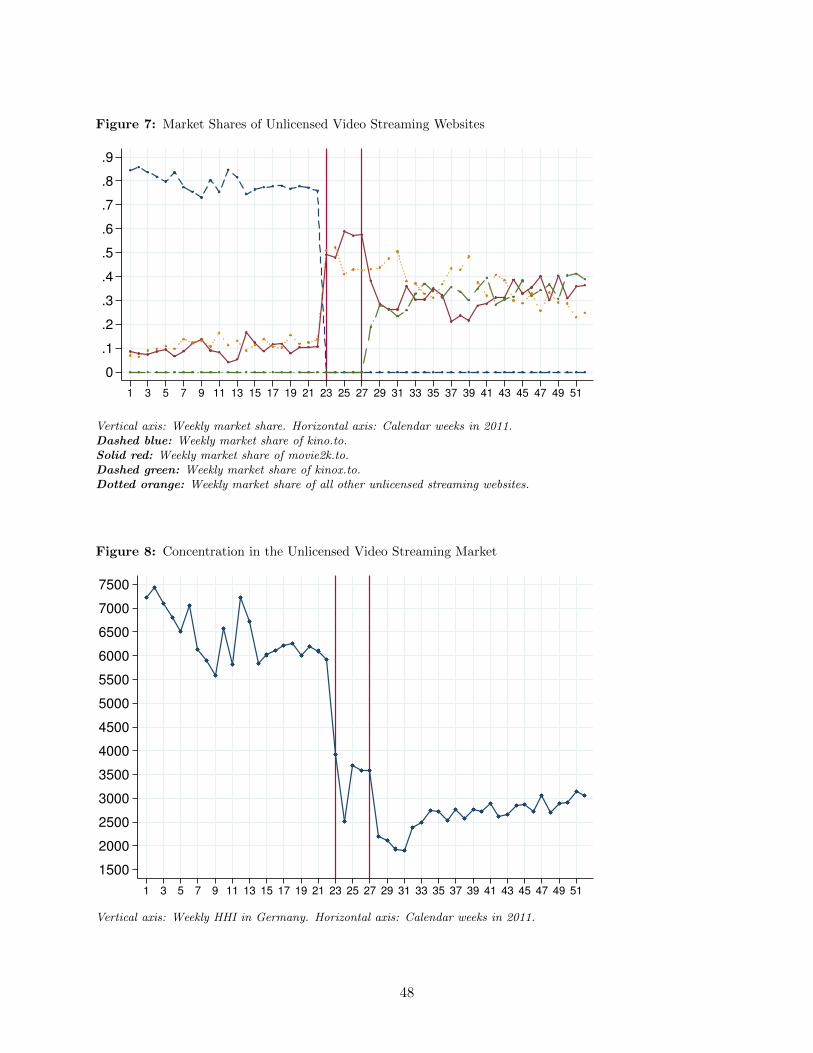
Figure 7: Market Shares of Unlicensed Video Streaming Websites
0
.1
.2
.3
.4
.5
.6
.7
.8
.9
Mark
et S
hare
1 3 5 7 9 11 13 15 17 19 21 23 25 27 29 31 33 35 37 39 41 43 45 47 49 51
Week
Kino.to Movie2K
KinoX.to Others
Evolution of Market Shares of illegalmovie streaming websites
Vertical axis: Weekly market share. Horizontal axis: Calendar weeks in 2011.Dashed blue: Weekly market share of kino.to.Solid red: Weekly market share of movie2k.to.Dashed green: Weekly market share of kinox.to.Dotted orange: Weekly market share of all other unlicensed streaming websites.
Figure 8: Concentration in the Unlicensed Video Streaming Market
1500
2000
2500
3000
3500
4000
4500
5000
5500
6000
6500
7000
7500
HH
I
1 3 5 7 9 11 13 15 17 19 21 23 25 27 29 31 33 35 37 39 41 43 45 47 49 51
Concentration in the UnlicensedVideo Streaming Market
Vertical axis: Weekly HHI in Germany. Horizontal axis: Calendar weeks in 2011.
48