Catalyst efficiency, photostability and reusability study of ZnO nanoparticles in visible light for...
7
Catalyst efficiency, photostability and reusability study of ZnO nanoparticles in visible light for dye degradation Rohini Kitture a , Soumya J. Koppikar b , Ruchika Kaul-Ghanekar b , S.N. Kale c,n a Department of Electronic Science, Fergusson College, Pune 411 004, India b Interactive Research School for Health Affairs, Bharati Vidyapeeth University, Pune 411 017, India c Department of Applied Physics, Defence Institute of Advanced Technology, Girinagar, Pune 411 025, India article info Article history: Received 11 May 2010 Received in revised form 25 July 2010 Accepted 20 October 2010 Keywords: A. Oxides A. Semiconductors B. Chemical synthesis C. X-ray diffraction D. Surface properties abstract Polydispersed ZnO nanoparticles (ZnO1000 and ZnO600) with two different windows of particle size distributions ( 120 and 30 nm) were synthesized using citrate gel route and different annealing treatments (1000 and 600 1C, respectively). Photocatalytic efficiency of these samples was compared with TiO 2 in its commercial form-P25, on two dyes, Methylene blue (MB) and Methyl orange (MO). The X-ray diffraction data showed wrutzite ZnO and anatase and rutile phases of P25. UV–visible absorbance spectra of ZnO1000 showed broad absorption range from UV-to-visible (from 382 to 700 nm), as against sharp absorption peaks in UV range for both ZnO600 and P25. The microstructural morphology as seen through scanning electron micrographs showed ZnO1000 with tetrapod-like structures while the ZnO600 showed almost spherical morphologies. Upon subjecting these catalysts to dye solutions in sunlight it was found that both the dyes were completely decolorised within 20 min by ZnO1000, as against partial decolorisation by ZnO600 and P25 ( 53% and 78% for MO and 77% and 88% for MB samples). The effect of catalyst loading (from 125 mg to 1 g) on decolorisation showed that ZnO1000 had good efficiency for all concentrations which was followed by P25 and then by ZnO600. Small perturbations are attributed to the competition between sunlight scattering-induced, reduced irradiation field and the exposed surface area offered by catalyst, which work as active sites for decolorisation. The reusability of the catalysts when studied on fresh dye samples (4 trials), the decolorisation efficiency decreased merely from 99.2% to 99.12% for ZnO1000 as compared to ZnO600 (53.3% to 19.94%) and P25 (78.3% to 31.42%), indicating the efficient reusability of ZnO1000. The effective half life of the catalysts, in terms of number of reuses, were calculated and found to be 3 for both ZnO600 and P25 and was 43000 for ZnO1000, which justifies its extremely high reuse. The byproduct analysis (compared with standards prescribed by World Health Organisation (WHO) and Central Pollution Control Board of India (CPCB)) showed cleavage of the chromophore and of other bonds with opening of benzene rings, indicating degradation of the dyes in concurrence with decolorisation, in the stipulated time. Further, cytotoxicity studies performed on SiHa cell lines showed non-toxicity of the byproducts with ZnO1000 as compared to ZnO600 and P25. & 2010 Elsevier Ltd. All rights reserved. 1. Introduction As has been known, about 15% of the total world production of dyes is lost during the dyeing process and is released in the textile effluents [1]. The release of these colored wastewaters in the ecosystem is a dramatic source of toxic pollution, which leads to perturbations in aquatic life and also hazardous to human beings. As international environmental standards are becoming more stringent, development of technological systems for the removal (or degradation into non-toxic forms) of organic dyes have been recently on rise. These include physical methods (e.g. adsorption) [2], biological methods (e.g. biodegradation) [3,4] and chemical methods (e.g. chlorination, ozonation) [5]. The physical methods leave behind more concentrated pollutant-containing phase, while chemical and biological methods are less adopted because of fluctuation in wastewater composition [6,7]. Hence all the methods mentioned above are less feasible and thus chances for better method are still well open. Wide-band gap semiconductor materials have been the focus in this context for quite sometime, as photocatalysts for dye-degradation processes, [8,9] and are commonly referred to as the materials which involve advanced oxidation processes (AOPs). The photocatalytic process usually involves following steps: (1) adsorption of the dye; (2) photogenerated electrons in the conduction band, which are trapped by a recipient (such as oxygen) to give superoxide radicals; (3) photogenerated holes in the valence band are consumed by donors Contents lists available at ScienceDirect journal homepage: www.elsevier.com/locate/jpcs Journal of Physics and Chemistry of Solids 0022-3697/$ - see front matter & 2010 Elsevier Ltd. All rights reserved. doi:10.1016/j.jpcs.2010.10.090 n Corresponding author. E-mail address: [email protected] (S.N. Kale). Journal of Physics and Chemistry of Solids 72 (2011) 60–66
-
Upload
independent -
Category
Documents
-
view
1 -
download
0
Transcript of Catalyst efficiency, photostability and reusability study of ZnO nanoparticles in visible light for...

Journal of Physics and Chemistry of Solids 72 (2011) 60–66
Contents lists available at ScienceDirect
Journal of Physics and Chemistry of Solids
0022-36
doi:10.1
n Corr
E-m
journal homepage: www.elsevier.com/locate/jpcs
Catalyst efficiency, photostability and reusability study of ZnO nanoparticlesin visible light for dye degradation
Rohini Kitture a, Soumya J. Koppikar b, Ruchika Kaul-Ghanekar b, S.N. Kale c,n
a Department of Electronic Science, Fergusson College, Pune 411 004, Indiab Interactive Research School for Health Affairs, Bharati Vidyapeeth University, Pune 411 017, Indiac Department of Applied Physics, Defence Institute of Advanced Technology, Girinagar, Pune 411 025, India
a r t i c l e i n f o
Article history:
Received 11 May 2010
Received in revised form
25 July 2010
Accepted 20 October 2010
Keywords:
A. Oxides
A. Semiconductors
B. Chemical synthesis
C. X-ray diffraction
D. Surface properties
97/$ - see front matter & 2010 Elsevier Ltd. A
016/j.jpcs.2010.10.090
esponding author.
ail address: [email protected] (S.N
a b s t r a c t
Polydispersed ZnO nanoparticles (ZnO1000 and ZnO600) with two different windows of particle size
distributions (�120 and 30 nm) were synthesized using citrate gel route and different annealing
treatments (1000 and 600 1C, respectively). Photocatalytic efficiency of these samples was compared with
TiO2 in its commercial form-P25, on two dyes, Methylene blue (MB) and Methyl orange (MO). The X-ray
diffraction data showed wrutzite ZnO and anatase and rutile phases of P25. UV–visible absorbance spectra
of ZnO1000 showed broad absorption range from UV-to-visible (from 382 to 700 nm), as against sharp
absorption peaks in UV range for both ZnO600 and P25. The microstructural morphology as seen through
scanning electron micrographs showed ZnO1000 with tetrapod-like structures while the ZnO600 showed
almost spherical morphologies. Upon subjecting these catalysts to dye solutions in sunlight it was found
that both the dyes were completely decolorised within 20 min by ZnO1000, as against partial
decolorisation by ZnO600 and P25 ( 53% and 78% for MO and 77% and 88% for MB samples). The effect
of catalyst loading (from 125 mg to 1 g) on decolorisation showed that ZnO1000 had good efficiency for all
concentrations which was followed by P25 and then by ZnO600. Small perturbations are attributed to the
competition between sunlight scattering-induced, reduced irradiation field and the exposed surface area
offered by catalyst, which work as active sites for decolorisation. The reusability of the catalysts when
studied on fresh dye samples (4 trials), the decolorisation efficiency decreased merely from 99.2% to
99.12% for ZnO1000 as compared to ZnO600 (53.3% to 19.94%) and P25 (78.3% to 31.42%), indicating the
efficient reusability of ZnO1000. The effective half life of the catalysts, in terms of number of reuses, were
calculated and found to be �3 for both ZnO600 and P25 and was 43000 for ZnO1000, which justifies its
extremely high reuse. The byproduct analysis (compared with standards prescribed by World Health
Organisation (WHO) and Central Pollution Control Board of India (CPCB)) showed cleavage of the
chromophore and of other bonds with opening of benzene rings, indicating degradation of the dyes in
concurrence with decolorisation, in the stipulated time. Further, cytotoxicity studies performed on SiHa
cell lines showed non-toxicity of the byproducts with ZnO1000 as compared to ZnO600 and P25.
& 2010 Elsevier Ltd. All rights reserved.
1. Introduction
As has been known, about 15% of the total world production ofdyes is lost during the dyeing process and is released in the textileeffluents [1]. The release of these colored wastewaters in theecosystem is a dramatic source of toxic pollution, which leads toperturbations in aquatic life and also hazardous to human beings.As international environmental standards are becoming morestringent, development of technological systems for the removal(or degradation into non-toxic forms) of organic dyes have beenrecently on rise. These include physical methods (e.g. adsorption)
ll rights reserved.
. Kale).
[2], biological methods (e.g. biodegradation) [3,4] and chemicalmethods (e.g. chlorination, ozonation) [5]. The physical methodsleave behind more concentrated pollutant-containing phase, whilechemical and biological methods are less adopted because offluctuation in wastewater composition [6,7]. Hence all the methodsmentioned above are less feasible and thus chances for bettermethod are still well open.
Wide-band gap semiconductor materials have been the focus inthis context for quite sometime, as photocatalysts for dye-degradationprocesses, [8,9] and are commonly referred to as the materials whichinvolve advanced oxidation processes (AOPs). The photocatalyticprocess usually involves following steps: (1) adsorption of the dye;(2) photogenerated electrons in the conduction band, which aretrapped by a recipient (such as oxygen) to give superoxide radicals;(3) photogenerated holes in the valence band are consumed by donors
R. Kitture et al. / Journal of Physics and Chemistry of Solids 72 (2011) 60–66 61
(such as dye organics) or sometimes by OH– to generate OH˙
radicals;(4) The reaction of highly reactive radicals with the adsorbed dye togive degraded product(s). This finally results in desorption of theproduct(s) from the interface region [10] to make the water less toxic,so that it can be let into the river beds. The higher the mobility of thephotogenerated carriers (including holes and electrons), the better isthe performance of the photocatalyst. Additionally, the valence bandposition of a semiconductor and the incident photon energy also playsan important role in deciding the photocatalytic activity of thesemiconductor. The deeper the valence band of a semiconductor,the stronger is its oxidative activity, and the higher is the photo-catalytic property of the material [11,12]. Among such different AOPs,most preferred photocatalysts include TiO2 [13,14], CdS, ZnS, ZnO[15,16], Fenton [17] and polyoxometallates [18]. These materialsassisted processes, for their activation, demand higher photon energy,which could be near-UV or in UV range [19–23]. However, since UVoccupies merely ca. 4% of whole solar energy, the technology becomesdifficult, if not impossible, to widen the application. Therefore, it isindispensable and urgent to develop a particular photocatalystsensitive to sunlight for wastewater treatment. In order to developa sunlight sensitive photocatalyst, we either need an appropriatelyband-gap engineered material, or we need the material to possessthese characteristics which are brought out by its defect nature.
In this context we report on synthesis of polydispersed zincoxide nanoparticles, using the citrate gel route. The synthesisprocedures have been varied at the calcination stage in order toachieve particle size in two different size windows, namelycalcined at 1000 1C (referred henceforth as ZnO1000) with size�120 nm and calcined at 600 1C (referred henceforth as ZnO600)with size in the range 30 nm. These samples have been used asphotocatalyst in ambient sunlight for decolorisation of two classicdyes with different chemical structure, (1) methylene blue(MB)—a heteropolyaromatic dye and (2) methyl orange (MO)—anazo dye. The results have been compared with well-provenconventional photocatalyst- P25 which is a mixture of anataseand rutile phase of TiO2, procured commercially. X-ray diffractiontechnique (PHILIPS X-PERT, XRD), scanning electron microscopy(JOEL make, SEM) and UV–visible spectroscopy (Jasco (modelV-570), UV–vis); have been employed to study the microstructure,particle size and optical absorption characteristics of nanoparticles.Chemical assays have been employed for water analysis (pre- andpost-treatments) and biological assays have been used for cyto-toxicity studies to identify the degraded products and evaluatetheir safety as prescribed by World Health Organisation (WHO) andCentral Pollution Control Board (CPCB), India. The reusability of thephotocatalysts has been studied and probable degradation path-ways have been identified. The details about the further studies arementioned in the coming paragraphs.
2. Materials and methods
Precursors such as zinc acetate, citric acid and nitric acid wereobtained from CDH India and chemicals required for toxicitystudies were procured from Sigma Aldrich, USA. Double distilledwater was used throughout the experiments to prepare solutions.Dyes, MO and MB were procured from Thomas Baker, India.
2.1. Synthesis of zinc oxide nanoparticles
The citrate gel method was used for the synthesis of ZnO,wherein 4 mg zinc acetate was dissolved in 40 ml distilled water.Independently, 8 mg citric acid was dissolved in distilled water andwas later added to zinc acetate solution. The whole solution wasthen mixed with 10 ml nitric acid. This solution was then heated at100 1C in water bath to get yellow gel, which on further heating at
same temperature converted into yellow fluffy mass. This was thenfurnace dried at 110 1C. The product was crushed and annealed at400 1C for 4 h and then either at 600 (ZnO600) or at 1000 1C(ZnO1000) for 4 h.
2.2. Decolorisation studies
For all the experiments mentioned here, the dye (MO or MB)concentration was kept constant to 10 mg per 1 l of water. This wasused as stalk solution, out of which 50 ml solution was used for allindividual experiments. In this aliquot, 12.5 mg (250 mg/l) ofcatalyst (ZnO1000, ZnO600 or P25) was added and the solution/swas subjected to ambient sunlight. The catalyst concentration wasfixed after multiple optimization experiments. The sunlight expo-sure time was fixed in such a way that at least one of the samples(with catalyst either as ZnO1000, ZnO600 or P25) showed completedecolorisation. This time was found to be �20 min for the ZnO1000sample. All samples were further centrifuged at 10000 rpm toensure that no catalyst particles remain in the aliquots. Thesamples were then subjected to further characterizations. Thepercentage decolorisation efficiency (DE) % was determined using
DE%¼ fðC0�CÞ=C0g � 100
where C0 is the initial concentration of dye and C the concentrationof dye after photo irradiation, which could be determined fromtheir characteristic absorption maxima in UV–vis spectroscopy.
2.3. Reusability of catalyst
In order to handle the reusability issue of the catalysts, afterseparating it via centrifugation, the recovered catalyst was usedwith fresh dye solutions. All the experimental parameters werekept constant and the experiments were repeated for 4 sets of freshdye solutions. Using the basic equation of decay
lnðN=N0Þ ¼ �Kt
where N0 is the degradation efficiency during the first (fresh) use ofthe catalyst, N the efficiency after the fourth (t) use of the catalyst,decay constant (K) was estimated. This has provided the estimate ofhalf-life time of the catalysts, in terms of number of reuses.
2.4. Water analysis
The two control dye solutions viz. MB and MO as well as thetreated solutions were analyzed for various parameters using thestandard procedures [24]. The different parameters analyzed were:color (platinum cobalt method), suspended solids (gravimetricmethod), COD (close reflux method), Na (Flame photometer), Zn(Zencon colorimetric method at 620 nm), S (Iodometric titration),SO4 (Nephalometric), NO3 (brucin sulphanilic acid method,estimation at 410 nm) and chloride (Argentometric titration).
2.5. Cytotoxicity studies
The cytotoxicity studies were performed on SiHa cell lines.The cell lines were grown in DMEM supplemented with 2 mML-glutamine, 100 ml/ml of penicillin/streptomycin and 10% fetal calfserum. The cells were seeded at 1�105 cells/ml density in 96-wellplates (Nunc, Roskilde, Denmark). After 24 h, the cells wereincubated with fresh medium containing dye (MB/MO) solutions,treated independently with ZnO1000/ZnO600/P25, that wasadded at concentrations ranging from 0 to 30 mg/ml in each well(in triplicates) and the plates were incubated for 24 h at 37 1C in 5%CO2 incubator. The experiments were repeated at least three timeswith each cell line. Cell viability was determined by MTT assay. TheMTT solution (5 mg/ml) was added to each well, and the cells were

R. Kitture et al. / Journal of Physics and Chemistry of Solids 72 (2011) 60–6662
incubated for another 4 h at 37 1C in 5% CO2 incubator. Theintensity of colored formazan derivative was determined bymeasuring optical density (OD) with the ELISA microplate reader(Biorad, Hercules, CA) at 570 nm. The mean OD value of three wellswas used for assessing the cell viability expressed as
%Viability¼ ðnumber of treated cells=number of control cellsÞ � 100
Fig. 1.2. XRD data of P25 nanoparticles. The inset shows the SEM images of ZnO1000
(i), ZnO600 (ii) and P25 (iii). ZnO1000 shows tetrapod-like structures while the
ZnO600 shows almost spherical morphologies (elaborated by red circular outlines)
as against the agglomerated P25 structures of extremely small size (elaborated in
the inset of figure). (For interpretation of the references to colour in this figure
legend, the reader is referred to the web version of this article.)
3. Results and discussion
3.1. Analysis of catalysts
The XRD analysis of ZnO1000 (i) ZnO600 (ii) is shown in Fig. 1.1.Fig. 1.2 shows the pattern for P25. Characteristic reflectionscorresponding from various planes depicted in the figure confirmed(1) the wrutzite phase formation in both ZnO samples and (2) P25phase containing of anatase and rutile phases of TiO2 (as reported inJCPDS Powder Diffraction data). The broadening of peaks in theZnO600 samples indicated presence of nanoparticles and the Scherrerequation, estimated the size to be 28 nm, as against the ZnO1000�120 nm. It has to be mentioned here that the samples exhibitedpolydispersed nature, which was also seen using dynamic lightscattering experiments (results not shown). The P25 particles were�22 nm. The inset of Fig. 1.2 shows the SEM images of ZnO1000 (inset(i)), ZnO600 (inset (ii)) and P25 (inset (iii)). The samples exhibit theparticle size to be much different as compared to the XRD analysis,probably due to the cluster formation. The characteristics morphologyof ZnO1000 showed tetrapod-like structures while the ZnO600showed almost spherical morphologies (elaborated by red circularoutlines) as against the agglomerated and less resolvable P25structures of extremely small size (elaborated in the inset of figure).These morphologies and their relationship to the photocatalyticactivity are elaborated in coming paragraphs.
Fig. 2 shows the UV–vis data of ZnO1000 (a) ZnO600 (b) and P25(c). It was observed that the P25 particles showed absorption edge at�330 nm, ZnO1000 at 382 nm and ZnO600 at 378 nm. This absorp-tion was fairly sharp and in typical UV range, for both P25 and ZnO600sample, indicating relatively narrow particle size distribution. Shiftingof absorption towards blue region as compared to ZnO1000 could beexplained on the basis of the quantum confinement effect of
Fig. 1.1. XRD data of ZnO1000 (i), ZnO600 (ii), (b) shows XRD data of P25
nanoparticles. The spectrum shows phase formation and peak broadening in case
of nanoparticles.
Fig. 2. The UV–vis spectroscopy data of ZnO1000 (a), ZnO600 (b) and P25
nanoparticles (c). ZnO1000 shows an absorption edge at 382 nm, while ZnO600
show an absorption peak at 378 nm and P25 show that at 330 nm. The inset shows
ZnO1000 sample data duly magnified. The arrow shows the absorption edge, which
gets completely merged with the defect-state signature around 500 nm.
nanomaterials. The arrow shows the absorption edge, which getscompletely merged with the defect-state signature around 500 nm.Second point to note here was this that the absorption range ofZnO1000 was much larger and extended up to 700 nm (as shownelaborately in the inset).
3.2. Decolorisation studies
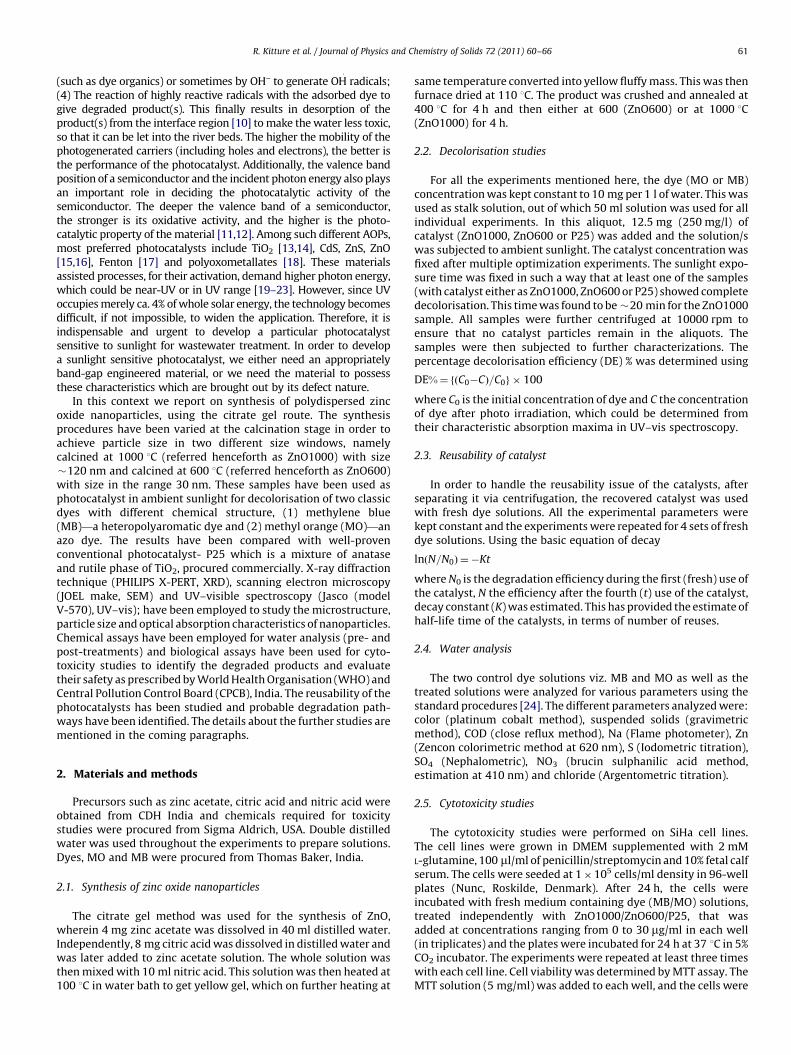
Fig. 3.1 shows photocatalytic decolorisation of MO withZnO1000, ZnO600 and P25 samples after 20 min of solar exposureusing UV–vis spectrum. Fig. 3.1(a) shows initial signature of MO,
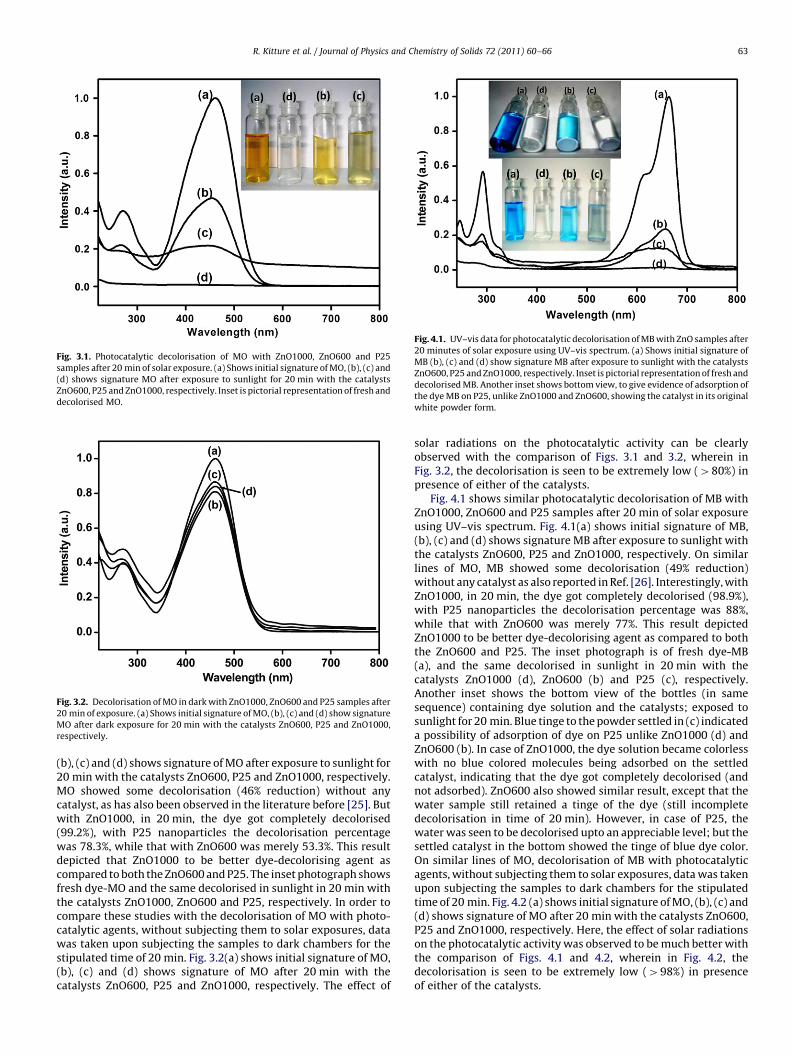
Fig. 3.1. Photocatalytic decolorisation of MO with ZnO1000, ZnO600 and P25
samples after 20 min of solar exposure. (a) Shows initial signature of MO, (b), (c) and
(d) shows signature MO after exposure to sunlight for 20 min with the catalysts
ZnO600, P25 and ZnO1000, respectively. Inset is pictorial representation of fresh and
decolorised MO.
Fig. 3.2. Decolorisation of MO in dark with ZnO1000, ZnO600 and P25 samples after
20 min of exposure. (a) Shows initial signature of MO, (b), (c) and (d) show signature
MO after dark exposure for 20 min with the catalysts ZnO600, P25 and ZnO1000,
respectively.
Fig. 4.1. UV–vis data for photocatalytic decolorisation of MB with ZnO samples after
20 minutes of solar exposure using UV–vis spectrum. (a) Shows initial signature of
MB (b), (c) and (d) show signature MB after exposure to sunlight with the catalysts
ZnO600, P25 and ZnO1000, respectively. Inset is pictorial representation of fresh and
decolorised MB. Another inset shows bottom view, to give evidence of adsorption of
the dye MB on P25, unlike ZnO1000 and ZnO600, showing the catalyst in its original
white powder form.
R. Kitture et al. / Journal of Physics and Chemistry of Solids 72 (2011) 60–66 63
(b), (c) and (d) shows signature of MO after exposure to sunlight for20 min with the catalysts ZnO600, P25 and ZnO1000, respectively.MO showed some decolorisation (46% reduction) without anycatalyst, as has also been observed in the literature before [25]. Butwith ZnO1000, in 20 min, the dye got completely decolorised(99.2%), with P25 nanoparticles the decolorisation percentagewas 78.3%, while that with ZnO600 was merely 53.3%. This resultdepicted that ZnO1000 to be better dye-decolorising agent ascompared to both the ZnO600 and P25. The inset photograph showsfresh dye-MO and the same decolorised in sunlight in 20 min withthe catalysts ZnO1000, ZnO600 and P25, respectively. In order tocompare these studies with the decolorisation of MO with photo-catalytic agents, without subjecting them to solar exposures, datawas taken upon subjecting the samples to dark chambers for thestipulated time of 20 min. Fig. 3.2(a) shows initial signature of MO,(b), (c) and (d) shows signature of MO after 20 min with thecatalysts ZnO600, P25 and ZnO1000, respectively. The effect of
solar radiations on the photocatalytic activity can be clearlyobserved with the comparison of Figs. 3.1 and 3.2, wherein inFig. 3.2, the decolorisation is seen to be extremely low (480%) inpresence of either of the catalysts.
Fig. 4.1 shows similar photocatalytic decolorisation of MB withZnO1000, ZnO600 and P25 samples after 20 min of solar exposureusing UV–vis spectrum. Fig. 4.1(a) shows initial signature of MB,(b), (c) and (d) shows signature MB after exposure to sunlight withthe catalysts ZnO600, P25 and ZnO1000, respectively. On similarlines of MO, MB showed some decolorisation (49% reduction)without any catalyst as also reported in Ref. [26]. Interestingly, withZnO1000, in 20 min, the dye got completely decolorised (98.9%),with P25 nanoparticles the decolorisation percentage was 88%,while that with ZnO600 was merely 77%. This result depictedZnO1000 to be better dye-decolorising agent as compared to boththe ZnO600 and P25. The inset photograph is of fresh dye-MB(a), and the same decolorised in sunlight in 20 min with thecatalysts ZnO1000 (d), ZnO600 (b) and P25 (c), respectively.Another inset shows the bottom view of the bottles (in samesequence) containing dye solution and the catalysts; exposed tosunlight for 20 min. Blue tinge to the powder settled in (c) indicateda possibility of adsorption of dye on P25 unlike ZnO1000 (d) andZnO600 (b). In case of ZnO1000, the dye solution became colorlesswith no blue colored molecules being adsorbed on the settledcatalyst, indicating that the dye got completely decolorised (andnot adsorbed). ZnO600 also showed similar result, except that thewater sample still retained a tinge of the dye (still incompletedecolorisation in time of 20 min). However, in case of P25, thewater was seen to be decolorised upto an appreciable level; but thesettled catalyst in the bottom showed the tinge of blue dye color.On similar lines of MO, decolorisation of MB with photocatalyticagents, without subjecting them to solar exposures, data was takenupon subjecting the samples to dark chambers for the stipulatedtime of 20 min. Fig. 4.2 (a) shows initial signature of MO, (b), (c) and(d) shows signature of MO after 20 min with the catalysts ZnO600,P25 and ZnO1000, respectively. Here, the effect of solar radiationson the photocatalytic activity was observed to be much better withthe comparison of Figs. 4.1 and 4.2, wherein in Fig. 4.2, thedecolorisation is seen to be extremely low (498%) in presenceof either of the catalysts.

Fig. 5. Effect of catalyst loading on dye degradation for the concentration 10 mg/l dye,
for the catalysts ZnO1000 (a), ZnO600 (b) and P25 (c).
Fig. 6. Reuse and photostability of catalysts ZnO1000 (a), ZnO600 (b) and P25
(c), and inset shows expanded view of reuse trials of ZnO1000. The lines indicate the
fitted curves.
Fig. 4.2. Decolorisation of MB in dark with ZnO1000, ZnO600 and P25 samples after
20 min of exposure. (a) Shows initial signature of MB, (b), (c) and (d) show signature
MB after dark exposure for 20 min with the catalysts ZnO600, P25 and ZnO1000,
respectively.
R. Kitture et al. / Journal of Physics and Chemistry of Solids 72 (2011) 60–6664
3.3. Effect of catalyst dose on dye decolorisation
For this study, catalyst concentration was varied from 0.125 to1 mg/l for 10 mg/l of dye solution. Fig. 5 shows the effect of catalystdose on decolorisation of dye. The results showed that ZnO1000 hasgood efficiency for all concentrations which was followed by P25and then by ZnO600. It was also observed that for ZnO600, initiallythe decolorisation efficiency was high and later with the catalystconcentration, the efficiency decreased. Comparing P25 withZnO600, since ZnO was a better decolorising agent, and P25 isan adsorbing agent, the poor decolorisation efficiency with catalystdose, in case of ZnO600 needs better understanding. At lowercatalyst concentration total surface area available for interactionwith dye and hence active site for decolorisation would be less, thusgiving lower efficiency. As the amount of catalyst in the solutionincreased, the turbidity of the solution would also increase. Thiswould restrict the light penetration and hence reduced irradiationfield, which further result in decreased photoactivity. Thus it may
be concluded that higher concentration may not be always usefulfor better efficiency.
3.4. Reusability and photostability
To study reusability of the catalysts, decolorisation studies wereperformed with 10 mg/l dye and 250 mg/l catalyst. The experi-ments for the decolorisation were performed four times, each timeusing the same catalyst (duly separated from the earlier lot) andfresh dye solution. The results are depicted in Fig. 6. The black datapoints in the graph shows the actual data and the red lines exhibitthe exponential fitting curves. ZnO1000, when used for the firsttime, could degrade 99.2% dye, with a very small change (to 99.12%)in the efficiency when used for four times (elaborately shown in theinset). ZnO600 lost their efficiency from 53% to 20% after fourreuses, while the numbers were 78% and 31.4% for P25. Thisdecrease in the efficiency for all the catalysts resulted probablyfrom the photocorrosion effect, which affected ZnO600 and P25to a large extent, whereas ZnO1000 exhibited inertness towardsphotocorrosion and hence comparatively higher stability. Largerphotocorrosion in both the nanoparticles (ZnO600 and P25) may beattributed to comparatively larger surface area and hence highsurface energy unlike ZnO1000. These results are in agreementwith similar studies done on Cu2O; wherein photocorrosion ratewas very rapid in Cu2O nanoparticles as against their micron sizedcounterparts [27]. Furthermore, the XRD data of the reusedZnO1000 was taken (results not shown) and it was seen that therewere no additional phases in the signatures, and the data matchedwith the fresh ZnO1000. This indicated that ZnO1000 did not leachout/corrode after reusing it multiple times.
The half-life of the catalyst was calculated using the decolor-isation efficiency data w.r.t. the number of trials and using theformula mentioned in the above paragraphs (ln(N/N0)¼�Kt). Ineach graphs shown in Fig. 6, the drop in decolorisation efficiencyfrom first (N0) to fourth (t¼4) trial (N) were noted down and decayconstant (K) were found out. Using these K values, the half-lives ofZnO600, P25 and ZnO1000 were calculated and were found to be�3 for both ZnO600 and P25 and was 43000 for ZnO1000. Thisdata also matches well with the observations of Fig. 6, wherein theefficiency is seen to drop to its 50% on 3 trials of reuse of ZnO600 aswell as P25. The drop in efficiency with ZnO1000 is indeed seen tobe very less, which justifies its extremely high reuse.
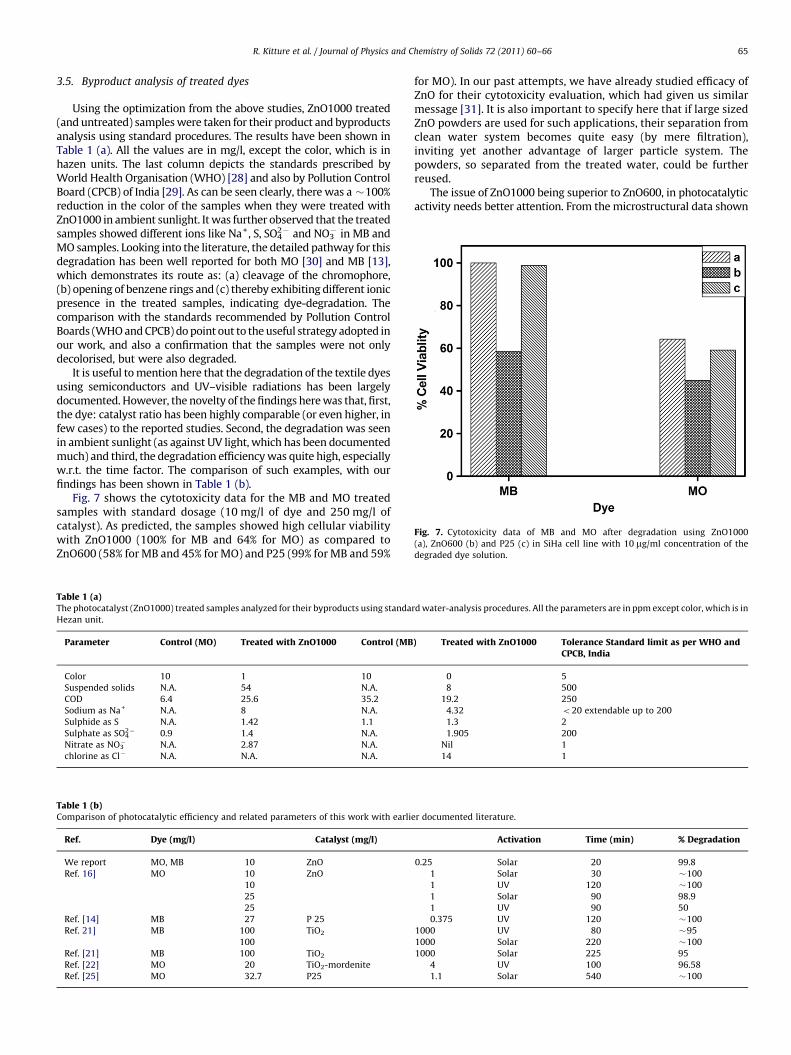
Fig. 7. Cytotoxicity data of MB and MO after degradation using ZnO1000
(a), ZnO600 (b) and P25 (c) in SiHa cell line with 10 mg/ml concentration of the
degraded dye solution.
R. Kitture et al. / Journal of Physics and Chemistry of Solids 72 (2011) 60–66 65
3.5. Byproduct analysis of treated dyes
Using the optimization from the above studies, ZnO1000 treated(and untreated) samples were taken for their product and byproductsanalysis using standard procedures. The results have been shown inTable 1 (a). All the values are in mg/l, except the color, which is inhazen units. The last column depicts the standards prescribed byWorld Health Organisation (WHO) [28] and also by Pollution ControlBoard (CPCB) of India [29]. As can be seen clearly, there was a �100%reduction in the color of the samples when they were treated withZnO1000 in ambient sunlight. It was further observed that the treatedsamples showed different ions like Na+, S, SO4
2� and NO3� in MB and
MO samples. Looking into the literature, the detailed pathway for thisdegradation has been well reported for both MO [30] and MB [13],which demonstrates its route as: (a) cleavage of the chromophore,(b) opening of benzene rings and (c) thereby exhibiting different ionicpresence in the treated samples, indicating dye-degradation. Thecomparison with the standards recommended by Pollution ControlBoards (WHO and CPCB) do point out to the useful strategy adopted inour work, and also a confirmation that the samples were not onlydecolorised, but were also degraded.
It is useful to mention here that the degradation of the textile dyesusing semiconductors and UV–visible radiations has been largelydocumented. However, the novelty of the findings here was that, first,the dye: catalyst ratio has been highly comparable (or even higher, infew cases) to the reported studies. Second, the degradation was seenin ambient sunlight (as against UV light, which has been documentedmuch) and third, the degradation efficiency was quite high, especiallyw.r.t. the time factor. The comparison of such examples, with ourfindings has been shown in Table 1 (b).
Fig. 7 shows the cytotoxicity data for the MB and MO treatedsamples with standard dosage (10 mg/l of dye and 250 mg/l ofcatalyst). As predicted, the samples showed high cellular viabilitywith ZnO1000 (100% for MB and 64% for MO) as compared toZnO600 (58% for MB and 45% for MO) and P25 (99% for MB and 59%
Table 1 (a)The photocatalyst (ZnO1000) treated samples analyzed for their byproducts using standa
Hezan unit.
Parameter Control (MO) Treated with ZnO1000 Control (MB
Color 10 1 10
Suspended solids N.A. 54 N.A.
COD 6.4 25.6 35.2
Sodium as Na+ N.A. 8 N.A.
Sulphide as S N.A. 1.42 1.1
Sulphate as SO42� 0.9 1.4 N.A.
Nitrate as NO3� N.A. 2.87 N.A.
chlorine as Cl� N.A. N.A. N.A.
Table 1 (b)Comparison of photocatalytic efficiency and related parameters of this work with earli
Ref. Dye (mg/l) Catalyst (mg/l)
We report MO, MB 10 ZnO
Ref. 16] MO 10 ZnO
10
25
25
Ref. [14] MB 27 P 25
Ref. 21] MB 100 TiO2
100
Ref. [21] MB 100 TiO2
Ref. [22] MO 20 TiO2-mordenite
Ref. [25] MO 32.7 P25
for MO). In our past attempts, we have already studied efficacy ofZnO for their cytotoxicity evaluation, which had given us similarmessage [31]. It is also important to specify here that if large sizedZnO powders are used for such applications, their separation fromclean water system becomes quite easy (by mere filtration),inviting yet another advantage of larger particle system. Thepowders, so separated from the treated water, could be furtherreused.
The issue of ZnO1000 being superior to ZnO600, in photocatalyticactivity needs better attention. From the microstructural data shown
rd water-analysis procedures. All the parameters are in ppm except color, which is in
) Treated with ZnO1000 Tolerance Standard limit as per WHO andCPCB, India
0 5
8 500
19.2 250
4.32 o20 extendable up to 200
1.3 2
1.905 200
Nil 1
14 1
er documented literature.
Activation Time (min) % Degradation
0.25 Solar 20 99.8
1 Solar 30 �100
1 UV 120 �100
1 Solar 90 98.9
1 UV 90 50
0.375 UV 120 �100
1000 UV 80 �95
1000 Solar 220 �100
1000 Solar 225 95
4 UV 100 96.58
1.1 Solar 540 �100

R. Kitture et al. / Journal of Physics and Chemistry of Solids 72 (2011) 60–6666
by SEM images, as observed, ZnO in its ZnO1000 form shows tetrapod-like structures as compared to the spherical morphologies of ZnO600and P25. The tetrapod-like structures (even rod-like) have beendocumented to exhibit higher photocatalytic activity as comparedto the spherical ones [32–34], which has been attributed to differentcrystal surfaces exposed on the surface and their preferential photo-catalytic responses. Han et al. [32] and Zheng et al. [33] haveattributed higher photocatalytic activities of rod-like structures tothe higher surface states in tetrapod-like surface structures and thedefects in ZnO nanocrystals. Wan et al. [34] have drawn similarinferences from their studies on ZnO nano-tetrapods. Our results,indeed agree with these findings. Zinc oxide, in its pure form has highexcitonic energy, with its spectra showing a characteristic signature at380 nm. It has been observed Singh et al. [35] and by many others[36,37] that a broad green emission is seen around 500 nm, which alsosuperimposes the signature at 380 nm (shown by an arrow in theinset of Fig. 2). Photocatalytic activity of ZnO is attributed both to thedonor states caused by the large number of defect sites such as oxygenvacancies and interstitial zinc atom and to the acceptor states thatarise from zinc vacancies and interstitial oxy gen atoms [38]. Oxygenvacancies located at energy positions 2.35–2.50 eV is responsible forgreen luminescence upon illumination with UV light. Since thesedefect states dominate in our ZnO1000, we do get excellent photo-catalytic dye degradation with these catalysts. ZnO600 (and also P25),on the other hand, show a blue shift in their UV–vis spectra, whichcould make them better candidates for UV-assisted degradation, butnot in the visible range. Indeed, the defect states in ZnO1000 powderscan give much practical solution for industrial dye effluent treat-ments. The efforts are being made to introduce these broad emissioncharacteristics in visible range, in more controlled way.
4. Conclusions
In conclusion, two industrial textile dyes, namely Methylene Blueand Methyl Orange were studied for their photocatalytic decolorisa-tion in ambient solar light using P25 and zinc oxide nanoparticles asphotocatalyst. Polydispersed ZnO nanoparticles with two differentwindows of particle size distributions were synthesized via the citrategel route and different annealing treatments. The XRD data showZnO with typical wrutzite structure, while P25 show combinationof anatase and rutile phases. SEM images show characteristic tetrapod-like structures of ZnO1000 as compared to the spherical structures ofboth ZnO600 and P25. UV–vis absorbance spectra of ZnO1000showed broad absorption range from UV-to-visible, as against sharpabsorption peaks in UV range for both ZnO600 and P25. Annealingtemperature affected the particle size and optical characteristics of thephotocatalysts, to large extent, giving ZnO1000 particle larger in sizeand utilizing broad range of sunlight. These ZnO1000 particles,although not in nanometer range, when used at comparatively lowerdose, were highly efficient in decolorising and degrading the two waterpollutants, MO and MB, as against their nano-sized counterparts, andconventional P25 photocatalyst. The decay analysis hinted on highreuse capability of ZnO1000 particles. The solution degraded usingZnO1000 in sunlight was safe, when checked against the WHO andCPCB standards, and also less toxic. All these results indicate thatZnO1000 can be a better candidate to handle the wastewater issuegently, to harmonize water system to its natural state.
Acknowledgements
The authors acknowledge Dr. S.L. Laware from Department ofBiotechnology, Fergusson College, Dr. Sonali Mokashi from AquatechSolutions, and Dr. S.B. Ogale from National Chemical Laboratory, Pune,India for their support in instrumental facilities.
References
[1] H. Zollinger, Color Chemistry: Synthesis, Properties and Applications ofOrganic Dyes and Pigments, Wiley-VCH publications, 2nd revised Edition,1991.
[2] B. Zargar, H. Parham, A. Hatamie, Chemosphere 76 (2009) 554–557.[3] S.S. Patil, V.M. Shinde, Environ. Sci. Technol. 22 (1988) 1160–1165.[4] A.T. Moore, A. Vira, S. Fogel, Environ. Sci. Technol. 23 (1989) 403–406.[5] Y.M. Slokar, A.M.Le Marechal, Dyes Pigm. 37 (1998) 335–356.[6] R.H. Horning, Text. Chem. Color. 9 (1997) 24–38.[7] U. Pagga, D. Brown, Chemosphere 15 (1986) 479–491.[8] H.H. Yin, J. Wada, T. Kitamura, S. Yanamuda, Environ. Sci. Technol. 35 (2001)
227–231.[9] W. Chen, Z. Wang, Z. Lin, L. Lin, J. Appl. Phys. 82 (1997) 3111–3115.
[10] J.M. Herrmann, Catal. Today 53 (1999) 115–129.[11] J. Sato, H. Kobayashi, X.Y. Inoue, J. Phys. Chem. B. 108 (2004) 4369–4375.[12] H. Tian, J.F. Ma, X. Huang, L. Xie, Z. Zhao, J. Zhou, P. Wu, J. Dai, Z. Zhu, H. Wang,
H. Chen, Mater. Lett. 59 (2005) 3059–3061.[13] A. Houas, H. Lachheb, M. Ksibi, E. Elaloui, C. Guillard, J.M. Herrmann, Appl.
Catal. B: Environ. 31 (2001) 145–157.[14] H. Lachheb, E. Puzenat, A. Houas, M. Ksibi, E. Elaloui, C. Guillard, J.M. Herrmann,
Appl. Catal. B: Environ. 39 (2002) 75–90.[15] C.L. Torres-Martinez, R. Kho, O.L. Mian, R.K. Mehra, J. Colloids Interf. Sci. 240
(2001) 525–532.[16] S.K. Kansal, M. Singh, D. Sud, J. Hazard. Mater. 141 (2007) 581–590.[17] R.P.F. Nogueira, M.R.A. Silva, A.G. Trovo, Sol. Energy 79 (2005) 384–392.[18] L.R. Hou, C.Z. Yuan, Y. Peng, J. Mol. Catal. A: Chem. 252 (2006) 132–135.[19] M. Keshmiri, M. Mohseni, T. Troczynski, Appl. Catal. B: Environ. 53 (2004)
209–219.[20] C. Su, B.Y. Hong, C.M. Tseng, Catal. Today 96 (2004) 119–126.[21] G. Sivalingam, K. Nagaveni, M.S. Hegde, G. Madras, Appl. Catal. B: Environ. 45
(2003) 23–38.[22] F. Li, S. Sun, Y. Jiang, M. Xia, M. Sun, B. Xue, J. Hazard. Mater. 152 (2008)
1037–1044.[23] K. Nagaveni, G. Sivalingam, M.S. Hegde, G. Madras, Appl. Catal. B: Environ 48
(2004) 83–93.[24] Standard methods for examination of waters and wastewaters, American
Public Health Association (APHA), American Water Works Association(AWWA), Water Environment Federation (WEF), 20th edition, Washington1998.
[25] M.N. Rashed, A.A. El-Amin, Int. J. Phys. Sci. 2 (2007) 073–081.[26] R. Ullah, J. Dutta, J. Hazard. Mater. 156 (2008) 194–200.[27] L. Huang, F. Peng, H. Yu, H. Wang, Solid State Sci. 11 (2009) 129–138.[28] A compendium of drinking-water quality standards in eastern Mediterranean
region, Office for the Eastern Mediterranean, Regional Centre for Environ-mental Health Activities CEHA (2006) (weblink: /http://www.emro.who.int/CEHA/newsdetails.asp?id=134S).
[29] Central Pollution Control Boards – Environmental Standards (GSR 801 (E),EPA, (1986); dated Dec. 31, 1993) (weblink: /http://www.cpcb.nic.in/oldwebsite/Environmental%20Standards/Emission/standard32.htmlS, /http://www.indiawaterportal.org/blog/wp-content/uploads/2008/07/is-10500.pdfS).
[30] K. Dai, H. Chen, T. Peng, D. Ke, H. Yi, Chemosphere 69 (2007) 1361–1367.[31] S. Dhobale, T. Thite, S.J. Koppikar, S.L. Laware, R. Kaul-Ghanekar, S.N. Kale,
J. Appl. Phys. 104 (2008) 094907–1–5.[32] X.G. Han, H.Z. He, Q. Kuang, X. Zhou, X.H. Zhang, T. Xu, Z.X. Xie, L.S. Zheng,
J. Phys. Chem. C 113 (2009) 584–589.[33] Y. Zheng, C. Chen, Y. Zhan, X. Lin, Q. Zheng, K. Wei, J. Zhu, Y. Zhu, Inorg. Chem. 46
(2007) 6675–6682.[34] Q. Wan, T.H. Wang, J.C. Zhao, Appl. Phys. Lett. 87 (2005) 083105–083107.[35] S. Singh, P. Thiyagarajan, K. Mohan Kant, D. Anita, S. Thirupathiah, N. Rama,
B. Tiwari, M. Kottaisamy, M.S.R. Rao, J. Phys. D: Appl. Phys. 40 (2007)6312–6327.
[36] Lim, K. Shin, H.W. Kim, C. Lee, J. Lumin. 109 (2004) 181–185.[37] J. Zhang, Z. Zhang, T. Wang, Chem. Mater. 16 (2004) 768–770.[38] F. Tuomisto, K. Saarinen, Phys. Rev. 72 (2005) 085206-1-11.