Case studies on the allocation of transferable quota rights in ...
365
Case studies on the allocation of transferable quota rights in fisheries ISSN 0429-9345 FAO FISHERIES TECHNICAL PAPER 411
-
Upload
khangminh22 -
Category
Documents
-
view
1 -
download
0
Transcript of Case studies on the allocation of transferable quota rights in ...

Case studies on theallocation of transferablequota rights in fisheries
ISSN 0429-9345
FAOFISHERIES
TECHNICALPAPER
411
This report, consisting of 23 studies, describes how the initial allocations of transferable
fishing (effort) or fish (catch) quotas have been done by a variety of fisheries management
regimes. The studies include two from the European Union (the United Kingdom and the
Netherlands), one from Iceland and three descriptions from the Maritimes of Canada. Of the
Canadian studies, that for herring provides an historical account of the introduction of
quotas in the management procedures of the International Commission for the Northwest
Atlantic (ICNAF), the precursor of the Northwest Atlantic Fisheries Organization (NAFO).
Three studies are presented for fisheries along the eastern seaboard of the United States,
though that for red snapper describes a fishery in which the actual implementation of the
programme was thwarted by the imposition of the moratorium on individual transferable
quotas (ITQs). The account for South Africa describes a difficult process in transition for a
specific fishery. Nine accounts are included from Australia, two of which describe fisheries
managed by the Commonwealth Government through the Australian Offshore
Constitutional Settlement (the Northern Prawn Fishery and the fishery for southern bluefin
tuna). The other six accounts of Australian experiences describe lobster fisheries in
Western Australia, South Australia and Tasmania and fisheries for abalone in Western
Australia and Tasmania. Two accounts describe more traditional finfish fisheries, that of the
Southeast Trawl Fishery and the trap and line fisheries in New South Wales. An omnibus
account is given for the allocation process of quotas in New Zealand. In the Western
Pacific, accounts are given for the Pacific halibut and sablefish fisheries in Alaska, the
variety of fisheries in British Columbia including these last two species and the fishery for
Patagonian toothfish in Chile.
Case studies on the allocation of transferable quota rights in fisheries
411FA
O

iii
Keywords: Allocation of Quota, Initial Allocations, Fisheries Management, Property Rights, ITQs,Individual Transferable Quotas, Fisheries Policy, Fishery Access Rights
Distribution:
FAO Regional Fishery OfficersFAO Fisheries DepartmentsFIRM Fisheries Mailing List
Shotton, R. (ed.)Case studies on the allocation of transferable quota rights in fisheries.FAO Fisheries Technical Paper. No. 411. Rome, FAO. 2001. 373p.
ABSTRACT
This report, consisting of 23 studies, describes how the initial allocations of transferable fishing (effort) or fish(catch) quotas have been done by a variety of fisheries management regimes. The studies include two from theEuropean Union (The UK and the Netherlands), Iceland and three descriptions from the Maritimes of Canada. Ofthe Canadian studies, that for herring provides an historical account of the introduction of quotas in themanagement procedures of the International Commission for the Northwest Atlantic (ICNAF), the precursor of theNorthwest Atlantic Fisheries Organization (NAFO). Three studies are presented for fisheries along the easternseaboard of the United States, though that for red snapper describes a fishery in which the actual implementationof the programme was thwarted by the imposition of the moratorium on Individual Transferable Quotas (ITQs).
The account for South Africa describes a difficult process in transition for a specific fishery. Nine accountsare included from Australia, two of which describe fisheries managed by the Commonwealth Government throughthe Australian Offshore Constitutional Settlement (the Northern Prawn Fishery and the fishery for southern bluefintuna). The other six accounts of Australian experiences describe lobsters fisheries in Western Australia, SouthAustralia and Tasmania and fisheries for abalone in Western Australia and Tasmania. Two accounts describe moretraditional finfish fisheries, that of the Southeast Trawl Fishery and the trap and line fisheries in New South Wales.
An omnibus account is given for the allocation process of quotas in New Zealand. In the Western Pacific,accounts are given for the Pacific halibut and sablefish fisheries in Alaska, the variety of fisheries in BritishColumbia including these last two species and the fishery for Patagonian toothfish in Chile. The last accountprovides an historical account of quota allocation in pelagic whaling.

FOREWORD
This FAO Fisheries Technical Paper achieves several objectives. First, it provides a further Case Study ofFisheries Management practices that were started with the publication of papers describing management ofelasmobranch fisheries1. Second, it continues the series of publications on the use of Rights-based FisheriesManagement undertaken by FAO’s Fisheries Department that, together with the publication of this paper’scompanion volume2, will constitute six publications in total3. These reflect the growing importance of this topicto contemporary fisheries management.
The selection of the topic of the allocation of transferable quota-rights in fisheries was not a matter ofhappenstance. In moving towards, or adopting, rights-based management, how quota will be allocated is one ofthe earliest operational decisions that fisheries administrators face and it is inevitably controversial. Certainly,in my experience, it is a question that is upper-most in the minds of those fishermen who will be affected andthus is a major factor in their receptivity to the adoption of rights-based fisheries management approaches.
How quota is allocated has major social and commercial effects through the potential for redistributingwealth, both within the fishing sector and between that sector and society in general. Not surprisingly, fishermenoften view the introduction of Rights-based Management with trepidation, if not hostility. Rightly, they see theirimmediate and longer-term employment at risk, if not personally, then at the level of their community,particularly if new-comers to the fishery are successful in securing significant amounts of catch quota from theinitial holders. Further, it is glaringly obvious to them that the way their quota share is determined will directlyaffect their material prosperity. Even if the catch rights for the major species are appropriate, an unbalancedallocation of bycatch species may close their operations down if, in the future, remaining unfished quota doesnot reflect what is being hauled in over the side.
The danger exists, and experience shows, that a poorly-handled quota-allocation process can result inprotracted hostility towards the management authority, and legal challenges that at a minimum, delay, if notnullify, the benefits to be obtained from the change in management approach. Numerous accounts show thatonce fishermen accept the quota allocation as being fair, or at least discover what they will get from the process,the hitherto opposition to a change in management approach is mollified, or disappears, particularly if thereexists an appeal process that protects their interests or which can be used to their advantage.
Two fundamental reasons provided the stimulus for undertaking this documentation of existing nationalpractices of the allocation of transferable fishing quota. First, there now exists considerable experience in theimplementation of rights-based fisheries management, which had required the devising of principles andprocedures for the allocation of fishing rights that were acceptable, or at least accepted, by the participatingfishermen. Second, in my view, this aspect of fisheries management was poorly documented, though there wereexceptions4. Certainly, how transferable quotas were, and could be, allocated, appears to be little known in thewider fisheries management community. For example, most involved in fisheries management are aware of therights-based fisheries management programmes in New Zealand and Iceland, and perhaps in a few othercountries such as the United States and Canada. But, in my experience, few have heard of, for example, the
v
1 Shotton, R. (Ed.) 1999. Case studies of the management of elasmobranch fisheries. FAO Fish. Tech. Pap. No. 378, Vols 1and 2.
2 Shotton, R. (Ed.) 2001. Case Studies on the Effect of Transferable Quota Rights on Fishing Fleet Capacity andConcentration of Catch-Quota Ownership. FAO Fish. Tech. Pap. No. 412. 238pp.
3 Earlier FAO publications are:Christy, F. 1982. Territorial use rights in marine fisheries: Definitions and Conditions. FAO Fish. Tech. Pap. No 227.FAO 1993. Papers presented at the FAO/Japan 1993. Expert Consultation on the Development of Community-Based
Coastal Fishery Management Systems for Asia and the Pacific. FAO Fish. Rep. No. 474. Suppl. Vol. 1 & 2. FAO, Rome.pp. 689.
Morgan, G.R. 1997. Individual quota management in fisheries. Methodologies for determining catch quotas and initialallocations. FAO Fish. Tech. Pap. No. 371. 41pp.
Shotton, R. 2000 (Ed.). Use of property rights in fisheries management. Proceedings of the FishRights99 Conference,Fremantle, Western Australia. 11-19 November 1999. Vol.1: Mini-course lectures and Core Conference presentations.FAO Fish. Tech. Pap. 404/1 (342pp). Vol 2: Workshop presentations. FAO Fish. Tech. Pap. 404/2 (468pp).
4 See, for one notable case, Kaufmann, B., G. Geen and S. Sen 1999. Fish Futures. Individual Transferable Quotas inFisheries. Fisheries Research and Development Corporation, Australia. 248pp.

rights-based programme in the unique Pilbara trap fishery5 in north-western Australia where the quota rightpertains to the number of days-of-fishing permitted, or of the geoduck fishery6 in British Columbia, where thespecies prosecuted is an enormous sedentary mollusc, which can reach an age of 100 years. Yet these twounusual and interesting fisheries, no less than the many larger and better-known conventional trawl fisheries,had to pass through the process of an initial allocation of quota in the change of their management to a rights-based approach too, in the first case to an input-controlled fishery and in the second case, to one managed withoutput-controls.
Other papers in the compilation deal with rights-allocations that were among the first of such approachesin the management of industrial fisheries, but are now almost forgotten (see the contributions by Derrick Ilesrelating to the ICNAF/NAFO story and by Sidney Holt regarding the IWC). However, some of the almostintractable problems faced in these relatively ancient cases are being re-encountered in contemporary fisheriesmanagement. Sidney Holt, drawing in part on his personal involvement, has provided a fascinating account7 ofhow quotas were allocated in the pelagic whale fishery in the 1960s when the whaling nations finally publiclyaccepted (albeit not soon enough) that open-access whaling was destroying the once-great whale fisheries. Hispaper may provide some prescient experiences if, in the future, high-seas fisheries come under the authority ofmanagement commissions willing and able to implement transferability of quota rights based on market demandand not simply on national interests. This would not be without precedent as the case for the Pribiloff IslandsSeal fishery in the first part of the last century shows.
As Sidney Holt notes8, allocation issues become contentious and difficult when the activities of those withthe smallest allocations are threatened by a reduction in their allocation below the minimum needed to maintaintheir participation in a fishery. In the case of pelagic whaling, there was an economic minimum whale-quotarequired to mount a whaling expedition. In effort-regulated fisheries, such as the Australian Northern PrawnFishery, where the allocation is based on gear dimension units, a minimum number of trawl head-rope lengthunits is required in order to put a single trawl “over the side”. In these cases, the operations of single-boatoperators are vulnerable to management-enforced reductions in TACs or permitted levels of fishing effort, whentheir entitlement falls below the minimum needed to operate when a TAC (or effort-limit equivalent) must bereduced.
Another review of a fishery with an interesting historical perspective is that for the Canadian MaritimesScotia-Fundy herring. Derrick Iles describes a first-hand account of the evolution of access-rights in a processthat started in the 1970s. Contemporary workers take for granted the setting of TACs and the granting of quotasand Iles’ account reminds us that these practices did not spring forth fully-formed, but rather had gestationstempered by international fisheries politics and the pursuit of national interests, often even then recognized asbeing of short-term duration. This story - the allocation of quotas for high seas fisheries - is as yet incomplete,and is one that many, including myself, believe should proceed as quickly as possible.
The perceptive reader will quickly realise from the papers in this collection what a wide range of fisherymanagement situations exist, and the diversity of the approaches in the allocation of quota and in undertakingthe introduction of rights-based management. Correspondingly, there has been an enormous variety in theoperational details that have been embraced. Given the differing commercial, biological, historical, social,political and cultural circumstances among the various fisheries of the world, anything else would be surprising.But, for those looking for solutions to what may seem intractable management problems, the variety of situationsin which the problems of implementing rights-based fisheries have been solved shows that this challenge can bemet with a success that would might otherwise seem astounding.
The uniqueness of the various fisheries situations in which rights-based management has beenimplemented renders attempts at a single nostrum almost certainly dangerous. But, the experiences and lessonslearnt from the various management regimes that have successfully implemented this management approach
vi
5 See Cooper, L. and L. Joll 2000. The Scalefish Fisheries of Northern Western Australia – The Use of Transferable EffortAllocations in the Management of Multi-Species Scalefish Fisheries. pp 445 – 453. In Shotton, R. (Ed.) Use of propertyrights in fisheries management. Proceedings of the FishRights99 Conference. Fremantle, Western Australia, 11 - 19November 1999. Workshop Presentations. FAO. Tech. Rep. No. 404/2, Rome, FAO.
6 See S. Heizer 2000. The Commercial Geoduck (Panopea abrupta) Fishery in British Columbia, Canada – An OperationalPerspective of a Limited Entry Fishery with Individual Quotas. 226 – 233. Ibid.
7 A further bonus of this long paper is its fascinating and detailed account of the political and economic background tomanagement events in this once important international high-seas fishery.
8 Holt, S. 2001. A comment on Tore Schweder’s “Protecting whales by distorting uncertainty: non-precautionarymismanagement”, Fisheries Research, 52(3):227-230.

offers much to the manager who has been given the task of evaluating the options for implementing rights-basedmanagement methods. And, it is the desire to make this variety of experiences easily available that has been amajor motive for me to compile this volume.
The reader may ask how the fisheries described in this Fisheries Technical Paper were selected for analysis,and why not some others. The answer is rather prosaic. While I have made a concerted effort to ensure thatthose management situations were selected that are, in my view, important in regard to their property-rightscharacteristics, equally important has been the availability of authors to undertake the studies and my ability tofind them. Despite my efforts, I am sure that there are fascinating and relevant fishery situations that I have beenunaware of. One such case that I became aware of in the closing stages of the collating this publicationconcerned the South East Trawl Fishery of Australia. Though I was aware of the management of the fishery ingeneral terms, I was unaware of how interesting the introduction of ITQs into the fishery had been until Ichanced upon a paper by Martin Exel and Barry Kaufmann. Rather than ignore this fishery, which I think hasimportant lessons to offer, I elected myself to provide a literature review about it. Readers should thus be warnedof the probable limitations of this particular study despite the kind assistance and comments of several of theAustralians familiar with the story.
From the various accounts, certain aspects of the process of allocating quota-rights in fisheries havesurprised me. In few of the fisheries described in this Paper does it appear that the authorities had clearlyconceived, or documented, strategic objectives, or principles, that should guide the process of allocating fishing-rights. This is not necessarily a criticism, though I believe so doing would have both facilitated the process inmany instances, and mitigated opposition to the management change. What does become apparent from theaccounts is the need that the initial allocation process should satisfy, or at least mollify, the fishermen who clearlyare the protagonists in the process, rather than to institutionalize them as antagonists. Some in management haveviewed it as unimportant how the process of initial allocation is undertaken, or how the principles that guide theprocess are established, as long as the task is achieved (I have been a subscriber to this view). But, it is alsoapparent that dissatisfactions of the fishermen, as clients of the process, may not disappear with the completionof the quota-allocations and implementation of the Rights-based Fisheries Management process, if the processis flawed. And rarely do the circumstances exist (i.e. those governing the re-allocation or sale of rights) wherea Coarsian view of the whole process can be unequivocally adopted. If this collection of case studies contributesto a better understanding of the principles, pitfalls and potential solutions of the process of allocating rights infisheries, then its objectives will have been achieved.
The contributing authors were asked to attempt to follow a common format for their reports so as tofacilitate a comparative analysis of different practices. But, at the same time they were told not to let such arequest constrain how they treated the topic. I noted that I would rather have an appropriate discourse by therespective author(s) that was justified in terms of the unique problems of the fishery they were describing, thanreceive an account that was contrived, or limited, by following too closely my suggested structure. For thisreason, readers must attempt to understand the differing conceptual elements and interpret the individualaccounts in this light.
Once again, I must thank my secretary, Marie-Thérèse Magnan, for her enormous effort in preparing thisPaper for publication, my colleague, Mike Mann, in ensuring that the editorial quality of the papers is again ofthe highest standard and Françoise Schatto, Publication Assistant, Fishery Information, Data and Statistics Unitfor the difficult and unenviable responsibility of transforming the manuscript into the published document. Imust also thank those who have selflessly made photo material available, usually to illustrate a paper that is nottheir own – I believe that such illustrations do much to bring these reports “to life” and emphasize that we arediscussing real-life, and not academic, processes. Credit for the cover design and its preparation goes entirelyto Emanuela D’Antoni of our Service.
Ross ShottonMarine Resources ServiceFAO, Rome.
vii

TABLE OF CONTENTS
The Allocation of Fishing Rights in UK FisheriesA. Hatcher and A. Read . . . . . . . . . . . . . . . . . . . . . . . . . . . . . . . . . . . . . . . . . . . . . . . . . . . . . . . . . . . . . . . . . 1Dutch Demersal North Sea Fisheries: Initial Allocation of Flatfish ITQsW. Smit . . . . . . . . . . . . . . . . . . . . . . . . . . . . . . . . . . . . . . . . . . . . . . . . . . . . . . . . . . . . . . . . . . . . . . . . . . . . . 15Initial Allocation of ITQs in the Icelandic FisheriesB. Runolfsson and R. Arnason . . . . . . . . . . . . . . . . . . . . . . . . . . . . . . . . . . . . . . . . . . . . . . . . . . . . . . . . . . . . 24Allocation of Harvesting Rights in Three Atlantic Canada Marine FisheriesJ. Barrow, G.E. Jefferson, M.D. Eagles and G.J. Stevens . . . . . . . . . . . . . . . . . . . . . . . . . . . . . . . . . . . . . . . . 32The Origin of Sub-Allocation of Fisheries Quota at the International Level The Recent History of the Management of Bay of Fundy HerringT.D. Iles . . . . . . . . . . . . . . . . . . . . . . . . . . . . . . . . . . . . . . . . . . . . . . . . . . . . . . . . . . . . . . . . . . . . . . . . . . . . . 58Initial Allocation of Quota Rights in the Scotia-Fundy Inshore Mobile-Gear Groundfish FisheryD.S.K. Liew . . . . . . . . . . . . . . . . . . . . . . . . . . . . . . . . . . . . . . . . . . . . . . . . . . . . . . . . . . . . . . . . . . . . . . . . . . 75Initial Allocation of Individual Transferable Quotas in the US Surf Clam and Ocean Quahog FisheryB.J. McCay . . . . . . . . . . . . . . . . . . . . . . . . . . . . . . . . . . . . . . . . . . . . . . . . . . . . . . . . . . . . . . . . . . . . . . . . . . 86Initial Allocation of Individual Transferable Quotas in the US Wreckfish FisheryJ.R. Gauvin . . . . . . . . . . . . . . . . . . . . . . . . . . . . . . . . . . . . . . . . . . . . . . . . . . . . . . . . . . . . . . . . . . . . . . . . . . 91Initial Allocation of ITQs in the Gulf of Mexico Red Snapper FisheryW.R. Keithly Jr. . . . . . . . . . . . . . . . . . . . . . . . . . . . . . . . . . . . . . . . . . . . . . . . . . . . . . . . . . . . . . . . . . . . . . . . 99The Allocation of Harvesting Rights in the South Africa Hake FisheryD. W. Japp . . . . . . . . . . . . . . . . . . . . . . . . . . . . . . . . . . . . . . . . . . . . . . . . . . . . . . . . . . . . . . . . . . . . . . . . . . 118Initial Allocation of Harvesting Rights in the Rock Lobster Fishery of Western AustraliaG.R. Morgan . . . . . . . . . . . . . . . . . . . . . . . . . . . . . . . . . . . . . . . . . . . . . . . . . . . . . . . . . . . . . . . . . . . . . . . . . 136Initial Allocation of ITQs in the Western Australia Abalone FisheryR. Metzner, F.M. Crowe and N.J. Borg . . . . . . . . . . . . . . . . . . . . . . . . . . . . . . . . . . . . . . . . . . . . . . . . . . . . . 144Initial Allocation of Harvesting Rights in the Fisheries of South AustraliaG.R. Morgan . . . . . . . . . . . . . . . . . . . . . . . . . . . . . . . . . . . . . . . . . . . . . . . . . . . . . . . . . . . . . . . . . . . . . . . . . 152Initial Allocation of Harvesting Rights in the New South Wales Ocean Trap and Line Fishery,AustraliaA. Goulstone and A. McIlgorm . . . . . . . . . . . . . . . . . . . . . . . . . . . . . . . . . . . . . . . . . . . . . . . . . . . . . . . . . . . 159The Initial Allocation of Individual Transferable Quotas in the Tasmanian Rock Lobster andAbalone FisheriesW. Ford and D. Nicol . . . . . . . . . . . . . . . . . . . . . . . . . . . . . . . . . . . . . . . . . . . . . . . . . . . . . . . . . . . . . . . . . . . 171Initial Allocations of Quota Rights: the Australian Southeast Trawl Fishery StoryR. Shotton . . . . . . . . . . . . . . . . . . . . . . . . . . . . . . . . . . . . . . . . . . . . . . . . . . . . . . . . . . . . . . . . . . . . . . . . . . . 187Initial Allocation of Unitisation (Boat/Engine Units) as Harvesting Rights in Australia’s NorthernPrawn FisheryA.E. Jarrett . . . . . . . . . . . . . . . . . . . . . . . . . . . . . . . . . . . . . . . . . . . . . . . . . . . . . . . . . . . . . . . . . . . . . . . . . . 202The Introduction of Individual Transferable Quotas into the Australian Sector of the SouthernBluefin Tuna FisheryF. Meany . . . . . . . . . . . . . . . . . . . . . . . . . . . . . . . . . . . . . . . . . . . . . . . . . . . . . . . . . . . . . . . . . . . . . . . . . . . . 212Initial Allocation of Individual Transferable Quota in New Zealand FisheriesR. Connor . . . . . . . . . . . . . . . . . . . . . . . . . . . . . . . . . . . . . . . . . . . . . . . . . . . . . . . . . . . . . . . . . . . . . . . . . . . 222Allocation of Individual Vessel Quota in the Alaskan Pacific Halibut and Sablefish Fisheries M. Hartley and M. Fina . . . . . . . . . . . . . . . . . . . . . . . . . . . . . . . . . . . . . . . . . . . . . . . . . . . . . . . . . . . . . . . . 251Initial Allocation of Transferable Fishing Quotas in Canada’s Pacific Marine FisheriesC. Sporer . . . . . . . . . . . . . . . . . . . . . . . . . . . . . . . . . . . . . . . . . . . . . . . . . . . . . . . . . . . . . . . . . . . . . . . . . . . . 266Initial Allocation of Harvesting Rights in the Chilean Fishery for Patagonian ToothfishE. González, R. Norambuena and M. García . . . . . . . . . . . . . . . . . . . . . . . . . . . . . . . . . . . . . . . . . . . . . . . . . 304Sharing the Catches of Whales in the Southern HemisphereS.J. Holt . . . . . . . . . . . . . . . . . . . . . . . . . . . . . . . . . . . . . . . . . . . . . . . . . . . . . . . . . . . . . . . . . . . . . . . . . . . . . 322
ix

THE ALLOCATION OF FISHING RIGHTS IN UK FISHERIES
A. Hatcher* and A. Read*** Centre for the Economics and Management of Aquatic Resources (CEMARE)
University of Portsmouth, Portsmouth PO4 8JF, United Kingdom<[email protected]>
** Danbrit Ship Management Ltd8 Abbey Walk, Grimsby DN31 1NB, United Kingdom
1. INTRODUCTION1.1 The UK fishing industry
The United Kingdom has a long history of fishing, reflecting its position as an island with a relatively longcoastline and its proximity to the productive fishing grounds of the European continental shelf, notably the North Sea,the English Channel and the West of Scotland.
The UK fisheries are heterogeneous and this is reflected in a complex fleet structure. The shape of the modernUK fleet is the product of technological and market changes together with political developments, in particular theloss of access to traditional distant water grounds (particularly Iceland and Greenland) in the 1970s and thedevelopment of the Common Fisheries Policy (CFP) by the European Community (EC - which the UK joined in1972). Under the CFP (see below) there have been national quotas for most stocks since the early 1980s, coupled witha succession of fleet reduction programmes (the so-called MAGPs or multi-annual guidance programmes).
There are currently just over 8000 fishing vessels in the UK, although nearly three-quarters of these are inshoreboats under 10m in length. Table 1 shows the trend in vessel numbers for the period 1994 to 1999 by vessel type (the“sectors” shown correspond to the classification used by the EC for measuring fleet size).
Table 1Number and type of UK fishing vessels 1994-1999
Source: MAFF UK Sea Fisheries Statistics
The contraction of most of the over-10m sector of the fleet in terms of number is not matched by an equivalentdecrease in capacity as vessels have become bigger and more powerful, particularly in the pelagic, beam trawl anddemersal trawl sector. Hatcher and Read (2001) consider the changes in fleet capacity in the context of the UK’sattempts to comply with MAGP targets.
Employment in fishing has declined somewhat during the 1990s from around 21 000 to 18 000 but most of thedecline has been in part-time employment. Full-time employment in fishing has been rather stable in recent years ataround 15 000 positions.
Tables 2 and 3 show the total landings by weight and (nominal) value made by UK vessels during 1993-1999.Cod, haddock and whiting are the main whitefish species for UK vessels and together make up about 45% of totaldemersal landings by weight and 36% by value. Other species landed in large quantities include ling, anglerfish,plaice, sand eels and blue whiting. Although classed as demersal the latter two species are fished by pelagic vesselsand are the only species targeted for reduction to meal. High-value demersal species caught in smaller quantities
1
!"#$%&' ())*' ())+' ()),' ())-' ()).' ()))'
!"#$%&'( )*( )+( ,*( -.( ,/( -)(
0"$1(23$4#( 565( 55/( 56,( 6,7( 657( 66-(
8"1"39$#(23$4#( 6)--( 6,-.( 6-,6( 6-5*( 676*( 657,(
:&;"9<;"29( 7//( 5)+( 55-( 56-( 6*+( 6+5(
=>"##?&9>(1@A&#"( 5/)( 6.-( 5),( 55+( 5-6( 5-7(
=>"##?&9>(?&B"C( 7/,( 5*7( 77.( 7,5( 766( 7/6(
8&92$;2(4$2"3( 67( 65( 6,( 67( 6-( 65(
D2>"39( 7,,( 5)7( /( /( 5( 5(
E;9>@3"(F≤(6/1G( +6.,( )75/( ,)/)( ,-+-( )/5+( ,.5/(
H@2$#( 6/5.*( .6+,( *6+7( +.6/( *5+7( */-,(

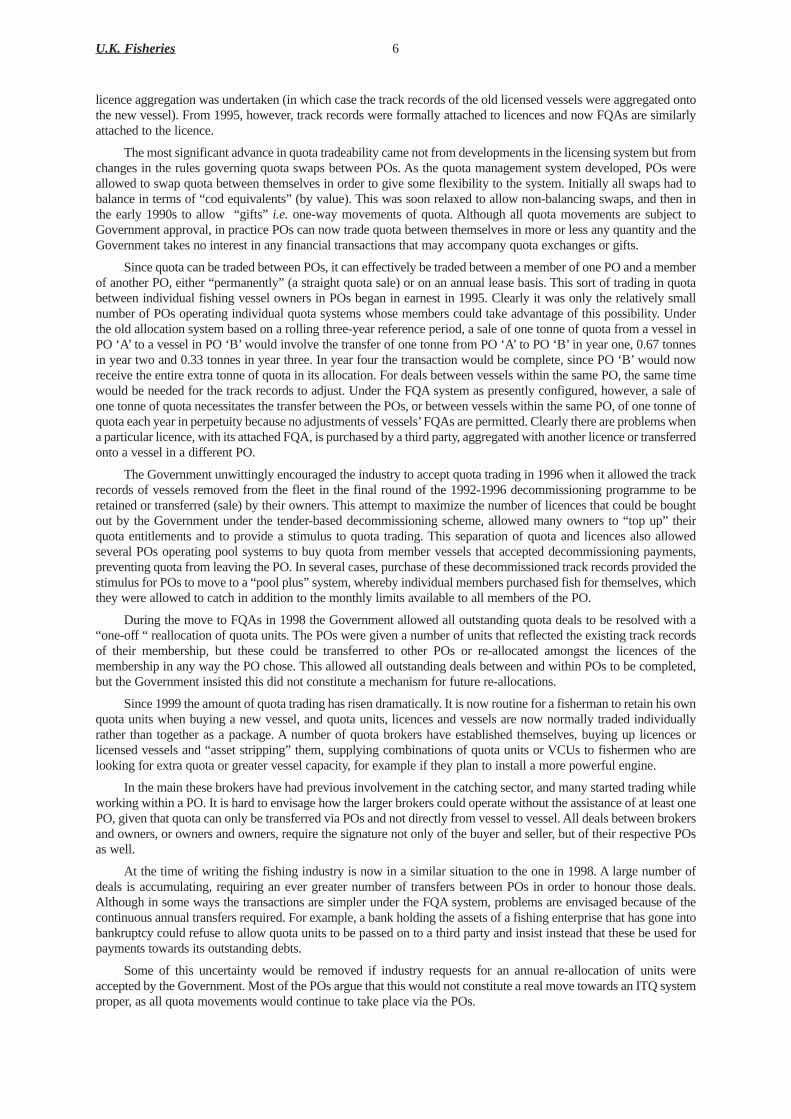
include sole, hake and megrim. Herring and mackerel account for roughly 80% of pelagic landings by weight andvalue. The most important shellfish species are Nephrops (Norway lobsters, or Dublin Bay prawns, or scampi - whichnow rival cod as the most valuable catch), crabs and scallops which together account for nearly three-quarters of thevalue of shellfish landings.
Table 2Volume of landings by UK vessels (‘000 tonnes)
Table 3Value of landings by UK vessels (£ millions nominal)
Source: MAFF UK Sea Fisheries Statistics
An increasing proportion of landings by UK vessels are made into ports in other EC or European Economic Areacountries. In 1997 around half of all catches of herring and mackerel were landed abroad (mainly into Norway andDenmark) as were UK catches of hake (into Spain) and plaice (into the Netherlands).1 Overall some 38% of UKlandings were made into non-UK ports.
Scotland accounts for 70% by weight and 60% by value of UK landings. The majority of the Scottish fleetoperates from the East Coast ports of Fraserburgh, Peterhead and, to a lesser extent, Aberdeen, with the ShetlandIslands an important base for the pelagic fleet. The major activity of the Scottish fleet is demersal trawling for bothwhitefish and Nephrops, and pelagic trawling for species such as herring and mackerel. Scallop dredging is locallyimportant around Southwest Scotland and the Isle of Man. Scottish vessels primarily operate in the Northern NorthSea (ICES area IVa) and the West of Scotland grounds (ICES area VI). There has been considerable development ofthe Scottish fleet during the 1990s with significant investment in new vessels and technology. Major advances thathave had an impact on the efficiency of the fleet are the development of twin-rig and pair trawling.
The rest of the UK fleet is spread throughout England, Wales and Northern Ireland. The Northern Irishcontribution is fairly small, and although locally important, there are only four ports with sizeable landings. Thefishing fleet in Northern Ireland has contracted significantly since the early 1990s with a 27% decrease in vesselnumbers. A similar contraction has been seen elsewhere in the UK. The traditionally important ports of the Humberregion on the Northeast Coast of England have been in steady decline, and although still very important in terms oftrans-shipment and processing, the catching sector is barely represented in the local ports. The Southwest of England,particularly Cornwall, has also seen reduced numbers of vessels during recent years, although the value of landingsremains high in the region.
The fleet is diverse in its characteristics and there are fishing methods that are particular to certain regions. Thepredominant fishing methods in the Southwest are beam trawling in the English Channel for sole and plaice, gillnetting and trawling for high-value demersal species such as hake and megrim, and scallop dredging. The mainmarkets are those of Newlyn, Brixham and Plymouth. Small-scale demersal trawling, gill-netting and crab/lobsterpotting is predominant in the English Channel. The North Sea fisheries of the East Coast include beam trawling forplaice and sole, but the predominant method is demersal trawling for whitefish such as cod and haddock. Also of greatimportance is the North Sea Nephrops fishery, targeted mainly by small-scale demersal trawlers of less than 24m inlength. The important markets are Lowestoft (for beam trawlers), Grimsby, and to a lesser extent Scarborough andWhitby.
U.K. Fisheries 2
' ())/' ())*' ())+' ()),' ())-' ()).'
8"1"39$#( 7,.I5( 7+6I)( 7*)I/( -/+I+( -5)I6( -,)I+(
!"#$%&'( 7.7I*( 7**I.( 7.)I7( 7-7I.( 757I5( 77-I-(
=>"##?&9>( 6/-I)( 66-I-( 65.I,( 6-/I)( 6-5I/( 675I+(
H@2$#( *,+I)( *+-I.( .66I*( *.5I7( *.6I7( .57I*(
' ())/' ())*' ())+' ()),' ())-' ()).'
8"1"39$#( 7,)I-( 7)-I*( 7).I-( 7*7I,( 7)*I,( 7+5I5(
!"#$%&'( ((,)I-( ((,*I-( (()-I7( ((./I/( ((**I-( 667I*(
=>"##?&9>( 667I)( 67*I5( 6,)I-( 6)7I/( 6),I/( 6+,I-(
H@2$#( ,5)I/( ,)6I-( ,./I6( )7)I,( )56I.( ))6I,(
1 In the case of hake and plaice the foreign landings reflect the foreign ownership of a significant part of the UK demersal fleetwhich is facilitated by the terms of EC membership.

1.2 International context and management responsibilities
The United Kingdom is a member of the European Community and its marinefisheries must therefore be managed within the framework of the EC’s CommonFisheries Policy.2 Since 1983 the CFP has provided for the setting of annual totalallowable catches (TACs) for most commercially important stocks within the overallzone of extended fisheries jurisdiction created by the 200-mile limits of those MemberStates bordering the North East Atlantic and adjacent seas. The TACs are divided intonational catch quotas according to an established allocation mechanism that giveseach Member State a fixed percentage share each year (although a number ofintergovernmental quota swaps are regularly and routinely undertaken).
Fishing opportunities in the waters of third countries and in international waters(such as the NAFO area in the North West Atlantic) are negotiated by the EuropeanCommission on behalf of the Community and are allocated to Member States in asimilar way.
While national fleets fishing in Community waters are subject to certaincommon controls under the CFP (in particular technical conservation measures suchas minimum mesh sizes) each Member State is able to determine the means forallocating its quotas to their national fleet and for regulating quota uptake.3 EC rulesnevertheless require all vessels of 10m or over in length to keep a logbook of theiractivities, which must include details of the quantities of TAC species caught andretained on board, and the time and location of capture.4 Inshore vessels less than10m long are not obliged to carry logbooks but Member States are still required tomonitor their landings to ensure that national quota limits are respected.
2. FISHING RIGHTS AND THEIR ALLOCATION2.1 Licensing (access/capacity rights)
In the UK fishing rights are conferred on UK-registered vessels by means of alicensing system. The right to fish is dependent upon possession of a licenceappropriate to the type of vessel and the species targeted. As a general rule,quantitative restrictions on catches are imposed as licence conditions which, in thecase of vessels not in membership of a producers’ organization (see Section 2.2), are varied as necessary (often on amonthly basis). Licences are issued annually by the Government Fisheries Departments5 but licence entitlements canbe transferred between vessels (subject to certain restrictions) and between ownerships.
The licensing scheme has developed considerably in breadth and complexity since 1984 when the number ofover-10m vessels authorized to fish for the most heavily exploited quota stocks was first restricted by means of“pressure stock” licences (Appendix I describes the development of the system in some detail). The current licencestructure limits not only the total number of vessels but also their size and power and the extent to which effort canbe shifted between stocks and between fishing methods.
3 Hatcher & Read
2 The CFP has four principal components: a common structural policy, a common market organization, a resource conservationand management system, and an external policy (concerned with fisheries agreements with third countries). The commonstructural policy and the common organization of the market both date back to 1971 (two years before the UK joined the EEC).In addition to provisions for common structural actions (which include aids for fleet renewal as well as capacity reductionprogrammes) the structural regime lays down certain fundamental conditions for fishing, notably the principle of equal access ofMember State’s fishing fleets to each other’s waters (beyond the six-mile territorial limit). The common market organizationprovides for a system of marketing standards, minimum prices and intervention arrangements (with compensation for productswithdrawn from the market at minimum prices). In 1977 all the EC Member States in concert extended their fishery limits outto 200 miles (except in the Mediterranean). Negotiations then began on a system to regulate catches within Community waters.Because of the difficulty of reaching agreement on national shares of the TAC the “conservation and management” system wasnot finally adopted until 1983.
3 Article 9 of Council Regulation (EEC) No 3760/92 establishing a Community system for fisheries and aquaculture (OfficialJournal of the European Communities, No L 389, 31.12.92, p.1).
4 Article 6 of Council Regulation (EEC) No 2847/93 establishing a control system applicable to the common fisheries policy(Official Journal of the European Communities, No L 261, 20.10.93, p.1).
5 In the UK responsibility for the day-to-day management of fisheries is shared between the Ministry of Agriculture, Fisheries andFood (MAFF - for fisheries in England), the Agriculture and Fisheries Departments of the Scottish Executive, the WelshAssembly, and of Northern Ireland. MAFF, however, remains the “lead” Department and takes overall responsibility for nationalpolicy and international responsibilities.
Scampi(Nephros norvegicus)

Following the revised licence structure introduced in 1995, there are now four main categories of fishing vessellicence. Category “A” licences for over-10m vessels (equivalent to the old “pressure stock” licences) authorize fishingfor all the commercially important stocks subject to quotas under the CFP. Category “B” licences (equivalent to theold “non-pressure stock” licences) authorize fishing by vessels over 10m for a smaller number of quota stocks whichinclude cod and plaice in the Irish Sea, North Sea plaice, Area VI megrim as well as Nephrops in all areas. Category“C” licences (equivalent to the old “miscellaneous species” licences) authorize fishing by vessels over 10m for non-quota species only (principally shellfish). All vessels of 10m or under in length are issued with a special class ofCategory A licence.6
Within these main licence categories there are a number of specific licence types which apply to particularfisheries or which authorize fishing using certain types of vessel or gear. Category A or B beam trawl licences arerequired, for example, for the use of beam trawls by vessels over 10m in the North Sea and in Area VII (the EnglishChannel and Western Waters). Specific licences are also required for the use of scallop dredges. There are also specialCategory A licences for pelagic purse-seiners and freezer-trawlers.
Since 1993, when restrictive licensing was finally extended to all vessels 10m and under, no new licences havebeen issued and new vessels must be licensed by the transfer of an appropriate licence from another vessel, ifnecessary from another ownership. The once complex rules governing the transferability of different types of licence7
were simplified by the introduction of the “capacity unit” system in 1990 (see below) and by the structural changesmade in 1995, since when all licence types have been more or less freely transferable between vessels and betweenownerships.
The capacity unit system introduced in 1990 was designed to control the total capacity of the fleet and to uselicence transfers as an aid to the progressive reduction of capacity required by the Community’s capacity reductionprogrammes (the so-called MAGPs). A number of “vessel capacity units” (VCUs), calculated according to a standardformula based upon the vessel’s size and engine power,8 was allocated to each licensed vessel and specified in itslicence. If a licence was subsequently transferred to another vessel a VCU “penalty” of 10% was incurred. The systemalso allowed licences from a number of vessels to be aggregated onto a larger or more powerful vessel, again with anoverall 10% VCU penalty.9
The capacity penalties and other licence transfer rules have since been altered a number of times. The currentrules may be summarized as follows:
i. in general licences cannot be “upgraded” by transfer or aggregation e.g. ordinary category A demersal specieslicences cannot be transferred onto pelagic vessels, and ordinary pelagic licences cannot be transferred ontopurser or freezer vessels10
ii. a 10% penalty is imposed for all licence transfers (except in the case of 10m and under licences and pelagicpurser/freezer licences)
iii. a 20% penalty is imposed for aggregations of two licences and 30% for aggregations of 3 or more licences(except in the case of purser and freezer licences for which the penalty is 10%)
iv. no licence transfers or aggregations may result in any increase in either total tonnage or engine power11 andv. there is an exemption, subject to certain conditions, for distant water vessels.
The total numbers of the main types of licence issued to vessels in the UK fleet in 1997 and the correspondingVCU totals are shown in Table 4.
U.K. Fisheries 4
6 There are also Category “D” licences which authorise distant-water fishing.7 Numerous rules to restrict transferability of licences between vessels and between ownerships were introduced in the period
1984-1994 in order to regulate pressure on certain fisheries and in addition to control the growth of foreign ownership in theUK fleet.
8 (overall length in metres x maximum breadth in metres) + (engine power in kW x 0.45).9 The principal tool for achieving reductions in the capacity of the UK fleet under the MAGPs, however, was a series of annual
decommissioning schemes from 1993-1997. These were operated on a competitive tender basis, with applicants required tosubmit sealed bids for the amount of Government compensation they would accept in order to scrap their vessel and surrendertheir licence entitlement. The detailed eligibility rules for the decommissioning schemes varied from year to year in order totarget particular fleet sectors, but in general tenders were assessed on the basis of VCUs removed.
10 However, there was a partial suspension of this rule for new pelagic freezer trawlers until 30 June 2001.11 In addition no aggregations of beam trawler licences may result in an engine power in excess of 1500kW and no aggregations
of 10m and under licences may result in a VCU total of over 100.
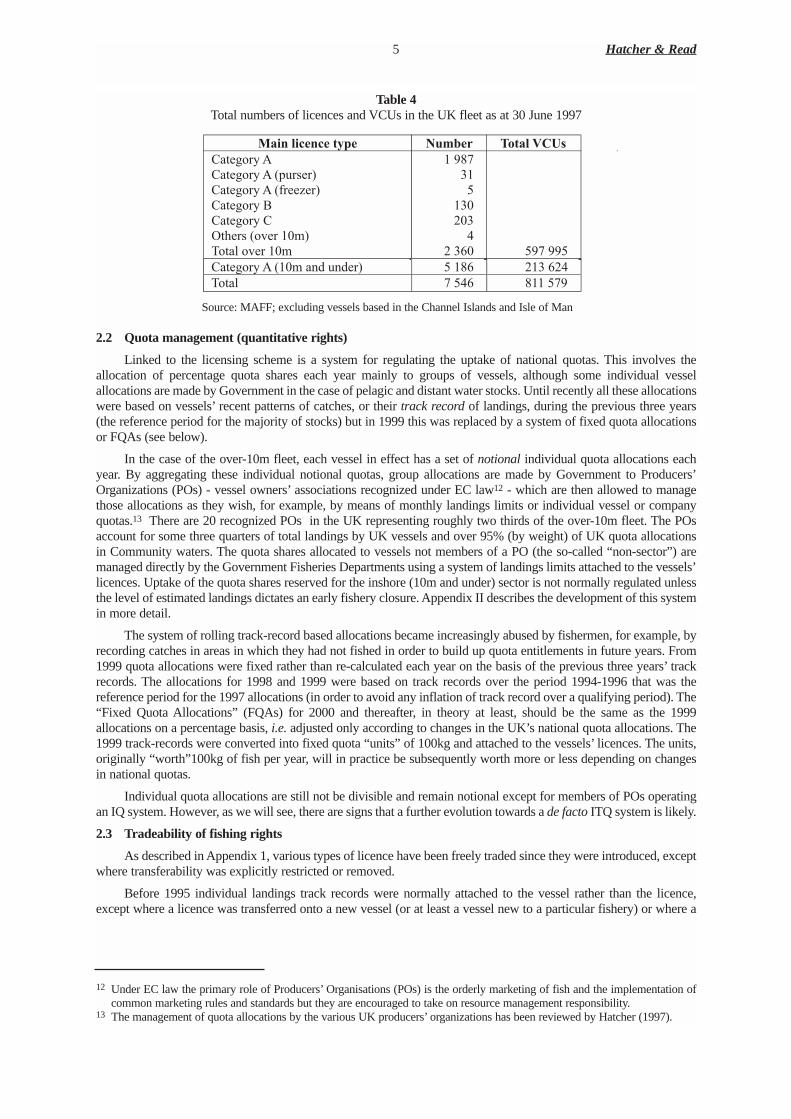
Table 4Total numbers of licences and VCUs in the UK fleet as at 30 June 1997
Source: MAFF; excluding vessels based in the Channel Islands and Isle of Man
2.2 Quota management (quantitative rights)
Linked to the licensing scheme is a system for regulating the uptake of national quotas. This involves theallocation of percentage quota shares each year mainly to groups of vessels, although some individual vesselallocations are made by Government in the case of pelagic and distant water stocks. Until recently all these allocationswere based on vessels’ recent patterns of catches, or their track record of landings, during the previous three years(the reference period for the majority of stocks) but in 1999 this was replaced by a system of fixed quota allocationsor FQAs (see below).
In the case of the over-10m fleet, each vessel in effect has a set of notional individual quota allocations eachyear. By aggregating these individual notional quotas, group allocations are made by Government to Producers’Organizations (POs) - vessel owners’ associations recognized under EC law12 - which are then allowed to managethose allocations as they wish, for example, by means of monthly landings limits or individual vessel or companyquotas.13 There are 20 recognized POs in the UK representing roughly two thirds of the over-10m fleet. The POsaccount for some three quarters of total landings by UK vessels and over 95% (by weight) of UK quota allocationsin Community waters. The quota shares allocated to vessels not members of a PO (the so-called “non-sector”) aremanaged directly by the Government Fisheries Departments using a system of landings limits attached to the vessels’licences. Uptake of the quota shares reserved for the inshore (10m and under) sector is not normally regulated unlessthe level of estimated landings dictates an early fishery closure. Appendix II describes the development of this systemin more detail.
The system of rolling track-record based allocations became increasingly abused by fishermen, for example, byrecording catches in areas in which they had not fished in order to build up quota entitlements in future years. From1999 quota allocations were fixed rather than re-calculated each year on the basis of the previous three years’ trackrecords. The allocations for 1998 and 1999 were based on track records over the period 1994-1996 that was thereference period for the 1997 allocations (in order to avoid any inflation of track record over a qualifying period). The“Fixed Quota Allocations” (FQAs) for 2000 and thereafter, in theory at least, should be the same as the 1999allocations on a percentage basis, i.e. adjusted only according to changes in the UK’s national quota allocations. The1999 track-records were converted into fixed quota “units” of 100kg and attached to the vessels’ licences. The units,originally “worth”100kg of fish per year, will in practice be subsequently worth more or less depending on changesin national quotas.
Individual quota allocations are still not be divisible and remain notional except for members of POs operatingan IQ system. However, as we will see, there are signs that a further evolution towards a de facto ITQ system is likely.
2.3 Tradeability of fishing rights
As described in Appendix 1, various types of licence have been freely traded since they were introduced, exceptwhere transferability was explicitly restricted or removed.
Before 1995 individual landings track records were normally attached to the vessel rather than the licence,except where a licence was transferred onto a new vessel (or at least a vessel new to a particular fishery) or where a
5 Hatcher & Read
0123'42#"3#"'$56"' 789:"&' ;%$14'<=>? 'J$2"%@3K(L(J$2"%@3K(L(FMN39"3G (J$2"%@3K(L(F?3""O"3G (J$2"%@3K(0(J$2"%@3K(J(D2>"39(F@P"3(6/1G(H@2$#(@P"3(6/1(
6(.*+(76(,(
67/(5/7(-(
5(7)/(
((((((
,.+(..,(J$2"%@3K(L(F6/1($;C(N;C"3G ( ,(6*)( 567()5-(H@2$#( +(,-)( *66(,+.(
12 Under EC law the primary role of Producers’ Organisations (POs) is the orderly marketing of fish and the implementation ofcommon marketing rules and standards but they are encouraged to take on resource management responsibility.
13 The management of quota allocations by the various UK producers’ organizations has been reviewed by Hatcher (1997).
licence aggregation was undertaken (in which case the track records of the old licensed vessels were aggregated ontothe new vessel). From 1995, however, track records were formally attached to licences and now FQAs are similarlyattached to the licence.
The most significant advance in quota tradeability came not from developments in the licensing system but fromchanges in the rules governing quota swaps between POs. As the quota management system developed, POs wereallowed to swap quota between themselves in order to give some flexibility to the system. Initially all swaps had tobalance in terms of “cod equivalents” (by value). This was soon relaxed to allow non-balancing swaps, and then inthe early 1990s to allow “gifts” i.e. one-way movements of quota. Although all quota movements are subject toGovernment approval, in practice POs can now trade quota between themselves in more or less any quantity and theGovernment takes no interest in any financial transactions that may accompany quota exchanges or gifts.
Since quota can be traded between POs, it can effectively be traded between a member of one PO and a memberof another PO, either “permanently” (a straight quota sale) or on an annual lease basis. This sort of trading in quotabetween individual fishing vessel owners in POs began in earnest in 1995. Clearly it was only the relatively smallnumber of POs operating individual quota systems whose members could take advantage of this possibility. Underthe old allocation system based on a rolling three-year reference period, a sale of one tonne of quota from a vessel inPO ‘A’ to a vessel in PO ‘B’ would involve the transfer of one tonne from PO ‘A’ to PO ‘B’ in year one, 0.67 tonnesin year two and 0.33 tonnes in year three. In year four the transaction would be complete, since PO ‘B’ would nowreceive the entire extra tonne of quota in its allocation. For deals between vessels within the same PO, the same timewould be needed for the track records to adjust. Under the FQA system as presently configured, however, a sale ofone tonne of quota necessitates the transfer between the POs, or between vessels within the same PO, of one tonne ofquota each year in perpetuity because no adjustments of vessels’FQAs are permitted. Clearly there are problems whena particular licence, with its attached FQA, is purchased by a third party, aggregated with another licence or transferredonto a vessel in a different PO.
The Government unwittingly encouraged the industry to accept quota trading in 1996 when it allowed the trackrecords of vessels removed from the fleet in the final round of the 1992-1996 decommissioning programme to beretained or transferred (sale) by their owners. This attempt to maximize the number of licences that could be boughtout by the Government under the tender-based decommissioning scheme, allowed many owners to “top up” theirquota entitlements and to provide a stimulus to quota trading. This separation of quota and licences also allowedseveral POs operating pool systems to buy quota from member vessels that accepted decommissioning payments,preventing quota from leaving the PO. In several cases, purchase of these decommissioned track records provided thestimulus for POs to move to a “pool plus” system, whereby individual members purchased fish for themselves, whichthey were allowed to catch in addition to the monthly limits available to all members of the PO.
During the move to FQAs in 1998 the Government allowed all outstanding quota deals to be resolved with a“one-off “ reallocation of quota units. The POs were given a number of units that reflected the existing track recordsof their membership, but these could be transferred to other POs or re-allocated amongst the licences of themembership in any way the PO chose. This allowed all outstanding deals between and within POs to be completed,but the Government insisted this did not constitute a mechanism for future re-allocations.
Since 1999 the amount of quota trading has risen dramatically. It is now routine for a fisherman to retain his ownquota units when buying a new vessel, and quota units, licences and vessels are now normally traded individuallyrather than together as a package. A number of quota brokers have established themselves, buying up licences orlicensed vessels and “asset stripping” them, supplying combinations of quota units or VCUs to fishermen who arelooking for extra quota or greater vessel capacity, for example if they plan to install a more powerful engine.
In the main these brokers have had previous involvement in the catching sector, and many started trading whileworking within a PO. It is hard to envisage how the larger brokers could operate without the assistance of at least onePO, given that quota can only be transferred via POs and not directly from vessel to vessel. All deals between brokersand owners, or owners and owners, require the signature not only of the buyer and seller, but of their respective POsas well.
At the time of writing the fishing industry is now in a similar situation to the one in 1998. A large number ofdeals is accumulating, requiring an ever greater number of transfers between POs in order to honour those deals.Although in some ways the transactions are simpler under the FQA system, problems are envisaged because of thecontinuous annual transfers required. For example, a bank holding the assets of a fishing enterprise that has gone intobankruptcy could refuse to allow quota units to be passed on to a third party and insist instead that these be used forpayments towards its outstanding debts.
Some of this uncertainty would be removed if industry requests for an annual re-allocation of units wereaccepted by the Government. Most of the POs argue that this would not constitute a real move towards an ITQ systemproper, as all quota movements would continue to take place via the POs.
U.K. Fisheries 6

A significant feature of the UK quota management system is that it is essentially an informal arrangementbetween Government and industry. Legislation provides for the issuing of fishing licences and for the attachment ofcertain conditions to those licences including quantitative restrictions on landings. There is no legal basis for thenotional individual quota allocations which are used to calculate group allocations, they are merely an administrativetool used by the Government Fisheries Departments in the exercise of the Government’s discretionary right to issuelicences in order to regulate sea fishing. Fishermen have no legal right to receive a licence and certainly no legal titleto any share of national quotas. The Government also retains the right to create additional quota units at its discretion.Thus although quota units are traded as very valuable assets, their legal status appears extremely weak. A legal testhas yet to arise, but the only argument in law for a fisherman’s right to quota might derive from the notion of“legitimate expectations” in common law.
2.4 Enforcement issues
Enforcement of fishery regulations is the job of the Sea Fisheries Inspectorates of MAFF (in England andWales), the Scottish Fisheries Protection Agency (SFPA) and the Department of Agriculture for Northern Ireland(DANI). For England and Wales enforcement at sea is undertaken by the Royal Navy, while the SFPA has its ownvessels and aircraft, and DANI has one patrol vessel.
There is no specific offence of landing over-quota fish, but there are offences relating to non-compliance withlicence conditions and to the inaccurate completion of vessel logbooks and landings declarations. Vessels notbelonging to a PO commit an offence if they land more than the quantity specified in their licence within a givenmonth. Clearly accurate recording of landings in excess of those permitted would be picked up directly by theFisheries Departments and sanctions could then readily be imposed. In practice therefore vessels landing in excess oftheir quota allocations are likely to falsify the required documentation.
No such licence offence can apply to PO members since their licences contain no specific landings restrictions.The POs are all either registered mutual societies or companies and their quota management rules are thereforeprivately rather than publicly enforceable. In theory a PO could request that the Government take action againstpersistent offenders, for example by revoking their licences, but in practice the Government would be extremelyreluctant to become involved in the legal disputes that would undoubtedly follow. If PO members exceed theirrestrictions or allocations they are merely infringing the private rules of their PO.14 In practice violations by POmembers are likely to be hidden from both the Sea Fisheries Inspectorate and the POs’ own officers by falsifyinglandings declarations, which are monitored by the POs as well as by the Fisheries Departments.
Within the POs a number of penalties may be applied to members who are observed to exceed their quotaallocations. In some POs the member is fined the entire value of the excess catch, the money levied being used tooffset the POs normal running costs. Other POs may either insist that an individual retrospectively rents additionalquota to cover his overshoot, or they will rent in the additional quota required to cover the excess landings themselves,and pass the rental charges onto the member.
The amount of inter-PO quota trading that now takes place means that it is now rare for a PO to finish the yearwith a recorded overshoot of any particular quota. If the overshoot is deemed by the Government to have preventedother POs from landing fish they were entitled to, however, penalties do exist. Under the current rules the PO that hasovershot its allocation will have the equivalent amount of quota deducted form its allocation in the following year,and this will be distributed to those POs who had been prevented from taking their allocation.15
3. INDUSTRY VIEWS
The acceleration in quota trading has received a mixed reception within the fishing industry. The UK FisheriesMinister acknowledged in 1999 that the total value of quota units attached to licences during the move to FQAs“exceeded £1 billion” and those able to realize the value of their quota naturally wish to retain their rights to it. Byway of contrast, fishermen who largely fished for non-quota species during the final quota reference period of1994-96, new entrants and vessel owners who for some reason lost fishing time in this period see the permanent lossof quota as unfair and discriminatory.
The rise of the quota brokers and so-called “armchair fishermen” has further angered certain sections of thefishing industry. The latter are a significant number of skippers, some but not all close to retirement age, who haverealized that they can live off the income generated by leasing out their quota entitlements to other fishermen.Although this may have helped towards the overall reduction in the number of active vessels in the fleet, and allowed
7 Hatcher & Read
14 There have been occasions where POs have resorted to Court injunctions against recalcitrant members.15 A similar mechanism exists within the EU, when a Member State is recorded as having taken more than its share of the national
quota in any particular year.
more of the remaining vessels to land all or a greater part of their catch legally, there is also considerable resentmentamong fishermen who did not receive such a valuable endowment and who are now forced to rent quota fromfishermen who no longer go to sea.
There is support for some means of limiting the amount of quota that can be held by brokers or “armchairfishermen”, allowing only a certain percentage of quota to be leased out, the rest either having to be caught or forfeitedto the Government.
A further complication is that an increasing number of local councils are assisting their local fishermen bypurchasing quota, which is then leased below the market rate. In addition a small but growing number of fishermenare using personal pension plans to invest in quota units, which are then leased out to their own or to other vessels. Insome cases the cost of leasing is actually charged to the vessel, meaning that the crew, who work on a self-employedbasis, are forced to pay their share of the rental costs to the owner.
4. FUTURE DEVELOPMENTS
Although ITQs do not officially exist in the UK, and in spite of opposition to the notion of tradeable quotas frommany within the UK fishing industry, the de facto ITQ system that has arisen over the last few years is expected withinthe industry to continue to develop and spread in the future.
The POs are likely to continue toargue strongly that they have a centralrole to play in quota management, but ithas become apparent since 1998 that amajority of vessel owners within the POsfavour moves to make quota trading bothsimpler and more widespread.
Following representations by theindustry at a Quota ManagementWorking Group established early in2000, a review of the effects of the moveto FQAs has been brought forward from2001 to the autumn of 2000. This ispartly in response to a majority viewwithin the industry in favour of an annualre-allocation of quota units, similar to theone-off exercise in 1998.
The Government seems more reluctant than many within the industry to accelerate the move to what someare calling “Transferable FQAs” but appears to accept that further reallocations that reflect quota trade are nowinevitable.
The support for greater freedom of trade is, however, subject to several caveats. Concerns about the role ofbrokers and traders, as well as “armchair fishermen”, has led to calls from many within the industry for a cap on thevolume of trade that any individual PO can enter into. The UK Association of Fish Producer Organizations hasrequested a cap on the trade of unattributed quota units within POs (held on so-called “dummy vessels”) with a limiton the proportion of any stock that can be transferred. The aim of this would be to ensure that only fishermen with agenuine interest in catching fish could engage in trade, and that this trade would reflect the requirements of vesselsfor fish, which in turn reflected the availability of fish on the grounds that the different vessels worked on. However,such regulations will probably serve to do little other than create a “paper trail” of ownership, and do little to curtailthe current trade that is taking place.
A further development that is expected will be to allow vessels under 10m to engage in quota trading in theirown right. Difficulties in the over-10m sector, allied with much cheaper licence availability within the under 10mfleet, has seen an explosion in under-10m “rule beaters” within the last 2 years. These vessels often have a catchingcapacity as great as much larger vessels within PO memberships, and the increased landings they have achieved havehad a marked effect on the availability of quota. In the autumn of 1999, for the first time, a monthly limit wasintroduced for under-10m vessels in the North Sea Nephrops fishery, and such limits are seen as inevitable in otherinshore fisheries in future.
The introduction of limits for these vessels has been accompanied by a realization that the larger “rule beaters”should be able to obtain the additional quotas that they require to remain profitable. As a result it appears likely thatunder-10m vessels will be able to join POs and purchase additional quota. As quota units can only be purchased from
U.K. Fisheries 8
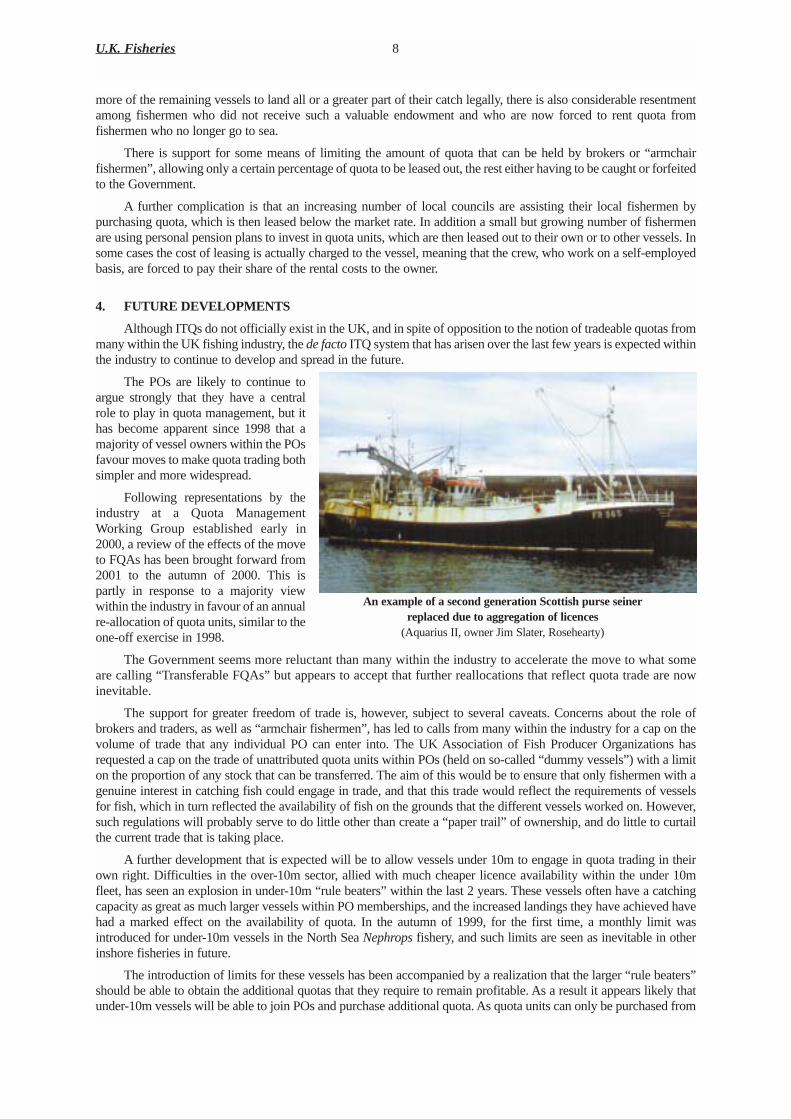
An example of a second generation Scottish purse seinerreplaced due to aggregation of licences
(Aquarius II, owner Jim Slater, Rosehearty)

vessels over 10m, it appears likely that vessels under 10m will be able to increase their overall share of a stock, whilstat the same time being forced to “ring fence” this within a PO, as individual vessels under 10m are not presently ableto have quota units attached to their licences.
The implications for control and enforcement, however, have yet to be fully discussed. While the Governmentmay welcome in theory the idea of allowing smaller vessels to obtain the extra quota they require on the open market,the difficulties and cost of extending full monitoring and enforcement effort to the whole of the inshore fleet may beprohibitive.
5. CONCLUDING REMARKS
The experience of the UK’s quota management system provides an interesting case study of the development oftradeable fishing rights largely driven by the industry itself. Despite occasional policy “visions” the UK Governmenthas arguably been predominantly reactive to industry initiatives and demands. There is clear and persuasive evidencehere of a latent desire to trade quota, which is expressed once some form of property rights, however incompletelydefined, are introduced into a fishery.
The story is not yet complete, though, and expectations within the industry that some form of ITQ system properis now inevitable are probably justified. On the other hand it is considered unlikely within the industry that theGovernment will give up its right, for example, to create extra quota units for vessels remaining outside the system,or that the POs will not retain their existing pivotal role in quota management.
At the time of writing a joint Government-industry working group is meeting and a review of the managementsystem and feasibility study into an ITQ system are shortly to be commissioned by the Government.
Whichever way the quota management system develops in the future, it is worth noting that the Government hasnever attempted to extract any resource rent from the industry through quota or licence fees, nor indeed to recoup anyof its management costs through charges. It has so far allowed all the returns from sales of licences and quota (initiallyfreely given by the Government) to remain in private hands (see Hatcher and Pascoe 1998). This attitude may changeif the costs of management increase significantly or if quota prices increase in a more organized and efficient marketenvironment.
6. LITERATURE CITED
Hatcher, A.C. and S. Pascoe 1998. Charging the UK Fishing Industry, Report to the Ministry of Agriculture, Fisheriesand Food. CEMARE Report No. 49. University of Portsmouth.
Hatcher, A. and A. Read 2001. Fishing rights and structural changes in the UK fishing industry. FAO Fish. Tech. PaperNo. 412. pp 1-14.
Hatcher, A. 1997. Producers’ organizations and devolved fisheries management in the United Kingdom: collectiveand individual quota systems. Marine Policy 21 (6) pp 519-534.
9 Hatcher & Read

Appendix IDevelopment of the UK licensing system
Before 1983 fishing licences were a requirement for UK vessels operating in the main pelagic fisheries(mackerel and herring) and demersal fisheries (cod, haddock, whiting, sole and plaice) in all areas around the UK.However, in most cases they were only required by vessels of 40ft or over in length, and with the exception of licencesfor the large pelagic purse- and freezer vessels, they were quite freely available.
During 1983 licensing was extended to cover fishing for all the stocks subject to catch quotas (under theCommunity’s new conservation and management system) by all vessels over 10m in length. To begin with, mostlicences continued to be freely available, but in 1984 the number of licences authorizing fishing for those quota stocksconsidered to be under greatest pressure was restricted. The so-called “pressure stock licences” (PSLs) were onlyissued to registered vessels which could demonstrate at least a 12-month record of fishing for one or more of thestocks concerned,16 or which already held an appropriate licence. Although restricted in number, pressure stocklicences were transferable. They could only be transferred between ownerships while they remained attached to avessel, but within the same ownership they could be transferred from one vessel to another, the only restrictioninitially put in place being that licence transfers from vessels under 40ft to those of 40ft and over were not permitted.
For those vessels targeting other quota stocks, the required “non-pressure stock licences” (non-PSLs) continuedto be issued freely to any fishing vessel on the UK register,17 while vessels under 10m in length were still not requiredto have a licence.
The licensing scheme as it was introduced in 1984 was originally intended to run for a period of three years.However, because of the free availability of non-PSLs and the ease with which PSLs could be transferred to morepowerful vessels (as well as the complete lack of control of the under-10m sector) the overall size and capacity of theUK fleet was allowed to expand. For this reason, a series of additional restrictions on the availability andtransferability of licences were introduced during the next few years. These developments are summarized in Table 5.Certain restrictions were designed in particular to try and control the expansion of the beam trawler sector fishing forsole and plaice in Area VII (the Channel and Western waters) and to impede the acquisition of licences by non-UK(predominantly Spanish) interests.18
In 1988, pending the implementation of new measures to reduce capacity (and with no decommissioning schemein operation at the time), a temporary ban was placed on all transfers of licences between vessels except in cases wherethere was no resultant increase in either tonnage or engine power. Then in 1989 the Government indicated that itintended to employ a market-oriented approach, specifically by introducing flexible licence transfer arrangementswhich would also allow some measure of licence aggregation in order to “allow the fleet to modernize and adapt to
U.K. Fisheries 10
16 The “pressure stocks” originally designated in 1984 were as follows (species/area):herring all quota stocks cod all except VII & VIIImackerel all quota stocks haddock all except VII & VIIIsaithe all quota stocks whiting IIa, IV, Vb, VIanglerfish all quota stocks plaice Vb, VI, VIIdefghake IIa, IV sole VIIadefg
The following stocks were also designated pressure stocks from 1986:hake Vb, VI & VII cod VIIb-k, VIII, IX, Xsole IIa, IV haddock VII, VIII, IX, Xmegrim VII
17 From 1986, the list of “non-pressure stocks” was as follows:plaice IIa, IV, VIIahjk cod VIIasole VI, VIIhjk megrim Vb, VIwhiting VII sprat VIIdepollack Vb, VI, VII nephrops Vb, VI, VII
18 In order to try and foil attempts by Spanish interests to gain access to various UK quotas in Area VII, the Governmentaccompanied a restriction on the issue of non-PSLs in 1987 with a ban on transfers between ownerships. In addition, in theprevious year a number of key stocks (including hake and megrim in Area VII) had been added to the list of pressure stocks (seenote 1). Vessels with non-PSLs having a record of fishing for the new pressure stocks were issued with special “limited pressurestock licences” which were also non-transferable between ownerships.

changing conditions and to permit individuals to expand their enterprises while preventing any growth in the licensedfleet as a whole”19.
In the following year licence requirements were extended to include fishing for all species in all areas by allvessels over 10m and a new “miscellaneous species” licence was introduced for those over-10m vessels (mainlyshellfish boats) which had not previously required a licence. As all licences were now restricted, the free availabilityof non-pressure stock licences for vessels under 40ft and of licences for Nephrops was ended.
At the same time, transfers of licences between vessels were once again permitted under a new system of “vesselcapacity units” (VCUs). Each licence was assigned a certain number of VCUs, calculated for the vessel to which thelicence was attached according to a formula taking into account vessel size and power20. Licence transfers were nowallowed more or less freely, provided that there was no increase in either gross vessel tonnage or engine power, or thatthere was a 10% decrease in VCUs for the recipient vessel. In addition, under the new “capacity aggregation” scheme,two or more licences (which had to be of a similar type) could be transferred onto a single larger or more powerfulvessel provided that the capacity of that vessel measured in VCUs was no more than 90% of the combined capacityof the “donor” vessels21.
Since 1990 the VCU “penalties” for licence transfers and aggregations have been altered a number of times,while additional restrictions have again been introduced in an attempt to make some progress towards meeting theUK’s MAGP targets for tonnage and engine power. In particular, the inshore (10m and under) sector was finallyrestricted in 1993 and in the previous year the number of beam trawlers licensed to fish in the North Sea (Area IV)was restricted (partly because of licence acquisitions by Dutch interests wishing to gain access to UK North Sea soleand plaice quotas).
In February 1996 it was announced that in addition to the existing VCU penalties, no licence transfers oraggregations would now be allowed to result in any increase in either tonnage or engine power. On the other hand,since an overall revision of the licensing system in 1995 all licences were by now fully transferable independently ofvessels.
11 Hatcher & Read
19 MAFF News Release 445/89, 13 November 1989.20 (overall length in metres x maximum breadth in metres) + (engine power in kW x 0.45).21 For the purposes of capacity aggregation the rule that a licence could only be transferred between ownerships while attached to
a vessel was relaxed, so that licences from vessels in different ownerships could be aggregated onto another vessel, providedthat the owners of the “donor” vessels were at least part-owners of the “recipient” vessel.
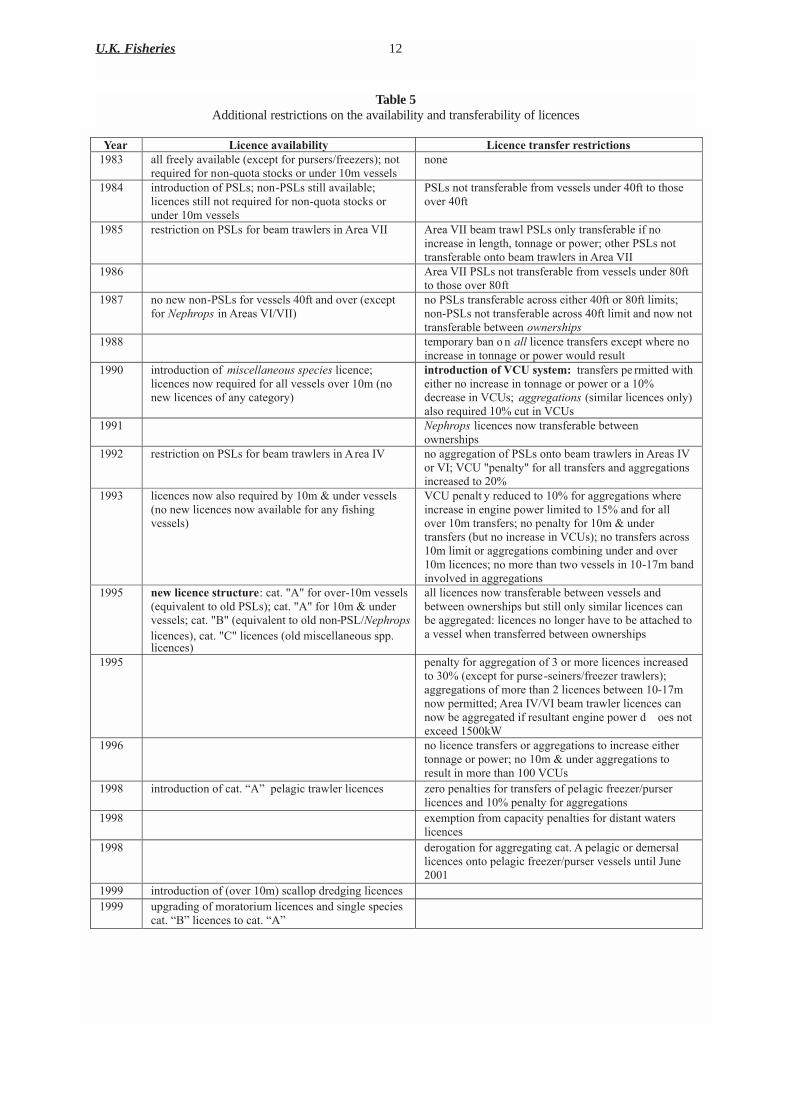
Table 5Additional restrictions on the availability and transferability of licences
U.K. Fisheries 12
@"1& ' A2#"3#"'1B1241:242$5' A2#"3#"'$&13?C"&'&"?$&2#$2%3?'6.*7( $##(?3""#K($P$&#$A#"(F"B'"M2(?@3(MN39"39<?3""O"39GQ(;@2(
3"RN&3"C(?@3(;@;SRN@2$(92@'T9(@3(N;C"3(6/1(P"99"#9(;@;"(
6.*-( &;23@CN'2&@;(@?(!=:9Q(;@;S!=:9(92&##($P$&#$A#"Q(#&'";'"9(92&##(;@2(3"RN&3"C(?@3(;@;SRN@2$(92@'T9(@3(N;C"3(6/1(P"99"#9(
!=:9(;@2(23$;9?"3$A#"(?3@1(P"99"#9(N;C"3(-/?2(2@(2>@9"(@P"3(-/?2(
6.*,( 3"923&'2&@;(@;(!=:9(?@3(A"$1(23$4#"39(&;(L3"$(UEE ( L3"$(UEE(A"$1(23$4#(!=:9(@;#K(23$;9?"3$A#"(&?(;@(&;'3"$9"(&;(#";%2>V(2@;;$%"(@3(M@4"3Q(@2>"3(!=:9(;@2(23$;9?"3$A#"(@;2@(A"$1(23$4#"39(&;(L3"$(UEE (
6.*)( ((
L3"$(UEE(!=:9(;@2(23$;9?"3$A#"(?3@1(P"99"#9(N;C"3(*/?2(2@(2>@9"(@P"3(*/?2(
6.*+( ;@(;"4(;@;S!=:9(?@3(P"99"#9(-/?2($;C(@P"3(F"B'"M2(?@3(!"#$%&#'(&;(L3"$9(UE<UEEG (
;@(!=:9(23$;9?"3$A#"($'3@99("&2>"3(-/?2(@3(*/?2(#&1&29Q(;@;S!=:9(;@2(23$;9?"3$A#"($'3@99(-/?2(#&1&2($;C(;@4(;@2(23$;9?"3$A#"(A"24"";(&()"%'$*#'(
6.**( ((
2"1M@3$3K(A$;(@ ;(+,,(#&'";'"(23$;9?"39("B'"M2(4>"3"(;@(&;'3"$9"(&;(2@;;$%"(@3(M@4"3(4@N#C(3"9N#2 (
6../( &;23@CN'2&@;(@?(-*'.",,+)"&/'0'#".*"'(#&'";'"Q(#&'";'"9(;@4(3"RN&3"C(?@3($##(P"99"#9(@P"3(6/1(F;@(;"4(#&'";'"9(@?($;K('$2"%@3KG (
23$&%D8#$2%3'%C'<=>'?5?$"9E (23$;9?"39(M" 31&22"C(4&2>("&2>"3(;@(&;'3"$9"(&;(2@;;$%"(@3(M@4"3(@3($(6/W(C"'3"$9"(&;(UJX9Q(+11%"1+2*&)'(F9&1&#$3(#&'";'"9(@;#KG($#9@(3"RN&3"C(6/W('N2(&;(UJX9(
6..6( ((
!"#$%&#'(#&'";'"9(;@4(23$;9?"3$A#"(A"24"";(@4;"39>&M9(
6..5( 3"923&'2&@;(@;(!=:9(?@3(A"$1(23$4#"39(&;(L3"$(EU( ;@($%%3"%$2&@;(@?(!=:9(@;2@(A"$1(23$4#"39(&;(L3"$9(EU(@3(UEQ(UJX(YM";$#2KY(?@3($##(23$;9?"39($;C($%%3"%$2&@;9(&;'3"$9"C(2@(5/W(
6..7( #&'";'"9(;@4($#9@(3"RN&3"C(AK(6/1(Z(N;C"3(P"99"#9(F;@(;"4(#&'";'"9(;@4($P$&#$A#"(?@3($;K(?&9>&;%(P"99"#9G(
UJX(M";$#2 K(3"CN'"C(2@(6/W(?@3($%%3"%$2&@;9(4>"3"(&;'3"$9"(&;(";%&;"(M@4"3(#&1&2"C(2@(6,W($;C(?@3($##(@P"3(6/1(23$;9?"39Q(;@(M";$#2K(?@3(6/1(Z(N;C"3(23$;9?"39(FAN2(;@(&;'3"$9"(&;(UJX9GQ(;@(23$;9?"39($'3@99(6/1(#&1&2(@3($%%3"%$2&@;9('@1A&;&;%(N;C"3($;C(@P"3(6/1(#&'";'"9Q(;@(1@3"(2>$;(24@(P"99"#9(&;(6/S6+1(A$;C(&;P@#P"C(&;($%%3"%$2&@;9(
6..,( 3"F'42#"3#"'?$&8#$8&"[('$2I(YLY(?@3(@P"3S6/1(P"99"#9((F"RN&P$#";2(2@(@#C(!=:9GQ('$2I(YLY(?@3(6/1(Z(N;C"3((P"99"#9Q('$2I(Y0Y(F"RN&P$#";2(2@(@#C(;@;(!=:<!"#$%&#'S(#&'";'"9GV('$2I(YJY(#&'";'"9(F@#C(1&9'"##$;"@N9(9MMI#&'";'"9G (
$##(#&'";'"9(;@4(23$;9?"3$A#"(A"24"";(P"99"#9($;C(A"24"";(@4;"39>&M9(AN2(92&##(@;#K(9&1&#$3(#&'";'"9('$;(A"($%%3"%$2"C[(#&'";'"9(;@(#@;%"3(>$P"(2@(A"($22$'>"C(2@($(P"99"#(4>";(23$;9?"33"C(A"24"";(@4;"39>&M9 (
6..,( ( M";$#2K(?@3($%%3"%$2&@;(@?(7(@3(1@3"(#&'";'"9(&;'3"$9"C(2@(7/W(F"B'"M2(?@3(MN39"S9"&;"39<?3""O"3(23$4#"39GQ($%%3"%$2&@;9(@?(1@3"(2>$;(5(#&'";'"9(A"24"";(6/S6+1(;@4(M"31&22"CQ(L3"$(EU<UE(A"$1(23$4#"3(#&'";'"9('$;(;@4(A"($%%3"%$2"C(&?(3"9N#2$;2(";%&;"(M@4"3(C @"9(;@2("B'""C(6,//T\(
6..)( ((
;@(#&'";'"(23$;9?"39(@3($%%3"%$2&@;9(2@(&;'3"$9"("&2>"3(2@;;$%"(@3(M@4"3Q(;@(6/1(Z(N;C"3($%%3"%$2&@;9(2@(3"9N#2(&;(1@3"(2>$;(6//(UJX9(
6..*( &;23@CN'2&@;(@?('$2I(]L^((M"#$%&'(23$4#"3(#&'";'"9 ( O"3@(M";$#2&"9(?@3(23$;9?"39(@?(M"#$%&'(?3""O"3<MN39"3(#&'";'"9($;C(6/W(M";$#2K(?@3($%%3"%$2&@;9 (
6..*( ((
"B"1M2&@;(?3@1('$M$'&2K(M";$#2&"9(?@3(C&92$;2(4$2"39(#&'";'"9(
6..*( ((
C"3@%$2&@;(?@3($%%3"%$2&;%('$2I(L(M"#$%&'(@3(C"1"39$#(#&'";'"9(@;2@(M"#$%&'(?3""O"3<MN39"3(P"99"#9(N;2&#(_N;"(5//6(
6...( &;23@CN'2&@;(@?(F@P"3(6/1G(9'$##@M(C3"C%&;%(#&'";'"9( (6...( NM%3$C&;%(@?(1@3$2@3&N1(#&'";'"9($;C(9&;%#"(9M"'&"9(
'$2I(]0^(#&'";'"9(2@('$2I(]L^(((

Appendix IIDevelopment of the UK “sectoral” quota management system
When the TAC/quota component of the CFP was put into place in 1983, the UK Government had alreadyinstituted quota management arrangements for a number of fish stocks for which national quotas had previously beenagreed in the North East Atlantic Fisheries Commission (NEAFC). UK vessels fishing for the Western mackerel stockand for the main herring stocks, for example, were subject to weekly or fortnightly landings limits set according tovessel length, while daily or weekly limits had from time to time been applied for cod, haddock and whiting stocksin ICES Areas IV and VI (set according to crew size). In addition, since 1980 separate allocations from the quotas formackerel and the main herring stocks had been reserved for the relatively small pelagic freezer trawler sector. Thesevessels, together with the purse-seiners, were the only UK fleet sectors to come under restrictive licensing before1984.
In 1983 a much wider range of stocks became subject to quotas. As fishing effort increased over the next fewyears from an industry which was still expanding in domestic waters, particularly in the Area VII demersal fisheries,weekly (later monthly) landings limits were gradually extended to cover fishing for quota stocks by all vessels over10m in length. Early in 1984, however, the Shetland Fish Producers’ Organization (SFPO), one of 14 POs thenestablished in the UK, successfully applied to the Government to be given its own annual allocations from the AreaIV and VI haddock quotas to manage on behalf of its members. These allocations were based on the historic share ofthe UK’s haddock catches landed by SFPO members. Later that year a number of other POs (as well as a few largefishing firms) were given allocations from the Area IV and VI cod quotas on a similar basis, while in 1985 annualquotas were allocated to POs for Area IV/VI cod, haddock, whiting and saithe as well as Area IV herring. By thefollowing year, most of the POs whose members were active in the North Sea and West of Scotland areas werereceiving annual quota allocations for most of the stocks in these areas. Also from 1985, annual allocations from themain mackerel and herring quotas were granted to individual freezer trawlers and purse-seiners instead of parts of thequotas being reserved for these sectors as a whole.
The system of PO quota allocations was extended to include quotas in the Irish Sea in 1990 and the remainderof Area VII in 1991. By this time all the UK POs were managing quota allocations on behalf of their members andthe annual allocations were routinely based on the combined landings track records of each PO’s over-10m vesselmembership during the previous three years (calculated as a percentage of the total landings by UK vessels over thesame reference period). Fishing for quota stocks by vessels not belonging to a PO, as well as by PO member vesselswhose PO had not requested an allocation for a particular stock, continued to be regulated directly by the Governmentby means of (in most cases) monthly landings limits.
Until 1995 the POs could more or less freely decide each year which quotas they wished to manage. Given thetrackrecord-based allocation system, this produced some predictable results. For example, it was possible for POs to“build up” relatively strong trackrecords for particular stocks while fishing against the Government’s monthlylandings limits before requesting an annual allocation. Conversely, it was also possible for a PO to decline anallocation in one year if its performance in the immediately preceding three years would otherwise have meant stricterquota controls for its members than they would have faced fishing against national monthly limits. Also, members ofsome POs had allegedly been reporting catches as coming from areas in which they did not have quota allocationswhen they should have been counted against their PO quotas. To simplify the system, and to press the POs intoaccepting more management responsibility, in 1995 the Government obliged POs to accept allocations for alldemersal species quotas (however small some of the allocations might be), although the management of pelagicquotas remained optional.
While the Government retains overall responsibility for quota uptake at the national level, the POs decide on themeans by which they manage their quota allocations. They can also undertake quota swaps with other POs at any timeas well as with those companies that receive individual vessel allocations of pelagic quotas. To begin with, all suchswaps had to balance in terms of “cod-equivalents”22 but in 1993 this restriction was removed, although someexchange of fish still had to take place. In 1996 quota “gifting” was allowed for the first time (with the financial termsof the transactions, if any, being a matter for the POs).
In 1994 the Government introduced a provision to enable POs to retain the landings track record of a membervessel whose owner would agree to surrender his licence: in practice the PO would pay financial compensation to theowner for effectively decommissioning his vessel. A PO could arrange to “ring-fence” the additional landings track
13 Hatcher & Read
22 The notion of “cod-equivalents” was first used within the EC in the early 1980s during the negotiations over internationalTAC shares. Tonnages of species other than cod are inflated or deflated according to their average market price compared tothat for cod.

record, so that if any of the remaining member vessels subsequently leave the PO, that proportion of their track recordwhich is attributable to extra quota obtained in this way could be retained within the PO. This facility was used in oneor two cases, but rapidly became redundant as the value of licences grew.
The move to fixed quota allocations in 1999 (described in the text) was largely industry-driven. The mainmotivations were to allow more flexibility in patterns of fishing without jeopardizing quota allocations in thefollowing year and to end the temptation for vessels, either individually or in groups, to artificially inflate landingsrecords in order to sustain quota shares.
Note that individual vessel allocations continue to be granted directly by the Government only to purse-seinersand freezer trawlers in respect of the main mackerel and herring stocks (where the vessels are not in membership ofa PO taking a quota allocation for these stocks). While PO allocations are normally only revised at the beginning ofeach year, the big pelagic vessels can transfer their notional allocations at any time between POs or between a POallocation and an individual allocation. Since 1990 these vessels have also been able to arrange for up to 70% of theirindividual allocations to be fished by other similar vessels within the same ownership or within the same PO.
U.K. Fisheries 14
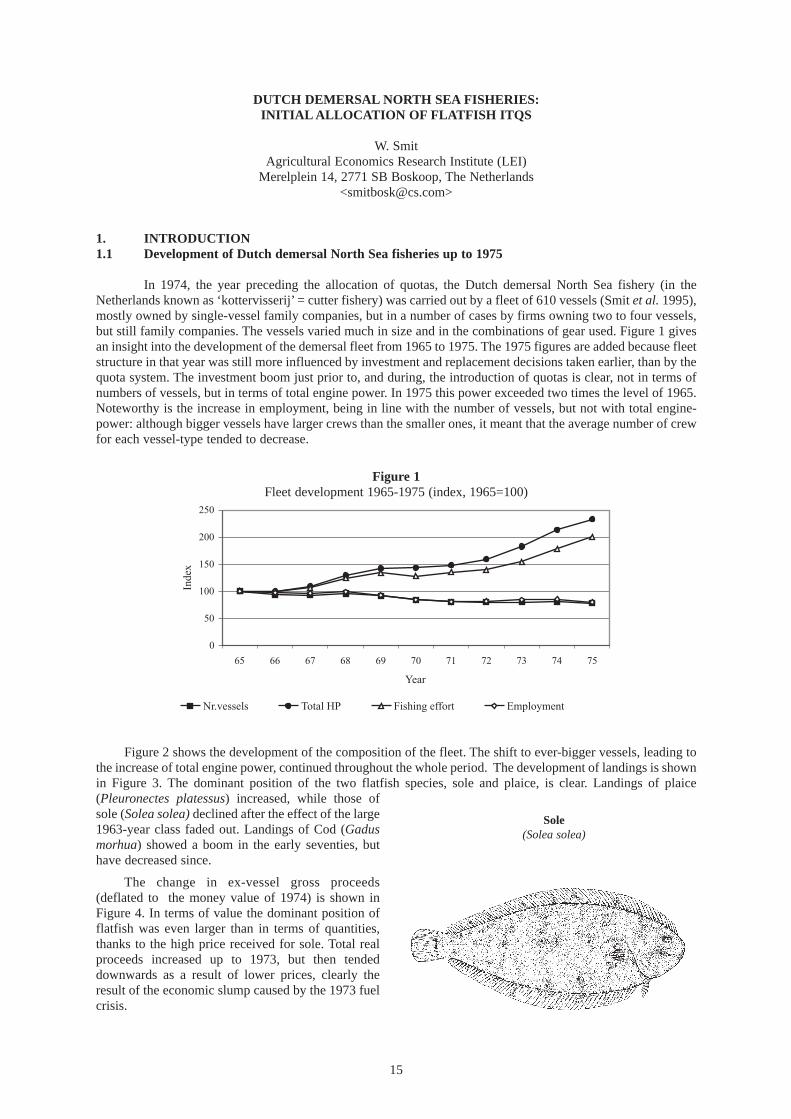
DUTCH DEMERSAL NORTH SEA FISHERIES:INITIAL ALLOCA TION OF FLATFISH ITQS
W. SmitAgricultural Economics Research Institute (LEI)
Merelplein 14, 2771 SB Boskoop, The Netherlands<[email protected]>
1. INTRODUCTION1.1 Development of Dutch demersal North Sea fisheries up to 1975
In 1974, the year preceding the allocation of quotas, the Dutch demersal North Sea fishery (in theNetherlands known as ‘kottervisserij’= cutter fishery) was carried out by a fleet of 610 vessels (Smit et al.1995),mostly owned by single-vessel family companies, but in a number of cases by firms owning two to four vessels,but still family companies. The vessels varied much in size and in the combinations of gear used. Figure 1 givesan insight into the development of the demersal fleet from 1965 to 1975. The 1975 figures are added because fleetstructure in that year was still more influenced by investment and replacement decisions taken earlier, than by thequota system. The investment boom just prior to, and during, the introduction of quotas is clear, not in terms ofnumbers of vessels, but in terms of total engine power. In 1975 this power exceeded two times the level of 1965.Noteworthy is the increase in employment, being in line with the number of vessels, but not with total engine-power: although bigger vessels have larger crews than the smaller ones, it meant that the average number of crewfor each vessel-type tended to decrease.
Figure 1Fleet development 1965-1975 (index, 1965=100)
Figure 2 shows the development of the composition of the fleet. The shift to ever-bigger vessels, leading tothe increase of total engine power, continued throughout the whole period. The development of landings is shownin Figure 3. The dominant position of the two flatfish species, sole and plaice, is clear. Landings of plaice(Pleuronectes platessus) increased, while those ofsole (Solea solea) declined after the effect of the large1963-year class faded out. Landings of Cod (Gadusmorhua) showed a boom in the early seventies, buthave decreased since.
The change in ex-vessel gross proceeds(deflated to the money value of 1974) is shown inFigure 4. In terms of value the dominant position offlatfish was even larger than in terms of quantities,thanks to the high price received for sole. Total realproceeds increased up to 1973, but then tendeddownwards as a result of lower prices, clearly theresult of the economic slump caused by the 1973 fuelcrisis.
15
0
50
100
150
200
250
65 66 67 68 69 70 71 72 73 74 75
Year
Inde
x
Nr.vessels Total HP Fishing effort Employment
Sole(Solea solea)
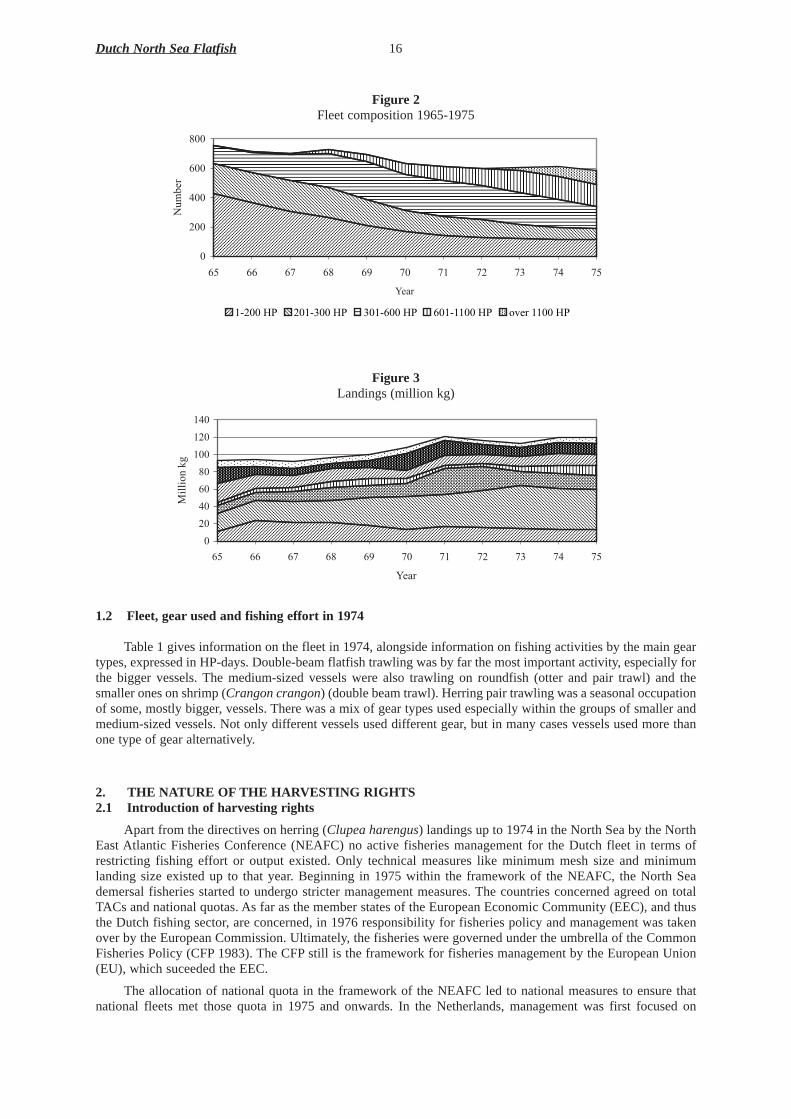
Figure 2Fleet composition 1965-1975
Figure 3Landings (million kg)
1.2 Fleet, gearused and fishing effor t in 1974
Table 1 gives information on the fleet in 1974, alongside information on fishing activities by the main geartypes, expressed in HP-days. Double-beam flatfish trawling was by far the most important activity, especially forthe bigger vessels. The medium-sized vessels were also trawling on roundfish (otter and pair trawl) and thesmaller ones on shrimp (Crangon crangon) (double beam trawl). Herring pair trawling was a seasonal occupationof some, mostly bigger, vessels. There was a mix of gear types used especially within the groups of smaller andmedium-sized vessels. Not only different vessels used different gear, but in many cases vessels used more thanone type of gear alternatively.
2. THE NATURE OF THE HAR VESTING RIGHTS2.1 Introduction of harvesting rights
Apart from the directives on herring (Clupea harengus) landings up to 1974 in the North Sea by the NorthEast Atlantic Fisheries Conference (NEAFC) no active fisheries management for the Dutch fleet in terms ofrestricting fishing effort or output existed. Only technical measures like minimum mesh size and minimumlanding size existed up to that year. Beginning in 1975 within the framework of the NEAFC, the North Seademersal fisheries started to undergo stricter management measures. The countries concerned agreed on totalTACs and national quotas. As far as the member states of the European Economic Community (EEC), and thusthe Dutch fishing sector, are concerned, in 1976 responsibility for fisheries policy and management was takenover by the European Commission. Ultimately, the fisheries were governed under the umbrella of the CommonFisheries Policy (CFP1983). The CFPstill is the framework for fisheries management by the European Union(EU), which suceeded the EEC.
The allocation of national quota in the framework of the NEAFC led to national measures to ensure thatnational fleets met those quota in 1975 and onwards. In the Netherlands, management was first focused on
Dutch North Sea Flatfish 16
0
200
400
600
800
65 66 67 68 69 70 71 72 73 74 75
Year
Num
ber
1-200 HP 201-300 HP 301-600 HP 601-1100 HP over 1100 HP
0
20
40
60
80
100
120
140
65 66 67 68 69 70 71 72 73 74 75
Year
Mill
ion
kg

flatfish. One reason for this was the predominant position of flatfish fishing in the North Sea of this country.Another was the feeling that the flatfish stocks badly needed management.
Figure 4Proceeds (million NLG of 1974)
Table 1Dutch demersal North Sea fleet 1974
Source: Agricultural Economics Research Institute LEI, Fisheries Division.
2.2 Harvesting rights
The two flatfish species to be managed were sole and plaice. In 1975 the government (Fisheries Directorateof the Ministry of Agriculture and Fisheries – MAF) had only some general directives. Lengthy consulting roundsbetween the MAF, organisations in the fishing industry and research institutes (Netherlands Institute for FisheryResearch – RIVO, and the Fisheries Division of the Agricultural Economics Research Institute - LEI) resulted ina management system from 1 April 1976 onwards. The decision was to manage the flatfish fishery by vessel quotafor sole and plaice. These flatfish species were the main target species of the twin-beam trawler fleet. This fleetwas the biggest sector of the North Sea demersal fleet, which also included roundfish (pair) trawling, shrimp(Crangon) trawling and herring pair trawling. Many vessels were exploiting two or more of these fisheries.
Other species for which the NEAFC had decided to establish quota (herring, and roundfish species like codand whiting (Micromesistius poutassou)) were not included in the quota system by the Netherlands for the timebeing, as the government expected that those, relatively minor, landings would not distort the system too badly.Also problems arising from the multi-species character of these fisheries (e.g.many vessels participating in twoor more types of fishery, the bycatches, etc.) prevented them having a complete system for all species ready fromthe beginning of the implementation of a quota system. To be sure, over the course of the years managementdeveloped for these species also, culminating in individual quota as well.
This case study deals with the allocation system for individual quota of sole and plaice. To illustrate theimpact of the measures, it should be noted that the level of the quotas (at least for a period of nine months)extended to only 42% of the highest landings of sole during one of the (reference) years 1972, 1973 and 1974,and 54% of the highest landings of plaice.
Initially IQs could not be sold, leased, or used as collateral, etc.One reason for this was that quota transferswould cause extra management problems; another was the fear that quotas would be concentrated in an undesirable
17 Smit
0
50
100
150
200
250
300
350
65 66 67 68 69 70 71 72 73 74 75
Year
Mill
ion
NL
G
HP-days (x 1000) HP-group
Number of craft
Double beam flatfish trawl
Roundfish
(pair) trawl
Herring
pair trawl
Double beam shrimp trawl
Total
1-200 116 30 42 0 2 245 2 317 201-300 84 612 414 0 2 181 3 207 301-600 189 11 176 2 088 872 772 14 908 601-1100 156 22 390 1 373 268 0 24 031
1101- 65 16 787 329 124 0 17 240 Total 610 50 995 4 246 1 264 5 198 61 703

way. Nevertheless “unofficial” transfers of IQs developed rapidly, for instance by transfer of vessels including theirIQs to other enterprises, by merging or splitting of enterprises and by individuals switching from the one firm tothe other, taking IQs with them. Gradually the management followed practice, and trade in IQs became ever moreofficial. Nowadays there is an official system of IQ trade including a central clearing institution. This system ismanaged by a co-management framework (Smit et al. 1996) with a high degree of self-responsibility for theindustry, organised in “groups” of fishing firms. Fishermen in these groups pool the use of their individualharvesting rights (ITQs and days-at-sea). The group board controls transfers of ITQs (and the accessory days-at-sea) between members on a permanent basis (buying/selling), or on a one-year basis (leasing), using agreed transferprices. In some cases even the ownership of some quotas has been assumed by the group boards. The system worksso well in terms of ITQs that the common view is that the effort regulations (maximum days-at-sea), introducedaround 1987 as an auxiliary measure, do not play a significant role anymore. It must be stressed that thismanagement system took many years of development, the “group” system only having been established in 1992.
3. THE METHOD OF ALLOCA TION3.1 Policy objectives
The main objective was a political one: to get the fleet to adhere to the internationally agreed national quota,with the least pain and sorrow. This objective was not extended to the management of fish stocks themselves,since this was done on the international level. So the basis of national policy objectives was only the nationalquotas resulting from that management. No objectives concerning fleet size or structure were pursued by the IQsystem initially. As the Director of Fisheries of the MAF put it at that time: “It is the fishermens’decision to fishthe quota by a Mercedes or a Citroen 2CV. As long as they obey the quota rules that is no concern of thegovernment”. Another (sub)objective was to further as much as possible an even spread of landings over thecourse of the year. This objective was of an economic nature, to ensure an optimal price for the catches taken.
Over the course of the years there have been several factors resulting in changes in management objectives:
i. Major problems in getting the industry to adhere to the quota, as fleet capacity was too large for the availablequota.
ii. Uneasiness with regard to the economic future of the fleet, in view of the discrepancy between quotas andfishing capacity (and costs). Already in 1975 the government tried to limit fishing capacity unilaterallythrough the use of scrapping-premiums. But, after an initial fleet reduction, and in the absence of any formof licensing system, the initial quota system did not prevent the fleet expanding again when fishermen beganto circumvent the quota systems.
iii. Fishing capacity directives from the EEC Multi-annual Guidance Programmes.
A more forceful CFPmanagement regime has developed since 1983 under the EU, and a set of otherobjectives were formulated, especially in terms of fishing capacity and fishing effort. Management instrumentslike engine power (HP) licences and maximum days-at-sea permits were introduced. These instruments served tomeet the new objectives, but were also thought to strengthen quota management since it appeared difficult toadjust landings in line with quotas using only ITQs. The original IQ-management left too many loopholes for thefishermen to exploit (e.g.misreporting and direct sales to merchants, thus avoiding the administrative controls inplace at the fish auctions).
3.2 Process used in determining the allocation
It was recognised in an early stage that a total sector quota, even split by periods within the year, was not anoptimal economic solution. Obviously, such a system would not prevent a “race for fish” and thus excessivecompetition. This was clear to both the government (MAF) and the fisheries organisations, centralised in PublicSector Organisations (either horizontally integrated, e.g. the Board of Fisheries – Visserijschap, or verticallyintegrated, e.g. the Dutch Fish Board – Produktschap Vis), both existing on the basis of a national law on PublicIndustry Organisations. So those involved – the various shareholders – came to think of individual harvesting rights.
Creation of harvesting rights by managing individual fishing capacity and fishing effort were contemplated,but abandoned. In the first place there was insufficient information on the relationship between effort andlandings, especially with regard of the recent investments in big vessels. Subsequently, research by LEI indeedrevealed that engine power simply measured in HPs did not provide a reliable measure of fishing capacity, nordid HP-days represent fishing effort accurately. Fishing capacity in terms of horsepower clearly decreased whenvessels were bigger, thus distorting any time-series on fishing effort when vessels were replaced by bigger ones,and, it might then be a problem to monitor innovations and other means of increasing vessel efficiency. In thesecond place such management would not guarantee that (multi-species) fishing would reflect the quota allocatedby individual species. It was feared that landings of certain species would then be closed prematurely, probablyresulting in fish being thrown overboard or landed in “black” or “grey” markets.
Dutch North Sea Flatfish 18

Ultimately, MAF and theindustry agreed on an individualquota management programmefor sole and plaice. It must bekept in mind that the time forpreparation of the programmewas rather short. No one hadthought intensively aboutorganising a managementsystem prior to theannouncement in 1974 of quotasby NEAFC for the coming years.And, at that time, thegovernment and industry wereadvised by the FisheriesDivision of the LEI.
3.3 Allocation methodchosen
After a provisional sectorregulation in 1975, for eachvessel active on 1 January 1976 and having a recent history of flatfish fishing, individual quota for sole and plaicewere allocated. The National Fisheries Statistics (see Section 4) for 1972, 1973 and 1974 were used to calculate“track-records” by species per vessel. Each vessel was ‘awarded’as its track-record the highest landings of soleand plaice that it had achieved during one of those reference years.
But then many problems started to become apparent. A large number of enterprises had replaced theirvessel(s) in these years. That was not only the case for fishing firms investing in new vessels, but also for thebuyers of second-hand vessels. The investment in a new vessel frequently triggered a chain of replacements intwo to four firms. Track-records for the old vessels (in nearly all cases smaller than the new one) needed somehowto be corrected to give a reasonable track-record for the new vessel. Not only do bigger vessels have a largerfishing capacity, but in many cases the types of gear used and/or the composition of landings for the new vesselmight differ from that of the vessel replaced. Also, the system needed to provide for enterprises which did nothave a vessel sailing on 1 January 1976, for instance when an old vessel was already sold but the new one wasnot yet operational. There was a comparable problem in those cases where vessels were laid up for some timeduring the reference period (because of engine trouble, etc.).
To resolve those difficulties it was agreed that in all cases of vessel change, where the replacment vessel wasbrought into service, or ordered, before 1 January 1975, there would be consideration and a correction becausefishermen were allowed to choose which of the three reference years would be taken as the basis period: someinvestors could use a reference year in which the new vessel was already sailing. For cases in which thereplacement date would not allow for a full year’s fishing with the new vessel a theoretical track-record was tobe calculated. To that end the relationship between engine power and the landings of sole and plaice in thereference years was derived by the LEI from data in the National Fisheries Statistics, to arrive at a sufficientcorrelation level. It should be acknowledged that for the newest generation of big vessels the data wereextrapolated (rather conservatively) in order to obtain the relationship. On this basis “problem vessels” wereawarded theoretical track-records. However, they were still allowed to use a “real” track-record on the basis ofone of the reference years if they so wished.
Some owners who had changed their vessels complained that one should account for their fishing resultsbeing better than the average in their HP-class during the reference period. They wanted their “average”theoretical track-record to be corrected, but of course, no complaints were heard from vessels that had fishedbelow the fleet average! To resolve this problem the system applied to vessel changes was altered: in 1977 stepswere taken to allow for a mix of real and theoretical track-records. Ultimately the track-records were based on50% of real historical landings and 50% on the theoretical landings. This system of allocation is still used today.
Initially the Dutch Fish Board was to manage this system, but the Board could not satisfactorily administerthe programme because of its limited management capacity, and also because too many interest groups wererepresented on the Board, which might lead to a clash of interests. In addition, the availability of accurate data onindividual vessels’landings to a non-government organisation seems to have been a problem. Thus after a shortperiod the Dutch Fish Board returned the responsibility for the system’s management to the government.
19 Smit
The Dutch North Sea trawling fleet is characterized by modern powerfulbeam trawlers

The last step was to distribute the total available national quota of sole and plaice among all track-recordholders, in proportion to their track-records. To that end a change of the National Fisheries Law(NFL) waspresented by the government and then passed by Parliament. In the framework of this new Law the MAF couldimpose quota regulations on the sector. The vessel owners were informed by the MAF of their quota for thecoming year by letter. Unfortunately, because of several years delay in the decision-making process at theEEC/EU level and the following rounds of calculations by the MAF, the letters arrived long after the beginningof the new year. This caused extra uncertainity as to the final decisions on IQ amounts in the course of the fishingcurrent year, and lead to some complaints and appeals. Incidentally, a small part (1 to 3%) of the national quotawas not divided, but kept aside as a “national reserve” to cover any cases of fishermen exceeding their quotas.
4. DATA REQUIREMENTS AND COMPUTATIONAL PROCESS
For a long time the MAF and the Central Bureau of Statistics (CBS, Ministry of Economic Affairs) hadalready been co-operating to keep a system of detailed statistics on landings. The MAF organised the initial datato be sent to the CBS who put them in a landings statistical system. Among other things this system could furnishdata on landings per vessel by species.
These data were seen as being very reliable. All fishing firms were compulsory members of the Dutch FishBoard which obliged North Sea fishermen to sell their fish through public fish auctions. This system was wellcontrolled. Furthermore, landings statistics were based on a law obliging all auctions to supply a copy of eachsale slip to the statistics authority. In each fishing port representatives of both the MAF and the Dutch Fish Boardsupervised the procedure to ensure that it functioned correctly. The representative of the Dutch Fish Boardsupervised the “auction duty” and the MAF representative was responsible for all sale slips to be sent to the CBS.For research purposes the MAF representative also added data such as trip-length, fishing time and fishing area,which were obtained through regular inquiries. Total landings of all vessels were then checked against theaggregated landings figures that were published by the auctions.
It should be noted that the obligation by the Dutch Fish Board to land at fish auctions officially ceased after1970. The reason was that it was not compatible with EEC market regulations. But the long tradition in landingfish at auctions did not change and practically all fishermen continued this way of selling their fish during theperiod 1971-1974. Therefore, the data in the national landings statistics were felt to provide a solid basis forfisheries management. Also, the overwhelming part of the industry saw no problems in the process.
Only after the establishment of IQ systems did fishermen began to make use of the absence of the auctionobligation to circumvent the system, for instance, by direct sales to merchants and processors. This incidentallyseverely hampered the reliability of the (still auction-based) statistics. While the MAF was one of the owners ofthe data they were directly available for use. For research purposes LEI also had access to these data. All datawere already computerised at that time so that calculating (real and theoretical) track-records was easy.
5. APPEALS PROCESS
As noted, the industry was consulted sufficiently in the process of organising the system and the allocationof IQs. Some initial problems such as correcting track-records when vessels had been replaced could be met bymutual deliberation during the process. Later, an appeals process was created through which complaints fromfishermen could be formally dealt with. First, they might appeal to the managing authority and then, to theDirector of Fisheries of the MAF. Their ultimate step was an appeal in public courts against decisions of theDirector of Fisheries.
Some fishing companies started law-suits against the government, generally to contest the basic right of thegovernment to impose the IQ system (Keus 1991). In one case the Dutch court judged that the national systemderived its judicial basis from the European Community. So the case was referred to the European Court ofJustice, which found the EC to be within its rights (Decision of July 14th 1976). Even when such quantitativemeasures seemed to be contrary to general principles of free enterprise, free trade and enhancing economicbenefits, the importance of ensuring acceptable levels of fish stocks was judged to overrule those principles. TheEuropean Court stated that such measures may temporary restrict production, but were taken to ensure increasedproduction (and thus increasing economic benefits) in the future. As a consequence, this meant that the Dutchgovernment was within its rights, and given the rules laid down in the revised Law passed by Parliament (theNFL), the appeals process created within the quota management system was also judged to be legal.
Dutch North Sea Flatfish 20

6. ADMINISTRA TION OF THE ALLOCA TION PROCESS6.1 Staff requirements
The MAF had staff available for organising the quota system and the Fisheries Directorate already had staffworking on management schemes such as: minimum mesh sizes, minimum landing sizes, licensing of shrimpfishing, various regulations on inshore fishing and on shell-fish culture. The Statistics Department expanded itsmanpower while the data were gradually computerised at the CBS. The LEI undertook the required calculationsand provided advice.
Another factor influenced fishermen in their adherence to their quotas: after the first shock fishermen rapidlybegan to overfish their quotas and so in order to check this behaviour the services were requested of officers ofthe Agricultural Inspection Service. Nevertheless after some time even this input needed an increase in themanpower provided by that Service.
6.2 Additional pr ogramme funding requirements
No extra funding was needed for the allocation process since the system was managed by the standing staff ofthe MAF, and the LEI was available to undertake research and analyses. Only later was extra effort needed to getthe fishermen to observe their quotas, requiring additional funding from the Agricultural Inspection Unit of the MAF.
7. EVALUA TION OF THE INITIAL ALLOCA TION PROCESS7.1 Success in achieving initial policy objectives
After the initial adjustments the fishermen rapidly found ways to circumvent the IQ system. The MAFmanagers, having had little experience with the allocation system were not prepared for the reaction by thefishermen, so effective control and punishment lagged behind for a rather long time. Success in achieving themain policy objective was clearly questionable in the early years. Extra measures (such as early closures of thefishery) had to be taken when there was sufficient evidence that total landings (derived from statistics andincluding “grey” landings as far as they could be traced by the Agricultural Inspection Service) began to exceedthe quotas. This also stood in the way of the achievement of the sub-objective: an optimal spread of the landingsover the whole year. Later, as the system began to work satisfactorily and landings tended to spread smoothlyover the year, the LEI could show that returns had indeed increased.
One of the issues that some fishermen complained of was a lack of legal guarantee to fish their IQs whenothers exceeded their own IQs, which when total landings overshot the quotas, caused for instance, an earlyclosure of the fishery. This obviously induced fishermen to try to dodge the system even more. The onlypossibility that MAF had to guarantee the IQs was to get all fishermen to fish within their IQs, but until thatworked, no guarantee could be provided because MAF was committed to adhering to the national quotas byspecies agreed on internationally.
In principle the IQ system as such was a good way to achieve the main policy objective. Only the controlsystem failed. However after a good control and enforcement system was organised the programme ran smoothly:ITQs are still (25years later) in force as the basis for an excellent working system, be it that some extramanagement measures had to be included: first for fishing capacity (HP) and effort (days at sea), then later anintegrated co-management system.
7.2 Satisfaction of rights-holders with the process
In principle fishermen generally felt the problems of intensified fishing and were generally not opposed tosome sort of catch restrictions. Also, the IQ-management system was reasonably well accepted. However, manyfishermen did not fully realise its impact on their own enterprises, for instance, they hoped that the system wouldaffect mostly their colleagues not themselves. When the effects were felt, many fishermen were startled badly bythe consequences (see Section5).
After a short time a further source of dissatisfaction for the fishermen was that the government could notguarantee the legal right on each individual IQ (see Section 7.1). However, this feeling was gradually alleviatedby the development of the practice of dodging quotas, of “grey” landings, as well as the rather weak hand of thegovernment in opposing these. When controls were tightened, the sector had already found ways to adapt fleetcapacity, for a large part, by ‘flag-hopping’and ‘quota-hopping’(Davidse 1999), and the remaining fleet generallydeveloped a positive approach to the programme. Unmistakably contributing to this positive feeling were somerather satisfying financial outcomes: fewer vessels sharing the same quotas, a favourable development of fishprices, and falling fuel prices in 1986.
Around 1995 a research project (Davidse 1997) included a number of interviews with vessel owners. Amongother questions, 31 owners were asked about their attitudes towards the ITQ management system. Twenty fivehad a positive view, three were neutral and only three had a negative view. The positive views expressed were:
21 Smit

i. ‘you know where you are now’ii. ‘more certainty’iii. ‘protection against big vessels which are also limited now’iv. ‘more tranquillity in the sector’v. ‘better planning possibilities’vi. ‘a fence around the fleet’and vii. ‘on the basis of quota the banks may grant loans easier’.
Negative views included ‘bad utilisation of quotas’, ‘wrong allocation of the rights’i.e. the continuedexistence of grievances about distribution of individual quotas in the past, and ‘no chances for newcomers’. Inrelation to the problem of the inheritance of fishing units, 22 owners agreed that fishing rights restrained suchsuccessions.
7.3 Views of othercommunity groups
At the time the IQ system was introduced there were practically no other community groups interested inthe change in the method of management, although obviously one related sector, that of fish trade and processing,was interested. But this sector was also represented in the vertically-integrated Dutch Fish Board and couldalready participate in deliberations and consultations. The trade and processing sector supported the ITQ system,expecting that it would ensure more regular landings.
7.4 Hind-sight assessment
The initial setting of quotas seems to have been satisfactory; in the end the system of ITQs is still workingand there is a general feeling that it is a good practice. But one must not forget that in the course of years a lothas happened: the system has been improved and expanded. It must be stressed that each initial allocation ofrights will give rise to grudges from several of those involved. After the first allocation round inevitably a processis needed to adjust the rules and make them more effective. And there was the trend to cheat the system that, inthe case of the Netherlands, was not well opposed by management. Later, when management did control thelandings to a large extent and introduced fleet and effort restrictions, the fleet found ways to adapt the fleetwithout too much sorrow (see Section7.2). Ultimately, the introduction of the co-management “group”mechanism contributed much to develop the system. Now it satisfies the policy objectives and is also acceptableto the remaining fleet under the Dutch flag.
If the management (and the fishing industry) had known what it knows now - and had acted accordingly -it may have been be possible that the system would have worked more satisfactorily from the start. There wereseveral important features in the development of the system difficult years in starting up:
i. With the help of other measures such as effort regulation (which lost their meaning gradually after the quotacontrol within the co-management system began to work well), management succeeded in matchingfishermen’s landings with their quotas.
ii. The sector found ways to decrease fleet capacity, for a large part by ‘flag-hopping’.iii. A co-management system working well was developed - which is generally seen as the major element
leading to the programme’s success.
Naturally problems remain. One is the high price to be paid for the establishment of a new enterprise:vessel(s) plus harvesting rights must be financed. This makes it utterly impossible for newcomers to enter thesector, even the financing of management succession from father to son is difficult. But surely thesedisadvantages somehow occur in all systems that restrict free or open access fishing in a society where thegovernment basically does not interfere with free competition.
Another important issue was that the Dutch fishery was the forerunner in organising an ITQ system withinthe EC’s quota system. Consequently, the industry developed a clear perception of the ‘ins’and ‘outs’of such asystem, including the value of ITQs, at an early stage. This enabled Dutch fishing enterprises to operate on theproperty rights markets in other EU Member States (notably the UK, and to a lesser extent Germany, Belgiumand France) well before fishermen in those States were conscious of those opportunities. As a consequence, ratherextensive ‘flag-hopping’and ‘quota-hopping’occured. Enterprises went out fishing on the quota of other States,resulting in fewer vessels sharing the Dutch quota.
8. LITERA TURE CITED
Davidse W.P., J. De Jager, R. Rijneveld, W. Smit and J.W. De Wilde 1975. De Nederlandse zeevisserij op dedrempel van een nieuw tijdvak (Dutch sea fisheries on the threshold of a new era). LEI, Mededeling nr. 127.
Davidse W.P., H. Harmsma, M.O. van Wijk, L.V. McEwan, N. Vestegaard, H. Frost 1997. Property rights infishing. LEI report 159, 1997.
Dutch North Sea Flatfish 22

Davidse W.P. 2001. The effects of transferable property rights on the fleet capacity and ownership of harvestingrights in the Dutch demersal North Sea fisheries. In: Shotton, R. (Ed.) 2001. Case Studies on the Effects ofTransferable Fishing Rights on Fleet Capacity and Concentration of Quota Rights. FAO Fish. Tech. Paper.No 412.
De Wilde J.W. 1993. Capacity and effort limitations in The Netherlands. In: Proceedings of the Fifth AnnualConference of the EAFE (European Association of Fisheries Economists), Barcelona, Spain, 1993
Keus B.J. 1991. Juridische aspecten van het EG-visserijbeleid (Legal aspects of the EC fisheries management).LEI, Mededeling nr. 445.
Rijneveld R., W. Smit and J.W. De Wilde 1973.Economische perspectieven van de kottervisserij in Nederland(Economic perspectives of demersal fishing in The Netherlands). LEI, Rapport nr. 5.20.
Smit W., W.P. Davidse, J. de Jaeger, M.H. Smit, C. Taal, M.O. van Wijk 1995. Visserij in cijfers 1995 (Fisheriesin figures 1995). LEI, PR 31-95 and preceding editions.
Smit W., A.J. Berg, E. Hoefnagel, R. de Lange, J.A.E. Vervaele, J. de Vries, A.K. Yesilkagit 1996. Bijdrage aande eindevaluatie van de uitvoering van de voorstellen van de stuurgroep Biesheuvel (Contribution to thefinal evaluation of the execution of the proposals of the Biesheuvel steering group). LEI, Mededeling 575.
Tienstra Th.J., J.H.L. van Lissa, 1980. Vijfentwintig jaar overheidsbeleid ten aanzien van de visserij (Twenty-fiveyears of government management in fisheries). In: Speerpunt voor de Visserij, commemorating 25 yearsVisserijschap.
23 Smit

INITIAL ALLOCA TION OF ITQS IN THE ICELANDIC FISHERIES
B. Runolfsson and R. ArnasonDepartment of Economics, University of IcelandOddi V Sturlugotu, Reykjavik, IS-101, Iceland
<[email protected]> <[email protected]>
1. INTRODUCTION1.1 Background
Until the extension of the fisheries jurisdiction to 200 miles in 1976, the Icelandic fisheries were, for all intentsand purposes, international and open-access fisheries. Large foreign fishing fleets featured prominently on thefishing grounds, taking almost half of the demersal catch. The extension of the fisheries jurisdiction to 200miles allbut eliminated foreign participation in the Icelandic fisheries. However, the initial management measures taken inthe demersal fisheries following the extension of the fisheries jurisdiction in 1976 were inadequate and therefore didnot alter the common-property nature of these fisheries as far as domestic fishers were concerned. They were stillforced to compete for shares in the catch. Therefore not surprisingly, the development of the Icelandic fisheries inthe post-war era closely followed the path predicted for common-property fisheries: exhibiting increasinglyexcessive capital and fishing effort relative to reproductive capacity of the fish stocks.
The value of fishing capital employed in the Icelandic fisheries increased by over 1400% from 1945-1983.Real catch values, on the other hand, only increased by 300% during the same period. Thus, the growth in fishingcapital exceeded the increase in catch values by a factor of more than four, and, in 1983, the output-to-capitalratio in the Icelandic fisheries was less than one-third of the output-to-capital ratio in 1945. The post-wardevelopment of fishing capital and catch values since 1945 is illustrated in Figure 1.
Figure 1Fishing capital and catch values 1945-1997 (index 1945=100)
Source: National Economic Institute.
This long-term decline in the economic performance of the Icelandic fisheries did not go unnoticed. Withthe defacto recognition of the exclusive 200-mile zone in 1976, the situation dramatically changed. The Icelandicfisheries gradually came under increased management until, after 1990, a uniform system of individualtransferable quotas was instituted in practically all fisheries.
1.2 The pelagic fisheries
Due to an alarming decline in the stocks of herring (Clupea harengus), an overall quota in the form of a totalallowable catch was imposed on this fishery in 1969. But since this did not halt the decline in the stocks’biomasses, a complete moratorium on herring was introduced in 1972. In 1975, when fishing on the Icelandicherring stocks was partly resumed, it was obvious that the whole fleet could not participate, and the rule of open-access for all vessels had to be abandoned. Hence, an individual vessel quota system with limited eligibility(licensing) was introduced. All vessels with a history of catching herring in the late 1960s and still in operation,
24
0
500
1,000
1,500
2,000
1945 1950 1955 1960 1965 1970 1975 1980 1985 1990 1995
Fishing capital Catch value
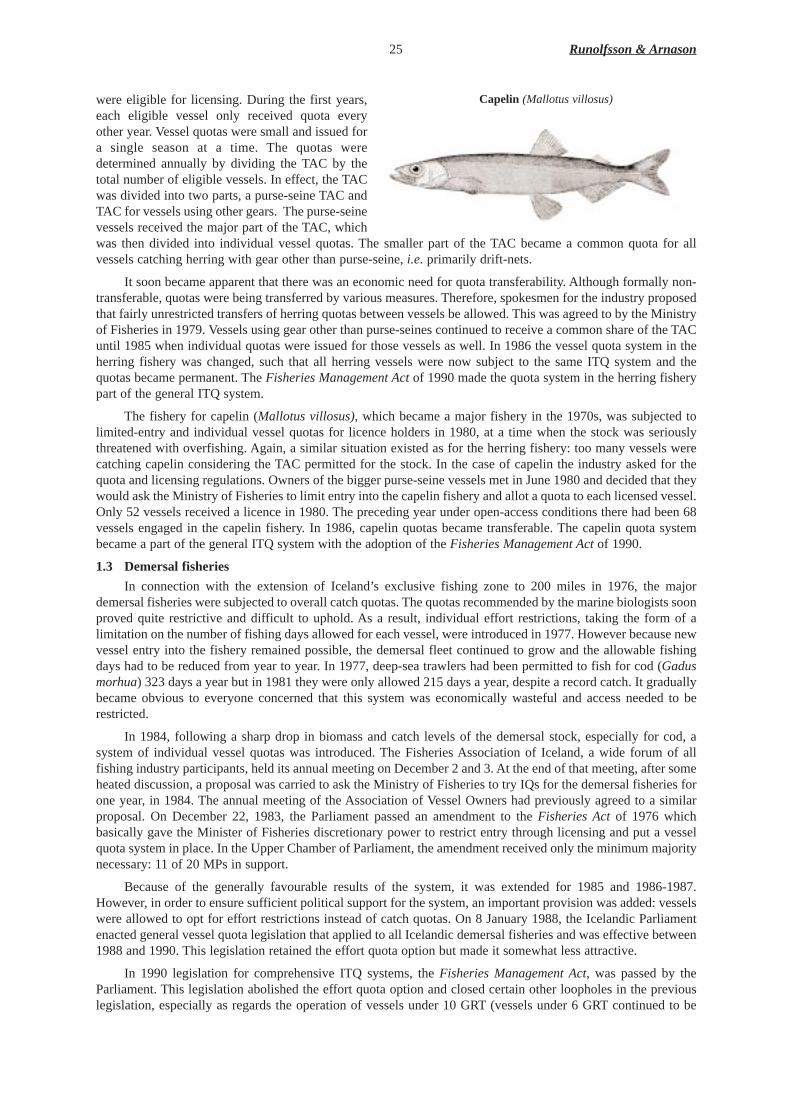
were eligible for licensing. During the first years,each eligible vessel only received quota everyother year. Vessel quotas were small and issued fora single season at a time. The quotas weredetermined annually by dividing the TAC by thetotal number of eligible vessels. In effect, the TACwas divided into two parts, a purse-seine TAC andTAC for vessels using other gears. The purse-seinevessels received the major part of the TAC, whichwas then divided into individual vessel quotas. The smaller part of the TAC became a common quota for allvessels catching herring with gear other than purse-seine, i.e. primarily drift-nets.
It soon became apparent that there was an economic need for quota transferability. Although formally non-transferable, quotas were being transferred by various measures. Therefore, spokesmen for the industry proposedthat fairly unrestricted transfers of herring quotas between vessels be allowed. This was agreed to by the Ministryof Fisheries in 1979. Vessels using gear other than purse-seines continued to receive a common share of the TACuntil 1985 when individual quotas were issued for those vessels as well. In 1986 the vessel quota system in theherring fishery was changed, such that all herring vessels were now subject to the same ITQ system and thequotas became permanent. The Fisheries Management Act of 1990 made the quota system in the herring fisherypart of the general ITQ system.
The fishery for capelin (Mallotus villosus), which became a major fishery in the 1970s, was subjected tolimited-entry and individual vessel quotas for licence holders in 1980, at a time when the stock was seriouslythreatened with overfishing. Again, a similar situation existed as for the herring fishery: too many vessels werecatching capelin considering the TAC permitted for the stock. In the case of capelin the industry asked for thequota and licensing regulations. Owners of the bigger purse-seine vessels met in June 1980 and decided that theywould ask the Ministry of Fisheries to limit entry into the capelin fishery and allot a quota to each licensed vessel.Only 52 vessels received a licence in 1980. The preceding year under open-access conditions there had been 68vessels engaged in the capelin fishery. In 1986, capelin quotas became transferable. The capelin quota systembecame a part of the general ITQ system with the adoption of the Fisheries Management Act of 1990.
1.3 Demersal fisheries
In connection with the extension of Iceland’s exclusive fishing zone to 200 miles in 1976, the majordemersal fisheries were subjected to overall catch quotas. The quotas recommended by the marine biologists soonproved quite restrictive and difficult to uphold. As a result, individual effort restrictions, taking the form of alimitation on the number of fishing days allowed for each vessel, were introduced in 1977. However because newvessel entry into the fishery remained possible, the demersal fleet continued to grow and the allowable fishingdays had to be reduced from year to year. In 1977, deep-sea trawlers had been permitted to fish for cod (Gadusmorhua) 323 days a year but in 1981 they were only allowed 215 days a year, despite a record catch. It graduallybecame obvious to everyone concerned that this system was economically wasteful and access needed to berestricted.
In 1984, following a sharp drop in biomass and catch levels of the demersal stock, especially for cod, asystem of individual vessel quotas was introduced. The Fisheries Association of Iceland, a wide forum of allfishing industry participants, held its annual meeting on December 2 and 3. At the end of that meeting, after someheated discussion, a proposal was carried to ask the Ministry of Fisheries to try IQs for the demersal fisheries forone year, in 1984. The annual meeting of the Association of Vessel Owners had previously agreed to a similarproposal. On December 22, 1983, the Parliament passed an amendment to theFisheries Act of 1976 whichbasically gave the Minister of Fisheries discretionary power to restrict entry through licensing and put a vesselquota system in place. In the Upper Chamber of Parliament, the amendment received only the minimum majoritynecessary: 11 of 20 MPs in support.
Because of the generally favourable results of the system, it was extended for 1985 and 1986-1987.However, in order to ensure sufficient political support for the system, an important provision was added: vesselswere allowed to opt for effort restrictions instead of catch quotas. On 8 January 1988, the Icelandic Parliamentenacted general vessel quota legislation that applied to all Icelandic demersal fisheries and was effective between1988 and 1990. This legislation retained the effort quota option but made it somewhat less attractive.
In 1990 legislation for comprehensive ITQ systems, the Fisheries Management Act, was passed by theParliament. This legislation abolished the effort quota option and closed certain other loopholes in the previouslegislation, especially as regards the operation of vessels under 10 GRT (vessels under 6 GRT continued to be
25 Runolfsson & Arnason
Capelin (Mallotus villosus)
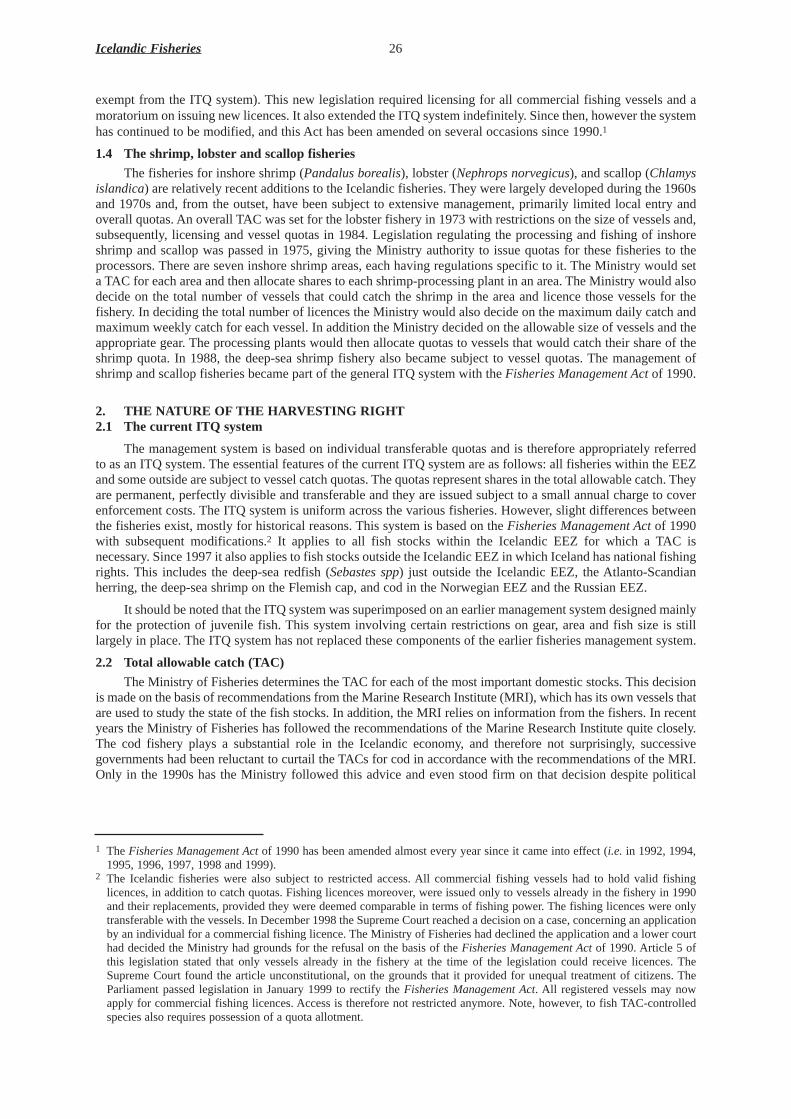
exempt from the ITQ system). This new legislation required licensing for all commercial fishing vessels and amoratorium on issuing new licences. It also extended the ITQ system indefinitely. Since then, however the systemhas continued to be modified, and this Act has been amended on several occasions since 1990.1
1.4 The shrimp, lobsterand scallop fisheries
The fisheries for inshore shrimp (Pandalus borealis), lobster (Nephrops norvegicus), and scallop (Chlamysislandica) are relatively recent additions to the Icelandic fisheries. They were largely developed during the 1960sand 1970s and, from the outset, have been subject to extensive management, primarily limited local entry andoverall quotas. An overall TAC was set for the lobster fishery in 1973 with restrictions on the size of vessels and,subsequently, licensing and vessel quotas in 1984. Legislation regulating the processing and fishing of inshoreshrimp and scallop was passed in 1975, giving the Ministry authority to issue quotas for these fisheries to theprocessors. There are seven inshore shrimp areas, each having regulations specific to it. The Ministry would seta TAC for each area and then allocate shares to each shrimp-processing plant in an area. The Ministry would alsodecide on the total number of vessels that could catch the shrimp in the area and licence those vessels for thefishery. In deciding the total number of licences the Ministry would also decide on the maximum daily catch andmaximum weekly catch for each vessel. In addition the Ministry decided on the allowable size of vessels and theappropriate gear. The processing plants would then allocate quotas to vessels that would catch their share of theshrimp quota. In 1988, the deep-sea shrimp fishery also became subject to vessel quotas. The management ofshrimp and scallop fisheries became part of the general ITQ system with the Fisheries Management Act of 1990.
2. THE NATURE OF THE HAR VESTING RIGHT2.1 The current ITQ system
The management system is based on individual transferable quotas and is therefore appropriately referredto as an ITQ system. The essential features of the current ITQ system are as follows: all fisheries within the EEZand some outside are subject to vessel catch quotas. The quotas represent shares in the total allowable catch. Theyare permanent, perfectly divisible and transferable and they are issued subject to a small annual charge to coverenforcement costs. The ITQ system is uniform across the various fisheries. However, slight differences betweenthe fisheries exist, mostly for historical reasons. This system is based on the Fisheries Management Act of 1990with subsequent modifications.2 It applies to all fish stocks within the Icelandic EEZ for which a TAC isnecessary. Since 1997 it also applies to fish stocks outside the Icelandic EEZ in which Iceland has national fishingrights. This includes the deep-sea redfish (Sebastes spp) just outside the Icelandic EEZ, the Atlanto-Scandianherring, the deep-sea shrimp on the Flemish cap, and cod in the Norwegian EEZ and the Russian EEZ.
It should be noted that the ITQ system was superimposed on an earlier management system designed mainlyfor the protection of juvenile fish. This system involving certain restrictions on gear, area and fish size is stilllargely in place. The ITQ system has not replaced these components of the earlier fisheries management system.
2.2 Total allowable catch (TAC)
The Ministry of Fisheries determines the TAC for each of the most important domestic stocks. This decisionis made on the basis of recommendations from the Marine Research Institute (MRI), which has its own vessels thatare used to study the state of the fish stocks. In addition, the MRI relies on information from the fishers. In recentyears the Ministry of Fisheries has followed the recommendations of the Marine Research Institute quite closely.The cod fishery plays a substantial role in the Icelandic economy, and therefore not surprisingly, successivegovernments had been reluctant to curtail the TACs for cod in accordance with the recommendations of the MRI.Only in the 1990s has the Ministry followed this advice and even stood firm on that decision despite political
Icelandic Fisheries 26
1 The Fisheries Management Act of 1990 has been amended almost every year since it came into effect (i.e. in 1992, 1994,1995, 1996, 1997, 1998 and 1999).
2 The Icelandic fisheries were also subject to restricted access. All commercial fishing vessels had to hold valid fishinglicences, in addition to catch quotas. Fishing licences moreover, were issued only to vessels already in the fishery in 1990and their replacements, provided they were deemed comparable in terms of fishing power. The fishing licences were onlytransferable with the vessels. In December 1998 the Supreme Court reached a decision on a case, concerning an applicationby an individual for a commercial fishing licence. The Ministry of Fisheries had declined the application and a lower courthad decided the Ministry had grounds for the refusal on the basis of the Fisheries Management Act of 1990. Article 5 ofthis legislation stated that only vessels already in the fishery at the time of the legislation could receive licences. TheSupreme Court found the article unconstitutional, on the grounds that it provided for unequal treatment of citizens. TheParliament passed legislation in January 1999 to rectify the Fisheries Management Act. All registered vessels may nowapply for commercial fishing licences. Access is therefore not restricted anymore. Note, however, to fish TAC-controlledspecies also requires possession of a quota allotment.
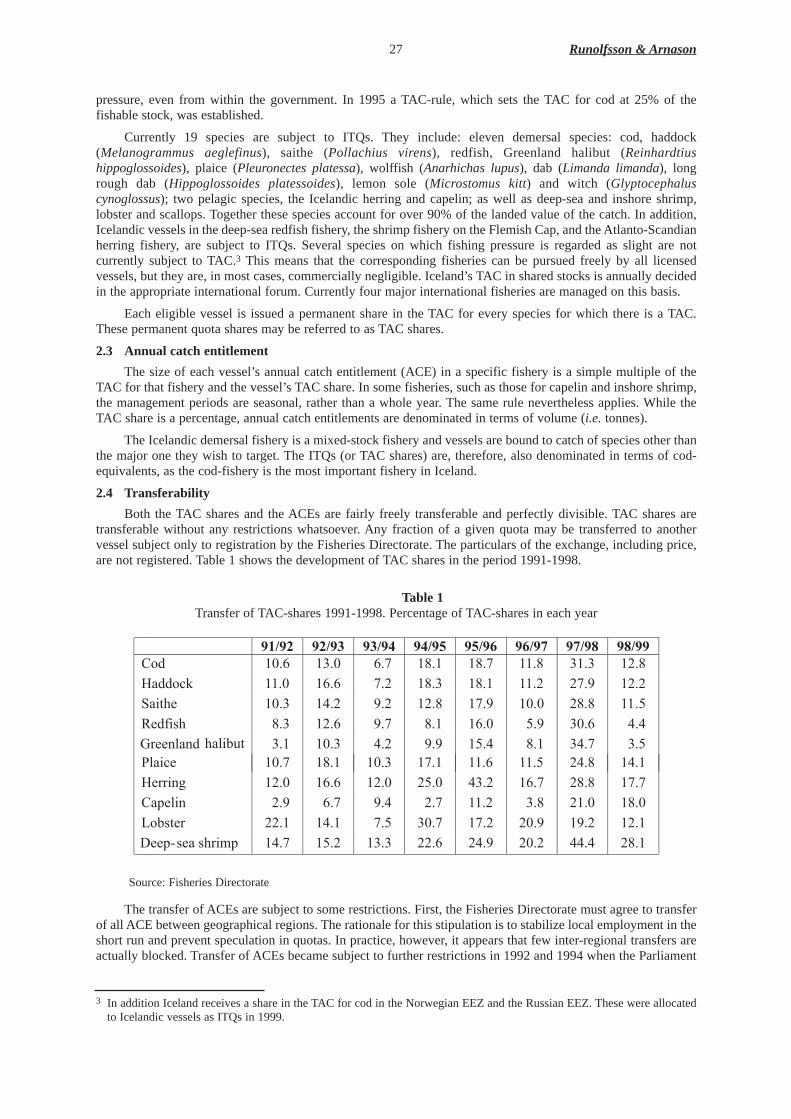
pressure, even from within the government. In 1995 a TAC-rule, which sets the TAC for cod at 25% of thefishable stock, was established.
Currently 19 species are subject to ITQs. They include: eleven demersal species: cod, haddock(Melanogrammus aeglefinus), saithe (Pollachius virens), redfish, Greenland halibut (Reinhardtiushippoglossoides), plaice (Pleuronectes platessa), wolffish (Anarhichas lupus), dab (Limanda limanda), longrough dab (Hippoglossoides platessoides), lemon sole (Microstomus kitt) and witch (Glyptocephaluscynoglossus); two pelagic species, the Icelandic herring and capelin; as well as deep-sea and inshore shrimp,lobster and scallops. Together these species account for over 90% of the landed value of the catch. In addition,Icelandic vessels in the deep-sea redfish fishery, the shrimp fishery on the Flemish Cap, and the Atlanto-Scandianherring fishery, are subject to ITQs. Several species on which fishing pressure is regarded as slight are notcurrently subject to TAC.3 This means that the corresponding fisheries can be pursued freely by all licensedvessels, but they are, in most cases, commercially negligible. Iceland’s TAC in shared stocks is annually decidedin the appropriate international forum. Currently four major international fisheries are managed on this basis.
Each eligible vessel is issued a permanent share in the TAC for every species for which there is a TAC.These permanent quota shares may be referred to as TAC shares.
2.3 Annual catch entitlement
The size of each vessel’s annual catch entitlement (ACE) in a specific fishery is a simple multiple of theTAC for that fishery and the vessel’s TAC share. In some fisheries, such as those for capelin and inshore shrimp,the management periods are seasonal, rather than a whole year. The same rule nevertheless applies. While theTAC share is a percentage, annual catch entitlements are denominated in terms of volume (i.e. tonnes).
The Icelandic demersal fishery is a mixed-stock fishery and vessels are bound to catch of species other thanthe major one they wish to target. The ITQs (or TAC shares) are, therefore, also denominated in terms of cod-equivalents, as the cod-fishery is the most important fishery in Iceland.
2.4 Transferability
Both the TAC shares and the ACEs are fairly freely transferable and perfectly divisible. TAC shares aretransferable without any restrictions whatsoever. Any fraction of a given quota may be transferred to anothervessel subject only to registration by the Fisheries Directorate. The particulars of the exchange, including price,are not registered. Table 1 shows the development of TAC shares in the period 1991-1998.
Table 1Transfer of TAC-shares 1991-1998. Percentage of TAC-shares in each year
Source: Fisheries Directorate
The transfer of ACEs are subject to some restrictions. First, the Fisheries Directorate must agree to transferof all ACE between geographical regions. The rationale for this stipulation is to stabilize local employment in theshort run and prevent speculation in quotas. In practice, however, it appears that few inter-regional transfers areactually blocked. Transfer of ACEs became subject to further restrictions in 1992 and 1994 when the Parliament
27 Runolfsson & Arnason
91/92 92/93 93/94 94/95 95/96 96/97 97/98 98/99 Cod 10.6 13.0 6.7 18.1 18.7 11.8 31.3 12.8 Haddock 11.0 16.6 7.2 18.3 18.1 11.2 27.9 12.2 Saithe 10.3 14.2 9.2 12.8 17.9 10.0 28.8 11.5 Redfish 8.3 12.6 9.7 8.1 16.0 5.9 30.6 4.4 Greenland halibut
3.1 10.3 4.2 9.9 15.4 8.1 34.7 3.5
Plaice 10.7 18.1 10.3 17.1 11.6 11.5 24.8 14.1 Herring 12.0 16.6 12.0 25.0 43.2 16.7 28.8 17.7 Capelin 2.9 6.7 9.4 2.7 11.2 3.8 21.0 18.0 Lobster 22.1 14.1 7.5 30.7 17.2 20.9 19.2 12.1 Deep-sea shrimp 14.7 15.2 13.3 22.6 24.9 20.2 44.4 28.1
3 In addition Iceland receives a share in the TAC for cod in the Norwegian EEZ and the Russian EEZ. These were allocatedto Icelandic vessels as ITQs in 1999.

amended the Fisheries Management Act of 1990. These amendments were designed to further discouragespeculative quota holdings. The constraints were, however, relatively insignificant. Further restrictions came intoeffect in 1998: up to only 50% of all ACE is freely tradeable between vessels under different ownership inexchange for money. However, the offsetting of transfers of different species with equal value is not subject toany such restrictions. Further, as vessel owners are not allowed to include the crew share in the cost of quotapurchases, all ACE transfers, as of 1998/99, have to take place at an official Quota Trade Exchange.
Table 2 shows transfers of ACE in 1992-1998. Note that the reduction in ACE transfers in 1998/99 mayreflect the impact of the new restrictions introduced in 1988 and the impact of the Quota Trade Exchange.
Table 2Transfers of quota between vessels 1992-1998. As percentage of total ACE1
1 These quotas are measured in cod equivalents and represent temporary annual quota (gross) transfers only.2 Type A: Transfers between vessels with the same owner.
Type B: Transfers between vessels with different owners operated from the same port. Type B and D aregrouped together as of 98/99
Type C: Offsetting transfers of different species with equal value between vessels with different owners.Type D: Transfers between vessels with different owners operated from different ports.Source: Fisheries Directorate.
2.5 Exemptions from the ITQ System
There is one minor exemption from the current ITQ system: in the demersal fisheries, hook-and-linefisheries by vessels under six GRT are exempted from quota restrictions, but are subject instead to limited fishingdays and an overall TAC. Although this arrangement was to end in 1994, the exemption was extended though thenumber fishing days was reduced. Under the 1996 amendment to the Fisheries Management Act these vesselsnow choose between a cod-share quota system and a cod-effort restriction system (maximum number ofallowable fishing days). As a group, they receive a 13.75% share of the general TAC for cod.
3. QUALITY OF THE ITQ PROPERTY RIGHT
Economic theory suggests that the efficiency of an ITQ system stems from its creation of private propertyin harvesting rights (e.g. Scott 1988, 1996; Arnason 1995b, 1999; Libecap 1989). This suggests that the higherthe quality of this property right in terms of permanence, exclusivity, and transferability, the greater will be theresulting efficiency of the ITQ system (see Scott 1988, 1989 for more details). ITQs are, of course, imperfectproperty rights. An ITQ is a harvesting right and not property in the fish stock. They are, therefore, different fromwhat is commonly referred as property rights on land. As pointed out by Hannesson (1994), ITQs are comparableto a right to extract a certain quantity of timber from a given forest or the right to harvest a certain number of deerfrom a given population. Although this may give the necessary incentives to cut the timer and catch the deer inefficient ways, it may not be suitable for the optimal husbandry of the forest or the population of deer.
Article 1 of the Fisheries Management Act of 1990states that the fish stocks in Icelandic waters are thecommon property of the Icelandic people. It further states that the allocation of ITQs to individual firms andvessels does not give irrevocable property rights in these TAC shares. Alas, this Article has created uncertaintyconcerning the permanence and exclusivity of the ITQs and has undermined its economic effectiveness.
Legal scholars in Iceland have debated these issues and there seems to be a general consensus among themthat Article 1 of the Fisheries Management Act of 1990 lacks grounding in other legislation. These scholars, itshould be noted, do not consider the fishery the property of TAC shareholders, but rather that they have a property(an asset) in the harvesting rights. The Parliament could, in principle, revert to open-access without compensationto vessel owners, as long as access continued to be open for them.4
Icelandic Fisheries 28
Transfer 2 92/93 93/94 94/95 95/96 96/97 97/98 98/99 Type A 33.0 26.3 41.3 32.5 31.3 38.6 26.7 Type B 20.2 23.9 13.6 18.3 19.4 15.4 - Type C 12.6 11.3 12.0 7.2 10.1 9.0 8.1 Type D 34.3 38.5 33.1 42.1 39.2 37.0 11.5 Total 66.2 63.7 78.1 71.2 68.1 69.3 46.3
4 The uncertainty and insecurity of the property rights in ITQs also created problems for tax authorities and the banks. Thetax authorities were uncertain whether a vessel-quota should be regarded as an asset on the firm’s books or if expenditures
As a result, the quality of the property rights of Icelandic ITQs is substantially reduced. Thus Arnason (1999)finds that on a scale of zero to one, the quality of the Icelandic ITQ property right is only about 0.7, considerablyless than the quality of the New Zealand ITQ right.
4. METHOD OF ALLOCA TION
The initial allocation of TAC shares to individual vessels varies somewhat between fisheries. The generalpolicy behind issuing quotas has always been to distribute the quotas in a “fair” way, when it was recognized thata TAC had to be set and entry in the fishery had to be limited.
Eligibility and the method for deciding on allocations have always been done in close cooperation with theparties concerned, i.e. the government, the vessel owners and the fishermen. In the demersal fisheries, forexample, after the Parliament had changed the necessary legislation in December 1983 (a change that was basedon the proposals of the Fisheries Association and the Association of Vessel Owners) a committee was formed todevelop specific regulations for the quota system. The committee was comprised of representatives ofgovernment, vessel owners and fishermen. The committee was assisted in its task by the staff at the Ministry ofFisheries and the Fisheries Association. In January 1984 the committee published its proposals and the Ministry,with only minor changes in the proposals, issued regulations in February for the demersal fishery for 1984.Included in the regulations was the formation of an appeals committee comprising three members, one each fromthe Ministry, the Association of Vessel Owners, and the Association of Fishermen.
The general rule for eligibility to receive quota in a given fishery has been that a vessel had to demonstratea catch history in that fishery. In the demersal fisheries the initial allocation was equal to the vessel’s averageshare in the total catch during the three years prior to the introduction of the ITQ system in 1984. However therewere noteworthy exceptions to this rule: if for instance, the vessel in question was not operating normally duringthe period from 1981 to 1983 (for instance because of major repairs, or had entered the fleet after 1981) thecalculated share was adjusted upwards. Several vessel-owners, based on these issues complained about theirinitial quota shares in 1984, and the appeals committee made several changes. During the years 1985-1987 it waspossible to modify the TAC shares by temporarily opting for effort restrictions instead of vessel quotas, and bydemonstrating high catches during this period.
In the lobster and deep-sea shrimp fisheries the shares of the TACs are also normally based on the vessel’shistorical catch recorded during certain base years. In the herring and inshore shrimp fisheries the initial TACshares were equal for all eligible vessels. The same held for the capelin fishery, except that a third of the TACshares were initially allocated on the basis of vessel hold-capacity. The general rule now, is to issue TAC sharesin new fisheries to vessels on the basis of the catch record of the three previous years.
5. EVALUA TION OF THE INITIAL ALLOCA TION PROCESS5.1 Success in achieving initial policy objectives
As discussed earlier, the allocation of quota rights in Iceland took place at different times in differentfisheries. As new fisheries have been brought under the ITQ regime, new quota allocations have taken place.Moreover, even in established ITQ fisheries, quota allocations have been subject to modifications. In thedemersal fisheries, for instance, the allocation of quota rights was not a once-and-for-all affair but an extendedprocess, due to the impact of the effort option between 1985 and 1990, and the gradual inclusion of segments ofthe small artisanal fleet into the ITQ system during 1991-1998. Thus, the allocation of quota rights in theIcelandic fisheries is a process that, though begun in 1975, is still going on. This prolonged period of quotaallocations immediately suggests a certain difficulty in identifying and even discussing policy objectives of initialallocations in a useful way.
29 Runolfsson & Arnason
on quotas should be regarded as outlays that are deductible from taxable income. When the tax authorities and the Ministryof Finance could not agree on the rules it was left for the courts to decide the matter. The courts decided that transfer of ACEswould be treated as taxable outlay while transfers of TAC shares would be treated as assets and depreciated over 5 years.Allocated quotas, whether annual or shares, were not subject to these tax rules and were treated as non-taxable. In 1997 theParliament passed legislation whereby depreciation of TAC was abolished gradually through the year 2000. The banks hadbeen unsure whether a vessel’s quota should be regarded as part of the vessel’s equity (value) when a vessel is put up ascollateral for a bank loan. Both the Parliament and the courts agreed that quotas were not to be regarded as the property of avessel owner, and were, therefore, not a legitimate collateral for loans. The Parliament passed legislation in 1997 that clarifiedthis issue. Vessel owners and banks have, however, figured out ways to circumvent this: for example, a bank may make a loanon the condition that it must approve of any transfers of TAC shares.

Broadly speaking, the initial allocation, of quotas have taken place at the time quota systems in the variousfisheries were introduced. It is also broadly true that on those occasions the policy objectives for the particularallocation selected, if they existed at all, were not stated. On reviewing the discussion at the times the mostsignificant steps in the allocation of ITQ rights occurred (i.e. 1975, 1979/80, 1984 and 1990) it emerged that theoverriding concern in all cases was to improve the operating conditions and economic efficiency of the fleets inquestion. Concluding in each case that the way to go was IQs and ITQs, the question of quota allocation wassimply settled by whatever the main interested parties, primarily the vessel owners, fishermen and regionalrepresentatives, could agree on.
This suggests that policy objectives in the sense of well defined goals were not a part of this procedure. Itwas more like a balancing of the various (largely similar) interests. In most cases the agreement was to allocatequotas on the basis of retaining historical catch shares, thus suggesting that the overall consensus may have beento (a) respect historical rights and (b) avoid rapid, radical changes in the distribution of catch across regions andvessels.
In retrospect it is very clear that the main objective of increased economic efficiency has been achieved.Moreover, historical rights have been largely respected and the reallocation of catch via quota trades acrossregions and vessels has been a fairly slow moving, smooth process. Thus the two allocation objectives have alsobeen achieved.
5.2 Satisfaction of rights-holders with the process
First, it is important to realize that there is no hard data available on the views of rights-holders (or others)about the ‘process’. There are no reliable studies on this issue. Therefore what follows merely represents ourimpression.
It is useful here to distinguish between two groups of fishermen: vessel-owners on the one hand, and fishinglabour on the other. As the quotas are associated with vessels, fishing labour are not rights-holders. Both partieswere reasonably happy with the allocation at the outset of each ITQ system. Today, vessel-owners, broadlyspeaking, continue to be happy with the process. This is to be expected: they were the recipients of considerableasset appreciation in the form of quota price increases. There is only a certain amount of dissatisfaction amongthose who sold their quotas prematurely, i.e. before they reached the current value. The only identifiable groupof vessel-owners that seems to be partly critical of the quota allocation process are the small vessel-owners,especially those who entered the system later and do not hold quotas. These, however, represent a small part ofthe overall fishery.
Today, a subset of fishing labour appears critical of the quota allocations, especially those fishermen whosevessels have reduced their quota holdings, and those fishermen who are in the position of having to participate inthe cost of quota purchases at the insistence of the owner of their vessel.
5.3 Views of othercommunity groups
The caveat regarding lack of reliable data (in Section 5.2) applies even more to this section. Communitygroups outside the fishing industry were not involved in the initial allocation of quota rights in the variousfisheries and did not seem interested in the process. During the past few years, more precisely in the 1990s, thesharing of the quota rents has become a significant topic in Icelandic political debate. While this debate is mostlyconcerned about reallocating quota rents by the means of taxes and does not necessarily question theappropriateness of the initial allocation, this unavoidably enters into the discussion. Therefore, it does not seemfar from the truth to say that the various community groups, or more appropriately, the large part of the generalpublic, now questions the fairness of the initial allocation of the quotas. However, perhaps it is not so much thefairness of the allocation itself - most people seem to realize that the vessel owners should be the ones to actuallyoperate the fishery - but the allocation of the quotas without any provision for quota fees.
One particular class of community groups should be singled out in this respect: the inhabitants of fishingvillages and towns from which quotas have been transferred. These are typically critical of the initial allocationof quotas and often suggest that their community should receive (or have received) its own local quota.
5.4 Hind-sight assessment
Should rights have been allocated differently, given hind-sight? In general the answer would be no. Noother course was really feasible at the time. It has to be remembered that, at the time IQs and ITQs wereintroduced in the various fisheries, the fisheries were usually in crisis and there had to be substantial cutbacksin TACs.
Icelandic Fisheries 30

In retrospect it seems that perhaps it might have been useful, at the time, to have undertaken two otheractions:
i. Drawn attention to, and provided more information on, the long-term financial implications of the initialquota allocation.
ii. Defined the quota asset (right) in such a way that later concerns about equity and fair distribution could bemore easily dealt with.
Assuming that the efficiency aspects of the ITQ system must not be compromised, this, of course, impliestwo diametrically opposite approaches: (a) provisions for a later taxation of the quota right and (b), unqualifiedproperty right protection for the quotas.
6. LITERA TURE CITED
Arnason, R. 1990. Minimum information management in fisheries. Canadian Journal of Economic 23, 630-653.
Arnason, R. 1994. On Catch Discarding in Fisheries. Marine Resource Economics 9, 189-207.Arnason, R. 1995a. The Icelandic Fisheries: Evolution and management of a fishing industry. Oxford: Fishing
News Books.Arnason, R. 1995b. The ITQ Fisheries Management System: Advantages and Disadvantages. In: Johansen,
S.T.F., (ed.) Nordiske Fiskerisamfund I Fremtiden. Kobenhaven: Nord, 43-70.Arnason, R. 1996a. On the ITQ fisheries management system in Iceland. Reviews in Fish Biology and Fisheries
6, 63-90.Arnason, Ragnar 1996b. Property Rights as an Organizational Framework in Fisheries: The Case of Six Fishing
Nations, In: Crowley, B.L. (ed.) Taking Ownership; Property Rights and Fishery Management on theAtlantic Coast. 99-144. Halifax: Atlantic Institute for Market Studies.
Arnason, R. 2000. Property Rights as a Means of Economic Organization In: Shotton, R. (ed.) Use of PropertyRights in Fisheries Management. Proceedings of the FishRights99 Conference, Fremantle, Australia, 11-19November 1999. Mini-course lectures and Core Conference presentations. FAO Fish. Tech Pap. 404/1 pp14-25.
Crowley, B.L. (ed.) 1996. Taking Ownership; Property Rights and Fishery Management on the Atlantic Coast.Halifax: Atlantic Institute for Market Studies.
Gissurarson, H. and R. Arnason, (eds.) 1999. Individual Transferable Quotas, in Theory and Practice, Reykjavik:University of Iceland Press.
Hannesson, R. 1994. Trends in Fishery Management. In: LoyayzaE.A. (ed.) Managing Fishery Resources, WorldBank Discussion Papers 217.
Libecap, G.D. 1989. Contracting for Property Rights. Cambridge: Cambridge University PressNeher, P., R. Arnason and N. Mollet 1989. Rights Based Fishing. Boston: Kluwer Academic PressRunolfsson, B. 1997. The Icelandic System of ITQs: Its Nature and Performance. In: Gissuarson H. and R.
Arnason (eds.) Individual Transferable Quotas in Theory and Practice. Reykjavik: University of IcelandPress.
Scott, A. 1988. Conceptual Origins of Rights Based Fishing. In: Neher, P.A., R. Arnason and N. Mollett (eds.)Rights Based Fishing. Dordrecht: Kluwer.
Scott, A. 1996. The ITQ as a Property Right: Where It Came From, How It Works, and Where It Is Going. In:Crowley, B.L. (ed.) Taking Ownership: Property Rights and Fisheries Management on the Atlantic Coast.31-98. Halifax: Atlantic Institute for Market Studies.
31 Runolfsson & Arnason

ALLOCA TION OF HARVESTING RIGHTSIN THREE ATLANTIC CANADA MARINE FISHERIES
Julia Barrow1
Resource Management – Atlantic, Department of Fisheries and Oceans200 Kent St., Ottawa, Ontario, Canada K1A0E6
G.E. JeffersonFisheries Management Consulting Services
40 Gateway Road, Halifax, Nova Scotia, Canada, B3M 1M9<[email protected]>
M.D. Eagles1 and G.J. Stevens1
Department of Fisheries & Oceans176 Portland Street, Dartmouth, Nova Scotia, Canada, B2Y4T6.
<[email protected]> <[email protected]>.
1. INTRODUCTION
The fisheries of Atlantic Canada comprise a wide variety of species taken using a wide variety of gears andthey remain the dominant fisheries in Canada, both in volume landed and value, despite the major changes in thespecies composition of the catch that has occurred in the last ten years, not least among two of the three speciesthat are described in this paper (Figure 1). And, not unsurprisingly, this variety in their characteristics is matchedin the approaches that have been used in deciding how allocations of quota would be made when the managementof these particular fisheries has switched to a rights-based approach.
Figure 1Reported landings of snow crab, northern shrimp and scallops in Atlantic Canada, 1985 - 1999
Responsibility for the management of marine fisheries in Canada rests with the Department of Fisheries andOceans, which is part of the Canadian Federal Government. The authority to manage Canada’s marine fisherieshas its origins in the Dominion Fisheries Act 1868 which gave the Canadian cabinet complete power to make anyregulations it saw fit “… for the better management and regulation of the sea-coast and inland fisheries…”(Parsons 1993). An important amendment was made in 1985 when a new “Purposes” section was added that aswell as the traditional objectives of conservation and protection and proper management recognized that thefederal government had the right:
32
0
20,000
40,000
60,000
80,000
100,000
1985 1986 1987 1988 1989 1990 1991 1992 1993 1994 1995 1996 1997 1998 1999
Chionoecetes opilio
Pandalus borealis
Placopecten magellanicus
1 The views expressed in this paper are not necessarily those of the Department of Fisheries and Oceans, Canada.
Tonn
es
“to ensure a continuing supply of fish and, … taking into consideration the interests of user groupsand on the basis of consultations, to maintain and develop the economic and social benefits from theuse of fish to fishermen and others employed in the Canadian seacoast fishing industry, to those whoselivelihoods depends in whole or in part on seacoast fishing and to the people of Canada ….”.
However, from 1987, this objective has no longer been formally pursued.
Since the 1970s there have been different policy priorities in Canada’s federal Department of Fisheries andOceans, which have changed about every decade in response to what was believed to be important to sustain fishstocks and the economic well-being of the industry. During the 1970s the priority was to gain control over thefisheries in the Atlantic coastal waters by extending management authority throughout the 200-mile zone. In the1980s more attention was focused on regulating fishing capacity and conserving stocks. In the 1990s, duringsome stock collapses and severe cutbacks in government resources, the government attempted to reduce thenumber of fishing vessels and encourage more responsible fishing practices. It was also a time when a formalizedco-management fisheries practices, a new licensing policy and the beginning of cost recovery for some of theDepartment’s services, such as the cost of monitoring the landings of fishing vessels at shore based facilities(referred to as quota monitoring) were implemented. Throughout the past 30 years there were periods of shiftsin the fishing economy and frequent conflicts over allocations and access. Discussions on policy objectives ofthat era were often dominated by disagreements on economic and social aspects of the management regime bythe fishing industry. This prompted the need for more involvement and participation by private industry,individuals and communities to encourage an increased role in the planning, management and participation infishing activities and stock conservation.
During the 1970s, various forms of controls were used to regulate the fisheries such as limiting the numberof entrants to a fishery and strict vessel replacement rules to limit “ over-capacity “ in various fisheries. Theseregulations concentrated on the effects of the property problem but did not address the real cause of overfishingand overcapacity, which were both conservation and economic issues. The first attempt at implementingindividual quotas in Canadian fisheries was seriously considered at that time. During the late 1970s and the early1980s, economists considered individual quotas, quasi-property rights, or quantitative rights, as a means toachieve better economies and returns from the fisheries. The first enterprise allocation programme2 wasimplemented for a five-year period in the management of the offshore ground-fishery. By the end of the 1980sthe individual quota system had been introduced into many of Canada’s Atlantic fisheries. The allocation ofindividual quotas meant that enterprises could eliminate competitive fishing and schedule fishing operations ona more rational basis, especially regulating supply in response to market demands and so achieve best productprices.
The fisheries that operated under the enterprise allocation programme were more profitable than if they hadcontinued in a competitive fishery although not all of the industry was happy. With the reduction in fleet capacitycame reduced crew numbers to operate the vessels. The crews that remained in the fishery did much betterfinancially because the crew shares were higher resulting from increased efficiency in the fewer remaining vesselsand lower overhead costs. Crew that were displaced by the downsizing of the fleet were much less pleased withthe programme as they had to find other employment in their respective communities or in other fisheries. Insome cases, there was a need to establish fleet separation between the inshore and offshore fleets when grantingthe various shares of the available catch and there were instances where some believed their share was notadequate. Nonetheless, the enterprise allocation programmes were successful in rationalizing the large fleetsectors, conserving the limited stock levels and contributing towards economic improvement.
2. THE CANADIAN ATLANTIC NOR THERN SHRIMP FISHERY2.1 Intr oduction
The northern shrimp (Pandalus borealis) fishery3 takes place off the coast of eastern Canada from latitude49° 15’ N to Baffin Bay in the far north. A new fishing area was added in 2000, bringing the southern limit to46°N. Although separate stocks of shrimp have not been clearly defined, scientists have observed differences inrates of growth and maturation, which are attributable to different habitat conditions across the geographic rangeof the species. These differences provide the basis for delineating assessments (Figure 3).
33 Barrow, Jefferson, Eagles & Stevens
2 Various terms have been used in describing the allocation of property rights in these fisheries such as: quota licences;enterprise allocations; individual transferable quotas (ITQs); and individual boat quotas (IBQs) .
3 Some Pandalus montaguiare caught at higher latitudes.

Figure 2Generalized shrimp fishing areas
Atlantic Canadian Marine Fisheries 34
Quebec
Labrador
Greenland
BaffinIs.
Hawke+3KSFA 6
Hopedale+
Cartwright
SFA 5
2GSFA 4
0B
SFA 2
Territory
of Nunavut
SFA 3
70¡ 68¡ 66¡ 64¡ 62¡ 60¡ 58¡ 56¡ 54¡ 52¡ 50¡ 48¡ 46¡48¡
50¡
52¡
54¡
56¡
58¡
60¡
62¡
64¡
66¡
200 mile limit
Nfld.
200 m.
500 m.
fishing grounds
Quebec
Labrador
Greenland
BaffinIs.
Hawke+3KSFA 6
Hopedale+
Cartwright
SFA 5
2GSFA 4
0B
SFA 2
Territory
of Nunavut
SFA 3
70¡ 68¡ 66¡ 64¡ 62¡ 60¡ 58¡ 56¡ 54¡ 52¡ 50¡ 48¡ 46¡48¡
50¡
52¡
54¡
56¡
58¡
60¡
62¡
64¡
66¡
200 mile limit
Nfld.
200 m.
500 m.
fishing grounds

The northern shrimp fishery is complex in regard to bothinternational and domestic considerations. The fishery in the DavisStrait exploits a joint Canada-Greenland stock, the sharing andmanagement of which is the subject of annual bilateral meetingsbetween the two countries. The fishery on the Flemish Cap andneighbouring areas of the Grand Banks, outside Canada’s 200-milelimit, is also the subject of international negotiations with othermembers of the Northwest Atlantic Fisheries Organization. Fordomestic considerations, sharing of the shrimp resource withadjacent, inshore fishermen, especially those affected by thedownturn in ground-fish stocks, has become a major issue in recentyears. Further, Aboriginal interests adjacent to the resource areseeking greater access; they currently hold five of the seventeen commercial offshore licences. One land claim(Nunavut) has been settled, while other adjacent Aboriginal groups are currently negotiating resolution of theirland claims, which include fisheries components.
The northern shrimp fishery began in Eastern Canada in the late 1970’s after the federal Department ofFisheries and Oceans conducted exploratory cruises that verified the presence of shrimp stocks in the waters offNewfoundland and Labrador. In 1977, the Department of Fisheries and Oceans, in conjunction with FisheryProducts Limited, conducted a study to determine the commercial feasibility of harvesting these stocks. Fourvessels, two Canadian and two Norwegian, carried out a test fishery over approximately five months, achievingan average catch rate of eight tonnes per day, which demonstrated the potential for a commercial fishery.
This successful experiment was followed by a flood of applications to the Department of Fisheries andOceans for shrimp harvesting licences. Approximately forty applications were received from interested partiesthroughout Eastern Canada. The Department of Fisheries and Oceans first issued eleven licences in 1978,followed by one more licence in 1979 and four additional licences in 1987. The last of the current seventeenoffshore licences was issued in 1991. Twelve companies hold the seventeen licences. The early years of thefishery were characterized by weak markets and an adjustment period for participants, some of whomexperienced financial and development difficulties. This led to several licences changing hands and others beingfished under joint ventures with dedicated operating companies. Also, several of the licences were not fished fora number of years during the early and mid 1980s.
The last of the current 17 offshore licences were issued in 1991. The average crew in the offshore fleet variesbetween 17 and 28, depending on the size of vessel, for a total of approximately 600 crew in the entire fleet.Currently, there are seventeen offshore northern shrimp licences held by twelve corporate entities: four companieshold two licences each, eight others hold a single licence and two of these are joint owners of a company holdingone licence. The holders of the licences would be categorized in a number of ways but, from an operationalperspective they can be divided into two groups: (a) those who operate their own licence; and (b) those who havean operating company do their harvesting and carry the risk for them. Another factor that distinguished the licenceholders is whether they fished with a foreign or domestic flag vessel. Ice-strengthened, factory-type vesselsrequired for the shrimp fishery did not exist in Canada. A number of foreign vessels were purchased andreflagged, and others were chartered on a long-term basis. In 1990, the Minister of Fisheries and Oceans requiredthat all vessels in the shrimp fishery operate under a Canadian flag.
Vessel specifications have provided a means to distinguish the operators and since 1986 there has been ahigh rate of investment in shrimp vessels, principally in reaction to the fundamental changes in product prices,landings and fishing effort. Some variation exists in the fleet in terms of vessel age, size, ability to fish in iceconditions and capability to process shrimp on board the vessel. Prior to 1987, many operators believed that itwas uneconomic to fish shrimp without also having an allocation of groundfish. Because of the closure of thefishery for northern cod, this aspect of the fishery is not included and the introduction of specialized fishing gear(the Nordmore Grate) has all but eliminated the bycatch of groundfish.
The northern shrimp fishery makes an important contribution to northern development through employmentand training as the incomes from fishing, processing and service industries make substantial contributions to 30– 40 northern communities. The offshore fleet averages crew complements of 17 to 28, depending on the size ofvessel. There is approximately 600 crew in the entire fleet. The vessels operate out of ports in Newfoundland andNova Scotia, with occasional landings in Greenland when fishing in the far northern region. Fishing tripsgenerally last until the hold is full, a period ranging from 25 to 75 days, depending on catch rates and holdcapacity. Large vessels make six to eight fishing trips per year, averaging 270 – 320 days at sea annually. This
35 Barrow, Jefferson, Eagles & Stevens
Northern Shrimp(Pandalus borealis)

makes the offshore northern shrimp fishery a year-round fishery, which is essential to provide a continuous supplyof shrimp to the fiercely competitive international market and to maintain a financially viable operation. The totallandings of northern shrimp for the years 1977 to 2000 are given in Table 1.
Table 1Commercial and exploratory landings of Northern Shrimp (t) 1977-2000
1 Beginning in 1991, data for the competitive fishery in exploratory areas have been eliminated.2 Landings prior to 1997 are for the offshore fleet only; from 1997 on, landings for temporary, inshore harvesters
are includedSource: Canada Department of Fisheries and Oceans, Economic Analysis Division, St. Johns, Newfoundland, andCanadian Atlantic Quota Reports, 1990 - 2000.
Following the exploratory fishing, the commercial fishery for northern shrimp began and the early resultswere encouraging. The 1986 fishery showed the beginning in future trends in landings with higher prices forproduct and a depreciated Canadian dollar attracted additional effort. However, the weak markets during the mid-1980s caused landings to decline. Annual catches had increased to 9000t in 1981 but then declined to only 3000tin 1984. By 1986, landings were double those of 1985 and market conditions had improved and the industryresponded with substantially increased fishing effort and catches; in 1987 the landings doubled again. Thepercentage of the commercial quota harvested was only 26% in 1984 but reached 95% in 1987. Landings perlicence were 1172t in 1987, 1618t in 1988 and 1685t in 1989.
On April 23, 1997, the then federal Minister of Fisheries and Oceans announced that the total allowablecatch (TAC) of northern shrimp would be increased to 59050t from 37600t the previous year. Based on theaverage price per tonne for northern shrimp, the fishery would generate about $Can75 million of additionalrevenue, bringing the total value to $Can215 million that year. The 1997 catch of approximately 48000t was thehighest recorded. Appendix I provides an outline of the sharing plan in 1997.
This increased TAC was limited to the SFAs 2,5, and 6 and the increased allocations were shared betweenthe existing fleet and a temporary fleet composed of inshore (<65’) vessels. Temporary access will continue untilthere is a decrease below the 1996 threshold levels.
Atlantic Canadian Marine Fisheries 36
Year Commercial quota (t)
Commercial catch (t)
% harvested
Exploratory catch
Total reported landings
1977 - 2 617 - 0 2 617 1978 8 200 3 630 44 0 3 630 1979 8 850 5 459 62 92 5 551 1980 9 350 7 070 76 0 7 070 1981 11 850 8 881 75 0 8 881 1982 11 850 3 795 32 0 3 795 1983 12 500 6 443 52 0 6 443 1984 11 900 3 144 26 0 3 144 1985 12 390 4 329 35 0 4 329 1986 13 920 9 334 67 0 9 334 1987 15 620 14 807 95 3 945 18 752 1988 15 620 15 885 102 10 008 25 893 1989 19 200 19 093 99 7 873 26 966 1990 19 200 14 717 77 3 290 18 007 1991 26 516 19 051 72 (1) 19 172 1992 29 350 24 199 82 24 199 1993 37 165 25 797 69 25 797 1994 36 410 28 835 79 28 985 1995 37 600 30 047 80 30 213 1996 37 600 31 340 83 31 340 1997 59 050 48 310 82 (2) 48 310 1998 87 020 78 867 91 78 867 1999 102 052 85 183 83 85 183 2000 110 052 100 091 91 100 091
2.2 The nature of the harvesting right
For the offshore shrimp fishery to attract dedicated shrimp fishing vessels, there had to be some assurancethat the fishery could support such a vessel. Strong shrimp product markets in 1987 and 1988, supported byattractive exchange rates and a surging growth in landings, encouraged the introduction of vessels that were solelyequipped for fishing shrimp. The then competitive nature of the exploratory fishery also contributed to the trendtoward dedicated vessels. The competitive fishery provided companies with an incentive to acquire a vessel thatcould land a larger share in the competitive fishery. Generally, those with the best vessels got the biggest share.The level of capital investment in new vessels was at least 13 million dollars with many in the range of 16 millionto 18 million dollars. These were powerful and sophisticated vessels that used the latest in communications,navigation, harvesting and processing technology.
The technological change in vessel construction and equipment facilitated the move toward a fleet ofdedicated shrimp fishing vessels designed to fish in harsh conditions and spread fishing time over a longer periodand a larger volume of landings which helped defray the initial capital cost and the annual operating costs. Thesedevelopments contributed to an improvement in fleet efficiency and further reduced the risk of catch failures,which allowed the fishery to be conducted as an independent fishery. However, the participants in the fisheryexpected assurances of access to the fishery and some degree of stabilization over time in allocations to theresource. There was also concern by some companies that they would be disadvantaged in a competitive fisherybecause of others holding more than one shrimp licence and the role of foreign flag vessels which required lessinvestment by those licence holders using them.
In 1987, a two-year experimental enterprise-allocation programme was introduced and provided an equalallocation to licence holders of the allowable catch in each of the SFAs set out in the North Atlantic underCanadian jurisdiction. The allocations were transferable on a temporary basis during the current fishing season.Each licence holder had an opportunity to participate in a competitive exploratory fishery in new areas.
In 1989, the programme was instituted on a permanent basis and a compulsory observer programme with100% coverage was implemented at the expense of the licence holders. Under the permanent enterprise allocationprogramme, inter-enterprise transfers were permitted on a temporary basis and were freely transferable betweenand within enterprises provided that the transfer applied to the current season. The allocations were made toindividual licence holders in the form of a quota expressed in tonnes and based on the TAC established for therespective northern SFAs, divided equally among the seventeen licences. The licence holders were given equalaccess to all northern shrimp stocks and fishing areas and their allocations were determined by dividing the TACset for each SFA equally by the 17 offshore licences in the fishery.
Canadian federal fishing licences are generally issued for one fishing season at a time. The Minister ofFisheries and Oceans has the legislative authority to allocate fish in any way he or she sees fit each year. However,in practice, to ensure stability in the various fisheries-related sectors, allocations to fleets each season are largelybased on past practice. The offshore northern shrimp licensees were given assurances with the introduction of theenterprise allocation programme that future allocation decisions would not jeopardize their viability and theywould retain their allocations.
2.3 The method of allocation2.3.1 Policy objectives
The basic long-term policy objectives for this fishery, stated in management plans starting in 1987, were:
i. optimum exploitation of all northern shrimp stocks, with due regards to effective resource conservation andthe orderly long-term development of the entire northern shrimp fishery.
ii. Fair access to, and equitable sharing of, the northern shrimp resource by all legitimate Canadian user groups,with particular emphasis on the needs of the people and communities most adjacent to the resource.
iii. Canadianization of all aspects of the northern shrimp fishery – harvesting, processing and marketing – sothat the maximum benefits from this fishery accrue to Canadian user groups.
iv. Development of a modern, commercially viable, and self-sustaining, northern shrimp fishery.
By 1987, enterprise allocation programmes were already in place in Canadian offshore groundfish,offshore lobster and offshore scallop fisheries, and provided good examples to follow. With the consensus ofthe northern shrimp stakeholders at the time, and economic analyses indicating that stable access to theresource would enhance the offshore northern shrimp fleet’s overall viability, the models offered by these otherfisheries were followed for northern shrimp. Enterprise allocations support, in various ways, all of the abovepolicy objectives.
37 Barrow, Jefferson, Eagles & Stevens
2.3.2 Process used in determining the allocation
The Northern Shrimp Advisory Committee (NSAC) has served, and continues to serve, as the consultativeforum for the discussion, advice and input on allocations and issues on the management and development of thenorthern shrimp fishery. The NSAC members are representatives of the federal Department of Fisheries andOceans, licence holders, provincial and territorial governments, and processing interests. The NSAC providesadvice to the Minister of Fisheries and Oceans. NSAC members first discussed an enterprise allocation system in1986 and all agreed with its implementation in 1987.
The economic study carried out by the Department of Fisheries and Oceans in 1987 indicated that the fleetas it was then configured was generally not achieving an economic profit (Collins 1987). The study based itsfindings on average landings of 600t per vessel. The final decision for the 1987 management plan was to establisha two-year experimental enterprise allocation programme with initial enterprise allocations of 1000t per licence,given that the projected global TAC would be about 16 000t per year over the two-year trial period. The numberof licences at that time was sixteen. There was also provision made for reallocation of unused quota three-quartersof the way through the fishing season. In 1987, the average landings were 1172t per licence, includingcompetitive exploratory fishing, although many licences were relatively inactive. In 1988 and 1989, averagelandings were 1618t and 1685t per licence, respectively. The individual allocations in 1989 were increased from1000t per licence to 1200t per licence although the average potential quota per licence was approximately 1700tbecause of the availability of the exploratory fishery in new fishing areas.
The economic advice provided in 1990 suggested that 1000t was an inadequate amount of shrimp uponwhich to support a new, dedicated shrimp-fishing vessel. At the same time, scientific advice supported increasedTACs. Rather than add licences to the fishery, enterprise allocations to existing licensees were increased. As aresult, the individual quotas were increased to 1700t in 1990.
With the increase in TAC in 1997, and the need for a fair allocation, the industry was invited to makeproposals for developing an appropriate sharing formula. The proposals were then reviewed at a public meetingto maximize industry input. Recommendations were then presented to the NSAC and submitted to the Ministerof Fisheries and Oceans for approval.
2.3.3 Allocation method chosen
The conferring of individual quotas to the offshore licence holders was based on equal access to all SFAs,as had generally been the case from the beginning of the fishery. Licensees received equal quota amounts,expressed in absolute tonnage, in each SFA that in total equalled the TAC for the SFA. The TACs are decided bythe federal Minister of Fisheries and Oceans, with recommendations from the NSAC, which considers the stockstatus advice from the federal Department of Fisheries and Oceans scientists. The inter-enterprise transfers ofquota were permitted between companies for the current fishing season only. Licence holders had until 15 Januaryof the subsequent year to complete transfers to cover any overruns of their quotas. Penalty clauses were built inthe quota over-run situations where an excess of five tonnes would result in a two-for-one reduction in the quotain the fishing area for the following year.
The rationale behind the introduction of individual quotas for the temporary inshore fleet relied heavily onthe need to maximize employment and economic benefits to the local communities. Five groups receivedtemporary allocations and local Management Boards were established to manage the temporary quotas.
2.4 Data requirements and computational process
As noted earlier, the northern shrimp fishery was a developmental fishery initiated by the federalDepartment of Fisheries and Oceans through exploratory cruises that verified the presence of shrimp stocks offthe coasts of Newfoundland and Labrador. As the knowledge of shrimp availability and location expanded in theearly years through exploratory fishing, new licences were added. The general principle followed from the startof the fishery was that each licence would have equal access and opportunity in each SFA.
The exploratory content of fishing operations throughout the developmental stages of the fishery,commencing in 1978, meant that the participants benefited by accurate reporting of landings. At-sea monitoringby independent observers of the catch was also important to provide landings verification, as well as to ensurecompliance with regulations pertaining to bycatch of groundfish and discards of broken shrimp although coverageby observers was less than 100% until 1989. Landings statistics were collected by the Department of Fisheriesand Oceans through the use of daily hails of fishing activities and logbooks compiled and submitted by the licenceholders, with these records being verified and retained by the Department.
Atlantic Canadian Marine Fisheries 38
The computational process has remained straightforward. Once the TAC for each SFA was established, eachof the licences was allocated a tonnage in that SFA equal to one-seventeenth of the TAC. As of 1997, the equalshares are based on that portion of the TAC apportioned to the offshore fleet.
2.5 Appeals process
There was no formal appeals process, although complaints could be raised at any time with the Departmentof Fisheries and Oceans or the Minister of Fisheries and Oceans. The Northern Shrimp Advisory Committeeserves as the forum for consultations and discussions of issues on the management and development of thenorthern shrimp fishery, including the enterprise allocation programme, and provides advice to the Minister. In1987, the Committee members unanimously agreed with the establishment of equal enterprise allocations. In1989 the programme was made permanent by the Minister of Fisheries and Oceans, with assurances that theviability of the existing enterprises would not be jeopardized and licence holders would retain their quotas in theshrimp fishing areas. Also, the existing licence holders continued to share equally in increased allocations in areaswhere there was an increase in the total allowable catch. A more recent economic assessment of the offshorenorthern shrimp operations, conducted in 1995, concluded that a total enterprise allocation of about 2400t wouldbe required for a new vessel in the fishery to break even. This conclusion led, in part, to the establishment, in1997, of a quota threshold of 37 600 t for this fishery, above which sharing with new participants would occur.This threshold provided enterprise allocations of over 2200t per existing offshore licence. It is anticipated thatany future major change in the economic situation or shrimp abundance would trigger another economicassessment prior to any decision to change the enterprise allocation programme.
2.6 Administration of the allocation process2.6.1 Staff requirements
The implementation of the enterprise allocation programme was conducted within the available staffresources of the Department of Fisheries and Oceans. The consultations with representatives of the shrimpfishing and processing sectors are conducted through the Northern Shrimp Advisory Committee, as the forumfor negotiations and resolution of issues including the enterprise allocation programme. This Committee isorganized and chaired by officials in National headquarters in Ottawa. A major workload associated with theprogramme is the preparation of licence documents and processing of in-season transfers of quota betweenlicences. Both of these functions are also carried out in Ottawa. The transfers are handled through one centralpoint of contact, so that an accurate record of how much quota each licence has in each SAis maintained.Transfer requests are reviewed to ensure that adequate quota is available and confirmation of the transfer issent to both parties. An average of 300 transfers is processed annually for the offshore shrimp fishery,occupying about 10% of one person’s time.
2.6.2 Additional pr ogramme funding requirements
No additional funding was provided by the Department of Fisheries and Oceans for the implementation ofthis programme. The costs for the observers carried on the offshore shrimp vessels at all times are paid byindustry. Random dockside monitoring of landings from offshore shrimp vessels in Canada is performed tocompare catch reports with actual landings and is also at industry’s expense. Completion and submission to theDepartment of accurate fishing and production logbooks and purchase slips is required of the licence holders. Alloffshore shrimp vessels must report their position and catch on a daily basis to their company and this report isforwarded to the Department daily.
Fishery patrol vessels are deployed to northern areas as required for operational activities and are multi-tasked. Air surveillance patrols are conducted in northern areas as part of a co-operative arrangement with thefederal Department of National Defence. Observer coverage and air surveillance are key activities in themonitoring of the northern offshore shrimp fishery. These activities are carried out within existing enforcementbudgets.
2.7 Evaluation of the initial allocation process2.7.1 Success in achieving initial policy objectives
The objectives of the allocation process have been, and continue to be, successfully achieved throughorderly long-term development of the fishery. These ensure that the economic viability of the existing licenceholders is not jeopardized, and ensuring benefits for the harvesting and processing sectors, all with particularemphasis on the needs of the people and communities most adjacent to the shrimp resource.
The catch of northern shrimp increased dramatically between 1977 and 2000, rising from 2600t to over100000t. Prices for product averaged $Can 4380/t over the 1994-1996 period and the long-term average has beenaround $Can 4000/t. The total value of the catch by the offshore fleet in 2000 is estimated at $Can 180 million,
39 Barrow, Jefferson, Eagles & Stevens

up from $Can 78 million in 1989. Enterprise allocations have given this fleet long-term stability, enablingexploration and orderly, cautious expansion of fishing areas and catches.
The northern shrimp fishery currently makes an important contribution to northern development throughemployment and training of northern residents, including a substantial number of Inuit residing in Labrador,Northern Quebec and Baffin Island. The total income earned by northern residents was estimated to be $Can4 million in 1995 and these incomes make a substantial contribution to 30 - 40 northern communities. Inaddition, the fees paid by operating companies that fish the allocations held by northern companies havebecome an important source of funds for northern development.
2.7.2 Satisfaction of rights holders with the allocation process
The licence holders are generally of the view that the introduction of the enterprise allocation programmeinto the offshore northern shrimp fleet “has been a major factor in the development of an economically stableoffshore fleet” (Angel 1999). Although some of the offshore fleet were at first reluctant to pay for full observercoverage, they did accept it as a condition of moving to the enterprise allocation system.
Since 1997 the social climate has been such that access to expanding fisheries is shared with groups whohave been affected by the downturn in the fishery. However the allocation process includes protection for theexisting fleet by providing a portion of the increased quota and ensuring that there would be no permanentincrease in harvesting capacity. Although some feel they deserve a larger share of the quota, as long as theirinterests are protected, the existing fleet is generally supportive of the process
The number of offshore licences has been frozen at 17 since 1991, which, in conjunction with assuredaccess to the resource through enterprise allocations, has provided an incentive for the industry to balancevessel capacity with resource availability. The offshore participants believe that there is a direct correlationbetween the degree of security of access to the resource and their ability to enhance and support developmentof the fishery and responsible fishing practices. Also, fishing activities could be conducted at the best times formarketing purposes. Examples of initiatives undertaken by licensees at their expense are: exploratory fishingleading to expansion of the fishing grounds, gear trials to minimize groundfish by-catch and fish moreselectively, and industry co-funding of scientific and technical programmes. In addition, licence holders havefound that operating under an enterprise allocation system has allowed them to invest in quality improvementand end-product development, rather than catch maximization.
The level of satisfaction with the allocation process, within the temporary fleet, although variable isgenerally good. Industry feels that communities adjacent to the resource should be the beneficiaries of quotaincreases and this is part of the allocation process. However, satisfaction also depends on a group’s perceivedright to the fishery. Temporary fishermen have the same rights as the permanent fleet during times of highabundance but would be removed from the fishery during a period of decreasing quota. Some groups feel thatit is their right to have permanent access as well. The level of access causes dissatisfaction with the process aswell. Some groups perceive that they have a right to a larger share of the quota than they are allocated.
2.7.3 Views of othercommunity groups
Other groups have not expressed any strong views on the implementation or continuation of the enterpriseallocation programme for the northern shrimp fishery.
In 1996 and 1997, when the northern shrimp resource was increasing in abundance and value well abovehistorical levels, and sharing with other participants was being considered by the Department of Fisheries and Oceans,many individuals and groups in Atlantic Canada and Quebec argued that offshore shrimp fleet had enough shrimp tobe viable and sharing should occur. Sharing has been done since 1997 with mainly inshore harvesters on a temporarybasis. The offshore fleet continues to receive enterprise allocations totalling 37 600t plus a share of any quota increases.
Various interested sectors interpret the adjacency principle in ways that most optimizes their ownpositions. Many ports have used the increase in the shrimp biomass in adjacent waters to support theircontention that they should receive access to replace reduced landings and employment due to the downturnin the groundfish fishery. The processing sector further suggests that ports where processing historicallytook place should be given precedence. Many processors and communities also suggest that the allocationprocess move away from the traditional distribution to CORE1 and move towards community allocations.
Atlantic Canadian Marine Fisheries 40
1 A CORE participant holds a major fishing licence and has minimum annual earnings of $Can5 000-10 000 (dependingon area) from all fishing sources, excluding processing. It only applies to people holding licences for vessels under 65feet in legth. Many fishermen, especially in Newfoundland became excluded from the fisheries by failing to qualify.All benefits in new licenses, etc, go to CORE fishermen.

The application of the adjacency principle is further compounded by the rationale from groups representingFirst Nations to have additional access based upon both adjacency and aboriginal heritage criteria. This has leadto further discussions on what percentage of access should be provided for the First Nations people. Althoughmany groups consider that adjacency means exclusive access for themselves the government does not support thisposition. As such, a temporary licence, based in Prince Edward Island, was introduced in 2000 in response to thatprovince’s continued efforts to have previous historical access taken into account. This was met with considerableresistance by representatives of adjacent groups.
The allocation of additional quota to the Northern Coalition in 1987, noted above, resulted fromrepresentations made by this subgroup of the licence holders to the effect that they should receive priorityconsideration because of their emphasis on the needs of Aboriginal and northern communities. The allocation tothe Northern Coalition is temporary, and does not affect the equal shares principle established for the long termby the northern shrimp enterprise allocation programme. In general, although there is support for the allocationprocess the various interest groups are unable to work together in a way that will ensure the optimum distributionof the available resource. Therefore, the government must make final decisions that are never fully supported bymost sectors of the fishery.
2.7.4 Hind-sight assessmentThe present allocation method utilizes general criteria that ensure reasonable distribution of the quota. It has
allowed new participants while at the same time giving some control to community/groups through theirinvolvement in how allocations are to be harvested and profits distributed. However, the sharing of the allocationwas not clearly defined. With the unprecedented increases in shrimp biomass over the last few years there hasbeen an increase in the number of parties interested in access. In many cases, groups with similar backgroundsand circumstances are vying for what they perceive as their rightful share without regard for other proponents.This is difficult enough when the size of the stock is increasing but will be even more of a problem when theinevitable decrease in stock sizes requires reduction of quota or even removal of licences from the fishery.
The establishment of clear eligibility criteria and sharing formula would have enabled the allocation processto be implemented in a more acceptable fashion. In addition, the inclusion of industry in meetings to develop thiscriteria and sharing formula would have been a progressive step forward towards a higher degree of industryacceptance in the process.
The northern shrimp enterprise allocation programme is considered a success, illustrated by the fact that theprogramme has remained basically unchanged since its introduction in 1987. The offshore licence holders havegenerally abided by its rules with few problems. In the early years of the programme, there was a period of licenceconsolidation as some licences changed hands, resulting in the current structure of twelve corporate entitiesholding the seventeen licences.
Without the race for the fish and uncertainty with respect to allocations year to year, the offshore northernshrimp fleet takes a reasonable and mature approach to management of the fishery. There are few enforcementproblems in this fishery. Significant progress has been made by the industry on further developing harvesting,processing and marketing of the shrimp. In 1997, this fleet received an environmental award for its progress ingroundfish bycatch control.
Although payment for full observer coverage was not at first easily accepted by the industry, this part of theprogramme has also progressed smoothly, and has brought added benefits to both the government and the licenceholders. The observers provide data that cannot be obtained any other way and that enhance the scientificinformation available and the assessment of the stocks. Observers can also report on any questionable activitiesor possible infractions of the rules, thus providing the department with an “extra eye” on the fishing activities.Finally, the licence holders themselves have found that having 100% observer coverage helps dispel criticism oftheir fishing activities. For example, there have been media reports from time to time about high levels of bycatchin shrimp fisheries around the world. The Canadian offshore northern shrimp harvesters can respond that, withbetter gear in recent years, their fishery has a minimal bycatch level, and observers are there to see and report thatfact.
2.7.5 DiscussionFisheries where there is little annual change in biomass have been viewed by industry as requiring little
change in the management of allocations. However, in fisheries where there is considerable increases in thebiomass, such as the Northern Shrimp fishery, industry has pushed the government into allowing additionalaccess without concern for the existing stake holders or other interested parties. Industry generally feels that allfishermen and communities deserve access to any expanding fishery to offset the economic effect of the downturnin the groundfish fishery.
41 Barrow, Jefferson, Eagles & Stevens
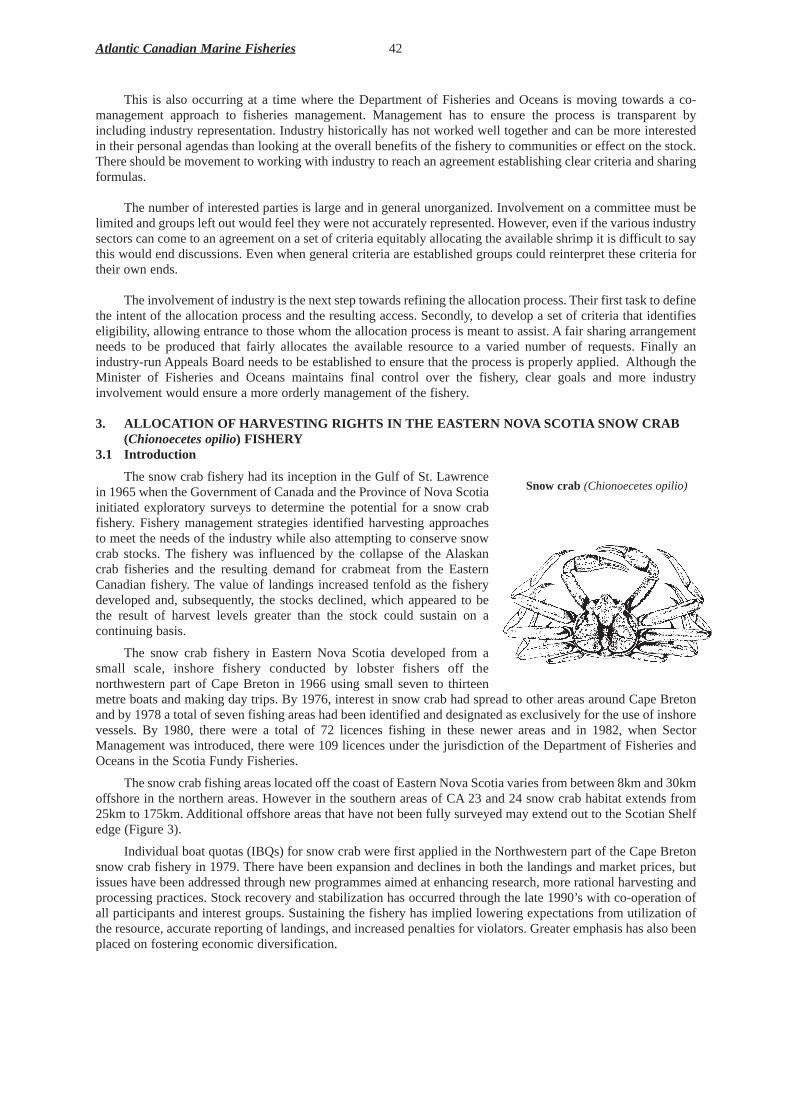
This is also occurring at a time where the Department of Fisheries and Oceans is moving towards a co-management approach to fisheries management. Management has to ensure the process is transparent byincluding industry representation. Industry historically has not worked well together and can be more interestedin their personal agendas than looking at the overall benefits of the fishery to communities or effect on the stock.There should be movement to working with industry to reach an agreement establishing clear criteria and sharingformulas.
The number of interested parties is large and in general unorganized. Involvement on a committee must belimited and groups left out would feel they were not accurately represented. However, even if the various industrysectors can come to an agreement on a set of criteria equitably allocating the available shrimp it is difficult to saythis would end discussions. Even when general criteria are established groups could reinterpret these criteria fortheir own ends.
The involvement of industry is the next step towards refining the allocation process. Their first task to definethe intent of the allocation process and the resulting access. Secondly, to develop a set of criteria that identifieseligibility, allowing entrance to those whom the allocation process is meant to assist. A fair sharing arrangementneeds to be produced that fairly allocates the available resource to a varied number of requests. Finally anindustry-run Appeals Board needs to be established to ensure that the process is properly applied. Although theMinister of Fisheries and Oceans maintains final control over the fishery, clear goals and more industryinvolvement would ensure a more orderly management of the fishery.
3. ALLOCA TION OF HARVESTING RIGHTS IN THE EASTERN NOVA SCOTIA SNOW CRAB(Chionoecetes opilio) FISHERY
3.1 Intr oduction
The snow crab fishery had its inception in the Gulf of St. Lawrencein 1965 when the Government of Canada and the Province of Nova Scotiainitiated exploratory surveys to determine the potential for a snow crabfishery. Fishery management strategies identified harvesting approachesto meet the needs of the industry while also attempting to conserve snowcrab stocks. The fishery was influenced by the collapse of the Alaskancrab fisheries and the resulting demand for crabmeat from the EasternCanadian fishery. The value of landings increased tenfold as the fisherydeveloped and, subsequently, the stocks declined, which appeared to bethe result of harvest levels greater than the stock could sustain on acontinuing basis.
The snow crab fishery in Eastern Nova Scotia developed from asmall scale, inshore fishery conducted by lobster fishers off thenorthwestern part of Cape Breton in 1966 using small seven to thirteenmetre boats and making day trips. By 1976, interest in snow crab had spread to other areas around Cape Bretonand by 1978 a total of seven fishing areas had been identified and designated as exclusively for the use of inshorevessels. By 1980, there were a total of 72 licences fishing in these newer areas and in 1982, when SectorManagement was introduced, there were 109 licences under the jurisdiction of the Department of Fisheries andOceans in the Scotia Fundy Fisheries.
The snow crab fishing areas located off the coast of Eastern Nova Scotia varies from between 8km and 30kmoffshore in the northern areas. However in the southern areas of CA23 and 24 snow crab habitat extends from25km to 175km. Additional offshore areas that have not been fully surveyed may extend out to the Scotian Shelfedge (Figure3).
Individual boat quotas (IBQs) for snow crab were first applied in the Northwestern part of the Cape Bretonsnow crab fishery in 1979. There have been expansion and declines in both the landings and market prices, butissues have been addressed through new programmes aimed at enhancing research, more rational harvesting andprocessing practices. Stock recovery and stabilization has occurred through the late 1990’s with co-operation ofall participants and interest groups. Sustaining the fishery has implied lowering expectations from utilization ofthe resource, accurate reporting of landings, and increased penalties for violators. Greater emphasis has also beenplaced on fostering economic diversification.
Atlantic Canadian Marine Fisheries 42
Snow crab (Chionoecetes opilio)
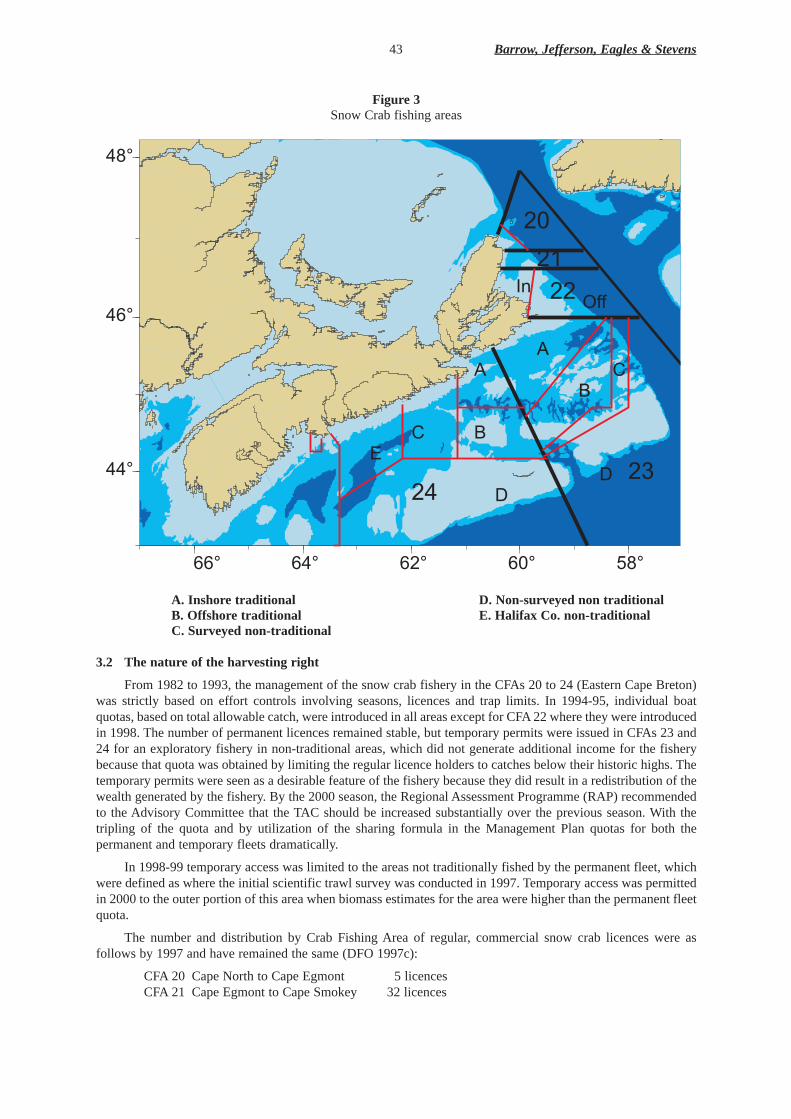
Figure 3Snow Crab fishing areas
A. Inshore traditional D. Non-surveyed non traditionalB. Offshore traditional E. Halifax Co. non-traditionalC. Surveyed non-traditional
3.2 The nature of the harvesting right
From 1982 to 1993, the management of the snow crab fishery in the CFAs 20 to 24 (Eastern Cape Breton)was strictly based on effort controls involving seasons, licences and trap limits. In 1994-95, individual boatquotas, based on total allowable catch, were introduced in all areas except for CFA 22 where they were introducedin 1998. The number of permanent licences remained stable, but temporary permits were issued in CFAs 23 and24 for an exploratory fishery in non-traditional areas, which did not generate additional income for the fisherybecause that quota was obtained by limiting the regular licence holders to catches below their historic highs. Thetemporary permits were seen as a desirable feature of the fishery because they did result in a redistribution of thewealth generated by the fishery. By the 2000 season, the Regional Assessment Programme (RAP) recommendedto the Advisory Committee that the TAC should be increased substantially over the previous season. With thetripling of the quota and by utilization of the sharing formula in the Management Plan quotas for both thepermanent and temporary fleets dramatically.
In 1998-99 temporary access was limited to the areas not traditionally fished by the permanent fleet, whichwere defined as where the initial scientific trawl survey was conducted in 1997. Temporary access was permittedin 2000 to the outer portion of this area when biomass estimates for the area were higher than the permanent fleetquota.
The number and distribution by Crab Fishing Area of regular, commercial snow crab licences were asfollows by 1997 and have remained the same (DFO 1997c):
CFA 20 Cape North to Cape Egmont 5 licencesCFA 21 Cape Egmont to Cape Smokey 32 licences
43 Barrow, Jefferson, Eagles & Stevens
66¡ 64¡ 62¡ 60¡ 58¡
44¡
46¡
48¡
InOff
A
BC
D
A
BC
DE
20
2122
2324

CFA 22 Cape Smokey to Scatarie 37 licencesCFA 23 Scatarie to Kempt Point 24 licencesCFA 24 Kempt Point and South 23 licences
Total 121 licences.
Certified observers conducted at-sea monitoring and a voluntary reduction in the trap limits from 30 to 25traps were implemented in CFA 21 based on the rational that it would afford more space on the fishing groundsas fishers moved from the small wooden traps to the larger steel and mesh traps. Scientific research surveysindicated that exploratory fishing effort should be directed in the non-traditional fishing areas of CFAs 23 and 24to help verify results. Temporary allocations of 250t were given for the offshore areas not traditionally fished bythe existing fleet. These temporary allocations were distributed to eligible, adjacent core fishers and NativeCommunities in units of 25 tonnes each which accounted for ten participants in CFA 23 and ten participants inCFA 24.
Individual Transferable Quotas (ITQs) were introduced in 2000 for CFA 24 as a pilot project and weresubjected to the following limitations:
i. no transfer between the permanent and temporary fleetsii. transfers are limited to a single seasoniii. resulting vessel quota is no more than double initial quotaiv. no increase in licence feesv. 100 % dockside monitoringvi. industry funded observer coverage andvii. fisher participation in tagging and temperature studies.
Until recent years, participants in the snow crab fishery were largely Cape Breton/Eastern Shore fishers whoalso held lobster licences and concentrated on the snow crab fishery following the lobster fishing season for abouttwo months in mid-summer of each year. Consultations between the federal Department of Fisheries and Oceansand industry representatives indicated pressure on the government to consider various changes in regard to quotasand long term stability for the fishery. There were also pressures to expand the fishing areas into offshore non-traditional areas and new quota allocations. It was determined that on the basis of recent stock status reports thata five-year plan would be introduced for CFA 23 and CFA 24 and a one-year plan implemented for the other CFAsuntil further scientific information was available to apply multi-year plans.
3.3 The method of allocation3.3.1 Policy objectives
The snow crab fishery in Eastern Canada is the most important commercial crab species and ranks sixth inthe value order of commercial species and was worth nearly $Can20 million for landed value in 1979 and 1980.The fishery in Eastern Nova Scotia, CFAs 20 to 24, was a somewhat smaller activity than in other areas of theGulf of St. Lawrence and in the coastal areas of Conception Bay and Bonavista Bay in Newfoundland. In CapeBreton, the fishery lasts about two months and the fishing trips are conducted on a one to two day basis.Generally, there are various management controls applying to the snow crab fisheries. They deal with the numberof licences issued each year, the allowed number of traps per boat, the mesh size in traps, the individual boatquotas, the fishing areas and the respective total allowable catch set for each area and the minimum legal size ofcrabs.
Although most of these measures have been implemented throughout the CFAs, a key change in managingthe fishery was the implementation of individual boat quotas. This process brought the licence holders into themanagement aspects of the fishery by accepting increased responsibility for quota sharing and co-management.The long-term objectives for this fishery are as follows (DFO 1997c).
i. To ensure the continuation of a biologically sustainable and economically viable fishery for a limitednumber of participants, thereby providing benefits in terms of creation of employment, income andprotection of the snow crab resource and habitat.
ii. To promote the co-management of the fishery by the Department of Fisheries and Oceans jointly with thesnow crab fleet.
iii. To promote the inclusion of the Aboriginal Community in this fishery in a manner consistent with the aboveobjectives.
iv. To permit, after consultation with the industry, the broader distribution of income from this fishery to othermembers of the commercial fisheries when resource and market conditions are favourable and in a mannerthat will not threaten the viability of the fishery for the current licence holders.
Atlantic Canadian Marine Fisheries 44

Since 1995, new elements have been added to the management of the fishery with the co-operation of thelicence holders, and in some cases, completely funded by the fishers themselves. Some of these elements are asfollows:
i. a voluntary limit on the percentage of white (soft-shelled) crab in the landingsii. individual quotas or fleet caps on landingsiii. dockside monitoring of landingsiv. shortened season in two CFAsv. voluntary tagging and temperature monitoring projects during the crab fishing seasonvi. contribution of cash and in kind to trawl surveys to better assess the crab resourcevii. introduction of certified at-sea observers andviii. the formulation of fisher’s Snow Crab Associations in each CFA.
3.3.2 Process used in determining the allocation
As previously mentioned in Section 3.1, the present day fishery developed from a small scale, inshorefishery conducted by lobster fishers off the northwestern part of Cape Breton using small boats and making daytrips. By 1976, interest in fishing snow crab had spread to other areas around Cape Breton. The fishery in CFAs20 to 24 began in 1978 but the fishery collapsed in the mid-1980s. In 1982, quotas were not being reached and itwas determined that given the trap controls already on the fishery and the lack of scientific information to predictstock biomass, quotas at that time were ineffective and, consequently, in 1984 they were removed. No licenceswere removed from the fishery and fishers were permitted to harvest what they could within the limitations of theregulatory measures in place at that time. Annual effort and landings declined through to 1985.
Licence distribution, although stable from 1989 until 1995, began to change in 1995 when conditionschanged to produce a large number of requests to government to allow new entrants into the snow crab fishery.Market prices for Atlantic snow crab began to improve and pressures occurred from fishers because the groundfishstocks and lobster stocks were also beginning to decline. In the Scotia-Fundy Fisheries, CFAs 23 and 24 wereidentified by the Department of Fisheries and Oceans as having been most productive in terms of catch per traphaul, total harvest and average catch per fisher. Also, these fishing areas were the least crowded in terms of fishingground available for each fisher. These two areas were selected for the issuance of temporary crab permits asfollows:
i. CFA 23 - six licences of 10000lb eachii. CFA 24 - six licences of 10000lb each.
The regular licence holders agreed to limit themselves to a certain level below their five-year averagecatches for one year to make the temporary quota available. In 1996, fishers from CFAs 22, 23 and 24 set asidefunds to pay for a scientific trawl survey in the spring of the following year. Until 1997, participants havingregular, limited-entry licences were Cape Breton/Eastern Shore fishers who also held lobster licences withexception of one Native fisher in CFA 24. The Department of Fisheries and Oceans proceeded to issue twotemporary licences to Native Communities in CFA 23 and two permanent licences in CFA 24 during 1997.
During 1997 and 1998, the Department of Fisheries and Oceans consulted with industry representatives andsnow crab licence holders in an attempt to direct the fishery toward longer term stability. Through numerousmeetings it was concluded that there be no further increases in effort by new entrants until further scientificinformation was available. Through the consultative process advice is sought on management of the snow crabfishery in the CFAs. Once the scientific advice for the coming year is approved during the Regional ScientificAdvisory Process of the Department of Fisheries and Oceans as meeting scientific standards, separate meetingsare convened by the Department Area Manager with the representatives of each CFA as well as a general sessionwith the members of the Eastern Nova Scotia Snow Crab Advisory Committee. The scientific review of thefishery and advice is formally presented to the snow crab fishers and discussed by all official participants at themeetings. In areas with multi-year management plans, at present CFA 23 and CFA 24, management boards arebeing established to discuss in-season fishery related issues and to ensure adherence to the approved plan.
After the establishment of a significantly increased TAC in 2000 temporary access was expanded. Up to thistime temporary access was limited to associations representing CORE adjacent fishermen, Native Bands andgroundfish dependent fishermen. This was extended in 2000 to non-adjacent CORE fishermen in Eastern NovaScotia. Allocations were given to associations who determined who would catch the quota and how the profitswere to be distributed. This was a major advancement to the co-management approach to management beingdeveloped in this fishery.
45 Barrow, Jefferson, Eagles & Stevens
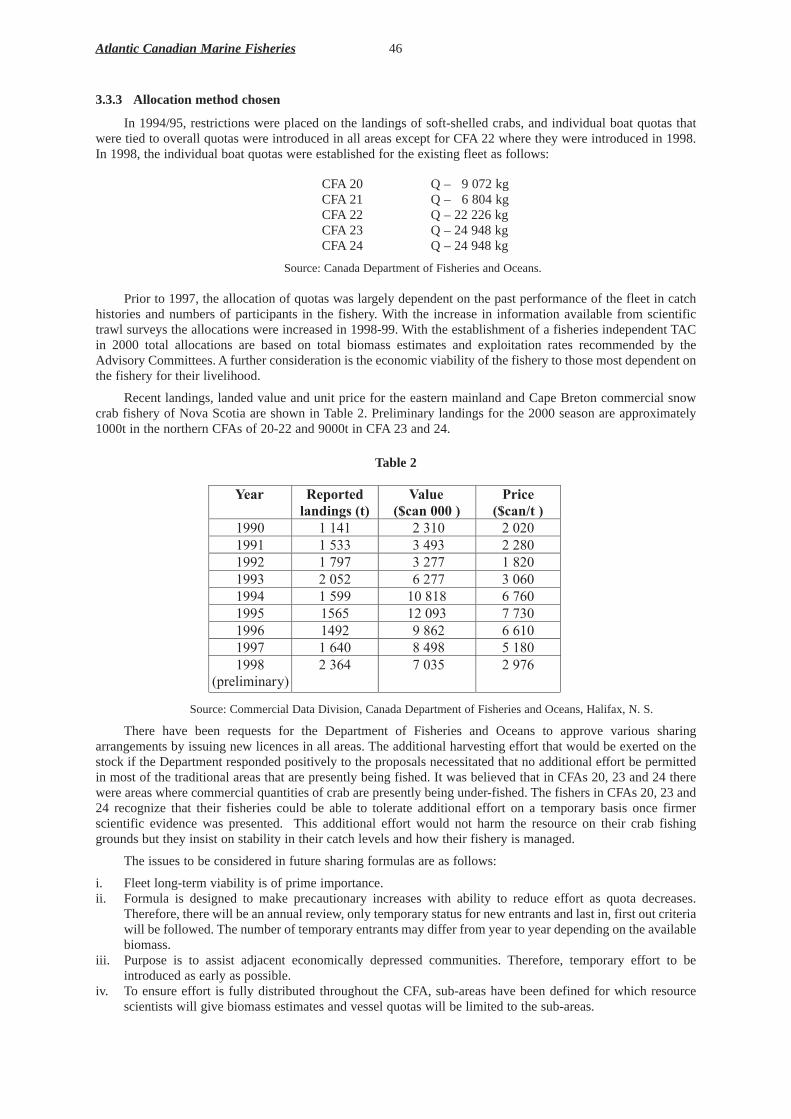
3.3.3 Allocation method chosen
In 1994/95, restrictions were placed on the landings of soft-shelled crabs, and individual boat quotas thatwere tied to overall quotas were introduced in all areas except for CFA 22 where they were introduced in 1998.In 1998, the individual boat quotas were established for the existing fleet as follows:
CFA 20 Q – 9 072 kgCFA 21 Q – 6 804 kgCFA 22 Q – 22 226 kgCFA 23 Q – 24 948 kgCFA 24 Q – 24 948 kg
Source: Canada Department of Fisheries and Oceans.
Prior to 1997, the allocation of quotas was largely dependent on the past performance of the fleet in catchhistories and numbers of participants in the fishery. With the increase in information available from scientifictrawl surveys the allocations were increased in 1998-99. With the establishment of a fisheries independent TACin 2000 total allocations are based on total biomass estimates and exploitation rates recommended by theAdvisory Committees. A further consideration is the economic viability of the fishery to those most dependent onthe fishery for their livelihood.
Recent landings, landed value and unit price for the eastern mainland and Cape Breton commercial snowcrab fishery of Nova Scotia are shown in Table 2. Preliminary landings for the 2000 season are approximately1000t in the northern CFAs of 20-22 and 9000t in CFA 23 and 24.
Table 2
Source: Commercial Data Division, Canada Department of Fisheries and Oceans, Halifax, N. S.
There have been requests for the Department of Fisheries and Oceans to approve various sharingarrangements by issuing new licences in all areas. The additional harvesting effort that would be exerted on thestock if the Department responded positively to the proposals necessitated that no additional effort be permittedin most of the traditional areas that are presently being fished. It was believed that in CFAs 20, 23 and 24 therewere areas where commercial quantities of crab are presently being under-fished. The fishers in CFAs 20, 23 and24 recognize that their fisheries could be able to tolerate additional effort on a temporary basis once firmerscientific evidence was presented. This additional effort would not harm the resource on their crab fishinggrounds but they insist on stability in their catch levels and how their fishery is managed.
The issues to be considered in future sharing formulas are as follows:
i. Fleet long-term viability is of prime importance.ii. Formula is designed to make precautionary increases with ability to reduce effort as quota decreases.
Therefore, there will be an annual review, only temporary status for new entrants and last in, first out criteriawill be followed. The number of temporary entrants may differ from year to year depending on the availablebiomass.
iii. Purpose is to assist adjacent economically depressed communities. Therefore, temporary effort to beintroduced as early as possible.
iv. To ensure effort is fully distributed throughout the CFA, sub-areas have been defined for which resourcescientists will give biomass estimates and vessel quotas will be limited to the sub-areas.
Atlantic Canadian Marine Fisheries 46
Year Reported landings (t)
Value ($can 000 )
Price ($can/t )
1990 1 141 2 310 2 020 1991 1 533 3 493 2 280 1992 1 797 3 277 1 820 1993 2 052 6 277 3 060 1994 1 599 10 818 6 760 1995 1565 12 093 7 730 1996 1492 9 862 6 610 1997 1 640 8 498 5 180 1998
(preliminary)
2 364 7 035 2 976
v. Quota distribution considered assuming five sub-areas (a) nearshore grounds, (b) offshore traditionalgrounds, (c) nearshore non-traditional grounds, (d) offshore non-traditional grounds and (e) Halifax Countynon-traditional grounds.
vi. Historical fishing patterns are not to be used to restrict the permanent fleet, which is allowed to fish anywherewithin the CFA.
Fleet long-term viability is of prime importance including years where there is a decreased price. Thereforeboth a landing and monetary threshold have been used in the sharing formula. Landed value would be calculatedon the average price within a crab fishing area for the previous year.
3.4 Data requirements and computational process
From year to year, various information is collected on the biology of the crabs and on the fisheriesthroughout the fishing season. Biologists sample crabs in port and on board vessels for size, maturity, shellhardness and weight. Information is also collected on the distribution and intensity of the fishing effort fromlogbooks that fishers keep on their fishing activities. The Department of Fisheries and Oceans also maintainedcatch histories through purchase slips on sales that are collected throughout the fishing season and compiled andretained by the Department. From 1982 to 1993, the management of the snow crab fishery was based on effortcontrols including seasons, licences and trap limits. Changes were introduced in the fishery from 1994 to 1997which included the introduction of mandatory logbooks, dockside monitoring and at-sea certified observercoverage to detail landings and fishing effort. In 2000, with the introduction of temporary access in those areasfarthest from shore and not covered by the trawl survey, more accurate information on the effort distribution ofthis portion of the fleet was required. A vessel monitoring system (VMS) was introduced to supplement thelogbooks being completed by the licence holders.
3.5. Appeals process
There was no appeals process in place for the individual boat quotas implemented because the allocationswere developed through extensive consultations with the snow crab fishers. The allocations depend upon theallowable catches for the CFAs based on the scientific advice provided on a year to year basis.
There is an industry run appeals board that ensures that fishermen applying for temporary access areevaluated properly by the associations and DFO against the eligibility criteria.
3.6. Administration of the allocation process3.6.1 Staff requirements
No additional Departmental staff were deployed to implement the IBQ process which involves theDepartment of Fisheries and Oceans Branches on an intermittent basis and includes Resource Management,Economics, Aboriginal Affairs, Oceans, Policy and Licensing and Regulations. The Science and Conservation &Protection Branches allocate considerable manpower during the short nine-week season. Science personnelinclude indeterminate and seasonal staff for supervision, analyses, data entry and sampling. Conservation &Protection task their resources based on established enforcement priorities and ongoing fishing activities in thearea.
3.6.2 Additional pr ogramme funding requirements
Limited at-sea monitoring has been conducted on this fishery until 1996 when a number of trips weremonitored by the Department of Fisheries and Oceans scientific staff at sea. The level of monitoring conductedin 1996 was augmented in 1997 and continued through 1998. The cost for the industry for at-sea observers is asfollows (DFO 1998a):
i. CFA 20 - Certified Observers, 5 % of sea days (cost estimated per fisher $Can203)ii. CFA 21 - Certified Observers, 5 % of sea days (cost estimated per fisher $Can203)iii. CFA 22 - Certified Observers, 5 % of sea days (cost estimated per fisher $Can203)iv. CFA 23 - Certified Observers, 10 % of sea days (cost estimated per fisher $Can450)v. CFA 24 - Certified Observers, 10 % of sea days (cost estimated per fisher $Can472).
Trawl surveys conducted during the fishery in 1996 was continued for the 1998 season and costs by industry(DFO 1998a) were projected as follows:
i. CFA 20, $Can11 000 ($Can2200/fisher)ii. CFA 21, $Can11 000 ($Can344/fisher)iii. CFA 22, $Can19000 ($Can513/fisher)iv. CFA 23, $Can45100 ($Can1879/fisher)
47 Barrow, Jefferson, Eagles & Stevens
v. CFA 24, $Can45100 ($Can1960/fisher)vi. CFA 23 - non-traditional area $Can20000 ($Can2000/permit)vii. CFA 24 - non-traditional area $Can20000 ($Can2000/permit).
Source: Canada Department of Fisheries and Oceans.
In response to requests by the fishers, tagging studies were initiated in 1994/95 in CFAs 20, 21 and 22 withparticipation by the licence holders.
In summary, the industry pays the cost for licence fees, at-sea observer coverage, dockside monitoring andsupports the Science survey within their area. These costs vary depending on area and the quantity of crabavailable. The industry also pays their own travel costs to consultative and advisory meetings. As well as hailingat-sea to a monitoring company, fisheries are required to submit accurately completed logbooks. The fundingrequirements for the Department of Fisheries and Oceans personnel are within the current budget levels for therespective Branches involved.
3.7. Evaluation of the initial allocation process3.7.1 Success in achieving initial policy objectives
Through 2000, stock status appeared better than in previous years. Catch rates were above average andincreasing in all CFAs. Trawl surveys have indicated that the resource is well distributed. However, it is believedthat a large portion of this fishery is on a built-up biomass from years when the exploitation rate was notmaximized. It is expected that in the near future the TAC will decrease since recruitment does not appear to besufficient to offset the fishery. The present allocation process allows for the maximization of the benefits whilethe biomass remains high and will ensure fair distribution during the period of lowered quota.
Promotion of co-management in the snow crab fishery is well underway with approaches for projectimplementation. Since 1995, new elements have been added to the management of this fishery with the co-operation of the fleet and, in some cases, funded by the fishers themselves.
In 1997, a commercial licence in CFA 23 was acquired by the Department of Fisheries and Oceans underthe Allocation Transfer Programme and transferred to a consortium of three First Nations Bands. This licence wasoperated as a communal commercial licence under the auspices of the Aboriginal Fisheries Strategy. Also, theDepartment issued two temporary licences to Native Communities in CFA 23 and two permanent licences inCFA 24.
The landings, value and unit price of snow crab for CFAs 20 to 24 are shown in Item 3.2 and indicate ageneral increase in value since 1990. There has been a great deal of exploration in areas of CFA 20, 23 and CFA24 that were not being fished by the licensed fleet and scientific surveys were only being introduced. Communityproposals have been submitted and supported requesting new quota in most commercial areas especially in CFAs23 and 24. In addition, there is a small exploratory fishery in NAFO Division of 4X where four vessels areconducting an exploratory fishery.
3.7.2 Satisfaction of rights holders with the process
The rights holders (licence holders) have been, and continue to be participants in the consultative andadvisory process with the federal Department of Fisheries and Oceans. These consultative processes involve DFOScience/Fisher consultations, DFO Fisheries Management/Industry consultations and DFO/Non-Licence Holdersconsultations. The industry has been, and continues to be, an important part of the assessment and managementprocess and signifies a major influence on the measures implemented for this fishery. With the introduction of thetemporary access this consultative process has been extended to representatives of the temporary fleet as well.Although there are conflicting opinions between the two fleets there is a high overall satisfaction with the process.
3.7.3 Views of othercommunity groups
The main objective of the commercial fishery is to maximize net revenues for all entrants while ensuringsustainability of the stock and equitable sharing between the existing and temporary fleets. Communityproposals submitted requesting new quota in most commercial areas and quota to explore in offshore areasespecially in CFAs 20, 23 and 24 have been supported. Some crab fishers in CFA 22 sought to relieveovercrowding on the Glace Bay grounds by giving access to a portion of CFA 23, but with the introduction oftemporary access by adjacent fishermen this was not permitted. With the expansion of temporary access to non-adjacent CORE fishermen in Eastern Nova Scotia all CORE fishermen in eastern Nova Scotia have someaccess to the fishery. Although some groups feel their level of access should be larger they are supportive ofthe allocation process.
Atlantic Canadian Marine Fisheries 48

The processing capacity for snow crab in Eastern Nova Scotia was historically limited. Due to the largercrab populations in the Gulf of St. Lawrence there is a larger capability for processing in the Provinces of NewBrunswick and Prince Edward Island. Therefore, much of the snow crab landed in Eastern Nova Scotia istransported outside the local community areas for processing. However, with the expansion of existing plants andthe establishment of several new plants since the 2000 season more processing is done locally.
3.7.4 Hind sight assessment
Although initially intended to be supplementary, this has developed into a primary fishery withoutdiscussions on changes to the management process. It is only during the last few years that with the developmentof a multi-year Management Plan in CFA 23 and 24 that management changes were discussed and this was inresponse to an increased demand for access.
Considerable discussions were held with both stake holders and interested parties during the developmentof the present Plan. A sharing formula is in place that identifies the allocation between the existing stakeholdersand groups representing temporary access. This has reduced the resistance to the overall allocation process andallowed for a smoother implementation. Allocation to area based groups has ensured the economic benefits wouldstay within local communities. This process has allowed the allocation process to support all stakeholders (bothpermanent and temporary) during the present period of surplus biomass. It also identifies the process to befollowed during the expected future decrease in biomass.
A lack of clear definition of the intent of the temporary access was not put into the Plan. Although this hasnot inhibited associations from maximizing access it has allowed individuals not eligible for the present allocationprocess to use their own interpretation in an effort to gain access. Additional clarification of the intent of thetemporary access will address this limited opposition. The scientific and management planning continues to bea co-management process to ensure sustainability of the fishery.
3.8 Discussion
Several management issues concerning allocation were identified in the present multi-year plan (DFO1999a) as requiring additional refinement. Progress is briefly outlined as follows:
i. With the introduction of the sharing formula, allocations are now clearly defined. Although there is a desireto see at least some of these converted to limited entry licences this will only be discussed when the long-term viability of the stock can be assessed.
ii. Scientific advice recommends that there is no basis to indicate a change is needed in the current level ofcatch and effort, but there have been requests for the Department of Fisheries and Oceans to approve varioussharing arrangements by issuing new licences in all areas. In 2000, the results from a scientific trawl surveywere used in determining a TAC. Catch and effort can now be evaluated based on fishery independent data.
iii. At-sea sampling in recent years has shown that there can be high percentages of soft-shelled or “ white “crab encountered in all Eastern Nova Scotia CFAs. Fishing white crab is both a conservation and marketingissue and at-sea observer trips are used to determine the percentage of white crab in the catch. If thepercentage stays above 20% partial or complete closure of the fishery would be discussed.
iv. Industry-funded at-sea observers have been introduced to supplement and increase the collection ofbiological data. In the northern areas 5% coverage is being obtained and in CFA 23 –24 the target of 10%coverage is in place.
v. An industry-supported overrun programme is in place that reduces quota in the following year for fishermenwho exceed their individual quota.
vi. Representation has been made to the Department of Fisheries and Oceans by the First Nations to increasethe First Nations quotas as additional resource is made available.
vii. Exploratory fishing is being conducted in areas of CFA 20, 23 and 24 where trawl survey information islimited. This will supplement the available knowledge on the TAC without increasing effort in any of thetraditional fishing areas in CFAs 20 - 24.
viii. Additional survey sites and changes to the methodology used in making biomass estimates will reduce thesource of uncertainty around the concentrations of crab were found in the gullies between banks.
ix. Tagging studies initiated in 1994/95 in CFAs 20 - 22 with the licence holders’participation to monitor crabmovements and the fate of soft-shelled crab released back to the crab grounds and the movement of fishablecrab between and within the CFAs will be continued.
x. With the increases in TAC, industry has requested and received an increased trap limit in CFAs 23 and 24of up to 50%.
49 Barrow, Jefferson, Eagles & Stevens

All of the above issues will continue to be addressed through consultations with representatives of the CFAsand the Eastern Nova Scotia Snow Crab Advisory Committee in the planning processes for future IntegratedFishery Management Plans for the snow crab fishery (DFO 1999b).
4. ALLOCA TION OF HARVESTING RIGHTS IN THE CANADIAN ATLANTIC OFFSHORESCALLOP FISHERY
4.1 Intr oduction
Excessive catching capacity in the offshore scallop (Placopecten magellanicus) fleet was first recognized inthe early 1970s and by 1984 the Canadian scallop landings from Georges Bank were the lowest on record, lessthan 2000t of meats, for the offshore fleet. In the same year the International Court Of Justice (ICJ) in their Gulfof Maine boundary decision between Canada and the United States awarded to Canada the most productivescallop area of Georges Bank.
In the latter part of 1985, the ten companies holding offshore scallop licences had identified an EnterpriseAllocation (EA) concept as being the most desired option for achieving the objectives of stock rebuilding andconservation, stabilization of landings, fleet replacement and rationalization. Despite the companies’position, thecaptains and crews were rejecting the enterprise allocation concept on the basis of threatened reduction ofemployment in the fishery. The captains and crews position was to implement more effort control mechanismssuch as closed winter seasons, a maximum of sixteen day trip limits, and reduction of quotas from 13636kg to6364kg per trip to achieve the same objective.
The Department of Fisheries and Oceans supported the enterprise allocation concept on the basis that fleetrationalization would occur more efficiently and effectively rather than if the fishery continued with a competitivelyfished quota or a total allowable catch with quarterly allocations. The Department also supported the introduction ofan experimental Enterprise Allocation programme developed in concert with the vessel owners and crews togetherwith an acceptable and cost-efficient enforcement programme that had credible administrative rules.
The ICJ boundary decision in 1984 settled the Georges Bank ownership issue and cleared the way for seriousconsultations among industry members to develop and implement a management strategy to rebuild and maintainthe offshore scallop stocks as well as address the orderly replacement and economic stability of the ageing scallopvessel fleet. Consultations were conducted during the latter part of 1984 and early 1985 between the representativesof the licence holders, the captains and crews and the Department of Fisheries and Oceans. These consultations werearranged through the previously established Offshore Scallop Advisory Committee (OSAC). The discussionsresulted in development of improved conservation measures such as larger minimum scallop shell height and a morerestrictive total allowable catch in the sensitive stock areas. The industry unanimously supported the more restrictivetotal allowable catch given the high level of fishing mortality inflicted by the fleet at the time.
It was generally accepted by the industry that a fully replaced fleet of 76 vessels would not be economicallyviable in the future. A report by the Department of Fisheries and Oceans in 1985 (Nelson 1985) determined that theoptimal fleet size should be in therange of 39 - 44 vessels. In June1986 the vessel owners and crewsagreed to a three-year experimentalprogramme of individualtransferable quotas but had oneremaining serious issue to beresolved, which was the fishingactivity of the inshore scallop fleeton Georges Bank. The inshore fleethad access to 2.9% of each previousyear’s scallop catch, which causedconcern for the success of theexperimental ITQ programme.However, this issue was resolvedthrough separation of the inshore andoffshore fleets at the 43°40’Nparallel, which meant the offshorefleet could not fish for scallops northof this line and the inshore fleetwould be phased out of the GeorgesBank fishery over a two-year period.
Atlantic Canadian Marine Fisheries 50
A southwest Nova Scotian offshore scallop dredger

The inshore fleet was allocated 8% of the offshore TAC in 1987, 4% in 1988 and no further access thereafter(Stevens 1997). In 1989, based on the success of the experimental programme in meeting objectives and the nearlyunanimous support of the scallop industry, the federal Minister of Fisheries and Oceans approved the permanencyof the ITQ programme for the offshore scallop fishery. Figure 4 shows the Maritime Scallop management areas.
Figure 4Offshore scallop regions
4.2 The nature of the harvesting right
The offshore scallop fishery was competitive in pursuit of the catch from the mid-1940s when it firstcommenced on Georges Bank until the introduction of the ITQ programme in 1986. The licence holders(enterprises) developed percentage shares of the TAC for each company and established administrative guidelinesfor the management of the programme. The guidelines are summarized as follows.
i. Permanent transfers of a portion of a company’s allocation to another company were not permitted. In theevent of a sale of a company, the new owner must obtain the entire quota and licences held by that company.
ii. The Minister of Fisheries and Oceans must approve all permanent transfers.iii. Inter-enterprise transfers are permitted during the fishing year as companies fine-tune their harvesting plans.
These transfers are temporary only and must be previously approved by the Department of Fisheries andOceans.
iv. Barring catastrophic events, a company will not be permitted to transfer in excess of 25 % of its quota formore than two consecutive years.
v. In the event of the collapse of the ITQ programme, the fishery could revert to a competitive fishery in whichcase the companies or their replacements would be entitled to return to the number of licences held in 1986,prior to implementation of the experimental programme.
51 Barrow, Jefferson, Eagles & Stevens
4.3 Method of allocation4.3.1 Policy objectives
The long-term objectives in the offshore scallop fishery (DFO 1998b) were to ensure biologicalsustainability and economic viability through the implementation of an ITQ programme and more specifically to:
i. ensure the conservation and restoration of the offshore scallop resourceii. stablize landings over time andiii. provide increased economic benefitsfor crews, vessel owners, shore workers and the community.
4.3.2 Process used in determining the allocation
Percentage shares were negotiated between the existing offshore scallop licence holders using two basiccriteria namely (a) historical fishing performance on Georges Bank and (b), the number of vessel licences heldby each company. The sharing arrangement agreed to in 1986 provided the basis for sharing in other fishing areasand there are currently eight separate offshore scallop fishing areas where TACs are established annually. Theallocation process was achieved through consultations between the offshore companies with DFO as thefacilitator at the Offshore Scallop Advisory Committee, the official management consultative committee foroffshore scallop resources. The landing records provided by the offshore companies matched the records held bythe DFO and the percentage shares were based on these long-term records of landings together with the catchpotential of currently owned vessels. Company officials were satisfied with the percentages agreed among them.Most of the work was done by the company representatives assisted by DFO managers. There was no indicationof dissatisfaction at the OSAC meetings by the company representatives.
4.3.3 Allocation method chosen
The percentage shares that were established were negotiated among the companies holding offshore scalloplicences at the time and although changes have occurred in ownership of some companies (Parsons 1993); thegeneral basis for percentage distribution remains the same today. The current percentage shares are as follows:
LaHave Seafoods Limited 3.66 %Mersey Seafoods Limited 7 %Adams & Knickle Limited 9.77 %Comeau’s Seafoods Limited 15.42 %Scotia Trawler Equipment Limited 16.32 %Fishery Products International 16.77 %Clearwater Fine Foods Inc. 31.06 %
A company may not hold more than 50 % of any specific scallop stock.
4.4 Data requirements and computational process
Historical catch data were available for the years 1975 to 1983 and the provision of accurate catch data wasa regulatory requirement. The comparison of this information with company records showed similar results andthe catch information over this period was not in dispute. The key control measures in the offshore scallop fisherywere the establishment of meat counts (e.g. the number of scallops occupying 500ml) and the setting and integrityof the total allowable catch. All scallops landed from offshore scallop vessels were monitored by docksideobservers and recorded against the enterprise allocation of the appropriate company. All licence holders wererequired to provide catch and effort information in the form of a fishing logbook report with all information onfishing operations to the Department of Fisheries and Oceans at the end of each fishing trip. A close check on themeat count of shucked scallops was conducted to ensure adherence to the regulated number of meats, whichvaried for different fishing areas. At present, all landings are monitored by an independent dockside monitoringcompany funded by the industry. These catch data for each landing are entered into a computerized system andretained by the federal Department of Fisheries and Oceans. In addition, all offshore scallop vessels carry on-board electronic monitoring devices to enable monitoring of the position of vessels when fishing in designatedareas and the related TACs.
4.5 Appeals process
Licence holders developed their own formula for establishing the sharing arrangement of the available catchand reported to the Department of Fisheries and Oceans the percentage shares to be applied to the TAC’s. Sincethis was an industry process and there was agreement by all of the licence holders, there was no need for a furtherappeals process.
Atlantic Canadian Marine Fisheries 52

4.6 Administration of the allocation process4.6.1 Staff requirements
The implementation of the programme was accomplished within the available staff resources of theDepartment of Fisheries and Oceans. Consultations became less frequent upon implementation of the three-yearexperimental programme and the subsequent management plans. Most effort now expended for administration isin the area of data compilation and analysis, the annual setting of TACs, monitoring of quota transfers anddevelopment of integrated fishery management plans.
4.6.2 Additional pr ogramme funding requirements
No additional funding was allocated for this process as the licence holders developed their ownadministrative guidelines for the programme. Regulatory enforcement effort by the Department of Fisheries andOceans has decreased despite the increased management obligations of the industry and provision of funding bythe industry. Scallops landed from the offshore scallop vessels were required to be monitored by a certifieddockside observer and all landings are now monitored with the catch from each landing being entered directlyinto the Department’s database by a dockside monitoring company funded by the industry. The estimated annualcost to industry is approximately $Can40000.
4.7 Evaluation of the initial allocation process4.7.1 Success in achieving initial policy objectives
A review of the three-year experimental ITQ programme was conducted through the Offshore ScallopAdvisory Committee to determine the results of the programme and progress towards meeting the initial policyobjectives. It was concluded that the experimental programme had contributed to increased economic benefits forthe licence holders, crews and shore workers, and all those engaged in the fishery were experiencing a muchimproved situation than if they had continued in a competitive fishery (Brander and Burke 1995). The scientificadvice also indicated that there was a wider range of scallop year classes appearing, which would continue tostablize the fishery over time. Fleet rationalization was also achieved by allowing licence holders to concentrateon their own allocations and apply the appropriate effort to catch their permitted percentage of the TACs (Nelson1989). The ageing fleet of sixty-eight scallop vessels in 1986 has now been reduced to twenty-five mostly steel-hulled vessels ranging from 27m to 43m in length and crewed by seventeen members each throughout the year.Trips last about ten to twelve days and scallops are landed at five ports. These results imply that the objectivesof improved economic benefits, stock conservation and fleet rationalization have been met.
4.7.2 Satisfaction of rights holders with the process
Since 1986, forty-three vessels have been removed from the offshore scallop fleet resulting in a decrease ofapproximately 700 crew positions. However, for those remaining the opportunities for employment has improvedand this downsizing in the fleet is not considered severe. The local labour market had very little difficultyabsorbing sixty to seventy displaced crewmembers a year since 1986. Some service industries, such as vesselmaintenance, have been adversely affected but the work rather than the number of employees have been reduced.Local employment centres report that many crewmembers have continued their attachment to fishing or areemployed in the construction industry or forestry operations.
Under the programme, the offshore scallop stocks have been rebuilt, landings have been more stable and thefleet has been rationalized as expected. Landings for the period 1985 to1996 averaged 5800t of meats, which isclose to the expected long-term average of 6000t. The fleet has been reduced in size, is more efficient, and nowspends approximately 4400 fewer days fishing than was the case in 1986 before the programme wasimplemented.
Revenue per vessel has been increasing on average as the fleet has been reduced: About $Can600000 pervessel in 1985 to almost $Can 2000000 in 1994. This amount varies with the landed value of catch, licence fees,observer and dockside monitoring costs, and scientific research activities funded by the licence holders. Therights holders unanimously agree that the process has met, or exceeded, the objectives.
4.7.3 Views of othercommunity groups
Community impacts appear to be minimal as the offshore fleet has traditionally landed in five or six ports.In Yarmouth, Nova Scotia, the transfer of one offshore company to Lunenburg, Nova Scotia has reduced theoverall landings but, given the major port activities in the fisheries in the Yarmouth area, the impact of thistransfer was not considered to be major. Overall, there have been improvements in earnings as the result of gainsin efficiency since the programme was introduced. The steady nature of fleet rationalization, coupled with
53 Barrow, Jefferson, Eagles & Stevens
employment opportunities in the primary sector, eased the transition to the ITQ programme and the rebuildingand stabilization of the scallop resource has meant greater economic stabilization for all participants in theindustry including, shore workers and the local communities.
4.7.4 Hindsight assessment
The most controversial issue arising from implementation of the programme has been the reduction of jobsin the offshore scallop fishery. The downsizing was gradual and occurred over more than a decade. It was reportedthat an efficient offshore fleet matched to the available TACs could be in the range of 30 - 35 vessels, to 39 - 44vessels (Nelson 1985). But the fleet was reduced to 25 vessels, which accounted for a loss of employment forcrewmembers. In hindsight, the crewmember unions could have negotiated some mechanism for establishing afund for severance or early retirement for their members. Another mechanism could have been an orderly rotationof crew aboard vessels on a schedule negotiated between the vessel owners and the crewmember’s unions.
4.8 The nature of the harvesting right
The offshore scallop fishery was competitive in pursuit of the catch from the mid-1940s when it firstcommenced on Georges Bank until the introduction of the ITQ programme in 1986. The licence holders(enterprises) developed percentage shares of the TAC for each company and established administrative guidelinesfor the management of the programme. The guidelines are summarized as follows.
i. Permanent transfers of a portion of a company’s allocation to another company were not permitted. In theevent of a sale of a company, the new owner must obtain the entire quota and licences held by that company.
ii. The Minister of Fisheries and Oceans must approve all permanent transfers.iii. Inter-enterprise transfers are permitted during the fishing year as companies fine-tune their harvesting plans.
These transfers are temporary only and must be previously approved by the Department of Fisheries andOceans.
The federal Department of Fisheries and Oceans encouraged the implementation of the property rightsprogramme in the offshore scallop fishery and has continued to support it at the present time. The programme hasmet the objectives and has been termed successful to the point where licence holders are prepared to accept ashared management (partnership) with the Department for future management of the fishery. The licence holdersare currently making significant financial and operational contributions for catch monitoring and scientificresearch activities.
5. LITERA TURE CITED
Angel, J.R. 1999. Canadian Association of Prawn Producers. Management of The Canadian Shrimp Fishery.Presentation to the Pandalid Shrimp Symposium, Halifax, Nova Scotia, Canada. September 8-10, 1999.
Brander, L and D.L. Burke 1995. Rights-based vs. competitive fishing of sea scallops Placopecten magellanicusin Nova Scotia. Aquatic Living Resources Vol. 8(3): 279-288.
Collins, J.F. 1987. An Assessment Of The Economics Of The Northern Shrimp Fishery. Program Coordinationand Economics Branch, Newfoundland Region, Department of Fisheries and Oceans, St. John’s, Canada.
DFO 1997a. Department of Fisheries and Oceans, Canada. Integrated Fisheries Management Plan, NorthernShrimp, Northeast Newfoundland, Labrador Coast and Davis Strait, (1997 - 1999). Resource ManagementBranch, Atlantic Fisheries and Oceans.
DFO 1997b. Department of Fisheries and Oceans, Canada. News Release, Mifflin Announces 57 Per CentIncrease For Northern Shrimp Quotas. 23 April 1997. Office of the Minister of Fisheries and Oceans,Ottawa.
DFO 1997c. The 1997 Snow Crab Integrated Fishery Management Plan, Scotia -Fundy Fisheries, MaritimesRegion. Department Of Fisheries And Oceans, Canada.
DFO 1998a. The 1998 Snow Crab Integrated Fishery Management Plan, Scotia Fundy Fisheries, MaritimesRegion. Department Of Fisheries And Oceans, Canada.
DFO 1998b. Department of Fisheries and Oceans, Scotia-Fundy Offshore Scallop Integrated FisheriesManagement Plan, Maritimes Region, 1998 - 1999.
DFO 1999a. Eastern Nova Scotia Snow Crab. DFO Science Stock Status Report C3 - 02. Department Of FisheriesAnd Oceans, Canada.
DFO 1999b. Eastern Nova Scotia Snow Crab Integrated Fishery Management Plan, Scotia-Fundy Sector, MaritimesRegion, CFA 20 - 22, 1999, CFA 23 - 24, 1999 - 2003. Department Of Fisheries And Oceans, Canada.
Atlantic Canadian Marine Fisheries 54

MacDonald, J.K. and J.F. Collins 1990. Department of Fisheries and Oceans, Canada. Canada’s NorthernShrimp Industry: An Economic Assessment Of The Fishery. Economic and Commercial Analysis ReportNo. 79.
Nelson, J. 1985. Report On Economic And Financial Aspects Of Offshore Scallop Fleet Replacement. ProgramCo-ordination and Economics Branch, Department of Fisheries and Oceans, Dartmouth, Canada.Unpublished MS.
Nelson, J. 1989. Economic Assessment of the Offshore Scallop Enterprise Allocation Program. Program Co-ordination and Economics Branch, Department of Fisheries and Oceans, Dartmouth, Canada. UnpublishedMS.
Parsons, L.S. 1993. Management of Marine Fisheries in Canada. National Research Council of Canada. 763pp.Stevens, G.J. 1997. Offshore Scallop Enterprise Allocation Program Internal Review. September 30, 1997,
Resource Management Branch, Department of Fisheries and Oceans, Dartmouth, Canada.
55 Barrow, Jefferson, Eagles & Stevens
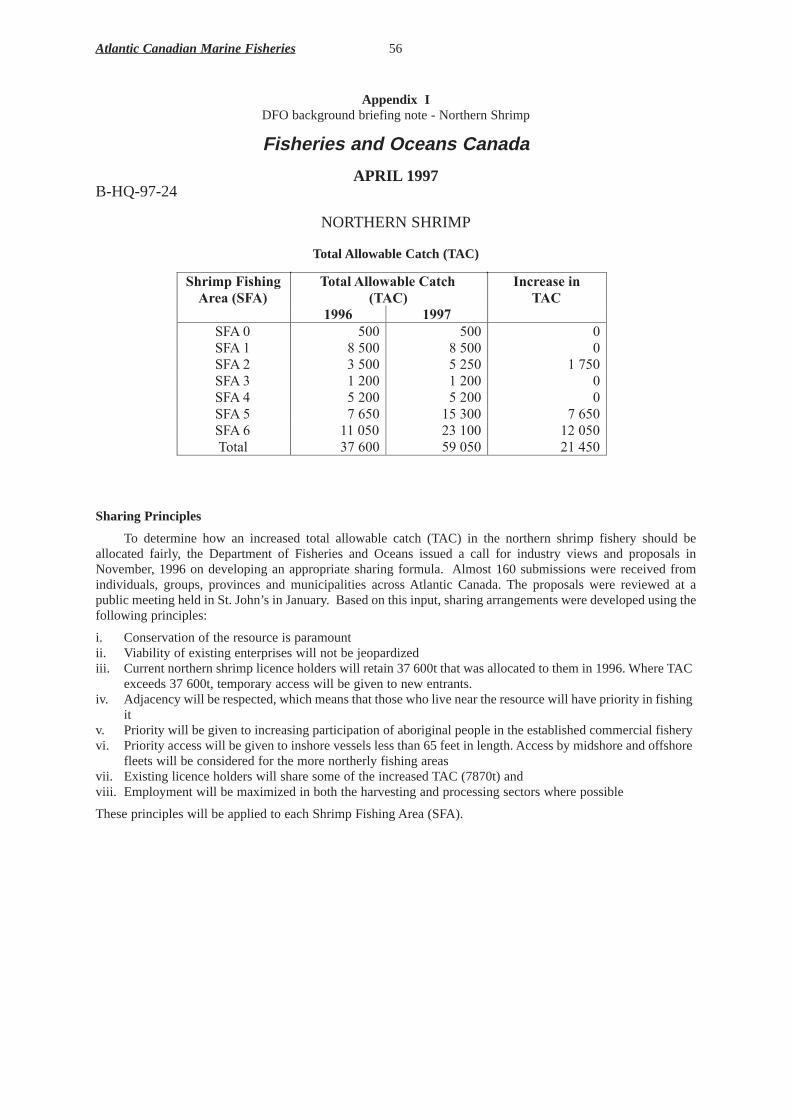
Appendix IDFO background briefing note - Northern Shrimp
Fisheries and Oceans Canada
APRIL 1997B-HQ-97-24
NORTHERN SHRIMP
Total Allowable Catch (TAC)
Sharing Principles
To determine how an increased total allowable catch (TAC) in the northern shrimp fishery should beallocated fairly, the Department of Fisheries and Oceans issued a call for industry views and proposals inNovember, 1996 on developing an appropriate sharing formula. Almost 160 submissions were received fromindividuals, groups, provinces and municipalities across Atlantic Canada. The proposals were reviewed at apublic meeting held in St. John’s in January. Based on this input, sharing arrangements were developed using thefollowing principles:
i. Conservation of the resource is paramountii. Viability of existing enterprises will not be jeopardizediii. Current northern shrimp licence holders will retain 37600t that was allocated to them in 1996. Where TAC
exceeds 37600t, temporary access will be given to new entrants.iv. Adjacency will be respected, which means that those who live near the resource will have priority in fishing
itv. Priority will be given to increasing participation of aboriginal people in the established commercial fisheryvi. Priority access will be given to inshore vessels less than 65 feet in length. Access by midshore and offshore
fleets will be considered for the more northerly fishing areasvii. Existing licence holders will share some of the increased TAC (7870t) andviii. Employment will be maximized in both the harvesting and processing sectors where possible
These principles will be applied to each Shrimp Fishing Area (SFA).
Atlantic Canadian Marine Fisheries 56
Shrimp Fishing
Area (SFA) Total Allowable Catch
(TAC) Increase in
TAC 1996 1997
SFA 0 500 500 0 SFA 1 8 500 8 500 0 SFA 2 3 500 5 250 1 750 SFA 3 1 200 1 200 0 SFA 4 5 200 5 200 0 SFA 5 7 650 15 300 7 650 SFA 6 11 050 23 100 12 050 Total 37 600 59 050 21 450

Sharing of Increase in TAC
Management of increase in TAC
The management of the increase in TAC for new entrants will be done by Local Management Boards in eacharea. The Boards will be represented on the Northern Shrimp Advisory Committee which is responsible formaking recommendations on TAC levels and management measures.
Appendix 2Offshore scallop average vessel performance
1983 and 1987
PERFORMANCE INDICA TORS ($Can ‘000)
Source: Canada Department of Fisheries and Oceans.
57 Barrow, Jefferson, Eagles & Stevens
SFA 2 Quota recipient 1997 Quota (t)
Existing Licence Holders 1 750 Total (TAC) 1 750
SFA 5
Quota recipient 1997 Quota (t) Northern Coalition (Existing Licence Holders)
6 120
Inshore vessels (< 65Õ) 1 530 Total (TAC) 7 650
SFA 6
Quota recipient 1997 Quota (t) Special Allocation Ð N. Peninsula 3 000 4R/4S fishers (north of 50¼ 30Õ N) 2 000 3L fishers 2 000 Resident SFA 6 fishers (< 65Õ) South of 50¼ 30Õ N
3 000
Resident SFA 6 fishers (< 65Õ) North of 50¼ 30Õ N
2 050
Total TAC 12 050
1983 1987 Steel Wood Steel Wood # in sample 6 10 13 16 Catch (meat weight) 106 54 132 103 Sea days 194 135 149 108 Catch / sea day (t) 0.55 0.4 0.89 0.95 Revenue / sea day $6129 $4436 $9137 $9671 Total cost / sea day (including labour and depreciation)
$6536 $4778 $8320 $8317
Profit/(loss) / sea day -$407 -$342 $817 $1354 Cost / sea day (excluding labour and depreciation)
$3070 $2763 $3336 $2889
Cost / sea day (average steel and wood) $2879 $3089

THE ORIGIN OF SUB-ALLOCA TION OF FISHERIES QUOTA AT THE INTERNA TIONAL LEVELTHE RECENT HISTORY OF THE MANAGEMENT OF BAY OF FUNDY HERRING
T.D. IlesBiological Station
531 Brandy Cove Road, St. Andrews, N.B., Canada E5B 2L9<[email protected]>
1. INTRODUCTION
Modern fisheries management, whenever it has been successful, is based on the process of the sub-allocation of a total allowable catch (TAC) among individual fishing interests, and this is so at both theinternational and national levels. It is not generally known that, at both levels, the first application of sub-allocation involved the herring (Clupea harengus) fisheries in the Gulf of Maine, Bay of Fundy area. Thisreport, which is in two parts, deals with the events from the early 1960s to the early 1980s when the crucialdecisions were first made. This first part refers to agreement at the international level and the second partdiscusses the internalization of the same issues within a country, namely Canada. The process of“allocation” isnow referred to as“National Allocations”, “Individual Transferable Quotas” (ITQs) or “Enterprise Allocations”(EA’s) but all are designed to avoid the uncontrolled scramble for fish that unallocated catch limits generate.
Until recently there was almostcommon agreement that the seas beyond thethree-mile national limit were freelyavailable to all countries so thatinternational management involvedinternational agreement. Obviously this is apre-requisite to national management ofwaters off countries’ coasts and it isconvenient therefore to treat these twoissues separately.
In 1961 I joined the Lowestoftlaboratory in the United Kingdom to work with the most distinguished group of workers in the modern field offisheries dynamics and management. These included Ray Beverton, Sidney Holt, David Cushing, John Gulland,Ray Harden Jones and others. Over the following eight years I became familiar with this field and worked on boththe quantitative and general biological theory of fish and fisheries. I myself worked on Atlantic herring, which,of course, is found on both sides of the North Atlantic basin.
In 1968 I witnessed the virtual cessation of the East Anglian herring fishery, which had been sustained overcenturies and was the one being studied at Lowestsoft. At one time it had been among the largest fihseries in theworld, but there was no agreement whether the collapse was, or was not, the result of overfishing. I had developedmy own views on this while at Lowestoft and took advantage of an offer to work on the same species on theother side of the Atlantic in Canada in early 1969. During the 1960s, west Atlantic herring stocks were beingthreatened by the transfer of fishing effort from the East Atlantic, and by an increase in the offshore Canadianherring fisheries and I hoped that my views and experience would be appropriate to the developing problem inthe West Atlantic.
This report deals with a success story for a West Atlantic herring fishery and a story of virtual completefailure in the east Atlantic despite a large difference in scientific and management effort in the two areas. Figure1shows the reported landings for herring from the western and eastern sides of the North Atlantic.
2. THE BIOLOGY OF ATLANTIC HERRING
To understand the biology of herring it is necessary to outline the history of the Atlantic basin, theories ofwhich have undergone drastic revision over the period covered by this report. In doing this I will indicate aspectsof this study of more general interest for both fisheries management and fish biology.
Atlantic herring belongs to the Clupeomorph group, one of the most ancient groups of teleost (bony) fishes,the group which sustains all of the largest and most important marine fisheries. The clupeomorphs date to theJurassic period, but have not given rise, apparently, to any of the“modern” groups, maintaining their essentialbiological and ecological niches for over 150 million years. The Atlantic herring is a true representative of itsbasic form and ecology and feeds almost exclusively on zooplankton for the whole of its life history.
58
Herring (Clupea harengus)
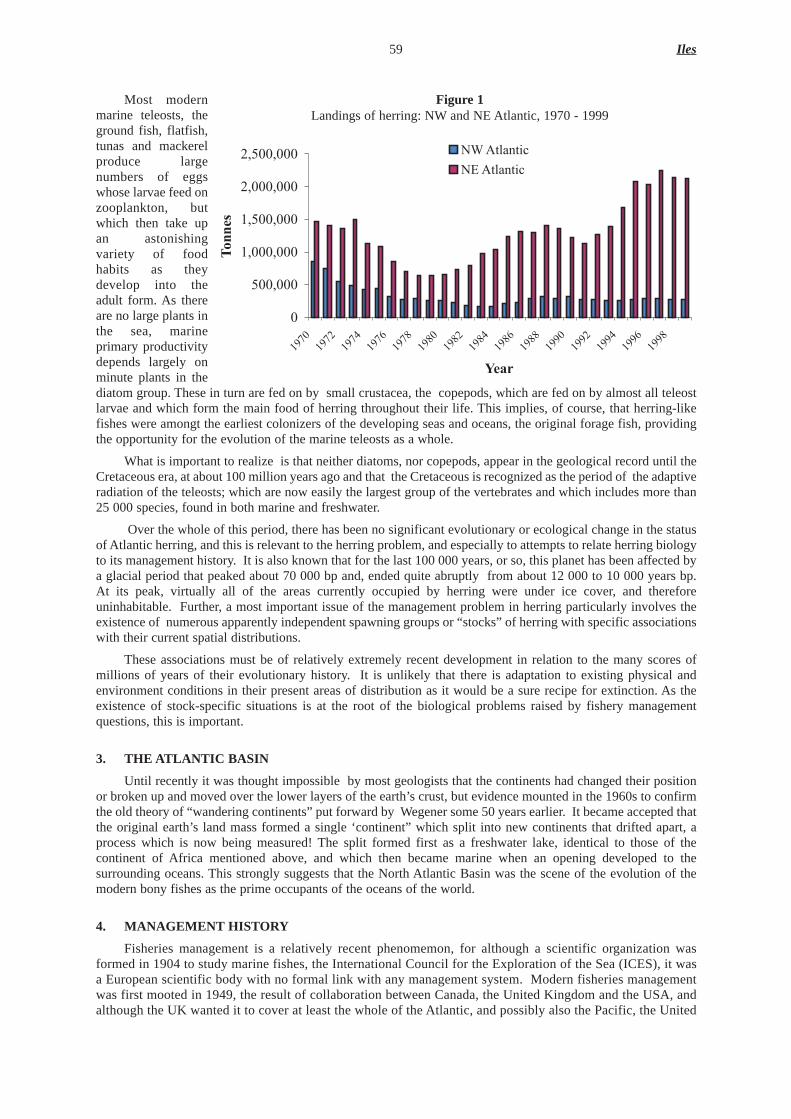
Most modernmarine teleosts, theground fish, flatfish,tunas and mackerelproduce largenumbers of eggswhose larvae feed onzooplankton, butwhich then take upan astonishingvariety of foodhabits as theydevelop into theadult form. As thereare no large plants inthe sea, marineprimary productivitydepends largely onminute plants in thediatom group. These in turn are fed on by small crustacea, the copepods, which are fed on by almost all teleostlarvae and which form the main food of herring throughout their life. This implies, of course, that herring-likefishes were amongt the earliest colonizers of the developing seas and oceans, the original forage fish, providingthe opportunity for the evolution of the marine teleosts as a whole.
What is important to realize is that neither diatoms, nor copepods, appear in the geological record until theCretaceous era, at about 100 million years ago and that the Cretaceous is recognized as the period of the adaptiveradiation of the teleosts; which are now easily the largest group of the vertebrates and which includes more than25 000 species, found in both marine and freshwater.
Over the whole of this period, there has been no significant evolutionary or ecological change in the statusof Atlantic herring, and this is relevant to the herring problem, and especially to attempts to relate herring biologyto its management history. It is also known that for the last 100000 years, or so, this planet has been affected bya glacial period that peaked about 70000 bp and, ended quite abruptly from about 12000 to 10000 years bp.At its peak, virtually all of the areas currently occupied by herring were under ice cover, and thereforeuninhabitable. Further, a most important issue of the management problem in herring particularly involves theexistence of numerous apparently independent spawning groups or “stocks” of herring with specific associationswith their current spatial distributions.
These associations must be of relatively extremely recent development in relation to the many scores ofmillions of years of their evolutionary history. It is unlikely that there is adaptation to existing physical andenvironment conditions in their present areas of distribution as it would be a sure recipe for extinction. As theexistence of stock-specific situations is at the root of the biological problems raised by fishery managementquestions, this is important.
3. THE ATLANTIC BASIN
Until recently it was thought impossible by most geologists that the continents had changed their positionor broken up and moved over the lower layers of the earth’s crust, but evidence mounted in the 1960s to confirmthe old theory of “wandering continents” put forward by Wegener some 50 years earlier. It became accepted thatthe original earth’s land mass formed a single ‘continent” which split into new continents that drifted apart, aprocess which is now being measured! The split formed first as a freshwater lake, identical to those of thecontinent of Africa mentioned above, and which then became marine when an opening developed to thesurrounding oceans. This strongly suggests that the North Atlantic Basin was the scene of the evolution of themodern bony fishes as the prime occupants of the oceans of the world.
4. MANAGEMENT HISTORY
Fisheries management is a relatively recent phenomemon, for although a scientific organization wasformed in 1904 to study marine fishes, the International Council for the Exploration of the Sea (ICES), it wasa European scientific body with no formal link with any management system. Modern fisheries managementwas first mooted in 1949, the result of collaboration between Canada, the United Kingdom and the USA, andalthough the UK wanted it to cover at least the whole of the Atlantic, and possibly also the Pacific, the United
59 Iles
0
500,000
1,000,000
1,500,000
2,000,000
2,500,000
1970
1972
1974
1976
1978
1980
1982
1984
1986
1988
1990
1992
1994
1996
1998
Year
Ton
nes
NW Atlantic
NE Atlantic
Figure 1Landings of herring: NWand NE Atlantic, 1970 - 1999
States saw this as an Atlantic coastal-state issue and itself produced a protocol for its inception, which wasaccepted.
The organization was set up in 1949 as the International Convention for the Northwest Atlantic Fisheries(ICNAF) and came into being in 1951. It should be noted that it was a Convention, i.e. a binding treaty, andoperated under an appointed Commission. Direct organization and responsibility was shared by the USAandCanada, and amongt its objectives was the achievement of the “maximum sustained catch” of fishes.
It was the first convention to include a list of specific management “tools”, e.g. closure of spawning groundsand fishing periods, etc. and it was directed mainly towards groundfish management; herring did not becomeinvolved in its work until the mid-1960s. It was also dependent for its management advice on “scientificconsiderations” and only on these . The Commission included a scientific arm, which took a direct interest in itsmeetings; this too was a new feature. But while the Commission could use the tool of the “total allowable catch”there was no provision for its sub-allocation to individual countries.
By the early 1960s doubt was accumulating as the effectiveness of the Commission’s management tools andthe Commission asked two distinguished scientists, Wilf Templeman of the St.John’s Biological Station and JohnGulland, who had recently joined the FAO from Lowestoft, to examine and suggest improvements. Their finalreport concluded that the real justification for rational management was economic and not biological, and thecatch limitation was only a pre-requisite to improve the economic efficiency of fisheries. This was morerevolutionary than expected but the report was accepted and acted on and the required changes were made in theprotocol of the Convention
The exact manner in which the Commission worked is important because those who have commented on itsmanagement have failed to appreciate the context in which these changes were made. The convention noted that“The Commission may, on the recommendations of one or more Panels, and on the basis of scientificinvestigations, and economic and technical considerations, transmit appropriate proposals for joint action by theContracting Governments, designed to achieve the optimal utilization of the stocks of those species of fish whichsupport international fisheries in the Convention Area”.
Note that it is not “maximum sustainable yield”, and that “optimum” is not defined and thus has its properdefinition as the best in the current circumstances and with the current objectives. This protocol was approvedby the Commission on June 5 and 6 1969 and came into force on 15 December 1971 when all member countrieshad ratified it, but sub-allocation was not available until that date. This was a most important limitation as weshall see.
5. DEVELOPMENTS IN THE 1960s
In the eastern Atlantic, following the war time cessation of fishing, fishing effort increased markedly in thelate 1940s to levels well beyond those of the pre-war period. Two very important areas that were affected withina decade or so involved the largest fish stocks and the largest fisheries of the area. These were the Norwegianherring fisheries, the largest in the world at the time, and the East Anglian fishery, also extremely large and onethat had affected European history for a thousand years. In both cases the young stages of herring were beingexploited in huge amounts; much of the catch, for all age groups, was being used to manufacture fish meal tosupport the relatively newly-expanded industry of stock feeding to pigs, cattle, chickens and the like.
However none of the herring biologists of the time considered, or were convinced, that the stock and catchdeclines in both areas was the result of “overfishing”. In addition this period saw the emergence of the USSRand members of the communist block as potential large new fishing countries in “international waters”. In theearly 1960s for example, Russia formed fishing bases in Cuba! Other countries transferred fishing effort acrossthe Atlantic to waters off the coast of the USAand Canada, and as members of ICNAF, had a perfect right to doso. Even so, the key event that triggered the changes that I will describe took place off the west coast of Canada,where a large fishery for meal had developed on the sister herring species of the Pacific (Clupea pallasii).
Without warning, this fishery, in 1966, recorded a drastic decline in catches to a degree that forced the thenfisheries Minister of Canada to close the fishery in 1968. Those boat-owning firms that had invested a largecapital in new and large boats moved them to the east coast of Canada and insisted that the Minister, who washimself from the West Coast, take action to ensure that the east coast stocks were protected from a similar fate.
The Minister commissioned a report from a west coast scientist and an administrator and ordered the eastcoast research branch to both take part in its preparation and be responsible for the action that was finally calledfor. This led, in late 1969, to a large meeting held in Halifax attended by regional scientists and industrypersonnel representing herring processors. The meeting excluded fishermen’s organizations, which at the timewere virtually non-existent.
Bay of Fundy Herring 60

I had recently begun research on east coast herring and its fisheries and was the only scientist there with firsthand knowledge of management methodologies from the east Atlantic, and was required to present the case formanagement. By then I had become convinced of the fact that excess fishing effort could extinguish herringstocks and had demonstrated this for another clupeid fishery, the Californian Sardine (Sardinops sagax). I wastherefore able to present a case quite different in its approach from that attempted by more orthodox scientists,and which could be easily appreciated by a single diagram.
The industry representatives accepted my arguments as they did my emphasis on the need to concentrate onfisheries for human food, as being much more economically justisfied. Immediately after the meeting I wasapproached by the Science Director for the east coast and offered a position as “Coordinator” for a departmentalprogramme of herring management.
This was a major new initiative for the department, which at that time had no potential managementstructure in place and whose research component had downplayed management-supportive, or “applied” scienceas being of little value compared to “academic” science. Although some individuals were involved in worksupporting the ICNAF organization, their work was not given much weight in considering promotion prospects.
6. PREPARATIONS AND BASIC ORGANIZA TION OF A MANAGEMENT PROGRAMME – 1970
During the latter part of 1970 I organized sampling and analytical procedures at the St. Andrews BiologicalStation, including the introduction of internationally approved biological protocols and the collation of relevantcatch data etc. In addition, an international programme to survey a major spawning area on Georges Bank, off theGulf of Maine was undertaken, which was successful in traversing a large egg-bed to yield vital evidence toestablish the nature of the spawning procedure that at the time was only poorly known.
Over the same period I also completed an analysis of Bay of Fundy fisheries, which revealed a discoveryof, and heavy exploitation of, schools of juvenile herring that resulted in an enormous mortality of these stocks.This obviously posed a major threat to recruitment to the adult stocks, but more to the point, showed that Canadahad initiated a type of fishery that, in Europe was now being blamed for the continuing decline of the Europeanstocks. This, in turn, threatend the prospects of obtaining international agreement on management, especially withthe USSR who were particularly concerned with the effect of juvenile fisheries generally, and who was the singlecountry whose acceptance was most desired.
In October 1970, I became Coordinator and Chairman of the newly created Herring Working Group ofICNAF. This latter was of special significance in that I became an Officer of the Commission and was able, whenthe need arose, to present the views of a scientist both in the official report, and directly to the Plenary Sessionsof the Commission. This was not a trivial point, as will be seen.
7. CANADA – USABILA TERAL PREPARATIONS FOR ICNAF – 1971
The year 1971 was seen as an opportunity to gain the attention of the various Canadian special interestgroups, to explain the management situation and its opportunities and problems, and to get their agreement andsupport. But, there was a more pressing question to be resolved with the USAconcerning a bilateral agreementwith Canada made in 1970 for reciprocal fishing privileges. This governed the transfer of herring between the twocountries, two fisheries of great importance to both. The first was a fixed-gear wier fishery, developed from theaboriginal trap fishery along the shore for mainly juvenile herring, which supported a canning industry for“sardines” and was contiguous with the New Brunswick shore and Maine coast line, well within the respective3 mile limits. The fishery was almost a hundred years old and was for over much of its history the largest singlecommercial fishery in the area with a large economic and social impact in both countries. A meeting was calledto revise the agreement in early 1971 with the intention of explaining Canada’s programme for the extension ofjurisdiction, which in 1970 had reached the stage of a 12-mile territorial sea and the closure of the Bay of Fundyand the Gulf of St. Lawrence to foreign fishing, both of which actions were not acceptable to the USA.
The approach was to search for a joint agreement on proposals to present to the forthcoming Annual ICNAFmeeting to be held in Halifax in June 1971 and to extend management control over the foreign herring fisheriesoff the coast of both countries. These were seen to threaten both the inshore fisheries and the adult fish foundfurther offshore. It was expected to eventually allow exploitation of the adults by the coastal states, for theGeorges Bank fishery, for example, was becoming the largest fishery in the West Atlantic. Canada also proposedthe protection of the newly-found offshore juveniles by banning the catching of juveniles by stringent size limits,both to protect the inshore fishery and to encourage acceptance by the foreigners. At the same time, Canadawished to assure the USAthat transport of Canadian adult herring, caught in the Jefferies ledge area to US plantsfor fishmeal manufacture for, especially, Kentucky fried chicken, would be permitted to continue. In this area,the herring interests of both countries were in effect, completely “free trade”. Agreement was reached and joint
61 Iles
proposals prepared, with the closest administrative and scientific collaboration between the two countries. Thismeeting was the first ever in which Canadian fishermen were included in the official delegation and whose viewswere sought during, and after, the discussions and developments. They also, of course, gave factual informationof a kind available only to fishermen, which allowed practical decisions to be made,
8. ONE MILLION TONNES OFHERRING???
In May of 1971 a meeting was called by the Fisheries Council of Canada in Ottawa. This council was therepresentative body for fish manufacturing interests for Canada as a whole and had a long and direct interactionwith the government in Ottawa and the department’s bureaucracy, who wished to be fully informed of thesituation, which by now was receiving a great deal of media publicity, e.g. an article by a departmental scientistin Newfoundland claimed that a complete failure of herring fisheries could result unless management wasquickly instituted.
The need for management as soon as possible was fully appreciated and supported by the Annual ICNAFmeeting in Halifax, which was attended by the Minister who made it clear that Canada was determined toachieve agreement on management measures, and the herring proposals were the first specific case to beconsidered. As had happened in Europe with herring there, there was general agreement on the need formanagement, but the discussion concentrated on the fact that under the current ICNAF protocol it was notpossible to sub-allocate a TAC and that the different seasonal fisheries among the different countries meant thatthe total TAC could be caught by a single country if it was first in catching the quota that year. No agreementwas possible.
Because it was expected that the new 1969 protocol would be in place by the end of 1971, it was decidedthat there should be a special meeting as early in 1972 as possible to try and reach agreement on sub-allocations.Moreover, the specific scientific information needed to ensure that the appropriate proposals that could be madewas identified and discussed so that the Herring Working Group could make “extraordinary efforts’ to obtain it.The date was fixed for January 1972, and the FAO organization offered to host the meeting at its headquaretersin Rome. This was the first time such an arrangement was made, and it indicated to all concerned that a realattempt should be made to achieve success.
In the meantime, other important internal Canadian issues had to be settled. The first concerned a majorproblem that had two separate government branches at loggerheads over a central question; one maintained thatmanagement was essential at the earliest opportunity, and the other that the herring stocks in Canadian waterswere, in fact, under-exploited. In 1966 a meeting in Fredericton had claimed that at least one million tons ofherring could be taken each year in Canadian waters alone, and all attempts to challenge this were ignored. Thisgeneral view was the subject of the work of The Federal Provincial Atlantic Fisheries Committee, the only groupthat involved provincial interests, and it became necessary for the views expressed there to be effectivelychallenged. Our attempts internationally would be worthless if a formally organized government body heldconflicting views on the need for management, and I prepared a document putting forward the case formanagement to be presented at their next meeting in October. The opposing view was also presented but the casefor management was fully accepted, and, subsequently, the Committee was allowed to lapse.
Also in October 1966, two other meetings were held. The first of these was with New Brunswick fishermenand was organized by the New Brunswick Deputy Minister of Fisheries. At the meeting, views were discussedon a proposed organization to record and analyze fisheries statistics on a real-time basis, the Canadian AtlanticFisheries Information Service (CAFIS). This was accepted by the fishermen who promised their support on theunderstanding that the information would be used to ensure the health of the resource by rational management.This organization developed sophisticated plans, although the major fisheries processing companies refused tojoin on the grounds that their information gave them a necessary competitive advantage.
Alas, the project was cancelled without notice or explanation by dictat from “Ottawa” and after much efforthad been put into its organization,. But, on a more promising note, in November of 1971 a meeting was organizedby the Industrial Development Board at the Bedford Institute of Oceanography in Halifax for which invitationswere widely extended to all fisheries interests. The intention of this meeting was to present details on thepreparations being made for the forthcoming ICNAF meeting and to discuss issues that were relevant from thepoint of view of all special interests who would be represented.
This was easily the most representative meeting on fisheries ever held in Canada. Over 90 people took partfrom both coasts of Canada, Europe and USA. All the maritime provinces were represented by Deputy Ministersof Fisheries, there were 28 processors and an equal number of fishermen and a number of individuals from theFisheries Operations Branch, Halifax. The Department was represented by three biologists from the two “herring”research stations at St. Andrews and St. John’s.
Bay of Fundy Herring 62

The November 1971 meeting at the Bedford Institute of Oceanogaphy was successful in convincing allgroups involved in the exploitation of herring of the size of the resource potential I put forward. This was lessthan half the estimate made in 1966 by the Industrial Development Board, and which had been, in the meantime,accepted as justification for a huge increase in meal plant production, through the Board’s influence with theFederal-Provincial Atlantic Management Committee. The November meeting also accepted the opinion thatimmediate control at the national and international level was required and therefore of the key importance of theforthcoming ICNAF meeting and the need for cooperation among Government and industry to prepare for it .
While there were comments on the failure to consider fishermen’s views, a suggestion by the Dean1 of thefishing community that a “multidisciplinary” body be set up to interact with the government programme on real-time basis was adopted by the Minister who announced the next day of the proposed formation of the AtlanticHerring Management Committee. This replaced the Federal-Provincial committee, and all suggestions of largeunexploited Canadian stocks were removed from the management stage.
This meeting and its results received front page headlines in the biggest Halifax newspaper. This was thefirst time that herring management, indeed, fisheries management had became a public issue in Canada, and thetreatment was accurate and detailed. I was cited as saying that unless stringent management measures wereinitiated immediately the Canadian herring fisheries could be lost within, even, two years, and the leading fishcompanies were quoted as strongly supporting the joint industry-government control group. It must be stressedthat nothing like this had been achieved in the groundfish fisheries, which were several years behind in theirattempts to involve co-ordinated action by industry.
9. THE 1971 NORTHEAST ATLANTIC FISHERIES COMMISSION MEETING, MOSCOW ,DECEMBER 1971
The Halifax meeting had been timed to precede the crucial Special Meeting of ICNAF to be held inJanuary–February in 1972, in Rome and I learned, at short notice, that the equivalent organization for the EastAtlantic planned an Extraordinary Meeting of its Commission, to discuss the North Sea Herring, to be held inMoscow in December 1972.
The situation in the east Atlantic was generally accepted as bad, and without any agreement as to co-operative international management action. Many of the same countries were involved in the ICNAF meeting sothat attendance at the meeting was likely to prove informative and helpful. The Moscow Meeting was planned toproduce proposals to be discussed at a later meeting of Ministers and represented, almost, a last chance to achieverational management of the herring resources, as agreed by some of the attending countries.
The meeting was considered by most delegates as a failure. No agreement was reached to extendconservation measures for conservation of North Sea herring and even the weak proposal that was agreed to wasthought unlikely to be approved by member governments, a belief that was confirmed soon after. Nor was theMinisters meeting more successful. This was despite the fact that all delegations agreed that the situation wasserious, even desperate, in much the same way as did the ICNAF delegates in June, and all paid lip-service tothe needs for fisheries management!
The fact was that some delegates did not wish for agreement because of commitments they had made, whichcould not be met under any management constraints. Thus Norway had recently agreed with both the USSR andIceland to close their winter fishery for Norwegian herring and severely restrict their fishery on juveniles. TheNorth Sea was the only place they could divert effort and they could not accept its virtual closure. The Danes,beside their commitment to North Sea juveniles, had recently allowed the Faroese to invest heavily in a purse-seine fleet, which had to go somewhere. Both these situations were well known to all the delegates who couldexpress concern over the lack of management knowing that it was an extremely unlikely development at that time.
However, neither of these countries would be involved in the ICNAF meeting, and it was the USSR andPoland who were the most likely to take a similar attitude to Norway and Denmark on the other side of theAtlantic. While at Moscow I learned that the USSR fisheries ministry had been put in an impossible position bya decision that Russia’s fish catch was to be doubled within a short period, and that this was seen to be impossibleby the Russian minister. There seemed to be an attitude that favoured conservation as a possible excuse for failure
63 Iles
1 This person, the “Dean”, is Captain Medford Matthews of Campobello who introduced purse seining in the Bay of Fundyin the 1930s and is the only fisherman to have been awarded an honorary Ph.D, by University of New Brunswick.

to reach the economic goal. There had also been an economic decision affecting Poland, which was relevant andthat both of these factors played a part in the ICNAF story.
However, there were other factors operating. The Northeast Atlantic Fisheries Commission (NEAFC) didnot have a forum for direct interaction with fishery scientists, who operated within a purely scientificorganization, the International Council for the Exploration of the Sea, and interacted with the NEAF through aliaison committee. The ICES case that was presented put far too much emphasis on the inadequacy of data, ofthe poor catch statistics and insufficient biological sampling. This allowed their report to be treated asa“provisional” document rather than a guide to action, and it quickly became irrelevant to the issues that wereraised in the general discussions. In addition, and compared to my own views on the “stock question”, theiranalysis of the North Sea stock situation was not detailed enough to allow the proper allocation of catches to thebiological unit that was to be protected. It should be remembered that this issue had been carefully defined at theJune ICNAF meeting. Finally, the recommendations were too general and in terms of such imponderables as“total catch limits” and alternative measures such as closed seasons and areas, with little specific power to limitcatches.
An important conclusion was that the failure of this meeting had thrown doubt on the value of internationalcommissions in general, and a similar failure at ICNAF would re-enforce any doubts. Comments to this effectwere made by several delegates, and as a senior member of the US Fisheries Department was also present as anobserver, this view could well prevail in the USA. As will be seen, this was avoided by the results of the ICNAFmeeting. Indeed, ICNAF became a convenient forum in which advances towards the extension of jurisdictionbecame acceptable for sovereign countries, including the USA.
All of these factors had to be considered, both in the preparation for the ICNAF meeting and as a guide tothe conduct of the meeting itself. Of particular importance was the question of the Canadian juvenile fisheries.The USSR had made it clear that it had grave reservations about the West Atlantic juvenile fisheries and wouldnot agree about controls over their very large Georges Bank fishery until, and unless, they were convinced thatthe juvenile catch would not cause its collape
10. THE FIRST SPECIAL ICNAF MEETING ON HERRING – F AO, ROME, 30 JANUARY– 12 FEBRARY 1972
The commission meeting was preceded by a scientific meeting that addressed the specific question raised atthe June 1971 meeting concerning the stock structure in relation to the administrative context of the conservationproposals and to the possible relationships between the adult spawning stocks and the juveniles exploited by theinshore fisheries.
It was first agreed that stocks fished behind the Canadian closing lines in the Gulf of St. Lawrence, inNewfoundland waters and the northern section of the Scotian Shelf were not associated to any degree with thethree stocks off Southwest Nova Scotia, the Gulf of Maine and Georges Bank. These, it was agreed, neededinternational control measures. It was also accepted that each of these three spawning stocks was independent ofthe other two, which meant that each could have its own management procedures. Finally, it was accepted that ineach of the areas there occurred other stocks, but these were independent and so small as to not affect the valueof the management measures on the major stocks.
The relation with juvenile fisheries in the area was not as well clarified, but some progress was made inshowing the adult Nova Scotia stock was probably not fished in the New Brunswick- Maine “sardine” fisheries.this meant that appropriate management had to be applied to all juvenile fisheries in the area. This, of course, wasthe central issue concerning the USSR and it happened that while the USSR would not accept any agreement untilthe juvenile question was resolved, the official Canadian position was that nothing could be agreed which in anyway interfered with the New Brunswick sardine industry. Either could theoretically affect the other and theproblem was apparently intractable.
It happened that the empirical and historical evidence could be interpreted to show that while there was noexcuse for the more recent purse seine offshore fishery for juveniles, the “sardine” fishery could be absolved. Aserious decline in juvenile catches after some 80 years of continuous and stable catches followed the developmentof the offshore fisheries on Georges Bank that indicated that the effort level inshore was not too high and thatcontrol of the adult fisheries was necessary for both fisheries. After consultation with the USAin 1971, theoffshore juvenile (purse seine) fisheries were closed. This coincided with the appearance of a large year-class,which was then virtually untouched by this fishery and there was quantitative evidence that this had a large andbeneficial effect on recruitment, and probably, to adult stocks not exploited by Canada. This satisfied the USSRdelegation and cleared the way for the necessary calculations to determine recommended TAC’s and thesubsequent discussion amongst the delegations as the their fairest sub-allocation. It should be noted that theUSSR had accepted that because of the reliance of coastal communities on “local” fisheries, coastal states
Bay of Fundy Herring 64

deserved special consideration. This was consistent with Russia’s polite, even considerate, approach to thediscussions, which had established a friendly relationship without ignoring the real differences in objectives.
However, for the first time in the history of ICNAF the scientific report was challenged as to its validity, andthis by the intervention of Polish diplomats in Rome before its presentation to the Plenary Session for formalacceptance. The arrival of the head of the Polish delegation revealed the problem. Under the recently decidedagreements of the COMCOM, the communist block economic commission, Poland was to be responsible for thebuilding of all new fishing vessels, and this would increase available effort whereas for conservation reasons, areduction was required. This was at a time when Polish workers were beginning to organize their own tradeunions, in a movement which led, eventually to the break up of the “Soviet” block. Later, the Polish head ofdelegation approached me at a social occasion and asked for a frank opinion as to the validity of the scientificreport, which I defended. And, at the Plenary Session I had to justify this before all the delegations. The challengewas rejected, which, in fact, strengthened its significance and the Polish Head of Delegation immediately flewback to Warsaw to get new instructions that allowed him to accept the final agreements on the quotas for all thestocks being considered.
This was but one of the “political” factors that operates at all times in international fisheries negotiationsand under virtually all conditions during negotiations in general, as those experienced in such matters are aware.Management has scientific, technical, social and political aspects, and in this respect is, and always will be, multi-disciplinary in context, a reality that is discovered anew in most fishery text books written after the event.
The rest of the discussions at the 1972 ICNAF meeting involved a great deal of bargaining among thedifferent countries, but this did not affect the reaching of agreements for each of the stocks, together with theancillary agreements that were required. Unlike the NEAF meeting less that two months before, the meeting wasconsidered a complete success and had a number of influences, some obvious and others rather unexpected.
11. POST 1972 DEVELOPMENTS
The results of the 1972 ICNAF special meeting were quickly recognized as indicating more promisingdevelopments in fisheries management. Herring, of course was not the only species that required managementin the area and much had been done to prepare for the opportunity that now appeared. At the June 1972 AnnualMeeting held in Washington DC, agreement was reached for 16 ground fish stocks, and by 1974, virtually allspecies of all types in the ICNAF area were under allocations and TAC controls. Moreover, it became acceptedthat even newly discovered stocks of fishes should be protected from overfishing, and the conceptof“precautionary quotas” was established and applied. In addition, and after a most valuable scientific discussion,it was decided that species interaction could affect the validity of assessments on single stock fisheries and thisled to the proposal that after all quotas for a particular country had been allocated, there should be a reduction intotal catch by that country to the extent of 20%, to be decided in its application by the country itself.
Of course, all of this has not dealt with the question of the monitoring of catches to ensure that quotas arerespected, and this problem is virtually a permanent one, but beyond the scope of this report.
There were other, more significant results, for Canada’s strategic goal was the extension of jurisdiction tothe 200 mile limit. Perhaps, the Law of the Sea meeting in 1958 and its lack of result was the reason for Canada’sunilateral actions in the 1960s culminating in the 12-mile territorial sea and the closing lines across the Bay ofFundy and Gulf of St Lawrence. Canada now saw the success at ICNAF as an opportunity for more“unilateral”action towards extension by the process of bilateral or multilateral agreements with individual or groups ofcountries. ICNAF was a convenient umbrella for this tactic and, by 1977, had allowed Canada’s claims toterritorial extension, which also affected the LOS negotiating process itself into accepting such methods.
Canada’s action also forced the USAto take action, one that to begin with was not particularly favouredbecause of the possible effect on freedom of passage for its naval forces around the world. Another effect was todraw academic attention to the question of fisheries management, to the extent that it became almost an obligatorysubject for universities in countries with marine fisheries. Finally, the ICNAF experience provided a realopportunity for the education of scientists, public servants and diplomats in the “science” of management,although I hope I have demonstrated, that “natural history” is perhaps a better term.
There was an inevitable result on the effect of national quotas within Canada on the way in which fisherieswere conducted. Essentially, this transferred the problem of competition among nations into one amongindividual national boats and groups of fishermen, and the story of this ”internalization” of problems and itsresolution in eastern Canada in the later 1970’s follows.
65 Iles
12. THE 1972 OTTAWA MEETING
The success of the Special Meeting on Herring in Rome caused wide-spread Departmental interest and inearly March I proposed a meeting in Ottawa for senior members of various departmental branches to whom Icould present the important facts and discuss their implications. Virtually all the branches of the Department wererepresented and with the news of Poland’s acceptance of the ICNAF herring agreement, it became clear that evenin 1972 Canada would have specific responsibilities in monitoring and reporting on herring catches under hernational quota. Any failure on Canada’s part could affect the fragile international situation.
This responsibility would involve all the major branches including Conservation and Protection, Economics,International Affairs and the Fisheries Research Board. The Fisheries Research Board, in addition, would haveresponsibility for assessing the biological affect, hopefully positive, on the health of the resource. It was agreedthat this area might be dealt with under the aegis of the Canadian Atlantic Fisheries Information Service (CAFIS)meetings.
The Conservation and Protection Branch had already begun preparation for the drafting of the necessaryregulations and had included in these, provisions for compulsory catch reporting by fishermen, and withrecognition that all sections of industry would be needed for their support. In the event, the CAFIS plan for real-time reporting of catch effort information, including catch locations, failed to win the support of the major boat-owning firms, although independent boat owners, especially in the herring purse-seine industry, were inagreement wih the plan’s objectives. Thus, support for CAFIS from Ottawa Headquarters was suddenlywithdrawn and the programme lapsed.
This reflected a fundamental difference of opinion within the research and operation arms of the Departmenton the relative importance of recording and reporting catches and analyzing their biological effect, which hasbeen a constant problem since. A report by the representatives of the Development Incentive Programme alsorevealed problems concerning a possible imbalance between resource potential and the increasing pressure puton it by Government grants – both federal and provincial – to subsidize construction of new plants and boats. Theinflated expectations of total catch for herring had been successfully reduced, but another issue was foreseen inthe meantime.
The adult herring fisheries were overwhelmingly directed towards a low-priced and low-employment meal-industry and already was grossly overcapitalized, in terms of plant capacity. On the other hand, the facilities forthe use of fresh herring for the human-food market were virtually non-existent. The impact of this situation onsubsequent events will become clear.
It was pointed out that the Economics Branch responsible for these issues in Ottawa was being given littleor no guide-lines or instructions on policy, but analysis of the relevant acts shows that grants should be grantedonly if sufficient resources were shown to be available for the appropriate facility. It was agreed therefore, thatfor herring facilities, the Co-ordinator for the herring programme would pass final judgement on this aspect. Thevalue of meetings to encourage communication was accepted and that continuing contacts could be facilitated bythe office of the Co-ordinator, Atlantic Herring Programme.
Such meetings encouraged an essential development of informed interaction between the headquarters leveland the “local” level represented by the Atlantic Herring Management Committee and the focus for the biologicalaspects in the St. Andrews Herring Programme. Thus, it was possible to bridge administration gaps by personalinteractions between informed individuals that significantly reduced misunderstandings and conflicting views.
13. THE EXTENSION OF JURISDICTION
The first Law of the Sea meeting was held in 1958 and was followed by a further meeting in 1960. Thesemeetings failed to define limits of territorial sea and fishing zones and Canada, with the longest coastal area inthe world, planned a series of unilateral actions to achieve its objectives of complete control over its marineresources. In 1964 Canada extended fisheries control a further nine miles beyond the ancient three-mile territorialsea; and in 1971 the three-mile territorial sea and the nine-mile fishing zone were replaced by a twelve-mileterritorial sea. Also in 1971 special fishing zones were established in the Gulf of St. Lawrence and Bay of Fundyand in areas of the west coast.
In 1972 the ICNAF agreement on catches promised a more favourable reception to Canada’s actions and agroup of senior managers in Ottawa began building on this development. They planned the large expansion inthe fisheries departments on both coasts, in preparation for the administrative need when jurisdictional extensionbecame a reality. Their tactics were to negotiate bilateral agreements with major ICNAF countries by 1976; thosewith Norway, USSR, Poland, Spain and Portugal who had accounted for 88% of the total foreign catch had beensigned.
Bay of Fundy Herring 66

In the meantime, Law of the Sea meetings in 1974, 1975 and 1976 had provided a Revised SingleNegotiating Text that recognized a new concept in International Law, a 200-mile inclusive economic zone. Thisallotted sovereign rights over fish and other living and non-living things but reserved freedom of navigation.Canada then announced its intention to assume this authority as of 1 January 1977 having got ICNAF to acceptthat the already-decided 1977 TAC levels would be modified to allow Canada to take as much of the quota as wasneeded.
It was agreed to replace ICNAF with a similar body to deal with issues involving borderline stocks andinteraction with Canada fishing zones. This meant that all of the scientifically approved herring TAC offCanadian coasts was available to Canada and this was a valuable stimulus to the development of the Bay of FundyProject. It should be mentioned that none of the earlier claims by Canada had been accepted by the USA, whowere almost forced to extend their jurisdiction at the same time as Canada while disagreeing with Canadianboundary lines. During the subsequent negotiations, that were finally adjudicated at the Hague, the USAignoredthe history of Canadian Herring Management, which involved important cross-border stocks. As they hadclaimed a much superior record of management through ICNAF, their case would hardly have been supported bythe successful Canadian management of herring as an important exception.
14. THE 1972 SEASON AND THE EVENTS OF 1973
The ICNAF agreement on herring was gladly reviewed by the fishing industry and publicly applauded inthe Atlantic Press, especially as it was quickly followed by similar agreements on 16 groundfish stocks at theICNAF June meeting. Within a year or so virtually all ICNAF stocks came under “allocated-TAC” control. Whatalso became accepted was that all fish stocks, even those about with little was known, should be protected fromtoo rapid an increase in exploitation. This allowed the acceptance of “pre-cautionary quotas”, and ICNAF alsodiscussed the implications of “species interactions”. It was recommended that this could be allowed for by 10%reduction in each country’s “global” allocation for all stocks. Both of these were new “twists” in internationalfisheries management practices.
For those who took part in these developments this represented a gradual change in the attitudes thatinfluenced and changed the approach to management problems at all levels, international and national. Even so,as early as 1972, the effect of an unallocated national quota on a national fishery within Canada becamenoticeable to the extent that fishing seasons became reduced and largely because of the scramble amongstindividual boats to take the largest share of a “limited annual resource”. In 1972 Canada reached its quota early,but this overrun by Canada, was accepted because of the newness of the system - which alleviated the situation.This problem came to a head inthe 1973 Bay of Fundy purse-seine fishery. I was at that timeworking in Ottawa at theMinistry’s headquarters andreceived a call from a senioroperations branch memberresponsible for monitoringcatches, who had been warnedof a possible collusion betweenboats and plants to evade theclosure of the fishery, for theCanadian allocation had beenreached in mid-August, theseason being virtually halved.
Such an action, at thattime, could have destroyedICNAF’s newly-developingprogramme, but, the currentMinister made it quite clear bypublic statement, that closurewould be rigorously enforced. Such action was necessary because Ministers in the past had been known to deferto strong requests from interested parties, and this was by no means unknown to the local departmental staff.Closure was successfully applied, but there was strong disagreement expressed by the industry whichmanifested, in particular, by a demonstration outside Saint John’s Harbour in New Brunswick by virtually thewhole seiner fleet.
67 Iles
A typical Bay of Fundy Herring Seiner
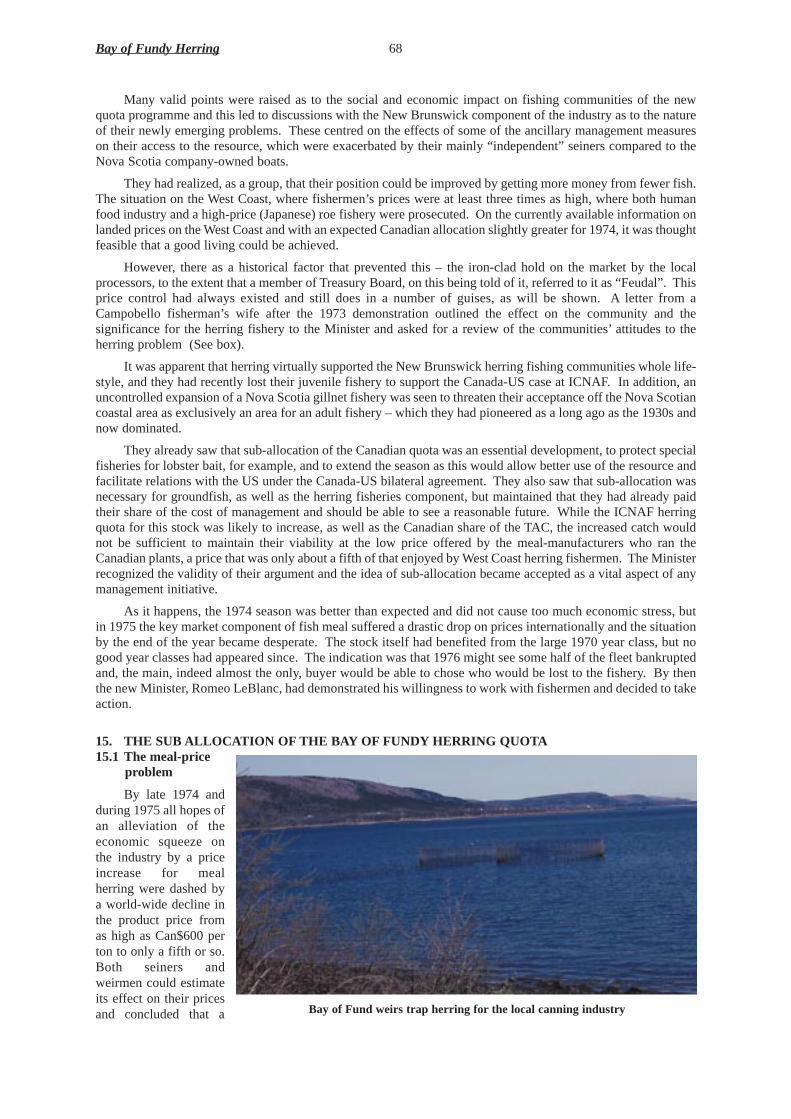
Many valid points were raised as to the social and economic impact on fishing communities of the newquota programme and this led to discussions with the New Brunswick component of the industry as to the natureof their newly emerging problems. These centred on the effects of some of the ancillary management measureson their access to the resource, which were exacerbated by their mainly “independent” seiners compared to theNova Scotia company-owned boats.
They had realized, as a group, that their position could be improved by getting more money from fewer fish.The situation on the West Coast, where fishermen’s prices were at least three times as high, where both humanfood industry and a high-price (Japanese) roe fishery were prosecuted. On the currently available information onlanded prices on the West Coast and with an expected Canadian allocation slightly greater for 1974, it was thoughtfeasible that a good living could be achieved.
However, there as a historical factor that prevented this – the iron-clad hold on the market by the localprocessors, to the extent that a member of Treasury Board, on this being told of it, referred to it as “Feudal”. Thisprice control had always existed and still does in a number of guises, as will be shown. A letter from aCampobello fisherman’s wife after the 1973 demonstration outlined the effect on the community and thesignificance for the herring fishery to the Minister and asked for a review of the communities’attitudes to theherring problem (See box).
It was apparent that herring virtually supported the New Brunswick herring fishing communities whole life-style, and they had recently lost their juvenile fishery to support the Canada-US case at ICNAF. In addition, anuncontrolled expansion of a Nova Scotia gillnet fishery was seen to threaten their acceptance off the Nova Scotiancoastal area as exclusively an area for an adult fishery – which they had pioneered as a long ago as the 1930s andnow dominated.
They already saw that sub-allocation of the Canadian quota was an essential development, to protect specialfisheries for lobster bait, for example, and to extend the season as this would allow better use of the resource andfacilitate relations with the US under the Canada-US bilateral agreement. They also saw that sub-allocation wasnecessary for groundfish, as well as the herring fisheries component, but maintained that they had already paidtheir share of the cost of management and should be able to see a reasonable future. While the ICNAF herringquota for this stock was likely to increase, as well as the Canadian share of the TAC, the increased catch wouldnot be sufficient to maintain their viability at the low price offered by the meal-manufacturers who ran theCanadian plants, a price that was only about a fifth of that enjoyed by West Coast herring fishermen. The Ministerrecognized the validity of their argument and the idea of sub-allocation became accepted as a vital aspect of anymanagement initiative.
As it happens, the 1974 season was better than expected and did not cause too much economic stress, butin 1975 the key market component of fish meal suffered a drastic drop on prices internationally and the situationby the end of the year became desperate. The stock itself had benefited from the large 1970 year class, but nogood year classes had appeared since. The indication was that 1976 might see some half of the fleet bankruptedand, the main, indeed almost the only, buyer would be able to chose who would be lost to the fishery. By thenthe new Minister, Romeo LeBlanc, had demonstrated his willingness to work with fishermen and decided to takeaction.
15. THE SUB ALLOCA TION OF THE BAY OF FUNDY HERRING QUOTA15.1 The meal-price
problem
By late 1974 andduring 1975 all hopes ofan alleviation of theeconomic squeeze onthe industry by a priceincrease for mealherring were dashed bya world-wide decline inthe product price fromas high as Can$600 perton to only a fifth or so.Both seiners andweirmen could estimateits effect on their pricesand concluded that a
Bay of Fundy Herring 68
Bay of Fund weirs trap herring for the local canning industry

69 Iles
NewspaperCorr espondence
Those involved in “hands-on” fisheries management (and not simply answering such letters) will recognize the level ofemotion that can be evoked, and personal consequences that can result, from changes in fishery management practicesas described in this letter, written nearly thrity years ago. The issues remain as topical now as then - Ed.
Honourable Jack DavisMinister of FisheriesParliament Hill OttawaOntario23 August 1973
Dear Jack Davis:
I am writing to protest the closure of the herring fishery in the Bay of Fundy. Are you not the minister offisheries? Is it not your position to try to help the industry? Well, I must say that somebody has certainly made abooby. What do you plan to do with all the men who come under your ministry who are left without any way to makea living?
It is al very well to say that they can have unemployment insurance. Some of them, my husband included,have never been able to be insured, nor to draw benefits in the off-season. Others have not been fishing enoughweeks to have the necessary contributions. Could you live all year on two months salaary? I doubt it, even on thehigh salary a cabinet minister draws.
Another thing, under the unemployment insurance act fishermen are considered seasonal employees andare not allowed to draw benefits until December. Most fishermen are in debt by the time the fishing season starts.They have to pay their bills before they can save any money. Most of these men have not enough money to live on,even for a few weeks.
The ones who own their boats are the ones hardest hit. These men have obtained loans to purchase theirboats and gear. They have to pay back this money and they have to pay interest on it. How will they make theirpayments with such a short fishing season? Has anyone thought about all these things. It is easy to look at thelanded value of al these fish and say that the men are making a good living. Have you ever figured out how muchof this is expense for food, oil, food, gear, nets, twine, paint, putty, gasoline, telephone, insurance; electronicequipment alone costs each boat about $50 to $100 per week. Now stop and think how the people who deal inthese commodities will also suffer if our fishing is stopped. This is in addition to those people in the fish plants andpacking plants that process herring.
The fishermen will be allowed to go back to work in January. January brought no fish last year, nor theyear before. Nor were there any in February, nor March, April, May, and very few in June. The time to fish is whenthe fish are there, and that is now. As with other crops, fall is trtaditionally the harvest of the herring. And it is true,no matter what the biologists say. The fishermen have always considered that the few summer herring would paytheir back bills, but the fall fishing is what pays for the boat, helps to build and maintain their homes, puts food onthe table, and a bit of Christmas for their families.
I do not understand all this business about quotas. I think we should extend our fishing boundary outfurther and cut off all the foreign boats, and let our own people who live in Canada get a decent living. Fishing atbest is little enough, but it is all we have in this area. when fishing is down, the whole area is a in a slump.
My recommendation is that you let the men go back fishing. The why don’t you come here and go aboardone of the boats for at least a week. This time of year it is a pleasure. The weather is generally good, not so mucha chance of fog and you might find out what all this business is about. This would give you an opportunity to talk tothe men. It is a sad thing that the officials making these laws cannot understand and appreciate the essence ofthese men. They have built up their fleet of boats by courage, hardship, and even deprivation. These are MEN andthey are not going to give up their work easily. They are independent and they WANT TO FISH.
For the past three years fishing has been very poor and most men have amassed debts of enormousproportions. Now, when a few fish have come, they are told that they cannot fish. It is not fair, in fact it is a crime onthe part of those responsible.
Thank you for your attention, I hope this letter gets through to your conscience.
Sincerely and hopefullyAlice GoughWelshpoolCampobello Island,New Brunswick

high degree of fleet reduction would be inevitable in 1976. This would allow processors to establish an eventighter, and perhaps irreversible, control on those that would be permitted to survive.
An urgent approach was made to the new Minister, Romeo LeBlanc and was met with an unexpected andrevolutionary response. He welcomed their interest, assured them of his intention to help, but invited them toget together and come up with a proposal that they themselves thought was appropriate. These would have toconform to the departmental policy on conservation but any likely solution would be backed by the Minister’spower and influence.
For the first time in Canadian history the exploiters of a natural resource were officially invited to play apositive role in its management, and to their satisfaction and benefit. His attitude was based on the acceptancethat fishermen were the experts, and given their need and determination would in any case be essential for thesuccess of any scheme.
To initiate the process the Minister sent his Senior Advisor to the Atlantic area to meet with fishermen’sgroups in November and by December his advisor, the key representatives of the two groups and the ex-coordinator (the present author) were named as the group that would be responsible for the development of theprocess. The group was non-departmental and through the advisor could exercise the Minister’s authority andinfluence whenever convenient or necessary, effectively bypasing the departmental bureaucracy.
There followed dozens of meetings and discussions throughout the Atlantic provinces and in Ottawa, atwhich the Minister sometimes spoke and he developed a unique relationship with fishermen, gaining their respectand trust. The meetings covered any and all aspects of the fisheries. For example, an overnight meeting inCampobello revealed the full extent of the various methods used by them and the processors to under-report theircatches. They appreciated that under a TAC arrangement, this would lead to under-estimated stock levels andthat accurate monitoring of catches, a major objective of the project, would then be to their advantage.
It became obvious that any successful management regime would depend either on frank and accuratereporting by the fishermen or the much more expensive method of full and continuous supervision of the wholeoperation, which in any case, could not possibly be set up in a reasonable time. In addition, their skill, expertiseand knowledge would be an enormous help to all of the Departmental responsibilities and requirements.
15.2 The sub-allocation procedure
All of this however, depended on the acceptance of an appropriate sub-allocation procedure for individualboats that not only had to be developed by the fishermen and, to begin with at any rate, operated by the fishermenthemselves in collaboration with the department. Its completeness and necessary reliability in 1976 made thisessential
A meeting in Halifax in early 1976, including representatives from all groups of seiners was set up to dealwith this, under my chairmanship. They had provided records of the individual catches from the 48 boats in thefishery in 1975 which totalled 92905t but which had an enormous range, from 10 to 3851 tonnes.
An essential aspect of the process was that no distinction could be made between boats on the basis of itsgroup membership, the Coop or processor, nor of its provincial origin. The Coop was the name given to theAtlantic Fishermen’s Marketing Cooperative Ltd. which had been set up for the seiners. Also, each boat was tobe given an reasonable chance of financially surviving the 1976 season. However, in view of the large range of1975 catches it was necessary to set a maximum and minimum quota of 1500 and 2500t respectively. Thosebelow the minimum would be allotted the minimum and those above the maximum, the maximum. Thisarrangement required 8290t for the “low-liners”, and the highliners were to contribute 6635t leaving a shortfallof 1655t. This was made up by a sliding-scale adjustment for boats in the 2100 to 2800t catch range, which meantall boats catching more than the mean level in 1975 . Each boat sent its 1975 catch records to St. Andrews forverification and it was agreed that the Chairman’s decision on their validity would be accepted. Other criteriawere discussed but this simple method was agreed to by all.
This allotment procedure represented a revolutionary change in outlook on the part of notoriouslyindependent fishermen, and to emphasize this, the most successful were themselves at the Halifax meeting. Itwas also decided that this was only a first attempt and that the basis could be changed at any time if it becamenecessary. That equal shares would be the best eventual outcome was recognized, and indeed was approachedeven in the next few years.
The final figures were analyzed to compare the effects for the four main landing areas for the fishery, forthe provincial breakdown and between company and Coop boats, and with no significant proportional changefrom 1975. It was agreed that any small group that wished to pool their quotas could do so if they registeredtheir group and indicated their mutual interests and that this raised no problems or antagonism.
Bay of Fundy Herring 70
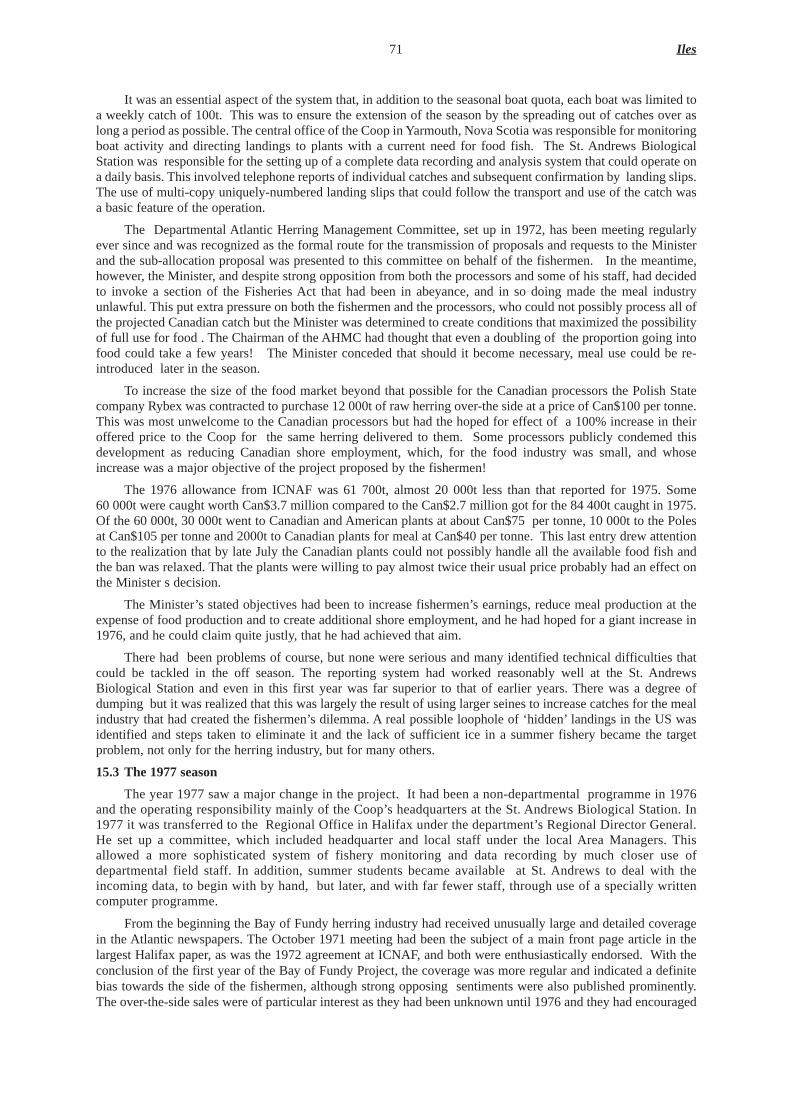
It was an essential aspect of the system that, in addition to the seasonal boat quota, each boat was limited toa weekly catch of 100t. This was to ensure the extension of the season by the spreading out of catches over aslong a period as possible. The central office of the Coop in Yarmouth, Nova Scotia was responsible for monitoringboat activity and directing landings to plants with a current need for food fish. The St. Andrews BiologicalStation was responsible for the setting up of a complete data recording and analysis system that could operate ona daily basis. This involved telephone reports of individual catches and subsequent confirmation by landing slips.The use of multi-copy uniquely-numbered landing slips that could follow the transport and use of the catch wasa basic feature of the operation.
The Departmental Atlantic Herring Management Committee, set up in 1972, has been meeting regularlyever since and was recognized as the formal route for the transmission of proposals and requests to the Ministerand the sub-allocation proposal was presented to this committee on behalf of the fishermen. In the meantime,however, the Minister, and despite strong opposition from both the processors and some of his staff, had decidedto invoke a section of the Fisheries Act that had been in abeyance, and in so doing made the meal industryunlawful. This put extra pressure on both the fishermen and the processors, who could not possibly process all ofthe projected Canadian catch but the Minister was determined to create conditions that maximized the possibilityof full use for food . The Chairman of the AHMC had thought that even a doubling of the proportion going intofood could take a few years! The Minister conceded that should it become necessary, meal use could be re-introduced later in the season.
To increase the size of the food market beyond that possible for the Canadian processors the Polish Statecompany Rybex was contracted to purchase 12000t of raw herring over-the side at a price of Can$100 per tonne.This was most unwelcome to the Canadian processors but had the hoped for effect of a 100% increase in theiroffered price to the Coop for the same herring delivered to them. Some processors publicly condemed thisdevelopment as reducing Canadian shore employment, which, for the food industry was small, and whoseincrease was a major objective of the project proposed by the fishermen!
The 1976 allowance from ICNAF was 61700t, almost 20000t less than that reported for 1975. Some60 000t were caught worth Can$3.7 million compared to the Can$2.7 million got for the 84400t caught in 1975.Of the 60000t, 30000t went to Canadian and American plants at about Can$75 per tonne, 10000t to the Polesat Can$105 per tonne and 2000t to Canadian plants for meal at Can$40 per tonne. This last entry drew attentionto the realization that by late July the Canadian plants could not possibly handle all the available food fish andthe ban was relaxed. That the plants were willing to pay almost twice their usual price probably had an effect onthe Minister s decision.
The Minister’s stated objectives had been to increase fishermen’s earnings, reduce meal production at theexpense of food production and to create additional shore employment, and he had hoped for a giant increase in1976, and he could claim quite justly, that he had achieved that aim.
There had been problems of course, but none were serious and many identified technical difficulties thatcould be tackled in the off season. The reporting system had worked reasonably well at the St. AndrewsBiological Station and even in this first year was far superior to that of earlier years. There was a degree ofdumping but it was realized that this was largely the result of using larger seines to increase catches for the mealindustry that had created the fishermen’s dilemma. A real possible loophole of ‘hidden’landings in the US wasidentified and steps taken to eliminate it and the lack of sufficient ice in a summer fishery became the targetproblem, not only for the herring industry, but for many others.
15.3 The 1977 season
The year 1977 saw a major change in the project. It had been a non-departmental programme in 1976and the operating responsibility mainly of the Coop’s headquarters at the St. Andrews Biological Station. In1977 it was transferred to the Regional Office in Halifax under the department’s Regional Director General.He set up a committee, which included headquarter and local staff under the local Area Managers. Thisallowed a more sophisticated system of fishery monitoring and data recording by much closer use ofdepartmental field staff. In addition, summer students became available at St. Andrews to deal with theincoming data, to begin with by hand, but later, and with far fewer staff, through use of a specially writtencomputer programme.
From the beginning the Bay of Fundy herring industry had received unusually large and detailed coveragein the Atlantic newspapers. The October 1971 meeting had been the subject of a main front page article in thelargest Halifax paper, as was the 1972 agreement at ICNAF, and both were enthusiastically endorsed. With theconclusion of the first year of the Bay of Fundy Project, the coverage was more regular and indicated a definitebias towards the side of the fishermen, although strong opposing sentiments were also published prominently.The over-the-side sales were of particular interest as they had been unknown until 1976 and they had encouraged
71 Iles

Canadian processors to double their original price paid to fishermen, as was mentioned with satisfaction. Thesearticles drew attention to the key issue, that this had attacked the closed-shop monopsonistic arrangement werethe fishermen had only one market for their fish, and compared the situation with that on the west coast whereprices paid were four or five times as high. It concluded that fishermen were entitled to share extensively in theprofit and that they had effectively formed a union that would stay in the [Fundy] Bay. In 1977 boats belongingto a meal processing plant that had performed noticeably less successfully than the Coop boats in 1976 weresold to their skipper-fishermen by the meal company. The federal department gave grants towards the downpayment, and the Provincial government made loans available on favourable terms. These boats then joined theCoop, which greatly improve its fleet coverage, and it continued its role of directing the activities of the wholefleet to ensure processing quality of landed herring. The results of the 1977 season showed another largeimprovement for the fishermen and for theindustry as whole. An estimated 98% of thecatch was processed for food, the fishermen’sprice more than trebled, as did the value of thefishery, and plant employment rose about fivetimes. This did not result in the ConstantCritic apologizing! Handling facilities of allkinds were being improved to meet thedemands of what was developing into asophisticated fishery and investment inprocessing became much more acceptable andwidespread outside the herring industry. Bothsides of the industry had clearly benefited andall this with a federal investment of but Can$5million. Figure 2 shows how catches, TACsand prices have varied in the four year period1975 – 1978 for all of the sectors harvestingherring.
Over the remainder of the 1970s this momentum was maintained. On the monitoring, recording andanalytical side the St. Andrews organization continued to improve on coverage, precision and reliability and theassessment of the health of the stock was closely followed. In 1977 a weekly Bay of Fundy newsletter wasinitiated that became the mode for the reporting of news of all kinds relating to fisheries for the general area.
16. THE DECLINE AND FALL OF FISHERMEN’S INFLUENCE IN ATLANTIC CANADA
It is all the more regretful that from 1980 onwards virtually all that had been gained in terms of fishermen’sinfluence and effort was lost. This was the result of a number of events which began with a change in theDirectorship of the Coop, which was built into its original rules. The position was of limited term and was to befilled alternatively from the two provinces – Nova Scotia and New Brunswick. There was a provincially-basedsplit in the organization with the foundation of the South West Seiner Association, and inexperience on the part ofthe incoming president in the functioning of the by-now complex reporting system led to the loss of the centraldistributional aspects, leaving only the over-the side sales to provide leverage for higher prices. The unpopularityof this arrangement was as great as ever among the processing component and it would clearly be soon lost.
In June 1980 the St. Andrews analytical programme detected a change in the pattern of reporting, by nowfamiliar to the staff responsible, which by numerical analysis could best be explained by collusion betweencertain boats and certain plants, but this evidence, because it was circumstantial was not acted on. This madesuspect the most vital of the function of the project, to produce information to ensure resource protection. Figure3 shows how landings and TACs have varied over the period 1997 – 2000.
Over that period there was also major changes in the departmental personnel responsible for localsupervision who were replaced with individuals with less knowledge and interest. A change at the RegionalDirector level resulted in an more significant change for under the new Director the personal interest needed inthe project was such that local supervision and interaction became almost absent. A new 10-year plan for theherring/mackerel fisheries introduced in 1981 hardly referred to the recent history of the original project, and thesame can be said for the 1982 Kirby Report, which was intended to indicate the best policy to be followed by theAtlantic fisheries as a whole. All this meant that the unique experience by certain departmental staff and theirunusually effective cooperation with fishermen, and indeed both sides of industry, could not be applied to otherfisheries, and, of course, it was lost to the Bay of Fundy fishermen.
Bay of Fundy Herring 72
0
20000
40000
60000
80000
100000
120000
140000
1975 1976 1977 1978
Cat
ch
0
50
100
150
200
$/to
nne
Catch (t)
$/tonne
Figure 2Trends in catch and price - All sectors

These changesincluded scientific concl-usions that could be relevantto the exploitation of the codstocks, which despite theprojection of large increasesin the Kirby report, declinedand collapsed during the1980s with the enormoussocial and economic effectsthat still remain. In fact, it isthe way in which the historyof the herring fisheries inthis area can play a part inmore promising develop-ments that has encouragedme to write this report.
17. THE 1980s AND 1990s
The new Director General, by advertising the overall results of the Bay of Fundy project, ensured that itsoriginal success became recognized world wide, through his attendance at the many meetings that were beingheld on management matters. The full effect of the 200 nautical mile national jurisdictional extension hadbecome felt, as had the necessity for sub-allocation. Many countries took appropriate action but the change inthe Canadian position was not emphasized.
In the Bay of Fundy area the 1980s was a time when little local intervention was possible because of thelack of scientific staff, caused by position reductions and postings, but the remaining technical staff, who had beenresponsible for the setting up of the data base collation and analysis, continued to improve its reliability andcoverage even during a period when under-reporting was thought on the increase. By the mid 1980s the authorreturned to the St. Andrews station and more staff were hired to support the assessment mandate, but still withinthe context of boat quotas .
There had been no indications of biological stock failure despite significant environmental variability inthe 1980s and the marked improvement in the length and the quality of the database, which had accumulated since1969, ensured reasonably quick diagnoses. The degree of under-reporting during the season did not affectrelations with either side of industry which, on a personal basis, was friendly and trusting, bearing witness to along period of mutual co-operation, and the biological sampling regime was building up an exceptionally broadpicture of herring biology.
There was, over the same period, significant changes both in herring products demanded and in theiravailability but the industry was more flexible and better able to adjust. Two significant developments were theroe market and the developing salmon aquaculture industry, which interacted greatly with herring in the area.
In the 1990s the St. Andrews herring programme renewed and improved the system of what could be calledan in-season management approach based on close and frequent discussions with all fishery participants. Onenotable development was the involvement of the largest herring company in the area in the sampling programmewhich covered all herring landed with them. The data handling techniques took advantage of the improvement incomputer techniques and knowledge of the stock structure was greatly increased. The result, over some 30 years,is the accumulation of a unique data set for a major fish component of the marine environment whose existencecan claim to be one of the major achievements of the project. The reality of the changes are demonstrated by thefact that a few years ago the major company involved was taken over by the Weston complex, a global companyof Canadian origin, who are now inviting buyers with an expected price rumoured to be not far short of a billiondollars!
18. THE 2001 ATLANTIC FISHERIES POLICY
A policy review for Atlantic fisheries is now being discussed, and is widely reported to give an indicationof attitudes, particularly those of the fishermen, whose influence is responsible for the current situation. Since1975, the sub-allocation programme has become virtually universal, for all species in all areas, and it is a keyelement of departmental policy and function.
73 Iles
0
50000
100000
150000
200000
1977
1979
1981
1983
1985
1987
1989
1991
1993
1995
1997
1999
Year
Tonn
es
Landings
TAC
Figure 3Reported landings and TACs

At a recent meeting in Atlantic Canada, attended by representatives of both sides of industry, stakeholdersinvolved in all important species and gear types, showed a level of distrust and frustration that showed that itwould be impossible to gain their combined support for the objectives of the review. The arguments presentedby the fishermen’s leaders were well based and knowledgeable, making the idea that fishermen should be testedand licensed, if successful, quite ridiculous. They were certainly more professional that most departmentalrepresentatives.
The fishermen’s main argument was, not that they disagreed with the principle of sub-allocation but thatits original promise had become subverted to serve the special interests of the processing side of industry. Theresource had been diverted to fewer and larger groups controlled by the processing sector. These had receivedpublic money in large quantities, in the interests of creating shore jobs, and especially during the groundfishdebacle, but had survived to use political inflluence at the highest level for favourable treatment against theowner-operator.
A major problem was the transfer of licences and their concentration in the hands of individual companiesthat effectively converted a privilege, to be constantly justified, to ownership . The result, it was claimed, meantin practice, that the Federal Government had virtually lost control over, and ownership of, the marine resource.The resource had been privatized destroying both the force of the 1867 Fisheries Act and preventing its use toachieve public and not private objectives. This loss included the globalization of a publicly-owned resource toforces which can easily match the government in litigating power.
The leasing process, by which the licence to fish is rented from the processor, who loses the expense of boatoperation, but controls the purchase of the catch, to convert professional fishermen into low grade employeesrather than shareholders in a worthy and dangerous profession, should be made impossible. Fishing rights shouldbe given to professional fishermen.
Other equally important issues were raised, but two that deserve to be emphasized are the proposed intentionto license professional fishermen, an insult a group who are already professionals and which raises the point forfishermen as to who, amongst a department of amateurs, is going to define what is meant by the term. Andsecond, is the apparent intent to manage fisheries by policy. It was pointed out that Canadian’s rights areenshrined in legislation and policy is the bureaucratic way of evading rights, while those doing so maintain theirs.It would make impossible the achievement of the stated objective, to allow the industry to become involved inthe creation of policy in Atlantic Canada and ignores the part played by organized fishermen, in getting to thecurrent situation and the fact that they have been excluded for some 20 years. Even these concerns do not includethat raised by the Aboriginal question arising from the Supreme Court’s recent decision. This could be seen asgranting fishing privileges, not to individuals, but to a poorly defined group, which surely raises the question ofownership in a different context.
19. DISCUSSIONS AND CONCLUSIONS
The theme of this report is that the Bay of Fundy herring fisheries, and particularly the seine fishery, haveplayed a crucial role in the origin and development of modern fisheries management on a world-wide basis basedon the acceptance of jurisdictional extension and the use of the process of sub-allocation. This has been usedby most maritime countries to achieve, it must be stressed, sovereign ownership of its offshore resources.
This is realized and accepted by a small and diminishing group of individuals who were direct partners inthe original developments. This means that the elements that can be linked to its original success are becomingunknown and ignored even though they could well make a significant contribution to current problems, bothtechnical and scientific.
The emphasis is that management is, always was, and always will be, a multi-disciplinary andinterdisciplinary process and attempts to oversimplify problems should be avoided. In particular, while sub-allocation is necessary to achieve results in anything but the most simple situation, it does not guarantee theachievement of any specific goals, which are the result of economic, social and political influence thatthemselves are dependent on the current situation and the social and political system that is being used, orchallenged.
Bay of Fundy Herring 74
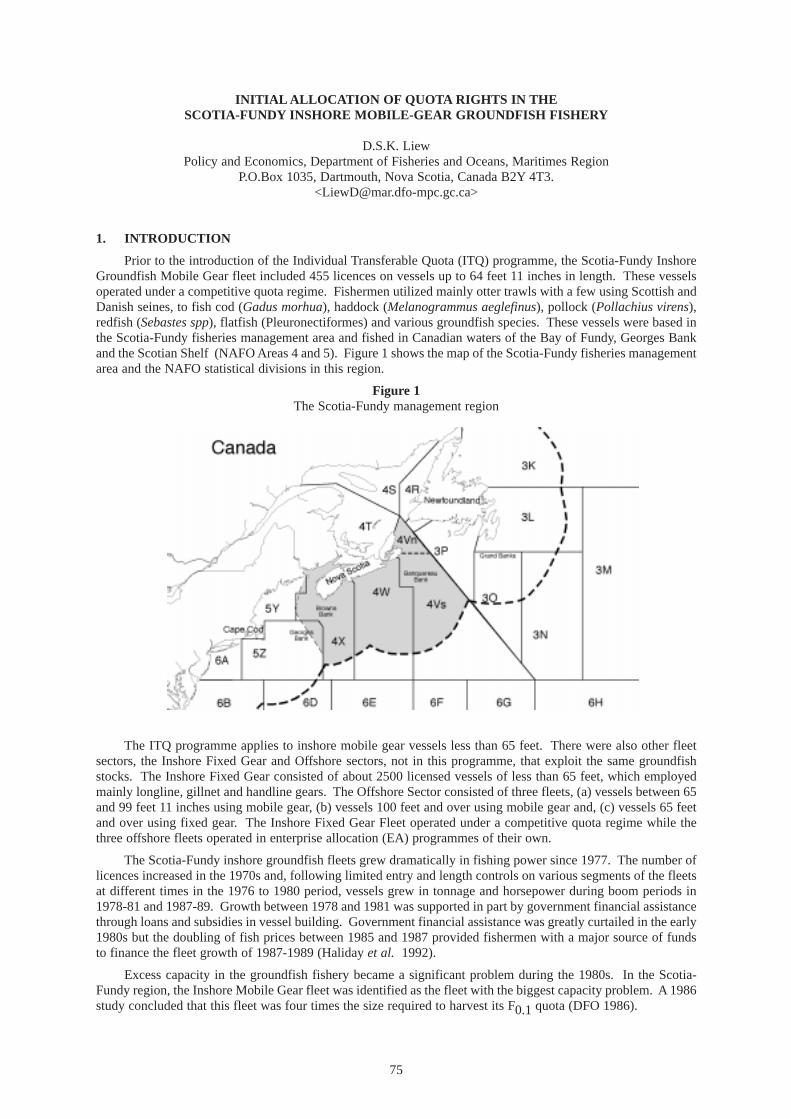
INITIAL ALLOCA TION OF QUOTA RIGHTS IN THE SCOTIA-FUNDY INSHORE MOBILE-GEAR GROUNDFISH FISHER Y
D.S.K. LiewPolicy and Economics, Department of Fisheries and Oceans, Maritimes Region
P.O.Box 1035, Dartmouth, Nova Scotia, Canada B2Y4T3.<[email protected]>
1. INTRODUCTION
Prior to the introduction of the Individual Transferable Quota (ITQ) programme, the Scotia-Fundy InshoreGroundfish Mobile Gear fleet included 455 licences on vessels up to 64 feet 11 inches in length. These vesselsoperated under a competitive quota regime. Fishermen utilized mainly otter trawls with a few using Scottish andDanish seines, to fish cod (Gadus morhua), haddock (Melanogrammus aeglefinus), pollock (Pollachius virens),redfish (Sebastes spp), flatfish (Pleuronectiformes) and various groundfish species. These vessels were based inthe Scotia-Fundy fisheries management area and fished in Canadian waters of the Bay of Fundy, Georges Bankand the Scotian Shelf (NAFO Areas 4 and 5). Figure 1 shows the map of the Scotia-Fundy fisheries managementarea and the NAFO statistical divisions in this region.
Figure 1The Scotia-Fundy management region
The ITQ programme applies to inshore mobile gear vessels less than 65 feet. There were also other fleetsectors, the Inshore Fixed Gear and Offshore sectors, not in this programme, that exploit the same groundfishstocks. The Inshore Fixed Gear consisted of about 2500 licensed vessels of less than 65 feet, which employedmainly longline, gillnet and handline gears. The Offshore Sector consisted of three fleets, (a) vessels between 65and 99 feet 11 inches using mobile gear, (b) vessels 100 feet and over using mobile gear and, (c) vessels 65 feetand over using fixed gear. The Inshore Fixed Gear Fleet operated under a competitive quota regime while thethree offshore fleets operated in enterprise allocation (EA) programmes of their own.
The Scotia-Fundy inshore groundfish fleets grew dramatically in fishing power since 1977. The number oflicences increased in the 1970s and, following limited entry and length controls on various segments of the fleetsat different times in the 1976 to 1980 period, vessels grew in tonnage and horsepower during boom periods in1978-81 and 1987-89. Growth between 1978 and 1981 was supported in part by government financial assistancethrough loans and subsidies in vessel building. Government financial assistance was greatly curtailed in the early1980s but the doubling of fish prices between 1985 and 1987 provided fishermen with a major source of fundsto finance the fleet growth of 1987-1989 (Haliday et al. 1992).
Excess capacity in the groundfish fishery became a significant problem during the 1980s. In the Scotia-Fundy region, the Inshore Mobile Gear fleet was identified as the fleet with the biggest capacity problem. A 1986study concluded that this fleet was four times the size required to harvest its F0.1quota (DFO 1986).
75
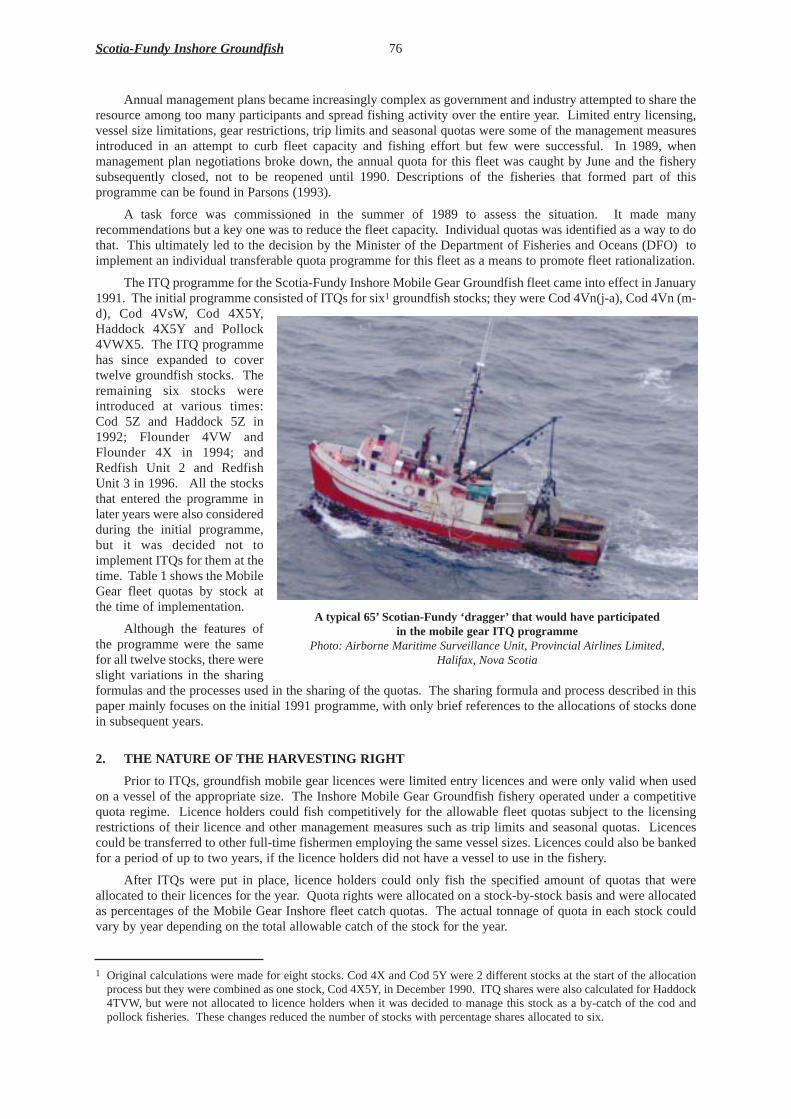
Annual management plans became increasingly complex as government and industry attempted to share theresource among too many participants and spread fishing activity over the entire year. Limited entry licensing,vessel size limitations, gear restrictions, trip limits and seasonal quotas were some of the management measuresintroduced in an attempt to curb fleet capacity and fishing effort but few were successful. In 1989, whenmanagement plan negotiations broke down, the annual quota for this fleet was caught by June and the fisherysubsequently closed, not to be reopened until 1990. Descriptions of the fisheries that formed part of thisprogramme can be found in Parsons (1993).
A task force was commissioned in the summer of 1989 to assess the situation. It made manyrecommendations but a key one was to reduce the fleet capacity. Individual quotas was identified as a way to dothat. This ultimately led to the decision by the Minister of the Department of Fisheries and Oceans (DFO) toimplement an individual transferable quota programme for this fleet as a means to promote fleet rationalization.
The ITQ programme for the Scotia-Fundy Inshore Mobile Gear Groundfish fleet came into effect in January1991. The initial programme consisted of ITQs for six1 groundfish stocks; they were Cod 4Vn(j-a), Cod 4Vn (m-d), Cod 4VsW, Cod 4X5Y,Haddock 4X5Y and Pollock4VWX5. The ITQ programmehas since expanded to covertwelve groundfish stocks. Theremaining six stocks wereintroduced at various times:Cod 5Z and Haddock 5Z in1992; Flounder 4VW andFlounder 4X in 1994; andRedfish Unit 2 and RedfishUnit 3 in 1996. All the stocksthat entered the programme inlater years were also consideredduring the initial programme,but it was decided not toimplement ITQs for them at thetime. Table 1 shows the MobileGear fleet quotas by stock atthe time of implementation.
Although the features ofthe programme were the samefor all twelve stocks, there wereslight variations in the sharingformulas and the processes used in the sharing of the quotas. The sharing formula and process described in thispaper mainly focuses on the initial 1991 programme, with only brief references to the allocations of stocks donein subsequent years.
2. THE NATURE OF THE HAR VESTING RIGHT
Prior to ITQs, groundfish mobile gear licences were limited entry licences and were only valid when usedon a vessel of the appropriate size. The Inshore Mobile Gear Groundfish fishery operated under a competitivequota regime. Licence holders could fish competitively for the allowable fleet quotas subject to the licensingrestrictions of their licence and other management measures such as trip limits and seasonal quotas. Licencescould be transferred to other full-time fishermen employing the same vessel sizes. Licences could also be bankedfor a period of up to two years, if the licence holders did not have a vessel to use in the fishery.
After ITQs were put in place, licence holders could only fish the specified amount of quotas that wereallocated to their licences for the year. Quota rights were allocated on a stock-by-stock basis and were allocatedas percentages of the Mobile Gear Inshore fleet catch quotas. The actual tonnage of quota in each stock couldvary by year depending on the total allowable catch of the stock for the year.
Scotia-Fundy Inshore Groundfish 76
A typical 65’ Scotian-Fundy ‘dragger’ that would have participatedin the mobile gearITQ pr ogramme
Photo: Airborne Maritime Surveillance Unit, Provincial Airlines Limited,Halifax, Nova Scotia
1 Original calculations were made for eight stocks. Cod 4X and Cod 5Ywere 2 different stocks at the start of the allocationprocess but they were combined as one stock, Cod 4X5Y, in December 1990. ITQ shares were also calculated for Haddock4TVW, but were not allocated to licence holders when it was decided to manage this stock as a by-catch of the cod andpollock fisheries. These changes reduced the number of stocks with percentage shares allocated to six.

The quotas could be traded either on a temporary (for the year only) or permanent basis. When quotas weretraded on a temporary basis, the actual quantities (tonnages) of quota for the year were traded and the permanentpercentage shares were not affected. Quota entitlements revert to the permanent quota holder the following year.In permanent trades, the percentage shares were traded along with the corresponding quantities. Only temporarytransfers were allowed during the first two years of the programme. Permanent transfers came into effect in 1993and since then, both permanent and temporary transfers have been allowed.
There was also a limit on the maximum amount of quota a licence could accumulate. At the start of theprogramme in 1991, this limit was set at 2% of the total Mobile Gear fleet quota in all 6 stocks. This 2% appliedto the total only, so it was possible for a licence to accumulate more than 2% in any single stock. The 2% limitincluded both permanent and temporary quotas. As stocks were added to the ITQ programme, the 2% wouldremain the same but the absolute amount of quota would increase. The groundfish resource decline in 1993 putthe quota holdings of some licences over the 2% limit and this limit was subsequently changed to the greater of2% of the total Inshore Mobile Gear Groundfish quotas or 600t.
No banking of quotas were permitted. Any uncaught quotas at the end of the year were not added to thefollowing year’s entitlement. Uncaught quotas could be temporarily transferred to other licence holders who hadoverfished their quotas.
Table 1Groundfish quotas by stock,
Scotia-Fundy inshore mobile gear fleet
3. THE METHOD OF QUOTA ALLOCA TION3.1 Policy objectives
There were no pre-set objectives on how the shares were to be divided. Fisheries management committeesin the Maritimes Region had always operated based on consensus among members. The allocation process usedcontinued this consensus approach. The allocation formula chosen attempted to minimize the amount ofdeviations from current levels of activity and also provided some access to those who had not fished in recentyears, so enhancing the environment for consensus building.
3.2 Process used in determining the allocation
The allocation process started in February 1990 and a Working Group was established. The Working Groupconsisted of representatives from members of the Mobile Gear Groundfish fleet and groundfish industryassociations, Nova Scotia and New Brunswick provincial governments, and DFO. The mandate of the WorkingGroup included: (a) to decide on the stocks to include in the programme, (b) to choose the sharing formula andthe appeal system, (c) to set the initial operating guidelines of the programme, and (d) to discuss the effectivemonitoring of the quotas.
77 Liew
Stock
Quotas in year of implementation
(tonnes)
ITQ allocated in 1991 Cod 4VN (j-a) Cod 4VN (m-d) Cod 4VsW Cod 4X5Y Haddock 4X5Y Pollock 4VWX5 Subtotal ITQ allocated in 1992 Cod 5Z Haddock 5Z ITQ allocated in 1994 Flounder 4VW Flounder 4X5Y ITQ allocated in 1996 Redfish Unit 2 Redfish Unit 3
Total all stocks
626 2 121 4 010
11 130 2 770 9 840
30 497
4 430 2 535
2 375 3 350
1 034 3 707
47 928

Between February and May 1990, the Working Group held three workshops each of 2-3 days in durationand four one-day meetings to formulate the allocation formula. The implementation date for the programme,originally set for 1 May 1990, was deferred to 1 January 1991 due to the complexity of the programme.Notifications of the first set of sharing options and approximate individual shares were mailed to all licenceholders in June 1990. The Working Group also held meetings in the summer of 1990 in fishing communitiesaround the Scotia-Fundy fishery management area to explain the proposed programme and hear the views oflicence holders. The Working Group held a few more meetings between June and December 1990 to discuss thefeatures of the programme such as transferability options and processes, possible limits on quota accumulationand the duration of the programme.
The Working Group considered a number of sharing formula options. Among these were: (a) equal shares,(b) shares based on the level of investment in the fishery, (c) shares based on the number of years in the fishery,(d) shares based on historic catch, (e) shares based on the size of vessel, (f) minimum and maximum shares, and(g) combinations or variations on the above. The advantages and disadvantages of each option were debated andthey were also evaluated using simple examples. The sharing formulas that offered better potential for adoptionwere further evaluated by applying the formula to the actual data and impact analyses were run. The impactanalyses were presented to the Working Group who might then decide to discard the option or fine-tune theformula for further consideration. All the data presented to the Working Group did not contain any identificationof the vessels or licence holders, to protect the confidentiality of stakeholders and to prevent conflict of interests.A few rounds of analyses were presented to the Working Group before they voted for the final (or semi-final)formula. As will be explained in Section 3.3, there were two separate allocation formulas, (a) one for vessels lessthan 45 feet (C1) and (b) one for vessels 45-64 feet (C2). The Working Group offered only one sharing optionfor C1 but two for C2. The C2 licence holders voted for the final formula used.
Two mail-outs to all 455 licence holders were made, one in June and one in early December 1990, beforethe final allocations were sent out in late December 1990. The June mail-out contained information on thelicence-vessel histories, catch histories of the licence and approximate quotas in each stock, along with appealsinformation and forms for appeals. The early December mail-out contained updated information on the catchhistories and quota allocations, as well as ballots for the licence holders to choose whether to remain in theprogramme, preferred features of the programme and on the formula to use for C2 licences.
3.3 Allocation method chosen
The average best two of four years’mobile gear catch histories of the licence for the years 1986-1989 waschosen as the basis to allocate the quota. Subject to some refinements, quota shares were distributedproportionately based on the average best two of four years’mobile catch histories of the licence in each stock.
In the Scotia-Fundy fisheries, groundfish licences could be transferred from one licence holder to anotherand licences could also be switched from one vessel to another. As a result, the catch history of the licence holdercould be different from that of the licence or the vessel. The Working Group chose the catch histories of thelicence and not that of the person or vessel as a basis for sharing quotas.
There were two allocation formulas, one for licences on vessels less than 45 feet (C1) and one for licenceson vessels 45-64 feet (C2). In fact, the Working Group offered two different formulas for C2, and C2 licenceholders were asked to vote on the final formula to use. Only the formulas used are presented in this report - detailson the other C2 formula can be found in DFO (1991). While the fishery was managed on competitive quotasprior to the ITQ programme, there were separate quotas for each vessel length group and this past division ofquotas aided the separate calculation of IQs for each vessel length category. Licences within a category sharedthe quota in that category and each stock was allocated separately.
The basic sharing in both vessel categories was the same - it was proportionate to the average best two offour years’mobile catch histories for the years 1986 to 1989. The main difference between the C1 and C2formulas was in the minimum allocation and in how the pool of quota to settle appeals was set aside. In the C1formula, licences with total allocations of less than 7t (for all six stocks) were topped up to 7t, while in C2, therewas no top up. It was therefore possible for some C2 licences to have no quota at all. In C1, a pool of quota forallocations arising from appeals (Appeal Pool) was created by taxing 10% of the quota from licences that werenot topped up to 7t, excluding the successful appellants. In C2, the Appeal Pool was created by setting aside1100t or about 7.51% of the C2 quota prior to the individual allocations.
In summary, the allocation formula consisted of a basic share, refinements to the basic shares (such asminimum allocation) and settlement of appeals from the pools of quota set aside especially for this purpose. Table 2summarizes the allocation formulas for C1 and C2. The details of the allocation process including thecomputational process and settlement of appeals will be described in Sections 4 and 5.
Scotia-Fundy Inshore Groundfish 78
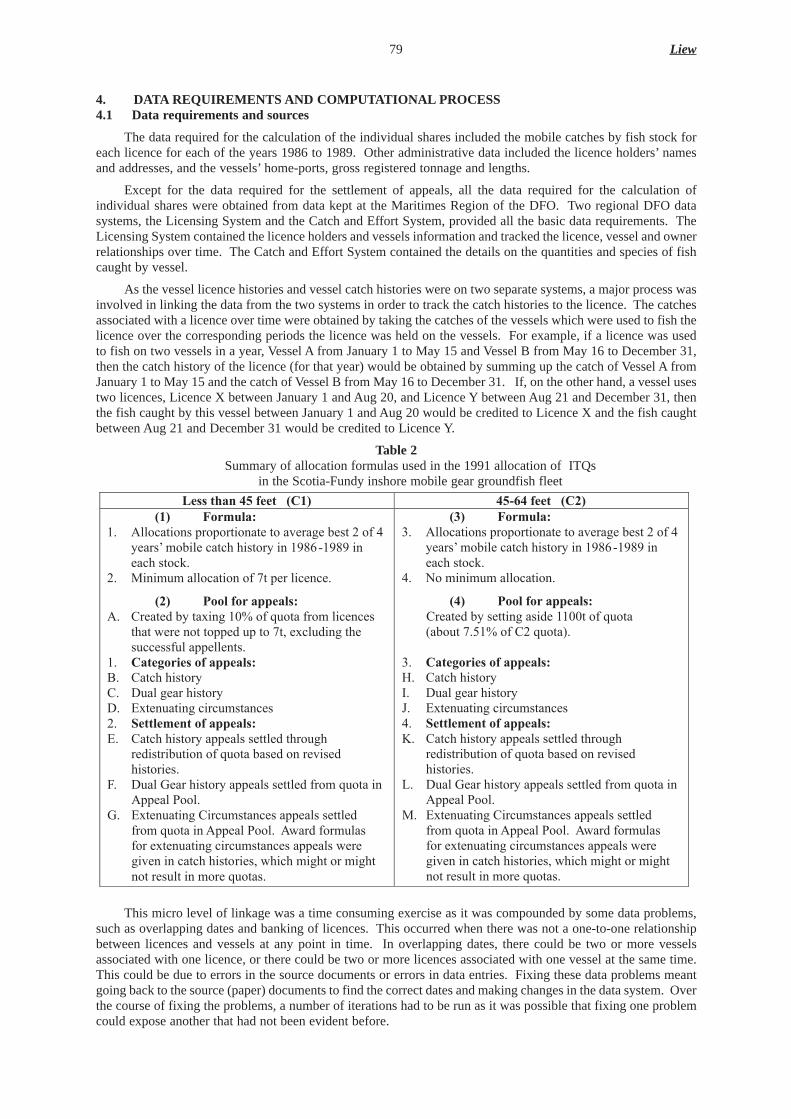
4. DATA REQUIREMENTS AND COMPUTATIONAL PROCESS4.1 Data requirements and sources
The data required for the calculation of the individual shares included the mobile catches by fish stock foreach licence for each of the years 1986 to 1989. Other administrative data included the licence holders’namesand addresses, and the vessels’home-ports, gross registered tonnage and lengths.
Except for the data required for the settlement of appeals, all the data required for the calculation ofindividual shares were obtained from data kept at the Maritimes Region of the DFO. Two regional DFO datasystems, the Licensing System and the Catch and Effort System, provided all the basic data requirements. TheLicensing System contained the licence holders and vessels information and tracked the licence, vessel and ownerrelationships over time. The Catch and Effort System contained the details on the quantities and species of fishcaught by vessel.
As the vessel licence histories and vessel catch histories were on two separate systems, a major process wasinvolved in linking the data from the two systems in order to track the catch histories to the licence. The catchesassociated with a licence over time were obtained by taking the catches of the vessels which were used to fish thelicence over the corresponding periods the licence was held on the vessels. For example, if a licence was usedto fish on two vessels in a year, Vessel A from January 1 to May 15 and Vessel B from May 16 to December 31,then the catch history of the licence (for that year) would be obtained by summing up the catch of Vessel A fromJanuary 1 to May 15 and the catch of Vessel B from May 16 to December 31. If, on the other hand, a vessel usestwo licences, Licence X between January 1 and Aug 20, and Licence Y between Aug 21 and December 31, thenthe fish caught by this vessel between January 1 and Aug 20 would be credited to Licence X and the fish caughtbetween Aug 21 and December 31 would be credited to Licence Y.
Table 2Summary of allocation formulas used in the 1991 allocation of ITQs
in the Scotia-Fundy inshore mobile gear groundfish fleet
This micro level of linkage was a time consuming exercise as it was compounded by some data problems,such as overlapping dates and banking of licences. This occurred when there was not a one-to-one relationshipbetween licences and vessels at any point in time. In overlapping dates, there could be two or more vesselsassociated with one licence, or there could be two or more licences associated with one vessel at the same time.This could be due to errors in the source documents or errors in data entries. Fixing these data problems meantgoing back to the source (paper) documents to find the correct dates and making changes in the data system. Overthe course of fixing the problems, a number of iterations had to be run as it was possible that fixing one problemcould expose another that had not been evident before.
79 Liew
Less than 45 feet (C1) 45-64 feet (C2) (1) Formula:
1. Allocations proportionate to average best 2 of 4 yearsÕ mobile catch history in 1986-1989 in each stock.
2. Minimum allocation of 7t per licence.
(2) Pool for appeals: A. Created by taxing 10% of quota from licences
that were not topped up to 7t, excluding the successful appellents.
1. Categories of appeals: B. Catch history C. Dual gear history D. Extenuating circumstances 2. Settlement of appeals: E. Catch history appeals settled through
redistribution of quota based on revised histories.
F. Dual Gear history appeals settled from quota in Appeal Pool.
G. Extenuating Circumstances appeals settled from quota in Appeal Pool. Award formulas for extenuating circumstances appeals were given in catch histories, which might or might not result in more quotas.
(3) Formula: 3. Allocations proportionate to average best 2 of 4
yearsÕ mobile catch history in 1986-1989 in each stock.
4. No minimum allocation.
(4) Pool for appeals: Created by setting aside 1100t of quota (about 7.51% of C2 quota).
3. Categories of appeals: H. Catch history I. Dual gear history J. Extenuating circumstances 4. Settlement of appeals: K. Catch history appeals settled through
redistribution of quota based on revised histories.
L. Dual Gear history appeals settled from quota in Appeal Pool.
M. Extenuating Circumstances appeals settled from quota in Appeal Pool. Award formulas for extenuating circumstances appeals were given in catch histories, which might or might not result in more quotas.

“Banking” problems, (i.e. where a licence was maintained but not in association with a vessel) occurredwhen the same vessel was associated with two or more licences at the same time. This problem was more of astructural problem than a source document or data entry one. In the Maritimes Region, licences could be bankedfor a period of up to two years. While the licence was banked, the vessel could be sold or leased to another licenceholder to be used in the same or different fishery. The system had to keep the vessel association to the bankedlicence for policy requirements. Although the majority of the banking problems were solved by changing thecomputer programme used to extract the data, some manual intervention was also required. Again, this meantgoing back to the source documents, which was often a time consuming process.
4.2 Computational process
Each allocation process could be divided into the following main steps:
i. Basic sharing,which was based on catch histories in 1986-1989 on a stock by stock basis.ii. Refinements to the basic sharing formulawhich included the topping-up to minimum allocations and the
setting-aside of quotas to settle appeals.iii. Settlement of appealswhere successful appellants were given additional quotas from the Pool of quota set
aside. Any unused Pool was redistributed back to the non-appellants (excluding licences topped up to 7t inthe case of C1).
The allocation was done at the stock level. A licence’s basic share in each stock was proportionate to thelicence’s average best two of four years’mobile gear catch history over the years 1986 to 1989. For each fishstock, the sum of all the individual licences’average best two years then formed the total base for the stock (ineach category). The individual licence’s share of the quota would be equal to the licence’s average best two years’history divided by the stock’s total base. For each licence, the best two years in each stock were computedseparately and it could be possible that Stock A might have the same or different best two years than Stock B.
After the basic sharing was done, refinements were made to the basic allocation. These refinementsconsisted of a series of “top-ups” for licences with low initial quotas and the taxing of quota for the Appeal Pool.The top-up conditions vary, and together with taxing and the appeal process, made the allocation an extremelycomplex process.
The rest of this Section explains steps 1 and 2 of the allocation process. The allocation of quotas tosuccessful appellants was a complex process and is described in the Appeals Section (Section 5).
C1 Formula
Basic allocations were first calculated using the average best-two-of-four years’mobile catch histories. Alicence’s individual quota would be proportional to the licence’s best-two-of-four mobile history in the stockdivided by the total best-two-of-four mobile histories of all C1 licences. After this was done, the licences whosebasic allocations in all six stocks totaled less than 7t were identified and their allocations were topped up to 7t.For these licences, the licences’basic allocations were discarded and the stock composition of the 7t were madeaccording to the following criteria:
i. For licences adjacent to NAFO Division 4VN, the 7t were taken from the stocks below in the followingproportions (weights):
Cod 4VN(m-d) 90% (6.30t)Pollock 4VWX5 10% (0.70t)
ii. For licences adjacent to NAFO Division 4W, the 7t were taken from the stocks below in the followingproportions (weights):
Cod 4VsW 74% (5.18t)Pollock 4VWX5 26% (1.82t)
iii. For the rest of the licences, that is licences adjacent to NAFO Division 4X, the 7t were taken from the stocksbelow in the following proportions (weights):
Cod 4X5Y 46% (3.22t)Haddock 4X5Y 18% (1.26t)Pollock 4VWX5 36% (2.52t)
The assignment of stocks to the licences was made according to the licences’home areas. This was done toensure accessibility or proximity of the licences to the stocks. Moreover, to ensure that some stocks were notover-allocated, the 7t were taken from the stocks in proportion to the respective C1 quota of each stock.
After the licences with basic allocations less than 7t were allocated 7t each, the remaining C1 quotas weredistributed among the rest of the licences, again using the average best-two-of-four histories. At the same time,a 10% tax was applied to these licences, excluding the successful appellants, to create the Appeal Pool. On doing
Scotia-Fundy Inshore Groundfish 80

this however, a few licences that had basic allocations of more than 7t before ended up with less than 7t. Thistop-up and taxing step was repeated until every licence had a minimum of 7t.
C2 formula
An amount equal to 1100t was deducted from the total 1990 C2 quota of 14,640t to create the Appeal Pool.The 1100t was taken from stocks in proportion to the 1990 quota for each stock. The impact of this was equivalentto reducing each basic allocation by 7.51%. After the quota for the Appeal Pool was set aside, the remaining quotain each stock was distributed among the licences based on the average best-two-of-four years’mobile catch histories.
5. APPEALS 5.1 Reasons forappeals
There were three main categories for appeals; they were (a) disputes over catch history, (b) dual gear catchhistory and (c), extenuating circumstances.
Catch history
Licence holders could appeal if they disagreed with the catch histories DFO sent to them. The discrepanciesin catch histories could be due to one or both of the following two factors: (a) differences in the licence-vesselhistories, and (b) differences in the quantities of catches that were credited to the licence even though the licence-vessel histories were correct.
Licence holders who appealed their licence-vessel histories had to complete a form with the licence holdername, vessel name and time-period the licence was registered on the vessel. Those with correct licence-vesselhistories but incorrect catch histories credited to the licence had to submit purchase slips (sales slips issued by thebuyer when fish was sold) and logbook records (records of where the fishing occurred and estimates of amountsof fish caught) of the landings made for the period in dispute.
Dual gear catch history
Only the mobile gear catch histories were used in the basic allocation formula. There were some licencesholders who routinely fished groundfish using both mobile and fixed gears. These licence holders could appealto get credits for their fixed gear catches if they routinely fished groundfish using both gears in the same year.
Licence holders had to submit a letter requesting to be considered for this appeal category. There was noneed to submit their fixed gear catch histories as these catches would be in DFO’s data systems, unless of coursethere were discrepancies between their catch records and DFO records.
Extenuating circumstances
Included in this category for appeal were circumstances such as (a) licence holder acquired the licence or vesselduring the review period, (b) vessel breakdown or under construction, and (c) family or health problems.
Licence holders had to submit a letter describing the circumstances, historical earnings and expensesinformation as well as a projection for 1991 earnings and expenses. They could also opt to have their historicaldata confirmed through taxation or unemployment insurance data sources by signing a Revenue Canada orUnemployment Insurance Compensation information release declaration.
5.2 The appeals process
The Working Group set the terms of reference for the appeals and appointed an Allocation Review Board todetermine the appeals allocations. The selected board consisted of DFO area managers from the three MaritimesRegions - Eastern Nova Scotia (ENS), Western Nova Scotia (WNS) and Southwest New Brunswick (SWNB). Inaddition to the Allocation Review Board members, nine industry observers were also selected by the WorkingGroup. The nine observers selected were from members of the Inshore Mobile Gear Groundfish fleet, three eachfrom ENS, WNS and SWNB.
The role of the industry observers was to attend the appeal hearings as observers to ensure that the appealswere conducted fairly and in accordance with the guidelines. Up to three observers could be present at any reviewor hearing session but they could not participate in the deliberations of the Allocation Review Board. Theobservers had to sign an oath that they would treat the reviews or hearings as strictly confidential. They couldnot discuss the case with the licence holder at any time. Observers could, if they felt a particular case has beenhandled improperly or unfairly, submit a written report to the Minister of DFO.
81 Liew
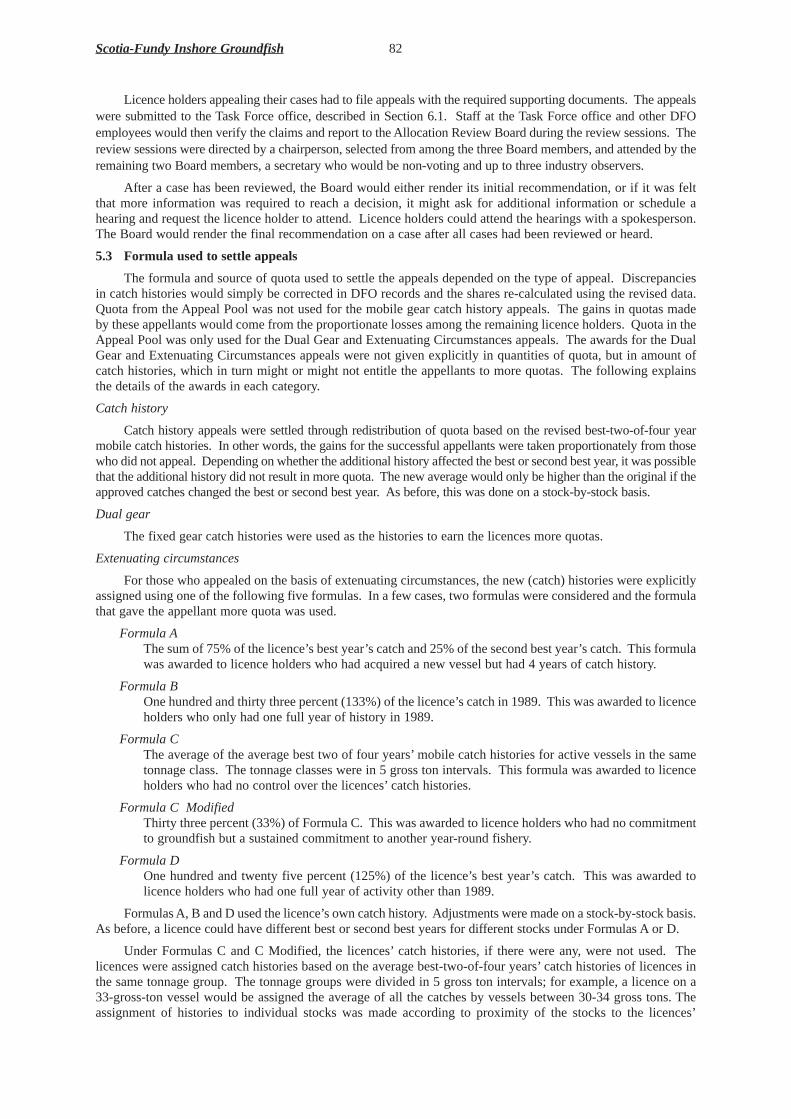
Licence holders appealing their cases had to file appeals with the required supporting documents. The appealswere submitted to the Task Force office, described in Section 6.1. Staff at the Task Force office and other DFOemployees would then verify the claims and report to the Allocation Review Board during the review sessions. Thereview sessions were directed by a chairperson, selected from among the three Board members, and attended by theremaining two Board members, a secretary who would be non-voting and up to three industry observers.
After a case has been reviewed, the Board would either render its initial recommendation, or if it was feltthat more information was required to reach a decision, it might ask for additional information or schedule ahearing and request the licence holder to attend. Licence holders could attend the hearings with a spokesperson.The Board would render the final recommendation on a case after all cases had been reviewed or heard.
5.3 Formula used to settle appeals
The formula and source of quota used to settle the appeals depended on the type of appeal. Discrepanciesin catch histories would simply be corrected in DFO records and the shares re-calculated using the revised data.Quota from the Appeal Pool was not used for the mobile gear catch history appeals. The gains in quotas madeby these appellants would come from the proportionate losses among the remaining licence holders. Quota in theAppeal Pool was only used for the Dual Gear and Extenuating Circumstances appeals. The awards for the DualGear and Extenuating Circumstances appeals were not given explicitly in quantities of quota, but in amount ofcatch histories, which in turn might or might not entitle the appellants to more quotas. The following explainsthe details of the awards in each category.
Catch history
Catch history appeals were settled through redistribution of quota based on the revised best-two-of-four yearmobile catch histories. In other words, the gains for the successful appellants were taken proportionately from thosewho did not appeal. Depending on whether the additional history affected the best or second best year, it was possiblethat the additional history did not result in more quota. The new average would only be higher than the original if theapproved catches changed the best or second best year. As before, this was done on a stock-by-stock basis.
Dual gear
The fixed gear catch histories were used as the histories to earn the licences more quotas.
Extenuating circumstances
For those who appealed on the basis of extenuating circumstances, the new (catch) histories were explicitlyassigned using one of the following five formulas. In a few cases, two formulas were considered and the formulathat gave the appellant more quota was used.
Formula AThe sum of 75% of the licence’s best year’s catch and 25% of the second best year’s catch. This formulawas awarded to licence holders who had acquired a new vessel but had 4 years of catch history.
Formula BOne hundred and thirty three percent (133%) of the licence’s catch in 1989. This was awarded to licenceholders who only had one full year of history in 1989.
Formula CThe average of the average best two of four years’mobile catch histories for active vessels in the sametonnage class. The tonnage classes were in 5 gross ton intervals. This formula was awarded to licenceholders who had no control over the licences’catch histories.
Formula C Modified Thirty three percent (33%) of Formula C. This was awarded to licence holders who had no commitmentto groundfish but a sustained commitment to another year-round fishery.
Formula D One hundred and twenty five percent (125%) of the licence’s best year’s catch. This was awarded tolicence holders who had one full year of activity other than 1989.
Formulas A, B and D used the licence’s own catch history. Adjustments were made on a stock-by-stock basis.As before, a licence could have different best or second best years for different stocks under Formulas A or D.
Under Formulas C and C Modified, the licences’catch histories, if there were any, were not used. Thelicences were assigned catch histories based on the average best-two-of-four years’catch histories of licences inthe same tonnage group. The tonnage groups were divided in 5 gross ton intervals; for example, a licence on a33-gross-ton vessel would be assigned the average of all the catches by vessels between 30-34 gross tons. Theassignment of histories to individual stocks was made according to proximity of the stocks to the licences’
Scotia-Fundy Inshore Groundfish 82
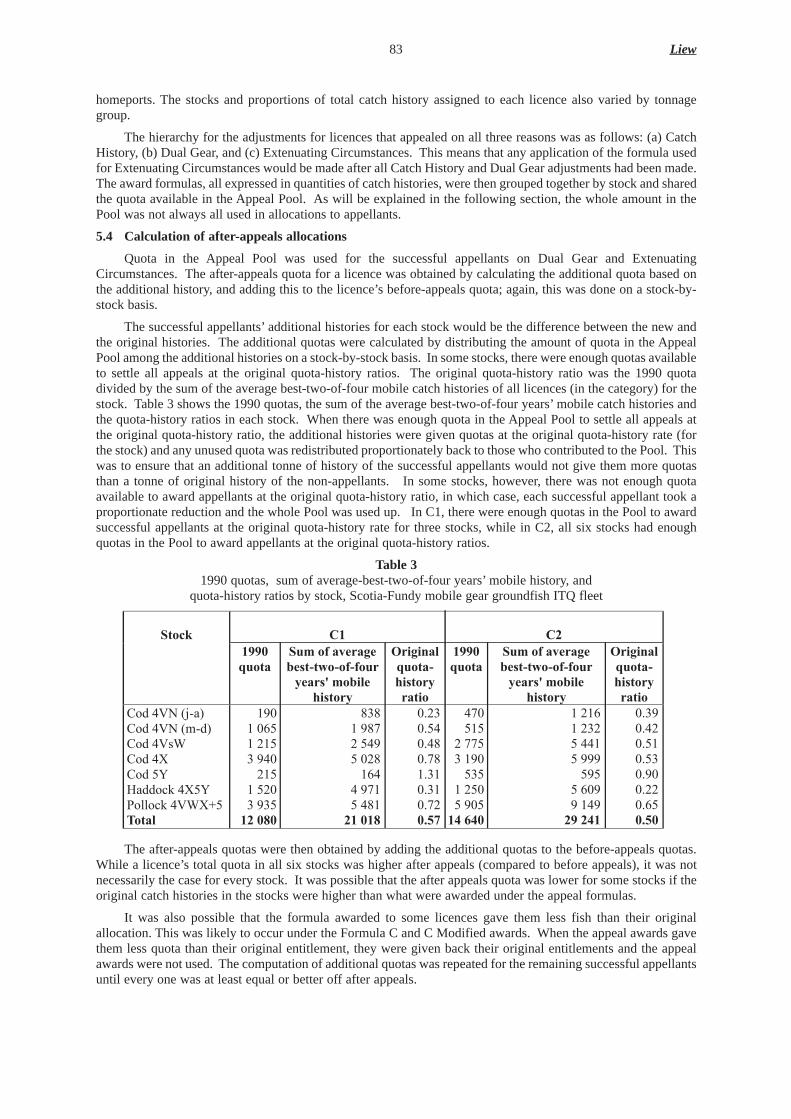
homeports. The stocks and proportions of total catch history assigned to each licence also varied by tonnagegroup.
The hierarchy for the adjustments for licences that appealed on all three reasons was as follows: (a) CatchHistory, (b) Dual Gear, and (c) Extenuating Circumstances. This means that any application of the formula usedfor Extenuating Circumstances would be made after all Catch History and Dual Gear adjustments had been made.The award formulas, all expressed in quantities of catch histories, were then grouped together by stock and sharedthe quota available in the Appeal Pool. As will be explained in the following section, the whole amount in thePool was not always all used in allocations to appellants.
5.4 Calculation of after-appeals allocations
Quota in the Appeal Pool was used for the successful appellants on Dual Gear and ExtenuatingCircumstances. The after-appeals quota for a licence was obtained by calculating the additional quota based onthe additional history, and adding this to the licence’s before-appeals quota; again, this was done on a stock-by-stock basis.
The successful appellants’additional histories for each stock would be the difference between the new andthe original histories. The additional quotas were calculated by distributing the amount of quota in the AppealPool among the additional histories on a stock-by-stock basis. In some stocks, there were enough quotas availableto settle all appeals at the original quota-history ratios. The original quota-history ratio was the 1990 quotadivided by the sum of the average best-two-of-four mobile catch histories of all licences (in the category) for thestock. Table 3 shows the 1990 quotas, the sum of the average best-two-of-four years’mobile catch histories andthe quota-history ratios in each stock. When there was enough quota in the Appeal Pool to settle all appeals atthe original quota-history ratio, the additional histories were given quotas at the original quota-history rate (forthe stock) and any unused quota was redistributed proportionately back to those who contributed to the Pool. Thiswas to ensure that an additional tonne of history of the successful appellants would not give them more quotasthan a tonne of original history of the non-appellants. In some stocks, however, there was not enough quotaavailable to award appellants at the original quota-history ratio, in which case, each successful appellant took aproportionate reduction and the whole Pool was used up. In C1, there were enough quotas in the Pool to awardsuccessful appellants at the original quota-history rate for three stocks, while in C2, all six stocks had enoughquotas in the Pool to award appellants at the original quota-history ratios.
Table 31990 quotas, sum of average-best-two-of-four years’mobile history, and
quota-history ratios by stock, Scotia-Fundy mobile gear groundfish ITQ fleet
The after-appeals quotas were then obtained by adding the additional quotas to the before-appeals quotas.While a licence’s total quota in all six stocks was higher after appeals (compared to before appeals), it was notnecessarily the case for every stock. It was possible that the after appeals quota was lower for some stocks if theoriginal catch histories in the stocks were higher than what were awarded under the appeal formulas.
It was also possible that the formula awarded to some licences gave them less fish than their originalallocation. This was likely to occur under the Formula C and C Modified awards. When the appeal awards gavethem less quota than their original entitlement, they were given back their original entitlements and the appealawards were not used. The computation of additional quotas was repeated for the remaining successful appellantsuntil every one was at least equal or better off after appeals.
83 Liew
C1
C2
Stock
1990 quota
Sum of average best-two-of-four
years' mobile history
Original quota-history ratio
1990 quota
Sum of average best-two-of-four
years' mobile history
Original quota-history ratio
Cod 4VN (j-a) Cod 4VN (m-d) Cod 4VsW Cod 4X Cod 5Y Haddock 4X5Y Pollock 4VWX+5 Total
190 1 065 1 215 3 940
215 1 520 3 935
12 080
838 1 987 2 549 5 028
164 4 971 5 481
21 018
0.23 0.54 0.48 0.78 1.31 0.31 0.72 0.57
470 515
2 775 3 190
535 1 250 5 905
14 640
1 216 1 232 5 441 5 999
595 5 609 9 149
29 241
0.39 0.42 0.51 0.53 0.90 0.22 0.65 0.50
6. ADMINISTRA TION OF THE ALLOCA TION PROCESS6.1 Staff requirements
A Task Force office was set up in the summer of 1989 during the Task Force study into the groundfish crisis.This office operated throughout the ITQ Programme implementation stage in 1990. It had a staff of three,consisting of a manager, an analyst and an office administrator. During 1990, this office handled all mattersrelated to the implementation of the ITQ Programme, including answering inquiries from the industry, handlingthe correspondence to licence holders, providing administrative support to the Working Group and industryconsultations, conducting data and document checks and providing support to the Allocation Review Board. Theoperation of this office continued for about a year after the implementation of ITQs to develop and implement theCatch Monitoring Programme, which is a programme for the dockside reporting of fish landed. The CatchMonitoring Programme was a mandatory requirement of the ITQ Programme.
Besides the Task Force staff, there were also a number of other DFO employees involved. The DFOrepresentatives on the Working Group were two senior managers from the Maritimes Region. Besides the twosenior managers, a DFO Fisheries Management manager and a DFO economist also attended most of the WorkingGroup meetings and helped to develop options and facilitate discussions. The technical work on the calculationof the individual shares was managed by another DFO economist and supported by a computer programmer andadditional programmers on an as-required basis. The technical work on the allocation of shares, includingrunning the impact analyses, quality control of data, awarding of appeal quotas, and preparing the quota reportsto licence holders was almost a full time job for the technical team for about six months. In addition, two otherDFO employees in the Maritimes Region were also involved in the data checking and document validation forabout two months.
6.2 Additional pr ogramme funding requirements
There was some special funding from DFO available for this Programme. All the expenses of the TaskForce office including the salaries of the three staff, the salaries of the computer programmers, the travelling costsof DFO and industry members to the Working Group meetings, and the expenses of the Allocation Review Boardcame from this special allocation. The salaries of the other DFO staff involved were paid out of their normaloperating budgets.
7. EVALUA TION OF THE INITIAL ALLOCA TION PROCESS7.1 Success in achieving initial policy objectives
As already indicated in Section 3.1, there were no pre-set objectives on how the shares were to be divided.The Working Group, composed mainly of fishing industry stakeholders, designed the sharing formula and set theterms of reference for the appeals. This was done in an environment of open dialogue and consensus building.
7.2 Satisfaction of rights holders with the process
There was general acceptance of the allocation and appeal processes. As could be expected, there weresome disagreements during the Working Group discussions, and some complaints from licence holders whoclaimed that DFO did not have all their catch history records and the low level of the quotas they wereallocated. The complaints on catch history records were dealt with through the appeals process describedearlier. The complaints on low levels of quotas arose mainly because licence holders did not realize that theaverage best-two-of-four years formula used as the basis for sharing was an inflated catch history base. Bydefinition, the average best-two-of-four years’catch in any stock would be higher than the average catch of allfour years, and even if the quota levels were to remain constant over the 1986-1990 period, a tonne of averagebest-two-of-four years’history would result in less than a tonne of quota allocation. As shown in Table 3, thequota-history ratios varied by stock and ranged from 0.22 to 1.31. On average, the quota-history ratio was justover 0.50 for all stocks.
The acceptance of the basic sharing formula and appeals process was also indicated by the continued use ofthe catch history of the licence as the primary basis for sharing quotas in stocks that came into ITQs in later years.The appeals process appeared to be fair to licence holders as well. The transparency of the appeals process withits clear guidelines and the presence of industry observers also helped. In fact, in the 1992 allocation of Cod 5Zand Haddock 5Z, the ITQ Management Committee requested that the original Review Allocation Board membersconduct the appeals again. However, this request was rejected by the original Board members!
7.3 Hindsight assessment
The process of involving industry participation in the allocation process and letting the licence holderschoose the features of the program continued the DFO practice of co-management, involving stake holders in
Scotia-Fundy Inshore Groundfish 84

fisheries management. If the allocations were to be done today, there would likely be little change from theprocess employed then.
The use of catch history as the primary basis for the sharing of quotas appears to be the preferred choiceamong licence holders in the groundfish fishery, as is evident by the subsequent uses of catch histories in thesharing formulas of other stocks in later years. Catch history was also used as the primary basis to allocateindividual quotas in the Scotia-Fundy Groundfish Fixed Gear 45’-64’fleet in 1997. The use of catch historiesminimized the disruptions from current activity levels and should provide for a smoother transition from the oldto the new regime.
More recent discussions on individual quota allocations have tended towards having a small portion of thequota allocated based on equal shares to give access to those with low catch histories. While this was not anexplicit feature of the formula, the minimum allocation of seven tonnes in the C1 group was another way ofgiving access to those licence holders with low catch histories. A similar minimum allocation of 50t was alsoproposed for licences with low catch histories in the other C2 formula, but the licence holders voted not to adoptit. Topping up to minimum allocations would generally give a higher level of access to those with low catchhistories when compared to allocating a small portion of quota based on equal shares and this practice reducesthe gap between the highest and lowest allocations.
The different formulas for appeal awards and the awarding of two formula choices in some cases made theallocation of appeals extremely complex. There was no guarantee that the successful appellants would get morequota as a result and numerous iterations had to be run to ensure that they did not end up with less quotas after asuccessful appeal. While still using catch histories as the basis for allocating quotas for appellants, the ITQManagement Board also recognized the complexity of the original award formulas. In allocations of individualquotas in later years they moved away from the complicated five-formula award system to a simplified version.Overall, the allocation process and sharing formulas used in the initial ITQ program in 1991 appeared to be wellaccepted by the industry.
8. ACKNOWLEDGEMENTS
The author would like to thank the following people at the Department of Fisheries and Oceans, MaritimesRegion, for their contributions to make this paper possible; G. Leo Brander, D. Leslie Burke, Robert Huggins,Don Digou and Jorgen Hansen for providing some of the background information and helping to reconstruct someof the events that occurred in 1990, and Norwood Whynot for providing the Scotia-Fundy Management map. Theauthor also wished to specifically thank G. Leo Brander for reviewing the report and providing many usefulcomments. Any errors or omissions are the sole responsibility of the author and any views expressed here arethose of the author and may not be those of the Department of Fisheries and Oceans.
9. LITERA TURE CITED
DFO 1986. Capacity Management for the Groundfish Fishery: A Study of the Western Scotia-Fundy Small VesselFleet. 1986. MS Report.
Haché, J.-E., 1989. Report of the Scotia-Fundy Groundfish Task Force. Department of Fisheries and Oceans.Ministry of Supply and Services Canada 1989. Cat. No. Fs 23-157/1989E ISBN 0-662-17464-X.
DFO 1990. Commercial Fisheries Licensing Policy for Eastern Canada, 1990, Department of Fisheries andOceans. Ministry of Supply and Services Canada 1990. Fs23-88/1990. ISBN 0-662-57712-4. June 1990.
DFO 1991. Scotia-Fundy Region Individual Transferable Quota Program (ITQ) Mobile Gear Groundfish VesselsUnder 65 Feet: Calculation of Percentage Shares, November 1991. MS Report
DFO Scotia Fundy Region Individual Transferable Quota Program (ITQ) Mobile Gear Groundfish Vessels Under65 Feet: Operational Guidelines. MS Report.
Halliday, R.G., F.G. Peacock and D.L. Burke 1992. Development of Management Measures for the GroundfishFishery in Atlantic Canada: A Case Study of the Nova Scotia Inshore Fleet, Marine Policy, 411-426.
Liew, D.S.K. 1999. Measurement of Concentration in Canada’s Scotia-Fundy Inshore Groundfish Fishery. InShotton, R. (Ed) 2000. Proceedings of the Conference on the User of Property Rights in FisheriesManagement. Workshop Papers. FAO Fish. Tech. Pap. 404/2: 279-287.
Parsons, L.S. 1993. Management of Marine Fisheries in Canada. National Research Council of Canada andDepartment of Fisheries and Oceans, Ottawa. Can. Bull. Fish. Aquatic Sci. 225.
85 Liew

INITIAL ALLOCA TION OF INDIVIDUAL TRANSFERABLE QUOTAS IN THE US SURFCLAMAND OCEAN QUAHOG FISHER Y
B.J. McCayRutgers the State University
New Brunswick, New Jersey 08901 [email protected]
1. THE MID-A TLANTIC SURF CLAM AND OCEAN QUAHOG FISHER Y: FROM MORA TORIUM TO ITQS
The Mid-Atlantic Fishery Management Council (MAFMC, or the Mid-Atlantic Council) is one of eightregional councils responsible for managing United States fisheries in the 3 - 200 nm zone of federal jurisdictionunder the framework of the Magnuson-Stevens Fishery Conservation and Management Act (Public Law 94-265),which went into effect in 1977. The surf clam (Spisula solidissima) fishery, which is under the jurisdiction of theMid-Atlantic Council, was the first federal fishery subject to restrictions on entry. (The states have jurisdictionfrom 0-3 nm; there were some limited entry systems in state fisheries prior to 1976; in 1977 the State of NewJersey also imposed limited entry on the surf clam fishery prosecuted in its waters.) Beginning in 1978 amoratorium was imposed, limiting the fishery to the existing vessels which then numbered 184, a numberadjusted to 142 because of inactivity (MAFMC 1990). An annual total allowable catch (TAC) was set and dividedinto quarterly quotas. Limits on fishing-time (per vessel) were also established to encourage and balancedistribution of fishing effort throughout the year and stabilize the supply to processors. The MAFMC eventuallyagreed upon an explicit policy to set the TAC at a level which allowed for a ten-year supply of surf clams basedon the then present standing stock. A similar TAC-setting process occurred for the closely related fishery forocean quahogs (Arctica islandica) but without fishing-time restrictions and for a 30-year supply horizon. InSeptember 1989 the Mid-Atlantic Council voted to create individual transferable quotas in both the surf clam andthe ocean quahog fisheries. The ITQs went into effect 1October 1990 (National Research Council 1999, McCayand Creed 1994).
2. THE NATURE OF THE HAR VESTING RIGHT2.1 Prior to the introduction of ITQs
Before 1978 the harvesting right in surf clamming was free and open to anyone willing and able to acquirea vessel to prosecute the fishery, which takes place offshore and requires heavy hydraulic dredges as well asaccess to markets. The raw product harvested by the fishery is processed into frozen or canned items before itreaches consumers.
In 1978 the rights were restricted to the owners of vessels then in the surf clam fishery through a moratoriumon new vessels in the fishery. At that time there was no significant ocean quahog fishery. Only permitted vesselswere allowed to catch and sell surf clams. Entry into the fishery depended on ownership of one of the permittedvessels or their replacements. Replacement of vessels that were severely damaged or lost at sea was allowed,with a 10% leeway in their capacity. There were no restrictions on sale or purchase of these vessels, andcapitalized values of moratorium permits were very high, estimated at between $50 000 and $150000 (MAFMC1990). Many old vessels remained nominally in the fishery because of this. Harvesting rights were conditionalupon a modest permit fee, detailed logbook reporting requirements, and many restrictions on fishing time and,for a while, the size of clams. Fishing time was progressively reduced during this period, as catch per unit ofeffort increased and the TAC stayed roughly the same.
In the ocean quahog fishery, which developed in the early 1980s, harvesting rights remained free and open,subject to a modest permit fee and detailed logbook reporting requirements. There were no restrictions on timeor clam size, and the TAC was never reached (market demand for ocean quahogs improved during this period butremained lower than demand for surf clams).
2.2 After the introduction of ITQs
With the introduction of ITQs in October 1990, the harvesting right was no longer associated with vesselownership but rather with ownership or lease rights to shares of the TAC. For both surf clams and ocean quahogs– which are part of the same fishery management plan but managed separately – the ITQ is a percentage of theTAC. The ITQ has two components: (a) the “quota share,” expressed in percentages of the TAC, which can betransferred permanently, and (b) the “allocation permit”, which takes the physical form of a set of tags that areallocated at the beginning of each calendar year to the ITQ holders. These coded tags must accompany the 32-bushel steel mesh cages in which the clams and quahogs are moved from the vessel to the processing plants. They
86
can be transferred only within a calendar year. The amount of the allocation permit is calculated by multiplyingthe individual quota share by the TAC, or allowable harvest, in bushels. Bushel allocations are then divided by32 to yield the number of cages allotted, for which cage tags are issued. Cage tags may be sold to otherindividuals but they are valid for only one calendar year.
The minimum holding of ITQs is five cages (160 bushels); there is no maximum holding and no limit toaccumulation except as might be determined by application of U.S. antitrust law. By law the ITQ is not a propertyright; it is designated revokable privilege.
3. METHOD OF ALLOCA TION3.1 Policy objectives forthe allocation3.1.1Procedural objective
The initial allocation of ITQs was divided among owners of all permitted vessels that harvested surf clamsor ocean quahogs between 1 January 1979 and 31 December 1988. Logbook data on landings were available forthis period of time enabling the use of historical landings as well as other criteria in the allocation formula. TheITQ went to the owner of a vessel at the time of the allocation, and that vessel’s history and dimensions werefactored into the allocation irrespective of who owned and crewed the vessel in the past. Subsequent to the initialallocation, any person who meets the U.S. requirements for owning a fishing vessel may purchase or lease ITQ,whether or not that person owns a fishing vessel or has any other qualifications. Entities with majority foreignownership are excluded.
A primary objective for the initial allocation appears to have been to reproduce the status quoin terms ofshares of the catch as much as possible (McCay and Creed 1994, Creed 1991). Finding a formula that came closeto the status quowas important in order to gain support for ITQs in the context of widespread industry concernabout possible “winners” and “losers” as as consequence of the process.
3.1.2Formal objectives
The formal policy objectives of the ITQ system are:
i. “...[C]onserve and rebuild Atlantic surf clam and ocean quahog resources by stabilizing annual harvestrates throughout the management unit in a way that minimizes short-term economic dislocations”
ii. “Simplify...the regulatory requirement of clam and quahog management to minimize the government andprivate cost of administering and complying”
iii. “...[P]rovide the opportunity for the industry to operate efficiently, consistent with the conservation ofclam and quahog resources, which will bring harvesting capacity in balance with processing and biologicalcapacity and allow industry participants to achieve economic efficiency including efficient utilization ofcapital resources by the industry” and
iv.“A management regime and regulatory framework which is flexible and adaptive to unanticipated short-term events or circumstances and consistent with overall plan objectives and long-term industry planningand investment needs” (MAFMC 1988, p.1; MAFMC 1996, p.3).
3.2 Process of determining the allocation
The allocation method was determined through a participatory process within the Mid-Atlantic Council.The Council’s Surf Clam Committee, staff members of the Council, of the National Marine Fisheries Service, anda Plan Development Team, held consultations with an Industry Advisory Committee over a period of about twoyears after the decision had been made to use something like ITQs in these fisheries and before the final plan wasadopted. This was the end point of a process that had begun in 1978, involving a search for alternatives to thevessel moratorium, which preserved the situation of over-capitalization reached by the late 1970s, and theincreasingly complicated and cumbersome system of quarterly quotas, fishery closures and time limits. By themid-1980s surf clam vessels were lucky to be allowed to fish six hours every three weeks despite increasedgrowth of certain year-classes of clams and improved harvesting technology (for example, enlarged hydraulichoses and dredges), because of the uncertainty about the abundance of future year-classes being sufficient tomaintain even a low TAC.
The idea of “stock certificates” was discussed as early as 1978. However, from 1978 to about 1987 mostdiscussion concerned per-vessel quota allocations, or “vessel allocations,” with limited rights to “consolidate”the allocations of several vessels on one. The industry structure was asymmetric, with a few vertically-integrated firms that dominated by harvesting and processing and many owner-operator vessels plus small firmsdependent on them, as well as a few processing firms without vessels. Concentration of ownership and hencecontrol over market share and prices was a major issue, and it proved extremely difficult to come to anagreement (McCay and Creed 1990, McCay and Creed 1994, Marvin 1992, MAFMC 1990). In September 1989the Mid-Atlantic Council voted for the plan amendment that created ITQs for both surf clams and ocean
87 McCay

quahogs, believing that there was enough industry agreement to justify this. Disgruntled processors and vesselowners filed a law suit to stop the plan amendment, but the court upheld the Council, and the ITQ system wentinto effect in October 1990.
3.3 Allocation method chosen
The formula finally chosen regarding surf clams for vessels coming from ports in the Mid-Atlantic area –the vast majority of vessels in the fishery – was primarily based on the vessel’s average historical catch between1979 and 1988. The last four years were counted twice and the two worst years were excluded. The resultingfigures were summed and divided by the total catch of all harvesters for the period. Eighty percent of a vessel’sallocation came from this ratio. A second ratio was computed on the basis of the vessel’s cubic capacity (lengthtimes width times depth); it accounted for 20% of the vessel’s initial allocation. This was in response tocomplaints by younger and newer participants in the fishery who had invested in larger (replacement) vessels thatdid not have strong historical landings, and/or had large vessel mortgages. It was called a “cost factor,” and itwas a key element in coming to agreement (Creed 1991).
The allocation method chosen for ocean quahog vessels (which might be surf clam vessels as well) and forsurf clam vessels coming from New England ports (a distinct minority) was simpler. It was determined from theaverage historical catch for the years actually fished between 1979 and 1988, excluding the year of the lowestcatch.
4. DATA REQUIREMENTS AND COMPUTATIONAL PROCESS
For the initial allocations the data required were the historical landings and the vessel size. Vessel-size datawere readily available through National Marine Fisheries Service and U.S. Coast Guard registries. Historicallandings data were readily available because of the logbook requirements during the moratorium – which appliedto ocean quahog fishing as well as surfclamming – even though there was no moratorium on ocean quahogvessels. This was, and is, an unusually detailed record of the fishing history of individual vessels. The accuracyof the logbook records was a matter of great dispute and was one of the reasons for delay in agreeing on ITQs.Nonetheless, these data were used in the initial allocations. Computer workstations and desktop computers wereadequate for the task of computing the initial allocations.
5. APPEALS PROCESS
There was no formal appeals process. By the time ITQs and the method of initial allocation had been agreedupon, every vessel owner in the industry had had several opportunities to object, based on computer printouts ofwhat a particular formula would mean to him. However, politicians and the law courts became major arenas forappeal. Informal appeals also occurred in attempts to increase allocations.
6. ADMINISTRA TION OF THE ALLOCA TION PROCESS
Administration of the allocation process was handled by the Northeast Division of the National MarineFisheries Service, located in Gloucester, Massachusetts.
7. EVALUA TION OF THE INITIAL ALLOCA TION PROCESS7.1 Success in achieving initial policy objectives
It is difficult to assess the policy-related outcomes of the initial allocation process independently from theeffects of the entire ITQ system and process. The initial allocation by itself had nothing to do with the formalpolicy objectives of: stabilizing annual harvest rates, simplifying regulatory requirements, fostering efficientoperations, or establishing a flexible and adaptive management regime (see Section 3.1.2 above). One mightargue that its emphasis on reproducing the status quohelped meet the objective of minimizing “short-termeconomic dislocations” while accomplishing other objectives (3.1.2.(i)). An analysis of the first four years of theITQ fishery showed that the size of the initial allocation did have a statistically significant effect on which firmswere still in the fishery by 1993 and 1994 – the larger the initial allocation, the greater the likelihood that a firmwas still in the fishery (Weisman 1997). However, when disaggregated, this effect turned out to be restricted tothe ocean quahog fishery and not the surf clam fishery, where the allocational formula was designed to maintainthe status quo. The initial allocation process was fairly successful in achieving political acceptability of ITQs, bydeveloping and using an allocation formula that came close to replicating the status quowithin the surf clamindustry. This did not happen within the ocean quahog part of the industry, resulting in a law suit (see below).
US Surf Clam & Ocean Quahog 88

7.2 Satisfaction of the rights-holders with the process
By-and-large the rights-holders – that is, those who owned surf clam and, or, ocean quahog fishing vesselsbetween 1979 and 1988 – were and are satisfied with the allocation process. The formula used for surf clams inparticular resulted in allocations that came close to the preceding status quo, in terms of which vessel caught howmany clams. Subsequently, many rights-holders have become very wealthy individuals, taking advantage of theITQ system to reduce their investment in harvesting vessels (even to the point of withdrawing from the fisheryaltogether even gaining value by leasing their annual allocation permits) and increase their profits.
However, there were some “victims” of the system, and some “villains” among the rights-holders. Amongthe alleged villains were vessel owners who had high allocations based on historical landings records, at leastsome of which were due to flagrantly illegal fishing. Reportedly, even vessel owners who were caught and finedfor illegal fishing (undersized clams, fishing in closed areas, fishing outside the allowed times) received credit forthe clams they caught illegally, in the reckoning of the initial allocation. (This issue was also a major point ofdebate in the years prior to 1990). Alleged victims were small-scale owner-operators who had had trouble findingmarkets for their clams, competing with the larger firms and the vertically-integrated processors; in this business,there are no landings unless there is a market. It should be noted that some of the large firms felt potentiallyvictimized by competition from other firms that had amassed quota share by accumulating marginal, non-fishing,and sometimes truly “ghost” vessels in anticipation of a system like ITQs that would allow them to consolidatetheir harvesting rights onto fewer vessels (Marvin 1992).
There were other equity concerns. For example, data-accuracy issues surfaced after ITQs were promulgated.One of the lawsuits that occurred after October 1990 was on behalf of ocean quahog vessel-owners who claimedthat having ITQs for ocean quahogs had not been intended, and that it was a surprise when it occurred. For thisreason, they had not taken care to record their ocean quahog landings accurately, in contrast with surf clamlandings, and were disadvantaged in the initial allocation. However, the court upheld the Mid-Atlantic Counciland the National Marine Fisheries Service.
7.3 Views of othermembers of the community
The major source of dissatisfaction with the allocation system is the large group of people who worked inthe industry but were not vessel owners between 1979 and 1988, and therefore were not eligible to receive quotashare. The exclusive, transferable rights created by ITQs were assigned only to vessel owners. The surf clamand ocean quahog fisheries were heavily dependent on hired captains, and during the 1980s many of the owner-operator vessels had been sold to become parts of large fleets. No matter how long they had worked in theindustry and how much they had contributed to the historical records of the vessels, the hired captains receivedno quota share. Nor did other members of the crew – unless, of course, they were vessel owners – which wasunlikely. Moreover, because the most direct response to ITQs was to reduce the number of vessels in the fishery,many captains, mates and deckhands lost their jobs (McCay and Creed 1994). Knowledge of these problemsspread rapidly and contributed to the development of a fervent “anti-ITQ” movement in the United States, whichled to a Congressional moratorium on new ITQ systems, that went into effect in 1995 and will continue to 2002(Creed and McCay 1996).
7.4 Assessment of the process in hindsight
The highly participatory nature of the decision-making process for surf clam and ocean quahogmanagement, within a democratic “council” system of management, contributed to the care that was given todesigning the initial allocation formulas. The appointed Mid-Atlantic Council members voted in favor of thefishery management plan amendment that introduced ITQs to these fisheries, only when they knew that there waswidespread, nearly unanimous, agreement. Gaining that agreement depended on an approach to the initialallocation that was perceived as equitable. Hence the long search for formulas acceptable to the majority in theindustry.
However, the social structure of the fishery favored vessel-owners. Most of the participation – in industryadvisory meetings, at Council meetings, at special industry-run conferences – involved the owners or theirrepresentatives. Non-owning captains and crew members did not feel free to express their opinions or desires,given their vulnerability to being unemployed at a time – the 1980s – when vessel-owners were reducing theircrewing because of the shorter periods of time that the boats were allowed to fish clams (McCay and Creed 1987).Consequently, for this fishery there were no attempts to address the question of the rights of non-owners to ITQ.Again, a result was strong anti-ITQ sentiment for other fisheries in the United States.
8. ACKNOWLEDGEMENTS
The research on which this report is based was supported in part by the New Jersey Agricultural ExperimentStation, the National Science Foundation, the New Jersey Sea Grant College Program, and the CMER
89 McCay
(Cooperative Marine Education and Research) Cooperative Agreement between Rutgers the State University andthe Northeast Fisheries Science Center of the National Marine Fisheries Service, NOAA, Department ofCommerce. Particular thanks must be given to people in the surf clam and ocean quahog industry: includingconsultants Dave Wallace and Ricks Savage and vessel owners Barney Truex, Warren Alexander, the Marrinerfamily; the Osmundsons and Joe Garvilla, for trying to explain the industry and allowing me to go out clamming;and to people in the agencies who cooperated, especially Clay Heaton, Tom Hoff, and David Keifer (ret.), at theMid-Atlantic Fishery Management Council. Thanks are also due to graduate students who worked on aspects ofthe project: Carolyn Creed, Jonathan O’Neil, David Weisman, Julia Menzo, all formerly at Rutgers University;and to Sylvia Brandt at the University of California Berkeley.
9. LITERA TURE CITED
Creed, C.F. 1991. Cutting Up the Pie: Private Moves and Public Debates in the Social Construction of a Fishery.Unpub. Ph.D. dissertation, Department of Anthropology, Rutgers the State University of New Jersey.
Creed, C.F. and B.J. McCay 1996. Property Rights, Conservation and Institutional Authority: Policy Implicationsof the Magnuson Act Reauthorization for the Mid-Atlantic Region. Tulane Environmental Law Journal9(2): 245-256.
MAFMC - Mid-Atlantic Fishery Management Council 1988. Amendment #8, Fishery Management Plan for theAtlantic Surf Clam and Ocean Quahog Fishery. July 1988; draft 14 December 1989. Dover, Delaware: Mid-Atlantic Fishery Management Council in cooperation with the National Marine Fisheries Service and theNew England Fishery Management Council.
MAFMC - Mid-Atlantic Fishery Management Council 1990. Amendment #8, Fishery Management Plan for theAtlantic Surf Clam and Ocean Quahog Fishery. June 20 1990. Dover, Delaware: Mid-Atlantic FisheryManagement Council in cooperation with the National Marine Fisheries Service and the New EnglandFishery Management Council.
MAFMC - Mid-Atlantic Fishery Management Council 1996. Amendment #9, Fishery Management Plan for theAtlantic Surf Clam and Ocean Quahog Fisheries. April 1996. Dover, Delaware: Mid-Atlantic FisheryManagement Council in cooperation with the National Marine Fisheries Service and the New EnglandFishery Management Council.
Marvin, K.A. 1992 Protecting Common Property Resources Through the Marketplace: Individual TransferableQuotas for Surf Clams and Ocean Quahogs. Vermont Law Review 16: 1127-1168.
McCay, B.J. and C.F. Creed 1987. Crews and Labor in the Surf Clam and Ocean Quahog Fleet of the Mid-Atlantic Region. A Report to the Mid-Atlantic Fisheries Management Council, October 1987. Dover,Delaware: Mid-Atlantic Fisheries Management Council.
McCay, B.J. and C.F. Creed 1990. Social Structure and Debates on Fisheries Management in the Mid-AtlanticSurf Clam Fishery. Ocean & Shoreline Management 13: 199-229.
McCay, B.J. and C.F. Creed 1994. Social Impacts of ITQs in the Sea Clam Fishery. Final Report to the NewJersey Sea Grant College Program, New Jersey Marine Sciences consortium. February 1994.
National Research Council 1999. Sharing the Fish; Toward a National Policy on Individual Fishing Quotas.Washington, D.C.: National Academy Press.
Weisman, D. 1997. An Economic Analysis of the Mid-Atlantic Surf Clam and Ocean Quahog Fishery UsingLogit, Hazard and Survival Rate Functions. Unpublished M.S. thesis, Department of AgriculturalEconomics and Marketing, Rutgers University, New Brunswick, New Jersey.
US Surf Clam & Ocean Quahog 90

INITIAL ALLOCA TION OF INDIVIDUAL TRANSFERABLE QUOTASIN THE US WRECKFISH FISHER Y
J.R. GauvinDirector, Groundfish Forum, Inc.4215 21stAvenue West, Suite 201Seattle, Washington 98199 USA
1. INTRODUCTION TO THE WRECKFISH FISHER Y AND ITS MANAGEMENT HISTORY
During the mid-1980s swordfish and tilefish fishermen discovered commercial concentrations of wreckfish(Polyprion americanus) on the Blake Plateau, deep fishing grounds located about 120 nautical miles due east ofSavannah, Georgia on the Atlantic coast of the United States. Although wreckfish resemble grouper inappearance, they are members of the temperate bass family found in the Atlantic Ocean. They are found only atconsiderable depths in Northwestern Atlantic waters and are thought to be closely related to striped bass (Moronesaxatilis) also found off the east coast of the UnitedStates. Wreckfish also occur in commercial landings infisheries off mainland Portugal, Madeira and the AzoresIslands.
The initial development of the U.S. fishery forwreckfish is described in detail by Sedberry et al.(1993) and the wreckfish fishery management plan(FMP) developed by the South Atlantic FisheryManagement Council (Snapper/Grouper FMPAmendment 3), one of the eight regional managementcouncils in the United States (SAFMC 1990).
Wreckfish are caught in the northwest Atlantic atdepths from 450-600m over benthic structurescharacterized by rock ridges and relief featuresextending vertically more than 30m (Sedberry et al.1993). Although wreckfish can exceed 100kg in weight, mosttaken from the Blake Plateau weigh approximately 15kg (Vaughan et al.1993).
The fishery was developed by fishermen using hook-and-line gear employing hydraulic reels spooled withsteel wire and terminal rigs consisting of a monofilament spine and eight to twelve monofilament leadersdeploying a single circle hook per leader. The primary bait used for wreckfish is frozen squid and 10 to 20 kglead weights are deployed to sink the gear and baited hooks to the ocean floor in a semi-vertical fashion.Typically, four to six hydraulic reels are used per vessel spaced evenly across both sides of the fishing deck.Vessels fishing wreckfish range in length from 15 to 25m (SAFMC 1990).
In some respects, the initial phase of the wreckfish fishery management was similar to other U.S. efforts toregulate commercial fisheries. The fishery developed rapidly with little or no long range planning or control,expanding from fewer than five vessels in 1988 to more than 40 vessels in 1990 (Sedberry et al. 1993). In thespring of 1990 a rapid influx of refitted shrimp trawlers and the concurrent introduction of bottom longlines bysome fishermen resulted in increased landings and harvester conflicts (SAFMC 1990). With the addition ofvessels from the shrimp fishery, managers estimated that as many as 60 to 70 vessels were geared to fish forwreckfish in 1990-1991, two years prior to ITQ management (SAFMC 1991a). There were approximately 90vessels permitted to fish for wreckfish the first year that permits for the fishery were required (Gauvin et al.1994).
To establish control over the burgeoning fishery and attempt to resolve user conflicts, the first of a series offishery management plan amendments was approved in June of 1990. These initial measures were “fast tracked”by Federal Emergency Rule to “prevent a fishery that would seriously interfere with the necessary protection ofthe resource” (United States Department of Commerce 1990a,b). The fishery management plan and emergencyrules established several management measures including: an April to April fishing year, a two million pound totalallowable catch (900t) for the 1990-1991 fishing year, a prohibition on use of bottom longline gear for wreckfish,and a vessel catch per trip limit of 10 000lb (4100kg). Even with these emergency measures, the fishery exceededthe TAC by landing roughly 3.6 million pounds (1600t) during 1990-1991, effectively catching fish faster thanthe new regulations could be implemented. From that point in time forward, fishermen continued to pressmanagers for measures to address declining earnings and increasing user conflicts (SAFMC 1991a).
91
Wreckfish(Polyprion americanus)
Source: Robbie Cada
Managers moved in response to the rapid expansion and expeditiously requested public comments, anddeveloped measures for different proposals for limited entry and individual quota systems during 1991. The endresult, achieved approximately one year later, was the development of an individual transferable quota (ITQ)system for wreckfish, only the second such programme implemented for a fishery under federal management inthe United States.
This paper evaluates the process of how the initial rights were distributed in the ITQ programme and severalaspects of the nature of rights and consequential effects of the initial allocation decisions. Information on theinitial allocations is drawn principally from three sources: the fishery management plan amendments developedby the management council responsible during the development of the wreckfish ITQ programme, and twoseparate follow-up studies (Gauvin et al.1994; Richardson 1994) of the programme describing different aspectsof the intent and outcome of decisions affecting initial allocation of individual transferable rights to wreckfishharvests.
The focus of this analysis is limited to the first five years (1990-1994) of the fishery because roughly fouryears after the ITQ system became effective, the fishery, in effect, began to collapse. Because the failure of thefishery is not likely directly related to ITQ management, the fishery still serves as a reasonable case study for theissues of initial allocations and share concentration. One has to recognize, however, that the collapse probablyinfluenced both the equity and efficiency of the initial allocation and incentives for share concentration in the longrun. The reason for the failure of the fishery is not known exactly but fishermen and managers cite severalpossible explanations. Below, I have reported, without prejudice (I hope), some of the leading opinions to explainthe fishery’s demise. These opinions represent the current thinking by fishermen and managers as conveyedby R. Mahood, Executive Director, South Atlantic Fishery Management Council (SAFMC).
One explanation is that the fishery suffered from an initial overestimation of sustainable yield from the“stock”1 (assuming wreckfish off the southeastern United States is a separate stock, a question that has never beenresolved). Hence, according to some managers and fishermen, wreckfish are no longer found in concentrationsthat support economically feasible harvests. Another explanation is that former wreckfish fishermen are takingadvantage of more profitable inshore fishing opportunities in lieu of exercising their options to fish wreckfish.Still others contend that the ex-vessel price does not adequately compensate fishing operations. Whatever thereason or combination of reasons that might best explain the situation, I will focus on the first few years of theITQ fishery because participation in the fishery today is apparently limited to one or two full-time vessels peryear. Although the annual total allowable catch has been maintained at the two million pound level, onlyapproximately one-tenth of that harvest has been achieved in recent years (1999 and 2000).
2. NATURE OF RIGHTS PRIOR TO AND UNDER ITQ MANAGEMENT
Before ITQs, the fishery was virtually uncontrolled, particularly since the aggregate annual catch limit forthe fishery first constrained the fishery only one year prior to the formation of the ITQ programme. As the fisherydeveloped, the rapid expansion in participation and catch rates prompted fishery managers to implement controlmeasures to stem harvest rates and user conflicts. These measures generally failed, however, to address declinesin economic returns to fishermen. Trip limits probably contributed to the erosion of profits, especially for thelarger vessels, which according to public comment, would operate more profitably if allowed to catch more thanthe allowed amount of fish per trip (SAFMC 1991a, 1991b). The erosion of economic performance as a result ofthe fishing derby itself, and the manner in which the trip-limit quantity of harvest affected vessels of differentsizes, are identified as key considerations in the selection of objectives for the ITQ plan (SAFMC 1991a). Relatedobjectives of the plan are economic efficiency, long term incentives for resource conservation, reductions in userconflicts, and lower management and regulatory costs.
The documents summarizing public comment during the development of the ITQ plan amendment elaborateon concerns of fishermen regarding the erosion of earnings in the fishery. Of note are comments submitted byfishermen claiming to have developed the fishery. These comments state that the lack of real restrictions on entryand effort, in conjunction with rules established to make the fishery more manageable under open access,contributed to the loss of economic viability on an individual-firm basis (SAMFC 1991b).
The requirement for harvester permits in the fishery implemented in 1990 also failed to create an effectivebarrier to entry and exclusivity of rights because virtually anyone could obtain a permit simply by filling out andsubmitting an application to the Southeast Regional Office of the National Marine Fisheries Service (NMFS) andpaying what amounted to a nominal fee for the processing and handling of the permit application. In fact, theMagnuson Fishery Conservation and Management Act, as it stood when the wreckfish ITQ programme was
US Wreckfish Fishery 92
1 See Connor, this volume for a similar tale regarding orange roughy – Ed.
developed, expressly prohibited the NMFS from collecting fees in excess of the costs of processing and handlingpermit applications (SAFMC 1991a).
The prohibition on collecting fees even extended to the collection of fees or resource royalty/rent recaptureonce ITQs were in place, a limitation that according to the management plan amendment establishing the ITQsystem, troubled some managers and temporarily served to persuade some council members not to vote in favorof an ITQ system (SAFMC 1991a).
Once the ITQ programme was established, however, the rights provided to harvesters were relatively freefrom restrictions. Rights were assigned in perpetuity and allowed to be traded freely to anyone, regardless ofwhether or not that person or business entity was able to document ownership of a vessel in the United States(SAFMC 1991a).
ITQ rights were granted as a percentage share of the annual TAC. Recipients received a percentage sharecertificate and paperwork entitling them to the quantity of wreckfish (annual individual quota) for a given yearamounting to the shareholder’s percentage share of the annual total allowable catch.
The only limitation placed on the rights distributed by the initial allocation was that recipients had to bequalified wreckfish fishermen (see below), and that no single entity could receive an initial allocation of morethan 10 of the 100 (i.e.10%) of the shares initially distributed (see below). An additional minor requisite was thatleases of annual rights could only be between permitted wreckfish fishermen. This leasing restriction amounts tolittle more than a requirement that the owner of a vessel not granted an initial share had to complete theappropriate paperwork in order to fish for leased wreckfish quota.
There are several statements of intent in the management plan that appear to be aimed at further limitationson the rights granted to qualified wreckfish fishermen under the plan. These are, ostensibly, guidance to theNMFS rather than actual elements of the management plan. For instance, in several places the plan notes that itis the Council’s intent that major violations of the ITQ regulations be met with forfeiture of the shareholder’spermanent rights in the fishery (i.e. their percentage shares) (SAFMC 1991a). Another similar statement is thatmanagement fees and royalty or economic rent extractions should be considered for the wreckfish fishery underITQs if, and when, such collections become allowable under the applicable laws governing fishery management(SAFMC 1991a). While possibly helpful for the NMFS’interpretation of the intent of the plan, in reality, theCouncil members recommending the plan for final approval by the Secretary of Commerce actually have nopurview over the matters of enforcement and collection of fees. Those areas of management are the responsibilityof the NMFS Enforcement branch and NMFS respectively.
3. POLICY OBJECTIVES OF THE INITIAL ALLOCA TION
Although the management plan is not explicit as to the policy objectives of the initial allocation, the intentof managers can be gleaned from the plan’s objectives, regulations governing the ITQ system and considerationof how issues raised in the public comment were addressed in the final plan. In particular, the overt decision toallow free trade of shares under ITQs, and the single area where the Council did opt for restrictions on the initialallocation, (that no one entity could initially receive more than 10% from the initial allocation), are instructive asto the intent of managers for the initial allocation. In effect, the Council appears to have intended an unrestrictedmarket to sort out participation in the fishery after the initial allocation.
For the initial allocation of rights, managers opted to weigh factors such as historical participation andcurrent participation. These factors were, in fact, required by language in the Magnuson Fishery Conservation andManagement Act, as the Act read at the time the wreckfish programme was developed. Given that the planacknowledged that there were more vessels in the fishery prior to ITQs than the fishery could support andeconomic returns were thought to be rapidly declining, the implicit policy objectives of the initial allocation wereto allow free trade of wreckfish shares among a pool of participants deemed too large for the fishery to support.This, one can surmise, was expected to resolve the problem of overcapitalization and it was hoped resolveassociated problems that open access had engendered in the fishery. Although not stated explicitly, it seemsevident that the intent of the Council was to allow the market for shares to compensate, in some measure, late-comer fishermen for their gear expenditures and other investment in the fishery. At the same time, the market forrights would promote the exit of less efficient harvesters, thereby allowing for a more efficient and moreprofitable fishery under ITQs.
4. PROCESS USED IN DETERMINING THE ALLOCA TION
The process for determining the initial allocation of rights was accomplished through the normal publicprocess for the development of recommendations by regional management councils as set out in the MagnusonAct. Councils in the United States are charged with recommending to the Secretary of Commerce management
93 Gauvin

measures for federally managed fisheries in their respective regions of the country. The SAFMC became involvedwith the wreckfish fishery after several fishermen came forward with testimony about a rapidly increasing fisheryand conflicts in the unmanaged fishery (SAFMC 1990). Although the plan for ITQs was developed andimplemented in just over a year, the elements of the programme, and specifically the initial allocation of rights,were on the agenda and discussed at four separate council meetings lasting approximately one week per meeting.Development of the wreckfish plan occupied roughly 10-12 hours per meeting, according to the documentationin the final plan proposal (SAFMC 1991a).
The 1991 management plan establishing the Council’s recommendations for the ITQ programme describethe public record upon which the problem statement and objectives for the ITQ programme are based. The recordincludes the testimony of fishermen during seven public hearings that were held in different ports in southeasternstates within the Council’s area of jurisdiction. These public comment hearings were announced in Council’snewsletters and held both in conjunction with, and separate from, regular council meetings.
The plan recommending the final ITQ system also presents considerable documentation of publicparticipation, supplies some of the catch data and, to a lesser degree, the available information on decliningeconomic performance in the fishery when as many as forty vessels or more were fishing for wreckfish prior tothe final decision to approve ITQs. All of this information is described as meeting the “best available data”standard required of the fishery management process governed under the Magnuson Fishery Conservation andManagement Act.
In addition to oral testimony the documents refer to considerable information the Council received throughwritten comment. This information details problems in the fishery leading up to the ITQ as well as comments onthe proposed plan (SAFMC 1991b). Overall, this record can be summarized as supportive of the ITQ programmeitself. Where there were obvious differences in opinion, as might be surmised, was on the subject of the initialallocation.
Comments from persons describing themselves as early participants in the fishery, claiming to beresponsible for the initial discovery of the wreckfish in fishable concentrations and development of the gear usedto catch them, generally focus on the perceived inequity of the initial allocation of shares. These individualsfavored an initial allocation based solely on historical catch as recorded on state landings management documentscalled “fish tickets”.
Those whose self-described history in the fishery was more recent, generally were more critical of the needto move forward with an ITQ programme. These individuals felt that growth of the fishery would be self-controlling as economic conditions in the fishery evolve. These newer fishermen reported that they had madeconsiderable investments in gearing up for wreckfish and thus should be provided some additional opportunity tolearn how to fish for wreckfish and recover the cost of their investment in the hydraulic gears, cable and otherwreckfish-specific gear. This group was generally in favor of an ITQ system, however, only if the initialallocation of rights was equal across all current participants in fishery.
Another position expressed mostly in written comments by fish processors raised broader concerns over ITQmanagement. In their comments, processors felt that the system could give excessive market power to fishermen,possibly creating the disenfranchisement of processors. Other processors commented that they had full or partialownership in vessels, which would alleviate the market advantage that fishermen might receive. Some processorsfelt the ITQ programme might force them to acquire ownership or control of vessels holding wreckfish sharesand some even “promise” that processors will own all the wreckfish shares in a short period of time if theprogramme is enacted.
One final area of comment from processors was a recommendation not to move forward with a unilateralITQ system for wreckfish, but to develop a more comprehensive ITQ system for all the deep water snapper andgrouper species, the swordfish fishery, etc. These comments suggested that a single fishery focus will createinequities for other fisheries, vis-à-visthe advantage wreckfish fishermen would have with their “guaranteed”opportunity in wreckfish, which was not shared by other fishermen.
5. ALLOCA TION METHOD CHOSEN
The South Atlantic Fishery Management Council’s final plan essentially compromised evenly between thetwo positions on the initial allocation. The plan divided half of the initial shares based on historical catch from1987-1990 and the other half were divided evenly among qualified participants. The test of “qualified” was basedon being able to document any landings of wreckfish from 1989 to 1990. Fishermen’s total initial allocations werethe sum of the shares received based on the two sets of criteria.
As mentioned before, the only restriction placed on the distribution of shares at the initial allocation was thatno single individual or business entity could receive an initial share of 10% or more of the total available shares
US Wreckfish Fishery 94
(100). In the event that an initial share amounted to 10% or more, the recipient would receive the smallestfractional increment under 10%, and the remainder of that participant’s share (based on the two criteria) wouldbe reallocated to the pool of qualified applicants based on the historical and recent participation criteria.
According to the plan, the reason the 10% provision was made was because some of the preliminary statefish ticket data made available to the Council to illustrate the effects of the initial allocation, were thought tosuffer from data quality and coverage differences. While preliminary data from three of the four states comprisingthe management region did not suggest that any initial share would even approach 10%, the Council remainedcautious on this issue and opted to keep its initial allocation provision in place (SAFMC 1991a). The Council’sobjection to the possibility of an initial share of the magnitude of 10% is interesting given that the Council’s planclearly allowed for the later accumulation of shares in excess of 10%. In fact, the Council’s plan allowed foressentially unlimited accumulation of shares unless some anti-trust concern was triggered (SAFMC 1991a). Ifextreme share accumulation did occur, then according to the Council’s plan, existing United States law should beused to identify problems and construct remedies to any anti-trust concerns (SAFMC 1991a).
6. DATA REQUIREMENTS AND COMPUTATION
Given the brief historical existence of the fishery, the relative problem posed by data limitations wasprobably small compared to ITQs developed for other fisheries. Overall, the wreckfish industry involved a fairlysmall potential number of vessels and because these were the region’s larger, and hence higher profile vessels, itwas generally believed that landings data were of adequate quality for assigning initial rights (SAFMC 1991a).
The SAFMC’s plan set up the allocation process based on dividing up the pool of catch as claimed by thepersonal records of applicants (documented through their landings receipts and other means) and verified byavailable state agency data. An important consideration for this approach was that the overall pool of catch forthe historical portion of the allocation was not the actual overall catch of wreckfish fishermen, but the pool ofcatch submitted during the application period that passed verification. So the universe of historical catch was whatwas claimed by fishermen’s applications. This meant that once the application period had expired, an individualwho could document catch but who had failed to properly submit a timely application essentially was left out ofthe initial allocation.
This initial allocation scheme made no provisions for a “hold back” system to accommodate late applicantsor later grievances of any sort. In fact, there were no late applications for participation in the wreckfish ITQprogramme, so the problem of how to accommodate such a claim never arose. In addition, no legal challenge tothe constructs of the initial allocation system for the ITQ programme or the application process itself was evermade (R.Mahood, Executive Director, South Atlantic Fishery Management Council, pers. comm.).
Through its plan, the SAFMC arranged for receiving applications itself and then forwarding the materialsto the Southeast Regional Office of the NMFS. An interesting note on the data requirements for applicants isthat the wreckfish plan also required applicants to submit a copy of the portion of their federal tax returns thatdetailed revenues from fishing over the period of record for the landings claimed in applications (SAFMC1991a). While this tax form information was described as part of the “requirements” for applicants, it is notknown whether such information was used as a corroborating piece of information regarding the validity of theother materials in an application, or a criterion against which applicants could be denied some or all of theirinitial shares.
In fact, for most tax forms for single proprietorship businesses, and even some categories of corporate taxforms for small corporations, a signature is not required on the detailed revenues portion of a tax return, and insome cases, fishery-specific revenues are simply part of a worksheet. For this reason, it is unclear exactly howthis information was used in the application process. Once again, no legal challenge was made of the validity ofthe applications process or the elements of the requirements and applicable confidentiality issues (R. Mahood,Executive Director, South Atlantic Fishery Management Council, pers. comm.).
The application process provided approximately three months for completion and submittal of applicationmaterials. According to the plan, the SAFMC staff would collect the application materials and review them forinitial completeness. While the plan explicitly states that the Council staff would have no role, formal orotherwise, in judging the merits of applications (as that responsibility fell to the Southeast Region of the NMFS),the SAFMC staff ’s role was apparently one of providing the service of pre-deadline notification to applicants ifsome portion, or some necessary information, was missing.
7. APPEALS PROCESS
The role of judging applications was handled by the Southeast Region of the NMFS. Southeast Regionemployees prepared recommendations on the acceptability of application materials and initial estimations of
95 Gauvin
historical catches during the period of record. The NMFS personnel apparently reviewed fishermen’s catchestimates based on their receipts and compared these to finalized state landings information and (presumably) taxrecords. In the end, the process used to review applications is hard to depict because it is only outlined in a cursorymanner in the Council’s plan and Federal Register notices describing the applications process.
Once initial judgements were made by the NMFS, the agency informed applicants of the determinationsmade on their applications and their initial share estimates prior to the end of the established appeals period. TheNMFS notified applicants and the public at large that it would convene an “applications oversight committee”comprised of the NMFS personnel. The plan also states that SAFMC members who were state agencyrepresentatives were invited to serve on this extraordinary board (SAFMC 1991a).
The plan states that the mission of the oversight committee was to judge whether the determinations onapplications were correct in terms of the processing of the information submitted, and the judgements made onthe available information (SAFMC 1991a). The plan makes it quite plain that the oversight committee is notempowered to consider cases where an applicant, for whatever reason, did not submit the proper information orfailed to submit an application, but is somehow otherwise thought to be entitled due to extenuated circumstances.The application oversight board apparently was set up to be an accounting check and had no purview to raise orconsider cases of “other merits”.
The applications oversight committee session lasted about four hours and heard approximately four cases(R. Mahood, Executive Director, South Atlantic Fishery Management Council, pers. comm.). Applicants wereinvited to attend the review of their own applications by the oversight committee, and some fishermen did sowhile others raised issues of discrepancies through written materials. It is not known how many of the appealswere successful in terms of overturning the initial decision by the NMFS (R. Mahood, Executive Director, SouthAtlantic Fishery Management Council, pers. comm.).
8. ADDITIONAL FUNDING REQUIREMENTS FOR THE PROGRAMME
The SAFMC’s wreckfish ITQ plan was developed at a time when the National Environmental Policy Actstandards for analysis and documentation of public and private costs of management alternatives were notablyless extensive than today’s standards. The plan does devote a brief section to this issue and lists approximately$65 000 in costs associated with development of the plan, applications review, development of the percentageshare documentation certificates and annual quota “coupons”, and documentation of share transfers. The area ofenforcement costs for the programme is referenced, but enforcement costs are not estimated for the ITQprogramme because these costs are assumed to have already been accounted for under the earlier managementmeasures put in place for wreckfish (enforcement of the trip limit system and the prohibition on the use of longlines). Given the likely changes in incentives in the fishery under ITQs, it is doubtful that there were no addedenforcement costs compared to an existing trip limit enforcement system, but according to the plan documents,the NMFS and Coast Guard did not attribute any specific new costs to ITQ enforcement.
9. EVALUA TION OF THE INITIAL ALLOCA TION PROCESS
Richardson’s (1994) study of the wreckfish ITQ system devotes considerable attention to the policy intentof the initial allocation formula and resulting equity and efficiency considerations of the initial allocation. Hisconclusions pose interesting questions for the merits of the “split the baby” approach to the initial allocation thatwas employed by the SAFMC, based on competing criteria such as recent and historical participation. In essence,the Richardson study reads between the lines to some degree and assumes that the SAFMC implicitly intendedto compensate the late entrants (mostly dedicated shrimp vessels) for their investment in wreckfish gear. Thepaper posits that this is the reason the Council based half the criteria for initial allocation on simply having anylandings of wreckfish during the 1989-1990 period (Richardson 1994). The equity and efficiency of this approachis evaluated by Richardson using share transaction prices from a dedicated survey of wreckfish fishermen as wellas cost and earnings data collected for his study. The survey directly inquired about costs that wreckfish fishermenpaid to obtain shares, and particular focus is made on the issue of how much it cost the core of dedicatedwreckfish fishermen to regain their actual current level of wreckfish landings (what they were catching prior tothe ITQ programme).
Richardson’s study presents convincing evidence that the cost of regaining historical catch levels wassignificant for dedicated wreckfish fishermen and recent participants were likely more than compensated for theirgear investments. If the share transaction data presented by Richardson accurately reflect what occurred, then theinitial allocation significantly reduced the amount of fish available to many of the larger share holders comparedto what they were catching the year just prior to the ITQ programme. This likely served to guarantee thatwreckfish fishermen who lost catch quantities through the initial allocation would be strong bidders for additionalrights to wreckfish landings.
US Wreckfish Fishery 96
While this may indicate that dedicated wreckfish fishermen were willing, and possibly eager buyers, thereported prices paid for wreckfish shares are still not completely explained by the “shortage” that was apparentlyinduced by the allocation formula. For some reason, vessel owners who elected to sell out at the outset were ableto sell their rights to the core group of dedicated wreckfish fishermen at extraordinary prices. Based on cost andearnings data reported in the study, prices for transactions of permanent rights suggest that it would take the buyeran extended period to recover the investment, particularly if a discount rate of 10% were employed to the streamof expected profits estimated from the performance data. This finding conflicts with other studies on ITQprogrammes where initial sellers of ITQs are expected to capitalize only a fairly modest portion of discountedfuture net returns from the sale of initial shares (Muse and Schelle 1989; Geen and Nayer 1989).
This skewed market solution for wreckfish rights may have resulted from some unknown and unexploredmarket imperfections inherent in the programme. Alternatively, sellers, who were generally new to the fishery,may for some reason have had better information about the actual extent of the wreckfish resource or its market.This is, of course, counter intuitive because dedicated wreckfish fishermen would be expected to have a betternotion of the state of the resource or even the relative strength of the market for wreckfish. In any case, studiesevaluating performance of ITQ systems have noted the inherent difficulty for ITQ valuation when resourceabundance is not well understood or annual harvest levels fluctuate widely (Copes 1986, Squires et al. 1995).While one can expect that markets would not function well under resource uncertainty, the more likely outcomebased on studies evaluating ITQ performance would be lack of trading of rights or low prices for trades. Whatapparently occurred with wreckfish was that buyers were, for some unknown reason, extremely “bullish” on thefuture of the fishery and sellers, who were less experienced with the fishery, seemed to have a much better abilityto accurately assess the future.
In the end, the findings from Richardson’s report suggest that the core wreckfish fleet suffered from theburden placed on them to buy out the recent participants in the fishery. Richardson believes that this problem mayhave had some insidious effect on the functioning of the market for shares and the programme overall. While thisis possible, it is also possible that the effects on dedicated wreckfish fishermen of purchasing shares from recentparticipants placed an extra burden on them in the face of a declining or initially overestimated resource base. Ifwhatever factor that affected the fishery did not become evident until after share purchases had occurred, then itis possible that purchases of shares from recent participants did strongly favor the seller over the buyer. If, in fact,the collapse was due to an overestimation of the resource base, then this is an example of the dangers of managinga fish stock with an assessment model that was based primarily on CPUE data, especially for a schooling fishsuch as wreckfish. Assuming whatever caused the collapse had not occurred, however, then one can onlyspeculate about how the “equity” formula used for the initial allocation of wreckfish rights would have beenjudged in the long run.
10. LITERA TURE CITED
Copes, P. 1986. A critical review of the individual quota as a device in fisheries management. Land Management62: 278-91.
Gauvin, J.R., J.M. Ward and E.E. Burgess 1994. Description and evaluation of the wreckfish (Polyprionamericanus) fishery under individual transferable quotas. Marine Resource Economics 9 (2) 99-118.
Geen, G. and M. Nayer 1989. Individual transferable quotas in the southern bluefin tuna fishery: and economicappraisal. In: Rights Based Fishing (P.A. Neyer, R. Arnason and N. Mollet eds.) London: Kluwer AcademicPublishers.
Muse, B. and K. Schelle 1989. Individual fishermen’s quotas: a preliminary review of some recent programmes.Alaska Commercial Fisheries Entry Commission, Juneau, Alaska.
Richardson, E.J. 1994. Wreckfish economic and resource information collection with analysis for management.A report pursuant to National Oceanic and Atmospheric Administration Award No. NA37FF0047-01.
SAFMC: South Atlantic Fishery Management Council 1990. “Wreckfish amendment number 3, regulatoryimpact review, initial regulatory flexibility determination, and environmental assessment for the snapper/grouper fishery of the South Atlantic region”. Fishery management document, South Atlantic FisheryManagement Council, 1 Southpark Circle, Charleston, South Carolina, USA.
SAFMC: South Atlantic Fishery Management Council 1991a. “Final Amendment 5 (wreckfish ITQs), regulatoryimpact review, initial regulatory flexibility determination, and environmental assessment for the snapper/grouper fishery of the South Atlantic region”. Fishery management document, South Atlantic FisheryManagement Council, 1 Southpark Circle, Charleston, South Carolina, USA.
SAFMC: South Atlantic Fishery Management Council 1991b. “Snapper/grouper FMPamendment 5 (wreckfishITQs) informal review comments” Compilation of letters from individuals, organizations, and agencies,summaries of scoping meetings and public hearing minutes by the South Atlantic Fishery ManagementCouncil, 1 Southpark Circle, Charleston, South Carolina, USA.
97 Gauvin

Sedberry, G.R., G.F. Ulrich and A.J. Applegate 1993. Development and status of the fishery for wreckfish(Polyprion americanus) in the southeastern United States. Proceedings of the Gulf and Caribbean FisheriesInstitute, Vol. 58, 118-129.
Squires, D., J. Kirkley and C. Tisdell 1995. Individual transferable quotas as a fishery management tool. Reviewin Fisheries Science 3 (2): 141-169.
United States Department of Commerce 1990a. Emergency Rule. “Snapper/grouper fishery of the South Atlantic”Federal Register 55, no. 153, 8 August 32257-59.
United States Department of Commerce 1990b. Notice of Closure. “Snapper/grouper fishery of the SouthAtlantic” Federal Register 55, no. 155, 10 August 32635-36.
Vaughan, D.S., C.S. Manooch, J. Potts and J.V. Merriner 1993. Assessment of South Atlantic wreckfish stock forthe fishing years 1988-1992. Manuscript of the Beaufort Laboratory, National Marine Fisheries Service,Beaufort, N.C., United States.
US Wreckfish Fishery 98

INITIAL ALLOCA TION OF ITQSIN THE GULF OF MEXICO RED SNAPPER FISHERY
W.R. Keithly Jr.Coastal Fisheries Institute, Louisiana State University
Baton Rouge, Louisiana 70803, USA<[email protected]>
1. INTRODUCTION
The U.S. Gulf of Mexico Fishery Management Council (GMFMC, hereafter Council), under provisions of theFishery Conservation and Management Act of 1976 (P.L. 94-265), is responsible for management of species withinits geographical area of authority: approximately 264 thousand square miles in total with a continental shelf thatranges in width from about 12miles off the Mississippi River to almost 200 miles off west Florida (Amendment 1).To manage a given species (or groups of species), the Council must first develop a Federal Management Plan (FMP)and submit it to the Secretary of Commerce for approval.
The Reef Fish Fishery Management Plan (RFMP) was one of the first FMPs developed by the Council. It wassubmitted in August 1981 and approved by the Secretary of Commerce in June 1983. Implementation of the Planwas initiated in November 1984. Reef fish identified and managed under the original Plan included 14 species ofsnappers (Lutjanidae), 15 species of groupers (Serranidae), and three species of sea basses (Serranidae). SubsequentAmendments to the Plan added five species of tilefishes (Branchiostegidae), two species of jacks (Carangidae), whitegrunt (Haemulon plumieri), red porgy (Pagrus pagrus), and gray triggerfish (Balistes capriscus). The goal identifiedin the original Plan was “[t]o manage the reef fish fishery of the United States waters of the Gulf of Mexico to attainthe greatest overall benefit to the Nation with particular reference to food production and recreational opportunitieson the basis of maximum sustainable yield as modified by relevant economic, social or ecological factors (p. 2)”.Pursuant to this goal, one of the primary objectives set forth in the Plan was to rebuild declining reef fish stockswherever they occur in the fishery.
While encompassing a large number of species, the majority of the Council’s reef fish management activitieshave concerned red snapper. The fishery, which is targeted by both commercial and recreational fishermen, is nowknown to be heavily overfished and evidence of a decline in adult population was documented as early as 1979 atwhich time the fishery was primarily supportedby younger fish of ages one to three (RFMPAmendment 1). The overfished status of theGulf of Mexico red snapper (Lutjanuscampechanus) stock is the result not only of anexcessive amount of effort but also a high levelof bycatch mortality associated with shrimpfishing.
Trends in commercial red snapper landingshave recently been provided by Waters (2000).He indicates that published landings areavailable since the early 1950s on a regular basisand on a less frequent basis back to before the1930s. He suggests that commercial Gulf ofMexico red snapper landings increasedthroughout the 1950s and peaked in the mid-1960s to about 14 million pounds annually. Thereafter, landings declined steadily to less than 3 million pounds in1990 (Figure 1). Reasons for the decline in commercial landings include: loss of fishing privileges in Mexicanwaters, declining red snapper stocks, and regulations designed to rebuild the declining stocks (Waters 2000).Increases in landings in more recent years reflect the larger quotas given to the commercial fishing industry. Thecommercial fishery, which had originated in Northwest Florida prior to the Civil War (i.e. before 1860) is nowprimarily concentrated in Louisiana and Texas. Since 1995, landings at ports in Florida have averaged only aboutfive percent of the total Gulf wide production compared to about 50% as recently as the early-to-mid 1980s(Waters 2000).
99
Red snapper(Lutjanus campechanus)
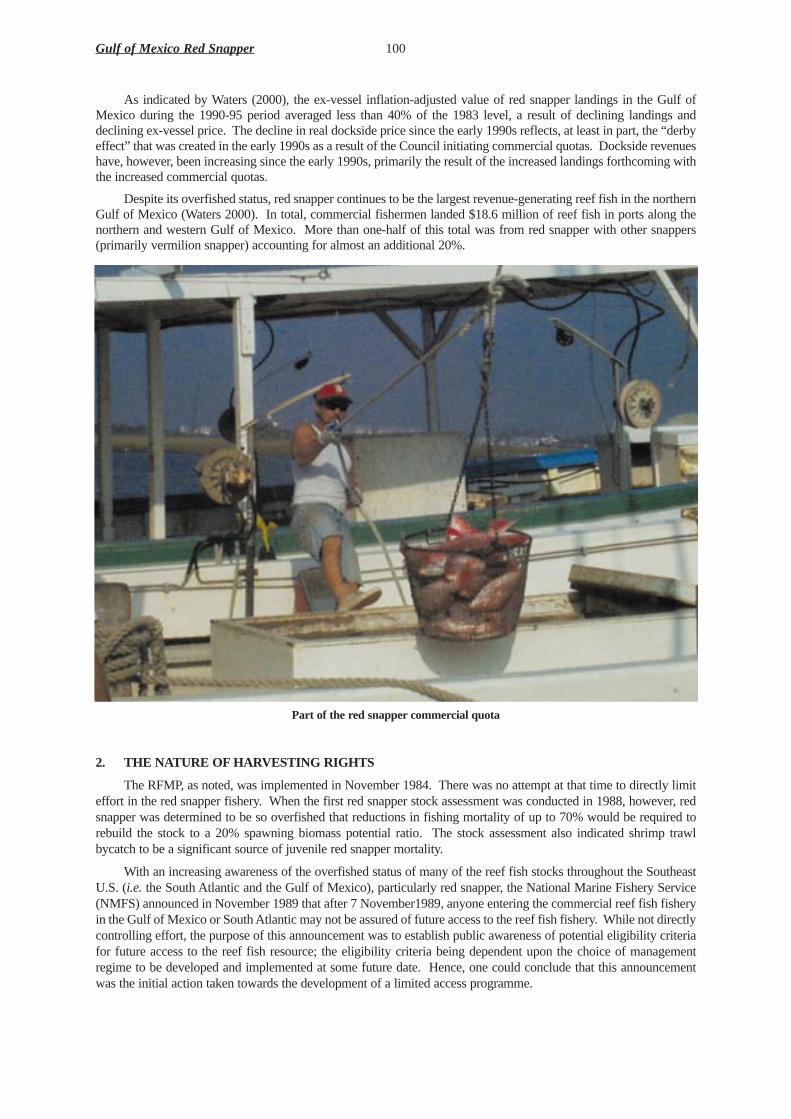
As indicated by Waters (2000), the ex-vessel inflation-adjusted value of red snapper landings in the Gulf ofMexico during the 1990-95 period averaged less than 40% of the 1983 level, a result of declining landings anddeclining ex-vessel price. The decline in real dockside price since the early 1990s reflects, at least in part, the “derbyeffect” that was created in the early 1990s as a result of the Council initiating commercial quotas. Dockside revenueshave, however, been increasing since the early 1990s, primarily the result of the increased landings forthcoming withthe increased commercial quotas.
Despite its overfished status, red snapper continues to be the largest revenue-generating reef fish in the northernGulf of Mexico (Waters 2000). In total, commercial fishermen landed $18.6 million of reef fish in ports along thenorthern and western Gulf of Mexico. More than one-half of this total was from red snapper with other snappers(primarily vermilion snapper) accounting for almost an additional 20%.
Part of the red snappercommercial quota
2. THE NATURE OF HARVESTING RIGHTS
The RFMP, as noted, was implemented in November 1984. There was no attempt at that time to directly limiteffort in the red snapper fishery. When the first red snapper stock assessment was conducted in 1988, however, redsnapper was determined to be so overfished that reductions in fishing mortality of up to 70% would be required torebuild the stock to a 20% spawning biomass potential ratio. The stock assessment also indicated shrimp trawlbycatch to be a significant source of juvenile red snapper mortality.
With an increasing awareness of the overfished status of many of the reef fish stocks throughout the SoutheastU.S. (i.e. the South Atlantic and the Gulf of Mexico), particularly red snapper, the National Marine Fishery Service(NMFS) announced in November 1989 that after 7 November1989, anyone entering the commercial reef fish fisheryin the Gulf of Mexico or South Atlantic may not be assured of future access to the reef fish fishery. While not directlycontrolling effort, the purpose of this announcement was to establish public awareness of potential eligibility criteriafor future access to the reef fish resource; the eligibility criteria being dependent upon the choice of managementregime to be developed and implemented at some future date. Hence, one could conclude that this announcementwas the initial action taken towards the development of a limited access programme.
Gulf of Mexico Red Snapper 100

The Council, through Amendment 1 to the RFMP, which was implemented in January 1990, established a3.1million pound quota for the commercial harvest of red snapper in the Gulf of Mexico as well as a seven-fish baglimit for the recreational sector. In addition, the Amendment implemented a framework procedure, referred to as aRegulatory Amendment, which allows for annual management changes (such as TAC) without going through a PlanAmendment procedure.
The first Regulatory Amendment to the RFMPwas implemented in 1991. It set the red snapper TAC at4.0million pounds with 2.04 million pounds of the TAC being allocated to the commercial sector and the remaining1.96 million pound being allocated to the recreational sector.1
The 1990 commercial quota of 3.1 million pounds did not prove to be a binding constraint on the commercialharvest for that year which totaled 2.7 million pounds and the fishery remained open during the entire year. The2.04million pound quota established for the 1991 year, however, was achieved before the end of the year and thefishery was closed to commercial activities on 23 August, after 235 days of permitted fishing activities. The finalreported commercial catch for the year totaled 2.24 million pounds, or about 10% above that permitted under thequota.
Given an increasing stock abundance and an accelerated harvesting rush, the 1992 quota of 2.04 million poundswas reached after only 53 days, resulting in a closure of the commercial season on 22 February. To alleviate economicand social disruptions that occurred as a result of the shortened season, the commercial red snapper season wasreopened on 3 April 1992 by an emergency rule implemented by the NMFS at the request of the Council. Thisemergency rule, which extended through 14 May 1992, limited commercial harvest of red snapper to 1000lb per tripand resulted in an additional harvest of about 600 000lb of red snapper.
The first comprehensive attempt to curtail the expansion of effort in the reef fish fishery of the Gulf of Mexicowas enacted under Amendment 4 to the RFMP. This Amendment, implemented in May 1992, established a maximumthree-year moratorium on the issuance of new reef fish permits.2 As identified in the Problems Requiring PlanAmendment Section of Amendment 4 (Section 3), “[t]he open access nature of the fishery has resulted in additionalfishing effort or changes in the timing of existing effort in response to quotas and in response to actual or anticipatedincreases in stock levels. The additional effort and the timing of the use of current effort both tend to dissipate thepotential net benefits, which were originally forecast to result from the earlier management actions (p.4)”. Themoratorium, which permitted the transfer of permits between vessels owned by an individual who is the incomequalifier or between individuals when the vessel is transferred, was instituted “to moderate short term future increasesin fishing effort and to attempt to stabilize fishing mortality while the Council considers a more comprehensive effortlimitation programme (p.4)”3. Amendment4, one should recognize, was general in nature and did nothing to reducethe level of effort that was being directed at the red snapper fishery at the time of its enactment nor did it restrict themovement of fishing effort from vessels fishing reef fish into the red snapper fishery.
The Council recognized the limitations afforded to it by enactment of the reef fish fishery moratorium and inSeptember 1992 requested the NMFS to implement a series of measures to extend the commercial red snapper seasonby emergency action4. The major provisions of the emergency action were to establish a red snapper endorsementfor qualified reef fish permittees. To qualify for an endorsement, these people were required to demonstrate they hadcaught 5000lb of annual red snapper landings in two of the three years 1990-1992. Permitted vessels with thisendorsement were allowed a 2000lb possession limit of red snapper. Reef-fish permitted-vessels that did not qualifyfor the endorsement were allowed to land 200lb of red snapper per trip. During the emergency rule, transfer of thered snapper endorsement to another vessel owned by an income qualifier was allowed but not transfer to anotherindividual. The emergency provision also created an appeals board to handle disputes arising from the 5000lb redsnapper landing requirements (Section 5).
101 Keithly
1 The Regulatory Amendment also contained information on the intent of the Council to reduce red snapper bycatch in the EEZby the shrimp trawl fleet by 50% in 1994 via technological devices and/or area and seasonal closures.
2 While the moratorium could have been made retroactive to 7 November 1989, based on the November 1989 announcement bythe National Marine Fishery Service, the Council chose not to do so.
3 The term “income qualifier” refers to an individual who documented that 50% of his earned income was derived fromcommercial fishing activities and used this documentation for obtaining a reef fish permit.
4This section draws heavily on, and is often quoted directly from, Amendment 6 to the Reef Fish Management Plan.
The purpose of the trip limit was to forestall the recurrence of the 1992 derby fishery situation. The red snapperTAC for 1993, established under a Regulatory Amendment, was set at 6.0 million pounds with 3.06 million poundsof the total allocated to the commercial sector, managed under quota. The opening of the 1993 commercial red snapperseason was delayed until 16 February to allow the NMFS sufficient time to process and issue the endorsements. Theemergency action, initially effective for 90 days, was extended for an additional 90 days with the concurrence of theNMFS and Council. Despite the reef fish vessel moratorium and the red snapper endorsement system, the 1993 quotaof 3.06 million pounds was met in less than 95 days. When the fishery was finally closed on 20 May, the actualharvest totaled 3.41 million pounds.
To provide the Council with the time needed to develop a comprehensive effort management programme,Amendment 6, which was implemented in June 1993, extended the provisions of the emergency rule through 1994.The commercial red snapper season, which opened on 10 February, lasted for 78 days. When finally closed on27April, total catch was 3.25 million pounds.
A comprehensive effort management programme as originally proposed was to be implemented in the Gulf ofMexico red snapper fishery by early 1995. Due to Council delays in selecting and implementing such a programme,however, the endorsement system was extended through 1995.5 The season, which opened on 24 February, lasted 51days and when it closed on 14 April the commercial catch had reached about 3 million pounds.
The 1996 commercial red snapper season, managed under a continuation of the endorsement system, was toopen in February under an interim 1.0 million pound quota until 31 March. An ITQ system was to becomeoperational on 1April 1996. Because of the furlough of NMFS employees in December 1995 and a continuingresolution that provided budget funds for the Department of Commerce, however, the NMFS was unable to completethe work needed prior to implementation of the ITQ programme (see Federal Register, 29 February 1996 for details).The programme was originally suspended for 90 days with the provision of an additional 90 day suspension, ifneeded. Shortly thereafter, Congress, in its re-authorization of the Magnuson Act, placed a moratorium on all newITQ programmes in the U.S. and retroactive dates on the moratorium that would exclude the Gulf Council fromimplementing any red snapper ITQ programme.
Because of the pending moratorium on ITQs, the Council, in 1995, developed and submitted to the NMFSAmendment 13 which, among other things, extended the red snapper endorsement system through 1997. Amendment15, implemented in 1998, formalized the two-tier trip limit system in conjunction with a licence-limitationprogramme. A total of 134vessels were granted Class 1 status which permitted them to harvest 2000lb of red snapperper trip when the fishery was open to commercial activities. Another 579 vessels were afforded Class 2 status, whichallowed them to land 200lb of red snapper per trip when the season was open.
3. THE METHOD OF ALLOCA TION3.1 Policy objectives
As identified in Section 6 of Amendment 8 to the Reef Fish Fishery Management Plan for the Reef FishResources of the Gulf of Mexico (RFMP), a number of problems existed that limited the ability of the Gulf of MexicoFishery Management Council to meet the management objectives for red snapper. As noted in Section 6, most, if notall of the problems were related to the situation whereby the quota management system, implemented as a result ofthe overfished status of the red snapper stock, created a derby fishery.
Specific problems included (quoted from Section 6 of Amendment 8):
i. The harvest capability of the current red snapper fleet was larger than that needed to harvest the commercialquota in an economically efficient manner.
ii. The derby fishery compromised vessel safety by encouraging fishermen to begin or continue trips under adverseweather conditions.
iii. The total revenue derived from current landings did not achieve the highest level possible because the quotasystem created a derby, which depressed the average price paid to the fishermen, though lower prices maybenefit consumers.
iv. A derby fishery tends to reduce producer surplus that would otherwise be available from the fishery and has anunknown but limited effect on consumer surplus derived from the fishery.
Gulf of Mexico Red Snapper 102
5See Section 3.2 for details concerning delays in development and implementation of the ITQ programme.
v. The current management system contains a number of regulations which, in aggregate, lead to highadministration costs, difficulties in enforcement and compliance, inefficient production of available quota,frustrations on the part of fishery participants and difficulties in collecting timely data needed to track andmanage the fishery.
vi. The red snapper stock rebuilding programme could be affected by possible quota overruns associated with thederby fishery, and discard mortality during extended closed periods.
vii. User conflicts are being exacerbated by differential trip limits under the endorsement system and by the shortred-snapper quota seasons, which favor those fishermen who are closer to the resource, or have vessels that canoperate in inclement weather.
viii. Net economic benefits were being eroded due to the market glut from the derby fishery and the inability of theindustry to provide a red-snapper product year round.
ix. The red-snapper endorsement system was to finish in 1995 and could not be extended because the system wasclosed to new entrants. Unless replaced by ITQ or licence-limitation system, management would revert to openaccess with equal trip limits for each vessel with harvest allowed until the commercial quota is reached. Thiswould have exacerbated the derby fishery.
3.2 Process used in determining the allocation
In November 1990 the National Marine Fisheries Service set a 1 November 1989 control date for future entryinto the reef fish fishery. The primary purpose of this proposed control date was not to prevent selection of anotherdate for eligibility or any other method of controlling effort from being proposed and implemented, but rather toestablish a public awareness of potential eligibility criteria for future access to the reef fish resources. This notice,because it applied to all reef fish, would, even upon implementation, likely have little impact on the direct control ofthe targeted red snapper effort.
The Council, having observed the derby development as a result of the commercial quota, recognized the needto institute a long-term effort management programme for the red snapper fishery.6 As such, the overriding issueconfronting the Council was not one of whether to develop an effort management programme but, rather, the type ofprogramme which would be best suited for the fishery. To this end, the Council initiated drafting of an Options Paperto begin evaluation of an effort management programme for red snapper in the Gulf of Mexico. In addition, theCouncil contracted a socio-anthropologist (Dr. Michael Orbach, East Carolina State University) in March 1992 toconduct a series of workshops. The purpose of the first workshop series, held in June 1992, was “...to discuss withfishermen the problems and issues in the red snapper fishery, and to discuss the different forms of effort managementand how they have been used in other fisheries (RFMPAmendment 8, p. 6)”.
A second series of workshops was held in August of 1992 whose goal was “...to summarize the results of thefirst series and to evaluate fishermen’s perceptions on the impact of various open and limited access alternatives withrespect to fishermen’s flexibility, biological, economic and social impacts, enforceability, and administrative impacts(p.6)”. To organize discussions, a list of alternative management scenarios was developed as well as a list of criteriawith which to evaluate the alternatives (Orbach, letter to the Gulf Council, 27 August 1992). Options consideredincluded: (a) licence-limitation, (b) individual transferable quotas, (c) licence-limitation combined with ITQs, (d) triplimits and temporal openings/closures, and (e) the present management system.7 The last two alternatives, as notedby Orbach, were included primarily for comparative purposes.
These five choices were evaluated based on seven criteria: (a) fishermen flexibility, (b) biological impacts, (c)economic impacts, (d) sociological impacts, (e) enforceability, (f) administrative impacts, and (g) other [at thesuggestion of the participants]. The options, based on the criteria were rated from positive to negative with an attemptto reach consensus.
Some of the relevant findings of this second workshop were as follows. First, participants ranked the existingsystem low on all criteria. With respect to trip limits and temporal openings/closures, concern, particularly amongsmall boat fishermen, focused on the “...potential for creating “mini-derbies” with adverse economic and sociological(safety and conflict) impacts. With respect to ITQs, concern focused primarily on enforceability and administrationlargely as result of the complexity of the system’s geographic spread and diversity within the fishery. ITQs were
103 Keithly
6 The need to develop an effort management programme for red snapper was exacerbated by Council goals to rebuild anyoverfished reef fish stock within a one-and-one-half generation period. The target date for red snapper was 2007.
7 It was assumed that the 50% income requirement would remain in place for evaluation of each of the alternatives.
generally ranked positively on all other criteria. In general, small-boat fishermen expressed concern that large-boatfishermen would receive a disproportionate share of the overall quota under an ITQ programme. Finally, the licence-limitation alternative was ranked the highest among all possible alternatives. While being ranked the highest amongalternatives, there were concerns “...over the potential cost of licences and a great deal of discussion over how theoriginal licences would be distributed at the outset of the system (p.3)”. Concern was also expressed that the licence-limitation, by itself, would not solve the derby problem.8
Several “special issues” of concern were also raised at the second series of workshops. The first issue was thatof enforcement. As stated by Orbach in his letter to the Council, “[t]here was a common concern that it is difficult orimpossible to enforce even our current regulations, much less a much more complicated system such as those beingconsidered (p.3)”. Orbach further commented that “...virtually all participants agreed that MUCH (emphasis byOrbach) better enforcement capability would be required for proper management. This includes stiffer penalties forviolators”. Tied to the issue of enforcement, participants expressed concern that either a licence-limitation programmeor an ITQ programme would be difficult to enforce without a substantial amount of state cooperation.
A second “special issue” raised at the workshops was that of the original allocation of licences or ITQs. Aspectsassociated with this issue included: (a) the base period for qualification, (b) the determination of what constituteshaving fished in the fishery for purposes of obtaining a licence or minimum landings requirement for obtaining anITQ, and (c)documentation to determine whether any individual or vessel qualifies under a given rule.
A third “special issue” addressed at the second series of workshops was that of dealer licensing. As stated byOrbach, “[v]irtually all workshop participants agreed that some form of dealer licensing is appropriate, and would benecessary under any form of effort management..”. Other “special issues” raised by participants included: (a)extending effort management to all reef fish, (b) development of a limited access programme for professionalfishermen, i.e. charter and headboat, and (c) concern that the commercial fishing sector would have an effortmanagement programme while the recreational sector does not.
The final series of management workshops was conducted by Orbach in December 1992. The goals of theseworkshops were to (a) review the results of the previous workshop series and (b) evaluate details of licence-limitationand ITQ programmes, i.e. those programmes ranked highest by participants at the previous series of workshops(Orbach, Third Workshop, December 1992). With respect to the licence-limitation programme, primary issuesaddressed included the issuing of initial licences and whether the licence should be issued to a vessel or individual.With respect to an ITQ programme, major issues addressed included how might the initial ITQ be issued and whetherthe ITQ should be based on a fixed poundage or percentage of the annual quota. This issue, as noted by Orbach (ThirdWorkshop), would become particularly relevant if the commercial allocation was to be increased over time inassociation with expansion of the stock.
In January 1993 the Reef Fish Management Committee9 and the full Council met to discuss a limited accessoptions paper prepared by Council staff and, in particular, red snapper effort management.10 After considerablediscussion, often led by Orbach, the Reef Fish Management Committee passed a motion “that if the Councildeveloped a limited entry system for red snapper, it would be an ITQ system (Minutes of the Reef Fish ManagementCommittee, 13-15 January 1993, p. 25)”. Preferred options for implementation of an ITQ system, if this option wereto be selected as the preferred alternative, were also selected. The full Council, upon hearing the recommendationsby the Reef Fish Management Committee, voted to “...fully develop the ITQ option for effort management, and alsoto include other options for presentation at the next Council meeting, at which time a preferred option would beselected (RFMPAmendment 8, p.6)”. Preferred options for implementation of an ITQ system (e.g.duration andinitial shares), if this option were to be selected as the preferred alternative, were also considered and selected by theCouncil. The next Council meeting was scheduled to be held in March 1993.
Gulf of Mexico Red Snapper 104
8 Licence-limitation combined with other alternatives (trip limits and temporal openings/closures) was also addressed at someworkshops. These combinations, in general, were ranked higher than a “stand alone” licence-limitation programme because theyaddressed both the number of participants and the derby conditions (Orbach, letter to the Gulf Council, 27 August 1992).
9 This committee includes some Council members and meets immediately preceding the full Council.10 The limited access paper developed by Council staff included a number of different options that would directly or indirectly limit
effort. One of these options was an ITQ programme.
Prior to the scheduled March Council meeting, a “Red Snapper Industry Meeting” was held in New Orleans,Louisiana (31 January 1993). Orbach, who attended the Industry meeting, provided a summary of it to the Councilat the March meeting. Orbach stated that “...the industry meeting corroborated the general perception at theworkshops that the only feasible system for extending the seasons was through an ITQ system; however, there wereexpressions at the meeting that the industry was simply uncomfortable with ITQs (Minutes of the March 11-12Council Meeting, pp. 4-5)”. Orbach went on to explain that “...the rationale for the industry’s reluctance (to an ITQprogramme) was that it was a complicated system, and the industry was distrustful of anything the Council and theNMFS proposed and would not support such action”. After considerable discussion, the Council “...reviewed the firstdraft of Reef Fish Amendment 7. This draft Amendment contained limited and open access options for red snappermanagement, plus the preferred and alternative options for implementation of an ITQ system and the alternatives forimplementation of licence-limitation programme (RFMPAmendment 8, p.6)”. The Council, by a vote of 10 to 6,made ITQs the preferred management system. The Council also voted to defer public hearings until after the currentred snapper season but before the July Council meeting.
The Reef Fish Advisory Panel11 met at the end of April 1993 to review the public hearing draft of Reef FishAmendment 7. In general, many of the concerns raised by this panel mirrored concerns expressed at the workshopsconducted by Orbach and the “Red Snapper Industry Meeting” held in January. This was not surprising given the factthat many of the members of the Reef Fish Advisory Panel were extremely active in the management process and hadlikely attended many of the Council-sponsored workshops and the “Red Snapper Industry Meeting”. One relevantissue that was raised, which had not previously been addressed, however, was that of red snapper ITQs being “boughtup” by the recreational fishermen. Specifically, unlike most other established ITQ programmes, the Gulf of Mexicored snapper fishery has a large recreational component. Hence, in an effort to increase its share of the Total AllowableCatch, it was possible that the recreational sector could “buy up” ITQs. The Reef Fish Advisory Panel, afterconsiderable deliberation “...recommended that implementation of a red snapper management system be deferreduntil industry has had a chance to work on developing a business plan, and Council and industry has had a chance tolook at all the ramifications of an ITQ system (RFMPAmendment 8, p. 6)”. When evaluating the ramifications ofthe ITQ system the Advisory Panel requested a full examination of: (a) enforcement implications, (b) buy-outs byspecial interest groups, (c) additional distributions from increases in the total allowable catch, and (d) administrativefees (Minutes of the Reef Fish Management Committee, 11 May 1993).
At its May meeting the Council decided to proceed with public hearings of Reef Fish draft Amendment 7. Atotal of twelve meetings, extending from June 7 to June 18, were scheduled throughout the coastal communities ofthe Gulf of Mexico. As reported in the Summary of Public Hearing Commentsby one of the Council staff whoattended many of the public hearings, “...only half of the fishermen (who attended the hearings) offered testimony,and the majority of the fishermen that did testify at public hearings, spoke against ITQs (Minutes of the Reef FishManagement Committee, 12 July 1993 (p. 2)”. The Council staff member also indicated that, in his opinion, “...asfishermen learned more about ITQs (from the public hearing process), the views changed from total objection to adesire to learn more about the system (Minutes of the Reef Fish Management Committee, 12 July 1993 (p. 2)”.
The Council convened again in July 1993. By the time of this meeting, it had become clear to a number ofCouncil members and staff that a large number of issues related to a long-term effort management of the Gulf ofMexico red snapper fishery had yet to be resolved and that industry support for the programme was, at best,“marginal”. Such a situation was problematic because certain issues in Amendment 7 pertained to the 1994 seasonand were not oriented to the issue of long-run effort limitation in the red snapper fishery.12 Issues relating to the 1994season would need to be submitted to the Secretary of Commerce before all of the issues related to a long-term effortmanagement programme could be resolved. To this end, the Council voted to “...split Draft Amendment 7 into twoamendments. The resulting Amendment 7 consisted of proposals other than those dealing with red snapper effortmanagement and the reef fish permit moratorium. Amendment 8 would deal solely with red snapper fishing effortmanagement and an extension of the reef fish permit moratorium. In addition, the effort management provisions wereto be reorganized and simplified to address just three general management options: (a) the current management systemas it was prior to the creation of red snapper endorsements, (b) a permanent licence-limitation system based on thered snapper endorsement system and (c), an ITQ system (RFMPAmendment 8, p. 7)”. Finally, the Council, byunanimous vote, recommended that (a) additional workshops be held during the development of Amendment 8, (b)further public hearings be held on the reorganized document [i.e.Amendment 8], and (c) a minimum of one meetingof the Ad Hocred snapper advisory panel be convened prior to final Council Action on Amendment 8 (Minutes of theCouncil Meeting, July 13-14 1993).
105 Keithly
11 The Reef Fish Advisory Panel is largely comprised of commercial fishermen active in the reef fish fishery. As its name wouldinfer, the primary purpose of this panel is to advise the Council regarding proposed regulations.
12 Many of these issues did not relate directly to red snapper but rather involved issues of fish traps.

The red snapper endorsement system was scheduled to terminate after 1995. It had been the intent of theCouncil to establish a red snapper effort limitation programme prior to the expiry of the endorsement system (i.e. forthe 1995 year). At the September 1993 Reef Fish Management Committee meeting, however, the Executive Directorof the Council indicated to members of the Committee that fulfillment of all the actions taken at the previous Councilmeeting (i.e. additional public workshops, public hearings, etc.) would delay the implementation of an ITQ systembeyond the originally intended start date of 1 January 1995.13 The Executive Director recognized that implementationof a functional effort management system was not feasible by the originally intended date and proposed twoalternatives to the Committee. The first alternative, referred to as the “Fast Track Option”, would allow forimplementation of an effort limitation system in March 1995 by combining a number of functions, such as publichearings and workshops. The second alternative, the “More Deliberate Track Option”, would postponeimplementation of any effort management system until January 1996. As implied by the Executive Director, theadvantage of the second option is that it would have given more time for fishermen to provide input regardingprovisions of the amendment through the workshop process and would have allowed more time for the collection ofeconomic information which could be included in the Regulatory Impact Review.14 The disadvantage of adopting the“More Deliberate Track Option”, according to the Executive Director, was that implementation would be delayeduntil 1996 and “...the fishery would then be managed in 1995 by only trip limits under the framework procedure (equallimits for all vessels with permits) unless an additional amendment was prepared and implemented before 1995extending the endorsement system or some modification of it (Minutes of the Reef Fish Management Committee,September 1993, p.21)”. The Committee referred this decision to the full Council who subsequently decided to adoptthe “More Deliberate Track Option”.
The adoption of the “More Deliberate Track Option” by the Council was, at least in part, related to divisivenessamong Council members and apprehension by the fishing industry regarding implementation of an ITQ system.There was also an impression that fishermen would eventually realize the benefits of an effort limitation programmeand become more amenable to implementation of such as system. The Regional Director of the NMFS stated at theSeptember 1993 Council Meeting that it was his opinion that after one more season of trip limits and seasonalclosures, “...there would be strong demands (in the next season) towards an ITQ or similar programme (Minutes ofthe September 15-16 Council meeting, p. 17)”. In selecting the “More Deliberate Track Option”, the Council alsovoted to establish an Ad HocAdvisory Panel to address allocation issues consisting of owners, owner/operators andhistorical hired captains.15
The Reef Fish Advisory Panel met in early November 1993. The Panel indicated that there remainedconsiderable industry opposition to ITQs and some of the opposition emanated from the fact that the fishermen hadno knowledge as to what their individual allotments would be under an ITQ programme. The Panel moved that theCouncil request that the NMFS require fishermen to submit landings records to be processed by the NMFS in orderto determine individual allotments. When it met later in the month, the Council heeded the advice of the Reef FishPanel and moved that the NMFS initiate the data collection process.16
The Council, waiting for the NMFS to collect and analyze red snapper landings records, took little action onAmendment 8 during much of 1994. The information became available to the Council at its November 1994 meeting.After listening to the analysis pertaining to initial allotments, the Council made some technical changes to theAmendment and voted unanimously to hold public hearings on it.
A set of eight public hearings were held in December 1994. While generating less than full support, it wasobvious to some that the set of meetings and comments revealed more acceptance and support for ITQs than had beenthe case during previous public meetings. In fact, a number of fishermen who had previously spoken out against ITQschanged their position after they received information as to their initial shares.
Gulf of Mexico Red Snapper 106
13 As indicated by the Executive Director, “...NMFS estimated approximately eight months to implement an ITQ system”, whichrequired that the final rule would have to be published by 1 May 1994. The time required for review and approval of a finalamendment was 140 days which meant that the amendment/EA/RIR/IFR A would have to have been submitted to the NMFSby 10December 1993 for the ITQ process to be in place by 1 January 1995 (Minutes of the Reef Fish Management Committee,September, 1993)”. The eight months needed to implement an ITQ system included time to review all the data records forfishermen, convene an appeals board and issue ITQ certificates (Minutes of the Council Meeting, September 1993, p. 21).
14 A Regulatory Impact Review, which is required by law, serves three purposes: (a) it provides a comprehensive review of thelevel and incidence of impacts associated with a proposed or final regulatory action, (b) it provides a review of the problemsand policy objectives prompting the regulatory proposals and an evaluation of the major alternatives that could be used to solvethe problem and (c) it ensures that the regulatory agency systematically and comprehensively considers all available alternativesso that the public welfare can be enhanced in the most efficient and cost effective manner.
15 The issue of owner/operators and historical captains is addressed in greater detail in Section 3.3.2 of this paper.16 A more detailed discussion of this data collection process is presented in Section 4.
In addition to the public hearings, both the Reef Fish Advisory Panel and the Ad HocRed Snapper AdvisoryPanel met in late 1994 to review Amendment 8 for a final time. Both Panels opted for a licence-limitation system inconjunction with trip limits in lieu of an ITQ programme.
The Council, when it met in mid-January 1995, after supporting an ITQ programme for several years, reverseditself and, following the advice of the Panels, voted for a licence-limitation system as the preferred option.17
Subsequently, the Council, at its May 1995 meeting, reversed itself once again and voted in support of an ITQprogramme. Furthermore, the Council at the same meeting voted to submit Amendment 8 to the Secretary ofCommerce for final approval at which point no further action could be taken by the Council on the Amendment.
In summary, the Council devoted about three years, off and on, to the development of a comprehensivemanagement programme for red snapper with an anticipated implementation date almost a year later. The reasons forthe extended process are varied. First, commercial fishermen were, in general, unfamiliar with effort limitationprogrammes and, hence, time was devoted to familiarizing them with alternative effort management programmes.Second, there was considerable uncertainty among Council members as to whether an ITQ programme could besuccessfully implemented (and the related intricacies of such a programme) and, as such, they relied extensively onthe industry (through panels and the public hearings process) to provide guidance on the specifics related to such aprogramme (e.g.the status of historical captains). Finally, there was a need for information to be collected to providefishermen with an estimate of individual ITQ allotments under an ITQ system. The collection of this information wastime consuming but, in the opinion of many, exceedingly helpful in garnering increased support by fishermen for anITQ programme. After all this work, however, support by the industry for an ITQ programme was considerably lessthan unanimous and it is debatable whether even the majority of the industry supported an ITQ programme.
3.3 Allocation method chosen3.3.1 Qualifying period
The Council, by and large, was constrained by what years it could use as a qualifying period for ITQ shares.Prior to 1990, there was no systematic records of individual vessel harvest. After 1992, there was an endorsementsystem which could tend to seriously distort catch records. Hence, the Council, with little objection, settled on 1990-92 qualifying time frame.
While there was little challenge to the time frame for qualification, there was considerable debate regarding theyears to use within this time period. There was some discussion that the highest catch year within this three-year timeframe should be used in determining the ITQ shares. In part, this option was rejected because it would, some thought,benefit speculators and individuals who entered the fishery in 1992, the most productive year despite a shortenedseason. Another option considered was an average of all vessel red snapper production records over the three-yearperiod. This option was rejected because it might penalize individuals who had a bad year or missed a year of fishingduring the eligibility period for unforseen reasons. As a compromise, the Council chose to allocate ITQ sharesproportionately based on the average of the highest two out of three years during 1990 to 1992.
3.3.2 Initial eligibility
On the surface, the issue of eligibility may appear relatively straight forward. Vessels fishing in the Gulf ofMexico reef fish fishery were required to have a reef fish permit. One might conclude, therefore, that matching ofthe permitted vessels with documented red snapper landings attached to those vessels would provide the potentialuniverse of ITQ shareholders. However, at the time that Amendment 8 was being developed, 6.2% of the reef fishvessel permits were based on records of income qualifications of operators rather than owners. This raised the issueof whether the initial red snapper ITQ allocation should be provided to the owner or operator of the reef fish permittedvessel in those instances where the operator’s income was used to qualify the vessel. In addition, public testimonypointed to the fact that “[i]n some instances, captains operate vessels under vessel lease agreements with the ownerswhere the captain is classified as a self-employed independent contractor. Under these arrangements (which may bewritten or verbal) the captains pay the owner for use of the vessel through a share of the catch landed and hire andpay the crew”.18 In these instances, the historical captain’s income was not used to qualify the vessel. In all instances,however, the landings records were attached to the vessel.
107 Keithly
17 A detailed discussion of what happened at the January 1995 meeting and subsequent May meeting is presented in Section 3.3.9.18 As noted in RFMPAmendment 8, “[h]istorical captains are classified as captains operating continuously in the red snapper
fishery under a verbal or written share agreement with an owner to lease a vessel from prior to the control date of 7 November1989 set for the reef fish fishery, who have landed at least 5000lb of red snapper in two of the last three years 1990,1991 and1992 and who can satisfy the more than 50% earned income requirement from the year of the control date (1989) to present.The agreement must provide that the captain is responsible for hiring the crew who were paid for shares under his control(p.34)”.

Amendment 8 listed seven alternative options regarding initial eligibility. Most of these options recognized onlythe current owners, operators, captains and income qualifiers who are in the fishery at the time of implementation ofthe amendments as eligible for initial allocation.19 The preferred option by the Council was that of “[e]ither thecurrent owners or operators of permitted vessels depending on whose income qualified for the permit (i.e. only theincome qualifier is eligible) and historic captains”. In the proposed rule establishing an ITQ programme andpublished in the Federal Register (25 August 1995), initial eligibility was defined as follows: “An initial shareholderunder the ITQ system would be either the owner or operator of a vessel with a valid permit on 29 August 1995provided such owner or operator had the required landing of red snapper during the period 1990 through 1992. If theearned income of an operator was used to qualify for the permit valid on 29 August 1995, such operator would be theinitial shareholder rather than the owner. The term “owner” includes a corporation or other legal entity. Additionally,a historical captain could be an initial ITQ shareholder”.
The rationale for inclusion of some operators (i.e.those whose earned income was used to qualify for the permit)and historical captains in the initial ITQ allocation process was based, at least in part, on the Magnuson FisheryConservation and Management Act, 16 U.S.C. 1853, Section 303 which provides that the Council, when establishinga system for limiting access to a fishery in order to achieve optimum yield, take into account: (a) present participationin the fishery, (b) historical fishing practices in, and dependence on, the fishery, (c) the economics of the fishery and(d), the cultural and social framework relevant to the fishery.20 Referring to those instances where the operatorsearned income was used for qualification, the Amendment 8 states: “[i]n these situations, it is the skill and effort ofthe operator that results in the vessel qualifying for a permit. Under these situations, it may be desirable to reward theindividual responsible for the permit being issued (p.36)”. With respect to historical captains, the Amendment goeson to state that “[u]nder such agreements the success of the fishing venture is largely based on the captain’s expertiseas a historical participant in the fishery”.
3.3.3 Initial ITQ shares
As is the case with most ITQ programmes, the initial allocation of ITQ shares was based on historical productionof vessels in the fishery. Individual shares were determined on a percentage basis of the commercial quota and thentransformed into pounds that each shareholder was to receive. The expression of initial (and thereafter annual)allocations on a percentage basis, which was then converted to a poundage basis, was selected by the Council tofacilitate allocation determinations over the long run as the stock and, hence, commercial quota was expected toincrease.
An additional feature regarding the initial ITQ shares was that no initial shareholder was to receive an initialpercentage share that would equate to less than 100lb whole weight. This was, in essence, a bycatch allowance forthose initial shareholders who had minimum red snapper landings records during the qualifying period. After theminimum shares were calculated, the remaining percentage shares would then be apportioned based on eachremaining shareholder’s red snapper landings records during the qualifying period.
3.3.4 ITQ coupons
Each shareholder was to receive coupons in various denominations equal to the shareholder’s calculated totalbased on shares owned as of 1 November of the proceeding year. The coupons would be transferrable by completingthe sale endorsement thereon, including the name of the recipient. Any vessel under the ITQ programme was notpermitted to possess red snapper in excess of ITQ coupons on board that vessel. In accordance with the sale of redsnapper to a dealer throughout the year (or the transfer of coupons) remaining coupons would decrease accordingly(unless additional coupons were purchased).
3.3.5 Transfer of landings records
The qualifying period for red snapper landings to be used in the initial allocation under the red snapper ITQprogramme, as noted, was from 1990 through 1992. The Proposed Rule for implementing the ITQ programme,however, did not come out in the Federal Register until 29 August 1995. A moratorium on the issue of new reef fishpermits, as noted, was established in May 1992 and the transfer of these permits was permitted only under certainconditions: (a)transfer of permits between vessels owned by the income qualifying owner of a permitted vessels, (b)transfer of permits between individuals was allowed only with the transfer of the permitted vessel (e.g.sale) and (c),in the event of death or disability of a permit-holder, the Regional Director shall have the authority to transfer, eitherpermanently or temporarily, the permit to a person specified by the permit-holder or the legal guardian, or estate(RFMPAmendment 8, p.41). These transfers raised the issue of who would receive the initial ITQ allocation; theowner/operator at the time of transfer or the owner/operator after the transfer.
Gulf of Mexico Red Snapper 108
19 In general, the alternative options ranged from the most restrictive measures (i.e.only owners of permitted vessels are eligibleto receive initial allocations) to less restrictive measures and covered most variations.
20 This is not a complete list of factors that can be considered.
The Council addressed this issue as follows. First, the Council made the determination that records for the 1990-92 period should be retained by the permitted owner if the permit was transferred to additional vessels owned by theincome qualifying owner. Second, the Council determined that the landings records for the 1990-92 period should betransferred to the new permitted owner, if the vessel permit was transferred through sale of the vessel or transferreddue to death or disability, unless there was a legally binding agreement for such transfer. Finally, the Councildetermined that the owner of a currently permitted vessel should retain the landings record for a vessel that wassubstantively controlled by him even though the ownership of such vessel may be in the name of a different legalentity (“substantively controlled” means that the same entity had at least a 50% interest in the vessel immediately priorto, and after, the change in ownership).
3.3.6 Transfer of shares
As indicated in the Proposed Rules for the Gulf of Mexico red snapper ITQ programme “[t]he transfer of shareswould be prohibited for the first 6 months after the date that ITQ coupons are required to be carried on board. From6 months after the date that coupons are required to be carried on board to 18 months after such date, shares could betransferred only to persons who are initial shareholders and are U.S. citizens. Thereafter, ITQ participants maytransfer all or a portion of their percentage shares to any person who is a U.S. citizen or permanent resident alien(Federal Register, 29 August 1995 p.44827)”. All transfers of shares, furthermore, were required to be registered withthe Regional Director of the NMFS. There would be a fee imposed on these transfers. Transfers during Novemberand December of each year would not be recorded until the next year.
Several issues related to transferring of ITQ shares are worth evaluating in greater detail. First, the transfer ofITQ shares from one individual to another did not automatically provide sufficient conditions for use of the ITQ sharesbecause a reef fish permit was still a requirement for harvesting red snapper under an ITQ programme. Hence, if theindividual to whom the ITQ shares were being transferred to did not have a reef fish permit, he would not be able todirectly use the ITQ shares.
A second relevant issue with respect to the transfer of ITQ shares was that any transfer would be prohibited forsix months after the implementation of the ITQ programme. The rationale for inclusion of this restriction indevelopment of the red snapper ITQ programme was two fold: (a) to give the NMFS sufficient time to fully preparefor the ITQ programme, including the determination of eligibility, assessing ITQ levels, and resolving disputes; and(b) to prevent speculation during the initial phase of the programme.
For the 6 to 18 month-period, as noted, transfer of shares could only be made to individuals who were initialshareholders and were U.S. citizens. The Council imposed this constraint on transferring shares during the initialphases of the programme to give preference to existing reef fish fishermen. Similarly, transfers during the first 18months were to be limited to U.S. citizens because of concerns that foreign entities might buy shares before themarketplace was able to set a “fair” market price.
Finally, all transfers were to be registered with the Regional Director and transfers that were made duringNovember or December of each year would not be recorded and confirmed until the following year. The rationalefor this was that it was during the November/December period that each shareholder’s allocation of the commercialquota would be made for the next fishing year.
3.3.7 The “lose it or use it” criteria
The Council, in developing the red snapper ITQ programme, considered a “use it or lose it” criterion forindividuals to maintain ITQ shares over the long run. One reason for considering such an option was that a userequirement would tend to “weed out” speculators during the early phases of the programme. The use requirementwould also ensure that the total annual crop not above overfishing levels was harvested over the life span of theprogramme. This, some presumed, would effectively stop environmental groups from purchasing ITQ shares and notfishing them.
The Council realized, however, that there were two drawbacks associated with including a “use it or lose it”clause. First, it would generate a certain amount of instability in the harvesting sector. Second, it would create anegative conservation impact by forcing individuals to harvest red snapper. Given these factors, the Council made adetermination that no ITQ shares or portions thereof should revert back to the management programme because oflack of use.
109 Keithly
3.3.8 Maximum ownership oruse of ITQs
The issue of maximum ownership or use of ITQs was considered by the Council on the basis of both initialownership and ownership or use after implementation of an ITQ programme. These issues were addressed during theearly stages of the Council deliberation process and with little objection, the decision was made almost immediatelyto impose no maximum on the initial holding of ITQs (Minutes of the Reef Fish Committee Meeting, January 1993).The rationale for this decision was based, in part, on the fact that the maximum boat landings of red snapper in anyyear during the 1990-92 period was only 75 000lb and, hence, no individual would initially dominate the market(Minutes of the Council Meeting, 19-22 January 1993).
With respect to maximum ownership or use after implementation of an ITQ programme, a suite of options wasoriginally proposed to the Council from which to choose. One option would impose no maximum on the possessionand fishing of ITQ shares during a given year. A second option would require that no individual could possess andfish more than a specified fraction of all outstanding ITQs in any single year. A final option, which was a variationof the second option, would relax the ‘single year” time constraint but would limit the time frame to some specifiednumber of consecutive years.
At its May 1993 meeting, the Council, by a vote of nine to eight, selected that “No maximum shall be imposedon the possession and fishing of ITQs for any single fishing year” as the preferred option to be taken to publichearings. The close vote on this issue is an indication of the divisiveness among the Council members at the time andgeneral concern, as expressed by a number of fishermen in the sponsored workshops, that monopolization of ITQswas a distinct possibility. This concern was fueled, at least in part, by the aggregation of ITQs in the Atlantic surfclam fishery where the Mid-Atlantic Council chose not to include any anti-monopoly features in its ITQ systempreferring instead to leave it to the anti-trust laws (see Minutes of the Council Meeting, 11-12 March 1993).
In a final action taken on Amendment 8, the Council chose not to impose any maximum on the possession ofITQ shares or the fishing of ITQ coupons in any given year. This decision was made despite the concern had beenexpressed regarding the potential for monopolization of ITQ market during the sponsored workshops and publichearing process. There were essentially three reasons the Council chose not to impose any “cap” on ITQ shares. First,they recognized that anti-trust laws could be easily invoked, at some date after implementation of the programme, ifthe situation was warranted. Second, Council realized that any “cap” could easily be circumvented by a family orcorporation where the individuals each maintained levels under the “cap”. Third, the Council realized that imports ofred snapper were large and competed directly with the domestic product. As such, the ability of any ITQ shareholderto manipulate price was of little concern.21
3.3.9 Regions of applicability of programme
As a general rule, the Council has authority to only manage fisheries in federal waters (outside nine nauticalmiles in Texas and Florida and three nautical miles in the other states) with individual Gulf of Mexico statesmaintaining management responsibilities in state waters. Red snapper are not estuarine-dependent, thus, one wouldnot anticipate sizeable harvests in state waters. In fact, reported harvests from state waters averaged only about 2%of the total annual catch. These harvests were primarily in Florida where state waters extend offshore for 9nm.
When federal waters were closed to commercial red snapper harvesting (i.e. quota having been reached),however, reported landings from state waters showed a sizeable increase. As such the NMFS concluded thatcompatible state regulations were essential for the successful realization of any red snapper ITQ system. As indicatedin the Proposed Rules establishing the ITQ programme, “[t]o the extent that non-compatibility state regulations allowred snapper to be harvested outside the ITQ system, the system would be compromised because monitoring andenforcement would be hindered (Federal Register, 29 August 1995 p. 44828)”.
Therefore to help ensure success of the ITQ programme, the NMFS asked the individual Gulf of Mexico statesto develop compatible regulations. Before publication of the final rules, the NMFS had received assurances from allfive of the Gulf of Mexico states that they either had, or would, enact compatible regulations in waters under theirjurisdictions (Federal Register, 29 November 1995). As stated in the Federal Register “[t]hus, in making its decisionto approve and implement the remaining measures of Amendment 8, NMFS obtained reasonable assurance from allof the affected states that they would be able to issue compatible state regulations effective on or about the time thatAmendment 8 is fully implemented (1 April 1996). This cooperation will greatly enhance enforcement of theregulations (Federal Register, 29 November 1995 p. 61203)”.
Gulf of Mexico Red Snapper 110
21 However, the Council advised that it could, at a subsequent time, recommend and implement (with NMFS approval) a differentallocation scheme via the FMPAmendment process, if concentration in the industry became “excessive” under the ITQprogramme.

Thus, the Council and the NMFS worked closely with the individual Gulf of Mexico states to help ensure thatan ITQ programme would be acceptable and workable. Without this assurance, it is unknown whether the NMFSwould have accepted an ITQ programme for the Gulf of Mexico red snapper fishery.
3.3.10 Duration of ITQ programme
As indicated in the Federal Register that provided the proposed rules for creation of the red snapper ITQprogramme (29 August 1995), “...the proposed ITQ system would remain in effect for 4 years from the date that thesystem is implemented during which the NMFS and Council would evaluate the system. Based on the evaluation,NMFS and the Council would modify, extend, or terminate the system (p.44825)”. Given this somewhat unusualduration arrangement, it is worthwhile to examine how this arrangement evolved.
The issue of the duration of the red snapper ITQ programme was originally addressed at the January 1993Council Meeting. In general, two options were proposed to the Reef Fish Management Committee and subsequentlyto the Council. The first option was to confer on the ITQ the privilege to harvest the specified amount indefinitely.The second option was confer on the ITQ the privilege to harvest the specified amount for an unspecified, but limited,amount of time. With little debate, the Council confirmed that it was the Council’s intent to continue the ITQprogramme as long as the objectives of the plan were met. While there had been some discussion by the Reef FishAdvisory Panel of inserting some type of a “sunset” rule to re-evaluate any ITQ system (see Minutes of the Reef FishAdvisory Panel, 29-30 April 1993), the Council appears to have never seriously considered this option as a long-runeffort management programme was being more fully developed.
In January 1995 the Reef Fish Management Committee and the full Council met and final action was to be takenon Amendment 8. At the time of these meetings, there were still considerable doubts and uncertainties, on the part ofboth Council members and the commercial fishing sector, regarding whether an ITQ programme or a licence-limitation system would adequately address the problems confronting the fishery. Adding to this uncertainty weretwo Congressional bills that were being prefiled to amend the Magnuson Act, which specifically addressed ITQprogrammes throughout the United States. A detailed summary of the Senate version of the bill was provided by theExecutive Director of the Council (GMFMC) to the Reef Fish Management Committee at the January meeting,“Senator Stevens and Senator Carey introduced a bill with a provision relating to ITQs. This would proposed (sic)that upon implementation of the revised Magnuson Act, there would be a moratorium on implementation of ITQs untilNMFS had developed a policy paper on how they should be structured and that any ITQ systems implemented priorto the implementation of the Act would become subject to meeting the provisions of the NMFS policy paper withinthree years. There was also a provision for fees for ITQ systems only. The fee level would be up to four per cent ex-vessel value of landings. There would also be an additional one percent ex-vessel value in the case of transfers ofITQs (Minutes of the Reef Fish Management Committee, 17 January 1995 p.13)”. The Executive Director alsoindicated that the House version of the bill did not contain language on taxes.
Given the cloud of uncertainty surrounding the ITQ system, a motion was made by one of the Reef FishManagement Committee members to adopt the Licence Limitation System as the preferred option. This motion failedand, subsequently, the Committee confirmed ITQs as the preferred alternative by a vote of five to two.
When the Council met the next day, there was considerable debate whether to make the Licence LimitationSystem or the ITQ system the preferred option.22 One Council member, actively involved in the red snapper fisheryas both a boat owner and dealer, spoke passionately against adopting ITQs. His rationale was based on severaldifferent issues. First, he asserted that if a red snapper ITQ programme was to be implemented, similar programmeswould be developed for all other fisheries in the Gulf (presumably limited to reef fish species). This would, heasserted, reduce the “...flexibility the fishermen have to move from one fishery to another, without having to go to thebank and buy something that they don’t know if the value would be worth the effort (Minutes of the Council Meeting,January 18-19 p.25)”. Second, in expressing his concern regarding possible Congressional action and its impact onan ITQ programme, the Council member stated “[w]e heard yesterday that we don’t know what Congress is going todo with user fees. We (implement) an ITQ (programme) and they come back and tell us that there will be a three orfour percent cost on your ITQs and have to pay that (p. 25)”. Third, the Council member suggested that the three yearqualifying period (i.e.1990-92) was not representative of historical years in the red snapper fishery. Specifically, hestated that “...[t]hose years were where the fishery was changed, different ways of fishing were forced, due toregulations this Council put on the fishermen. The fishermen changed habits prior to this time because of low catchrates and moved out of the red snapper fishery into other fisheries (p.25)”. Fourth, the Council member expressedconcerns that the ITQs could be bought up by a large entity, “...like Tyson Chicken who could buy them up to recoupthe profits over a long period of time whereas the fishermen would not have that option (p. 25-26)”. Fifth, the Councilmember, questioned the quality of the reporting process used during the qualifying period. And last, the Council
111 Keithly
22 A twenty-three page verbatim transcript of the discussion is given in the January 1995 Council Minutes.

member questioned the appropriateness of an ITQ programme for the commercial sector when there existed a largerecreational sector which was not bound to its share of the TAC.23 The Council member finished his plea with amotion that the Licence Limitation Option be adopted as the preferred alternative for Amendment 8.24
This plea resulted in a long discussion as to whether the Council member’s assertions were accurate and whetherthe Objectives attached to Amendment 8 (see Section 3.1; Policy Objectives) could be achieved with a licence-limitation programme. When finally brought to a vote, the Council, by nine to six, voted in favor of licence-limitationas the preferred alternative for Amendment 8 in lieu of an ITQ system. All five Council members with commercialinterests voted in favor of Licence Limitation. Hence, it appeared as though the Gulf of Mexico red snapper fisherywould by 1996 be operating under a Licence Limitation Programme rather than an ITQ Programme.
The Council next addressed Amendment 8 at its May meeting. While the focus of the meeting was to be onfinalizing specific options with respect to the Licence Limitation Management Programme, the issue of adopting anITQ quota system was raised once again. This time, however, implementation the ITQ Management System “...wouldconfer on an ITQ share certificate holder the privilege to harvest the specified amount for four years after inceptionof the programme after which the programme may be extended (Minutes of the Council Meeting, May 10-12, p. 42)”.This time, the Council voted in favor of the ITQ Management System and subsequently voted at the same meeting tosend Amendment 8 to the Secretary of Commerce for final approval.25
The Council member who moved for a specific four-year evaluation period of the ITQ system stated that thepurpose for doing so “...was to end speculation in the windfall gain by holding (the system) to confined periods andallowing the system to be evaluated after four years on the basis of what it had accomplished in terms of efficiency,enforcement and cost (Minutes of the Council Meeting, 10-12 May 1995 p. 42)”. He proceeded to explain that a four-year period was adequate because “[t]he effectiveness of the system could be evaluated in years two and three andCouncil (would then) consider whether to extend it in year four”.
In subsequent discussions, the Council member more fully explained his rationale for a limited duration of theITQ system (pers. comm. Dr. Kenneth Roberts, Cooperative Extension Service, Lousiana State Universtiy, BatonRouge, Louisiana). Specifically, he indicated that many members of the Council were largely uncertain whether anITQ programme for red snapper would be effective given its large number of unique characteristics including, but notlimited to, a large recreational component and the multi-species nature of the commercial fleet. In addition, some ofthe Council members were concerned with “giving up” control of the management process, particularly if the ITQprogramme failed to achieve the objectives set forth in Amendment 8. Evaluation of the programme would, hence,allow it to be modified accordingly or, if found to be grossly inadequate, terminated. Thus, the Council could, ifneeded, remain actively involved in the management process.
3.4 Enforcement
Enforcement had been of concern throughout the development of a red snapper effort limitation programme;particularly an ITQ programme. There had been persistent allegations, during the workshop and public hearingprocess, that a large portion of landings had not been accounted for under the quota management system. It was alsorecognized that monitoring of any ITQ programme at sea would be extremely difficult; in part because of the multiplespecies landed on any given trip and also because of overall lack of enforcement personnel. To maximize enforcementcapabilities under the ITQ programme, the Council adopted a monitoring programme similar to that developed for theSouth Atlantic wreckfish ITQ programme.
The steps included in the monitoring programme were to be: First, each shareholder would receive couponsbased upon pounds he was allocated under the ITQ programme. Second, the amount of red snapper on board a vesselwith a federal reef fish permit (or any vessel in the EEZ) would not be able to exceed the total of ITQ coupons onboard that vessel. Third, red snapper harvested by a permitted vessel (or otherwise harvested from the EEZ) wouldbe transferrable only to a dealer who held a federal reef fish dealer permit.26. These federally-permitted dealers wereallowed to receive red snapper only from vessels with reef fish permits and coupons equal to, or exceeding, the
Gulf of Mexico Red Snapper 112
23 The recreational component of the red snapper fishery, during discussion of Amendment 8, was being managed primarilythrough size limits and bag limits. There was no provision to close the recreational fishery when its share of the TAC wasreached and significant “overruns” were the rule rather than the exception. Congress has since mandated that the recreationalred snapper fishery be closed when its share of the TAC is reached.
24 Technically, this was a substitute motion because the motion on the floor was that which came from the Reef Fish Committeein support of an ITQ programme.
25 Given the framework of Amendment 8, it was necessary for the Council to first vote on the adoption of the ITQ managementsystem prior to deciding its duration. It was well known though that the issue of the duration of the ITQ programme would bere-visited immediately after Council’s adoption of the ITQ system.
26 The Federal Reef Fish dealer permitting system was established in RFMPAmendment 7. Much of the impetus for establishingthis permitting system was to provide a more accurate tracking system of red snapper and other reef fish landings.

amount of red snapper being transferred. When transferred, the vessel operator would provide the dealer with part ofthe ITQ coupon (the “Fish House part”, equal in denominated to the weight of the red snapper transferred to thedealer. He would retain the other part (the “Fisherman” part) for his records.
The dealer when receiving these coupons from the vessel operator was required to indicate the date received,the vessel permit number and his permit number. The dealer was required to submit these records to the NMFS atmonthly intervals, or more often if requested. The vessel operator was required to submit the “Fisherman” part of thecoupons with his log book records.
This monitoring method allowed for enforcement of ITQs at sea (i.e.on the vessel) as well as ashore (i.e.of thedealer). In addition, the submission of coupons by both the vessel operators and the dealers allowed for compliancechecks which would reduce fraudulent activities. Last, the requirement that Federally-permitted dealers were allowedto receive red snapper only from vessels with reef fish permits and coupons would facilitate enforcement in two ways.First, it helped to identify all dealers since most, if not all, would desire purchasing product from permitted vesselsand would thus need a permit. Second, it allowed for closer monitoring of dealer records by enforcement.
4. DATA REQUIREMENTS AND COMPUTATIONAL PROCESS
The Reef Fish Advisory Panel met in November 1993 to discuss the overall management programme for redsnapper. Many of the Panel members expressed concern that many fishermen were unwilling to support an ITQprogramme because they did not know what their initial allocation would be. By unanimous agreement, the Reef FishAdvisory Panel requested that the Council ask the NMFS to obtain landings information from fishermen and togenerate initial estimates of ITQ allocations (Minutes of the Reef Fish Advisory Panel, November 1993). Thisrequest arose from the fact that “[m]any fishermen were uncertain of what their allocations would be if ITQs wereimplemented, and felt that there would be a large number of fraudulent or previously unreported fish house receiptssubmitted, which would decrease their personal allocations (Minutes of the Council Meeting, November 17-18,p.11)”. The Council, in response to the request by the Reef Fish Advisory Panel, moved to gather the requisite datathrough the Amendment process (RFMPAmendment9).
Amendment 9 provided the NMFS with the authority to “collect and compile commercial red snapper landingsdata for the years 1990, 1991 and 1992 for vessels by owner and, in the case of permitted vessels for which the permitwas based on the earned income qualification of an operator, by such operator of vessels that were operating in thecommercial red snapper fishery and had red snapper landings in any of the years 1990, 1991 and 1992, whether suchpersons are currently owners or income-qualifying operators or permitted vessels or not (RFMPAmendment 9, p.7)”.Landings data which would be used as the basis for initial allocation were as follows: (a) for vessels which submittedlogbooks, only the logbook landings during the appropriate period would be considered for that time period duringwhich a log book was required or was voluntarily submitted,27 (b) in the absence of log book records, for those vesselslanding red snapper in Florida, only Florida trip tickets would be considered for landings in Florida, and (c) forlandings where neither of the other criteria apply, the owner or operator of the vessel whose income was used toqualify the vessel for the permit was required to provide the NMFS with documentation of red snapper landings inaccordance with the criteria used for a red snapper endorsement.
Amendment 9 provided the only opportunity for individuals to submit landings records. Thus, anyone wishingto participate in an initial allocation of ITQ shares would have to submit the requested landings data. In general, thecollection of landings data was so broad that it would accommodate fishermen who left the fishery after 1992 but hadlandings during the qualifying period. It also accommodated fishermen who never obtained a reef fish permit but whoharvested red snapper during the qualifying period when reef fish could be legally harvested without a permit. Onlythose fishermen who did not submit log books or landed fish in Florida (trip ticket) were required to resubmit records.
In addition, Amendment 9 addressed the issue of records documenting historical captain status. Among otherthings, the Amendment required historical captains to: (a) provide documentation of red snapper landings during theperiod of that the individual was a historical captain, (b) identify the vessel or vessels and period of time the shareagreement was in effect, (c) provide statements signed by each vessel owner with whom they had the share agreementattesting to the share agreement and acknowledging that the captain determined the shares/payment to the crew [orother documentation]28 and (d), submit income tax records for the period 1989 through 1993 to verify that they hadmet the earned-income criteria.
113 Keithly
27 Further, logbook records that were not submitted when required could no longer be submitted as proof of landings. 28 In public testimony, the requirement for a signed statement from vessel owners stating terms of the share agreement was met
with some resistance by vessel owners who indicated that they would refuse to sign any such document. If the vessel ownerrefused to sign the document, the historical captain was allowed to provide other documentation of the share arrangement.
Documentation of historical captain status was required to ascertain which vessel the historical captain operatedand what his share agreement was with the owner so that both the historical captain and the vessel owner could receivethe appropriate credit for the vessel’s landings. The provision that captains controlled crew shares/payments wasincluded as a means of providing evidence that captains operated as independent operators.
In total, the NMFS accepted catch records for 930 corporations and individuals through the Amendment 9process (November 1994 Council Minutes). Of the 930 total, only 374 had current reef fish permits suggesting that556 individuals (accounting for approximately one third of the total catch) would not qualify under the Council’spreferred alternative. To advise fishermen what their individual ITQ shares might be, reports were issued to thefishermen indicating their individual status with respect to catch records, non-accepted catch records, catch during thetwo highest years and the ITQ share under a 3.06 million pound commercial quota.
The process associated with the collection and analysis of data associated with Amendment 9 served severaluseful purposes. First, there had been a major concern when the Council began discussing ITQs that once they wereimplemented the Council would realize that the landings greatly exceeded recorded catch and, hence, the shares thatlegitimate fishermen would receive would be extremely low relative to their actual landings. The data collected andanalyzed under Amendment 9 showed this not to be the case. Second, it allowed for identification of all individualswho qualified for participation in the red snapper effort management regime. Finally, fishermen were advised whattheir catch allotments would be under alternative scenarios.
5. APPEALS PROCESS
There were actually two appeal processes of relevance in the formulation of an ITQ programme for red snapperin the Gulf of Mexico. The first was in response to an emergency rule that established the red snapper endorsementfor qualified reef fish permittees. To qualify for this endorsement reef fish permittees were required to demonstrate5000lb of red snapper in two of the three years from 1990 through 1992.29 An appeals board, consisting of statedirectors or their designees was established by the Council to hear disputes between the NMFS and individuals inrelation to what would be considered acceptable proof of catch. The Council explicitly noted that the appeals boardwould not consider hardship cases.
There were about 2200 permitted reef fish vessels in the Gulf of Mexico in 1992. Endorsement applicationforms and pre-approval notifications were sent out on 11 December 1992.30 Applications were returned to the NMFSby 251 permitted reef fish vessels and of this total, 115 (46%) were initially approved with the remaining 136 beingrejected; primarily for insufficient landings (Minutes of the Council Meeting; 19-23 January 1993). Those applicantsnot approved for endorsement were informed of the appeals process, and 55 of the 136 rejected permittees appealedfor further consideration (RFMPAmendment 6 to the Endorsement Oversight Committee, which met during the firstweek of February 1993).
In general, the 55 appeals focused on a number of different issues (Minutes of the Reef Fish ManagementCommittee, November 16,1993). Eight individuals appealed because they had not harvested the amount of redsnapper required for endorsement; none of these eight cases were accepted by the appeals board. Sixteen cases werepresented to the appeals board based on the issue that the vessel was permitted in only one or two of the three years,generally the result of the entity having just recently acquired a vessel and was planning to participate in the redsnapper fishery. Only one of these sixteen cases was accepted by the appeals board. A third issue presented to theappeals board related to discrepancies between red snapper catch as reported in the application for endorsement andthe catch reported on acceptable documents (e.g.log books or Florida trip tickets). In many cases, the discrepancieswere found to be the result of data coding errors and six of the eighteen cases presented to the appeals board relativeto this issue were resolved in favor of the individual. A fourth issue presented to the appeals board for the red snapperendorsement related to the number of individuals informed that they had provided insufficient documentation oflandings history at the time of application. Five individuals falling into this category provided new or additionaldocumentation to the appeals board and all five cases were accepted. Other issues addressed by the appeals boardincluded: (a) three cases where there was no history of red snapper catch but the applicants wanted to protest themanagement regime; none of the three cases were accepted, (b) one fisherman with a long history of reef fish fishingwho did not fish for red snapper during the period of record because he chose to fish for alternative species; notaccepted by the appeals board, (c) three disputes between owners and operators of which one was accepted, and (d)instances where income requirements were met by a number of operators during the period of record rather than the
Gulf of Mexico Red Snapper 114
29 Acceptable proof of catch, as determined by the Council, included: (a) Florida Department of Natural Resources trip tickets,(b) NMFS log books or (c), fish house receipts (Minutes of the Council Meeting; 16-17 September 1992).
30 A total of 81 applications were pre-approved by the National Marine Fisheries Service, based upon log book data (Minutes ofthe Council Meeting; 19-23 January 1993).
requirement being met by a single operator; none of these three cases were rejected. In total, the appeals boardrecommended approval of an additional 16 applicants, which resulted in a total of 131 red snapper endorsementsfinally being issued.
The endorsement appeals board provided considerable insight to the Council in its deliberation of thedevelopment of an ITQ appeals board. First, the state directors (or their designees) who sat on the endorsementappeals board felt that political pressure and pressure from the commercial industry hindered their performance andsome of the endorsement appeals board members felt that the ITQ appeals board could best function if the appealsboard was comprised only of industry members. Second, many of the Council members, after hearing the nature ofmany of the appeals, felt a strong need to include hardship cases in the appeals process. Finally, the appeals processbrought to light errors in vessel catch information. While many of the errors were simply of a coding nature, therecognition of such errors made Council wary of “over dependence” on available information and the need to addresscatch information issues in any subsequent appeals process.
Before sending Amendment 8 to the Secretary for approval, the Council voted to create an appeals board thatconsisted solely of commercial industry members. These members would be selected by the Council and their taskwas to review and evaluate appeals. Their recommendations would be sent to the NMFS Regional Director whowould render a final decision on the appeal.
In furtherance of findings related to the endorsement appeals board, the Council also determined that the ITQappeals board should consider hardship cases when resolving disputes.31 At the recommendation of the NMFSRegional Director and the NMFS legal counsel, the Council developed a set of guidelines to assist the appeals boardin reviewing and evaluating hardship appeals. As stated in RFMPAmendment 8, “[s]ince hardships are, by nature,unique situations, the Council cannot predict all of the circumstances which would merit consideration. The Councilemphasizes that hardship allotments are to be awarded on the basis of circumstances that were beyond an individual’scontrol, as opposed to difficulties resulting from unfortunate business judgements. The following examples ofmeritorious circumstances are offered to aid the special advisory panel in its determinations: (a) The fisherman’svessel was in the boat-yard for reconditioning and the work was not done in a timely manner despite the owner’spersistent efforts, (b) the fisherman’s vessel was the subject of litigation and was thereby prevented from fishing, (c)a health problem, physical or mental, or a degree sufficient to prevent the fisherman from fishing existed, regardlessof whether he was, himself, the patient, (d)a family situation required the fisherman’s presence and attendance to theextent that he could not fish (RFMPAmendment 8, p. 56)”. The Council further instructed the special advisory panelto require documentation and/or proof of the claims made pursuant to the hardship appeal.
Despite the guidelines developed by the Council for evaluation of hardship cases, the final rules for the redsnapper ITQ programme rejected any hardship appeals. As stated in the Federal Register that provided the ProposedRules for the red snapper ITQ programme (29 August 1995), “NMFS has determined that the hardship appealscriterion in Amendment 8 is too vague and subjective to identify circumstances constituting hardships. Thesubjectivity, in turn, would invite arbitrary decision-making (p.44827)”. Hence, the ITQ appeals board would havebeen unable to consider hardship cases in its deliberations.
The appeals board was to meet in January 1996 to review appeals related to ITQ allotments. Due to the federalfurlough in December 1995 and early January 1996, however, “...NMFS was unable to process fishermen’s requestsfor appeals of NMFS initial determinations regarding historical captain status and red snapper landings records(Federal Register 29 February 1996 p. 7752)”. Hence the appeals board did not meet in January as originally intendedand the NMFS further concluded that “...it would be unreasonable to expect red snapper fishermen to pursue theirappeals before the Council Appeals Board during February 1996 when the commercial red snapper fishery is openand fishermen are busy with harvesting operations (Federal Register, 29 February 1996, p. 7752)”. Given thesubsequent retroactive repeal of the Gulf of Mexico red snapper ITQ programme by Congress, this appeals boardnever met and, hence, there is no information to determine the nature of the appeals that would have beenforthcoming.
6. ADMINISTRA TION OF THE ALLOCA TION PROCESS6.1 Staff requirements
Nothing is documented regarding the additional staff that would have been required to successfully implementand oversee a red snapper ITQ programme in the Gulf of Mexico. As discussed in Section 6.2, however, additionalstaff requirements, outside of enforcement, were estimated to be rather small: approximately two positions. These
115 Keithly
31 Hardship allocations were to come from a quota set-aside of three percent. Fishermen who did not appeal would not have anyreduction in their initial allocation as a result of hardship awards but fishermen receiving hardship allotments would receivereduced shares if the set-aside was insufficient.
additional positions, one envisions, would have been responsible for determining individual allotments on an annualbasis and maintaining the additional records that would be required under an ITQ programme. One should realize,however, that part of the reason that few additional staff would have been required reflects the fact that theendorsement system that was implemented for the red snapper fishery likely required additional staff and, to someextent, these staff would merely transfer duties.
6.2 Additional pr ogramme funding requirements
While this ITQ programme was never implemented, estimated additional programme funding requirementswere estimated in the preparation of the Regulatory Impact Review for RFMPAmendment 8. As stated, “[c]ostsunder ITQ management will be higher than under the other management systems (i.e.either the status quo or licence-limitation) largely due to the need for increased enforcement and the extensive records and tracking system forcoupons (or similar tracking devices) and ITQ shares (p. 115)”. In terms of the current system that was in place atthe time that the ITQ system was proposed (i.e. the endorsement programme), the NMFS administrative costs wereestimated to equal $30 000 annually. Under an ITQ programme, it was estimated that the NMFS annualadministrative costs would have increased to $145 000.
Enforcement costs under the proposed compliance system were estimated to equal $400 000 annually. Thislevel of enforcement expenditures was considered to be inadequate for that needed to achieve even a “minimum”acceptable compliance under the endorsement system. The Regulatory Review concluded that an additional $450 000would be required to enforce regulations under the current system at a “high” level of compliance. These additionalenforcement expenditures would also provide an “adequate” level of enforcement under an ITQ programme. Toachieve “full” compliance (defined as a compliance level of at least 90%) under the ITQ programme, however,enforcement expenditures of about $1.5 million would be required annually. Hence, it was concluded that achievinga “high” level of compliance within the confines of an ITQ system would cost approximately $1.0 million moreannually than that which would be required under the then current endorsement programme.
There was one major caveat provided regarding the higher enforcement costs required to achieve a “high” levelof compliance in the ITQ programme. As indicated in the Regulatory Impact Review for RFMPAmendment 8,“[i]deally, a high level of enforcement would occur initially (with the ITQ programme), and it could diminish overtime as the ‘self-enforcement’aspects of ITQs begin to take hold (p. 119)”. Since the red snapper ITQ programmewas never implemented, it is unknown whether the “ideal” scenario would have been forthcoming.
7. DISCUSSION
The Council spent more than three years developing an ITQ programme for the Gulf of Mexico red snapperfishery. Shortly after the programme had been approved by the Secretary of Commerce, but beforeimplementation, Congress placed a moratorium on the implementation of any new ITQ programme and made themoratorium retroactive to include the Gulf of Mexico red snapper fishery. Hence, there is no information as towhether the programme would have been successful in terms of ameliorating the problems identified in RFMPAmendment 8.
With Congress set to possibly relax the moratorium, however, the Council at its May 2000 meeting proposedcreating a panel to evaluate IFQ’s in the red snapper fishery. In addition, members of the red snapper industry haverecently drafted an IFQ options paper for distribution. These signs suggest that the process may be re-consideredwhen Congress lifts the moratorium.
8. REFERENCES
Federal Register 1995. Vol. 60, No. 167/Tuesday 29 August 1995/ Proposed Rules.Federal Register 1995. Vol. 60, No 229/Wednesday 29 November 1995/Rules and Regulations.Federal Register 1996. Vol. 61, No. 101/ Thursday 23 May 1996/ Rules and Regulations.GMFMC (Gulf of Mexico Fishery Management Council) 1981. Environmental Impact Statement and Fishery
Management Plan for Reef Fish Resources of the Gulf of Mexico. Lincoln Center Drive, Suite 881, 5401 WestKennedy Boulevard, Tampa , Fl. 33609
GMFMC (Gulf of Mexico Fishery Management Council) 1989. Amendment Number 1 to the Reef Fish FisheryManagement Plan. Lincoln Center, Suite 881, 5401 West Kennedy Boulevard, Tampa, Fl. 33609.
GMFMC (Gulf of Mexico Fishery Management Council) 1991. Amendment Number 4 to the Reef Fish FisheryManagement Plan for Reef Fish Resources of the Gulf of Mexico. Lincoln Center, Suite 881, 5401 WestKennedy Boulevard, Tampa, Fl 33609.
GMFMC (Gulf of Mexico Fishery Management Council) 1993. Amendment Number 6 to the Reef Fish FisheryManagement Plan for Reef Fish Resources of the Gulf of Mexico. Lincoln Center, Suite 881, 5401 WestKennedy Boulevard, Tampa, Fl 33609.
Gulf of Mexico Red Snapper 116

GMFMC (Gulf of Mexico Fishery Management Council) 1995. Amendment Number 8 and EnvironmentalAssessment (Effort Management Amendment) to the Reef Fishery Management Plan for the Reef FishResources of the Gulf of Mexico, Lincoln Center, Suite 331, 5401 West Kennedy Boulevard, Tampa Fl 33609.
GMFMC (Gulf of Mexico Fishery Management Council) 1994. Amendment Number 9 to the Reef Fish FisheryManagement Plan for the Reef Fish Resources of the Gulf of Mexico, Lincoln Center, Suite 331, 5401 WestKennedy Boulevard, Tampa Fl 33609.
GMFMC (Gulf of Mexico Fishery Management Council). Various dates. Minutes of Council Meetings and VariousPanel Meetings.
Orbach, M. Letter to the Gulf of Mexico Fishery Management Council 27 August 1992Orbach, M.K. 1992 (December). “Effort Management and the Gulf of Mexico Red Snapper Fishery: A Discussion
of Issues and Alternatives. Third Workshop”. Roberts, K.J. 2001. Personal Communication (previous chair of the Gulf of Mexico Fishery Management Council).Waters, J. R. 2000. “Quota Management in the Commercial Red Snapper Fishery”. Contribution SERO-ECON-00-
06. National Marine Fisheries Service, 101 Pivers Island Road, Beaufort, North Carolina, 28516.
117 Keithly
THE ALLOCA TION OF HARVESTING RIGHTS IN THE SOUTH AFRICA HAKE FISHER Y
D.W. JappFisheries & Oceanographic Support Services cc.
P.O. Box 50035, Waterfront, Cape Town, South Africa 8002<[email protected]>
1. INTRODUCTION
This paper was drafted as fisheries allocations in South Africa were undergoing a major revision. Therefore,it deals only with the recent allocation procedures; the outcome of the present process, which is expected toculminate in the issuing of “medium” term fishing-rights for the year 2002, may bear no resemblance to thatpresented herein. However, so as to present a balanced perspective, the views and procedures leading up to the2002 allocations are also presented. Many of these may not be factors that are ultimately used by the Statemanagement authority in the 2002 allocations.
Fisheries in South Africa are passing through a critical phase of transformation and change. This process hasunquestionably resulted in major disruptions to the fishing industry as a result of administrative instability andpersistent litigation by the industry. At the centre of the debate has been the re-allocation of fishing-rights with“historical” rights-holders defending their past rights while many new potential fishers apply for fishing access-rights which can only come at the expense of the existing fishing industry. It would be foolish to drawcomparisons between the South African allocations-process and those in other areas in the world because theSouth African situation presents a unique political and socio-economic situation, although the principles andconflicts associated with the granting of fishing-rights remain similar throughout the world. The transition inSouth Africa’s fisheries may be compared with Namibia where the authorities, after independence, immediatelyset about drafting a fisheries policy and legislation. Namibia has in fact recently completed its first period of theallocation of “long-term” fishing-rights (seven years). Where South Africa and Namibia differ however is theirrespective points of departure in the allocation process. In Namibia all rights issued from the outset were “new”and in theory consideration of historical performance was not an issue in the granting of future fishing-rights(although many groups, particularly South African interests, who had been active in Namibian waters under theInternational Commission for the South East Atlantic Fisheries (ICSEAF) acquired rights through Namibianholding-companies or other restructured companies).
South Africa, having undergone a profound political transition in 1994 from a minority-controlled state to anew democracy that effectively empowered the whole nation, set about correcting the discrimination of the past.Fisheries have not escaped this process and in October 1994 the Minister of Environmental Affairs and Tourismappointed a Fisheries Policy Development Committee (FPDC) with a view to developing a new fisheries policyfor the country. Between 1994 and 1996 the FPDC set up a working committee and technical subcommittees toorganise and bring together inputs from many interest groups and people. This resulted in the writing in 1997 ofa White Paper based on the FPDC report and subsequently the enactment of the new Marine Living ResourcesAct No. 18 of 1998.
Amongst the many stated aims of the Policy were the following extracts that are related directly to thegranting of access-rights:
i. Optimization of long-term social and economic benefits to the nation.ii. Management and development of fisheries shall in all material aspects comply with the principles of the
Constitution of South Africa and the long-term objectives and principles of the Reconstruction andDevelopment Programme (RDP).
iii. The allocation of rights to utilize marine resources will be impartial, noting that access must be limited inorder to achieve the policy objective of sustainable utilization.
iv. A fairer system of allocation of access to rights to harvest South Africa’s living marine resources.v. A system which ensures greater access to the resource by those who have been denied access previously.
More than seven years after the start of the fisheries policy development and three years after theintroduction of the new Act, and the various attempts to follow the stated aims and guidelines using the newallocation procedures and structures, the fisheries in South Africa are seemingly unstable and persistentlydisrupted by litigation. This prompted the Minister of Environment Affairs and Tourism to declare a moratoriumon the granting of fishing-rights for 2001 thereby effectively carrying over the rights held in 2000, but still withno guarantee to rights-holders of any form of tenure.
Since 1990 up until the present - 2001 - and into the future, the allocation of fishing-rights in South Africatherefore presents an interesting, but as yet unresolved case study. South Africa is a rich fishing nation although
118

fishing contributes less than 2% to the country’s gross domestic product (GDP). From a political perspective,however, it carries far more weight and the subject of fishing-rights allocations has been an emotional andsometimes acrimonious issue.
A case study of the largest and wealthiest of the fish resources in South Africa: hake (Merluccius spp.), hasbeen selected to describe the rights-allocation issues in South Africa. Not only is this hake resource a strongcompetitor on the international whitefish market, it also is the subject of historical rights-claims from previouslydisadvantaged person (HDPs)1. Further, it is a dynamic fisheries sector, which has undergone major shifts ineffort from the historical trawl fishery (starting in 1900) to the introduction of longlining (from 1983), and morerecently the development of a significant handline fishery for hake. This has resulted in an enormous increase inthe effective users of the resource, who now range from the sophisticated industrial trawl sector (with largefactory/processing vessels and land-based value-adding processing plants) to the smaller labour-intensive, buthighly selective, longline sector (targeting large mature adult hake) and the small-boat (handline) operationanalogous to small-scale subsistence fishing but which in reality is developing into a highly profitable andcompetitive fishery.
2. THE NATURE OF THE HAR VESTING RIGHTS FOR HAKE2.1 Past situation
Up until 1996, the offshore- and inshore-trawl sectors (hake-directed fisheries with associated bycatch)contributed up to 80% of the total value of all fisheries in South Africa (Table 1) – a proportional value that isstill valid in 2001. The only other fishery in which hake was reported up to 1996 was the highly controversialhake longline sector. South Africa’s most valuable fishery commercially is therefore the demersal fishery, afishery dominated by deep-sea trawling for the two Cape hake species: Merluccius paradoxusand M. capensis,the former (the deep-water species) being predominantly caught by trawlers, and the second (the shallow-waterspecies) being caught by the inshore-trawlers, longliners, and by the handline sector.
Table 1Comparison of nominal commercial catches (whole mass) and wholesale values
of different fisheries sectors in South Africa
* Hake sectors relevant to this discussion document.
2.2 Trawl sector
The trawl fishery targeting hake developed at the start of the century and grew rapidly after World War II topeak at more than 300 000t in the early 1970s. It then went into decline, which prompted the implementation ofa larger minimum mesh-size in 1975 and the declaration of a 200 nautical mile fishing zone in November 1977.The exclusion of foreign vessels and a conservative management strategy with effect from 1983 led to a gradual
119 Japp
INDUSTRY SECTOR 1993 1994 1995 Catch
(tonnes) Value
(thousand Rand)
Catch (tonnes)
Value (thousand
Rand)
Catch (tonnes)
Value (thousand
Rand) Offshore Trawl* 196 605 570 373 171 286 626 268 162 543 744 508 Inshore Trawl* 15 280 43 455 15 104 52 164 15 235 60 722
TOTAL DEMERSAL 211 885 613 828 186 390 678 432 177 778 805 230 Purse Seine (Pelagic) 357 040 232 134 314 46 1 289 475 366 456 403 835 Rock Lobster 3 161 138 270 3 190 168 347 2 850 185 901 Crustacean Trawl 554 12 667 609 13 298 512 11 261 Line Fish* 20 114 145 118 23 389 164 321 24 745 216 946 Demersal Longlining* 0 0 2 452 38 122 1 696 26 520 Abalone 599 32 777 613 53 884 616 54 054 Miscellaneous Nets 1 766 3 197 1 228 2 555 1 338 3 895 Oysters 52 408 120 945 160 1 431 Mussel and Oyster Farm 2 237 9 481 2 887 13 759 2 082 23 586
TOTAL 597 408 1 187 880 535 339 1 423 138 578 233 1 732 659 Seaweed 995 2 819 857 2 782 1 250 4 215 Guano 0 0 281 219 0 0
GRAND TOTAL 598 403 1 190 699 536 477 1 426 139 579 483 1 736 874
1 The expression “HDP” is commonly used in South Africa referring to “historically disadvantaged persons” who prior todemocratic elections in 1994 were unenfranchised.

recovery in catch-rates. In fact, hake catch-rates by the mid-1990s had returned to levels last seen in the late1960s. Since the late 1970s the hake fishery has been controlled largely by means of company-allocated quotaswithin a total allowable catch (TAC), with limits on the number of vessels permitted in the fishery, and withclosed fishing areas. The hake fishery was also split between two trawl sectors: “deepsea” and “inshore”.
The deepsea trawl fishery operates primarily on the shelf edge in waters deeper than 300m, from theNamibian border south to the south coast (including the whole Agulhas Bank) and up the Indian Ocean coast ofSouth Africa to Port Elizabeth, the eastern-most location of the fishery. The target species is the deep-water hake,Merluccius paradoxus. A few foreign vessels still operated in South African waters until 1992, but by 1993 theonly foreign quota of hake was 1000t awarded to a joint-venture with Moçambique through a bilateral fishingagreement. Separation of the two hake species is difficult and until recently the assessment of the hake stockshad not differentiated between the two species. Further, the rights-allocation of the TAC has also notdifferentiated between the two hake species although allocations to the Inshore and Deepsea sectors do, to someextent, limit the catch of eachspecies.
Allocations in the deepseasector have formed the backbone ofthe hake fishery and have historicallybeen dominated by a few largeoperators (Table 2). Since 1994,however, the deepsea sector hasundergone considerable change withthe inclusion of many new entrants(Table 3). Since 1978, when onlyfour groups were active, the sectorhas evolved from six companies in1979 to 18 entrants prior to theintroduction of the Quota Board.Companies continued to enterbetween 1991 and 1998, reaching 55in number when the FisheriesTransformation Council wasintroduced, and 57 in 2001 when themoratorium was introduced. This represents a substantial change in the number of deepsea rights-holders,particularly since political transition (although allocations are still dominated by a few large companies withrespect to quota-mass).
Table 2The status of the hake fishery and number of quota (rights)-holders relative
to some of the other major fishing sectors in South Africa in 1996
The small inshore trawl fishery operates along the South African south coast and typically comprises mostlysmall side-trawlers working in waters shallower than 110m on the Agulhas Bank. The fishery lands only 6% ofthe national hake2 catch, but rights in this sector are normally linked to the allocation of sole(Austroglossuspectoralis) which, in addition to hake, is also an important target fishery. The nature of the fishery is quitedifferent from the deepsea sector and although small, it has been stable and has undergone rationalisation not onlyof the number of rights-holders, but also strict effort control has been maintained in terms of vessel size andcapacity (Table 4).
South Africa Hake 120
A full net of deepsea trawl-caught hake being emptied into a factorystocker pond
Fishery TAC (tonnes)
No. of quota-holders
Percentage of TAC held by the largest quota-holders
TOP 3 TOP 10 TOP 20 Hake 148 300 49 72 82 87
W Coast Rock Lobster 1 500 104 23 51 73 S Coast Rock Lobster 427 6 82 100 (6 all) -
Abalone 615 16 75 95 100 (16 all) Pilchard 105 000 59 30 55 63 Anchovy 70 000 18 36 79 100 (18 all)
Sole 872 11 71 100 (11 all) -
2 The target hake species in this sector is the shallow-water hake, Merlucccius capensis

Table 3Historical allocations and the structure of hake allocations in South Africa
showing the dramatic increase in new rights-holders
121 Japp
COMPANY 1978 1979 1980 1981 1982 1983 1984 1985 1986 1987 1988 1989 1990
I&J active 64125 64125 64125 56465 49760 50756 50756 52893 53715 53431 53575 53386
SEA HARVEST active 49575 49575 49575 43655 38470 39240 39240 40892 41527 41307 41462 41272
ATLANTIC TRAWLING active 15000 15000 15000 13215 11645 11879 11879 12379 12571 12506 12495 12495
SECIFA inshore trawling (11 in 20 01) active 5000 8400 9000 9000 8000 9350 9350 9744 9896 9835 9870 9834
VIKING - 1650 2000 2000 1760 1555 2505 2505 2611 2652 2637 2644 2634
MARPRO - 4650 4150 4150 3660 3225 6225 6225 6487 6588 6554 6571 6548
FERNPAR - - 450 450 395 345 1045 1045 1489 1506 1200 1303 1299
SADSTIA - - - - - - - 2500 2605 IFPA
EX LONG LINERS (ex Kingklip Allocations) - - - - - - - - 1500 1000 600 240 1440
BLUE CONTINENT - - - - - - - - - 524 522 523 522
EIGELAAR - - - - - - - - - 524 522 523 522
MORESON - - - - - - - - - 524 522 523 522
SELECTA - - - - - - - - - 524 522 523 522
SNOEK WHOLESALERS - - - - - - - - - 524 522 523 522
RADACO SEA PRODUCTS - - - - - - - - - 524 522 523 522
PORT NOLLOTH COMMUNITY TRUST - - - - - - - - - 500 500 500 453
TRACHURUS GROUP - - - - - - - - - 500 500 800 725
PAT -DRO SEA PRODUCTS - - - - - - - - - - - 300 272
OOSTERLIG/EYETHU 200
ATLANTIC FISHING - - - - - - - - - - - - -
VISKO - - - - - - - - - - - - -
ANGLOMAR/CIC INTERNATIONAL - - - - - - - - - - - - -
SIYALOBA - - - - - - - - - - - - -
ZIYABUYA - - - - - - - - - - - - -
SURMON - - - - - - - - - - - - -
NEW SOUTH AFRICA FISHING - - - - - - - - - - - - -
HOUT BAY FISHING - - - - - - - - - - - - -
COMMUNITY TRUSTS - - - - - - - - - - -
SISTRO (Ex Kingklip Longline) - - - - - - - - - - - - -
PIMENTA (ex Kingklip Longline Allocation) - - - - - - - - - - - - -
ALGOA BAY - - - - - - - - - - - - -
AZANIAN FISHING - - - - - - - - - - - - -
BAYVIEW FISHERS KO -OP - - - - - - - - - - - - -
COMMUNITY WORKERS FISHING ENT - - - - - - - - - - - - -
DMA FISHING - - - - - - - - - - - - -
HANGBERG FISHING - - - - - - - - - - - - -
IMPALA FISHING - - - - - - - - - - - - -
JOHN OVENSTONE LTD - - - - - - - - - - - - -
LAINGVILLE FISHERIES - - - - - - - - - - - - -
LUCAS BE & PARTNER/COMBINED FISHING ENTERPRISES #
- - - - - - - - - - - -
MAYIBUYE FISHING CC - - - - - - - - - - - - -
NOORDKAAP VISSERMAN ONDERNEMING - - - - - - - - - - - -
PELLSRUS HISTORICAL FISHING ENT - - - - - - - - - - - -
QUAYSIDE FISH SUPPLIERS - - - - - - - - - - - - -
BHANA L K * - - - - - - - - - -
DYER EILAND VISSERYE * - - - - - - - - - -
ENGELBRECHT B J * - - - - - - - - - -
HOXIES (PTY) LTD * - - - - - - - - - -
J&J VISSERYE CC * - - - - - - - - - -
KHOI-QWA FISHING DEV CORP - - - - - - - - - -
TRADEFORTH 13 (PTY) LTD - - - - - - - - - -
PHAMBILI FISHERIES (PTY) LTD * - - - - - - - - - -
PORT NOLLOTH FISHERIES (PTY) LTD * - - - - - - - - - -
RAINBOW NATION FISHING CC * - - - - - - - - - -
SIYAPAMBILI FISHING CO-OP LTD * - - - - - - - - - -
ST HELENABAAI LYN -EN NETVISSERS VRG * - - - - - - - - - -
USUTHU FISHING CC * - - - - - - - - - -
WALTERS E F H * - - - - - - - - - -
ZWM FISHING CC * - - - - - - - - - -
BATO STAR FISHING (PTY) LTD
CALAMARI FISHING (PTY) LTD
OFFSHORE FISHING COMPANY (PTY) LTD
NTSHONALANGA FISHING (PTY) LTD
PREMIER FISHING (PTY) LTD
TOTAL ALLOCATIONS RSA (TRAWLING) 140000 143700 144300 128150 113000 121000 123500 130600 133600 132200 132900 133691
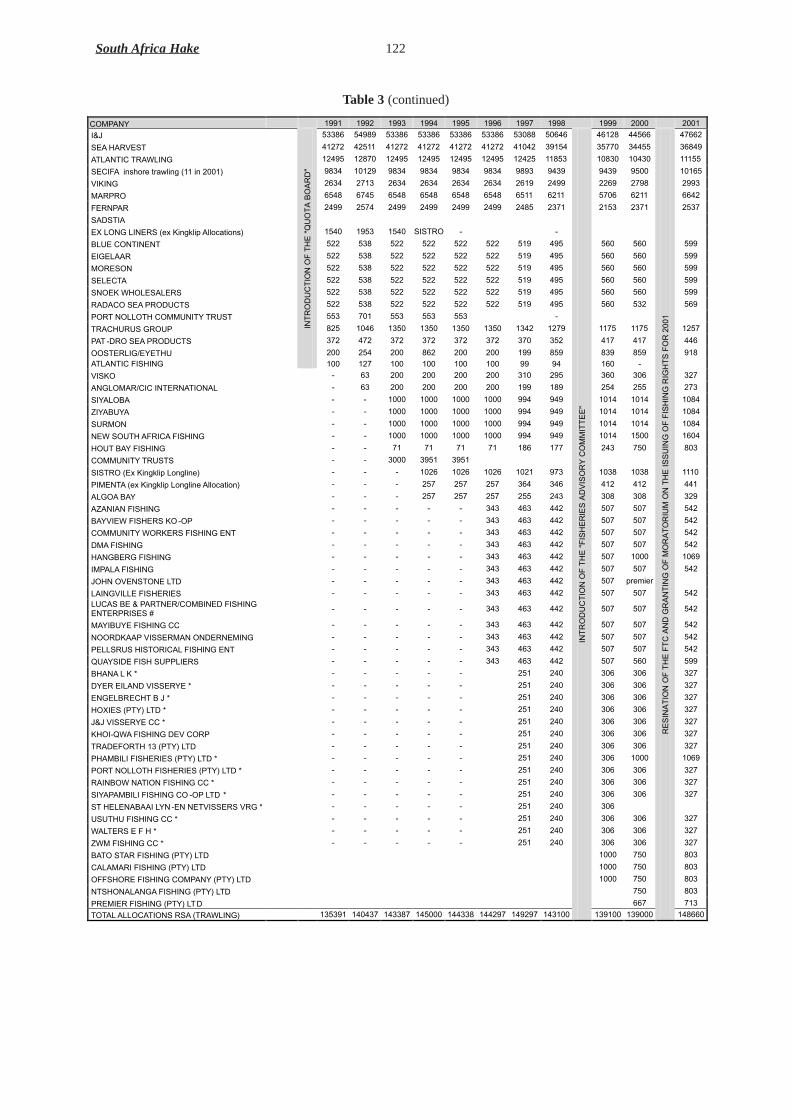
Table 3(continued)
South Africa Hake 122
COMPANY 1991 1992 1993 1994 1995 1996 1997 1998 1999 2000 2001
I&J 53386 54989 53386 53386 53386 53386 53088 50646 46128 44566 47662
SEA HARVEST 41272 42511 41272 41272 41272 41272 41042 39154 35770 34455 36849
ATLANTIC TRAWLING 12495 12870 12495 12495 12495 12495 12425 11853 10830 10430 11155
SECIFA inshore trawling (11 in 2001) 9834 10129 9834 9834 9834 9834 9893 9439 9439 9500 10165
VIKING 2634 2713 2634 2634 2634 2634 2619 2499 2269 2798 2993
MARPRO 6548 6745 6548 6548 6548 6548 6511 6211 5706 6211 6642
FERNPAR 2499 2574 2499 2499 2499 2499 2485 2371 2153 2371 2537
SADSTIA
EX LONG LINERS (ex Kingklip Allocations) 1540 1953 1540 SISTRO - -
BLUE CONTINENT 522 538 522 522 522 522 519 495 560 560 599
EIGELAAR 522 538 522 522 522 522 519 495 560 560 599
MORESON 522 538 522 522 522 522 519 495 560 560 599
SELECTA 522 538 522 522 522 522 519 495 560 560 599
SNOEK WHOLESALERS 522 538 522 522 522 522 519 495 560 560 599
RADACO SEA PRODUCTS 522 538 522 522 522 522 519 495 560 532 569
PORT NOLLOTH COMMUNITY TRUST 553 701 553 553 553 -
TRACHURUS GROUP 825 1046 1350 1350 1350 1350 1342 1279 1175 1175 1257
PAT -DRO SEA PRODUCTS 372 472 372 372 372 372 370 352 417 417 446
OOSTERLIG/EYETHU 200 254 200 862 200 200 199 859 839 859 918
ATLANTIC FISHING
INT
RO
DU
CT
ION
OF
TH
E"Q
UO
TA
BO
AR
D"
100 127 100 100 100 100 99 94 160 -
VISKO - 63 200 200 200 200 310 295 360 306 327
ANGLOMAR/CIC INTERNATIONAL - 63 200 200 200 200 199 189 254 255 273
SIYALOBA - - 1000 1000 1000 1000 994 949 1014 1014 1084
ZIYABUYA - - 1000 1000 1000 1000 994 949 1014 1014 1084
SURMON - - 1000 1000 1000 1000 994 949 1014 1014 1084
NEW SOUTH AFRICA FISHING - - 1000 1000 1000 1000 994 949 1014 1500 1604
HOUT BAY FISHING - - 71 71 71 71 186 177 243 750 803
COMMUNITY TRUSTS - - 3000 3951 3951
SISTRO (Ex Kingklip Longline) - - - 1026 1026 1026 1021 973 1038 1038 1110
PIMENTA (ex Kingklip Longline Allocation) - - - 257 257 257 364 346 412 412 441
ALGOA BAY - - - 257 257 257 255 243 308 308 329
AZANIAN FISHING - - - - - 343 463 442 507 507 542
BAYVIEW FISHERS KO -OP - - - - - 343 463 442 507 507 542
COMMUNITY WORKERS FISHING ENT - - - - - 343 463 442 507 507 542
DMA FISHING - - - - - 343 463 442 507 507 542
HANGBERG FISHING - - - - - 343 463 442 507 1000 1069
IMPALA FISHING - - - - - 343 463 442 507 507 542
JOHN OVENSTONE LTD - - - - - 343 463 442 507 premier
LAINGVILLE FISHERIES - - - - - 343 463 442 507 507 542
LUCAS BE & PARTNER/COMBINED FISHING ENTERPRISES #
- - - - - 343 463 442 507 507 542
MAYIBUYE FISHING CC - - - - - 343 463 442 507 507 542
NOORDKAAP VISSERMAN ONDERNEMING - - - - - 343 463 442 507 507 542
PELLSRUS HISTORICAL FISHING ENT - - - - - 343 463 442 507 507 542
QUAYSIDE FISH SUPPLIERS - - - - - 343 463 442 507 560 599
BHANA L K * - - - - - 251 240 306 306 327
DYER EILAND VISSERYE * - - - - - 251 240 306 306 327
ENGELBRECHT B J * - - - - - 251 240 306 306 327
HOXIES (PTY) LTD * - - - - - 251 240 306 306 327
J&J VISSERYE CC * - - - - - 251 240 306 306 327
KHOI-QWA FISHING DEV CORP - - - - - 251 240 306 306 327
TRADEFORTH 13 (PTY) LTD - - - - - 251 240 306 306 327
PHAMBILI FISHERIES (PTY) LTD * - - - - - 251 240 306 1000 1069
PORT NOLLOTH FISHERIES (PTY) LTD * - - - - - 251 240 306 306 327
RAINBOW NATION FISHING CC * - - - - - 251 240 306 306 327
SIYAPAMBILI FISHING CO -OP LTD * - - - - - 251 240 306 306 327
ST HELENABAAI LYN -EN NETVISSERS VRG * - - - - - 251 240 306
USUTHU FISHING CC * - - - - - 251 240 306 306 327
WALTERS E F H * - - - - - 251 240 306 306 327
ZWM FISHING CC * - - - - - 251 240 306 306 327
BATO STAR FISHING (PTY) LTD 1000 750 803
CALAMARI FISHING (PTY) LTD 1000 750 803
OFFSHORE FISHING COMPANY (PTY) LTD 1000 750 803
NTSHONALANGA FISHING (PTY) LTD 750 803
PREMIER FISHING (PTY) LTD 667 713
TOTAL ALLOCATIONS RSA (TRAWLING) 135391 140437 143387 145000 144338 144297 149297 143100
INT
RO
DU
CT
ION
OF
TH
E"F
ISH
ER
IES
AD
VIS
OR
YC
OM
MIT
TE
E"
139100 139000
RE
SIN
AT
ION
OF
TH
EF
TC
AN
DG
RA
NT
ING
OF
MO
RA
TO
RIU
MO
NT
HE
ISS
UIN
GO
FF
ISH
ING
RIG
HT
SF
OR
2001
148660

123 Japp
1982
19
89
1995
20
01
Com
pany
B
oats
Hak
e %
Sol
e %
C
ompa
ny
Boa
ts
Hak
e %
S
ole
%
Com
pany
B
oats
H
ake
%
Sol
e %
C
ompa
ny
Boa
ts
Hak
e %
S
ole
%
I&J
15
42.0
7 11
.075
I&
J 15
42
.494
11
.08
I&
J 10
42
.494
10
.85
I&J
7 39
.79
10.8
4
B
MC
Vis
sery
e B
k 1
1.83
1.
14
Cro
nje
Vis
sery
e 1
1.59
3.
441
Cro
nje
Vis
sery
e 1
1.59
3.
441
Cro
nje
Vis
sery
e 1
1.59
3.
441
Cro
nje
Vis
sery
e 1
1.58
3.
37
G. C
hetty
1
0.95
7 0.
753
G. C
hetty
1
0.95
7 0.
54
G. C
hetty
1
0.95
7 0.
53
G. C
hetty
1
2.09
0.
53
B
. Oos
thui
zen
1 0.
967
1.61
B
. Oos
thui
zen
1 0.
967
1.59
B
. Oos
thui
zen
1 0.
94
1.57
S
B C
hetty
1
0.96
7 0.
75
SB
Che
tty
1 0.
967
0.73
S
B C
hetty
1
0.94
0.
73
Out
eniq
ua
8 11
.461
18
.925
H
arve
st D
awn
5 6.
393
7.20
4 M
arie
tte
5 16
.91
26.0
4
Dun
vega
n 1
3.36
9 4.
731
J. V
an R
ensb
urg
1 4.
27
6.12
M
aran
atha
1
1.66
1 3.
871
Mar
iette
/ S
eaV
una
6.
5 22
.61
35.9
8
Sta
lletto
1
1.98
3 4.
946
JV
ves
sel
S
terli
ng
1 0.
957
0.75
3 J&
R F
ishi
ng
1 2.
969
6.12
Mar
iett
e 7
24.1
49
37.4
9
Vec
to T
rade
126
0.
5 1.
84
1.14
P. C
ronj
e 1
2.29
3 3.
333
Pel
awin
2 2.
713
5.80
6 P.
Cro
nje
2 3.
287
5.98
P.
Cro
nje
3 3.
287
5.86
P.
Cro
nje
3 3.
23
5.86
H
erm
anus
Sea
food
s 4
3.82
7 5.
914
Wa
vecr
est
2 1.
913
1.50
5 H
erm
anus
S
eafo
ods
3 7.
571
10.5
7 H
erm
anus
S
eafo
ods
2 7.
571
10.3
6 H
erm
anus
S
eafo
ods
2 7.
43
10.3
5
Prid
e 1
2.10
2 4.
839
To
scan
ini
1 1.
626
5.26
9 J.
Cro
us
2 3.
764
10.1
1
Trio
mf
1 1.
948
3.33
3
K
arib
a 2
5.46
6.
344
Vik
ing
Insh
ore
4 13
.009
23
.06
Vik
ing
Insh
ore
6 12
.8
22.2
7
Sar
atog
a 1
1.74
4 3.
763
Vik
ing
Insh
ore
4 9.
245
13.4
4
R
anki
n 1
2.11
6
1.72
G
&T
Oos
terli
g 1
0.95
7 0.
645
G&
T O
oste
rlig
3 4.
069
2.91
G
&T
Oos
terli
g
2 4.
069
2.26
G
&T
Oos
terli
g 1
3.99
2.
86
Wal
to
1 0.
957
0.53
8
K
olga
ns
1 0.
957
0.53
8
B
loug
ans
1 0.
914
1.29
J. C
rous
1
0.91
4 3.
33
J. C
rous
1
0.91
3.
32
See
gans
1
0.95
7 0.
753
1982
54
bo
ats
23
Co
's.
90
00
ton
s 93
0 to
ns
1989
41
bo
ats
14
Co
's
9835
to
ns
868
ton
s 19
95 1
1 C
o's
33
bo
ats
98
34 t
on
s 87
2 to
ns
2001
32
bo
ats
13
Co
's
98
35
ton
s 86
8 to
ns
Tabl
e 4
Sou
th C
oast
Ins
hore
Fis
hery
: C
hang
es in
Str
uctu
re b
etw
een
1982
- 1
989
- 19
95 -
200
1

The allocation of rights in the hake trawl sector have,however, become increasingly complex with recent concernsover the effective increase in exploitation of the shallow-water hake by the longlining and handlining sectors.Biological (stock) concerns are clearly becoming an integralpart of the “rights” debate as the sector allocations willundoubtedly have implications for the effects of the fisheryon stock sizes. Note also from Table 4 that the number ofrights-holders in the sector in 1998 was 11 and two newallocations have since been granted.
2.3 Hake-directed longlining
By 1996 the TAC of hake had risen from 120000t in1983 to about 150000t. At that time entrepreneurs lobbiedfor the introduction of experimental longlining, a fishingmethod used successfully in European waters for hake, asthere promised to be a valuable fresh-fish export marketfrom South Africa for catches made using this technique.Primarily because of the pressure by hake rights-holders tokeep new entrants from the hake sector, the fishery evolvedinto a kingklip-directed (Genypterus capensis) experimentand away from the intended target species of hake. Thesubsequent demise of the kingklip stock and short durationof the introduction of rights to kingklip (two years between1988 - 1989) resulted in many of the experimental kingkliprights-holders being compensated in the form of small hake-trawl quotas3. After the closure of the “kingklip-directed”longline fishery in the early 1990s, local fishingentrepreneurs exerted considerable political pressure for theintroduction of hake-directed longlining in South Africa.Longlining is seen as a less capital-intensive method of catching hake and a means by which access to the hakeresource can be broadened. Part of the hake TAC was therefore set aside for a scientific and socio-economicexperiment to test the advisability of hake-directed longlining. This experiment, which started in 1994 and endedthree years later, was shrouded in controversy, but as shall be illustrated later, provided an innovative means ofcreating access to the hake resource during the experimental period.
The hake longline experiment started at the time of democratic change in South Africa and created enormousexpectations from HDPs as a potential means of entering the hake fishery. The allocation of hake longline rightssubsequent to the hake longline experiment provides a further complication in the recent rights allocation processin South Africa and has been the source of persistent litigation. It was also a major factor contributing to theintroduction of the moratorium on new entrants to the fishery in 2001. Litigation, appeals and rights-allocationsrelating to the hake longline fishery are still outstanding from 1998.
2.4 Hake handline sector
The complexity of the allocation process in the management of the hake resource has been furthercomplicated by the development of a hake handline fishery. The origins of the handline hake fishery can be tracedback to the late 1980s. Historically hake have always been caught by commercial handline fishers, but no realcommercial value was attached to the species (due primarily to the higher value of other available species). Thequantities that were caught were small and hake were accepted as a bycatch in linefish-directed fishery for thenumerous other species. No quota was set aside for the hake caught and the only form of control was throughlimitation of effort (numbers of boats), indirectly through the linefish management. Vessel-owners and fisherswho had traditionally targeted squid and linefish explored the potential availability of alternative resources on theSouth Cape Coast as a commercial “filler” activity when the other species were not targeted, because there wasa desperate need to keep vessels and crew economically active for as much of the year as possible.
Infrastructure existed for the processing of the other species (e.g. linefish and squid) and the developmentof the hake handline fishery resulted in a logical extension and growth of the land-based processing facilities. Animportant consequence of these developments was the increase in local employment and a natural value-addingcontribution to the regional economies.
South Africa Hake 124
A typical catch of hake from an inshore sidetrawler. Note that the operational area and techniques
dif fer considerably from the deepsea sector
3 These new hake trawl-rights were too small to trawl independently and are a complicating historical factor in the hakerights-allocation process.

The fishery was, however, startedat a time when the old Sea FisheriesAct of 1988 was enforced. The growthof the fishery was well known to thestate management authority, howeverbecause of the ongoing rights-allocation issues in the majorcommercial sectors, no control wasexerted over the growth of the fisheryas it developed. Both species of hakefell within the “exploitable” list withregard to the “Linefish Bag Limits” interms of the old Act, thereby enablingholders of commercial (A) or semi-commercial (B) linefish permits theright to catch an unlimited quantity ofspecies on the list (provided they didnot exceed the limit of 10 hooks on asingle line). Further, recreationalfishers were also permitted to catch intotal 10 fish per day of any speciesdefined as “exploitable”. This ruling has remained in force, even though the promulgation of the Marine LivingResources Act (September 1998) replaced the old Act and placed hake on the “restricted” list that limits alllinefishers (commercial and recreational) to a maximum of five hake per day. The new regulations did not,however, differentiate between “commercial” and “semi-commercial” linefish operators, but they did specify a“recreational” activity. As the state authority (Department of Environmental Affairs and Tourism: Directorate ofMarine and Coastal Management) was not in a position to reassess the status of the fishery when permits expiredin mid-1998, extensions to permits were granted that, up to mid-2001, were all still valid. Further confusing theissue is the fact that until such time asthe applications for new rights in thesector are called for, and processed interms of the New Act (1998), fishersmay continue to operate in terms of theold Sea Fisheries Act. However asecond interpretation is that from astrictly legal point of view, thetransition period from the old to thenew Acts (six months, Section85)expired on 1 March 1999 leaving thelinefish operations in a legal void.Permits have therefore been extendedto accommodate the time taken toprocess applications, but in themeantime the transition period setaside by the Minister has expired.
The growth of the handline hakefishery since 1984 is illustrated inFigure 1 (below) and the value of thefishery to the regional economics isshown in Table 5.
2.5 Summary of the hake sector
Rights in the hake sector can be divided into the following “sub-sectors” (Figure 2):
i. A historically well-developed deepsea-trawl fishery targeting hake, which up to 1994 had a limited numberof rights-holders who had developed the fishery over a period of many years.
ii. A historically well-developed inshore-trawl sector targeting hake and sole, which up to 1994 also had alimited number of rights-holders or controls that restricted fishing effort.
iii. Since 1994 an experimental hake-directed longline fishery with no tenure and an uncertain future in ahighly competitive hake market. Attempts to introduce rights from 1998 were fraught with legal problemsand ‘stop – start’fishing.
125 Japp
A typical South African hake-dir ected longline operationThe fishery is highly size selective targeting spawning hake
A typical handline hake-directed operation Small open deck ski ordeckboats are used. Fishing is by line only and is conducted in deep water(for
line fishing) and the product is landed daily on beaches and in smallharbours around the South African south and east coasts.

Figure 1Historical handline catches of hake
Data for 1998-1999 are estimates and for 2000 catches are based on availablecatch data submitted by the industry. Data for 2001 is a predicted figureextrapolated from present catch rates.
Table 5Economic considerations of the Handline Fishery for hake
(Figures are approximate up to the year 2000)
South Africa Hake 126
0
1000
2000
3000
4000
5000
6000
7000
8000
1984
1985
1986
1987
1988
1989
1990
1991
1992
1993
1994
1995
1996
1997
1998
1999
2000
2001
Lan
ding
s(t
onne
s)
MCM DataHandline
Under Reporting30% Assumed
Infrastructure
Employment
Value (thousand Rand)
Robberg Seafoods (Plettenberg Bay) 40 8 000 Mannys (Bay) Fisheries (Mossel Bay) 17 4 000 Pesca Fresca (Plettenberg Bay) 15 4 000 Almero (Mossel Bay) 12 3 000 Vishoekie (Mossel Bay) 7 1 000 Viking Inshore (PQ operation) 40 5 000 I&J Inshore (part operation) 20 4 000 Knysna (JDAK Ent.) 11 1 000 Port St Francis 30 3 400 Caladero 40 3 000 Jeffreys Bay / PE 40 2 500 Deck Boats 30 (approx @14 crew) 420 10 000 Ski Boats (300 boats @ 6 men average) 1 800 30 000
Transport 50 8 000
Total 2 542 87 000
Hake Landed (estimated for the year 2000) 4500 t @ R20-R30 kg gross value Approximate income per fisher (R3-R50/kg) R10 000 to R16 000/yr To Vessel (R10/kg) R 45 million To Packing (R2/kg) R 9 million To Freight (R10/kg) R 45 million To Transport (R1/kg) R 4.5 million
To Exporter R 7 million
Information approx. and updated since
1998
Returns R 110 million (approx.)

127 Japp
Dee
psea
Hak
e -
90%
Par
adox
us10
%?
Cap
ensi
s
56 R
ight
s H
olde
rs (
2001
)
138
495
mt
Insh
ore
Hak
e10
0% C
apen
sis
Lim
ited
to A
gulh
asB
ank
Ab
ou
t 20
000
t
HA
KE
TA
C C
OM
PR
ISIN
G T
WO
SP
EC
IES
(D
EE
P A
ND
SH
AL
LO
W)
166
000
mt
Lo
ng
line
50 -
150
use
rs10
800
mt
Spl
it -
Cap
ensi
s an
d P
arad
oxus
Tra
wl H
ake
1016
5 m
t13
Rig
hts
10 1
65 m
t
Hak
e H
andl
ine
5 50
0 m
t>
200
use
rs
Par
ado
xus
(dee
p)
- 67
% o
f B
iom
ass
Cap
ensi
s (s
hal
low
) -
33%
of
Bio
mas
s
Sol
e 87
2 m
t13
Rig
hts
Par
adox
us lo
nglin
e (w
est)
?
Cap
ensi
s lo
nglin
e (e
ast)
?
How
muc
h C
apen
sis
take
n by
deep
sea
traw
l? The
re a
re p
oten
tially
ove
r 40
0us
ers
expl
oitin
g C
apen
sis
insh
ore
EX
PL
OIT
AT
ION
OF
HA
KE
IN T
HE
INS
HO
RE
The
Hak
e TA
C
1. D
eeps
ea -
138
495
t
2.
Insh
ore
- 10
165
t
3.
Lon
glin
e -
10 8
00 t.
4. L
ine
- 5
500
t
5.
Bila
tera
l - 1
000
t
Fig
ure
2
Rep
rese
ntat
ion
of t
he c
ompl
exity
of
the
dif
fere
nt f
ishe
ry s
ecto
rs f
or w
hich
hak
e al
loca
tions
are
pre
scrib
ed

iv. The growth of an unstructured handline fishery for hake since 1992 that falls outside of the “quota” structureand TAC, which only recently acquired recognition as a significant component of the hake sector. Thisfishery has never been allocated rights as a recognised hake-directed fishery but is due for allocation ofrights in 2002.
Clearly, with an unstable “fisheries” environment in which tenure is uncertain, the sector exploiting the mostvaluable single fish resource in South Africa is confronted with an uncertain future in which many historicalclaims to a right to catch hake can be made from the developers (who it may be claimed were advantaged throughthe previous political dispensation). Further, recent performers in the hake longline sector who took part in alegitimate experiment to develop the hake longline fishery have strong arguments for hake rights. Then there isthe almost completely unstructured handline sector with an unclear legal status, but one that offers potential forgreater inclusivity and future for small operators.
3. THE METHOD OF ALLOCA TION3.1 Policy objectives
The allocation of fishing-rights and the introduction of quotas first started in South Africa in 1978. Overtime the process has evolved and in 1986 a special commission was appointed by the then Minister of theEnvironment to investigate the fisheries allocation process (the Diemont Commission). Judge Diemont gaveconsiderable thought to access-rights and related matters and proposed that the allocation of quotas be entrustedto a statutory board. This recommendation was accepted by the Government by way of its 1986 White Paper, andthe Sea Fishery Act 1988made provision for the establishment of a Quota Board (Table 3). The first Boardbecame operative in 1990. The Quota Board was appointed by the Minister responsible who determined thenumber of members and the quorum. The chairman had to meet certain requirements in respect of possessing alegal background and no person with interests in the fishery could serve. The Act also stipulated that “a personin the employment of the State” may not serve on the Board. Notwithstanding the fact that politicians are notregarded as being in the employment of the State, their appointment would be contrary to the aims of the Board,namely to remove quota allocation from the political arena. The Board’s function consisted of the allocation ofquotas to persons according to guidelines approved by the Minister. The Quota Board could attach conditions toits quota allocations and no quota could be transferred without the Board’s approval. The Board exerted controlover access-rights in the hake, Agulhas sole, pilchard, anchovy, West Coast rock lobster, South Coast rock lobster,and abalone sectors.
The new fisheries policy objectives introduced a new dynamic to the allocation process. Extracts from thispolicy stated:
“Marine resources are by definition a national asset and the heritage of all citizens. However, in order to ensurethe sustainability of the resource, it is necessary to limit harvesting levels, and therefore access to the resource.Limiting entry creates a privileged group of sectoral actors who enjoy access to living marine resources, incontrast to all other South Africans who do not. In South Africa, access to these resources has not always beenfair and equitable. As a result, the industry is faced with numerous problems which even threaten thesustainability of the resource itself”.
Other broad policy objectives include the following:
i. broadening accessii. the promotion of small and medium enterprises within the context of creating a globally competitive
industryiii. current holders of fishing-rights will be encouraged to restructure their ownership and control to achieve
empowerment objectives throughout the industry4 andiv. initial allocation of rights should make provision for a range of players of varying sizes, to avoid excessive
domination of some fisheries by a few large players, but avoiding excessive proliferation of the industrywhich would reduce the ability of the State to effectively regulate it.
3.2 Process used in determining the allocations
Policy development (including the sensitive issue of access-rights) in South African fisheries is ongoing.The new Marine Living Resources Act 1998 remains the cornerstone of South Africa’s fisheries developmentalthough there have been shifts in management strategy.
South Africa Hake 128
4 There are several ways whereby the existing large players can enable others to achieve the empowerment criteria which willenable them to compete for access-rights including: (a) expanding equity ownership in companies, (b) restructuring of theindustry in order to move in the direction of larger proportions of the quota being sold to small-scale fishing operators,(c) encouraging contracts with fish-processing companies, (d) helping small-scale operators improve efficiency andunbundling mergers, and (e) the formation of co-operatives and other forms of formal commercial cooperation.
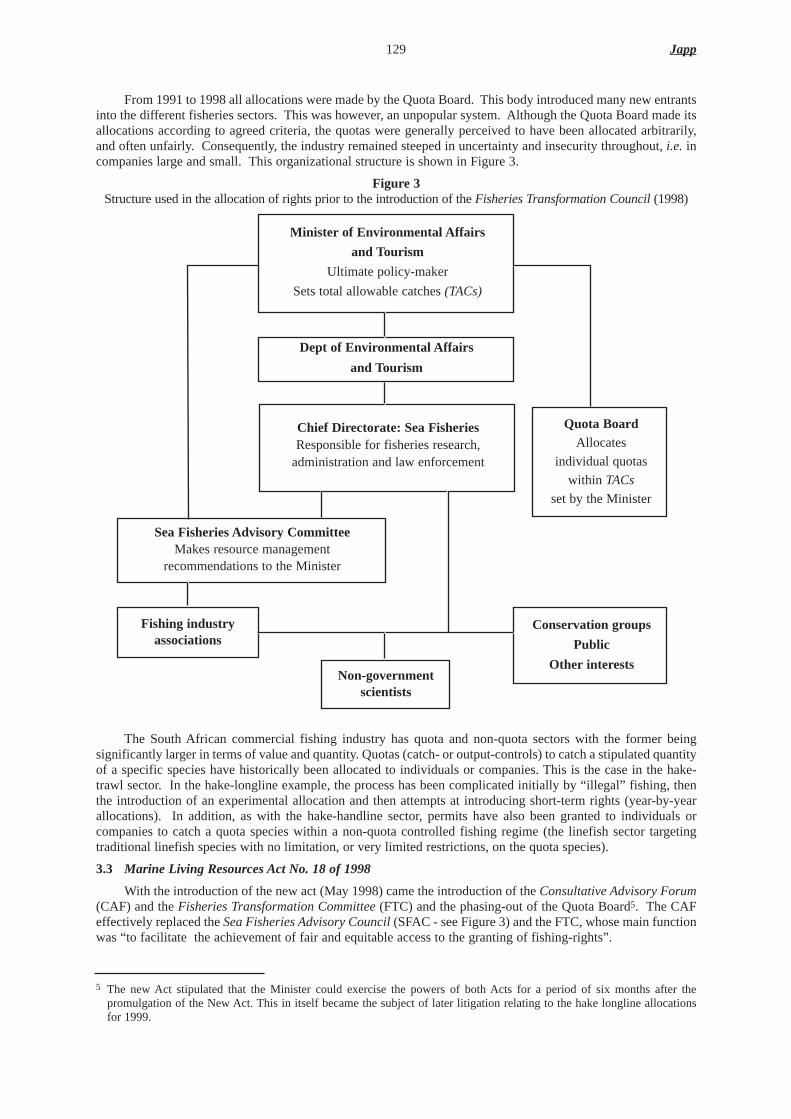
From 1991 to 1998 all allocations were made by the Quota Board. This body introduced many new entrantsinto the different fisheries sectors. This was however, an unpopular system. Although the Quota Board made itsallocations according to agreed criteria, the quotas were generally perceived to have been allocated arbitrarily,and often unfairly. Consequently, the industry remained steeped in uncertainty and insecurity throughout, i.e. incompanies large and small. This organizational structure is shown in Figure 3.
Figure 3Structure used in the allocation of rights prior to the introduction of the Fisheries Transformation Council(1998)
The South African commercial fishing industry has quota and non-quota sectors with the former beingsignificantly larger in terms of value and quantity. Quotas (catch- or output-controls) to catch a stipulated quantityof a specific species have historically been allocated to individuals or companies. This is the case in the hake-trawl sector. In the hake-longline example, the process has been complicated initially by “illegal” fishing, thenthe introduction of an experimental allocation and then attempts at introducing short-term rights (year-by-yearallocations). In addition, as with the hake-handline sector, permits have also been granted to individuals orcompanies to catch a quota species within a non-quota controlled fishing regime (the linefish sector targetingtraditional linefish species with no limitation, or very limited restrictions, on the quota species).
3.3 Marine Living Resources Act No. 18 of 1998
With the introduction of the new act (May 1998) came the introduction of the Consultative Advisory Forum(CAF) and the Fisheries Transformation Committee (FTC) and the phasing-out of the Quota Board5. The CAFeffectively replaced the Sea Fisheries Advisory Council (SFAC - see Figure 3) and the FTC, whose main functionwas “to facilitate the achievement of fair and equitable access to the granting of fishing-rights”.
129 Japp
5 The new Act stipulated that the Minister could exercise the powers of both Acts for a period of six months after thepromulgation of the New Act. This in itself became the subject of later litigation relating to the hake longline allocationsfor 1999.
Minister of Environmental Af fairs
and Tourism
Ultimate policy-maker
Sets total allowable catches (TACs)
Dept of Environmental Af fairs
and Tourism
Chief Directorate: Sea FisheriesResponsible for fisheries research,
administration and law enforcement
Quota BoardAllocates
individual quotas
within TACs
set by the Minister
Sea Fisheries Advisory CommitteeMakes resource management
recommendations to the Minister
Fishing industryassociations
Non-governmentscientists
Conservation groups
Public
Other interests

The appointment of the Fisheries Transformation Council (FTC) was fraught with problems leading to theresignation of most members at the end of 1999. To date these members have not been replaced, the status of thebody remains uncertain, and there is general uncertainty as to whether the body will remain in place or, whetheran alternative will be sought. At present (early 2001) there are initiatives to form a “Rights Allocation Unit”whose primary objective will be to allocate medium- and long-term rights (effectively replacing the FTC).
3.4 The allocation procedures underthe new act3.4.1 Eligibility
Applications for fishing-rights in the 1999/2000 fishing season were published in the Government Gazettein August 1999, outlining the periods between which applications for each fishery had to be submitted. For haketrawling (deepsea and inshore) and hake longline, for example, there was a one-month period in which to apply,from mid-September to mid-October. The notice stated that only South African citizens might apply (asindividuals), or companies/ closed corporations/ trusts, in which the beneficial interests were held by SouthAfrican citizens.
3.4.2Application forms
Application forms were standardised for all sectors. The basic form required name of applicant / companyinformation, species applied for (and quantum), and a declaration of the size of the entity6. Applicants had todeclare how and with what means (e.g.by vessel) they intended to harvest the right applied for and had to submitto the office of Marine & Coastal Management (M&CM) an original “Application Form” plus 10 copies. Inaddition a comprehensive set of annexures had to be submitted with each application that included the following:
Annexure 1 – Previous rights and fishing performance – Specific criteria:i. Evidence of past performanceii. Compliance, legislation and catch returnsiii. Utilisation of previous rights and reinvestmentiv. Past fishing-rights and the development of local fisheries and the economyv. Vested interests and/or proof of historical involvement (new applicants)vi. Political effects – has a right been applied and not granted, removed,etc.
Annexure 2 – Company structure and profileAnnexure 3 – Proof of registration of company and share-holding Annexure 4 – Identity documents of all shareholdersAnnexure 5 – Certified vessel safety certificate and South Africa registration certificateAnnexure 6 – Charter AgreementAnnexure 7 – Joint venture agreements (if applicable)Annexure 8 – Members’involvement in fishing (see application)Annexure 9 – Employment and employee benefitsAnnexure 10 – Product enhancement:
i. Extent of involvement in product enhancementii. Extent of quality control
Annexure 11 – Resource and Environmental criteriai. Code of conductii. Environmental education , training, sustainable use, etc.iii. Supporting M&CM re science, enforcement, etc.iv. Bycatch – supply ideas management proposals, etc.
Annexure 12 – Transformationi. Employment of historically disadvantaged, gender equality, etc.ii. Historical imbalances and involvement of disadvantaged.iii. Equity developmentiv. Commitment to transform and affirmative actionv. Empowerment partnerships, joint-ventures, etc.vi. Opportunities to own shares in business.
All documentation had to be verified by a Commissioner of Oaths and a sworn statement made that theinformation contained in the application was the truth.
South Africa Hake 130
6 Entities applying for rights were asked to declare their size or class (Large, Medium, Small, or Very Small, based on eitherthe number of employees, annual turnover or gross asset value) with reference to the National Business Act of 1996(Act No 102 of 1996).

3.4.3 Selection criteria
Simultaneous to the call for applications, “Selection Criteria” and “Guidelines” for the assessment ofapplications in respect of the rights applied for were released. These selection criteria were similar in structureto the application form.
“Section 0: General:” and “Section 1: Basic Information” mirrored the application form as specified in theAnnexes above, and was neither weighted or scored.
“Section 2: General” was to be weighted and scored7 and formed the basis for determining much of the allocation.The focus in this section is summarised as follows:
i. establishment, or enhancement of employment opportunities (including five sub-criteria)ii. historical involvement and performance (with eight sub-criteria)iii. product enhancement (two sub-criteria)iv. resource and nature conservation (three sub-criteria)v. transformation (two sub-criteria) andvi. economic viability of the venture (three sub-criteria).
In addition to the above, special criteria were applied to the “Linefishery” in which applicants had todemonstrate dependence on the species applied for and had to prove they were bona fidefishers. All applicantsalso had to submit business plans and a framework for a business plan was appended to the Selection Criteriadocument along with a “Code of Conduct for Fishing in South Africa”.
3.4.4 Processing procedures, data capture and administration
Processing of these applications (in 1999 for the 2000 allocations) was an enormous task. The Departmentresponsible had to accept and distribute one original and 10 copies of each application (the purpose of the largenumber of copies was for distribution to each member of the committees dealing with each species or sector).The exact procedure that was followed had not been fully determined, although the general approach for allsectors is described below.
The processing and adjudication of applications was therefore done under the control of the Chief Director,Sea Fisheries (now Marine & Coastal Management - M&CM). Teams, or management committees, for eachsector were selected and individuals were given copies of each application, who then scored a particular sectionof each application (for example the section on economics was evaluated and scored by an economist). Scoringwas however at the discretion/ interpretation of the individual. These scores were also weighted and the totalssubsequently calculated.
It should be noted however that the deliberations of each committee and the exact scores were generallywithheld from the public, although applicants with their legal advisors were subsequently permitted to viewapplications and scores (as was the case in the longline fishery). It is also emphasized that the process was takento a point of refinement in which poor-scoring candidates were removed and only strong candidates were givenfurther consideration. Ultimately, the final decisions on successful applicants rested with the Chief Director whothen made his recommendations to the Minister.
4. RESULTS OFTHE APPLICA TION PROCESS
Many thousands of applications were received for all sectors. However, the hake trawl sector had relativelyfew applicants, as the nature of the fishery and the potential capital outlay resulted in fewer applications than thehake longline sector for example, for which almost 1000 applications were received.
For the deepsea trawl sector, prior to the year 2000, applications to participate in this sector were receivedfrom 52 rights-holders. In the first allocation released, this number was drastically reduced to 28 with one “New”entrant. The subsequent threat of legal action and the likelihood of an interdict against the allocation processforced a review of the decisions that had been made for this sector. Through negotiations between the“traditional” deepsea sector, which consisted of the major stakeholders, it was agreed that a “donation” of up to10 000t of hake would be made for the express purpose of introducing new deserving entrants into the sector. Asa result no rights-holders lost their rights, but four new entrants were accepted, effectively increasing the numberof rights-holders in the deepsea sector to 56. Each of the four new entrants was allocated 750t of hake. This ledto further controversy, as the original purpose of the “donation” was to accommodate deserving new entrants, andtwo of the successful “new” entrants were considered to be “front” companies for existing stakeholders.
131 Japp
7 Weightings and scores per category were not stated, although the scoring system actually used became known after theallocations had been made and formed part of the basis for subsequent litigation.

Figure 4Processing of applications for hake rights in South Africa in 1999 (for the 2000 fishing season)
The case of the inshore trawl sector was somewhat different as rights had to be linked to the additionalallocation of sole quota. As this hake sector comprised only eleven applicants, only two new entrants (HDPs)were accepted, thereby increasing the number of stakeholders to thirteen.
The hake longline sector proved to be the most difficult as it was a relatively new group and there were highexpectations from the many new applicants and also from previously disadvantaged persons and groups. Afurther complication was that many applicants had participated in the experimental longline fishery for four yearsand obviously believed they were deserving of rights (even though in the experimental period no guarantee of
South Africa Hake 132
Submission of Applications and Payment (R100 each)
Hake Trawl (Inshoreand Deepsea)
Linefish (hake notspecified)
Hake Longline
Distribution to Committee Members for Evaluation = up to 10
Scoring (totals) andEvaluation
Scoring (totals) andEvaluation
Individuals Responsible for subsector scoring
Further ajudication / separation into categories eg. size of company,empowerment, political influence etc
Scoring (totals) andEvaluation

future rights was given)8. The result of the application evaluation and scoring, in which applicants weresystematically reduced in number (e.g.all those scoring less than 50% were rejected in the first evaluation) wasthat some 100 “top” applicants were then considered for rights by the Chief Director, i.e. the scoring andevaluation ended at this point and the final decision was taken by the Chief Director. The outcome was that therewere 45 successful applicants who subsequently fished their rights in the year 2000.
In the case of the Line fishery, at this point in time, hake were not differentiated from other linefish species.The outcome of this application period will, however, have important consequences for the future of the hake-directed linefish fishery. To date (three years after application) no rights in the linefish sector have been granted.The significance of this is that in this period the hake-directed linefish fishery has developed into a fullystructured and economically-viable sector. It has been separated from other linefish species, but carries thecomplication of how hake-directed performance (a likely selection criteria for future rights) in 2002 will beevaluated. Further, because of its low capital requirements for entry into this fishery, and the potential benefitsto coastal communities and regional economies, the hake handline sector is seen as ideal for new entrants ofpreviously disadvantaged backgrounds.
5. THE APPEAL PROCESS
The Marine Living Resources Act (MLRA) allows for appeals to be made directly to the Minister against“any decision taken by any person acting under a power delegated in terms of this Act or section 238 of theConstitution” and appellants are afforded the opportunity to “state his or her case” (re Section 80 of the MLRA).Many appeals were received, particularly from the longline applicants. It should also be noted that a precedenthad been set in 1998 in which the West Coast Rock Lobster fishery had been stopped as a result of an interdictagainst the Minister. This resulted in the closure of the fishery for a period. In the case of the hake longline fisherythe Supreme Court (after legal representation by groups of unsuccessful applicants) set aside the allocation madeby the FTC and ordered new allocations from more than 900 applicants to be reviewed again9 Subsequently themembers of the FTC resigned and the newly appointed Deputy Director General (as opposed to the former ChiefDirector) was tasked with considering the appeals.
This was duly done and some 150 appeals were upheld and a small allocation approximating 30t wasgranted in the middle of the season (in addition to the 45 successful applicants with 100t each). No sooner hadthe permits for the “appeal” hake been issued and the process was again successfully interdicted (only the“appeal” fish - the original applicants continued fishing and were unaffected by the litigation). As a result of thislitigation the department was again instructed by the Supreme Court to review the appeal applications. At thetime of the drafting of this paper the longline issue had not being resolved and one further attempt at reviewingthe applicants appeals had been rejected. The status of the longline fishery for hake therefore remains uncertainand legally unresolved.
6. DISCUSSION AND HIND-SIGHT ASSESSMENT6.1 Recent allocation arrangements
The evolution of the Fisheries Policy Development, the disbanding of the old allocation system (QuotaBoard), the promulgation of the Marine Living Resources Act (replacement of the Sea Fisheries Act), and thesubsequent attempts to use these new structures as tools to apply the Fisheries Policy and to allocate rights inSouth Africa, was largely unsuccessful up to the end of 2000.
In reality, however, if the status of the hake resource since the 1994 elections in South Africa is reviewed, itcan be seen that significant changes in the numbers of rights-allocations have indeed been made. Rights-holdershowever have no tenure in the form of medium- or long-term rights. The fisheries sector remains highly unstable.In the case of the deepsea trawl sector many new entrants have been added, but it can be argued that for a highlyindustrial capital-intensive fishery, there are too many allocations which are too small for viable deepseaoperation. Attempts in 1999 to reduce the number of entrants failed due to the threat of litigation, and in realityall that has happened is an increase in the number of rights-holders, thereby spreading the effort within a relativelystable Total Allowable Catch (TAC). The objective of future allocations will therefore in all likelihood focus onconsolidation of the smaller allocations into viable units. Linked to this process are the socio-political objectives,focusing on “transformation” of the industry. No clear definition of transformation in the fisheries sector has been
133 Japp
8 Note that in the longline experiment, allocations had been successfully given and managed to different sectors including:“deepsea”, “tuna longline” (comprising tuna boats), and “inshore longline” aimed at coastal communities (and for which asuccessful tendering scheme was used to allocate tranches).
9 The basis for the appeals was that there had been inconsistency and irregularities in the application and scoring process andthat all applications had to be re-evaluated.

made, but it is obvious that the pace of transformation since 1994 has been questioned (political perspective). Theneed for greater inclusivity of historically disadvantaged persons (HDPs) is also in direct conflict with biologicaland economic objectives (as they could lead to uncontrolled fishing or over-exploitation of the resource andunstable markets).
Perhaps the best example of both industrial stability and good fisheries management is the inshore trawlsector. There are few rights-holders and the introduction of two new (HDP) allocations (rights) has been achievedwithout major disruptions or litigation.
In direct contrast however, the introduction of a hake longline sector has proven highly disruptive to theattempts to put in place a structured allocation-process. There are many reasons for this - however the mostinfluential of these, accounting for the failure of the rights allocation-process and the subsequent litigation - is thefact that historically it can be argued that there can be no claim to rights in the sector. As the fishery is lucrativeand the demand for fresh longline-caught hake is high10, combined with the relatively low entry-capital inputrequired, expectations from potential users is high. Many argue that having taken part in an experiment to test theviability (economic and biological) of hake-directed longlining, they have a historical right to access in the sector.Precisely where this sector will go with regard to future allocations is unclear, because although there is anexisting group of rights-holders, there remain upwards of 150 others who were granted rights on appeal (beforebeing stopped by interdict). Generally, dissatisfaction within the interested and affected parties is high, andfurther legal action as a result of the pending allocation (2002) is almost certain.
Although no attempt has been made in the past to allocate hake handline rights, this fishery has been usedin this paper to demonstrate that with respect to its status, it is probably in a similar position to the hake longlinefishery in 1997 (at the end of the experimental period). The sector has been permitted to develop, creating relatedinfrastructure and socio-economic benefits to regional economies. The declaration of a “Crisis” in the linefishsector at the beginning of 2001 has complicated the pending sectoralisation of the hake handline fishery.Applicants who believe they have performed in the sector are likely to find themselves marginalized as a resultof severe limitations on the number of likely entrants in the sector, as well as having to compete with thetransformation objectives and likely favouring of previously disadvantaged persons and/or “transformed”companies. The handline sector of the hake fishery adds a new dimension to the hake rights-allocations, placingfurther demand on the limited global TAC for the species.
Allocations for the subsectors (deepsea, inshore, longline, and now handline) will potentially increase in theyear 2002 the number of “users” of the hake resource to upwards of 300 rights-holders (i.e. 50-60 deepsea trawl,13 inshore trawl, 45 - 150 longline, and 130 or more hake handline). In 1979, at a time when the hake stockswere recovering and catch-rates in the fishery increasing, there were six rights-holders. In 2001 there are 104 legalrights-holders and over 350 hake handline operators and 150 longline rights on appeal.
6.2 Curr ently pending allocation arrangements
Towards the end of the year 2000, with the repeated court interdicts and other threatened litigation, the Ministerof Environmental Affairs and Tourism declared a moratorium on the issue of all fishing rights in 2001 (this had tobe done through the passing of a temporary amendment of the MLRA, whereby a moratorium of one-year only wasgranted). The purpose of this was, as a temporary measure only, to introduce some stability to all fisheries and toallow time to restructure the allocation-process with a view to introducing medium-term rights in 2002.
The office of Marine and Coastal Management (M&CM) under the directive of the Minister initiated a fullconsultative process whereby the interested and affected parties in all fisheries sectors were actively engaged andasked to deliver “Rule Books”, the purpose of which was for anyone (individual, organisation, industrial body)to submit for consideration their criteria for selection and allocation within their sector of interest. After havingengaged all fishers, several draft documents were produced by M&CM for distribution amongst fishers thatdiscussed firstly a “Fisheries management plan to improve the process of allocating fishing rights” and secondly“Stability, Transformation and Growth”. At the time of writing the following processes were active.
i. Finalisation of Industry “Rule Books”.ii. An Economic Sectoral Study (to improve the understanding of the economics of the different sectors). The
objectives included estimating the size-based structure of the industry, transformation and cost structures, sothat logical levies and application/ rights fees could be set.
iii. Setting up of a “verification” unit to audit applications.iv. Setting up of an independent allocations unit.v. Designing of a new application form and criteria (partly based on the rule books).
South Africa Hake 134
10 The fishery operates in a lucrative but unstable environment that is prone to market saturation and high freight costs (forfresh-fish export).

vi. Setting up of the necessary administrative procedures and cost structure for the pending applications.
The time-frames for the completion of the above were limited, with the seasons for some fisheriescommencing before the end of the calendar year e.g. West Coast rock lobster and abalone. The call forapplications (by Government Gazette notice) was pending at the end of July, with the likely first submission ofrights applications for 2002 commencing in mid-August 2001.
135 Japp

INITIAL ALLOCA TION OF HARVESTING RIGHTS IN THE ROCK LOBSTER FISHER YOF WESTERN AUSTRALIA
G.R. Morgan106 Barton Tce. West, North Adelaide, SA5006, Australia
1. INTRODUCTION
The commercial fishery for Panulirus cygnus, the western rock lobster, is one of the largest and mostvaluable fisheries in Australia and a major contributor to the global supply of rock lobsters. The fishery beganin the latter years of the Second World War when a small fishery was established at the Abrolhos Islands (seeFigure 1) to supply canned rock lobster tails to the armed forces. The rock lobsters were captured using pots,similar in design to those in use today, which were pulled by hand from a small number of sailing craft. The
fishery was restricted to shallow water areasbecause of the comparatively inefficient methodof fishing. This is perhaps the main reason whythe Abrolhos Islands (with its vast expanse ofshallow reefs) was the preferred fishing arearather than the deeper limestone reefs of thecoastal areas.
After the Second World War, the industryshared in the advantages of post-warreconstruction with marine engines and powerwinches for pulling pots becoming available. Thisenabled the fishery to expand into deeper watersas well as leading to more intensive fishing of theshallow water areas. Markets for frozen rocklobster tails were quickly established in theUnited States and in those earliest days of thefishery, 90-95% of the catch was exported to theUSA (Sheard 1962). These export markets weresupplied by processing and freezingestablishments situated at Geraldton, Lancelinand Fremantle (Figure 1) and also by a number ofsmall vessels equipped with facilities to processand freeze the tails at sea. The fishery todayremains an export-orientated fishery.
With increasing prices being paid for rocklobster tails, the fishery rapidly expanded until bythe late 1950s, it supported over 1000 fishermenwho yearly took approximately 8600t of rocklobsters from coastal areas as well as theAbrolhos Islands. As the number of boats andfishermen continued to increase and the fleetbecame more efficient, it became apparent thatrestrictions would have to be placed on theunbridled expansion of the industry if the stocksof rock lobsters were to be managed for long termsustainability. This philosophy of restricting theindustry so as to manage the resource for longterm sustainability was, at the time, a relativelynew concept and was one which was generatingconsiderable discussion in Australia andelsewhere. It probably helped the discussion thatthe then Directors of Fisheries in the states(including Western Australia) were mostlyscience or biology graduates. They therefore wereable to provide significant intellectual leadership
136
Figure 1Coast of the southern part of Western Australia
showing the major fishing areas for the Western RockLobster and the three zones (A, B and C) into which the
fishery is divided for management purposes
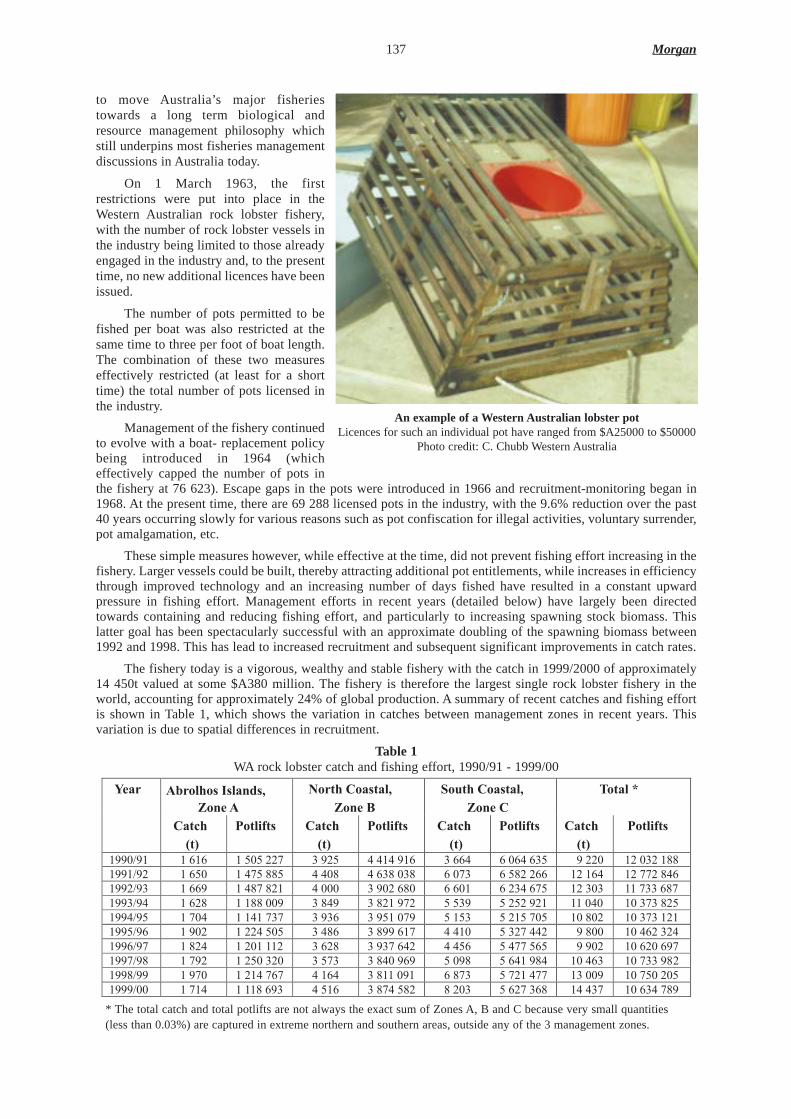
to move Australia’s major fisheriestowards a long term biological andresource management philosophy whichstill underpins most fisheries managementdiscussions in Australia today.
On 1 March 1963, the firstrestrictions were put into place in theWestern Australian rock lobster fishery,with the number of rock lobster vessels inthe industry being limited to those alreadyengaged in the industry and, to the presenttime, no new additional licences have beenissued.
The number of pots permitted to befished per boat was also restricted at thesame time to three per foot of boat length.The combination of these two measureseffectively restricted (atleast for a shorttime) the total number of pots licensed inthe industry.
Management of the fishery continuedto evolve with a boat- replacement policybeing introduced in 1964 (whicheffectively capped the number of pots inthe fishery at 76 623). Escape gaps in the pots were introduced in 1966 and recruitment-monitoring began in1968. At the present time, there are 69 288 licensed pots in the industry, with the 9.6% reduction over the past40 years occurring slowly for various reasons such as pot confiscation for illegal activities, voluntary surrender,pot amalgamation, etc.
These simple measures however, while effective at the time, did not prevent fishing effort increasing in thefishery. Larger vessels could be built, thereby attracting additional pot entitlements, while increases in efficiencythrough improved technology and an increasing number of days fished have resulted in a constant upwardpressure in fishing effort. Management efforts in recent years (detailed below) have largely been directedtowards containing and reducing fishing effort, and particularly to increasing spawning stock biomass. Thislatter goal has been spectacularly successful with an approximate doubling of the spawning biomass between1992 and 1998. This has lead to increased recruitment and subsequent significant improvements in catch rates.
The fishery today is a vigorous, wealthy and stable fishery with the catch in 1999/2000 of approximately14 450t valued at some $A380 million. The fishery is therefore the largest single rock lobster fishery in theworld, accounting for approximately 24% of global production. A summary of recent catches and fishing effortis shown in Table 1, which shows the variation in catches between management zones in recent years. Thisvariation is due to spatial differences in recruitment.
Table 1WA rock lobster catch and fishing effort, 1990/91 - 1999/00
* The total catch and total potlifts are not always the exact sum of Zones A, B and C because very small quantities(less than 0.03%) are captured in extreme northern and southern areas, outside any of the 3 management zones.
137 Morgan
An example of a Western Australian lobster potLicences for such an individual pot have ranged from $A25000 to $50000
Photo credit: C. Chubb Western Australia
Year Abrolhos Islands, Zone A
North Coastal, Zone B
South Coastal, Zone C
Total *
Catch (t)
Potlifts Catch (t)
Potlifts Catch (t)
Potlifts Catch (t)
Potlifts
1990/91 1 616 1 505 227 3 925 4 414 916 3 664 6 064 635 9 220 12 032 188 1991/92 1 650 1 475 885 4 408 4 638 038 6 073 6 582 266 12 164 12 772 846 1992/93 1 669 1 487 821 4 000 3 902 680 6 601 6 234 675 12 303 11 733 687 1993/94 1 628 1 188 009 3 849 3 821 972 5 539 5 252 921 11 040 10 373 825 1994/95 1 704 1 141 737 3 936 3 951 079 5 153 5 215 705 10 802 10 373 121 1995/96 1 902 1 224 505 3 486 3 899 617 4 410 5 327 442 9 800 10 462 324 1996/97 1 824 1 201 112 3 628 3 937 642 4 456 5 477 565 9 902 10 620 697 1997/98 1 792 1 250 320 3 573 3 840 969 5 098 5 641 984 10 463 10 733 982 1998/99 1 970 1 214 767 4 164 3 811 091 6 873 5 721 477 13 009 10 750 205 1999/00 1 714 1 118 693 4 516 3 874 582 8 203 5 627 368 14 437 10 634 789
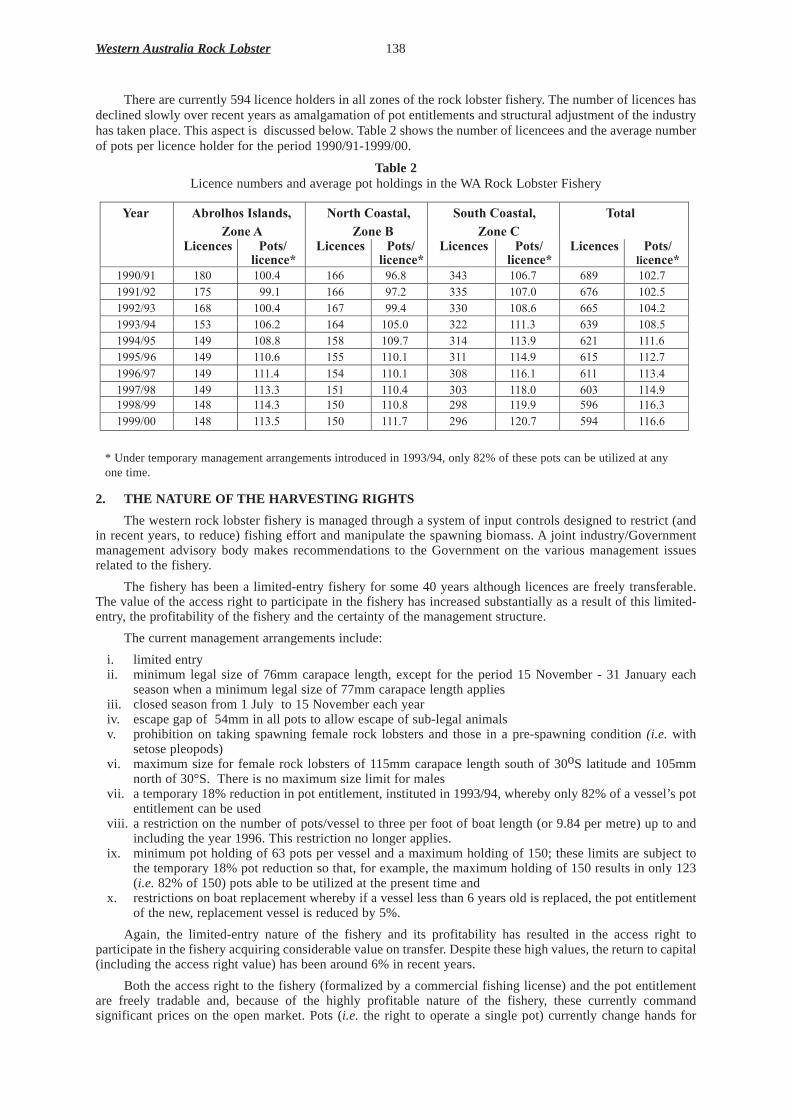
There are currently 594 licence holders in all zones of the rock lobster fishery. The number of licences hasdeclined slowly over recent years as amalgamation of pot entitlements and structural adjustment of the industryhas taken place. This aspect is discussed below. Table 2 shows the number of licencees and the average numberof pots per licence holder for the period 1990/91-1999/00.
Table 2Licence numbers and average pot holdings in the WA Rock Lobster Fishery
* Under temporary management arrangements introduced in 1993/94, only 82% of these pots can be utilized at anyone time.
2. THE NATURE OF THE HAR VESTING RIGHTS
The western rock lobster fishery is managed through a system of input controls designed to restrict (andin recent years, to reduce) fishing effort and manipulate the spawning biomass. A joint industry/Governmentmanagement advisory body makes recommendations to the Government on the various management issuesrelated to the fishery.
The fishery has been a limited-entry fishery for some 40 years although licences are freely transferable.The value of the access right to participate in the fishery has increased substantially as a result of this limited-entry, the profitability of the fishery and the certainty of the management structure.
The current management arrangements include:
i. limited entryii. minimum legal size of 76mm carapace length, except for the period 15 November - 31 January each
season when a minimum legal size of 77mm carapace length appliesiii. closed season from 1 July to 15 November each yeariv. escape gap of 54mm in all pots to allow escape of sub-legal animalsv. prohibition on taking spawning female rock lobsters and those in a pre-spawning condition (i.e. with
setose pleopods)vi. maximum size for female rock lobsters of 115mm carapace length south of 30oS latitude and 105mm
north of 30°S. There is no maximum size limit for malesvii. a temporary 18% reduction in pot entitlement, instituted in 1993/94, whereby only 82% of a vessel’s pot
entitlement can be usedviii. a restriction on the number of pots/vessel to three per foot of boat length (or 9.84 per metre) up to and
including the year 1996. This restriction no longer applies.ix. minimum pot holding of 63 pots per vessel and a maximum holding of 150; these limits are subject to
the temporary 18% pot reduction so that, for example, the maximum holding of 150 results in only 123(i.e. 82% of 150) pots able to be utilized at the present time and
x. restrictions on boat replacement whereby if a vessel less than 6 years old is replaced, the pot entitlementof the new, replacement vessel is reduced by 5%.
Again, the limited-entry nature of the fishery and its profitability has resulted in the access right toparticipate in the fishery acquiring considerable value on transfer. Despite these high values, the return to capital(including the access right value) has been around 6% in recent years.
Both the access right to the fishery (formalized by a commercial fishing license) and the pot entitlementare freely tradable and, because of the highly profitable nature of the fishery, these currently commandsignificant prices on the open market. Pots (i.e. the right to operate a single pot) currently change hands for
Western Australia Rock Lobster 138
Year Abrolhos Islands, Zone A
North Coastal, Zone B
South Coastal, Zone C
Total
Licences Pots/ licence*
Licences Pots/ licence*
Licences Pots/ licence*
Licences Pots/ licence*
1990/91 180 100.4 166 96.8 343 106.7 689 102.7 1991/92 175 99.1 166 97.2 335 107.0 676 102.5 1992/93
168
100.4
167
99.4
330
108.6
665
104.2
1993/94
153
106.2
164
105.0
322
111.3
639
108.5
1994/95
149
108.8
158
109.7
314
113.9
621
111.6 1995/96
149
110.6
155
110.1
311
114.9
615
112.7
1996/97
149
111.4
154
110.1
308
116.1
611
113.4
1997/98
149
113.3
151
110.4
303
118.0
603
114.9
1998/99 148 114.3 150 110.8 298 119.9 596 116.31999/00 148 113.5 150 111.7 296 120.7 594 116.6
approximately $A27000 each. Therefore, the free market price for an access right with the average pot holdingof 116 pots would be approximately $A3.13 million. This does not include the cost of the vessel and otherequipment.
The tradable entity is therefore the pot, and transfers occur freely in an open market. The market, however,is restricted to those who have a rock lobster license to fish in this limited-entry fishery and hence it is notpossible for persons external to the fishery to operate pots, although it is possible for non-licence holders to ownpots. Because of the minimum pot holding of 63 pots (and a maximum of 150), a licence to operate in the fisheryis only available to those persons who own, or have leased, this minimum of 63 pots. Once the minimum potholding is achieved, there are no barriers to the issuing of a licence to fish and to operate those pots. The currentaverage pot holding, for all areas combined, is 116 pots per vessel.
The Rock Lobster Industry, like other major commercial fisheries in Western Australia, operates on a cost-recovery basis whereby the Government’s costs of management, research and enforcement are recoveredthrough substantial licence fees. These licence fees were $A83 per licensed pot in 1998/99.
3. THE METHOD OF ALLOCA TION3.1 Policy objectives
When restrictions on the number of vessels and pots and other input controls were implemented in the 1960s,the primary policy objective addressed was one of resource sustainability. There was a concern that catch rates weredeclining while the number of vessels operating in the fishery was increasing rapidly. Simple analyses of catch andfishing effort data at the time (Bowen and Chittleborough 1966) indicated that increasing fishing effort was nolonger leading to increasing catches, with the result that catch rates were declining. Economic issues received littleattention as a defined policy objective in the initial allocation although monitoring of economic performance is nowundertaken for the fishery through the joint Government/Industry Management Advisory Committee.
Brown, Caputi and Barker (1993) estimated that fishing power within this input-controlled managementenvironment had increased by 36% between 1971/72 and 1992/93, with the greatest increases being in deeperwater areas where the increase in fishing power over the same period was estimated at 53%. The increase indeeper water areas was significant because this is the area where the majority of the spawning stock occurs. Asimproved technology of vessels and gear resulted in these continuing increases in effective fishing effort withinthe input-controlled management system, additional restrictions were implemented to counteract theseincreases. Again, the policy objective was clearly, and solely, one of resource sustainability.
Some of the additional measures introduced were:
i. 1965 – boat replacement policy introduced, restricting the size of vessels and the number of pots theycould operate
ii. 1966 – escape gaps in pots made mandatory to facilitate the escape of undersize animalsiii. 1971 – restrictions on the operations of vessels which were processing at sea because of evidence that such
vessels were processing undersized animalsiv. 1972 – the size of the escape gap was increased to 54 mmv. 1978 – fishing season shortened by 6 weeksvi. 1984 – the size of pots was regulatedvii. 1986 – a temporary 10% reduction in the number of pots allowed to be usedviii. 1987-1991 – a permanent 10% reduction in the number of pots in the industry was implementedix. 1992 – legal maximum sizes introduced andx. 1993 – a ‘temporary’18% pot reduction was implemented, which is still in force.
In 1992, additional concerns began to be expressed at the rapid decline in the abundance of mature,spawning female rock lobsters, and the forecast (based on puerulus settlement) of poor recruitment for the yearsat least to 1994/95. In Zone A of the fishery the decline in spawning stock was estimated to be more than a 50%reduction over the previous decade, with only slightly lesser reductions in other areas. In addition, analyses atthe time (reported in Bowen 1994) ruled out environmental variability as the sole cause of this reduction.
As a consequence, a management package was adopted in 1993/94 with the aim of rebuilding spawningstock levels to at least those of the late 1970s. This was to be achieved by:
i. an 18% reduction in the number of pots ii. a total ban on the taking of female rock lobsters in spawning condition (previously, the ban only
included those actually carrying eggs) iii. an increase in the minimum size to 77mm carapace length for part of the year and iv. the introduction of latitudinal differences in maximum size for female lobsters to reflect differences in
growth rate and size at maturation.
139 Morgan

Again, the policy objective was solely related to resource sustainability issues.
During the extensive discussion on the most appropriate long-term management strategy to address thedeclining abundance of the spawning stock, detailed consideration was given to the merits of moving to an ITQsystem of management. However, this move was not adopted, primarily because of the apparent highcompliance costs which would result (see Bowen 1994).
Following the outstanding success of the 1993/94 stock-rebuilding programme, recruitment to the fisheryincreased markedly and, in the late 1990s, the fishery began to experience a series of high-catch years. Forexample the catch for 1999/2000 was a record 14437t (Table 1) with catch rates, expressed as catch/pot-lift,some 30% higher than those of 1992/93 when the rebuilding strategy commenced. These high catch-volumesbegan to have a significant affect on the marketing and prices received for the product, with wholesale prices inthe period 1998-2000 being some 25% less than those received in the period 1995-97. The fishery was aneconomic victim of its biological success.
As a consequence, in 1998, the Management Advisory Committee, for the first time, explicitly consideredpolicies related to optimizing the economic performance of the fishery. A number of options have been exploredwhich aim at achieving the dual objectives of:
i. maintaining steady supplies of live rock lobsters (primarily for the export market) throughout the year andii. reducing year-to-year variability in supply as a means of reducing large year-to-year price fluctuations.
The mechanisms for achieving these objectives are still under consideration.
3.2 Process used in determining the allocation
When boat numbers were initially restricted in 1963, great reliance was placed on formal scientificassessments of the stocks and this scientific underpinning of management remains a feature of the industrytoday. As a consequence, continuing expenditure on research related to management of the fishery isconsiderable and averages around 2-3% of the annual Gross Value of Product (GVP). Much of this cost isrecovered from the industry through licence fees, under an explicit ‘cost-recovery’arrangement. Industryperceptions are that this expenditure on research has provided a good return in terms of long-term sustainabilityand there is a generally close and harmonious working relationship between the research staff and industry.
The initial allocation decision in 1963 was to restrict access to the fishery to those vessels licensed on1 March 1963. However, the announcement of the change was made some 6 months prior to the implementationand this allowed a brief opportunity for anyone who wanted to be part of the limited-entry fishery to obtain alicence. However, because of the novelty of limited-entry fisheries at the time and the fact that the fishery wasthen not particularly attractive financially, there was no significant rush to enter the fishery prior to theimposition of limited entry (Bowen and Chittleborough 1966).
All subsequent management changes have occurred within this context of limited entry and negotiationsbetween Government and industry on management changes have taken place with the original licence-holdersor their successors.
3.3 Allocation method chosen
The chosen allocation-method for access rights was simply an access restriction to those vessels licensed asof 1 March 1963. It appears that no other allocation method was considered at the time. Allocation between zones(Figure 1) was also based on historic areas of operations and a formal process was established whereby changes ofzones required an application to the Minister for Fisheries who may or may not approve such application. Thisformal process has significantly slowed and managed short-term re-location between zones. This has resulted inrelativevessel numbers in each zone remaining virtually unchanged over the recent history of the fishery, althoughall zones have seen a reduction in vessel numbers as a result of concentration of ownership.
4. DATA REQUIREMENTS AND COMPUTATIONAL PROCESS
The primary data used in the initial allocation process were biological and stock assessment data. Thesedata were used in the simple analysis of catch and effort to support the move to control fishing effort throughrestriction of access. It is interesting however that, in 1963, no specific catch or fishing effort target appears tohave been determined. Later management measures, however, have included specific targets, most notably inthe move to restore spawning stock levels to 25% of the virgin spawning biomass, which was the level of thelate 1970s. Extensive data-collection processes have been in place in the fishery since the 1960s and theseinclude comprehensive data on catches, fishing effort, areas of operation, size frequency of the catch and theretained catch, and various measures of spawning biomass, including annual fishery-independent surveys. Thesedata have been, and continue to be, used in ongoing assessments of the stock.
Western Australia Rock Lobster 140

Economic data has only recently been collected (e.g.Marec 1997) although informal economic and marketassessments have been part of the Management Advisory Committee’s deliberations since the late 1980s.Financial data on individual operations have been sporadically collected since the 1970s although, again, thefinancial aspects of existing and proposed management decisions have been considered by the ManagementAdvisory Committee through the inclusion of industry members on that Committee.
5. APPEALS PROCESS
No formal appeals process was established during the initial allocation of access rights although, incommon with other fisheries management decisions, appeals directly to the Minister for Fisheries were possible.However, care was taken during the allocation process to involve the relevant industry sector at an early stagein consultation. Such close industry/Government dialogue is a well established feature of the management offisheries in Western Australia and was, and continues to be, critical to the success of both the allocationprocedure and the ongoing management of the fishery.
6. ADMINISTRA TION OF THE ALLOCA TION PROCESS6.1 Staff requirements
The entire process of allocation of access rights was handled by existing staff within the Western AustralianGovernment. Subsequent scientific analyses of management options have used consultants to a very limitedextent, and all such work continues to be resourced primarily from within existing Government and industrybudget allocations.
6.2 Additional pr ogramme funding requirements
There were no additional funds made available for the allocation process.
7. EVALUA TION OF THE INITIAL ALLOCA TION PROCESS7.1 Success in achieving initial policy objectives
In the 40 years since the initial allocation of access rights, the fishery has been maintained as a productiveand highly profitable fishery, and annual assessments of stock status have indicated that the primary policyobjective of ensuring long term biological sustainability has been met. Within this time, however, there has beenan ongoing process of preventing the escalation of fishing effort in the face of technology improvements andincreased value of the product. As Lindner (1994) has noted, it is only in fisheries where the technology ofproduction is sufficiently inflexible that licence-limitation and other input-controls can be expected to controlthe expansion of total fishing capacity. Such conditions are met in the western rock lobster fishery where thelimitation on the number of pots has been an effective policy instrument because the feasibility of lifting potsmore than once in a 24 hour period is subject to severe diminishing catch returns.
The constant attention that has needed to be given to the ongoing process of controlling fishing effort andcapacity has seen relatively large expenditure (partially industry funded) in the areas of administration,compliance and research. Morgan (1997) showed that, for example, surveillance and compliance costs in thefishery had increased at a rate greater than the rate of inflation during the period 1985-1996, in response to evermore stringent and complicated regulations.
7.2 Satisfaction of rights-holders with the process
The initial allocation process was done at a time when the concept of limited entry was novel andbecause the fishery was not particularly lucrative from a financial viewpoint, there was little dissatisfactionwith the process. This general satisfaction was enhanced by the opportunity that was provided for anyone toparticipate in the allocation of licences by establishing a presence in the fishery prior to 1 March 1963.However, as the fishery has become extremely profitable, with the asset value of the access right increasingat a compound rate of around 15% per annum over a 20-30 year period, there have been occasions wherefurther restrictions on the access right has met considerable industry resistance. These further restrictionshave been needed, as noted above, to continue to keep fishing capacity under control in this input-controlledfishery.
In essence, there exists a tension between the long-term need to further restrict the rights of those who haveaccess to the fishery and the short-term financial incentives and imperatives to prevent erosion of those accessrights. This debate has ebbed and flowed over the past 20-30 years and, in the author’s opinion, has only beenmanaged by the close working relationship between Government and industry. At the present time, there is ageneral feeling of satisfaction by rights-holders because of the success of the programme, begun in 1993/94, ofrebuilding the spawning stock biomass and hence leading to vastly improved catches and catch rates in recent
141 Morgan
years. Most rights-holders consider the costs of such success (in terms of an 18% ‘temporary’pot reduction) areasonable one given the demonstrated benefits that have resulted.
An important issue in facilitating rational debate on all management issues has been the increasingfinancial sophistication of the industry and the longer-term view that is taken by rights-holders. Restriction ofaccess rights and the subsequent sustainability of the fishery has resulted in large asset values (commonlygreater than $A2million) accruing to the access right. This, in turn, has resulted in the need to better managethese significant assets, a process that has been supported by lending institutions and accountants. This increasedfinancial sophistication, and the tradition of industry/Government co-operation in fisheries management inWestern Australia, has lead to an increasingly harmonious management environment within which a joint visionof long-term sustainability remains at the core.
Recent reductions in prices as a result of large catches has, however, focussed industry’s attention on theeconomic performance of the industry and on the economic and financial consequences of good resource-management practices. Whether the most appropriate structure for optimizing economic performance of theindustry continues to be a Government/industry partnership remains to be seen.
7.3 Views of othercommunity groups
There was little debate or consultation with other community groups in the initial allocation procedure.While not initially an issue of great concern, this is becoming an increasing point of debate. Another emergingaspect of the allocation debate revolves around the escalating values of the access right. Community groups arequestioning the wisdom of past Government decisions that have provided a very large windfall gain (in termsof asset values of access rights) to a small number of fishermen. These groups lobby for a more equitabledistribution of the resource and the participation of a greater number and diversity of user groups in theexploitation of the resource. Such debates are likely to become more significant in future years.
Conservation and ecosystem-management issues have been addressed within the context of the resourcemanagement arrangements over a number of years and the recent accreditation of the fishery by the MarineStewardship Council has enhanced the reputation of the fishery in the area of environmental and ecosystemsustainability.
7.4 Hind-sight assessment
Several major issues could have been addressed better in the initial allocation process. First, there wereno economic or social considerations in the initial allocation debate although, at the time, these wereconsiderations that a fisheries agency was not expected to address. This resulted in a number of unexpectedconsequences, the most significant of which is the impact on coastal communities that depend on the rocklobster industry for their survival. Reductions in fishing vessel numbers due to a concentration of ownership,and the ability of faster and more seaworthy vessels to operate from ports with the best facilities have resultedin changes in many of these smaller coastal communities. However, in no area has it become catastrophic sincealternative industries (particularly the burgeoning tourist industry) have replaced the business revenues of rocklobster fishermen.
Secondly, and as mentioned above, the allocation process has had the effect of producing large asset valuesfor the access rights created. This is becoming a major social debate as the Government defends having createda group of wealthy, elite fishermen. During the initial allocation process, this effect was unforeseen and theprocess for re-allocation of access rights was not addressed. In hind-sight, such a process would have been bestconsidered as part of the initial allocation package rather than trying to address the issue in later years after assetvalues have increased
8. ACKNOWLEDGEMENTS
Special thanks are due to Chris Chubb, Eric Barker and staff of the Western Australia FisheriesDepartment, for making data available for the analyses presented in this paper.
9. LITERATURE CITED
Bowen, B.K. 1994. Long term management strategies for the western rock lobster fishery. Fish. Management.Pap. 67, Fisheries Dept. of Western Australia (4 vols.).
Bowen, B.K. and R.G. Chittleborough 1966. Preliminary assessment of stocks of the Western Australiancrayfish, Panulirus cygnusGeorge. Aust. J. Mar. Freshw. Res. 17: 93-121.
Brown, R.S., N. Caputi and E. Barker 1993. A preliminary assessment of increases in fishing power on stockassessment and fishing effort expended in the western rock lobster fishery. Proc. 4th Int. Workshop onLobster Biology and Management, Japan, 1993.
Western Australia Rock Lobster 142

Lindner, B. 1994. Economic efficiency of alternative input and output based management systems in the westernrock lobster fishery. In: Long term management strategies for the western rock lobster industry (4 Vols).Fish. Management Pap. 68, Fisheries Dept. of Western Australia, Perth.
Marec Pty. Ltd. 1997. Optimizing the worth of the lobster catch: options and issues. Fish. Management Pap. 101,Fisheries Dept. of Western Australia, Perth
Morgan, G.R. 1997. Individual quota management in fisheries: methodologies for determining catch quotas andinitial quota allocation. FAO Fish. Tech. Pap. 371, FAO, Rome, 41pp.
Sheard, K. 1962. The Western Australian Crayfishery, 1944-1961. Paterson Brockensha, Perth, 145pp.
143 Morgan

INITIAL ALLOCA TION OF ITQS IN THE WESTERN AUSTRALIA ABALONE FISHER Y
R. Metzner, F.M. Crowe and N.J. BorgFisheries Western Australia
Locked Bag 39, Chifley Square Post Office, Perth, 6850, Australia<[email protected]> <[email protected]> <[email protected]>
1. THE WESTERN AUSTRALIAN ABALONE FISHER Y
The commercial abalone fishery of Western Australia is Australia’s smallest abalone fishery in terms of thetonnage harvested, the gross value of this production1, and the number of participants (currently 26, down fromthe maximum number of 36 participants). Most of this catch prior to 1970 was of Roe’s abalone (Haliotis roei)which is harvested from waters of up to approximately 3 metres in depth. Since then, the species composition ofthe catch has expanded to include the other two species which are found off the coast of Western Australia. Evenwith the current high world market value of abalone, only three of the 11 existing species of abalone in WesternAustralian waters are commercially exploited: Roe’s abalone, the greenlip abalone (H. laevigata) and thebrownlip abalone (H. conicopora), primarily because of the low abundance and exceedingly small size of theother species at maturity. Catches of commercial abalone species are shown in Figure 1.
Figure 1Abalone catches by species
More than 99% of the catch is exported to the port of Hong Kong for further distribution to China, TaiwanProvince of China, Republic of Korea, Japan and Malaysia. About half the brownlip and most of the Roe’sabalone from Western Australia are exported as canned product while the remaining brownlip and most of thegreenlip abalone are exported as frozen meat. Canned abalone currently attracts a lower import tariff than frozenabalone in Taiwan Province, which is a major buyer. A small proportion of abalone is dried in Western Australiafor export to China, although the traditional source of dried abalone destined for Chinese consumption has beenJapan. There is also a developing live transport trade to SE Asia, but this is in its infancy at this stage. Finally,abalone shell is also sold to the Republic of Korea for manufacture of buttons, jewellery and inlay work, althoughdemand and prices for shell have declined in recent years (Fisheries Western Australia 1998).
2. THE NATURE OF THE HAR VESTING RIGHT2.1 Nature of the harvesting right prior to intr oduction of individual transferable quotas
Prior to 1999 and the implementation of an individual transferable quota (ITQ) management system, thenature of the harvesting rights in the abalone fishery has been an evolving one that reflects 28 years ofmanagement changes. As the fishery has moved from being an unmanaged fishery to being a limited entry fisheryand then to one based on individual quotas (IQs), the rights associated with it have become increasingly exclusive,transferable, durable, secure and divisible.
For example, the fishery was managed under open access until 1971, that is, it could be accessed by anyonewho had a commercial fishing boat licence and, or, a commercial fisherman’s licence, which was available uponapplication to the Fisheries Department. Rights-related licence characteristics of exclusivity, durability, securityand transferability had no bearing.
144
Year
76 77 78 79 80 81 82 83 84 85 86 87 88 89 90 91 92 93 94 95 96 97 98 99
To
nn
esw
ho
lew
eig
ht
0
50
100
150
200
250
300Greenlip Brownlip Roei
1 In 1980 the gross ex-vesel value of production of the fishery was estimated to be $A650 000. This had increased to $A7 millionby 1991/92 and peaked around $A13 million in 1998/99 (Fisheries WA file no. 149/75 V2 Folios 8, 9 and 10).
This began to change, however, in 1970 when an influx of divers from other states of Australia caused arapid expansion of the fishery. The Western Australia abalone divers responded with strong representations tocontrol the expansion of the industry while scientists voiced their concerns about possible overexploitation of theresource. As a result, Fisheries Western Australia2 decided to limit entry to the fishery and in 1971 the fisherybecame a ‘concession’fishery, meaning that the wild capture fishery was recognised by Fisheries WA, but that itdid not have a formal management plan as such.
Thus, the first change in the nature of the commercial harvesting rights was to introduce the notion ofexclusivity with the implementation of a non-transferable licence system. The use of qualifying criteria resultedin the issuance of 36 annually-renewable licences, which were issued to each diver in the fishery in conjunctionwith regulations based on input controls such as area closures and zoning restrictions3.
Between 1972 and 1976, the Agency pursued a dual policy of de factotransferability coupled with attrition.If an individual wished to leave the fishery, what amounted to a transfer could take place:
“3.4 A concession holder who wishes to leave the fishery may dispose of his boat and gear as inthe rock lobster fishery. Whoever bought the boat and gear would be required to take out a licencein his own name and operate the concession” (Government Gazette of Western Australia, 21 July1972).
However, the licence-cancellation policy which was in place meant that licensees had to use the licence andharvest abalone or they would lose it, and under this policy the number of licences had dropped to 26 by 1976.
At this point, the agency declared the fishery to be a Limited Entry Fishery, meaning that the fishery’smanagement was formally recognised in a management plan which formalised the restricted entry provisions,zoning, and owner-operator provisions. These provisions were supplemented by seasonal and area closures, sizelimits and restrictions on processing procedures - as well as explicit recognition of the transferability of thelicences. A diver wishing to leave the industry could, with the approval of the Director of Fisheries, now sell hislicence directly to another diver.
Along with annual changes to the abalone fishery’s seasons, closed areas, and TACs in 1983 Fisheries WAissued ancillary management measures, which had the potential to affect participants in the abalone fishery: afreeze was imposed on all new applications from people wanting to enter the Western Australian fishing industry.This measure effectively limited the number of commercial fishing boats in Western Australia by ensuring thatany new entrants to commercial fishing had to buy an existing commercial fishing boat licence. In the context ofthe abalone fishery, this meant that any shore-based abalone diver who might want to start fishing from a boathad to purchase an existing Western Australian fishing boat licence to do so.
The next direct change in the nature of the property rights in the abalone fishery occurred in the mid-1980s.Members of the industry who were operating in two of the three zones in the fishery moved to promote “orderlyfishing” and to reduce competition between divers by initiating a voluntary individual quota (IQ) system. The IQsystem allocated equivalent shares of the TAC in 1985 for the major fishing areas in Zone 1 (it did not apply toall of Zone 1). In 1986, having seen the system in place and working for Zone 1, fishers in Zone 2 put in place asimilar system for the heavily fished areas of Zone 2. Again, it did not apply to the whole zone. For both zones,the allocation was 24t per diver4..
In 1988, the Zone 3 divers who were only allowed to harvest Roe’s abalone also sought an IQ system. Thiswas implemented by the Agency the same year along with the introduction of a statewide TAC for Roe’s abalone5.Zone 3 participants were also given access to the stocks of this species along the south coast effectively givingthem access to all Roe’s abalone stocks throughout their range within the state.
145 Metzner, Crow & Borg
2 The official name of the arm of the Western Australian (WA) Government with legislated responsibility for managing thefisheries resources of WA has changed over time. For simplicity, the current name of “Fisheries WA” or the term “theAgency” is used throughout this paper.
3 The zoning was driven by two factors, the participation patterns of three fairly distinct sets of participants and the stockdistribution of the three abalone species. By 1975 there were six licences for Zone 1, eight for Zone 2 and twelve for Zone3. Participants were restricted to one zone only, and the licence owner had to be the operator/diver (known as an ‘owner-operator’ provision).
4 In 1988, the TACs for these two zones were reduced. Divers were not catching their 24t allocations and, given that the onlydata available in this fishery was provided by the divers, managers took a risk-averse approach in response to scientificconcerns about the sustainability-related implications of the low catches. Zone 1 quota was reduced to 18t per diver becausethe divers did not catch the 24t quota, and in 1989 the quota in Zone 2 was reduced to 15t.
5 The initial TAC for the Zone 3 Roe’s abalone IQ system was 9.5t; in 1989 this was reduced to 9.0t. Zone 3 licensees hadnot sought an IQ system earlier as they had been involved in trying to resolve other management issues.

Thus, it was over a 14-year period, from 1971 to 1988, prior to the formal introduction of an IQ systemthat the bundle of rights associated with the Western Australian abalone fishery were:
i. increasingly defined (through more formalised recognition of the rights associated with licences)ii. made exclusive (with the implementation of limited access to the entire Western Australian fishery)iii. annually renewable (by the Director of Fisheries)iv. relatively secure (unless government scrutiny revealed that licence owner had committed an offence that
could justify the revocation of the licence) andv. not divisible (i.e. they were only available for sale as entire licences).
More specifically, in moving from open access to limited entry to individual quotas, the characteristics ofthe associated rights went through 6 phases:
i. Harvesting rights: increasingly definedAs described above, the nature of the harvesting right in the Western Australian fishery has become
increasingly more defined. Prior to 1971, the Western Australian abalone fishery was an open access fishery. Inorder to gain access to it, all that was needed was a Western Australian fishing boat licence and a commercialfisherman’s licence - both of which were available upon request.
It progressively became a non-transferable ‘concession’fishery (in 1971), a transferable ‘concession’fishery (in 1972), a formally managed fishery with transferability (in 1976) and a formally managed fisherywhich recognised individual quota shares of a total allowable catch (1988). During the same period, the numberof fishing boat licences was limited (in 1983), further restricting the pool of potential participants.
ii. Exclusivity of the harvesting right: increasedThe 1971 limitation of access to only 36 divers gave these ‘concessionaires’exclusive access to the abalone
resource. This exclusivity was strengthened in 1976 with the introduction of formal management measures.
iii. Transferability of harvesting right: became possibleInitially non-transferable, licences became transferable - first, under implicit rules and then later under
strict conditions. In addition in 1981 the Agency concluded there was no biological reason for refusing theacquisition of an authorisation in two zones, allowing divers to hold licences in more than one zone. (TheAgency’s attitude was that it was a private transaction between two individuals and within the policy rules ofthe fishery.)
iv. Durability of harvesting right: increasedBy convention, fishery licences and the rights associated with them in Western Australia are annual but
renewable. The Fish Resources Management Act 1994(FRMA) formalized this position so that, subject tocertain conditions related to payment of fees, the life of the management plan, adherence to the provisions ofthe Act, and Ministerial decisions to the contrary, licensees have an expectation that their access right isrenewable in perpetuity (Fisheries Western Australia 2000). The most obvious example of this is that it takesthree serious breaches of the fisheries legislation for a licensee to have a licence and its associated rightsrevoked.
v. Security of access of harvesting right: increasedSecurity of access is, in its broadest sense, subject to any changes to the management of the fishery by the
Minister or Executive Director. Given the level of consultation that is required as part of the formal managementof this fishery, it would be difficult to capriciously change the rights conveyed by the management system.
Although nominated divers have been permitted to operate the licence on behalf of the licensee since1992/93, potential new owner-operators were seldom able to find the capital to enable them to make an outrightpurchase of the increasingly valuable licences. The introduction of regulations allowing for the use of“Nominated Divers” increased the flexibility associated with holding an abalone licence. Nominees couldparticipate in the fishery without having to purchase an entire licence, thus eliminating the related problem oftrying to service a large debt. In addition, licensees could effectively retire from diving without relinquish theirlicence, thereby retaining an increasingly valuable asset.
Furthermore, the FRMAgives the licence holder the right to apply for a fishing licence, but not the ‘right’to that licence. The Minister for Fisheries has reserved his position to amend or revoke a management plan thatwould, in effect, cause any entitlement or authorisation established by a managed fishery to lapse. “In realitythis has not happened, but this position provides a fine line between that which could be described as ‘property’in the final sense or some form of quasi property entitlement” (Fisheries Western Australia 2000).
Since the introduction of the FRMAin the mid 1990s, Fisheries WA has maintained a Register of Interestsfor all Western Australian fishing licences. This register has been used by financial institutions and otherinterested parties seeking collateral against loans, facilitating the use of licences as security in such situations.
Western Australia Abalone 146

vi. Divisibility: an increasing issueBecause divisibility of harvesting rights was not allowed until 1999 and the introduction of the ITQ system,
commercial licence ownership ended up becoming “corporatized”, i.e. when original licence holders wanted tosell their asset, their inability to divide the harvest rights meant that the pool of potential buyers was restricted tothose entities having access to sufficient amounts of capital. In such cases, the entities holding the licence wouldemploy divers under lease arrangements (Prince and Sheperd 1992).
2.2 Nature of harvesting right following the introduction of individual transferable quotasIn broad terms the current system for assigning access to the State’s fish resources ensures that the state
confers rights and regulates permission to catch these fish. Therefore, the nature of the property rights is a rightto actually attempt to harvest fish, but not the right to the fish as an entity (fish are only “owned” once they arecaught). Thus, Western Australia does not guarantee abalone licence holders a quantity of fish, but it does haveduty to provide the best resource management circumstances for those who are granted permission to fish(Fisheries Western Australia 2000).
The 1999 Abalone Management Plan set up an individual transferable quota (ITQ) system through a systemof “units” which were initially attached to each commercial abalone licence by means of an endorsement calleda “catch entitlement”. Although the number of units allocated to an area does not change, the amount of potentialharvest ascribed to each unit may change from year to year because units are denominated as a percentage of theTAC6. Additionally, because the respective TACs for the areas vary, the respective values for the units will varybetween zones.
Under this system, there have been changes to the various rights-related characteristics of the harvestingrights. The definition, exclusivity, durability and security of these rights has been clarified and, quite importantly,they have been made divisible.
Exclusivity of harvesting rightWith the advent of the ITQ system, the exclusivity of the rights has remained clearly defined. However, the
pool of potential participants who can hold these rights has been broadened because of the separation of the rightof access to the fishery (vis-à-visthe managed fishery licence) from the right to harvest abalone (vis-à-vistheholding of units).
TransferabilityAlthough licences have been explicitly transferable since 1972, the introduction of ITQs has increased the
ease with which explicit harvest rights can be transferred (i.e. leased and/or traded).
Durability and security of harvesting rightThe introduction of ITQs has not formally affected the durability or security of the harvesting rights.
Licences are still annually renewable with the same caveats as previously. In addition, current Western Australianpolicy under the FRMAis clear that any ‘rights’extended to the commercial fishing industry are prescribed bythe nature of the entitlement outlined in the legislation for a managed fishery or by licence (Fisheries WesternAustralia 2000).
The new fisheries legislation that established the ITQ programme also includes provisions for mandatoryconsultation with industry prior to any changes in management arrangements. Although consultation has alwaysbeen part of the commercial fisheries management approach in Western Australia, the new mandatory nature ofthe consultation has given the perception of increased rights for licence holders, especially in terms of security.Legislation states that the Minister must, except in cases of urgency, consult with the advisory committees orpersons specified in the fishery’s management plan prior to amending the plan. The 1992 management planspecified the professional fishing association representing each of the three zones as those who must be consultedprior to any abalone management plan amendments. The replacement provision in the 1999 management planformally nominates all licence holders.
147 Metzner, Crow & Borg
6 For example, say the fishery had a total of 260 units distributed evenly among the 26 licence holders, that is each unit holderhad 10 units. If each unit was given a value of 1t (TAC of 260t) then each licensee could take 10t of abalone. If it wasnecessary to reduce the TAC to, say 208t, the number of units would not change, only the value of each unit. Instead of eachunit having a value of 1t, it would have a value of 0.8t. Each licensee could now only take 8t, however, the unit holdingwould not have changed - it would still be 10 units.
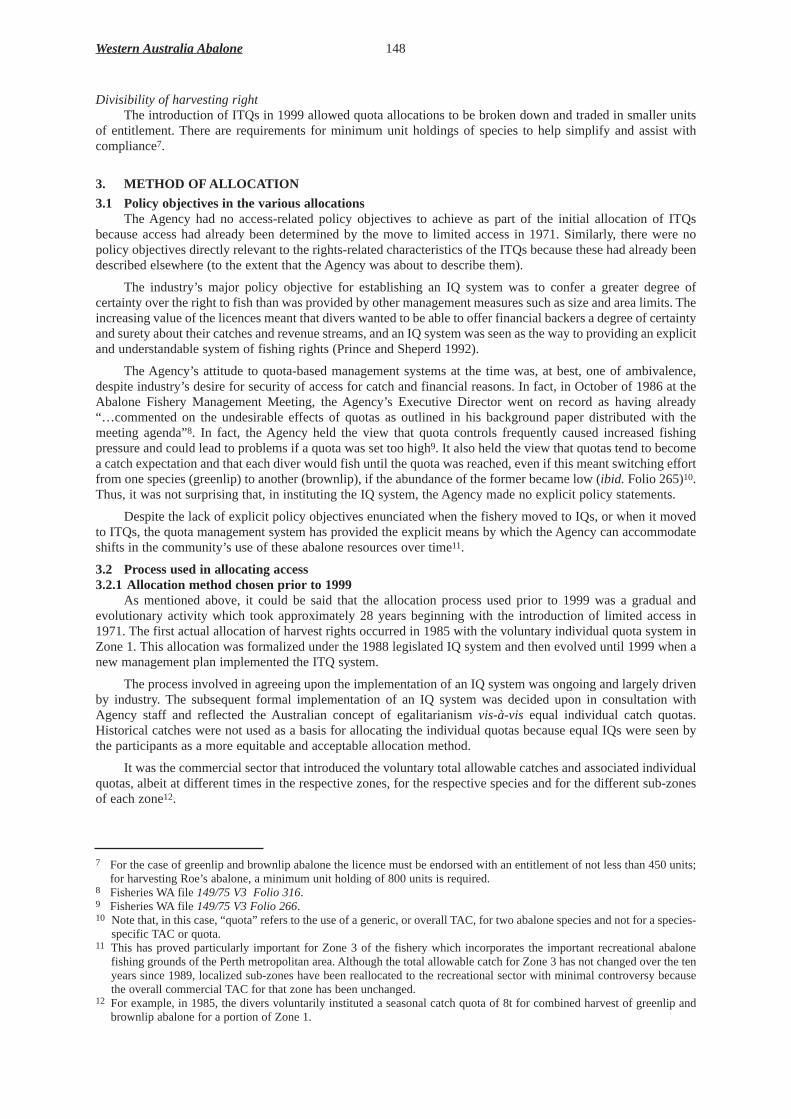
Divisibility of harvesting rightThe introduction of ITQs in 1999 allowed quota allocations to be broken down and traded in smaller units
of entitlement. There are requirements for minimum unit holdings of species to help simplify and assist withcompliance7.
3. METHOD OF ALLOCA TION
3.1 Policy objectives in the various allocationsThe Agency had no access-related policy objectives to achieve as part of the initial allocation of ITQs
because access had already been determined by the move to limited access in 1971. Similarly, there were nopolicy objectives directly relevant to the rights-related characteristics of the ITQs because these had already beendescribed elsewhere (to the extent that the Agency was about to describe them).
The industry’s major policy objective for establishing an IQ system was to confer a greater degree ofcertainty over the right to fish than was provided by other management measures such as size and area limits. Theincreasing value of the licences meant that divers wanted to be able to offer financial backers a degree of certaintyand surety about their catches and revenue streams, and an IQ system was seen as the way to providing an explicitand understandable system of fishing rights (Prince and Sheperd 1992).
The Agency’s attitude to quota-based management systems at the time was, at best, one of ambivalence,despite industry’s desire for security of access for catch and financial reasons. In fact, in October of 1986 at theAbalone Fishery Management Meeting, the Agency’s Executive Director went on record as having already“…commented on the undesirable effects of quotas as outlined in his background paper distributed with themeeting agenda”8. In fact, the Agency held the view that quota controls frequently caused increased fishingpressure and could lead to problems if a quota was set too high9. It also held the view that quotas tend to becomea catch expectation and that each diver would fish until the quota was reached, even if this meant switching effortfrom one species (greenlip) to another (brownlip), if the abundance of the former became low (ibid. Folio 265)10.Thus, it was not surprising that, in instituting the IQ system, the Agency made no explicit policy statements.
Despite the lack of explicit policy objectives enunciated when the fishery moved to IQs, or when it movedto ITQs, the quota management system has provided the explicit means by which the Agency can accommodateshifts in the community’s use of these abalone resources over time11.
3.2 Process used in allocating access3.2.1Allocation method chosen priorto 1999
As mentioned above, it could be said that the allocation process used prior to 1999 was a gradual andevolutionary activity which took approximately 28 years beginning with the introduction of limited access in1971. The first actual allocation of harvest rights occurred in 1985 with the voluntary individual quota system inZone 1. This allocation was formalized under the 1988 legislated IQ system and then evolved until 1999 when anew management plan implemented the ITQ system.
The process involved in agreeing upon the implementation of an IQ system was ongoing and largely drivenby industry. The subsequent formal implementation of an IQ system was decided upon in consultation withAgency staff and reflected the Australian concept of egalitarianism vis-à-vis equal individual catch quotas.Historical catches were not used as a basis for allocating the individual quotas because equal IQs were seen bythe participants as a more equitable and acceptable allocation method.
It was the commercial sector that introduced the voluntary total allowable catches and associated individualquotas, albeit at different times in the respective zones, for the respective species and for the different sub-zonesof each zone12.
Western Australia Abalone 148
7 For the case of greenlip and brownlip abalone the licence must be endorsed with an entitlement of not less than 450 units;for harvesting Roe’s abalone, a minimum unit holding of 800 units is required.
8 Fisheries WA file 149/75 V3 Folio 316.9 Fisheries WA file 149/75 V3 Folio 266.10 Note that, in this case, “quota” refers to the use of a generic, or overall TAC, for two abalone species and not for a species-
specific TAC or quota.11 This has proved particularly important for Zone 3 of the fishery which incorporates the important recreational abalone
fishing grounds of the Perth metropolitan area. Although the total allowable catch for Zone 3 has not changed over the tenyears since 1989, localized sub-zones have been reallocated to the recreational sector with minimal controversy becausethe overall commercial TAC for that zone has been unchanged.
12 For example, in 1985, the divers voluntarily instituted a seasonal catch quota of 8t for combined harvest of greenlip andbrownlip abalone for a portion of Zone 1.

3.2.2Allocation method chosen in 1999Eventually, participants found that IQs did not give them the business flexibility they needed to carry on
their business efficiently, and the Abalone Management Consultative Group recommended a move to ITQs inorder to provide greater flexibility and administrative simplicity. As a result, in 1999 management of the fisherymoved to an individual transferable quota system. This move did not involve an explicit reallocation of harvestrights. Instead, it merely involved another calculation which converted IQ holdings into species-specific units andamounts. Under the system there is a TAC for each zone of the fishery and a licence holder for the zone is allowedto take a proportion of the zone’s TAC according to the number of units held.
The introduction of an ITQ system via unitisation of the fishery has ensured that the harvest rights do nothave to be traded in their entirety along with the managed fishery licence as was required under the pre-IQ systemand even under the IQ system. Units can now be traded in small amounts, which means that the number oflicences is no longer a limiting factor, rather the minimum quota holdings and the extent to which consolidationoccurs (or not) are the constraint on the number of participants.
4. DATA REQUIREMENTS AND COMPUTATIONAL PROCESS
Catch records are kept by all commercial fishermen in Western Australia as a requirement of the FishResources Management Regulations 1995. Specific requirements for participants in the abalone fishery aredetailed in the Abalone Management Plan and all abalone sold by abalone divers must be accompanied by therequired documentation. These records are closely monitored and checked against the licence holder’s catchentitlement.
With the initial introduction of the voluntary IQ system, a number of essential mandatory control measureswere put in place:
“1. The abalone produce is to be sold only to a small number of licensed processing establishments asnominated by the fishermen.
2. The approved processing establishments are required to maintain a precise set of data of receivals ofabalone setting out date, weights, number of animals, from whom received etc and also be able toaccount for all abalone held. “Cash sales” will not be acceptable and the name of the fishermanconsigning the abalone must be recorded. These requirements are to be included as a condition of theprocessing licence.
3. Zone 1 and Zone 2 abalone fishermen must keep a daily record of abalone caught, setting out dates,number of animals, weights and processor to whom product is consigned.
The data as per 2 and 3 is to be kept on a form to be known as “Abalone Catch and Disposal Record” andthe form is to be made available on a regular basis (daily or per consignment) to the local District FisheriesOfficer.” (Agency letter to the abalone industry, 22 December 1986)
The data system has continued in a similar though more formalized form since that time. When catch recordsfirst arrive at Fisheries WA, they are checked for accuracy and the data are then entered into the Agency’scomputerised Catch and Effort Statistical System. The need for these tight systems is largely compliance-driven,rather than research-driven, although the data requirements have been amended over time for research purposes(Fisheries Western Australia 1998).
Sustainable management of the abalone resource is based on three things:
i. the ‘catch and effort’ returns provided by participants for the quota monitoring systemii. consultation with industry andiii. the observations of divers form.
Despite the fact that this is relatively limited information, the long-term data series from the fishery appearsto indicate that the current quota levels are biologically sustainable and that the use of quotas linked to areas andsub-areas has largely addressed concerns about localized depletion.
5. APPEALS PROCESS
There have been no appeals regarding the introduction of IQ or ITQ allocations in the Western Australianabalone fishery13.
149 Metzner, Crow & Borg
13 The generic process for fisheries appeals prior to the introduction of the FRMAin 1995, was that appeals for access to afishery would be made to the Minister for Fisheries, who would then decide the merits of the appeal. Under the FRMA, aformal independent objections tribunal process has been established.
6. ADMINISTRA TION OF THE ALLOCA TION PROCESS6.1 Staff requirements
Relatively few Agency staff resources have been allocated to the management of this fishery generally, andthere has been minimal staff involvement in terms of the allocation process. This is not to say that considerablemanagement, compliance and research resources have not been spent in the development of managementarrangements at various times in its history. It simply means that these resources were devoted to responding toother management issues and needs and not to the allocation process (which was generally agreed upon by theindustry and the Agency).
6.2 Additional pr ogramme funding requirements
No special funds were explicitly set aside for the introduction of either the IQ or the ITQ systems in theabalone fishery until the late-1990s when a specific quota-management computer-system was purchased byFisheries WA to manage all of its quota managed fisheries in a more efficient manner14. Furthermore, since 1995the Abalone Managed Fishery has been under the Government’s policy of full recovery of management, researchand compliance costs15.. With the phase-in of full cost recovery, this has meant that, increasingly, there are fundsavailable for the services required by the fishery.
7. EVALUA TION OF THE INITIAL ALLOCA TION PROCESS7.1 Success in achieving initial policy objectives
The gradual introduction of IQs into all zones of the fishery was generally considered successful inachieving industry’s policy objectives of:
i. conferring more certainty of access to an increasingly valuable resource andii. providing greater flexibility for business decision-making.
The move to an ITQ system has also allowed for innovation on the part of licence-holders and requiresminimal agency oversight. For example, a recent newspaper advertisement called for tenders of offers to buyabalone ITQs, meaning that private ITQ owners now have an asset worth advertising in an innovative way.
The introduction of output-based IQs and ITQs has provided industry with more certainty over access to theabalone stocks, and the community with an understandable reference point for resource sharing debates. It hasalso provided a way for the agency to effect specific shifts in resource use over time by establishing an explicitmeans by which commercial TACs could be amended in response to other community uses if required.
7.2 Satisfaction of rights-holders with the process
The industry has been the major driver for the change to a quota management system. They saw theadvantages of the IQ and ITQ systems that were being introduced in other Australian States during the late 1970sand early 1980s. Thus, the IQ and the ITQ systems were promoted by industry, rather than Government, for anumber of reasons:
i. the increasing value of licences meant that divers had to take more of the resource to service their debtsii. the floating of the Australian dollar saw the product become more valuable in Australian dollar terms, which
may have led to rapid fishing down of the resource andiii. industry required more long-term certainty that the resource would be available.
The changes have achieved industry’s objectives of increased certainty over the right to fish and increasedflexibility . In particular, the introduction of divisibility (via units) in 1999 and greater transferability (coupledwith the removal of the restriction on the number of licence holders in the fishery) have increased the flexibilityof participants.
It is worth noting that this fishery gradually went from limited access to an industry-initiated IQ and then toan ITQ management system, steps which appear to have helped to circumvent many of the allocation-relatedarguments which arise when fisheries move directly from open access input-based systems to ITQ-based outputcontrols.
7.3 Views of othercommunity groups
Recreational fishing groups supported the introduction of an output-based quota management systembecause the recreational sector saw the system as a means of ensuring their share of the resource. This isparticularly the case in Zone 3 where there is a sub-zone in which most recreational abalone fishing occurs. In
Western Australia Abalone 150
14 Various elements and costs of the computer system have also been shared with the state of South Australia.15 The application of full cost recovery for this fishery was based on its high gross value of production, which led to its being
classified as one of the six major fisheries in Western Australia.
this sub-zone a specific TAC has been set for commercial fishers and this is adjusted when necessary to maintainthe resource share with recreational fishers. Ironically, however, the commercial TAC for Zone 3 has not beenaltered, implying that although there has been a spatial redistribution of access, which may affect the costs ofcommercial harvesting activities, the commercial sector has not lost in terms of the quantity of its potentialharvest.
7.4 Hind-sight assessment
The introduction of output-based IQs and ITQs has provided industry with more certainty over access to theabalone stocks and the community with an understandable reference point for resource sharing debates. Despiteearly misgivings, the Agency eventually realised that, although output controls confer quasi-property rights toharvest abalone, they also offer much tighter control over each year’s catch without the problems associated withcontrolling effort using input controls. IQs have also reduced the competition between divers and, hence, allowthe divers to operate on their own schedule and to take the responsibility for their own personal health and safety.
The current information on which all management decisions, including TAC setting, is solely based on catchdata supplied by the commercial fishers. No other source of data has been developed to provide a broaderinformation platform on which to base quota-advice (Fisheries Western Australia 2000).
Although the introduction of quota management to the Western Australian abalone fishery was a long andtortuous process, it had industry and community support and was accepted as the most appropriate way to managethat resource. Taking a long-term view, there was a need for a gradual shift to clearer forms of access entitlementsthat provide a framework for continuous adjustments between commercial and recreational fishers. The quotaarrangements in the abalone fishery have enabled this to happen, particularly in Zone 3.
8. LITERA TURE CITED
Crowe F.M., Lehre W. and R. Lenanton 1999. A study into Western Australia’s open access and wetline fisheries,Fisheries Technical Report No. 118, Fisheries Western Australia, Perth, Western Australia, 142pp.
Fisheries Western Australia 2000. Protecting and Sharing Western Australia’s Coastal Finfish Resources – thePath to Integrated Management, Fisheries Management Paper No 135, Perth, Western Australia, 90pp.
Fisheries Western Australia 1998. Abalone Managed Fishery – Overview 1998, Fisheries Overview No 1, Perth,Western Australia, 29pp.
Fisheries Department 1985. Discussion Paper – Arrangements for Entry to all Fisheries off and along the WesternAustralian Coast, Fisheries Department, Perth, Western Australia.
Lenanton, R. 1984. The Commercial Fisheries of Temperate Western Australian Estuaries: Early Settlement to1975, Department of Fisheries and Wildlife, Perth.
Prince J. and S.A. Shepherd 1992. Australian abalone fisheries and their management. In: Shepherd S.A., TegnerM.J., Guzman del Proo S.A. (eds) Abalone of the World, Biology, Fisheries and Culture. Proceedings of the1st International Symposium on Abalone, Fishing News Books: Oxford, pp 417-423.
Further information is also available from the Fisheries WA website - http://www.wa.gov.au/westfish
151 Metzner, Crow & Borg

INITIAL ALLOCA TION OF HARVESTING RIGHTS IN THE FISHERIES OF SOUTH AUSTRALIA
G.R. Morgan106 Barton Tce. West, North Adelaide, SA5006, Australia
1. INTRODUCTION
South Australia has three important quota-managed fisheries – those for southern rock lobster (Jasusedwardsii), abalone (Haliotis laevigataand H. rubra) and pilchards (Sardinops neopilchardis).
Of the input-controlled fisheries in South Australia, the fishery for southern rock lobster is probably uniquein that it has both an input-controlled zone and an output-controlled zone which enables direct comparison ofperformance of the two management regimes within an identical stock and socio-economic environment.
The South Australian Rock Lobster Fishery began in the early 1870s as a hoop net fishery. The firstcommercial lobster pots were used in 1889 and around the turn of the century small industries began to emergein different parts of the state. In the late 1940s a thriving lobster-tail export market to America had beendeveloped based on the processing and export of rock lobster-tails.
The industry then developed rapidly with vessels becoming more sophisticated and catches increasing. Thedevelopment of alternative markets in South East Asia and more recently in Europe, together with thedevelopment of products such as whole-cooked and live lobsters, maintained the development momentum of theindustry and resulted in increasing profitability for operators. The industry is now a significant and expandingindustry in South Australia generating a business turnover of more than $A230 million and supporting over 2200jobs (EconSearch 1999a, b).
About 95% of the annual commercial catch of 2600t is sold live through Asian markets, with a landedvalue of almost $A80 million and which brings more than $A100 million into the state. The catch has remainedrelatively stable in the past decade (Table 1) as both fishers and managers have taken steps to ensure the long-term sustainability of the resource.
Fishing is carried out in thewaters off South Australia’s entirecoastline with the exception ofMarine Park exclusion zones. Thefishery is divided into Southern andNorthern Zones. The SouthernZone extends from theVictorian/South Australia Stateborder to the Murray River mouth,south of Adelaide, and the NorthernZone covers the area from theMurray River mouth to the WesternAustralian Border. Whilegeographically smaller, theSouthern Zone is more significantin terms of commercial vessel
numbers. There are currently 183 boats operating in the Southern Zone, compared with 71 in the Northern Zone.The total annual catch in the Southern Zone averages around 1700t, compared to around 900t in the NorthernZone (Table 1).
The Rock Lobster season runs from 1 October to 31 April in the Southern Zone, and from 1 November to30May in the Northern Zone. All commercial fishers must be licensed and their activities are controlled throughinput-controls and quotas in the South, and management of fishing-time and pot-lifts in the North.
Fishers record the catch every day and participate in voluntary pot sampling. Economic performance ofthe fishery is monitored through surveys and independent economic analyses.
There are currently 254 licence holders in both zones of the rock lobster fishery with the numbers oflicences having declined slowly over recent years as amalgamation of pot entitlements and structural adjustmentof the industry has taken place. This aspect will be further discussed below. Table 2 shows the number oflicensees and the average number of pots per licence holder for the period 1989-1998.
152
Year Southern zone Northern zone South Australia
(t) ($Am) (t) ($Am) (t) ($Am) 1990/91 1562 26.7 1104 18.2 2666 44.9 1991/92 1940 36.3 1222 21.4 3162 57.8 1992/93 1754 34.8 1064 20.5 2818 55.3 1993/94 1669 43.2 930 23.4 2599 66.6 1994/95 1720 48.6 891 25.5 2611 74.0 1995/96 1684 44.6 903 23.8 2587 68.4 1996/97 1635 47.0 893 24.4 2528 71.4 1997/98 1680 50.9 942 27.7 2622 78.6 1998/99p 1713 47.2 1016 26.7 2729 73.9
Table 1SA Rock Lobster Catch and Value of Catch, 1990/91 - 1998/99

The abalone and pilchard industries in SouthAustralia operate within an ITQ system withoutsignificant additional (input) controls. In bothfisheries, there are some restrictions on areasfished and size limits are in place for the abalonefishery.
The abalone industry in South Australiabegan in the 1960s in response to the emergingmarket for abalone in South East Asia. In 1971,the number of licences was restricted and thefishery was divided into three managementzones, which remain the basis of management ofthe fishery. The number of licences in 1971 wasmore than 100, but this was reduced over theyears by a policy of non-transferability. There arecurrently 35 licences on issue. The 1999/00 totalcatch of abalone in South Australia wasapproximately 832t whole weight with the
fishery being valued at approximately $A30 million based on producer prices. Table 3 gives the recent catchhistory of the fishery.
Although the catch has remained relatively stable, thevalue of the fishery (Table 3) has increased markedly as thedemand for the wild-caught product continues to outstripsupply. Average prices increased by 104% in nominal termswithin the decade starting with the 1990/91 fishing season.
Access to both the rock lobster and abalone stocks isopen to the public for recreational purposes with daily baglimits and size limits applying. In the case of recreationalfishing for rock lobsters, there are also restrictions on thenumber of recreational licences issued and the number of pots(currently2) that can be used by a recreational fisherman. Therecreational catch of both rock lobsters and abalone is thoughtto be around 6% of the total catch although no ongoing catchmonitoring is undertaken. Illegal catches, particularly ofabalone, are an important but unmeasured component of thetotal catch of both rock lobsters and abalone with informalestimates of the illegal catch of abalone being as high as 40%of the commercial TAC.
The pilchard fishery in South Australia, like other Sardinopsfisheries, exhibits large annual variations inabundance. This has been magnified in recent years by major fish kills in 1995 and 1998, which have beenlinked to a herpes-like virus infection among pilchard. It has been estimated that these fish kills resulted in theloss of up to 60% of the total adult population, although juvenile fish were not affected.
Despite these large fluctuations in abundance, the pilchard fishery is managed using a TAC which is seteach year in response to estimates of abundance based on annual egg and larval surveys. The current quota of3600t is divided equally between the 23 licence holders to produce an annual ITQ with daily monitoring ofindividual quotas taking place. There are further restrictions on areas permitted to be fished, which are designedto separate larger and smaller operators between offshore and inshore waters.
Annual TACs in the pilchard fishery have ranged from 3600t to over 11 000t during the period 1997-2000,with the vast majority of the fish being utilized locally as feed for the burgeoning tuna aquaculture industry. Thefishery nevertheless, supplies only about 20% of the tuna aquaculture industry’s feed needs.
2. THE NATURE OF THE HAR VESTING RIGHTS
The southern zone of the rock lobster fishery is managed through a system of ITQs with the annual TACbeing set each year by a joint industry/Government management advisory body (see below). The TAC has notchanged in recent years in response to steady (or slightly increasing) indices of both overall stock abundanceand breeding stock levels. Although the southern zone of the rock lobster fishery has been managed by such
153 Morgan
Year Southern zone Northern zone Licence
number Av. pots/
licence
Licence number
Av. pots/ licence 1989 190 82
1990 192 82 1991 191 83 1992 192 62.1 80 49.4 1993 189 63.1 79 50.0 1994 187 63.8 78 50.6 1995 186 64.1 77 51.3 1996 186 64.1 75 52.7 1997 183 65.2 73 54.1 1998 183 65.2 71 55.6
Table 2Licence numbers and average pot holdings
in SARock Lobster Fisheries
Year Catch (t)
Value ($A million)
1990/91 863 14.0 1991/92 885 15.1 1992/93 869 23.7 1993/94 802 27.2 1994/95 851 22.8 1995/96 902 22.5 1996/97 903 25.2 1997/98 812 26.9 1998/99 860 27.4 1999/00 832* 30.4*
Table 3South Australian abalone catch and value,
1990/91-1999/00
* Estimate

output controls for a number of years, various elements of input control still remain. The industry, in fact, hasbeen fiercely protective of its management arrangements and cites stock-sustainability and socio-economicissues as reasons for not moving to greater deregulation of the fishery.
The fishery has been a limited-entry fishery for some 30 years although licences are freely transferable.The value of the access-right to participate in the fishery has increased substantially as a result of this limitedentry, the profitability of the fishery and the certainty of the management structure.
In the Southern Zone a 15% pot reduction (1984) and an industry-funded buy back, which removed 41licences (1987), were implemented and on 1 October 1994 individual transferable quotas (ITQs) wereintroduced. The current management arrangements include:
i. total allowable catch of 1720t allocated at 144kg/potii. pots limited to a total of 11 900iii. limited-entryiv. legal minimum size of 98.5mmv. closed season from May 1 to September 30vi. minimum mesh diameter on pots of 50mmvii. maximum of 100 pots per licence with 80 allowed to be worked andviii. prohibition on taking berried females.
The northern zone of the fishery is managed exclusively by input controls that are often different to theinput controls that exist in the southern zone of the fishery. The northern zone also operates in a limited-entryenvironment which has been in place for more than 30 years.
In the Northern Zone a 10% pot-reduction was implemented in 1985 and again in 1992. These measureswere followed by a shortening of the season by one week in 1993 as a real time management system was usedfor the fist time. The season was shortened by another week in 1993 and again in 1994. Current managementarrangements include:
i. limited-entryii. legal minimum size of 102mmiii. closed season from 1 June to 31 October iv. 21 days time-closure within a 210 day seasonv. minimum mesh diameter on pots of 50mmvi. maximum of 60 pots per licencevii. no double pulling of pots within a 24 hour periodviii. prohibition on taking berried females andix. restriction on boat size to 18 meters and engine capacity of 1200hp.
Again, the limited-entry nature of the fishery and its profitability has resulted in the access-right toparticipate in the fishery acquiring considerable value on transfer. But, despite these high values, the return tocapital (including the access-right value) has been around 4.4% in recent years.
The Rock Lobster Industry, like other commercial fisheries in South Australia, operates on a full cost-recovery basis and finances its own management, research and resource protection.
The abalone fishery is also a limited-entry fishery and, like the rock lobster fishery, the transferableharvesting right has acquired considerable value with the most recent estimates being around $A4 million.However, no licences have changed hands for several years and hence the actual market value may be higherthan this.
Quota management has been in place since the late 1980s (the timing of the introduction of annual TACsystem being slightly different for the three zones). A separate TAC is set for the two species of abalone (H.laevigataand H. rubra) in the three management zones and an ITQ established as equal shares of these TACs.The minor exception to this is for one part of the Western Zone fishery where a combined (all species) quota of600kg meat weight per diver is allocated. The TAC is set annually by a joint industry/Government managementadvisory body (which provides advice to the Minister for Primary Industries) although, as for other SouthAustralian fisheries, the final decision on the TAC lies with the Minister for Primary Industries.
Some input-controls remain in the fishery, particularly a size limit that is currently 130mm for blacklipabalone (H. rubra) in the western and central zones, and 125mm in the southern zone. The size limit for greenlipabalone (H. laevigata) is 145mm in the western zone, and 130mm in the central and southern zones. There isalso a restriction of two divers per licence with only one diver being able to operate on any one day.
Although full licenses are freely tradeable, permanent transfer of quota is not permitted, although transferfor a single fishing season is allowed. This restriction on quota-transfer has effectively prevented amalgamation
South Australia Fisheries 154
of quota holdings and has also most likely impacted negatively on the value of the access-right. To retain localownership and control, no more than 15% of any licence may be held by a foreign citizen or Company.
The harvesting right in the pilchard fishery is, like the abalone and southern zone rock lobster fisheries, anequal share of the annually established TAC. As indicated above, there are also some input-control measures inthe fishery that principally relate to restrictions on areas fished.
3. THE METHOD OF ALLOCA TION3.1 Policy objectives
In all cases (rock lobsters, abalone and pilchards) the primary policy objective for quota-management wasthe long-term sustainability of the respective stocks. Although all three quota-controlled fisheries were managedby limited-entry and had a range of input-controls in place, fishing effort was increasing within the constraintsof the management system. These increases in fishing effort were principally a result of improving technologyand increasing prices. Concerns were expressed in all three fisheries at various times about apparent declines instock abundance and catch rates.
In the abalone fishery, as in the other fisheries, attempts were made to further strengthen the input-controlsand licences were also made non-transferable in 1971. This situation lasted until 1980 and resulted in thenumber of licences being reduced from over 100 in 1971 to 30 in 1976 when an additional 5 licences wereissued.
Economic issues received little attention as a defined policy objective in the initial allocation, althoughannual monitoring of economic performance is now undertaken for each fishery.
3.2 Process used in determining the allocation
The primary debate in the allocation process was one surrounding the appropriate TAC, while a majorsecondary issue was how the allocation of the TAC was to be made to existing licence holders. Since all threefisheries were already limited-entry fisheries, the question of allowing additional entrants into the fishery didnot arise.
Scientific and biological advice was heavily relied upon in the initial setting of the TAC while economic,social or financial data were not considered. The current system for TAC-setting, which is through jointGovernment/Industry Fisheries Management Committees, enables the broader economic and social issues to beincluded in the TAC setting process, although the biological issues of ensuring long-term sustainability remainparamount.
The allocation of the TAC into ITQs for the rock lobster fishery generated considerable debate and anumber of allocation models were discussed with existing licence-holders. These included allocation of the TACin accordance with the average of the last 3-years’catches, allocation according to pot entitlement, etc. Finally,a process known as the “adjusted preferred method” was selected.
The allocation of the TAC in both the abalone fishery and the pilchard fishery was done on an equal basisamong all existing licence-holders. Since both fisheries were relatively homogenous in terms of gear used, theinitial allocation issue was relatively easily resolved.
Licensees were required to choose the basis upon which they would like the allocation based. The choiceswere limited to a number of canvassed options such as on the basis of average catch over the past 3 years, onthe basis of current pot entitlement, etc. Each licencee obviously chose the option that would give them the mostadvantage in terms of the greatest proportion of the TAC. The choices were then summed to give a total catchunder the licensee’s preferred options. The individual choices were then scaled back to the TAC by dividing eachlicensee’s choice by the fraction (total expected quota under the licensees preferred options)/TAC. The resultantquota was the individual’s ITQ.
4. DATA REQUIREMENTS AND COMPUTATIONAL PROCESS
Biological and stock-assessment data used in the allocation process were to determine the TAC, and datafrom rock lobster licence-holders as to their preferred method of allocation. The latter data was collected as aspecific exercise while the data to determine the TAC for the rock lobster, abalone and pilchard fisheries wereavailable as part of ongoing research programmes. Information on past year’s catches, effort, pot entitlements,etc. which were used during the consultation process with licence-holders, were available as part of ongoingdata-collection programmes conducted by the South Australian Government.
155 Morgan
5. APPEALS PROCESS
Great care was taken during the allocation process to involve the relevant industry sector at an early stagein consultations regarding the method of allocation and the TAC-setting process. Such closeindustry/government dialogue is a well established feature of the management of fisheries in South Australia andwas crucial to the success of the allocation procedure. Because of such close consultation, appeals were few andinvolved mainly the initial allocation of ITQs in the rock lobster fishery. The appeal process was not a formalprocess established for the purpose of the allocation procedure but rather the usual, commonly available processof appeal to the South Australian Minister for Primary Industries.
6. ADMINISTRA TION OF THE ALLOCA TION PROCESS
The entire process was handled by existing staff within the South Australian Government, with theexception of the development of the model for allocation in the rock lobster fishery (the “adjusted preferredmethod”) which was developed by a resource economist under a specific contract for that purpose. Apart fromconsultant fees, there were no additional funds made available for the allocation process.
7. EVALUA TION OF THE INITIAL ALLOCA TION PROCESS7.1 Success in achieving initial policy objectives
All fisheries have been maintained as productive fisheries and annual assessments of stock status haveindicated that the primary policy objective of ensuring long-term biological sustainability was met.
7.2 Satisfaction of rights holders with the process
The allocation process began a long-term debate on the issue of fisheries property rights in South Australiawhich is still progressing. Satisfaction levels were not specifically measured after the allocation procedure butanecdotal evidence indicates that initial scepticism was replaced after several years with a general satisfactionas to the results of the allocation procedures. However, as the debate over the nature of property rights, and thepractical issue of providing security for loans, etc.has evolved, there is growing dissatisfaction that the processis not yet complete. Industry groups are lobbying strongly for a clearer definition of the nature of the propertyright embodied in, and initiated with, the allocation process and are wanting to move towards greater industrycontrol over the management of that property right within a Government stewardship context. Government has,however, been reluctant to agree to moving in this direction and has maintained tight control over day-to-daymanagement of the fishery. The debate has been sharpened by the large asset-values which the property rightsnow have and the desire of industry to maximize both the value and the return on that asset. It is thereforesignificant that the continuing debate over the evolution of property rights in South Australia is most advancedin those fisheries (abalone and rock lobster) where the asset-values of the access-right are largest.
As a result, the current industry view is one of general satisfaction with the results of the initial allocationprocess from a stock-sustainability point of view but a growing frustration that additional economic benefitsfrom the access right are not being realized. As an example, although the access right to all quota-managedfisheries has been defined, the administration of the access right involves an annual renewal by the Government.Such annual renewal, with no legislative guarantees that the renewal will occur, significantly diminishes thevalue of the property right as a bankable asset.
7.3 Views of othercommunity groups
There was little debate, or consultation, with other community groups in the initial allocation procedure.While not initially an issue of great concern, this is becoming an increasing point of debate. Both recreationalfishing groups and conservation groups are lobbying the Government for specific allocations of the TAC. TheGovernment has, in fact, recently implemented a specific TAC for recreational purposes for rock lobsters, andthe overall management of the rock lobster resource will be conducted taking this recreational TAC into account.However, it was significant that the recreational TAC was an additional TAC (based loosely on a knowledge ofexisting recreational catch) and was not a re-allocation of a part of the existing commercial fishery TAC.
Another emerging aspect of the allocation debate revolved around the escalating values of the access right.Community groups are questioning the wisdom of past Government decisions that have provided a very largewindfall capital gain (in terms of asset values of access rights) to a small number of fishermen. These groupslobby for a more equitable distribution of the TAC and the participation of a greater number and diversity of usergroups in the exploitation of the resource. Such debates are likely to become more vociferous in future years.
South Australia Fisheries 156
7.4 Hind-sight assessment
Several major issues could have been addressed better in the initial allocation process. First, there were noeconomic or social considerations in the initial allocation debate in any fishery. This resulted in a number ofunexpected consequences, the most significant of which is in the rock lobster fishery. Here, there has beenvirtually no restructuring of the fishery to take advantage, for example, of higher prices in some months of theyear and to maximize economic performance. The explanation for this lack of restructuring seems to be social,one of entrenched habits and traditions of fishermen regarding family and holiday commitments, etc. It shouldbe noted for the first five years of quota management, transfers in the Southern Zone were only allowed withinthe fishery and this undoubtedly would have slowed the rate of adjustment. Both zones also maintain upper potlimits, which are an artificial impediment to free market adjustment in the respective fleets.
Another major issue has been the secondary impacts on coastal communities. In those areas and fisherieswhere fishing patterns have changed, there have been significant impacts on small local businesses, which havehad major cash-flow disruptions as fishermen take their quota in only a few months of the year and then oftenleave the town until the next season.
Second, as mentioned above, the allocation process has had the effect of producing large asset-values forthe access rights created to those who own them. This is becoming a major social debate as the Governmentdefends its past role in having created a group of wealthy, elite fishermen. During the initial allocation process,this effect was unforeseen and the process for re-allocation of access rights was not addressed. In hind-sight,such a process would have been best considered as part of the initial allocation package rather than trying toaddress the issue in later years after asset-values have increased.
7.5 Industr y views1
The introduction of individual transferable quotas in the South Australian Southern Zone lobster fisheryalongside the Northern Zone input-controlled lobster fishery presented a unique opportunity for social,economic, biological and management comparisons. There have been many social and economic consequences.Some important ones are listed below.
i. The allocation on an average per pot saw a redistribution of wealth from historically high catchers tothe historically low catchers.
ii. Those not able to take quota now, as they are poor catchers, in many cases lease it to those who werehistorically high catchers.
iii. In effect the allocation has redistributed annual profits.iv. The allocation has seen new investment in gear by those who received the wind fall wealth/profits.v. Those who lost catch and do not lease quota now have excess capacity. This excess capacity will no
doubt be taken up in the future by the wealthier fishers.vi. The problems with initial allocation has also seen a shift in catch pressure within the fishery. The
allocation dispute went through various courts, with their case funded by groups of fishermen.vii. Families were divided and remain divided on the initial allocation outcome.viii. The industry was divided on the allocation issue and remains divided, with two of seven ports
representing about 33% of licence holders effectively disengaged from recognized industry structures.ix. The input-control fishery (i.e. the northern zone) sees industry unified with consistent 90% support for
industry structures on a voluntary basis.x. The management time remains relatively high in the quota-fishery: industry and Fisheries Management
Committee (FMC) meetings are much more frequent (a ratio of 2:1 quota-managed fishery: input-control fishery) in the quota-managed southern zone fishery.
xi. Costs of management are higher in the quota fishery at $A1250/t compared with $A841/t in the input-controlled northern zone of the fishery.
xii. Compliance costs are also higher in the quota-managed southern zone at $A690/t for quota versus$A290/t for the input-controlled northern zone. This is seen by fishers as a gross injustice since it is thefishers who pay for these costs under the ‘cost-recovery’system.
xiii. Fishing patterns have emerged under the quota regime which are clearly sub-optimal from an economicpoint of view. Stock, weather and price-uncertainty, results in most of the quota being caught in periodswhen profits are low although catch rates might be high.
In short, the ITQ system has pitted one fisherman against another and has lead to social and industrydisharmony, which is not seen in the input-controlled northern zone fishery.
157 Morgan
1 These views on the initial allocation-process of access-rights were provided by members of the South Australian RockLobster Industry.

8. LITERA TURE CITED
EconSearch 1999a. Economic Indicators for the SASouthern Zone Rock Lobster Fishery 1997/98. Reportprepared for Primary Industries and Resources South Australia, February 1999.
EconSearch 1999b. Economic Indicators for the SANorthern Zone Rock Lobster Fishery 1997/98. Reportprepared for Primary Industries and Resources South Australia, February 1999.
South Australia Fisheries 158
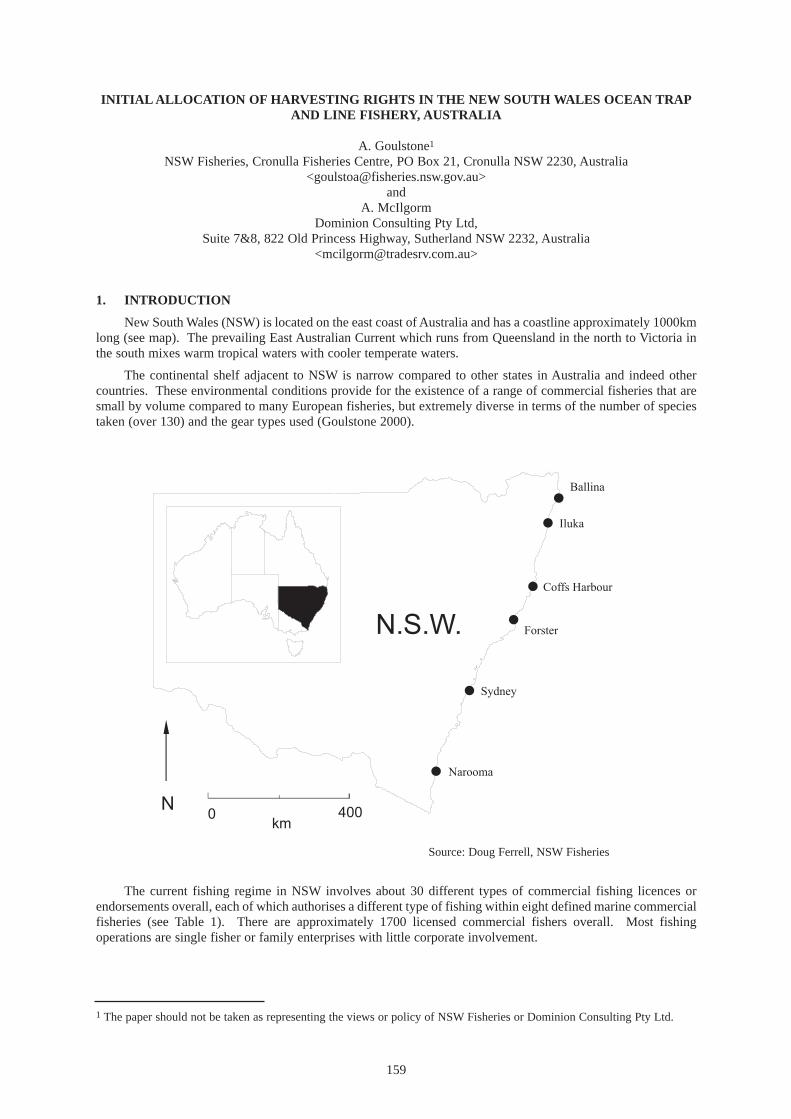
INITIAL ALLOCA TION OF HARVESTING RIGHTS IN THE NEW SOUTH WALES OCEAN TRAPAND LINE FISHER Y, AUSTRALIA
A. Goulstone1NSW Fisheries, Cronulla Fisheries Centre, PO Box 21, Cronulla NSW2230, Australia
<[email protected]>and
A. McIlgorm Dominion Consulting Pty Ltd,
Suite 7&8, 822 Old Princess Highway, Sutherland NSW2232, Australia<[email protected]>
1. INTRODUCTION
New South Wales (NSW) is located on the east coast of Australia and has a coastline approximately 1000kmlong (see map). The prevailing East Australian Current which runs from Queensland in the north to Victoria inthe south mixes warm tropical waters with cooler temperate waters.
The continental shelf adjacent to NSWis narrow compared to other states in Australia and indeed othercountries. These environmental conditions provide for the existence of a range of commercial fisheries that aresmall by volume compared to many European fisheries, but extremely diverse in terms of the number of speciestaken (over 130) and the gear types used (Goulstone 2000).
The current fishing regime in NSWinvolves about 30 different types of commercial fishing licences orendorsements overall, each of which authorises a different type of fishing within eight defined marine commercialfisheries (see Table 1). There are approximately 1700 licensed commercial fishers overall. Most fishingoperations are single fisher or family enterprises with little corporate involvement.
159
N0 400
km
N.S.W.
Coffs Harbour
Ballina
Sydney
Narooma
Iluka
Forster
Source: Doug Ferrell, NSWFisheries
1 The paper should not be taken as representing the views or policy of NSWFisheries or Dominion Consulting Pty Ltd.

New South Wales Trap and Line 160
O
cean
tra
p-
and-
line
Oce
an p
raw
n tr
awl
Oce
an f
ish
traw
l O
cean
hau
ling
Lob
ster
A
balo
ne
Est
uary
pra
wn
traw
l E
stua
ry g
ener
al
Met
hods
D
emer
sal t
rap
Han
dlin
e Se
tline
D
ropl
ine
Lif
t net
Otte
r tr
awl
Otte
r tr
awl
Bea
ch s
eine
net
Pu
rse
sein
e ne
t
Tra
p/po
t D
ivin
g
(hoo
kah)
Otte
r tr
awl n
et
Han
dlin
e T
rap/
pot
Sein
e ne
t M
esh/
gill
net
Mai
n sp
ecie
s Sn
appe
r K
ingf
ish
Mor
won
g Sp
anne
r cr
abs
Silv
er tr
eval
ly
Eas
tern
kin
g pr
awn
Sc
hool
pra
wn
Roy
al r
ed p
raw
ns
Bal
mai
n bu
gs
Oct
opus
Silv
er tr
eval
ly
Tig
er f
lath
ead
Red
fish
Sea
mul
let
Sea
garf
ish
L
uder
ick
Yel
low
tail
Pi
lcha
rds
Roc
k lo
bste
r (e
aste
rn)
B
lack
lip
abal
one
Scho
ol p
raw
n E
aste
rn k
ing
praw
n
Yel
low
fin
brea
m
Dus
ky f
lath
ead
Sand
whi
ting
L
ongf
inne
d ee
ls
Sea
mul
let
Tot
al c
atch
in
1998
/99
(t)
1995
34
29
413
2463
11
0 32
3 49
5 49
43
Est
. val
ue in
19
98/9
9 (A
$m)
9.6
22.7
1.
5 4.
1 4.
2 12
.6
3.2
17.5
No.
of
auth
oris
ed
fish
ing
busi
ness
es
630
330
102
399
170
37
294
944
Stan
dard
boa
t le
ngth
(m
) 6-
8 14
14
4
6-8
6 9
5
Gen
eral
no.
of
unlic
ense
d cr
ew
0-1
2 2-
3 0*
0-
1 1
1 0*
Tabl
e 1
Ove
rvie
w o
f th
e m
ajor
mar
ine
com
mer
cial
fis
herie
s in
NS
W(S
ourc
e: F
letc
her
and
McVe
a, 2
000;
Tann
er a
nd L
iggi
ns,
2000
; N
SWF
ishe
ries
Lice
nsin
g da
taba
se –
Mar
ch 2
001)
* N
ote:
law
pro
hibi
ts t
he u
se o
f un
licen
sed
crew
in t
hese
fis
herie
s

Although NSWhas had a requirement to licence commercial fishers and fishing boats since the introductionof The Fisheries Act 1881 it was only relatively recently, in the 1980s, that fishing licences were first restricted.
Fishing boat licences were first limited in 1984, whereas fisher licences were not limited until 1987. Thenature of the limitation was general, allowing licence holders to undertake most activities. Limited access hasbeen introduced for some individual fisheries over the years, however only as of 1997 were restrictions bymethod, species and area implemented in the main commercial fisheries through the introduction of a specificrestricted fishery management regime (see Table 2).
Table 2Chronology of management events in NSW
Some significant milestones with respect to the allocation of harvesting rights in NSWwere thecommencement of the Licensing Policy in 1994 and the introduction of The Fisheries Management Act 1994.
The Licensing Policy inaugurated the process of catch validation, which involved identifying the records ofhistorical catch for each fishing business between the years 1986 to 1993. The policy included a requirement fornew entrants to the industry to acquire a fishing business with a minimum level of validated catch history beforea new licence could be issued. It has provided a way of consolidating unused, or little used, fishing licences overtime, and ensures that real fishing effort is being reduced upon licence transfer.
The validated catch history of a ‘fishing business’is quantified prior to the transfer of the business, and themarket value of the business normally varies depending on the amount of validated catch history associated withit. The validated catch history was later used to allocate endorsements in the new restricted fisheries, which isthe subject of this case study.
The introduction of the Fisheries Management Act 1994provided two broad frameworks for managingcommercial fisheries; share management fisheries and restricted fisheries2. The share management fisheryscheme enables the issue of shares with a statutory right to compensation if the shares are cancelled. Therestricted fishery regime provides an alternate limited access management framework which does not have thesame right to compensation. A detailed comparative review of the share management fishery and restrictedfishery regimes has been described by Goulstone (2000) and is not repeated here.
161 Goulstone & McIlgorm
Year Management event mid 1800Õs Commercial fishing commenced in NSW estuaries
1865 Fisheries Act 1865 commenced in response to concerns of overfishing, enabling the declaration of seasonal and area fishing closures
1881 Fisheries Act 1881 commenced, allowing for the regulation of fishing gear, including controls over mesh sizes in nets, the licensing of fishers and fishing boats
1980 Access to abalone fishery limited 1984 Freeze on the issue of new fishing boat licences introduced 1986 Access to estuary and offshore prawn trawling limited 1987 Freeze on the issue of new fisher licences (Òcommercial fishing licencesÓ)
introduced 1993 Access to the lobster fishery limited 1994 Licensing Policy introduced, commencing the process of catch validation 1995 Commencement of the Fisheries Management Act 1994 which provided for
the establishment of Ôshare-management fisheriesÕ and Ôrestricted fisheriesÕ 1997 Restricted fisheries introduced for major marine commercial fisheries:
ocean prawn trawl, ocean fish trawl, ocean trap-and-line, ocean hauling, estuary prawn trawl, estuary general (NB. the abalone and lobster fisheries were declared share-management fisheries)
2000 Commencement of share fishery management plans for the abalone and lobster fisheries Amendment to the Fisheries Management Act 1994 provides an alternate share-management fishery model
2 The Act has since been amended to include a third management framework called Category 2 share management fisheries,which is discussed in Section 8.

An example of a NSWtrap and line boat(Source: NSWFisheries Dept.)
In this account we follow the allocation process with the Ocean Trap and Line Restricted Fishery. The fisheryuses square wire mesh fish traps3, a variety of line methods including handline, dropline, bottom set longline,trolling, and lift nets targeting spanner crabs. Normally one or two persons conduct daily trips to sea on boats ofaround 6-8 metres (20-26 feet) in length. The fishery operates along the entire length of the NSWcoast.
2. THE NATURE OF THE HAR VESTING RIGHT
The introduction of the Fisheries Management Act 1994brought about significant changes to commercialfishing rights and entitlements in NSW. Prior to the introduction of this Act, fishing licences were renewedannually and were subject to cancellation if a fisher failed to spend the major portion of their time, or earn themajor portion of their income, from fishing.
This provided little security for the industry as fishers were sometimes required to prove their financialdetails, and licences could potentially be cancelled at each annual renewal. The requirement forced fishers towork harder than they may have wanted or apply more fishing pressure on the resource than was desirable(Goulstone 2000).
This regime was replaced by an automatic licence renewal process. Irrespective of the new sharemanagement provisions, this change to the licensing regime was a significant enhancement to the rights andsecurity of the industry. No longer are fishers subjected to annual licence renewal assessments and theGovernment now has limited grounds upon which to refuse a renewal application, when they do so it is primarilyrelated to breaches of the Act.
The relatively open licensing-regime that was in effect prior to the introduction of restricted fisheries in1997 failed because there were no controls on the movement of fishers, boats or effort between fisheries. Forinstance, if the majority of licence holders decided to begin fishing in the ocean trap and line fishery there wasno easy way of preventing it. It was necessary to clearly define each fishery and limit the number of participantsto ensure the long-term sustainability of the resource.
The decision to establish a restricted fishery for ocean trap and line and the other major commercial fisherieswas made in August 1995. The fishery commenced some 18 months later, on 1 March 1997. The fishery wasdivided into different component parts. The harvesting right granted through the allocation process could have up
New South Wales Trap and Line 162
3 The traps have maximum dimensions of 2x2x2 metres (or 6.5x6.5x6.5 feet).

to six specific endorsements4. The endorsements authorise the use of gear and the taking of species in the variousparts of the fishery. Fishing businesses became eligible for the entitlements based on their validated catch history.
The fishing business is transferable as an entire package with all associated validated catch history. A newentrant is eligible for a fishing licence if the combined validated catch history of the business meets the minimumlevel (called a “recognised fishing operation” or “RFO”), and then qualifies for endorsements in each fisherybased on whether the individual eligibility criteria for each endorsement are satisfied.
There is cap on the total number of fishing businesses, with new entrants having to buy existing businesseswith validated catch history to operate in the fishery. All licences and endorsements associated with a fishingbusiness must be transferred together and cannot be split.
The endorsements on the licence are valid for the period specified in the endorsement, which is currentlythe same annual period as the licence. Licences or endorsements can be suspended, cancelled, or refused renewalby the Minister for breaches of the Fisheries Management Act 1994and in other circumstances such as the failureto pay the relevant fees or contributions.
Fishing businesses can be held in company or partnership names but licences and endorsements can only beissued to natural persons. Consequently, there are provisions which allow fishing business owners to nominate aperson to hold the endorsements of the business, though the nomination must involve all endorsements of thebusiness. Although not legally recognised, the nomination provision makes leasing possible under certaincircumstances.
Since the allocation of endorsements in specific fisheries, the market value of businesses has changeddepending on the endorsements held and the amount of validated catch history associated with the fishingbusiness.
3. THE METHOD OF ALLOCA TION3.1 Policy objectives
The policy objectives of the allocation process were to include and legitimise past fishing activity andestablish a base for future management through relating fishers’past participation to designated fisheries. Theaim was not to radically restructure fishing capacity, but to limit the number of different designated fisheriesaccessible to a business.
Once the participants in the fishery were defined, it was considered more effective and efficient to consultwith those fishers on the development of a fishery management plan. It has been difficult historically to resolvemanagement issues in the fishery without having a defined group of fishers who had a substantial interest in thefishery to consult with. As will become apparent, the first set of criteria proposed for the ocean trap-and-linefishery was criticised as being too high, potentially excluding many of the smaller or diversified businesses.
3.2 Process used in determining the allocation
The first step in the process was to seek nominations from the commercial fishing industry and therecreational fishing sector for positions on the Ocean Trap and Line Steering Committee.
The Steering Committee was required inter alia to clearly define the fishery (including the endorsementtypes that would apply) and make recommendations to the Minister on the eligibility criteria required for ongoingaccess to the fishery. Membership of the Committee comprised four industry representatives, two recreationalfishing representatives, NSWFisheries Managers and observers from the areas of fisheries research andcompliance.
A set of proposed eligibility criteria, based on a minimum tonnage, or value of validated catch history, weredeveloped at the first meeting of the Steering Committee and mailed to all licence holders in December 1995.The criteria were also published in the bimonthly industry magazine. Fishers were asked to provide writtencomments on the proposals in time for a second meeting of the Steering Committee in February 1996. Fisherymanagers held meetings at various ports during this period to personally discuss the draft criteria with fishers.
The draft criteria were relatively high to start with and some parts of industry began to lobby theGovernment that the criteria would penalize small and diversified operators. The following quotes from theindustry magazine published at the time, titled “The New South Wales Fisherman”, show the depth of feeling(Anon. 1996):
163 Goulstone & McIlgorm
4 Endorsements are placed on the commercial fishing licence of a person, and both are required to take fish for sale in NSW.

“The Evans Head Fishermen’s Co-operative could close down if proposed entry criteria for thetrap & line fishery are introduced.”
“But with NSW Fisheries proposing that a fisherman should have a history of big catches to gainentry to a particular fishery, the fisherman with a lower level of catch across a number of fisherieswill be knocked out.”
“The Fisheries Department has got to be flexible enough to look again at this properly and workthrough the problem with fishermen, and give a fair go to fishermen with a genuine commitmentto the fishery” .
Out of the 440 written submissions submitted on the draft criteria for all proposed restricted fisheries5, 49% werefrom fishers concerned with the performance level of the ocean trap-and-line criteria.
The draft criteria were revised at the second (and last) meeting of the Steering Committee. The criteria weresoftened to take into account the legitimate contention that diversified fishers would have suffered had theyremained as originally proposed. Of particular significance was the change from a weight or value of catchhistory to one based on the number of monthly catch returns that showed relevant activity. In other words, it wasnot the quantity of catch that counted at that stage but the fact that the fishing activity had been historicallyundertaken.
The revised criteria were once again mailed to all licence holders for comment and published in the industrymagazine. The distribution was wider this time with the criteria published in the NSWGovernment Gazette anda statewide prominent newspaper seeking public comment. Surprisingly few submissions were received frommembers of the public and the changes seemed to have addressed most of industry’s concerns.
Small variations were made to the draft criteria following the round of public consultations and the criteriawere subsequently approved by the Minister. An invitation to apply for endorsements in the new Ocean Trap andLine Restricted Fishery was sent to each fisher in September 1996, some 10 months after the first steeringcommittee meeting. Applications closed on 31 December 1996.
3.3 Allocation method chosen
The allocation process defined ongoing access to the ocean trap-and-line fishery in the form ofendorsements on the licence. The diversity in fishing methods within the fishery led to six different endorsementtypes being created, each one authorising a different form of trap-and-line fishing.
The criteria for the allocation of endorsements was based predominantly of the level of validated catchhistory of the business. Table 3 provides a description of the endorsement types and the approved eligibilitycriteria.
4. DATA REQUIREMENTS AND COMPUTATIONAL PROCESS
The eligibility criteria for the Ocean Trap and Line fishery, and indeed most other restricted fisheries, reliedheavily on the historic catch data submitted by licensed fishers over the years. Fishers have been legally requiredto submit monthly catch returns to the Government for over 50 years, declaring generally where and how theyfished, and the quantity of each species landed.
The catch validation process which commenced in 1994 took into account records of catch between theyears 1986 to 1993. Whilst available, the accuracy of the records prior to 1986 was questionable and they wereavoided. The catch return forms were changed in July 1990 to improve the level of reporting. Whereas the oldcatch returns only required fishers to indicate the main method used during each month, the new form requiredfishers to list every method that had been used. Because the eligibility criteria were based largely on the numberof catch returns indicating that a method had been used, the old returns posed some difficulties in the allocationprocess. Fishers claimed that particular methods have been used, but that it was not their primary activity.
This was a situation well known by the fishery managers and the Steering Committee members when thecriteria were being developed, and there was general agreement that applicants who could not satisfy the criteriaon the basis of the catch return information would need to lodge an appeal and provide evidence of their activities.However, to facilitate the assessment process and avoid the need for genuine fishers to have to appeal, a speciesmatrix was developed and used on a case-by-case basis to determine whether a gear type had been used. Forexample, where commonly trapped species such as snapper, morwong and leatherjacket appeared together on acatch return, it would normally be accepted as a ‘fish trapping’return.
New South Wales Trap and Line 164
5 Draft criteria were distributed at the same time for the ocean prawn trawl, ocean fish trawl, ocean hauling (purse seinesector), estuary prawn trawl and estuary general fisheries.

Table 3Endorsements and eligibility criteria in the ocean trap-and-line restricted fishery
* An interim restriction was implemented for spanner crabs in 1995 in response to concerns of overfishing, and administeredthrough a permit scheme.
For the endorsement types where a quantity of product was required (such as the spanner crab endorsements,school and gummy shark endorsement), fishers were able to provide audited marketing records to prove that theyhad landed a greater amount of product than that indicated on their catch returns. However, these additionalrecords were not accepted unless signed by a registered company auditor. Catch return data or market data thatwere known, or suspected, to be wrong were not counted towards the eligibility assessment for a businesses.
The identification of validated catch history and assessment of each fishing business against the approvedcriteria was a time-consuming and complex process, but was seen to be an equitable way of defining ongoingharvesting rights.
5. APPEAL PROCESS
Fishers who were unsuccessful in their applications for endorsements were provided with the opportunity toappeal to an independent review panel. The composition of the panel, the grounds for appeal and the process tobe followed were established in legislation. The appeal process provided an inexpensive alternative for fishersto the normal Court process.
165 Goulstone & McIlgorm
Endorsement type Description Eligibility criteria Demersal fish trap Authorises the use of a fish trap to take
fish (other than spanner crab) in ocean waters
The applicant must have submitted a minimum of 6 ocean-waters catch returns for the years 1986 to 1990 and 4 ocean-waters catch returns for the years 1991 to 1993, that indicate that fish were taken using a fish trap of a kind known as a bottom or demersal fish trap
Line fishing (western zone)
Authorises the use of line methods to take fish from ocean waters that are less than 100 fathoms (183 metres) in depth
The applicant must have submitted a minimum of 6 ocean-waters catch returns for the years 1986 to 1990 and 4 ocean-waters catch returns for the years 1991 to 1993, that indicate that fish were taken by the method of line fishing
Line fishing (eastern zone)
Authorises the use of line methods to take fish from ocean waters that are greater than 100 fathoms (183 metres) in depth
The applicant must have submitted a minimum of 4 ocean-waters catch returns for the years 1986 to 1990 and 2 ocean-waters catch returns for the years 1991 to 1993, each of which indicate that at least two of the following species were taken by line methods: blue-eye trevalla, hapuku, ling, bass groper and gemfish
School and gummy shark
Authorises the use of line methods to take school or gummy shark from ocean waters that are south of a line drawn due east from the northern point of the entrance to the Moruya River
The applicant must have taken a minimum of 200kg of school or gummy shark (or a combination of the two) in the years 1986 to 1990 and 100 kg in the years 1991 to 1993
Spanner crab (northern zone)
Authorises the use of a spanner crab net to take spanner crabs for sale from ocean waters north of a line drawn due east from the southern breakwall at Yamba
The applicant must have taken a minimum of 1200kg of spanner in that area in the period 1986 to 1990, or hold a spanner crab permit*
Spanner crab (southern zone)
Authorises the use of a spanner crab net to take spanner crabs for sale from ocean waters between a line drawn due east from the southern breakwall at Yamba in the north to Ko rogoro Point (near Hat Head) in the south
The applicant must have submitted a minimum of 3 ocean-waters catch returns in the years 1986 to 1990 that indicate that spanner crab were in that area using a spanner crab net, or hold a spanner crab permit*

The review panel consisted of a panel of 3 members, as follows:
i. a chairperson of the panel, being a person who was neither engaged in the administration of the FisheriesManagement Act 1994 nor in commercial fishing and who, in the opinion of the Minister, wasappropriately qualified to conduct the review; the appointed person was a retired magistrate
ii. the Director of NSWFisheries or a nominee of the Director; the appointed person was an experiencedDepartmental compliance officer and
iii. a person with extensive practical experience in the commercial fishing industry (but not a person whohad a financial interest in the fishery to which the appeal relates); the appointed person was a wellrespected retired NSWcommercial fisher.
The grounds for appeal were relatively broad and are included in Box 1. To prevent frivolous or spuriousappeals, fishers were only allowed to appeal for endorsements that they applied for and were subsequentlyrefused. The closing date for appeals was set at 31 December 1997, some 10 months after the commencement ofthe restricted fishery, to give fishers ample opportunity to assemble their supporting information.
The review panel did not have the power to grant an endorsement to a fisher, but could makerecommendations to the Minister on whether or not an appellant should receive an endorsement. The Ministerwas unable to decide against the decision of the review panel by law, but could refer the matter back to the panel(together with comments or recommendations) for further consideration. This model proved successful atpreventing the Minister from being heavily lobbied by appellants following the recommendation by the reviewpanel.
Within the applications submitted, the grounds for appeal varied considerable. Table 4 indicates the numberof appeals lodged for each endorsement type and the success rate of the appeals. The number of withdrawnapplications is relatively high, due partly to the existence of a policy that required all pending appeals for a fishingbusiness to be withdrawn prior to a business being transferred.
Once an appeal was lodged, appellants were permitted to fish in that part of the fishery until the result oftheir appeal was known. This was an important aspect to have included in the appeal process for both equity,fairness and political reasons, but meant that some fishers lodged appeals simply to be able to continue fishingpast the restricted fishery commencement date. There is no easy solution to this problem.
New South Wales Trap and Line 166
Box 1Grounds for appeal (extracted from the Fisheries Management Act 1994)
A panel that conducts a review may decide that a person is eligible foran endorsement in arestricted fishery, or should be eligible foran endorsement in the fishery, if the person whoapplied for the review satisfies the panel:
(a) that the records relied on to make a determination whether the person is eligible for anendorsement (for example, catch history records) are, for reasons that are not attributable tothe fault of the person, inaccurate or incomplete and, on the basis of verified recordsproduced to the panel by the person, the person does in fact satisfy the eligibility criteria forthe endorsement, or
(b) that a determination as to the catch history associated with the person’s fishing business isincorrect and, on the basis of verified records produced to the panel by the person, the persondoes in fact satisfy the eligibility criteria for the endorsement, or
(c) if eligibility is based on the person’s activities in a fishery during a particular period, that:(i) the person suffered illness or other incapacity for a significant period and the illness or
incapacity substantially affected his or her ability to satisfy the eligibility criteria for theendorsement, or
(ii) the person lost his or her commercial fishing boat due to an accident or misadventure andthe loss substantially affected his or her ability to satisfy the eligibility criteria for theendorsement, or
(iii) the person was engaged in fishing during that period and for other significant reasons(that are not attributable to the fault of the person) the person was unable to satisfy theeligibility criteria.

Table 4Appeal record for the Ocean Trap and Line Restricted Fishery
(Source: NSWFisheries licensing database – March 2001)
The appeal process was conducted in 3 stages, as follows:
Stage 1was an initial consideration by the review panel of the evidence supplied with the application for appeal.If sufficient evidence was available a recommendation was made to the Minister that the endorsement/s begranted.
Stage 2was a request by the panel for further documentary evidence to be supplied, and reconsideration of theappeal following the provision of additional information. As with Stage 1, if sufficient evidence became availablea recommendation was made to the Minister that the endorsement/s be granted.
Stage 3was a face-to-face hearing, including the provision of verbal evidence from the appellant and from NSWFisheries, with questioning and cross examination. At this stage, the panel made a final decision as to whetheror not an endorsement would be recommended to the Minister.
The face-to-face hearings conducted by the review panel at stage 3 were normally held in meeting rooms atDistrict Courts. To reduce the need for fishers to travel, the review panel conducted hearings in convenientregional locations.
6. ADMINISTRA TION OF THE ALLOCA TION PROCESS6.1 Staff requirements
The allocation process was completed by NSWFisheries without assistance from external consultants.However, the substantially increased workload necessitated the employment of additional temporary staff andconsiderable periods of overtime.
It is not possible to estimate the level of resources expended specifically to allocate harvesting rights in theocean trap-and-line fishery because the assessments for five other restricted fisheries were being undertaken atthe same time. When it got closer to the restricted fishery commencement date and the deadline for mailing outthe results of each fisher’s assessment, up to 25 staff were working on the overall project, often throughout thenight and over weekends to ensure that things would be delivered on time. This required a high level ofdedication, motivation and morale of the individual staff involved.
Once the results had been sent to fishers6, substantial staff resources were required to answer telephoneinquiries and check the assessments for apparent errors. Relevant staff were sent on a short training course inconflict resolution to learn how best to deal with disgruntled fishers who were displeased with the results of theirassessment.
167 Goulstone & McIlgorm
Endorsement type
No. of appeals lodged
No. of successful
appeals
No. of unsuccessful
appeals
Success rate (%)
No. withdrawn
Demersal fish trap
199 69 50 58 80
Line fishing (western zone)
224 118 44 73 62
Line fishing (eastern zone)
181 69 46 60 66
School and gummy shark
61 16 25 39 20
Spanner crab (northern zone)
9 0 4 0 5
Spanner crab (southern zone)
6 0 1 0 5
6 All fishers were notified of the results of their applications for access to all restricted fisheries at the same time.

The Fisheries Managers and administrative staff spent a number of days in the field after the allocationresults were sent to fishers to go through the assessment with unsatisfied fishers. This proved to be a valuableexercise. The appeals process also consumed substantial staff and financial resources and was a two to three yearprocess to complete. The resources needed for appeal processes should not be underestimated!
6.2 Additional pr ogramme funding requirements
It is also not possible to calculate the level of financial resources used to allocate endorsements in the oceantrap-and-line fishery separately because all new restricted fisheries were administered under the same applicationand assessment process. However, the overall process used significantly more resources than initially envisagedand resources were eventually diverted from other Departmental programs to ensure that the project wascompleted on time.
The application fee charged for each endorsement (A$30) recovered only a small proportion of the totalcosts incurred in completing the project. The fee for appeal (A$100 per fishery) was also small compared to thecosts of providing the appeals service, and was refundable to successful appellants.
7. EVALUA TION OF THE INITIAL ALLOCA TION PROCESS 7.1 Success in achieving initial policy objectives
The Ocean Trap and Line Fishery is now a distinct fishery with six different endorsement types. Theprogram was successful in reducing the number of fishing businesses able to operate in the fishery, from around1800 to 630. The number of endorsements allocated in each part of the fishery, after the appeals have beenfinalised, is detailed in Table 5.
Table 5Number of endorsements allocated in the Ocean Trap and Line Restricted Fishery
(as at 26 March 2001)
The identification of specific endorsement holders in the fishery has enabled a formal ManagementAdvisory Committee to be formed, with industry representatives being elected by their respective endorsementholders. NSWFisheries has been working with the Management Advisory Committee since 1997 to developmore robust fishery management arrangements, and is due to commence the development of a 5-year fisherymanagement strategy later in 2001.
7.2 Satisfaction of rights holders with the process
As with the introduction of any fishery management strategy, there were mixed views about entering into arestricted fishery regime and about the level of the initial entry criteria. Not surprisingly, the full time ocean trap-and-line fishers pushed hard for the arrangements to be introduced and sought high entry criteria. A lesser numberof endorsement holders means less competition and a reduced chance of effort shifts which could have led toincreased pressure on trap-and-line resources. Conversely, the diversified or part-time fishers lobbied hardagainst the scheme and sought very low criteria so that they could remain in the fishery.
There were often claims by fishers throughout the process that other applicants had provided false ormisleading information, or gained endorsements that they did not deserve. There were also varying views aboutthe appeals process with most people believing that it was fair and equitable, but some criticism that the reviewpanel accepted false evidence and was too lenient. Three years on, fishers have adopted the new regime anddiscussions with industry representatives have indicated acceptance amongst the majority.
New South Wales Trap and Line 168
Endorsement type Number of endorsements
Demersal fish trap 336
Line fishing (western zone) 589
Line fishing (eastern zone) 120
School and gummy shark 31
Spanner crab (northern zone) 60
Spanner crab (southern zone) 14

7.3 Views of the othercommunity groups
While formal views about the restricted fishery program have not been readily communicated by non-commercial interest groups, there appears to be a good overall acceptance of the restricted fishery program as thefirst step in the process of management plan development.
The fact that recreational fishing representatives were involved in the development of the eligibility criteriafor endorsements ensured that any concerns from the recreational sector were dealt with early in the managementprocess. The conservation sector were not involved in the steering committee process, but have had arepresentative on the Ocean Trap and Line Management Advisory Committee since 1997 and have been closelyinvolved in management discussions to date.
7.4 Hind-sight assessment
The process of allocating harvesting rights in the fishery was successful. The fact that industry groups andother sector groups were involved in the development of the criteria from the outset through the steeringcommittee process was an important factor in its success. Other strengths of the program in hindsight were:
i. the extensive period of meaningful consultation on the criteria, including mailing two sets of draftcriteria to industry for comment, and requests for public input
ii. the robust and comprehensive appeals process – it was designed to provide a low-cost appealsmechanism for industry and has been valuable in preventing costly formal Court challenges and
iii. the inclusion of validated catch history in the eligibility criteria meant that fishers who had a record ofparticipation received ongoing entitlements, whereas access was denied to fishers with no recordedhistory; this was seen as an equitable way of allocating access arrangements.
If anything about the process could be changed it would probably be a simplification of the eligibilitycriteria. One of the reasons for needing such a high level of resources to implement the scheme was thecomplexity of the criteria and the subsequent difficulties encountered in the assessments. Additionally, a higherapplication fee would have been beneficial to cover the full costs of implementation and avoid drawing resourcesaway from other areas within the Department.
8. DISCUSSION
Since the restricted fishery commenced in 1997, NSWFisheries has been working with the Ocean Trap andLine Management Advisory Committee to develop new transfer criteria. The criteria are aimed at ensuring thatfishing businesses with ocean trap-and-line endorsements and small catch histories cannot be transferred to newentrants who may increase effort levels in (parts of) the fishery.
After a further period of consultation with endorsement holders, a substantially higher level of catch historyhas been agreed, to apply upon the transfer of fishing businesses. The new criteria will have the effect of reducingthe overall number of available endorsements over time, by consolidating small or part-time trap-and-line fisheryoperations.
An important feature of this regime is that the small or diversified fishers have been catered for in the initialallocation process, but will not cause effort blowouts (i.e. large, rapid and unexpected increases in effort) whenthey exit the fishery. The fishery restructure is also funded by people wishing to enter the fishery, rather than byexisting participants or Government.
There has been a further development of the rights-based management structure for the ocean trap-and-linefishery more recently. The Fisheries Management Act was amended in December 2000 to roll the fishery into anew share-management fishery framework. The new framework provides a fishing right that sits somewhere inbetween the traditional share-management fishery model discussed earlier in this paper and the restricted fisheryscheme.
The new share-management scheme will involve the issue of shares in the fishery for a term of 15 years(rather than in perpetuity), which are subject to statutory compensation if they are cancelled. The model has beendesigned to give fishers more secure harvesting rights than those conferred by the restricted fishery regime, butwith lower fees and contributions payable than under the full share-management system.
The Ocean Trap and Line Management Advisory Committee will soon have the task of recommending thebasis on which shares should be issued in the new share-management fishery. The options include using thevalidated catch history of fishing businesses, or issuing shares on the basis of the endorsements previously issuedin the restricted fishery (or a combination of the two). It will be interesting to see how the harvesting rights willchange, if at all, as the fishery moves through this next era.
169 Goulstone & McIlgorm

9. LITERA TURE CITED
Anon. 1996. Draft Fishery Criteria: Trap & line rules could shut down Evans Head Co-op. The New South WalesFisherman. January-February 1996. pp40-41.
Goulstone, A.R 2000. Rights-based Fisheries Management in New South Wales, Australia. In: Shotton, R. (ed.)Use of property rights in fisheries management. Proceedings of the FishRights99 Conference. Fremantle,Western Australia, 11-19 November 1999, Workshop presentations. FAO Fisheries Technical Paper.No.404/2. Rome, FAO. 2000. p78-83.
Fletcher, W. and T. McVea. (eds) 2000. NSWFisheries 1998/99 Status of Fisheries Resources. NSWFisheriesResearch Institute. 219 pp.
Tanner, M. and G.W. Liggins 2000. New South Wales Commercial Fisheries Statistics 1998/99. NSWFisheries,Cronulla Fisheries Centre. 21 pp.
New South Wales Trap and Line 170

THE INITIAL ALLOCA TION OF INDIVIDUAL TRANSFERABLE QUOTAS IN THE TASMANIANROCK LOBSTER AND ABALONE FISHERIES
W. Ford and D. NicolDepartment of Primary Industries, Water and Environment
GPO Box 44A- Hobart Tasmania, Australia 7001<[email protected]>
1. INTRODUCTION1.1 Individual transferable quotas in Tasmania
In Tasmania four fisheries operate under a management regime where the access rights are provided as ashare of a total allowable catch (TAC). Individual quotas were introduced into the abalone fishery in 1985, theselater became transferable. Individual transferable quotas (ITQs) were introduced to the rock lobster fishery in1998 and the giant crab fishery in 1999. A combination of a competitive TAC and individual quota are used tomanage the jack mackerel fishery. This paper provides a summary of the rock lobster and abalone fisheries priorto quotas, some rationale for quota management, the process of allocating those ITQs and discussion about thesuccess or otherwise of the process.1
The giant crab fishery is not discussed in detail as ITQs were only introduced in November 1999 andinsufficient time has elapsed to provide meaningful information about the allocation-process and its effects. TheITQs were allocated to eligible fishers on a 50/50 basis, half for holding a permit to fish that was issued by theCommonwealth Government, and half based on the previous catch history. This process resulted in the allocationof 5 quota units to each fisher who held a Commonwealth permit and another 1 quota unit for each 150kg of catchhistory above a yearly average of 500kg, with a maximum of 35 quota units per licence-holder. The result wasthat 535 quota units were issued on the basis of holding a permit, and 500 quota units issued on the basis of pastcatch history. The total allowable catch (TAC) for this fishery is 100t.
The rock lobster quota allocation mechanism was set up so that the allocation of the TAC was to be in10 507 equal units (per pot allocation). However, in recognition of the past high catches by some operators theequal allocation was phased-in over three years. The initial allocation in March 1998 split the TAC 90.909% ona per-pot basis (10,507 units of 130kg), and 9.091% allocated in relation to the the best year’s catch out of theprevious nine years. In March 1999 the allocation was 94.406% on a per-pot basis (10507 units of 135kg) and5.594% on the basis of past catch history. In March 2000 the allocation was 97.902% on a per-pot basis (10507units of 140kg) and 2.098% on the basis of past catch history. In March 2001 (and for subsequent years) theallocation was 100% on a per-pot basis (10507 units of 143kg) and 0% on the basis of past catch history.
The abalone fishery had individual quotas introduced in January 1985 and the units were allocated to125 divers. All had an equal allocation, apart from 5 divers who received a lesser allocation but who were laterallocated additional units. The initial allocation provided 120 divers with 28 quota units each, and 5 divers with20 quota units each. Later this became 125 divers with 28 quota units each. In 1993 the quotas became openlytransferable and therefore became ITQs. There are 3500 quota units in the fishery and the TAC is currently 2730t.
2. THE ROCK LOBSTER FISHER Y2.1 Intr oduction
The Tasmanian rock lobster fishery targets the southern rock lobster (Jasus edwardsii) in the waters adjacentto Tasmania. Since 1986 Tasmania has had jurisdiction for the fishery in waters generally south of 39o12’S, andout to 200 nautical miles from the coastline. This jurisdiction was provided to Tasmania by way of an OffshoreConstitutional Settlement agreement with the Commonwealth Government.
Prior to 1966 access to commercial rock lobster licences was not limited, but there were limits on thenumber of rock lobster pots that could be used by each vessel. In 1966 the number of commercial licences waslimited to 442 (Harrison 1986a). During the following 30 years there were a number of effort- and licence-reduction strategies that resulted in the number of licences falling to 321 in 1997, with a total limit of 10 507 rocklobster pots.
During the early 1980s the fishery continued to expand as fishers moved their fishing operations furtheroffshore. Catches peaked at 2217t in 1985, and then began to decline. This decline in catch occurred despite an
171
1 The views expressed in this paper are those of the authors and may not be the views of the current or previous TasmanianGovernments.

increase in effort, which peaked at nearly 2.1 million pot-lifts in 1992. During the period from 1985 to 1992 thefishing effort increased by about 30%, and as the catch was declining the catch-rate began to fall dramatically, asshown in Figure 1.
Figure 1Rock lobster catch, effort and catch rates (1970 to 1997)
Following the peak catch in 1985, and the subsequent decline despite the increase in effort, the industry andscientists became increasingly concerned about the sustainability of the fishery. Given that the fishery had beenexploited since about the 1830s, and the heavy fishing pressure during the 1960s, there was general concern thatthe stocks were declining.
During the early 1990s various management options were explored and debated within the industry, andwith government. The Government established a working group to investigate the management options andtheir suitability for the rock lobster fishery. It was apparent that there were only two options: (a) either asubstantial reduction in the fishing effort (of about 30%) or (b), the introduction of a total allowable catch(Anon. 1993). The industry was divided on the issue, with the majority recognising that there needed to bereductions in the catch and effort, but no agreement about how to do it. Finally, in August 1996 the Governmentdecided that the fishery would be managed by output-controls and that individual transferable quotas (ITQs)would be introduced.
The Government had two objectives in mind: the first was to reduce the catch to a level that would besustainable and allow the biomass to rebuild over time. The second was to provide a mechanism whereby theindustry could restructure, and allow those who wished to leave the fishery to achieve a reasonable return fortheir previous access. It was recognised that whatever management option was adopted, reducing the catchwould inevitably lead to fewer fishers participating in the fishery, or a less viable industry. The Governmentbelieved that quota was the better option for achieving its two objectives, and was supported by a majority ofthe industry (54% at the time of the decision to introduce ITQs and 67% at the time the legislation was debatedby Parliament).
Prior to the introduction of quota there were 309 active fishing vessels working in the fishery out of apossible 321 licences. These 309 vessels were operated by fishers who owned and operated a licence, by familyoperations and lease holders. In January 1997, 188 licences were operated by the owner or by the nominatedperson if the licence-holder was a company or partnership. Twenty-one licences were operated by a familymember of the owner, usually a son, brother, or husband. In some of these cases the operator may have beenpurchasing the family business. At that stage there were 112 licences that were leased or operated by someoneother than the licence owner or the owner’s family. It is estimated that there were about 850 people wereemployed directly on fishing vessels.
The value of the 1660t of rock lobster landed in 1997 was just over $A50 million. Economic assessmentsconducted in 1990/91 and 1997 estimated that on average between 41 - 45% of the landed value of rock lobster,was paid as wages to skippers and deckhands (Morrow 1991, CREA1997). Typically deckhands are paid about10% of the gross landed value, depending on their skill and how many deckhands are on the vessel. Skippersmay be paid up to 20% of the landed value of the catch, again depending upon experience.
Tasmania Rock Lobster and Abalone 172
0
500
1000
1500
2000
2500
1970
1972
1974
1976
1978
1980
1982
1984
1986
1988
1990
1992
1994
1996
Years
Cat
ch(t
onne
s)or
effo
rt(1
000s
ofpo
tfif
ts)
0
0.4
0.8
1.2
1.6
2
Cat
chra
te(t
onne
s/10
00po
tlif
ts)
Catch Effort Catch rate (kg/potlift)
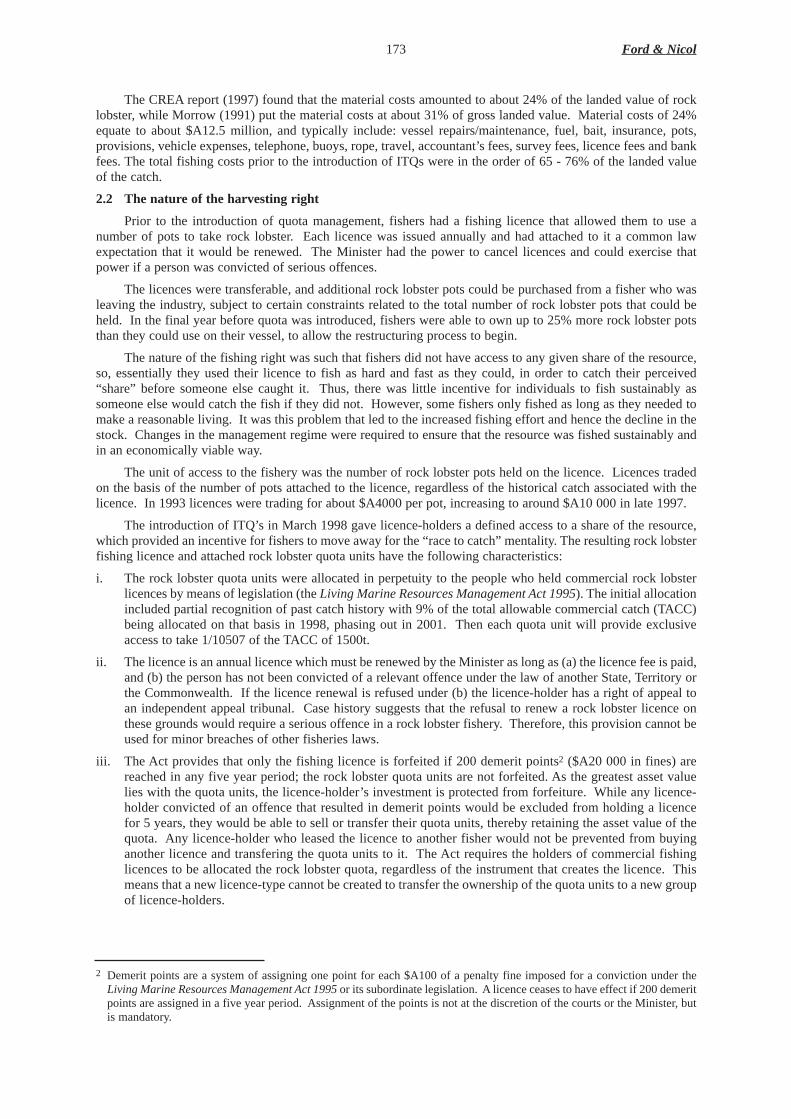
The CREAreport (1997) found that the material costs amounted to about 24% of the landed value of rocklobster, while Morrow (1991) put the material costs at about 31% of gross landed value. Material costs of 24%equate to about $A12.5 million, and typically include: vessel repairs/maintenance, fuel, bait, insurance, pots,provisions, vehicle expenses, telephone, buoys, rope, travel, accountant’s fees, survey fees, licence fees and bankfees. The total fishing costs prior to the introduction of ITQs were in the order of 65 - 76% of the landed valueof the catch.
2.2 The nature of the harvesting right
Prior to the introduction of quota management, fishers had a fishing licence that allowed them to use anumber of pots to take rock lobster. Each licence was issued annually and had attached to it a common lawexpectation that it would be renewed. The Minister had the power to cancel licences and could exercise thatpower if a person was convicted of serious offences.
The licences were transferable, and additional rock lobster pots could be purchased from a fisher who wasleaving the industry, subject to certain constraints related to the total number of rock lobster pots that could beheld. In the final year before quota was introduced, fishers were able to own up to 25% more rock lobster potsthan they could use on their vessel, to allow the restructuring process to begin.
The nature of the fishing right was such that fishers did not have access to any given share of the resource,so, essentially they used their licence to fish as hard and fast as they could, in order to catch their perceived“share” before someone else caught it. Thus, there was little incentive for individuals to fish sustainably assomeone else would catch the fish if they did not. However, some fishers only fished as long as they needed tomake a reasonable living. It was this problem that led to the increased fishing effort and hence the decline in thestock. Changes in the management regime were required to ensure that the resource was fished sustainably andin an economically viable way.
The unit of access to the fishery was the number of rock lobster pots held on the licence. Licences tradedon the basis of the number of pots attached to the licence, regardless of the historical catch associated with thelicence. In 1993 licences were trading for about $A4000 per pot, increasing to around $A10 000 in late 1997.
The introduction of ITQ’s in March 1998 gave licence-holders a defined access to a share of the resource,which provided an incentive for fishers to move away for the “race to catch” mentality. The resulting rock lobsterfishing licence and attached rock lobster quota units have the following characteristics:
i. The rock lobster quota units were allocated in perpetuity to the people who held commercial rock lobsterlicences by means of legislation (the Living Marine Resources Management Act 1995). The initial allocationincluded partial recognition of past catch history with 9% of the total allowable commercial catch (TACC)being allocated on that basis in 1998, phasing out in 2001. Then each quota unit will provide exclusiveaccess to take 1/10507 of the TACC of 1500t.
ii. The licence is an annual licence which must be renewed by the Minister as long as (a) the licence fee is paid,and (b) the person has not been convicted of a relevant offence under the law of another State, Territory orthe Commonwealth. If the licence renewal is refused under (b) the licence-holder has a right of appeal toan independent appeal tribunal. Case history suggests that the refusal to renew a rock lobster licence onthese grounds would require a serious offence in a rock lobster fishery. Therefore, this provision cannot beused for minor breaches of other fisheries laws.
iii. The Act provides that only the fishing licence is forfeited if 200 demerit points2 ($A20 000 in fines) arereached in any five year period; the rock lobster quota units are not forfeited. As the greatest asset valuelies with the quota units, the licence-holder’s investment is protected from forfeiture. While any licence-holder convicted of an offence that resulted in demerit points would be excluded from holding a licencefor 5 years, they would be able to sell or transfer their quota units, thereby retaining the asset value of thequota. Any licence-holder who leased the licence to another fisher would not be prevented from buyinganother licence and transfering the quota units to it. The Act requires the holders of commercial fishinglicences to be allocated the rock lobster quota, regardless of the instrument that creates the licence. Thismeans that a new licence-type cannot be created to transfer the ownership of the quota units to a new groupof licence-holders.
173 Ford & Nicol
2 Demerit points are a system of assigning one point for each $A100 of a penalty fine imposed for a conviction under theLiving Marine Resources Management Act 1995or its subordinate legislation. A licence ceases to have effect if 200 demeritpoints are assigned in a five year period. Assignment of the points is not at the discretion of the courts or the Minister, butis mandatory.

The above threecharacteristics effectivelymean that the rock lobsterquota units and rock lobsterlicences are issued to thelicence-holders inperpetuity, and they cannotbe made to forfeit the assetvalue if convicted underState law.
Rock lobster quotaunits can be freelytransferred between the 316licence-holders on apermanent or seasonalleasing basis. Only licence-holders may own quotaunits, this means themaximum number of unitholders recognised by theGovernment is 316. Thiswill be one of the issues forthe future, in that there arealready a number of licence-holders who believe that theownership of quota should be separate from the fishing entitlement. Currently the majority of licence-holderswant ownership of quota to remain with the fishing licence. This issue is further compounded as the industry hassought to have legislation introduced so as to allow financiers to register financial interests in licences and quotaunits. Already it is apparent that there are a number of licence-holders with investor partners who have fundedthe purchase of additional quota units and this trend may continue, thus there will be increasing pressure to allowthese investor partners to be formally recognised (Ford 2000).
2.3 Method of allocation2.3.1 Policy objectives
The Government decided in August 1996 that it would introduce ITQs into the fishery. This decision wastaken after three and half years of intense debate following the release of the Working Group’s interim report inMarch 1993 (Anon. 1993). This report recommended two management options: one being the introduction ofITQs, and the other being a 15% pot-reduction followed by ITQs or a further 15% pot reduction. The industrywas fairly evenly divided over the issue, with a slight majority favouring quota. During this period there were anumber of discussion papers released on how ITQs could be implemented, two formal industry ballots (bothresulting in a small majority for quota), many industry meetings and much political lobbying.
Between the time when the Government announced its decision in 1996 and the Parliament finally approvedthe ITQ legislation, there was intense political lobbying by the supporters of quota and those opposed to it. Thelobbying from those opposed to ITQs resulted in a Select Committee being established by the Upper House ofthe Parliament, which set out to review the management of the fishery and consider future options. The SelectCommittee report was handed down in July 1997 (Schulze et al. 1997) and contained 18 conclusions. One ofwhich concerned the difficulty of determining an equitable formula to transfer management from the establishedpot-allocations to ITQs. The report made nine recommendations, two key ones were: that ITQs not be introduceduntil the industry had been rationalised substantially through input-controls, and that if ITQs were ultimatelyintroduced, they be phased-in.
The Government rejected the findings of this report on a number of grounds, but one of the key concernswas that rationalisation by further input-controls would not achieve sustainability in the short-term.Subsequently, the Government proceeded with developing the ITQ system and an appropriate allocation method.
The Government had three objectives in mind when it set about allocating the quota. The first was that theaccess rights be maintained, and that one should preserve the 30-year history of the value of the licence being tiedto the number of pots on it. The second objective was that the allocation method needed to be secure from legalchallenge. The third objective was that the method needed to be simple to implement, without substantialadministrative work being required.
Tasmania Rock Lobster and Abalone 174
Emptying a lobster potCredit: Tasmanian Agriculture and Fisheries Institute
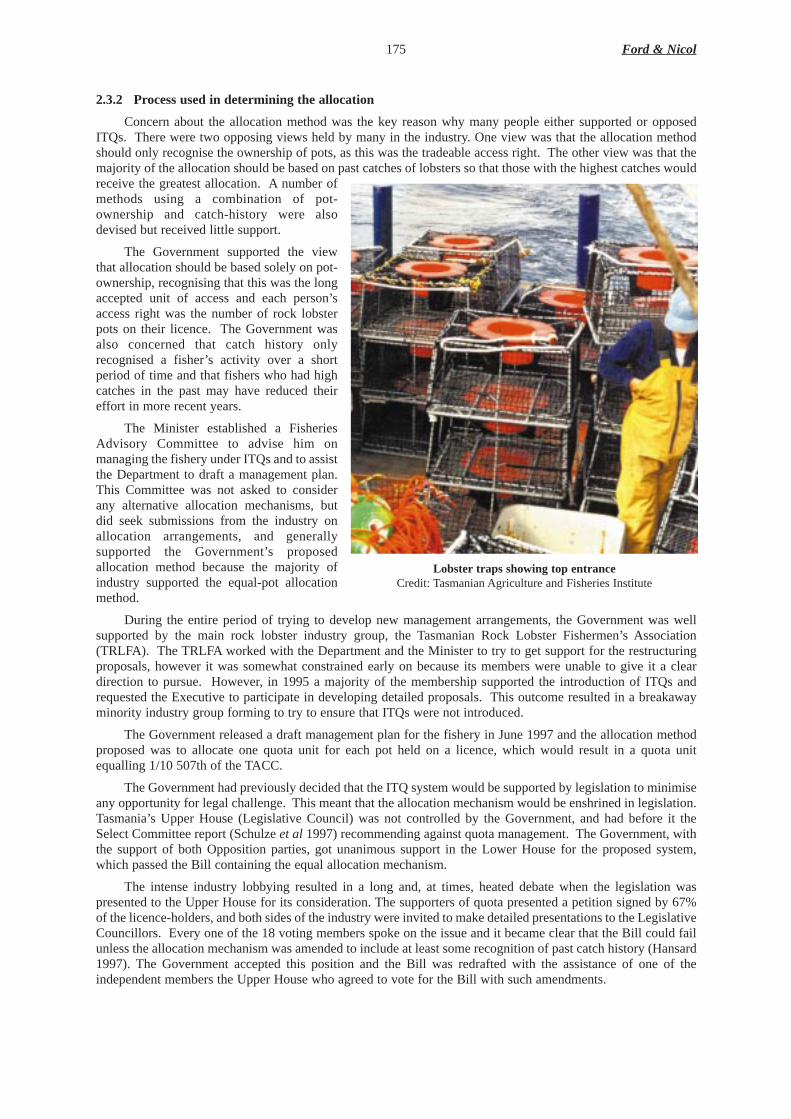
2.3.2 Process used in determining the allocation
Concern about the allocation method was the key reason why many people either supported or opposedITQs. There were two opposing views held by many in the industry. One view was that the allocation methodshould only recognise the ownership of pots, as this was the tradeable access right. The other view was that themajority of the allocation should be based on past catches of lobsters so that those with the highest catches wouldreceive the greatest allocation. A number ofmethods using a combination of pot-ownership and catch-history were alsodevised but received little support.
The Government supported the viewthat allocation should be based solely on pot-ownership, recognising that this was the longaccepted unit of access and each person’saccess right was the number of rock lobsterpots on their licence. The Government wasalso concerned that catch history onlyrecognised a fisher’s activity over a shortperiod of time and that fishers who had highcatches in the past may have reduced theireffort in more recent years.
The Minister established a FisheriesAdvisory Committee to advise him onmanaging the fishery under ITQs and to assistthe Department to draft a management plan.This Committee was not asked to considerany alternative allocation mechanisms, butdid seek submissions from the industry onallocation arrangements, and generallysupported the Government’s proposedallocation method because the majority ofindustry supported the equal-pot allocationmethod.
During the entire period of trying to develop new management arrangements, the Government was wellsupported by the main rock lobster industry group, the Tasmanian Rock Lobster Fishermen’s Association(TRLFA). The TRLFA worked with the Department and the Minister to try to get support for the restructuringproposals, however it was somewhat constrained early on because its members were unable to give it a cleardirection to pursue. However, in 1995 a majority of the membership supported the introduction of ITQs andrequested the Executive to participate in developing detailed proposals. This outcome resulted in a breakawayminority industry group forming to try to ensure that ITQs were not introduced.
The Government released a draft management plan for the fishery in June 1997 and the allocation methodproposed was to allocate one quota unit for each pot held on a licence, which would result in a quota unitequalling 1/10507th of the TACC.
The Government had previously decided that the ITQ system would be supported by legislation to minimiseany opportunity for legal challenge. This meant that the allocation mechanism would be enshrined in legislation.Tasmania’s Upper House (Legislative Council) was not controlled by the Government, and had before it theSelect Committee report (Schulze et al1997) recommending against quota management. The Government, withthe support of both Opposition parties, got unanimous support in the Lower House for the proposed system,which passed the Bill containing the equal allocation mechanism.
The intense industry lobbying resulted in a long and, at times, heated debate when the legislation waspresented to the Upper House for its consideration. The supporters of quota presented a petition signed by 67%of the licence-holders, and both sides of the industry were invited to make detailed presentations to the LegislativeCouncillors. Every one of the 18 voting members spoke on the issue and it became clear that the Bill could failunless the allocation mechanism was amended to include at least some recognition of past catch history (Hansard1997). The Government accepted this position and the Bill was redrafted with the assistance of one of theindependent members the Upper House who agreed to vote for the Bill with such amendments.
175 Ford & Nicol
Lobster traps showing top entranceCredit: Tasmanian Agriculture and Fisheries Institute

2.3.3 Allocation method chosen
The allocation method finally passed by Parliament (Statute No. 56 of 1997) set up two allocation schedules,one for the allocation of quota in relation to the number of pots, and the other for the allocation in relation to pastcatch history. The catch history component of the allocation was designed to be phased out by the end of the thirdyear of the quota system. The split of the total allowable commercial catch (TACC) is shown in Table 1. Thecatch history period was set as the sum of best three years from the period November 1988 to October 1997.
Table 1The allocation schedule for rock lobster quota units
The allocation method for the catch history component was calculated using Formulas 1 and 2 (see below).These formulas allocated to each licence-holder a single quota unit with a differing kilogram value depending ontheir catch history. A rock lobster catch history that was negative was taken to be zero. The rock lobster catchhistory (RLCH) was the sum of the best three yearly catch histories. The allocation-process issued each licence-holder a share of the quota provided to the catch history part of the TACC, calculated as a percentage of the sumof the rock lobster catch history for all 316 licence-holders. Formula 1 was used to calculate the catch historyabove the per pot allocation of 130kg for each licence-holder for each year, and Formula 2 was used to determinethe value of their rock lobster catch history unit. The resulting allocation of quota is shown in Figure 2, the actualquota allocation is compared against the proposed equal allocation method to show the effect that the amendmentshad on the licence-holders.
where:
YCH = yearly catch history (for a November to October year)P = maximum number of rock pots licensed for that yearYC = yearly catch of rock lobster for that year in kilograms.
where:
RLCHU = kilogram value of the rock lobster catch history unitRLCH = rock lobster catch history, which is the sum of the best three YCHsTACCch = part of the TACC set aside for the catch history allocation, see Table 1.
2.4 Data requirements and computational process
The allocation method required each licence-holder’s number of rock lobster pots and their rock lobstercatch history since November 1988 to be quantified. The licensing and the catch history information were bothcontained within the Department’s rock lobster catch-and-effort system (CRAYBASE), however the informationstored could not be extracted in a form that allowed each licence-holder’s catch history to be determined. Thereason for this was that the primary code for linking data was by vessel or licence number, and not by licence-holder. As the licence-holders often changed licences and vessels, the task of extracting the data needed to becoded into the database.
This problem was compounded because a number of licence-holders were, in fact, the same entity andeffectively able to claim a pooled catch history, so all the licence-holders had to be able to be linked to all the
Tasmania Rock Lobster and Abalone 176
Quota year commencing in
March
Allocation as a percentage of the
TACC on the basis of 10 507 pots
attached to 316 fishing licences
Value of one quota unit
with a TACC of 1502.5t
(10 507 quota units)
Allocation as a percentage of the
TACC on the basis of the past rock lobster catch history of 316
fishing licences
Total catch history allocation between
316 licence-holders under a
TACC of 1502.5t (TACCch)
1998 90.909% 130kg 9.091% 136.6t 1999 94.406% 135kg 5.594% 84.0t 2000 97.902% 140kg 2.098% 31.5t
2001 and all subsequent years
100% 143kg 0% 0
-= 130P
YCPYCH ( )
( )ch
3161TACCx
RLCHSUM
RLCHRLCHU −=
(1)
(2)

other licence-holders. The legislation for the allocation method did not deal with such issues, so they weredecided upon by Ministerial Guideline, in accordance with the Living Marine Resources Management Act 1995.
Figure 2The initial allocation of rock lobster quota compared with the proposed equal allocation method
The Department had begun to consider these matters some years before, when allocation mechanisms werebeing discussed and it conducted a thorough data-quality checking process which took six months. This processenabled the allocation to be done with high quality data. Once the reporting tools were written to allow the catchhistory to be calculated, further data-checking was undertaken. This process took an additional two months.
During the process of amending the allocation Bill, it was recognised that, while the catch data was held onthe database as submitted, it may not have reflected the true catches, due to under- or over-reporting of catches.Therefore, to remove any debate over what was actually caught, the legislation established that the catch historywas to be based on the catch returns held by the Department. This removed the need to verify the majority of theclaims for catch history. Licence-holders were provided with a summary of their reported catch history.
2.5 Appeals process
The quota legislation established an appeal mechanism whereby the licence-holders could seek to have theirrock lobster catch history reviewed on the basis of one of the following: (a) an error in data entry; (b) a mistakeexisting in the licensing data; or (c) a vessel or an associated licence-holder had been omitted from their catchhistory. Each licence-holder was provided with a yearly summary, their licensing records, and the value of therock lobster catch history they were to be assigned, together with an application form to have their catch historyreviewed. They had 30 days to lodge an application for review. The review process was undertaken bydepartmental staff and each review application was considered by the Secretary of the Department.
This review process was then appealable to an independent Appeal Tribunal. There were 18 applicationsfor review, the stated reasons included: data entry errors; omitted licences; the opposition to the allocationmechanism; leasing arrangements; wrongly assigned catch history; missing vessels; and incorrect number of pots.Of these, 4 review applications were successful and 14 were dismissed. Four of these unsuccessful reviews weretaken to the Appeal Tribunal where two were conceded on legal grounds, one was resolved by mediation in favourof the appellant, and one appeal was heard and rejected.
2.6 Administration of the allocation-process2.6.1 Staff requirements
The allocation and review process was conducted by staff of the Department, the determination of eachlicence-holder’s catch history was achieved in two months using three staff. The four appeals lodged with theAppeals Tribunal were prepared by a lawyer within the Government’s Office of the Director of PublicProsecutions.
177 Ford & Nicol
0
2000
4000
6000
8000
10000
12000
1 51 101 151 201 251 301
Allocation for each licence holder
Quo
taal
loca
tion
(kg)
Total initial allocation (kg) proposed equal allocation
2.6.2 Additional pr ogramme funding requirements
The allocation, review and appeal processes were conducted within the Department’s existing budget,however the task required the re-assignment of two staff for the much of period.
2.7 Evaluation of the initial allocation-process2.7.1 Success in achieving initial policy objectives
The introduction of the ITQs using the allocation mechanism described has been highly successful and hasresulted in significant industry restructuring, and an increase in the biomass and egg production levels in thefishery.
The industry restructuring objective recognised that the fishery was overcapitalised with too many vesselsand there were too many fishers in the fishery. The allocation mechanism was designed in such a way that fisherscould sell off their allocated quota and leave the fishery, but still get a good return on their investment even ifthey had not been catching large amounts of rock lobster. Many older licence-holders took the opportunity toretire and sold their licences and quota, receiving up to $A20 000 per quota unit. The value of the access rightshave doubled since quota were introduced, from $A10 000 per rock lobster pot in late 1997 to the present valueof $A20 000 per unit.
However, a detriment to the ITQs system and the allocation mechanism, has been the loss of employmentfor up to 60 lease-holder skippers and their deckhands. Unfortunately many of these fishers have been unable tocontinue to lease licences, because the licence they fished was owned by another fisher who now required theadditional quota. Regardless of the restructuring option implemented, it would have resulted in a smaller fleetand these people would still have been the first to leave the fishery. These fishers received none of the rewardsof being able to sell quota, and invest the monies in other businesses or retirement.
The sustainability objective is being achieved much faster than was anticipated, with an estimated 11%increase in statewide lobster biomass, a 5% increase in catch-rates statewide, and increased egg production byrock lobsters in the northern part of the State after only one year. However, there is some regional variation, withsome minor declines in some areas (Gardner 1999).
The objectives related to the allocation mechanism were largely met, despite the proposed allocation methodbeing amended by the Parliament. The process for determining each allocation and issuing licences ran verysmoothly and was completed within seven months. The equal-allocation component was finalised and completedin three months, with the final catch history appeals being resolved four months later. The legislation was passedin November 1997 and the quota system began on 1 March 1998, with licence-holders able to commence fishingon their pot-based quota units.
The legislation has been robust enough to deter any legal challenge. The objective of recognising theimportance of the past access-rights and preserving their value has been achieved. As a result those who havesold their licences have made substantial gains.
2.7.2 Satisfaction of rights holders with the process
The introduction of the ITQs was an extremely contentious issue that divided the industry, local fishingports, friends and families. The intensity and acrimonious nature of the debate took its toll of all concerned. Thelevel of animosity increased over the period from 1993 to the end of 1997 as each side in the debate believed theirarguments were right and the other’s wrong. Some fishers took the view that they would take every possible stepto ensure ITQs were not implemented.
The debate became intensely political. The move to ITQs in the fishery was strongly influenced by a fewpoliticians on both sides of Parliament. The entire process was conducted across the period of three successivegovernments and was handled by four successive Ministers. This lengthy timeframe concerned many and therewere increasing concerns that any meaningful decision would be too hard for the government to make.
The level of support for quota management was just over 50% in 1993 and remained at this level until themonths preceding the legislation being tabled in Parliament, when there was a dramatic increase in supportresulting in a petition being presented signed by 67% of the licence-holders. Importantly, this support was froma range of fishers with both low and high catch histories. However, it is important to recognise that support oropposition for the system was based on the allocation method and process, rather than the concept of quotamanagement. The amendments to the allocation mechanism went some way to appease the licence-holders withlarge catch histories who were being disadvantaged.
The process of determining the catch histories in making the quota allocation was generally well receivedby the licence-holders, as they could see that the review process and appeal process provided avenues to sort outgenuine problems in determining catch history. Two years after the introduction of the quota system the vastmajority of fishers are now satisfied with the system and are seeing benefits from it. However, there are still a
Tasmania Rock Lobster and Abalone 178
few fishers opposed to the system. The industry is beginning to put the allocation-process behind it and theopposing factions are starting to come together, however, this process will take some years as the divisions in theindustry were deep. The process of bringing the industry together has largely been about establishing trust andre-establishing working relationships.
There are many in the industry who believe that the quota system has resulted in significant benefits byallowing them to take more control of their fishing operations and choose the time and weather when they fish.Many of the higher catchers are also satisfied with the system, even though they have had to buy additional quota.
2.7.3 Views of community groups
The recreational fishing community and the conservation groups are two stakeholder groups who have aninterest in the sustainable management of the rock lobster fishery, both are supportive of ITQs. The recreationalfishing community see the direct benefits of a sustainable fishery as being improved catch-rates where the stockis being rebuilt. The conservation lobby is supportive of ITQs as they directly limit the catch.
Some of the coastal communities who are concerned about regional employment and the effects ofrationalising industries (like the fishing industry) expressed concern during the development of ITQs. However,their input or criticism was largely driven by the views of the fishers in their local community.
2.7.4 Hind-sight assessment
The restructuring of the rock lobster fishery has been very successful, however there have been a number ofsocial costs associated with fishers having to leave the fishery and the deep divisions that were generated withinindustry.
One of the significant factors which worked against a smoother development phase was the length of timetaken between the Working Group releasing its two management options in March 1993, the decision to introduceITQs in August 1996, and the finalisation of the legislation in November 1997. This lengthy period resulted inthe industry becoming more divided and polarised. The time-frame was set through the political process, andthere was little that the industry could do to speed up the political decision-making process. The political realityresulted in a lengthy process of gathering information, discussing options and trying to convince the industry tosupport ITQs.
One of the key issues associated with the introduction of ITQs was the concern that the allocation methodwould redistribute the wealth in the fishery. This argument can be, and was, used by those supporting the equalallocation method and those supporting recognition of past catches. The difficulty with the argument lies in howthe wealth of the fishery is perceived. Some believed the wealth of the fishery was tied solely to the existingaccess rights, while others believed the wealth of the fishery was related to the amount of rock lobster a fishercaught. So the argument about wealth redistribution was used by both sides to convince the politicians that theallocation mechanism was either fair or not. This only acted to complicate the political process.
One of the lessons to be learnt from the allocation-process is that there needs to be some degree of balancein the chosen allocation mechanisms, rather than favouring either end of the spectrum of views. Even though thefinal allocation mechanism took into account both the long-standing tradeable access right, and the fishers’pastcatch history, it got no support from the industry when it was first proposed. However, when the allocationmechanism legislation was debated in Parliament, the political process sought such a compromise mechanism.
If the industry had been prepared to push for such an allocation mechanism it may have found there was lesspolitical interest, and ITQs might have been introduced in mid-1997 or earlier. In fact, if the industry had beenprepared to accept such a compromise allocation method, the decision to move to ITQs may have come in late1994 and the system may have been able to commence in 1996. There may be a lesson for industry in that holdingout for an allocation method that results in big winners and big losers, inevitably means the issue becomespolitically sensitive and lengthy delays can be the result, often producing a compromise that could have beenreached by the industry itself.
3. THE ABALONE FISHER Y3.1 Intr oduction
Two species of abalone are harvested in Tasmania: blacklip abalone (Haliotis rubra) and greenlip abalone(Haliotis laevigata) (McNee 1993a, 1993b). Both species are mobile bottom dwellers that graze on driftseaweeds and algae on rock surfaces. They occur on rocky bottoms, mainly within the littoral zone from depthsof five to thirty metres, although they are taken from the shallows down to 40 metres. Both blacklip and greenlipabalone are distributed around Tasmania and across southern Australia on suitable rocky bottoms. Greenlipabalone are patchy in their distribution. Greenlip abalone, in Tasmania, tend to frequent less complex and patchy
179 Ford & Nicol

reefs and are most abundant alongthe north coast and around theBass Strait islands. Blacklipabalone occur on rocky reefs inboth exposed and shelteredwaters. Their distribution isvariable but less patchy thangreenlip abalone (McNee 1993a,1993b).
3.1.1 Commercial abalone fishery prior to 1985
Prior to 1963 the Tasmanianabalone stocks were notsignificantly fished. For the past7500 years at least, TasmanianAborigines have been harvestingabalone (Jones 1971). During thenineteenth century there wasminor exploitation by Chineseimmigrants. In the 1950s asmall-scale fishery was attemptedbut was not a commercialsuccess. By 1963, however,modern diving equipment and theidentification of Asian marketsprovided the basis of the modernfishery (Harrison 1983, 1986b).Catches rose rapidly from 1963 to1971, then went through a cycleof decline and recovery between 1972 and 1977 (see Figure 3). From a low of 1450t in 1978, the fisheryexpanded to a maximum of 4500t in 1984. The abalone catch in 1984 from Tasmania was approximately 22%of the world abalone catch (Harrison 1986b).
Figure 3Annual landings of abalone in Tasmania
Tasmania Rock Lobster and Abalone 180
Diver “gearing-up”Credit: Tasmanian Agriculture and Fisheries Institute
0
500
1000
1500
2000
2500
3000
3500
4000
4500
5000
1966
1968
1970
1972
1974
1976
1978
1980
1982
1984
1986
1988
1990
1992
1994
1996
1998
2000
Years
Cat
ch(t
onne
)

A minimum-size limit was the first management measure imposed on the fishery. This was followed in 1965by the introduction of a licence for commercial divers with a requirement for monthly catch returns. Abalone hadto be landed alive, thereby preventing processing at sea, to assist with the enforcement of the new size-limitrestrictions.
The number of diving licences were limited to the 120 licences that were current in 1969, so as to preventexcessive fishing. In 1972 to encourage the exploitation of the abalone resources around the islands of theFurneaux Group (off the north east of Tasmania), five special abalone licences where issued exclusively for theuse of residents of the Furneaux Group. These special licensees were restricted to operating around the FurneauxGroup. The 120 other “mainland licences” were prevented from diving around the Furneaux Group.
Between 1972 and 1985, additional changes were made to the regulations governing the commercialabalone fishery, mainly involving progressive increases in the size of penalties. Also during this time severalchanges were made in how a commercial abalone diver’s licence could be transferred.
Under theFisheries Act 1959, personal licences i.e. a licence that authorised the holder to personally gofishing) could not be transferred, thus several pseudo-transfer methods were developed for the commercialabalone diver’s licence. Initially, a diver if retiring from the fishery due to health reasons, could nominate hisreplacement. This was subsequently withdrawn and replaced with an unofficial system whereby a diver whoretires for any reason could nominate his replacement.
During the early 1980s abalone divers approached the government expressing concern regarding potentialoverfishing of Tasmania’s abalone resource. The industry and Government decided to implement a quota systemof management from 1985 onwards.
3.1.2 History of the commercial abalone fishery since 1985
During 1984, the industry and the Government agreed to introduce a total allowable catch (TAC) for thecommercial abalone fishery. It was to be divided into 3500 equal quota units and each diver was to have had anequal share of the units. Thus the 125 divers were to have 28 units each. The proposed total allowable catch wasto be 3500t or one tonne per abalone quota unit.
The abalone fishery was still divided into two parts, the mainland of Tasmania with 120 divers and theFurneaux Group with five divers. When the potential annual catch for the five Furneaux divers of 140t wascompared with the long-term average catch for the area, it was found to be 40t greater. To keep the new catchlevel within the long-term average it was agreed to decrease the allocation to the five Furneaux divers to only20 units each.
In 1985 a total allowable catch of 3806t and a system of individual quotas (IQs) were introduced, being3460 quota units at 1.1t each. Each mainland diver was allocated 28 abalone quota units of which up to 12 unitscould be transferred to another diver for the season, thereby allowing for limited transferability of the quota. TheFurneaux Group divers received 20 quota units but they could only seasonally transfer their quota to otherFurneaux Group divers.
Industry and Government continued to have concerns that overfishing might be occurring and in the fourseasons from 1986 to 1989 they agreed to a series of reductions in the total allowable catch down to 2076t (Figure3). The Tasmanian commercial abalone fishery was made a single fishery in 1990 when the division between themainland divers and the Furneaux Group divers was removed. To put the five Furneaux divers on an equal basiswith the mainland divers, the Furneaux divers where each granted an additional eight quota units to bring theirlevel of access to 28 quota units. The 40 extra quota units brought the total allowable catch up to 2100t, where itremained until 1997 when there was a 20% increase to 2520t.
In 1990, after pressure from the abalone industry, the Government conducted a review of the abalonelicensing system (DPI 1990). A commercial abalone licence was then worth about $A1 000 000, which meantthat, without financial backing, it was beyond the means of most people to enter the fishery. Most formalfinancial institutions would not lend such money, when a commercial abalone licence was the sole, or main,collateral.
As a result of the review, from the beginning of the 1991 quota year (which ran from 1 January to31 December 1991) the commercial abalone licence was divided into two licences: authority to dive for abalone,and to hold abalone quota units. This system was a reflection of the changes that had already occurred in theTasmanian commercial abalone fishery where increasing numbers of divers were leasing their licences off formerdivers, processors or other financiers. The splitting of the entitlement allowed those arrangements to be officiallyrecognised. Only the holder of a commercial abalone diving licence could dive from a fishing vessel to takeabalone for commercial purposes. A diver needed to be authorised by the holder of an abalone quota unit to takethe abalone which the abalone quota unit represented.
181 Ford & Nicol

Holders of abalone quota units didnot need to be commercial abalonedivers and the number of units that couldbe held by an individual or companywas unrestricted, in terms of bothminimum and maximum holdings.Many of the commercial abalone diversowned all or part of the 28 abalone quotaunits originally attached to the licence.
Figure 4 shows the average beachprice for each three months since thebeginning of 1990. During the early1990s whilst the catches were stable (seeFigure 3) the value of the fishery beganto increase, reaching a peak in 1993(beach prices reached $A55/kg duringOctober and November of that year).
During 1993 the Fisheries Act1959 was amended to allow for thetransfer of personal licences such ascommercial abalone diving and abalonequota licences. Thus the managementarrangements for the commercialabalone fishery could be called anindividual transferable quota (ITQ)system.
In 1994, contracts (called Abalone Deed of Agreement) were introduced that increased the level of securityfor quota holders and their financial backers, whilst potentially increasing the return paid to the TasmanianGovernment. These Deeds also provided a high level of financial and operational security. Over 95% of quotaunits are under such Deeds of Agreement, with the remaining units being under annual licences. The Deed is forten years with an right of renewal, thus the Deeds are essentially for perpetuity.
In 1994, there was a decline in the beach price back to 1992 levels (Figure 4). During 1995, the beach pricecontinued to fall, with some individual beach prices reaching as low as $A18/kg. There has been an improvementin the beach price during late 1995 and 1996 through to late 1999.
3.2 The nature of the harvesting rights3.2.1 Overview
The nature of fishing rights in the Tasmanian commercial abalone fishery has undergone several changessince the introduction of licences in 1965. There are two main phases, prior to 1985 and afterwards. The natureof the rights since 1985 have undergone three changes with the introduction of separate licences for diving andthe quota, then transferability for both licences, and thirdly the introduction of the abalone Deed of Agreement.
3.2.2 Rights before 1985
The commercial abalone diver’s licence was an annual licence that authorised the holder to take, for sale,an unlimited quantity of legal size abalone from Tasmanian waters. There was no “official” right of transfer andthere was no legislative basis for renewal. The Fisheries Act 1959, and its subordinate regulations, only referredto issuing such licences. The licences were subject to ministerial powers to revoke a licence if the holdercommitted a serious offence. There was, however, a common law expectation of renewal so that unless theholder had committed a serious breach of the regulations or the management arrangements had been changed,the holder would have his licence reissued. It should be noted that only once did a Minister remove a licencefrom a holder.
3.2.3 Rights after 1985
In 1985, a commercial abalone licence for a mainland diver comprised the right to 28 units of quota and theright to dive to take these abalone. The abalone quota units each provided a right to 1/3500th of the totalallowable catch. At the beginning of each year a diver was issued his licence and 28 units of quota. Each diverwas required to take at least 16 units and was allowed to temporally transfer up to 12 units. Thus it was anindividual quota system without transferability.
Tasmania Rock Lobster and Abalone 182
Unloading abalone at wharfsideCredit: Tasmanian Aquaculture and Fisheries Institute

Figure 4Quarterly beach price for the abalone fishery
The introduction of an individual quota system did not alter the basic nature of the commercial abalonelicences. It retained the common law expectation of re-issue and they could be terminated by ministerialdirection for serious breaches of the regulations.
In 1991 the nature of the commercial abalone licence was significantly altered when it was separated intotwo entitlements, the authority to dive for the abalone, and a share of the abalone total allowable catch throughabalone quota units. Both entitlements were in the form of two new annual licences. Again both new licencesmaintained the central features of the earlier commercial abalone licence, as outlined above.
In 1993, both the diving and quota licences became transferable. Since the transfer of abalone licenceswas now formalised, they come under the powers of the Minister to refuse a transfer. The grounds under whichthe Minister could take such action included the circumstance where the current or future holder was facingserious charges or had been convicted of such. This increased the degree of property right by formalising thetrade in both licences.
The most significant alteration in the nature of the rights of the abalone quota licence occurred in 1994with the introduction of the Abalone Deed of Agreement. This contract provided holders of rights under aDeed (that is people who hold abalone quota units under a Deed) with the right to take from State watersabalone that are above the legal minimum size to the amount of 1/3500th of the total allowable catch for everyquota unit held by those people.
The Deed allowed for the transfer of all or some of the rights under a deed in accordance with Tasmaniancontract law. The Deed moved the control of such transfer from the Minister to the holders of the rights.However, the Secretary retained the right to say whether or not the potential holder was a “fit and properperson”.
The Deed was for an initial ten year duration but with an ongoing right of renewal, thus the deed iseffectively for perpetuity. The Deed set out three reasons for which it (or the rights under it) could beterminated:
i. non-payment of the feesii. the holder being convicted offences against the abalone fishery within any three-year period andiii. the holder entering into an arrangement with a diver for the diver to pay the royalty.
For the first and third reasons, the deed stated that if the holder of rights under a deed corrected the matterat hand, then the rights could not be terminated. That is, if the holder later paid the royalties or terminated theagreement with a diver, then there were no longer any grounds for the termination of the rights under a deed.Such an option is not available for offences against the abalone fishery, however, in such a case the holdercould sell his or her rights, rather than having them terminated.
183 Ford & Nicol
0.00
10.00
20.00
30.00
40.00
50.00
60.00
Jan-
Mar
90
Jul-
Sep
90
Jan-
Mar
91
Jul-
Sep
91
Jan-
Mar
92
Jul-
Sep
92
Jan-
Mar
93
Jul-
Sep
93
Jan-
Mar
94
Jul-
Sep
94
Jan-
Mar
95
Jul-
Sep
95
Jan-
Mar
96
Jul-
Sep
96
Jan-
Mar
97
Jul-
Sep
97
Jan-
Mar
98
Jul-
Sep
98
Jul-
Sep
99
Pri
cepe
rki
logr
am(A
$)
The amendment to the Fisheries Act 1959that established the power for the Director to enter into a deedalso established a formal register of third party interests in quota units under a deed. Any registered third partyinterest was maintained even if the quota units were transferred to another party.
The increased security for quota holders, and their third parties, has been at a cost in terms of the flexibilityof possible management arrangements due to the wording of the abalone Deed of Agreement. For example, thedeed is written in terms of a single fishery covering all abalone of the genus Haliotis. Thus, any moves to zonethe fishery either in terms of area or species becomes very difficult. Complex solutions are required because morestraight forward options are excluded by the deed. For example, the greenlip abalone fishery has to be managedas a part of the overall abalone fishery, with the total allowable catch for this fishery of 140t for the year 2000,being divided equally between the 3500 abalone quota units. Thus, each quota unit has 40 kg of greenlip abaloneas part of its allocation in 2000. The alterative of separating-off the greenlip abalone fishery and allocating it tothose quota holders with some history was not available due to the wording of the deed.
3.3 Allocation method3.3.1 Policy objectives
For the introduction of the individual quota system, the main policy objective was to limit the overall catchof abalone. The secondary objectives were to provide equal access to the fishery for all participants and providethe industry with an opportunity to plan their future diving operations.
The main objective in the separation of the diving authority from the quota units was to allow investment inthe fishery, via ownership of quota units, and to allow young divers to enter the fishery without extremely highdebt loads. The secondary objective was to reflect changes that were already occurring within the commercialfishery.
3.3.2 Process fordetermining the allocation
In both cases, the allocation method was determined through consultation with participants in thecommercial fishery. For the introduction of the individual quota system, the commercial abalone industry held astrong view that while individuals may have had different catch histories, they all had the same access rights. Forthe allocation of quota units, the Department and the industry agreed that it was for the industry participants toagree on the individual allocations, rather than for the Government to be making decisions about the status ofcompeting claims.
3.3.3 Allocation method
For the introduction of the individual quota system, the allocation method used was for each holder of acommercial abalone licence to receive an equal share of the total allowable catch. The exception was for the fiveFurneaux divers who received only 20 abalone quota units against the 28 quota units for each of the other 120divers. The reasons behind this difference were the restricted area and the lower catch available in the areaoffered to these divers.
The allocation method for the separation of the authority to dive from the holding of abalone quota unitswas through the agreement of the current holder of the commercial abalone licence. That is, the Departmentwould only accept claims for quota units where the current holder of the licence agreed.
3.4 Appeals process
Under the Fisheries Act 1959there were no appeal provisions, however, as the introduction of the individualquota system was on the basis of an equal share to each diver there was no requirement for appeals. There hadbeen extensive consultation with the commercial industry prior to the introduction, which had given opportunitiesfor individuals to make their particular case to the Minister. With the separation of the quota from the divingauthority, the Department had adopted the position that any changes could only occur with the agreement of thecurrent holder, therefore, disputes had to be dealt with outside the Department. The final option was for theparties to take their dispute to the civil courts.
3.5 Evaluation of the allocation-process3.5.1 Success in achieving policy objectives
The quota system has been successful in limiting the commercial catch of abalone, although it took severalyears with reductions in the total allowable catch to reach a level of catch that was believed by the Departmentand industry to be sustainable. The fact that two subsequent increases in the total allowable catch could beintroduced, indicate that the abalone resources were in a healthy state because the quota system had been able tolimit the commercial catch. The secondary objectives appear to have also been met.
In the separation of the diving and quota parts of the licence, the principal objective of allowing access ofinvestment in abalone fishery has been achieved. This is indicated by the increase in the value of an abalone
Tasmania Rock Lobster and Abalone 184

quota unit from $A30 000 in 1991 (when a unit was equal to 600kg of abalone and the beach price was $A22/kg)to $A280 000 at the beginning of 2000 (when a unit equalled 780kg of abalone and the beach price was $A40/kg).
3.5.2 Satisfaction of participants
The participants in the commercial abalone fishery have gained from the various changes in the nature oftheir property rights, through a stable fishery over the past twelve years following an initial few years to adjustthe total allowable catch. They have also gained through the significant increase in the value of abalone quotaunits. Members of the industry, either through the industry association, the Tasmanian Abalone Council, orindividually have a strong commitment to the quota system.
3.5.3 Views of othergroups
Many groups have expressed concern at the rights of the commercial abalone fishery, mainly dealing withthe large incomes coming to quota-unit holders, compared to the poor return coming to the community via theGovernment. Most comments have occurred when the total allowable catch has been increased (at the end of1996 and 1999).
3.5.4 Hind-sight assessment
The main areas where improvements could have occurred are in the nature of the Deed of Agreement. Thedeed has a limiting effect on the management arrangements that can be introduced without overwhelming, if notunanimous, agreement from holders of rights under deeds. It would have been an improvement if the deed hadallowed for flexibility in management arrangements without reducing the rights of the holders.
The Deed was also introduced to allow for a reasonable recovery of a share of the resource rent available inthe commercial abalone fishery, however, the inflexible nature of the deed has meant that large proportions of theresource rent, as indicated in the significant increase in the value of abalone quota units, have gone to the abalonequota unit holders, with little passing to the community through fees to the Government.
4. LITERA TURE CITED
Anon. 1993. Restructuring of the Tasmanian Rock Lobster Fishery. Unpublished report Rock Lobster WorkingGroup – Department of Primary Industry and Fisheries, Tasmania.
CREA- Centre for Regional Economic Analysis 1997. An economic analysis of the Tasmanian Fishing Industry.Report prepared for the Fisheries Research Development Corporation - Project 95/159.
DPI - Department of Primary Industry 1990. Options for Amending the System of Licensing CommercialAbalone Divers: A Report from the Ministerial Working Group into Tasmanian Abalone Licensing;Department of Primary Industry, Hobart.
DPIF - Department of Primary Industry and Fisheries 1998. Review of the Tasmanian Abalone FisheryManagement Plan: the Greenlip Abalone Fishery around the Furneaux Group and the Rest of Tasmania, andSome Minor Clarifications; DPIF, Hobart.
Ford, W. 2000. Will improving access rights lead to better management - Quota management in the Tasmanianrock lobster fishery. In: Shotton, R. (ed.) Use of property rights in fisheries management. Proceedings of theFishRights99 Conference, Fremantle, Western Australia, November 1999, Workshop presentations. FAOFish. Tech. Pap. 404/2 pp 289-295.
Gardner, C. 1999. Tasmania rock lobster fishery 1998/99 – Fishery Assessment Report, Unpublished report,Tasmanian Aquaculture and Fisheries Institute, University of Tasmania.
Hansard 1997. Legislative Council Hansard, Tasmanian Parliament, 19 November 1997, Parts 1-2 pp 1-107.Harrison, A.J. 1986a. The Development of Existing Rules in the Tasmanian Rock Lobster Fishery. In:Tasmanian
Rock Lobster Seminar 1986 (Ed.) Bear, S. Department of Sea Fisheries Technical Report 25. pp 7-10.Harrison, A.J. 1986b. Gastropod Fisheries of the Pacific with Particular References to Australian Abalone, In:
Jamieson G.S. and Bourne, N. (Eds), North Pacific Workshop on Stock Assessment and Management ofInvertebrates; Canadian Special Publication of Fisheries and Aquatic Sciences 92. pp 14-22.
Harrison, A.J. 1983. The Tasmanian Abalone Fishery; Tasmanian Fisheries Research No. 26; Tasmanian FisheriesDevelopment Authority.
Jones, R. 1971. Rocky Cape and the problem of the Tasmanians; PhD Thesis, University of Sydney, NSW. LivingMarine Resources Management Act 1995. Statute 25 of 1995, Parliament of Tasmania.
McNee, A. 1993a. Greenlip Abalone: In: Kailola, P.J., Williams, M.J., Stewart, P.C., Reichelt, R.E., McNee, A.and Grieve, C. (Eds.). Australian Fisheries Resources: Bureau of Resource Science, Department of PrimaryIndustry and Energy, and Fisheries Research and Development Corporation, Canberra, pp 78-80.
McNee, A. 1993b. Blacklip Abalone: in Eds Kailola, P.J., Williams, M.J., Stewart, P.C., Reichelt, R.E., McNee,A. and Grieve, C. Australian Fisheries Resources: Bureau of Resource Science, Department of PrimaryIndustry and Energy, and Fisheries Research and Development Corporation, Canberra, 81-83pp.
185 Ford & Nicol

Morrow, H.P.R. 1991. An Economic Analysis or the Tasmanian rock lobster Fishery 1990/91. Unpublished reportto the Rock Lobster Working Group – Department of Primary Industry and Fisheries, Tasmania.
Schulze, P., R Ginn, P. Harriss, D. Parkinson and G. Squibb 1997. Tasmanian Rock Lobster Fishery, LegislativeCouncil Select Committee Report – Parliament of Tasmania.
Statute 57 of 1997. Living Marine Resources Management Amendment (Rock Lobster Quota) Act 1997,Parliament of Tasmania.
Tasmania Rock Lobster and Abalone 186
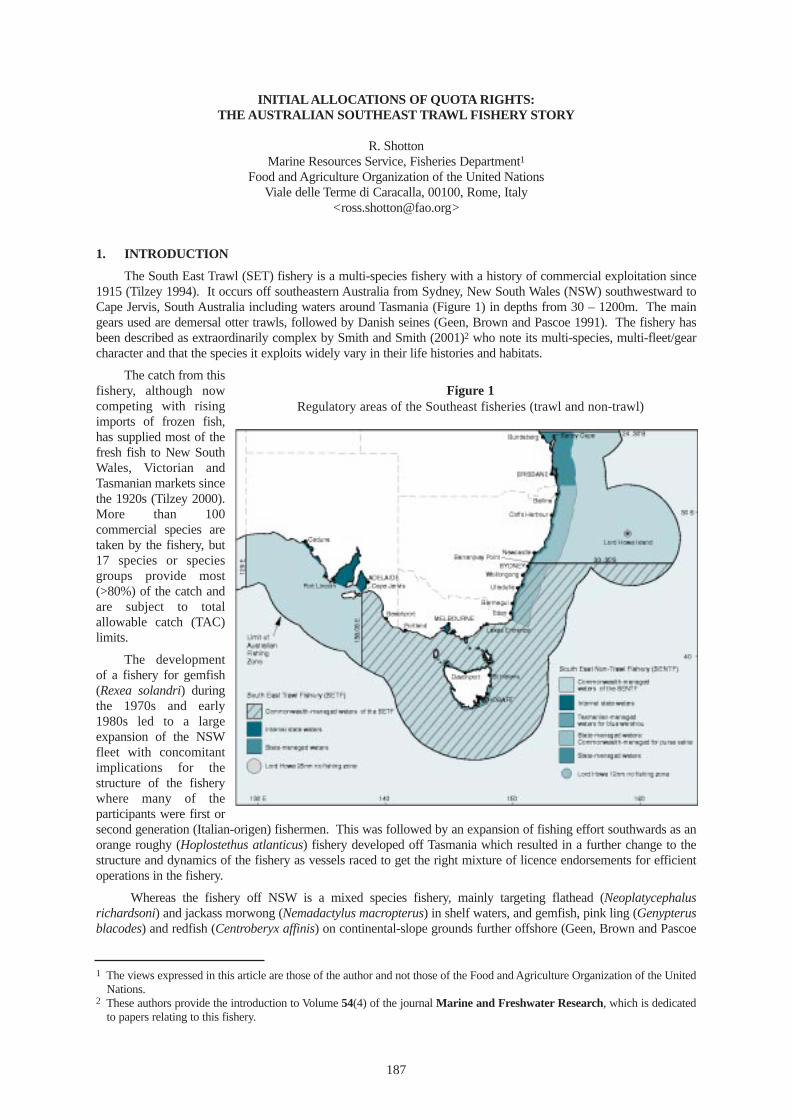
INITIAL ALLOCA TIONS OF QUOTA RIGHTS:THE AUSTRALIAN SOUTHEAST TRAWL FISHERY STORY
R. ShottonMarine Resources Service, Fisheries Department1
Food and Agriculture Organization of the United NationsViale delle Terme di Caracalla, 00100, Rome, Italy
1. INTRODUCTION
The South East Trawl (SET) fishery is a multi-species fishery with a history of commercial exploitation since1915 (Tilzey 1994). It occurs off southeastern Australia from Sydney, New South Wales (NSW) southwestward toCape Jervis, South Australia including waters around Tasmania (Figure 1) in depths from 30 – 1200m. The maingears used are demersal otter trawls, followed by Danish seines (Geen, Brown and Pascoe 1991). The fishery hasbeen described as extraordinarily complex by Smith and Smith (2001)2 who note its multi-species, multi-fleet/gearcharacter and that the species it exploits widely vary in their life histories and habitats.
The catch from thisfishery, although nowcompeting with risingimports of frozen fish,has supplied most of thefresh fish to New SouthWales, Victorian andTasmanian markets sincethe 1920s (Tilzey 2000).More than 100commercial species aretaken by the fishery, but17 species or speciesgroups provide most(>80%) of the catch andare subject to totalallowable catch (TAC)limits.
The developmentof a fishery for gemfish(Rexea solandri) duringthe 1970s and early1980s led to a largeexpansion of the NSWfleet with concomitantimplications for thestructure of the fisherywhere many of theparticipants were first orsecond generation (Italian-origen) fishermen. This was followed by an expansion of fishing effort southwards as anorange roughy (Hoplostethus atlanticus) fishery developed off Tasmania which resulted in a further change to thestructure and dynamics of the fishery as vessels raced to get the right mixture of licence endorsements for efficientoperations in the fishery.
Whereas the fishery off NSW is a mixed species fishery, mainly targeting flathead (Neoplatycephalusrichardsoni) and jackass morwong (Nemadactylus macropterus) in shelf waters, and gemfish, pink ling (Genypterusblacodes) and redfish (Centroberyx affinis) on continental-slope grounds further offshore (Geen, Brown and Pascoe
187
Figure 1Regulatory areas of the Southeast fisheries (trawl and non-trawl)
1 The views expressed in this article are those of the author and not those of the Food and Agriculture Organization of the UnitedNations.
2 These authors provide the introduction to Volume 54(4) of the journal Marine and FreshwaterResearch, which is dedicatedto papers relating to this fishery.

1991), the vast majority of the SETcatch now consists of blue grenadier (Macruronus novaezealandiae) and orangeroughy (Tilzey 1994, Kaufmann, Geen and Sen 1999).
From the mid-1970s onwards, eastern gemfish comprised the dominant SETcatch with annual landings between3300 and 5500t during the period 1977 to 1988, but this fishery subsequently collapsed and has been virtually closedsince 1993. A zero directed-fishery TAC is in effect. However, a bycatch of this species remains unavoidable and asmall “bycatch” TAC (150t in 2001) is allocated as ITQs. As Tilzey (1994) notes, the reasons for this decline wereat that time unclear but it was recognized that overfishing was a problem. The orange roughy fishery began in 1986when 4200t were taken off western Tasmania. In 1989 a major spawning aggregation was discovered off easternTasmania, which led to a peak in reported landings of 43900t in 1990. The orange roughy resource has since beenfished down and blue grenadier now comprises the major SETcatch.
In 1985 a halt was made to the issuance of new licences in an attempt to control the large amount of latent effortin the fishery. Despite this, from 1986 through 1989 the profitability of the demersal sector steadily worsened asprices declined and operating costs rose. Thus, the fishery was characterised by increasing trawl-fishing capacity andeffort, leading to the overfishing of some species. TACs were placed on the eastern gemfish and orange roughyfisheries in 1988 and 1990, respectively. On 1 January 1992 TACs allocated as ITQs were introduced for the 17 majorspecies or species groups (see Table 1) in the fishery. Most of the TACs were based on historic catch levels rather thanyield estimates. Although the number of active trawlers has decreased since ITQs were introduced, fishing effort hassignificantly increased from 1992 to 2000.
Approximately 35500t were allocated under TACs in 2000, but as has been the case since the introduction ofITQs, the actual catches for many species were below the TACs that had been set (Table 1). Tilzey (2000) notes thatthese shortfalls may reflect reduced fish abundance or catchability and other factors such as quota-availability,impediments to quota-transfer, or marketing-barriers. He further commented that several TACs are probably too high,having remained at their initial (1992) levels, which were based on historic annual catch maxima.
Some quota species are also caught by methods other than trawl or Danish seine. In 1998, global TACs(encompassing both trawl and non-trawl sectors) were introduced for blue-eye trevalla (Hyperoglyphe antarctica),ling and blue warehou (Seriolella brama). The global TACs for blue warehou and blue-eye trevalla were considerablyhigher than their previous values for the trawl fishery only. In 2001 global TACs were applied to all quota species.In acknowledgement of the different gear sectors active in the fishery, it is now known as the South East Fishery(SEF)3. Important species that are not included in the quota programme include oreos (Allocyttus spp. and Cyttusspp.), black sharks (Dalatias licha) and king dory (Cyttus traversi) (Tilzey 2000).
The recent catch can be summarized as follows:
Marketing adds an additional 21% to the ex-vessel value (Tilzey 2000). The value of the year 2000 catch is expectedto be about 9% greater that that of 1999 (Pers. comm. R.Tilzey, BRS, Australia).
2. MANAGEMENT OF THE FISHERY
Grieve and Richardson (2001) summarise the recent management of the fishery. Prior to the mid-1980s theSoutheast Trawl Fishery was lightly regulated with few management constraints. The initial reaction to the fleet
Australia Southeast Trawl Fishery 188
1999 2000
tonnes $A million
(ex-vessel value)
tonnes
Trawl quota species 27 261 56.7 26 157
Trawl non-quota species 3 925 5.2 4061
Noon-trawl quota species 901 3.4 899
Non-trawl non-quota species 299 0.2 314
3 While this fishery has been known as the South East Fishery since 1992 because of its mult-gear character; the original namehas been used here as the emphasis of this article is on the fishery’s early period.

189 Shotton
Spec
ies
St
atus
R
elia
bilit
y of
as
sess
men
t
2000
T
AC
2 (t
) 20
00
TA
C3
(t)
2000
To
tal c
atch
(t)
20
01
TA
C2
(t)
glob
al
2001
T
AC
3 (t
) tr
awl
2001
T
AC
3 (t
) no
n-t
raw
l B
lue-
eye
trev
ally
?
P
100
10
0
89
630
10
2
576
Blu
e gr
enad
ier
F
G
10
000
11
938
8
647
10
000
12
230
9
Blu
e w
areh
ou
O
M
615
98
9a
434
75
0
474
64
3
Eas
tern
sch
ool w
hitin
g (S
illa
go s
pp.)
?
M
1 50
0
1 87
0
759
1
500
1
899
0
Tig
er f
lath
ead
(Pla
tyce
phal
us a
nd N
eopl
atyc
epha
lus
spp.
)
F
M
3 50
0
3 74
2
3 32
4
3 50
0
3 94
1
1
Gem
fish
: E
aste
rn
O
G
0
200
93
15
0c
144
5
Wes
tern
? P
30
0
336
34
9
330
30
6
1
Jack
ass
mor
won
g
(Nem
adac
tylu
s m
acro
pter
us)
F
P
1
200
1
536
88
0
1 20
0
1 41
3
14
John
Dor
y
? P
24
0
290
18
3
240
28
8
<1
Lin
g ?
M
2 09
5
2 59
9a
1 59
2
2 40
0
2 53
1
323
Mir
ror
dory
(Z
enop
sis
nebu
losu
s)
? P
80
0
977
20
8
800
99
6
<1
Oce
an p
erch
(H
elic
olen
us p
erco
ides
)
F
P
500
59
9
351
50
0
595
9
Ora
nge
roug
hy:
Sout
hern
O
M
70
0
700
30
7
560
56
0
0
E
aste
rn
O
G
2 00
0
1 94
4
1996
1
800
1
747
0
W
este
rn
O
P
1 25
0
1 61
3
192
1
000
1
319
0
C
asca
de
?
P
1 60
0
1 46
9
1 53
4
1 60
0
1 52
2
0
R
emot
e
? P
n.
a.
n.a.
`1
8
n.a.
n.
a.
n.a.
Red
fish
O
M
1
750
2
097
84
6
1 57
5
1 98
9
5
Roy
al r
ed p
raw
n (H
alip
oroi
des
sibo
gae)
?
P
500
56
1
485
50
0
569
0
Silv
er tr
eval
ly (
Pse
udoc
aran
x de
ntex
)?
P
500
61
6
151
50
0
573
51
Spot
ted
war
ehou
(Se
riol
lela
pun
ctat
a)
? P
4
000
4
289
3
719
4
080
4
706
81
Tota
l
34
800
35
510
27
058
33
465
37
904
1
718
Tabl
e 1
Sum
mar
y of
sta
tus
and
rece
nt
TAC
s an
d ca
tche
s of
SE
F q
uota
spe
cies
F -
Ful
ly f
ishe
d
U
- U
nder
fishe
d
?
- U
ncer
tain
O
- O
verf
ishe
dR
elia
bilit
y of
ass
essm
ent:
P- P
oor,
M -
Mod
erat
e,
G
- G
ood

expansion in the 1970s was to place a limit on maximum length (32m) with three exceptions for existing largervessels4. But, as the most efficient vessel size was smaller than this, it had little effect on reducing fishing effort(later, with the development of the fishery for deepwater species such as orange roughy, vessel size became moreimportant). Rising costs, especially for fuel, and declining catch-rates prompted the industry to call for controls onaccess to the fishery.
In 1985, the traditional area of the fishery off NSW and eastern Victoria was split into eastern “A” and “B”management regions and separate vessel licences were required for each region. The rest of the fishery was classedas developing and thus open to new entrants and was called the Southwest Sector. The resources are now managedusing a combination of individual transferable quotas, limited-entry, area-restrictions and some gear-restrictions(Tilzey 2000). Initially, few restrictions were placed on the developing deepwater fisheries (Geen, Brown and Pascoe1991), a situation now much changed.
In 1986, a programme to manage fleet-capacity in the fishery was introduced. A total of 24000 fishing-capacityunits5 was established for the fishery – these being based on vessel dimensions and engine power. Should an operatorwish to increase the fishing power of a vessel or replace one with a larger vessel, he then had to buy capacity unitsfrom those willing to sell (Coutts 1991). A fleet total of 24086 units was in existence in 1985, but by 1991 this valuehad increased to 24664, despite the provisions in the programme that were intended to lead to a reduction in totalfleet capacity (Tilzey 1994).
At that time, entry criteria were put in place to control which vessels would be part of the limited-entry scheme.These criteria were based on commitment to the fishery during the 12-18 month period prior to the ministerialannouncement foreshadowing implementation of the limited-entry programme (Lilburn 1986). The entry criteria forthe eastern A and B zones were related to the period immediately prior to June 1981, while the criteria for the rest ofthe fishery were based on commitments prior to January 1984.
The option of managing the Southeast Trawl fishery using ITQs was first identified in 1988, along with threeother choices, all involving modifications to the existing system, e.g.changing the boat-replacement rules, changes tofishing-sector boundaries, non-transferable individual quotas, and licence buy-backs. However, it was not possiblethen for the working group evaluating the options to decide which of the choices would be best, and so a modelling-exercise was undertaken. Though there were important data limitations, modelling was based on assumptions thatfishermen have an investment horizon of five years and a discount rate of 20% (of which 10% reflects the risk anduncertainty in the industry). The results of the analyses showed that the industry would earn the most profits ifmanaged using an ITQ system. This system would also result in the greatest structural adjustments.
This development, during the mid-to-late 1980s, by the Federal Government of a management policy based onfisheries economic theory and the emerging concepts of ecological sustainability (Grieve and Richardson 2001)resulted in a document titled “New Developments” (Anon 1989) which suggested that ITQs would lead to morerational economic and sustainable outcomes for both the fishing operators and society. And, it was the SoutheastTrawl fishery that was the first fishery to come under this new policy directive. The three main objectives set out bythe Commonwealth government in this document were:
i. to ensure the conservation of fisheries resources and the environment which sustains these resourcesii. to maximize economic efficiency in the exploitation of those resources andiii. to collect an appropriate charge from individual fishermen exploiting a community resources for private gain.
It is interesting that even as early as 1989, industry members, through a working group to consider furtheroptions, had noted (e.g.Thomas 1991) their preference to include ITQs in the future management programme, at leastfor gemfish, redfish and morwong. However, at that time industry felt too little was known about the developingorange roughy fishery to predict whether ITQs would be appropriate for that fishery.
ITQs were introduced into the Southeast trawl fishery on 1 January 1992 (operators were informed in December1991 of their allocations) two years after the decision was made to adopt this form of management. The system was
Australia Southeast Trawl Fishery 190
4 Grieve and Richardson (2001) report that this regulation was successfully challenged in the Federal Court on the basis thatrestricting vessel length was contrary to the AFMA’s objective of pursuing maximum economic efficiency.
5 Hull units were calculated according to:L x B x D X 0.6
2.83
where length (L), breadth (B) and depth (D) were measured in metres. Engine units were measured by:kW3.5
where kWwas the maximum continuous brake power at a water temperature of 25° - 27°C as recommended by the enginemanufacturer’s specifications. (Tilzey 1994)
applied to 16 species or species groups for a total TAC of 31680t. Of this, approximately 29000t were allocated bythe Australian Fisheries Service. The remaining part of the TAC (5 - 10% held back in 1992) could theoretically beused for scientific purposes or for additional allocations made by the Appeals Committee (Geen, Nielander and Meany1993). The ITQs are fully transferable between operators in the trawl fishery. In the case of the trawl and non-trawlgear sectors, inter-sector leasing of ling and blue warehou quota is permitted, but permanent sales of quota are not(Kaufmann, Geen and Sen 1999).
At the time of the introduction of ITQs into the SE Fishery about 140 licences existed for this fishery. By 1997there were 108 active vessels although a further 42 permits were held by ‘fishermen’not active in the fishery. During1997, a Commonwealth Government adjustment scheme removed a further 27 permits. Other operators also received‘targeted financial assistance’for the “loss of asset value of fishing entitlements” in the change to ITQs from the inputcontrol regime. (Grieve and Richardson 2001). However, despite these potential effort withdrawals, fishing effortduring the period 1992 - 2000 has nearly doubled. (Pers. comm. R. Tilzey). The recently developed Cascade Plateauorange roughy fishery 200 km southeast of Tasmania was initially subject to a competitive TAC (1600t), although theTAC was split into four quarters with an equal allocation of 400t in each three month period to spread fishing effortacross the year. In the case of this orange roughy fishery, ITQ were not introduced until 1 April 2001.
3. ALLOCA TION OF QUOTAS3.1 Intr oduction
The original policy objectives of the Australian Fisheries Service in undertaking the allocations in the way theydid were not explicitly articulated, even if the reasons for making the management change to a rights-based approachwere well documented. This makes discussion of the allocation objectives, nearly a decade later, more difficult. Thisis not the case at present as the Authority’s goals are now well expressed.
Current Australian Fisheries Management Authority6 (AFMA) policy contains no social goals, rather it isentirely concerned with achieving sustainable resource and economic objectives. Thus allocation of quota shouldseek to avoid or minimize redistribution of wealth; i.e. once the core resource objectives were obtained, its policiesshould attempt to achieve a minimal level of resource distribution. These concerns, to avoid or minimize theredistribution of wealth, have been highlighted by an increased sensitivity concerning potential court challenges anda wish to avoid this situation. Thus, three criteria emerged in relation to quota allocation by AFMA, which influencedtheir policy approach (AFMA1997):
i. the allocation criteria should be sensible and reasonableii. they should avoid redistribution of wealth andiii. they should discourage legal challenge.
3.2 Process used in determining the original SETfishery allocations3.2.1Catch history
Operators received an allocation based on verified records of their historical catch and investment in the fishery.A vessel’s catch history was considered by the authorities to be attached to the vessel’s licence endorsement, whichpermitted them to participate in the fishery. If the endorsement was transferred, e.g.through a vessel sale, then thecatch history was considered to have been transferred with the endorsement unless there had been an explicitagreement to the contrary.
In determining the catch histories, a decision was taken not to rely on logbooks, whose objectives were intendedto primarily be for the collection of scientific data. Further, it was considered that these data were not reliable andoften did not indicate what the target species were, being completed after the fact. Rather, catch history was to bebased on certifiable catch revenue returns.
3.2.2 Investment in the fishery
An operator’s investment in the fishery was estimated on the basis of a measure of vessel-capacity that had beenused earlier in the management of the fishery. It was based on the vessel’s cubic number7 and the vessel’s engine-power. In the case of the Danish-seine fleet, each vessel was deemed to have an equal “investment” value in thefishery – so this factor only applied to trawlers.
191 Shotton
6 The Australian Fisheries Management Authority was formed as a statutory body with its own board in February 1992. It operatesunder new legislation and took over the functions of the then disbanded Australian Fisheries Service, which was a Division ofthe Department of Primary Industries.
7 Length x breadth (beam) x depth.
3.3 Allocation formula
Initially, the allocation to a demersal trawler entitlement-holder was to be calculated by the formula:
where:
UI = number of individual quota-units of a species, expressed as a percentage of the units of the species available to the demersal-trawl vessels
á = catch history weighting factor - 80% for traditional species, 50% for newly-exploited species
1-α = boat unit weighting factor
C = catch
t = time
s = species
T = the set of years over which the catch was calculated.
The formula for Danish-seiners was similar but weighting factors of 70% and 30% were used respectively fortraditional and newly-exploited species. However, as a consequence of a court challenge (see Sections 5 and 6 below)the formula was changed.
For species caught by both the Danish-seine and demersal-trawl fisheries, the number of quota units was firstdivided between these two gear sectors based on their historical catch. Trawl operators were then allocated a sharebased on a percentage of the total catch for each species by the fisherman. This was estimated as the percentage ofthe total catch of that species for each year using the five years during the period 1984-1989 inclusive. Thesepercentages were then weighted and summed to determine the “historical” catch. Extending the qualification periodback to 1984 meant that many operators who had left the inshore fishery, e.g.to participate in the developing offshoreorange roughy fishery in the southwest sector, would receive entitlements for a fishery that they no longer participatedin, though the allocation formula would correspondingly discount the entitlement they received, in relation to the timethey had been out of that fishery. The catch histories for the operators’best four years were then averaged andmultiplied by 100 to produce the catch history data used in the calculations (Geen, Nielander and Meany 1993).
The relative weights given to historic-catch and investment differed between species. For most demersal speciesthe historic-catch was given an 80% weighting for the trawl fishery and 70% for the Danish seine fishery. Fordeepwater species that were the targets of relatively new fisheries, such as orange roughy and blue grenadier, thehistoric-catch was given a 50% weighting.
3.4 Administrative pr ocess
An ITQ Liaison Committee for overseeing the quota allocation-process was established in August 1990,composed of industry and government members. The committee met eight times from August 1990 until September1991. In addition, a committee formed of government members from state and Commonwealth levels was formed.A Commonwealth Quota Implementation Team was also formed, which had the operational responsibility forimplementation of the programme. Two rounds of port meetings were held in September and November-December1990; these were well attended (Exel and Kaufmann 1997).
A number of complaints were expressed at the fishermen’s meetings, specifically about the consultation-processand the allocation formula. Some individuals in industry believed the consultation process to be perfunctory; therewere also complaints that the final management plan was available only one month before it would be implemented.They noted that these consultations were not intended to debate whether (or not) ITQs should be introduced, but ratherhow they should be introduced. This did not engender a co-operative attitude from those in the industry that werehostile to the idea (Exel and Kaufmann 1997).
3.5 The Cascade Plateau8 Orange Roughy Fishery
The quota allocation process in this orange roughy fishery occurred almost a decade after the initial allocation(2001 versus 1992) and in the perspective of past successful Court challenges. (The allocation came into effect on
Australia Southeast Trawl Fishery 192
8 The Cascade Plateau occurs to the southeast of Tasmania about 200 km distant from the coast and within the Australian EEZ.

1 April 2001.) No doubt as a consequence of the earlier legal experiences, the AFMA decided to use anindependent Allocation Advisory Panel (AAP) in an effort to distance itself from the allocation process and beperceived to be neutral in regards to the ultimate decision on how allocations should be determined.
Thus, the AFMA outlined the general principles that were to be used in the allocation process and the AAPwould be responsible for recommending the method to be used. In this way, it was hoped that the allocationprocess would (a) be an improvement over previous attempts to allocate rights, (b) would be separated from theAFMA, which was responsible for day-to-day management and (c), would stand a better chance of being upheldshould it be subject to legal challenge.
At the time of the allocation, 14 boats had a catch history for orange roughy, but 110 boats were legallyeligible to participate in the orange roughy fishery (i.e. they possessed a SEF trawl or Danish seine licence).However most vessels were of designs that were unsuitable for fishing in the open ocean environment of theCascade Plateau area and, or, used inappropriate gear - the case for the Danish seine vessels.
The AAP decided that because ‘in theory’these vessels could participate in the orange roughy fishery, allvessels legally eligible to fish should get an allocation and that the amount should be equal for all potentialparticipants, i.e. each licence holder would receive an amount equal to the TAC divided by 124, the number ofboats licensed in the SEF at that time. However, this view was not shared by the Board of the AFMA whomodified the allocation so that only 50% of the TAC (i.e. 1600t ÷ 2 = 800t) was allocated to vessels with a catchhistory and the other 50% to the remaining SEF vessels. Their reasoning in doing this was that the licence valuesof all (124) vessels in the fleet partially reflected their right to exploit fish resources of the Cascade Plateau regioneven if they chose not to do so.
4. DATA REQUIREMENTS AND VERIFICA TION OF THE CATCH-HIST ORY
The catch-history of each licence-holder was collected by the Australian Fisheries Service and verified.Individual fishermen were visited at least once to evidence and to verify their catch record for the period 1984-1989. The AFS accepted the following types of documents as evidence of past catches:
i. statements from a fishermen’s co-operativeii. landing documents from the fisherman’s co-operativeiii. certified statements from fish-marketing authoritiesiv. invoices, receipts, sales documents, carriers’consignment notices andv. company financial records and tax returns.
These data were subject to random audits and such checks were extended to the information supplied byprocessors and other providers of data. Commonwealth logbook data were also accepted but, were subject to a15% discount (it is not clear from available documentation why this was done). Personal fishing diaries werealso accepted and were treated in the same manner (Geen, Nielander and Meany 1993). Studies werecommissioned to examine the veracity of the current logbook data (e.g. Carterand Smith1991). In the cases ofvessels that were disabled, an “imputation” procedure was undertaken to determine an equivalent catch that couldbe used for quota allocation purposes.
5. THE APPEALS PROCESS
Because of the dissatisfaction in the industry regarding the allocation-process, at a request from the politicallevel, a Review Committee was established. There were also several formal appeals: (a) to the internal reviewprocess of the AFMA; (b) to the Administrative Appeals Tribunal, an independent body that hears appeals againstCommonwealth administrative decisions; (c) an application to the federal court to overturn the management plan.
AFMA (1997) notes that when the allocation system is contained in a Statutory Management Plan, anyappeals would be considered by the Statutory Fishing Rights Allocation Review Panel (SFRARP) establishedunder AFMA legislation. The allocation system would initially appear in the draft Management Plan, which issubject to extensive consultation arrangements, consideration of submissions, determination by AFMA andacceptance by the Minister. Those not satisfied by a decision of the SFRARPmay appeal to the Federal Courton points of law. Where the allocation is effected through conditions on Fishing Permits, the allocation systemwill be appellable through the internal review, AAT and Federal Court process.
An AFMA review was also undertaken of the allocation methodology (Exel and Kaufmann 1997). TheReview Committee concluded that the industry was not adequately consulted on either the allocation process orthe allocation formula. In the defence of the Australian Fisheries Service, they had been constrained by a deadlinefor programme implementation, which the Review Committee found was an impediment to adequateconsultation.
193 Shotton

6. DISCUSSION6.1 The Federal Court Appeals
The least desirable outcome for an administration attempting to implement an ITQ management-system is tohave the programme challenged in court, and alas, this happened with the Southeast Trawl fishery: two companiesapplied to the courts contesting the quota-allocation. In the first of these (Austral Fisheries Pty Ltd v Minister forPrimary Industry and Energy, 37 FCR 463), Austral Fisheries challenged the formula used to determine its orangeroughy allocation. Austral Fisheries asserted that the allocation formula contained a statistical fallacy, produced anirrational result, and was therefore ultra viresby virtue of its manifest unreasonableness. Austral Fisheries maintainedthat the catch-history should have been computed by summing an individual’s catch over the relevant time period andthen dividing this sum by the total catch by the industry.
Austral Fisheries were successful in their case, and Exel and Kaufmann (1997) report that: the “Federal Courtfound, in their September 1992 decision, the allocation formula to be ‘capricious and irrational’and declared theparagraph in the management plan containing the formulate to be void. Kaufmann and Geen (1998) note that thejudge found no reason for adopting the formulae that were used. He stated “When, as here, it produces such an absurdresult, doubling quota formulae, and giving him 18% of the TAC whilst reducing everybody else’s, there isjustification for judicial intervention to redress an understandable sense of injustice.”
This judgement was appealed by the government (Minister for Primary Industries and Energy v AustralFisheries Pty Ltd) but the Federal Court, in a February 1993 decision, dismissed the appeal. In doing so, it was statedthat:
“In substance, the Judge held that the relevant provisions of the plan were capricious and irrational, suchthat no reasonable person could ever have devised it. This was an extreme conclusion, but it was justifiedon the expert witness of Dr Nicholls. We are not persuaded that, in principle, his Honour was wrong inthe conclusion. In the absence of evidence, or a process of reasoning to propound any rational basis towarrant the adoption of a statistically flawed formula for the calculation of the catch history over the fiveyear period, it was we think, reasonably open to his Honour to conclude that the relevant provisions for theplan were beyond power and thus void. No case for interfering with that conclusion has, in our view, beenmade out.” (Beaument and Hill – cited in Kaufmann, Geen and Sen 1999.)
The second court case (La Macchia and Others v Simon Crean, Minister for Primary Industries and Energy;and AFMAv Musumeci and Others) was brought by a group of companies challenging their gemfish allocations, whohad appealed on the same basis as Austral Fisheries and with the same result. In this case Kaufmann, Geen and Sencite the following outcome of the initial decision, in March 1994:
“Where a statute provides for an allocation of a scarce resource amongst participants in the relevantindustry, in general, and failing some clear indication to the contrary, the statute should be understood asauthorising a method of allocation in accordance with some intelligible principle appropriate to achieve areasonable division as between these participants. On the expert evidence before me, the principle uponwhich the method here in question was selected is not intelligible (and if there was some intelligible basisthe respondents were in a position to prove it in detail, so that I am entitled to give full weight in theinferences arising from the evidence of Dr Nichols (Burette J.)”.
The allocation formula was then changed so that an operator’s catch-history was calculated by summing hiscatch over the qualifying period. Thus, as a result of this and the earlier review, the allocation formula was changedin October 1992 in such a way that each operator’s share was calculated over the entire qualifying period as a simpleaverage, and not as an average of the averages in each of the qualifying years.
In the new reformulation, the AFMA adopted a “winners - no losers” approach, which applied for the remainderof the first quota year, and in the subsequent year with no adjustment for “losers”. Despite this, Exel and Kaufann(1997) report that many operators remained dissatisfied with the allocations they had received and that legal battlesat that time (1999) were still continuing. This matter became the subject of a review by the Australian Senate ofCommonwealth fisheries legislation. They found convincing evidence that the allocation formula was seriouslyflawed from the beginning and that as a consequence, problems in establishing an effective management regimewould continue unless they were resolved.
As a result of the continuing dissatisfaction with the programme, in 1995 the Commonwealth Governmentintroduced a limited buyout programme with quota recovered by the buyout redistributed among the remaining quotaholders. This redistribution was focussed on the inshore fishermen, who were most vocal in expressing theirdissatisfaction with the programme. The rational for this use of government funding was that the government shouldaccept some responsibility for allowing excess fishing capacity to develop in the fishery during the previousregulatory regime. This adjustment helped mitigate dissatisfaction on the part of many of the quota holders, notwithstanding the (then pending) administrative court appeals.
Australia Southeast Trawl Fishery 194

An important consequence of the continuing legal challenges and expressions of dissatisfaction by theindustry was that permanent legal transfer of quotas was unable to take place until January 1994. This wouldhave, of course, negated many of the initial benefits that were anticipated to follow from the introduction of theprogramme.
It is germane to note the comments by Kaufmann, Geen and Sen (1999) on the basis for the success of theinitial litigants and the failure of the government’s appeals. They note that the government lost because theindustry was able to show that taking the average of unweighted-means, gives a different result to the average ofweighted-means, and in doing so favours those who had the greatest share of the catch when the total catch wasleast. Of course, if the operators took a constant share or fraction of the catch in each year of the qualificationperiod, these two means would be the same9.
Kaufmann, Geen and Sen (op. cit.) argue that method used was not unjust if it is desired that the quotaallocation policy should recognize the “investment” that the 1st operator may have put into the fishery. Forexample, he may have been the only operator in the first year, or may have assigned five boats to the fishery,while the 2nd operator, if present at all, may have assigned only one boat to the fishery. Thus the allocation to 1st
operator should acknowledge the greater risk he took in developing the fishery and that should justifiably berewarded, if investment in the fishery is one of the criteria to be used in the allocation of quotas. Kaufmann, Geenand Sen concluded that there might have been a failure to argue the government’s case appropriately in thecourts10.
In fact, one view that has been expressed is that the original formula initially used by the Australian FisheriesService, was deliberately intended to reward the pioneers in the fishery by giving an extra weighting to theirallocation. As is known, the expert witness for the fishing industry was successful in convincing the judge of theview that the results from the AFS’s method were not fair as they were not weighted by the annual landings.However, for whatever reason, the AFMA did not call a statistical expert to argue the counter case for theirselection of the original formula. Not did they give evidence to the effect that they intended to give adisproportionate weighting to the allocations to the pioneer fishermen, who established the fishery. Indeed,apparently the counsel for the industry expected this justification to be made by AFMA. Thus, in its absence, itwas left open for the judge to make the decision he did.
In the aftermath of the Court rejection of AFMA’s allocation it was decided that none of those who hadreceived quota would suffer a reduction in their allocation; rather those who would gain under the new formulawould be given additional formula, a process that became known as the “no losers” principle. The additionalquota was taken from a 10% TAC quota reserve that was purportedly established for scientific purposes. Thisprinciple was adopted only for the first year; in the following year, the new quota formula was applied.
195 Shotton
9 This is easily demonstrated by a simplified example, as shown in the table below which gives an example of differences betweenthe average catches as calculated using weighted as unweighted means
The simple average for the 1st operator is
80% + 40% / (80% + 40% + 20% + 60%) = 60% (1)
And for the 2nd operator is the average is
20% + 60% / (80% + 40% + 20% + 60%) = 40% (2)
But if the catches are totalled for the two years, then for the 1stoperator, the average will be
2000 + 2000 / (2000 + 500 + 2000 + 3000)
= 4000 / 7500 = 53.33%The 2nd operator would then receive 46.66% of the quota - significantly more than with method (1).
10 Any person who has been a scientific expert-witnesses in court, will know the unpredictable way technical facts can beinterpreted by judges, and the obfuscation and un-scientific ways that scientific testimony can be challenged. Above all is thefrequent lack of understanding of the scientific issues by those responsible for making the critical decisions.
Year Catch Total Operator 1 Operator 2 tonnes average tonnes average tonnes
1st 2 000 80% 500 20% 2 500t 2nd 2 000 40% 3 000 60% 5 000

6.2 Social equity and policy effectiveness
Geen, Nielander and Meany (economists employed either by the Department of Primary Industries or theAFMA), in their 1993 account, published contemporaneously with the introduction of ITQs into the SoutheastTrawl Fishery, noted that one objective of quota-allocation in Australia was usually to achieve an equitabledistribution of the available catch. They acknowledged that failure to achieve a distribution that was perceivedas equitable by the fishermen, would result in their loss of support for the scheme and possible subsequent lackof compliance with the new regulations. They perceived that this would result in increased management-costsand loss of the potential efficiency-gains to be obtained from ITQ management-systems.
Another concern of an internal review, noted at that time by Geen, Brown and Pascoe (1991), was that theallocation formula should not allow operators who took large shares of the total harvest during the developmentalphase of a fishery to gain permanent large shares through the subsequent allocation-process. In Geen, Nieland andMeany’s 1993 article, they had noted that the industry was dissatisfied with the allocation-process (a phenomenonconsistently found in most quota allocation-procedures) and that effort was intended then, to make the allocationmore equitable and reflect as much as possible the current pattern of fishing operations. This may imply that aperiod of six years, as the basis for establishing a catch-history record, was considered by many in the industryto be too long, given the rate of change in the participants and the nature of their fishing operations. Geen,Nieland and Meany (op. cit.) also noted that 15% discount factor applied to data on landings derived fromlogbooks, was to be discontinued.
Geen, Nieland and Meany (1993) also noted that the management plan, when introduced, did not extend toother gear-types harvesting the same species as those included in the sixteen quota species taken by the southeasttrawl fishery. This they predicted would be a management deficiency that would need addressing in the future,as has been the case.
Exel and Kaufmann (1997) noted too that the allocation-process had been subject to much criticism and thattwo years after the introduction of ITQs, dissatisfaction was sufficient to continue to jeopardize the acceptance ofthe management regime. They also noted that although ITQs were not introduced until almost two years after thedecision had been taken to implement this management approach, they believed that preparation for themanagement-change had been incomplete. They believed that consultation with the industry had been inadequateand ineffective, and perhaps, was part of the reason that certain sectors of the industry remained opposed to ITQsup until the time this management system was implemented.
The issue of the short time that was available for the implementation of the new ITQ regime had arised asthe Commonwealth Minister for Primary Industries (which had the mandate for fisheries), the Hon. John Kerin,wanted the ITQ scheme to be in place by 1 January 1992 prior to the creation of the new Australian FisheriesManagement Authority. However, the industry argued strongly that implementation should be deferred to allowtime to development the required management activities and the allocation protocols, if the ITQ scheme was tobe successful once implemented - sentiments that proved to be prescient. In the end, those responsible for theallocation process, the Quota Implementation Team of the Australian Fisheries Service, had only some fourmonths to develop the allocation process.
Not surprisingly , accurate determination of what a vessel’s catch history was, once the decision not to uselogbooks had been taken, was difficult. This gave rise to another source of antipathy towards the programme.Not unexpectly, where ex-vessel fish sales had, as a practice, been unreported to avoid tax payments, fishermenwere consequently penalized in terms of having a lower verifiable catch (i.e. from their sales records) than theiractual catch. A consequence of this was less acceptance of the new programme, at a time when the AFMA wasattempting to achieve the opposite.
Exel and Kaufmann also highlighted the problem of uncertainty in establishing appropriate TACs: theybelieved that in the case of the Southeast Trawl Fishery, this process was rushed. Most TACs were set on pastaverage catch-levels over the period 1986 – 1991, rather than being determined from a formal analysis of thedynamics of the fishery. No formal stock-assessment process was established prior to the commencement ofthe ITQ management-system and no funds were made available to undertake stock-assessment. Exel andKaufmann concluded that the cost of stock-assessment, the impact of ITQs on the usefulness of catch and effortdata, high-grading, and other stock-assessment issues should have been more fully considered prior tointroducing ITQs.
Exel and Kaufmann (1997) also raised the issue of “over-quota“ fishing. This they found to be exacerbatedby:
i. the freeze on the permanent transfer of quotaii. the lack of a formal lease-marketiii. the high leasing-transaction costs and
Australia Southeast Trawl Fishery 196
iv. the permission given to fishermen (during 15 days after the end of each month) when they are allowed toobtain extra quota-units to cover any landings made in excess of their initial quota.
Exel and Kaufmann (1997) came to several strongly held conclusions: they believed that broad-basedindustry acceptance of ITQs, and industry partnership in the implementation-process are the most importantprerequisites to the development of a successful ITQ regime. They asserted that it is better to continue to managewith dysfunctional input-controls, than to introduce ITQs in a fishery where the industry is strongly opposed tothe regime. They concluded that even if support is given by the industry, equitable quota-allocation can bedifficult to achieve, and appeals are likely to continue for a longer period than first anticipated. The issue ofappeals should be given attention prior to the implementation of the ITQ management-system and rights of appealshould be constrained to a predetermined time-period if at all possible. As well, quota should be set aside tohandle successful appeals.
Not surprisingly, Exel and Kaufmann (1997) believed that “the allocation of quota in ITQ fisheries isnotoriously tricky”. They noted that if possible, fisheries managers should have no decision-making involvementin the allocation-formula or allocation-process, though they may be called upon to make suggestions. Further,they believed that being a fisheries manager provides no comparative advantage in quota-allocation decision-making, and that there are at least three good reasons for keeping the fisheries management organization out ofthe decision-making involved in the allocation of quotas:
i. because of the intimate involvement in the fishery, managers tend to have subjective preferences about whodeserves quota
ii. for this reason, industry believes that the administration is biased andiii. long after the allocation is complete, any perceived inequities in the quota-allocation will make it difficult
for managers to work with the industry.
For these reasons, they believed that the establishment of an independent allocation-body is preferable toencumbering the management body with allocation decisions.
Exel and Kaufmann offer a further caution: they note that rights-based fisheries management-regimes areoften introduced into fisheries that are suffering some form of management crisis (such as over-exploitation ordifficulties of excess fleet fishing-capacity). As a result there is (they claim) a false sense of urgency related tothe introduction of ITQs, and that bureaucratic imperatives often take precedence over operational realities, e.g.determining acceptable allocations and establishing an effective monitoring and surveillance system. The lessonthey drew from the experience in the Southeast Trawl fishery was that it was extremely difficult to correctmistakes that arise from the premature and insufficiently planned introduction of any new management-regime.After ITQs were introduced, new vested interests were created and some previously available managementoptions become foreclosed.
Another conclusion to be drawn is the importance of appropriate consideration of historical and socialfactors when quota rights are to be assigned, in effect, indefinitely. There was a considerable mixture in thetraditions of participation in the original SETfishery. On one hand there were third-generation fishermen whohad developed the fishery, mainly based on tiger flathead and other inshore species; on the other hand, manyfishermen were recent participants attracted by the high catches and prices that could be obtained for gemfish.Not surprisingly, different participants had different views as to what was fair and what was not. Yet further, inthe three years prior to ITQs originally being implemented, the orange roughy ‘boom’saw many new entrantsinto the fishery contributing to a significant and concurrent change in the social traditions of the fishery andchanges in who were the relative beneficiaries of the resources managed under a single management plan.
The allocation procedure suffered, in the views of others, another defect. Among the recipients of quota,some had similar sized boats that were not active during the period used for determining the catch history. Inthese cases, their quota entitlement was based on the catch history of other boats that many believed had aboveaverage fishing performance. Thus, the boats whose shared was “imputed” received more quota through thisprocess than many boats that had an actual catch history.
There is no doubt that the circumstances under which ITQs were introduced in this fishery were extremelycomplex. First, insufficient biological information existed on which to confidently set appropriate TACs. Neitherdid the required assessment and management institutions exist for the provision of fully satisfactory resourcemanagement advice. Second, as noted earlier, the fishery itself was complex, involving a variety of gears andindustry sectors, each with different fishing traditions. Third, many of the resources were (and still are) subjectto more than one regulatory agency. Forth, the management agencies of the Commonwealth government withthe mandate for fishery management were themselves being reorganized and being provided with new enablinglegislation. Fifth, the South East Trawl fishery was one of the first in Australia in which ITQs were beingintroduced as a management approach, indeed, globally, this was still a relatively new management approach with
197 Shotton

only limited institutional experience. Sixth, there was a political exigency to move ahead quickly with theintroduction of this management approach.
When taken in this perspective, the difficulty in achieving success is more understandable. And, the viewsof some fishermen, as reported by Aslin, Connor and Fisher (2001) are hardly surprising. These authors note thatsome fishermen in this fishery felt “they were diddled out of something” and that the allocation process “was areal stuff up”. In this context, a positive outcome of the allocation process is that considerable efforts have beenput into understanding the social impacts and management dynamics that were involved and appraising pastpolicies and management practices (e.g. the study by Aslin, Connor and Fisher). Further, it is apparent thatAFMA staff are well aware of the difficulties and problems encountered in this process and the ways in whichimprovements can be made.
6.3 Cascade Orange Roughy
It is noteworthy, that despite the efforts of the AFMA to devise what they hoped would be an impartialformula for the assigning of vessel quotas in the Cascade orange roughy fishery by devolving this responsibilityto an independent committee, they were dissatisfied with the outcome to the extent that they modified the AAP’srecommendation. It can be assumed that they thought it unfair that those who had recently invested in the fishery(and thus be subject to the current associated commercial risks) should not be recognized for their commitment.This action was consistent with their mandate as the AAP were an advisory body with no management authority;this lay entirely with the AFMA. Thus AFMA were entitled to reject the view of the AAP that allocations shouldbe based entirely on catch history as being (politically?) unfeasible in entirely ignoring current investment in thefishery. In the event, their action was seen by most as being sound. What the views of AFMA were regardingthe many vessels that would have received orange roughy quota although they would be physically incapable ofharvesting the entitlement they had received remains unknown.
Despite Exel andKaufman’s views notedabove, and what wouldseem to have been theAFMA’s bestintentions, and their useof an independentallocation body, theywere still unsuccessfulin avoiding courtchallenges over theallocation process withfive of the Cascadeoperators mounting alegal challenge to thedecision. In effectAFMA appeared tohave had an “each waybet” which ended insatisfying few in thefishery. For example, ithas been observed thatmost Danish seineoperators professed tobe embarrassed atreceiving orangeroughy quota andsympathised with theCascade operators.
6.4 Subsequent AFMA Policy Developments
As FERM (1997) has noted, its is important that the AFMA demonstrate that it had considered theimplications on fishing concession holders of re-allocations and that it had acted consistently with its legislatedobjectives if is to avoid having its re-allocations being viewed as capricious and, or, irrational. In a Fisheries
Australia Southeast Trawl Fishery 198
The Cape Hood, seen here undergoing engine trials in Hobart harbour,October 2001, is an example of vessels entering the orange roughy fishery off
Tasmania. One of fourin its class, she was built in 1975 in Pictou, Nova Scotia,for use in the Canadian northern cod fishery. The 45.9m, 2400 BHP, 189 GRTvessel was originally owned by H.B. Nickersons of North Sydney, N.S., Canada

Management Paper, AFMA (1997) note that its supporting legislation, regulations and objectives11 provide nospecific guidance on the allocation of fishing concessions when management arrangements are changed.However, AFMA does believe that the Authority’s objectives do provide guidance for undertaking allocation offishing rights.
AFMA (1997) note that it is “the fishing concessions that exist in a fishery at the time that the managementarrangements are proposed to change, are the ones that will be taken into account under any allocation ofconcessions required by the move from one management regime to another”. They also note that they anticipatecircumstances where it will not be possible to achieve an equivalent translation of the fishing concession whenchanging management regimes and that in these situations it will be impossible to avoid having some impact onthe economic positions of the individual operators.
Thus, AFMA (1997) note that in making any management changes they will ensure that:
i. “such changes are consistent with and support the pursuit of AFMA’s legislative objectives; andii. any differential economic impacts of allocations on individual fishing concession holders are minimized
unless there are reasons, justifiable with respect to AFMA’s legislative objectives, that dictate otherwise.”
AFMA (1997) holds the view that “operators will have greater confidence in allocation outcomes where theyresult from an independent assessment of the fishery and individual circumstances.” For this, AFMA deems itnecessary that the recommended basis of any allocation be done at “arms length” from AFMA and the AFMAboard. AFMA policy is to use an independent Allocation Advisory Panel (AAP) though the allocation isultimately done in accord with the its responsibilities under Section 7 of the Fisheries Administration Act (1991).The AAP may consist of up to three members, one of whom is to be a qualified member of the legal profession,such as a retired judge.
The AFMA requires that the AAP advise it on:
i. the most appropriate basis for allocation of fishing concessions in a fishery or between fisheries(intersectoral allocation) in accordance with the policy guidelines in AFMA (1997) and
ii. to identify and include in that allocation system any exceptional circumstances wwhich the AAP considersshould be taken into account.The AAP should
i. “consult with relevant parties and any persons or organizations with appropriate knowledge or experienceii. identify the data necessary to support the allocation system as determined above and the most cost effective
and appropriate methods of collection and verification of that dataii. explain and justify the recommended allocation system to the AFMA Board and to the relevant Marine
Advisory Councils or CCsiii. provide advise for the AFMA officers appearing as witnesses before tribunals or courts in any challenge to
the recommended allocation system implemented; andiv. maintain full records of all activities undertaken by the Panel.”
AFMA policy (AFMA 1977) stresses consultation and explicit guidelines are offered in relation to thisprocess. The AAP in addition to consulting fishermen, may, if they wish, also consult with “any person/s ororganizations with appropriate knowledge, experience or expertise as appropriate”. Where necessary the AAPmay obtain advice from relevant legal, economic or statistical experts. Appropriate funding is to be madeavailable by the AFMA for the AAP’s activities.
6.5 Administrative challenges
It was since been recognized that specialized legal expertise and logistical support (e.g. in the way ofappropriate databases and data to support trial evaluation of different allocation options) would have greatly
199 Shotton
11 AFMA (1997) lists its functional objectives as:
i. implementing efficient and cost-effective fisheries management on behalf of the Commonwealth (the cost effectivenessobjective)
ii. ensuring that the exploitation of fisheries resources and the carrying on of any related activities are conducted in a mannerconsistent with the principles of ecologically sustainable development and the exercise of the precautionary principle, inparticular the need to have regard to the impact of fishing activities on non-target species, and the long term sustainability ofthe marine environment (the ESD objective); and
iii. maximizing economic efficiency in the exploitation of fisheries resources (the economic efficiency objective); andiv. ensuring accountability to the fishing industry and to the Australian community in the Authority’s management of the
fisheries resources (the accountability objective); andv. achieving government targets in relation to the recovery of the costs of the Authority.

improved the draft plan for the programme that was produced. These were not available, and, to comply withdeadlines somewhat self-imposed by the Service, a plan was hastened by the Project Implementation Team to theMinister, with, as could expected, various imperfections. As a consequence of the work load and the timeavailable, it was not until late September/early October that industry members received by envelope notificationof what their allocation would be for the following season. Until then, it had not even been possible to confirmthat the conversion in the management process would occur. None of this was helped by the subsequentdiscovery of a fault in the software used in determining the allocations that resulted in some boats having thecatch histories switched in a haphazard manner. And on 23 December, the decision was taken to proceed withthe programme, despite the recognition that some vessels had catch histories that had been incorrectly assigned.
As happens in any management change, the risk of industry frustration existed, and in this case there wasthe view among many of the operators that their views had neither been properly considered nor had they beengenuinely consulted. That such concerns existed would have been normal. Under the input control programme(the VCUs were assigned in 1988), and as the fishery for gemfish developed and later that for orange roughy, thevalue of VCUs had risen from A$600 to a high of A$4000 per VCU. Thus a vessel assigned 750 VCUs wouldhave had an implied value of A$3 000 000. Naturally, operators were anxious as to how this imputed input-control value would by re-valued as an output-control ITQ asset. After the change, many boats were no longereconomic, though in their exitfrom the fishery their ownerswere able to sell their quotaholdings.
As Exel and Kaufmann(1997) note, the length of timefollowing the beginning ofactive management of theSoutheast Trawl Fishery to theintroduction of ITQ-management was, relative tomany other fisheries, extremelyshort. Area management hadbeen introduced in 1985 andinput controls in 1986. By 1July 1990, the AFS had formeda quota implementation teamwho had to work in anindustry-government environ-ment of what had beendescribed as a traditionalcommand-control model -government regulated andindustry complied. To be fairto AFS, this managementmodel was normal not only for the management regimes found in Australia, but represented a commongovernment-industry negotiating situation of that era - mutual suspicion, traditional bureaucratic control and anadversarial win-loose, or ‘zero-sum’, mentality to negotiations. Where a truly consultative approach was needed,time had not existed to allow for the, subsequently achieved, co-operative approach to management. To thesedifficulties must be added those arising from the complexity of the fishery - the many gear sectors, the mixtureof backgrounds of the participants, the relatively rapidly evolving nature of the fishery, plus the decision toencompass 16 species in the programme despite the lack of institutional expertise that would be needed toaccurately determine appropriate TACs based on good stock assessments.
As if these difficulties were not enough, in the middle of this fundamental change in management approach,the AFS was restructured; all staff were required to re-apply for their positions (not all were rehired) and the neworganization, AFMA, came into being in November 1991. The new Authority was to function with a then,relatively new, industry-government co-management approach. Thus, in looking back at the administrativechange, it might be claimed that the new management regime is testament to the robustness of an ITQmanagement approach that the process weathered its birthing difficulties. Now, it can be claimed that the ITQmanagement regime is reasonably widely accepted by the fisheries’participants for there is little, if any,indication that any of the South East Fisheries’participants wish to return to the former management regime. Butcertainly, this fishery offers a host of lessons for the prudent administrator facing the step of turning to atransferable-quota management approach.
Australia Southeast Trawl Fishery 200
The Crianda, 18.2m LOA, 440hp, 60GT, shown above in Victoria Dock, Hobart,was completed in 1980 in Melbourne, Victoria. It is typical of the trawlers
targeting “anvthing that swims” in the South East Fishery for market species.
7. ACKNOWLEDGEMENTS
I am most grateful to Martin Exel, Austral Fisheries, Pty., Fremantle, Geoff Rowan, AFMA, Canberra, RichardTilzey, Bureau of Rural Sciences, Canberra, and Anna Willock, Traffic Oceania, Sydney for their insights andinvaluable suggestions for the improvement of this text. However, responsibility for all omissions and errors of factand interpretation must remain mine.
8. LITERA TURE CITED
AFMA 1997. Allocation of Fishing Concessions where Management Arrangement Change. Fisheries ManagementPaper Series FMPNo. 8. 5pp.
Anon. New Directions for Commonwealth Fisheries Management in the 1990s. A government policy statement.Department of Primary Industries and Energy, Canberra.
Anon. 1996. Report of the South East Fishery Adjustment Working Group. Prepared for the Minister for Resourcesand Energy, Canberra, Australia.
Anon. 1997. Report of the Advice Concerning Apportionment and Allocation in Respect of Blue Eye Trevalla, BlueWarehou and Pink Ling . The South East Fishery. Report to the Board of the Australian Fisheries ManagementAuthority, Canberra, Australia.
Aslin, H.J., R.D. Connor and M. Fisher 2001. Sharing the catch or cashing in the share? Social Impacts of IndividualTransferable Quotas and the South East Fishery. BRS and Centre for Resource and Environmental Studies,ANU. 113pp.
Carter, D.J. and Smith, D.C. 1991. South East Trawl landings in Victoria and South Australia 1988-1990. Acomparison of data sources. Internal Report. Vic. Dept. Cons. Env. Mar. Sci. Lab.
Coutts, D. 1991. A Management Profile of Australia’s Southern Trawl Fisheries. In: Abel, K., M. Williams and P.Smith (Eds). Australian and New Zealand Southern Trawl Fisheries Conference: Issues and Opportunities.Melbourne, 6 - 9 May 1990. Bureau of Rural Resouces, Proc. No. 10. pp.114-122.
Exel, M. and B. Kaufmann 1997. Allocation of Fishing Rights: Implementation Issues in Australia. In: Pikitch, E.K.,D.D. Huppert and M.P. Sissenwine (Eds.) Global Trends: Fisheries Management. Proc. Symp. Seattle,Washington, USA. 14 - 16 June 1994. Am. Fish. Soc. Symp. 20. pp 246–255.
FERM 1997. Re-Allocation of Fishing Concessions Where Management Arrangements Have Changed. BackgroundPaper prepared for the AFMA Board. 14pp.
Geen, G., D. Brown and S. Pascoe 1991. In: Abel, K., M. Williams and P. Smith (Eds). Australian and New ZealandSouthern Trawl Fisheries Conference: Issues and Opportunities. Melbourne 6-9 May 1990. Bureau of RuralResources, Proc. No. 10. pp.129-141.
Geen, G., W. Nielander and T.F. Meany 1993. Australian Experience with Individual Transferable Quota Systems.In:The Use of Individual Quotas in Fisheries Management. OECD, Paris. pp. 73-94.
Grieve, C. and G. Richardson 2001. Recent history of Australia’s South East Fishery; a manager’s perspective. Marineand Freshwater Research. 52: 377-386.
Halvorson, K. 1997. Recommedations for the Allocation of Commercial Groundfish between Trawl and Hook & LineGear Sectors, and Recommendations for a Groundfish Trawl Individual Vessel Quota Program. Report preparedfor the Minister of Fisheries and Oceans, Canada.
Kaufmann, B. and G. Geen 1998. Quota Allocation and Litigation: An Economic Perspective. Mar. Res. Econ.13:143-157.
Kaufmann, B., G. Geen and S. Sen 1999. Fish Futures: Individual Transferable Quotas in Fisheries. FisheriesResearch and Development Corporation, Australia. 248pp.
Lilburn, B. 1986 Management of Australian Fisheries: Broad Developments and Alternate Strategies. In: Mollet, N.(Ed.).Fishery Access Control Programs Worldwide. Proceedings of the Workshop on Management Options forthe North Pacific Longline Fisheries. Orcas Is., Washington, 21-25 April 1986. Alaska Sea Grant CollegeProgram. Report 86-4, pp.141-187.
Smith, A.D.M. and D.C. Smith 2001. A complex quota-managed fishery: science and management in Australia’sSouth-east Fishery. Introduction and Overview. Mar. Freshwater Res. 52(4):353-359.
Thomas, D. 1991. Community Return from the South-East Trawl Fishery. In: Abel, K., M. Williams and P. Smith(Eds). Australian and New Zealand Southern Trawl Fisheries Conference: Issues and Opportunities. Melbourne6-9 May 1990. Bureau of Rural Resources, Proc. No. 10. pp.163-170.
Tilzey, R.D.J. 1994. The South East Fishery. A Scientific Review with Particular Reference to Quota Management.Bureau of Resource Sciences. Parkes, ACT Australia. 360pp.
Tilzey, R. 2000. South East Fishery – quota species: 119-141. In: Fishery Status Reports 1999: Resource Assessmentsof Australian Commonwealth Fisheries. Caton, A and McLoughlin, K (Eds). Bureau of Rural Sciences,Canberra.
201 Shotton
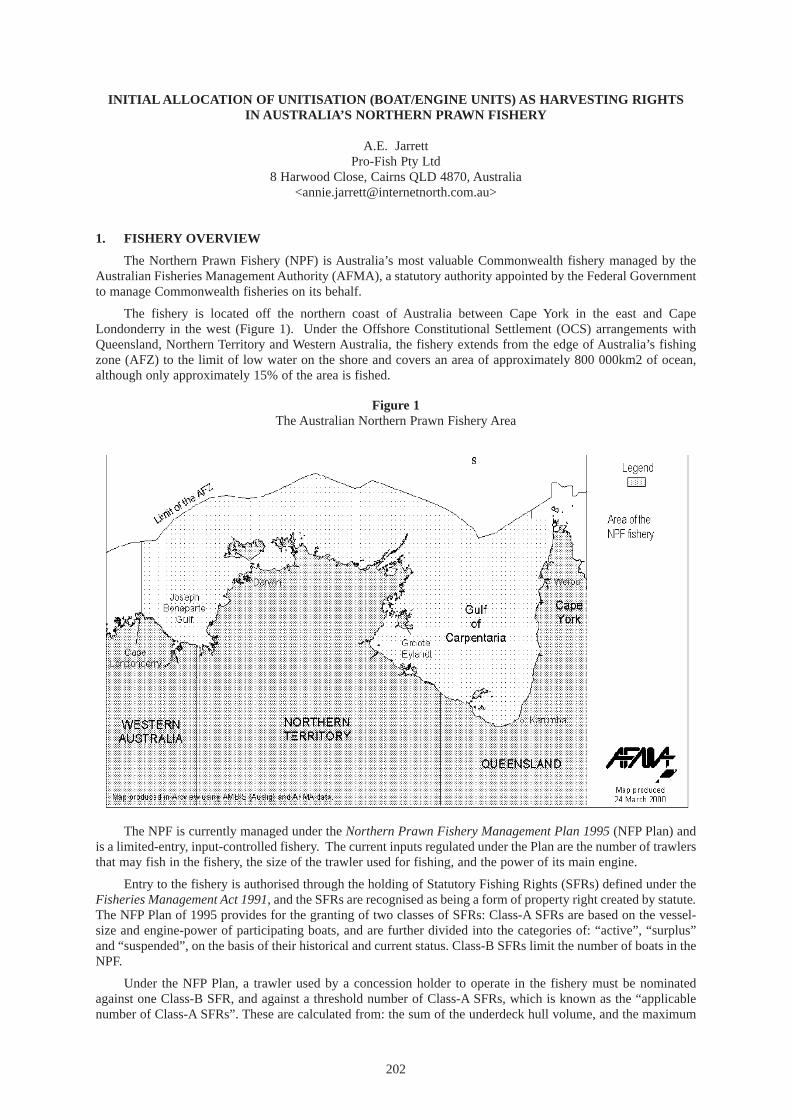
INITIAL ALLOCA TION OF UNITISA TION (BOAT/ENGINE UNITS) AS HARVESTING RIGHTSIN AUSTRALIA ’S NORTHERN PRAWN FISHERY
A.E. JarrettPro-Fish Pty Ltd
8 Harwood Close, Cairns QLD 4870, Australia<[email protected]>
1. FISHERY OVERVIEW
The Northern Prawn Fishery (NPF) is Australia’s most valuable Commonwealth fishery managed by theAustralian Fisheries Management Authority (AFMA), a statutory authority appointed by the Federal Governmentto manage Commonwealth fisheries on its behalf.
The fishery is located off the northern coast of Australia between Cape York in the east and CapeLondonderry in the west (Figure 1). Under the Offshore Constitutional Settlement (OCS) arrangements withQueensland, Northern Territory and Western Australia, the fishery extends from the edge of Australia’s fishingzone (AFZ) to the limit of low water on the shore and covers an area of approximately 800 000km2 of ocean,although only approximately 15% of the area is fished.
Figure 1The Australian Northern Prawn Fishery Area
The NPF is currently managed under the Northern Prawn Fishery Management Plan 1995 (NFPPlan) andis a limited-entry, input-controlled fishery. The current inputs regulated under the Plan are the number of trawlersthat may fish in the fishery, the size of the trawler used for fishing, and the power of its main engine.
Entry to the fishery is authorised through the holding of Statutory Fishing Rights (SFRs) defined under theFisheries Management Act 1991,and the SFRs are recognised as being a form of property right created by statute.TheNFPPlan of 1995 provides for the granting of two classes of SFRs: Class-ASFRs are based on the vessel-size and engine-power of participating boats, and are further divided into the categories of: “active”, “surplus”and “suspended”, on the basis of their historical and current status. Class-B SFRs limit the number of boats in theNPF.
Under the NFPPlan, a trawler used by a concession holder to operate in the fishery must be nominatedagainst one Class-B SFR, and against a threshold number of Class-ASFRs, which is known as the “applicablenumber of Class-ASFRs”. These are calculated from: the sum of the underdeck hull volume, and the maximum
202

continuous rated power of the main engine in the boat, expressed in kilowatts. The Plan limits the total numberof Class-B SFRs to 133 (note: there are currently only 132 Class-B SFRs in the fishery, as one has been cancelledsince the Plan came into force), and the total number of Class-ASFRs to 53 844. All SFRs in the fishery are fullytransferable and may be bought, sold or leased.
The Plan provides the objectives to be pursued in managing the fishery, the measures by which theobjectives will be pursued, and the performance criteria by which management of the fishery can be assessed.The objectives in the Plan parallel the AFMA’s legislative objectives as set out in Section 3 of the FisheriesManagement Act 1991 and include, but are not limited to, objectives relating to ecological sustainabledevelopment of fish resources, the precautionary principle, and the economic efficiency of the fishery.
The Plan also provides for the making of Fishery Directions that prohibit holdersor operators from specified activities. Directions are a flexible management tool thatobviate the need to amend legislation, and are currently used in the NPF to establish:
i. permanent trawl closures around nursery areas and sensitive habitats ii. seasonal closures that: prevent overfishing of small prawns, protect spawning
prawns, and more recently, reduce fishing effortiii. daylight-trawl bans to protect tiger prawns during the tiger prawn seasoniv. vessel-movement bans in certain areas and times to prevent disturbance of
banana prawn aggregations v. requirements to have fishing gear (trawl nets and doors) fitted with
tamper-proof seals when boats are on the fishing grounds during closedseasons (for compliance purposes)
vi. specific areas and times that are exempt from closures for the purposes oftrawling-trials
vii. bycatch limits determined under Memorandums of Understandingbetween the Commonwealth and State governments and
viii. prawn-net restrictions limiting operators to single or dual net rigs andspecifying the dimensions for try-nets.1
The target commercial catch includes white banana (Penaeus merguiensis), Indian banana (Penaeusindicus), brown tiger (Penaeus esculentus), grooved tiger (Penaeus semisulcatus), giant tiger (Penaeusmonodon), blue endeavour (Metapenaeus endeavour), red endeavour (Metapenaeus ensis), western king(Penaeus latisulcatus) and red spot king prawns (Penaeus longistylus).
The annual gross value of production ranges between $A100 million and $A150 million. The long-termannual sustainable yield is projected at about 4000t of banana prawns and about 4000t of mixed species of tiger,king, and endeavour prawns, of which the majority are tiger prawns.
2. HISTORY OF THE FISHERY DEVELOPMENT
Prawn fishing began in the NPF in the 1950s when banana prawns were discovered in the Gulf ofCarpentaria (Figure 1) in remote Northern Australia. This discovery created interest in both fishing and scientificcommunities, and proposals to undertake formal exploratory fishing surveys were first discussed in the late 1950sand early 1960s. Exploration was undertaken by private companies in the late 1950s as a result of Governmentconcerns that the Queensland East Coast and Northern New South Wales prawn fisheries were becoming over-capitalised and over-exploited, it was agreed that new fishing grounds needed to be found. However thesesurveys did not yield encouraging catches of prawns. The first formal prawn survey of the Southern Gulf ofCarpentaria region commenced in 1963. As result of collaborative efforts by industry and the CSIRO, acommercial prawn fishery was established there by the late 1960s. The main species caught at that time werebanana prawns, but the fishery was slow to develop due to the remoteness of the area and lack of infrastructure.
The fishery expanded beyond the Southern Gulf of Carpentaria during the 1960s, and the first bananaprawns caught in Joseph Bonaparte Gulf were recorded by a Japanese research vessel in 1967. In the same yearthe Department of Fisheries and Fauna of Western Australia undertook surveys from Broome to King Sound, butwith little result. Between 1968 and 1972 surveys were conducted in the Joseph Bonaparte Gulf, Kimberley andVanderlin Islands regions (Figure 1).
203 Jarrett
Tiger prawn
Banana prawn
1 A try-net is a small sampling net used to determine the abundance of prawns or a fishing ground. Based on the try-net catchresults, the main trawl may or may not be deployed.

There is no formal documentation on the number of boats fishing in the NPF in the mid- to late-1960s.However records exist indicating that at least 65 boats landed product in 1968. During this period the majority ofthe fleet were small wooden trawlers with ice boxes or brine tanks under the sorting tray. However a number oftrawlers owned by the Japanese and Chinese from Taiwan were fishing in the NPF in the late 1960s and early 1970s.These foreign-owned trawlers generally supplied motherships operating in the NPF and were able to fish 24 hoursa day, whereas the local small wooden trawlers had to return to port at frequent intervals to unload, refuel and obtainstores and supplies.
Interest in the fishery escalated in 1974 when, as a result of huge monsoonal rains, in excess of 12 500t ofbanana prawns were caught. This bumper season, coupled with the open-door policy of the government of the day,which was intent on developing Northern Australia and increasing industry interest, resulted in vessel numbers andfishing effort rising at an alarming rate over the next couple of years. At this time it was an open-access fishery, withno input- or output-controls in place. Large catches of tiger prawns were also being recorded at this time and thenegative impact on the stocks was inevitable.
During the 1960s, fishing gear was limited to a single otter trawl net towed off the stern, but by the early 1970smost vessels were towing double-rigs, known as twin gear, with on each side of the vessel, a net towed from a boom.This dramatically improved prawn catches.
Due to the remote location of the fishery it was inevitable that larger, purpose-built trawlers with considerablefreezer capacity would need to be built if the fishery were to expand. The first Australian freezer vessels entered thefishery in 1970 and by the end of that decade more than 120 new freezer vessels had been built. These vessels werethe most technologically advanced trawlers of the time, having the latest electronic fish-finding equipment, lazy linewinches2, snap freezers, prawn sorting conveyors, Kort nozzles and controlled-pitch propellers. By the mid 1980sno wet boats (those that held prawns in ice or chilled brine only) remained in the fishery (Figure 2). The rapidincrease in the number of new purpose-built freezer vessels was partly due to the introduction of the Government’sshipbuilding subsidy3 which was designed to maintain a viable Australian shipbuilding industry and to assistAustralian shipbuilders to compete internationally.
Figure 2Type of boats (wet or freezer) in the Northern Prawn Fishery from 1970 to 1992
The arrival of the freezer-boats caused the fishery to expand, with additional grounds explored in areasfurther west along the Arnhem Land coast and beyond. With the expansion in fishing grounds came adiversification in the species caught, and tiger prawns became an increasingly important part of the catch. Unlike
Australia Northern Prawn Fishery 204
0
100
200
300
1970 1974 1978 1982 1986 1990
Year
Nu
mb
ero
fTr
awle
rs
Unknown
Freezer
Wet
2 The lazy line is the rope that is wrapped around the top of the cod end, and then around the capstan head, as a means of bringingthe trawl on board when the tow is finished.
3 A direct government subsidy of approximately 20% of the construction cost of the trawler was paid to the shipbuilder to offsetthe cost to the buyer, which allowed trawlers to be upgraded to 150 gross construction tons and approximately 23m in length.
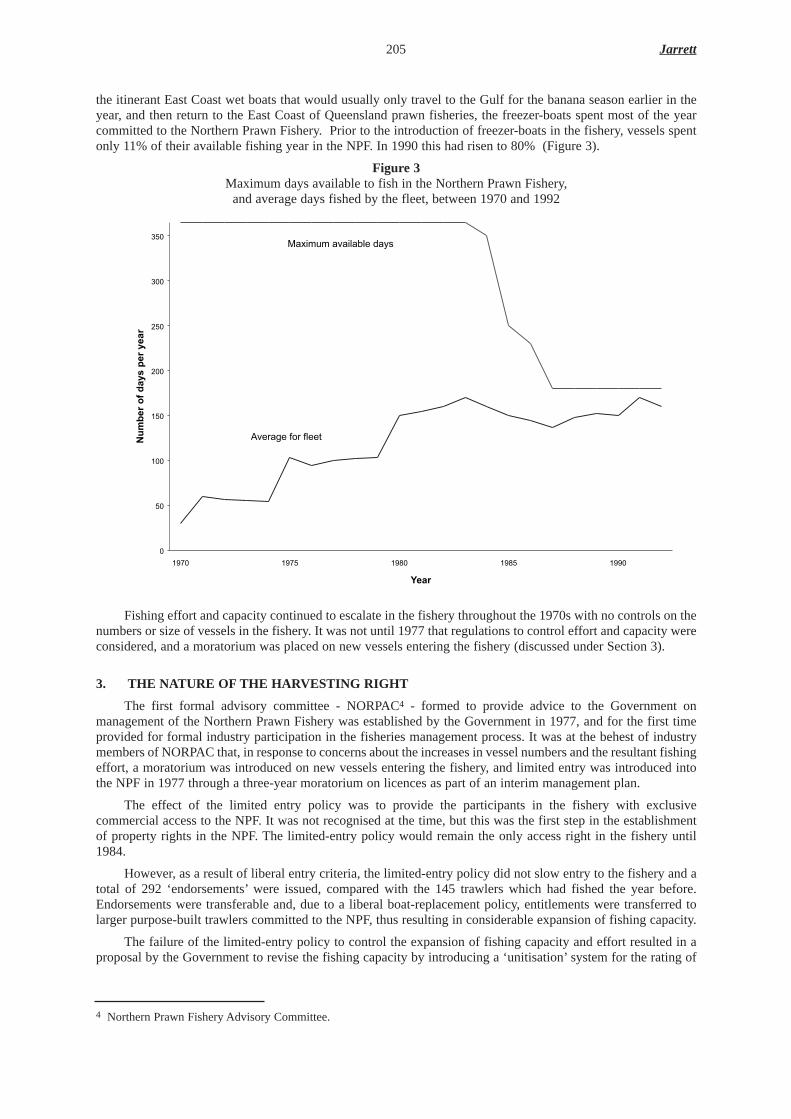
the itinerant East Coast wet boats that would usually only travel to the Gulf for the banana season earlier in theyear, and then return to the East Coast of Queensland prawn fisheries, the freezer-boats spent most of the yearcommitted to the Northern Prawn Fishery. Prior to the introduction of freezer-boats in the fishery, vessels spentonly 11% of their available fishing year in the NPF. In 1990 this had risen to 80% (Figure 3).
Figure 3Maximum days available to fish in the Northern Prawn Fishery,and average days fished by the fleet, between 1970 and 1992
Fishing effort and capacity continued to escalate in the fishery throughout the 1970s with no controls on thenumbers or size of vessels in the fishery. It was not until 1977 that regulations to control effort and capacity wereconsidered, and a moratorium was placed on new vessels entering the fishery (discussed under Section 3).
3. THE NATURE OF THE HAR VESTING RIGHT
The first formal advisory committee - NORPAC4 - formed to provide advice to the Government onmanagement of the Northern Prawn Fishery was established by the Government in 1977, and for the first timeprovided for formal industry participation in the fisheries management process. It was at the behest of industrymembers of NORPAC that, in response to concerns about the increases in vessel numbers and the resultant fishingeffort, a moratorium was introduced on new vessels entering the fishery, and limited entry was introduced intothe NPF in 1977 through a three-year moratorium on licences as part of an interim management plan.
The effect of the limited entry policy was to provide the participants in the fishery with exclusivecommercial access to the NPF. It was not recognised at the time, but this was the first step in the establishmentof property rights in the NPF. The limited-entry policy would remain the only access right in the fishery until1984.
However, as a result of liberal entry criteria, the limited-entry policy did not slow entry to the fishery and atotal of 292 ‘endorsements’were issued, compared with the 145 trawlers which had fished the year before.Endorsements were transferable and, due to a liberal boat-replacement policy, entitlements were transferred tolarger purpose-built trawlers committed to the NPF, thus resulting in considerable expansion of fishing capacity.
The failure of the limited-entry policy to control the expansion of fishing capacity and effort resulted in aproposal by the Government to revise the fishing capacity by introducing a ‘unitisation’system for the rating of
205 Jarrett
0
50
100
150
200
250
300
350
1970 1975 1980 1985 1990
Year
Nu
mb
ero
fd
ays
pe
ry
ear
Average for fleet
Maximum available days
4 Northern Prawn Fishery Advisory Committee.

each vessel, and to constrain increases in fishing capacity through restrictions on boat-replacement. The proposalto ‘unitise’vessels had been first mooted in 1979, although at that time it was proposed that the units be based onhull size only. Whilst the initiative had wide consideration, and some acceptance by industry, it was abandoned.
The expanding effort and capacity in the fishery was further exacerbated by a decision taken in 1980 toallow, without penalty, boats below the size that attracted a shipbuilding subsidy, to be replaced with vesselsqualifying for construction subsidies (150 gross construction tons and about 23m in length), with such vesselsover the subsidy-size being replaced on a one-for-one basis. This decision was taken as a concession to ownersof small-boats whose vessels had not qualified for the shipbuilding subsidy. This proved to be retrograde step asit resulted in wide-scale boat-replacement, thus substantial increases in vessel size and capacity, to the detrimentof the biological and economic sustainability of the fishery.
In 1981/82 an industry/government working group was established to review management arrangements inthe NPF. This working group produced several recommendations, one of which was that a management advisorycommittee should be established to advise on NPF management, and another was that this committee shouldreport to the Minister for Fisheries, rather than to the existing Northern Fisheries Committee (made up ofDirectors of Fisheries from the State and Territory governments).
As a result NORPAC was disbanded and the Northern Prawn Fishery Management Advisory Committee(NORMAC) was established.The working group also considered a number of options for addressing the over-exploitation of prawn stocks and the over-capacity in the fishery. These included, but were not limited to: theproposal to unitise (measure and control fishing capacity) the fishery, the possible introduction of a buy-backscheme, a more stringent boat-replacement policy, and area-closures to protect prawn stocks. In reviewing theunitisation proposal, NORMAC and industry were of the view that, if introduced, to be effective such a systemmust include both hull-size and engine-power constraints, and must be capable of being controlled and enforced.
F o l l o w i n gtwo years ofdiscussion andnegotiation on theproposal, the NPF‘ u n i t i s a t i o n ’scheme wasintroduced in1984, with eachvessel beingallocated a Class-Bunit (the right tofish) and a numberof Class-Aunits (a‘capacity’ factorbased on acombination ofhull-volume andengine-power). Asa result of agreement by industry at the timethat the minimum size trawler to qualify for the shipbuilding subsidyshould be 375 Class-Aunits, all vessels with an actual measure of less than 375 Class-Aunits were in factallocated a minimum of 375 Class-Aunits. This concession was granted on grounds of equity, because of thenumber of operators who had already taken advantage of the shipbuilding subsidy to significantly upgrade toboats of subsidy-size. Concessional units (being the difference between the number of Class-Aunits determinedby hull-size and engine-power rating of each small trawler, and the minimum allocation of 375 Class-Aunits),were called “suspense” Class-Aunits.5
The total number of class B-units was determined by the number of boats licenced to operate in the fishery,which was fixed with the introduction of limited-entry in 1977, with revised limited-entry criteria confirmed in1980. In total, 133 269 Class-Aand 302 Class-B6 units were granted. All units of Class-Aand Class-B were/are
Australia Northern Prawn Fishery 206
5 Units which are between the number of active units (determined by the formula) and the total of 375 issued to ‘small’operators are called ‘suspense units’as they are held in suspense. They are not transferable to other operators and if theybecome activated (by increasing the horsepower or being allocated to a vessel bigger than the active units), they become‘active units’.
6 This included 10 Class C units: under which 10 trawlers were allowed to operate only in the Joseph Bonaparte Gulf.
Typical Northern Prawn Fishery Trawler

transferable, and remain the “currency” in the fishery today. Transferability of Class-Aunits allowed fishers touse any size boat they chose, provided that the requisite number of Class-Aunits was attached to each boat andthat the existing total pool of Class-Aunits did not increase. These units in the NPF quickly achieved a marketvalue, and financial institutions accepted them as collateral against loans. This resulted in the units quickly beingaccepted as the ‘currency’and as the property rights in the fishery, and they also became the basis on whichadditional constraints were imposed, to offset continual increases in fishing effort.
In 1985 a voluntary buy-back scheme was implemented to remove the excess capacity-units, in response toconcerns that stocks were being overfished and that the fishery was over-capitalised. The buy-back was industry-funded by a Voluntary Adjustment Scheme (VAS) loan, and supported by a Government guarantee. At aroundthis time, a ‘user-pays’ policy was adopted by the Government, that required industry to pay levies for thegovernment’s costs in management and research on the fishery. Levies, including those to fund the buy-backscheme, were calculated based on the number of Class-Aunits held. There were a total of 133 269 Class-Aunitsand 292 active Class-B units attached to vessels in the fishery.
A more restrictive boat-replacement policy was implemented in 1987, requiring any owner who decided tovoluntarily replace a boat of any size to forfeit one extra Class-B unit. For vessels measuring over 375 units, anequal number of Class-Aunits to the total Class unit holding of the replacement boat also had to be forfeited.
In 1987 gear restrictions were implemented to reduce fishing effort. Whilst not directly proportional to theunits held, an arbitrary two-tiered gear restriction was imposed on vessels, based on whether the vessels wereunder- or over-375 units. Boats rated as under 375 Class-Aunits were restricted to towing a maximum of twin9-fathom nets, and boats rated larger than 375 Class-Aunits were restricted to towing a maximum of twin 14-fathom nets.
In 1990 NORMAC agreed to a further reduction in Class-Aunits so as to achieve a limit of 54 000 Class-A units by the beginning of the 1993 prawn season. This was to be achieved by an accelerated buy-back scheme,and a compulsory, across-the-board proportionate surrender (forfeiture) of Class-Aunits in 1993 so as to achievethis target (if necessary). At the end of 1992 the target was not reached, and on 1 April 1993, 30.76% of theremaining Class-Aunits were compulsorily cancelled, in accordance with the surrender provisions contained inthe NPF Management Plan.
After the establishment of the AFMA and its enacting legislation, a new NPF Management Plan wasestablished in 1995 under the Fisheries Management Act 1991, to replace the Plan which had been in place underthe Fisheries Act 1952. The fishing rights granted under the 1952 Act through the NPF Management Plan, beingthe Class-Aand Class-B units, were automatically rolled over into the new Plan, and became A-Class and B-ClassStatutory Fishing Rights (SFRs). This meant that each operator was given the equivalent number of A-Class andB-Class rights under the new Plan, as they held under the previous Plan.
However the SFRs established under the Fisheries Management Act 1991were considered to have moresecurity than the rights which existed under the Fisheries Act 1952, being a form of property rights establishedby statute; having a life of at least ten years; being automatically ‘rolled over’ if the NPF management plan isrevoked and a new plan is implemented in the fishery; and with compensation that may be payable if the rightsare acquired on unjust terms. It is worth noting that the rights issued under the 1952 Act: were issued for a periodof 12 months; were renewable at the government’s/Minister’s discretion; had no on-going tenure and no provisionfor compensation.
In my view, the implementation of management measures based on Class-Aunits, including the allocation ofStatutory Fishing Rights under the Fisheries Management Act 1991, has firmly entrenched the Class-Aunits allocatedunder the NPF unitisation scheme, as the ‘currency’and property rights in the NPF. This premise is generally acceptedby NPF industry, by financial institutions, the Australian Fisheries Management Authority and the Courts.
4. THE METHOD OF ALLOCA TION4.1 Policy objectives
The main policy objective behind the NPF unitisation system was to provide a system of management whichwould allow fishing capacity to be measured and controlled, in order to avoid over-exploitation of stocks andover-capitalisation in the fishery. It was considered at the time that boat-size and engine-power were a reasonablemeasure of fishing capacity. The concessional units7 awarded to the owners of small vessels were not a matter ofpolicy and had little to do with the benefits of the vessel unitisation system as a capacity-controlling measure.These concessions were agreed to through industry negotiation, in compensation for the fact that the smallervessels were not eligible for the shipbuilding subsidy.
207 Jarrett
7 ‘suspense units’.

Whilst somerationalisation of thefleet was desirablethrough the boat-replacement policy, theunitisation policy wasnot based on the need, ordesire, for anydistributional changewithin the overall fleetstructure.
4.2 Process used fordeterminingallocation
The introduction ofunitisation in the NPFoccurred in 1984 at atime when fewAustralian fisheries hadrights-based manag-ement. At that timemanagement of fisherieswas generally carriedout by government departments and/or bureaucracies, with little input from the fishing industry or otherstakeholders. As a result, the development of the unitisation system was carried out by employees of theAustralian Fisheries Service, a Federal Government department. However, considerable consultation took placewith NORMAC and the NPF industry prior to the implementation of the system. In addition, NORMAC,government, and industry representatives consulted with boat-builders and engine-manufacturers to determine anappropriate formula that would allow the inclusion of both boat-size and engine-power in the unitisation system,and provide for a system of controls which would not be easily open to manipulation, and which could be policed.
At the time of implementation the Offshore Constitutional Settlement8 had not been signed and various areasof the fishery were under either State or federal jurisdiction, which required fishers to have both State and federalfishing licences to participate in the fishery. This needed the involvement of both State and federal fisheriesmanagement agencies in the consultation and implementation phases of the unitisation scheme, because the Statefishing licences had to reflect the same management arrangements as the federal fishing licences.
4.3 Allocation method chosen
As no previous rights existed in the fishery, other than the limited-entry right to access the fishery, it wasnot necessary to take account of any pre-existing rights in the unitisation allocation-process. The allocationmethod for Class-B units was to allocate one to each licenced vessel. The allocation of Class-Acapacity units wasaccording to a formula based on a combination of underdeck volume (tonnage) and engine-power, which wouldapply to each vessel licensed for the fishery:
No. of Capacity Units = Length (m) x Breadth (m) x Depth (m) x 0.2120141(engine-power in kW)(1)
This formula enabled each vessel to be allocated a total number of Class-Aunits. No vessel could accessthe fishery unless it had one Class-B unit (the right to fish) and the requisite number of Class-Aunits attachedto it. Boat-replacement was allowed, however a boat could only replace a vessel of the same or lower rating (ofClass-Aunits), unless the operator purchased additional units from the total pool of Class-Aunits.
In the cases where there was no particular trawler attached to a licence, the allocation was based on thelicence details (boat length and engine-power) applicable to the previous boat to which the licence was attached.
5. DATA USED IN ALLOCA TION PROCESS
As the allocation was based on vessel specifications, rather than catch history or fishing time, A-class unitswere allocated upon verification of:
Australia Northern Prawn Fishery 208
Processing tigerprawns (Penaeus spp.) aboard a Northern Prawn Fishery trawler
8 This was a jurisdictional control agreement between federal, state and territory governments giving the federal governmentresponsibility for managing the NPF (and other fisheries).
i. vessel licence information (including vessel-size and engine-power where applicable)ii. survey documents verifying vessel-sizeiii. boat plansiv. independent measurement of vessel-size by appointed naval architects or ship surveyorsv. engine manufacturer’s documentation on engine-power and vi. engine checks by compliance officers.
It was considered that the data used in the allocation-process was generally reliable and were verifiable where anyuncertainty existed.
6. APPEALS PROCESS
At the time of allocation, the only appeals process which existed was an internal (departmental)arrangement, although decisions taken by fisheries management agencies could be challenged through the legalsystem. To the best of my knowledge, no internal formal appeals were lodged when units were allocated althoughmany ‘special case’letters were lodged, with government making some subsequent adjustments to the unitpackages. There is no record of any legal appeal being lodged through the judicial process.
It is considered that this may be because there were a number of means (as described above) through whichoperators could verify their vessel-size and engine-power ratings which, at the time, were not easily manipulatedand therefore the allocation of units was relatively straightforward.
It should also be noted that an intensive process of consultation and negotiation was undertaken indeveloping the unitisation formula, and that the allocation formula was applied consistently across all operators– i.e. all Class-Aunits were based on existing hull-size and engine-power at the date of the scheme beingintroduced. From a philosophical point of view the lack of appeals could have been due to the fact that, at thetime, Australian fishers were not litigious in their approach to management, and appeals on fisheries issues werethe exception, not the rule.
7. ADMINISTRA TION OF THE ALLOCA TION PROCESS
There is no evidence to suggest that any special staffing arrangements or funding allocations were made inorder to develop and implement the NPF unitisation system. Given the multi-jurisdictional arrangements thatexisted at the time, and the fact that there was no cost-recovery system in place, the costs of the process wouldhave been subsumed into the budgets of the federal and state fisheries management agencies. The process ofdocumenting unit allocations on vessel licences was undertaken by the relevant fisheries management agencies.
8. EVALUA TION OF INITIAL ALLOCA TION8.1 Success in achieving initial policy objectives
At the time the unitisation system was implemented in the NPF (1984) the capacity formula given inSection 4.3 above was generally considered to be a reasonable measure of fishing capacity, and therefore anacceptable input-control mechanism for restricting and controlling fishing capacity. In its initial stages theunitisation system was relatively effective in controlling fishing capacity as it both restricted the number ofvessels in the fishery, and restricted to a reasonable degree the catching and processing capacity of vesselsthrough limitation of vessel-size and engine-power.
The unitisation system was also effective in that it achieved some reduction in capacity and effort in itsapplication through the boat-replacement policy (based on Class-Aand Class-B units) as it resulted in a certainnumber of Class-Aand Class-B units being forfeited as new boats were built. However over time the two-for-one boat-replacement policy proved to be ineffective: few new boats were built due to the cost constraints ofhaving to forfeit Class-Aand Class-B units, and this resulted in an aging, inefficient and uneconomical fleetoperating in the fishery.
The unitisation system also served as a useful, and to some degree successful, means on which to base theNPF buy-back scheme which commenced in 1985. Between 1985 and 1993, approximately 60 000 Class-Aunitswere removed from the fishery, mostly through the buy-back scheme. However the buy-back scheme did notachieve the target set, and a compulsory cancellation of approximately 30% of the Class-Aunits was thenrequired in order to reduce the fishery to the target of approximately only 54 000 Class-Aunits.
In addition, the unitisation system has been proved to be an effective and legally defensible basis on whichto implement the compulsory surrender of Class-Aunits (which occurred in 1993 so as to reduce fleet fishingcapacity and improve economic efficiency in the fishery). On 1 April 1993, 30.76% of the Class-Aunits werecompulsorily cancelled in accordance with the surrender provisions contained in the Northern Prawn Fishery
209 Jarrett
Management Plan, resulting in a reduction in the number of Class-Aunits from 72 218 to 53 844, and the numberof active fishing vessels in the NPF fell from 171 in 1992, to 124 in 1993.
However, over time, the unitisation system in the NPF has proven to be ineffective, and it is now consideredby many to be severely flawed as a means of controlling fishing effort and capacity. Advances in technology,including innovations in vessel design and engine configurations, have resulted in the unitisation rules in the NPFbeing manipulated in many instances. The inability of legislators to practically and cost-effectively enforce boat-size and engine-power rules, particularly at sea, has resulted in considerable uncontrolled effort-creep9 in theNPF.10 With design innovation, technological changes, and clever manipulation of the unitisation rules, thetrawlers built today for the NPF have more fishing power than most of the vessels of older design andconstruction, and yet are rated as having considerably less Class-Aunits.
The current unitisation system is not a flexible system. As a result it is difficult to implement effectivemanagement controls through the system when it is required to balance effort and sustainability, and not toimpede the economic efficiency of the fishery. Whilst effective in reducing fleet fishing-capacity in terms ofvessel numbers, draconian measures such as compulsory surrender of Class-Aunits do not give operators theflexibility to adjust their fishing operations in an orderly manner, because operators are unable to fish without therequisite number of Class-Aunits. Such measures also result in severe financial hardship, dislocation of operatorsand often result in costly and disruptive legal challenges.
As a result of the deficiencies that have been identified in the unitisation system, the NPF is currently in theprocess of converting the existing harvesting rights (A-Class SFRs) to a different type of input-control harvestingright, based on fishing gear. It is important to note that under legislation regarding the AFMA and in accordancewith legal advice from the Australian Attorney General’s Department, to be legally defensible and to ensure thatthere is no redistribution of wealth (change in the value of the existing fishing property right) between operatorsin the fishery, the transition to the new rights must be based on the existing rights (the A-Class SFRs) and mustbe as directly proportional to those rights as possible.
8.2 Satisfaction of rights holders with the process
As stated above, at the time the unitisation system was implemented it was considered to be an effectivemethod of controlling fishing capacity and effort, and it generally had the support of most operators as a usefulcontrol mechanism for the NPF.
The intensive negotiation and consultation processes surrounding the development of the rating-formula,and the verification means available to operators in the allocation-process, resulted in NPF operators generallyaccepting, when it was initially introduced, the constraints of the unitisation system on their fishing operations.
8.3 Views of othercommunity groups
At the time the unitisation system was introduced the only stakeholders involved in the consultation processwere the government and industry interests.
8.4 Hind-sight assessment
It is fair to say that at the time of its implementation, the unitisation system was considered to be a legitimateand relatively effective method of controlling fishing effort and capacity. It was not possible to predict theadvances in technology, vessel design, and engine configuration which have resulted in wide-scale uncontrolledeffort-creep in the fishery since unitisation was implemented.
In the current climate, where the system is open to manipulation as a result of innovations in vessel andengine configurations, many NPF operators now hold the view the system is defective and must be abandoned.These views are based on a number of factors including:
i. Inequities arising from the fact that in some instances the system has been manipulated, whereas in othersit has not. This is a costly exercise in terms of both catch/income constraints and management levies forthose operators who have not manipulated the system.
Australia Northern Prawn Fishery 210
9 Increases in effective fishing effort resulting from new technology and other efficiencies, from improvements in catchingcapacity such as new technology and skills.
10 There have been many innovations over the years in response to the policy of unitization; vessels built prior to this had noreasons to compromise any of their design variables. After the introduction of this policy, responses such as ‘tonnagewells’ and ‘stepped-down accommodation’(which were not included in the overall design) were introduced so that a biggerboat could have the same number of capacity units. One of the biggest changes is that engines with the same rating canhave a greater output, e.g.by changing injectors and fuel settings after the motor is installed, can increase the horsepowerwithout the motor being re-unitised. Also engine manufacturers changed the relative horsepower value without affectingthe ‘rating’of motors by, for instance, setting the maximum continuous rating at lower levels than they were previouslyset. This allows operators to increase horsepower by increasing engine revolutions.

ii. As a result of manipulations of the current system, not all operators are towing the same length of headrope(net size) per Class-Aunit.
iii. Studies show that Class-Aunits are not a good measure of fishing effort, and that effort-creep, which cannoteasily be controlled through the current system, is occurring in the fishery.
iv. The unitisation system is not flexible or easily adjustable when measures to balance effort and sustainabilityare required.
Today, where the effects of technology and other factors contributing to effort-creep can be reasonablyquantified, managers of input-control fisheries such as the NPF, must seek to identify and implement a system ofmanagement which is a better analogue for fishing effort – enforceable, flexible and adjustable when restructuringis required. A determining factor in identifying the most appropriate system would be its ability to predict withsome certainty the appropriate level of effort, or the level of catches required to maintain a sustainable resource.This may disqualify individual transferable quotas (ITQs) or global totally allowable catch (TACs) as was thecase in the NPF.
9. LITERATURE CITED
Pownall, P. C. (Ed.) Australia’s Northern Prawn Fishery – the first 25 years. 179pp.Australian Fisheries Magazine November 1993. NPF Restructuring – lessons for the future. 3pp.Taylor, B. 1992. Northern Prawn Fishery Information Notes. Special Collated issue Number 16 February. pp. 3-12.
10. ACKNOWLEDGMENTS
I wish to thank:F. Meany, Consultant, Canberra, Australia,P. Pownall, SPC Consultants, Canberra, Australia,M. France, Managing Director, Kailis & France Pty Ltd, AustraliaD. Carter, Chief Executive Officer, Newfishing Australia
for their assistance with this paper.
211 Jarrett

THE INTRODUCTION OF INDIVIDUAL TRANSFERABLE QUOTAS INTOTHE AUSTRALIAN SECT OR OF THE SOUTHERN BLUEFIN TUNA FISHERY
F. Meany225 Stevenson St, Torrens A.C.T., 2607 Australia
1. INTRODUCTION1.1 Distribution and life histor y
Southern bluefin tuna (Thunnus maccoyii) is a highly migratory species, apparently forming a single stock, witha single spawning area, although as mature fish they probably have a circumpolar distribution between latitudes 30ºand 50º South. Figure 1 shows the geographical range of the different life-history stages of this species.
Figure 1Map showing distribution of the different life-history stages of Southern Blue Fin Tuna
Map credit: Bureau of Rural Sciences, Australia
212
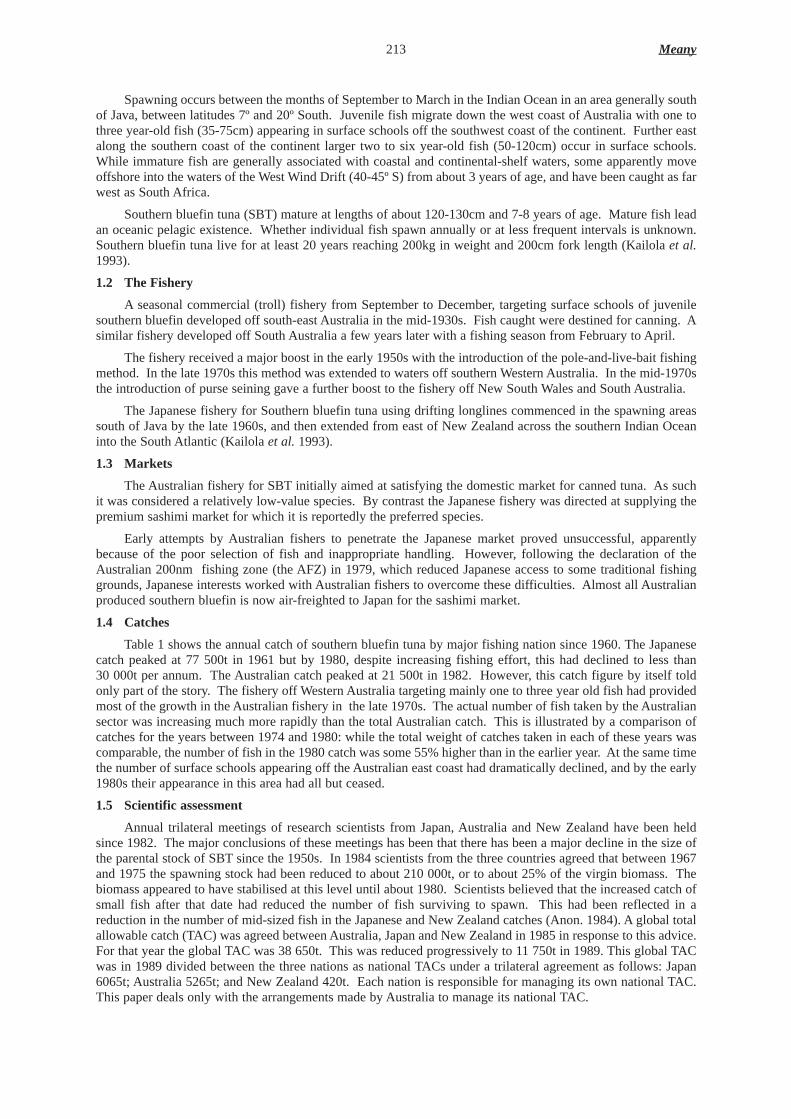
Spawning occurs between the months of September to March in the Indian Ocean in an area generally southof Java, between latitudes 7º and 20º South. Juvenile fish migrate down the west coast of Australia with one tothree year-old fish (35-75cm) appearing in surface schools off the southwest coast of the continent. Further eastalong the southern coast of the continent larger two to six year-old fish (50-120cm) occur in surface schools.While immature fish are generally associated with coastal and continental-shelf waters, some apparently moveoffshore into the waters of the West Wind Drift (40-45º S) from about 3 years of age, and have been caught as farwest as South Africa.
Southern bluefin tuna (SBT) mature at lengths of about 120-130cm and 7-8 years of age. Mature fish leadan oceanic pelagic existence. Whether individual fish spawn annually or at less frequent intervals is unknown.Southern bluefin tuna live for at least 20 years reaching 200kg in weight and 200cm fork length (Kailola et al.1993).
1.2 The Fishery
A seasonal commercial (troll) fishery from September to December, targeting surface schools of juvenilesouthern bluefin developed off south-east Australia in the mid-1930s. Fish caught were destined for canning. Asimilar fishery developed off South Australia a few years later with a fishing season from February to April.
The fishery received a major boost in the early 1950s with the introduction of the pole-and-live-bait fishingmethod. In the late 1970s this method was extended to waters off southern Western Australia. In the mid-1970sthe introduction of purse seining gave a further boost to the fishery off New South Wales and South Australia.
The Japanese fishery for Southern bluefin tuna using drifting longlines commenced in the spawning areassouth of Java by the late 1960s, and then extended from east of New Zealand across the southern Indian Oceaninto the South Atlantic (Kailola et al. 1993).
1.3 Markets
The Australian fishery for SBTinitially aimed at satisfying the domestic market for canned tuna. As suchit was considered a relatively low-value species. By contrast the Japanese fishery was directed at supplying thepremium sashimi market for which it is reportedly the preferred species.
Early attempts by Australian fishers to penetrate the Japanese market proved unsuccessful, apparentlybecause of the poor selection of fish and inappropriate handling. However, following the declaration of theAustralian 200nm fishing zone (the AFZ) in 1979, which reduced Japanese access to some traditional fishinggrounds, Japanese interests worked with Australian fishers to overcome these difficulties. Almost all Australianproduced southern bluefin is now air-freighted to Japan for the sashimi market.
1.4 Catches
Table 1 shows the annual catch of southern bluefin tuna by major fishing nation since 1960. The Japanesecatch peaked at 77 500t in 1961 but by 1980, despite increasing fishing effort, this had declined to less than 30 000t per annum. The Australian catch peaked at 21 500t in 1982. However, this catch figure by itself toldonly part of the story. The fishery off Western Australia targeting mainly one to three year old fish had providedmost of the growth in the Australian fishery in the late 1970s. The actual number of fish taken by the Australiansector was increasing much more rapidly than the total Australian catch. This is illustrated by a comparison ofcatches for the years between 1974 and 1980: while the total weight of catches taken in each of these years wascomparable, the number of fish in the 1980 catch was some 55% higher than in the earlier year. At the same timethe number of surface schools appearing off the Australian east coast had dramatically declined, and by the early1980s their appearance in this area had all but ceased.
1.5 Scientific assessment
Annual trilateral meetings of research scientists from Japan, Australia and New Zealand have been heldsince 1982. The major conclusions of these meetings has been that there has been a major decline in the size ofthe parental stock of SBTsince the 1950s. In 1984 scientists from the three countries agreed that between 1967and 1975 the spawning stock had been reduced to about 210 000t, or to about 25% of the virgin biomass. Thebiomass appeared to have stabilised at this level until about 1980. Scientists believed that the increased catch ofsmall fish after that date had reduced the number of fish surviving to spawn. This had been reflected in areduction in the number of mid-sized fish in the Japanese and New Zealand catches (Anon. 1984). A global totalallowable catch (TAC) was agreed between Australia, Japan and New Zealand in 1985 in response to this advice.For that year the global TAC was 38 650t. This was reduced progressively to 11 750t in 1989. This global TACwas in 1989 divided between the three nations as national TACs under a trilateral agreement as follows: Japan6065t; Australia 5265t; and New Zealand 420t. Each nation is responsible for managing its own national TAC.This paper deals only with the arrangements made by Australia to manage its national TAC.
213 Meany

Table 1Catches of southern bluefin tuna, by country, fish numbers and weight, 1960 to 1986
Source: Geen and Nayar (1989).
It should be noted that these management arrangements are complicated by the fact that much of this fishery isin international waters and arrangements made under the trilateral agreement are not binding on other nations, whichare free to expand their activities in the fishery on the high-seas.
1.6 Management of the Australian sectorof the southern bluefin tuna fishery
The Australian sector of the southern bluefin fishery remained largely unregulated until the early 1980s.Restrictions on the number of purse-seine vessels licensed to operate had been in force since the mid-1970s. Whilejustified on the basis of uncertainty about the state of the resource, these restrictions were also designed to satisfycomplaints from the pole-and-live-bait sector about ‘unfair’ competition from purse-seiners.
Reaching decisions with respect to the management of this fishery was complicated by the fact that theAustralian Commonwealth and three state governments (New South Wales, South Australia and Western Australia)were directly involved (the Commonwealth government had jurisdiction outside the three mile Territorial Sea and theindividual states within that limit).1 The industry in each area also had its own characteristics and was targeting fishof different ages.
To further complicate the position, until Australia declared its 200nm Fishing Zone on 1 November 1979, it hadno control over foreign fishing outside its 12nm fishing zone. It was politically difficult to impose restrictions onAustralian fishers when no similar restrictions could be imposed on Japanese and other fishers operating on the samefishing grounds.
Australia Southern Bluefin Tuna 214
Australia Japan New Zealand Total Year Number Tonnes Number Tonnes Number Tonnes Number Tonnes (Ô000) (Ô000) (Ô000) (Ô000) (Ô000) (Ô000) (Ô000) (Ô000) 1960 259 3 545 1 188 75 672 1 447 79 217 1961 282 3 678 1 209 77 491 1 491 81 169 1962 335 4 636 675 40 852 1 010 45 488 1963 427 6 199 1 009 59 200 1 436 65 399 1964 693 6 832 743 42 718 1 436 49 550 1965 448 6 876 721 40 595 1 169 47 503 1966 588 8 008 683 39 607 1 271 47 615 1967 546 6 357 931 59 068 1477 65 443 1968 917 8 737 828 49 482 1 745 58 219 1969 1 151 8 679 844 49 644 1 995 58 323 1970 956 7 097 699 40 622 1 655 47 719 1971 846 6 969 697 38 120 1 543 45 089 1972 1 010 12 397 806 39 604 1 816 52 001 1973 847 9 890 651 31 205 1 498 41 095 1974 1 193 12 672 672 33 924 1 865 46 596 1975 1 132 8 833 441 24 118 1 573 32951 1976 996 8 383 634 33 714 1 630 42 097 1977 1 352 12 569 536 29 595 1 888 42 164 1978 1 293 12 190 451 22 974 1 744 35 164 1979 1 383 10 783 520 17 715 1 904 38 498 1980 1 619 11 195 586 33 364 1 130 2 206 44 689 1981 1 482 16 843 477 28 056 2 173 1 961 45 072 1982 2 368 21 501 331 20 809 4 208 2 703 42 518 1983 2 063 17 695 424 24 735 1 112 2 488 42 542 1984 1 447 13 411 365 23 323 1 86 1 813 36 820 1985 973 12 589 304 20 393 1 99 1 283 33 088 1986 999 12 531 213 15 522 1 83 1 213 28 136
1 Note that: subsequent to the introduction of the management measures described in this paper, a legal regime called the OffshoreConstitutional Settlement (OCS) was negotiated between the Commonwealth Government and the various state governments.Under this OCS, agreements can be made with respect to specific fisheries that allow either the Commonwealth or a stategovernment to manage the fishery from low water mark to the outer edge of the AFZ. Under agreements enabled by the OCS,the Commonwealth Government now has sole responsibility for managing the SBTfishery.

2. THE NATURE OF THE HAR VESTING RIGHT
The individual transferable quota (ITQ) management-arrangements introduced into the southern bluefinfishery in 1984 was designed to be a fully operational system of transferable fishing rights. The main componentsof the management regime were given legal force through the Southern Bluefin Tuna Management Plan, madeunder the Fisheries Act 1952. The basis of management was that each fisher had to hold a CommonwealthFishing Boat Licence (CFBL) to which a certain number of quota units were assigned. As tuna were caught theequivalent number of quota units were subtracted from those assigned to the CFBL. Once all the quota assignedto a licence had been caught the holder had to either acquire more quota or cease fishing.
In 1984 14 500 quota units were granted (i.e. in that year each quota unit was equal to one kilogram ofcatch). There are still 14 500 quota units but as the Australian TAC has been reduced so has the weight-value ofeach quota unit. The catch allowed for each quota unit each year is calculated by dividing the total allowablecatch (TAC) in kilograms by the total number of quota units.
The Fisheries Act 1952made no provision for the leasing of quota, nor did it provide for the recording ofthird party interests (for example, where quota was used as security). Leasing was dealt with administratively byformally transferring the quota units to the lessee at the beginning of the leasing period, and then formallytransferring the quota units back to the lessor the end of the season. Third party interests were also recordedadministratively, with an undertaking to advise the third party before any further dealings with the quota unitsconcerned would be processed. There were, and are, no limits on who could own quota, or the minimum ormaximum quantity of quota an individual or company can hold.
3. THE METHOD OF ALLOCA TION3.1 Policy objectives
Scientific advice clearly indicated that the level of catch from the southern bluefin fishery in the early 1980swas not sustainable (Majkowskiand Caton1984, Hampton andMajkowski 1986). Two main factors contributedto this: first, the level of total catch (by weight); second, the high number of small fish being taken, especially inthe Western Australian sector of the fishery.
To safeguard the future of the fishery a substantial reduction in catch was clearly essential. It was alsoevident that a reduction in catch of the magnitude required was likely to lead to on-going enforcementdifficulties and continuing economic hardship unless a significant reduction in the size of the fishing fleetcould also be achieved. In addition, any measures introduced had to address the problem of targeting one andtwo year-old fish.
The policy objectives from a biological perspective were therefore: (a) to achieve a significant reduction intotal catch and a diversion of fishing effort away from one and two year-old fish; and (b) from a socio-economicperspective, to achieve a substantial fleet reduction while minimising social dislocation and hardship.
3.2 Process used in determining allocation
Because of the divided responsibility for managing the southern bluefin fishery that existed at the time, andin response to the disturbing scientific advice coming from the 1982 trilateral scientific meeting, a Tuna TaskForce (TTF) was established to consider and recommend future management options. The TTF comprisedscientists, industry representatives, plus officers from the Commonwealth government and the state governmentsof New South Wales, South Australia and Western Australia, with a chairman from Tasmania (which was notdirectly involved with the southern bluefin fishery).
Following a series of port meetings with fishers the TTF issued a draft ‘plan of management’in July 1983.The draft plan contained 14 recommendations, the most important of which include the use of catch-quotas,minimum limits on fish-size, limited-entry and further limits on purse-seine operations (Anon. 1983) It wasproposed that the plan should come into effect at the beginning of the 1983-84 fishing season (on 1 October1993). Because of difficulties in reaching agreement on all aspects, this target was not achieved.
In view of the failure to reach an agreement in time, a national TAC of 21 000t was set for 1983-84. Thiswas allocated as follows: 4000t (a reduction of 28%) for the Western Australia sector (west of 127º E); and15 000t (a 2% reduction) for eastern sector (New South Wales and South Australia). Of the latter, 10 000t wasallocated for poling/trolling and 5000t for purse-seining. Two thousand tonnes were held in reserve for ‘specialuse’in both sectors (Media Release of 23/9/83 and Ministerial letter to fishers of 13 October 1983). A minimumsize-limit of 54cm for tuna was also imposed.
In early 1984 a further discussion paper, prepared by the Australian Fisheries Service at the request of theTTF, was released for consideration by industry. This discussion paper proposed a move to individual
215 Meany

transferable quotas (ITQs), removal of the minimum size-limits for tuna, and the freedom to trade quotaregardless of fishing area or catching method (Anon. 1984).
At the same time, and to assist with the implementation of whatever arrangements might be finally agreed,a register of boats that had operated in the tuna fishery between 1 April 1980 and 31 October 1983 was compiled.“The boat register is designed to provide boat, catch and investment information to assist in the development ofmanagement arrangements to apply in the fishery beyond the 1983-84 season. ... tuna boat operators, whobecause of genuine reasons have not used their boats in the fishery during the period but can demonstrate specialcircumstances and significant commitment to the fishery, will also be considered for inclusion on the boatregister” (Anon. 1984).
Simultaneously with the work of the TTF and the compilation of the register, a review of the SBTfisherywas undertaken by the Industries Assistance Commission (IAC).2 The genesis of this review was a claim by fish-canners in 1983 that imports of canned tuna were having an adverse impact on the Australian fish canningindustry. The inquiry was widened somewhat to include aspects of SBTmanagement. The terms of referencespecified by the Commonwealth Government for the IAC on 30 November 1983 required it to inquire into andreport on:
i. whether adjustment assistance should be extended to the catching and processing sectors of the southernbluefin tuna (SBT) fishery and, if so, the nature, extent and duration of such assistance
ii. changes to the management programme necessary to facilitate conservation of the resource and efficientdevelopment of the SBTindustry and
iii. in the light of recommendations on the above, what changes, if any, should be made to the arrangementswhich apply to the importation of tuna for subsequent processing.
The IAC’s draft report was released in March 1984. It recommended terminating the competitive quotaarrangements for the Australian fishery and replacing it with a TAC of about 10 000t (including a western sectorquota of 1000t), and a management system using ITQs. It also recommended that the cost of managing thefishery be recovered from fishers with each fisher contributing in proportion to the amount of quota held (Anon.1984).
After considering submissions made in response to its draft report the IAC released its final report on28June 1984. This report recommended a 14 000t Australian TAC for 1984-85 (including 1000t for the WesternAustralian sector). It also recommended a move to ITQs but that no adjustment assistance be paid to either thecatching or canning sectors. It also recommended that the embargo on the importation of tuna for canning belifted. It further drew attention to the need for both Australia and Japan to take complementary action(IAC 1984).
3.3 Allocation method chosen
Following consideration of the various issues, the Commonwealth, New South Wales, South Australian andWestern Australian governments agreed on the following arrangements to come into effect from 1 October 1984:
i. a TAC of 14 500t for the Australian fishery to be allocated as ITQsii. individual fishers to be allocated ITQs based on a formula incorporating the highest annual catch in the
three years from 1 October 1980 to 30 September 1983 and the current market-value of the boat (75% ofthe quota was allocated on catch history and 25% on capital investment)
iii. no size-limit to apply to fish from the fisheryiv. a two month closure March/April to apply in the western part of the fisheryv. a ban on fishing north of the 34º South parallel off the Australian west coast andvi. individual ITQs to be proportional to the TAC set in each subsequent year (Anon. 1984).
The decision not to impose a minimum size-limit or to set a separate quota for the western sector was partlythe result of a political compromise so as to secure the Western Australian government’s support for thearrangements. More important was the advice from the Commonwealth Scientific and Industrial ResearchOrganisation relating to alleged widespread dumping of undersized (under 54cm) SBTin the 1983 season. Insome cases dumping of up to 75% of catch was alleged. Because many schools of SBTwere of mixed size,such dumping would create future problems with statistical interpretation (CSIRO letter of 22 March 1984, FileF84-85).
The two-month closure and the ban on fishing north of 34º South were designed to restrict the targeting ofsmall fish. It was believed that because small tuna attracted a lower price, quota-trading would lead Western
Australia Southern Bluefin Tuna 216
2 The IAC was an expert body set up by the Commonwealth Government to advise on the need to provide assistance (subsidies,tariffs, etc.) to various sectors of the Australian economy.

Australian-based fishers to sell quota to other areas. In view of this, it was argued, imposing differential ruleson Western Australian fishers was unnecessary, discriminatory and probably counter productive.
It was also agreed that as the TAC was to be set at a level designed to protect the SBTstock, it wasunnecessary for management to attempt to prescribe the fishing methods used. This would best be determinedby economic forces. No further restrictions were therefore placed on purse-seine boats. It was further agreedthat fishers using troll-lines, long-lines, drop-lines, etc, and taking SBTas a bycatch, would be permitted to doso provided the catch-per-boat did not exceed 5 tonnes. A fisher who took more than 5 tonnes would have toacquire quota from a quota-holder. This again was a political compromise designed to satisfy the concern bysome States that the measures proposed might inadvertently cause unintended disruption to the operations ofrelatively small-scale diversified fishers.
To be eligible to be allocated SBTquota a fisher had to meet one of the following criteria.
I. The current holder of a CFBLwho was the licensee of a boat that took at least 15t of SBTin any one season inthe period 1 October 1980 and 30 September 1983.
II. A person who would have qualified under (I) above but who sold or otherwise disposed of the boat, but whocould demonstrate that contracts had been signed and monies paid before 7 September 1984 for the purpose ofacquiring another boat for the fishery.
III. A SBTfisher who purchased a boat before 6 July 1984 with the express purpose of entering the SBTfishery andwho worked in the fishery for at least two complete fishing seasons in the qualifying period on a boat that tookat least 15t of SBTin at least one season (Anon. 1984).
Those who satisfied one of the above criteria were allocated quota units on the following bases.
i. 75% of the quota units was allocated according to the best catch taken by a boat in a fishing year in the period1980-81 to 1982-83. The catch of each fisher (in that fisher’s best year) was calculated as a proportion of thetotal catch taken by all qualifying fishers in his/her best year. This fraction was then multiplied by 0.75 x 14500.
ii. 25% of the quota was allocated according to each qualifying fisher’s investment in the fishery. This again wascalculated as a proportion of the value of the individual boat as a proportion of the value of all qualifying boats.This fraction was than multiplied by 0.25 x 14 500.
iii. These two above amounts (i and ii) were then summed to give each individual’s allocation of quota units, andtheir actual quota allocation for 1984-85 (Geen, Neilander and Meany 1993).
Under this formula fishers who qualified under criterion II or III were allocated quota on the basis of investment inthe fishery only.
4. DATA REQUIREMENTS AND COMPUTATIONAL PROCESS
The compilation of data sets for the SBTfishery was relatively simple, compared to most fisheries. This wasprimarily because only one species was involved and although the fishery covered a wide geographic area, there wererelatively few market outlets. Fish was mostly sold either to a small number (four or five) of canneries, or wereexported to Japan. Very little was sold on the domestic fresh fish market. The data sources used to determineindividual catch histories were therefore fishing logbooks, sales documents from canneries and export documentation(Geen, Neilander and Meany 1993).
To ensure consistency in the valuation of boats, a marine surveyor was contracted to independently assess eachboat that satisfied the entry criteria. The valuation included fishing gear and navigation equipment (Geen, Neilanderand Meany 1993).
5. APPEALS PROCESS
A panel of government officials, the Southern Bluefin Tuna Review Panel, was established to consider appealsover quota-allocations. The chair of this panel was an officer of the Commonwealth government. The other threepanel members were officials from the South Australian, Western Australian and New South Wales fisherydepartments. It was agreed that no panel member could have had previous involvement in management of the SBTfishery.
The Panel visited fishing ports to allow appellants to personally present their cases. The Panel considered atotal of 53 appeals in December 1984 and appellants were advised of the outcome in February 1985. As a resultof the Panel’s review, recommendations were made that two additional Western Australian fishers be allocatedquota and that six applicants should have their quota allocation increased. The Panel’s task was to consider onlywhether the formula for allocating quota had been properly applied in each case. It could not review theallocation formula itself.
217 Meany

Many of the appellants sought additional quota because they considered that their initial quota-allocation wasinsufficient for their commercial viability. This was not an issue that the Panel could take into consideration andwas largely a result of the reduction in total catch (as represented by the TAC) rather than from the allocation formulaitself. The instances where the Panel recommended additional allocations were mostly those where fishers were ableto provide evidence of catches not previously considered.
Applicants who were disatisfied with outcome of the Panel’s review also had the right of appeal to theAdministration Appeals Tribunal (AAT).3 A total of 24 appeals were made to the AAT. Following consideration ofeach of these appeals the AAT approved either the allocation of quota or, the allocation of additional quota, in fivecases (Geen, Neilander and Meany 1993).
6. ADMINISTRA TION OF THE ALLOCA TION PROCESS6.1 Staff requirements
As previously noted an independent marine surveyor was employed to assess the boat values used in the quota-allocation formula. The use of an independent valuer was primarily to avoid any possible claim of bias that mayhave arisen had a person in government employment been used.
Apart from this, the personnel who undertook the project were provided from existing staff resources. To anextent this was facilitated by the fact that several governments were involved, so that the work involved was spreadover a relatively large staffing base. However, the involvement of many different governments, each with slightlydifferent regional objectives, also added to the complexity of the task.
Different staff, with different skills, were used at each stage of the implementation process. The TTF whichwas set up to make the initial recommendations, comprised relatively senior officers who worked part-time on thisproject in addition to their other responsibilities. The two-person secretariat to the TTF was, however, committedfull-time to this project for its duration.
The officers who compiled the catch-histories used in the initial quota-allocation were seconded from otherduties in their respective departments for the duration of their task, as were the officers who comprised the SouthernBluefin Tuna Review Panel. In view of the time that has elapsed since the initial quota-allocation was made it is notfeasible now to make an estimate of the total manpower involved.
6.2 Additional pr ogramme funding requirements
Funding for this project was provided from within existing budget resources. Each of the different departmentsinvolved (state and Commonwealth) was responsible for funding its own part in this project. As none of theorganisations involved were using programme-budgeting when ITQs were introduced into the Australian sector ofthe SBTfishery, it is impossible to identify the actual expenditure involved.
The Commonwealth government met the full cost of the marine surveyor used to value the boats, and also thecost of industry participation in the TTF. This latter payment was, however, limited to out-of-pocket expenses (traveland accommodation). Industry members of the TTF did not receive payment from government for the time devotedto this activity. It is, however, probable that some of these industry members received some compensation from theirindustry organisation for the time devoted to this activity.
7. EVALUATION OF THE INITIAL ALLOCA TION PROCESS7.1 Success in achieving initial policy objectives
It is difficult to differentiate between the impact of introducing ITQs into the Australian sector of the SBTfishery as an exercise in creating transferable harvesting rights, and the impact on the fishery of the TAC reductionswhich were happening at the same time.
At the first meeting, in February 1985, of the industry/government Southern Tuna Management AdvisoryCommittee (to a large extent the same individuals who had been members of the TTF) it was reported that the systemwas working well and that there had been a significant increase in the average size of fish taken. There had alsobeen an increase in the amount of catch sold on the Japanese sashimi market.
The Committee was also advised that 143 boats had initially been allocated quota, but that after ITQ transfersonly 85 remained. A total of 6750t of quota about (46%) had been transferred. Most of these transfers wereassociated with intra-state transfers, which largely represented consolidation of quota-holdings. However, asignificant number represented transfers to South Australian fishers from fishers in other states as Table 2 illustrates.
Australia Southern Bluefin Tuna 218
3 The AAT is a general review body, set up by the Commonwealth government to consider claims relating to bias or other lack ofequity in administrative decisions by Commonwealth government departments.
Of particular interest was that 37% of the initial allocation to Western Australian fishers had already beentransferred. It should be noted that these figures include only ‘permanent’transfers of quota (i.e. quota that hadbeen sold). The table does not include seasonal transfers (i.e. leased quota), which were reportedly of similarmagnitude (Anon. 1985).
Table 2Comparison of SBTQuota holdings October 1984 and February 1985
Source: Anon. 1985
Three principal factors appear to have driven this rapid change in quota holdings:
i. the reduction from a total catch from 21 500t for the year 1982 to an TAC of about 14 500t in 1984ii. the continued absence of surface schools of 3-4 year-old SBTfrom NSWwaters (these schools were still
present in the 1980-81 and 1981-82 seasons, so that the fishers involved qualified for quota-allocation, butwith the continued absence of surface schools many of the holders elected to sell or lease this quota) and
iii. in the Western Australian sector the reduced individual allocation associated with the lower TAC wascompounded by the price differential between fish for canning, and what South Australian fishers could getfor larger sashimi-quality fish. As a result the price South Australian fishers were prepared to pay for quotawas attractive to Western Australian fishers.
7.2 Satisfaction of rights-holders with the process
As a general rule it is probably true that most rights-holders were disappointed with their initial allocationof SBTquota. This was because most failed to differentiate between the impact of the allocation formula itselfand the reduction in the TAC that occurred at the same time. This TAC reduction, which continued after theintroduction of ITQs (the TAC for the Australian sector of the fishery is now 5265t), was essential for the long-term survival of the commercial fishery. This catch reduction would inevitably have resulted in hardship formany in the fishery, irrespective of whether ITQs or some other management mechanism was used. Regardlessof this, most fishers appeared to ignore the inevitable consequences of the reduction in the TAC, and tended toplace all the blame for dislocation to their fishing activity that followed their introduction, on the ITQ-system.
The reduction in the TAC meant that all fishers suffered a reduction from their historic catch-levels. Forsome this meant having to buy additional quota to remain viable. For others, it meant having to sell quota andcease tuna fishing. It might be noted that many fishers, particularly those in New South Wales and WesternAustralia, were only part-time tuna fishers. The sale of tuna quota by these fishers meant that they were notforced to leave the fishing industry but could continue to fish by targeting other species.
Although tuna fishing may have been only a seasonal operation for these fishers, it did bring in vital income.In many cases the loss of this income meant that a previously marginal operation became sub-marginal. It alsomeant that, at least in New South Wales and Western Australia, it is likely that additional fishing pressure wasplaced on other fish-stocks, many of which were at, or near, full exploitation. It should be noted that thisadditional fishing effort would come not only from boats from which SBTquota had been sold, but also fromboats that had retained their quota allocation, although because of the reduced TAC were obliged to then take lessSouthern bluefin tuna. This is another instance where it is not possible to separate the impact of introducing ITQsfrom that associated with a reduction in the TAC.
If this diversion of effort onto species in other fisheries did in fact occur, it would mean that part of the costsassociated with the adjustment process were carried by fisheries other than the SBT. It would also mean thatfishers, operating in those fisheries that did not have tuna quota, suffered reduced catches and loss of incomebecause of increased fishing effort by ex-SBTfishers. This would mean that these other fisheries subsidised the
219 Meany
State Quota allocation Quota holdings as at October 1984 as at 15 February 1985 Tonnes Boats Tonnes Boats
South Australia 9 281 41 11 156 27 Western 2 878 75 1 832 47
Australia New South 1 875 26 1 196 11 Wales Victoria 150 1 - - Total 14 184 143 14 184 85

adjustment in the tuna fishery. The rate of adjustment in the SBTfishery was much greater than that experienced inother fisheries when ITQs were first introduced, for example in New Zealand, or in the trawl sector of the AustralianSouth-East Fishery. In these fisheries the rate of adjustment appeared to be much better aligned with the rate thatthe fishing boats became obselete.
It is also true that many fishers considered that the allocation formula was based on the wrong years. NewSouth Wales fishers considered the allocation formula should have used a greater range of years (which would havefavoured them) while Western Australian fishers would have preferred a formula biased towards the later years. Allsectors of the fishery were unhappy with their quota-allocation. This dissatisfaction was not, however, necessarilyrelated to the allocation process itself, but was the inevitable result in the concurrent reduction in the TAC.
7.3 Views of othercommunity groups
Apart from some local concern relating to potential loss of employment, there appears to have been limitedcommunity interest in the introduction of ITQs. Even the concern about reduced employment appears to have beenrelated more to the reduction in the TAC and its likely impact on employment in fish-canning rather than in thefishing industry itself.
Conservation groups did not appear to have realised how bad the stock situation in the fishery had become, andthere is no record of their being an active party to the debate on this issue. Neither was there apparently any interestin this issue on the part of the wider public, either because of the loss of public right to enter the commercial fishery,which ceased when the fishery became limited-entry or, with respect to the public benefit associated with theestablishment more secure, tradable harvesting rights.
7.4 Hind-sight assessment
Considering the rapidly deteriorating situation with SBTstocks in the early 1980s it is evident that decisiveaction had to be taken if a viable commercial fishery was to be maintained. This had to involve a significantreduction in total catch and a diversion of catching away from one and two year-old fish. The setting of the TACachieved the first of these objectives, while the fortuitous circumstance of the large price differential between smalland larger tuna provided the incentive for Western Australian fishers to benefit from the market and to sell much oftheir quota, thereby significantly reducing the catch of small fish.
The biggest problem with introducing ITQs, as it is with most significant changes to the management of anyfishery, is getting a reasonably acceptable formula for making individual allocations. In the case of the SBTfisherythis difficulty was compounded by the fact that the introduction of ITQs was accompanied by a TAC that representeda substantial reduction in the annual catch taken in the proceeding few years. No matter what allocation formulawas chosen, the individual fishers were faced with a significant reduction from their previous levels of catch.
The fact that this is a single-species fishery, with a few well defined market outlets, made the SBTfishery wellsuited to the use ITQs. This applied both to the ready availability of market records on which to make the initialquota allocations and, just as important, to the monitoring of catches against quota-holdings after ITQs wereintroduced.
In summary, given the circumstances in this fishery and even with the benefit of perfect hind-sight, it wouldseem that in just about all respects the fisheries managers, in cooperation with scientists and the fishers themselves,for once got all aspects as about as right as they could have reasonably hoped, in making the transition in the methodof management. It may have helped if greater attention had been paid to explaining the impact of the quota-allocation separately from the issue of TAC-reduction. It is, however, likely that most fishers would have noted onlytheir actual quota-allocation. The detail of how this was arrived at, and the wider issues involved would probablyhave received limited attention.
The introduction of ITQs has certainly assisted in the further adjustments to the fishery which have resultedfrom subsequent TAC reductions. Fishers have now adjusted completely to the system, so that these subsequentTAC reductions were handled entirely through the market place and without the need for further intervention bymanagers.
8. LITERA TURE CITED
Anon. Australian Fisheries 1983. 42(8) p 13. AGPS, Canberra.Anon. Australian Fisheries 1984. 43(4): 8-9, AGPS, Canberra.Anon. Australian Fisheries 1984. 43(9): 5-6, AGPS, Canberra.Anon. Australian Fisheries1985. 44(3): 2-4. AGPS, Canberra.Campbell, D., T. Battaglene and D. Brown 1996. Use of individual transferable quotas in Australian fisheries,
ABARE Conference Paper 96-21, ABARE (Australian Bureau of Agricultural and Resource Economics),Canberra.
Australia Southern Bluefin Tuna 220

Geen, G., W. Nielander and T.F. Meany 1993. Australian Experience with Individual Transferable Quota Systems.In: The Use of Individual Quotas in Fisheries Management. OECD, Paris. pp. 73-94.
Geen, G. and M. Nayar 1989. Individual Transferable Quotas and the Southern Bluefin Tuna Fishery, ABAREOccasional Paper No 105, AGPS, Canberra.
Hampton, J. and J. Majkowski 1986. Scientists fear SBTproblems worsening. Australian Fisheries 45(12):6-9.IAC (Industries Assistance Commission) 1984. Southern Bluefin Tuna, Industries Assistance Commission Report,
AGPS, Canberra.Kailola, P., M. Williams, P. Stewart, R. Reichelt, A. McNee and C. Greive 1993. Australian Fisheries Resources,
Bureau of Resource Sciences, Canberra.Majkowski, J. and M. Caton 1984. Scientists’concerns behind tuna management. Australian Fisheries, 43(3): 371-
382.Wesney, D., B. Scott and P. Franklin 1985. Recent developments in the management of major Australian fisheries:
theory and practice. In: Proceedings of the Second Conference of the Institute of Fisheries Economics and Trade,Vol. 1, Christchurch, New Zealand, August 20-23 1984, pp. 289-303.
221 Meany
INITIAL ALLOCATION OF INDIVIDUAL TRANSFERABLE QUOTAIN NEW ZEALAND FISHERIES
R. ConnorCentre for Resource & Environmental Studies
Australian National University, Canberra, ACT 0200 Australia<[email protected]>
1. INTRODUCTION AND BACKGROUND1.1 Introduction
In 1986 New Zealand introduced management by individual transferable quota (ITQ) for 26 of the country’smost economically-significant fishery species. The system has since been expanded and extensively modified,and remains the most comprehensive and perhaps most robust example of ITQ management in the world today.The system was born of dual motivations: (a) concern for the stress on stocks being imposed by rapidly expandingeffort in the inshore fin-fisheries; and (b), the desire for a mechanism to allow the domestic industry to capturerents and build capacity in the deep-water sector, dominated in the past by foreign fleets.
This paper summarises the policies and processes encompassing the initial allocation of ITQ fishing rightsin New Zealand. Both primary data and existing published sources have been used in compiling this account.Although a reasonable volume of published material exists on the New Zealand quota-management system, muchof this is only generally descriptive of the policy process, focusing more on accounts of system features and, morerarely, on outcomes. This paper assembles existing material on the establishment of the system, reconciles someof the disparity in these accounts, adds supplementary data where useful, and provides some analysis andcommentary on the processes and outcomes of the allocation of ITQ in New Zealand.
The following (Section 1.2) gives some background to the fisheries and a synopsis of management historyleading up to the adoption of the quota system. Section 2 then outlines the nature of the ITQ harvesting rightimplemented in New Zealand. Section 3 deals with the method used in allocation of quota, discusses theobjectives of the allocation process, the consultative and policy process by which that method was determinedand the method itself. Section 4 deals with the data and computational issues for quota allocation, and Section 5with the appeals processes for addressing the concerns of fishers with regard to their entitlements. Section 6touches on the administrative resources required to manage and implement the allocation process, and Section 7provides a brief evaluation of the process and outcomes. The final Section (8) reflects on the general issues raisedby the case study.
1.2 New Zealand fisheries management – Life before quota
New Zealand is an island nation in the South-west Pacific. It was settled by Polynesians (the Maori) fromabout 800 AD, and by Europeans from the late 18th Century. Fishery resources have always been significant asa food source and as trade goods, but are only moderately abundant in international terms. The estimatedmaximum sustainable yield for the Exclusive Economic Zone (EEZ) of 4.1million km2 is something over half amillion tonnes, with about one third of the zone fishable by modern ‘industrial’ demersal methods. EarlyEuropeans were attracted to the exploitation of seal and whale populations, but these resources were well depletedby 1900. The first government regulation of commercial fishing came with the passing of the Fisheries Act 1908,and active policies encouraging judicious exploitation were adopted in 1914 following advice from a Canadianconsulting academic, Professor E.E. Prince (Riley 1982).
Foreign fishing began in New Zealand’s coastal waters in the 1950s, when Japanese vessels first appearedoutside the three-mile Territorial Sea. At this time domestic fishing had been under a conservative managementstrategy since the 1920s, and a strict licensing authority regime since 1945, based on concern for conservation offish stocks. Entry was limited, gear controlled, area and seasonal closures were used, fish and mesh size minimaimposed, and ports for operation and landing of fish were fixed for each boat (Riley 1982). The appearance oflarge foreign vessels only three miles off the shore prompted the government to commission a ParliamentarySelect Committee inquiry into the fishing industry in 1961 (AJHR 1962). Either this new foreign effort wouldsoon destroy New Zealand fish stocks, or the domestic industry was being denied use of a valuable resourcewithout cause. The inquiry resulted in a new policy to expand and develop the local fleet to compete with thevisitors for economic benefits from the fisheries resources. In 1963 the previously restrictive licensing policieswere overturned, opening domestic access to all-comers, and a period of government subsidy and unconstrainedgrowth took place through to the 1980s.
In 1965 New Zealand extended its management jurisdiction to twelve nautical miles, and by 1970 hadmoved the Japanese long-liners out of this zone (Sharp 1997). Between 1967 and 1977, the domestic fleet
222
expanded from 2161 fishing vessels to 5178, encouraged by government tax and loan concessions, with thehighest growth in vessel classes under 12m (163%) and over 21m (122%) in length. Landings consequently grewrapidly in both the inshore and the deepwater sectors. More than 100 species were fished commercially using alarge number of gear types and methods. However foreign catches grew more quickly, and by 1977 90% of the476 000t known demersal finfish catch from the EEZ area was being taken by foreign vessels, mainly from Japan,Korea and the Soviet Union (Sharp 1997).
Responsibility for the management of New Zealand’s fisheries lay with the Ministry of Agriculture andFisheries (MAF).1 Initially, following the declaration of the EEZ, the fisheries outside the twelve-mile limit weremanaged separately from the inner zone, now the Territorial Sea. Total allowable catches (TACs) were struck forthe deeper-water species, and these were allocated preferentially to the domestic industry, and only then to theforeign fleets under licence and government bilateral agreements. The policies offered the foreign fleets less ofthe prime species and areas than they had been fishing, changing the economic balance and resulting in a muchreduced total catch for the next few years (OECD 1997).
Government policies also provided incentives for domestic companies to invest in onshore processing plantsand vessels for deepwater fishing, but the main initial domestic involvement in deep-water fishing was developedthrough joint ventures with foreign companies and foreign vessel charter. Joint ventures brought local crew ontothe big vessels and direct involvement of domestic companies in the management of fishing operations andmarketing, paving the way for further domestic expansion. Foreign vessels began delivering large catches toonshore processing. By about 1982 local companies had learnt what they needed to know from joint ventures,and arrangements with foreign vessels moved towards simpler contracts in order to charter fishing capacity tocatch against domestic company quotas. Foreign vessel charter has remained an important part of deepwaterfishing in New Zealand since that time, gradually diminishing as domestic companies have invested in largefreezer trawlers. Both arrangements brought greatly increased cash flow to the domestic industry, foreignexchange from exports, and employment in processing.
Throughout the 1960s and 1970s the New Zealand Government had been providing financial assistance toaccelerate development of the fishing industry. This increased with the declaration of the EEZ. Concessionaryloans were provided for buying and building vessels and establishing and expanding shore-based processingfacilities, and suspensory loans were granted for developing export markets and vessel construction (NZDoS1983). In addition, import duty exemptions were made for purchase of vessels from outside New Zealand, andother favourable tax treatments were applied to the industry. Figure 1 shows the dramatic increase in numbers oflarger vessel and in tonnage of the domestic fleet after 1976. Both the number of 24-33m vessels and theirtotal capacity increased by nearly 500% in the decade leading up to implementation of the quota system in 1986,while the number of vessels over 33m in length increased by an order of magnitude. Some of these large vessels,imported under duty concessions to increase domestic participation in the deep-water species, had also beenfishing inshore, increasing pressure on stocks (Riley 1982, Martin 1984).
It was at this time that the inshore fisheries began showing signs of stress, and management gradually movedinto crisis mode. New powers to declare controlled fisheries were introduced in 1977 and a moratorium onissuing new scallop and rock lobster permits followed in 1978. Alarming fluctuations in catches of the mosteconomically important inshore species: snapper (Pagrus auratus), and rapidly increasing catches of vulnerablespecies of sharks and gropers, brought a total moratorium on the issue of new fishing permits in 1982. These fishstocks were believed to be already over-fished and a review of inshore management provisions was initiatedunder the auspices of the newly constituted National Fisheries Management Advisory Committee (NAFMAC).Figure 2 shows the long-term trend in the snapper catch, which had been at high levels since the mid-1960s andunderwent abrupt fluctuations under increasing fishing effort in the late 1970s before declining sharply. As themost valuable export species and most popular domestic eating fish and recreational catch, the crash of thesnapper catch caused grave concern. Figure 3 indicates trends for most of the other significant inshore finfishspecies, indicating that the catch of these more than doubled between 1975 and 1984.
Both management and industry had recognised that there were economic as well as stock problems in theinshore fisheries (Riley 1982). Five per cent of the fleet was taking two thirds of the catch, and there were largenumbers of part-time operators. From a total of 5184 licensed vessels in 1978, 2942 are reported to have earnedless than $NZ500 from fishing (National Research Advisory Council 1980, cited in Wallace 1997). In August1983 the NAFMAC produced a discussion paper, “Future policy for the inshore fishery,” in which they estimatedthat the inshore fleet was overcapitalised by about $NZ28 million (NAFMAC 1983). The surplus capacity wasmainly concentrated on the north-east coast of the North Island.
223 Connor
1 The Ministry of Agriculture and Fisheries was reformed in 1994 as the Ministry of Fisheries (MFish). In this document theagency will be referred to as MAF or the Ministry.

Figure 1Domestic fleet – Numbers and capacity of large length classes 1974 to 1998
Data sources: King 1985; FSU data; QMS data.
Figure 2NZ reported domestic catch for snapper (Pagrus auratus) 1960-s1986
New Zealand Fisheries 224
!
"!
#!
$!
%!
&!!
&"!
&'(# &'($ &'(% &'%! &'%" &'%# &'%$ &'%% &''! &''" &''# &''$ &''%
)*+,-./01/2-33-43/01/5-6789/7.-:8-./89:6/"#/+-8.-3
!
&!;!!!
"!;!!!
<!;!!!
#!;!!!
=!;!!!
$!;!!!>08:4/?:@:AB8C/B6/DE/>066-3
5-6789/F<<+<!G<<+
"(G<!+"#G"(+
5-6789/F<<+<!G<<+"(G<!+"#G"(+
!
Data source: Annala & Sullivan 1997.
Rep
orte
d Sn
appe
r C
atch
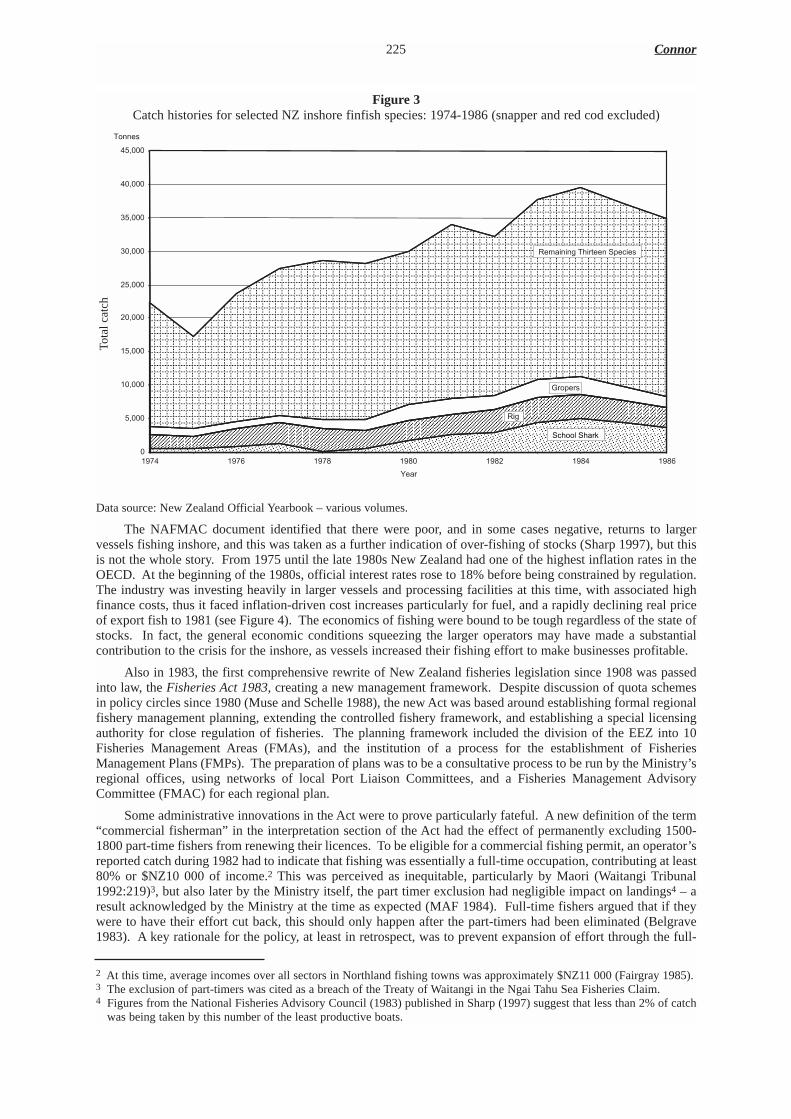
Figure 3Catch histories for selected NZ inshore finfish species: 1974-1986 (snapper and red cod excluded)
Data source: New Zealand Official Yearbook – various volumes.
The NAFMAC document identified that there were poor, and in some cases negative, returns to largervessels fishing inshore, and this was taken as a further indication of over-fishing of stocks (Sharp 1997), but thisis not the whole story. From 1975 until the late 1980s New Zealand had one of the highest inflation rates in theOECD. At the beginning of the 1980s, official interest rates rose to 18% before being constrained by regulation.The industry was investing heavily in larger vessels and processing facilities at this time, with associated highfinance costs, thus it faced inflation-driven cost increases particularly for fuel, and a rapidly declining real priceof export fish to 1981 (see Figure 4). The economics of fishing were bound to be tough regardless of the state ofstocks. In fact, the general economic conditions squeezing the larger operators may have made a substantialcontribution to the crisis for the inshore, as vessels increased their fishing effort to make businesses profitable.
Also in 1983, the first comprehensive rewrite of New Zealand fisheries legislation since 1908 was passedinto law, the Fisheries Act 1983, creating a new management framework. Despite discussion of quota schemesin policy circles since 1980 (Muse and Schelle 1988), the new Act was based around establishing formal regionalfishery management planning, extending the controlled fishery framework, and establishing a special licensingauthority for close regulation of fisheries. The planning framework included the division of the EEZ into 10Fisheries Management Areas (FMAs), and the institution of a process for the establishment of FisheriesManagement Plans (FMPs). The preparation of plans was to be a consultative process to be run by the Ministry’sregional offices, using networks of local Port Liaison Committees, and a Fisheries Management AdvisoryCommittee (FMAC) for each regional plan.
Some administrative innovations in the Act were to prove particularly fateful. A new definition of the term“commercial fisherman” in the interpretation section of the Act had the effect of permanently excluding 1500-1800 part-time fishers from renewing their licences. To be eligible for a commercial fishing permit, an operator’sreported catch during 1982 had to indicate that fishing was essentially a full-time occupation, contributing at least80% or $NZ10 000 of income.2 This was perceived as inequitable, particularly by Maori (Waitangi Tribunal1992:219)3, but also later by the Ministry itself, the part timer exclusion had negligible impact on landings4 – aresult acknowledged by the Ministry at the time as expected (MAF 1984). Full-time fishers argued that if theywere to have their effort cut back, this should only happen after the part-timers had been eliminated (Belgrave1983). A key rationale for the policy, at least in retrospect, was to prevent expansion of effort through the full-
225 Connor
Tota
l cat
ch
2 At this time, average incomes over all sectors in Northland fishing towns was approximately $NZ11 000 (Fairgray 1985).3 The exclusion of part-timers was cited as a breach of the Treaty of Waitangi in the Ngai Tahu Sea Fisheries Claim.4 Figures from the National Fisheries Advisory Council (1983) published in Sharp (1997) suggest that less than 2% of catch
was being taken by this number of the least productive boats.

time deployment of these under-used permits. This was to help curtail the over-exploitation of fish stocks and toprotect the livelihood of those who were wholly, or substantially, reliant on the commercial fishery (Dobson1988). The move certainly reduced administrative loads and the size of the group of fishers to be dealt with inthe later implementation of quota.
Figure 4Mean value of New Zealand seafood exports 1969-95
Data source: New Zealand Official Yearbook – various volumes.
Figure 5 shows the expansion in numbers of small boats in the late 1970s and the sharp reduction subsequentto the 1983 legislation.5 The underlying area plot shows the minimal effect on the capacity of the inshoredomestic fleet (under 33m length), with increasing numbers of the larger vessels more than compensating for thecapacity lost through exclusion of small boats. Figure 6 shows the long-term fate of small-boat capacity, with theline plot indicating again the close matching of expanding capacity in larger classes filling the gap as small boatsexited. Total numbers and capacity of vessels in the intermediate sizes (12 to 24m) have not varied more than10% from the early 1970s to the late 1990s. This core capacity of the inshore fleet comprises about 560 vesselswith a total capacity of 20 000 gross registered tons (GRT).
Section 89(g) of the 1983 Act provided for regulations to be promulgated prescribing TACs and empoweringthe Minister to allocate quota in a discretionary manner to any specified commercial fishers. This was thestatutory basis of what was to become the pilot program for quota management in New Zealand. It was put towork immediately for its intended purpose in the deep-water sector, where nine commercial entities, includingtwo consortia, were allocated enterprise quotas for seven species. The significant and increasing magnitude andvalue of the pelagic and deep-water catch taken by the domestic fleet can be seen in Figures 7 and 8. Catch ofinshore finfish species in 1983/4 contributed around 56 000t, i.e. less than half of the total finfish shown.6
Meanwhile the NAFMAC was developing a range of options for management of the inshore fisheries underthe new FMP framework. ITQs were an option included from the beginning, and, through an extensiveconsultative process lasting nearly two years, much of the fishing industry became convinced that this was thepath management should take. By mid-1985 the government had made its decisions and the FisheriesAmendment Act 1986 brought the Quota Management System into force on 1 October 1986.
New Zealand Fisheries 226
Mea
nV
alue
per
tonn
e
5 The range of data sources available covering the transition period between 1982 and 1987 show considerable discrepancies.Some data show a more gradual reduction in vessel registrations in 1983-85 than is illustrated in Figure 1. Prior to theexclusion of part-timers fishermen the total number of small boats was starting to decline, but the net loss from exclusionswas still around 2000 boats. The dip in the capacity plot in 1983 is split about equally between vessels under, and over,12m in length, with the rebound, sustained past 1986, due entirely to larger boats.
6 See Figures 9, 10 and 11 in Section 7 for further detail on inshore catches.

Figure 5New Zealand domestic fleet capacity: vessels less than 33m length – 1974 to 1998
Data sources: King 1985; FSU data; QMS data.
Figure 6New Zealand small boat sector: Capacity (GRT), and proportion of inshore fleet capacity – 1974 to 1998
Data sources: King 1985; FSU data; QMS data. Photograph: Bonnie McCay.
227 Connor
Cap
acity
in G
RT
(are
a pl
ot)
Cap
acity
in G
RT
(are
a pl
ot)
Cap
acity
of
boat
s <
12m
as
% o
f al
l boa
ts <
33m

Figure 7Landings by New Zealand domestic fleet 1969 to 1985
Data source: New Zealand Official Yearbook, various volumes.
Figure 8Landed value of New Zealand domestic catch - 1969 to 1982
Data source: New Zealand Official Yearbook, various volumes.
New Zealand Fisheries 228

A significant issue in the lead up to the introduction of ITQs in New Zealand was the change of governmentin 1984. This ended a long period of intensive economic regulation, and signalled the beginning of one of themost rapid and intense periods of market-oriented regulatory reform experienced anywhere in the world. Thiswas the perfect political climate for the introduction of ITQs, and was coincident with a high level of concern,within both industry and the regulatory agency, to see changes in the management framework to protect failinginshore stocks and build investment in the deep-water sector.
2. THE NATURE OF THE HARVESTING RIGHT
The basis of the legal right to engage in commercial fishing in New Zealand before the introduction of quotamanagement was, and remains today, a fishing permit issued by the government department responsible forfisheries management – then the Ministry of Agriculture and Fisheries (MAF or the Ministry), reformed as theMinistry of Fisheries (MFish) in 1994. Permits were issued pursuant to the Fisheries Act 1908, replaced by theFisheries Act 1983, and were subject, in addition, to attached conditions such as area, method and quantityrestrictions (required to be substantially the same for all permits of a given class) and to regulations promulgatedunder the Act. Permits could be legally issued for up to five years but have always been made renewable annuallyand had never been tradable. From 1963 to 1982 (1978 for rock lobster and scallops) there was no restriction onthe number of permits available, and hence there was no need for trade. The system was that of regulated open-access. From March 1982 there was a moratorium on the issue of new permits for the inshore finfish fisheries.The provisions of the 1983 Act regarding the definition of a “commercial fisherman”, which excluded part-timers,demonstrated that the permit did not comprise a secure ongoing right to fisheries access, despite the expectationof annual renewal.
During 1983 the deep-water enterprise allocation scheme was also put in place. This program was appliedto seven species or species groups7 of finfish caught in quantity mainly in the greater EEZ outside the 12 mileTerritorial Sea8. The domestic portion of the TAC for each of these species was allocated as quota to the sevenlargest companies and two consortia of smaller companies fishing for them. A further amount was to be fishedby “others” (mainly owner-operators) as a competitive TAC. Modelled on the then recently-establishedEnterprise Allocation program for offshore trawlers in Atlantic Canada, the quotas applied to the company, not tothe vessel or individual, and were initially valid for ten years. Companies were free to catch their allocation inany way they wished, including joint ventures and foreign vessel charter arrangements. These quotas weretransferable with the administrative collaboration of the Ministry, although there was no statutory basis fortransferability. This system served as a precursor to the more generalised quota system, giving MAF staffvaluable experience with setting TACs and dealing with changes in quota ownership, and the industry a taste forsecure quantified access rights (MAF 1982; Clark and Duncan 1986). The same companies were major playersin the inshore fisheries and their experience with the deep-water allocations made them firm advocates fordevelopment of the ITQ system.
On the introduction of the quota management system (QMS) in October 1986, a new right was created: theindividual transferable quota (ITQ). ITQ was to be a perpetual right to a part of the fish harvest, designated inmetric tonnes for a particular species or species group to be taken annually from a specified quota managementarea (QMA). Each QMA comprised one or more Fishery Management Areas (FMAs), based on theunderstanding of biological stock distributions at the time (see Figures 9 and 10 for an example). So each specieswas split into one to ten quota stocks nationally. The 26 species or species groups initially introduced formed153 stocks, and comprised 83% by weight of all finfish taken in the commercial fishery in 1985 (Boyd andDewees 1992). These rights were allocated free of charge to existing participants in the fisheries. Freetransferability and lease was subject to reporting of all transactions, and transaction prices, to the Ministry, andto aggregation limits of 20% for inshore or 35% for deep-water stocks. Only New Zealand residents, orcompanies at least 75% New Zealand owned, could own or hold quota. The ITQ allocated rights to utilise theresources, but the fishing permit remained as the right of access. Under the QMS legislation, a fishing permitwas to be granted to anyone who fulfilled the minimum quota holdings requirement of five tonnes for finfish. Theenterprise allocation system that had been in use for deepwater species since 1983 was unified with the new QMS,with enterprise quota being converted directly into ITQ.
The rhetoric of ITQs at the time of the introduction referred to them as exclusive and perpetual propertyrights (for example see MAF 1984:9). However they were not referred to directly as property in the Fisheries
229 Connor
7 In the deep-water fisheries three oreo species are managed as a group – that is subject to the same quota (see Appendix 1). Inthe inshore fisheries, eight species of flounder and sole are managed as the species group flatfish, and two groper species ashapuku/bass.
8 These were the deep-water orange roughy and oreo species, hoki, hake, ling, barracouta and silver warehou. See Appendix 1for a listing of species common and scientific names, quota codes and Total Allowable Commercial Catch (TACC).
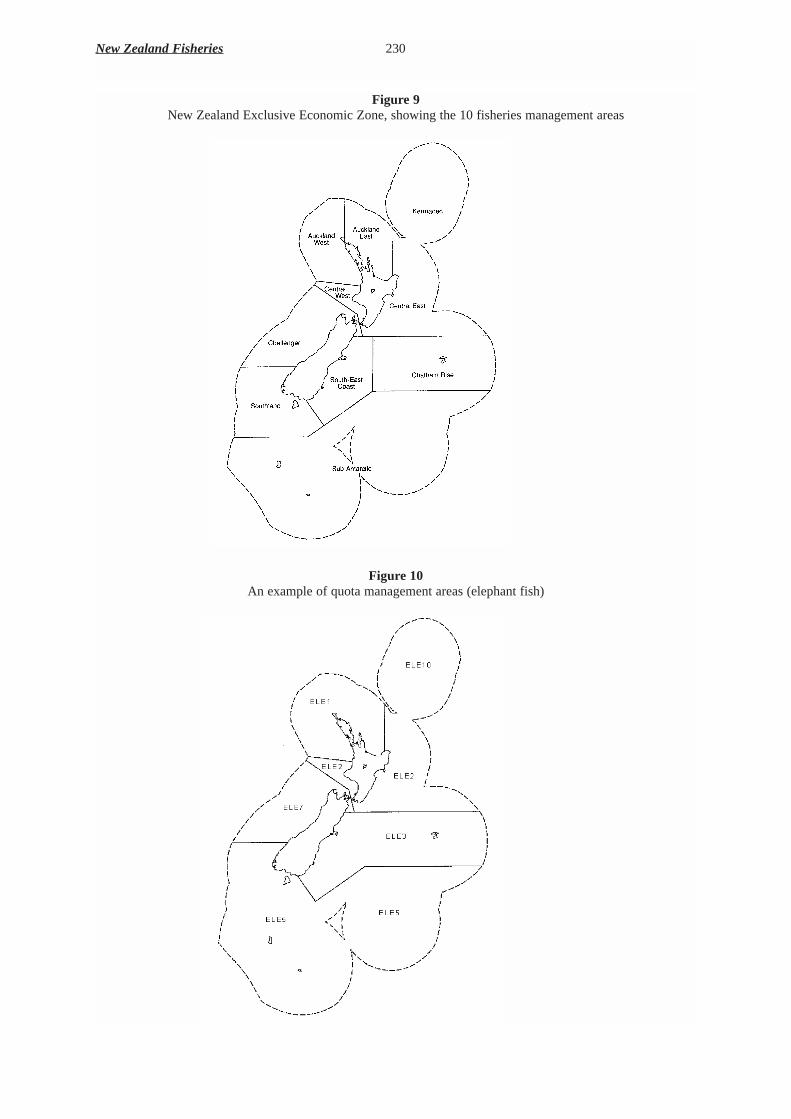
Figure 9New Zealand Exclusive Economic Zone, showing the 10 fisheries management areas
Figure 10An example of quota management areas (elephant fish)
New Zealand Fisheries 230

Amendment Act 1986, but were characterised by the attributes and conditions imposed by Section 10 of theamendment that created a new Part IIA in the principal Act. Key among these, ITQs were:
i. a right to take fish of a nominated species in a specified Quota Management Area in the amount shown inthe quota, on an annual basis
ii. allocation in perpetuityiii. expressed in absolute weights of whole fish measured in metric tonnesiv. subject to minimum holdings (weights) before fishing is allowed, and maximum holdings (percentage of
total)v. able to be freely transferred by sale or lease andvi. fully compensable in the event of TAC reductions.
Responsibilities attached to quota ownership included legal obligations to:
i. land all catch of quota species, unless under minimum legal sizeii. submit monthly quota monitoring reports, in addition to completing catch and landing returns and catch-
effort logs and iii. pay resource rentals on all quota held whether caught or not.
These characteristics establish the character of the ITQ as private property in the right to harvest fish froma given stock – not in the fish stocks themselves – and a clear understanding of this character has becomegeneralised in New Zealand since 1986. There was no legal impediment to the use of ITQ as security for bankloans, but the Ministry did not make provision for the registration of liens or caveats against the title to ownershipand this in many cases prevented such use.
The nature of the ITQ right underwent a major change in 1990. The original specification of ITQ in tonnesof fish required the government to enter the quota market to buy or sell quota when it wanted to alter the totalallowable catch (TAC). When faced with potential for stock collapse in orange roughy and the need to reducethis valuable quota by large percentages, the system was changed so that ITQ were denominated as a percentageof the TAC, rather than as a specific tonnage. Adjustment then implied merely the automatic pro rata adjustmentof all ITQ holdings at the beginning of each season to match the TAC.
The two systems have different effects on who bears the burden of uncertainty in fisheries management. Inthe initial system the government incurred all of the consequences of the uncertainties surrounding stockassessments, species biology, environmental change, impacts of fishing practices and so on, that in othercommercial areas are borne by the industry. In the proportional system the industry faces the uncertainty. Thismay have consequences for levels of investment, but should also improve incentives for industry to invest insupporting science and management information in order to reduce uncertainties concerning stock size anddynamics, and therefore future TAC levels. This new industry interest in research reinforced the need for industryand management to engage in policy dialogue and may thereby produce more coherent management policies.
Arguably, the proportional system implies something closer to ownership rights to the fish stock, as quotaowners are able to capture any changes in the value of the whole stock. If new information reveals stocks to belarger or more productive than previously thought or restraint leads to stock size increase in previously overfishedstocks, the value of an individual holding increases accordingly. The ability for someone to capture changes inasset value is a significant test of ownership applied by law courts. Under the original New Zealand system oftonnage-designated quotas, the government captured such changes in value.
The other key issue in the nature of ITQ rights in New Zealand has been the presumption of Crown (state)ownership of the resource, and thereby an ability of the Government to create exclusive rights of access. Theindigenous people of New Zealand, the Maori, challenged this presumption immediately following the Cabinetdecisions in May 1985 to implement the quota system. The challenge was eventually successful in achievingrecognition that the quota system as initially conceived contravened both the Treaty of Waitangi and the FisheriesAct 1983 itself. Two High Court injunctions were granted in late 1987 preventing further implementation of thesystem pending negotiations between the parties, but not before the major allocations of quota were completed.The issue of Maori commercial fishing rights was not finally settled until 1992. In the interim, the only additionalspecies added to the QMS was rock lobster (and the associated packhorse-cray) in 1990. By agreement amongthe parties, rock lobster quota was limited in term to 25 years, but was subsequently converted to a perpetual rightfollowing the final settlement of Maori claims.9
231 Connor
9 For details of Maori claims to fishery resources and the settlements reached see (Waitangi Tribunal 1988; Memon andCullen 1992; Waitangi Tribunal 1992; Munro 1994; Wickliffe 1995; Hooper and Lynch 2000).
3. THE METHOD OF ALLOCATION3.1 Policy objectives
As is usually the case with fisheries management, there was a multiplicity of objectives sought by theintroduction of the ITQ system in New Zealand. The unification of the deep-water and inshore managementsystems was an objective in itself, but the aims for the two sectors were far apart.
Two major objectives for the introduction of the QMS in the inshore fisheries were to provide a viable meansto halt effort expansion, to reduce catches immediately so as to allow over-fished stocks to recover and to promoterationalisation of the over-capitalised fleet. The strategy adopted in allocating ITQs reflected both the economiclogic by which the system had been advocated, and the need to gain and maintain the support of fishers for themanagement system. That catch reductions would be compensated by government was a principle agreed earlyin the discussion of quota management. The Government’s condition for providing compensation was thatreductions in fishing pressure were to be binding and permanent. Compensation reinforced the concept that quotarepresented an explicit quantified property right and implied a discipline on the regulator to fully justify cutsbefore acting. It also offered a means by which fishers could determine themselves who would contribute to thereduction of effort, and provide a dignified exit from the fishery for those who chose to retire.
For the government’s part, they had one eye on the future, particularly of the deep-water fisheries, wherethis principle would pay a handsome dividend: they would be able to tender large quantities of quota to theindustry as domestic capacity expanded. The goals for the deep-water fisheries were the rational developmentand “New Zealandisation” of harvesting without getting into the trap of over-capitalisation, and for thegovernment to realise revenues through quota auction sales and resource rentals. It was this combination ofoutcomes, which would allow the government to cover compensation costs for inshore restructuring by sellingquota for the deep-water species, that drove the choice of tonnage-based quota. The original deep-waterenterprise allocations had been proportional, but were switched to fixed tonnages for the introduction of the morecomprehensive QMS (Clark et al. 1988).
For the inshore fisheries, the policy discussion document published by the new Government in September1984 listed the following objectives and aims:
“The objectives of [the ITQ policy] are:i. to achieve the long-term continuing maximum economic benefits from the resources;ii. to preserve a satisfactory recreational fishery.” (MAF 1984:6)
“Aims of proposed policy:i. to rebuild fish stocks to their former levels;ii. to ensure that catches are limited to levels that can be sustained over the long term;iii. to ensure that these catches are harvested efficiently with the maximum benefit to fishermen and the
nation;iv. to allocate each entitlement equitably based on fishermen’s current commitment to the industry;v. to manage the fisheries so that fishermen retain maximum security of access to fish and flexibility of
harvesting;vi. to integrate the ITQ system of the inshore and deepwater fisheries;vii. to develop a management framework that can administered regionally in each fisheries management area; viii. to financially assist the harvesting sector to restructure its operations to achieve the above aims;ix. to enhance the recreational fishery.” (MAF 1984:10)
The main objectives of this generic list distil down to stock conservation, economic efficiency andequitable allocation. The overall economic allocation objective of the ITQ policy was to maximise the neteconomic return to the nation (Annala 1996). On the other hand, the objectives of the initial allocation processwere to ensure that entitlements were equitably based on fishermen’s commitment to the industry at that time,and to financially assist the harvesting sector to restructure its operations to achieve the overall economicallocation objective.
At the operational level the objectives for the allocation process boiled down to putting in place the ITQsystem while maintaining and enhancing the support of fishers. This was constrained by a requirement for catchreductions in what were believed to be threatened inshore stocks and a limited budget for compensation.
3.2 Process used in determining the allocation method
The management planning structure and process mandated in the Fisheries Act 1983 established aframework for Ministry consultation with the industry and other interest groups at the regional (FMP) level. Thiscomprised a network of local Port Liaison Committees and regional Fishery Management Advisory Committees(FMACs) to work with MAF staff in each regional centre to build the fisheries plans. In addition, a NationalFisheries Management Advisory Committee (NAFMAC) was established to advise on national policies, with
New Zealand Fisheries 232
representation from all industry sectors including processors, fishers, share-fishers, the New Zealand FishingIndustry Board (FIB) and government.
The NAFMAC, supported by MAF and FIB staff, reviewed the state of the inshore fisheries and released adetailed discussion document in August 1983 (NAFMAC 1983). This set out an analysis of the problems – over-exploitation of stocks and overcapitalisation, and supplied a detailed account of the state of the fisheries, dividedinto 14 regions, of industry structure, and proposed a range of policy alternatives including ITQs.
In September twelve Port Liaison consultative meetings were held by the NAFMAC around the country fordiscussion of the review. Some 1500 people including 900 full-time fishers attended these meetings. Discussionrevolved around: MAF resource yield estimates and the degree of their correspondence with fisher perceptions;a means of immediate effort reduction including removal of part-timers fisheries and cancellation of ‘sleeperpermits’ and unused method endorsements; and long-term management policies. There was general consensuson the need to stop inshore effort expanding, and that the moratorium on permits and further speciesendorsements of existing permits should be maintained. Fishers viewed ITQs as having merit but were scepticalof the ability of the Ministry to monitor compliance with such a system, and feared increased dominance of largecompanies through concentration of quota ownership (Cooper 1983). At this stage quotas were one of a rangeof options being considered, all of which were viewed as potentially working within the FMP framework.Following these discussions with industry and further review by MAF and FIB staff, the NAFMAC made theirreport to the Minister of Fisheries in late 1983 (Belgrave 1983).
The NAFMAC documents included both interim and long-run yield estimates (prospective TAC levels)produced by the Ministry for inshore species. The interim estimates represented major reductions for somespecies of high economic importance thought to be over-fished. MAF scientists reviewed the figures again inApril 1984. This review attempted to define natural stock boundaries for the quota system, and attempted toseparate the issues of long-term sustainable yield, from the management problem of how to get there by settinglower interim TACs (McKoy 1986). Two further reviews were carried out in March 1985 and 1986 before finalTACs were set. These assessment reviews were the precursors to the annual stock assessment rounds later carriedout by the Ministry as part of the QMS.
In the meantime, the New Zealand Government was heading for a fiscal crisis, culminating with PrimeMinister Muldoon calling a snap election in July 1984. Policy decision-making had gone into recess to thefrustration of the fishing industry (Martin 1984). However, the Government changed with the election. The newCabinet had a reformist economic agenda and accepted the policy recommendations of MAF and NAFMACquickly, publishing a proposal in September 1984 setting out policy for the quota management system, more orless in the form it would be implemented two years later (MAF 1984). Consultation meetings with industrycontinued. A two-month tour by several teams of MAF and FIB staff in early 1985 put the proposals tocommercial fishers through a country-wide series of some 65 public meetings (Muse and Schelle 1988). Two“mini-summit” meetings were held between industry leaders and the Minister of Fisheries, and the Federation ofCommercial Fishermen conducted a referendum of all licensed fishers in March 1985 before approving the policyin principle (Anon. 1985). Final proposals were aired at an industry conference, before Cabinet approved thequota system policies in May 1985 including the allocation process.
Conspicuously absent from the process to this point was effective consultation with Maori. Although Maorihad mandated representation within the FMP liaison network, no systematic attempt was made to consult withestablished Maori decision making and information networks by, for example, seeking MAF representation. Atwo-day National Fisheries Hui (meeting) – Te Runanga a Tangaroa – was held in October 1985, well afterdecisions were finalised, but this did not directly address commercial fishing issues or the quota system. Maorifisheries interests were conceived generally as non-commercial “traditional” fishing along with cultural andspiritual values. They were therefore not seen by the Government as in conflict with the incipient QMS (e.g. thespeech by Ken Shirley MP, reported in Cooper 1987:17).
3.3 Allocation method chosen
The basic principle of both allocation schemes was that quota entitlements should reflect establishedcommitment to the fishery. For the deep-water fishery in 1983, catch levels were combined with the companies’degree of investment in on-shore processing, employment and fishing capital to determine commitment.Allocations of quota were only to be made where this commitment would provide at least 2000t per company.The smaller operators were allowed to combine into consortia to achieve this level and attract allocations. Theremaining smaller participants were to continue to fish under competitive TACs comprising more than the sumof their historical catches, to allow for further development by these operators. Investment in vessels wasassessed separately for mid-depth and deep-water quotas, with vessels less than 30m in length excluded from theassessment for deep-water species such as orange roughy, as they are unable to fish at the required depths (Museand Schelle 1988).
233 Connor
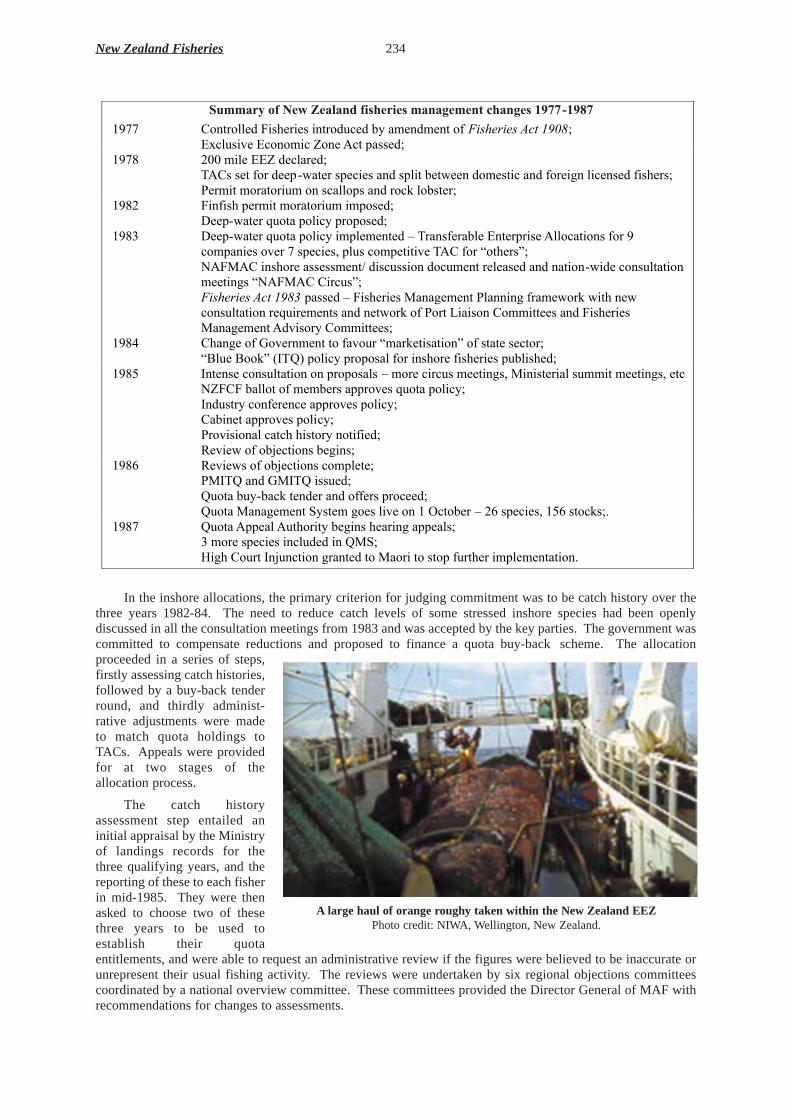
In the inshore allocations, the primary criterion for judging commitment was to be catch history over thethree years 1982-84. The need to reduce catch levels of some stressed inshore species had been openlydiscussed in all the consultation meetings from 1983 and was accepted by the key parties. The government wascommitted to compensate reductions and proposed to finance a quota buy-back scheme. The allocation proceeded in a series of steps,firstly assessing catch histories,followed by a buy-back tenderround, and thirdly administ-rative adjustments were madeto match quota holdings toTACs. Appeals were providedfor at two stages of theallocation process.
The catch historyassessment step entailed aninitial appraisal by the Ministryof landings records for thethree qualifying years, and thereporting of these to each fisherin mid-1985. They were thenasked to choose two of thesethree years to be used toestablish their quotaentitlements, and were able to request an administrative review if the figures were believed to be inaccurate orunrepresent their usual fishing activity. The reviews were undertaken by six regional objections committeescoordinated by a national overview committee. These committees provided the Director General of MAF withrecommendations for changes to assessments.
New Zealand Fisheries 234
!"##$%&'()'*+,'-+$.$/0')123+%1+2'#$/$4+#+/5'63$/4+2'7899:78;9!
!"#$$! %&'()&**+,!-./0+).+/!.'()&,12+,!34!56+',6+'(!&7!!"#$%&"%#'()*'+,-.8!9:2*1/.;+!92&'&6.2!<&'+!=2(!>5//+,8 !
!"#$?! @AA!6.*+!99<!,+2*5)+,8!B=%/!/+(!7&)!,++>CD5(+)!/>+2.+/!5',!/>*.(!3+(D++'!,&6+/(.2!5',!7&)+.E'!*.2+'/+,!7./0+)/8!F+)6.(!6&)5(&).16!&'!/25**&>/!5',!)&2G!*&3/(+)8!
!"#?@! -.'7./0!>+)6.(!6&)5(&).16!.6>&/+,8!H++>CD5(+)!I1&(5!>&*.24!>)&>&/+,8!
!"#?J! H++>CD5(+)!I1&(5!>&*.24!.6>*+6+'(+,!K!B)5'/7+)53*+!9'(+)>)./+!=**&25(.&'/!7&)!#!2&6>5'.+/!&;+)!$!/>+2.+/L!>*1/!2&6>+(.(.;+!B=%!7&)!M&(0+)/N8 !O=-P=%!.'/0&)+!5//+//6+'(Q!,./21//.&'!,&216+'(!)+*+5/+,!5',!'5(.&'CD.,+!2&'/1*(5(.&'!6++(.'E/!MO=-P=%!%.)21/N8!!"#$%&"%#'()*'+,./!>5//+,!K!-./0+).+/!P5'5E+6+'(!F*5''.'E!7)56+D&)G!D.(0!'+D!2&'/1*(5(.&'!)+I1.)+6+'(/!5',!'+(D&)G!&7!F&)(!R.5./&'!%&66.((++/!5',!-./0+).+/!P5'5E+6+'(!=,;./&)4!%&66.((++/8!
!"#?S! %05'E+!&7!T&;+)'6+'(!(&!75;&1)!M65)G+(./5(.&'N!&7!/(5(+!/+2(&)8!MU*1+!U&&GN!VWBXY!>&*.24!>)&>&/5*!7&)!.'/0&)+!7./0+).+/!>13*./0+,8!
!"#?Z! W'(+'/+!2&'/1*(5(.&'!&'!>)&>&/5*/!K!6&)+!2.)21/!6++(.'E/L!P.'./(+).5*!/166.(!6++(.'E/L!+(2[!O<-%-!35**&(!&7!6+63+)/!5>>)&;+/!I1&(5!>&*.248!W',1/()4!2&'7+)+'2+!5>>)&;+/!>&*.248!%53.'+(!5>>)&;+/!>&*.248!F)&;./.&'5*!25(20!0./(&)4!'&(.7.+,8!\+;.+D!&7!&3]+2(.&'/!3+E.'/8!
!"#?^! \+;.+D/!&7!&3]+2(.&'/!2&6>*+(+8!FPWBX!5',!TPWBX!.//1+,8!X1&(5!314C352G!(+',+)!5',!&77+)/!>)&2++,8!X1&(5!P5'5E+6+'(!_4/(+6!E&+/!*.;+!&'!"!`2(&3+)!K!@^!/>+2.+/L!"Z^!/(&2G/8[!
!"#?$! X1&(5!=>>+5*!=1(0&).(4!3+E.'/!0+5).'E!5>>+5*/8 !J!6&)+!/>+2.+/!.'2*1,+,!.'!XP_8!a.E0!%&1)(!W']1'2(.&'!E)5'(+,!(&!P5&).!(&!/(&>!71)(0+)!.6>*+6+'(5(.&'[ !
A large haul of orange roughy taken within the New Zealand EEZPhoto credit: NIWA, Wellington, New Zealand.
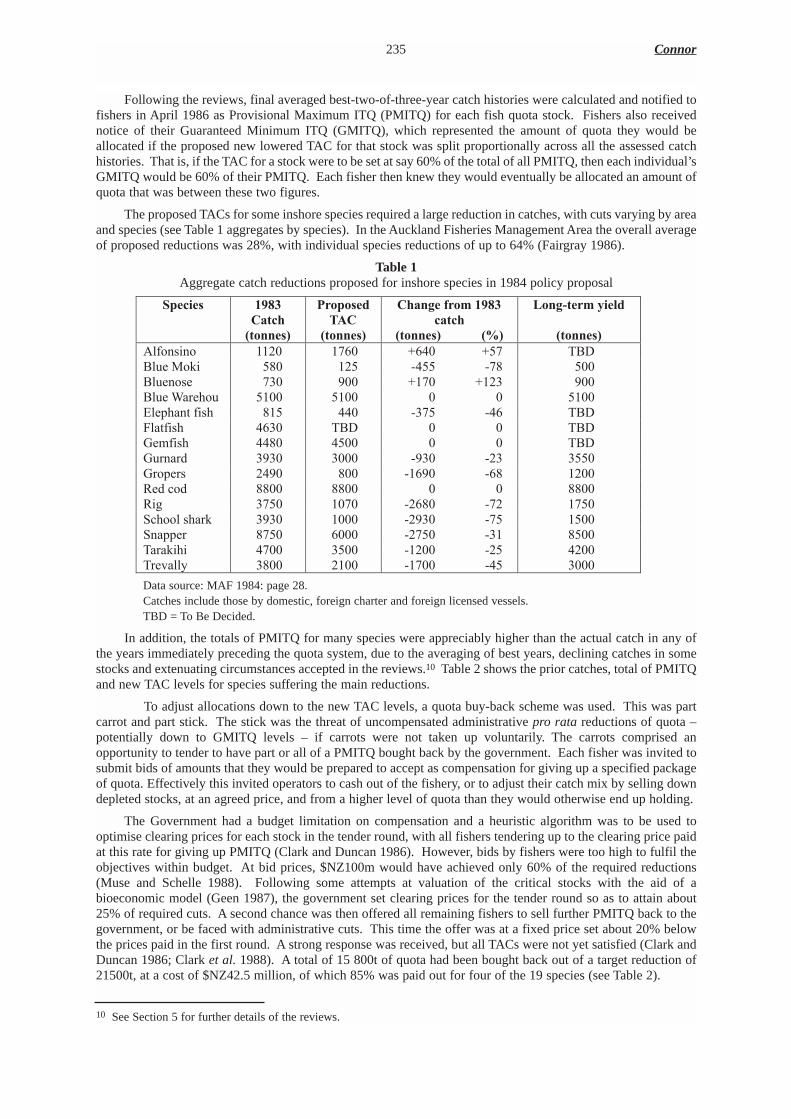
Following the reviews, final averaged best-two-of-three-year catch histories were calculated and notified tofishers in April 1986 as Provisional Maximum ITQ (PMITQ) for each fish quota stock. Fishers also receivednotice of their Guaranteed Minimum ITQ (GMITQ), which represented the amount of quota they would beallocated if the proposed new lowered TAC for that stock was split proportionally across all the assessed catchhistories. That is, if the TAC for a stock were to be set at say 60% of the total of all PMITQ, then each individual’sGMITQ would be 60% of their PMITQ. Each fisher then knew they would eventually be allocated an amount ofquota that was between these two figures.
The proposed TACs for some inshore species required a large reduction in catches, with cuts varying by areaand species (see Table 1 aggregates by species). In the Auckland Fisheries Management Area the overall averageof proposed reductions was 28%, with individual species reductions of up to 64% (Fairgray 1986).
Table 1Aggregate catch reductions proposed for inshore species in 1984 policy proposal
Data source: MAF 1984: page 28.Catches include those by domestic, foreign charter and foreign licensed vessels.TBD = To Be Decided.
In addition, the totals of PMITQ for many species were appreciably higher than the actual catch in any ofthe years immediately preceding the quota system, due to the averaging of best years, declining catches in somestocks and extenuating circumstances accepted in the reviews.10 Table 2 shows the prior catches, total of PMITQand new TAC levels for species suffering the main reductions.
To adjust allocations down to the new TAC levels, a quota buy-back scheme was used. This was partcarrot and part stick. The stick was the threat of uncompensated administrative pro rata reductions of quota –potentially down to GMITQ levels – if carrots were not taken up voluntarily. The carrots comprised anopportunity to tender to have part or all of a PMITQ bought back by the government. Each fisher was invited tosubmit bids of amounts that they would be prepared to accept as compensation for giving up a specified packageof quota. Effectively this invited operators to cash out of the fishery, or to adjust their catch mix by selling downdepleted stocks, at an agreed price, and from a higher level of quota than they would otherwise end up holding.
The Government had a budget limitation on compensation and a heuristic algorithm was to be used tooptimise clearing prices for each stock in the tender round, with all fishers tendering up to the clearing price paidat this rate for giving up PMITQ (Clark and Duncan 1986). However, bids by fishers were too high to fulfil theobjectives within budget. At bid prices, $NZ100m would have achieved only 60% of the required reductions(Muse and Schelle 1988). Following some attempts at valuation of the critical stocks with the aid of abioeconomic model (Geen 1987), the government set clearing prices for the tender round so as to attain about25% of required cuts. A second chance was then offered all remaining fishers to sell further PMITQ back to thegovernment, or be faced with administrative cuts. This time the offer was at a fixed price set about 20% belowthe prices paid in the first round. A strong response was received, but all TACs were not yet satisfied (Clark andDuncan 1986; Clark et al. 1988). A total of 15 800t of quota had been bought back out of a target reduction of21500t, at a cost of $NZ42.5 million, of which 85% was paid out for four of the 19 species (see Table 2).
235 Connor
!<+61+2' 78;='>$563'?5(//+2@'
A%(<(2+0'BC>'?5(//+2@'
>3$/4+')%(#'78;='6$563'
?5(//+2@' ''''''?D@'
E(/4:5+%#'&1+.0'''
?5(//+2@'=*7&'/.'&! ""@A ! "$^A ! b^SA! bZ$ ! ! BUH !U*1+!P&G.! Z?A ! "@Z ! CSZZ! C$? ! ! ZAA !U*1+'&/+! $JA ! #AA ! b"$A! b"@J ! ! #AA !U*1+!c5)+0&1 ! Z"AA ! Z"AA ! A! A ! ! Z"AA !9*+>05'(!7./0! ?"Z ! SSA ! CJ$Z! CS^ ! ! BUH !-*5(7./0! S^JA ! BUH ! A! A ! ! BUH !T+67./0! SS?A ! SZAA ! A! A ! ! BUH !T1)'5),! J#JA ! JAAA ! C#JA! C@J ! ! JZZA !T)&>+)/! @S#A ! ?AA ! C"^#A! C^? ! ! "@AA !\+,!2&,! ??AA ! ??AA ! A! A ! ! ??AA !\.E! J$ZA ! "A$A ! C@^?A! C$@ ! ! "$ZA !_20&&*!/05)G! J#JA ! "AAA ! C@#JA! C$Z ! ! "ZAA !_'5>>+)! ?$ZA ! ^AAA ! C@$ZA! CJ" ! ! ?ZAA !B5)5G.0.! S$AA ! JZAA ! C"@AA! C@Z ! ! S@AA !B)+;5**4! J?AA ! @"AA ! C"$AA! CSZ ! ! JAAA !
10 See Section 5 for further details of the reviews.

ALLOCA TION OF INDIVIDUAL VESSEL QUOTA IN THE ALASKAN PACIFIC HALIBUTAND SABLEFISH FISHERIES
M. Hartley and M. FinaNorthern Economics
880 ‘H’ Street, Suite 210Anchorage, AK 99501, U.S.A.
1. INTRODUCTION
In 1995 the federally-managed commercial longline fisheries for Pacific halibut (Hippoglossus stenolepis)and sablefish (Anoplopoma fimbria) in the U.S. North Pacific moved from open-access management with limitson the Total Allowable Catch (TAC), to management systems with individual fishing quotas (IFQs). At that time,the halibut fisheries had the greatest number of participants of any fishery managed with individual quotas. Thisis the first of two papers that examine the IFQ system in the U.S. North Pacific halibut and sablefish fisheries.This paper discusses the circumstances leading up to the IFQ programme, the development of the IFQprogramme, and the initial allocation of interests in the fisheries under the programme. The second paper (Hartleyand Fina 2001) provides a more quantitative examination of effects of the IFQ programme, includingparticipation levels, fleet consolidation, and other changes that have resulted from the programmes.
The transition from open-access to IFQs was a long, arduous process marked by periods of progress,followed by periods of retreat, eventually leading to approval and implementation of an effective programme. Asone might expect, the division of interests in a fishery after several years of open-access management is highlycontroversial. To develop an understanding of the subtleties of the IFQ programme, it is necessary follow a pathsimilar to the path of the IFQ policymakers — taking several steps forward, then stepping back for a freshperspective. The complexities of the open-access and IFQ management regimes and the, at times, conflictinggoals and objectives of the involved policymakers complicate the task of describing programme processes andresults. To aid readers in keeping important contextual information in mind as new concepts or data areintroduced, this document is repetitive at times.
Figure 1Pacific halibut fishery regulatory areas
(Source: International Pacific Halibut Commission)
251

2. BACKGROUND – THE PRE-IFQ FISHERY2.1 A brief history of the halibut fishery
Alaska halibut and sablefish fisheries are regulated by similar IFQ programmes that were developed by asingle process. The fisheries differ both historically and in the manner of prosecution but, in general, have a highdegree of similarity. This section describes the two fisheries before IFQ programme implementation.
Halibut are fished exclusivelywith hook-and-line gear.1 Becausehalibut can be harvested in waters asshallow as 90 feet, the fishery cangenerally be prosecuted close to shorein small boats, including skiffs.Before settlement of the PacificNorthwest by Europeans, NativeAmericans fished for halibut withlarge canoes using hook-and-linemethods (IPHC 1987).
The Pacific halibut fisherydeveloped into a commercial fisheryin Washington and British Columbiain the 1880s by fishers who fishedfrom dories, which were transportedby larger vessels to and from halibutfishing grounds. In the 1920s, thefishery changed substantially with theintroduction of diesel-poweredvessels and mechanical longline gearand expanded to the Gulf of Alaska.Stock declines in the 1920s promptedthe first regulation of harvests, a three-month closing intended to protectspawning. Regulation was institutedby the Halibut Convention of 1923between the U.S. and Canada, thesame convention that established theInternational Fisheries Commission,the predecessor to the IPHC, whichcurrently provides biologicalmanagement of the Pacific halibutfishery (IPHC 1987).
As early as the 1930s, thefishery was developing as a part-timefishery and a substitute fishery forvessels that participated in otherfisheries. Vessels with trawls andpurse seines were adapted to fishhalibut with longlines. During the 1930s and 1940s, several small salmon trollers and gillnetters entered thefishery, targeting halibut during slow salmon seasons. By the 1960s, halibut stocks were thought to be in decline,prompting the IPHC to lower catch limits. In the 1970s, increases in the price of halibut, together withimplementation of limited entry programmes in the salmon fisheries, stimulated greater entry of small vesselsto the halibut fishery. During the 1980s, the fishery experienced an influx of many larger vessels from crabfisheries as crab stocks declined (IPHC 1987). The obvious implication from this history is that, for much of itsexistence, the commercial Pacific halibut fishery has been a supplemental fishery, attracting vessels from otherfisheries during slow seasons or periods of stock declines. The attractiveness of the fishery as a supplemental
Alaska Halibut and Sablefish 252
Typical Pacific halibut longlining fishing vessel(Credit: International Pacific Halibut Commission)
1 The halibut fishery is primarily a longline fishery, but other hook-and-line methods are used.
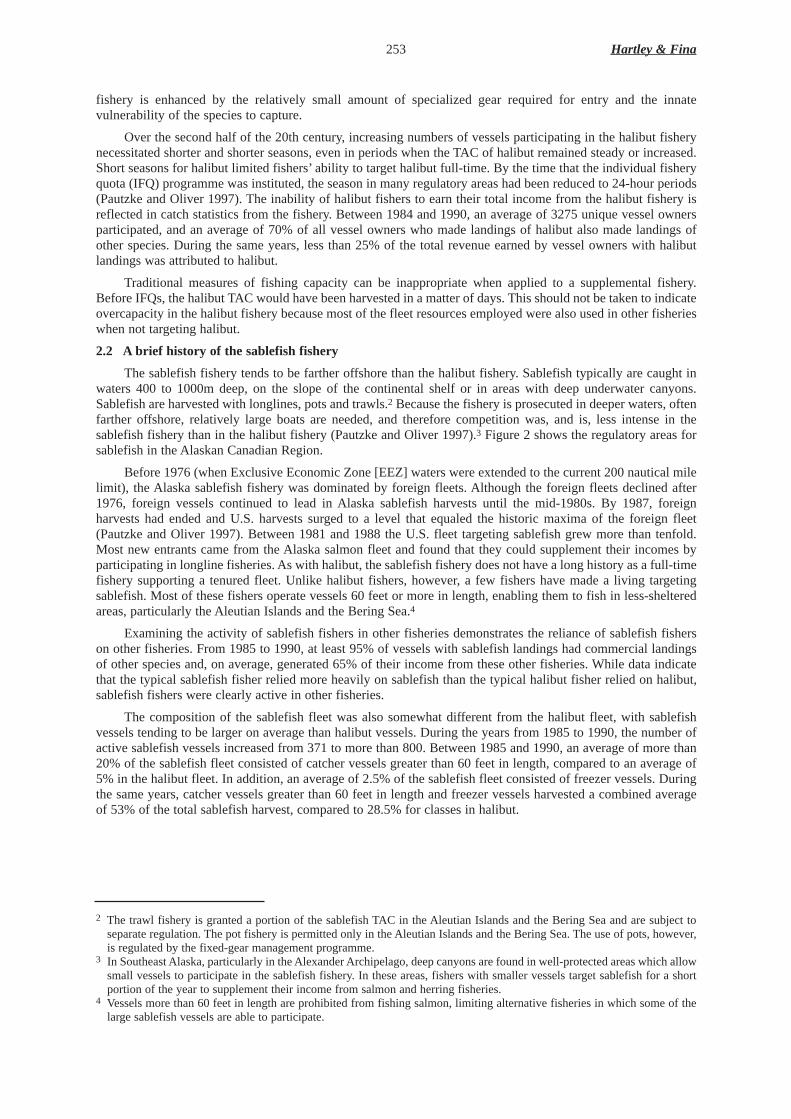
fishery is enhanced by the relatively small amount of specialized gear required for entry and the innatevulnerability of the species to capture.
Over the second half of the 20th century, increasing numbers of vessels participating in the halibut fisherynecessitated shorter and shorter seasons, even in periods when the TAC of halibut remained steady or increased.Short seasons for halibut limited fishers’ability to target halibut full-time. By the time that the individual fisheryquota (IFQ) programme was instituted, the season in many regulatory areas had been reduced to 24-hour periods(Pautzke and Oliver 1997). The inability of halibut fishers to earn their total income from the halibut fishery isreflected in catch statistics from the fishery. Between 1984 and 1990, an average of 3275 unique vessel ownersparticipated, and an average of 70% of all vessel owners who made landings of halibut also made landings ofother species. During the same years, less than 25% of the total revenue earned by vessel owners with halibutlandings was attributed to halibut.
Traditional measures of fishing capacity can be inappropriate when applied to a supplemental fishery.Before IFQs, the halibut TAC would have been harvested in a matter of days. This should not be taken to indicateovercapacity in the halibut fishery because most of the fleet resources employed were also used in other fisherieswhen not targeting halibut.
2.2 A brief histor y of the sablefish fishery
The sablefish fishery tends to be farther offshore than the halibut fishery. Sablefish typically are caught inwaters 400 to 1000m deep, on the slope of the continental shelf or in areas with deep underwater canyons.Sablefish are harvested with longlines, pots and trawls.2 Because the fishery is prosecuted in deeper waters, oftenfarther offshore, relatively large boats are needed, and therefore competition was, and is, less intense in thesablefish fishery than in the halibut fishery (Pautzke and Oliver 1997).3 Figure 2 shows the regulatory areas forsablefish in the Alaskan Canadian Region.
Before 1976 (when Exclusive Economic Zone [EEZ] waters were extended to the current 200 nautical milelimit), the Alaska sablefish fishery was dominated by foreign fleets. Although the foreign fleets declined after1976, foreign vessels continued to lead in Alaska sablefish harvests until the mid-1980s. By 1987, foreignharvests had ended and U.S. harvests surged to a level that equaled the historic maxima of the foreign fleet(Pautzke and Oliver 1997). Between 1981 and 1988 the U.S. fleet targeting sablefish grew more than tenfold.Most new entrants came from the Alaska salmon fleet and found that they could supplement their incomes byparticipating in longline fisheries. As with halibut, the sablefish fishery does not have a long history as a full-timefishery supporting a tenured fleet. Unlike halibut fishers, however, a few fishers have made a living targetingsablefish. Most of these fishers operate vessels 60 feet or more in length, enabling them to fish in less-shelteredareas, particularly the Aleutian Islands and the Bering Sea.4
Examining the activity of sablefish fishers in other fisheries demonstrates the reliance of sablefish fisherson other fisheries. From 1985 to 1990, at least 95% of vessels with sablefish landings had commercial landingsof other species and, on average, generated 65% of their income from these other fisheries. While data indicatethat the typical sablefish fisher relied more heavily on sablefish than the typical halibut fisher relied on halibut,sablefish fishers were clearly active in other fisheries.
The composition of the sablefish fleet was also somewhat different from the halibut fleet, with sablefishvessels tending to be larger on average than halibut vessels. During the years from 1985 to 1990, the number ofactive sablefish vessels increased from 371 to more than 800. Between 1985 and 1990, an average of more than20% of the sablefish fleet consisted of catcher vessels greater than 60 feet in length, compared to an average of5% in the halibut fleet. In addition, an average of 2.5% of the sablefish fleet consisted of freezer vessels. Duringthe same years, catcher vessels greater than 60 feet in length and freezer vessels harvested a combined averageof 53% of the total sablefish harvest, compared to 28.5% for classes in halibut.
253 Hartley & Fina
2 The trawl fishery is granted a portion of the sablefish TAC in the Aleutian Islands and the Bering Sea and are subject toseparate regulation. The pot fishery is permitted only in the Aleutian Islands and the Bering Sea. The use of pots, however,is regulated by the fixed-gear management programme.
3 In Southeast Alaska, particularly in the Alexander Archipelago, deep canyons are found in well-protected areas which allowsmall vessels to participate in the sablefish fishery. In these areas, fishers with smaller vessels target sablefish for a shortportion of the year to supplement their income from salmon and herring fisheries.
4 Vessels more than 60 feet in length are prohibited from fishing salmon, limiting alternative fisheries in which some of thelarge sablefish vessels are able to participate.

Figure 2Sablefish regulatory areas
2.3 Halibut and sablefish fisheries management 2.3.1 Management institutions
In 1976 the Fishery Conservation and Management Act (now known as the Magnuson-Stevens FisheryConservation Act) established the current management regime for fisheries in U.S. EEZ waters (waters between3 and 200nm of the coast). The regime described in the Act called for creation of the North Pacific FisheriesManagement Council (NPFMC)5 which has the mandate to make management recommendations to the U.S.Secretary of Commerce. Measures approved by the Secretary become binding regulations that are implementedby the National Marine Fisheries Service (NMFS).6 Management of sablefish and halibut fixed-gear fisheries inEEZ waters is conducted by this regime.7 While both fisheries are managed by NMFS and NPFMC, halibut TACsare determined by the IPHC, a commission created by a treaty between the U.S. and Canada to coordinateregulation of the North American Pacific halibut fishery (Pautzke and Oliver 1997).
Alaska Halibut and Sablefish 254
5 The NPFMC is composed of a panel of 11 voting members (six from Alaska, four from Washington, and one from Oregon)and four non-voting members. Voting members represent the fishing industry, fish processors, and federal, state and localagencies (Pautzke and Oliver 1997).
6 NMFS is an agency of the National Oceanic and Atmospheric Administration (NOAA) under the U.S. Department ofCommerce.
7 Since its creation, NPFMC has had jurisdiction of sablefish. Halibut came under its jurisdiction only after the resolution oftreaty issues with Canada in 1982. Halibut is managed jointly by NMFS and IPHC. In general, the IPHC is charged withmonitoring stocks and setting overall catch limits. Allocation of catch limits within the three separate jurisdictions (Alaska,British Columbia, and the Pacific U.S.) is handled by the respective agencies responsible for management in those areas.In Alaska, NMFS and NPFMC determine catch allocations. These agencies were responsible for developing the IFQprogramme.
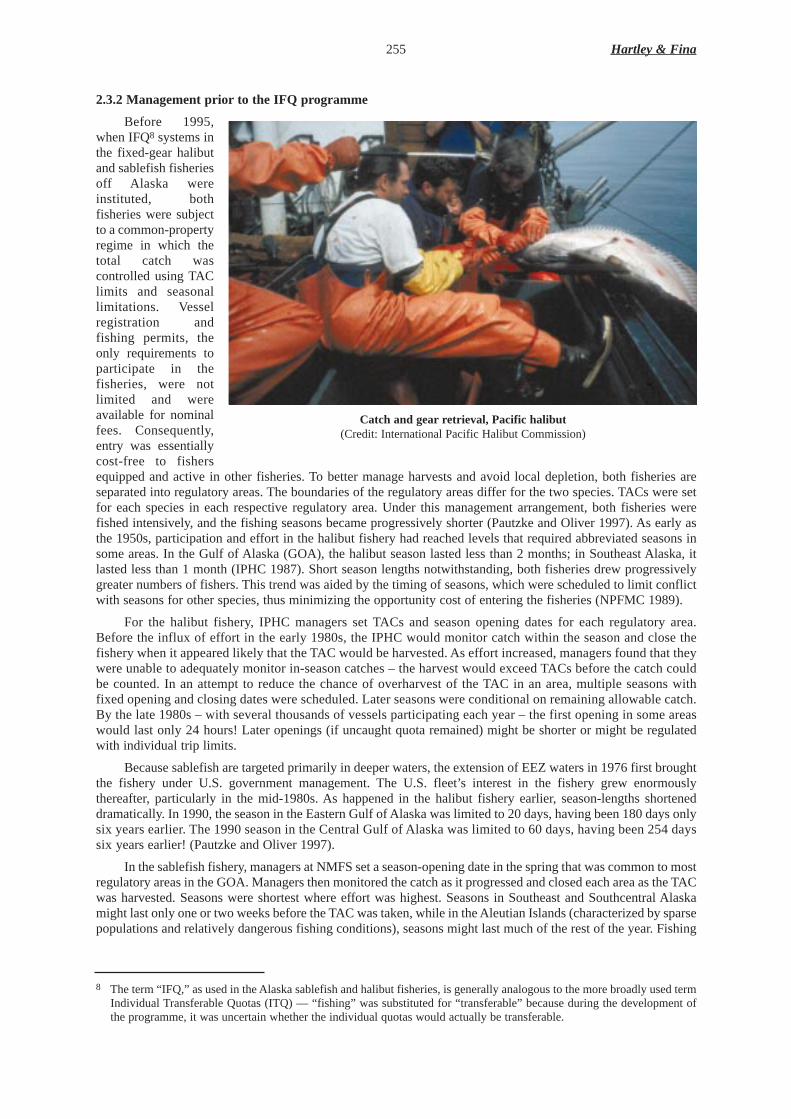
2.3.2 Management priorto the IFQ programme
Before 1995,when IFQ8 systems inthe fixed-gear halibutand sablefish fisheriesoff Alaska wereinstituted, bothfisheries were subjectto a common-propertyregime in which thetotal catch wascontrolled using TAClimits and seasonallimitations. Vesselregistration andfishing permits, theonly requirements toparticipate in thefisheries, were notlimited and wereavailable for nominalfees. Consequently,entry was essentiallycost-free to fishersequipped and active in other fisheries. To better manage harvests and avoid local depletion, both fisheries areseparated into regulatory areas. The boundaries of the regulatory areas differ for the two species. TACs were setfor each species in each respective regulatory area. Under this management arrangement, both fisheries werefished intensively, and the fishing seasons became progressively shorter (Pautzke and Oliver 1997). As early asthe 1950s, participation and effort in the halibut fishery had reached levels that required abbreviated seasons insome areas. In the Gulf of Alaska (GOA), the halibut season lasted less than 2 months; in Southeast Alaska, itlasted less than 1 month (IPHC 1987). Short season lengths notwithstanding, both fisheries drew progressivelygreater numbers of fishers. This trend was aided by the timing of seasons, which were scheduled to limit conflictwith seasons for other species, thus minimizing the opportunity cost of entering the fisheries (NPFMC 1989).
For the halibut fishery, IPHC managers set TACs and season opening dates for each regulatory area.Before the influx of effort in the early 1980s, the IPHC would monitor catch within the season and close thefishery when it appeared likely that the TAC would be harvested. As effort increased, managers found that theywere unable to adequately monitor in-season catches – the harvest would exceed TACs before the catch couldbe counted. In an attempt to reduce the chance of overharvest of the TAC in an area, multiple seasons withfixed opening and closing dates were scheduled. Later seasons were conditional on remaining allowable catch.By the late 1980s – with several thousands of vessels participating each year – the first opening in some areaswould last only 24 hours! Later openings (if uncaught quota remained) might be shorter or might be regulatedwith individual trip limits.
Because sablefish are targeted primarily in deeper waters, the extension of EEZ waters in 1976 first broughtthe fishery under U.S. government management. The U.S. fleet’s interest in the fishery grew enormouslythereafter, particularly in the mid-1980s. As happened in the halibut fishery earlier, season-lengths shorteneddramatically. In 1990, the season in the Eastern Gulf of Alaska was limited to 20 days, having been 180 days onlysix years earlier. The 1990 season in the Central Gulf of Alaska was limited to 60 days, having been 254 dayssix years earlier! (Pautzke and Oliver 1997).
In the sablefish fishery, managers at NMFS set a season-opening date in the spring that was common to mostregulatory areas in the GOA. Managers then monitored the catch as it progressed and closed each area as the TACwas harvested. Seasons were shortest where effort was highest. Seasons in Southeast and Southcentral Alaskamight last only one or two weeks before the TAC was taken, while in the Aleutian Islands (characterized by sparsepopulations and relatively dangerous fishing conditions), seasons might last much of the rest of the year. Fishing
255 Hartley & Fina
Catch and gearretrieval, Pacific halibut(Credit: International Pacific Halibut Commission)
8 The term “IFQ,” as used in the Alaska sablefish and halibut fisheries, is generally analogous to the more broadly used termIndividual Transferable Quotas (ITQ) — “fishing” was substituted for “transferable” because during the development ofthe programme, it was uncertain whether the individual quotas would actually be transferable.
effort generally flowed in a westerly direction from more populous and sheltered areas in Southeastern Alaskatoward less populous areas where sablefish were found in increasingly open seas. Owners of larger vessels oftenwould begin the year fishing in the Southeast when the season opened and fish there until the TAC was taken.They would then move westward into the Central Gulf until that fishery closed. This progression would continuewestward into the Western Gulf and finally into the Aleutians and the Bering Sea. Owners of smaller vessels(more likely to be residents of Alaska) would more typically start the year fishing in the areas nearest theirresidences until those areas closed. Larger vessels would move to other areas to fish sablefish; smaller vesselswould generally begin to prepare for summer salmon fisheries.
Regulation by TAC and season limitations had several shortcomings.
i. Safety was often compromised by fishers who would fish the short (sometimes single-day) season regardlessof weather. This problem was especially prominent in the halibut fishery in which many fishers use smallvessels, including skiffs (NMFS 1994).
ii. TAC management was imprecise. In the halibut fishery, seasonal limitations proved to be a crude tool forachieving a prescribed TAC. In short seasons, particularly those with only a single-day opening whichbecame characteristic in the halibut fishery, over-harvesting (or under-harvesting) could not be predicted,because individual fishers generally were permitted unlimited catch during the season.
iii. The fisheries had excess fishing capacity in the sense that the total TAC could be harvested faster than themanagement agency could monitor the catch (NMFS 1994). Further, as fishers entered fisheries and seasonswere shortened, fishers overequipped their vessels with redundant gear to limit downtime. By 1990, anestimated $3 million worth of gear was redundant in the halibut fishery (NPFMC 1992b).
iv. Gear losses were excessive. To maximize catch in the single-day season, fishers typically would set morelines than they could retrieve in the allowable time. Maximum revenues were realized by fishers who alwayshad a line to haul. At the end of the fishing period, fishers were prohibited from retrieving any additionalgear, so they would simply abandon all lines they had not retrieved.9 Gear losses were estimated to be up to25% of the gear set in some seasons (NPFMC 1992b).
v. Over-harvesting was compounded by losses resulting from abandoned gear. Abandoned gear contributedsubstantially to population declines because its contribution to fishing mortality was more persistent thanretrieved gear and might go through multiple cycles, as the first-caught fish would become bait for latercatch. In 1990 and 1991, ‘deadloss’was estimated at 2 million pounds and 2.5 million pounds, respectively.The ex-vessel value10 of the lost catch was estimated to be between $2.4 million and $4 million per year(NPFMC 1992b).
vi. Higher-value fresh fish would be available only for a brief time after the short season. Most of the fishcaught during short seasons was frozen for later use. Quality also suffered as the rush to maximize catch inthe short season led to poor handling and storage of some catch (NMFS 1994).
These problems were generally much more severe in the halibut fishery than in the sablefish fishery.Participants and managers of the sablefish fishery, however, could see that trends from the halibut fishery weredeveloping in the sablefish fishery. This was particularly true in Southeastern Alaska where a greater coastalpopulation had better access to sablefish because of the relatively sheltered waters in that area.
The IFQ programme was developed to address these problems. Industry and fishery managers alikerecognized the need for a change. The process of change proved to be long and controversial.
3. IFQ PROGRAMME DEVELOPMENT PROCESS
In the 1995 fishing season, after several years of in-depth social and economic analysis, discussion,negotiation, public meetings, comment periods, regulatory development, and implementation processes, the IFQprogramme was instituted in the halibut and sablefish fisheries. Development of IFQ programmes for sablefishand halibut cannot be separated. Throughout the process, attention and programme development shifted betweenthe two fisheries with changes in political pressures.
Problems developed first in the halibut fishery. In the late 1970s, NPFMC began considering limited entryoptions to protect the halibut fishery. By 1983 the severity of the threat to the fishery compelled the NPFMC to
Alaska Halibut and Sablefish 256
9 Abandoned gear could be retrieved with permission from the regulatory agencies after the season ended and all fish wereoffloaded. Any fish remaining on the gear that was retrieved had to be discarded at sea.
10 Ex-vessel value is the value of landed, raw fish delivered by a fisher.

recommend a moratorium on entry. The moratorium, however, was not approved by the Secretary of Commerce,who favored a more thorough limited-entry programme (Pautzke and Oliver 1997). This rejection of themoratorium slowed development of management strategies for the halibut fishery, and the NPFMC’s efforts todevelop a new management regime for halibut waned.
Development of the sablefish fishery lagged slightly behind that of the halibut fishery. Yet, as momentumto develop new management procedures for halibut declined, similar management issues arose in the smallersablefish fishery. In the mid-1980s, the NPFMC decided to focus on programme development in the sablefishfishery. By 1987 the short, intense seasons and gear conflicts in the sablefish fishery had begun to resemble thoseof the halibut fishery (NMFS 1995, Pautzke and Oliver 1997). In the same year, the NPFMC adopted acommitment to develop and analyze licence limitation and transferable quota systems for sablefish management.By 1988 workshops were held to obtain further input from the industry and public on management alternatives.In early 1988 the NPFMC directed its staff to develop and evaluate various different management regimes for thesablefish fishery, including continued open-access, licence limitations, the IFQ system, and hybrids thatintertwined these three different management systems. The environmental impact statement developed inpursuance of the resolution for the sablefish fishery was revised to include an IFQ management scheme and wasdistributed for public review in May 1991 (NMFS 1994).
Because many fishers had been active in both halibut and sablefish fisheries, the NPFMC decided to use thesablefish IFQ programme as a prototype for developing a similar programme in the larger halibut fishery. It wasbelieved that simultaneous implementation would decrease obstacles and reduce resistance to the programme inthe halibut fishery. In 1991, an environmental impact statement incorporating an IFQ programme was alsodeveloped for halibut, bringing management development for the two fisheries to an even plane (NMFS 1995).
In September 1991, the NPFMC provisionally recommended IFQ management for both the sablefish andhalibut fisheries. After an additional round of analysis and public comment the final recommendation of NPFMCwas issued late in 1992 and approved by the Secretary of Commerce in January 1993. Applications for initialallocations were collected and processed in 1994. Fishing under the IFQ management system began with theopening of the 1995 season in March of that year (NMFS 1995).
The NPFMC and the NMFS had developed the IFQ programme over the course of more than 15 years. Theyhad held numerous public meetings and considered several alternative management regimes and several differenttypes of allocation schemes before the IFQ programmes were approved and finally implemented in 1995.
4. THE IFQ PROGRAMME AND INITIAL ALLOCA TION4.1 Intr oduction
The IFQ system substantially changed rights in the fisheries. At the commencement of the programme, theNMFS issued quota shares (QS) to fishers for each regulatory area of each fishery. At the beginning of eachseason, the TAC for each regulatory area of each fishery is determined.11 The holder of quota shares is entitled toa portion of the annual TAC in the applicable regulatory area. This annual allotment is referred to as the fisher’sIFQ and is the weight12 of the fisher’s permitted catch for the year. The amount of IFQs is equal to the area TACmultiplied by the fisher’s quota shares, divided by the total quota shares issued in the area (the quota share pool).IFQs may be fished at any time during open season. Under the IFQ programme, an extended season, which beginsMarch 15 and ends November15, was established. Unused IFQ cannot be retained for use in a future year. Onthe other hand, recognizing that unintentional overages can occur, over-harvests of up to 10% of a fisher’s IFQare addressed by a reduction in the following year’s IFQ without penalty. Fishers with ‘overages’in excess of10% are subject to enforcement sanctions, including confiscation of harvests (NMFS 1995).
Holders of quota shares may sell their rights13. Several restrictions on the sale of quota shares were adoptedto avoid excessive consolidation and other changes in the character of the fishing fleet. Although the systemcreates a property right in the fishery, to avoid costly litigation in the event that the management programme ischanged, the programme does not create a permanent interest in the fishery. Quota shares remain valid
257 Hartley & Fina
11 The sablefish TAC is determined by the NPFMC, subject to approval by the Secretary of Commerce. The halibut TAC isdetermined by the IPHC.
12 Halibut traditionally have been landed in a headed-and-gutted form. Halibut TACs and IFQs are set in terms of headed-and-gutted weight. Sablefish TACs and IFQs are set in terms of round weight (NMFS 1995).
13 The right to sell IFQs (properly considered a lease of quota shares) was initially limited and, after 1997, was prohibitedfor shares designated for use on catcher vessels. The lease of quota shares is allowed on freezer vessels (NMFS 1995).

indefinitely; however, if the programme is discontinued, the quota shares holders will not be entitled tocompensation (NMFS 1995).
Fundamental to an IFQ programme is the initial issuance of quota shares in the fishery. Fishers who haveissued quota shares receive a right to harvest a predetermined fraction of the TAC. This initial allocationinfluences both the distribution of wealth among fishers and the character of the fishery. The importance of theinitial allocation did increase because of restrictions on transferability of quota shares. This section examinespolicy objectives of the initial allocation and the method by which the allocation was determined.
4.2 Policy objectives of the initial allocation of quota shares
Several key policy objectives guided the initial allocation of quota shares. Some of the major objectiveswere as follows:i. to preserve the character of the fleetii. to limit and discourage corporate ownership of the fisheriesiii. to reward active participants in the fisheriesiv. to reward long-time participants over relative newcomers to the fisheriesv. to reward those who invested in the fisheries by purchasing vessels, over those who simply worked in the
fisheries as crewvi. to limit windfalls to fishers receiving quota shares, regardless of federal policies precluding any charge for
quota shares distributed in the initial allocation andvii. to discourage speculative entry into the fishery.
The initial allocation recommended by the NPFMC embodied these objectives, specifically the overridingtheme of preserving the size and character of the fleet (NMFS 1994). Rewarding current participants with quotashares served this objective. By 1990 it was apparent that, in the future, entry to the fishery would need to belimited in some manner. Consequently, the NPFMC decided that activity after 1990 would not be used indetermining the initial allocation of quota shares to prevent fishers from entering the fishery simply to obtainquota shares, in essence, gaining a property right in the fishery (NMFS 1995, Pautzke and Oliver 1997).
At the time of programme development, the Magnuson-Stevens Act prohibited any charge on issuance ofquota shares. The absence of a charge had the added effects of helping to meet the objective of preserving fleetcharacter and avoiding opposition to the programme. Requiring payment for the initial allocation might haveexcluded some traditional participants from the fleet simply because of their inability to afford quota shares. Saleof the initial allocation might have allowed corporations, banks, or owners of large industrial vessels, to purchasea large part of the initial allocation. Not charging for quota shares, however, created potential windfalls profits toquota recipients.
To limit the windfall gains, the NPFMC used a broad, inclusive policy that provided an initial allocation tomany more fishers than had participated in any given year. The programme issued quota shares to all vesselowners active in the fisheries from 1988 through 1990. Eligible fishers received quota shares equal to theirharvests over an even longer period — for halibut, vessel owners were allowed to submit the best records for 5of the past 7 years back to 1984; for sablefish, vessel owners used the best 5 of 6 years back to 1985.14
An ancillary goal of the broad-based initial allocation was to allow fishers to determine the extent of theiractivity in the fishery. Fishers could choose to exit the fishery by selling quota shares, increase activity in thefishery by purchasing additional quota shares or IFQs, or simply fish their initial allocations. With a broad-basedallocation of initial shares, market conditions would be more likely to determine activity in the fishery.
One limiting factor in the initial allocation was that only vessel owners and fishers leasing vessels wereallocated quota shares. Crews were not granted shares (NMFS 1994). The objective of this rule was to rewardboat owners, who had invested in the fisheries. Operators who could demonstrate a leasehold interest in vesselswere also thought to have invested sufficiently in the fishery to entitle them to quota shares.15 Omittingcrewmembers from the initial allocation also made the process workable. Further, unlike the case for data for vesselsand vessel owners, no official data were available to verify past participation of crewmembers in the fishery.
Alaska Halibut and Sablefish 258
14 Part of the rationale for considering several years was to avoid excluding from the fisheries fishers that typicallyparticipated but could not participate for a year or two due to illness or other uncontrollable circumstances (NMFS 1994,Pautzke and Oliver 1997).
15 Records such as licence purchase, tax records showing deductions of lease and crew payments, and other similardocuments could be used to show that a vessel was being operated under a lease.
A few adjustments were made to quota shares allocations in determining the final issuance. In regulatoryareas in the Aleutian Islands and Bering Sea, the allocations were reduced to develop a Community DevelopmentQuota (CDQ) programme. The CDQ programme was designed to assist area communities by allocating themportions of the TAC. Historically, these communities have reaped little reward from the fisheries because of a lackof economic capital. By allocating portions of the TAC to the communities, it was hoped that they would becomeactive participants in the fisheries. Fishers who had been denied quota shares to accommodate the CDQprogramme were granted a proportional amount of quota shares in regulatory areas that did not have CDQprogrammes, and there were proportional decreases in the quota shares of all other fishers in those areas (NMFS1994).
While a major policy objective in the initial issuance was to reward active fishers, the NPFMC also soughtto minimize complaints. This goal was pursued by using a cost-free, broad-based system for issuing quota sharesand by developing the initial allocation rules through a public process.
4.3 Method of initial allocation
The initial allocation of quota shares was based on the historical activity in the fisheries. Vessel owners16
with any landings of halibut or sablefish in 1988, 1989 or 1990 were eligible to receive quota shares for theapplicable fishery. For halibut, one quota share was issued for each pound of halibut landings in the fisher’s bestfive of the seven years from 1984 to 1990 inclusive. Similarly, for sablefish, a fisher’s quota share allocationequaled the fisher’s total pounds of sablefish landings in the best five of the six years from 1985 to 1990 inclusive.The decision to use multiple years to determine eligibility and quota shares allotments was made to accommodatefishers who had been unable to fish for one or more years because of unexpected circumstances, such as illnessor the Exxon Valdezoil spill.17 Because quota shares entitle the holder to a portion of the annual TAC, the systemallows annual management of total harvest levels without re-issuing quota shares (NMFS 1994, NMFS 1995).
4.4 Implementation of the initial allocation
Once the policy decisions had been made, the job of implementing the programme (including the initialallocation) was turned over to the NMFS. The NMFS developed a separate division, the Restricted AccessManagement (RAM) Division, to administer the programme, including the initial allocation. At onset, this RAMoffice staff comprised nine persons, two transferred from other divisions of the NMFS, and seven newly hired.The office was understaffed during initial allocation and has since grown to 18 persons. The growth is attributableto fulfillment of staff requirements, expansion of duties outside the IFQ programme, and replacement of contractconsultants with in-house employees. Currently, IFQ programme management comprises 80% of RAM duties(Gharrett 2000).
Substantial funding was required at the outset — an estimated $2 million was spent initiating the IFQprogramme. Changes as the programme was developed required significant expenditures in the first few years,but in the past few years, spending has leveled. The budget for the RAM office in fiscal year 2000, $1.1 millionfor IFQ programmes, is a reasonable estimate of yearly administration costs (Gharrett 2000). An additional $2.3million is spent on enforcement of the IFQ each year, or approximately 1.8% of the total ex-vessel value (Smith2001).
The programme was initially funded through direct budgeting from the NMFS. Beginning in the 2001season, a cost-recovery fee programme will be implemented, which is expected to cover the majority of the costsof programme administration. The cost-recovery programme permits RAM to charge fishers a fee of up to 3% ofthe ex-vessel value of IFQ landings. Total fee collections cannot exceed the annual cost of programmemanagement and enforcement. Programme management and enforcement may not be fully funded by the cost-recovery programme because 25% of the fees collected is set aside to fund a loan programme for fishers wishingto enter IFQ fisheries, and owners of small vessels wishing to increase their quota shares (NMFS 2000a).
259 Hartley & Fina
16 “Vessel owners” includes fishers operating a vessel under lease. Partners and corporations were also eligible for quotashares. Former owners of dissolved partnerships and corporations were entitled to quota shares proportional to theirinterest in the venture.
17 The decision to use multiple-year qualification criteria also eliminated the need to allow appeals based on hardships.Fishers that had been unable to participate for three consecutive years in the fishery were deemed not to be activeparticipants.
Development of the cost-recovery programme has added substantially to this year’s budget for the RAM office(Gharrett 2000).18
Because the initial allocations were based simply on historical landings and vessel ownership in the twofisheries, the allocation was, for the most part, a largely book-keeping exercise. To determine eligibility for quotashares, the NMFS required a record of ownership and catch of all vessels active in the halibut and sablefishfishery for each year from 1984 to 1990. This record would be sufficient for determining both entitlement andquantities of the initial allocation. During those years, vessel owners had been legally obliged to report their catchto the NMFS19, which used the data to determine season-lengths and otherwise manage the fisheries.Consequently, the NMFS had most of the necessary data.20
In general, the quality of catch data was good. Ownership data were less complete and less accurate becauseowners were under no obligation to report many of the details of vessel ownership or vessel lease interests.21
Although this was time-consuming, data organization for determining quota shares allocations did not posesubstantive problems. Beginning in the late 1980s, the NPFMC staff organized the data for the halibut andsablefish fisheries to analyze different management alternatives. Once the decision to proceed with the systemhad been approved by the Secretary of Commerce in January 1993, the NMFS began to finalize data for the initialallocation. By January 1994, slightly less than one year later, the NMFS had produced preliminary estimates ofinitial allocations for all fishers.
Once the data had been fully organized, the NMFS prepared individual applications for each vessel ownerqualified to receive quota shares. The preprinted applications, which included a report of relevant catch andownership data, were mailed to each qualified vessel owner. Those who did not receive an application by a certaindate, but who thought they were entitled to initial quota shares, were asked to call the NMFS to request anapplication. The development of the programme and its progress toward implementation were public knowledgeas they were reported by both trade journals and the popular press. Because fishers were involved in the processfrom the onset, few if any, failed to obtain quota shares because of lack of knowledge of the need to apply.
The NMFS required vessel owners to verify the data in the applications and to submit the applications withina 6-month period that began 17 January and ended 15 July 1994. Owners were entitled to correct or disputeexisting records, if needed. The NMFS reviewed each returned application for any data discrepancies.Applications returned without change were forwarded to the NMFS technical reviewers. If an application wascorrected or disputed by the vessel owner, the NMFS requested documentation supporting the change, such asfish tickets, leases or ownership documentation. The owner was required to resubmit the application withsupporting documentation within 90 days. On receipt of the application and supporting documentation, theapplication materials were passed on for technical review (NMFS 1994). Within 45 days of receipt of theapplication (and supporting documentation when applicable) the NMFS technical reviewers were required toprocess the application and notify the vessel owner of the quota shares entitlement.22 This completed the technicalreview process and issuance of quota shares began in November 1994. Any vessel owner who disagreed with thequota shares determination of the technical review could file an appeal (NMFS 1994).
The appeals process began with issuance of the first quota shares. Appeals were heard by the hearing officerfrom the parent agency of NMFS – NOAA(the National Oceanic and Atmospheric Administration, under theDepartment of Commerce). Administrative appeals consisted of a review of the pertinent documentation(primarily fish tickets, ownership records, and leases) and hearings.23 Hearing officers were required to issue
Alaska Halibut and Sablefish 260
18 At the onset of the programme, collection of fees from IFQ holders was not permitted by the Magnuson-Stevens Act. Thefee collection programme was authorized by changes to the act by the U.S. Congress on 11 October 1996, after the IFQprogramme had been implemented.
19 Actual data were usually collected by ADF&G and the IPHC and forwarded to the NMFS.20 The greatest information shortcoming was the absence of good records related to leasehold interests. Other problems were
related to divorced couples, deceased vessel owners and dissolved corporations and partnerships.21 The vessel registration required to participate in the fisheries in Alaska did not (and still does not) require a full disclosure
of all owners with an interest in the vessel, nor was there any requirement for leaseholders to report their use of a givenvessel. The lack of detailed reporting on ownership meant that available data were too imprecise to support determinationof allocations in all situations, particularly cases in which partial ownership levels changed over the relevant catch historyperiod.
22 NMFS refers to this decision as an “Initial Administrative Determination”.23 Appeals were allowed only on questions of fact. Appeals claiming that hardships had prevented persons from participating
were not allowed — a conscious decision of the NPFMC, which believed that it had provided for hardships by allowingpersons to qualify if they had participated at all in 1988, 1989 or 1990.
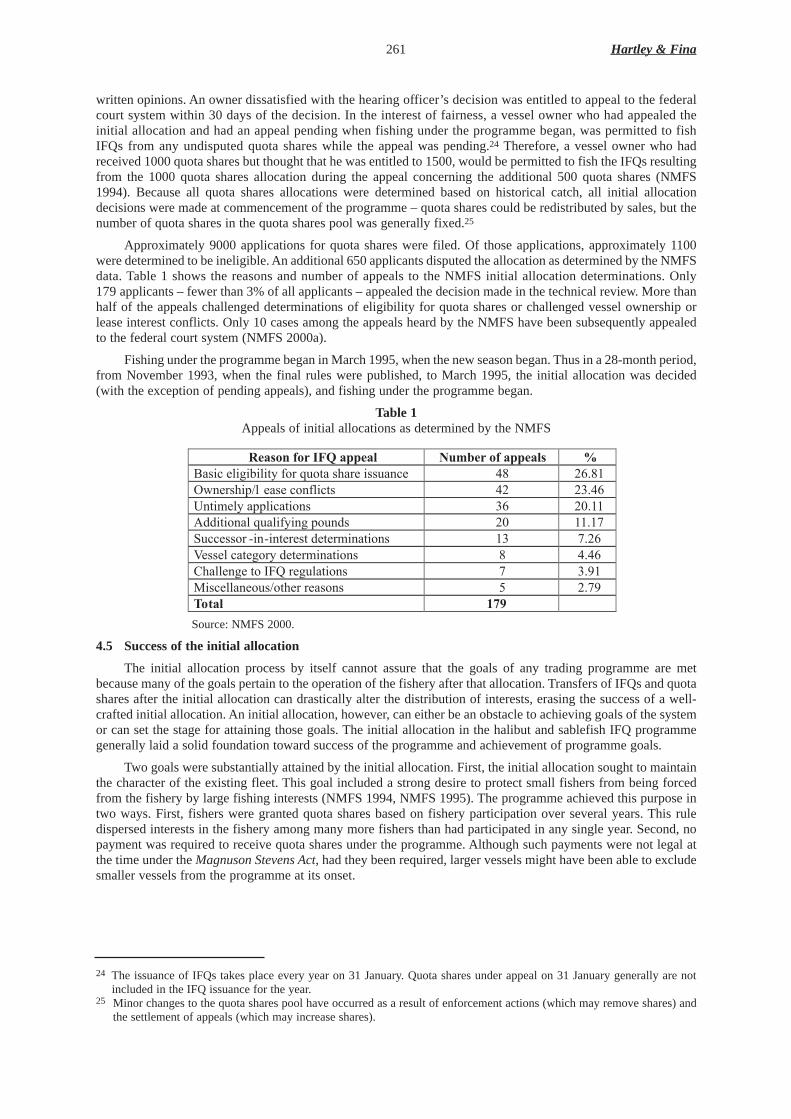
written opinions. An owner dissatisfied with the hearing officer’s decision was entitled to appeal to the federalcourt system within 30 days of the decision. In the interest of fairness, a vessel owner who had appealed theinitial allocation and had an appeal pending when fishing under the programme began, was permitted to fishIFQs from any undisputed quota shares while theappeal was pending.24 Therefore, a vessel owner who hadreceived 1000 quota shares but thought that he was entitled to 1500, would be permitted to fish the IFQs resultingfrom the 1000 quota shares allocation during the appeal concerning the additional 500 quota shares (NMFS1994). Because all quota shares allocations were determined based on historical catch, all initial allocationdecisions were made at commencement of the programme – quota shares could be redistributed by sales, but thenumber of quota shares in the quota shares pool was generally fixed.25
Approximately 9000 applications for quota shares were filed. Of those applications, approximately 1100were determined to be ineligible. An additional 650 applicants disputed the allocation as determined by the NMFSdata. Table 1 shows the reasons and number of appeals to the NMFS initial allocation determinations. Only179 applicants – fewer than 3% of all applicants – appealed the decision made in the technical review. More thanhalf of the appeals challenged determinations of eligibility for quota shares or challenged vessel ownership orlease interest conflicts. Only 10 cases among the appeals heard by the NMFS have been subsequently appealedto the federal court system (NMFS 2000a).
Fishing under the programme began in March 1995, when the new season began. Thus in a 28-month period,from November 1993, when the final rules were published, to March 1995, the initial allocation was decided(with the exception of pending appeals), and fishing under the programme began.
Table 1Appeals of initial allocations as determined by the NMFS
Source: NMFS 2000.
4.5 Success of the initial allocation
The initial allocation process by itself cannot assure that the goals of any trading programme are metbecause many of the goals pertain to the operation of the fishery after that allocation. Transfers of IFQs and quotashares after the initial allocation can drastically alter the distribution of interests, erasing the success of a well-crafted initial allocation. An initial allocation, however, can either be an obstacle to achieving goals of the systemor can set the stage for attaining those goals. The initial allocation in the halibut and sablefish IFQ programmegenerally laid a solid foundation toward success of the programme and achievement of programme goals.
Two goals were substantially attained by the initial allocation. First, the initial allocation sought to maintainthe character of the existing fleet. This goal included a strong desire to protect small fishers from being forcedfrom the fishery by large fishing interests (NMFS 1994, NMFS 1995). The programme achieved this purpose intwo ways. First, fishers were granted quota shares based on fishery participation over several years. This ruledispersed interests in the fishery among many more fishers than had participated in any single year. Second, nopayment was required to receive quota shares under the programme. Although such payments were not legal atthe time under the Magnuson Stevens Act, had they been required, larger vessels might have been able to excludesmaller vessels from the programme at its onset.
261 Hartley & Fina
Reason for IFQ appeal Number of appeals % Basic eligibility for quota share issuance 48 26.81 Ownership/l ease conflicts 42 23.46 Untimely applications 36 20.11 Additional qualifying pounds 20 11.17 Successor -in-interest determinations 13 7.26 Vessel category determinations 8 4.46 Challenge to IFQ regulations 7 3.91 Miscellaneous/other reasons 5 2.79 Total 179
24 The issuance of IFQs takes place every year on 31 January. Quota shares under appeal on 31 January generally are notincluded in the IFQ issuance for the year.
25 Minor changes to the quota shares pool have occurred as a result of enforcement actions (which may remove shares) andthe settlement of appeals (which may increase shares).

A second goal was to disburse the windfall profits created by giving fishers quota shares free of charge. Thiswas accomplished by considering fishing activity over several years, which brought more fishers into theprogramme. The NPFMC knew that the fleet would consolidate in time, but the goal was to let that consolidationoccur through the market rather than in the initial allocation. With a widely-disbursed initial allocation, windfallswere minimized and the market was left to respond, with fishers deciding whether to remain in the fishery orleave (NPFMC 1992b).
A third goal was pursued through a separate avenue. The NPFMC sought to develop a system for the benefitof the small communities in the Aleutian Islands and on the Bering Sea that have traditionally been unable toparticipate in the fisheries. The CDQ programme was developed for this purpose. In regulatory areas in theAleutian Islands and the Bering Sea, between 20 and 100% of the quota shares was set aside for this programme.Fishers denied shares by the CDQ allocation were compensated with shares in other regulatory areas (NMFS1994). CDQ shares are nontransferable, but the communities can hire fishers to fish their quota. Communitiesgranted these shares have handled their shares in one of two ways. Some have sold the annual harvest rights tofishers, and although this approach is not what policymakers had initially hoped would happen, transfers ofannual fishing rights for royalties have proven an effective source of income for some communities. Othercommunities have developed their own fishing sector and have benefited from both revenue created and jobsgenerated by the CDQ programme.
4.6 Satisfaction of rights holders and others with initial allocation
At the time that the IFQ programme was implemented, many fishers were wary of its potential impacts ontheir fishing. After initial trepidation subsided, fishers in general seemed satisfied with the programme and itsinitial allocation process.26 The most satisfied were those fishers who were historically the most active in thelongline fisheries. These fishers received the largest allocations because quota shares were issued in proportionto activity in the fishery. A few groups, however, were dissatisfied with the initial allocation: fishers who weregiven small quotas because of scant participation history, crewmembers, and fishers active between 1991 and1994 but not in the qualifying years before 1991.
A significant number of fishers who had limited history in the fisheries felt that their quota shares were notsufficient to support their continuing in the fishery. In a survey of sablefish quota shares holders, 20% expressedthe opinion that their quota shares were insufficient to fish economically. Approximately 10% believed that theirallocation was not fair (Knapp and Hull 1996a). As expected, these criticisms came mainly from quota share-holders who received small initial allocations. Most had participated in the fishery for only a year or two. Sincea fisher’s initial allocation was based on activity in the fishery over a five-year period, those participants whoseinitial allocations were supported by only one year’s catch ended up with approximately 20% of a single year’scatch. By using many years of activity to determine the initial allocation, the programme had the effect of dilutingthe shares so that shareholders with limited catch histories could not fish economically. Many such shareholderssold their quota shares and left the programme after the first few years.
Crewmembers were left out of the initial allocation for two reasons: one based on practicality, and one basedon principle. Unlike vessel-owners, crewmembers historically had not reported their fishery participation to theNMFS. Evaluating the credibility of crewmember-participation reports would not be feasible, and therefore usinghistorical catch to determine the initial allocation was impracticable. In principle, the initial allocation wasintended to reward those who had invested in the fishery. While crewmembers had invested time, for which theyhad been paid, only vessel-owners and lessees had put monetary investments at risk to participate.27
Fishers active between 1991 and 1994, but not before 1991, were excluded from receiving an initialallocation. These fishers represented a substantial part of both the halibut and sablefish fisheries in the yearsimmediately before the IFQ system was initiated in 1995. More than 25% of the sablefish and more than 17% ofthe halibut (by weight) harvested in these years had been caught by fishers who received no initial allocation.28
The 1990 cutoff date was used to prevent fishers from entering the fishery simply to obtain a valuable interest inthe fishery once it had been decided that entry would be limited in the future.29 Although these fishers were
Alaska Halibut and Sablefish 262
26 In a survey of sablefish quota shares holders in the first year, 17% said the programme had “no positive effects.” In thesame survey, 23% said the programme had “no negative effects” (Knapp and Hull 1996a).
27 Partially to appease crewmembers who had not received an initial allocation, the system created a transfer preference forcrewmembers who had been active in any U.S. commercial fishery for at least 150 days.
28 These entry rates were similar to entry rates in the years before 1991.29 As with crew, these fishers would be permitted to buy quota shares to enter the fishery if they met the 150-day threshold.
dissatisfied with the initial allocation, the overall response was that it was fair. Because allocation was basedstrictly on historical activity, fishers who received small initial allocations were deprived of the argument thatthey deserved an interest in the fishery over others. In addition, the transferability of quota shares allowed thosewho desired to increase their activity the right to purchase into the fishery to make up for the absence of an initialallocation. While doing so would be costly, the ability to increase one’s interest in the fishery provided a remedyfor those who desired to do so.
4.7 Alternatives to the initial allocation
Some criticisms of the initial allocation were leveled by a few dissatisfied groups. Some fishers and crewwere dissatisfied with being omitted. Other fishers were dissatisfied with the size of their initial allocation,arguing that it was too small to fish economically. Alternative allocation methods were considered and rejected.While each of these alternatives would have increased the proportion of the harvest that qualifiers with minimalparticipation records would have received, each alternative also had shortcomings. Among the alternatives thatmight have addressed some of the concerns of fishers and crew were the following which would:
i. require a minimum catch to qualify for an initial allocationii. require multiple years of fishery participation to be entitled to sharesiii. provide a minimum number of quota shares to all fishers who qualify for the programme andiv. base distribution strictly on whether an owner (and possibly crew) had participated in the fishery during a
period of years. Each year of participation would have been worth a fixed number of quota shares (1000,for example) regardless of the participant’s actual catch during those years.30
The first two alternatives would have reduced the initial number of qualified vessel owners, therebyincreasing the proportion of the annual harvest (IFQs) to which each qualifier would have been entitled. Thesetwo alternatives were rejected because they would have eliminated some vessel owners with a history of fisheryparticipation, whilst the minimum standards and additional qualification criteria might have been seen asarbitrary. In addition, because anyone receiving an initial allocation would have the right to purchase or sell quotashares, the programme was thought to provide an option for any fishers who believed they had received an initialallocation that could not be fished economically. In the end, the initial allocation was designed as a broadlyinclusive programme that provided an initial allocation to as many fishers as showed activity in the fishery in thepast.
The third and fourth alternatives might have reduced the number of fishers who received entitlements thatwere uneconomic to fish, but both represented a move away from allocation of quota shares based on actual catchhistory in the fishery. If the allocation had provided a minimum number of quota shares to all qualifiers regardlessof catch (the third alternative), then the quota shares of qualifiers who had exceeded the minimum would havebeen diluted — an outcome that was politically unacceptable and raised questions of fairness. The fourthalternative also would have raised contentious issues of fairness. A vessel owner who landed only 100lb in a yearwould receive the same allocation as a vessel owner who landed 10 000lb in the same year.
Any method of initial allocation of harvest right can be expected to generate controversy. The system thatwas chosen was based on historical catches in the fishery and did not include criteria that might have appearedarbitrary or artificial. The system used was deemed the best available and the least controversial because it reliedon the most comprehensive data for fisheries participation. Furthermore, data that would be used were “official”and had been required for the programme implementation. Use of these data reduced the risk that fraudulentinformation would be used to obtain shares. Despite the benefits of fairness, the method used for the initialallocation was found to be data intensive, costly and time consuming to implement.31
5. CONCLUSION
The initial allocation of shares of an IFQ programme cannot ensure the success of the programme. Tradingof shares after the initial distribution can thwart efforts to achieve programme goals, despite the best-definedinitial allocation. The initial allocation, however, can start a programme toward success by defining the characterof the fishery for the first few years while the trading system develops, and by facilitating acceptance of theprogramme by fishers.
263 Hartley & Fina
30 One advantage of a system based exclusively on participation (rather than on catch) is that it is less data intensive.31 In addition, fishers in Alaska have come to believe that historical catch will be used if and when IFQs or similar systems
are enacted in other fisheries. This belief has had the unintended consequence of assigning value to catch history of vessels.Now when vessels are bought and sold, the catch history of a vessel is considered. Vessels with more historical catch garnerhigher prices than similar vessels with less catch history.

The initial allocation of IFQs in the halibut and sablefish fisheries served several defined objectives. Bydistributing shares based on historical catch, the allocation preserved the character of the fleet. The broaddistribution of shares limited the windfalls created by the distribution of shares at no cost. Although the quantityof shares received by a fisher was reduced, the broadly inclusive initial allocation had the effect of limiting thedissatisfaction of excluded fishers. Once active in the fishery, fishers could trade shares in the market todetermine their level participation. By allocating shares only to vessel owners, the initial allocation rewardedthose who had invested to participate in the fishery. Clearly, the initial allocation served these specificprogramme goals.
Most fishers believed that the process by which the programme (and the initial allocation) weredetermined, fairly considered the opinions of all interests. Open meetings and comment periods ensured that allopinions were heard and evaluated. The initial allocation carefully defined programme goals, tailored the rulesgoverning the initial allocation to achieve those goals, and strictly adhered to those rules. The process by whichthe programme was developed, and the well-defined rules for the initial allocation, created a foundation ofsupport for the programme on which to build future success. The overall goal of the IFQ programme was tocreate a safe, productive, profitable fishery. This goal could not be accomplished without acceptance of theprogramme by its participants. The initial allocation developed the support for the programme necessary for itssuccess.
6. LITERA TURE CITED
Alaska Commercial Fisheries Entry Commission 1999. Changes Under Alaska’s Halibut IFQ Programme 1995to 1998. Juneau, Alaska. November 1999.
Gharrett, J. 2000. Data Operations Manager, National Marine Fisheries Service, Restricted Access ManagementDivision. Personal communication with Northern Economics, Inc. 3 December 2000.
Hartley, M. and M. Fina 2001 Changes in fleet capacity following the introduction of Individual Vessel Quotasin the Alaskan Pacific Halibut and Sable Fishery. pp. 186-207. In: Shotton, R. (Ed.) 2001 Case Studies onthe effect of transferable quota rights on fishing fleet capacity and concentration of ownership of harvestingrights. FAO Fish. Tech. Pap. No. 412
IPHC - International Pacific Halibut Commission 1987. The Pacific Halibut: Biology, Fishery and Management.Seattle, Washington.
Kingeter, J. 2000. Assistant Special Agent in Charge for IFQ Enforcement, Alaska; National Marine FisheriesManagement Service. Pers. comm. with Northern Economics Inc., 3 December 2000.
Knapp, G. and D. Hull 1996a. University of Alaska Anchorage, Institute for Social and Economic Research. TheFirst Year of the Alaska IFQ Programme: A Survey of Sablefish Quota Share Holders. September 1996.
Knapp, G., and D. Hull 1996b. University of Alaska Anchorage, Institute for Social and Economic Research.The First Year of the Alaska IFQ Programme: A Survey of Halibut and Sablefish Registered Buyers.September 1996.
Lowe, S. 2001. NMFS Fishery Biologist. Personal communication with Northern Economics Inc., January 2001.Matthews, D. 1997. Beyond IFQ Implementation: A Study of Enforcement Issues in the Alaska Individual
Fishing Quota Programme. Silver Spring, Maryland. April 1997.NMFS – National Marine Fisheries Service 1994. Restricted Access Management Division. The IFQ
Programme, Insights and Updates. February 1994.NMFS 1995. Restricted Access Management Division. The IFQ Programme, Underway. February 1995.NMFS 2000a. Restricted Access Management Division. 2000 Report to the Fleet. July 2000.NMFS 2000b. Alaska Enforcement Division. Enforcement Report for the Period 10/1/2000 through 12/5/2000.
Juneau, Alaska. December 2000.NMFS 2001. Restricted Access Management Division. Individual Fishing Quota (IFQ)/Community
Development (CDQ) Halibut Programme Reports on the Internet at http://www.fakr.noaa.gov/ram/ifqreports.htm. February 2001.
NPFMC - North Pacific Fishery Management Council 1989 Draft Supplemental Environmental ImpactStatement for Longline and Pot Gear Sablefish Management in the Gulf of Alaska and the BeringSea/Aleutian Islands. November 16, 1989.
NPFMC 1992a. Final Supplemental Environmental Impact Statement/ Environmental Impact Statement for theIndividual Fishing Quota Management Alternative for Fixed Gear Sablefish and Halibut Fisheries.September 1992.
NPFMC 1992b. True North. October 1992.NPFMC 1997. Draft Environmental Assessement/Regulatory Impact Review/ Initial Regulatory Flexibility
Analysis for Proposed Regulatory Amendments to Implement Management Alternatives for the GuidedSport Fishery for Halibut off Alaska. April 1997.
NPFMC 2000. Electronic data provided to Northern Economics Inc., by special request. November 2000.
Alaska Halibut and Sablefish 264

Pautzke, C.G. and C.W. Oliver 1997. North Pacific Fishery Management Council. Development of the IndividualFishing Quota Programme for Sablefish and Halibut Longline Fisheries off Alaska.
Smith, P. 2001. NMFS Restricted Access Management Division Chief, Personal Communication with NorthernEconomics Inc., 27 February 2001.
Tremaine, D. 2000. Former NPFMC Staff Economist and contributing Author to NPMFC 1992, PersonalCommunication with Northern Economics Inc., November 2000.
265 Hartley & Fina
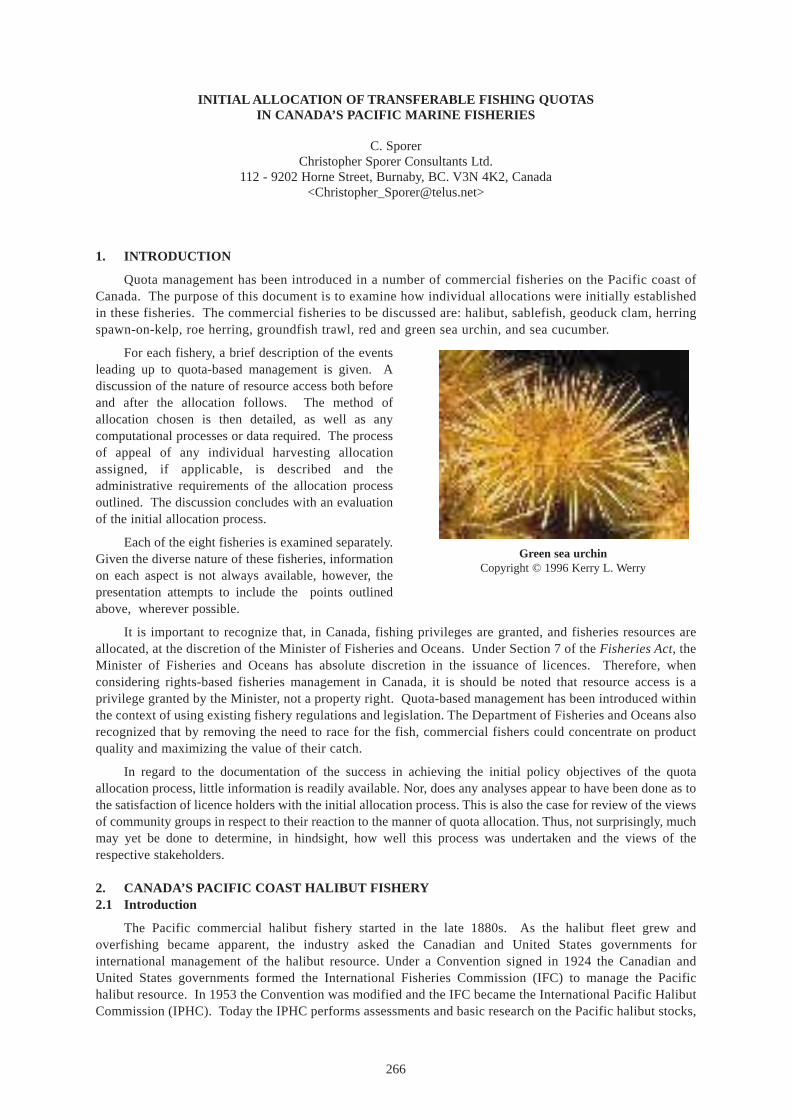
INITIAL ALLOCA TION OF TRANSFERABLE FISHING QUOT ASIN CANADA ’S PACIFIC MARINE FISHERIES
C. SporerChristopher Sporer Consultants Ltd.
112 - 9202 Horne Street, Burnaby, BC. V3N 4K2, Canada<[email protected]>
1. INTRODUCTION
Quota management has been introduced in a number of commercial fisheries on the Pacific coast ofCanada. The purpose of this document is to examine how individual allocations were initially establishedin these fisheries. The commercial fisheries to be discussed are: halibut, sablefish, geoduck clam, herringspawn-on-kelp, roe herring, groundfish trawl, red and green sea urchin, and sea cucumber.
For each fishery, a brief description of the eventsleading up to quota-based management is given. Adiscussion of the nature of resource access both beforeand after the allocation follows. The method ofallocation chosen is then detailed, as well as anycomputational processes or data required. The processof appeal of any individual harvesting allocationassigned, if applicable, is described and theadministrative requirements of the allocation processoutlined. The discussion concludes with an evaluationof the initial allocation process.
Each of the eight fisheries is examined separately.Given the diverse nature of these fisheries, informationon each aspect is not always available, however, thepresentation attempts to include the points outlinedabove, wherever possible.
It is important to recognize that, in Canada, fishing privileges are granted, and fisheries resources areallocated, at the discretion of the Minister of Fisheries and Oceans. Under Section 7 of the Fisheries Act, theMinister of Fisheries and Oceans has absolute discretion in the issuance of licences. Therefore, whenconsidering rights-based fisheries management in Canada, it is should be noted that resource access is aprivilege granted by the Minister, not a property right. Quota-based management has been introduced withinthe context of using existing fishery regulations and legislation. The Department of Fisheries and Oceans alsorecognized that by removing the need to race for the fish, commercial fishers could concentrate on productquality and maximizing the value of their catch.
In regard to the documentation of the success in achieving the initial policy objectives of the quotaallocation process, little information is readily available. Nor, does any analyses appear to have been done as tothe satisfaction of licence holders with the initial allocation process. This is also the case for review of the viewsof community groups in respect to their reaction to the manner of quota allocation. Thus, not surprisingly, muchmay yet be done to determine, in hindsight, how well this process was undertaken and the views of therespective stakeholders.
2. CANADA’S PACIFIC COAST HALIBUT FISHERY2.1 Intr oduction
The Pacific commercial halibut fishery started in the late 1880s. As the halibut fleet grew andoverfishing became apparent, the industry asked the Canadian and United States governments forinternational management of the halibut resource. Under a Convention signed in 1924 the Canadian andUnited States governments formed the International Fisheries Commission (IFC) to manage the Pacifichalibut resource. In 1953 the Convention was modified and the IFC became the International Pacific HalibutCommission (IPHC). Today the IPHC performs assessments and basic research on the Pacific halibut stocks,
266
Green sea urchinCopyright © 1996 Kerry L. Werry
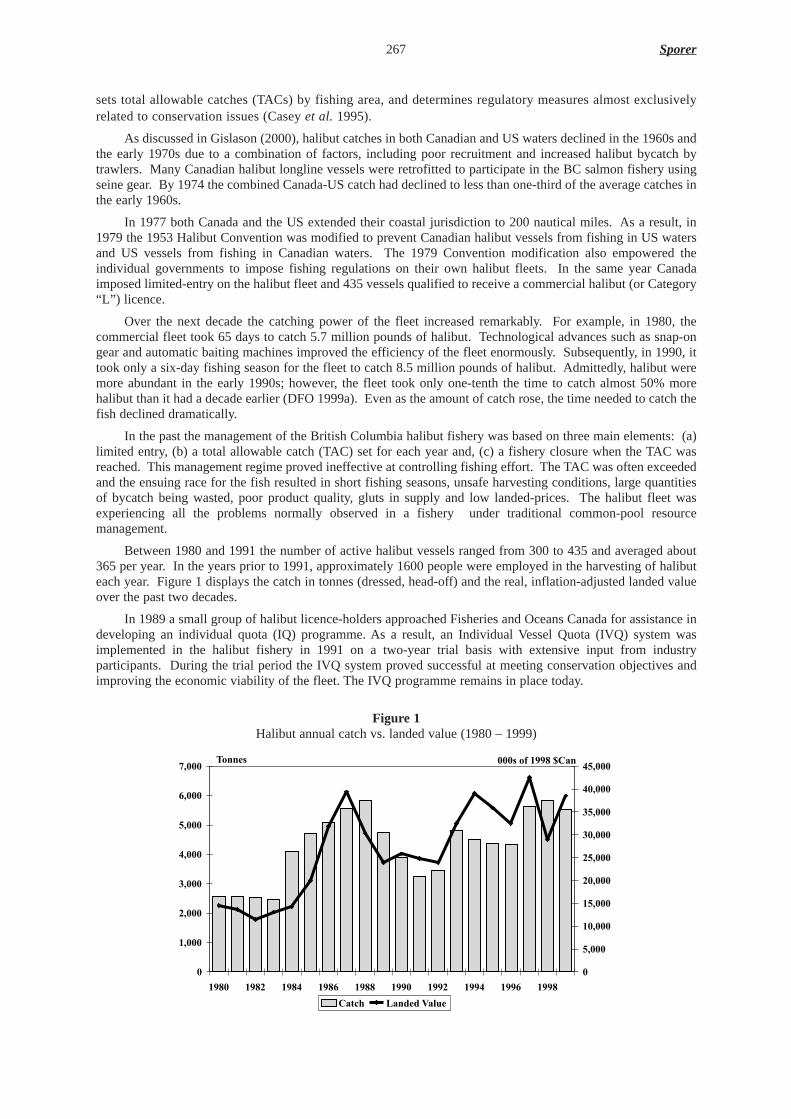
sets total allowable catches (TACs) by fishing area, and determines regulatory measures almost exclusivelyrelated to conservation issues (Casey et al.1995).
As discussed in Gislason (2000), halibut catches in both Canadian and US waters declined in the 1960s andthe early 1970s due to a combination of factors, including poor recruitment and increased halibut bycatch bytrawlers. Many Canadian halibut longline vessels were retrofitted to participate in the BC salmon fishery usingseine gear. By 1974 the combined Canada-US catch had declined to less than one-third of the average catches inthe early 1960s.
In 1977 both Canada and the US extended their coastal jurisdiction to 200 nautical miles. As a result, in1979 the 1953 Halibut Convention was modified to prevent Canadian halibut vessels from fishing in US watersand US vessels from fishing in Canadian waters. The 1979 Convention modification also empowered theindividual governments to impose fishing regulations on their own halibut fleets. In the same year Canadaimposed limited-entry on the halibut fleet and 435 vessels qualified to receive a commercial halibut (or Category“L”) licence.
Over the next decade the catching power of the fleet increased remarkably. For example, in 1980, thecommercial fleet took 65 days to catch 5.7 million pounds of halibut. Technological advances such as snap-ongear and automatic baiting machines improved the efficiency of the fleet enormously. Subsequently, in 1990, ittook only a six-day fishing season for the fleet to catch 8.5 million pounds of halibut. Admittedly, halibut weremore abundant in the early 1990s; however, the fleet took only one-tenth the time to catch almost 50% morehalibut than it had a decade earlier (DFO 1999a). Even as the amount of catch rose, the time needed to catch thefish declined dramatically.
In the past the management of the British Columbia halibut fishery was based on three main elements: (a)limited entry, (b) a total allowable catch (TAC) set for each year and, (c) a fishery closure when the TAC wasreached. This management regime proved ineffective at controlling fishing effort. The TAC was often exceededand the ensuing race for the fish resulted in short fishing seasons, unsafe harvesting conditions, large quantitiesof bycatch being wasted, poor product quality, gluts in supply and low landed-prices. The halibut fleet wasexperiencing all the problems normally observed in a fishery under traditional common-pool resourcemanagement.
Between 1980 and 1991 the number of active halibut vessels ranged from 300 to 435 and averaged about365 per year. In the years prior to 1991, approximately 1600 people were employed in the harvesting of halibuteach year. Figure 1 displays the catch in tonnes (dressed, head-off) and the real, inflation-adjusted landed valueover the past two decades.
In 1989 a small group of halibut licence-holders approached Fisheries and Oceans Canada for assistance indeveloping an individual quota (IQ) programme. As a result, an Individual Vessel Quota (IVQ) system wasimplemented in the halibut fishery in 1991 on a two-year trial basis with extensive input from industryparticipants. During the trial period the IVQ system proved successful at meeting conservation objectives andimproving the economic viability of the fleet. The IVQ programme remains in place today.
Figure 1Halibut annual catch vs. landed value (1980 – 1999)
267 Sporer
0
1,000
2,000
3,000
4,000
5,000
6,000
7,000
1980 1982 1984 1986 1988 1990 1992 1994 1996 1998
Tonnes
0
5,000
10,000
15,000
20,000
25,000
30,000
35,000
40,000
45,000000s of 1998 $Can
Catch Landed Value
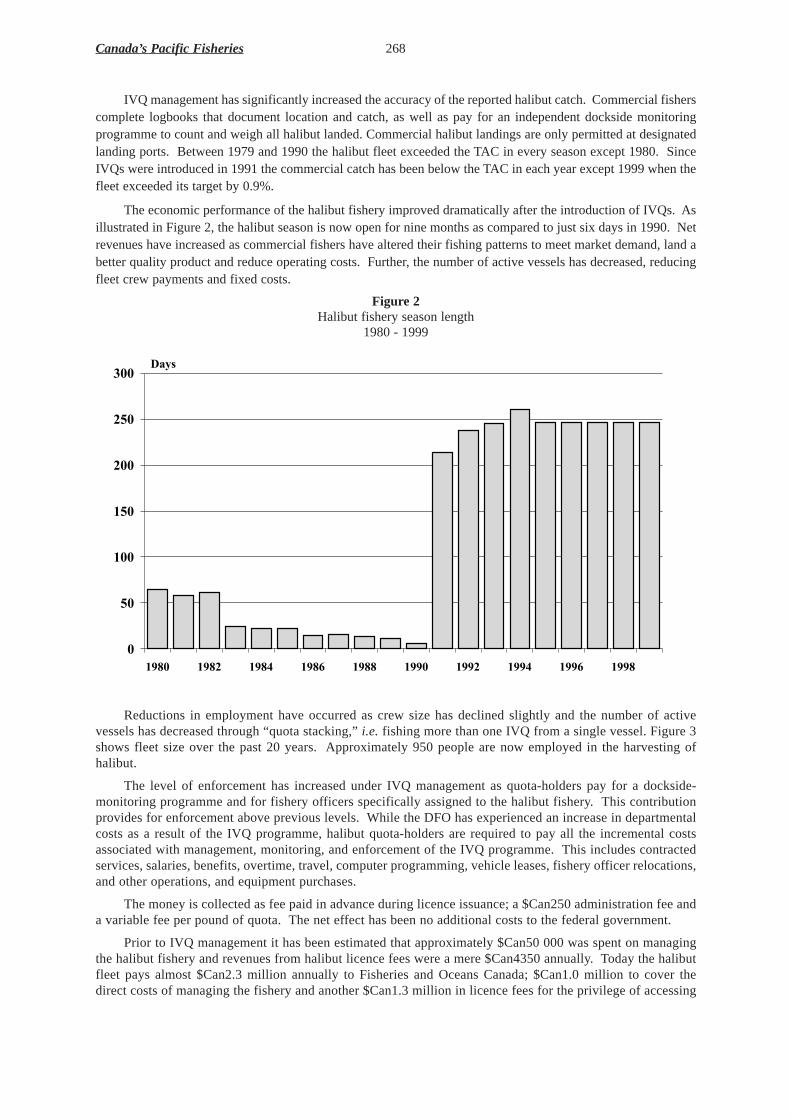
IVQ management has significantly increased the accuracy of the reported halibut catch. Commercial fisherscomplete logbooks that document location and catch, as well as pay for an independent dockside monitoringprogramme to count and weigh all halibut landed. Commercial halibut landings are only permitted at designatedlanding ports. Between 1979 and 1990 the halibut fleet exceeded the TAC in every season except 1980. SinceIVQs were introduced in 1991 the commercial catch has been below the TAC in each year except 1999 when thefleet exceeded its target by 0.9%.
The economic performance of the halibut fishery improved dramatically after the introduction of IVQs. Asillustrated in Figure 2, the halibut season is now open for nine months as compared to just six days in 1990. Netrevenues have increased as commercial fishers have altered their fishing patterns to meet market demand, land abetter quality product and reduce operating costs. Further, the number of active vessels has decreased, reducingfleet crew payments and fixed costs.
Figure 2Halibut fishery season length
1980 - 1999
Reductions in employment have occurred as crew size has declined slightly and the number of activevessels has decreased through “quota stacking,” i.e. fishing more than one IVQ from a single vessel. Figure 3shows fleet size over the past 20 years. Approximately 950 people are now employed in the harvesting ofhalibut.
The level of enforcement has increased under IVQ management as quota-holders pay for a dockside-monitoring programme and for fishery officers specifically assigned to the halibut fishery. This contributionprovides for enforcement above previous levels. While the DFO has experienced an increase in departmentalcosts as a result of the IVQ programme, halibut quota-holders are required to pay all the incremental costsassociated with management, monitoring, and enforcement of the IVQ programme. This includes contractedservices, salaries, benefits, overtime, travel, computer programming, vehicle leases, fishery officer relocations,and other operations, and equipment purchases.
The money is collected as fee paid in advance during licence issuance; a $Can250 administration fee anda variable fee per pound of quota. The net effect has been no additional costs to the federal government.
Prior to IVQ management it has been estimated that approximately $Can50 000 was spent on managingthe halibut fishery and revenues from halibut licence fees were a mere $Can4350 annually. Today the halibutfleet pays almost $Can2.3 million annually to Fisheries and Oceans Canada; $Can1.0 million to cover thedirect costs of managing the fishery and another $Can1.3 million in licence fees for the privilege of accessing
Canada’s Pacific Fisheries 268
0
50
100
150
200
250
300
1980 1982 1984 1986 1988 1990 1992 1994 1996 1998
Days

the halibut resource. IVQ management has provided an excellent opportunity to capture some of the resourcerents as well as pay for management costs.
Figure 3Number of active halibut vessels
1980 - 1999
2.2 The nature of the harvesting right
Commercial halibut licences (Category “L”) are vessel-based; the owner of the vessel controls thelicence. Fisheries and Oceans Canada issues the licences on an annual basis. The halibut fishery is managedunder a limited-entry licensing regime. Prior to 1991, a halibut licence could not be separated from any othercommercial fishing licences attached to the vessel. All licences attached to a single vessel were considered“married” and had to be transferred together.
During the trial period of the halibut IVQ programme no changes were made to the transferability rulesfor licences and quotas were not transferable. For 1993, after extensive consultation with industry, each initialhalibut quota was split into two equal shares and the temporary transfer of quota shares and/or licences waspermitted. To prevent consolidation of quotas in a few hands, a maximum of four quota shares could be heldor fished by a licensed halibut vessel.
In 1994 the above quota transferability rules were kept, but provisions were made to allow halibutlicences to be separated from any combination of “married” licences and permanently or temporarilytransferred to another licensed vessel of any shorter length, or even one upto 10 feet longer. These regulationsremained in effect from 1994 to 1998.
In 1999, both permanent and temporary quota transfers were permitted. Licences could be transferred toanother licensed vessel of a shorter length, or up to 25 feet longer. Quota shares were dropped and IVQ couldbe traded on a per pound basis to another licenced halibut vessel. Quota that had already been caught couldnot be transferred. No one vessel could hold more than 1% of the TAC (unless it had fished greater than thisamount from 1993 to 1998). Further, each “L” licensed vessel was required to hold a minimum amount ofpermanent IVQ (0.01149% of the TAC in 1999). This minimum could be temporarily transferred during theyear (Gislason 2000).
2.3 The method of allocation2.3.1Policy objectives
There were no specific Fisheries and Oceans Canada policy objectives for the initial allocationformula. Generally, the government’s objectives focused more on issues related to resource conservationand sound fisheries management. The move to IVQ management in the halibut fishery was largely anindustry initiative.
269 Sporer
0
50
100
150
200
250
300
350
400
450
1980 1982 1984 1986 1988 1990 1992 1994 1996 1998

While industry advisors established four important guidelines to help them design the halibut IVQprogramme, only one of these guidelines touched on the issue of the initial allocation of quota. Specifically,industry advisors felt that “the programme should not, if possible, disenfranchise participants historically activein the halibut fishery.” (DFO 1995). Industry advisors went on to express concern about the distribution ofincome under IVQ management.
The initial allocation formula of an individual quota programme has the potential to affect individualcommercial fishers if it results in a redistribution of wealth among the fleet. An initial allocation formula thatresults in a major change in the relative economic position of individual operators could “disenfranchiseparticipants historically active in the halibut fishery”. Given this stated objective it is of little surprise that thehalibut industry eventually chose an initial allocation formula heavily weighted toward historical landings in thefishery.
2.3.2Process used in determining initial allocations
After two industry meetings in 1989, a survey was distributed to halibut licence-holders. Eighty-two percentof the 435 licence-holders responded and 77% stated they supported the IQ concept. Fisheries and OceansCanada firmly believed that, if the halibut IQ initiative was to move forward, it would be necessary to establisha formal advisory board comprised of licence-holders, processors, First Nations and union representatives. TheHalibut Advisory Board (HAB) was established using a selection process suggested by industry.
In January 1990, the first HAB meeting was held and lasted four days. The focus of the meeting was theinitial allocation of quotas. At one point 17 different proposals were on the table. Proposals included equalshares, pounds per foot of vessel length, auctions, historical performance and shares based on the number of crew.By the fourth day HAB members had negotiated down to two basic allocation formulas and eventually agreed onan initial allocation formula. Only one of the 18 licence-holder representatives opposed the compromise position.
2.3.3Initial allocation formula chosen
Under the initial allocation formula, each halibut vessel received a percentage of the annual TAC. Seventypercent of the initial allocation was based on the vessel’s historical catch between 1986 and 1989. Thirty percentof the vessel’s initial allocation was based on the vessel’s overall length.
The catch history used was based on the one best catch year, adjusted for variations in the annual total catch,during 1986 to 1989. The catch had to be attributable to the current owner of the halibut licence regardless ofwhat vessel fished the licence during that period. If the current vessel owner acquired the licence after the startof the 1989 halibut fishery, then the historical allocation was based on the previous owner’s catch history duringthe 1986-1989 period. The catch history share was determined by dividing a commercial fisher’s best adjusted-catch year by the total of the best adjusted-catches for the entire fleet. The resulting percentage was thenmultiplied by 70% of the annual TAC.
To determine the length-factor in the initial allocation formula, the vessel’s overall length was divided bythe total length of all vessels with halibut licences. This percentage was then multiplied by 30% of the annualTAC.
2.4 Data requirements and computational process
The information required to develop an allocation formula was readily available from Fisheries and OceansCanada databases. DFO sales-slip data were used to determine the catch history portion of the initial allocationformula. Vessel length had been previously collected as part of the DFO licensing requirements and, at that time,had been determined by a certified marine surveyor.
Fisheries and Oceans Canada provided each halibut fisher with the catch history on file for their licence andthe necessary information about their vessel. Licence-holders were also provided with the initial IVQ for theirvessel for the upcoming season. In the event of a disagreement with the data presented, fishermen wereencouraged to contact the DFO. Halibut fishers were required to provide documentation proving an error hadbeen made. In such cases, the error was corrected. In cases where there was some question as to the validity ofthe error, or if there was an objection to the process used, an appeal process was established.
2.5 Appeals process
The Pacific Region Halibut Quota Review Board (PRHQRB) was established in February 1991 to hearappeals by halibut licence-holders regarding the IVQ share allocated to their licence. The Board was directed toconsider individual circumstances, assess to the best of their ability whether or not an individual halibut licence-holder had been unfairly treated by the implementation of the halibut IVQ programme, and recommend to theMinister of Fisheries and Oceans whether or not the quota should be increased, and, if so, by how much. The
Canada’s Pacific Fisheries 270
terms of reference of the PRHQRB did not include considering changes to the halibut IVQ initial allocationformula or the halibut IVQ proposal.
In 1991, the Board held hearings for six weeks from the beginning of March to the middle of April.Licence-holders were required to submit, in writing, the important points of their appeals as well as copies ofall supporting documentation. Licence-holders could appear in person, make a written submission or havesomeone represent them to the Board. The Board would hear the appeal and then make a recommendation tothe Minster of Fisheries and Oceans. The decision of the Minister would be final.
Out of 435 halibut licences, there were sixty-three appeals for increases in the individual vessel quotaassigned to a halibut licence. Based on the recommendations of the review board, the Minister of Fisheriesand Oceans accepted thirty appeals and changed the IVQ allocations of all licences. There was an opportunityfor halibut fishers to request a second appeal if they had new information to be considered. Only two halibutfishers considered this option and both were unsuccessful.
Despite this appeal process, a small group of nine halibut licence-holders felt they had beendisenfranchised by the initial IVQ formula and, in 1996, challenged the decision in the courts (CarpenterFishing Corporation et al. v. Her Majesty the Queen et al.). These fishermen were successful in the initial caseagainst Fisheries and Oceans Canada. However, an appeal court overturned the decision stating that, under thelaw, the Minister of Fisheries has absolute discretion in the allocation of Canada’s fisheries resources (FederalCourt of Appeal 1996).
2.6 Administration of the allocation process2.6.1Staff requirements
The majority of the work to determine the initial allocation formula was performed by industry advisorson the Halibut Advisory Board. DFO staff helped provide the forum and process for industry to discuss IVQsand the initial allocation formula. Departmental staff also assisted with technical advice when required.
With respect to the appeals process, the Pacific Region Halibut Quota Review Board was comprised offive members from the private sector. All members were respected individuals known in the commercialfishing industry. All had experience in halibut and other fisheries. None of the members had a directinvolvement in the halibut fishery at the time of the appeal process. There was a sixth ex-officiomember of thereview board from Fisheries and Oceans Canada. This individual served as technical advisor and liaison to theBoard, but did not participate in the decision-making process.
2.6.2Additional pr ogramme funding requirements
The quota review process required additional funds above and beyond those available to the PacificRegion Groundfish Management Unit. Existing funds in the Pacific Region budget of Fisheries and OceansCanada were allocated to establish and administer the process. However, any incremental costs of operatingthe IVQ programme are borne by the halibut licence-holders.
2.7 Evaluation of the initial allocation process2.7.1Success in achieving initial policy objectives
While Fisheries and Oceans Canada had no explicit policy objectives outside resource conservation andmanagement, it appears the initial allocation formula was successful at meeting the stated industry objectiveof not disenfranchising participants historically active in the halibut fishery. Only 14.5% of the halibut licence-holders appealed the initial allocation formula, indicating that the majority of the fleet did not feel they wereunfairly treated.
2.7.2Satisfaction of quota-holders with the process
There is no specific documentation available that records rights holders’satisfaction with the allocationprocess. However in December 1992, halibut licence-holders were asked to vote on whether to continue thePacific halibut IVQ programme. Ninety-one percent of those responding voted in favour of continuing withthe programme. This overwhelmingly favourable response, combined with the fact only a few appeals of theallocation formula were requested at the outset, seems to indicate licence-holders were satisfied with theprocess and the outcome.
2.7.3Views of othercommunity groups
There is no specific documentation available relating to the views of other stakeholder groups on theinitial allocation process of halibut IVQs. However, a common criticism of individual quotas is that itconcentrates fishing privileges in the hands of a few individuals. Many groups feel individual quotas“privatize” the resource and restrict broad access to a publicly owned resource. Many coastal communities
271 Sporer
would like to see fish allocated as community development quota, or CDQ, and used to improve regionaleconomic opportunities (Turris 2000).
Individual quota management has also been criticized for the detrimental effects it has on employmentlevels in a fishery. IQs generally lead to a smaller fishing fleet and, therefore, reduced employment levels inthe fishery. Admittedly, there are fewer people employed in the harvesting of halibut; however, crew membersstill employed in the fishery are generally working a longer season and earning higher incomes.
Another common criticism of halibut IQ management is the “windfall profits” that accrue to quotaholders as increased profitability in the fishery translates into higher market values for quotas. However, thiscriticism can also be directed at some non-IQ, limited-entry fisheries. A limited-entry, commercial fishinglicence has market value based on the expected earnings from the fishery. The greater these expected earnings,the more valuable the fishing privilege. Regardless of the management regime employed, it can be difficultfor new entrants to enter a fishery if the costs of fishing privileges are prohibitive.
2.7.4Hind-sight assessment
The initial allocation formula for IVQs in the halibut fleet was accomplished through negotiations amongindustry representatives at the first HAB meeting. The process lacked transparency, which was of particularconcern to those licence-holders not in the room. A closed-door process can be attacked as being potentiallybased on vested interests rather than clear principles (Kaufmann and Geen 1998). In the case of halibut, thisconcern resulted in a counter-productive court case that pitted commercial fishers against one another as wellas commercial fishers against the Department of Fish and Ocean. In retrospect it may have been morebeneficial to use an independent arbitrator to determine initial allocations in the halibut IVQ programme. Theprocess would thus have seen to be more impartial and would have been less open to criticism.
Quota allocation is always a contentious issue. Independent advisors/arbitrators can provide advice to theMinister on the most appropriate allocation system within a defined fishery, or between defined fisheries(intersectoral allocation). These individuals are simply advisory; the Minister still makes the final decision inrelation to allocation. Where necessary, advisors/arbitrators can obtain advice or input from relevant legal,economic or statistical experts.
Since quotas were introduced in the halibut fishery in 1991, Fisheries and Oceans Canada has started touse independent advice on allocations of fishing resources on the Pacific coast. For example, the Canadiangovernment used an independent arbitrator to recommend allocation arrangements between the groundfishtrawl, and the hook-and-line fleets. At the same time the arbitrator provided advice on the initial allocationformula for the groundfish trawl IVQ programme.
2.8 Discussion
The IVQ programme has successfully involved vessel owners more closely in the management of theresource from which they derive their livelihood and a co-operative approach has evolved in the commercialhalibut fishery. Halibut licence-holders have recently formed the Pacific Halibut Management Associationof B.C. (PHMA) through which halibut fishers would like to enter formal co-management arrangementswith Fisheries and Oceans Canada, and assume greater responsibility for the day-to-day operations of thefishery.
3. CANADA’S PACIFIC COAST GEODUCK CLAM FISHER Y3.1 Intr oduction
Heizer (2000) provides an excellent history and description of the commercial geoduck (Panopeaabrupta) fishery in British Columbia. Geoduck clams can be found on the west coast of North America fromAlaska to the Gulf of California. They are found from the intertidal zone to depths of at least 110 m, buriedup to one metre deep in soft substrates ranging from mud to pea gravel. Once dug in, they remain in the samespot for the duration of their lifespan, which is well over 100 years.
Recruitment to the fishery begins at age four and by age 12 geoducks are fully available for harvest.Juveniles can be harvested at any age but are not marketable. Geoducks are harvested commercially by diversusing high pressure water delivered through a nozzle (known as a “stinger”) which loosens the substrate aroundthe clam and allows the diver to lift the clams out alive (DFO 2000).
Canada’s Pacific geoduck fishery began in 1976. In 1983 the fishery came under a limited-entry licensingprogramme. Following several licence appeals, 55 geoduck (Category “G”) licences were issued. Between
Canada’s Pacific Fisheries 272
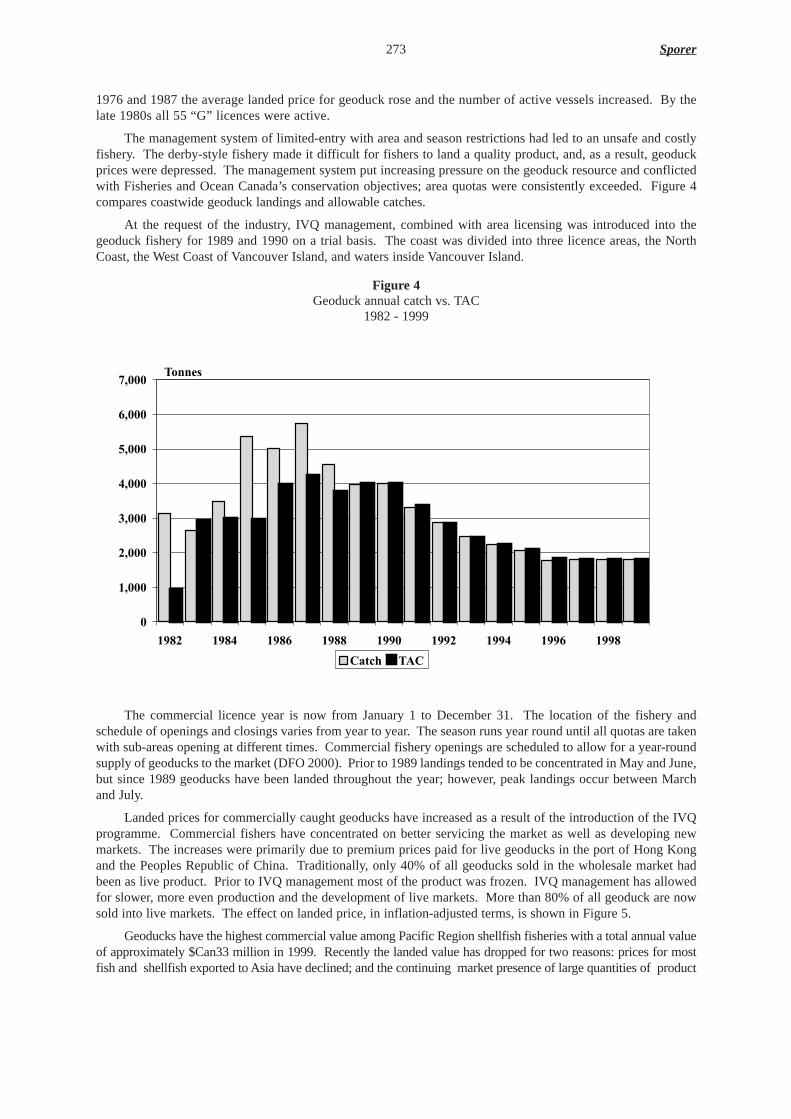
1976 and 1987 the average landed price for geoduck rose and the number of active vessels increased. By thelate 1980s all 55 “G” licences were active.
The management system of limited-entry with area and season restrictions had led to an unsafe and costlyfishery. The derby-style fishery made it difficult for fishers to land a quality product, and, as a result, geoduckprices were depressed. The management system put increasing pressure on the geoduck resource and conflictedwith Fisheries and Ocean Canada’s conservation objectives; area quotas were consistently exceeded. Figure 4compares coastwide geoduck landings and allowable catches.
At the request of the industry, IVQ management, combined with area licensing was introduced into thegeoduck fishery for 1989 and 1990 on a trial basis. The coast was divided into three licence areas, the NorthCoast, the West Coast of Vancouver Island, and waters inside Vancouver Island.
Figure 4Geoduck annual catch vs. TAC
1982 - 1999
The commercial licence year is now from January 1 to December 31. The location of the fishery andschedule of openings and closings varies from year to year. The season runs year round until all quotas are takenwith sub-areas opening at different times. Commercial fishery openings are scheduled to allow for a year-roundsupply of geoducks to the market (DFO 2000). Prior to 1989 landings tended to be concentrated in May and June,but since 1989 geoducks have been landed throughout the year; however, peak landings occur between Marchand July.
Landed prices for commercially caught geoducks have increased as a result of the introduction of the IVQprogramme. Commercial fishers have concentrated on better servicing the market as well as developing newmarkets. The increases were primarily due to premium prices paid for live geoducks in the port of Hong Kongand the Peoples Republic of China. Traditionally, only 40% of all geoducks sold in the wholesale market hadbeen as live product. Prior to IVQ management most of the product was frozen. IVQ management has allowedfor slower, more even production and the development of live markets. More than 80% of all geoduck are nowsold into live markets. The effect on landed price, in inflation-adjusted terms, is shown in Figure 5.
Geoducks have the highest commercial value among Pacific Region shellfish fisheries with a total annual valueof approximately $Can33 million in 1999. Recently the landed value has dropped for two reasons: prices for mostfish and shellfish exported to Asia have declined; and the continuing market presence of large quantities of product
273 Sporer
0
1,000
2,000
3,000
4,000
5,000
6,000
7,000
1982 1984 1986 1988 1990 1992 1994 1996 1998
Tonnes
Catch TAC
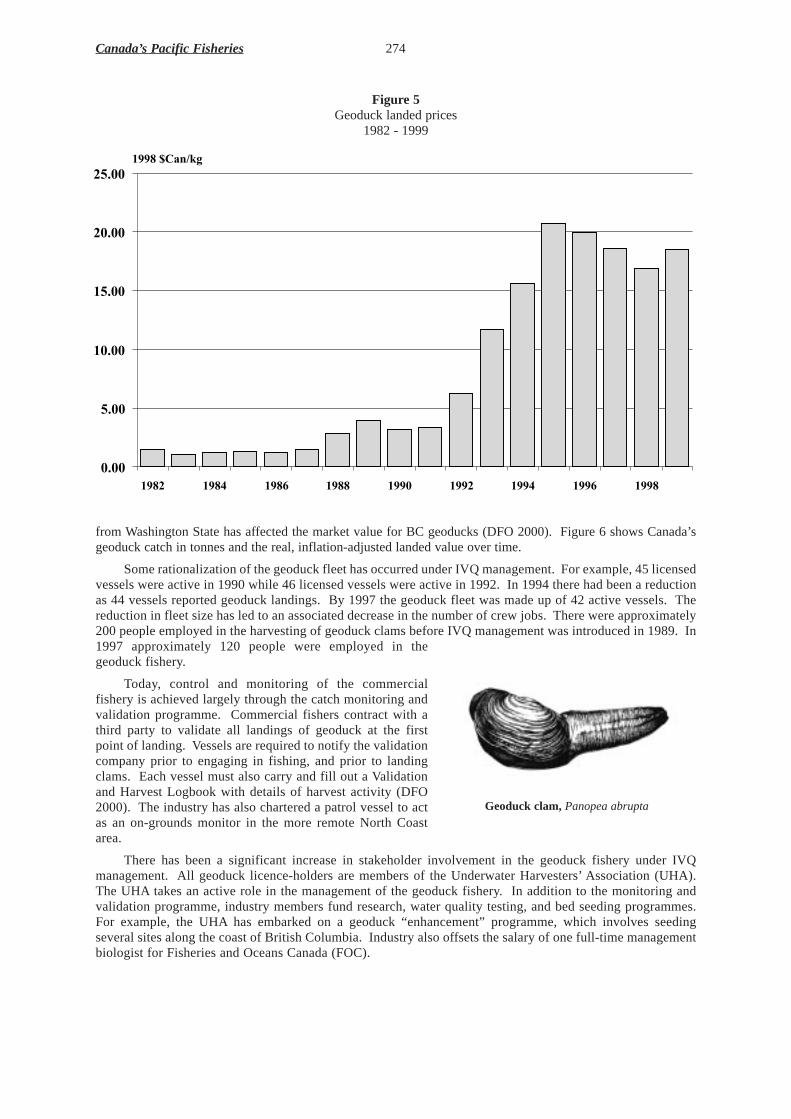
Figure 5Geoduck landed prices
1982 - 1999
from Washington State has affected the market value for BC geoducks (DFO 2000). Figure 6 shows Canada’sgeoduck catch in tonnes and the real, inflation-adjusted landed value over time.
Some rationalization of the geoduck fleet has occurred under IVQ management. For example, 45 licensedvessels were active in 1990 while 46 licensed vessels were active in 1992. In 1994 there had been a reductionas 44 vessels reported geoduck landings. By 1997 the geoduck fleet was made up of 42 active vessels. Thereduction in fleet size has led to an associated decrease in the number of crew jobs. There were approximately200 people employed in the harvesting of geoduck clams before IVQ management was introduced in 1989. In1997 approximately 120 people were employed in thegeoduck fishery.
Today, control and monitoring of the commercialfishery is achieved largely through the catch monitoring andvalidation programme. Commercial fishers contract with athird party to validate all landings of geoduck at the firstpoint of landing. Vessels are required to notify the validationcompany prior to engaging in fishing, and prior to landingclams. Each vessel must also carry and fill out a Validationand Harvest Logbook with details of harvest activity (DFO2000). The industry has also chartered a patrol vessel to actas an on-grounds monitor in the more remote North Coastarea.
There has been a significant increase in stakeholder involvement in the geoduck fishery under IVQmanagement. All geoduck licence-holders are members of the Underwater Harvesters’Association (UHA).The UHAtakes an active role in the management of the geoduck fishery. In addition to the monitoring andvalidation programme, industry members fund research, water quality testing, and bed seeding programmes.For example, the UHAhas embarked on a geoduck “enhancement” programme, which involves seedingseveral sites along the coast of British Columbia. Industry also offsets the salary of one full-time managementbiologist for Fisheries and Oceans Canada (FOC).
Canada’s Pacific Fisheries 274
0.00
5.00
10.00
15.00
20.00
25.00
1982 1984 1986 1988 1990 1992 1994 1996 1998
1998 $Can/kg
Geoduck clam,Panopea abrupta
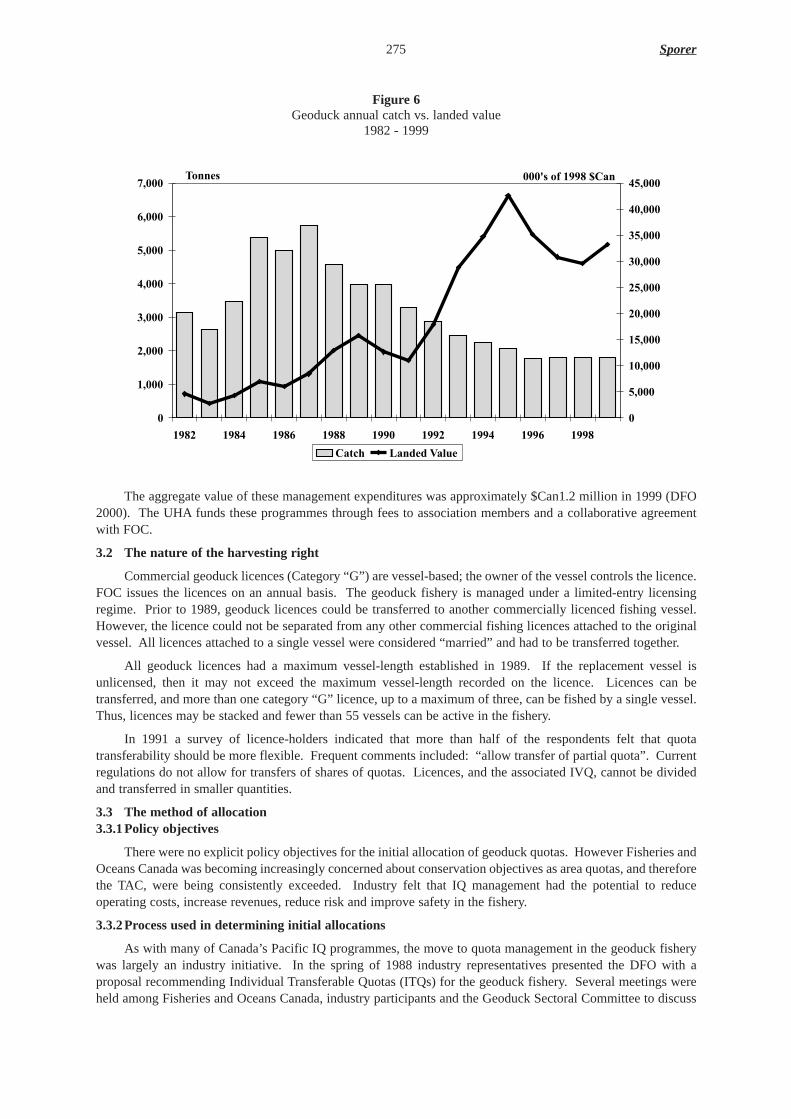
Figure 6Geoduck annual catch vs. landed value
1982 - 1999
The aggregate value of these management expenditures was approximately $Can1.2 million in 1999 (DFO2000). The UHAfunds these programmes through fees to association members and a collaborative agreementwith FOC.
3.2 The nature of the harvesting right
Commercial geoduck licences (Category “G”) are vessel-based; the owner of the vessel controls the licence.FOC issues the licences on an annual basis. The geoduck fishery is managed under a limited-entry licensingregime. Prior to 1989, geoduck licences could be transferred to another commercially licenced fishing vessel.However, the licence could not be separated from any other commercial fishing licences attached to the originalvessel. All licences attached to a single vessel were considered “married” and had to be transferred together.
All geoduck licences had a maximum vessel-length established in 1989. If the replacement vessel isunlicensed, then it may not exceed the maximum vessel-length recorded on the licence. Licences can betransferred, and more than one category “G” licence, up to a maximum of three, can be fished by a single vessel.Thus, licences may be stacked and fewer than 55 vessels can be active in the fishery.
In 1991 a survey of licence-holders indicated that more than half of the respondents felt that quotatransferability should be more flexible. Frequent comments included: “allow transfer of partial quota”. Currentregulations do not allow for transfers of shares of quotas. Licences, and the associated IVQ, cannot be dividedand transferred in smaller quantities.
3.3 The method of allocation3.3.1Policy objectives
There were no explicit policy objectives for the initial allocation of geoduck quotas. However Fisheries andOceans Canada was becoming increasingly concerned about conservation objectives as area quotas, and thereforethe TAC, were being consistently exceeded. Industry felt that IQ management had the potential to reduceoperating costs, increase revenues, reduce risk and improve safety in the fishery.
3.3.2Process used in determining initial allocations
As with many of Canada’s Pacific IQ programmes, the move to quota management in the geoduck fisherywas largely an industry initiative. In the spring of 1988 industry representatives presented the DFO with aproposal recommending Individual Transferable Quotas (ITQs) for the geoduck fishery. Several meetings wereheld among Fisheries and Oceans Canada, industry participants and the Geoduck Sectoral Committee to discuss
275 Sporer
0
1,000
2,000
3,000
4,000
5,000
6,000
7,000
1982 1984 1986 1988 1990 1992 1994 1996 1998
Tonnes
0
5,000
10,000
15,000
20,000
25,000
30,000
35,000
40,000
45,000000's of 1998 $Can
Catch Landed Value
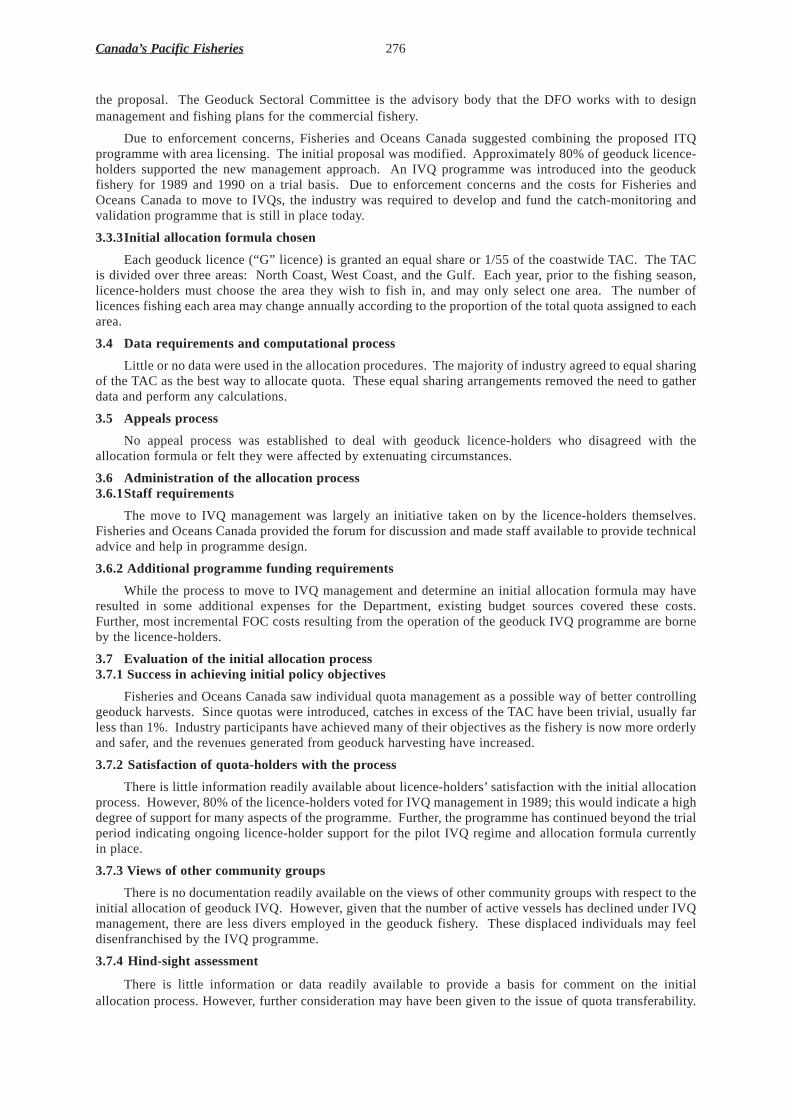
the proposal. The Geoduck Sectoral Committee is the advisory body that the DFO works with to designmanagement and fishing plans for the commercial fishery.
Due to enforcement concerns, Fisheries and Oceans Canada suggested combining the proposed ITQprogramme with area licensing. The initial proposal was modified. Approximately 80% of geoduck licence-holders supported the new management approach. An IVQ programme was introduced into the geoduckfishery for 1989 and 1990 on a trial basis. Due to enforcement concerns and the costs for Fisheries andOceans Canada to move to IVQs, the industry was required to develop and fund the catch-monitoring andvalidation programme that is still in place today.
3.3.3Initial allocation formula chosen
Each geoduck licence (“G” licence) is granted an equal share or 1/55 of the coastwide TAC. The TACis divided over three areas: North Coast, West Coast, and the Gulf. Each year, prior to the fishing season,licence-holders must choose the area they wish to fish in, and may only select one area. The number oflicences fishing each area may change annually according to the proportion of the total quota assigned to eacharea.
3.4 Data requirements and computational process
Little or no data were used in the allocation procedures. The majority of industry agreed to equal sharingof the TAC as the best way to allocate quota. These equal sharing arrangements removed the need to gatherdata and perform any calculations.
3.5 Appeals process
No appeal process was established to deal with geoduck licence-holders who disagreed with theallocation formula or felt they were affected by extenuating circumstances.
3.6 Administration of the allocation process3.6.1Staff r equirements
The move to IVQ management was largely an initiative taken on by the licence-holders themselves.Fisheries and Oceans Canada provided the forum for discussion and made staff available to provide technicaladvice and help in programme design.
3.6.2Additional pr ogramme funding requirements
While the process to move to IVQ management and determine an initial allocation formula may haveresulted in some additional expenses for the Department, existing budget sources covered these costs.Further, most incremental FOC costs resulting from the operation of the geoduck IVQ programme are borneby the licence-holders.
3.7 Evaluation of the initial allocation process3.7.1Success in achieving initial policy objectives
Fisheries and Oceans Canada saw individual quota management as a possible way of better controllinggeoduck harvests. Since quotas were introduced, catches in excess of the TAC have been trivial, usually farless than 1%. Industry participants have achieved many of their objectives as the fishery is now more orderlyand safer, and the revenues generated from geoduck harvesting have increased.
3.7.2Satisfaction of quota-holders with the process
There is little information readily available about licence-holders’satisfaction with the initial allocationprocess. However, 80% of the licence-holders voted for IVQ management in 1989; this would indicate a highdegree of support for many aspects of the programme. Further, the programme has continued beyond the trialperiod indicating ongoing licence-holder support for the pilot IVQ regime and allocation formula currentlyin place.
3.7.3Views of othercommunity groups
There is no documentation readily available on the views of other community groups with respect to theinitial allocation of geoduck IVQ. However, given that the number of active vessels has declined under IVQmanagement, there are less divers employed in the geoduck fishery. These displaced individuals may feeldisenfranchised by the IVQ programme.
3.7.4Hind-sight assessment
There is little information or data readily available to provide a basis for comment on the initialallocation process. However, further consideration may have been given to the issue of quota transferability.
Canada’s Pacific Fisheries 276
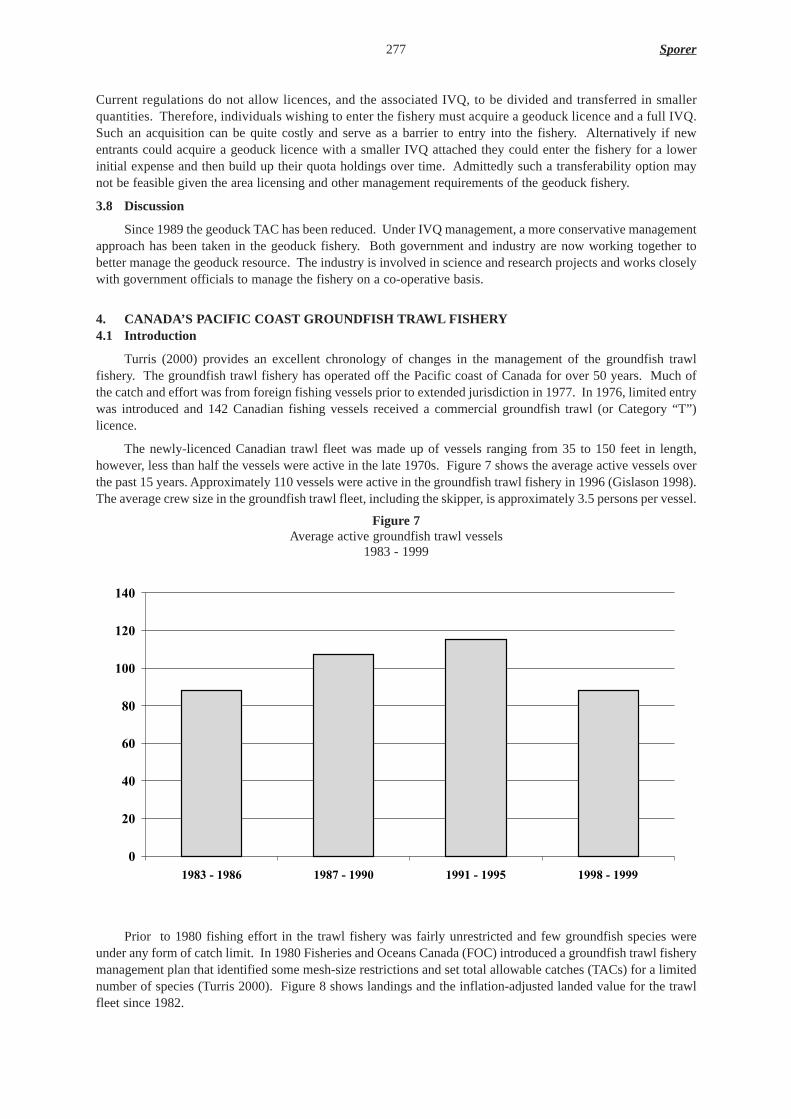
Current regulations do not allow licences, and the associated IVQ, to be divided and transferred in smallerquantities. Therefore, individuals wishing to enter the fishery must acquire a geoduck licence and a full IVQ.Such an acquisition can be quite costly and serve as a barrier to entry into the fishery. Alternatively if newentrants could acquire a geoduck licence with a smaller IVQ attached they could enter the fishery for a lowerinitial expense and then build up their quota holdings over time. Admittedly such a transferability option maynot be feasible given the area licensing and other management requirements of the geoduck fishery.
3.8 Discussion
Since 1989 the geoduck TAC has been reduced. Under IVQ management, a more conservative managementapproach has been taken in the geoduck fishery. Both government and industry are now working together tobetter manage the geoduck resource. The industry is involved in science and research projects and works closelywith government officials to manage the fishery on a co-operative basis.
4. CANADA’S PACIFIC COAST GROUNDFISH TRAWL FISHERY4.1 Intr oduction
Turris (2000) provides an excellent chronology of changes in the management of the groundfish trawlfishery. The groundfish trawl fishery has operated off the Pacific coast of Canada for over 50 years. Much ofthe catch and effort was from foreign fishing vessels prior to extended jurisdiction in 1977. In 1976, limited entrywas introduced and 142 Canadian fishing vessels received a commercial groundfish trawl (or Category “T”)licence.
The newly-licenced Canadian trawl fleet was made up of vessels ranging from 35 to 150 feet in length,however, less than half the vessels were active in the late 1970s. Figure 7 shows the average active vessels overthe past 15 years. Approximately 110 vessels were active in the groundfish trawl fishery in 1996 (Gislason 1998).The average crew size in the groundfish trawl fleet, including the skipper, is approximately 3.5 persons per vessel.
Figure 7Average active groundfish trawl vessels
1983 - 1999
Prior to 1980 fishing effort in the trawl fishery was fairly unrestricted and few groundfish species wereunder any form of catch limit. In 1980 Fisheries and Oceans Canada (FOC) introduced a groundfish trawl fisherymanagement plan that identified some mesh-size restrictions and set total allowable catches (TACs) for a limitednumber of species (Turris 2000). Figure 8 shows landings and the inflation-adjusted landed value for the trawlfleet since 1982.
277 Sporer
0
20
40
60
80
100
120
140
1983 - 1986 1987 - 1990 1991 - 1995 1998 - 1999

Figure 8Groundfish trawl annual catch vs. landed value
1982 – 1998
As in other limited-entry fisheries, effort began to increase as vessel owners invested heavily in their fishingoperations to stay competitive in the race for the fish. Catching capacity increased as vessels used more engine-power, effective gear, new fish-finding electronics, improved hydrographic charts and stern trawls instead of sidetrawls (Turris 2000). As a result of the increased catching capacity the TACs for many species were reachedbefore the end of the year.
Increasingly complex management plans were designed in an effort to keep the fishery open year round.Trip limits and monthly limits were implemented in an attempt to distribute effort and catch throughout the year.Despite these measures, fishing effort continued to increase. Trip limits were reduced and at-sea discarding andmisreporting of catch worsened (Turris 2000). The situation was exacerbated as the Department of Fisheries andOceans began to place catch-limits on previously unrestricted species. By 1995 the catching capacity of the fleethad increased so dramatically that is was becoming very difficult to stay within annual TACs.
Although unprecedented, the groundfish trawl fishery closed for the first time in September 1995 due tosignificant catches in excess of the TAC. The fishery re-opened in 1996 with numerous new regulations,including 100% at-sea observer coverage for all bottom trawl trips, 100% dockside monitoring of landed catchesand new species- and stock-specific catch-limits (Turris 2000). These new regulations imposed significant costson the industry while the fishery was already struggling financially because of low landed prices and shrinkingmarkets.
The existing management structure left industry with little flexibility to improve returns from the fishery.The groundfish trawl industry recognized that significant change had to occur if their fishery was to surviveeconomically in the future. In early 1996, the DFO and industry began to discuss changes to the management ofthe groundfish trawl fishery (Turris 2000). The consultative process was initiated with the distribution of adiscussion paper that gave background information on the fishery and listed six long-term management optionsunder consideration.
In July 1996 four public meetings were held to solicit advice from interested stakeholders. Writtensubmissions were also accepted. A survey was widely distributed to industry stakeholders, environmentalorganizations and coastal community representatives to encourage input on the issue. Individuals were alsoencouraged to express their views to a Groundfish Trawl Advisory Committee (GTAC) representative. GTAC isthe advisory body that the DFO works with to design management and fishing plans for the groundfish trawlfishery.
Canada’s Pacific Fisheries 278
0
20,000
40,000
60,000
80,000
100,000
120,000
140,000
160,000
180,000
1982 1984 1986 1988 1990 1992 1994 1996 1998
Tonnes
0
10,000
20,000
30,000
40,000
50,000
60,000000s of 1998 $Can
Catch Landed Value

Individual vessel quotas (IVQs) were considered for the groundfish trawl industry. A subcommittee ofGTAC, the Groundfish Special Industry Committee (GSIC), was formed to negotiate IVQ programme detailssuch as transferability, species-caps and holdings-caps. After 14 months of consultation and difficultnegotiations, IVQs were introduced into the groundfish trawl fishery.
Turris (2000) provides a complete overview of the groundfish trawl IVQ programme. The fishery is nowopen from 1 April through 31 March. While fishers are free to fish at any time during the open season, trawlvessels are subject to various restrictions. For all bottom trawl trips, all vessels must carry an at-sea observerto estimate location, towing time, catch, discards and collect biological samples. All trawl landings areweighed and validated at the dock by an independent contractor certified by Fisheries and Oceans Canada.Vessels are also subject to quota and species-caps to limit quota concentration and fleet rationalization. If avessel exceeds a species IVQ by more than the permitted amount, the vessel is restricted to mid-water trawlingin that area for the remainder of the year. Alternatively, the vessel can acquire additional quota for that speciesand continue fishing.
The groundfish trawl IVQ programme is by far the most complex of all individual quota fisheries onCanada’s Pacific Coast. There are over 55 groundfish species under quota and various transferability andfishing rules exist. Despite these complexities, the groundfish trawl IVQ programme has proven verysuccessful. Catch limits are not being exceeded, the industry is becoming profitable and the programme’ssocial benefit objectives are, for the most part, being realized.
4.2 The nature of the harvesting right
Commercial groundfish trawl licences (Category “T”) are vessel-based; the owner of the vessel controlsthe licence. The groundfish trawl fishery is managed under a limited-entry licensing regime. Fisheries andOceans Canada issues the licences on an annual basis. Prior to the 1999/2000 fishing season, a groundfishtrawl licence could not be separated from any other commercial fishing licences attached to the vessel. Allvessel licences had to be transferred together to a vessel of equal or less length.
Beginning in 1999/2000, vessels licensed only for the groundfish trawl fishery were permitted to movetheir single “T” licence (the vessel does not have any other commercial fishing licences attached to it). Thelicence can be moved to a vessel of equal or less length. It is important to note that this new rule does notapply to any vessel holding multiple vessel-based licences.
Groundfish trawl IVQ can only be transferred between Category “T” licensed vessels. All quota transfersmust be registered and approved by FOC. Unlimited transfers of quota are permitted subject to species- andholdings-caps designed to prevent excessive quota concentration. There are no temporary quota transfers;FOC considers all groundfish trawl IVQ transfers permanent. However, lease arrangements between licence-holders do result in short-term or annual transfers.
The minimum quantity of IVQ that can be transferred is one pound, measured as a percentage of the TAC(DFO 1997).
4.3 The method of allocation4.3.1Policy objectives
When the groundfish trawl IVQ programme was being designed, explicit conservation, economic andsocial objectives were determined. The allocation formula for the groundfish trawl IVQ programme containedspecific social objectives with respect to the distribution of benefits arising from the new management regime.The specific objectives were to: (a) maintain existing processing capability; (b) stabilize groundfish industryemployment; (c) encourage economic development in coastal communities; (d) allow fair treatment of crews(earnings and working conditions); (e) allow for a controlled rationalization to an economically viable fleetlevel (in the range of 60 – 80 active vessels); and (f) avoid the pitfalls associated with leasing and quotaconcentration.
As a result of these objectives, the initial allocation of IVQ in the groundfish trawl fishery was designedto influence the way in which any economic benefits arising from the management change were divided. Theinitial allocation was also designed to control the pace of the change that could result from such a radical shiftin the management of the fishery.
4.3.2 Process used in determining initial allocations
The determination of the initial allocation formula for the groundfish trawl fishery was turned over to anindependent arbitrator, a retired Supreme Court justice. This arbitrator received hundreds of recommendationsthrough the mail, as well as from numerous industry and public meetings held throughout the province between
279 Sporer

January and December 1996. His recommendations were submitted to the Minister of Fisheries and Oceans inJanuary 1997, were accepted and incorporated into the groundfish trawl IVQ programme.
4.3.3Initial allocation formula chosen
As outlined in Turris (2000), the groundfish trawl commercial TAC is allocated to three different quotas:vessel owner IVQs (80%), Groundfish Development Quota (10%), and Code of Conduct Quota (10%).
Each year, 80% of the TAC is allocated to the groundfish trawl fleet and each licenced vessel’s initial quotawas based on 1986 to 1989 catch history (70%) and vessel length (30%). The Minister allocates the remaining10% Groundfish Development Quota (GDQ) and the 10% Code of Conduct Quota (CCQ) based on advicereceived from the Groundfish Development Authority (GDA).
The GDAwas established solely to provide advice on groundfish trawl allocations. The GDAhas sevenvoting members and a number of non-voting, ex-officio participants to provide background information andexpertise necessary for the GDAprocess. The purpose of the GDAis to aid regional development, attain marketand employment objectives, support sustainable fishing practices and ensure fair treatment of crews and safevessel operation.
GDQ proposals are submitted jointly to the GDAby a group of vessel owners and a processor. Proposalsare evaluated and ranked based on the extent to which the proposal contributes to the achievement of GDAobjectives, the total IVQ commitment of proponents, the processing history of the applicant and evidence ofadherence to previously submitted plans (Turris 2000). The rating assigned determines the amount of GDQ theproposal receives and the allocation is added to the IVQ of the licenced vessels that made the proposal. GDQcannot be transferred.
CCQ are used to provide an incentive to help ensure that crew members are treated fairly and equitablyunder the IVQ programme. The 10% CCQ is allocated to each vessel in proportion to the vessel’s IVQ holdings(Turris 2000). Any complaints of poor treatment of crew are made to the GDA. The GDAreviews all availableinformation and make recommendations to the Minister on whether or not to hold back some, or all, of the CCQof the vessel involved in the claim. CCQ is subject to the same transferability rules as IVQ.
4.4 Data requirements and computational process
Data was required to calculate the 80% portion of the TAC allocated to each groundfish trawl licencedvessel. Catch history (70%) and vessel length (30%) data were required. The information required was readilyavailable from databases held by Fisheries and Oceans Canada. DFO sales slip data were used to determine thecatch history portion of the initial allocation formula. Vessel length had been previously collected as part of DFOlicensing requirements and, at that time, had been determined by a certified marine surveyor.
4.5 Appeals process
An appeals process was established for groundfish trawl licence-holders that were in disagreement with thecatch history, vessel length information or IVQ allocated to the vessel’s trawl licence. A special panel of theDFO’s Pacific Region Licence Appeal Board (PRLAB) heard the groundfish trawl IVQ appeals1. The GroundfishPanel of PRLAB was established in July 1997 to hear the appeals generated by the trawl IVQ programme.
If an appellant claimed additional landings during the years used under the allocation formula, theselandings had to be substantiated by way of fish slips or log records, hail records, dock tallies, affidavits frombuyers or income tax records. If an appellant was claiming extenuating circumstances during the years usedunder the initial allocation formula, these conditions or events must have directly affected their ability to fishgroundfish or hake in the relevant years (such as health problems, vessel breakdown, personal hardship, licencetransfers).
Forty-five licence-holders appealed for an increased groundfish trawl IVQ allocation. The Panelrecommended the Minister approve seventeen of the appeals. The additional information generated from theseseventeen successful appeals was incorporated into the initial allocation methodology and new IVQ allocationswere determined. To accommodate these increases, initial allocations were slightly reduced across the fleet.
Canada’s Pacific Fisheries 280
1 The Minister of Fisheries and Oceans established the PRLAB in 1979 to be the last administrative level of appeal for fishersdissatisfied with DFO licensing decisions pertaining to West Coast fisheries. The PRLAB does not make decisions onlicence policy or fisheries programs. PRLAB is strictly an advisory body to the Minister regarding exceptions to establishedpolicies and programs.

4.6 Administration of the allocation process4.6.1Staff requirements
An independent arbitrator determined the initial allocation formula. A consultant was hired to assist thearbitrator with meetings and help provide background information. Staff of Fisheries and Oceans Canadaprepared discussion papers, assisted with the industry and public meetings and provided technical advice whenrequested.
4.6.2Additional pr ogramme funding requirements
Additional funding above the budget of the groundfish trawl programme was required to pay for theindependent arbitrator, plus industry and stakeholder meetings. These funds came from the existing FOC –Pacific Region Fisheries Management Branch budget.
4.7 Evaluation of the initial allocation process4.7.1 Success in achieving initial policy objectives
As outlined above, specific objectives were set when IVQ management was considered for the groundfishtrawl fishery. Through the allocation of the TAC, the groundfish trawl IVQ programme attempts to meet theseobjectives by influencing the way in which economic and other benefits derived from the fishery are divided.The decisions and activities of quota holders can directly impact crews, shoreworkers and coastal communities(Groundfish Special Industry Committee 1999).
A 1999 evaluation of the groundfish trawl IVQ programme indicated that many of the social objectivesare being met. Specifically, the programme appears to have led to increased stability in the processing sector.Further, more groundfish is being landed in coastal communities, although evidence regarding final processinglocation is inconclusive.
The GDAgives influence to non-vessel/quota-owning interests as it creates the potential for vessels tolose 10% of their individual allocation and, therefore, encourages vessel owners to treat their crews fairly.However, as discussed in the 1999 evaluation of the trawl IVQ programme, the incentives of the CCQ areinherently flawed. The successful filing of a claim with the GDAwill ultimately result in less IVQ for thecrewman’s vessel and this may inhibit the filing of complaints (Groundfish Special Industry Committee 1999).
While the GDAencourages more broad distribution of the benefits derived from the fishery, the holdings-caps permit some rationalization of the fleet but place a limit on quota concentration. While there aretechnically no temporary transfers of groundfish trawl IVQ due to the current transferability provisions, quota-leasing has occurred and resulted in short-term or annual transfers (Turris 2000). However, this is not beyondwhat was deemed acceptable when the programme was initially designed (Groundfish Special IndustryCommittee 1999).
4.7.2Satisfaction of quotas-holders with the process
While there is a general consensus in the industry that the IVQ programme moved the groundfish trawlfishery in the right directions, some vessel owners feel disenfranchized by the allocation process. For example,vessel owners who entered the fishery after the period used to determine the catch history portion of IVQallocations (1986 to 1989) were unhappy with the years chosen. Owners of small vessels felt the allocationformula favored the larger boats and did not recognize that some operators deliver small amounts of fish tofocus on quality rather than quantity (Turris 2000). According to Turris (2000), many licence-holders areunhappy about the GDQ programme and believe that processing companies and communities use it to leveradditional IVQ from independent operators. These licence-holders feel that the GDQ programme restrictshealthy competition and results in lower prices.
4.7.3Views of othercommunity groups
Even though individual quotas are not legally considered property in Canada, many groups feel theyprivatize the resource and restrict broad access and utilization to a publicly owned resource. Many coastalcommunities would like to see fish allocated as community development quota and used to improve localeconomic opportunities (Turris 2000). In the groundfish trawl IVQ programme, crews, shore-workers andcoastal communities have a say in the allocation of the resource through the GDA.
4.7.4Hind-sight assessment
By 1996, when discussions on IVQ management for the trawl fishery began, Fisheries and OceansCanada had already implemented a number of individual quota programmes on Canada’s Pacific coast. Anumber of lessons had been learned and the valuable experience gained was used in the design of the
281 Sporer
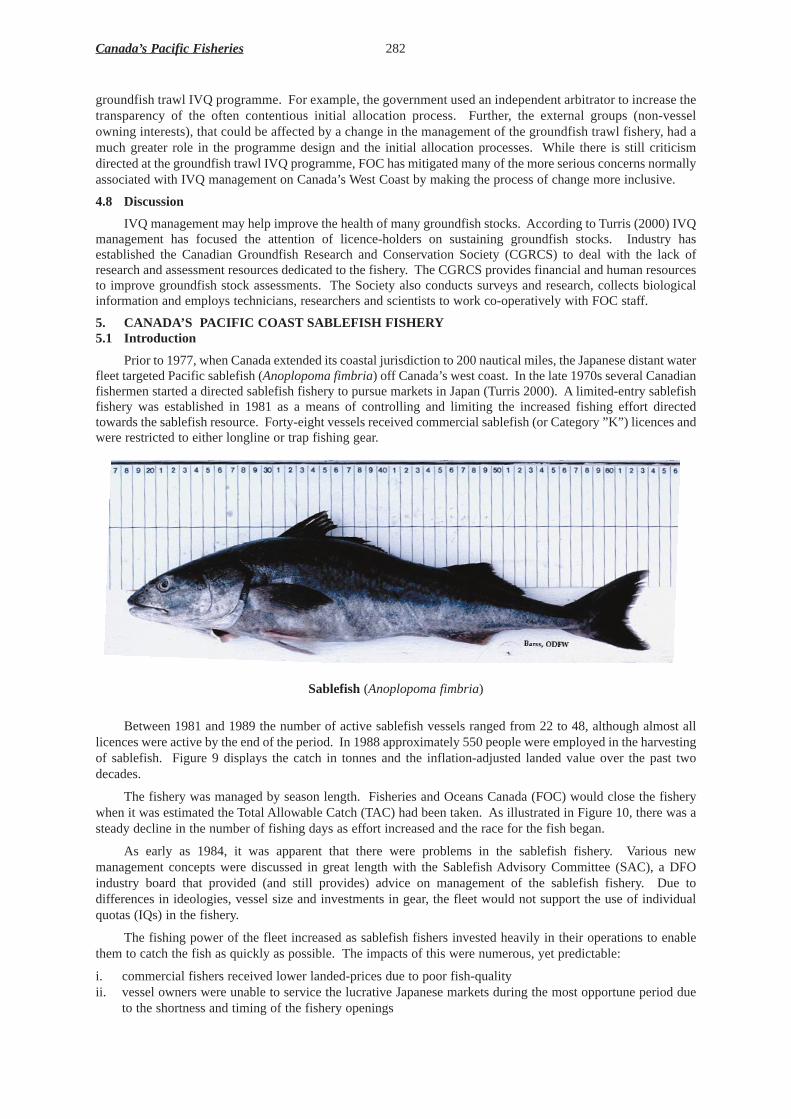
groundfish trawl IVQ programme. For example, the government used an independent arbitrator to increase thetransparency of the often contentious initial allocation process. Further, the external groups (non-vesselowning interests), that could be affected by a change in the management of the groundfish trawl fishery, had amuch greater role in the programme design and the initial allocation processes. While there is still criticismdirected at the groundfish trawl IVQ programme, FOC has mitigated many of the more serious concerns normallyassociated with IVQ management on Canada’s West Coast by making the process of change more inclusive.
4.8 Discussion
IVQ management may help improve the health of many groundfish stocks. According to Turris (2000) IVQmanagement has focused the attention of licence-holders on sustaining groundfish stocks. Industry hasestablished the Canadian Groundfish Research and Conservation Society (CGRCS) to deal with the lack ofresearch and assessment resources dedicated to the fishery. The CGRCS provides financial and human resourcesto improve groundfish stock assessments. The Society also conducts surveys and research, collects biologicalinformation and employs technicians, researchers and scientists to work co-operatively with FOC staff.
5. CANADA’S PACIFIC COAST SABLEFISH FISHERY5.1 Intr oduction
Prior to 1977, when Canada extended its coastal jurisdiction to 200 nautical miles, the Japanese distant waterfleet targeted Pacific sablefish (Anoplopoma fimbria) off Canada’s west coast. In the late 1970s several Canadianfishermen started a directed sablefish fishery to pursue markets in Japan (Turris 2000). A limited-entry sablefishfishery was established in 1981 as a means of controlling and limiting the increased fishing effort directedtowards the sablefish resource. Forty-eight vessels received commercial sablefish (or Category ”K”) licences andwere restricted to either longline or trap fishing gear.
Sablefish (Anoplopoma fimbria)
Between 1981 and 1989 the number of active sablefish vessels ranged from 22 to 48, although almost alllicences were active by the end of the period. In 1988 approximately 550 people were employed in the harvestingof sablefish. Figure 9 displays the catch in tonnes and the inflation-adjusted landed value over the past twodecades.
The fishery was managed by season length. Fisheries and Oceans Canada (FOC) would close the fisherywhen it was estimated the Total Allowable Catch (TAC) had been taken. As illustrated in Figure 10, there was asteady decline in the number of fishing days as effort increased and the race for the fish began.
As early as 1984, it was apparent that there were problems in the sablefish fishery. Various newmanagement concepts were discussed in great length with the Sablefish Advisory Committee (SAC), a DFOindustry board that provided (and still provides) advice on management of the sablefish fishery. Due todifferences in ideologies, vessel size and investments in gear, the fleet would not support the use of individualquotas (IQs) in the fishery.
The fishing power of the fleet increased as sablefish fishers invested heavily in their operations to enablethem to catch the fish as quickly as possible. The impacts of this were numerous, yet predictable:
i. commercial fishers received lower landed-prices due to poor fish-qualityii. vessel owners were unable to service the lucrative Japanese markets during the most opportune period due
to the shortness and timing of the fishery openings
Canada’s Pacific Fisheries 282

iii. fishing costs continued to increase as fishermen tried to maintain their share of the catch with on-going gearand vessel improvements
iv. commercial fishers, under pressure to fish in bad weather and to overload their vessels with gear and crew,often compromised safety and
v. slight miscalculations in the efficiency of the fleet by fisheries managers lead to catches in excess of the TACin every year from 1981 to 1989.
Figure 9Sablefish annual catch vs. landed value
1981 - 1999
Figure 10Sablefish fishery season length
1981 - 1999
283 Sporer
0
1,000
2,000
3,000
4,000
5,000
6,000
1981 1983 1985 1987 1989 1991 1993 1995 1997 1999
Tonnes
0
5,000
10,000
15,000
20,000
25,000
30,000
35,000000s of 1998 $Can
Catch Landed Value
0
50
100
150
200
250
300
350
400
1981 1983 1985 1987 1989 1991 1993 1995 1997 1999
Days
The Department of Fisheries and Oceans was also concerned about monitoring and enforcement of thesablefish fishery. There were rumours of operators fishing outside of the season and other commercial users(groundfish trawlers and longliners) illegally landing sablefish throughout the year (Turris 2000). Due to thecost of monitoring and enforcement, budget cuts and departmental priorities, the Department of Fisheries andOceans lacked the resources to effectively monitor sablefish landings.
When the sablefish fishery was projected to be open for no more than eight days in 1990, the PacificBlackcod Fishermen’s Association (an organization of sablefish licence-holders) approached the Departmentof Fisheries and Oceans in October 1989, recommending that an IQ programme be developed for the sablefishfishery for 1990 An Individual Vessel Quota (IVQ) programme was implemented in the sablefish fishery in1990 for a two-year trial period.
The trial IVQ programme proved very successful. The programme was extended and continues today.Since the introduction of IVQs, catches have been within 0.5% of TAC, and in some years the fleet has landedless than the allowable catch. All landings are verified through an independent dockside-monitoringprogramme paid for by the sablefish fishers. Catches are also monitored through mandatory logbooks, sales-slip information and restricted offloading locations.
The sablefish fishery is now open from 1 January to 31 December and licenced vessels are permitted tofish at any time but must “hail-out” prior to proceedings to the fishing grounds and “hail-in” prior to landing(Turris 2000). Prior to IVQ management, most landings of sablefish occurred between March and September.Since 1990 landings have occurred year round, but a significant proportion occur between September andMarch to take advantage of greater market demand.
The number of active sablefish vessels has declined since IVQs were introduced. In 1998, 24 Category“K” licenced vessels reported sablefish landings. The reduction in fleet size has obviously led to a decline inthe number of crew jobs. However, total earnings for crews increased from $Can6.4 million in 1988 to$Can7.4 million in 1991 and $Can7.0 million in 1994. The average earnings per crew member increased fromabout $Can12 000 before IVQs to $Can33000 in 1991, and $Can46 500 in 1994.
The biggest change in sablefish fishery regulations arose from the port-offloading validation and quota-monitoring programme, operated independently of the DFO by a third-party contractor. To further increaseenforcement, one additional fishery officer person-year has been dedicated to the sablefish fishery. Licence-holders pay for both these initiatives. In fact, as in the halibut fishery, sablefish licence-holders are requiredto pay all the incremental costs associated with management, monitoring, and enforcement of the IVQprogramme. The net effect has been no additional costs to the Department of Fisheries and Oceans.
Stakeholder involvement has increased significantly under IVQ management. Through the PacificBlackcod Fishermen’s Association, licence-holders are taking an active role in the management of their fisheryand the sablefish resource. The Association works closely with the Department of Fisheries and Oceans staffon the development of management plans and has hired scientific staff to work with government biologists onstock assessments and other research.
5.2 The nature of the harvesting right
Commercial sablefish licences (Category “K”) are vessel-based; the owner of the vessel controls thelicence. Fisheries and Oceans Canada issues the licences on an annual basis. The sablefish fishery is managedunder a limited-entry licensing regime.
Prior to 1989, a sablefish licence could not be separated from any other commercial fishing licencesattached to the vessel. All licences attached to the vessel had to be transferred together. Today a sablefishlicence can be permanently or temporarily separated, and be transferred from any combination of licences ona vessel as long as it is placed on another commercially licenced fishing vessel (of any length) that does notalready have a Category “K” licence.
Since 1989, only temporary (annual) transfers of quotas have been permitted between “K” licensedvessels. Initially, each sablefish licence was assigned a “quota block”, determined by the initial allocationformula, and vessel owners were permitted to trade quota blocks. Once a quota block had landings against it,it could not be transferred. In 1993 each quota block was broken into smaller quota shares that could betransferred. Once a quota share had landings against it, the remainder of that share could not be transferred.In 1995, quota shares were dropped and sablefish IVQ could be traded on a per pound basis. This practiceremains in place today.
Canada’s Pacific Fisheries 284

5.3 The method of allocation5.3.1Policy objectives
There were no explicit policy objectives for the initial allocation of quota. Fisheries and Oceans Canada,in general, wanted an alternative management strategy for the sablefish fishery to be able to better controlharvests and meet conservation objectives.
5.3.2Process used in determining initial allocations
As stated above, the Pacific Coast Blackcod Fishermen’s Association made a recommendation to moveto IQ management. Fisheries and Oceans Canada then consulted with the Sablefish Advisory Committee(SAC), an industry advisory body made up of eight licence-holders and a processing company representative.After several meetings to develop the initial allocation formula and design the IVQ system, the DFOdistributed a discussion paper outlining the concept of IQs, each sablefish vessel owner’s IVQ allocation, andthe details of a two-year trial programme.
Sablefish fishers were asked to vote on the proposed IVQ programme (Turris 2000). More than 95%supported the proposal. Individual quotas were introduced in the sablefish fishery a mere nine months afterthe initial request from industry.
5.3.3Initial allocation formula chosen
Each vessel in the sablefish fleet was allocated an individual quota using a set formula. The formulacalculates 70% of the quota based on historical catch and 30% of the quota on the licensed vessel’s overalllength. Historic catch was determined by taking each licence’s best catch in either 1988 or 1989. This numberwas then divided by the total of all sablefish vessel highest landings in either 1988 or 1989, and then multipliedby 70% of the 1990 TAC. Overall length was determined for each individual vessel by a certified marinesurveyor and then divided by the total length for the fleet. This number was then multiplied by 30% of the1990 TAC.
5.4 Data requirements and computational process
The information required was readily available from Fisheries and Oceans Canada databases. DFO sales-slip data was used to determine the catch history portion of the initial allocation formula. Vessel length hadbeen previously collected as part of DFO licensing requirements and, at that time, had been determined by acertified marine surveyor.
In the discussion paper sent to vessel owners, Fisheries and Oceans Canada provided each sablefish fisherwith the catch history on file for their licence and the necessary information about their vessel. Licence-holders were also provided with the initial IVQ for their vessel for the upcoming season. In the event of adisagreement with the data presented, fishermen were encouraged to contact Fisheries and Oceans Canada.Fishers were required to provide documentation proving an error had been made.
5.5 Appeals process
No appeal process was established to deal with sablefish fishers who disagreed with the allocationformula or felt they were affected by extenuating circumstances. The Department only considered thediscrepancies between sales-slip records or overall vessel-length measurements.
5.6 Administration of the allocation process5.6.1Staff requirements
The move to IVQ management in the sablefish fishery was largely an industry initiative. Fisheries andOceans Canada provided the forum for discussion and made staff available to provide technical advice, aid inprogramme design and calculate initial allocations based on the formula derived by SAC.
5.6.2Additional pr ogramme funding requirements
While the process to move to IVQ management and determine an initial allocation formula may haveresulted in some additional expenses for the Department, existing budget sources covered these costs. Anyincremental costs resulting from the operation of the sablefish IVQ programme were borne by the licence-holders.
5.7 Evaluation of the initial allocation process5.7.1Success in achieving initial policy objectives
While there were no explicit policies for the initial allocation process, Fisheries and Oceans Canada sawindividual quota management as a possible way to achieve an orderly harvest of the sablefish resource.
285 Sporer
Catches have been within 0.5% of TAC since the introduction of IVQ. In some years the fleet has landed lessthan their total allowable catch.
5.7.2Satisfaction of quota-holders with the process
There is little information readily available about licence-holders’satisfaction with the initial allocationprocess. The fact that an overwhelming majority of licence-holders voted in favor of the proposed initial IVQallocation formula in 1989 would suggest licence-holders were not displeased with the process. Today themajority of the remaining industry participants are satisfied with the move to IVQs in the sablefish fishery(Turris 2000).
5.7.3Views of othercommunity groups
There is no information readily available on crew opinions on the initial allocation process. Turris (2000)discusses the views of crew members with respect to the move to IVQ management. As the number of activesablefish vessels has declined under IVQ management, there has also been a corresponding decline in crewemployment. However, those crew members remaining have more stable employment and are better paid.Crew members are often unhappy about having to absorb the costs of quota leasing through reduced crewshares. In some instances, crew members are paid a daily rate rather than a share.
5.7.4Hind-sight assessment
With respect to the initial allocation process, a more independent and transparent process may have beenpreferable. However, given the overwhelming support the IVQ proposal received, this criticism is moot. Asillustrated by Turris (2000), more thought could have been given to the issues of temporary versuspermanenttransferability of quotas. Only temporary (annual) quota transfers are permitted in the sablefish fishery.Fisheries and Oceans Canada was only willing to allow temporary transfers when the programme was firstintroduced. This led to a considerable amount of leasing between licence-holders, and this practice has becomeentrenched in the industry. If transferability had been more thoroughly analyzed prior to programmeimplementation, some of the criticisms regarding “armchair” fishing, leasing costs being passed onto crews,and high lease rates, etc. may have been mitigated (Turris 2000).
5.8 Discussion
There is greater industry involvement in the research, assessment, monitoring and administration of thesablefish fishery as a direct result of the IVQ programme (Turris 2000). The Pacific Blackcod Fishermen’sAssociation, which represents sablefish fishers, funds all management costs of the Department of Fisheries andOceans through cost-recovery mechanisms and employs independent researchers, scientists and fisherymanagers to help manage the resource.
6. CANADA’S PACIFIC COAST ROE HERRING FISHER Y6.1 Intr oduction
The fishery for roe herring (Clupea pallasi) is by far the largest user of the herring resource: on averageit uses approximately 80% of the harvestable surplus each year. Prior to 1998 the roe herring fishery by bothseine and gillnet vessels, was an intensely competitive, frantic race, timed precisely to catch female herringjust before they spawn when their roe yield is highest.
Canada’s Pacific roe herring fishery began in 1972 when herring stocks had recovered from a collapse inthe 1960s and the lucrative Japanese market for roe became accessible to Canadian producers. A newcommercial fishery was started to harvest herring for its roe. Figure 11 shows the catches and inflation-adjusted landed values for the roe herring fishery. The history and evolution of roe herring management aredescribed below.
Limited entry: In 1974 steps were taken to control the rapid expansion of the roe herring fleet by restrictingfuture access to the fishery to those who obtained licences that year. Fisheries and Oceans Canada now issues252 seine licences and 1301 gillnet licences annually.
Effort controls: Since the fishery began, the fishing effort of the roe herring fleet has been controlled througha variety of input controls such as numerous restrictions on gear (e.g.net length) and effort (e.g.time and areaopenings and closures).
Area licensing: In 1981 area-licensing was introduced to restrict excessive participation in each roe herringopening. Prior to 1981 a roe herring licence entitled the holder to participate in all openings on the coast ofBritish Columbia. The majority of the herring fleet would move from opening to opening, and fisheries
Canada’s Pacific Fisheries 286

managers faced increasing difficulty restricting the catch. Under area licensing, the coast is divided into fivegeographic areas and each licence is eligible to fish in only one area. This significantly reduces the number ofvessels participating in each opening.
Multiple area licensing: Given the timing of the fishery in each area, it is possible for a vessel to fish more thanone area in a single season provided that the vessel is able to obtain a separate licence for each area. This practiceof a vessel fishing more than one area, referred to as multiple licensing, reduced the number of active vesselsparticipating in the fishery. As the number of active vessels declined, so did employment in the fishery.
Double or triple licensing: In some instances the Department of Fisheries and Oceans has required that a vesselhave at least two roe herring licences to be eligible to fish in a specific area. The objective of this double-licencerequirement was to give managers better control over a fishery, by reducing the size of the fleet. This practicestarted in 1985 and was used increasingly over time. In 1997 double-licensing was required for all areas exceptthe Central Coast gillnet fishery. This also reduced employment levels in the fishery.
Figure 11Roe herring annual catch vs. landed value
1972 - 1999
Thus, as noted above, management of the Pacific roe herring fishery evolved steadily over the past 25 yearswith considerable input from participants in the fishery. Unfortunately, the fishing power of the fleet grew andthese measures proved incapable of controlling the harvest. Area target-catches were often exceeded, particularlyby the seine fleet.
By 1997 due to multiple area and double/triple licensing requirements, the fleet had been reduced toapproximately 105 active seine vessels and 415 active gillnet vessels. The average crew for a seine vessel wassix people including the skipper. Gillnet vessels had an average crew of four persons, including the skipper(Gislason 1998).
Two significant events occurred in 1997 that led to major change in the roe herring fishery. First, roe herringprices collapsed. The weakness of the Japanese economy and changing tastes in that country hurt market returns.Landed prices dropped by more than one third. Second, the seine fleet exceeded its target catch by over 100% inone management area and by more than 70% in another. The Minister of Fisheries and Oceans declared thisunacceptable and announced that change must occur in the roe herring fishery.
The Department of Fisheries and Oceans announced that, by the 1998 roe herring season, the governmentintended to have the necessary measures in place that would ensure area target-catches were not exceeded. Strictmanagement measures, unprecedented in the fishery’s history, were announced for 1998. The DFO recognized
287 Sporer
0
10,000
20,000
30,000
40,000
50,000
60,000
70,000
80,000
90,000
100,000
1972 1974 1976 1978 1980 1982 1984 1986 1988 1990 1992 1994 1996 1998
Tonnes
0
50,000
100,000
150,000
200,000
250,000
300,000000's of 1998 $Can
Catch Landed Value

that such measures could have profound impacts on roe herring fishery participants, and industry was given theopportunity to develop an acceptable alternative management strategy for the future.
After extensive industry and stakeholder consultation, a trial ‘pool’fishery plan was tested in all seinefisheries and in three small gillnet fisheries in 1998. Under the new pool fishery plan, vessels were groupedtogether or “pooled”. Each licence was granted an equal share of the target-catch in the fishing area chosen for1998. Each group of fishers or “pool” could catch the total amount of herring designated to the licences in thepool.
Any catch estimated to be in excess of an individual vessel’s authorized amount was transferred, in order ofpriority, to other vessels within the pool, to other pools in the management area, and, where total catch exceededthe target, to test fishing vessels, or the excess catch was allocated to an industry-run society, sold and the fundsused for research purposes. Catch weights were validated at the point of landing and this weight was measuredagainst the licence catch share. Vessel pooling continued in the 1999 and 2000 roe herring fisheries.
6.2 The nature of the harvesting right
Roe herring licences are issued to the person, rather than to the vessel. Initially roe herring licences werenon-transferable. However, since some roe herring licences were issued to companies and selling the companycould effectively transfer control over the licence. Also, in the 1970s, the non-transferability rule was relaxedwhen the Minister began to approve the transfer of roe herring licences to deceased licensee’s spouses or next ofkin.
Once the holder/operator restriction was dropped in 1979, other ways of legally circumventing the non-transferability rule were found, e.g. leases and trust holdings. Leasing became a common practice and licenceswere changing hands, though at some inconvenience and cost. In 1990, after consultation with the HerringIndustry Advisory Board (HIAB), transferability was recognized as roe herring licencees were able to relinquishtheir licence eligibility and nominate another individual for that eligibility. HIAB is the advisory body that theDepartment of Fisheries and Oceans works with to design management and fishing plans for the commercialherring fisheries.
After vessel-pooling was introduced, an allocation of herring was attached to each licence. While thelicence can still be transferred, the entire allocation moves with the licence and cannot be separated or split intoshares. Under vessel-pooling a maximum of two licences can be placed on a single vessel. Prior to vessel-pooling there was no limit on the number of licences that could be placed on a vessel. In fact, the former multiplearea and double/triple licensing requirements often forced vessels to hold more than one licence for the season.
6.3 The method of allocation6.3.1Policy objectives
A number of objectives and guiding principles were listed in a discussion paper that focused on alternativemanagement strategies for the roe herring fishery. However there were no explicit objectives, from eithergovernment or industry that dealt specifically with the individual allocation of the herring resource. The industryoutlined the importance of meeting the overall gear catch shares (55% to the seine fleet and 45% to the gillnetfleet), but there were no explicit objectives related the issue of individual allocations.
When vessel-pooling was introduced, the industry recommended that a maximum of two licences bepermitted to be “stacked” on a single vessel for the fishing season. This was done to protect employment in thefishery and avoid concentration of fishing opportunity. Industry also introduced the limitation in an attempt tocontrol the demand for roe herring licence leases and keep leasing costs low.
6.3.2Process used in determining initial allocations
After the DFO announced the need for changes to the roe herring fishery, a small government-industryworking group was established to discuss the feasibility of different management options. Meetings were held inMay and June 1997. In August a discussion paper based on the outcome of the working group meetings was sentto all roe herring licence-holders on record, Aboriginal bands and other interested stakeholders. Objectives andguiding principles were outlined and a number of alternative management options were considered.
Broad consultation was then undertaken through three industry meetings open to the public duringSeptember. Written submissions were also accepted. The Department hired an independent facilitator to chairthe industry meetings and report on the results and written submissions. The advice received from the publicprocess was carried to the HIAB meeting in October for review and to provide guidance for the development ofmanagement options for the 1998 roe herring fishery. At the meeting, the Department re-iterated its position oncatches in excess of targets and re-stated management requirements for future roe herring fisheries.
Canada’s Pacific Fisheries 288

The HIAB caucus met and industry members emerged with recommendations for the 1998 roe herringseason. While support was not unanimous, the majority of HIAB members felt their organizations could acceptthe recommendations. Specifically, “pool” fisheries were recommended for the seine fleet on a coastwidebasis. Gillnet representatives indicated they wanted to try some form of pool fishery on a pilot programmebasis. The HIAB representatives recommended target catches be allocated on an equal basis among thelicences in an area.
6.3.3Initial allocation formula chosen
The Minister of Fisheries and Oceans accepted the HIAB recommendation for equal allocations of theherring target-catches, which are divided equally among the licences eligible to fish in each management area.Licences and the associated quota cannot be divided and transferred in smaller quantities.
6.4 Data requirements and computational process
As part of the annual stock assessment, Fisheries and Oceans Canada determines target-catches bymanagement area. Once the target-catches are announced, roe herring licence-holders are given a deadline inwhich they must designate a management area for their licence(s) for the upcoming season. Roe herring fisherscan change management areas if an area is over-subscribed. Once the deadline passes the target-catch isdivided by the number of licences designated to the area and allocations are determined for the season.
The practice of choosing management areas was in place for many years prior to the introduction ofpooling. The only change resulting from vessel-pooling is that an allocation is now granted to each licence.The Department of Fisheries and Oceans had to develop a new computer programme to document the catch onthe fishing grounds to ensure pool allocations were being complied with, and that area target-catches were notbeing exceeded.
6.5 Appeals process
To date there has been no appeals process. A group of roe herring seine licence-holders has expresseddissatisfaction with the allocation formula and have requested an appeals process. The Department ofFisheries and Oceans is currently considering the request of this group.
6.6 Administration of the allocation process6.6.1Staff requirements
To date, there has been no separate allocation process for the roe herring fishery. The process describedin this paper was undertaken to discuss management change in the roe herring fishery. The DFO staffconducted the working group meetings, prepared the discussion paper, which was sent to all stakeholders andprovided technical advice. An independent facilitator was hired to chair the stakeholder meetings, reviewwritten briefs and prepare a report summarizing the advice received.
6.6.2Additional pr ogramme funding requirements
Additional funding above the budget of the herring programme was required to pay for the independentfacilitator and the three stakeholder meetings held in September. These funds came from the existingDepartment of Fisheries and Oceans – Pacific Region Fisheries Management Branch budget.
6.7 Evaluation of the initial allocation process6.7.1Success in achieving initial policy objectives
As stated above, there were no explicit objectives that dealt with the allocation of the herring resource.The main objective was to design a management regime that would ensure the gillnet and seine roe herringfleets harvests adhered to area target-catches. As a result of this management change in 1998 and 1999, catchesin the seine fisheries were 5% over the target, as compared to a long-term average catch overage of 20%. Thegillnet fleet was below its target-catch for 1998. Roe herring fisheries managers believe that vessel-poolinggives them greater control over the fleet and, therefore, increases their ability to manage to the target-catches.
6.7.2Satisfaction of rights-holders with the process
While this does not directly focus on the allocation process, after the 1998 season, the Department ofFisheries and Oceans held a review of the roe herring fishery and vessel-pooling. A survey was sent to all roeherring licence-holders as well as to First Nations and other interested stakeholders. An independentconsultant was hired to review the 1998 roe herring season and compile the survey results. Of the surveysreceived, 85% of the gillnet responses and 88% of the seine responses indicated that the pool experiment wasa success and should be continued in 1999.
289 Sporer

However, a group of seine licence-holders has expressed dissatisfaction with the process of allocation.These licence-holders feel strongly that they have been unfairly treated by the equal allocation formula in theroe herring seine fishery, as it fails to take into account historic participation and investment in the fishery.They would like the Department of Fisheries and Oceans to appoint an independent arbitrator to rule on theallocation formula.
6.7.3Views of othercommunity groups
No information is readily available on the views of other community groups on the initial allocationprocess. Officials of the Department of Fisheries and Oceans indicate that many First Nations, recreationalfishing groups and environmental organizations have expressed some support for the vessel-poolingmanagement regime as it affords fisheries managers greater control over the roe herring fleet.
6.7.4Hind-sight assessment
A change in the management regime can have different impacts on individual operators in a commercialfishery. A group of seine licence-holders feels they have been disenfranchised by the management change inthe roe herring fishery, specifically by the initial allocation formula. They feel the equal sharing arrangementdoes not take into account their past participation in the fishery or the significant investments they made invessels and gear.
When regulatory bodies consider changes to the management of a fishery, they should carefully considerhow the options being discussed could affect relative economic positions within the fleet. More importantly,this sentiment should be explicitly documented as an objective of the process. Specifically, efforts should bemade to minimize a redistribution of wealth within the fleet due to a change in the management of the fishery.
6.8 Discussion
Results from the review of the 1998 season indicate that there are other economic benefits to vessel-pooling. Specifically, many roe herring fishers cited lower operating costs under pool fishery management.As they no longer had to race for the fish, licence-holders could concentrate on quality and keeping costs lowto improve profits. Roe herring processors also noticed a reduction in operating costs after vessel-pooling wasintroduced, specifically from reduced tendering (the vessels that take the catch to processors’facilities) andpacking expenses. Many of these cost savings can be attributed to a more orderly harvest and delivery of fish.
Most importantly, safety has improved under vessel-pooling. Historically, the roe herring fishery hasbeen a frantic race for the fish. There have been cases of vessels sinking from collisions or overloading of thevessel. Lives have been lost. According to survey results the majority of the roe herring fleet believes that thefishery is safer under pool fishery management.
7. CANADA’S PACIFIC COAST HERRING SPAWN-ON-KELP FISHERY7.1 Intr oduction
Pacific herring (Clupea pallasi) are the most abundant fish species on Canada’s west coast. Herring areshort-lived (usually less than age 8) and, as a result, individual year-classes contribute to the fishablepopulation for only a few years. Herring populations can fluctuate markedly from one year to the nextdepending on the number of fish entering the spawning population. Pacific herring spawn during March andApril in coastal areas.
Herring are harvested in a number of different fisheries. The focus of this paper is the herring spawn-on-kelp fishery. Natives living along the B.C. coast have traditionally harvested herring spawn deposited onmarine plants and hemlock boughs that grew near the low tide mark. This Native food-product was adaptedto the Japanese market. Japan began importing spawn-on-kelp (SOK) from Alaska in the early 1960s. Japanis essentially the only market for spawn-on-kelp.
In 1971 the Canadian Department of Fisheries and Oceans (DFO) issued an experimental permit toproduce SOK in the Queen Charlotte Islands off the northern part of Canada’s Pacific coast. A second permitfollowed in 1974. The commercial herring SOK fishery started in 1975 with the issuance of 13 Category “J”licences and has expanded in stages over the years. There are currently 46 “J” licences issued each year.
The SOK fishery has operated under an individual quota (IQ) system since its inception. From the startof the fishery, each licence-holder was authorized to produce a set (and equal) amount of SOK product. It isimportant to distinguish between the harvestable resource (herring) and the market product (SOK). In the SOKfishery, the IQ is based on the quantity of SOK produced, not the amount of herring used.
Canada’s Pacific Fisheries 290

Therefore, the total quota for the SOK fishery is determined by the number of licences issued each year.Since 1978, each licence-holder has had an individual quota of 7257.6kg of product, with the exception of 1986when only 5443.2kg could be produced (due to concerns over herring stocks).
There are two basic methods of producing spawn-on-kelp product; closed ponding and open ponding.Closed ponding requires the temporary capture and impoundment of herring. It is the most common method usedin the SOK fishery and produces the highest quality product. Log frames are constructed to suspend harvestedkelp and placed in the impoundment or pond site. Most operators use the same log frames year to year, beachingthem near the area of operation between seasons. Herring are seined close to the impoundment, slowly broughtto the pond and released into it. After herring deposit a sufficient amount of roe on the suspended kelp they arereleased and the product, both the spawn and the kelp, is harvested (ARAConsulting Group Inc. 1993).
Methods of open ponding are identical to those for closed ponding, except that the herring are not capturedand impounded, rather the log frame containing the suspended kelp is moved close to an area of natural spawning(ARA Consulting Group Inc. 1993).
Figure 12 shows SOK landings in tonnes and landed values in inflation-adjusted terms. The herring SOKhas traditionally been one of the more lucrative commercial fisheries on the Pacific coast of Canada. However,over the past two years there has been a significant decline in the landed value of the fishery. Much of this declinecan be attributed to the downturn of the Japanese economy and a major shift in the marketing of spawn-on-kelpin Japan.Spawn-on-kelp has traditionally been sold as a luxury product in sushi-bars. When economic conditionsin Japan are depressed, the high-priced end of the market is quickly saturated. Industry sources indicate that theJapanese are now trying to sell spawn-on-kelp as a consumer item at a lower price for home consumption.
Increased supply may also have negatively affected SOK prices in recent years. The DFO issued four newSOK permits in 1997 and an additional three new SOK permits in 1998. It is likely the increased supply putadditional downward pressure on landed prices. The combined result has been lower landed prices paid toCanadian SOK operators. A time series of inflation-adjusted landed prices is shown in Figure 13.
In most years, all SOK licences are actively fished. Each spawn-on-kelp operation can employ between fiveand twelve people, although the average crew size per operation is six. There are designated landing sites andport validation of landed product in this fishery. Licence-holders began to pay for on-ground and plantmonitoring programs to increase enforcement and improve compliance in the fishery in 1996.
SOK licence-holders take an active role in the management of their fishery. The Spawn-on-Kelp OwnersAssociation (SOKOA) represents licence-holders in advisory sessions with the DFO. In addition, one spawn-on-kelp licence-holder sits on the Herring Industry Advisory Board (HIAB). HIAB is the advisory body that theDFO works with to design management and fishing plans for the commercial herring fisheries.
7.2 The nature of the harvesting right
SOK (or Category “J”) licences are personal licences and are not vessel-based. They are issued to anindividual or Aboriginal band and the licence and associated quota are not transferable. IQ cannot be separatedfrom a SOK licence and transferred. When “J” licences were first issued, they were made non-transferable withthe intent that the licence would revert back to DFO when the licence-holder decided to retire from thecommercial fishery. At this point DFO could decide whether or not to re-issue the licence, and to whom.
In the SOK fishery there have been since 1975 four transfers by Ministerial appeal due to the death of thelicence-holder. Some SOK licence-holders want to leave the fishery. They would like the DFO to implementpolicy changes that would allow them to somehow “transfer” their licences legitimately instead of having themrevert back to the DFO. There is evidence to suggest that licence lease agreements are starting to occur in thiscommercial fishery as SOK operator attempt to “transfer” their fishing privilege.
7.3 The method of allocation7.3.1Policy objectives
In many cases the SOK fishery has been used to promote economic development opportunities withinAboriginal communities. Of the 46 SOK licences issued each year, 24 are held by Aboriginal Bands, 13 are heldby Native individuals, and nine are held by non-Native individuals.
291 Sporer

Figure 12SOK annual catch vs. landed value
1975 - 1999
Figure 13SOK landed prices
1975 - 1999
Canada’s Pacific Fisheries 292
0
50
100
150
200
250
300
350
400
450
1975 1977 1979 1981 1983 1985 1987 1989 1991 1993 1995 1997 1999
Tonnes
0
5,000
10,000
15,000
20,000
25,000000's of 1998 $Can
Catch Landed Value
0.00
10.00
20.00
30.00
40.00
50.00
60.00
70.00
80.00
90.00
100.00
1975 1977 1979 1981 1983 1985 1987 1989 1991 1993 1995 1997 1999
1998 C$/kg

7.3.2Process used in determining initial allocations
The selection process for the initial allocation of SOK licences considered factors such as previousexperience in the handling and ponding of herring. Preference was given to fishers and natives living in remoteareas of the coast. Readers are reminded that the SOK fishery is sometimes used to promote economicdevelopment in Aboriginal communities.
Those individuals that qualified for a Category “J” SOK permit had to surrender a roe herring seinelicence. In later years, Aboriginal Bands receiving new SOK licences were required to surrender either oneroe herring seine licence or six roe herring gillnet licences. This was done to avoid putting additionalharvesting pressure on the herring resource and to compensate roe herring fishers for the re-allocation ofherring to a new user group.
7.3.3Initial allocation formula chosen
Each licence is permitted to land 7257.6kg of SOK product in a given year.
7.4 Data requirements and computational process
In order to attach an initial IQ of SOK production to each licence, the Department of Fisheries and Oceanshad to determine the impacts of a SOK operation on the herring resource. After accounting for herring mortalitiesin the ponding operation and the impacts on the biomass as a result of the removal of the spawn, the amount ofherring required to produce 7257.6kg of SOK product was calculated. Commercial fishers were required tosurrender a roe herring seine licence to receive their SOK permit to ensure no additional pressure was put on thealready fully subscribed herring resource.
7.5 Appeals process
There was no appeals process as the SOK fishery has always been managed as an IQ fishery.
7.6 Administration of the allocation process7.6.1Staff requirements
Fisheries and Oceans science staff were required to determine how much herring had to be attributed to aSOK operation to ensure the new SOK fishery did not negatively impact the resource.
7.6.2Additional pr ogramme funding requirements
Funding of the management costs of the commercial SOK fishery is covered by the budget of the regionalDFO fisheries management branch. Monitoring costs paid for by industry vary between $Can150 000 and$Can200 000 each year.
7.7 Evaluation of the initial allocation process7.7.1Success in achieving initial policy objectives
The Department of Fisheries and Oceans has used the SOK fishery to create economic developmentopportunities for some Aboriginal bands. Generally speaking, the fishery has historically generated positiveemployment and income benefits for the Bands involved in the fishery. However, some Bands have not been assuccessful as others in the SOK fishery.
7.7.2Satisfaction of quota-holders with the process
There is little information readily available about operators’satisfaction with the allocation of licences inthe SOK fishery. Some existing licence-holders are critical of the Department of Fisheries and Oceans forcontinuing to issue new permits and increasing the supply of SOK. They feel this depresses SOK prices and,therefore, has a negative impact on their revenues. These licence-holders would rather the DFO purchase existingSOK licences and then transfer these fishing privileges to Native Bands. They feel this practice would create lessof a disruption in the SOK market.
7.7.3Views of othercommunity groups
There is little information readily available on the views of other community groups. However, FOCofficials indicate that those Aboriginal Bands that did not receive a SOK licence are dissatisfied with theallocation process for licences (and, therefore, quota).
293 Sporer

7.7.4 Hind sight assessment
As stated earlier there are two methods of producing spawn-on-kelp product; closed ponding and openponding. For closed pond operations, 90.7t of herring must be allocated to account for herring mortality andremoval from the biomass. However, as open pond techniques result in less herring mortality only 31.8 tonnesof herring must be allocated to the operation. Despite this substantial difference in the use of herring both openand closed pond operations receive the same IQ of SOK product. In retrospect, it may have been preferableto link SOK IQs to the amount of herring actually used in production. This may encourage SOK operators toadopt harvesting methods that have the least impact on the herring resource.
8. CANADA’S PACIFIC COAST SEA CUCUMBER FISHERY8.1 Intr oduction
This section is based on information from Fisheries and Oceans Canada’s Sea Cucumber ManagementPlan (1999/2000) and Stock Status Report C6-10 (1999).
Canada’s Pacific coast giant red sea cucumber (Parastichopus californicus) fishery is managed under aprecautionary regime as little is known of the biology and abundance of the species. There are no size limitsfor sea cucumbers. Divers harvest sea cucumbers by hand in the commercial fishery. Marketable productsinclude frozen muscle strips and dried skins. These products are exported to the port of Hong Kong, the Taiwanprovince of China, the mainland of the Peoples’Republic of China, and to the Republic of Korea, as well asto Canada and the U.S.
The fishery is relatively small. There are eight buyers and registered processors involved in thecommercial sea cucumber industry. Under the current management regime, the fishery generally lasts threeweeks and occurs during October when product quality is higher and weather conditions are still favorable.Figure 14 gives sea cucumber landings (in round weight) and the inflation-adjusted landed value. Littleinformation on employment is currently available; however, for 1999, there were 39 active vessels employing69 divers.
Figure 14Sea cucumber annual catch vs. landed value
1983 - 1998
Sea cucumbers were first harvested commercially in Canada in 1971. A scientific fishery then occurred insouthern waters during the early 1980s. During this time markets were established for the product. There was arapid escalation in effort during the 1980s that led to conservation concerns. In an attempt to control effort andalleviate conservation concerns, fishing times were reduced and a precautionary total allowable catch (TAC) wasintroduced. Increasing effort was still a concern for the Department of Fisheries and Oceans and in 1991 limited
Canada’s Pacific Fisheries 294
0
500
1,000
1,500
2,000
2,500
1983 1985 1987 1989 1991 1993 1995 1997
Tonnes
0
200
400
600
800
1,000
1,200
1,400
1,600000's of 1998 $Can
Catch Landed Value

entry licensing was introduced into the sea cucumber fishery. A total of 85 Category “Z-D” licences were issued.Figure 15 shows the number of active vessels in the sea cucumber fishery from 1980 to 1998.
Figure 15Number of active sea cucumber vessels
1983 - 1998
Despite these measures, it was becoming increasingly difficult to comply with area quotas and the TAC wasoften exceeded. The short duration of the fishery enticed some commercial fishers to “stock pile” sea cucumbersunderwater prior to the fishery opening and then land them once the season began. The pace of the fishery wasalso creating dangerous fishing conditions. In 1995, FOC implemented an individual quota (IQ) programme forthe sea cucumber fishery as a two-year pilot. The sea cucumber programme is modeled after the geoduck clamIVQ management regime.
Currently the fishery is administered under an adaptive management plan that sets a precautionary TAC andleaves part of the coast closed to harvesting. Five licence areas have been designated for the sea cucumberfishery. Licence-holders are required to select one licence area in which to fish. For over-subscribed areas, aprocess of voluntary area selection and lottery draw is used to determine the final licence area selection. Prior tofishing, licence-holders may jointly exchange licence areas. The Pacific Sea Cucumber Harvesters Association(PSCHA), an industry organization representing sea cucumber licence-holders, is responsible for ensuring thatthe area selection process is completed prior to the fishery opening.
The PSCHAhas contracted a service bureau to weigh and validate the catch at the first point of landing.Fishermen are required to report to the service bureau before they begin fishing operations and prior to landingharvested sea cucumbers. This catch-monitoring and validation programme was a requirement of IVQmanagement in the sea cucumber fishery.
8.2 The nature of the harvesting right
The sea cucumber fishery is managed under a limited-entry licensing regime. A Category “ZD” licence isrequired to harvest sea cucumbers. The licences are issued to individuals and are not vessel-based, however, theymust be designated to a commercial fishing vessel each season.
Prior to quota management, sea cucumber licences were not transferable. Under IVQ management, licenceswere made transferable and vessel length restrictions do not apply. A maximum of three active “Z-D” licencesmay be designated to any one vessel. Current regulations do not allow licences, and the associated IVQ, to bedivided and transferred in smaller quantities.
295 Sporer
0
20
40
60
80
100
120
140
1983 1985 1987 1989 1991 1993 1995 1997

8.3 The method of allocation8.3.1Policy objectives
There do not appear to have been any explicit policy objectives for the initial allocation of quota in thesea cucumber fishery. While there is little information available on this aspect of programme implementation,it appears that the Department of Fisheries and Oceans believed moving to IQ management would help acquirea better understanding of the resource and enable the Department to better meet conservation objectives.Industry had expressed a willingness to spend their own time and money to improve knowledge andmanagement of the resource. Further, based on comments in the management plan for the fishery, the move toindividual quota management appears to have been in response to conservation concerns and to move thefishery away from a “race for the fish”.
8.3.2Process used in determining initial allocations
There is little information available on this aspect of programme implementation. The move to IVQmanagement was mainly an industry-driven process and was discussed internally prior to approaching theDepartment of Fisheries and Oceans.
8.3.3Initial allocation formula chosen
The Department of Fisheries and Oceans approved individual quota management for the green sea urchin,red sea urchin and sea cucumber fisheries at the same time. At that time the Minister of Fisheries and Oceansdirected that 2% of the total allowable catch (TAC) in each fishery would be reserved for First Nations whilethe remaining 98% would be split equally among the licences in the commercial fishery.
The annual TAC is set based on surveys and assessments. In 1999, the TAC was divided over four of thefive licence areas. Each sea cucumber (“Z-D” licence) is granted an equal share or 1/85th of the annualcommercial TAC. Prior to each fishing season, licence-holders must choose the area they wish to fish. Thenumber of licences fishing each area may change annually according to the proportion of the total quotaassigned to each area.
8.4 Data requirements and computational process
Little or no fishery data were required for the allocation procedures. The equal-sharing arrangementsremoved the need to gather data and perform any calculations.
8.5 Appeals process
No appeals process was established to deal with sea cucumber licence-holders who disagreed with theallocation formula or felt they were affected by extenuating circumstances.
8.6 Evaluation of the initial allocation process
There is little information available on the success in achieving initial policy objectives or about licence-holders’satisfaction with the initial allocation process. And, there is no data readily available on the views ofother community groups with respect to the initial allocation of sea cucumber quotas or hind-sight assessmentinformation or data to enable an evaluation on the initial allocation process.
8.7 Discussion
Under IQ management, industry is taking a more active role in the management of the resource. TheDepartment holds a collaborative agreement with the Pacific Sea Cucumber Harvesters Association (PSCHA)for catch validation and biological sampling. The PSCHAalso funds research and management programsthrough fees to association members. This includes stock assessment surveys, biological research surveys, acatch validation programme and a biologist hired to co-ordinate research with the Department. Association feesin 1998 were $Can825 per licence.
9. CANADA’S PACIFIC COAST RED SEA URCHIN FISHER Y9.1 Intr oduction
This section is based on information from the Department of Fisheries and Oceans Red Sea UrchinManagement Plan (DFO 1999/2000) and Stock Status Report C6-09 (DFO 1999).
The red sea urchin (Strongylocentrotus franciscanus) is one of three sea urchin species historically fishedin British Columbia waters. Red sea urchins are harvested for their roe. The roe is extracted and processed inshore-based plants. The red sea urchin roe is marketed almost exclusively in Japan, where it is sold as ‘uni’;however, a smaller market is developing in other Asian countries and in North America.
Canada’s Pacific Fisheries 296

To ensure a quality product and a steady supply to markets, fishing times are determined by the Departmentof Fisheries and Oceans in consultation with sea urchin processors and the Pacific Urchin Harvesters Association(PUHA), an organization of red sea urchin licence-holders. Figure 16 shows commercial landings and theinflation-adjusted landed value for the commercial red sea urchin fishery. Information on employment iscurrently unavailable.
Figure 16Red sea urchin annual catch vs.landed value
1988 - 1998
The commercial dive fishery for red sea urchins began in the late 1970s. It has grown rapidly since 1982.The red sea urchin “Z-C” licence category was established in 1983. The number of licences peaked at 240 in1989, although only 109 were actively fished. Licence-limitation was introduced in 1991 in an attempt tocontrol fishing effort and 102 Category “Z-C” limited-entry licences were issued. By 1994, licence appealshad increased the number of licences to 110, although only 89 vessels were active that year.
In 1994 the PUHAimplemented a voluntary individual quota (IQ) programme that the industry haddeveloped. The Department of Fisheries and Oceans adjusted the management plane to facilitate the voluntaryprogramme. The programme was modeled after the geoduck IVQ management regime and included arealicensing. The coast was divided into two licence areas, the North Coast and the South Coast. Docksidemonitoring was introduced and the PUHAcontracted an independent company to perform catch validations toensure compliance with the individual quotas. Industry continued to run and manage their fishery under avoluntary individual quota system for two years while the DFO considered such a change in the fishery.
Mr M. Featherstone (pers. comm., Pacific Urchin Harvesters Association) reported that in the first seasonin 1994, there was one opening in January which lasted only a few days. Prices started out “ok” but as soon asthe second day’s harvest arrived at the plants the price dropped, the market was flooded and the plants couldnot process all the product. The industry had set up to fish 1 million pounds per month on the North Coast, butit was all landed in the first few days, then everyone had to sit till the start of the next month. There was avery poor price paid as well! It looked as if the same thing would happen on the second opening but thefishermen decided not to go out until a better plan was reached – all the fishermen “just tied up and booked ameeting room at the Moby Dick Hotel in Prince Rupert”. At the meeting a quota system was proposed andwhile there was a lot of debate and some people though it would not work, after three days, the details werehammered out and phone calls were made to all the licence-holders who were not represented in order to figureout the split of the catch, validation of the system, costs, etc.
Mr Featherstone has recalled that it was amazing that it all came together. Management fees werecollected by D&D Pacific, a company hired to monitor and validate landings of red sea urchins by the
297 Sporer
0
2,000
4,000
6,000
8,000
10,000
12,000
14,000
1988 1990 1992 1994 1996 1998
Tonnes
0
2,000
4,000
6,000
8,000
10,000
12,000
14,000000's of 1998 $Can
Catch Landed Value

commercial fishers through an industry-funded program. It was a totally grass-roots endeavour by thefishermen and independent of DFO. Further, everyone played by the rules, as there would have been no legalrecourse if someone decided to just keep fishing. There was unanimous acceptance, although by somegrudgingly. The participants in this fishery had an advantage in that many of the participants were involved,or associated with the geoduck fishery (see Heizer 2000) and knew the basics of such management systems.The Association had also organized a workshop to discuss options for the management of the fishery in the fallof 1993. Mr David Smith (Ministry of Fisheries, Province of British Columbia) helped with the funding andgetting it together. Quotas were discussed at length at the workshop, so the idea of IQs was not all that foreignto the different fishermen.
In 1996 DFO sanctioned the programme as a two-year pilot initiative. Under the DFO pilot IQprogramme, red sea urchin licences are assigned to either the South Coast area or the North Coast area. Twopercent of the harvest was reserved for Section 352 - Aboriginal food, social and ceremonial requirements, andother quota put aside for industry-funded surveys, etc., all of which became part of the pilot programme. ThePUHA remains responsible for developing and implementing the third-party catch monitoring and validationprogramme to ensure that area quotas and IQs are not exceeded. Industry also contracts an on-grounds monitorto assist in the management of the fishery for areas above the mid-point of the coast of British Columbia.
Annual changes to the TAC are made based on surveys and updated assessments. There is a minimumsize limit for red sea urchins. All commercial fishing vessels harvesting red sea urchins must be in possessionof a logbook approved by the Department of Fisheries and Oceans. Prior to fishing, the vessel master mustconfirm the remaining vessel quota from the catch validation logbook.
9.2 The nature of the harvesting right
The red sea urchin fishery is managed under a limited-entry licensing regime. A Category “ZC” licenceis required to harvest red sea urchins. The licences are issued to individuals and are not vessel-based, however,they must be designated to a commercial fishing vessel each season.
Prior to quota management red sea urchin licences were not transferable. Under IVQ management,licences were made transferable and vessel length restrictions did not apply. A maximum of three active “Z-C” licences may be designated to any one vessel. Current regulations do not allow licences, and the associatedIVQ, to be divided and transferred in smaller quantities.
9.3 The method of allocation9.3.1Policy objectives
There do not appear to have been any explicit policy objectives for the initial allocation of quota in thered sea urchin fishery. While there is little information available on this aspect of programme implementation,
Canada’s Pacific Fisheries 298
2 Section 35 of the Canadian Constitution Act 1982recognizes Native Rights. The Courts have interpreted this Section tomean that Native Bands that have traditionally relied on fishing hold a collective right to fish for “food, social, andceremonial purposes and the aboriginal right to fish must be accorded first priority after conservation needs are met”. Thisinterpretation is based on a decision taken in May 1990 in which the Supreme Court of Canada ruled in the SparrowDecision. The Section is is worded as follows:Section 35. RIGHTS OF THE ABORIGINAL PEOPLES OF CANADA
(1) The existing aboriginal and treaty rights of the aboriginal peoples of Canada are hereby recognized and affirmed.
(2) In this Act, “aboriginal peoples of Canada” includes the Indian, Inuit and Métis peoples of Canada.
(3) For greater certainty, in subsection (1) “treaty rights” includes rights that now exist by way of land claims agreementsor may be so acquired. Aboriginal and treaty rights are guaranteed equally to both sexes
(4) Notwithstanding any other provision of this Act, the aboriginal and treaty rights referred to in subsection (1) areguaranteed equally to male and female persons. Commitment to participation in constitutional conference 35.1 Thegovernment of Canada and the provincial governments are committed to the principle that, before any amendment ismade to Class 24 of section 91 of the “Constitution Act, 1867”, to section 25 of this Act or to this Part, (a) aconstitutional conference that includes in its agenda an item relating to the proposed amendment, composed of the PrimeMinister of Canada and the first ministers of the provinces, will be convened by the Prime Minister of Canada; and (b)the Prime Minister of Canada will invite representatives of the aboriginal peoples of Canada to participate in thediscussions on that item.

it appears the Department of Fisheries and Oceans believed that moving to IQ management would help acquirea better understanding of the resource and enable the Department to better meet conservation objectives. Theindustry members themselves had expressed a willingness to spend their own time and money to improveknowledge and management of the resource.
9.3.2Process used in determining initial allocations
Little information appears available on how the programme was implemented. The Department ofFisheries and Oceans sanctioned individual quotas in the red sea urchin fishery two years after industryintroduced their voluntary programme. Mr Featherstone (Pacific Urchin Harvesters Association) reports thatthe quota’s were split equally “just to keep it simple”. The North and South Areas were selected and the quotasdivided between licences by area. Under the Voluntary IQ the North and South Coasts had different harvestamounts.
9.3.3Initial allocation formula chosen
Fisheries and Oceans Canada approved individual quota management for the green sea urchin, red seaurchin and sea cucumber fisheries at the same time. At that time the Minister directed that 2% of the totalallowable catch (TAC) in each fishery would be reserved for First Nations while the remaining 98% would besplit equally among the licences in the commercial fishery.
Each red sea urchin (“Z-C” licence) is granted an equal share or 1/110th of the annual commercial TAC.The TAC is divided over two areas: North Coast and South Coast. Each year, prior to the fishing season,licence-holders must choose the area they wish to fish. The number of licences fishing each area may changeannually according to the proportion of the total quota assigned to each area. Licence area selection isfacilitated by the PUHA.
9.4 Data requirements and computational process
Little or no data was used in the allocation procedures. Industry agreed an equal sharing of the TAC wasthe best way to allocate quota under the voluntary plan. Under the direction of the Minister, Fisheries andOceans Canada adopted this allocation formula when it officially sanctioned individual quota management inthe red sea urchin fishery. The equal sharing arrangements removed the need to gather data and perform anycalculations for the allocation process.
9.5 Appeals process
Red sea urchin licence-holders voluntarily implemented an equal allocation individual quota programme.Therefore, when the Ministry officially sanctioned the programme, there was little need for an appeals process.Therefore, no appeal process was established to deal with red sea urchin licence-holders who disagreed withthe allocation formula or felt they were affected by extenuating circumstances. The IVQ programme wasmodeled after the geoduck fishery that had demonstrated considerable success with individual quotamanagement.
9.6 Administration of the allocation process
The move to IVQ management in the red sea urchin fishery was a decision by the industry. Licence-holders determined the allocation formula through internal discussions and with Fisheries and Oceans Canadaofficials. Thus there were few demands on the Department.
As the licence-holders voluntarily introduced IQ management into their fishery and designed the sharingarrangement, it is unlikely that significant Departmental was required in the allocation process.
9.7 Evaluation of the initial allocation process
There is little information readily available on the success in achieving initial policy objectives regardingthis aspect of programme implementation. Nor is information available about licence-holders’satisfaction withthe initial allocation process. However, given the industry’s voluntarily agreed to accept IQ management andequal allocations, it is likely most licence-holders feel the process to formally institutionalize individual quotaswas adequate.
There is no data readily available on the views of other community groups with respect to the initialallocation of red sea urchin quotas.
It is noteworthy that immediately after the start of the programme, the price for urchins started to climband $Can1.00/lb became the norm; this gave the programme a lot of positive reinforcement (pers. comm.,M. Featherstone, Pacific Urchin Harvesters Association).
299 Sporer

9.8 Discussion
The fishery is currently managed on a precautionary basis. Scientific research and joint industry, FirstNations, and Fisheries and Oceans Canada stock assessment surveys are underway to move the red sea urchinfishery to a more biologically sustainable harvest level.
Fisheries and Oceans Canada holds a collaborative agreement with the PUHAfor catch validation andbiological sampling. The PUHA funds research and management activities by collecting fees from itsmembers. This includes stock assessment surveys, biological research surveys and a catch validationprogramme. Further, the PUHAalso pays for a biologist to co-ordinate research with Fisheries and OceansCanada as well as a charter patrolman to monitor and guide the harvest in the North Coast region for eightmonths of the year. Association fees in 1999/2000 were approximately $Can5320 per licence. But ofparticular note is that the fishermen are satisfied to have implemented this quota system, that they believe it isworking well and that it is improving with each year.
It is of interest that intially, it has been reported, that the DFO would not support the programme after thefirst year, and it was not until later in the second year that DFO decided to adopt it. It has also been noted thatone possible concern was that the system would potentially make licences more valuable. This would providewindfall profits to fishermen and could cost the Department more money in the future, because it was planninga buy-back of quota for redistribution to Native groups.
10. CANADA’S PACIFIC COAST GREEN SEA URCHIN FISHER Y10.1 Intr oduction
This section is based on information from the Department of Fisheries and Oceans’Green Sea UrchinManagement Plan (June 1/99 to May 31/99) (DFO 1999b) and Stock Status Report C6-11 (DFO 1999c).
Green sea urchins (Strongylocentrotus droebachiensis) occur in the Atlantic and Pacific Oceans. Theyare generally found in intertidal zones at depths of more than 140m. Divers harvest the green sea urchins livefor their roe and the product is shipped whole and alive to Japan. The fishery generally occurs in winter, whenroe quality and quantity are the highest and market prices are the best. Due to better roe quality and proximityto processing plants, the majority of landings have come from southern B.C. waters.
The fishery is relatively small. Since 1996 the green sea urchin commercial fishery has been restrictedto areas with a known catch history. In 1998/99, total landings were 156t with a landed value of almost$Can1.0 million. Figure 17 shows total landings and inflation-adjusted landed value from 1988 to 1998.Information on employment is currently unavailable.
The fishery began in 1987. The green sea urchin fishery was managed by a minimum size limit of 55mmand by time- and area-openings. Effort began to increase steadily and in 1991 the Department of Fisheries andOceans limited entry to the fishery in an attempt to control effort. Forty-nine green sea urchin licences wereissued. Despite licence-limitation effort remained high. Landings peaked in 1992 when 49 vessels reported1042t for a landed value of $Can4.4 million. Figure 18 shows the inflation-adjusted landed prices for the greensea urchin fishery.
Beginning in 1995, a two-year pilot programme of individual quotas (IQ’s) and area licensing wereimplemented in the green sea urchin fishery. The programme was modeled after the geoduck IVQ system.Under the pilot programme, an industry funded catch validation and monitoring programme was put in placeto ensure monitoring of quotas and recovery of accurate catch data. Today, the management system consistsof precautionary area quotas and closures, a minimum size limit and individual vessel quotas.
Under the IVQ programme, vessel masters are required to notify an industry-funded contractor at least24 hours prior to harvesting, changing fishing areas and landing green sea urchins. All catches must be landedat a designated landing port. Industry-funded dock side validators weigh and validate all catches and performbiological sampling of green sea urchins landed from each vessel off-load. Catches are also recorded inmandatory logbooks maintained by the vessel master.
10.2 The nature of the harvesting right
The green sea urchin fishery is managed under a limited-entry licensing regime. Green sea urchin(Category “Z-A”) licences are issued to individuals and are not vessel-based, however, they must be designatedto a commercial fishing vessel each season.
Canada’s Pacific Fisheries 300

Figure 17Green sea urchin annual catch vs. landed value
1988 - 1998
Figure 18Green sea urchin landed prices
1988 – 1998
301 Sporer
0
200
400
600
800
1,000
1,200
1988 1990 1992 1994 1996 1998
Tonnes
0
1,000
2,000
3,000
4,000
5,000
6,000000's of 1998 $Can
Catch Landed Value
0.00
1.00
2.00
3.00
4.00
5.00
6.00
7.00
8.00
9.00
1988 1990 1992 1994 1996 1998
1998 $Can/kg

Prior to quota management green sea urchin licences were not transferable. Licence transferability wasnot permitted during the first two years of the pilot quota programme. Vessel length restrictions did not apply.In 1999, licences were made transferable. A maximum of three active “Z-A” licences may be designated toany one vessel at one time. Current regulations do not allow licences, and the associated IVQ, to be dividedand transferred in smaller quantities.
10.3 The method of allocation10.3.1 Policy objectives
There do not appear to have been any explicit policy objectives for the initial allocation of quota in thegreen sea urchin fishery. While there is little information available on this aspect of programmeimplementation, it appears Fisheries and Oceans Canada believed moving to IQ management would helpacquire a better understanding of the resource and enable the Department to better meet conservationobjectives. Industry had expressed a willingness to spend their own time and money to improve knowledgeand management of the resource.
10.3.2 Process used in determining initial allocations
There is little information available on this aspect of programme implementation. For the green seaurchin fishery, it appears that the move to IVQ management was largely an industry-driven process. Anindustry organization approached FOC with a proposal for quota management in the fishery and supportedequal allocations. The industry association had discussed the idea internally and the proposal had the supportof the industry. Green seas urchin licence-holders had noted the success of the geoduck IVQ programme andmodeled their proposal after that system. After some deliberation, Fisheries and Oceans Canada implementedIVQ management in the green sea urchin fishery.
10.3.3 Initial allocation formula chosen
Fisheries and Oceans Canada approved individual quota management for the green sea urchin, red seaurchin and sea cucumber fisheries at the same time. At that time the Minister of Fisheries and Oceans directedthat 2% of the total allowable catch (TAC) in each fishery would be reserved for First Nations while theremaining 98% would be split equally among the licences in the commercial fishery.
Each green sea urchin (“Z-A” licence) is granted an equal share or 1/49th of the annual coastwide TAC.The TAC is divided over two areas: North Coast, South Coast. Each year, prior to the fishing season, licence-holders must choose the area they wish to fish. The number of licences fishing each area may change annuallyaccording to the proportion of the total quota assigned to each area.
Currently the TAC is allocated in South Coast areas. Opportunities to harvest in other areas of the coastare available under scientific harvest protocols. After careful review, additional TAC may be determinedthrough this process.
10.4 Data requirements and computational process
Little or no data were used in the allocation procedures. The majority of industry agreed equal-sharingof the TAC was the best way to allocate quota. These equal-sharing arrangements removed the need to gatherdata on past fishing activity or perform any calculations.
10.5 Appeals process
No appeal process was established to deal with green sea urchin licence-holders who disagreed with theallocation formula or felt they were affected by extenuating circumstances.
10.6 Administration of the allocation process10.6.1 Staff requirements
The move to IVQ management was largely an initiative taken up by the green sea urchin licence-holders.Aside from the industry proposal, it does not appear that there was a formal process to discuss theimplementation of IVQ management in this fishery. The directive from the Minister of Fisheries and OceansCanada was discussed at the Green Sea Urchin Sectoral Committee. However, there is little informationreadily available on this aspect of programme implementation.
10.7 Discussion
Industry and government are working together to encourage the development of this fishery in ascientifically based manner. DFO, in consultation with the West Coast Green Sea Urchin Association, havedeveloped an exploratory fishing protocol to allow expanded commercial harvest while collecting data to
Canada’s Pacific Fisheries 302
improve the understanding of the resource. Industry also contributes to the management of the fishery byfunding stock surveys and the catch validation and monitoring programme.
IVQ management of this fishery has resulted in a better managed, more rational and safer fishery thatachieves the conservation objectives set by Fisheries and Oceans Canada.
11. LITERA TURE CITED
ARA Consulting Group Inc. 1993. The 1991 Expansion of the Herring Spawn-on-Kelp Fishery: An Evaluation,Fisheries and Oceans Canada Vancouver, B.C., August 1993.
Casey, K.E., C.M. Dewees, B.R. Turris and J.E. Wilen 1995. The effects of Individual Vessel Quotas in the BritishColumbia Halibut Fishery, Marine Resource Economics, Volume 10, pp. 211-230.
Carpenter Fishing Corporation et al. v. Her Majesty the Queen et al. (Court No.: T-554-91)DFO Department of Fisheries and Oceans, Canada 1995. Individual Quota Management: Canada’s Experience
Featuring the Pacific Halibut Fishery, Ottawa, Canada. DFO Canada, Pacific Region Groundfish Trawl Fishery Management Plan: 1997.DFO Canada, Pacific Region Integrated Fisheries Management Plan: Halibut 1999a.DFO Canada, Pacific Region Integrated Fisheries Management Plan: Green Sea Urchins 1999b.DFO Canada, Stock Status Report C6-11, Nanaimo, Canada, July 1999c.DFO Canada, Pacific Region Integrated Fisheries Management Plan: Red Sea Urchins 1999d.DFO Canada, Stock Status Report C6-09, Nanaimo, Canada, July 1999e.DFO Canada, Pacific Region Integrated Fisheries Management Plan: Sea Cucumbers 1999f.DFO Canada, Stock Status Report C6-10, Nanaimo, Canada, July 1999g.DFO Canada, Pacific Region Integrated Fisheries Management Plan: Geoduck 2000.Federal Court of Appeal, Carpenter Fishing Corporation et al.v. Her Majesty the Queen et al., and Titan Fishing
Ltd. v Her Majesty the Queen et al., Docket A-941-96.Fisheries Economics, Research & Management Specialists (FERM) 1997. Re-allocation of Fishing Concessions
Where Management Arrangement Have Changed. Background Paper Prepared for the Australian FisheriesManagement Authority, June 1997.
Fisheries and Oceans Canada – Commercial Licence Unit, Pacific Coast Commercial Licensing Handbook 1994,Vancouver, Canada, April 1994.
Gislason, G.S. 1998. B.C. Commercial Fisheries Profile and Outlook, Fisheries and Oceans Canada, Vancouver,B.C., March 1998.
Gislason, G.S. 2000. Stronger Rights, Higher Fees, Greater Say: Linkages for the Pacific Halibut Fishery inCanada. In: Shotton, R. (Ed.) Use of property rights in fisheries management. Proceedings of theFishRights99 Conference, Freemantle, Australia, 11–19 November 1999, Workshop Presentations. FAOFish. Tech. Pap. 404/2 pp383-389.
Groundfish Special Industry Committee 1999. Review of the Groundfish Trawl Individual VesselQuota/Groundfish Development Authority Plan, Fisheries and Oceans Canada, Vancouver, B.C., September29 1999.
Heizer, S. 2000. The Commercial Geoduck (Panopea abrupta) Fishery In British Columbia, Canada – AnOperational Perspective Of A Limited Entry Fishery With Individual Quotas. In: Shotton, R. (Ed.) Use ofproperty rights in fisheries management, Proceedings of the FishRights99 Conference, Freemantle,Australia, 11–19 November 1999, Workshop presentations. FAO Fish. Tech. Pap. 404/2 pp226-233.
Kaufmann, B. and G. Geen 1998. Quota allocation and litigation: An economic perspective. Marine ResourceEconomics, vol. 13, no. 2, pp143-157.
Turris, B.R. 2000. A Comparison of British Columbia’s ITQ Fisheries for Groundfish Trawl and Sablefish:Similar Results from Programs with Differing Objectives, Designs, and Processes. In: Shotton, R. (Ed.) Useof property rights in fisheries management, Proceedings of the FishRights99 Conference, Freemantle,Australia, 11-19 November 1999, Workshop presentations. FAO Fish. Tech. Pap. 404/1 pp254-261.
303 Sporer

INITIAL ALLOCATION OF HARVESTING RIGHTS IN THE CHILEAN FISHERY FOR PATAGONIAN TOOTHFISH
E. GonzálezInteramerican Centre for Sustainable Ecosystems Development (ICSED)
Casilla 27016, Santiago, Chile,<[email protected]> or <[email protected].>
R. Norambuena and M. GarcíaFisheries Department, Under-Secretariat for Fisheries, Chile
Casilla 100-V, Valparaíso, Chile<[email protected].> and <[email protected]>
1. INTRODUCTION
The deepwater Patagonian toothfish (Dissostichus eleginoides)1 is a long-lived fish species (up to 55 yearsof age) with a low fecundity rate and slow growth, reaching its first sexual maturity at 5-8 years of age and fullmaturity between years 9-12. The Chilean Patagonian toothfish fishery is conducted by two commercial fleets:a small-scale fleet, and a fleet of larger industrial vessels. These fleets operate in two different, but adjacent, areasoff the Chilean coast (Figure 1).
Lemaitre et al. (1991) reports that the commercial fishery was initiated by the small-scale fishing fleetoperating in waters of central Chile during the 1970s, and rapidly expanded to the south of the country due to theexistence of fishing grounds with higher yields in that region. At present the small-scale fishery operates fromthe northern border of the country in Region I (18º15’S)to Region XI (47ºS). Its southern border is the limit of thefishing area reserved for the large-scale Patagoniantoothfish fishery (Under-Secretariat for Fisheries 1999).
Landings of Patagonian toothfish by the small-scale(artisanal) sector have continuously increased since thebeginning of the fishery and reached approximately 6000tin 1986. Since then, the annual landings by this small-scale sector have fluctuated between 3300t and 5600t witha slight decreasing tendency towards the end of the 1990s(Figure 2). At present the official number of small-scalefishing boats operating in the fishery is approximately120. They generate employment for approximately 900fishermen and 400 people on shore (SERNAPESCA1999).
The industrial or large-scale, deep-water Patagoniantoothfish fishery began in 1991 as a fishery that wasmanaged under the RFID system (“Regime for Fisheriesunder Initial Development”) [Pesquerías en Régimen deDesarrollo Incipiente] as defined by the Chilean FisheriesAct of 1991. The fishing area reserved for the large-scalefishery is shown in Figure 3.
The northern limit of this fishing area is the parallel47ºS, and the southern limit is the parallel 57ºS. Theeastern boundary of the fishing area is the “straightbaseline” 2 and the western boundary is the line drawnparallel and 70 nautical miles west of the baseline.
304
1 The Chilean common name for this species is Bacalao de profundidad which is sometimes translated as “cod”. Anothercommon name in Spanish is Austromerluza negra.
2 The “straight baseline” is the hypothetical straight line drawn between the most seaward points of the coastal of the country,which is used as a geographical reference for fisheries management purposes.
Figure 1Geographical location of the two sectors
of the toothfish fishery

Figure 2Landings of Chilean Deep Water Patagonian toothfish 1980 – 1999
The large-scale fishing fleet is comprised of 13 factory-vessels and 2 freezer-vessels. The entire fleet usesdeepwater long-lines. Each of these vessels may fish, onaverage, a total of 10 000 hooks per set and the fleet operatessome seven months a year in Chilean waters (January toMay, and September to December). For the rest of the year(May to August) they operate in international waters. Thelarge-scale fleet redirects its fishing effort to hake(Merluccius australis) from the beginning of January tomid-March of every year. This large-scale fishery employsa total of 520 fishermen plus another 150 personnel ashore.
It is important to note that the large-scale fishingvessels not only operate in the reserved area depicted inFigure 3, but also outside the Chilean Extended EconomicZone (EEZ): off the coast of Argentinean Patagonia, theMalvinas or Falkland Islands, Southern Georgia andKerguelén (Under-Secretariat for Fisheries 1999).
Landings of Chilean Patagonian toothfish by theindustrial or large-scale sector started in 1991 and theycomprised catches taken both inside the Defined FisheryArea and outside the Chilean EEZ (here referred to asinternational waters). Peak landings of approximately25 000t were obtained in 1991, after which landings by thelarge-scale sector have steadily decreased reaching aminimum in 1995 of approximately 5900t (Figure 2).3 From1997 to 1999 a moderate recovery was observed in large-scale landings, reaching approximately 13 000t in 1999 (Figure 2).
305 González, Norambuena & García
Tonn
es
3 This peak in landings was generated through research fishing in 1992, which produced large catches.
Figure 3Geographical location of the large-scale
Chilean Deep Water Cod
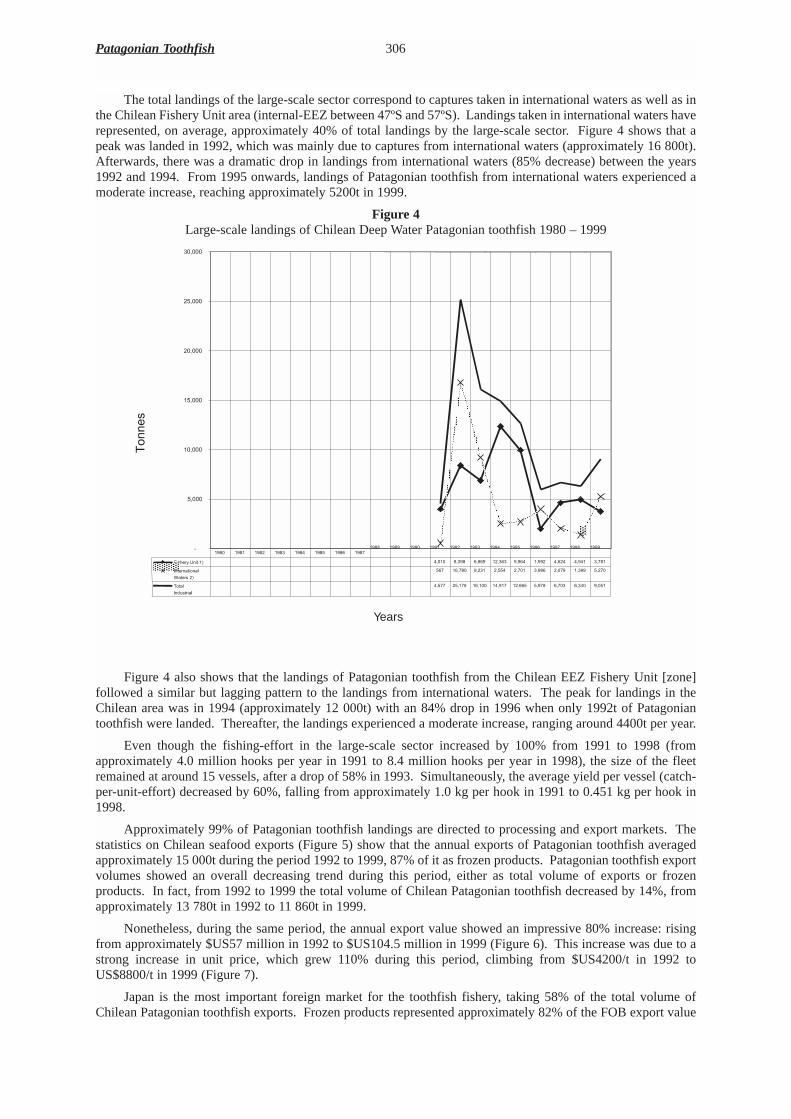
The total landings of the large-scale sector correspond to captures taken in international waters as well as inthe Chilean Fishery Unit area (internal-EEZ between 47ºS and 57ºS). Landings taken in international waters haverepresented, on average, approximately 40% of total landings by the large-scale sector. Figure 4 shows that apeak was landed in 1992, which was mainly due to captures from international waters (approximately 16 800t).Afterwards, there was a dramatic drop in landings from international waters (85% decrease) between the years1992 and 1994. From 1995 onwards, landings of Patagonian toothfish from international waters experienced amoderate increase, reaching approximately 5200t in 1999.
Figure 4Large-scale landings of Chilean Deep Water Patagonian toothfish 1980 – 1999
Figure 4 also shows that the landings of Patagonian toothfish from the Chilean EEZ Fishery Unit [zone]followed a similar but lagging pattern to the landings from international waters. The peak for landings in theChilean area was in 1994 (approximately 12 000t) with an 84% drop in 1996 when only 1992t of Patagoniantoothfish were landed. Thereafter, the landings experienced a moderate increase, ranging around 4400t per year.
Even though the fishing-effort in the large-scale sector increased by 100% from 1991 to 1998 (fromapproximately 4.0 million hooks per year in 1991 to 8.4 million hooks per year in 1998), the size of the fleetremained at around 15 vessels, after a drop of 58% in 1993. Simultaneously, the average yield per vessel (catch-per-unit-effort) decreased by 60%, falling from approximately 1.0 kg per hook in 1991 to 0.451 kg per hook in1998.
Approximately 99% of Patagonian toothfish landings are directed to processing and export markets. Thestatistics on Chilean seafood exports (Figure 5) show that the annual exports of Patagonian toothfish averagedapproximately 15 000t during the period 1992 to 1999, 87% of it as frozen products. Patagonian toothfish exportvolumes showed an overall decreasing trend during this period, either as total volume of exports or frozenproducts. In fact, from 1992 to 1999 the total volume of Chilean Patagonian toothfish decreased by 14%, fromapproximately 13 780t in 1992 to 11 860t in 1999.
Nonetheless, during the same period, the annual export value showed an impressive 80% increase: risingfrom approximately $US57 million in 1992 to $US104.5 million in 1999 (Figure 6). This increase was due to astrong increase in unit price, which grew 110% during this period, climbing from $US4200/t in 1992 toUS$8800/t in 1999 (Figure 7).
Japan is the most important foreign market for the toothfish fishery, taking 58% of the total volume ofChilean Patagonian toothfish exports. Frozen products represented approximately 82% of the FOB export value
Patagonian Toothfish 306
Years

to Japan in 1998. The USA is the second most important foreign market for Chilean Patagonian toothfish exports,taking 27% of total export volume. Fresh refrigerated products represent 99.3% of the FOB export value in thismarket (Fisheries Export Statistics, unpublished data from the Customs Service of Chile and SERNAPESCA, theNational Fisheries Institute, 1993 to 2000).
Figure 5Export volume (tonnes) of Chilean Patagonian toothfish, period 1992-1999
Figure 6Export value (FOB US$) of Chilean Patagonian toothfish, Period 1992-1999
307 González, Norambuena & García

2. THE NATURE OF THE HARVESTING RIGHT
As noted, from the legal, institutional and management perspective, the Chilean Patagonian toothfish fisherycan be clearly divided into two types of activities operating under different management schemes: the small-scalefishery [Pesqueria Artesanal de Bacalao de profundidad] and the large-scale fishery [Pesqueria Industrial deBacalao de profundidad].
The small-scale fishery is conducted north of the parallel 47ºS, and its two most important managementregulations are: limits on boat-size (18m of overall length; MINECOM DS 43 and 439 of 1986), and gearrestrictions (only deep water long-lines may be used with a limit of 12 000 hooks per cast; MINECOM DS 4391986). No use- or property-rights are applied in this fishery, and it has been conducted under a quasi-open-accessregime since its beginning. It is defined as quasi-open-access, because although almost anyone may enter thefishery, in order to do so, the small-scale fisherman and the boat must be registered in the “National Registry ofSmall-scale Fishermen” (or Non-industrial Registry).4 In 1999 this National Registry reported a total of 12 356fishermen targeting the Chilean stock of deepwater Patagonian toothfish.
Figure 7Apparent price (FOB US$/tonne) of Chilean Patagonian toothfish, period 1992-1999
Fishing pressure by the small-scale sector on the Chilean stock of Patagonian toothfish increased steadilyover time, stimulated by increasing national exports to international markets, triggered by both increasinginternational demand and a government policy directed at strengthening the national economy through exports.This trend continued until 1986 when limits on boat-size and number of hooks-per-cast were enacted (DecreeNo. 439, 1986). These limits were triggered by the decreasing yields observed by the small-scale fishermen, dueboth to the effect of their increased fishing-power and fishing-effort on the stock’s abundance, and to the new andincreasing redirection of fishing effort by the large-scale fleet, from hake to Patagonian toothfish (pers. comm.,F. Ponce, Chilean Under-Secretariat for Fisheries)
At the same time, the Fisheries and Aquaculture Act 1991 had just been enacted, which included a numberof new regulatory measures applicable to Chilean fisheries. Consequently, the Under-Secretariat for Fisheries(USF) decided to officially include the large-scale Patagonian toothfish fishery within one of the newly-createdaccess-regimes, namely the ““Regime for Fisheries under Initial Development” (RFID) [Pesquerías en Régimende Desarrollo Incipiente] (MINECOM DS 328, 1992), and in this way he established incentives leading to theachievement of a sustainable industrial Patagonian toothfish fishery.
Article 40 of the Chilean Fisheries and Aquaculture Act [Ley General de Pesca y Acuicultura de 1991] statesthat in a fishery under this type of management regime, an annual total allowable catch (TAC) must be calculated
Patagonian Toothfish 308
4 The National Registry of Small-scale Fishermen is a record kept by the National Fisheries Service, containing a list of peopleauthorized to conduct small-scale fishing activities in Chilean waters.

by the Under-Secretariat for Fisheries and distributed among the eligible fishing companies or operators. In thelarge-scale Patagonian toothfish fishery, fishing- or harvesting-rights are allocated to fishing companies, andunder the Chilean legislation are known as “Extra Fishing Permits” (EFPs) [Permisos Extraordinarios de Pesca].These fishing-rights are divisible, transferable once a year, and can be leased or freely-lent (Article 31, 2ndParagraph, Fisheries Act 1991). Even though this Act does not explicitly state it, under Chilean legislation thesefishing-rights may also be banked.
Other regulations applying to both the small-scale and the large-scale Patagonian toothfish fisheries are:
i. The establishment of a seasonal closure from 1 June to 31 August of every year between the parallels 53ºSand 57ºS (DS No. 273).
ii. Only trotlines or long-lines may be used to harvest Patagonian toothfish (Under-Secretariat for Fisheries,Res. 1249, 1992).
iii. Patagonian toothfish harvested as by-catch between the parallels 41º28,6’S and 57º00’S, may constituteonly 2% in weight of the total harvest of southern hake or kingclip (MINECOM, DS No. 679, 1993).
3. THE METHOD OF ALLOCATION
Articles 39 and 40 of the Chilean Fisheries Act 1991 state that, once a fishery has been specified under theRFID regulations, the Under-Secretariat for Fisheries is required to calculate an annual TAC which is to beallocated among fishing companies or operators by means of a public auction. Successful bidders will be issuedan Extraordinary Fishing Permit (EFP) stating their right to harvestannually, for a 10-year period, a maximum amount of fish equivalent tothe result of multiplying the corresponding TAC by the fraction that wasawarded (i.e. the fraction of the TAC won in the auction by eachbidder). These EFPs take effect as of the calendar year following thedate that the auction was conducted.
To ensure the liquidity of the fishing-rights under the RFIDmanagement system, the duration of the fishing-rights auctioned andawarded varies depends on whether the auction process is a ‘First-TimeAuction’ [Primera subasta] or an ‘Ordinary Annual Auction’ [SubastaAnnual Ordinaria]. Also, the duration of fishing-rights vary if a SpecialAuction [Subasta Especial] is required for the reallocation of EFPs.5
Therefore, under the RFID management system, EFPs auctionedfor the first time have a designed initial lifetime of 10 years. But, thetotal number of EFPs that any particular operator may be awarded underthis arrangement decreases by 10% each year.6 Thus, as of the secondyear of the RFID management system, only 10% of the TAC will beauctioned every year by means of Ordinary Annual Auctions.
Fishing-rights or EFPs awarded at an Ordinary Annual Auctionwill have a lifetime of 10 years, but their amounts do not vary duringtheir lifetime. Ordinary Annual Auctions are conducted starting fromthe second year that the RFID management system was set up.
Special Auctions are conducted once a year, but they only involvethose EFPs that are to be re-allocated, due to the failure of their holdersto comply with the regulations of the fishery, or with the payment of therent (which is paid in annuities). During a Special Auction the fishing-rights awarded will have a lifetime equivalent to the remaining lifetimethat the EFP had at the moment its previous owner failed to comply andlost possession.
Under the RFID management system, if at the time the system was put into effect there were fishingcompanies (or vessel-owners) holding valid fishing-authorizations for this particular fishery, they were entitled tocontinue their fishing activity as usual for an additional 3-year period. Upon expiry of this 3-year period, these
309 González, Norambuena & García
A Patagonian toothfish(Bacalão de profundidad)being brought on board
5 Re-allocation of Extraordinary Fishing Permits (EFPs) is required whenever a fishermen or operator fails to abide with theregulations of the fishery, or with the payment for its fishing-rights.6 That is, the first time successful bidders will be issued Extraordinary Fishing Permits (EFPs) with a variable coefficient. Thisvariable coefficient will decrease by 10% each year until the expiry of the lifetime of the share awarded. Thus, the owner ofthese first-time fishing rights will have in the first year, the right to fish 100% of the share awarded, 90% of it the second year,80% of it the third year and so on, until the lifetime of the first-time fishing rights expires.
fishing companies would be issued EFPs that note their right to harvest an amount of fish (expressed in tonnes)equivalent to a percentage of the corresponding TAC, calculated by dividing their average annual harvest by theaverage TAC during the previous 3-year period. These EFPs have a lifetime of 10 years, and their sum is equalto 10% of the TAC.
Therefore, if there are valid fishing-authorizations at the time that the RFID system came into effect, theUnder-Secretariat for Fisheries can award only 90% of the TAC during the first public auction. Otherwise, theUnder-Secretariat for Fisheries must award the complete TAC at the First-Time Auction.
Additional regulations governing the auction of EFPs and the allocation system are as follows.
i. Only fishing companies or vessel-owners duly registered in the National Industrial Fishing Registry areeligible to bid in the public auction.7
ii. To be eligible to register in this special Registry, fishing companies or vessel-owners must presentdocuments showing their legal property-rights or use-rights over the fishing vessel(s) that they designate touse the EFPs issued. Also, they must present documents describing the technical characteristics and thelegal status of those fishing vessels.
iii. Bidders must present financial deposits as evidence of their bona fide commitment to bid in the publicauction.
iv. No bidder may be awarded more than 50% of the TAC to be auctioned.v. The National Fisheries Service will open a Register of the EFPs for each fishery managed under the RFID
system. This Register will record all EFPs issued against the TAC percentages awarded by auction, as wellas all subsequent EFPs awarded following the division, transference or transmission, lease or free-lendingof the rights.
Three aspects should be highlighted regarding the process followed in designing and implementing therights-allocation system: first, although no explicit policy objectives were set, the allocation-system designed bythe Under-Secretariat for Fisheries aims at providing equal opportunity among bidders, and to avoid a monopolyin the market for fishing-rights in a fishery under a RFID management system. This system may also be seen asa way of preventing, or minimizing, complaints and conflicts among stakeholders. Second, since the fisherywhere the fishing-rights were allocated was new, no change in the fishery’s structure or distribution was intended.Third, the allocation-system was designed by a small number of senior officers in the Under-Secretariat forFisheries, and few changes have been made to what was originally proposed.
4. DATA REQUIREMENTS AND COMPUTATIONAL PROCESS4.1 Data requirements
The process of allocating fishing-rights requires the computation of at least three indicators to be taken intoconsideration by bidders. These are: the Floor Price [Precio Piso], the Bid Warranty [Garantia de Seriedad] andthe Annuity Payment [Anualidades] 8 on every allocation awarded.
The Decree No. 97 of 1996 containing the “Regulations for the Auction of Extraordinary Fishing Permits”lists the following data as the information required by auctioneers and bidders.
i. The amount (tonnes) of the TAC determined by the Under-Secretariat for Fisheries.ii. A Floor Price.iii. The Penalty Amount [Valor de Sanción] used to calculate the Bid Warranty which is to be deposited with
the Under-Secretariat before the auction takes place.iv. A Chilean monetary-converter labelled ‘Monthly Tax Unit’ [Unidad Tributaria Mensual] which
approximates nominal monetary-values to real monetary-values.9v. The number and type of allocations to be auctioned at a First-Time Auction, expressed as 10%, 5%, 2% and
1% of the TAC. If no original fishing-rights exist a total of 26 allocations would be auctioned. If anyoriginal fishing-rights exist, a total of 25 allocations would be auctioned. Table 1 shows the number ofallocations per category in both cases.
vi. A number of fixed parameters used in the computation process for one or more of the previous indicators.
Patagonian Toothfish 310
7 The National Industrial Fishing Registry is a record kept by the National Fisheries Service containing a list of peopleauthorized to conduct industrial or large-scale fishing activities.8 Note – this payment is equal to the bid for the entire 10 year period divided by 10 – there is no allowance for any interestthat may be due.9 A real monetary-value or real price is an indicator that has been corrected to reflect the change in the value of money overtime due to economic inflation or deflation.
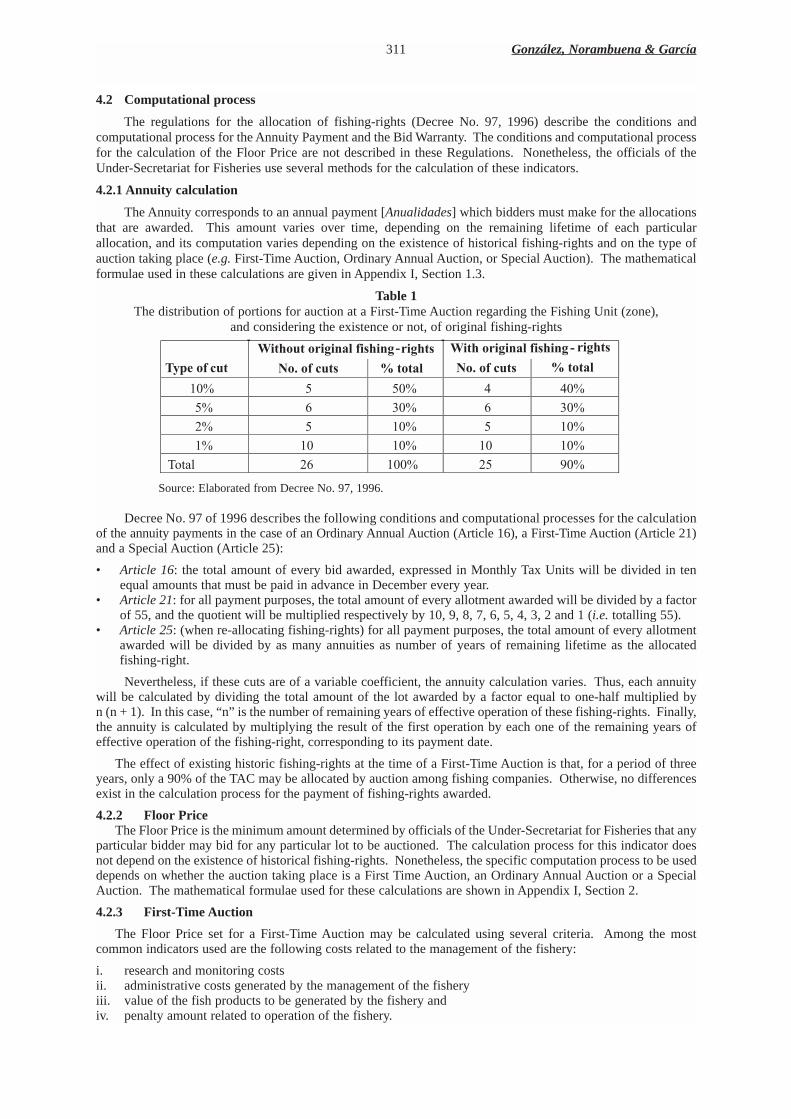
4.2 Computational process
The regulations for the allocation of fishing-rights (Decree No. 97, 1996) describe the conditions andcomputational process for the Annuity Payment and the Bid Warranty. The conditions and computational processfor the calculation of the Floor Price are not described in these Regulations. Nonetheless, the officials of theUnder-Secretariat for Fisheries use several methods for the calculation of these indicators.
4.2.1 Annuity calculation
The Annuity corresponds to an annual payment [Anualidades] which bidders must make for the allocationsthat are awarded. This amount varies over time, depending on the remaining lifetime of each particularallocation, and its computation varies depending on the existence of historical fishing-rights and on the type ofauction taking place (e.g. First-Time Auction, Ordinary Annual Auction, or Special Auction). The mathematicalformulae used in these calculations are given in Appendix I, Section 1.3.
Table 1The distribution of portions for auction at a First-Time Auction regarding the Fishing Unit (zone),
and considering the existence or not, of original fishing-rights
Source: Elaborated from Decree No. 97, 1996.
Decree No. 97 of 1996 describes the following conditions and computational processes for the calculationof the annuity payments in the case of an Ordinary Annual Auction (Article 16), a First-Time Auction (Article 21)and a Special Auction (Article 25):
• Article 16: the total amount of every bid awarded, expressed in Monthly Tax Units will be divided in tenequal amounts that must be paid in advance in December every year.
• Article 21: for all payment purposes, the total amount of every allotment awarded will be divided by a factorof 55, and the quotient will be multiplied respectively by 10, 9, 8, 7, 6, 5, 4, 3, 2 and 1 (i.e. totalling 55).
• Article 25: (when re-allocating fishing-rights) for all payment purposes, the total amount of every allotmentawarded will be divided by as many annuities as number of years of remaining lifetime as the allocatedfishing-right.
Nevertheless, if these cuts are of a variable coefficient, the annuity calculation varies. Thus, each annuitywill be calculated by dividing the total amount of the lot awarded by a factor equal to one-half multiplied byn (n + 1). In this case, “n” is the number of remaining years of effective operation of these fishing-rights. Finally,the annuity is calculated by multiplying the result of the first operation by each one of the remaining years ofeffective operation of the fishing-right, corresponding to its payment date.
The effect of existing historic fishing-rights at the time of a First-Time Auction is that, for a period of threeyears, only a 90% of the TAC may be allocated by auction among fishing companies. Otherwise, no differencesexist in the calculation process for the payment of fishing-rights awarded.
4.2.2 Floor PriceThe Floor Price is the minimum amount determined by officials of the Under-Secretariat for Fisheries that any
particular bidder may bid for any particular lot to be auctioned. The calculation process for this indicator doesnot depend on the existence of historical fishing-rights. Nonetheless, the specific computation process to be useddepends on whether the auction taking place is a First Time Auction, an Ordinary Annual Auction or a SpecialAuction. The mathematical formulae used for these calculations are shown in Appendix I, Section 2.
4.2.3 First-Time Auction
The Floor Price set for a First-Time Auction may be calculated using several criteria. Among the mostcommon indicators used are the following costs related to the management of the fishery:
i. research and monitoring costsii. administrative costs generated by the management of the fisheryiii. value of the fish products to be generated by the fishery andiv. penalty amount related to operation of the fishery.
311 González, Norambuena & García
!"#$%&#'%(")"*+,'-".$"*)/(")$#.'
!"#$'%(")"*+,'-".$"*) / (")$#.'
0123'%-'4&#' 5%6'%-'4&#.'
7'#%#+,'
5%6'%-'4&#.'
7'#%#+,'
!"# $ $% $ $%"# $ $& $ &"# $$%# $ $' $ $("# $ $' $ ("# $$)# $ $% $ $!"# $ $% $ !"# $$!# $ !" $ $!"# $ !" $ !"# $
*+,-. $ )' $ !""# $ )% $ /"# $
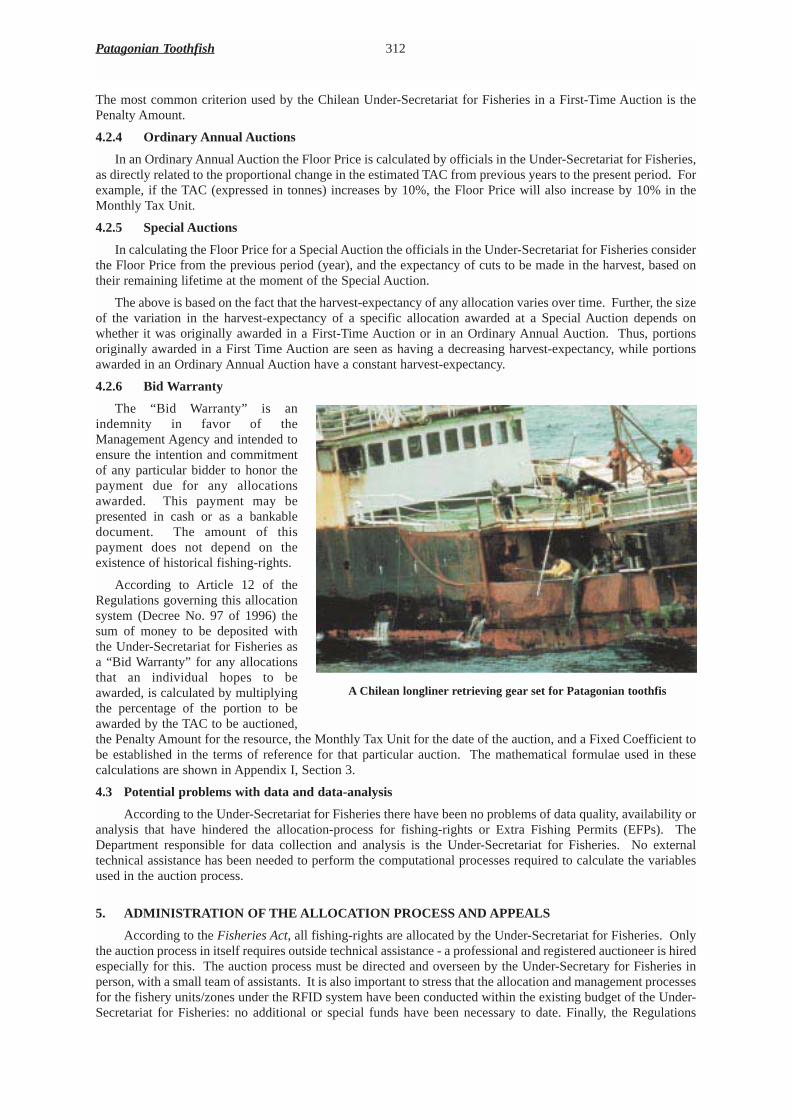
The most common criterion used by the Chilean Under-Secretariat for Fisheries in a First-Time Auction is thePenalty Amount.
4.2.4 Ordinary Annual Auctions
In an Ordinary Annual Auction the Floor Price is calculated by officials in the Under-Secretariat for Fisheries,as directly related to the proportional change in the estimated TAC from previous years to the present period. Forexample, if the TAC (expressed in tonnes) increases by 10%, the Floor Price will also increase by 10% in theMonthly Tax Unit.
4.2.5 Special Auctions
In calculating the Floor Price for a Special Auction the officials in the Under-Secretariat for Fisheries considerthe Floor Price from the previous period (year), and the expectancy of cuts to be made in the harvest, based ontheir remaining lifetime at the moment of the Special Auction.
The above is based on the fact that the harvest-expectancy of any allocation varies over time. Further, the sizeof the variation in the harvest-expectancy of a specific allocation awarded at a Special Auction depends onwhether it was originally awarded in a First-Time Auction or in an Ordinary Annual Auction. Thus, portionsoriginally awarded in a First Time Auction are seen as having a decreasing harvest-expectancy, while portionsawarded in an Ordinary Annual Auction have a constant harvest-expectancy.
4.2.6 Bid Warranty
The “Bid Warranty” is anindemnity in favor of theManagement Agency and intended toensure the intention and commitmentof any particular bidder to honor thepayment due for any allocationsawarded. This payment may bepresented in cash or as a bankabledocument. The amount of thispayment does not depend on theexistence of historical fishing-rights.
According to Article 12 of theRegulations governing this allocationsystem (Decree No. 97 of 1996) thesum of money to be deposited withthe Under-Secretariat for Fisheries asa “Bid Warranty” for any allocationsthat an individual hopes to beawarded, is calculated by multiplyingthe percentage of the portion to beawarded by the TAC to be auctioned,the Penalty Amount for the resource, the Monthly Tax Unit for the date of the auction, and a Fixed Coefficient tobe established in the terms of reference for that particular auction. The mathematical formulae used in thesecalculations are shown in Appendix I, Section 3.
4.3 Potential problems with data and data-analysis
According to the Under-Secretariat for Fisheries there have been no problems of data quality, availability oranalysis that have hindered the allocation-process for fishing-rights or Extra Fishing Permits (EFPs). TheDepartment responsible for data collection and analysis is the Under-Secretariat for Fisheries. No externaltechnical assistance has been needed to perform the computational processes required to calculate the variablesused in the auction process.
5. ADMINISTRATION OF THE ALLOCATION PROCESS AND APPEALS
According to the Fisheries Act, all fishing-rights are allocated by the Under-Secretariat for Fisheries. Onlythe auction process in itself requires outside technical assistance - a professional and registered auctioneer is hiredespecially for this. The auction process must be directed and overseen by the Under-Secretary for Fisheries inperson, with a small team of assistants. It is also important to stress that the allocation and management processesfor the fishery units/zones under the RFID system have been conducted within the existing budget of the Under-Secretariat for Fisheries: no additional or special funds have been necessary to date. Finally, the Regulations
Patagonian Toothfish 312
A Chilean longliner retrieving gear set for Patagonian toothfis

regarding the fishing-rights allocation-process (Decree No. 97, 1996) do not explicitly state any conditions orprocesses for anyone to appeal the process regarding the allocations received, and no legal appeals have occurredto date in this fishery.
6. EVALUATION OF THE INITIAL ALLOCATION PROCESS
Three aspects should be considered in evaluating the initial allocation-process in this fishery: (a) the levelof success in achieving initial policy objectives; (b) the satisfaction of rights-holders with the system and theprocess in place; and (c) the views of other community groups.
6.1 Level of success in achieving initial policy objectivesOfficials of the Under-Secretariat for Fisheries feel that at present there is not sufficient scientific or
practical evidence to show whether (or not) the Chilean Patagonian toothfish fishery has yet reached sustainablelevels. However, they are convinced that the RFID management system has turned this fishery in one of the best-regulated fisheries in the country.
6.2 Satisfaction of rights-holders with the system and the process now in place
The level of satisfaction (or dissatisfaction) of rights-holders with respect to fishing-rights and theallocation-process set up in this fishery was determined through interviews by telephone with three importantfishing-company managers. The landings by these three companies surveyed represent approximately 77% of thepresent TAC.
The extent of the rights-holders’ satisfaction was surveyed with respect to three specific aspects of thesystem: (a) the allocation mechanism and process in itself; (b) the economic output of the activity; and (c) theefficiency of the enforcement system in place for the fishery. Those interviewed were asked to consider theirinitial and present perception of this system.
6.2.1 The allocation mechanism and process
The general perception was that system in place has been adequate, but that it now requires someimprovements. The system was perceived as adequate for three main reasons: first, there was general agreementthat payment for fishing-rights brings a clear sense of ownership (even though temporary) over the portion of theresource available for harvest. This applies not only to the quota-holder, but most importantly, also to third partiesor operators. Second, the system gives fishing companies, or operators, the freedom to regulate their activitiesover time, according to their own efficiency-criteria, by allowing them to focus their fishing during those periodsof the year when fish are abundant, and operating costs and market prices are most favorable (i.e they cangenerate the largest net-benefit). Third, the lifetime of ten years attributed to the fishing-rights is considered bythe fishing operators to be an adequate time-horizon for economic and financial planning, as well as beingconsistent with a medium- to long-term commitment towards resource (stock) sustainability.
The system is also considered to be capable of improvement, based on the grounds of equity and efficiency.Desired improvements on the grounds of equity relate to the initial-allocation mechanisms, and to the maximumpercentage of the TAC that a single operator or fishing company may hold over time.
The initial-allocation system for the fishing unit/zone [Unidad de Pesqueria] is based on the existence ofhistorical-rights corresponding to 10% of the TAC that was to be allocated among fishing companies or operatorsholding valid fishing-permits at the time the RFID system was set up. This system is perceived as unfair becausesome operators obtained fishing-rights for free, which they could sell at any time, thus capturing benefits for nocost.
Furthermore, some respondents stressed the need for mechanisms to regulate the percentage of the TAC thata fishing company or operator may hold, but based on their differences in operational capacity. Some operatorsare able to operate on fishing grounds both inside and outside the Chilean EEZ, while other smaller companiescan only operate within the Chilean fishing areas. Some argue that the larger operators have better opportunitiesto obtain their harvest-quota than do those who can only operate inside the fishing units/zones. Thus, there is theperception that the smaller operators should have had a preference with respect to the percentage of the TAC thatthey may hold and in this way, the differences in harvest-opportunities would be more balanced.
Desired improvements on the grounds of efficiency are aimed at improving the present method of quota-allocations, specifically, with respect to the open-bid system, the level of the Bid Warranty required, and thevirtual lack of any barriers to quitting the fishery.
The perceived problem is that with the present operating situation, the open-bid system tends to raise theprices paid for fishing-rights beyond the actual value of the resource. It is claimed that the allocation-systemcreates incentives for fishing operators to enter the fishery and excessively exploit the resources in the short-term.
313 González, Norambuena & García

This argument is based on the fact that the present low level of the Bid Warranty (which is initially set based uponthe Penalty Amount), and the non-existence of barriers to quitting the fishery, stimulate a rise in the prices thatare bid. Thus, a proposed improvement would be to use a system of secret bidding, to raise the value of the BidWarranty, and to introduce some penalties (presumably economic) for quitting the fishery before the expiry of thelifetime of the fishing-rights that have been awarded.
6.2.2 The economic output of fishing activity
One general perception among those interviewed was that the RFID system results in better economicoutputs, than under a global-quota or a competitive TAC (Total Allowable Catch) system. Support for this viewis that the system of individual fishing-rights creates incentives to regulate fishing-effort and fishing-harvestthroughout the year. Thus, the fishing companies or operators are able to direct their fishing effort to thoseperiods of the year when fishing-effort is most profitable (i.e. when costs are minimal and/or net-benefits aremaximized).
In contrast, under a system of global-quotas there are incentives to exert as much fishing-effort as possiblein the shortest possible time, so as to harvest as much as possible of the common quota (i.e. gold-rush behavior).These conditions lead in turn to fishing-costs that are higher than desirable (although not all the operators sharethis view, nor do they perceive any difference between a system of individual catch-quotas and a system withglobal-quota).
6.2.3 Efficiency of the enforcement system
There were different perceptions about the efficiency of enforcement in the fishery, ranging from those whobelieved that there are no enforcement problems, to those who believed that there is mis-reporting with respectto the quantities of catches at sea (factory-vessels) and the location of harvesting operations (catches outside thelimits of the fishing-area). At the same time, there was agreement that, in spite of the fact that the personnel ofthe National Fisheries Service make their best effort to conduct enforcement, this Service suffers a lack of properinfrastructure and equipment, as well as a shortage of personnel in its regional offices.
There was also a recognition that the new regulation regarding the mandatory use of a Vessel MonitoringSystem (VMS) for marking the position of every vessel at any time, should correct the problem of harvestingoperations taking place outside the limits of the fishing-areas.
Some operators argue that the observed differences in the declarations of on-board production, is a minorproblem originating from the existing working conditions at sea, and the lack of precision of the instruments inuse. This problem is however believed to be corrected at the time of the landings, when it is necessary to checkthe catches and provide production statistics.
There is a general perception that enforcement is a key factor for the RFID system to be successful. Someoperators expressed the need for a stronger link between the collection of scientific data, and enforcementactivities, especially, with respect to the determination of the annual TAC values (e.g. consideration of the effectof large marine mammals on catches and available biomass).
6.3 Views of other community groupsThere was a general perception among many members of the small-scale fisheries sector that the system of
allocating individual harvest-quotas (transferable or not) has been devised so as to favor the larger and richeroperators, because the system is viewed as a continuation of the privatization of the country’s natural resourcesthat mainly occurred in the mid-1970s and through the 1980s.
7. DISCUSSION
Four aspects relating to the implementation of the RFID management system merit comment: (a) its abilityto preclude monopoly; (b) consideration of the economic value of the natural resource; (c) the computationalprocess of the Floor Price used for auction purposes; and (d) general equity issues.
7.1 Ability to preclude monopoly
The fishing-rights allocation-system presently in use ensures that no operator can have access to more than50% of the TAC through successful bids at auctions (First-Time Auction or Ordinary Annual Auction).Nonetheless, this limit in itself may not be completely effective in precluding the development of a monopolyand concentration of capital among the fishing units, because it is possible for an operator to hold more than50% of the TAC by acquiring fishing-rights at a Special Auction or through market transactions by lease or sale.During the time that the RFID management system has been in effect in the Patagonian toothfish fishery, asignificant quantity of fishing rights (EFPs) have been transferred internally by means of sale, rental or free-loans.
Patagonian Toothfish 314
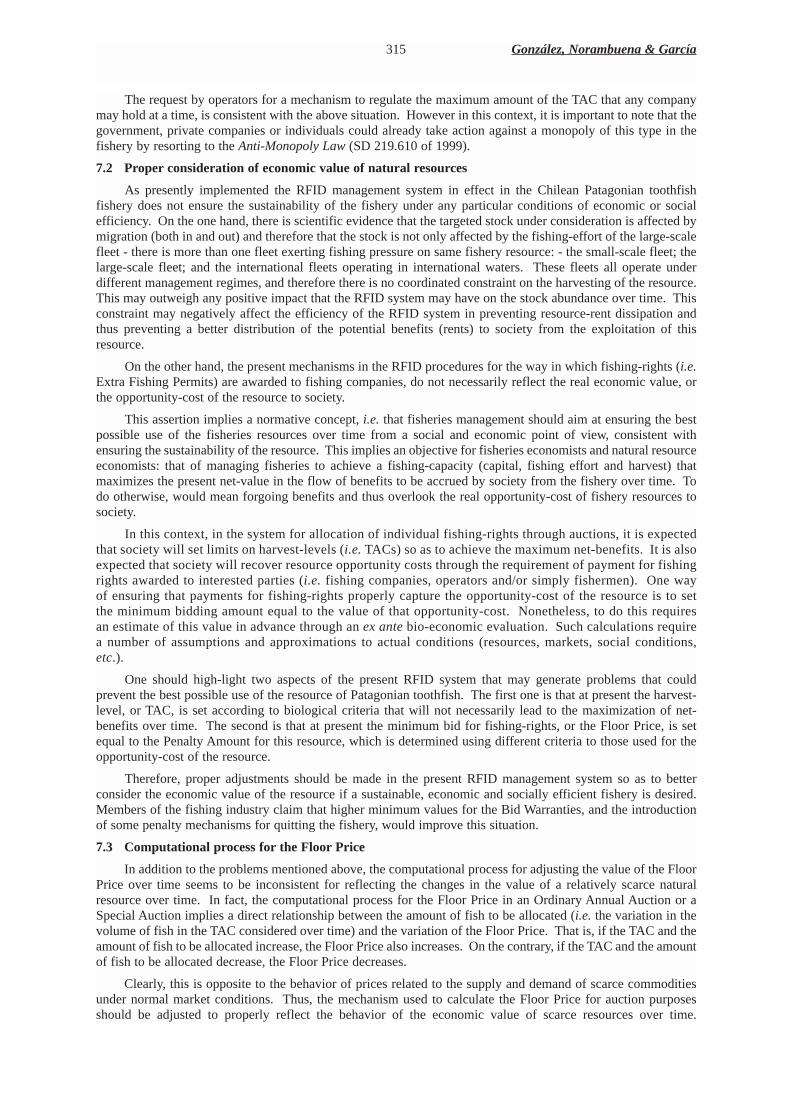
The request by operators for a mechanism to regulate the maximum amount of the TAC that any companymay hold at a time, is consistent with the above situation. However in this context, it is important to note that thegovernment, private companies or individuals could already take action against a monopoly of this type in thefishery by resorting to the Anti-Monopoly Law (SD 219.610 of 1999).
7.2 Proper consideration of economic value of natural resources
As presently implemented the RFID management system in effect in the Chilean Patagonian toothfishfishery does not ensure the sustainability of the fishery under any particular conditions of economic or socialefficiency. On the one hand, there is scientific evidence that the targeted stock under consideration is affected bymigration (both in and out) and therefore that the stock is not only affected by the fishing-effort of the large-scalefleet - there is more than one fleet exerting fishing pressure on same fishery resource: - the small-scale fleet; thelarge-scale fleet; and the international fleets operating in international waters. These fleets all operate underdifferent management regimes, and therefore there is no coordinated constraint on the harvesting of the resource.This may outweigh any positive impact that the RFID system may have on the stock abundance over time. Thisconstraint may negatively affect the efficiency of the RFID system in preventing resource-rent dissipation andthus preventing a better distribution of the potential benefits (rents) to society from the exploitation of thisresource.
On the other hand, the present mechanisms in the RFID procedures for the way in which fishing-rights (i.e.Extra Fishing Permits) are awarded to fishing companies, do not necessarily reflect the real economic value, orthe opportunity-cost of the resource to society.
This assertion implies a normative concept, i.e. that fisheries management should aim at ensuring the bestpossible use of the fisheries resources over time from a social and economic point of view, consistent withensuring the sustainability of the resource. This implies an objective for fisheries economists and natural resourceeconomists: that of managing fisheries to achieve a fishing-capacity (capital, fishing effort and harvest) thatmaximizes the present net-value in the flow of benefits to be accrued by society from the fishery over time. Todo otherwise, would mean forgoing benefits and thus overlook the real opportunity-cost of fishery resources tosociety.
In this context, in the system for allocation of individual fishing-rights through auctions, it is expectedthat society will set limits on harvest-levels (i.e. TACs) so as to achieve the maximum net-benefits. It is alsoexpected that society will recover resource opportunity costs through the requirement of payment for fishingrights awarded to interested parties (i.e. fishing companies, operators and/or simply fishermen). One wayof ensuring that payments for fishing-rights properly capture the opportunity-cost of the resource is to setthe minimum bidding amount equal to the value of that opportunity-cost. Nonetheless, to do this requiresan estimate of this value in advance through an ex ante bio-economic evaluation. Such calculations requirea number of assumptions and approximations to actual conditions (resources, markets, social conditions,etc.).
One should high-light two aspects of the present RFID system that may generate problems that couldprevent the best possible use of the resource of Patagonian toothfish. The first one is that at present the harvest-level, or TAC, is set according to biological criteria that will not necessarily lead to the maximization of net-benefits over time. The second is that at present the minimum bid for fishing-rights, or the Floor Price, is setequal to the Penalty Amount for this resource, which is determined using different criteria to those used for theopportunity-cost of the resource.
Therefore, proper adjustments should be made in the present RFID management system so as to betterconsider the economic value of the resource if a sustainable, economic and socially efficient fishery is desired.Members of the fishing industry claim that higher minimum values for the Bid Warranties, and the introductionof some penalty mechanisms for quitting the fishery, would improve this situation.
7.3 Computational process for the Floor Price
In addition to the problems mentioned above, the computational process for adjusting the value of the FloorPrice over time seems to be inconsistent for reflecting the changes in the value of a relatively scarce naturalresource over time. In fact, the computational process for the Floor Price in an Ordinary Annual Auction or aSpecial Auction implies a direct relationship between the amount of fish to be allocated (i.e. the variation in thevolume of fish in the TAC considered over time) and the variation of the Floor Price. That is, if the TAC and theamount of fish to be allocated increase, the Floor Price also increases. On the contrary, if the TAC and the amountof fish to be allocated decrease, the Floor Price decreases.
Clearly, this is opposite to the behavior of prices related to the supply and demand of scarce commoditiesunder normal market conditions. Thus, the mechanism used to calculate the Floor Price for auction purposesshould be adjusted to properly reflect the behavior of the economic value of scarce resources over time.
315 González, Norambuena & García

Otherwise society, represented by its Government, is forgoing revenues and benefits which could be obtainedfrom the efficient use of its natural resources.
Finally, it is important to bear in mind, that the proper setting of a Floor Price to values reflecting theopportunity-cost of the resource (i.e. its value in the water) may play the central role in determining theappropriate rental to be paid by rights-holders, if proper adjustment of possible inequities is to be achieved.
7.4 General equity issues
Although efficiency objectives and criteria are central to fisheries management if the achievement ofsustainable development is desired, equity objectives and criteria are also important to consider when designingand implementing systems of individual transferable quotas (ITQs). One relevant issue in designing initial-allocation mechanisms is the financial and economic capacity of a sector, such as the small-scale or artisanalfisheries sector. Another relevant issue in any particular fishery is the potential concentration of capital andeconomic power that can arise from the existence of a system of ITQs, which may lead to a monopoly if thereare no restrictions on the concentration of harvesting-rights by a single operator. The real social impact of theseissues will depend on what a country and/or a society considers to be an equitable situation.
8. ACKNOWLEDGEMENTS
The authors wish to thank Mr. Francisco Ponce from the Chilean Under-Secretariat for Fisheries, for thesharing of his thorough knowledge and understanding of the historic evolution of this fishery and the fisheriesregulations in Chile. We are also thankful to the many persons in the private sector who kindly received ourinquiries and answered them with a sound understanding of the practical and theoretical aspects of thismanagement system.
9. LITERATURE CITED
Government of Chile 1991. General Law of Fisheries and Aquaculture. SD No. 430. Santiago: Official Gazetteof the Republic of Chile.
Government of Chile 1996. Regulations for the Auction of Extraordinary Fishing Permits. SD. No. 97. Santiago:Official Gazette of the Republic of Chile.
Lemaitre, C., P.S. Rubilar, P. Gebauer, and C.A. Moreno 1991. Regional Catch Analysis of Long-line Fisheriesof Dissostichus eleginoides in Chile. Document WG-FSA-91/10 CCAMLR, Hobart, Australia.
SERNAPESCA (National Fisheries Service) 1999. Registry of Artisanal Fishermen of Chile. Ministry ofEconomy, Santiago.
Under-Secretariat for Fisheries 1999. Total Allowable Catch Quota for the Deep Water Cod Fishery, Year 2000.Technical Report No 67. Fishery Resources Department, Ministry of Economy, Valparaíso.
Patagonian Toothfish 316

Appendix IComputational process for relevant auction indicators.
1. ANNUITY CALCULATION
To calculate the Annuity Payments (AP) to be made by a successful bidder it is necessary to know thepercentage of the TAC awarded to him or her at different auctions, as well as the total value paid for theseallocations awarded. These calculations depend upon whether the TAC percentages already existed or not, andwhether there were historic fishing-rights at the date of the First-Time Auction.
1.1 When no historic fishing rights exist1.1.1 Percentage of TAC awarded and in effect operation
Equation 1 shows the mathematical expression used to calculate the percentage of the TAC awarded to anyoperator at a First-Time Auction or Ordinary Annual Auction, and in effect at the time of analysis.
QAa,t,i = i * ja,i * FACt,a (1)Where:
a = subscript used to account for the position of auctions in time (i.e. a = 1, 2, 3, 4, …, n)t = time vector accounting for the time horizon of the analysisi = subscript expressing the ith type of cut (expressed as a % of the TAC) awarded to a particular
operator. At a First-Time Auction the subscript “i” is a vector assuming the values 1%, 2%, 5%and 10% (see Table 1), and at an Ordinary Annual Auction the sub-index “i” is a constant equalto 1%.
QAa,t,I = percentage of the TAC awarded at the ath auction for the ith type of cut and in effect operatingin the tth time interval.
ja,I = subscript expressing the number of cuts of the ith type, awarded by any operator at the ath
auction. The variable “j” may be equal to, or greater than zero (0), and lower than, or equal to,the maximum number of cuts of the ith type as defined by the Regulations of the RFIDmanagement system.
FACt,a = an auxiliary variable used to calculate the proportion of the cut awarded at the ath auction thatis in effect operating at the tth time interval.
Where:ata =year the ath auction takes place.
Equation 2 shows the mathematical expression used to calculate the percentage of the TAC awardedby any operator at a Special Auction of any allocations:
SQAa,t,i = i * sja,i * SFACt,a (2)Where:
QAa,t,i = percentage of the TAC awarded at the ath Special Auction for the ith type of allocation in effectin the tth time interval.
sja,i = subscript expressing the number of cuts of the ith type, awarded by any operator at the ath
Special Auction. The variable “sj” may be equal to or greater than zero and lower than orequal to the maximum number of allocations of the ith type as defined by the regulations ofthe RFID management system.
SFACt,a = auxiliary variable used to calculate the proportion of allocation awarded at the ath auction thatis in effect at the tth time interval.
317 González, Norambuena & García

Where:sata = year the ath the Special Auction takes place.saia = year of initial auction of reallocationssna = remaining lifetime of cuts auctioned at the sata Special Auction calculated as:
Thus, the total percentage of a TAC awarded by any operator and in effect at the tth time interval may be expressedas in equation 3.
(3)
Where:TQAt = total percentage of the TAC awarded by to any operator at a First Time Auction, Ordinary
Annual Auction,or Special Auction, and in effect at the tth time interval.All other variables, parameters and constants are as previously defined.
1.1.2 Value of the cuts awarded
The value of the quantity of fish awarded by any individual at the ath auction may be expressed as inequations 4 and 5.
VQAa,i = uva,i * i * ja,i * TACa (4)
Where:VQAa,i = value of the monthly tax unit of the ith type of cut awarded by any operator at the ath auctionuva,i = unit value of the monthly tax unit offered by any operator for every tonne of fish of the ith
type of cut awarded at the ath First-Time Aunction or Ordinary Annual Auctionja,i = number of cuts of the ith type auctioned at the ath First-Time Auction or Ordinary Annual
AuctionTACa = total allowable quantity (tonnes) of fish harvest to be allocated among operators at the ath
First-Time Auction or Ordinary Annual Auction.
SVQAa,i = suva,i * i * sja,i * TACa (5)Where:
SVQAa,i = value of the monthly tax unit of the ith type of cut awarded by any operator at the ath SpecialAuction
suva,i = unit value of the monthly tax unit offered by any operator for every tonne of fish of the ithtype of allocation awarded at the ath Special Auction
sja,i = number of allocations of the ith type auctioned at the ath Special AuctionTACa = total allowable catch (tonnes) to be allocated among operators at the ath Special Auction.
1.1.3 Annuity payment
The calculation process used to determine the value of the annuity payment of a First-Time Auction orOrdinary Annual Auction is expressed in Equation 6.
ANa,t,i = VQAa,i * FAC1t,a (6)
Patagonian Toothfish 318

Where:ANa,t,i = amount of monthly tax unit to be paid as an annuity for the total amount of fish of the ith
type of cut awarded at the ath First-Time Auction or Ordinary Annual Auction at the tth timeinterval
FAC1t,a = auxiliary variable used to calculate the factor for the annuity payment for the cut awarded atthe ath auction that must to be paid at the tth time interval. This factor is calculated based onconditions established in Articles 16 and 21 of Decree No. 97 of 1996. The mathematicalexpression for this factor is:
Where all variables, parameters and constants are as previously defined.
The calculation process to determine the value of the annuity payment of a Special Auction may be expressed asin equation 7.
(7)
Where:SANa,t,i = amount of monthly tax unit to be paid as an annuity, for the total amount of fish of the ith
type of cut awarded at the ath Special Auction at the tth time intervalSFAC1t,a = auxilliary variable used to calculate the factor for the annuity payment for the cut awarded
at the ath auction that must to be paid at the tth time interval. This factor is calculated basedon conditions established in article 25 of Decree No. 97 of 1996. The mathematicalexpression for this factor is:
Where all variables, parameters and constants are as previously defined. Thus, the total annuity payment to bemade by any operator at the tth time interval may be expressed as in equation 8.
(8)
Where:TANt = amount of monthly tax unit to be paid as an annuity by any operator at the tth time interval.
1.4 When historic fishing rights do exist
To consider the existence of historic fishing-rights during the first three years of the RFID managementsystem, the calculation process must consider only 90% of the TAC to be allocated in a First-Time Auction untilthe third year. Afterwards, 100% of the TAC must be considered. Since the above variations affect the fishingunit/zone as a whole, these differences will not be reflected in the mathematical expressions used above toestimate the required indicators.
319 González, Norambuena & García

2. FLOOR PRICE
The Under-Secretariat for Fisheries uses different formulae in calculating the Floor Price to bid for fishing-rights, depending on whether the auction taking place is a First-Time Auction, an Ordinary Annual Auction, or aSpecial Auction. The calculations shown below are for an Ordinary Annual Auction and a Special Auction only.
2.1 Ordinary Annual Auctions
In an Ordinary Annual Auction the Floor Price is calculated according to the proportional change in the TACallocated from year to the next. Equation 9 shows the mathematical expression used by Under-Secretariat forFisheries to calculate this.
(9)
Where:FPa = floor price for the ath auctionFPa-1 = floor price for the previous auctionTACa = total allowable catch to be allocated at the ath auctionTACa-1 = total allowable catch allocated at the previous auction.
2.2 Special auctions
In calculating the Floor Price for a Special Auction the officials in the Under-Secretariat for Fisheriesconsider the Floor Price from the previous period (year) and a harvest-expectancy of cuts to be awarded based onthe remaining lifetime at auction time,
(10)
Where:E = harvest-expectancy of the cut to be auctioned, expressed as a % the TAC to be allocated
among operators.
In turn, the calculation of E varies depending on whether the Special Auction refers to a First-Time Auction, orvariable cuts, or to an Ordinary Annual Auction, or fixed cuts.
Equation 11, shows the mathematical expression used by Under-Secretariat for Fisheries to calculate E for fixedcuts to be auctioned.
Ei = i * sna (11)Where:
i = subscript expressing the ith type of cut (expressed as a % of the TAC) awarded by a particularoperator. At an Ordinary Annual Auction the sub-index “i” is a constant equal to 1%
Ei = expected harvest (% of the TAC) to be obtained from the remaining lifetime of the ith fixedcut.
Equation 12 shows the mathematical expression used by the Under-Secretariat for Fisheries to calculate E forvariable cuts to be auctioned.
(12)
Where:sat5 = time interval at which the ath Special Auction takes place for variable cuts.FAC2a,i = auxiliary variable to account the ith type of variable cut actually awarded at the ath Special
Auction.
All other variables, parameters and constants are as previously defined.
Patagonian Toothfish 320

3. BID WARRANTY
According to the definitions presented in section 4.2.3 the mathematical expression to calculate the BidWarranty may be as follows
(13)
Where:WBa,i = sum of the Monthly Tax Unit to be presented as Bid Warranty for the ith type of allocation
awarded in the ath auctionVPa = value of the Penalty Amount in Chilean $ in effect at the time of the ath auctionMTUa = value in Chilean $ of the Monthly Tax Unit index, used as a money converterFIXCa = fixed coefficient to be applied to the TAC in order to calculate the Bid Warranty at the ath
auction. This coefficient is to be determined by the Under-Secretariat for Fisheries.
All other variables, parameters and constants are as previously defined. Therefore, the total amount of money tobe presented as Bid Warranty at the ath auction by any operator may be calculated as:
321 González, Norambuena & García

SHARING THE CATCHES OF WHALES IN THE SOUTHERN HEMISPHERE
S.J. Holt4 Upper House Farm,Crickhowell, NP8 1BZ, Wales (UK)
1. INTRODUCTION
What historians have labelled modernwhaling is largely a twentieth century enterprise. Its definingfeature is the cannon-fired harpoon with an explosive head, launched from a motorised catcher boat.1 Thissystem was first devised about 1865 by Svend Foyn, the son of a ship-owner from Tønsberg, in Vestfold,southeast Norway. Foyn believed that “God had let the whale inhabit the waters for the benefit and blessing ofmankind, and consequently I considered it my vocation to promote these fisheries”. He has been described as“...a man with great singularity of vision, since virtually everything he did ...was dedicated to the profitablekilling of whales”.
Foyn’s system allowed for the first time the systematic hunting and killing of the largest and fastestswimming species of whales, the rorquals, a sub-class of whalebone whales (Mysticetes spp.). The basictechnology was supplemented by significant developments in cabling, winches and related hardware and inprocessing. Powered vessels could not only tow the dead rorquals back to land bases quickly and thus in goodcondition for processing, but could provide ample compressed air to keep them afloat.
Modern whaling could not, however, have become a major industry world-wide, without other technologicaldevelopments. Other kinds of whales had already been killed in enormous numbers, primarily for their oil, forover a century.2 In 1905 it was discovered that oil from baleen whales could be hydrogenated and the resultingproduct could be used in the manufacture of soap and food products. During World War I it was the prime sourceof glycerine, for production of explosives. Although margarine had been produced since 1869 by a Frenchprocess, it was not until 1929 that a satisfactory, tasteless product from whale oil became available for thispurpose. In the first half of the twentieth century other products included meal (from flesh and bones from whichthe last drops of oil had been wrung) - called guano in the trade - while in the second half of that century meatfor human consumption became dominant. Foyn tried to market whale meat in Norway but it was not palatableto Norwegians, and did not become so until after the 1930s through intensive marketing campaigns. In Japan, onthe other hand, eating whale meat had a long tradition, though even there the great expansion into the Antarcticwas driven by demand for oil, not protein.
In this study I examine three episodes - and an incipient fourth - in the history of modern whaling inwhich governments, and the whaling and trading companies legally dependent on them, have sought to reachnecessary agreements on total catches or commodity production, on the sharing of those catches and on the“policing” of those agreements. Their dual purposes were to maintain (and enhance) profitability byregulating competition among participants in the industry and to impede entry by others. These efforts weremore often than not cloaked in the rhetoric of “conservation”, and indeed, to the limited degree that they weresuccessful, they could be seen as a factor in dragging the industry towards sustainability and “saving” thestocks of whales.
I confine the discussion to whaling in the Antarctic (although a similar analysis could be made of whalingin the North Pacific). This was, almost from the beginning of the twentieth century, by far the most importantsector of the industry, and by the 1930s the pelagic-whaling (using factory-ships to process caught whales andmove the products) was by far the biggest part of that sector. In each episode the negotiations had to take someaccount of the fact that there were other sources of identical products from whaling elsewhere, that each operationtook a variety of species of whale and produced a variety of commodities, and that industries other than whalingyielded products that could substitute for products from whales and hence affect the market for those. The first
322
1 The explosive head was dispensed with for some years in the 1970-1980s when the “small” minke whale was the primetarget; the explosion destroyed the whale’s body and also spoilt much of the meat. The “cold grenade” was substituted forthe explosive head. This was, however, eventually prohibited by the IWC, on humanitarian grounds. A smaller explosive(penthrite) head is now used.
2 Whaleoil (once called train oil) is the statistical term for edible oil from baleenwhales. Inedible spermoil comes from thespermwhale, and a similar oil is obtained from other toothedwhales, particularly several species of bottlenosewhale (notto be confused with the bottlenose dolphin of Flipper fame). Baleen whales (having baleen plates - “whalebone” - on theirpalattes rather than teeth in their jaws) include the gray whale, the right whalesand the rorquals. This last group iscomprised of blue, fin, humpback, sei, Bryde’s and minkewhales (in roughly descending order of size); in some of thoseclasses - including the presently important minke - there are now known to be two or more species or sub-species. Thestatistical category oil includes both whaleand spermoil. Of the baleen whales, right whales’carcasses float, rorquals’sink.

two of the three episodes also occurred in periods of recovery from the World Wars and the economic disruptionthat followed them. The three episodes were:
i. the 1930s (during and after the global economic depression)ii. the 1960s (when it was agreed that biological sustainability was a universal management objective)iii. the decade from about 1976 to 1986 (after Norway, its originator, had dropped out of Antarctic whaling and
before the general moratorium on commercial whaling adopted in 1982 came into effect for most countries).
An incipient fourth episode arises from the possibility that some commercial whaling might be legitimised3
under a Revised Management Scheme (RMS) currently being negotiated by the International WhalingCommission (IWC). This is complicated by the emergence of three new factors: first, world-wide growth ofwhale-watching as an economic activity which is not entirely compatible with whaling; second, the idea that ifthe whales “belong” to anyone it is to humanity as a whole and not merely to those who kill them for profit; andthird, the slow but steady increase in concern that commercial whaling is intrinsically inhumane, and because itno longer satisfies any human need it should cease. On top of these there remain widespread doubts thatcommercial whaling can, in the present state of world affairs and the Law of the Sea, be effectively regulated(given especially its history as partially recounted here), and hence it should not be legitimised.
In each episode the negotiations were conditioned by events in the preceding decade, so these are describedfirst. The thrust and flavour of the long, complicated and frustrating negotiations in the 1960s (the secondepisode) can best be understood from a rather full and detailed chronological account, which is thereforeincluded.
2. PRECURSOR TO THE FIRST EPISODE
Sven Foyn’s new whaling system was first deployed in the far north of his country. In 1864 he set up ashore-station, with one catcher-boat, on the east coast of Finnmark (the region north of the Arctic circle) inVaranger Fjord, at Vadsø, giving ready access to the whale-rich Barents Sea. For a decade Foyn was the soleoperator, gradually increasing the number of his catcher-boats to four by 1880, taking at first mainly blue whales.But by 1882 the catch was predominantly fin whales, and remained so until 1903. By 1896 19 whaling companieswere operating from Finnmark. But catches fell steadily as local whale populations were exterminated, andoperations had to move further afield, to Bear Island and Spitsbergen (Svalbard).4 This shift called for theemployment of tugs to tow dead whales much longer distances to shore, an operation made practicable by thecold environment. To facilitate this the shore-stations were moved westward.
This move brought the whalers into the realm of the cod fishers, who considered that whaling wasprejudicial to their interests.5 They prevailed on the Norwegian authorities to prohibit whaling off the north coast,from 1905. This reinforced a further shift to other areas where modern whaling had already begun - to Iceland,Faeroes, Shetlands, Hebrides, Newfoundland, and eventually to the Orient and the coasts of Africa and SouthAmerica. The expansion was facilitated by the use of floating factories. These were mostly converted cargovessels on which whales could be processed, rather than being dragged up ramps at land-stations. The carcassescould not be taken aboard, but were stripped of blubber and meat on a floating platform next to the mooredfactory. They made the whaling operations more mobile and also possible in regions with poor or non-existentlanding places. They could also be used to transport products in bulk, rather than whale carcasses, to the homebases. But they could not work in the open ocean. The first such factory, Telegraf, was used at Spitsbergen in1903, and was immensely successful. By 1905 a second factory, Admiralen, was sent to the Antarctic, wheregreat things were in the offing.
A Norwegian whaler and sealer, Carl Larsen, set up a shore-station on South Georgia, in 1904, establishedas an Argentine company. Other parts of the Falkland Islands dependencies were less hospitable for shore-bases,but in 1905/06 the Admiralenwas also able to moor in and work from South Shetland. Three years later there
323 Holt
3 Commercial whaling operations now being carried out by two States, members of the IWC - Japan and Norway - are notillegal, under the terms of the ICRW 1946, but they are unregulated.
4 The English explorer, William Scoresby, had recorded in 1820 the presence of large numbers of fin whales near Spitsbergenbut, apart from the difficulty of catching them noted that they yielded little, and inferior, oil in comparison with what wasthen the mainstay of whale oil production: the North Atlantic right whale. Blues and fins could also be dangerous so hejudged them to be “unworthy of attention”. Similarly, the relatively small minke whale, now the mainstay of the residualwhaling industry, was judged to be unworthy of attention while the larger species were still abundant.
5 Some said the whales herded the cod into fjords, making them more accessible to humans in small boats. Others observedthat the onshore processing of large whales was extremely noxious, with huge volumes of decomposing waste to bedisposed of. This has caused whaling to be unpopular with the other inhabitants even those of traditional whaling towns onthe coast of Japan - despite the money it brought in during its heyday.
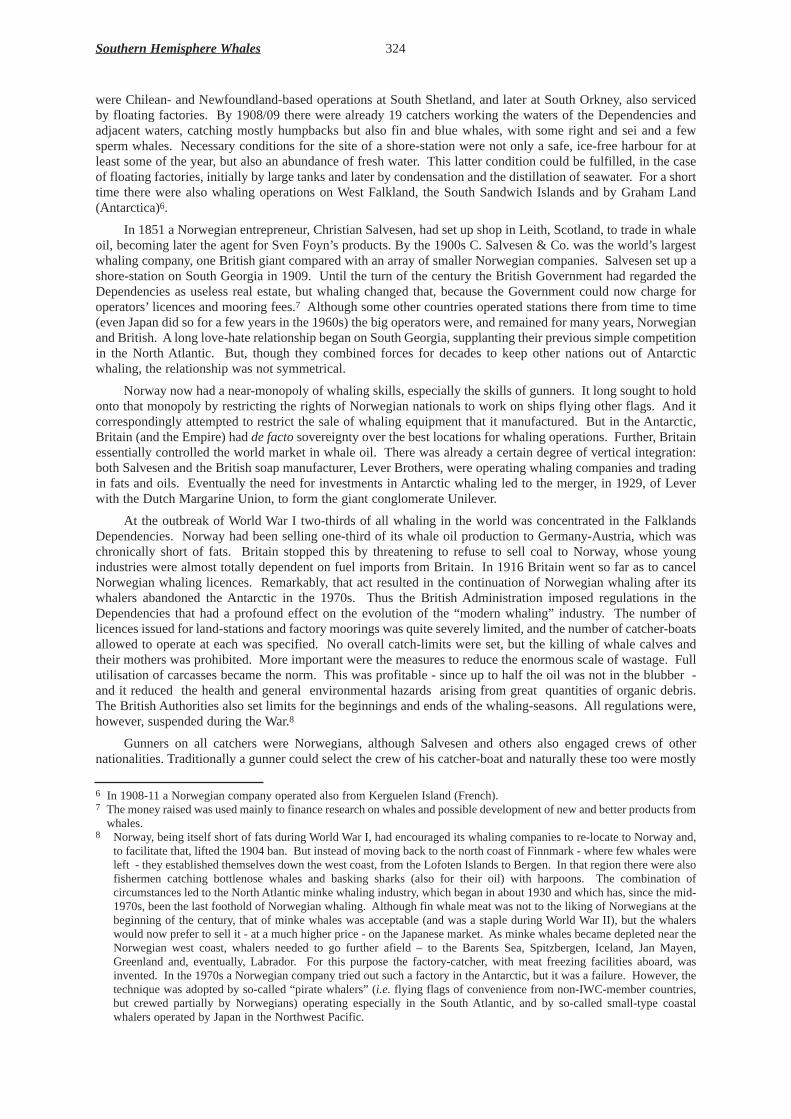
were Chilean- and Newfoundland-based operations at South Shetland, and later at South Orkney, also servicedby floating factories. By 1908/09 there were already 19 catchers working the waters of the Dependencies andadjacent waters, catching mostly humpbacks but also fin and blue whales, with some right and sei and a fewsperm whales. Necessary conditions for the site of a shore-station were not only a safe, ice-free harbour for atleast some of the year, but also an abundance of fresh water. This latter condition could be fulfilled, in the caseof floating factories, initially by large tanks and later by condensation and the distillation of seawater. For a shorttime there were also whaling operations on West Falkland, the South Sandwich Islands and by Graham Land(Antarctica)6.
In 1851 a Norwegian entrepreneur, Christian Salvesen, had set up shop in Leith, Scotland, to trade in whaleoil, becoming later the agent for Sven Foyn’s products. By the 1900s C. Salvesen & Co. was the world’s largestwhaling company, one British giant compared with an array of smaller Norwegian companies. Salvesen set up ashore-station on South Georgia in 1909. Until the turn of the century the British Government had regarded theDependencies as useless real estate, but whaling changed that, because the Government could now charge foroperators’licences and mooring fees.7 Although some other countries operated stations there from time to time(even Japan did so for a few years in the 1960s) the big operators were, and remained for many years, Norwegianand British. A long love-hate relationship began on South Georgia, supplanting their previous simple competitionin the North Atlantic. But, though they combined forces for decades to keep other nations out of Antarcticwhaling, the relationship was not symmetrical.
Norway now had a near-monopoly of whaling skills, especially the skills of gunners. It long sought to holdonto that monopoly by restricting the rights of Norwegian nationals to work on ships flying other flags. And itcorrespondingly attempted to restrict the sale of whaling equipment that it manufactured. But in the Antarctic,Britain (and the Empire) had de factosovereignty over the best locations for whaling operations. Further, Britainessentially controlled the world market in whale oil. There was already a certain degree of vertical integration:both Salvesen and the British soap manufacturer, Lever Brothers, were operating whaling companies and tradingin fats and oils. Eventually the need for investments in Antarctic whaling led to the merger, in 1929, of Leverwith the Dutch Margarine Union, to form the giant conglomerate Unilever.
At the outbreak of World War I two-thirds of all whaling in the world was concentrated in the FalklandsDependencies. Norway had been selling one-third of its whale oil production to Germany-Austria, which waschronically short of fats. Britain stopped this by threatening to refuse to sell coal to Norway, whose youngindustries were almost totally dependent on fuel imports from Britain. In 1916 Britain went so far as to cancelNorwegian whaling licences. Remarkably, that act resulted in the continuation of Norwegian whaling after itswhalers abandoned the Antarctic in the 1970s. Thus the British Administration imposed regulations in theDependencies that had a profound effect on the evolution of the “modern whaling” industry. The number oflicences issued for land-stations and factory moorings was quite severely limited, and the number of catcher-boatsallowed to operate at each was specified. No overall catch-limits were set, but the killing of whale calves andtheir mothers was prohibited. More important were the measures to reduce the enormous scale of wastage. Fullutilisation of carcasses became the norm. This was profitable - since up to half the oil was not in the blubber -and it reduced the health and general environmental hazards arising from great quantities of organic debris.The British Authorities also set limits for the beginnings and ends of the whaling-seasons. All regulations were,however, suspended during the War.8
Gunners on all catchers were Norwegians, although Salvesen and others also engaged crews of othernationalities. Traditionally a gunner could select the crew of his catcher-boat and naturally these too were mostly
Southern Hemisphere Whales 324
6 In 1908-11 a Norwegian company operated also from Kerguelen Island (French).7 The money raised was used mainly to finance research on whales and possible development of new and better products from
whales.8 Norway, being itself short of fats during World War I, had encouraged its whaling companies to re-locate to Norway and,
to facilitate that, lifted the 1904 ban. But instead of moving back to the north coast of Finnmark - where few whales wereleft - they established themselves down the west coast, from the Lofoten Islands to Bergen. In that region there were alsofishermen catching bottlenose whales and basking sharks (also for their oil) with harpoons. The combination ofcircumstances led to the North Atlantic minke whaling industry, which began in about 1930 and which has, since the mid-1970s, been the last foothold of Norwegian whaling. Although fin whale meat was not to the liking of Norwegians at thebeginning of the century, that of minke whales was acceptable (and was a staple during World War II), but the whalerswould now prefer to sell it - at a much higher price - on the Japanese market. As minke whales became depleted near theNorwegian west coast, whalers needed to go further afield – to the Barents Sea, Spitzbergen, Iceland, Jan Mayen,Greenland and, eventually, Labrador. For this purpose the factory-catcher, with meat freezing facilities aboard, wasinvented. In the 1970s a Norwegian company tried out such a factory in the Antarctic, but it was a failure. However, thetechnique was adopted by so-called “pirate whalers” (i.e. flying flags of convenience from non-IWC-member countries,but crewed partially by Norwegians) operating especially in the South Atlantic, and by so-called small-type coastalwhalers operated by Japan in the Northwest Pacific.

Norwegians. Under UK law the captain of the vessel hadto be British. The gunners were paid bonuses accordingto the species of whale they killed - bigger bonuses forbigger or more productive species. These were not,however, in proportion to the relative oil yields.9 Theoverall effect was to encourage, for example, thepreferential killing of blue and right whales relative tothe in and humpback. Also, some whales were moreaccessible than others: humpbacks tended to swim closerto shore than the other species, and so were in some areasselectively killed until they were nearly exterminated.The matter of gunners’bonuses was controversialthrough to the 1970s.
Immediately after World War I regulations were re-imposed, and the British also exacted a tax on everybarrel of oil produced in the Dependencies. This moneywas used to finance research relevant to whales andwhaling, and in particular the expeditions ofR.M.S.Discovery (the explorer Robert Falcon Scott’s oldship) to the Antarctic. Vertical integration of productionand marketing continued with the purchase by LeverBrothers of the Southern Whaling Company, andattention switched from glycerine production to otheruses of whale oil as food.
Norway sought to escape from British hegemony byinvesting in larger floating factories that could operatefar from the Dependencies, in particular in the SouthPacific sector at around 170ºWlongitude. The Ross SeaWhaling Company bought and converted an old steamerinto what was then the largest and best equipped whalingship, theSir James Clark Ross. With Carl Larsenaboardshe arrived in the Antarctic in 1923/24 and entered the Ross Sea.
The voyage was nearly a failure, since the factory could not operate effectively in open water and couldnot handle blue whales weighing up to 100 tonnes. In 1925 a new vessel, the first purpose-built factory-shipwas commissioned.10 This vessel, the C. A. Larsen, had a slipway in the bow, up which whales could behauled.It was not a success, but another, the Lancing, with a stern ramp, was successful; it was tested intropical waters, and minor modifications were made on its voyage south.11 Pelagic-whaling had begun.
The Norwegian companies next decided to apply a licensing system to their new operations, primarily inorder to strengthen their negotiating position with the British. In the 1920s concern was also beginning to beexpressed in both Britain and Norway about the future of the whale stocks, and Britain threatened to withdrawall Dependencies licences from Norwegian companies unless the Norwegians either ceased or restrained theirpelagic-whaling. The two countries eventually agreed, in 1928, that licensing would resume and that bothshore-based and pelagic-whalingwould be conducted under the same basic rules.
This set the scene for the first episode of the long negotiations over the limitation and sharing ofAntarctic whale catches. But before I look at that episode in detail what was happening outside theNorwegian-British relationship must be examined. The arenas were the recently established InternationalCouncil for the Exploration of the Sea (ICES) and the League of Nations. In 1929 ICES announced, in astatement addressed to the League, among others, that: “...While fully admitting that it is not likely that anydefinitive results can be derived from the scientific investigations now in progress until a considerable timehas elapsed, the [Council’s] Committee on Whaling feels strongly that the enormous expansion of the whaling
325 Holt
9 Right whale: 200NKr, 60-70 barrels of oil; sperm: 100NKr, 60 barrels; blue: 80 NKr, 70-80 barrels; fin: 50NKr, 50 barrels;humpback: 25-35 NKr, 25-35 barrels.
10 She operated in the Weddell Sea. These, and very many later similar, floating-factory operations, far from shore bases,became known as ice whaling.
11 The critical technical problem that had to be solved before factory-ships with a stern ramp could transform the whalingindustry was not making the hole, but preventing its interference with steering.
Modern catcher-vessels proved efficient incapturing whales on the high-seas(Photo-credit: Greenpeace/Culley)
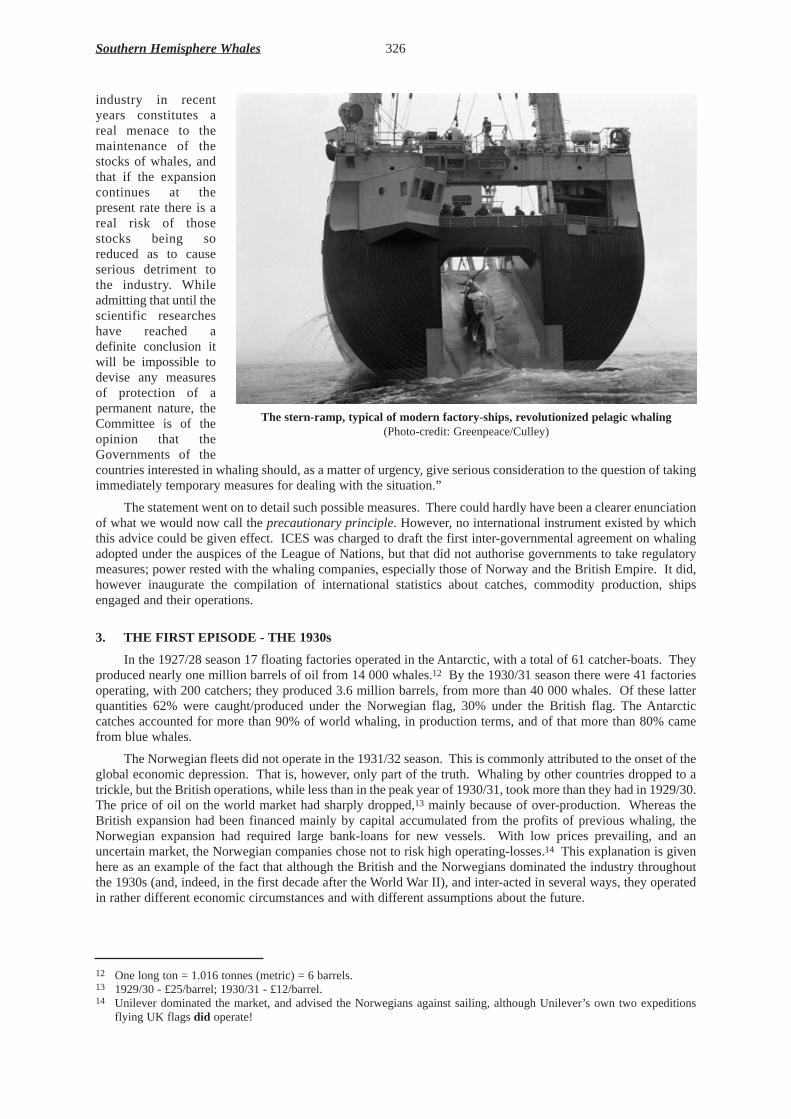
industry in recentyears constitutes areal menace to themaintenance of thestocks of whales, andthat if the expansioncontinues at thepresent rate there is areal risk of thosestocks being soreduced as to causeserious detriment tothe industry. Whileadmitting that until thescientific researcheshave reached adefinite conclusion itwill be impossible todevise any measuresof protection of apermanent nature, theCommittee is of theopinion that theGovernments of thecountries interested in whaling should, as a matter of urgency, give serious consideration to the question of takingimmediately temporary measures for dealing with the situation.”
The statement went on to detail such possible measures. There could hardly have been a clearer enunciationof what we would now call the precautionary principle. However, no international instrument existed by whichthis advice could be given effect. ICES was charged to draft the first inter-governmental agreement on whalingadopted under the auspices of the League of Nations, but that did not authorise governments to take regulatorymeasures; power rested with the whaling companies, especially those of Norway and the British Empire. It did,however inaugurate the compilation of international statistics about catches, commodity production, shipsengaged and their operations.
3. THE FIRST EPISODE - THE 1930s
In the 1927/28 season 17 floating factories operated in the Antarctic, with a total of 61 catcher-boats. Theyproduced nearly one million barrels of oil from 14 000 whales.12 By the 1930/31 season there were 41 factoriesoperating, with 200 catchers; they produced 3.6 million barrels, from more than 40 000 whales. Of these latterquantities 62% were caught/produced under the Norwegian flag, 30% under the British flag. The Antarcticcatches accounted for more than 90% of world whaling, in production terms, and of that more than 80% camefrom blue whales.
The Norwegian fleets did not operate in the 1931/32 season. This is commonly attributed to the onset of theglobal economic depression. That is, however, only part of the truth. Whaling by other countries dropped to atrickle, but the British operations, while less than in the peak year of 1930/31, took more than they had in 1929/30.The price of oil on the world market had sharply dropped,13 mainly because of over-production. Whereas theBritish expansion had been financed mainly by capital accumulated from the profits of previous whaling, theNorwegian expansion had required large bank-loans for new vessels. With low prices prevailing, and anuncertain market, the Norwegian companies chose not to risk high operating-losses.14 This explanation is givenhere as an example of the fact that although the British and the Norwegians dominated the industry throughoutthe 1930s (and, indeed, in the first decade after the World War II), and inter-acted in several ways, they operatedin rather different economic circumstances and with different assumptions about the future.
Southern Hemisphere Whales 326
The stern-ramp, typical of modern factory-ships, revolutionized pelagic whaling(Photo-credit: Greenpeace/Culley)
12 One long ton = 1.016 tonnes (metric) = 6 barrels.13 1929/30 - £25/barrel; 1930/31 - £12/barrel.14 Unilever dominated the market, and advised the Norwegians against sailing, although Unilever’s own two expeditions
flying UK flags did operate!
The 1931/32 season was a watershed for Antarctic whaling. The companies thought that operations couldonly remain profitable if the oil price was stabilised, which meant keeping production well below the 1930/31level of 3.6 million barrels. This meant reducing the number of expeditions, which in turn meant encouragingolder vessels to move out. Accordingly, the companies agreed to limit the catch and catching effort ofexpeditions15 by allocating a quota to each of them, with freedom to transfer and trade these quotas betweencompanies. Transferability meant that the older expeditions could be bought out.
As a result of these agreements the production of baleen oil was stabilised at between 2.2 and 2.5 millionbarrels until 1937, when other nations - principally Germany and Japan - began to operate in the Antarctic on asubstantial scale. Thus, in 1937/38, 46 000 whales were killed, yielding 3.3 million barrels of oil. This was notas much as in the peak season of 1930/31, because although the efficiency of oil extraction had improved, by nowmore than 40% of the whales were fin whales (the blues having been depleted), each of which provided onlyabout half the yield from a blue whale.
There was a dispute about the basis for quotas. The Norwegian companies wanted these to be based on thetankcapacity of the factory, while the British - particularly the biggest company, Salvesen - wanted the basis tobe processingcapacity, as more relevant to efficiency. The British also insisted on the quota being expressed interms of numbers of whales, rather than quantities of oil, on the grounds that this would encourage fullprocessing. During the negotiations it was taken that one blue whale would yield about 110 barrels andequivalents were calculated for other species. This was the origin of the measure that prevailed in Antarcticwhaling management through to 1972 - the Blue Whale Unit (BWU). 16
The expedition quotas were negotiated annually, under broad ground rules established by the 1931 GenevaConvention, which had been drawn up on the initiative of the ICES, beginning in 1926 and adopted under theLeague of Nations. This Convention was derived in large part from the Norwegian Whaling Act of 1929(whichwas strengthened in 1934). Participants in the inter-governmental negotiations were France, Germany, Japan,Norway, Portugal, the UK and the USA. Crucially, this Convention could not come into force before it wasratified by the UK, which was not done until October 1934. The 1931 Convention applied to all whaling,everywhere, both pelagic and from land-stations and by the few remaining floating factories. It gave fullprotection to the endangered right whale, set minimum sizes of whales that could be legally caught, and protectedlactating females and accompanying calves of all species. It required licensing of all operations by the nationswhose flags they flew, and the passage of domestic implementing legislation along the lines of the Norwegianlaw. And it provided for the collection and publication of statistics. It did not, however, give governments powerto establish catch-limits. After the entry of other nations to Antarctic pelagic-whaling, Germany ratified thesuccessors to the Geneva Convention, but Japan did not.17
An overall Antarctic catch-limit (including landstations) was first negotiated among companies in June1932, for the 1932/33 season. This limit was 18 584 BWU, being calculated as a barrelage of 2.03 million,equivalent to a blue whale yielding 110 barrels. In fact, that season the catch was 16 985 BWU, but with an actualyield of 116.4 barrels per BWU, the barrelage reached 2.09 million. So, in 1933 a new agreement was negotiatedfor the 1933/34 season. This was for 17 074 BWU, but calculated at 115 barrels per BWU. These two agreementshad the intended effect of bringing catches down by one third from the unregulated high in 1930/31. At the timesome people genuinely thought - quite wrongly as it turned out - that such a catch would be sustainable.
But, although the principal motive was the wish to limit production in order to improve the market price ofwhale oil, Unilever - both a major producer and the market leader - broke ranks from the second agreement, andNorwegian-British cooperation fell apart. Until then these two nations had held a virtual monopoly in Antarcticpelagic-whaling. Consequently the seasons 1934/35 to 1936/37 were chaotic, with failures to reach viable newagreements and with the entry of new nations - Japan and Germany - to the industry and other expeditions froma number of countries making trial operations, some flying flags of convenience.
Table 1(below) gives an overall view of changes in the Antarctic pelagic fleets and their performance fromnear the beginning of the quota negotiations, to the period of intensive German and Japanese operations.
327 Holt
15 An “expedition” is basically a factory plus its catchers. However, many other craft were also involved: tankers (some aslarge as, or bigger than, the factory), transports for fuel and products, including - in later years - refrigerated ships, othersupply vessels, vessels to transfer products from factory to tanker, scouts, occasionally ship-borne aircraft.
16 Eventually fixed at: 1 blue = 2 fins = 2.5 humpbacks = 6 sei whales.17 The 1931 Geneva Convention provided the template for subsequent inter-governmental agreements during the 1930s - and
eventually for the International Convention for the Regulation of Whaling (1946), which established the InternationalWhaling Commission (IWC).

So, although the total production had hardly changed, it had been secured only through increases in thenumber of expeditions, in the sizes of the factories, in the number of catchers per factory and in the sizes andpowers of the catchers.
Table 1Changes in the Antarctic pelagic fleets
Originally the British had effectively controlled Antarctic whaling through their sovereignty over the sub-Antarctic islands, especially South Georgia. When these became secondary, with the growth first of ice whaling thenof pelagic-whaling, the Norwegian Government, at the behest of its whalers, sought control over new entries to theindustry through the domestic laws which prohibited Norwegians from working on foreign ships. This had limitedeffect because, if offered enough money, top gunners were willing to flout that law, even when it meant going to liveabroad. Furthermore, because much of the Norwegian oil production was sold to Germany, through Unilever,Norway was reluctant to offend the new Nazi Government there and so did not enforce the law very seriously.
Generally the several Norwegian companies acted jointly in selling to Unilever. But their inter-companyloyalty was weak. Eventually one company, Lars Christensen, contracted unilaterally to sell to Unilever oil fromthe 1934/35 and 1935/36 seasons and announced this after that company had recommended a general lay-up ofexpeditions to improve the price. Negotiations collapsed. Then, in 1936, another Norwegian entrepreneur,Anders Jahre, produced a new proposal to involve the entire Norwegian and British fleets supported by theincreasingly powerful Norwegian trade unions and the Government. But it involved a new condition - that onlyNorwegians would be employed on all whaling vessels - which was obviously not going to be acceptable to theUK. It led to moves by the British companies, and Unilever, to train and employ British crews for all tasks exceptas gunners and some of their selected comrades on the catchers.
The German entry to Antarctic pelagic-whaling was the consequence of a national policy of self-sufficiency(except that the Germans did not much bother to train their own gunners.). It was achieved by blocking Unileverassets and earnings in Germany and causing them to be used to acquire factories to sail under the German flag. By1937 there were nine “German” expeditions: one of the Norwegian vessels had been purchased, two more chartered,then a British factory was purchased, two new ones built – the Unitasand the Walter Rau18 - and another convertedfrom a cargo vessel. The two new ones were very advanced technically, the Walter Rau being the first factory-shipto have provision for freezing meat, producing blood meal, meat extract, canned meat and liver oil.
Japanese enterprises entered the business in 1935 through purchase of an old Norwegian factory-ship,(which engendered complaints from UK) and getting hold of the plans for the newest generation of ships fromBritish builders. By 1939 Japan was operating five expeditions - the original and four new ones. By the timeJapan entered the Antarctic it was self-sufficient in skills, no longer dependent on Norwegian gunners.
Around this time a revised Convention, of 1937, introduced a new concept: the prohibition of floatingfactories and factory-ships operating in warmer waters of all oceans, in particular north of 40ºS in the Southernhemisphere. This measure, though effectively closing breeding grounds to pelagic-whaling, did not haveprimarily a conservation objective, it was derived from the wish to keep oil-yield high (baleen whales, when theyleave the Antarctic - and Arctic - feeding grounds steadily lose much of their oil content by metabolism).
So the first “sharing” episode involved attempted agreements through the 1930s, initially betweencompanies and later involving the governments whose flags their vessels flew. Although even then somescientists and government officials and politicians saw this as a move to conserve whale stocks, the primarypurpose was to maintain the price of whale oil in the already global market, and secondarily as one of severalinstruments by which companies and governments of Norway and UK - at the time the only significantparticipants in this new industry - sought to maintain a virtual monopoly by hindering the access of other aspiringnationals to the natural resource and to the market for whale products, primarily baleen oil.
Southern Hemisphere Whales 328
Season Factory-ships Catcher-boats Catch No. Average
(tons) No. No. per
Expedition
Average (tons)
Average
(HP) HP/ton
(BWUs)
1933/34 19 12 559 114 6.0 256 880 3.4 19 861
1938/39 34 13 751 270 7.9 298 1 139 3.8 20 271
18 After World War II the Unitas, renamed Empire Victory, then AbrahamLarsen, was taken by UK as reparations and soldto South Africa; and the Walter Rauwas transferred to Norway, being re-named KosmosIV. A third, the Vikinger, wastransferred to the USSR, re-named Slava, and played an important role in the quota negotiations of the 1950s and 1960s(Second Episode).

Parallel with the company-to-company negotiations there was an inter-governmental activity. In 1926 theICES had charged a committee - le comité international pour la protection de la baleine- to draft principles foran international agreement for the regulation of whaling. ICES called upon the League of Nations (LoN) to takeover this task. The agreement proposed at the LoN Expert Meeting in Geneva in 1930 was based on theNorwegian Whaling Act 1929. It was negotiated among France, Germany, UK, Japan, Norway Portugal and theUSA, and signed in September 1931.
The Geneva Convention included, inter alia, prohibition of the killing of right whales, of calves andlactating mothers, and of sexually immature animals. It also established that all whaling operations must belicensed by states and that statistical records be kept and submitted to the Bureau of International WhalingStatistics (BIWS). The matter of licensing had a practical importance: while Antarctic whaling was largely shore-based, the UK, which claimed and now vigorously defended sovereignty19 over the most favourable sub-Antarctic islands, especially South Georgia, could unilaterally set regulations for, and collect rents and licencefees from Norwegian and other land-stations there. The onerous licensing system in itself encouraged theNorwegians and then others to “go pelagic” once the new technology had been perfected (mainly by inclusion ofstern slipways on the factories), and so to escape licensing. Naturally, it was this that freed whaling to take placethroughout the entire Southern Ocean, there being a virtual absence of possible land-station sites along the entirecontinental coast.
The Geneva Convention did not come into force until four and a half years after its adoption, because theUK did not ratify it until October 1934.
After four years of chaos yet another whaling conference was convened in June 1937. Prior to this theNorwegian and British Governments had conspired to find a way of preventing Japanese and German expansion.This was to be by offering to meet Germany’s own oil requirements for several years at a price determined by theprice of oil from vegetable seed and at the same time to deprive Japan of its major customer for whale oil -Germany! This plot did not work; two Norwegian companies sold their expeditions to Germany. More or lesssimultaneously a company was set up, registered in the USA, using Norwegian catchers and crews, and withAmerican citizens as Fleet Captain and Engineer. This last provision would ensure that the oil could be importedto the USAfree of duty. This and another similar operation enraged the American producers of terrestrial animaloils and edible vegetable oils, which in turn led the US authorities to change the domestic law so that only whale-catchers built in the USAand crewed by US citizens could shoot “tax-free whales”.
The 1937 Conference, the prime aim of which had been declared to be to restrict catches in order to preservewhale stocks was, in the words of the whaling historians J. N. Tonnessen and A. O. Johnsen, “a total fiasco”.Germany and the USAparticipated, others were Argentina, Australia, Ireland (which provided a flag ofconvenience for a Scottish/Norwegian company), UK, Norway and South Africa. Japan was invited - evenpressurised - but did not participate either as a Delegation or an observer. The 1937/38 catch, and oil productionwere higher than ever (the increase coming mainly from Japanese and German operations) and there was a hugeincrease in the number of catchers (but not in factory-ships) engaged. This alone caused a price slump that wasexacerbated by the USAbecoming, by the beginning of 1938, an exporter instead of an importer of fats and oils,based on huge increases in its production of oleaginous seed, particularly from soya.
These events paved the way for another Preparatory Conference in May 1938 in Oslo. By then, a strikingpolitical change had occurred: the Oslo Conference was dominated by Germany, UK and USA, not Norway. TheUSA proposed what was thought to be a revolutionary change of approach; its delegate was Dr RemingtonKellogg who later also represented the USAat the 1946 Conference in Washington DC to negotiate anInternational Convention for the Regulation of Whaling (ICRW). The US proposals were derived from what wereat the time seen as successful international negotiations on sealing and halibut fishing in the North Pacific andBering Sea. They included dividing the Southern Ocean into sectors, some of which would be closed to whalingand others bound by catch-limits for each sector, which would be enforced through closure of the season. TheUK accepted this in principle but favoured a global catch-limit, which would be shared out among theparticipating nations, who would in turn allocate shares to each of their factories. The USAcould not accept, onprinciple, national or fleet allocations.20 The ideas of setting total catch-limits by sector and species, andawarding national shares, were both bitterly opposed by Norway.
329 Holt
19 In fact the enforcement of the British sovereignty claim derived entirely from the belated realisation in London - followingthe chance discovery of a Norwegian-Argentine whaling operation already there - that South Georgia was in fact a usefulplace.
20 These had been avoided also in the model halibut agreement, which eventually led to the disastrous over-investment in thatindustry, as in subsequent whaling, as operators increased their effective effort in order to gain bigger shares of a limited- and dwindling - total catch. The USAapproach of seeking to model whaling agreements on its experience with regionalinter-governmental fisheries agreements was to prove of great importance when, in 1958, negotiations began in earnest onnational sharing of overall catch-limits.

The Oslo Preparatory Conference was followed by a Diplomatic Conference in June 1938 that adopted aprotocol amending the 1937 agreement. It established most of the provisions subsequently incorporated in the1946 Convention, except that no BWU limit was agreed, nor any limitation of the number of catchers to bedeployed (which was strongly opposed by Japan, Germany and the biggest trader, Unilever). In the hope tosecure the adherence of Japan to the basic 1937 agreement, as well as to the new protocol, several regressiveconcessions were made, particularly a reduction in the minimum size-limits for blue, fin and sperm whales to betaken from land-stations. Proposals to ban the sale of vessels and gear to countries not party to the agreement,and the purchase of oil from such countries, were dropped.
Japan declared that it would abide by the London agreement after one year. Meanwhile it had proven thatpelagic-whaling was now practicable without employment of Norwegian expertise. It was also interested morein meat than in oil; hence its oil yield from a given catch was relatively low. The Japanese catch in the 1938/39season was exceptionally low despite deployment of two large new factories and an extra 18 catchers, eventhough they operated with no restrictions at all and no open-season limits.21
In this situation Germany called for another conference. This was held in London in July 1939 and attendedby Germany, UK, Japan, Norway and USA, with Canada, Ireland, New Zealand and South Africa as observers.Again, Japan made promises but did not honour them; its Government, “...with a view to protecting the whale,instructed companies to observe the conditions in line with international agreements and hoped that thecompanies would comply with this request.”
In September the War began in Europe. The Japanese press announced a rise in the oil price on the worldmarket, declaring that because of the War many expeditions would not be operating, so there would be less oil onthe European market, a situation that Japanese producers could cash in on.22 However, the escalation andexpansion of the war made it impossible to transport whale oil to Europe by sea. Efforts to transport it by railfrom Manchuria also failed.
4. INTERMEZZO - THE WAR YEARS
Some pelagic-whaling continued through World War II, but eventually most factory-ships, and manycatchers which had been given over to other duties, were sunk or converted. However, a perceived increased needfor fats and oils in the post-war world stimulated further consultations in London in January-February 1944; theminutes of them constituted the 1944 Protocol. This was regarded as amending the 1937 and 1938 Londonagreements, to apply to the first post-war season, which was already expected to be 1945/46.
The Chairman of the major British company - H. K. Salvesen - had, in 1942, urged the UK government topull out of the pre-war agreements on the grounds that with only Norway and UK being engaged in the future inpelagic-whaling, no such international accord was necessary. According to Salvesen - and one suspects otherinterested parties off the record - the overwhelming need would be to produce as much oil as possible in the firstseason or two, and later introduce conservation measures as these might become necessary. A subsidiaryargument advanced at the time was that whale stocks would at least have partially recovered as a consequence ofreduced exploitation during wartime.23 The UK government did not accept these arguments except insofar as tosuggest extending the season to seven months and suspending the requirement to fully utilise the carcasses. Atthe same time it agreed to propose an overall limitation to 20 000 animals (not BWU), which, if it had been putinto effect, would have led to an enhanced slaughter of blue whales.
Instead of the British proposal the 1944 Conference agreed to an overall catch-limit of 16 000 BWU, anumber that was carried through to the post-war conference in 1946. The participating states this time wereAustralia, Canada, UK, New Zealand, Norway, South Africa and USA. At this Conference the US announced itsintention to convene a comprehensive international whaling conference in Washington DC immediately after thewar “with a view to complete regulation of catching in future”.
Partly by way of preparation for this the UK convened a conference in London in November 1945.24
Additional participants were Denmark and France. The Netherlands also asked to be invited as it had advancedplans to start pelagic-whaling; the UK, as host country, agreed without consulting Norway, despite the fact that
Southern Hemisphere Whales 330
21 The other whaling countries said at the time that their poor results of the previous seasons were due to Japan’s unregulatedcatching, in which size-limits, the ban on humpback catching, and opening and closing dates were all ignored.
22 Japan was in these years selling whale oil to obtain cash for purchase of mineral (fuel) oil of which it had no domesticsource.
23 Subsequent research failed to confirm that hypothesis.24 One might suspect that the UK hoped by this to better steer the forthcoming Washington conference in the direction of its
policy and practice rather than that of the USA.
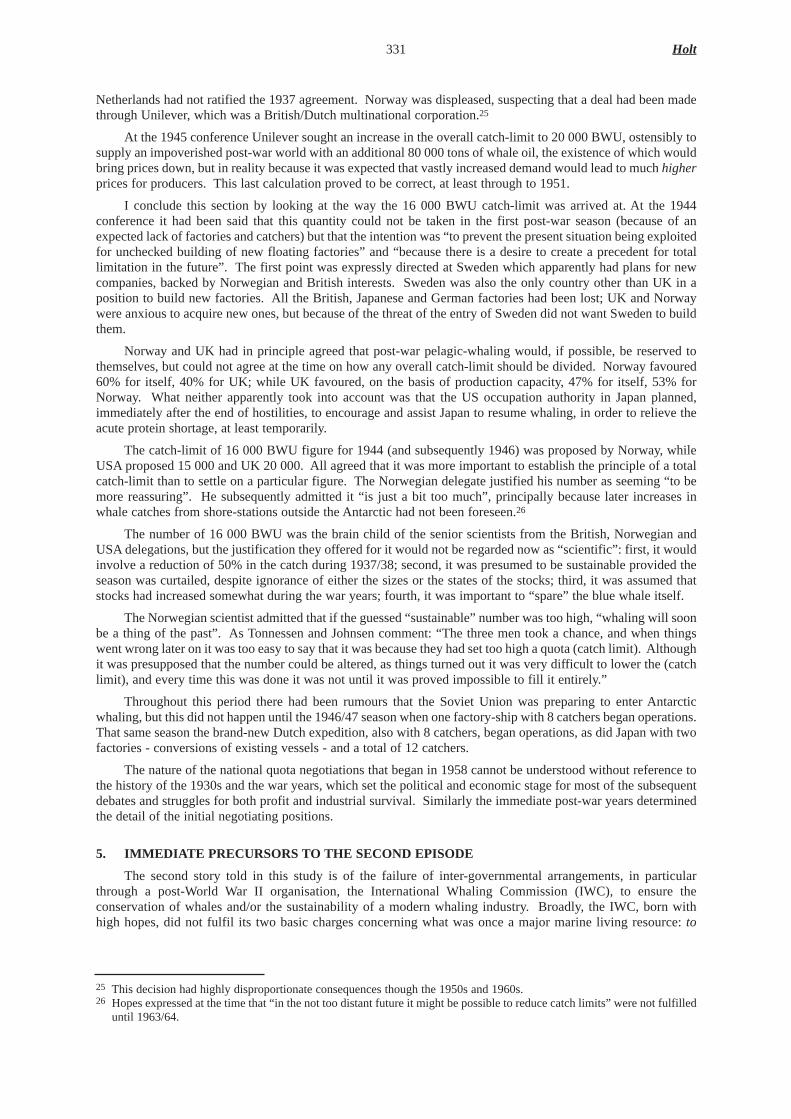
Netherlands had not ratified the 1937 agreement. Norway was displeased, suspecting that a deal had been madethrough Unilever, which was a British/Dutch multinational corporation.25
At the 1945 conference Unilever sought an increase in the overall catch-limit to 20 000 BWU, ostensibly tosupply an impoverished post-war world with an additional 80 000 tons of whale oil, the existence of which wouldbring prices down, but in reality because it was expected that vastly increased demand would lead to much higherprices for producers. This last calculation proved to be correct, at least through to 1951.
I conclude this section by looking at the way the 16 000 BWU catch-limit was arrived at. At the 1944conference it had been said that this quantity could not be taken in the first post-war season (because of anexpected lack of factories and catchers) but that the intention was “to prevent the present situation being exploitedfor unchecked building of new floating factories” and “because there is a desire to create a precedent for totallimitation in the future”. The first point was expressly directed at Sweden which apparently had plans for newcompanies, backed by Norwegian and British interests. Sweden was also the only country other than UK in aposition to build new factories. All the British, Japanese and German factories had been lost; UK and Norwaywere anxious to acquire new ones, but because of the threat of the entry of Sweden did not want Sweden to buildthem.
Norway and UK had in principle agreed that post-war pelagic-whaling would, if possible, be reserved tothemselves, but could not agree at the time on how any overall catch-limit should be divided. Norway favoured60% for itself, 40% for UK; while UK favoured, on the basis of production capacity, 47% for itself, 53% forNorway. What neither apparently took into account was that the US occupation authority in Japan planned,immediately after the end of hostilities, to encourage and assist Japan to resume whaling, in order to relieve theacute protein shortage, at least temporarily.
The catch-limit of 16 000 BWU figure for 1944 (and subsequently 1946) was proposed by Norway, whileUSA proposed 15 000 and UK 20 000. All agreed that it was more important to establish the principle of a totalcatch-limit than to settle on a particular figure. The Norwegian delegate justified his number as seeming “to bemore reassuring”. He subsequently admitted it “is just a bit too much”, principally because later increases inwhale catches from shore-stations outside the Antarctic had not been foreseen.26
The number of 16 000 BWU was the brain child of the senior scientists from the British, Norwegian andUSAdelegations, but the justification they offered for it would not be regarded now as “scientific”: first, it wouldinvolve a reduction of 50% in the catch during 1937/38; second, it was presumed to be sustainable provided theseason was curtailed, despite ignorance of either the sizes or the states of the stocks; third, it was assumed thatstocks had increased somewhat during the war years; fourth, it was important to “spare” the blue whale itself.
The Norwegian scientist admitted that if the guessed “sustainable” number was too high, “whaling will soonbe a thing of the past”. As Tonnessen and Johnsen comment: “The three men took a chance, and when thingswent wrong later on it was too easy to say that it was because they had set too high a quota (catch limit). Althoughit was presupposed that the number could be altered, as things turned out it was very difficult to lower the (catchlimit), and every time this was done it was not until it was proved impossible to fill it entirely.”
Throughout this period there had been rumours that the Soviet Union was preparing to enter Antarcticwhaling, but this did not happen until the 1946/47 season when one factory-ship with 8 catchers began operations.That same season the brand-new Dutch expedition, also with 8 catchers, began operations, as did Japan with twofactories - conversions of existing vessels - and a total of 12 catchers.
The nature of the national quota negotiations that began in 1958 cannot be understood without reference tothe history of the 1930s and the war years, which set the political and economic stage for most of the subsequentdebates and struggles for both profit and industrial survival. Similarly the immediate post-war years determinedthe detail of the initial negotiating positions.
5. IMMEDIA TE PRECURSORS TO THE SECOND EPISODE
The second story told in this study is of the failure of inter-governmental arrangements, in particularthrough a post-World War II organisation, the International Whaling Commission (IWC), to ensure theconservation of whales and/or the sustainability of a modern whaling industry. Broadly, the IWC, born withhigh hopes, did not fulfil its two basic charges concerning what was once a major marine living resource: to
331 Holt
25 This decision had highly disproportionate consequences though the 1950s and 1960s.26 Hopes expressed at the time that “in the not too distant future it might be possible to reduce catch limits” were not fulfilled
until 1963/64.

provide for the proper conservation of whale stocks, and thereby to make possiblethe orderly development ofthe whaling industry.
The International Convention for the Regulation of Whaling 1946 (ICRW) had many admirable provisions.For example, it explicitly recognised the interest of nations in safeguarding natural resources for futuregenerations, and it applied to all waters in which whaling is prosecutedby any means, including Territorial Seasand even - where appropriate - within the baselines from which Territorial Seas were measured. But it also hadnumerous loopholes and flaws, which hampered the Commission’s work. These included:
i. a decision procedure which required an unusually high three-fourths majority of voting Members formaking binding decisions, coupled with an “objection” procedure which was used increasingly by whalingstates to exempt themselves from otherwise binding decisions - even sometimes ones they had voted forand
ii. a provision for the killing of an unlimited number of whales for “scientific purposes” by unilateral decisionof any Member, but which also were required, as far as practicable, to be processed and to yield “proceeds”,and so almost inevitably to enter commerce.
The two flaws that concerned the problem taken up here, however, were the lack of provision foramendment of the ICRW (other than of the Scheduleappended to it) except by preparation of Protocols. Thisrequired ratification by every Party before they could come into effect, and the provision that amendments to theSchedule shall not involve restrictions on the number or nationality of factory ships or land stations, nor allocatespecific quotas to any factory or ship or land station, or to any group of factory ships or land stations, such asthose operating under a particular flag or located in a particular nation or geographic region.
The first meeting of the IWC was held in 1949, but until 1971 it regulated only the catches of the four majorspecies of rorquals in Antarctic waters by pelagic expeditions. Whales were harpooned by the catchers and towedfor processing aboard each factory-ship. The number of catchers “attached” to a factory-ship varied considerablyfrom nation to nation, from company to company, and from time to time. Thus when whales were abundant morecatchers might be added to an expedition, and when catch-limits were reduced the number of catchers perexpedition might also be reduced, unless the change was so drastic that one or more expeditions would bewithdrawn from a national fleet. Such adjustments were particularly difficult for countries with only one factory-ship.
Starting in 1955/56 all whaling companies except the Soviets had an agreement to restrict the number ofcatcher boats per factory-ship. In 1956/57, 1957/58 and 1958/59 this number was 12, at least for the large newships; in that period the one Soviet fleet had twice as many. These variations in catchers per factory could beregarded as tacticaladjustments. But the strategicchanges were of another kind. The pre-War trend of increasesin the sizes and powers of factory-ships and of catchers was continued in the post-War renewal.
Catch-limits were applied only to the BWU group of baleen species. Two other rorquals were free fromregulation: Bryde’s (very similar to the sei but living generally in warmer waters) and the smallest, the minke.Catch-limits were set only by Blue Whale Units(BWU - see footnote16 p. 317). These ratios had been agreedamong whaling companies in the 1930s on the basis of relative oil production. In fact oil production alsodepended on the average size of individuals of each species caught, which changed over the years as they becamedepleted. Furthermore, in the second part of the post-World War II period, meat became the more valuablecommodity. Retaining meat for freezing reduced the oil production per whale since some of the oil, which hadhitherto been extracted when muscle was reduced to meal as a by-product, remained in the meat produced forhuman consumption.
It is worth recalling why catch-limits were originally determined in terms of numbers of whales rather thanof barrelage. Since the early negotiations were among companies, not states, for allocations of quotas toindividual expeditions, it was thought that the BWU-type regulation would encourage maximisation of oilproduction per whaleand thus discourage waste. At the same time bonuses to whalers were allocated accordingto oil production. This was intended to encourage gunners to concentrate on the largest individual whales, givingthe highest oil yield per whale. Those were, especially, pregnant female blue whales.
Two other types of baleen whale, in addition to the minke and Bryde’s, had originally been importantsources of edible oil and/or meat for human consumption: three species of right whale and the gray whale. Thislast occurs only in the northern hemisphere, and is a protected species, following hunting to near extinction in the19th Century; it is therefore not relevant to the present analysis. One of the right whale species (Eubalaenaglacialis) inhabits the southern hemisphere but it was (and still is) also legally protected from commercialwhaling, following its near extermination in the second half of the nineteenth century and the first half of thetwentieth. But as will been see it had, at least by the 1960s, sufficiently recovered to become an attractive targetfor illegal whaling. The minke whale, which has separate populations in each hemisphere (and of which there
Southern Hemisphere Whales 332

are now thought to be two distinct species), was hunted only in small numbers in the Antarctic prior to 1972 afterwhich it became the main target following the near extermination of the larger rorquals.
The four species in the BWU system have different, though overlapping, geographical distributions withintheir southern summer feeding zones: blue whales tend to feed near the ice edge, fin whales feed there and alsofurther north, sei whales again further north. Humpback whales tend to hug coastlines. As the larger, hencepreferred, species became less abundant the centres of pelagic-whaling moved northward, within the Antarcticregion generally. The combination of differential species-depletion and latitudinal-shift caused the speciescomposition of catches within BWU catch-limits to change. These changes were compounded by some confusionregarding species identification. Thus, a “pygmy” sub-species of blue whale feeds further to the north than thelarge type-species; it was sometimes thought that these pygmy animals were simply young blue whales, whichwas important because minimum size (length) limits were in force. The pygmies were treated equally with the“normal” blue whale in BWU calculations although their oil yield was much lower. Likewise, catch statistics didnot distinguish between sei whales and the similar Bryde’s whale feeding in warmer waters.
In addition to catching baleen whales for production of edible oils and meat, the pelagic expeditionsoperating in the Antarctic also caught large numbers of sperm whales, mainly for production of industrial oils.The interest in this species varied from one whaling nation to another and, over time; the USSR was the majorexploiter. Catches were not regulated until the 1970s, and could be made both in the Antarctic and in warmerwaters during the voyages from northern hemisphere bases to and from the baleen-whaling grounds. The twosexes of the sperm whale are very different in size; the larger males tend to migrate further south to feed. When,eventually, the catching of sperm whales was regulated, catch-limits were set separately for males and females.
Sperm whale catches by pelagic expeditions have been given limited attention by analysts. Theyprovided a substantial part of the total catches, as might be inferred from the total number of animals caughtby pelagic expeditions that operated in the Antarctic in the period 1961/62 - 1978/79: sperm: 115 600; blue: 2 200;fin: 89 500; humpback: 600; sei/Bryde’s: 118 300. These numbers should be appraised in terms of the relativesizes of the animals, which is about 40 tonnes for a male sperm whale, 20t for a female, compared with about 40tfor a fin whale. Sperm oil production per whale has averaged nearly 50 barrels, about the same as the productionof whale oil per humpback whale.27
The prices of whale oil and sperm oil fluctuated wildly in the period mainly concerned with here - the 1960sand 1970s. For example in the mid-1960s the whale oil price was quoted at £85/long ton. It dropped to UK£49in 1968 and this price collapse was one of the factors that led Norway eventually to abandon Antarctic whaling.However, the price rose to UK£114 in 1970. After that the price quotations on the world market changed fromUK£ to US$. The price rose to a record US$550 in 1974, then fell sharply, then rose again to US$450 in 1977.
The sperm oil price was at an all-time low of UK£60/long ton in 1967. But by 1975 it was being quoted atUS$400; at US$780 the following year, and US$850 in 1977. The USSR was the main producer. FromNovember 1960 to November 1972 all Soviet sperm oil production was sold in Europe and earned tens of millionsof dollars in hard currency. From 1973 the sperm oil was retained within the Soviet bloc.
This discussion of the prices of oils, and the relation between baleen and sperm, are given here to illustrateone of the economic considerations in quota negotiations and the difficulties that the industry must have had inmaking its production plans. It should be borne in mind also that the principal aim of the Japanese industry duringthe 1960s - 1970s was production of meat for human consumption within Japan.
Females of baleen whales are - unusually for mammals - rather larger than the males, but the sexes cannotbe distinguished before capture. Since the BWU, although based on bulk quantity, was defined in numericalterms, whalers would - other things being equal - tend to concentrate on where the larger animals of each species,were to be found and hence a higher proportion of females. It is also possible that when a large group (a “pod”,in whaling terminology) was found, first attention would be given to the larger individuals. However, asabundances declined, aggregations became smaller and it became rare to refrain from catching an available whalejust because it was small.
So, the economy of the post-World War II pelagic-whaling operations rested on two basic commodities frombaleen whales, the catching of most of which was regulated, and one commodity from sperm whales, unregulated.These commodities supplied different world markets.
There were other constraints on Antarctic pelagic-whaling operations than overall catch-limits in terms ofBWUs. The catching of right whales was prohibited throughout the post-World War II period; they were“protected”. Subsequently the IWC’s power to declare “protected species” was applied to the blue and humpbackwhales. Only when the BWU unit was abandoned by decision of the 1971 IWC meeting (effective from 1972/73)
333 Holt
27 The notional production used in establishing the BWU was 110 barrels per blue whale, 2.5 humpbacks to one blue whale.

and replaced by catch-limits for each species (or, more generally, for a species in a specified region) could analternative protection procedure be introduced - the setting of some or all catch-limits to zero.
Commercial whaling was conducted in the Antarctic also from land-stations on sub-Antarctic islands,principally South Georgia. Their catches were not constrained by catch-limits. Their control - such as it was -differed in other respects also from that of pelagic-whaling: minimum size-limits and open-seasons were differentand, in particular, they were permitted to take humpbacks in years when pelagic operations were denied this (forexample from 1946/47 to 1948/4).
The definition of a “factory ship” had been a matter of great controversy at the ICRW negotiatingconference, the question being whether it included a ship stationed in coastal waters, within the Territorial Sea,whether it was moored, and if so “permanently”. Basically, a “floating factory” that moved from time to time, orcontinuously, was deemed to be engaged in pelagic-whaling and so subject to whatever rules applied to that typeof operation. For two seasons (1969/70 and 1970/71) a Norwegian vessel - the Peder Huse- operated in theAntarctic. It combined catching and processing functions. Such factory-catchers have since been commonlyused for pelagic-whaling in the North Atlantic and Northwest Pacific, but this unique Antarctic operation waseconomically unsuccessful; Peder Huse’s catches were included in BWU catch-limits, and the IWC classed it andany others like it as “factory ships” engaged in pelagic-whaling. Other factory-catchers operated from time totime in the Southern Hemisphere under flags of convenience of states not party to the ICRW - the so-called piratewhalers- but they never entered Antarctic waters as far as is known. They caught mainly Bryde’s whales.28
Pelagic expeditions engaged in Antarctic whaling were permitted to operate only in waters south of 40°Slatitude. This delimits roughly what is now referred to here as the Southern Ocean, most of which was declaredin 1994 to be a whale sanctuary, under the ICRW Article V.1(c). The original Schedulealso provided that “afactory ship which has been used during a season in any waters south of 40°S latitude for the purpose of treatingbaleen whales...” was forbidden to operate “in any other area for the same purpose within a period of one yearfrom the termination of that season.” This evidently affected the economics of pelagic-whaling world-wide andit was inevitable that later, when whales were much less plentiful, that restriction would be relaxed.29
From the 1946/47 season factory-ships were forbidden from operating in the South Pacific sector of theSouthern Ocean from 70°W longitude westward as far as 160°W longitude; this continued a prohibition datingfrom negotiations in 1937. This sector, designated at the time as The Sanctuary, was re-opened to pelagic baleenwhaling from the 1955/56 season, initially temporarily but eventually for an indefinite period. Originally theSanctuary was thought to provide a haven for whales, but it was at the same time believed that there were fewwhales to be found in that sector. In fact, those few expeditions that tried operating there, from 1956/57 on,obtained high catch-rates, and in one open-season 40% of the entire Antarctic catch was taken within it. Theopening of theSanctuary was decided against scientific advice in the forlorn hope of spreading the whaling effortand thus partially “relieving” the more intensely exploited sectors.
Pelagic baleen whaling in the Southern Ocean was, under the ICRW, permitted initially only from15 December to the following 1 April. Expeditions were required to send weekly reports of their catches to theBureau of International Whaling Statistics (BIWS), maintained by the Government of Norway. When it appearedthat the total BWU catch-limit might be reached before 1 April the BIWS would estimate the date on which thatlimit could be expected to be reached, and if this was earlier than 1 April the season would be closedcorrespondingly early. This procedure occasionally led to catches being under or over the BWU catch-limits, butthis did not mean in itself that either whales were too scarce for the whalers to catch in sufficiency, or that thewhalers were cheating, as has sometimes been alleged.
However, as the abundances of whales declined so that catch-limits could not always be closely approachedwithin the designated season it was inevitable that there would be pressures to keep the season open after 1April,to begin it earlier than 15 December, or both. In practice the whaling-season was limited also by seasonal weatherconditions in the Antarctic. When the original dates were eventually relaxed they tended to permit an earlier start.Also, dates were applied selectively to the catching of particular species, especially to the extremely depletedhumpback whale, but changes in opening dates affected the accessibility of the different species, which tended toarrive on their feeding grounds at slightly different times.
Unlike some later fisheries agreements (and eventually the Law of the Sea as determined by UNConventions) the ICRW did not set out any general or specific management objectives. This allowed the IWCconsiderable freedom to evolve. But it meant, for example that although the IWC held its first Annual Meetingin 1949, it was not until 1960 that it formally determined that total allowable catches (“catch limits” in IWC
Southern Hemisphere Whales 334
28 When one of them took a fin whale, it capsized and sank with its Norwegian skipper and its crew.29 It should be noted that this restriction did not prevent catchers from being transferred from attachment to one factory-ship
to another operated in different waters by another company.
terminology) should be set at such levels as to be biologically sustainable, or as to permit recovery of greatlydepleted stocks. Another decade was to pass before the IWC sought to go beyond mere sustainability and to“optimise” catch-rates and stocks. It was, however, ahead of its time in introducing and quantifying the idea ofprecautionin situations of scientific uncertainty even though it did this inadequately.
A major flaw, which was common to almost all fishery management agreements at the time, was theabsence of provisions for international inspection and enforcement. Some such provisions were eventually andfalteringly introduced but, again, inadequately, and far too late to save either the whale resources or the industry.
Another factor in the history of the IWC was the manner in which annual national subscriptions to costswere calculated, which meant that there was a very weak link between what a country took from the sea andwhat it had to pay. Non-whaling countries had to pay not much less than countries whose companies weremaking immense profits from whaling, making it difficult or impossible for “developing” and relatively poorsmall countries to participate in managing the utilization of resources which were global in distribution, mobile,very valuable, and spending much of their lives on the high-seas. The whales were commonly described as a“common heritage” though they never acquired that formal status as did, later, the mineral resources of the deepseabed.
The ICRW provides in Article V.3 that each adopted amendment to the Schedulebecomes effective for allParties ninety days after they have been notified by the Secretariat of the decision, except that:
“(a) if any government presents an objectionto an amendment before the expiry of this ninety-day period, theamendment shall not become effective with respect to any of the governments for an additional ninetydays;
(b) thereupon any government may object to the amendment at any time prior to the expiry of of the additionalninety day period, or before the expiry of thirty days from the date of receipt of the last objectionreceivedduring such additional ninety-day period, whichever date shall be later; and
(c) thereafter the amendment shall become effective with respect to all governments which have not objectedbut shall not become effective with respect to any government which has so objected until such date as theobjectionis withdrawn.”
This complex objectionprocedure played a very important role both in decision-making about catch-limitsand in the negotiations for national quotas. Article XI provides that any government may withdraw from theICRW on 30 June of any year by giving notice on or before 1 January of that year. This, too, played a key rolein the above decisions and negotiations. It should also be noted that the IWC, under Article VI of the ICRW, isempowered to make, from time to time, recommendations to any or all Contracting Governments on any matterswhich relate to whales or whaling and to the objectives and purposes of the Convention. Such recommendations,requiring only a simple majority of votes in favour, have frequently been made in the form of non-bindingresolutions; those, too, played their part in the national quota issue.
6. LAUNCHING THE IWC
As we have seen, the International Whaling Commission (IWC) inherited the blue-whale unit (BWU) fromregulations agreed among whaling companies during the 1930s when edible oil was by far the most valuablecommodity provided by whales and gave the basic reason for going whaling anywhere, especially in theAntarctic. Many subsequent attempts by scientists and some governments to convert this into a system ofsetting limits by species, and also by areas, were foiled until the major crisis of the early 1970s.
In the first twenty years of its existence the IWC put most of its effort into regulating the catching of rorqualsby pelagic expeditions, its main tool being the BWU. Other, supplementary, regulatory procedures were alsoavailable to the IWC and it used most of them. Although the IWC resisted setting catch-limits by species (and inthe case of the sperm whale by sex) it sometimes modulated the application of these by setting different openingand closing times for the whaling-season, and even protected certain species in designated areas, though usuallyonly when they were close to extermination. It could close certain areas for indefinite periods (as Sanctuaries)but only did so intermittently, from 1949 to 1955 (baleen whales only), and then after 1979 (all whales).Minimum size-limits were set for most species (but never for minke whales, which eventually came to comprisevirtually all the legal catches). Different regulations could be applied to pelagic operations and to land-stations.Standing general regulations theoretically protected calves and accompanying mothers.
Initially expeditions operating in the Antarctic were prohibited from operating also in the NorthernHemisphere during the northern summers. When whales became scarce this was relaxed, which substantiallychanged the economy of the industry. The resurgence of both pelagic and land-station whaling elsewhere alsoaffected the economy of Antarctic pelagic-whaling. Additionally, the price of whale oil was affected greatly bythe changing world market for edible oils and fats, from both animal and vegetable primary sources.
335 Holt

Furthermore, the changing emphasis on oil relative to whale meat products, and the different market locationsfor these, greatly affected the decisions of companies regarding what they would tell their flag-governmentsconcerning their concrete needs to remain profitable.
Another factor, which affected all subsequent negotiations, was the difference in the dates on which differentcountries entered Antarctic whaling. The British and Norwegians were the first, and for many years sought byone means or another to discourage the entry of other countries. They had much experience and Norway had formany years a virtual monopoly on skilled crews, especially gunners, which it guarded most jealously throughdomestic legislation and union rules. Late entrants, post-World War II, especially the USSR, made hugeinvestments and so had strong incentives to maximise their catches and to stay in the business to capitalise onthose investments as soon as possible. The USSR also invested in training skilled crews when it was about toembark on a great expansion in the late 1950s. It did this, for example, by adding a large number of extra catchersto the elderly factory-ship Slava, the ex-German vessel taken as a prize of war.30 There was also a constant threatof whaling operations starting under flags of non-members of IWC.
Then there was an incomplete vertical integration of the oil industry, with one huge multinationalcorporation - Unilever - engaged both in whaling and in marketing oil, including that produced by othercompanies. On the other hand several of the member states of the IWC were not whaling, yet had votes inmanagement decisions, and this proportion increased as countries, one by one, dropped out of whaling, and alsoas countries that never had engaged in whaling joined the IWC so as to exert their right to a say in managing theuse of a global resource.
In the post-World War II years there was not always harmony between companies and the governmentsunder whose flags their vessels sailed. The use of flags of convenience, both of other Members of the IWC andof some notorious non-Members, was a temptation to which many succumbed.
Last it should be mentioned that there being no international inspection arrangements in force until almostthe very end of pelagic-whaling, an enterprise operating one expedition could mislead other governments innegotiations as well as subvert the IWC’s deliberations as a whole. Such a situation put a premium on“intelligence” if not industrial espionage.31
Antarctic whaling was always linked to questions of both maritime and terrestrial sovereignty. The AntarcticTreaty, which froze territorial claims on that continent, was signed in 1957, within the period discussed here. Oneof its consequences was that, when extensions of maritime jurisdictions began to multiply, the waters around thecontinent remained as high-seas. Britain’s sovereignty over sub-Antarctic islands as operating bases - especiallySouth Georgia - continued to be of immense value post-World War II, and not only as sites for land-stationssometimes operated by British companies and sometimes by others under lease; they also provided shelter forsome catchers during the southern winters (avoiding the long and expensive voyages to and from the northernexpedition bases) as well as repair and maintenance facilities, especially freshwater supplies.32
The 1946 negotiating conference established a catch-limit of 16 000 BWU for Antarctic pelagic baleenwhaling. The origins of this number have been detailed in the previous section; it derived ultimately from thecatch-limits negotiated in June 1932 for the 1932/33 season. At that time, the limit agreed among companies(then including the land-stations) was 18 584 BWU, being calculated as a barrelage of 2.03 million, equivalentto a blue whale yielding 110 barrels. In fact, in that season the catch was 16 985 BWU, but with an actual yieldof 116.4 barrels per BWU the barrelage reached 2.09 million. In 1933 a new agreement was negotiated, for the1933/34 season; this was for 17 074 BWU but calculated at 115 barrels per BWU. These two agreements hadhad the desired effect of bringing catches down, by the outbreak of World War II, by one-third from theunregulated high in 1930/31.
The 1946 Convention was signed by representatives of 15 Governments, several of which had notpreviously participated in such discussions: Argentina, Australia, Brazil, Canada, Chile, Denmark, France,Netherlands, New Zealand, Norway, Peru, South Africa, USSR and USA. Japan, then under military occupation,was not represented. To come into force the Convention required that at least six signatory Governments should
Southern Hemisphere Whales 336
30 The resulting low catches per catcher-days-worked (a classic measure of whaling effort) compared with that of otherwhaling nations was interpreted by IWC scientists as evidence of Soviet inefficiency, but the matter was in fact morecomplicated.
31 A notable case was the operation of the first Soviet expedition. This, and later the newer ones, consistently under-reportedtheir catches to the Bureau of International Whaling Statistics (BIWS) after the end of each season. But the Slavaover-reported its catches until close to the end of the season, thus causing a premature announcement of closure of the seasonas the overall total catch-limit was apparently approached. Then, when others had (presumably) ceased operations, theSoviet catchers continued to operate, reputedly unobserved, though in fact the Norwegian operators, at least, had some ideaof what was going on.
32 The dismantling of a South Georgia land-station owned by Salvesen, by Argentine scrap-metal merchants (under contractwith the owners), precipitated the Falklands/Malvinas war!

have ratified it, and that these must include Netherlands, Norway, USSR, UK and also the USA- this last beingthe Host to the Conference and also the Depository Government. So, if all eventually ratified, any agreement onthe Antarctic catch-limit would depend on the votes of the non-pelagic states, which were at that time all engagedin whaling only from land-stations. But, at the same time, four out of fifteen could constitute a blocking vote ofmore than one-quarter, provided there were no abstentions.
The original Scheduleto the ICRW required that there “...be maintained on each factory ship at least twoinspectors of whaling for the purpose of maintaining twenty-four hour inspection”. These inspectors were to beappointed and paid for by the Government having jurisdiction over the factory-ship. This put into the inter-governmental arena earlier provisions for inspectors that were followed by many of the companies and requiredunder domestic laws.
7. THE EARL Y YEARS OF THE IWC – 1949-1952
The first meeting of the new International Whaling Commission (IWC) was held in London in May 1949.The four essential ratifications specified had been obtained with, in addition, those of Australia, Canada, Denmarkand France among the original signatories. Other signatories attended as observers: Argentina, Brazil, Chile,Denmark and New Zealand. Representatives of FAO and of the Supreme Commander of Allied Powers (SCAP- Japan) were also admitted as observers. But some other states that were not signatories originally hadmeanwhile ratified the Convention: Iceland, Panama, Sweden, South Africa, though Panama did not attend thefirst meeting.
At this first meeting the catch-limit of 16 000 BWU was retained without question, but the full protectionof the humpback whale from pelagic-whaling was relaxed. Up to 1250 humpbacks could be caught in each ofthe seasons 1949/50 and 1950/51, although of course these catches would be included in the BWU totals(Australia and Netherlands opposed this decision, while Iceland and Canada abstained). In addition, the open-period for the Antarctic pelagic-whaling season was changed by consensus, to December 22 through April 7.
The IWC’s second meeting was held in Oslo in July 1950. By then Brazil and Mexico had become memberstates - and attended the meeting, but New Zealand and Panama were not represented. Argentina, Chile andDenmark again sent observers, but the Commission decided that after its third meeting, scheduled to be held inCape Town in July 1951, “...countries which had not ratified or adhered to the Convention could not be expectedto be invited to future meetings”. SCAPwas again represented by an observer, as was FAO, but on this occasionICES - an intergovernmental organisation - attended, and for the first time a non-governmental organisation - theAssociation of Whaling Companies (AWC). No substantive changes were made to the Schedule, although therelaxation of the protection of humpbacks was reconfirmed and the open-season dates for that species wereamended to provide that the permitted 1250 whales could be taken only in the last weeks of the season,specifically after 31 January.
By the time of the third meeting (1951) Japan was a full member of the IWC in its own right. Members notattending were Brazil, Iceland, Mexico and New Zealand. Panama attended for the first time. Argentina,Denmark again sent observers; so did Italy and Peru. The only non-government observers were from FAO andICES.
The IWC strongly regretted that “certain countries who had hitherto, by invitation, attended theCommission’s meetings, had not yet seen their way to adhere to or ratify the 1946 Convention“. It pointed itsfinger especially to those who had been signatories in 1946 - Argentina, Chile and Peru, and “viewed withdisappointment the continued failure of countries interested in whaling to cooperate in the maintenance of theprinciples underlying the 1946 Convention, on which the future conservation of the whale stocks of the world somuch depends.” Fine words!
However, although it was not revealed at the time, Chile and Peru were already beginning to consider, withEcuador, the establishment of a new body, later identified as the Comissión Permanente del Pacífico Sur(CPPS)which, on the initiative of Chile was launched at a conference in Santiago in August 1954. As is now well knownthe CPPS was the instrument by which the three countries coordinated their several claims for extendedjurisdiction over the exploitation of living marine resources, specifically including whales, in a coastal zone of200 nautical miles. This explains, one may presume, the action of the observer for Chile at the second meetingin explaining that although it had been a signatory “it had been unable to date to ratify the Convention”.
The third meeting of the IWC was largely occupied with financial and administrative matters and minoramendments to and clarifications of the Schedule. It established for the first time two standing committees - theTechnical Committee and the Scientific Committee - the membership of which was formed annually bydesignations by the national Commissioners. Thus this decision did not - as is still commonly assumed - provideindependentscientific advice to the decision-making body. At its first meeting the Scientific Committee
337 Holt

recommended that it was unnecessary to set minimum size-limits for minke whales. The Commission acceptedthis and it also made exemptions for minke whales with respect to open- and closed-seasons. At that time mostminke whales were being caught from land-stations, but these decisions began to have consequences for Antarcticpelagic-whaling when the species became dominant in the catches from 1971/72. The limit of 16 000 BWU forthe Antarctic was unchanged.
All Member States except Mexico sent representatives to the fourth meeting of the IWC (London, June1952). Observers were admitted from Argentina, Italy and Peru and, for the first time, Portugal. Observersattended also from FAO, ICES and the AWC. At this meeting the Commission decided to set up a sub-committeecomprised of a nominee from each of the five Antarctic pelagic-whaling countries “to consider the question ofthe 16 000 BWU limit and that of sanctuaries.” Meanwhile, the 16 000 limit was retained. The humpback whaleexemption was again renewed, but it was decided that catching of that species would be restricted to three days- 1, 2 and 3 February, except that if the permitted 1250 whales had not by then been caught the BIWS wasauthorised to extend the season for one or more days until they hadbeen caught.33
At this point we may glance at the course of the Antarctic pelagic operations in these first four seasons ofthe IWC’s existence. First, in each year the 16 000 BWU limit was reached before the statutory closure of theseason, which was consequently closed early. In the first three of the four seasons the final totals were 16 059,16 413 and 16 006 BWU respectively. But in the fourth, 1952/53, only 14 855 BWU had been taken; it appearsthat the notification and estimation procedure had not worked well that year. Considering what happenedsubsequently, at the 1953 meeting, it seems likely that in fact the whalers were beginning to find it difficult toattain the catch-limit.
In 1949/50 18 factory-ships had been engaged, with 216 catchers; in 1950/51 19 factories, with 241 catchers;in 1951/52 20 factories, with 270 catchers; in 1952/53 a reduced number - 16 factories, with 232 catchers.However, the older, smaller and less powerful vessels were being gradually withdrawn from Antarctic operationsand new bigger and more powerful ones were coming on stream.
8. 1953 - 1957
By the time of the fifth IWC meeting (London, June 1953) no new countries had adhered to the Convention.All Members attended. There were observers from Argentina, Italy, Peru but not Chile; and from FAO, ICESand the AWC. Several important decisions were made, the most significant being a reduction of the catch-limitto 15 500 BWU, adopted without dissent. This was based on the report of a special sub-committee establishedat the 1952 meeting and chaired by the Norwegian Commissioner. But the IWC rejected the sub-committee’ssuggestion that catching of blue whales not be permitted before January 15 in each year. A proposal to prohibitthe catching of blue whales in a broad sector from the Greenwich meridian to 70°W was also rejected. Otherregressive decisions were that minke whales should be exempted from the seasonal date-limits, and instead eachgovernment was to be required to set its own dates for catching minke, from both pelagic and land-stations, in acontinuous season of not longer than six months in any period of twelve months. A similar provision, but for aneight-month season, was made for pelagic sperm-whaling.
A new Scientific Sub-Committee was established, this one including also nominees from Australia andFrance in addition to the representatives of the five pelagic countries, with the following terms of reference:
i. to examine progress on research on humpback whales and to study the catches of this species by bothpelagic operations and from land-stations
ii. to examine catch figures of blue and fin whales in relation to recommended measures for conservation andiii. to consider and report upon the increased catches of sperm whales in certain areas in recent years.
In the event, 17 factory-ships, with 206 catchers participated in the 1953/54 season, which was closed on18 March by which date 15 439 BWU had been taken.
It is perhaps indicative of a power shift that the sixth meeting of IWC was held in July 1954 in Tokyo andthe seventh was scheduled for Moscow in July 1955. In Tokyo and Moscow all Members were present exceptIceland (in 1954) and Brazil (in 1955), with observers as usual from Argentina and Italy (and also Chile andPortugal in 1954), from FAO and ICES (also from AWC in 1955, now renamed the InternationalAWC, IAWC).
The Report of the IWC’s 1954 meeting contains the first published substantive report from the ScientificSub-Committee. This clearly reveals that this committee was playing politics rather than offering objectivetechnical advice; its recommendations were essentially what the scientists thought the Commission would
Southern Hemisphere Whales 338
33 These details may seem trivial but they did eventually significantly affect the national quota negotiations.
accept.34 Thus the Sub-Committee generally thought that Antarctic catch-limits should be set by species and thatthe limit for blue whales should be very low, but this was opposed by two of the three Norwegian members whothought such an arrangement would be impracticable, so no recommendation was made.
As to the states of the Antarctic stocks it was concluded not only that the blue whale was still declining butalso the fin whale. This latter was substantiated by new methods of age determination for whales, from ridges onbaleen plates (Norway) and from ovarian analyses indicating the number of previous pregnancies (UK).
The idea was that a catch of about 11-12 000 BWU might be sustainable. However, it was thought that sucha reduction from previous years would be unacceptable if made immediately, so a reduction by stages wasrecommended, with a number of 14 500 for the 1955/56 season. This recommendation was not adopted by theCommission, which merely recorded its opinion that “...it may soon become necessary to restrict more severelythe Antarctic catch of blue whales, while guarding at the same time against a corresponding increase in the catchof fin whales (which) alone would involve a reduction in the total permitted catch in the Antarctic.” TheCommission’s opinion continued: “If there should be clear signs of depletion of fin whale stocks also, theCommission believe that a further and very substantial reduction of the total permitted catch should be made atonce.” It decided to draw these views to the attention of Member governments so they could inform the whalingcompanies.
Here I note that in this period the Commissioners, though appointed by name by their Governments, werenot regarded as fully accredited governmental representatives, and equally, that the representatives of the whalingcompanies who were close behind their backs, when not actually included in the delegations.
It was at this meeting that there first appeared a rift between the scientist from Netherlands (Dr E. J. Slijper)and the other Scientific Sub-Committee members, especially those from UK and Norway. Slijper said “while notdisposed to dissent out of hand (from the 14 500 recommendation) I am not prepared to endorse it whole-heartedly at the moment”. He wanted more time to study the matter.35 The Sub-Committee advised him to comeback next year with more analyses. Meanwhile it approached the question of how to keep blue whale catchesdown without species catch-limits, in the same manner as it had previously dealt with the humpback whaleproblem - by proposing a later opening of the season for catching this species. This was accepted by theCommission, which agreed to a general opening date of 7 January (with closure not later than 7 April) but a dateof 21 January for blue whales. The Commission decided to close the sector 0° to 70°W (the South Atlantic sector,including the Antarctic Peninsula) to humpback catching, for five years.36
Last, the scientists reiterated their opinion that “there is no reason for supposing there is danger to the stocksof sperm whales provided the size limit is strictly observed“. And the senior Norwegian scientist (Prof. J. Ruud)suggested the convening of a meeting to bring together scientists (including specifically the younger ones) notnecessarily connected with the Commission but engaged on research on whales in various parts of the world, toexchange views and ideas.
In the event Antarctic whaling operations were halted on 19 March, the catch being 15 300 BWU. Nineteenfactories participated, with 233 catchers. A significant development, noted in the routine report from BIWS, wasthat an expedition flying the Panamanian flag had operated in the 1954/55 season.
On 11 May 1955 the Norwegian Commissioner had submitted a proposal that the IWC should appoint anobserver on each factory-ship, but not of the nationality of the ship on which he is to serve. These IWCobservers would report directly to the Commission, their expenses being paid by the Commission but to berefunded by a levy from whaling countries proportional to the number of expeditions operated under each flag.This was overlooked at the Tokyo meeting (owing, it was said, to the absence of the Secretary and his staff at
339 Holt
34 Thus the opening of theSanctuary in the Pacific sector was proposed. In doing so it was thought desirable for theCommission to close another sector, but this was not formally proposed because it was judged that the Commission wouldnot accept it. Alone among the scientists the Soviets strongly opposed the opening of theSanctuary since relevantscientific investigation was lacking
35 In this, and in later years, the harmony between Slijper’s views and the negotiating position of the Netherlands delegationand industry led to accusations in the 1990s that he had been dishonest. There is no more than slight circumstantialevidence for this, however; in fact he provided more scientific material to the 1954 meeting than any other member. Slijperpressed hard for the use of strengthened minimum length rules to ensure that older whales were selectively targeted andso the recruitment rate kept high. For further discussion of the question of the integrity of the IWC Scientific Committee(see Schweder 2001 and Holt 2001).
36 This year also saw the beginning of serious discussion of the growth of pelagic-whaling in the North Pacific, first byJapanese vessels and later by the USSR. This evidently began to alter the virtually total market dominance of the Antarcticproduction. It also led to a development whereby regulatory decisions came, in effect, to be made on a regional basis onlyby the coastal states, including the operators (Japan, USSR, USAand Canada), though the recommendations made jointlyby their Commissioners after separate closed meetings did still have to be formally endorsed - or, rarely, challenged by theCommission as a whole.

the time), and was brought forward to the Moscow meeting. It was quickly decided that no effective action couldbe taken and that the proposal was probably out of order, particularly because “the Convention did not allowprovisions of the Schedule relating to inspection to be altered.” It was suggested that the Convention might beamended by a Protocol providing for the insertion of a new Article V.1 (i) methods of inspection, and thedepository government (USA) was asked to investigate this possibility.
The inspection debate was mixed with another question: whether a refrigerated transport-ship thatperformed any processing on board would fall within the definition of a factory-ship. Amending this definitionwould also require alteration of the main text of the Convention. The link was that, whatever the definition, itwas thought by some to be desirable that refrigerated transports should at least carry national inspectors. Similarquestions arose concerning the use and status of helicopters carried aboard factories.
The Commission also faced at its seventh meeting the implications of the recent creation of the ComissiónPermanente del Pacífico Sur(CPPS) by Chile, Peru and Ecuador. Naturally a heated argument about the rightsand wrongs of 200-mile limits ensued. Japan wanted the IWC to bring the whole issue to the notice of the UnitedNations, even in advance of current work by the International Law Commission, which would report to theGeneral Assembly in 195637. Norway supported Japan, but eventually it was agreed that the IWC did not as suchwant to bring the UN into this matter.
In Moscow the IWC decided that Professor Ruud’s idea for a scientific meeting would cost money, and tookno action. It also rejected the renewed suggestion by scientists that catch-limits should be set separately for blueand fin whales. The scientists’suggestion that the Sanctuary should be opened for three years and then closedagain automatically was adopted, but Japan did not like the second part of that decision. A further advance of thedate for opening the catching of blue whales (to 1 February) was agreed but was controversial.38
Japan alleged that the expedition flying the Panamanian flag (the Olympic Challenger, actually a Greekoperation) had been observed catching humpback whales outside the permitted days. The PanamanianCommissioner said the national inspectors were competent and trustworthy officers of the PanamanianGovernment. It was noted that no report of infractions had been received from Panama, and South Africa raisedthe question of the effectiveness of Article IX of the Convention, which deals with implementation, enforcement,prosecution and punishment. No action was taken other than to change the layout of the Infractions reportingform.
The main item of discussion was, of course, the BWU catch-limit and its reduction in stages in accordancewith the scientists’advice. It was decided to set the limit at 15 000 for 1955/56 and 14 500 for 1956/57 andthereafter, but the decision was controversial (11 in favour, 3 against, with Panama and Netherlands opposingboth numbers, the UK opposing the 1955/56 limit, and Japan the 1956/57 limit). It is notable that both here andin later controversies, Japan in particular did not wish to be bound by future commitments.
Other matters of interest were: the IWC backed down from its earlier threat to exclude observers fromcountries that did not ratify the Convention; a request from the Secretary for advice on how to deal with publicitywas met by agreement that post-meeting press releases should be issued, while some delegations considered itinadvisable to reproduce the verbatim reports of plenary sessions.39 The Commission instructed a Scientific Sub-Committee to function inter-sessionally, setting its own agenda. This mustconsist only of scientists (previousmeetings had often been attended by active political and diplomatic members of delegations). This Sub-Committee was to be composed as before with respect to countries, i.e. the five pelagic-whaling countries (thusexcluding Panama) plus France and Australia. The Sub-Committee did not meet until March 1956, in London,and its report is contained in the Seventh Report of the Commission.
After the 1956 meeting the Netherlands objected to the second part of the decision on BWUs, relating to1956/57 and subsequent seasons. Most of the other countries then also objected (UK, Panama, South Africa,Norway, Japan, USA, Canada). It is significant however that the USSR (along with nine others) did not object,explaining that a decision to reduce the catch-limit had been negotiated and agreed, and countries should stickwith that as “a correct and progressive step towards conservation of whale stocks”. This declaration should now
Southern Hemisphere Whales 340
37 This led, as we now know, to the UN Technical Conference in 1957 and the first UN Law of the Sea Conference in 1958.38 Another warm debate concerned the use of whales’bodies as ships’fenders, a procedure which had been followed since
the beginning of pelagic-whaling but which was now frowned upon as wasteful. It was agreed that safety at sea must takeprecedence over the strict letter of the Convention. The USSR Commissioner said they were working on a fender made ofporous rubber and would share their results with other countries.
39 This is of some importance because the IWC does not agree on reports of its meetings; it merely issues Reports of themeetings by the Chairman (who is assisted by the Secretary) so only the verbatim records disclose what happened, and inparticular how votes were cast. The question of whether verbatim records should be continued, and whether votes may besecret and under what conditions, had become serious items of debate in the 1990s.

be evaluated in the light of subsequent revelations of the extent and scale of Soviet “adjustments” of the catchstatistics it was providing to the BIWS.
Nineteen expeditions (including Panama‘s) took part in the 1955/56 season; they deployed 257 catchers andtook 14 874 BWU before closure on 4 March.
Dutch scientists did not attend the 1956 London meeting of the Scientific Sub-Committee. It considered forthe first time what should be the species catch-limits were the IWC to decide later to set such limits. This wasnot specifically connected with abandonment of the BWU; it was felt that species limits might be set within theoverall BWU figure, which could lead to cut off dates equivalent to the (by then) established practice ofmodifying the seasonal dates for humpback and blue whales. The Sub-Committee recommended 1500 bluewhales, 1250 humpbacks and 26 000 fins, with the effective 13 000 BWU of fin whales to include any sei whalestaken. Furthermore, if the overall BWU were to be reduced below 13 000, the numbers of humpback and bluewhales could be maintained and only those of fin (plus sei) reduced. Furthermore, the Sub-Committeerecommended that all quotas should be reviewed annually, well before the following annual meeting.
This Sub-Committee meeting was the first at which the emergent science of population dynamics wasseriously applied to the whaling question within the IWC, through a study made by Professor P. Ottestad ofNorway. Although there were critical assumptions in Ottestad’s analysis, particularly of the original number offin whales in a stable unexploited population (which was at the time unknown but guessed to have been about300-350 000) it convinced the other scientists that the current fin whale catches were unsustainable and that thestock was “declining rather sharply”.
All Members except Brazil were represented at the eighth IWC meeting (London, July 1956), with observersfrom Portugal and Italy, and from FAO, ICES and IAWC. No further countries had joined and the members ofthe CCPS - Chile and Peru - were conspicuously absent. One new item on the Provisional Agenda was“Consideration of a draft by the UN International Law Commission of Provisional Articles concerning theRegime of the High Seas”. This item was deleted, but “correspondence which had reached the Commission” wascirculated.
The Commission said there were practical difficulties in setting catch-limits by species, and also in routinecollection of waxy ear-plugs for age-determination. Norway withdrew its proposal to bring forward the openingdate of the Antarctic season. Further action on Norway’s proposal regarding international inspectors waspostponed pending completion of negotiation for an appropriate Protocol to the Convention. The question ofwhether a refrigerated transport vessel was a factory-ship was unresolved.
The Scientific Committee (except Slijper) agreed that substantial reduction in the fin whale catch wasneeded urgently. The Commission responded by setting the catch-limit at 14 500 BWU for the 1956/57 season,but this was embedded in an open-ended decision that the catch-limit would not exceed 15 000 in any one season.This second part of the decision went through without dissent; the Netherlands dissented from the first,immediately operative catch-limit, but did not subsequently object to it.
Twenty pelagic expeditions operated in the 1956/57 season, with a reduced number of 225 catchers, byagreement among companies. The Panamanian expedition had been handed over to Japan, which also operatedanother new one. It was announced that the South African expedition would be handed over to Japan for the1957/58 season. These changes apparent stabilised the pelagic nations at five, though this turned out to betransitory.
At the end of the 1956 IWC meeting the observer for FAO broke the usual silence of an observer to warnthat the world was watching the Commission, expecting it to get its act together and conservatively regulate theuse of whale resources.
The special Scientific Sub-Committee was again authorised to meet inter-sessionally at the discretion of theChairman of the full Committee. It did so, in London in March 1957.
The 1956/57 season was closed on 16 March, making it an exceptionally prolonged one since the institutionof regulations (this was “explained” as due to poor weather conditions towards the season’s end or to the reducednumber of catchers, but not to a shortage of whales). The final catch was 14 745 BWU, of which 40% was takenin the newly opened Sanctuary. This year, as in several previous years, the Commission noted increases in theoil production per BWU. This was commonly ascribed to increases in efficiency of extraction, which thereundoubtedly were. However, throughout the post-War years the species composition of an average BWU waschanging. It was well known that one fin whale normally yielded more than half as much as a blue whale, i.e.the ratios embedded in the BWU definition were not exact in relation to modern processing technology, and thesteady increase in the numbers of fin whales vis-à-vis the blue whales in catches was contributing to the apparentincrease in extraction efficiency.
341 Holt
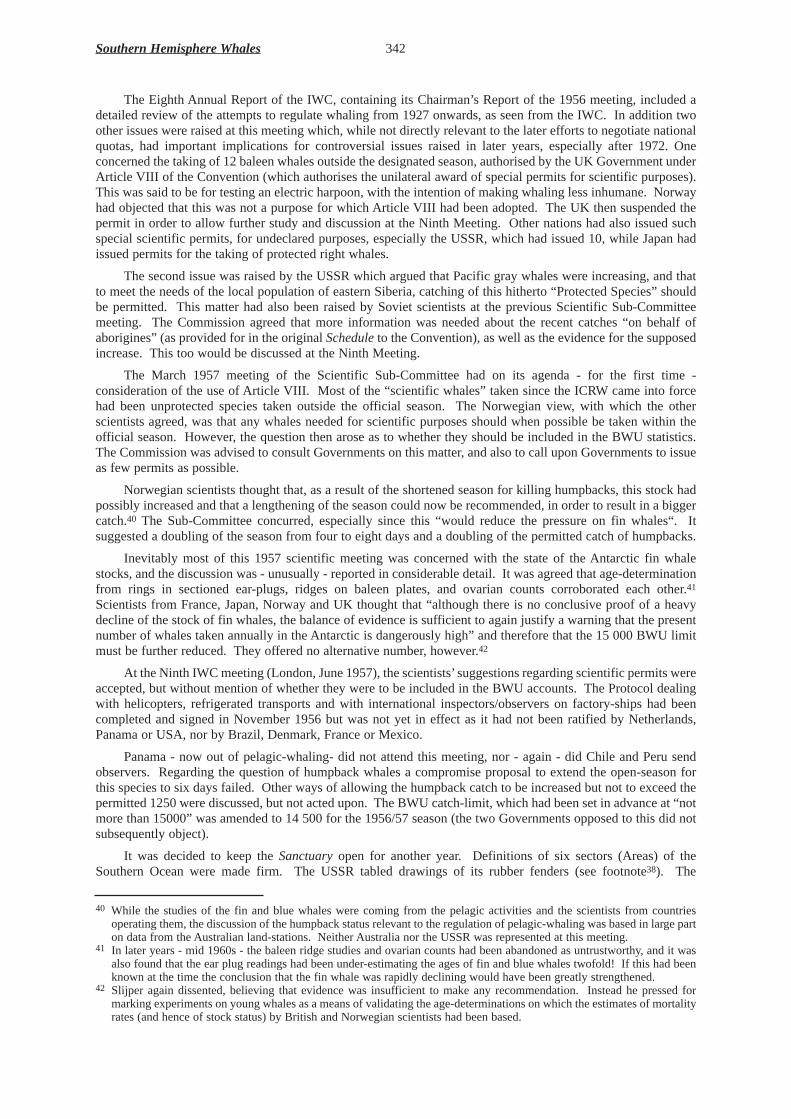
The Eighth Annual Report of the IWC, containing its Chairman’s Report of the 1956 meeting, included adetailed review of the attempts to regulate whaling from 1927 onwards, as seen from the IWC. In addition twoother issues were raised at this meeting which, while not directly relevant to the later efforts to negotiate nationalquotas, had important implications for controversial issues raised in later years, especially after 1972. Oneconcerned the taking of 12 baleen whales outside the designated season, authorised by the UK Government underArticle VIII of the Convention (which authorises the unilateral award of special permits for scientific purposes).This was said to be for testing an electric harpoon, with the intention of making whaling less inhumane. Norwayhad objected that this was not a purpose for which Article VIII had been adopted. The UK then suspended thepermit in order to allow further study and discussion at the Ninth Meeting. Other nations had also issued suchspecial scientific permits, for undeclared purposes, especially the USSR, which had issued 10, while Japan hadissued permits for the taking of protected right whales.
The second issue was raised by the USSR which argued that Pacific gray whales were increasing, and thatto meet the needs of the local population of eastern Siberia, catching of this hitherto “Protected Species” shouldbe permitted. This matter had also been raised by Soviet scientists at the previous Scientific Sub-Committeemeeting. The Commission agreed that more information was needed about the recent catches “on behalf ofaborigines” (as provided for in the original Scheduleto the Convention), as well as the evidence for the supposedincrease. This too would be discussed at the Ninth Meeting.
The March 1957 meeting of the Scientific Sub-Committee had on its agenda - for the first time -consideration of the use of Article VIII. Most of the “scientific whales” taken since the ICRW came into forcehad been unprotected species taken outside the official season. The Norwegian view, with which the otherscientists agreed, was that any whales needed for scientific purposes should when possible be taken within theofficial season. However, the question then arose as to whether they should be included in the BWU statistics.The Commission was advised to consult Governments on this matter, and also to call upon Governments to issueas few permits as possible.
Norwegian scientists thought that, as a result of the shortened season for killing humpbacks, this stock hadpossibly increased and that a lengthening of the season could now be recommended, in order to result in a biggercatch.40 The Sub-Committee concurred, especially since this “would reduce the pressure on fin whales“. Itsuggested a doubling of the season from four to eight days and a doubling of the permitted catch of humpbacks.
Inevitably most of this 1957 scientific meeting was concerned with the state of the Antarctic fin whalestocks, and the discussion was - unusually - reported in considerable detail. It was agreed that age-determinationfrom rings in sectioned ear-plugs, ridges on baleen plates, and ovarian counts corroborated each other.41
Scientists from France, Japan, Norway and UK thought that “although there is no conclusive proof of a heavydecline of the stock of fin whales, the balance of evidence is sufficient to again justify a warning that the presentnumber of whales taken annually in the Antarctic is dangerously high” and therefore that the 15 000 BWU limitmust be further reduced. They offered no alternative number, however.42
At the Ninth IWC meeting (London, June 1957), the scientists’suggestions regarding scientific permits wereaccepted, but without mention of whether they were to be included in the BWU accounts. The Protocol dealingwith helicopters, refrigerated transports and with international inspectors/observers on factory-ships had beencompleted and signed in November 1956 but was not yet in effect as it had not been ratified by Netherlands,Panama or USA, nor by Brazil, Denmark, France or Mexico.
Panama - now out of pelagic-whaling- did not attend this meeting, nor - again - did Chile and Peru sendobservers. Regarding the question of humpback whales a compromise proposal to extend the open-season forthis species to six days failed. Other ways of allowing the humpback catch to be increased but not to exceed thepermitted 1250 were discussed, but not acted upon. The BWU catch-limit, which had been set in advance at “notmore than 15000” was amended to 14 500 for the 1956/57 season (the two Governments opposed to this did notsubsequently object).
It was decided to keep the Sanctuary open for another year. Definitions of six sectors (Areas) of theSouthern Ocean were made firm. The USSR tabled drawings of its rubber fenders (see footnote38). The
Southern Hemisphere Whales 342
40 While the studies of the fin and blue whales were coming from the pelagic activities and the scientists from countriesoperating them, the discussion of the humpback status relevant to the regulation of pelagic-whaling was based in large parton data from the Australian land-stations. Neither Australia nor the USSR was represented at this meeting.
41 In later years - mid 1960s - the baleen ridge studies and ovarian counts had been abandoned as untrustworthy, and it wasalso found that the ear plug readings had been under-estimating the ages of fin and blue whales twofold! If this had beenknown at the time the conclusion that the fin whale was rapidly declining would have been greatly strengthened.
42 Slijper again dissented, believing that evidence was insufficient to make any recommendation. Instead he pressed formarking experiments on young whales as a means of validating the age-determinations on which the estimates of mortalityrates (and hence of stock status) by British and Norwegian scientists had been based.

Commission decided it did not wish to be represented at the forthcoming UN Conference on the Law of the Sea(March 1958), but would remain in contact with FAO and ICES.
Twenty expeditions with 237 catchers from the five nations participated in the 1957/58 season in accordancewith a renewed agreement among whaling companies. The Soviet expedition included the unprecedented highnumber of 25 catchers, including training vessels. The total catch was 14 850 BWU, the season again being closedon 16 March. Attention was for the first time drawn to the fact that the catch per expedition varied greatly, evenamong factories of similar capacities, ranging from about 500 BWU to the Soviet 1600 BWU.
The Scientific Sub-Committee met again in London, in March 1958. On the vexed question of thehumpbacks the Sub-Committee was now floundering despite a long detailed report from Australia. It had beentold that Norway would be proposing increasing the catching-days from four to eight (as the Committee hadsuggested the previous year), and limiting the catch to 1250 with 1 February as the opening date.
The only new data indicated a deterioration of the stock in the eastern Indian Ocean sector. After muchhumming and hawing the Sub-Committee reported it “is inclined to think that a catch of 1250 in the wholeAntarctic is about the right number. [It] realises that it may be difficult to regulate the catch so that it reaches thisfigure and no more each year but suggested (on a proposal by the Dutch scientist) that if this number is exceededin any one year it should be correspondingly reduced in the next year so that the average catch is kept to 1250.”.43
This quote gives the flavour of advice from the scientists, which gradually led to the Commission’sdisillusionment with them, perhaps unfairly since they were attempting an essentially impossible task in the thencurrent state of knowledge and analytical techniques.
Similarly it was noted that the catch of sei whales had increased dramatically, but the “explanations” couldbe: fleets operating in lower latitudes; the sea becoming unusually warm in higher latitudes; other species beingmore difficult to find. The scientists suggested that they might be able to clarify this question if they were givenaccess to the catch-data for each factory, but this commercially sensitive information, though existing in theBureau of International Whaling Statistics (BIWS), was denied them.
New analyses of fin whale data were presented by UK, comparing age compositions in the former Sanctuaryand elsewhere. These gave no conclusive evidence but reinforced the majority view of the previous year that “thebalance of evidence indicates that the stock is declining and that the present level of catching is too high”. Againthe Dutch delegates dissented, insisting that there was insufficient evidence on which to base anyrecommendation to the Commission. The majority did not recommend any particular number.
Regarding the dates for opening of the season, it was understood that there would be a proposal from aCommissioner for an earlier date. The scientists said they would prefer no change but realised that with areduction in the number of catchers, more time might be needed to reach the catch-limit.
9. 1958: THE CRUCIAL YEAR - QUOTA NEGOTIA TIONS BEGIN
At the Tenth Meeting of the IWC (London, June 1958) the UK Commissioner “drew attention to the positionresulting from the decline which, in the majority opinion, was taking place in the stock(s) of fin whales (beingexploited in Antarctic waters) at the same time as the number of factory ships operating in the Antarctic wasincreasing... . The UK Delegation therefore wished to suggest that the Antarctic whaling countries should consulttogether to find a solution to the economic problem, perhaps by an agreement to share the permitted catchbetween them. Under the terms of the (International) Convention (for the Regulation of Whaling 1946) any sucharrangement would have to be made and operated outside the Commission, unless the Commission shouldrecommend amendment of the Convention to widen its scope.” 44
The UK Commissioner’s statement is reported under the agenda item “National Quotas - Antarctic PelagicWhaling”, but the Commissioner referred to “permitted catch”. The powers given to the IWC by Article V.1 of
343 Holt
43 This is the first time that the idea was broached of what were later called “block quotas” and “roll-overs”. These wereused but were controversial through to the mid-1980s.
44 This last reference to the fact that the ICRW requires that amendments to its Schedule (an attachment which “…forms anintegral part…” of the ICRW) “…shall not involve restrictions on the number or nationality of factory ships or land-stations, nor allocate specific quotas to stations…” [Article V.2(c)] This wording was included at the insistence of theUS delegation to the 1946 Conference; the British and Norwegian representatives unsuccessfully sought to haveallocations to Parties provided for. A consequence was what came to be called “the whaling Olympics”, in whichcountries and companies enormously increased their capacity in order to retain or gain higher shares of catch-limits withina limited season. This in turn added to the pressures to keep catch-limits high in order to keep the new and expanded fleetsin operation and profitable. The Schedulemay be amended by a three-fourths majority vote of Parties (not counting abstentions) but the ICRW itselfcontains no provision for its own amendment. Thus changes can be brought into being only by negotiation of Protocolsthat, to come into force, require ratification by all Contracting Parties.

the ICRW include amending “from time to time the provisions of the Schedule by adopting regulations withrespect to the conservation and utilization of whale resources (by) fixing inter alia (e) time, methods, andintensity of whaling (including the maximum catch of whales to be taken in any one season).” More commonlythe maximum permitted catch is referred to as the Catch Limit.45 National quotaswere allocations of parts of anycatch-limit as agreed (outside the IWC) among states participating in a defined whaling operation.46
The UK suggestion set in train negotiations that continued through to 1971 concerning the 1971/72 Antarcticwhaling-season. The negotiations for a workable system of allocating quotas, which had to be conducted in aformal sense outside the IWC, were tightly closed to all but some members of the national delegations involved.Some of the factors in this process could be deduced by reasonably shrewd observers of this process, some ofthem were known to some participants (in governments and from whaling companies) and some were revealedin various ways many years afterwards. The negotiations were naturally linked with the process of determiningoverall catch-limits, and with establishing a system of international monitoring and control. This latter, intendedto limit and discover cheating generally, obviously would become much more crucial once quotas wereestablished.
In principle the catch-limits were expected to be set in accordance with scientific advice based on carefulanalyses (subject to internal peer review), inevitably modified by economic and political considerations, and thenthe shares would be negotiated. In practice, however these two processes were tightly linked, even to the extentthat countries clearly sometimes determined in advance what national quotas they wanted or would accept andthen sought to arrange for the overall limit to be set accordingly. It is primarily because of this linkage, continuedthrough time, that the account here must be essentially chronological, both processes, as well as the internationalobservation controversy, being recounted in parallel.
So here one must look at attempts, through the 1960s and early 1970s, to share permitted catches amongseveral participants, which came down to negotiating “fair shares” of a “suite” of four large species of“whalebone” whales killed in Antarctic waters by catcher boats accompanying large factory-ships, an industry inwhich five nations participated in the early years, but which were reduced to three and then two by the timeagreements were reached. The ostensible purpose of this was to ensure that future catches would be sustainable,and to limit over-investment in vessels and equipment resulting from unregulated competition between nationsand whaling companies for a restrictive catch-limit. In retrospect it is alternatively understood as an effort, atleast by some, to arrange the extinction of the industry in as orderly and profitable way as possible. During thisperiod the product on which the whaling economy mainly depended, changed from whale oil to frozen whalemeat, with the market for the latter overwhelmingly concentrated in Japan.
The economic and logistical parameters in the national quota negotiations included consideration of eventsoutside this favoured Antarctic region. The most important were that:
i. pelagic operations also took sperm whales (for a commodity with a completely different market) andincluding catches by expeditions in ocean areas in which pelagic baleen whaling was forbidden - particularlyin the southern hemisphere north of 40°S and
ii. pelagic-whaling was intensive for a few years also in the North Pacific Ocean where at first different fleetsoperated but where, eventually, for economic reasons, the same fleets were permitted to operate in the same12-month period in both hemispheres.
Additionally, two other rorqual species - minke and Bryde‘s - not included in the original suite of four, cameto dominate the catches in both hemispheres when stocks of the four had all been greatly depleted, becoming ofpractical significance for the Antarctic in the late 1960s. But the catching of sperm whales by the same pelagicexpeditions was not regulated until much later. Prevailing values of these two groups of animals affected thedistribution of whaling effort between them, and the different nations and companies also had relatively differentinterests in these two basic types of whale.47 As the pelagic-whaling enterprises were almost all based in thenorthern hemisphere this meant that sperm-whaling was undertaken during the long voyages to and from thebaleen whaling-grounds; the larger, male animals were also taken deep in the Antarctic.
Southern Hemisphere Whales 344
45 The “permitted catch” here means the maximum season’s catch as determined by the Commission, and qualified withreference to other types of regulations under Article V.1. These include “…fixing (a) protected and unprotected species;(b) open and closed seasons; (c) open and closed waters, including the designation of sanctuary areas; (d) size limits foreach species; and (f)types and specifications of gear and apparatus and appliances which may be used…” “Catch limit”is roughly synonymous with Total Allowable Catch(TAC) in modern fisheries management.
46 At various times there were also “company quotas”. These were of two kinds: in the period between the First and SecondWorld Wars agreements on catch-limits were reached among companies rather than governments. Later, when nationalquotas were agreed, any government concerned might decide to allocate shares of its national quota to each of thecompanies whose vessels flew its flag.
47 Baleen and sperm oil necessarily had to be stored in separate tanks on factory-ships, and any change of use involved tank-cleaning.

The prevailing view of scientists - and even of fisheries economists - at the time of the post-World War IIwhaling negotiations, about sustainable use of wild living resources, was that operators/investors had a powerfuland potentially over-riding vested interest in such long-term use provided that regulated limitations of eithercatches or whaling/fishing effort could ensure that animals left alive in the sea by each participant, as aconservation measure, in order to grow or reproduce, would not be prematurely killed by others. When appliedto so-called “common property resources” this was hallowed by the writings of Garrett Hardin in the catch-phrase“The Tragedy of the Commons” (see, for example, Hardin and Baden 1977). But by 1975 the mathematicianColin Clark had elegantly demonstrated that this was not plausible if the natural rate of growth/recovery of theliving resource was slow in comparison with the prevailing financial discount rate. In such a case, of whichwhales and hardwood trees are the best exemplars, it would always pay to exploit the resource unsustainably, thusdepleting or even exterminating it, and then to invest the profits in another enterprise. This was in stark contrastwith the then dominant idea that if only everyone could agree, and not cheat, then they would all naturally act soas to ensure a future for their enterprises, and act within that constraint in battling for market share and improvedefficiency.
One of Clark’s first analyses was in fact of the southern hemisphere blue whale stocks. Indeed it had alreadybeen remarked that the Norwegian city of Sandefjord - the home base of Norwegian Antarctic whaling - had beenbuilt on the carcasses of whales, which also provided much of the capital subsequently invested in Norway’sburgeoning ship-building industry. In further studies Clark showed that the most profitable course is to depletethe resource steadily, but not as fast as might be technically possible, since that would involve inordinately highshort-term investments in ships which could have a viable use period of twenty years or more. So, while manythought at the time that the intense debates, over catch-limits, national quotas and international monitoring ofcatching operations, were directed towards the sustainability of both the natural resources and the industry, inharsh economic reality they were about achieving a controlled, rather than chaotic, depletion of the resources andwind-down of the industry. Commercial whaling was “mining”, not “harvesting”.
Another myth, at the core of this study, was that the proper sequence of events was, first, to obtain agreementon total allowable catches, based on scientific advice modulated by broad economic and social considerations,and second, to agree on appropriate shares of this among operators, which might be governments or companies.The reality was that negotiations on catch-limits and quotas were, although conducted in separate rooms,completely intertwined, and with them the negotiations about effective monitoring of the resulting internationalarrangements. All these elements inevitably made deduction of the real factors in essentially secret quotanegotiations somewhat speculative.
And, last, it must be said that the ICRW made demands on the scientific process that could not be fulfilled.Certainly great advances were made during the period under consideration, beginning in the early 1960s, thoughfew of the analyses then made would stand up to modern scrutiny. In fact the scientific advice offered wasfrequently not acted upon, or action was delayed, sometimes for many years. We can never know whether thestocks and the industry would now be in better shape if the advice had been promptly acted upon, even thoughwe see in retrospect that the advice was highly over-optimistic: we now know, for example that the blue, fin andsei whales were depleted to a much greater degree than was imagined at the time when strenuous efforts werebeing made to save the industry for a few years and the whales for ever.48
On the face of it attendance at the 1958 IWC Meeting was much as before. Except for Brazil, Mexico andPanama all Members were represented; and the usual observers were present from Italy and Portugal, FAO, ICESand IAWC. But most delegations were larger than before. The Protocol had still not been ratified by Brazil,Mexico and Panama and so was not yet in effect. However, after the meeting it was announced that all had thenratified so it came into force on 4 May 1959.
Although the Commission had decided not to be represented at the UN Conference that year on the Law ofthe Sea, it accepted the spirit of a resolution passed there which “called upon states to prescribe, by all meansavailable to them, those methods for the capture and killing of marine life, particularly of whales and seals, whichwould spare them suffering to the greatest extent possible”. While this was not directly relevant to the questionsof catch-limits and quotas, it was one more signal that the outside world was increasingly paying attention to theCommission, which had hitherto worked in virtual isolation.
345 Holt
48 Hence, although this account is the history of a failed enterprise, it may give some guidance for future management offisheries. Although not dealt with here it is a fact that this very failure, and the near extermination of the most valuablewhale resources, led to the declaration in 1982 of a moratorium on all commercial whaling. This released whale scientistsfrom the need to determine catch-limits every year, for every species in every region. They could give their full attentionto devising a completely new approach to setting limits (called the Revised Management Procedure - RMP).

The Commission voted on a proposal that the Sanctuary should remain open for another year, the extendedperiod being about to expire. Six were in favour, six against, with two abstentions. Thus the Sanctuary wouldagain be closed to pelagic baleen whaling in the 1958/59 season.
The Commission accepted the scientists’advice not to alter the opening date of the season. Efforts byNorway and UK to increase the length of the humpback season from 4 to either 6 or 8 days were defeated, andNorway’s proposal to fix the humpback catch at 1250 was withdrawn. A Japanese proposal to bring the opendates forward to 20-23 January was also withdrawn. Humpbacks would remain protected in the South AtlanticSector for a further five years. It was decided that the verbatim records of plenary discussions were to “beregarded as papers for transmission to Contracting Governments not for public distribution and quotation (fromthem) should not be permitted in a public press or in trade journals”.
The superficial tranquillity of these actions was broken by a sharp debate concerning the BWU catch-limit,in the light of the absence of a specific recommendation from the scientists. The Netherlands proposedraising the limit to 16 000 BWU, excluding humpbacks. This was not voted upon, but a motion to retain the14 500 catch-limitfor another year was adopted with the Netherlands dissenting.
After the 1958 meeting the five pelagic-whaling countries all lodged objectionsto this BWU decision. Thismeant that the effective limit for 1957/58 became 15 000 by default, according to the 1956 decision. But then aseries of withdrawals from the Commission began. The first was not Netherlands, as expected, but Norway, on29 December 1958. It announced that “Should the negotiations for an agreement between the five nations ... onthe rational conduct of the whale fisheries have reached a satisfactory conclusion before (the date on which itswithdrawal notice would come into effect - 30 June 1959), providing for the proper allocation between them ofthe annual total catch under the Convention, the notice of withdrawal would be cancelled”.
The next withdrawal, by the Netherlands (31 December 1958), simply said that its notice would be cancelledif pending problems could be solved in due time. Japan’s withdrawal notice followed (6 February 1959), with noexplanation but a promise of cancellation “in the light of circumstances that might arise”.
These notices of withdrawal followed the apparently successful conduct of a Whaling Conference held inLondon in November 1958 to negotiate shares of the catch-limit. There, the representatives of the “Five-Powers”had agreed to recommend to their Governments a sharing scheme for a seven-year period beginning with the1959/60 season. The substantive elements of this were:
i. The USSR would be allocated 20% of the catch-limit, the remaining 80% to be shared among the other fournations, by negotiation which should be finalised by 1 June 1959 (an inconclusive meeting to that end washeld in Tokyo in May; another was planned for June in London. That, too, was inconclusive).
ii. The USSR would not add more than three new expeditions to its existing fleet; but that none of the five shallincrease the number of its expeditions “other than by purchase one from another of ships engaged at the timeof purchase in Antarctic pelagic-whaling”.
iii. None of the ships belonging to any of the five would be transferred to another party to the Conventionwithout at the same time transfer of a proportionate part of the seller’s quota and a commitment by the buyerto honour the present agreement; or unless the purchaser guarantees that the ship will not be used as such inAntarctic pelagic-whaling during the 7-year period.
iv. The agreement would become null and void if a factory-ship under any other flag of a country, which is orbecomes Party to the Convention, engages in Antarctic pelagic-whaling, unless the above conditions oftransfer are met.
The Scientific Sub-Committee met again in London in March 1959 under the cloud of objectionsandwithdrawals. It had another disadvantage: that year Easter was at an inconvenient time, so the meeting had to beheld early when the catch-data for the previous season were not yet available. In the circumstances the scientistscould do no more than chat about methodology and interpretations of past data and reiterate the previous advice,with regrets that the catch-limit had reverted to 15 000 BWU. Dutch scientists once again declared theirdisagreement with the concerns of the others about the decline of the fin whale stock.
When the operational data did become available they showed that 20 expeditions had operated, with 235 catchers,the USSR being outside the voluntary agreement to limit that number. The catch had reached 15 301 BWU whenthe season was closed on 16 March. Meanwhile the Norwegian landstation on South Georgia, which had beenclosed, reopened for the 1958/59 season.
10. THE SECOND EPISODE - THE 1960s
When the IWC held its eleventh meeting (London, June-July 1959), the representatives of the pelagic-whaling countries were meeting in parallel, but without success. This meant that the announced withdrawals ofNetherlands and Norway came into effect on the last day of the meeting, but Japan withdrew its notice. There
Southern Hemisphere Whales 346

being no proposal for a new catch-limit, the default number of 15 000 would remain in place for the 1959/60season. This was of course now largely notional since it would apply only to UK, Japan and USSR. However,the Netherlands announced an assurance by its whaling company that it would take no more than 1200 BWU ineach of the next seven years, and would adhere to all the other IWC regulations except the seasonal dates.Norway said it would do likewise, but also abide by the season, and would later announce the quota it wouldaward to its own fleet. The USSR said it would abide by the Convention conditionally on its own interests notbeing damaged by the activities of non-members, which of course now included especially Norway and theNetherlands. At this point the UK said it would in the circumstances have to reconsider its position, but it did notthreaten to withdraw.49
Now that the Protocolwas in force the way was open, if not yet clear, to negotiate an international observerscheme (IOS), the principle of which had at last been accepted. The three remaining pelagic-whaling Memberswere asked to work out a scheme, and Norway and Netherlands were invited to join them in that task. Specificproposals had been put to the Commission, and these raised questions as to whether the nationalities ofinternational observers should be restricted to the other pelagic countries (favoured by Japan) or could also befrom other countries (favoured by Norway), and whether the Commission would be required to consult flag-countries before appointing observers on their factory-ships. The UK invited all five countries to a consultationfor this purpose in London in the autumn of 1959, but the USSR declined on the grounds that the scheme wouldbe valueless while any of the five countries remained outside the Commission. This proposed consultation wastherefore aborted.
Twenty expeditions took part in the 1959/60 season, but with a reduced number of catchers (217). The totalcatch, including that by the Netherlands and Norway, was 15 512 BWU. The season had opened for fin whaleson 28 December, as agreed, with the blue whale opening as before on 1 February, but British and Norwegianexpeditions continued until the authorised closure date of 7 April. Japanese and Soviet whaling ended early, whilethe Netherlands’operation continued to 15 April, that is beyond the authorised date. There were, moreover,major changes to the compositions of the fleets. The smallest of the Norwegian expeditions (7500 tons factory,with 6 catchers), was withdrawn from service, and a new, second Soviet factory, the S. Ukraina(36 000 tons, with18 catchers) began operations.
At the next meeting of the Scientific Sub-Committee (London, May 1960) Norway was represented by an“observer” with full right of participation. (there was no one from the Netherlands; and New Zealand attendedinstead of Australia).50 New analyses indicated that the fin whales were still rapidly declining and the blue whaleseven more rapidly. The group thought the blue whale should at least have some respite by closure of some sectorsand by a later opening date, but wished to recommend total protection for, say, two or three years, after which thesituation should be reviewed again. New analyses by British and Norwegian scientists also confirmed thecontinuing decline of the fin whale. Other important trends were an extremely rapid increase in the catches ofsei whales (the reason for this was still unclear, but no recommendations could be made) and continuing highcatches of sperm whales, the average size of which was diminishing. It was not clear to what extent this trendwas caused by deliberate selection of larger whales when catches were fewer, or because older whales had beenlargely eliminated. Either way, however, it was thought that this trend indicated whaling was having an effect onthe stocks. As to humpbacks, increases had been noticed in certain areas, declines in others - especially in theeastern Indian Ocean and Atlantic sectors - and apparent stability elsewhere. In particular the former should befully protected for at least two or three years.
Argentina joined the IWC in May 1960 and its twelfth Meeting (London, June 1960) was focused entirelyon two suggestions by the UK. One was to suspend the Antarctic catch-limit for at least two seasons in order toclear the way for a quota agreement to be reached and as a device to open the way for a return of Norway andNetherlands to membership of the Commission. The idea was that the UK, USSR and Japan should vote for suchaction but undertake to object to the decision within the proscribed 90 days if Norway and Netherlands did notrejoin. This proposal acknowledged implicitly that the problem was not to agree on a total and then on how todivide it up, but rather the reverse: to agree on a formula for sharing, and then adopt an overall catch-limit. Inpractice, of course, the two agreements had to be reached hand-in-hand. For countries such as Norway, with morethan one expedition, a “totals first, quotas after” approach was feasible because if the total would be too low itcould reduce the number of its many expeditions. But the Netherlands, with only one expedition, had to be
347 Holt
49 At this meeting the Commission made some amendments to the regulations. A Japanese proposal to advance the openingdate for fin and blue whales from 7 January to 28 December was adopted despite the opposition of the scientists on thegrounds that this would lead to more pregnant females being taken. Also, a Japanese proposal to advance the fourhumpback catching days from beginning on 1 February to 20 January was adopted. TheSanctuary was opened to whalingfor another three years, on the proposal of Australia.
50 This group was now called an Ad HocScientific Committee.

assured of a specific quota so as to ensure profitability. Therein lay a dilemma that generated fundamentaldifferences in strategy.
Seconded by South Africa (then engaged in coastal whaling on the southern hemisphere baleen and spermwhale stocks), this UK proposal was adopted, but after the meeting Objectionsto suspension of the catch-limitwere lodged by Japan and the USSR, which had both voted against it. South Africa then also seconded a non-binding US resolution; this was adopted, its effect being to urge all countries to limit their national catches to alevel no greater than that adopted for the 1959/60 season. Another resolution, proposed by UK, again secondedby South Africa, and adopted without dissent, appealed to Norway and the Netherlands to rejoin the Commissionand participate in actions for arranging sharing of the total limit and introduction of an international inspectionsystem. Then a Scheduleamendment proposed by UK to delay beginning of blue whale catching from 1 to14 February was carried without dissent.
The second major suggestion by the UK at this meeting was appointment of a special ‘Committee of Three’scientists in the field of population dynamics, drawn from countries not engaged in pelagic-whaling in theAntarctic, “to assist in the assessment of the condition of the whale stocks there”. They would be asked to reportwithin one year on the sustainable yield of these stocks and on any conservation measures that would increasethat yield. The three would be appointed by the Commission’s Chairman, in consultation with the Vice-Chairmanand the Chairman of the Scientific Committee. In doing this, the IWC would declare its intention to bring thecatch-limit into line with the scientific findings not later than 31 July 1964. In doing so it would have regard toArticle V.2 of the Convention, which mandates, inter alia, that Scheduleamendments must be such as arenecessary to provide for the conservation, development, and optimum utilization of the whale resources, and bebased on scientific findings.
This suggestion was formulated in a resolution proposed by Canada, seconded by South Africa and adoptedwithout dissent. Japan supported it only in principle however, because it did not specify that the report of the‘Committee of Three’should pass through the Scientific Committee. This omission was, naturally, deliberate,since the idea was that they would work with the Commission’s scientists but that their advice would be quiteindependent and seen to be so. It only became apparent later, however, that the Japanese delegation was unwillingto make a prior commitment “to act on scientific advice which had not yet been formulated”.
In this matter the delegation of the USAwas very active behind the scenes, and with a clear purpose. TheUSA had made great efforts to promote the establishment of regional inter-governmental fisheries regulatorycommission around the world. Observing the IWC to be on the brink of complete collapse, there were fears ofrepercussions on this evolving global management structure, a structure that the USAwished to nurture. Alsobehind the scenes the FAO observer (the Organisation’s Assistant Director-General for Fisheries, a Canadian) wasactive, and it was no accident that the resolution eventually adopted was put forward by the CanadianCommissioner.
After the meeting negotiations began for the composition of the Committee of Three. Appointments werenot completed until March 1961; the chosen members were D.G. Chapman (USA), K.R. Allen (New Zealand)and myself (British, but nevertheless politically acceptable, being at the time a staff member of FAO/UN). At thesame time the Ad HocScientific Committee was instructed to prepare data, review methodology and consider theneeds for better data collection and research in the future.
The Committee of Three and the Ad HocScientific Committee met jointly for two weeks in Rome (April-May 1961) and put together a plan of action for the coming months. Scientists from Australia, Japan, NewZealand, Norway, UK, USSR and Netherlands participated. At a subsequent meeting of the Ad HocCommittee(London, June 1961) work on the execution of the plan of action began in earnest. It was noted however thatpending the completion of the Committee of Three’s work the Ad HocCommittee would have to “continue toresort to the rather qualitative indexes they had employed in the past”. The preparatory work involved, inter alia,putting all existing statistical and relevant biological data onto punch cards for a new-fangled computer analysis,which meant handling and processing more than one million items.
During 1961, the USSR then confirmed its acceptance of a 20% national quota, and representatives of theother four pelagic-whaling countries met three times in failed attempts to agree on division of their 80% of anycatch-limit (the USSR participated as an observer in the first of the three meetings). Tentative proposals were inthe hands of their Governments but no decision had been made by the time of the thirteenth IWC Meeting, heldin London in June 1961.
All member countries participated in this 1961 Meeting. Italy and Portugal were again represented byobservers as, this year, were Chile and the Netherlands. Others were FAO and ICES, as usual, joined now by theCommittee of Three (represented by Chapman, its Chairman). The UK Commissioner explained to theCommission the status and nature of the quota negotiations, and put to it three questions on behalf of theNetherlands (which now, as an observer, could not itself present them). Agreement was near on allocations of
Southern Hemisphere Whales 348

33% to Japan, 32% to Norway, 9% to UK and 6% to the Netherlands with, in addition, a bonus to theNetherlands depending on the catch of their expedition by a certain date during the season. The threequestions were:
i. Could the principle be established of carrying over to the next season the balance of any unused quotaallocation?
ii. Could the Antarctic season be lengthened?iii. Would an IOS be introduced and implemented?
The Commission’s answers were:
i. While it was understood that this aspect was of special interest to a nation operating only one expedition,and there would be no harm - and possible some economic benefit - in carry-over if the catch-limit was lowenough to be sustainable, it would be harmful to do so if the catch-limit was higher than “optimal”. Onbalance the Commission decided it would oppose any carry-over.
ii. The arguments put forward by scientists against opening the season earlier were ambiguous and theconsequences uncertain. Under the circumstances the Commission agreed (by majority vote) to advance theopening from 28 December to 12 December.
iii. That the Commission agreed on the need and that action was urgent, and asked the pelagic-whalingcountries, including the Netherlands, to work out details as quickly as possible, with an aim of provisionalimplementation in the 1961/62 season.
On the matter of the BWU limit the Commission limited itself to reminding the Governments of the five countriesof the resolution from the 1960 Meeting.
At this 1961 meeting the Committee of Three presented its First Interim Report. This contained nosubstantive recommendations but simply described the lines of cooperation that would be followed by theCommission’s scientists, warned the Commission that some costs would be incurred, especially in computing,and pressed for a large expansion of the whale marking programme.51
The Scientific Committee expressed alarm at the state of humpback stocks in certain sectors. In responsethe Commission called upon the four member countries to withdraw their Objectionsto the protection status thathad been granted at the Twelfth Meeting.
After the 1961 meeting Japan and USSR withdrew their objectionsto the suspension of the catch-limit thathad been decided in 1960 (19 December 1961 and 9 April 1962, respectively). With respect to the voluntarynational catch-limits the Netherlands announced a limit of 1200 BWU for the 1960/61 season, the same as in1958/59 and 1959/60. The USSR, which had increased its expeditions from two to four in those years,maintained a limit of 3000 BWU, calculated as 20% of the total permitted by IWC in 1959/60. The UK held itselfto 1800 BWU, for two expeditions, the same as in 1960/61 and compared with 2500 BWU for three expeditionsin 1959/60. Norway awarded itself 5100 BWU, which was 700 fewer than in the two previous seasons,consequent on sale of one expedition to Japan. Japan correspondingly increased its catch-limit by 700, to 6680,for eight expeditions, as compared with 5980 for 7 expeditions in 1960/61 and 5100 for six expeditions in 1959/60.
The total catch in the 1961/62 season was 15 253 BWU, by 21 expeditions with 261 catchers. Apart fromthe transfer of one expedition from Norway to Japan, which had withdrawn its smallest factory from service, theUSSR increased its fleet from three to four by addition of the 33 000-ton S. Rossiya, with 16 catchers. The seasonhad opened on 12 December as decided at the 1961 meeting. All expeditions (except the Japanese) ceasedoperations on the latest legal date (7 April); four of the Japanese expeditions ceased on 28-29 March. It is notablethat with a substantially longer season and bigger total fleet size (by tonnage of factories and number of catchers)the catch was 7% lower than in the previous season.
Within the BWU total the number of sei whales had increased again (by more than 10%). The ScientificCommittee had expressed concern, in the belief that “the maximum sustainable sei catch from the Antarctic wasbeing approached or might be already passed.” (No real evidence had been offered, however, for thissupposition).52
The (unregulated) catch of sperm whales also increased. The amendment made at the Twelfth IWC Meetingregarding the opening date for catching blue whales, from 1 February to 14 February, was inoperative becausethe four pelagic-whaling Member countries had all objected to it.
349 Holt
51 The Commission was not yet used to spending any money on securing scientific advice.52 A feature of this and recent seasons’catches which drew comment, was that there was an increasing proportion of pygmy
blue whales among the blue whale catches. It was not realised at the time but this was linked with the general displacementof whaling operations northward, principally for the taking of sei whales, which brought them into the distribution rangeof the pygmy blues.

Although the preparation of data undertaken by the Committee of Three and the Ad Hoc ScientificCommittee went ahead on schedule between the Thirteenth (1961) and Fourteenth (July 1962) meetings of theIWC, the funds needed for a second joint meeting of the two committees (to be assured by the pelagic-whalingcountries, the budget being set at UK£8000) were not authorised in time for that meeting to be held before or atthe time of the Fourteenth Meeting. The second joint meeting was only eventually held in December 1962 (inSeattle, USA), which meant at least one full year of delay in completion of the study by the Committee of Three.
The plea to the five pelagic-whaling countries to complete an IOS for implementation, at least on a trial basisin the 1961/62 season, was heard but not acted upon; as they could not agree among themselves to negotiatebefore the Netherlands rejoined the IWC; that happened in May 1962.
In June 1962 the document entitled Arrangements for the Regulation of Antarctic Pelagic Whalingwassigned by the five Governments concerned. The allocation of 20% to the USSR was confirmed, as also 6% forthe Netherlands. However, in the meantime there had been further transfers of factories to Japan: one by Norway,another by UK. This resulted in reallocations: Japan 41%, Norway 28%, UK 5%.
The 1962 meeting of the IWC was attended by all Members except Panama, and by observers from Chile,Italy, FAO53 and ICES. Representatives of the five pelagic countries met during the meeting, under theChairmanship of the Commissioner for Australia, to study proposals from the Netherlands, UK and USSR and adetailed text for a Scheduleamendment provided by Norway. The discussion was inconclusive and wasadjourned until August. As a result of the delay in the scientific work there was little discussion about Antarcticregulations. Only New Zealand expressed regret at the delay. The BWU limit remained by default at 15 000.54
The Commission agreed with the substance and timetable of the scientists’proposals for completing the specialassessments of the large baleen whales included in the BWU, but decided that they “should be extended to spermwhales in all regions and eventually to all other species of economic importance”.55
The total 1962/63 catch was only 11 306 BWU (out of a possible 15 000), taken by 17 expeditions with201catchers. Only Japan reached its national quota, despite all (except Japan) continuing operations until 7April.Although two expeditions had been transferred to Japan together with their quotas, Norway in fact operated threefewer than in 1961/62, while Japan operated the same number - seven. Also all countries except the USSRreduced both the total number of their catchers and the number per factory.
A meeting planned for August 1962 to complete the IOS was not held because the USSR said that furtherdiscussion would not be useful until the agreement on quota Arrangements had been ratified by all fivesignatories. That process was not completed until April 1963. Further meetings on the IOS were held in April-May 1963 (Moscow) and June 1963 (London). The results were to be reported to the Fifteenth Meeting of theIWC.
The Fifteenth IWC Meeting was held in London (July 1963) and had to deal with a large volume of business.The Agreement on the IOS was negotiated outside the ICRW but formulated in such a way that it could notoperate unless the Commission was empowered to appoint the observers and receive their reports. This wassecured by a consensus to insert in Paragraph 1(a) of the Schedule(which required that “There shall be maintainedon each factory ship at least two inspectors....”) the additional provision: “… and also such observers as themember countries engaged in the Antarctic pelagic whaling may arrange to place on each other’s factory ships”.The Commission also resolved that: “The operation of the observer arrangements shall be the responsibility of acommittee consisting of the Commissioners for the member countries engaged in the Antarctic pelagic whaling”.
The essential features of the Agreement on the IOS were as follows:
i. The governments of the five countries would each nominate observers in numbers equivalent to the numberof expeditions each government operates. These are each to be appointed to serve in the expeditions of theother four governments.
Southern Hemisphere Whales 350
53 I represented the Committee of Three as well as FAO.54 It was not agreed to prolong the season further. It was decided to leave The Sanctuary open to pelagic baleen whaling by
rendering Paragraph 5 of the Schedule“inoperative until the Commission otherwise decides”; and the Commission heldoff proposals to give additional protection for blue whales until the Committee of Three had reported, despite agreementthat “Assessments show that the stock has indeed reached a level at which there is no hope of any appreciable catches everbeing taken unless it is given complete protection for a long period”.
55 As to the requests for withdrawal of objectionsto the previous decisions concerning season dates for blue and humpbackcatching most of the five countries replied that they were willing to withdraw if the others all did. With respect to the bluewhale there were no withdrawals because Norway declined to consider the matter until the Committee of Three’s workwas finished. With respect to the humpback only the objectionsby UK and Japan were withdrawn, and those only inFebruary and March 1963 respectively, that is after the opening of the 1962/63 humpback season.
ii. Each of the five governments also had the right to put one observer of its own nationality on every foreignexpedition engaged in Antarctic pelagic-whaling.
iii. All observers would be formally appointed by the Commission, would be enabled to verify those activitieson the factory-ships which pertained to the provisions of the Convention, including its Schedule, and wouldreport to the Secretariat of the Commission.
The IOS agreement was linked to the quota arrangements agreement by a provision that it would onlyremain in force so long as the latter was also in force. Various other provisions dealt with: payments of costs andstipends (to be split by complex formula between the country of which the observer was a national, the countryor company operating the expeditions to which he was assigned, and the Commission itself); language andinterpretation; communications between the international observer and the national inspectors; and provision offacilities including especially access to radio communications.
It had also been noticed that the numbers of various species of whales being killed under special scientificpermits had been increasing, and some steps had been proposed to discourage this practice, primarily byinvolving the Scientific Committee in a review process.56
Turning to the work of the Committee of Three, a Second Interim Report, dated January 1963, and givingprovisional conclusions - and strong warnings of what was to come - had been circulated to MemberGovernments. Further analyses had been made subsequently, the results of which, with the results of the Seattlemeeting, were embodied in aFinal Reportwhich was also circulated to Commissioners and other scientists priorto the IWC’s 1963 Meeting. Then, in June 1963, the Committee of Three met with the Scientific Committee,from which a Supplementary Reportof the Committee of Three was prepared and circulated.
The Commission had before it at its 1963 Meeting all these substantial documents from the Committee ofThree and also the Report of its Scientific Committee, which had met at the end of June. The scientificconclusions and recommendations were, in summary:
i. Both the blue and the humpback whales were in danger of extinction and both should be completelyprotected for many years.
ii. The current sustainable yield of the fin whale was about 5000 whales, i.e.2500 BWU. Catches would needto be substantially below that number if the stock were to be permitted to increase towards a higher numberwhich could eventually sustain a higher level of catch.
iii. If catches were to be unlimited in 1963/64 but zero thereafter, an “optimal” stock level to give a maximumsustainable catch of 20 000 whales would be attained in about 11 years; but if catching continued to exceed5000 animals the stock would be reduced to near extinction in 10 to 20 years, depending on the catchestaken.
iv. No estimates for the sustainable catches of sei or sperm whales could be given.
In spite of strong recommendations from the scientists the Commission was not prepared to abolish theBWU because that “was the only practical method of regulation that could be administered”. In thesecircumstances there were proposals for a catch-limit in 1963/64 of 4000, 10 000 or 12 000 BWU. Eventually thenumber 10 000, as proposed by Japan and USSR, was adopted. It should be noted that many Commissioners,who in fact supported the lowest number, voted for 10 000 because they presumed that at least three of thewhaling countries would lodge objectionson economic grounds - this was almost certainly correct - and the limitwould then revert to the default 15 000 BWU. The Commission decided to suspend humpback catchingthroughout the southern hemisphere.57 As to the blue whale, Japan opposed a total ban in the southernhemisphere because it was particularly interested in the pygmy blues in lower latitudes. A compromise offeredby UK and Japan resulted in the ban on blue whale being limited to south of 40°S except they could be caughtbetween 40° and 55°S in the sector from 0° to 80°W. This was adopted.58
If the scientists’predictions were correct these decisions would ensure a continuing decline of the three largespecies, and probably of the sei whale also.59
351 Holt
56 This development presaged a future in which the Special Permit provision in Article VIII, which requires full utilizationof the carcasses, would be abused on a large scale to supplement low or even zero catch-limits.
57 Australia and New Zealand sought but failed to obtain agreement that this ban would apply only south of 40°S, whichwould have permitted their land-stations to continue operating. During this year the Commission was advised ofunprecedented large catches of “scientific whales” by Australia, New Zealand, and also by Canada and the USA.
58 Norway and the Netherlands again sought, but failed, to have the Sanctuary closed again. It was agreed that the openingand closing dates of the season would remain unchanged.
59 It later turned out that these scientific analyses were still wildly over-optimistic.
Finally, the Commission requested the continuation for one more year of the work of the ScientificCommittee with the Committee of Three and asked if FAO would take over this work thereafter.60 Agreementfor continuation of the scientific work did not come easily. Some countries “felt strongly that as the findings andrecommendations of the Committee of Three had not been met by appropriate action at this meeting, there wasno reason for the continuation of work the results of which were not used”. Others, however, recalled thecommitment made in 1960 to act positively on the findings. This commitment was reaffirmed on a show ofhands. However, after a long discussion of financial implications (estimated at UK£3000, with provision even ofthat small sum being conditional on actions being taken on the advice to be given) a proposal by UK that the workshould be continued in the same way for one more year, and that FAO should be asked to agree to undertake suchwork in future years, was put to the vote and carried, but only by 6 in favour and 3 against, with 4 abstentions.61
A month after the close of this 1963 meeting it was announced that the UK expedition had been sold, withits quota, to Japan. Thus Japan acquired 46% of the catch-limit but it nevertheless sent the same number ofexpeditions to the Antarctic for 1963/64 as in the previous season. It later transpired that the Government ofJapan had intervened with the whaling industry to prevent any increase in the number of Japanese expeditionsbecause this might upset the negotiation of quotas. Thus the total value of an expedition that was sold becamereduced practically to the potential value of the quota transferred with it; the vessels and plant were commonlyscrapped or put to other uses.
The 1963/64 catch, by 16 expeditions with 190 catchers, totalled only 8429 BWU, despite the seasoncontinuing in most cases almost to the IWC’s closing date. The Norwegian and Dutch expeditions did not reachtheir quotas. Whaling resumed at two land-stations on South Georgia.
The IOS was not implemented in the 1963/64 season. Although the Agreement had come into force by28 October 1963, this was too late: the factories were already on their way to the Antarctic and it was said thatways could not be found to get the international observers in place for the opening of the season, even by theirbeing passengers on supply ships and catchers, since they were travelling separately.
I now move on to June 1964 when both the Scientific Committee and the Committee of Four met, the formerin Sandefjord (Norway), the latter in Lowestoft (UK). In its Report to the Commission the latter reviewedsubmissions from Dutch and Japanese scientists that had been made available during the 1963 meetings. TheDutch scientist had raised some technical questions about the reliability of some of the data used by theCommittee of Three/Four that had been answered in the Supplementary Report last year. The Japanese papersgave estimates of current sustainable yield of fin whales much higher than the Committee of Three’s estimates.The Committee of Four did not accept these, but nevertheless pointed out that the Japanese scientists’numberswere lower than the agreed BWU catch-limit so the difference did not call for an immediate change in policydecisions.
The 1964 meeting of the IWC was convened in Sandefjord in June 1964.62 Four Members were absent:Brazil, Mexico, Panama, and Sweden. Observers were from Chile, Italy and Portugal, for the first time theComissión Permanente del Pacífico Sur(CPPS), two members of the Committee of Four, and the InternationalSociety for the Protection of Animals (ISPA). Three proposals for future catch-limits were on the table:
i. 4000 BWU in 1964/65, 3000 in 1965/66, 2000 in 1966/67 (USA/Australia)ii. 6000 in 1964/65 (Norway/Iceland) andiii. 8500 in 1964/65 (Japan/USSR).
The two members of the Committee of Four were invited to comment on the consequences of adopting anyone of these. The reply was in essence: that it was not feasible to predict the consequences when the speciescomposition of the catch is not specified, when it was not known whether proposals concerning humpback andblue whale protection would be accepted, and when the amount of whaling effort directed by some expeditionsto hunting baleen whales would in part depend on the amount of hunting for sperm whales, especially by Sovietvessels.
The Norway/Iceland proposal was put to the vote first; and defeated.63 The Japan/USSR proposal was alsodefeated. The USA/Australia proposal did not obtain the requisite three-fourths majority, being opposed by thefour pelagic-whaling countries. A modification was then put forward by the Netherlands and Norway, for “not
Southern Hemisphere Whales 352
60 By now the Committee of Three had transmuted into a Committee of Four by the addition of J.A. Gulland, a Britishscientist who had joined the FAO staff. Subsequently, FAO agreed to collaborate in future regular analyses andassessments of whale stocks only “...on the understanding that such work is likely to be fruitful in the sense that theCommission’s actions on catch restrictions would be in accordance with the scientific findings...”
61 This was adopted by a simple majority, since it did not involve an amendment to the Schedule.62 The scientific meetings were held aboard a whaling factory.63 1 in favour, 12 against, 1 abstention. It seems that either Iceland or Norway did not support its own proposal!
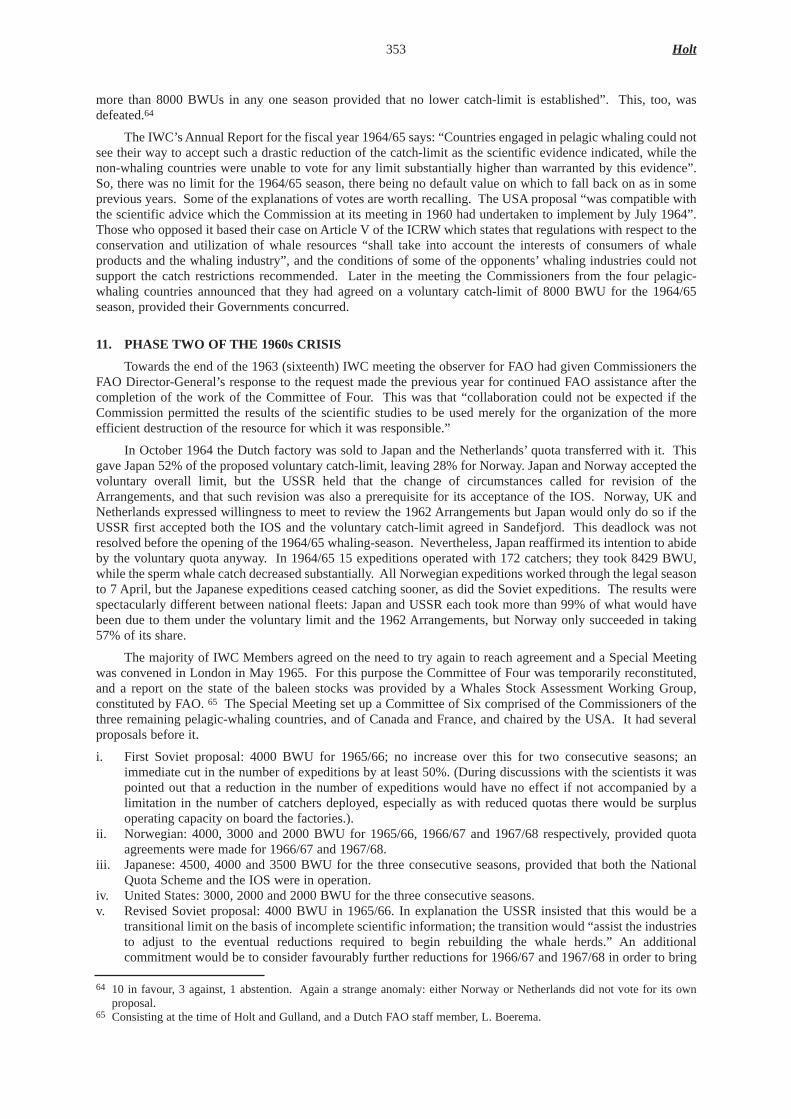
more than 8000 BWUs in any one season provided that no lower catch-limit is established”. This, too, wasdefeated.64
The IWC’s Annual Report for the fiscal year 1964/65 says: “Countries engaged in pelagic whaling could notsee their way to accept such a drastic reduction of the catch-limit as the scientific evidence indicated, while thenon-whaling countries were unable to vote for any limit substantially higher than warranted by this evidence”.So, there was no limit for the 1964/65 season, there being no default value on which to fall back on as in someprevious years. Some of the explanations of votes are worth recalling. The USAproposal “was compatible withthe scientific advice which the Commission at its meeting in 1960 had undertaken to implement by July 1964”.Those who opposed it based their case on Article V of the ICRW which states that regulations with respect to theconservation and utilization of whale resources “shall take into account the interests of consumers of whaleproducts and the whaling industry”, and the conditions of some of the opponents’whaling industries could notsupport the catch restrictions recommended. Later in the meeting the Commissioners from the four pelagic-whaling countries announced that they had agreed on a voluntary catch-limit of 8000 BWU for the 1964/65season, provided their Governments concurred.
11. PHASE TWO OF THE 1960s CRISIS
Towards the end of the 1963 (sixteenth) IWC meeting the observer for FAO had given Commissioners theFAO Director-General’s response to the request made the previous year for continued FAO assistance after thecompletion of the work of the Committee of Four. This was that “collaboration could not be expected if theCommission permitted the results of the scientific studies to be used merely for the organization of the moreefficient destruction of the resource for which it was responsible.”
In October 1964 the Dutch factory was sold to Japan and the Netherlands’quota transferred with it. Thisgave Japan 52% of the proposed voluntary catch-limit, leaving 28% for Norway. Japan and Norway accepted thevoluntary overall limit, but the USSR held that the change of circumstances called for revision of theArrangements, and that such revision was also a prerequisite for its acceptance of the IOS. Norway, UK andNetherlands expressed willingness to meet to review the 1962 Arrangements but Japan would only do so if theUSSR first accepted both the IOS and the voluntary catch-limit agreed in Sandefjord. This deadlock was notresolved before the opening of the 1964/65 whaling-season. Nevertheless, Japan reaffirmed its intention to abideby the voluntary quota anyway. In 1964/65 15 expeditions operated with 172 catchers; they took 8429 BWU,while the sperm whale catch decreased substantially. All Norwegian expeditions worked through the legal seasonto 7 April, but the Japanese expeditions ceased catching sooner, as did the Soviet expeditions. The results werespectacularly different between national fleets: Japan and USSR each took more than 99% of what would havebeen due to them under the voluntary limit and the 1962 Arrangements, but Norway only succeeded in taking57% of its share.
The majority of IWC Members agreed on the need to try again to reach agreement and a Special Meetingwas convened in London in May 1965. For this purpose the Committee of Four was temporarily reconstituted,and a report on the state of the baleen stocks was provided by a Whales Stock Assessment Working Group,constituted by FAO. 65 The Special Meeting set up a Committee of Six comprised of the Commissioners of thethree remaining pelagic-whaling countries, and of Canada and France, and chaired by the USA. It had severalproposals before it.
i. First Soviet proposal: 4000 BWU for 1965/66; no increase over this for two consecutive seasons; animmediate cut in the number of expeditions by at least 50%. (During discussions with the scientists it waspointed out that a reduction in the number of expeditions would have no effect if not accompanied by alimitation in the number of catchers deployed, especially as with reduced quotas there would be surplusoperating capacity on board the factories.).
ii. Norwegian: 4000, 3000 and 2000 BWU for 1965/66, 1966/67 and 1967/68 respectively, provided quotaagreements were made for 1966/67 and 1967/68.
iii. Japanese: 4500, 4000 and 3500 BWU for the three consecutive seasons, provided that both the NationalQuota Scheme and the IOS were in operation.
iv. United States: 3000, 2000 and 2000 BWU for the three consecutive seasons.v. Revised Soviet proposal: 4000 BWU in 1965/66. In explanation the USSR insisted that this would be a
transitional limit on the basis of incomplete scientific information; the transition would “assist the industriesto adjust to the eventual reductions required to begin rebuilding the whale herds.” An additionalcommitment would be to consider favourably further reductions for 1966/67 and 1967/68 in order to bring
353 Holt
64 10 in favour, 3 against, 1 abstention. Again a strange anomaly: either Norway or Netherlands did not vote for its ownproposal.
65 Consisting at the time of Holt and Gulland, and a Dutch FAO staff member, L. Boerema.

the latter down to less than the combined sustainable yields of fin and sei whales as determined on the basisof more precise scientific evidence”.66
It soon became clear that none of these proposals would attract the necessary votes for adoption in the fullCommission meeting. There it emerged that Japan would accept the revised Soviet proposal if it were amendedto 4500 BWU. Norway and Argentina proposed this amendment, which was adopted unanimously. It wasannounced that the five Parties to the 1962 Arrangements, and to the IOS, would meet in London in June todiscuss both these matters.
The Scientific Committee met in June 1965 in unusual circumstances: its distinguished Chairman,ProfessorJ. Ruud (Norway) had resigned as he said he was not prepared to preside over a committee whoseadvice was continually ignored by the Commission. No other member was ready to take the chair, and eventuallyDr Chapman, ex-Chairman of the Committee of Three/Four, was appointed as Rapporteur to convey theCommittee’s proceedings to the Commission.
The Scientific Committee was at this meeting ready to give serious attention to sperm whales, as it had beeninstructed to do. After considering much new data, and beginning to apply stock assessment techniques similarto those applied to the fin and blue whales, this Committee expressed its concern about what was happening tothe sperm whale stocks, especially in the Indian Ocean and Atlantic sectors of the Southern Ocean but also inlower latitudes in the eastern South Pacific. The problem was quite different from that faced in the earlier studies.The sperm whale is a polygamous species, the two sexes differ greatly in size and are commonly distinguishablein the sea, and have, in feeding, rather different geographical distributions. As we have seen, the pelagic fleetswere not prohibited from taking them in the southern hemisphere in latitudes north of 40°S, and there werenumerous land-stations catching them in temperate and tropical waters as well as in the Antarctic.
On this occasion, the Scientific Committee recommended that “there should be no further increase in spermwhale catching effort and that the Commission urge each country to limit its catches by broad oceanic areas in1965/66 and 1966, to the 1964 level pending further assessments.”
It also asked the Commission to appeal to Chile and Peru to adhere to the ICRW, to observe theCommission’s minimum size-limits and to supply statistical data to the BIWS. In this connection the Committeeprovided evidence from the available statistics, that the minimum size-limits fixed by the Commission were notbeing observed by its Members. This was not really new information, but was the first time it was broughtformally to the attention of the Commissioners. That the reported measurements of lengths of baleen whalescaught were routinely faked by several, if not all, countries, despite the presence of national inspectors onfactories, had long been known; it could be seen from anomalies in the size distributions given in the BIWS data.The phenomenon of “stretched whales” was well known to the scientists, and presumably to the companies, too.It was natural, therefore, to assume that if cheating was occurring regarding size-measurements it was probablyalso going on with respect to other regulations, including catch-numbers and species.67 The Scientific Committeerecommended that the IOS should be made applicable to all pelagic operations.
Naturally, the Scientific Committee was unhappy about the result of the Special Commission Meeting, butdid recognise that if implemented it would represent the first major cut in whaling effort and that meeting’srecommendation that governments should support further reductions should be turned into a bindingcommitment. If it was not, then the catch-limit for 1965/66 should be set at about 2500 BWU, and the Sanctuaryshould be closed again.
The Scientific Committee also pointed out that if further declines in stocks were to be avoided then thecatch-limit should include land-station catches, which had not previously been regulated.68 And, althoughseparate species limits were advocated, they would have no point if the total permitted catches remained abovesustainable yields.
Lastly, the Scientific Committee hoped that countries which had objected to the more stringent protectionof blue whales adopted by the Commission would withdraw their objectionsand also that the Commission
Southern Hemisphere Whales 354
66 The USAwent along generally with the revised Soviet proposal but wanted editorial changes.67 Although there were suspicions, the true scale of cheating, at least by one country, was not revealed, documented and
officially acknowledged until much later, in the 1990s. As we shall see this evidently has important consequences for ourunderstanding of the quota and IOS negotiations during the 1960s - early 1970s.
68 In this connection reference was made to submissions to by several non-governmental organisations, namely WorldWildlife Fund (WWF, now World Wide Fund for Nature), the Fauna Preservation Society (FPS, now Fauna and FloraInternational) and the International Union for the Conservation of Nature and Natural Resources (IUCN, now the WorldConservation Union).

would close the entire southern hemisphere to the catching of blue whales.69 A final recommendation by theScientific Committee was that the Commission should consider proposals put forward by three members of theCommittee of Four for study of the economic aspects of regulation of whaling in addition to the ongoing workon the biological aspects.
12. CRISIS PASSED - OR DEEPENING?
Attendance at the Seventeenth IWC Meeting (London, June-July 1965) was higher than on any previousoccasion. Not only were virtually all Parties represented,70 mostly by larger delegations, but in addition to theusual observers from Chile, Peru, Portugal and Italy, FAO and ICES, there were observers from CPPS, WWF,FPS, ISPA and the Universities Federation for Animal Welfare (UFAW) - evidence of the growing interest and,eventually, influence of the non-governmental movements for conservation of living resources, for theenvironment and for animal welfare.
The Commission agreed with the views expressed by Australia and the USSR that the suggestion foreconomic studies should be considered at the 1966 Meeting. It adopted, without dissent, a proposal by Canadaand USAthat the blue whale should be fully protected throughout the southern hemisphere for five yearsbeginning 1966 (i.e. from the 1965/66 season). This resulted in the countries that had previously maintainedobjectionsto blue whale protection withdrawing those. A corresponding protection for humpback whales wassuggested by Australia and USSR and adopted unanimously. So, henceforth, it appeared, discussion about BWUcatch-limits would be effectively about the fin and sei whale only.
As to the sperm whale, the Commission agreed that reduction in BWU limits in the Southern Ocean couldlead to more pressure by pelagic expeditions on sperm whales in warmer waters, where it was also known thatsize-limit regulations were being broken on a large scale. To ameliorate this New Zealand proposed a Scheduleamendment with the effect of prohibiting pelagic-whalingfor sperm whales between 40°N and 40°S. This wasadopted by the requisite three-fourths majority, but after the meeting Japan, Norway and USSR all objected.
With respect to the operations of land-stations some progress was apparently made - though without anybinding decisions - it being acknowledged that they were becoming more important “in light of the recentsituation of whale stocks in the Antarctic.” Other agreements were:
i. A special group of representatives of countries concerned with land-stations situated south of 40°S (i.e.including any such as UK with territories from which bases were being operated or had been used and couldin future be used) as well as in other areas of the Southern Hemisphere, was set up to “elaborate suggestionsto bring into order the catching of whales at such land-stations”. It was told to report to the next Meeting.
ii. The BWU catch-limit for pelagic-whaling should be set taking into consideration the land-station catches inthe Southern Hemisphere.
iii. Governments concerned “...should take domestic measures on a voluntary basis so that the level of catchfrom land stations” in the Southern hemisphere “...does not exceed that in the 1964/65 Antarctic season orthe average (calculated in BWUs) of the catches over the three seasons 1963, 1964 and 1965, outside theAntarctic as the case may be”.
iv. Countries discussing the problems of national quotas should, for the 1966/67 and 1967/68 seasons take intoconsideration the catches of Antarctic whales from land-stations in the Southern Hemisphere.
All Commissioners assented to these provisions, but the USSR reserved its position on paragraph (iv),contending that this should also apply to the 1965/66 season. The countries concerned had met, both before andduring the Seventeenth Meeting, but did not conclude their discussions on this subject.
The Commissioners for Norway and Japan made a formal proposal to the effect that the IOS should beimplemented for the 1965/66 season because they feared, considering that the original agreement would expireafter that season, the scheme might then never come into existence. All Commissioners voted in favour of this,but the USSR said it had only done so to ensure it had the right to discuss the problems of quota allocation. TheUSSR also stated that “while they favoured implementing the IOS, in the coming season their assurance must bequalified by the reserve that both the (catch limit) and the IOS should be extended to both factory ships and land
355 Holt
69 A new feature of the scientists’report this year was that it advocated counting whales by visual sightings, systematicallyconducted, this especially as with the protection of species such as humpback and blue going ahead there would otherwisebe no way of monitoring their recovery, if any. Such surveys are now almost the sole acceptable means of counting whalesbut the idea was a novelty at the time. Some sightings were reported from whaling vessels (especially the “scout boats”attached to Japanese expeditions) but the reliability of those for assessment purposes was always doubtful.
70 Except Brazil and Panama, both of which gave notice after the meeting of their intention to withdraw from the IWC.
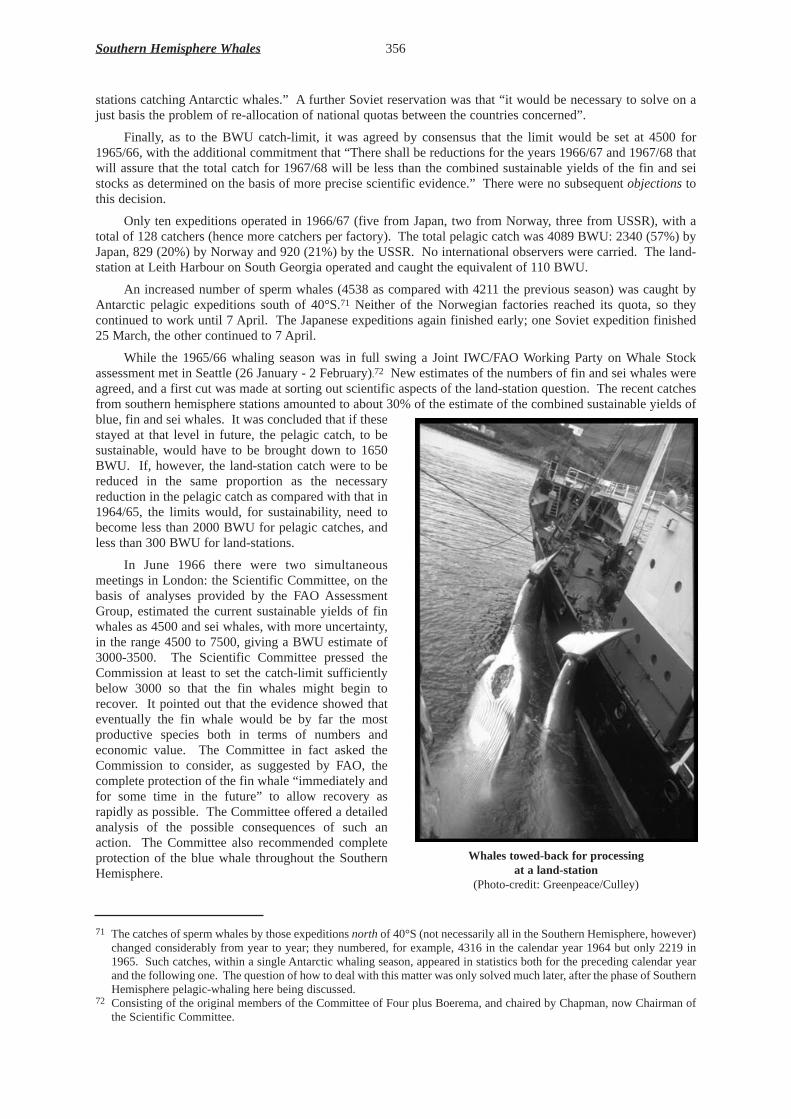
stations catching Antarctic whales.” A further Soviet reservation was that “it would be necessary to solve on ajust basis the problem of re-allocation of national quotas between the countries concerned”.
Finally, as to the BWU catch-limit, it was agreed by consensus that the limit would be set at 4500 for1965/66, with the additional commitment that “There shall be reductions for the years 1966/67 and 1967/68 thatwill assure that the total catch for 1967/68 will be less than the combined sustainable yields of the fin and seistocks as determined on the basis of more precise scientific evidence.” There were no subsequent objectionstothis decision.
Only ten expeditions operated in 1966/67 (five from Japan, two from Norway, three from USSR), with atotal of 128 catchers (hence more catchers per factory). The total pelagic catch was 4089 BWU: 2340 (57%) byJapan, 829 (20%) by Norway and 920 (21%) by the USSR. No international observers were carried. The land-station at Leith Harbour on South Georgia operated and caught the equivalent of 110 BWU.
An increased number of sperm whales (4538 as compared with 4211 the previous season) was caught byAntarctic pelagic expeditions south of 40°S.71 Neither of the Norwegian factories reached its quota, so theycontinued to work until 7 April. The Japanese expeditions again finished early; one Soviet expedition finished25 March, the other continued to 7 April.
While the 1965/66 whaling season was in full swing a Joint IWC/FAO Working Party on Whale Stockassessment met in Seattle (26 January - 2 February).72 New estimates of the numbers of fin and sei whales wereagreed, and a first cut was made at sorting out scientific aspects of the land-station question. The recent catchesfrom southern hemisphere stations amounted to about 30% of the estimate of the combined sustainable yields ofblue, fin and sei whales. It was concluded that if thesestayed at that level in future, the pelagic catch, to besustainable, would have to be brought down to 1650BWU. If, however, the land-station catch were to bereduced in the same proportion as the necessaryreduction in the pelagic catch as compared with that in1964/65, the limits would, for sustainability, need tobecome less than 2000 BWU for pelagic catches, andless than 300 BWU for land-stations.
In June 1966 there were two simultaneousmeetings in London: the Scientific Committee, on thebasis of analyses provided by the FAO AssessmentGroup, estimated the current sustainable yields of finwhales as 4500 and sei whales, with more uncertainty,in the range 4500 to 7500, giving a BWU estimate of3000-3500. The Scientific Committee pressed theCommission at least to set the catch-limit sufficientlybelow 3000 so that the fin whales might begin torecover. It pointed out that the evidence showed thateventually the fin whale would be by far the mostproductive species both in terms of numbers andeconomic value. The Committee in fact asked theCommission to consider, as suggested by FAO, thecomplete protection of the fin whale “immediately andfor some time in the future” to allow recovery asrapidly as possible. The Committee offered a detailedanalysis of the possible consequences of such anaction. The Committee also recommended completeprotection of the blue whale throughout the SouthernHemisphere.
Southern Hemisphere Whales 356
71 The catches of sperm whales by those expeditions north of 40°S (not necessarily all in the Southern Hemisphere, however)changed considerably from year to year; they numbered, for example, 4316 in the calendar year 1964 but only 2219 in1965. Such catches, within a single Antarctic whaling season, appeared in statistics both for the preceding calendar yearand the following one. The question of how to deal with this matter was only solved much later, after the phase of SouthernHemisphere pelagic-whaling here being discussed.
72 Consisting of the original members of the Committee of Four plus Boerema, and chaired by Chapman, now Chairman ofthe Scientific Committee.
Whales towed-back forprocessingat a land-station
(Photo-credit: Greenpeace/Culley)
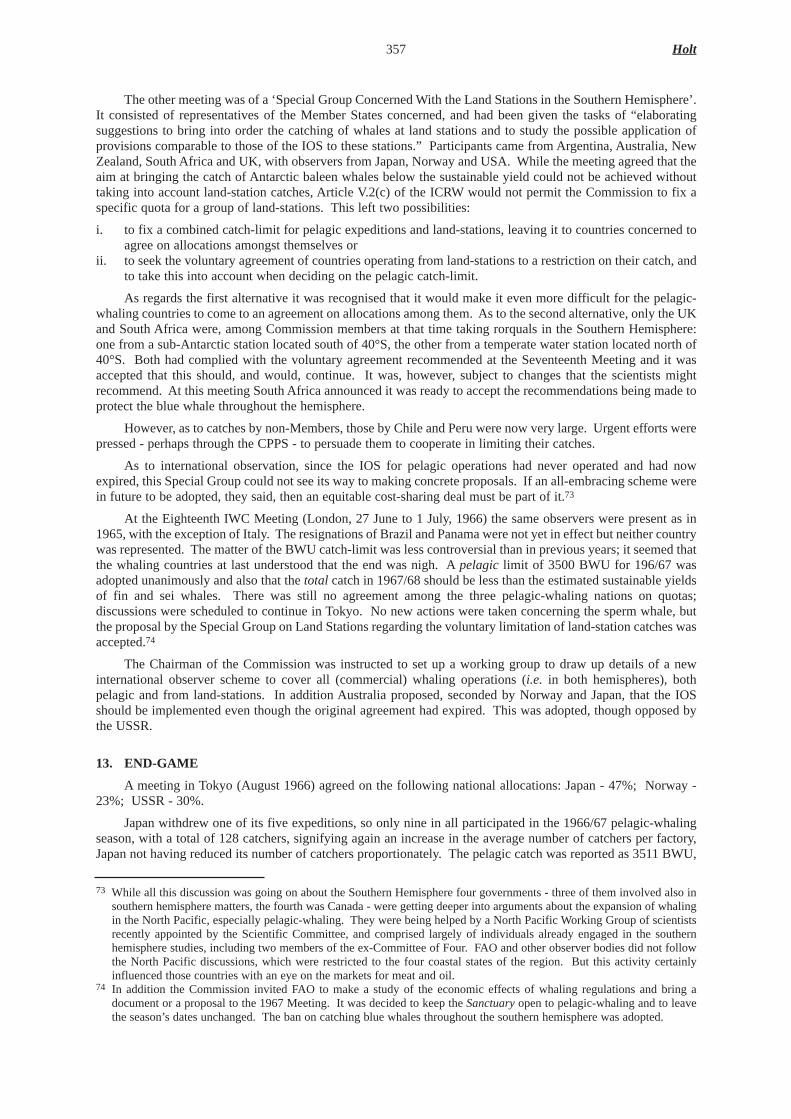
The other meeting was of a ‘Special Group Concerned With the Land Stations in the Southern Hemisphere’.It consisted of representatives of the Member States concerned, and had been given the tasks of “elaboratingsuggestions to bring into order the catching of whales at land stations and to study the possible application ofprovisions comparable to those of the IOS to these stations.” Participants came from Argentina, Australia, NewZealand, South Africa and UK, with observers from Japan, Norway and USA. While the meeting agreed that theaim at bringing the catch of Antarctic baleen whales below the sustainable yield could not be achieved withouttaking into account land-station catches, Article V.2(c) of the ICRW would not permit the Commission to fix aspecific quota for a group of land-stations. This left two possibilities:
i. to fix a combined catch-limit for pelagic expeditions and land-stations, leaving it to countries concerned toagree on allocations amongst themselves or
ii. to seek the voluntary agreement of countries operating from land-stations to a restriction on their catch, andto take this into account when deciding on the pelagic catch-limit.
As regards the first alternative it was recognised that it would make it even more difficult for the pelagic-whaling countries to come to an agreement on allocations among them. As to the second alternative, only the UKand South Africa were, among Commission members at that time taking rorquals in the Southern Hemisphere:one from a sub-Antarctic station located south of 40°S, the other from a temperate water station located north of40°S. Both had complied with the voluntary agreement recommended at the Seventeenth Meeting and it wasaccepted that this should, and would, continue. It was, however, subject to changes that the scientists mightrecommend. At this meeting South Africa announced it was ready to accept the recommendations being made toprotect the blue whale throughout the hemisphere.
However, as to catches by non-Members, those by Chile and Peru were now very large. Urgent efforts werepressed - perhaps through the CPPS - to persuade them to cooperate in limiting their catches.
As to international observation, since the IOS for pelagic operations had never operated and had nowexpired, this Special Group could not see its way to making concrete proposals. If an all-embracing scheme werein future to be adopted, they said, then an equitable cost-sharing deal must be part of it.73
At the Eighteenth IWC Meeting (London, 27 June to 1 July, 1966) the same observers were present as in1965, with the exception of Italy. The resignations of Brazil and Panama were not yet in effect but neither countrywas represented. The matter of the BWU catch-limit was less controversial than in previous years; it seemed thatthe whaling countries at last understood that the end was nigh. A pelagic limit of 3500 BWU for 196/67 wasadopted unanimously and also that the total catch in 1967/68 should be less than the estimated sustainable yieldsof fin and sei whales. There was still no agreement among the three pelagic-whaling nations on quotas;discussions were scheduled to continue in Tokyo. No new actions were taken concerning the sperm whale, butthe proposal by the Special Group on Land Stations regarding the voluntary limitation of land-station catches wasaccepted.74
The Chairman of the Commission was instructed to set up a working group to draw up details of a newinternational observer scheme to cover all (commercial) whaling operations (i.e. in both hemispheres), bothpelagic and from land-stations. In addition Australia proposed, seconded by Norway and Japan, that the IOSshould be implemented even though the original agreement had expired. This was adopted, though opposed bythe USSR.
13. END-GAME
A meeting in Tokyo (August 1966) agreed on the following national allocations: Japan - 47%; Norway -23%; USSR - 30%.
Japan withdrew one of its five expeditions, so only nine in all participated in the 1966/67 pelagic-whalingseason, with a total of 128 catchers, signifying again an increase in the average number of catchers per factory,Japan not having reduced its number of catchers proportionately. The pelagic catch was reported as 3511 BWU,
357 Holt
73 While all this discussion was going on about the Southern Hemisphere four governments - three of them involved also insouthern hemisphere matters, the fourth was Canada - were getting deeper into arguments about the expansion of whalingin the North Pacific, especially pelagic-whaling. They were being helped by a North Pacific Working Group of scientistsrecently appointed by the Scientific Committee, and comprised largely of individuals already engaged in the southernhemisphere studies, including two members of the ex-Committee of Four. FAO and other observer bodies did not followthe North Pacific discussions, which were restricted to the four coastal states of the region. But this activity certainlyinfluenced those countries with an eye on the markets for meat and oil.
74 In addition the Commission invited FAO to make a study of the economic effects of whaling regulations and bring adocument or a proposal to the 1967 Meeting. It was decided to keep the Sanctuary open to pelagic-whaling and to leavethe season’s dates unchanged. The ban on catching blue whales throughout the southern hemisphere was adopted.

shared exactly in accordance with the Tokyo agreement. There was no whaling from South Georgia. All pelagicoperations ceased before the 7 April official closure-date.
When the IWC gathered for its Nineteenth Meeting (London, June 1967) the participation was as in 1966;Brazil’s withdrawal was now in effect. The Commission was faced with a bland report from its ScientificCommittee, which largely handed on the results of an inter-sessional study by the FAO Assessment Group. Thisled to marginally higher estimates of current sustainable yields of both fin and sei whales, and a combined yieldin the range 3100 to 3600 BWU. The FAO estimates for sei whales had, however, come under sustained attackby Japanese scientists who had come up with their own estimates of sustainable yield in the range 1020 to1250BWU, in contrast with FAO’s 730 to 1170 BWU. The Committee noted that both estimates indicated thatthe stock in the south-western Atlantic sector (Area II in the Commission’s statistical terminology) appeared tobe close to the assumed maximum sustainable yield (MSY) level, and suggested that the Commission shouldconsider closing that Area to the catching of sei whales.75
Sei stocks in other sectors, however, appeared to be above the (hypothetical) MSYlevel - which was at thattime assumed to be about 50% of the original population number - and the stocks as a whole would also be abovethat critical level. Now the Japanese scientists introduced, for the first time, another new concept: that if a stockis thought to be above MSYlevel then the catch-limit should be set to MSYeven though that would lead to adecrease in the stock. Thus they subtly modified, in their proposed recommendations to the Commission, theeffective definition of sustainability. The FAO and Japanese assessments did not differ remarkably, but the catch-limit advice would of course be distinctly different. The debate around this issue led to a tacit decision to presentneither the closure of Area II nor the Japanese catch-limit approach to the Commissioners for action.
The Scientific Committee asked FAO to convene a special workshop on sperm whale assessment beforeMay 1968.
This year, 1967, the Commission honoured its commitment to bring the catch-limit down further in the lightof scientific analyses, but not without argument over what were by now quite small differences.Argentina/Mexico proposed 3100 BWU as had been agreed by majority vote in the Technical Committee.UK/USA proposed an amendment of this to 3200. Japan/USSR proposed a further amendment to 3300. This lastwas rejected, though naturally favoured by the three pelagic-whaling countries. The UK/USA proposal wasadopted (only Japan and USSR opposed). The UK said there would be no whaling from South Georgia in1967/68. Peru had informed the Commission that it had ceased catching blue and humpback whales; Chile hadreduced its catches; South Africa would retain its voluntary limit as in 1966 and 1967.76
There was no reference in 1967 to quota negotiations. The Chairman’s working group on observer schemes(which had met 19-23 June, with Australia, UK, South Africa, Japan, Norway and USSR participating) had agreedthat there should be a number of distinct regional schemes, but as far as the southern hemisphere was concernedthere was no general agreement on the definition of “region”. Five countries thought the pelagic operations andthe land-station operations should be treated as two separate regions; the USSR thought that within any areapelagic and land-station operations should be included in one scheme. When this came to the Commission aprocedural question arose - as to whether it would be in order to amend the Schedulewithout the proposedamendments being included as a specific item on the provisional Agenda. The matter was adjourned until the1968 meeting, pending legal advice. It was, however, clear that, if the Commission had gone ahead with themajority proposal, and even if it had been adopted (which it most probably would have been), the USSR wouldsurely have objected.
Again, only eight expeditions took part in the 1967/68 Antarctic whaling-season, the Norwegian effort havingbeen reduced to one expedition. In all 97 catchers were deployed (24 fewer than in the previous year), so that thenumber of catchers per expedition was now diminishing. The three pelagic-whaling countries had agreed, atmeetings in Oslo under a British Chairman, on the following allocations: 47% for Japan, 23% Norway, 30% USSR.
The catch was only 2804 BWUs. Of the total, Japan took 53%, Norway 10%, USSR 37%. Evidently thecountries were not adjusting the scale of their whaling capacities to the quotas. The pelagic catch of sperm whalessouth of 40°S was 2568 (compared with 4960 in 1966/67). Pelagic expeditions in 1967 took 1288 sperm whalesin the southern hemisphere north of 40°S. Once again the Norwegian operations continued through to 7April,while the Japanese and Soviet ceased early.
Southern Hemisphere Whales 358
75 This is the first occasion on which the scientists suggested closure for a reason other than because a species was thoughtto be endangered, an approach that later was developed in the negotiation of a New Management Procedure (NMP) in1974.
76 The Sanctuary was voted to remain open to whaling. Blue whales were protected in the southern hemisphere. FAO wasgiven the go-ahead to write again to Commissioners for economic information because - unsurprisingly - little had beenforthcoming during the previous year; economics was placed on the agenda (without much enthusiasm, it must be said)for 1968.

The proposed workshop on sperm whale assessment (IWC/FAO) was held in Rome in March 1969. Basedon its results, the Scientific Committee when it met in Tokyo in June 1969, agreed to advise the Commission “thatfurther expansion of sperm whale catching in the southern hemisphere, not based on scientific evidence, isundesirable”.
The IWC’s 1969 twentieth meeting convened in Tokyo in June 1969. There was no change in participationfrom previous years. It did not act on the scientists’advice concerning sperm whales.77 There was again noreference to quota discussions. As to the IOS and related schemes, amendments were agreed to the Scheduletoadjust its paragraph dealing with inspection so as to extend the powers of the Commission to cover land-stationsas well as pelagic operations.
The Scientific Committee had reviewed its fin whale assessments. Although uncertainties remained, it hadagreed that the best estimate of the sustainable yield of fin whales was about 5000 animals.
The sei whale was another matter. Once again one assessment was available from the FAO group, andanother, with very different findings, from Japanese scientists. The FAO estimate of current sustainable yield was3970 animals, excluding Area I (SE Pacific, part of the old Sanctuary sector); the Japanese estimate was 5620animals for the entire Antarctic. The Scientific Committee agreed that stocks in Areas II, III, and IV(Atlanticand Indian Ocean sectors) had already been reduced to below their MSYlevels, but might still be above thoselevels in Areas V and VI SW Pacific). It was accepted that if catches in future seasons were to be the same as in1967/68, when they were 5000 animals more than the estimated sustainable yield, then all stocks would in a fewyears be reduced below the MSYlevel.
In the circumstances the Commission felt it could do no other than retain the same combined catch-limit for1968/69, i.e.3200 BWU, and it was so agreed.78 In July representatives of Japan, Norway and USSR, again underthe Chairmanship of the UK, negotiated a quota arrangement which was identical with that agreed in 1967. Inthe event Norway did not take up its allocation. Also, Japan withdrew one of its 4 expeditions, so only 6expeditions in all took part in the 1968/69 season, with a total of 85 catchers. The total pelagic catch was 2469BWU, 60% being taken by Japan, 40% by USSR. There were no land-station operations. Both the Japanese andthe Soviet expeditions continued whaling until the official close of the season on 7 April.
The pelagic catch of sperm whales south of 40°S was 2682 (up from 1967/68), while a catch was reportedof 1288 sperm whales by pelagic expeditions north of 40°S. in 1968. From this season, the fact that only twocountries were left in the southern hemisphere pelagic-whaling, changed the nature of the arguments about quotasand international observers.79
The 1969 meeting of the Commission (London, June) had the usual attendance; Panama and Iceland werenot represented. FAO announced its withdrawal from its commitment to undertake Antarctic stock assessmentsfor the Commission. The Scientific Committee had agreed that its best estimate of the sustainable yield of seiwhales was 830 BWU, but had been unable to agree on a current sustainable yield for fin whales, estimates ofwhich now ranged from 1650 or fewer (agreed by all Committee members except Japanese scientists) and 2450to 2800 BWU, by Japanese scientists. In the circumstances the Commission agree to reduce the catch-limit to2700 BWU for the 1969/70 season, pending a reassessment to be made by the Scientific Committee at a SpecialMeeting scheduled for early 1970. The Commission did not act on the scientists’renewed plea for setting catch-limits by species. The Sanctuary was kept open to pelagic baleen whaling and the seasonal dates were unchanged.
In the absence of agreement on the status of southern hemisphere sperm whale stocks it was agreed that aSpecial Meeting on these should also be convened inter-sessionally. There was no progress with the IOS, and theCommission put off for another year acting on the scientists’repeated request that the Bryde’s whale be treated
359 Holt
77 FAO reported it was unable to proceed with any economic studies as it had received little information from whalingcountries.
78 Apparently by consensus. The IWC records are unclear about this and I am not now in possession of my own notes.79 Before recounting the closing phase of fin and sei whaling in the southern hemisphere it may be useful to indicate events
that were not discussed or recorded in the context of the IWC. One of these was a gradual change in processing andmarketing arrangements: Japan had always - at least since the end of World War II - given prior attention to meatproduction. In Europe, on the other hand, there was a very limited market for whale meat. The three remaining pelagic-whaling countries were greatly affected by wild fluctuations in the price of oil, but with a general trend downward, despitethe steady reduction in production. This was because whale oil was competing with other sources of edible oils and fats,especially from seeds and fish. Also, the price in any particular year could be wobbled by external events, such as the Cubamissile crisis in the midst of the Cold War, when the price rose. Thus, these countries had an incentive to add value to theircatches by making new, and more expensive products than meal from flesh and bone. One such was meat extract for humanconsumption. In the later years Norway also turned to frozen meat production for export to Japan, the meat beingtransferred at sea onto Japanese refrigerated-vessels. That was why the question of whether a refrigerated-transport was afactory-ship in IWC terms, required to carry inspectors (and international observers if the IOS should ever come intoeffect), was so important.

as a distinct species and the Schedulebe amended accordingly. Economic studies were permanently droppedfrom the agenda.
Norway, Japan and the USSR had once more agreed among themselves on national allocations: 55%, 9%and 36% respectively. However, again Norway did not take up its quota. Six expeditions participated in the1969/70 season (3 Japanese, 3 Soviet), with a total of 84 catchers, i.e. the same as in the 1968/69 season. But forthe first time a Norwegian factory-catcher operated in the Antarctic, its catch was only 6 BWU. The catch byJapan and USSR totalled 2471 BWU, with 60% taken by Japan and 40% by USSR. The pelagic expeditionscaught 3039 sperm whales south of 40°S, and 1862 in the southern hemisphere north of 40°S.
In 1970 the Commission was again faced with disagreements between the Japanese scientists and the otherson the sustainable yield of the fin whale. The Special Meeting, held in Hawaii in March that year had resulted inlower estimates all round: 1760-2175, and 1350 BWU respectively. There was a tentative agreement on830 BWU, as before, for the sei whale. The Commission decided to keep the overall catch-limit unchanged at2700 BWU.
It was agreed that the Norwegian factory-catcher was indeed a factory-ship in terms of the ICRW.
The Scientific Committee had again been unable to estimate the sustainable yield of sperm whales in thesouthern hemisphere following the Special Meeting on sperm whales held in Hawaii in March.
At this 1970 IWC meeting an important agreement, from the operational and economic point of view, wasreached in principle: to remove the prohibition of expeditions that had participated in Antarctic whaling, fromoperating in the Pacific sector of the northern hemisphere in the same calendar year
The number of whales killed under special permits for scientific purposes continued to escalate, particularlyby Canada (40 fin whales and 30 humpbacks) and Norway (20 fin whales), South Africa (15 sperm whales and12 female minke whales with their calves), and USSR (10 Bryde’s, plus some pygmy blues and pygmy rightwhales).
Country participation in the 1970 Meeting was diminished: Denmark, Mexico, and the Netherlands beingabsent. One new NGO participating was the International Association of Game, Fish and ConservationCommissioners.
Even though Norway was barely retaining its foothold in Antarctic whaling, the trilateral quota negotiationswere resumed, with agreement on 55% for Japan, 9% for Norway and 36% for the USSR. However, in the event,Norway once more did not send an expedition, nor did the factory-catcher operate again. The total catch was2470 BWU, with 60% by Japan, 40% by the USSR. The same number of expeditions (6) took part as in theprevious year, but with two more catchers added to the Japanese fleet and 2745 sperm whales were caught south,and 2499 north, of 40°S.
At the meeting of the Scientific Committee, which preceded the 1971 (twenty-third) IWC meeting inWashington DC, there was still no agreement on the sustainable yield of the fin whale stocks. All scientists exceptthose from Japan and USSR agreed on a best estimate of 1100 BWU, while Japanese scientists estimated it to bein the range 1950-2300 BWU. Soviet scientists thought the Committee should offer advice to the Commissionsomewhere between these two ranges. Japanese scientists also, for the first time, insisted that the fin whale hadbeen increasing since 1969/70. The estimate for sei whales remained unchanged, and still highly uncertain.
In these circumstances the Commission reduced the catch-limit to 2300 BWU. It also decided at last - atleast in principle - to set catch-limits by species as from the following season, but procedural difficulties againimpeded change. The decision of principle was based upon the success in making such an arrangement forwhaling in the North Pacific.
At the 1971 IWC meeting the very important decision - to remove the long-standing prohibition of the useelsewhere of expeditions which had operated in the Antarctic - was confirmed. This immediately altered theeconomic parameters of both Antarctic and North Pacific pelagic-whaling.80
Agreements on the placing of international observers on both pelagic and land-station operations werereached at long last but they were not implemented for the 1971/72 season; it was expected that the agreementfor the Antarctic would be signed in June 1972. An agreement for two of the land-stations in the southernhemisphere, outside the Antarctic (in Australia and South Africa) was already in force.
Southern Hemisphere Whales 360
80 Pelagic-whaling had begun its expansion in the North Pacific (including the Bering Sea and Kamtchatka) in 1954. Itinvolved the catching of all the “BWU” species, plus sperm whales.

National quotas were agreed at 59% Japan, 2% Norway and 39% USSR. An additional expedition wasdeployed by Japan, making a total of seven, with 87 catchers. The Norwegian factory-catcher operated again fora few days, taking only minke and sei whales.
This season saw dramatic changes in the pattern of Southern Hemisphere pelagic-whaling. The newJapanese expedition took only minke whales - more than 3000. The Japanese and Soviet expeditions caught theirBWU quotas, but the total limit of 2300 BWU was not reached because Norway took only one 1% of its quota.As to sperm whales, 3366 were taken south of 40°S, almost all by the Soviet expeditions; 2750 were taken northof 40°S on the voyages to the Antarctic (including 860 by Japan and 30 by Norway) and 1219 by Soviet fleets ontheir way home.
When the Scientific Committee met in London in June 1972 it had confused signals from different groupsof scientists about the states of the fin, sei and also minke stocks. Theoretical calculations suggested that the finwhales should be increasing, but observed indices (from the frequency of sightings and from catch-per-unit-effort) indicated continuing decline, both in the Antarctic as a whole, and near the South African land-station atDurban. Thus no change was advised to the previous estimate of sustainable yield at 3200 animals. Similardeclines were observed in apparent sei whale abundance, and again, for want of better data, the sustainable yieldestimate of 5000 was retained.
The scientists concluded that the previous “provisional” estimate of minke whales (ranging from 150 000 to200 000) was too low, but no higher number was agreed, so the previous figure of 5000 animals for the currentsustainable yield was retained.
At this Scientific Committee meeting a few novelties were on the table. The Committee had been invitedto comment on proposals being made for a moratorium on commercial whaling. It opposed such a move,emphasising instead the need for more research, and proposing the institution of a decade of intensified research.What it called (following Japanese terminology) “a blanket moratorium” would be, it said, like the BWU, an“attempt to regulate several stocks as one group whereas prudent management requires regulation of the stocksindividually.” The Committee also feared that a pause in catching “would make it impossible to obtain certainkinds of information which are essential for continuing assessments.”
A second novelty was the presentation of a paper by two of the FAO staff (Gulland and Boerema) who hadbeen responsible for the FAO contribution to the IWC’s work after the Committee of Three/Four had beendisbanded. This discussed “Scientific Advice on Catch levels”, taking into account recent developments in otherfisheries management bodies such as the International Commission for the Northwest Atlantic Fisheries (ICNAF,now NAFO).81 After consideration of the properties of “sustainable yield” in relation to “maximum sustainableyield” the authors examined other quantities emerging from studies of population dynamics. One of these was“replacement yield”, defined as “that catch for a given year which, if taken, would leave the abundance of theexploitable part of the population at the end of the year the same as at its beginning.” They pointed out that if astock had been changing, lag effects in the age-distribution could lead to further stock declines even if theestimated sustainable yield was not exceeded (and even, it should be said, if that estimate was correct). Theseauthors also defined the “maintainable yield” as “the largest catch that can be maintained from the population, atwhatever level of stock size, over an indefinite period.” They concluded by advocating the use of replacementyield in the management of whaling “as the best guide for decisions in situations in which stock sizes haverecently been changing.”
In subsequent years the IWC commonly made catch-limit decisions on the basis of replacement-yieldestimates, especially where, far from knowing the stock had been changing, the scientists really had little or noidea what was going on. If the industry had continued for many more years this policy, too, would have addedto disaster, because the replacement-yield of a stock that has been declining itself declines from year to year andensures a continuing decline, even if at a decelerating rate.
A third innovation at the 1972 Scientific Committee meeting was that, having been noted that large malesperm whales were a favoured target and declining, the restoration of the “balance” should be encouraged bymeasures designed to concentrate catching more on females, to remove the supposed “excess” of them. Onepractical consequence was a recommendation that separate catch-limits for this species be set by sex and also thatlimits should be established for each of nine sectoral Divisions.82
The 24th meeting of the IWC opened with a flourish in 1972, receiving the request from the immediatelypreceding UN Conference on the Human Environment, held in Stockholm, that the Commission consideradopting a ten-year moratorium on all commercial whaling. The Commission rejected that idea, as expected, but
361 Holt
81 See paper by D. Iles, this volume.82 An echo of the idea of “balance” was heard years later when Japanese scientists advocated the intensification of minke whaling
in the Antarctic in order to “restore the ecological balance” caused by the near extermination of blue and fin whales.
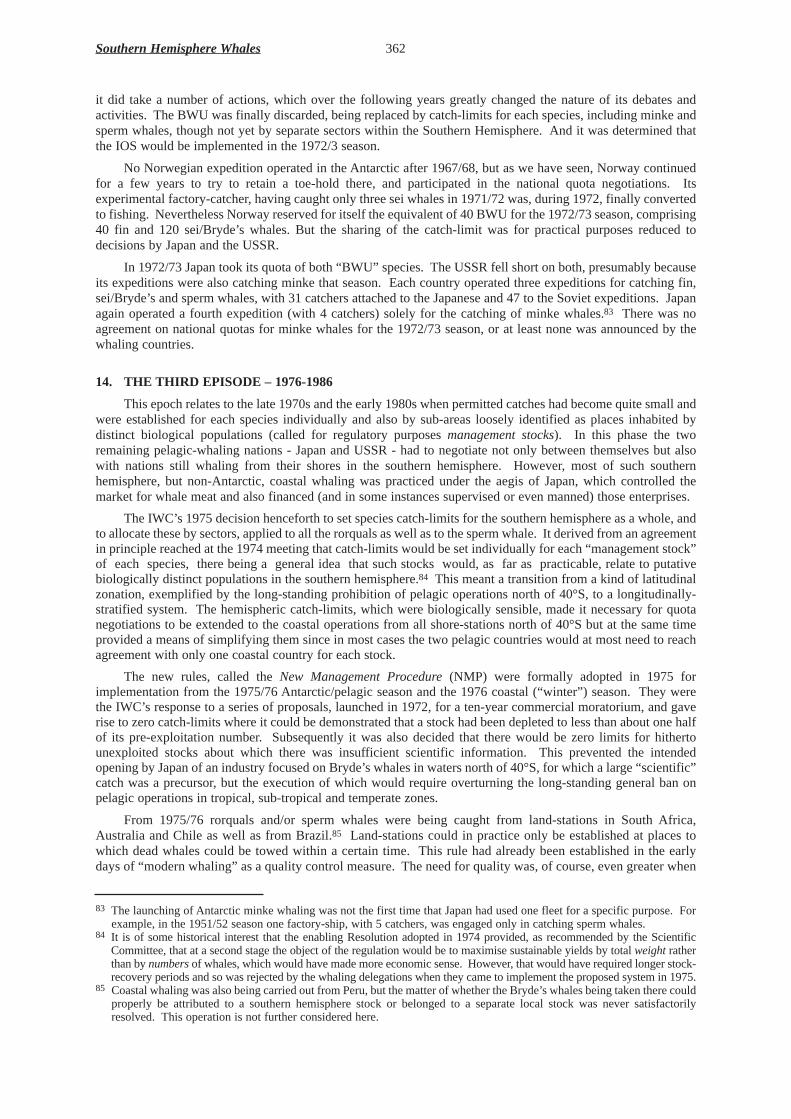
it did take a number of actions, which over the following years greatly changed the nature of its debates andactivities. The BWU was finally discarded, being replaced by catch-limits for each species, including minke andsperm whales, though not yet by separate sectors within the Southern Hemisphere. And it was determined thatthe IOS would be implemented in the 1972/3 season.
No Norwegian expedition operated in the Antarctic after 1967/68, but as we have seen, Norway continuedfor a few years to try to retain a toe-hold there, and participated in the national quota negotiations. Itsexperimental factory-catcher, having caught only three sei whales in 1971/72 was, during 1972, finally convertedto fishing. Nevertheless Norway reserved for itself the equivalent of 40 BWU for the 1972/73 season, comprising40 fin and 120 sei/Bryde’s whales. But the sharing of the catch-limit was for practical purposes reduced todecisions by Japan and the USSR.
In 1972/73 Japan took its quota of both “BWU” species. The USSR fell short on both, presumably becauseits expeditions were also catching minke that season. Each country operated three expeditions for catching fin,sei/Bryde’s and sperm whales, with 31 catchers attached to the Japanese and 47 to the Soviet expeditions. Japanagain operated a fourth expedition (with 4 catchers) solely for the catching of minke whales.83 There was noagreement on national quotas for minke whales for the 1972/73 season, or at least none was announced by thewhaling countries.
14. THE THIRD EPISODE – 1976-1986
This epoch relates to the late 1970s and the early 1980s when permitted catches had become quite small andwere established for each species individually and also by sub-areas loosely identified as places inhabited bydistinct biological populations (called for regulatory purposes managementstocks). In this phase the tworemaining pelagic-whaling nations - Japan and USSR - had to negotiate not only between themselves but alsowith nations still whaling from their shores in the southern hemisphere. However, most of such southernhemisphere, but non-Antarctic, coastal whaling was practiced under the aegis of Japan, which controlled themarket for whale meat and also financed (and in some instances supervised or even manned) those enterprises.
The IWC’s 1975 decision henceforth to set species catch-limits for the southern hemisphere as a whole, andto allocate these by sectors, applied to all the rorquals as well as to the sperm whale. It derived from an agreementin principle reached at the 1974 meeting that catch-limits would be set individually for each “management stock”of each species, there being a general idea that such stocks would, as far as practicable, relate to putativebiologically distinct populations in the southern hemisphere.84 This meant a transition from a kind of latitudinalzonation, exemplified by the long-standing prohibition of pelagic operations north of 40°S, to a longitudinally-stratified system. The hemispheric catch-limits, which were biologically sensible, made it necessary for quotanegotiations to be extended to the coastal operations from all shore-stations north of 40°S but at the same timeprovided a means of simplifying them since in most cases the two pelagic countries would at most need to reachagreement with only one coastal country for each stock.
The new rules, called the New Management Procedure (NMP) were formally adopted in 1975 forimplementation from the 1975/76 Antarctic/pelagic season and the 1976 coastal (“winter”) season. They werethe IWC’s response to a series of proposals, launched in 1972, for a ten-year commercial moratorium, and gaverise to zero catch-limits where it could be demonstrated that a stock had been depleted to less than about one halfof its pre-exploitation number. Subsequently it was also decided that there would be zero limits for hithertounexploited stocks about which there was insufficient scientific information. This prevented the intendedopening by Japan of an industry focused on Bryde’s whales in waters north of 40°S, for which a large “scientific”catch was a precursor, but the execution of which would require overturning the long-standing general ban onpelagic operations in tropical, sub-tropical and temperate zones.
From 1975/76 rorquals and/or sperm whales were being caught from land-stations in South Africa,Australia and Chile as well as from Brazil.85 Land-stations could in practice only be established at places towhich dead whales could be towed within a certain time. This rule had already been established in the earlydays of “modern whaling” as a quality control measure. The need for quality was, of course, even greater when
Southern Hemisphere Whales 362
83 The launching of Antarctic minke whaling was not the first time that Japan had used one fleet for a specific purpose. Forexample, in the 1951/52 season one factory-ship, with 5 catchers, was engaged only in catching sperm whales.
84 It is of some historical interest that the enabling Resolution adopted in 1974 provided, as recommended by the ScientificCommittee, that at a second stage the object of the regulation would be to maximise sustainable yields by total weightratherthan by numbersof whales, which would have made more economic sense. However, that would have required longer stock-recovery periods and so was rejected by the whaling delegations when they came to implement the proposed system in 1975.
85 Coastal whaling was also being carried out from Peru, but the matter of whether the Bryde’s whales being taken there couldproperly be attributed to a southern hemisphere stock or belonged to a separate local stock was never satisfactorilyresolved. This operation is not further considered here.

the rorquals were increasingly exploited for meat rather than oil. The effective offshore operating distance thusdepended in part on the latitude (surface water temperature), and the power and hence speed of the catchers whenencumbered with dead whales. Earlier this was commonly in the region of 20 miles, but the Brazilian minkewhaling was being carried out on breeding concentrations 60 miles offshore.
The last season of whaling in South Africa was 1975, when fin and sperm whales were caught (previouslythere had also been small catches of sei and Bryde’s whales). These were never subject to negotiation. Australiacontinued catching sperm whales until 1977, and Brazil until 1979, when the IWC adopted a moratorium onsperm whaling. In 1975 the five southern whaling countries which were members of IWC - USSR, Japan,Australia, Brazil and South Africa - tried and failed to agree on shares of the 1975/76 and 1976 catch-limits forfin, sei, Bryde’s and sperm whales. Numbers were specified by majority vote; these were published as “withoutprejudice to future negotiations” and were approximately honoured. When South Africa subsequently decided toclose its land-station, its small quota of 134 minke whales was taken over by Brazil which, however, only actuallycaught 16 more than its own quota.
That year (1977) the USSR took its quota of 6454 sperm whales (60% of the total catch-limit) but Japantook only 38% of its quota, which had been 14% of the total, the same as South Africa’s. Australia, on the otherhand, took twice its 11% allocation. Brazil only took 9 animals from an allocation of 67, and the total catch wasonly three-quarters of the catch-limit.
Evidently, in this closing phase of commercial whaling in the southern hemisphere, arrangements among theIWC Member nations were rather chaotic. Chile, however, was not an IWC member, and yet caught substantialnumbers of sei/Bryde’s and sperm whales in every year. It took sei/Bryde’s until 1979 (when it joined the IWCand accepted the zero catch-limit by then in force) and sperm whales until 1981 when the moratorium wasdeclared on sperm whaling. But as pelagic sperm whaling had ceased from 1980 no quota negotiations withJapan and USSR were called for. However, Peru also joined the IWC in 1979 and therefore had to share thesperm whale catch-limit for its IWC sector (Division 9) with Chile. This was 550 for 1980 and 300 for 1981 (setat the 1979 meeting as zero for 1982 and thereafter). In 1980 the overall catch-limit was exceeded by 74 whales,with Peru taking 78% of the catch and Chile 22%. In 1981 the catch-limit was again exceeded, this time by28 whales, with Peru again taking the greater share - 80% - of the catch. Whether this similarity represented theresult of a quota negotiation or simply reflected the capacities of the two land-stations was not publiclyannounced.
Regarding “The Last Whale”, as the minke has been called, let us retrace the steps to 1972/73 when catch-limits were first set by species. That year shares of minke whales were not negotiated (although shares of thecatch-limits for fin and sei/Bryde’s were agreed, including a small number for Norway, which it did not take). Inthe event 5745 minke were killed, more than the 5000 catch-limit (because, it was claimed, of a miscalculationof the closing date of the season). The USSR took 64% of them.
The following season (1973/74) the same (5000) minke catch-limit was set, but Japan and USSR objected,and agreed among themselves to take 4000 each. The USSR did that, but the specialised Japanese minke whalingexpedition only managed to take 3700. This put the total more than 50% over the IWC-authorised limit.
An innovation for the 1974/75 season was the assignment by IWC of separate catch-limits for threeAntarctic sectors.86 This arrangement also provided that catches could, within a sector, exceed the agreed limitby a certain percentage, so long as the total did not exceed the designated total. Japan and USSR divided the catchequally between them, but did not report whether they had agreed on shares in each sector, nor did the Bureau ofInternational Whaling Statistics (BIWS) that year report their catches by sector.
A further innovation, from the 1975/76 season, in addition to allocating the total catch-limit to sixlongitudinal sectors, was to declare the catch-limit not for the Antarctic but for the entire Southern Hemisphere.This was in accord with scientific advice, because Brazil had long been catching substantial numbers of minkewhales from its near-equatorial land-station. These whales were known to feed in the southwesternAtlanticsector of the Antarctic, but also it was known, from marking experiments, that some minke whale that breed offBrazil were feeding in the southeasternAtlantic. The resulting tri-lateral negotiation not only divided the overallcatch-limit but also involved a decision that the pelagic expeditions would not operate in the southwestern sector.They did operate in the IWC’s Area III, which covered the southeast Atlantic and the western Indian Ocean, butthe pelagic catches were taken mainly in the Indian Ocean. Further, a pattern became established (though notformally announced) by which the pelagic fleets overlapped their operations only in Area IV (eastern IndianOcean), and Japanese expeditions avoided the Atlantic sectors. When the other pelagic countries had dropped outof Antarctic whaling, and all species other than the minke had been recognised as severely depleted and sobecame “protected” by the IWC, then only Japan, USSR and Brazil were left hunting minke whales in the
363 Holt
86 Such a sub-division had already begun for sperm whales in 1973/74.

Southern hemisphere. But the meat, and most of the other products from this activity, ended up in Japan. Soalthough the three countries “negotiated” shares of the hemispheric catch-limits the Japanese delegation naturallydominated the secret discussions.
In fact, the overall minke catch-limit was higher than could be taken by the one remaining Japaneseexpedition, so it suited the interest of Japanese meat traders to tolerate continued Antarctic whaling by the USSR.Hence the catch-limit was shared between them fairly evenly once a small allocation for Brazil (where thecompany was Japanese anyway) had been agreed. The USSR was unhappy that some of the profit from southernhemisphere minke whaling would accrue to the Brazilian company instead of to its own, but could do nothingabout that. At this time the USSR still had another substantial interest in continuing whaling in the hemisphere:the production of sperm oil, a strategic commodity. In 1979, however, the IWC declared a moratorium on thepelagic catching of all types of whale except minke; then, in 1981 all sperm whale catch-limits were set to zero,and the USSR did not object.
From the 1978/79 season, with the setting to zero of the catch-limit for sei and Bryde’s whales throughoutthe Southern Hemisphere, the negotiations of national quotas were limited to minke whales, and involved onlyJapan, USSR and Brazil, which continued to host a Japanese land-station on its territory, taking whales on thebreeding grounds of the South Atlantic stock or stocks.87 The Scientific Committee was unable to calculate asustainable yield, and a hemispheric catch-limit of 6321 was eventually agreed, based on estimates ofreplacement-yield, but calculated in such a way that a preference by whalers for female animals would berestrained (replacement-yields as the basis for catch-limits do not guarantee that the stock will not decline furtherin the medium term).
The trilateral negotiations led to Brazil being “awarded” 755 whales (12% of the total, this beingapproximately the percentage that Brazil’s catches had been of the total since Japan and USSR had both beencatching minke whales on a large scale), with the remainder being split evenly between the two pelagic countries:2733 each, which they took. Japan, however, “topped up” its catch with 120 Bryde’s taken in the Indian Oceansector under special scientific permits, while the Soviet expeditions took nearly 4000 sperm whales.
The Brazilian share remained at about 12% through to the 1981/82 season, after which it was reduced to9%. Through to 1983/84 the total southern hemisphere catch-limit changed in accordance with variations in thescientific advice, but in the range 6000-8000. For the 1984/85 season - the last before all commercial catch-limitswere set to zero when the 1982 decision came into effect - the catch-limit was reduced to about 4000 minkewhales, but the three countries objected to this, gave themselves the same as the official limit of the previous year,and divided it between them by the same formula.
In addition, for both the 1983/84 and 1984/85 seasons, Japan and the USSR agreed to avoid the westernSouth Atlantic. Both operated in the western Indian Ocean and mid-South Pacific, but while Japan would takeits part of the sectoral quota in the eastern Indian Ocean and western South Pacific, the USSR would take its partin the eastern South Pacific.
When, in 1982, the IWC declared an indefinite pause in all commercial whaling (the so-called “moratorium“to come into effect in 1986), Brazil accepted the decision and minke whaling operations from its shores ceased.For a time Japan and USSR continued minke whaling under objectionsto the moratorium. In 1984/85 theircombined catch had only reached 4970, with the USSR taking 61% of that. This determined their self-imposedcatch-limits for 1985/86 and 1986/87 with the same division of shares. Japan withdrew its objection to the“moratorium” in May 1987 and did not undertake commercial minke whaling in the 1987/89 season; instead itprepared to embark on a long period of large-scale minke whaling under special scientific permits. TheUSSR/Russia maintains its objection“on principle” but nevertheless ceased commercial whaling from 1989/90.There was no more need for sharing.
As far as the Antarctic was concerned, the debates in the IWC henceforth concerned the validity of Japan’sclaim to be conducting necessary science, and the propriety of doing this within the region of the southernhemisphere (coinciding roughly with the region where pelagic-whaling had been permitted), which wasdesignated, as from 1994, as a Sanctuary, but to which Japan has objected.
15. QUOTAS AND THE CONTROL OF TRADE
International trade has always been an important element of the economics and politics of commercialwhaling, from the time of the Basque excursions throughout the North Atlantic in the 10th Century to 21st
Century whaling by Norway and Japan. Modern whaling, from its beginning in the late 19th Century, was
Southern Hemisphere Whales 364
87 Tagging experiments showed that at least some of the whales whose breeding ground was off the coast of Brazil migratedto feed as far eastward as the Western Indian Ocean sector of the Antarctic.

dependent on the world market for whale oil, though by the last decades of the 20th Century this dependence hadshifted largely to the market for frozen meat, focused on Japan
The importance of trade was never limited to the commodities produced. Trade in ships, equipment such asguns and harpoons, processing equipment on factory-ships, the technology, possession of which ensuredincreases in efficiency and hence continued profit margins despite depletion of the natural resources, were allcritical issues. And so was the movement across national boundaries of human resources, particularly the skillsof gunners.
In the heyday of “modern” pelagic-whaling, that is the 1930s, Norway and UK sought to keep others out ofthe industry mainly through control of the movement of labour and of the oil market, including the formation ofcartels. After World War II attention shifted to attempted bans on the export of equipment and technology andon trade in products with non-Members of the IWC. These all played their parts in negotiations concerningsharing of catches. But the general restriction of international trade as a means of enforcing IWC regulatorymeasures was, in the end, by far the most important trade-related factor.
The IWC itself has no powers to limit trade, though from time to time it has passed non-binding resolutionson this issue. Most recently, agreement on general prohibition of international trade in products from whales hasbeen suggested as one element in a proposed negotiation88, which would result in non-zero catch-limits being setfor particular identified commercial coastal whaling operations. This could be seen as a partial annulment of theglobal zero-limits adopted in 1982.
The inter-governmental instrument that does have the power to exert some control over trade is theConvention on International Trade in Endangered Species of Flora and Fauna (CITES) which lists, through itsConferences of Parties (COPs), species in which trade is prohibited (CITES Appendix I) or regulated in someother way (Appendix II). A feature of CITES is that “Introduction from the Sea” - meaning the removal of fish,whales, etc, from locations on the legally defined High-Seas - and transported alive or as processed commoditiesto shore - is to be treated as international trade. Practically all pelagic-whaling using expeditions of factory-shipsand associated catchers has been conducted on the High-Seas, especially in the Southern Ocean
CITES was negotiated at a diplomatic conference in Washington DC in March 1973. It came into force inJuly 1975. The first COPwas held in Berne, Switzerland, in 1976. As far as whales are concerned as objects ofattention by CITES the position of the IWC has been a determining factor. Thus the three species of right whale(Eubalaenaand Balaena), the humpback (Megaptera), the blue whale (Balaenopteramusculus) and the greywhale (Eschrichtius), which were already classed as Protected Species in the 1946 Convention, were included inCITES Appendix I from the beginning - i.e. in 1975. Then, at the Second COP, held in Costa Rica in 1979 allspecies of cetaceans (whales and dolphins) that were not on Appendix I were added to Appendix II. At a SpecialCOP, held in Geneva in 1977 certain “management stocks”, which had been given zero commercial quotas underthe IWC’s New Management Procedure (NMP), were added to Appendix I. These were the sei whale (NorthPacific stock, and the southern hemisphere stock between 0 and 70°E); and the fin whale (all stocks except thoseleft in Appendix II, which were - as far as southern hemisphere whaling was concerned - the stock south of 40°Sin the sector from 120°W to 60°W, and also the fin whales in the North Atlantic off Iceland and Newfoundland).
CITES decisions are, of course, applicable both to exporting and importing Parties. As in the IWC, Partiescan register Reservations (objections) to otherwise binding decisions. However, a state newly acceding to the1946 Convention cannot make objectionsto regulatory decisions made previously, but a government joiningCITES may, at the moment of joining, lodge reservations to any previous species listings. But in bothorganisations the Member governments may - irrevocably - withdraw any or all of their objections/reservationsat any time. Thus Canada, already in 1975, lodged reservations on the Appendix I listings of the two right whalespecies in the northern hemisphere, though it withdrew these in 1977. Subsequently several whaling countriesthat had made reservations on one or more of the 1977 decisions withdrew these in 1979 or in 1981.
At the 3rd COP, held in New Delhi, India in 1981, a number of species and stocks of large whales were “up-listed” from Appendix II to I: these were all stocks of sei, fin and sperm whale not previously so listed. Then atthe 4th COP, in Gaborone, Botswana, in 1983, all populations of minke (except that off West Greenland) andBryde’s whale were up-listed to Appendix I, though the change for minke was not to come into force until 1986when the IWC’s decision of 1982 for zero-quotas also would come into force. (At COPIV four species ofbottlenose whales were also up-listed, but this had no consequences for the southern hemisphere.)
The changes in 1981 and 1983, and the several reservations made to them, considerably affected the courseof commercial baleen and sperm whaling in the southern hemisphere. They influenced decisions by countriesabout whether or not they would continue whaling and their bargaining about shares of catch-limits. All the
365 Holt
88 By the Commissioner for Ireland.

countries still engaged in hunting minke whales during the 1980s - Japan, Norway, Brazil, USSR - objected tothe minke up-listing, as did another whaling country - Peru - which was not so engaged. Brazil and the USSRsubsequently withdrew their reservations when they decided to abide by the 1982 IWC “moratorium” decision,even though the USSR still maintains its objectionto that decision.
South Africa and the USSR withdrew their reservations concerning sei whale listing, but Japan and Norwaymaintain theirs. All dissenting states have withdrawn their reservations to fin whale listing on Appendix I,although USSR did not do so until 1995, apparently due to an oversight.89
When Norway resumed hunting minke whales commercially in 1993, under objection to the 1982 IWCdecision, the Government nevertheless acted, to a certain extent at least, in the spirit of international agreementsby, among other things, denying its whalers the opportunity to export. However, both Japan and Norway havefor the past four years been seeking to down-list some or all minke whale stocks to Appendix II, including bybreaking the supportive link between CITES and the IWC. In particular, Norway, having saturated its domesticmarket for whale meat, and also having stockpiles of specialist products for which it has no domestic market,wishes to increase its minke whale catches substantially, for export to Japan. The two countries have to dateconspicuously failed in this endeavour within CITES.
The other species of interest from the point of view of the theme of this paper is the sperm whale. Again,Norway and Japan lodged reservations to the Appendix I listing of this species, in June 1981. However,immediately after that the IWC decided on a moratorium on the catching of sperm whales (which is not limitedto commercial catching, and is indefinite in duration, with no specified review or renewal period). No Objectionswere made to that decision. This was seen as confirming that the USSR, which was by far the biggest exploiterof this species, had definitively abandoned any expectation of resuming such whaling, after the 1979 ban on allpelagic-whaling except for minke whales.
The reservations from 1 January 1986, by Brazil, Japan and USSR, to the listing of minke in Appendix Imeant that they were free to continue minke whaling and the associated trade for some years under Objectionstothe 1982 IWC decision. However, because of that decision the IWC could set no non-zero catch-limits for the1985/86 season and after. The three countries then determined their own catch-limit, but because of the tradearrangements (Brazil and USSR were selling all their production to Japan and, furthermore had Japanese“international” observers watching their operation) were obliged to negotiate shares.
Advance contracts for provision of types and quantities of commodities from whales, especially intointernational trade channels have also played their part in the quota negotiations. This is explained in AppendixI.
16. QUOTAS AND CHEATING
In 1993 Russian scientists announced that data on whale catches in the Antarctic - numbers, species,locations - had been systematically falsified for submission to the BIWS/IWC. This was subsequently confirmedby State officials, including some who had participated in whaling expeditions as national inspectors. The correctdata, taken from surviving logbooks and the notes of scientists on board the four Soviet expeditions operating inthe period 1946/47 to 1971/72, were then published. At the same time the Russian Government decided tosupport the proposal by France that the Southern Ocean be designated as a Sanctuary, and withdrew itsreservations to the CITES Appendix I listings for blue, fin, Bryde’s and minke whales, as well as for all speciesof bottlenose whale.
Although it had long been suspected, by scientists and officials elsewhere, that Soviet catch-data were notreliable, the degreeof falsification revealed was a universal surprise (see Table 2). As a matter of fact, since 1960at least, scientists in the IWC had noticed clear falsifications, or systematic error of measurements, in datasubmitted to the Bureau of International Whaling Statistics (BIWS) by several countries.
In 1994 the IWC adopted a resolution congratulating the Russian authorities on their efforts to reveal anddocument the truth, and calling upon other governments to examine their data from past whaling operations.None have responded to this call, perhaps because any original records are, in other countries, in the possessionof companies rather than governmental agencies. However, that same year, Soviet officials revealed that Japanesecompany officials and at least some government operatives were aware of what had been happening becauseJapanese ocean-going refrigerated transport-vessels were constantly at work with the Soviet whaling fleets,picking up at sea frozen meat destined for the Japanese home market.
Southern Hemisphere Whales 366
89 Interestingly, St Vincent and the Grenadines maintains its reservation on the humpback listing, which it lodged at the timeof joining CITES in 1989. This country, a member of IWC, is permitted to hunt this species in limited numbers, but solelyfor subsistence purposes, which by definition precludes export.
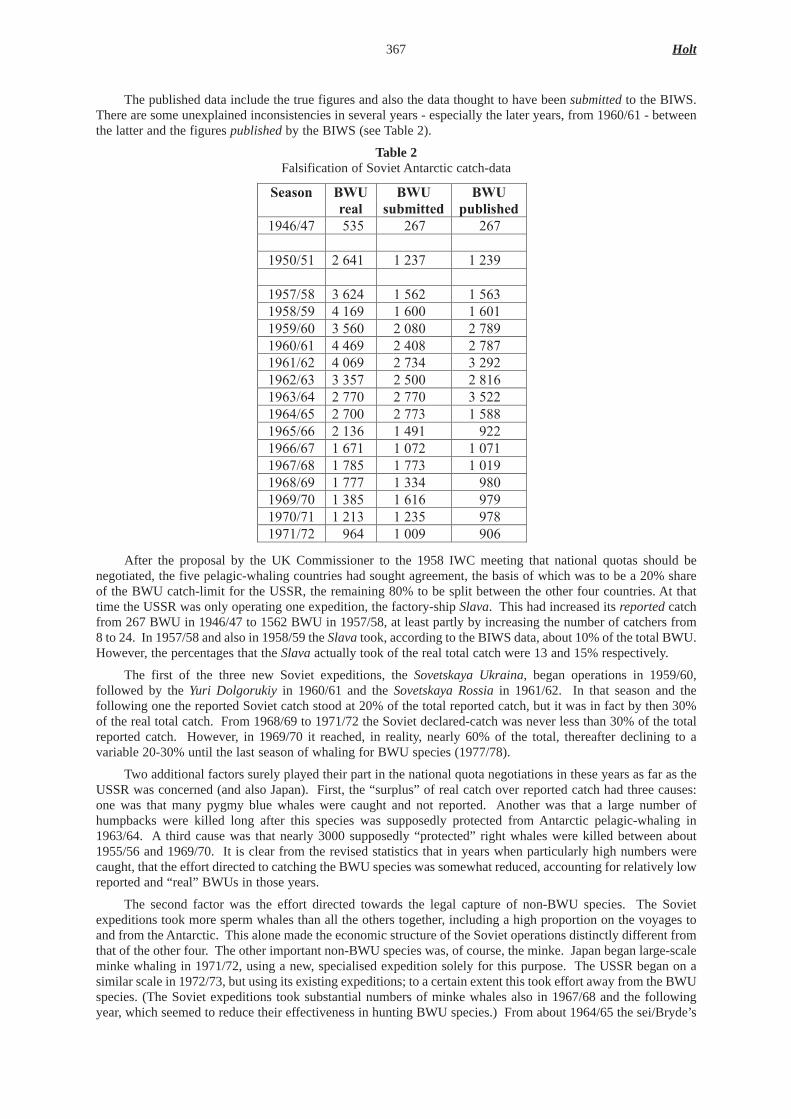
The published data include the true figures and also the data thought to have been submitted to the BIWS.There are some unexplained inconsistencies in several years - especially the later years, from 1960/61 - betweenthe latter and the figures publishedby the BIWS (see Table 2).
Table 2Falsification of Soviet Antarctic catch-data
After the proposal by the UK Commissioner to the 1958 IWC meeting that national quotas should benegotiated, the five pelagic-whaling countries had sought agreement, the basis of which was to be a 20% shareof the BWU catch-limit for the USSR, the remaining 80% to be split between the other four countries. At thattime the USSR was only operating one expedition, the factory-ship Slava. This had increased its reported catchfrom 267 BWU in 1946/47 to 1562 BWU in 1957/58, at least partly by increasing the number of catchers from8 to 24. In 1957/58 and also in 1958/59 the Slavatook, according to the BIWS data, about 10% of the total BWU.However, the percentages that the Slava actually took of the real total catch were 13 and 15% respectively.
The first of the three new Soviet expeditions, the SovetskayaUkraina, began operations in 1959/60,followed by the Yuri Dolgorukiy in 1960/61 and the SovetskayaRossiain 1961/62. In that season and thefollowing one the reported Soviet catch stood at 20% of the total reported catch, but it was in fact by then 30%of the real total catch. From 1968/69 to 1971/72 the Soviet declared-catch was never less than 30% of the totalreported catch. However, in 1969/70 it reached, in reality, nearly 60% of the total, thereafter declining to avariable 20-30% until the last season of whaling for BWU species (1977/78).
Two additional factors surely played their part in the national quota negotiations in these years as far as theUSSR was concerned (and also Japan). First, the “surplus” of real catch over reported catch had three causes:one was that many pygmy blue whales were caught and not reported. Another was that a large number ofhumpbacks were killed long after this species was supposedly protected from Antarctic pelagic-whaling in1963/64. A third cause was that nearly 3000 supposedly “protected” right whales were killed between about1955/56 and 1969/70. It is clear from the revised statistics that in years when particularly high numbers werecaught, that the effort directed to catching the BWU species was somewhat reduced, accounting for relatively lowreported and “real” BWUs in those years.
The second factor was the effort directed towards the legal capture of non-BWU species. The Sovietexpeditions took more sperm whales than all the others together, including a high proportion on the voyages toand from the Antarctic. This alone made the economic structure of the Soviet operations distinctly different fromthat of the other four. The other important non-BWU species was, of course, the minke. Japan began large-scaleminke whaling in 1971/72, using a new, specialised expedition solely for this purpose. The USSR began on asimilar scale in 1972/73, but using its existing expeditions; to a certain extent this took effort away from the BWUspecies. (The Soviet expeditions took substantial numbers of minke whales also in 1967/68 and the followingyear, which seemed to reduce their effectiveness in hunting BWU species.) From about 1964/65 the sei/Bryde’s
367 Holt
Season BWU BWU BWU real submitted published
1946/47 535 267 267
1950/51 2 641 1 237 1 239
1957/58 3 624 1 562 1 563 1958/59 4 169 1 600 1 601 1959/60 3 560 2 080 2 789 1960/61 4 469 2 408 2 787 1961/62 4 069 2 734 3 292 1962/63 3 357 2 500 2 816 1963/64 2 770 2 770 3 522 1964/65 2 700 2 773 1 588 1965/66 2 136 1 491 922 1966/67 1 671 1 072 1 071 1967/68 1 785 1 773 1 019 1968/69 1 777 1 334 980 1969/70 1 385 1 616 979 1970/71 1 213 1 235 978 1971/72 964 1 009 906

whales accounted for 50% or more of the total BWU catch. Minke whales are hunted near to the ice edge, whilesei, and also Bryde’s were caught mostly just south of the 40°S boundary. Thus, to take both species called foroperations during one season in both higher and lower latitudes.
The falsifications of Soviet data involved the under-reporting of catches of BWU-species; the non-reportingof large numbers of protected species; and the misreporting of catches of some non-BWU species. However,there were many subtleties in this. On many occasions numbers caught of some species were over-reported, andthe reported locations of catches have little resemblance to the actual cruise tracks. A consequence of the formeris that in several cases the actual and reported BWU (and hence presumably oil and meat production) do not differas much as might be expected. A possible explanation is that the operators and officials of the powerful Ministryof Fisheries were concealing their scam (which had as much to do with money-laundering as with production)from other state authorities concerned with customs and fiscal controls and the like.
The USSR claimed a relatively high quota on the grounds of its huge investment in new expeditions, justcoming into service during the quota negotiations, rather than on the grounds of its actual production. If the realcatches had been recorded it would, it seems have had an even better case. The other pelagic-whaling countriesappeared to make little if any effort to alter the Soviet’s 20%. Perhaps this was because they - or some of them- knew first hand, or guessed, that the Soviet catches were higher than were being reported. Obviously the USSRhad good reason for dragging its feet over agreement to implement the IOS. But the other countries handed itgood excuses by being “difficult” over taking into account land-station catches in the quota negotiations.
The falsification of catch statistics described above, referring to USSR data, is described in some detailbecause that is the most prolonged and fully documented occurrence as far as the Antarctic is concerned. I wouldnot, however, wish to give the impression that the USSR was alone in large-scale falsification of whaling statistics;this is known now because of the subsequent collapse of the State. More recently similar kinds of falsification ofJapanese statistics have been documented, but relating to the coastal whaling activities in the North Pacific. This,too, occurred in the period when international (IWC) observers were assigned to the whaling platforms and, as withthe Soviet revelations, have been brought to light by scientists and by official inspectors who were involved at thetime. The devices adopted to defy timely detection were similar: species wrongly identified; two or more smallwhales counted as one large one; inspectors and observers lured away from their posts.
As such information comes at last, into the open, it seems increasingly likely that such falsification wasmore widespread in the various Antarctic operations – both pelagic and from land-stations – than had beenpresumed even by cynics.90
17. THE INCIPIENT FOURTH EPISODE
The IWC is negotiating a management scheme for baleen whaling which, if it is ever implemented, wouldnot in principle exclude the possibility that vessels of more than one nation might be competing for catches fromthe same “stock” of whales. However, the prevailing legal regime would appear to make such inter-action verylimited in scope. Most so-called “coastal whaling” - which includes operations by factory-catchers (which arelegally pelagic operations and so, at present, subject to the ban on all such operations except for the catching ofminke whales) - would take place in waters now under national jurisdictions. And as far as the high-seas areconcerned the main region of possible interest is still the Antarctic - as it always has been - and that is all withinthe Southern Ocean Sanctuary. The Indian Ocean Sanctuary - declared in 1979 - includes the tropical, sub-tropical and temperate high seas zones, as would sanctuaries in the South Pacific and South Atlantic nowproposed by Australia and New Zealand, and by Brazil and Argentina respectively.
Japan is the sole survivor of the pelagic-whaling wars, with one expedition continuing to hunt minke whales.The “big five” nations were successful in keeping out further newcomers, but at the price of a great expansion ofcoastal whaling - including some so-called “pirate whaling“ under flags of non-IWC states - mainly for the Japanesemarket. The Netherlands had to drop out early because, with only one expedition, it could not adjust to reducingcatch-limits, while not having the political clout to increase its share of the total. The UK’s situation was different -Salvesen in particular came to the conclusion that Antarctic whaling was finished, and adopted a strategy of phasingdown and out over about 7 years. Salvesen’s profits then went into the road-haulage industry. There was an attemptto convert the “stern-ramp” technology to trawling for demersal fishes (the Fairtry); this was a failure for Britain, butwas taken up vigorously by the USSR91 and, eventually, by all countries engaged in factory-trawling worldwide.
Southern Hemisphere Whales 368
90 This is important for current negotiations regarding a new International Observer Scheme (IOS) for implementation at suchtime as the current “moratorium” on commercial whaling might be lifted or modified in order to legitimize a renewal ofsome such whaling. History shows that while an international scheme can check corrupt practices at the level of nationalinspection, it cannot - in the forms so far tried - eliminate them.
91 How this came about is in itself a fascinating story of commercial espionage and international subterfuge whose tellingmust wait a more appropriate occasion - Ed.

The profits from whaling could no longer provide for the construction of cities and ship-yards, as they hadin Norway, and the industry was no longer of global or local strategic interest; this ended with the cessation ofsperm whaling and the arrival of natural (jojoba oil) and synthetic substitutes for sperm oil. Norway’s attempt tocontinue minke whaling in the Antarctic, using factory-catchers, and converting entirely to meat production forthe Japanese market, was an economic and technical failure, even though it was successful in the North Atlanticfor a time, until extensions of the maritime jurisdictions of other nations - Canada (Labrador), Iceland, Denmark(Greenland and Faeroes) - came into effect. Norway continues whaling in the Northeast Atlantic, in its ownwaters and on the high seas, and claims to operate under objectionsto IWC regulations, but using the agreed -but not yet implemented - Revised Management Procedure to calculate its own “quota”. However, the RMP,being conservative and precautionary, does not provide the numbers the industry wants, so in the past two yearsNorway has awarded itself excess (nearly double) quotas by “retuning” the RMPalgorithm, which increases thealways-present risk of inadvertent depletion of the resource. The profitability of the industry is limited by theNorwegian Government’s refusal to allow export of accumulated commodities (from cold storage) to Japan,despite having announced that it would do so and maintaining a reservation to the CITES listing of minke whaleon its Appendix I. Both Japan and Norway have sought to have the CITES listing amended, but have so far failed,though by a smaller margin of votes with each try.
The USSR, while having an objectionto the 1982 decision, ceased Antarctic minke whaling soon after itcame into effect. The reason is obscure. Public opinion, and the views of some influential advisers to the SovietPresident and authorities, seem to have contributed to the decision; pessimistic cost-benefit calculations probablyhelped. There was also, perhaps some reluctance by Japanese traders to continue purchases in the prevailingcircumstances; the price elasticity of the greatly reduced supplies of whale meat is such that the traders see littlebenefit in increasing production, particularly by other nations. The remaining Soviet factory-ships were convertedto other uses. To add to the industry’s troubles, scandals involving money-laundering by fisheries officials and aMinister came to public attention; a significant amount of those funds had been derived from Antarctic and NorthPacific whaling.
Japan, while having withdrawn its original objection to the 1982 decision, continued Antarctic minkewhaling using the loop-hole provided in the ICRW for unlimited unilateral issuance of “scientific permits”, aprovision which strongly encouraged rather than prohibited the commercialisation of the products. This wasmade economically possible by a substantial annual subsidy from Government for several years. This subsidywas eventually reduced but profitability was ensured by increases in the market price of what was by now a rarecommodity, and by gradually increasing the level of catch. Continuation of the industry was deemed worthwhilebecause it was expected that the IWC would, in at most a few years, re-open the Antarctic to minke whaling undernew regulations. However, after the declaration of the Southern Ocean Sanctuary in 1994, continuation becamea political act of defiance of world-opinion; by this time many others than the employees and shareholders ofwhaling companies, and meat traders, had acquired vested interests in it. In fact organs of the JapaneseGovernment - as do those of Norway - spend far more on keeping the industry barely alive, than its economicworth now or in the near future.
With the collapse of all Antarctic activities except a residual Japanese operation (which itself involved theamalgamation of several whaling companies into one) the process of concentration of ownership was completed.Initial hopes by companies, assisted by the governments under whose flags their vessels operated, to stabilise arapidly declining industry, were bedevilled by inability to agree on national shares and on an effective monitoringregime for compliance with both general regulations and any agreements on shares.92 The treatment of the valueof agreed national shares of the total catch as a commodity linked to the sale of factory-ships certainly affectedthe concentration process and the pace of running down the industry. Norway in particular benefited from this,first by maintaining its share claim even when not taking it, then selling expeditions - with their share - to Japanat higher prices than would otherwise have been obtainable for what was, increasingly, scrap metal. In the endJapan wanted the shares but not the vessels, so did not deploy them.
A number of new features have, however, appeared in these discussions through the past decade or so. Oneis the emergence of governments that are opposed to commercial whaling in general, and to whaling using pelagicexpeditions in particular.93 They tend to be supported by their publics especially because whaling is presumedby many to be an inhumane activity. This is manifest mainly in their determination to keep the 1982 decision ineffect, but also in other ways. For example, there have from time to time been suggestions that since the whaleresources are regarded as “a common heritage”, non-whaling countries should be able to claim shares of any
369 Holt
92 The refusal of the remaining whaling countries, especially Norway, to agree to an effective international inspection schemewithin a broader compliance regime, now bedevils efforts to get broad agreement on a Revised Management scheme whichmight legitimise commercial minke whaling in the Northeast Atlantic and Northwest Pacific.
93 The smaller factory-catchers have also been criticised because they are far less efficient in ensuring the full utilisation ofthe whale carcasses, an aim of the government regulation of the industry since its beginnings in the 1920s.
agreed overall catch-limit, and then not kill those whales. Another suggestion, put forward by J.AGulland andmyself, and published in the 1960s by ICES, was that the United Nations should appropriate the whale resourcesand charge for their lethal “use”, which could have changed drastically the economic basis for the industry, itsscale and its mode of operation.
But the greatest challenge to the remaining whalers has been the phenomenal growth of “benign”, non-lethaleconomic use of the resources, through whale watching as an element of eco-tourism. This is now still growingworld-wide, and of much greater economic value than present whaling. It is taking place also within pro-whalingcountries - Iceland, for example - and affecting decisions about the possible resumption of past whaling activity.Questions have been raised about the compatibility of careful but profitable whale-watching with whaling on thesame stocks or co-existing species, and/or in the same area. Some answers could come from research on scientificproblems of types not yet addressed. But, additionally, there are questions of perception: for example a majorityof tourists to Iceland, visiting to see whales as well as Arctic birds and so on, have said, in response to pollquestions, that if Iceland resumes whaling they will not return.
Evidently, the debates about commercial whaling continue, but with new and altered parameters.
18. ACKNOWLEDGEMENTS
My valued assistant, Ms Olga Nêve, has done much of the work involved in searching through documentsof the IWC and BIWS and compiling information for this essay, as well as engaging with the author in criticalconversation. Mr Gerald Elliot and Mrs Rosalind Marsden have very kindly provided me with historical materialand other leads. Views and interpretations of events presented here are, however, those of the author exceptwhere specifically acknowledged in the text.
19. BIBLIOGRAPHY
Beverton, R.J.H. and S.J. Holt 1993. On the dynamics of exploited fish populations. Chapman and Hall. London.As a corrected and revised reprint of book originally published in 1957 by HMSO, London.
Birnie, P.W. 1985. International Regulation of Whaling: from conservation of whaling to conservation of whalesand regulation of whale watching (2 volumes). Oceana Publications, London.
Butterworth, D.S., D.L. Borchers and S. Chalis 1993. Updates of abundance estimates for southern hemisphereblue, fin, sei and humpback whales incorporating data from the second circumpolar set of IDCR cruises IWCDocument SC/44/SHB 19
Cooke, J.G. 1995. The International Whaling Commission’s Revised Management Procedure as an Example of anew Approach to Fishery Management. In Whales, seals, fish and man Ed. by A.S. Blix, L. Walloe and O.Ulltang. Published by Elsevier, Oxford and Amsterdam. [pp. 647-57, in Proceedings of the InternationalSymposium on the Biology of Marine Mammals in the North East Atlantic, Tromso, Norway, 29 November-1 December 1994]
De la Mare, W.K. 1986. Simulation Studies on Management Procedure. Rep. int Whal. Commn.36: 429-50. Elliot , G.H. 1998. Whaling Enterprise: Salvesen in the Antarctic. Michael Russell, Norwich, UK.
Sir Gerald spent his working life with the firm of Christian Salvesen, being for part of that time Chairmanof the Board of this major British whaling company based in Leith, Scotland, but also with extensiveexperience at sea and in the Antarctic. He also served from time to time on the UK delegation to the IWC.
Ellis, R 1992. Men and Whales. Robert Hale Ltd, London. This is a popular illustrated book drawing on material not otherwise readily accessible.
Gurney, A. 1998. Below the Convergence. (paperback) Pimlico, London.This popular book gives an account of the exploration of the Southern Ocean and the coast of Antarcticafrom the last decade of the 18th Century to the first decades of the 20th Century and gives a good idea ofthe importance - in that enterprise - of the search for marine mammals, first fur-seals and elephant-seals,and then whales.
Hardin, G. and C. Clark have been prolific writers on “the tragedy of the commons” and on the effects ofdiscounting on resource use, respectively. Perhaps the most relevant in the present context are:Clark, C.W. 1975. The economics of whaling: a two species model, In: New Directions in the Analysis ofEcological Systems, Simulation Councils Proc. Ser. 5 (No. 1): 111-19, Ed. G.S. Innis. Clark, C.W. 1976. Mathematical Bioeconomics: the Optimal Management of Renewable Resources.Wiley-Interscience, New York.Clark, C.W., F.H. Clarke and G.R. Munro 1979. The optimal exploitation of renewable resource stocks:problems of irreversible investment. Econometrics 47: 25-49.Clark, C.W. and G.R. Munro 1978. Renewable resource management and extinction. J. Envir. Econ.Manag. 5: 198-205.Hardin, G. and J. Baden 1977. Managing the Commons. Freeman, San Francisco.
Southern Hemisphere Whales 370

Hjort, J., G. Jarn and P. Otterstad 1933. The optimum catch: essays on population. Hvalraad. Skr. 7: 92-127, 92-127.
Holt, S.J. 1995. Creating Confidence. Marine Pollution Bulletin30: 583-5.Holt, S.J. January 2000. Whales and Whaling
More background to the whaling issue - science and politics - a short version of which is included as achapter in Volume III “Global Issues and Processes” of: Seas at the Millennium: An EnvironmentalEvaluation, Ed. C. Sheppard, published in three volumes by Elsevier Science Ltd., Amsterdam, 2000.
Holt, S.J. 2001. A comment on Tore Schweder’s “Protecting whales by distorting uncertainty; non-precautionarymismanagement” pp 227-30. in Fisheries Research 52.
International Whaling Statistics. Edited by the Committee for Whaling Statistics. Det Norske Hvalråds StatistiskePublikasjoner.Two annual volumes are compilations and analyses of data provided by whaling companies (or, in certaincases, governments) to the Bureau of International Whaling Statistics, Sandefjord. Subsequent to the periodcovered in this review the statistical system was taken over by the IWC and the original records, or copiesof them, are now with the IWC Secretariat.
IWC. Reports of the International Whaling Commission.These containing the Annual Report, the Report of the Chairman on each Annual and Special Meeting, theReports of the Commission’s Scientific Committee (and of its Sub-Committees and Working Groups), plusselected scientific papers presented to and discussed by that Committee. The reports of the Commission’sTechnical Committee are not published, but are available from the IWC Secretariat, in Cambridge, UK.
IWC. Verbatim Records.The records of the Plenary sessions of IWC Meetings are available to accredited persons.
Kasuya, T. and R.L. Brownell Jr. 2001. Illegal Japanese Coastal Whaling and Other Manipulation of Catchrecords. IWC Doc. SC/53/RMP/24. On Japanese coastal-whaling falsification.
Kondo, I. 2000. Rise and Fall of Japanese Coastal Whaling. Sanyo-sha, Tokyo. 499pp. (in Japanese).Also on Japanese coastal-whaling falsification.
Mangel, M. et al. (58 authors) 1996. Principles for the conservation of wild living resources EcologicalApplications6 (2): 338-62.
Marsden, R.R.G. 1999. The Discovery Committee - Motivation, Means and Achievements. Scottish Naturalist111:69-92.
Ruud, J.T. 1942. A Review of the Investigations on Whales and Whaling in Recent Years in International WhalingStatisticsXVI.
Schweder, T. 2001. Protecting whales by distorting uncertainty; non-precautionary mismanagement in FisheriesResearch 52. 217-25.on the integrity of scientific advice.
Soviet Antarctic Whaling Data (1947-1972) 1995. Moscow. Center for Russian Environmental Policy.Reprinted with text in both Russian and English, in 1996, available from the Bristol, UK office of theInternational Fund for Animal Welfare. This tabulates, for each of the expeditions, the catch-data by speciesas originally presented to the Bureau of International Whaling Statistics (BIWS) and as subsequentlydetermined when archives were opened following the structural collapse of the USSR. The true data wereverified against notes taken by scientists and national inspectors aboard the factory-ships. The data are,however, incomplete, some notes having been destroyed.
Tønnessen, J.N. and A.O. Johnsen 1982. The History of Modern Whaling. C. Hurst & Co., London.This is a much shortened translation, by R.I. Christophersen, of a four volume work, in Norwegian,published in Oslo and Sandefjord in 1959, 1967, 1969 and 1970. The English version, however, carries thehistory forward to about 1980.
Other technical and scientific papers and articles too numerous to list here have been consulted. I have alsodrawn upon my own notes and memories from participating in activities of the IWC from 1960 to the present,usually - during the period reviewed here - as observer for the Food and Agriculture Organization of the UnitedNations (FAO), sometimes for UNEP, but also as a member of the Special Committee of Three (later Four)Scientists set up by the IWC for a few years beginning in 1960.
371 Holt

Appendix ISpecies, commodities and contracts
Attempts to regulate modern commercial whaling have always concentrated on three major commoditiestraded internationally: baleen whale oil (“train oil” in early statistics, “whale oil” in later ones), baleen whale meatand sperm oil. For decades there had been market alternatives to baleen oil, especially from vegetable sources.For sperm oil, with mainly industrial use in the twentieth century (it was designated as a “strategic material” inboth USSR and USA), synthetic substitutes began to become available during the period focused on here: - post-World War II - and later a vegetable oil with similar properties derived from the fruit of the jojoba plant, a bushgrowing wild, then cultivated, in desert climates. There was, on the other hand, no market substitute for baleenwhale meat.
The meat from the different baleen species could be distinguished by experts and gourmet consumers butbasically served a single market; there are bigger differences between cuts from different parts of a given species(attracting different prices) than between the species. However, of the four BWU species the meat from thesei/Bryde’s whale is generally preferred and fetches higher prices.
The scale of “values” of the four species (1:2 1:2:5 1:6) was originally set in rough accordance with the oilcontent according to the extraction technology of the time (early 1930s), and when sei whales were barely givenattention. The scale probably slightly under represented the sei whale “value” in oil, but it considerably under-valued the species as far as meat production was concerned, both with respect to quantity and quality. Althoughminke whales were never incorporated in the BWU-system, some ratios appear in the industry literature: 1:50 interms of oil, 1:30 in terms of meat, for example, but these possibly under-value the minke.
It is well known that the species composition of Antarctic baleen catches, especially pelagic catches,changed over the years. It has usually been assumed that this reflected the depletion of the larger species, one byone. This is particularly noticeable for the humpback whale which was nearly exterminated by legal pelagic-whaling, whaling from land-stations both in the Antarctic and in the Southern hemisphere north of 40°S, and byillegal whaling by Soviet fleets and at least one other fleet.
In the early 1930s the blue whale dominated the catches, at 80-90% of the BWU. By the end of the decadeblue and fin whales were about par in BWU terms, with humpbacks varying from 1 to 8%. After the SecondWorld War the percentage contributions to the BWU total in resumed whaling had not changed, but from 1951/52a steady decline began in the blue whale contribution. From 1955/56 to 1962/63 it stabilised in the range 8 - 11%,and then collapsed completely, aided by partial protection being offered late by the IWC.
This final decline in the blue whale contribution coincided with a rapid rise in the sei contribution, whichhad been negligible until then. The sei dominated the catches (60-70% of the BWU) for three seasons, and thensettled back to 40% for four years, up to 1972/73.
In 1970/71 Japan took a large catch of minke whales, deploying a new special expedition for the purpose.But in 1971/72 the USSR also began catching large numbers of minke whales, using its existing expeditions andnot specialising among them. Soon after this both fin and sei whales were protected in the Antarctic, but apartfrom the differential effects of catch-limits the species composition was changed by the shift back to higherlatitudes to take minke whales, whereas sei and Bryde’s were taken further north, even north of the Antarcticconvergence. It is also worthy of note that throughout the 1970s the southern hemisphere catch of sperm whalesby the pelagic expeditions was never less than 50% by number of the total catch of large whales, and by weightwas more than that.
There were also differences in species composition from one longitudinal sector to another. This meant thatwhalers could in principle chose to operate, within the BWU catch-limit system, to optimise the speciescomposition of their catches according to national and market preferences. In particular, for countries operatingonly one or a few expeditions, and for all of them as the industry in general contracted, choices had to be madefor logistic reasons - one expedition could not exploit the entire Antarctic in a single season. These choices wereinfluenced also by the specific locations of the base ports, and hence North-South-North steaming-distances,which determined whether expeditions would operate more in one ocean sector than another.
The contribution of sei whales first reached about 50% of the total in 1964/65 in Japanese and Norwegiancatches (the UK and the Netherlands were both out of the picture by the time of the sei boom). However, thisonly happened in the Soviet catches in 1973/74, according to the official statistics. The shift northward of Sovietoperations that began then also brought those fleets into the range of the pygmy blue whale, and as we have noted,large numbers of these were taken but not reported. The Southern right whale also inhabits the more northerlywaters, hence the great increase then in illegal catches of that nominally “protected” species.
Southern Hemisphere Whales 372

The coincidence in time of the switch in catches by Norwegian and Japanese operators was connected withthe contracts for meat sales from Norwegian vessels to Japan. (Similar synchrony appeared with the switch inthe early 1970s to minke whaling by Japan and USSR, for the same reason.) In fact trade-deals played a leadingrole in the efforts to gain acceptance within the IWC for lower, sustainable catch-limits. For instance it has cometo light on several occasions that a country or company operating a land-station could not accept a reduced limitor quota because it had signed advance contracts with Japanese buyers to provide specified quantities of meat thefollowing season or, similarly, contracts with buyers of sperm oil on the global market. This matter came to ahead when some countries, which were prepared to cease commercial whaling when the 1982 “moratorium”decision was being debated, made it clear that they needed a “phase down” time (eventually three years wasconceded) in order to meet contractual obligations to supply particular commodities.
All the factors and considerations mentioned here surely influenced the national BWU-quota negotiations,but it is not possible to evaluate them without access to company accounts and files and to the records of secretgovernmental discussions.
373 Holt

Case studies on theallocation of transferablequota rights in fisheries
ISSN 0429-9345
FAOFISHERIES
TECHNICALPAPER
411
This report, consisting of 23 studies, describes how the initial allocations of transferable
fishing (effort) or fish (catch) quotas have been done by a variety of fisheries management
regimes. The studies include two from the European Union (the United Kingdom and the
Netherlands), one from Iceland and three descriptions from the Maritimes of Canada. Of the
Canadian studies, that for herring provides an historical account of the introduction of
quotas in the management procedures of the International Commission for the Northwest
Atlantic (ICNAF), the precursor of the Northwest Atlantic Fisheries Organization (NAFO).
Three studies are presented for fisheries along the eastern seaboard of the United States,
though that for red snapper describes a fishery in which the actual implementation of the
programme was thwarted by the imposition of the moratorium on individual transferable
quotas (ITQs). The account for South Africa describes a difficult process in transition for a
specific fishery. Nine accounts are included from Australia, two of which describe fisheries
managed by the Commonwealth Government through the Australian Offshore
Constitutional Settlement (the Northern Prawn Fishery and the fishery for southern bluefin
tuna). The other six accounts of Australian experiences describe lobster fisheries in
Western Australia, South Australia and Tasmania and fisheries for abalone in Western
Australia and Tasmania. Two accounts describe more traditional finfish fisheries, that of the
Southeast Trawl Fishery and the trap and line fisheries in New South Wales. An omnibus
account is given for the allocation process of quotas in New Zealand. In the Western
Pacific, accounts are given for the Pacific halibut and sablefish fisheries in Alaska, the
variety of fisheries in British Columbia including these last two species and the fishery for
Patagonian toothfish in Chile.
Case studies on the allocation of transferable quota rights in fisheries
411FA
O