CASE-BASED REASONING - QSpace
133
i CASE-BASED REASONING – AN EFFECTIVE PARADIGM FOR PROVIDING DIAGNOSTIC SUPPORT FOR STROKE PATIENTS By MARIAM BAIG A thesis submitted to the School of Computing In conformity with the requirements for the degree of Master of Science Queen’s University Kingston, Ontario, Canada (September, 2008) Copyright ©Mariam Baig, 2008
-
Upload
khangminh22 -
Category
Documents
-
view
1 -
download
0
Transcript of CASE-BASED REASONING - QSpace

i
CASE-BASED REASONING – AN EFFECTIVE PARADIGM FOR PROVIDING DIAGNOSTIC SUPPORT FOR STROKE PATIENTS
By
MARIAM BAIG
A thesis submitted to the School of Computing
In conformity with the requirements for
the degree of Master of Science
Queen’s University
Kingston, Ontario, Canada
(September, 2008)
Copyright ©Mariam Baig, 2008

ii
Abstract
A Stroke can affect different parts of the human body depending on the area of brain affected; our
research focuses on upper limb motor dysfunction for stroke patients. In current practice, ordinal
scale systems are used for conducting physical assessment of upper limb impairment. The
reliability of these assessments is questionable, since their coarse ratings cannot reliably
distinguish between the different levels of performance. This thesis describes the design,
implementation and evaluation of a novel system to facilitate stroke diagnosis which relies on
data collected with an innovative KINARM robotic tool. This robotic tool allows for an objective
quantification of motor function and performance assessment for stroke patients.
The main methodology for the research is Case Based Reasoning (CBR) - an effective
paradigm of artificial intelligence that relies on the principle that a new problem is solved by
observing similar, previously encountered problems and adapting their known solutions. A CBR
system was designed and implemented for a repository of stroke subjects who had an explicit
diagnosis and prognosis. For a new stroke patient, whose diagnosis was yet to be confirmed and
who had an indefinite prognosis, the CBR model was effectively used to retrieve analogous cases
of previous stroke patients. These similar cases provide useful information to the clinicians,
facilitating them in reaching a potential solution for stroke diagnosis and also a means to validate
other imaging tests and clinical assessments to confirm the diagnosis and prognosis.

iii
Acknowledgements
I would like to extend my heartfelt gratitude to Dr. Janice Glasgow who has been far
more than an advisor. With her patience, guidance, encouragement, and overwhelming support, I
was able to conquer my own Everest. I would also like to thank Dr. Stephen Scott and the entire
team at the Laboratory of Integrative Motor Behavior (LIMB) namely, Helen Bretzke, Dr. Sean
Dukelow, MaryJo Demmers and Dr. Ian brown for their essential assistance with data
acquisitions and timely feedback.
Furthermore, I would like to take this opportunity to acknowledge the effort, prayers, and
day to day support, put forth by my family, both here in Canada as well as in Pakistan. My
husband Zermaan, along with my children Rayaan and Maazin, have been wonderful in
displaying their patience and forbearance through this entire process. This immense support has
inevitably facilitated the eventual completion of this research. I now look forward to celebrating
this success with all of them.
Last but not the least, I want to thank the Queen’s University fraternity, all my professors,
colleagues and support staff who made this an incredible learning experience for me. Special
thanks, to Sara Rahmati, Amr Abuzeid, Jae-Yoon Jung, Kathrin Tyryshkin, Bev Smith and
Hazem Ahmed Radwan for their friendship and continued support during my research. It would
not be fair if I did not mention the name of Debby Robertson. From my first day until the
submission of this thesis and my defense, Debby has always been there answering queries,
replying to emails and assisting in applications whether it was for teaching-assistance ship,
funding, or maternity leave. I thank you all for being so wonderful and for assisting me in
reaching, where I am today.
MARIAM BAIG
Queen’s University, Kingston, Canada
September, 2008

iv
Table of Contents
Abstract ii
Acknowledgements iii
Table of Contents iv
List of Figures vii
List of Tables viii
Glossary of Terms and Abbreviations ix
Chapter 1. Introduction 1
1.1 Case Based Reasoning. . . . . . . . . . . . . . . . . . . . . . . . . . . . . . . . . . . . . . 2
1.2 Conventional Stroke Assessment Protocols . . . . . . . . . . . . . . . . . . . 3
1.3 KINARM . . . . . . . . . . . . . . . . . . . . . . . . . . . . . . . . . . . . . . . . . . . . . . . 4
1.4 Thesis Objectives. . . . . . . . . . . . . . . . . . . . . . . . . . . . . . . . . . . . . . . . . . 4
1.5 Thesis Outline. . . . . . . . . . . . . . . . . . . . . . . . . . . . . . . . . . . . . . . . . . . . . 5
Chapter 2. Problem Domain - Stroke 6
2.1 What is Stroke? . . . . . . . . . . . . . . . . . . . . . . . . . . . . . . . . . . . . . . . . . . . . . 6
2.2 Pathophysiology of Stroke . . . . . . . . . . . . . . . . . . . . . . . . . . . . . . . . . . . . 7
2.3 Potential Effects of Stroke . . . . . . . . . . . . . . . . . . . . . . . . . . . . . . . . . . . . 8
2.4 Effects of Stroke on Upper Limbs. . . . . . . . . . . . . . . . . . . . . . . . . . . . . . 10
2.5 Stroke Diagnosis . . . . . . . . . . . . . . . . . . . . . . . . . . . . . . . . . . . . . . . . . . . 11
2.5.1 Imaging Tests . . . . . . . . . . . . . . . . . . . . . . . . . . . . . . . . . . . . . . . 11
2.5.2 Clinical Assessment of Upper Limbs . . . . . . . . . . . . . . . . . . . . . 12
2.6 Stroke Patients – Care and Rehabilitation. . . . . . . . . . . . . . . . . . . . . . . 14
2.7 Summary . . . . . . . . . . . . . . . . . . . . . . . . . . . . . . . . . . . . . . . . . . . . . . . . 16
Chapter 3. KINARM – Kinesiological Instrument for N ormal and Altered
Reaching Movement 17
3.1 Use of Robotic Technology in Assessment and Rehabilitation . . . . . . . 17
3.2 Visually Guided Reaching Movements in Stroke Patients . . . . . . . . . . 18
3.3 Bilateral KINARM setup . . . . . . . . . . . . . . . . . . . . . . . . . . . . . . . . . . . . . 19

v
3.4 KINARM Tasks. . . . . . . . . . . . . . . . . . . . . . . . . . . . . . . . . . . . . . . . . . . 21
3.4.1 Sensory Matching Task . . . . . . . . . . . . . . . . . . . . . . . . . . . . . . . . . 21
3.4.2 Center-Out reaching Task . . . . . . . . . . . . . . . . . . . . . . . . . . . . . . . 22
3.5 Parameters selection . . . . . . . . . . . . . . . . . . . . . . . . . . . . . . . . . . . . . . . . 25
3.6 Research Conclusions . . . . . . . . . . . . . . . . . . . . . . . . . . . . . . . . . . . . . . 26
3.7 Correlation of Summarized Parameters with Clinical Scores . . . . . . . 27
Chapter 4. Background – The Computational Techniques 28
4.1 What is CBR? . . . . . . . . . . . . . . . . . . . . . . . . . . . . . . . . . . . . . . . . . . . . . . 29
4.1.1 Significance of CBR . . . . . . . . . . . . . . . . . . . . . . . . . . . . . . . . . . 30
4.1.2 Architecture of CBR. . . . . . . . . . . . . . . . . . . . . . . . . . . . . . . . . . . 31
4.1.3 Case Representation . . . . . . . . . . . . . . . . . . . . . . . . . . . . . . . . . . . 32
4.1.4 Case Retrieval. . . . . . . . . . . . . . . . . . . . . . . . . . . . . . . . . . . . . . . 33
4.1.5 Attribute Selection. . . . . . . . . . . . . . . . . . . . . . . . . . . . . . . . . . . . 37
4.1.6 Reuse – Adaptation . . . . . . . . . . . . . . . . . . . . . . . . . . . . . . . . . . . 47
4.1.7 Revise – Evaluation . . . . . . . . . . . . . . . . . . . . . . . . . . . . . . . . . . . 49
4.1.8 Retain – Memory Update . . . . . . . . . . . . . . . . . . . . . . . . . . . . . . . 50
4.1.9 A Classification of CBR Applications . . . . . . . . . . . . . . . . . . . . 52
4.1.10 CBR in Medical Informatics . . . . . . . . . . . . . . . . . . . . . . . . . . . . 54
4.1.11 Is CBR the Right Choice? . . . . . . . . . . . . . . . . . . . . . . . . . . . . . . 56
4.2 What is TA 3? . . . . . . . . . . . . . . . . . . . . . . . . . . . . . . . . . . . . . . . . . . . . . . . 57
4.2.1 TA 3 Architecture. . . . . . . . . . . . . . . . . . . . . . . . . . . . . . . . . . . . 57
4.2.2 Retrieval in TA 3. . . . . . . . . . . . . . . . . . . . . . . . . . . . . . . . . . . . 58
4.2.3 Context . . . . . . . . . . . . . . . . . . . . . . . . . . . . . . . . . . . . . . . . . . 58
4.2.4 TA 3 Spécifications . . . . . . . . . . . . . . . . . . . . . . . . . . . . . . . . . . 61
4.2.5 TA- 3 Applications . . . . . . . . . . . . . . . . . . . . . . . . . . . . . . . . . . . 62
4.2.6 Summary. . . . . . . . . . . . . . . . . . . . . . . . . . . . . . . . . . . . . . . . . . . . 63
Chapter 5. The Modus Operandi – Development of a Case Based Reasoning
System for Stroke Patients 64
5.1 Stroke Data. . . . . . . . . . . . . . . . . . . . . . . . . . . . . . . . . . . . . . . . . . . . . . . . 65
5.1.1 Raw Data . . . . . . . . . . . . . . . . . . . . . . . . . . . . . . . . . . . . . . . . . . . . . 66
5.1.2 Database . . . . . . . . . . . . . . . . . . . . . . . . . . . . . . . . . . . . . . . . . . . . . 68

vi
5.1.3 Views of Database . . . . . . . . . . . . . . . . . . . . . . . . . . . . . . . . . . . . . . 68
5.2 Case Base . . . . . . . . . . . . . . . . . . . . . . . . . . . . . . . . . . . . . . . . . . . . . . . . . 70
5.3 PHASE I – Representation of Cases . . . . . . . . . . . . . . . . . . . . . . . . . . . . 73
5.3.1 Step I - Attribute Selection . . . . . . . . . . . . . . . . . . . . . . . . . . . . . . . 73
5.3.2 Step II – Classification. . . . . . . . . . . . . . . . . . . . . . . . . . . . . . . . . . 75
5.3.3 Step III – Case Structure in TA 3. . . . . . . . . . . . . . . . . . . . . . . . . . 78
5.4 PHASE II – Retrieval of Cases . . . . . . . . . . . . . . . . . . . . . . . . . . . . . . . . 80
5.5 PHASE III – Experiments and Results . . . . . . . . . . . . . . . . . . . . . . . . . . . 82
5.6 PHASE IV – Testing and Evaluation. . . . . . . . . . . . . . .. . . . . . . . . . . . . . 86
5.7 PHASE V – Scope of Adaptation. . . . . . . . . . . . . . .. . . . . . . . . . . . . . . . 90
Chapter 6. Conclusions 91
6.1 Objectives Vs. Contributions . . . . . . . . . . . . . . . . . . . . . . . . . . . . . . . . . . 92
6.2 Future Directions. . . . . . . . . . . . . . . . . . . . . . . . . . . . . . . . . . . . . . . . . . . . 93
Bibliography 95
Appendix 105
Appendix A Kinarm Specifications . . . . . . . . . . . . . . . . . . . . . . . . . . . . . . . . . . . 105
Appendix B Scanned forms . . . . . . . . . . . . . . . . . . . . . . . . . . . . . . . . . . . . . . . . . . 111

vii
List of Figures
2.1 Right Hemisphere of the Brain . . . . . . . . . . . . . . . . . . . . . . . . . . . . . . . . . . . 9
2.2 Perdue Pegboard . . . . . . . . . . . . . . . . . . . . . . . . . . . . . . . . . . . . . . . . . . . . . . 14
2.3 Physiotherapy performed by Rehabilitational team. . . . . . . . . . . . . . . . . . . . 16
3.1 The Bilateral KINARM Device . . . . . . . . . . . . . . . . . . . . . . . . . . . . . . . . . . 20
3.2 Sensory Matching Task . . . . . . . . . . . . . . . . . . . . . . . . . . . . . . . . . . . . . . . . . 21
3.3 Center-out Reaching Task . . . . . . . . . . . . . . . . . . . . . . . . . . . . . . . . . . . . . . . 22
3.4 Target positions on the KINARM device . . . . . . . . . . . . . . . . . . . . . . . . . . . 23
3.5 Reaching tasks performed by control and stroke subjects. . . . . . . . . . . . . . . 24
4.1 CBR Cycle . . . . . . . . . . . . . . . . . . . . . . . . . . . . . . . . . . . . . . . . . . . . . . . . . . . 31
4.2 Representation of cases in various case-based systems . . . . . . . . . . . . . . . . . 34
4.3 Data processing in WEKA . . . . . . . . . . . . . . . . . . . . . . . . . . . . . . . . . . . . . . . 43
4.4 Classification in WEKA . . . . . . . . . . . . . . . . . . . . . . . . . . . . . . . . . . . . . . . . . 44
4.5 Attribute Selection in WEKA . . . . . . . . . . . . . . . . . . . . . . . . . . . . . . . . . . . . . 46
4.6 Classification hierarchy of CBR Applications . . . . . . . . . . . . . . . . . . . . . . . . 53
5.1 Clinical Database Structure . . . . . . . . . . . . . . . . . . . . . . . . . . . . . . . . . . . . . . 69
5.2 Pictorial demonstration of CBR system for stroke patients . . . . . . . . . . . . . . 72
5.3 Visualizations of attributes in WEKA . . . . . . . . . . . . . . . . . . . . . . . . . . . . . . . 75
5.4 Classification for ‘Type of Stroke’. . . . . . . . . . . . . . . . . . . . . . . . . . . . . . . . . . 77
5.5 Classification for ‘Side of Brain’ . . . . . . . . . . . . . . . . . . . . . . . . . . . . . . . . . . . 77
5.6 Composition of case structure . . . . . . . . . . . . . . . . . . . . . . . . . . . . . . . . . . . . . 79
5.7 Source cases in TA 3 . . . . . . . . . . . . . . . . . . . . . . . . . . . . . . . . . . . . . . . . . . . 80
5.8 Retrieval results in TA 3. . . . . . . . . . . . . . . . . . . . . . . . . . . . . . . . . . . . . . . . 83
5.9 Graph showing True and False positives . . . . . . . . . . . . . . . . . . . . . . . . . . . . 85
5.10 CBR Cycle revisited . . . . . . . . . . . . . . . . . . . . . . . . . . . . . . . . . . . . . . . . . . . 90

viii
List of Tables
4.1 Case-based systems with retrieval algorithms . . . . . . . . . . . . . . . . . . . . . . . . 37
4.2 Case-based systems with adaptation strategies . . . . . . . . . . . . . . . . . . . . . . . . 49
4.3 Attribute-value reference . . . . . . . . . . . . . . . . . . . . . . . . . . . . . . . . . . . . . . . . 59
5.1 KINARM Parameters and their corresponding tables . . . . . . . . . . . . . . . . . . 66
5.2 Clinical parameters and their corresponding tables . . . . . . . . . . . . . . . . . . . . 67
5.3 Data entities and their units . . . . . . . . . . . . . . . . . . . . . . . . . . . . . . . . . . . . . . . 68
5.4 List of ranked attributes . . . . . . . . . . . . . . . . . . . . . . . . . . . . . . . . . . . . . . . . . 74
5.5 Classification Results . . . . . . . . . . . . . . . . . . . . . . . . . . . . . . . . . . . . . . . . . . . 76
5.6 Contexts: A, B and C . . . . . . . . . . . . . . . . . . . . . . . . . . . . . . . . . . . . . . . . . . . 81
5.7 Retrieval results with varying contexts . . . . . . . . . . . . . . . . . . . . . . . . . . . . . . 84
5.8 Statistical Results . . . . . . . . . . . . . . . . . . . . . . . . . . . . . . . . . . . . . . . . . .. . . . 86
5.9 Results of Leave one out cross validation . . . . . . . . . . . . . . . . . . . . . . .. . . . 88
5.10 Hypothesis, methodology and Results . . . . . . . . . . . . . . . . . . . . . . . . . . . . . . 89

ix
Glossary
Stroke Medically known as Paralysis, Apoplexy, or (CVA) Cerebrovascular
Accident. A stroke occurs when the blood supply to a part of the brain is
suddenly interrupted, due to a clot or when a blood vessel in the brain
bursts, spilling blood into the spaces surrounding brain cells. Brain cells
(neurons) die in the affected area when they no longer receive oxygen
and nutrients from the blood or there is sudden bleeding into or around
the brain.
Stroke
Rehabilitation: It is restorative learning phenomenon that intends to improve and
maximize recovery from stroke by treating the activity limitations
(Impairments) due to stroke and to enable the survivor to reintegrate into
the daily life as much as possible.
Hemiplegia Complete paralysis on one side of the body.
Hemiparesis One-sided weakness -which is not as debilitating as paralysis is.
Prognosis A prediction of the probable course and outcome of a disease, the
likelihood of recovery from a disease.
Stenosis Narrowing of an artery or a valve.
Atrophy A wasting or decrease in size of a body organ, tissue, or part owing to
disease, injury, or lack of use: muscular atrophy of a person affected with
paralysis.
Infarction An area of tissue that undergoes necrosis (die out) as a result of
obstruction of local blood supply, as by a thrombus or embolus.

GLOSSARY
x
Spasticity A disorder of the body's motor system in which certain muscles are
continuously contracted. This contraction causes stiffness or tightness of
the muscles and may interfere with gait, movement, and speech.
Kinematics Kinematics is a branch of mechanics which describes the motion of
objects without the consideration of the masses or forces that bring about
the motion. In contrast, dynamics is concerned with the forces and
interactions that produce or affect the motion.
DB2 Short for Database 2, a family of relational database products offered by
IBM. DB2 provides an open database environment that runs on a wide
variety of computing platforms. A DB2 database can grow from a small
single-user application to a large multi-user system. Using SQL, users
can obtain data simultaneously from DB2 and other databases. DB2
includes a range of application development and management tools.
(http://publib.boulder.ibm.com/infocenter/db2luw/v8//index.jsp)
CHAPTER 1. INTRODUCTION
1
Chapter 1
Introduction
“If we knew what we were doing, it wouldn’t be called research, would it?”
(Albert Einstein)
According to the Heart and Stroke Foundation of Canada, stroke is the fourth leading
cause of death or long-term disability in the world. Eighty percent of strokes occur when the
blood supply to a part of the brain is suddenly interrupted (Ischemic stroke), usually due to a clot
in an artery leading to the brain. The remaining 20% are caused by uncontrolled bleeding in the
brain, due to a ruptured blood vessel (Hemorrhagic stroke). Of every 100 people who have a
stroke, 10 recover completely, 25 recover with a minor impairment or disability, 40 are left with a
moderate to severe impairment, 10 are so severely disabled that they require long-term care and
15 are unable to survive [1]. The research carried out for this thesis focuses on the 85 % of people
who survive stroke and may potentially benefit from rehabilitation therapy and regain their lost
independence.

CHAPTER 1. INTRODUCTION
2
1.1 Case Based Reasoning
When we talk about magnitude of healthcare resources used to diagnose and recuperate
stroke survivors, significant efforts are involved; however, there is still a need for a standardized
and comprehensive classification system in order to document the resultant impairment and
disability. The diagnosis and prognosis of stroke patients is therefore a complex domain because
of the fact that a multitude of varying factors are involved with each patient. In addition, keeping
track of all the different experiences during their treatment is an intricate phenomenon for even
adept neurologists. Case Based Reasoning (CBR) is an effective paradigm of Artificial
Intelligence (AI) that has proved to be a prolific landmark in healthcare for its diagnostic and
therapeutic support [2]. This research describes yet another progressive role of CBR in healthcare
applications, with the innovation that now we are applying it to the stroke domain.
CBR is based on the principle that a new problem is solved by observing similar,
previously encountered problems, and adapting their known solutions. It is analogous to the
human mind as it solves new problems based on previous experiences [20, 21]. Choosing this
paradigm of AI as our main methodology for this research, my hypothesis is that:
CBR can be utilized to create a repository of information, of the stroke patients who have
an explicit diagnosis and prognosis and are receiving subsequent rehabilitation. For a new
stroke patient, whose diagnosis is yet to be confirmed and has an indefinite prognosis, by
applying CBR, similar cases can be retrieved from the case base which may provide useful
information to the clinicians, hence facilitating them in reaching a potential solution for stroke
diagnosis and assessment.
The main components of CBR cycle can be described as four processes that are also
referred to as the mnemonic, “the four REs” [3]. They are: Retrieve the most similar case(s);
Reuse the information from the retrieved case(s) to propose a new solution; Revise the proposed
solution to solve the new problem, and Retain this problem as a new solved case in the case base.
Another reason to use CBR for this domain in particular, is the assumption that patients with

CHAPTER 1. INTRODUCTION
3
analogous sensory and motor deficits have similar impairments; therefore they may have similar
prognoses and may lead to not only the diagnosis of impairment but to the quantification of the
impairment as well.
1.2 Conventional Stroke Assessment Protocols
Once a cerebrovascular accident has taken place, proper diagnosis and accurate prognosis
is the next critical step, followed by effective rehabilitation therapies. There are numerous
conventional assessment tests performed by clinicians and therapists in order to confirm the
occurrence of a stroke and measure the degree of impairment. However the lack of quantifiable
constructs in these protocols makes them all subjective in nature. Based on the evaluation of
psychometric standards, there is no assessment scale that can be regarded as perfect, although
they are partially reliable [4]. Normally, an early diagnosis is made by assessing the symptoms,
reviewing medical history, conducting tests to confirm the occurrence of a brain attack, and
measuring the degree of impairment.
Conventional stroke assessment scales usually convert motor status to a score along an
ordinal scale. In a usual assessment setup, the patient is asked to perform a task where the main
emphasis is laid on task completion rather than specific details. Therefore it is a non-qualitative
scoring. In a qualitative scoring other factors are considered as well, like measurement of the
amount of assistance required, alteration in the normal (gross) position, and time utilized to
complete a test [5].
There has recently been an explosion in the usage of robotic technology for quantifying
motor function, because of the fact that they are objectively sensitive to small changes in
neurological status, and are of value for studying and quantifying stroke impairment [6]. For these
reasons, we have incorporated a robotic device, KINARM, as our main assessment protocol in
this research, besides other assessment methods.

CHAPTER 1. INTRODUCTION
4
1.3 KINARM - Kinesiological Instrument for Normal a nd Altered Reaching
Movements
One of the most commonly associated ailments caused by stroke is that of limited upper
limb movement. The KINARM monitors and manipulates arm motion in the horizontal plane [7].
It is a robotic exoskeleton, developed by Dr. Stephen H. Scott and his colleagues at the
Neuroscience Centre of Queen’s University. KINARM calculates kinetic / kinematic data, such as
reaction time, velocity, joint torque and hand trajectories of both stroke and control subjects for
specific motor and sensory tasks. This data is saved in a database for later reference, thus
providing for an efficient means of data access and a standardized way to keep track of a patient’s
recovery as a result of rehabilitation therapy.
1.4 Thesis Objectives
The purpose of this research is to apply strategies of automated reasoning in order to simplify the
complex phenomenon of motor and sensory dysfunction assessment in stroke patients. This may
potentially facilitate clinicians in prognoses and rehabilitation of future stroke patients.
The main objectives of this research are to:
1. Develop a case structure comprising of relevant attributes of stroke patients that have a
direct impact on diagnosis and prognosis.
2. Construct a case base system comprising of various stroke patients’ cases in order to
implement the CBR model.
3. Define a similarity criterion for retrieval of relevant cases given a new stroke case.
4. Determine the diagnostic support measures that can be taken in order to propose the
potential motor and/or sensory deficit, based on the previous known impairments
(solutions).
5. Test and evaluate the CBR system to retrieve the most relevant cases with useful
diagnostic information that can facilitate the prognosis of the new patient.

CHAPTER 1. INTRODUCTION
5
Chapter 1. INTRODUCTION
Chapter 5. METHODOLOGY
Chapter 2. STROKE Chapter 3. KINARM
Chapter 4. COMPUTATIONAL TECHNIQUES
Chapter 6. CONCLUSIONS
6. Scrutinize the validity of results.
1.5 Thesis Outline
In Chapter 2, background information is presented in order to elaborate on concepts about
the neuro-scientific domain – stroke – its causes, effects and rehabilitation methods presently
used. Besides this, there is a brief description of significant concepts used later in the following
chapters. Chapter 3 gives information about the use of robotic technology in the field of
medicine, with an emphasis on its use for stroke subjects and giving details about the functioning,
and the assessment procedure carried out by KINARM. Chapter 4 describes the computational
techniques CBR and TA-3. It provides the literature review of CBR and its diverse applications
highlighting the ones in healthcare. It also elaborates on the architecture of TA-3, its functionality
and how it was used as a framework to develop the CBR system for stroke domain. Chapter 5
emphasizes the main methodology of CBR, the procedural details of how we made use of this
paradigm as a distinct approach in merging neuroscience with AI. It also illustrates the
experiments performed on data used and the corresponding results obtained. Chapter 6 describes
the contributions that were made with this thesis, justification of hypothesis and limitations of the
present system leading to the future directions. The following flowchart further clarifies the
organization of various chapters and their interdependence. The components in pink refer to the
background chapters where as the ones in blue refer to the other fundamental chapters for the
thesis organization.

6
Chapter 2
Problem Domain – Stroke
"Wisdom is knowing what to do next; virtue is doing it.”
(David Starr Jordan – American Scientist 1851-1931)
This chapter presents relevant background information about the domain of the research -
stroke. The main aim behind writing this chapter was to provide information for the reader to
understand the concepts later used in this thesis. It gives an overview of stroke, its
pathophysiology and various impairments caused by it, specifically the motor and sensory deficits
of upper limbs. This chapter also elaborates on current tests and assessments used for stroke
diagnosis and how rehabilitation and care is brought into the picture of stroke patients.
2.1 What is Stroke?
Stroke, medically also known as paralysis, apoplexy, or hemiparesis, is a sudden damage
to a part of the brain due to an interruption in the normal blood supply [1]. Stroke can be
categorized into two types depending on the cause. 80% of strokes are ischemic, meaning they
result from a blockage, usually a clot (thrombus) in an artery leading to the brain. 20% of strokes
are hemorrhagic. They are less common but with severe effects, due to uncontrolled bleeding in

CHAPTER 2. PROBLEM DOMAIN - STROKE
7
the brain. In ischemic stroke, if the clot is formed in the artery directly leading to the brain it is
called thrombotic, whereas if the clot travels from some other part of the body into the brain then
it is referred to as an embolic stroke. A hemorrhagic stroke can be subarachnoid, leaking blood in
the space around the brain in the area between the brain and skull, or an intracerebral
hemorrhage, where rupturing of a deep artery in the brain tissue causes bleeding. Irrespective of
the cause of stroke, the interruption in the blood supply causes depletion of oxygen and glucose in
the affected area. This immediately reduces or abolishes neuronal function, and initiates an
ischemic cascade which causes neurons to die or be seriously damaged, further impairing brain
function [8].
2.2 Pathophysiology of Stroke
Stroke causes a depletion of blood to the brain or a part of the brain. In the absence of
oxygen, the brain tissue ceases to function if deprived for more than 60 to 90 seconds and after a
few hours it will undergo irreversible injury that may lead to death of the tissue referred to as
infarction [8]. Due to collateral circulation, within the region of brain tissue affected by ischemia,
there is a spectrum of severity. Thus, part of the tissue may immediately die while other parts
may only be injured and could potentially recover. The ischemic area where tissue might recover
is referred to as the “ischemic penumbra”. Therefore, for clinicians it is essential to diagnose
which areas of the brain have been fully affected and which can be recovered.
A secondary effect of loss of blood in ischemic brain tissue is the deficiency of oxygen or
glucose. As a result, the production of adenine triphosphate (a high energy phosphate compound)
fails leading to the failure of energy dependent processes necessary for tissue cell survival [8].
This sets off a series of interrelated events that result in damage to cellular organelles such as the
failure of mitochondria (the power house of a cell), which can further lead to energy depletion
and ultimately trigger cell death. Other processes that may take place are the loss of membrane

CHAPTER 2. PROBLEM DOMAIN - STROKE
8
ion pump function, leading to electrolyte imbalances in brain cells and the release of excitatory
neurotransmitters, which have toxic effects if released in excessive concentrations.
2.3 Potential effects of stroke
The effects of stroke vary depending on the type, severity, and location in the brain
affected. The brain is an extremely complex structure within the human body and each area is
responsible for a specific function. When an area of the brain is affected by stroke, it results in a
corresponding potential loss of normal function associated with that particular part. The brain is
divided into three main areas: Brain stem, Cerebellum and Cerebrum (consisting of the right and
left sides or hemispheres) [1].
The brain stem, as the name explains, constitutes the base of the brain. It creates a bridge
between the brain and the top of the spine. It is responsible for involuntary actions like heart beat,
breathing, digestion, swallowing, and eye movement. A stroke resulting in a lesion of the brain
stem may be fatal since it will interrupt the functioning of these vital involuntary processes.
The cerebellum looks like a miniature brain attached to the bottom of the brain. On the
back, it is attached to the brain stem. It controls the important task of maintaining balance as well
as managing some automatic responses and behavior. A stroke resulting in a lesion of cerebellum
may potentially result in movement disorders, lack of coordination and cause clumsiness.
The cerebrum is referred to as the “thinking brain” and mainly constitutes the central
bulky part. It not only controls the motor function but this is the main part where thinking and
intelligence takes place. The cerebrum is subdivided into right and left hemispheres. The right
hemisphere controls the left side of the body where as the left controls the right side. The right
hemisphere is associated with the artistic abilities of a person, music, spatial relationship,
recognizing faces etc. The left hemisphere is responsible for scientific functions, mathematical
skills and reasoning. It also controls the ability to understand written and spoken language.

CHAPTER 2. PROBLEM DOMAIN - STROKE
9
The entire cerebrum is composed of two layers, the outer being the cerebral cortex, gray
matter composed of neurons and their unmyelinated fibers, while the white matter below the grey
matter of the cortex is predominantly composed of myelinated axons that interconnect different
regions of the central nervous system. The cortex is deeply convoluted into folds and is
hypothetically divided on the basis of functionality into four distinct lobes.
Figure 2.1: Right hemisphere of the brain. Different colors represent the labeled parts.
Graphic Courtesy of: www.heartandstroke.ca (used with permission)
The frontal lobe is the anterior part of the brain and controls movement and higher
cognitive processes. So a stroke patient with affected right frontal lobe would have movement
affected on the left side and with affected left lobe, the right side would be affected. The parietal
lobe, which is behind the frontal lobe, is mainly responsible for sensory activities such as
receiving and interpreting information from all parts of the body. Stroke affecting the parietal
lobe in the right hemisphere can result in a strange kind of disorder called “agnosia”. Stroke
survivors with Agnosia can feel, see and hear, but may not be able to comprehend what they
perceive. In some cases, a condition “Neglect” may develop in which the patient may ignore
everything on the affected side.

CHAPTER 2. PROBLEM DOMAIN - STROKE
10
The temporal lobe controls the auditory functions and memory. A lesion in the temporal
lobe of the dominant hemisphere (usually the left one) may cause a speech disorder known as
“Wernicke’s Aphasia”. Memories are stored in the inner part of the temporal lobe therefore
memory loss after stroke is usually temporary unless both the left and right lobes are damaged.
The occipital lobe, located at the posterior end of the cerebrum, is responsible for visual
perception. A stroke affecting the left occipital lobe can result in loss of right side vision although
the eyes are functioning normally. The problem lies within the brain’s processing of the
information from the eyes.
2.4 Effects of Stroke on Upper Limbs
Stroke can cause varied impairments depending on the area of lesion. In majority of
stroke patients, upper limbs are more affected than lower limbs [9]. The middle cerebral artery is
one of the three major paired arteries which is responsible for supplying blood to the brain. The
occlusion of this artery may result in the paralysis and sensory loss of the contra lateral face side
and arm [8]. Stroke affecting an upper limb can cause various sensori-motor deficits in the
patient, such as weakness of muscle [10], abnormal muscle tone [11], spasticity and abnormal
movement synergies [12].
After the onset of a stroke, the impaired muscles of the affected limb become weak
within a span of few weeks. These flaccid muscles become hyper-reflexive [11]. Research has
revealed that during the recovery of upper limb function, stereotypic multi-joint movement
patterns are observed that reflect the loss of independent joint control, referred to as spasticity
[13]. This spasticity hinders the normal movement and results in slower response during
movement.

CHAPTER 2. PROBLEM DOMAIN - STROKE
11
2.5 Stroke diagnosis
Physicians have several diagnostic techniques and imaging tools to help diagnose the
cause of stroke quickly and accurately. An early diagnosis can be made by assessing the
symptoms and reviewing medical history. Once a neurological examination is performed along
with the stroke onset details, the occurrence of a brain attack is confirmed. Having that
confirmed, the next step is to identify the location of the lesion (area of brain or vascular territory
in brain affected) and assess the degree of impairment caused. There are a number of assessment
protocols used to measure the neurological deficits caused by stroke. These include Chedoke
McMaster, Perdue pegboard, Fugl Myer test, Glasgow Coma Scale, NIH and many more [64].
Some of them are discussed later in the chapter, in detail. The idea of providing this information
here is to set the context of stroke diagnosis. It indirectly refers to the objective of this research
and that is to simplify the stroke assessment procedure and to be able to computationally analyze
the sensory and motor deficits. Following are some of the routine screening tests performed to
confirm the occurrence and analyze the degree of damage caused by the stroke [1-a].
2.5.1 Imaging Tests:
• An echocardiogram uses sound waves (ultrasound) to create a picture of the heart. The
recorded waves show the shape, texture and movement of the valves, as well as the size
of the heart chambers and how well they are working. This test is carried out to assess
any abnormalities in the functioning of heart that can possibly be a cause of the stroke.
• An electrocardiogram measures the electrical activity in the heart and determines any
irregularity in the rhythmic motion of the heart that may result in a stroke.
• An electroencephalogram monitors the electrical activity in the brain in order to assess
the damage caused by stroke. It involves placing of small metal discs (electrodes) on a

CHAPTER 2. PROBLEM DOMAIN - STROKE
12
person's scalp to pick up electrical impulses. These electrical signals are printed out as
brain waves.
• Cerebral / Carotid angiography examines the blood flowing in the arteries of neck
(carotids) and brain. The test involves injecting a dye into an artery and a series of rapid-
image x-rays are taken as the dye travels through the arteries. By examining the flow of
blood, the size and location of any blockages can be marked. This procedure is also
sometimes used to help identify problems or malformations in blood vessels.
• A Computerized tomography scan is a special imaging technique that uses X-rays to
produce a 3-dimensional series of cross-sectional slices of the brain. These images can
determine whether the stroke was ischemic or hemorrhagic. They are also helpful to rule
out other processes in the brain that can mimic the effects of a stroke.
• A Magnetic Resonance Imaging test works on the principle of low energy radio waves
emitted by a large magnet and presents a detailed view on a monitor to produce 2 or 3-D
images of the brain. An MRI is used to detect bleeding in the brain, tumors or stroke. It is
also an excellent device for detecting smaller strokes or strokes in the back of the brain,
which other imaging devices can miss. The image produced by MRI is sharper and more
detailed than a CT scan so it's often used to diagnose small, deep injuries.
2.5.2 Clinical Assessment of Upper Limbs
There are numerous clinical assessments performed, in addition to the imaging tests
carried out, not only to assess the level of upper limb impairment but also to identify the stage of
recovery. Following are some of these included in our research work and are also included in this
project.
The Chedoke-McMaster test [17] consists of two main inventories, an impairment
inventory and an activity inventory. The activity inventory test is used to assess the patient’s
functional level. It is focused on task completion rather than task performance. The Impairment
CHAPTER 2. PROBLEM DOMAIN - STROKE
13
Inventory focuses on analyzing the stage of recovery of the shoulder, postural (positional)
control, the arm, the hand, the leg and the foot. There are 7 defined stages of recovery and based
on patient’s response, the clinician derives the assessment.
In the Impairment Inventory test, the clinician starts by assessing the degree of shoulder
pain in order to assess the stage of recovery of the shoulder. At first the patient is seated with
his/her feet on the floor while the clinician carefully examines the position of the shoulder. The
clinician then physically abducts (takes away from body) and adducts (brings towards body) the
patient’s shoulder and notes whether there is less than 90 degrees of pain free range. The
Impairment Inventory has seven stages defined for shoulder, arm, hand, leg, foot and postural
control. The clinician then looks at the description of each of the 7 defined stages of recovery and
matches the description with his/her evaluation of the patient’s pain.
The Fugl-Meyer test is a well-designed, practical and efficient clinical examination
method that has been tested widely in the stroke population. It was developed by Twitchell and
Brunnstrom [13] as the first quantitative evaluative instrument for measuring sensori-motor
stroke recovery. Fugl Meyer assessment includes a scale comprising of 226 points and was
developed to assess patients recovering from hemiplegic (one sided lesion) stroke. It is divided
into five domains: motor function, sensory function, balance, joint range of motion and joint pain.
Each domain consists of many items and each item is scored on a 3 point scale (0, 1, 2) [14]. A
score of zero implies inability to perform, a score of one, partial performance, and a score of two
suggests full performance. Similar to the Chedoke-McMaster, the Fugl-Meyer test involves
physical and observational assessment by clinicians.
Numerous studies carried out to understand the sensori-motor deficits and recovery from
stroke have used the Fugl-Meyer test as the primary clinical assessment tool [5, 9, 12]. Other
studies focusing on the use of robotic devices in rehabilitation have also used the Fugl-Meyer test,
to assess improvements in patients after robotic assisted rehabilitation [15, 16].
CHAPTER 2. PROBLEM DOMAIN - STROKE
14
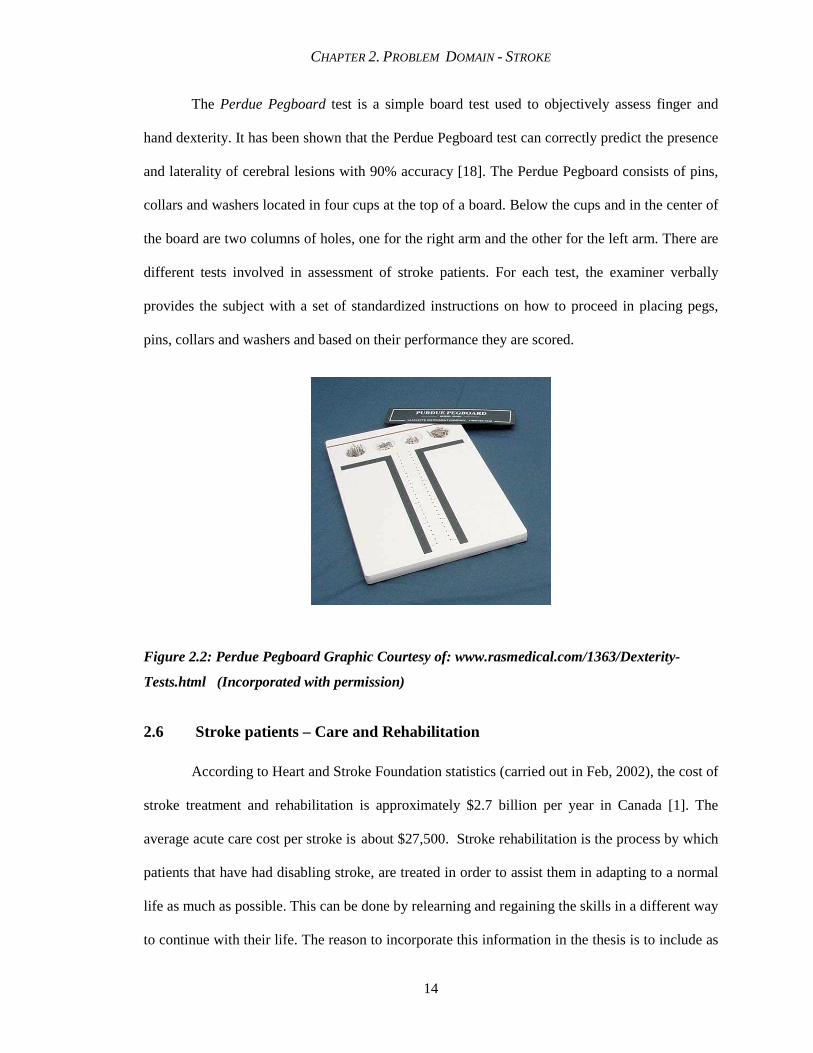
The Perdue Pegboard test is a simple board test used to objectively assess finger and
hand dexterity. It has been shown that the Perdue Pegboard test can correctly predict the presence
and laterality of cerebral lesions with 90% accuracy [18]. The Perdue Pegboard consists of pins,
collars and washers located in four cups at the top of a board. Below the cups and in the center of
the board are two columns of holes, one for the right arm and the other for the left arm. There are
different tests involved in assessment of stroke patients. For each test, the examiner verbally
provides the subject with a set of standardized instructions on how to proceed in placing pegs,
pins, collars and washers and based on their performance they are scored.
Figure 2.2: Perdue Pegboard Graphic Courtesy of: www.rasmedical.com/1363/Dexterity-
Tests.html (Incorporated with permission)
2.6 Stroke patients – Care and Rehabilitation
According to Heart and Stroke Foundation statistics (carried out in Feb, 2002), the cost of
stroke treatment and rehabilitation is approximately $2.7 billion per year in Canada [1]. The
average acute care cost per stroke is about $27,500. Stroke rehabilitation is the process by which
patients that have had disabling stroke, are treated in order to assist them in adapting to a normal
life as much as possible. This can be done by relearning and regaining the skills in a different way
to continue with their life. The reason to incorporate this information in the thesis is to include as
CHAPTER 2. PROBLEM DOMAIN - STROKE
15
much knowledge about the domain as possible in order to enhance the functionality of our case
based system. Successful rehabilitation of stroke patients is a vital multidisciplinary phenomenon
since the main goal and output of diagnosis and prognosis is ultimately to what level did the
patient improve? This phenomenon is comprehensive, and is based on various factors, a few of
which are:
• extent of brain damage
• timing of rehabilitation
• support and patience of family and friends
• patient’s positive attitude towards recovery and
• the adeptness of the rehabilitation team, which includes the nursing staff,
therapists, social workers, pharmacists and/or psychologists.
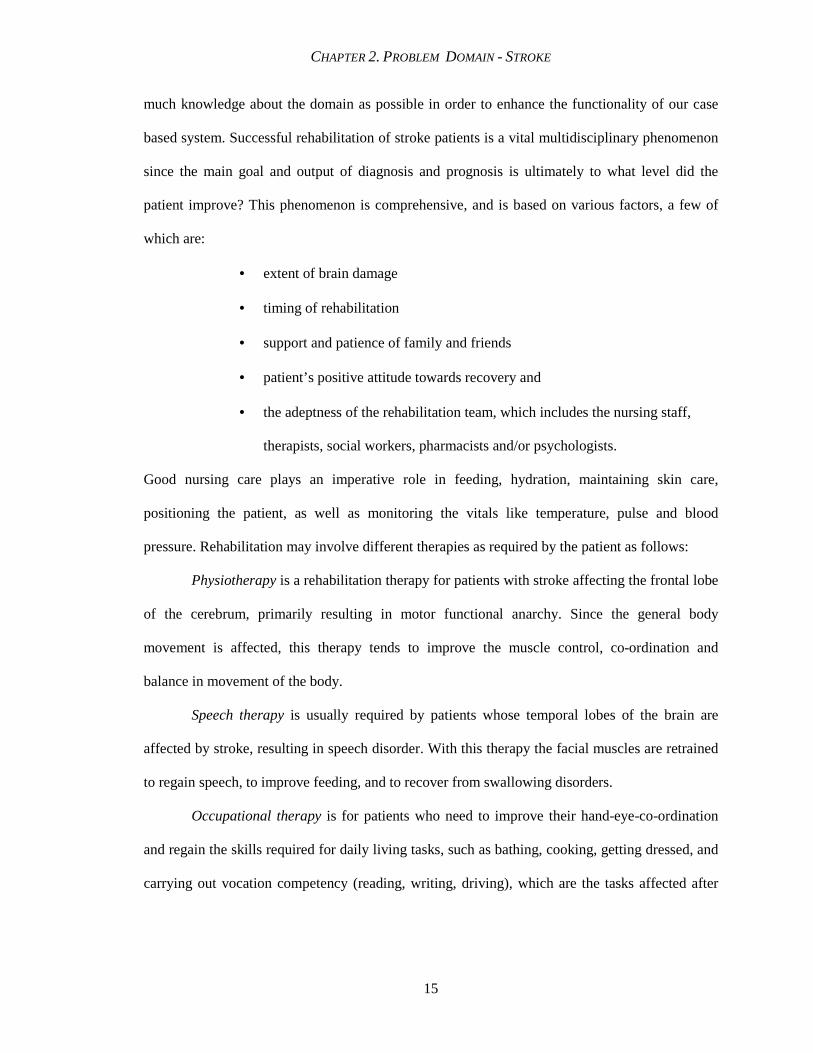
Good nursing care plays an imperative role in feeding, hydration, maintaining skin care,
positioning the patient, as well as monitoring the vitals like temperature, pulse and blood
pressure. Rehabilitation may involve different therapies as required by the patient as follows:
Physiotherapy is a rehabilitation therapy for patients with stroke affecting the frontal lobe
of the cerebrum, primarily resulting in motor functional anarchy. Since the general body
movement is affected, this therapy tends to improve the muscle control, co-ordination and
balance in movement of the body.
Speech therapy is usually required by patients whose temporal lobes of the brain are
affected by stroke, resulting in speech disorder. With this therapy the facial muscles are retrained
to regain speech, to improve feeding, and to recover from swallowing disorders.
Occupational therapy is for patients who need to improve their hand-eye-co-ordination
and regain the skills required for daily living tasks, such as bathing, cooking, getting dressed, and
carrying out vocation competency (reading, writing, driving), which are the tasks affected after
CHAPTER 2. PROBLEM DOMAIN - STROKE
16
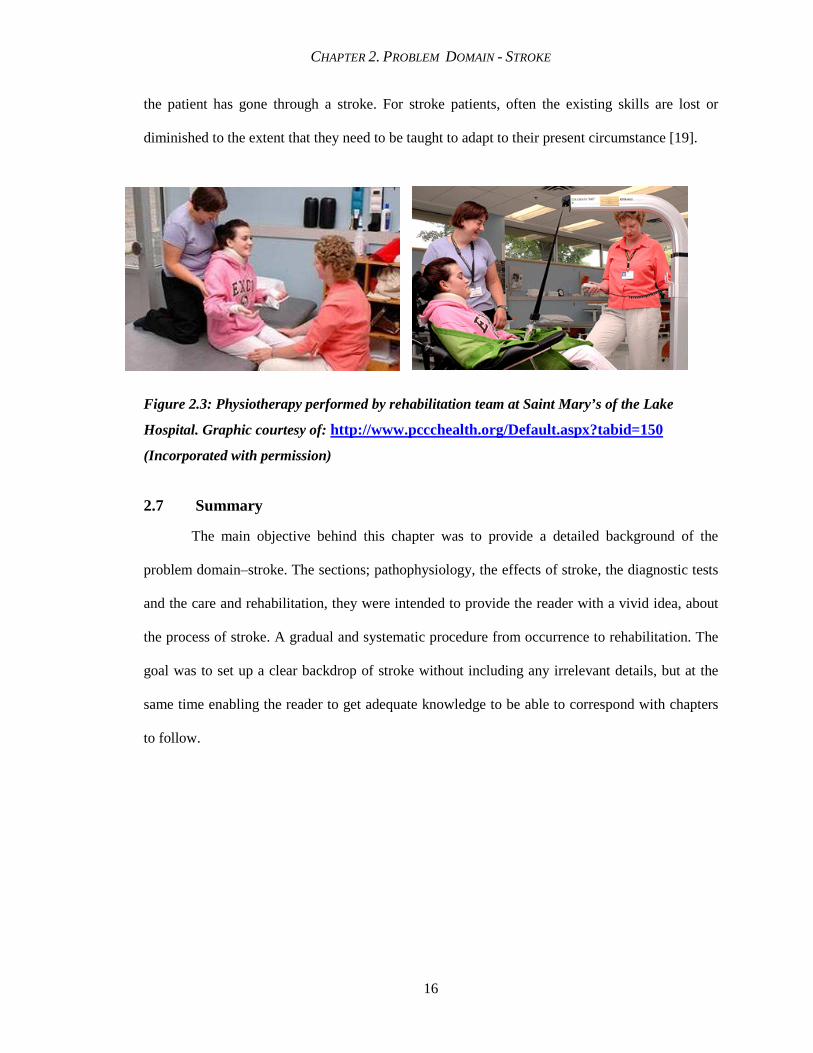
the patient has gone through a stroke. For stroke patients, often the existing skills are lost or
diminished to the extent that they need to be taught to adapt to their present circumstance [19].
Figure 2.3: Physiotherapy performed by rehabilitation team at Saint Mary’s of the Lake
Hospital. Graphic courtesy of: http://www.pccchealth.org/Default.aspx?tabid=150
(Incorporated with permission)
2.7 Summary
The main objective behind this chapter was to provide a detailed background of the
problem domain–stroke. The sections; pathophysiology, the effects of stroke, the diagnostic tests
and the care and rehabilitation, they were intended to provide the reader with a vivid idea, about
the process of stroke. A gradual and systematic procedure from occurrence to rehabilitation. The
goal was to set up a clear backdrop of stroke without including any irrelevant details, but at the
same time enabling the reader to get adequate knowledge to be able to correspond with chapters
to follow.

17
CHAPTER 3
KINARM - Kinesiological Instrument for
Normal and Altered Reaching Movement "I never think of the Future - it comes soon enough" (Albert Einstein)
This chapter elaborates on the robotic devices used in the assessment and rehabilitation of
upper limbs with an emphasis on KINARM as an innovative means of quantifying upper limb
impairments. It also describes the setup and method of how KINARM assessment was
incorporated in the CBR system.
3.1 Use of Robotic Technology in Assessment and Rehabilitation
Recently, there has been an explosion in the application of robotic technologies for
quantifying motor function. These devices have significantly made a difference in contributing to
the knowledge of neural and mechanical basis of motor control [7]. The successful use of such
robots in research has shown potential for their use in a clinical setting. With an increased
demand on the healthcare system and limited resources, researchers are motivated to think about
ways in which to optimize the quality and cost- effectiveness of healthcare. Many robots have

CHAPTER 3. KINARM
18
been designed with a focus on rehabilitation uses. The robots were developed, not to replace
therapists, but to assist and support them in their efforts to facilitate a disabled individual's
functional recovery.
The MIME (Mirror-Image Motion Enabler) robot is used to move the affected arm in
straight lines or in complex patterns, along a tabletop surface or in a 3-dimensional space [72].
The subject’s forearm movement is passive when the subject is unable to move by himself,
therefore, the movement is facilitated by the robot. On the other hand, the action is active when
the subject initiates the movement. The robot provides any necessary assistance to the impaired
arm if required to complete the movement. MIME takes commands from the unaffected arm to
help move the affected arm in a mirror-image pattern. This permits practice of bi-manual
movements to aid in the recovery of muscle control. Research studies with MIME show that both
robot-assisted and unassisted stroke groups improved their ability to move the affected arm, but
the robot-assisted group showed a faster recovery [72]. The MIME project used the Fugl-Meyer
test to assess the improvements in motor performance.
ARM Guide (Assisted Rehabilitation and Measurement Guide) is used to assist in
recovery [73]. The aim is to examine whether the mechanical assistance provided by the robot or
the repetitive movement attempts made by the patients is the primary cause of recovery.
Experiment results showed comparable results between subjects who performed free reaching and
subjects that underwent robot assisted reaching. ARM Guide uses Chedoke-Mcmaster for
assessment.
3.2 Visually Guided Reaching Movements in Stroke Patients
Several studies have examined the kinesiology of patients following stroke. It
was seen that patients with hemiparesis produce hand movements that are less smooth,
more variable, slower and more segmented with a greater number of velocity peaks, than
neurologically intact subjects [92], [93], [94]. Along with these differences in hand
CHAPTER 3. KINARM
19
kinematics, stroke subjects can also be characterized by high within-subject variability on
repeated performance [95], [96]. In a recent study early this year [97] it was observed
that “directional deviation”, or the difference between the initial hand movement
direction and target location, was anisotropic and greatest to targets farther away from the
subjects. It was also noted, through an analysis of joint kinetics, that these directional
deviations were associated with abnormal spatial tuning of the muscle torque at the
elbow. Another research reported that hemiparetic patients exhibited a deficit in inter
joint coordination, as characterized by a lag in elbow rotation with respect to that of the
shoulder [12].
The goal of most upper limb studies on stroke patients was generally focused on
quantifying recovery after stroke, or on showing quantitative differences between
neurologically intact subjects and a group of stroke patients. In most cases, the
populations of stroke patients chosen for the studies were relatively homogeneous such as
in this study [98], 15 stroke patients were chosen, 14 of which had a single ischemic
stroke in the territory of the middle cerebral artery. Another study [10] had only 8
subjects, out of which 6 exhibited similar deficits. Therefore, while they can identify
clear differences between stroke and control subjects, the experiments were not
developed to create quantitative assessment tools.
3.3 Bi-lateral KINARM Setup
Robots have been used extensively in rehabilitation [15, 16, 76]. There have been limited
attempts, so far, for their use as clinical assessment tools [40]. One of the particular interests is
the robot’s ability to quantify even subtle variations in motor performance during different

CHAPTER 3. KINARM
20
Figure 3.1 Bilateral KINARM device used in this study.
experimental trials. Such differences are not visible to the naked eye as observed in most of the
clinical assessment settings.
In this research, the dual-arm robotic device KINARM was used to collect data for stroke
assessment besides the other conventional assessment measures. KINARM, which stands for
Kinesiological Instrument for Normal and Altered Reaching Movement, is a robotic bilateral-arm
system (BKIN Technologies Ltd., Kingston, Canada; Scott 1999). It is the only device of its kind
that measures multi-joint movement at the shoulder, elbow and hand, leading to new findings
about how the brain coordinates limb movements. It is an exoskeleton comprising of hinge joints
that align the subject’s shoulder and elbow in a way that enables arm movement on a horizontal
plane. The subject's arm (including the upper and forearm) is attached to the mechanical linkage
by fiberglass braces (see Figure 3.1). Motors attached to the mechanical linkage provide angular
position of the joints and can apply torques either to the shoulder or elbow, or both.
Although many studies were aimed at understanding upper limb impairments in stroke
subjects, very few incorporated motion analysis [12, 74, 75]. KINARM is used in combination
with a computer projection system that uses a graphical development environment, LabView,

CHAPTER 3. KINARM
21
which manipulates and analyzes the entire data. The same computer also controls eight virtual
targets in the plane of the arm, such that the index finger tip and target positions are projected as
small circles on a semi-transparent mirror.
3.4 KINARM Tasks
KINARM is being used to study the sensory and motor functioning in upper limbs;
therefore, several tasks are designed that are performed by the stroke subjects as well as the
controls in order to study the phenomenon. For details of the KINARM tasks please refer to
Appendix A. Figure 3.2 shows the sensory matching task.
Figure 3.2: Sensory Matching Task. The subject is supposed to match the right arm to the left
arm that is moved by the robot.
3.4.1 Sensory-Matching Task (Position Matching)
In the sensory matching task, the subject cannot see his/her arms. There are nine different
spatial locations. One arm is moved passively by the KINARM to one of these nine spatial
locations in the horizontal plane and then the subject is required to actively move the other arm to
a mirrored location in space. Data for the actively moving arm is collected in terms of joint angles
and hand position. There is no visual feedback during the task [85].

CHAPTER 3. KINARM
22
Figure3.3: Centre-out reaching task. Finger tip position is marked by the green circle.
3.4.2 Center-Out reaching Task
For each center out-reaching task the subject is required to match their finger tip position
with a target position as soon as the target illuminates. Figure 3.3 clearly shows the green circle
marking the finger tip position. The subject moves his/her hand to one of eight targets from the
center-hold position. Once the target light comes on and after it is turned off the subject moves
back to the central position and waits for the next random target light to be turned on. The
position of the finger tip and the velocity during a reaching task are recorded. Eight repeat trials
are performed for each target as seen in Figure 3.4. The order of target presentation is random.
Three seconds are given to complete a single reaching trial and data recording stops after three
seconds are over. If a subject completes the trial in a time frame less than three seconds then they
are required to maintain their hand in the peripheral target location until the peripheral target light
goes off.
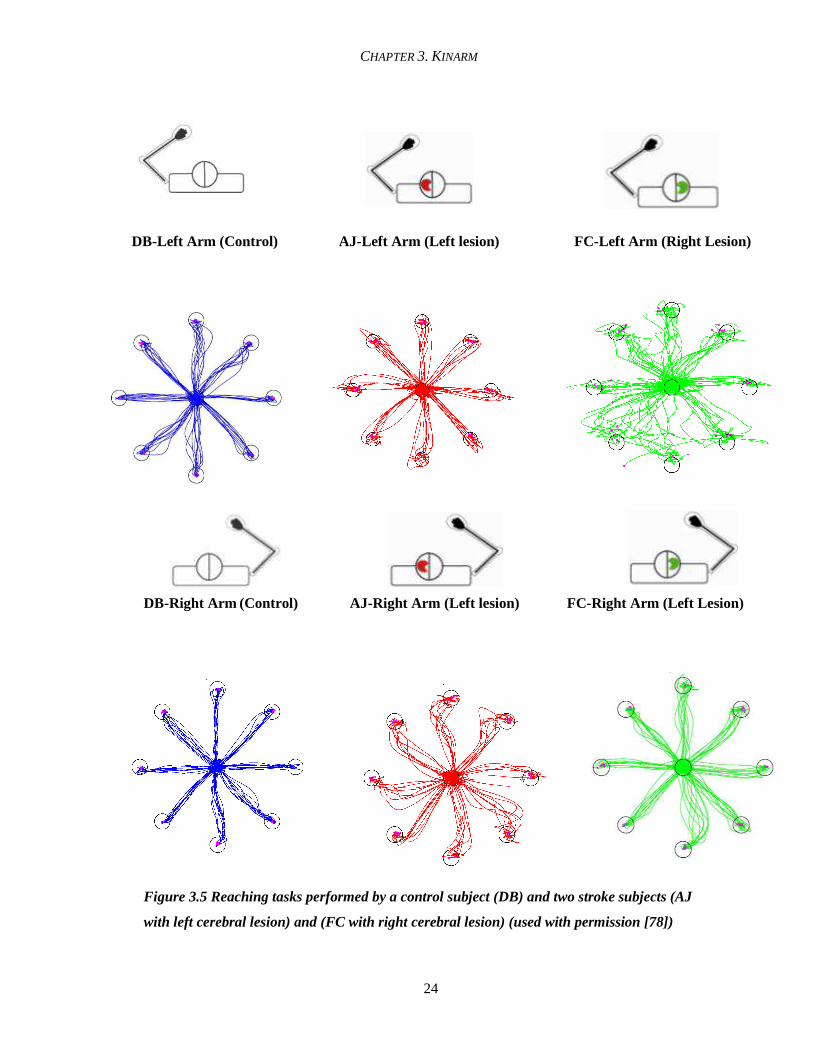
In order to further elaborate how the performance of different subjects can be visually
distinguished by the center-out reaching task, some results are shown in Figure 3.5.

CHAPTER 3. KINARM
23
A. B.
Figure 3.4: Target positions on the KINARM device. A. The subject moves his/her hand to one of eight targets from the center hold position (fingertip) once the target light comes on. B. Targets in terms of angular design on the bilateral system
The figure displays hand trajectories of three subjects in three different colors, blue for
the control subject, red for the stroke subject with right side of brain affected and green for the
stroke subject with lesion on the left side of the brain. The results are visually significant and
distinct as for the control subject (DB), it can be clearly observed that the hand performance is
quite smooth for both the arms. However for the subject with right side of the brain affected (AJ)
the irregularity is seen in the left hand performance whereas for the subject with left side of the
brain affected (FC), the hand trajectory of the contra-lateral side (right side) exhibits irregularity.
This also corresponds to the information provided earlier (Chapter 2, Section 2.3), that right side
of the cerebrum controls the left side of the body and left side controls the right side of body.
CHAPTER 3. KINARM
24
DB-Left Arm (Control) AJ-Left Arm (Left lesion) FC-Left Arm (Right Lesion)
DB-Right Arm (Control) AJ-Right Arm (Left lesion) FC-Right Arm (Left Lesion)
Figure 3.5 Reaching tasks performed by a control subject (DB) and two stroke subjects (AJ
with left cerebral lesion) and (FC with right cerebral lesion) (used with permission [78])

CHAPTER 3. KINARM
25
3.5 Parameters Selection
There are many variables and parameters to clarify motion analysis by KINARM that
were studied by previous students such as hand path length, number of first peak velocities, hand
path distance ratio and tangential velocity [6]. The parameters that are chosen for this research to
be used in the CBR system are enumerated as follows:
• RT_mean (s): the subject’s reaction time i.e. the length of the interval between when the
target light appeared and first volitional movement was detected.
• PostureSP_mean (m/s): Posture speed is the average hand speed.
• TMT_mean(s): Total movement time is the total time of movement from start till the end.
• PathLenRatio_mean (m): Path length ratio is the estimated length of the hand path
during the total movement.
• MTMaxSP_mean (m/s): Movement maximum speed, MTMaxSP_mean refers to the
maximum hand speed between the movement onset and offset
• FMTMaxSP_mean (m/s): First movement max speed indicates the first local maximum
hand speed found after the target light came on.
• FMTDisErr_mean (m): First movement distance error is the distance between the
hand position after the first movement (at the minimum hand speed subsequent to
FMTmaxSP) and the centre of the peripheral target (T2).
• FMTDirErr_mean (rad): First movement direction error is the difference in angle
between the optimal reach path and the subject’s initial reach direction.
For each parameter the mean for all trials (for each target) was used, reason being that it is
insensitive to the noise that may be caused by inattention of the subjects. These eight parameters
are particularly given preference over the others because each of them possessed important
information that was later utilized in classification of stroke subjects. Please refer to Chapter 5,
Section 5.3.2 for details. For instance, FMTMaxSP_mean refers to the maximum hand speed

CHAPTER 3. KINARM
26
between the movement onset and offset. In classifying stroke impairment this is a fundamental
piece of information since stroke subjects reveal greater variability in the kinematics/kinetics of
their movements than controls. RT_mean on the other hand measures the response time of a
subject to a stimulus that is the length of the interval between when the target light appeared and
first volitional movement was detected. However, it was chosen because theoretically it reflects
the sensory capacity of brain to detect a stimulus, and the processing time involved in planning
and initiating a response. This mechanism of brain processing is referred to as open loop
processing [77].
An algorithm for the automated detection of movement onset has been developed by
Scott’s group [6]. This allows for the calculation of reaction time (See Figure 3.5). Now with the
latest development of movement offset algorithm, recently developed, parameters that can
measure the closed loop components can be calculated (example, total movement time that could
not be calculated before, in the absence of movement off set.). It is expected that stroke subjects
with a lesion affecting the open loop processing will present a higher reaction time value,
meaning a slower response. FMTMaxSP_mean of the hand measures the speed of the initial
movement; therefore, if a subject can only initiate slow movements, it can be clearly identified by
this parameter.
3.6 Research Conclusions
The data analysis that has been carried so far, regarding this research by fellow
researchers have concluded that although control subjects show variability in the magnitude of
reaction time, they tend to show symmetry in reaction time values for both arms and both
movement directions [78]. Although some stroke subjects had shown a longer reaction time than
control subjects, a stronger observation that was reflected in the results was that of the difference
in reaction time for both arms caused by single arm impairments. Symmetry in reaction time for

CHAPTER 3. KINARM
27
both arms and both movement directions could therefore be incorporated as part of a new clinical
score on reaction time.
Analysis of FMTMaxSP_mean for different muscle groups proved to be more difficult as
symmetry of both arms for control subjects was only observed on shoulder extension and
shoulder flexion. Many stroke subjects also showed similarity in FMTMaxSP_mean for the
shoulder muscle groups. For elbow extension and elbow flexion the only notable difference
between control and stroke subjects was that of magnitude as some stroke subjects (with affected
left arm) presented a lower value for FMTMaxSP_mean [78].
3.7 Correlation of Summarized Parameters with Clinical Scores
The results of RT_mean and FMTMaxSP_mean were compared with the Chedoke
Arm scores and the Purdue Pegboard scores that revealed that some correlation was
observed but each measure has its own advantage. For instance, RT_mean and
FMTMaxSP_mean are parameters that are capable of capturing delayed response time
which the other two clinical protocols are unable to capture. Clinical measures on the
contrary, are able to capture impairments not detected by the KINARM parameters. For
example, the Purdue Pegboard score can measure hand dexterity problems. Therefore it is
suggested that the KINARM system should not replace current assessment measures;
rather its use could provide new additional information that could assist in rehabilitation
[78]. In our research we incorporated KINARM assessment as well as the assessments
done with Chedoke McMaster and Purdue pegboard protocols.

28
Chapter 4
Background - The Computational
Techniques
"I have but one lamp by which my feet are guided, and that is the lamp of experience. I know no
way of judging the future but by the past”. (Patrick Henry)
This chapter consists of two main parts, referring to the main computational technique - CBR and
the particular framework that was applied – TA-3. The first part provides a synopsis of CBR
elaborating on the main principle of this AI paradigm, its architecture, previous work carried out
in this area and its diverse applications, with a special emphasis on its significance in health
informatics. The second part presents the background of TA-3 (tatry), its design, functionality
and its diverse applications that provided motivation to use it in this research.
CHAPTER 4. BACKGROUND – THE COMPUTATIONAL TECHNIQUES
29
4.1 What is CBR?
We humans are strong problem-solvers. We solve every day problems ranging from a
simple task like a change of recipe (to alter the taste), avoidance of heavy traffic hours and routes,
to complex tasks like troubleshooting locomotive problems of an airplane. In all the scenarios the
objective is to improve the performance and efficiency with the utilization of experience and
that’s what the objective of AI is as well. In our day to day living, we observe that carrying out
human expertise using a machine is much more precise, accurate and time-efficient.
Theoretically speaking, CBR is an important paradigm of artificial intelligence mainly
used for problem-solving [3]. It tends to apply efficient methods to define descriptive patterns and
explanations within an enormous amount of data. The basic idea behind CBR is to solve a new
problem by remembering and reusing information from a previous similar experience. It can be
applied in a variety of ways based on the intended use of the reasoning, such as to adapt and
combine old solutions to solve a new problem, to critique new solutions based on old cases or, to
classify entities based on the criterion of similar features.
The roots of CBR in AI can be traced from the theories of concept formation, problem
solving and experiential learning within philosophy and psychology [23, 24]. Their objective was
to develop decision-support systems that help to solve problems in open and weak theory
domains. In other words, hard problems need improved methods to ground their models in real
world situations. The field was further enhanced with the contributions of Roger Schank by his
research in dynamic memory and situation patterns in problem solving and learning [25]. His
idea of a problem-solving system comprised of a problem-solution criterion, in which the
reasoner solves new problems by adapting relevant cases from the problem library.
Analogy-making, refers to our ability to see a particular object or situation in one context
as being “the same as” another object or situation in another context. It plays a significant role in
problem solving, decision making, perception, and communication just like CBR. Gentner

CHAPTER 4. BACKGROUND – THE COMPUTATIONAL TECHNIQUES
30
performed investigations that are attributed to analogical reasoning [26]. He developed a
theoretical framework for analogy. Carbonell explored the role of analogy in learning and plan
generalization [33]. CBR has also been applied to the field of legal reasoning, which requires a lot
of expertise and involves multiple factors. Rissland was the pioneer who applied CBR to this field
[34].
The first system that is considered as a case-based reasoner can be attributed to Janet
Kolodner at Yale University and was named CYRUS [22]. It was based on Schank's dynamic
memory model. CYRUS contained knowledge, in the form of cases, and was basically a
question-answering system with information of the various travels and meetings of former US
Secretary-of-State Cyrus Vance. Subsequently, with an increasing number of research papers and
diverse applications, CBR has grown into a field of widespread interest. It has proven itself to be
a methodology suited to solve “weak theory” domains, which are the areas in which it is difficult
or impossible to educe first principle rules to obtain solutions.
4.1.1 Significance of CBR
Humans and computers can interact in a prolific manner in order to solve problems with
the application of CBR. Looking at the CBR phenomenon, some processes are easier to perform,
for humans where as others are more appropriate for computers. People for instance can perform
creative adaptation very well but might not remember the complete range of applicable cases due
to being biased in their memory or for novices they still do not have the adequate experience to
solve a variety of problems. Previous work has shown that CBR provides a number of advantages
over alternative approaches [22].
• CBR does not require extensive analysis of domain knowledge. It permits problem
solving even if the reasoner does not have full domain knowledge. The main requirement
is to be able to compare two cases.
CHAPTER 4. BACKGROUND – THE COMPUTATIONAL TECHNIQUES
31
New Case
Case Base
Cases
Solved Case Tested
repaired Case
Learned Case
RETRIEVE
R E U S E
REVISE
Suggested Solution
Confirmed Solution
R E T A I N
Problem
• CBR allows shortcuts in reasoning. If a suitable case is found, a solution can be promptly
proposed.
• CBR can lead to improved explanation capability in situations where the most
comprehensible explanations are those that involve specific instances [62].
• CBR can help in avoiding previous errors and in facilitating learning. In fact the system
keeps a record of each situation that occurred for future reference.
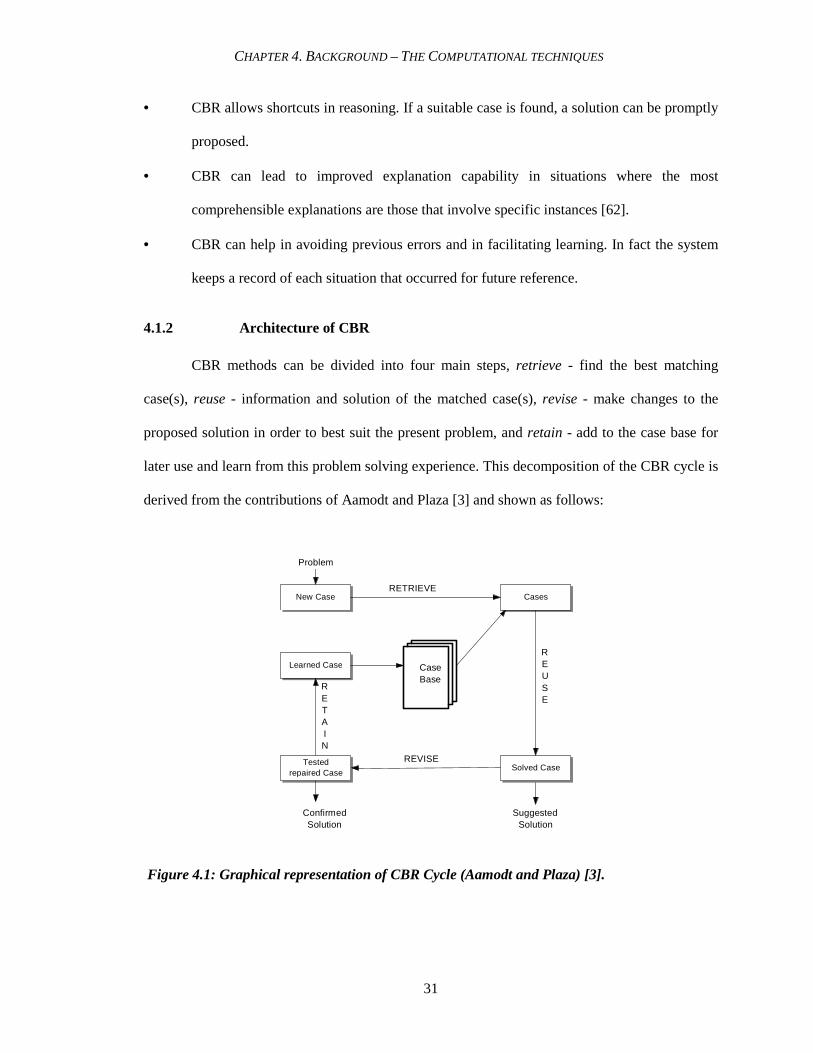
4.1.2 Architecture of CBR
CBR methods can be divided into four main steps, retrieve - find the best matching
case(s), reuse - information and solution of the matched case(s), revise - make changes to the
proposed solution in order to best suit the present problem, and retain - add to the case base for
later use and learn from this problem solving experience. This decomposition of the CBR cycle is
derived from the contributions of Aamodt and Plaza [3] and shown as follows:
Figure 4.1: Graphical representation of CBR Cycle (Aamodt and Plaza) [3].

CHAPTER 4. BACKGROUND – THE COMPUTATIONAL TECHNIQUES
32
4.1.3 Case Representation
A case refers to a real-world experience in a certain set of circumstances. Generally a
case is composed of three main parts: a problem, its solution and the corresponding outcome that
can make it a positive or a negative experience [22]. A case should not be misunderstood with a
simple record. Let us consider a library database, containing hundreds of records (books, journals
and articles). In order to change one of these simple records into a case, it is required to associate
an experience to the record, such as a student accessing the library database with a goal, (e.g. find
a fiction novel), with a situation context (e.g., Thursday afternoon), with a strategy (e.g., book of
a particular year, by an author) and with an outcome/feedback (e.g., specific record accessed or
student’s satisfaction/dissatisfaction).
A record is static information with no particular goal, task or action associated to it. On
the other hand, a case comprises of active information - active in the sense that there is real time
experience associated with it. A case has been defined as “A contextualized piece of knowledge
representing an experience that teaches a lesson fundamental to achieving the goals of the
reasoner” [22].
Example: A case comprises of three main parts: problem, solution and the outcome.
Problem in some cases is further divided into goal, description and constraints, depending on the
reasoner. CHEF which is a case-based planner used for recipe creation can be used as an example
[28]. Let’s take an example of making a dish with chicken and corn that should be sour and spicy.
The case components for this case would be; the goal – making a dish, the problem description -
should have the constraints that it should have chicken and corn as ingredients and have a sour
and spicy taste. Solution for this case will be ‘Chicken corn soup’ which is the dish that satisfies
all the constraints, and the outcome/feedback is how the taste was. Was it too sour or perfect?
Was it too thick, too watery or perfect?

CHAPTER 4. BACKGROUND – THE COMPUTATIONAL TECHNIQUES
33
Case Representation in various CBR Systems
There are numerous ways to represent a case. Previous case-based systems have adapted
various methods to represent cases. They can be as simple as database records, as in Battle
planner (Goodman 1989) that consisted of 600 cases, or it may have a complex frame-based
representation as in Mediator [69] which was used for dispute resolution area. CHEF [28] which
was a simple meal planning system, represented cases in the format of a goal, a situation, a
solution and a feedback.
Cardie [67] presented his case-based system and represented cases in the form of a single
open-class word and the corresponding context. In this case base, cases were described by 38
attribute-value pairs. PROTOS that was developed in the domain of clinical audiology was used
to classify hearing disorders. It comprised of 200 cases in 24 categories, from a speech and
hearing clinic [43]. Figure 4.2 shows the visual representation of a case designed by Cardie, case
representation in CHEF and in PROTOS. Before we proceed to the first main step of CBR cycle;
case-retrieval, some important concepts about indexing are elaborated that play an important role
during case retrieval.
4.1.4 Case Retrieval
The goal of case retrieval is to return the best matching case(s) from the case base. The
process of retrieving a case or a set of cases from the case base is also termed out as
‘ remembering’. It basically involves two steps: [22]
i. Recalling previous cases: The main aim of this step is to retrieve those cases that have the
potential to make relevant predictions about the new case. This step is carried out by using
features of the new case as indexes; based on which a match is generated from the case library.
ii. Selecting the best subset: The most promising case(s) is (are) selected in this step. The main
aim of this step is to minimize the number of relevant cases to a few most closely matched-ones.
Sometimes only one case is selected; sometimes a small set is chosen.

CHAPTER 4. BACKGROUND – THE COMPUTATIONAL TECHNIQUES
34
CHEF
Case
Composition
Goal
Example:
(To prepare a dish)
Situation
Example:
(Available / missing
ingredients)
Solution
Example:
(Recipe to follow)
Feedback
Example:
(Result of food preparation)
Cardie
Open Class
Word
Context
Valu
Attribute
PROTOS
Case Representation
Example: In planning a meal for a group of friends, the host might remember (refers to
retrieval) how she did the planning for the previous get-together (referring to case-library). Her
experience (refers to one of the relevant cases) would help her plan the dishes such as she
remembered one of her friends is a vegetarian and one is allergic to nuts.
A.
B.
C.
Figure 4.2: Representation of Cases in different Case-Based Systems A.CHEF [28],
B. PROTOS [43] and C. CARDIE [67].
Therefore, keeping both of them in mind she would try to include some vegetarian dishes and
avoid any nuts in the desserts or dishes that she prepares. Similarly, in CBR, cases that satisfy the
similarity criterion are retrieved and information contained in them is used to solve the situation.

CHAPTER 4. BACKGROUND – THE COMPUTATIONAL TECHNIQUES
35
Case Retrieval in various CBR Systems
There are several retrieval algorithms that have been applied by different reasoners. Case
retrieval takes place as a combination of searching and matching. The case base is searched in
order to find the matching cases, which can be analyzed for their potential usefulness. This
analysis of potential usefulness is performed with the help of ‘matching functions’. In some CBR
systems, search and matching is a sequential method, where as in some it is interleaved [22].
Similarity and Matching
The degree of match refers to how well the values of the corresponding attributes match.
It is an important parameter pertaining to measuring the distance between two values, on a
qualitative scale [22]. Two main concepts that require importance with regards to matching are:
importance of a dimension (descriptor/attribute) in analyzing the similarity and degree of match
of the values, along a certain dimension.
Dimension: Some dimensions (descriptors/attributes) of a case are more important in
judging the usefulness than others, therefore, an efficient retrieval algorithm takes into account
which features/attributes of a case are more important and categorizes (scores) the cases
accordingly. For example, if the reasoner is attempting to choose a diagnosis based on the age,
then a match between the current case’s age and value of age in an old case are most important.
Next in importance are matches between the constraints that guide how the range of symptoms
must match; next in importance are matches of the descriptive features which assisted in choosing
the plan previously. If two values are within the same qualitative range, they are considered a
match, for example age 60 and up is considered as old age, therefore, 62 and 75 are a good match,
40 through 59 is middle age and 20 through 39 is considered as young adult. Therefore, ages 41
and 63 are one qualitative region apart where as 33 and 63 are two qualitative regions apart. This
concept is reflected later in Chapter 5 for the retrieval algorithm for this case base system.

CHAPTER 4. BACKGROUND – THE COMPUTATIONAL TECHNIQUES
36
Degree of match: Sometimes, dimensions (attributes) match each other partially. For
example in one case the dimension color is specified as red and another as orange. Red and
orange match better than red and blue but not as well as red and red. Therefore, an efficient
matching algorithm also takes into account the degree of match along with the dimension
(attribute). However, cases that match well on important dimensions (attributes) are considered as
better matches than those that match well on less important dimensions [22]. For example, for a
reasoner to diagnose a disease, a case that matches the symptoms (heart rate, pulse, and
temperature) would be a better match than the one that has same height, weight or hair color.
Following are a few of the algorithms used by various reasoners [22]:
i. Serial search on a flat memory: This algorithm is easy to implement and performs a full
search of the case library by applying a matching function sequentially to each case in the library
and returning the best matching ones, but the problem arises when the case library gets larger and
eventually the search becomes slower. In order to deal with this problem the memory should be
partitioned so that the search algorithm can work efficiently.
ii. Shared–feature networks partition: It divides the case library according to the sizes of the
sets of features shared by cases. Searching such networks is more efficient than a serial search but
it has a disadvantage of missing even well-matching cases if the network is not prioritized.
iii. Prioritized discrimination networks: In such networks the case library is divided into one
dimension at a time, the one being the most important dimension being the first. However this
algorithm has problems dealing with missing features in a new case and also if the system is used
for several tasks that have to be prioritized separately.
iv. Redundant discrimination networks: This overcomes one of the problems faced by
prioritized discrimination networks because it can deal with the missing features in a new case.
Multiple discriminations are performed at each level of the network. This has been one of the
most commonly used algorithms in most of the popular systems. The reason being that this
approach provides the best matching cases, but on the other hand it also returns barely-matching

CHAPTER 4. BACKGROUND – THE COMPUTATIONAL TECHNIQUES
37
cases, therefore a second phase of matching has to be performed. Several variations have been
performed on this algorithm; however, this method allows for a better and more accurate
retrieval.
v. Parallel retrieval algorithms: In parallel retrieval, unlike serial search, a matching
function is applied to all the cases in the library which makes the search far more efficient than
serial search. However, the main significance of parallel approach is not in terms of efficiency but
rather it is meant to allow indexing as a label-assignment process rather than a process of pointer
assignment [22]. Parallelism tends to speed up the process but the need to partition the case
library will have its own significance. Table 4.1 shows some of the retrieval algorithms applied
by different case base systems:
Case-based System Retrieval Algorithm
CHEF[28] Discrimination net search
CASEY [42] Redundant discrimination network
PROTOS [43] Classification algorithm
CYCLOPS [27] Serial search
Table 4.1 A few case base systems with their retrieval algorithms [22].
4.1.5 Attribute Selection
In a CBR system, attributes are the key features used to classify cases and develop a basis
for the similarity criterion. Since case-based classifiers and nearest-neighbor algorithms are very
sensitive to their input features, irrelevant attributes may cause an increase in the classification
error. The classification of attributes is a complex and important phenomenon because the main
goal here is not to include any attributes/features; but informative attributes/features. The
significance of removing the irrelevant attributes/features (non-informative) ones is to overcome
the curse of dimensionality [79]. The term refers to the problem caused in scenarios, where there
are tens of thousands of attributes but only a few hundred cases/samples, such as in domains like
CHAPTER 4. BACKGROUND – THE COMPUTATIONAL TECHNIQUES
38
micro array data sets measuring thousands of genes simultaneously. The potential benefits of
attribute selection may include: enhancement of CBR performance, facilitation in data
visualization and data understanding; reduction in storage requirements and improvement of
prediction performance.
Attribute Selection Techniques
There are various attribute selection techniques which can be categorized according to a
number of criteria. One popular categorization is in terms of “filter and wrapper” to describe the
nature of the metric used to evaluate the worth of attributes [106]. Wrappers evaluate attributes by
using accuracy estimates provided by the actual target learning algorithm. Filters, on the other
hand, use general characteristics of the data to evaluate attributes and operate independently of
any learning algorithm. Another useful taxonomy used for attribute selection is dividing
algorithms into those which evaluate and hence rank individual attributes and those which
evaluate and rank subsets of attributes. We consider three methods that evaluate individual
attributes (Information gain attribute ranking, relief & principal components analysis) and
produce a ranking unassisted, and a further three methods (Correlation-based feature selection,
consistency-based subset evaluation & wrapper subset evaluation) which evaluate subsets of
attributes. Following are some of the popular attributes selection techniques:
• Information Gain Attribute Ranking: This is one of the simplest (and fastest) attribute ranking
methods and is often used in text categorization applications where the sheer dimensionality
of the data precludes more sophisticated attribute selection techniques [111]. If A is an
attribute and C is the class, the amount by which the entropy of the class decreases reflects
the additional information about the class provided by the attribute and is called ‘information
gain’. Each attribute is assigned a score based on the information gain between itself and the
class.

CHAPTER 4. BACKGROUND – THE COMPUTATIONAL TECHNIQUES
39
• Relief: Relief is an instance based attribute ranking scheme introduced by Kira and Rendell
[107]. Relief works by randomly sampling an instance from the data and then locating its
nearest neighbor from the same and opposite class. The values of the attributes of the nearest
neighbors are compared to the sampled instance and used to update relevance scores for each
attribute.
• PCA - Principal Component Analysis: Principal component analysis is a statistical technique
that can reduce the dimensionality of data as a by-product of transforming the original
attribute space. Transformed attributes are formed by first computing the covariance matrix
of the original attributes, and then extracting its eigenvectors. Eigenvectors can be ranked
according to the amount of variation in the original data that they account for. Typically the
first few transformed attributes account for most of the variation in the data and are retained,
while the remainder are discarded [108].
Following are the methods that evaluate the subsets of attributes:
• CFS - Correlation-based Feature Selection: This is the first of the methods that evaluate
subsets of attributes rather than individual attributes. At the heart of the algorithm is a subset
evaluation heuristic that takes into account the usefulness of individual features for predicting
the class along with the level of inter-correlation among them. The heuristic assigns high
scores to subsets containing attributes that are highly correlated with the class and have low
inter-correlation with each other [109].
• Consistency-based subset evaluation: Several approaches to attribute subset selection use
class consistency as an evaluation metric method. These methods look for combinations of
attributes whose values divide the data into subsets containing a strong single class majority
[110]. What usually happens in this technique is that the search is biased in favor of small
feature subsets with high class consistency. Data sets with numeric attributes are first

CHAPTER 4. BACKGROUND – THE COMPUTATIONAL TECHNIQUES
40
discretized and then a modified forward selection search is used to produce a list of attributes,
ranked according to their overall contribution to the consistency of the attribute set.
• Wrapper Subset Evaluation: Wrapper attribute selection uses a target learning algorithm
to estimate the worth of attribute subsets. Cross-validation is used to provide an estimate for
the accuracy of a classifier on novel data when using only the attributes in a given subset.
Wrappers generally give better results than filters because of the interaction between the
search and the learning scheme's inductive bias [108]. But improved performance is attained
at the cost of computational expense; a result of having to invoke the learning algorithm for
every attribute subset considered during the search.
Machine learning using WEKA
Baker and Jain reported experiments comparing eleven feature evaluation criteria and
concluded that the feature rankings induced by various rules are very similar [102]. The
conclusions are that no feature selection rule is superior to the others, and that no specific strategy
for alternating different rules seems to be significantly more effective. Mingers compared several
attribute selection criteria, and concluded that the quality of selected attributes is independent of a
specific criterion [103]. He even claimed that random attribute selection criteria are as good as
measures such as information gain ranking method described in the last section [104]. Although,
the later claim was refuted [105], where the authors argued that random attribute selection criteria
fail when there are several noisy attributes.
For the CBR system in this research, the tool that was used is based on all of the
techniques explained above. In order to perform attribute selection, we applied “WEKA”
(Waikato Environment for Knowledge Analysis), which is a powerful open-source Java-based,
machine learning workbench [112]. WEKA is comprised of numerous machine learning
algorithms and tools under a common framework along with an intuitive graphical user interface.
WEKA has two primary modes: a data exploration mode, and an experimental mode. The

CHAPTER 4. BACKGROUND – THE COMPUTATIONAL TECHNIQUES
41
experimental mode, ‘experimenter’ allows large scale experiments to be run with results stored in
a database for later retrieval and analysis where as the data exploration mode ‘explorer’ provides
easy access to WEKA's various modules to explore data, which include data pre-processing,
clustering, classification, association, attribute selection and data visualization. These actions can
be performed by the respective tabs at the top as seen in Figure 4.3 and 4.4:
1. Preprocess: To choose and modify the data being used.
2. Classify: To train and test learning schemes that classify or perform regression.
3. Cluster: To Learn clusters for the data.
4. Associate: To learn association rules for the data.
5. Select Attributes: To select the most relevant attributes in the data.
6. Visualize: To view an interactive 2D plot of the data.
Attribute Selection in WEKA
Attribute selection in WEKA involves searching through all possible combinations of
attributes in the data to find the best subset of attributes that can be used for prediction. This
requires two steps: to select an attribute evaluator and to choose a search method. The evaluator
determines which method to be used in order to assign worth to each subset of attributes, where
as the search method decides the style of search performed.
Evaluator Methods: Section 4.1.5.1 provides a detail of various popular attribute selection
techniques. WEKA incorporates all of those as well as few more described as follows [112]:
1. CfsSubsetEval evaluates the worth of a subset of attributes by considering the individual
predictive ability of each feature along with the degree of redundancy between them.
2. ChiSquaredAttributeEval evaluates the worth of an attribute by computing the value of the
chi-squared statistic with respect to the class.
3. Classifier subset evaluator evaluates attribute subsets on training data or a separate hold out
testing set.

CHAPTER 4. BACKGROUND – THE COMPUTATIONAL TECHNIQUES
42
4. ConsistencySubsetEval evaluates the worth of a subset of attributes by the level of
consistency in the class values when the training instances are projected onto the subset of
attributes.
5. GainRatioAttributeEval evaluates the worth of an attribute by measuring the gain ratio with
respect to the class.
6. InfoGainAttributeEval evaluates the worth of an attribute by measuring the information gain
with respect to the class.
7. OneRAttributeEval evaluates the worth of an attribute by using the OneR classifier.
8. PrincipalComponents: It performs a principal components analysis and transformation of the
data.
9. ReliefFAttributeEval evaluates the worth of an attribute by repeatedly sampling an instance
and considering the value of the given attribute for the nearest instance of the same and
different class. In other words it searches for nearest neighbors of examples with different
class labels, and hence the features are weighed according to how well they differentiate these
examples.
10. SVMAttributeEval evaluates the worth of an attribute by using an SVM classifier.
11. SymmetricalUncertAttributeEval evaluates the worth of an attribute by measuring the
symmetrical uncertainty with respect to the class.
12. WrapperSubsetEval evaluates attribute sets by using a learning scheme.

CHAPTER 4. BACKGROUND – THE COMPUTATIONAL TECHNIQUES
43
Figure 4.3: Screen shot of WEKA showing data preprocessing of the selected attribute left
(Side of Brain), further details at right top (Control 10, Left side affected 26, Right side
affected 17 and both sides affected 2. Right bottom shows the corresponding visualization
represented by different colors.
Search Methods: There are numerous search methods that can be chosen for attribute selection
in WEKA. A brief description of each is given as follows [112]:
1. BestFirst searches the space of attribute subsets by greedy hill climbing augmented with a
backtracking facility. Setting the number of consecutive non-improving nodes allowed
controls the level of backtracking done. BestFirst may start with the empty set of attributes
and search forward, or start with the full set of attributes and search backward, or start at any
point and search in both directions [112].

CHAPTER 4. BACKGROUND – THE COMPUTATIONAL TECHNIQUES
44
2. ExhaustiveSearch performs an exhaustive search through the space of attribute subsets
starting from the empty set of attributes. It reports the best subset found.
Figure 4.4: Screen shots of WEKA showing Classify tab high-lighted showing the
classification of’ type of stroke’. The classifier output area on the right gives the details of
correctly classified (93.3 %) and incorrectly classified (6.6%) instance.
3. FCBF (FastCorrelationBasedFilter) is a feature selection method based on correlation
measure and relevance and redundancy analysis. It is use in conjunction with an attribute set
evaluator (SymmetricalUncertAttributeEval).
4. GeneticSearch performs a search using the simple genetic algorithm described in Goldberg
(1989) [113].

CHAPTER 4. BACKGROUND – THE COMPUTATIONAL TECHNIQUES
45
5. GreedyStepwise performs a greedy forward or backward search through the space of attribute
subsets.
6. LinearForwardSelection is an extension of BestFirst.
7. RaceSearch determines the cross validation error of competing attribute subsets.
8. RandomSearch performs a random search in the space of attribute subsets.
9. Ranker ranks attributes by their individual evaluations.
10. RankSearch uses an attribute/subset evaluator to rank all attributes.
11. SubsetSizeForwardSelection is an extension of LinearForwardSelection.
Once the evaluator and search methods are chosen, the next step is to choose one of the
attribute selection modes. One possibility is the Full Training set in which the worth of the
attribute subset is determined using the full set of training data. The other is Cross-validation that
uses a process of cross-validation to determine the worth of the attribute subset. Besides these two
modes there is another option of Classify to be used to specify the attribute that can be used as a
class. In Section 5.2.2.1 Chapter 5, further details follow where WEKA has been applied in
conjunction with the expert advice to determine the ranking of attributes for our proposed CBR
system. The main case structure (Section 5.2.2.3 Chapter 5) was based on these selected
attributes.

CHAPTER 4. BACKGROUND – THE COMPUTATIONAL TECHNIQUES
46
Figure 4.5: Screen shots of WEKA showing Attribute selection tab high-lighted showing the
ranked attributes.

CHAPTER 4. BACKGROUND – THE COMPUTATIONAL TECHNIQUES
47
4.1.6 Reuse – Adaptation
The goal of case adaptation is to use the solution of similar retrieved Source Case(s) in
solving the new problem Target Case, by applying some modifications to the retrieved- case
solution. A good adaptation of Source Case (s) to fit the Target Case can reduce the amount of
work required, significantly. In other words, adaptation is the phenomenon of fixing up an old
solution to meet the requirements of a new situation. It can be considered as simple as
substituting one component of a solution for another, or as complex as modifying the entire
structure of a solution such as something new might be inserted or something can be eliminated
from the old solution or in some cases a certain part of the solution might be transformed.
Adaptation can be sub-divided into two main steps: [22]
i. Figuring out what needs to be adapted: One way to identify what needs to be adapted
can be achieved by observing inconsistencies between new needs and old solutions. Some of the
methods used in AI such as reason-maintenance and constraint propagation can be useful in
finding these variations.
ii. Performing the adaptation: For any particular task or domain a set of its own specific
adaptation strategies or heuristics can be developed, which is a rather ad hoc approach. However,
the main idea is to identify a general set of adaptation strategies that provide guidelines for
specialized adaptation strategies.
Example: If one of the guests attending the party is a vegetarian, the meat can be taken
out of a recipe in order to make the dish vegetarian. This is a specialization of a more general
adaptation strategy that is referred to as delete secondary component strategy. According to this
general strategy, a secondary component of an item can be deleted if it is not performing an
essential function.
Although there are many adaptation strategies available, the responsibility of many case-
based reasoners ends at the retrieval phase [70]. The main goal is to be able to retrieve the

CHAPTER 4. BACKGROUND – THE COMPUTATIONAL TECHNIQUES
48
appropriate cases. Once the goal is achieved the case solutions can be reused in whatever manner
that is workable and practical by the domain experts. This is referred to as null adaptation [70].
Since CBR is usually applied on weak theory domains, the knowledge required to make
adjustments is not available (as in ADHD domain) or if that knowledge is available, it is not
standardized (as in stroke domain). In the absence of adaptation rules, it is better not to use them
at all on the CBR system.
Another approach that is referred to as CBR adaptation is to store the adaptation
strategies and outcomes as part of the CBR system [70]. After the retrieval phase, a second round
of retrieval can take place in order to retrieve similar adaptation strategies. If the result of
retrieval is no adaptation strategy, default is set to null adaptation. The justification for this is that,
ability to adapt also improves over the period of time just like reasoning does.
Case Adaptation in various CBR Systems
There are a number of strategies that are used by CBR systems for case adaptation. Some
of them are: substitution methods, transformation methods and special-purpose methods [22]:
i. Substitution methods: Substitution is the method by which a certain part of an old
solution is chosen and replaced. There are various kinds of substitution methods such as,
reinstantiation; where new objects are instantiated in the old solution. Parameter adjustment; is
another one used to adjust numerical parameters, of the old solution. Local search; provides a
means for finding an auxiliary knowledge structure, as a substitute for some old value,
inappropriate for the new situation. Another method known as query memory; either asks for
auxiliary knowledge structures or the case memory to return something with a given description.
In specialized search; both auxiliary knowledge structures and case memory are queried, in
addition to the search heuristics for guiding memory search and case-based substitution utilizes
other cases to suggest substitutions.

CHAPTER 4. BACKGROUND – THE COMPUTATIONAL TECHNIQUES
49
ii. Transformation methods: Transformation methods provide strategies, which transform
an old solution in a way that it can work for the new situation. A commonsense heuristic known
as delete secondary component (used in the example in Section 4.1.6) is an example of
transformation. Model-guided repair is another transformation method used by a causal model
(for diagnosis, or designing of devices).
iii. Special-purpose adaptation: Special-purpose repair heuristics are used to carry out
domain-specific and structure-modifying adaptations that are not covered by the other two
methods. These heuristics are indexed according to situations in which they are applicable. The
following table shows various adaptation strategies applied by some of the CBR systems:
Case-based System Adaptation Strategy
CHEF [28] Reinstantiation
JULIA [31] Specialized adaptation heuristics
CLAVIER [36] Case-based Substitution
CASEY [42] Model-guided repair (Transformation)
Table 4.2 CBR systems with their adaptation strategies [22].
4.1.7 Revise – Evaluation
The main goal of case evaluation is to provide feedback to the case-based reasoner
system, whether or not the new case was solved adequately. Evaluation is the process of
acquiring feedback. Feedback is an essential requirement in order to learn from experience and to
be able to interpret, what was right and what was wrong with its solutions. In the absence of
feedback, the CBR system may become faster at solving problems but it is at a higher potential to
repeat its mistakes and would not be able to improve its capabilities.
“Interpretive case-based reasoning is a process of evaluating situations or solutions, in the
context of previous experience” [22]. The main feature of interpretive case-based reasoning is the

CHAPTER 4. BACKGROUND – THE COMPUTATIONAL TECHNIQUES
50
comparison and contrast of new situations to the old ones. Example: Members of the admission
committees in universities evaluate the potential of applicants (to make it in their school) by
comparing them with similar students who have, or have not done well. Based on this
feedback/evaluation, the committee members are able to decide, whether they should be accepted
or not.
Evaluation can be further categorized as exemplar-based classification, case-based
argumentation and case-based projection of outcome. Case-based classification is best
exemplified by PROTOS [43] which diagnoses hearing disorders by looking for the case in the
case base that is the most similar to the new one and assigning the new case, the same
classification.
In case of inadequate solution, the retrieval of additional cases may be required, that may
result in the need of “repair” – an additional adaptation or cardinality relaxation /restriction
procedure. With the relaxation of context, the number of similar cases is increased. More relaxed
the context, more matching cases in retrieval.
4.1.8 Retain – Memory Update
This step refers to the storage of a new case in the case base, appropriately for future use.
This case now comprises of the problem, its solution plus any facts supporting the reasoning. The
most important step in this phase of memory update is choosing the ways to index the new case in
the case library. This is the most important step because if the case is indexed properly, it would
be able to recalled and retrieved during later reasoning when it can be most helpful. At the same
time it should not be over indexed to avoid being retrieved indiscriminately which means that the
reasoner must be able to anticipate the importance of the case for later reasoning.
Performance evaluation in CBR goes beyond error assessment due to the dynamic nature
of the process. Task-contexts keep changing over time along with the addition of more cases in
the case base. But this does not give a reason for inability to assess the CBR system’s

CHAPTER 4. BACKGROUND – THE COMPUTATIONAL TECHNIQUES
51
performance. Following are some guidelines that were proposed, in order to ensure the accuracy
of retrieval and analyze the performance of the CBR system [70]
1. Individual accuracy - Is the case able to retrieve itself during a retrieval request?
2. Retrieval requests - Are the retrieval requests consistent?
3. Repeated Requests - Are same cases retrieved when attempting repeated requests?
4. Cross-validation test - Is the error rate same, when performing a cross-validation test?
5. Duplicate elimination- Are the duplicates scanned for?
The answer to all these questions should be a ‘Yes’. A ‘No’ to any one of them might reflect a
problem in the design. However, in case of assessing consistency, in some systems, a chance of a
small variation is permissible, due to randomness in the retrieval process. Duplication should be
taken into account when adding a new case to the case base.
Over all Coverage: This is another important feature to take into consideration during
case base assessment. Over all coverage is not an issue till the case base becomes too big. When
tasks change, the case base may not cover the essential cases that are useful for that task. Case
utilization statistics can play important role at this point. According to case utilization statistics,
cases that were never retrieved can be discovered. Sometimes these unusual cases need to be
retained since they may refer to a rare situation and might be useful in future.
Granularity: If a case seems to be retrieved too frequently, that refers to the condition
that the domain lacks sufficient granularity; therefore, more cases need to be added surrounding
this popular case. With an increase in the number of cases to the CBR system, the accuracy of the
system may improve but on the contrary it might diminish the speed. This depends on the
discretion of user, if accuracy should be given priority over time consumed or vice-versa. If the
CBR system is used a decision support tool, (like in stroke domain) where an expert can make the
final determination, the system may be more successful if it gives a fast response in contrary to
utilizing hours to present decision support. On the other hand, when the CBR system is used as
diagnostic tool, accuracy has to be the most important feature so that even if the reasoner takes a

CHAPTER 4. BACKGROUND – THE COMPUTATIONAL TECHNIQUES
52
long time to get an answer, it may be worth as compared to the consequences of a wrong
diagnosis.
CBM (Case-based Maintenance) is a field that has recently flourished in the area of CBR.
It deals with improvement of performance and increases the integrity of the entire system not just
the case base [87].The work in this area focuses on the development of systematic strategies that
enable the user to measure and maintain the quality of system, without the constant intervention
of the expert.
4.1.9 A Classification of CBR Applications
There are two main reasons to incorporate applications of CBR in this chapter. First
because it emphasizes the importance of CBR and its diversity and second, because it depicts the
thorough research about CBR, manifesting the fact that it has not been applied to the stroke
domain. However, there have been many diagnostic tools and shells, but not for stroke.
CBR has diverse applications that are widely used. Althoff and his colleagues suggested a
classification method of CBR applications [63] as shown in Figure 3.3. According to this
classification scheme, CBR applications can be classified into two main categories, Classification
and Synthesis tasks. This dichotomy is at the conceptual level, however most of the times a blend
of both types is seen. This is the reason why a combination of both methods is observed in most
effective case-based situations. For instance, the labor mediation application SYCARA [29]
makes use of both the methodologies, interpreting the situation and then deriving a solution based
on precedents. The classification hierarchy is presented in the Figure 4.6.
Classification tasks
These CBR applications are common in business and everyday life. A new case is
assigned to a specific class in the case-base from which a solution can be derived. In fact, most
commercial CBR tools support classification tasks. One of their representative applications for

CHAPTER 4. BACKGROUND – THE COMPUTATIONAL TECHNIQUES
53
CBR Systems
Synthesis TasksClassification Tasks
Planning ConfigurationDesignPlanningPrediction
Diagnosis Process ControlAssessment
Equipment Failure
MedicalDiagnosis
maintenance is CASELINE [44], which is used for aero-plane maintenance and airplane trouble
shooting in order to reduce airplane downtime [59].
Figure 4.6: A Classification hierarchy of CBR Applications [63]
Maintenance systems for telecommunication networks [45] and engineering applications such as
detecting locomotive faults [58] are a few more in this category. Legal and medical knowledge
management and diagnosis [47, 48] also fall in this category. Product recommendation in e-
commerce (online self service color selection for paint) [60] and efficient helpdesks and customer
support systems (Compaq computers) [61] are additional novel classification applications of
CBR.
Synthesis Tasks
Synthesis tasks attempt to get a new solution by combining previous solutions.
There are a variety of constraints during this process. Comparatively, they are harder to
implement. CBR systems that perform synthesis tasks must make use of adaptation and

CHAPTER 4. BACKGROUND – THE COMPUTATIONAL TECHNIQUES
54
are usually hybrid systems. They combine CBR with other techniques. Recently, within
the problem solving type of CBR, several systems have been built to do case-based
planning and design. Among them are CYCLOPS used for landscape design [27], CHEF
[28] and JULIA [31] for planning meals, and KRITIK [29, 35] which combines case-
based and model-based reasoning for the design of mechanical assemblies. In addition,
CLAVIER [36] is used to arrange compounds in an autoclave, SMART memory model
[37] to improve the efficiency of the system PRODIGY [38], and then there are ARCHIE
[39] and CADRE [30] to facilitate architects in understanding and solving conceptual
design problems.
4.1.10 CBR in Medical Informatics
The medical domain has always been an area of ever-emerging challenges; therefore
medical professionals are facing new problems and dealing with a need for better dynamic
resources every day. This is one of the underlying reasons for improvement of the healthcare
market and a requirement to support physicians in order to facilitate them [47]. Effective
knowledge management is another driving force for health care organizations to ensure cost
effectiveness, efficiency and justification of cost containment and better quality of care. The cost
of healthcare is increasing accordingly because there is a demand of better service from patients
[46]. Therefore the need for knowledge management is becoming an important requirement these
days. The applications of CBR in medical domain can be classified into the following two groups:
diagnostic and prognostic.
Diagnostic Applications
Diagnosis, in medical terminology refers to the act or process of identifying or
determining the nature and cause of a disease. Diagnostic applications constitute an important
CHAPTER 4. BACKGROUND – THE COMPUTATIONAL TECHNIQUES
55
branch of problem-solving CBR. The idea of applying knowledge-based systems to facilitate
health professionals in diagnosis goes back to about three and a half decades in the 1970’s. This
involved statistical methods to support diagnosis but unfortunately did not get significant
solutions [48]. There were various underlying reasons for being unsuccessful such as complexity
of domain, enormous amount of data, inconsistency in data and parameters, missing information
and significant outliers.
In diagnosis, just as in planning or design, it is necessary to adapt an old case to fit a new
problem. CASEY [42] is a popular example of a case-based system for diagnosing problems of
patients suffering with heart disease. This is also based on the principle of adaptation of the
known diagnoses of previous patients. Another early case-based diagnosis system is PROTOS
[43], which was used to diagnose hearing disorders applying a learning apprentice approach.
FLORENCE [49] is a system that deals with health care planning for nursing. MEDIC [50],
which is a schema-based diagnostic reasoner, is specialized for pulmonology. This memory
organization and retrieval allows a reasoner to determine the most specific problem-solving
procedures available.
GS.52 [51] differs from typical CBR systems in a way that cases are clustered into
prototypes. It is used to diagnose dysmorphic syndrome (a morphological disorder by birth). It is
another domain with incomplete knowledge and experts themselves have only seen a few
syndromes during their entire lifetime. TROPIX [52] is an application to diagnose tropical
diseases that are infectious and more widespread in the tropics. NIMON [53] is a renal function
monitoring system to facilitate kidney dysfunctional diagnosis. ICONS [54] is another renal
diagnostic tool that provides an automatic interpretation of the present state of intensive care
patients and presents a suitable calculated antibiotic therapy as well.

CHAPTER 4. BACKGROUND – THE COMPUTATIONAL TECHNIQUES
56
Prognostic Applications
Prognosis, referring to the medical concept comprising of patient data, medical
intervention, outcome, utilities and probabilities, is another area which came into the limelight in
recent years. There have been CBR tools in this classification as well, such as TeCoMED [56],
which is used to generate forecasts of epidemics and infectious diseases. CIM [57] is another
application used for the prevention of clinical incidents in general practice. TA-3, the framework
that we used for this research, is also a significant prognostic tool that had been used before to
increase the success rate of in-vitro fertilization [55]. In the next section the role and function of
this tool is elaborated in detail.
4.1.11 Is CBR the right choice?
Most knowledge-based systems perform problem-solving by acting on certain
generalized rules that are based on facts. Rule-based systems rely on ‘explicit knowledge of the
domain’, which is not only agreed upon by the experts, but also is used to construct a
comprehensive set of rules [71]. This works well in genres where there are fixed rules and
defined features such as weather prediction, equipment maintenance, and troubleshooting. But, if
there is not enough knowledge available or there is a lack of standardization in defining criteria or
the procedure for a knowledge engineer to practically create a model-based reasoning system, is
enormously time consuming; CBR is often the best alternative.
In accordance to this fact, there are problem domains such as diagnosis of ADHD
(Attention-Deficit Hyperactivity Disorder) [83] and diagnosis of patients suffering with heart
disease [42], where rules cannot be simply derived based on a set of facts. Analogously, the
stroke domain cannot be characterized as a set of explicit rules with regards to symptoms and
diagnosis, due to the lack of an objective approach in stroke assessment, and a lack of
standardization in rehabilitational techniques that clinicians can agree upon unanimously [90].
According to a recent study carried out by clinical practice committee of American Geriatrics

CHAPTER 4. BACKGROUND – THE COMPUTATIONAL TECHNIQUES
57
Society, it is necessary to implement some guidelines which should be used by hospitals, sub
acute-care units and providers of long-term care in order to implement a structured approach to
improve rehabilitational practices and by clinicians to determine best interventions to achieve
improved patient outcomes [90].
There are some underlying reasons for this lack of standardization, the protocols for
clinical assessments vary, the modes of diagnoses vary and the approaches towards
rehabilitational therapies vary. CBR is a unique and prolific approach in problem-solving, with
which the above-mentioned reasons for lack of standardization can be overcome in stroke
diagnosis and rehabilitation. Instead of relying on generally accepted domain knowledge, CBR
builds a system based on the specific knowledge contained in previously experienced problems
and their solutions. This is one of the exclusive reasons for applying CBR to the stroke domain.
The next section further elaborates on the significance of using CBR.
4.2 What is TATATATA---- 3 3 3 3
The comprehensive framework that we are using in this research (pronounced as tah-tree)
is based on a research collaboration [82]. TA-3 stands for The Advisor 3 where the 3 refers
to the three main components of The Advisor – representation, reasoning and presentation
[55]. These three components are the main functionality of the CBR in terms of representing the
cases, retrieving similar cases, reusing information for adaptation and ultimately retaining the
learned case for presentation.
4.2.1 TATATATA----3333 Architecture
The case-base repository uses either a relational database or a simple file system. Cases
are represented as attribute/value pairs and their domains are defined in a case description (for
details please see Chapter 5). Case description contains three classes of data (i) Description,
which is non-predictive; (ii) Problem, which contains predictive data and (iii) Solution, which is

CHAPTER 4. BACKGROUND – THE COMPUTATIONAL TECHNIQUES
58
also non-predictive and provides the classification of the case. To further elaborate the TA-3
case structure, an example from Attention Deficit Hyperactivity Disorder (ADHD) diagnosis case
can be used, where the description portion comprised of the patient initials, and sex, (non
predictive data), the problem part consisted of age, the direction error and saccade reaction time
(predictive data) and the solution part is made up of the diagnosis as a control or ADHD (non-
predictive) [83].
The reason behind dividing the case description into these classes is that it allows the
application of different constraints and priorities, to particular entities and these constraints have
to be satisfied in order to perform a successful case-retrieval. It also diminishes the effect of
irrelevant or less-relevant attributes on the system performance and presents complex information
in a more comprehensible manner.
4.2.2 Retrieval in TATATATA----3333
The retrieval process takes place by the application of nearest-neighbor matching [80].
The goal of retrieval in the CBR system is to retrieve not only exact matches (equivalent cases)
but partial matches (similar cases) as well. During the similarity assessment, an explicit context is
used; therefore, the retrieval algorithm is based on incremental context transformations. The
details for context–based retrieval are explained in the next section.
4.2.3 Context
In various research areas, context is defined differently. In databases it is referred to as
views where as in pattern recognition it is mentioned as aspects. A Context can be defined as a
subset of the problem class data with applied constraints (range of allowable values). A Context is
a view of a case, which comprises of a finite set of attributes with associated constraints on the
attribute values. The function for discovering context is an attribute-oriented clustering algorithm.
The function maps a set of cases and a case base into a context, which guarantees the relevance of

CHAPTER 4. BACKGROUND – THE COMPUTATIONAL TECHNIQUES
59
cases [114]. It is an efficient query relaxation algorithm which is based on incremental context
transformations [82]. The following expression will further elaborate the relation between the
context, the attributes and their allowable values. In this equation, Ω refers to the context, a0
refers to the attribute and cv0 refers to the set of allowable values for matching the attribute. Any
values other than the constraint will not be considered.
Equation 1. Ω = <a0:cv0>, <a1:cv1>, <a2:cv2>,…, <an:cvn>
A general example will further simplify the concept expressed in Equation 1. For instance, ‘a0’
refers to the ‘age’ and the constraint on the value specifies the range of 40 to 60.
a – Attribute v – Value
a0 Age cv0 40-60 (yrs)
a1 Height cv1 150-180 (cm)
a2 Weight cv2 60-90 (kg)
Table 4.3: Attribute / value reference.
Constraints can be applied to individual attributes or categories on the whole and can be of two
types: Value and Cardinality. Value refers to the range of allowable values, where as cardinality
refers to the number of attributes that must be satisfied for the entire category to be satisfied. A
case C, satisfies a context Ω, denoted as sat (C, Ω), if and only if for all pairs <ai:Cvi> Ω,
there exists a pair <ai:vi> C such that vi is in Cvi:
Equation 2.

CHAPTER 4. BACKGROUND – THE COMPUTATIONAL TECHNIQUES
60
Two cases are considered similar if they both satisfy the same context and a case would
be considered to satisfy a context, if every attribute value in the case satisfies the constraints
(range of allowable values provided). Retrieval for the CBR system is further explained in
(Section 5.4.2). A case C1 is similar to a case C2 with respect to a given context Ω, denoted: C1
ΩC2, if and only if both C1 and C2 satisfy context Ω:
C1 Ω C2 sat (C1, Ω) ^ sat (C2, Ω)
Equation3.
TA-3 being a decision support system reflects optimum performance when used interactively, as
a conversational CBR system. The similar retrieved cases are presented to the user and the query
can be subsequently modified with relaxation and restriction transformations. Following are the
two transformations that can be applied:
Relaxation
Context A is said to be a relaxation of context B if A contains a subset of the attributes in
B and the constraints on the attributes in A are a subset of the constraints on the attributes in B.
Relaxation can be further sub-divided into two implementations: reduction and generalization.
Reduction (also referred to as m_of_n matching), reduces the number of attributes needed for the
match as the name implies. Generalization, on the other hand, increases the range of allowable
values that the attributes may have. Both these transformations tend to relax the constraints in a
way that, more cases are retrieved.
Restriction
If context A is a relaxation of B, then context B will be a restriction of A. Restriction can
be further sub-divided into expansion and specialization which are opposite in effect to reduction

CHAPTER 4. BACKGROUND – THE COMPUTATIONAL TECHNIQUES
61
and generalization respectively. So expansion increases the number of attributes (in contrast to
reduction) while specialization decreases the range of allowable values. These concepts will be
recalled in section 5.4.2 (Figure 5.5) By applying restriction, fewer cases are expected to be
retrieved since it intends to restrict the constraints.
4.2.4 TA TA TA TA ---- 3 3 3 3 Functional Specifications
TA-3 is regarded as a flexible framework in the sense that its responsibility is over at the
retrieval process. It is the expert’s, user’s or possibly another program’s job from there to use the
set of cases retrieved appropriately. There is no specific module to perform adaptation in the
system. For knowledge mining, TA-3 provides limited support and that is through an explain
function. The explain function automatically creates a context (a case interpretation) which is
satisfied by the set of retrieved cases or the entire case base, meaning that a minimal context is
created in a way that all cases in the returned set are similar. It is a useful function for the
categorization of cases. For example, in in vitro fertilization (IVF) study [55] two contexts were
created, one for pregnancy with abortion and the other without abortion, in order to make a
comparison between both the contexts and determine the significantly predictive attributes among
the two.
Recently, a context refinement function [83 was created and added to maximize the
potential to produce a context with best fitness. This function makes use of a genetic algorithm
iteratively creating, mutating and evaluating the fitness of hundreds of contexts. The genetic
algorithm manipulates a context in a way that it increases the inter-class distance (between two
classes) and decreases the intra-class distance (within the same class). The inter-class and intra-
class distance is based on the distance between two cases, which is defined in equation 2:
Equation 2.
Distance between two cases = Number of relaxations required to make the cases
similar.

CHAPTER 4. BACKGROUND – THE COMPUTATIONAL TECHNIQUES
62
The main advantage of this process is the significant information it yields, which is useful in
determining unknown relations in the data and may provide a new context that can potentially
improve the retrieval phase and achieve better prediction accuracy. Therefore, this process is
iterative and user-guided.
4.2.5 TATATATA----3333 Applications
The effectiveness of TA-3 has been proved in many complex domains such as robotics
[84]], molecular biology [66], protein crystallography [65] and for ADHD diagnosis [83]. The
novel feature of TA-3 is its flexibility in knowledge representation and efficient case retrieval.
When we talk about prediction in medicine, TA-3 has been applied as a cost-effective treatment
for IVF [55]. IVF is an assisted reproductive technology affecting success of pregnancy. Because
there are so many variables involved, even for adept physicians, it is a challenge to perform
decision-making and improve the pregnancy rates. A complex domain with numerous variables
and an enormous collection of previous treatment experiences is the perfect situation to apply
CBR and this was the foundation of TA-3. The procedure followed the organization of a case
base which comprised of previous IVF patient-treatments. This case base was used for the
prediction of hormonal stimulation in new patients to increase the likelihood of a successful
pregnancy and further the case base was used for knowledge mining, in order to derive innovative
and interesting relationships for future reference.
Another non-linear study was carried out in the field of robotics [84]. The aim was to
predict the joint angles on a 3-hinged robot such that the end-effector could be placed at a specific
co-ordinate in 3-space. A large case-base was available for this task. Each case was comprised of
9 attributes that described the arm lengths, joint angles, and end co-ordinates. The attributes were
divided into 3 categories and two retrieval techniques were applied, one based on value relaxation
and the other based on m_of_n matching.

CHAPTER 4. BACKGROUND – THE COMPUTATIONAL TECHNIQUES
63
Recently, TA-3 had been applied to the protein crystal growth domain [65]. The aim of
this study was to speed up the process of determining protein structure with single crystal X-ray
diffraction by providing decision support in novel crystal growth experiments. High-throughput
crystallization techniques were used to develop the case base, which had the capacity of
performing 40,000 crystallization experiments per day. The goal was to retrieve similar
precipitation experiments given a novel experiment and guide a successful outcome by suggesting
possible parameters and warning of any potential problems.
TA-3 had also been used for the prediction of ADHD [83]. The neurophysiological data
used is multidimensional and its complex correlation with neurological dysfunction is not well
understood. However, the success of CBR in complex domains suggested the potential for this
application. TA-3 was used as an effective decision support system for the diagnosis of ADHD.
4.2.6 Summary
The purpose of this chapter was to present the basic concepts that were adopted for this
research in order to implement CBR using the TA-3 framework. Having these concepts well-
explained, we move on to the next phase of applying them for the problem domain-stroke. The
next chapter will demonstrate how the mechanism of CBR was carried out, starting from the
preliminary steps of data collection and database organization, to the final steps of case
representation, case base organization and case retrieval.

CHAPTER 5. CASE BASED REASONING – THE MODUS OPERANDI
64
Chapter 5
The Modus Operandi – Development of
Case Based Reasoning System for Stroke Patients
"Computers have promised us a fountain of wisdom but delivered a flood of data"
(A frustrated MIS executive)
This chapter gives an overview of the methodology of the research. It describes the main
components of the experiments conducted to apply CBR in the stroke domain. It gives a brief
description of data collection, case base management issues and theTA-3 functional
implementations. Following is the hypothesis of the thesis, restated in order to verify that the
goals which were set in the beginning are fulfilled adequately.
CBR can be utilized to create a repository of information of the stroke patients who
have an explicit diagnosis and prognosis and who are receiving subsequent
rehabilitation. For a new stroke patient, whose diagnosis is yet to be confirmed and
who has an indefinite prognosis, similar cases can be retrieved from the case base, to

CHAPTER 5. CASE BASED REASONING – THE MODUS OPERANDI
65
provide useful information. These potential solutions can assist the clinician for stroke
diagnosis and assessment.
5.1 Stroke Data
The database currently has data for 80 controls and 108 stroke subjects, who are (or were)
under treatment at Saint Mary’s of the Lake Hospital. The stroke subjects were provided with a
detailed questionnaire related to the KINARM assessment and were included in the study by
clinicians, given that they fulfilled the following selection criteria:
1) Hemiparesis resulting from stroke occurring at most 3-4 weeks prior to participation in
the study.
2) Absence of severe cognitive or effective dysfunction (mental health).
3) Absence of severe concurrent medical problems.
4) Absence of dysphasia – the inability to understand and follow the given instructions
due to impairment of speech comprehension.
5) Endurance to complete the experimental protocol.
Due to severe impairments, muscle atrophy and weakness of the upper limb could occur
as a result of prolonged and in-sufficient use by the subject. Eventually, this may masquerade the
underlying deficits of the sensorimotor system that need to be fully understood by a clinician to
plan an effective rehabilitation therapy [88]. Thus, as opposed to an earlier study with a
unilateral-KINARM device [89], where subjects were admitted at least 6 months after the
occurrence of stroke, this study aims at capturing the upper limb impairments at their earliest
stage.

CHAPTER 5. CASE BASED REASONING – THE MODUS OPERANDI
66
5.1.1 Raw Data
Experimental (KINARM) Data: The data from KINARM is collected for each Center-Out
reaching trial (for details please refer to Section 3.4, Chapter 3). About 40 different data
parameters are recorded each millisecond for the length of the trial (three seconds). These data
parameters are stored in various tables of the database. Table 5.1 provides further details of these
tables and their corresponding parameters. Other KINARM tasks have already been discussed in
Section 3.4. For the scope of this research, in case base development, only the Center-Out
reaching task is considered.
TABLES
KINARM PARAMETERS
SETS
• Task Number • Task Code • Task Description • Main Arm • Task Variant
CONDITIONS
• Reach angle • Reach magnitude • Target id sequence
TARGETS
• Target id • x and y coordinates relative to origin at centre hold target • Radius of target displayed (virtual) • Accepted radius of target (logical)
FEATURES
• End position of hand (x, y) and joint angles (elbow and shoulder) • First peak tangential velocity • Max tangential velocity • Movement onset • Movement offset • Reaction time • Total movement time • Name of method or algorithm used to derive the feature • Error codes output by the derivation algorithm
Table 5.1: Tables and their corresponding KINARM parameters that constitute the KINARM
database (Courtesy of LIMB- Laboratory of Integrative Motor Behavior).

CHAPTER 5. CASE BASED REASONING – THE MODUS OPERANDI
67
Clinical Data: The clinical data is collected manually on assessment forms (refer to the
Appendix for the detailed Forms A and B) by the physiotherapist (Mary Jo Demmers at Saint
Mary’s of the Lake Hospital). The data from the forms is entered manually in the database (by
Helen Bretzke, the database administrator, and Kim Moore, the lab technologist).
TABLES CLINICAL PARAMETERS
FEATURES
• Trial key • Arm • Feature • Method • Time • Feature Value • Units
ASSESSMENTS
• Subject key • Height • Weight • CT/MRI(Dates) • Handedness • Reflex Biceps Left and Right • Folstein scores • Ashworth Left and Right • ROM Left and Right • Dynaheld Left and Right • Thumb Left and Right • Chedoke Left and Right • Vision Left and Right • …
STROKE_
SUBJECT_VISITS
• Date • Subject Key • Date of Birth • Type of Stroke • Side of Brain • Lesion Location • Vascular Territory • Structures Damaged • …
Table 5.2: Tables and their corresponding clinical parameters that constitute the clinical data
in the database. (Courtesy of LIMB- Laboratory of Integrative Motor Behavior).
The clinical data is comprised of two types of information, the subject’s biographical
information (age, sex, weight, height etc.), and physical information (strength scores, reflexes,
tone, proprioception, grip and pinch strength scores, Purdue pegboard scores, Chedoke-McMaster

CHAPTER 5. CASE BASED REASONING – THE MODUS OPERANDI
68
scores, vision, FIM scores etc.). This information is stored in the database in corresponding
tables. Table 5.2 further elaborates the storage of data with respect to a few of the database tables.
5.1.2 Database
The previous sub-section described the data stored in the tables. The next step is to
introduce the actual database of this research. HUMAN2 (alias CLINICAL) is a DB2 [100]
database that stores experimental (KINARM) as well as clinical data. This database is currently
under development. Drivers for connecting to DB2 and executing SQL queries in a Mat lab
running environment have been developed earlier [99]. Figure 5.1 demonstrates how the structure
of the database has been organized. Table 5.3 shows the various data entities and their
corresponding units in which they are measured and are stored in the database.
Data Entities: Units Distance Metres Angle Radians Load Nanometres(Nm)
Date Format YYYY-MM-DD Time Format HH:MM:SS
Time Seconds(s)
Table 5.3 Data entities and their units as used for storing data in the database.
5.1.3 Views of the Clinical Database
In the CLINICAL database, a special feature of ‘views’ has been created by the database
manager. A view can be referred to as a read-only table. As a result of generating queries (using
SELECT statements), the results of expressions returned from a query is stored in them. They are
also significant because the data can be presented conveniently from multiple tables which are
linked by their primary and foreign keys.

CHAPTER 5. CASE BASED REASONING – THE MODUS OPERANDI
69
Figure 5.1: A demonstration of the Clinical database structure showing various tables
constituting the database, their features and the relationships among them.(Courtesy of LIMB)
This feature has been effective in accessing the data for the case base. Following is a list of
examples illustrating various views and presenting data by linking multiple related tables:

CHAPTER 5. CASE BASED REASONING – THE MODUS OPERANDI
70
• STROKES_FOR_SUBJECTS: This view was created by linking STROKES and
SUBJECTS tables.
• STROKE_SUBJECT_VISITS: This view is the result of linking existing view,
STROKES_FOR_SUBJECTS, with the SESSIONS table.
• KEYS_LOOKUP: This is a convenience table which links all of the tables in the
hierarchy by their primary and foreign keys. Using this view, for instance, the user can
ask for al trial keys for a given subject, session (day) and set.
• SESSIONS_AND_SUBJECTS: As the name explains, this view is created by linking
SESSIONS taken and the SUBJECTS table.
5.2 Case Base
The database described in the previous subsection provides most of the information
necessary for populating our case base. But before continuing, its appropriate to distinguish the
main difference between a database and a case base. A database is a structured collection of
records or data that is stored in a computer system [101]. A database usually contains software
(database management system) so that a person or program can use it to answer queries, or
extract the desired information. On the other hand, a case base is a collection of previous cases or
problems that are stored as a repository in order to be utilized for solving a new case or a new
problem. Secondly, in databases queries extract information from the database on the basis of a
word-for-word match or according to the provided statement conditions, whereas in our case
base, there’s a context-based retrieval. A context is defined as explicitly comprising of a set of
allowable range of attribute values, therefore, cases that fulfill the criteria in a context, are
retrieved as matching cases.
A case base is composed of cases that contain quantitative, textual or categorical
information, whereas a database structure (e.g. relational database) consists of one or

CHAPTER 5. CASE BASED REASONING – THE MODUS OPERANDI
71
more tables contained in files, and each table defined by rows and columns. However, as
a matter of fact, both the data structures are meant for storage but the utilization and the
mechanism of data retrieval are the features that explicitly distinguish one from the other.
For this research, from the database we selected 35 stroke subjects and 10 controls for our
case base. Out of these 45 subjects, 19 were female and 26 were male. The number of cases could
have been increased, but at this point, these were the only cases that were complete, without any
missing data. The stroke and control subjects included in the study varied in age (22-90 years
old). Out of 35 stroke subjects, 17 were with lesion on the right hemisphere of the brain, 16 with
lesion on the left hemisphere, and 2 with both the left and right side affected.
For the purpose of simplicity, the development of the CBR system was sub-divided into
five main phases, which are in accordance with the objectives of this research as well. Figure 5.2
gives a picturesque demonstration of the entire procedure from entering data into the database, to
accessing data and transforming it into a case base and achieving the corresponding results.
Phase I – Representation of cases – Case Structure
Phase II – Retrieval of Cases – Context–based criterion
Phase III – Experiments and Results
Phase IV – Testing and Validation of Results
Phase V – Adaptation
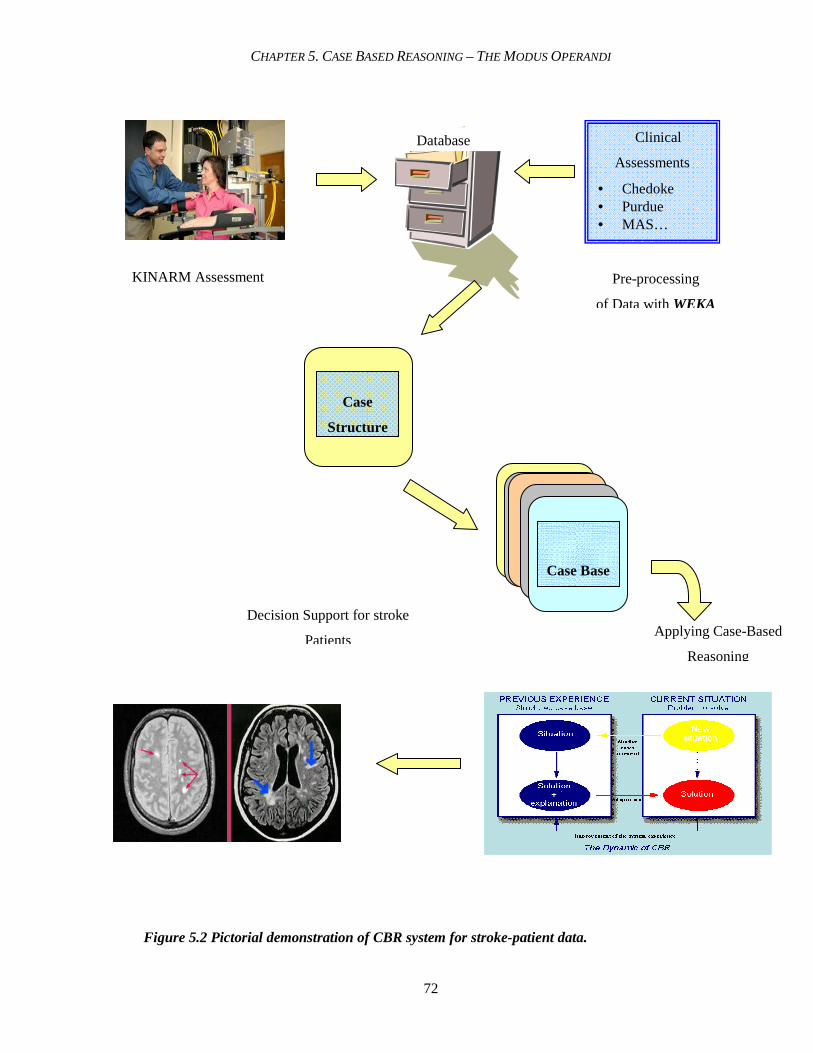
CHAPTER 5. CASE BASED REASONING – THE MODUS OPERANDI
72
Decision Support for stroke
Patients
Case
Structure
Case Base
Figure 5.2 Pictorial demonstration of CBR system for stroke-patient data.
Pre-processing
of Data with WEKA
Clinical
Assessments
• Chedoke • Purdue • MAS…
KINARM Assessment
Applying Case-Based
Reasoning
Database

CHAPTER 5. CASE BASED REASONING – THE MODUS OPERANDI
73
5.3 Phase I – Representation of Cases
The first phase in building the case base commences with the first objective of the thesis and
that is to represent the cases by building an appropriate case structure from the pre-screened data.
During the screening of data, it was ensured that the data used was complete. This was an
important step because any missing data might lead to uncertain consequences; therefore, all
those cases that had any missing data were not included in the study. The following three steps
were employed to accomplish this phase:
• Step I – Attribute Selection
• Step II – Classification
• Step III – Case Structure in TA – 3
5.3.1 Step I - Attribute Selection
Attribute selection is an important step in this research due to the fact that with an
enormous amount of data being produced by KINARM at a frequency of 1000 Hertz, there are
1000 time values generated per second. Each trial of KINARM (Center-Out reaching task only),
takes maximum 10 seconds. As mentioned earlier (Section 3.4), there are 8 targets and 8-10 trials
per target. This adds up to about 64-80 trials for a single session, and multiplying it by two for
both the left and right hand, makes it almost a million values per session. Therefore, attribute
selection played a major role and is a significant contribution of this thesis.
In Section 4.3.1.2, we explained the structure and functionality of WEKA [112]. WEKA
has played an important role in determining the selection and ranking of attributes, using machine
learning algorithms in order to construct the case structure for the CBR. Please refer to the
Appendix, for a detailed list of all the attributes before attribute selection was performed. Table
5.4 demonstrates the lists of attributes selected by the evaluator methods to classify type of stroke.
One important thing to be mentioned here is the goal of classification. In this case, the goal was

CHAPTER 5. CASE BASED REASONING – THE MODUS OPERANDI
74
type of stroke, with change in the goal of classification, different sets of attributes with different
ranking would be generated but it was noticed that principal components selected the same
attributes regardless of the classification criterion.
Sr. No.
Evaluator Method Used Search Method
Used
Attributes Selected and Ranked
1. Cfs Subset Eval BestFirst 15,19
2. ChiSquared Attribute Eval: Ranker 18,5,2,15,6,19,11,9,20,10,21,8,4,1,7,3,23,22,25,24,13,12,17,14,16
3. Classifier subset Evaluator: Greedy Step wise
None
4. Gain Ratio Attribute Eval :
Ranker
15,9,11,18,5,2,6,19,10,21,8,20,4,1,3,7,23,22,25,24,13,12,17,14,16
5. Info Gain Attribute Eval : Ranker
18,5,2,15,6,9,11,19,20,10,21,8,4,1,7,3,23,22,25,24,13,12,17,14,16 : 25
6. One RAttribute Eval : Ranker
10,8,9,13,11,12,3,1,2,7,4,5,23,24,21,22,15,14,18,25,17,19,16,6,20
7. Principal Components Ranker 1,2,3,4,5,6,7,8,9,10,11,12,13,14,15,16,17,18
8. ReliefF Attribute Eval : Ranker
9,11,24,15,19,14,16,12,17,18,25,13,20,22,7,6,2,5,23,21,4,10,3,1,8
9. Symmetrical Uncert Attribute :Eval:
Ranker
15,18,5,2,9,11,6,19,10,20,21,8,4,3,7,1,23,22,25,24,13,12,17,14,16
10. SymmetricalUncertAttribute SetEval :
Greedy Step wise
None
11. Wrapper SubsetEval: Greedy Step wise
None
Table 5.4: Ranked list of attributes attained by using the corresponding evaluator and search
methods in WEKA. Column 3 shows the respective number of the attribute as selected and
ranked by the corresponding search and evaluator method.
Having a number of selected attribute-lists, in order to choose the most appropriate one, a scheme
was defined which is referred to as “SAS” (Scheme for-Attribute-Selection). According to SAS,
the ranking of each attribute was aggregated as the sum of ranking, based on each evaluator
method. The attributes with the smallest sum value are the ones with highest ranks. A constant
(n+1) is added every time an attribute does not appear in a list; ‘n’ being the total number of

CHAPTER 5. CASE BASED REASONING – THE MODUS OPERANDI
75
Control Right Brain
Right+left Left Brain
attributes selected (27+1). Due to this addition, the rank would increase by a value of 28 and the
less important attributes would be maintained at a lower rank. For further details of selected
attributes, please refer to the appendix.
Figure 5.3 Visualizations of various attributes in WEKA.
5.3.2 Step II – Classification in WEKA
Classification is another important and significant automated function of WEKA that was
used to identify predictor attributes for CBR. The application itself is not very complicated but
the results obtained are quite significant. WEKA has a number of classifiers including bayes,
functions, lazy, meta, mi, misc, trees and rules. Each one of the classifiers further has numerous

CHAPTER 5. CASE BASED REASONING – THE MODUS OPERANDI
76
functions. One thing to be noted here is that these classification results have been an important
milestone in defining the retrieval criterion for context–based retrieval. Further details follow in
the next section, in retrieval.
Table 5.5: Classification results performed in WEKA.
The following figures will further elaborate this process of classification in terms of the important
attributes that reflect the results shown in the table 5.5.
Feature Classification
Algorithm
Correctly
Classified
Incorrectly
Classified
Type of Stroke Trees-J-48-C 0.25-M2 44/45
97.70%
1/45
2.22%
Side of Brain Trees-J-48-C 0.25-M2 40/45
88.89%
5/45
11.11%

CHAPTER 5. CASE BASED REASONING – THE MODUS OPERANDI
77
Figure 5.4: Classification for Type of Stroke: Control / Hemorrhagic / Ischemic Scheme: weka.classifiers.trees.J48 -C 0.25 -M 2 Correctly Classified Instances 44 (97.78 %) Incorrectly Classified Instances 1 (2.22 %)
Figure 5.5: Classification for Side of Brain: Control / L / R/ B Scheme: weka.classifiers.trees. J48 -C 0.25 -M 2 Correctly Classified Instances 40 (88.89 %) Incorrectly Classified Instances 5 (11.11%)

CHAPTER 5. CASE BASED REASONING – THE MODUS OPERANDI
78
5.3.3 Step III - Case Structure in TA - 3
TA–3 is a versatile framework for implementing a CBR system, as it can handle both
quantitative and qualitative data. As explained in Section 4.1.3, a case is composed of three main
parts: problem, solution and the outcome, but in this CBR system, the case structure has been
slightly changed due to insufficient data at this stage of research. However, the attributes that
were selected by ‘attribute selection’ using WEKA, constitute the following three parts of case
structure for this case base system: description, problem and solution. These three sections in the
case structure are explained as follows:
Description: All those selected attributes, which may be relevant but are not predictive,
should be assigned to this category of the data. For instance, subject key which is not predictive,
but without this attribute, identification of one case from the other would not be possible,
therefore, it is assigned to the description data. Solution: This is another non-predictive category
which contains the set of attributes describing the goal, for instance, the vascular territory of the
stroke patients. It also contains feedback or outcome, like lesion location. Problem: This is the
category that contains the predictive data. Even if the predictivity is in question, the attribute is
still included since the retrieval system can be later adjusted (through restriction / relaxation
Section 4.2.1.2). Attributes like affected arm and KINARM scores are the predictive attributes in
this category. Figure 5.6 displays the structure of a case in CBR system.
Based on this structure, cases that constitute the case base are referred to as the “source
cases”. A source case corresponds to a control subject, or a previous stroke patient who has a
confirmed diagnosis as well as prognosis. Therefore, the information in a source case may be
prolific for a new target case and may act as a milestone in terms of treatment and rehabilitation.

CHAPTER 5. CASE BASED REASONING – THE MODUS OPERANDI
79
A Source Case A Target Case
Figure 5.6: Composition of a case structure - the basis of CBR organization.
On the other hand, the “input case” which initially is not a part of the case base is the case that
needs to be solved and is denoted as the “target case”. It has the description and problem but does
not have a solution yet. The goal of CBR is to draw a solution for the target case. The target case
here refers to a new stroke patient whose diagnosis is yet to be confirmed and who has an
indefinite prognosis. Figure 5.7 further elaborates how cases are represented in TA-3.
Problem
Solution
Description
Affected Arm FMTDirErr_mean FMTDisErr_mean
MaxSP_mean PathLenRatio_mean
TMT_mean PostureSP_mean
RT_mean FMTMaxSP_mean
SOLUTION?
Affected Arm FMTDirErr_mean FMTDisErr_mean
MaxSP_mean PathLenRatio_mean
TMT_mean PostureSP_mean
RT_mean FMTMaxSP_mean
Type of stroke Side of Brain
Vascular Territory Lesion Location

CHAPTER 5. CASE BASED REASONING – THE MODUS OPERANDI
80
Figure 5.7: View of TA-3 showing three different source cases with corresponding attributes
of patients with subject keys 191, 320 and 343.
5.4 Phase II – Retrieval of Cases
Having the case base built, the next step is to proceed towards the third objective of this
thesis, which is to finalize a retrieval criterion capable of retrieving similar cases, when a target
case is provided. Identification of appropriate attributes to be considered for matching is the
main step in defining the retrieval criterion. This is the point where applying automated machine
learning classification was prolific. As mentioned earlier in Section 5.3.2, with the application of
classification and attribute selection functions, the predictor attributes, that constituted the
problem part of the case structure, were identified.

CHAPTER 5. CASE BASED REASONING – THE MODUS OPERANDI
81
As explained in section 4.2.3, the main retrieval criterion is context-based where the
Context is a view of a case, comprising of a finite set of attributes with associated constraints on
the attribute values. TA-3 provides a flexible approach in making the context an explicit
parameter in the similarity function [81]. This means that for a particular retrieval request, the
reasoner can specify the context as a subset of useful attributes, and can also apply constraints
(automatically or manually) on the attributes within that context.
In order to carry out experiments three contexts, A, B and C, were defined and were
based on the automated classification performed by WEKA. Results from different contexts and
comparing them in terms of maximum true positives and least false positives, is shown in Table
5.6. Each attribute in a context is assigned a priority which is responsible for the transformation
that takes place during retrieval. For instance, a lower priority attribute is more likely to undergo
transformation, whereas a higher priority attribute will remain unchanged. Therefore, if one
attribute has a low priority of 0, and another has a high priority of 3, the constraints on the low
priority category will be relaxed three times before any change is made to the high priority
category during transformation. In this way even if the relevance of certain attributes is uncertain,
they can still be included (with a low priority) and will not negatively affect the system
performance. The lower the priority, the higher the chance of transformation and vice versa.
Context A Priority Context B Priority Context C Pri ority
RT_mean 1 Affected Arm 3 Affected Arm 8
Affected Arm 0 RT_mean 2 FMTDirErr_mean 7
PathLenRatio_mean 1 FMTDisErr_mean 6
PostureSp_mean 0 MTMaxSP_mean 5
PathLenRatio_mean 4
TMT_mean 3
PostureSP_mean 2
RT_mean 1
FMTMaxSP_mean 0
Table 5.6: Context A, B and C; their constituent features and corresponding priorities.

CHAPTER 5. CASE BASED REASONING – THE MODUS OPERANDI
82
5.5 Phase III – Experiments and Results
The main objective of this experimentation was to be able to classify a new stroke subject
according to the following four perspectives:
• To classify the type of stroke: hemorrhagic or ischemic.
• To classify the stroke subject as a right brain affected or left brain affected stroke.
• To classify the prognosis of stroke patient in terms of affected vascular territory and
identify the lesion location.
• To differentiate a stroke subject from a control.
Possible results of retrieval could be:
• No cases retrieved – meaning no match found
• All cases retrieved are of the same category, or
• The result is a mixture of cases from different categories.
The first result implies that either there are too few cases in that class, or the range in context is
too small, or the similarity function needs to be redefined. The second result is simple and
applicable, therefore, the solution of the returned cases could be applied to the target case.
However, a third and interesting possibility is a mixture of different categories where some cases
satisfy few constraints of the context while some do not. Figure 5.8 displays a snap shot from
TA-3 showing the retrieval phenomenon with respect to transformations applied.

CHAPTER 5. CASE BASED REASONING – THE MODUS OPERANDI
83
Figure 5.8: Different retrieval results inTA-3 reflecting variations in transformations. More
cases are retrieved with increasing relaxation (12) and with increase in restriction, the number
of cases falls to (5), (1) and no cases.

CHAPTER 5. CASE BASED REASONING – THE MODUS OPERANDI
84
Table 5.7: Retrieval results reflecting number of cases retrieved with varying contexts. The experiment was conducted with alternating target cases as control, left brain affected and right brain affected strokes. The 0% and 50% column represents the corresponding change in retrieval results with respective transformation. The change in transformation clearly shows the changed number of retrieved cases. More similar cases are retrieved with the increase in relaxation of the retrieval criterion.
According to the graph in Figure 5.9 on the next page, it is clearly understood that context C has
the best retrieval results in terms of highest number of true positives and least number of false
positives. Therefore, context C was preferred over the other two contexts and chosen for the
experimentation for diagnostic purpose.
Trial No.
Context
Target Case
Relaxation
No. of cases
retrieved
True Positives
False Positives
True Negatives
False Negatives
0% 5 4 1 34 6 1
A Control
50% 10 9 1 34 0
0% 5 5 0 35 5 2
B Control
50% 10 10 0 35 0
0% 5 5 0 35 5 3
C Control
50% 10 10 0 35 0
0% 2 2 0 29 14 4
A Left Brain Stroke 50% 10 8 2 27 8
0% 7 7 0 29 9 5
B Left Brain Stroke 50% 10 7 3 26 9
0% 3 3 0 29 13 6
C Left Brain Stroke 50% 12 12 0 29 4
0% 8 8 0 28 9 7
A Right Brain Stroke 50% 11 10 1 27 7
0% 4 4 0 28 13 8
B Right Brain Stroke 50% 10 8 2 26 9
0% 9 9 0 28 8 9
C Right Brain Stroke 50% 10 10 0 28 7

CHAPTER 5. CASE BASED REASONING – THE MODUS OPERANDI
85
0 2 4 6 8 10 12 14
Control A
Left Brain A
Right Brain A
Control B
Left Brain B
Right Brain B
Control C
Left Brain C
Right Brain C
Tar
get
Cas
es
Number of cases retrieved
True +
False +
Figure 5.9: Graph showing the retrieved true and false positives with respect to contexts A, B
and C. Context C(on top) clearly reveals not only the highest number of true positives but also
absence of any false positives, shown as yellow tip.
In order to perform statistical analysis of the results, the sensitivity, specificity and
accuracy were calculated in order to quantify the performance of the CBR system. The sensitivity
or the recall rate measures the proportion of actual positives which are correctly identified as such
(i.e. the percentage of sick people who are identified as having the condition) and the specificity
measures the proportion of negatives which are correctly identified (i.e. the percentage of well
people who are identified as not having the condition). A sensitivity of 100% means a test
recognizes all sick people as such where as a specificity of 100% means that the test recognizes
all healthy people as healthy. Table 5.8 shows the result of these statistical values.
Sensitivity = ∑ True Positives * 100%
∑ True Positives + ∑ False Negatives
Specificity = ∑ True Negatives * 100%
∑ True Negatives + ∑ False Positives

CHAPTER 5. CASE BASED REASONING – THE MODUS OPERANDI
86
Accuracy = ∑ True Positives + ∑ True Negatives * 100%
∑True Positives + ∑ False Negatives + ∑ True Negatives + ∑ False Positives
To explain the designation of true and false positives and negatives, respectively let us take for
instance the case of a left brain affected stroke as a target:
• A True Positive is a left brain stroke case that was correctly retrieved according to the
context.
• False Negative is a left brain stroke case that was left during retrieval but should have been
retrieved.
• True Negative will be all the controls and right brain stroke cases other than the left brain
affected cases.
• False Positive: A control or a right brain affected case, incorrectly retrieved in a left brain
stroke target.
Table 5.8: Statistical results
5.6 Phase IV - Testing and Evaluation for diagnostic support
A good evaluation not only analyzes how well the system performs, but it may also
reflect how the system can be improved. Furthermore, the evaluation may also reveal the various
factors influencing the system’s performance that can be regulated to achieve optimum results. In
order to meet our objective to evaluate the accuracy of the CBR system in classifying cases,
cross-validation testing [91], was applied. Cross-validation is the statistical practice of
partitioning a sample of data into subsets in a way that the analysis is initially performed on a
single subset, whereas the other subset(s) are retained for subsequent use in confirming and
validating the initial analysis.
Sensitivity Specificity Accuracy
50.97 % 98.06 % 82.42 %

CHAPTER 5. CASE BASED REASONING – THE MODUS OPERANDI
87
In order to perform cross validation for the CBR system, the data set was divided into
two subsets. One subset of data is the training set with 30 cases and the other is the validation or
testing set with 15 cases. The test set was used to assess the performance of the system by
removing each case in the test set from the case base, one after the other, considering it a target
case. Based on this test case (target case) from the system, a context was defined. The system
was then directed to retrieve one or more similar case(s) from the case base, based on the current
context.
The results of these experiments are elaborated in the following Table 5.9. The target
case column displays the information whether it is a right arm affected stroke, a left arm affected
stroke or a control. Total cases are the total number of cases retrieved, for instance in trial 1, the
target case was a right affected arm stroke. 11 cases were retrieved altogether out of which, 9
strokes were ischemic and 2 were hemorrhagic. The majority refers to ischemic. In vascular
territories, there are 9 MCAs (middle cerebral artery), 1 PCA (posterior cerebral artery) and 1 VA
(vertebral artery). MCA is the leading one. Out of 11 retrieved cases, 9 are with left side of the
brain affected and 2 with the right brain affected so more cases refer to the left brain. For lesion
location 5 are SC (sub cortical), 3 are C (cortical), 2 are C+S (Cortical+Subcortical) and 1 is with
lesion in the BS (Brain stem). Proposed solution is derived on the basis of majority of retrieved
cases. Therefore, for the first trial, the proposed solution is that the target case is a subject with
ischemic stroke, left side of the brain affected with an MCA and SC affected by stroke. When the
proposed solution was checked if what was predicted about the target case was right or wrong, all
four solutions that were proposed were correct, therefore the error percentage was calculated to
be 0%, where as when 1of the solution is wrong out of 4, as in trial 3, the error percentage is
25%.

CHAPTER 5. CASE BASED REASONING – THE MODUS OPERANDI
88
Table 5.9: Results of Cross Validation with 15 cases as targets in the testing set. Please refer to the Appendix for abbreviations of vascular territories and lesion locations.
Cases
Retrieved Diagnostic Analysis
Trial
No. Target
Case
Total Cases
Type of
Stroke
Vascular
Territory
Affected
Side of
Brain
Lesion
Location
Proposed
Solution
Error % in
prediction
1 Affected
Right arm 11
Isch:9
Hem:2
MCA:9, PCA:1,
VA:1
Left:9
Right:2
SC:5, C:3,
C+SC:2,
BS:1
Ischemic,
MCA, Left
Brain, SC 0%
2 Affected
Right arm 10
Isch:8
Hem:2
MCA:5, PA:1,
PIA:1, VA:2,
PCA:1 Left:10
BS:4, SC:2,
C:3, C+SC:1
Ischemic,
MCA, Left
Brain, BS 0%
3
Affected
Right arm 2
Isch:1
Hem:1 MCA:2 Left:2 C:2
I/H, MCA,
Left Brain, C
Conflict between
I/H 25%
4 Affected
Right arm 10 Isch:10
MCA:6, PICA:1,
PA:1, VA:1,
PCA:1 Left:10
C:3, C+S:4,
SC:2, C:1
Ischemic,
MCA, Left
Brain, C+S 0%
5
Affected
Right arm 11 Isch:11
MCA:7 , PA:1,
PICA:1, VA:2
Left:9,
Right:2
C:4, C+S:2,
BS:3, SC:2
Ischemic,
MCA, Left
Brain, C 0%
6 Control 10 Control N/A N/A N/A Control 0%
7 Control 10 Control N/A N/A N/A Control 0%
8 Control 10 Control N/A N/A N/A Control 0%
9 Control 10 Control N/A N/A N/A Control 0%
10 Control 10 Control N/A N/A N/A Control 0%
11 Affected
Left arm
2
Isch:2
MCA:2
Left:1,
Right:1
SC:2
Ischemic,
MCA, L/R
Brain, SC
L/R Brain
conflict 25%
12
Affected
Left arm
11
Isch:11
MCA:8, PICA:1,
, PCA:1,
PCA+MCA:1
Left:2,
Right:8,
L+R:1
C+S:6,
SC:3, C:1,
Cereb:1
Ischemic,
MCA, Right
Brain, C+S
0%
13 Affected
Left arm
11
Isch:11
MCA:8, PICA:1,
, PCA:1,
PCA+MCA:1
Left:2,
Right:8,
L+R:1
C:1, C+S:6,
Cereb:1,
SC:3
Ischemic,
MCA, Right
Brain, C+S
C instead of C+S
25%
14 Affected
Left arm
1
Isch:1
MCA:1
Right:1
C+S:1
Ischemic,
MCA, Right
Brain, C+S
0%
15
Affected
Left arm
11
Isch:11
PCA:3, MCA:6,
PCA+MCA:1,
PICA:1
Left:1,
Right:9,
L+R:1
SC:6, C:1,
C+S:3,
Cereb:1
Ischemic,
MCA, Right
Brain, SC
PCA instead of
MCA 25%

CHAPTER 5. CASE BASED REASONING – THE MODUS OPERANDI
89
Table 5.10: Experiments, demonstrating the corresponding hypothesis, methodology and
results of the classification.
Diagnostic Results
Experiment
Hypothesis
Methodology
True
%age
False
%age
Perspective 1
A stroke subject can
be identified as
suffering from a
hemorrhagic or
ischemic stroke.
93.3%
14/ 15
6.6%
1/15
Perspective 2
A stroke subject
can be classified as
a right brain
affected or left
brain affected
stroke.
93.3%
14/15
6.6%
1/15
Perspective 3
The prognosis of a
stroke subject can
be predicted in
terms of the
potential vascular
territory affected
and the potential
lesion location.
Vas.Ter
14/15
93.3%
Les.loc
14/15
93.3%
Vas.Ter
1/15
6.6%
Les.loc
1/15
6.6%
Perspective 4
A target case can be
classified as a
control or a stroke
subject.
Context C that comprised of
9 parameters was chosen as
the most efficient and
effective retrieval criterion.
The constituent parameters
of Context C were: Affected
arm, FMTDirErr,
FMTDistErr, MaxSP, Path
LenRatio, TMT, PostureSP,
RT and FMTMaxSP. One of
the cases was selected at
random by the CBR system
as a target case such that the
solution was unknown. The
proposed solution was
derived from retrieval results
according to the context.
The accuracy of proposed
solution was determined by
checking the actual solution
of the target case.
100%
15/15
0%
0/15

CHAPTER 5. CASE BASED REASONING – THE MODUS OPERANDI
90
N ew C ase
C ase B ase
C ases
S olve d C ase Tested
rep aired Case
L earn ed C ase
RE T R IEVE
R E U S E
RE V IS E
S uggested S olution
Confirm ed Solu t ion
R E T A I
N
P rob lem
5.7 Phase V – Scope of Adaptation
There is no specific adaptation module in the TA-3 system. It is up to the user to re-use
the retrieved cases in order to solve the new problem. The main goal is to be able to retrieve the
appropriate cases that satisfy the context. According to null adaptation [70], once the goal is
achieved, the case solutions can be re-used in any workable and practical manner by the domain
experts or some other program that can provide decision support. As a reasoner, as far as the
scope of this research is concerned, the objective is fulfilled. One of the approaches applied in
this research to choose one case from a number of retrieved cases is to classify the retrieved cases
in terms of number of transformations; the case with minimum transformations should be given
priority over the others.
Figure 5.10: CBR Cycle
If we recall the CBR cycle repeated here as figure 5.10, the results refer to the “suggested
solution” phase. The results are tested and verified by comparing the solution attained by
applying CBR and according to the true and false percentage in Table 5.9, the diagnostic
capabilities are significantly good. The results can be further improved with a variety in lesion
location and vascular territory values as well as more number of hemorrhagic stroke subjects,
which was limited for now.

91
Chapter 6
Conclusions
"No person was ever honored for what he received.
Honor has been the reward for what he gave.”
(Calvin Coolidge)
This chapter concludes the thesis with a discussion of results that were derived from this research.
It also outlines the contributions that were made by the application of this computational
technique to the knowledge base. In addition, it gives a brief description of the future directions
which offer a promising avenue for further research in the broad horizon of AI. This research
enabled me to validate the significance of CBR for the stroke domain. The CBR system presented
a simple approach towards reasoning in this domain by providing a flexible case representation,
an efficient case base organization and an effective retrieval algorithm.
There are multiple features that were discovered by applying TA-3 as a frame work for
this research. Since TA-3 is a flexible system, it can be applied to any decision support system
where information can be represented as attribute-value pairs, and where problems are solved by
iteratively accessing and using previously derived information. TA-3 is different from other

CHAPTER 6. CONCLUSIONS
92
case-based tools because it does not use pre-defined retrieval strategies. Instead, case retrieval is
customized and can be dynamically changed for a particular domain and specific application. It
provides a meaningful classification system which not only improves access time, but also makes
visualization easier to understand. Knowledge-mining with TA-3 is user-oriented; therefore it
enables the user/reasoner to have full control of the precision, recall and coverage.
6.1 Objectives vs. Contributions
The major and most important contribution that this research has made is the opening of a new
horizon in the field of stroke assessment and that is with the development of a new diagnostic
support tool for the first time by implementing CBR. CBR has been successfully applied and
demonstrated to have great results in health informatics and now with the domain of stroke, it
adds to its list of diagnostic applications.
I would further like to recall the objectives that were stated in the first chapter in order to evaluate
if they were successfully met by conducting this research:
• The first objective was to develop a case structure comprising of relevant attributes of stroke
patient data that will have an impact on diagnosis and rehabilitation. This objective was
fulfilled by performing “automated attribute selection” that produced a set of significant
relevant attributes, and after applying machine learning classification, an appropriate case
structure was successfully constituted.
• The second objective led to the construction of a case based system for implementing the
CBR model. With this research a case base was built which comprised of forty-five (45)
cases. Out of which there were ten (10) controls, seventeen (17) right brain affected strokes,
sixteen (16) left brain affected strokes and two (2) with both sides of the brain affected.
• The third objective was to define a retrieval method to conduct CBR. TA-3 was the tool
used for devising a flexible approach for context-based retrieval criterion. Context was

CHAPTER 6. CONCLUSIONS
93
employed as a user-defined, explicit parameter to carry out particular retrieval requests and
the most appropriate context was chosen by comparing different context experiments.
• The fourth objective was to determine the diagnostic support measure that can be taken to
propose the potential motor and / or sensory deficit based on the previous known
impairments (solutions). By analyzing the results of retrieval experiments, four perspectives
were defined as a means of diagnostic analysis, namely:1) identifying if it is a control or a
stroke subject; 2)if a stroke, which type of stroke; 3) Which side of the brain was affected; 4)
Identifying the affected vascular territory and the location of lesion; all based on the similar
retrieved cases.
• The last two objectives referred to testing, evaluating and validating the CBR system
performance. The sensitivity, specificity and accuracy were calculated for the experiments
and the percentage of true and false results verifies the success of this application itself.
• The CBR system for stroke patients can be considered as a novel CBR application for the
stroke domain that may facilitate the clinicians in not only their decision-making of the
diagnosis and prognosis but also an effective means to validate the imaging test results
(CT/MRI).
• KINARM was used for the assessment of stroke patients in this research, which was a more
objective means of dysfunction assessment as compared to all the other clinical assessment
protocols used till date.
6.2 Shortcomings
Every research has some shortcomings and deficiencies that create room for improvement. For
this study I would say that data accuracy and completeness of data is a fundamental factor
because no conclusion can be justified unless the authentication and comprehensiveness of input
data is guaranteed. Secondly, with the increase in the number of representative cases and recorded
tasks, the CBR performance can be further improved and be more prolific in terms of diagnostic
accuracy.

CHAPTER 6. CONCLUSIONS
94
6.3 Future Directions
• One of the most important factor that this research leads to is the field of analysis of
stroke rehabilitation outcomes. CBR may prove to be an effective approach in analyzing
outcomes of stroke rehabilitation, because it can be used as a repository of different
stroke patients. In normal practice, the estimates and predictions of activity
limitations/disability following a stroke are very difficult to obtain, because the patients
that are selected for stroke studies are either population based or referral based.
Therefore, it influences the severity of limitations measured in a stroke sample. This is
one of the reasons why outcome measures may be inconsistent, unreliable or invalid. The
times of assessment during recovery period also varies for the same reason.
• Using CBR as a diagnostic facilitator tool may also give the clinician an estimate of the
time frame involved in rehabilitation.
• In future, it is very likely that with the availability of more periodic (clinical and
KINARM) assessment data, the clinician / therapist would be able to decide what
protocols can be prolific and what would not be beneficial for the patient in the light of
what previous patients have experienced. As a consequence, it may prove to be an
efficient strategy to implement cost analysis on rehabilitation of stroke patients.
• In terms of KINARM future innovations, an eye-tracking system is to be incorporated in
the robotic setup, in order to elaborate the assessment of stroke patients by tracking their
vision along with their ability to perform movement. This will not only enable the
clinicians to quantify eye motor function of the stroke patients but eventually provide
interesting outcomes of eye-hand coordination.
• The KINARM set-up is to incorporate a gaming interface, in order to avoid monotony of
subjects during the reaching tasks that will not only keep them captivated, but also
perform the experiment in a potentially better way.

95
Bibliography
[1] Heart and Stroke Foundation/News and Media room/Stroke statistics
http://ww2.heartandstroke.ca/Page.asp?PageID=1017&CategoryID=2&Src=stroke
(2007). Date Accessed: May 13, 2007
[1-a] Heart and Stroke Foundation/Living with stroke/Stroke Rehabilitation
http://ww2.heartandstroke.ca/Page.asp?PageID=1017&CategoryID=2&Src=stroke
(2007). Date Accessed: June 14, 2007
[2] Alexandrini, F., Krechel, D., Maximini, K., Wangenheim, A.V., (2003) Integrating
CBR into the Health Care Organization. Proceedings of the 16th IEEE Symposium on
Computer-Based Medical Systems (CBMS’03) 1063-7125/03
[3] Aamodt, A., Plaza E. (1994) Case-Based Reasoning; Foundational Issues,
Methodological Variations, and System Approaches. AI Communications. IOS Press,
Vol. 7:1, pp. 39 -59.
[4] Croarkin, E., Danoff, J., Barnes, C. (2004) Evidence-Based Rating of Upper-Extremity
Motor Function Tests Used for People Following a Stroke. Physical Therapy Vol. 8:1
[5] Cirstea M.C., Levin M. F. (2000) Compensatory strategies for reaching in stroke. Brain,
Vol. 123: 5, 940-953
[6] Demmer, M., Selbie, W.S., Bagg, S.D. and Scott, S.H. (2004) Quantitative assessment of
motor learning patterns for stroke patients using KINARM. 32nd Annual Meeting of the
Society for Neuroscience.

BIBLIOGRAPHY
96
[7] Scott S.H. (1999) Apparatus for measuring and perturbing shoulder and elbow joint
positions and torques during reaching. Journal of Neuroscience Methods 89:119-127,
[8] Wikipedia, The free encyclopedia. http://en.wikipedia.org/wiki/Stroke (2007]
Date accessed : July 13, 2007
[9] Shelton F.N., Reding M.J. (2001) Effect of lesion location on upper limb motor recovery
after stroke. Stroke 32: 107-112.
[10] Beer, R.F., Given J.D., Dewald J.P. (1999) Task-dependent weakness at the elbow in
patients with hemi paresis. Arch.Phys.Med.Rehabil. 80: 766-772
[11] Burke, D. (1988) Spasticity as an adaptation to pyramidal tract injury. Adv. Neurol. 47:
401-423
[12] Levin, M.F. (1996) Inter joint coordination during pointing movements is disrupted in
spastic hemi paresis. Brain 119: 281-293
[13] Twitchell, T.E. (1951) The restoration of motor function following hemiplegia in man.
Brain: 74:443-480.
[14] Gladstone D. J., Danells C. J., and Black S. E. (2002) The Fugl-Meyer Assessment of
Motor Recovery after Stroke: A Critical Review of its Measurement Properties.
Neurorehabilitation and Neural Repair 16(3)
[15] Volpe B.T., Krebs H.I., Hogan N. (2001) Is robot-aided sensorimotor training in stroke
rehabilitation a realistic option? Curr.Opin.Neurol. 14: 745-752
[16] Burgar C.G., Lum P.S., Shor P.C., Machiel Van der Loos H.F. (2000) Development of
robots for rehabilitation therapy: the Palo Alto VA/Stanford experience.
J.Rehabil.Res.Dev. 37: 663-673
[17] J. Moreland, C., Gowland, S. V., Hullenaar, M. Huijbregts, S. VanHullenaar, W.
Torresin, B. Vanspall, S. Barrecca, M. Ward, P. Stratford, R. Barclay-Doddard. Chedoke-
McMaster Stroke Assessment: Development, Validation and Administration Manual.
1995.
[18] Costa L.D., Vaughan H.G., Jr., Levita E., Farber N. (1963) Purdue Pegboard as a
predictor of the presence and laterality of cerebral lesions. J.Consult Psychol. 27:133-137
[19] The Stroke Foundation of New Zealand Inc. http://www.stroke.org.nz/rehabilitation.htm
Date Accessed: July 25, 2007
[20] Klein G.A. (1999) Sources of power: How people make decisions. 1st MIT Press pbk.
Cambridge, Mass.; London, MIT Press; p. xviii, 330.

BIBLIOGRAPHY
97
[21] Svenson O. Maule A.J. (1993) Time pressure and stress in human judgment and decision
making. New York, Plenum Press; p. xxii, 335.
[22] Kolodner, J. (1993) Case-Based Reasoning. San Mateo: Morgan Kaufmann
[23] Wittgenstein, L. (1953) Philosophical investigations. Blackwell, pp. 31-34.
[24] Tulving, E. (1977) Episodic and semantic memory. In E. Tulving and W. Donaldson:
Organization of memory, Academic Press, 1972. pp. 381-403.
[25] Schank, R. Leake, D (1989) Creativity and learning in a case-based explainer. Artificial
Intelligence, Vol. 40:1-3, pp 353-385.
[26] Gentner, D. (1983) Structure mapping - a theoretical framework for analogy. Cognitive
Science, Vol.7. s.155-170.
[27] Navinchandra, D. (1988) Case-based reasoning in CYCLOPS, a design problem solver.
In Kolodner (ed.): Proceedings Case-Based Reasoning Workshop, San Mateo,
California, Morgan-Kauffman Publ.
[28] Kristian, J., Hammond: Case-based planning. Academic Press. 1989.
[29] Goel, A. (1989) Integration of case-based reasoning and model-based reasoning for
adaptive design problem solving. Ph.D. Thesis. The Ohio State University.
[30] Dave B., Schmitt G., Shih S-G., Bendel L., Faltings B., Smith I., Hua K., Bailey S.,
Ducret J.M., Jent K. (1994). Case-based spatial design reasoning. Proceedings Second
European Workshop on Case-Based Reasoning. 115-124.
[31] Hinrichs, T.R. (1992) Problem solving in open worlds. Lawrence Erlbaum Associates
[32] Marir, F. (1995) Representing and indexing building refurbishment cases for multiple
retrieval of adaptable pieces of cases. In Proceedings of First International Conference
on Case-Based Reasoning, 55-66. Berlin: Springer Verlag.
[33] Carbonell, J. (1983) Learning by analogy: Formulating and generalizing plans from past
experience. In (Michalski, Carbonel and Mitchell, eds): Machine Learning: An Artificial
Intelligence Approach, Tioga, Palo Alto.
[34] Rissland, E.L. (1983). Examples in legal reasoning: legal hypotheticals. Proceedings
IJCAI’83, Karlsruhe.
[35] Goel, A., Chandrasekaran B. (1989) Use of device models in adaptation of design cases.
In Hammond (ed.): Proceedings Second Workshop on case-based reasoning, Pensacola
Beach, Florida, Morgan-Kauffman.
[36] Barletta, R. and Hennessy D. (1989). Case adaptation in autoclave layout design. In
Hammond (ed.): Proceedings Second Workshop on case-based reasoning, Pensacola
Beach, Florida, Morgan-Kauffman.

BIBLIOGRAPHY
98
[37] Veloso, M. (1992) Learning by analogical reasoning in general problem solving. Ph.D.
Thesis. Carnegie Mellon University.
[38] Carbonell, J., Knoblock C.A., Minton S. (1991) PRODIGY: An integrated architecture
for planning and learning. In (Kurt Van Lehn ed.) Architectures for Intelligence, The
Twenty- Second Carnegie Mellon Symposium on Cognition. Erlbaum Publ.
[39] Pearce, M., Goel A., Kolodner J., Zimring C., Sentosa L., Billington R. (1992). Case-
based design support: A case study in architectural design. IEEE EXPERT 7, 14-20.
[40] Hinrichs, T.R. (1988). Towards an architecture for open world problem solving. In
Kolodner (ed.): Proceedings Case-Based Reasoning Workshop, San Mateo, California,
Morgan-Kauffman Publ.
[41] Hinrichs, T.R. (1989) Strategies for adaptation and recovery in a design problem solver.
In Hammond (ed.): Proceedings Second Workshop on case-based reasoning, Pensacola
Beach, Florida, Morgan-Kauffman.
[42] Koton P. (1988). Using experience in learning and problem solving. Ph.D. Thesis.
Computer Science Dept. MIT.
[43] Bareiss, E.R., Porter B., Weir C.C. (1988) PROTOS: An exemplar-based learning
apprentice. Int. J. of Man-Machine Studies 29, 549-561.
[44] Magaldi R. (1994). Maintaining airplanes using CBR. Proceedings Second European
Workshop on Case-Based Reasoning. 1-12.
[45] Deters, R.D. (1994) CBR for maintenance of telecommunication networks. Proceedings
Second European Workshop on Case-Based Reasoning.23-32.
[46] Marchetti, Lanzola, and Stefanelli. (2001) An AI-Based Approach to Support
Communication in Health Care Organizations. In: Proceedings of the 8th Conference on
Artificial Intelligence in Medicine in Europe (AIME’01)
[47] Alexandrini F., Krechel D. Maximini K., Wangenheim AV. (2003) Integrating CBR into
the Health Care Organization Proceedings of the 16th IEEE Symposium on Computer-
Based Medical Systems (CBMS’03)
[48] Gierl, Bull, Schmidt. (1998) CBR In Medicine. In: Case-Based Reasoning Technology,
From Foundations to Applications. Springer Verlag Berlin.
[49] Bradburn and. Zeleznikow, J. (1993) The application of Cased-Based reasoning to the
tasks of health care planning. In: S. Wess, Editor, Proceedings of European workshop on
CBR, Springer, Berlin, pp. 365–378.

BIBLIOGRAPHY
99
[50] Turner (1988) Organizing and using schematic knowledge for medical diagnosis. In: J.
Kolodner, Editor, First workshop on CBR, Morgan Kaufmann, San Mateo, pp. 435–446.
[51] Gierl, L., Rutkowski, S.S (1994) Integrating consultation and semi-automatic knowledge
acquisition in a prototype-based architecture: experiences with dysmorphic syndromes,
Artificial Intelligence in Medicine 6, pp. 29–49.
[52] Ochi-Okorie, A.S. (1998) Disease diagnosis validation in TROPIX using CBR. Artificial
Intelligence in Medicine 12 (1): 43-60
[53] Wenkebach, U., Pollwein, B., Finsterer, U. (1992) Visualization of large data sets in
intensive care. In Proceedings of annual symposium computing applied medical care (pp.
18–22).
[54] Liang, T. (1993) Special section: research in integrating learning capabilities into
information systems, Journal of Management Information Systems 9 pp. 5–15.
[55] Jurisica, I., Mylopoulos, J., Glasgow, J., Shapiro,H., Casper, R.H. (1998) Case-based
reasoning in IVF: prediction and knowledge mining. Artificial Intelligence in Medicine
12 vol. 12, pp. 1-24
[56] Schulze-Wollgast, P., H. Schumann, C. Tominski Visual Analysis of Human Health Data
http://wwwicg.informatik.uni- rostock.de/Forschung/vishealth /IR MA 2003.pdf Date
visited: August 22, 2007.
[57] Wong, W.Y., Lee, M., Zhang D.M. (1999) Managing Clinical Incidents in General
Practice. In: Exploring Synergies of Knowledge Management and Case-Based
Reasoning, Papers from the AAAI Workshop.
[58] Varma, A., Roddy, N. (1999) ICARUS: a case-based system for locomotive diagnostics.
Engineering Applications of Artificial Intelligence 12(6), 681–690.
[59] Göker, M., Roth-Berghofer, T. (1999) The development and utilization of the case-based
help-desk support system HOMER. Engineering Applications of Artificial Intelligence
12(6), 665–680.
[60] Cheetham, W, (2003) Global Grade Selector: A Recommender System for Supporting the
Sale of Plastic Resin (Lecture Notes in Computer Science, 2689). Berlin: Springer, pp.
96–106.

BIBLIOGRAPHY
100
[61] Acorn, T.L., Walden, S. H. (1992) SMART: support management cultivated reasoning
technology for Compaq customer service. In Scott, S and Klahr, P (eds) Innovative
Applications of Artificial Intelligence 4, Proceedings of AAAI-92. Cambridge, MA: AAAI
Press/MIT Press.
[62] Branting, K., Aha, D.W. (1995) Stratified case-based reasoning: reusing hierarchical
problem solving episodes. In Proceedings of the Fourteenth International Joint
Conference on Artificial Intelligence, San Francisco, CA: Morgan Kaufmann, pp. 384–
390.
[63] Aamodt, A., Althoff, K.-D., Magaldi, R. & Milne, R. (1995). Case-Based Reasoning: A
New Force In Advanced Systems Development. Tutorial, London, April 27, 1995,
Unicom Seminars & AI Intelligence, UK (143 pages)
[64] National Institutes of Neurological Disorders and Stroke.
http://www.ninds.nih.gov/disorders/stroke/detail_stroke.htm#93801105 Date accessed:
August 29, 2007.
[65] Jurisica, I., Rogers, P., Glasgow, J. I., Fortier, S. Luft, J. R. Wolfley, J.R., Bianca, M.A.,
Weeks, D.R., DeTitta, G.T.(2001) Intelligent decision support for protein crystal growth
IBM SYSTEMS JOURNAL, VOL 40:2
[66] Jurisica, I., Glasgow, J. I (2004) Applications of Case Based Reasoning in Molecular
biology. American Association for Artificial Intelligence, 0738-4602-2004
[67] Cardie, C. (1993a). A Case- Based Approach to Knowledge Acquisition for Domain-
Specific Sentence Analysis. In Proceedings of the Eleventh National Conference on
Artificial Intelligence, pages 798-803, Washington, DC. AAAI Press / MIT Press.
[68] C. Cardie. 1993b. Using Decision Trees to Improve Case-Based Learning. In P.tgoff,
editor, Proceedings of the Tenth International Conference on Machine Learning, pages
25-32, University of Massachusetts, Amherst, MA. Morgan Kaufmann.
[69] Simpson, R. L. (1985). A Computer Model of Case-Based Reasoning in Problem
Solving: An Investigation in the Domain of Dispute Mediation. Technical Report GIT-
ICS-85/18, Georgia Institute of Technology, School of Information and Computer
Science, Atlanta,US.
[70] Watson, I. (1997) Applying Case-based Reasoning: techniques for Enterprise Systems.
Morgan Kaufmann Publishers, Inc., San Francisco, California.
[71] Hayes-Roth, F. (1985) Rule-based systems automate problem-solving know-how,
provide a means for capturing and refining human expertise, and are proving to be
commercially viable. Communications of the ACM Vol. 28: 9

BIBLIOGRAPHY
101
[72] Burgar, C.G., Lum, P.S. Shor, P.C., Van der Loos, H.F. (2000) Development of robots
for rehabilitation therapy: The Palo Alto VA/Stanford experience. Journal of
Rehabilitation Research and Development. 37: 663-673.
[73] Khan, L., Averbuch, M., Rymer, W. and Reinkensmeyer, D. (2001) Comparison of robot-
assisted reaching to free reaching in promoting recovery from chronic stroke. Integration
of Assistive Technology in the Information. IOS Press, pp. 39-44.
[74] Kamper, D.G., McKenna-Cole, A.N., Kahn, L.E., Reinkensmeyer, D.J. (2002)
Alterations in reaching after stroke and their relation to movement direction and
impairment severity. Archives of Physical Medicine and Rehabilitation. 83: 702-707.
[75] Shelton, F.N., Reding, M.J. (2001) Effect of lesion location on upper limb motor
recovery after stroke. Stroke. 32: 107-112.
[76] Finley, M.A. Fasoli, S.E. Dipietro, L. Ohlhoff J., MacClellan, L. Meister, C.. Whitall, J.
Macko, R. Bever, C.T, Krebs H.I., Hogan N. (2005) Short-duration robotic
BIBLIOGRAPHY 121 Therapy in stroke patients with severe upper-limb motor
impairment. Journal of Rehabilitation Research and Development. 42(5): 683-692.
[77] Fisk, J.D., Goodale, M.A. (1988) The effects of unilateral brain damage on visually
guided reaching: hemispheric differences in the nature of the deficit. Experimental Brain
Research. 72 (2): 425 – 435.
[78] Abu Zeid, A. (2007) A Parameter Analysis for Robotic Assessment of Impairments in
Reaching Due to Stroke Quantitative Assessment of arm movements in chronic stroke
patients. Master of Science thesis submitted to the School of Computing. Queen’s
University, Kingston, ON.
[79] Jurisica, I., Arshadi, N. (2004). Maintaining Case-based Reasoning Systems: A Machine
Learning Approach ECCBR4, LNAI 3155, pp. 17-31.
[80] Wettschereck, D., Dietterich, T. (1995) An experimental comparison of the nearest
neighbor nearest hype rectangle algorithms. Machine Learning 19(1) 5-27.
[81] Jurisica, I. (1994) Context-Based Similarity Applied to Retrieval of Relevant Cases.
AAAI Fall Symposium Series New Orleans, Louisiana, November 4-6, 1994
[82] Jurisica, I., Glasgow, J., Mylopoulos, J. (2000) Incremental iterative retrieval and
browsing for efficient conversational CBR systems. International Journal of Applied
Intelligence 12(3) 251-268
[83] Brien, D.C., Glasgow, J., Munoz, D. (2005) The applications of a case-based reasoning
system to attention-deficit-hyperactivity disorder. Springer-Verlag ICCBR 2005, LNAI
3620, pp.122-136

BIBLIOGRAPHY
102
[84] Jurisica, I., Glasgow, J. (1996) Case-based Reasoning Approach to Learning Control. In
5th Int. Conf. on Data and Knowledge Systems for Manufacturing and Engineering,
Phoenix, AZ, DKSME-96, October 24-25.
[85] Dukelow, S., Moore, K., Swaine, J., Bagg, S., Norman, K., Glasgow, J. and Scott, S.
(2006) In Proceedings of American Academy of Physical Medicine and Rehabilitation.
Robotic Analysis of Limb Position Sense Following Stroke.
[86] Jurisica, I., Glasgow, J. (1996) Case-Based Classification Using Similarity-Based
Retrieval. In proceedings of 8th IEEE International Conference on Tools with Artificial
Intelligence, Toulouse, France, Nov. 16-19, 1996.
[87] Leake, D.B., Wilson, D.C. (1998) Categorizing Case-based maintenance: Dimensions
and directions. In Advances in case-based Reasoning: Proceedings of the fourth
European Workshop on Case-based Reasoning, EWCBR-98. Springer-Verlan Berlin.
196-207.
[88] Adams, H. P., Hachinski, V., Norris. J.W. (2001) Ischemic Cerebrovascular disease.
Oxford University Press
[89] Demmer, M. J. (2006) Quantitative Assessment of arm movements in chronic stroke
patients. Thesis submitted to the Department of Anatomy and Cell Biology. Queen’s
University, Kingston, ON.
[90] Rodin, M., Saliba, D., B-Smith, K. (2006) Guidelines Abstracted From the Department of
Veterans Affairs/Department of Defense Clinical Practice Guideline for the Management
of Stroke Rehabilitation J Am Geriatric Soc. 2006; 54 (1):158-162. Blackwell
Publishing.
[91] Kohavi, R. (1995) "A study of cross-validation and bootstrap for accuracy estimation and
model selection” Proceedings of the Fourteenth International Joint Conference on
Artificial Intelligence 2 (12): 1137–1143. (Morgan Kaufmann, San Mateo)
[92] Fisk, J.D., Goodale, M.A. (1988) The effects of unilateral brain damage on visually
guided reaching: Hemispheric differences in the nature of the deficit, Experimental Brain
Research 72 pp. 425–435.
[93] Micera, S., Carpaneto, J., Posteraro, F., Cenciotti, L., Popovic, M., Dario, P.(2005)
Characterization of upper arm synergies during reaching tasks in able-bodied and
hemiparetic subjects Clinical Biomechanics Volume 20, Issue 9, Pages 939-946.
[94] Beer, R.F., Dewald, J., Dawson, M.L., Rymer, W.Z. (2004) Target-dependent
differences between free and constrained arm movements in chronic hemiparesis
Experimental Brain Research Vol. 156:4 pp. 458-470.

BIBLIOGRAPHY
103
[95] Kemal, N., Ali, G., Remzi, C., Jale, S.A. (2004) The relationship between physical
Impairment and disability during stroke rehabilitation: effect of cognitive status.
International Journal of Rehabilitation Research. 27(3):181-184
[96] Condliffea, E.G., Clarka, D.J., Pattena, C.(2005) Reliability of elbow stretch reflex
assessment in chronic post-stroke hemiparesis Clinical Neurophysiology
Volume 116:8, Pages 1870-1878.
[97] Dipietro, L., Krebs, H. I., Fasoli, S. E.,Volpe, B. T Stein, Bever, J.C., Hogan, N. (2007)
Changing Motor Synergies in Chronic Stroke J Neurophysiol 98: 757-768, 2007. First
published June 6, 2007; doi:10.1152/jn.01295.2006
[98] Brami, R., AFeydy, A. Combeaud, M., Biryukova, E. V., Bussel, B.Levin, M. F. (2003)
Motor compensation and recovery for reaching in stroke patients. Acta Neurologica
Scandinavica. 107(5):369-381
[99] Devani, B., (2004) Data Warehousing for Scientific Behavioral Data. Master’s Thesis
submitted to School of Computing, Queen’s Universty.
[100] http://publib.boulder.ibm.com/infocenter/db2luw/v8//index.jsp
Date accessed: Sep 23, 2008.
[101] IBM DB2 - Application Development Guide Version 7 Copyright © IBM Corp.
[102] Baker, E., JAIN, A. K. (1976) On feature ordering in practice and some finite sample
effects. In Proceedings of the Third International Joint Conference on Pattern
Recognition, pages 45-49, San Diego, CA
[103] Mingers, J. (1989) An empirical comparison of selection measures for decision tree
induction. Machine Learning, 3:319-342.
[104] Quinlan, J. R.. (1986) Induction of decision trees. Machine Learning, 1:81-106.
[105] Liu W. Z., White, A. P. (1994) The importance of attribute selection measures in decision
tree induction. Machine Learning, 15:25-41.
[106] Kohavi, R., John G.H. (1997) Wrappers for feature subset selection, Artificial
Intelligence, vol. 97, pp. 273-324.
[107] Kira, K. Rendell, L. (1992) A practical approach to feature selection," in Proceedings of
the Ninth International Conference on Machine Learning., pp. 249-256, Morgan
Kaufmann.
[108] Hall, M. A., Holmes, G. (2003) Benchmarking Attribute Selection Techniques for
Discrete Class Data Mining. IEEE Transactions on Knowledge and data engineering,
VOL. 15: 3, May/June 2003.

BIBLIOGRAPHY
104
[109] Hall, M. A.(1998) Correlation-based feature selection for machine learning, Ph.D. thesis,
Department of Computer Science, University of Waikato, Hamilton, New Zealand.
[110] Almuallim, H., Dietterich, T. G. (1991) Learning with many irrelevant features. In
Proceedings of the Ninth National Conference on Artificial Intelligence., pp. 547-552,
AAAI Press.
[111] Yiming Yang and Jan O. Pedersen, (1997) A comparative study on feature selection in
text categorization. In Proceedings of International Conference on Machine Learning,
pp. 412-420.
[112] WEKA documentation http://www.cs.waikato.ac.nz/ml/weka/
Date accessed: February 29, 2008.
[113] Goldberg, D.E. (1989). Genetic algorithms in search, optimization and machine learning.
Addison-Wesley Longman Publishing Co., Inc. Boston, MA, USA
[114] Jurisica, I.(1996) Inductive Learning and Case-Based Reasoning. Canadian AI
conference Workshop on What is Inductive Learning?
[115] BKIN Technologies. Creators of KINARM Robotic System.
http://www.bkintechnologies.com/index.cfm?page=products&s=human&t =kinarm
Date accessed July 25, 2008.

105
APPENDIX A
KINARM Specifications
Human KINARM Lab Specifications
Two motorized KINARM™ robots for simultaneous right and left-handed investigation
• Workstation and visual display for presentation of 2D virtual targets in the actual plane of
limb motion
• System-integrated chair with wheelchair-style seating (including removable foot, arm and
head rests)
• Data acquisition hardware, including up to 32 channels of analog input
• Dexterit-E™ - data acquisition and experimental control software
• Computer system to run Dexterit-E™ (including a real-time computer for precise and safe
action)
• Simlib - a library of Simulink blocks to assist with rapid custom Task Program creation
(Simulink and other Mathworks toolboxes must be purchased separately)
• Optional data analysis software (Visual 3D)
System Specifications:
• Real-time control and data acquisition at 1kHz
• Peak torque pulse of 12Nm (~35N at the hand)
• Feedback resolution of 0.0045°, (~30micron at the hand)
• End-point stiffness of ~5 N/mm
• 45" wide usable workspace
• Fits a large range of adult sizes (approximately 4'10" to 6'6")
• System footprint 10‘x10’ (when in use)

APPENDIX A
106
Human KINARM Lab Includes:
The human KINARM Lab is a complete research lab based on the KINARM, a robotic
exoskeleton for the arm. Currently, the human KINARM Lab is used by basic and clinical
researchers studying motor learning, coordination, neural basis of movement, Brain-Machine
Interface, haptics, stroke, cerebral palsy, Fetal Alcohol Syndrome, cerebellar dysfunction,
dystonia, and spinal cord injury.
Complete Research Lab
The human KINARM Lab lets you start collecting data immediately. Standard system includes
two KINARM™ robotic exoskeletons for the upper limbs, 2D virtual reality display,
experimental control software and hardware, ready-to-use tasks and optional data analysis
software.
Study Both Arms Simultaneously
The use of two KINARM robots permits comparison of inter-arm performance as well as the
study bimanual coordination.
Dual Function Robots
Each KINARM robot can be used as an exoskeleton for the shoulder and elbow (leaving the hand
free to interact with objects in the environment) or as a hand-based end-point robot.
2D Virtual Reality
Standard system includes 45" wide 2D virtual reality display for natural, intuitive presentation of
visual stimuli.
Easy To Use and Powerful
System includes Dexterit-E™, behavioural control and data acquisition software, which combines
the power of a real-time operating system with the ease of a WindowsTM-based interface.
Standard Task Programs can be used immediately for data collection. Custom Task Programs can
be created using high-level graphical programming tools.
(Courtesy of BKIN technologies [115]
List of KINARM Tasks:
A – Unloaded targets in space
B – Sensory matching (human subjects only)
C – Passive movement
D – Postural trials where loads are applied, but no movement occurs

APPENDIX A
107
E – Reaching to targets in space with a viscous load applied
F – Reaching to targets in space with an interaction load applied
G – Reaching to targets in space with a bias load applied
H – Not assigned
I – Perturbation from centre target
List of Vascular Territory Abbreviations:
MCA: Middle Cerebral Artery
PCA: Posterior Cerebral Artery
VCA: Vertebral Cerebral Artery
PICA: Posterior Inferior cerebral artery
PA: Pontine Artery
List of Lesion location Abbreviations:
C: Cortical
SC: Sub-cortical
C+SC: Cortical +Sub-Cortical
Cer: Cerebellar
BS: Brain Stem
List of Attributes:
Clinical Data: Features Table:
Affected Side Trial Key
Initials Arm
Date of Birth Features
Age Method
Gender Time
Date of Stroke Feature Value
Height: Units

APPENDIX A
108
Weight
Stroke Subject visits table:
Dominant Hand Date
CT/MRI performed (Y/N) Subject Key
Location of Stroke Stroke Key
Days since stroke Type of Stroke
Sessions and Subjects Table: Side of Brain
Subject key Lesion Location
Date of birth Vascular Territory
Expermentor Structures Damaged
Project Assessments Table:
Category(Stroke/Control) CT/MRI dates
Features for set table: Reflex Biceps (Left+Right)
Set key Reflex Triceps (Left+Right)
Condnum Reflex Brachio (Left+Right)
Trial Folstein Score
Number in set Ashworth (Left+Right)
trial Key ROM (Left+Right)
Start time Dyna Hand (Left+Right)
Method Dyna Pinch (Left+Right)
Arm Thumb (Left+Right)
Feature Perdue (Left+Right)
Time Perdue (Assembly)
Feature Val. Perdue (Both)
Code comments Chedoke arm (Left+Right)
Units Chedoke Hand (Left+Right)
Strokes Table: Vision (Left+Right)
Stroke key Hemi Neglect

APPENDIX A
109
Type of stroke BIT
Affected arm FIM Score
Previous Stroke Aphasia
Vasc Key Proprioception
Comments Sets Table:
Location Key Session Key
Side of brain Set Number
Subjects Table: Task Variable Key
Category Task Code
Gender File name
KGH ID Rate
Physician Name Time Stamp
Physician Phone Arm moved by motors
Dominant Hand Task description Sessions Table: Task variant
Session Variant Description
Day Trial Table:
Project Condition Key
KIN Version Trial Key
Soft Version Start Time
Hard Version Numbers in set
PLC Version Error
File Version Comments
Session Key
Ax Key
Site Code

APPENDIX A
110
List of Selected Attributes: Attribute Number Attribute Ranking according to various WEKA Algorit hms:
Name of Attribute
Sum of
Rank-ing Cfs
Chi squar
Gain Ratio
Info Gain
OneR PCA
Sym. Uncert. Wrapper
1 15 Affected Arm 47 15 18 15 18 10 1 9 15 2 9 FMTDirErr_mean 62 19 5 9 5 8 2 11 18 3 2 FMTDisErr_mean 68 (n+1) 2 11 2 9 3 24 5 4 11 MaxSP_mean 69 (n+1) 15 18 15 13 4 15 2 5 5 PathLenRatio_mean 75 (n+1) 6 5 6 11 5 19 9 6 18 TMT_mean 83 (n+1) 19 2 9 12 6 14 11 7 19 PostureSP_mean 87 (n+1) 11 6 11 3 7 16 6 8 6 RT_mean 98 (n+1) 9 19 19 1 8 12 19 9 10 FMTMaxSP_mean 99 (n+1) 20 10 20 2 9 17 10 10 8 Dominant Arm 110 (n+1) 10 21 10 7 10 18 20 11 4 Structures Damaged 117 (n+1) 21 8 21 4 11 25 21 12 7 Side of Brain 121 (n+1) 8 20 8 5 12 13 8 13 3 Date of Stroke 123 (n+1) 4 4 4 23 13 2 4 14 12 Vascular Territory 130 (n+1) 1 1 1 24 14 22 3 15 21 Lesion Location 133 (n+1) 7 3 7 21 15 7 7 16 1 Chedoke Arm_R 134 (n+1) 3 7 3 22 16 6 1 17 13 Chedoke Hand_L 141 (n+1) 23 23 23 15 17 2 23 18 20 Chedoke Hand_R 147 (n+1) 22 22 22 14 18 5 22 19 24 Chedoke Arm_L 159 (n+1) 25 25 25 18 (n+1) 23 25 20 23 Weight 156 (n+1) 24 24 24 25 (n+1) 21 24 21 22 Height 158 (n+1) 13 13 13 17 (n+1) 4 13 22 14 MAS_L 162 (n+1) 12 12 12 19 (n+1) 10 12 23 25 MAS_R 163 (n+1) 17 17 17 16 (n+1) 3 17 24 17 Gender 167 (n+1) 14 14 14 6 (n+1) 1 14 25 16 Age 174 (n+1) 16 16 16 20 (n+1) 8 16 26 26 Subject Key 183 (n+1) 20 10 20 2 (n+1) 17 10 27 27 Type of Stroke 224 (n+1) (n+1) (n+1) (n+1) (n+1) (n+1) (n+1) (n+1)
List of selected attributes and their corresponding ranks according to the scheme for attribute
selection (SAS).

111
APPENDIX B
Scanned Forms
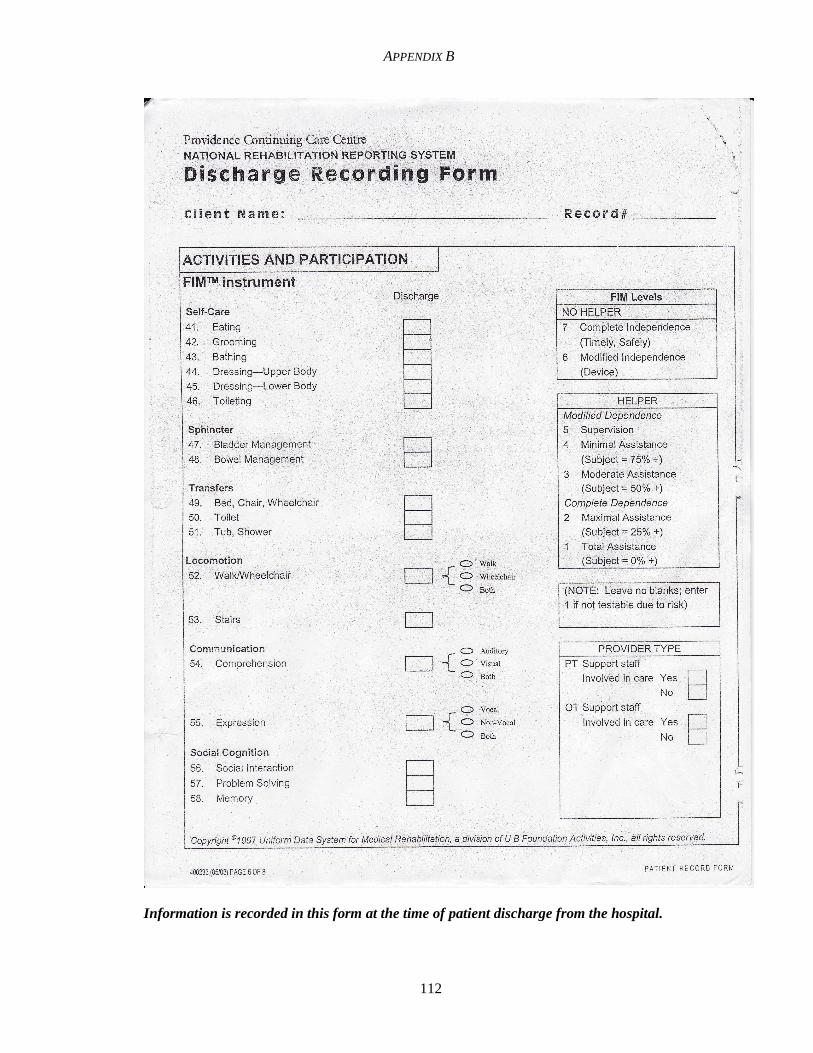
APPENDIX B
112
Information is recorded in this form at the time of patient discharge from the hospital.
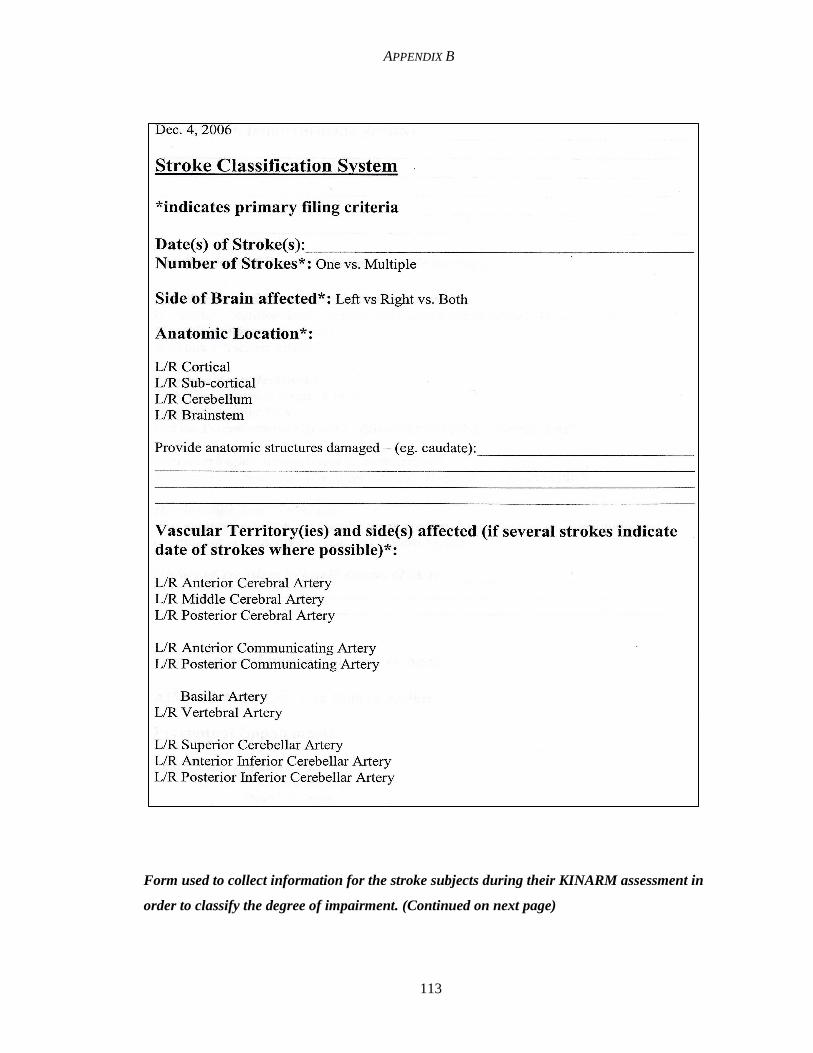
APPENDIX B
113
Form used to collect information for the stroke subjects during their KINARM assessment in
order to classify the degree of impairment. (Continued on next page)

APPENDIX B
114

115
Form used to collect information for the stroke and control subjects during their KINARM
assessment Page 1 of 9 (Continued)

APPENDIX B
116
Page 2 of 9

APPENDIX B
117
Page 3 of 9

APPENDIX B
118
Page 4 of 9

APPENDIX B
119
Page 5 of 9

APPENDIX B
120
Page 6 of 9

APPENDIX B
121
Page 7 of 9

APPENDIX B
122
Page 8 of 9

APPENDIX B
123
Page 9 of 9