Sarah Kitner - QSpace - Queen's University
168
INTERINDIVIDUAL DIFFERENCES IN OXYGEN DELIVERY DEMAND MATCHING AND ITS IMPACT ON EXERCISE FATIGABILITY by Sarah Kitner A thesis submitted to the Department of Kinesiology and Health Studies In conformity with the requirements for the degree of Master of Science Queen’s University Kingston, Ontario, Canada (February, 2018) Copyright ©Sarah Kitner, 2018
-
Upload
khangminh22 -
Category
Documents
-
view
0 -
download
0
Transcript of Sarah Kitner - QSpace - Queen's University
INTERINDIVIDUAL DIFFERENCES IN OXYGEN DELIVERY DEMAND
MATCHING AND ITS IMPACT ON EXERCISE FATIGABILITY
by
Sarah Kitner
A thesis submitted to the Department of Kinesiology and Health Studies
In conformity with the requirements for
the degree of Master of Science
Queen’s University
Kingston, Ontario, Canada
(February, 2018)
Copyright ©Sarah Kitner, 2018
ii
Abstract
Background: At the start of exercise, the energy demand of the muscle increases. To meet this demand,
energy production using oxygen increases. More oxygen is brought to the muscle mainly by a widening
of the blood vessels. In small muscle mass exercise, it is generally accepted that oxygen delivery is tightly
coupled to the demand of the muscle (Wagner, 2012, Wajner & Goodman, 2011). Recently however,
individual differences in oxygen delivery demand matching have been revealed, and these differences
predict performance. (Kellawan et al., 2014; Bentley et al., 2014; Bentley et al., 2017).
Objectives: 1) Quantify an individual’s oxygen delivery (O2D) to oxygen consumption (V̇O2) ratio using
a range of exercise intensities 2) Quantify the association between the oxygen delivery to oxygen
consumption ratio and exercise fatigability.
Methods: 10 participants performed multiple incremental rhythmic forearm handgrip exercise tests until
exhaustion to quantify individual oxygen delivery to oxygen consumption ratio. These participants were
divided into high and low responder groups, where ‘high responders’ were defined as having higher
oxygen delivery relative to oxygen consumption and ‘low responders’ had lower oxygen delivery relative
to oxygen consumption. A fatiguing exercise test, using intermittent maximal contractions, was used to
quantify fatigability. Oxygen delivery was determined by measuring forearm blood flow with ultrasound
and by estimating the oxygen content of the blood through venous blood sampling. Forearm oxygen
consumption was calculated as the product of forearm blood flow and arterial-venous oxygen content
difference.
Results: High responders experienced less fatigability than the low responders. High responders had
greater absolute change in O2D (p < 0.01), forearm blood flow (FBF) (p<0.05) and in forearm vascular
conductance (FVC) (p<0.05), reflecting a greater widening of the blood vessels.
Conclusions: In forearm handgrip exercise, the high responders demonstrated less exercise fatigability.
High responders had greater widening of the blood vessels, suggesting the potential for relative
enhancement of the blood vessel response to the same exercise demand.

iii
Acknowledgements
Thank you to the following people for being with me every step of the way:
Dr. Michael Tschakovsky, you have taught me to never take any findings at face value. You have taught
me to always delve deeper and to make sense of what the data is telling me. For this, I am forever
grateful. Thank you to the participants who volunteered for my study, without you this project would not
have been possible. To my colleagues Robert Bentley, Jeremy Walsh, Alyssa Fenuta, Patrick Drouin, and
Mytchel Lynn, thank you for devoting your time and energy to lending help when necessary. Alyssa, a
special thanks must go to you! Do not know where I would be without my mama hen. Lizz – thank you so
much for your devotion to this project! I am so glad that we met! Alex, you have been more than my
colleague throughout this process. You have been my biggest support system here at Queen’s, and I am so
grateful that you stood by my side through every step of this journey. I do not know what I would have
done without our Smitty Sundays, Brass popcorn, and evening swim adventures! Margo, thanks big sis. I
have always looked up to your strong character, intelligence, and perseverance. My ECS girls, my day
one ladies… love you psychos! Thanks for shaping me into the goofy gal I am today! Mom and Dad, I
love you more than chocolate. There is no hug that is strong enough and no smile that is big enough to
show you how much thanks I have for you two. The McGill-me could have never imagined climbing over
those mountains and coming this far. I could not have done in without you two. Thank you for helping me
put things into perspective and for teaching me that kindness and happiness are the most important things
in life. You two are always there for me and constantly reassure me that it will all work out. Bubby, 93
years old and you’re still a rock star! Thank you for everything! I would not be where I am today without
you. You know how much I love and admire you. Your wise words never cease to amaze and inspire me.
I am so grateful to have you here with me today, to watch me graduate from this milestone.
iv
Table of Contents
Abstract ......................................................................................................................................................... iiAcknowledgements ...................................................................................................................................... iiiList of Figures ............................................................................................................................................ viiiList of Tables .................................................................................................................................................xList of Abbreviations ................................................................................................................................... xiChapter 1 Introduction ...................................................................................................................................1Chapter 2 Literature Review ..........................................................................................................................7
2.1 Introduction ..........................................................................................................................................72.2 Bioenergetics of ATP Production and the Role of Oxygen .................................................................72.3 Experimental Manipulations in Oxygen Delivery ...............................................................................9
2.3.1 Involuntary Exercise – The Oxygen Conformer Hypothesis ........................................................92.3.2 Voluntary Exercise – The Net Drive Hypothesis .......................................................................102.3.3 Impact on Muscle Contractile Function ......................................................................................122.3.4 Summary .....................................................................................................................................13
2.4 Cardiovascular Control of Oxygen Delivery .....................................................................................142.4.1 Exercise Onset – The Disturbance ..............................................................................................142.4.2 Control of Local Muscle Blood Flow and Oxygen Delivery: Demand Matching ......................16
2.4.2.2 Feedback Mechanisms .........................................................................................................172.4.3 Control of Blood Pressure Regulation ........................................................................................192.4.4 Sympathetic Restraint and Functional Sympatholysis ................................................................232.4.5 Summary .....................................................................................................................................26
2.5 Oxygen Delivery Demand Matching .................................................................................................262.6 Coming to the Purpose of the Current Thesis ....................................................................................282.7 Challenges in Identifying Individual Response Data .........................................................................29
2.7.1 Summary .....................................................................................................................................302.8 Measuring Fatigue .............................................................................................................................302.9 Purpose ...............................................................................................................................................322.10 Objectives ........................................................................................................................................322.11 Hypothesis........................................................................................................................................33
Chapter 3 Methods .......................................................................................................................................343.1 Participant Characteristics .................................................................................................................343.2 Overview of Protocol .........................................................................................................................34
v
3.3 Pre-Screening .....................................................................................................................................363.4 Screening Visit and Familiarization ...................................................................................................36
3.4.1 Anthropometric Measurements ...................................................................................................363.4.2 The Physical Activity Readiness Questionnaire (Appendix D) ..................................................363.4.3 Medical Screening (Appendix E) ................................................................................................373.4.4 Seven-Day Physical Activity Recall (Appendix C) ....................................................................373.4.5 Doppler and Echo Ultrasound Screening ....................................................................................373.4.6 Familiarization Protocol ..............................................................................................................38
3.5 Instrumentation ..................................................................................................................................383.6 Experimental Protocol .......................................................................................................................39
3.6.1 Pre-Test Maximum Voluntary Contraction (MVC) ...................................................................393.6.2 Incremental Exercise Test (IET) (Days 1 and 2) ........................................................................393.6.3 Accumulated Fatigue Exercise Test (FET) (Day 3) ...................................................................40
3.7 Data Acquisition ................................................................................................................................423.7.1 Forearm Blood Flow – Brachial Artery Diameter and Mean Blood Velocity ............................423.7.2 Deep Venous Blood Samples ......................................................................................................433.7.3 Central Hemodynamic Monitoring .............................................................................................443.7.4 Force Output ...............................................................................................................................453.7.5 Impulse Via Force Output ...........................................................................................................46
3.8 Data Analysis .....................................................................................................................................493.8.1 Impulse Analysis via Force Output .............................................................................................493.8.2 Complete Data Analysis .............................................................................................................66
3.9 Statistical Analysis .............................................................................................................................663.9.1 Oxygen Delivery and Oxygen Delivery Utilization Ratio (O2D/V̇O2) .......................................663.9.2 Accumulated Fatigue Exercise Test (FET) .................................................................................663.9.3 Forearm Volume, Maximum Voluntary Contraction (MVC), Peak Oxygen Delivery (O2D),
Peak Oxygen Consumption (VO2), and Peak IET Impulse achieved ..................................................663.9.4 Vascular Conductance (FVC), Mean Arterial Pressure (MAP), and Forearm Blood Flow (FBF)
..............................................................................................................................................................67Chapter 4 Results .........................................................................................................................................68
4.1 Oxygen Delivery and Oxygen Delivery Utilization Ratio (O2D/V̇O2) ..............................................684.2 Accumulated Fatigue Exercise Test (FET) ........................................................................................684.3 Forearm Volume, Maximum Voluntary Contraction (MVC), Peak IET Impulse, Peak V̇O2, and
Peak Oxygen Delivery (O2D) Achieved ..................................................................................................68
vi
4.4 Oxygen Delivery (O2D), Vascular Conductance (FVC), Mean Arterial Pressure (MAP), and
Forearm Blood Flow (FBF) .....................................................................................................................75Chapter 5 DISCUSSION .............................................................................................................................87
5.1 Primary Purpose, Objectives, and Hypotheses of Thesis ..................................................................875.2 FBF and O2D/V̇O2 Interaction on Fatigability ...................................................................................875.3 Forearm Volume, Maximum Voluntary Contraction (MVC), Peak IET Impulse, Peak V̇O2, and
Peak Oxygen Delivery (O2D) Achieved ..................................................................................................905.3.1 MVC ...........................................................................................................................................905.3.2 Forearm Volume .........................................................................................................................915.3.3 Impulse, V̇O2, and O2D in IET ...................................................................................................91
5.4 Vascular Conductance (FVC), Mean Arterial Pressure (MAP), and Forearm Blood Flow (FBF) ...925.4.1 Peak Responses ...........................................................................................................................925.4.2 Comparing Relative Changes in FBF, FVC, and MAP ..............................................................935.4.3 Comparing Absolute Changes in FBF, FVC, and MAP .............................................................94
5.5 Strengths ............................................................................................................................................955.5.1 Individual Response Data ...........................................................................................................955.5.2 Multiple Trials and Confidence Intervals ...................................................................................96Averaging Multiple IET .......................................................................................................................96
5.6 Limitations .........................................................................................................................................975.6.1 Inability to Measure Intracellular Oxygen Levels ......................................................................975.6.2 Venous Blood Sampling .............................................................................................................985.6.3 Small Sample Size ......................................................................................................................99
5.7 Areas for Future Research .................................................................................................................995.8 Implications of Findings ..................................................................................................................100
Chapter 6 SUMMARY AND CONCLUSIONS .......................................................................................1016.1 Summary of MSc Research Experience ..........................................................................................1016.2 Conclusion .......................................................................................................................................101
References ..................................................................................................................................................103APPENDIX ................................................................................................................................................116
APPENDIX A – Recruitment Fliers ....................................................................................................116Seven-DAY PAR Instructions / Script ..................................................................................................117APPENDIX C - Physical Activity Readiness Questionnaire ................................................................121APPENDIX D- Medical Screening Form ..............................................................................................122APPENDIX E- Consent Form ...............................................................................................................123

vii
APPENDIX F - Sample of IET data for participant 9. ..........................................................................137APPENDIX G- Fatiguing Exercise Test Impulse Data .........................................................................147
viii
List of Figures
Figure 1 Cardiovascular pathway for oxygen delivery to the mitochondria. ................................................3Figure 2 The electron transport chain (ETC) .................................................................................................4Figure 3 Schematic representation of net drive and oxygen conformer responses ......................................12Figure 4 Theoretical impact of alterations in oxygen delivery on exercise performance time. ...................13Figure 5 Feedforward and feedback control mechanisms in the cardiovascular response to exercise ........15Figure 6 Schematic representation of fatigue protocol using intermittent MVC. ........................................31Figure 7 Exercising forearm experimental setup. ........................................................................................39Figure 8 Experimental protocol of incremental exercise test. .....................................................................40Figure 9 Experimental protocol for fatigue exercise test. ............................................................................41Figure 10 Doppler ultrasound probe angle of insonation ............................................................................43Figure 11 The ModelFlow™ Model. ...........................................................................................................45Figure 12 Sample of Lab Chart window. .....................................................................................................47Figure 13 Sample of BeatScope window. ....................................................................................................48Figure 14 Lab Chart quantification of the contraction impulse. ..................................................................49Figure 15 Sample of IET test performance using participant 9.. .................................................................50Figure 16 Sample of how accumulated percent deficit is calculated to get the fatigue index (FI).. ............51Figure 17 Sample of deriving O2D/V̇O2 using participant 2. .....................................................................53Figure 18 The 95% confidence interval (CI) based on multiple O2D/V̇O2 values from the multiple IET
trials.. ............................................................................................................................................................55Figure 19 High and low responder group categorization using mean O2D/V̇O2 and 95% CI for each
participant ....................................................................................................................................................56Figure 20 Sample of deriving FBF for participant 9. ...................................................................................58Figure 21 Edge detection software sample in MAUI. .................................................................................59Figure 22 Raw Lab Chart data sample for 12 seconds of MBV recording ..................................................60Figure 23 Sample of MAP value generation from Beatscope for a given IET using Participant 7 IET 1. ..61Figure 24 Sample of deriving MAP for participant 9 ..................................................................................62Figure 25 Sample of deriving FVC for participant 9. ..................................................................................64Figure 26 Sample of residuals used to determine which order of sigmoidal function is best fit for a given
trial ...............................................................................................................................................................65Figure 27 Oxygen delivery utilization ratio (O2D/V̇O2) and Fatigue index (FI;%) for high and low
responder groups. .........................................................................................................................................70
ix
Figure 28 High and low responder group categorization using mean O2D/V̇O2 and 95% confidence
intervals (CI) for each participant organized by fatigue index ....................................................................71Figure 29 IET as a percentage of MVC .......................................................................................................72Figure 30 Forearm volume, MVC, and peak IET impulse for high and low responder groups.. ................73Figure 31 Peak V̇O2 and peak O2D ..............................................................................................................74Figure 32 Peak FBF (mL/min) for high and low responder groups. ...........................................................75Figure 33 Peak FVC and peak MAP for high and low responder groups ...................................................76Figure 34 Baseline FBF (mL/min) for high and low responder groups. .....................................................77Figure 35 Baseline FVC and MAP for high and low responder groups. .....................................................78Figure 36 Absolute average change in O2D from baseline to each steady state stage of IET. ...................80Figure 37 Absolute average change in FBF from baseline to each steady state stage of IET. ....................81Figure 38 Absolute average change in MAP from baseline to each steady state stage of IET. ..................82Figure 39 Absolute average change in FVC from baseline to each steady state stage of IET. ...................83Figure 40 Average relative change in FBF with increasing exercise intensity during IET relative to peak
V̇O2 for high and low responders. ...............................................................................................................85Figure 41 Average changes in MAP (mmHg) and FVC (mL/min • mmHg) with increasing exercise
intensity during IET relative to peak V̇O2 for high and low responders. ....................................................86

x
List of Tables
Table 1. Participant anthropometric characteristics. ....................................................................................35Table 2 Participant anthropometric characteristics for low responders. ......................................................57Table 3 Participant anthropometric characteristics for high responders. .....................................................57Table 4. Participant exercise test characteristics. .........................................................................................69
xi
List of Abbreviations
ADP = Adenine diphosphate
ATP = Adenosine Triphosphate
BGA = Blood Gas Analyzer
BF = Blood Flow
bpm = Beats per Minute
bsl = Baseline
CaO2 = Arterial Oxygen Concentration
CK = Creatine Kinase
CvO2 = Venous Oxygen Concentration
CO = Cardiac Output
cm = Centimeter
DICOM = Digital Imaging and Communications in Medicine dL = Deciliter
ECG = Electrocardiogram
EMG = Electromyography
FAPP = Forearm Arterial Perfusion Pressure
FBF = Forearm Blood Flow
FET = Fatiguing Exercise Test
FI = Fatigue Index
FVC = Forearm Vascular Conductance
Hb = Haemoglobin
HR = Heart Rate
Hz = Hertz
IET = Incremental Exercise Test
Kg = Kilogram
Kg·s = Kilogram Second
La = lactate
MAP = Mean Arterial Pressure
MBF = Muscle Blood Flow
MBV = Mean Blood Velocity
ml = Milliliter

xii
ml/min = Milliliters per Minute
ml/min/100 mmHg = Milliliters per Minute per 100 Millimeters of Mercury
mlO2/min = Milliliters of Oxygen per Minute
mmHg = Millimeter of Mercury
MVC = Max Voluntary Contraction
MHz = Mega Hertz
NAD+ = Oxidized NADH
NADH = Nicotinamide adenine dinucleotide
N = Number of Subjects
O2 = Oxygen
O2D = Oxygen Delivery
ΔP = Change in Pressure
PARQ = Physical Activity Readiness Questionnaire
PaO2 = Partial Pressure of Arterial Oxygen
PcapO2 = Partial Pressure of Oxygen in the Capillaries
PcellO2 = Partial Pressure of Oxygen in the Cell
Pi = Inorganic Phosphate
PCr = Phosocreatine
RBC = Red Blood Cell
SO2 = Oxygen Saturation
SaO2 = Arterial Oxygen Saturation
SvO2 = Venous Oxygen Saturation
SE = Standard Error
SV = Stroke Volume
TCA = Tricarboxylic Acid
TPR = Total Peripheral Resistance
VC = Vascular Conductance
V̇O2 = Oxygen Consumption
WR = Work Rate
1
Chapter 1
Introduction
Adequate muscle oxygenation is important for oxygen mediated adenosine triphosphate (ATP)
production in the muscle mitochondria and for the ability to sustain skeletal muscle contractile activity
(Burke et al., 1971; Edstrom & Kugelberg, 1968; Kugelberg and Lindergren, 1979; Nemeth et al., 1981).
Muscle oxygenation depends on both convective oxygen delivery and diffusive oxygen flux (Andersen &
Saltin, 1985; Mortesen et al., 2008; Richardson et al., 1993).
Convective oxygen delivery (O2D) is the product of muscle blood flow (MBF) and of arterial
oxygen content (CaO2), where MBF is the product of the muscle vascular conductance and of the arterial
pressure. It is well established that CaO2 does not change during submaximal small muscle mass exercise
(i.e., forearm), therefore increases in convective O2D during this type of exercise are determined by
increases in MBF (González-Alonso et al., 2006; Mortensen et al., 2005).
The increase in oxygen delivery to the tissues is proportional to their metabolic demand and the
current dogma is that O2D is tightly coupled to metabolic demand (Andersen and Saltin 1985; Richardson
et al., 1993). This statement is based upon observations that in the adjustment of oxygen delivery to meet
the oxygen demand in small muscle mass exercise, there is a linear increase in blood flow and in
exercising muscle oxygen consumption with increases in demand or in work rate. For example, Andersen
and Saltin (1985) had participants perform single leg knee extension exercise at work-loads ranging from
10 to 60 W, and observed linear increases in exercising muscle blood flow and in oxygen consumption.
This is also observed in cycle ergometer exercise, in a study conducted by Richardson et al., (1993),
where leg blood flow and leg oxygen uptake increased linearly with increasing work rate.
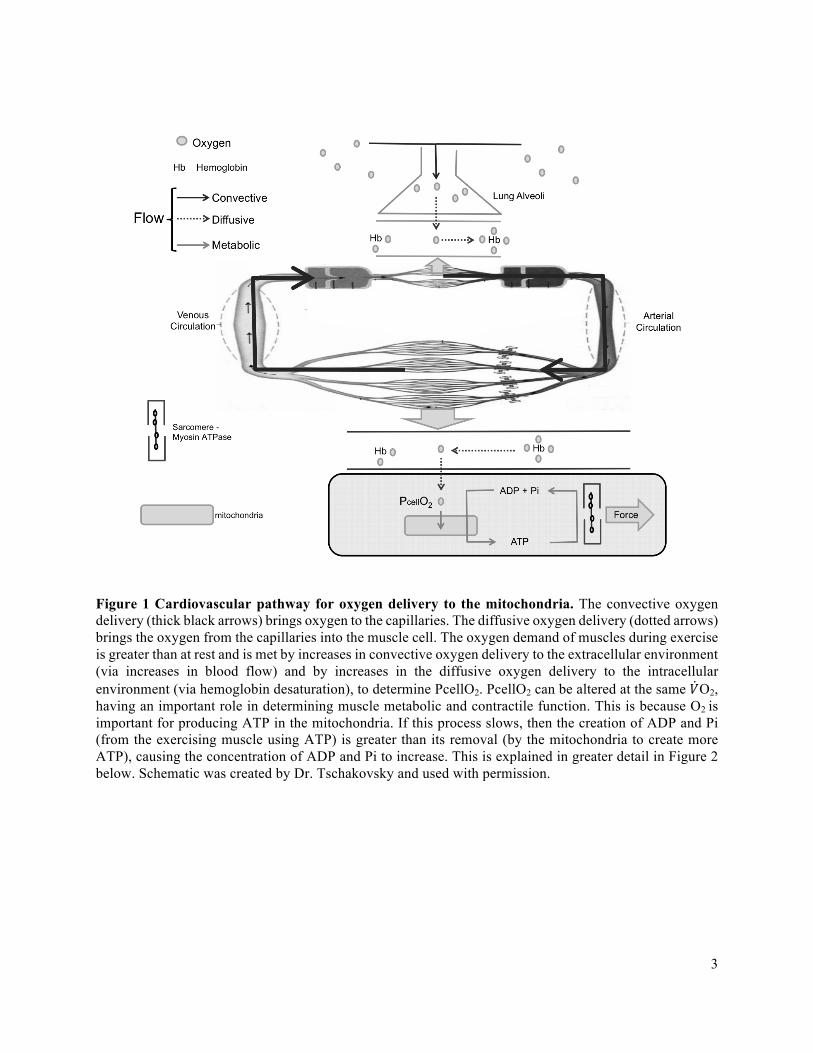
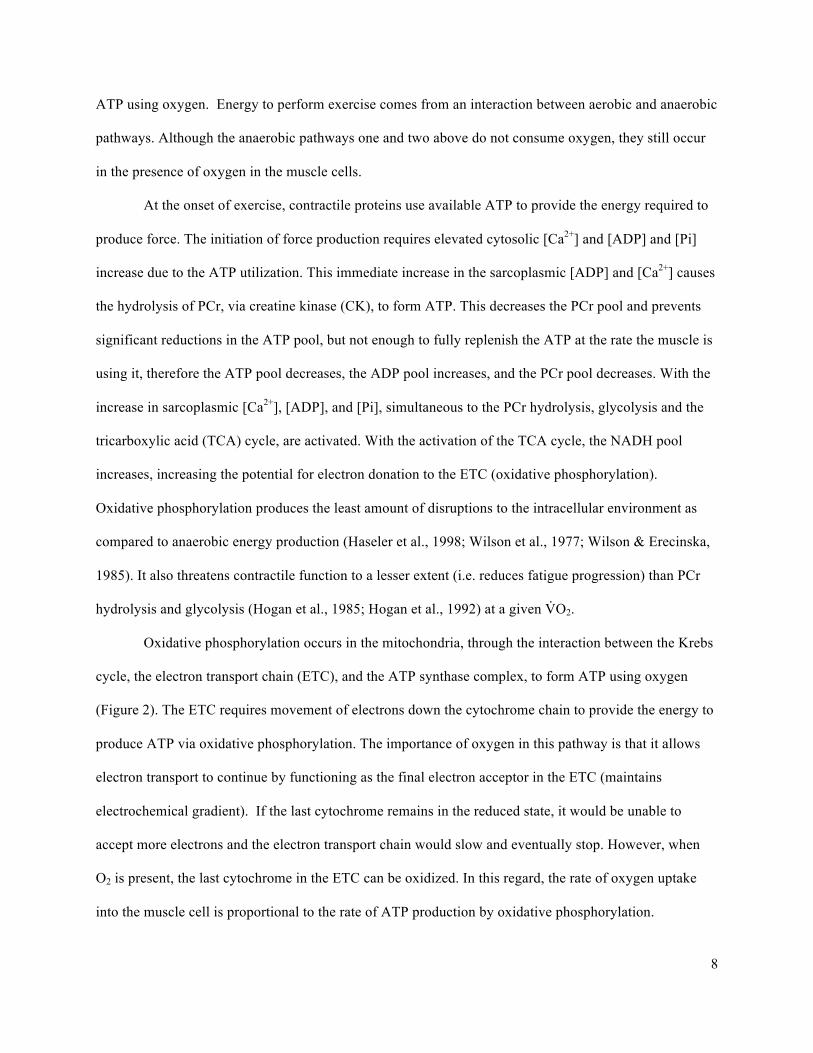
The cardiovascular pathway for oxygen delivery to the mitochondria is depicted in Figure 1
below. A closer look and an explanation of what occurs in the mitochondria is depicted in Figure 2 in the
next paragraph. The pressor and vasodilatory responses serve to increase MBF and therefore O2D to meet
2
the oxygen and the energy requirements of the muscle. The pressor response is the increase in mean
arterial pressure and the vasodilatory response is the increase in vessel diameter. Convective oxygen
delivery determines the partial pressure of O2 in the capillaries (PcapO2), the driving pressure for diffusion
of O2 from the capillaries into the muscle cell (diffusive oxygen delivery). Therefore, there is a positive
relationship between MBF, the partial pressure of O2 in the capillaries (PcapO2), and the partial pressure
of O2 in the exercising muscle cells (PcellO2) for a given rate of O2 consumption (V̇O2) and ATP demand
(Figure 1 below). In other words, an increase in MBF (at a constant CaO2) would increase PcapO2 and
thus PcellO2, by increasing O2 delivery for a given V̇O2. Alternatively, a decrease in MBF (at a constant
CaO2) would decrease PcapO2 and thus PcellO2, by decreasing O2 delivery for a given V̇O2.
With a greater PcellO2, the muscle mitochondria create energy with less disruptions to the
intracellular environment (Haseler et al., 1998; Wilson et al., 1977; Wilson & Erecinska, 1985),
threatening protein contractile function and skeletal muscle fatigue the least (Hogan et al., 1985; Hogan et
al., 1992). A schematic of what occurs in the mitochondria is shown in Figure 2. If PcellO2 is insufficient
to maintain aerobic ATP, intracellular phosphorylation potential ([ATP]/[ADP][Pi]), and redox potential
([NADH]/[NAD+]) can change to compensate at submaximal exercise intensities (ADP = adenosine
triphosphate; Pi = inorganic phosphate; NADH = nicotinamide adenine dinucleotide; NAD+= oxidized
NADH) (Haseler et al., 1998; Hogan et al., 1992; Hogan et al., 1999; Wilson et al., 1977). This however
occurs at the expense of muscle metabolic and contractile function (Cooke & Pate 1990; Dahlstedt &
Westerblad, 2001; Duke & Steele, 2000; Wilson et al., 1997), since there is a build-up of ADP, Pi, and
NADH due to the slowing of the flow of electrons through the electron transport chain. Thus, convective
oxygen delivery is an important determinant of PcellO2 and therefore of skeletal muscle contractile and
metabolic function.
3
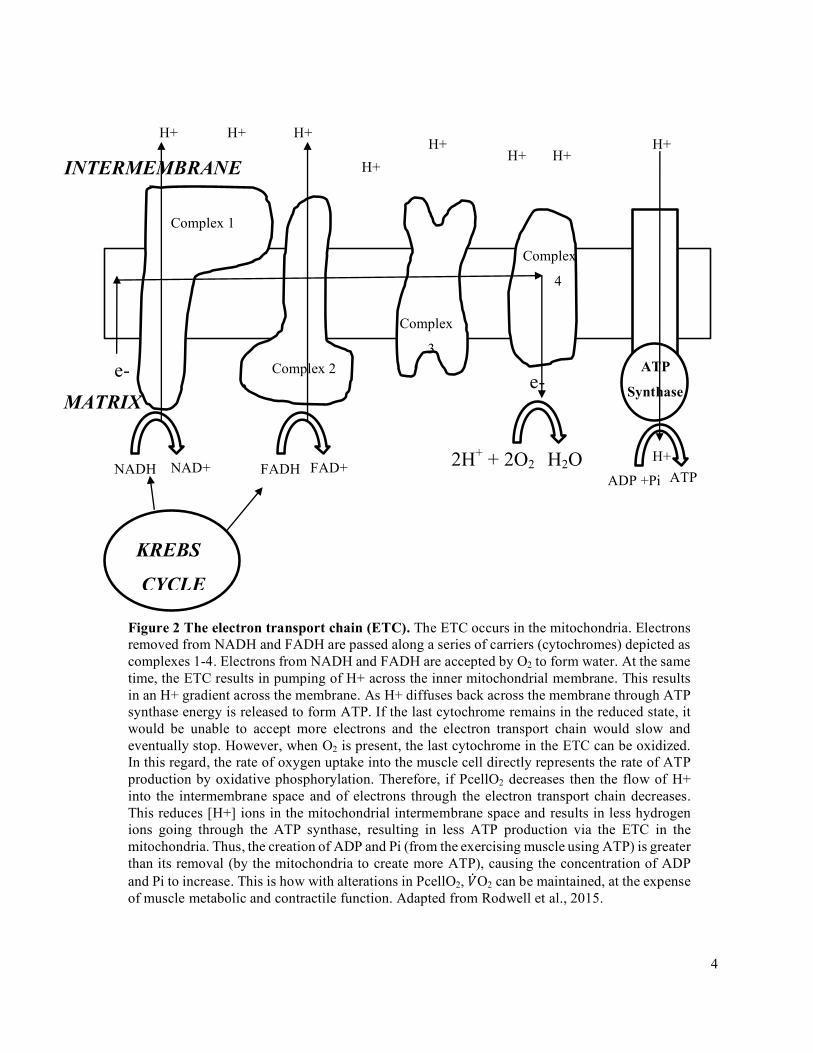
Figure 1 Cardiovascular pathway for oxygen delivery to the mitochondria. The convective oxygen delivery (thick black arrows) brings oxygen to the capillaries. The diffusive oxygen delivery (dotted arrows) brings the oxygen from the capillaries into the muscle cell. The oxygen demand of muscles during exercise is greater than at rest and is met by increases in convective oxygen delivery to the extracellular environment (via increases in blood flow) and by increases in the diffusive oxygen delivery to the intracellular environment (via hemoglobin desaturation), to determine PcellO2. PcellO2 can be altered at the same 𝑉O2, having an important role in determining muscle metabolic and contractile function. This is because O2 is important for producing ATP in the mitochondria. If this process slows, then the creation of ADP and Pi (from the exercising muscle using ATP) is greater than its removal (by the mitochondria to create more ATP), causing the concentration of ADP and Pi to increase. This is explained in greater detail in Figure 2 below. Schematic was created by Dr. Tschakovsky and used with permission.
4
H2O H+
NADH
NAD+
H+
2H+ + 2O2
H+
H+
H+
H+
H+
H+
H+
FADH
FAD+
ADP +Pi
ATP
KREBS
CYCLE
Complex 1
Complex 2
Complex
3
Complex
4
e- e- MATRIX
INTERMEMBRANE
ATP
Synthase
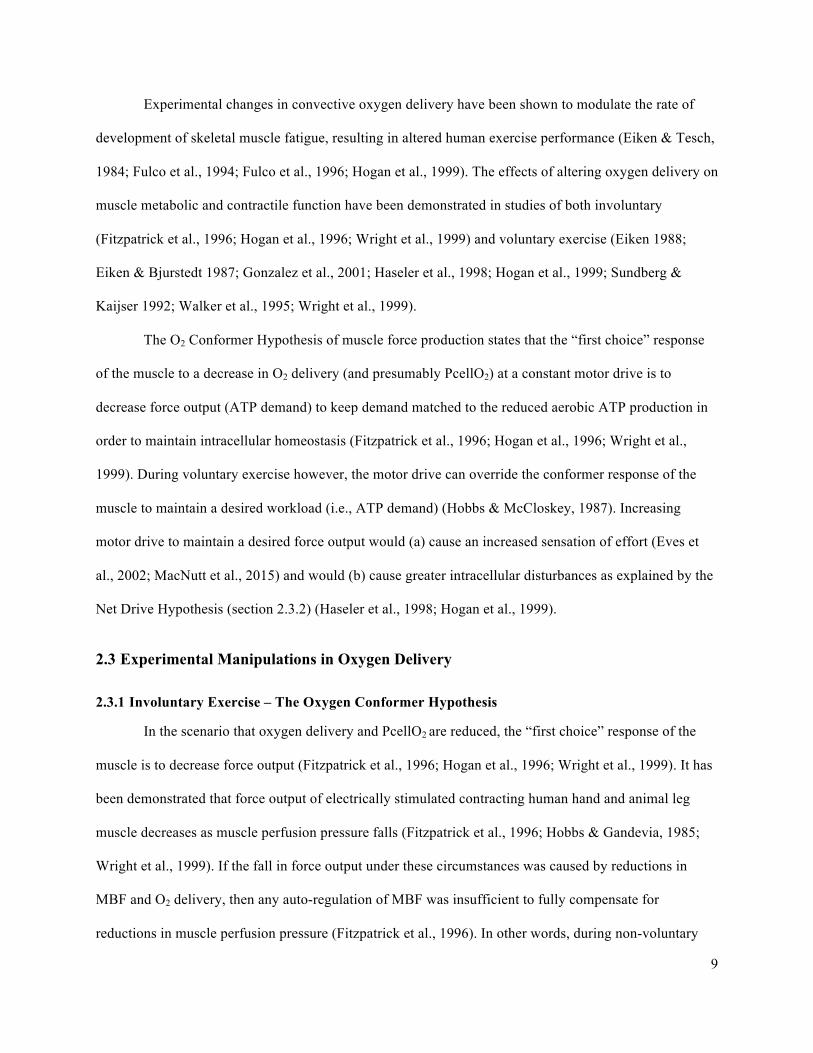
Figure 2 The electron transport chain (ETC). The ETC occurs in the mitochondria. Electrons removed from NADH and FADH are passed along a series of carriers (cytochromes) depicted as complexes 1-4. Electrons from NADH and FADH are accepted by O2 to form water. At the same time, the ETC results in pumping of H+ across the inner mitochondrial membrane. This results in an H+ gradient across the membrane. As H+ diffuses back across the membrane through ATP synthase energy is released to form ATP. If the last cytochrome remains in the reduced state, it would be unable to accept more electrons and the electron transport chain would slow and eventually stop. However, when O2 is present, the last cytochrome in the ETC can be oxidized. In this regard, the rate of oxygen uptake into the muscle cell directly represents the rate of ATP production by oxidative phosphorylation. Therefore, if PcellO2 decreases then the flow of H+ into the intermembrane space and of electrons through the electron transport chain decreases. This reduces [H+] ions in the mitochondrial intermembrane space and results in less hydrogen ions going through the ATP synthase, resulting in less ATP production via the ETC in the mitochondria. Thus, the creation of ADP and Pi (from the exercising muscle using ATP) is greater than its removal (by the mitochondria to create more ATP), causing the concentration of ADP and Pi to increase. This is how with alterations in PcellO2, �̇�O2 can be maintained, at the expense of muscle metabolic and contractile function. Adapted from Rodwell et al., 2015.
5
The ability of the circulatory system to deliver oxygen to meet the demands of the muscle is
known as O2D to demand matching. It is thought that this matching is tight during submaximal small
muscle mass exercise (i.e. forearm handgrip) (Raadegran & Saltin, 1998; Richardson et al., 1995;
Saunders et al., 2005; Wagner, 2012; Wajner & Goodman, 2011), since oxygen consumption (𝑉O2) and
O2D increase in proportion to exercise intensity across individuals (Richardson et al., 1995, Wagner,
2012, Wajner & Goodman, 2011). Observations from studies that experimentally manipulate O2D have
supported this notion; compensatory vasodilation or vasoconstriction occurs in the face of a decrease or
increase in O2D respectively, to protect this matching (Casey et al., 2011; Crecelius et al., 2011; Wilkins
et al., 2008). While there is a compensatory response to protect O2D demand matching, there are inter-
individual differences in how well the oxygen delivery demand matching is protected (Bentley et al.,
2014; Bentley et al., 2017). In the case of a reduction in O2D during submaximal exercise, some
individuals compensate through vasodilation to partially offset the reduction in oxygen delivery
(compensators), while others do not (non-compensators) (Bentley et al., 2014; Bentley et al., 2017), with
non-compensators experiencing a greater compromise to O2D, to 𝑉O2, and to exercise capacity (Bentley
et al., 2014; Bentley et al., 2017).
Thus, while O2D demand matching is adequate at submaximal intensities to support the required
aerobic ATP production, it may be more optimal in certain individuals than others, influencing cellular
metabolism and the amount of change in the intracellular substances that cause muscle fatigue and
exercise intolerance (Amann et al., 2007; Hogan et al., 1994; Wilson & Erecinska, 1985). Therefore, our
current understanding of O2D demand matching (in that it is achieved during submaximal small muscle
mass exercise) may hold true on average, but the degree of matching may differ between individuals,
with significance to individual exercise tolerance levels.
At present, little is understood about the degree of differences in O2D demand matching
between individuals and the cardiovascular mechanisms dictating these differences (i.e., vasodilatory
or pressor response). Traditionally, within-person experimental increases and decreases in O2D have
6
resulted in improvements and reductions in their exercise performance respectively (Eiken 1988; Eiken &
Bjurstedt 1987; Gonzalez et al., 2001; Haseler et al., 1998; Hogan et al., 1999; Sundberg & Kaijser 1992;
Walker et al., 1995; Wright et al., 1999). No consideration has been given to potential inter-individual
responses to O2D demand matching and whether this might contribute to differences in exercise tolerance
between individuals.
While there is sufficient O2D demand matching in all submaximal exercise such that 𝑉O2 is not
compromised, the question is perhaps a difference of “adequate” versus “optimal” O2D. If achieving
optimal O2D matching depends on the individual, then it is important to consider inter-individual
differences in the O2D response to exercise, rather than averaging the responses across healthy
individuals. If these inter-individual differences do exist, then the possibility that they contribute to
differences in exercise tolerance between individuals should be considered; We propose that there are
inter-individual differences in oxygen delivery demand matching that are of functional significance.
Since muscle contractile function and exercise tolerance within an individual are sensitive to changes in
oxygen delivery, differences in oxygen delivery demand matching between individuals could account for
some of the difference in their exercise performance and capacity.
Therefore, the purpose of this thesis was to test the hypothesis that inter-individual differences in
oxygen delivery demand matching exist and to determine whether the differences in oxygen delivery to
demand matching are predictive of exercise performance as quantified by a fatiguing exercise test (FET).
The significance of this thesis is that if there are inter-individual differences and they are great enough to
predict accumulated fatigue in exercise, the importance of acknowledging inter-individual differences
when addressing an individual’s exercise tolerance will become evident.
7
Chapter 2
Literature Review
2.1 Introduction
While O2D demand matching is adequate at submaximal intensities to support the required
aerobic ATP production, it may be more optimal in certain individuals than others. It is unknown to what
extent these inter-individual differences in O2D demand matching explain inter-individual differences in
exercise performance and fatigue progression.
The specific aim of this thesis was to test the hypothesis that inter-individual differences in
oxygen delivery demand matching exist and to determine whether the differences in oxygen delivery to
demand matching are predictive of exercise performance as quantified by a fatiguing exercise test (FET).
More specifically the specific purpose was to test the hypothesis that individuals with lower O2D/V̇O2
experience greater fatigue development at the same relative exercise intensity with the use of this FET.
Therefore, this literature review will first explain the role of O2 in the bioenergetics of ATP production, in
the intracellular metabolic milieu, and in fatigue. It will then explain the interaction of the cardiovascular
control mechanisms that regulate convective oxygen delivery. Lastly, the limitations associated with
identifying inter-individual differences in O2D demand matching and how they will be addressed in the
current study will be outlined.
2.2 Bioenergetics of ATP Production and the Role of Oxygen
The energy required for a muscular contraction is derived from the hydrolysis of adenosine
triphosphate (ATP) to form adenosine diphosphate (ADP) and inorganic phosphate (Pi). Three
interconnected metabolic pathways in the muscle cells are responsible for matching ATP supply to ATP
demand at rest and during exercise: (1) ATP-Phosphocreatine (PCr) system - the formation of ATP via
the degradation of phosphocreatine. (2) Glycolysis – the formation of ATP without the use of oxygen via
the degradation of glucose or glycogen to form lactate. (3) Oxidative Phosphorylation – the formation of
8
ATP using oxygen. Energy to perform exercise comes from an interaction between aerobic and anaerobic
pathways. Although the anaerobic pathways one and two above do not consume oxygen, they still occur
in the presence of oxygen in the muscle cells.
At the onset of exercise, contractile proteins use available ATP to provide the energy required to
produce force. The initiation of force production requires elevated cytosolic [Ca2+] and [ADP] and [Pi]
increase due to the ATP utilization. This immediate increase in the sarcoplasmic [ADP] and [Ca2+] causes
the hydrolysis of PCr, via creatine kinase (CK), to form ATP. This decreases the PCr pool and prevents
significant reductions in the ATP pool, but not enough to fully replenish the ATP at the rate the muscle is
using it, therefore the ATP pool decreases, the ADP pool increases, and the PCr pool decreases. With the
increase in sarcoplasmic [Ca2+], [ADP], and [Pi], simultaneous to the PCr hydrolysis, glycolysis and the
tricarboxylic acid (TCA) cycle, are activated. With the activation of the TCA cycle, the NADH pool
increases, increasing the potential for electron donation to the ETC (oxidative phosphorylation).
Oxidative phosphorylation produces the least amount of disruptions to the intracellular environment as
compared to anaerobic energy production (Haseler et al., 1998; Wilson et al., 1977; Wilson & Erecinska,
1985). It also threatens contractile function to a lesser extent (i.e. reduces fatigue progression) than PCr
hydrolysis and glycolysis (Hogan et al., 1985; Hogan et al., 1992) at a given V̇O2.
Oxidative phosphorylation occurs in the mitochondria, through the interaction between the Krebs
cycle, the electron transport chain (ETC), and the ATP synthase complex, to form ATP using oxygen
(Figure 2). The ETC requires movement of electrons down the cytochrome chain to provide the energy to
produce ATP via oxidative phosphorylation. The importance of oxygen in this pathway is that it allows
electron transport to continue by functioning as the final electron acceptor in the ETC (maintains
electrochemical gradient). If the last cytochrome remains in the reduced state, it would be unable to
accept more electrons and the electron transport chain would slow and eventually stop. However, when
O2 is present, the last cytochrome in the ETC can be oxidized. In this regard, the rate of oxygen uptake
into the muscle cell is proportional to the rate of ATP production by oxidative phosphorylation.
9
Experimental changes in convective oxygen delivery have been shown to modulate the rate of
development of skeletal muscle fatigue, resulting in altered human exercise performance (Eiken & Tesch,
1984; Fulco et al., 1994; Fulco et al., 1996; Hogan et al., 1999). The effects of altering oxygen delivery on
muscle metabolic and contractile function have been demonstrated in studies of both involuntary
(Fitzpatrick et al., 1996; Hogan et al., 1996; Wright et al., 1999) and voluntary exercise (Eiken 1988;
Eiken & Bjurstedt 1987; Gonzalez et al., 2001; Haseler et al., 1998; Hogan et al., 1999; Sundberg &
Kaijser 1992; Walker et al., 1995; Wright et al., 1999).
The O2 Conformer Hypothesis of muscle force production states that the “first choice” response
of the muscle to a decrease in O2 delivery (and presumably PcellO2) at a constant motor drive is to
decrease force output (ATP demand) to keep demand matched to the reduced aerobic ATP production in
order to maintain intracellular homeostasis (Fitzpatrick et al., 1996; Hogan et al., 1996; Wright et al.,
1999). During voluntary exercise however, the motor drive can override the conformer response of the
muscle to maintain a desired workload (i.e., ATP demand) (Hobbs & McCloskey, 1987). Increasing
motor drive to maintain a desired force output would (a) cause an increased sensation of effort (Eves et
al., 2002; MacNutt et al., 2015) and would (b) cause greater intracellular disturbances as explained by the
Net Drive Hypothesis (section 2.3.2) (Haseler et al., 1998; Hogan et al., 1999).
2.3 Experimental Manipulations in Oxygen Delivery
2.3.1 Involuntary Exercise – The Oxygen Conformer Hypothesis
In the scenario that oxygen delivery and PcellO2 are reduced, the “first choice” response of the
muscle is to decrease force output (Fitzpatrick et al., 1996; Hogan et al., 1996; Wright et al., 1999). It has
been demonstrated that force output of electrically stimulated contracting human hand and animal leg
muscle decreases as muscle perfusion pressure falls (Fitzpatrick et al., 1996; Hobbs & Gandevia, 1985;
Wright et al., 1999). If the fall in force output under these circumstances was caused by reductions in
MBF and O2 delivery, then any auto-regulation of MBF was insufficient to fully compensate for
reductions in muscle perfusion pressure (Fitzpatrick et al., 1996). In other words, during non-voluntary
10
exercise, a decrease in muscle perfusion pressure results in a decrease in MBF, O2 delivery, and
presumably in intracellular pressure of oxygen (PcellO2). A decrease in PcellO2 in turn results in a
decrease in muscle force output at a constant motor drive (Fitzpatrick et al., 1996). Importantly, force
was restored when O2 delivery was restored (Fitzpatrick et al., 1996). Similar reductions in force output
of electrically stimulated contracting dog hind limb muscle were observed by Hogan et al. (1996) when
O2 delivery was experimentally reduced by (1) decreasing CaO2 at a constant MBF and by (2) decreasing
MBF at a constant CaO2. The down-regulation of force that results from a reduction in O2D protects the
myocyte environment. This is indicated by a lack of change in ADP, in Pi, and in lactate (Hogan et al.
1996). Collectively these findings support the O2 Conformer Hypothesis of muscle force production. The
O2 Conformer Hypothesis states that the muscle responds to a decrease in O2 delivery (and presumably in
PcellO2) at a constant motor drive by decreasing force output. This decreases the ATP demand to match
the reduced aerobic ATP production and thereby avoid changes in ADP, Pi, and Lactate, to maintain
intracellular homeostasis.
2.3.2 Voluntary Exercise – The Net Drive Hypothesis
What occurs in involuntary exercise is however not the case in voluntary exercise, where the
motor drive can override the conformer response of the muscle in order to maintain a desired workload
(i.e., ATP demand) (Hobbs & McCloskey, 1987).
The Net Drive Hypothesis states that aerobic ATP production is a function of the net drive of
intracellular oxygen (PcellO2), the Phosphorylation Potential [ATP] / [ADP][Pi], and the Redox Potential
[NADH]/[NAD+]. Changes in one driver can be compensated for by changes in the other drivers to
maintain aerobic ATP production (Haseler et al., 1998; Hogan et al., 1992; Hogan et al., 1999; Wilson et
al., 1977). Thus, intracellular phosphorylation potential ([ATP]/[ADP][Pi]) and redox potential
([NAD+]/[NADH]) can change to compensate for changes in PcellO2 (as result of altering convective
and/or diffusive oxygen delivery) such that muscle V̇O2 is maintained. This hypothesis is supported by
studies which demonstrate that alterations in PcellO2 shift cellular levels of PCr, ADP, and Pi (Haseler et
11
al., 1998; Hogan et al., 1992; Hogan et al., 1999; Wilson et al., 1997) and the amount of change in the
intracellular substances that cause muscle fatigue and exercise intolerance (i.e., ADP, Pi) (Dahlstedt &
Westerblad, 2001; Eiken 1988; Eiken & Bjurstedt 1987; Eiken & Tesch, 1984; Fitzpatrick et al., 1996;
Fulco et al., 1994; Fulco et al., 1996; Gonzalez et al., 2001; Hogan et al., 1996; Hogan et al., 1999;
Sundberg & Kaijser 1992; Walker et al., 1995; Westerblad and Allen, 1996; Westerblad et al., 2002;
Wilson et al., 1977; Wright et al., 1999). For example, Wilson et al., (1977) measured the rate of
mitochondrial respiration with gradual reductions of O2 in an in vitro cell bath. They found that as oxygen
tension decreased, there were compensatory decreases in [ATP]/[ADP][Pi].
This was also demonstrated in situ by Hogan et al., (1992), who found that there was a shift in the
PCr - V̇O2 relationship in canine gastrocnemius muscle in hypoxia and hyperoxia compared to normoxia,
as long as increases in frequency of electrically stimulated contractions maintained force output. As PCr
hydrolysis occurs and PCr decreases, the phosphorylation potential increases. The amount of PCr
depletion for a given increase in V̇O2 was greater in hypoxia and lower in hyperoxia compared to
normoxia (Hogan et al., 1992). Thus, with less oxygen, the same level of V̇O2 can be achieved but
requires a greater disturbance to the regulators of V̇O2 (i.e., ADP) (Hogan et al., 1992). Similar results
were also demonstrated using plantar flexion exercise in humans with altered PcellO2 (by breathing
different gas mixtures) during incremental exercise (Hogan et al., 1999) and at steady state exercise
(Haseler et al., 1998).
Haseler et al., (1998) used constant-load, steady-state submaximal exercise to eliminate the
possibility that changes in the concentration of the high-energy phosphate metabolites may be due to
differences in time taken to achieve steady-state O2 uptake. Oxygen tension was altered half way through
steady state exercise by having the participants breathe different fractions of inspired O2: (1) hypoxia to
normoxia, (2) hypoxia to hyperoxia, and (3) hyperoxia to hypoxia. The switch induced significant
changes in PCr levels in all three treatments, even when working at the same submaximal work intensity.
This demonstrates that changes in intracellular oxygen levels cause significant changes the intracellular
environment (i.e., PCr) during submaximal exercise at a constant V̇O2. Similarly to Haseler et al., (1998),

12
Hogan et al., (1999) had participants perform plantar flexion exercise while inspiring gas mixtures with
different fractions of oxygen. This group however had participants perform incremental exercise to
examine the effects of altered rates of PCr hydrolysis on fatigue. They demonstrated that experimental
reductions in O2 delivery during incremental human calf plantar flexion exercise increased the amount of
change in PCr degradation, Pi accumulation, and development of acidosis for a given change in work rate.
Peak exercise performance was also decreased with reductions in O2D, as evidenced by reductions in
exercise endurance time and in the peak work rate achieved.
2.3.3 Impact on Muscle Contractile Function
With less PcellO2 and a greater contribution from other drivers, there is reduced exercise capacity
due to the increased intracellular concentrations of Pi and ADP (Eiken & Tesch, 1984; Fulco et al., 1994;
Fulco et al., 1996; Hogan et al., 1999). Increases in Pi decrease contractile function (Cooke & Pate, 1990)
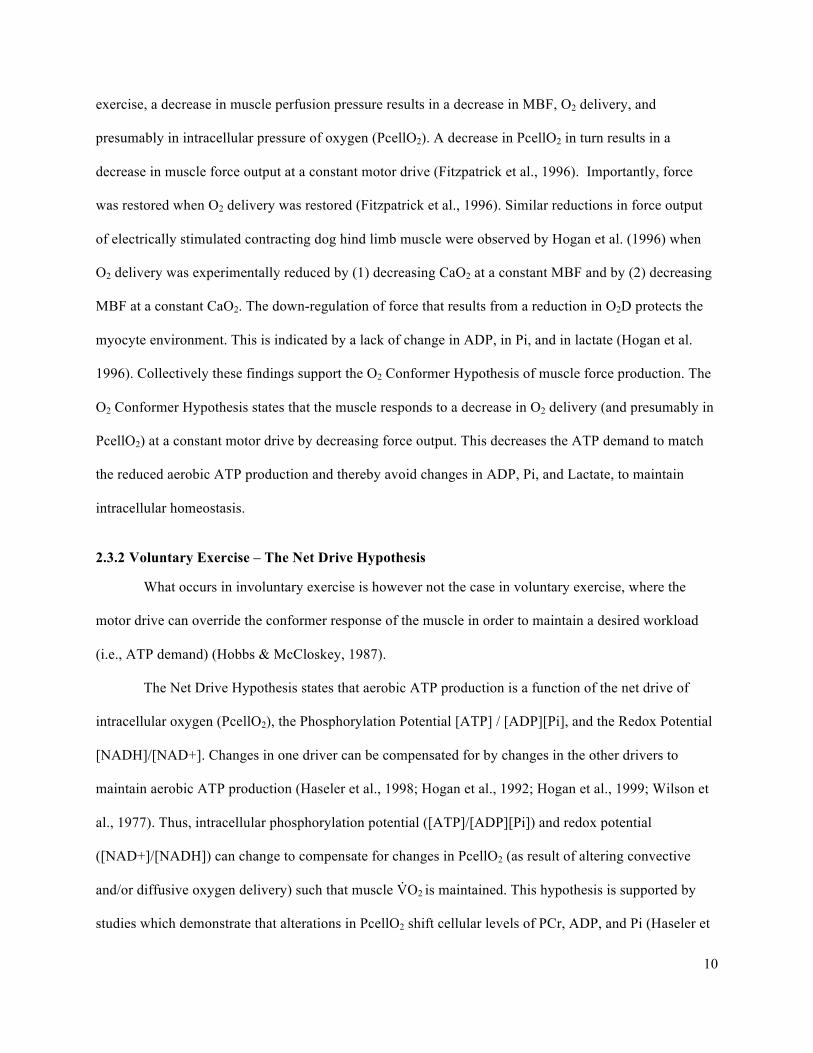
Figure 3 Schematic representation of net drive and oxygen conformer responses. Oxygen conformer response dictates that with reductions in oxygen availability, there is a compromise to exercise intensity and therefore to ATP demand. This requires either an obligatory reduction in exercise intensity, or an increase in motor drive to maintain the work rate. This is experienced as an increase in perceived effort. The maintenance of work rate is made possible according to the net drive hypothesis, which dictates that with reductions in oxygen availability, there are increases in phosphorylation and redox potentials to maintain a given aerobic ATP demand and exercise intensity. Modified from Bentley et al., 2014.
Convective and
Diffusive Oxygen
Delivery
Skeletal Muscle
Contraction
Glycolysis and
Krebs Cycle
PcellO2
ADP +Pi
NADH
ATP
ADP +Pi
MUSCLE
CONTRACTILE
FORCE
ATP
Demand
MOTOR
DRIVE
EFFORT
13
by reducing cross-bridge force production and sarcoplasmic reticulum Ca2+ release (Dahlstedt &
Westerblad, 2001; Duke & Steele, 2000). Moreover, with increased intracellular [ADP] and [Pi],
glycolysis is stimulated, resulting in a greater rate of pyruvate production than conversion to Acetyl-CoA
by pyruvate dehydrogenase. This in turn increases the rate of accumulation of [La-] and [H+] in the
exercising muscles. Collectively, these changes serve to increase the rate of development of skeletal
muscle fatigue, resulting in a limitation in human exercise performance (Eiken & Tesch, 1984; Fulco et
al., 1994; Fulco et al., 1996; Hogan et al., 1999). Alternatively, increasing O2 delivery by increasing
MBF, CaO2, or both in combination, decreases the rate of development of muscular fatigue for a given
exercise intensity, thereby increasing exercise endurance time (Eiken & Tesch, 1984; Fulco et al., 1994;
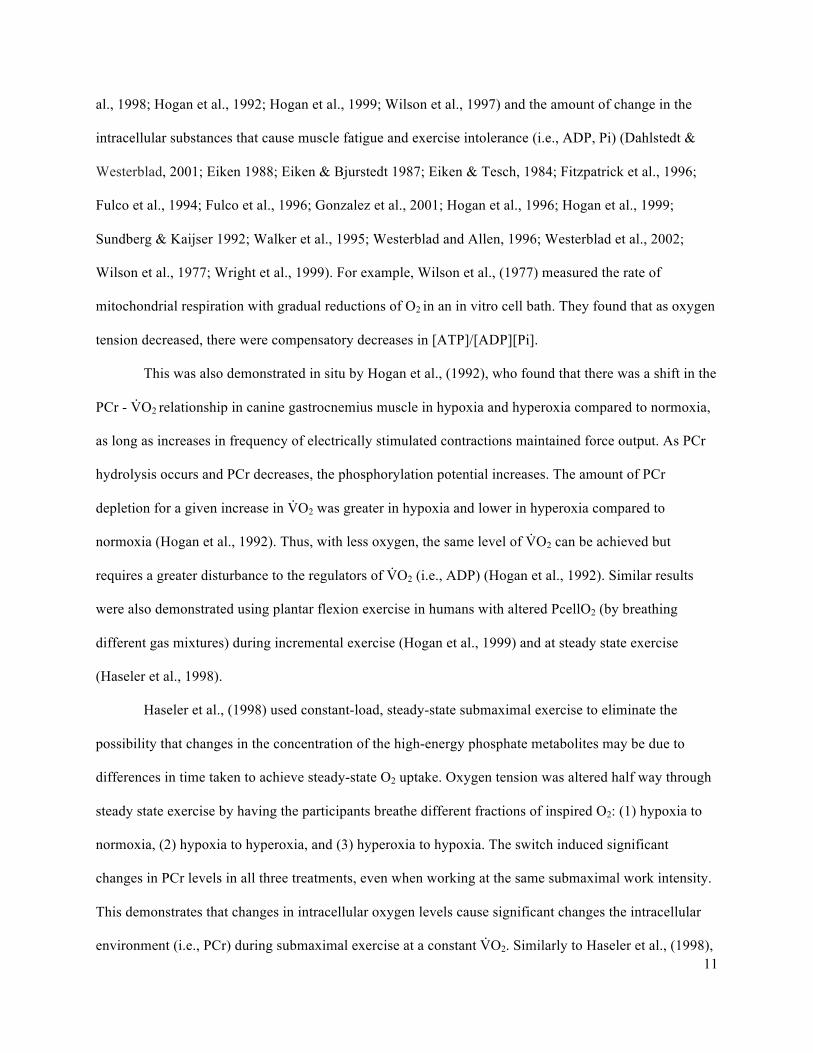
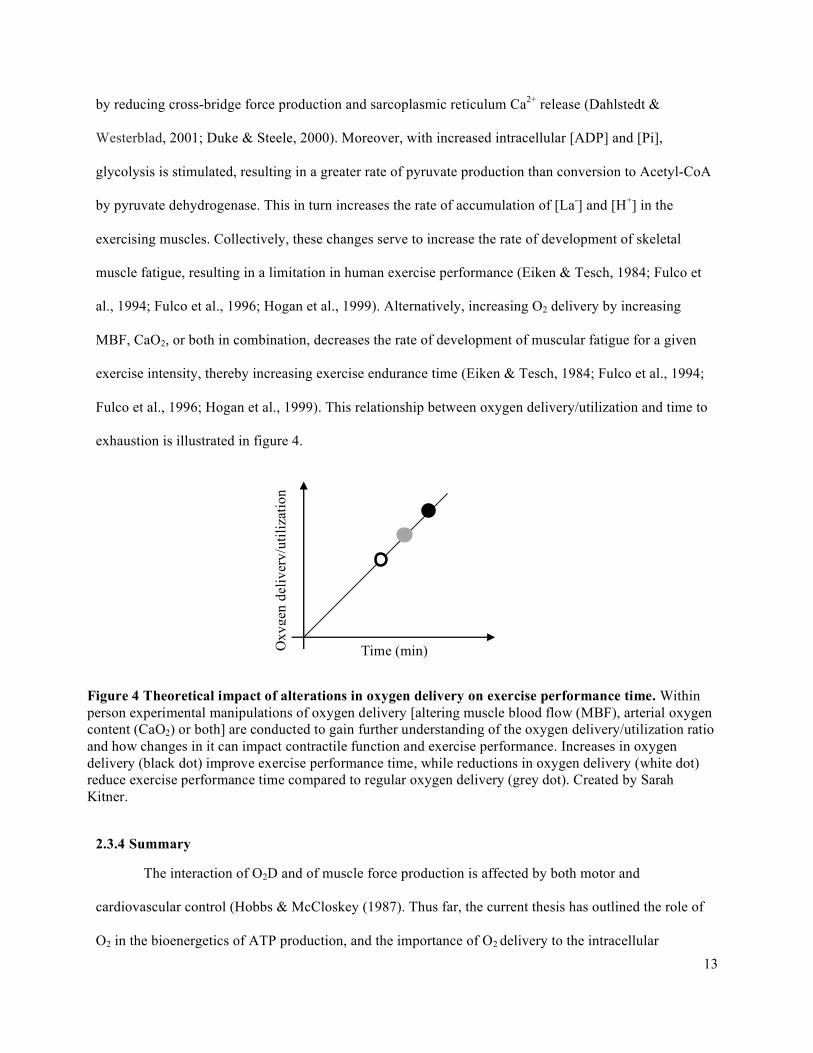
Fulco et al., 1996; Hogan et al., 1999). This relationship between oxygen delivery/utilization and time to
exhaustion is illustrated in figure 4.
2.3.4 Summary
The interaction of O2D and of muscle force production is affected by both motor and
cardiovascular control (Hobbs & McCloskey (1987). Thus far, the current thesis has outlined the role of
O2 in the bioenergetics of ATP production, and the importance of O2 delivery to the intracellular
Time (min) Oxy
gen
deliv
ery/
utili
zatio
n
Figure 4 Theoretical impact of alterations in oxygen delivery on exercise performance time. Within person experimental manipulations of oxygen delivery [altering muscle blood flow (MBF), arterial oxygen content (CaO2) or both] are conducted to gain further understanding of the oxygen delivery/utilization ratio and how changes in it can impact contractile function and exercise performance. Increases in oxygen delivery (black dot) improve exercise performance time, while reductions in oxygen delivery (white dot) reduce exercise performance time compared to regular oxygen delivery (grey dot). Created by Sarah Kitner.
14
metabolic milieu and to fatigue. The following portion of this thesis will explain the motor and
cardiovascular control of O2D demand matching.
2.4 Cardiovascular Control of Oxygen Delivery
The ability of the cardiovascular system to meet the demand for O2 is known as O2D to demand
matching. To meet increased O2D during small muscle mass exercise, the primary response is
vasodilation of the arterioles in exercising muscle to allow more blood flow. The mean arterial pressure
driving this blood flow can also be increased by increases in CO and in vasoconstriction of the other areas
of the body. The regulation of vascular conductance and of mean arterial pressure will be discussed in the
following two sub-sections. These mechanisms will also be discussed in the context of a reduced PcellO2.
2.4.1 Exercise Onset – The Disturbance
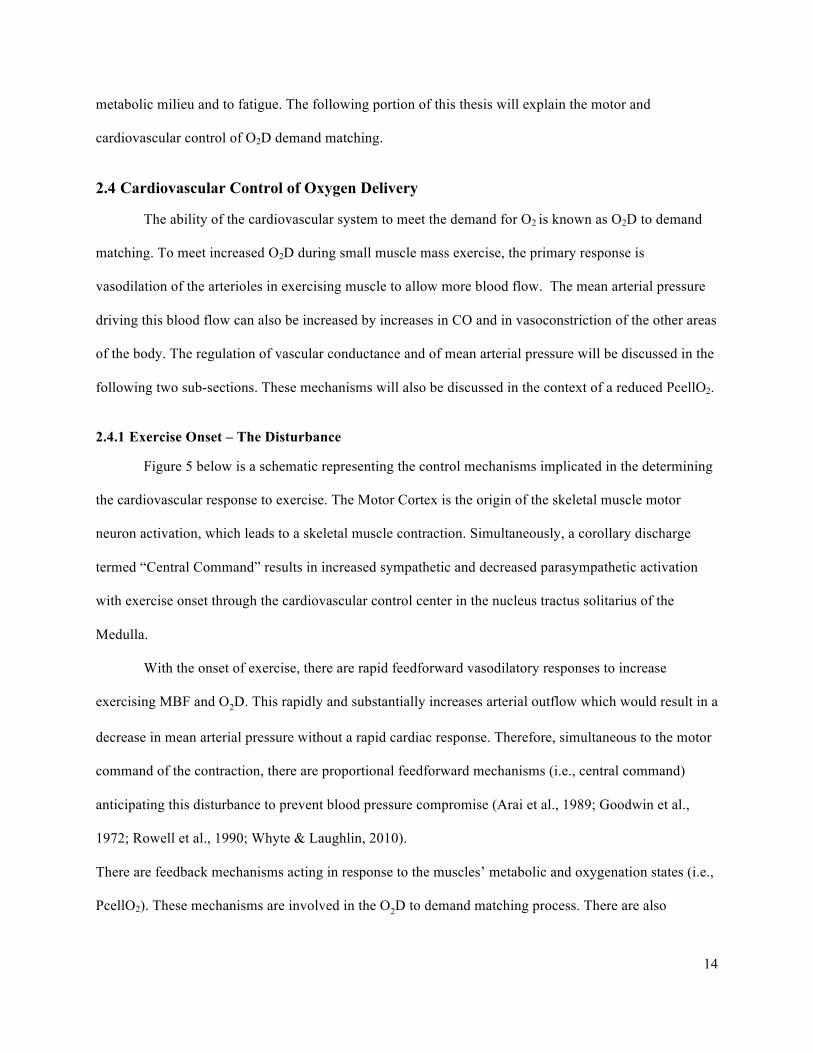
Figure 5 below is a schematic representing the control mechanisms implicated in the determining
the cardiovascular response to exercise. The Motor Cortex is the origin of the skeletal muscle motor
neuron activation, which leads to a skeletal muscle contraction. Simultaneously, a corollary discharge
termed “Central Command” results in increased sympathetic and decreased parasympathetic activation
with exercise onset through the cardiovascular control center in the nucleus tractus solitarius of the
Medulla.
With the onset of exercise, there are rapid feedforward vasodilatory responses to increase
exercising MBF and O2D. This rapidly and substantially increases arterial outflow which would result in a
decrease in mean arterial pressure without a rapid cardiac response. Therefore, simultaneous to the motor
command of the contraction, there are proportional feedforward mechanisms (i.e., central command)
anticipating this disturbance to prevent blood pressure compromise (Arai et al., 1989; Goodwin et al.,
1972; Rowell et al., 1990; Whyte & Laughlin, 2010).
There are feedback mechanisms acting in response to the muscles’ metabolic and oxygenation states (i.e.,
PcellO2). These mechanisms are involved in the O2D to demand matching process. There are also
15
feedback mechanisms acting to regulate MAP. These however do not work to regulate O2D to demand
matching.
Efferent Information
Afferent Information
Direction of Blood Flow
Sympathetic Nervous Activity
Parasympathetic Nervous Activity
Figure 5 Feedforward and feedback control mechanisms in the cardiovascular response to exercise. Feedforward (central command) and feedback (muscle mechano- and metaboreceptors, and arterial baroreflex) control mechanisms implicated in the determining the cardiovascular response to exercise. The Motor Cortex is the origin of the skeletal muscle motor neuron activation, which leads to a skeletal muscle contraction. Simultaneously, a corollary discharge termed “Central Command” causes sympathetic activation and parasympathetic withdrawal of vagus nerve activity through the cardiovascular control center in the nucleus tractus solitaries of the Medulla. This increases the contraction rate of the heart and causes vasoconstriction of the resistance vessels. The skeletal muscle contraction causes a disturbance to the arterial outflow, impacting mean arterial pressure. Fine-tuning of the cardiovascular response is accomplished through a series of afferent information from muscle metaboreceptors and mechanoreceptors, and arterial baroreceptors. MVK= Muscle vascular conductance; OVK= Other vascular conductance.
16
2.4.2 Control of Local Muscle Blood Flow and Oxygen Delivery: Demand Matching
With the onset of a muscle contraction, there are rapid feedforward vasodilatory responses
working to increase BF and O2D to exercising muscle proportional to the strength and the frequency of
the contractions (Clifford et al., 2006; Kirby et al., 2007; Tschakovsky et al., 2004). The immediate
increase in MBF plateaus at five to seven seconds (MacDonald et al., 1998; Shoemaker et al., 1998).
2.4.2.1 Feedforward Mechanisms
Muscle Pump
With a skeletal muscle contraction, the microvasculature in the muscle is mechanically
compressed. The mechanical effect of emptying the vein in contracting muscle is termed ‘the muscle
pump’ (Laughlin, 1987; Sheriff et al., 1993). Upon the muscle contraction, blood is expelled from the
muscle vascular bed towards the heart due to the one-way valves in the veins (the muscle pump effect).
With the venous volume being translocated to the heart, the pressure on the venous side of the muscle is
reduced, increasing the pressure gradient for flow from the arterial side to the venous side when the
muscle relaxes. This serves to increase MBF and O2D to the exercising muscle.
The contributions of the muscle pump to the initial increase in muscle blood flow and O2D during
exercise was studied by Tschakovsky et al., (1996). They measured human forearm blood flow with the
arm above or below the heart level during three conditions. The first condition used rapid cuff
inflation/deflations to simulate rhythmic muscle pump emptying of the forearm veins. The second
condition used handgrip contractions and the third used handgrip contractions during cuff inflation. The
first observation was that rhythmic cuff inflations only increased FBF when the arm was positioned below
heart level. With the arm below the heart level, there is a greater venous pressure, indicating that the
muscle pump only operates under conditions of elevated venous pressure. The second observation was
that FBF was higher in response to a single contraction than in response to the cuff inflation. This implies
that the muscle pump only partially contributes to the initial rapid increase in forearm blood flow (FBF)
and O2D at the onset of exercise. Lastly, they observed that the increase in FBF was greatest when there
was cuff inflation during the contraction. Again, this increase in FBF only occurred when the arm was
17
below the heart. This implies that both the vasodilation and the muscle pump effect induced by muscle
contraction are necessary for a full FBF response. It also reinforces that adequate venous pressure is
necessary for the muscle pump to be effective.
Resistance Vessel Compression-Induced Dilation
The compression of the arteries and veins within the muscle as it contracts has a resulting
vasodilatory effect (González-Alonso et al., 2008; Kirby et al., 2007; Tschakovsky et al., 2004). Evidence
for resistance vessel compression induced dilation is provided by Tschakovsky et al., (2004). This
research team explored the rapid vasodilation contributions to exercise hyperemia during single forearm
contractions at a range of %MVC. To rule out the contributions of rapid vasodilation from the muscle
pump, they had participants perform the exercise with their arm below and above heart level. With the
arm above heart level, they confirmed that venous blood volume was emptied using a forearm strain
gauge (i.e., muscle pump is ineffective). In the above heart level condition, there were linear increases in
FBF that were proportional to the contraction intensity from five to 70% MVC. This provides evidence
that rapid vasodilation in human forearm muscle during exercise results in an increase in muscle vascular
conductance and in MBF, independent of contributions from the muscle pump.
2.4.2.2 Feedback Mechanisms
The immediate increase in MBF plateaus at five to seven seconds and is followed by a slower
increase to steady state occurring at 15-20 seconds (MacDonald et al., 1998; Shoemaker et al., 1998). The
second phase increase occurs due to feedback mechanisms acting in response to the muscles’ metabolic
and oxidative states (i.e., PcellO2). These feedback mechanisms work to achieve O2D to demand
matching.
Vasodilatory Metabolite Buildup
The contracting muscle produces metabolites in proportion to the metabolic rate (Murrant &
Sarelius, 2000; Shepherd, 1983; Tschakovsky & Pyke, 2010). Metabolite build up in the interstitial space
occurs when the production of metabolites by the muscle exceeds their removal as they diffuse into the
18
blood stream, indicating a mismatch between oxygen delivery and oxygen utilization (Shepherd, 1983;
Tschakovsky & Pyke, 2010). Some of the metabolites are vasodilatory with their build-up causing
vasodilation. The vasodilation in result of the metabolite build up serves to restore blood flow and
increase the rate of metabolite removal, until metabolite production and removal are again in balance.
Build-up of adenosine in the interstitial space has been shown to contribute to this vasodilation
(Casey & Joyner, 2011; Hellsten et al., 1998). Raadegran and Calbet (2001) studied the contribution of
adenosine to steady state exercise increases in blood flow by infusing adenosine receptor blockade. With
the infusion of this blockade into the femoral artery, there was approximately a 20% reduction in
exercising muscle blood flow during one-legged knee-extensor exercise.
When muscle blood flow and oxygen delivery is reduced relative to the oxygen demand, there is
a greater metabolite build up in the muscle cell. If the magnitude of metabolite release or the
responsiveness to the metabolite build up is reduced in an individual, then this person would not increase
blood flow and would have a lower blood flow response to the same demand. As explained by the net
drive hypothesis discussed earlier in this literature review, the concentrations of ADP and Pi increase
when there is less oxygen in the cell to maintain a given rate of oxidative phosphorylation. Someone with
a relatively lower blood flow and oxygen delivery would therefore have a greater concentration of ADP
and Pi within the muscle cell and interstitial space for a given metabolic demand, increasing fatigue. This
greater concentration of ADP and Pi would also be expected to increase the rate of glycolysis in this
individual, as well as an earlier fatigue onset (Tschakovsky & Pyke, 2008). There is also a greater lactate
and H+ accumulation (Tschakovsky & Pyke, 2008), however they do not seem to contribute to muscle
fatigue (Hogan et al., 1995; Karlsson et al., 1975; Spangenburg et al., 1998).
Red Blood Cell Oxygen Sensory
RBC functions as an O2 sensor that causes ATP-mediated vasodilation. When the RBC
deoxygenates, the hemoglobin changes shape and releases ATP (Jagger et al., 2001). With greater
exercise intensity, the oxygen hemoglobin desaturation increases, leading to a greater and proportional
release of ATP (Sprague et al., 2007). Traditionally, it was believed that this ATP would bind to
19
purinergic receptors on the endothelial cells, causing endothelial nitric oxide synthase to produce and
release nitric oxide (NO). This along with other prostaglandins would diffuse onto the vascular smooth
muscle to cause resistance vessel relaxation (i.e., vasodilation) (Calbet et al., 2006; Gonzalea-Alonso et
al., 2002; Saltin et al., 1986). Recently however, Crecelius et al., (2013) tested the hypothesis that
inwardly rectifying potassium (KIR) channels and sodium-potassium (Na+/K+)-ATPase activation
contributed to reactive hyperemia in human as opposed to the traditionally explained NO and
prostaglandins response. They used KIR channel, Na+/K+-ATPase, NO, and prostaglandin inhibitors in
different combinations during temporary arterial forearm occlusion to study the mechanisms contributing
to reactive hyperemia in humans. They also used a saline solution injection as a control. They found that
the activation of KIR channels and Na+/K+-ATPase explained the majority of the reactive hyperemia
response, while NO and prostaglandins had no significant role in the response.
With increases in work rate, there is an increased oxygen consumption, requiring a greater
oxygen extraction. With this, there is more hemoglobin desaturation, triggering the ATP mechanisms to
increase dilation until delivery matches demand. However, if a person has a lower blood flow response to
the same demand, then either the magnitude of response of this mechanism in terms of ATP release, or in
terms of responsiveness to the ATP effects, would be reduced.
2.4.3 Control of Blood Pressure Regulation
As mentioned, the vasodilation that occurs at the onset of exercise (if the exercising muscle mass
is large enough) increases arterial outflow and threatens arterial blood pressure. Simultaneous to the
activation of skeletal muscle is a neural corollary discharge to the cardiovascular control center. This
causes feedforward regulation of arterial blood pressure in anticipation of the disturbance to blood
pressure at the onset of exercise. Feedback mechanisms work to achieve the target blood pressure by
balancing cardiac output (CO) and peripheral blood flow.
2.4.3.1 Feedforward Control of Mean Arterial Pressure
Central Command
20
The central command is a feedforward blood pressure regulation response that counteracts the
rapid dilation at the onset of exercise. The effect is to increase efferent sympathetic cardiac activity and
decrease efferent parasympathetic cardiac activity, resulting in an increased heart rate and a resetting of
the arterial baroreflex to increase sympathetic efferent activity to the arterioles to cause vasoconstriction
(Gandevia & Hobbs, 1990; Gandevia et al., 1993; Hobbs & Gandevia, 1985; Victor et al., 1989; Victor et
al., 1995). The elevation in neural activity to the cardiovascular control center is proportional to the motor
neuron activity creating the muscle contractions, often termed a corollary discharge.
Evidence for central motor command control of the cardiovascular response to exercise is
demonstrated by studies that have participants perform attempted forearm handgrip contractions through a
range of exercise intensities, under forearm muscle paralysis (Gandevia & Hobbs, 1990; Gandevia et al.,
1993; Hobbs & Gandevia, 1985; Victor et al., 1989; Victor et al., 1995). For example, Victor et al., 1995
recorded muscle sympathetic nerve activity (MSNA) at the peroneal nerve during intermittent isometric
handgrip at various %MVC in human participants. They observed results before and after partial
neuromuscular blockade to isolate the influence of central command while minimizing force output and
muscle afferent feedback. The data demonstrated that MAP, HR, and sympathetic nervous activity
activity (SNA) increase in direct proportion to the intensity of the attempted contraction, even in the
absence of both muscle mechano- and metaboreceptor activation. These findings support a role for
increased central command in the cardiovascular response to exercise because the paralyzed muscle is
neither moving nor accumulating metabolites (i.e., providing no sensory feedback information). By
exclusion, feedforward efferent information from the motor cortex must be responsible, at least in part,
for the increased MAP, HR and SNA observed under these experimental conditions. In this regard, an
increase in central motor command output should raise MAP by increasing HR and CO, (i.e., arterial
inflow).
Given that the central command corollary discharge is proportional to the motor drive, any
increases in the motor drive would be expected to increase corollary discharge. Motor command increases
when muscle fatigue is occurring or when the oxygen conformer effect is occurring (i.e., when convective

21
O2D and PcellO2 is reduced). According to the central command theory, SNA would increase, causing
increases in HR and in CO, serving to increase arterial blood pressure.
Muscle Pump
As explained above the mechanical effect of emptying the veins in contracting muscle is termed
‘the muscle pump’ (Laughlin, 1987; Sheriff et al., 1993). With the muscle pump effect, upon muscle
contraction, blood is expelled from the muscle vascular bed towards the heart. With the venous volume
being translocated towards the heart, central venous pressure rises. This increases ventricular filling
during diastole and there is a subsequent increase in stroke volume and in CO, which by itself would
increase arterial blood pressure.
Mechanoreflex
The muscle mechanoreflex is a feedforward mechanism that senses muscle distortion and evokes
a cardiovascular response to regulate blood pressure during exercise. The muscle mechanoreflex
contributes to the increase in blood flow, through its impact on blood pressure. Afferent neurons respond
to the stretch and pressure of a contraction in proportion to the intensity of the contraction and to the
number of activated muscle fibers (Kaufman & Hayes, 2002; Leshnower et al., (2001); Williamson et al.,
1994). When these afferents are stimulated, there is a resetting of the arterial baroreflex to a higher MAP
‘set-point’, causing reflex reductions in parasympathetic nervous system (PNS) serving to increase
arterial blood pressure (Gallagher et al., 2001; Vorluni & Volianitis, 2008).
A study by Leshnower et al., (2001) demonstrated that passive stretching of an animal muscle,
increased CO (via increase in HR) and MAP to levels observed during an experimentally-induced
muscular contraction. Since the stretching is passive, mechanosensitive afferent nerve fibers are
stimulated in the complete absence of increased central command and muscle metaboreceptor activation.
Further support that muscle mechanoreceptors contribute to the cardiovascular response in exercise is that
the increases in HR and CO leading to an increase MAP during passive muscle stretch is completely
abolished when the afferent nerves are cut or severed (Leshnower et al., 2001).
22
2.4.3.2 Feedback Control of Mean Arterial Pressure
Arterial Baroreflex
Pressure-sensitive afferent nerve fibers (baroreceptors) located within the carotid arteries and the
aortic arch provide sensory feedback information on arterial blood pressure to the cardiovascular control
center (Kim et al., 2005; Rowell & O’Leary, 1990; Whyte & Laughlin, 2010). The arterial baroreflex is a
negative feedback reflex where increased activity of the receptors has an inhibitory effect on the
cardiovascular control center. At rest, with increased activity of the receptors, hypertension is sensed.
When hypertension is sensed, there is a decrease in sympathetic activity to the heart and blood vessels, at
both the exercising and resting tissue, and an increase in parasympathetic activity to the heart (Kim et al.,
2005; Rowell & O’Leary, 1990). The opposite response is triggered when hypotension is sensed.
Metaboreflex
Feedback information is provided to the cardiovascular control center by metabosensitive
afferents in the active skeletal muscle that are sensitive to the build-up of Pi and H+ in the interstitial
space (Boushel et al., 2010; Hansel et al., 1994; Rowell & O’Leary 1990). The increased firing of
metabosensitive afferents causes an increase in global sympathetic nerve activity (SNA), which causes an
increase in CO and in peripheral vasoconstriction. The peripheral vasoconstriction induced by the
metaboreflex occurs in non-exercising tissue, but whether it happens in the exercising muscle from which
the reflex originates depends on whether functional sympatholysis prevents it or not (to be explained in
section 2.4.4). The increase in CO and in peripheral vasoconstriction results in an increased MAP, the
pressure gradient for flow (flow = conductance x pressure gradient), to increase O2D (Amann et al., 2010;
Boushel et al., 2010; Hansel et al., 1994; Rowell & O’Leary 1990).
Rotto et al., (1988, 1989) isolated the metaboreflex by stimulating Type III and IV muscle
metabosensitive afferent nerve fibers by injecting metabolic bi-products of muscular exercise (i.e., lactic
acid) into a resting muscle of an anaesthetized animal. With the anesthesia, a resting animal is in the
complete absence of central command and muscle mechanoreceptor activity. They found that after
injecting lactic acid and arachidonic acid into the femoral artery of anasthesized cats, there were
23
significant increases in the activity of group III and IV afferents which caused increases in HR, CO, and
MAP. Blockade of metabosensitive muscle afferents has also been done in humans during single leg knee
extensor exercises (Amman et al., 2011). This caused reductions in SV, HR, CO, MAP, and O2D at
several exercise intensities (Amman et al., 2011).
O’Leary (1993) studied the pressor response in treadmill exercising dogs experiencing gradual
reductions in hindlimb blood flow. It was found that the early periods of occlusion had no effect on MAP
or HR and that it was only with further reductions in hindlimb blood flow that the metabolites (i.e., Pi and
H+) increased enough to bring the metaboreflex to threshold. Once this threshold was reached, there were
significant increases in both MAP and HR.
As explained by the net drive hypothesis discussed earlier in this literature review, the
concentrations of ADP and Pi increase when there is not enough oxygen in the cell to maintain a given
rate of oxidative phosphorylation. Someone with a relatively lower blood flow and oxygen delivery
would therefore have a greater concentration of ADP and Pi within the muscle cell and interstitial space
for a given metabolic demand. The metaboreflex in this individual could reach threshold at a lower
exercise intensity. With incremental increases in work rate, this individual would have an elevated arterial
blood pressure earlier in the exercise challenge. In addition, with greater ADP and Pi concentrations, the
rate of glycolysis in this individual may be increased, and an earlier fatigue onset (Tschakovsky & Pyke,
2008).
2.4.4 Sympathetic Restraint and Functional Sympatholysis
The peripheral vasoconstriction (i.e., sympathetic restraint) induced by the metaboreflex, the
mechanoreflex, and the arterial baroreflex occurs at both the inactive and the active skeletal muscle
resistance vessels, as explained above (Hansen et al., 1996). The degree of vasoconstriction that occurs at
the exercising muscle from which the reflexes originate depends on the interplay between sympathetic
restraint and functional sympatholysis. Functional sympatholysis is a concurrent and opposing response
that attenuates sympathetic restraint (Peterson et al., 1988). It is suggested that functional sympatholysis

24
is graded to the intensity of the exercise, increasing with greater exercise intensities, to ensure that the
active muscle receives adequate blood flow (Buckwalter et al., 2001).
There is an abundance of research that demonstrates the existence of sympathetic restraint.
Peterson, Armstrong, and Laughlin (1988) demonstrated that hind limb blood flow in an exercising rat
increased after having undergone a sympathectomy. This finding validated that with the entire nervous
system intact, the rats experienced some level of sympathetically mediated vasoconstriction during
exercise in the exercising muscle. O’Leary et al. (1997) further demonstrated that with alpha-1
(sympathetic receptor) blockade infusion in treadmill running dogs, terminal aortic conductance
(surrogate for total peripheral conductance) and BF to the exercising hind limb increased at mild to
moderately heavy intensities. Buckwalter et al., (1997) used a similar experimental design and found
evidence for the existence of sympathetic vasoconstriction in active skeletal muscle in dogs at mild,
moderate, and heavy exercise. This study also demonstrated that alpha-1 receptor sympathetically
mediated vasoconstriction is inversely proportional to the exercise intensities, where sympathetic restraint
is greatest at lowest intensities and decreases as exercise intensity increases. Buckwalter & Clifford
(1999) extended this information to demonstrate that alpha-2 adrenergic receptors also contribute to
vascular tone in skeletal muscle at rest and during exercise in dogs. Unlike alpha-1 adrenergic mediated
restraint, alpha-2 adrenergic mediated restraint on blood flow was constant across exercise intensities
(Buckwalter & Clifford 1999).
There is also evidence of sympathetic restraint in human studies (Joyner et al., 1992; Shoemaker
et al. 1997). Joyner et al., (1992) demonstrated that during moderate to intense hand grip exercise,
forearm BF increases after sympathetic blockade. Similar results were demonstrated by Shoemaker et al.
(1997), where exercising muscle blood flow increased considerably following blockade during rhythmic
handgrip exercise.
The degree of sympathetic restraint and functional sympatholysis determines the resulting
exercising muscle blood flow. While the studies above provide evidence for the existence of sympathetic
restraint at all exercise intensities, there is some evidence showing that functional sympatholysis
25
completely prevents constriction at exercising muscle (Hartling & Trap-Jensen 1983; Heinonen et al.,
2013). A study by Heinonen et al., (2013) found a lack of increased perfusion to the exercising muscle
upon administration of sympathetic blockade. Hartling & Trap-Jensen (1983) demonstrated similar
results, where administering a sympathetic blockade during small muscle mass forearm exercise had no
influence on blood flow, or on the vascular resistance in the exercising forearm.
To sum, while some studies demonstrate the existence of sympathetic restraint (Buckwalter et al.,
1997; Joyner et al., 1992; O’Leary et al. 1997; Peterson et al., 1988; Shoemaker et al. 1997), others do not
(Hartling & Trap-Jensne, 1983; Heinonen et al., 2013). Perhaps these inconsistencies are due to inter-
individual variability in cardiovascular responses to exercise. This possibility is supported by Perrey et
al., (2001) who evoked the metaboreflex in the calf of human participants and observed the effect on their
exercising forearm. The systemic blood pressure elevation induced by the metaboreflex could increase
FBF if: 1) the increase in MAP was only due to increases in CO (i.e. no sympathetic vasoconstrictor
component) and there was no local O2D to demand matching keeping the flow at the steady state level
(i.e., counter constriction); or if 2) there was sympathetic vasoconstrictor outflow to all tissue but the
functional sympatholysis prevented constriction in the exercising forearm muscle. Results demonstrated
an increase in MAP in all participants (i.e., metaboreflex was induced in all participants). However, only
half of the participants experienced increases in FBF, with the other half experiencing a counter
constriction due to a greater amount of sympathetic restraint and less functional sympatholysis. Perhaps
those participants who experienced increases in FBF had a more effective functional sympatholysis than
those who did not. The effectiveness of functional sympatholysis to blunt sympathetic restraint may
therefore play a role in the inter-individual differences observed in the cardiovascular responses to
exercise. For example, in a person with lower muscle blood flow for a given exercise demand, perhaps
they have less effective functional sympatholysis than those with greater perfusion.
26
2.4.5 Summary
With the onset of a muscle contraction, there are rapid feedforward vasodilatory responses
(muscle pump and resistance vessel compression-induced dilation) to increase arterial outflow, working
to increase exercising MBF and O2D. By increasing arterial outflow, there is a disturbance to the system
causing a decrease in mean arterial pressure. Simultaneous to the motor command of the contraction,
there are proportional feedforward mechanisms induced by the corollary discharge to the cardiovascular
control center anticipating this disturbance to prevent blood pressure compromise (Arai et al., 1989;
Goodwin et al., 1972; Rowell et al., 1990; Whyte & Laughlin, 2010). When there are increases in the
motor drive to maintain force during (1) fatigue or (2) a reduced convective O2D, the central command
remains active in proportion to this increase in motor drive. This would increase the cardiac and arterial
blood pressure responses, according to the information provided above.
RBC oxygen sensor and vasodilatory metabolite buildup are feedback mechanisms acting in
response to the muscles’ metabolic and oxidative states (i.e., PcellO2). These mechanisms are involved in
the O2D to demand matching process. The arterial baroreflex and metaboreflex are feedback mechanisms
acting to regulate MAP.
2.5 Oxygen Delivery Demand Matching
It is generally stated that blood flow is regulated to match the oxygen demand through the
mechanisms explained above. For example, under conditions of increased O2 availability (i.e., hyperoxia),
vascular conductance to exercising muscle decreases to match the demand (Casey et al., 2011; Gonzalez-
Alonso et al., 2001). The opposite is true such that reductions in O2 availability (i.e., hypoxia) causes
compensatory vasodilation to increase blood flow to the exercising muscle and preserve O2D (Wilkins et
al., 2006).
Casey et al., (2011) tested the hypothesis that blood flow responses to exercising forearm muscle
would be reduced during hyperbaric (high environmental pressure) hyperoxic conditions compared to
hyperbaric normoxic conditions. They found that at rest, FBF and FVC were reduced during hyperbaric
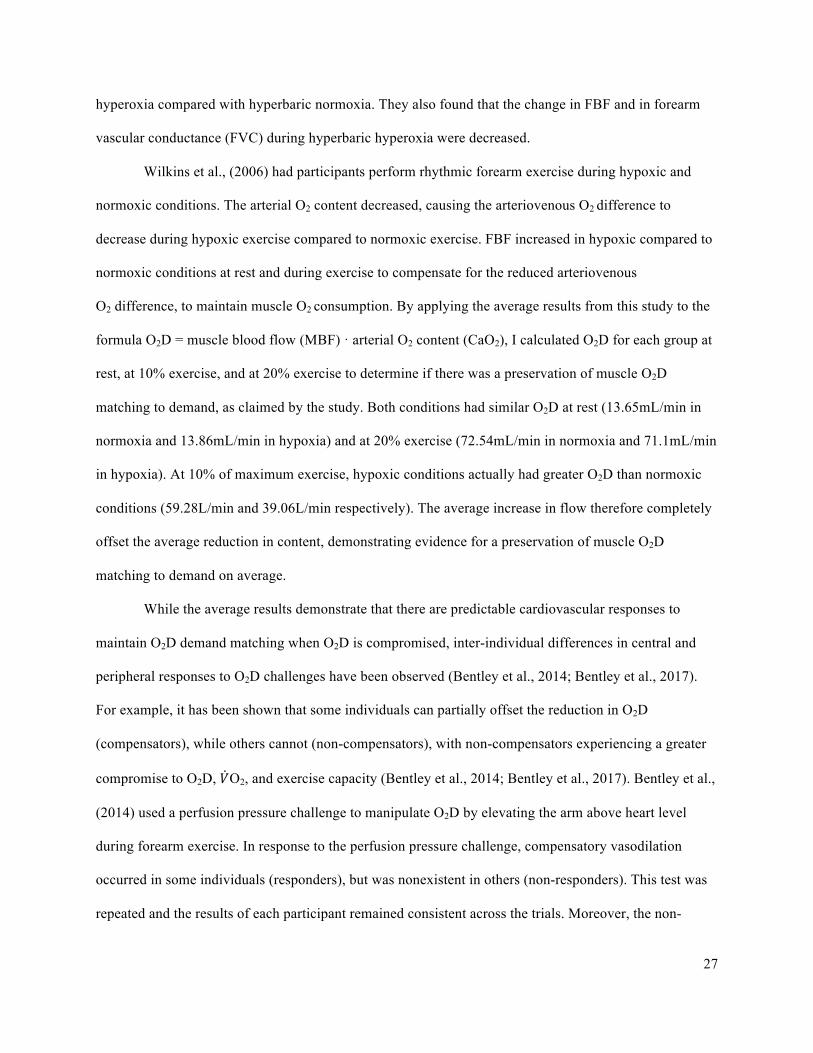
27
hyperoxia compared with hyperbaric normoxia. They also found that the change in FBF and in forearm
vascular conductance (FVC) during hyperbaric hyperoxia were decreased.
Wilkins et al., (2006) had participants perform rhythmic forearm exercise during hypoxic and
normoxic conditions. The arterial O2 content decreased, causing the arteriovenous O2 difference to
decrease during hypoxic exercise compared to normoxic exercise. FBF increased in hypoxic compared to
normoxic conditions at rest and during exercise to compensate for the reduced arteriovenous
O2 difference, to maintain muscle O2 consumption. By applying the average results from this study to the
formula O2D = muscle blood flow (MBF) · arterial O2 content (CaO2), I calculated O2D for each group at
rest, at 10% exercise, and at 20% exercise to determine if there was a preservation of muscle O2D
matching to demand, as claimed by the study. Both conditions had similar O2D at rest (13.65mL/min in
normoxia and 13.86mL/min in hypoxia) and at 20% exercise (72.54mL/min in normoxia and 71.1mL/min
in hypoxia). At 10% of maximum exercise, hypoxic conditions actually had greater O2D than normoxic
conditions (59.28L/min and 39.06L/min respectively). The average increase in flow therefore completely
offset the average reduction in content, demonstrating evidence for a preservation of muscle O2D
matching to demand on average.
While the average results demonstrate that there are predictable cardiovascular responses to
maintain O2D demand matching when O2D is compromised, inter-individual differences in central and
peripheral responses to O2D challenges have been observed (Bentley et al., 2014; Bentley et al., 2017).
For example, it has been shown that some individuals can partially offset the reduction in O2D
(compensators), while others cannot (non-compensators), with non-compensators experiencing a greater
compromise to O2D, 𝑉O2, and exercise capacity (Bentley et al., 2014; Bentley et al., 2017). Bentley et al.,
(2014) used a perfusion pressure challenge to manipulate O2D by elevating the arm above heart level
during forearm exercise. In response to the perfusion pressure challenge, compensatory vasodilation
occurred in some individuals (responders), but was nonexistent in others (non-responders). This test was
repeated and the results of each participant remained consistent across the trials. Moreover, the non-
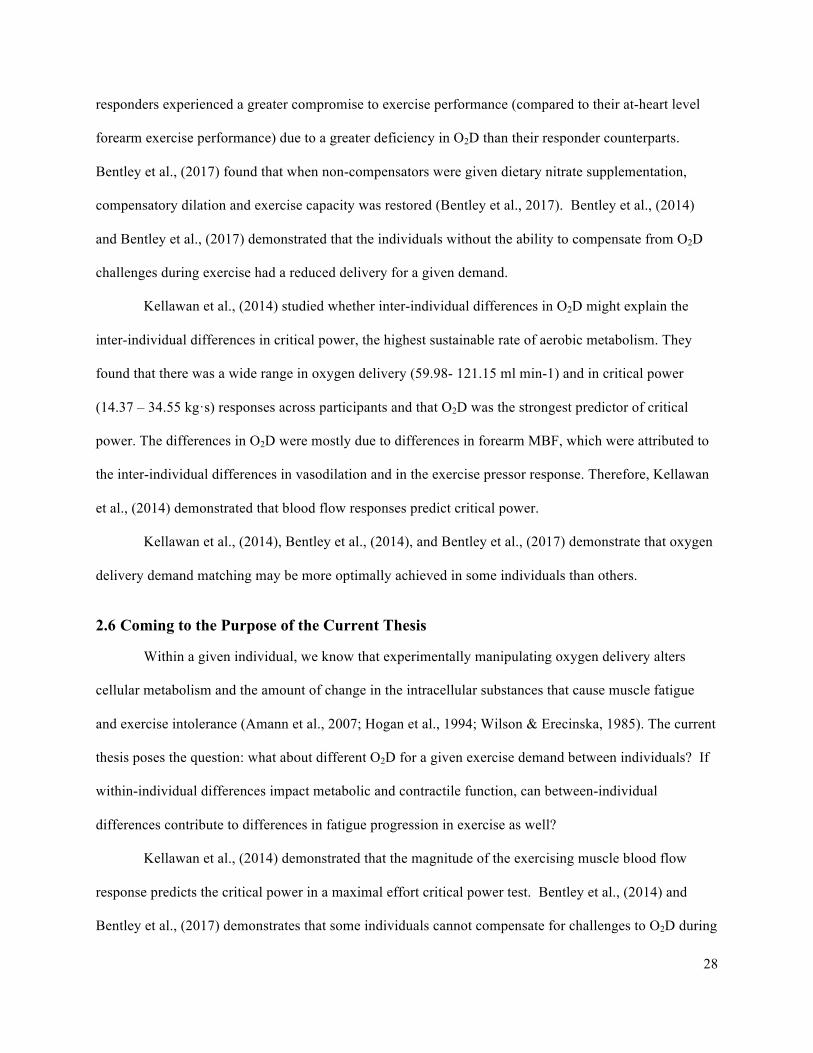
28
responders experienced a greater compromise to exercise performance (compared to their at-heart level
forearm exercise performance) due to a greater deficiency in O2D than their responder counterparts.
Bentley et al., (2017) found that when non-compensators were given dietary nitrate supplementation,
compensatory dilation and exercise capacity was restored (Bentley et al., 2017). Bentley et al., (2014)
and Bentley et al., (2017) demonstrated that the individuals without the ability to compensate from O2D
challenges during exercise had a reduced delivery for a given demand.
Kellawan et al., (2014) studied whether inter-individual differences in O2D might explain the
inter-individual differences in critical power, the highest sustainable rate of aerobic metabolism. They
found that there was a wide range in oxygen delivery (59.98- 121.15 ml min-1) and in critical power
(14.37 – 34.55 kg·s) responses across participants and that O2D was the strongest predictor of critical
power. The differences in O2D were mostly due to differences in forearm MBF, which were attributed to
the inter-individual differences in vasodilation and in the exercise pressor response. Therefore, Kellawan
et al., (2014) demonstrated that blood flow responses predict critical power.
Kellawan et al., (2014), Bentley et al., (2014), and Bentley et al., (2017) demonstrate that oxygen
delivery demand matching may be more optimally achieved in some individuals than others.
2.6 Coming to the Purpose of the Current Thesis
Within a given individual, we know that experimentally manipulating oxygen delivery alters
cellular metabolism and the amount of change in the intracellular substances that cause muscle fatigue
and exercise intolerance (Amann et al., 2007; Hogan et al., 1994; Wilson & Erecinska, 1985). The current
thesis poses the question: what about different O2D for a given exercise demand between individuals? If
within-individual differences impact metabolic and contractile function, can between-individual
differences contribute to differences in fatigue progression in exercise as well?
Kellawan et al., (2014) demonstrated that the magnitude of the exercising muscle blood flow
response predicts the critical power in a maximal effort critical power test. Bentley et al., (2014) and
Bentley et al., (2017) demonstrates that some individuals cannot compensate for challenges to O2D during
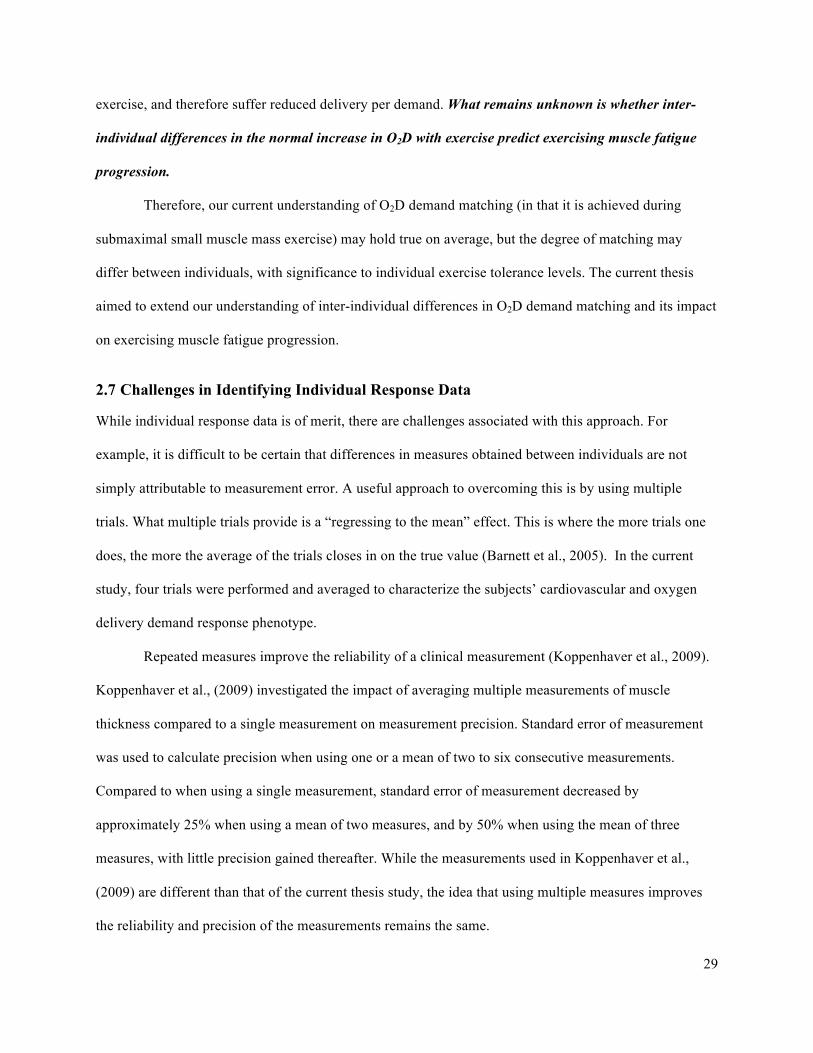
29
exercise, and therefore suffer reduced delivery per demand. What remains unknown is whether inter-
individual differences in the normal increase in O2D with exercise predict exercising muscle fatigue
progression.
Therefore, our current understanding of O2D demand matching (in that it is achieved during
submaximal small muscle mass exercise) may hold true on average, but the degree of matching may
differ between individuals, with significance to individual exercise tolerance levels. The current thesis
aimed to extend our understanding of inter-individual differences in O2D demand matching and its impact
on exercising muscle fatigue progression.
2.7 Challenges in Identifying Individual Response Data
While individual response data is of merit, there are challenges associated with this approach. For
example, it is difficult to be certain that differences in measures obtained between individuals are not
simply attributable to measurement error. A useful approach to overcoming this is by using multiple
trials. What multiple trials provide is a “regressing to the mean” effect. This is where the more trials one
does, the more the average of the trials closes in on the true value (Barnett et al., 2005). In the current
study, four trials were performed and averaged to characterize the subjects’ cardiovascular and oxygen
delivery demand response phenotype.
Repeated measures improve the reliability of a clinical measurement (Koppenhaver et al., 2009).
Koppenhaver et al., (2009) investigated the impact of averaging multiple measurements of muscle
thickness compared to a single measurement on measurement precision. Standard error of measurement
was used to calculate precision when using one or a mean of two to six consecutive measurements.
Compared to when using a single measurement, standard error of measurement decreased by
approximately 25% when using a mean of two measures, and by 50% when using the mean of three
measures, with little precision gained thereafter. While the measurements used in Koppenhaver et al.,
(2009) are different than that of the current thesis study, the idea that using multiple measures improves
the reliability and precision of the measurements remains the same.
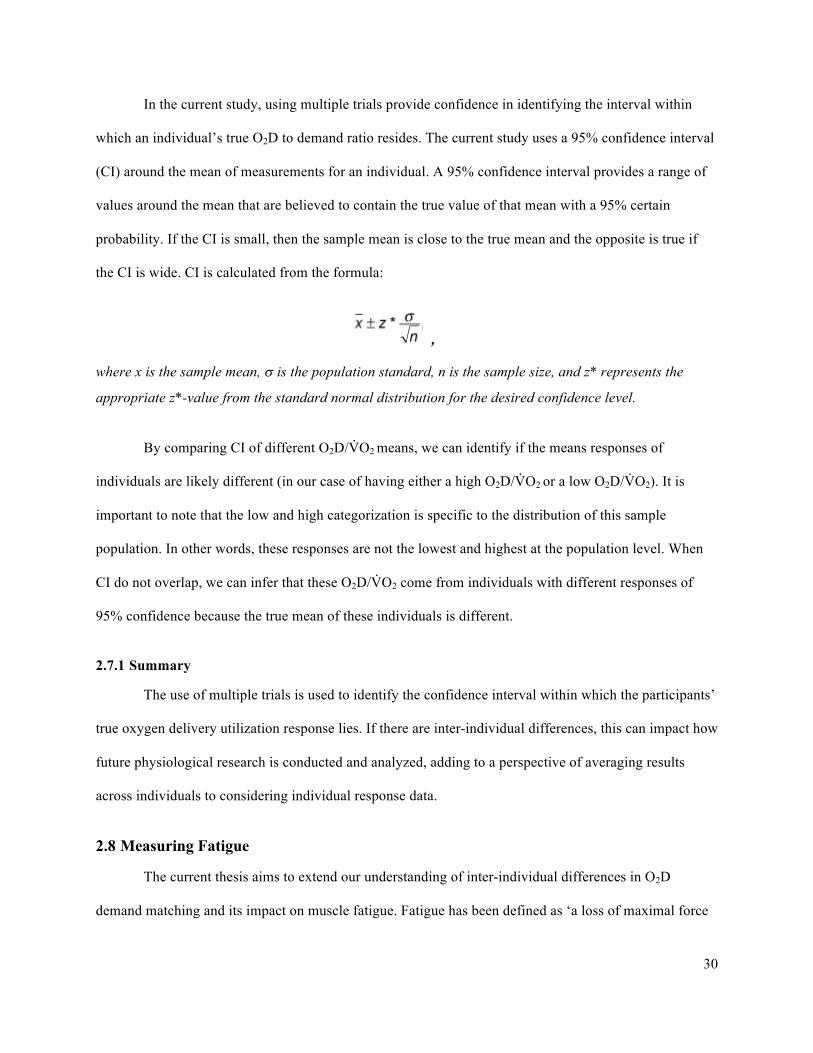
30
In the current study, using multiple trials provide confidence in identifying the interval within
which an individual’s true O2D to demand ratio resides. The current study uses a 95% confidence interval
(CI) around the mean of measurements for an individual. A 95% confidence interval provides a range of
values around the mean that are believed to contain the true value of that mean with a 95% certain
probability. If the CI is small, then the sample mean is close to the true mean and the opposite is true if
the CI is wide. CI is calculated from the formula:
, where x is the sample mean, s is the population standard, n is the sample size, and z* represents the
appropriate z*-value from the standard normal distribution for the desired confidence level.
By comparing CI of different O2D/V̇O2 means, we can identify if the means responses of
individuals are likely different (in our case of having either a high O2D/V̇O2 or a low O2D/V̇O2). It is
important to note that the low and high categorization is specific to the distribution of this sample
population. In other words, these responses are not the lowest and highest at the population level. When
CI do not overlap, we can infer that these O2D/V̇O2 come from individuals with different responses of
95% confidence because the true mean of these individuals is different.
2.7.1 Summary
The use of multiple trials is used to identify the confidence interval within which the participants’
true oxygen delivery utilization response lies. If there are inter-individual differences, this can impact how
future physiological research is conducted and analyzed, adding to a perspective of averaging results
across individuals to considering individual response data.
2.8 Measuring Fatigue
The current thesis aims to extend our understanding of inter-individual differences in O2D
demand matching and its impact on muscle fatigue. Fatigue has been defined as ‘a loss of maximal force

31
generating capacity’ (Bigland-Ritchie et al., 1986a; Bigland-Ritchie & Woods, 1984; Vøllestad &
Sejersted, 1988).
A common protocol used to assess muscle fatigue is to use intermittent brief maximal
contractions that are either voluntary (Baudry et al., 2007; Hunter et al. 2004) or electrically stimulated
(Baudry et al., 2007; Bigland-Ritchie et al. 1986b; Merton, 1954; Søgaard et al. 2006) to determine the
decline in the maximal force capacity (Figure 6). With intermittent contractions, hyperemia occurs
between contractions to supply the muscle with sufficient oxygen (Vøllestad et al., 1990; Sahlin et al.,
1992). Additionally, using intermittent MVC only requires a brief effort and a brief motivation, which is
important considering that motivation plays a role in determining central fatigue (Humphreys & Lind,
1963).
Figure 6 Schematic representation of fatigue protocol using intermittent MVC. Time to task failure (TTF) protocol using repeated contractions at 45% MVC to track fatigue. Fatigue occurs when the target force can no longer be maintained. Adapted from Vøllestad, 1997.
Motivation impacts fatigue because fatigue can occur within the central nervous system (CNS),
within the neural transmission from the CNS to the muscle, or within the muscle (Humphreys & Lind,
1963). Central fatigue may occur if the participant is unmotivated or cannot tolerate the discomfort
associated with the exercise (Humphreys & Lind, 1963). While the gold standard of assessing peripheral
muscle fatigue is with electrical stimulation, using voluntary contractions have been shown to have
correlated results, with force decline from 50 Hz stimulation falling linearly and in parallel with MVC
32
decline (Bigland-Ritchie et al., 1986b; Dolmage & Cafarelli, 1991). Bigland-Ritchie et al., (1986b)
combined voluntary and electrical fatigue tests to evaluate the fatigue in human quadriceps and soleus
muscles. Participants held a 50% MVC target for a six to four second duty cycle (i.e., contract for six
seconds, relax for four seconds) until they could no longer attain the target force. Intermittently, an MVC
was performed and was followed by a single supramaximal shock, followed by a brief tetanus (eight
stimulation pulses at 50 Hz). The values of the electrical stimulation and of the MVC were highly
correlated. This indicates that electrical stimulation and voluntary contractions are both able to assess the
same physiological components of fatigue. Dolmage and Cafarelli (1991) used a similar protocol
rendering similar results in their calculated rate of fatigue. The rate of fatigue was the rate of decline of
MVC calculated from regression analysis. Force from 50 Hz stimulation and from twitch force fell
linearly and in parallel with MVC. Therefore, while MVC does not isolate peripheral fatigue, central
fatigue encompasses the peripheral events that would result from poorer O2D to demand matching.
A potential limitation of using voluntary contractions is that we cannot isolate the site of fatigue.
If a participant is less motivated, decline in force generation may not be reflecting peripheral muscle
fatigue alone. This being said, voluntary effort is the most representative assessment of fatigue in
everyday life (i.e., encompassing both peripheral and central fatigue).
2.9 Purpose
The purpose of the current thesis is to extend our understanding of inter-individual differences in
O2D demand matching and its impact on fatigue progression. The current study uses MVC intermittently
to submaximal contractions to track fatigue progression.
2.10 Objectives
1. To quantify an individual’s oxygen delivery to utilization ratio across a range of exercise
intensities.
2. To compare fatigue progression between groups with lower vs. higher oxygen delivery/utilization
ratios with the use of a fatigue exercise test across individuals.
33
2.11 Hypothesis
1. It is hypothesized that there will be inter-individual differences in oxygen delivery/utilization
ratios across a range of exercise intensities.
2. It is further hypothesized that the group with a higher oxygen delivery/utilization ratio (high
responders) will have a lesser accumulated fatigue in a fatigue inducing exercise test compared to
the group with the lower oxygen delivery/utilization ratio (low responders).

34
Chapter 3
Methods
This study was approved by the Health Sciences Research Ethics Board of Queen’s University in
agreement with the Declaration of Helsinki. Procedures followed were in agreement with institutional
guidelines. Each participant provided signed consent after receiving verbal and written descriptions of the
experimental protocol and potential risks.
3.1 Participant Characteristics
Ten healthy males (age 21.56 ± 2.13 years) with no history of smoking, cardiovascular disease, or
hypertension participated in the study. The participants had no specific forearm training and were
recreationally active (234 ±19METS/week). Participants’ characteristics are outlined in Table 1 below.
3.2 Overview of Protocol
All participants completed the same series of forearm exercise tests on three collection visits,
separated by at least 24 hours. All forearm exercise consisted of rhythmic, isometric forearm handgrip
contractions with a duty cycle of one second contraction: two second relaxation.

35
Table 1. Participant anthropometric characteristics. Last row includes mean ± SD. BMI, body mass index; PAR, physical activity recall.
Days 1 and 2: Two identical incremental rhythmic forearm exercise tests (rhythmic isometric
forearm handgrip contractions) to exhaustion (IET), separated by a 90-minute rest period, were performed
on day 1 and day 2. Due to technical issues with forearm venous catheterization or with equipment, only
two to three trials were completed in certain cases. Issues included the inability to thread the catheter (in
the case of participants 6 and 7) or the expression of pain at the site of catheterization with the request that
no more blood be drawn (in the case of participants 1 and 8). In the case of participant 3, fewer IET were
completed due to the computer hardware shutting down during the fourth IET. This participant expressed
not wanting to come back to redo this IET. Therefore, between two and four tests were averaged for each
participant to provide a better estimate of the true response, as previously performed in our laboratory
(Bentley et al., 2011; Bentley et al., 2014; Bentley et al., 2017). The IET is used to quantify the oxygen
delivery and submaximal 𝑉O2 relationship (i.e., quantify oxygen delivery utilization ratio (O2D/V̇O2).
Age (years) Height (cm) Weight (kg) BMI (kg/
m2)
Forearm
Volume (mL)
PAR Score (MET/ week)
1 18 181 84 25.64 950 224
2 20 176 63 20.345 606 231
3 21 181 79 24.25 807 214
4 22 183 75 22.24 763 233
5 21 185 84 24.54 796 238
6 22 170 63 21.80 724 217
7 22 173 66 22.05 704 226
8 22 179 87 27.15 1091 250
9 21 187 91 26.02 920 279
10 26 180 70 21.60 804 229
Mean ± SD
22±
2
180±
5
76±
10
23.58±
2.25
816±
138
234±
19
36
Day 3: A forearm exercise fatiguing exercise test (FET).
The IET protocol was used to determine the exercise work rate for the FET. The FET was
performed at 70% of maximum WR achieved in the IET and was used to quantify individual participant’s
exercise capacity.
Full detail of the methods is to follow.
3.3 Pre-Screening
When participants expressed interested in the study, they were sent a series of four questions over
e-mail to ensure that they were eligible to participate. These questions were:
1. Are you between the ages of 18-35? (yes or no)
2. Are you physically active on less than or equal to 3 hours per week? (yes or no)
3. Are you a cigarette smoker within the last 6 months? (yes or no)
4. Do you have any history of high blood pressure or cardiovascular disease? (yes or no)
If they answered 1. Yes, 2. Yes, 3. No, 4. No, then they were eligible to come in for a screening
visit.
3.4 Screening Visit and Familiarization
3.4.1 Anthropometric Measurements
Measures of the participant’s height (cm), body weight (kg), and forearm volume (mL) were
taken for participant characterization. Height and body weight was measured using a Nuevo Leon scale
(Nuevo Leon, Industrial Place Grass Valley, CA USA) in the laboratory and forearm volume was
measured using water displacement.
3.4.2 The Physical Activity Readiness Questionnaire (Appendix D)
The Physical Activity Readiness Questionnaire is used to assess if the participant can engage
safely in physical activity without needing to check with their physician. If participants answered yes to
any of the questions, then they were unable to participate in the current study.
37
3.4.3 Medical Screening (Appendix E)
Participants filled out a Medical Screening Form (Appendix E). This form ensured that
participants did not have any cardiovascular or comorbid conditions. It was also used to gain information
on any medications the participants were taking to confirm that they would have no impact on
cardiovascular physiology.
3.4.4 Seven-Day Physical Activity Recall (Appendix C)
The Seven-Day Physical Activity Recall (PAR) was administered to assess the participant’s
current physical activity levels. The Seven-Day PAR is a validated interviewer-administered assessment
of leisure and occupational physical activity (Jacobs et al., 1993; Taylor et al., 1978). The scoring of the
interview estimates the total energy expenditure for the participant across seven days in Metabolic
Equivalents (METs). METs are used to compare energy expenditure across people with different body
weight.
3.4.5 Doppler and Echo Ultrasound Screening
All participants were screened for quality of the brachial artery image (i.e., detectable and clear
artery walls) with the Echo ultrasound. Using the echo ultrasound, participants were screened to ensure
that the bifurcation of the brachial artery occurs distal to the antecubital fossa (elbow joint) of the
exercising arm. This is to ensure that all measurement instrumentation can be placed proximal to the
bifurcation. This is important because if you are measuring distal to the bifurcation, only a portion of the
total blood flow to the exercising muscle is measured.
Quality of the brachial artery velocity signal was screened using the Doppler ultrasound. The
Doppler ultrasound works by directing ultrasound energy of a known frequency to diagonally intersect the
blood vessel (Tschakovsky et al., 1995). Objects that do not move (i.e., vessel wall) reflect the ultrasound
back at the same frequency, whereas moving objects (i.e., red blood cells) reflect the ultrasound so that
the reflected frequency is shifted (i.e., Doppler shift) (Tschakovsky et al., 1995). This allows for the
measurement of the speed of blood flow through the vessel. The Doppler ultrasound picks up the blood

38
flow in both directions (i.e., in the arteries and veins). Since these blood flows are in the opposite
direction, if the artery and the vein are in too close proximity, then both of these speeds would cancel
each other out. Therefore, during this screening process it was ensured that the artery blood flow signal is
not being interfered by the signal from the vein blood flow.
3.4.6 Familiarization Protocol
Familiarization of the one to two second contraction duty cycle and the progressive incremental
nature of the IET protocol was completed. To accomplish this, participants went through three
incremental exercise test stages starting from baseline. This process continued until the participant was
able to hit the target force and hold the contraction for the one second during 10 consecutive duty cycles
in each stage. Maximum voluntary contractions (MVC) were practiced so that participants could become
familiar with the discomfort associate with maximal exercise efforts.
3.5 Instrumentation
Participants lay supine in a temperature controlled room (~18-22oC) with both arms extended at
heart level. The experiment was performed in a cool environment to minimize skin blood flow in attempt
to isolate muscle blood flow responses. They were instrumented with a finger photoplethysmograph
(Finometer MIDI, Finapres Medical Systems, The Netherlands) and pulse oximeter (Nellcor N-395,
Covidien-Nellcor, Boulder CO) on the non-exercising left hand. The exercising arm (right) had the 20-
gauge intravenous (IV) catheter inserted retrograde to flow in an accessible vein at the antecubital fossa
(elbow joint), the Doppler ultrasound probe (Model 500V Transcranial Doppler, Multigon Industries, Mt.
Vernon NY) proximal to that, held in place by an adhesive, and the echo ultrasound probe (Vivid i GE
Medical Systems, London Ontario, Canada) positioned proximal to the Doppler probe (Figure 7).
Participants were asked to lay quietly to bring blood flow down to baseline levels.
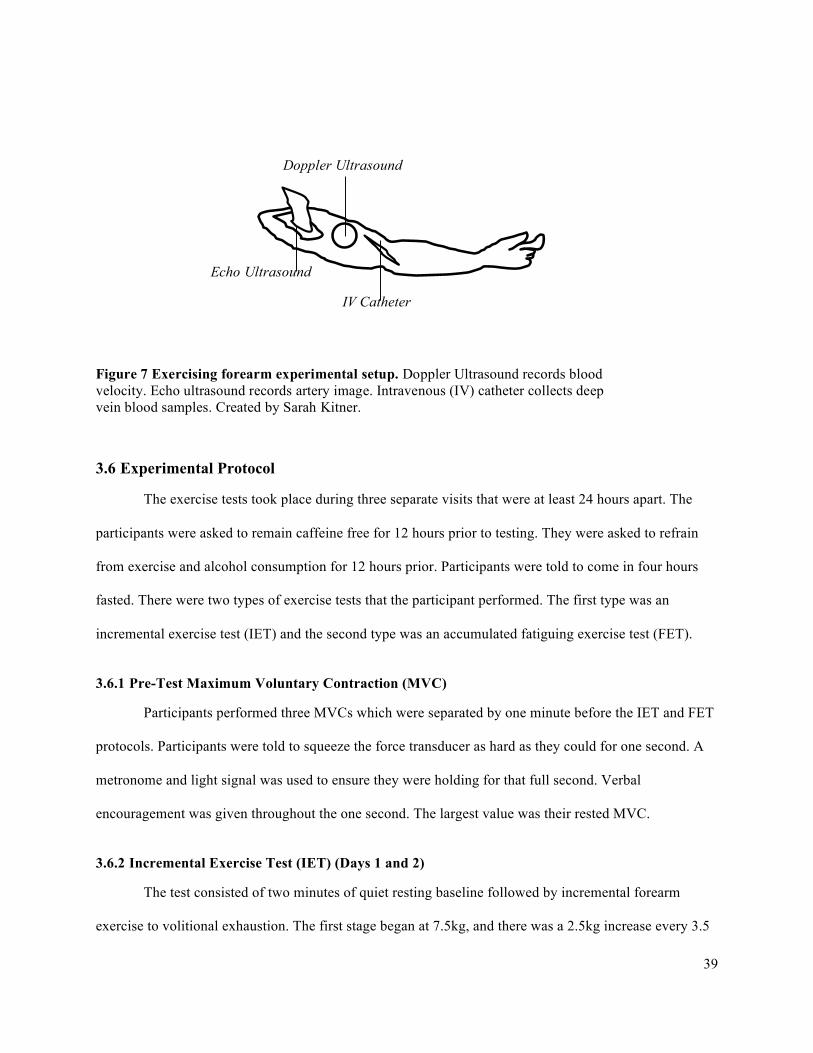
39
3.6 Experimental Protocol
The exercise tests took place during three separate visits that were at least 24 hours apart. The
participants were asked to remain caffeine free for 12 hours prior to testing. They were asked to refrain
from exercise and alcohol consumption for 12 hours prior. Participants were told to come in four hours
fasted. There were two types of exercise tests that the participant performed. The first type was an
incremental exercise test (IET) and the second type was an accumulated fatiguing exercise test (FET).
3.6.1 Pre-Test Maximum Voluntary Contraction (MVC)
Participants performed three MVCs which were separated by one minute before the IET and FET
protocols. Participants were told to squeeze the force transducer as hard as they could for one second. A
metronome and light signal was used to ensure they were holding for that full second. Verbal
encouragement was given throughout the one second. The largest value was their rested MVC.
3.6.2 Incremental Exercise Test (IET) (Days 1 and 2)
The test consisted of two minutes of quiet resting baseline followed by incremental forearm
exercise to volitional exhaustion. The first stage began at 7.5kg, and there was a 2.5kg increase every 3.5
Doppler Ultrasound
Echo Ultrasound
IV Catheter
Figure 7 Exercising forearm experimental setup. Doppler Ultrasound records blood velocity. Echo ultrasound records artery image. Intravenous (IV) catheter collects deep vein blood samples. Created by Sarah Kitner.
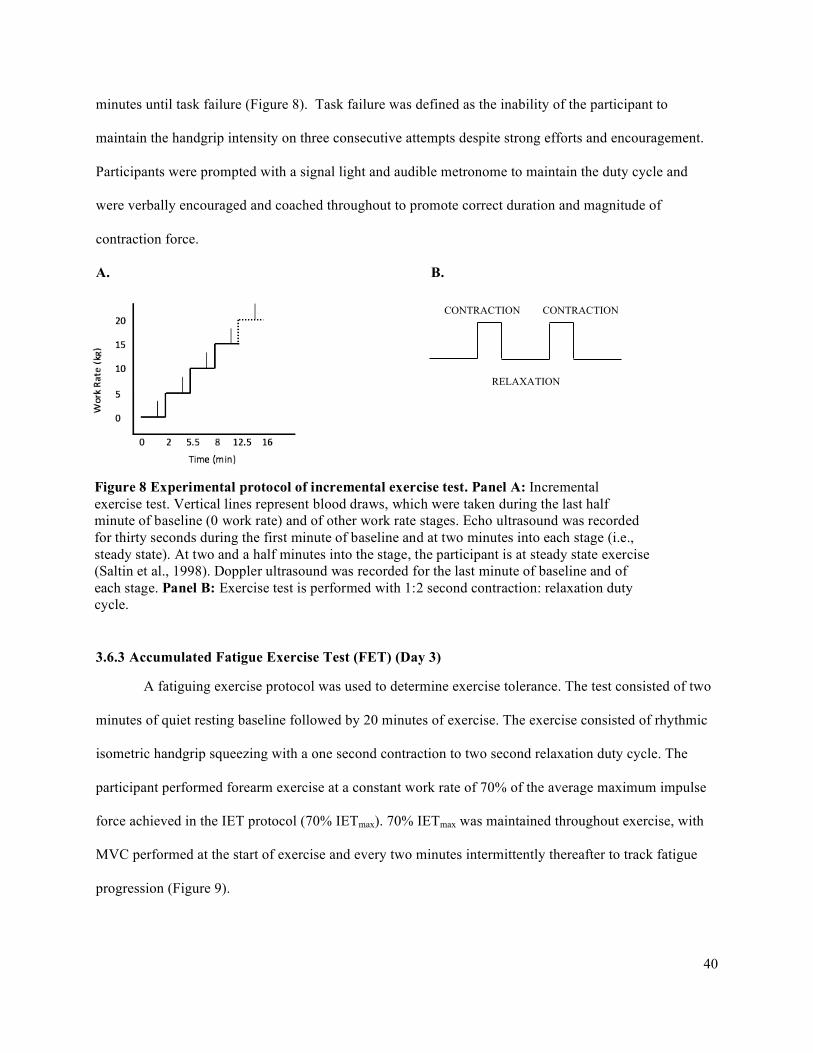
40
minutes until task failure (Figure 8). Task failure was defined as the inability of the participant to
maintain the handgrip intensity on three consecutive attempts despite strong efforts and encouragement.
Participants were prompted with a signal light and audible metronome to maintain the duty cycle and
were verbally encouraged and coached throughout to promote correct duration and magnitude of
contraction force.
A. B.
3.6.3 Accumulated Fatigue Exercise Test (FET) (Day 3)
A fatiguing exercise protocol was used to determine exercise tolerance. The test consisted of two
minutes of quiet resting baseline followed by 20 minutes of exercise. The exercise consisted of rhythmic
isometric handgrip squeezing with a one second contraction to two second relaxation duty cycle. The
participant performed forearm exercise at a constant work rate of 70% of the average maximum impulse
force achieved in the IET protocol (70% IETmax). 70% IETmax was maintained throughout exercise, with
MVC performed at the start of exercise and every two minutes intermittently thereafter to track fatigue
progression (Figure 9).
CONTRACTION
RELAXATION
CONTRACTION
Figure 8 Experimental protocol of incremental exercise test. Panel A: Incremental exercise test. Vertical lines represent blood draws, which were taken during the last half minute of baseline (0 work rate) and of other work rate stages. Echo ultrasound was recorded for thirty seconds during the first minute of baseline and at two minutes into each stage (i.e., steady state). At two and a half minutes into the stage, the participant is at steady state exercise (Saltin et al., 1998). Doppler ultrasound was recorded for the last minute of baseline and of each stage. Panel B: Exercise test is performed with 1:2 second contraction: relaxation duty cycle.
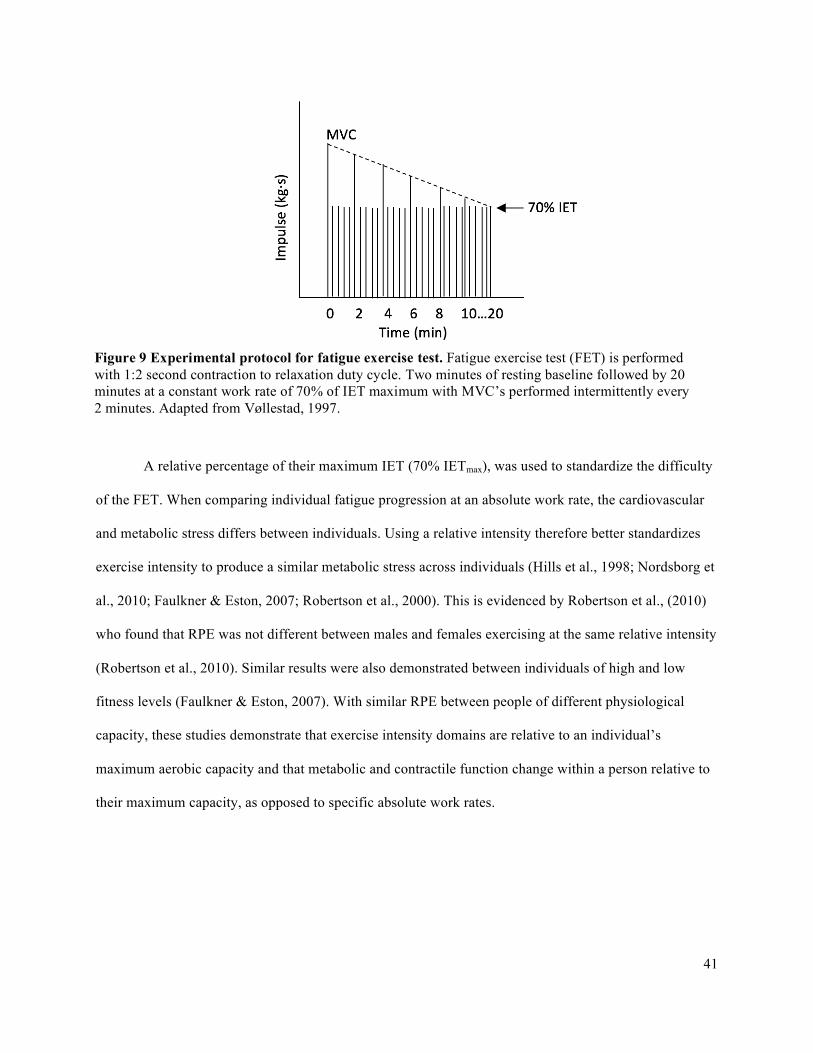
41
A relative percentage of their maximum IET (70% IETmax), was used to standardize the difficulty
of the FET. When comparing individual fatigue progression at an absolute work rate, the cardiovascular
and metabolic stress differs between individuals. Using a relative intensity therefore better standardizes
exercise intensity to produce a similar metabolic stress across individuals (Hills et al., 1998; Nordsborg et
al., 2010; Faulkner & Eston, 2007; Robertson et al., 2000). This is evidenced by Robertson et al., (2010)
who found that RPE was not different between males and females exercising at the same relative intensity
(Robertson et al., 2010). Similar results were also demonstrated between individuals of high and low
fitness levels (Faulkner & Eston, 2007). With similar RPE between people of different physiological
capacity, these studies demonstrate that exercise intensity domains are relative to an individual’s
maximum aerobic capacity and that metabolic and contractile function change within a person relative to
their maximum capacity, as opposed to specific absolute work rates.
Figure 9 Experimental protocol for fatigue exercise test. Fatigue exercise test (FET) is performed with 1:2 second contraction to relaxation duty cycle. Two minutes of resting baseline followed by 20 minutes at a constant work rate of 70% of IET maximum with MVC’s performed intermittently every 2 minutes. Adapted from Vøllestad, 1997.

42
3.7 Data Acquisition
3.7.1 Forearm Blood Flow – Brachial Artery Diameter and Mean Blood Velocity
Forearm muscle blood flow (FBF) was calculated based on the brachial artery diameter (BAD) and on
the mean blood velocity (MBV):
FBF (mL/min) = MBV (cm/s) · 60 s/min · π · (BAD(cm)/2)2.
A. Brachial Artery Diameter
Images of the brachial artery were taken with a 10 MHz linear Echo ultrasound probe (Vivid i2, GE
Medical Systems), operating in two-dimensional B-mode, and recorded continuously in Measurements
from Arterial Ultrasound Imaging (MAUI), provided by hedgehogmedical.com. Echo ultrasound
measures were recorded during the first 60 seconds of baseline and for 30 seconds, two minutes into each
stage of the test (see Figure 8).
B. Brachial Artery Mean Blood Velocity
MBV was measured using a 4-MHz (four million cycles per second) pulsed flat Doppler probe
(Model 500V Transcranial Doppler, Multigon Industries, Mt. Vernon NY).
The probe was attached to the skin with an adhesive over the brachial artery, proximal to the
elbow joint of the exercising arm. For an optimal signal, the probe was placed in a location on the artery
that picked up no venous blood flow signal. Depth and gate were adjusted to insonate the entire artery
lumen.
MBV was collected over the last minute of each stage of the IET, during steady state (see Figure
8). The corresponding voltage output was recorded continuously at 200 Hz in the data acquisition
software program Lab Chart (ADInstruments) for analysis.
After the trials on a given day were complete, the brachial artery was imaged with the echo
ultrasound probe where the Doppler probe was placed. This allowed the quantification of the angle of
insonation. When the blood vessel is parallel to the skin, the angle of insonation is 570 (Figure 10). The
angle of insonation is important because as explained by the Doppler shift effect, the MBV estimated by

43
the Doppler ultrasound is dependent on the angle that the probe intersects the blood vessel (Gill, 1985)
(Figure 10). Based on calibration done in the laboratory, the appropriate calibration factor can be applied
to the MBV depending on a given angle of insonation. This calibration factor is applied to obtain the
absolute values of MBV.
3.7.2 Deep Venous Blood Samples
The forearm vein was imaged with the echo ultrasound to ensure the vein was draining from the
muscle and was not going superficial to the skin. Forearm venous blood samples (3mL) were taken at
baseline and during the last 30 seconds of each work rate (steady-state). A 2mL discard was drawn before
to ensure the blood sample was fresh and a 2-ml saline flush was given after each sample to prevent
Figure 10 Doppler ultrasound probe angle of insonation. (A) When the blood vessel is parallel to the skin, the angle of insonation of the transmitted ultrasound is 570 for the probe used in this study. (B) If the angle of insonation is less than 570, MBV will be overestimated. (C) If the angle of insonation is greater than 570, MBV will be underestimated. Adapted from V. Poitras MSc.

44
catheter clotting. The syringes were prepared prior to collection with heparin to prevent clotting of the
sample. Once drawn, the blood was put on ice.
Blood samples were analyzed using the blood gas analyzer (BGA) to measure: PCO2, PO2, pH,
lactate, SVO2, and Hb. Hb was then used to calculate CaO2 and CvO2 (to obtain the Ca-vO2), V̇O2, O2D,
and the O2D/ V̇O2. This is explained in data analysis section below.
3.7.3 Central Hemodynamic Monitoring
All central hemodynamic measurements derived from electrocardiogram (ECG), finger
photoplethysmography (Finometer Midi, Finapres Medical Systems, The Netherlands), and pulse
oximetry (Nellcor N-395, Covidien-Nellcor, Boulder CO) were measured continuously. HR and MAP
were recorded on a PC in BeatScope (BeatScope version 1.1, Finapres Medical Systems BV, Amsterdam,
Netherlands). A sample of a BeatScope screen is presented in Figure 13. A pulse oximeter was placed on
the index finger of the non-exercising hand to monitor arterial oxygen saturation (SaO2) continuously.
SaO2 was recorded on a PC in Lab Chart software (Lab Chart version 7, ADInstruments Colorado
Springs, CO). A sample of the Lab Chart screen is presented in Figure 12.
Heart rate (HR) was measured continuously using a three-lead electrocardiogram (ECG). The
electrodes were placed on the skin in standard CM5 configuration to detect the QRS complex peak. A
pulse oximeter was placed on the index finger of the non-exercising hand to monitor arterial oxygen
saturation (SaO2) continuously on a PC in Lab Chart (Lab Chart version 7, ADInstruments Colorado
Springs, CO) software. It was recorded during baseline and during each completed work stage. The pulse
oximeter measures SaO2 by passing lights of two different wavelengths to the skin on the finger: Red
(660nm) and infrared (940nm) (Jubran, 1999). At the red wavelength, the deoxygenated hemoglobin
absorbs more light than oxygenated hemoglobin (Jubran, 1999). The opposite is true of infrared light. The
pulse oximeter uses the ratio of red to infrared light absorbed and reflected to estimate arterial saturation
(Jubran, 1999).
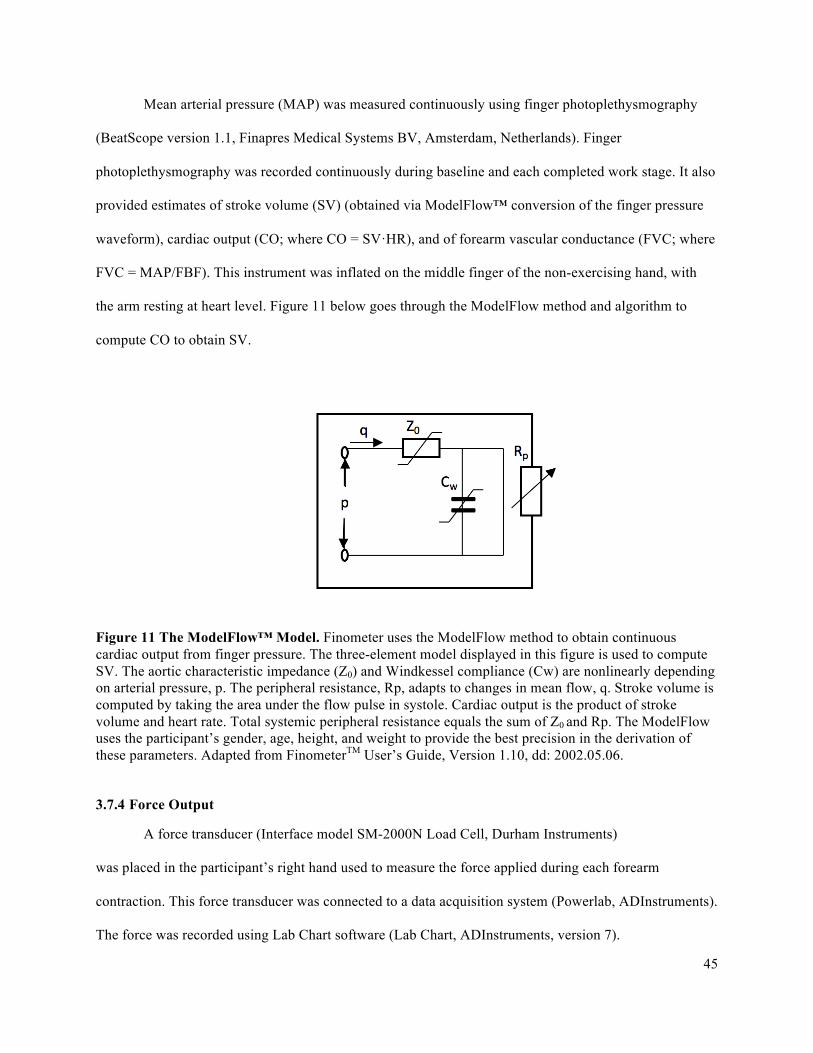
45
Mean arterial pressure (MAP) was measured continuously using finger photoplethysmography
(BeatScope version 1.1, Finapres Medical Systems BV, Amsterdam, Netherlands). Finger
photoplethysmography was recorded continuously during baseline and each completed work stage. It also
provided estimates of stroke volume (SV) (obtained via ModelFlow™ conversion of the finger pressure
waveform), cardiac output (CO; where CO = SV·HR), and of forearm vascular conductance (FVC; where
FVC = MAP/FBF). This instrument was inflated on the middle finger of the non-exercising hand, with
the arm resting at heart level. Figure 11 below goes through the ModelFlow method and algorithm to
compute CO to obtain SV.
Figure 11 The ModelFlow™ Model. Finometer uses the ModelFlow method to obtain continuous cardiac output from finger pressure. The three-element model displayed in this figure is used to compute SV. The aortic characteristic impedance (Z0) and Windkessel compliance (Cw) are nonlinearly depending on arterial pressure, p. The peripheral resistance, Rp, adapts to changes in mean flow, q. Stroke volume is computed by taking the area under the flow pulse in systole. Cardiac output is the product of stroke volume and heart rate. Total systemic peripheral resistance equals the sum of Z0 and Rp. The ModelFlow uses the participant’s gender, age, height, and weight to provide the best precision in the derivation of these parameters. Adapted from FinometerTM User’s Guide, Version 1.10, dd: 2002.05.06.
3.7.4 Force Output
A force transducer (Interface model SM-2000N Load Cell, Durham Instruments)
was placed in the participant’s right hand used to measure the force applied during each forearm
contraction. This force transducer was connected to a data acquisition system (Powerlab, ADInstruments).
The force was recorded using Lab Chart software (Lab Chart, ADInstruments, version 7).

46
3.7.5 Impulse Via Force Output
For the IET test, the force was converted into a contraction impulse, which is the integral of the
force over time for each contraction (kg•s). This was done in Lab Chart which displays the instantaneous
calculated integral of the force over the course of each contraction. This results in a peak accumulated
area under the force curve at the end of the contraction and this peak represents the total force • time
impulse for that contraction.
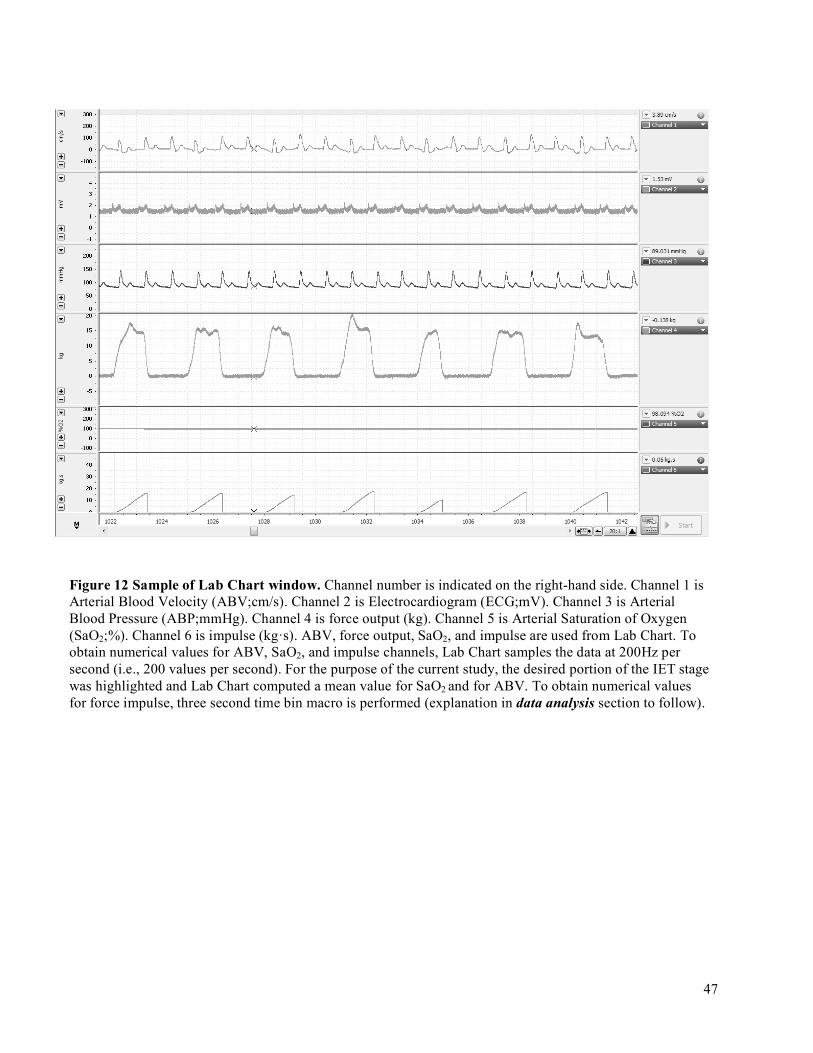
47
Figure 12 Sample of Lab Chart window. Channel number is indicated on the right-hand side. Channel 1 is Arterial Blood Velocity (ABV;cm/s). Channel 2 is Electrocardiogram (ECG;mV). Channel 3 is Arterial Blood Pressure (ABP;mmHg). Channel 4 is force output (kg). Channel 5 is Arterial Saturation of Oxygen (SaO2;%). Channel 6 is impulse (kg·s). ABV, force output, SaO2, and impulse are used from Lab Chart. To obtain numerical values for ABV, SaO2, and impulse channels, Lab Chart samples the data at 200Hz per second (i.e., 200 values per second). For the purpose of the current study, the desired portion of the IET stage was highlighted and Lab Chart computed a mean value for SaO2 and for ABV. To obtain numerical values for force impulse, three second time bin macro is performed (explanation in data analysis section to follow).
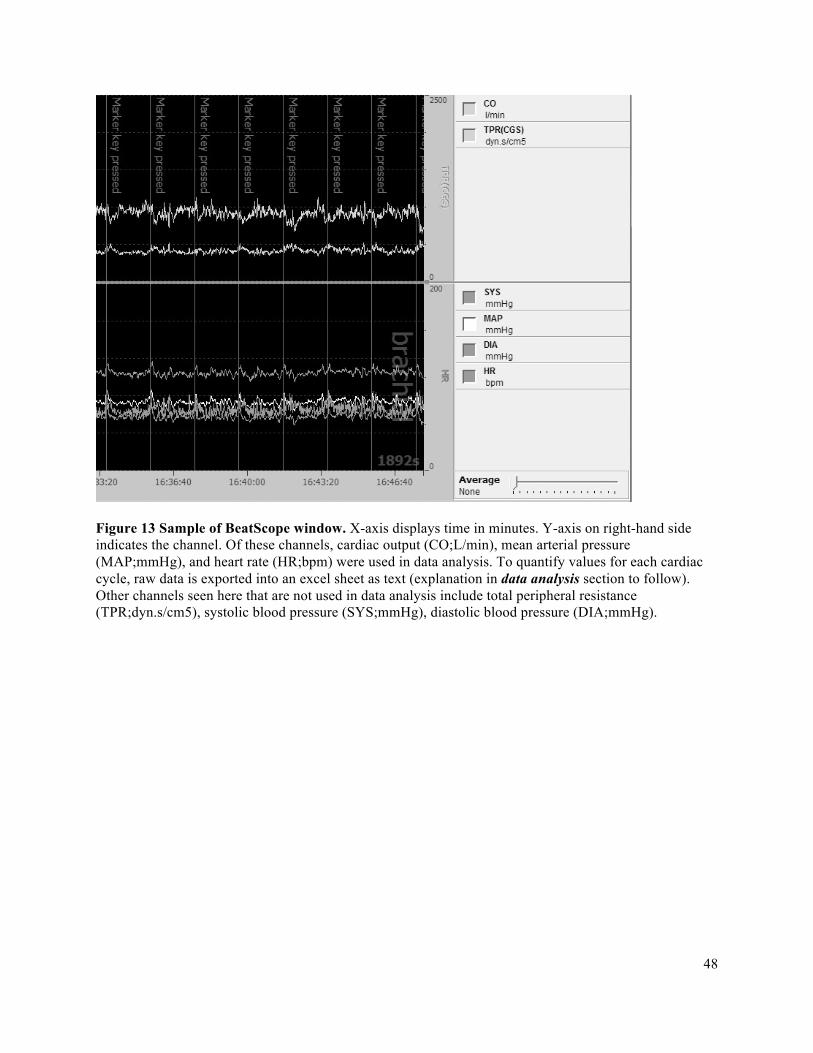
48
Figure 13 Sample of BeatScope window. X-axis displays time in minutes. Y-axis on right-hand side indicates the channel. Of these channels, cardiac output (CO;L/min), mean arterial pressure (MAP;mmHg), and heart rate (HR;bpm) were used in data analysis. To quantify values for each cardiac cycle, raw data is exported into an excel sheet as text (explanation in data analysis section to follow). Other channels seen here that are not used in data analysis include total peripheral resistance (TPR;dyn.s/cm5), systolic blood pressure (SYS;mmHg), diastolic blood pressure (DIA;mmHg).

49
3.8 Data Analysis
3.8.1 Impulse Analysis via Force Output
3.8.1.1 Incremental Exercise Test (IET):
To obtain total force output over the course of a contraction (contraction impulse), a computer
macro is written in Lab Chart. This is a set of commands that accumulates the area under the curve of a
contraction (the integral). At the end of the contraction, the final area under the entire curve quantifies the
contraction impulse (Figure 14). This was done for each contraction. The macro dictates that the
contraction impulse will be obtained every three seconds as described by Pyke et al., (2008). Three
second average times are chosen to complement the three second duty cycle. Lab Chart samples the data
at 200Hz.
A. B.
Figure 14 Lab Chart quantification of the contraction impulse. Macro in Lab Chart accumulates area under the curve from panel A (kg) (black shading) to get integral in panel B (kg·s).
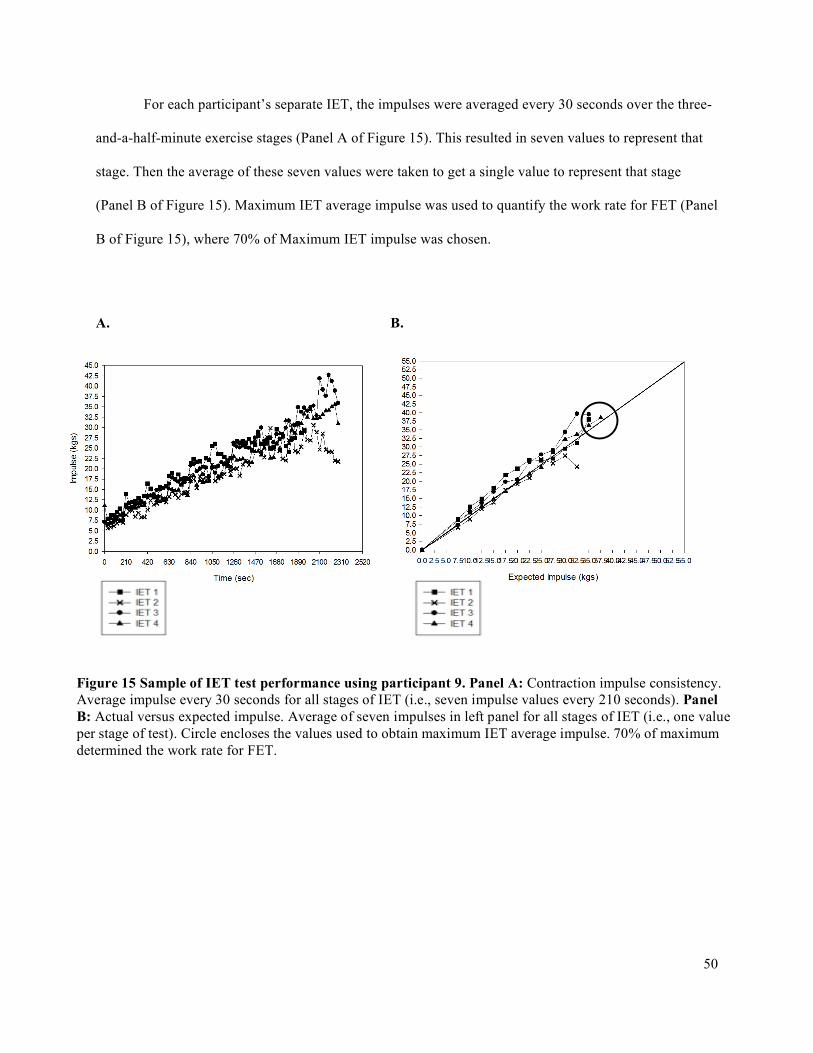
50
For each participant’s separate IET, the impulses were averaged every 30 seconds over the three-
and-a-half-minute exercise stages (Panel A of Figure 15). This resulted in seven values to represent that
stage. Then the average of these seven values were taken to get a single value to represent that stage
(Panel B of Figure 15). Maximum IET average impulse was used to quantify the work rate for FET (Panel
B of Figure 15), where 70% of Maximum IET impulse was chosen.
A. B.
Figure 15 Sample of IET test performance using participant 9. Panel A: Contraction impulse consistency. Average impulse every 30 seconds for all stages of IET (i.e., seven impulse values every 210 seconds). Panel B: Actual versus expected impulse. Average of seven impulses in left panel for all stages of IET (i.e., one value per stage of test). Circle encloses the values used to obtain maximum IET average impulse. 70% of maximum determined the work rate for FET.
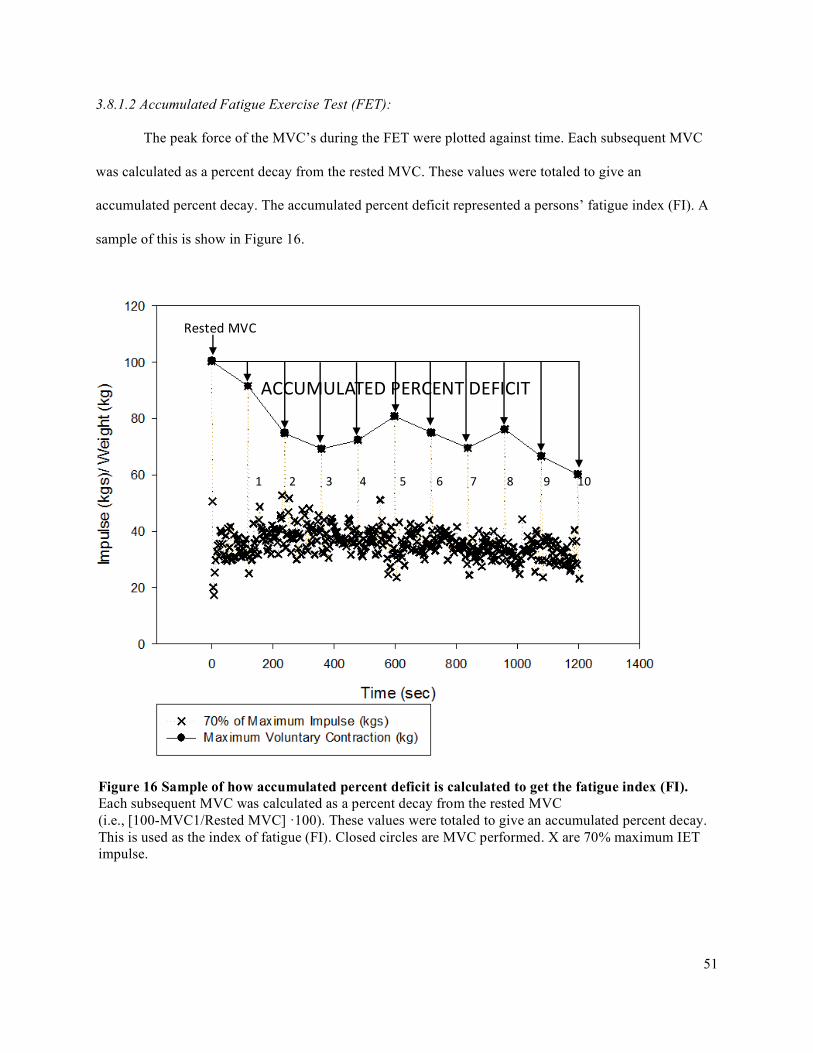
51
RestedMVC
ACCUMULATEDPERCENTDEFICIT
3.8.1.2 Accumulated Fatigue Exercise Test (FET):
The peak force of the MVC’s during the FET were plotted against time. Each subsequent MVC
was calculated as a percent decay from the rested MVC. These values were totaled to give an
accumulated percent decay. The accumulated percent deficit represented a persons’ fatigue index (FI). A
sample of this is show in Figure 16.
12345678910
Figure 16 Sample of how accumulated percent deficit is calculated to get the fatigue index (FI). Each subsequent MVC was calculated as a percent decay from the rested MVC (i.e., [100-MVC1/Rested MVC] ·100). These values were totaled to give an accumulated percent decay. This is used as the index of fatigue (FI). Closed circles are MVC performed. X are 70% maximum IET impulse.
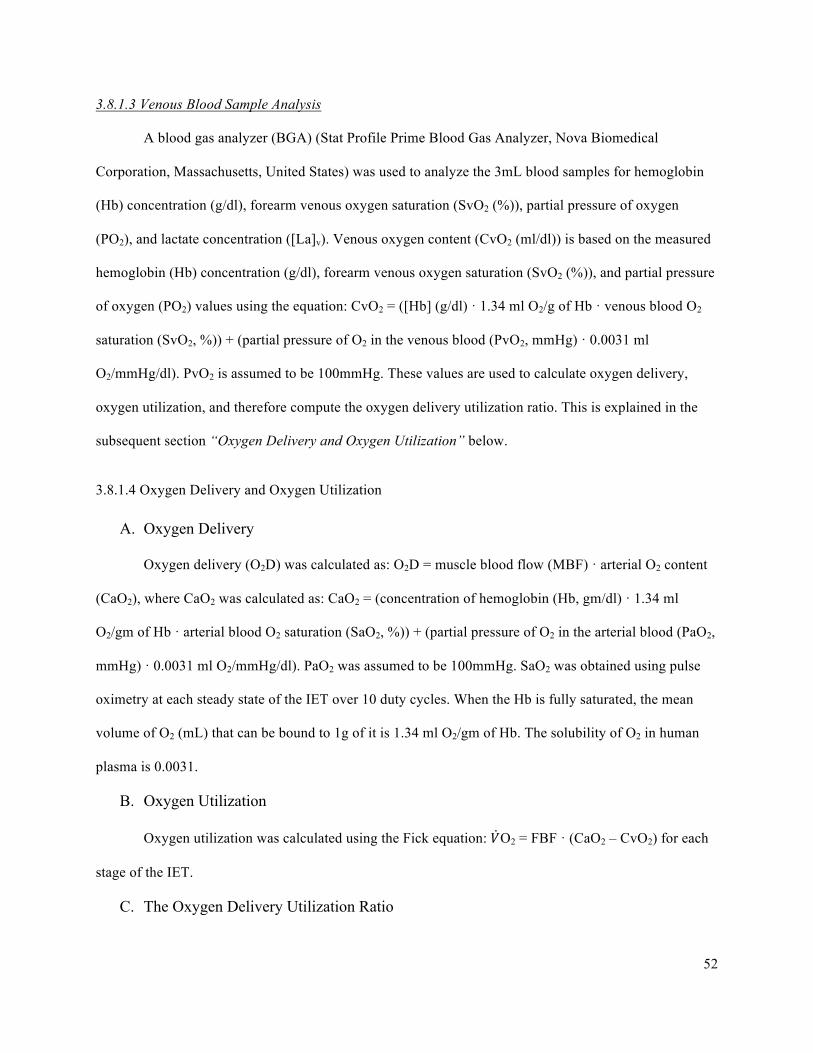
52
3.8.1.3 Venous Blood Sample Analysis
A blood gas analyzer (BGA) (Stat Profile Prime Blood Gas Analyzer, Nova Biomedical
Corporation, Massachusetts, United States) was used to analyze the 3mL blood samples for hemoglobin
(Hb) concentration (g/dl), forearm venous oxygen saturation (SvO2 (%)), partial pressure of oxygen
(PO2), and lactate concentration ([La]v). Venous oxygen content (CvO2 (ml/dl)) is based on the measured
hemoglobin (Hb) concentration (g/dl), forearm venous oxygen saturation (SvO2 (%)), and partial pressure
of oxygen (PO2) values using the equation: CvO2 = ([Hb] (g/dl) · 1.34 ml O2/g of Hb · venous blood O2
saturation (SvO2, %)) + (partial pressure of O2 in the venous blood (PvO2, mmHg) · 0.0031 ml
O2/mmHg/dl). PvO2 is assumed to be 100mmHg. These values are used to calculate oxygen delivery,
oxygen utilization, and therefore compute the oxygen delivery utilization ratio. This is explained in the
subsequent section “Oxygen Delivery and Oxygen Utilization” below.
3.8.1.4 Oxygen Delivery and Oxygen Utilization
A. Oxygen Delivery
Oxygen delivery (O2D) was calculated as: O2D = muscle blood flow (MBF) · arterial O2 content
(CaO2), where CaO2 was calculated as: CaO2 = (concentration of hemoglobin (Hb, gm/dl) · 1.34 ml
O2/gm of Hb · arterial blood O2 saturation (SaO2, %)) + (partial pressure of O2 in the arterial blood (PaO2,
mmHg) · 0.0031 ml O2/mmHg/dl). PaO2 was assumed to be 100mmHg. SaO2 was obtained using pulse
oximetry at each steady state of the IET over 10 duty cycles. When the Hb is fully saturated, the mean
volume of O2 (mL) that can be bound to 1g of it is 1.34 ml O2/gm of Hb. The solubility of O2 in human
plasma is 0.0031.
B. Oxygen Utilization
Oxygen utilization was calculated using the Fick equation: 𝑉O2 = FBF · (CaO2 – CvO2) for each
stage of the IET.
C. The Oxygen Delivery Utilization Ratio
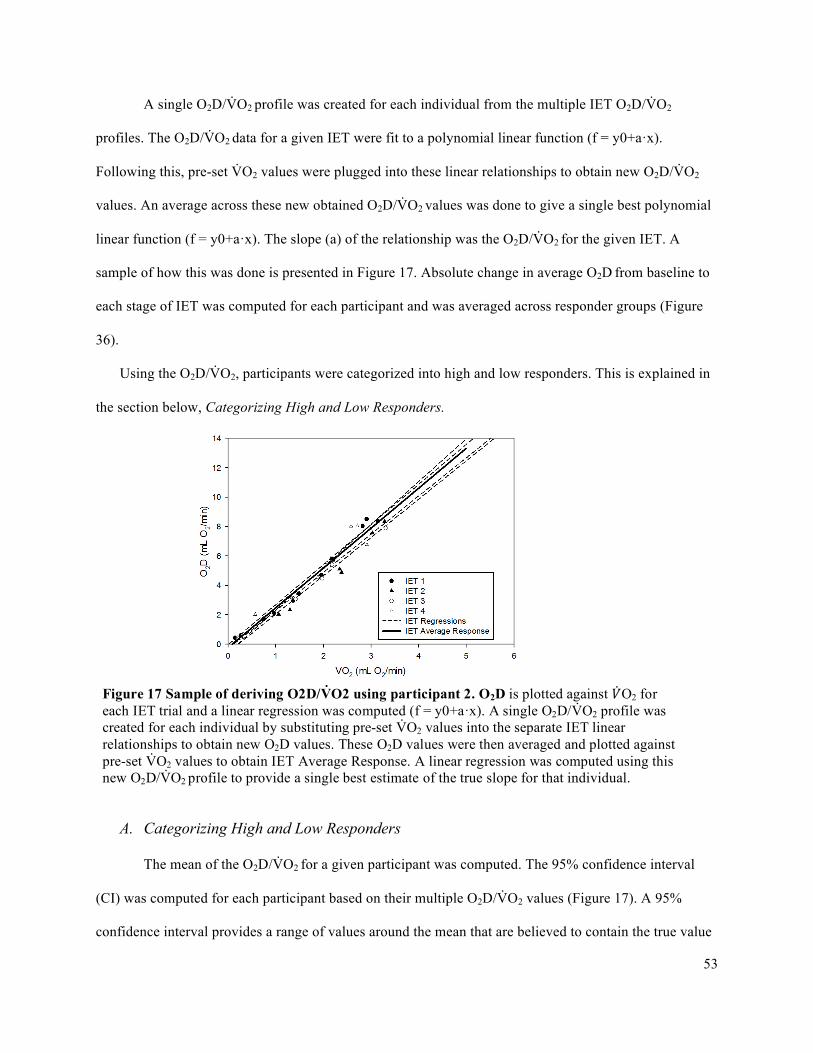
53
A single O2D/V̇O2 profile was created for each individual from the multiple IET O2D/V̇O2
profiles. The O2D/V̇O2 data for a given IET were fit to a polynomial linear function (f = y0+a·x).
Following this, pre-set V̇O2 values were plugged into these linear relationships to obtain new O2D/V̇O2
values. An average across these new obtained O2D/V̇O2 values was done to give a single best polynomial
linear function (f = y0+a·x). The slope (a) of the relationship was the O2D/V̇O2 for the given IET. A
sample of how this was done is presented in Figure 17. Absolute change in average O2D from baseline to
each stage of IET was computed for each participant and was averaged across responder groups (Figure
36).
Using the O2D/V̇O2, participants were categorized into high and low responders. This is explained in
the section below, Categorizing High and Low Responders.
A. Categorizing High and Low Responders
The mean of the O2D/V̇O2 for a given participant was computed. The 95% confidence interval
(CI) was computed for each participant based on their multiple O2D/V̇O2 values (Figure 17). A 95%
confidence interval provides a range of values around the mean that are believed to contain the true value
Figure 17 Sample of deriving O2D/V̇O2 using participant 2. O2D is plotted against �̇�O2 for each IET trial and a linear regression was computed (f = y0+a·x). A single O2D/V̇O2 profile was created for each individual by substituting pre-set V̇O2 values into the separate IET linear relationships to obtain new O2D values. These O2D values were then averaged and plotted against pre-set V̇O2 values to obtain IET Average Response. A linear regression was computed using this new O2D/V̇O2 profile to provide a single best estimate of the true slope for that individual.
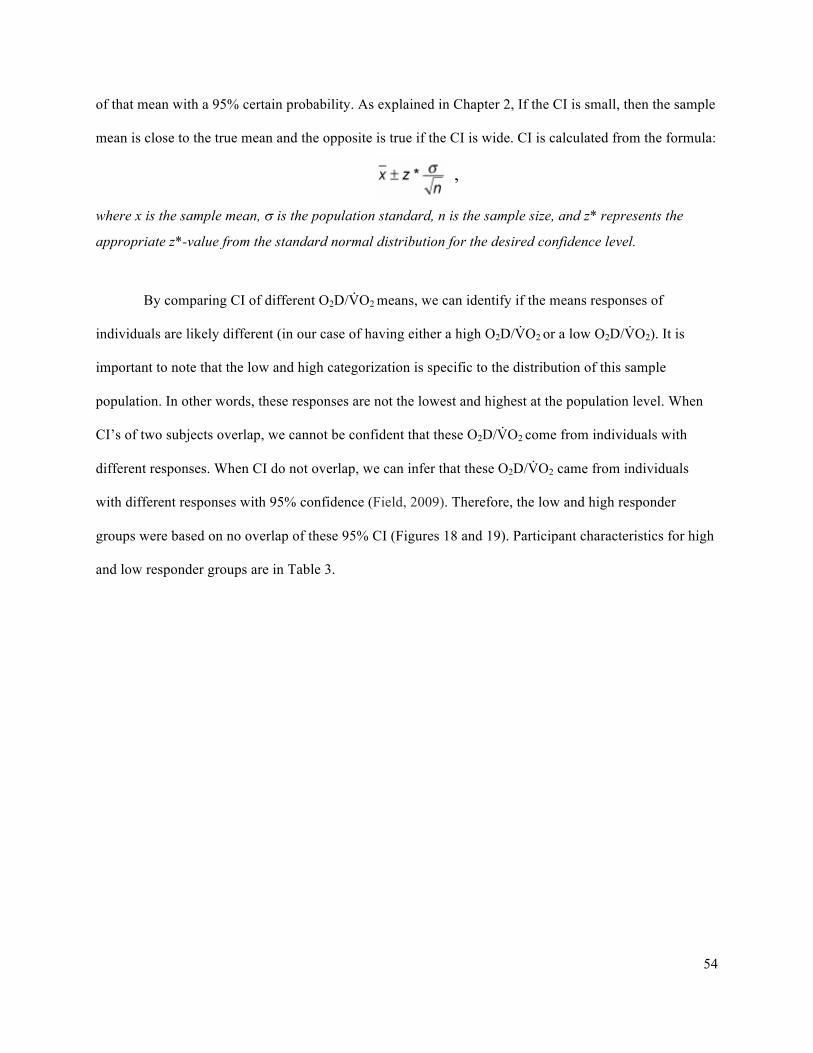
54
of that mean with a 95% certain probability. As explained in Chapter 2, If the CI is small, then the sample
mean is close to the true mean and the opposite is true if the CI is wide. CI is calculated from the formula:
,
where x is the sample mean, s is the population standard, n is the sample size, and z* represents the
appropriate z*-value from the standard normal distribution for the desired confidence level.
By comparing CI of different O2D/V̇O2 means, we can identify if the means responses of
individuals are likely different (in our case of having either a high O2D/V̇O2 or a low O2D/V̇O2). It is
important to note that the low and high categorization is specific to the distribution of this sample
population. In other words, these responses are not the lowest and highest at the population level. When
CI’s of two subjects overlap, we cannot be confident that these O2D/V̇O2 come from individuals with
different responses. When CI do not overlap, we can infer that these O2D/V̇O2 came from individuals
with different responses with 95% confidence (Field, 2009). Therefore, the low and high responder
groups were based on no overlap of these 95% CI (Figures 18 and 19). Participant characteristics for high
and low responder groups are in Table 3.
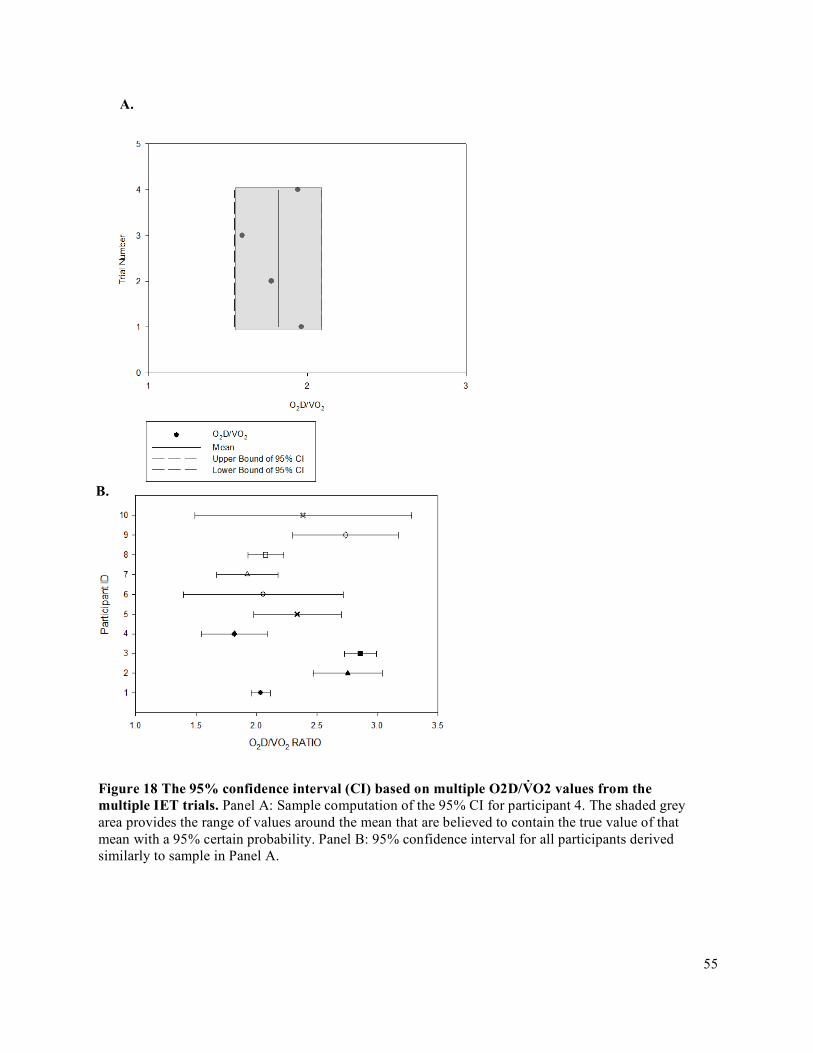
55
A.
B.
Figure 18 The 95% confidence interval (CI) based on multiple O2D/V̇O2 values from the multiple IET trials. Panel A: Sample computation of the 95% CI for participant 4. The shaded grey area provides the range of values around the mean that are believed to contain the true value of that mean with a 95% certain probability. Panel B: 95% confidence interval for all participants derived similarly to sample in Panel A.
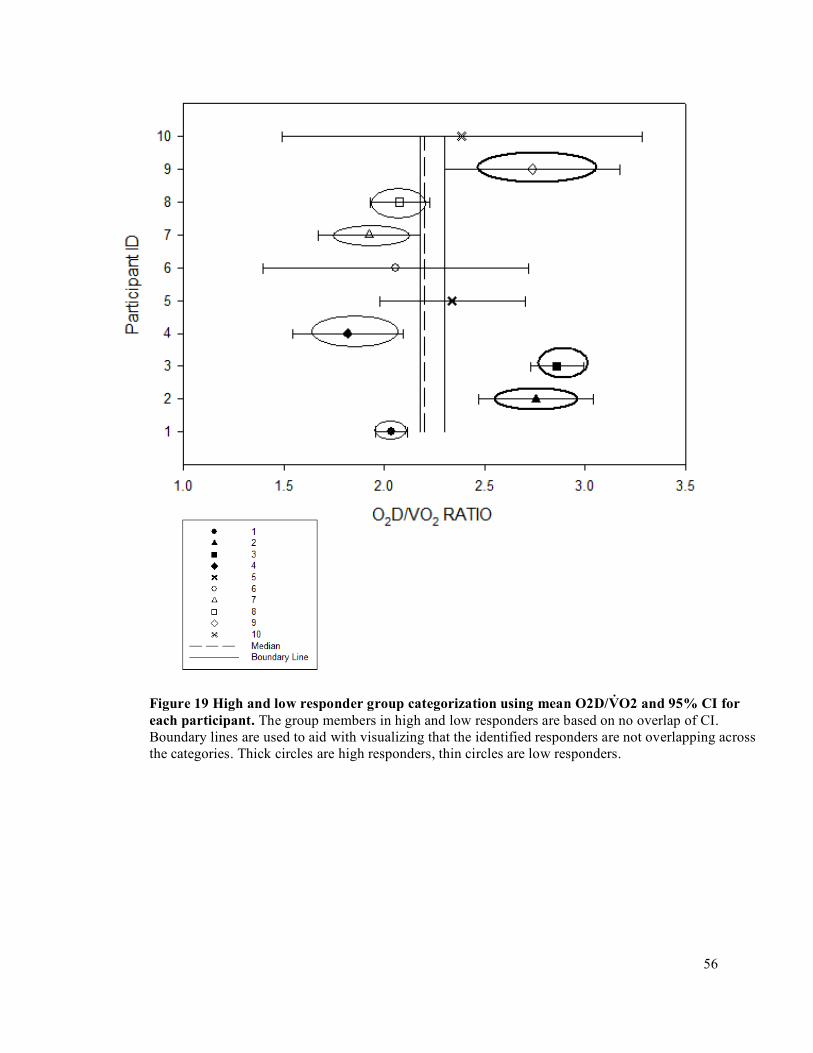
56
Figure 19 High and low responder group categorization using mean O2D/V̇O2 and 95% CI for each participant. The group members in high and low responders are based on no overlap of CI. Boundary lines are used to aid with visualizing that the identified responders are not overlapping across the categories. Thick circles are high responders, thin circles are low responders.
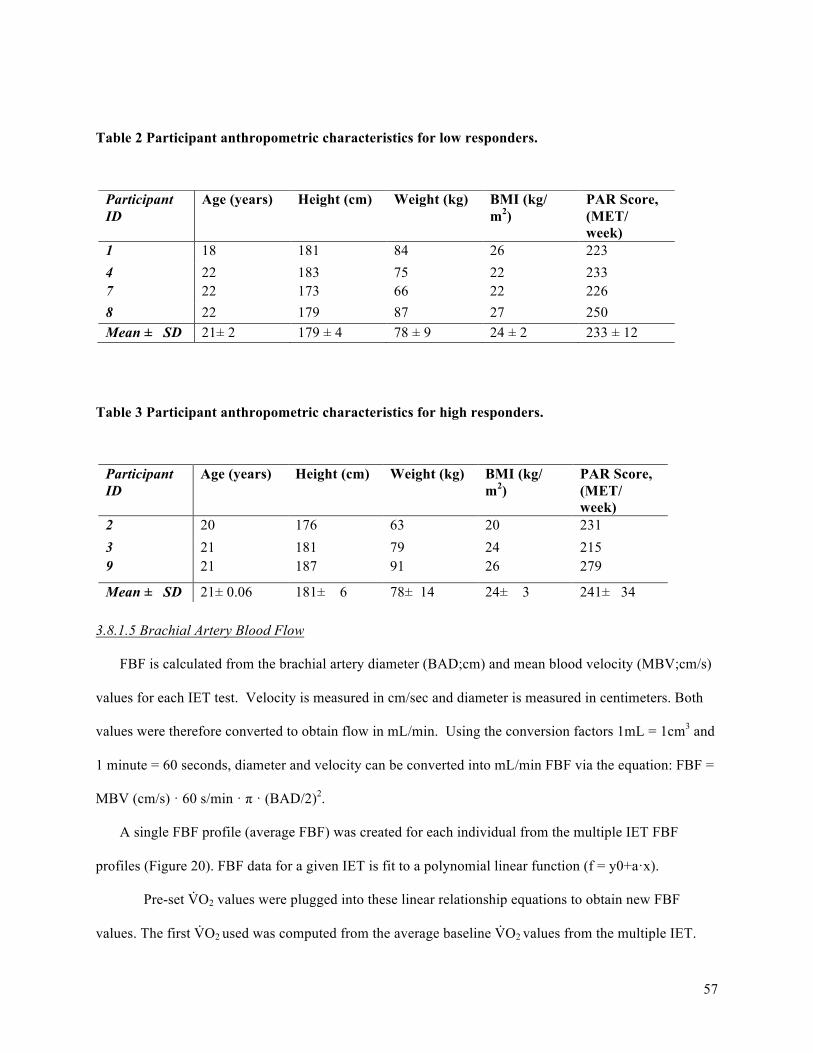
57
Table 2 Participant anthropometric characteristics for low responders.
Table 3 Participant anthropometric characteristics for high responders.
3.8.1.5 Brachial Artery Blood Flow
FBF is calculated from the brachial artery diameter (BAD;cm) and mean blood velocity (MBV;cm/s)
values for each IET test. Velocity is measured in cm/sec and diameter is measured in centimeters. Both
values were therefore converted to obtain flow in mL/min. Using the conversion factors 1mL = 1cm3 and
1 minute = 60 seconds, diameter and velocity can be converted into mL/min FBF via the equation: FBF =
MBV (cm/s) · 60 s/min · π · (BAD/2)2.
A single FBF profile (average FBF) was created for each individual from the multiple IET FBF
profiles (Figure 20). FBF data for a given IET is fit to a polynomial linear function (f = y0+a·x).
Pre-set V̇O2 values were plugged into these linear relationship equations to obtain new FBF
values. The first V̇O2 used was computed from the average baseline V̇O2 values from the multiple IET.
Participant ID
Age (years) Height (cm) Weight (kg) BMI (kg/ m2)
PAR Score, (MET/ week)
1 18 181 84 26 223 4 22 183 75 22 233 7 22 173 66 22 226 8 22 179 87 27 250 Mean ± SD 21± 2 179 ± 4 78 ± 9 24 ± 2 233 ± 12
Participant ID
Age (years) Height (cm) Weight (kg) BMI (kg/ m2)
PAR Score, (MET/ week)
2 20 176 63 20 231 3 21 181 79 24 215 9 21 187 91 26 279
Mean ± SD 21± 0.06 181± 6 78± 14 24± 3 241± 34

58
This was used as the first value because V̇O2 cannot be zero and the participant was at rest for all of these
measurements, therefore fluctuations are only coming from measurement error and from natural
fluctuations. V̇O2 was chosen to increase in increments of 5mL·O2/min thereafter. An average across these
new obtained FBF values was computed to give a single best relationship.
Absolute change in average FBF from baseline to each stage of IET was computed for each
participant and was averaged across responder groups. Relative change in average FBF from baseline to
25%, 50%, 75%, and 100% of V̇O2 Peak was computed for each participant and was averaged across
responder groups.
Figure 20 Sample of deriving FBF for participant 9. Forearm blood flow (FBF;mL/min) is plotted against Oxygen Consumption (�̇�O2;mLO2/min) separately for each incremental exercise test (IET) and a polynomial linear function (f = y0+a·x) is fit to each. A single FBF profile was created for each individual by substituting pre-set V̇O2 values into the separate IET linear relationships, starting with average baseline V̇O2. The second value used is 5 mL·O2/min, and the increase thereafter is by 5 mL·O2/min to obtain corresponding FBF values. These FBF values were then averaged and plotted against pre-set V̇O2 values to obtain ‘Average’ FBF Response. A linear regression was computed using this new FBF profile to provide a single best estimate of the average response for that individual.

59
A. Brachial Artery Diameter
Brachial artery diameter was analyzed using an automated edge-detection software, Measurements
from Arterial Ultrasound Imaging (MAUI), provided by hedgehogmedical.com. The section with the
clearest vessel image is selected. The edge-detection software tracks the arterial walls in this region
(Figure 21) and collects one diameter measurement for every pixel column, with 10 frame samples every
second (10 Hz sampling rate). It then uses the median diameter as the diameter for that frame.
Figure 21 Edge detection software sample in MAUI. This figure shows how a section of the artery image a selected. Once a portion of the artery image is selected, the software runs through the whole video, outputting the median diameter for every frame (10 frames per second)
Once the program outputs the diameters, diameter measurements from the relaxation phases with
the best quality image are manually selected from 30 seconds (300 frames) worth of data. Diameters from
the relaxation phases are used because this is when the image is most clear and stable. This was done for
every stage of the IET. An average of all 300 frames diameters for each stage is averaged to give an
overall diameter for each stage of the IET.
Brachial Artery Mean Blood Velocity
Mean blood velocity is recorded in Lab Chart at 200 Hz (i.e., 200 values per second). The minute of
echo ultrasound recording (see Figure 8) provided 20 duty cycles of data. To obtain the MBV for a given
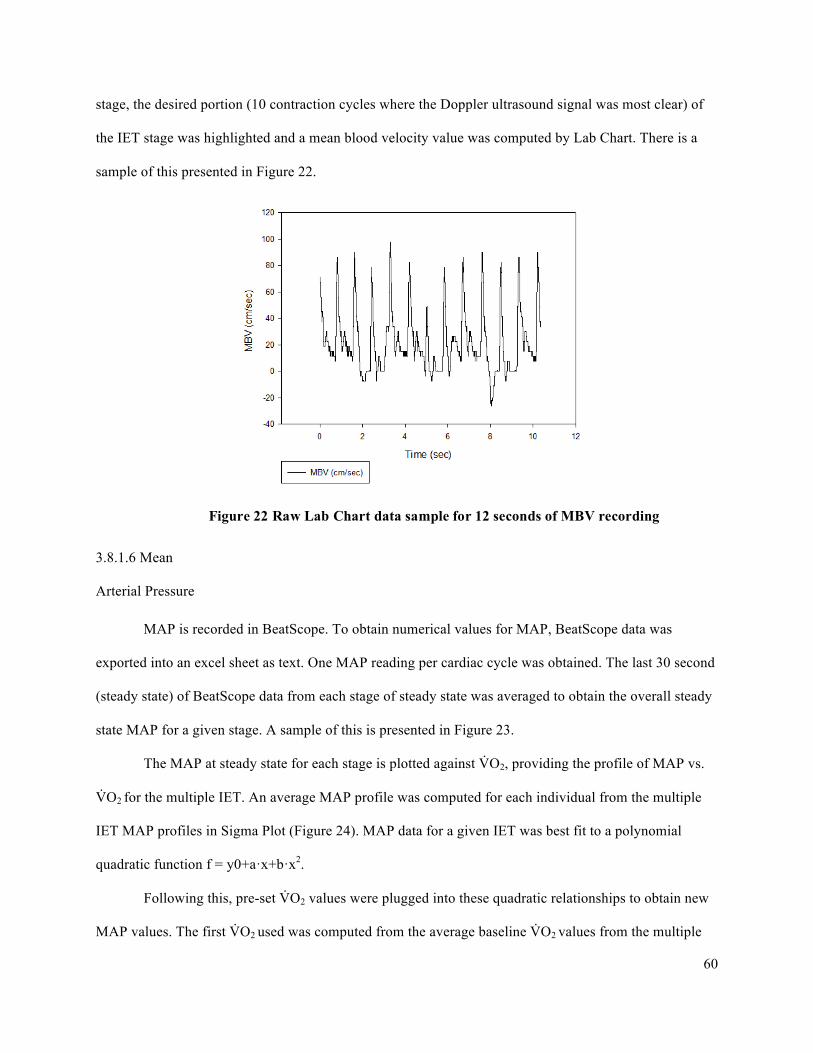
60
stage, the desired portion (10 contraction cycles where the Doppler ultrasound signal was most clear) of
the IET stage was highlighted and a mean blood velocity value was computed by Lab Chart. There is a
sample of this presented in Figure 22.
3.8.1.6 Mean
Arterial Pressure
MAP is recorded in BeatScope. To obtain numerical values for MAP, BeatScope data was
exported into an excel sheet as text. One MAP reading per cardiac cycle was obtained. The last 30 second
(steady state) of BeatScope data from each stage of steady state was averaged to obtain the overall steady
state MAP for a given stage. A sample of this is presented in Figure 23.
The MAP at steady state for each stage is plotted against V̇O2, providing the profile of MAP vs.
V̇O2 for the multiple IET. An average MAP profile was computed for each individual from the multiple
IET MAP profiles in Sigma Plot (Figure 24). MAP data for a given IET was best fit to a polynomial
quadratic function f = y0+a·x+b·x2.
Following this, pre-set V̇O2 values were plugged into these quadratic relationships to obtain new
MAP values. The first V̇O2 used was computed from the average baseline V̇O2 values from the multiple
Figure 22 Raw Lab Chart data sample for 12 seconds of MBV recording
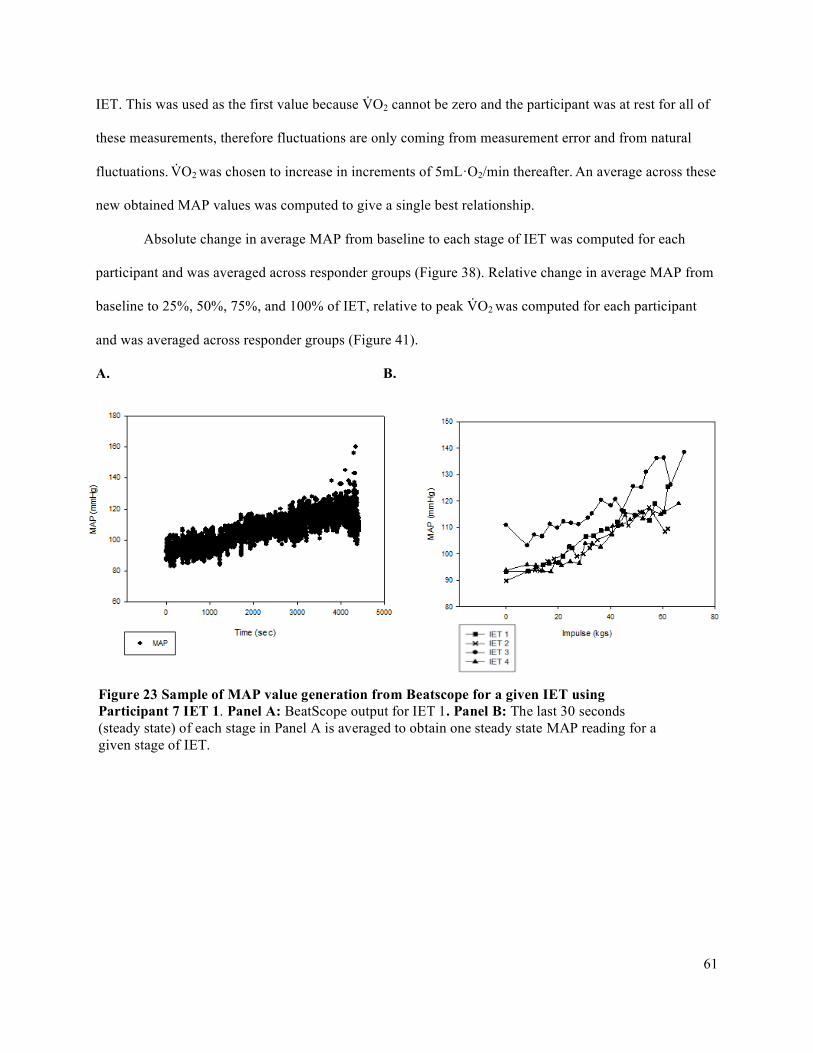
61
IET. This was used as the first value because V̇O2 cannot be zero and the participant was at rest for all of
these measurements, therefore fluctuations are only coming from measurement error and from natural
fluctuations. V̇O2 was chosen to increase in increments of 5mL·O2/min thereafter. An average across these
new obtained MAP values was computed to give a single best relationship.
Absolute change in average MAP from baseline to each stage of IET was computed for each
participant and was averaged across responder groups (Figure 38). Relative change in average MAP from
baseline to 25%, 50%, 75%, and 100% of IET, relative to peak V̇O2 was computed for each participant
and was averaged across responder groups (Figure 41).
A. B.
Figure 23 Sample of MAP value generation from Beatscope for a given IET using Participant 7 IET 1. Panel A: BeatScope output for IET 1. Panel B: The last 30 seconds (steady state) of each stage in Panel A is averaged to obtain one steady state MAP reading for a given stage of IET.

62
3.8.1.7 Forearm Vascular Conductance
Steady state forearm vascular conductance (FVC) was calculated as: FVC= FBF/FAPP · (100
mmHg), where FAPP is forearm arterial perfusion pressure. Again, with the forearm at the same level as
the finger, the FAPP is equal to MAP and is measured directly by the finger photoplethysmograph. FBF is
calculated for each stage of the IET. This was done from the average brachial artery diameter (BAD; in
cm) and mean blood velocity (MBV; in cm/s) values from the desired stage.
Figure 24 Sample of deriving MAP for participant 9. MAP is plotted against �̇�O2 for each IET trial and a polynomial quadratic regression (f = y0+a·x+b·x2) was computed. A single MAP profile was created for each individual by substituting pre-set V̇O2 values into the separate IET polynomial relationships to obtain new MAP values. These MAP values were then averaged and plotted against pre-set V̇O2 values to obtain Average MAP response. A polynomial regression was computed using this new MAP profile to provide a single best estimate of the average response for that individual.
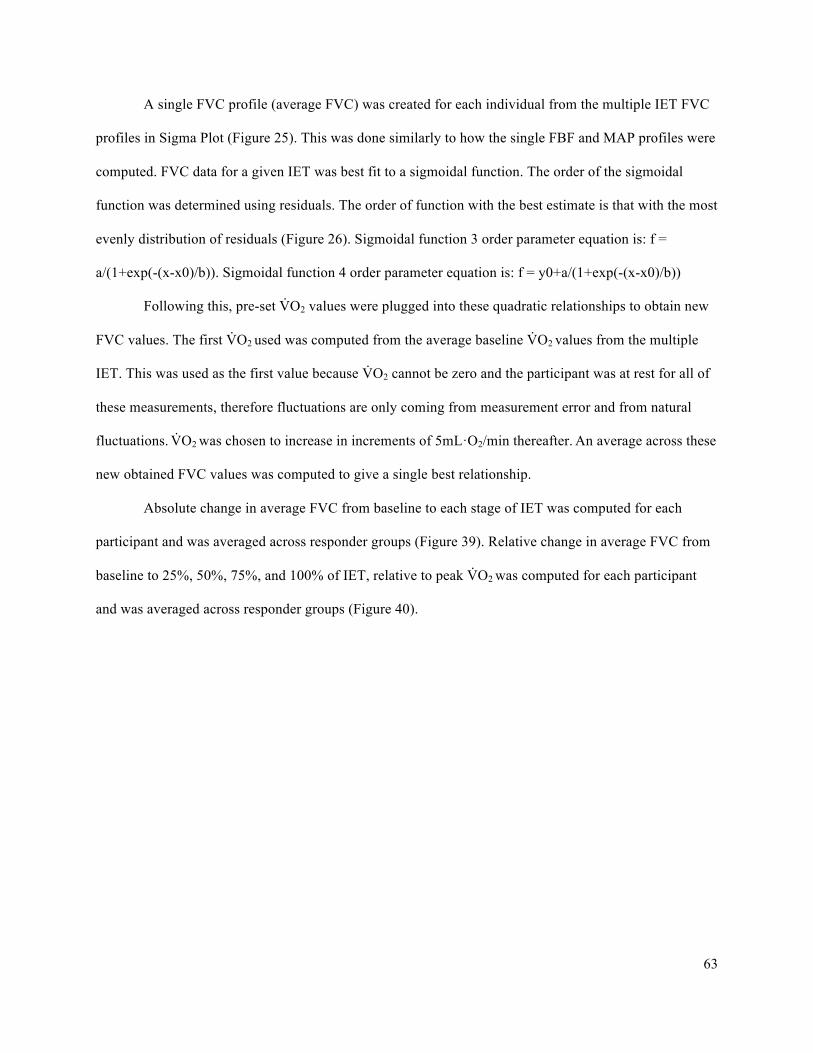
63
A single FVC profile (average FVC) was created for each individual from the multiple IET FVC
profiles in Sigma Plot (Figure 25). This was done similarly to how the single FBF and MAP profiles were
computed. FVC data for a given IET was best fit to a sigmoidal function. The order of the sigmoidal
function was determined using residuals. The order of function with the best estimate is that with the most
evenly distribution of residuals (Figure 26). Sigmoidal function 3 order parameter equation is: f =
a/(1+exp(-(x-x0)/b)). Sigmoidal function 4 order parameter equation is: f = y0+a/(1+exp(-(x-x0)/b))
Following this, pre-set V̇O2 values were plugged into these quadratic relationships to obtain new
FVC values. The first V̇O2 used was computed from the average baseline V̇O2 values from the multiple
IET. This was used as the first value because V̇O2 cannot be zero and the participant was at rest for all of
these measurements, therefore fluctuations are only coming from measurement error and from natural
fluctuations. V̇O2 was chosen to increase in increments of 5mL·O2/min thereafter. An average across these
new obtained FVC values was computed to give a single best relationship.
Absolute change in average FVC from baseline to each stage of IET was computed for each
participant and was averaged across responder groups (Figure 39). Relative change in average FVC from
baseline to 25%, 50%, 75%, and 100% of IET, relative to peak V̇O2 was computed for each participant
and was averaged across responder groups (Figure 40).
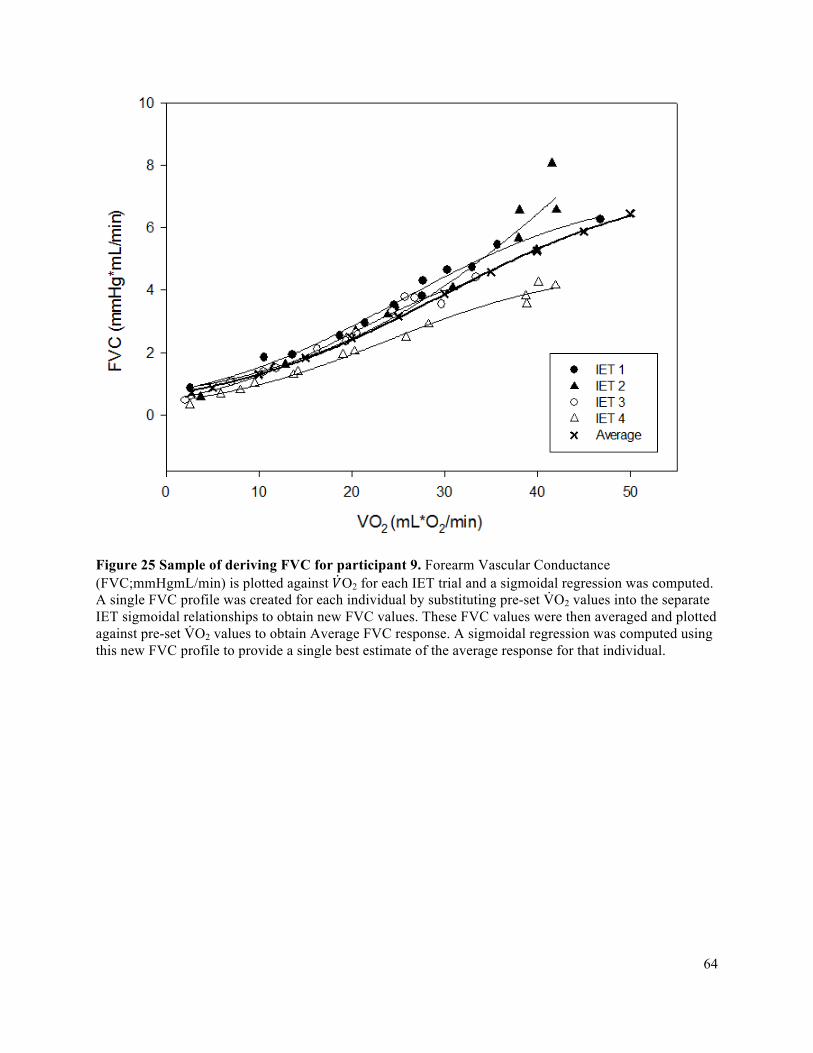
64
Figure 25 Sample of deriving FVC for participant 9. Forearm Vascular Conductance (FVC;mmHgmL/min) is plotted against 𝑉O2 for each IET trial and a sigmoidal regression was computed. A single FVC profile was created for each individual by substituting pre-set V̇O2 values into the separate IET sigmoidal relationships to obtain new FVC values. These FVC values were then averaged and plotted against pre-set V̇O2 values to obtain Average FVC response. A sigmoidal regression was computed using this new FVC profile to provide a single best estimate of the average response for that individual.
65
A.
B.
Figure 26 Sample of residuals used to determine which order of sigmoidal function is best fit for a given trial. Sample is from IET 1 for participant 3. Panel A: Residuals for fourth order sigmoidal curve fit. Panel B: Residuals for fifth order sigmoidal curve fit. The best fit is determined by visual inspection of having residuals that are closer to the zero line and that are more evenly dispersed around the zero line. In this case, fourth order sigmoidal curve fit (Panel A) had residuals that were more evenly dispersed around the zero line. This process was also done using a quadratic function. It was also used to determine sigmoidal function order.
66
3.8.1.8 Saturation of Oxygen
Saturation of oxygen was recorded in Lab Chart. It was averaged over the last 30 second (steady
state) of each stage by using the same 10 contraction cycles that was used to obtain mean blood velocity.
3.8.2 Complete Data Analysis
A sample of a complete data analysis for IET variables is in Appendix F.
3.9 Statistical Analysis
3.9.1 Oxygen Delivery and Oxygen Delivery Utilization Ratio (O2D/V̇O2)
A mixed model two-way ANOVA with factors Group (between subjects: high responders and
low responders) and Absolute Change V̇O2 from baseline (within subjects: 5, 10, 15, 20, 25, 30, 35
mL/min) was used to assess absolute change in O2D from baseline. The Holms-Sidak post-hoc test was
used to explore significant interactions and main effects.
A one-tailed t-test with significance level of p<0.05 was run to determine if absolute peak O2D
was different between high and low responder groups.
A one-tailed t-test with significance level of p<0.05 was run to compare the slopes of the high
and low responder groups within the context of the directional hypothesis that O2D/V̇O2 would be greater
in the high responders.
3.9.2 Accumulated Fatigue Exercise Test (FET)
A one-tailed t-test with significance level of p<0.05 was run to compare the FI of the high and
low responder groups within the context of the directional hypothesis that FI would be greater in the low
responders.
3.9.3 Forearm Volume, Maximum Voluntary Contraction (MVC), Peak Oxygen Delivery (O2D),
Peak Oxygen Consumption (VO2), and Peak IET Impulse achieved
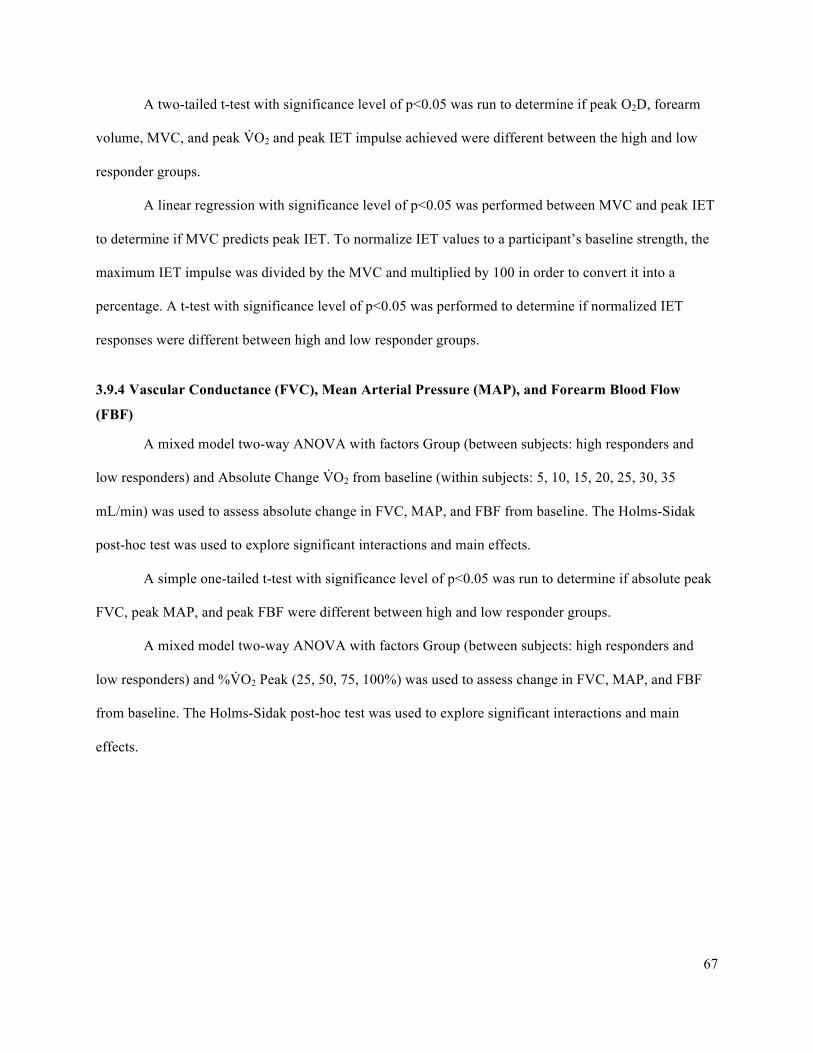
67
A two-tailed t-test with significance level of p<0.05 was run to determine if peak O2D, forearm
volume, MVC, and peak V̇O2 and peak IET impulse achieved were different between the high and low
responder groups.
A linear regression with significance level of p<0.05 was performed between MVC and peak IET
to determine if MVC predicts peak IET. To normalize IET values to a participant’s baseline strength, the
maximum IET impulse was divided by the MVC and multiplied by 100 in order to convert it into a
percentage. A t-test with significance level of p<0.05 was performed to determine if normalized IET
responses were different between high and low responder groups.
3.9.4 Vascular Conductance (FVC), Mean Arterial Pressure (MAP), and Forearm Blood Flow
(FBF)
A mixed model two-way ANOVA with factors Group (between subjects: high responders and
low responders) and Absolute Change V̇O2 from baseline (within subjects: 5, 10, 15, 20, 25, 30, 35
mL/min) was used to assess absolute change in FVC, MAP, and FBF from baseline. The Holms-Sidak
post-hoc test was used to explore significant interactions and main effects.
A simple one-tailed t-test with significance level of p<0.05 was run to determine if absolute peak
FVC, peak MAP, and peak FBF were different between high and low responder groups.
A mixed model two-way ANOVA with factors Group (between subjects: high responders and
low responders) and %V̇O2 Peak (25, 50, 75, 100%) was used to assess change in FVC, MAP, and FBF
from baseline. The Holms-Sidak post-hoc test was used to explore significant interactions and main
effects.
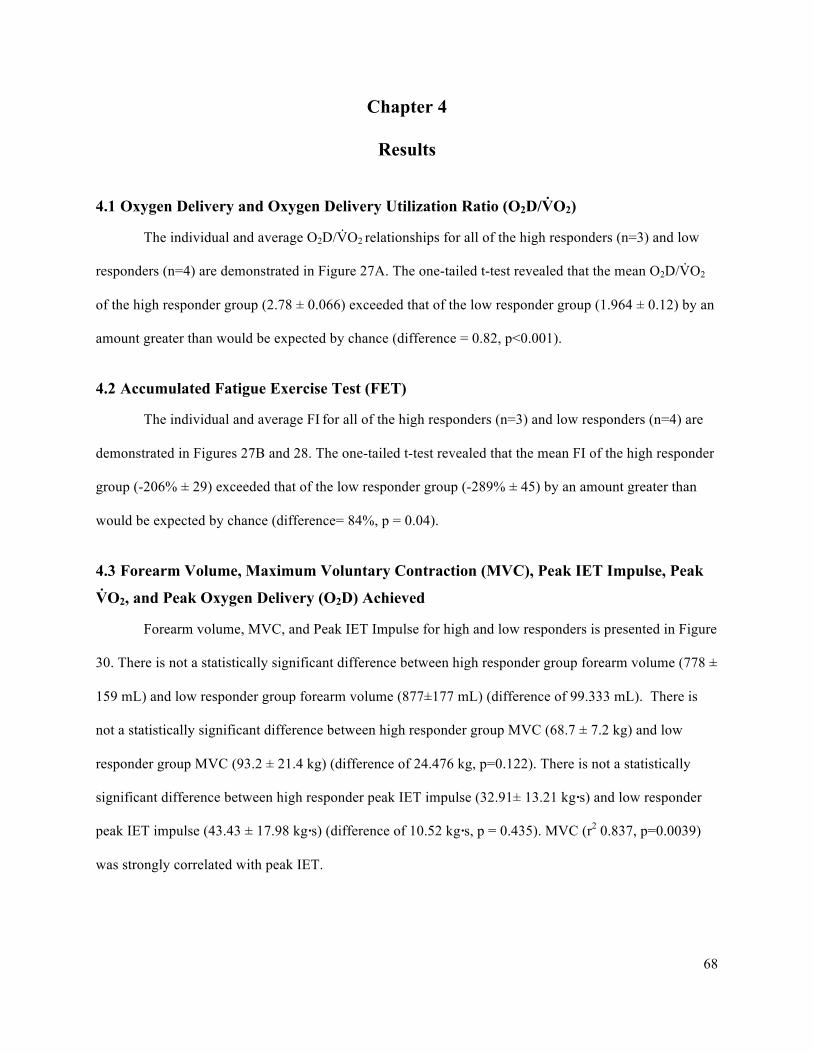
68
Chapter 4
Results
4.1 Oxygen Delivery and Oxygen Delivery Utilization Ratio (O2D/V̇O2)
The individual and average O2D/V̇O2 relationships for all of the high responders (n=3) and low
responders (n=4) are demonstrated in Figure 27A. The one-tailed t-test revealed that the mean O2D/V̇O2
of the high responder group (2.78 ± 0.066) exceeded that of the low responder group (1.964 ± 0.12) by an
amount greater than would be expected by chance (difference = 0.82, p<0.001).
4.2 Accumulated Fatigue Exercise Test (FET)
The individual and average FI for all of the high responders (n=3) and low responders (n=4) are
demonstrated in Figures 27B and 28. The one-tailed t-test revealed that the mean FI of the high responder
group (-206% ± 29) exceeded that of the low responder group (-289% ± 45) by an amount greater than
would be expected by chance (difference= 84%, p = 0.04).
4.3 Forearm Volume, Maximum Voluntary Contraction (MVC), Peak IET Impulse, Peak
V̇O2, and Peak Oxygen Delivery (O2D) Achieved
Forearm volume, MVC, and Peak IET Impulse for high and low responders is presented in Figure
30. There is not a statistically significant difference between high responder group forearm volume (778 ±
159 mL) and low responder group forearm volume (877±177 mL) (difference of 99.333 mL). There is
not a statistically significant difference between high responder group MVC (68.7 ± 7.2 kg) and low
responder group MVC (93.2 ± 21.4 kg) (difference of 24.476 kg, p=0.122). There is not a statistically
significant difference between high responder peak IET impulse (32.91± 13.21 kg·s) and low responder
peak IET impulse (43.43 ± 17.98 kg·s) (difference of 10.52 kg·s, p = 0.435). MVC (r2 0.837, p=0.0039)
was strongly correlated with peak IET.

69
Table 4. Participant exercise test characteristics. Last row includes mean ± SD. MVC, maximal voluntary contraction; FET WR; accumulated fatigue exercise test work rate; FI, fatigue index. Please see Figure 16 for explanation of FI.
MVC (kg) O2D/V̇O2 FET WR (kg) FI (%)
1 100.5 2.04 25 -267
2 60.5 2.76 12 -224
3 72.1 2.86 30 -222
4 72.1 1.82 18 -308
5 96.7 2.34 21 -232
6 68.7 2.06 32 -174
7 80.3 1.93 23 -343
8 119.9 2.08 60 -240
9 73.7 2.74 27 -172
10 95.9 2.39 24 -207
Mean ± SD 84.0 ± 18.4 2.30± 0.38 29 ± 13
-238± 54
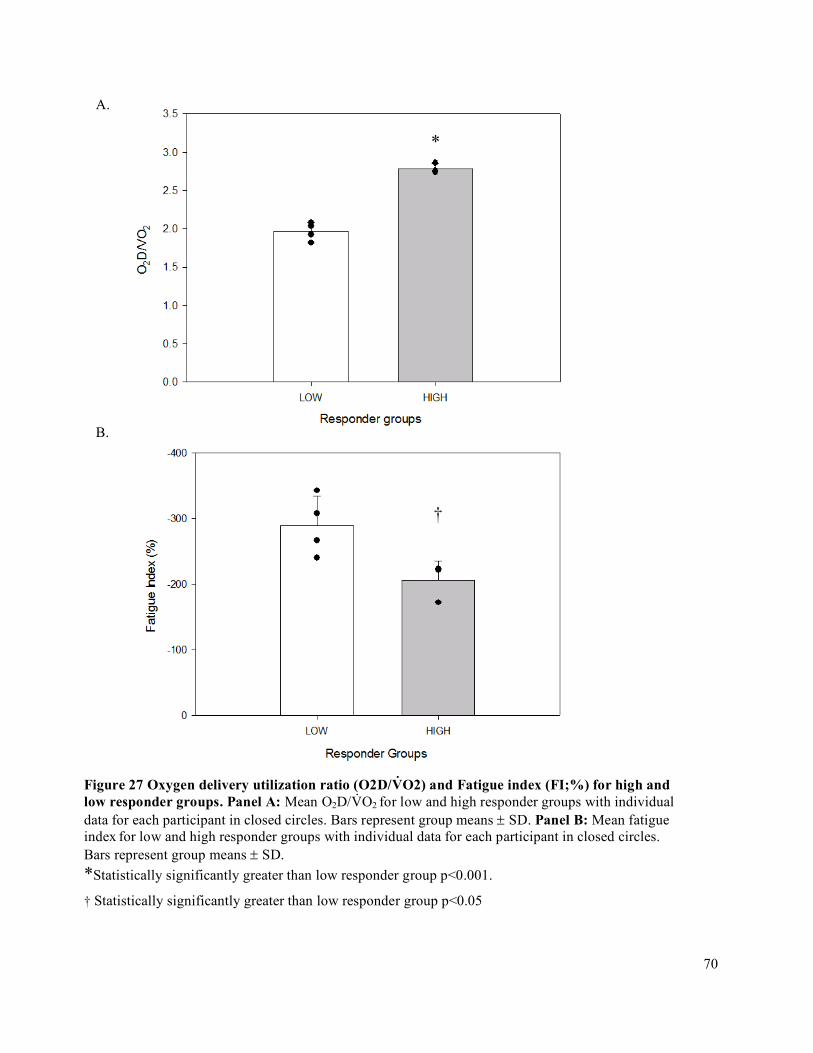
70
A.
B.
*
†
Figure 27 Oxygen delivery utilization ratio (O2D/V̇O2) and Fatigue index (FI;%) for high and low responder groups. Panel A: Mean O2D/V̇O2 for low and high responder groups with individual data for each participant in closed circles. Bars represent group means ± SD. Panel B: Mean fatigue index for low and high responder groups with individual data for each participant in closed circles. Bars represent group means ± SD. *Statistically significantly greater than low responder group p<0.001.
† Statistically significantly greater than low responder group p<0.05
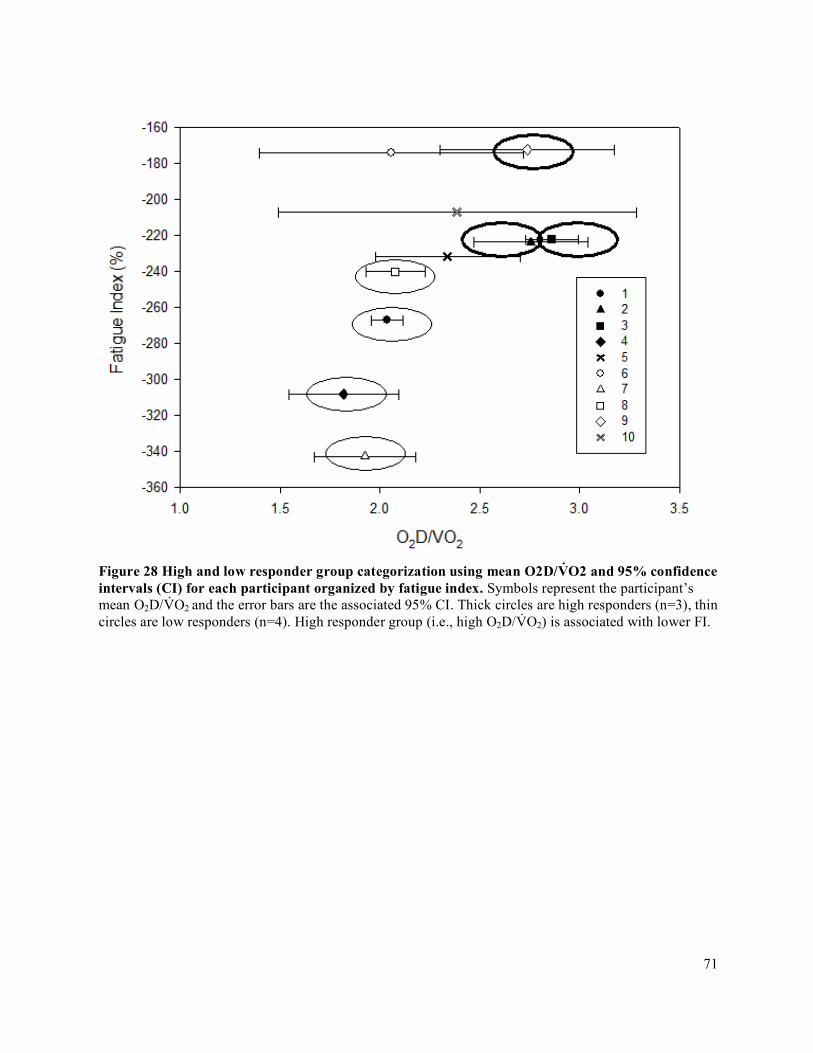
71
Figure 28 High and low responder group categorization using mean O2D/V̇O2 and 95% confidence intervals (CI) for each participant organized by fatigue index. Symbols represent the participant’s mean O2D/V̇O2 and the error bars are the associated 95% CI. Thick circles are high responders (n=3), thin circles are low responders (n=4). High responder group (i.e., high O2D/V̇O2) is associated with lower FI.
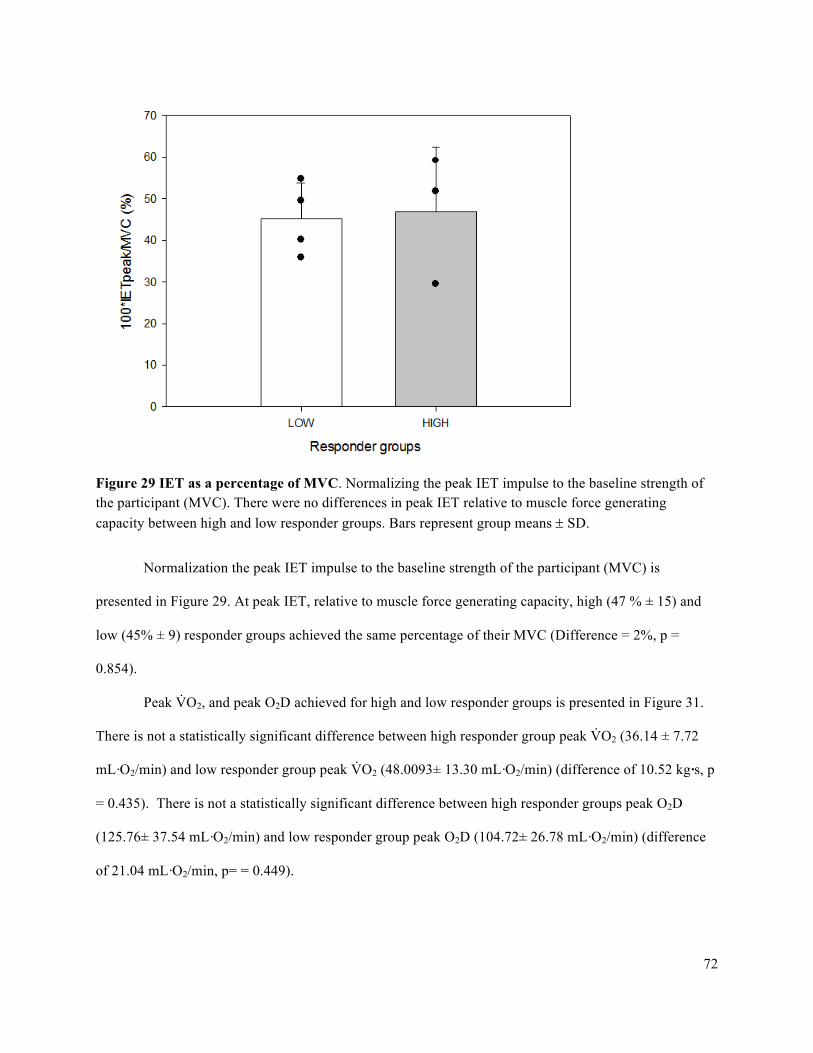
72
Figure 29 IET as a percentage of MVC. Normalizing the peak IET impulse to the baseline strength of the participant (MVC). There were no differences in peak IET relative to muscle force generating capacity between high and low responder groups. Bars represent group means ± SD.
Normalization the peak IET impulse to the baseline strength of the participant (MVC) is
presented in Figure 29. At peak IET, relative to muscle force generating capacity, high (47 % ± 15) and
low (45% ± 9) responder groups achieved the same percentage of their MVC (Difference = 2%, p =
0.854).
Peak V̇O2, and peak O2D achieved for high and low responder groups is presented in Figure 31.
There is not a statistically significant difference between high responder group peak V̇O2 (36.14 ± 7.72
mL·O2/min) and low responder group peak V̇O2 (48.0093± 13.30 mL·O2/min) (difference of 10.52 kg·s, p
= 0.435). There is not a statistically significant difference between high responder groups peak O2D
(125.76± 37.54 mL·O2/min) and low responder group peak O2D (104.72± 26.78 mL·O2/min) (difference
of 21.04 mL·O2/min, p= = 0.449).
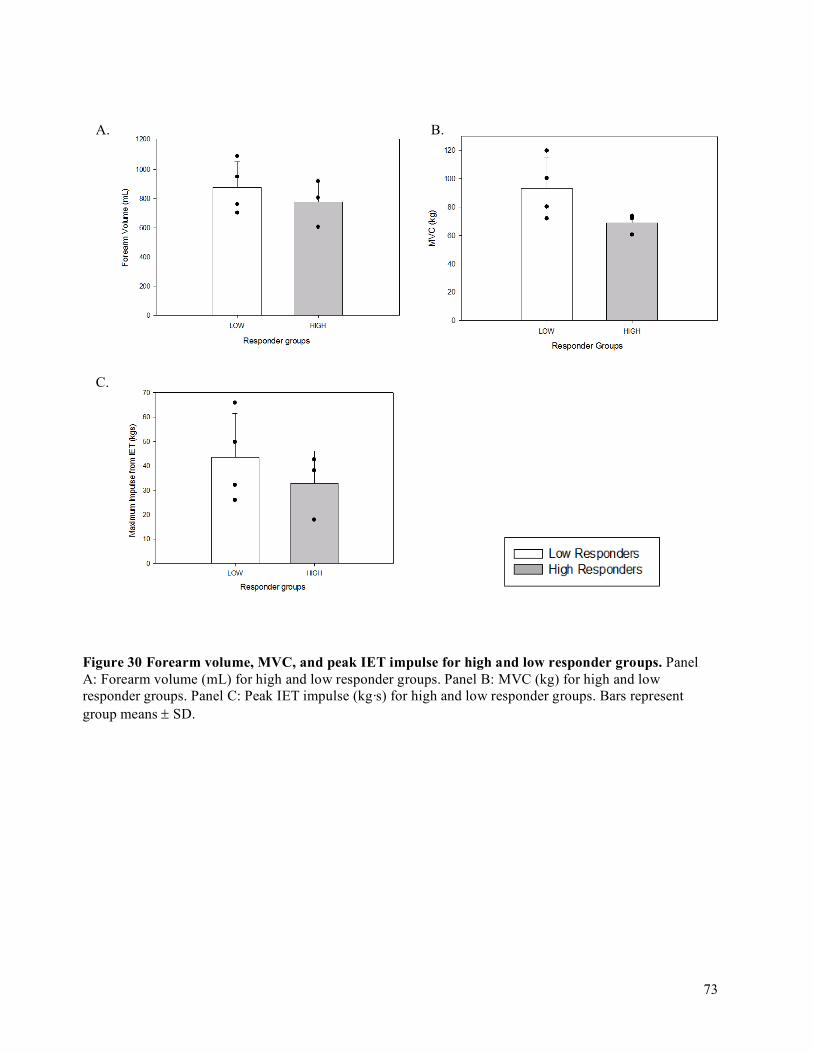
73
A. B.
C.
Figure 30 Forearm volume, MVC, and peak IET impulse for high and low responder groups. Panel A: Forearm volume (mL) for high and low responder groups. Panel B: MVC (kg) for high and low responder groups. Panel C: Peak IET impulse (kg·s) for high and low responder groups. Bars represent group means ± SD.
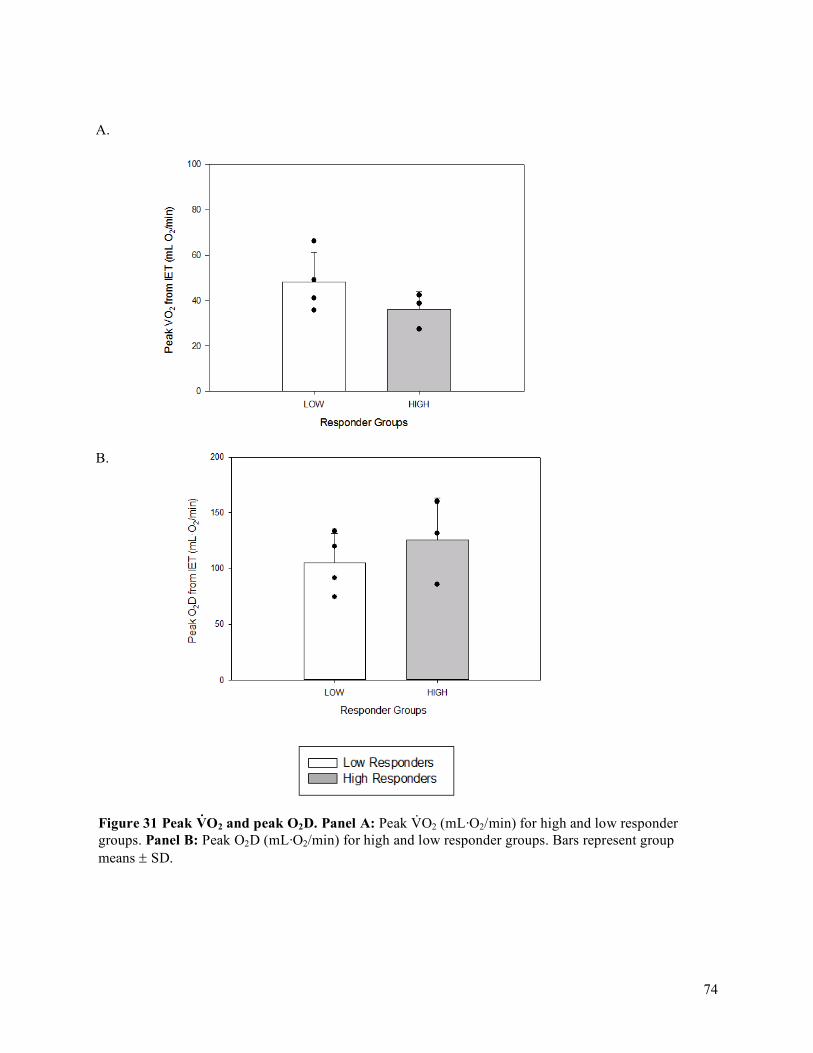
74
A.
B.
Figure 31 Peak V̇O2 and peak O2D. Panel A: Peak V̇O2 (mL·O2/min) for high and low responder groups. Panel B: Peak O2D (mL·O2/min) for high and low responder groups. Bars represent group means ± SD.
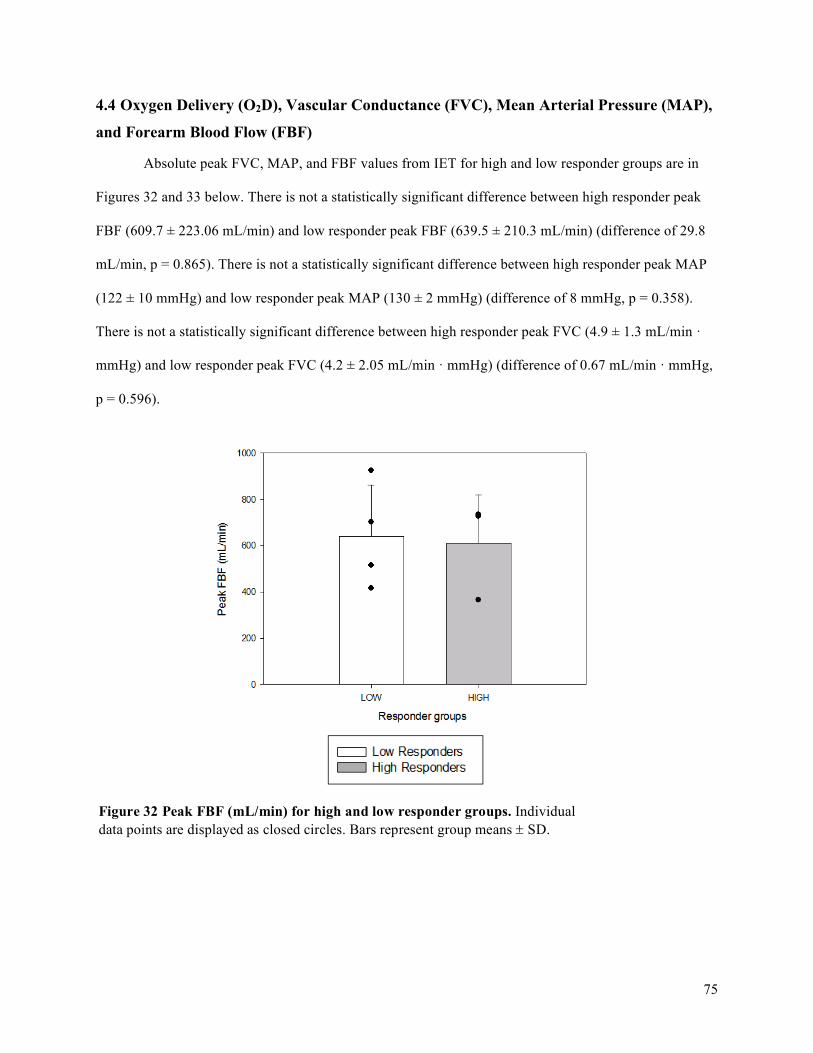
75
4.4 Oxygen Delivery (O2D), Vascular Conductance (FVC), Mean Arterial Pressure (MAP),
and Forearm Blood Flow (FBF)
Absolute peak FVC, MAP, and FBF values from IET for high and low responder groups are in
Figures 32 and 33 below. There is not a statistically significant difference between high responder peak
FBF (609.7 ± 223.06 mL/min) and low responder peak FBF (639.5 ± 210.3 mL/min) (difference of 29.8
mL/min, p = 0.865). There is not a statistically significant difference between high responder peak MAP
(122 ± 10 mmHg) and low responder peak MAP (130 ± 2 mmHg) (difference of 8 mmHg, p = 0.358).
There is not a statistically significant difference between high responder peak FVC (4.9 ± 1.3 mL/min ·
mmHg) and low responder peak FVC (4.2 ± 2.05 mL/min · mmHg) (difference of 0.67 mL/min · mmHg,
p = 0.596).
Figure 32 Peak FBF (mL/min) for high and low responder groups. Individual data points are displayed as closed circles. Bars represent group means ± SD.
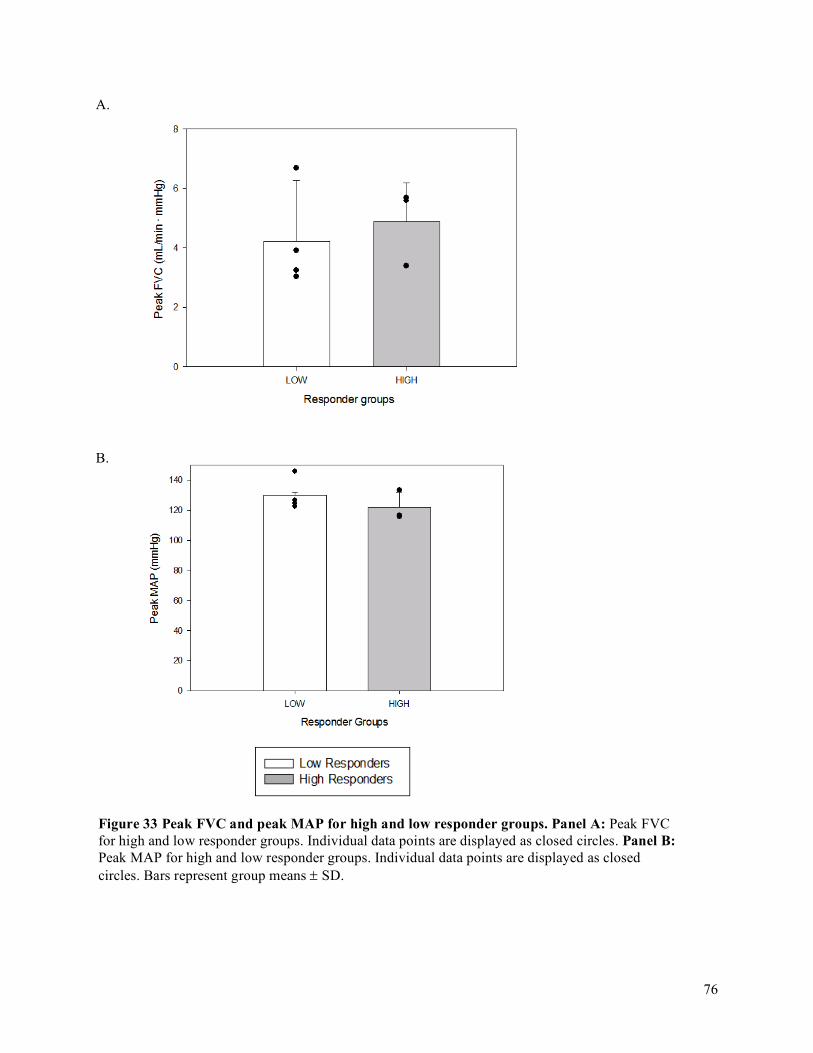
76
A.
B.
Figure 33 Peak FVC and peak MAP for high and low responder groups. Panel A: Peak FVC for high and low responder groups. Individual data points are displayed as closed circles. Panel B: Peak MAP for high and low responder groups. Individual data points are displayed as closed circles. Bars represent group means ± SD.
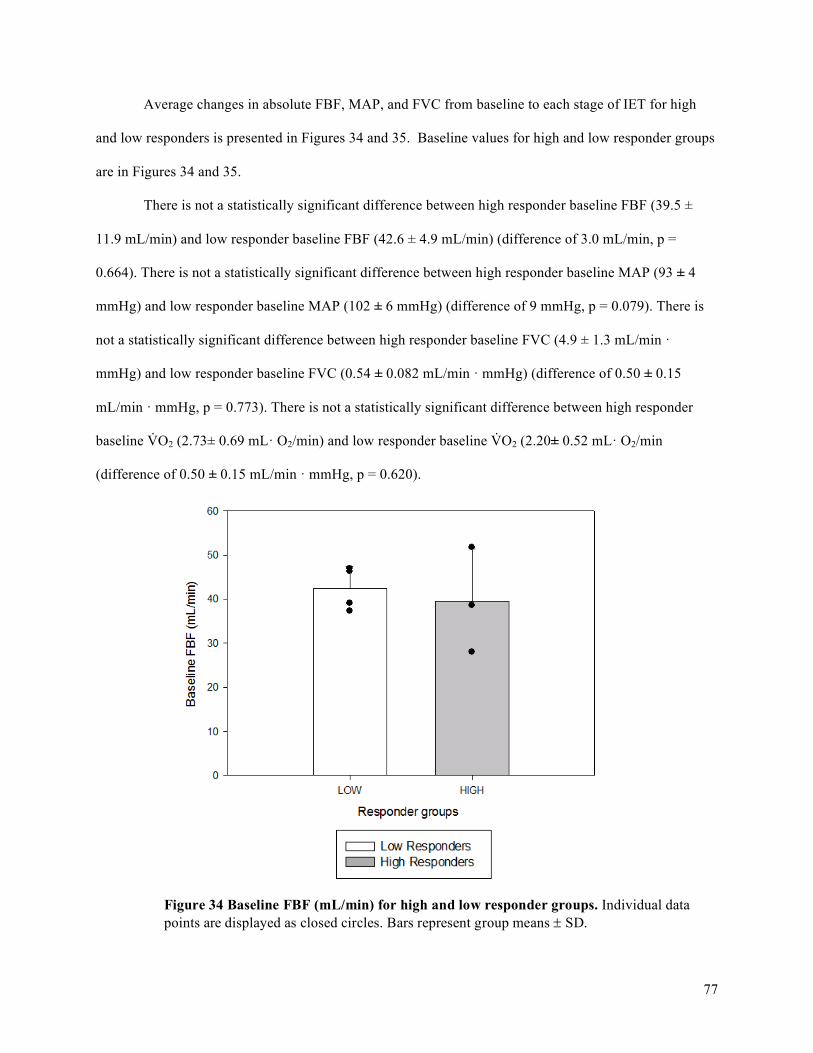
77
Average changes in absolute FBF, MAP, and FVC from baseline to each stage of IET for high
and low responders is presented in Figures 34 and 35. Baseline values for high and low responder groups
are in Figures 34 and 35.
There is not a statistically significant difference between high responder baseline FBF (39.5 ±
11.9 mL/min) and low responder baseline FBF (42.6 ± 4.9 mL/min) (difference of 3.0 mL/min, p =
0.664). There is not a statistically significant difference between high responder baseline MAP (93 ± 4
mmHg) and low responder baseline MAP (102 ± 6 mmHg) (difference of 9 mmHg, p = 0.079). There is
not a statistically significant difference between high responder baseline FVC (4.9 ± 1.3 mL/min ·
mmHg) and low responder baseline FVC (0.54 ± 0.082 mL/min · mmHg) (difference of 0.50 ± 0.15
mL/min · mmHg, p = 0.773). There is not a statistically significant difference between high responder
baseline V̇O2 (2.73± 0.69 mL· O2/min) and low responder baseline V̇O2 (2.20± 0.52 mL· O2/min
(difference of 0.50 ± 0.15 mL/min · mmHg, p = 0.620).
Figure 34 Baseline FBF (mL/min) for high and low responder groups. Individual data points are displayed as closed circles. Bars represent group means ± SD.

78
A.
B.
Figure 35 Baseline FVC and MAP for high and low responder groups. Panel A: Baseline FVC for high and low responder groups. Individual data points are displayed as closed circles. Panel B: Baseline MAP for high and low responder groups. Individual data points are displayed as closed circles. Bars represent group means ± SD.
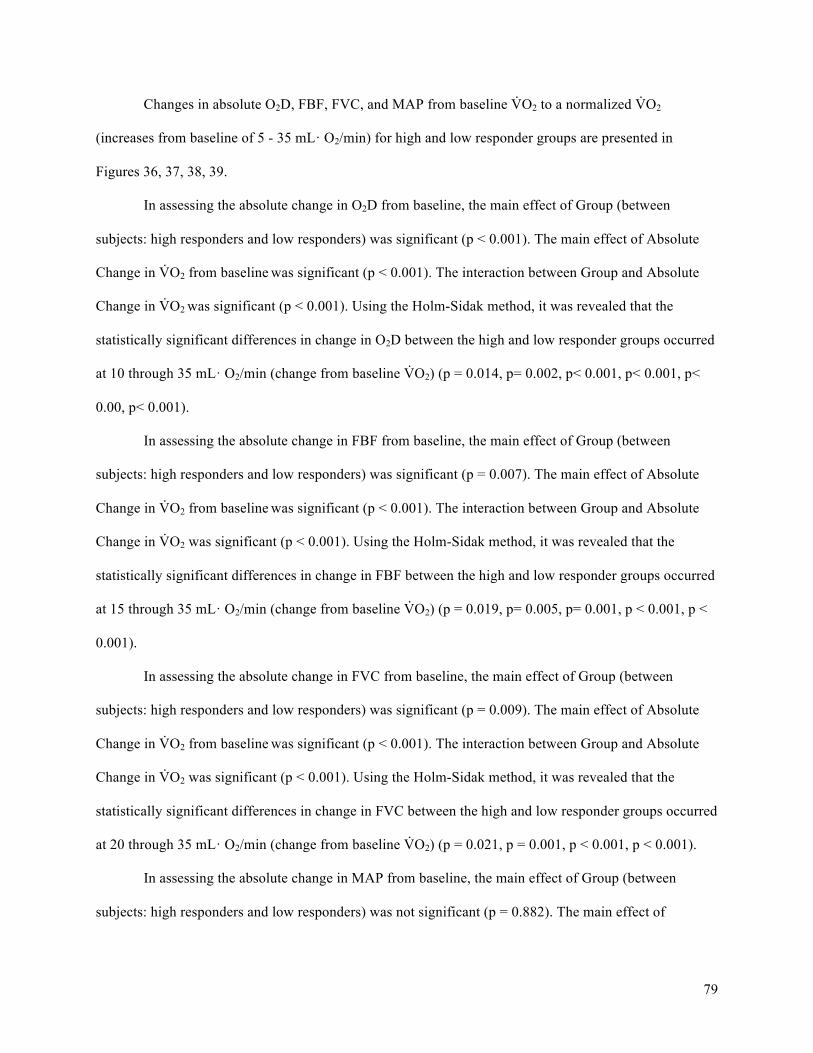
79
Changes in absolute O2D, FBF, FVC, and MAP from baseline V̇O2 to a normalized V̇O2
(increases from baseline of 5 - 35 mL· O2/min) for high and low responder groups are presented in
Figures 36, 37, 38, 39.
In assessing the absolute change in O2D from baseline, the main effect of Group (between
subjects: high responders and low responders) was significant (p < 0.001). The main effect of Absolute
Change in V̇O2 from baseline was significant (p < 0.001). The interaction between Group and Absolute
Change in V̇O2 was significant (p < 0.001). Using the Holm-Sidak method, it was revealed that the
statistically significant differences in change in O2D between the high and low responder groups occurred
at 10 through 35 mL· O2/min (change from baseline V̇O2) (p = 0.014, p= 0.002, p< 0.001, p< 0.001, p<
0.00, p< 0.001).
In assessing the absolute change in FBF from baseline, the main effect of Group (between
subjects: high responders and low responders) was significant (p = 0.007). The main effect of Absolute
Change in V̇O2 from baseline was significant (p < 0.001). The interaction between Group and Absolute
Change in V̇O2 was significant (p < 0.001). Using the Holm-Sidak method, it was revealed that the
statistically significant differences in change in FBF between the high and low responder groups occurred
at 15 through 35 mL· O2/min (change from baseline V̇O2) (p = 0.019, p= 0.005, p= 0.001, p < 0.001, p <
0.001).
In assessing the absolute change in FVC from baseline, the main effect of Group (between
subjects: high responders and low responders) was significant (p = 0.009). The main effect of Absolute
Change in V̇O2 from baseline was significant (p < 0.001). The interaction between Group and Absolute
Change in V̇O2 was significant (p < 0.001). Using the Holm-Sidak method, it was revealed that the
statistically significant differences in change in FVC between the high and low responder groups occurred
at 20 through 35 mL· O2/min (change from baseline V̇O2) (p = 0.021, p = 0.001, p < 0.001, p < 0.001).
In assessing the absolute change in MAP from baseline, the main effect of Group (between
subjects: high responders and low responders) was not significant (p = 0.882). The main effect of

80
Absolute Change in V̇O2 from baseline was significant (p < 0.001). The interaction between Group and
Absolute Change in V̇O2 was not significant (p = 0.122).
Figure 36 Absolute average change in O2D from baseline to each steady state stage of IET. Baseline V̇O2 was determined from the average V̇O2 of multiple trials. Horizontal error bars show the standard deviation in absolute change in V̇O2. Vertical error bars show the standard deviation in change in O2D. Peak responses are displayed for each responder group. * Significantly different between high and low responder groups
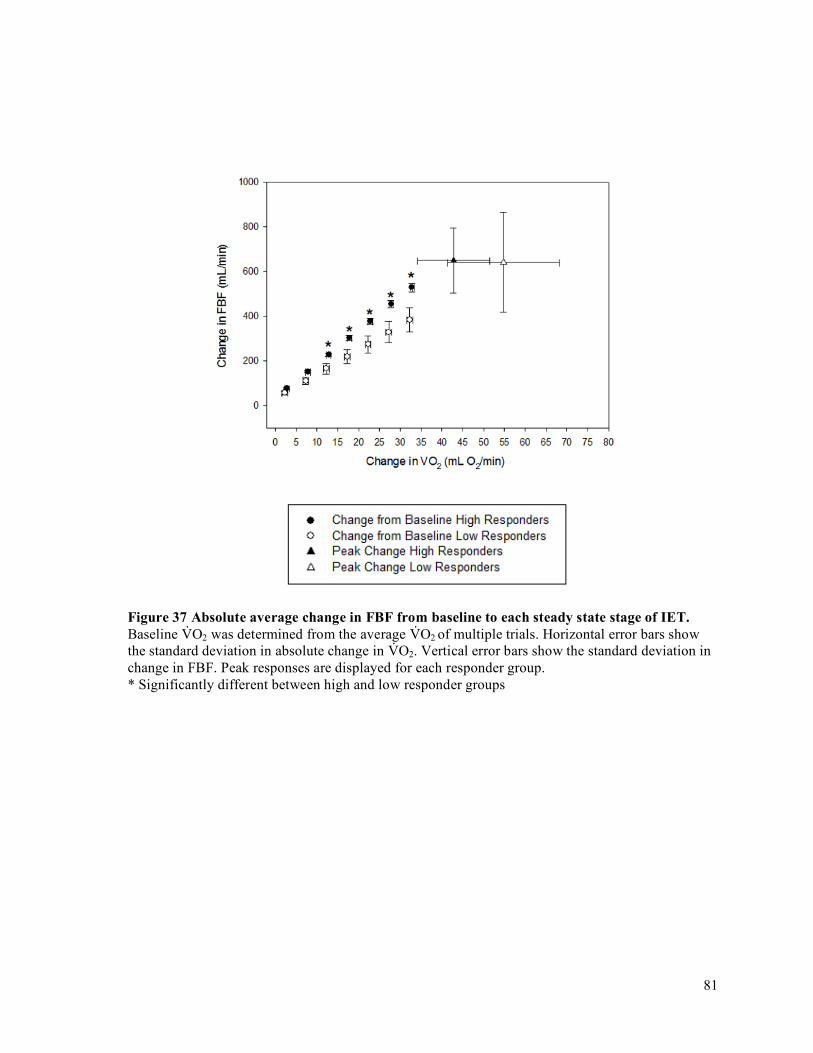
81
Figure 37 Absolute average change in FBF from baseline to each steady state stage of IET. Baseline V̇O2 was determined from the average V̇O2 of multiple trials. Horizontal error bars show the standard deviation in absolute change in V̇O2. Vertical error bars show the standard deviation in change in FBF. Peak responses are displayed for each responder group. * Significantly different between high and low responder groups
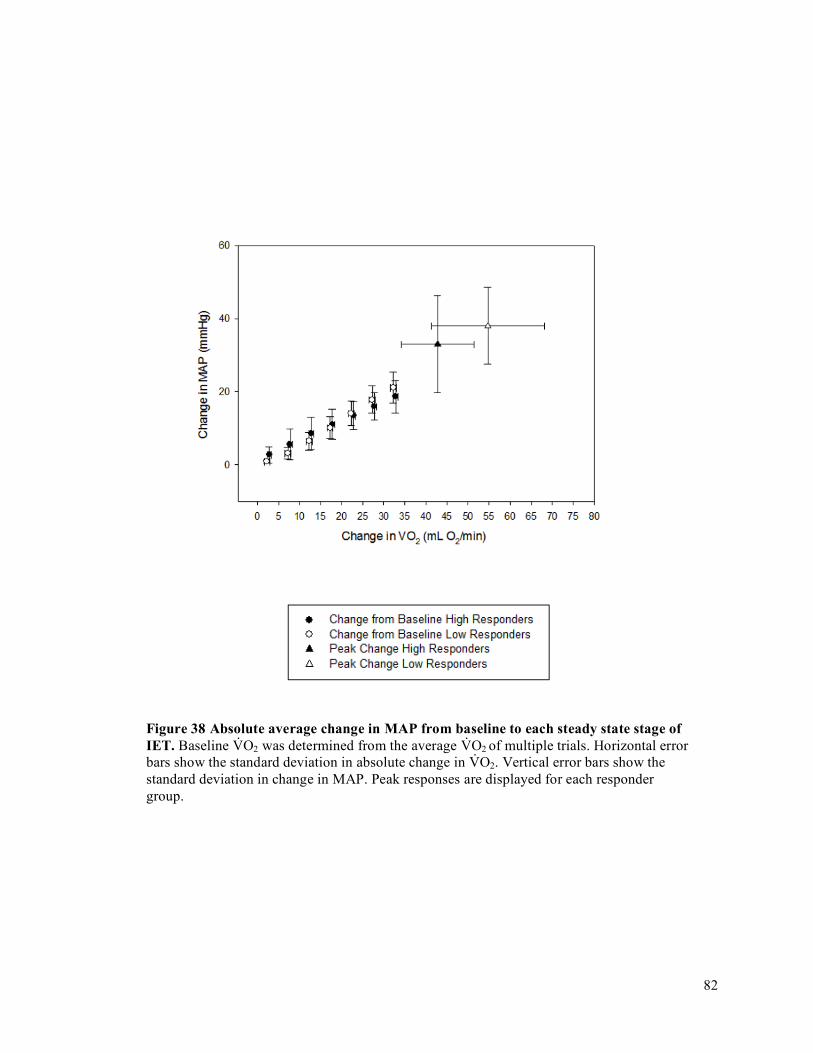
82
Figure 38 Absolute average change in MAP from baseline to each steady state stage of IET. Baseline V̇O2 was determined from the average V̇O2 of multiple trials. Horizontal error bars show the standard deviation in absolute change in V̇O2. Vertical error bars show the standard deviation in change in MAP. Peak responses are displayed for each responder group.

83
Figure 39 Absolute average change in FVC from baseline to each steady state stage of IET. Baseline V̇O2 was determined from the average V̇O2 of multiple trials. Horizontal error bars show the standard deviation in absolute change in V̇O2. Vertical error bars show the standard deviation in change in FVC. Peak responses are displayed for each responder group. * Significantly different between high and low responder groups
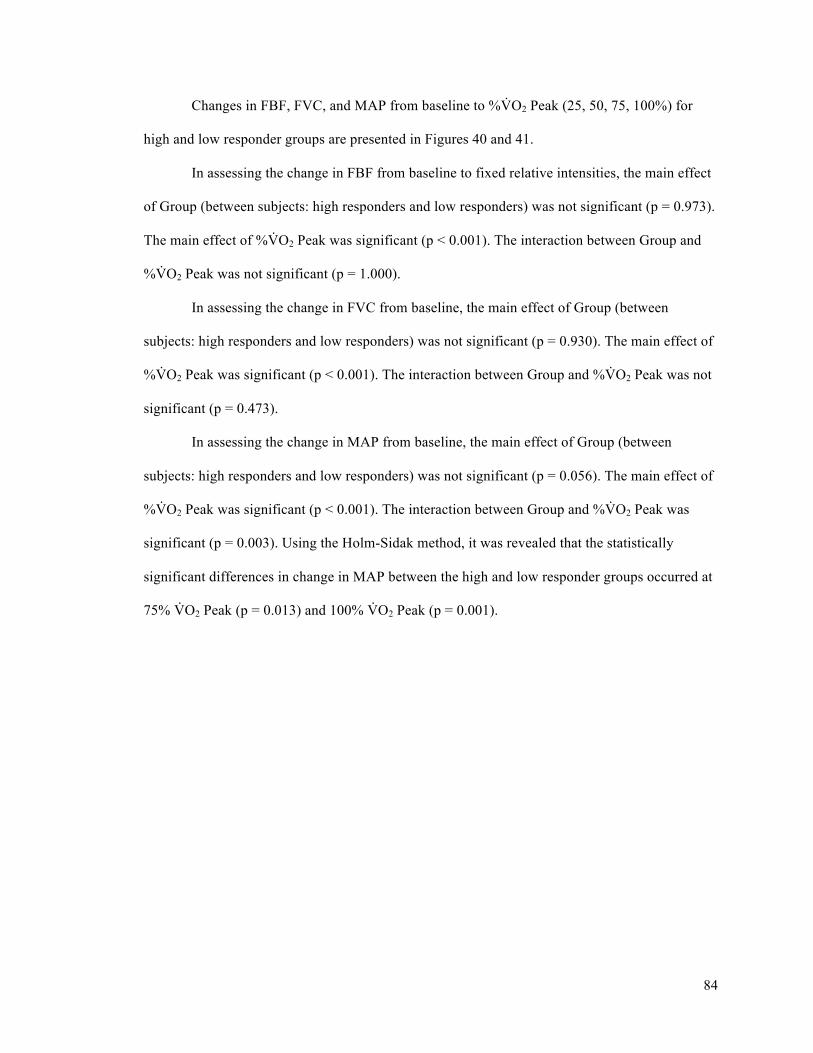
84
Changes in FBF, FVC, and MAP from baseline to %V̇O2 Peak (25, 50, 75, 100%) for
high and low responder groups are presented in Figures 40 and 41.
In assessing the change in FBF from baseline to fixed relative intensities, the main effect
of Group (between subjects: high responders and low responders) was not significant (p = 0.973).
The main effect of %V̇O2 Peak was significant (p < 0.001). The interaction between Group and
%V̇O2 Peak was not significant (p = 1.000).
In assessing the change in FVC from baseline, the main effect of Group (between
subjects: high responders and low responders) was not significant (p = 0.930). The main effect of
%V̇O2 Peak was significant (p < 0.001). The interaction between Group and %V̇O2 Peak was not
significant (p = 0.473).
In assessing the change in MAP from baseline, the main effect of Group (between
subjects: high responders and low responders) was not significant (p = 0.056). The main effect of
%V̇O2 Peak was significant (p < 0.001). The interaction between Group and %V̇O2 Peak was
significant (p = 0.003). Using the Holm-Sidak method, it was revealed that the statistically
significant differences in change in MAP between the high and low responder groups occurred at
75% V̇O2 Peak (p = 0.013) and 100% V̇O2 Peak (p = 0.001).
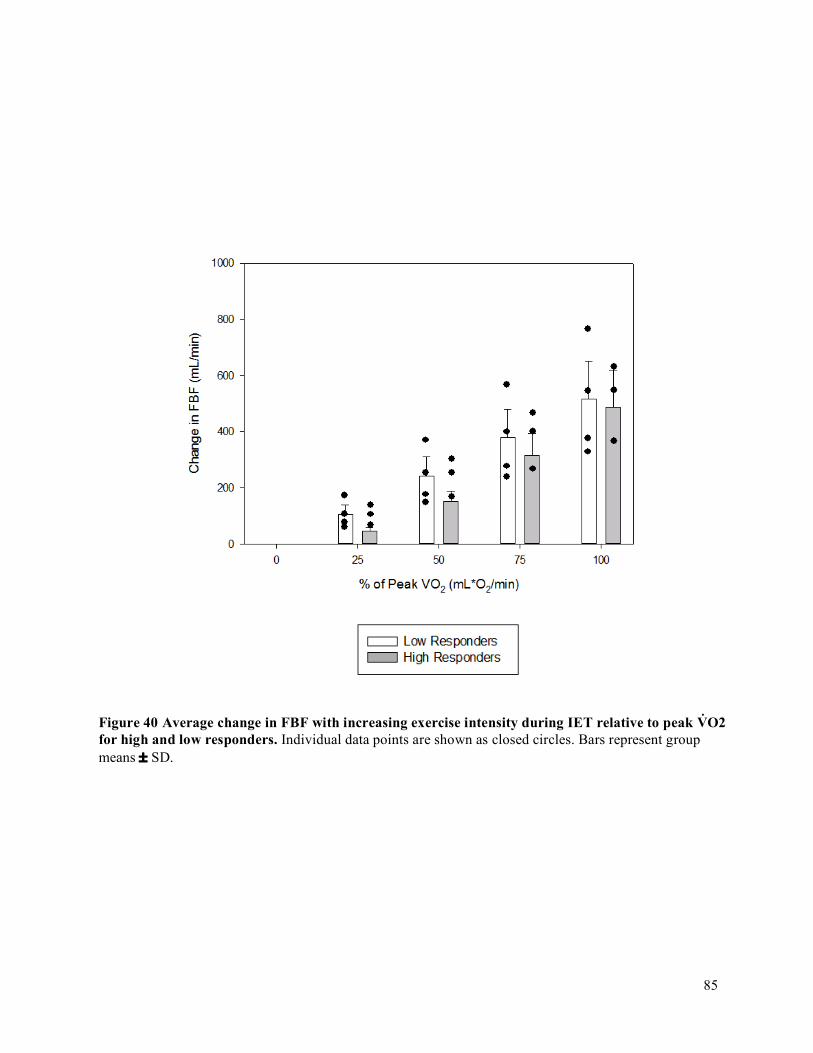
85
Figure 40 Average change in FBF with increasing exercise intensity during IET relative to peak V̇O2 for high and low responders. Individual data points are shown as closed circles. Bars represent group means ± SD.
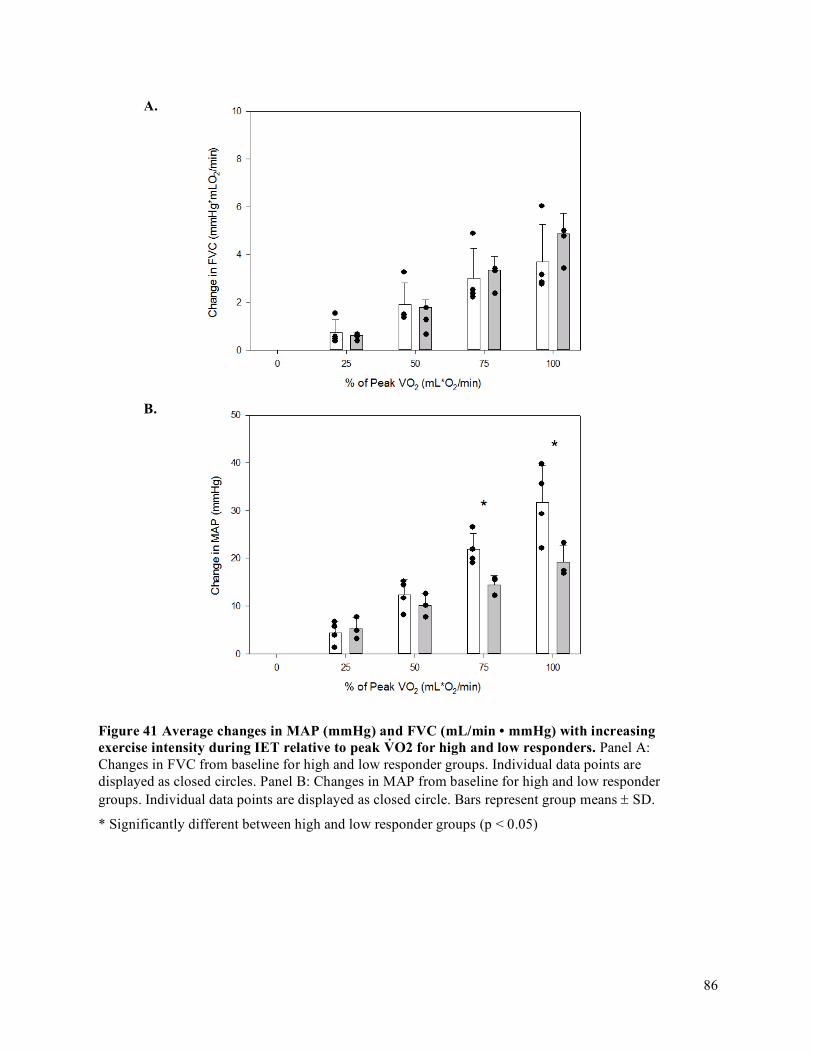
86
A.
B.
Figure 41 Average changes in MAP (mmHg) and FVC (mL/min • mmHg) with increasing exercise intensity during IET relative to peak V̇O2 for high and low responders. Panel A: Changes in FVC from baseline for high and low responder groups. Individual data points are displayed as closed circles. Panel B: Changes in MAP from baseline for high and low responder groups. Individual data points are displayed as closed circle. Bars represent group means ± SD.
* Significantly different between high and low responder groups (p < 0.05)
87
Chapter 5
DISCUSSION
5.1 Primary Purpose, Objectives, Hypotheses and Primary Findings of Thesis
The current thesis was designed with the purpose to extend our understanding of inter-
individual differences in O2D demand matching and to determine its impact on accumulated
fatigue throughout IET. The objectives were first to quantify an individual’s oxygen
delivery/utilization ratio using a range of exercise intensities and were secondly to quantify the
association between the oxygen delivery to oxygen consumption ratio and exercise fatigability.
To quantify an individual’s oxygen delivery/utilization ratio, a range of exercise intensities was
used in order to identify individuals with higher O2D/V̇O2 ratios and individuals with lower
O2D/V̇O2 ratios. We then compared accumulated fatigue between the groups with the use of an
accumulated fatigue exercise test across individuals. The hypothesis was that individuals with
higher O2D/V̇O2 relationship would have a reduced accumulated fatigue in fatiguing exercise than
those with lower O2D/V̇O2 relationship. It was found that the high responder group had relative
hyper-perfusion for a given exercise demand and reduced accumulated fatigue during a 70% peak
exercise test. Hyper-perfusion (i.e., a more optimal O2D/V̇O2) in the high responder group was
attributed to a greater FVC throughout submaximal exercise. This is in line with the directional
hypothesis of the current thesis that a higher O2D/V̇O2 relationship results in a reduced
accumulated fatigue in fatiguing exercise. Surprisingly, hyper-perfusion in the high responder
group was not associated with greater peak V̇O2 or work rate.
5.2 FBF and O2D/V̇O2 Interaction on Fatigability
High responders have a relative hyper-perfusion for a given V̇O2 compared to low
responders within the study population. The finding that high responders have a reduced

88
accumulated fatigue during a 70% peak exercise test is in line with studies that have manipulated
O2D within participants and observed an effect on fatigue progression (Eiken & Tesch, 1984;
Fulco et al., 1994; Fulco et al., 1996; Hogan et al., 1999). Specifically, these studies demonstrate
that within a person, decreasing O2D reduces time to fatigue to compromise performance while
increasing O2D elongates time to fatigue to ameliorate performance. A reduction in O2D,
achieved by breathing hypoxic gas, has been shown to increase the rate of fatigue in human knee-
extensor exercise (Eiken & Tesch, 1984; Fulco et al., 1996) and in repetitive human adductor
pollicis (thumb adduction) muscle contractions (Fulco et al., 1994). A reduction in O2D has also
been shown to decrease the time to fatigue in human knee-extensor exercise (Fulco et al., 1996),
and in human plantar flexion exercise (Hogan et al., 1999). On the contrary, an increase in O2D
by increasing the red blood cell count through injection of packed erythrocytes in in situ canine
gastrocnemius muscle, decreased the rate of fatigue during tetanic contractions (Frisbee et al.,
1999). An increase in O2D, achieved by breathing hyperoxic gas, has also been shown to increase
the time to fatigue in human plantar-flexion exercise (Hogan et al., 1999).
Traditionally manipulations of O2D are performed within a person to study the effects of
O2D on fatigue progression and exercise performance. Recent data from our laboratory
demonstrated that differences between individuals in their ability to restore O2D to demand
matching upon a perturbation in small muscle mass exercise affects exercise performance
(Bentley et al., 2014; Bentley et al., 2017). As well, Kellawan et al., (2014) demonstrated that
blood flow responses predicted critical power, the highest sustainable rate of aerobic metabolism.
Together, these data with that of the current thesis suggests that O2D to demand matching may be
more optimally achieved in certain individuals than others and that differences in matching
contribute to inter-individual differences in muscle fatigue progression.
Oxygen impacts muscle fatigue through its role in skeletal muscle bioenergetics, as
explained in Chapter 2. To reiterate, the Net Drive Hypothesis explains how muscle V̇O2 can be
maintained when oxygen delivery is altered. According to the Fick equation,V̇O2 = FBF x [CaO2
89
– CvO2], where FBF is forearm muscle blood flow, CaO2 and CvO2 are arterial and venous
oxygen content respectively, and CaO2 – CvO2 is the amount of oxygen that is extracted from the
blood by the working muscle. This hypothesis states that aerobic ATP production is a function of
the net drive of intracellular oxygen (PcellO2), the Phosphorylation Potential [ATP] / [ADP][Pi],
and the Redox Potential [NADH]/[NAD+] and that changes in one driver can be compensated for
by changes in the other drivers to maintain aerobic ATP production (Haseler et al., 1998; Hogan
et al., 1992; Hogan et al., 1999; Wilson et al., 1977). With less PcellO2 and a greater contribution
from other drivers, there is reduced exercise capacity due to the increased intracellular
concentrations of Pi and ADP. Increases in Pi decrease contractile function (Cooke & Pate, 1990)
by reducing cross-bridge force production and sarcoplasmic reticulum Ca2+ release (Dahlstedt &
Westerblad, 2001; Duke & Steele, 2000). Moreover, with increased intracellular [ADP] and [Pi],
glycolysis is stimulated, resulting in a greater rate of pyruvate production than conversion to
Acetyl-CoA by pyruvate dehydrogenase. This in turn increases the rate of accumulation of [La-]
and [H+] in the exercising muscles. Collectively, these changes serve to increase the rate of
development of skeletal muscle fatigue, resulting in a limitation in human exercise performance
(Eiken & Tesch, 1984; Fulco et al., 1994; Fulco et al., 1996; Hogan et al., 1999).
While the blood supply is necessary for the delivery of oxygen to the muscle, it is also
important for the removal of the muscles’ waste products (Adrian P. Harriso et al., 2008). With
the loss in force that occurs with metabolic waste accumulation, adequate waste removal during
exercise is necessary to sustain a given muscle contraction. The higher perfusion in the high
responder group relative to the low responder group is therefore likely causing a greater wash out
of metabolic accumulation, contributing to a greater performance in the high responder group
relative to the low responder group.

90
5.3 Forearm Volume, Maximum Voluntary Contraction (MVC), Peak IET Impulse,
Peak V̇O2, and Peak Oxygen Delivery (O2D) Achieved
The primary focus of the current study was to identify the existence of relative hyper-
perfusion and hypo-perfusion phenotypes in response to a given exercise challenge. A secondary
focus was to identify characteristics that could explain why individuals have different relative
levels of perfusion for a given exercise intensity. The differences detected in IET and in FI
between high and low responder groups were not a function of MVC, forearm volume, peak
impulse, peak V̇O2, or peak O2D achieved in IET.
5.3.1 MVC
Studies have established that MVC is not related to metabolic exercise intensity variables
(i.e., Pi and H+) (Saugen et al., 1997; Kellawan et al., 2014; Kent-Braun et al., 1993). For
example, Kent-Braun et al. (1993) used a progressive ankle flexion exercise test from 10% MVC
to 80% MVC, with an MVC performed at the beginning of each stage. The decrease in MVC was
used to assess fatigue. They found that the relationship between force and Pi/PCr (MVC/(Pi/PCr)
was very variable between subjects, with the slope ranging from 85-167%. Saugen et al., (1997)
also found substantial inter-individual differences in time course and magnitude of PCr and pH
changes during 40% MVC exercise in otherwise similar participants. Kellawan et al., 2014 found
no relationship between MVC and forearm critical power (maximal effort rhythmic isometric
handgrip exercise), with oxygen delivery being the biggest predictor of performance on the
critical power. These studies reinforce that MVC is not a function of metabolic demand or of
oxygen delivery. MVC is a function of the cross-sectional area (i.e., forearm volume), the
percentage of fast-twitch muscle fibers, and the number of motor units activated of the exercising
muscle fibers (Herbert & Gandevia, 1996; Todd et al., 2003, Wilson & Murphy 1996).
91
5.3.2 Forearm Volume
The findings of the current thesis demonstrate that inter-individual differences in muscle
mass did not account for inter-individual differences in FBF or O2D. A study by Mortesen et al.,
(2008), although not the primary focus of the study, demonstrated that with greater muscle mass
and an effectively greater cross-sectional area of muscle recruited, there were no differences in
leg blood flow (LBF) or in O2D. This group of researchers had participants engage in both single-
leg knee extension and two-leg cycling exercise. Within subject LBF and O2D for a given V̇O2
was not different between the two exercise modalities even though the muscle mass recruited for
each modality was different. In line with these findings, inter-individual differences in muscle
mass between participants likely does not contribute to inter-individual differences in FBF of the
current study.
5.3.3 Impulse, V̇O2, and O2D in IET
Peak impulse, peak V̇O2, and peak O2D achieved in IET were also not different between
high and low responder groups. Peak V̇O2, and peak O2D increase in proportion to exercise
intensity (i.e., peak impulse achieved) (Jasperse et al., 1994; Richardson et al., 1995, Wagner,
2012, Wajner & Goodman, 2011). Similarly to the results of the current study, Jasperse et al.,
(1994) found that peak FBF responses during incremental handgrip exercise to exhaustion was
not different between younger and older subject groups. During increasing submaximal handgrip
contractions, the older subjects had greater FBF responses for a given workload that reached
significance with increasing workloads. Seeing as FBF dictates O2D, these data serve to
demonstrate that although the absolute peaks in O2D may be similar between the high and low
responder groups, their delivery at a submaximal exercise may still differ.
A surprising finding from the current study was that the low responder group, with lower
relative changes in O2D from baseline, were achieving greater peak V̇O2 (although not
statistically significant). This is a surprising finding given that O2D is thought to limit peak
92
capacity (Eiken & Tesch, 1984; Fulco et al., 1994; Fulco et al., 1996). With high responders
having a higher relative O2D, we would predict that their PCr reduction per increase in work rate
would be less (Haseler et al., 1998; Hogan et al., 1992; Hogan et al., 1999; Wilson et al., 1997),
causing them to achieve a higher peak work rate. However, peak work rate was actually greater in
our low responder group. It is plausible that peak V̇O2 is lower in high responders as MVC (r2
0.837, p=0.0039) was a strong contributor for peak IET. Upon normalizing the peak IET impulse
to the baseline strength of the participant (MVC), it was apparent that the responder groups
achieved the same percentage of their MVC at IET peak (Difference = 2%, p = 0.854). This
finding is surprising seeing as the low responder group would be expected to achieve IET peak at
a lower percentage of their MVC than the high responder group since they are relatively under
perfused. I am unable to explain why we do not see the expected results, however, the absence of
statistical difference between the high and low responder groups may be a result of the small
sample size and of the variability in the maximum IET stage and MVC achieved between the
participants in these groups (Figure 30 Panel B and Panel C). In other words, in a given group,
the variability in peak IET stage and in MVC was large in small sample populations.
5.4 Vascular Conductance (FVC), Mean Arterial Pressure (MAP), and Forearm
Blood Flow (FBF)
5.4.1 Peak Responses
Similarities between peak FBF were briefly addressed in light of findings from Jasperse
et al., (1994). This study also found similar results for peak FVC. They found that peak FVC
responses during incremental handgrip exercise to exhaustion were not different between younger
and older subject groups. During increasing submaximal handgrip contractions, the older
participants had greater FVC changes from baseline than younger participants that reached
significance with increasing workloads. They found that measurements of mean arterial pressure
were not different at peak of incremental handgrip exercise test between the two groups. They

93
also found that mean arterial pressure throughout all submaximal workloads was not different
between the two groups. With greater changes in FVC and in FBF in the older men, these authors
associated the change in FBF with a greater vasodilatory response as opposed to a greater pressor
response. Bentley et al., (2017) also found that the non-compensator and compensator phenotypes
determined by responses to a perfusion pressure challenge had the same peak vasodilatory
capacity. The two phenotype response groups had the same peak forearm vascular conductance in
exercise and in response to ischemic exercise, used to induce maximal vasodilation.
These findings are in line with those of the current thesis since peak FBF, FVC, and MAP
responses were not different between high and low responder groups. At any given V̇O2 however,
changes in FBF were greater in the high responder group compared to the low responder group,
reaching significance at higher workloads. Similarly, to Jasperse et al., (1994), these changes in
FBF were attributed to changes in FVC and not in MAP.
5.4.2 Comparing Changes in FBF, FVC, and MAP at Relative Intensities
FBF and FVC were not different between high and low responder groups at any given
relative workload (p<0.05). Similar findings were found be Jasperse et al., (1994) who
demonstrated that at a given percentage of the maximum workload, FBF and FVC were not
different between their young and old exercising groups. While we are comparing only young,
healthy individuals in the current study, Jasperse et el., (1994) found that only at a given exercise
intensity were FBF and FVC differences observed between their two groups.
At a relative workload of 75% and 100% of peak IET, MAP was greater in low
responders compared to high responders. This finding fits with the theory that there is a pressor
response due to metabolic stress and central command. When there are increases in the motor
drive to maintain force during (1) fatigue or (2) a reduced convective O2D, the central command
remains active in proportion to this increase in motor drive. This would increase the cardiac and
arterial blood pressure responses, according to the information provided in Chapter 2.

94
Relative comparisons are important, as they allow us to compare individuals with
different exercise capacities. When assessing relative to an individual’s peak, it makes sense that
the differences in the cardiovascular variables are less? apparent, because the metabolic stress on
the individual is standardized to their maximum capacity.
5.4.3 Comparing Absolute Changes in FBF, FVC, and MAP
The absolute change in forearm blood flow (FBF) from baseline V̇O2 to 15-35 mL O2/min
was greater in the high responder group (p<0.05), resulting in the greater absolute change in O2D
from baseline to 5-35 mL· O2/min in the high responder group (p < 0.01). The hyper-perfusion in
the high responder group can be attributed to a greater FVC, since the change in FVC from
baseline V̇O2 to 20-35 mL O2/min was greater in the high responder group compared to the low
responder group (p<0.05). The hyper-perfusion in the high responder group is not attributable to
greater MAP since the absolute change in MAP from baseline V̇O2 to 5-35 mL O2/min was not
different between high and low responder groups (p>0.05).
We were most interested in assessing the differences in the absolute measures of the
cardiovascular response to increasing exercise intensities. This was because it was important to
know how well the muscle’s demand for oxygen was met at a given oxygen demand and
therefore at a given absolute exercise intensity. Identifying the adjustments of the cardiovascular
system during a range of exercise intensities allowed us to assess how well the matching of
oxygen delivery to demand in the exercise muscle was achieved in our high and low responder
groups. This allowed us to assess if there were important differences between individuals in the
mechanisms involved in this matching and in their effectiveness at a given metabolic demand.
There are several possible explanations as to why the high responder groups may be
experiencing a greater relative hyper-perfusion compared to the low responders. The high
responder group either has a greater magnitude of vasodilatory metabolite release (i.e., adenosine)
or a greater responsiveness to them compared to the low responder group. When muscle blood
95
flow and oxygen delivery is reduced relative to the oxygen demand, there is a greater metabolite
build up in the muscle cell. These metabolites would diffuse into the interstitial space and cause
vasodilation to increase muscle blood flow and oxygen delivery until delivery matches demand.
However, if the magnitude of metabolite release or the responsiveness to the metabolite build up
is reduced in an individual (i.e., low responders), then this person would not restore blood flow
and would have a lower blood flow response to the same demand. The same is true for the RBC
oxygen sensory mechanism. In a low responder with lower change in FVC and in O2D, the
magnitude of response of this mechanism in terms of ATP release, or in terms of responsiveness
to the ATP effects, could be reduced.
Another possible explanation as to why high responders have a greater change in FVC for
a given exercise demand may be due to the effectiveness of their functional sympatholysis to
blunt sympathetic restraint. In a low responder, perhaps there is a less effective functional
sympatholysis to blunt sympathetic restraint than the high responders, rendering a less of a
change in FVC and in O2D from baseline.
5.5 Strengths
5.5.1 Individual Response Data
This study is one of only a handful of studies to explore individual response data in the
mechanisms governing oxygen delivery demand matching (Bentley et al., 2014; Bentley et al.,
2017; Kellawan et al., 2011). The best asset of this study is that individual oxygen delivery
demand matching ratios were quantified from multiple incremental exercise tests. With multiple
trials used to characterize the participants’ response phenotype, we can be confident in
identification of individuals as being different in their oxygen delivery demand matching slope.

96
5.5.2 Multiple Trials and Confidence Intervals
Multiple trials provide a “regressing to the mean” effect. This is where the more trials one
does, the more the average of the trials closes in on the true mean (Barnett et al., 2005). As
explained in Chapter 2 of this thesis, using multiple trials improves the reliability of a clinical
measurement (Koppenhaver et al., 2009).
With the use of multiple trials, the current study was able to use a 95% confidence
interval (CI) around the mean of measurements. By comparing CI of different O2D/V̇O2 means,
we can identify if the means are from the same or from different ‘populations’, in our case of
having either a high O2D/V̇O2 or a low O2D/V̇O2, specific to the distribution of our sample
population. Using 95% CI is also advantageous as it helps to remove participants from the study
that had large variability around their mean O2D/V̇O2. When multiple measurements of the same
quantity on a given participant are different, the sources of these differences are from natural
variation in the participant, from variation in the measurement process, or both. Large trial to trial
variability in the current study are likely due to measurement error as opposed to natural
physiological fluctuations. This is because our participants’ health is not changing and because
collection was completed within a three-week period for each participant. Participants with large
CI for their O2D/V̇O2 (likely due to measurement error) were consequently eliminated from the
analysis portion of the study as their CI overlapped with participants in both the high and low
responder groups.
Averaging Multiple IET
A linear model was used to average O2D/V̇O2. This model could appropriately provide us
with a constant slope in order to appropriately compare between participants. Furthermore,
increases in FBF during forearm exercise have been shown to follow a linear pattern (Andersen &
Saltin, 1985; Jasperse et al., 1994; Lind & Williams, 1979; Robergs et al., 1997; Saltin and
Radegran, 1998; Saunders et al., 2005) supporting the use of a linear fit for FBF and for
97
O2D/V̇O2. Furthermore, with many data points throughout each individuals IET, linear
correlations for these data analysis passed Normality and Equal Variance tests. In contrast, each
IET MAP was fit to a polynomial quadratic regression and each IET FVC was fit to a sigmoidal
regression. Using a sigmoidal regression is appropriate as it has been demonstrated that FVC
plateaus before peak work rate in small muscle mass knee-extensor exercise (Mortensen et al.,
2008).
5.6 Limitations
5.6.1 Inability to Measure Intracellular Oxygen Levels
The outlined study investigates convective oxygen delivery, but is unable to measure and
determine diffusive oxygen delivery and intracellular oxygen levels. This is a limitation because
there can be metabolic differences (i.e., oxidative capacity of the muscle) that moderate the
degree of the disturbance when PcellO2 is less. It is the muscle’s intrinsic properties that can
contribute to oxidative capacity. These properties include number of capillaries, mitochondria,
and the fiber type composition.
Fiber type composition plays a large role in determining the mitochondria content. This is
because type 1 fibers are highly oxidative and contain more elaborate mitochondria networking,
whereas type 2 fibers are glycolytic, containing less elaborate mitochondria networking (Ogata &
Yamasaki, 2007). For example, someone with more type 1 fibers and a greater mitochondrial
content, can produce ATP through oxidative phosphorylation at a lower PcellO2 with less
intracellular disturbances. With less intracellular perturbation, force production can be maintained
with lowered perfusion. Walker et al., (1982) studied the metabolic effect of reducing exercising
muscle blood flow in different muscle types in in situ rat hind-limb. Reductions in blood flow and
O2D during sciatic nerve stimulation caused greater PCr degradation, greater decreases in
ATP/ADP, and greater increases in [lactate] and [lactate]/[pyruvate], compared to normal
perfusion, in the gastrocnemius muscle (glycolytic). In the soleus muscle (oxidative), the only

98
difference observed in a low perfusion state compared to a normal perfusion state was that there
was an increase in the [lactate]/[pyruvate]. These results demonstrate that oxidative muscle can
better compensate the metabolic challenges associated with a reduction in muscle blood flow.
Howlett & Hogan (2000), were able to demonstrate that type II glycolytic muscle fatigues much
more rapidly than type I oxidative muscle. In rat hind limb, the decline in force production and in
[PCr] was greater in gastrocnemius than soleus muscle in normoxia and in hypoxia.
Contrastingly, the soleus muscle had similar decline in force production and in [PCr] in normoxia
and in hypoxia.
Depending on the forearm muscle composition differences between individuals in the
current study, some may exhibit greater metabolic sensitivity and greater fatigability for a given
level of perfusion. Given the evidence in rodent fibers, this might be occurring in the current
study, seeing as human forearm muscle has been shown to be made up of both type I and type II
muscle fibers (Sadamoto et al., 1992). Therefore, there are other factors moderating the end effect
of convective O2D differences on PcellO2 and on how much disturbance happens if PcellO2 is
less.
5.6.2 Venous Blood Sampling
Oxygen utilization was calculated using the Fick equation: 𝑉O2 = FBF · (CaO2 – CvO2).
FBF is calculated based on the brachial artery diameter and the mean blood velocity, which are
measured using echo and Doppler ultrasound respectively. CaO2 – CvO2 are calculated based on
analysis of various blood constituents obtained from venous blood sampling. A limitation to the
current study is that the calculation CaO2 – CvO2 may be underestimated because venous blood
sampling cannot be obtained from exercising muscle alone. Although echo ultrasound imaging
was used to select a deep vein, blood flow from inactive tissues could be contributing to the
venous blood sample at this site.
99
5.6.3 Small Sample Size
It is recognized that the current thesis has a limited sample size, rendering our statistical
tests underpowered. We were only able to collect data from four participants in the low responder
group and from three participants in the high responder group. The concern with small sample
size is the inability to detect differences in our variables of interest between high and low
responder groups. Despite the small sample size, we clearly demonstrated the presence of inter-
individual differences in O2D/V̇O2. There are individuals with lower O2D/V̇O2 and individuals
with higher O2D/V̇O2 and these differences have a clear impact on exercise tolerance as proven
by our FI from FET. Due to our small sample size however, performing a valid Pearson
Correlation is unlikely, as it is based on sample size and four assumptions. The four assumptions
are that the data are continuous, that there is a linear relationship, that there are no outliers, and
that the sample population is normally distributed (Field, 2009). A correlation however was used
to determine if MVC predicted peak IET. It was found that they were highly correlated (r2 0.837,
p=0.0039). This linear regression failed the Constant Variance Test (P = 0.038). Constant
Variance indicates that when you plot the individual error against the predicted value (i.e.,
residuals), the variance of the error predicted value should be constant. The results of this test
should be interpreted cautiously since predictions with an unstable regression have the possibility
of being inaccurate. If sample size was larger, instead of using a directional hypothesis, a cause
and effect relationship could have been made (i.e., having a greater FI is a cause of having a low
O2D/V̇O2). Unfortunately, with such a small sample size, correlation statistics (as explained
above) must be interpreted with caution.
5.7 Areas for Future Research
An area for future research is to determine if those with less optimal oxygen delivery
demand matching can improve this matching using dietary nitrate supplementation (i.e., beetroot
juice). There is evidence that non-compensators can take on the compensator phenotype by
100
consuming beetroot juice upon a perturbation to oxygen delivery (Bentley et al., 2017). If oxygen
delivery demand matching can improve with dietary nitrate supplementation, then this can be
applied to improve low responder oxygen delivery deficits.
This study has many follow up questions that could be asked through a series of
investigations. Using the same cohort of participants, we could investigate if low responders
experience lower relative perfusion in small muscle mass exercise of the leg. This could also be
investigated in large muscle mass exercise. Lastly, this question could be extended to training
response phenotypes (i.e., does the high responder group respond better to training than the low
responders group?).
Lastly, the differences in rate of perceived exertion between high and low responder
groups could be investigated. This is based on the idea that with reductions in oxygen availability,
there is a compromise to exercise intensity and therefore to ATP demand, which requires either
an obligatory reduction in exercise intensity, or an increase in motor drive to maintain the work
rate. This is experienced as an increase in perceived effort. The maintenance of work rate is made
possible according to the net drive hypothesis, which dictates that with reductions in oxygen
availability, there are increases in phosphorylation and redox potentials to maintain a given
aerobic ATP demand and exercise intensity.
5.8 Implications of Findings
Finding inter-individual differences in oxygen delivery demand matching can influence
how future physiological research is conducted and analyzed, adding to a perspective of
averaging results across individuals to considering individual response data.
101
Chapter 6
SUMMARY AND CONCLUSIONS
6.1 Summary of MSc Research Experience
With my experience as a graduate student within the School of Kinesiology and Health
Studies at Queen’s University, I have greatly expanded my knowledge in the field of exercise
physiology. During my first year, I took classes focusing on the fundamentals of statistics,
cardiovascular and respiratory physiology, as well as complete an independent study. This
independent study allowed me to delve deeper into cardiovascular physiology, focusing on
sympathetic restraint and its role during submaximal exercise. I took on the role of a research
assistant, working with Robert Bentley, a PhD student in the lab. At this time, I learned how to
run a study, becoming proficient at using the computer equipment, drawing and analyzing blood
samples, as well as operating the ultrasound equipment. At the end of my first year, I travelled to
San Diego, California to attend my first Experimental Biology conference.
During the second year of my Master’s program I collaborated with Dr. Tschakovsky to
conceptualize and design the study protocol. I independently conducted a literature review for
rationale and contextualization of findings within the relevant literature. I had the opportunity to
present my research thesis proposal at the Ontario Exercise Physiology conference in Barrie,
Ontario. I completed all data acquisition, data analysis, and statistical analysis. Data interpretation
was done in collaboration with Dr. Tschakovsky. During the data acquisition process, I was
responsible for manipulating both of the ultrasound equipment.
6.2 Conclusion
Within a given individual, we know that experimentally manipulating oxygen delivery
alters cellular metabolism and the amount of change in the intracellular substances that cause
muscle fatigue and exercise intolerance (Amann et al., 2007; Hogan et al., 1994; Wilson &
102
Erecinska, 1985). The current thesis investigated how inter-individual differences in O2D for a
given exercise demand might impact exercise tolerance.
This was based of the idea that O2D demand matching is adequate at submaximal
intensities to support the required aerobic ATP production, but it may be more optimal in certain
individuals than others. This notion was reinforced by the studies that demonstrated that inter-
individual differences in cardiovascular responses to metabolic stressors in small muscle mass
exercise contributed to exercise performance differences between individuals (Bentley et al.,
2014; Bentley et al., 2017; Kellawan et al., 2014).
The purpose of the current study was to study the inter-individual differences in the
degree of oxygen matching between individuals, and to explore its significance to individual
exercise tolerance levels. It was hypothesized that would be inter-individual differences in
oxygen delivery/utilization ratios across a range of exercise intensities. It was further
hypothesized that the group with a higher oxygen delivery/utilization ratio (high responders)
would have a lesser accumulated fatigue in a fatigue inducing exercise test compared to the group
with the lower oxygen delivery/utilization ratio (low responders).
The current study found that there were inter-individual differences in O2D/V̇O2 that
were attributable to differences in FVC conductance. Individuals with high O2D/V̇O2 slope were
associated with having greater exercise tolerance in a forearm grip exercise model. This supports
the current hypothesis that inter-individual differences in O2D/V̇O2 slope impact fatigability.

103
References
Abbiss CR, Peiffer JJ, Meeusen R, and Skorski S. (2015) Role of Ratings of Perceived
Exertion during Self-Paced Exercise: What are We Actually Measuring? Sports Med 45:
1235- 1243.
Adams GR, Fisher MJ, Meyer RA. (1991). Hypercapnic acidosis and increased H2PO 4
concentrations do not decrease force in cat skeletal muscle. Am J Physiol Cell Physiol
260: C805–C812.
Adrian P. Harrison, Stefan G. Pierzynowski, Jens Risbo, & Dagmar A. Bruggemann.
(2008). Muscle Contraction and Force: the Importance of an Ancillary Network, Nutrient
Supply and Waste Removal. International Journal of Molecular Sciences, 9, 8, 1472-
1488.
Amann M, Romer LM, Subudhi AW, Pegelow DF, and Dempsey JA. (2007). Severity of
Arterial hypoxaemia affects the relative contributions of peripheral muscle fatigue to exercise
performance in healthy humans. J Physiol 581: 389-403.
Andersen P, and Saltin B. (1985). Maximal perfusion of skeletal muscle in man. J Physiol 366:
233 249.
Arai Y, Saul JP, Albrecht P, Hartley LH, Lilly LS, Cohen RJ, and Colucci WS. (1989)
Modulation of cardiac autonomic activity during and immediately after exercise. Am J
Physiol 256: H132-141.
Assendelft, O. W. (1970). Spectrophotometry of haemoglobin derivatives. Assen: Van Gorcum.
Barnett, A. G., van, . P. J. C., & Dobson, A. J. (2005). Regression to the mean: what it is and
How to deal with it. International Journal of Epidemiology, 34, 1, 215-20.
Bassett, D. R. J., & Howley, E. T. (2000). Limiting factors for maximum oxygen uptake and
determinants of endurance performance. Medicine and Science in Sports and Exercise,
32, 1, 70-84.
Baudry S, Klass M, Pasquet B & Duchateau J. (2007). Age-related fatigability of the ankle
dorsiflexor muscles during concentric and eccentric contractions. Eur J Appl Physiol 100,
515–526.
Bentley R, Hong T, Poitras V, Kellawan JM, Pak M, Jazuli F, Chung B, and Tschakovsky
ME. (2011). Challenging O2 delivery: metabolism coupling in small muscle mass
exercise. FASEB J 25: 1023.1024.
104
Bentley RF, Kellawan JM, Moynes JS, Poitras VJ, Walsh JJ, and Tschakovsky ME.
(2014). Individual susceptibility to hypoperfusion and reductions in exercise performance
when perfusion pressure is reduced: evidence for vasodilator phenotypes. J Appl Physiol
(1985) 117: 392-405.
Bentley, R. F., Walsh, J. J., Drouin, P. J., Velickovic, A., Kitner, S. J., Fenuta, A. M., &
Tschakovsky, M. E. (2017). Dietary nitrate restores compensatory vasodilation and
exercise capacity in response to a compromise in oxygen delivery in the non-compensator
phenotype. Journal of Applied Physiology (bethesda, Md. : 1985).
Bigland-Ritchie, B., Cafarelli, E. and Vøllestad, N.K. (1986a). Fatigue of submaximal static
contractions, Acta Physiol. Scand., 128: 137 – 148.
Bigland-Ritchie B, Furbush F & Woods JJ. (1986b). Fatigue of intermittent submaximal
voluntary contractions: central and peripheral factors. J Appl Physiol 61, 421–429.
Bigland-Ritchie, B., Johansson, R., Lippold, O. C., & Woods, J. J. (1983). Contractile speed
And EMG changes during fatigue of sustained maximal voluntary contractions. Journal
of Neurophysiology, 50, 1, 313-24.
Bigland-Ritchie, B., & Woods, J. J. (1984). Changes in muscle contractile properties and
neural control during human muscular fatigue. Muscle & Nerve, 7, 9.
Borg G. (1970). Perceived exertion as an indicator of somatic stress. Scand J Rehabil Med 2: 92-
98.
Boushel R. (2010). Muscle metaboreflex control of the circulation during exercise. Acta Physiol
(Oxf) 199: 367-383.
Brodal P, Ingjer F, and Hermansen L. (1977). Capillary supply of skeletal muscle fibers in
Untrained and endurance-trained men. Am J Physiol 232: H705-712.
Buckwalter JB, Clifford PS. (1999). alpha-adrenergic vasoconstriction in active skeletal
muscles during dynamic exercise. Am J Physiol 277: H33–9.
Buckwalter, J. B., Naik, J. S., Valic, Z., & Clifford, P. S. (2001). Exercise attenuates alpha
Adrenergic receptor responsiveness in skeletal muscle vasculature. Journal of Applied
Physiology (bethesda, Md. : 1985), 90, 1, 172-8.
Burke, R. E., D. N. Levine, F. E. Zajac, P. Tsairis, and W. K. Engel. (1971). Mammalian
Motor units: Physiologi- cal-histochemical correlation in three types in cat
gastrocnemius. Science 174: 709-712, 1971.
Calbet JA, Lundby C, Koskolou M, and Boushel R. (2006). Importance of hemoglobin
concentration to exercise: acute manipulations. Respir Physiol Neurobiol 151: 132
140.
105
Casey DP, Curry TB, Wilkins BW, Joyner MJ. (2011). Nitric oxide-mediated vasodilation
Becomes independent of beta-adrenergic receptor activation with increased intensity of
hypoxic exercise. J Appl Physiol 110: 687–694, 2011.
Chilibeck PD, Paterson DH, Cunningham DA, Taylor AW, and Noble EG. (1997). Muscle
capillarization O2 diffusion distance, and VO2 kinetics in old and young individuals. J
Appl Physiol 82: 63-69.
Clifford PS, Kluess HA, Hamann JJ, Buckwalter JB, and Jasperse JL. (2006). Mechanical
compression elicits vasodilatation in rat skeletal muscle feed arteries. J Physiol 572: 561-
567.
Cooke, R., and E. Pate. (1990). The inhibition of muscle contraction by the products of ATP
hydrolysis. In: Bio chemistry of Exercise. VII, edited by A.W. Taylor, P.O. Gollnick, HJ.
Green, C.D. lanuzzo, E.G. Noble, G. Metivier, and J.R. Sulton. Champaign, II, USA:
Human Kinetics, pp. 59-72.
Crecelius AR, Kirby BS, Voyles WF, Dinenno FA. (2011). Augmented skeletal muscle
hyperaemiaduring hypoxic exercise in humans is blunted by combined inhibition of nitric
oxide and vasodilating prostaglandins. J Physiol (Lond) 589: 3671–3683.
Crecelius, A. R., Richards, J. C., Luckasen, G. J., Larson, D. G., & Dinenno, F. A. (2013).
Reactive hyperemia occurs via activation of inwardly rectifying potassium channels and
Na+/K+-ATPase in humans. Circulation Research, 113, 8, 1023-32.
Dahlstedt, A. J., & Westerblad, H. (2001). Inhibition of creatine kinase reduces the
rate of fatigue-induced decrease in tetanic [Ca2+] in mouse skeletal muscle. Journal
of Physiology, 533, 3, 639-649.
Dolmage, T., & Cafarelli, E. (1991). Rate of fatigue during repeated submaximal contractions
of human quadriceps muscle. Canadian Journal of Physiology and
Pharmacology, 69, 10, 1410-5.
Duke AM, Steele DS. (2000). Characteristics of phosphate-induced Ca2+ efflux from the SR in
mechanically skinned rat skeletal muscle fibers. Am J Physiol 278:C126–C135.
Edstrom, L. and E. Kugelberg. (1968). Histochemical composition, distribution of fibres and
fatiguability of single motor units. Anterior tibial muscle of the rat. Neurol.
Neurosurg. Psychiatrv 31: 424-433.
Edwards, R. H., Hill, D. K., & Jones, D. A. (1975). Heat production and chemical changes
During isometric contractions of the human quadriceps muscle. The Journal of
Physiology, 251, 2, 303-15.
Edwards RH, Melcher A, Hesser CM, Wigertz O, and Ekelund LG. (1972). Physiological

106
correlates of perceived exertion in continuous and intermittent exercise with the same
average power output. Eur J Clin Invest 2: 108-114.
Eiken, O. (1988). Effects of increased muscle perfusion on responses to dynamic leg exercise in
man. Eur. J. Appl. Physiol. 57: 772-776.
Eiken O, Bjurstedt H. (1987). Dynamic exercise in man as influenced by experimental
restriction of blood flow in the working muscles. Acta. Physiol. Scand. 131: 339-345.
Eiken, O., & Tesch, P. A. (1984). Effects of hyperoxia and hypoxia on dynamic and sustained
static performance of the human quadriceps muscle. Acta Physiologica
Scandinavica, 122, 4, 629-633.
Eves ND, Petersen SR, and Jones RL. (2002). The effect of hyperoxia on submaximal exercise
With the self-contained breathing apparatus. Ergonomics 45: 840-849.
Faulkner, J., & Eston, R. (2007). Overall and peripheral ratings of perceived
exertion during a graded exercise test to volitional exhaustion in individuals of high and
low fitness. European Journal of Applied Physiology, 101, 5, 613-620.
Field, A. P. (2009). Discovering statistics using SPSS: (and sex and drugs and rock 'n' roll). Los
Angeles [i.e. Thousand Oaks, Calif.: SAGE Publications.
Fitzpatrick R, Taylor JL, McCloskey DI. (1996). Effects of arterial perfusion pressure on
Force production in working hand muscles. J. Physiol. 495: 885-891.
Folkow B, Gaskell P, and Waaler BA. (1970). Blood flow through limb muscles during heavy
rhythmic exercise. Acta Physiol Scand 80: 61-72.
Frisbee, J. C., Murrant, C. L., Wilson, B. A., & Barclay, J. K. (1999). Polycythemia
decreases fatigue in tetanic contractions of canine skeletal muscle. Medicine and Science
in Sports and Exercise, 31, 9, 1293-8.
Fulco CS, Cymerman A, Muza SR, Rock PB, Pandolf KB, Lewis SF. (1994). Adductor
pollicis muscle fatigue during acute and chronic altitude exposure and return to sea level.
J Appl Physiol. 77:179–83.
Fulco CS, Lewis SF, Fryman PN, et al. (1996). Muscle fatigue and exhaustion during
dynamic leg exercise in normoxia and hypobairc hypoxia. J Appl Physiol. 81:1891–900.
Gallagher KM, Fadel PJ, Smith SA, Norton KH, Querry RG, Olivencia-Yurvati A, and
Raven PB. (2001). Increases in intramuscular pressure raise arterial blood pressure
during dynamic exercise. J Appl Physiol 91: 2351-2358.
Gandevia SC and Hobbs SF. (1990). Cardiovascular responses to static exercise in man:
central and reflex contributions. Journal of Physiology. 430: 105-117.
Gandevia SC, Killian K, McKenzie DK, et al. (1993). Respiratory sensations, cardiovascular

107
control, kinaesthesia and transcranial stimulation during paralysis in humans. Journal of
Physiology. 470: 85-107.
Gill RW. (1985). Measurement of blood flow by ultrasound: accuracy and sources of error.
Ultrasound Med Biol 11: 625-641.
Gillach MC, Sallis JF, Buono MJ, Patterson P, and Nadar PR. (1989). The Relationship
Between Perceived Exertion and Heart Rate in Children and Adults. Pediatric Exercise
Science 1: 360-368.
González-Alonso J, Mortensen SP, Dawson EA, Secher NH, Damsgaard R. (2006).
Erythrocytes and the regulation of human skeletal muscle blood flow and oxygen
delivery: role of erythrocyte count and oxygenation state of haemoglobin. J Physiol
(Lond) 572: 295–305.
González-Alonso J, Olsen DB, Saltin B. (2002). Erythrocyte and the regulation of human
Skeletal muscle blood flow and oxygen delivery: role of circulating ATP. Circ Res 91:
1046–1055.
Gonzalez-Alonso J, Richardson RS, and Saltin B. (2001). Exercising skeletal muscle blood
flow in humans responds to reduction in arterial oxyhaemoglobin, but not to altered free
oxygen. J Physiol 530: 331-341.
Goodwin GM, McCloskey DI, and Mitchell JH. (1972). Cardiovascular and respiratory
responses to changes in central command during isometric exercise at constant muscle
tension. J Physiol 226: 173-190.
Hansen, J., Thomas, G. D., Harris, S. A., Parsons, W. J., & Victor, R. G. (1996). Differential
sympathetic neural control of oxygenation in resting and exercising human skeletal
muscle. The Journal of Clinical Investigation, 98, 2, 584-96.
Hansen J, Thomas GD, Jacobsen TN, and Victor RG (1994). Muscle metaboreflex triggers
parallel sympathetic activation in exercising and resting human skeletal muscle. Am J
Physiol 266: H2508-2514.
Haseler, L. J., Richardson, R. S., Videen, J. S., & Hogan, M. C. (1998). Phosphocreatine
hydrolysis during submaximal exercise: the effect of FIO2. Journal of Applied
Physiology (bethesda, Md. : 1985), 85, 4, 1457-63.
Hearn J, Cahill F, Behm DG. (2009). An inverted seated posture decreases elbow flexion force
And muscle activation. Eur. J. Appl. Physiol. 106: 139-147.
Herbert RD, Gandevia SC. (1996). Muscle activation in unilateral and bilateral efforts assessed
by motor nerve and cortical stimulation. J Appl Physiol 80: 1351-1356.
108
Hepple RT. The role of O2 supply in muscle fatigue. Can. J. Appl. Physiol. 27: 56-69, 2002.
Hills, ., Byrne, ., & Ramage,. (1998). Submaximal markers of exercise intensity. Journal of
Sports Sciences, 16, 4, 71-76.
Hobbs SF and Gandevia SC. (1985). Cardiovascular responses and the sense of effort during
Attempts to contract paralyzed muscles: role of the spinal cord. Neuroscience Letters.
57: 85-90.
Hogan MC, Gladden LB, Kurdak SS, Poole DC. (1995). Increased [lactate] in working dog
muscle reduces tension development independent of pH. Med Sci Sports Exercise 27:
371–377.
Hogan MC, Kurdak SS, Arthur PG. (1996). Effect of gradual reduction in O2 delivery on
Intracellular homeostasis in contracting skeletal muscle. J. Appl. Physiol. 80: 1313-
1321.
Hogan MC, Richardson RS, and Kurdak SS. (1994). Initial fall in skeletal muscle force
Development during ischemia is related to oxygen availability. J Appl Physiol (1985) 77:
2380- 2384.
Hogan MC, Richardson RS, and Haseler LJ. (1999). Human muscle performance and PCr
Hydrolysis with varied inspired oxygen fractions: a 31P-MRS study. J Appl Physiol
(1985) 86: 1367 1373.
Hogan, M. C., & Welch, H. G. (1986). Effect of altered arterial O2 tensions on muscle
metabolism in dog skeletal muscle during fatiguing work. The American Journal of
Physiology, 251, 2, 216-22.
Howlett RA., and Hogan MC. (2000). Differential fatigue rates of muscle fiber types in
response to hypoxia. Physiologist, 43(4): 358.
Humphreys, P. W., & Lind, A. R. (1963). The blood flow through active and inactive muscles
of the forearm during sustained hand-grip contractions. The Journal of
Physiology, 166, 120-35.
Hunter SK, Critchlow A, Shin IS & Enoka RM. (2004). Men are more fatigable than strength
matched women when performing intermittent submaximal contractions. J Appl Physiol
96, 2125–2132.
Jacobs DR, Jr., Ainsworth BE, Hartman TJ and Leon AS. (1993). A simultaneous evaluation
of 10 commonly used physical activity questionnaires. Med Sci Sports Exerc 25: 81-91.
Jagger, J. E., Bateman, R. M., Ellsworth, M. L., & Ellis, C. G. (2001). Role of erythrocyte in
regulating local O2 delivery mediated by hemoglobin oxygenation. American Journal of
Physiology. Heart and Circulatory Physiology, 280, 6, 2833-9.

109
Jasperse, J. L., Seals, D. R., & Callister, R. (1994). Active forearm blood flow adjustments to
handgrip exercise in young and older healthy men. The Journal of Physiology, 474, 2,
353-60.
Jöbsis, F. F. (1977). Noninvasive, infrared monitoring of cerebral and myocardial oxygen
sufficiency and circulatory parameters. Science (new York, N.y.), 198, 4323, 1264-7.
Jubran A. (1999). Pulse oximetry. Critical Care. 3(2): R11-R17.
Karlsson J, Funderburk CF, Essen B, Lind AR. (1975). Constituents of human muscle in
isometric fatigue. J Appl Physiol 38: 208–211.
Kaufman MP, and Hayes SG. (2002). The exercise pressor reflex. Clin Auton Res 12: 429-439.
Kellawan, J. M., Bentley, R. F., Bravo, M. F., Moynes, J. S., & Tschakovsky, M. E. (2014).
Does oxygen delivery explain interindividual variation in forearm critical
impulse?. Physiological Reports, 2, 11.
Kent-Braun JA, Miller RG, Weiner MW. (1993). Phases of metabolism during progressive
exercise to fatigue in human skeletal muscle. J Appl Physiol 75: 573-580.
Kim JK, Sala-Mercado JA, Rodriguez J, Scislo TJ, and O'Leary DS. (2005). Arterial
Baroreflex alters strength and mechanisms of muscle metaboreflex during dynamic
exercise. Am J Physiol Heart Circ Physiol 288: H1374-1380.
Kirby BS, Carlson RE, Markwald RR, Voyles WF, and Dinenno FA. (2007). Mechanical
influences on skeletal muscle vascular tone in humans: insight into contraction-induced
rapid vasodilatation. J Physiol 583: 861-874.
Koppenhaver, S. L., Parent, E. C., Teyhen, D. S., Hebert, J. J., & Fritz, J. M. (2009). The
effect of averaging multiple trials on measurement error during ultrasound imaging of
transversus abdominis and lumbar multifidus muscles in individuals with low back
pain. The Journal of Orthopaedic and Sports Physical Therapy, 39, 8, 604-611.
Kugelberg, E. and B. Lindegren. (1979). Transmission and contraction fatigue of rat motor
Units in relation to succinate dehydrogenase activity of motor unit fibres.
1.Physiol.(Lond.) 288: 285-300.
Laughlin MH. (1987). Skeletal muscle blood flow capacity: role of muscle pump in exercise
hyperemia. Am J Physiol 253: H993-1004.
Lechner, A. J., Matuschak, G. M., & Brink, D. S. (2012). Respiratory: An integrated
approach to disease. New York: McGraw-Hill Medical.
Leshnower BG, Potts JT, Garry MG, Mitchell JH. (2001). Reflex cardiovascular responses
Evoked by selective activation of skeletal muscle ergoreceptors. Journal of Applied

110
Physiology. 90: 308-316.
Lind, A. R., & Williams, C. A. (1979). The control of blood flow through human
forearm muscles following brief isometric contractions. The Journal of
Physiology, 288, 1, 529-549.
MacNutt MJ, Peters CM, Chan C, Moore J, Shum S, and Sheel AW. (2015). Day-to-day
Variability in cardiorespiratory responses to hypoxic cycle exercise. Appl Physiol Nutr
Metab 40: 155-161.
Merton PA. (1954). Voluntary strength and fatigue. J Physiol 123, 553–564.
Mortensen SP, Damsgaard R, Dawson EA, Secher NH, and Gonzalez-Alonso J. (2008).
Restrictions in systemic and locomotor skeletal muscle perfusion, oxygen supply and
VO2 during high-intensity whole-body exercise in humans. J Physiol 586: 2621-2635.
Mortensen SP, Dawson EA, Yoshiga CC, Dalsgaard MK, Damsgaard R, Secher NH,
González-Alonso J. (2005). Limitations to systemic and locomotor limb muscle oxygen
delivery and uptake during maximal exercise in humans. J Physiol (Lond) 566: 273–
285.
Murrant CL, and Sarelius IH. (2000). Coupling of muscle metabolism and muscle blood
flow in capillary units during contraction. Acta Physiol Scand 168: 531-541.
Nemeth, P. M., D. Pelte, and G. Vrbova. (1981). Comparison of enzyme activities among
Single muscle fibres within defined motor units. Physiol.(Lond.) 311: 489-495.
Nordsborg, N. B., Lundby, C., Leick, L., & Pilegaard, H. (2010). Relative workload
determines exercise-induced increases in PGC-1alpha mRNA. Medicine and Science in
Sports and Exercise, 42, 8, 1477-84.
Ogata, T., & Yamasaki, Y. (1997). Ultra-high-resolution scanning electron microscopy of
mitochondria and sarcoplasmic reticulum arrangement in human red, white, and
intermediate muscle fibers. The Anatomical Record, 248, 2, 214-223.
O'Leary, D. S. (1993). Autonomic mechanisms of muscle metaboreflex control of heart
rate. Journal of Applied Physiology (bethesda, Md. : 1985), 74, 4, 1748-54.
Perrey, S., Tschakovsky, M. E., & Hughson, R. L. (2001). Muscle chemoreflex elevates
muscle blood flow and O2 uptake at exercise onset in nonischemic human
forearm. Journal of Applied Physiology (bethesda, Md. : 1985), 91, 5, 2010-6.
Pyke, K. E., Poitras, V., & Tschakovsky, M. E. (2008). Brachial artery flow
mediated dilation during handgrip exercise: evidence for endothelial transduction of the
mean shear stimulus. American Journal of Physiology. Heart and Circulatory
Physiology, 63, 6.)
111
Pyke KE, and Tschakovsky ME. (2005). The relationship between shear stress and flow-
mediated dilatation: implications for the assessment of endothelial function. J Physiol
568: 357-369.
Raadegran G, and Calbet JA. (2001). Role of adenosine in exercise-induced human skeletal
muscle vasodilatation. Acta Physiol Scand 171: 177-185.
Raadegran, G., & Saltin, B. (1998). Muscle blood flow at onset of dynamic exercise in humans.
American Journal of Physiology, 274: 2.
Ranatunga KW. (1987). Effects of acidosis on tension development in mammalian skeletal
muscle. Muscle Nerve 10: 439–445.
Raven PB, Potts JT and Shi X. (1997). Baroreflex regulation of blood pressure during dynamic
exercise. Exercise and Sport Science Reviews. 25: 365-389.
Richardson, R. S., Knight, D. R., Poole, D. C., Kurdak, S. S., Hogan, M. C., Grassi, B., &
Saltin B, Râdegran G, Koskolou MD, Roach RC. (1998).Skeletal muscle blood flow in
humans and its regulation during exercise. Acta Physiol Scand 162: 421–436.
Richardson RS, Poole DC, Knight DR, Kurdak SS, Hogan MC, Grassi B, Johnson EC,
Kendrick KF, Erickson BK, and Wagner PD. (1993). High muscle blood flow in man:
is maximal O2 extraction compromised? J Appl Physiol (1985) 75: 1911-1916.
Robergs, R. A., Icenogle, M. V., Hudson, T. L., & Greene, E. R. (1997). Temporal
nhomogeneity in brachial artery blood flow during forearm exercise. Medicine and
Science in Sports and Exercise, 29, 8, 1021-7.
Robertson, R. J., Moyna, N. M., Sward, K. L., Millich, N. B., Goss, F. L., & Thompson, P.
D. (2000). Gender comparison of RPE at absolute and relative physiological
criteria. Medicine and Science in Sports and Exercise, 32, 12, 2120-9.
Rodwell, V.W., Bender, D.A., Botham, K.M., Kennelly, P.J., & Weil, P.A. (2015). Harper’s
illustrated biochemistry.
Rossi, P., & Boussuges, A. (2005). Hyperoxia-induced arterial compliance decrease in healthy
man. Clinical Physiology and Functional Imaging, 25, 1, 10-15.
Rotto DM and Kaufman MP. (1988). Effect of metabolic products of muscular contraction on
discharge of group III and IV afferents. Journal of Applied Physiology. 64: 2306-2313.
Rotto DM, Stebbins CL, Kaufman MP. (1989). Reflex cardiovascular and ventilator
responses to increasing H+ activity in cat hindlimb muscle. Journal of Applied
Physiology. 67: 256-263.
Rowell LB, and O'Leary DS. (1990). Reflex control of the circulation during exercise:
Chemoreflexes and mechanoreflexes. J Appl Physiol 69: 407-418.

112
Sadamoto, T., Mutoh, Y., & Miyashita, M. (1992). Cardiovascular reflexes during sustained
handgrip exercise: role of muscle fibre composition, potassium and lactate. European
Journal of Applied Physiology and Occupational Physiology, 65, 4, 324-330.
Sahlin, K., Cizinsky, S., Warholm, M. and Ho ̈berg, J. (1992). Repetitive static muscle
contractions in humans - a trigger of metabolic and oxidative stress? Eur. J. Appl.
Physiol., 64: 228–236.
Saltin B, Kiens B, Savard G, and Pedersen PK. (1986). Role of hemoglobin and
capillarization for oxygen delivery and extraction in muscular exercise. Acta Physiol
Scand Suppl 556: 21-32.
Saltin, B., Raadegran, G., Koskolou, M. D., & Roach, R. C. (1998). Skeletal muscle blood
Flow in humans and its regulation during exercise. Acta Physiologica
Scandinavica, 162, 3, 421-436.
Saugen E, Vollestad NK, Gibson H, Martin PA, Edwards RH. (1997). Dissociation between
metabolic and contractile responses during intermittent isometric exercise in man. Exp
Physiol 82: 213-226.
Saunders NR, Pyke KE, Tschakovsky ME. (2005). Dynamic response characteristics of local
Muscle blood flow regulatory mechanisms in human forearm exercise. J Appl Physiol 98:
1286–1296.
Scherr J, Wolfarth B, Christle JW, Pressler A, Wagenpfeil S, and Halle M. (2013).
Associations between Borg's rating of perceived exertion and physiological measures of
exercise intensity. Eur J Appl Physiol 113: 147-155.
Sejersted, O. M., Hargens, A. R., Kardel, K. R., Blom, P., Jensen, O., & Hermansen, L.
(1984). Intramuscular fluid pressure during isometric contraction of human skeletal
muscle. Journal of Applied Physiology: Respiratory, Environmental and Exercise
Physiology, 56, 2, 287-95.
Shepherd JT. (1983).Circulation to skeletal muscle. In: Handbook of Physiology The
Cardiovascular System: Periperhal Circulation and Organ Blood Flow, edited by
Shepherd JT, Abboud FM, and Geiger SR. Bethesda, MD: American Physiology Society.
Sheriff DD, Rowell LB, and Scher AM. (1993).Is rapid rise in vascular conductance at onset of
dynamic exercise due to muscle pump? Am J Physiol 265: H1227-1234.
Sjogaard, G., Kiens, B., Jorgensen, K., & Saltin, B. (1986). Intramuscular pressure,
EMG and blood flow during low-level prolonged static contraction in man. Acta
Physiologica Scandinavica, 128, 3, 475-484.
Søgaard K, Gandevia SC, Todd G, Petersen NT & Taylor JL.(2006). The effect of sustained
113
low-intensity contractions on supraspinal fatigue in human elbow flexor muscles. J
Physiol 573, 511–523.
Spangenburg EE, Ward CW, Williams JH. (1998). Effects of lactate on force production by
mouse EDL muscle: implications for the development of fatigue. Can J Physiol
Pharmacol 76: 642–648.
Sprague, R. S., Ellsworth, M. L., Stephenson, A. H., & Lataonigro, A. J. (2001). Participation
of
cAMP in a signal-transduction pathway relating erythrocyte deformation to ATP
release. American Journal of Physiology. Cell Physiology, 281, 4, 1158-64.
Sundberg CJ & Kaijser L. (1992). Effects of graded restriction of perfusion on circulation and
metabolism in the working leg; quantification of human ischaemia-model. Acta. Physiol.
Scand. 146: 1-9.
Taylor HL, Jacobs DR, Jr., Schucker B, Knudsen J, Leon AS and Debacker G. A
(1978). Questionnaire for the assessment of leisure time physical activities. J Chronic Dis
31: 741-755.
Thomas GD, Segal SS. (2004). Neural control of muscle blood flow during exercise. J Appl
Physiol 97: 731–738.
Thomson, A. J., Drummond, G. B., Waring, W. S., Webb, D. J., & Maxwell, S. R. (2006).
Effects of short-term isocapnic hyperoxia and hypoxia on cardiovascular
function. Journal of Applied Physiology (bethesda, Md. : 1985), 101, 3, 809-16.
Tipton, C. M. (2012). Historical Perspective: Origin to Recognition. In: ACSM's advanced
Exercise physiology, edited by Emily Lupash, and Lippincott Williams & Wilkins.
Todd G, Taylor JL, Gandevia SC. (2003). Measurement of voluntary activation of fresh and
fatigued human muscles using transcranial magnetic stimulation. J Physiol 551: 661-671.
Clinical Trial.
Tschakovsky ME, and Pyke KE. (2010). Control of skeletal muscle microcirculation in
exercise. In: Exercise Physiology: from a cellular to an integrative approach, edited by
Connes P, Hue O, and Perrey SIOS Press.
Tschakovsky ME, Rogers AM, Pyke KE, Saunders NR, Glenn N, Lee SJ, Weissgerber T,
and Dwyer EM. (2004). Immediate exercise hyperemia in humans is contraction
intensity dependent: evidence for rapid vasodilation. J Appl Physiol 96: 639-644.
Tschakovsky, M. E., Shoemaker, J. K., & Hughson, R. L. (1995). Beat-by-beat forearm blood
flow with Doppler ultrasound and strain-gauge plethysmography. Journal of Applied
Physiology (bethesda, Md. : 1985), 79, 3, 713-9.
114
Tschakovsky, M. E., Shoemaker, J. K., & Hughson, R. L. (1996). Vasodilation and muscle
pump contribution to immediate exercise hyperemia. American Journal of
Physiology, 271, 2.)
Ueda T, and Kurokawa T. (1995). Relationships between perceived exertion and physiological
variables during swimming. Int J Sports Med 16: 385-389.
Victor RG, Pryor SL, Secher NH, et al. (1989). Effects of partial neuromuscular blockaded on
sympathetic nerve responses to static exercise in humans. Circulation Research. 65:
468-476.
Victor RG, Secher NH, Lyson T, et al. (1995). Central command increases muscle
sympathetic nerve activity during intense intermittent isometric exercise in humans.
Circulation Research. 76: 127-131.
Vøllestad, N. K. (1997.) Measurement of human muscle fatigue. Journal of Neuroscience
Methods, 74, 2, 219-227,
Vøllestad, N. K., & Sejersted, O. M. (1988). Biochemical correlates of fatigue: A brief
review. European Journal of Applied Physiology and Occupational Physiology, 57, 3,
336-347.
Vøllestad, N.K., Wesche, J. and Sejersted, O.M. (1990). Gradual increase in leg oxygen
uptake during repeated submaximal con- tractions in humans, J. Appl. Physiol., 68:
1150–1156.
Vorluni L, and Volianitis S. (2008). Baroreflex control of sinus node during dynamic exercise
in humans: effect of muscle mechanoreflex. Acta Physiol (Oxf) 192: 351-357.
Wagner, P. D. (2012). Muscle intracellular oxygenation during exercise: optimization for
oxygen transport, metabolism, and adaptive change. European Journal of Applied
Physiology, 112, 1, 1-8.
Wajner M, and Goodman SI. (2011). Disruption of mitochondrial homeostasis in organic
acidurias: insights from human and animal studies. J Bioenerg Biomembr 43: 31-38.
Walker PM, Idstrom JP, Schersten T, and Bylund-Fellenius AC. (1982). Metabolic response
in different muscle types to reduced blood flow during exercise in perfused rat hindlimb.
Clinical Science, 63: 293-299.
Walker KL, Saunders NR, Jensen D, Kuk JL, Wong SL, Pyke KE, Dwyer EM,
Tschakovsky ME. (2007). Do vasoregulatory mechanisms in exercising human muscle
compensate for changes in arterial perfusion pressure? Am. J. Physiol. Heart Circ.
Physiol. 293: H2928-H2936.
Wesche, J. (2010). The time and magnitude of blood flow changes in the human quadriceps

115
Muscles following isometric contraction, J. Physiol. Lond., 377: 445–462, 1986.
Westerblad H, Bruton JD, Lannergren J. (1997). The effect of intracel- lular pH on
contractile function of intact, single fibres of mouse muscle declines with increasing
temperature. J Physiol 500: 193– 204.
Whyte, J. J., & Laughlin, M. H. (2010). The effects of acute and chronic exercise on the
vasculature. Acta Physiologica (oxford, England), 199, 4, 441-50.
Wilkins BW, Pike TL, Martin EA, Curry TB, Ceridon ML, Joyner MJ. (2008). Exercise
Intensity dependent contribution of beta-adrenergic receptor-mediated vasodilatation in
Hypoxic humans. J Physiol (Lond) 586: 1195–1205.
Wilkins BW, Schrage WG, Liu Z, Hancock KC, Joyner MJ. (2006). Systemic hypoxia and
vasoconstrictor responsiveness in exercising human muscle. J Appl Physiol 101: 1343–
1350.
Williamson JW, Mitchell JH, Olesen HL, Raven PB, and Secher NH. (1994). Reflex increase
in blood pressure induced by leg compression in man. J Physiol 475: 351-357.
Wilson, D. F., Erecińska, M., Drown, C., & Silver, I. A. (1977). Effect of oxygen tension on
Cellular energetics. The American Journal of Physiology, 233, 5, 135-40.
Wilson GJ, Murphy AJ. (1996). The use of isometric tests of muscular function in athletic
assessment. Sports Med 22: 19-37.
Wright JR, McCloskey DI, Fitzpatrick RC. (1999). Effects of muscle perfusion pressure on
Fatigue and systemic arterial pressure in human subjects. J. Appl. Physiol. 86: 845-851.
Zoladz JA, Semik D, Zawadowska B, Majerczak J, Karasinski J, Kolodziejski L, Duda K,
and Kilarski WM. (2005). Capillary density and capillary-to-fibre ratio in vastus
lateralis muscle of untrained and trained men. Folia Histochem Cytobiol 43: 11-17.
116
APPENDIX
APPENDIX A – Recruitment Fliers

117
Seven-DAY PAR Instructions / Script
The following is a sample script for the of the seven-day PAR Interview.
Now we are going to do a Physical Activity (PA) questionnaire, where I ask you about your PA
over the last 7 days. This is simply a recall of actual activities for the past week, and isn’t a
history of what you “usually” do. It’s not a test, and it will not affect the exercise that you do as
part of this study, we’re just interested in physical activity levels so that we can match our
participants based on PA.
I’m going to start off by asking you some questions about the past week.
Questions on page 1 of Seven-Day PAR.
Over the course of this interview, I’ll be asking questions about yesterday, and then working
backwards through the previous 7 days.So first, let’s talk about the time you spent sleeping in
the past week.
By “sleeping”, I mean the time you went to bed one night and the time that you got out of bed the
next morning. You may not necessarily have been asleep the entire time you were in bed. You
may have been reading, watching TV, or doing paperwork. Time spent in sexual activity is not
counted as “sleep”.
Today is (i.e. Monday), so yesterday was (i.e. Sunday). What time did you go to bed (Sunday)
night and get up (Monday) morning. Record to the nearest 1⁄4 hour. Do this for each of the 7-d
recall. Calculate total time spent sleeping after completing the interview. Did you have any naps
on (Sunday)? Did you have any disruptions to your sleep – any times when you got out of bed for
15 minutes or more?
Repeat for all other days
Now I’m going to ask you about physical activities done in the past 7 days. In talking about PA,
we will classify activities into 3 categories:
The “moderate” category is similar to how you feel when you’re walking at a normal pace,
walking as if you were going somewhere
The “very hard” category” is similar to how you feel when you are running
The “hard” category just falls in between à in other words, if the activity seems harder than
walking but not as strenuous as running, it should go in the hard category
These cards give examples of some activities that fall into each of these categories (sample
activities were shown).
I’m going to ask you about the PAs you engaged in during three segments of the day, which
includes morning, afternoon, and evening.

118
“Morning” is considered from the time you get up in the morning to the time you have lunch
“Afternoon” is from lunch to dinner
And “evening” is from dinner until the time you go to bed
NOTE: If a meal is skipped, “morning” is from the time a person wakes up to 12:00 pm,
afternoon from 12:00-6:00pm, and evening from 6pm to bed.
For this interview we are not considering light activities such as desk work, standing, light
housework, strolling, and stop-and-go walking such as grocery shopping or window shopping.
We are interested in occupational, household, and sports activities that make you feel similar to
how you feel when you are walking at a normal pace.
Remember that this is a recall of activities for the past week, not a history of what you usually do.
We’ll start with yesterday. Today is (i.e. Monday), so yesterday was (i.e. Sunday). Think about
what you did in general yesterday morning. Did you do any PA (Sunday morning)? How long did
you do that activity? How much of that time was spent standing still or taking breaks? Did that
activity feel similar to how you feel when you are walking or running or is it somewhere in
between? Did you do any PA (Sunday afternoon)? (Duration, intensity). Did you do any PA
(Sunday evening)? (Duration, intensity).
If people are giving too much information, it is appropriate to ask “how much time in general?” –
i.e. remind them they do not need to account for every minute of the day. For an activity to be
counted, it must add up to at least 10 min in one intensity category for one segment of the day
(round to 15 min).
At the end of each day: Are there any PAs you might have forgotten? Did you do any PA at
work? Any other recreational or sport activities? Housework or gardening? Were there any other
walks that you might have taken?
On the last day of recall: Take a moment to think back over the course of the week and think of
any activities you may have forgotten.
Last question: The last question I’m going to ask you is, “Compared to your PA over the past 3
mo, was last week’s PA more, less, or about the same?”
Thank you.
Prompting questions (examples):
What were you doing [day] morning?
You said that you got up at 6am. Did you go anywhere after that?
Did you watch any particular TV show?

119
What did you make for dinner?
What did you do that evening?
Did you take any walks that you may have overlooked?
Did you do any vigorous home repair or gardening?
Are there any activities that you are unsure about?
Scoring
10 min and 22 min are rounded to 15 min = 0.25
23 min and 37 min are rounded to 30 min = 0.5
38 min and 52 min are rounded to 45 min = 0.75
53 min and 67 min are rounded to 60 min = 1.0
68 min and 1 hr 22 min are rounded to 1hr 15 min = 1.25
108
Day of the week form completed: ��Sunday ��Monday ��Tuesday ��Wednesday
��Thursday ��Friday ��Saturday
Physical Activity Recall 1. Were you employed in the last seven days (paid or volunteer)? ��YES ��NO
2. How many days of the last seven did you work? (round to nearest day)
3. How many total hours did you work in the last seven days?
hours
4. What days of the week do you consider to be your weekend or non-work days? For most people, this would be Saturday and
Sunday, but it may be different for you. ��Sunday ��Monday ��Tuesday ��Wednesday ��Thursday ��Friday ��Saturday
**********************Explain Moderate, Hard, and Very Hard Intensity levels ************************* At the end of the interview: 5. Compared to your physical activity over the past three months, was last week’s physical activity more, less or about the same?
� ���More
��Less
��About the same
Go to question 4
Date: _____/_____/_______
month / day / year
Subject ID: ___________ Interviewer Initials: _________
120
109
7-Day PAR: Interview Evaluation Form
Were there any problems with the 7-Day PAR interview? (circle one)
1. Yes 2. No
Yesterday
One Week Ago
Sleep - - - - - - -
Moderate
Hard
Very Hard
Moderate
Hard
Very Hard
Moderate
Hard
Very Hard
Rounding: 10-22mins = .25hrs 23-37mins = .50hrs 38-52mins= .75hrs 53-1:07mins=1.0hrs 1:08-1:22= 1.25hrs
Subject ID: __________ Interviewer Initials: ___________
Naps [+] / Disruptions [-] > 30 min
110
Explain:
_________________________________________________________________________________________________________
_________________________________________________________________________________________________________
Do you think this was a valid 7-Day PAR interview?
1. Yes 2. Maybe 3. No
Please list below any activities reported by the participant that you don’t know how to classify:
_________________________________________________________________________________________________________
_________________________________________________________________________________________________________
Other comments/concerns:
_________________________________________________________________________________________________________
_________________________________________________________________________________________________________
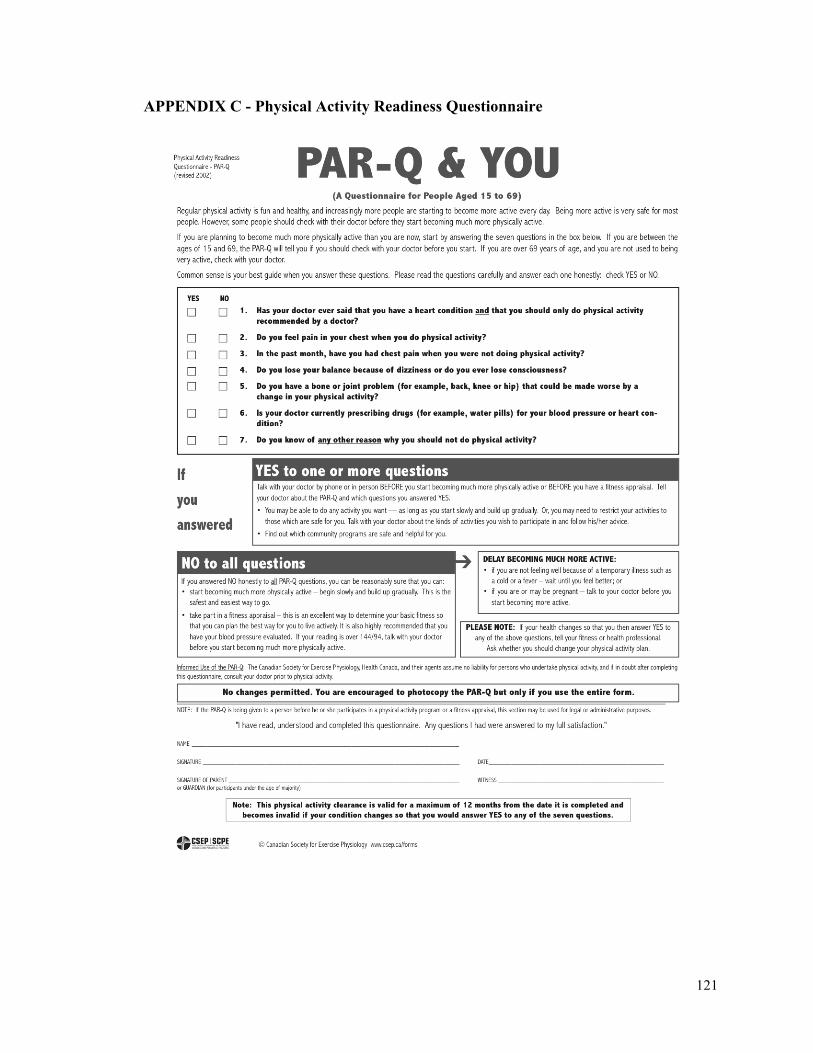
121
APPENDIX C - Physical Activity Readiness Questionnaire
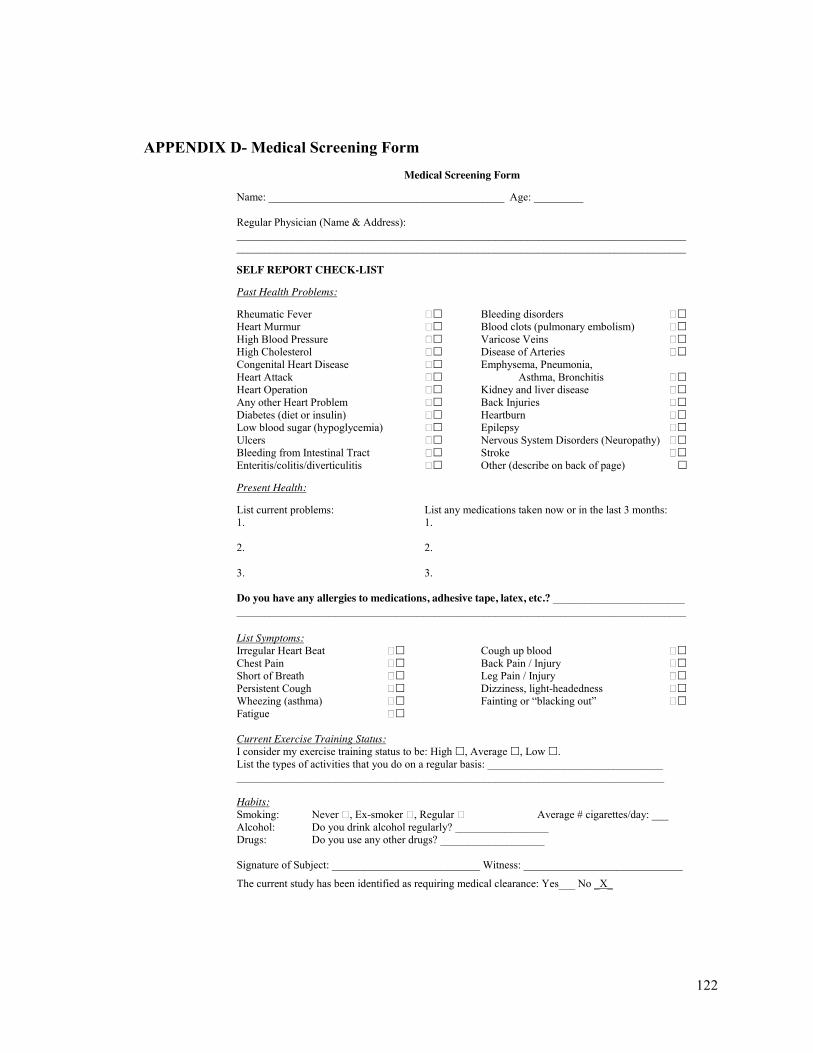
122
Medical Screening Form Name: ___________________________________________ Age: _________ Regular Physician (Name & Address): ____________________________________________________________________________________________________________________________________________________________________ SELF REPORT CHECK-LIST Past Health Problems: Rheumatic Fever � Heart Murmur � High Blood Pressure � High Cholesterol � Congenital Heart Disease � Heart Attack � Heart Operation � Any other Heart Problem � Diabetes (diet or insulin) � Low blood sugar (hypoglycemia) � Ulcers � Bleeding from Intestinal Tract � Enteritis/colitis/diverticulitis �
Bleeding disorders � Blood clots (pulmonary embolism) � Varicose Veins � Disease of Arteries � Emphysema, Pneumonia,
Asthma, Bronchitis � Kidney and liver disease � Back Injuries � Heartburn � Epilepsy � Nervous System Disorders (Neuropathy) � Stroke � Other (describe on back of page) �
Present Health: List current problems: List any medications taken now or in the last 3 months: 1. 1. 2. 2. 3. 3. Do you have any allergies to medications, adhesive tape, latex, etc.? ________________________ __________________________________________________________________________________ List Symptoms:Irregular Heart Beat � Chest Pain � Short of Breath � Persistent Cough � Wheezing (asthma) � Fatigue �
Cough up blood � Back Pain / Injury � Leg Pain / Injury � Dizziness, light-headedness � Fainting or “blacking out” �
Current Exercise Training Status: I consider my exercise training status to be: High �, Average �, Low �. List the types of activities that you do on a regular basis: ________________________________ ______________________________________________________________________________ Habits: Smoking: Never , Ex-smoker , Regular Average # cigarettes/day: ___ Alcohol: Do you drink alcohol regularly? _________________ Drugs: Do you use any other drugs? ___________________ Signature of Subject: ___________________________ Witness: _____________________________
The current study has been identified as requiring medical clearance: Yes___ No _X_
APPENDIX D- Medical Screening Form
123
APPENDIX E- Consent Form
School of Kinesiology and Health Studies
Queen’s University
“Peripheral Vascular Control in Humans” Research Program
Human Vascular Control Laboratory
Room 400B, Kinesiology and Health Studies Building
Michael E. Tschakovsky, Ph.D., Co-ordinator
CONSENT FORM
FOR RESEARCH PROJECTS ENTITLED:
Investigation into Peripheral Vascular Control in Humans
You are invited to participate in a research study conducted under the “Peripheral
Vascular Control in Humans” Research Program.
This is an important form. Please read it carefully. It tells you what you need to know
about this study. If you agree to take part in this research study, you need to sign this form.
Your signature means that you have been told about the study and what the risks are. Your
signature on this form also means that you want to take part in this study.
Purpose of the Study:
The purpose of this study is to improve our understanding of how the flow of blood through
your arms and/or legs is controlled.
Benefits For You:
There are no direct benefits to you by participating in this study.
Description of Experiment and Risks:
124
What will happen? During this study, you will take part in some of the specific experimental
procedures outlined below. These procedures have been checked. They may be performed at
one or more of three sites: The Human Vascular Control Laboratory (HVCL) on the
Queen’s University Campus, the Laboratory for Clinical Exercise Physiology (LACEP) of
Dr. Alberto Neder in Kingston General Hospital, or at Hotel Dieu Hospital. Depending on
the specific experimental protocol, the combination of these procedures will be different. The
investigator will explain to you in detail how each of these procedures will be combined in the
particular experiment involving your participation. Please initial by each bullet point that is
marked.
● HEART RATE MEASUREMENTS: Heart rate is continuously monitored by an electrocardiogram (EKG) through 3 spot electrodes on the skin surface. The electrodes are normally placed in the lower portion of the chest and they can detect the electrical activity that makes your heart beat.
RISKS: This procedure is entirely safe. In a very small group of individuals, a skin rash
might occur from the adhesive on the electrodes. There is no way of knowing this ahead
of time. The rash, if it develops, will resolve itself within a day or so. Avoid scratching
the rash and keep clean.
● BLOOD PRESSURE MEASUREMENTS: 1. A cuff that can be inflated with air is wrapped around your upper arm, just as would
occur if you had your blood pressure measured at the doctor’s office. This cuff is inflated to a pressure higher than your systolic blood pressure (the pressure in your blood vessels when the heart beats), and gradually deflated over a number of seconds to measure systolic blood pressure and diastolic (the pressure in your blood vessels when the heart is relaxed) blood pressure. Meanwhile, your wrist is secured in a wrist brace and a small pressure sensor is placed over your radial artery at the wrist. This pressure sensor is able to detect the increases and decreases in size of your radial artery that occur with each heart beat, and what the pressure sensor measures is compared to the pressure that the upper arm cuff measures (this calibrates the sensor). From then on, the pressure sensor at the wrist measures blood pressure continuously, while the upper arm cuff may be inflated intermittently.
OR
2. A small cuff is fit around your finger. This cuff inflates to pressures that match the blood pressure in your finger, so you feel the cuff pulsing with your heart beat. It shines infrared light through your finger to measure changes in the size of your finger with each heartbeat.
RISKS: These techniques are non-invasive and pose no risk.
125
● LIMB BLOOD FLOW AND BLOOD VESSEL DIAMETER MEASUREMENTS: The blood flowing through your brachial (above the elbow), radial (above the wrist), or femoral (above the groin) artery can be detected and your artery diameter measured using Doppler and imaging ultrasound. A probe will be placed on the skin over your artery and adjustments in its position controlled by hand by the investigator. Measurement of femoral artery flow takes place on the lower abdomen just above the groin. Shorts will be tied up at the site of measurement to expose the skin in this region. High frequency sound (ultrasound) will penetrate your skin. The returning sound provides information on blood vessel size and blood flow.
RISKS: This technique is non-invasive and poses no risk.
● ELECTROMYOGRAPHY (EMG): This measures the electrical activity of your muscles. Electrodes will be placed on muscles of interest for a given study.
RISKS: This procedure is entirely safe. In a very small group of individuals, a skin rash
might occur from the adhesive on the electrodes. There is no way of knowing this ahead
of time. The rash, if it develops, will resolve itself within a day or so. Avoid scratching
the rash and keep clean.
● GAS EXCHANGE: This measures your breathing and the changes in oxygen and carbon dioxide as a result of your body utilizing oxygen and producing carbon dioxide. It involves breathing through a mouthpiece attached to a one way valve system, and wearing nose clips.
RISKS: This procedure is entirely safe. There are no known risks.
• MULTIPLE INERT GAS REBREATHE: This technique measures the amount of blood pumped by your heart. You will breathe through a mouthpiece connected to an inflatable bag. This bag will contain two gases (nitrous oxide, sulfur hexafluoride) that are completely inert, which means that they do not react with anything in your body and are completely safe to breathe. When measurements are taken, you will be asked to breathe at a certain rhythm for up to 10 seconds and to inhale enough to empty the bag with each breath in.
RISKS: The inert gases are completely safe to breathe. There are no known risks to this
procedure.
• NEAR INFRARED SPECTROSCOPY: This technique is used to measure the oxygen in your muscle. It consists of an infrared light emitter and sensor block that is positioned on the skin surface of your leg or arm and secured by wrapping with bands that prevent

126
penetration of outside light. The infrared light that shines into your tissue is partially absorbed and partially reflected back to the sensor and this provides information on how much oxygen there is in the blood in your muscle. RISKS: There are no risks to this non-invasive procedure.
• FEMORAL NERVE MAGNETIC STIMULATION: This technique involves placing a magnetic coil over your femoral nerve just above your thigh. This magnetic coil is activated in order to cause your femoral nerve to fire. This will result in the thigh muscles on the front of your thigh to contract.
RISKS: The sensation of nerve stimulated muscle contraction can be strange and even
uncomfortable. However, this technique is well established and has minimal risk, other
than the typical risk of muscle strain that occurs with any everyday activity involving
voluntary muscle contraction.
● VENOUS BLOOD SAMPLING: Blood samples from veins are used to measure the
amount of lactic acid and oxygen in your blood. We need to take a blood sample from a vein on the back of your hand, after we have increased blood flow to that hand by having you hold it in tolerably hot water until blood flow is maximized. For this, a researcher trained and certified in venipuncture (needle or catheter placement into a vein) will use sterile technique to draw a blood sample of ~1 ml into a syringe. We also need to take multiple 1 ml samples of blood from a vein at the elbow. In this instance, the researcher will place a teflon catheter into your vein using sterile technique. The catheter will be secured to your skin with tape and a self-sealing access attached to allow for drawing blood from the vein. We will take a volume of blood that is in total no more than ~120 ml. This represents approximately 1/3 of the volume of blood taken when you donate blood (370-400 ml). Periodically, the researcher may, after drawing some blood, inject (flush) sterile saline through the catheter into your vein. When the study is over, we will remove the catheter and secure sterile gauze over the puncture site. RISKS: The most common complications of inserting a small catheter in the arm is a
small bruise and pain at the site of catheter insertion. This might last several days after
removal of the catheter. It is also possible that this pain may refer down the arm (a
“shooting” pain sensation), if there has been nerve irritation in the catheterization
process. When the catheter is removed pressure must be applied to the vein to prevent
internal bleeding. If adequate pressure is not applied a bruise and some discomfort might
result for a short period of time. The puncture site should be kept clean and covered with
a sterile gauze pad while stopping the bleeding after catheter removal to prevent
infection. There is very little risk of infection or injury to the vein. The amount of
blood taken can result in at most a 2% reduction in the hemoglobin content in your blood
(hemoglobin carries oxygen in your blood), in comparison to ~7.5% reductions
experienced when you donate blood. Nevertheless, this 2% does constitute a very mild

127
anemia, and in the case of a person with chronic hemoglobin disorders it could increase
the risk of adverse health consequences.
● FOREARM AND LEG VOLUME MEASUREMENTS: The volume of your forearm or calf can be measured by a thin, stretchable rubber band placed around your respective limb that is filled with mercury. A very small electrical current runs through this gauge and changes in the length of this mercury-filled rubber band are detected by changes in this current that occur in proportion to changes in the length of the rubber band.
RISKS: This technique is non-invasive and poses no risk.
● BLOOD OXYGEN CONTENT: A plastic clip is placed over your left index finger. This clip aims light through your finger, and the absorption of that light by the blood provides information on how much oxygen the blood contains.
RISKS: This technique poses no risks.
● MUSCLE MASS: Circumference and length measurements of segments of your arm or leg will be taken via manual placement of a tape measure on your limbs by the investigator.
OR
At Kingston General Hospital, you will lay on a table and a scan of your body will be
performed using a technique called “dual-energy x-ray absorptiometry” (DXA). This
technique uses a small amount of x-ray energy to scan a “picture” of your body and
identify how much muscle there is on your arms and legs.
RISKS: Radiation levels with DXA are considered trivial by radiation regulatory
agencies. The technique uses less radiation than a dental X-ray, roughly equivalent to the
background amount a person would be exposed to when flying from Cincinnati to the
West Coast. This is a mere fraction of the radiation dose we are all exposed to every
week, from just being alive.
● FOREARM OR LEG OCCLUSION: In order to completely block the blood flow through your forearm or leg, a pressure cuff will be inflated around your arm or around your upper or lower leg for 1-10 min or inflated and deflated rhythmically depending on the protocol. You may feel a strong pressure and some mild tingling with cuff inflation but it should not be uncomfortable. If there is pain, immediately notify the investigator and the cuff will be deflated and repositioned. Upon cuff release there will be a large rush of blood into your forearm or leg. This may feel warm and you may experience
128
mild tingling but no discomfort.
RISKS: This technique is non-invasive and poses no risk.
● FOREARM COMPRESSION: A stylus will be positioned over your artery pulse to control the amount of flow through the artery. The arterial compression provided by the stylus will be varied to create different blood flow profiles. Increases in stylus downward pressure with result in decreases in blood flow, while controlled release of stylus downward pressure will result in increases in blood flow. The blood flow to your limb will never be completely occluded by the arterial compression. In some cases, manual finger pressure will be used instead of the stylus.
OR
A cuff will be positioned around your forearm or leg, and can be inflated and deflated at
will to increase and decrease blood flow to your limb.
RISKS: The brachial artery and nerve run close together, thus the compression of this
particular artery may result in a tingling sensation and some temporary numbness in the
forearm. The compression of the artery can also become somewhat uncomfortable over
time. These symptoms will subside within 5 minutes of compression release. There are
no risks to your forearm from temporarily stopping blood flow to the forearm.
● FOREARM OR HAND HEATING: In order to increase the blood flow through your brachial artery and/or radial artery, your forearm or hand will be enclosed in a water bath that is circulated with warm water. The warm water will result in the dilation of your skin blood vessels. The water bath consists of a cylinder that is circulated with heated water. Your arm will rest inside the tube enclosed in a plastic glove that prevents your skin from being in direct contact with the water. A temperature sensor will be fixed to your skin and your skin temperature will be maintained between 41 and 42˚ Celsius. The water for the bath is heated remotely to a temperature not exceeding 45˚ Celsius and is circulated into the bath via a water pump. The water in the bath will feel quite warm, but not too hot. If at any time you feel discomfort the warm water inflow will be stopped and replaced with cooler water to allow the bath temperature to drop to a more comfortable level. Your forearm may be heated for a total of one to two hours.
RISKS: When the skin blood vessels fill with blood for an extended period while
undergoing arterial compression it causes a temporary swelling as some fluid escapes
from the blood vessels into the surrounding tissue. This minor swelling should resolve
itself within 24 hours. Elevation of the arm will help to speed up the process. Your skin
may appear red after removal from the bath. This is due to the increased skin circulation.
The redness should resolve within 24-36 hours.
129
● CONGESTION OF YOUR FOREARM OR LEG VEINS: One inflatable cuff will be placed around your upper arm or above the knee and another may be placed around your wrist or ankle. The wrist cuff will be inflated to a pressure that prevents blood flow to your hand for a period of 10-15 minutes at a time. This should not be uncomfortable. If it is, notify the investigator and the position of the cuff will be adjusted until inflation without discomfort is achieved. These cuffs will be inflated to pressures that feel like a mild to moderate squeeze. This will prevent blood from flowing out of your limb back to the heart, but allow blood to flow in to your arm. Your limb will fill with blood and if the cuff inflation is maintained for a number of minutes, you may feel a sensation of swelling. This is because some of the plasma (water portion of your blood) will leak out of the small blood vessels and into the space between other cells in your limb. This is similar to when you stand up in the morning and stay upright during the day. In that case, gravity makes it difficult for blood to flow back to the heart from the legs, and they slowly swell over the course of the day as plasma leaves the blood vessels. When the cuff is released, the limb will slowly return to normal as the plasma moves back into the blood vessels.
RISKS: The movement of fluid out of the blood vessels into your limb may in extreme
cases cause discomfort. This discomfort should resolve itself within minutes of deflating
the cuff, and the swelling should subside within 24 hrs. Elevating the arm above the
heart for 15 minutes should speed this process.
● INTERMITTENT COMPRESSION OF THE FOREARM OR LEG: You will have an inflatable cuff placed around your forearm or leg. We can rapidly inflate and deflate this cuff to different pressures that are able to squeeze the blood out of the veins in your limb. Inflation is maintained for only a brief period of time (a few seconds). The sensation of limb compression will feel like a strong grip, but should not be painful. If it is uncomfortable, notify the investigator and the position of the cuff can be adjusted.
RISKS: There are no risks associated with this procedure.
● ALTERNATING FOREARM SUCTION AND COMPRESSION: Your forearm will be enclosed in a plexiglass box and sealed with a neoprene sleeve around the upper arm. Suction or compression of your forearm can be created by rapidly adding or removing air in the box via a connected automated air compressor. The sensation of suction and compression should not be painful. Notify the investigator if there are any feelings of discomfort.
RISKS: There are no risks associated with this procedure.
● EXERCISE MANEUVERS THAT ALTER BLOOD PRESSURE: You may be asked to perform one of the following MANEUVERS to temporarily increase your blood
130
pressure: 1) squeezing a handgripper with your forearm for a few minutes with or without blood flow to your forearm being prevented 2) contracting your leg muscles with or without blood flow to your leg being prevented.
RISKS: When muscle contractions are performed while the blood flow to the limb is
prevented, you may experience considerable discomfort similar to that when doing
maximal weightlifting repetitions. However, there is no risk to your muscles in
performing this exercise.
● STROOP TEST: In order to create a mental stress a “STROOP” test will be performed. A series of words for colours will be displayed such as “RED”. However, the word will be displayed in a different colour, perhaps the colour green. You must read out the colour in which the word is written in, not the word itself. Therefore, upon seeing “RED” (written in green text) you will respond by saying “green”. You will be asked to perform the task as fast as you can. Part of the study evaluates the score you achieve on the test and it is very important that your score achieves the normal range for persons of your age and education. Your performance will be measured by how much of the list you read through in two minutes time, as well as how many mistakes you make. RISKS: There are no risks posed by this procedure.
● ANGER TEST: In order to create emotional stress an anger test will be performed. Prior to the testing day, you will have been asked to fill out an anger questionnaire in order to recall a past event that made you very angry. We will use the questionnaire to elicit momentary anger. You will be asked to describe the event while re-experiencing the event in your imagination, as well as report on thoughts, feelings, and physical aspirations about the situation. The test will last two minutes.
RISKS: You will feel momentary anger that will subside following the interview. It is
possible that this anger interview might contribute to renewing problems between
yourself and this individual. If you believe that this might in any way be problematic,
you are encouraged to withdraw from participation in this study.
● CONTROL TEST: A control test will be performed in order to understand if verbalization is contributing to the blood vessel response. You will simply count from ‘one’ in Mississippi’s. Your verbalization will start as “one Mississippi, two Mississippi, three Mississippi¼” and will continue for two minutes.
RISKS: There are no risks posed by this procedure.
● LOWER BODY NEGATIVE PRESSURE: You will lay on your back and your lower body will be enclosed in an air-tight box. Various levels of suction will then be applied
131
to the box to simulate how the blood normally shifts in the body during activities like standing up. This will cause your heart rate to increase and your blood vessels to constrict to maintain blood pressure. This is a normal response that you experience every morning when you get up out of bed.
RISKS: There is a small chance that you may begin to faint with this procedure. We will
be monitoring your blood pressure continuously. If you experience any of the following
symptoms, notify the investigator immediately: nausea, narrowing field of vision,
sweating. Changes in your blood pressure that we detect will most likely indicate that
fainting is imminent well before you experience any of these symptoms. By shutting off
the suction, blood will rapidly return to your heart and symptoms of fainting will be
reversed. You may feel nauseous for a few hours after this procedure if you came close
to fainting. This should resolve itself without any complications.
● COLD PRESSOR TEST: In this test, you will place your hand or foot in an ice water bath for a few (1-3) minutes. This will cause your heart rate to increase and your blood vessels to constrict as the cold will activate your sympathetic nervous system (the part of your nervous system involved in the “fight or flight” response).
RISKS: There are no risks posed by this procedure. However, it can be quite
painful. You have the right at any time to withdraw your hand or foot from the ice
water bath if you feel unable to continue.
• CHEST WALL STRAPPING: You will have either a tensor bandage or a custom strapping device applied to your chest and abdomen. You are asked to breathe out as much air from your lungs as you can, and then hold that as the strapping is tightened around your chest and abdomen. You can indicate the need to breathe during this procedure at any time. After catching your breath you will again empty your lungs and strapping will continue. This will be repeated until the strapping is complete. The purpose of this is to restrict how much you can expand your chest and abdomen in the effort of breathing in and to reduce the amount of air left in your lungs at the end of a normal expiration. This mimics “restrictive” lung disease.
RISKS: The strapping can feel uncomfortable but should not be painful. If it is painful
notify the investigator immediately and strapping will be adjusted. There is a small
chance that you may begin to faint with this procedure. We will be monitoring your
blood pressure continuously. If you experience any of the following symptoms, notify
the investigator immediately: nausea, narrowing field of vision, sweating. Changes in
your blood pressure that we detect will most likely indicate that fainting is imminent well
before you experience any of these symptoms. These are reversed by rapidly removing
132
the strapping and having you rest laying on your back with your legs raised.
● HANDGRIP EXERCISE: You will be asked to perform handgrip squeezing exercise. The duration of this exercise can vary from a few seconds to 10-20 minutes, and at an intensity that can vary from very mild to maximal contraction force. Exercise may take place in combination with any of the above-mentioned techniques which can control the blood flow to your limbs, congest the limbs, and which can alter your blood pressure.
RISKS: When forearm muscle contractions are performed while the blood flow to the
forearm is prevented, you may experience considerable discomfort similar to that when
doing maximal weightlifting repetitions. However, there is no risk to your muscles in
performing this exercise. You may experience muscle soreness in the muscles of your
forearm for 24-72 hours after performing the handgrip exercise, much as you would if
you had been lifting weights.
● LEG EXERCISE: You will be asked to contract your leg muscles, either continuously or intermittently. The duration of this exercise can vary from a few seconds to 10-20 minutes, and at an intensity that can range from very mild to maximal contraction force. Exercise may take place in combination with any of the above-mentioned techniques which can control the blood flow to your limbs, congest the limbs, and which can alter your blood pressure.
RISKS: When leg muscle contractions are performed while the blood flow to the
forearm is prevented, you may experience considerable discomfort similar to that when
doing maximal weightlifting repetitions. However, there is no damage or risk to your leg
from this. You may experience muscle soreness in the muscles of your leg for 24-72
hours after performing the leg exercise, much as you would if you had been lifting
weights.
• DIETARY NITRATE CONSUMPTION: Nitrate is a compound that is present in several foods, including plant foods (vegetables and a few fruits), processed meats, baked goods, cereals, and drinking water. Beets are an excellent source of nitrate. You will be randomly assigned to a “nitrate” or “placebo” group, and this will be done in a double-blind fashion (meaning that neither you nor the experimenters involved in data collection and analysis will know which group you are in until the completion of the study). You will be asked to either: 1. consume a specified amount each day for a few days prior to your testing day, and to consume your final amount a few hours before coming to the lab for your testing session, 2. Consume a specified amount a few hours before coming for your testing. Beetroot juice comes in small “shots” which are commercially available (Beet It Beetroot Products Co.). The quantity of nitrate in the beetroot juice is an amount achievable through normal dietary intake by making appropriate selections of high-nitrate-containing foods as part of the Dietary approaches to Stop Hypertension (DASH)
133
diet, and is similar to the dose of dietary nitrate provided in several recent studies. You may experience red urine and red stools during this time period (due to the red beet colour), and this is a normal response to consuming beetroot juice. RISKS: There are no known risks of acute dietary nitrate supplementation. Dietary nitrate can interact with certain medications (proton pump inhibitors, phosphodiesterase type 5 inhibitors, nitroglycerine or other “nitric oxide donor” drugs); if you are taking any of these medications, you will be excluded from the study.
How long will it take?
On an initial visit we will use ultrasound to get an image of the blood vessels in your
limbs in order to determine whether you are eligible to participate in the main study.
For the main study: preparing all of the techniques for measuring your response and
creating the correct experiment conditions usually takes ~45 minutes. The actual
experiment will take ~1-3 hours.
Talking and Movements:
Talking or moving during the times that we are taking measurements will cause
variations in the measurements we are making If you have any discomfort, please let us
know immediately and we can temporarily break from data collection. However, if
everything is comfortable, please maintain a very quiet posture. Even very slight
movements interfere with our experiments.
Special Instructions:
Participants are asked to not drink alcohol or caffeine during the 12 hours prior to the
study. Also, we ask that you do not consume any food during the 4 hours preceding the
experiments. You should empty your bladder immediately prior to starting the test.
When the study is finished, we will have you sit in the laboratory for a short time to allow
you to readjust to the upright posture. These precautions should be enough to prevent
any sensations of dizziness. Please be aware that sensations of dizziness are not normal
and you should let us know if you experience any discomfort before you leave the
laboratory.
134
Attached Medical Screening Form:
This questionnaire asks some simple questions about your health. This information is
used to guide us with your entry into the study. Current health problems indicated on this
form which are related to cardiovascular diseases (including high blood pressure) and
liver or kidney problems will exclude you from the study only if the particular
experiment in question requires healthy participants.
Safety Precautions:
Safety precautions for the study will include the following:
● Participants who enter the study will be identified as either healthy men and women, insulin resistant, or type II diabetic.
● Before entering the study you will be screened using a medical screening form. You will not be able to enter the study if anything is found which indicates that it is dangerous for you to participate.
● We will continuously monitor your heart rate and blood pressure, and you will be laying on your back or seated upright. These precautions allow us to quickly identify if you are becoming faint and simply stopping the experimental manipulation will allow you to quickly recover.
Confidentiality:
All information obtained during the course of the study is strictly confidential and will
not be released in a form traceable to you, except to you and your personal physician.
Your data will be kept in locked files which are available only to the investigators and
research assistants who will perform statistical analysis of the data. There is a possibility
that your data file, including identifying information, may be inspected by officials from
the Health Protection Branch in Canada in the course of carrying out regular government
functions. The study results will be used as anonymous data for scientific publications
and presentations, or for the education of students in the School of Physical and Health
Education at Queen’s University.

135
Study Compensation
A monetary compensation for your time will be identified by a research team member
during the explanation of the study. This will include any expenses you incur and reflect
imposition on your time by your participation in this study.
Freedom to Withdraw from the Study
Your participation in this study is voluntary. You may refuse to participate or you may
discontinue participation at any time during the duration of the study without penalty and
without affecting your future medical care.
Participant Statement and Signature Section
I have read and understand the consent form for this study. I have had the purposes,
procedures and technical language of this study explained to me. I have been given
sufficient time to consider the above information and to seek advice if I choose to do so.
I have had the opportunity to ask questions which have been answered to my satisfaction.
I am voluntarily signing this form. I will receive a copy of this consent form for my
information.
If at any time I have further questions, problems or adverse events, I will contact:
Michael E. Tschakovsky, Ph.D.
(Principal Investigator)
KHS 306, Kinesiology and Health Studies Building
Queen’s University, Kingston, ON, K7L 3N6
Tel: (613) 533-6000, ext, 74697
Jean Cote, Ph.D.
Director, School of Kinesiology and Health Studies
KHS 206, Kinesiology and Health Studies Building
Queen’s University, Kingston, ON, K7L 3N6
Tel: (613) 533-3054
136
If I have any questions concerning research participant’s rights, I will contact:
Dr. Albert F. Clark, Chair
Office of Research Services
Fleming Hall, Jemmett Wing 301
Queen’s University, Kingston, ON, K7L 3N6
Tel: 1-844-535-2988
By signing this consent form, I am indicating that I agree to participate in this study.
______________________ _________________________
Participant Signature Signature of Person Obtaining Consent
______________________ _________________________
Participant Name (please print) Name of Person Obtaining Consent (please print)
______________________ _________________________
Date (day/month/year) Date (day/month/year)

137
APPENDIX F - Sample of IET data for participant 9.
Performance of participant in terms of force production. Upper panel: Contraction impulse
consistency over time of IET. Seven values per stage of 210 seconds. Lower panel: Average
impulse achieved during each stage.
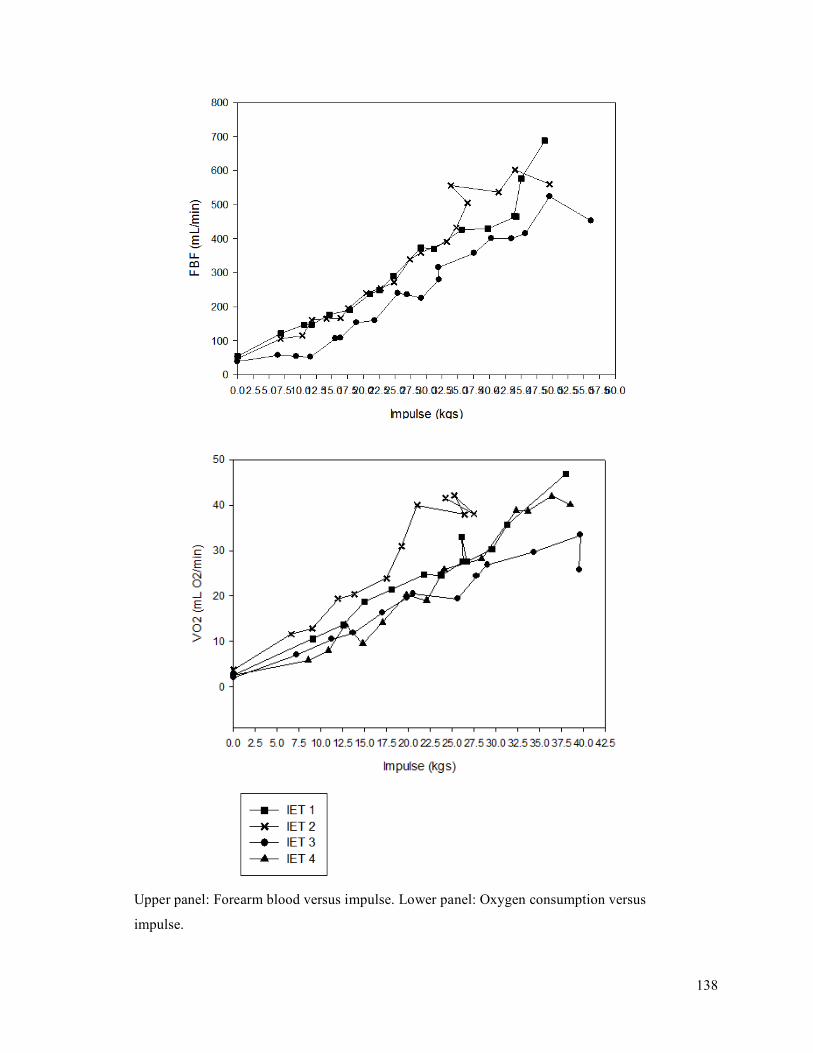
138
Upper panel: Forearm blood versus impulse. Lower panel: Oxygen consumption versus
impulse.

139
Upper panel: Oxygen delivery versus impulse. Lower panel: Oxygen delivery versus oxygen
consumption.

140
Upper panel: Mean arterial pressure versus impulse. Lower panel: Forearm vascular
conductance versus oxygen consumption.
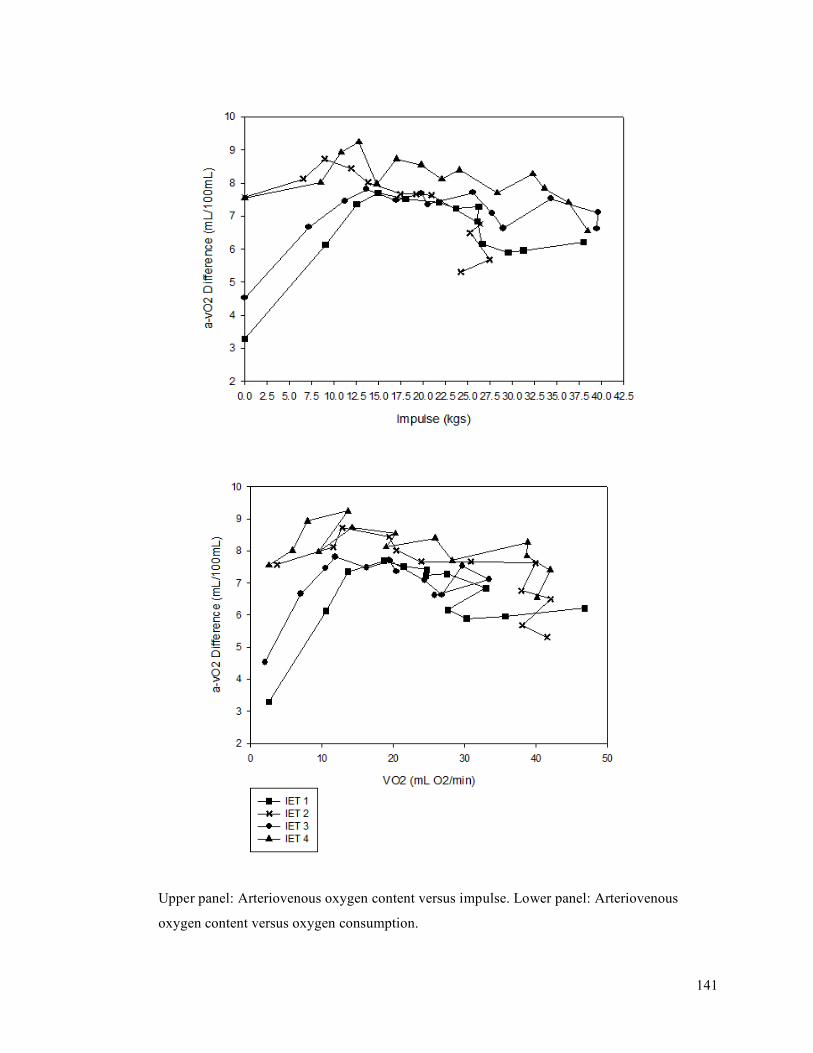
141
Upper panel: Arteriovenous oxygen content versus impulse. Lower panel: Arteriovenous
oxygen content versus oxygen consumption.

142
Upper panel: Saturation of venous oxygen percent versus impulse. Lower panel: Saturation of
venous oxygen percent versus oxygen consumption.

143
Upper panel: Lactate versus impulse. Lower panel: Lactate versus oxygen consumption.
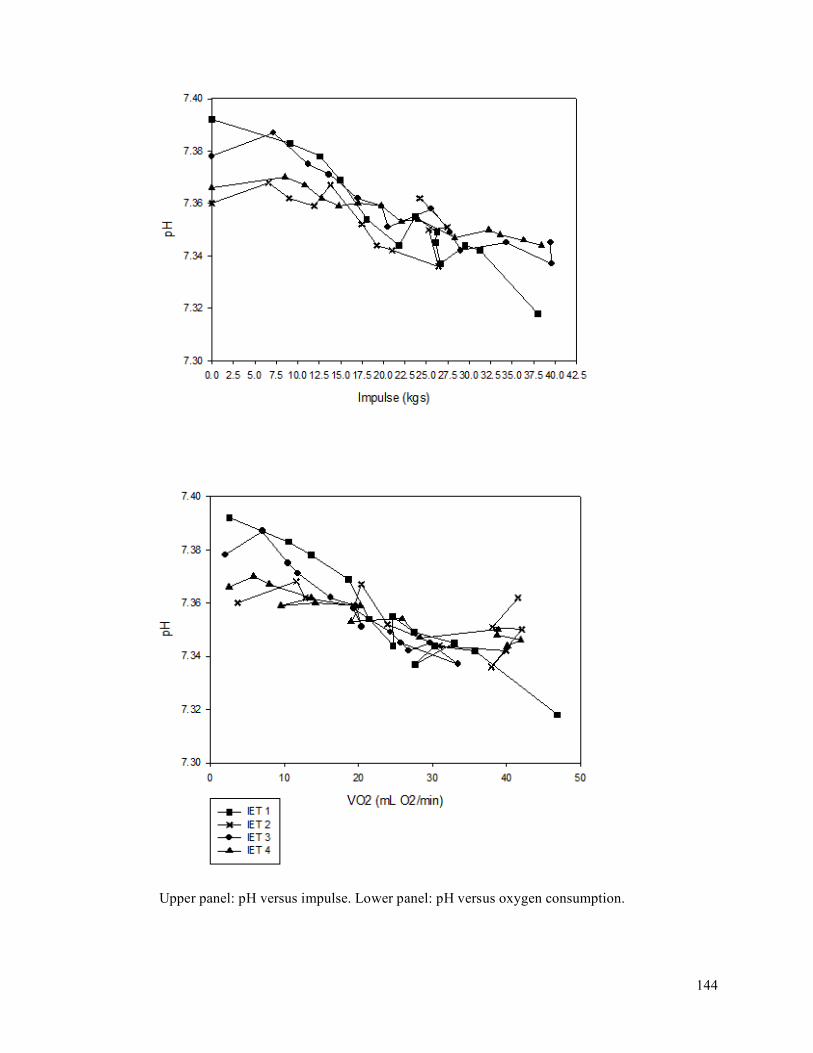
144
Upper panel: pH versus impulse. Lower panel: pH versus oxygen consumption.
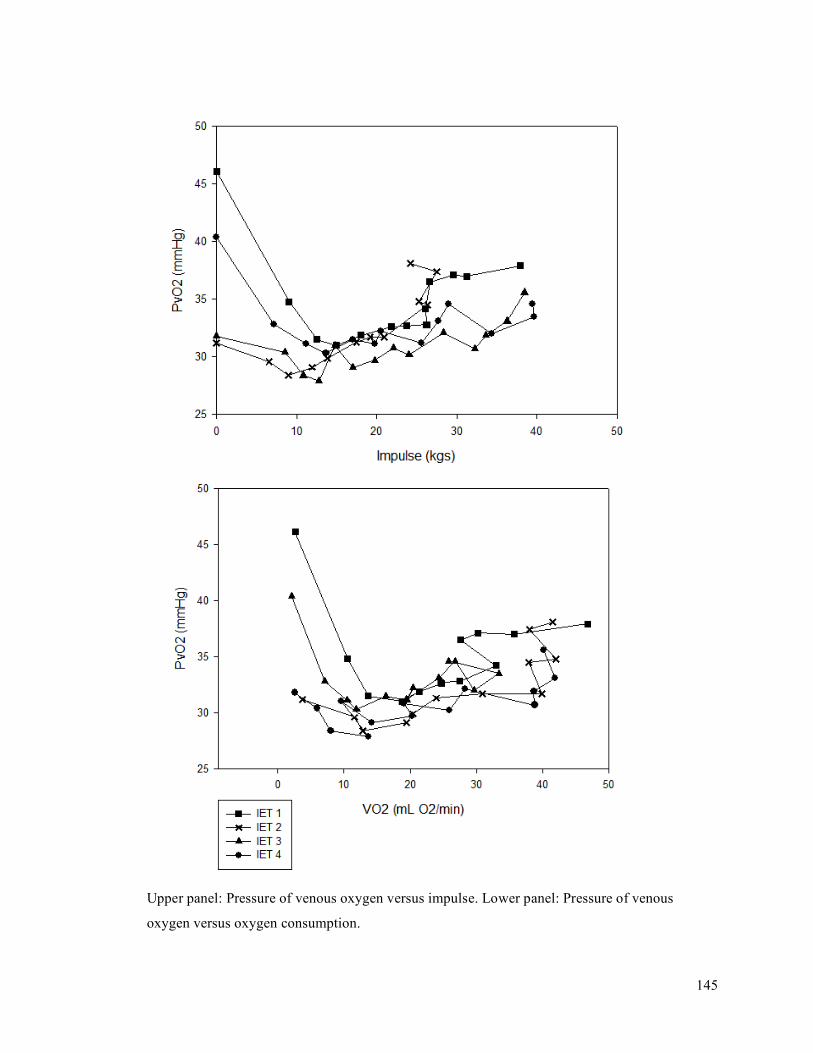
145
Upper panel: Pressure of venous oxygen versus impulse. Lower panel: Pressure of venous
oxygen versus oxygen consumption.
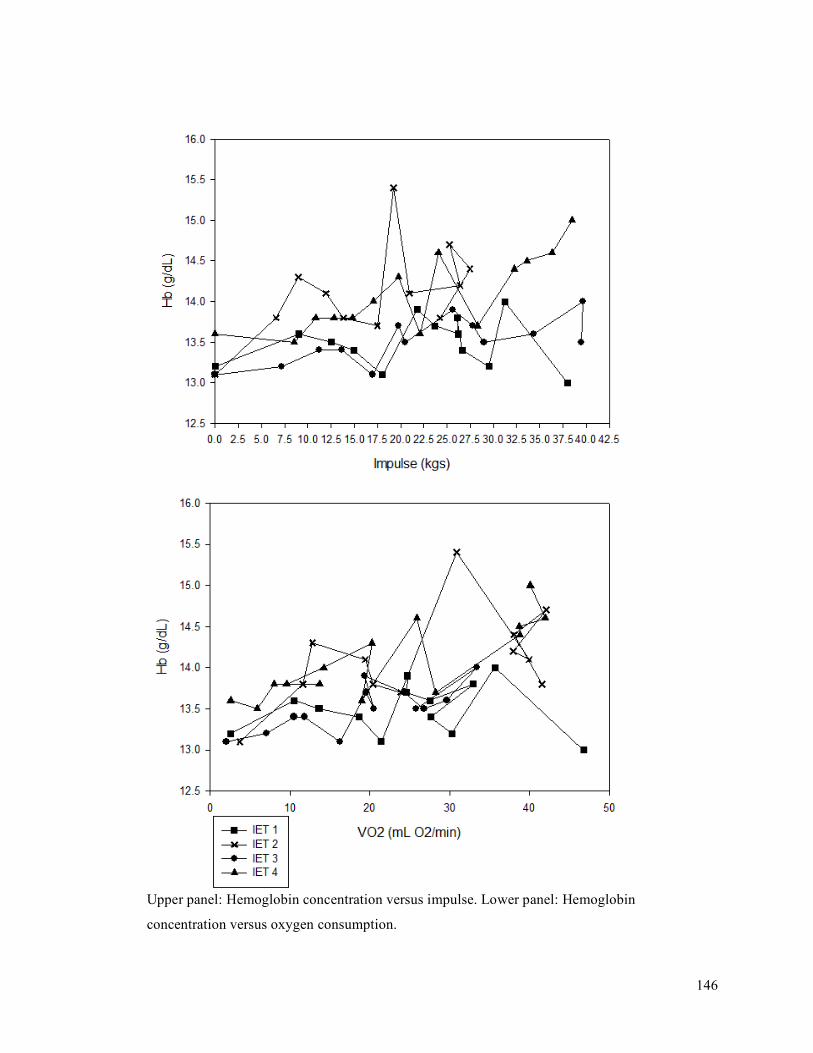
146
Upper panel: Hemoglobin concentration versus impulse. Lower panel: Hemoglobin
concentration versus oxygen consumption.
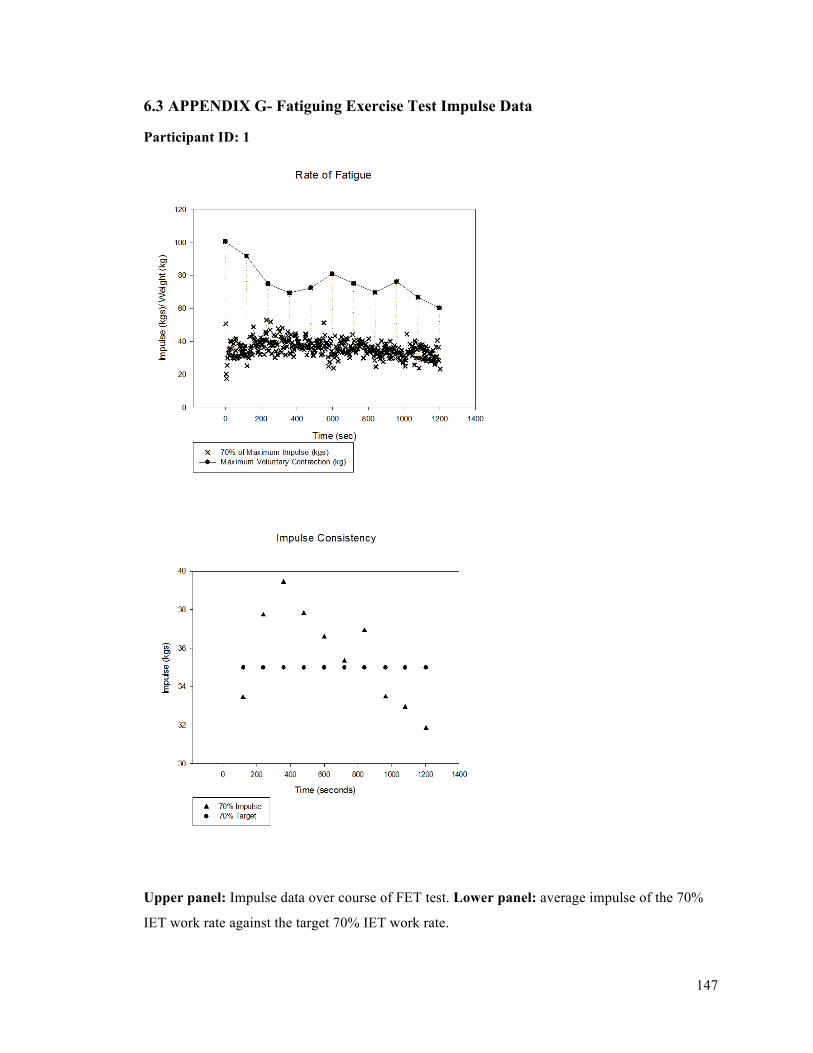
147
6.3 APPENDIX G- Fatiguing Exercise Test Impulse Data
Participant ID: 1
Upper panel: Impulse data over course of FET test. Lower panel: average impulse of the 70%
IET work rate against the target 70% IET work rate.

148
Participant ID: 2
Upper panel: Impulse data over course of FET test. Lower panel: average impulse of the 70%
IET work rate against the target 70% IET work rate.
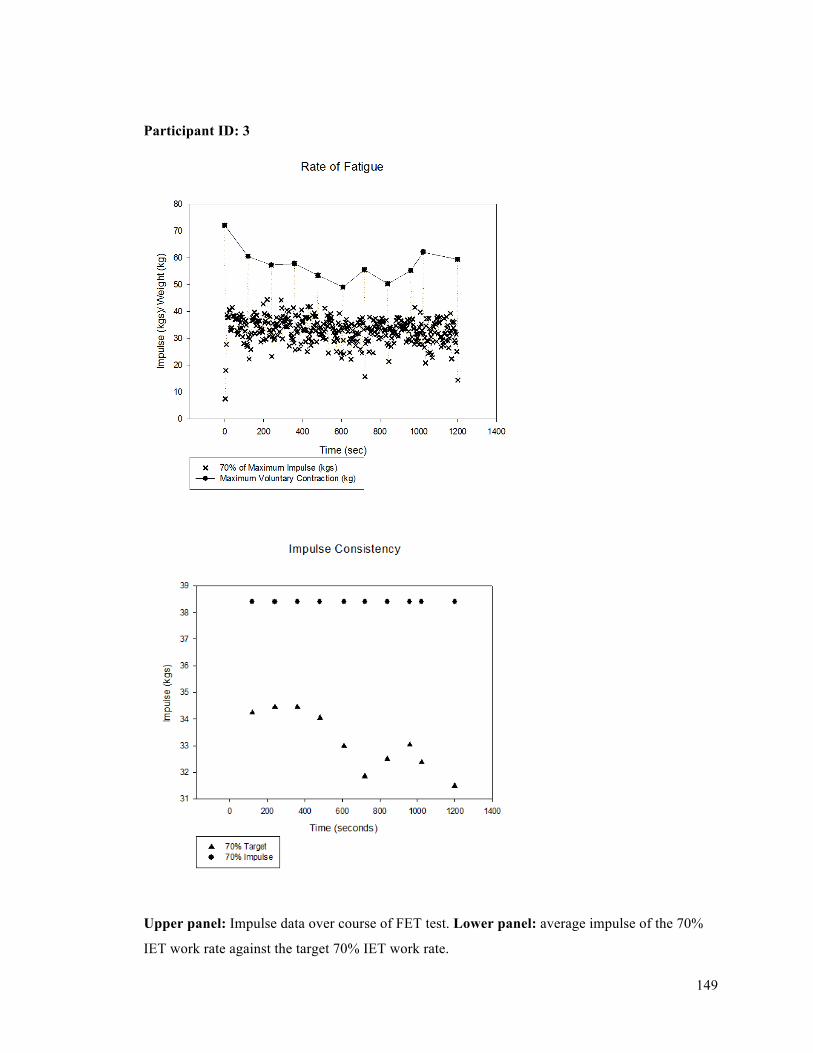
149
Participant ID: 3
Upper panel: Impulse data over course of FET test. Lower panel: average impulse of the 70%
IET work rate against the target 70% IET work rate.
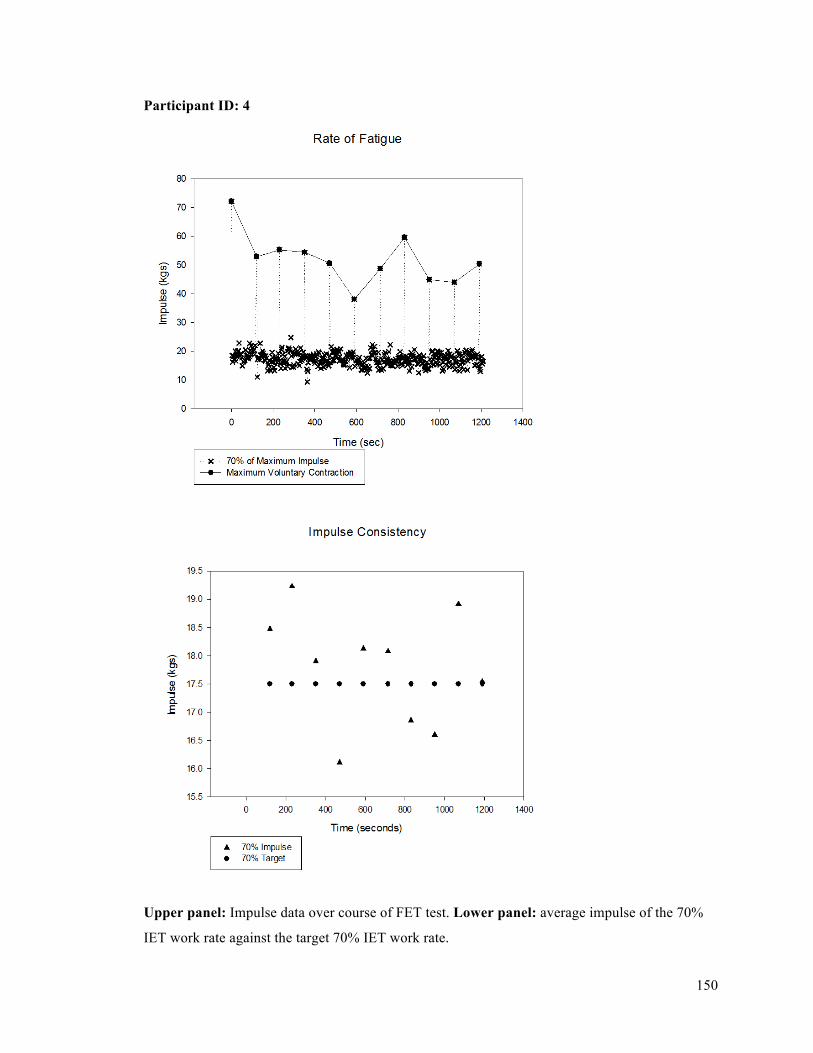
150
Participant ID: 4
Upper panel: Impulse data over course of FET test. Lower panel: average impulse of the 70%
IET work rate against the target 70% IET work rate.
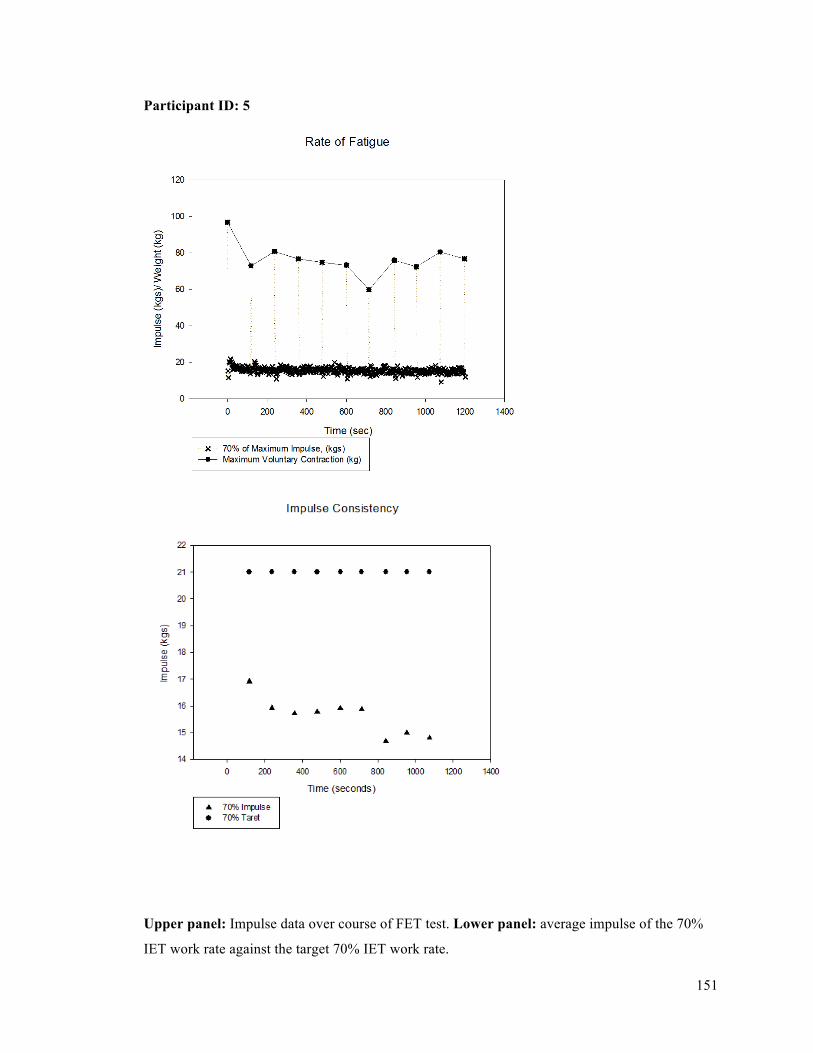
151
Participant ID: 5
Upper panel: Impulse data over course of FET test. Lower panel: average impulse of the 70%
IET work rate against the target 70% IET work rate.
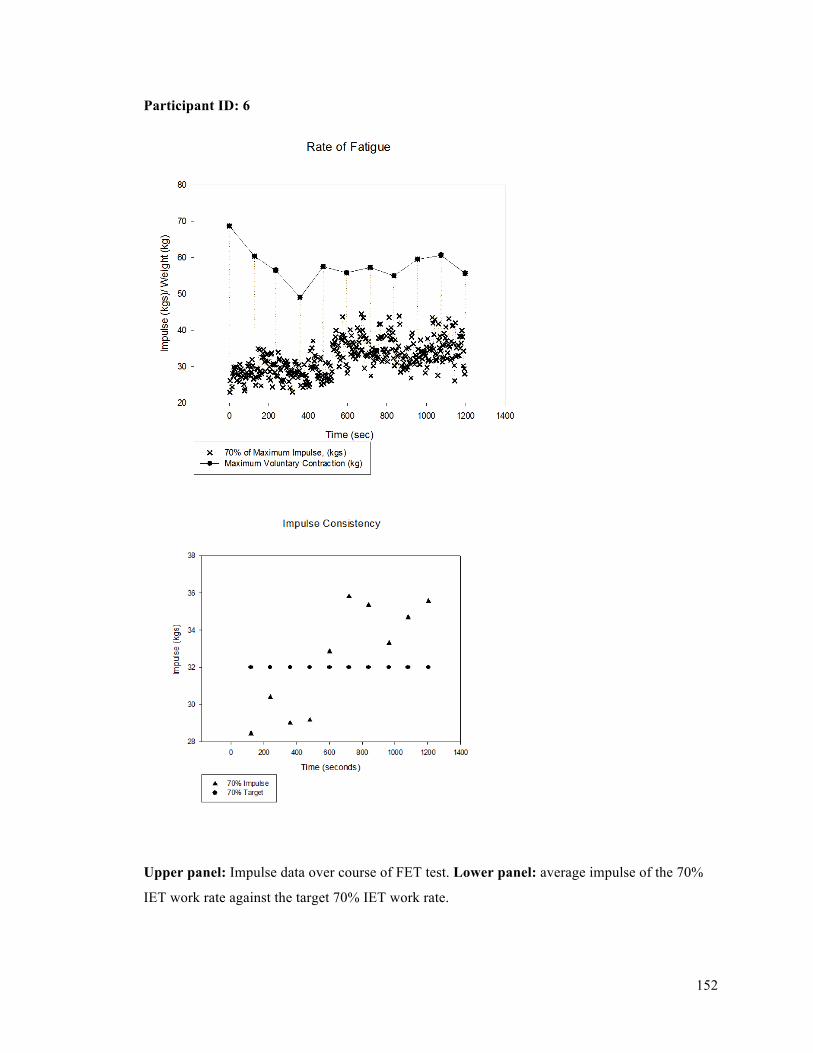
152
Participant ID: 6
Upper panel: Impulse data over course of FET test. Lower panel: average impulse of the 70%
IET work rate against the target 70% IET work rate.
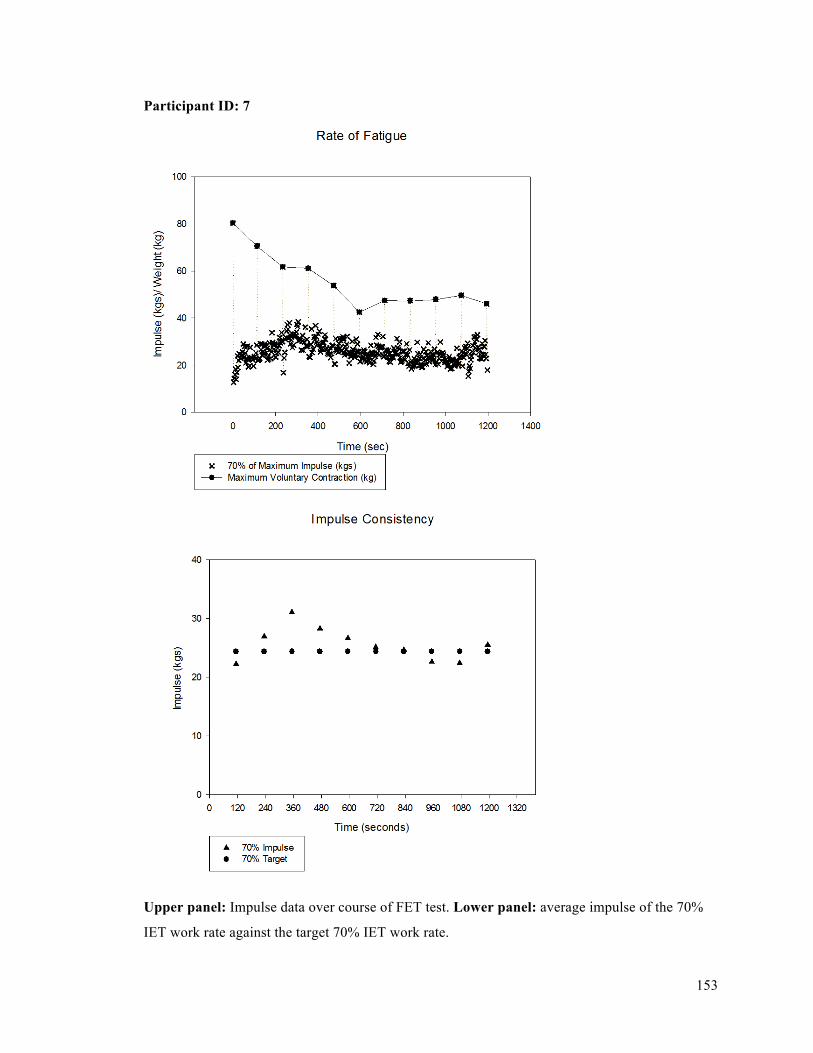
153
Participant ID: 7
Upper panel: Impulse data over course of FET test. Lower panel: average impulse of the 70%
IET work rate against the target 70% IET work rate.
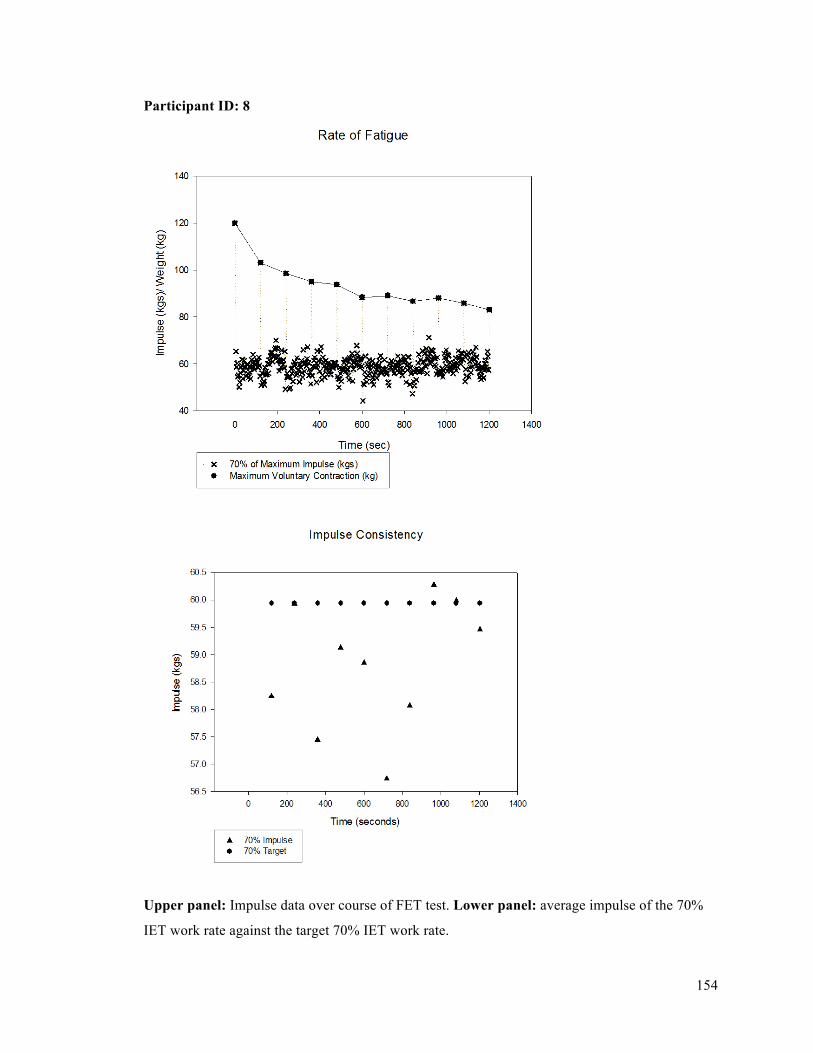
154
Participant ID: 8
Upper panel: Impulse data over course of FET test. Lower panel: average impulse of the 70%
IET work rate against the target 70% IET work rate.
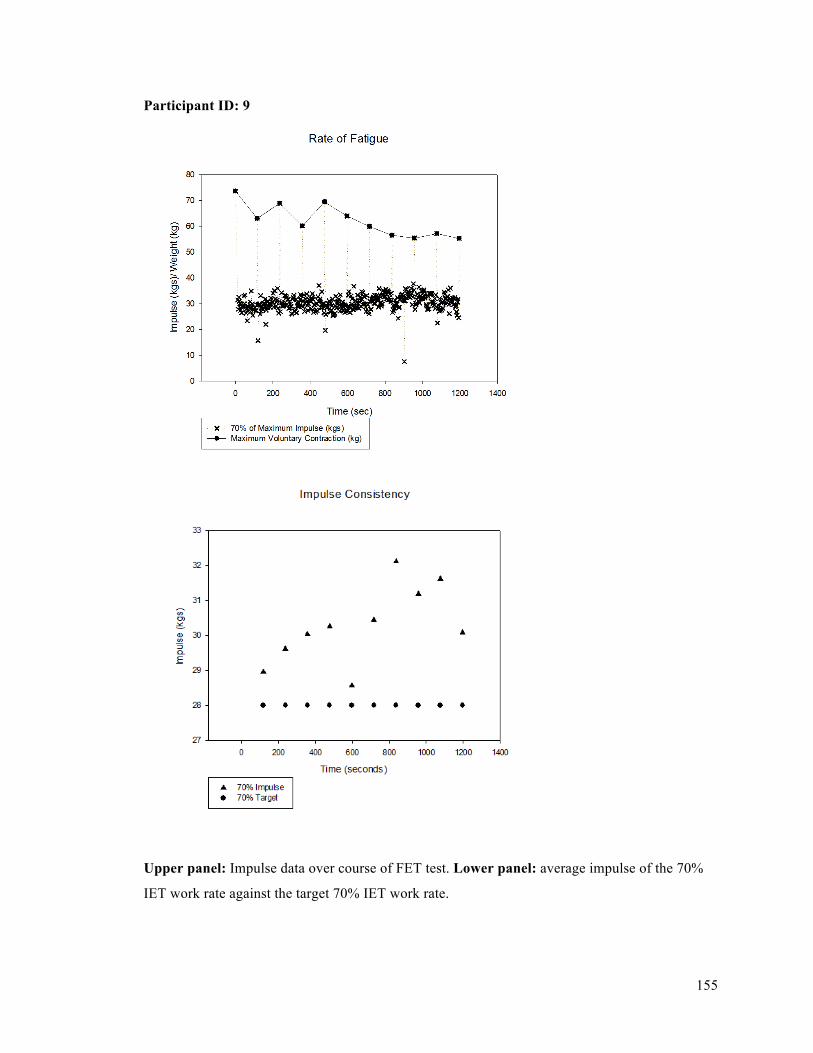
155
Participant ID: 9
Upper panel: Impulse data over course of FET test. Lower panel: average impulse of the 70%
IET work rate against the target 70% IET work rate.
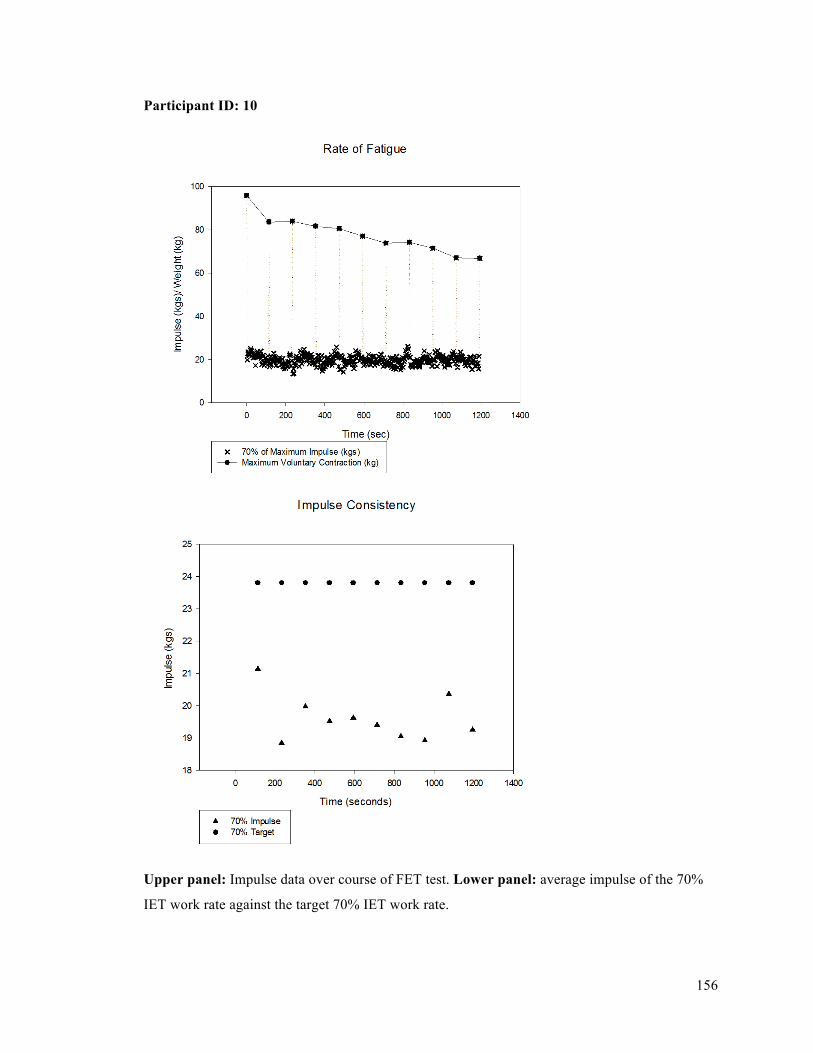
156
Participant ID: 10
Upper panel: Impulse data over course of FET test. Lower panel: average impulse of the 70%
IET work rate against the target 70% IET work rate.