
Caryologia - Open Journal Systems
158
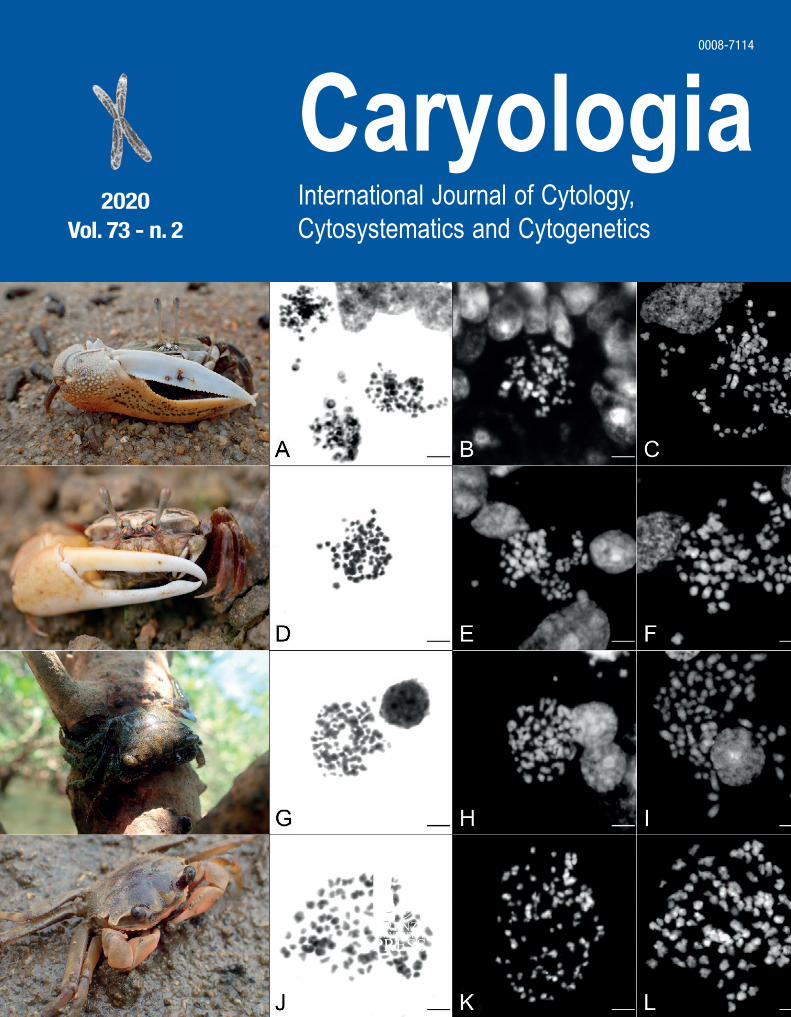
Caryologia International Journal of Cytology, Cytosystematics and Cytogenetics FIRENZE UNIVERSITY PRESS 2020 Vol. 73 - n. 2 0008-7114
-
Upload
khangminh22 -
Category
Documents
-
view
1 -
download
0
Transcript of Caryologia - Open Journal Systems
Caryologia2020 Vol. 73 – n. 2
CaryologiaInternational Journal of Cytology, Cytosystematics and Cytogenetics
FIRENZEUNIVERSITY
PRESS
2020Vol. 73 - n. 2
0008-7114
Caryologia. International Journal of Cytology, Cytosystematics and CytogeneticsCaryologia is devoted to the publication of original papers, and occasionally of reviews, about plant, animal and human kar-yological, cytological, cytogenetic, embryological and ultrastructural studies. Articles about the structure, the organization and the biological events relating to DNA and chromatin organization in eukaryotic cells are considered. Caryologia has a strong tradition in plant and animal cytosystematics and in cytotoxicology. Bioinformatics articles may be considered, but only if they have an emphasis on the relationship between the nucleus and cytoplasm and/or the structural organization of the eukaryotic cell.
Editor in Chief
Alessio PapiniDipartimento di Biologia VegetaleUniversità degli Studi di FirenzeVia La Pira, 4 – 0121 Firenze, Italy
Associate Editors
Alfonso Carabez-Trejo - Mexico City, MexicoKatsuhiko Kondo - Hagishi-Hiroshima, JapanCanio G. Vosa - Pisa, Italy
Subject Editors
Mycology Renato Benesperi Università di Firenze, Italy
Human and Animal CytogeneticsMichael Schmid University of Würzburg, Germany
Plant Cytogenetics Lorenzo Peruzzi Università di Pisa
Plant Karyology and Phylogeny Andrea Coppi Università di Firenze
Histology and Cell Biology Alessio Papini Università di Firenze
ZoologyMauro MandrioliUniversità di Modena e Reggio Emilia
Editorial Assistant
Sara FalsiniUniversità degli Studi di Firenze, Italy
Editorial Advisory Board
G. Berta - Alessandria, ItalyD. Bizzaro - Ancona, ItalyA. Brito Da Cunha - Sao Paulo, BrazilE. Capanna - Roma, Italy D. Cavalieri - San Michele all'Adige, ItalyE. H. Y. Chu - Ann Arbor, USAR. Cremonini - Pisa, ItalyM. Cresti - Siena, ItalyG. Cristofolini - Bologna, ItalyP. Crosti - Milano, Italy
G. Delfino - Firenze, ItalyS. D'Emerico - Bari, ItalyF. Garbari - Pisa, ItalyC. Giuliani - Milano, ItalyM. Guerra - Recife, BrazilW. Heneen - Svalöf, SwedenL. Iannuzzi - Napoli, ItalyJ. Limon - Gdansk, PolandJ. Liu - Lanzhou, ChinaN. Mandahl - Lund, Sweden
M. Mandrioli - Modena, ItalyG. C. Manicardi - Modena, ItalyP. Marchi - Roma, ItalyM. Ruffini Castiglione - Pisa, ItalyL. Sanità di Toppi - Parma, ItalyC. Steinlein - Würzburg, GermanyJ. Vallès - Barcelona, Catalonia, SpainQ. Yang - Beijing, China
Cover: figure from the article inside by Shambhavi et al. "Phagocytic events, associated lipid peroxidation and peroxidase activity in hemocytes of silkworm Bombyx mori induced by microsporidian infection". Electron microscope observations of silkworm hemocytes after microsporidian infection at the nucleus level.
CaryologiaInternational Journal of Cytology, Cytosystematics and Cytogenetics
Volume 73, Issue 2 - 2020
Firenze University Press

Caryologia. International Journal of Cytology, Cytosystematics and CytogeneticsPublished by Firenze University Press – University of Florence, ItalyVia Cittadella, 7 - 50144 Florence - Italy http://www.fupress.com/caryologia
Copyright © 2020 Authors. The authors retain all rights to the original work without any restrictions.Open Access. This issue is distributed under the terms of the Creative Commons Attribution 4.0 International License (CC-BY-4.0) which permits unrestricted use, distribution, and reproduction in any medium, provided you give ap-propriate credit to the original author(s) and the source, provide a link to the Creative Commons license, and indicate if changes were made. The Creative Commons Public Domain Dedication (CC0 1.0) waiver applies to the data made available in this issue, unless otherwise stated.
Caryologia. International Journal of Cytology, Cytosystematics and Cytogenetics 73(2): 3-13, 2020
Firenze University Press www.fupress.com/caryologiaCaryologia
International Journal of Cytology, Cytosystematics and Cytogenetics
ISSN 0008-7114 (print) | ISSN 2165-5391 (online) | DOI: 10.13128/caryologia-750
Citation: S.S. Sobieh, M.H. Darwish (2020) The first molecular identifica-tion of Egyptian Miocene petrified dicot woods (Egyptians’ dream becomes a reality). Caryologia 73(2): 3-13. doi: 10.13128/caryologia-750
Received: December 1, 2019
Accepted: March 13, 2020
Published: July 31, 2020
Copyright: © 2020 S.S. Sobieh, M.H. Darwish. This is an open access, peer-reviewed article published by Firenze University Press (http://www.fupress.com/caryologia) and distributed under the terms of the Creative Com-mons Attribution License, which per-mits unrestricted use, distribution, and reproduction in any medium, provided the original author and source are credited.
Data Availability Statement: All rel-evant data are within the paper and its Supporting Information files.
Competing Interests: The Author(s) declare(s) no conflict of interest.
The first molecular identification of Egyptian Miocene petrified dicot woods (Egyptians’ dream becomes a reality)
Shaimaa S. Sobieh*, Mona H. Darwish
Botany Department, Faculty of Women for Arts, Science and Education, Ain Shams Uni-versity, Cairo, EgyptE-mail: [email protected]; [email protected]*Corresponding author
Abstract. This is the first work on Egyptian ancient DNA (aDNA) from plant fossil remains. Two aDNA extracts from Miocene petrified dicot woods were successful-ly obtained, amplified, sequenced and recorded for the first time in the world using a DNA barcoding technique. Internal transcribed spacers (ITS) barcoding is a tech-nique for delimiting and identifying specimens using standardized DNA regions. The two Miocene dicot woods: Bombacoxylon owenii (Malvaceae/Bombacoideae) and Dalbergioxylon dicorynioides (Leguminosae/Papilionoideae) were collected from the Wadi Natrun area in Egypt and were identified by palaeobotanists on the basis of wood anatomy. The molecular identification by ITS region of Bombacoxylon owe-nii did not match the wood taxonomic assignation. The molecular identification of Bombacoxylon owenii suggested that it is more related to the extant genus Ceiba rather than to the extant genus Bombax. In contrast, the molecular identification by ITS of Dalbergioxylon dicorynioides matched the identification of the palaeobotanist (related to extant genus Dalbergia). Therefore, we suggest that this region should be used as a starting point to identify several plant fossil remains and this work will be helpful in solving problems related to the identification of plant fossils.
Keywords: Egyptian petrified woods, aDNA, DNA barcoding, ITS.
INTRODUCTION
Over the past twenty years, several ancient DNA studies have been published, but none has targeted ancient Egyptian DNA. Initial studies on ancient plant DNA were published in the mid-eighties (Golberg et al. 1991). Rogers and Bendich (1985) reported the extraction of nanogram amounts of DNA from plant tissues ranging in age from 22000 to greater than 44600 years old. DNA from fossils facilitates the calibration of mutation rates among related taxa (Poinar et al. 1993).
Ancient DNA (aDNA) is the most important and informative biological component that scientists can find in archaeological areas for identification purposes. Ancient DNA analysis is used synergistically with other identifi-
4 Shaimaa S. Sobieh, Mona H. Darwish
cation methods, such as morphological and anatomical observations and microscopic analyses. DNA barcod-ing complements the microscopic techniques used in archaeobotany. DNA analysis can be solely used for the identification of specimens when the morphological and anatomical characteristics are absent (Hamalton 2016). Ancient DNA may be used to reconstruct proximal his-tories of species and populations. Studies involving the extraction, sequencing, and verification of fossil DNA demonstrate the existence of material that can be use-ful to both palaeontologists and evolutionary geneti-cists. This opens the possibility for coordinated studies of macro- and microevolutionary patterns that directly approach the relationship between morphological chang-es on the one hand and genetic changes on the other. In addition, molecular evolutionary studies attempt to reconstruct relationships between concurrent taxa by deducing ancestral states and the genetic distances between them (Golenberg 1994).
Ancient wood is found in high abundance, and sam-ples are usually large enough to be analysed. For that reason, wood is an ideal target for ancient plant DNA studies (Kim et al. 2004). However, three problems obstruct the isolation and amplification of DNA from any aDNA specimens (Nasab et al. 2010). The first is the presence of contamination. The second is the exist-ence of inhibitors of Taq DNA polymerase in ancient samples, while the third is the small quantity and low quality of DNA that is regained from dead wood (Kaes-tle and Horsburgh 2002) and this is due to degradation of DNA into small fragments in dead tissue (Deguil-loux et al. 2002). Nevertheless, there are several reports of molecular analyses of aDNA from plants. Ancient DNA was extracted from 1600 year-old millet (Panicum miliaceum) by Gyulai et al. (2006) and in 1993, aDNA was extracted from 600- year-old maize cobs (Gol-oubinoff et al. 1993). Wagner et al. (2018) character-ized the aDNA preserved in subfossil (nonpetrified) and archaeological waterlogged wood from the Holocene age (550–9,800 years ago).
DNA barcoding is used to identify unknown sam-ples, in terms of a pre-existing classification (Tripathi et al. 2013) or to assess whether species should be com-bined or separated. It is also used to establish a shared community resource of DNA sequences that can be used for organismal identification and taxonomic clarification (Tripathi et al. 2013). The nuclear ribosomal internal transcribed spacer (ITS) region is indicated as a plant barcoding region (Hollingsworth et al. 2011).
Miocene fossils are believed to be the best-preserved fossils of Egypt (El-Saadawi et al. 2014). These fossils are chemically well preserved because of the low oxy-
gen content and cold temperatures of the water in which they were deposited (Kim et al. 2004). DNA sequences can be obtained from Miocene-age plant remains and the success rate is increased through the use of improved methods of DNA extraction and the amplification of small segments of the fossil DNA (Kim et al. 2004).
El-Saadawi et al. (2014) reported that Egypt contains the second largest deposit of Miocene dicot woods in Africa (containing 23 taxa) after Ethiopia that contains 55 taxa. Seven petrified dicot woods were collected from the Wadi Natrun area in Egypt by Prof. Wagih El-Saad-awi and Prof. Marwa Kamal El-Din (Botany Depart-ment, Faculty of Science, Ain Shams University). They identified only three of them, namely (Bombacoxylon owenii (Leguminosae/Papilionoideae), Dalbergioxylon dicorynioides (Fabaceae/Faboideae) and Sapindoxylon stromeri (Sapindaceae) based on the wood anatomy (El-Saadawi et al. 2014). Therefore, the main purpose of the present study was to extract and amplify aDNA from these Egyptian Miocene petrified dicot woods to pro-vide a complete identification. DNA was successfully isolated from the wood samples of Bombacoxylon owenii and Dalbergioxylon dicorynioides. We used molecular techniques to confirm the wood anatomy identification of the two Egyptian wood fossils using DNA barcod-ing method. In addition, we validated the relationship between the plant fossil woods and the nearest living relative (NLR) based on molecular data acquired from the ITS barcode.
MATERIAL AND METHODS
Population sampling
Fossil samples
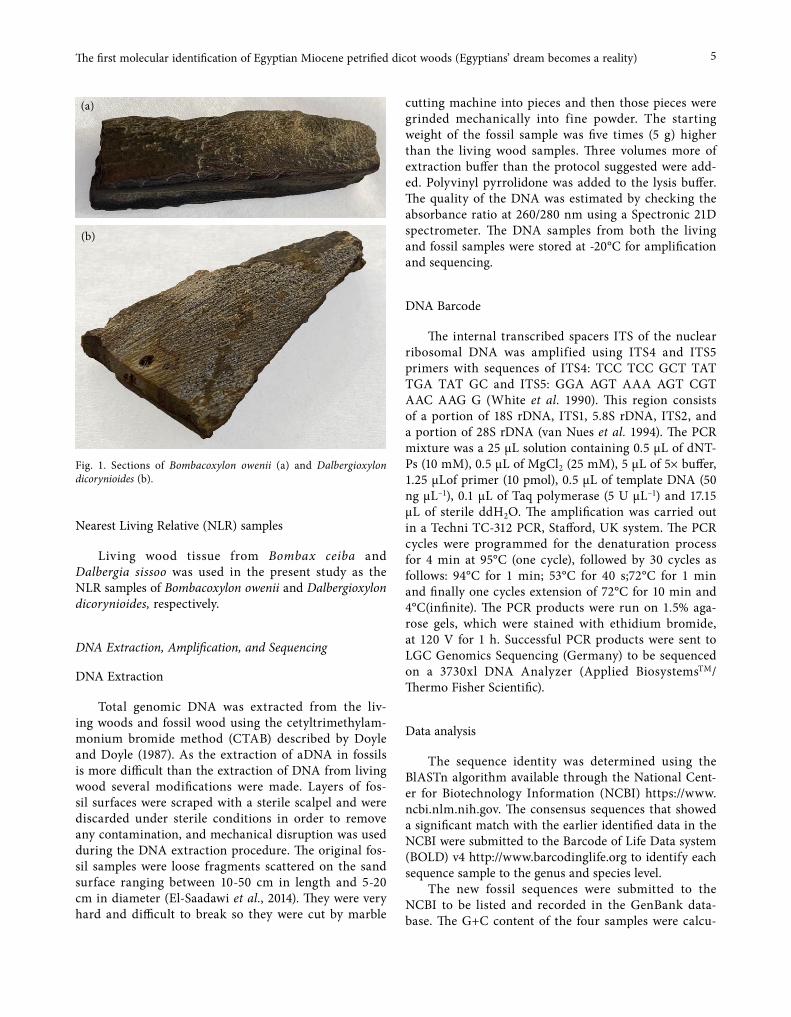
Seven of the good quality Egyptian ancient Mio-cene petrified dicot wood specimens (23.03 to 5.33 Ma. years ago) were used to extract the aDNA. Only two specimens (Bombacoxylon owenii (Bombacaceae) and Dalbergioxylon dicorynioides (Fabaceae) (Fig. 1a, b) were successfully identified to the genus level by the analysis of the ITS of the nuclear ribosomal DNA and the other five samples gave negative results. These Miocene petri-fied dicot woods were found in the Wadi Natrun area in Egypt and were previously identified by palaeobotanists (El-Saadawi et al. 2014; Kamal EL-Din et al. 2015) on the basis of the wood anatomy. The wood specimens were housed in the palaeobotanical collection of the Botany Department, Faculty of Science, Ain Shams University, Cairo-Egypt.
5The first molecular identification of Egyptian Miocene petrified dicot woods (Egyptians’ dream becomes a reality)
Nearest Living Relative (NLR) samples
Living wood tissue from Bombax ceiba and Dalbergia sissoo was used in the present study as the NLR samples of Bombacoxylon owenii and Dalbergioxylon dicorynioides, respectively.
DNA Extraction, Amplification, and Sequencing
DNA Extraction
Total genomic DNA was extracted from the liv-ing woods and fossil wood using the cetyltrimethylam-monium bromide method (CTAB) described by Doyle and Doyle (1987). As the extraction of aDNA in fossils is more difficult than the extraction of DNA from living wood several modifications were made. Layers of fos-sil surfaces were scraped with a sterile scalpel and were discarded under sterile conditions in order to remove any contamination, and mechanical disruption was used during the DNA extraction procedure. The original fos-sil samples were loose fragments scattered on the sand surface ranging between 10-50 cm in length and 5-20 cm in diameter (El-Saadawi et al., 2014). They were very hard and difficult to break so they were cut by marble
cutting machine into pieces and then those pieces were grinded mechanically into fine powder. The starting weight of the fossil sample was five times (5 g) higher than the living wood samples. Three volumes more of extraction buffer than the protocol suggested were add-ed. Polyvinyl pyrrolidone was added to the lysis buffer. The quality of the DNA was estimated by checking the absorbance ratio at 260/280 nm using a Spectronic 21D spectrometer. The DNA samples from both the living and fossil samples were stored at -20°C for amplification and sequencing.
DNA Barcode
The internal transcribed spacers ITS of the nuclear ribosomal DNA was amplified using ITS4 and ITS5 primers with sequences of ITS4: TCC TCC GCT TAT TGA TAT GC and ITS5: GGA AGT AAA AGT CGT AAC AAG G (White et al. 1990). This region consists of a portion of 18S rDNA, ITS1, 5.8S rDNA, ITS2, and a portion of 28S rDNA (van Nues et al. 1994). The PCR mixture was a 25 μL solution containing 0.5 μL of dNT-Ps (10 mM), 0.5 μL of MgCl2 (25 mM), 5 μL of 5× buffer, 1.25 μLof primer (10 pmol), 0.5 μL of template DNA (50 ng μL–1), 0.1 μL of Taq polymerase (5 U μL–1) and 17.15 μL of sterile ddH2O. The amplification was carried out in a Techni TC-312 PCR, Stafford, UK system. The PCR cycles were programmed for the denaturation process for 4 min at 95°C (one cycle), followed by 30 cycles as follows: 94°C for 1 min; 53°C for 40 s;72°C for 1 min and finally one cycles extension of 72°C for 10 min and 4°C(infinite). The PCR products were run on 1.5% aga-rose gels, which were stained with ethidium bromide, at 120 V for 1 h. Successful PCR products were sent to LGC Genomics Sequencing (Germany) to be sequenced on a 3730xl DNA Analyzer (Applied BiosystemsTM/ Thermo Fisher Scientific).
Data analysis
The sequence identity was determined using the BlASTn algorithm available through the National Cent-er for Biotechnology Information (NCBI) https://www.ncbi.nlm.nih.gov. The consensus sequences that showed a significant match with the earlier identified data in the NCBI were submitted to the Barcode of Life Data system (BOLD) v4 http://www.barcodinglife.org to identify each sequence sample to the genus and species level.
The new fossil sequences were submitted to the NCBI to be listed and recorded in the GenBank data-base. The G+C content of the four samples were calcu-
Fig. 1. Sections of Bombacoxylon owenii (a) and Dalbergioxylon dicorynioides (b).
(a)
(b)

6 Shaimaa S. Sobieh, Mona H. Darwish
lated online using the CG content calculator website https://www.biologicscorp.com/tools/GCContent#.WrS-k5OhubIU.
The multiple DNA sequences alignments (MSA) were performed using the Molecular Evolution-ary Genetics Analysis version 6 (MEGA 6) (Tamura et al. 2013), while double sequence alignment using the CLUSTAL W algorithm was performed according Thompson et al. (1994).
The genetic distances were computed using MEGA 6.06 according to the Kimura-2-Parameter (K2P) model (Kimura 1980).
Phylogenetic reconstruction
The aligned DNA sequences by the CLUSTAL W algorithm of MEGA 6 were trimmed online using the trimming website: http://users-birc.au.dk/biopv/php/fabox/alignment_trimmer.php. The final aligned sequences were used to construct the phylogenetic trees. Sixteen species with their accession numbers (Table 1) were used to construct the phylogenetic tree for cf. Ceiba sp., and 36 species with their accession numbers (Table 2) were used to construct the phylogenetic tree for cf. Dalbergia sp. Moreover, the sequences of Persea pseudo-carolinensis (accession number. AY337335) and Persea palustris (accession number. AY3377330) from GenBank, were chosen as outgroup to root the trees.
The maximum likelihood (ML) analysis was applied to construct the phylogenetic trees. The ML analy-sis was constructed in MEGA 6 using the K2P model, with 1,000 bootstrap replicates. The codon positions were combined as 1st+2nd+3rd+noncoding. All posi-tions containing gaps and missing data were eliminated. The tree was drawn to scale, with branch lengths in the same units as those of the evolutionary distances used to assume the phylogenetic tree.
Table 1. The eighteen species used for constructing the phylogenetic tree for cf. Ceiba sp. with their accession numbers.
Accession number Corresponding species
MG603734 cf. Ceiba sp.KM453172 Ceiba ventricosaKM453167 Ceiba erianthosKM453170 Ceiba pubifloraHQ658387 Ceiba crispifloraKM453171 Ceiba rubrifloraHQ658388 Ceiba speciosaKM488629 Ceiba insignisKM453168 Ceiba jasminodoraDQ284851 Ceiba pentandraHQ658389 Ceiba schottiiHQ658384 Ceiba aesculifoliaHQ658385 Ceiba acuminataHQ658376 Bombax buonopozensKM453163 Bombax ceibaDQ826447 Bombax malabaricumAY337335 Persea pseudocarolinensisAY3377330 Persea palustris
Table 2. The thirty-eight species used for constructing the phyloge-netic tree for cf. Dalbergia sp. with their accession numbers.
Accession number Corresponding species
MG450751 cf. Dalbergia sp.KM521409 Dalbergia sissooKP092712 Dalbergia balansaeKM521377 Dalbergia odoriferaAB828610 Dalbergia assamica KM521378 Dalbergia hupeanaKM521413 Dalbergia stipulaceaAB828616 Dalbergia bintuluensisAB828639 Dalbergia hostilisKM521372 Dalbergia dyerianaAB828619 Dalbergia bracteolataAF068140 Dalbergia congestifloraAB828632 Dalbergia frutescensAB828633 Dalbergia glomerataAB828649 Dalbergia melanocardiumKM276143 Dalbergia melanoxylonKM276125 Dalbergia latifoliaAB828614 Dalbergia benthamiiAB828622 Dalbergia canescensAB828608 Dalbergia arbutifoliaAB828626 Dalbergia cultrateAB828605 Dalbergia acariianthaAB828618 Dalbergia bojeriAB828613 Dalbergia baroniiAB828640 Dalbergia humbertiiAB828635 Dalbergia greveanaAB828604 Dalbergia abrahamiiKM521415 Dalbergia trichocarpaAB828648 Dalbergia martiniFR854138 Dalbergia tonkinensisAB828653 Dalbergia parvifloraHG313773 Dalbergia entadoidesKM521404 Dalbergia rimosaHG004883 Dalbergia cf. kingianaHG313775 Dalbergia dialoidesKM521414 Dalbergia subcymosaAY337335 Persea pseudocarolinensisAY3377330 Persea palustris
7The first molecular identification of Egyptian Miocene petrified dicot woods (Egyptians’ dream becomes a reality)
RESULTS AND DISCUSSION
DNA isolation
As far as is known, this is the first time that DNA from ancient Egyptian wood samples was extracted. The absorbance ratios (A260/280 nm) of the DNA extracts ranged between 1.81- 1.94 (Table 3), indicat-ing good quality of the DNA from both fossil and liv-ing specimens. The concentrations of the DNA extracts were 175,285, 375 and 470 ng/ μL for Dalbergioxylon dicorynioides, Bombacoxylon owenii, Bombax ceiba and Dalbergia sissoo, respectively, as given in Table 3.
At the present time, publications of aDNA from plant fossils are still relatively infrequent; however, there are many aDNA publications from animals and humans which make up most samples in this field (Gugerli et al. 2005).
Helentjaris (1988) indicated that plant material from archaeological sites may also be amenable to DNA analysis. Many researchers have explored the possibility of isolating DNA from ancient wood samples. DNA has been extracted from samples of modern papyri (writ-ing sheets made with strips from the stem of Cyperus papyrus) varying in age from 0-100 years BP and from ancient specimens from Egypt, with an age-span from 1,300-3,200 years BP. The results showed that the DNA half-life in papyri is approximately 19-24 years. This means that the last DNA fragments will vanish within no more than 532-672 years from the sheets being man-ufactured (Marota et al. 2002). In the case of ancient wood, the risk of contamination during handling and analysis is lower than with human or microbial DNA
(Gilbert et al. 2005). Earlier works on fresh wood by Asif and Cannon (2005), Deguilloux et al. (2006) and studies of aDNA from ancient wood from Quercus and Crypto-meria by Deguilloux et al. (2002) suggested the possibil-ity of DNA survival in ancient wood remains, which was confirmed by the current work.
Liepelt et al. (2006) reported that, it was possible to isolate DNA from wood as old as 1000 years. Depending on the mode of conservation and the climate at the exca-vation site, as well older samples could be isolated and analysed successfully (Deguilloux et al. 2006).
DNA Barcoding by ITS
The DNA barcoding affords an important step for the molecular identification of aDNA from petrified woods. The amplification of genomic DNA uses the uni-versal primers for the ITS region.
Two of seven aDNA extracts from the dicot wood fossil samples (Bombacoxylon owenii and Dalbergioxylon dicorynioides) were successfully used to amplify the ITS region. The PCR and sequencing success rates for the fossil and living samples were 100% (Table 4). The genus and species identity results of the query sequences were then determined using the BLAST and BOLD databases to estimate the reliability of the genus identification. The results of both databases showed that ITS was 100% cor-rectly identified at the genus level, while the success rates for species identification were 50 and 25% for BLAST and BOLD respectively (Table 5).
Many studies have compared the discriminatory power revealed by the ITS region in its entirety with
Table 3. Optical densities and concentrations of the DNA isolated from fossil and living specimens.
Plant nameOptical density
Ratio 260/280 nm DNA concentration(ng/µL)260 nm 280 nm
Bombacoxylon owenii 0.057 0.032 1.84 285Bombax ceiba 0.075 0.041 1.82 375Dalbergioxylon dicorynioides 0.035 0.018 1.94 175
Dalbergia sissoo 0.094 0.052 1.81 470
Table 4. Success rates of the amplification and sequencing.
Barcode locus Number of tested samples (fossil and living samples)
No of samples amplified and percentage of PCR
success
Number and percentage of PCR failure
Number and percentage of sequencing success
ITS 4 4 (100%) 0 (0%) 4 (100%)
8 Shaimaa S. Sobieh, Mona H. Darwish
ITS2, proposing the use of ITS2 as an alternative bar-code to the entire ITS region (Han et al 2013). ITS2 was previously used as a standard DNA barcode to identify medicinal plants by Chen et al. (2010) and a barcode to identify animals (Li et al 2010). The length of the ITS2 region is sufficiently short to allow for the easy amplifi-cation of even degraded DNA, and the ITS2 region has enough variability to distinguish even closely related species and has conserved regions for designing univer-sal primers (Yao et al. 2010). Therefore, it could be used as a DNA barcode for plant fossils in further investiga-tions.
In addition, all 4 raw nucleotide sequences were verified with the other available sequences in Gen-Bank using the BLASTn algorithm. The sequences of the two living samples of Bombax ceiba and Dalbergia sissoo showed an identity ratio of 99% with Bombax ceiba (accession no. KM453163) and Dalbergia sissoo (accession no. AB828659), respectively (Table 6).
The identification of the fossil samples:
Based on the author’s knowledge, thus far, there has been no published work on aDNA from petrified wood. Therefore, this is considered the first molecular identi-fication of Egyptian plant fossil remains and of petri-fied wood (Bombacoxylon owenii and Dalbergioxylon dicorynioides) worldwide. Meanwhile, the authors hope that many other fields (anatomy and morphology) besides the molecular field will contribute to determin-ing the relationship between living plants and their fossil remains.
Bombacoxylon owenii (cf. Ceiba sp. accession no.: MG603734)
The ITS sequence from the fossil specimen was amplified and produced a 704 bp fragment. The sequence was uploaded to the NCBI database and was documented, for the first time with accession number MG603734.
Bombacoxylon owenii was listed in the NCBI data-base as cf. Ceiba sp. because the GenBank policy is not to add fossil taxa to the taxonomy database, since it is a database of living or recently extinct organisms. Bombacoxylon is a fossil genus for woods with fea-tures characteristic of the Bombacoideae, not a whole plant. Moreover, the molecular identification revealed a close resemblance of the submitted sequence to Ceiba pentandra (the commercial kapok tree) rather than Bombax as was expected by Kamal El-Din et al. (2015). This identification is not surprising since the two living genera (Bombax and Ceiba) are grouped in the same subfamily Bombacoideae and have very few differences between them. Moreover, the wood anatomy of both genera reveals the high resemblance between them, and they can be only distinguished by a combination of macroscopic characteristics, which are the shape of the vessel-ray pit, the ray width, the sheath cells and mineral inclusion (Nordahlia et al., 2016). The NLR of some fossil wood taxa might be wrong, Bombacoxylon shares characters with Sterculi-aceae and Bombacaceae rather than only with Bombax, Grewioxylon with other members of the Malvaceae with tile cells, (e.g., Craigia) instead of only Grewia (Skala 2007). In addition, Wickens (2008) stated that it must
Table 5. Identification efficiency of the barcode loci using BLAST and BOLD.
Barcode Locus No. of samples identified
Family level using BLAST
Family level using BOLD
Genus level using BLAST
Genus level using BOLD
Species level using BLAST
Species level using BOLD
ITS 4 100% 100% 100% 100% 50% 25%
Table 6. Identification matches of the ITS sequences using the BLAST and BOLD Databases.
Sample identification Plant order Plant family Plant subfamily
BLAST search match
BLAST similarity
(%)BOLD search match
BOLD similarity
(%)
cf. Ceiba sp.(Bombacoxylon owenii) Malvales Malvaceae Bombacoideae cf. Ceiba sp. 100 Ceiba pantandra 90.83
Bombax ceiba Malvales Malvaceae Bombacoideae Bombax ceiba 99 Bombax malabaricum 99.14cf. Dalbergia sp.(Dalbergioxylon dicorynioides) Fabales Fabaceae Papilionoideae cf. Dalbergia sp. 100 Dalbergia odorifera 87.94
Dalbergia sissoo Fabales Fabaceae Papilionoideae Dalbergia sissoo 99 Dalbergia sissoo 98.57
9The first molecular identification of Egyptian Miocene petrified dicot woods (Egyptians’ dream becomes a reality)
not be assumed that the names of fossil wood necessar-ily represent species close to modern genera.
The sequence of cf. Ceiba sp. was compared with other available sequences in GenBank using the BLASTn algorithm. The results showed that the sequences belonged to the homologous sequences of the genus Ceiba. The sequence of cf. Ceiba sp. showed identities with several living Ceiba species rather than Bombax. The identity ratios among the Ceiba species indicated that the Ceiba pentandra ITS nucleotide sequence (acces-sion no. DQ284851) was the nearest related ITS sequence for Bombacoxylon owenii (cf. Ceiba sp.).
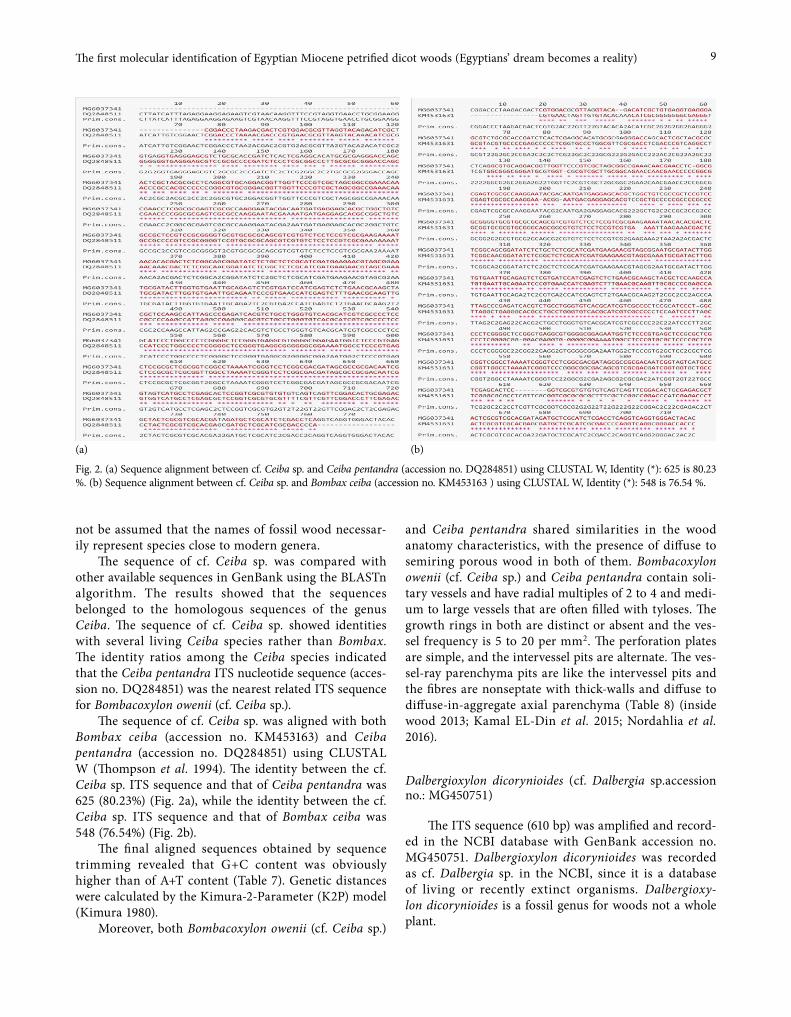
The sequence of cf. Ceiba sp. was aligned with both Bombax ceiba (accession no. KM453163) and Ceiba pentandra (accession no. DQ284851) using CLUSTAL W (Thompson et al. 1994). The identity between the cf. Ceiba sp. ITS sequence and that of Ceiba pentandra was 625 (80.23%) (Fig. 2a), while the identity between the cf. Ceiba sp. ITS sequence and that of Bombax ceiba was 548 (76.54%) (Fig. 2b).
The final aligned sequences obtained by sequence trimming revealed that G+C content was obviously higher than of A+T content (Table 7). Genetic distances were calculated by the Kimura-2-Parameter (K2P) model (Kimura 1980).
Moreover, both Bombacoxylon owenii (cf. Ceiba sp.)
and Ceiba pentandra shared similarities in the wood anatomy characteristics, with the presence of diffuse to semiring porous wood in both of them. Bombacoxylon owenii (cf. Ceiba sp.) and Ceiba pentandra contain soli-tary vessels and have radial multiples of 2 to 4 and medi-um to large vessels that are often filled with tyloses. The growth rings in both are distinct or absent and the ves-sel frequency is 5 to 20 per mm2. The perforation plates are simple, and the intervessel pits are alternate. The ves-sel-ray parenchyma pits are like the intervessel pits and the fibres are nonseptate with thick-walls and diffuse to diffuse-in-aggregate axial parenchyma (Table 8) (inside wood 2013; Kamal EL-Din et al. 2015; Nordahlia et al. 2016).
Dalbergioxylon dicorynioides (cf. Dalbergia sp.accession no.: MG450751)
The ITS sequence (610 bp) was amplified and record-ed in the NCBI database with GenBank accession no. MG450751. Dalbergioxylon dicorynioides was recorded as cf. Dalbergia sp. in the NCBI, since it is a database of living or recently extinct organisms. Dalbergioxy-lon dicorynioides is a fossil genus for woods not a whole plant.
Fig. 2. (a) Sequence alignment between cf. Ceiba sp. and Ceiba pentandra (accession no. DQ284851) using CLUSTAL W, Identity (*): 625 is 80.23 %. (b) Sequence alignment between cf. Ceiba sp. and Bombax ceiba (accession no. KM453163 ) using CLUSTAL W, Identity (*): 548 is 76.54 %.
(a) (b)

10 Shaimaa S. Sobieh, Mona H. Darwish
The total sequence length of ITS in the Dalbergia genus ranged from 600 to 800 bp as reported by several records in the NCBI database for ITS in the Dalbergia genus.
The sequence was tested with other available sequences in GenBank using the BLASTn algorithm. The results showed that the sequences belonged to the homologous sequences of the genus Dalbergia. The sequence of cf. Dalbergia sp. showed identities with sev-eral living Dalbergia species, but when we compared the identity ratios among them we found that the Dal-bergia sissoo ITS nucleotide sequences (accession no. AB828659.1) were the nearest ITS sequence for Dalbergi-oxylon dicorynioides (cf. Dalbergia sp.), with an identity ratio of 91%.
The final aligned sequences obtained by sequence trimming revealed that the G+C content was obviously higher than the A+T content (Table 7). Genetic distances for Dalbergia sequences alignment were calculated by the Kimura-2-Parameter (K2P) model (Kimura 1980).
The comparison of the wood anatomy characteris-tics of Dalbergioxylon dicorynioides (cf. Dalbergia sp.) with those of living Dalbergia species revealed that Dal-bergia sissoo was most closely related to Dalbergioxylon dicorynioides (Table 9) because both contained diffuse-
porous wood, solitary vessels and radial multiples of 2 to 3, indistinct or absent growth rings, exclusively sim-ple perforation plates, alternate and vestured intervessel pits, vessel-ray pits similar to intervessel pits in size and shape throughout the ray cell, combinations of aliform, confluent and irregular banded (1 to 4 cells wide) axial parenchyma, 1-3 seriate rays up to 20 cells high, and thick-walled non-septate fibers (inside wood 2013; El-Saadawi et al. 2014).
Phylogenetic analysis
The phylogenetic analyses were conducted in MEGA6 (Thompson et al. 1994) and the phylogenetic trees were inferred with the ML based on the Kimura model (Kimura 1980). Nowadays, several programs can be used to construct maximum likelihood phylogenetic tree. The fastest ML-based phylogenetic programs that differ in implementations of rearrangement algorithms are PhyML (Guindon et al. 2010) and RAxML/ExaML (Stamatakis 2014).
The topologies of the phylogenetic trees were evalu-ated using the bootstrap resampling method of Felsen-stein (1985) with 1000 replicates. The analysis involved
Table 7. Sequence length and GC and AT content.
Sample name Full length G+C G+C% A+T A+T%
cf. Ceiba sp. 704 221+219 62% 134+130 38%Bombax ceiba 692 231+234 66% 113+114 34%cf. Dalbergia sp. 610 185+194 61% 135+96 39%Dalbergia sissoo 610 189+211 64% 127+83 36%
Table 8. Comparison of anatomical features between Bombacoxylon owenii & Ceiba pentandra.
Species Feature Bombacoxylon owenii Ceiba pentandra (L.)
Growth ring Distinct Distinct, indistinct or absentPorosity Diffuse to semiring-porous Diffuse-porousPerforation plates Simple SimpleIntervessel pits Alternate AlternateRadial diameter 240 μm (220 to260) 350 to 800 µmVessels groupings Solitary and in radial multiples of 2 to 4 Restricted to marginal rowsTyloses Common CommonVessel/mm2 5 to 15(8) 5 to 20Vessel element length μm 335 μm 350 to 800 µm
Axial Parenchyma Diffuse, diffuse-in-aggregates, scanty, narrow vasicentric paratracheal and in narrow bands or lines
Diffuse, diffuse-in-aggregates, scanty, narrow vasicentric paratracheal and in narrow bands or lines
Rays 1 to 3 cells, seriate Larger rays commonly 4 to 10 seriateFibers Nonseptate with very thick walls Nonseptate with thin- to thick-walled
11The first molecular identification of Egyptian Miocene petrified dicot woods (Egyptians’ dream becomes a reality)
18 nucleotide sequences (cf. Ceiba sp., 12 species of Ceiba and 3 species of Bombax which were downloaded from the NCBI database), and Persea pseudocarolinensis and Persea palustris were used as outgroups. There was a total of 1374 positions in the final dataset, and the ambiguous positions were completely eliminated for each sequence pair.
The ML tree was divided into two clades, namely A and B. Clade A included Bombax members, while clade B included the Ceiba species in addition to cf. Ceiba sp. (Bombacoxylon owenii). Both cf. Ceiba sp. and Ceiba pentandra were on the same branch. Therefore, the phylogenetic tree showed that Bombacoxylon owenii (cf. Ceiba sp.) was very similar to the Ceiba genus, which
previously was thought to resemble the Bombax genus (Kamal EL-Din et al. 2015) (Fig. 3).
In the ML tree, all the Dalbergia species were divid-ed into two clades, namely clade A and clade B (Fig. 4). Clade A includes cf. Dalbergia sp. and Dalbergia sissoo. The second group (clade B) was subdivided into many subclades that contained the other species of Dalbergia. Therefore, the present work matches the palaeobotanist
Table 9. Comparison of anatomical features between Dalbergioxylon dicorynioides & Dalbergia sissoo.
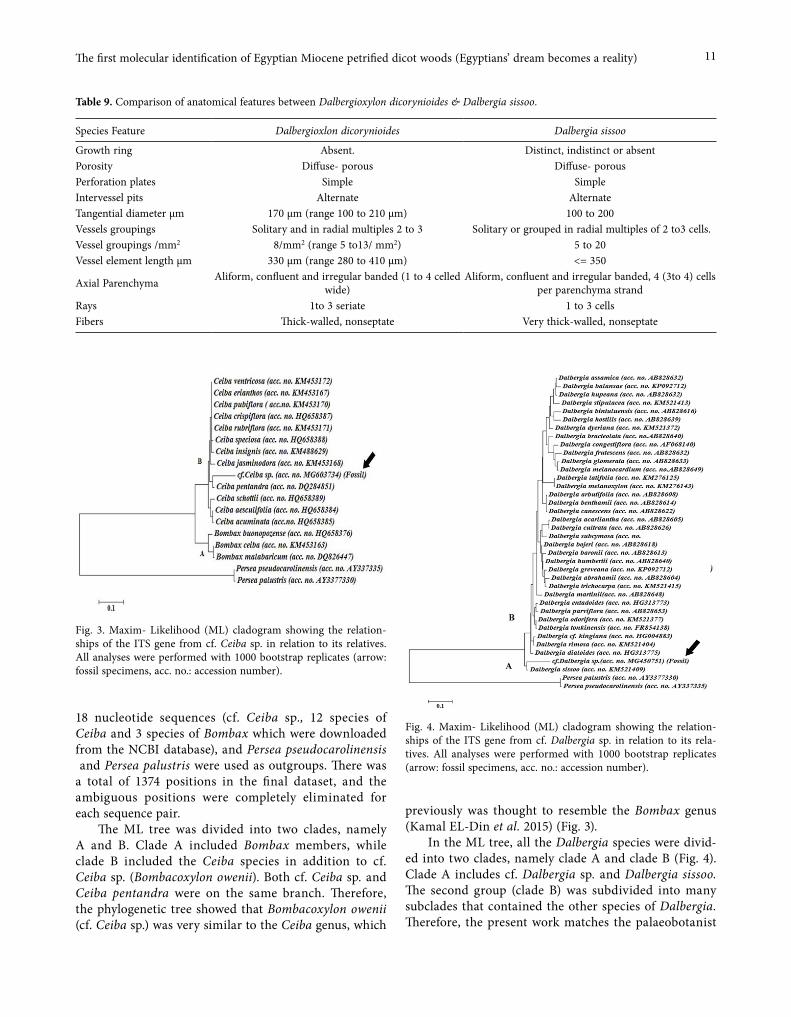
Species Feature Dalbergioxlon dicorynioides Dalbergia sissoo
Growth ring Absent. Distinct, indistinct or absentPorosity Diffuse- porous Diffuse- porousPerforation plates Simple Simple Intervessel pits Alternate Alternate Tangential diameter μm 170 μm (range 100 to 210 μm) 100 to 200 Vessels groupings Solitary and in radial multiples 2 to 3 Solitary or grouped in radial multiples of 2 to3 cells. Vessel groupings /mm2 8/mm2 (range 5 to13/ mm2) 5 to 20 Vessel element length μm 330 μm (range 280 to 410 μm) <= 350
Axial Parenchyma Aliform, confluent and irregular banded (1 to 4 celled wide)
Aliform, confluent and irregular banded, 4 (3to 4) cells per parenchyma strand
Rays 1to 3 seriate 1 to 3 cellsFibers Thick-walled, nonseptate Very thick-walled, nonseptate
Fig. 3. Maxim- Likelihood (ML) cladogram showing the relation-ships of the ITS gene from cf. Ceiba sp. in relation to its relatives. All analyses were performed with 1000 bootstrap replicates (arrow: fossil specimens, acc. no.: accession number).
Fig. 4. Maxim- Likelihood (ML) cladogram showing the relation-ships of the ITS gene from cf. Dalbergia sp. in relation to its rela-tives. All analyses were performed with 1000 bootstrap replicates (arrow: fossil specimens, acc. no.: accession number).
12 Shaimaa S. Sobieh, Mona H. Darwish
assumption that there is a close relationship between Dalbergioxylon dicorynioides (cf. Dalbergia sp.) and Dal-bergia sissoo.
CONCLUSION
The DNA barcoding dataset in the present study provides an important first step towards establish-ing an effective molecular tool for the identification of aDNA from petrified woods. We hope that these results will encourage reliable aDNA studies of other petrified woods. The further studies of ancient wood DNA from the abundant store of fossil plant remains will rely on this study and by the intensive works of researchers from different fields, and these findings could provide a powerful tool to increase world knowledge about the history of forests, plant evolution and historical bioge-ography.
AUTHOR CONTRIBUTIONS
Both authors suggested the point of the work and Dr. Shaimaa S. Sobieh planned the experimental design to achieve this point. Both authors supplied the financial support for the work. Prof. Mona Darwish shared other palaeobotanists in the identification of dicot woods (see El-Saadawi et al. 2014). The experimental part was done by Dr/Shaimaa S. Sobieh. The writing of the manuscript was done by both authors.
ACKNOWLEDGEMENTS
The authors would like to thank Prof. Wagih El-Saadawi and Prof. Marwa Kamal El-Din (Profs. of Pal-aeobotany, Botany Department, Faculty of Science, Ain Shams University) for supplying them the fossil speci-mens. In addition, they thank Fatma Abdel Naby Mursi and Aya Abdel Gawad (MSc. students, Botany Depart-ment, Faculty of Women for Art, Science and Education, Ain Shams University) for helping them in the extrac-tion of aDNA. Finally, the authors would like to thank Dr Enas Hamdy Ghallab (Lecturer of Medical Entomol-ogy, Entomology Department, Faculty of Science, Ain Shams University) and Mohamed Emad El-din Elsaid (Biotechnology Bachelors, Misr University for Science and technology) for helping the authors in understand many points in the bioinformatics programs.
REFERENCES
Asif MJ, Cannon CH. 2005. DNA extraction from pro-cessed wood: a case study for the identification of an endangered timber species (Gonstylus bancanus). Plant Mol Biol Rep. 23:1–8.
Chen S, Yao H, Han J, Liu C, Song J, Shi L, et al .2010. Validation of the ITS2 region as a novel DNA bar-code for identifying medicinal plant species. PLoS ONE 5: e8613. doi.org/10.1371/journal.pone.0008613
Deguilloux MF, Bertel L, Celant A, Pemonge MH, Sadori L, Magri D, Petit RJ. 2006. Genetic analysis of archae-ological wood remains: first results and prospects, J Archaeol Sci. 33: 1216–1227.
Deguilloux MF, Petit MH, Pemonge RJ. 2002. Novel perspectives in wood certification and forensics: dry wood as a source of DNA. Proc R Soc London. 269: 1039-1046.
Doyle JJ, Doyle JL. 1987. A rapid DNA isolation proce-dure for small quantities of fresh leaf tissue. Phytoch Bull. 19: 11-15.
El-Saadawi W, Kamal El-Din MM, Darwish MH, Osman R. 2014. African Miocene dicot woods with two new records for this epoch from Egypt. Taeckholmia. 34:1-2.
Felsenstein J. 1985. Confidence limits on phylogenies: An approach using the bootstrap. Evol. 39: 783-791.
Gilbert MTP, Bandelt HJ, Hofreiter M, Barnes I. 2005. Assessing ancient DNA studies. Tren Ecol Evol. 20: 541–544.
Golberg EM, Brown TA, Bada JL, Westbroek P, Bishop MJ, Dover GA. 1991. Amplification and analysis of Miocene plant fossil DNA. Phil Trans R Soc Lond B. 333: 419-427.
Golenberg EM. 1994. Fossil samples DNA from plant compression fossils. In: Herrmann B, Hummel S, (eds) Ancient DNA recovery and analysis of genetic material from paleontological, archaeological, muse-um, medical, and forensic specimens. New York: Springer-Verlag Inc pp 237-256.
Goloubinoff P, Pääbo S, Wilson A. 1993. Evolution of Maize Inferred from Sequence Diversity of an adh2 Gene Segment from Archaeological Specimens. Proc Natl Acad Sci USA. 90:1997-2001.
Gugerli F, Parducci L, Petit RJ. 2005. Ancient plant DNA: review and prospects, New Phytologist. 166: 409–418.
Guindon S, Dufayard JF, Lefort V, Anisimova M, Hordijk W, Gascuel O. 2010. New algorithms and methods to estimate maximumlikelihood phylogenies: assessing the performance of PhyML 3.0. Syst Biol. 59(3): 307–321.
Gyulai G, Humphreys M, Lagler R, Szabó Z, Tóth Z, Bittsánszky A, Gyulai F, Heszky L. 2006. Seed
13The first molecular identification of Egyptian Miocene petrified dicot woods (Egyptians’ dream becomes a reality)
remains of common millet from the 4th (Mongolia) and 15th (Hungary) Centuries: AFLP, SSR and mtD-NA sequence recoveries. Seed Sci Res. 16: 179-191.
Han J, Zhu Y, Chen X, Liao B, Yao H, Song J, Chen S, et al. 2013. The short ITS2 sequence serves as an effi-cient taxonomic sequence tag in comparison with the full-length ITS. Biomed Res Int. 2013:741476. doi.org/10.1155/2013/741476
Hamalton T. 2016. DNA from ancient wood. Van Sang-yan. 3: 27-30.
Helentjaris T. 1988. Maize Genet Coop. News Lett. 62: 104-105.
Hollingsworth PM, Graham SW, Little DP. 2011. Choos-ing and using a plant DNA barcode. PLoS ONE. 6: e19254. doi.org/10.1371/journal.pone.0019254
Kaestle AF, Horsburgh KA. 2002. Ancient DNA in anthropology: methods, applications, and ethics. Am J Phys Anthropol. 35: 92-130.
Kamal EL-Din MM, Darwish MH, EL-Saadawi W. 2015. Novelties on Miocene woods from Egypt with a sum-mary on African fossil woods of Fabaceae, Malva-ceae and Dipterocarpaceae. Palaeontographica Abt B. 292:173-199.
Kim S, Soltis DE, Soltis PS, Suh Y. 2004. DNA sequences from Miocene fossils: an ndhF sequence of Magno-lia latahensis (Magnoliaceae) and an rbcl sequence of Persea pseudocarolinensis (Lauraceae). Am J Bot . 91: 615–620.
Kimura M. 1980. A simple method for estimating evolu-tionary rate of base substitutions through compara-tive studies of nucleotide sequences. J Mol Evol. 16: 111-120.
Liepelt S, Sperisen C, Deguilloux MF, Petit RJ, Kissling R, Spencer M, De Beaulieu J, Taberlet P, Gielly l, Zie-genhagen B. 2006. Authenticated DNA from Ancient Wood Remains. Ann Bot. 98: 1107–1111.
Li YW, Zhou X, Feng G, Hu HY, Niu LM, Hebert PD, et al. 2010. COI and ITS2 sequences delimit species, reveal cryptic taxa and host specificity of fig-associat-ed Sycophila (Hymenoptera, Eurytomidae). Mol Ecol Resour 10: 31–40.
Marota I, Basile C, Ubaldi M, Rollo F. 2002. DNA decay rate in Papyri and human remains from Egyptian archaeo-logical sites. Am j phys anthropol. 117: 310–318.
Nasab HM, Mardi M, Talaee H, Nashli HF, Pirseyedi SM, Nobari AH, Mowla SJ. 2010. Molecular analysis of ancient DNA extracted from 3250-3450 year-old plant seeds excavated from Tepe Sagz Abad in Iran. J Agr Sci Tech. 12: 459-470.
Nordahlia AS, Noraini T, Chung RCK, Lim SC, Nadiah I, Azahana NA, Solihani NS. 2016. Comparative wood anatomy of three Bombax species and Ceiba
pentandra (Malvaceae: Bombacoideae) in Malaysia. Mal Nat J. 68: 203-216.
Poinar HN, Cano RJ, Poinar GO. 1993. DNA from an extinct plant. Nature 363: 677.
Rogers SO, Bendich AJ. 1985. Extraction of DNA from milligram amounts of fresh, herbarium and mummi-fied plant tissues. Pl molec Biol. 5: 69-76.
Sakala, J. 2007. The potential of fossil angiosperm wood to reconstruct the palaeoclimate in the Tertiary of Central Europe (Czech Republic, Germany). Acta Palaeobotanica.. 47: 127–133 (2007).
Stamatakis A. 2014. RAxML version 8: a tool for phyloge-netic analysis and post-analysis of large phylogenies. Bioinformatics. 30(9):1312–1313.
Tamura K, Stecher G, Peterson D, Filipski A, Kumar S. 2013. MEGA6: Molecular Evolutionary Genetics Analysis version 6.0. Mol Biol Evol. 30: 2725-2729.
Thompson JD, Higgins DG, Gibson TG. 1994. CLUSTAL W: improving the sensitivity of progressive multiple sequence alignment through sequence weighting, positions-specific gap penalties and weight matrix choice. Nucl Aci Res. 22: 4673-4680.
Tripathi AM, Tyagi A, Kumar A, Singh A, Singh S, Chaudhary LB, Roy S. 2013. The internal transcribed spacer (ITS) region and trnhHpsbA are suitable can-didate loci for DNA barcoding of tropical tree species of India. PloS ONE. 8: e57934. doi.org/10.1371/jour-nal.pone.0057934.
van Nues R W, Rientjes J M J, van der Sande C A F M., Zerp S F, Sluiter C, Venema J, Planta R J, Raue´ HA. 1994. Separate structural elements within internal transcribed spacer 1 of Saccharomyces cerevisiae pre-cursor ribosomal RNA direct the formation of 17S and 26S rRNA. Nucl Aci Res. 22: 912–919.
Wagner S, Lagane F, Seguin-Orlando A, et al. 2018 High-Throughput DNA sequencing of ancient wood. Mol Ecol. 27: 1138-1154.
White TJ, Bruns TD, Lee SB, Taylor JW. 1990. Amplifi-cation and direct sequencing of fungal ribosomal RNAgenes for phylogenetics. In: Innis MA, Gelfard H, Sninsky JS, WhiteTJ (eds) PCR-protocols and applications. A laboratory manual. New York: Aca-demic Press, pp 315–322.
Wickens GE. 2008. The Baobabs: Pachycauls of Africa, Madagascar and Australia Springer Science & Busi-ness Media
Wood data base available at inside wood home page. 2013. Online search of fossil and modern.
Yao H, Song J, Liu C, Luo K, Han J, Li Y, et al. 2010. Use of IRS2 region as the universal DNA barcode for plants and animals. PLoS ONE 5: e13102. doi.org/10.1371/journal.pone.0013102

Caryologia. International Journal of Cytology, Cytosystematics and Cytogenetics 73(2): 15-25, 2020
Firenze University Press www.fupress.com/caryologiaCaryologia
International Journal of Cytology, Cytosystematics and Cytogenetics
ISSN 0008-7114 (print) | ISSN 2165-5391 (online) | DOI: 10.13128/caryologia-672
Citation: F. Ito, D.J. Gama-Maia, D.M.A. Brito, R.A. Torres (2020) Title. Caryologia 73(2): 15-25. doi: 10.13128/caryologia-672
Received: October 23, 2019
Accepted: March 27, 2020
Published: July 31, 2020
Copyright: © 2020 F. Ito, D.J. Gama-Maia, D.M.A. Brito, R.A. Torres. This is an open access, peer-reviewed article published by Firenze University Press (http://www.fupress.com/caryologia) and distributed under the terms of the Creative Commons Attribution License, which permits unrestricted use, distri-bution, and reproduction in any medi-um, provided the original author and source are credited.
Data Availability Statement: All rel-evant data are within the paper and its Supporting Information files.
Competing Interests: The Author(s) declare(s) no conflict of interest.
Gene flow patterns reinforce the ecological plasticity of Tropidurus hispidus (Squamata: Tropiduridae)
Fernanda Ito, Danielle J. Gama-Maia, Diego M. A. Brito, Rodrigo A. Torres*
LAGEA – Laboratório de Genômica Evolutiva & Ambiental, Departamento de Zoologia, Centro de Biociências, Universidade Federal de Pernambuco, Recife, Brazil*Corresponding author: [email protected]
Abstract. The analysis of gene flow patterns can provide important insights into pop-ulation dynamics in the context of landscape ecology. In lizards, this approach has been used to evaluate patterns related to climate change, habitat fragmentation, and taxonomic uncertainties. Tropidurus hispidus is an ecologically plastic species, which presents some evidence of population structuring. In the present study, we investi-gated the potential structuring of T. hispidus populations across a gradient of tropical biomes, including the Amazon and Atlantic rainforests, the Caatinga dry forest, the Caatinga-Atlantic Forest transition zone (Agreste), coastal Restinga, and urban envi-ronments. Nuclear ISSR markers were obtained by PCR/electrophoresis, and a num-ber of population parameters were estimated and analyzed. Despite the extreme envi-ronmental discontinuities found across the vast study area, the results revealed a high degree of genetic connectivity among the different demes. This pattern indicates that the species can be considered to be a single evolutionary taxon with gene flow among all populations, despite the marked environmental discontinuities. Tropidurus hispidus clearly has a marked capacity for dispersal, which may be favored by its intrinsic genet-ic diversity.
Keywords: Tropidurus hispidus, ISSRs, gene flow, dispersal capacity, population con-nectivity.
INTRODUCTION
Gene flow is one of the most important components in population struc-ture because it can determine how much populations have evolved indepen-dently (Slatkin 2018). Therefore gene flow patterns can also provide impor-tant insights for studies on population ecology and also on population genet-ics based on a landscape ecology approach. The genetic admixture resulting from gene flow may contribute to a short-term increase in population fitness (Facon et al. 2005) and adaptive potential (Verhoeven et al. 2011). However, the approach usually focuses on micro-evolutionary phenomena and process-es that lead to intraspecific discontinuities (Holderegger and Wagner 2006).
16 Fernanda Ito et al.
Genetic studies, especially in the Neotropical region, and in particular for reptile species, have been more frequent in the last years focusing on questions related to climate change, habitat fragmentation, and taxonomic uncer-tainties (e.g. Ricketts 2001; Stow et al. 2001; Berry et al. 2005; Driscoll and Hardy 2005; Sumner 2005; Hoehn et al. 2007; O’Neill et al. 2008; Tolley et al. 2009; Freedman et al. 2010; Levy et al. 2010; Werneck et al. 2015; Men-ezes et al. 2016; Fazolato et al. 2017; Cacciali and Köhler 2018; Oliveira et al. 2018). However studies focused on landscape genetics and on the gene flow patterns are still scarce in Neotropical region.
Tropidurus hispidus is one of the largest species of the genus, reaching a rostrum-caudal length (RCL) of 114 mm (Kolodiuk et al. 2010). It is found on a variety of substrates such as sand, tree trunks, and rocky outcrops, but it is primarily saxicolous, given that rocks provide space for foraging, shelter, nesting, and thermoregula-tion (Pelegrin et al. 2017). Also, this species is commonly found in urban areas, foraging and thermoregulating on walls and fences (Rodrigues 1987; Abreu et al. 2002; Pel-egrin et al. 2017). The ecological tolerance of T. hispidus allows this species to occupy a number of distinct mor-phoclimatic domains, such as the Brazilian Atlantic For-est, coastal shrubby vegetation (Restinga), transition are-as between the Caatinga scrub (in Portuguese Agreste), the Atlantic Forest, Cerrado savanna, and rocky out-crops in the Amazon basin (Vanzolini et al. 1980; Vitt 1995; Abreu et al. 2002; Carvalho 2013). The species is a habitat generalist, able to colonize a wide range of microhabitats (Rodrigues 1987; Vitt 1995; Vitt and Car-valho 1995; Vitt et al. 1997; Pelegrin et al. 2017).
This species is also an opportunistic sit-and-wait predator with a diverse trophic niche, feeding mainly on arthropods, in particular ants, but in some areas they may include plant material in their diet, especially flow-ers (Van Sluys et al. 2004; Ribeiro and Freire 2011; Pel-egrin et al. 2017). Differences in the composition of the diet among biomes reinforce the ecological plasticity of the species (Pelegrin et al. 2017), but may also reflect distinct selective pressures on different populations.
In addition to these dietary differences, there is some evidence of genetic structuring among popula-tions. Three distinct karyotypes have been found in six populations from different ecosystems in eastern Brazil (Kasahara et al. 1987; Kasahara et al. 1996). All karyo-types had 2n = 36 and XX/XY sex chromosomes, but three variants (prominent, mild or absent) were found in a secondary constriction of the second chromosome pair, which appeared to be typical of specific sites, sug-gesting genetic variation on an inter-population level. However, specimens from the six populations are mor-
phologically indistinguishable (Kasahara et al. 1987; Kasahara et al. 1996). Also there is a clear evidence for cryptic diversity in T. hispidus as revealed by karyo-type and DNA barcode sequences analyses (Matos et al. 2016).
Tropidurus hispidus is abundant across an extremely diverse ecological landscape (Carvalho 2013). From the coast of Pernambuco (north-eastern Brazil) to the Ama-zon basin there is a major shift in the geographical and ecological landscape, in which environmental variation may be reflected into distinct selective regimes, as previ-ously suggested by the chromosomal and molecular evi-dences. Then, given previous ecological, distributional, karyotypical, and molecular evidence, we tested for the hypothesis of the existence of population-level divisions in Tropidurus hispidus along a highly diverse adaptive landscape in Brazil, using nuclear DNA markers adopt-ing a gene flow approach.
MATERIALS AND METHODS
A total of 155 specimens of Tropidurus hispidus were captured at sites representing the distinct phytophysi-ognomic domains found across the landscape between the Pernambuco and Paraiba coasts in eastern Bra-zil, and the Amazon basin, in the north of the country (Table 1; Figure 1). The specimens were identified using the taxonomic key of Rodrigues (1987). Liver and mus-cle samples for DNA analyses were collected from each specimen. These samples were immersed in 96% etha-nol and stored in a freezer at -20°C. Tissue was also obtained from three specimens of Tropidurus torquatus from Maricá, Rio de Janeiro, south-eastern Brazil, and one Eurolophosaurus divaricatus from Alagoado, Bahia, north-eastern Brazil, for inclusion in the study as out-groups.
DNA extraction and ISSR amplification
The extraction of DNA was conducted using the Sambrook and Russell (2001) procedure. The integrity of the DNA was checked by electrophoresis in agarose gel and the concentration was estimated by visual com-parison with the intensity of the DNA of the Lambda phage. The DNA was then diluted to a standard concen-tration of 5 ng/ul for the PCR-ISSR reactions. Inter sim-ple sequence repeats (ISSRs) are PCR-amplified nuclear genomic regions using primers anchored at microsatel-lite regions (SSRs) (Gupta et al. 1994; Zietkiewicz et al. 1994). These markers have been considered of low cost and highly reproducible (Sarwat 2012), and very effective
17Gene flow patterns reinforce the ecological plasticity of Tropidurus hispidus (Squamata: Tropiduridae)
in terms of studying the genetic variation and popula-tion cohesiveness in several biological groups (Gama-Maia and Torres 2016; Al Salameen et al. 2018; Hassani-em & Al Rashada 2019). The PCRs were carried out in a final volume of 20 µL in which consisted of 0.2 units of Taq DNA polymerase (New England/Biolabs), 1x buffer, 50 mM MgCl2, 50 mM of primer, 0.2 mM dNTP and 20 ng of genomic DNA. The PCR reactions were run in a Biocycler thermocycler and comprised a cycle of 4 min at 94°C, 39 cycles of 40 s at 94°C, 40 s at the specific temperature of each primer (Table 2), and 120 s at 72°C, with a final annealing cycle of 7 minutes. All reactions were run with a negative control.
Horizontal electrophoresis was conducted in 1.8% agarose gel containing 0.5X TBE buffer diluted from an original 10X solution (0.89 M Tris, 0.89 M boric acid and EDTA, 0.01M, pH = 8.3) for 4 hours at 60 volts. In each well of the gel we placed a solution containing 10 µL of the PCR product in 1.5 mL of gel loading dye blue (6x) and 1.5 mL of gel green (0.5 ml 10,000x in H20). To support the analysis of bands, we inserted 2 µL of 1 Kb DNA ladder marker with 1.5 mL of gel loading dye blue (6x) in one well. After the run, all gels were photo-graphed using a transilluminator under an ultraviolet light source.
Data analyses
Initially, 17 different random ISSR primers were tested for their reproducibility and their degree of pol-ymorphism. They were tested in five specimens from four sites using different PCR reagents from Fermentas (Thermo Fisher Scientific) and New England Biolabs Inc. (Table 2). The 10 most polymorphic primers were then selected for the amplification of the DNA of all the specimens (Table 2), with the objective of generating at least 60 polymorphic loci, as recommended by Telles et al. (2001) and Nelson and Anderson (2013). After pho-tographic documentation, the gels were transformed into a binary matrix of presence and absence (0 = absent and 1= presence) of the DNA bands. In order to avoid the misinterpretation of valid markers, only clear and well-defined bands were assigned as markers. It is important to note that to increase sample size, the animals sampled in the localities of Caraguetama and Tamandaré were treated as a single sample in all analyzes, since both are-as represent the same adaptive landscape (named Restin-
Table 1. Number (N) of Tropidurus hispidus, T. torquatus, and Eurolophosaurus divaricatus specimens captured in each site along the study area.
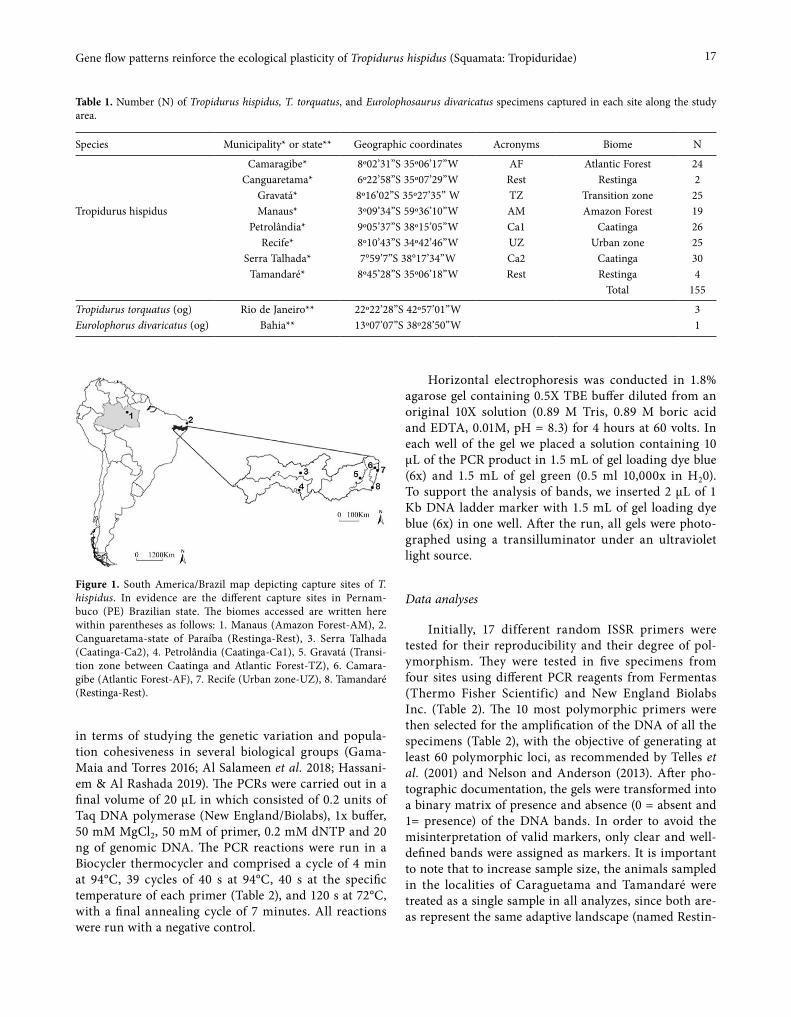
Species Municipality* or state** Geographic coordinates Acronyms Biome N
Camaragibe* 8º02’31”S 35º06’17”W AF Atlantic Forest 24Canguaretama* 6º22’58”S 35º07’29”W Rest Restinga 2
Gravatá* 8º16’02”S 35º27’35” W TZ Transition zone 25Tropidurus hispidus Manaus* 3º09’34”S 59º36’10”W AM Amazon Forest 19
Petrolândia* 9º05’37”S 38º15’05”W Ca1 Caatinga 26Recife* 8º10’43”S 34º42’46”W UZ Urban zone 25
Serra Talhada* 7°59’7”S 38°17’34”W Ca2 Caatinga 30Tamandaré* 8º45’28”S 35º06’18”W Rest Restinga 4
Total 155
Tropidurus torquatus (og) Rio de Janeiro** 22º22’28”S 42º57’01”W 3Eurolophorus divaricatus (og) Bahia** 13º07’07”S 38º28’50”W 1
Figure 1. South America/Brazil map depicting capture sites of T. hispidus. In evidence are the different capture sites in Pernam-buco (PE) Brazilian state. The biomes accessed are written here within parentheses as follows: 1. Manaus (Amazon Forest-AM), 2. Canguaretama-state of Paraíba (Restinga-Rest), 3. Serra Talhada (Caatinga-Ca2), 4. Petrolândia (Caatinga-Ca1), 5. Gravatá (Transi-tion zone between Caatinga and Atlantic Forest-TZ), 6. Camara-gibe (Atlantic Forest-AF), 7. Recife (Urban zone-UZ), 8. Tamandaré (Restinga-Rest).
18 Fernanda Ito et al.
ga) (Table 1). The overall genetic variation was measured in percentage by the proportion of the polymorphic loci having the total number of observed loci as 100%.
To evaluate the existence of potential genetic and/or evolutionary groupings among biomes, multi-dimen-sional scaling (MDS) with neighbour-joining (NJ) genetic distances was applied on local and regional scales through the simple matching technique (Primer software) (Clarke and Gorley 2006). An additional NJ topology was also obtained by using PAUP* v.4.0b10 (Swofford 2000) in order to observe alternative group-ings among sampled specimens. A Maximum parsimony (MP) method was also used in order to test for hidden evolutionary diversity in T. hispidus across those differ-ent adaptive landscapes (biomes) having Eurolophosau-rus divaricatus and Tropidurus torquatus as outgroups given their phylogenetic proximity to the study spe-cies (Frost et al. 2001; Passoni et al. 2008). These analy-ses were run in PAUP* v.4.0b10 (Swofford 2000), in its graphic interface PaupUp v.1.0.3.1 (Calendini and Mar-tin 2005). A maximum number of 100,000 random trees with 5000 replications were computed. The robustness of the branches was tested by the bootstrap method with 1000 random replicates.
Population structuring was tested by the Bayesian approach using the Structure 2.3.3 software (Pritchard et al. 2000; Falush et al. 2003, 2007; Hubisz et al. 2009). In order to determine the number of populations (K) within
the complete data set, ten independent runs for K= 1-10 and 100,000 MCMC (Markov Chains Monte Carlo) inter-actions after burn-in period were computed. The analysis was performed by using both the admixture model of pop-ulation structure and allele frequencies correlated among populations. The number of populations (K) was estimated using the protocol described by Evanno et al. (2005).
In addition, we conducted an analysis of molecular variance (AMOVA) to check for patterns of genetic iso-lation within and among local populations (Excoffier et al. 1992) with Arlequin v.3.5.1.2 (Excoffier and Lischer 2010). This method also permits the calculation of the global fixation index (ΦST). Parameters of genetic dif-ferentiation among populations (GST) and the number of migrants per generation (Nm – gene flow) were calculat-ed with PopGene 1.3.2 (Yeh et al. 1999).
RESULTS
Based on the 10 ISSR primers selected, a total of 283 loci were observed. Overall, 99.2% of the observed loci were polymorphic. Mean genetic neighbor-joinning dis-tances among local populations varied from 0.12720 to 0.48763.
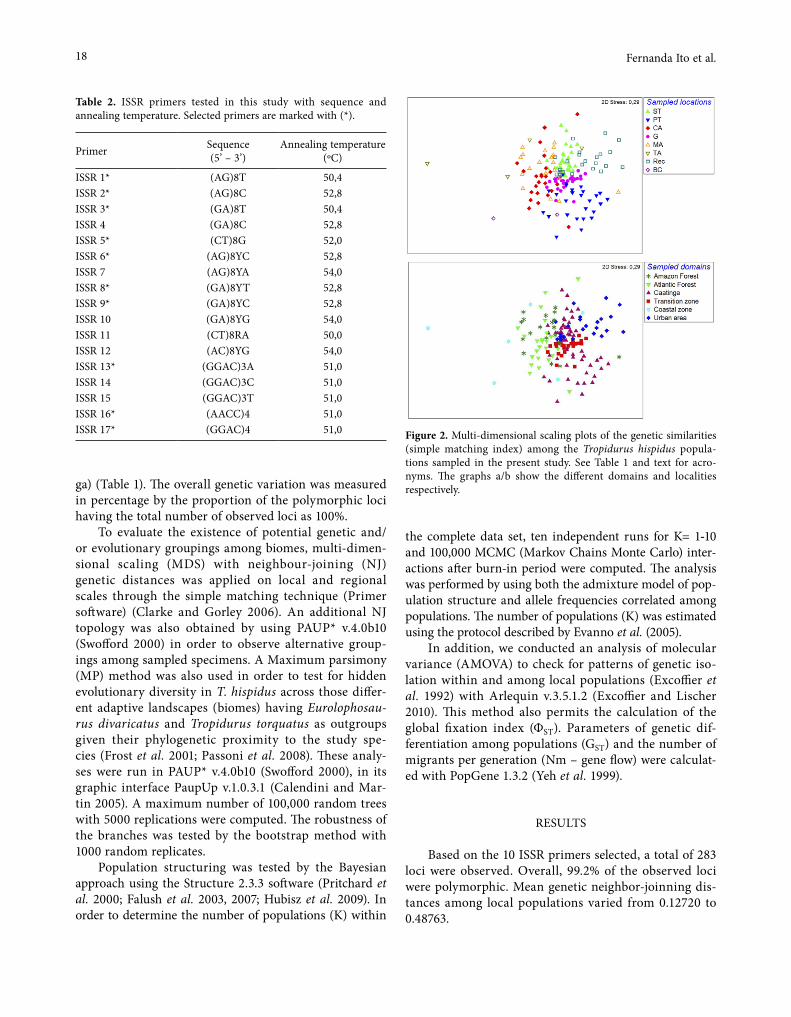
Table 2. ISSR primers tested in this study with sequence and annealing temperature. Selected primers are marked with (*).
Primer Sequence (5’ – 3’)
Annealing temperature (ºC)
ISSR 1* (AG)8T 50,4ISSR 2* (AG)8C 52,8ISSR 3* (GA)8T 50,4ISSR 4 (GA)8C 52,8ISSR 5* (CT)8G 52,0ISSR 6* (AG)8YC 52,8ISSR 7 (AG)8YA 54,0ISSR 8* (GA)8YT 52,8ISSR 9* (GA)8YC 52,8ISSR 10 (GA)8YG 54,0ISSR 11 (CT)8RA 50,0ISSR 12 (AC)8YG 54,0ISSR 13* (GGAC)3A 51,0ISSR 14 (GGAC)3C 51,0ISSR 15 (GGAC)3T 51,0ISSR 16* (AACC)4 51,0ISSR 17* (GGAC)4 51,0 Figure 2. Multi-dimensional scaling plots of the genetic similarities
(simple matching index) among the Tropidurus hispidus popula-tions sampled in the present study. See Table 1 and text for acro-nyms. The graphs a/b show the different domains and localities respectively.

19Gene flow patterns reinforce the ecological plasticity of Tropidurus hispidus (Squamata: Tropiduridae)
The simple matching MDS analysis revealed a single grouping comprising all sampled populations on both regional and local scales (Figure 2a-b). The NJ topology showed also no particular genetic groupings among T. hispidus sampled from different biomes (Figure 3). The maximum parsimony (MP) analysis revealed 2 constant and 281 informative characters. The majority-rule con-sensus topology (Supplemental material) had a length (L)
of 6236, a consistency index (Ci) of 0.045, and a reten-tion index (R) of 0.310. This topology also failed to iden-tify any evolutionary differentiation among the popula-tions analysed.
The analysis identified a total of 283 loci and more than 90% were variable in terms of the proportion of polymorphic loci. This amount of molecular informa-tion satisfies the recommendation of Nelson and Ander-
Figure 3. Neighbor-Joinning topology from Tropidurus hispidus specimens for ISSR markers. See Table 1 and text for acronyms.

20 Fernanda Ito et al.
son (2013) for the application of AMOVA and Bayesian structuring analyses. The AMOVA indicated that 90.99% of the total genetic variance was found within popula-tions and only 9.01% among populations (Table 3). The Bayesian structuring analysis revealed the existence of two genetic populations (K= 2; Figure 4), and these genetic profiles were clearly distributed in all specimens throughout the geographic areas sampled. The global GST value was 0.07, while the Nm was 6.59. The pairwise analyses showed values ranging from 0.03 to 0.06 for GST and from 7.75 to 15.03 for Nm (Table 4).
DISCUSSION
The genetic evidence of this study indicates strong connectivity among local T. hispidus groups, despite the intense ecological distinctiveness of the landscapes seen in the study area. The MDS (Figure 2), the NJ topology (Figure 3), and the MP topology (Supplemental material) evidenced a lack of any genetic or evolutionary differen-tiation among T. hispidus groups, pointing to a high dis-persive behaviour in this species.
Tropidurus hispidus is widely distributed in the Caatinga and can also be found along the Brazilian coast and in the Amazon Forest (Carvalho 2013). The extent
of its distribution range would suggest a high probability of differentiation due to strong and diverse evolutionary pressures imposed to the populations (Kisel and Barra-clough 2010). However, the clustering produced by the Bayesian analyses showed also no genetic structuring (Figure 4). Although there are two genetic populations, the analysis indicated a clear admixture of these two T. hispidus gene pools among the demes studied.
The lack of genetic structuring resulted from an intense gene flow among populations as indicated by the degree of migrants per generation (Table 4). The observed global Nm value (6.59), as well as the pairwise ones (7.75 – 16.03), support the hypothesis of strong evo-lutionary cohesion, since Nm ≥ 1 indicates a minimum amount of genetic migration capable of homogenizing demes within species (Mills and Allendorf 1996), includ-ing in lacertids (Levy et al. 2010). This feature of a highly cohesive species could be also explained by a recent irra-diation phenomenon. However this hypothesis requires a robust phylogeographic study offering coalescence-dat-ing analyses.
Considering all the results, it is possible to argument in favour to the hypothesis of panmixia in T. hispidus, despite the discontinuity and historical changes seen in the biomes studied. This is surprising since T. hispidus individuals are sit-and-wait predators, territorialists, and oviparous that would suggest a tendency for struc-turings (Prieto et al. 1976; Van Sluys et al. 2010; Ribeiro and Freire 2011). Besides not dispersing through long distances (Pontes et al. 2008), sit-and-wait predators are usually opportunists and can feed on a variety of food items according to the local availability (Rodrigues 1987, 1988; Vitt 1991; Bergallo and Rocha 1993; Vitt 1995; Vitt et al. 1997; Pontes et al. 2008) suggesting ecologi-cal plasticity. Ecological plasticity predicts high genetic diversity. Higher genetic diversity tends to favour a bet-ter adaptation at the population, community and eco-system levels (Hughes et al. 2008). The feeding plasticity observed in T. hispidus (Pelegrin et al. 2017) is related to its high success in attempts to colonize new sites (Teixei-
Table 3. Results of the AMOVA for the Tropidurus hispidus popula-tions in the study area. (p < 0.01).
Source of variation
Degrees of freedom
Sum of squares
Components of variance % of variance
Among populations 6 729.782 3818.75 va 9.01
Within populations 148 5709.625 38,578.55 vb 90.09
Total 154 6439.407 42,397.30 100ΦST 0.09007
Figure 4. Bayesian structuring analysis. The Y axis indicates the probability-based assignments for the genetic composition of each specimen analyzed (vertical bars). Note (1) Ca2, (2) Ca1, (3) AF, (4) TZ, (5) UZ, (6) AM, (7) Rest (including specimens from Canguare-tama and Tamandaré) . For a description of the sites, see Table 1.
Table 4. Pairwise GST (above diagonal) and Nm (below diagonal) values recorded between Tropidurus hispidus populations. For acro-nyms, please refer to Table 1.
Ca2 Ca1 TZ AF UZ AM Rest
Ca2 - 0.0420 0.0363 0.0363 0.0322 0.0360 0.0527Ca1 11.4029 - 0.0457 0.0379 0.0368 0.0435 0.0511TZ 13.2673 10.4325 - 0.0383 0.0388 0.0458 0.0605AF 13.2673 12.7004 12.5522 - 0.0302 0.0341 0.0455UZ 15.0321 13.0902 12.3747 16.0316 - 0.0341 0.0505AM 13.3976 10.9953 10.4261 14.1587 14.1595 - 0.0492Rest 8.9877 9.2855 7.7588 10.4786 9.4000 9.6556 -
21Gene flow patterns reinforce the ecological plasticity of Tropidurus hispidus (Squamata: Tropiduridae)
ra and Giovanelli 1999) and to its capacity of expanding towards new habitats (Levy et al. 2010; Breininger et al. 2012). This hypothesis is supported by the high degree of genetic diversity observed herein in T. hispidus and this feature might be favouring historically the species to a better adaptation to different biomes. These combined evidences suggest the stepping-stone model of range expansion as a probable explanation for wide distribu-tion of T. hispidus.
Molecular studies with species of Tropidurus have revealed different patterns of evolutionary cohesion among populations, depending on the species studied. For instance, in Tropidurus semitaeniatus and T. hygomi, populations tend to be highly structured, but due to dif-ferent processes. In T. semitaeniatus the process of pop-ulation structuring was mediated by the course of the River São Francisco (Northeastern Brazil; Werneck et al. 2015). In T. hygomi, the population structuring was associated to different marine transgression/regression events, which isolated or connected regions along the Brazilian coastal plains (Fazolato et al. 2017).
Tropidurus hispidus was expected to show the same pattern of genetically structured populations due to geographic isolation by different ecological pressures of morphoclimatic domains of humid forests and the Caat-inga (González et al. 2011; Matos et al. 2016). The data supporting these conclusions were the karyotypic struc-ture and COI gene sequences, respectively (Matos et al. 2016). However, our data failed to reinforce this idea and the analyses of the hypervariable regions of ISSR nuclear markers strongly pointed to panmixia. This occurred despite the geographical distances and the different selective pressures among studied biomes. A likely explanation for these contrasting evidences could be an intense dispersive behavior showed by T. hispidus males. Indeed, the use of bi-parental genetic markers has been recommended as a strategy to understand patterns of gene flow and demography (Goudet et al. 2002). The ISSRs markers analysed in this study agree with this rec-ommendation and allow inferences about the gene flow among T. hispidus demes.
Cases of male-mediated dispersion in lizards have been documented in the literature in the last years (e.g. Johansson et al. 2008; Mouret et al. 2011; Ferchaud et al. 2015). When considering mitochondrial markers, of female inheritance, populations seem structured, (Matos et al. 2016) but when the male genetic pools is also ana-lysed such structuring disappears, as seen here using the ISSRs markers. This supports the hypothesis that the expansion of T. hispidus distribution range, and there-fore, new colonisations, would depend on a higher eco-logical ability of males to disperse farther than females.
Mark-recapture studies of males and females could con-firm the explanations given herein.
The occurrence of T. hispidus in urban areas, and its use of anthropogenic structures, (Carvalho 2013; Pel-egrin et al. 2017) could lead to facilitated dispersion and extend its distribution range. Human-facilitated disper-sion occurs in other lizard species, including exotic and invasive species (Vanzolini 1978; Mausfeld et al. 2002; Anjos and Rocha 2008). The T. hispidus population of Manaus (Amazon), which was recently invaded by indi-viduals from Roraima (Northern Brazil), is an example of this phenomenon (Ávila-Pires 1995; Carvalho 2013). However, this is speculative since we lack genetic data from Roraima. On the other hand, the individuals from Manaus had the same genetic profiles as the populations from Pernambuco, and did not show any type of genetic structuring, corroborating the hypothesis of panmixia along our study area.
Our results revealed also that Tropidurus hispidus has a genetic variation above 90%. This points to an excellent conservation status along the studied area, con-sidering that low genetic variation would decrease this species’ ability to adapt to current and stochastic selec-tive pressures (Frankham and Ralls 1998; Frankham et al. 2002; Allendorf and Lundquist 2003). Indeed, T. his-pidus seems to have a high tolerance to habitat modifi-cations (Rodrigues 1987; Ávilla-Pires 1995), and it is a generalist regarding its microenvironmental require-ments (Vitt 1995; Mendonça and Moura 2011; Pelegrin et al. 2017). Therefore, our data reinforces this biological attribute (evolutionary potential), due to the high genetic variation observed.
To conclude, according to our results, the sharing of a high genetic variation among the several T. hispi-dus population demes from different morphoclimatic domains seems to explain its ecological plasticity/evo-lutionary potential. According to Vitt et al. (1997) and Ivkovich et al. (2010) this is common in species with wide distribution ranges. This is a testable hypothesis that could be further tested in other Neotropical lizard species that have distribution patterns similar to T. his-pidus.
ACKNOWLEDGMENTS
This study was financed in part by the Coorde-nação de Aperfeiçoamento de Pessoal de Nível Superior (CAPES) – Brazil - Finance Code 001. Funds supporting this study were also provided by Facepe. F Ito and DMA Brito are grateful to CNPq for the Master fellowships provided (Graduate Program in Animal Biology-UFPE
22 Fernanda Ito et al.
and grant number 552364/2010-0). RA Torres is espe-cially grateful to CNPq for the research fellowships pro-vided (grant numbers 301208/2012-3 and 306290/2015-4) and to Drs. Miguel Trefaut Rodrigues and Marco Aurélio de Sena for providing tissue samples of E. divari-catus and T. torquatus.
REFERENCES
Abreu MLS, Frota JG, Yuki RN. 2002. Geographic distri-bution of Tropidurus hispidus. Herpetological Review. 33:66.
Al Salameen F, Habibi N, Kumar V, Al Amad S, Dashti J, Talebi L, Al Doaij B. 2018 Genetic diversity and pop-ulation structure of Haloxylon salicornicum moq. in Kuwait by ISSR markers. PLoS One 13(11): e0207369.
Allendorf FW, Lundquist LL. 2003. Introduction: popula-tion biology, evolution, and control of invasive spe-cies. Conservation Biology. 17:24–30.
Anjos LA, Rocha CFD. 2008. A lagartixa Hemidactylus mabouia Moreau de Jonnes, 1818 (Gekkonidae): uma espécie exótica e invasora amplamente estabelecida no Brasil. Natureza & Conservação. 6(1): 78-89.
Ávila-Pires TCS. 1995 Lizards of Brazilian Amazonia (Reptilia: Squamata). Zoologische Verhandelingen. 299: 1–706.
Bergallo HG, Rocha CFD. 1993. Activity patterns and body temperatures of two sympatric lizards (Tropi-durus torquatus and Cnemidophorus ocellifer) with different foraging tactics in southeastern Brazil. Amphibia-Reptilia. 14:312–315.
Berry O, Tocher MD, Gleeson DM, Sarre SD. 2005. Effect of vegetation matrix on animal dispersal: genetic evi-dence from a study of endangered skinks. Conserva-tion Biology. 19:855–864.
Breininger DR, Mazerolle MJ, Bolt MR, Legare ML, Drese JH, Hines JE. 2012. Habitat fragmentation effects on annual survival of the federally protected eastern indigo snake. Animal Conservation. 15: 361-368.
Cacciali P, Köhler G. 2018. Diversity of Tropidurus (Squa-mata: Tropiduridae) in Paraguay—an integrative taxonomic approach based on morphological and molecular genetic evidence. Zootaxa. 4375(4): 511-536.
Calendini F, Martin JF. 2005. PaupUP v1.0.3.1 A free graphical frontend for Paup* Dos software.
Carvalho ALG. 2013. On the distribution and conserva-tion of the South American lizard genus Tropidu-rus Wied-Neuwied, 1825 (Squamata: Tropiduridae). Zootaxa. 3640 (1): 42–56.
Clarke KR, Gorley RN. 2006. Primer v6: user manual/tutorial. Plymouth: PRIMER-E.
Driscoll DA, Hardy CM. 2005. Dispersal and phyloge-ography of the agamid lizard Amphibolurus nobbi in fragmented and continuous habitat. Molecular Ecol-ogy. 14(6):1613–1629.
Evanno G, Regnaut S, Goudet J. 2005. Detecting the number of clusters of individuals using the software Structure: a simulation study. Molecular Ecology. 14: 2611–2620.
Excoffier L, Smouse PE, Quattro JM. 1992. Analysis of molecular variance inferred from metric distanc-es among DNA haplotypes: application to human mitochondrial DNA restriction data. Genetics. 131(2):479–491.
Excoffier L, Lischer HEL. 2010. Arlequin suite ver 3.5: a new series of programs to perform population genet-ics analyses under Linux and Windows. Molecular Ecology Resources. 10:564–567.
Facon B, Jarne P, Pointier JP, David P. 2005. Hybridiza-tion and invasiveness in the freshwater snail Mela-noides tuberculata: hybrid vigour is more important than increase in genetic variance. Journal of Evolu-tionary Biology. 18: 524–535.
Falush D, Stephens M, Pritchard JK. 2003. Inference of population structure using multilocus genotype data: linked loci and correlated allele frequencies. Genet-ics. 164:1567–1587.
Falush D, Stephens M, Pritchard JK. 2007. Inference of population structure using multilocus genotype data: dominant markers and null alleles. Molecular Ecol-ogy Notes. 7:574–578.
Fazolato C, Fernandes F, Batalha-Filho H. 2017. The effects of Quaternary sea-level fluctuations on the evolutionary history of an endemic ground lizard (Tropidurus hygomi). Zoologischer Anzeiger. 270: 1-8.
Ferchaud A, Eudeline R, Arnal V, Cheylan M, Pottier G, Leblois R, Crochet P. 2015. Congruent signals of population history but radically different patterns of genetic diversity between mitochondrial and nuclear markers in a mountain lizard. Molecular Ecology. 24: 192-207.
Frankham R, Ralls K. 1998. Inbreeding leads to extinc-tion. Nature. 392:441–442.
Frankham R, Ballou JD, Briscoe DA. 2002. Introduction to conservation genetics. Cambridge: Cambridge University Press.
Freedman AH, Thomassen HA, Buermann W, Smith TB. 2010. Genomic signals of diversification along eco-logical gradients in a tropical lizard. Molecular Ecol-ogy. 19:3773–3788.
23Gene flow patterns reinforce the ecological plasticity of Tropidurus hispidus (Squamata: Tropiduridae)
Frost DR, Rodrigues MT, Grant T, Titus TA. 2001. Phy-logenetics of the lizard genus Tropidurus (Squa-mata: Tropiduridae: Tropidurinae): direct optimiza-tion, descriptive efficiency, and sensitivity analysis of congruence between molecular data and mor-phology. Molecular Phylogenetics and Evolution. 21(3):352–371.
Gama-Maia, D, Torres, R. 2016. Fine-scale genetic struc-turing, divergent selection, and conservation pros-pects for the overexploited crab (Cardisoma guanhu-mi) in tropical mangroves from North-eastern Brazil. Journal of the Marine Biological Association of the United Kingdom, 96(8), 1677-1686.
González LAS, Bonilla A, Velásquez J. 2011. Cariotipo del lagarto Tropidurus hispidus (Sauria: Tropiduridae) en el Oriente de Venezuela. Acta Biológica Colombi-ana. 16:121–134.
Goudet J, Perrin N, Waser P. 2002. Tests for sex-biased dispersal using bi-parentally inherited genetic mark-ers. Molecular Ecology. 11: 1103-1114.
Gupta M, Chyi YS, Romero-Severson J, Owen JL. 1994. Amplification of DNA markers from evolutionar-ily diverse genomes using single primers of simple-sequence repeats. Theoretical. Applied Genetics, 89: 998–1006.
Hassanien HA, Al‐Rashada, Y. 2019. Estimation of genetic variation in green tiger prawn, Penaeus semisulcatus by using random amplified polymorphic DNA, inter simple sequence repeat and simple sequence repeat markers. Aquaculture Research, 50: 1626– 1633.
Hoehn M, Sarre SD, Henle K. 2007. The tales of two geckos: does dispersal prevent extinction in recent-ly fragmented populations? Molecular Ecology. 16:3299–3312.
Holderegger R, Wagner HH. 2006. A brief guide to land-scape genetics. Landscape Ecology. 21:793–796.
Hubisz MJ, Falush D, Stephens M, Pritchard JK. 2009. Inferring weak population structure with the assis-tance of sample group information. Molecular Ecol-ogy Resources. 9:1322-1332.
Hughes AR, Inouye BD, Johnson M T, Underwood N, Vellend M. 2008. Ecological consequences of genetic diversity. Ecology Letters. 11: 609-623.
Ivkovich T, Filatova OA, Burdin AM, Sato H, Hoyt E. 2010. The social organization of resident-type killer whales (Orcinus orca) in Avacha Gulf, Northwest Pacific, as revealed through association patterns and acoustic similarity. Mammal Biology. 75: 98–210.
Johansson H, Surget‐Groba Y, Thorpe RS. 2008. Micro-satellite data show evidence for male‐biased disper-sal in the Caribbean lizard Anolis roquet. Molecular Ecology. 17: 4425-4432.
Kasahara S, Yonenaga-Yassuda Y, Rodrigues MT. 1987. Geographical karyotipic variations and chromosome banding patterns in Tropidurus hispidus (Sauria, Iguanidae) from Brazil. Caryologia. 40:43-57.
Kasahara S, Pellegrino KCM, Rodrigues MT, Yonenaga-Yassuda Y. 1996. Comparative cytogenetic studies of eleven species of the Tropidurus torquatus group (Sauria, Tropiduridae). Hereditas. 125:37-46.
Kisel Y, Barraclough TG. 2010. Speciation has a spatial scale that depends on levels of gene flow. American Naturalist. 175(3)316-334.
Kolodiuk MF, Ribeiro LB, Freire EMX. 2010. Diet and foraging behaviour of two species of Tropidurus (Squamata, Tropiduridae) in the Caatinga of North-eastern Brazil. South American Journal of Herpetol-ogy. 5(1):35-44.
Levy E, Kennington WJ, Tomkins JL, Lebas NR. 2010. Land clearing reduces gene flow in the granite out-crop-dwelling lizard, Ctenophorus ornatus. Molecular Ecology. 19:4192–4203.
Matos NB, Ferreira M, de Jesus Silva F, Rodrigues MT, Santos da Silva E, Garcia C. 2016. Taxonomy and Evolution of Tropidurus (Iguania, Tropiduridae) based on Chromosomal and DNA Barcoding Analy-sis. Journal of Herpetology. 50(2): 316-326.
Mausfeld P, Schimitz A, Böhme W, Misof B, Vrcibradic D, Rocha CFD. 2002. Phylogenetic Affinities of Mabuya atlantica Schimidt, 1945, Endemic to the Atlantic Ocean Archipelago of Fernando de Noronha (Bra-zil): Necessity of portioning the genus Mabuya Fitz-inger, 1826 (Scincidae: Lygosominae). Zoologischer Anzeiger. 241:281-293.
Mendonça S, Moura GJB. 2011. Distribuição espacial, temporal e biometria de duas espécies de Tropiduri-dae em remanescente de Mata Atlântica, Nordeste do Brasil. Herpetologia no estado de Pernambuco. 1st ed. Recife: IBAMA.
Menezes L, Canedo C, Batalha-Filho H, Garda AA, Gehara M, Napoli MF. 2016. Multilocus phylogeogra-phy of the treefrog Scinax eurydice (Anura, Hylidae) reveals a plio-pleistocene diversification in the Atlan-tic Forest. PLoS ONE 11(6): e0154626.
Mills LS, Allendorf FW. 1996. The one-migrant-per-gen-eration rule in conservation and management. Con-servation Biology. 10(6)1509-1518.
Mouret V, Guillaumet A, Cheylan M, Pottier G, Ferchaud A, Crochet P. 2011. The legacy of ice ages in moun-tain species: post‐glacial colonization of mountain tops rather than current range fragmentation deter-mines mitochondrial genetic diversity in an endemic Pyrenean rock lizard. Journal of Biogeography. 38: 1717-1731.
24 Fernanda Ito et al.
Nelson MF, Anderson NO. 2013. How many marker loci are necessary? Analysis of dominant marker data sets using two popular population genetic algorithms. Ecology and Evolution. 3(10): 3455–3470.
O’neill SB, Chapple DG, Daugherty CH, Ritchie PA. 2008. Phylogeography of two New Zealand liz-ards: McCann’s skink (Oligosoma maccanni) and the brown skink (O. zelandicum). Molecular Phylogenet-ics and Evolution. 48:1168–1177.
Oliveira EF, Martinez PA, São-Pedro VA, Gehara M, Bur-brink FT, Oliveira DM, Garda AA, Colli GR & Costa GC. 2018. Climatic suitability, isolation by distance and river resistance explain genetic variation in a Brazilian whiptail lizard. Heredity. 120: 251–265.
Passoni JC, Benozzati ML, Rodrigues MT. 2008. Phylog-eny, species limits, and biogeography of the Brazil-ian lizards of the genus Eurolophosaurus (Squamata: Tropiduridae) as inferred from mitochondrial DNA sequences. Molecular Phylogenetics and Evolution. 46:403–414.
Pelegrin N, Mesquita DO, Albinati P, Caldas FLS, Cav-alcanti LBQ, Costa TB, Falico DA, Galdino JYA, Tucker DB, Garda AA. 2017. Extreme specialization to rocky habitats in Tropidurus lizards from Bra-zil: Trade-offs between a fitted ecomorph and auto-ecology in a harsh environment. Austral Ecology. 42: 677–689.
Pontes MC, Garri RG, Chiamenti A. 2008. Atividade de predação de Tropidurus hispidus (Sauria, Tropiduri-dae) de Nisia floresta- RN, Brasil. Revista Brasileira de Zoociências. 10(3):203-209.
Prieto AS, Léon JR, Lara O. 1976. Reproduction in the tropical lizard Tropidurus hispidus (Sauria: Iguani-dae). Herpetologica. 32:318–323.
Pritchard JK, Stephens M, Donnelly P. 2000. Inference of population structure using multilocus genotype data. Genetics. 155:945–959.
Ribeiro LB, Freire EMX. 2011. Trophic ecology and for-aging behavior of Tropidurus hispidus and Tropidurus semitaeniatus (Squamata, Tropiduridae) in a caatinga area of northeastern Brazil. Iheringia. Série Zoologia. 101(3): 225-232.
Ricketts TH. 2001. The matrix matters: effective isola-tion in fragmented landscapes. American Naturalist. 158:87–99.
Rodrigues MT. 1987. Sistemática, ecologia e zoogeografia de Tropidurus do grupo torquatus ao sul do rio Ama-zonas (Sauria, Iguanidae). Arquivos de Zoologia da Universidade de São Paulo. 31:105-230.
Rodrigues MT. 1988. Distribution of lizards of the genus Tropidurus in Brazil (Sauria: Iguanidae). In: Proceed-ings of a workshop on neotropical distribution pat-
terns. Rio de Janeiro: Academia Brasileira de Ciên-cias; p. 305-315.
Sambrook J, Russell DW. 2001. Molecular Cloning: a Laboratory Manual. 3rd. ed. Cold Spring Harbor: Cold Spring Harbor Laboratory Press.
Sarwat M. 2012. ISSR: A Reliable and Cost-Effective Technique for Detection of DNA Polymorphism BT - Plant DNA Fingerprinting and Barcoding: Meth-ods and Protocols. Edited by Sucher NJ, Hennell JR, Carles MC. Humana Press, Totowa, NJ. pp. 103–121. doi:10.1007/978-1-61779-609-8_9.
Slatkin, M 2018. Gene flow and population structure. In: Real, L. Ecological Genetics. Princeton University Press. Pp.: 4-17.
Stow AJ, Sunnucks P, Briscoe DA, Gardner MG. 2001. The impact of habitat fragmentation on dispersal of Cunningham’s skink (Egernia cunninghami): evidence from allelic and genotypic analyses of microsatellites. Molecular Ecology. 10:867–878.
Sumner J. 2005. Decreased relatedness between male prickly forest skinks (Gnypetoscincus queenslandiae) in habitat fragments. Conservation Genetics. 6:333–340.
Swofford DL. 2000. PAUP - Phylogenetic Analysis Using Parsimony (and other methods) V.4.0b10. Sunder-land (Massachusetts): Sinauer Associates.
Teixeira RL, Giovanelli M. 1999. Ecologia de Tropidu-rus torquatus (Sauria: Tropiduridae) da Restinga de Guriri, São Mateus, ES. Revista Brasileira de Biologia. 59(1):11-18.
Telles MPC, Monteiro MSR, Rodrigues FM, Soares TN, Resende LV, Amaral AG, Marra PR. 2001. Marca-dores RAPD na análise de divergência genética entre raças de bovinos e número de locos necessários para a estabilidade da divergência estimada. Ciência Ani-mal Brasileira. 2: 87-95.
Tolley KA, Makokhab JS, Houniet DT, Swart BL, Matthee CA. 2009. The potential for predicted climate shifts to impact genetic landscapes of lizards in the South African Cape Floristic Region. Molecular Phyloge-netics and Evolution. 51: 120–130.
Van Sluys M, Rocha CFD, Vrcibradic D, Galdino CA, Fontes AF. 2004. Diet, activity and micro-habitat use of two syntopic Tropidurus species (Lacertília:Tropiduridae) in Minas Gerais, Brazil. Journal of Herpetology. 38(4): 606-611.
Van Sluys M, Martelotte SB, Kiefer MC, Rocha CFD. 2010. Reproduction in neotropical Tropidurus lizards (Tropi-duridae): evaluating the effect of environmental factors on T. torquatus. Amphibia-Reptilia. 31: 117–126.
Vanzolini PE. 1978. On South American Hemidactylus (Sauria, Gekkonidae). Papéis Avulsos Zoologia. 31 (20): 307-343.

25Gene flow patterns reinforce the ecological plasticity of Tropidurus hispidus (Squamata: Tropiduridae)
Vanzolini PE, Ramos-Costa AMM, Vitt LJ. 1980. Répteis das Caatingas. Academia Brasileira de Ciências, Rio de Janeiro.
Verhoeven KJF, Macel M, Wolfe LM, Biere A. 2011. Population admixture, biological invasions and the balance between local adaptation and inbreeding depression. Proceedings of the Royal Society B: Bio-logical Sciences. 278: 2–8.
Vitt LJ. 1991. An introduction to the ecology of Cerrado lizards. Journal of Herpetology. 25:79-90.
Vitt LJ. 1995. The ecology of tropical lizards in the caatin-ga of northeast Brazil. Occasional Papers of the Okla-homa Museum of Natural History. 1:1-29.
Vitt LJ, Carvalho CM. 1995. Niche partitioning in a tropi-cal wet season: lizards in the Lavrado area of north-ern Brazil. Copeia. 1995: 305–329.
Vitt LJ, Caldwell JP, Zani PA, Titus TA. 1997. The role of habitat shift in the evolution of lizard morphology: evidence from tropical Tropidurus. Proceddings of the National Academy of Sciences – USA. 94: 3828–3832.
Werneck, F.P., Leite, R.N., Geurgas, S.R., Rodrigues, M.T., 2015. Biogeographic history and cryptic diversity of saxicolous Tropiduridae lizards endemic to the semi-arid Caatinga. BMC evolutionary biology, 15: 94.
Yeh FC, Yang RC, Boyle T. 1999. POPGENE 32-version 1.31. Population Genetics Software.
Zietkiewicz E, Rafalski A, Labuda D. 1994. Genome fingerprinting by simple sequence repeat (SSR) – Anchored polymerase chain reaction amplification. Genomics, 20: 176-193.

Caryologia. International Journal of Cytology, Cytosystematics and Cytogenetics 73(2): 27-37, 2020
Firenze University Press www.fupress.com/caryologiaCaryologia
International Journal of Cytology, Cytosystematics and Cytogenetics
ISSN 0008-7114 (print) | ISSN 2165-5391 (online) | DOI: 10.13128/caryologia-730
Citation: A. Giovino, F. Martinelli, A. Perrone (2020) The technique of Plant DNA Barcoding: potential application in floriculture. Caryologia 73(2): 27-37. doi: 10.13128/caryologia-730
Received: December 12, 2019
Accepted: April 1, 2020
Published: July 31, 2020
Copyright: © 2020 A. Giovino, F. Martinelli, A. Perrone. This is an open access, peer-reviewed article pub-lished by Firenze University Press (http://www.fupress.com/caryologia) and distributed under the terms of the Creative Commons Attribution License, which permits unrestricted use, distri-bution, and reproduction in any medi-um, provided the original author and source are credited.
Data Availability Statement: All rel-evant data are within the paper and its Supporting Information files.
Competing Interests: The Author(s) declare(s) no conflict of interest.
The technique of Plant DNA Barcoding: potential application in floriculture
Antonio Giovino1,*, Federico Martinelli2,*, Anna Perrone3
1 Council for Agricultural Research and Economics (CREA), Research Centre for Plant Protection and Certification (CREA-DC), Bagheria, Italy2 Department of Biology, University of Florence, Sesto Fiorentino, Florence, 50019, Italy3 Department of Biological, Chemical and Pharmaceutical Sciences and Technologies Uni-versity of Palermo, Viale delle Scienze, Palermo, 90128, Italy*Correspondonding authors. E-mail: [email protected]; [email protected]
Abstract. The objective of this work was to assess the ability of the DNA barcoding approach to identify different taxonomic groups from two flowering plant collec-tions: 1) the most relevant commercial taxa (nursery production) and 2) Mediterra-nean plants with ornamental attitude (new emerging species). “Core markers”, rbcL and matK, were adoptedthe identification step of 100 taxa belonging to 20 families. A third marker, the intergenic spacer trnH-psbA, was also tested, on 74 taxa, when the core markers were not able to discriminate well the analysed germplasm.DNA barcode fragments were recovered for all the total taxa investigated (100%). The rbcL showed the best performances: the greatest amplification success, the best sequencing perfor-mance both in terms of the number of sequences obtained and in terms of quality of the sequences obtained. Despite having recorded greater amplification difficulties, according to numerous other studies, matK has shown a good success in sequencing and quality of the obtained sequences (de Vere et al. 2012), unlike what is indicated in some protocols that suggests for this region the need for further primers to be adopted for the sequencing phase (Hollingsworth et. al 2011). Results showed that sixty-one taxa overall (61%) were totally resolved at specific or subspecific level, by at least one of the three markers. The matK and rbcL locus respectively resolved 44% and 35% of the taxa. The core markers in multilocus approach led to the discrimination of a total of 49% taxa. The trnH-psbA was able to discriminate 52% of taxa analysed and resulting determinant in the discrimination of 14 taxa. Four families, including the major num-ber of taxa (Arecaeae, Fabaceae, Euphorbiaceae, Asteraceae), were evaluated in terms of genetic distance (K2P% value). This work highlighted the potential of the barcoding approach for a rapid identification of plant species in order to solve taxonomic disputes and support commercial traceability of floreal products.
Keywords: DNA barcoding, DNA fingerprinting, floriculture,genetic identification.
1 INTRODUCTION
Genetic certification of plant material is, today more than ever, a funda-mental requirement to increase the competitiveness of plant nurseries, even

28 Antonio Giovino, Federico Martinelli, Anna Perrone
in the ornamental sector. This represents a unique and effective tool for unambiguous determination of nature of plant species. These improvements will enhancethe floriculture sector through the successful obtainment of the following to objectives: 1) genetic identification (especially for native plants) and particularly to iden-tify the link between genetic resources of ornamental interest and the relative territory of origin, thus pro-moting the products in harmony with the territory and with sustainability criteria, 2) traceability (native plants and imported plants) through the characterization of autochthonous products, plant material of supply chain and non-native incoming material. Therefore, the genet-ic certification of plant material is an extremely impor-tant aspect for the resolution of related problems:1) taxonomic controversies (synonymy/homonymy) and species of difficult identification, 2) newly introduced programs, genetic improvement, 3) early identification of species with very long phenological cycles, 4)corre-spondence checks of vegetable species entering the mar-kets, 5) protection of biodiversity, of native or endan-gered species. Recently, DNA barcoding has emergedas a new molecular tool for taxonomists (Hebert, Ratnas-ingham & deWaard, 2003). A DNA barcodeis a univer-sally accepted short DNA sequence normally employed for the identification of species (Savolainen et al., 2005), promoted for a variety of biological applications (Holl-ingsworth, Graham & Little, 2011), including the identi-fication of cryptic species, species discovery (Bickford et al., 2007) and taxonomic revisions (Simeone et al 2013). The genotype is nothing but the set of all the genes that make up the DNA of an organism. Thus DNA-based taxonomy has proved to be a valuable support to the classical taxonomy allowing to face the growing need for accurate and accessible taxonomic information (Tautz et al., 2003). In particular, the advent of molecu-lar markers has marked a remarkable turning point in the world of plant genetics allowing the construction of association genetic maps and the identification of genes responsible for agronomic characters (Giovino et al. 2015a). In taxonomic studies, markers are important for botanical classifications and the analysis of phyloge-netic relationships (Varshney et al., 2005). Among the molecular techniques, a new approach to the study of biodiversity has become widespread, with all the prob-lems related to this study: the DNA barcoding, literally “DNA barcode”. The name of this approach refers to the identification method by which a scanner distinguishes various commercial products using linear bar codes or “UPC” (Universal Product Code).This molecular inves-tigation approach was first proposed to the scientific community in 2003 by the population geneticist Paul
Hebert of the University of Guelph (Canada) (Hebert et al 2003). In this work it was used for the identifica-tion of species, a gene sequence located in the region of the mitochondrial gene COI, coding for the subu-nit I of the cytochrome-c oxidase (also known as War-burg’s respiratory fragment), therefore the variability of a molecular marker for the identification of biological identities is exploited.Over the years, COI has been suc-cessfully used in various animal taxa, including birds (Hebert et al., 2004b), arthropods (Barrett and Hebert, 2005), fish (Ward et al., 2005) and Lepidoptera (Hebert et al., 2004a). In vegetables, COI has not proved to be an excellent marker for phylogenetic studies, due to the low evolutionary rate of the mitochondrial genome. In order to overcome this problem, other markers for DNA barcoding of plants have been identified in recent years. These are DNA sequences present in some sections of the chloroplast genome, such as the trnH-psbA inter-genic region, the matK gene or the rbcL gene, which have characteristics similar tocoxI useful for species identification. There are several requirements for a marker to be considered appropriate for DNA barcod-ing. First of all it is advisable that the marker has a wide taxonomic coverage (also called universality), which would allow the applicability of the gene chosen as bar-code markern to the largest possible number of taxa and have a high success rate of PCR and sequencing. A high resolution capacity of the gene is also important, i.e the ability of a given barcode to differentiate species. This is typically based on the amount of interspecific differences between DNA sequences (Polymorphism). Another fundamental assumption is that the molecular marker chosen as a barcode should show a higher inter-specific variability than intraspecific variability. Inter- and intra-specific variability are separated by a certain distance (discontinuity between intra and interspecific variability) called “barcoding gap” (Meyer and Paulay, 2005).The ideal marker therefore consists of a highly variable region, which provides for species discrimina-tion, flanked by highly conserved regions for which ade-quate primers can be designed (Saunders and Kucera, 2010). Therefore, for the plants, the Barcoding proto-cols refer to the indications of the Plant working Group, which suggests the use of a multi-locus approach (Hol-lingsworth et al., 2011; Domina et al. 2017). The gen-eral objective of the research was to use the technique of DNA barcoding to help nursery production thanks to the easy identification of new products, ornamental plants and ornamental-food valueto respond to new and growing market needs.
29The technique of Plant DNA Barcoding: potential application in floriculture
2 MATERIALS AND METHODS
2.1 Plant collection
Native Sicilian plant species of high ornamental val-ue or dual aptitude for new introduction were selected, collected and morphologically analyzed. Selection was also extended to autochthonous or exotic species already produced at Faro srl (Catania, Italy) in order to gain more insights into: 1) taxonomic controversies (synony-my / homonymy); 2) early identification of species with very long phenological cycles; 3) correct identification of species with significant commercial impact. Samples collection for DNA analysis includes 100 plant species. (Tab. 1). We have included 52 species commercialized by Faro srl in addition to 36 native species that were pre-sent in the collection at the CREA-DC (Bagheria, Italy). For all the selected species, a bank of freeze-dried plant material and the respective DNA bank was set up at the CREA-DC of Bagheria for long-term conservation stock. Before proceeding with the application of the molecular characterization protocols, it was necessary to carry out a preliminary characterization at a morphological level,
The plant material under study is represented by 3 replicates for each species (or three distinct plants for each species), specifically from each of them tissue sam-ples were taken, represented by young leaves, which con-stitute the plant material from which to proceed with DNA extraction . Every single sample was cataloged with an identification code (ID) in order to set up a real germplasm collection, as well as for the establishment of a bank of germplasm DNA (freeze-dried).
For all the selected species, a bank of freeze-dried plant material and the respective DNA bank was made at CREA in Bagheria, as an important stock for the con-servation of the plant material in question.
2.2 Molecular analysis
For the molecular identification of the plants, young leaves, previously subjected to lyophilization, were used as starting material for DNA extraction.DNA was extracted from three biological replicates (lyophilized) for each taxonomic entity using CTAB-related method (Doyle & Doyle, 1987). Amplification and sequencing protocols of three regions of DNA usingrbcL, matK and trnH-psbA were performed,as defined by the Consorti-um for the Barcode of Life (CBOL). Firstly, these plastid portions, named “core markers”, were used for genetic characterization. For those species in which the core markers were unsuccessful, a third marker was tested based on the trnH-psbA intergenic region. This portion
is in fact known to support a greater degree of discrimi-nation between related species. A pipeline of the genetic characterization analysis is shown in Figure 1. Sequences of the rbcL, matK and trnH-psbA primers used in the PCR amplification were the following:• rbcL-F: ATGTCACCACAAACAGAGACTAAAGC • rbcL-R: GTAAAATCAAGTCCACCRCG • matK-3F KIM: CGTACAGTACTTTTGTGTTTAC-
GAG • 4) matK-1R KIM: ACCCAGTCCATCTG-
GAAATCTTGGTTC • 5) trnHf_05: CGCGCATGGTGGATTCACAATCC • 6) psbA3_f: GTTATGCATGAACGTAATGCTC
In relation to the PCR conditions, the protocol suggested by the CBOL Plant Working Group (Hol-lingsworth et al., 2009) was followed, and the amplifi-cations were conducted with a Gene®Amp PCR System 9700 thermocycler (Applied Biosystems).The amplicons were run on 2% agarose gel, whose purpose is to ensure the successful amplification of the segments of DNA involved, using the barcode primers used. The gels were analysed using the image acquisition “Gel Doc” of BIO-RAD, which allows to use a special “Quantity One” soft-ware, to identify amplified DNA bands.
2.3 Data analysis
The PCR products were purified and sequenced fol-lowing the DYEnamic™ ET termination kit sequencing kit (Amersham Biosciences) using an automatic sequenc-er AB3730XL DNA Analyzer (Applied Biosystems). The fragments were sequenced both forward and in reverse, using the same primers adopted for PCR.Through Sequencer software 4.10 (Gene Codes Corporation, USA) the electropherograms were carefully checked and eventually cleaned manually,and assembled in contigs.The obtained sequences were blasted and aligned using MUSCLE software, implemented within Mega 6 pro-gram (Tamura et al. 2013) used for phylogenetic analysis.
Several parameters have been evaluated to be able to efficiently determine the real discriminating power of the Barcoding markers used. Two categories of param-eters were taken into account: 1) thoserelated to techni-cal performances and those useful for assessing the dis-criminated power. The number of PCR positive samples for each marker was calculated, both for the total num-ber of biological replicates and number of taxa analyzed. Dealing with sequencing success, the number of samples positive for the sequencing procedure was calculated, which concerned only the PCR-positive samples for each marker, both in relation to the total number of biologi-cal replicates and to the number of taxa. Quality of the
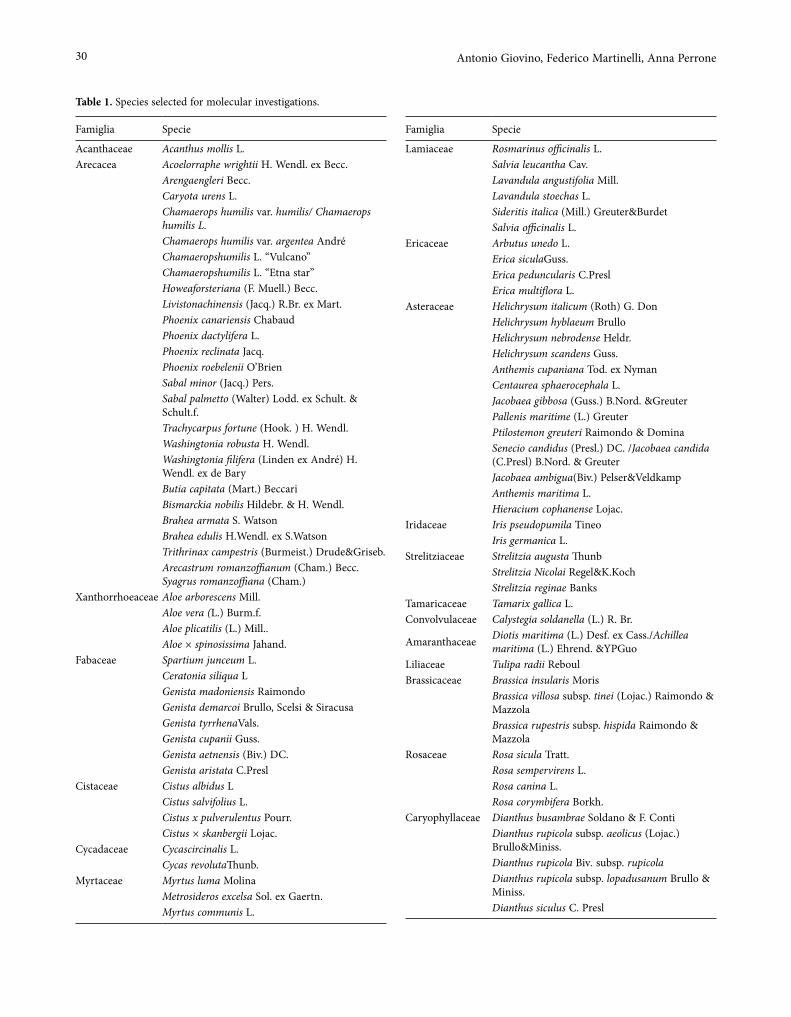
30 Antonio Giovino, Federico Martinelli, Anna Perrone
Table 1. Species selected for molecular investigations.
Famiglia Specie
Acanthaceae Acanthus mollis L.Arecacea Acoelorraphe wrightii H. Wendl. ex Becc.
Arengaengleri Becc.Caryota urens L.Chamaerops humilis var. humilis/ Chamaerops humilis L.Chamaerops humilis var. argentea AndréChamaeropshumilis L. “Vulcano”Chamaeropshumilis L. “Etna star”Howeaforsteriana (F. Muell.) Becc.Livistonachinensis (Jacq.) R.Br. ex Mart.Phoenix canariensis ChabaudPhoenix dactylifera L.Phoenix reclinata Jacq.Phoenix roebelenii O’BrienSabal minor (Jacq.) Pers.Sabal palmetto (Walter) Lodd. ex Schult. & Schult.f.Trachycarpus fortune (Hook. ) H. Wendl.Washingtonia robusta H. Wendl.Washingtonia filifera (Linden ex André) H. Wendl. ex de BaryButia capitata (Mart.) BeccariBismarckia nobilis Hildebr. & H. Wendl.Brahea armata S. WatsonBrahea edulis H.Wendl. ex S.WatsonTrithrinax campestris (Burmeist.) Drude&Griseb.Arecastrum romanzoffianum (Cham.) Becc.Syagrus romanzoffiana (Cham.)
Xanthorrhoeaceae Aloe arborescens Mill.Aloe vera (L.) Burm.f.Aloe plicatilis (L.) Mill..Aloe × spinosissima Jahand.
Fabaceae Spartium junceum L.Ceratonia siliqua LGenista madoniensis RaimondoGenista demarcoi Brullo, Scelsi & SiracusaGenista tyrrhenaVals.Genista cupanii Guss.Genista aetnensis (Biv.) DC.Genista aristata C.Presl
Cistaceae Cistus albidus LCistus salvifolius L.Cistus x pulverulentus Pourr.Cistus × skanbergii Lojac.
Cycadaceae Cycascircinalis L.Cycas revolutaThunb.
Myrtaceae Myrtus luma MolinaMetrosideros excelsa Sol. ex Gaertn.Myrtus communis L.
Famiglia Specie
Lamiaceae Rosmarinus officinalis L.Salvia leucantha Cav.Lavandula angustifolia Mill.Lavandula stoechas L.Sideritis italica (Mill.) Greuter&BurdetSalvia officinalis L.
Ericaceae Arbutus unedo L.Erica siculaGuss.Erica peduncularis C.PreslErica multiflora L.
Asteraceae Helichrysum italicum (Roth) G. DonHelichrysum hyblaeum BrulloHelichrysum nebrodense Heldr.Helichrysum scandens Guss.Anthemis cupaniana Tod. ex NymanCentaurea sphaerocephala L.Jacobaea gibbosa (Guss.) B.Nord. &GreuterPallenis maritime (L.) GreuterPtilostemon greuteri Raimondo & DominaSenecio candidus (Presl.) DC. /Jacobaea candida (C.Presl) B.Nord. & GreuterJacobaea ambigua(Biv.) Pelser&VeldkampAnthemis maritima L.Hieracium cophanense Lojac.
Iridaceae Iris pseudopumila TineoIris germanica L.
Strelitziaceae Strelitzia augusta ThunbStrelitzia Nicolai Regel&K.KochStrelitzia reginae Banks
Tamaricaceae Tamarix gallica L.Convolvulaceae Calystegia soldanella (L.) R. Br.
Amaranthaceae Diotis maritima (L.) Desf. ex Cass./Achillea maritima (L.) Ehrend. &YPGuo
Liliaceae Tulipa radii ReboulBrassicaceae Brassica insularis Moris
Brassica villosa subsp. tinei (Lojac.) Raimondo & MazzolaBrassica rupestris subsp. hispida Raimondo & Mazzola
Rosaceae Rosa sicula Tratt.Rosa sempervirens L.Rosa canina L.Rosa corymbifera Borkh.
Caryophyllaceae Dianthus busambrae Soldano & F. ContiDianthus rupicola subsp. aeolicus (Lojac.) Brullo&Miniss.Dianthus rupicola Biv. subsp. rupicolaDianthus rupicola subsp. lopadusanum Brullo & Miniss.Dianthus siculus C. Presl

31The technique of Plant DNA Barcoding: potential application in floriculture
sequence was given by the quality of the peaks present on the electropherograms to indicate the precision and reliability of the sequences obtained. Sequences with quality over 70% were considered suitable. The reported value indicates the average of biological replicates. Frag-ment length was determined and referred to the aver-age length of the fragments obtained for each marker, in relation to the total of biological replicates, follow-ing the analysis and cleaning of the electropherograms.The value of thepower of discrimination parameter was given by the number of taxa that have been univocally discriminated on the level of species (or subspecies).The discriminating power was assessed both for single locus and in multi-locus approach. The discrimination power of each locus was evaluated by phylogenetic analysis with Mega6, conducted by comparing all the sequences generated in this study and using a subset of referring sequences related to each taxa found by BOLD Database / GenBank. The level of genetic divergence was deter-mined and indicated the degree of variability between a group of sequences, obtained from the distance matrices calculated according to the parameter K2P% (Kimura, 1980). It was calculated within some families considered most representative by number of species. Number of variable sites was determined. It indicated the number of bases subject to variations within the gel phylogenetic group considered on the total length of the fragments obtained for each locus. Like the previous one, it was calculated within some families considered most repre-sentative of the entire collection of analyzedplant spe-cies.
3 RESULTS AND DISCUSSION
Results of discrimination outputs for each of the three markers are reported in Tab. 2. Using a total of
300 samples (including biological replicates), rbcLob-tained 93% PCR success, 95% sequencing success, with 90% sequence quality and an average fragment length of 569 bp. MatK showed a success of PCR and sequencing, respectively of 70% and 93% and a quality of sequences of 80% with an average length of fragments of 766 bp. The use of trnH-psbA marker showed PCR and sequenc-ing success respectively of 80% and 91% and a sequence quality of 85% with an average fragment length of 518 bp. Consideringa total number of 100 taxa tested, rbcL showed higher values than the other two markers, with PCR success of 97% and a success of sequencing of 99%, for matK the recorded values were of 81% for suc-cessful apmification and 96% for sequencing success, while trnH-psbA marker showed respectively PCR and sequencing successof 89% and 94%. In relation to the above results, rbcL showed the best performances: the greatest amplification success, the best sequencing yield both in terms of the number of sequences obtained and in terms of the quality of the sequences obtained. The matK, despite having experienced greater amplification difficulties agreeing with numerous other studies (de Vere et al. 2012), it showed a good success of sequencing and good quality of obatined sequences. This does not agree withprevious works that suggest the need to use matK with additional primers for sequencing purpos-es (Hollingsworth et. to 2011). Taxa identification was firstly carried out using “core markers” (rbcL and matK). The use of the third marker, the IGS trnH-psbA was reserved for those situations in which both core mark-
Famiglia Specie
Dianthus rupicola subsp. hermaensis (Coss.) O. Bolòs& Vigo
Euphorbiaceae Euphorbia ceratocarpa Ten.Euphorbia characias L.Euphorbia dendroides L.Euphorbia meuselii GeltmanEuphorbia myrsinites L.Euphorbia helioscopia L.Euphorbia bivonae Steud.Euphorbia pithyusa subsp. cupanii (Guss. ex Bertol.) Radcl.-Sm.Euphorbia amygdaloides L.
Table 2. Technical performancesof markers used in DNA barcod-ing techniques referred to the total of biological replicates (a) and tested taxa (b).
(a)
rbcL matK trnH-psbA
Number of tested samples* 300 300 222
Successful amplification (93%) 279/300
(70%) 210/300
(80%) 177/222
Successful sequencing (contigs) (95%) 265/279
(93%) 195/210
(91%) 161/177
High quality sequence (contigs) 90% 80% 85%Fragment length (average in bp) 569 766 518
(b)
rbcL matK trnH-psbA
Number of tested samples* 100 100 74
Successful amplification (97%) 97/100
(81%) 81/100
(89%) 66/74
Number of taxa successfully sequenced
(99%) 96/97
(96%) 78/81
(94%) 62/66

32 Antonio Giovino, Federico Martinelli, Anna Perrone
ers presented difficulties, due to lack of amplification, failure of sequencing reactions or insufficient discrimi-nating power. The overall identification results at species level for each tested taxawere reported in Tab. S1. Out of a total of 100 taxa tested, 61% of taxa were success-fully identified at the species level with at least one of the three locus, while 37% remained at the genus level. Only the remaining 2% of the taxa remained undetermined due to the failure of all three markers employed.Con-sidering the individual markers, rbcL allowed a unique identification at the species level of 34 taxa (35%), matK of 34 taxa (44%) and trnH-psbA of 32 taxa (52%) (Tab. 3). MatK showed greater percentage values of resolv-ing power in terms of discrimination of taxa than rbcL, confirming the trends indicated by other studies (Chen et al. 2010). When rbcL and matKwere not able to dis-criminate species (belonging to 14 taxa), trnH-psbA was decisive in the identification of them, allowing to increase the total number of discriminated taxa from 47 to 61 taxa. The core markers, used in multi-locus, rbcL + matK, allowed the unambiguous identification at the species level of 38 taxa. Further combinations of the two markers rbcL + trnH-psbA and matK + trnH-psbA allowed the discrimination of 32 taxa and 25 taxa respectively.The use of the multi-locus approach based on core markers appeared to be the most efficient, with a good compromise between the high technical perfor-mance of the rbcL and the best resolving power support-ed by the matK.The following families showed the high-est success rate of species discrimination: Asteraceae (9 uniquely discriminated taxa out of 13, Caryophillaceae with 4 taxa of 6, Fabacecae with 8 taxa out of 8, Euphor-biaceae with 9 taxa out of 9, Brassicaceae with 3 taxa out of 3, Ericaceae with 4 taxa out of 4. Minor successes in terms of unambiguous resolution at the species level, have been found for Arecaceae, (7 taxa discriminated at the species level on a total of 24), and for the Cistaceae (none). Levels of genetic divergence for larger families were reported in Tab. 4. The rbcL marker showed the lowest values of genetic divergence for Arecaceae, with 0.7%, and the highest values for Asteraceae, with 2.1%,
while matK showed the lowest values for the Arecace-ae with 1.5% and the highest for Fabaceae with 6.4%. TrnH-psbA showed the highest values for Euphorbi-aceae with 9.1% and the lowest for Arecaceae with 2.9%. TrnH-psbA has confirmed high variability values and its ability to discriminate within very similar taxonom-ic groups (Chase et al. 2007).In the Arecaceae family, which in our study included 24 species from 15 differ-ent genera, the trnH-psbA marker recorded the highest genetic divergence value with a percentage of 2.9%. The lowest values occurred with rbcL with a percentage of 0.7%, while matK showed intermediate values compared with the first two with a value of 1.5% (Tab. 4). The rbcL was able to identify two species of Arecaceae (Acoelor-raphe wrightii and Caryota urens L.). When rbcL failed, matK was decisive for identification of 4 taxa (Arenga engleri Becc., Phoenix roebelenii O’Brien, Sabal minor (Jacq.) Pers., Bismarckia nobilis Hildebrandt & H.Wendl., 1881). Other authors indicated rbcL and matK as highly decisive phylogenetic analysis of this family (Asmussen et al. 2006).Only in the case of Washingtonia robusta H. Wendl., the discrimination was possible through the use of both core markers. Relating to Fabaceae (8 species investigated from 3 different genera), the lowest values of genetic divergence were recorded with rbcL with 1.5% and the highest with trnH-psbA with values of 7.4%. Using matK a genetic divergence of 6.4% was obtained, discriminating 4 species out of 8. The matK was deter-minant for 1 taxa (Genista aristata C.Presl), while the trnH-psbA was determinant for 2 taxa (Genista tyrrhena Vals., Genista demarcoi Brullo, Scelsi & Siracusa). Con-sidering that Genista was the most represented genus (with 6 species), rbcL showed a better result than matK within this group, discriminating 5 species (Spartium junceum L., Ceratonia siliqua L., Genista madonien-sis Raimondo, Genista cupanii Guss., Genista aetnensis Raf. ex Biv.). This result appears to be in contrast with the potential expressed by matK within the Fabaceae in other studies (Gao et al 2011; Gao and Chen 2009). Here, the Genista group showed excellent levels of discrimina-tion with this marker. Relating to Asteraceae (13 inves-tigated species belonging to 8 different genera),matK showed values of genetic divergence of 4.4% and rbcL 2.1%. As for the trnH-psbA, given the excessive vari-ability shown by the analyzed sequences, a subdivision into genera. The lowest genetic divergence values were recorded for Anthemis with 1% and higher for Jacobaea with 3.3%. (Tab. 4).
Relating to Asteraceae, rbcL has allowed us to iden-tify at the species level 4 taxa (Centaurea sphaerocephala L., Helichrysum nebrodense Heldr., Ptilostemon greu-teri Raimondo & Domina, Pallenis maritima (L.) Greu-
Table 3. Discriminating power of Barcoding markers.
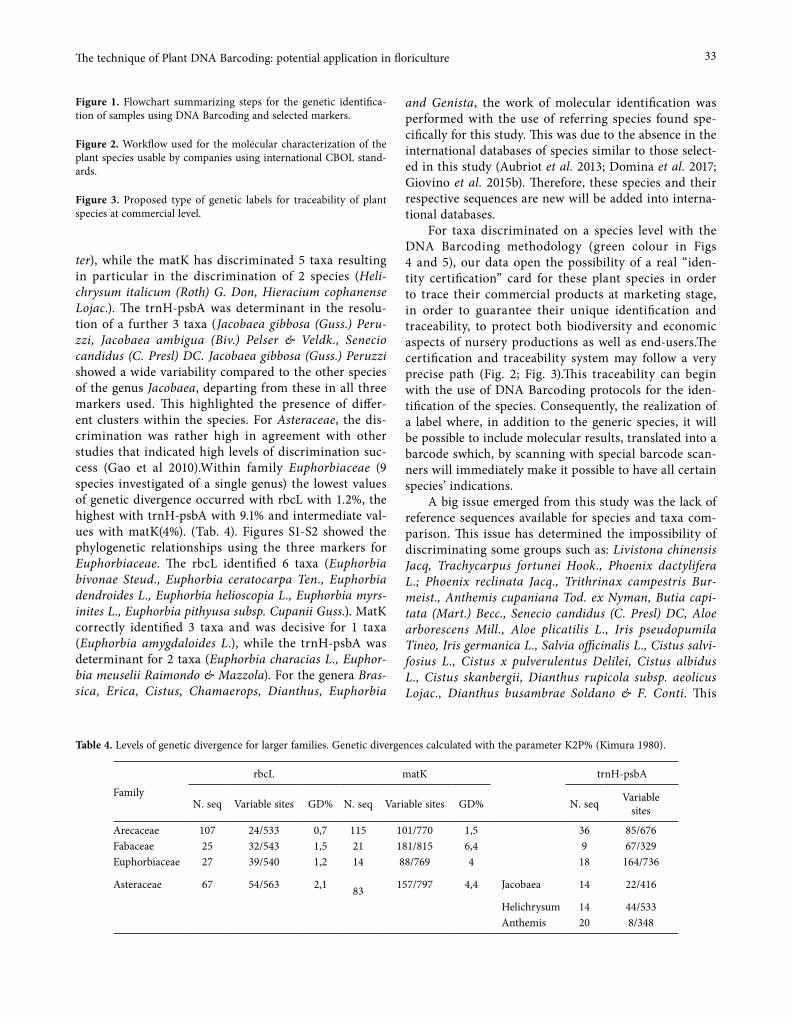
33The technique of Plant DNA Barcoding: potential application in floriculture
ter), while the matK has discriminated 5 taxa resulting in particular in the discrimination of 2 species (Heli-chrysum italicum (Roth) G. Don, Hieracium cophanense Lojac.). The trnH-psbA was determinant in the resolu-tion of a further 3 taxa (Jacobaea gibbosa (Guss.) Peru-zzi, Jacobaea ambigua (Biv.) Pelser & Veldk., Senecio candidus (C. Presl) DC. Jacobaea gibbosa (Guss.) Peruzzi showed a wide variability compared to the other species of the genus Jacobaea, departing from these in all three markers used. This highlighted the presence of differ-ent clusters within the species. For Asteraceae, the dis-crimination was rather high in agreement with other studies that indicated high levels of discrimination suc-cess (Gao et al 2010).Within family Euphorbiaceae (9 species investigated of a single genus) the lowest values of genetic divergence occurred with rbcL with 1.2%, the highest with trnH-psbA with 9.1% and intermediate val-ues with matK(4%). (Tab. 4). Figures S1-S2 showed the phylogenetic relationships using the three markers for Euphorbiaceae. The rbcL identified 6 taxa (Euphorbia bivonae Steud., Euphorbia ceratocarpa Ten., Euphorbia dendroides L., Euphorbia helioscopia L., Euphorbia myrs-inites L., Euphorbia pithyusa subsp. Cupanii Guss.). MatK correctly identified 3 taxa and was decisive for 1 taxa (Euphorbia amygdaloides L.), while the trnH-psbA was determinant for 2 taxa (Euphorbia characias L., Euphor-bia meuselii Raimondo & Mazzola). For the genera Bras-sica, Erica, Cistus, Chamaerops, Dianthus, Euphorbia
and Genista, the work of molecular identification was performed with the use of referring species found spe-cifically for this study. This was due to the absence in the international databases of species similar to those select-ed in this study (Aubriot et al. 2013; Domina et al. 2017; Giovino et al. 2015b). Therefore, these species and their respective sequences are new will be added into interna-tional databases.
For taxa discriminated on a species level with the DNA Barcoding methodology (green colour in Figs 4 and 5), our data open the possibility of a real “iden-tity certification” card for these plant species in order to trace their commercial products at marketing stage, in order to guarantee their unique identification and traceability, to protect both biodiversity and economic aspects of nursery productions as well as end-users.The certification and traceability system may follow a very precise path (Fig. 2; Fig. 3).This traceability can begin with the use of DNA Barcoding protocols for the iden-tification of the species. Consequently, the realization of a label where, in addition to the generic species, it will be possible to include molecular results, translated into a barcode swhich, by scanning with special barcode scan-ners will immediately make it possible to have all certain species’ indications.
A big issue emerged from this study was the lack of reference sequences available for species and taxa com-parison. This issue has determined the impossibility of discriminating some groups such as: Livistona chinensis Jacq, Trachycarpus fortunei Hook., Phoenix dactylifera L.; Phoenix reclinata Jacq., Trithrinax campestris Bur-meist., Anthemis cupaniana Tod. ex Nyman, Butia capi-tata (Mart.) Becc., Senecio candidus (C. Presl) DC, Aloe arborescens Mill., Aloe plicatilis L., Iris pseudopumila Tineo, Iris germanica L., Salvia officinalis L., Cistus salvi-fosius L., Cistus x pulverulentus Delilei, Cistus albidus L., Cistus skanbergii, Dianthus rupicola subsp. aeolicus Lojac., Dianthus busambrae Soldano & F. Conti. This
Figure 1. Flowchart summarizing steps for the genetic identifica-tion of samples using DNA Barcoding and selected markers.
Figure 2. Workflow used for the molecular characterization of the plant species usable by companies using international CBOL stand-ards.
Figure 3. Proposed type of genetic labels for traceability of plant species at commercial level.
Table 4. Levels of genetic divergence for larger families. Genetic divergences calculated with the parameter K2P% (Kimura 1980).
Family
rbcL matK
trnH-psbA
N. seq Variable sites GD% N. seq Variable sites GD% N. seq Variable sites
Arecaceae 107 24/533 0,7 115 101/770 1,5 36 85/676Fabaceae 25 32/543 1,5 21 181/815 6,4 9 67/329Euphorbiaceae 27 39/540 1,2 14 88/769 4 18 164/736
Asteraceae 67 54/563 2,1 83 157/797 4,4 Jacobaea 14 22/416
Helichrysum 14 44/533Anthemis 20 8/348
34 Antonio Giovino, Federico Martinelli, Anna Perrone
evidence demonstrated the great importance of creating molecular databases that incorporate the widest pos-sible biodiversity with universal markers. In addition, it highlighted the importance of creating a dedicated database of the main floricultural species of ornamental interest, which can support the practical application of the molecular protocol for the purposes of traceability and monitoring by control bodies (Giovino et al. 2014). Although DNA Barcoding can reach 80-90% of resolu-tion levels, it can lack sufficient discrimination power in some families, including Ericaceae, Lamiaaceae, Orchi-daceae. This is due to the modest evolutionary distance between closely related species evolved from recent divergence, as suggested before (Hollingsworth et al., 2009). Although in some cases, the multi-locus approach can have a great success, the evaluation of additional barcoding regions in relation to the success of discrimi-nation, requires the use of individual taxonomic groups with difficult discrimination (Hollingsworth et al., 2011).
In conclusions, this work confirmed the high per-formances of rbcL and matK markers usin a total of 100 plant taxa, belonging to 20 different families. The taxa successfully sequenced for at least one of the considered markers were 98 and 61% of the total evaluated ones at level of species or subspecies. Considering that the fail-ure of taxa is linked to particular genus, or species, with very low evolutionary divergence, this result confirms the potential of the barcoding approach for the rapid analysis of unknown samples. Cryptic groups found in this study highlighted the already well-known techni-cal problems due to the low level of matK amplification and sequencing success. Anyway, this marker greater power of discrimination compared to rbcL.Therefore, we can conclude that although the adoption of core mark-ers appeared to be a good compromise, in some cases the multi-locus approach and the addition of the third trnH-psbA marker can promote greater success, as dem-onstrated here.
The evaluation of additional barcoding regions can be useful for increasing the success of discrimination, but thisdepends on the individual taxonomic groups showing problems of PCR amplification and sequencing with core markers. However, it is worthy to notice that a large sample of references related to eachtaxa is neces-sary to validate the accuracy of the method.This study highlighted the great importance of creating molecular databases incorporating the widest possible biodiversity with universal markers, developing a dedicated database, especiallyfor floricultural species with ornamental inter-est to enhance their traceability and monitoring of com-mercial exchanges by control national authorities.
DISCLOSURE STATEMENT
No fincial interests or benefits has been arisen from the application of our research.
DATA AVAILABILITY STATEMENT
We declare that all data presented here have been included in the present work and related supplemental material.
DATA DEPOSITION
Most of the analysed species were submitted in the Bold database within the project: FMED: Manager Gio-vino Antonio (Tab. 5).
REFERENCES
AsmussenCB, Dransfield J, DeichmannV, BarfodAS, Pin-taudJC, Baker WJ. 2006. A new subfamily classifica-tion of the palm family (Arecacee): Evidence from plastid DNA phylogeny. Bot J Linn Soc. 151(1):15-38.
Aubriot X, Lowry PP 2nd, Cruaud C, Couloux A, Haev-ermans T. 2013. DNA barcoding in a biodiversity hot spot: potential value for the identification of Mala-gasy Euphorbia L. listed in CITES Appendices I and II. Mol EcolResour. 13(1):57-65. doi: 10.1111/1755-0998.12028.
Barrett R, Hebert PDN. 2005. Identifying spiders through DNA barcodes. Can J Zool. 83:481–491.
Bickford D, Lohman DJ, Sodhi NS, Ng PKL, Meier R,Winker K, Ingram KK, Das I 2007. Crypticspecie-sas awindow on diversity and conservation. Trends in Ecologyand Evolution 22: 148–155.
Chase MW, CowanRS, Hollingsworth PM, van den Berg C, Madriñán S, Petersen G, Seberg O,Jørgsensen T, Cameron KM, Carine M, Pedersen N, Hedderson TAJ, Conrad F, Salazar GA, Richardson JE, Hollings-worth ML, Barraclough TG, Kelly L, Wilkinson M. 2007. A proposal for a standard protocol to barcode all land plants. Taxon. 56(2):295–299.
Chen SL, Yao H, Han JP, Liu C, Song JY, Shi LC, Zhu YJ, Ma XY, Gao T, Pang XH, Luo K, Li Y, Li XW, Jia XC, Lin YL, Leon C. 2010. Validation of the ITS2 region as a novel DNA barcode for identifying medicinal plant species. PLoS ONE. 5:e8613. doi:10.1371/jour-nal.pone.0008613.
De Vere N, Rich TC, Ford CR, et al. DNA barcoding the native flowering plants and conifers of Wales. PLoS One. 2012;7(6):e37945. doi:10.1371/journal.pone.0037945
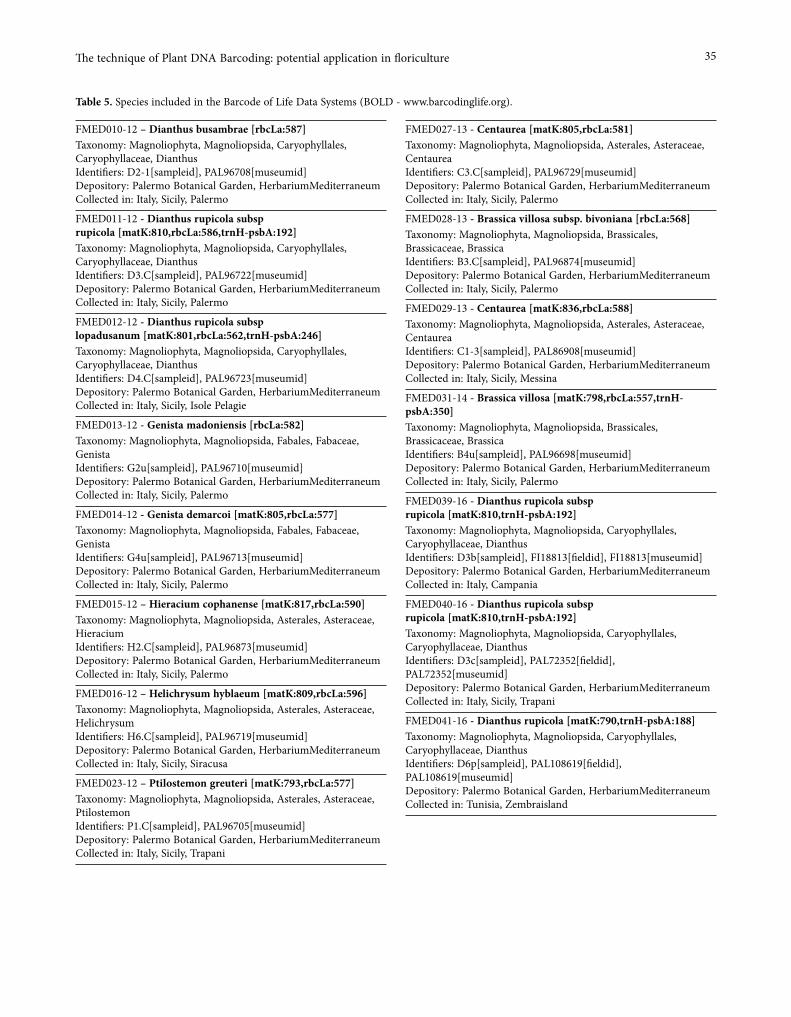
35The technique of Plant DNA Barcoding: potential application in floriculture
Table 5. Species included in the Barcode of Life Data Systems (BOLD - www.barcodinglife.org).
FMED010-12 – Dianthus busambrae [rbcLa:587]Taxonomy: Magnoliophyta, Magnoliopsida, Caryophyllales, Caryophyllaceae, Dianthus Identifiers: D2-1[sampleid], PAL96708[museumid] Depository: Palermo Botanical Garden, HerbariumMediterraneum Collected in: Italy, Sicily, Palermo
FMED011-12 - Dianthus rupicola subsp rupicola [matK:810,rbcLa:586,trnH-psbA:192]Taxonomy: Magnoliophyta, Magnoliopsida, Caryophyllales, Caryophyllaceae, Dianthus Identifiers: D3.C[sampleid], PAL96722[museumid] Depository: Palermo Botanical Garden, HerbariumMediterraneum Collected in: Italy, Sicily, Palermo
FMED012-12 - Dianthus rupicola subsp lopadusanum [matK:801,rbcLa:562,trnH-psbA:246]Taxonomy: Magnoliophyta, Magnoliopsida, Caryophyllales, Caryophyllaceae, Dianthus Identifiers: D4.C[sampleid], PAL96723[museumid] Depository: Palermo Botanical Garden, HerbariumMediterraneum Collected in: Italy, Sicily, Isole Pelagie
FMED013-12 - Genista madoniensis [rbcLa:582]Taxonomy: Magnoliophyta, Magnoliopsida, Fabales, Fabaceae, Genista Identifiers: G2u[sampleid], PAL96710[museumid] Depository: Palermo Botanical Garden, HerbariumMediterraneum Collected in: Italy, Sicily, Palermo
FMED014-12 - Genista demarcoi [matK:805,rbcLa:577]Taxonomy: Magnoliophyta, Magnoliopsida, Fabales, Fabaceae, Genista Identifiers: G4u[sampleid], PAL96713[museumid] Depository: Palermo Botanical Garden, HerbariumMediterraneum Collected in: Italy, Sicily, Palermo
FMED015-12 – Hieracium cophanense [matK:817,rbcLa:590]Taxonomy: Magnoliophyta, Magnoliopsida, Asterales, Asteraceae, Hieracium Identifiers: H2.C[sampleid], PAL96873[museumid] Depository: Palermo Botanical Garden, HerbariumMediterraneum Collected in: Italy, Sicily, Palermo
FMED016-12 – Helichrysum hyblaeum [matK:809,rbcLa:596]Taxonomy: Magnoliophyta, Magnoliopsida, Asterales, Asteraceae, Helichrysum Identifiers: H6.C[sampleid], PAL96719[museumid] Depository: Palermo Botanical Garden, HerbariumMediterraneum Collected in: Italy, Sicily, Siracusa
FMED023-12 – Ptilostemon greuteri [matK:793,rbcLa:577]Taxonomy: Magnoliophyta, Magnoliopsida, Asterales, Asteraceae, Ptilostemon Identifiers: P1.C[sampleid], PAL96705[museumid] Depository: Palermo Botanical Garden, HerbariumMediterraneum Collected in: Italy, Sicily, Trapani
FMED027-13 - Centaurea [matK:805,rbcLa:581]Taxonomy: Magnoliophyta, Magnoliopsida, Asterales, Asteraceae, Centaurea Identifiers: C3.C[sampleid], PAL96729[museumid] Depository: Palermo Botanical Garden, HerbariumMediterraneum Collected in: Italy, Sicily, Palermo
FMED028-13 - Brassica villosa subsp. bivoniana [rbcLa:568]Taxonomy: Magnoliophyta, Magnoliopsida, Brassicales, Brassicaceae, Brassica Identifiers: B3.C[sampleid], PAL96874[museumid] Depository: Palermo Botanical Garden, HerbariumMediterraneum Collected in: Italy, Sicily, Palermo
FMED029-13 - Centaurea [matK:836,rbcLa:588]Taxonomy: Magnoliophyta, Magnoliopsida, Asterales, Asteraceae, Centaurea Identifiers: C1-3[sampleid], PAL86908[museumid] Depository: Palermo Botanical Garden, HerbariumMediterraneum Collected in: Italy, Sicily, Messina
FMED031-14 - Brassica villosa [matK:798,rbcLa:557,trnH-psbA:350]Taxonomy: Magnoliophyta, Magnoliopsida, Brassicales, Brassicaceae, Brassica Identifiers: B4u[sampleid], PAL96698[museumid] Depository: Palermo Botanical Garden, HerbariumMediterraneum Collected in: Italy, Sicily, Palermo
FMED039-16 - Dianthus rupicola subsp rupicola [matK:810,trnH-psbA:192]Taxonomy: Magnoliophyta, Magnoliopsida, Caryophyllales, Caryophyllaceae, Dianthus Identifiers: D3b[sampleid], FI18813[fieldid], FI18813[museumid] Depository: Palermo Botanical Garden, HerbariumMediterraneum Collected in: Italy, Campania
FMED040-16 - Dianthus rupicola subsp rupicola [matK:810,trnH-psbA:192]Taxonomy: Magnoliophyta, Magnoliopsida, Caryophyllales, Caryophyllaceae, Dianthus Identifiers: D3c[sampleid], PAL72352[fieldid], PAL72352[museumid] Depository: Palermo Botanical Garden, HerbariumMediterraneum Collected in: Italy, Sicily, Trapani
FMED041-16 - Dianthus rupicola [matK:790,trnH-psbA:188]Taxonomy: Magnoliophyta, Magnoliopsida, Caryophyllales, Caryophyllaceae, Dianthus Identifiers: D6p[sampleid], PAL108619[fieldid], PAL108619[museumid] Depository: Palermo Botanical Garden, HerbariumMediterraneum Collected in: Tunisia, Zembraisland

36 Antonio Giovino, Federico Martinelli, Anna Perrone
Domina G, Scibetta S, Scafidi F, Giovino A. 2017. Con-tribution to the identification of Dianthus rupicola (Caryophyllaceae) subspecies using morphological and molecular approaches. Phytotaxa. 291(1): 017–032. doi.org/10.11646/phytotaxa.291.1.2.
Gao T, Chen SL. 2009. Authentication of the medicinal plants in Fabaceae by DNA barcoding technique. Planta Med.; 75 - P-13DOI: 10.1055/s-2009-1216451
Gao T, Sun Z, Yao H, Song J, Zhu Y, Ma X, Chen S. 2011. Identification of Fabaceae plants using the DNA bar-code matK. Planta Med. 77(1): 92-94.
Giovino A, Marino P, Domina G, Scialabba A, Schic-chi R, Diliberto G, Rizza C, Scibetta S. Evaluation of the DNA barcoding approach to develop a reference data-set for the threatened flora of Sicily. 2014. Plant Biosyst. 150(4):631-640. DOI:10.1080/11263504.2014.989285.
Giovino A, Bertolini E, Fileccia V, Al hassan M, Labra M, Martinelli F. 2015a. Transcriptome Analysis of Phoe-nix canariensisChabaud in Response to Rhynchopho-rusferrugineus Olivier Attacks. Frontiers Plant Sci. 6:817. doi:10.3389/fpls.2015.00817.
Giovino A, Marino P, Domina G, Rapisarda P, Rizza G, Saia S. 2015b. Fatty acid composition of the seed lipids of Chamaerops humilis L. natural populations and its relation with the environment.Plant Biosys-tems. 149(4):767-776.
Hebert PDN, Cywinska A, Ball SL, deWaard JR. 2003. Biological identifications through DNA barcodes. Proc Biol Sci. 270(1512):313-2.
Hebert PDN, Penton EH, Burns JM, Janzen DH, Hallwachs W. 2004.Ten species in one: DNA barcod-ing reveals cryptic species in the neotropical skipper butterfly Astraptesfulgerator. Proc Natl Acad Sci U S A. 101(41):14812-7.
Hebert PDN, Stoeckle MY, Zemlak TS, Francis CM. 2004. Identification of birds through DNA barcodes. PLoS Biol. 2(10):e312.
Hollingsworth PM, Graham SW, Little DP. 2011. Choos-ing and Using a Plant DNA Barcode. PLoS ONE. 6(5): e19254.
Hollingsworth P.M. et al. CBOL Plant Working Group. 2009. A DNA barcode for land plants. Proc Nat Acad Sci United States Amer. 106:12794–12797.
Kimura M. 1980. A simple method for estimating evo-lutionary rates of base substitution through com-parative studies of nucleotide sequences. J Mol Evol. 16(2):111-120
Meyer CP, Paulay G. 2005. DNA Barcoding: Error Rates Based on Comprehensive Sampling. PLoS Biol. 3(12): 422.
Saunders GW, Kucera H. 2010. An evaluation of rbcL, tufA, UPA, LSU and ITS as DNA barcode markers for the marine green macroalgae. Cryptogamie Algol. 31(4):487-528.
Savolainen Vincent, Cowan Robyn S, Vogler Alfried P, Roderick George K and Lane Richard Towards writ-ing the encyclopaedia of life: an introduction to DNA barcoding360Phil. Trans. R. Soc. Bhttp://doi.org/10.1098/rstb.2005.1730.
Simeone MC, Piredda R, Papini A, Vessella F, Schirone B (2013) Application of plastid and nuclear mark-ers to DNA barcoding of Euro – Mediterranean oaks
FMED042-16 - Dianthus rupicola [matK:780,trnH-psbA:247]Taxonomy: Magnoliophyta, Magnoliopsida, Caryophyllales, Caryophyllaceae, Dianthus Identifiers: D9p[sampleid], PAL108620[fieldid], PAL108620[museumid] Depository: Palermo Botanical Garden, HerbariumMediterraneum Collected in: Spain, BalearicIslands, Majorca
FMED001-12 - Rosa sempervirens [matK:824,rbcLa:590]Taxonomy: Magnoliophyta, Magnoliopsida, Rosales, Rosaceae, Rosa Identifiers: R3-1[sampleid], SV Term[fieldid] Depository: Research Unit for Mediterranean Flower Species Collected in: Italy, Sicily, Palermo
FMED003-12 - Asteraceae [rbcLa:577]Taxonomy: Magnoliophyta, Magnoliopsida, Asterales, Asteraceae Identifiers: A4u[sampleid], PAL[museumid] Depository: Palermo Botanical Garden, HerbariumMediterraneum Collected in: Italy, Sicily, Palermo
FMED004-12 - Anthemis [matK:806,rbcLa:580]Taxonomy: Magnoliophyta, Magnoliopsida, Asterales, Asteraceae, Anthemis Identifiers: A7.C[sampleid], PAL[museumid] Depository: Palermo Botanical Garden, HerbariumMediterraneum Collected in: Italy, Sicily, Palermo
FMED005-12 - Brassica insularis [rbcLa:594]Taxonomy: Magnoliophyta, Magnoliopsida, Brassicales, Brassicaceae, Brassica Identifiers: B2.23[sampleid], PAL[museumid] Depository: Palermo Botanical Garden, HerbariumMediterraneum Collected in: Italy, Sicily, Isola di Pantelleria
FMED006-12 - Brassica [matK:779,rbcLa:582]Taxonomy: Magnoliophyta, Magnoliopsida, Brassicales, Brassicaceae, Brassica Identifiers: B5.C[sampleid], PAL[museumid] Depository: Palermo Botanical Garden, HerbariumMediterraneum Collected in: Italy, Sicily, Palermo
FMED009-12 - Dianthus rupicola subsp aeolicus [matK:623,rbcLa:578,trnH-psbA:256]Taxonomy: Magnoliophyta, Magnoliopsida, Caryophyllales, Caryophyllaceae, Dianthus Identifiers: D1-2[sampleid], PAL96703[museumid] Depository: Palermo Botanical Garden, HerbariumMediterraneum Collected in: Italy, Sicily, Messina
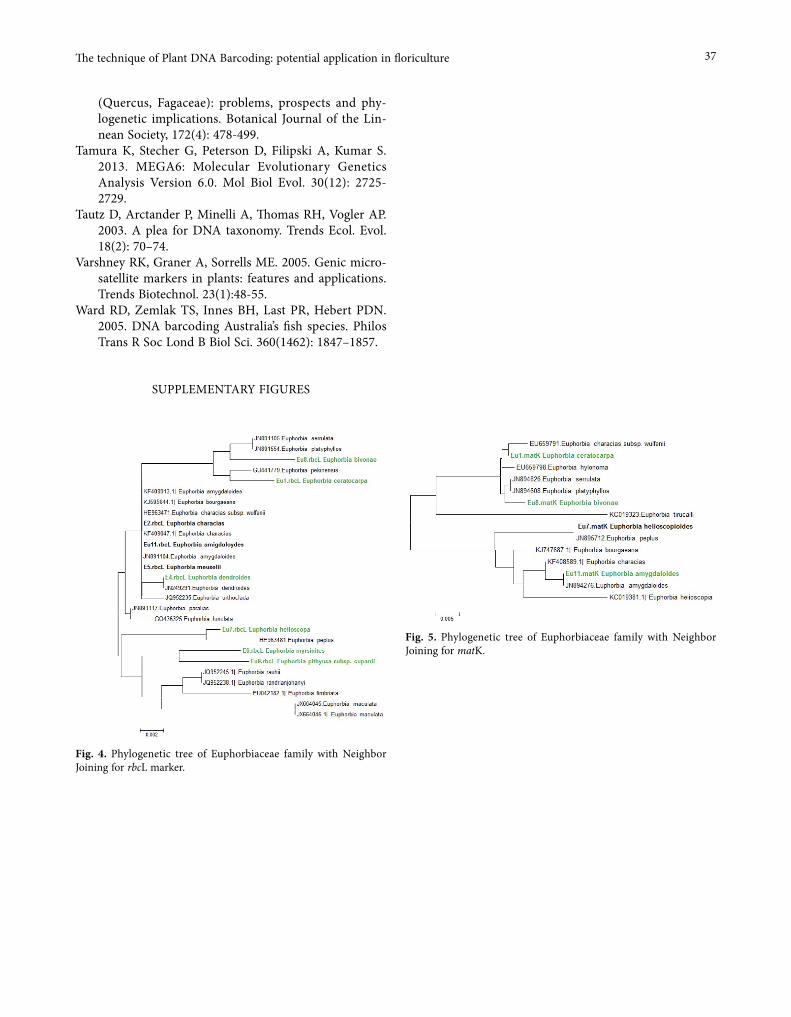
37The technique of Plant DNA Barcoding: potential application in floriculture
(Quercus, Fagaceae): problems, prospects and phy-logenetic implications. Botanical Journal of the Lin-nean Society, 172(4): 478-499.
Tamura K, Stecher G, Peterson D, Filipski A, Kumar S. 2013. MEGA6: Molecular Evolutionary Genetics Analysis Version 6.0. Mol Biol Evol. 30(12): 2725-2729.
Tautz D, Arctander P, Minelli A, Thomas RH, Vogler AP. 2003. A plea for DNA taxonomy. Trends Ecol. Evol. 18(2): 70–74.
Varshney RK, Graner A, Sorrells ME. 2005. Genic micro-satellite markers in plants: features and applications. Trends Biotechnol. 23(1):48-55.
Ward RD, Zemlak TS, Innes BH, Last PR, Hebert PDN. 2005. DNA barcoding Australia’s fish species. Philos Trans R Soc Lond B Biol Sci. 360(1462): 1847–1857.
SUPPLEMENTARY FIGURES
Fig. 5. Phylogenetic tree of Euphorbiaceae family with Neighbor Joining for matK.
Fig. 4. Phylogenetic tree of Euphorbiaceae family with Neighbor Joining for rbcL marker.


Caryologia. International Journal of Cytology, Cytosystematics and Cytogenetics 73(2): 39-49, 2020
Firenze University Press www.fupress.com/caryologiaCaryologia
International Journal of Cytology, Cytosystematics and Cytogenetics
ISSN 0008-7114 (print) | ISSN 2165-5391 (online) | DOI: 10.13128/caryologia-791
Citation: A. Iannucci, S. Cannicci, Z. Lin, K.W.Y. Yuen, C. Ciofi, R. Stan-yon, S. Fratini (2020) Cytogenetic of Brachyura (Decapoda): testing techni-cal aspects for obtaining metaphase chromosomes in six mangrove crab species. Caryologia 73(2): 39-49. doi: 10.13128/caryologia-791
Received: December 23, 2019
Accepted: April 6, 2020
Published: July 31, 2020
Copyright: © 2020 A. Iannucci, S. Cannicci, Z. Lin, K.W.Y. Yuen, C. Ciofi, R. Stanyon, S. Fratini. This is an open access, peer-reviewed article published by Firenze University Press (http://www.fupress.com/caryologia) and distributed under the terms of the Creative Commons Attribution License, which permits unrestricted use, distri-bution, and reproduction in any medi-um, provided the original author and source are credited.
Data Availability Statement: All rel-evant data are within the paper and its Supporting Information files.
Competing Interests: The Author(s) declare(s) no conflict of interest.
Cytogenetic of Brachyura (Decapoda): testing technical aspects for obtaining metaphase chromosomes in six mangrove crab species
Alessio Iannucci1, Stefano Cannicci1,2,*, Zhongyang Lin3, Karen WY Yuen3, Claudio Ciofi1, Roscoe Stanyon1, Sara Fratini1
1 Department of Biology, University of Florence, via Madonna del Piano 6, 50019 Sesto Fiorentino, Italy. E-mail: [email protected]; [email protected]; [email protected]; [email protected] The Swire Institute of Marine Science and Division of Ecology and Biodiversity,The University of Hong Kong, Pokfulam road, Hong Kong SAR. E-mail: [email protected] The School of Biological Sciences, The University of Hong Kong, Pokfulam Road, Hong Kong, Hong Kong S.A.R. E-mail: [email protected]; [email protected].*Corresponding author.
Abstract. Brachyura is one of the most specious infra-order belonging to Decapoda and it plays a central role from an ecological and economic point of view. Despite its importance, cytogenetic studies on Brachyura (Decapoda) are extremely limited due to the difficulties in obtaining chromosome preparations of good quality. Molecu-lar cytogenetic have proven to provide basic knowledge on the genome organization of species and in methods for manipulating genomes. It is also very useful to support aquaculture. In this study we focused on six semi-terrestrial mangrove crab species to test several variations of technical steps to produce chromosome preparations in Brachyura. The best results were obtained using cells from early stage embryos incu-bated with 0.0005% nocodazole or 0.05% colchicine and hypotonized with 0.075 M KCl solution. The best method to analyze the chromosomes was the use of confocal microscope after DAPI staining. We recorded a high chromosome number for the six study species. Similar chromosome morphology was recorded for allied species likely due to phylogenetic relationship. Variable results with cytogenetic treatments in dif-ferent species suggest that there may be a species-specific response to the techniques we tested. Chromosome number ranges reported in this study will be useful in future genome sequencing studies, i.e. to assess the quality of sequencing assemblies.
Keywords: aquaculture, chromosomes, confocal microscope, mangrove crabs, DAPI, metaphase.
INTRODUCTION
Decapoda represents the most species-rich crustacean order with more than 2,700 genera and 17,000 species inhabiting marine, intertidal, fresh-water and terrestrial ecosystems (De Grave et al., 2009). The infra-order Brachyura is particularly species-rich (about 6,800 species in 1270 genera)
40 Alessio Iannucci et al.
and includes all the extant true crabs (Ng et al., 2008; Ahyong et al., 2011; Tsang et al., 2014). The importance of this group is unquestionable both from an ecological and economic point of view. Many species of brachy-uran crabs are edible, being extensively fished and eat-en worldwide. According to recent data from the Food and Agriculture Organization (FAO 2019), the species of the genus Portunus, such as P. trituberculatus (Miers, 1876) and P. pelagicus (Linnaeus, 1975) represent the most fished crabs together with Callinectes sapidus Rath-bun, 1896, Cancer pagurus Linnaeus, 1758 and species belonging to the genus Scylla De Haan, 1833.
Information about species karyotypes is a funda-mental prerequisite for many advanced and applied studies. In genomics, for example, knowledge about spe-cies chromosome numbers is critical to assess the qual-ity of assemblies and have an idea of the genome organi-zation (e.g. Sharakhov et al., 2014). Moreover, comparing the sequence and structure of genes and their organi-zation into chromosomes is now the best approach to understand genome evolution and consequently organ-ism evolution (see Coghlan et al., 2005). Moreover, cytogenetic information is necessary in methods for modifying and manipulating genomes (see Abdelrah-man et al., 2017). Aquaculture can also greatly benefit from improved cytogenetic analysis. It is fundamental in mapping loci involved in disease resistance and to improve commercial stocks by selecting cloned lines of aquacultured species (see Gui and Zhu 2012). It is neces-sary for controlling sex and inter-specific hybridization (see Colombo et al., 1998; Bartley et al., 2001; Shpak et al., 2017).
Despite their ecological and economic importance, little is known about the karyology of brachyuran crabs. Cytogenetics studies of brachyurans are relatively few, probably because they are technically more difficult than in other decapods as well as in mollusks and fishes (e.g. Sola et al., 1981; Galetti et al., 2000; Coluccia et al., 2004; Thiriot-Quievreux 2002, 2003; Scalici et al., 2010; Salva-dori et al., 2012, 2014; Torrecilla et al., 2017; Guo et al., 2018). Brachyurans have a high number of chromosomes that are usually very small (e.g. Niiyama 1959; Lécher et al., 1995; Lee et al., 2004; Tan et al., 2004). In addi-tion, despite cell culture might provide better and more abundant materials for karyological analyses, the few attempts to establish cell cultures in this taxon have not meet with great success and, thus, chromosome prepa-rations are usually obtained directly from living tissues (e.g. in Toullec 1999; Sashikumar et al., 2008; Zeng et al., 2010; Hong et al., 2013).
For these reasons, the preparation of good quality karyotyping and chromosome banding in Brachyura has
been never obtained, the only works being restricted to descriptions of chromosome numbers (see Lécher 1995). Moreover, most of karyological studies on brachyurans are decades old (Niiyama 1942, 1959, 1966; Mittal and Dhall 1971; Vishnoi 1972; Trentini et al., 1989, 1992; Lécher 1995 and references therein), while recent works are scarce and mostly related to species of economic importance (Lee et al., 2004; Zhu et al., 2005; Swagatika and Kumar 2014; Cui et al., 2015). These recent papers reported that the mitten crabs Eriocheir japonica (De Haan, 1835) and E. sinensis (H. Milne-Edwards, 1853) have a diploid chromosome number of 2n = 146 (Lee et al., 2004; Cui et al., 2015), and the karyotype of Portu-nus pelagicus includes 51 pairs of chromosomes (Jazay-eri et al., 2010), whereas the congeneric P. trituberculatus has 53 pairs (Zhu et al., 2005). Recently, Swagatika and Kumar (2014) recorded that the mud crab Scylla serrata (Forsskål, 1775) and the blue crab P. pelagicus have 2n = 106 and 2n = 98 chromosomes, respectively.
The present study aims to contribute a step forward in the crab cytogenetic methods by comparing differ-ent variables necessary to obtain chromosome prepara-tions from live tissues. We selected six crab species, from four different brachyuran families, commonly found in the mangrove forest of the South China Sea, for which we systematically tested different technical variations in order to obtain metaphase chromosomes. The key ele-ments for obtaining a high number of mitotic cells were scrutinized.
MATERIALS AND METHODS
Study species
About 5 adult males and 5 females, including 2 ovi-gerous, from six species of Hong Kong semi-terrestrial and mangrove crabs were collected at low tides, in Octo-ber 2017. In particular, we collected Parasesarma bidens (De Haan, 1835) and Metopograpsus frontalis (Miers, 1880) at Tung Chung mangroves (Lantau Island); Chi-romantes haematocheir (De Haan, 1833) and Gelasimus borealis (Crane, 1975) at Uk Tau (New Territories), and Austruca lactea (De Haan, 1835), G. borealis and Meta-plax tredecim Tweedie, 1950 at Starfish Bay (New Terri-tories). These species, belonging to four different brach-yuran families, are common inhabitants of lowland forests, mangrove forests and adjacent mudflats. They are all active during low tide, despite occupying differ-ent supratidal and intertidal habitats. All are also sold in pet trade for aquariophily (e.g. Mong Kok market, Hong Kong). Taxonomical and ecological information con-cerning the studied species are summarized in Table 1.
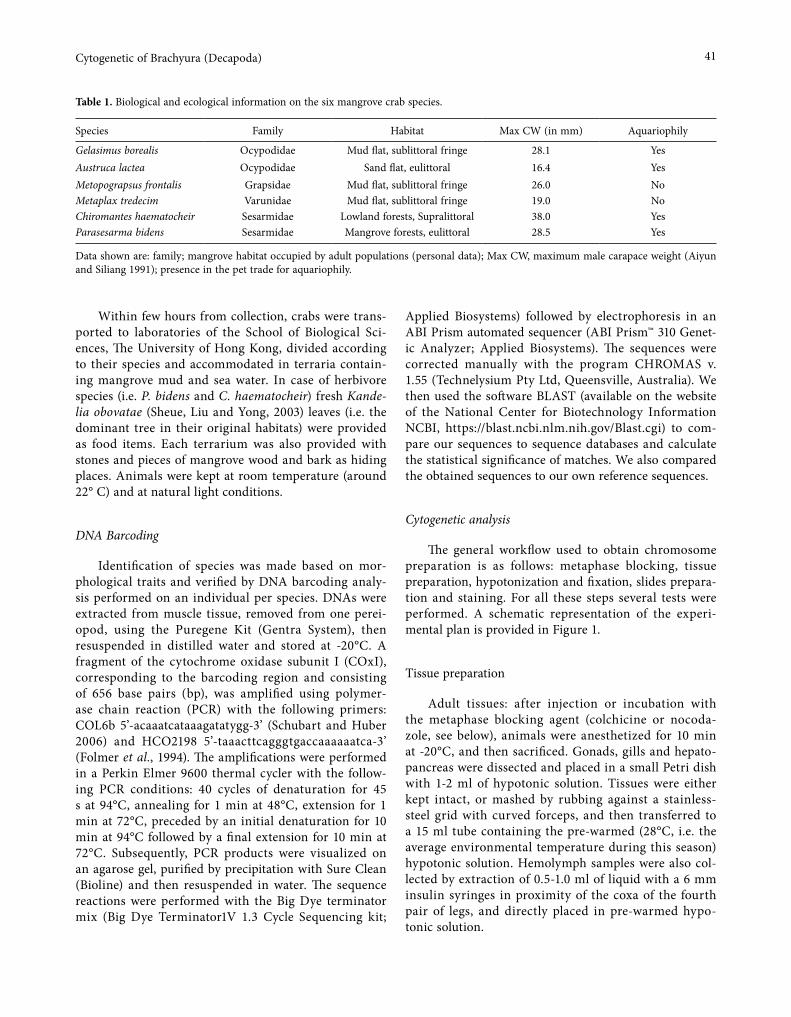
41Cytogenetic of Brachyura (Decapoda)
Within few hours from collection, crabs were trans-ported to laboratories of the School of Biological Sci-ences, The University of Hong Kong, divided according to their species and accommodated in terraria contain-ing mangrove mud and sea water. In case of herbivore species (i.e. P. bidens and C. haematocheir) fresh Kande-lia obovatae (Sheue, Liu and Yong, 2003) leaves (i.e. the dominant tree in their original habitats) were provided as food items. Each terrarium was also provided with stones and pieces of mangrove wood and bark as hiding places. Animals were kept at room temperature (around 22° C) and at natural light conditions.
DNA Barcoding
Identification of species was made based on mor-phological traits and verified by DNA barcoding analy-sis performed on an individual per species. DNAs were extracted from muscle tissue, removed from one perei-opod, using the Puregene Kit (Gentra System), then resuspended in distilled water and stored at -20°C. A fragment of the cytochrome oxidase subunit I (COxI), corresponding to the barcoding region and consisting of 656 base pairs (bp), was amplified using polymer-ase chain reaction (PCR) with the following primers: COL6b 5’-acaaatcataaagatatygg-3’ (Schubart and Huber 2006) and HCO2198 5’-taaacttcagggtgaccaaaaaatca-3’ (Folmer et al., 1994). The amplifications were performed in a Perkin Elmer 9600 thermal cycler with the follow-ing PCR conditions: 40 cycles of denaturation for 45 s at 94°C, annealing for 1 min at 48°C, extension for 1 min at 72°C, preceded by an initial denaturation for 10 min at 94°C followed by a final extension for 10 min at 72°C. Subsequently, PCR products were visualized on an agarose gel, purified by precipitation with Sure Clean (Bioline) and then resuspended in water. The sequence reactions were performed with the Big Dye terminator mix (Big Dye Terminator1V 1.3 Cycle Sequencing kit;
Applied Biosystems) followed by electrophoresis in an ABI Prism automated sequencer (ABI Prism™ 310 Genet-ic Analyzer; Applied Biosystems). The sequences were corrected manually with the program CHROMAS v. 1.55 (Technelysium Pty Ltd, Queensville, Australia). We then used the software BLAST (available on the website of the National Center for Biotechnology Information NCBI, https://blast.ncbi.nlm.nih.gov/Blast.cgi) to com-pare our sequences to sequence databases and calculate the statistical significance of matches. We also compared the obtained sequences to our own reference sequences.
Cytogenetic analysis
The general workflow used to obtain chromosome preparation is as follows: metaphase blocking, tissue preparation, hypotonization and fixation, slides prepara-tion and staining. For all these steps several tests were performed. A schematic representation of the experi-mental plan is provided in Figure 1.
Tissue preparation
Adult tissues: after injection or incubation with the metaphase blocking agent (colchicine or nocoda-zole, see below), animals were anesthetized for 10 min at -20°C, and then sacrificed. Gonads, gills and hepato-pancreas were dissected and placed in a small Petri dish with 1-2 ml of hypotonic solution. Tissues were either kept intact, or mashed by rubbing against a stainless-steel grid with curved forceps, and then transferred to a 15 ml tube containing the pre-warmed (28°C, i.e. the average environmental temperature during this season) hypotonic solution. Hemolymph samples were also col-lected by extraction of 0.5-1.0 ml of liquid with a 6 mm insulin syringes in proximity of the coxa of the fourth pair of legs, and directly placed in pre-warmed hypo-tonic solution.
Table 1. Biological and ecological information on the six mangrove crab species.
Species Family Habitat Max CW (in mm) Aquariophily
Gelasimus borealis Ocypodidae Mud flat, sublittoral fringe 28.1 YesAustruca lactea Ocypodidae Sand flat, eulittoral 16.4 YesMetopograpsus frontalis Grapsidae Mud flat, sublittoral fringe 26.0 NoMetaplax tredecim Varunidae Mud flat, sublittoral fringe 19.0 NoChiromantes haematocheir Sesarmidae Lowland forests, Supralittoral 38.0 YesParasesarma bidens Sesarmidae Mangrove forests, eulittoral 28.5 Yes
Data shown are: family; mangrove habitat occupied by adult populations (personal data); Max CW, maximum male carapace weight (Aiyun and Siliang 1991); presence in the pet trade for aquariophily.

42 Alessio Iannucci et al.
Fertilized eggs: clusters of fertilized eggs were removed from ovigerous females by cutting the proximal part of pleopods. For G. borealis, eggs at two different embryonic stages were used, stage I and V (Simoni et al., 2011). For all other species, we utilized embryos at stage V of devel-opment. Eggs were incubated in metaphase blocking agent (see below), hypotonized, and then either fixed directly on slides or minced. Mincing of eggs was performed with nee-dles in a small Petri dish in 1-2 ml of fixative.
Metaphase blocking
Two different metaphase blocking agents were tested to arrest the mitotic spindle and visualize chromosomes: nocodazole (15 mg/ml in dimethyl sulfoxide, DMSO) and colchicine (powder). Metaphase blocking agents were diluted/dissolved in sterile sea water to obtain dif-ferent final concentrations and applied to tissues and eggs via injection and incubation respectively.
Injection: animals were injected in proximity of the coxa of the fourth pair of legs. Both agents were tested for the amount of 0.2 and 2 µg/g crab weight. Animals were kept in terraria at room temperature for 8, 16 or 24 hours and then dissected as described above.
Incubation: eggs were transferred to 15 ml tubes and incubated in 10 ml of 0.0005, 0.005 or 0.05% of colchi-cine or nocodazole solution for 2, 4, 8, 16 or 24 hours at 28°C, and then transferred to pre-warmed hypotonic solutions. To guarantee eggs an appropriate level of oxy-genation, tubes were kept without lids and gently stirred during incubation process.
Hypotonization
Tissues (intact or mashed) and eggs were incubat-ed in hypotonic solution to achieve a good cell swelling and metaphase spreading. To facilitate the access of the hypotonic solution to the embryos, part of the eggs was punctured before incubation. Two different solutions were tested, 0.1% sodium citrate and 0.075 M potassium chloride, with incubation times of 15, 30 or 45 min. After centrifuge at 150 rcf for 10 min, hypotonic solution was removed from mashed tissues, while it was removed from intact tissues and eggs by gently pipetting out the liquid.
Fixation
After hypotonic removal, tissues and eggs were fixed by applying 3–5 ml of cold, freshly prepared fixative (3 parts methanol or absolute methanol: 1 part glacial ace-
tic acid). Eggs were then minced as described above and transferred to a 15 ml tube. Tubes containing cell sus-pensions from eggs and mashed tissues were centrifuged at 200 rcf for 10 min. The supernatant was removed, and fresh fixative was added. This step was repeated three times. Intact tissues were left in 15 ml tubes containing fixative solution for 20 min, then fixative was changed, and tissues stored at -20°C, until slides preparation.
Part of hypotonized eggs were also transferred directly to a clean slide and macerated using a thin nee-dle. After the maceration, we applied a fixation solution of 3:3:4 ethanol:acetic acid:distilled water three times, followed by a fixation solution of 1:1 acetic acid:ethanol and finally a few drops of glacial acetic acid. Between each application of the fixation solutions, the excess was removed with the aid of a filter paper. The slides were left to dry at room temperature.
Slides preparation
Intact tissues were macerated with the help of two needles directly on slides. Few drops of glacial acetic
Figure 1. Schematic representation of the experimental plan. Crabs representations modified from www.fiddlercrab.info.
43Cytogenetic of Brachyura (Decapoda)
acid were used to help maceration. Slides were then air dried. Cell suspensions obtained from eggs and mashed tissues were gently shacked and left decanted to sepa-rate cells from egg chorion and largest pieces of tissues. The upper part of decanted preparation was transferred to a 2 ml tube and centrifuged at 1,200 rcf for 10 min. Fixative was removed and resuspended cell pellet was used to drop slides. Few drops of acetic acid were added to part of the cell suspensions to improve chromosome spreading. For cell suspensions, three different protocols for slides preparation were tested:
Air dried: cell suspension was dropped with a sili-conized Pasteur pipette from a height of about 10 cm onto a pre-cleaned microscope slide and dried at room temperature before staining.
Hot dried: the above procedure was applied, but slide was pre-heated and dried at 50°C.
Humid dried: the cell suspension was dropped from a height of about 10 cm onto a pre-cleaned microscope slide chilled to -20°C. After a short drying period at room temperature in which the fixative was partially evaporated, the slides were held two to three times brief-ly into water steam. The slides were then dried on a met-al block which was half submerged in a 75°C water bath.
After drying, the slides were stained with Giemsa 10% solution for 20 min or 4’,6-diamidino-2-phenylin-dole (DAPI) and mounted.
Image capture and chromosomes counting
Metaphases were observed under optical, fluores-cence and confocal microscopes. Leitz Dialux 20 opti-cal microscope was mounted with Moticam Pro 205B. Zeiss Axio Imager.D2 f luorescence microscope was mounted with Zeiss Axiocam 503 mono. Zeiss LSM 710 NLO confocal microscope was mounted with Airyscan Module for super resolution. Images were edited with Adobe® Photoshop® CS5 extended (Adobe Systems Inc., San Jose, California, USA). The mode of diploid chro-mosome numbers was calculated, using Excel, after counting 42, 18, 13, 21, 19 metaphases of G. borealis, A. lactea, M. frontalis, M. tredecim and C. haematocheir respectively.
RESULTS
Barcoding analysis
The PCR successfully amplified the mtDNA COxI gene in the six species, resulting in sequences about 600 bp long, excluding the primer. All the sequences have
an A-T rich nucleotide composition as expected for the mitochondrial DNA of arthropods (Simon et al., 1994). The DNA barcoding confirmed the morphological iden-tification of the six species. The sequences have been deposited in GenBank ((access numbers: MT265074-79).
Tissue preparation
Injection of the metaphase blocking agents did not cause any visible damage to the animals, and individu-als of all species survived the treatments. No metaphases were observed in cytogenetic preparations obtained from mashed and intact tissues, regardless of the concentra-tions and exposure times to metaphase blocking agents. Slides obtained from intact tissues presented well pre-served nuclei at different cell cycle stages. Preparations obtained from cell suspensions of mashed tissue showed well separated cells, indicating that manipulation and maceration procedures were correctly performed.
Metaphases were observed in the cell suspensions obtained from eggs of all the six species (Fig. 2). The highest number of metaphases was observed in prepa-rations obtained from embryonic stage I eggs (Fig. 2A). Both nocodazole and colchicine were effective in metaphase arrest of embryonic cells. Optimal results were obtained with colchicine and nocodazole at 0.05% and 0.0005%, respectively. No visible differences were observed between colchicine and nocodazole treatments (i.e. chromosome condensation or metaphase spreading). Preparations obtained with higher concentrations of nocodazole did not show any metaphases. On the other hand, few metaphases were also detected in preparations obtained with lower concentrations of colchicine.
Same hypotonization treatments gave different level of spreading in the six species, as described below. No relevant differences were registered between the two hypotonic solutions, and the three incubation times. However, results obtained with 0.075 M potassium chlo-ride solution, with an incubation time of 30 min pro-duced better spreading metaphases in M. tredecim as described below (Figs. 2J, K, L). No differences were reg-istered between punctured and unpunctured eggs. An increase of incubation time with hypotonic solution up to 3 hours did not affect or improve metaphase quality.
Chromosome preparation obtained from mashed eggs suspensions showed well separated cells and very few residues of chorion, indicating that the manipulation and fixation procedures were adequate, and the decan-tation step was useful. No metaphases were observed in preparations obtained from eggs directly fixated on slides. Moreover, cells were sparse and clustered, pre-venting an accurate observation of the preparation.
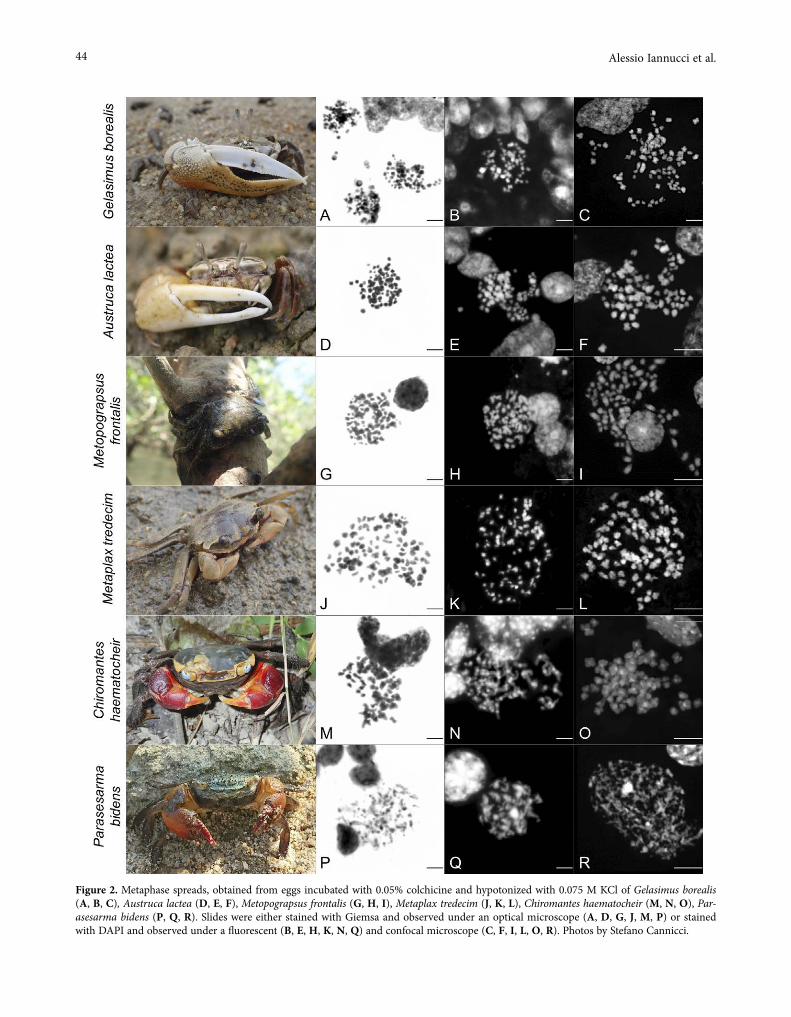
44 Alessio Iannucci et al.
Figure 2. Metaphase spreads, obtained from eggs incubated with 0.05% colchicine and hypotonized with 0.075 M KCl of Gelasimus borealis (A, B, C), Austruca lactea (D, E, F), Metopograpsus frontalis (G, H, I), Metaplax tredecim (J, K, L), Chiromantes haematocheir (M, N, O), Par-asesarma bidens (P, Q, R). Slides were either stained with Giemsa and observed under an optical microscope (A, D, G, J, M, P) or stained with DAPI and observed under a fluorescent (B, E, H, K, N, Q) and confocal microscope (C, F, I, L, O, R). Photos by Stefano Cannicci.
45Cytogenetic of Brachyura (Decapoda)
Slides dropping methods were all successful, and no differences were registered among the three methods. The addition of a few drops of acetic acid to cell suspen-sions visibly increased the spreading of chromosomes. Metaphases were better detected when DAPI staining was applied as, contrastingly to Giemsa, it did not stain organic and inorganic residual material, making it easier to detect metaphases. Confocal microscopy gave better resolution of chromosome morphology and heterochro-matic regions were visible.
Chromosome number and morphology
We obtained metaphase chromosomes for all the studied species but P. bidens, for which only broken metaphases were observed with all treatments (Figs. 2P-R). We analyzed an average of 50 metaphases for each species.
In G. borealis the number of chromosomes per cell ranged between 30 and 60 with a mode at 48. Chromo-somes morphology was hardly distinguishable due to their small size. Metaphase spreading was limited (Figs. 2A-C), however a high number of metaphases per slides was observed when preparations were made with eggs at embryonic stage I (Fig. 2A).
Chromosome morphology and metaphase spreads in A. lactea were very similar to preparations obtained from the eggs of the allied species G. borealis (Figs. 2D-F). In this ocypodid the number of chromosomes per cell ranged between 56 and 74 with a mode at 60.
We obtained a very low number of metaphases for M. frontalis, and the hypotonic treatment was less suc-cessful in this species than in the other ones (Figs. 2G-I). The number of chromosomes per cell ranged between 38 and 62 with a mode at 55.
The hypotonization treatment gave the best results for the varunid M. tredecim, despite its chromosomes appeared very small (Fig. 2J-L). The number of chromo-somes per cell ranged between 78 and 108 with a mode at 80.
For the two sesarmid species concerned, we obtained reliable results for C. haematocheir only. Chro-mosomes of C. haematocheir were larger than those of the other species, and their morphology could be bet-ter observed (Figs. 2M-O). Confocal images showed that most chromosomes were biarmed, and DAPI staining revealed AT-rich pericentromeric regions (Fig. 2N, O). The number of chromosomes per cell ranged between 58 and 74 with a mode at 66.
DISCUSSION
This study, reporting the results of several cytoge-netic technical trials on six semi-terrestrial and man-grove crab species selected as representatives of the infraorder Brachyura, provides insights on the technical aspects necessary to obtain chromosome preparations in brachyuran crabs.
The best results were obtained with pre-hatching embryos incubated with colchicine or nocodazole at 0.05% and 0.0005%, respectively, hypotonized in 0.075 M KCl solution for 30 min and fixed in freshly prepared fixative. The best method to analyze the chromosomes resulted to be the use of confocal microscope after DAPI staining.
Embryos and post-hatched larvae of decapods con-tain rapidly growing tissues with a high mitotic activ-ity (Anger 2001). Thus, these life stages represent an optimal material to obtain metaphases for karyologi-cal studies. Optimal results for chromosome prepara-tions using fertilized eggs have already been obtained by Campos-Ramos (1997) for another suborder of the Decapoda, the Dendrobranchiata. In agreement with the present study, this author tested colchicine con-centrations from 0.006% to 0.1% in Penaeus vannamei (Boone, 1931) and P. californiensis (Holmes, 1900) eggs and obtained optimal results using 0.05% colchicine, with no differences in chromosomes condensation at variable colchicine concentrations. Recently Martin et al., (2016) also obtained optimal chromosome prepara-tions from Procambarus virginalis (Lyko, 2017) (Decap-oda: Pleocyemata: Astacidea) eggs using 0.05% colchi-cine. Larvae at early zoeal stages were used by Cui et al. (2015) who obtained good chromosome prepara-tions for the Chinese mitten crab Eriocheir sinensis. In the present study, clear differences were obtained using embryos of G. borealis at different stages, with early stage embryos presenting the highest number of meta-phases with respect to the late stage ones. This suggests that the highly dividing tissues of embryos at initial stage are even more suitable for chromosome prepara-tion, despite the abundance of yolk, which reduces the cleanliness of the preparations. Absence of metaphases in preparations obtained with higher concentrations of nocodazole is likely due to the toxicity of DMSO pre-sent in nocodazole solution, which caused an arrest of cell cycle in embryos (Moralli et al., 2011).
The hypotonic treatment was the most critical phase as several metaphases did not spread sufficiently and overlapping of the chromosomes made it difficult to make reliable chromosome counts. The best results were obtained with 0.075 M potassium chloride as hypotonic
46 Alessio Iannucci et al.
solution, which is the most commonly used in decapods (e.g. in Salvadori et al., 2012; Cui et al., 2015; Martin et al., 2016; Torrecilla et al., 2017).
However, it was also evident that the same hypo-tonization treatments yielded different level of chromo-some spreading in each of the six analyzed species. Such differences may be due to differences in the character-istics of the chorion, or in the osmotic concentration and physiological characteristics of the embryos of dif-ferent species. Our target species, in fact, occupy differ-ent habitats in Hong Kong, from the lowland forests, in the case of C. hematocheir, to the true mangrove forests, such as P. bidens and M. frontalis, to the lower intertidal sand and mud flats, such as A. lactea, G. borealis and M. tredecim. Indeed, the permeability and osmotic char-acteristics of their chorions, as well as the osmotic and physiological traits of their embryos are adapted to dif-ferent conditions in terms of salinity, temperature, sub-mersion and water availability. It is known that eggs of semi-terrestrial and intertidal families are permeable to air-borne gasses and can intake oxygen from air, while the embryos of marine species can only rely on water (Cannicci et al., 2011; Simoni et al., 2011). Moreover, the osmolarity of tissues of brachyuran crabs is strictly related to their microhabitat, since they are osmocon-formers (Charmantier 1998). It is plausible that the dif-ferences we obtained for the six species using the same treatments may be related to differences in permeability to solutes of their chorion and in osmoregulation mech-anisms of their embryos, which may have influenced the response of cells to hypotonization. The best spreading results were obtained for M. tredecim which is the only species colonizing the lower intertidal belt.
We failed to obtain metaphases from adult tissues. In decapods, there are a few cytogenetic studies using gills and hepatopancreas as tissue of choice for chro-mosome preparation (e.g. Indy et al., 2010; Salvadori et al., 2012, 2014; González-Tizón et al., 2013). A few other studies concluded that testes were a suitable tissue for chromosome preparations (e.g. Lee et al., 2004; Tan et al., 2004; Awodiran et al., 2016; Milnarec et al., 2016). However, the inactivity of testes in species with sea-sonality of reproductive activity (commonly described in male crustaceans, especially in representatives from colder regions: Adiyodi 1988) may lead to a scarcity of dividing cells in this organ, and thus to the lack of meta-phases. This could be the case in our samples, whose sperm ducts appeared reduced in size as expected during the “resting” reproductive phase. This result is plausible since our sampling was performed at the very end of the reproductive period for Hong Kong crab species, when only very few females were still ovigerous.
We recorded a high chromosome number for our species, as known for other brachyuran crabs and Decapoda in general (Niiyama 1959; Lécher et al., 1995; Lee et al., 2004; Cui et al., 2015). The highest chro-mosome numbers were recorded for the varunid M. tredecim, with a mode value of 80. This is indeed lower than what reported for other two varunid species, the mitten crabs Eriocheir japonica and E. sinensis whose diploid chromosome number is 2n = 146.
While we recorded different chromosome numbers for G. borealis and A. lactea (numbers ranging between 30-60 and 56-74, respectively), their chromosomes are more similar to each other than to the rest of the study species. This similarity is likely due to their close phy-logenetic relationship: the two species being part of the same ocypodid subfamily Gelasiminae (Shih et al., 2016).
The wide range of chromosome number registered in our study species can be attributed to a poor meta-phase spreading. This was mainly due to an ineffective hypotonic treatment, a step that proved to be one of the most crucial ones, as previously stated. A further evi-dence of this comes from the fact that the numerical counts of chromosomes registered for metaphases ana-lyzed under the confocal microscope are greater than the mode (all these values fall into the right tail of the frequency distributions). Indeed, the higher resolution of confocal microscope allowed a better visualization of the smallest chromosomes when the metaphase was poorly spread, resulting in a higher chromosome number (e.g. Fig 2E, F). The issue of poor spreading of metaphases is known to affect the counts of chromosomes in crusta-ceans, and some authors suggested to use the scanning electron microscope (SEM) to gain more resolution for a better analysis of chromosomes (Lee et al., 2004, 2008). However, this technology is very laborious and thus not very effective.
The wide variability in distribution of chromosome numbers as well as the small size of chromosomes pre-vented us from proposing a reference karyotype for the species. Such problems were also registered for the other species described so far, for which authors did not pro-vide a karyotype. To our knowledge, the only karyo-types available for Brachyura are those of Scylla serrata and Portunus pelagicus (Swagatika et al., 2014). Analy-ses under a confocal microscope gave the best resolu-tion, allowing discernment of chromosome morphology and revealing the presence of AT-rich pericentromeric regions in C. haematocheir. This is the first observation of this kind for crab chromosomes, albeit being a com-mon feature of eutherian species (Sumner 2008).
Nonetheless the lack of a reference karyotype for any of the study species, our results on species’ chro-

47Cytogenetic of Brachyura (Decapoda)
mosome numbers will be extremely valuable in future genomic studies, i.e. for assessing genome assem-bly quality. It is known, in fact, that the comparison between the number of final scaffolds in assemblies and the chromosome number range of a given species may provide a clear indication of the level of fragmentation of the assembly. In particular, when the number of final scaffolds is much higher than the chromosome number mode, the assembly needs more refinement; while if the number of final scaffolds is much lower than the mode, the assembly presumably includes chimeric scaffolds and thus needs to be revised (Ma et al., 2012; Burton et al., 2013; Sharakhov et al., 2014).
CONCLUSIONS
Brachyura are undoubtedly an ecologically and eco-nomically important taxon, however, so far, very few studies have targeted their karyology, with information generally limited to the description of chromosomes numbers. Many authors report difficulties in obtain-ing cytogenetic information in this taxon due to high number and small size of chromosomes (Lécher et al., 1995; Lee et al., 2004; Tan et al., 2004). Our results cor-roborate the presence of such methodological issues and stress the fact that several improvements are still need-ed to reach the quality standard needed for molecular cytogenetic researches. This study also underlines that ecological and physiological adaptations of a species can affect its responses to the sequential steps of karyotyp-ing analysis. This outcome makes the design of a stand-ard protocol for cytogenetic analyses in brachyurans even more difficult. However, our comparative approach highlighted the critical steps that must be improved to obtain high quality material in true crabs. We believe therefore that this study provides a step forward in the cytogenetic of brachyurans and represents an important basis for further cytogenetic methods in this taxon.
ACKNOWLEDGEMENTS
We thank Lok Yi Cheng, Pedro Juliao-Jimenez, Marti-na Scigliano and Sandra Colombo for helping us to collect animals. We also thank Aline Ferreira de Quadros and Elisabetta Rovida for the useful suggestions in the prepara-tion of chromosomes and image acquisition. Marta Svart-man provided precious comments to the last version of the manuscript: we are greatly thankful to her support.
The authors declare that all the experiments were performed in the respect of ethical rules. They also
declare that there is no conflict of interest in publishing the present paper. This study was funded to SC by the HKU Seed Fund for Basic Research no. 201605159004 and the Faculty of Sciences RAE Improvement Fund no. 000250449.088562.26000.100.01.
REFERENCES
Abdelrahman H, ElHady M, Alcivar-Warren A, Allen S, Al-Tobasei R, Bao L, Beck B, Blackburn H, Bos-worth B, Buchanan J, Chappell J. 2017. Aquaculture genomics, genetics and breeding in the United States: current status, challenges, and priorities for future research. BMC Genomics. 18:191.
Adiyodi RG. 2008. Reproduction and Development. In: Burggren WW, McMahon BR, editors. Biology of Land Crabs. Cambridge, New York: Cambridge Uni-versity Press; pp. 139-185.
Ahyong ST, Lowry JK, Alonso M, Bamber RN, Boxshall GA, Castro P, Gerken S, Karaman GS, Goy JW, Jones DS, Meland K. 2011. Subphylum Crustacea Brün-nich, 1772. In: Zhang, Z-Q, editor. Animal biodi-versity: An outline of higher-level classification and survey of taxonomic richness. Zootaxa. 3148:165-91.
Aiyun D, Siliang Y. 1991. Crabs of the China seas. Bei-jing: China Ocean Press and Berlin: Springer-Verlag.
Anger K. 2001. The Biology of Decapod Crustacean Lar-vae. In: Anger K, Balkema AA, editors. Crustacean Issues 14. Lisse: AA Balkema Publishers; pp. 1-420.
Awodiran MO, Fajana HO, Yusuf AO. 2016. Chromo-somal and ecological studies of freshwater crabs, Sudanonautes aubryi (H. Milne-Edward, 1853) (Brachyura: Potamonautidae) from Ile-Ife, Nigeria. Zool Ecol. 26:295-300.
Bartley DM, Rana K, Immink AJ. 2001. The use of inter-specific hybrids in aquaculture and fisheries. Rev Fish Biol Fish. 10:325-337.
Burton JN, Adey A, Patwardhan RP, Qiu R, Kitzman JO, Shendure J. 2013. Chromosome-scale scaffolding of de novo genome assemblies based on chromatin interactions. Nat Biotechnol 31:1119.
Campos-Ramos R. 1997. Chromosome studies on the marine shrimps Penaeus Uannamei and P. Californ-iensis (Decapoda). J Crust Biol. 17:666-673.
Cannicci S, Simoni R, Giomi F. 2011. Role of the embryo in crab terrestrialisation: an ontogenetic approach. Mar Ecol Prog Ser. 430:121-131.
Charmantier G. 1998. Ontogeny of osmoregulation in crustaceans: a review. Invert Reprod Dev. 33:177-190.
Coghlan A, Eichler EE, Oliver SG, Paterson AH, Stein L. 2005. Chromosome evolution in eukaryotes: a multi-kingdom perspective. Trends Genet. 21:673-82.

48 Alessio Iannucci et al.
Colombo L, Barbaro A, Francescon A, Libertini A, Bor-tolussi M, Argenton F, Dalla Valle L, Vianello S, Belvedere P. 1998. Towards an integration between chromosome set manipulation, intergeneric hybridi-zation and gene transfer in marine fish culture. In: Bartley D, Basurco B, editors. Genetics and Breed-ing of Mediterranean Aquaculture Species. Zaragoza: Ciheam; pp. 77-122 (Cahiers Options Méditerranée-nnes; n. 34).
Coluccia E, Cannas R, Cau A, Deiana AM, Salvadori S. 2004. B chromosomes in Crustacea Decapoda. Cytogenet Genome Res. 106:215-221.
Cui Z, Hui M, Liu Y, Song C, Li X, Li Y, Liu L, Shi G, Wang S, Li F, et al. 2015. High-density linkage map-ping aided by transcriptomics documents ZW sex determination system in the Chinese mitten crab Eri-ocheir sinensis. Heredity. 115:206-215.
De Grave S, Pentcheff ND, Ahyong ST, Chan T, Cran-dall KA, Dworschak PC, Felder DL, Feldmann RM, Fransen CHJM, Goulding LYD, et al. 2009. A classifi-cation of living and fossil genera of decapods crusta-ceans. Raff Bull Zool. 21:1-109.
FAO. 2019. FAO yearbook. Fishery and Aquaculture Sta-tistics 2017. Rome.
Folmer O, Black M, Hoeh W, Lutz R, Vrijenhoek R. 1994. DNA primers for amplification of mitochondrial cytochrome c oxidase subunit I from diverse metazo-an invertebrates. Mol Mar Biol Biotechnol. 3:294-299.
Galetti PM, Aguilar CT, Molina WF. 2000. An over-view of marine fish cytogenetics. In: Solè-Cava AM, Russo CAM, Thorpe JP, editors. Marine Genetics. Dordrecht: Springer; pp. 55-62.
González-Tizón AM, Rojo V, Menini E, Torrecilla Z, Martínez-Lage A. 2013. Karyological analysis of the shrimp Palaemon serratus (Decapoda: Palaemoni-dae). J Crust Biol. 33:843-848.
Gui J, Zhu Z. 2012. Molecular basis and genetic improve-ment of economically important traits in aquaculture animals. Chin Sci Bull. 57:1751-1760.
Guo L, Accorsi A, He S, Guerrero-Hernández C, Sivag-nanam S, McKinney S, Gibson M, Sánchez Alvara-do A. 2018. An adaptable chromosome preparation methodology for use in invertebrate research organ-isms. BMC Biology. 16:25.
Hong Y, Yang X, Cheng Y, Liang P, Zhang J, Li M, Shen C, Yang Z, Wang C. 2013. Effects of pH, tempera-ture, and osmolarity on the morphology and survival rate of primary hemocyte cultures from the mitten crab, Eriocheir sinensis. In Vitro Cell Dev Biol Anim. 49:716-727.
Indy JR, Arias-Rodriguez L, Páramo-Delgadillo S, Hernández-Vidal U, Álvarez-González CA, Con-
treras-Sánchez WM. 2010. Mitotic karyotype of the tropical freshwater crayfish Procambarus (Austro-cambarus) llamasi (Decapoda: Cambaridae). Rev Biol Trop. 58:655-662.
Jazayeri A, Papahn F, Moslehabadi Z. 2010. The study of karyological of Blue crab (Portunus plagicus). J Mar Biol. 2:37-44.
Lécher P, Defaye D, Noel P. 1995. Chromosomes and nuclear DNA of Crustacea. Invertebr Reprod Dev. 27:85-114.
Lee TH, Naitoh N, Yamazaki F. 2004. Chromosome stud-ies on the mitten crabs Eriocheir japonica and E. sin-ensis. Fish Sci. 70:211-214.
Lee TH, Shirayama S. 2008. A preliminary study on the problems in the preparation of Artemia parthenoge-netica chromosomes for scanning electron micros-copy. J Crust Biol, 28:167-170.
Ma C, Chen H, Xin M, Yang R, Wang X. 2012. KGBas-sembler: a karyotype-based genome assembler for Brassicaceae species. Bioinformatics. 28:3141-3143.
Martin P, Thonagel S, Scholtz G. 2016. The parthenoge-netic Marmorkrebs (Malacostraca: Decapoda: Cam-baridae) is a triploid organism. J Zool Syst Evol Res. 54:13-21.
Mittal OP, Dhall U. 1971. Chromosome studies in three species of freshwater decapods (Crustacea). Cytolo-gia. 36:633-638.
Mlinarec J, Porupski I, Maguire I, Klobučar G. 2016. Comparative karyotype investigations in the white-clawed crayfish Austropotamobius pallipes species complex and stone crayfish A. torrentium (Decapoda: Astacidae). J Crust Biol. 36:87-93.
Moralli D, Yusuf M, Mandegar MA, Khoja S, Monaco ZL, Volpi EV. 2011. An improved technique for chromo-somal analysis of human ES and iPS cells. Stem Cell Rev Rep. 7:471-477.
Ng PKL, Guinot D, Davie PJF. 2008. Systema Brachyuro-rum: part I. An annotated checklist of extant Brachy-uran crabs of the world. Raff Bull Zool. 17:1-286.
Niiyama H. 1942. On the chromosomes of four species of crabs (Brachyura, Decapoda) (in Japanese). Zool Mag. 54:302-304.
Niiyama H. 1959. A comparative study of the chromo-somes in decapods, isopods and amphipods, with some remarks on cytotaxonomy and sex-determina-tion in the Crustacea. Mem Fac Fish Hokkaido Univ. 7:1-60.
Niiyama H. 1966. The chromosomes of two species of edible crabs (Brachyura, Decapoda, Crustacea). Mem Fac Fish Hokkaido Univ. 16:201-205.
Salvadori S, Coluccia E, Deidda F, Cau A, Cannas R, Dei-ana AM. 2012. Comparative cytogenetics in four spe-
49Cytogenetic of Brachyura (Decapoda)
cies of Palinuridae: B chromosomes, ribosomal genes and telomeric sequences. Genetica. 140:429-437.
Salvadori S, Coluccia E, Deidda F, Cau A, Cannas R, Lobina C, Sabatini A, Deiana AM. 2014. Karyotype, ribosomal genes, and telomeric sequences in the crayfish Procambarus clarkii (Decapoda: Cambari-dae). J Crust Biol. 34:525-531.
Sashikumar A, Desai PV. 2008. Development of primary cell culture from Scylla serrata. Cytotech. 56:161-169.
Scalici M, Solano E, Gibertini G. 2010. Karyological analyses on the Australian crayfish Cherax destructor (Decapoda: Parastacidae). J Crust Biol. 30:528-530.
Schubart CD, Huber MGJ. 2006. Genetic comparisons of German populations of the stone crayfish, Austro-potamobius torrentium (Crustacea: Astacidae). Bull Fr Peche Prot Milieux Aquat. 380-381:1019-1028.
Sharakhov IV. 2014. Protocols for Cytogenetic Mapping of Arthropod Genomes. Boca Raton: CRC Press.
Shih H, Ng PKL, Davie PJF, Schubart CD, Türkay M, Naderloo R, Jones D, Liu MY. 2016. Systematics of the family Ocypodidae Rafinesque, 1815 (Crusta-cea: Brachyura), based on phylogenetic relationships, with a reorganization of subfamily rankings and a review of the taxonomic status of Uca Leach, 1814, sensu lato and its subgenera. Raff Bull Zool. 64:139-175.
Shpak N, Manor R, Aflalo ED, Sagi A. 2017. Three gen-erations of cultured prawn without W chromosome. Aquaculture. 467:41-48.
Simon C, Frati F, Beckenbach A, Crespi B, Liu H, Flook P. 1994. Evolution, weighting, and phylogenetic util-ity of mitochondrial gene sequences and a compila-tion of conserved polymerase chain reaction primers. Ann Entomol Soc Am. 87:651-701.
Simoni R, Cannicci S, Anger K, Pörtner HO, Giomi F. 2011. Do amphibious crabs have amphibious eggs? A case study of Armases miersii. J Exp Mar Biol Ecol. 409:107-113.
Sola L, Cataudella S, Capanna E. 1981. New develop-ments in vertebrate cytotaxonomy III. Karyology of bony fishes: a review. Genetica. 54:285-328.
Sumner AT. 2008. Chromosomes: organization and func-tion. 1st ed. New Jersey: John Wiley & Sons.
Swagatika S, Kumar MP. 2014. Karyological analysis of mud crab and flower crab of Odisha. Int Res J Biol Sci. 3:51-56.
Tan X, Qin JG, Chen B, Chen L, Li X. 2004. Karyological analyses on redclaw crayfish Cherax quadricarinatus (Decapoda: Parastacidae). Aquaculture. 234:65-76.
Thiriot-Quievreux C. 2002. Review of the literature on bivalve cytogenetics in the last ten years. Cah Biol Mar. 43:17-26.
Thiriot-Quiévreux C. 2003. Advances in chromosomal studies of gastropod molluscs. J Molluscan Stud. 69:187-202.
Torrecilla Z, Martínez-Lage A, Perina A, González-Ortegón E, González-Tizón AM. 2017. Compara-tive cytogenetic analysis of marine Palaemon species reveals a X1X1X2X2/X1X2Y sex chromosome system in Palaemon elegans. Front Zool. 14:47.
Toullec JY. 1999. Crustacean primary cell culture: a tech-nical approach. Methods Cell Sci. 21:193-198.
Trentini M, Corni MG, Froglia C. 1989. The chromo-somes of Liocarcinus vernalis (Risso, 18 16) and Lio-carcinus depurator (L., 1758) (Decapoda, Brachyura, Portunidae). Biol Zent Bl. 108:163-166.
Trentini M, Corni MG, Froglia C. 1992. The chromo-somes of Carcinus mediterraneus Czerniavsky, 1884 Liocarcinus maculatus (Risso, 1827) and Necora puber (L., 1767) (Decapoda, Brachyura, Portunidae). Zool Anz. 228:39-44.
Tsang LM, Schubart CD, Ahyong ST, Lai JC, Au EY, Chan TY, Ng PK, Chu KH. 2014. Evolutionary history of true crabs (Crustacea: Decapoda: Brachyura) and the origin of freshwater crabs. Mol Biol Evol. 31:1173-87.
Vishnoi DN. 1972. Studies on the chromosomes of some Indian Crustacea. Cytologia. 37:43-51.
Zeng H, Ye H, Li S, Wang G, Huang J. 2010. Hepatopan-creas cell cultures from mud crab, Scylla paramamo-sain. In Vitro Cell Dev Biol Anim. 46:431-437.
Zhu DF, Wang CL, Li ZQ. 2005. Karyotype analysis on Portunus trituberculatus. J Fish China. 25:649-653.

Caryologia. International Journal of Cytology, Cytosystematics and Cytogenetics 73(2): 51-61, 2020
Firenze University Press www.fupress.com/caryologiaCaryologia
International Journal of Cytology, Cytosystematics and Cytogenetics
ISSN 0008-7114 (print) | ISSN 2165-5391 (online) | DOI: 10.13128/caryologia-891
Citation: A. Lima-de-Faria (2020) Comparison of the Evolution of Orchids with that of Bats. Caryologia 73(2): 51-61. doi: 10.13128/caryologia-891
Received: February 12, 2020
Accepted: April 16, 2020
Published: July 31, 2020
Copyright: © 2020 A. Lima-de-Faria. This is an open access, peer-reviewed article published by Firenze University Press (http://www.fupress.com/caryo-logia) and distributed under the terms of the Creative Commons Attribution License, which permits unrestricted use, distribution, and reproduction in any medium, provided the original author and source are credited.
Data Availability Statement: All rel-evant data are within the paper and its Supporting Information files.
Competing Interests: The Author(s) declare(s) no conflict of interest.
Comparison of the Evolution of Orchids with that of Bats
Antonio Lima-de-Faria
Professor Emeritus of Molecular Cytogenetics, Lund University, Lund, Sweden E-mail: [email protected]
Abstract. The evolution of orchids and bats is an example of DNA’s own evolution which has resulted in structures and functions which are not necessarily related to any obvious advantage to the organism. The flowers of orchids resemble: humans, apes, liz-ards, frogs and even shoes. The faces of bats resemble plant leaves but also horseshoes. These similarities are not accidental because they emerge repeatedly in different gen-era and different families. This evolutionary situation bewildered botanists and zoolo-gists for many years, but is now elucidated by the molecular unification of plants and animals derived from the following evidence: (1) Contrary to expectation, plant and animal cells (including those of humans) could be fused and the human chromosomes were seen dividing in the plant cytoplasm. (2) Orchids, bats and humans have about the same number of genes: orchids, 21,841; bats, 21,237 and humans circa 20,000. (3) These three groups contain the same homeotic genes which decide: flower formation (orchids), body segmentation (bats) and body segmentation (humans). The leaf pat-tern, is formed in plants by the LEAFY master gene, but this pattern even appears in minerals, which have no genes, an indication that pure atomic processes are responsi-ble for its emergence at the organism level.
Keywords: orchids, bats, evolution, DNA’s own evolution.
EVOLUTION IS A WELL ESTABLISHED PHENOMENON BUT ITS MECHANISM REMAINS TO BE ELUCIDATED
Evolution is one of the best established phenomena in biology. Its firm basis rests mainly on the following data: (1) The comparison of structures and functions in invertebrates and vertebrates. (2) The documentation from the fossil record. (3) Analysis of cells and chromosomes in most well known organisms. (4) Sequencing of DNA, in a long array of species, that has allowed to establish phylogenetic relationships at the molecular level. (5) Other molecular studies that included the structures and functions of RNA and proteins and their key interactions.
However, this does not mean that the mechanism that is responsible for evolution is known. (1) A mechanism can only be physico-chemical, and we are only approach-
ing this stage of investigation with the building of Synchrotron Radiation

52 Antonio Lima-de-Faria
Accelerators and Spallation Sources as those built at Lund University, Sweden, and in other countries.
(2) One is also far from understanding the source of the ramification into many branches of organisms which has led to the establishment of the different alleys that are called: phyla, orders, families, and other natural divisions. Examples of this situation are: (a) The origin of vertebrates from invertebrates which remains far from being understood (Daeschler and Shubin 2011). (b) The emergence of birds from rep-tiles which is a source of permanent debate (Zhou 2004). (c) The classification of flowering plants, with their recurring symmetries, which bewilders bota-nists (Denffer et al. 1971). (d) The comparative work, based on the sequencing of DNAs. This has led to the creation of Databases but many species have not yet been included (Fang et al. 2015).
(3) The own evolution of DNA, as well as that of pro-teins and RNA, continue to be virgin land. As point-ed out by Branden and Tooze (1991), as long as we do not know the rules of the interactions between these molecules at the atomic level, evolution of the chemistry of life will remain in a primitive stage. However, every important phenomenon in science,
demands an explanation. The recourse, called the ”pre-vailing theory”, has been the use of random mutation and selection. Geneticists know well that random muta-tion and selection occur in nature, but these are anti-quated ”solutions” that have been superseded . Selection is solely a system of choice and as such cannot substi-tute a physico-chemical mechanism. Random mutations occur, but have been shown to be of little importance in evolution. Directed mutations have now been well established as positive events in species transformations (Zhang and Saier 2009).
SIMILARITY BETWEEN PLANTS AND ANIMALS. — THE IMPOSSIBLE BECAME POSSIBLE
1) In the early days of Genetics it became established that plant and animal chromosomes needed to have a centromere and telomeres if they were to survive during cell division. But plants were so different from animals that these basic similarities were not considered significant.
2) Genes started to be located in great numbers in the chromosomes of Drosophila, humans and maize. However, plants had no brain, and no blood circula-tion, as a consequence they had to have quite differ-ent genes.
3) When the first genes were isolated in the test tube, the ribosomal RNA genes could be recognized in
bacteria, plants and animals, not having changed appreciably for millions of years. Haemoglobin, the carrier of oxygen in animal blood, was also present in plants. Again this similarity of molecular organi-zation was a curiosity.
4) The genes for 18S and 28S ribosomal RNA were found in over 500 species to be located not at ran-dom, but tended to appear in plants, animals and humans, near telomeres. Their position could be defined by an equation (Lima-de-Faria 1973). Genes were considered to occur at random, as one still tends to think today, and the response was that this was a particular case.
5) Suddenly, what was considered impossible, became possible. The fusion between plant cells and human cells was considered impossible. But it was achieved rapidly when the enzymes to remove the cell wall of plant cells became available. The experiments were controlled by the use of the radioisotope tritium and the human chromosomes were seen to divide in the plant cytoplasm. Later the fusion of human sperm with plant cells could be observed occurring under the microscope (Dudits et al. 1976, Lima-de-Faria et al. 1983). Actually this work opened the way to pre-sent day biotechnology.
6) Molecular analysis brought the crucial information. The genes that decided the segmentation of the body of insects, were the same that led to the formation of vertebra in the human column and those which decided the formation of floral parts (sepals, petals, stigma and anthers) in a plant. These are the home-otic or Hox genes (Lu et al. 1996).
7) This does not mean, however, that we are in posses-sion of the molecular cascades that occur between the gene and the final formation of traits that shape the pattern of animals and plants. This is why the comparison of the evolution of the Orchids with that of Bats becomes relevant.
THE STRUCTURES AND FUNCTIONS OF ORCHIDS EXHIBIT A REMARKABLE EVOLUTIONARY
VARIATION
The Orchids (Family Orchidaceae) have confused botanists for three centuries due to the following fea-tures:
THE RICHNESS OF ORCHID SPECIES
The orchids display an extraordinary variation. They constitute approximately 10% of flowering plant spe-
53Comparison of the Evolution of Orchids with that of Bats
cies (Zhang et al. 2017) having about 28,000 currently accepted species, distributed in about 763 genera (Chris-tenhusz and Byng 2016).
The number of orchid species is nearly equal to the number of bony fishes, more than three times the num-ber of bird species, and about four times the number of mammal species.
THE ORIGIN OF ORCHIDS AND THE FOSSIL RECORD
About 135 million years ago the plant kingdom began to develop vascular plants with enclosed seeds, the angiosperms, which spread rapidly (Barth 1985).
Orchid fossils trapped in amber, in the Baltic Sea, are 15 to 20 million years old (Poinar and Rasmussen 2017). But genetic sequencing indicates that orchids may have arisen 76 to 84 million years ago or may go back to 100 million years ago (Chase 2001).
The fossil record from rocks is poor because orchids ”are herbaceous plants and therefore are not good sub-jects for fossilization”. As a result they are poorly docu-mented in sedimentary deposits. Besides, fossils are not considered reliable because of their resemblance to pre-sent-day orchids. This means that ”Most extant groups are probably very young” (Arditti 1992). The result is that: ”There is no general agreement regarding the time of the origin of the orchids” (Arditti 1992).
Dressler (1993) asks: ”To what other group of plants are the orchids most closely related?” His answer is ”Unfortunately, there is little agreement on the proper classification of these plants”.
ORCHID FLOWERS ASSUME THE MOST UNEXPECTED SHAPES RESEMBLING: HUMANS,
APES, BEES, WASPS AND EVEN SHOES
It is not only the great variation in flower shape that has confused researchers but, above all, is the display of patterns that have no immediate relationship to the environment or any obvious advantage to the organism (Table 1, Fig. 1).
Blamey et al. (2013) in their ”Wild Flowers of Brit-ain and Ireland” give the common names of near 20 species of orchids. Most of them have a resemblance to animals and to humans. These last are called ”mani-kins” (meaning a little man). They are: (1) Manikin Orchid, Burnt-tip Orchid (Neotinia ustulata). (2) Mani-kin Orchid, Lady Orchid (Orchis purpurea). (3) Manikin Orchid, Military Orchid (Orchis militaris). (4) Manikin Orchid, Monkey Orchid (Orchis simia). (5) Manikin Orchid, Man Orchid (Orchis anthropophora). (6) Lizard
Orchid (Himantoglossum hircinum). (7) Frog Orchid (Coeloglossum viride). (8) Greater Butterf ly Orchid (Platanthera chlorantha). (9) Bee Orchid (Ophrys apif-era). (10) Wasp Orchid (Ophrys trollii). (11) Fly Orchid (Ophrys insectifera). (12) Late Spider Orchid (Ophrys fucif lora). (13) Ghost Orchid (Epipogium aphyllum). (14) Lady’s Slipper (Cypripedium calceolus). (15) Tongue Orchid (Serapias lingua) (Fig. 4).
Several features are remarkable: (1) The patterns are not accidental because the same shape reappears in spe-cies which do not belong to the same genus (i.e. are not closely related). This is the case of the human figure in Neotinia and Orchis. (2) The resemblance displayed by the flowers is so perfect that it is included in the scien-tific name: monkey-face Orchid, Dracula simia (simia = monkey), Orchis anthropophora (anthro = human), Ophrys apifera (apis = bee), Ophrys insectifera (fly), Sera-pias lingua (lingua = tongue). (3) The pattern that exhib-its these unexpected similarities, is not displayed by all the parts of the flower, but is usually restricted to the lip. This is the lower petal of the flower called also ”label-lum”, another constraint in pattern development. (4) The common names, given to these species, were coined by leading botanists who, generation after generation, rec-ognized the same similarities (Table 1).
THE STRUCTURES AND FUNCTIONS OF BATS DISPLAY ALSO A REMARKABLE EVOLUTIONARY
VARIATION
Like systematists dealing with the classification of Orchids, zoologists were confronted with great difficul-ties when analyzing the evolutionary features of bats.
THE LARGE VARIATION OF BAT SPECIES
The bats build the Order Chiroptera which is divided into 21 Families. These comprise not less than 1,400 species, an impressive number since it represents about 20% of the described mammalian species (Fang et al. 2015). Besides, they are present on every conti-nent except Antarctica (Wilson and Mittermeier 2019). According to Hill and Smith (1984) they constitute one of the largest and most widely distributed groups of mammals.
THE ORIGIN OF BATS AND THE FOSSIL RECORD
“The origin and evolution of bats is poorly under-stood” (Hill and Smith 1984) and they add that ”Any

54 Antonio Lima-de-Faria
Table 1. Orchid species in which the flowers are similar to animal structures and other unexpected shapes. Common and scientific names according to Blamey et al. 2013, “Wild flowers of Britain and Ireland”. The words used and the statements made by the authors are in quota-tion marks.
Common name Species name Resemblance described by botanists
Common Spotted Orchid Dactylorhiza fuchsii Common orchid General patternPyramidal Orchid Anacamptis pyramidalis Foxy—smelling Green-winged Orchid Anacamptis morio Fragrant, Purple Dark green veinsManikin Orchid Burnt-tip Orchid Neotinia ustulata ”Manikin” is the name given to a little man. Manikin lip
Manikin Orchid Lady Orchid Orchis purpurea Manikin lip ”Lip” is the lower petal of an orchid flower, also called ”labellum”
Manikin Orchid Military Orchid Orchis militaris Sepals (the ”soldier’s” helmet)
Manikin Orchid Monkey Orchid Orchis simia Manikin lip having narrow “limbs” as a human
Manikin Orchid Man Orchid Orchis anthropophora Lip with very narrow ”limbs”
Lizard Orchid Himantoglossum hircinum ”Fancifully lizard-like by taking the manikin theme to an extreme”Frog Orchid Coeloglossum viride ”Flowers supposedly like a jumping frog”Greater Butterfly Orchid Platanthera chlorantha Two petals diverging at right anglesBee Orchid Ophrys apifera ”Look remarkably like the rear of a small bumblebee”Wasp Orchid Ophrys trollii Wasp looking flowersFly Orchid Ophrys insectifera Manikin lip. ”Petals antenna-like (hence the ”fly”)”Late Spider Orchid Ophrys fuciflora ”Hieroglyphic on its lip”Ghost Orchid Epipogium aphyllum Excellent camouflage lip bent backLady’s Slipper Cypripedium calceolus Billowing unspurred lipHeart-flowered Tongue Orchid Serapias cordigera ”Middle lobe shaped like an ace-of spades (not hearts)”
Tongue Orchid Serapias lingua Middle lobe intermediate between the other two species
Monkey-face Orchid Dracula simia Central part of flower ”bears a striking resemblance to a monkey’s face” (Thorogood 2018)
Figure 1. Three different types of orchid flowers, which represent their great variation in pattern. The shape of the flower is not related to any obvious advantage to the organism. (A) Orchis Morio, Green-winged orchid. An example of a flower with the general shape. (B) Orchis militaris, Manikin orchid or Military orchid. In this species the flower’s ”lip” resembles the human body with: head, open arms and open legs. (C) Cypripedilum acaule, Lady’s slipper. Another species in which the ”lip” resembles a shoe or a slipper.
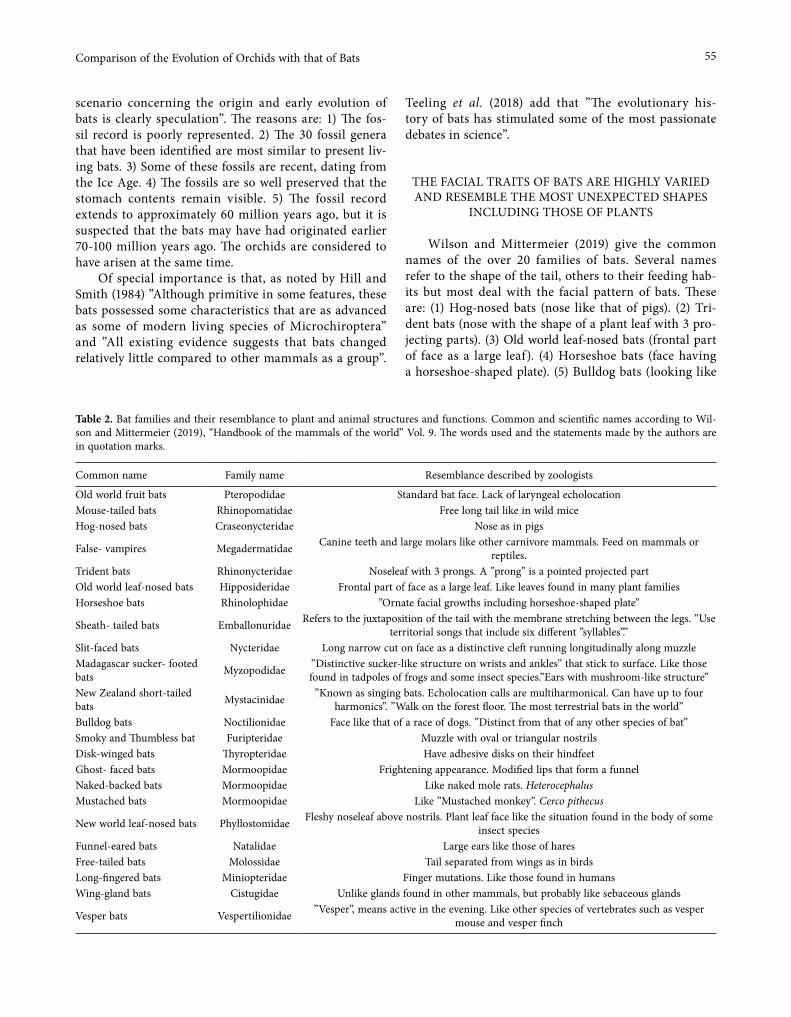
55Comparison of the Evolution of Orchids with that of Bats
scenario concerning the origin and early evolution of bats is clearly speculation”. The reasons are: 1) The fos-sil record is poorly represented. 2) The 30 fossil genera that have been identified are most similar to present liv-ing bats. 3) Some of these fossils are recent, dating from the Ice Age. 4) The fossils are so well preserved that the stomach contents remain visible. 5) The fossil record extends to approximately 60 million years ago, but it is suspected that the bats may have had originated earlier 70-100 million years ago. The orchids are considered to have arisen at the same time.
Of special importance is that, as noted by Hill and Smith (1984) ”Although primitive in some features, these bats possessed some characteristics that are as advanced as some of modern living species of Microchiroptera” and ”All existing evidence suggests that bats changed relatively little compared to other mammals as a group”.
Teeling et al. (2018) add that ”The evolutionary his-tory of bats has stimulated some of the most passionate debates in science”.
THE FACIAL TRAITS OF BATS ARE HIGHLY VARIED AND RESEMBLE THE MOST UNEXPECTED SHAPES
INCLUDING THOSE OF PLANTS
Wilson and Mittermeier (2019) give the common names of the over 20 families of bats. Several names refer to the shape of the tail, others to their feeding hab-its but most deal with the facial pattern of bats. These are: (1) Hog-nosed bats (nose like that of pigs). (2) Tri-dent bats (nose with the shape of a plant leaf with 3 pro-jecting parts). (3) Old world leaf-nosed bats (frontal part of face as a large leaf). (4) Horseshoe bats (face having a horseshoe-shaped plate). (5) Bulldog bats (looking like
Table 2. Bat families and their resemblance to plant and animal structures and functions. Common and scientific names according to Wil-son and Mittermeier (2019), “Handbook of the mammals of the world” Vol. 9. The words used and the statements made by the authors are in quotation marks.
Common name Family name Resemblance described by zoologists
Old world fruit bats Pteropodidae Standard bat face. Lack of laryngeal echolocationMouse-tailed bats Rhinopomatidae Free long tail like in wild mice Hog-nosed bats Craseonycteridae Nose as in pigs
False- vampires Megadermatidae Canine teeth and large molars like other carnivore mammals. Feed on mammals or reptiles.
Trident bats Rhinonycteridae Noseleaf with 3 prongs. A ”prong” is a pointed projected partOld world leaf-nosed bats Hipposideridae Frontal part of face as a large leaf. Like leaves found in many plant familiesHorseshoe bats Rhinolophidae ”Ornate facial growths including horseshoe-shaped plate”
Sheath- tailed bats Emballonuridae Refers to the juxtaposition of the tail with the membrane stretching between the legs. ”Use territorial songs that include six different ”syllables”.”
Slit-faced bats Nycteridae Long narrow cut on face as a distinctive cleft running longitudinally along muzzle Madagascar sucker- footed bats Myzopodidae ”Distinctive sucker-like structure on wrists and ankles” that stick to surface. Like those
found in tadpoles of frogs and some insect species.”Ears with mushroom-like structure” New Zealand short-tailed bats Mystacinidae ”Known as singing bats. Echolocation calls are multiharmonical. Can have up to four
harmonics”. ”Walk on the forest floor. The most terrestrial bats in the world” Bulldog bats Noctilionidae Face like that of a race of dogs. ”Distinct from that of any other species of bat” Smoky and Thumbless bat Furipteridae Muzzle with oval or triangular nostrils Disk-winged bats Thyropteridae Have adhesive disks on their hindfeet Ghost- faced bats Mormoopidae Frightening appearance. Modified lips that form a funnelNaked-backed bats Mormoopidae Like naked mole rats. HeterocephalusMustached bats Mormoopidae Like ”Mustached monkey”. Cerco pithecus
New world leaf-nosed bats Phyllostomidae Fleshy noseleaf above nostrils. Plant leaf face like the situation found in the body of some insect species
Funnel-eared bats Natalidae Large ears like those of hares Free-tailed bats Molossidae Tail separated from wings as in birds Long-fingered bats Miniopteridae Finger mutations. Like those found in humans Wing-gland bats Cistugidae Unlike glands found in other mammals, but probably like sebaceous glands
Vesper bats Vespertilionidae ”Vesper”, means active in the evening. Like other species of vertebrates such as vesper mouse and vesper finch
56 Antonio Lima-de-Faria
a race of dogs). (6) Ghost-faced bats (with frightening appearance). (7) New world leaf-nosed bats (with fleshy noseleaf above nostrils, the leaf pattern being similar to that present on the body of some insect species).
The leaf pattern has arisen in not less than three independent families: Rhinonycteridae, Hipposideridae
and Phyllostomidae. Thus, it is not an accidental event.The nose takes not only the shape of different ani-
mals but even of a horseshoe (horseshoe bats). This is a most unexpected pattern, like that of an orchid which resembles a ladie’s slipper (Table 2, Fig. 2).
Significant is that the common names given to all species were not coined by the general public but by leading zoologists. Besides, successive generations of sci-entists continued to use the same designation, a confir-mation that the patterns displayed are so striking that their names were not modified.
SELECTION HAS BEEN INVOKED AND DENIED TO EXPLAIN ORCHID AND BAT EVOLUTION
Dressler (1993) uses several new types of selection, which are called r-selection and k-selection, to explain the evolution of the orchids. But he feels obliged to con-clude that ”At first glance, the production of many tiny seeds would seem to fit the characteristics of r-selection, but in other respects, most orchids fit this pattern poor-ly” and he adds: ”The classification of the orchids has been difficult because of the great amount of parallel-ism”. By parallelism he means the repetition of the same pattern that is seen in: pollen structures, flower form, seed formation and pollination patterns (Table 7).
The great difficulty for evolutionists who follow the general interpretation is that for selection to have a posi-tive effect it has to have an advantage for the individual. But such is far from being the case when a flower looks like a shoe or a bat has a face that resembles a horseshoe.
“Mimicry is bizarre” (Dressler 1993). ”There are many cases of generalized food flower mimicry, that do not involve a clear and recognizable model”. ”In general-ized food flower mimics, the pollinators soon learn that the flowers offer no reward”. ”Orchids do not just deceive
Figure 2. Three different types of facial structures of bats that repre-sent their great variation in pattern. The shape of the nose is not relat-ed to any obvious advantage to the organism. (A) Bat species (name not indicated). Common facial pattern with protruding nose. (B) Phyllostomus hastatus. Face with shape of leaf. Belongs to Family Phyl-lostomidae, New World Leaf-nosed bats. This species is called Spear-nosed bat because the leaf has a sharp point on the upper part like the leaf of many deciduous trees (e.g. Oaks, Elms, Mangolias and others). (C) Rhinolophus ferrumequinum. Called Mediterranean Horseshoe bat. The facial pattern which resembles a horseshoe, is so striking that is included in the scientific name (ferrum = iron, equinum = horse).
Table 3. Number of protein-coding genes in animals and plants.
Organism Species Gene number Reference
Animal Pteropus Alecto (bat) 21,237 Fang, J. et al. 2015
Homo sapiens 20,000 Pennisi 2003 Merchant et al. 2007
Ascaris suum (worm) 18,500 Jex et al. 2011Daphnia pulex (water flea) 30,907 Colbourne et al. 2011
Plant Apostasia shenzhenica (orchid) 21,841 Zhang et al. 2017Chlamydomonas reinhardtii (unicellular alga) 15,143 Merchant et al. 2007
Arabidopsis (flowering plant) 26,341 Merchant et al. 2007 Medicago truncatula (legume plant) 62,388 Young et al. 2011
Cajanus cajan (pigeon pea) 48,680 Varshney et al. 2012

57Comparison of the Evolution of Orchids with that of Bats
pollinators through sexual deception of animals, but also through mimicry of other plants” (Stevens 2016) and adds: ”how this type of deception evolved is also unclear”.
Zoologists were led to a similar approach when analysing the value of selection in the evolution of bats. Some invoked ”positive natural selection” and ”Darwin-
Table 4. Evolutionary similarities between orchids and bats.
Property Orchids Bats
Origin Eastern Asia 40 to 80 million years ago. No general agreement regarding time and origin
Australasia 30 to 60 million years ago. No general agreement regarding time and origin
Fossil record Fossils poorly documented in sedimentary rocks
Fossils found from various periods but limited
Fossil preservation Leaves and seeds preserved but ”no positive or useful record”
Stomach contents well preserved as in extant species
Fossil appearance Fossils are already very similar to living orchids. ”Evolved fully formed”
Fossils are already very similar to modern living bats
Systematic location Under debate, included in the order Asparagales
No intermediate forms to other mammalian orders. Location most uncertain
Number of species 22,000 to 30,000 1,400Extreme variation Tremendous radiation. Flowers with most
unexpected formsFace with most different forms
Resemblance to particular structures Assuming the shape of: Ghost
Humans Apes Frogs
Lizards Butterflies
Bees Wasps Flies
Spiders
Assuming the shape of: Ghost Mouse
Hog Horse shoes
Bulldog Leaves
Plant exhibiting animal pattern and animal exhibiting plant pattern
Resemblance of flowers to bees and wasps is so striking that insect males copulate with
flowers
Face with leaf form which is characteristic of several tree families
Repeated occurence of plant-animal pattern Similarity to insects occurs in: 3 species of Ophrys;
and similarity to humans occurs in: Neotinia and 4 species of Orchis
Similarity to leaves occurs in 3 distinct families:
1) Old world leaf-nosed bats 2) New world leaf-nosed bats
3) Trident bats
Table 5. Occurrence of structures with leaf shape from minerals to bats.
Minerals Flowering plants Insects Bats
Native copperNative goldNative bismuth
The typical shape of leaves is most common in deciduous trees
Wings with leaf shape Kallima (butterfly) Phyllium pulchrifolium
(grasshopper)
Frontal part of head with leaf shape. Old world leaf-nosed bats 90 species. New world leaf-nosed
bats 217 species.
No genes present. Atomic self-assembly
Homeotic genes deciding formation and position of flower parts.
Master gene LEAFY deciding leaf formation
Homeotic genes deciding body segmentation which affects body
pattern
Homeotic genes deciding body segmentation, but effect on facial
pattern not yet investigated
58 Antonio Lima-de-Faria
ian selection” (Hawkins et al. 2019, Dong et al. 2016), but others considered selection inappropriate to explain the evolution of bats (Hill and Smith 1984), Teeling et al. 2018) (Table 7).
SIMILARITY OF GENE NUMBER, AND OF GENES, BETWEEN ORCHIDS AND BATS ELUCIDATE THE
EMERGENCE OF IDENTICAL PATTERNS AND THE APPEARANCE OF TRAITS NOT ADVANTAGEOUS TO
THE ORGANISM
From the beginning it was assumed that humans had to have at least 200,000 genes. As late as 2000 Gil-bert (2000) gave the figure 150,000 genes, based on the number of proteins present in the human body.
This value sprang from the one gene — one protein relationship accepted in the 1970s. Soon, it became evi-dent, that a single gene could give rise to several differ-ent proteins and later genes turned out to be large com-
plex structures consisting of coding and non-coding regions (exons and introns).
The sequencing of the bases in DNA led to a surpris-ing answer. Humans had about 32,000 genes coding for proteins (Bork and Copley 2001), but this figure has sub-sequently been reduced to circa 20,000 (Table 3).
As DNAs continued to be sequenced, in many different organisms, it turned out that the number of genes is not a good indicator of evolutionary rela-tionships and moreover it is not related to organism complexity (Lima-de-Faria 2014). The flowering plant Arabidopsis has 26,341 genes. Some plants have even more genes than humans. Medicago is a legume plant with 62,388 and Cajanus (a pea) 48,680 genes. Their large numbers are due to genome duplications. Even more relevant is that Daphnia (a minute water flea) has 30,907 genes.
It is thus not surprising that bats, orchids and humans have about the same gene numbers: 21, 237, 21,841 and circa 20,000 respectively (Table 3).
Table 6. Structures and functions with no obvious positive effect for the organism and those with a positive effect.
Orchids Bats
No obvious positive effect Positive effect No obvious
positive effect Positive effect
Flower resembling:Lady’s slippers
Monkeys Humans
FrogsLizards
Movement of flower lips.Enhancing of pollination by insect
trapping.Enhancing of pollination by resembling bees and wasps.
Face resembling:Leaf
HorseshoeHog
Bulldog
Movement of larynx producing sounds.
Echolocation used in insect trapping
Table 7. Present interpretations of orchid and bat evolution, evoking selection as well as denying it. The statements made by the various authors are in quotation marks.
Orchids Bats
Interpretation Reference Interpretation Reference
Selection deciding evolution. New kinds of selection: r-selection and k-selection related to habitat and environment
Stearns 1977Bat genes submitted to ”positive natural selection” Hawkins et al. 2019
Genomes submitted to ”Darwinian selection” Dong et al. 2016
”Selection pressure” as the motor of evolution Arditti 1992 Bat genes have undergone ”Relaxed natural selection” Dong et al. 2016
Selection considered inappropriate to explain evolution of orchids. ”Great deal of parallel evolution”
Dressler 1993Selection considered inappropriate to explain evolution of bats. ”Evolution of bats is clearly speculation”
Hill and Smith 1984
Fossils are similar to modern orchids Arditti 1992 ”Fossils are already very similar to modern Microbats” Wikipedia
Fossil record is limited and reveals little about evolution Arditti 1992
”The evolutionary history of bats has stimulated some of the most passionate debates in science”
Teeling et al. 2018
59Comparison of the Evolution of Orchids with that of Bats
In addition many basic genes are common to mam-mals and plants. But one could hardly conceive that the Homeotic genes, which decide the segmentation of the vertebral column in humans, are the same that deter-mine the sequence of the flower parts in plants (Lu et al. 1996). The lip of orchids is one component in the process of flower formation (Table 5). Moreover, the leaf pattern found in orchids, like in other plants, is decided by a series of leaf genes that have been sequenced, the master gene being called LEAFY (Glover 2007).
Hence, the similarity between the patterns of orchids and bats is not fortuitous, but has a genetic basis (Tables 4 and 5).
Remarkable is that minerals, which have no genes, and whose pattern emerged before DNA and the cell appeared in evolution, also build leaf patterns (Fig. 3). One should not forget that DNA consists of the same
atoms that are found in minerals and that different atom combinations result in the same mineral pattern (Lima-de-Faria 2017) (Table 5). In this connection it is relevant to recall that the basic function of proteins and other macromolecules resides, not on their amino acid sequences, but on their metal atoms. This is the case in: haemoglobin (iron), chlorophyll (magnesium), vitamin B12 (cobalt) and zinc proteins (zinc). It is the atoms that are exposed to other molecules that create the final pat-tern of the organism.
Figure 3. The leaf pattern which occurs in minerals, plants and insects. (1) Mineral, pure bismuth in native state. (2) Plant, leaf of poison ivy Rhus toxicodendron. (3) The leaf-like butterfly Kallima. (4) The leaf-insect Chitoniscus feedjeanus showing leaf-like modifi-cations of the fore-wings, including a midrib and lateral veins. Figure 4. An insect copulates with a flower. Orchid Ophrys insectif-
era. (1) Flowering plant. (2) Male of the insect species Gorytes mys-taceous making copulatory movements over the flower. (3) Female of the same species. (4) Flower lip drawn separately to show simi-larity to insect. (5) The flower of the orchid Ophrys bombyliflora covered by the copulating male of the insect Eucera sp.
60 Antonio Lima-de-Faria
DNA’S OWN EVOLUTION DOES NOT NECESSARILY LEAD TO THE BUILDING OF ORGANS WITH
ADVANTAGE TO THE ORGANISM
It is usually not realized that DNA has its own evo-lution which results in the formation of traits that may be of advantage but may also be of no advantage to the organism.
By manipulation of eye genes, in which DNA sequences were moved within the genome, Gehring (1998) was able to produce fruit flies with eyes located on: the head, legs and even wings. Flies, which nor-mally have only two wings were also produced with four wings. This work was further extended to birds leading to the creation of birds with four wings instead of two (Cohn et al. 1997). In all cases the new organs were normal and functional, being constituted by the same body parts such as muscles, veins and articula-tions. Hence, DNA can produce, by alteration of its own sequences novel structures that the organism gets as a ”surprise”.
The evolution of the orchids and of the bats is a valuable example of the production of structures with-out any special advantage to the organism. But this does not exclude that there are also structures and functions which led to a subsequent positive effect to the organ-ism’s survival or reproduction (Table 6).
At present, botanists and zoologists, continue in vain to evoke, or deny, the role of selection in the evolu-tion of orchids and bats. But the use of the large acceler-ators of electrons and neutrons is transforming molecu-lar biology into atomic biology. Consequently it will fur-nish a better picture of the basic evolutionary similari-ties that unite these organisms.
SOURCE OF FIGURES
Fig. 1 (A) Gola, G. et al. 1943. Tratado de Botanica. Editorial Labor, Barcelona, Spain (Fig. 718, page 924). (B) Strasburger, E. 1943. Tratado de Botanica. Manuel Marin Editor, Barcelona, Spain (Fig. 831, page 671). (C) Lindman, C.A.M. 1926. Bilder ur Nordens Flora (Plate on page 419).
Fig. 2 (A) From Lima-de-Faria, A., 1995, ”Biologi-cal Periodicity”, Fig. 3.5, page 18, Source: Perrins, C. 1976. Bird Life. An Introduction to the World of Birds. Elsevier, Phaidon, London, UK (Fig. page 28). (B) Cabrera, D.A. et al. 1935. Historia Natural, Volume 1, Zoologia. Instituto Gallach, Barcelona, Spain (Fig. page 37). (C) Cabrera, D.A. et al. 1935. Historia Natural, Volume 1, Zoologia. Instituto Gallach, Barcelona, Spain (Fig. page 37).
Fig. 3 From Lima-de-Faria, A., 1988, ”Evolution without Selection”, Fig. 3.8, page 27, Sources: (1) Meden-bach, O. and Sussieck-Fornefeld, C. 1983. Minerais (Translation of: Mineralien. Mosaik Verlag, Munich 1982). Ed. Publica, Lisbon, Portugal. (2) Feininger, A. 1956. The Anatomy of Nature. Crown Publishers, New York, USA. (3) Cott, H.B. 1951. Animal form in rela-tion to appearance. In: Aspects of Form. Whyte, L.L. (Editor). Lund Humphries, London, UK: 121-156. (4) Cott, H.B. 1951. Animal form in relation to appearance. In: Aspects of Form. Whyte, L.L. (Editor). Lund Hum-phries, London, UK: 121-156.
Fig. 4 From Lima-de-Faria, A., 1988, ”Evolution without Selection”, Fig. 9.26, page 116, Sources: (1) to (4) Mossberg, B. and Nilsson, S. 1977. Nordens Orkidéer. J.W. Cappelens Förlag, Oslo, Norway, pages 1-128 (Page 15). (5) Kullenberg, B. 1961. Studies in Ophrys Pollina-tion. Zoologiska Bidrag från Uppsala 34: 1-340.
REFERENCES
Arditti, J. 1992. Fundamentals of Orchid Biology. John Wiley and Sons, USA.
Barth, F.G. 1985. Insects and Flowers. The Biology of a Partnership. Princeton University Press, USA.
Blamey, M. et al. 2013. Wild Flowers of Britain and Ire-land. Bloomsbury, London, UK.
Bork, P. and Copley, R. 2001. Filling in the gaps. Nature 409: 818-820.
Branden, C. and Tooze, J. 1991. Introduction to Protein Structure. Garland Publishing, Inc. New York, USA.
Chase, M.W. 2001. The origin and biogeography of the Orchidaceae. In: Orchidoideae (Part 1). Eds. A.M. Pridgeon et al. Oxford University Press, UK.
Christenhusz, M.J.M. and Byng, J.W. 2016. The number of known plant species in the world and its annual increase. Phytotaxa 261(3): 201-217.
Cohn, M.J. et al. 1997. Hox 9 genes and vertebrate limb specification. Nature 387: 97-101.
Colbourne, J.K. et al. 2011. The ecoresponsive genome of Daphnia pulex. Science 331: 555-561.
Daeschler, T. and Shubin, N. 2011. Fossil discovery and the origins of tetrapods. In: In the Light of Evolution. Ed. J.B. Losos. Roberts and Co., USA.
Denffer, D. von et al. 1971. Strasburger’s Textbook of Bot-any. Longman, London, UK.
Dong, D. et al. 2016. The genomes of two bat species with long constant frequency echolocation calls. Mol. Biol. Evol. 34(1): 20-24.
Dressler, R.L. 1993. Phylogeny and Classification of the Orchid Family. Cambridge University Press, UK.

61Comparison of the Evolution of Orchids with that of Bats
Dudits, D. et al. 1976. Fusion of human cells with carrot protoplasts induced by polyethylene glycol. Hereditas 82: 121-124.
Fang, J. et al. 2015. BGD: A Database of Bat Genom-es. PLoS ONE 10(6): e0131296, doi:10.1371/journal,pone.0131296
Gehring, W.J. 1998. Master Control Genes in Develop-ment and Evolution: the Homeobox Story. Yale Uni-versity Press, New Haven CT, USA.
Gilbert, S.F. 2000. Developmental Biology. Sinauer Asso-ciates, Sunderland, MA, USA.
Glover, B.J. 2007. Understanding Flowers and Flowering. Oxford University Press, Oxford, UK.
Hawkins, J.A. et al. 2019. A metaanalysis of bat phylo-genetics and positive selection based on genomes and transcriptomes from 18 species. PNAS 116(23): 11351-11360.
Hill, J.E. and Smith, J.D. 1984. Bats. A Natural History. British Museum (Natural History), UK.
Jex, A.R. et al. 2011. Ascaris suum draft genome. Nature 479: 529-533.
Lima-de-Faria, A. 1973. Equations defining the position of ribosomal cistrons in the eukaryotic chromosome. Nature 241: 136-139.
Lima-de-Faria, A. et al. 1983. Fusion of bull and human sperm with Nicotiana protoplasts. Hereditas 99: 191-201.
Lima-de-Faria, A. 2014. Molecular Origins of Brain and Body Geometry. Springer, Heidelberg, Germany.
Lima-de-Faria, A. 2017. Periodic Tables Unifying Living Organisms at the Molecular Level. World Scientific, Singapore.
Lu, P. et al. 1996. Identification of a meristem L1 layer-specific gene in Arabidopsis that is expressed during embryonic pattern formation and defines a new class of homeobox genes. Plant Cell 8: 2155-2168.
Merchant, S.S. et al. 2007. The Chlamydomonas genome reveals the evolution of key animal and plant func-tions. Science 318: 245-251.
Pennisi, E. 2003. Gene counters struggle to get the right answer. Science 301: 1040-1041.
Poinar, G. and Rasmussen, F.N. 2017. Orchids from the past, with a new species in Baltic amber. Botanical J. of the Linnean Society 183(3): 327-333.
Stearns, S.C. 1977. The evolution of life history traits: A critique of a theory and a review of the data. Annual Review of Ecology and Systematics 8: 145-171.
Stevens, M. 2016. Cheats and Deceits. How Animals and Plants Exploit and Mislead. Oxford University Press, Oxford, UK.
Teeling, E.C. et al. 2018. Bat biology, genomes, and the bat 1K project: To generate chromosome—level
genomes for all living bat species. Annu. Rev. Anim. Biosci. 6: 23-46.
Thorogood, C. 2018. Weird Plants. Kew Publishing, Royal Botanic Gardens, Kew, UK.
Varshney, R.K. et al. 2012. Draft genome sequence of pigeon pea (Cajanus cajan) an orphan legume crop of resource-poor farmers. Nat. Biotechnol. 30: 83-91.
Wikipedia. Retrieved from https://en.wikipedia.org/w/index,26November2019.Pages1-28
Wilson, D.E. and Mittermeier, R.A. Eds. 2019. Handbook of the Mammals of the World, vol. 9, Bats. Lynx Edi-cions, Barcelona, Spain.
Young, N.D. et al. 2011. The Medicago genome provides insight into the evolution of rhizobial symbioses. Nature 480: 520-523.
Zhang, G.-Q. et al. 2017. The Apostasia genome and the evolution of orchids. Nature 549: 379-383.
Zhang, Z. and Saier, M.H. 2009. A mechanism of trans-poson-mediated directed mutation. Mol. Microbiol. 74(1): 29-43.

Caryologia. International Journal of Cytology, Cytosystematics and Cytogenetics 73(2): 63-72, 2020
Firenze University Press www.fupress.com/caryologiaCaryologia
International Journal of Cytology, Cytosystematics and Cytogenetics
ISSN 0008-7114 (print) | ISSN 2165-5391 (online) | DOI: 10.13128/caryologia-752
Citation: P. Vosough-Mohebbi, M. Zah-ravi, M. Changizi, S. Khaghani, Z.-S. Shobbar (2020) Identification of the dif-ferentially expressed genes of wheat genotypes in response to powdery mil-dew infection. Caryologia 73(2): 63-72. doi: 10.13128/caryologia-752
Received: December 3, 2019
Accepted: April 3, 2020
Published: July 31, 2020
Copyright: © 2020 P. Vosough-Mohebbi, M. Zahravi, M. Changizi, S. Khaghani, Z.-S. Shobbar. This is an open access, peer-reviewed article published by Firenze University Press (http://www.fupress.com/caryologia) and distributed under the terms of the Creative Commons Attribution License, which permits unrestricted use, distri-bution, and reproduction in any medi-um, provided the original author and source are credited.
Data Availability Statement: All rel-evant data are within the paper and its Supporting Information files.
Competing Interests: The Author(s) declare(s) no conflict of interest.
Identification of the differentially expressed genes of wheat genotypes in response to powdery mildew infection
Panthea Vosough-Mohebbi1, Mehdi Zahravi2,*, Mehdi Changizi3, Sha-hab Khaghani1, Zahra-Sadat Shobbar4
1 Department of Agronomy and Plant Breeding, Arak Branch, Islamic Azad University, Arak, Iran2 Seed and Plant Improvement Institute, Agricultural Research, Education and Extension Organization (AREEO), Karaj, Iran3 Department of Agriculture, Arak Branch, Islamic Azad University, Arak, Iran4 Department of System Biology, Agricultural Biotechnology Research Institute, Agricul-tural Research, Education and Extension Organization (AREEO), Karaj, IranCorresponding author: Email: [email protected]
Abstract. Bread wheat (Triticum aestivum L.) is the most widely grown crop world-wide. Powdery mildew caused by fungal pathogen Blumeria graminis is one of the most devastating diseases of wheat. The present study aimed to identify differential-ly expressed genes and investigate their expression in response to B. graminis in sus-ceptible (Bolani) and resistant (KC2306) wheat genotypes, using publicly available microarray data set and qRT-PCR analysis. A total of 5760 and 5315 probe sets were detected which 5427 and 4630 by adjusted P-value < 0.05 and 168 and 144 genes based on e-value < 1 × 10⁻⁵ cut-off were differentially expressed in susceptible and resistant wheat genotypes, respectively. Among exclusively up regulated genes in the resistant genotype 12 hpi compared to its control, fifteen potential genes that may be respon-sible for B. graminis inoculation resistance were detected. The results of real time PCR for the candidate genes showed that the genes were upregulated in the resistant geno-type 12 hpi compared to its control, which validated the results of microarray analysis. The bZIP, ERF, and ARF1 genes may play an important role in B. graminis resistance. The powdery mildew responsive genes identified in the present study will give us a bet-ter understanding on molecular mechanisms involved in B. graminis resistance in dif-ferent wheat genotypes.
Keywords: wheat, genotype, powdery mildew, microarray, qRT-PCR.
INTRODUCTION
Bread wheat (Triticum aestivum L, AABBDD 2n = 42) is the most wide-ly grown crop in the world, belongs to Poaceae family (Chen S et al. 2018). It occupying 17% of all the cultivated land and providing approximately 20% of globally consumed calories (Gill et al. 2004; Vetch et al. 2019). In

64 Panthea Vosough-Mohebbi et al.
Iran, more than 39% of all cultivated lands belongs to wheat, as the most important human food (Abdollahi 2008). There are many biotic and abiotic stresses which affecting the quality and quantity of crops in the coun-try (Sheikh Beig Goharrizi et al. 2016; Sheikh-Moham-adi et al. 2018; Sanjari et al., 2019). Powdery mildew caused by fungal pathogen Blumeria graminis is one of the most devastating diseases of wheat, occurring in regions with cool and humid climate that particularly is very conducive for the development of this disease (Chang et al. 2019; Liu N et al. 2019). Iran is one of the most important primary centers of the wheat distribu-tion, thereby it has one of the richest wheat germplasm worldwide. Therefore, the wild wheat relatives in the area could be a source of novel resistance genes to be transferred into wheat cultivars (Pour-Aboughadareh et al. 2018). Also, this rich wheat germplasm can be used as a valuable material for better understanding of the molecular mechanisms involved in the wheat-pathogen interaction (Brunner et al. 2012). Traditional breeding has been used to transmitting resistant genes to sus-ceptible wheat cultivars, by this method some powdery mildew resistant genes were discovered (Xin et al. 2012). Traditional breeding is based on the phenotype, there-fore less information can derived and some traits, such as disease resistance, cannot be observed easily (Chen H et al. 2014). The microarray technology provides us a lot of information about the genes. Recognizing new genes and analyzing their expression in response to powdery mildew will provide a valuable molecular informa-tion for enhancing disease resistance in the plant and microarray analysis could provide a plethora of gene expression profiles (Xin et al. 2011). Microarray has been widely used to detect the pathogen-resistant genes in wheat responding to different plant diseases. Li et al. (2018) identified 36 Lr39/41-resistance related differ-entially expressed genes at 48 h post inoculation (hpi) in leaf rust resistant and susceptible wheat isogenic lines. Foley et al. (2016) investigated the differentially expressed wheat genes in response to the Rhizoctonia solani isolate (AG8) and identified a significant number of genes involved in reactive oxygen species production and redox regulation. Erayman et al. (2015) examined the early response to Fusarium head blight in moder-ately susceptible and susceptible wheat cultivars at 12 hpi using microarray technology. The authors reported that 3668 genes were differentially expressed at least in one time comparison, which the majority of them were associated with disease response and the gene expres-sion mechanism. Putative transcription factor (TF) genes constitute 7% of all plant genes, they are pro-teins which play a major role in gene expression regula-
tion (Yazdani et al., 2020). Xin et al. (2012) examined the leaves transcriptomes before and after B. graminis inoculation in a susceptible and its near-isogenic wheat line and compared the result of microarray with qRT-PCR analyses. Since Iran has one of the richest wheat germplasm in the world however, limited studies has performed regarding pathogen resistant genes in the germplasm. Therefore the present study aimed to iden-tify differentially expressed genes and investigate their expression in response to B. graminis in both suscepti-ble and resistant wheat genotypes, using publicly avail-able microarray data set and qRT-PCR analysis.
MATERIALS AND METHODS
Plant material and growth condition
Two susceptible (Bolani) and resistant (KC2306) wheat genotypes to powdery mildew, were obtained from the National Plant Gene-bank, Karaj, Iran. The seeds of these two genotypes were planted in 10 cm diameter pots, at greenhouse condition. At the first fully expanded leaf stage, the plants inoculated with a patho-type (B. graminis) collected from Moghan, Ardabil, Iran (a local pathotype). Inoculation was performed by dust-ing or brushing conidia from neighboring sporulating susceptible seedlings onto the test seedlings. Leaf sam-ples of each genotype were collected at 0 and 12 hpi. The samples were stored in liquid nitrogen for qRT-PCR analysis.
In silico powdery mildew gene expression survey
In the present study we used a publicly available microarray data set published by Xin et al. (2011), avail-able at GEO (http://www.ncbi.nlm.nih.gov/gds/) with GSE27320 accession number. The authors used a sus-ceptible wheat cultivar ‘8866’ and it’s near isogenic line with single powdery mildew resistance gene. The differ-entially expressed sequences were homology searched against wheat transcription factor (TF) database (http://planttfdb.cbi.pku.edu.cn/), and then BLAST analysis with a strict cutoff e-value <1 × 10⁻⁵ was performed. Venn diagram was generated to find the differentially expressed genes between the two genotypes and the TFs which up-regulated in the resistant genotype were selected. To confirm the authenticity of the selected TFs, Pfam proteins family database (https://pfam.xfam.org/) was used. Also, the hierarchical cluster algorithm was performed on the differentially expressed genes among the samples.
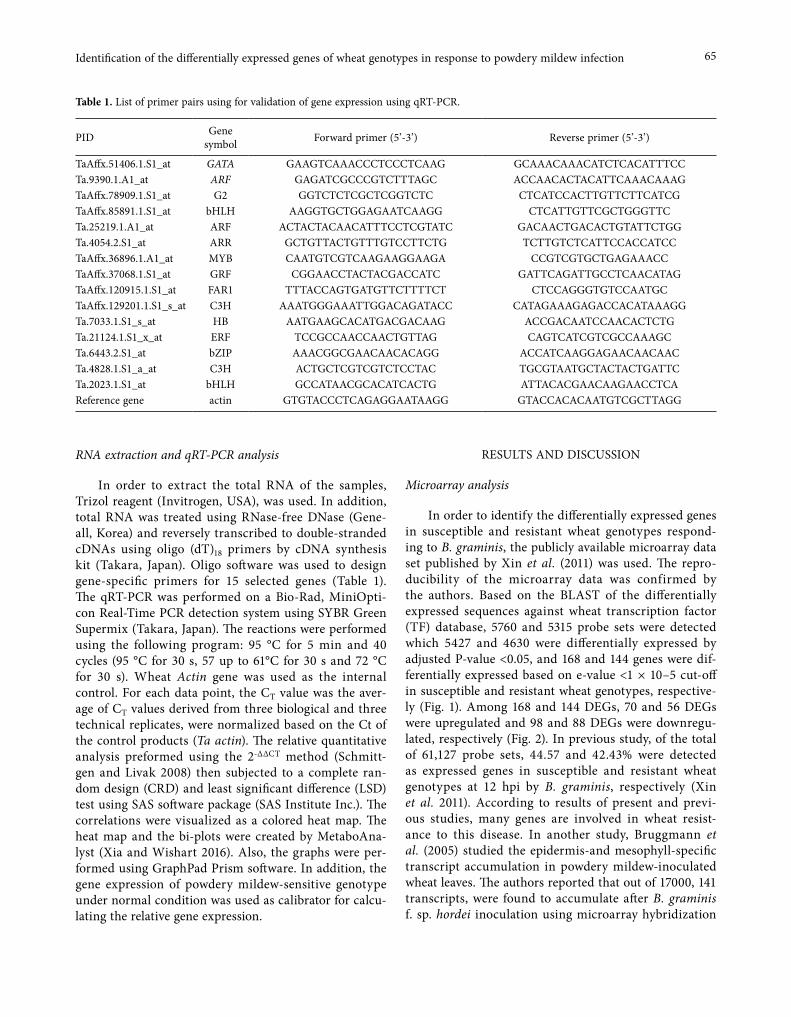
65Identification of the differentially expressed genes of wheat genotypes in response to powdery mildew infection
RNA extraction and qRT-PCR analysis
In order to extract the total RNA of the samples, Trizol reagent (Invitrogen, USA), was used. In addition, total RNA was treated using RNase-free DNase (Gene-all, Korea) and reversely transcribed to double-stranded cDNAs using oligo (dT)18 primers by cDNA synthesis kit (Takara, Japan). Oligo software was used to design gene-specific primers for 15 selected genes (Table 1). The qRT-PCR was performed on a Bio-Rad, MiniOpti-con Real-Time PCR detection system using SYBR Green Supermix (Takara, Japan). The reactions were performed using the following program: 95 °C for 5 min and 40 cycles (95 °C for 30 s, 57 up to 61°C for 30 s and 72 °C for 30 s). Wheat Actin gene was used as the internal control. For each data point, the CT value was the aver-age of CT values derived from three biological and three technical replicates, were normalized based on the Ct of the control products (Ta actin). The relative quantitative analysis preformed using the 2-ΔΔCT method (Schmitt-gen and Livak 2008) then subjected to a complete ran-dom design (CRD) and least significant difference (LSD) test using SAS software package (SAS Institute Inc.). The correlations were visualized as a colored heat map. The heat map and the bi-plots were created by MetaboAna-lyst (Xia and Wishart 2016). Also, the graphs were per-formed using GraphPad Prism software. In addition, the gene expression of powdery mildew-sensitive genotype under normal condition was used as calibrator for calcu-lating the relative gene expression.
RESULTS AND DISCUSSION
Microarray analysis
In order to identify the differentially expressed genes in susceptible and resistant wheat genotypes respond-ing to B. graminis, the publicly available microarray data set published by Xin et al. (2011) was used. The repro-ducibility of the microarray data was confirmed by the authors. Based on the BLAST of the differentially expressed sequences against wheat transcription factor (TF) database, 5760 and 5315 probe sets were detected which 5427 and 4630 were differentially expressed by adjusted P-value <0.05, and 168 and 144 genes were dif-ferentially expressed based on e-value <1 × 10⁻⁵ cut-off in susceptible and resistant wheat genotypes, respective-ly (Fig. 1). Among 168 and 144 DEGs, 70 and 56 DEGs were upregulated and 98 and 88 DEGs were downregu-lated, respectively (Fig. 2). In previous study, of the total of 61,127 probe sets, 44.57 and 42.43% were detected as expressed genes in susceptible and resistant wheat genotypes at 12 hpi by B. graminis, respectively (Xin et al. 2011). According to results of present and previ-ous studies, many genes are involved in wheat resist-ance to this disease. In another study, Bruggmann et al. (2005) studied the epidermis-and mesophyll-specific transcript accumulation in powdery mildew-inoculated wheat leaves. The authors reported that out of 17000, 141 transcripts, were found to accumulate after B. graminis f. sp. hordei inoculation using microarray hybridization
Table 1. List of primer pairs using for validation of gene expression using qRT-PCR.
PID Gene symbol Forward primer (5’-3’) Reverse primer (5’-3’)
TaAffx.51406.1.S1_at GATA GAAGTCAAACCCTCCCTCAAG GCAAACAAACATCTCACATTTCCTa.9390.1.A1_at ARF GAGATCGCCCGTCTTTAGC ACCAACACTACATTCAAACAAAGTaAffx.78909.1.S1_at G2 GGTCTCTCGCTCGGTCTC CTCATCCACTTGTTCTTCATCGTaAffx.85891.1.S1_at bHLH AAGGTGCTGGAGAATCAAGG CTCATTGTTCGCTGGGTTCTa.25219.1.A1_at ARF ACTACTACAACATTTCCTCGTATC GACAACTGACACTGTATTCTGGTa.4054.2.S1_at ARR GCTGTTACTGTTTGTCCTTCTG TCTTGTCTCATTCCACCATCCTaAffx.36896.1.A1_at MYB CAATGTCGTCAAGAAGGAAGA CCGTCGTGCTGAGAAACCTaAffx.37068.1.S1_at GRF CGGAACCTACTACGACCATC GATTCAGATTGCCTCAACATAGTaAffx.120915.1.S1_at FAR1 TTTACCAGTGATGTTCTTTTCT CTCCAGGGTGTCCAATGCTaAffx.129201.1.S1_s_at C3H AAATGGGAAATTGGACAGATACC CATAGAAAGAGACCACATAAAGGTa.7033.1.S1_s_at HB AATGAAGCACATGACGACAAG ACCGACAATCCAACACTCTGTa.21124.1.S1_x_at ERF TCCGCCAACCAACTGTTAG CAGTCATCGTCGCCAAAGCTa.6443.2.S1_at bZIP AAACGGCGAACAACACAGG ACCATCAAGGAGAACAACAACTa.4828.1.S1_a_at C3H ACTGCTCGTCGTCTCCTAC TGCGTAATGCTACTACTGATTCTa.2023.1.S1_at bHLH GCCATAACGCACATCACTG ATTACACGAACAAGAACCTCAReference gene actin GTGTACCCTCAGAGGAATAAGG GTACCACACAATGTCGCTTAGG
66 Panthea Vosough-Mohebbi et al.
analysis. Our results were consistent with the previous studies that pathogen infection activates a wide range of genes and pathways in the transcriptional networks in wheat plant (Bolton et al. 2008; Coram et al. 2008; Boz-kurt et al. 2010). Among exclusively up regulated genes in the resistant genotype 12 hpi compared to its control, potential genes that may be responsible for B. graminis
infection resistance were detected (Table 2). For exam-ple, G2 (TaAffx.78909.1.S1_at) was the top upregulated gene with a log2 fold change of 3.39, and its expres-sion might has a function in stress and disease resist-ance (Liu F et al. 2016; Zeng et al. 2018). The bHLH1 (TaAffx.85891.1.S1_at) was also in the top fifteen upreg-ulated genes with a log2 fold change of 3.08, the plant bHLH transcription factors family have key function in regulation of developmental processes and environmen-tal stresses (Wang et al. 2015). However, limited infor-mation is available on their roles in wheat disease caused by pathogens infection. Another bHLH family member, bHLH2, was also revealed to be upregulated in resistant genotype.
Gene expression analysis
Fifteen potential genes that may be responsible for B. graminis infection resistance were selected for gene expression analysis by real-time PCR. The genes includ-ing ARF1, HB, C3H2, C3H1, bZIP, MYB, ARR, bHLH1, G2, FAR1, bHLH2, GATA, ERF, ARF2 and GR were selected among exclusively up regulated genes in the resistant genotype 12 hpi. The result of gene expression indicated that all the selected genes were upregulated in the resistant genotype, and HB, C3H2, C3H1, MYB, ARR, and bHLH1 genes were downregulated in the sus-ceptible genotype at 12 hpi compared to their controls (Fig 3). Based on the results of cluster analysis, the top fifteen genes were classified in four main groups (Fig. 4). The bZIP and ERF genes formed the first group, which their expressions were significant at 12 hpi in both geno-types compared to their control conditions (before inoc-
R-up R-down S-up S-down0
50
100
150
Num
ber o
f gen
es
56
8870
98
Figure 1. Venn diagrams showing the common and unique differ-entially expressed genes in S (red) and R (blue) genotypes detected (P-value < 0.05) and S-evalue (yellow) and R-evalue (green) based on e-value <1 × 10⁻⁵ cut-off.
Figure 2. Number of up- and down-regulated genes responsive to powdery mildew in susceptible and resistant genotypes.
Table 2. Top 15 exclusively upregulated genes in the resistant geno-type 12 hpi.
Probe set ID log2(fold change) Adj. P-Value P-Value
TaAffx.51406.1.S1_at 1.4868 0.0354 0.0023Ta.9390.1.A1_at 1.2165 0.0171 0.0006TaAffx.78909.1.S1_at 3.3896 0.0329 0.0021TaAffx.85891.1.S1_at 3.0839 0.0149 0.0004Ta.25219.1.A1_at 2.2206 0.0198 0.0008Ta.4054.2.S1_at 1.0219 0.0383 0.0027TaAffx.36896.1.A1_at 1.0314 0.0462 0.0037TaAffx.37068.1.S1_at 1.7241 0.0449 0.0036TaAffx.120915.1.S1_at 1.2725 0.0151 0.0004TaAffx.129201.1.S1_s_at 1.1133 0.0411 0.0031Ta.7033.1.S1_s_at 1.1329 0.0184 0.0006Ta.21124.1.S1_x_at 1.7122 0.0143 0.0004Ta.6443.2.S1_at 1.5355 0.0107 0.0002Ta.4828.1.S1_a_at 1.0126 0.0397 0.0029Ta.2023.1.S1_at 1.3044 0.0158 0.0005
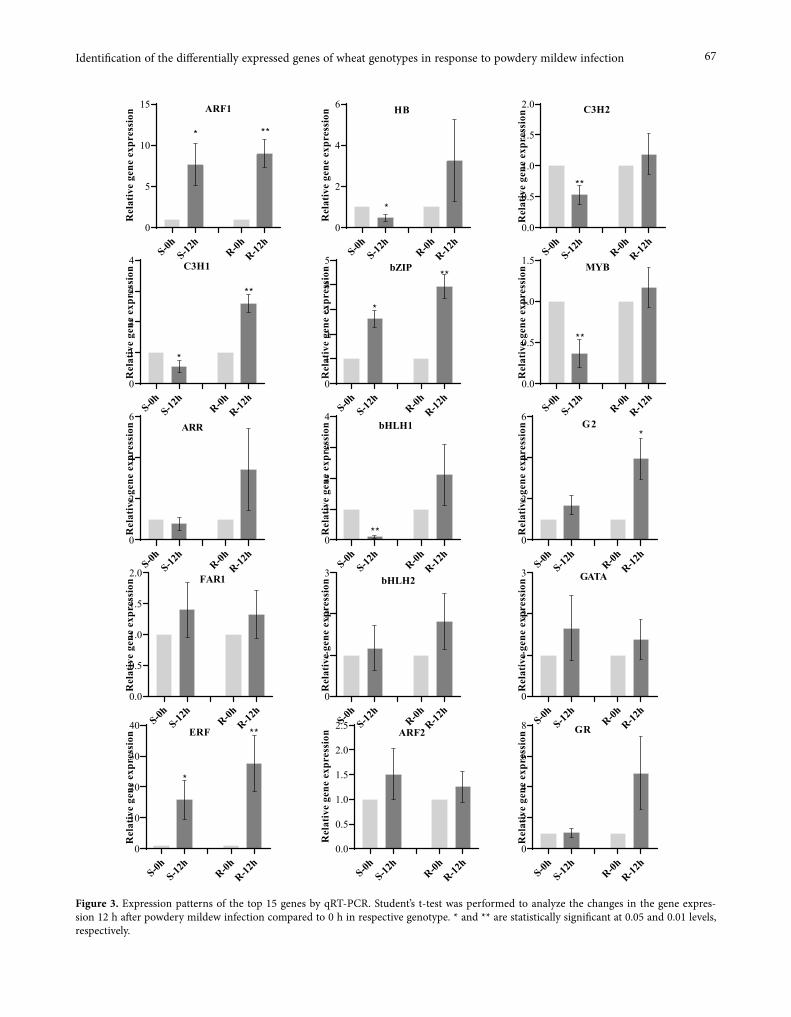
67Identification of the differentially expressed genes of wheat genotypes in response to powdery mildew infection
S-0hS-12
hR-0h
R-12h
0
5
10
15
Rel
ativ
e ge
ne e
xpre
ssio
n***
ARF1
S-0hS-12
hR-0h
R-12h
0
2
4
6
Rel
ativ
e ge
ne e
xpre
ssio
n
*
HB
S-0hS-12
hR-0h
R-12h
0.0
0.5
1.0
1.5
2.0
Rel
ativ
e ge
ne e
xpre
ssio
n
**
C3H2
S-0hS-12
hR-0h
R-12h
0
1
2
3
4
Rel
ativ
e ge
ne e
xpre
ssio
n
*
**
C3H1
S-0hS-12
hR-0h
R-12h
0
1
2
3
4
5
Rel
ativ
e ge
ne e
xpre
ssio
n*
**bZIP
S-0hS-12
hR-0h
R-12h
0.0
0.5
1.0
1.5
Rel
ativ
e ge
ne e
xpre
ssio
n
**
MYB
S-0hS-12
hR-0h
R-12h
0
2
4
6
Rel
ativ
e ge
ne e
xpre
ssio
n ARR
S-0hS-12
hR-0h
R-12h
0
1
2
3
4
Rel
ativ
e ge
ne e
xpre
ssio
n
**
bHLH1
S-0hS-12
hR-0h
R-12h
0
2
4
6
Rel
ativ
e ge
ne e
xpre
ssio
n G2*
S-0hS-12
hR-0h
R-12h
0.0
0.5
1.0
1.5
2.0
Rel
ativ
e ge
ne e
xpre
ssio
n FAR1
S-0hS-12
hR-0h
R-12h
0
1
2
3
Rel
ativ
e ge
ne e
xpre
ssio
n bHLH2
S-0hS-12
hR-0h
R-12h
0
1
2
3
Rel
ativ
e ge
ne e
xpre
ssio
n GATA
S-0hS-12
hR-0h
R-12h
0
10
20
30
40
Rel
ativ
e ge
ne e
xpre
ssio
n
*
**ERF
S-0hS-12
hR-0h
R-12h
0.0
0.5
1.0
1.5
2.0
2.5
Rel
ativ
e ge
ne e
xpre
ssio
n ARF2
S-0hS-12
hR-0h
R-12h
0
2
4
6
8
Rel
ativ
e ge
ne e
xpre
ssio
n GR
Figure 3. Expression patterns of the top 15 genes by qRT-PCR. Student’s t-test was performed to analyze the changes in the gene expres-sion 12 h after powdery mildew infection compared to 0 h in respective genotype. * and ** are statistically significant at 0.05 and 0.01 levels, respectively.

68 Panthea Vosough-Mohebbi et al.
ulation). There are different pathways including salicylic and jasmonic acids, and ethylene, which involved in the plant resistance against pathogens (Yuan et al. 2019). The ERF and bZIP transcription factors are two main families responding to pathogen attack due to their importance, abundance, and availability of function-ally well-characterized (Amorim et al. 2017). The result of present study showed that the expression of bZIP and ERF genes were upregulated in the genotypes, however this upregulation in resistant genotype was higher than the susceptible genotype. Many studies have shown that up-regulation and activation of bZIP and ERF tran-scription factor families are common as part of plant defense mechanism to response to pathogen attack (Tateda et al. 2008; Amorim et al. 2017; Tezuka et al. 2019). For examples, the bZIP60 gene was significantly up-regulated in Nicotina benthamiana in response to Pseudomonas cichorii inoculation, showing an involve-ment of the bZIP in the plant innate immunity (Tateda et al. 2008). An ERF transcription factor in Oriza sativa (OsERF83) was expressed in leaves in response to blast fungus infection and led to blast resistance by regulat-ing the expression of defense related genes (Tezuka et al. 2019). The result of PCA analysis, based on the first two main components showed that these two genes were far from the other genes (Fig 5), indicating different expres-sion patterns for the genes. This result was consistent with the cluster analysis. The high regulation and differ-ent expression patterns of these genes, indicating their important roles in responding to pathogen attack. Also, the result of correlation analysis showed a low and posi-tive correlation coefficient between these two genes.
The second group consisted of three genes includ-ing ARF1, ARF2, and G2 genes. ARF1 gene similar to
the genes in the first group was significantly upregu-lated in the susceptible and resistant genotypes 12 hpi compared to their control, however the upregulation in resistant genotype was higher than the susceptible genotype. This result was confirmed by PCA analysis, which had similar expression pattern with bZIP and ERF genes. In the present study the expression level of two auxin response factors were investigated. Recently, the ARFs were introduced as an active actor in plant resistance mechanism against different pathogens attack (Bouzroud et al. 2018). Similar to our results, two ARFs were detected in rice upon Magnaporthe grisea and Striga hermonthica infections (Ghanashyam and Jain 2009). Differential expression of ARF genes were observed in cotton in response to Fusarium oxyspo-rum f. sp vasinfectum infection (Dowd et al. 2004). Our results showed that the expression of both ARF genes were upregulated in the genotypes 12 hpi compared to their controls, indicating the importance of auxin pathway in wheat resistance mechanism against the B. graminis. The result of gene expression revealed that G2 gene was significantly upregulated in the resistant geno-type, while it was not significant for susceptible geno-type 12 hpi compared to their controls. The result of real time PCR confirmed the result of microarray anal-ysis, in both analyses G2 was highly upregulated in the resistant genotype. Previous studies have shown that G2 plays an important role in disease defense mechanism
Figure 4. Hierarchical clustering analysis of the top 15 differentially expressed genes among the susceptible and resistant samples.
Figure 5. Bi-plot derived from PCA analysis based on the top 15 genes.
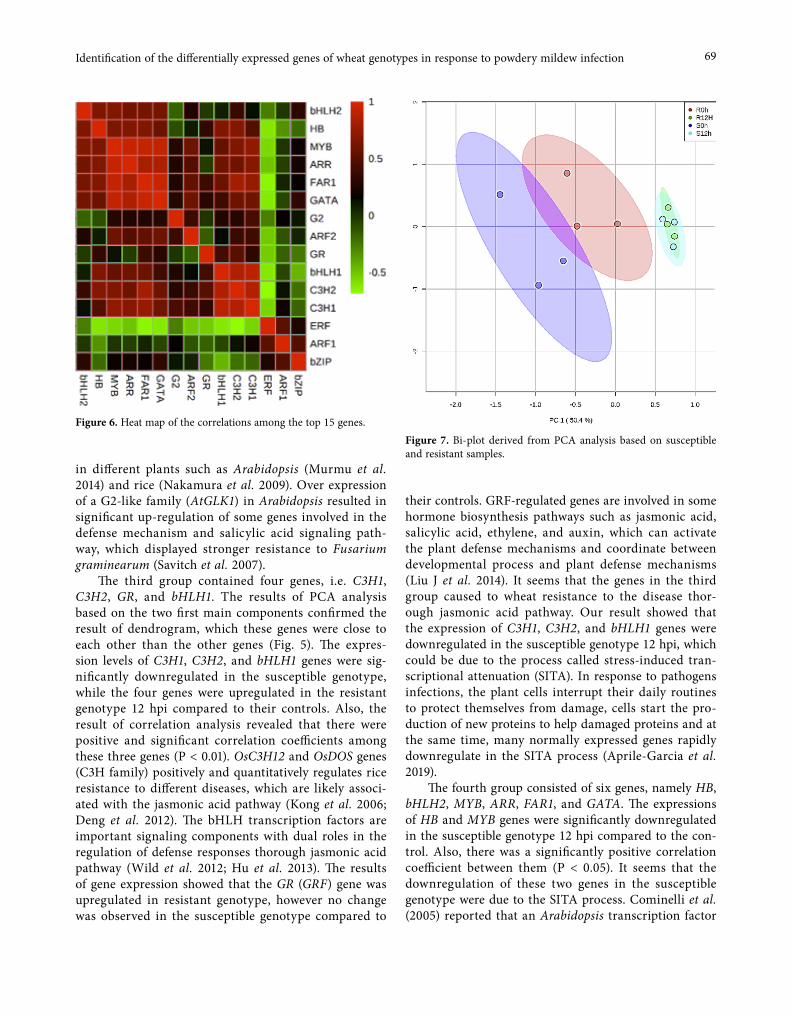
69Identification of the differentially expressed genes of wheat genotypes in response to powdery mildew infection
in different plants such as Arabidopsis (Murmu et al. 2014) and rice (Nakamura et al. 2009). Over expression of a G2-like family (AtGLK1) in Arabidopsis resulted in significant up-regulation of some genes involved in the defense mechanism and salicylic acid signaling path-way, which displayed stronger resistance to Fusarium graminearum (Savitch et al. 2007).
The third group contained four genes, i.e. C3H1, C3H2, GR, and bHLH1. The results of PCA analysis based on the two first main components confirmed the result of dendrogram, which these genes were close to each other than the other genes (Fig. 5). The expres-sion levels of C3H1, C3H2, and bHLH1 genes were sig-nificantly downregulated in the susceptible genotype, while the four genes were upregulated in the resistant genotype 12 hpi compared to their controls. Also, the result of correlation analysis revealed that there were positive and significant correlation coefficients among these three genes (P < 0.01). OsC3H12 and OsDOS genes (C3H family) positively and quantitatively regulates rice resistance to different diseases, which are likely associ-ated with the jasmonic acid pathway (Kong et al. 2006; Deng et al. 2012). The bHLH transcription factors are important signaling components with dual roles in the regulation of defense responses thorough jasmonic acid pathway (Wild et al. 2012; Hu et al. 2013). The results of gene expression showed that the GR (GRF) gene was upregulated in resistant genotype, however no change was observed in the susceptible genotype compared to
their controls. GRF-regulated genes are involved in some hormone biosynthesis pathways such as jasmonic acid, salicylic acid, ethylene, and auxin, which can activate the plant defense mechanisms and coordinate between developmental process and plant defense mechanisms (Liu J et al. 2014). It seems that the genes in the third group caused to wheat resistance to the disease thor-ough jasmonic acid pathway. Our result showed that the expression of C3H1, C3H2, and bHLH1 genes were downregulated in the susceptible genotype 12 hpi, which could be due to the process called stress-induced tran-scriptional attenuation (SITA). In response to pathogens infections, the plant cells interrupt their daily routines to protect themselves from damage, cells start the pro-duction of new proteins to help damaged proteins and at the same time, many normally expressed genes rapidly downregulate in the SITA process (Aprile-Garcia et al. 2019).
The fourth group consisted of six genes, namely HB, bHLH2, MYB, ARR, FAR1, and GATA. The expressions of HB and MYB genes were significantly downregulated in the susceptible genotype 12 hpi compared to the con-trol. Also, there was a significantly positive correlation coefficient between them (P < 0.05). It seems that the downregulation of these two genes in the susceptible genotype were due to the SITA process. Cominelli et al. (2005) reported that an Arabidopsis transcription factor
Figure 6. Heat map of the correlations among the top 15 genes.Figure 7. Bi-plot derived from PCA analysis based on susceptible and resistant samples.
70 Panthea Vosough-Mohebbi et al.
(AtMYB60) involved in stomata movement, which rap-idly downregulated by stress. One of the plants defense mechanism to pathogen attack, is closing their stomata to prevent pathogen entry (Arnaud and Hwang 2015). It seems that the susceptible genotype downregulated the MYB gene to close the stomata and preventing pathogen entry, which can be a part of SITA process. The results demonstrated that all genes in the fourth group were up regulated in the resistant genotype 12 hpi compared to the control, however none of them was statistically sig-nificant. The roles of these transcription factors in plant pathogen resistant were reported in different studies. For example, Zhang et al. (2018) studied the expression pat-tern of TFs in resistant (Vernicia montana) and suscep-tible (V. fordii) tung trees responding to Fusarium wilt disease. The authors reported that the MYB and bHLH families had the largest number of TFs among 59 dif-ferent families in both V. fordii and V. montana spe-cies during the four infection stages. According to the result of correlation analysis all the genes in the fourth group had a significant correlation coefficient with each other (P < 0.05 or P < 0.01), although the highest cor-relation coefficient among the studied genes was between GATA and FAR1 (r=0.94, P < 0.01). According to the PCA analysis based on the genotypes, the two first main components confirmed more than 68% of total variance (Fig. 7). It was obvious from the figure 7, the main vari-ance of PC1 (50.4%) and PC2 (17.8%) were explained by infection treatment (0 and 12 hpi) and genotype fac-tors, respectively. Usually under similar conditions, genetic factors are the main source of variances among the samples (Hassanabadi et al. 2019; Farajpour et al., 2017). Finally, the result of PCA confirmed the results of microarray and real time PCR analyses.
CONCLUSIONS
In the present study, the publicly available wheat microarray data set and the real time PCR analysis were used to study the transcriptomes and gene expres-sion of susceptible (Bolani) and resistant (KC2306) wheat genotypes in response to powdery mildew. A total of 5760 and 5315 probe sets were detected which 5427 and 4630 were differentially expressed by adjusted P-value < 0.05, in susceptible and resistant wheat gen-otypes, respectively. Among exclusively up regulated genes in the resistant genotype 12 hpi compared to its control, fifteen potential genes that may be responsible for B. graminis inoculation resistance were detected. The results of real time PCR for the candidate genes showed that the genes were upregulated in the resist-
ant genotype 12 hpi compared to its control, which validated the results of microarray analysis. Our results illustrated aforementioned genes positively regulated resistance mechanism to powdery mildew infection. Also, they may be good candidate genes for studying and improving resistance to powdery mildew in wheat. The powdery mildew responsive genes identified in the present study will give us a better understanding on molecular mechanisms involved in B. graminis resist-ance in different wheat genotypes.
REFERENCES
Abdollahi M. 2008. Comparison of some Indian popu-lations of cereal cyst nematode, Heterodera avenae (Wollenweber, 1924) using RAPD. Proc Pakistan Acad Sci. 45:1-10.
Amorim A, Lidiane L, da Fonseca dos Santos R, Pacif-ico Bezerra Neto J, Guida-Santos M, Crovella S, Maria Benko-Iseppon A. 2017. Transcription factors involved in plant resistance to pathogens. Curr Pro-tein Pept Sci. 18(4):335-351.
Aprile-Garcia F, Tomar P, Hummel B, Khavaran A, Sawarkar R. 2019. Nascent-protein ubiquitination is required for heat shock–induced gene downregula-tion in human cells. Nat Struct Mol Biol. 26(2):137.
Arnaud D, Hwang I. 2015. A sophisticated network of signaling pathways regulates stomatal defenses to bacterial pathogens. Mol Plant. 8(4):566-581.
Bolton MD, Kolmer JA, Xu WW, Garvin DF. 2008. Lr34-mediated leaf rust resistance in wheat: transcript pro-filing reveals a high energetic demand supported by transient recruitment of multiple metabolic pathways. Mol Plant Microbe In. 21(12):1515-1527.
Bouzroud S, Gouiaa S, Hu N, Bernadac A, Mila I, Bendaou N, Smouni A, Bouzayen M, Zouine M. 2018. Auxin response factors (ARFs) are poten-tial mediators of auxin action in tomato response to biotic and abiotic stress (Solanum lycopersicum). PloS one. 13(2):e0193517.
Bozkurt TO, McGrann GR, MacCormack R, Boyd LA, Akkaya MS. 2010. Cellular and transcriptional responses of wheat during compatible and incom-patible race‐specific interactions with Puccinia strii-formis f. sp. tritici. Mol Plant Pathol. 11(5):625-640.
Bruggmann R, Abderhalden O, Reymond P, Dudler R. 2005. Analysis of epidermis-and mesophyll-specific transcript accumulation in powdery mildew-inocu-lated wheat leaves. Plant Mol Biol. 58(2):247-267.
Brunner S, Stirnweis D, Diaz Quijano C, Buesing G, Her-ren G, Parlange F, Barret P, Tassy C, Sautter C, Win-
71Identification of the differentially expressed genes of wheat genotypes in response to powdery mildew infection
zeler M. 2012. Transgenic Pm3 multilines of wheat show increased powdery mildew resistance in the field. Plant Biotechnol J. 10(4):398-409.
Chang X, Luo L, Liang Y, Hu Y, Luo P, Gong G, Chen H, Khaskheli M, Liu T, Chen W. 2019. Papilla formation, defense gene expression and HR contribute to the powdery mildew resistance of the novel wheat line L699 carrying Pm40 gene. Physiological and Molecu-lar Plant Pathology. 106:208-216.
Chen H, Xie W, He H, Yu H, Chen W, Li J, Yu R, Yao Y, Zhang W, He Y. 2014. A high-density SNP geno-typing array for rice biology and molecular breeding. Mol Plant. 7(3):541-553.
Chen S, Wang J, Deng G, Chen L, Cheng X, Xu H, Zhan K. 2018. Interactive effects of multiple vernalization (Vrn-1)-and photoperiod (Ppd-1)-related genes on the growth habit of bread wheat and their association with heading and flowering time. BMC Plant Biol. 18(1):374.
Cominelli E, Galbiati M, Vavasseur A, Conti L, Sala T, Vuylsteke M, Leonhardt N, Dellaporta SL, Tonelli C. 2005. A guard-cell-specific MYB transcription factor regulates stomatal movements and plant drought tol-erance. Current biology. 15(13):1196-1200.
Coram TE, Settles ML, Chen X. 2008. Transcriptome anal-ysis of high‐temperature adult‐plant resistance condi-tioned by Yr39 during the wheat–Puccinia striiformis f. sp. tritici interaction. Mol Plant Pathol. 9(4):479-493.
Deng H, Liu H, Li X, Xiao J, Wang S. 2012. A CCCH-type zinc finger nucleic acid-binding protein quanti-tatively confers resistance against rice bacterial blight disease. Plant Physiol. 158(2):876-889.
Dowd C, Wilson IW, McFadden H. 2004. Gene expres-sion profile changes in cotton root and hypoco-tyl tissues in response to infection with Fusarium oxysporum f. sp. vasinfectum. Mol Plant Microbe In. 17(6):654-667.
Erayman M, Turktas M, Akdogan G, Gurkok T, Inal B, Ishakoglu E, Ilhan E, Unver T. 2015. Transcriptome analysis of wheat inoculated with Fusarium gramine-arum. Front Plant Sci. 6:867.
Farajpour M, Ebrahimi M, Baghizadeh A, Aalifar M. 2017. Phytochemical and yield variation among Iranian Achillea millefolium accessions. HortSci-ence. 52(6):827-830.
Foley RC, Kidd BN, Hane JK, Anderson JP, Singh KB. 2016. Reactive oxygen species play a role in the infec-tion of the necrotrophic fungi, Rhizoctonia solani in wheat. PLoS One. 11(3):e0152548.
Ghanashyam C, Jain M. 2009. Role of auxin-responsive genes in biotic stress responses. Plant Signal Behav. 4(9):846-848.
Gill BS, Appels R, Botha-Oberholster A-M, Buell CR, Bennetzen JL, Chalhoub B, Chumley F, Dvořák J, Iwanaga M, Keller B. 2004. A workshop report on wheat genome sequencing: International Genome Research on Wheat Consortium. Genetics. 168(2):1087-1096.
Hassanabadi M, Ebrahimi M, Farajpour M, Dejahang A. 2019. Variation in essential oil components among Iranian Ferula assa-foetida L. accessions. Industrial Crops and Products. 140:11598.
Hu P, Zhou W, Cheng Z, Fan M, Wang L, Xie D. 2013. JAV1 controls jasmonate-regulated plant defense. Mol Cell. 50(4):504-515.
Kong Z, Li M, Yang W, Xu W, Xue Y. 2006. A novel nuclear-localized CCCH-type zinc finger protein, OsDOS, is involved in delaying leaf senescence in rice. Plant Physiol. 141(4):1376-1388.
Li X, Wang X, Kang Z, Ren Z, Bi W, Yang W, Liu D. 2018. Suppression subtractive hybridization and microarray analysis reveal differentially expressed genes in the Lr39/41-mediated wheat resistance to Puccinia trit-icina. Eur J Plant Pathol. 152(2):479-492.
Liu F, Xu Y, Han G, Zhou L, Ali A, Zhu S, Li X. 2016. Molecular evolution and genetic variation of G2-like transcription factor genes in maize. PloS one. 11(8):e0161763.
Liu J, Rice JH, Chen N, Baum TJ, Hewezi T. 2014. Syn-chronization of developmental processes and defense signaling by growth regulating transcription factors. PloS one. 9(5):e98477.
Liu N, Lei Y, Zhang M, Zheng W, Shi Y, Qi X, Chen H, Zhou Y, Gong G. 2019. Latent Infection of Powdery Mildew on Volunteer Wheat in Sichuan Province, China. Plant Dis.PDIS-06-18-1003-RE.
Murmu J, Wilton M, Allard G, Pandeya R, Desveaux D, Singh J, Subramaniam R. 2014. A rabidopsis GOLD-EN2‐LIKE (GLK) transcription factors activate jas-monic acid (JA)‐dependent disease susceptibility to the biotrophic pathogen H yaloperonospora arabi-dopsidis, as well as JA‐independent plant immunity against the necrotrophic pathogen Botrytis cinerea. Mol Plant Pathol. 15(2):174-184.
Nakamura H, Muramatsu M, Hakata M, Ueno O, Naga-mura Y, Hirochika H, Takano M, Ichikawa H. 2009. Ectopic overexpression of the transcription factor OsGLK1 induces chloroplast development in non-green rice cells. Plant Cell Physiol. 50(11):1933-1949.
Pour-Aboughadareh A, Ahmadi J, Mehrabi AA, Etmi-nan A, Moghaddam M. 2018. Insight into the genetic variability analysis and relationships among some Aegilops and Triticum species, as genome progenitors
72 Panthea Vosough-Mohebbi et al.
of bread wheat, using SCoT markers. Plant Biosyst. 152(4):694-703.
Savitch LV, Subramaniam R, Allard GC, Singh J. 2007. The GLK1 ‘regulon’encodes disease defense related proteins and confers resistance to Fusarium gramine-arum in Arabidopsis. Biochem Biophys Res Com-mun. 359(2):234-238.
Schmittgen TD, Livak KJ. 2008. Analyzing real-time PCR data by the comparative C T method. Nat Prot. 3(6):1101.
Sanjari S, Shirzadian-Khorramabad R, Shobbar ZS, Shah-bazi M. 2019. Systematic analysis of NAC transcrip-tion factors’ gene family and identification of post-flowering drought stress responsive members in sor-ghum. Plant Cell Reports. 38(3):361-376.
Sheikh-Mohamadi M-H, Etemadi N, Nikbakht A, Fara-jpour M, Arab M, Majidi MM. 2018. Wheatgrass ger-mination and seedling growth under osmotic stress. Agronomy Journal. 110(2):572-585.
Sheikh Beig Goharrizi M, Dejahang A, Tohidfar M, Izadi Darbandi A, Carrillo NJ, Hajirezaei M, Vahdati K. 2016. Agrobacterium mediated transformation of somatic embryos of Persian walnut using fld gene for osmotic stress tolerance. Journal of Agricultural Sci-ence and Technology. 18:423-435.
Tateda C, Ozaki R, Onodera Y, Takahashi Y, Yamagu-chi K, Berberich T, Koizumi N, Kusano T. 2008. NtbZIP60, an endoplasmic reticulum-localized tran-scription factor, plays a role in the defense response against bacterial pathogens in Nicotiana tabacum. J Plant Res. 121(6):603-611.
Tezuka D, Kawamata A, Kato H, Saburi W, Mori H, Imai R. 2019. The rice ethylene response factor OsERF83 posi-tively regulates disease resistance to Magnaporthe ory-zae. Plant physiology and biochemistry. 135:263-271.
Vetch JM, Stougaard RN, Martin JM, Giroux MJ. 2019. Revealing the genetic mechanisms of pre-harvest sprouting in hexaploid wheat (Triticum aestivum L.). Plant Sci.
Wang F, Lin R, Feng J, Qiu D, Chen W, Xu S. 2015. Wheat bHLH transcription factor gene, TabHLH060, enhances susceptibility of transgenic Arabidopsis thaliana to Pseudomonas syringae. Physiological and molecular plant pathology. 90:123-130.
Wild M, Davière J-M, Cheminant S, Regnault T, Baum-berger N, Heintz D, Baltz R, Genschik P, Achard P. 2012. The Arabidopsis DELLA RGA-LIKE3 is a direct target of MYC2 and modulates jasmonate sign-aling responses. Plant Cell. 24(8):3307-3319.
Xia J, Wishart DS. 2016. Using MetaboAnalyst 3.0 for comprehensive metabolomics data analysis. Curr Protoc Bioin. 55(1):14.10. 11-14.10. 91.
Xin M, Wang X, Peng H, Yao Y, Xie C, Han Y, Ni Z, Sun Q. 2012. Transcriptome comparison of susceptible and resistant wheat in response to powdery mildew infection. Genom Proteom Bioinf. 10(2):94-106.
Xin M, Wang Y, Yao Y, Song N, Hu Z, Qin D, Xie C, Peng H, Ni Z, Sun Q. 2011. Identification and char-acterization of wheat long non-protein coding RNAs responsive to powdery mildew infection and heat stress by using microarray analysis and SBS sequenc-ing. BMC Plant Biol. 11(1):61.
Yazdani B, Sanjari S, Asghari-Zakaria R, Ghanegolmo-hammadi F, Pourabed E, Shahbazi M, Shobbar Z. 2020. Revision of the barley WRKY gene family phy-logeny and expression analysis of the candidate genes in response to drought. Biologia Plantarum. 64:9-19.
Yuan M, Huang Y, Ge W, Jia Z, Song S, Zhang L, Huang Y. 2019. Involvement of jasmonic acid, ethylene and salicylic acid signaling pathways behind the systemic resistance induced by Trichoderma longibrachiatum H9 in cucumber. BMC Genomics. 20(1):144.
Zeng L, Liu X, Zhou Z, Li D, Zhao X, Zhu L, Luo Y, Hu S. 2018. Identification of a G2-like transcription fac-tor, OsPHL3, functions as a negative regulator of flowering in rice by co-expression and reverse genetic analysis. BMC Plant Biol. 18(1):157.
Zhang Q, Gao M, Wu L, Wu H, Chen Y, Wang Y. 2018. Expression network of transcription factors in resist-ant and susceptible tung trees responding to Fusar-ium wilt disease. Industrial crops and products. 122:716-725.

Caryologia. International Journal of Cytology, Cytosystematics and Cytogenetics 73(2): 73-80, 2020
Firenze University Press www.fupress.com/caryologiaCaryologia
International Journal of Cytology, Cytosystematics and Cytogenetics
ISSN 0008-7114 (print) | ISSN 2165-5391 (online) | DOI: 10.13128/caryologia-135
Citation: S. Mohsenzadeh, M. Sheidai, F. Koohdar (2020) Populations genetic study of the medicinal species Planta-go afra L. (Plantaginaceae). Caryologia 73(2): 73-80. doi: 10.13128/caryolo-gia-135
Received: April 26, 2019
Accepted: February 23, 2020
Published: July 31, 2020
Copyright: © 2020 S. Mohsenza-deh, M. Sheidai, F. Koohdar. This is an open access, peer-reviewed article published by Firenze University Press (http://www.fupress.com/caryologia) and distributed under the terms of the Creative Commons Attribution License, which permits unrestricted use, distri-bution, and reproduction in any medi-um, provided the original author and source are credited.
Data Availability Statement: All rel-evant data are within the paper and its Supporting Information files.
Competing Interests: The Author(s) declare(s) no conflict of interest.
Populations genetic study of the medicinal species Plantago afra L. (Plantaginaceae)
Saeed Mohsenzadeh*, Masoud Sheidai, Fahimeh Koohdar
Faculty of Life Sciences & Biotechnology, Shahid Beheshti University, Tehran, Iran*Corresponding author. E-mail: [email protected]
Abstract. Plantago afra (Plantaginaceae) is the most medicinally important species in genus Plantago and it is native to the western Mediterranean region, West Asia and North Africa, and cultivated extensively in Asia and Europe for seed husk known as black Psyllium. We have no data on the population genetic structure of this species in the world. Therefore a population genetic and morphological investigation was per-formed through light on genetic and morphological variability in this taxa. We used ISSR molecular markers for population genetic investigation. Genetic diversity analyses revealed a moderate genetic variability within Plantago afra, while PCoA showed some degree of genetic admixture among populations. AMOVA produced significant genetic difference among populations. The Mantel test showed a positive significant correla-tion between the genetic and geographic distance of the studied populations. STRUC-TURE analysis showed that there are different genetic groups in the studied popula-tions. Morphometric analysis showed that one population differed in seed color and mean stem diameter. The same population contained specific allele combinations and differed genetically from the rest of the studied populations. Therefore, we considered it as a new variety within Plantago afra.
Keywords: Plantago afra, ISSR, PCoA, STRUCTURE analysis.
INTRODUCTION
Genus Plantago L. is the largest genus of the Plantaginaceae family which contains more than 200 annual and perennial herbs and subshrubs with a worldwide distribution (Rahn 1996; Rønsted et al. 2002).
Most species of the genus Plantago are small, with rosette leaves, ovoid and cylindrical spikes that contain tiny flowers. Plantago species have been used in both conventional and traditional systems of medicine throughout Asia, Europe, and North America (Sarihan et al. 2005; Goncalves and Roma-no 2016). Moreover, few species like P. afra L. and P. ovata Forssk. are high-ly valued in the nutraceutical, pharmaceutical and cosmetic industries The polysaccharides obtained from husks in these species can improve intestinal performance, obesity, high cholesterol, colon cancer, constipation and diabe-tes (Goncalves and Romano 2016).
74 Saeed Mohsenzadeh, Masoud Sheidai, Fahimeh Koohdar
P. afra (syn. P. psyllium L.) is native to the western Mediterranean region, West Asia, and North Africa. It is an Annual herb with well-developed stems (grow up to 40 cm long), leaves narrow-linear and opposite or whorl covered sparsely with short, hard and glandular hairs (Kazmi 1974). This medicinal plant species grows in different regions of the country and forms several local populations. We have no information on genetic diversity and available gene pools in this species. Popu-lation genetic studies is a proper approach to investigate geographical populations within a single species and to identify divergent plant populations, both in genetic content as well as morphological differentiation (Sheidai et al. 2016a,b, 2018).
Population genetic analyses provide valuable data on the rate of genetic divergence, genetic variability within/between populations, self-pollination versus outcrossing, gene flow and inbreeding. Also, data regarding morpho-logical differentiation among populations, together with data on genetic diversity, are vital to support population management and conservation strategies (Zanella et al. 2011; Sheidai et al. 2016a).
Different molecular markers have been used in population genetic studies such as neutral multi-locus markers (RAPD, RFLP, ISSR, SSR, SRAP, AFLP, etc.) and gene sequence data (cp-DNA, nuclear ITS, ETS, etc.) (Ferreira et al. 2013; Mosaferi et al. 2015; Sheidai et al. 2013, 2016a,b, 2018). In the present work, we carried out population genetic analyses of P. afra by using inter-sim-ple sequence repeats (ISSR) markers as they are repro-ducible, and cheap in cost (Sheidai et al. 2013; 2016 a,b; Safaei et al. 2016).
Morphological analyses of these populations were also performed to study if genetic divergence in popula-tions is accompanied by morphological differentiation.
MATERIAL & METHODS
Plant materials
For the present study, 88 plant accessions were col-lected from 10 geographical populations in two provinc-es of Fars and Bushehr, that are located in South of Iran. Details of localities are provided in Table 1. The voucher specimens are deposited in the Herbarium of Shahid Beheshti University (HSBU). Identification of P. afra was done by using different references (Patzak & Rechinger 1965; Kazmi 1974; Sell et al. 2010).
DNA extraction and PCR details
Total DNA was extracted from 40 mg of leaf tissue by using CTAB-activated charcoal protocol (Križman et al. 2006). Quality of extracted DNA was examined by running on 0.8% agarose gel.
Each ISSR amplification was performed in a 25μL volume containing 20 ng of genomic DNA, 10 mM Tris-HCl buffer at pH 8, 50 mM KCl, 1.5 mM MgCl2, 0.2 μM of a single primer, 0.2 mM of each dNTP and 3 U of Taq DNA polymerase (Bioron Germany).
ISSR analyses
The ISSR primers employed were (GA)9A, (GA)9T, UBC 807, UBC 811, UBC 810, UBC 834, CAG(GA)7, (CA)7AC, (CA)7AT and (CA)7GT commercialized by the University of British Columbia. Amplification reactions were done in a Techne thermocycler (Germany) with the following program: 5 min for initial denaturation step at 94 °C, 1 min at 94 °C, 45s at 55 °C, 2 min at 72 °C and a final run of 10 min at 72°C. The amplification products were visualized by running on 1% agarose gel, followed
Table 1. The studied populations, their localities and voucher numbers.
Pop. Locality Longitude Latitude Altitude (m) Voucher no.
1 Fars, Kazeroun, Taleghanei mountain 51°40’13” 29°38’29” 970 HSBU-20184102 Fars, Kazeroun, Aboali village 51°42’2” 29°31’32” 838 HSBU-20184113 Fars, Kazeroun, mountains around Baladeh village 51°56’48” 29°17’22” 781 HSBU-20184124 Fars, Farashband, Nougin village 52°0’46” 29°10’16” 740 HSBU-20184135 Fars, Bishapour 51°35’21” 29°44’43” 840 HSBU-20184146 Fars, mountains around Ghaemieh 51°25’21” 29°50’26” 928 HSBU-20184157 Fars, mountains around Noorabad 51°35’1” 29°58’51” 1080 HSBU-20184168 Fars, Konartakhteh 51°24’40” 29°31’45” 512 HSBU-20184179 Bushehr, Dalaki 51°17’10” 29°25’13” 83 HSBU-201841810 Bushehr, Chahkhani village 51°6’27” 29°11’42” 20 HSBU-2018419
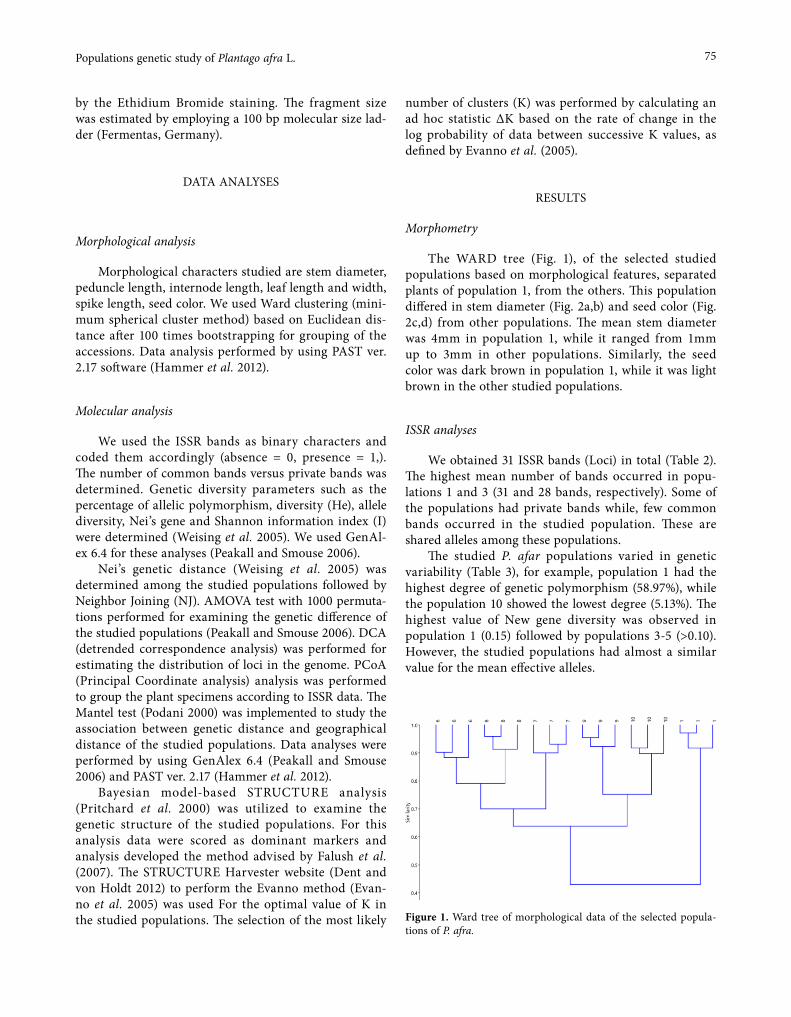
75Populations genetic study of Plantago afra L.
by the Ethidium Bromide staining. The fragment size was estimated by employing a 100 bp molecular size lad-der (Fermentas, Germany).
DATA ANALYSES
Morphological analysis
Morphological characters studied are stem diameter, peduncle length, internode length, leaf length and width, spike length, seed color. We used Ward clustering (mini-mum spherical cluster method) based on Euclidean dis-tance after 100 times bootstrapping for grouping of the accessions. Data analysis performed by using PAST ver. 2.17 software (Hammer et al. 2012).
Molecular analysis
We used the ISSR bands as binary characters and coded them accordingly (absence = 0, presence = 1,). The number of common bands versus private bands was determined. Genetic diversity parameters such as the percentage of allelic polymorphism, diversity (He), allele diversity, Nei’s gene and Shannon information index (I) were determined (Weising et al. 2005). We used GenAl-ex 6.4 for these analyses (Peakall and Smouse 2006).
Nei’s genetic distance (Weising et al. 2005) was determined among the studied populations followed by Neighbor Joining (NJ). AMOVA test with 1000 permuta-tions performed for examining the genetic difference of the studied populations (Peakall and Smouse 2006). DCA (detrended correspondence analysis) was performed for estimating the distribution of loci in the genome. PCoA (Principal Coordinate analysis) analysis was performed to group the plant specimens according to ISSR data. The Mantel test (Podani 2000) was implemented to study the association between genetic distance and geographical distance of the studied populations. Data analyses were performed by using GenAlex 6.4 (Peakall and Smouse 2006) and PAST ver. 2.17 (Hammer et al. 2012).
Bayesian model-based STRUCTURE analysis (Pritchard et al. 2000) was utilized to examine the genetic structure of the studied populations. For this analysis data were scored as dominant markers and analysis developed the method advised by Falush et al. (2007). The STRUCTURE Harvester website (Dent and von Holdt 2012) to perform the Evanno method (Evan-no et al. 2005) was used For the optimal value of K in the studied populations. The selection of the most likely
number of clusters (K) was performed by calculating an ad hoc statistic ΔK based on the rate of change in the log probability of data between successive K values, as defined by Evanno et al. (2005).
RESULTS
Morphometry
The WARD tree (Fig. 1), of the selected studied populations based on morphological features, separated plants of population 1, from the others. This population differed in stem diameter (Fig. 2a,b) and seed color (Fig. 2c,d) from other populations. The mean stem diameter was 4mm in population 1, while it ranged from 1mm up to 3mm in other populations. Similarly, the seed color was dark brown in population 1, while it was light brown in the other studied populations.
ISSR analyses
We obtained 31 ISSR bands (Loci) in total (Table 2). The highest mean number of bands occurred in popu-lations 1 and 3 (31 and 28 bands, respectively). Some of the populations had private bands while, few common bands occurred in the studied population. These are shared alleles among these populations.
The studied P. afar populations varied in genetic variability (Table 3), for example, population 1 had the highest degree of genetic polymorphism (58.97%), while the population 10 showed the lowest degree (5.13%). The highest value of New gene diversity was observed in population 1 (0.15) followed by populations 3-5 (>0.10). However, the studied populations had almost a similar value for the mean effective alleles.
Figure 1. Ward tree of morphological data of the selected popula-tions of P. afra.

76 Saeed Mohsenzadeh, Masoud Sheidai, Fahimeh Koohdar
DCA detrended correspondence analysis plot of ISSR alleles (Fig. 3) revealed that the loci studied are dis-tributed in the genome and are not closely linked as they are scattered in this plot. Therefore, ISSR loci studied are suitable molecular markers for genetic variability inves-tigation in P. afar.
The discriminating power of the ISSR loci is present-ed in Table 4. We presented only the loci with at least 0.70 Gst value/ or above 1 Nm indicating their migration and shared value. The mean Gst value 0.62 for all ISSR loci, indicates that these molecular markers have a good discriminating power and can be used in date Plantago
Figure 2. a: stem of population 1; b: stem of other populations; c: dark brown seed in population 1; d: light brown seed in other popula-tions.
Figure 3. DCA plot of ISSR alleles of P. afra.Figure 4. PCoA plot of the studied populations based on ISSR data.
Table 2. ISSR bands in P. afar populations studied.
Population Pop1 Pop2 Pop3 Pop4 Pop5 Pop6 Pop7 Pop8 Pop9 Pop10
No. Bands 31 26 28 24 23 17 14 17 16 14No. Bands Freq. >= 5% 31 26 28 24 23 17 14 17 16 14No. Private Bands 3 0 1 1 1 0 0 0 0 0No. LComm Bands(<=25%) 4 2 2 1 1 0 0 0 1 1
No. LComm Bands (<=50%) 13 9 10 5 6 2 1 1 2 2
77Populations genetic study of Plantago afra L.
cultivar genetic fingerprinting. The studied P. afar populations almost showed a
high degree of genetic similarity (Mean = 0.84) (Table 4). The highest degree of genetic distance (0.32) occurred between populations 3 and 9, while the lowest degree (0.03) between populations 9 and 10.
PCoA grouping of the P. afar populations based on ISSR data (Fig. 4), placed the studied specimens in 4 major groups. Individuals of populations 9 and 10 were intermixed and formed the first major group at the left top part of the PCoA plot. Individuals from three pop-
ulations 1-3, are also close to each other and comprised the second major group, at the right top corner of this plot. Similarly, plants in populations 6-8 and 4 and 5 comprised the next two major groups, which are placed in lower parts of the PCoA plot. These results indicate that a limited degree of genetic admixture has occurred in some of the studied populations.
NJ tree obtained (Fig. 5), revealed the genetic affin-ity between P. afar populations. The four genetic groups are well separated in distinct clusters. As also indicated before, the populations 6-8 formed a distinct cluster, in which populations 6 and 7 showed closer genetic similar-ity. The populations 9 and 10 formed the second genetic
Figure 5. NJ tree of the studied populations based on ISSR data.
Figure 6. STRUCTURE plot of the studied P. afra populations.
Table 3. Genetic diversity parameters in the studied populations (N = number of samples, Na= number different alleles, Ne = number of effective alleles, I= Shannon’s information index, He gene diver-sity, UHe = unbiased gene diversity, P%= percentage of polymor-phism).
Pop Na Ne I He uHe %P
Pop1 1.385 1.236 0.241 0.151 0.160 58.97%Pop2 1.000 1.120 0.124 0.077 0.081 33.33%Pop3 1.154 1.216 0.202 0.131 0.139 43.59%Pop4 0.974 1.179 0.168 0.109 0.114 35.90%Pop5 0.897 1.180 0.160 0.106 0.116 30.77%Pop6 0.692 1.176 0.143 0.097 0.105 25.64%Pop7 0.538 1.089 0.084 0.054 0.058 17.95%Pop8 0.641 1.128 0.111 0.075 0.079 20.51%Pop9 0.513 1.031 0.035 0.021 0.022 10.26%Pop10 0.410 1.035 0.029 0.020 0.021 5.13%
Table 4. Discriminating power of ISSR loci studied in P. afar popu-lations.
Locus Sample Size Ht Hs Gst Nm*
Locus2 88 0.0333 0.0306 0.0823 5.5745Locus4 88 0.4011 0.0982 0.7949 0.1290Locus7 88 0.4790 0.0982 0.7949 0.1290Locus11 88 0.1378 0.1267 0.0808 5.6895Locus12 88 0.0215 0.0205 0.0440 10.8533Locus13 88 0.0333 0.0306 0.0823 5.5745Locus15 88 0.0233 0.0208 0.1075 4.1492Locus17 88 0.0233 0.0208 0.1075 4.1492Locus24 88 0.5000 0.1022 0.7956 0.1284Locus25 88 0.0360 0.0300 0.1682 2.4719Locus26 88 0.4434 0.0536 0.8790 0.0688Locus28 88 0.3200 0.0000 1.0000 0.0000Locus30 88 0.4592 0.0929 0.7977 0.1268Locus32 88 0.4899 0.0531 0.8915 0.0608Locus34 88 0.1238 0.1071 0.1343 3.2217Locus35 88 0.2314 0.1685 0.2716 1.3407Locus36 88 0.0604 0.0487 0.1933 2.0870Locus36 88 0.0730 0.0664 0.0899 5.0614Mean 88 0.2266 0.0840 0.6293 0.2945
St. Dev 0.0335 0.0041
* Nm = estimate of gene flow from Gst or Gcs. E.g., Nm = 0.5(1 - Gst)/Gst; See McDermott and McDonald, Ann. Rev. Phytopathol. 31: 353-373 (1993). Ht = Totale diversity, Hs = Diversity due to population.

78 Saeed Mohsenzadeh, Masoud Sheidai, Fahimeh Koohdar
group and were positioned in a separate cluster. The same holds true for the populations 4 and 5. Similarly, popula-tions 1-3 comprised the last genetic group, with popula-tions 2 and 3 showing closer genetic similarity.
AMOVA produced significant genetic difference among the studied populations (P = 0.001). It reveals that 61% of total genetic difference occurred due to among populations difference, while 39% was due to within populations genetic variability. Similarly, pair-wise AMOVA among populations (Table 6), revealed that most of the populations differed significantly in their genetic content.
STRUCTURE analysis revealed more detailed infor-mation on the genetic structure of the studied P. afra populations (Fig. 6). The populations 2-3, and the popu-lations 9-10 are genetically similar due to a high degree of shared common/ancestral alleles (similarly colored segments). Population 1 and 4, contained distinct allele combinations and differed in color segments.
The Mantel test performed between the genetic and geographical distance of the studied populations pro-duced a significant positive correlation (p = 0.0002). Therefore, with an increase in the population geographi-cal distance, they become genetically more diverged. This is called isolation by distance (IBD). This also indi-cates that gene flow may occur among the neighboring populations only, which is in agreement with low degree of Nm and genetic admixture obtained.
IDENTIFICATION OF NEW VARIETY IN PLANTAGO AFAR
Based on both morphological and genetic results, we consider population 1 as a new variety for Plantago afra. Seed color and diameter of the stem are among impor-tant morphological characters that can be used in the taxonomy of the genus at the bellow species rank.
Discussion
P. afra is medicinally important plant and producing data on its genetic affinity, genetic structure and vari-ability can be used in conservation and probably future breeding programs.
In the process of populations divergence, they may form new taxonomic entity bellow the species rank. This may be, ecotype, variety or subspecies (Sheidai et al. 2013, 2014). The species delimitation in complex groups and in cases where the species have morphological over-lap is a tedious and difficult task. Therefore, using mul-tiple approaches is suggested to determine the species boundaries (Carstens et al. 2013). In the recent years, combined approaches of morphological and molecular studies have been used to delimit the species and sub-
Table 5. Nei genetic distance versus genetic identity of P. afar popu-lations. Nei’s genetic identity (above diagonal) and genetic distance (below diagonal).
Pop ID 1 2 3 4 5 6 7 8 9 10
1 **** 0.87 0.81 0.77 0.76 0.82 0.80 0.76 0.78 0.76 2 0.13 **** 0.92 0.83 0.84 0.78 0.73 0.83 0.76 0.75 3 0.20 0.08 **** 0.84 0.84 0.78 0.74 0.83 0.72 0.74 4 0.25 0.17 0.16 **** 0.89 0.90 0.80 0.85 0.77 0.78 5 0.26 0.17 0.16 0.11 **** 0.89 0.81 0.86 0.75 0.78 6 0.19 0.23 0.24 0.10 0.11 **** 0.95 0.91 0.85 0.85 7 0.21 0.31 0.30 0.21 0.20 0.04 **** 0.92 0.842 0.84 8 0.26 0.17 0.18 0.16 0.15 0.08 0.08 **** 0.87 0.87 9 0.23 0.26 0.32 0.25 0.27 0.15 0.17 0.13 **** 0.96 10 0.26 0.28 0.30 0.24 0.23 0.15 0.16 0.13 0.03 ****
Table 6. Pair-wise AMOVA among P. afar populations. PhiPT Values below diagonal. Probability, P(rand >= data) based on 999 permuta-tions is shown above diagonal.
Pop1 Pop2 Pop3 Pop4 Pop5 Pop6 Pop7 Pop8 Pop9 Pop10
0.000 0.001 0.001 0.001 0.001 0.001 0.001 0.001 0.001 0.001 Pop10.431 0.000 0.001 0.001 0.001 0.001 0.001 0.001 0.001 0.001 Pop20.459 0.263 0.000 0.001 0.001 0.001 0.001 0.002 0.001 0.001 Pop30.567 0.547 0.475 0.000 0.001 0.001 0.001 0.001 0.001 0.001 Pop40.555 0.559 0.452 0.459 0.000 0.005 0.002 0.001 0.001 0.001 Pop50.506 0.615 0.542 0.392 0.477 0.000 0.004 0.001 0.001 0.001 Pop60.590 0.732 0.653 0.623 .658 0.245 0.000 0.001 0.001 0.001 Pop70.596 0.589 0.526 0.534 0.558 0.360 0.463 0.000 0.001 0.001 Pop80.679 0.756 0.714 0.724 0.783 0.660 0.750 0.692 0.000 0.001 Pop90.698 0.775 0.715 0.731 0.764 0.682 0.750 0.701 0.575 0.000 Pop10

79Populations genetic study of Plantago afra L.
species (Seif et al. 2014; Mosaferi et al. 2015; Sheidai et al. 2016a). This multiple approaches seems to be an effi-cient method in P. afra as Wolff & Morgan-Richards (1988) concluded that PCR-generated polymorphic markers like RAPD and inter-SSR are useful tools to study populations of the two subspecies of P. major and to group the plants into the two subspecies.
Population genetic study produces important infor-mation on the genetic structure of plants, the stratifica-tion versus gene flow among the species populations, genetic divergence of the populations, etc. (Sheidai et al. 2014). The ISSR-PCR marker technique is also efficient for genetic characterization even at the varietal level of a species. For example, Charters et al. (1996) distin-guished 20 cultivars of Brassica napus using ISSR mark-ers, Similarly, Seif et al. (2012) used combined analysis of morphological and ISSR-RAPD molecular markers in 13 populations of Cirsium arvense to recognize new varie-ties within this species. Meyers and Liston (2008) recog-nized 4 varieties of P. ovata in the New and Old World by using sequence data of ITS and morphological char-acters included corolla lobe length/width ratio, Trichome length to length of bracts, color midrib on corolla lobes and bracts.
The occurrence of IBD in the studied populations indicates that the neighboring populations are genetical-ly more alike than distantly placed populations. There-fore, the reason for the genetic similarity of population 2 with 3, and Populations 9 and 10 together, and popu-lation 6 with 7 and 8 revealed by STRUCTURE plot is probably their geographical vicinity, followed by their pollination system and the distribution of their seeds by the wind, which can bring about a frequent gene flow among these populations.
Genetic study revealed that there are different genetic groups in the studied populations. Morphologi-cal study of the selected studied population showed that we have two different groups based on morphological features. Therefore, we suggest the existence of new taxa within this species.
Taxonomy
Plantago afra L. var. kazerunensis Sheidai var. nov. Iran. Fars Prov.: Kazerun, 970 m, Saeed Mohsenzadeh, 10 April 2018, 2018410 (HSBU).
Description: Plants annual, ca. 20 cm tall; all parts covered with short, hard and glandular hairs, stems, erect, highly branched usually of basal, diameter ca. 4 mm; internodes 3–3.5 cm; Leaves opposite 3–3.5 long up to 1mm broad, linear-lanceolate or linear, margins
entire; Spikes ovate, 8–10 mm; peduncle 3–3.5 cm; fertile bracts 3-5 mm long, covered with glandular hairs, nar-row-ovate to ovate, lower bracts in the upper part pro-duced into a long, narrow acuminate part; Sepals 3-3.5 mm long narrow-ovate covered with similar hairs as on the bracts; Corolla tube up to 4 mm long, rugulose, lobes 2 mm long, narrow-ovate, acute; Seeds 2, dark brown, narrow-elliptic, shining, 3 mm long.
Distribution and habitat: Plantago afra var. kazerun-ensis was found at only one locality in Kazerun, in the west Fars Province, Iran. Dozens of individuals were found at the type locality in the hillside of Talegha-nei mountain to 970 m above sea level. This area is the southern IranoTuranian phytogeographic region (Takhta-jan 1986), which is characterized by mean temperatures of 44˚C (in the hottest month) and 3˚C (in the coldest month) and a mean annual precipitation of 260 mm.
IUCN Red List category: Plantago afra var. kazerun-ensis has not yet been evaluated using IUCN Red List criteria (IUCN 2010), although it is abundant at the col-lection site and produces many seeds. For now, its con-servation status is estimated as Data Deficient (DD).
Key to the varieties of Plantago afra
1- Stem diameter up to 3 mm, seed color light brown Plantago afra var. afra
- Stem diameter, usually more above, about 4mm, seed color dark brown Plantago afra var. kazerunensis
REFERENCES
Carstens BC, Pelletier TA, Reid NM, Satler JD. 2013. How to fail at species delimitation. Mol Ecol. 22:4369-4383.
Charters YM, Robertson A, Wilkinson MJ, Ramsay G. 1996. PCR analysis of oilseed rape cultivars (Bras-sica napus L. ssp. oleifera) using 5’-anchored simple sequence repeat (SSR) primers. Theor Appl Genet. 92:442-447.
Dent EA, vonHoldt BM. 2012. STRUCTURE HARVEST-ER: a website and program for visualizing STRUC-TURE output and implementing the Evanno method. Conserv Genet Resour. 4(2):359–361.
Evanno G, Regnaut S, Goudet J. 2005. Detecting the number of clusters of individuals using the software STRUCTURE: a simulation study. Mol Ecol. 14:2611-2620.
Falush D, Stephens M, Pritchard JK. 2007. Inference of population structure using multilocus genotype data:

80 Saeed Mohsenzadeh, Masoud Sheidai, Fahimeh Koohdar
dominant markers and null alleles. Mol Ecol Notes. 7:574-578.
Ferreira V, Matos M, Correia S, Martins N, Gonçalves S, Romano A, Pinto-Carnide P. 2013. Genetic diver-sity of two endemic and endangered Plantago species. Biochem Syst Ecol. 51:37-44.
Goncalves S, Romano A. 2016. The medicinal potential of plants from the genus Plantago (Plantaginaceae) Ind Crops Prod. 83:213–226.
Hammer Ø, Harper DAT, Ryan PD. 2012. PAST: Pale-ontological Statistics software package for education and data analysis. Palaeontol Electron. 4:9.
IUCN. 2010. The IUCN Red list of the threatened spe-cies, version 2010.4. Available from: http://www.iuc-nredlist.org
Kazmi MA.1974. Plantaginaceae. In: Flora of Pakistan. (Eds.): E. Nasir & S.I. Ali. No. 62 pp. 1- 21, Islama-bad.
Križman M, Jakše J, Baričevič D, Javornik B, Prošek M. 2006. Robust CTAB-activated charcoal protocol for plant DNA extraction. Acta Agric Slov. 87(2):427-433.
McDermott JM, McDonald BA.1993. Gene flow in plant pathosystems. Annu Rev Phytopathol. 31:353-373.
Meyers SC, Liston A. 2008. The biogeography of Plan-tago ovata Forssk. (Plantaginaceae). Int J Plant Sci. 169(7):954-962.
Mosaferi S, Sheidai M, Keshavarzi M, Noormohammadi Z. 2015. Genetic diversity and morphological vari-ability in Polygonum aviculare s.l. (Polygonaceae) of Iran. Phytotaxa. 233(2):166–178.
Patzak A, Rechinger KH. 1965. Plantaginaceae in K. H. Rechinger Flora Iranica. 15:1-21. Graz: Academische Druck und Verlagsantalt.
Peakall R, Smouse PE .2006. GENALEX 6: genetic analy-sis in Excel. Population genetic software for teaching and research. Mol Ecol Notes. 1:288-295.
Podani J. 2000. Introduction to the Exploration of Mul-tivariate biological Data. Backhuyes, Leiden. 407 pp.
Pritchard JK, Stephens M, Donnelly P. 2000. Inference of population structure using multilocus genotype Data. Genetics 155(2):945−959.
Rahn K. 1996. A phylogenetic study of the Plantaginace-ae. Bot J Linn Soc. 120:145-198.
Rønsted N, Chase MW, Albach DC, Bello MA. 2002. Phylogenetic relationships within Plantago (Plan-taginaceae): evidence from nuclear ribosomal ITS and plastid trnL-F sequence data. Bot J Linn Soc. 139(4):323-338.
Safaei M, Sheidai M, Alijanpoor B, Noormohammadi Z. 2016. Species delimitation and genetic diversity anal-ysis in Salvia with the use of ISSR molecular mark-ers. Acta Bot Croat. 75:45-52.
Sarihan EO, Ozturk M, Basalma D, Khawar KM, Par-maksiz I, Özcan S. 2005. Prolific Adventitious Shoot Regeneration from Black Psyllium (Plantago afra L.) Int J Agri Biol. 7(6):879-881.
Seif E, Sheidai M, Norouzi M, Noormohammadi Z. 2012. Biosystematic studies of Cirsium arvense populations in Iran. Phytol Balc. 18(3):305–314.
Sheidai M, Zanganeh S, Haji-Ramezanali R, Nouroozi M, Noormohammadi Z, Ghsemzadeh-Baraki S. 2013. Genetic diversity and population structure in four Cirsium (Asteraceae) species. Biologia. 68:384-397.
Sheidai M, Ziaee S, Farahani F, Talebi SM, Noormoham-madi Z, Hasheminejad Ahangarani Farahani Y. 2014. Infra-specific genetic and morphological diversity in Linum album (Linaceae). Biologia. 69:32-39.
Sheidai M, Taban F, Talebi SM, Noormohammadi Z. 2016a. Genetic and morphological diversity in Stach-ys lavandulifolia (Lamiaceae) populations. Biologija. 62(1):9-24.
Sheidai M, Naji M, Noormohammadi Z, Nouroozi M, Ghasemzadeh-Baraki S. 2016b. Contemporary inter-specific hybridization between Cirsium aduncum and C. Haussknechtii (Asteraceae). Genetika. 48(2):497-514.
Sheidai M, Moradian Poode Z, Koohdar F, Talebi M. 2018. Infra-specific morphological, anatomical and genetic variations in Lallemantia peltata (L.) Fisch. & C. A. Mey. (Lamiaceae). Acta Biologica Sibirica. 4(3)85–93.
Sell PD. 2010. Flora Europaea: (Plantaginaceae to Com-positae and Rubiaceae). In: Tutin TG, Heywood VH, Burges NA, Moore DM, Valentine DH, Walters SM, Webb DA (Eds.). Cambridge: Cambridge University Press; 4:38-44.
Takhtajan A .1986. Floristic Regions of the World. Uni-versity of California Press, Berkeley.
Weising K, Nybom H, Wolff K, Kahl G . 2005. DNA Fingerprinting in Plants: Principles, Methods, and Applications. 2nd ed. Boca Raton FL, USA: CRC Press; pp. 472.
Wolff K, Morgan-Richards M. 1998. PCR markers distin-guish Plantago major subspecies. Theor Appl Genet. 96:282-286.
Zanella CM, Bruxel M, Paggi GM, Goetze M, Buttow MV, Cidade FW, Bered F. 2011. Genetic structure and phenotypic variation in wild populations of the medicinal tetraploid species Bromelia antiacantha (Bromeliaceae). AJB. 98(9):1511-1519.
Caryologia. International Journal of Cytology, Cytosystematics and Cytogenetics 73(2): 81-88, 2020
Firenze University Press www.fupress.com/caryologiaCaryologia
International Journal of Cytology, Cytosystematics and Cytogenetics
ISSN 0008-7114 (print) | ISSN 2165-5391 (online) | DOI: 10.13128/caryologia-580
Citation: T.B. Jha, P.S. Saha, S. Jha (2020) A comparative karyo-morpho-metric analysis of Indian landraces of Sesamum indicum using EMA-giemsa and fluorochrome banding. Caryologia 73(2): 81-88. doi: 10.13128/caryolo-gia-580
Received: August 1, 2019
Accepted: March 12, 2020
Published: July 31, 2020
Copyright: © 2020 T.B. Baran Jha, P.S. Saha, S. Jha. This is an open access, peer-reviewed article pub-lished by Firenze University Press (http://www.fupress.com/caryologia) and distributed under the terms of the Creative Commons Attribution License, which permits unrestricted use, distri-bution, and reproduction in any medi-um, provided the original author and source are credited.
Data Availability Statement: All rel-evant data are within the paper and its Supporting Information files.
Competing Interests: The Author(s) declare(s) no conflict of interest.
A comparative karyo-morphometric analysis of Indian landraces of Sesamum indicum using EMA-giemsa and fluorochrome banding
Timir Baran Jha1,*, Partha Sarathi Saha2, Sumita Jha2
1 Department of Botany, Maulana Azad College, Rafi Ahmed Kidwi Road, Kolkata- 700113, West Bengal, India2 CAS, Department of Botany, University of Calcutta, 35, Ballygunge Circular Road, Kol-kata-700019, West Bengal, India*Corresponding author. E-mail: [email protected]
Abstract. Sesamum indicum commonly known as ‘Sesame’, ‘Til’ or ‘Gingli’ is an age-old high valued oil crop. With distinct seed and floral diversity and no detailed chro-mosomal analysis is available on Indian landraces of S. indicum (2n= 26). The present study demonstrates standardization of enzymatic maceration and air drying (EMA) method of chromosome preparation and comparative karyometric analysis in four Indian landraces of S indicum. All the landraces were characterized by very small chro-mosomes, length ranging from 1.24 ± 0.02 to 2.87 ± 0.09 µm. The EMA- Giemsa based karyotype analysis revealed nine pairs of chromosomes with nearly median primary constriction, three pairs were submedian and a single satellite pair in each of the stud-ied landrace. The CMA staining of Sesamum chromosomes revealed the presence of distinct CMA positive (CMA+ve) signals in all the studied landraces. The Black seeded til (BT) and White seeded til (WT) were characterized by six chromosomes with dis-tal CMA+ve signal on short arm, while the Dark brown seeded til (DBT) showed ten chromosomes with distal CMA+ve signal on short arm. The Light brown seeded til (LBT) was characterized by eight chromosomes with distal CMA+ve signal on short arm. The results obtained from the scatter plot of A1 versus A2 and PCA analysis pro-vide a strong relationship with that of the fluorochrome banding analysis. The present research offers an explicit karyo-morphometric characterization of four Indian lan-draces of S. indicum for the first time.
Keywords: fluorochrome banding, karyotype, sesame, Sesamum indicum, small chro-mosomes, til.
INTRODUCTION
Sesamum indicum L. commonly known as ‘Sesame’, ‘Til’ or ‘Gingli’ is an age-old high valued oil crop. As per the Index Kewensis the genus belongs to the family Pedaliaceae and comprises 36 species. However, S. indicum is the only cultivated species of this genus (Nayar and Mehra 1970). Sesame seeds are also known as the ‘Queen of the oil seeds’ and the first oil known to be
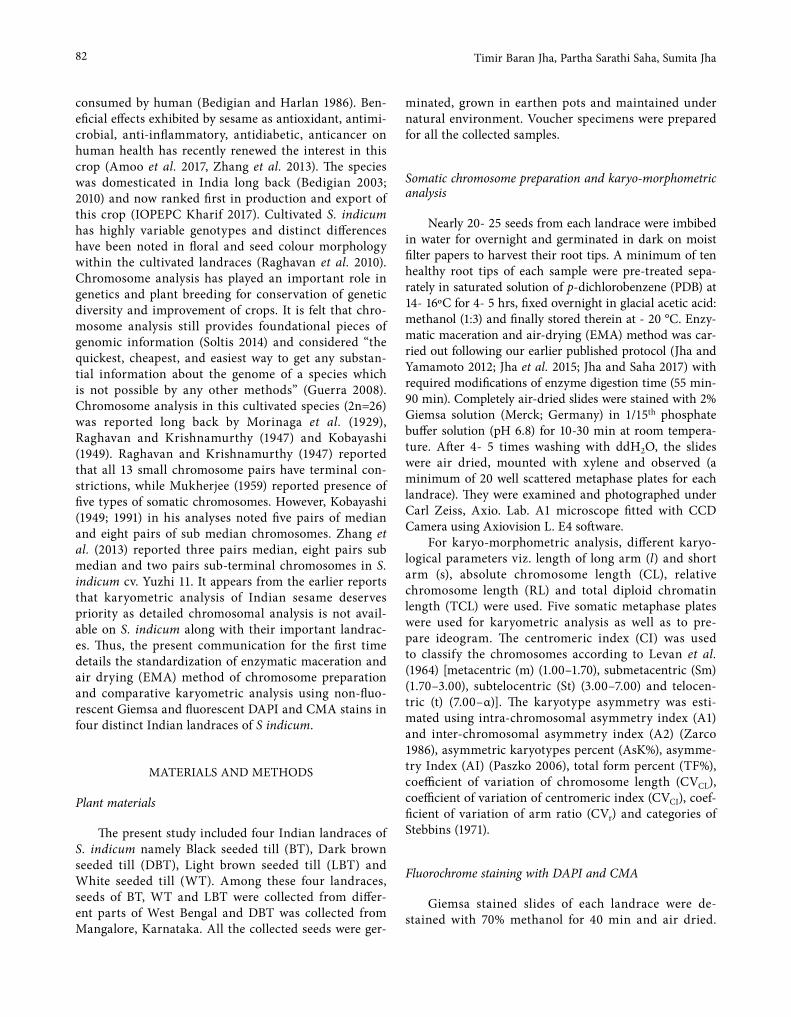
82 Timir Baran Jha, Partha Sarathi Saha, Sumita Jha
consumed by human (Bedigian and Harlan 1986). Ben-eficial effects exhibited by sesame as antioxidant, antimi-crobial, anti-inflammatory, antidiabetic, anticancer on human health has recently renewed the interest in this crop (Amoo et al. 2017, Zhang et al. 2013). The species was domesticated in India long back (Bedigian 2003; 2010) and now ranked first in production and export of this crop (IOPEPC Kharif 2017). Cultivated S. indicum has highly variable genotypes and distinct differences have been noted in floral and seed colour morphology within the cultivated landraces (Raghavan et al. 2010). Chromosome analysis has played an important role in genetics and plant breeding for conservation of genetic diversity and improvement of crops. It is felt that chro-mosome analysis still provides foundational pieces of genomic information (Soltis 2014) and considered “the quickest, cheapest, and easiest way to get any substan-tial information about the genome of a species which is not possible by any other methods” (Guerra 2008). Chromosome analysis in this cultivated species (2n=26) was reported long back by Morinaga et al. (1929), Raghavan and Krishnamurthy (1947) and Kobayashi (1949). Raghavan and Krishnamurthy (1947) reported that all 13 small chromosome pairs have terminal con-strictions, while Mukherjee (1959) reported presence of five types of somatic chromosomes. However, Kobayashi (1949; 1991) in his analyses noted five pairs of median and eight pairs of sub median chromosomes. Zhang et al. (2013) reported three pairs median, eight pairs sub median and two pairs sub-terminal chromosomes in S. indicum cv. Yuzhi 11. It appears from the earlier reports that karyometric analysis of Indian sesame deserves priority as detailed chromosomal analysis is not avail-able on S. indicum along with their important landrac-es. Thus, the present communication for the first time details the standardization of enzymatic maceration and air drying (EMA) method of chromosome preparation and comparative karyometric analysis using non-fluo-rescent Giemsa and fluorescent DAPI and CMA stains in four distinct Indian landraces of S indicum.
MATERIALS AND METHODS
Plant materials
The present study included four Indian landraces of S. indicum namely Black seeded till (BT), Dark brown seeded till (DBT), Light brown seeded till (LBT) and White seeded till (WT). Among these four landraces, seeds of BT, WT and LBT were collected from differ-ent parts of West Bengal and DBT was collected from Mangalore, Karnataka. All the collected seeds were ger-
minated, grown in earthen pots and maintained under natural environment. Voucher specimens were prepared for all the collected samples.
Somatic chromosome preparation and karyo-morphometric analysis
Nearly 20- 25 seeds from each landrace were imbibed in water for overnight and germinated in dark on moist filter papers to harvest their root tips. A minimum of ten healthy root tips of each sample were pre-treated sepa-rately in saturated solution of p-dichlorobenzene (PDB) at 14- 16ºC for 4- 5 hrs, fixed overnight in glacial acetic acid: methanol (1:3) and finally stored therein at - 20 °C. Enzy-matic maceration and air-drying (EMA) method was car-ried out following our earlier published protocol (Jha and Yamamoto 2012; Jha et al. 2015; Jha and Saha 2017) with required modifications of enzyme digestion time (55 min- 90 min). Completely air-dried slides were stained with 2% Giemsa solution (Merck; Germany) in 1/15th phosphate buffer solution (pH 6.8) for 10-30 min at room tempera-ture. After 4- 5 times washing with ddH2O, the slides were air dried, mounted with xylene and observed (a minimum of 20 well scattered metaphase plates for each landrace). They were examined and photographed under Carl Zeiss, Axio. Lab. A1 microscope fitted with CCD Camera using Axiovision L. E4 software.
For karyo-morphometric analysis, different karyo-logical parameters viz. length of long arm (l) and short arm (s), absolute chromosome length (CL), relative chromosome length (RL) and total diploid chromatin length (TCL) were used. Five somatic metaphase plates were used for karyometric analysis as well as to pre-pare ideogram. The centromeric index (CI) was used to classify the chromosomes according to Levan et al. (1964) [metacentric (m) (1.00–1.70), submetacentric (Sm) (1.70–3.00), subtelocentric (St) (3.00–7.00) and telocen-tric (t) (7.00–α)]. The karyotype asymmetry was esti-mated using intra-chromosomal asymmetry index (A1) and inter-chromosomal asymmetry index (A2) (Zarco 1986), asymmetric karyotypes percent (AsK%), asymme-try Index (AI) (Paszko 2006), total form percent (TF%), coefficient of variation of chromosome length (CVCL), coefficient of variation of centromeric index (CVCI), coef-ficient of variation of arm ratio (CVr) and categories of Stebbins (1971).
Fluorochrome staining with DAPI and CMA
Giemsa stained slides of each landrace were de-stained with 70% methanol for 40 min and air dried.
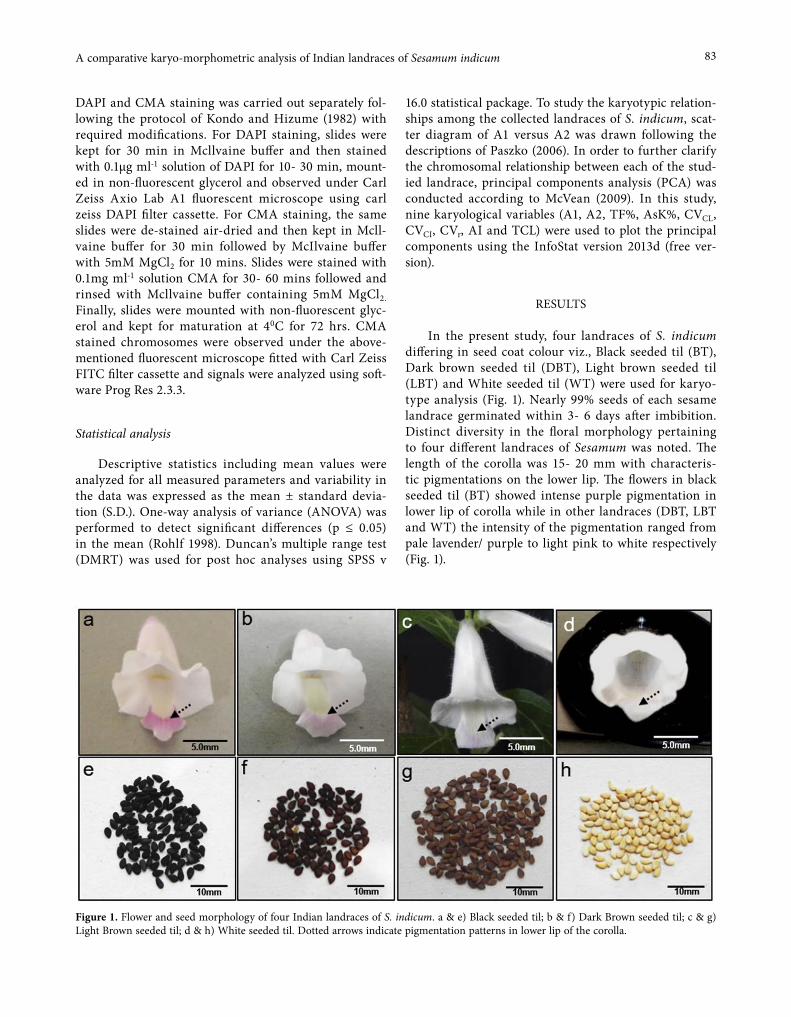
83A comparative karyo-morphometric analysis of Indian landraces of Sesamum indicum
DAPI and CMA staining was carried out separately fol-lowing the protocol of Kondo and Hizume (1982) with required modifications. For DAPI staining, slides were kept for 30 min in Mcllvaine buffer and then stained with 0.1µg ml-1 solution of DAPI for 10- 30 min, mount-ed in non-fluorescent glycerol and observed under Carl Zeiss Axio Lab A1 fluorescent microscope using carl zeiss DAPI filter cassette. For CMA staining, the same slides were de-stained air-dried and then kept in Mcll-vaine buffer for 30 min followed by McIlvaine buffer with 5mM MgCl2 for 10 mins. Slides were stained with 0.1mg ml-1 solution CMA for 30- 60 mins followed and rinsed with Mcllvaine buffer containing 5mM MgCl2. Finally, slides were mounted with non-fluorescent glyc-erol and kept for maturation at 40C for 72 hrs. CMA stained chromosomes were observed under the above-mentioned fluorescent microscope fitted with Carl Zeiss FITC filter cassette and signals were analyzed using soft-ware Prog Res 2.3.3.
Statistical analysis
Descriptive statistics including mean values were analyzed for all measured parameters and variability in the data was expressed as the mean ± standard devia-tion (S.D.). One-way analysis of variance (ANOVA) was performed to detect significant differences (p ≤ 0.05) in the mean (Rohlf 1998). Duncan’s multiple range test (DMRT) was used for post hoc analyses using SPSS v
16.0 statistical package. To study the karyotypic relation-ships among the collected landraces of S. indicum, scat-ter diagram of A1 versus A2 was drawn following the descriptions of Paszko (2006). In order to further clarify the chromosomal relationship between each of the stud-ied landrace, principal components analysis (PCA) was conducted according to McVean (2009). In this study, nine karyological variables (A1, A2, TF%, AsK%, CVCL, CVCI, CVr, AI and TCL) were used to plot the principal components using the InfoStat version 2013d (free ver-sion).
RESULTS
In the present study, four landraces of S. indicum differing in seed coat colour viz., Black seeded til (BT), Dark brown seeded til (DBT), Light brown seeded til (LBT) and White seeded til (WT) were used for karyo-type analysis (Fig. 1). Nearly 99% seeds of each sesame landrace germinated within 3- 6 days after imbibition. Distinct diversity in the floral morphology pertaining to four different landraces of Sesamum was noted. The length of the corolla was 15- 20 mm with characteris-tic pigmentations on the lower lip. The flowers in black seeded til (BT) showed intense purple pigmentation in lower lip of corolla while in other landraces (DBT, LBT and WT) the intensity of the pigmentation ranged from pale lavender/ purple to light pink to white respectively (Fig. 1).
Figure 1. Flower and seed morphology of four Indian landraces of S. indicum. a & e) Black seeded til; b & f) Dark Brown seeded til; c & g) Light Brown seeded til; d & h) White seeded til. Dotted arrows indicate pigmentation patterns in lower lip of the corolla.
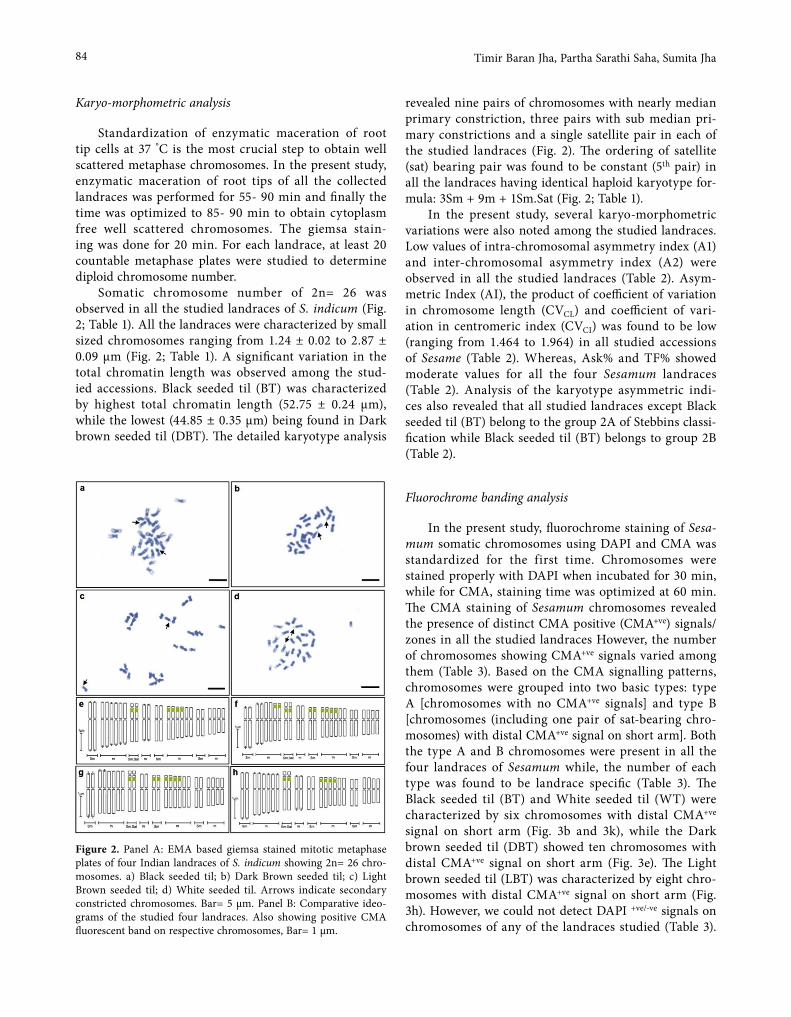
84 Timir Baran Jha, Partha Sarathi Saha, Sumita Jha
Karyo-morphometric analysis
Standardization of enzymatic maceration of root tip cells at 37 °C is the most crucial step to obtain well scattered metaphase chromosomes. In the present study, enzymatic maceration of root tips of all the collected landraces was performed for 55- 90 min and finally the time was optimized to 85- 90 min to obtain cytoplasm free well scattered chromosomes. The giemsa stain-ing was done for 20 min. For each landrace, at least 20 countable metaphase plates were studied to determine diploid chromosome number.
Somatic chromosome number of 2n= 26 was observed in all the studied landraces of S. indicum (Fig. 2; Table 1). All the landraces were characterized by small sized chromosomes ranging from 1.24 ± 0.02 to 2.87 ± 0.09 µm (Fig. 2; Table 1). A significant variation in the total chromatin length was observed among the stud-ied accessions. Black seeded til (BT) was characterized by highest total chromatin length (52.75 ± 0.24 µm), while the lowest (44.85 ± 0.35 µm) being found in Dark brown seeded til (DBT). The detailed karyotype analysis
revealed nine pairs of chromosomes with nearly median primary constriction, three pairs with sub median pri-mary constrictions and a single satellite pair in each of the studied landraces (Fig. 2). The ordering of satellite (sat) bearing pair was found to be constant (5th pair) in all the landraces having identical haploid karyotype for-mula: 3Sm + 9m + 1Sm.Sat (Fig. 2; Table 1).
In the present study, several karyo-morphometric variations were also noted among the studied landraces. Low values of intra-chromosomal asymmetry index (A1) and inter-chromosomal asymmetry index (A2) were observed in all the studied landraces (Table 2). Asym-metric Index (AI), the product of coefficient of variation in chromosome length (CVCL) and coefficient of vari-ation in centromeric index (CVCI) was found to be low (ranging from 1.464 to 1.964) in all studied accessions of Sesame (Table 2). Whereas, Ask% and TF% showed moderate values for all the four Sesamum landraces (Table 2). Analysis of the karyotype asymmetric indi-ces also revealed that all studied landraces except Black seeded til (BT) belong to the group 2A of Stebbins classi-fication while Black seeded til (BT) belongs to group 2B (Table 2).
Fluorochrome banding analysis
In the present study, fluorochrome staining of Sesa-mum somatic chromosomes using DAPI and CMA was standardized for the first time. Chromosomes were stained properly with DAPI when incubated for 30 min, while for CMA, staining time was optimized at 60 min. The CMA staining of Sesamum chromosomes revealed the presence of distinct CMA positive (CMA+ve) signals/ zones in all the studied landraces However, the number of chromosomes showing CMA+ve signals varied among them (Table 3). Based on the CMA signalling patterns, chromosomes were grouped into two basic types: type A [chromosomes with no CMA+ve signals] and type B [chromosomes (including one pair of sat-bearing chro-mosomes) with distal CMA+ve signal on short arm]. Both the type A and B chromosomes were present in all the four landraces of Sesamum while, the number of each type was found to be landrace specific (Table 3). The Black seeded til (BT) and White seeded til (WT) were characterized by six chromosomes with distal CMA+ve signal on short arm (Fig. 3b and 3k), while the Dark brown seeded til (DBT) showed ten chromosomes with distal CMA+ve signal on short arm (Fig. 3e). The Light brown seeded til (LBT) was characterized by eight chro-mosomes with distal CMA+ve signal on short arm (Fig. 3h). However, we could not detect DAPI +ve/-ve signals on chromosomes of any of the landraces studied (Table 3).
Figure 2. Panel A: EMA based giemsa stained mitotic metaphase plates of four Indian landraces of S. indicum showing 2n= 26 chro-mosomes. a) Black seeded til; b) Dark Brown seeded til; c) Light Brown seeded til; d) White seeded til. Arrows indicate secondary constricted chromosomes. Bar= 5 µm. Panel B: Comparative ideo-grams of the studied four landraces. Also showing positive CMA fluorescent band on respective chromosomes, Bar= 1 µm.
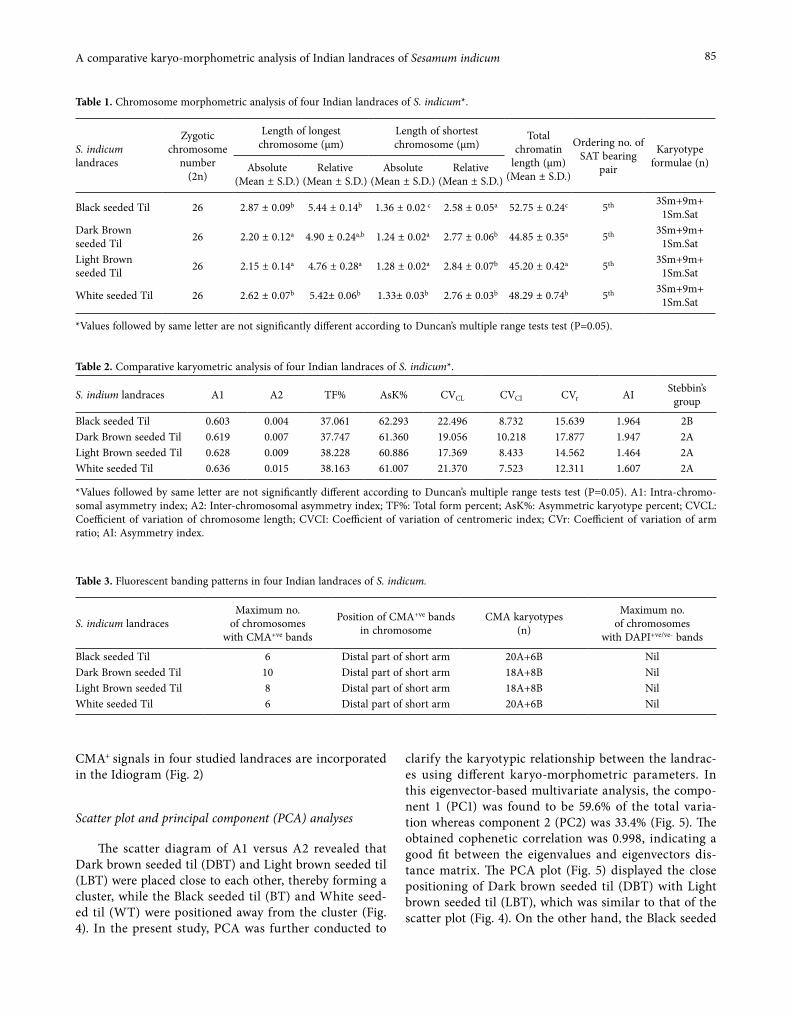
85A comparative karyo-morphometric analysis of Indian landraces of Sesamum indicum
CMA+ signals in four studied landraces are incorporated in the Idiogram (Fig. 2)
Scatter plot and principal component (PCA) analyses
The scatter diagram of A1 versus A2 revealed that Dark brown seeded til (DBT) and Light brown seeded til (LBT) were placed close to each other, thereby forming a cluster, while the Black seeded til (BT) and White seed-ed til (WT) were positioned away from the cluster (Fig. 4). In the present study, PCA was further conducted to
clarify the karyotypic relationship between the landrac-es using different karyo-morphometric parameters. In this eigenvector-based multivariate analysis, the compo-nent 1 (PC1) was found to be 59.6% of the total varia-tion whereas component 2 (PC2) was 33.4% (Fig. 5). The obtained cophenetic correlation was 0.998, indicating a good fit between the eigenvalues and eigenvectors dis-tance matrix. The PCA plot (Fig. 5) displayed the close positioning of Dark brown seeded til (DBT) with Light brown seeded til (LBT), which was similar to that of the scatter plot (Fig. 4). On the other hand, the Black seeded
Table 1. Chromosome morphometric analysis of four Indian landraces of S. indicum*.
S. indicum landraces
Zygotic chromosome
number(2n)
Length of longest chromosome (μm)
Length of shortest chromosome (μm)
Total chromatin
length (μm)(Mean ± S.D.)
Ordering no. ofSAT bearing
pair
Karyotypeformulae (n)Absolute
(Mean ± S.D.)Relative
(Mean ± S.D.)Absolute
(Mean ± S.D.)Relative
(Mean ± S.D.)
Black seeded Til 26 2.87 ± 0.09b 5.44 ± 0.14b 1.36 ± 0.02 c 2.58 ± 0.05a 52.75 ± 0.24c 5th 3Sm+9m+1Sm.Sat
Dark Brown seeded Til 26 2.20 ± 0.12a 4.90 ± 0.24a,b 1.24 ± 0.02a 2.77 ± 0.06b 44.85 ± 0.35a 5th 3Sm+9m+
1Sm.SatLight Brown seeded Til 26 2.15 ± 0.14a 4.76 ± 0.28a 1.28 ± 0.02a 2.84 ± 0.07b 45.20 ± 0.42a 5th 3Sm+9m+
1Sm.Sat
White seeded Til 26 2.62 ± 0.07b 5.42± 0.06b 1.33± 0.03b 2.76 ± 0.03b 48.29 ± 0.74b 5th 3Sm+9m+1Sm.Sat
*Values followed by same letter are not significantly different according to Duncan’s multiple range tests test (P=0.05).
Table 2. Comparative karyometric analysis of four Indian landraces of S. indicum*.
S. indium landraces A1 A2 TF% AsK% CVCL CVCI CVr AI Stebbin’s group
Black seeded Til 0.603 0.004 37.061 62.293 22.496 8.732 15.639 1.964 2BDark Brown seeded Til 0.619 0.007 37.747 61.360 19.056 10.218 17.877 1.947 2ALight Brown seeded Til 0.628 0.009 38.228 60.886 17.369 8.433 14.562 1.464 2AWhite seeded Til 0.636 0.015 38.163 61.007 21.370 7.523 12.311 1.607 2A
*Values followed by same letter are not significantly different according to Duncan’s multiple range tests test (P=0.05). A1: Intra-chromo-somal asymmetry index; A2: Inter-chromosomal asymmetry index; TF%: Total form percent; AsK%: Asymmetric karyotype percent; CVCL: Coefficient of variation of chromosome length; CVCI: Coefficient of variation of centromeric index; CVr: Coefficient of variation of arm ratio; AI: Asymmetry index.
Table 3. Fluorescent banding patterns in four Indian landraces of S. indicum.
S. indicum landracesMaximum no.
of chromosomeswith CMA+ve bands
Position of CMA+ve bands in chromosome
CMA karyotypes(n)
Maximum no.of chromosomes
with DAPI+ve/ve- bands
Black seeded Til 6 Distal part of short arm 20A+6B NilDark Brown seeded Til 10 Distal part of short arm 18A+8B NilLight Brown seeded Til 8 Distal part of short arm 18A+8B NilWhite seeded Til 6 Distal part of short arm 20A+6B Nil
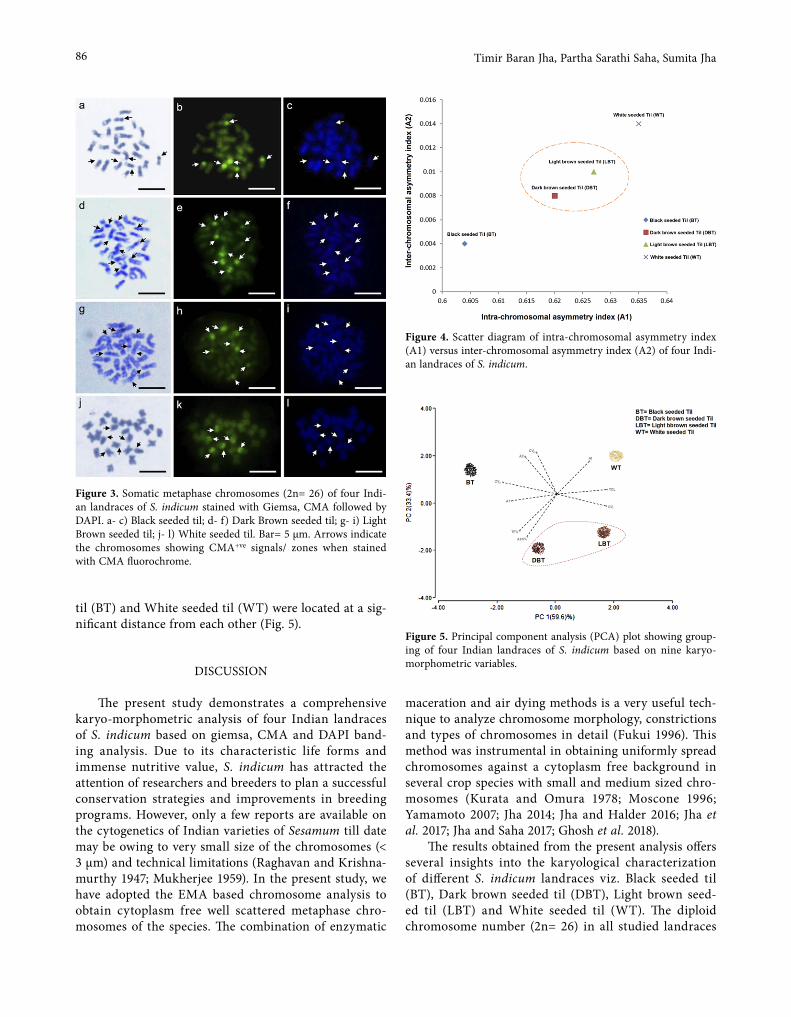
86 Timir Baran Jha, Partha Sarathi Saha, Sumita Jha
til (BT) and White seeded til (WT) were located at a sig-nificant distance from each other (Fig. 5).
DISCUSSION
The present study demonstrates a comprehensive karyo-morphometric analysis of four Indian landraces of S. indicum based on giemsa, CMA and DAPI band-ing analysis. Due to its characteristic life forms and immense nutritive value, S. indicum has attracted the attention of researchers and breeders to plan a successful conservation strategies and improvements in breeding programs. However, only a few reports are available on the cytogenetics of Indian varieties of Sesamum till date may be owing to very small size of the chromosomes (< 3 µm) and technical limitations (Raghavan and Krishna-murthy 1947; Mukherjee 1959). In the present study, we have adopted the EMA based chromosome analysis to obtain cytoplasm free well scattered metaphase chro-mosomes of the species. The combination of enzymatic
maceration and air dying methods is a very useful tech-nique to analyze chromosome morphology, constrictions and types of chromosomes in detail (Fukui 1996). This method was instrumental in obtaining uniformly spread chromosomes against a cytoplasm free background in several crop species with small and medium sized chro-mosomes (Kurata and Omura 1978; Moscone 1996; Yamamoto 2007; Jha 2014; Jha and Halder 2016; Jha et al. 2017; Jha and Saha 2017; Ghosh et al. 2018).
The results obtained from the present analysis offers several insights into the karyological characterization of different S. indicum landraces viz. Black seeded til (BT), Dark brown seeded til (DBT), Light brown seed-ed til (LBT) and White seeded til (WT). The diploid chromosome number (2n= 26) in all studied landraces
Figure 5. Principal component analysis (PCA) plot showing group-ing of four Indian landraces of S. indicum based on nine karyo-morphometric variables.
Figure 3. Somatic metaphase chromosomes (2n= 26) of four Indi-an landraces of S. indicum stained with Giemsa, CMA followed by DAPI. a- c) Black seeded til; d- f) Dark Brown seeded til; g- i) Light Brown seeded til; j- l) White seeded til. Bar= 5 µm. Arrows indicate the chromosomes showing CMA+ve signals/ zones when stained with CMA fluorochrome.
Figure 4. Scatter diagram of intra-chromosomal asymmetry index (A1) versus inter-chromosomal asymmetry index (A2) of four Indi-an landraces of S. indicum.
87A comparative karyo-morphometric analysis of Indian landraces of Sesamum indicum
of S. indicum is in agreement with the earlier reports (Morinaga et al. 1929; Kobayashi 1949; Raghavan and Krishnamurthy 1947). Raghavan and Krishnamur-thy (1947) identified 13 pairs of somatic chromosomes with terminal constrictions in this species, while Kob-ayashi (1991) classified five pairs of median and eight pairs of submedian chromosomes including one pair (10th pair) of sat-bearing chromosomes in S. indicum. In the present study, a significant variation in chromo-some size (ranging from 1.24 μm- 2.87 μm) has been scored among the Sesamum landraces. Mukherjee (1959) reported two pairs of chromosomes having second-ary constrictions in S. indicum, while the present EMA based analysis clearly revealed the presence of nine pairs of chromosomes with nearly median primary constric-tion, three pairs were submedian and a single pair (5th pair) of sat-bearing chromosomes in all the studied lan-draces and which can be considered as the modal karyo-type for Indian Sesame.
In addition to the EMA based giemsa staining, the fluorochrome banding patterns are documented here for the first time in four studied Indian landraces of Sesam-um. The application of nucleotide specific fluorochromes i.e. GC-specific CMA, AT-specific DAPI in chromosome analysis has been reported to be very expedient in prop-er karyological characterization of many plant species (Schweizer 1976; Moscone et al. 1996). In the present study, CMA banding analysis provides a comprehensive cytogenetic characterization of four Indian landraces of S. indicum. Based on both karyomorphology and CMA signalling patterns, distinct homologies could be estab-lished between the studied landraces. Presently, we could not locate DAPI+ve bands in any of the studied samples. However, the differences in distribution of CMA+ve sig-nals/ zones clearly delimit each of the studied landraces of Sesamum.
In the present study, all the collected landraces of S. indicum exhibited symmetrical karyotypes based on categories of Stebbins (1971). However, the analyses of scatter diagram of A1 versus A2 and PCA plot unam-biguously delimit each of the studied landrace (Fig. 4 and 5). PCA is a true eigenvector-based multivariate analysis, which can be used to project samples onto a series of orthogonal axes and to statistically clarify the genetic relationship among the studied samples (McVean 2009). The results obtained from scatter plot of A1 vs A2 and PCA analysis provide a strong relationship with that of the fluorochrome (CMA) banding analysis. The Dark brown seeded til (DBT) and Light brown seeded til (LBT) exhibited maximum CMA+ve signals/ zones and appeared close to each other, while both the Black seeded til (BT) and White seeded til (WT) characterized
by minimum CMA+ve signals (i.e. six chromosomes with distal CMA+ve signal on short arm) positioned distantly in the scatter diagram of A1 versus A2 and PCA plot.
As a whole, the present study involving EMA based giemsa staining techniques demonstrates an explicit kar-yo-morphometric characterization of four Indian lan-draces of S. indicum for the first time. Distinct landrace-specific variation in the distribution of CMA+ve signals/ zones in somatic chromosomes was also established in the species. The grouping of the studied landraces was also corroborated by the analysis of scatter diagram of A1 versus A2 and PCA plot which revealed a strong rela-tionship with that of the fluorochrome banding analysis. However, further studies employing in situ hybridization techniques like FISH/ GISH and DNA barcode analysis are required for clarification of evolutionary processes within the particular species.
In conclusion, the present karyo-morphometric analysis explicitly characterizes four important Indian landraces of S. indicum for the first time. Application of EMA method of chromosome analysis followed by giemsa and fluorescent dye CMA which targets GC rich constitutive heterochromatin regions on chromosomes has clearly demonstrated that the method may be used as useful tool to characterize and differentiate S. indicum at the varietal level.
ACKNOWLEDGEMENTS
TBJ acknowledges the Principal and HOD, Dept of Botany, Maulana Azad College Kolkata for the facilities provided and his teacher Late Prof. Arun Kumar Sharma for his inspiration.
REFERENCES
Amoo SO, Okorogbona AOM, Du Plooy CP, Venter SL. 2017. Sesamum indicum. In: Kuete V, editor. Medici-nal Spices and Vegetables from Africa. Therapeutic Potential against Metabolic, Inflammatory, Infectious and Systemic Diseases. Cambridge, Massachusetts, United States: Academic Press, pp. 549-579.
Bedigian D. 2003. Evolution of sesame revisited: domes-tication, diversity and prospects. Genet Resour Crop Evol. 50:779-787.
Bedigian D. 2010. Characterization of sesame (Sesamum indicum L.) germplasm: a critique. Genet Resour Crop Evol. 57:641-647.
Bedigian D, Harlan JR. 1986. Evidence for cultivation of sesame in the ancient world. Econ Bot. 40:137-154.

88 Timir Baran Jha, Partha Sarathi Saha, Sumita Jha
Fukui K. 1996. Plant chromosomes at mitosis. In: Fukui K, Nakayama S, editors. Plant chromosomes. Labo-ratory methods. Boca Raton, Tokyo: CRC Press, pp. 1-18.
Ghosh I, Bhowmick BK, Jha S. 2018. Cytogenetics of two Indian varieties of Momordica charantia L. (bit-tergourd) Sci Hort. 240:333-343.
Guerra M. 2008. Chromosome numbers in plant cyto-taxonomy: concepts and implications. Cytogenet Genome Res. 120:339-350.
IOPEPC Kharif. 2017. Survey of Sesame Crop, Indian Oilseeds and Produce Export Promotion Council (Under Ministry of Commerce, Govt. of India). htt-ps:// www.iopepc.org (accessed 04.01.19)
Jha TB. 2014. Somatic chromosomes of Aegle marme-los and Azadirachta indica through EMA method. Nucleus. 57:185-188.
Jha TB, Halder M. 2016. Searching chromosomal land-marks in Indian Lentils through EMA-based Giemsa staining method. Protoplasma. 253:1223-1231.
Jha TB, Mahanti A, Ghorai A. 2015. Karyotype analysis of Indian lentils through EMA-based Giemsa stain-ing. Caryologia. 68:280-288.
Jha TB, Saha PS. 2017. Characterization of some Indian Himalayan Capsicums through floral morphology and EMA-based chromosome analysis. Protoplasma. 254:921-933.
Jha TB, Saha PS, Nath S, Das A, Jha S. 2017. Morphologi-cal and cytogenetical characterization of ‘Dalle Khur-sani’: a polyploid cultivated Capsicum of India. Sci Hort. 215:80–90.
Jha TB, Yamamoto M. 2012. Application of EMA, fluo-rescence staining and FISH of rDNA in analysis of Aloe vera (L.) Burm. f. chromosomes. Bull Fac Agric Kagoshima Univ. 62:83-89.
Kobayashi T. 1949. Secondary pairing in S. orientale. Bot Mag. 62:71.
Kobayashi T. 1991. Cytogenetics of sesame (Sesamum indicum). In: Tsuchiya T, Gupta PK, editors. Chro-mosome Engineering in Plants: Genetics, Breeding, Evolution, Part B. Amsterdam: Elsevier, pp. 581–592.
Kondo T, Hizume M. 1982. Banding for the chromo-somes of Cryptomeria japonica D. Don. J Jap Forest Soc. 64:356-358.
Kurata N, Omura T. 1978. Karyotype analysis in rice I. A new method for identifying all chromosome pairs. Japan J Genet. 53:251-255.
Levan A, Fredga K, Sandberg AA. 1964. Nomenclature for centromeric position on chromosomes. Hereditas. 52:201-220.
McVean G. 2009. A genealogical interpretation of princi-pal components analysis. PLoS Genet. 5:e1000686.
Morinaga T, Fukushima E, Kano T, Yamasaki Y. 1929. Chromosome numbers in cultivated plants II. Bot Mag. 43:589.
Moscone EA, Lambrou M, Ehrendorfer F. 1996. Fluores-cent chromosome banding in the cultivated species of Capsicum (Solanaceae). Plant Syst Evol. 202:37–63.
Mukherjee S. 1959. Chromosome type Sesamum orientale Linn. Ind Oilseeds J. 31:41-42.
Nayar NM, Mehra KL. 1970. Sesame its uses, botany, cytogenetics and origin. Econ Bot. 24:20-31.
Paszko B. 2006. A critical review and a new proposal of karyotypes asymmetry indices. Plant Syst Evol. 258:39-48.
Raghavan K, Kumar A, Pal A, Khanum F, Bawan AS. 2010. Nutritional, Medicinal and Industrial Uses of Sesame (Sesamum indicum L.) Seeds- An Overview. Agric Conspec Sci. 75:159-168.
Raghavan TS, Krishnamurthy KV. 1947. Cytogenetical studies in Sesamum Part I. Cytology of the parents S. orientale Linn. and S. prostratum Retz. and cytology of the sterile hybrids between them and their fertile amphidiploid. Proc Ind Acad Sci. 268:236-275.
Rohlf FJ. 1998. On applications of geometric morphomet-rics to studies of ontogeny and phylogeny. Syst Biol. 47:147-158.
Schweizer D. 1976. Reverse fluorescent chromosome banding with chromomycin and DAPI. Chromo-soma. 58:307–324.
Soltis DE. 2014. Chromosome data. Iran J Bot. 20:228-229.
Stebbins GL. 1971. Chromosomal changes, genetic recombination and speciation. In: Barrington EJW, Willis AJ, editors. Chromosomal Evolution in Higher Plants. London: Edward Arnold Publishers Pvt. Ltd, pp. 72-123.
Yamamoto M. 2007. Application of fluorescent staining in chromosomes to genetic studies in Citrus. Jap J Plant Sci. 1:12-19.
Zarco CR. 1986. A new method for estimating karyotype asymmetry. Taxon. 35:526-530.
Zhang H, Miao H, Wang L, Qu L, Liu H, Wang Q, Yue M. 2013. Genome sequencing of the important oil-seed crop Sesamum indicum L. Genome Biol. 14:401.

Caryologia. International Journal of Cytology, Cytosystematics and Cytogenetics 73(2): 89-98, 2020
Firenze University Press www.fupress.com/caryologiaCaryologia
International Journal of Cytology, Cytosystematics and Cytogenetics
ISSN 0008-7114 (print) | ISSN 2165-5391 (online) | DOI: 10.13128/caryologia-618
Citation: H. Singh, J. Singh, P. Kumar, V. Kumar Singhal, B. Singh Kholia, L. Mohan Tewari (2020) Chromosome count, male meiotic behaviour and pollen fertility analysis in Agropyron thomsonii Hook.f. and Elymus nutans Griseb. (Triticeae: Poaceae) from Western Himalaya, India. Caryologia 73(2): 89-98. doi: 10.13128/caryolo-gia-618
Received: September 8, 2019
Accepted: April 3, 2020
Published: July 31, 2020
Copyright: © 2020 H. Singh, J. Singh, P. Kumar, V. Kumar Singhal, B. Singh Kholia, L. Mohan Tewari. This is an open access, peer-reviewed article published by Firenze University Press (http://www.fupress.com/caryologia) and distributed under the terms of the Creative Commons Attribution License, which permits unrestricted use, distri-bution, and reproduction in any medi-um, provided the original author and source are credited.
Data Availability Statement: All rel-evant data are within the paper and its Supporting Information files.
Competing Interests: The Author(s) declare(s) no conflict of interest.
Chromosome count, male meiotic behaviour and pollen fertility analysis in Agropyron thomsonii Hook.f. and Elymus nutans Griseb. (Triticeae: Poaceae) from Western Himalaya, India
Harminder Singh2, Jaswant Singh1,*, Puneet Kumar2, Vijay Kumar Sin-ghal1, Bhupendra Singh Kholia2, Lalit Mohan Tewari3
1 Department of Botany, Punjabi University Patiala, India, 1470022 Botanical Survey of India, Northern Regional Centre, Dehradun, India, 2481953 Department of Botany, D.S.B. Campus, Kumaun University, Nainital, India, 263001*Corresponding author. E-mail: [email protected]
Abstract. Present cytological study records existing chromosome number diversity, their male meiotic course and pollen fertility analysis in the two wheatgrass species of tribe Triticeae Dumort. (Poaceae) from Western Himalaya, India. Agropyron thomsonii Hook. f. is an endemic grass of alpine zones of Western Himalaya and Elymus nutans Griseb., a widely distributed grass in sub-alpine to glacial regions of Himalaya. The gametophytic chromosome number count of n=21 (Jadh Ganga Valley, Uttarkashi) is a pioneer count for A. thomsonii. During the male meiotic course of A. thomsonii, 14.04-16.29% and 2.97-4.17% pollen mother cells, respectively at prophase-I and metaphase-I, observed to be involved in phenomenon of cytomixis. Seven accessions of E. nutans collected from Bhagirathi Valley and Jadh Ganga Valley of Uttarkashi district, and Pan-gi Valley of Chamba district, recorded with gametophytic chromosome number count of n=21 and record of 1B-chromosome in PUN61958 is a new record for the species. In three accessions 5.56-9.41% and 2.5% pollen mother cells at prophase-I and met-aphase-I, respectively were also noted with phenomenon of cytomixis. In addition to phenomenon of cytomixis, during meiotic course of both species pollen mother cells also depicted associated meiotic course irregularities viz. non-synchronous disjunction of bivalents, chromatin bridges, laggards, micronuclei in sporads and shrivelled micro-spores. These species are growing in cold climatic condition habitats. So, cold stress seems to be a preferential inductor for cytomixis and associated meiotic abnormalities in the gametic cells of stamens of A. thomsonii and E. nutans that ultimately leads to reduction in pollen fertility.
Keywords: Himalayan grasses, cold stress, polyploidy, male meiosis, cytomixis and meiotic abnormalities, pollen sterility.
INTRODUCTION
Tribe Triticeae Dumort. (Poaceae) includes annual and perennial grass taxa, having large-sized chromosomes, comprising a polyploid complex of
90 Harminder Singh et al.
2x, 4x, 6x, 8x, 10x and 12x ploidy levels with a uniform base number of x=7 (Dewey 1984). The Members of tribe Triticeae have distribution to almost all floristic regions of the globe. In Himalaya, Agropyron Gaertn. and Ely-mus L. are prominent grass genera of temperate to alpine zone habitats, and an inflorescence is a spike that has one to many spikelets at each rachis node. Earlier, the genus Agropyron was represented by more than 33 species in Himalaya along with adjoining regions of similar ter-rain (Bor 1960), and the modern concept of Agropyron restricts it to only those species having keeled glumes and/or pectinately arranged spikelets (Cope 1982). So, the most of the species of Agropyron are now assigned to genus Elymus (Melderis 1978; Singh 1983; Karthikeyan et al. 1989). At present in Himalayan regions of India genus Agropyron is represented by a single species, i.e. A. thom-sonii Hook. f. and genus Elymus by 31 species (Singhal et al. 2018b). A. thomsonii Hook.f. [= E. thomsonii (Hook. F.) Melederis; = E. nayarii Karthik.] and Elymus nutans Griseb. are perennial and caespitose wild grasses growing in the high altitudinal regions of Himalaya (above 3000 m). Former is an endemic grass to Western Himalaya (Pusalkar and Singh 2012) and later species have wid-er in distribution that is growing in different ecological habitats of Bhutan, China, India (Himalaya), Iran, Japan, Mongolia, Nepal, Pakistan and Russia (Bor 1960; Lu 1993; Murti 2001; Chen and Zhu 2006; Pusalkar and Sin-gh 2012; Dvorský et al. 2018). Scrutiny of published cyto-logical data reveals that A. thomsonii is still unrecorded for its chromosome number. As germplasm of grasses remained in a central position towards the breeding pro-grams and germplasm enhancement to ensure the food and fodder demands. So to make their programs suc-cessful, there is a need to have complete knowledge and understanding about the genetic diversity of available germplasm (Kawano 2018). The present study is in a line of endeavour to explore the morphological diversity in the grasses from phytogeographically distinct and unex-plored regions of Western Himalaya. So, this study aimed to record the exact chromosome number in A. thomsonii and E. nutans along with to comment on the behaviour of pollen mother cells during the male meiotic course, and pollen fertility. We also try to correlate prevalence of cold conditions in natural habitat and the possible cause of cytomixis, associated meiotic abnormalities and reduc-tion in pollen fertility in the currently studied species.
MATERIALS AND METHODS
Wild plant accessions of A. thomsonii and E. nutans were collected for detailed male meiotic and pollen fer-
tility studies from Bhagirathi and Jadh Ganga valley, Uttarkashi district, Uttarakhand and Pangi valley, Cham-ba, Himachal Pradesh. Young and unopened spikes, fixed in Carnoy’s fixative (Ethanol: Chloroform: Glacial acetic acid= 6: 3: 1). After 48 h, the materials were transferred to 70% ethanol and stored in a refrigerator. Meiocyte prepa-rations were made by squashing the developing anthers from the unopened florets in 1% acetocarmine. Chromo-some counts and meiotic course was studied from fresh-ly prepared slides having pollen mother cells (PMCs)/ meiocytes at diakinesis, metaphase-I (M-I), anaphase-I (A-I) and telophases (T-I, T-II). Apparent pollen fertil-ity was estimated through stainability tests by squash-ing the mature anthers in glycerol and 1% acetocarmine (1:1) mixture. Well-filled pollen grains with completely stained nuclei and cytoplasm were scored as fertile/via-ble, while partially stained and shrivelled ones as sterile/non-viable. Good preparations of PMCs with well-spread bivalents/chromosomes, meiotic irregularities, and pol-len grains selected for photomicrographs using Nikon 80i Eclipse and Leica Qwin Digital Imaging System. Pollen size was measured through microscopy. Meiotically ana-lyzed accessions were identified by studying, in detail the floral characters and by consulting the floras viz. Grasses of Burma, Ceylon, India and Pakistan (Bor 1960), Flora of Pakistan-Poaceae (Cope 1982), Flora of Cold Deserts of Western Himalaya-Monocotyledons (Murti 2001) and Flora of Gangotri National Park, Western Himalaya (Pusalkar and Singh 2012). Identifications revalidated by comparing the specimens with the vouchers already sub-mitted by taxonomists in the Herbaria, Botanical Survey of India, Northern Circle, Dehra Dun (BSD) and avail-able specimens, facilitated by other herbaria as online resource (Global Plants1). Voucher specimens of cytologi-cally examined accessions deposited in the Herbarium, Department of Botany, Punjabi University, Patiala (PUN) and Herbarium Botanical Survey of India, Northern Cir-cle, Dehra Dun (BSD).
RESULTS
In the present exploration study, cytological investi-gations made on two accessions of A. thomsonii gathered from the alpine meadows of Jadh Ganga Valley and seven accessions of E. nutans from Bhagirathi Valley, Jadh Gan-ga Valley and Pangi Valley. Data regarding the name of taxon, sites of the collection with altitude, accession num-ber (BSD, PUN), gametic chromosome number, ploidy level, pollen fertility percentage tabulated in Table 1.
1 Global plants (https://plants.jstor.org/).
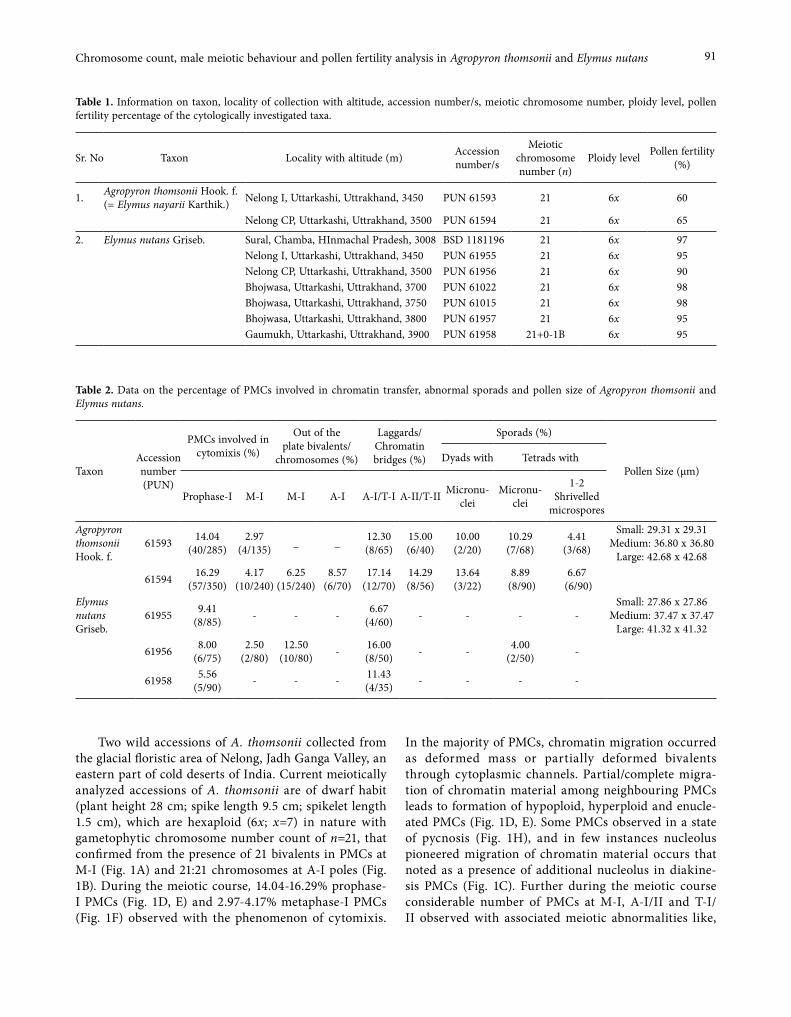
91Chromosome count, male meiotic behaviour and pollen fertility analysis in Agropyron thomsonii and Elymus nutans
Two wild accessions of A. thomsonii collected from the glacial floristic area of Nelong, Jadh Ganga Valley, an eastern part of cold deserts of India. Current meiotically analyzed accessions of A. thomsonii are of dwarf habit (plant height 28 cm; spike length 9.5 cm; spikelet length 1.5 cm), which are hexaploid (6x; x=7) in nature with gametophytic chromosome number count of n=21, that confirmed from the presence of 21 bivalents in PMCs at M-I (Fig. 1A) and 21:21 chromosomes at A-I poles (Fig. 1B). During the meiotic course, 14.04-16.29% prophase-I PMCs (Fig. 1D, E) and 2.97-4.17% metaphase-I PMCs (Fig. 1F) observed with the phenomenon of cytomixis.
In the majority of PMCs, chromatin migration occurred as deformed mass or partially deformed bivalents through cytoplasmic channels. Partial/complete migra-tion of chromatin material among neighbouring PMCs leads to formation of hypoploid, hyperploid and enucle-ated PMCs (Fig. 1D, E). Some PMCs observed in a state of pycnosis (Fig. 1H), and in few instances nucleolus pioneered migration of chromatin material occurs that noted as a presence of additional nucleolus in diakine-sis PMCs (Fig. 1C). Further during the meiotic course considerable number of PMCs at M-I, A-I/II and T-I/II observed with associated meiotic abnormalities like,
Table 1. Information on taxon, locality of collection with altitude, accession number/s, meiotic chromosome number, ploidy level, pollen fertility percentage of the cytologically investigated taxa.
Sr. No Taxon Locality with altitude (m) Accession number/s
Meiotic chromosome number (n)
Ploidy level Pollen fertility (%)
1. Agropyron thomsonii Hook. f.(= Elymus nayarii Karthik.) Nelong I, Uttarkashi, Uttrakhand, 3450 PUN 61593 21 6x 60
Nelong CP, Uttarkashi, Uttrakhand, 3500 PUN 61594 21 6x 65
2. Elymus nutans Griseb. Sural, Chamba, HInmachal Pradesh, 3008 BSD 1181196 21 6x 97Nelong I, Uttarkashi, Uttrakhand, 3450 PUN 61955 21 6x 95Nelong CP, Uttarkashi, Uttrakhand, 3500 PUN 61956 21 6x 90Bhojwasa, Uttarkashi, Uttrakhand, 3700 PUN 61022 21 6x 98Bhojwasa, Uttarkashi, Uttrakhand, 3750 PUN 61015 21 6x 98Bhojwasa, Uttarkashi, Uttrakhand, 3800 PUN 61957 21 6x 95Gaumukh, Uttarkashi, Uttrakhand, 3900 PUN 61958 21+0-1B 6x 95
Table 2. Data on the percentage of PMCs involved in chromatin transfer, abnormal sporads and pollen size of Agropyron thomsonii and Elymus nutans.
TaxonAccession number (PUN)
PMCs involved in cytomixis (%)
Out of the plate bivalents/
chromosomes (%)
Laggards/Chromatin bridges (%)
Sporads (%)
Pollen Size (µm)Dyads with Tetrads with
Prophase-I M-I M-I A-I A-I/T-I A-II/T-II Micronu-clei
Micronu-clei
1-2 Shrivelled
microspores
Agropyron thomsonii Hook. f.
61593 14.04(40/285)
2.97(4/135) _ _ 12.30
(8/65)15.00(6/40)
10.00(2/20)
10.29(7/68)
4.41(3/68)
Small: 29.31 x 29.31Medium: 36.80 x 36.80
Large: 42.68 x 42.68
61594 16.29(57/350)
4.17(10/240)
6.25(15/240)
8.57(6/70)
17.14(12/70)
14.29(8/56)
13.64(3/22)
8.89 (8/90)
6.67 (6/90)
Elymus nutans Griseb.
61955 9.41(8/85) - - - 6.67
(4/60) - - - -Small: 27.86 x 27.86
Medium: 37.47 x 37.47 Large: 41.32 x 41.32
61956 8.00(6/75)
2.50(2/80)
12.50(10/80) - 16.00
(8/50) - - 4.00(2/50) -
61958 5.56(5/90) - - - 11.43
(4/35) - - - -

92 Harminder Singh et al.
Figure 1. Male meiosis in Agropyron thomsonii: (A) M-I PMCs with 21 bivalents (B) A-I PMC with 21:21 chromosomes at each pole; (B) PMCs involved in chromatin migration at P I (arrowed); (C) a diakinesis PMC possessing relatively small sized additional nucleolus PMCs; (D) prophase-I PMCs depicting phenomenon of cytomixis (arrowed); (E) diakinesis PMCs with chromatin migration and depicting forma-tion of hyperploid and enucleated PMC (arrowed); (F) M-I PMC involved in chromatin migration (arrowed); (G) A-I PMC with non-syn-chronous dysjunction of bivalents depicted by univalents and bivalent bridges (arrowed); (H) a PMC depicting abnormal spindle and state of pycnosis with fragments (arrowed); (I) A-I PMC with several laggards (arrowed); (J) early T-I PMC with dicentric bridge, fragments and laggards (arrowed); (K) T-II PMC as dyad with on subunit with laggard (arrowed); (L) T-I PMCs with miocronuclei at one pole (arrowed); (M) dyad subunits with micronuclei (arrowed); (N) tetrad microspore subunits with micronuclei (arrowed); (O) A tetrad with two shriv-elled microspore units (arrowed); (P, Q) fully stained fertile, shrivelled and unstained as sterile pollen grains. Scale bar=10μm.

93Chromosome count, male meiotic behaviour and pollen fertility analysis in Agropyron thomsonii and Elymus nutans
chromatin bridges (Fig. 1G) and laggards/ fragments (Fig. 1I, J, K, L), and micronuclei in sporads (Figs. 1M, N), collectively depicting a syndrome of errors occurred during the meiotic course (Table 2). During, the micro-sporogenesis two types of sporads were noted, first hav-ing all normal microspores and another type with shriv-elled microspores (Fig. 1O). These meiotic abnormalities during meiotic course have resulted in low pollen fertil-ity (60-65%) and formation of heterogeneous sized pol-len grains in these accessions (Fig. 1P, Q).
Seven accessions of E. nutans collected from sub-alpine and glacial vegetation zones of three valleys not-
ed to have variable plant height in their natural habitat, viz. dwarf (PUN 60482, 61956: plant height, 9-15 cm; spike length, 3-5.5 cm; spikelet length, 10-12.5 mm; awn length, 7-10 mm), intermediate (PUN 61955: plant height, 25 cm; spike length, 8-8.5 cm; spikelet length, 9-10 mm; awn length, 15-17.5 mm) and tall (PUN 61022, 61957-58, BSD 1181196: plant height, 50-65 cm; spike length, 15-18 cm; spikelet length 30-45 mm; awn length, 25-45 mm). These accessions unequivocally have a gametic chromosome number count of n=21, confirmed from the presence of 21 bivalents in PMCs at M-I (Fig. 2A). 1B-chromosome was also observed in few pollen
Figure 2. Male meiosis in Elymus nutans: (A) M-I PMC with equal-sized 21 bivalents; (B) M-I PMC with 1B-chromosome associated with A-bivalent (arrowed); (C) M-I PMC with independent 1B-chromosome (arrowed); (D) M-I PMC with chromatin stickiness; (E) M-I PMC depicting the phenomenon of cytomixis (arrowed); (F) M-I PMC with migrated chromatin material as pycnotic mass (arrowed); (G) A-I PMC with non-synchronous dysjunction of bivalents (arrowed); (H) heterogeneous sized pollen grains (arrowed); (I, J) fully stained fertile, partially stained and unstained as sterile pollen grains. Scale bar=10μm.
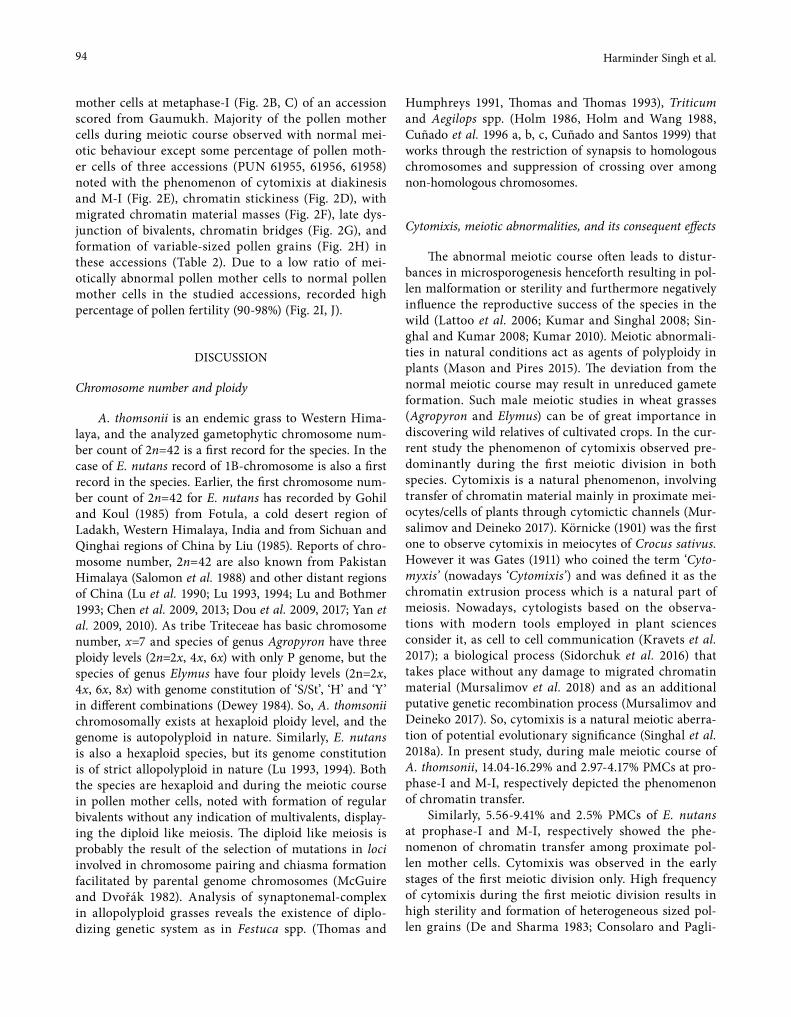
94 Harminder Singh et al.
mother cells at metaphase-I (Fig. 2B, C) of an accession scored from Gaumukh. Majority of the pollen mother cells during meiotic course observed with normal mei-otic behaviour except some percentage of pollen moth-er cells of three accessions (PUN 61955, 61956, 61958) noted with the phenomenon of cytomixis at diakinesis and M-I (Fig. 2E), chromatin stickiness (Fig. 2D), with migrated chromatin material masses (Fig. 2F), late dys-junction of bivalents, chromatin bridges (Fig. 2G), and formation of variable-sized pollen grains (Fig. 2H) in these accessions (Table 2). Due to a low ratio of mei-otically abnormal pollen mother cells to normal pollen mother cells in the studied accessions, recorded high percentage of pollen fertility (90-98%) (Fig. 2I, J).
DISCUSSION
Chromosome number and ploidy
A. thomsonii is an endemic grass to Western Hima-laya, and the analyzed gametophytic chromosome num-ber count of 2n=42 is a first record for the species. In the case of E. nutans record of 1B-chromosome is also a first record in the species. Earlier, the first chromosome num-ber count of 2n=42 for E. nutans has recorded by Gohil and Koul (1985) from Fotula, a cold desert region of Ladakh, Western Himalaya, India and from Sichuan and Qinghai regions of China by Liu (1985). Reports of chro-mosome number, 2n=42 are also known from Pakistan Himalaya (Salomon et al. 1988) and other distant regions of China (Lu et al. 1990; Lu 1993, 1994; Lu and Bothmer 1993; Chen et al. 2009, 2013; Dou et al. 2009, 2017; Yan et al. 2009, 2010). As tribe Triteceae has basic chromosome number, x=7 and species of genus Agropyron have three ploidy levels (2n=2x, 4x, 6x) with only P genome, but the species of genus Elymus have four ploidy levels (2n=2x, 4x, 6x, 8x) with genome constitution of ‘S/St’, ‘H’ and ‘Y’ in different combinations (Dewey 1984). So, A. thomsonii chromosomally exists at hexaploid ploidy level, and the genome is autopolyploid in nature. Similarly, E. nutans is also a hexaploid species, but its genome constitution is of strict allopolyploid in nature (Lu 1993, 1994). Both the species are hexaploid and during the meiotic course in pollen mother cells, noted with formation of regular bivalents without any indication of multivalents, display-ing the diploid like meiosis. The diploid like meiosis is probably the result of the selection of mutations in loci involved in chromosome pairing and chiasma formation facilitated by parental genome chromosomes (McGuire and Dvořák 1982). Analysis of synaptonemal-complex in allopolyploid grasses reveals the existence of diplo-dizing genetic system as in Festuca spp. (Thomas and
Humphreys 1991, Thomas and Thomas 1993), Triticum and Aegilops spp. (Holm 1986, Holm and Wang 1988, Cuñado et al. 1996 a, b, c, Cuñado and Santos 1999) that works through the restriction of synapsis to homologous chromosomes and suppression of crossing over among non-homologous chromosomes.
Cytomixis, meiotic abnormalities, and its consequent effects
The abnormal meiotic course often leads to distur-bances in microsporogenesis henceforth resulting in pol-len malformation or sterility and furthermore negatively influence the reproductive success of the species in the wild (Lattoo et al. 2006; Kumar and Singhal 2008; Sin-ghal and Kumar 2008; Kumar 2010). Meiotic abnormali-ties in natural conditions act as agents of polyploidy in plants (Mason and Pires 2015). The deviation from the normal meiotic course may result in unreduced gamete formation. Such male meiotic studies in wheat grasses (Agropyron and Elymus) can be of great importance in discovering wild relatives of cultivated crops. In the cur-rent study the phenomenon of cytomixis observed pre-dominantly during the first meiotic division in both species. Cytomixis is a natural phenomenon, involving transfer of chromatin material mainly in proximate mei-ocytes/cells of plants through cytomictic channels (Mur-salimov and Deineko 2017). Körnicke (1901) was the first one to observe cytomixis in meiocytes of Crocus sativus. However it was Gates (1911) who coined the term ‘Cyto-myxis’ (nowadays ‘Cytomixis’) and was defined it as the chromatin extrusion process which is a natural part of meiosis. Nowadays, cytologists based on the observa-tions with modern tools employed in plant sciences consider it, as cell to cell communication (Kravets et al. 2017); a biological process (Sidorchuk et al. 2016) that takes place without any damage to migrated chromatin material (Mursalimov et al. 2018) and as an additional putative genetic recombination process (Mursalimov and Deineko 2017). So, cytomixis is a natural meiotic aberra-tion of potential evolutionary significance (Singhal et al. 2018a). In present study, during male meiotic course of A. thomsonii, 14.04-16.29% and 2.97-4.17% PMCs at pro-phase-I and M-I, respectively depicted the phenomenon of chromatin transfer.
Similarly, 5.56-9.41% and 2.5% PMCs of E. nutans at prophase-I and M-I, respectively showed the phe-nomenon of chromatin transfer among proximate pol-len mother cells. Cytomixis was observed in the early stages of the first meiotic division only. High frequency of cytomixis during the first meiotic division results in high sterility and formation of heterogeneous sized pol-len grains (De and Sharma 1983; Consolaro and Pagli-
95Chromosome count, male meiotic behaviour and pollen fertility analysis in Agropyron thomsonii and Elymus nutans
arini 1995; de Souza and Pagliarini 1997; Pierozzi and Benatti 1998; Singhal and Kumar 2008). The chromatin transfer involves partial or complete migration of nuclear contents, which results into origin of hyper, hypoploid and enucleated meiocytes. Also, few PMCs during chro-matin transfer along with/without migrated chromatin material also acquire additional nucleoli (Kumar 2010). Kumar and Singhal (2016) while enlisting 31 species possessing additional nucleoli suggested that in major-ity of the species with an additional nucleoli are result-ed due to phenomenon of cytomixis. PMC’s at M-I, A-I/II and T-I/II observed with other meiotic abnormalities, depict a syndrome of errors occurred during the meiotic course. Differential extent and intensity of pairing/cross-ing over among non-sister chromatids of homologous chromosomes results to non-synchronous dysjunction of bivalents during meiosis-I, and formation of chroma-tin bridges occurs (Kumar 2010). Crossing over within paracentric inversion pairing loops or U-type exchange between non-sister chromatids during paring creates dicentric bivalent bridges and acentric fragments con-figurations observed at early T-I. Formation of dicen-tric bridge and laggards/fragment as meiotic configu-rations during meiotic course appears as a meiotic syn-drome that depicts reduced control over meiotic course (Jones and Brumpton 1971). Presence of large number of laggards, possibly due to abnormal spindle, disturbed cytoskeleton and other cellular changes. These chromatin fragments/laggards lead to formation of micronuclei in sporads. As, abnormal chromosome segregation, presence of micronuclei and reduced pollen fertility results due to formation of multiple spindles at meiosis-I (Vasek 1962). In Jadh Ganga Valley, cold conditions are prevalent and both the accessions of A. thomsonii growing in this region are prone to extreme temperature fluctuations i.e. short warm days and long cold nights. Male reproductive organs and their development are extremely sensitive to cold stress (Liu et al. 2019). So, during the microsporo-genesis, formation of shrivelled microspores noted in tetrads that may be due to cold stress-induced abnormal development mediated through malnutrition. Cold stress disrupts stamen development and prominently interferes with tapetum programmed cell death, which is crucial for progression of normal meiotic course and develop-ment of microspores to pollens (Oliver et al. 2005, 2007; Sharma and Nayyar 2014; Liu et al. 2019).
The phenomenon of cytomixis and associated mei-otic abnormalities in A. thomsonii and E. nutans seems to be due to low-temperature stress conditions that are prevalent in the region and have potential to alter the expression of certain alleles controlling the vital steps of meiosis. Previous cytological studies of Bedi (1990), Bel-
lucci et al. (2003), Malallah and Attia (2003), Kumar et al. (2010, 2011, 2014, 2017), Singhal and Kumar (2008, 2010) and Mandal et al. (2013) are also in the view that cytomixis is under direct control of genetic factors.
Pollen development is a complex process regulated at different genetic levels. Mutants showing abnormal pollen development can be of beneficial help in under-standing the process of pollen development (Sheila 1993). Cytomixis, coupled with associated meiotic abnormalities, leads to the formation of genetically vari-able pollen grains, affecting pollen size and fertility. Pol-len size variation depends upon the extent of chromatin material, or amount of DNA (Stebbins 1971) possessed/lost by meiocytes during chromatin transfer, and pres-ently somewhat pollen size variation was observed. Effects of cytomixis on meiotic course, pollen size, and pollen fertility have previously been reported in grasses viz. Agropyron cristatum (Bauchan et al. 1987), Alope-curus arundinaceus (Koul 1990), Brachiaria humidicola (Boldrini et al. 2006), Elymus semicostatus (Singhal et al. 2018c), Urochloa panicoides (Basavaiah and Murthy 1987), and many other flowering plants viz. Vicia faba (Bhat et al. 2006), Nicotiana tabacum (Mursalimov and Deineko 2011), Chlorophytum borivilianum (Mandal and Nandi 2017), Anchusa spp. (Keshavarzi et al. 2017), Thalictrum cultratum (Kumar et al. 2017) and Clematis ladakhiana (Khan et al. 2018).
In the end, it may be summarized that individu-als of A. thomsonii and E. nutans of cold desert habitat are of dwarf habit and whereas of other alpine regions of western Himalaya are taller. Respectively, both the species unequivocally noted with chromosome number count of 2n=42 and 2n=42+0-1B with 6x ploidy level are pioneer counts for the species. In natural habitats of these species cold climatic conditions are prevalent and seem these species are differentially affected by cold stress, which is a potential inducer for abnormal mei-otic course and sporads. The phenomenon of cytomixis and associated meiotic abnormalities observed in pollen mother cells of A. thomsonii and E. nutans affects the pollen size and pollen fertility in the species.
ACKNOWLEDGMENTS
The authors wish to thank the University Grants Commission (UGC), New Delhi for financial sup-port under DRS, SAP-I, II, III, ASIST program and DSA-I schemes; Department of Biotechnology (DBT), New Delhi under DBT-IPLS project [BT/PR4548/INF/22/146/2012]; for award of UGC-BSR-Fellowship [Award letter no. 15610/Research/03/06/2015] and Sci-
96 Harminder Singh et al.
ence and Engineering Research Board-Department of Science and Technology (SERB-DST) Start-Up Research Grant (Young Scientists) [vide SERB sanction No. SB/YS/LS-182/2014 dated 8/9/2015]. Thanks are also due to the Head, Department of Botany, Punjabi University Patiala, and Director, Botanical Survey of India, Kol-kata and Head of Office, NRC, Dehradun, for providing necessary laboratory, Herbarium (PUN, BSD), Inter-net facilities and Co-ordinator, University Sophisticat-ed Instrumentation Centre for kind permission to use imaging system facility.
REFERENCES
Basavaiah, Murthy TCS. 1987. Cytomixis in pollen moth-er cells of Urochloa panicoides P. Beauv. (Poaceae). Cytologia. 52:69–74.
Bauchan GR, Linkous LCW, Tai W. 1987. Cytomixis in Agropyron cristatum. Genome. 29:765–769.
Bedi YS. 1990. Cytomixis in woody species. In: Proc Indi-an Nat Sci Acad Plant Sci. 100:23–238.
Bellucci M, Roscini C, Mariani A. 2003. Cytomixis in pollen mother cells of Medicago sativa L. J Heredit. 94:512–516.
Bhat TA, Parveen S, Khan AH. 2006. MMS-induced cyto-mixis in pollen mother cells of broad bean (Vicia faba L.). Turk J Bot. 30:273–279.
Boldrini KR, Pagliarini MS, do Valle CB. 2006. Cell fusion and cytomixis during microsporogenesis in Brachiaria humidicola (Poaceae). S Af J Bot. 72:478–481.
Bor NL. 1960. Grasses of Burma, Ceylon, India and Paki-stan (excluding Bambuseae). London: Pergamon Press.
Chen SL, Zhu GH. 2006. Elymus L. Flora of China (Poaceae). Beijing and St. Louis, MO: Science Press and Missouri Botanical Garden. 22:400–429.
Chen SY, Ma X, Zhang XQ, Chen ZH. 2009. Genetic vari-ation and geographical divergence in Elymus nutans Griseb. (Poaceae: Triticeae) from West China. Bioch Syst Ecol. 37:716–722.
Chen S, Zhang X, Ma X, Huang L. 2013. Assessment of genetic diversity and differentiation of Elymus nutans indigenous to Qinghai-Tibet Plateau using simple sequence repeats markers. Can J Pl Sci. 93:1089–1096.
Consolaro MEL, Pagliarini MS. 1995. Cytomixis in pollen mother cells of Centella asiatica L. Nucleus. 38:80–85.
Cope TA. 1982. Poaceae. In: Nasir E, Ali SI. (Eds.). Flora of Pakistan. No. 143. Pakistan: Department of Bota-ny, University of Karachi.
Cuñado N, Santos JL. 1999. On the diploidization mech-anism of the genus Aegilops: Meiotic behaviour of interspecific hybrids. Theor. Appl. Genet. 99:1080–1086.
Cuñado N, Callejas S, García MJ, Fernández A, Santos JL. 1996a. Chromosome pairing in the allotetraploid Aegilops biuncialis and a triploid intergeneric hybrid. Genome 39:664–670.
Cuñado N, Callejas S, García MJ, Fernández A, Santos JL. 1996b. The pattern of zygotene and pachytene pair-ing in allotetraploid Aegilops species sharing the U genome. Theor. Appl. Genet. 93:1152–1155.
Cuñado N, García MJ, Callejas S, Fernández A, Santos JL. 1996c. The pattern of zygotene and pachytene pair-ing in allotetraploid Aegilops species sharing the D genome. Theor. Appl. Genet. 93:1175–1179.
Dewey DR. 1984. The genomic system of classification as a guide to intergeneric hybridization with the peren-nial Triticeae. In: Gustafson JP. (Ed.). Gene manipu-lation in plant improvement, 16th Stadler Genetics Symposium. Boston: Springer. pp. 209–279.
De M, Sharma AK. 1983. Cytomixis in pollen mother cells of an apomictic ornamental Ervatamia divari-cata (Linn.) Alston. Cytologia. 48:201–207.
Dou QW, Chen ZG, Liu YA, Tsujimoto H. 2009. High frequency of karyotype variation revealed by sequen-tial FISH and GISH in plateau perennial grass forage Elymus nutans. Breed Sci. 59:651–656.
Dou Q, Yu F, Li Y, Zhao Y, Liu R. 2017. High molecular karyotype variation revealed in indigenous Elymus nutans in the Qinghai Plateau. Pl Divers. 39:117–122.
Dvorský M, Klimes L, Dolezal J, Wild J, Dickoré BW. 2018. A Field Guide to the Flora of Ladakh. Praha: Academia.
Gates RR. 1911. Pollen formation in Oenothera gigas. Ann Bot. 25:909–940.
Gohil RN, Koul KK. 1985. In: Bir SS. (ed.). SOCGI plant chromosome number reports. J Cytol Genet. 21:155.
Holm PB. 1986. Chromosome pairing and chiasma for-mation in allohexaploid wheat, Triticum aestivum, analysed by spreading of meiotic nuclei. Carlsberg Res. Commun. 51:239–294.
Holm PB, Wang X. 1988. The effect of chromosome SB on synapsis and chiasma formation in wheat, Triti-cum aestivum, cv. Chinese Spring. Carlsberg Res. Commun. 53:191–208.
Jones GH, Brumpton RJ. 1971. Sister and non-sister chromatid U-type exchange in rye meiosis. Chromo-soma. 33:115–128.
Karthikeyan S, Jain SK, Nayar MP, Sanjappa M. 1989. Florae Indicae Enumeratio Monocotyledonae. Cal-cutta: Botanical Survey of India.
97Chromosome count, male meiotic behaviour and pollen fertility analysis in Agropyron thomsonii and Elymus nutans
Kawano S. 2018. Karyotype and chromosome behavior analyses in three regions of the Indomalayan Realm. Cytologia 83:223–228.
Keshavarzi M, Nasrollahi F, Sheidai M. 2017. Cytogenet-ic study of the genus Anchusa L. (Boraginaceae) in Iran. Caryologia. 70:57–365.
Khan NA, Singhal VK, Gupta RC. 2018. First record of chromosome count and cytomixis in an endemic species of Clematis ladakhiana Grey-Wilson (Ranun-culaceae) from cold deserts of Jammu and Kashmir. Caryologia 71:233–237.
Körnicke M. 1901. About change of location of cell nuclei. Meeting Reports of Society of Lower Rhine for Nature and Medicine (Bonn). pp. 14–25. (in Ger-men)
Koul KK. 1990. Cytomixis in pollen mother cells of Alo-pecurus arundinaceus Poir. Cytologia. 55:169–173.
Kravets EA, Yemets AI, Blume YB. 2017. Cytoskeleton and nucleoskeleton involvement in processes of cyto-mixis in plants. Cell Biol. Int. [doi:10.1002/cbin. 10842]
Kumar P. 2010. Exploration of cytomorphological diver-sity in the members of Polypetalae from Lahaul-Spiti and adjoining areas. PhD Thesis. India: Punjabi Uni-versity Patiala, Punjab.
Kumar P, Singhal VK. 2008. Cytology of Caltha palustris L. (Ranunculaceae) from cold regions of Western Himalayas. Cytologia. 73:137–147.
Kumar P, Singhal VK. 2016. Nucleoli migration coupled with cytomixis. Biologia. 71:651–659.
Kumar P, Singhal VK, Kaur D, Kaur S. 2010. Cytomixis and associated meiotic abnormalities affecting pollen fertility in Clematis orientalis. Biol Plant. 54:181–184.
Kumar P, Singhal VK, Rana PK, Kaur S, Kaur D. 2011. Cytology of Ranunculus laetus Wall. ex Royle from cold desert regions and adjoining hills of North-west Himalayas. Caryologia. 64:25–32.
Kumar P, Rana PK, Singhal VK, Gupta RC. 2014. Cyto-geography and phenomenon of cytomixis in Silene vulgaris from cold regions of Northwest Himalayas (India). Plant Syst Evol. 300:831–842.
Kumar P, Singhal VK, Srivastava SK. 2017. First detection of cytomixis and its consequences in Thalictrum cul-tratum Wall. (Ranunculaceae). Cytol Genet. 51:384–390.
Lattoo SK, Khan S, Bamotra S, Dhar AK. 2006. Cytomixis impairs meiosis and influences reproductive success in Chlorophytum comosum (Thunb.) Jacq. – an addi-tional strategy and possible implications. J Biosci. 31:629–637.
Liu B, Mo WJ, Zhang D, De Storme N, Geelen D. 2019. Cold influences male reproductive development in
plants: A hazard to fertility, but a window for evolu-tion. Plant Cell Physiol. 60:7–18.
Liu Y. 1985. Studies on the karyotypes of 11 species of Elymus from China. J Wuh Bot Res. 3:325–330.
Lu BR. 1993. Meiotic studies of Elymus nutans and E. jac-quemontii (Poaceae, Triticeae) and their hybrids with Pseudoroegneria spicata and seventeen Elymus spe-cies. Plant Syst Evol. 186:193–211.
Lu BR. 1994. Morphological identification of Elymus sibiricus, E. nutans, and E. burchan-buddae, and their genomic relationships. Acta Phytotax Sinic. (Chi-na). 32:504–513.
Lu B, Bothmer, RV. 1993. Meiotic analysis of Elymus caucasicus, E. longearistatus, and their interspecific hybrids with twenty-three Elymus species (Triticeae, Poaceae). Plant Syst Evol. 185:35–53.
Lu BR, Yan J, Yang JI. 1990. Cytological observation on Triticeae materials from Xinjiang, Qinghai and Sichuan. Acta Bot. Yunn. (China). 12:57–66.
Malallah GA, Attia TA. 2003. Cytomixis and its possible evolutionary role in a Kuwait population of Diplotax-is harra (Boraginaceae). Bot J Linn Soc. 143:169–175.
Mandal GD, Nandi AK, Das AB. 2013. Cytomixis and associated meiotic abnormalities in pollen mother cells of Chlorophytum tuberosum (Roxb.) Baker. Cyt-ologia. 78:157–162.
Mandal GD, Nandi AK. 2017. Cytomixis with associated chromosomal anomalies and the reproduction of Chlorophytum borivilianum Santapau & RR Fern. Tai-wania. 62:211–215.
Mason AS, Pires JC. 2015. Unreduced gametes: meiotic mishap or evolutionary mechanism? Trends Genet. 31:5–10.
McGuire PE, Dvořák J. 1982. Genetic regulation of heter-ogenetic chromosome pairing in polyploid species of the genus Triticum sensu lato. Canad. J. Genet. Cytol. 24:57–82.
Melderis A. 1978. Elymus. In: Hara H, Chater AO, Wil-liams LHJ. (eds.) An enumeration of the flowering plants of Nepal. London: British Museum (Natural History).
Mursalimov SR, Deineko EV. 2011. An ultrastruc-tural study of cytomixis in tobacco pollen mother cells. Protoplasma. 248:717–724.
Mursalimov S, Deineko E. 2017. Cytomixis in tobacco microsporogenesis: are there any genome parts pre-disposed to migration? Protoplasma. 254:1379–1384.
Mursalimov S, Zagorskaya A, Deineko E. 2018. Evalu-ation of DNA damage in tobacco male meiocytes involved in cytomixis using comet assay. Protoplas-ma. 255:413–417. [https://doi.org/10.1007/s00709-017-1144-6]

98 Harminder Singh et al.
Murti SK. 2001. Flora of cold deserts of Western Hima-laya. Vol I. Monocotyledons. Kolkata: Botanical Sur-vey of India.
Oliver SN, Dennis ES, Dolferus R. 2007. ABA regulates apoplastic sugar transport and is a potential signal for cold-induced pollen sterility 90 in rice. Plant Cell Physiol. 48:1319–1330.
Oliver SN, Van Dongen JT, Alfred SC, Mamun EA, Zhao X, Saini HS, Fernandes SF, Blanchard CL, Sutton BG, Geigenberger P, Dennis ES, Dolferus R. 2005. Cold-induced repression of the rice anther-specific cell wall invertase gene OSINV4 is correlated with sucrose accumulation and pollen sterility. Plant Cell Environ. 28:1534–1551.
Pierozzi NI, Benatti R. 1998. Cytological analysis in the microsporogenesis of ramie Boehmeria nivea Gaud. (Urticaceae) and the effect of colchicine on the chi-asma frequency. Cytologia. 63:213–221.
Pusalkar PK, Singh DK. 2012. Flora of Gangotri National Park, Western Himalaya, India. Kolkata: Botanical Survey of India.
Salomon B, Bothmer RV, Yang JL, Lu BR. 1988. Notes on the perennial Triticeae species in Northern Paki-stan. Bot Jahrb Syst. 110:7–15.
Sharma KD, Nayyar H. 2014. Cold stress alters transcrip-tion in meiotic anthers of cold tolerant chickpea (Cic-er arietinum L.). BMC Res. Notes. 7:717.
Sheila M. 1993. Male gametophyte develpoment. Plant Cell. 5:1265–1275.
Sidorchuk YV, Novikovskaya AA, Deineko EV. 2016. Cytomixis in the cereal (Gramineae) microsporogen-esis. Protoplasma. 253:291–298.
Singh G. 1983. New combinations in Asiatic Elymus (Poaceae). Taxon 32:639–640.
Singhal VK, Kumar P. 2008. Impact of cytomixis on mei-osis, pollen viability and pollen size in wild popu-lations of Himalayan poppy (Meconopsis aculeata Royle). J Biosci. 33:371–380.
Singhal VK, Kumar P. 2010. Variable sized pollen grains due to impaired male meiosis in the cold desert plants of North West Himalayas (India). In: Benja-min JK. (Ed.). Pollen: structure, types and effects. New York: Nova Science Publishers, pp 101–126.
Singhal VK, Kumar R, Kumar P. 2018a. A new percep-tion about cytomixis: Causes, mechanisms and role. Chromosome Sci. 21:61–66.
Singhal VK, Singh J, Kumari V. 2018b. Chromosome counts through male meiosis in seven species of genus Elymus L.(Tribe Triticeae: Poaceae) from North West Himalayas, India. Cytologia 83: 365–368.
Singhal VK, Singh J, Singh H, Kumar P, Kholia BS, Tewari, L.M. 2018c. Chromosome count, meiotic
abnormalities, pollen fertility and karyotype of Ely-mus semicostatus (Nees ex Steud.) Meld. from North-west Himalaya. Caryologia. 71:322–330.
de Souza A, Pagliarini M. 1997. Cytomixis in Brassica napus var. oleifera and Brassica campestris var. oleifera (Brassicaceae). Cytologia. 62:25–29.
Stebbins GL. 1971. Chromosomal evolution in higher plants. London, UK: Edward Arnold.
Thomas H, Humphreys MO. 1991. Progress and potential of interspecific hybrids of Lolium and Festuca. J. Agri. Sci. 117:1–8.
Thomas HM, Thomas BJ. 1993. Synaptonemal complex formation in two allohexaploid Festuca species and a pentaploid hybrid. Heredity 71:305–311.
Vasek FC. 1962. ‘Multiple spindle’ a meiotic irregularity in Clarkia exalis. Amer J Bot. 49:536–539.
Yan XB, Guo YX, Zhao C, Liu FY, Lu BR. 2009. Intra-population genetic diversity of two wheatgrass spe-cies along altitude gradients on the Qinghai-Tibetan Plateau: its implication for conservation and utiliza-tion. Conserv Genet. 10:359–367.
Yan XB, Guo YX, Liu FY, Zhao C, Liu QL, Lu BR. 2010. Population structure affected by excess gene flow in self-pollinating Elymus nutans and E. burchan-bud-dae (Triticeae: Poaceae). Popul Ecol. 52:233–241.
Caryologia. International Journal of Cytology, Cytosystematics and Cytogenetics 73(2): 99-110, 2020
Firenze University Press www.fupress.com/caryologiaCaryologia
International Journal of Cytology, Cytosystematics and Cytogenetics
ISSN 0008-7114 (print) | ISSN 2165-5391 (online) | DOI: 10.13128/caryologia-573
Citation: R. Tabaripour, M. Sheidai, S. Mehdi Talebi, Z. Noormohammadi (2020) Population genetic and phylo-geographic analyses of Ziziphora clino-podioides Lam., (Lamiaceae), “kakuti-e kuhi”: An attempt to delimit its subspe-cies. Caryologia 73(2): 99-110. doi: 10.13128/caryologia-573
Received: July 26, 2019
Accepted: April 16, 2020
Published: July 31, 2020
Copyright: © 2020 R. Tabaripour, M. Sheidai, S. Mehdi Talebi, Z. Noormo-hammadi. This is an open access, peer-reviewed article published by Firenze University Press (http://www.fupress.com/caryologia) and distributed under the terms of the Creative Com-mons Attribution License, which per-mits unrestricted use, distribution, and reproduction in any medium, provided the original author and source are credited.
Data Availability Statement: All rel-evant data are within the paper and its Supporting Information files.
Competing Interests: The Author(s) declare(s) no conflict of interest.
Population genetic and phylogeographic analyses of Ziziphora clinopodioides Lam., (Lamiaceae), “kakuti-e kuhi”: An attempt to delimit its subspecies
Raheleh Tabaripour1,*, Masoud Sheidai1, Seyed Mehdi Talebi2, Zahra Noormohammadi3
1 Faculty of Biological Sciences and biotechnology, Shahid Beheshti University, Tehran, Iran2 Department of Biology, Faculty of Science, Arak University, Arak, Iran3 Biology Department, Islamic Azad University, Sciences and Research Branch, Tehran, Iran*Correspondence author. E-mail: [email protected]
Abstract. Ziziphora clinopodioides Lam., (Lamiaceae), is a perennial herb which is used as traditional medicine in Iran. Different authors disagree on the number of subspe-cies. In general, taxonomic and biosystematic studies of Ziziphora clinopodioides have been limited and no molecular phylogenetic or biogeographic study of the species has been carried out. Therefore, the aims of this study were (1) to determine the number of subspecies, (2) to produce information on the species’ genetic structure and intra-spe-cific genetic variability, and (3) to produce data on the probable date of appearance of Ziziphora clinopodioides in Iran. We used a combination of morphological and molecu-lar data to study plants randomly collected from 5 geographical regions. Both analyses revealed a high level of within population variability and grouping of the studied prov-inces produced an admixture that indicated the absence of any subspecies within the species. STRUCTURE analysis and K-Means clustering identified two gene pools with-in the country. The probable date of divergence obtained was 5-10 Mya for the appear-ance of this species in the mountainous regions of Qazvin and Mazandaran.
Keywords: biogeography, genetic diversity, STRUCTURE analysis, subspecies delimi-tation, Ziziphora clinopodioides.
INTRODUCTION
Species and subspecies delimitation is a difficult and somewhat subjec-tive task in a species complex and in species with several overlapping geo-graphical populations (Wiens 2007). In general, the recognition of a species or subspecies is based on morphological observations.
Different species can be delimited by a few distinct morphological char-acteristics that show no overlap with other species. This criterion is very tra-
100 Raheleh Tabaripour et al.
ditional yet it makes sense biologically, which suggests that there is no gene flow between the species (based on some assumptions; for example any morphological difference has a genetic basis) (Wiens 2007). However, this approach can either fail to discriminate species and mask the presence of cryptic species or discriminate dif-ferent species while in reality there is only one. In these situations, it is suggested that different and combined approaches such as morphological, molecular, cytologi-cal, and other approaches are used to determine species boundaries (Duminil and Di Michele 2009; Carstens et al. 2013). In some cases, incongruence may occur across the results from different methods. This may be due to either introgression or a difference in the power to detect cryptic lineages across one or more of the approaches used (Carstens et al. 2013).
In recent years, parallel developments in the ana-lyzing power of both molecular phylogenetic and popu-lation genetic methods as well as their use in combina-tion have resulted in more powerful species delimita-tion strategies. One of the most striking examples of a joint population genetics and phylogenetic approach is the use of the multispecies coalescent model to estimate phylogeny (Edwards 2009; Kingman 1982). This is fur-ther strengthened by development of new algorithms for detecting population genetic structure (Pritchard et al. 2000; Huelsenbeck and Andolfatto 2007; Huelsenbeck et al. 2011).
The procedure usually involves comparing clusters obtained on the basis of observed polymorphism in both morphological and molecular characters to test if they are in agreement. In case of infra-specific taxon identi-fication (e.g. subspecies), the occurrence of discontinu-ity in both datasets can be suggestive (Seif et al. 2012; Koohdar et al. 2015).
Knowles and Carstens (2007) addressed how molecular data (i.e., gene trees from DNA sequence data) can be used in species delimitation. They pro-posed a new method which uses coalescent simulations to test hypotheses about species limits. Their method is particularly valuable in that it can incorporate data from multiple loci and does not require species to have diverged to the point of being reciprocally monophyl-etic. Similarly, Medrano et al. (2014), applied population genetics methods to the species delimitation problem in Narcissus (Amaryllidaceae) using amplified fragment length polymorphism (AFLP) molecular markers.
Ziziphora clinopodioides Lamarck (Lamiaceae) is a perennial herb with the common Persian name “kakuti-e kuhi”. It is used as a traditional medicine in Iran to treat diseases such as the common cold, gastrointesti-nal disorders and inflammation (Naghibi et al. 2010).
Controversy exists as to the number of subspecies that should be recognized. For example, there are nine sub-species native to Iran according to Flora Iranica (Rech-inger 1982), but in the Flora of Iran (Jamzad 2012), no subspecies are considered.
Ziziphora clinopodioides has prostrated to erect stems and mainly branches at the base. The leaves vary in size and shape. The flowers are light to dark pur-ple and white, with or without a peduncle, gathered in a compact capitulum. It is distributed in the eastern Balkan Peninsula, south east Asia and central Asia to the Pamir-Altay mountains and the Himalayas (Iran, Iraq and central and eastern parts of Turkey) as well as in Africa (Beikmohammadi 2011). In Iran it grows on rocky slopes, low hills and grasslands.
In general, there has been no detailed study looking at the taxonomy, molecular phylogeny and biogeography of this species. Therefore, the aims of this study were (1) to determine the number of subspecies, (2) to produce information on the species genetic structure and intra-specific genetic variability and (3) to produce data on the probable date of appearance in Iran of Z. clinopodioides and its ancestral area of distribution.
MATERIAL AND METHODS
Plant materials
In the present study, 69 plant specimens from 19 populations of Z. clinopodioides were randomly collected from five geographical localities (five provinces) of Iran. These populations occur from northern to eastern parts of the country and have almost a continous pattern of distribution. (Table 1, Fig. 1). Voucher specimens are deposited in the Herbarium of Shahid Beheshti Univer-sity (HSBU).
Morphological studies
In total 29 morphological (5 qualitative, 24 quanti-tative) characters were studied. These characters include both vegetative and reproductive (f loral) variables (Tables 2, 3).
Molecular studies
For molecular analyses, we used both multilocus molecular markers of inter-simple sequence repeats (ISSRs) as well as the chloroplast rpL16 region. For ISSR analysis we used 69 specimens (1-6 samples from each

101Population genetic and phylogeographic analyses of Ziziphora clinopodioides
population) and for cpDNA analysis, we used a subset of 15 randomly selected plants (1-3 samples) from the stud-ied populations of five provinces (Table 1).
Both markers are widely used for species diversity analysis and phylogeny (Weising et al. 2005; Sheidai et al. 2014). ISSRs are particularly suitable markers for infra-spe-cific studies and can reveal genetic discontinuities among populations (Sheidai et al. 2012; Sheidai et al. 2013).
DNA extraction, amplification and ISSR assay
Genomic DNA was extracted using a CTAB (cetyl trimethyl-ammonium bromide) activated charcoal pro-tocol (Sheidai et al. 2013). The quality of extracted DNA was examined by running on a 0.8% agarose gel.
10 ISSR (inter simple sequence repeat) primers, (AGC)5GT, (CA)7GT, (AGC)5GG, UBC810, (CA)7AT,
(GA)9T, UBC807, UBC811, (GA)9A and (GT)7CA, were used (University of British Columbia). PCR reac-tions were performed in a 25μl volume containing 10 mMTris-HCl buffer at pH 8, 50 mM KCl, 1.5 mM MgCl2, 0.2 mM of each dNTP (Bioron, Germany), 0.2 μM of each primer, 20 ng genomic DNA and 3 U of Taq DNA polymerase (Bioron, Germany). The reactions were performed in a Techne thermocycler (Germany) with the following program: 5 min initial denaturation step at 94 °C, followed by 40 cycles of 45s at 94 °C; 1 min at 60 °C and 1min at 72 °C. The reaction was completed with a 7 min extension step at 72 °C.
The amplification products were visualized by run-ning on 2% agarose gels. The fragment size was esti-mated using a 100 bp molecular size ladder (Fermentas, Germany). In order to identify reproducible bands, the experiment was replicated 3 times.
Table 1. Locality information for populations of Z. clinopodioides sampled, including herbarium vouchers for specimens used for morpho-logical and ISSR analyses and GenBank Accession numbers for specimens used for cp-DNA analysis.
Pop no. Province Elevation (m) Longitude Latitude
Number of specimens sampled
Voucher No. GenBank Accession no.ISSR &
Morphology cpDNA
1 Razavi Khorasan 2042 352715.9 595344.9 4 1 HSBU2014413 (1) MG738475
2 Razavi Khorasan 1976 353559.4 5839.7 4 2 HSBU2014414 (2) MG738476HSBU2014427 (3) MG738477
3 Mazandaran 1039 363610.3 534952.7 4 3 HSBU2014415 (4) MG738478HSBU2014428 (10) MG738484HSBU2014429 (11) MG738485
4 Mazandaran 2597 368309 511855 6 2 HSBU2014421 (5) MG738479HSBU2014430 (6) MG738480
5 Tehran 2978 354349 521384.8 4 1 HSBU2014425 (7) MG7384816 Qazvin 1400 362765.5 501711.4 5 2 HSBU2014431 (8) MG738482
HSBU2014432 (9) MG7384837 Mazandaran 2225 363107 5456 3 2 HSBU2014426 (12) MG738486
HSBU2014433 (13) MG7384878 Ardebil 1493 381209.9 483909.2 6 1 AUH522 (14) MG7384889 Ardebil 1389 381235 481757.3 3 1 ALUH526 (15) MG73848910 Tehran 2308 355775.2 512954.5 2 HSBU201442411 Qazvin 2750 392936 573450 4 HSBU201441612 Qazvin 1333 363155.1 509824 5 HSBU201441713 Razavi Khorasan 2652 362319.7 5959.5 6 HSBU201441214 Mazandaran 2103 362633.5 512838 1 HSBU201441915 Mazandaran 2299 355514 521172.8 2 HSBU201442016 Mazandaran 2341 355293.4 528320 4 HSBU201442317 Mazandaran 1510 311137.1 523006.6 1 AUH52918 Tehran 3245 362229.8 512628.2 3 HSBU201442219 Tehran 2398 354636.4 515869.6 2 HSBU2014418
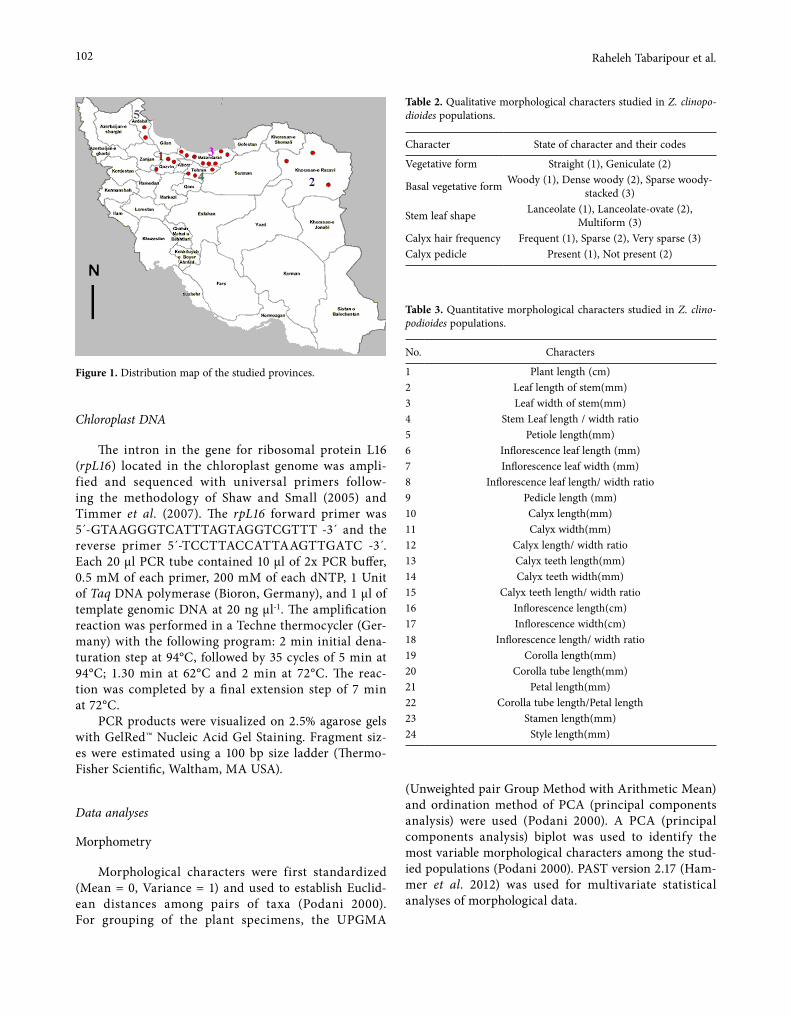
102 Raheleh Tabaripour et al.
Chloroplast DNA
The intron in the gene for ribosomal protein L16 (rpL16) located in the chloroplast genome was ampli-fied and sequenced with universal primers follow-ing the methodology of Shaw and Small (2005) and Timmer et al. (2007). The rpL16 forward primer was 5´-GTAAGGGTCATTTAGTAGGTCGTTT -3´ and the reverse primer 5´-TCCTTACCATTAAGTTGATC -3 .́ Each 20 µl PCR tube contained 10 µl of 2x PCR buffer, 0.5 mM of each primer, 200 mM of each dNTP, 1 Unit of Taq DNA polymerase (Bioron, Germany), and 1 µl of template genomic DNA at 20 ng µl-1. The amplification reaction was performed in a Techne thermocycler (Ger-many) with the following program: 2 min initial dena-turation step at 94°C, followed by 35 cycles of 5 min at 94°C; 1.30 min at 62°C and 2 min at 72°C. The reac-tion was completed by a final extension step of 7 min at 72°C.
PCR products were visualized on 2.5% agarose gels with GelRed™ Nucleic Acid Gel Staining. Fragment siz-es were estimated using a 100 bp size ladder (Thermo- Fisher Scientific, Waltham, MA USA).
Data analyses
Morphometry
Morphological characters were first standardized (Mean = 0, Variance = 1) and used to establish Euclid-ean distances among pairs of taxa (Podani 2000). For grouping of the plant specimens, the UPGMA
(Unweighted pair Group Method with Arithmetic Mean) and ordination method of PCA (principal components analysis) were used (Podani 2000). A PCA (principal components analysis) biplot was used to identify the most variable morphological characters among the stud-ied populations (Podani 2000). PAST version 2.17 (Ham-mer et al. 2012) was used for multivariate statistical analyses of morphological data.
Table 2. Qualitative morphological characters studied in Z. clinopo-dioides populations.
Character State of character and their codes
Vegetative form Straight (1), Geniculate (2)
Basal vegetative form Woody (1), Dense woody (2), Sparse woody- stacked (3)
Stem leaf shape Lanceolate (1), Lanceolate-ovate (2), Multiform (3)
Calyx hair frequency Frequent (1), Sparse (2), Very sparse (3)Calyx pedicle Present (1), Not present (2)
Table 3. Quantitative morphological characters studied in Z. clino-podioides populations.
No. Characters
1 Plant length (cm)2 Leaf length of stem(mm)3 Leaf width of stem(mm)4 Stem Leaf length / width ratio5 Petiole length(mm)6 Inflorescence leaf length (mm)7 Inflorescence leaf width (mm)8 Inflorescence leaf length/ width ratio9 Pedicle length (mm)10 Calyx length(mm)11 Calyx width(mm)12 Calyx length/ width ratio13 Calyx teeth length(mm)14 Calyx teeth width(mm)15 Calyx teeth length/ width ratio16 Inflorescence length(cm)17 Inflorescence width(cm)18 Inflorescence length/ width ratio19 Corolla length(mm)20 Corolla tube length(mm)21 Petal length(mm)22 Corolla tube length/Petal length23 Stamen length(mm)24 Style length(mm)
Figure 1. Distribution map of the studied provinces.
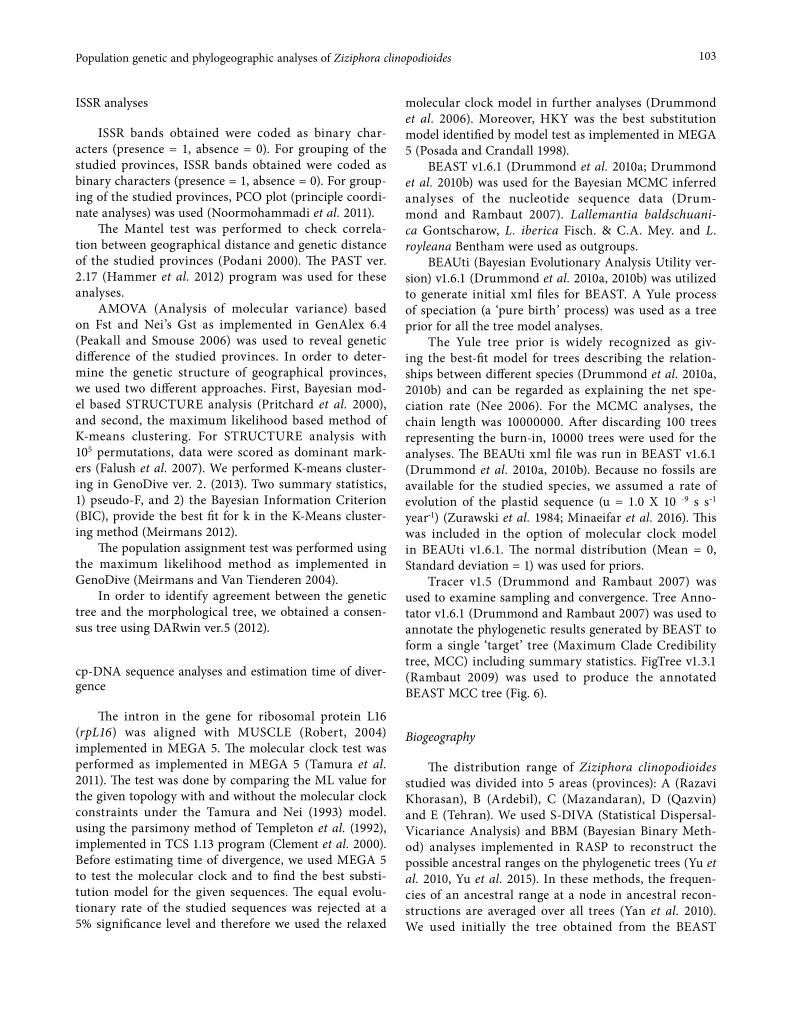
103Population genetic and phylogeographic analyses of Ziziphora clinopodioides
ISSR analyses
ISSR bands obtained were coded as binary char-acters (presence = 1, absence = 0). For grouping of the studied provinces, ISSR bands obtained were coded as binary characters (presence = 1, absence = 0). For group-ing of the studied provinces, PCO plot (principle coordi-nate analyses) was used (Noormohammadi et al. 2011).
The Mantel test was performed to check correla-tion between geographical distance and genetic distance of the studied provinces (Podani 2000). The PAST ver. 2.17 (Hammer et al. 2012) program was used for these analyses.
AMOVA (Analysis of molecular variance) based on Fst and Nei’s Gst as implemented in GenAlex 6.4 (Peakall and Smouse 2006) was used to reveal genetic difference of the studied provinces. In order to deter-mine the genetic structure of geographical provinces, we used two different approaches. First, Bayesian mod-el based STRUCTURE analysis (Pritchard et al. 2000), and second, the maximum likelihood based method of K-means clustering. For STRUCTURE analysis with 105 permutations, data were scored as dominant mark-ers (Falush et al. 2007). We performed K-means cluster-ing in GenoDive ver. 2. (2013). Two summary statistics, 1) pseudo-F, and 2) the Bayesian Information Criterion (BIC), provide the best fit for k in the K-Means cluster-ing method (Meirmans 2012).
The population assignment test was performed using the maximum likelihood method as implemented in GenoDive (Meirmans and Van Tienderen 2004).
In order to identify agreement between the genetic tree and the morphological tree, we obtained a consen-sus tree using DARwin ver.5 (2012).
cp-DNA sequence analyses and estimation time of diver-gence
The intron in the gene for ribosomal protein L16 (rpL16) was aligned with MUSCLE (Robert, 2004) implemented in MEGA 5. The molecular clock test was performed as implemented in MEGA 5 (Tamura et al. 2011). The test was done by comparing the ML value for the given topology with and without the molecular clock constraints under the Tamura and Nei (1993) model. using the parsimony method of Templeton et al. (1992), implemented in TCS 1.13 program (Clement et al. 2000). Before estimating time of divergence, we used MEGA 5 to test the molecular clock and to find the best substi-tution model for the given sequences. The equal evolu-tionary rate of the studied sequences was rejected at a 5% significance level and therefore we used the relaxed
molecular clock model in further analyses (Drummond et al. 2006). Moreover, HKY was the best substitution model identified by model test as implemented in MEGA 5 (Posada and Crandall 1998).
BEAST v1.6.1 (Drummond et al. 2010a; Drummond et al. 2010b) was used for the Bayesian MCMC inferred analyses of the nucleotide sequence data (Drum-mond and Rambaut 2007). Lallemantia baldschuani-ca Gontscharow, L. iberica Fisch. & C.A. Mey. and L. royleana Bentham were used as outgroups.
BEAUti (Bayesian Evolutionary Analysis Utility ver-sion) v1.6.1 (Drummond et al. 2010a, 2010b) was utilized to generate initial xml files for BEAST. A Yule process of speciation (a ‘pure birth’ process) was used as a tree prior for all the tree model analyses.
The Yule tree prior is widely recognized as giv-ing the best-fit model for trees describing the relation-ships between different species (Drummond et al. 2010a, 2010b) and can be regarded as explaining the net spe-ciation rate (Nee 2006). For the MCMC analyses, the chain length was 10000000. After discarding 100 trees representing the burn-in, 10000 trees were used for the analyses. The BEAUti xml file was run in BEAST v1.6.1 (Drummond et al. 2010a, 2010b). Because no fossils are available for the studied species, we assumed a rate of evolution of the plastid sequence (u = 1.0 X 10 -9 s s-1 year-1) (Zurawski et al. 1984; Minaeifar et al. 2016). This was included in the option of molecular clock model in BEAUti v1.6.1. The normal distribution (Mean = 0, Standard deviation = 1) was used for priors.
Tracer v1.5 (Drummond and Rambaut 2007) was used to examine sampling and convergence. Tree Anno-tator v1.6.1 (Drummond and Rambaut 2007) was used to annotate the phylogenetic results generated by BEAST to form a single ‘target’ tree (Maximum Clade Credibility tree, MCC) including summary statistics. FigTree v1.3.1 (Rambaut 2009) was used to produce the annotated BEAST MCC tree (Fig. 6).
Biogeography
The distribution range of Ziziphora clinopodioides studied was divided into 5 areas (provinces): A (Razavi Khorasan), B (Ardebil), C (Mazandaran), D (Qazvin) and E (Tehran). We used S-DIVA (Statistical Dispersal-Vicariance Analysis) and BBM (Bayesian Binary Meth-od) analyses implemented in RASP to reconstruct the possible ancestral ranges on the phylogenetic trees (Yu et al. 2010, Yu et al. 2015). In these methods, the frequen-cies of an ancestral range at a node in ancestral recon-structions are averaged over all trees (Yan et al. 2010). We used initially the tree obtained from the BEAST
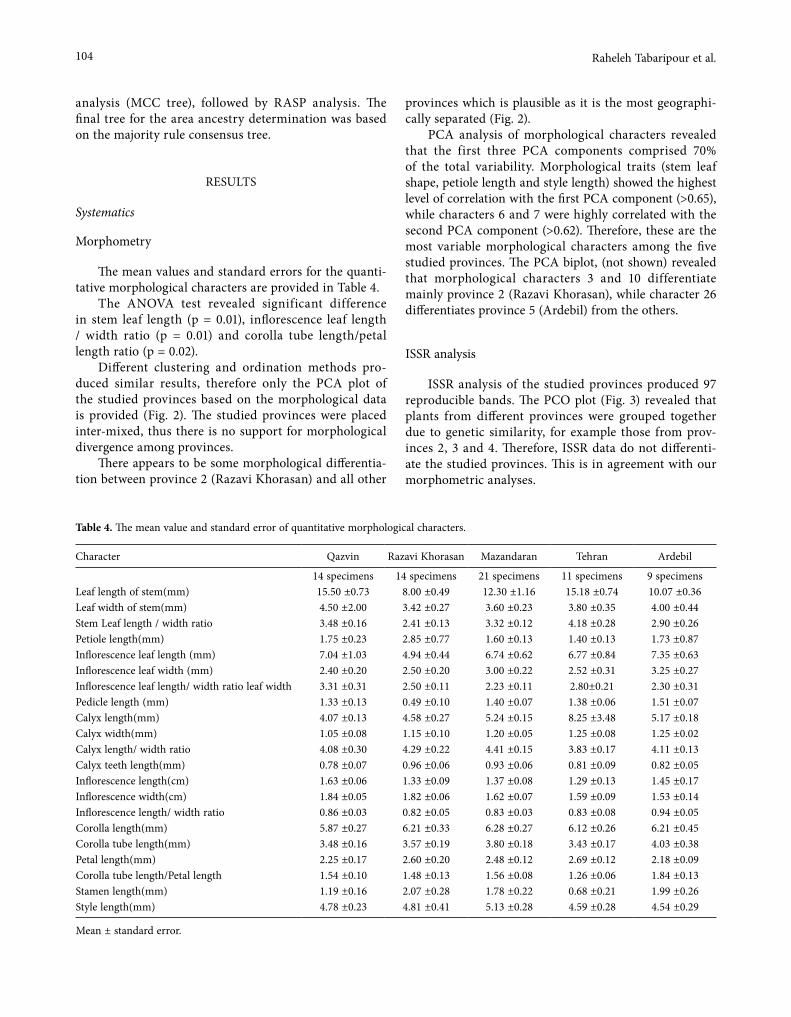
104 Raheleh Tabaripour et al.
analysis (MCC tree), followed by RASP analysis. The final tree for the area ancestry determination was based on the majority rule consensus tree.
RESULTS
Systematics
Morphometry
The mean values and standard errors for the quanti-tative morphological characters are provided in Table 4.
The ANOVA test revealed significant difference in stem leaf length (p = 0.01), inflorescence leaf length / width ratio (p = 0.01) and corolla tube length/petal length ratio (p = 0.02).
Different clustering and ordination methods pro-duced similar results, therefore only the PCA plot of the studied provinces based on the morphological data is provided (Fig. 2). The studied provinces were placed inter-mixed, thus there is no support for morphological divergence among provinces.
There appears to be some morphological differentia-tion between province 2 (Razavi Khorasan) and all other
provinces which is plausible as it is the most geographi-cally separated (Fig. 2).
PCA analysis of morphological characters revealed that the first three PCA components comprised 70% of the total variability. Morphological traits (stem leaf shape, petiole length and style length) showed the highest level of correlation with the first PCA component (>0.65), while characters 6 and 7 were highly correlated with the second PCA component (>0.62). Therefore, these are the most variable morphological characters among the five studied provinces. The PCA biplot, (not shown) revealed that morphological characters 3 and 10 differentiate mainly province 2 (Razavi Khorasan), while character 26 differentiates province 5 (Ardebil) from the others.
ISSR analysis
ISSR analysis of the studied provinces produced 97 reproducible bands. The PCO plot (Fig. 3) revealed that plants from different provinces were grouped together due to genetic similarity, for example those from prov-inces 2, 3 and 4. Therefore, ISSR data do not differenti-ate the studied provinces. This is in agreement with our morphometric analyses.
Table 4. The mean value and standard error of quantitative morphological characters.
Character Qazvin Razavi Khorasan Mazandaran Tehran Ardebil
14 specimens 14 specimens 21 specimens 11 specimens 9 specimensLeaf length of stem(mm) 15.50 ±0.73 8.00 ±0.49 12.30 ±1.16 15.18 ±0.74 10.07 ±0.36Leaf width of stem(mm) 4.50 ±2.00 3.42 ±0.27 3.60 ±0.23 3.80 ±0.35 4.00 ±0.44Stem Leaf length / width ratio 3.48 ±0.16 2.41 ±0.13 3.32 ±0.12 4.18 ±0.28 2.90 ±0.26Petiole length(mm) 1.75 ±0.23 2.85 ±0.77 1.60 ±0.13 1.40 ±0.13 1.73 ±0.87Inflorescence leaf length (mm) 7.04 ±1.03 4.94 ±0.44 6.74 ±0.62 6.77 ±0.84 7.35 ±0.63Inflorescence leaf width (mm) 2.40 ±0.20 2.50 ±0.20 3.00 ±0.22 2.52 ±0.31 3.25 ±0.27Inflorescence leaf length/ width ratio leaf width 3.31 ±0.31 2.50 ±0.11 2.23 ±0.11 2.80±0.21 2.30 ±0.31Pedicle length (mm) 1.33 ±0.13 0.49 ±0.10 1.40 ±0.07 1.38 ±0.06 1.51 ±0.07Calyx length(mm) 4.07 ±0.13 4.58 ±0.27 5.24 ±0.15 8.25 ±3.48 5.17 ±0.18Calyx width(mm) 1.05 ±0.08 1.15 ±0.10 1.20 ±0.05 1.25 ±0.08 1.25 ±0.02Calyx length/ width ratio 4.08 ±0.30 4.29 ±0.22 4.41 ±0.15 3.83 ±0.17 4.11 ±0.13Calyx teeth length(mm) 0.78 ±0.07 0.96 ±0.06 0.93 ±0.06 0.81 ±0.09 0.82 ±0.05Inflorescence length(cm) 1.63 ±0.06 1.33 ±0.09 1.37 ±0.08 1.29 ±0.13 1.45 ±0.17Inflorescence width(cm) 1.84 ±0.05 1.82 ±0.06 1.62 ±0.07 1.59 ±0.09 1.53 ±0.14Inflorescence length/ width ratio 0.86 ±0.03 0.82 ±0.05 0.83 ±0.03 0.83 ±0.08 0.94 ±0.05Corolla length(mm) 5.87 ±0.27 6.21 ±0.33 6.28 ±0.27 6.12 ±0.26 6.21 ±0.45Corolla tube length(mm) 3.48 ±0.16 3.57 ±0.19 3.80 ±0.18 3.43 ±0.17 4.03 ±0.38Petal length(mm) 2.25 ±0.17 2.60 ±0.20 2.48 ±0.12 2.69 ±0.12 2.18 ±0.09Corolla tube length/Petal length 1.54 ±0.10 1.48 ±0.13 1.56 ±0.08 1.26 ±0.06 1.84 ±0.13Stamen length(mm) 1.19 ±0.16 2.07 ±0.28 1.78 ±0.22 0.68 ±0.21 1.99 ±0.26Style length(mm) 4.78 ±0.23 4.81 ±0.41 5.13 ±0.28 4.59 ±0.28 4.54 ±0.29
Mean ± standard error.
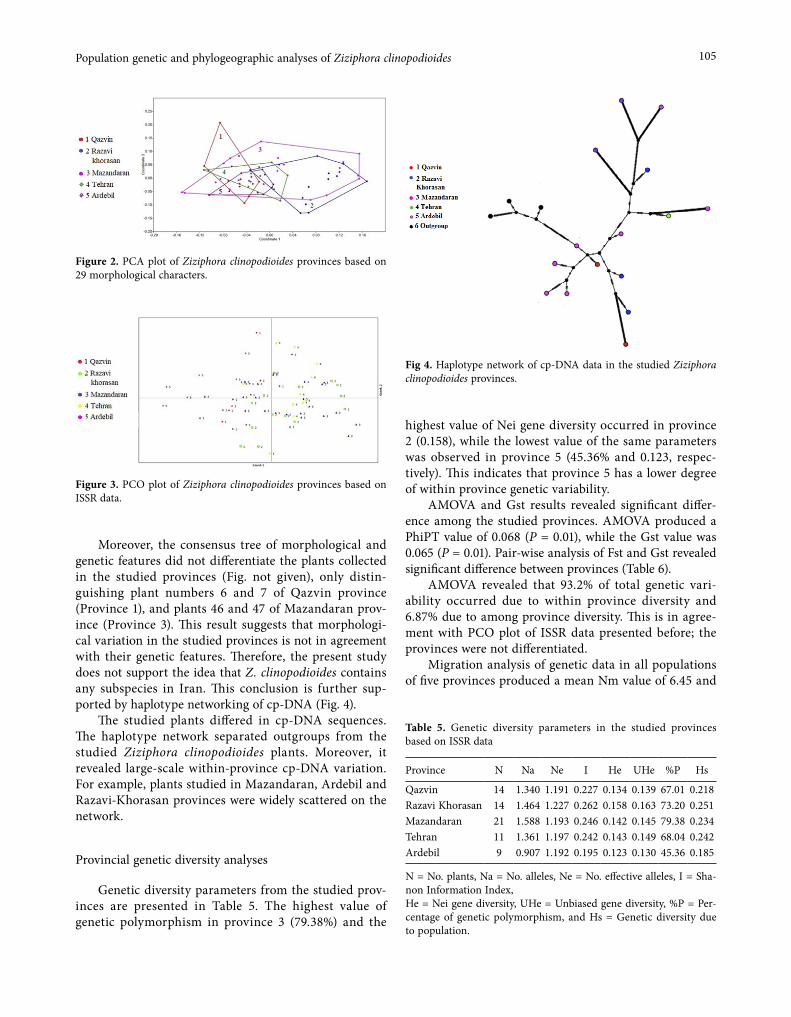
105Population genetic and phylogeographic analyses of Ziziphora clinopodioides
Moreover, the consensus tree of morphological and genetic features did not differentiate the plants collected in the studied provinces (Fig. not given), only distin-guishing plant numbers 6 and 7 of Qazvin province (Province 1), and plants 46 and 47 of Mazandaran prov-ince (Province 3). This result suggests that morphologi-cal variation in the studied provinces is not in agreement with their genetic features. Therefore, the present study does not support the idea that Z. clinopodioides contains any subspecies in Iran. This conclusion is further sup-ported by haplotype networking of cp-DNA (Fig. 4).
The studied plants differed in cp-DNA sequences. The haplotype network separated outgroups from the studied Ziziphora clinopodioides plants. Moreover, it revealed large-scale within-province cp-DNA variation. For example, plants studied in Mazandaran, Ardebil and Razavi-Khorasan provinces were widely scattered on the network.
Provincial genetic diversity analyses
Genetic diversity parameters from the studied prov-inces are presented in Table 5. The highest value of genetic polymorphism in province 3 (79.38%) and the
highest value of Nei gene diversity occurred in province 2 (0.158), while the lowest value of the same parameters was observed in province 5 (45.36% and 0.123, respec-tively). This indicates that province 5 has a lower degree of within province genetic variability.
AMOVA and Gst results revealed significant differ-ence among the studied provinces. AMOVA produced a PhiPT value of 0.068 (P = 0.01), while the Gst value was 0.065 (P = 0.01). Pair-wise analysis of Fst and Gst revealed significant difference between provinces (Table 6).
AMOVA revealed that 93.2% of total genetic vari-ability occurred due to within province diversity and 6.87% due to among province diversity. This is in agree-ment with PCO plot of ISSR data presented before; the provinces were not differentiated.
Migration analysis of genetic data in all populations of five provinces produced a mean Nm value of 6.45 and
Fig 4. Haplotype network of cp-DNA data in the studied Ziziphora clinopodioides provinces.
Figure 2. PCA plot of Ziziphora clinopodioides provinces based on 29 morphological characters.
Figure 3. PCO plot of Ziziphora clinopodioides provinces based on ISSR data.
Table 5. Genetic diversity parameters in the studied provinces based on ISSR data
Province N Na Ne I He UHe %P Hs
Qazvin 14 1.340 1.191 0.227 0.134 0.139 67.01 0.218Razavi Khorasan 14 1.464 1.227 0.262 0.158 0.163 73.20 0.251Mazandaran 21 1.588 1.193 0.246 0.142 0.145 79.38 0.234Tehran 11 1.361 1.197 0.242 0.143 0.149 68.04 0.242Ardebil 9 0.907 1.192 0.195 0.123 0.130 45.36 0.185
N = No. plants, Na = No. alleles, Ne = No. effective alleles, I = Sha-non Information Index,He = Nei gene diversity, UHe = Unbiased gene diversity, %P = Per-centage of genetic polymorphism, and Hs = Genetic diversity due to population.

106 Raheleh Tabaripour et al.
a Gst value of 0.07. These values indicate a high degree of gene flow among the studied populations. Moreover, STRUCTURE analysis based on a genetic admixture model also revealed a high degree of genetic admixture among the studied provinces as they had very similar allele combinations (similarly colored segments). These common shared alleles are either ancestral shared alleles or occurred due to ongoing gene flow among the popu-lations. The Evanno test identified two gene pools.
The province assignment test revealed that gene flow occurred between all provinces but was higher between plants in provinces 1, 3 and 4. Province 5 had the low-est degree of gene flow as revealed by the lowest within province genetic variability as stated above. This prov-ince had limited gene flow with provinces 3 and 4.
The pseudo-F value of K-Means clustering and Evanno test of STRUCTURE revealed two genetic groups. When we performed the STRUCTURE analy-sis for k = 2 (Fig. 5), it revealed that provinces 1 and 5 formed the first genetic group, while provinces 2-4 com-prised the second genetic group. Therefore, we have two gene pools in Iran for this medicinal plant that can be used in germplasm conservation and future medicinal evaluation.
The Mantel test produced significant correlation (r = 0.184, P = 0.01) between geographical distance and genetic distance of the studied provinces. This means that IBD (Isolation by distance) has occurred in Z. clino-podioides provinces and the neighboring provinces can
exchange genes more frequently compared to those that are further from each other. This could be the reason for the higher degree of genetic similarity observed between provinces 2, 3 and 4.
Divergence time estimation
cp-DNA haplotypes can be considered as good molecular markers for investigating probable dates of appearance of populations and their paths of distribu-tion in the country (Minaeifar et al, 2016). BEAST and RASP analyses (Figs 6, 7) suggested that the oldest cp-DNA haplotype of Z. clinopodioides appeared sometime around 5-10 Mya in Mazandaran province (province 3). This suggests that Z. clinopodioides could possibly have appeared in the northern regions of the country during the Miocene era, with plants subsequently dispersing towards the north-eastern (Razavi Khorasan), north-western (Ardebil) and central parts of Iran (Tehran and Qazvin).
DISCUSSION
In the present study molecular markers such mul-tilocus ISSRs and cp-DNA sequences and morphologi-cal variables were used for genetic diversity, species and subspecies delimitation of Z. clinopodioides. According
Table 6. Pair-wise analysis of Fst in the studied provinces based on ISSR data.
Qazvin Razavi Khorasan
Mazanda- ran Tehran Ardebil
Qazvin 0.000Razavi Khorasan 0.075 0.000Mazandaran 0.035 0.030 0.000Tehran 0.057 0.054 0.028 0.000Ardebil 0.099 0.156 0.123 0.132 0.000
Figure 5. STRUCTURE plot of Ziziphora clinopodioides provinces based on k = 2. (Provinces 1-5 are: 1- Qazvin, 2- Razavi Khorasan, 3- Mazandaran, 4- Tehran, and 5- Ardebil).
Figure 6. Chronogram from BEAST analysis of the studied prov-inces for Ziziphora clinopodioides based on the cp-DNA dataset (rpL16), showing 95% highest posterior density bars (HPD) in pur-ple. Numbers on nodes are clade credibility values. (Provinces 1-5 are: 1- Qazvin, 2- Razavi Khorasan, 3- Mazandaran, 4- Tehran, and 5- Ardebil).
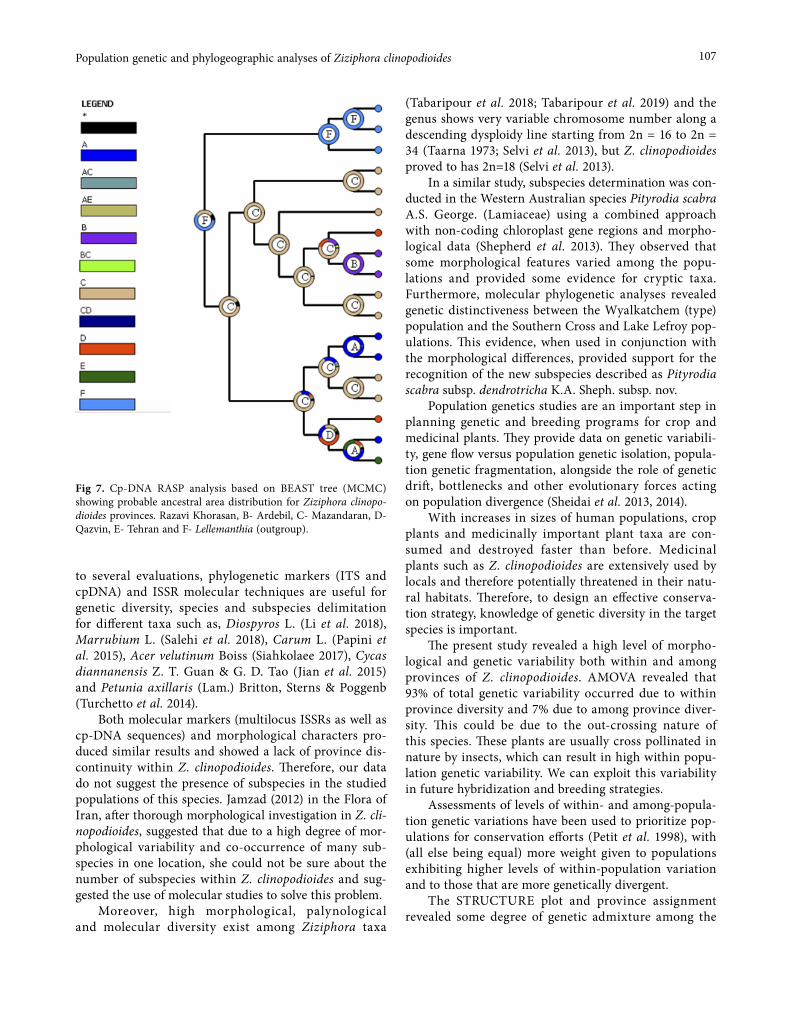
107Population genetic and phylogeographic analyses of Ziziphora clinopodioides
to several evaluations, phylogenetic markers (ITS and cpDNA) and ISSR molecular techniques are useful for genetic diversity, species and subspecies delimitation for different taxa such as, Diospyros L. (Li et al. 2018), Marrubium L. (Salehi et al. 2018), Carum L. (Papini et al. 2015), Acer velutinum Boiss (Siahkolaee 2017), Cycas diannanensis Z. T. Guan & G. D. Tao (Jian et al. 2015) and Petunia axillaris (Lam.) Britton, Sterns & Poggenb (Turchetto et al. 2014).
Both molecular markers (multilocus ISSRs as well as cp-DNA sequences) and morphological characters pro-duced similar results and showed a lack of province dis-continuity within Z. clinopodioides. Therefore, our data do not suggest the presence of subspecies in the studied populations of this species. Jamzad (2012) in the Flora of Iran, after thorough morphological investigation in Z. cli-nopodioides, suggested that due to a high degree of mor-phological variability and co-occurrence of many sub-species in one location, she could not be sure about the number of subspecies within Z. clinopodioides and sug-gested the use of molecular studies to solve this problem.
Moreover, high morphological, palynological and molecular diversity exist among Ziziphora taxa
(Tabaripour et al. 2018; Tabaripour et al. 2019) and the genus shows very variable chromosome number along a descending dysploidy line starting from 2n = 16 to 2n = 34 (Taarna 1973; Selvi et al. 2013), but Z. clinopodioides proved to has 2n=18 (Selvi et al. 2013).
In a similar study, subspecies determination was con-ducted in the Western Australian species Pityrodia scabra A.S. George. (Lamiaceae) using a combined approach with non-coding chloroplast gene regions and morpho-logical data (Shepherd et al. 2013). They observed that some morphological features varied among the popu-lations and provided some evidence for cryptic taxa. Furthermore, molecular phylogenetic analyses revealed genetic distinctiveness between the Wyalkatchem (type) population and the Southern Cross and Lake Lefroy pop-ulations. This evidence, when used in conjunction with the morphological differences, provided support for the recognition of the new subspecies described as Pityrodia scabra subsp. dendrotricha K.A. Sheph. subsp. nov.
Population genetics studies are an important step in planning genetic and breeding programs for crop and medicinal plants. They provide data on genetic variabili-ty, gene flow versus population genetic isolation, popula-tion genetic fragmentation, alongside the role of genetic drift, bottlenecks and other evolutionary forces acting on population divergence (Sheidai et al. 2013, 2014).
With increases in sizes of human populations, crop plants and medicinally important plant taxa are con-sumed and destroyed faster than before. Medicinal plants such as Z. clinopodioides are extensively used by locals and therefore potentially threatened in their natu-ral habitats. Therefore, to design an effective conserva-tion strategy, knowledge of genetic diversity in the target species is important.
The present study revealed a high level of morpho-logical and genetic variability both within and among provinces of Z. clinopodioides. AMOVA revealed that 93% of total genetic variability occurred due to within province diversity and 7% due to among province diver-sity. This could be due to the out-crossing nature of this species. These plants are usually cross pollinated in nature by insects, which can result in high within popu-lation genetic variability. We can exploit this variability in future hybridization and breeding strategies.
Assessments of levels of within- and among-popula-tion genetic variations have been used to prioritize pop-ulations for conservation efforts (Petit et al. 1998), with (all else being equal) more weight given to populations exhibiting higher levels of within-population variation and to those that are more genetically divergent.
The STRUCTURE plot and province assignment revealed some degree of genetic admixture among the
Fig 7. Cp-DNA RASP analysis based on BEAST tree (MCMC) showing probable ancestral area distribution for Ziziphora clinopo-dioides provinces. Razavi Khorasan, B- Ardebil, C- Mazandaran, D- Qazvin, E- Tehran and F- Lellemanthia (outgroup).
108 Raheleh Tabaripour et al.
studied Z. clinopodioides provinces. Gene flow is also important in conservation contexts, particularly for species with local populations. Fortunately, Z. clinopo-dioides provinces showed high within-province genetic variability and high among province gene flow. Gene flow among local populations could mitigate losses of genetic variation caused by genetic drift in local popula-tions and potentially save them from extinction (Sheidai et al. 2014; Safaei et al. 2016).
The Mantel test revealed isolation by distance in the studied Z. clinopodioides provinces. In plant species that form geographical populations, as geographical isolation increases, a reduction in both seed dispersal and pollen flow will result in decreased gene flow between distantly located populations (Freeland et al. 2011). This explains why the Evanno test and K-Means clustering identified two different gene pools for Z. clinopodioides within the country.
BEAST and RASP results suggested that Z. clino-podioides haplotypes appeared around 5-10 Mya in the mountainous regions of Qazvin and Mazandaran. Active divergence occurred between 1-5 Mya in these mountains due to their reactions to Pleistocene glacia-tions. Our mean date of 7 Mya is in agreement with the study of Drew and Sytsma (2012).
ACKNOWLEDGMENT
We thank the Iran National Science Foundation (INSF) with 95813755 Number for partial financial sup-porting and we thank also Dr. Maryam Keshavarzi for allowing us to use central Herbarium of Alzahra Univer-sity (ALUH).
REFERENCES
Beikeikmohammadi M. 2011. The evaluation of medici-nal properties of Ziziphora clinopodioides. WASJ. 12 (9): 1635-1638.
Carstens BC, Pelletier TA, Reid NM, Satler JD. 2013. How to fail at species delimitation. Mol Ecol. 22(17): 4369-4383.
Cirad. 2012. DARwin Ver. 5 - Dissimilarity Analysis and Representation for Windows. http://darwin.cirad.fr/.
Clement M, Posada D, Crandall KA. 2000. TCS: a com-puter program to estimate gene genealogies. Mol Ecol. 9: 1657–1660.
Drew BT, Sytsma KJ. 2012. Phylogenetics, biogeography, and staminal evolution in the tribe Mentheae (Lami-aceae). AM J BOT. 99(5): 933-953.
Drummond AJ, Rambaut A. 2007. BEAST: Bayesian evo-lutionary analysis by sampling trees. BMC Evol Biol. 7: 214.
Drummond AJ, Rambaut A, Suchard MA. 2010. BEAST (version 1.6.1) [computer program]. http://beast.bio.ed.ac.uk .
Drummond AJ, Ho SY, Phillips MJ, Rambaut A. 2006. Relaxed phylogenetics and dating with confidence. PLoS Biol. 4(5): e88.
Drummond AJ, Rambaut A, Xie W. 2010. BEAUti (ver-sion 1.6.1) [computer program]. http://beast.bio.ed.ac.uk .
Duminil J, Di Michele M. 2009. Plant species delimita-tion: a comparison of morphological and molecular markers. Plant Biosyst. 143(3): 528-542.
https://doi: 10.1080/11263500902722964. Edwards SV. 2009. Is a new and general theory of molec-
ular systematics emerging? Evolution. 63: 1–19.Falush D, Stephens M, Pritchard JK. 2007. Inference of
population structure using multilocus genotype data: dominant markers and null alleles. Mol Ecol Notes. 7: 574–578.
Fischer FEL, Andreevic CA, Rudolf E. 1835. Index Sem-inum, quae Hortus Botanicus Imperialis Petropoli-tanus pro Mutua Commutatione Offert. Accedunt Animadversiones Botanicae Nonnullae. St. Peters-burg.
Freeland JR, Kirk H, Peterson SD. 2011. Molecular ecol-ogy, 2nd ed. Wiley-Blackwell, Chichester, 449 pp.
Guan X, Yuyama N, Stewart A, Ding C, Xu N, Kiyoshi T, Cai H. 2017. Genetic diversity and structure of Lolium species surveyed on nuclear simple sequence repeat and cytoplasmic markers. Front Plant Sci. 8: 584. https://doi.org/10.3389/fpls.2017.00584.
Hammer Ø, Harper DAT, Ryan PD. 2012. PAST: Paleon-tological statistics software package for education and data analysis. Palaeontol Electron. 4: 1-9.
Huelsenbeck JP, Andolfatto P. 2007. Inference of popula-tion structure under a Dirichlet process model. Gen-et. 175: 1787–1802.
Huelsenbeck JP, Aadolfatto P, Huelsenbeck ET. 2011. Structurama: Bayesian inference of population struc-ture. Evol Bioinform. 7: 55–59.
Jamzad Z. 2012. Lamiaceae. Tehran: Research Institute of Forests and Rangelands. Fl. of Iran no. 76.
Jian L, Wei Z, Xun G. 2015. Species delimitation, genetic diversity and population historical dynamics of Cycas diannanensis (Cycadaceae) occurring sympatrically in the Red River region of China. Front Palnt Sci. 6: 696. https://doi.org/10.3389/fpls.2015.00696.
Kingman JFC. 1982. On the genealogy of large popula-tions. J Appl Probab Stat. 19: 27-43.
109Population genetic and phylogeographic analyses of Ziziphora clinopodioides
Knowles LL, Carstens B. 2007. Delimiting species with-out monophyletic gene trees. Syst Biol. 56: 887-895. http://dx.doi:10.1080/10635150701701091.
Koohdar F, Sheidai M, Talebi SM, Noormohammadi Z. 2015. Short communication population genetic struc-ture in medicinal plant Lallemantia iberica (Lami-aceae). Biodiversitas. 16: 139-144. http://dx.doi: 10.13057/biodiv/d160206.
Lamarck JdM. 1791. Tableau encyclopedique et method-ique des trois règnes de la nature: Botanique 1. Panckoucke, Paris, 250 pp.
Li W, Liu Y, Yang Y, Xie X, Lu Y, Yang Z, Jin X, Dong W, Suo Z. 2018. Interspecific chloroplast genome sequence diversity and genomic resources in Diospy-ros. BMC plant Boil. 18(1): 210.
Medrano M, López-Perea E, Herrera CM. 2014. Popula-tion genetics methods applied to a species delimita-tion problem: Endemic trumpet daffodils (Narcis-sus section Pseudonarcissi) from the southern Ibe-rian peninsula. IJPS. 175(5): 501-517. http://dx.doi: 10.1086/675977.
Meirmans PG, Van Tienderen PH. 2004. GENOTYPE and GENODIVE: two programs for the analysis of genetic diversity of asexual organisms. Mol Ecol Resour. 4(4): 792-794.
Meirmans PG. 2012. AMOVA-based clustering of popu-lation genetic data. J HERED 103: 744-750. http://dx.doi: 10.1093/jhered/ess047.
Minaeifar AA, Sheidai M, Attar F, Noormohammadi Z, Ghasemzadeh-Baraki S. 2016. Biosystematic study in the genus Cousinia Cass. (Asteraceae), section cous-inia. Biochem Syst Ecol. 69: 252-260.
Naghibi F, Mosaddegh M, Mohammadi Motamed M, Ghorbani A. 2010. Labiatae family in folk medicine in Iran: from ethnobotany to pharmacology. IJPR. 63-79.
Nee S. 2006. Birth-death models in macroevolution. Annu Rev Ecol Evol Syst. 37: 1-17.
Noormohammadi Z, Ghasemzadeh-Baraki S, Sheidai M. 2011. Preliminarily report on molecular diversity of Sargassum species in Oman Sea by using ISSR and RAPD markers. Acta Biol Szed. 55(1): 19-26.
Papini A, Banci F, Nardi E. 2007 Molecular evidence of polyphyletism in the plant genus Carum L. (Api-aceae) about the fact that You admit that at least dif-ferent populations (and subspecies) have a tree-like genetic relationship. Genet Mol Biol. 30(2): 475-482. http://dx.doi.org/10.1590/S1415-47572007000300029.
Peakall R, Smouse PE. 2006. GENALEX 6: genetic analy-sis in Excel. Population genetic software for teaching and research. Mol Ecol Notes. 6(1): 288−295. http://dx.doi.org/ 10.1111/j.1471-8286.2005.01155. x.
Petit RJ, El Mousadik A, Pons O. 1998. Identifying popu-lations for conservation on the basis of genetic mark-ers. Conserv Biol. 12(4): 844-855. (France).
Podani J (2000) Introduction to the Exploration of Multi-variate Data. Backhuyes, Leiden, 407 pp.
Posada D, Crandall KA. 1998. Modeltest: testing the model of DNA substitution. Bioinformatics (Oxford, England). 14(9): 817-818.
Pritchard JK, Stephens M, Donnelly P. 2000. Inference of population structure using multilocus genotype Data. Genetics. 155: 945-959.
Rambaut A. 2009. FigTree (v1.3.1). [computer program]. http://tree.bio.ed.ac.uk/ software/figtree.
Rechinger KH. 1982. Labiatae. In: Rechinger KH. (ed.), Flora Iranica, Austria, Graz, Wiena: Academische Druck-und Verlasantalt, 25-44 pp. (Germany).
Robert CE. 2004. MUSCLE: multiple sequence alignment with high accuracy and high throughput. Nucleic Acids Res 32(5): 1792-1797. http://dx. doi: 10.1093/nar/gkh340.
Safaei M, Sheidai M, Alijanpoor B, Noormohammadi Z. 2016. Species delimitation and genetic diversity anal-ysis in Salvia with the use of ISSR molecular mark-ers. Acta Bot Croat. 75(1): 42-52.
Salehi N, Kharazian N, Shiran B. 2018. Genetic Diver-sity of Marrubium Species from Zagros Region (Iran), Using Inter Simple Sequence Repeat Molec-ular Marker. J. Sci I R I. 29(1): 7-19. https://doi.org/10.22059/ JSCIENCES.2018.64789.
Seif E, Sheidai M, Norouzi M, Noormohammadi Z. 2012. Biosystematic studies of Cirsium arvense populations in Iran. Phytol Balcan. 18: 279-288.
Selvi S, Satil F, Martin E, Çelenk S, Dirmenci T. 2015. Some evidence for infrageneric classification in Ziziphora L. (Lamiaceae: Mentheae). Plant Bio-syst.149(2), 415-423. https://doi.org/10.1080/11263504.2013.853701.
Shaw J, Small RL. 2005. Chloroplast DNA phylogeny and phylogeography of the North American plums (Pru-nus subgenus Prunus section Prunocerasus, Rosace-ae). Am J Bot. 92(12): 2011-2030.
Shepherd KA, Perkins A, Collins J, Byrne M, Thiele KR. 2013. Morphological and molecular evidence sup-ports the recognition of a new subspecies of the critically endangered Pityrodia scabra (Lamiaceae). Invertebre Syst J. 26(1): 1-12.
Sheidai M, Afshar F, Keshavarzi M, Talebi SM, Noormo-hammadi Z, Shafaf T. 2014. Genetic diversity and genome size variability in Linum austriacum (Lin-eaceae) populations. Biochem Syst Ecol. 57: 20-26.
Sheidai M, Seif E, Nouroozi M, Noormohammadi Z. 2012. Cytogenetic and molecular diversity of Cirsium
110 Raheleh Tabaripour et al.
arvense (Asteraceae) populations in Iran. J Japanese Bot. 87: 193-205.
Sheidai M, Zanganeh S, Haji-Ramezanali R, Nouroozi M, Noormohammadi Z, Ghsemzadeh-Baraki S. 2013. Genetic diversity and population structure in four Cirsium (Asteraceae) species. Biologia. 68(3): 384-397. http://dx.doi.org/10.2478/s11756-013-0162-x.
Sheidai M, Ziaee S, Farahani F, Talebi SM, Noormoham-madi Z, Farahani Y. 2014. Infra-specific genetic and morphological diversity in Linum album (Linaceae). Biologia. 69(1): 32-39.
Siahkolaee SN, Sheidai M, Assadi M, Noormohammadi Z. 2017. Do we have different varieties in Acer veluti-num (Sapindaceae): Morphological and molecu-lar studies. Phytotaxa, 321(2): 151-165. https://doi.org/10.11646/phytotaxa. 321.2.1.
Stecher G, Nei M, Kumar S. 2011. Phylogenetic and molecular evolutionary analyses were conducted using MEGA version 5. Mol Biol Evol. 28: 2731-2739.
Taarna, K. (1973). Chromosome counts on Ziziphora L.(Labiatae). In Ann Bot Fenn.
Tabaripour R, Sheidai, M, Talebi SM, Noormohammadi Z. 2018. Genetic divergence and speciation with-in Ziziphora capitata (Lamiaceae): Molecular and micromorphological evidences. Biodiversitas. 19(2): 697-705. https://doi.org/10.13057/biodiv/d190250.
Tabaripour R, Sheidai M, Talebi SM, Noormohammadi Z. 2019. The pollen morphological diversity of Ziziphora clinopodioides (Lamiaceae). Acta Bot Hung. 61(3-4): 441-457. https://doi.org/10.1556/034.61.2019.3-4.13.
Turchetto C, Fagundes NJ, Segatto AL, Kuhlemeier C., Solis Neffa VG, Speranza PR, ... & Freitas LB. 2014. Diversification in the South American Pampas: the genetic and morphological variation of the widespread Petunia axillaris complex (Solanaceae). Mol Biol Evol 23(2): 374-389. https://doi.org/10.1111/mec.12632
Tamura K, Nei M. 1993. Estimation of the number of nucleotide substitutions in the control region of mitochondrial DNA in humans and chimpanzees. Mol Biol Evol. 10(3): 512-526.
Templeton AR, Crandall KA, Sing CF. 1992. A cladistic analysis of phenotypic associations with haplotypes inferred from restriction endonuclease mapping and DNA sequence data. III. Cladogram estimation. Genetics. 132(2): 619-633.
Timmer JC, Enoksson M, Wildfang E, Zhu W, Igarashi Y, Denault JB, Ma Y, Dummit B, Chang YH, Mast AE, Eroshkin A, Smith JW, Tao WA, Salvesen GS. 2007. Profiling constitutive proteolytic events in vivo. Bio-chem J. 407(1): 41-8.
Weising K, Nybom H, Pfenninger M, Wolff K, Kahl G. 2005. DNA fingerprinting in plants: principles, meth-ods, and applications: CRC press.
Wiens JJ. 2007. Species delimitation: new approaches for discovering diversity. Syst Biol. 56(6): 875-878. http://dx. doi:10.1080/10635150701748506.
Yan Y, Harris AJ, Xingjin H. 2011. RASP (Reconstruct Ancestral State in Phylogenies) (v.1.1.) Retrieved from: http://mnh.scu.edu.cn/soft/blog/RASP.
Yu Y, Harris A, He X. 2010. S-DIVA (Statistical Disper-sal-Vicariance Analysis): a tool for inferring biogeo-graphic histories. Mol Phylogenet Evol. 56(2): 848-850. http://dx.doi.org/ 10.1016/j. ympev. 2010.04.011.
Yu Y, Harris AJ, Blair C, He X. 2015. RASP (Reconstruct Ancestral State in Phylogenies): a tool for historical biogeography. Mol Phylogenet Evol. 87: 46-49. http://dx.doi.org/ 10.1016/j. ympev. 2015.03.008.
Zurawski G, Clegg MT Brown AHD. 1984. The nature of nucleotide sequence divergence between barley and maize chloroplast DNA. Genetics. 106: 735–749.
Caryologia. International Journal of Cytology, Cytosystematics and Cytogenetics 73(2): 111-119, 2020
Firenze University Press www.fupress.com/caryologiaCaryologia
International Journal of Cytology, Cytosystematics and Cytogenetics
ISSN 0008-7114 (print) | ISSN 2165-5391 (online) | DOI: 10.13128/caryologia-544
Citation: G. Kumar, S. Singh (2020) Induced cytomictic crosstalk behaviour among micro-meiocytes of Cyamopsis tetragonoloba (L.) Taub. (cluster bean): Reasons and repercussions. Caryolo-gia 73(2): 111-119. doi: 10.13128/cary-ologia-544
Received: July 14, 2019
Accepted: April 13, 2020
Published: July 31, 2020
Copyright: © 2020 G. Kumar, S. Singh. This is an open access, peer-reviewed article published by Firenze University Press (http://www.fupress.com/caryologia) and distributed under the terms of the Creative Commons Attribution License, which permits unrestricted use, distribution, and reproduction in any medium, provided the original author and source are credited.
Data Availability Statement: All rel-evant data are within the paper and its Supporting Information files.
Competing Interests: The Author(s) declare(s) no conflict of interest.
Induced cytomictic crosstalk behaviour among micro-meiocytes of Cyamopsis tetragonoloba (L.) Taub. (cluster bean): Reasons and repercussions
Girjesh Kumar, Shefali Singh*
Plant Genetics Laboratory, Department of Botany, University of Allahabad, India*Corresponding author. E-mail: [email protected]
Abstract. Cytomictic behaviour of chromosomes among pollen mother cells was observed in mutagenic studies in cluster bean (Cyamopsis tetragonoloba (L.) Taub.). The study of pollen mother cells (PMC) revealed various chromosomal aberrations among which cytomixis was notified due to its obtrusive peculiarity and is therefore given description in this article. Cytoplasmic and chromatin transmigration were dis-cernible among contiguous or slightly distant PMCs through recreation of passage via direct cell-to-cell fusion or channel formation. This cytomictic phenomenon was invariably more pronounced at meiosis I as compared to meiosis II. Plasmodesmatal connections play a paramount role in aiding this behaviour by establishing intercellu-lar crosstalks. The cellular intermingling resulted in syncyte cells which were identified due to their doubled size. Syncyte or unreduced PMC formation leading to unreduced fertile gametes is speculated to act as a possible way out for infraspecific polyploidi-zation of species. Pollen fertility was computed, alongwith this heterosized pollens of varying diameter were segregated. Large sized pollens were 2n pollens; where size dif-ference is a consequence of cytomixis. Cytoplasmic connections among pollens were also observed sporadically. It is opined that syncyte formation and 2n pollen produc-tion have evolutionary significance.
Keywords: Cyamopsis tetragonoloba, cytomixis, heterosized pollens, infraspecific poly-poidy, PMCs, syncyte.
INTRODUCTION
Cytomixis is promiscuous intercellular interaction for exchange of nuclear material, dividing chromosomal bodies and other integral cytoplasmic orga-nelles. The credit for first description of this phenomenon was conferred to Arnoldy (1900) in gymnosperms. Later on, the behaviour was also explored in PMCs of Crocus sativus by Koernicke (1901); however, the term ‘cytomix-is’ was christened by Gates (1911) during his findings in Oenothera gigas and Oenothera biennis. Besides reproductive cells, cytomixis has also been witnessed in root meristematic cells (Jacob 1941), tapetal cells (Cooper 1952), shoot apex
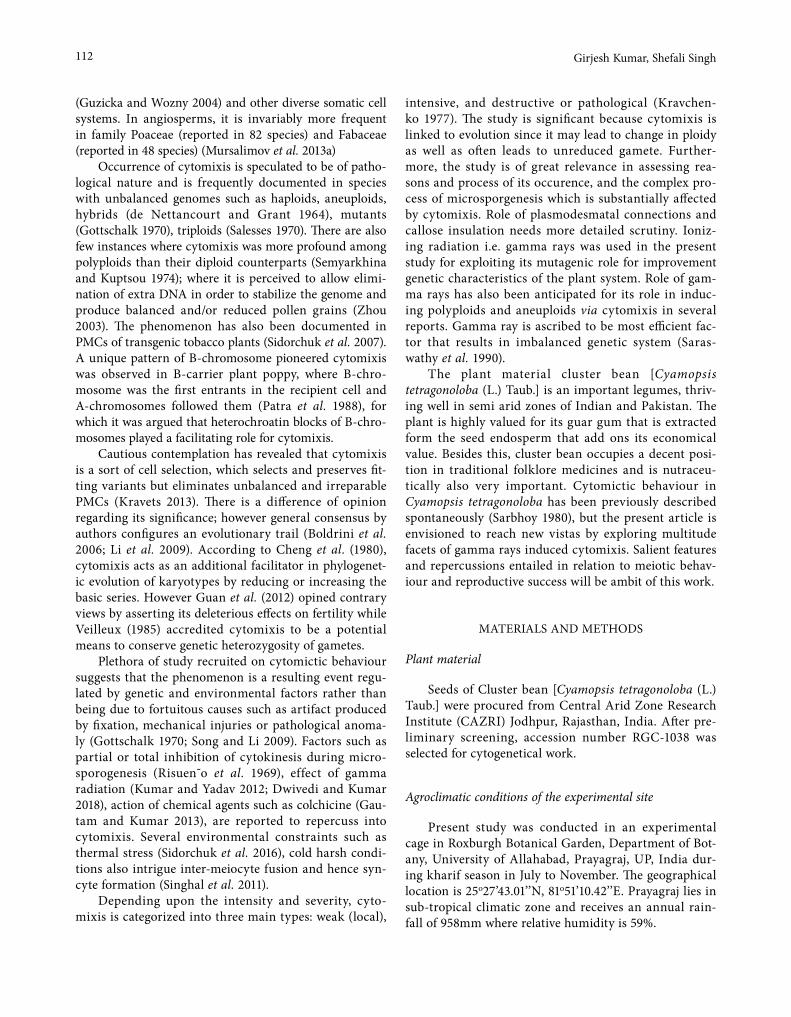
112 Girjesh Kumar, Shefali Singh
(Guzicka and Wozny 2004) and other diverse somatic cell systems. In angiosperms, it is invariably more frequent in family Poaceae (reported in 82 species) and Fabaceae (reported in 48 species) (Mursalimov et al. 2013a)
Occurrence of cytomixis is speculated to be of patho-logical nature and is frequently documented in species with unbalanced genomes such as haploids, aneuploids, hybrids (de Nettancourt and Grant 1964), mutants (Gottschalk 1970), triploids (Salesses 1970). There are also few instances where cytomixis was more profound among polyploids than their diploid counterparts (Semyarkhina and Kuptsou 1974); where it is perceived to allow elimi-nation of extra DNA in order to stabilize the genome and produce balanced and/or reduced pollen grains (Zhou 2003). The phenomenon has also been documented in PMCs of transgenic tobacco plants (Sidorchuk et al. 2007). A unique pattern of B-chromosome pioneered cytomixis was observed in B-carrier plant poppy, where B-chro-mosome was the first entrants in the recipient cell and A-chromosomes followed them (Patra et al. 1988), for which it was argued that heterochroatin blocks of B-chro-mosomes played a facilitating role for cytomixis.
Cautious contemplation has revealed that cytomixis is a sort of cell selection, which selects and preserves fit-ting variants but eliminates unbalanced and irreparable PMCs (Kravets 2013). There is a difference of opinion regarding its significance; however general consensus by authors configures an evolutionary trail (Boldrini et al. 2006; Li et al. 2009). According to Cheng et al. (1980), cytomixis acts as an additional facilitator in phylogenet-ic evolution of karyotypes by reducing or increasing the basic series. However Guan et al. (2012) opined contrary views by asserting its deleterious effects on fertility while Veilleux (1985) accredited cytomixis to be a potential means to conserve genetic heterozygosity of gametes.
Plethora of study recruited on cytomictic behaviour suggests that the phenomenon is a resulting event regu-lated by genetic and environmental factors rather than being due to fortuitous causes such as artifact produced by fixation, mechanical injuries or pathological anoma-ly (Gottschalk 1970; Song and Li 2009). Factors such as partial or total inhibition of cytokinesis during micro-sporogenesis (Risuen˜o et al. 1969), effect of gamma radiation (Kumar and Yadav 2012; Dwivedi and Kumar 2018), action of chemical agents such as colchicine (Gau-tam and Kumar 2013), are reported to repercuss into cytomixis. Several environmental constraints such as thermal stress (Sidorchuk et al. 2016), cold harsh condi-tions also intrigue inter-meiocyte fusion and hence syn-cyte formation (Singhal et al. 2011).
Depending upon the intensity and severity, cyto-mixis is categorized into three main types: weak (local),
intensive, and destructive or pathological (Kravchen-ko 1977). The study is significant because cytomixis is linked to evolution since it may lead to change in ploidy as well as often leads to unreduced gamete. Further-more, the study is of great relevance in assessing rea-sons and process of its occurence, and the complex pro-cess of microsporgenesis which is substantially affected by cytomixis. Role of plasmodesmatal connections and callose insulation needs more detailed scrutiny. Ioniz-ing radiation i.e. gamma rays was used in the present study for exploiting its mutagenic role for improvement genetic characteristics of the plant system. Role of gam-ma rays has also been anticipated for its role in induc-ing polyploids and aneuploids via cytomixis in several reports. Gamma ray is ascribed to be most efficient fac-tor that results in imbalanced genetic system (Saras-wathy et al. 1990).
The plant material cluster bean [Cyamopsis tetragonoloba (L.) Taub.] is an important legumes, thriv-ing well in semi arid zones of Indian and Pakistan. The plant is highly valued for its guar gum that is extracted form the seed endosperm that add ons its economical value. Besides this, cluster bean occupies a decent posi-tion in traditional folklore medicines and is nutraceu-tically also very important. Cytomictic behaviour in Cyamopsis tetragonoloba has been previously described spontaneously (Sarbhoy 1980), but the present article is envisioned to reach new vistas by exploring multitude facets of gamma rays induced cytomixis. Salient features and repercussions entailed in relation to meiotic behav-iour and reproductive success will be ambit of this work.
MATERIALS AND METHODS
Plant material
Seeds of Cluster bean [Cyamopsis tetragonoloba (L.) Taub.] were procured from Central Arid Zone Research Institute (CAZRI) Jodhpur, Rajasthan, India. After pre-liminary screening, accession number RGC-1038 was selected for cytogenetical work.
Agroclimatic conditions of the experimental site
Present study was conducted in an experimental cage in Roxburgh Botanical Garden, Department of Bot-any, University of Allahabad, Prayagraj, UP, India dur-ing kharif season in July to November. The geographical location is 25o27’43.01’’N, 81o51’10.42’’E. Prayagraj lies in sub-tropical climatic zone and receives an annual rain-fall of 958mm where relative humidity is 59%.

113Induced cytomictic crosstalk behaviour among micro-meiocytes of cluster bean
Treatment and Sowing
Fresh seeds of Cyamopsis tetragonoloba were arranged into different packets that were irradiated with gamma rays at increasing dose (viz. 100 Gy, 200 Gy and 300 Gy) from a Co-62 source radioisotope inside gam-ma chamber at National Botanical Research Institute (NBRI), Lucknow, India at radiation speed of 2gy per second. These irradiated seeds were sown in respective pots in replicates in complete randomized block design (CRBD) to raise the generation alongwith a control set that was maintained as a standard.
Bud Fixation
Floral buds were fixed in carnoy’s fixative (solution constituting 3 parts of 90% alcohol: 1 part glacial acetic acid) for duration of 24 hours. Buds were preserved in 70% alcohol at 4°C in refrigerator for future use.
Meiotic study
Flower buds of appropriate size were teased in a drop of 70% alcohol, followed by staining and mount-ing in 2% acetocarmine. Squash of the bud was pre-pared using a tapper. After squash preparation, slides were observed under Olympus light microscope whereas important stages were captured using Nikon Phase Con-trast Research photomicroscope (Nikon Eclipse, E200, Japan) at 40X resolution. Pollen fertility was also com-puted on the basis of glycerine-acetocarmine stainability test using temporary mounts (Marks 1954). Adequately stained, globose, nucleated pollens were marked as fer-tile whereas sparsely stained, shrivelled and enucle-ated pollens were regarded as sterile. Variation in pollen diameter was recorded.
Statistical calibration
The data obtained were analysed using statisti-cal software SPSS 16 and means were compared using Duncan’s Multiple Range Test (DMRT) (P≤0.05). All the results were expressed in form of Mean ± Standard Error.
RESULTS
Cytogenetical screening of microsporogenic cells is a reliable test for in-depth view of in Cluster bean [Cya-mopsis tetragonoloba (L.) Taub.]. Cytogenetical studies
revealed that chromosome complement set of the plant is n=7 (Fig. 2B showing metaphase I), confirming the somatic chromosomal configuration to be 2n=14. Meio-cytes, in control, were perfectly normal and bivalents morphology was canonical with no considerable indica-tion of aberrations; also there was no sign of cytomictic connections amongst PMCs. However, mutagenic treat-ment of gamma rays had impacted into a wide range of chromosomal anomalies alongwith cytomictic behaviour
Fig. 1. Cytomixis via direct cell fusion (A-F) where A: Direct cell fusion at Diplotene; B: Cell fusion between Prophase 1 and meta-phase I; C: Chromatin transfer between two PMCs; D: Horizontal transfer of chromosomes where one PMC is chromatin deficient; E: A chromosomal fragment in the transition phase; F: Migrating chromatin pushed towards periphery as sticky chromatin band. Cytomictic transmigration via Channel formation (G–I) where G: Single channel bridging two meiocytes; H: Simultaneous transfer of chromatin from 1 PMC to 2 PMCs; Multiple channel formation. Group formation (J – L) where J and K: Transitory micronuclei pushed at ends of meiocytes; L: Association between cells at Ana-phase II stage. Scale bar: 10.45 µm.
114 Girjesh Kumar, Shefali Singh
amidst dividing meiocytes.
PMCs exhibiting Cytomictic events
The frequency of cytomixis was computed to be 7.29±0.33 % at 100 Gy dose which increased from this value to 10.84±0.46% at 200 Gy and 14.67±0.60% at 300 Gy. It was witnessed to manifest either through direct cell to cell fusion or via cytoplasmic channels; where frequency of direct fusion was higher in comparison at all the three doses. Table 1 represents data on cytomic-tic frequency at various stages of meiosis. Traversing of cytoplasmic contents, chromatin material, cellular orga-nelles and other vital intrinsic trophic factors between proximate PMCs was witnessed. Onset of transitory
events was witnessed by acquisition of cell polarization where nucleus was positioned towards the cell periph-ery i.e in between the communicating meiocytes unlike the non-cytomictic cells where nucleus was in the cen-tral space of PMC. Direct fusion was recorded at diverse stages of division with different degree of cytomictic intensities. For categorising the intensity, three levels of cytomixis were identified according to Kravchenko (1977). Cells at lower doses had loose wall connexion; these formed pairs and led to cause local cytomixis since no indication of chromatin transmigration was observed. Several PMCs deciphered rather intensive cytomictic phenomena where the migrating chromatin and micronuclei were encountered in between the asso-ciating PMCs or were pushed towards periphery of the parent PMC. Transferring content was seen to pass via cytoplasmic channels as sticky chromatin bands. Cyto-plasmic channels (CC) were also of distinct morphology. It was, either, in the form of single channels (Fig. 1G) or multiple bridging (Fig. 1I) architectures through which nuclear transaction occurred. Fig.1H shows simultane-ous transfer of chromatin from one PMC to two PMCs through channel formation. At some instances, cytomix-is occurred via group formation where multiple PMCs participated in the confluence (Fig. 1J to L). Distinguish-ing feature of such grouping was the attainment of chain transfer. Chain transfer was peculiar where one cell donates a nucleus to the recipient cell and this recipient, in turn, transacts its nucleus to the succeeding one and so on.
Besides cytomixis, several other abnormalities were notifiable among which stickiness, univalents, disturbed polarity, unequal separation and laggards were more common alongwith less frequents anomalies such as bridges and micronuclei formation. An increasing trend for other chromosomal anomalies was recorded with respect to gamma irradiation i.e. from 9.80±0.29 at 100 Gy to 16.72±0.40 at 300 Gy gamma dose (Table 1).
Syncyte manifestation
A remunerative phenomenon of syncyte was wit-nessed at all the three doses of gamma irradiation viz. 100 Gy (0.25±0.25%), 200 Gy (0.55±0.28%) and 300 Gy (0.66 ±0.33%). Syncytes are recreated by complete con-fluence of two PMCs, where whole chromatin material is transferred to the recipient PMC. Therefore the recipient PMC is complemented with doubled chromatin comple-ment. Fig. 2C is a syncytic cell representing 14 bivalents in place of 7 bivalents. Conversely, hypoploid cells were also recorded with lesser number of bivalents (Fig. 2D is a hypoploid cell). Binucleate PMCs with supernumer-
Fig. 2. Consequence of cytomixis on late meiotic phases and pol-len morphology. A: Supernumerary nucleoli; B: Normal PMC with seven bivalents; C: Syncyte with 14 bivalents; D: Hypoploid meio-cyte; E: Normal tetrad; F: Polyad; G: Normal fertile pollen; H: Two nucleated pollen; I: Two pollens fusing through wall dissolution; J: Heterosized pollens; K: Pollens with differential size and diameter; L: Fertile and sterile pollens. Scale bar: 10.45 µm.
115Induced cytomictic crosstalk behaviour among micro-meiocytes of cluster bean
ary nucleolus were seen that might have been engineered due to nucleolar transfer via common meiocytic links.
Abnormal sporads, pollen fertility and size variation
Besides meiocytic fusion, tetrad and pollen grain fusion (Fig. 2I) were also recorded which is a rather uncommon and interesting phenomena to be reported in this study, since cytomictic behaviour is documented to occur more frequently at meiosis I. Abnormal micro-spores including monads, dyad and polyads (Fig. 2F) were also encountered. Variation in pollen size (diam-eter) was also recorded which were accounted to be heterosized pollens. In case of control, pollen diameter was not variable but in treated sets, alongwith medium normal sized pollens, differential frequency of small and large sized ‘2n pollens’ were recorded. Fig. 2J and 2K are heterosized pollens. Smaller pollens were generally non-viable whereas larger ones had a differential degree of fertility. Table 2 is a representation of pollen fertility in control and treated sets; it also depicts mean diam-eter and relative frequency of large, medium and small sized pollen grains. Pollen fertility was also calculated and a sharp reduction was discernible from 97±0.57% at 100Gy to 74.33±0.88% at 300 Gy dose.
DISCUSSION
Meiosis is a beautifully manoeuvred cellular event that has been established to ensure efficient chromo-some partitioning, recombination and trait assort-ment. Furthermore, its proper disposition is essential in restoring gametic viability. Henceforth, it becomes seemingly important to follow and magnify knowledge on the meiotic cell cycle. A typical promiscuous cytom-ictic behaviour among PMCs of Cluster bean (Cyamop-sis tetragonoloba (L.) Taub.) was reported in response to mutagenic incidence of gamma rays. Significance for recruiting studies on this phenomenon is vested in the fact that cytomictic events provide a larger view onto the mechanism of intercellular activities and cellular con-veyance.
Cytomixis was more profuse at meiosis I than at meiosis II and it appears to be active energy dependent process since KCN solution or decline in temperature checks it (Zhang et al. 1985). The perplexity surround-ing the mechanism through which chromatin transfer occurs was resolved after identification of the role of cytoplasmic connections (Gates 1911). These connec-tions form an important avenue for cytopasmic cross-talks among proximate PMCs. These are engineered
Tabl
e 1.
Effe
ct o
f Gam
ma
irrad
iatio
n on
the
inci
denc
e of
Cyt
omix
is an
d Sy
ncyt
e fo
rmat
ion
in C
lust
er b
ean
[Cya
mop
sis te
trago
nolo
(L.)
Taub
.].
Trea
tmen
t
Cyt
omix
is
Sync
ytes
(%
)
Freq
uenc
y of
cel
ls sh
owin
g cy
tom
ixis
at v
ario
us st
ages
of m
eios
is, %
(Mea
n ±
SE)
Oth
er
abno
rmal
ities
(Mea
n ±
SE)
NN
o. o
f PM
Cs
((M
ean)
Freq
uenc
y of
PM
Cs
invo
lved
in
Cyt
omix
is
Type
of c
ytom
ixis
Mei
osis
IM
eios
is II
DF
CC
PIM
IA
ITI
MII
AII
TII
PtD
pD
k
Con
trol
3315
--
--
--
--
--
--
--
100
Gy
2297
7.29
±0.3
361
.66±
1.66
38.3
3±1.
660.
25±0
.25
1.91
±0.1
61.
70±0
.27
1.00
±0.1
70.
77±0
.08
0.67
±0.0
40.
99±0
.15
0.45
±0.2
3-
-9.
80±0
.29
200
Gy
3300
10.8
4±0.
4671
.02±
2.41
28.9
6±2.
410.
55±0
.28
2.02
±0.1
71.
65±0
.06
1.68
±0.1
41.
34±0
.11
1.24
±0.2
00.
77±0
.07
0.97
±0.1
10.
68±0
.20
0.42
±0.2
512
.02±
0.31
300
Gy
2293
14.6
7±0.
6075
.11±
1.78
26.4
5±1.
450.
66±0
.33
2.61
±0.1
82.
15±0
.05
2.04
±0.0
61.
59±0
.15
1.47
±0.1
31.
59±0
.24
1.46
±0.0
70.
89±0
.28
0.79
±0.1
116
.72±
0.40
Abb
revi
atio
ns: P
MC
s-Po
llen
Mot
her C
ells,
CC
-Cyt
omic
tic c
hann
el, D
F-D
irect
fusio
n, P
I-Pr
opha
se I,
MI-
Met
apha
se I,
AI-
Ana
phas
e I,
TI-T
elop
hase
I, M
II-M
etap
hase
II, A
II-A
naph
ase
II, T
II-T
elop
hase
II, P
t-Pa
chyt
ene,
Dp-
Dip
lote
ne, D
k-D
iaki
nesis
.
116 Girjesh Kumar, Shefali Singh
at prophase I of meiosis and are recognised as primary CC. Persisting plasmodesmata expands its extremities, it forms passage of large interconnecting cells, which is termed as cytoplasmic channels. Cell wall dissolution between the adjacent cells may also lead to cytoplasmic connections (Falistocco et al. 1995). Hydrolytic enzymes released by endoplasmic reticulum and golgi bodies are involved in CC formation (Yu et al. 2004). These pri-mary CC may form via fusion of several plasmodesma-ta or through enlargement of single plasmodesmata or de novo in the region where no plasmodesmata occurs (Wang et al. 1998; Mursalimov et al. 2013a). However the cellulose-pectin wall is gradually replaced by cal-lose layer at subsequent stages, as explained by Kravets (2013). The callose deposition insulates the cellular crosstalks and ceases the primary CC. It is for this rea-son that cytomixis is more profusely recorded at mieois I rather than meiosis II. However cytomictic behaviour may still persits by the genesis of secondary CC which is formed by action of enzymes callase that acts on callose wall. Specific organelles-spherosome like vesicles secre-ate callase and points at which callose catalyzes destruc-tion of callose, secondary CC originates (Mursalimov et al. 2013b). These secondary CC remain available for cytomixis at the later stages of meiosis.
Local cytomixis represents association of meiocytes into groups via cytomictic channels in the early pro-phase of meiosis without any participation of migrating chromatin. Severe cytomictic channels such as Fig. 1H was also seen where cytoplasmic content of one PMC emanates in two PMCs. This has also been reported in Vicia faba (Bhat et al. 2017). Cytopathological symptoms are evident in intensive cytomixis, where transaction of chromatin; migration of the cytoplasmic content, nuclei etc are witnessed whereas destructive cytomixis involves complete destruction of the donor cells and severe path-ological signs the filling of the anther cavity with agglu-tinated chromatin, and the impairment of remaining microsporocytes during meiosis. Actually, destructive cytomixis represents rather the way of the MSC autoly-sis than the way of communication between microsporo-genic cells (Kravets 2013). Actin filaments play a key role
in cytomixis since migration of cell contents through cytomictic channels is stopped due to cytochalasin B, a chemical that prevents the growth of actin filaments (Zhang et al. 1985).
Several pertinent questions regarding function-al state of the transferring chromatin were answered by conducive histone modification experiments using immunostaining technique Mursalimov et al. (2015). Migrating chromatin had no signs of selective hetero-chromatinization and was decrypted to be in transcrip-tionally active state. Ultrastructural studies indicate that neither nucleus nor chromatin is damaged while traversing through cytomictic channel (Mursalimov and Deineko 2011). These arguments implicits ample evidence that cytomixis is a genetically controlled enig-matic phenomenon occurring due to environmental or physiological factors (Bellucci et al. 2003); which has been installed in cells to facilitate inter-cellular trans-migration of vital cellular components. Several reports elucidates that cytomictic behaviour is linked to meiotic segregation and aberrant gene functioning at preceding meiotic or mitotic stages subverts to both chromosomal aberration as well as cytomixis. Thus, cytomixis regula-tion may be controlled by genes responsible for the chro-mosome segregation such as the DIF1 gene in Arabidop-sis thaliana (Bhatt et al. 1999).
An intriguing aspect revealed was presence of more than one nucleus in PMCs which displayed coenocytic behaviour. This behaviour is persistently encountered in intergeneric hybrids for example in Meconopsis aculeate (Singhal and Kumar 2008). Consequently, one cell gets an extra nucleus, leaving behind the other nucleus defi-cient cell. Such coenocytes lead in formation of abnor-mal-sized pollen grains as suggested earlier by Mendes-Bonato et al. (2001). Furthermore, fusion of two PMCs led to syncyte formation, also documented in Chrysan-themum (Kim et al. 2009), Mertensia echioides (Malik et al. 2014). Frequency of syncytes is quite low but it is easily detectible due to its invariably larger size com-pared single meiocyte. The product of such meiocytes resulted into the formation of ‘2n’ or large-sized pollen grains. Jones and Reed (2007) approved that presence of
Table 2. Impact of Gamma rays on Pollen fertility and Relative pollen size frequency in Cluster bean [Cyamopsis tetragonoloba (L.) Taub.].
Treatment Pollen fertility (%)
Diameter(mm) Relative frequency of different Pollen size (%)
Small Medium Large Small Medium Large
Control 97.00±0.57 - 19.17±0.61 - - 100 -100 Gy 91.33±1.20 15.24±0.36 19.48±0.36 31.72±0.64 7.33±0.33 83.00±1.15 9.66±0.88200 Gy 82.66±0.66 15.94±0.50 19.98±0.40 32.83±0.57 11.66±0.33 71.00±0.57 17.33±0.88300 Gy 74.33±0.88 15.48±0.57 19.66±0.70 33.02±0.29 12.66±0.88 64.66±0.66 22.66±0.33
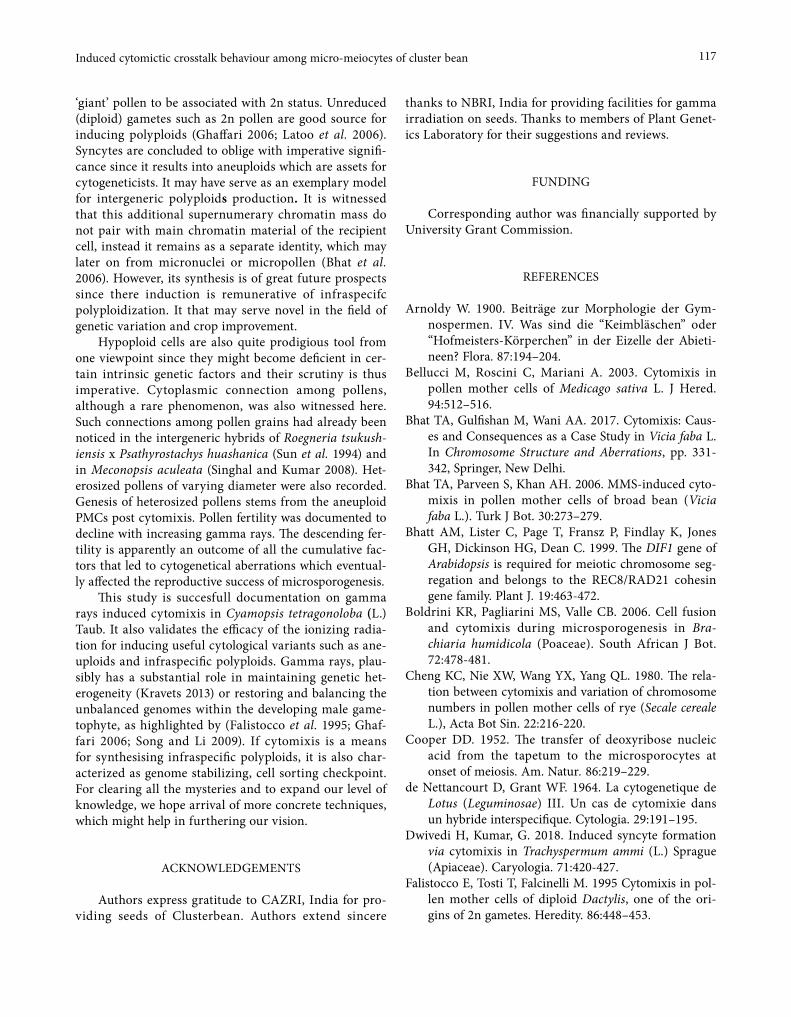
117Induced cytomictic crosstalk behaviour among micro-meiocytes of cluster bean
‘giant’ pollen to be associated with 2n status. Unreduced (diploid) gametes such as 2n pollen are good source for inducing polyploids (Ghaffari 2006; Latoo et al. 2006). Syncytes are concluded to oblige with imperative signifi-cance since it results into aneuploids which are assets for cytogeneticists. It may have serve as an exemplary model for intergeneric polyploids production. It is witnessed that this additional supernumerary chromatin mass do not pair with main chromatin material of the recipient cell, instead it remains as a separate identity, which may later on from micronuclei or micropollen (Bhat et al. 2006). However, its synthesis is of great future prospects since there induction is remunerative of infraspecifc polyploidization. It that may serve novel in the field of genetic variation and crop improvement.
Hypoploid cells are also quite prodigious tool from one viewpoint since they might become deficient in cer-tain intrinsic genetic factors and their scrutiny is thus imperative. Cytoplasmic connection among pollens, although a rare phenomenon, was also witnessed here. Such connections among pollen grains had already been noticed in the intergeneric hybrids of Roegneria tsukush-iensis x Psathyrostachys huashanica (Sun et al. 1994) and in Meconopsis aculeata (Singhal and Kumar 2008). Het-erosized pollens of varying diameter were also recorded. Genesis of heterosized pollens stems from the aneuploid PMCs post cytomixis. Pollen fertility was documented to decline with increasing gamma rays. The descending fer-tility is apparently an outcome of all the cumulative fac-tors that led to cytogenetical aberrations which eventual-ly affected the reproductive success of microsporogenesis.
This study is succesfull documentation on gamma rays induced cytomixis in Cyamopsis tetragonoloba (L.) Taub. It also validates the efficacy of the ionizing radia-tion for inducing useful cytological variants such as ane-uploids and infraspecific polyploids. Gamma rays, plau-sibly has a substantial role in maintaining genetic het-erogeneity (Kravets 2013) or restoring and balancing the unbalanced genomes within the developing male game-tophyte, as highlighted by (Falistocco et al. 1995; Ghaf-fari 2006; Song and Li 2009). If cytomixis is a means for synthesising infraspecific polyploids, it is also char-acterized as genome stabilizing, cell sorting checkpoint. For clearing all the mysteries and to expand our level of knowledge, we hope arrival of more concrete techniques, which might help in furthering our vision.
ACKNOWLEDGEMENTS
Authors express gratitude to CAZRI, India for pro-viding seeds of Clusterbean. Authors extend sincere
thanks to NBRI, India for providing facilities for gamma irradiation on seeds. Thanks to members of Plant Genet-ics Laboratory for their suggestions and reviews.
FUNDING
Corresponding author was financially supported by University Grant Commission.
REFERENCES
Arnoldy W. 1900. Beiträge zur Morphologie der Gym-nospermen. IV. Was sind die “Keimbläschen” oder “Hofmeisters-Körperchen” in der Eizelle der Abieti-neen? Flora. 87:194–204.
Bellucci M, Roscini C, Mariani A. 2003. Cytomixis in pollen mother cells of Medicago sativa L. J Hered. 94:512–516.
Bhat TA, Gulfishan M, Wani AA. 2017. Cytomixis: Caus-es and Consequences as a Case Study in Vicia faba L. In Chromosome Structure and Aberrations, pp. 331-342, Springer, New Delhi.
Bhat TA, Parveen S, Khan AH. 2006. MMS-induced cyto-mixis in pollen mother cells of broad bean (Vicia faba L.). Turk J Bot. 30:273–279.
Bhatt AM, Lister C, Page T, Fransz P, Findlay K, Jones GH, Dickinson HG, Dean C. 1999. The DIF1 gene of Arabidopsis is required for meiotic chromosome seg-regation and belongs to the REC8/RAD21 cohesin gene family. Plant J. 19:463-472.
Boldrini KR, Pagliarini MS, Valle CB. 2006. Cell fusion and cytomixis during microsporogenesis in Bra-chiaria humidicola (Poaceae). South African J Bot. 72:478-481.
Cheng KC, Nie XW, Wang YX, Yang QL. 1980. The rela-tion between cytomixis and variation of chromosome numbers in pollen mother cells of rye (Secale cereale L.), Acta Bot Sin. 22:216-220.
Cooper DD. 1952. The transfer of deoxyribose nucleic acid from the tapetum to the microsporocytes at onset of meiosis. Am. Natur. 86:219–229.
de Nettancourt D, Grant WF. 1964. La cytogenetique de Lotus (Leguminosae) III. Un cas de cytomixie dans un hybride interspecifique. Cytologia. 29:191–195.
Dwivedi H, Kumar, G. 2018. Induced syncyte formation via cytomixis in Trachyspermum ammi (L.) Sprague (Apiaceae). Caryologia. 71:420-427.
Falistocco E, Tosti T, Falcinelli M. 1995 Cytomixis in pol-len mother cells of diploid Dactylis, one of the ori-gins of 2n gametes. Heredity. 86:448–453.

118 Girjesh Kumar, Shefali Singh
Gates RR. 1911. Pollen formation in Oenothera gigas. Annals of Botany. 25:909–940.
Gautam N, Kumar G. 2013. Consequences of colchicine induced intermeiocyte connections in Helianthus annuus. Caryologia. 66:65-69
Ghaffari SM. 2006. Occurrence of diploid and polyploidy micro- spores in Sorghum bicolor (Poaceae) is the result of cytomixis. AfrJ Biotech. 5:1450-1453
Gottschalk W. 1970. Chromosome and nucleus migration during microsporogenesis of Pisum sativum. Nucleus. 13:1-9.
Guan JZ, Wang JJ, Cheng ZH, Liu Y, Li ZY. 2012. Cyto-mixis and meiotic abnormalities during microsporo-genesis are responsible for male sterility and chromo-some variations in Houttuynia cordata. Genet Mol Res.11:121-130.
Guzicka M, Wozny A. 2004. Cytomixis in shoot apex of Norway spruce (Picea abies L. Karst.). Trees. 18(6):722–724.
Jacob KT. 1941. Certain abnormalities in the root tips of cotton. Curr Sci. 10: 174-175.
Kim JS, Oginuma K, Tobe H. 2009. Syncyte formation in the microsporangium of Chrysanthemum (Aster-aceae): A pathway to infraspecific polyploidy. J Plant Res. 6:439–444.
Jones KD, Reed SM. 2007. Analysis of ploidy level and its effects on guard cell length, pollen diameter, and fertility in Hydrangea macrophylla. Hortscience. 42(3):483–488.
Koernicke M. 1901. Uber ortsveranderung von Zellkar-nern S B Niederhein. Ges Natur-U Heilkunde Bonn A.14–25.
Koul KK. 1990. Cytomixis in pollen mother cells of Alo-pecurus arundinaceus Poir. Cytologia. 55:169–173.
Kravchenko LN. 1977. Osobennosti meioza u pshenitsy i ee gibridov (Features of Meiosis in Wheat and Its Hybrids). Chisinau: Shtiintsa.
Kravets E.A. 2013. Cytomixis and its role in the regula-tion of plant fertility. Rus J Dev Biol. 44:113–128.
Kumar G, Yadav RS. 2012. Induction of cytomixis affects microsporogenesis in Sesamum indicum L. (Pedali-aceae). Russ J Dev Biol. 4(4):209–214.
Lattoo SK, Khan S, Bamotra S, Dhar AK. 2006. Cytomixis impairs meiosis and influences reproductive success in Chlorophytum comosum (Thunb) Jacq.- an additional strategy and possible implications. J Biosci. 31:629-6
Li XF, Song ZQ, Feng DS, Wang, HG. 2009. Cytomixis in Thinopyrum intermedium, Thinopyrum ponticum and its hybrids with wheat. Cereal Res Commun. 37:353-361.
Malik RA, Gupta RC, Kumari S, Malik AH. 2014. Cytom-ictic anomalous male meiosis and 2n pollen grain
formation in Mertensia echioides Benth. (Boraginace-ae) from Kashmir Himalaya. The Scientific World Journal.7.
Marks GE. 1954. An aceto-carmine glycerol jelly for use in pollen fertility counts. Stain Technol. 29:277.
Mendes-Bonato AB, Pagliarini MS, Silva N, Valle CB. 2001. Meiotic instability in invader plants of signal grass Brachiaria decumbens Stapf (Gramineae). Genet Mol Biol. 23:619-625.
Mursalimov S, Permyakov N, Deineko E, Houben A, Demidov D. 2015. Cytomixis doesn’t induce obvi-ous changes in chromatin modifications and pro-grammed cell death in tobacco male meiocytes. Front Plant Sci. 6:1-13.
Mursalimov SR, Deineko EV. 2011. An ultrastructural study of cytomixis in tobacco pollen mother cells. Protoplasma. 248:717–724.
Mursalimov SR, Sidorchuk YV, Deineko EV. 2013a. New insights into cytomixis: specific cellular features and prevalence in higher plants. Planta. 238:415-423.
Mursalimov SR, Sidorchuk YV, Deineko EV. 2013b. The role of sphero- some-like vesicles in formation of cytomictic channels between tobacco microsporo-cytes. Biol Plant. 57:291-297.
Patra NK, Srivastava HK, Chauhan SP. 1988. B chromo-somes in spontaneous and induced intercellular chro-mosome migration of Papaver somniferum. Indian J Genet. 48:31–42.
Risueño MC, Gime´nez-Martin G, Lo´pez-Sa´ez JF, R-Garcia MI. 1969. Connexions between meiocytes in plants. Cytologia. 34:262-272.
Salesses G. 1970. Sur La phenomeane de cytomixie cher des hybrids triploides de prainier. Consequences genetiquez possible. Ann Amelior Plant. 20:383–388.
Saraswathy Amma CK, Namboodiri AN, Panikkar AON, Sethuraj MR. 1990. Radiation induced male sterility in Hevea brasiliensis (Willd. ex Adr. De Juss.). Muell Arg Cytologia. 55:547–551.
Sarbhoy RK. 1980. Spontaneous occurrence of cytomix-is and syndiploidy in Cyamopsis tetragonoloba (L.) Taub. Cytologia. 45:375-379.
Semyarkhina SYA, Kuptsou MS. 1974. Cytomixis in vari-ous forms of sugarbeet. Vests I ANBSSE Ser Biyal. 4:43–47.
Sidorchuk YV, Deineko EV, Shumny V.K. 2007. Peculiari-ties of cytomixis in pollen mother cells of transgenic tobacco plants (Nicotiana tabacum L.) with mutant phenotype. Cell Tissue Biol.1:570–576.
Sidorchuk YV, Kravets EA, Mursalimov SR, Plokhovs-kaya SG, Yemets AI, Blume YB, Deineko EV. 2016. Efficiency of the induction of cytomixis in the micro-sporogenesis of dicotyledonous (N. tabacum L.) and

119Induced cytomictic crosstalk behaviour among micro-meiocytes of cluster bean
monocotyledonous (H. distichum L.) plants by ther-mal Stress. Rus J Dev Biol. 47(6):335–347.
Singhal VK, Kumar P. 2008. Impact of cytomixis on meiosis pollen viability and pollen size in wild pop-ulations of Himalayan poppy (Meconopsis aculeate Royle). J Biosci. 33:371-380.
Singhal VK, Rana PK, Kumar P. 2011. Syncytes during male meiosis resulting in 2n pollen grain formation in Lindelofia longiflora var. Falconeri. J Syst Evol. 49(5):406–410.
Song ZQ, Li XF. 2009. Cytomixis in Pollen Mother Cells of Salvia miltiorrhiza. Caryologia. 62(3):213-219.
Sun G, Yen C, Yang J. 1994. Intermeiocyte connections and cytomixis in intergeneric hybrids III Roegneria tsukushiensis x Psathyrostachys huashanica. Wheat Inf Serv.79:24–27.
Veilleux R. 1985. Diploid and polyploid gametes in crop plants: mechanisms of formation and utilization in plant breeding. Plant Breed Rev. 3:253-288.
Wang XY, Guo GQ, Nie XW, Zheng GC. 1998. Cyto-chemical localization of cellulase activity in pollen mother cells of David lily during meiotic prophase I and its relation to secondary formation of plas-modesmata. Protoplasma 204:128-138.
Yu CH, Guo GQ, Nie XW, Zheng GC. 2004. Cytochemi-cal localization of pectinase activity in pollen mother cells of tobacco during meiotic prophase I and its relation to the formation of secondary plasmodes-mata and cytoplasmic channels. Acta Bot Sinica 46:1443–1453.
Zhang WC, Yan WM, Lou CH. 1985. Mechanism of intercellular movement of protoplasm in wheat nucellus. Sci China. 28:1175-1183.
Zhou SQ. 2003. Viewing the difference between the dip-loid and the polyploid in the light of the upland cot-ton aneuploidy. Hereditas.138:65–72.


Caryologia. International Journal of Cytology, Cytosystematics and Cytogenetics 73(2): 121-126, 2020
Firenze University Press www.fupress.com/caryologiaCaryologia
International Journal of Cytology, Cytosystematics and Cytogenetics
ISSN 0008-7114 (print) | ISSN 2165-5391 (online) | DOI: 10.13128/caryologia-610
Citation: R. Monteiro do Nascimento, A. Freire Carvalho, W. C. Santana, A. Barth, M. A. Costa (2020) Karyotype diversity of stingless bees of the genus Frieseomelitta (Hymenoptera, Apidae, Meliponini). Caryologia 73(2): 121-126. doi: 10.13128/caryologia-610
Received: August 26, 2019
Accepted: April 13, 2020
Published: July 31, 2020
Copyright: © 2020 R. Monteiro do Nascimento, A. Freire Carvalho, W. C. Santana, A. Barth, M. A. Costa. This is an open access, peer-reviewed article published by Firenze University Press (http://www.fupress.com/caryologia) and distributed under the terms of the Creative Commons Attribution License, which permits unrestricted use, distri-bution, and reproduction in any medi-um, provided the original author and source are credited.
Data Availability Statement: All rel-evant data are within the paper and its Supporting Information files.
Competing Interests: The Author(s) declare(s) no conflict of interest.
Karyotype diversity of stingless bees of the genus Frieseomelitta (Hymenoptera, Apidae, Meliponini)
Renan Monteiro do Nascimento1, Antonio Freire Carvalho1, Weyder Cristiano Santana2, Adriane Barth3, Marco Antonio Costa1,*1 Departamento de Ciências Biológicas, Universidade Estadual de Santa Cruz, Ilhéus, BA, Brazil2 Departamento de Entomologia, Universidade Federal de Viçosa, Viçosa, MG, Brazil3 Instituto Federal de Educação Ciência e Tecnologia de Mato Grosso, Campus Rondonó-polis, Brazil*Corresponding author. E-mail: [email protected]
Abstract. Frieseomelitta (Ihering, 1912) is a genus of stingless bees, distributed in the Nearctic and Neotropical regions. Specimens can be found in forests, cerrado, caat-inga and mountainous regions. This genus has 16 species, of which 13 are recorded in Brazil. Cytogenetics has contributed to evolutionary studies of some Hymenoptera groups and although many Frieseomelitta species have been described, few species have been studied cytogenetically. The present study aims to contribute to the knowledge of the karyotype diversity of this genus, seeking to understand the possible evolutionary mechanisms that occurred in the diversification of the karyotype of this genus. Frie-seomelitta portoi and Frieseomelitta trichocerata and Frieseomelitta doederleini showed diploid karyotypes with 2n = 30 chromosomes, similarly to all the species previously analyzed in the genus. Unprecedentedly, Frieseomelitta longipes showed 2n = 34. These results confirm that the frequent diploid number of 30 chromosomes is typical of this genus. The finding of 2n = 34 chromosomes in F. longipes comprises the first record of a diploid chromosome number different from 2n=30 in this group, which suggests that it can be the result of a recent chromosome change event. An interspecific comparative analysis was developed involving present and previous studies, as well as a discussion on the mechanisms involved in the karyotypic evolution in the genus.
Keywords: heterochromatin, karyotype evolution, centric fission, chromosome, varia-tion.
INTRODUCTION
Frieseomelitta (Ihering, 1912) is a Neartic and Neotropical genus of stingless bees, and occurs from Mexico to southeast Brazil (Camargo and Pedro, 2013). These bees present small to medium size, with body meas-uring about 10 mm (Silveira et al., 2002). According to Camargo and Pedro (2013), 16 species are known to be valid in the genus Frieseomelit-

122 Renan Monteiro do Nascimento et al.
ta, of which 13 are found in Brazilian territory: Frie-seomelitta dispar (Moure, 1950), Frieseomelitta doed-erleini (Friese, 1900), Frieseomelitta flavicornis (Fab-ricius, 1798), Frieseomelitta francoi (Moure, 1946), Frieseomelitta freiremaiai (Moure, 1963), Frieseomelitta languida (Moure, 1989), Frieseomelitta longipes (Smith, 1854), Frieseomelitta meadewaldoi (Cockerell, 1915), Frieseomelitta paranigra (Schwarz, 1940), Frieseomelit-ta portoi (Friese, 1900), Frieseomelitta silvestrii (Friese, 1902), Frieseomelitta trichocerata (Moure, 1988) and Frieseomelitta varia (Lepeletier, 1836). Cytogenetic analysis has been a widely used tool in evolutionary and taxonomic studies in some groups of Hymenop-tera, however, for the genus Frieseomelitta, the chro-mosomal analysis are hitherto restricted the species F. doederleini (Kerr and Silveira, 1972; Tarelho, 1973; Rocha et al., 2003; Santos et al., 2018), F. languida (Rocha et al., 2003), F. varia (Kerr, 1969; Kerr and Sil-veira, 1972; Tarelho, 1973; Rocha et al., 2003; Santos et al., 2018), F. dispar (Carvalho and Costa, 2011; Santos et al., 2018), F. francoi (Carvalho and Costa, 2011; San-tos et al., 2018), Frieseomelitta meadewaldoi and Frie-seomelitta sp. n. (Santos et al., 2018).
During the karyotype analyzes of several species of bees, Kerr (1972a, b) recorded the haploid chromosome number n = 15 chromosomes in the species F. varia, F. doederleini and F. ghilianii. Rocha et al. (2003) reported the same chromosome number and described the karyo-type of the species F. doederleini, F. languida and F. var-ia as part of an analysis of different genera of stingless bees. Carvalho & Costa (2011) also described the karyo-types of F. dispar and F. francoi, and Santos et al. (2018) developed a comparative analysis of the hybridization patterns of microsatellite DNA probes in karyotypes of five species, F. dispar, F. doederleini e F. francoi, F. mead-ewaldoi, Frieseomelitta sp. n. and F. varia. In addition, other karyotypic features were reported. In all these cases the chromosome number was consistently n = 15 or 2n = 30. These differ from the chromosome numbers determined for other less closely related genera, such as n = 9 for Melipona, and n = 17, common to several of the other genera of stingless bees. However, groups closely related to Frieseomelitta such as genus Duckeola also have shown n = 15 chromosomes (Kerr 1972a, b).
The taxonomy and phylogeny of Friesomelitta is still not well resolved, and there are some species with broad geographic distribution. In this context, the present study aimed to contribute to the knowledge of the kar-yotype diversity of this genus, including characterizing samples of new points in the distribution of species and new species. Furthermost, we search for data that may aid in the taxonomic resolution of the group and in the
understanding of the possible evolutionary mechanisms that occurred in the diversification of the karyotype of the group.
MATERIAL AND METHODS
We analyzed samples of four species from different localities of Brazil, Frieseomelitta doederleini, from the municipality of Canavieiras, state of Bahia, (15º 61 ‘S, 39º42’ W), Frieseomelitta longipes, from the municipality of Belém, state of Pará, 1:30 ‘S, 48 ° 73’ W); Frieseomelit-ta portoi, from the municipality of Rio Branco, state of Acre (9º98 ‘S, 67º90’ W); and Frieseomelitta aff. tricho-cerata, from the municipality of Juína, state of Mato Grosso (11º52 ‘S, 60º50’ W). Taxonomist of bees identi-fied the collected specimens and adult specimens of each of the species were mounted on entomological pins and deposited in the entomological collection of the Univer-sidade Estadual de Santa Cruz, Ilheus, BA.
The slide preparations were made from cells of the cerebral ganglia of specimens in the prepupa stage, according to the protocol described by Imai et al. (1988). The prepared slides were stained conventionally with 3% Giemsa/Sorensens’s Buffer and the selected metaphases were photographed on an Olympus CX-41 microscope with attached Olympus C7070 digital camera.
Staining with the base-specific f luorochromes 4,6-diamidino-2-phenylindole (DAPI) and chromomy-cin A3 (CMA3) to evidence the chromosomal regions rich in AT (DAPI) and CG (CMA3), respectively, were performed according to Schweizer (1980), with modi-fications proposed by Guerra and Souza (2002). Cover-slips were mounted on slides with antifading Vectash-ield (Vector Laboratories, Burlingame, USA). The images were captured on a Leica DMRA2 epifluores-cence microscope using the Leica IM50 software (Leica Microsystems Imaging Solutions Ltda, Cambridge, UK).
To allow comparison with previous studies, we fol-lowed chromosomal nomenclature proposed by Imai (1991). (M) Metacentric chromosome: the arms of approximately equal sizes and euchromatic, the het-erochromatin restricted to the centromeric region; (A) Acrocentric chromosome: centromeric region and short heterochromatic arms; (AM) Pseudoacrocentric chromo-some: centromeric region, middle or long heterochro-matic arms and short eucrotic arm.
The Karyograms were organized with the use of Adobe Photoshop® CS6 13.0x 64 software. From the kar-yotypes, the chromosome pairs, diploid (2n) and haploid (n) numbers and karyotype formulas (2k) were defined.
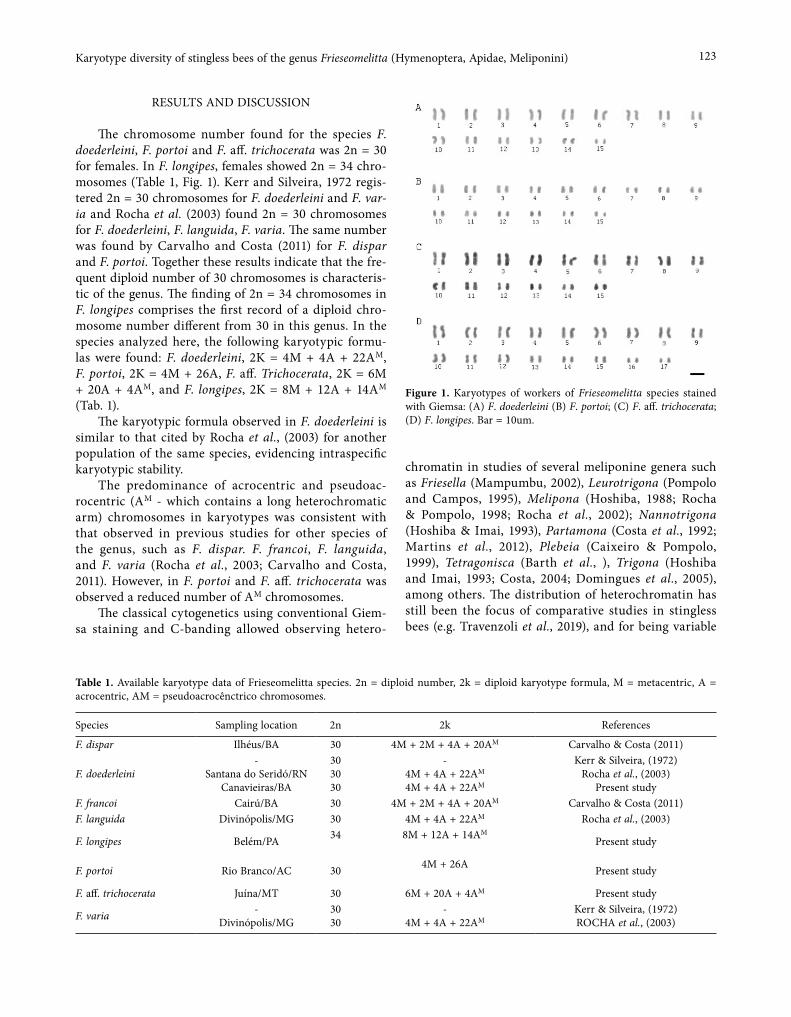
123Karyotype diversity of stingless bees of the genus Frieseomelitta (Hymenoptera, Apidae, Meliponini)
RESULTS AND DISCUSSION
The chromosome number found for the species F. doederleini, F. portoi and F. aff. trichocerata was 2n = 30 for females. In F. longipes, females showed 2n = 34 chro-mosomes (Table 1, Fig. 1). Kerr and Silveira, 1972 regis-tered 2n = 30 chromosomes for F. doederleini and F. var-ia and Rocha et al. (2003) found 2n = 30 chromosomes for F. doederleini, F. languida, F. varia. The same number was found by Carvalho and Costa (2011) for F. dispar and F. portoi. Together these results indicate that the fre-quent diploid number of 30 chromosomes is characteris-tic of the genus. The finding of 2n = 34 chromosomes in F. longipes comprises the first record of a diploid chro-mosome number different from 30 in this genus. In the species analyzed here, the following karyotypic formu-las were found: F. doederleini, 2K = 4M + 4A + 22AM, F. portoi, 2K = 4M + 26A, F. aff. Trichocerata, 2K = 6M + 20A + 4AM, and F. longipes, 2K = 8M + 12A + 14AM (Tab. 1).
The karyotypic formula observed in F. doederleini is similar to that cited by Rocha et al., (2003) for another population of the same species, evidencing intraspecific karyotypic stability.
The predominance of acrocentric and pseudoac-rocentric (AM - which contains a long heterochromatic arm) chromosomes in karyotypes was consistent with that observed in previous studies for other species of the genus, such as F. dispar. F. francoi, F. languida, and F. varia (Rocha et al., 2003; Carvalho and Costa, 2011). However, in F. portoi and F. aff. trichocerata was observed a reduced number of AM chromosomes.
The classical cytogenetics using conventional Giem-sa staining and C-banding allowed observing hetero-
chromatin in studies of several meliponine genera such as Friesella (Mampumbu, 2002), Leurotrigona (Pompolo and Campos, 1995), Melipona (Hoshiba, 1988; Rocha & Pompolo, 1998; Rocha et al., 2002); Nannotrigona (Hoshiba & Imai, 1993), Partamona (Costa et al., 1992; Martins et al., 2012), Plebeia (Caixeiro & Pompolo, 1999), Tetragonisca (Barth et al., ), Trigona (Hoshiba and Imai, 1993; Costa, 2004; Domingues et al., 2005), among others. The distribution of heterochromatin has still been the focus of comparative studies in stingless bees (e.g. Travenzoli et al., 2019), and for being variable
Table 1. Available karyotype data of Frieseomelitta species. 2n = diploid number, 2k = diploid karyotype formula, M = metacentric, A = acrocentric, AM = pseudoacrocênctrico chromosomes.
Species Sampling location 2n 2k References
F. dispar Ilhéus/BA 30 4M + 2M + 4A + 20AM Carvalho & Costa (2011)
F. doederleini-
Santana do Seridó/RNCanavieiras/BA
303030
-4M + 4A + 22AM 4M + 4A + 22AM
Kerr & Silveira, (1972) Rocha et al., (2003)
Present studyF. francoi Cairú/BA 30 4M + 2M + 4A + 20AM Carvalho & Costa (2011)F. languida Divinópolis/MG 30 4M + 4A + 22AM Rocha et al., (2003)
F. longipes Belém/PA 34 8M + 12A + 14AMPresent study
F. portoi Rio Branco/AC 30 4M + 26A Present study
F. aff. trichocerata Juína/MT 30 6M + 20A + 4AM Present study
F. varia -Divinópolis/MG
3030
-4M + 4A + 22AM
Kerr & Silveira, (1972) ROCHA et al., (2003)
Figure 1. Karyotypes of workers of Frieseomelitta species stained with Giemsa: (A) F. doederleini (B) F. portoi; (C) F. aff. trichocerata; (D) F. longipes. Bar = 10um.
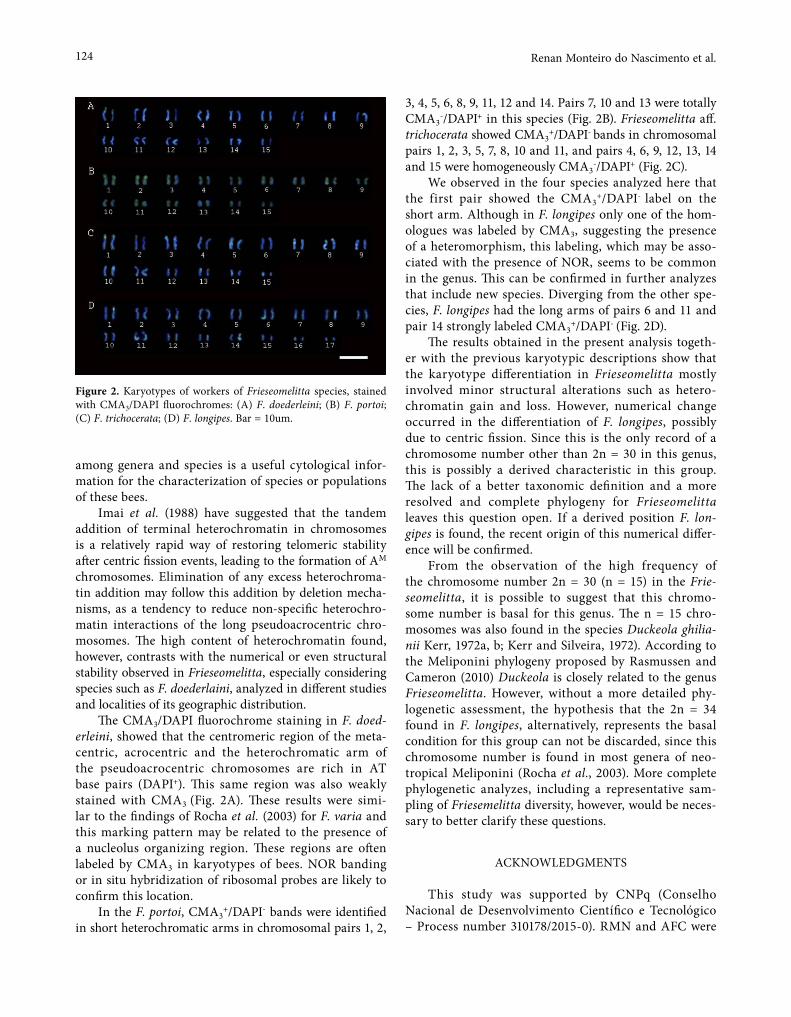
124 Renan Monteiro do Nascimento et al.
among genera and species is a useful cytological infor-mation for the characterization of species or populations of these bees.
Imai et al. (1988) have suggested that the tandem addition of terminal heterochromatin in chromosomes is a relatively rapid way of restoring telomeric stability after centric fission events, leading to the formation of AM chromosomes. Elimination of any excess heterochroma-tin addition may follow this addition by deletion mecha-nisms, as a tendency to reduce non-specific heterochro-matin interactions of the long pseudoacrocentric chro-mosomes. The high content of heterochromatin found, however, contrasts with the numerical or even structural stability observed in Frieseomelitta, especially considering species such as F. doederlaini, analyzed in different studies and localities of its geographic distribution.
The CMA3/DAPI fluorochrome staining in F. doed-erleini, showed that the centromeric region of the meta-centric, acrocentric and the heterochromatic arm of the pseudoacrocentric chromosomes are rich in AT base pairs (DAPI+). This same region was also weakly stained with CMA3 (Fig. 2A). These results were simi-lar to the findings of Rocha et al. (2003) for F. varia and this marking pattern may be related to the presence of a nucleolus organizing region. These regions are often labeled by CMA3 in karyotypes of bees. NOR banding or in situ hybridization of ribosomal probes are likely to confirm this location.
In the F. portoi, CMA3+/DAPI- bands were identified
in short heterochromatic arms in chromosomal pairs 1, 2,
3, 4, 5, 6, 8, 9, 11, 12 and 14. Pairs 7, 10 and 13 were totally CMA3
-/DAPI+ in this species (Fig. 2B). Frieseomelitta aff. trichocerata showed CMA3
+/DAPI- bands in chromosomal pairs 1, 2, 3, 5, 7, 8, 10 and 11, and pairs 4, 6, 9, 12, 13, 14 and 15 were homogeneously CMA3
-/DAPI+ (Fig. 2C). We observed in the four species analyzed here that
the first pair showed the CMA3+/DAPI- label on the
short arm. Although in F. longipes only one of the hom-ologues was labeled by CMA3, suggesting the presence of a heteromorphism, this labeling, which may be asso-ciated with the presence of NOR, seems to be common in the genus. This can be confirmed in further analyzes that include new species. Diverging from the other spe-cies, F. longipes had the long arms of pairs 6 and 11 and pair 14 strongly labeled CMA3
+/DAPI- (Fig. 2D). The results obtained in the present analysis togeth-
er with the previous karyotypic descriptions show that the karyotype differentiation in Frieseomelitta mostly involved minor structural alterations such as hetero-chromatin gain and loss. However, numerical change occurred in the differentiation of F. longipes, possibly due to centric fission. Since this is the only record of a chromosome number other than 2n = 30 in this genus, this is possibly a derived characteristic in this group. The lack of a better taxonomic definition and a more resolved and complete phylogeny for Frieseomelitta leaves this question open. If a derived position F. lon-gipes is found, the recent origin of this numerical differ-ence will be confirmed.
From the observation of the high frequency of the chromosome number 2n = 30 (n = 15) in the Frie-seomelitta, it is possible to suggest that this chromo-some number is basal for this genus. The n = 15 chro-mosomes was also found in the species Duckeola ghilia-nii Kerr, 1972a, b; Kerr and Silveira, 1972). According to the Meliponini phylogeny proposed by Rasmussen and Cameron (2010) Duckeola is closely related to the genus Frieseomelitta. However, without a more detailed phy-logenetic assessment, the hypothesis that the 2n = 34 found in F. longipes, alternatively, represents the basal condition for this group can not be discarded, since this chromosome number is found in most genera of neo-tropical Meliponini (Rocha et al., 2003). More complete phylogenetic analyzes, including a representative sam-pling of Friesemelitta diversity, however, would be neces-sary to better clarify these questions.
ACKNOWLEDGMENTS
This study was supported by CNPq (Conselho Nacional de Desenvolvimento Científico e Tecnológico – Process number 310178/2015-0). RMN and AFC were
Figure 2. Karyotypes of workers of Frieseomelitta species, stained with CMA3/DAPI fluorochromes: (A) F. doederleini; (B) F. portoi; (C) F. trichocerata; (D) F. longipes. Bar = 10um.
125Karyotype diversity of stingless bees of the genus Frieseomelitta (Hymenoptera, Apidae, Meliponini)
supported by a fellowships from CAPES (Coordenação de Aperfeiçoamento de Pessoal de Nível Superior) pela bolsa concedida durante o Mestrado. We thank Dr. Gabriel Augusto Rodrigues de Melo (UFPR) for spe-cies identification and Dr. Giorgio Cristino Venturieri (Embrapa Amazônia Oriental) for providing samples for cytogenetic analyzes.
REFERENCES
Barth A, Fernandes A, Pompolo SG, Costa MA (2011) Occurrence of B chromosomes in Tetragonisca Latreille, 1811 (Hymenoptera, Apidae, Meliponini): a new contribution to the cytotaxonomy of the genus. Genetics and Molecular Biology 34(1): 77–79
Caixeiro APA, Pompolo SG. 1999. Caracterização cit-ogenética de heterocromatina constitutiva e sua implicação na evolução do cariótipo de espécies do gênero Plebeia (Hymenoptera, Apidae, Meliponini). Genetics and Molecular Biology 22 (Supplement 3): 31-32.
Carvalho AF, Costa MA. 2011. Cytogenetic characteri-zation of two species of Frieseomelitta Ihering, 1912 (Hymenoptera, Apidae, Meliponini). Genetics and Molecular Biology (Impresso), v. 34, p. 237-239.
Camargo JMF, Pedro SRM. 2013. Meliponini Lepeletier, 1836. In Moure JS, Urban D and Melo GAR (Orgs). In Catalogue of Bees (Hymenoptera, Apoidea) in the Neotropical Region - online version. Available at http://www.moure.cria.org.br/catalogue. Accessed Agosto/14/2016.
Cockerell TDA. 1915. The Real Trigona dorsalis Smith rediscovered (Hym.) Entomological News, 26: 30-32.
Costa MA, Pompolo SG, Campos LAO. 1992. Supernu-merary chromosomes in Partamona cupira (Hyme-noptera, Apidae, Meliponinae). Revista Brasileira de Genetica 15, 801–806.
Costa KF, Brito RM, Miyazawa CS. 2004. Karyotypic description of four species of Trigona (Jurine, 1807) (Hymenoptera, Apidae, Meliponini) from the State of Mato Grosso, Brazil. Genetics and Molecular Biology. Vol. 27 nº 2 São Paulo.
Crozier RH. 1975. Hymenoptera. In: B. John (ed), Ani-mal Cytogenetics 3. Insecta 7. Berlin, Grebuder, Borntraeger. 95p.
Domingues AMT, Waldschmidt AM, Andrade SE, Souza VA, Alves RMO, Junior JCS, Costa MA. 2005. Karyo-type characterization of Trigona fulviventris Guérin, 1835 (Hymenoptera, Meliponini) by C banding and fluorochrome staining: Genetics and Molecular Biol-ogy, 28, 3, 390-393.
Fabricius JC. 1798. Suplementum Entomologiae System-aticae, Vol. 5 – Hafniae, Apud Proftet Stortch, 572pp.
Friese HFAKL. 1900. Neue Arten der Bienengattun-gen Melipona III., und Trigona Jur. Természetrajzi Fuzetek, 23(11): 381-394.
Friese HFAKL. 1902. Neue Meliponiden (Hym). Zeitschrift fur Systematische Hymenopterologie und Dipterologie, 2: 382-383.
Guerra MS, Souza MJ. 2002. Como Observar Cromo-ssomos: Um Guia de Técnicas em Citogenética Veg-etal, Animal e Humana. Ribeirão Preto, São Paulo, Brazil.
Hoshiba H. 1988. Karyological analysis of a stingless bee Melipona favosa (Apidae, Hymenoptera). Cytologia 53:153-156.
Hoshiba H, Imai HT. 1993. Chromosome evolution of bees and wasps (Hymenoptera, Apocrita) on the basis of C banding pattern analyses. Japanese Journal of Entomology 61:465-492.
Imai HT. 1988. Modes of spontaneous chromosomal mutation and karyotypes evolution in ants with refer-ence to he minimum intraction hypothesis. Japanese Journal of Genetics 63: 159-185.
Imai HT. 1991. Mutability of constitutive heterochroma-tin (c-bands) during eukaryotic chromosomal evolu-tion and their cytological meaning. Japanese Journal of Genetics 66: 653-661.
Imai HT, Taylor RW, Crosland MWJ, Crozier RH. 1988. Modes of spontaneous evolution in ants with refer-ence to the minimium interaction hypothesis. Japa-nese Journal of Genetics 66: 159-185.
Imai HT, Maruyama T, Gojobori T, Inoue Y., Crozier RH. 1986. Theoretical bases for karyotype evolution. The minimum-interaction hypothesis. American Natural-ist 128: 900-920.
Imai HT, Taylor RW, Crozier RH. 1994. Experimental bases for the minimium interaction theory. Chromo-some evolution in ants of the Myrmecia pilosula spe-cies complex (Hymenoptera: Formicidae: Myrmeci-nae). Japanese Journal of Genetics 69: 137-182.
Imai HT, Brown WL, Kubota JRM, Young HS, Tho YP. 1984. Chromosome observations of tropical ants in western Malasya. Annual Report National Institute of Genetics 63: 66-69.
Imai HT, Taylor RW. 1989. Chromosomal polymorphism involving telomere fusion, centromeric inactivation and centromere shipt in the ant Myrmecia (pilosula) n=1. Chromosoma 98: 456-460.
Imai HT, Crozier RH, Taylor RW. 1977. Karyotype evolu-tion in Australlian ants. Chromosoma 53: 341-393.
Imai HT, Kubota M. 1975. Chromosome polymorphism in the ant, Pheidole nodus. Chromosoma 51: 391-399.

126 Renan Monteiro do Nascimento et al.
Imai HT. 1991. Mutability of constitutive heterochroma-tin (c-bands) during eukaryotic chromosomal evolu-tion and their cytological meaning. Japanese Journal of Genetics 66: 653-661.
Kerr WE. 1972a. Numbers of Chromosomes in Some Species of Bees. Journal of the Kansas Entomological Society, 45 (1): 111-122.
Kerr WE. 1972b. Karyotypic Evolution of Bees and Cor-responding Taxonomic Implications. Evolution, 45 (1): 197-202.
Kerr WE, Silveira ZV. 1972. Karyotypc evolution of bees and corresponding taxonomic implications. Evolu-tion 26: 197-202.
Lepeletier de Saint-Fargeau A. 1836. Histoire Naturalle des Insects Hyménopteres. nº 10, Bis. Librairie Ency-clopédique de Roret, Paris. 547pp.
Mampumbu AR. 2002. Análise citogenética da hetero-cromatina e da NOR em Populações de abelhas sem ferrão Friesella schrottkyi (FRIESE, 1900) (Hymenop-tera: Apidae: Meliponini). Dissertação de Mestrado, Unicamp, Campinas.
Martins CCC, Diniz D, Sobrinho-Scudeler PE, Foresti F, Campos LAO, Costa MA. 2012. Investigation of Par-tamona helleri (Apidae, Meliponini) B chromosome origin. An approach by microdissection and whole chromosome painting. Apidologie 44, 75–81
Moure JS. 1946. Contribuição para o Conhecimento dos Meliponinae (Hym. Apoidea). Revista de Entomolo-gia, 17(3): 437-443.
Moure JS. 1950. Notas Sobre Alguns Meliponinae Bolivi-anos (Hymenoptera, Apoidea). Dusenia, 2(1): 70-80.
Moure JS. 1963. Uma Nova Espécie de “Trigona (Frie-seomelitta)” do Norte do Distrito Tupi (Hymenoptera, Apoidea). Revista Brasileira de Biologia, 23(1): 39-43.
Moure JS. 1989. Espécies Novas de Abelhas da Região Central do Estado de Minas Gerais, Brasil (Hyme-noptera, Apoidea). Acta Biológica Paranaense 18(1, 2, 3, 4): 115-127.
Moure JS. 1988. Uma Nova Espécie de Frieseomelitta do Oeste da Amazônia (Hymenoptera, Apoidea). Acta Biológica Paranaense 17(1, 2, 3, 4): 141-145.
Oliveira FF. 2003. Revisão do gênero Frieseomelitta von Ihering, 1912 (Hymenoptera, Apidae, Meliponinae), com notas bionômicas de algumas Espécies. Tese de Doutorado, Universidade Federal do Paraná, Curiti-ba, 327p.
Pompolo SG, Campos LAO. 1995. Karyotypes of two spe-cies of stingless bee, Leurotrigona muelleri and Leuro-trigona pusilla (Hymenoptera, Meliponinae). Revista Brasileira de Genetica 18:181-184.
Rasmussen C, Cameron SA. 2010. Global stingless bee phylogeny supports ancient divergence, vicariance,
and long-distance dispersal. Biological Journal of the Linnean Society, 99: 206–232.
Rocha MP, Pompolo SG. 1998. Karyotypes and hetero-chromatin variation (C-bands) in Melipona species (Hymenoptera, Apidae, Meliponinae). Genetics and Molecular Biology V. 21, p. 41-45.
Rocha MP, Pompolo SG, Dergam JÁ, Fernandes A, Cam-pos LAO. 2002. DNA characterization and karyotypic evolution in the bee genus Melipona (Hymenoptera, Meliponini). Hereditas 136:19-37.
Rocha MP, Pompolo SG, Campos LAO. 2003. Citogené-tica da tribo Meliponini (Hymenoptera, Apidae). In: Melo, G. A. R. and Santos I. A. (eds) Apoidea Neo-tropica: Homenagem aos 90 anos de Jesus Santiago Moure. UNESC, Criciúma, pp 311-320.
Santos JM, Diniz, D, Rodrigues TAS, Cioffi, MB, Wald-schmidt, AM. 2018. Heterochromatin distribution and chromosomal mapping of microsatellite repeats in the genome of Frieseomelitta stingless bees (Hyme-noptera: Apidae: Meliponini). Florida Entomologist. 101(1):33-39.
Schweizer D. 1980. Simultaneous fluorescent staining of R bands and specific heterochromatic regions (DA-DAPI bands) in human chromosomes. Cytogenetics and Cell Genetics 27:190-193.
Silveira FA, Melo GAR, Almeida EAB. 2002. Abelhas Bra-sileiras – Sistemática e Identificação. Editora Com-posição e Arte, Minas Gerais, Brasil. 1ª edição. Pg 86.
Smith F. 1854. Catalogue of Hymenopterous Insects in the Collection of the British Museum: Part II, Api-dae. Printed by Order of the Trustees, London. pp. 199-465.
Schwarz HF. 1940. Additional Species and Records of Stingless Bees (Meliponidae) from British Guiana. American Museum Novitates, 1078: 1-12p.
Travenzoli, N. M., Barbosa, I. C. de O., Carvalho-Zilse, G. A., Salomão, T. M. F., & Lopes, D. M. (2019) Karyotypic description and repetitive DNA chromo-some mapping of Melipona interrupta Latreille, 1811 (Hymenoptera: Meliponini). Caryologia 72(2), 91-95.

Caryologia. International Journal of Cytology, Cytosystematics and Cytogenetics 73(2): 127-143, 2020
Firenze University Press www.fupress.com/caryologiaCaryologia
International Journal of Cytology, Cytosystematics and Cytogenetics
ISSN 0008-7114 (print) | ISSN 2165-5391 (online) | DOI: 10.13128/caryologia-579
Citation: E. Martin, T. Dirmenci, T. Ara-baci, T. Yazici, T. Özcan (2020) Karyo-type studies on the genus Origanum L. (Lamiaceae) species and some hybrids defining homoploidy. Caryologia 73(2): 127-143. doi: 10.13128/caryologia-579
Received: July 31, 2019
Accepted: April 27, 2020
Published: July 31, 2020
Copyright: © 2020 E. Martin, T. Dir-menci, T. Arabaci, T. Yazici, T. Özcan. This is an open access, peer-reviewed article published by Firenze University Press (http://www.fupress.com/caryo-logia) and distributed under the terms of the Creative Commons Attribution License, which permits unrestricted use, distribution, and reproduction in any medium, provided the original author and source are credited.
Data Availability Statement: All rel-evant data are within the paper and its Supporting Information files.
Competing Interests: The Author(s) declare(s) no conflict of interest.
Karyotype studies on the genus Origanum L. (Lamiaceae) species and some hybrids defining homoploidy
Esra Martin1, Tuncay Dirmenci2,*, Turan Arabaci3, Türker Yazici2, Taner Özcan2
1 Department of Biotechnology, Faculty of Science, Necmettin Erbakan University, Konya, Turkey2 Department of Biology Education, Necatibey Education Faculty, Balıkesir University, Balıkesir, Turkey3 Department of Pharmaceutical Botany, Faculty of Pharmacy, İnönü University, Malatya, Turkey*Corresponding author. E-mail: [email protected]
Abstract. In this study, chromosome numbers and structures of some Origanum L. taxa growing in Turkey were identified. Using the Image Analysis System, the comple-ments of plant accessions belonging to eight sections, namely Amaracus (Gleditsch) Vogel, Anatolicon Benth., Brevifilamentum Ietsw., Longitubus Ietsw., Chilocalyx (Briq.) Ietsw., Majorana (Miller) Ietsw., Origanum, and Prolaticorolla Ietsw. were determined, by classification with the cytogenetic method. The chromosome number of all taxa except O. sipyleum L. (2n = 28) and O. rotundifolium Boiss. (2n = 28) is 2n = 30. In addition, the hybrids and their parental species have 2n = 30 chromosome numbers. Also, the smallest chromosome length is 0.32 μm in O. sipyleum. The largest chromo-some length is 2.02 μm in O. minutiflorum O.Schwarz & P.H.Davis. The smallest total haploid length is 10.08 μm in O. vulgare subsp. hirtum (Link) A.Terracc. and the larg-est value is 22.00 μm in O. haussknechtii Boiss. The smallest mean length is 0.33 μm in O. vulgare L. subsp. hirtum and O. saccatum P.H.Davis. The largest mean length is 0.74 μm in O. sipyleum L. The chromosome numbers obtained in this study support the speciation of Origanum members via homoploid hybridization. Finally, the somatic chromosome numbers of 10 taxa (including 2 hybrids), chromosome measurements of 22 taxa (including 2 hybrids), and ideograms of 19 taxa (including 2 hybrids) were for the first time performed in this study.
Keywords: chromosome, hybrid, karyotype, Lamiaceae, Origanum.
INTRODUCTION
The genus Origanum L. is placed in the family Lamiaceae, subfamily Nepetoideae, tribe Mentheae, subtribe Menthineae, contains 43 species and 20 hybrids (Ietswaart 1980, 1982; Govaerts et al. 2013; Dirmenci et al. 2018a, 2018b, 2019). Approximately, 21 species (24 taxa, including 13 endemic) and
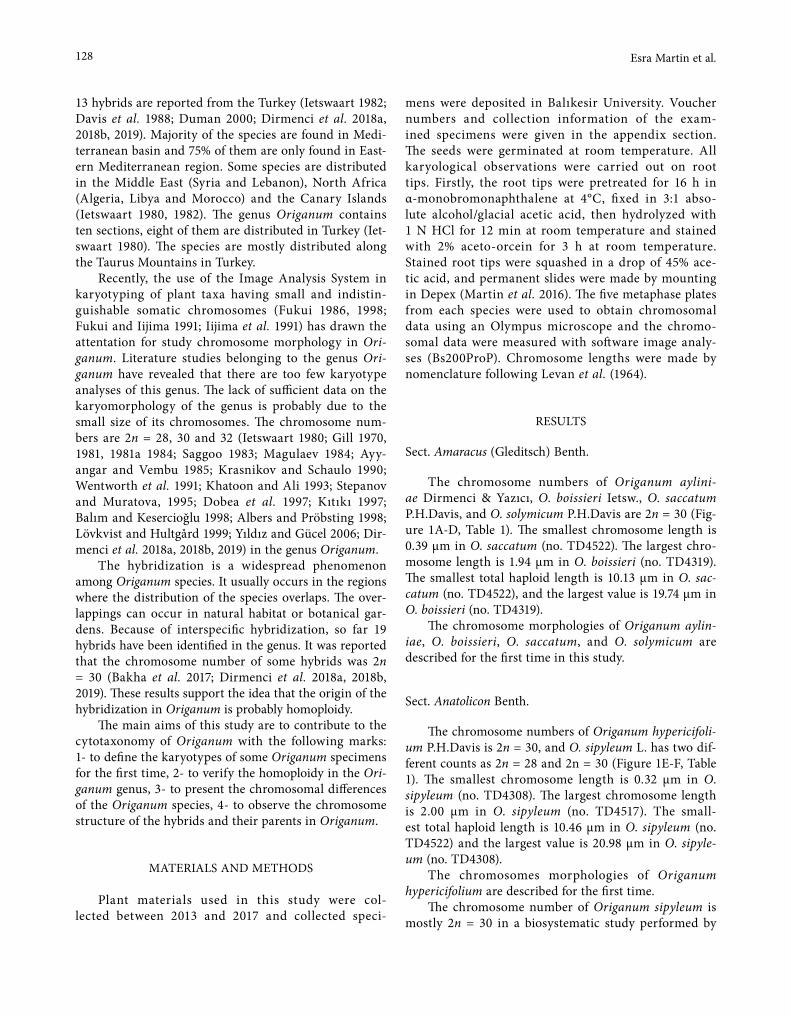
128 Esra Martin et al.
13 hybrids are reported from the Turkey (Ietswaart 1982; Davis et al. 1988; Duman 2000; Dirmenci et al. 2018a, 2018b, 2019). Majority of the species are found in Medi-terranean basin and 75% of them are only found in East-ern Mediterranean region. Some species are distributed in the Middle East (Syria and Lebanon), North Africa (Algeria, Libya and Morocco) and the Canary Islands (Ietswaart 1980, 1982). The genus Origanum contains ten sections, eight of them are distributed in Turkey (Iet-swaart 1980). The species are mostly distributed along the Taurus Mountains in Turkey.
Recently, the use of the Image Analysis System in karyotyping of plant taxa having small and indistin-guishable somatic chromosomes (Fukui 1986, 1998; Fukui and Iijima 1991; Iijima et al. 1991) has drawn the attentation for study chromosome morphology in Ori-ganum. Literature studies belonging to the genus Ori-ganum have revealed that there are too few karyotype analyses of this genus. The lack of sufficient data on the karyomorphology of the genus is probably due to the small size of its chromosomes. The chromosome num-bers are 2n = 28, 30 and 32 (Ietswaart 1980; Gill 1970, 1981, 1981a 1984; Saggoo 1983; Magulaev 1984; Ayy-angar and Vembu 1985; Krasnikov and Schaulo 1990; Wentworth et al. 1991; Khatoon and Ali 1993; Stepanov and Muratova, 1995; Dobea et al. 1997; Kıtıkı 1997; Balım and Kesercioğlu 1998; Albers and Pröbsting 1998; Lövkvist and Hultgård 1999; Yıldız and Gücel 2006; Dir-menci et al. 2018a, 2018b, 2019) in the genus Origanum.
The hybridization is a widespread phenomenon among Origanum species. It usually occurs in the regions where the distribution of the species overlaps. The over-lappings can occur in natural habitat or botanical gar-dens. Because of interspecific hybridization, so far 19 hybrids have been identified in the genus. It was reported that the chromosome number of some hybrids was 2n = 30 (Bakha et al. 2017; Dirmenci et al. 2018a, 2018b, 2019). These results support the idea that the origin of the hybridization in Origanum is probably homoploidy.
The main aims of this study are to contribute to the cytotaxonomy of Origanum with the following marks: 1- to define the karyotypes of some Origanum specimens for the first time, 2- to verify the homoploidy in the Ori-ganum genus, 3- to present the chromosomal differences of the Origanum species, 4- to observe the chromosome structure of the hybrids and their parents in Origanum.
MATERIALS AND METHODS
Plant materials used in this study were col-lected between 2013 and 2017 and collected speci-
mens were deposited in Balıkesir University. Voucher numbers and collection information of the exam-ined specimens were given in the appendix section. The seeds were germinated at room temperature. All karyological observations were carried out on root tips. Firstly, the root tips were pretreated for 16 h in α-monobromonaphthalene at 4°C, fixed in 3:1 abso-lute alcohol/glacial acetic acid, then hydrolyzed with 1 N HCl for 12 min at room temperature and stained with 2% aceto-orcein for 3 h at room temperature. Stained root tips were squashed in a drop of 45% ace-tic acid, and permanent slides were made by mounting in Depex (Martin et al. 2016). The five metaphase plates from each species were used to obtain chromosomal data using an Olympus microscope and the chromo-somal data were measured with software image analy-ses (Bs200ProP). Chromosome lengths were made by nomenclature following Levan et al. (1964).
RESULTS
Sect. Amaracus (Gleditsch) Benth.
The chromosome numbers of Origanum aylini-ae Dirmenci & Yazıcı, O. boissieri Ietsw., O. saccatum P.H.Davis, and O. solymicum P.H.Davis are 2n = 30 (Fig-ure 1A-D, Table 1). The smallest chromosome length is 0.39 μm in O. saccatum (no. TD4522). The largest chro-mosome length is 1.94 μm in O. boissieri (no. TD4319). The smallest total haploid length is 10.13 μm in O. sac-catum (no. TD4522), and the largest value is 19.74 μm in O. boissieri (no. TD4319).
The chromosome morphologies of Origanum aylin-iae, O. boissieri, O. saccatum, and O. solymicum are described for the first time in this study.
Sect. Anatolicon Benth.
The chromosome numbers of Origanum hypericifoli-um P.H.Davis is 2n = 30, and O. sipyleum L. has two dif-ferent counts as 2n = 28 and 2n = 30 (Figure 1E-F, Table 1). The smallest chromosome length is 0.32 μm in O. sipyleum (no. TD4308). The largest chromosome length is 2.00 μm in O. sipyleum (no. TD4517). The small-est total haploid length is 10.46 μm in O. sipyleum (no. TD4522) and the largest value is 20.98 μm in O. sipyle-um (no. TD4308).
The chromosomes morphologies of Origanum hypericifolium are described for the first time.
The chromosome number of Origanum sipyleum is mostly 2n = 30 in a biosystematic study performed by
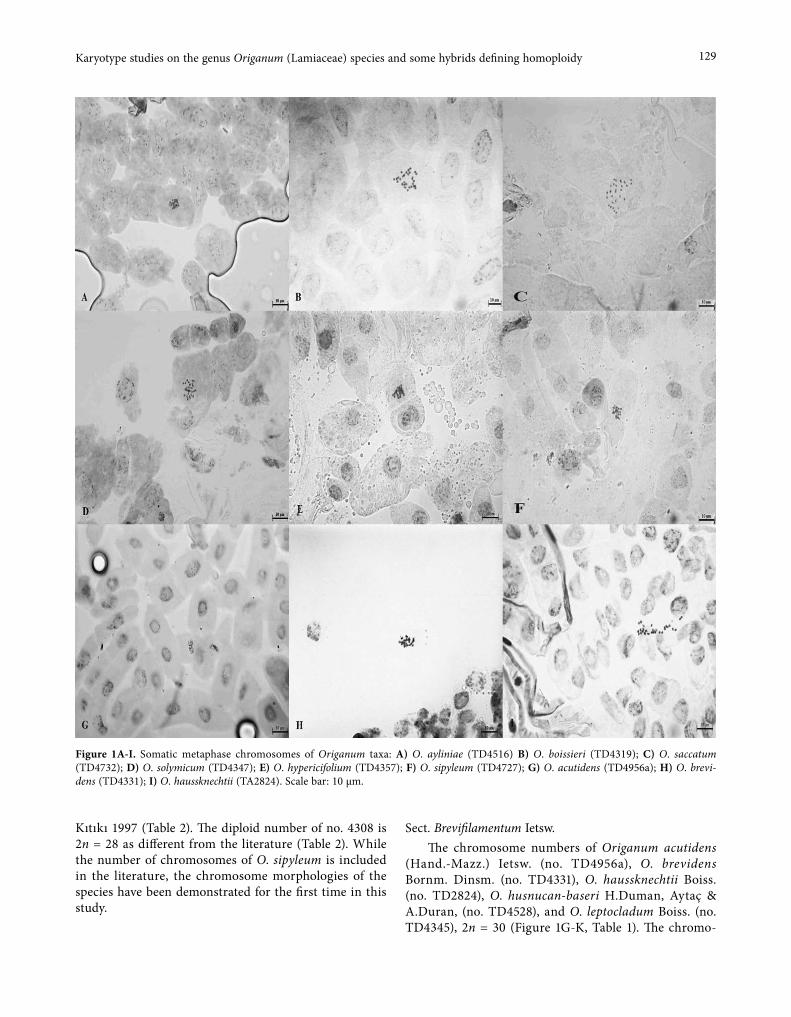
129Karyotype studies on the genus Origanum (Lamiaceae) species and some hybrids defining homoploidy
Kıtıkı 1997 (Table 2). The diploid number of no. 4308 is 2n = 28 as different from the literature (Table 2). While the number of chromosomes of O. sipyleum is included in the literature, the chromosome morphologies of the species have been demonstrated for the first time in this study.
Sect. Brevifilamentum Ietsw.The chromosome numbers of Origanum acutidens
(Hand.-Mazz.) Ietsw. (no. TD4956a), O. brevidens Bornm. Dinsm. (no. TD4331), O. haussknechtii Boiss. (no. TD2824), O. husnucan-baseri H.Duman, Aytaç & A.Duran, (no. TD4528), and O. leptocladum Boiss. (no. TD4345), 2n = 30 (Figure 1G-K, Table 1). The chromo-
Figure 1A-I. Somatic metaphase chromosomes of Origanum taxa: A) O. ayliniae (TD4516) B) O. boissieri (TD4319); C) O. saccatum (TD4732); D) O. solymicum (TD4347); E) O. hypericifolium (TD4357); F) O. sipyleum (TD4727); G) O. acutidens (TD4956a); H) O. brevi-dens (TD4331); I) O. haussknechtii (TA2824). Scale bar: 10 µm.
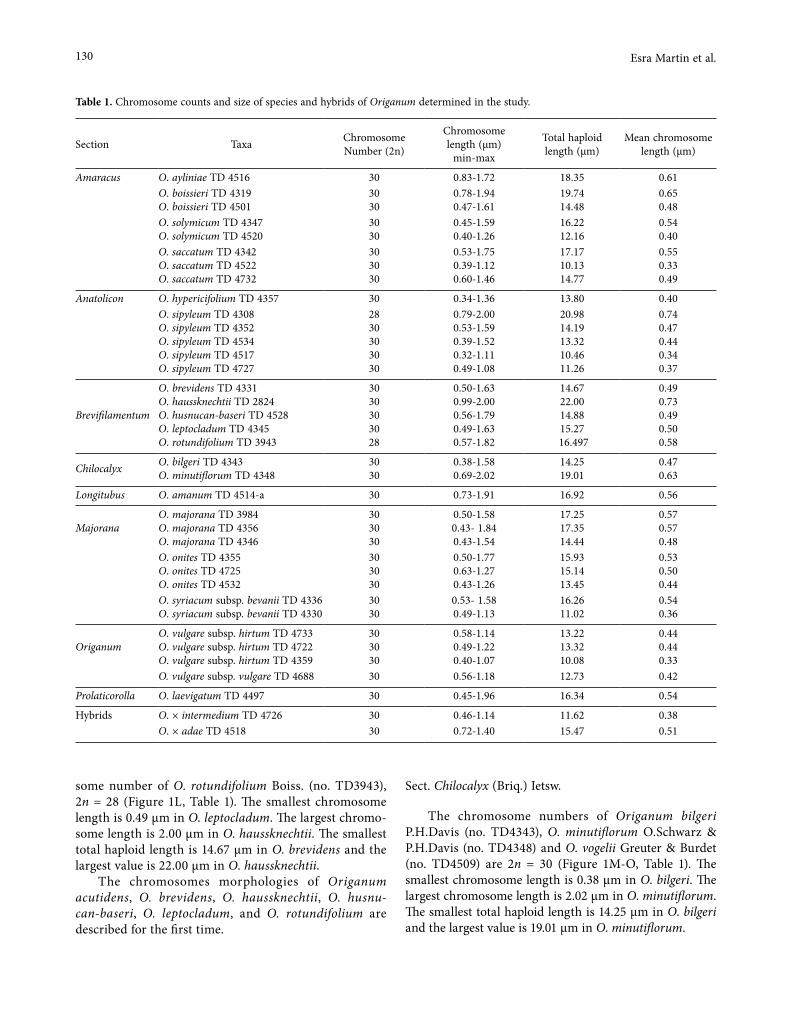
130 Esra Martin et al.
some number of O. rotundifolium Boiss. (no. TD3943), 2n = 28 (Figure 1L, Table 1). The smallest chromosome length is 0.49 μm in O. leptocladum. The largest chromo-some length is 2.00 μm in O. haussknechtii. The smallest total haploid length is 14.67 μm in O. brevidens and the largest value is 22.00 μm in O. haussknechtii.
The chromosomes morphologies of Origanum acutidens, O. brevidens, O. haussknechtii, O. husnu-can-baseri, O. leptocladum, and O. rotundifolium are described for the first time.
Sect. Chilocalyx (Briq.) Ietsw.
The chromosome numbers of Origanum bilgeri P.H.Davis (no. TD4343), O. minutiflorum O.Schwarz & P.H.Davis (no. TD4348) and O. vogelii Greuter & Burdet (no. TD4509) are 2n = 30 (Figure 1M-O, Table 1). The smallest chromosome length is 0.38 μm in O. bilgeri. The largest chromosome length is 2.02 μm in O. minutiflorum. The smallest total haploid length is 14.25 μm in O. bilgeri and the largest value is 19.01 μm in O. minutiflorum.
Table 1. Chromosome counts and size of species and hybrids of Origanum determined in the study.
Section Taxa ChromosomeNumber (2n)
Chromosome length (µm)
min-max
Total haploid length (µm)
Mean chromosome length (µm)
Amaracus O. ayliniae TD 4516 30 0.83-1.72 18.35 0.61O. boissieri TD 4319O. boissieri TD 4501
3030
0.78-1.940.47-1.61
19.7414.48
0.650.48
O. solymicum TD 4347O. solymicum TD 4520
3030
0.45-1.590.40-1.26
16.2212.16
0.540.40
O. saccatum TD 4342O. saccatum TD 4522O. saccatum TD 4732
303030
0.53-1.750.39-1.120.60-1.46
17.1710.1314.77
0.550.330.49
Anatolicon O. hypericifolium TD 4357 30 0.34-1.36 13.80 0.40O. sipyleum TD 4308O. sipyleum TD 4352O. sipyleum TD 4534O. sipyleum TD 4517O. sipyleum TD 4727
2830303030
0.79-2.000.53-1.590.39-1.520.32-1.110.49-1.08
20.9814.1913.3210.4611.26
0.740.470.440.340.37
Brevifilamentum
O. brevidens TD 4331O. haussknechtii TD 2824O. husnucan-baseri TD 4528O. leptocladum TD 4345O. rotundifolium TD 3943
3030303028
0.50-1.630.99-2.000.56-1.790.49-1.63 0.57-1.82
14.6722.0014.8815.27
16.497
0.490.730.490.500.58
Chilocalyx O. bilgeri TD 4343O. minutiflorum TD 4348
3030
0.38-1.580.69-2.02
14.2519.01
0.470.63
Longitubus O. amanum TD 4514-a 30 0.73-1.91 16.92 0.56
MajoranaO. majorana TD 3984O. majorana TD 4356O. majorana TD 4346
303030
0.50-1.580.43- 1.840.43-1.54
17.2517.3514.44
0.570.570.48
O. onites TD 4355O. onites TD 4725O. onites TD 4532
303030
0.50-1.770.63-1.270.43-1.26
15.9315.1413.45
0.530.500.44
O. syriacum subsp. bevanii TD 4336O. syriacum subsp. bevanii TD 4330
3030
0.53- 1.580.49-1.13
16.2611.02
0.540.36
OriganumO. vulgare subsp. hirtum TD 4733O. vulgare subsp. hirtum TD 4722O. vulgare subsp. hirtum TD 4359
303030
0.58-1.14 0.49-1.220.40-1.07
13.2213.3210.08
0.440.440.33
O. vulgare subsp. vulgare TD 4688 30 0.56-1.18 12.73 0.42
Prolaticorolla O. laevigatum TD 4497 30 0.45-1.96 16.34 0.54
Hybrids O. × intermedium TD 4726 30 0.46-1.14 11.62 0.38O. × adae TD 4518 30 0.72-1.40 15.47 0.51

131Karyotype studies on the genus Origanum (Lamiaceae) species and some hybrids defining homoploidy
Table 2. Chromosome counts of species and hybrids of Origanum according to references.
Section Species Chromosome numbers (2n) References
Amaracus O. ayliniae 30 (Dirmenci et al. 2018a)O. boissieri 30 (Dirmenci et al. 2018b, Kıtıkı et al., 1997)O. calcaratum. 30 (Von Bothmer, 1970)O. dictamnus 30 (Lepper, 1970)O. solymicum 30 (in this study; Kıtıkı et al., 1997)O. saccatum 30 (in this study; Kıtıkı et al., 1997)
Anatolicon O. hypericifolium 30 (in this study)
O. sipyleum 3028
(Kıtıkı et al., 1997)(in this study)
BrevifilamentumO. acutidens 30 (Dirmenci et al. 2019)O. brevidens 30 (in this study)O. haussknechtii 30 (in this study)O. husnucan-baseri 30 (in this study)O. leptocladum 30 (in this study)O. rotundifolium 28 (in this study)
Chilocalyx O. bilgeri 30 (in this study)O. minutiflorum 30 (in this study)O. vogelii 30 (in this study )
Elongatispica O. elongatum 30 (Bastida and Talavera, 1994; Bakha et al., 2017)O. grosii 30 (Bakha et al., 2017)
Longitubus O. amanum 30 (in this study; Lepper 1970)
Majorana O. majorana 30 (in this study; Harriman, 1975; Májovský, 1978; Fernandes and Leitão, 1984; Balim and Kesercioğlu, 1998)
O. onites 30 (in this study; Von Bothmer, 1970; Miege and Greuter, 1973; Ietswaart, 1980; Montmollin, 1986; Kıtıkı et al., 1997; Bakha et al., 2017)
O. syriacum subsp. bevanii 30 (in this study; Balim and Kesercioğlu, 1998; Yildiz and Gücel, 2006)
Origanum O. vulgare 28 (Magulaev, 1984)
O. vulgare 30 (Skalinska et al., 1971; Krasnikov and Schaulo, 1990; Stepanov and Muratova, 1995; Lövkvist and Hultgård, 1999)
O. vulgare 32 (Ayyangar and Vembu, 1985)O. vulgare subsp. hirtum 30 (Strid and Franzen, 1981; Markova and Goranova, 1995; Dirmenci et al. 2018b)O. vulgare subsp. gracile 30 (Astanova, 1981; Dirmenci et al. 2019)O.vulgare subsp. virens 30 (Fernandes and Leitão, 1984; Pastor et al. 1990; Bakha et al., 2017)O. vulgare subsp. viride 30 (in this study; Strid and Franzen 1981)O. vulgare subsp. viridulum 30 (Strid and Franzen, 1981; Markova and Goranova, 1995)O. vulgare subsp. vulgare 28 (Magulaev, 1984)
O. vulgare subsp. vulgare 30
(in this study; Gill, 1981, 1981a; Saggoo, 1983; Bir and Saggoo, 1984; Gill, 1984; Krasnikov and Schaulo, 1990; Wentworth et al., 1991; Khatoon and Ali, 1993; Stepanov and Muratova, 1995; Dobea et al., 1997; Albers and Pröbsting, 1998; Lövkvist and Hultgård, 1999)
O. vulgare subsp. vulgare 32 (Ayyangar and Vembu, 1985)
Prolaticorolla O. compactum 30 (Bakha et al., 2017) O. laevigatum 30 (Balim and Kesercioğlu, 1998)
Hybrids O. × adae 30 (Dirmenci et al. 2018a)O. × font-queri 30 (Bakha et al., 2017) O. × haradjanii 30 (in this study)O. × intermedium 30 (in this study)O. × munzurense 30 (Dirmenci et al. 2019)O. × sevcaniae 30 (Dirmenci et al. 2018b)
132 Esra Martin et al.
The chromosome morphologies of O. bilgeri, O. minutiflorum, and O. vogelii are described for the first time.
Sect. Longitubus Ietsw.
Sect. Longitubus contains only one species. The chromosome number of Origanum amanum Post (no. TD4514a) is 2n = 30 (Figure 1P, Table 1). Iet-swaart (1980) reported that the chromosome number of O. amanum was 2n = 30 (Table 2). The chromosome
Figure 1J-R. Somatic metaphase chromosomes of Origanum taxa: J) O. husnucan-baseri (TD4528); K) O. leptocladum (TA4345); L) O. rotundifolium (TD3943); M) O. bilgeri (TD4343); N) O. minutiflorum (TD4348); O) O. vogelii (TD4509); P) O. amanum (TD4514a); Q) O. majorana (TD3984); R) O. onites (TD4725). Scale bar: 10 µm.

133Karyotype studies on the genus Origanum (Lamiaceae) species and some hybrids defining homoploidy
lengths range from 0.73 to 1.91 µm. The chromosome morphologies of O. amanum are described for the first time.
Sect. Majorana (Mill.) Benth.
The chromosome numbers of Origanum majorana L. (no. TD3984), O. onites L. (no. TD4725), and O. syri-acum L. subsp. bevanii (Holmes) Greuter & Burdet (no. TD4336) are 2n = 30 (Figure 1Q-S, Table 1). The small-est chromosome length is 0.43 μm in O. majorana and O. onites (no. 4356, 4346, and 4532). The largest chromo-some length is 1.84 μm in O. majorana (no. 4356). The smallest total haploid length is 11.02 μm in O. syriacum subsp. bevanii (no. 4330), and the largest value is 17.35 μm in O. majorana (no. 4356).
It was reported that the chromosome number of Origanum onites and O. majorana was 2n = 30 (Iet-swaart 1980; Kıtıkı 1997; Balım and Kesercioğlu 1998) (Table 2). The number of chromosomes we obtained
overlapped with the literature. In addition to the chro-mosome numbers of taxa, chromosome measurements are also introduced to the scientific world.
Sect. Origanum
The chromosome numbers of Origanum vulgare L. subsp. gracile (K.Koch) Ietsw. (no. TD4821), O. vul-gare subsp. hirtum (Link.) A.Terracc. (no. TD4507), O. vulgare subsp. viridulum (Matrin-Dones) Nyman (no. TD4662a), and O. vulgare subsp. vulgare (no. TD4688) are 2n = 30 (Figure 1T-W, Table 1). The smallest chromo-some length is 0.40 μm in O. vulgare subsp. hirtum (no. TD4359). The largest chromosome length is 1.22 μm in O. vulgare subsp. hirtum (no. TD4722). The smallest total haploid length is 10.08 μm in O. vulgare subsp. hirtum (no. TD4359) and the largest value is 13.32 μm in O. vul-gare subsp. hirtum (no. TD4722).
It was reported that the chromosome numbers of Origanum vulgare, O. vulgare subsp. hirtum, O. vulgare
Figure 1S-X. Somatic metaphase chromosomes of Origanum taxa: S) O. syriacum subsp. bevanii (TD4336); T) O. vulgare subsp. gracile (TD4821); U) O. vulgare subsp. hirtum (TD4507); V) O. vulgare subsp. viridulum (TD4662a); W) O. vulgare subsp. vulgare (TD4688); X) O. laevigatum (TD4497). Scale bar: 10 µm.
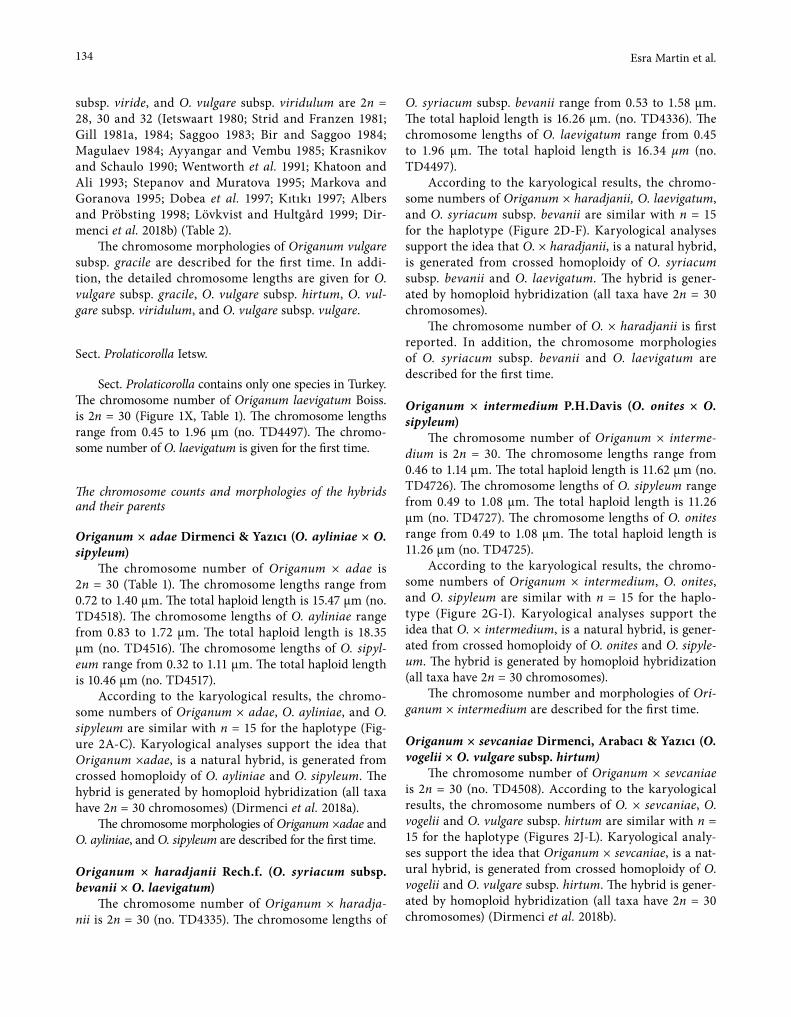
134 Esra Martin et al.
subsp. viride, and O. vulgare subsp. viridulum are 2n = 28, 30 and 32 (Ietswaart 1980; Strid and Franzen 1981; Gill 1981a, 1984; Saggoo 1983; Bir and Saggoo 1984; Magulaev 1984; Ayyangar and Vembu 1985; Krasnikov and Schaulo 1990; Wentworth et al. 1991; Khatoon and Ali 1993; Stepanov and Muratova 1995; Markova and Goranova 1995; Dobea et al. 1997; Kıtıkı 1997; Albers and Pröbsting 1998; Lövkvist and Hultgård 1999; Dir-menci et al. 2018b) (Table 2).
The chromosome morphologies of Origanum vulgare subsp. gracile are described for the first time. In addi-tion, the detailed chromosome lengths are given for O. vulgare subsp. gracile, O. vulgare subsp. hirtum, O. vul-gare subsp. viridulum, and O. vulgare subsp. vulgare.
Sect. Prolaticorolla Ietsw.
Sect. Prolaticorolla contains only one species in Turkey. The chromosome number of Origanum laevigatum Boiss. is 2n = 30 (Figure 1X, Table 1). The chromosome lengths range from 0.45 to 1.96 µm (no. TD4497). The chromo-some number of O. laevigatum is given for the first time.
The chromosome counts and morphologies of the hybrids and their parents
Origanum × adae Dirmenci & Yazıcı (O. ayliniae × O. sipyleum)
The chromosome number of Origanum × adae is 2n = 30 (Table 1). The chromosome lengths range from 0.72 to 1.40 µm. The total haploid length is 15.47 µm (no. TD4518). The chromosome lengths of O. ayliniae range from 0.83 to 1.72 µm. The total haploid length is 18.35 µm (no. TD4516). The chromosome lengths of O. sipyl-eum range from 0.32 to 1.11 µm. The total haploid length is 10.46 µm (no. TD4517).
According to the karyological results, the chromo-some numbers of Origanum × adae, O. ayliniae, and O. sipyleum are similar with n = 15 for the haplotype (Fig-ure 2A-C). Karyological analyses support the idea that Origanum ×adae, is a natural hybrid, is generated from crossed homoploidy of O. ayliniae and O. sipyleum. The hybrid is generated by homoploid hybridization (all taxa have 2n = 30 chromosomes) (Dirmenci et al. 2018a).
The chromosome morphologies of Origanum ×adae and O. ayliniae, and O. sipyleum are described for the first time.
Origanum × haradjanii Rech.f. (O. syriacum subsp. bevanii × O. laevigatum)
The chromosome number of Origanum × haradja-nii is 2n = 30 (no. TD4335). The chromosome lengths of
O. syriacum subsp. bevanii range from 0.53 to 1.58 µm. The total haploid length is 16.26 µm. (no. TD4336). The chromosome lengths of O. laevigatum range from 0.45 to 1.96 µm. The total haploid length is 16.34 µm (no. TD4497).
According to the karyological results, the chromo-some numbers of Origanum × haradjanii, O. laevigatum, and O. syriacum subsp. bevanii are similar with n = 15 for the haplotype (Figure 2D-F). Karyological analyses support the idea that O. × haradjanii, is a natural hybrid, is generated from crossed homoploidy of O. syriacum subsp. bevanii and O. laevigatum. The hybrid is gener-ated by homoploid hybridization (all taxa have 2n = 30 chromosomes).
The chromosome number of O. × haradjanii is first reported. In addition, the chromosome morphologies of O. syriacum subsp. bevanii and O. laevigatum are described for the first time.
Origanum × intermedium P.H.Davis (O. onites × O. sipyleum)
The chromosome number of Origanum × interme-dium is 2n = 30. The chromosome lengths range from 0.46 to 1.14 µm. The total haploid length is 11.62 µm (no. TD4726). The chromosome lengths of O. sipyleum range from 0.49 to 1.08 µm. The total haploid length is 11.26 µm (no. TD4727). The chromosome lengths of O. onites range from 0.49 to 1.08 µm. The total haploid length is 11.26 µm (no. TD4725).
According to the karyological results, the chromo-some numbers of Origanum × intermedium, O. onites, and O. sipyleum are similar with n = 15 for the haplo-type (Figure 2G-I). Karyological analyses support the idea that O. × intermedium, is a natural hybrid, is gener-ated from crossed homoploidy of O. onites and O. sipyle-um. The hybrid is generated by homoploid hybridization (all taxa have 2n = 30 chromosomes).
The chromosome number and morphologies of Ori-ganum × intermedium are described for the first time.
Origanum × sevcaniae Dirmenci, Arabacı & Yazıcı (O. vogelii × O. vulgare subsp. hirtum)
The chromosome number of Origanum × sevcaniae is 2n = 30 (no. TD4508). According to the karyological results, the chromosome numbers of O. × sevcaniae, O. vogelii and O. vulgare subsp. hirtum are similar with n = 15 for the haplotype (Figures 2J-L). Karyological analy-ses support the idea that Origanum × sevcaniae, is a nat-ural hybrid, is generated from crossed homoploidy of O. vogelii and O. vulgare subsp. hirtum. The hybrid is gener-ated by homoploid hybridization (all taxa have 2n = 30 chromosomes) (Dirmenci et al. 2018b).
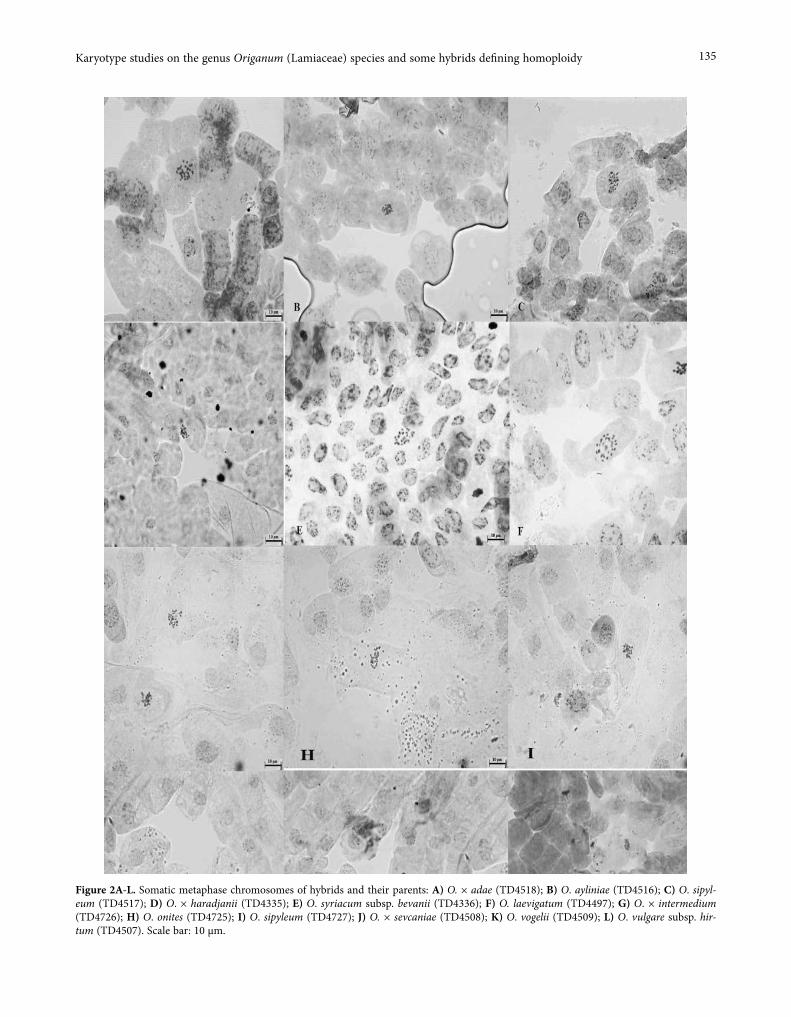
135Karyotype studies on the genus Origanum (Lamiaceae) species and some hybrids defining homoploidy
Figure 2A-L. Somatic metaphase chromosomes of hybrids and their parents: A) O. × adae (TD4518); B) O. ayliniae (TD4516); C) O. sipyl-eum (TD4517); D) O. × haradjanii (TD4335); E) O. syriacum subsp. bevanii (TD4336); F) O. laevigatum (TD4497); G) O. × intermedium (TD4726); H) O. onites (TD4725); I) O. sipyleum (TD4727); J) O. × sevcaniae (TD4508); K) O. vogelii (TD4509); L) O. vulgare subsp. hir-tum (TD4507). Scale bar: 10 µm.

136 Esra Martin et al.
Figure 3A-N. Ideograms of Origanum taxa: A) O. amanum (TD4514a); B) O. bilgeri (TD4343); C) O. boissieri (TD4319); D) O. brevidens (TD4331); E) O. haussknechtii (TA2824); F) O. husnucan-baseri (TD4528); G) O. hypericifolium (TD4357); H) O. leptocladum (TD4345); I) O. majorana (TD3984); J) O. minutiflorum (TD4348); K) O. rotundifolium (TD3943); L) O. saccatum (TD4732); M) O. solymicum (TD4347); N) O. vulgare subsp. vulgare (TD4688). Scale bar: 10 µm.
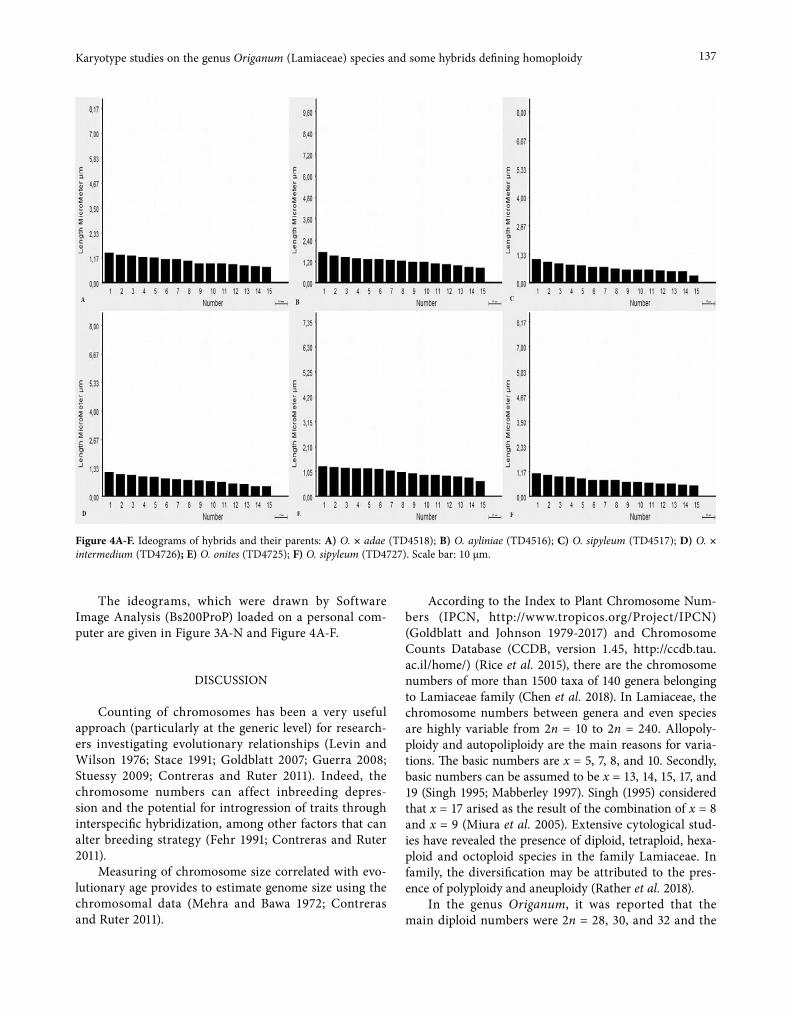
137Karyotype studies on the genus Origanum (Lamiaceae) species and some hybrids defining homoploidy
The ideograms, which were drawn by Software Image Analysis (Bs200ProP) loaded on a personal com-puter are given in Figure 3A-N and Figure 4A-F.
DISCUSSION
Counting of chromosomes has been a very useful approach (particularly at the generic level) for research-ers investigating evolutionary relationships (Levin and Wilson 1976; Stace 1991; Goldblatt 2007; Guerra 2008; Stuessy 2009; Contreras and Ruter 2011). Indeed, the chromosome numbers can affect inbreeding depres-sion and the potential for introgression of traits through interspecific hybridization, among other factors that can alter breeding strategy (Fehr 1991; Contreras and Ruter 2011).
Measuring of chromosome size correlated with evo-lutionary age provides to estimate genome size using the chromosomal data (Mehra and Bawa 1972; Contreras and Ruter 2011).
According to the Index to Plant Chromosome Num-bers (IPCN, http://www.tropicos.org/Project/IPCN) (Goldblatt and Johnson 1979-2017) and Chromosome Counts Database (CCDB, version 1.45, http://ccdb.tau.ac.il/home/) (Rice et al. 2015), there are the chromosome numbers of more than 1500 taxa of 140 genera belonging to Lamiaceae family (Chen et al. 2018). In Lamiaceae, the chromosome numbers between genera and even species are highly variable from 2n = 10 to 2n = 240. Allopoly-ploidy and autopoliploidy are the main reasons for varia-tions. The basic numbers are x = 5, 7, 8, and 10. Secondly, basic numbers can be assumed to be x = 13, 14, 15, 17, and 19 (Singh 1995; Mabberley 1997). Singh (1995) considered that x = 17 arised as the result of the combination of x = 8 and x = 9 (Miura et al. 2005). Extensive cytological stud-ies have revealed the presence of diploid, tetraploid, hexa-ploid and octoploid species in the family Lamiaceae. In family, the diversification may be attributed to the pres-ence of polyploidy and aneuploidy (Rather et al. 2018).
In the genus Origanum, it was reported that the main diploid numbers were 2n = 28, 30, and 32 and the
Figure 4A-F. Ideograms of hybrids and their parents: A) O. × adae (TD4518); B) O. ayliniae (TD4516); C) O. sipyleum (TD4517); D) O. × intermedium (TD4726); E) O. onites (TD4725); F) O. sipyleum (TD4727). Scale bar: 10 µm.

138 Esra Martin et al.
basic number was x = 15 (IPCN, http://www.tropicos.org/Project/IPCN) (Goldblatt and Johnson 1979-2017) and Chromosome Counts Database (CCDB, version 1.45, http://ccdb.tau.ac.il/home/) (Rice et al. 2015). The chro-mosome counts of the investigated species in present and previous studies are given in Table 2.
In Table 1 and Table 2, the chromosome number of all sections is 2n = 30 except some Origanum sipyl-eum specimens (because some of the specimens have 2n = 30) in sect. Anatolicon and O. rotundifolium in the sect. Brevifilamentum with 2n = 28. The smallest chro-mosome length is 0.32 μm in Origanum sipyleum (no. TD4517). The largest chromosome length is 2.02 μm in O. minutif lorum (no. TD4348). The smallest total haploid length is 10.08 μm in O. vulgare subsp. hirtum (no. TD4359) and the largest value is 22.00 μm in O. haussknechtii (no. TA2824). The smallest mean length is 0.33 μm in O. vulgare subsp. hirtum and O. saccatum (no. TD4359; TD4522, respectively). The largest mean length is 0.74 μm in O. sipyleum (no. TD4308). The chro-mosome lengths range from 0.75 to 6.00 μm. The chro-mosome lengths were measured between 0.33 and 0.74 in this karyological study of the genus Origanum. In the genus Origanum, the centromeric position could not be clearly observed because the chromosomes were general-ly very small compared to family members. On the other hand, total chromosome length could be measured.
The chromosome number as 2n = 30 is typical in some genera of Lamiaceae family (Clinopodium L., Micromeria Benth., Satureja L., Thymus L. etc.). Some Thymus species have the same chromosome number (Jalas & Kaleva 1967; Vaarama 1948). In addition, some species have different basic numbers as x = 6, 7, 9, 14, 21, 27, and 24 in the genus (Darlington and Wylie 1955; Vaarama 1948). The secondary basic numbers, namely x = 14 and 15 probably originate from x = 7. The most common numbers are 2n = 28, 30, 56, and 60, while 2n = 84 and 90 are rarely. Jalas (1967) showed that although the chromosome numbers of distinct Thymus subsec-tions were different, both subsections Vulgares L. and Piperella Willk. had the same chromosome number with 2n = 30.
In genus Micromeria s.str., the chromosome num-ber of most species was reported as 2n = 30 (Martin et al. 2011). On the other hand, Micromeria s.l. has various somatic chromosome numbers as 2n = 20, 22, 26, 30, 48, 50, and 60. Similarly, Clinopodium s.str. has various somatic chromosome numbers as 2n = 18, 20, 22, 24, and 48 (IPCN, http://www.tropicos.org/Project/IPCN) (Goldblatt and Johnson 1979-2017) and Chromosome Counts Database (CCDB, version 1.45, http://ccdb.tau.ac.il/home/) (Rice et al. 2015).
Morton (1962) reported that the basic numbers were x = 6, 7, 8, 9, 10, 11, and 15 in Satureja. Harley and Brighton (1977) reported that the genus Mentha had var-ious chromosome counts ranging from x = 6 to x = 54. This means that we can see diploid-octoploid members in this genus.
As mentioned before, the genus Origanum is a mem-ber of the Mentheae tribe and the Menthinae subtribe (Harley et al. 2004). The chromosome numbers of Men-thinae subtribe vary from 2n = 12 (Hyssopus) to 2n = 144 (Mentha). The chromosome numbers were 2n = 30 in most of the Thymbra L., Satureja, and Micromeria (s.str.) species belonging to the tribe Menthinae. In addi-tion, the chromosome numbers of some species in Thy-mus, Mentha and Prunella L. were 2n = 30 (Harley et al. 2004).
Ietswaart’s hypothesis with regard to the origin of the genus Origanum suggests that Origanum might have emerged in the Pliocene, and that formerly, the tribe Sat-urejeae genera (Clinopodium sl., Micromeria, Satureja, Thymus, etc.) were probably the main genera from which Origanum could be derived (see Ietswaart 1980: pp. 7-14 and 21-24, Figure 2). When we analyzed the clos-est genera mentioned in the discussion part, homoploid hybridization was the main ploidy type in Origanum. The emergence of other sections has been diversified by hybridization between the main sections and hybridi-zation of some Thymus and Origanum species (in part including Satureja, Micromeria s.str. and Clinopodium sl. species) (Ietswaart 1982). According to this hypothesis, the genera mentioned above are important regarding chromosome number compatibility. However, Thymbra, Prunella, and Clinopodium (partly) are morphological-ly very different from Origanum species. On the other hand, Satureja, Thymus, Micromeria s.str., and Clino-podium (partly) are morphologically closer. It may have been derived from one or more of these genera and then continued to speciation via hybridization in time. The compatibility of chromosome numbers between species supports Ietswaart’s hypothesis (1980).
Although the hybridization is widespread, the gen-eration of a unique and isolated hybrid lineage is prob-ably very rare. New hybrid lineages must establish repro-ductive isolation and a unique ecological niche to over-come genetic swamping and competition from parental species (Goulet et al. 2017). A new hybrid lineage may be formed through allopolyploidy or homoploid hybrid speciation. Allopolyploid lineages may be formed by the fusion of unreduced gametes, genome doubling follow-ing hybridization, or via a triploid bridge (Ramsey and Schemske 1998; Goulet et al. 2017). Homoploid hybrid speciation forms a new unreproductive hybrid lineage
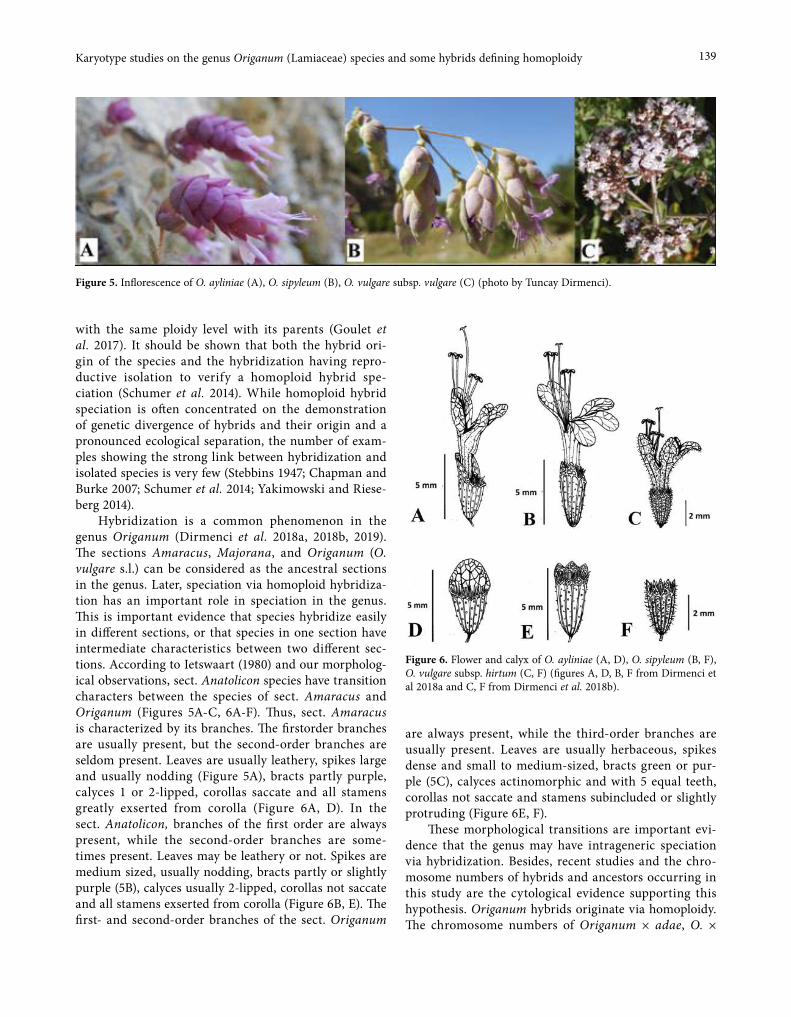
139Karyotype studies on the genus Origanum (Lamiaceae) species and some hybrids defining homoploidy
with the same ploidy level with its parents (Goulet et al. 2017). It should be shown that both the hybrid ori-gin of the species and the hybridization having repro-ductive isolation to verify a homoploid hybrid spe-ciation (Schumer et al. 2014). While homoploid hybrid speciation is often concentrated on the demonstration of genetic divergence of hybrids and their origin and a pronounced ecological separation, the number of exam-ples showing the strong link between hybridization and isolated species is very few (Stebbins 1947; Chapman and Burke 2007; Schumer et al. 2014; Yakimowski and Riese-berg 2014).
Hybridization is a common phenomenon in the genus Origanum (Dirmenci et al. 2018a, 2018b, 2019). The sections Amaracus, Majorana, and Origanum (O. vulgare s.l.) can be considered as the ancestral sections in the genus. Later, speciation via homoploid hybridiza-tion has an important role in speciation in the genus. This is important evidence that species hybridize easily in different sections, or that species in one section have intermediate characteristics between two different sec-tions. According to Ietswaart (1980) and our morpholog-ical observations, sect. Anatolicon species have transition characters between the species of sect. Amaracus and Origanum (Figures 5A-C, 6A-F). Thus, sect. Amaracus is characterized by its branches. The firstorder branches are usually present, but the second-order branches are seldom present. Leaves are usually leathery, spikes large and usually nodding (Figure 5A), bracts partly purple, calyces 1 or 2-lipped, corollas saccate and all stamens greatly exserted from corolla (Figure 6A, D). In the sect. Anatolicon, branches of the first order are always present, while the second-order branches are some-times present. Leaves may be leathery or not. Spikes are medium sized, usually nodding, bracts partly or slightly purple (5B), calyces usually 2-lipped, corollas not saccate and all stamens exserted from corolla (Figure 6B, E). The first- and second-order branches of the sect. Origanum
are always present, while the third-order branches are usually present. Leaves are usually herbaceous, spikes dense and small to medium-sized, bracts green or pur-ple (5C), calyces actinomorphic and with 5 equal teeth, corollas not saccate and stamens subincluded or slightly protruding (Figure 6E, F).
These morphological transitions are important evi-dence that the genus may have intrageneric speciation via hybridization. Besides, recent studies and the chro-mosome numbers of hybrids and ancestors occurring in this study are the cytological evidence supporting this hypothesis. Origanum hybrids originate via homoploidy. The chromosome numbers of Origanum × adae, O. ×
Figure 6. Flower and calyx of O. ayliniae (A, D), O. sipyleum (B, F), O. vulgare subsp. hirtum (C, F) (figures A, D, B, F from Dirmenci et al 2018a and C, F from Dirmenci et al. 2018b).
Figure 5. Inflorescence of O. ayliniae (A), O. sipyleum (B), O. vulgare subsp. vulgare (C) (photo by Tuncay Dirmenci).
140 Esra Martin et al.
intermedium, O. × haradjanii, O. × munzurense Sorg-er & Kit Tan, O. × sevcaniae, O. × font-queri and their parents were 2n = 30 (Bakha et al. 2017; Dirmenci et al. 2018a, 2018b, 2019).
Finally, it is clear that the cytologic findings obtained in this study combined with the previously obtained morphological, palynological and molecu-lar studies (continuing) will contribute significantly to answering the questions about the origin and diversity of the genus Origanum.
ACKNOWLEDGEMENTS
We would like to thank TÜBİTAK (project no: TÜBİTAK-113Z225) for financial support to our investi-gations.
REFERENCES
Albers F, Pröbsting W. 1998. In R. Wisskirchen & H. Haeupler, Standardliste der Farn- und Blütenpflanzen Deutschlands. Stuttgart, Germany: Bundesamt für Naturschutz & Verlag Eugen Ulmer.
Ayyangar KR, Vembu B. 1985. Karyo-specific and karyo-generic affiliations amongst Mentha arvensis Benth., M. piperita Linn. and Origanum vulgare Linn. Proc. Indian Sci. Congr. Assoc. 72(3-VI): 127.
Bakha M, Faiz CA, Daoud M, Mtili NE, Aboukhalid K, Khiraoui A, Machon N, Siljak-Yakovlev S. 2017. Genome size and chromosome number for six taxa of Origanum genus from Morocco, Botany Letters. 164(4): 361-370.
Balım AG, Kesercioğlu T. 1998. Doğu Akdeniz bölgesinde yayılış gösteren bazı Origanum L. türleri üzerinde sitotaksonomik araştırmalar. XIV. Ulusal Biyoloji Kongresi (7–10 Eylül 1998, Samsun) 1: 277-282.
Bir SS, Saggoo MIS. 1984. Cytological studies on the fam-ily Labiatae from Gharwal Himalayas. In: G.S. Pali-wal (editor), The Vegetational Wealth of the Himala-yas. pp. 471-482.
Chapman MA, Burke JM. 2007. Genetic divergence and hybrid speciation. Evolution 61: 1773-1780.
Chen YP, Zhao F, Peng H, Xiang CL, Funamoto T. 2018. Chromosome numbers of 24 taxa of Lamiaceae from Southwest China. Caryologia 71 (4) 298-306.
Contreras RN, Ruter JM (2011). Genome Size Estimates and Chromosome Numbers of Callicarpa L. (Lami-aceae). Hort Science. 46: 4 567-570.
Darlington CD, Wylie AP. 1955. Chromosome Atlas of Flowering Plants, George 2nd Ed Allen and Unwin, London. 134-155.
Davis PH, Tan K, Mill RR (eds). 1988. Flora of Turkey and the East Aegean Islands, Vol. 10 (suppl. 1). Edin-burgh: Edinburgh Univ Press.
Dirmenci T, Yazıcı T, Özcan T, Çelenk S, Martin E. 2018a. A new species and a new natural hybrid of Origanum L. (Lamiaceae) from the west of Turkey, Turkish Journal of Botany 42: 73-90.
Dirmenci T, Özcan T, Yazıcı T, Arabacı T, Martin E. 2018b. Morphological, cytological, palynological and molecular evidence on two new hybrids: an example of homoploidhybridization in Origanum (Lamiace-ae). Phytotaxa 371: 145-167.
Dirmenci T, Özcan T, Açar M, Arabacı T, Yazıcı T, Martin E. 2019. A rearranged homoploid hybrid species of Origanum (Lamiaceae): O. ×mun-zurense Kit Tan & Sorger. Botany Letters DOI: 10.1080/23818107.2019.1585283. (published online 01 Apr 2019).
Dobea C, Hahn B, Morawetz W. 1997. Chromosomen-zahlen zur Gefässpflanzen-Flora Österreichs. Linzer Biol. Beitr. 29(1): 5-43.
Duman H. 2000. Origanum L. In: Güner A, Özhatay N, Ekim T, Başer KHC, editors. Flora of Turkey and the East Aegean Islands (Suppl. 2), Vol. 11. Edinburgh, UK: Edinburgh University Press.
Fehr WR. 1991. in Principles of cultivar development: Theory and technique, Polyploidy, ed Fehr W.R. (Macmillan, New York, NY), Vol. 1, pp 59-65.
Fukui K. 1986. Standardization of karyotyping plant chromosomes by a newly developed chromosome image analyzing system (CHIAS). Theor. Appl. Gen-et. 72: 27-32.
Fukui K. 1998. Smallness: gain and loss in chromosome research. Cytogenet. Cell Genet. 81: 105.
Fukui K, Iijima K. 1991. Somatic chromosome map of rice by imaging methods. Theor. Appl. Genet. 81: 589-596.
Gill LS. 1970. Cytological observations on West-Himalayan Labiatae: Tribe. Stachydeae. Phytologia 27: 177-184.
Gill LS. 1981. Chromosomal evolution and incidence of polyploidy in the Canadian Labiatae. Rev. Cytol. Biol. Vég., Bot. 4: 331-339.
Gill LS. 1981a. Biosystematics of the tribe Satureineae (Labiatae) in Canada I. Cytologia 46: 45-55.
Gill LS. 1984. The Incidence of Polyplody in the West- Himalayan Labiatae, Revue de Cytologie et de Biolo-gie Végétales, le Botaniste, 7, 5-16.
Goldblatt P. 2007. The Index to Plant Chromosome Num-bers-Past and future. Taxon 56: 984-986.
Goldblatt P, Johnson DE. 1979-2017. Index to plant chro-mosome numbers. St. Louis: Missouri Botanical Gar-den.
141Karyotype studies on the genus Origanum (Lamiaceae) species and some hybrids defining homoploidy
Goulet BE, Roda F, Hopkins R. 2017. Hybridization in Plants: Old Ideas, New Techniques, Plant Physiology, 173: 65-78.
Govaerts R, Paton A, Harvey Y, Navarro T, Del Rosario Garcia Pena M. 2013. World Checklist of Lamiaceae. The Board of Trustees of the Royal Botanic Gardens, Kew. Website: www. kew.org/wcsp/ [accessed on 25 February 2013].
Guerra M. 2008. Chromosome numbers in plant cyto-taxonomy: Concepts and implications. Cytogenet. Genome Res. 120:339-350.
Harley RM, Brighton CA. 1977. Chromosome numbers in the genus Mentha L. Botanical Journal of the Lin-nean Society 74: 71-96.
Harley RM, Atkins S, Budantsev AL, Cantino PD, Conn BJ, Grayer R, Harley MM, De Kok R, Krestovskaja T, Morales R, Paton A, Ryding O, Upson T. 2004. Labia-tae. In: Kadereit JW, ed. The families and genera of vascular plants, Vol. VII. -flowering plants: dicoty-ledons (Lamiales except Acanthaceae including Avi-cenniaceae). Berlin and Heidelberg: Springer Verlag, pp. 167-275.
Ietswaart JH. 1980. A taxonomic revision of the genus Origanum (Labiatae). Netherlands: Leiden University Press.
Ietswaart JH. 1982. Origanum L. In: Davis PH (ed), Flora of Turkey and the East Aegean Islands, Vol. 7. Edin-burgh: Edinburgh Univ Press, pp. 297-313.
Iijima K, Kakeda K, Fukui K. 1991. Identification and characterization of somatic rice chromosomes by imaging methods. Theor. Appl. Genet. 81: 597-605.
Jalas J, Kaleva K. 1967. Chromosome studies in Thymus L. (Labiatae). V. Ann. Bot. Fennici 4: 74-80.
Khatoon S, Ali SI. 1993. Chromosome Atlas of the Angi-osperms of Pakistan. Department of Botany, Univer-sity of Karachi, Karachi.
Kıtıkı A. 1997. Status of cultivation and use of oregano in Turkey. S. Padulosi, (Ed.). Oregano, Promoting the conservation and use of underutilized neglected crops. (s.121-131). 14. Proceedings of the IPGRI International Workshop on Oregano: 8-12 May 1996-CIHEAM, Valenzano (Bari), Italy. Rome, Italy: International Plant Genetic Resources Institute.
Krasnikov AA, Schaulo DN. 1990. Chromosome num-bers in representatives of some families of vascular plants in the flora of the Novosibirsk region. II. Bot. Žhurn. (Moscow & Leningrad) 75: 118-120.
Levan A, Freda K, Sandberg AA. 1964. Nomenclature for centromeric position on chromosomes. Hereditas 52: 201-220.
Levin DA, Wilson AC. 1976. Rates of evolution in seed plants: Net increase in diversity of chromosome
numbers and species numbers through time. Proc. Natl. Acad. Sci. USA 73: 2086-2090.
Lövkvist B, Hultgård UM. 1999. Chromosome numbers in south Swedish vascular plants. Opera Bot. 137: 1-42.
Mabberley DJ. 1997. The plant book. 2 nd. ed. Cam-bridge, UK: Cambridge University Press, pp. 611.
Magulaev AV. 1984. Cytotaxonomic study in some flow-ering plants of the North Caucasus. Bot. Zhurn. SSSR 69(4): 511-517.
Markova M, Goranova V. 1995. Mediterranean chromo-some number reports 5 (435–473). Fl. Medit. 5: 289-317.
Martin E, Çetin Ö, Dirmenci T, Ay H. 2011. Karyological studies of Clinopodium L. (Sect. Pseudomelissa) and Micromeria Benth. s. str. (Lamiaceae) from Turkey. Caryologia 64 (4): 398-404.
Martin E, Dirmenci T, Arabacı T, Akçiçek E. 2016. Chro-mosome numbers of some species of the genus Ori-ganum in Turkey. Symposium on EuroAsian Biodi-versity, 541, Antalya, Turkey.
Mehra PN, Bawa KS. 1972. Cytogenetical evolution of hardwoods. Nucleus 15: 64-83.
Miura N, Iwatsubo Y, Naruhashi N. 2005. Chromosome numbers of five species of Lamium (Labiatae ) in Japan. Journal of Phytogeography and Taxonomy 53: 197-201.
Morton JK. 1962. Cytotaxonomic studies on the West African Labiatae. Journal of the Linnean Society of London. Botany 58(372): 231–283.
Ramsey J, Schemske DW. 1998. Pathways, mechanisms, and rates of polyploid formation in flowering plants. Annu. Rev. Ecol. Syst. 29: 467-501.
Rather AA, Banday A, Shabir PA, Nawchoo IA, Ganaie KA. 2018. Cytology and Pollination Biology of Lami-aceae: A Review. Research & Reviews. Journal of Botanical Sciences 7(2): 22-32.
Rice A, Glick L, Abadi S, Einhorn M, Kopelman NM, Salman-Minkov A, Mayzel J, Chay O, Mayrose I. 2015. The Chromosome Counts Database (CCDB) a community resource of plant chromosome numbers. New Phytol. 206(1): 19-26.
Saggoo MI. 1983. Cytomorphological studies on plants of economic importance of Bicarpellatae from India. Thesis Cell. Punjabi University, pp 259
Schumer M, Rosenthal GG, Andolfatto P. 2014. How common is homoploid hybrid speciation? Evolution 68: 1553-1560.
Singh TP. 1995. Alterations in the basic chromosome numbers as a means of speciation in Labiatae. Feddes Repert. Berlin 106: 39-47.
Stace CA. 1991. Plant taxonomy and biosystematics. Cambridge, UK: Cambridge University Press.
142 Esra Martin et al.
Stebbins GL. 1947. Types of polyploids: their classifica-tion and signifi- cance. Adv Genet 1: 403-429.
Stepanov NV, Muratova EN. 1995. Chromosome num-bers of some taxa of higher plants of Krasnoyarsk territory. Bot. Žhurn. (Moscow & Leningrad) 80(6): 114-116.
Strid A, Franzen R. 1981. In Chromosome number reports LXXIII. Taxon 30: 829-842.
Stuessy TF. 2009. Plant taxonomy: the systematic evalua-tion of comparative data. New York: Columbia Uni-versity Press.
Vaarama A. 1949. Some chromosome numbers in the genera Angelica, Ocimum, Satureja, Thymus and Cni-cus. Arch. Soc. Zool. Bot. Fenn. 55-59.
Wentworth JE, Bailey JP, Gornall RJ. 1991. Contributions to a cytological catalogue of the British and Irish flo-ra. 1. Watsonia 18: 415-417.
Yakimowski SB, Rieseberg LH. 2014. The role of homop-loid hybridization in evolution: a century of stud-ies synthesizing genetics and ecology. Am J Bot 101: 1247-1258.
Yıldız K, Gücel S. 2006. Chromosome numbers of 16 endemic plant taxa from northern Cyprus. Türk Bot. Derg. 30: 181-192.
APPENDIX
Origanum acutidens; Tunceli: Between Ovacık and Tunceli, 21-22. km, Aşağıtorunoba village, Mun-zur stream, near bridge, c. 1200 m, Dirmenci 4956a, T.Arabacı & M.Açar; Origanum amanum; Osmaniye, Düziçi district, Düldül mountain, between Mando Taşı and Hüseyinoluk Çeşme, 03.10.2015, Dirmenci 4514a & T.Arabacı; Origanum ayliniae: Aydın: Kuşadası, Dilek Yarımadası National Park, Radar, 3922 ft, 08.10.2015, Dirmenci 4516; Origanum bilgeri; Antalya: Gündoğmuş, between Hanboğazı and Oğuz yayla, 1. km, 4775 ft, 24.10.2014, Dirmenci 4343; Origanum bois-sieri: İçel: 15 km Çamlıyayla district to Saimdibi place, 6045 ft, 18.09.2014, Dirmenci 4319, T.Arabacı & T.Yazıcı; Origanum brevidens: Osmaniye: 1-2 km from Yarpuz to Yağlıpınar, 5030 ft, 19.09.2014, Dirmenci 4331, T.Arabacı & T.Yazıcı; Origanum haussknechtii; Erzincan, 15. km from Kemaliye to Arapkir, 1000 - 1100 m, 22.08.2013, T.Arabacı 2824; Origanum husnucan-baseri; Antalya: between Alanya and Hadim, 1-2 km to Gökbel Yayla, 4500 ft, 09.10.2015, Dirmenci 4528, T.Arabacı & T.Yazıcı; Origanum hypericifolium: Denizli: Honaz district, Honaz mountain, İncekara stream, 1300 m, 07.11.2014, Dirnmenci 4357 & T.Yazıcı; Origanum laevigatum: Osmaniye: Düziçi, above Kuşçu village, 03.10.2015, Dir-
menci4497 & T.Arabacı; Origanum leptocladum; Kara-man: between Ermenek and Kazancı, above Görmeli vil-lage, 1. km, 870 m, 24.10.2014, Dirmenci 4345, T.Arabacı & T.Yazıcı; Origanum majorana; Mersin: Güzeldere, 252 m, 13.07.2013, Dirmenci 3984, T.Arabacı & T.Yazıcı; İçel: between Anamur and Gazipaşa, 15-20. km, 300 m 26.10.2014, Dirmenci 4356 & T.Yazıcı; Karaman: Erme-nek, 2 km from Kazancı to Abanoz Yayla, 1238 m, 24.10.2014, Dirmenci 4346, T.Arabacı & T.Yazıcı; Ori-ganum minutiflorum: Antalya: Kemer, Üçoluk, above Tülek, 4470 ft, 25.10.2014, Dirmenci 4348 & T.Yazıcı; Origanum onites: Denizli: Taşocağı, 527 m, 26.10.2014, Dirmenci 4355 & T.Yazıcı; ibid, 11.10.2015, Dirmenci 4532 & T.Yazıcı; Denizli: between Buldan and Güney, 13 from road disjunction to Güney, Dirmenci 4725 & T.Yazıcı; Denizli: Origanum rotundifolium: Artvin: between Artvin and Ardanuç, 600-700 m, 27.08.2013, Dirmenci 3943, B.Yıldız & T.Arabacı; Origanum sac-catum: Antalya, 1 km from Gündoğmuş to Çayırözü village, 3715 ft, 24.10.2014, Dirmenci 4342, T.Arabacı & T.Yazıcı; Antalya: 38 km from Alanya to Hadim, Kuşkayası, 3814 ft, 09.10.2015, Dirmenci 4522 T.Arabacı & T.Yazıcı; ibid., Dirmenci 4732 & T.Arabacı; Origa-num sipyleum: Denizli: 5 km from Serinhisar to Deni-zli, 1066 m, 19.08.2014, Dirmenci 4308; ibid., 26.10.2014, Dirmenci 4352; Denizli: Taşocağı, 1808 ft, Dirmenci 4534 & T.Yazıcı; Aydın: Kuşadası, Dilek Peninsuna National Park, Radar, 3922 ft, 08.10.2015, Dirmenci 4517; Denizli: Denizli: between Buldan and Güney, 13 from road disjunction to Güney, Dirmenci 4727 & T.Yazıcı; Origanum solymicum: Antalya: Kemer, 4 km from Kesmeboğazı to Kuzdere village, 1470 m, 25.10.2014, Dirmenci 4347 & T.Yazıcı; Antalya: Kemer, 7 km from Kesmeboğazı to Karçukuru Yayla, 1506 ft, 09.10.2015, Dirmenci 4520 & T.Yazıcı;; Origanum syriacum sub-sp. bevanii: Hatay: between Antakya and Samandağ, around St. Symeone church, 20.09.2014, Dirmenci 4336, T.Arabacı & T.Yazıcı; Osmaniye: Düziçi, between Kuşçu village and Düldül mountain, 19.09.2014, Dirmenci 4330 & T.Arabacı; Origanum vogelii; Niğde: Ulukışla, Horoz village, Fenk Boğazı, 4800 ft, 02.10.2015, Dirmenci 4509 & T.Yazıcı; Origanum vulgare subsp. gracile: K.Maraş: Göksun, between Yeşilköy and Kınıkkoz villages, 400-450 m, 04.08.2017, Dirmenci 4821 & T.Arabacı; Tunceli: 20-21 km from Ovacık to Tunceli, c. 1200 m, 11.08.2017, Dirmenci 4958, T.Arabacı & M.Açar; Origanum vulgare subsp. hirtum: Antalya: Antalya: between Alanya and Hadim, 1 km to Gökbel Yayla, Dirmenci 4733, T.Arabacı & T.Yazıcı; Denizli: Taşocağı, 527 m, Dirmenci 4722 & T.Yazıcı; Denizli: Honaz district, North face of Honaz mountain, Arpacık Yayla road, 4160 ft, 07.11.2014, Dir-menci 4359 & T.Yazıcı; Niğde: Ulukışla, Horoz village,
143Karyotype studies on the genus Origanum (Lamiaceae) species and some hybrids defining homoploidy
Fenk Boğazı, 4800 ft,, 02.10.2015, Dirmenci 4507 & T.Yazıcı; Origanum vulgare subsp. viridulum: Giresun: 33 km from Şebinkarahisar to Tamdere, nort of Eğribel pass, Dirmenci 4662a & T.Arabacı; Origanum vulgare subsp. vulgare: 22 km from Şavşat to Ardahan, Dirmen-ci 4688 & T.Arabacı; Origanum × adae: Kuşadası, Dilek Yarımadası National Park, Radar, 3922 ft, 08.10.2015, Dirmenci 4518; Origanum × haradjanii: Hatay: between Antakya and Samandağ, around St. Symeone church, 20.09.2014, Dirmenci 4335, T.Arabacı & T.Yazıcı; O. × intermedium: Denizli: Denizli: between Buldan and Güney, 13 from road disjunction to Güney, Dirmenci 4726 & T.Yazıcı; Origanum × munzurense: Tunceli: Between Ovacık and Tunceli, 21-22. km, Aşağı Toruno-ba village, Munzur stream, near bridge, c. 1200 m, Dir-menci 4957a, Arabacı & Açar; Origanum × sevcaniae: Niğde: U Ulukışla, Horoz village, Fenk Boğazı, 4800 ft, 02.10.2015, Dirmenci 4508 & T.Yazıcı.


Caryologia. International Journal of Cytology, Cytosystematics and Cytogenetics 73(2): 145-153, 2020
Firenze University Press www.fupress.com/caryologiaCaryologia
International Journal of Cytology, Cytosystematics and Cytogenetics
ISSN 0008-7114 (print) | ISSN 2165-5391 (online) | DOI: 10.13128/caryologia-947
Citation: K.C. Trapp, C.A.L. Hister, H.D. Laughinghouse IV, A.A. Boligon, S.B. Tedesco (2020) Determination of phenolic compounds and evaluation of cytotoxicity in Plectranthus barbatus using the Allium cepa test. Caryologia 73(2): 145-153. doi: 10.13128/caryolo-gia-947
Received: March 23, 2020
Accepted: May 24, 2020
Published: July 31, 2020
Copyright: © 2020 K.C. Cauana Trapp, C.A.L. Hister, H.D. Laughing-house IV, A.A. Boligon, S.B. Tedesco. This is an open access, peer-reviewed article published by Firenze University Press (http://www.fupress.com/caryo-logia) and distributed under the terms of the Creative Commons Attribution License, which permits unrestricted use, distribution, and reproduction in any medium, provided the original author and source are credited.
Data Availability Statement: All rel-evant data are within the paper and its Supporting Information files.
Competing Interests: The Author(s) declare(s) no conflict of interest.
Determination of phenolic compounds and evaluation of cytotoxicity in Plectranthus barbatus using the Allium cepa test
Kássia Cauana Trapp1, Carmine Aparecida Lenz Hister1, H. Dail Laughinghouse IV2,*, Aline Augusti Boligon1, Solange Bosio Tedesco1
1 Universidade Federal de Santa Maria, Avenida Roraima, 1000, Cidade universitária, CEP 97105-900, Santa Maria/RS, Brazil2 Agronomy Department, Fort Lauderdale Research and Education Center, University of Florida – IFAS, 3205 College Avenue, Davie, FL 33314 USA* Corresponding author: E-mail: [email protected]
Abstract. Plectranthus barbatus, popularly known as Brazilian boldo or false boldo is mainly used for digestive problems. The aim of our study was to evaluate the prolif-erative and genotoxic potential of aqueous extracts obtained from fresh and dry leaves and stems of P. barbatus using the in vivo Allium cepa test. For the treatments, 6 g of fresh material was first weighed. This was then dried in the microwave, resulting in 0.9 g stems and 0.64 g leaves. The same amount of material was dried naturally at room temperature. We prepared the aqueous extracts by infusion of the leaves and decoc-tion of the stems. Water was used as a negative control and glyphosate 1.5% as a posi-tive control. The extracts were analyzed by high performance liquid chromatography (HPLC). Statistical analysis was performed using the Chi-square and Scott-Knott tests (p <0.05). The results showed that the extracts increased the cellular division of roots. No treatment found genotoxicity. The HPLC showed the predominance of isoquerci-trin and kaempferol in the leaves, and isoquercitrin, kaempferol, and quercitrin in the stems. We concluded that the aqueous extracts from both leaves and stems of P. barba-tus have proliferative and non-genotoxic activity on the cell division of A. cepa, which can be extrapolated to other eukaryotic cell types.
Keywords: Brazilian boldo, proliferation, liquid chromatography, mitotic index, medicinal plants.
INTRODUCTION
People have used medicinal plants for the treatment of ailments for thou-sands of years. Though current medicine is well developed, the World Health Organization (WHO) has found that a large part of the population in devel-oping countries (85%) still uses traditional folk medicine for their basic health care (Brasil, 2006). However, the use of some plants to treat diseases is still based on empirical knowledge, thus without science-based data. The indis-criminate consumption of these plants as herbal teas or other products can
146 Kássia Cauana Trapp et al.
result in negative side effects, mainly due to the lack of knowledge on their chemical constituents. Only plants whose effects are known should be consumed, thus understanding putative toxic effects (Martins et al., 2003).
Plectranthus barbatus Andrews is a species used in traditional medicine, known in Brazil as boldo, fake-boldo, and malva-santa. This species has a characteristic bitter taste when using its leaves in herbal teas, which is absent in its stems, but the substance causing this taste has not yet been identified (Lorenzi and Matos, 2008). Aqueous extracts of the leaves are used to treat heart-burn, gastric discomfort, dyspepsia, hangovers, as a laxa-tive (Lorenzi and Matos, 2008), and to prevent or control oral diseases (Figueiredo et al., 2010). It has also been shown to have contraceptive activity in rats (Almeida and Lemonica, 2000), and potential use as an antimalar-ial drug (Kiraithe et al., 2016).
Studies that validate putative genotoxic and pro-liferative effects of medicinal plants are necessary, and the use of cytogenetic bioassays - which use plants for detecting chromosomal damage that may be caused by other plant extracts, complex mixtures, chemicals, etc. - are highly recommended. The Allium cepa L. test is one of the few direct methods to measure damage to cells exposed to mutagenic or potentially carcinogenic agents and to assess the effects of such damage by observing chromosomal changes (Tedesco and Laughinghouse IV, 2012). Several studies have used the A. cepa test to evalu-ate plant extracts for cytotoxicity, such as Tedesco et al. (2015), Hister et al. (2017), and Sousa et al. (2018).
Rank and Nielsen (1994) found an 82% correlation between the A. cepa test and the mouse carcinogenic-ity test, concluding that A. cepa was even more sensitive than the Ames test. Teixeira et al. (2003) found the same results in tests comparing meristematic cells of onion roots, bone marrow cells of rats, and human lympho-cytes as bioindicators, validating the safety of A. cepa for cytogenetic studies.
Extracts from medicinal plants are a complex mix-ture of various bioactive compounds. To better under-stand these mixtures, High Performance Liquid Chro-matography (HPLC) can be used for phytochemical analyses (Trapp et al., 2016). This technique is able to analyze the amount of chemical compounds in a sample in one single analysis, revealing the chromatographic or fingerprint profile of the extract (Alaerts et al., 2007).
Our work aimed to evaluate the possible genotoxic and proliferative activities of fresh and dried leaves and stems of P. barbatus. This was undertaken using two dif-ferent methods: 1) analyzing the cell cycle of root tips of A. cepa and 2) determining the phenolic compounds in the extracts.
MATERIAL AND METHODS
Sampling of the material
Material was obtained from an adult plant grown in a natural garden and acclimatized for 4 years in a 10kg large pot. The plant was collected in Santa Maria, Rio Grande do Sul, Brazil (29°42’54.8”S and 53°43’12.0”W) and taxonomically identified by Dr. TS Canto-Dorow.
Treatments and criteria for analysis
The meristematic cells of roots of A. cepa (onion, 2n = 16) were used as a test system to evaluate morpho-logical and structural changes in chromosomes and to determine mitotic indices. Groups of four bulbs, each corresponding to a treatment, were placed in tap water for rooting.
After rooting, one group remained in water (nega-tive control), another group was placed in a 1.5% glyphosate solution (positive control), since this herbi-cide induces chromosomal alterations and inhibits cell division in meristematic cells (Dimitrov et al., 2006; Souza et al., 2010; Rodrigues et al., 2017). The other bulbs were transferred to the treatment solutions for 24 hours with the different extracts of P. barbatus. We used 24 hours because this is the duration of the mitotic cycle in A. cepa (Matagne, 1968).
The experiment was divided into two steps, using both dried and fresh material:
Step 1: 6 g (Brasil, 2011) of fresh material (leaves and stems) was weighed. A microwave was used to dry 6 g for comparison (5 minutes for leaves and 7 minutes for stems), which resulted in 0.64 g of leaves and 0.9 g of stems. The following treatments were then prepared: T1- water (negative control); T2- aqueous extract of 6 g L-1 of fresh stems; T3- aqueous extract of 0.9 g L-1 of micro-wave dried stems; T4- aqueous extract of 6 g L-1 of fresh leaves; T5- aqueous extract of 0.64 g L-1 of microwave dried leaves; T6- glyphosate 1.5% (positive control).
Step 2: Stems and leaves were dried naturally at room temperature, resulting in the same dry weight as those dried in the microwave. The following treatments were used: T1- water (negative control); T2- aqueous extract of 0.64 g L-1 of room temperature dried leaves; T3- aqueous extract of 0.9 g L-1 of room temperature dried stems; T4- glyphosate 1.5% (positive control).
After treatment, A. cepa rootlets were collected, fixed in ethanol:acetic acid (3:1) and stored in 70% ethanol at 4oC for further analysis. For slide preparation, a modified squashing technique was used, and acetic acid was used to stain the genetic material (Guerra and Souza 2002).
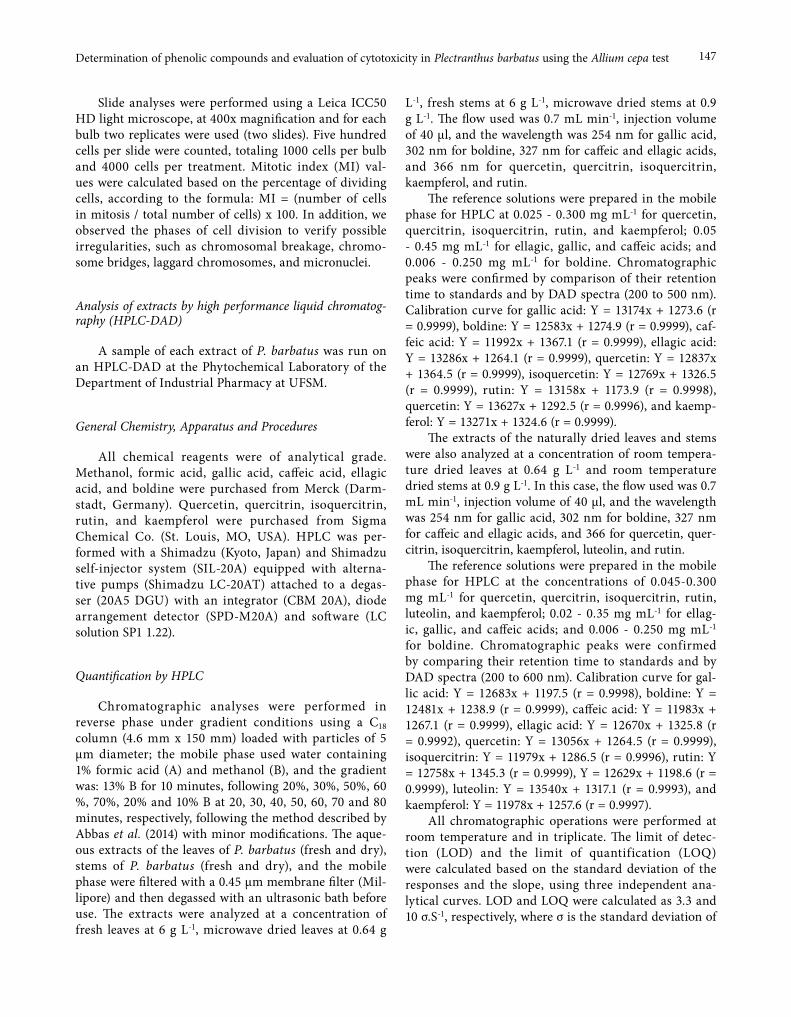
147Determination of phenolic compounds and evaluation of cytotoxicity in Plectranthus barbatus using the Allium cepa test
Slide analyses were performed using a Leica ICC50 HD light microscope, at 400x magnification and for each bulb two replicates were used (two slides). Five hundred cells per slide were counted, totaling 1000 cells per bulb and 4000 cells per treatment. Mitotic index (MI) val-ues were calculated based on the percentage of dividing cells, according to the formula: MI = (number of cells in mitosis / total number of cells) x 100. In addition, we observed the phases of cell division to verify possible irregularities, such as chromosomal breakage, chromo-some bridges, laggard chromosomes, and micronuclei.
Analysis of extracts by high performance liquid chromatog-raphy (HPLC-DAD)
A sample of each extract of P. barbatus was run on an HPLC-DAD at the Phytochemical Laboratory of the Department of Industrial Pharmacy at UFSM.
General Chemistry, Apparatus and Procedures
All chemical reagents were of analytical grade. Methanol, formic acid, gallic acid, caffeic acid, ellagic acid, and boldine were purchased from Merck (Darm-stadt, Germany). Quercetin, quercitrin, isoquercitrin, rutin, and kaempferol were purchased from Sigma Chemical Co. (St. Louis, MO, USA). HPLC was per-formed with a Shimadzu (Kyoto, Japan) and Shimadzu self-injector system (SIL-20A) equipped with alterna-tive pumps (Shimadzu LC-20AT) attached to a degas-ser (20A5 DGU) with an integrator (CBM 20A), diode arrangement detector (SPD-M20A) and software (LC solution SP1 1.22).
Quantification by HPLC
Chromatographic analyses were performed in reverse phase under gradient conditions using a C18 column (4.6 mm x 150 mm) loaded with particles of 5 μm diameter; the mobile phase used water containing 1% formic acid (A) and methanol (B), and the gradient was: 13% B for 10 minutes, following 20%, 30%, 50%, 60 %, 70%, 20% and 10% B at 20, 30, 40, 50, 60, 70 and 80 minutes, respectively, following the method described by Abbas et al. (2014) with minor modifications. The aque-ous extracts of the leaves of P. barbatus (fresh and dry), stems of P. barbatus (fresh and dry), and the mobile phase were filtered with a 0.45 μm membrane filter (Mil-lipore) and then degassed with an ultrasonic bath before use. The extracts were analyzed at a concentration of fresh leaves at 6 g L-1, microwave dried leaves at 0.64 g
L-1, fresh stems at 6 g L-1, microwave dried stems at 0.9 g L-1. The flow used was 0.7 mL min-1, injection volume of 40 μl, and the wavelength was 254 nm for gallic acid, 302 nm for boldine, 327 nm for caffeic and ellagic acids, and 366 nm for quercetin, quercitrin, isoquercitrin, kaempferol, and rutin.
The reference solutions were prepared in the mobile phase for HPLC at 0.025 - 0.300 mg mL-1 for quercetin, quercitrin, isoquercitrin, rutin, and kaempferol; 0.05 - 0.45 mg mL-1 for ellagic, gallic, and caffeic acids; and 0.006 - 0.250 mg mL-1 for boldine. Chromatographic peaks were confirmed by comparison of their retention time to standards and by DAD spectra (200 to 500 nm). Calibration curve for gallic acid: Y = 13174x + 1273.6 (r = 0.9999), boldine: Y = 12583x + 1274.9 (r = 0.9999), caf-feic acid: Y = 11992x + 1367.1 (r = 0.9999), ellagic acid: Y = 13286x + 1264.1 (r = 0.9999), quercetin: Y = 12837x + 1364.5 (r = 0.9999), isoquercetin: Y = 12769x + 1326.5 (r = 0.9999), rutin: Y = 13158x + 1173.9 (r = 0.9998), quercetin: Y = 13627x + 1292.5 (r = 0.9996), and kaemp-ferol: Y = 13271x + 1324.6 (r = 0.9999).
The extracts of the naturally dried leaves and stems were also analyzed at a concentration of room tempera-ture dried leaves at 0.64 g L-1 and room temperature dried stems at 0.9 g L-1. In this case, the flow used was 0.7 mL min-1, injection volume of 40 μl, and the wavelength was 254 nm for gallic acid, 302 nm for boldine, 327 nm for caffeic and ellagic acids, and 366 for quercetin, quer-citrin, isoquercitrin, kaempferol, luteolin, and rutin.
The reference solutions were prepared in the mobile phase for HPLC at the concentrations of 0.045-0.300 mg mL-1 for quercetin, quercitrin, isoquercitrin, rutin, luteolin, and kaempferol; 0.02 - 0.35 mg mL-1 for ellag-ic, gallic, and caffeic acids; and 0.006 - 0.250 mg mL-1 for boldine. Chromatographic peaks were confirmed by comparing their retention time to standards and by DAD spectra (200 to 600 nm). Calibration curve for gal-lic acid: Y = 12683x + 1197.5 (r = 0.9998), boldine: Y = 12481x + 1238.9 (r = 0.9999), caffeic acid: Y = 11983x + 1267.1 (r = 0.9999), ellagic acid: Y = 12670x + 1325.8 (r = 0.9992), quercetin: Y = 13056x + 1264.5 (r = 0.9999), isoquercitrin: Y = 11979x + 1286.5 (r = 0.9996), rutin: Y = 12758x + 1345.3 (r = 0.9999), Y = 12629x + 1198.6 (r = 0.9999), luteolin: Y = 13540x + 1317.1 (r = 0.9993), and kaempferol: Y = 11978x + 1257.6 (r = 0.9997).
All chromatographic operations were performed at room temperature and in triplicate. The limit of detec-tion (LOD) and the limit of quantification (LOQ) were calculated based on the standard deviation of the responses and the slope, using three independent ana-lytical curves. LOD and LOQ were calculated as 3.3 and 10 σ.S-1, respectively, where σ is the standard deviation of
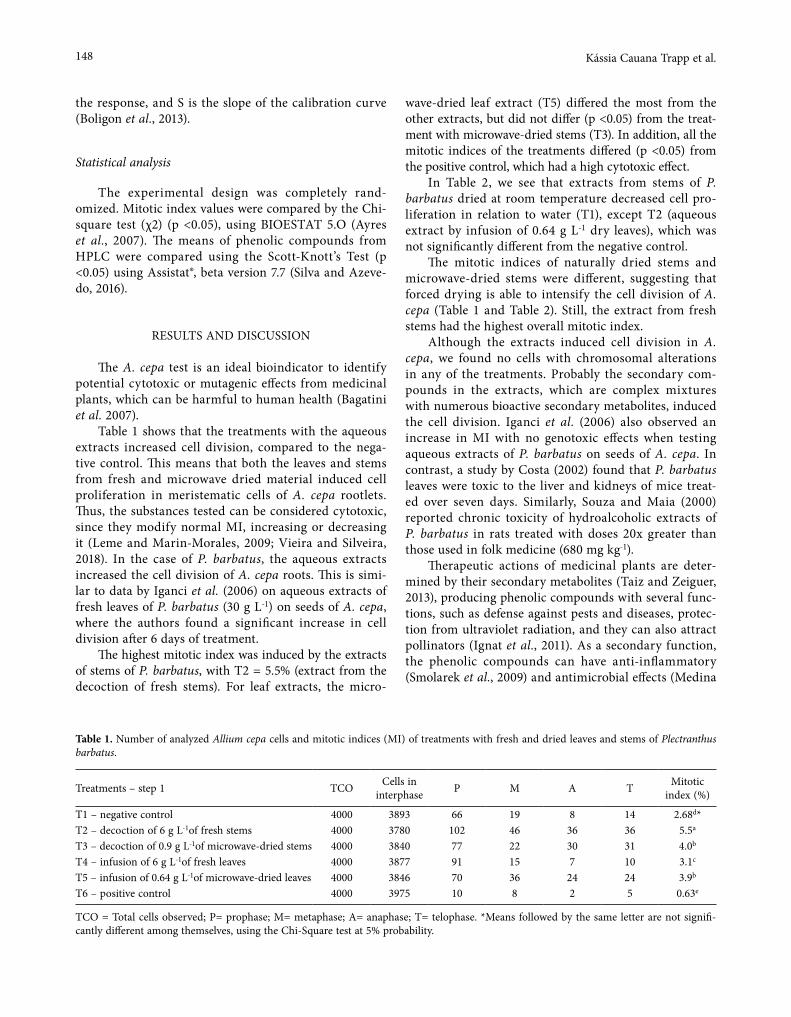
148 Kássia Cauana Trapp et al.
the response, and S is the slope of the calibration curve (Boligon et al., 2013).
Statistical analysis
The experimental design was completely rand-omized. Mitotic index values were compared by the Chi-square test (χ2) (p <0.05), using BIOESTAT 5.O (Ayres et al., 2007). The means of phenolic compounds from HPLC were compared using the Scott-Knott’s Test (p <0.05) using Assistat®, beta version 7.7 (Silva and Azeve-do, 2016).
RESULTS AND DISCUSSION
The A. cepa test is an ideal bioindicator to identify potential cytotoxic or mutagenic effects from medicinal plants, which can be harmful to human health (Bagatini et al. 2007).
Table 1 shows that the treatments with the aqueous extracts increased cell division, compared to the nega-tive control. This means that both the leaves and stems from fresh and microwave dried material induced cell proliferation in meristematic cells of A. cepa rootlets. Thus, the substances tested can be considered cytotoxic, since they modify normal MI, increasing or decreasing it (Leme and Marin-Morales, 2009; Vieira and Silveira, 2018). In the case of P. barbatus, the aqueous extracts increased the cell division of A. cepa roots. This is simi-lar to data by Iganci et al. (2006) on aqueous extracts of fresh leaves of P. barbatus (30 g L-1) on seeds of A. cepa, where the authors found a significant increase in cell division after 6 days of treatment.
The highest mitotic index was induced by the extracts of stems of P. barbatus, with T2 = 5.5% (extract from the decoction of fresh stems). For leaf extracts, the micro-
wave-dried leaf extract (T5) differed the most from the other extracts, but did not differ (p <0.05) from the treat-ment with microwave-dried stems (T3). In addition, all the mitotic indices of the treatments differed (p <0.05) from the positive control, which had a high cytotoxic effect.
In Table 2, we see that extracts from stems of P. barbatus dried at room temperature decreased cell pro-liferation in relation to water (T1), except T2 (aqueous extract by infusion of 0.64 g L-1 dry leaves), which was not significantly different from the negative control.
The mitotic indices of naturally dried stems and microwave-dried stems were different, suggesting that forced drying is able to intensify the cell division of A. cepa (Table 1 and Table 2). Still, the extract from fresh stems had the highest overall mitotic index.
Although the extracts induced cell division in A. cepa, we found no cells with chromosomal alterations in any of the treatments. Probably the secondary com-pounds in the extracts, which are complex mixtures with numerous bioactive secondary metabolites, induced the cell division. Iganci et al. (2006) also observed an increase in MI with no genotoxic effects when testing aqueous extracts of P. barbatus on seeds of A. cepa. In contrast, a study by Costa (2002) found that P. barbatus leaves were toxic to the liver and kidneys of mice treat-ed over seven days. Similarly, Souza and Maia (2000) reported chronic toxicity of hydroalcoholic extracts of P. barbatus in rats treated with doses 20x greater than those used in folk medicine (680 mg kg-1).
Therapeutic actions of medicinal plants are deter-mined by their secondary metabolites (Taiz and Zeiguer, 2013), producing phenolic compounds with several func-tions, such as defense against pests and diseases, protec-tion from ultraviolet radiation, and they can also attract pollinators (Ignat et al., 2011). As a secondary function, the phenolic compounds can have anti-inflammatory (Smolarek et al., 2009) and antimicrobial effects (Medina
Table 1. Number of analyzed Allium cepa cells and mitotic indices (MI) of treatments with fresh and dried leaves and stems of Plectranthus barbatus.
Treatments – step 1 TCO Cells in interphase P M A T Mitotic
index (%)
T1 – negative control 4000 3893 66 19 8 14 2.68d*T2 – decoction of 6 g L-1of fresh stems 4000 3780 102 46 36 36 5.5a
T3 – decoction of 0.9 g L-1of microwave-dried stems 4000 3840 77 22 30 31 4.0b
T4 – infusion of 6 g L-1of fresh leaves 4000 3877 91 15 7 10 3.1c
T5 – infusion of 0.64 g L-1of microwave-dried leaves 4000 3846 70 36 24 24 3.9b
T6 – positive control 4000 3975 10 8 2 5 0.63e
TCO = Total cells observed; P= prophase; M= metaphase; A= anaphase; T= telophase. *Means followed by the same letter are not signifi-cantly different among themselves, using the Chi-Square test at 5% probability.
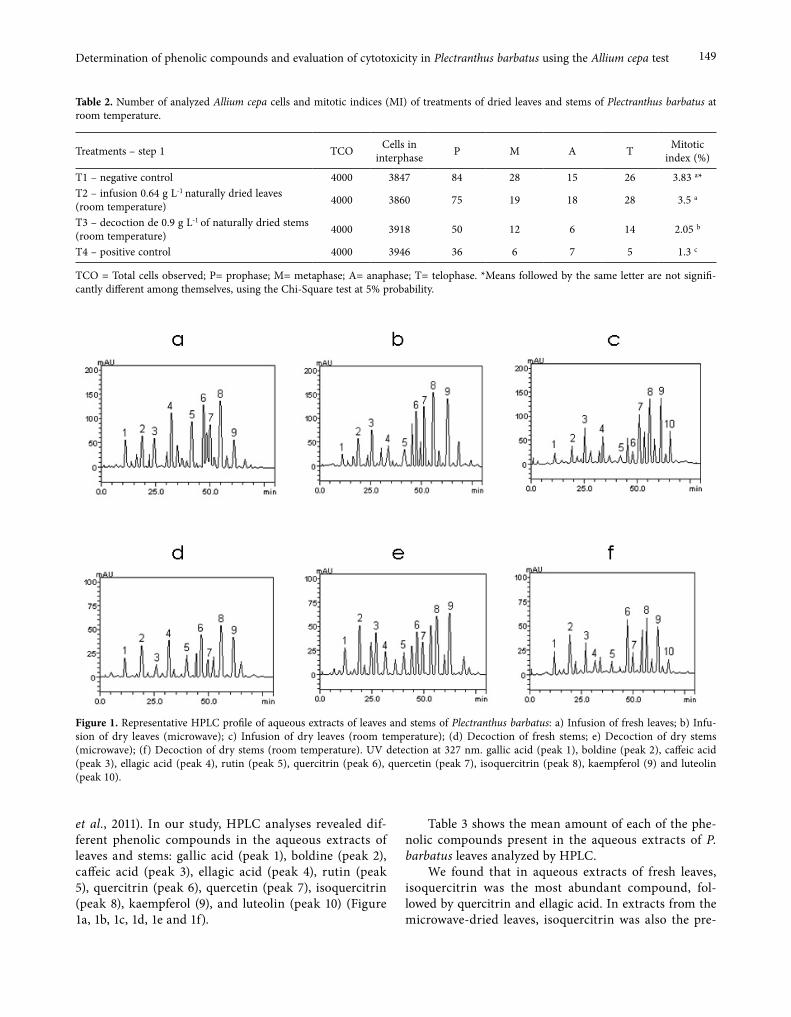
149Determination of phenolic compounds and evaluation of cytotoxicity in Plectranthus barbatus using the Allium cepa test
et al., 2011). In our study, HPLC analyses revealed dif-ferent phenolic compounds in the aqueous extracts of leaves and stems: gallic acid (peak 1), boldine (peak 2), caffeic acid (peak 3), ellagic acid (peak 4), rutin (peak 5), quercitrin (peak 6), quercetin (peak 7), isoquercitrin (peak 8), kaempferol (9), and luteolin (peak 10) (Figure 1a, 1b, 1c, 1d, 1e and 1f).
Table 3 shows the mean amount of each of the phe-nolic compounds present in the aqueous extracts of P. barbatus leaves analyzed by HPLC.
We found that in aqueous extracts of fresh leaves, isoquercitrin was the most abundant compound, fol-lowed by quercitrin and ellagic acid. In extracts from the microwave-dried leaves, isoquercitrin was also the pre-
Table 2. Number of analyzed Allium cepa cells and mitotic indices (MI) of treatments of dried leaves and stems of Plectranthus barbatus at room temperature.
Treatments – step 1 TCO Cells in interphase P M A T Mitotic
index (%)
T1 – negative control 4000 3847 84 28 15 26 3.83 a*T2 – infusion 0.64 g L-1 naturally dried leaves (room temperature) 4000 3860 75 19 18 28 3.5 a
T3 – decoction de 0.9 g L-1 of naturally dried stems (room temperature) 4000 3918 50 12 6 14 2.05 b
T4 – positive control 4000 3946 36 6 7 5 1.3 c
TCO = Total cells observed; P= prophase; M= metaphase; A= anaphase; T= telophase. *Means followed by the same letter are not signifi-cantly different among themselves, using the Chi-Square test at 5% probability.
Figure 1. Representative HPLC profile of aqueous extracts of leaves and stems of Plectranthus barbatus: a) Infusion of fresh leaves; b) Infu-sion of dry leaves (microwave); c) Infusion of dry leaves (room temperature); (d) Decoction of fresh stems; e) Decoction of dry stems (microwave); (f) Decoction of dry stems (room temperature). UV detection at 327 nm. gallic acid (peak 1), boldine (peak 2), caffeic acid (peak 3), ellagic acid (peak 4), rutin (peak 5), quercitrin (peak 6), quercetin (peak 7), isoquercitrin (peak 8), kaempferol (9) and luteolin (peak 10).

150 Kássia Cauana Trapp et al.
dominant compound (including more than in the fresh leaf extract), followed by kaempferol and quercetin. How-ever, in the aqueous extracts of naturally dried leaves, both isoquercitrin and kaempferol were most abundant, followed by quercetin, caffeic acid, and luteolin. Luteolin is a phenolic compound found only in the extract of nat-urally dried leaves. These results are similar to those by Grayer et al. (2010), who analyzed the chemical composi-tion of P. barbatus and observed kaempferol and querce-tin, in addition to Pires et al. (2016) who detected querci-trin, quercetin, and kaempferol.
The extract of fresh leaves had the highest amount of total quantified phenolic compounds, followed by the extract of microwave-dried leaves and then the extract of naturally dried leaves. Thus, slowly drying the leaves caused a greater loss of compounds compared to fresh leaves. Studies by Pereira et al. (2000) support this find-ing, where they identified that higher levels of bioactive compounds are linked with rapid drying.
In Table 4, we see that in fresh stems there were low amounts of phenolic compounds, which is a different pat-tern than seen in the fresh leaves. Isoquercitrin was the
Table 3. Phenolic compounds in aqueous extracts by infusion of Plectranthus barbatus leaves using high performance liquid chromatogra-phy (HPLC).
Compound Extract of fresh leaves mg g-1
Extract of microwave-dried leaves
µg mL-1
LOD mg g-1
LOQ µg mL-1
Extract of naturally dried leaves LOD LOQ
Gallic acid 5.28 h* 2.02 h 0.023 0.075 1.98 f 0.020 0.067Boldine 7.21 f 5.64 f 0.008 0.026 3.76 e 0.012 0.039Caffeic acid 5.11 h 7.05 e 0.015 0.049 7.12 c 0.019 0.061Ellagic acid 15.29 c 3.89 g 0.027 0.093 5.70 d 0.027 0.093Rutin 12.82 d 3.86 g 0.019 0.062 1.87 g 0.015 0.049Quercitrin 16.44 b 14.92 d 0.013 0.042 2.02 f 0.034 0.113Quercetin 10.14 e 16.09 c 0.024 0.079 9.92 b 0.008 0.026Isoquercitrin 17.82 a 19.65 a 0.017 0.056 13.57 a 0.017 0.056Kaempferol 5.63 g 17.23 b 0.035 0.115 13.62 a 0.025 0.081Luteolin - - 7.03 c 0.013 0.042TOTAL 95.74 90.35 66.59
Results are expressed as mean of three determinations. LOD is the limit of detection and LOQ is the limit of quantification. * Means fol-lowed by different letters differ by the Scott-Knott test (p <0.01).
Table 4. Phenolic compounds in aqueous extracts by decoction of Plectranthus barbatus stems using high performance liquid chromatogra-phy (HPLC).
Compound Extract of fresh leaves mg g-1
Extract of microwave-dried leaves
µg mL-1
LOD mg g-1
LOQ µg mL-1
Extract of naturally dried leaves LOD LOQ
Gallic acid 1.95 g* 3.08 f 0.023 0.075 2.81 e 0.020 0.067Boldine 3.44 e 7.12 c 0.008 0.026 4.99 c 0.012 0.039Caffeic acid 1.10 i 6.50 d 0.015 0.049 4.08 d 0.019 0.061Ellagic acid 4.75 d 2.37 g 0.027 0.093 1.34 g 0.027 0.093Rutin 2.15 f 2.34 g 0.019 0.062 1.41 g 0.015 0.049Quercitrin 6.07 b 6.52 d 0.013 0.042 7.87 a 0.034 0.113Quercetin 1.35 h 3.97 e 0.024 0.079 2.22 f 0.008 0.026Isoquercitrin 8.25 a 8.32 b 0.017 0.056 7.88 a 0.017 0.056Kaempferol 5.98 c 9.06 a 0.035 0.115 7.34 b 0.025 0.081Luteolin - - 1.49 g 0.013 0.042TOTAL 35.09 49.28 41.43
Results are expressed as mean of three determinations. LOD is the limit of detection and LOQ is the limit of quantification. * Means fol-lowed by different letters differ by the Scott-Knott test (p <0.01).

151Determination of phenolic compounds and evaluation of cytotoxicity in Plectranthus barbatus using the Allium cepa test
most abundant compound in fresh stems, followed by quercitrin and kaempferol. The extracts of microwave-dried stems contained the highest amount of compounds among the stems, with kaempferol being the major com-pound, followed by isoquercitrin and boldine. In the aqueous extract of the naturally dried stems, isoquercitrin and quercitrin were both the most abundant, followed by kaempferol and boldine. As in the leaf extracts, luteolin was also found in the extract of naturally dried stems.
Stem extracts had nearly 50% less phenolic com-pounds than the leaves, while inducing higher mitotic indices. Phenolic compounds such as flavonoids (quercitrin and isoquercitrin) are able to sequester free radicals (Deck-er, 1997) and their abundance has been positively corre-lated with antimicrobial action in Salmonella enteritidis (Medina et al., 2011). Interestingly, a study by Boligon et al. (2012) found that isoquercitrin isolated from Scutia buxifo-lia Reissek had a protective effect against human lympho-cyte damage caused by hydrogen peroxide. The authors hypothesize that this was due to the reduction of oxidative stress due to its antioxidant nature. Carvalho et al. (2007) found that phenols, such as ellagic acid and gallic acid, can inhibit seed germination, plant growth, and fungi. Accord-ing to Tomás-Barberán and Espín (2001), this group of secondary metabolites is related to the prevention of car-diovascular diseases and cancer.
In summary, aqueous extracts prepared with natu-rally dried material at room temperature did not affect the mitotic index of A. cepa. On the other hand, fresh and microwave-dried extracts of leaves and stems increased cell division (mitotic index). No cells with chromosomal alterations were found in any of the treat-ments.
Phytochemical analyses found a high amount of isoquercitrin in the aqueous extracts of leaves, with the major compound in naturally dried leaves being kaemp-ferol. The total amount of phenolic compounds was much lower in stems. Isoquercitrin was the major com-pound in the extracts of fresh and dried stems at room temperature, and in the latter quercitrin was also pre-dominant. The extracts of the microwave-dried stems were dominated by kaempferol.
Our results are preliminary, but we emphasize the importance to identify putative harmful compounds found in plants, to increase the safety for their use in folk medicine.
ACKNOWLEDGEMENTS
We thank Prof. M.L. Athayde (in memorian) for her valuable collaboration. Partial financial support was
made through a PIBIC/CNPq IC fellowship. HDL would like to thank the USDA NIFA Hatch project # FLA-FTL-005697.
REFERENCES
Abbas SR, Sabir SM, Ahmad SD, Boligon AA, Athayde, ML. 2014, Phenolic profile, antioxidant potential and DNA damage protecting activity of sugarcane (Sac-charum officinarum). Food Chem 147:10-16.
Alaerts G, Matthijs N, Verbeke J, Heyden Y. 2007. Chro-matographic fingerprint development for herbal extract: A screening and optimization methodology on monolithic columns. J Chromatogr A 1172:1-8.
Almeida FCG, Lemonica IP. 2000. The toxic effects of Coleus barbatus on the different periods of pregnancy in rats. J Ethnopharmacol 73:53–60.
Ayres M, Ayres JRM, Ayres DL, Santos AS. 2007. BioEstat: aplicações estatísticas nas áreas das ciências biomédicas [BioEstat: statistical applications in bio-medical sciences]. Belém: ONG Mamiraua.
Bagatini MD, Silva ACF, Tedesco SB. 2007. Uso do siste-ma teste de Allium cepa como bioindicador de geno-toxicidade de infusões de plantas medicinais [Use of the test system Allium cepa as a bioindicator of geno-toxicity in medicinal plant infusions]. Rev Bras Far-macogn 17:444-447.
Bianchi MLP, Antunes LMG. 1999. Radicais livres e os principais antioxidantes da dieta [Free radicals and the main antioxidants in the diet]. Rev Nutr 12:123-130.
Boligon AA, Sagrillo MR, Machado LF, Souza Filho O, Machado MM, Cruz, IBM, Athayde ML. 2012. Pro-tective effects of extracts and flavonoids isolated from Scutia buxifolia Reissek against chromosome damage in human lymphocytes exposed to hydrogen perox-ide. Molecules 17(5):5757-5769.
Boligon AA, Kubiça TF, Mario DN, Brum TF, Piana M, Weinblen R, Lovato L, Alves SH, Santos RCV, Alves CFS, Athayde ML. 2013. Antimicrobial and antiviral activity-guided fractionation from Scutia buxifolia Reissek extracts. Acta Physiol Plant 35:2229-2239.
Brasil. Agência Nacional de Vigilância Sanitária. 2011. Formulário de Fitoterápicos da Farmacopéia Brasilei-ra [Form of Phytotherapics of the Brazilian Pharma-copoeia]. Brasília: Anvisa.
Brasil. Ministério da Saúde. Secretaria de Ciência, Tecno-logia e Insumos Estratégicos. 2006. Política nacional de plantas medicinais e fitoterápicos [National policy of medicinal plants and herbal medicines]. Brasília: Editora MS.

152 Kássia Cauana Trapp et al.
Carvalho JCT, Gosmann G, Schenkel EP. 2007. Com-postos fenólicos simples e heterosídicos [Simple and heterosidic phenolic compounds]. In: Simões, CMO (editor), Farmacognosia: da planta ao medicamento [Pharmacognosy: from plant to medicine]. 6th ed. Porto Alegre: Editora da UFRGS; p. 13-28.
Costa MCCD. 2002. Aspectos farmacológicos de Plec-tranthus barbatus Andr. (Lamiaceae): atividades antimicrobiana, citotóxica e antitumoral [Pharmaco-logical aspects of Plectranthus barbatus Andr. (Lami-aceae): antimicrobial, cytotoxic and antitumor activi-ties]. 124p. Thesis - Universidade Federal de Pernam-buco, Recife.
Decker EA. 1997. Phenolics: prooxidants or antioxidants? Nutr Rev 55:396-407.
Dimitrov BD, Gadeva PG, Benova DK, Bineva MV. 2006. Comparative genotoxicity of the herbicides Roundup, Stomp and Reglone in plant and mammalian test sys-tems. Mutagenesis 21(6):375-382.
Figueiredo NL, de Aguiar SRMM, Falé PL, Ascensão L, Serralheiro MLM, Lino ARL. 2010. The inhibitory effect of Plectranthus barbatus and Plectranthus ecklo-nii leaves on the viability, glucosyltransferase activity and biofilm formation of Streptococcus sobrinus and Streptococcus mutans. Food Chem 119:664–668.
Grayer RJ, Eckert MR, Lever A, Veitch NC, Kite GC, Paton AJ. 2010. Distribution of exudate flavonoids in the genus Plectranthus. Biochem Syst Ecol 38:335–341.
Guerra M, Souza, MJ. 2002. Como observar cromosso-mos: um guia de técnicas em citogenética vegetal, animal e humana [How to observe chromosomes: a guide to techniques in plant, animal and human cytogenetics]. Ribeirão Preto: FUNPEC.
Hister CAL, Boligon AA, Laughinghouse IV HD, Tedesco SB. 2017. Determination of phenolic compounds and assessment of the genotoxic and proliferative poten-tial of Psidium cattleianum Sabine (Myrtaceae) fruits. Caryologia 70(4):350-356.
Iganci JRV, Bobrowski VL, Heiden G, Stein VC, Rocha BHG. 2006. Efeito do extrato aquoso de difer-entes espécies de boldo sobre a germinação e índice mitótico de Allium cepa L [Effect of the aqueous extract of different boldo species on the germination and mitotic index of Allium cepa L]. Arq Inst Biol 73(1):79-82.
Ignat I, Volf I, Popa VI. 2011. A critical review of meth-ods for characterisation of polyphenolic compounds in fruits and vegetables. Food Chem 126:1821-1835.
Kiraithe MN, Nguta JM, Mbaria JM, Kiama SG. 2016. Evaluation of the use of Ocimum suave Willd. (Lami-aceae), Plectranthus barbatus Andrews (Lamiaceae)
and Zanthoxylum chalybeum Engl. (Rutaceae) as anti-malarial remedies in Kenyan folk medicine. J Eth-nopharmacol 178:266–271.
Leme DM, Marin-Morales MA. 2009. Allium cepa test in environmental monitoring: A review on its applica-tion. Mutat Res 682:71–81.
Lorenzi H, Matos FJA. 2008. Plantas medicinais no Brasil: nativas e exóticas [Medicinal plants in Brazil: natives and exotics]. 2nd ed. Nova Odessa: Plantarum..
Martins ER, Castro DM, Castellani DC, Dias JE. 2003. Plantas Medicinais [Medicinal Plants]. Viçosa: Edi-tora UFV.
Matagne R. 1968. Duration of Mitotic Cycle and Pat-terns of DNA Replication in Chromosomes of Allium Cepa. Caryologia 21(3):209-224.
Medina AL, Haas LIR, Chaves FC, Salvador M, Zambia-zi RC, Silva WP, Nora L, Rombaldi CV. 2011. Araçá (Psidium cattleianum Sabine) fruit extracts with antioxidant and antimicrobial activities and antipro-liferative effect on human cancer cells. Food Chem 128:916-922.
Mendes SS, Andrade JA, Xavier MA, Secundo Junior JA, Pantaleão SM, Estevam CS, Garcia CAB, Ferrari SF. 2012. Genotoxicity test of Maytenus rigida and Aris-tolochia birostris in the radicular meristem of the onion, Allium cepa. Rev Bras Farmacogn 22(1):76-81.
Pires FB, Dolwitsch CB, Loose RS, Prá VD, Schneider VM, Schmidt MEP, Monego DL, Carvalho CA, Fer-nandes AA, Mazutti MA, Rosa MB. 2016. Perfil cro-matográfico e atividade antioxidante frente aos rad-icais peroxila (ROO•), superóxido (O2•-) e DPPH da folha, flor, ramo e inflorescência da Plectranthus barbatus [Chromatographic profile and antioxidant activity against the radicals peroxyl (ROO•), super-oxide (O2•-) and DPPH of the leaf, flower, branch and inflorescence of Plectranthus barbatus]. CeN 38(3):1215-1227.
Pereira AMS, Câmara FLA, Celeghini, RMS, Vilegas JHY, Lanças FM, França SC. 2000. Seasonal variation in coumarin content of Mikania glomerata. J Herbs Spices Med Plants 7(2):1-10.
Rank J, Nielsen MH. 1994. Evaluation of the Allium anaphase-telophase test in relation to genotoxicity screening of industrial wastewater. Mutat Res 312:17-24.
Roberto MM, Jamal CM, Malaspina O, Marin-Morales MA. 2016. Antigenotoxicity and antimutagenicity of ethanolic extracts of Brazilian green propolis and its main botanical source determined by the Allium cepa test system. Genet Mol Biol 39(2):257-269.
Rodrigues LB, Oliveira R, Abe FR, Brito LB, Moura, DS, Valadares MC, Grisolia CK, Oliveira DP, Oliveira
153Determination of phenolic compounds and evaluation of cytotoxicity in Plectranthus barbatus using the Allium cepa test
GAR. 2017. Ecotoxicological assessment of glypho-sate-based herbicides: effects on different organisms. Environ Toxicol Chem 36(7):1755-1763.
Silva FAS, Azevedo CAV. 2016. The Assistat Software Ver-sion 7.7 and its use in the analysis of experimental data. Afr J Agric Res 11(39): 3733-3740.
Smolarek FSF, Nunes PMP, Cansian FC, Mercali CA, Carvalho JLS, Dias JFG, Miguel OG. 2009. Abord-agem fitoquímica e das atividades biológicas da espécie vegetal Solidago microglossa DC [Phytochem-ical approach and biological activities of the plant species Solidago microglossa DC] Visão Acadêmica 10:77-82.
Souza WMA, Maia MBS. 2009. Estudo da toxicidade sub-crônica do Plectranthus barbatus a partir do levanta-mento etnofarmacológico de plantas medicinais no município de Tacaratu/PE [Study of the subchronic toxicity of Plectranthus barbatus from the ethnophar-macological survey of medicinal plants in the munic-ipality of Tacaratu / PE]. 49p. (Thesis) - Universidade Federal de Pernambuco, Recife.
Souza LFB, Laughinghouse IV HD, Pastori T, Tedesco M, Kuhn AW, Canto-Dorow TS, Tedesco SB. 2010. Gen-otoxic potential of aqueous extracts of Artemisia verl-otorum on the cell cycle of Allium cepa. Int J Environ Stud 67:871-877.
Taiz L, Zeiger E. 2013. Fisiologia Vegetal [Plant Physiol-ogy]. Porto Alegre: Artmed.
Tedesco SB, Laughinghouse IV HD. 2012. Bioindicator of Genotoxicity : The Allium cepa Test. In: Srivastava JK (ed.) Environmental Contamination. Rijeka: InTech. p. 137-156.
Tedesco M, Kuhn AW, Boligon AA, Laughinghouse IV HD, Athayde ML, Silva ACS, Tedesco SB. 2015. Chromatographic analysis, antiproliferative effect and genotoxicity of aqueous extracts of Citrus sinensis (L.) Osbeck on the Allium cepa L. test system. Biosci-ence J 31(4):1213-1221.
Teixeira RO, Camparoto ML, Mantovani MS, Vicentini VEP. 2003. Assessment of two medicinal plants, Psid-ium guajava L. and Achillea millefolium L., in vitro and in vivo assays. Genet Mol Biol 26:551-555.
Tomás-Barberán FA, Espín JC. 2001. Phenolic com-pounds and related enzymes as determinants of qual-ity in fruits and vegetables. J Sci Food Agric 81:853-876.
Trapp KC, Pasqualli M, Rodrigues LG, Boligon AA, Tedesco SB. 2016. Análise proliferativa e fitoquímica de Commelina erecta L. pelo teste Allium cepa L [Pro-liferative and phytochemical analysis of Commelina erecta L. by the Allium cepa L test]. Enciclopédia Biosfera 13(24):64-75.
Vieira LFA, Silveira GL. 2018. Cyto(Geno)Toxic End-points Assessed via Cell Cycle Bioassays in Plant Models. In: Çelik TA (ed). Cytotoxicity. Rijeka: InTech, p. 117–129.

Finito di stampare da Logo s.r.l. – Borgoricco (PD) – Italia
OPEN ACCESS POLICYCaryologia provides immediate open access to its con-tent. Our publisher, Firenze University Press at the Uni-versity of Florence, complies with the Budapest Open Access Initiative definition of Open Access: By “open access” , we mean the free availability on the public internet, the permission for all users to read, download, copy, distribute, print, search, or link to the full text of the articles, crawl them for indexing, pass them as data to software, or use them for any other lawful purpose, without financial, legal, or technical barriers other than those inseparable from gaining access to the internet itself. The only constraint on reproduction and distri-bution, and the only role for copyright in this domain is to guarantee the original authors with control over the integrity of their work and the right to be properly acknowledged and cited. We support a greater global exchange of knowledge by making the research pub-lished in our journal open to the public and reusable under the terms of a Creative Commons Attribution 4.0 International Public License (CC-BY-4.0). Furthermore, we encourage authors to post their pre-publication manuscript in institutional repositories or on their web-sites prior to and during the submission process and to post the Publisher’s final formatted PDF version after publication without embargo. These practices benefit authors with productive exchanges as well as earlier and greater citation of published work.
PUBLICATION FREQUENCYPapers will be published online as soon as they are accepted, and tagged with a DOI code. The final full bibliographic record for each article (initial-final page) will be released with the hard copies of Caryo-logia. Manuscripts are accepted at any time through the online submission system.
COPYRIGHT NOTICEAuthors who publish with Caryologia agree to the fol-lowing terms:• Authors retain the copyright and grant the jour-
nal right of first publication with the work simul-taneously licensed under a Creative Commons Attribution 4.0 International Public License (CC-BY-4.0) that allows others to share the work with an acknowledgment of the work's authorship and initial publication in Caryologia.
• Authors are able to enter into separate, additional contractual arrangements for the non-exclusive distribution of the journal's published version of the work (e.g., post it to an institutional repository or publish it in a book), with an acknowledgment of its initial publication in this journal.
• Authors are permitted and encouraged to post their work online (e.g., in institutional reposito-ries or on their website) prior to and during the submission process, as it can lead to productive exchanges, as well as earlier and greater citation of published work (See The Effect of Open Access).
PUBLICATION FEESOpen access publishing is not without costs. Caryologia therefore levies an article-processing charge of € 150.00 for each article accepted for publication, plus VAT or local taxes where applicable. We routinely waive charges for authors from low-income countries. For other countries, article-processing charge waivers or discounts are granted on a case-by-case basis to authors with insufficient funds. Authors can request a waiver or discount during the submission process.
PUBLICATION ETHICSResponsibilities of Caryologia's editors, reviewers, and authors concerning publication ethics and publication malpractice are described in Caryologia’s Guidelines on Publication Ethics.
CORRECTIONS AND RETRACTIONSIn accordance with the generally accepted standards of scholarly publishing, Caryologia does not alter arti-cles after publication: "Articles that have been pub-lished should remain extant, exact and unaltered to the maximum extent possible".In cases of serious errors or (suspected) misconduct Caryologia publishes corrections and retractions (expressions of concern).
CorrectionsIn cases of serious errors that affect or significantly impair the reader’s understanding or evaluation of the article, Caryologia publishes a correction note that is linked to the published article. The published article will be left unchanged.
Retractions In accordance with the "Retraction Guidelines" by the Committee on Publication Ethics (COPE) Caryologia will retract a published article if: • there is clear evidence that the findings are unreli-
able, either as a result of misconduct (e.g. data fab-rication) or honest error (e.g. miscalculation)
• the findings have previously been published else-where without proper crossreferencing, permission or justification (i.e. cases of redundant publication)
• it turns out to be an act of plagiarism• it reports unethical research.An article is retracted by publishing a retraction notice that is linked to or replaces the retracted arti-cle. Caryologia will make any effort to clearly identify a retracted article as such.If an investigation is underway that might result in the retraction of an article Caryologia may choose to alert readers by publishing an expression of concern.
COMPLYNG WITH ETHICS OF EXPERIMENTA-TIONPlease ensure that all research reported in submitted papers has been conducted in an ethical and respon-sible manner, and is in full compliance with all rel-evant codes of experimentation and legislation. All papers which report in vivo experiments or clinical trials on humans or animals must include a writ-ten statement in the Methods section. This should explain that all work was conducted with the for-mal approval of the local human subject or animal care committees (institutional and national), and that clinical trials have been registered as legislation requires. Authors who do not have formal ethics review committees should include a statement that their study follows the principles of the Declaration of Helsinki
ARCHIVINGCaryologia and Firenze University Press are experi-menting a National legal deposition and long-term digital preservation service.
ARTICLE PROCESSING CHARGESAll articles published in Caryologia are open access and freely available online, immediately upon publi-cation. This is made possible by an article-processing charge (APC) that covers the range of publishing ser-vices we provide. This includes provision of online tools for editors and authors, article production and hosting, liaison with abstracting and indexing ser-vices, and customer services. The APC, payable when your manuscript is editorially accepted and before publication, is charged to either you, or your funder, institution or employer.Open access publishing is not without costs. Caryolo-gia therefore levies an article-processing charge of € 150.00 for each article accepted for publication, plus VAT or local taxes where applicable.
FREQUENTLY-ASKED QUESTIONS (FAQ)Who is responsible for making or arranging the pay-ment?As the corresponding author of the manuscript you are responsible for making or arranging the payment (for instance, via your institution) upon editorial acceptance of the manuscript.At which stage is the amount I will need to pay fixed?The APC payable for an article is agreed as part of the manuscript submission process. The agreed charge will not change, regardless of any change to the jour-nal’s APC. When and how do I pay?Upon editorial acceptance of an article, the correspond-ing author (you) will be notified that payment is due. We advise prompt payment as we are unable to pub-lish accepted articles until payment has been received.Payment can be made by Invoice. Payment is due within 30 days of the manuscript receiving editorial acceptance. Receipts are available on request. No taxes are included in this charge. If you are resi-dent in any European Union country you have to add Value-Added Tax (VAT) at the rate applicable in the respective country. Institutions that are not based in the EU and are paying your fee on your behalf can have the VAT charge recorded under the EU reverse charge method, this means VAT does not need to be added to the invoice. Such institutions are required to supply us with their VAT registration number. If you are resident in Japan you have to add Japanese Consumption Tax (JCT) at the rate set by the Japanese government.Can charges be waived if I lack funds?We consider individual waiver requests for articles in Caryologia on a case-by-case basis and they may be granted in cases of lack of funds. To apply for a waiver please request one during the submission process. A decision on the waiver will normally be made within two working days. Requests made during the review process or after acceptance will not be considered. I am from a low-income country, do I have to pay an APC?We will provide a waiver or discount if you are based in a country which is classified by the World Bank as a low-income or a lower-middle-income economy with a gross domestic product (GDP) of less than $200bn. Please request this waiver of discount during submission.What funding sources are available?Many funding agencies allow the use of grants to cover APCs. An increasing number of funders and agencies strongly encourage open access publication. For more detailed information and to learn about our support service for authors.APC waivers for substantial critiques of articles pub-lished in OA journalsWhere authors are submitting a manuscript that represents a substantial critique of an article previ-ously published in the same fully open access journal, they may apply for a waiver of the article processing charge (APC).In order to apply for an APC waiver on these grounds, please contact the journal editorial team at the point of submission. Requests will not be consid-ered until a manuscript has been submitted, and will be awarded at the discretion of the editor. Contact details for the journal editorial offices may be found on the journal website.What is your APC refund policy?Firenze University Press will refund an article pro-cessing charge (APC) if an error on our part has resulted in a failure to publish an article under the open access terms selected by the authors. This may include the failure to make an article openly available on the journal platform, or publication of an article under a different Creative Commons licence from that selected by the author(s). A refund will only be offered if these errors have not been corrected within 30 days of publication.
CaryologiaInternational Journal of Cytology, Cytosystematics and Cytogenetics
2020Vol. 73 – n. 2
Table of contents
Shaimaa S. Sobieh, Mona H. DarwishThe � rst molecular identi� cation of Egyptian Miocene petri� ed dicot woods (Egyptians’ dream becomes a reality) 3
Fernanda Ito, Danielle J. Gama-Maia, Diego M. A. Brito, Rodrigo A. TorresGene � ow patterns reinforce the ecological plasticity of Tropidurus hispidus (Squamata: Tropiduridae) 15
Antonio Giovino, Federico Martinelli, Anna PerroneThe technique of Plant DNA Barcoding: potential application in � oriculture 27
Alessio Iannucci, Stefano Cannicci, Zhongyang Lin, Karen WY Yuen, Claudio Ciofi , Roscoe Stanyon, Sara FratiniCytogenetic of Brachyura (Decapoda): testing technical aspects for obtaining metaphase chromosomes in six mangrove crab species 39
Antonio Lima-de-FariaComparison of the Evolution of Orchids with that of Bats 51
Mehdi Zahravi, Panthea Vosough-Mohebbi, Mehdi Changizi, Shahab Khaghani, Zahra-Sadat ShobbarIdenti� cation of the differentially expressed genes of wheat genotypes in response to powdery mildew infection 63
Saeed Mohsenzadeh, Masoud Sheidai, Fahimeh KoohdarPopulations genetic study of the medicinal species Plantago afra L. (Plantaginaceae) 73
Timir Baran Jha, Partha Sarathi Saha, Sumita JhaA comparative karyo-morphometric analysis of Indian landraces of Sesamum indicum using EMA-giemsa and � uorochrome banding 81
Harminder Singh, Jaswant Singh, Puneet Kumar, Vijay Kumar Singhal, Bhupendra Singh Kholia, Lalit Mohan TewariChromosome count, male meiotic behaviour and pollen fertility analysis in Agropyron thomsonii Hook.f. and Elymus nutans Griseb. (Triticeae: Poaceae) from Western Himalaya, India 89
Raheleh Tabaripour, Masoud Sheidai, Seyed Mehdi Talebi, Zahra NoormohammadiPopulation genetic and phylogeographic analyses of Ziziphora clinopodioides Lam., (Lamiaceae), “kakuti-e kuhi”: An attempt to delimit its subspecies 99
Girjesh Kumar, Shefali SinghInduced cytomictic crosstalk behaviour among micro-meiocytes of Cyamopsis tetragonoloba (L.) Taub. (cluster bean): Reasons and repercussions 111
Renan Monteiro do Nascimento, Antonio Freire Carvalho, Weyder Cristiano Santana, Adriane Barth, Marco Antonio CostaKaryotype diversity of stingless bees of the genus Frieseomelitta (Hymenoptera, Apidae, Meliponini) 121
Esra Martin, Tuncay Dirmenci, Turan Arabaci, Türker Yazici, Taner ÖzcanKaryotype studies on the genus Origanum L. (Lamiaceae) species and some hybrids de� ning homoploidy 127
Kássia Cauana Trapp, Carmine Aparecida Lenz Hister, H. Dail Laughinghouse IV, Aline Augusti Boligon, Solange Bosio TedescoDetermination of phenolic compounds and evaluation of cytotoxicity in Plectranthus barbatus using the Allium cepa test 145
€ 25,00