Carss, Brian W. TITLE Resource Allocation Procedure ... - ERIC
142
DOCUMENT RESUME ED 272 096 HE 019 539 AUTHOR Galbraith, Peter L.; Carss, Brian W. TITLE Resource Allocation Procedure at Queensland University: A Dynamic Modelling Project. INSTITUTION Queensland Univ., Brisbane (Australia). Dept. of Education. PUB DATE Mar 86 NOTE 175p.; Appendix C, "Model Equations," will not reproduce well. PUB TYPE Reports - Descriptive (141) EDRS PRICE MF01/PC07 Plus Postage. DESCRIPTORS *Administrative Change; Budgeting; *College Administration; Decision Making; *Departments; *Financial Policy; Foreign Countries; Higher Education; Models; Money Management; *Organizational Change; Policy Formation; *Resource Allocation; School Organization IDENTIFIERS *Univeristy of Queensland (Australia) ABSTRACT A structural reorganization of the University of Queensland, Australia, was undertaken to promote efficient resource management, and a resource allocation model was developed to aid in policy evaluation and planning. The operation of the restructured system was based on creating five resource groups to manage the distribution of academic resources to departments. Positive outcomes of restructuring included: time scale of decision-making, additional flexibility with funds, better information, focus for decision-making, unifying influence, and cohering new directions. Negative outcomes included: increased administrative load, confrontation between department heads, between-group competition, increasing bureaucratization, and impacts on faculties and deans. Concerns about the change that were identified included: the rationale for tenurable positions and chairs, ad-hoc decision-making, staff personal problems, and inequality of access to information. The dynamic model represented the resource allocation and management mechanisms introduced in the structural reorganization. The dynamic model was evaluated by subjecting it to a variety of scenarios in the form of system stresses and policy alternatives. Questionnaires and interview schedules are appended, along with equations for the model. (SW) *********************************************************************** Reproductions supplied by EDRS are the best that can be made from the original document. *******************************************************w***************
-
Upload
khangminh22 -
Category
Documents
-
view
3 -
download
0
Transcript of Carss, Brian W. TITLE Resource Allocation Procedure ... - ERIC
DOCUMENT RESUME
ED 272 096 HE 019 539
AUTHOR Galbraith, Peter L.; Carss, Brian W.TITLE Resource Allocation Procedure at Queensland
University: A Dynamic Modelling Project.INSTITUTION Queensland Univ., Brisbane (Australia). Dept. of
Education.PUB DATE Mar 86NOTE 175p.; Appendix C, "Model Equations," will not
reproduce well.PUB TYPE Reports - Descriptive (141)
EDRS PRICE MF01/PC07 Plus Postage.DESCRIPTORS *Administrative Change; Budgeting; *College
Administration; Decision Making; *Departments;*Financial Policy; Foreign Countries; HigherEducation; Models; Money Management; *OrganizationalChange; Policy Formation; *Resource Allocation;School Organization
IDENTIFIERS *Univeristy of Queensland (Australia)
ABSTRACTA structural reorganization of the University of
Queensland, Australia, was undertaken to promote efficient resourcemanagement, and a resource allocation model was developed to aid inpolicy evaluation and planning. The operation of the restructuredsystem was based on creating five resource groups to manage thedistribution of academic resources to departments. Positive outcomesof restructuring included: time scale of decision-making, additionalflexibility with funds, better information, focus fordecision-making, unifying influence, and cohering new directions.Negative outcomes included: increased administrative load,confrontation between department heads, between-group competition,increasing bureaucratization, and impacts on faculties and deans.Concerns about the change that were identified included: therationale for tenurable positions and chairs, ad-hoc decision-making,staff personal problems, and inequality of access to information. Thedynamic model represented the resource allocation and managementmechanisms introduced in the structural reorganization. The dynamicmodel was evaluated by subjecting it to a variety of scenarios in theform of system stresses and policy alternatives. Questionnaires andinterview schedules are appended, along with equations for the model.(SW)
***********************************************************************Reproductions supplied by EDRS are the best that can be made
from the original document.*******************************************************w***************
DEPARTMENT OF EDUCATION
RESOURCE ALLOCATION PROCEDURE
AT QUEENSLAND UNIVERSITY:
A DYNAMIC MODELLING PROJECT
Peter L. Galbraith and Brian W. Carss
March, 1986
U S DEPARTMENT OP EDUCATIONOffice of Educational Research and Improvement
ED ATIONAL RESOURCES INFORMATIONCENTER (ERIC)
This document has been re..roduced asreceived from the person or organizationoriginating itMinor change, have been made to improvereproduction Quality
Points of view or opinions elated In this docu-ment do not nCeSaanly represent °Hit''OEM position or policy
2
"PERMISSION TO REPRODUCE THISMATERIAL HAS BEEN GRANTED BYd
lTO THE EDUCATIONAL RESOURCESINFORMATION CENTER (ERIC)"
UNIVERSITY OF QUEENSLAND
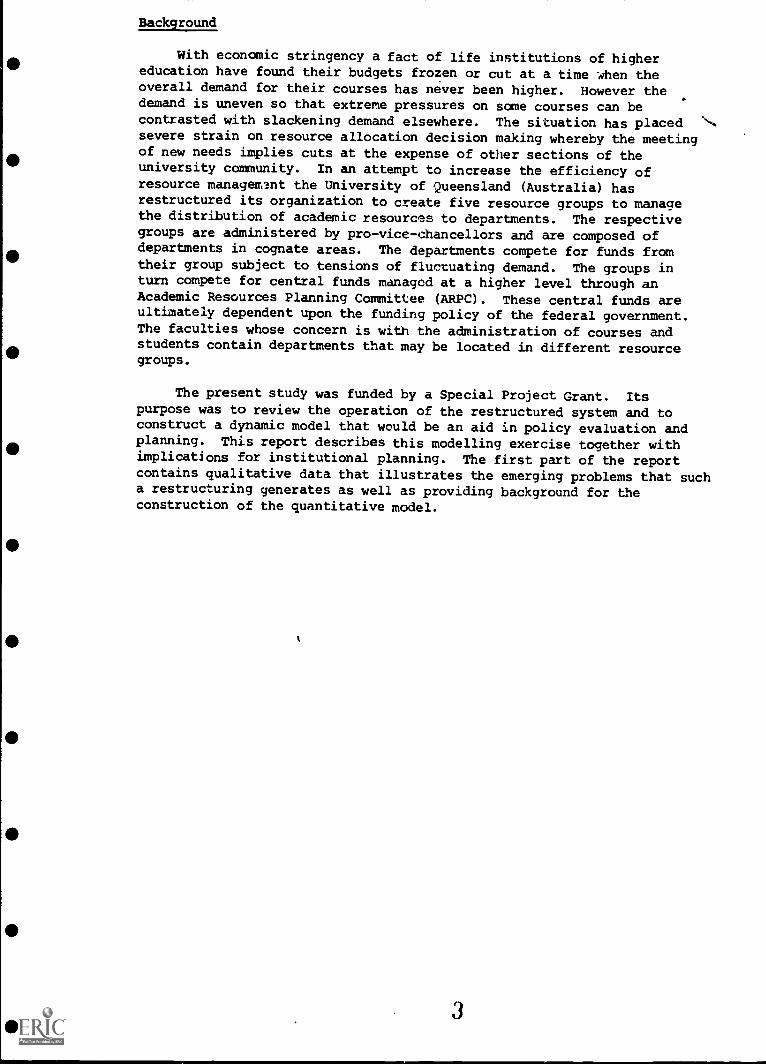
Background
With economic stringency a fact of life institutions of highereducation have found their budgets frozen or cut at a time when theoverall demand for their courses has never been higher. However thedemand is uneven so that extreme pressures on some courses can becontrasted with slackening demand elsewhere. The situation has placed 'N...
severe strain on resource allocation decision making whereby the meetingof new needs implies cuts at the expense of other sections of theuniversity community. In an attempt to increase the efficiency ofresource management the University of Queensland (Australia) hasrestructured its organization to create five resource groups to managethe distribution of academic resources to departments. The respectivegroups are administered by pro-vice-chancellors and are composed ofdepartments in cognate areas. The departments compete for funds fromtheir group subject to tensions of fluctuating demand. The groups inturn compete for central funds managed at a higher level through anAcademic Resources Planning Committee (ARPC). These central funds areultimately dependent upon the funding policy of the federal government.The faculties whose concern is with the administration of courses andstudents contain departments that may be located in different resourcegroups.
The present study was funded by a Special Project Grant. Itspurpose was to review the operation of the restructured system and toconstruct a dynamic model that would be an aid in policy evaluation andplanning. This report describes this modelling exercise together withimplications for institutional planning. The first part of the reportcontains qualitative data that illustrates the emerging problems that sucha restructuring generates as well as providing background for theconstruction of the quantitative model.
3
PAGE 2
CONTENTS
Executive Summary 4
Vice Chancelloriate 4
Faculties, Deans and heads of DepartmentsThe Dynamic Model 9
Part 1. A Qualitative Review 13
Introduction 13Vice cnancelloriate lb
Relationship between Heads and the PVC 19
Group Resource Allocation Mechanisms 20
Positive Outcomes of Restructuring 23Time scale of decision-making 23Additional flexibility with funds 23Better Information 24Focus for decision-making 24Unifying Influence 24Cohering new directions 25
Negative Outcomes of Restructuring 25Increased Administrative load 25Confrontation between Heads of Departments 2bBetween Group Competition 26Increasing Bureaucratization 27Impact on Faculties and Deans 27
Areas of Concern 28Rationale for tenurable positions and Chairs 28Ad-hoc decision making 29Personal Problems of Staff 29Inequality of Access to Information 29Costly Items Joint Facilities and General Staff 30Solidification of Groups 31
Timescale for restructuring 31
Cross Group Initiatives 32Role and Functioning of Committees 33
Deans and Faculties 35Perceptions of Deans 37Effect of Restructuring upon Faculties 37Relationships with Heads 37Contribution to Group Decision Making 3dAchievements of the Group Structure 39Concerns Generated by the Group Structure 39
Part 2. The Resource Allocation ModelThe Resource Allocation Model 44Model Structure 46Causal Diagram 49Feedback Structure 53Adjustment Allocations b0Adjustment Loops 60Simulation Experiments 63
4
PAGE 3
Basic Experiments 1 -b 65
Reading the Output o5
Dynamic Model SummaryParameter Sensitivity 109
Policy Analysis 110
Adjustment Allocations 112
Appendix A 114
Appendix B 122
Appendix C 131
PAGE 4
THE UNIVERSITY'S STRUCTURAL REORGANIZATION
lbPETER L. GALBRAITH & BRIAN W. CARSS
EXECUTIVE SUMMARY
The statements presented here, are summary statements, which
should be read from the standpoint of the people nominated in the
heading. In other words they reflect the investigators assessment of
the specific views of that group together with commentary.
Vice Ciaancelloriate
The Vice-chancelloriate views the committee of P.V.Cs as a
task-oriented, problem-solving group with respect to resources,
staffing, SSP, part-time monies etc. On staffing matters the P.V.Cs.
have to consult with the Vice-Chancellor on the merit of filling a
tenured position.
ARPC is viewed as a committee with broader representation which
is particularly concerned with policy issues. It takes on-board
recommendations from the P.V.Cs committee, but as the P.V.Cs hold the
voting majority in the ARPC, they, the P.V.Cs, can invoke their will.
However, this strengthens the role of ARPC in that if the PVCs are at
odds on an issue, the issue can be referred to the wider audience of
AHPC to consieer.
6

PAGE 5
Members of ARPC take for granted the existence of the major
support groups within the University i.e. The Prentice Computer
Centre, the Library and the University Administrative Services.
Because these support services are taken for granted, they are
afforded a degree of protection from the intrusion of the academic
resource groups who may seek to increase their own resource allocation
at the expense of the support groups.
We suggest that the continued existence and support of these
service units is not a matter for negotiation in principle. However,
the level of their financial support should always .e a matter for
scrutiny and justification.
The PVCs are acting as effective filters for many problems that
previously ended up on the VC'a or Dep.VC's desks, with the result
that Heads of Departments get answers to problems affecting their
staff more quickly and thereby reducing the level of staff
frustration.
It was envisaged that the .budgeting process would be 'bottom-up'
under the new organizational structure. However, in practice, the
Vice-Chancelloriate view budgeting very much as a 'top-doen' exercise.
Both processes appear to be operating with the PVCs becoming the
pivotal elements in the budgetary process. On balance, it is still a
'top-down' dominated process.
PAGE 6
The physical location of the PVCs in their respective groups has
encouraged communication ana brought about greater understanding on
the part of the PVC of a department's operation. On the other hand,
staff are aware of the presence of the PVC who can be seen to be
concerned about their problems, and this is a good thing.
Within the group of PVCs, there is a general acceptance of a
competitive environment with respect to resources, but a more
cooperative environment pervades when managerial, staff and student
matters are beilg considered. There is no doubt that it has been
impossible for the PVCs to separate themselves from academic matters.
Initially they were not viewed as having any academic leadership role
in the beginning, but it is obvious now, that resource matters cannot
be separated from academic matters.
For effective planning to take place, there is an obvious need to
clmmit resources to the planning process. This is particularly true
for strategic planning where detailed data needs to be collected,
analysed and interpreted within the constraints of a number of
strategy alternatives. We believe, this could be accomplished through
the establishment of a strategic planning researcn group.
Faculties, Deans and Heads of Departments,
The present role of the Faculties is seen to be ambiguous in that
by their charter they have academic responsibilities, but these arts
tempered by resource implications for new projected academic
8
PAGE 7
developments. This conflict of interests is made to seem bigger
because in the past, academic matters were separated from resource
allocation considerations. It is vital that academic decisions and
their associated resource implications be brought together at an early
stage in their development.
The separation of resource matters and academic developments
would seem to be the main contributing factor to the substantial
increase in committee and administrative work by Deans since the
reorganization took effect. These increased administrative demands
have affected the morale of some Deans and Heads of Departments and
detracted from their primary responsibilities of leadership, teacning
and research.
It would aeem that the degree of frustration of Heads and Deans
is inversely related to the proportion of their resources coming from
the University. People see themselves as having given time and energy
to supporting structures whim have contributed relatively little to
their total budget. These comments apply particularly to departments
who receive substantial amounts of money from external sources,
thereby giving them tne luxury of being relatively independent of
university funds.
Deans, within their Resource groups, viewed themselves as playing
an enhanced role by being able to take a more dispassionate view of
the Group's oudget proposals and proposed academic developments.
9

PAGE 8
The Deans' and Heads' of Departments perception of the
Vice-Chancelloriate is clouded by a lack of information as to the
composition and power of such committees as ARPC. ARPC is viewed by
some, as "mafia-like" and as being distant, mysterious, all powerful
14and secretive.
Concern was expressed about the apparent reduced role of the
Academic Hoard and its Standing Committee. This is in direct contrast
to Senate, which appeared to some, to be exercising a power of veto
over decisions taken elsewnere in the University.
The competition between Resource Groups and the
cooperative/competitive balance between departments within the Groups
are delicate issues which need careful handling and nurturing.
Heads of Departments continue to be frustrated by having to seek
information and maKe submissions for relatively trivial items, such as
pieces of furniture. This, and other matters contrasted starkly with
the effectiveness of the procedures channelled through the PVCs.
Heads also commented on the contrast that exists between how the PVCs
manage academic staff and now general staff are handled elsewnere.
This contrast was not flattering to the management of general staff.
We believe that this is anotner example of the need to consolidate all
resource matters into a single decision making structure based on the
Resource Groups.
10
Tne Dynamic Model
PAGE 9
Within the competitive environment of the Groups and their
departments, the principal lhallenge remains to devise planning
procedures that will enable resources to be moved across departmental
boundaries and between Groups in a non-disruptive way as needs and
demands change. The dynamic model was constructed to capture the
essential features of the actual university's organizational system.
If tne assumptions and the mechanisms of the model are accepted then,
its output suggests the following:
(1) It is unwise to attempt to fully adjust for sudden changes in
enrolment levels in the year that they occur as this generates
instability in the system, particularly when the system is
volatile with respect to changes in demand for places. A
triennium can be regarded as a suitable time period over which to
accommodate major changes.
(2) While an application of stringent resourccistudent ratios can be
used to restrict entry to subjects that are being subjected to
enrolment pressures, the model behaviour indicates that this has
minimal impact on the timescale of the adjustment for
equilibrium. Timescales are controlled by allocation policies
and not by entry policies, which affect amplitudes but not
periods.
If allocation policies cased un smoothed enrolment rates are
used, then the adjustment time is controlled by the enrolment
11
PAGE 10
averaging time and not by the size of the enrolment. While a
stringent policy may reduce the initial "pain" of an enrolment
blowout, it will lead ultimately to fewer resources for the Group
or department under a Ustribution policy based on average
enrolments. It is recommended that as far as possible,
elasticity be retained in the a;.plication e resource/student
ratios.
(3) Model behaviour is insensitive to changes in the COST/WSU ratio.
This means that while changes in this ratio will lead to the
expected alterations to the total Group costs, there is no
prolonged Disruptive effect in bringing about this change. This
means in turn, that the allocation profiles based on enrolments
are robust to changes in COST/WSU ratios and hence the search for
effec.ive methods of resource distribution need not be
complicated by hypothetical concerns about possible destabilizing
effects of cost changes.
(4) Resource allocation principles should be completely severed from
historical precedent. Rather, they should be based upon "dynamic
history" whereby allocations are made in terms of constantly
updated, and smoothed enrolments. Stability considerations
suggest a time of three (3) years as being satisfactory.
(5) In order to maintain the flexibility to adjust resources in line
with changes in smoothed enrolment rates it is necessary to have
a pool of rr Jurces free from long term commitment. Staffing
policies which ensure this flexibility is maintained are
12
PAGE 11
necessary. For example, an adequate proportion of fixed term
appointments will provide a continuing base of liquid assets
across Groups and departments.
(b) Resource allocation plaAning should not be in terms of some
external enrolment goal. External goal - directed allocation
procedures effectively remove the influence of feedback and lead
to persistent advantage or disadvantage within parts of the
system. By contrast, the "dynamic history" policy uses feedback
to equalize advantages or disadvantages throughout the
organization.
These comments apply particularly to the volatile sections of the
university where actual demand can vary widely and unpredictably
from the expected demand. For high-demand courses, such as
Medicine, it is known that enrolment goals are always met exactly
so that dynamic history and planned enrolment policies have
identical outcomes.
(7) Attention should be given to withholding a small amount of the
total Group money from the initial basic resource allocation.
'Following an examination of Group conditions, adjustment
allocations could be made to mitigate conditions of extreme need,
should they be warranted.
(6) In allocating additional rew,lirces or in distributing "pain" by
imposing cuts across Groups in tne event that resources available
do not match demands, we wish to draw particular attention to the
13
PAGE 12
problems associated with adopting a proportional allocation
procedure. It is our belief that the application of proportional
allocation involves the trading-off o's.' "fairness"against
"effectiveness". If the intention Is to help a disadvantaged
Group(s) then adopting a proportional allocation policy is
neither as fair or as effective as one might hope. It is
recommended that attention be given to devising 'criticality
criteria' through which Groups can roceive or lose resources
according to their relative needs, and for which there is no
expectation that all Groups will be treated on the same basis.
14
PART 1: A QUALITATIVE REVIEW
INTRODUCTION
PAGE 13
The specific aims of this project were (a) to construct a dynamic
model which represented the resource allocation and management
mechanisms introduced in the structural re-organization and (b) to
evaluate the dynamic model by subjecting it to a variety of scenarios
in the form of system stresses and policy alternatives.
To assist in the: construction of the dynamic model a number of
interviews were carried out in order to attempt to identify important
structural elements and their interrelationships. These qualitative
data also nerved to cross cheek on the behaviour of the dynamic model.
A series of interviews were carried out with the Vice-Chancelloriate,
and some Deans and Heads. An invitation was extended to Heads who
were not interviewed, to submit written comments. These comments were
also relevant to the verifying of the dynamic model with respect to
its scope and structure. The scenario which emerged was that of a
competitive one, in which parts of the University compete with each
other for scarce resources. The policy strategies tested in the model
were aimed at seeking those, whicn would provide for efficiency and
fairness subject to the constraints of the situation. A further
purpose served by the interviews was to provide information on the
actual operating procedures of the new structure as seen by a sample
of its Key actors. The associated findings form the qualitative part
of the review which follows.
15

PAGE 14
Data Collection
0In a many faceted institution like a university, conditions and
needs are subject to wide variation across the organisation. It makes
no sense to send out a standard questionnaire and expect to obtain
meaningful interpretations from aggregating responses to items. One
reason is that the relevance of a given item can vary from high to low
depending on the role and function of the respondent in the
institution. The comments of actors in the system nearly always
require a context to provide meaning, and consequently, we used the
extended interview as the major method of data collection. The
interviews were loosely structured so as to provide a framework
relevant to aspects of the new University organization. Information
was gathered on common issues from a variety of sources. In addition,
those people who were interviewed were invited to add comments of
their own on natters that they considered to be important, but which
had not arisen during the structured part, of the discussion.
Extended interviews were conducted with the following people.
Vice-Chancellor
Deputy Vice-Chancellor (Academic)
Deputy Vice-Chancellor (Fabric and Finance)
Pro-Vice-Chancellors (5)
Heads of Departments (10 - Two from each group.)
Deans of Faculties (4)
16
PAGE 15
Additionally other Heads of Department were invited to submit written
comments on aspects of the re-structuring. Nineteen (19) availed
themselves of this opportunity. Copies of the interview schedules all,
proiided in Appendix A. Access was also given to minutes of the
following committees
Academic Hoard
Research Committee
Social Sciences Group Council
Senate
Academic Resources and Planning Committee
The interviews and other data gathering took place in the period from
J,4 to December 19114. Interviews were tape recorded and
confidentiality was guaranteed as to all of those who participated.
For interpretation purposes, tne comments were placed in a
framework that enabled them to be focused on different aspects of the
structure and functioning of the restructured University. In this
way, it was possible to compare comments on common issues as seen
through alternative eyes. Tne manner of reporting the data is
important to appreciate. Again it makes no sense to simply add up
positive and negative comments on an issue, in order to decide whether
a particular matter was satisfactory or not. For example if 6 Heads
of Departments were happy with a particular procedure, and 4 were most
unhappy it would seem dubious to infer that the procedure was
basically satisfactory. One would expect the University to be
17
concerned that 40% of its xey leaders were dissatisfied.
PAGE 16
Similarly, frequency of comment on an issue, is not always a
valid measure of its potential importance. Particularly when a new
structure is developing, it can be that cne Head of Department, say,
becomes aware of a problem that has not yet appeared in the rest of
the sample. Hence, we thought important to include items in the
reported data on the basis of their perceived significance rather than
on frequency alone. Where widespread comment has occurred on a
particular topic, an indication is provided in the text. Bearing in
mind earlier comments about the contextual importance of remarks, a
significant proportion of the descriptive record of data is comprised
of extended quotations from taped transcripts and written comments.
Vice Chancelloriate
This neading covers the Vice-Chancellor, two deputy
Vice-Chancellors and the five PVCs. There was unanimous agr ament
tnat ARPC had replaced the former Planning Committee and that its role
was moving towards that of establishing policy. In its behaviour it
acted in a more or less cooperative manner.
In contrast to tne committee of PVCs, which operates in a
competitive environment, are issues whicn are now being brought to the
PVCs. They are mainly personal matters of staff, which may be
considered by tnis group in an attempt to tap into their combined
wisdom.
18
PAGE 17
Thera is a 100% overlap between ARPC and the Committee of PVCs
whicn means that the PVCs can dominate the voting on ARPC as they hold
a combined majority of votes. This suggests that there must be a
distinctive role for ARPC, so that it does not become a rubber stamp
for tne PVCs committee.
The restructuring process has not reduced the workload of the VC
or the Deputy VCs. In fact if anything, the workload has increased
and the problems being presented to this small group are more
difficult and more demanding of time. However, the PVCs are acting as
effective filters for some problems and the speed at which they are
able to respond to departmental or an individual's problems is
laudatory. We did not receive any unfavourable comment on the
relationships between the PVC and the departments.
The budgeting process is "top down" and the procedures
cumbersome. Tnis is evident in the amount of time taken to get a
finalised budget.
ARPC and the PVCs committee both seem to be hampered in their
work by not having ready access to timely data that is in an
appropriate form to assist decision-making. Data collection, to
answer a question, appears to be a "one-off" exercise rather than
there being a continuous collection and tracking of the institution's
performance criteria.
19
PAGE 18
There is a need for the estaolishment of a strategic planning
research group to carry out the detailed work of examining tne
implications of competing proposed developments, as well as supporting
the policy considerations of ARPC. This task at present, seems to
fall on the shoulders of the Vice-Chancellor and he is not able to
carry through this responsibility very well because of other pressures
on his time.
Operation of the Group Council Structure
As is to be expected, the operation of Group Councils is
perceived as varying between groups from strongly hierarchical to very
democratic. Similarly, the frequency of Council meetings varies from
frequent to infrequent. In no instance did a Head of Department feel
that it would have been a problem to get an issue on the agenda for a
Group Council's meeting, so that while PVC's generally determined the
order of business, (and indeed the agendas), this was done with a
Knowledge of departmental requests.
Typical comments describing perceptions of Group Council
functioning were
"More or less hierarchical - we have an occasional meetingwhere the PVC determines the order of business and tells uswhat he's thinking (or not). I can discuss matters with thePVC on an individual level - he's pretty open".
"Our council has functioned well as a collegiate committee -even contentious issues such as academic staffing have beenthreshed out in an atmosphere of general cordiality, evenwith out and thrust present".
20
PAGE 19
As was the case with the Pro-Vice-Chancellors, there was acute
awareness among Heads of Department of competition within and between
groups.
"I tnink it's (competition) inevitable given the structureand I don't particularly object to it. At a time when theUniversity is badly underfunded, and given there are fivegroups, they must compete and I would have thought the majorrole of the PVC is at that higher collegiate level tocompete for his group".
On the question of the frequency of council meetings, two groups
appeared to meet less frequently than others. This elicited both
positive and negative comment i.e. infrequency of meeting was
regarded as an advantage in some quarters vld a disadvantage in
others.
One respondent described the whole re-organization as a non-event
indicating that in his view it had made little or no impact on the
pursuit of excellence and scholarship.
Relationship between Heads and Pro-Vice-Chancellor
Without exception the PVC's were regarded very highly. Even
those Heads of Departments who had severe criticisms of aspects of the
restructuring were at pains to point out that access and personal
relations with the PVC were excellent, and in a number of cases
exceeded their expectations. Some heads did suggest that such
successes that had occurred may be because of the person, rather than
the position. They were not oonvinced that the structure of middle
21
PAGE 20
management in itself ensured tne benefits they observed. There was no
indication of a Department's autonomy had been infringed by the
restructuring and the impact on individual members of staff was said
to be minimal.
Group Resource Allocation Mechanisms
The resource allocation procedures varied markedly between
groups. Some of the procedures used were as follows
1. Individual submissions made pi departments with the group budget
then worked out and tabled by the PVC after appropriate
consultation with heads.
As one head described it
"The council has never impinged on my consciousness at all. The
mecnanism seems just to be between me and the PVC".
2. The continuation of (the main elements of) an earlier system in
which allocations were based on an agreed formula. The
departments work with the PVC in a collegial way with
co-operation (rather than confrontation) assisted by a budget
sub-committee.
3. Provision of a "one-line" budget for each department based on
criteria for cost/WSU worked out by the PVC after seeing each
Head of Department, and in the first instance based on historical
precedent. Little negotiation was permitted in the first year -
22
PAGE 21
the group effectively endorsed the PVC decision. One Head of
Department in noting that little public debate of criteria had
occurred observed that this was probably because of likely
acrimony.
"When we did talk about resources, we weren't talking seriously,
but nevertheless there was a certain amount of acrimony".
4. The allocation mechanism is a mix of confrontation between heads
and a clearinghouse role on the part of the PVC. After
consultation with eacn head, the PVC brings a consolidated budget
to Group Council for debate and a final approval.
"We subject them to scrutiny but our group has little
manouverability"
One Head specifically indicated his opposition to any "fait
accompli" situation where each was told how much he was getting.
5. The allocation mechanism is one of confrontation whereby
submissions are circulated by the PVC and respective heads argue
for their proposal at Group Council. In the words of one Head
"The most important attribute to obtain money is an agile tongue
and to be able to marshall all your arguments."
Another opinion suggested that long-serving, experienced Heads
were probably advantaged in knowing where to get documentation
and how to mount a convincing case.
23
PAGE 22
It was also suggested that tradition tended to dominate the
eventual distribution achieved by a group vote.
"There is difficulty in getting new formulae adopted".
An overview of the comments and responses located some areas cf
concern arising from the procedures adopted
(a) In two of the groups it was observed that group structure
comprised a set of closely aligned, historically allied
departments on the one hand, and a set of individual departments
on the other. It was suggested that the like departments grouped
together to support one another at Group Council to their mutual
advantage. It was stated that "this sort of division is much
more divisive and more likely to affect thi.igs than the actions
of a PVC."
(b) Several references were made to the practice of overbidding. "To
get $10,000 you bid $60,000. Honest estimates won't work because
they are cut proportionally when the group budget is exceeded."
The question seems to be not so much of a PVC being unaware of
such strategies but whether in prescribing cuts justice is done
to the "honest tenderers".
(c) In groups wnere there is public debate on Jubmissions, concern
was expressed that the prize goes to the best debater rather than
to the greatest need.
24
PAGE 23
"Those with the most persuasive arguments, and the agile debaters
obtain favours - not necessarily those in greatest need."
(d) A feeling that the good relations at resource allocation meetings
may be because it is known there is almost no money to bid for
beyond essentials. Some concern that relations could deteriorate
if more resource spoils became available.
POSITIVE OUTCOMES OF RESTRUCTURING
1. Time scale of decision making
The reduced time to obtain decisions on matters, now under PVC's
jurisdiction has featured strongly in comments. Heads have
appreciated that decisions that sometimes took "months and weeks" now
take "days and minutes". This has been particularly appreciated in
cases of staffing crises.
2. Additional flexibility with funds
(a) The facility of shifting funds from one purpose to another has
been valued at departmental level.
"Wherever there are funds for non-tenured academic staff it seems
you can shift them to other uses."
(b) The facility to carry money over from one year to the next by
effectively using tne PVC as a banker was noted appreciatively in
one department.
25
PAGE 24
(c) The more efficient use of group resources whereby group savings
can be used e.g to start a new initiative.
3. Better Information
It nas been observed that people are now better informed as to
the problem faced by the University with respect to resources. One
Head of Department apprf ated that he could now "speak with
confidence to a Departmental meeting about the real constraints of the
world we are operating in." It was mentioned several times that the
PVC was aware of the problems of departments in his group in a way
that more remote bodies could not be.
4. Focus for Decision Makin&
Several Heads appreciated the identification of
individual with a variety of requirements.
"The big practical difference is to have tneseveral bodies to take an issue to".
"It's very much better - the major advantageof applying and negotiating all over thecollective pocket - the group budget".
5. Unifying Influence
a single
PVC instead of
is that insteadplace there's a
Several comments indicated that interaction of heads through
group council had led to a better understanding of each other's work.
"In spite of competition, the new structure has brought theHeads of Departments together. Personal relationships havebeen enhanced and there is now a better appreciation ofother's roles".
26
PAGE 25
Interaction between the departments had also been enhanced according
to these comments.
6. Cohering New Directions
An example was cited of the change in nature of a group e.g. to
a technology using groun. It was felt that a PVC could bring together
the needs of such a group more effectively than could be achieved by
each department trying to make its own case.
NEGATIVE OUTCOMES OF RESTRUCTURING
This category is reserved for factors that have been deemed
undesirable outcomes of the new structure in operation. It does not
include reference to what might be termed deficiencies - important
areas that do not seem to have been adequately provided for in the
eyes of Heads of Departments. These issues are taken up in a later
section.
1. Increase in Administrative Load
A number of responses referred t) an enormous increase in
administration and committee work. This was seen as just more
competition for time although it was noted in some quarters that the
preparaticl of a departmental budget hal been a constructive exercise.
"In this restructuring there was just a relative enlargementof tne administrative side of the University at the expenseof the front line part - teaching and rasearch."
27
S
I
0

PAGE 26
2. Confrontation between Heads of apartment
This can be thought of as an opposite view to Pert No. 5 of the
previous section as a consequence of the competitive nature of Group
Councils. It has been expressed by Heads who see the competition as
promoting political, rather than academic decision making. This
concern is typified by the following comment
"I would argue with some of the parameters, and I've triedto, and its no use. The reason it's no use is because theother Departments can see that if they accept my argumentsthen they can take less out my Department, and the lessthey take out, the less there is for them".
"That's what I think might be wrong with groupstructure. You really do set Heads of Departments at eachother throats. My feeling is that if Departments workedtogether and told the PVC what to think then its our go.But they don't, so he tells them what to think."
Earlier comments upon the primacy of debating skills over actual
needs in obtaining resources would contribute to this view.
3. Between Group Competition
While Heads were principally concerned with their own Group
Council structures many raised issues in the wider context of the
university. One such issue was the future implications of competition
at the group level.
"I felt the reorganisationcreate five mini-Universitiessome extent."
"It may allow the developmenttradeoffs among PVC's".
would (undesirably) tend towhicn I think has happended to
of power play and undesirable
28
PAGE 27
4. Increasing Bureaucratization
There werc many references to the increase in middle management
and reasons for it. However it was felt by some that those in more
central bodies were expanding in such a way that it was doubtful
whether the devolution of authority to PVC's was producing the
economies of time expected. Two examples are cited.
(1) Concept of Accountability "Nobody really spelled out what it's
for - it's just a means of setting up machinery to give more
bureaucrats more jobs".
(2) Role of Professors document "Surely after 3 or 4 centuries of
this type of University, it isn't necessary to spend time writing
down the role of professors."
5. Impact on Faculties and Deans
This large and sensitive issue is considered separately in its
own right. For present purposes it suffices to note that concern (in
varying degrees) about the role of Faculties figured in many
discussions and responses, e.g.
"One undesirable effect of the new system has been that manystaff members see the Dean as playing a diminished role indecision-making procedures."
"The Faculties at the present time are not working."
29
PAGE 28
"The chief disadvantage of Faculty structure within therestructuring is in creating more administrative work whichinterferes with the main purpose of the advancement oflearning."
AREAS OF CONCERN
This category encompasses issues raised by Heads of Department
most frequently through their own initiative i Iscussion or through
a written communication. Some of them reflect perceived grey areas in
the restructured decision making procedures. Others express
reservations about the implications of the re-organization in certain
areas.
1. Rationale for tenurable positions and Chairs
Reference was made to mysterious decision making as to whether
replacement members of staff would be appointed to tenurable positions
or no",. With respect to the re-advertisement of chairs "several memos
circulated by senior administrators were in conflict leading to
unpleasantness." The problem was perceived as due to lack of proper
consultation with Groups. Given the speed with which some key
decisions can now be made them was additional concern expressed about
the time taken to finalise senior appointments. This was seen as not
only Asadvantageous to Departments but also as likely to lose good
appointments. These issues were raised in at least four different
interviews and clear guidelines were sought as to whose jurisdiction
the matter of new chairs came under.
30
PAGE 29
2. Ad-hoc decision making
Concern was expressed in one interview that "we're getting a
number of ad-hoc decisions on policy that I think, if they continue,
are going to upset people." This was not seen as related to the group
system but rather due to the "absence of power of the old Standing
Committee which would previously have been consulted and referred such
decisions to the Academic Board or elsewhere." The example of
re-advertising chairs was cited as-was the decision to set up the CAL
unit. Several interviewees commented unfavourably on the perceived
diminished role of the Academic Board and Standing Committee. The
general lack of access to some important decision making was echoed in
other interviews.
3. Personal Problems of Staff
Pastoral care is not a Dean's problem nor a resource matter and
there is no clear avenue of assistance for Heads of Departments with
major personal problems among their staff. The deputy Vice-Chancellor
(Academic) would be a resource for extreme emergencies but the system
was not seen to provide help for regular serious problems of this
kind.
4. Inequality of Access to Information
It was clear from interview comments that knowledge of university
structures and operations differed considerably between Heads.
31

PAGE 30
Significantly those with a wide past experience of committee work
indicated that these experiences and contacts enabled them to gain
wider access to information under the new system. One such Head was
concerned that the introduction of middle management had resulted in
inequality of opportunity for Heads of Departments to reach the ear of
top administration. His position was that without his contacts he
would not have known how or where to go for information of a type
inappropriate to the role of his PVC.
5. Costly Items Joint Facilities and General Staff
(a) It was observed that "the fairly formal structure for costly
items has disappeared somewhere" and that a series of judgments
needs to be made about the replacement of or initiation of a
proposal to buy high cost equipment. This was felt to be
particularly important when the use of such equipment crossed
group boundaries. Biotechnology was cited as an eight-department
co-operative venture that cut across resource groups. It was
suggested that "there's some very woolly administration in that
supra-group area at the moment".
(b) The question of joint facilities e.g. Electron Microscope was
raised as a potential problem as "users have little say in how
it's run or what resources go into it." It was suggested that,
the information that flows from UNITS such as this to
Departments, should he improved.
32
PAGE 31
The question of refurbishment and costly items was raised in
several interviews as was also the policy governing the allocation of
Technical Staff. It was suggested that the aggregate general staff
resources would be more efficiently deployed in a Group basis "instead
of each department operating as a miniature corporate administrative
entity regardless of economic viability - a situation which either
duplicates resources or penalises small departments if resources are
allocated on a teaching staff numbers basis."
6. Solidification of Groups
This concern is best portrayed 4y the following extract from a
written communication.
"The major potential disadvantage of the new structure isthe possibility that the group will 'solidify' with thedepartments within each group vying for the resourcestotally within the group. There needs to be a mechanismwhereby there can be a transfer of resources from thosegroups which are well-endowed to those which areunder-endowed. In many ways this problem stems from thecurrent inability of the university to determine a series ofspecific goals, objectives, and priorities for theUniversity, and then to set about achieving thoseobjectives. This problem is of particular concern toexpanding departments with the difficulties of achievingincreased resources at a. time of generally diminishinguniversity-wide resources. The move to groups is asignificant improvement as the previous situation whichrequired the Head to deal with a variety of individuals andcommittees had become unworkable."
7. Timescale for Restructuring
Several Heads indicated the need to allow the new arrangements to
shakedown,
33
S
Vb.
PAGE 32
"I believe that it will take up to five years for newpolicies and procedures to be worked out, and the new systemevolve into an efficient form of University administration.This can be seen in the current budgetary arrangements,where no department is currently sure of how to frame itsbudget, or to go about the 'politics' of the budgetingprocess."
The strength of feeling in some quarters on this issue may best
be illustrated by quoting the followiwng communciation
"Although we have great smathy for your project and canunderstand the reasons for surveying reactions to the latestUniversity re-organization my Department does not wish toparticipate. The greatest concern for my Department,Faculty and Group is the dreadful possibility of a furtherre-organization which your survey findings might provoke."
8. Cross Group Initiative
Some Heads indicatTd uncertainties they perceived with respect to
inter-Department activities that crossed group boundaries. One
example involved a joint research submission which ran into problems
because it was not resolved which group(s) was responsible for the
necessary cross group funding of the project.
"Grant giving bodies for years have stressed the need forinterdisciplinary research. With research across groups whois responsible for resource implications. Is there any wayto work out the percentage responsibility of the Departmentsand hence of the groups? This should go to the PVCcommittee."
Similar sentiments were echoed by another Head in the context of
inter-disciplinary studies
"I'm sorry to see that interdisciplinary courses have beeneroded - to a large extent because of the difficulty ofdistributing the resource costs to the contributingDepartments."
34
PAGE 33
A third comment spoke of similar questions in relation to joint
honours programs mounted by Departments in different groups.
9. Role and Functioning of Committees
This was the area (along with Faculty structures) most often
raised by Heads of Departments and their concerns embraced two
emphases
(a) the present status and role of committees which continue to exist
in name but whose purpose seems to have changed under the
restructuring.
(b) the nature and places of central decision making under the new
structure.
Several comments expressed severe displeasure at a perceived
downgrading of the Academic Board.
"I tnink the relationship between the Academic Board and theSenate is something that worries me more than any otherthing in this University. It allows for manipulation bycollusion."
"People in high positions say things that continuallyundermine the authority of the Academic Board."
"Senate should be a house of review to send things back -not a house of veto. I've seen signs of an implicit(sometimes explicit) threat from members who don't like theway the Board voted along the lines of 'Well say what youlike, this is going to Senate and Senate will votedifferently and that will be the end of it."
Other comments simply expressed doubts about the revised roles of
committees.
35
PAGE 34
"One of the real mysteries of the new system is what theStanding Committee does."
Still others expressed some mystification as to why the
restructuring involved an uncomfortable mix of new structures and old.
"Having got rid of sixty odd Departments going to StandingCommittee for staff we still need to individually list andsend to central a request for a single item of furniture."
"We still have two persons to approach for resourceallocation,
Deputy Vice-Chancellor (Fabric and Finance) for space, minorworks etcPro-Vice-Chancellor for other."
With respect to (b) considerable concern was expressed in relation to
the Academic Resource and Planning Committee (ARPC). This was
perceived in several Departments as a somewhat secretive committee
whose operation remained cloaked in mystery.
(It was clear that even the composition of the ARPC was not known
by several Heads.) e.g.
"I don't believe ARPC is functioning as it should. What hasit done? What information have they got? Maybe they needto do some publicity work for people like me so we know whatthey're doing."
Similar comments arose elsewhere
"I don't know what ARPC talks about - perhaps major academicdevelopments are, in fact, being discussed in ARPC but Idon't see much evidence of that"
"The remoteness of the ARPC - we don't see the minutes sohow do we know the basis of their decisions."
36
DEANS AND FACULTIES
PAGE 35
41
Heads of Departments and Deans did not perceive that personal
relationships between them had been affected by the re-organization.
However there were many comments on the Faculty structure and role of
Dean in relation to the Group structure and on this issue the views of
Deans and Heads of Departments showed some divergence as well as some
agreement. One fact that clearly emerged was the different issues
encountered because of the different natures of the faculties.
"I think the faculties have to accept that there are certain
activities (responsibilities) which they no longer have."
"The intermingling of the provinces of thePro-Vice-Chancellor (resources) and the Dean (academicmatters) makes it impossible to separate the two entirely.The chief disadvantage of the faculty structure within therestructuring is in creating more administration work."
"The time is coming when people are going to say that thisexpedient of retaining faculty structure with group councils- this expedient was just an expedient and were going tohave to bring the two together. More and more people aresaying this and some said it from the outset."
"Academic planning (as distinct from degree administration)has become pretty much a grey area between faculty and groupcouncil. Faculties are more democratic allowing anyone inthe university community to debate issues where the groupcouncils are more exclusive. However the democratic forumisn't working very well because of the poor attendance atFaculty meetings."
"The major thing that needs to be done given the weakness ofthe Faculty is to transfer academic power to the groupcouncil. Actually academic matters are being treated quitedirectly by our group council - and indirectly all the time"(An example cited was money for academic seminars notorganized through the faculty)
"There is no more problem than there's always been witnfaculty structure. Our faculties have never had muchinfluence on the resource allocation side. Since Deans areon the group council they can put the faculty's view where
37
PAGE 36
relevant so there's no problem theMi"
"In this group the Deans have in a way more power as thePro-Vice-Chancellor with two Deeds forms a kind of groupexecutive whicn works reasonably well."
"If tne University is going for somemanagement then they ;.should sheengthenDeans. The Dean should function throughHeads of Departments the academic focusfocus should be integrated."
"The Dean should act do a group executive -faculty structures are very close."
kind of middlethe power of the
committees withand tM resource
our group and
"Academic leadership, should come from the DeputyVice-Chancellor (Academic) and-4eans and related staffingand resources should be administered through the DeputyVice-Chancellor."
-.7 a
"Deans and Pro-Vice-Chancellors should be amalgamated intosuper deans." ,r i
.4 1
One Head expressed annoyance that the Dean's presence on.;i%1
selection committees had no valosun many cases due to his,rtly
unfamiliarity with the particularitiellat the Departments.
1 Wiest
These comments initiated by Headsgoe Department contain no single;me,
message. For the most part they concsaWated on the role of faculties
(while also making references to the Deanship).
,f
-e 4'The comments initiated by Deans tended to reverse this emphasis
.ionswith more concentration on the purpose and functions of the Dean.
. nc.
th
38
PAGE 37 4
PERCEPTIONS OF DEANS
1. Effect of Restructuring upon Faculties
Opinions varied from almost no effect to considerable effect
reflecting, perhaps, the nature of different faculties. The main
points raised involved changes in jurisdiction and in administrative
work.
"Faculty is well represented on group councils - its rolehasn't diminished at all. The main threat to the faculty'sstanding is the apathy of its own members in coming tofaculty meetings."
"There has been considerable impact on faculty by alteringthe traditional mix of departments in this field. Formerlyfaculty handled research, equipment money and maintenancefunds and this is now out of its province. While facultiesare still called on to determine priorities in academicdevelopments (e.g. courses or chairs) their determinationhas only a small impact on eventual outcomes because groupcouncils decide funding questions. This is an unfortuanteseparation of responsibilities."
"Biggest change is in decentralization. There are moremeetings to attend but you know what's going on in otherdepartments whicn is good - before you tended to beisolated."
"In terms of daytime hours the Deanship would take up about80% of my time (I expected about 50%). There is also a bigcall to serve on outside bodies which to some extent is ameasure of the size and importance of the faculty."
2. Relationships with Heads of Department
It was noticeable that when Heads commented on this topic their
remarks in the main centred on the personal relationships between the
individuals, The Deans on the other hand emphasized far more the
professional relationship between the positions.
39
40 PAGE 38
"There has been a very important change. Departments nowsee a need for a champion in the academic field.Departments use the Deans as support mechanisms to deal withPro-Vice-Chancellors. In some groups the Deans sit on groupexecutives and budget committees and so make major decisionson Departmental budgets, special projects and Special StudyLeave programs. This is a very important new role for theDean."
"Yes there has been a change. Heads now have to divid(their loyalties and attentions. One day they are with theDean to discuss the development of a new discipline - nextday they are with the group finding out whether the proposalcan be funded. For the convenience of group management thebest organization of educational objectives has beenabandoned."
3. Contribution to Group Decision Making that extends influence
beyond Faculty Departments
Tne clearest example of such an influence is a group in which the
Deans, together with the Pro-Vice-Chancellor, form an executive that
makes resource decisions affecting all Departments in the group.
Various comments were received pertinent to this aspect of a Dean's
role.
"I'm on a number of committees e.g. SSP committees andResearch committees where I provide information, opinions,and vote if appropriate."
"The Deans in my group give a more dispassionate objectiveapproach than Heads of Departments. We're a moderatinginfluence. Each Head pushes his own barrow and its naturalfor a Dean to take a more objective view. It's also easierfor a Dean to speak for or against Departmental submissionsas a Head is aware of competition and may feel hecompromises his own position by supporting or opposing otherDepartments submissions. This is a very distinctive roleand I think every Dean sees it that way."
40
PAGE 39
4. Achievements of the Group Structure
As to be expected the Deans were in general less acutely affecteu
by interaction with Pro-Vice-Chancellors than were Heads of
Department. Their reactions could be partitioned into positive
responses, and areas of concern which ranged from direct effects (such
as work loads) to wider matters of principle to do with the
functioning of the Univers1:4.
Positive responses encompassed the enhanced role of Deans in
resource decision making processes at group level and the increased
efficiency of some decision making due to the group structure. It is
interesting to compare the comments of Heads of Departments who
commonly saw the powers of faculties reduced and the views of Deans
who saw their roles on group execu ives etc as providing them with
more influence than previously. This seems due to Heads continuing to
view Deans largely in relation to administration of courses and
students whereas Deans perceived their influential role in terms of
their capacity to assess Departmental submissions in a disinterested
manner at a resource decision making level.
5. Concerns Generated a the Group Structure
a. Workload
"It's (the Deanship) a very effective role as oneresponsible for academic developments but the increase inadditional administrative work has been enormous - I
estimate an extra 40 to 50 additional meetings a year.While it was intended that Deans make a strong input intorespective groups the additional burdens implied were notunderstood. For example I attended three committees where
41
PAGE 40
the same material was argued - a faculty committee, then thecorresponding group committee and finally the groupcouncil."
"I believe the efficiency that has been gal.' i by having thepro-vice-chancellors concentrate on the use of resources hasbeen greatly diminished by the additional work thrust onDeans, Heads and other committee workers. The ramificationsof the extended committee structure produced by theadditional tier of administration was never understood."
b. Blurring of Distinctive Faculty Properties
"In the past, faculty structure disti:iguished between clearprofessional faculties and those with widely dispersedinterests and subjects. The new structure seems to haveincluded an attempt to reduce that difference and make allfaculties seem much the same. The responsibility of some"acuities ., the wider society seems to have been forgottenand the notion around at the time of re-organization thatthe deanship might be a part-time commitment is amazing tocontemplate. The task is quite overwhelming and I thinkthis points up an error in the original planning."
"A question has come up about the line of consultation andresponsibility for Deans compared with the resource groupstructure. Originally Deans were to be responsible directlyto the Deputy Vice-Chancellor (Academic) for non-resourceacademic responsibilities. Consulting with thepro-vice-chancellor was related to how new proposals couldbe funded from the group. Now there seems to be an attemptto blur this and to say that Deans are responsible onacademic matters first to the pro-vice-chancellor whichdiminishes the line of command on academic matters to thetop of the University. Some recent writings includingAcademic Board papers seem to confirm it as a quiteimportant change."
c. Clashes between Resource and Academic Planning
"Seriously there are so many times when the system does notwork. For example academic decision making often hasresource implications and we make them knowing full wellthat we don't have the r, 3ponsibility for them. Departmentsincrease practical work here and there which will increaseresource needs and its done at Faculty meetings. After suchdecisions have been made it's hard for a pro-vice-chancellorto tell a faculty of wall over 100 people to go back andstart again."
"Yo; are seeing decisions made which will have resourceimplications - and major resource implications - and thepeople who make the resource decisions are not involved in
42
PAGE 41
the first decision. That's happening right across theUniversity - its not limited to (my) faculty. A Dean cannotsay to a Department 'you can't do that because it will costthe group more money and we're not going to give you moremoney.' He has no power to say that but that's what heshould be saying."
"The main problem is artificial separation of resources asndacademic matters. Pro-Vice-Chancellors and Deans should becombined in some way. If you had, say, nine full time SuperDeans with academic and resource power I think theUniversity would work much better. At the moment theworkload of Pro-Vice-Chancellors is much less than Deans."
d. Role of Central Committees
"The Academic Board has been emasculated to some degree bythe mysterious Academic Resource and Planning Committee(ARPC) that obviously has great powers but doesn't seem tobe established by Statute, described anywhere, and seems tobe understood only by those who sit on it."
"It (ARPC) has become the most important sub-Senate part ofthe University's decision machinery, and I don't knowanything about it - or far too little - for what is clearlya vital part of he system."
"I worry greatly about the function of ARPC.Pro-Vice-Chancellors are making subjective decisions to lookafter their own groups and often they're wrong decisions.There's something wrong with the way decisions are made."
"You need something like ARPC - what is the point of theAcademic Beard? - its influence has lessened. It's onlyadvisory and its advice can be ignored."
"I don't want to have to fight against any attempt to makethe groups a series of mini Universities. You need acohesive whole but somewhere centralisation must give way todecentralization."
"Tne admissions procedure is more cumbersome than I wouldlike e.g. procedure for rarring miscellaneous students orspecial admissions are too involved and cumbersome. Mypreference would be for such decisions to be the province ofFaculty."
Suggestions for improving `he functioning of the University as
seen by Heads and Deans are implicit in many of the comments included
43
PAGE 42
in the preceding sections. Three basic positions seemed to underpin
the emphases provided by the interviewees. These related to whether
the individual had strong feelings for or against the restructuring.
One submission strongly urged a return to what was essentially the
former system. One or two strong supporters of the new structure were
very positive with an occasional reervation. The remainder generally
reacted in a mixed way with recognition of perceived improvements and
reservations about perceived deficiencies. Almost all suggested some
structural amendments or a clarification of procedures and roles in
certain areas. The general flavour of comments appeared to vary with
the level of outside funding available to the particular Departments.
Those who received most of their money from external grants appeared
to be more impatient with the new system than those relying more
heavily upon group resources. This was because increases in
administrative loads and perceived lack of clear avenues for some
decisions were more annoying when the associated resources were seen
as marginal in the total context of the Department.
From an overview of the reactions a number of observations can be
made.
i. The very clear improvement in some areas of decision making makesfor extra sensitivity to perceived deficiencies elsewhere. Theappreciative remarks about resource decisions under thejurisdiction of the pro-vice-chancellors stand in contrast tocomments on matters that were seen to lack a similardecisiveness. Heads of Departments collectively defined severalareas where they felt the decision making procedures were eitherinadequate or not sufficiently explicit. These areas included.
44
PAGE 43
General Staff . Refurbishment . Costly ItemsMinor Works . Space . FurnitureDecisions on tenurable appointments and ChairsResource allocation to cross group enterprises.
ii. Both Heads of Departments and Deans spoke of the need to alignresource allocation and academic planning more closely. In themajority of cases the faculty and group structures were seen as
uncomfortable bed-fellows.
iii. A very definite need was seen for the clarification of the rolesof central committees outside the groups and faculties.
(a) Committees which retain their former titles but which havehad their roles altered e.g. Academic Board and StandingCommittee.
(b) New and important committees such as the Academic Resourcesand Planning Committee.
It was clear that Heads and Deans were uncertain about the actualscope of the powers of such committees and that they feltdisadvantaged because of this. Better channels of informationwould have been greatly appreciated.
iv. There has clearly been a great increase in the adminiscrativeload at all levels of the University. It has not been obviousfrom any interview that administrative loads have been lessenedas distinct from altered. Mention of duplication, proliferationof meetings etc. suggests that the effectiveness of therestructuring is uneven. The efficiency of centering certaindecision making with Pro-Vice-Chancellors and Group Councilsneeds to be matched in other areas of the structure.
v. The co-operative/competitive balance between resource groups andbetween departments within resource groups is clearly a delicateissue.
Within the competitive framework two elements of resourceallocation at group and department level were in evidence asunsolved problems.
(a) How to arrive at figures for cost/student ratios within thevariety of departments and groups?
(b) What planning mechanisms will enable resources to beacceptably shifted across departments and between groups asneeds and demands change?
45
PAGb 44
PART 2: THE RESOURCE ALLOCATION MODEL
The preceding sections have sought to identify successes and
concerns associated with the restructuring and have pointed to some
areas that should be considered in a review of the whole. The data
discussed in the earlier sections of this report can be considered as
encompassing two main themes. The first theme has to do with the
operational struoture of the university and its effectiveness across
the university community.
The second theme encompasses decision making principles as
distinct from decision making procedures and machinery. The question
remains as to what principles of resource allocation are most
appropriate in a competitive system, where needs and demands in
different parts of the system change with time. From comments by
members of each of the groups that were interviewed, the competitive
aspect, is clearly a dominant feature. Heads of Departments and Deans
referred to the competition of departmar0;a1 submissions at Group
Council level. Pro-Vice-Chancellors clearly relayed the same message
with respect to competition between resource groups.
"There will be competition between Group Councils to righttraditional wrongs."
"We all recognize that when it comes to resource changedecisions for next year the Groups must be weighted againsteach other."
"We clearly have to work out some way of shifting resourcesto take account of planned decisions and developments".
46
PAGE 45 41
Not explored in detail in this project is the competition for
resources between centrally funded authorities, such as the Library
and the academic resource groups.
A Resource Allocation Model
Resource Groups as competitive operations have a generic
component, in the sense that, different situations contain the same
essential structure although they vary in detail. The allocation
model describes a situation in which several groups compete for
resources from a central source. As needs within tae groups change,
in response to influences from their environments, the balance of
relative advantage/disadvantage varies. The purpose of constructing
the dynamic model was to explore the effects of alternative policies
with a view to identifying those policies that appear more effective
in achieving satisfactory group performance. In its present form the
model is written in such a way as to portray the competition between a
set of resource groups for available central funds. With minor
adjustments, the model also describes the interaction of individual
departments within a resource group.
Since the purpose of the model is to describe the characteristic
behaviour of a system of competing groups, the precise number of
groups is not of great importance. The simplest system that contains
the necessary competitive structure, is a three group system. Adding
more groups serves only to add parallel structure with additional
detail resulting only in greater complexity. No additional
47
PAGE 46
behavioural characteristics are generated as can be inferred from the
feedback structure which includes all distinctive loops within the
three group system.
Model Structure
The model describes a system of resource groups that compete for
central funds, subject to variations in student demand and
within-group costs, as well as variations in the quantity of central
resources available. At the beginning of each calendar year, the
student population is augmented by a new intake that can be adjusted
to reflect varying enrolment policies, based on resource/student
ratios. Average enrolments are then updated and form the basis for
future funding applications to the Federal Government. Funds in the
form of central (controlling) resources are received. The actual
amount is determined by projections from past average enrolments
modified by external policies that the government may choose to
impose. Provisional allocations are made to the Groups on the basis
of their projected enrolments or according to one of the several
alternative policies provided for in the model. If the central funds
made available to the groups have been cut (or augmented) from those
planned for, or if changes in enrolment patterns have occurred, the
basic allocation may over-allocate or under-allocate the available
resources. In this situation an adjustment is made to the Group
allocations so that all funds are committed. The adjustment procedure
may be based upon alternative criteria, such as proportional
enrolments or proportional group dinauvantage. The Group disadvantage
48
PAGE 47
is calculated in the form of a ratio each year in terms of group
resources and average enrolments. The Group funds now allocated form
the resources for the following year, when the cycle begins again.
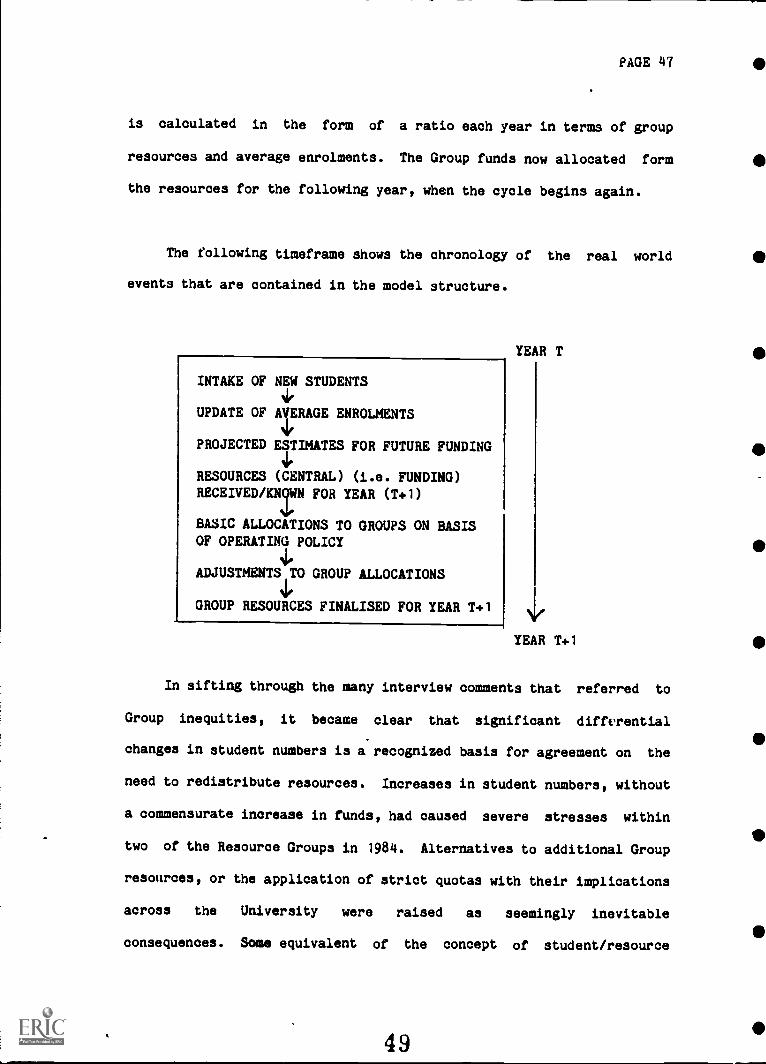
The following timeframe shows the chronology of the real world
events that are contained in the model structure.
INTAKE OF NEW STUDENTS
4e
UPDATE OF 9ERAGE ENROLMENTS
PROJECTED ESTIMATES FOR FUTURE FUNDING
RESOURCES (CENTRAL) (i.e. FUNDING)RECEIVED /KNQWN FOR YEAR (T+1)
BASIC ALLOCATIONS TO GROUPS ON BASISOF OPERATING POLICY
ADJUSTMENTS TO GROUP ALLOCATIONS
GROUP RESOURCES FINALISED FOR YEAR T+1
YEAR T
YEAR T+1
In sifting through the many interview comments that referred to
Group inequities, it became clear that significant differential
changes in student numbers is a recognized basis for agreement on the
need to redistribute resources. Increases in student numbers, without
a commensurate increase in funds, had caused severe stresses within
two of the Resource Groups in 1984. Alternatives to additional Group
resources, or the application of strict quotas with their implications
across the University were raised as seemingly inevitable
consequences. Some equivalent of the concept of student/resource
49
PAGE 48
ratio clearly underlies thinking that compares resource groups with
respect to funding adequacy. A rapid rise in student/staff ratio,
followed by a persistence at the higher value, has been the background
for comments relating to emerging inequities. Similarly, the
admission that a reduction of student numbers over time will reduce
resource claims, is connected to the overly favourable
student/resource balance that would otherwise occur. It is noted that
the question of COST/WSU in different groups and departments is a
continuing issue as technology changes the traditional cost weighting
associated with certain courses.
It is an assumption that elasticity is an important property of a
system variable, such a student/staff ratio. Such a variable fulfils
an impor*ant role in that it behaves as a "shock sorber." Rigid
quota systems can always be devised to constrain enrolments to within
a pre-determined upper limit. However the flexibility of a system in
responding to new enrolment trends, and in particular, in recognizing
the need to distribute resources away from a declining area, is
inhibited by too much control. A major achievement of a resource
allocation mechanism is to be able to damp down extreme variations in
variables such as student/staff ratios that occur as a result of
student enrolment surges. This amounts to devising policies within
which, elasticity is retained, but which control the variations
endogenously. Since Group resources include, but go beyond staffing,
the concept of student/resource ratio is introduced as a more general
concept than student/staff ratio.
50

PAGE 49
Causal Diagram
Figure 1 contains a causal diagram for the model structure. For
simplicity only group 1 variables are shown and where applicable links
from other groups are shown by means of broken lines. The policy
switches represent decisions made by policy makers and activate
criteria for alternative resource allocation mechanisms. They are not
switches that are activated by system conditions during the course of
a simulation. The loop structure of Figure 1 that is amplified in
Figure 2 (a) - (d) describes basic allocation procedures. Other links
become operative if the concept of an adjustment allocation is
introduced. Adjustment allocations can take the form of supplementary
funding as might occur if additional funds are made available, or cuts
in funding if less funds are received than were W.anned for.
A detailed discussion of the major model equations is provided in
Appendix B and complete model documentation in Appendix C. A
description of the main structure shown in the causal diagram now
follows.
The APPLICATION RATE is defined in terms of the qualified
applicants seeking places. To provide for a variety of input
conditions a range of options is made available in this exclenous
factor. Provision is made for the application rate to include
conditions of
51
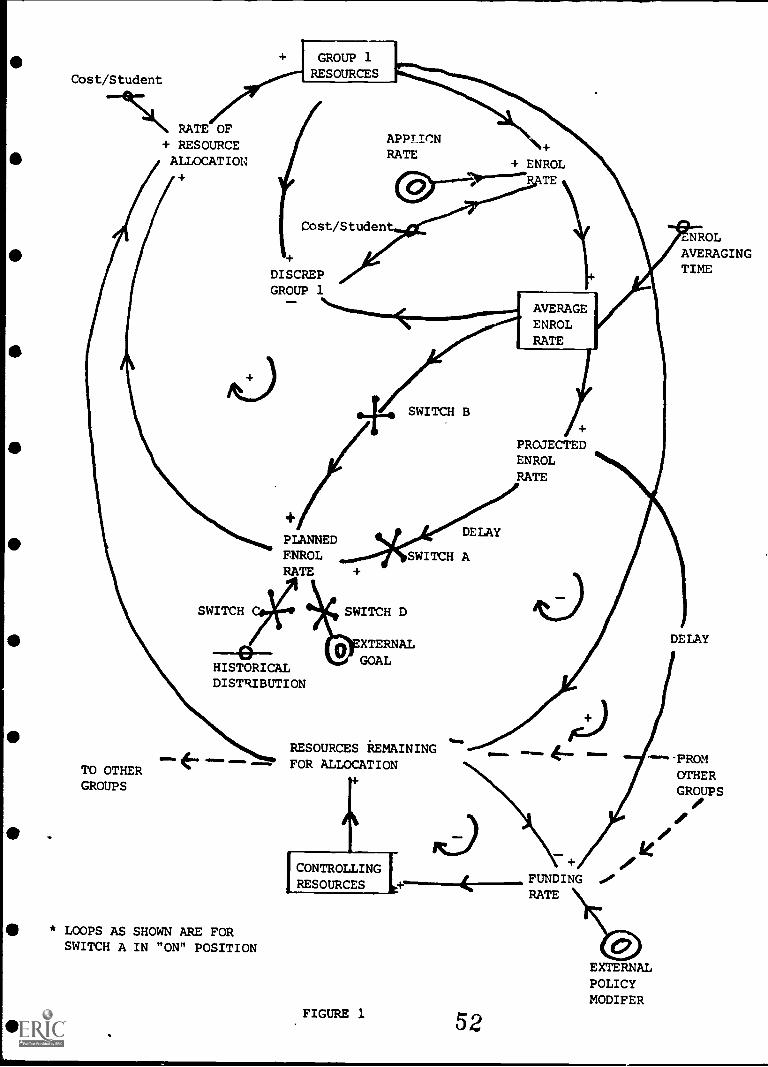
Cost/Student
.--4C411\ RATE OF+ RESOURCEALLOCATION
TO OTHERGROUPS
APPLICNRATE
+ ENROLTE
Cost/Studen
DISCREPGROUP 1
vousimma....1
+ SWITCH B
DELAY
AVERAGEENROLRATE
PROJECTEDENROL
RATE
NROLAVERAGINGTIME
SWITCH A
SWITCH SWITCH D
DELAYXTERNALGOAL
HISTORICALDISTRIBUTION
* LOOPS AS SHOWN ARE FORSWITCH A IN "ON" POSITION
RESOURCES REMAININGFOR ALLOCATION
CONTROLLING It
FIGURE 1. 52
FUNDINGRATE
OTHERGROUPS
0'
IF
d,
ACd'
EXTERNALPOLICYMODIFER
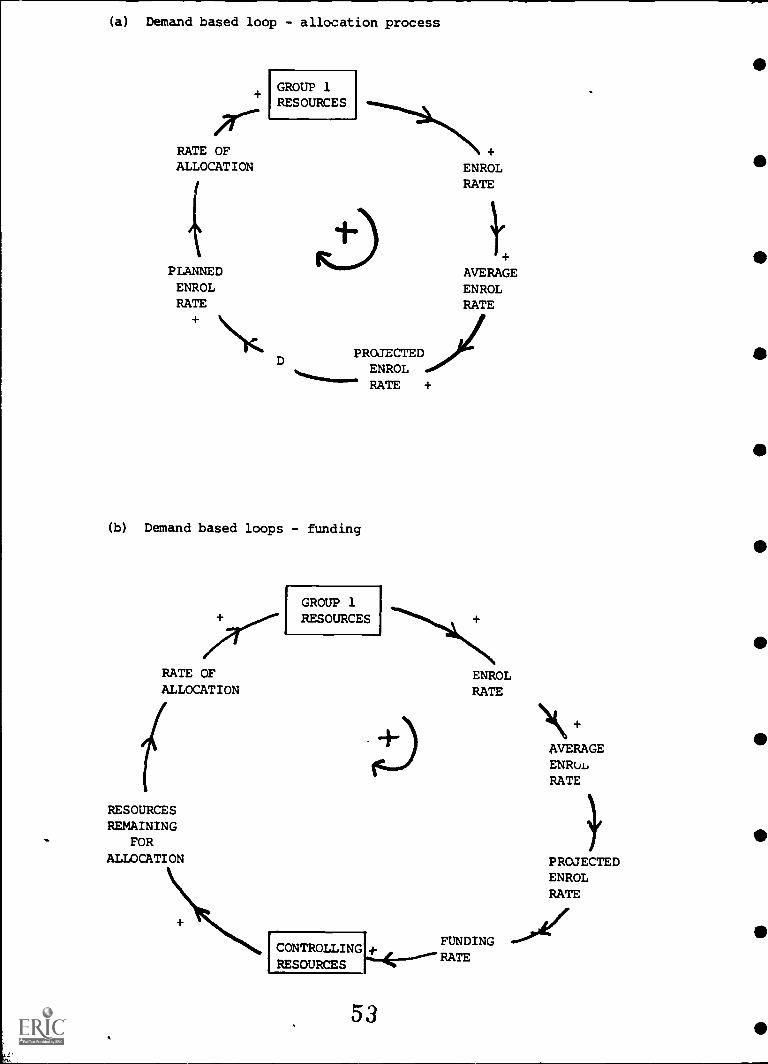
(a) Demand based loop - allocation process
GROUP 1RESOURCES
RATE OFALLOCATION ENROL
RATE
PLANNED AVERAGEENROL ENROLRATE RATE
\\VC PROJECTEDD ENROL
RATE +
(b) Demand based loops - funding
GROUP 1RESOURCES
RATE OF ENROLALLOCATION RATE
(RESOURCESREMAINING
FOR
ALLOCATION
I.....4(CONTROLLING . t---RATE
FUNDING
RESOURCES
53
AVERAGEENROLRATE
PROJECTEDENROLRATE
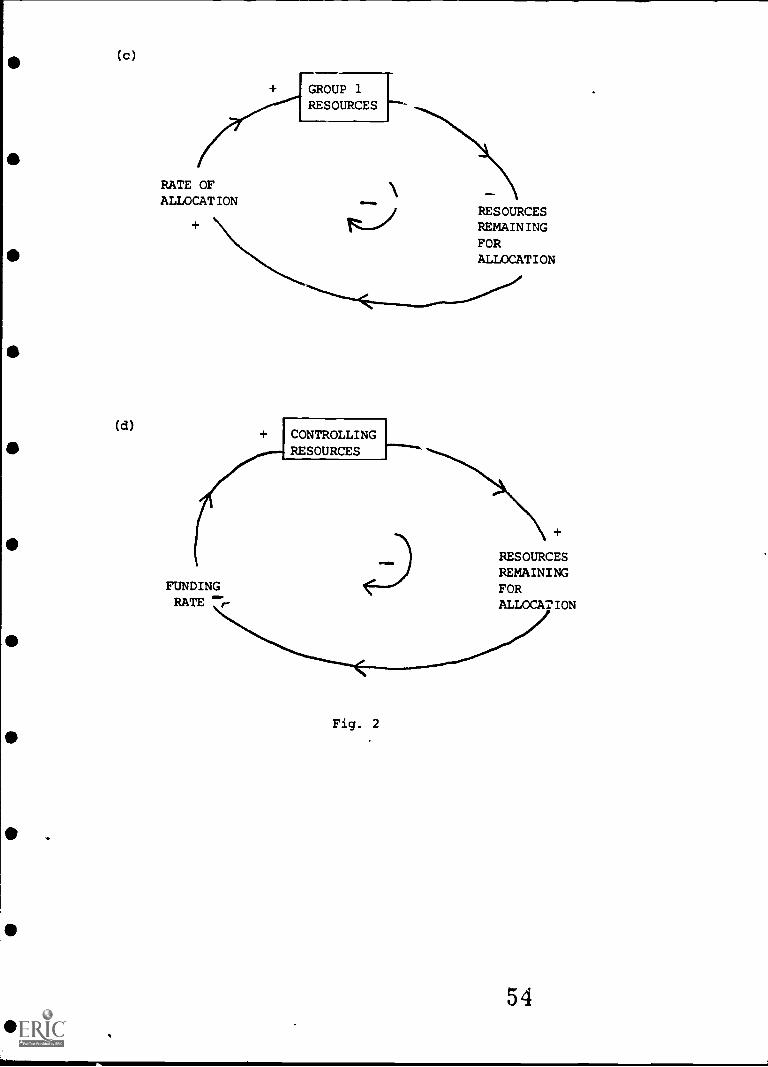
( c )
( d )
RATE OFALLOCAT ION
+ REMAIN ING
FORALLOCATION
GROUP 1RESOURCES
RESOURCES
+ CONTROLLINGRESOURCES
FUNDINGRATE ...r
Fig. 2
+
RESOURCESREMAININGFORALLOCATION
..-°#..../
54

J
[GROUP 1
PI:SOURCES
RATE OFALLOCATION +
PLANNED ENROLRATES
RESOURCES LEFTPOS/NEGSWITCH
Fig. 3
55
SUM OF PLANNEDENROL RATES +
i'. ------ -- OTHER
GROUPS
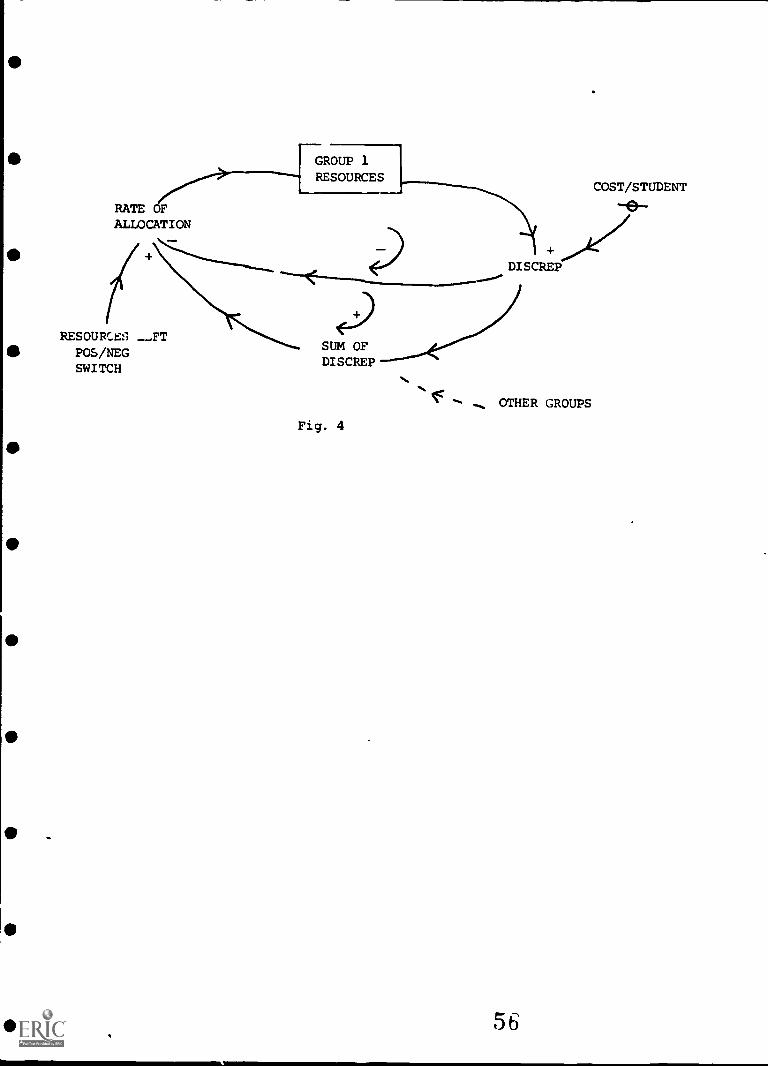
0 GROUP 1RESOURCES
RATE OFALLOCATION
COST/STUDENT
-1.}-
DISCREP.°°/1////............
RESOURCE:; -FT41 POS/NEG
SWITCH
SUM OFDISCREP
Fig. 4
F - .... OTHER GROUPS
56
PAGE 55
(a) steady intake and/or shock
(b) exponential growth
(c) per iodic(sinusoidal) variation
(d) generalised table input
The ENROLMENT RATE describes the entry of those students accepted
into courses. It is expressed as the minimum of the application rate
and the maximum number of students that the faculties are prepared to
accept. In equilibrium the COST/WSU has the accepted "normal" value
for the appropriate department or group. If the average amount of
money available per student is less than this, then enrolment will be
higher than "normal" relative to the resources. As the average
cost/student decreases it means that available resources are being
spread increasingly more thinly, which will be associated with a
reduction in the quality of education and a rise in staff work loads.
(For this purpose all resources are aggregated). A critical value of
COST/WSU exists which provides an absolute quality cut off. If this
critical value is reached, there can be no further enrolments unless
the resource position is improved. Under normal applicant pressure
(except in courses with rigidly enforced quotas), students are
enrolled and the average COST/WSU ratio allowed to drift downwards.
This downward drift is also evident by a corresponding rise In
student/staff ratios. When the critical value is reached an enrolment
limit is imposed unless further resources become available. In a
situation of declining enrolments all applicants can be accepted and
in some cases the cost/student ratio will be more favourable than the
57
PAGE 56
"normal" value. These conditions will make the Group relatively
favoured and render it vulnerable to having resources taken away from
it.
Since COST/STUDENT (or COST/WSU) is a measure of the resources
consumed in educating a student it will vary among departments and
groups. The model variable is an aggregated representative value
which can be regarded as typical of a Group. Provision is made for
the "normal" value of the cost ratio to be varied between, and within,
model runs. Step changes, exponential growth, and arbitrary table
function changes are provided for.
The critical ratio (or Group discrepancy) measures the relative
disadvantage/advantage of the Group. The equilibrium value is set at
1 when resources and enrolments balance according to the accepted
"normal" cost/student applicable within the Group. If the average
enrolment increases faster than the Group resources these resources
become spread more thinly and the Group discrepancy takes values 4; 1
- a condition of disadvantage. Similarly values ,> 1 represent
conditions of relative advantage with respect to "normal" conditions.
The behaviour of the respective discrepancy variables are key
indicators of the effectiveness of resource distribution policies.
The CONTROLLING RESOURCES represent the pool of central funs
that are made available for competitive allocation to the Groups.
They are generated by a FUNDING RATE and allocated to groups. The
58
PAGE 57
FUNDING RATE is determined on the basis of the PROJECTED ENROLMENT
RATE derived from enrolment data at an earlier time, modified by
amendments that the funding authority may choose to impose (EXT). A
variety of modifying options are provided for
(a) base allocation + step change
(b) exponential growth (or decline) of funds
(c) ramp growth of funds
(d) arbitrary table input to funding rate.
For example the step function provision enables the modelling of say a
10% cut or boost in projected funds. The ramp function is used to
represent rigid goal-based funding, in which feedback from the
existing system is overridden. Together with application rates and
cost components the external policy modifier represents the exogenous
inputs to the model.
PLANNED ENROLMENT RATE is the basis of the disbursement of basic
allocations to Groups. It refers to the number of students for which
the Groups are funded and can differ from the projected enrolment
rates that form inputs for funding submissions. Some of the interview
data refers to history or tradition in the allocation of funds to
competing parties. Since this model seeks to inform as to the likely
impact of policies, a variety of procedures for basic resource
allocation are provided through switches A to D. This amounts to
modifying the features of projected enrolments by e.g. using
historical precedent or planned development in arriving at a final
59

PAGE 58
outcome for planned enrolments for a particular year.
Basic allocations of central (controlling) resources to the
Groups are modelled to include the following alternatives
(a) distribution based upon historical precedent
(b) distribution based upon historical precedent modified by
subsequent movements in average enrolments.
(c) distribution based upon planned enrolments in which the planned
enrolments may themselves be determined by:
(i) projected enrolments based upon the dynamic or moving
history of the system
(ii) goal based enrolments as when a period of planned growth is
determined over time.
(d) distribution based upon current average enrolments
(e) a combination of several of the above
Feedback Structure
Figure 2(a)-(d) contain the most important loops that determine
the behaviour of the model whose basic structure is represented in
Figure 1.
Loop (a)
This loop contains the variables that fo,n the basis of enrolment
projections and future allocatic: mechanisms. An increase in
enrolment rates in group 1 leads to an increase in the average
60
PAGE 59
enrolment rates observed as typical of conditions in the group. This
increase, projects forward to increase the planned enrolment rate
which leads to an increase in resource allocation and hence to the
group resources. The increased group resources now tend to support a
further increase in enrolment rates as the positive cycle is
completed.
Loop (b)
This loop represents the mechanism whereby funding is related to
projected student numbers. An increase in enrolment rates increases
the average (observable) enrolment rate typical of the group, which
tends to increase the future projected enrolment rate and hence the
rate of funding as a future demand-based on projected numbers. (This
demand based funding rate can be modified by the external pc-tides of
the funding body). An increase in funding rate increases the total
amount of controlling resources available, and hence the amount of
resources available for allocation to groups. This increase in turn
increases the rate of resource allocation to group (1) which now tends
to support a further increase in enrolments. This loop is also a
positive cycle.
Loop (c)
This simple direct negative loop simply affirms that as group
resources are increased, fewer central resources remain for
allocation, and hence the rate of allocation Is reduced. This in turn
61
PAGE 60
tends to reduce the amount of group resources as the negative cycle is
completed.
Loop (d)
Loop (d) reflects the circumstances whereby unspent resources are
"lost". An increase in the quantity of controlling resources tends to
increase the amount of resources remaining unallocated. An increase
in funds not spent, will in turn, reduce the rate at which funds are
received and hence, to a reduction in the quantity of available
controlling resources.
Note: Other loop structures become operative with the activation
of various combinations of the switches A-D. Sume such mechanisms are
described in the discussion of model detail in appendix B.
Adjustment Allocations
As indicated previously if the available central resources differ
in quantity from those planned for an adjustment to the basic group
allocations will be necessary. Two alternative aujustment procedures
are represented in Figure 3 and 4 based respectively of proportional
criteria with respect to enrolments and group discrepancies.
Adjustment Loops
1. Enrolment based (sample loop): resources negative
62

PAGE 61
If RESOURCES LEFT after the basic allocation is negative, then
groups lose resources in proportion to the level of their planned
enrolments. If the basic allocation is in terms of planned
enrolments, then this represents a pro-rata reduction and could be
considered a single resource allocation decision. There are however,
other opportunities for adjustment e.g. by the use of reverse
feedback. This would occur if having made the basic allocation on the
basis of planned enrolments, it is argued that in any adjustment those
with the largest basic allocations can afford the least cuts. This
would distribute the resource-paring operation so that groups with
larger numbers would take proportionaatly lower cuts effectively
reversing the pro-rata mechanism. In either case the upper and lower
loops have opposite polarity so that the loop that allocates in
proportion to the weighted enrolment is undermined by the loop that
weights the allocation according to the conditions in all groups.
If RESOURCES LEFT is positive then there is opportunity to
recognize recent moves in group needs by distributing the excess in
proportion to average enrolments. Average enrolment rates, and the
sum of average enrolment rates should replace the planned enrolment
rate variables in the loop structure. Again the feedback structure
consists of two comoenaating loops with the net purpose of
redistribution in favour of grcups with increasing enrolments.
2. Discrepancy based (sar,.e loop): resources negative
If RESOURCES LEFT after the basic allocation is negative then
63
PAGE 62
groups lose resources in proportion to the value of their discrepancy.
This means the most poorly favoured group (lowest DISCREP) loses the
least. In this case the upper loop is negative and its influence in
favouring groups with low discrepancies is undermined by the influence
of the lower (positive) loop in which the discrepancy contributes to a
denominator factor in the proportional removal of resources.
If RESOURCES LEFT is positive then groups gain additional
allocations in proportion to their inverso discrepancies. This
ensures that the least favoured group receives proportionately the
most in any further allocation. The loop structure when redrawn with
inverse discrepancies and sum of inverse discrepancies has two
opposing loops in which the effect of the loop that distributes in
proportion to inverse discrepancy is undermined by the loop that
weights the allocation according to the conditions in all groups.
Note: The polarity of the dual loops comprising the adjustmentmechamism reverse according as to whether the resources remaining forallocation are positive or negative.
In the examples that we have shown, the basic allocations are
assumed to have overcommitted the central resources that are available
so that cut backs are necessary. With negative resources, an inc ease
in the rate of allocation to a group is equivalent to a reduction in
the amount removed. Hence in Figure 3 with a proportional policy
based on enrolment size, increases in enrolments will lead to
corresponding pro-rata reductions so the upper loop is negative. The
effect is mitigated by the lower positive loop as discussed
64
PAGE 63
previously. (Similar arguments apply within Figure 4.) If additional
resourc3s are made available the pro-rata policy will favour the
larger enrolments and the upper loop in Figure 3 will be positive and
the lower loop negative.
Simulation Experiments
More than 100 experiments have been conducted with the structural
model. These experiments have involved the combining of alternative
cost and enrolment inputs with various allocation policies. In
particular, the behaviour of the model has been examined under
conditions of enrolment step changes (shocks), exponential growth,
ramp growth and periodic fluctuation. A representative selection of
model run outputs has been included for illustration. It should be
emphasised that the wide variety of alternatives tested seeks to
provide information on policy implications across a much broader
spectrum of conditions than would pertain to any particualr
institution such as the University ,"f Queensland. It is noted however
that essentials of the local situation are included in the simulation
experiments.
It is not important that a dynamic model of this type should be
initialised and parameterized with values that are numerically equal
to those within the institution being modelled. Of much greater
importance is the structural validity of the model. The model is
started in equilibrium with a uniform application rate of 5000
students per group, or, in runs where application rates differ of
65
0 PAGE 64
ONO, 5000, 4000 students respectively. The "normal" costs/student
are set at $500 when group costs are equa' and $600, $500, $400 when
the "normal" costAtudent is assumed to differ according to group. A
simulation time of 15 years has beeniselected although a 10 year
period would have been adequate. The stability and behaviour of the
model was tested initially by means of enrolment and cost shocks.
This involved the introduction of step changes in application rates
and in "normal" cost/student values within the groups after the model
had been started in equiliorium.
The reference mode behaviour requiredeto be replicated by the
model is the sensitivity of student/resource ratios within groups to
alterations in student demand. The modehltd shown to generate this
mode of behaviour and is then used to test policies for their capacity
to redistribute resources in response to changing conditions.
si .
Step inputs (enrolment shocks) are used initially to the
stability of model behaviour. However, it is noted that while such
inputs are typically' used for this purposeEalone, it also happens that
the problem addressed by the model, is just that of a system, subject
to surges in demand- (positive and negative) distributed unequally
across groups. Hence the model behavidur under enrolment shock
provides useful information for policy evaluation in addition to its
role in testing model stability. Again, it is emphasised that the()
output of dynamic models should be interpreted at the behaviour mode
level rather tnan at the level of numerical detail. It is changes in
PAGE 65
the qualitative nature of the behaviour generated by a model as a
result of altering policies, and the direction of the movement of
numerical output that forms the basis for interpretation. The testing
by shock inputs typically overstates the severity of similar effects
when set in the context of actual real world conditions. It can be
noted that the reduction of resources for a declining group will
normally be damped by effects such as tenured staff commitments.
It was found that the relative characteristics of the policies
are preserved when modest exponential growth, or ramp growth is used
instead of enrolment shocks to generate student demand, and this
consistency across a variety of input types is a key factor in both
model and policy evaluation.
Basic Experiments 1-6
These simulate behaviour for a variety of policy mechanisms using
step changes of enrolment rates to generate stress.
Additional Experiments A-H
These are representative of the range of experimentation
conducted, with variation in both type of enrolment input and in basic
and adjustment allocation policies.
Reading the Output
Of the many variables tabulated and/or plotted just six have been
67
PAGE 66
chosen for display. These are the values of the group resources and
the critical ratios (measure of disadvantage) for each group.
GR1, GR2, GR3:
CRAT1, CRAT2, CRAT3:
The values at t=T are the group resources
for year T+1
These variables measure the resource/student
ratio in the groups for each year.
A brief description and interpretation of the output is provided for
each run. Printouts of tabular output for 36 of the model variables
are available from the authors. Many of these are redundant in that
they have been printed out as checks that the model equations are
functioning correctly, and they do not particularly illuminate
discussion.
6
MODEL RESPONSE TO ENROLMENT SHOCK (1 - 6)
1. Basic Allocation Policy: Based on historical distribution with weighting for relative
changes in average enrolments.
Costs/student (normal). in all.groups equal.
ENROLMENT SHOCK INPUT"
GROUP 1 : Step input of +20% at T=3
GROUP 2 : Step Input of 0%
GROUP 3 : Step input of -20% at T=3
Note: Behaviour of mod,..1 or a policy based on pure historical distribution weights
is more extreme (unsatisfactory) than for this run.
69
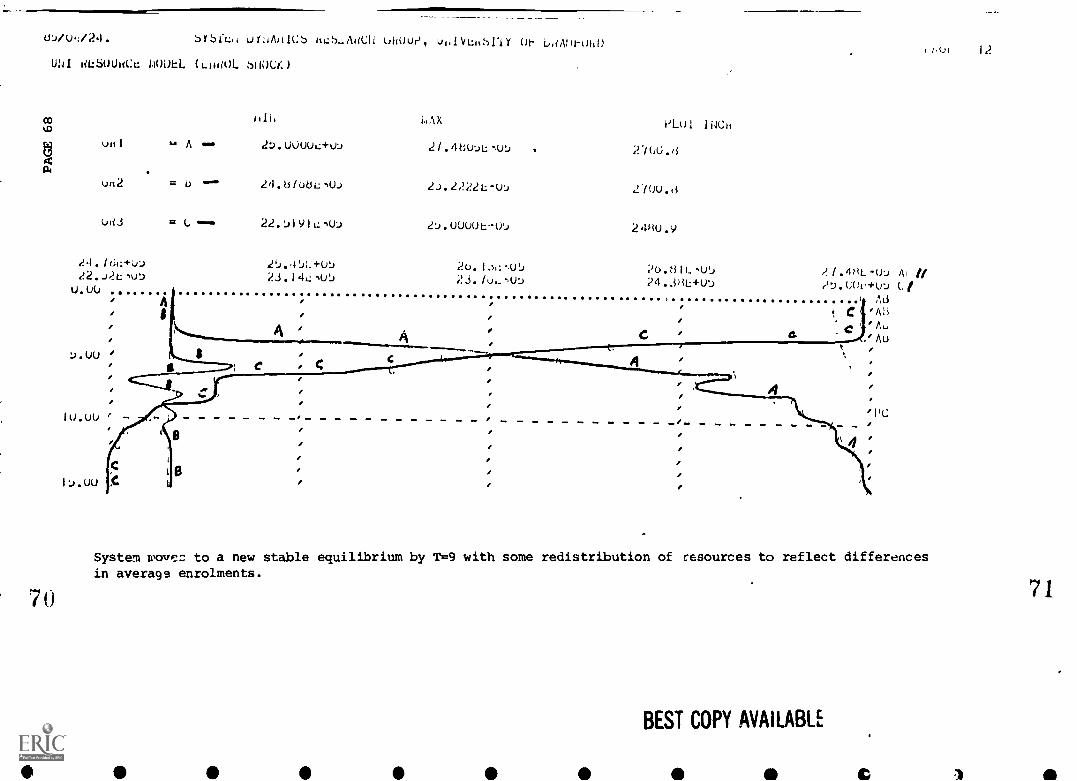
dVt.).:/24. brbiL,1 utNAl11Cb HL:S-AaCH uHouri, ul,I4LHSrtY Oh baAlit-OhO
UNI tiLSOUItCu 110D1. (LIOL SHOCK)
CO
aa,
70
A 2b.UUUUL+UJ
= 0 24.8(08LnUJ
= l OmM
21.46(4)Lt(PJ
2:J.UUWLI-UJ
Lol INCH
2700.d
270U.d
248u.9
.!4./61:+ul) 1t).41A.+Ut) 20. 1 ,.48L-tk.)22...)LnUt) 23.141;%ut, 23. 24.380-U5 e..).C(; +w,U.ut0
A0
C
di 'Au.. -7----- .
.UU ' t C A .. t C .
.. . .I . . .. . .
IU.Ute f I . ..
I :).U($
/PC
/1(...1
System wove= to a new stable equilibrium by T=9 with some redistribution of resources to reflect differencesin average enrolments.
BEST COPY AVAILABLE
71
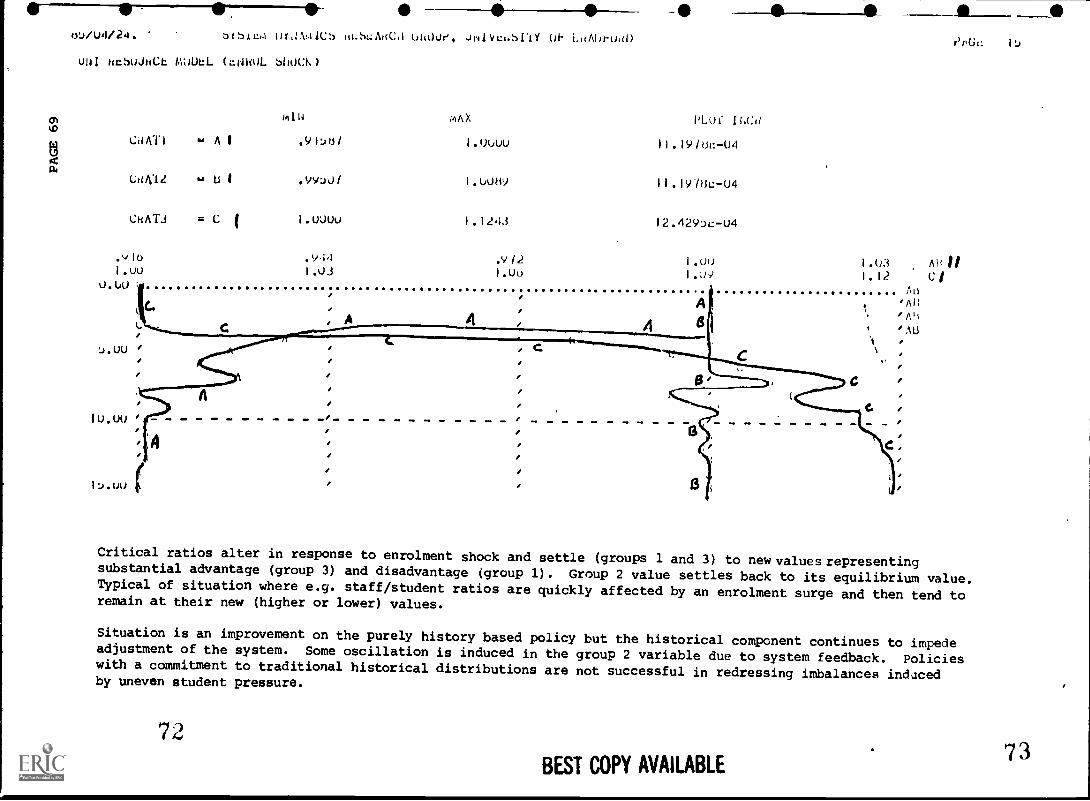
ot)/04/24.
- 1111_____
brbilt.1 oY,;A:41C;) iu.SuAKC I uli0Jr, JNIVL:htlnY LaAhroaD PpGi: It)
uNI ucSUJnCh (L:NliOL blIOCK)
CRATI
CHA11
CHAT)
.,410
I.uu0.U0
Iu.uu
It). 00
kak mAX
= A I .91:A/ 1.0000
= 13 I .tYY:)0/ 1.U0H9
= C ( I.0000 1.1243
.94 .9 121.03 I .Uo
e
A A A
PL0C
I1.191Or.-04
11.19/6L-04
12.429..)L-U4
1.001.09
1.03 All I
1.12 C/AU
Critical ratios alter in response to enrolment shock and settle (groups 1 and 3) to new values representingsubstantial advantage (group 3) and disadvantage (group 1). Group 2 value settles back to its equilibrium value.Typical of situation where e.g. staff/student ratios are quickly affected by an enrolment surge and then tend toremain at their new (higher or lower) values.
Situation is an improvement on the purely history based policy but the historical component continues to impedeadjustment of the system. Some oscillation is induced in the group 2 variable due to system feedback. Policieswith a commitment to traditional historical distributions are not successful in redressing imbalances inducedby uneven student pressure.
7 )4
BEST COPY AVAILABLE7 3
2. Parallel run to run 1 with "normal" costs/student different in the different groups.
group 1 : group 2 : group 3 = 6 : 5 : 4
costs costs coats
7 4
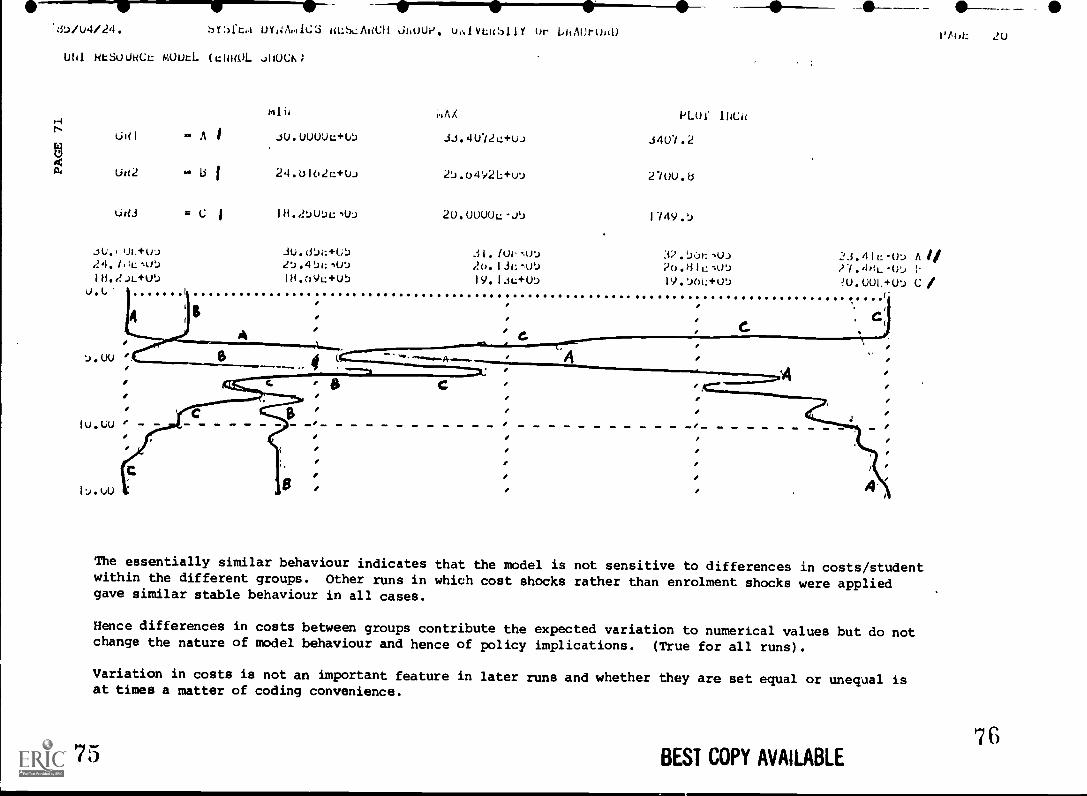
.:SD/U4/ 24 .
N
a
sthfc. UYIA.IC3 UhoUP, ue.LVLWIL1Y or LhAlirm0
UN! FILSUUKCe. mOutL (LINWL JIOCK:
A i
if 1
= c
JU.UUUUu+UJ
24.U102c+W
18.27U7n:-.UJ
;.,AX
2'.).o4Y2 -u7
20.00u0u-ut)
PLUI IhCk
4407.2
270U.8
1749.b
l'Abt: 2U
.5U.4 Ut.+UJ 3U.WJI:l.WJ 31. /01.,U7 32.'Jb1:1U.) 23.41L'07 Ai/,4. /.1L ti) 2b.41:+u7 20.131:,qib 20.81c,W7 ?7.4HLWJ :113.2JL+uU IH.09L+U5 19.IJL+Ut) IV.D61:+ut, (.).001.+UD C /
u.0 c. .
. . C:
' C.. C.
D.UU c - ......,pc-----------7a. la--",----r----__A_ ,,
, ---- . , I0 0 C I I I0
e I
Iu.UU i v .
1
.
I . .
o I o
o1:).UU
The essentially similar behaviour indicates that the model is not sensitive to differences in costs/studentwithin the different groups. Other runs in which cost shocks rather than enrolment shocks were appliedgave similar stable behaviour in all cases.
Hence differences in costs between groups contribute the expected variation to numerical values but do notchange the nature of model behaviour and hence of policy implications. (True for all runs).
Variation in costs is not an important feature in later runs and whether they are set equal or unequal isat times a matter of coding convenience.
75 BEST COPY AVAILABLE7 6

W/u4/24. 'AJft:M 0YoAm1CS ULSLAHCH UhOU1', JIIIVLsibIlY Oh 1..10.0r01?0
u01 utSuJ44C4 /..00EL CadkOL 5I 1OCK)
m114 MAX 1-4.01 Ikelq
ertAll = A 1 .910!)2 I.uuuu 11.19744:-041
CHAT1 u' .Q9.201/ I.WoU 11.1974;h-04
CHAra a. Cl 1.UuUu' 1.1393 13.92ou14-04
.910 .944 .972 Lou 1.0.3
I.uu 1.03 1.07 1.10 1.14U.UU
P/Ut 23
Ai, it
CIAll
f 0#Aii
0
to...........................e.... ..2 0
6 'AU
*Jotiti # Cf
0 ot 0
I r
0 1
1U.OU ' . _ .
I 0
0 I
0
it).U0 0 /
Generally closely similar behaviour to the parallel run with equal costs - the variation induced in group 2is slightly stronger.
BEST COPY AVAILABLE
78
*I%
3. Resource distribution based on projected enrolments which are based on changes in averageenrolments over time.
Costs : variable from group to group
79

S
8VO4/24. if SYSitA UYNAhICS u-SuAUCH uauJp, 111.11/LIISIII OF UAD1 -Oill)
UNI HLSUovCc hUUL (LNhUL SHUCK)
JU.uUL+uu24.14t,Ut,It)./UL+ul)
U.OU
1(.1.U°
1:1.00
--Ai
= 13 I
= C
MIN mAX
io.UOUULIW
24.14U/L1UJ
It).1018L,w
24.39: ,USlo./81.:+u5
A
30.3372LW
25. 1229L-W
20.000Ut+UL)
24.o3L-.U5li.hDt+OL)
A
PLO!' INCI1
033-1.2
982.21
4298.2
34.1L)L,U524.88L+OD18.93L:4-UD
36.34L-O)25.12L+ub,W.GOL-0-05
C
GROUP 1 resources settle to new value by T=8 (damped oscillati(
GROUP 2 is caught in the adjustment to the shock
GROUP 3 undergoes similar variatior to group 1 -
The resource redistribution is considerably more
- substantial adjustment by T=6
Ab
PAUL 28
through system feedback but adjusts to a value near the original.
behaviour is damped oscillation.1--(3 a new equilibrium distribution.
effective than in the previous runs.
BEST COPY AVAILABLE
81
oh
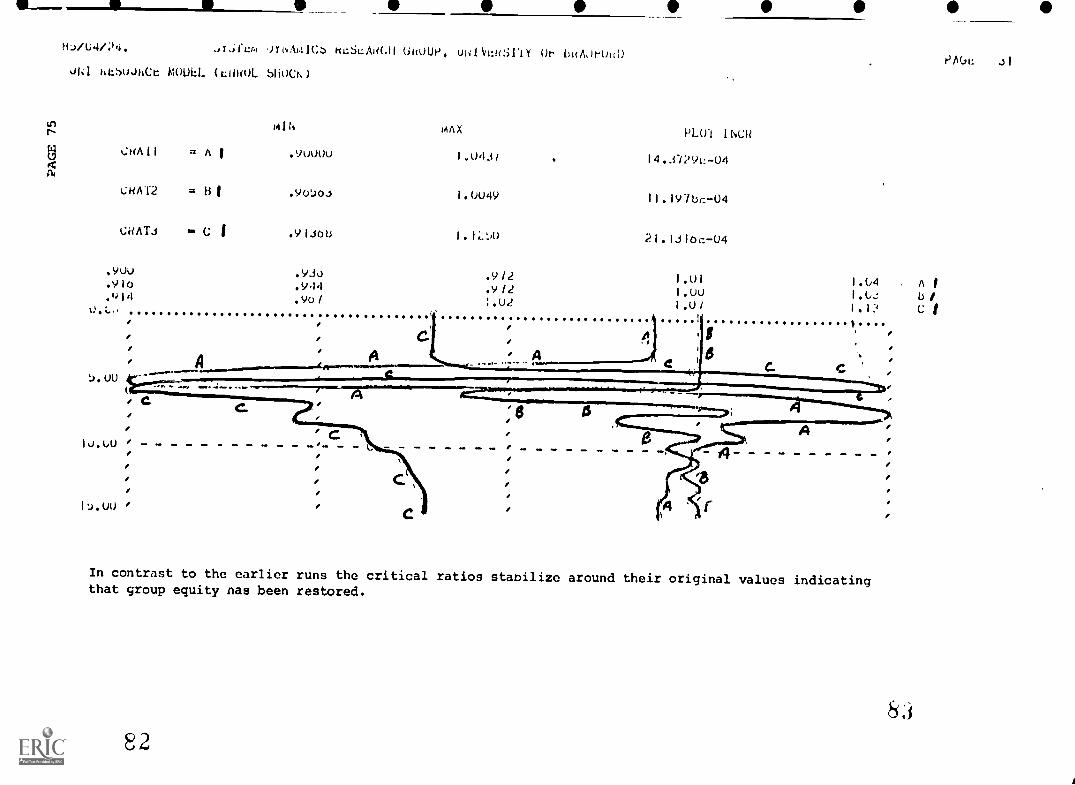
0 *
ti.J/U4/..)4. ,,I.iftzrA iioAmICJ RaSLARGH UkOUP, UNI4t:WinY Or birAorOliD
°NI riLoJriet MOUEL (LOHOL bliOCk)
oil ti mAX PLO-I I (CU
CHAII = A I .9W0U 1.04Jt 14.37?Vv-04
CHAT2 = 131 .Y050J 1.0U49 11.197bc-04
CRATJ ° C 1 .91Job 1.1i:50 21.1.316c-04
.90U
.910
.q14t:...
e
e
e
!).00(
e C
Iti.t.0 1
.
l'i.UU 1
In contrast to the earlier runs the critical ratios stabilize around their original values indicatingthat group equity nas been restored.
82
n
b/C
8,1
PAC' JI
4. Resource distribution based on projected enrolment (2/3) modifie0 by a weighting for currentaverage enrolments (1/3)
"Normal" costs/student equal across groups.
84
MI I A a
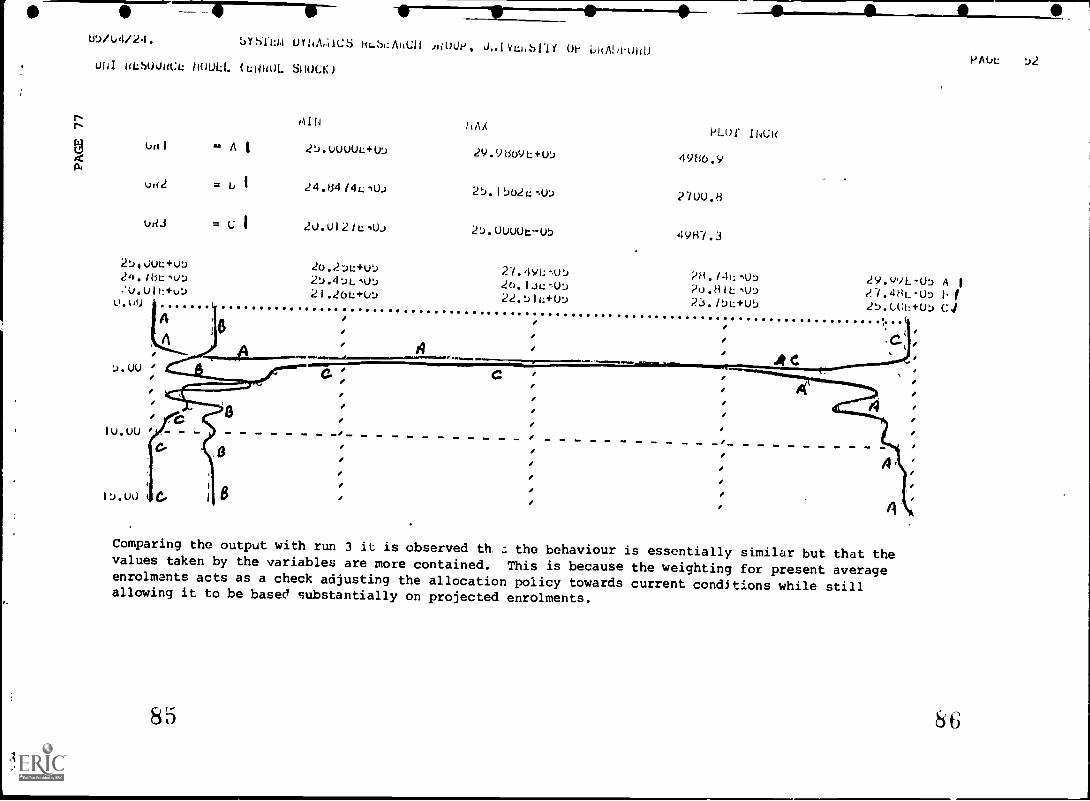
NN
ti4Ati
W/u4/24.
-1111r=111110-...-.)Y )1[I UYWIICS fiLbi:AltUll
'mode, 1/41.1VLI,1111Y OF LitAlft.uld)
UNI u0AWIICL hODL U.:01(UL SHOCK)
Urt I
un2
Ud3
AI
= L., 1
= c I
AIN
25.UUuUL+0..)
24.84/41.:103
2U.012/t1U3
20.2DO-u'J20.4t)L,wi2I.200-U5
0
liAAPLof INCH
29.9809L+u0 4980.9
25.1502i:-.u0 2700.8
20.00uUtu5 4987.3
21.49L-.(.)
20.1.3L-4P.)
22.5IL:+00
?H.14L,UD?0.81L,u.,23./5t+u5
29.9/L-Us A I
?7.48L-Up 1, I25.GOI+O5 C4
Comparing the output with run 3 it is observed th :. the behaviour is essentially similar but that thevalues taken by the variables are more contained. This is because the weighting for present averageenrolments acts as a check adjusting the allocation policy towards current conditions while stillallowing it to be based substantially on projected enrolments.
85
c 0
PAW: 52
6b
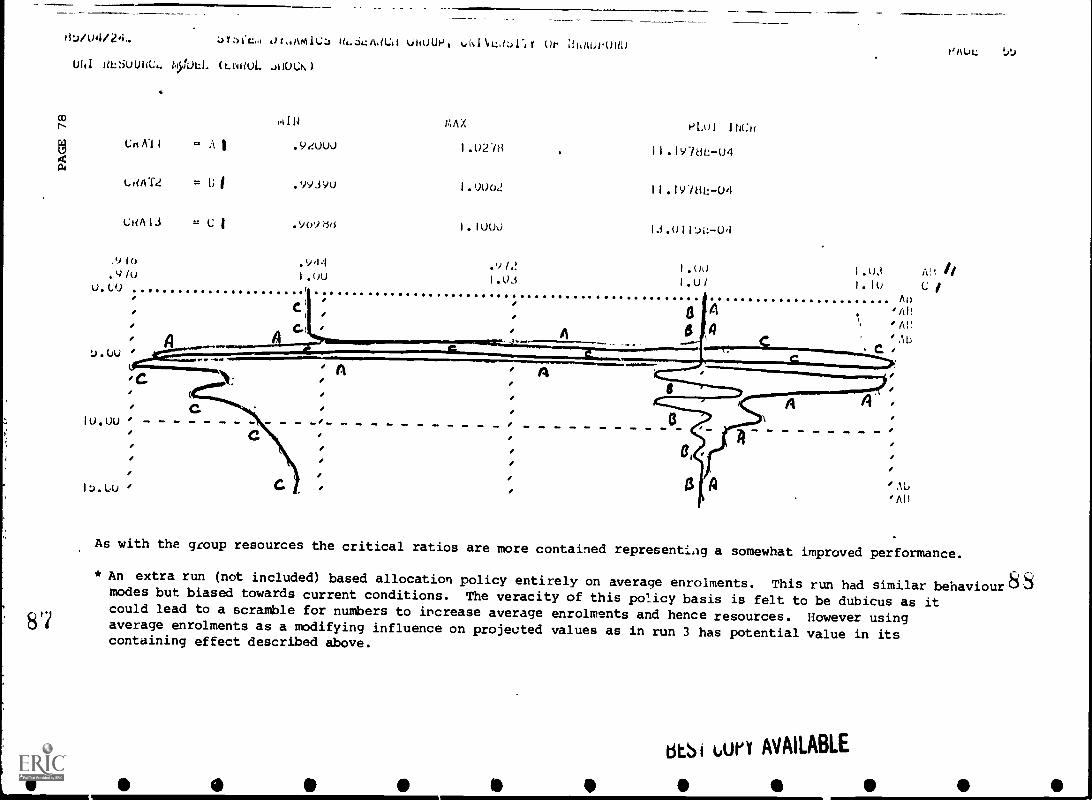
WJ/04/24.. JY:Ifeoi UhOUP. 0t iihAUVOQD
Uhl ULSUUliCL ItVULL (LNUOL .A1000
'Do
N
ill4a
en Al I
LaAT2
CHA1J
..it 1
= b i
= C 1
4114
.91WU0
.9Y39U
.9oWid
V.AX
1.02-18
1.0002
1.1000
8'i
,910 .944 .Y L!.Y(0 1.UU 1.03
U. CU .f
C(
1U.0u
4A
A
t'AUL: bt)
PLO1 1J4C11
11.1Y-1ft-04
11.1978L-04
13.0111:-01
As with the group resources the critical ratios are more contained representiAg a somewhat improved performance.
* An extra run (not included) based allocation policy entirely on average enrolments. This run had similar behaviourmodes but biased towards current conditions. The veracity of this policy basis is felt to be dubicus as itcould lead to a scramble for numbers to increase average enrolments and hence resources. However usingaverage enrolments as a modifying influence on projected values as in run 3 has potential value in itscontaining effect described above.
bb k,UtlY AVAILABLE
I 41) I
5. Basic allocation of resources is based on external goal for student numbers
Funding is based on the external numbers goal. (RAMP functions)
This run should be viewed as a test of model structure rrther than a test of policy. The steadilydegrading system is due to adherence to a given policy in the face of totally unsuitable circumstances.As a test of structure it is noted that !mposition of extreme conditions should lead to extremebehaviour - and it does.
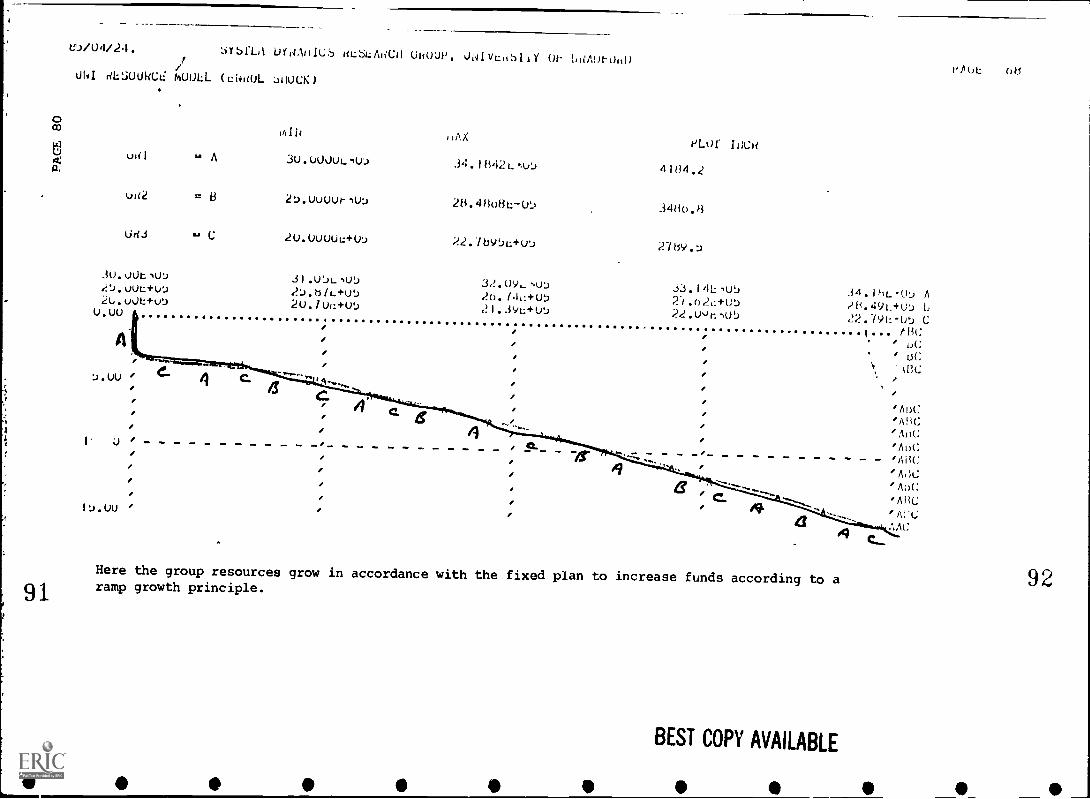
0CO
6a.
V.VU4/24.
UN! dLSUUkCi: MUOL
udl A
t.2d2 = B
Uri-S aa (;
.30.00LIO!)
2:).uOL+L.,2u.u0L+ut,
U,UU
A
DidAHICS riLSLAdCd
(Li4dUL :)OUCK)
3U.UUJOLIUJ
2t).UuUOr-,UL)
2U.UOUUL+U'i
31.O1)L-Ol,2:).h/L+Ut,2U./Oft+U5
UdOUP, JOIVud:AlY Of- baAur0.0
AX
.34.1842LtuL)
28.48o8L-U5
22.-ftsVt3L+ut.)
2o./4L:4-U5,?1.3VL+Ut)
PLOr Jocd
414,2
2-0$9.t)
33.14Lnut)
22.O,Jr.,ot)
VAOL o8
34.IhL-O._, A?H.4()L4O.J
22.79L-Ut, Cy... CRC' DC
OC
91
'
Here the group resources grow in accordance with the fixed plan to increase funds according to aramp growth principle.
BEST COPY AVAILABLE
C-
'A13('
'ANC'ADC'ADC
'ADC
'Ai L:
92
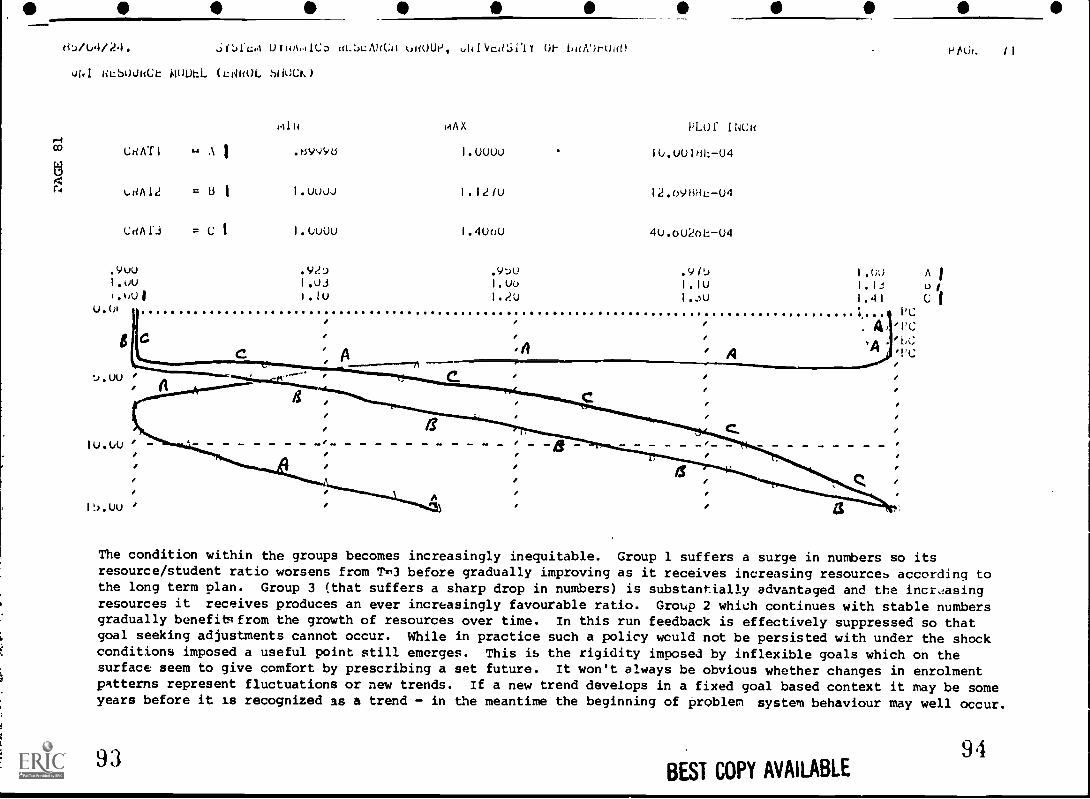
IW_Wk.4/24.
CO
4Ca
HSOJHCt }MULL (LOHOL SHuCK)
CliAT1
caAl2
CriA
as A I
= t3 I
= C
OROUP, ukiVcanY Uf bia)ruit0 PNL II
.4114 ktAX PLOf INCH
1.UUW
1.12/U
1.4UoU
1(..uUld1:-04
12.oYHHL-u4
4U.0U2oE-U4
.9UU .Y? .9tA.1 .9P_) 1.00 A Ii.uu 1.03 I.uo Liu I.Ii u1I OA) I 1.1U I.2U 1.ou 1.41 C f
u. ci I... PC. .
. Ai 'ye8 c , A .,i,k;
' ' 'PCe
...).UU '
e
'
e e .
.
13 c10.LoU ' e ' .
e e e e
e e /
0, .
it).(JU i e e
The condition within the groups becomes increasingly inequitable. Group 1 suffers a surge in numbers so itsresource/student ratio worsens from IN,3 before gradually improving as it receives increasing resources according tothe long term plan. Group 3 (that suffers a sharp drop in numbers) is substantially advantaged and the increasingresources it receives produces an ever increasingly favourable ratio. Group 2 which continues with stable numbersgradually benefitsfrom the growth of resources over time. In this run feedback is effectively suppressed so thatgoal seeking adjustments cannot occur. While in practice such a policy would not be persisted with under the shockconditions imposed a useful point still emerges. This is the rigidity imposed by inflexible goals which on thesurface seem to give comfort by prescribing a set future. It won't always be obvious whether changes in enrolmentpatterns represent fluctuations or new trends. If a new trend develops in a fixed goal based context it may be someyears before it is recognized as a trend - in the meantime the beginning of problem system behaviour may well occur.
93BEST COPY AVAILABLE
94
6. Each group has a different basis for allocation of resources.
Group 1 : on the bais of projected enrolments
Group 2 : on the basis of average enrolments
Group _ : on the basis of an externally determined growth goal (ramp)
Funding is on the basis of projected enrolments.
95
0
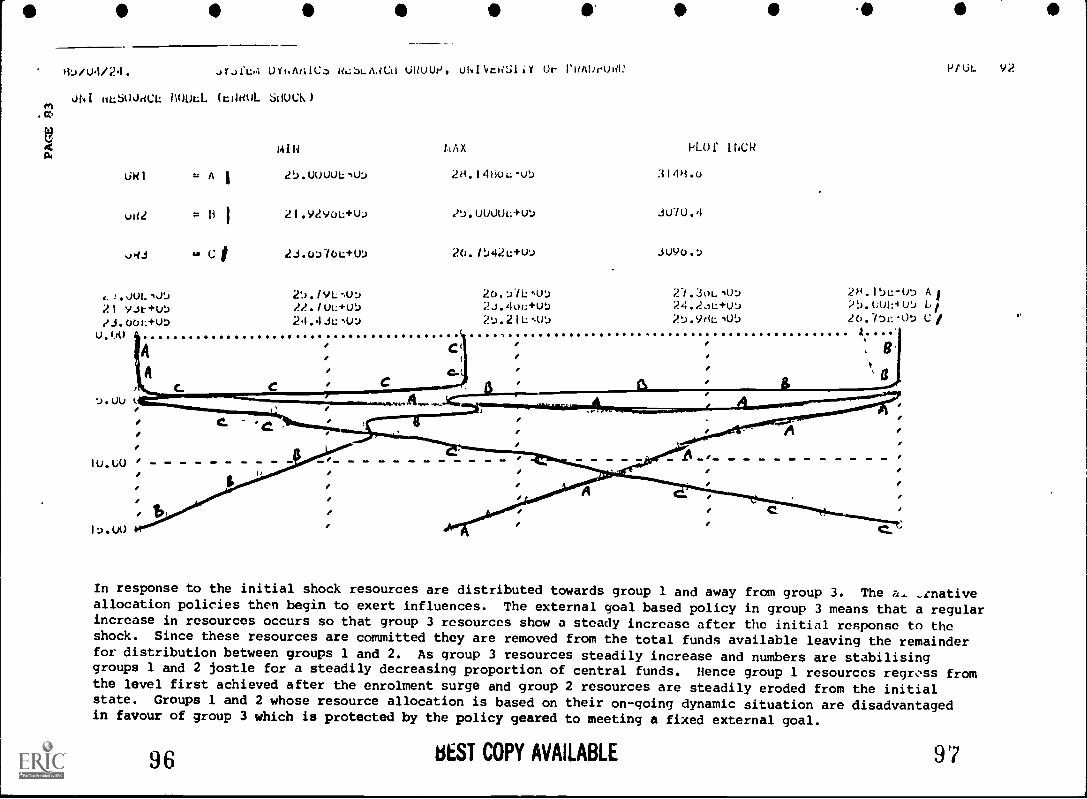
H.J/04/24. 01,011:A 14.1LA.g.:11 UULJUP uhIlitialliY Or rUAlirWW
J1,11 uLSOkidel: MULL (tdKUL SdUCK)
MIN
LAI at A I 25.UOUULJW
uit2 = 13 I 21.92,10L+LX)
oqJ ... C # 24.0:00L+W
c:.JULNJti;fl YJE-+U5
u.(10
2t)./YL..(r..)
22./UL+Ut)24.4.1(10;)
hAX
2H.148oL.(6
1:).OUUOL4t.)
20./to42L+Uu
20.1)71:*.W5
2.3.4ot:+W5
2t).21L..(5
PLO!' INCR
314H.0
J U7U.4
J UYO.
n.joLNU'D24.2.1L+WJ27.9HLNUI)
C,
I
2H.15L-05 A)25.1:0005 1.,/20.751: U5 C/
I
I
PtUL Y2
In response to the initial shock resources are distributed towards group 1 and away from group 3. The FA.,, _L-nativeallocation policies then begin to exert influences. The external goal based policy in group 3 means that a regularincrease in resources occurs so that group 3 resources show a steady increase after the initial response to theshock. Since these resources are committed they are removed from the total funds available leaving the remainderfor distribution between groups 1 and 2. As group 3 resources steadily increase and numbers are stabilisinggroups 1 and 2 jostle for a steadily decreasing proportion of central funds. Hence group 1 resources regross fromthe level first achieved after the enrolment surge and group 2 resources are steadily eroded from the initialstate. Groups 1 and 2 whose resource allocation is based on their on-going dynamic situation are disadvantagedin favour of group 3 which is protected by the policy geared to meeting a fixed external goal.
96 tiEST COPY AVAILABLE
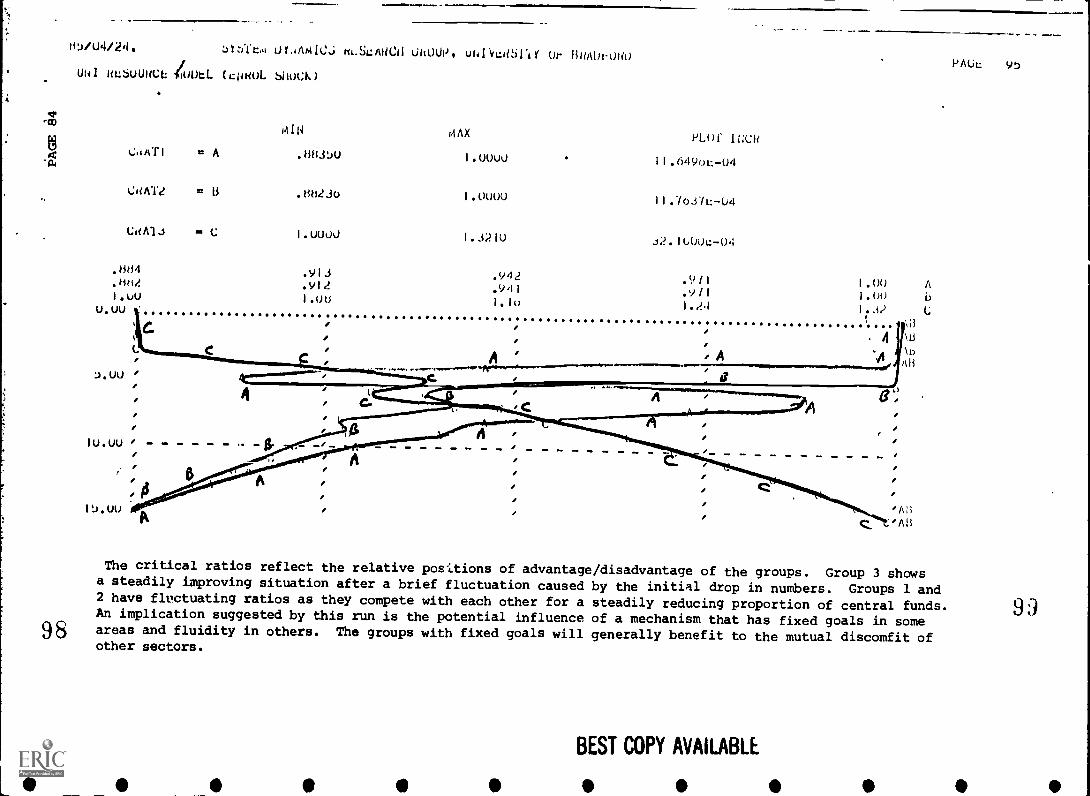
85/U4/24. :31';)Ttm 01.4AMIC.; hi..ScAded OhOUP, uI41,cdSCAY Or HUAOrUli0
U141 ULSUUUCL (cpuul. ShuCK1
1rqo
MIN
.(ATI A . 88.3w
PLOI ININCHU
: =
MAX
I'a
t;aAT2 = 13 .8823o 1.0uuU
CaAli ak C 1.0000 1.321U
98
C
:).00
.913
.9121.00
11.6490L-04
11.703M-04
j2.1GOuL-04
.942 .9(1 1.00 A.941 .9(1 i.001.10 1.2,1 1.J.)
A , A
Ir,
4
\;3
Ili
lu
PAUL 95
The critical ratios reflect the relative positions of advantage/disadvantage of the groups. Group 3 showsa steadily improving situation after a brief fluctuation caused by the initial drop in numbers. Groups 1 and2 have fluctuating ratios as they compete with each other for a steadily reducing proportion of central funds.An implication suggested by this run is the potential influence of a mechanism that has fixed goals in someareas and fluidity in others. The groups with fixed goals will generally benefit to the mutual discomfit ofother sectors.
BEST COPY AVAILABLE
(A) EXPERIMENTS WITH ENROLMENT SHOCK AND AMENDED ENTRY CONDITIONS
(1) Uniform enrolment shock of +20% at T=3 in all groups.
(2) Entry conditions (quotas) made more stringent in groups 1 (R11 = .95) and 2 (R21 = .85). (See Appendix B and C)
Value retained at 0.75 in group 3. R12 22
These parameters determine how many of an increased number of applicants will be givenplaces - see model equations.
(3) Resource allocation is on the basis of projected enrolments (weight 0.7) modified bycurrent average enrolment in groups (weighting 0.3).
(4) Adjustment allocation is a proportional policy based on enrolments.
100
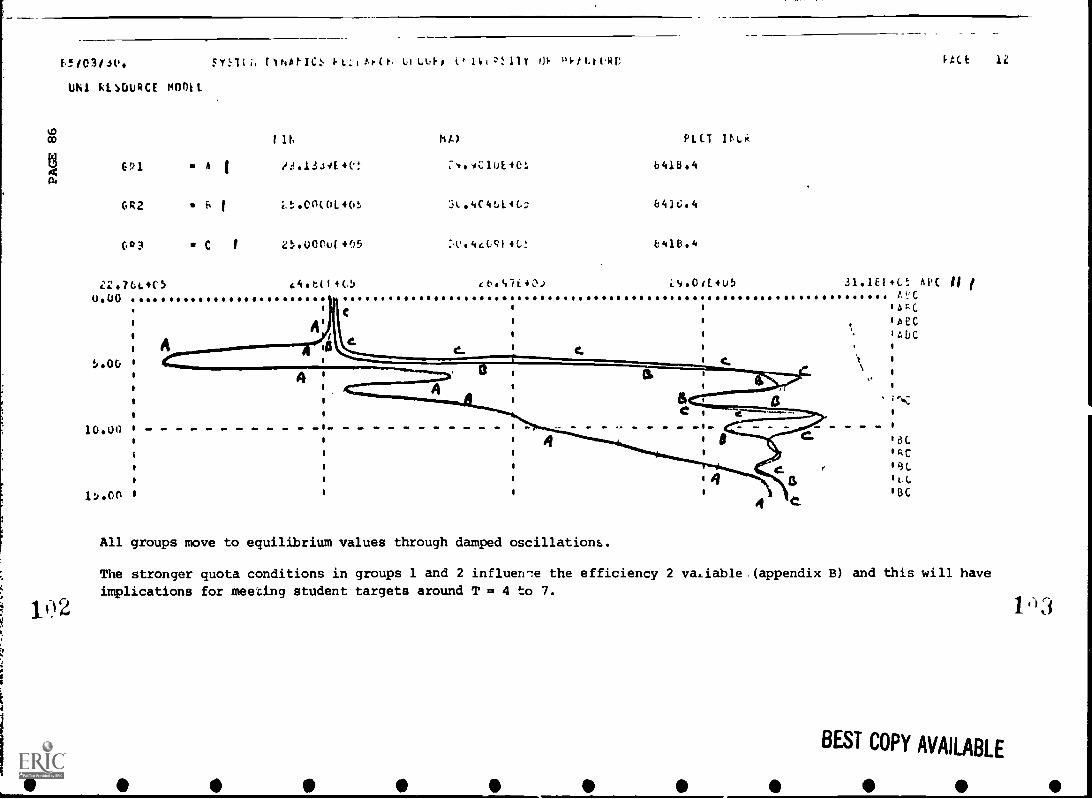
6`/03/ i(1.
Uhl 14.0URCE mnott
co
102
.5Y:1 1" Ors ?!. 11V "1./1.1- l'141;
I lts
621 A I 13.13A4E40:
GR2 f. f i.:600(01_46t,
603 C i 25.0°604'.0
tAitt1402267b1.40U.DO .
PLOT Doi
041004
6426.4
E4116.4
iS.01C4U5 31.1E1+Ct APCtPc
1 'ALL1
4 '
All groups move to equilibrium values through damped oscillations.
o
at
IOC1;C14L
IBC
FACE 12
The stronger quota conditions in groups 1 and 2 influen7e the efficiency 2 va,Aable.(appendix B) and this will have
implications for meeting student targets around T = 4 to 7.
BEST COPY AVAILABLE
113
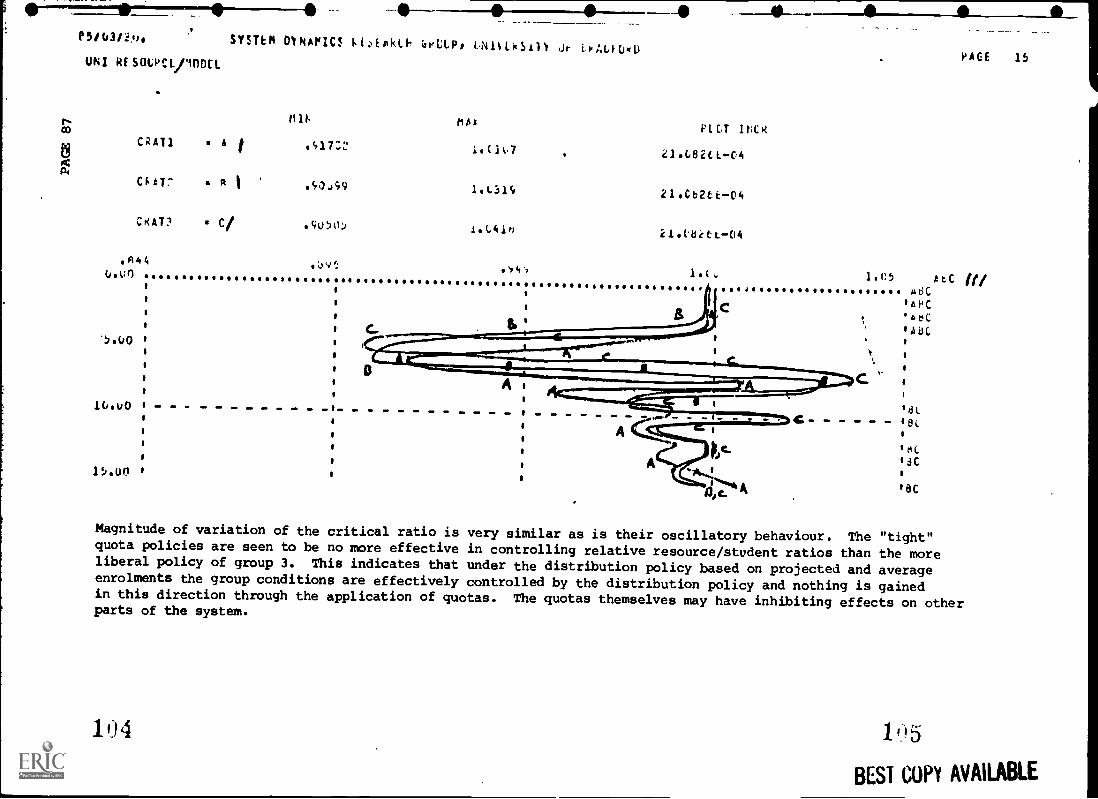
co
--f5/U3/!). SYSTLM D1NAPIC$ I 1,Epkh vPULP, ONI1Lk$111 Jr 1,0ALI04U
UNI krsupciprim
cRAll
C' T"
CRAT?
R44u.un
1
1
'5.00
IGu0 1
1
15,00
5,1 ci 9
',..$'4`)
MAOPICT
2lL82CL-04
21Cb2tEC4
21.ttrett-04
lot 1105
PACE 15
AtC ft/A6C
iaNC
.6tC
'PA
'HCig
lec
Magnitude of variation of the critical ratio is very similar as is their oscillatory behaviour. The "tight"quota policies are seen to be no more effective in controlling relative resource/student ratios than the moreliberal policy of group 3. This indicates that under the distribution policy based on projected and averageenrolments the group conditions are effectively controlled by the distribution policy and nothing is gainedin this direction through the application of quotas. The quotas themselves may have inhibiting effects on otherparts of the system.
104
di
1415
BEST COPY AVAILABLE
co(B) EXPERIMENTS WITH ENROLMENT SHOCK AND AMENDED ENTRY CONDITIONS
111 6
(1) Uniform enrolment shock of +20% at T=3 in all groups.
(2) Entry conditions (quotas) made more stringent in groups 1 (R11 = 0.95) and 2 (R21 = 0.85). (Appen3ix B and C)
Value retained at 0.75 in group 3. R12 R22
These parameters determine how many of an increased number of applicants will be given places -see model equations.
(3) Resource allocation is on the basis of projected enrolments (weight 0.7) modified by currentaverage enrolments in groups (weighting 0.3).
(4) Adjustment allocation is based on group discrepancies.

P5(C4/3.t.
UN1 RISUURCE mom.
03
:',!!Ttr
PIN
CO.P.
fqi
U1. 0.41.40.1
NLIi INCk
[13 041 A I ,0731 21C826L-04
CNA1? RI .C1%00 21026L-04
CR413 C .4034t 10a3 21.(82t1W4
.1.114,s .J,E 1.L
0.00
o
5.00 1
o
e
e e
luon 11
o
e
1.,.00 I o
AjC1 ABC
1 AU1APC
0,113;.,
1BC
IBC
1bC
PACE 23
The behaviour and amount of variation in the critical ratios is very close to that achieved using the enrolmentadjustment policy.
108 1119
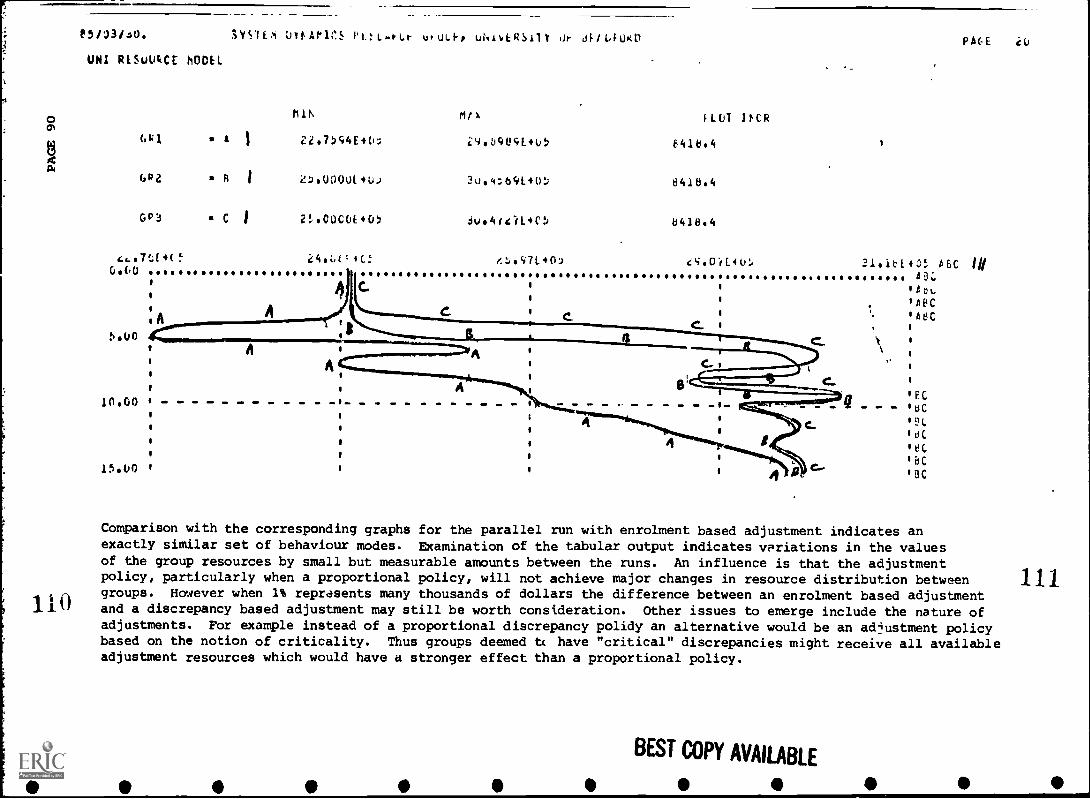
00
aa
110
e5/23/40. 3YS1LM Uit'APV.S PL: L$1.0- uNivkRSAV de J/L.FOUI PACE i0
UNI RISUVRCE hODU
611
6P2 p I
GP3 C
41-.71[4(!Go( )
IA A
NI\ Mth
22.7bC4E40::
2,0000i4U)
2t.0000E405
GLUT ItCR
e4111,4
8418.4
V438.4
c+.04140:
I
21.1E40:. A6C HIOa:,
Et%.
°ABC1A8C
°EC'OC
°N.t3C
let'BC8C
Comparison with the corresponding graphs for the parallel run with enrolment based adjustment indicates anexactly similar set of behaviour modes. Examination of the tabular output indicates variations in the valuesof the group resources by small but measurable amounts between the runs. An influence is that the adjustmentpolicy, particularly when a proportional policy, will not achieve major changes in resource distribution betweengroups. However when 1% represents many thousands of dollars the difference between an enrolment based adjustmentand a discrepancy based adjustment may still be worth consideration. Other issues to emerge include the nature ofadjustments. For example instead of a proportional discrepancy polidy an alternative would be an adjustment policybased on the notion of criticality. Thus groups deemed tc have "critical" discrepancies might receive all availableadjustment resources which would have a stronger effect than a proportional policy.
BEST COPY AVAILABLE
111
i
01 (C) EXPERIMENT: GOAL BASED FUNDING AND GOAL/PROJECTED ENROL BASED DISTRIBUTION
(1) SYSTEM receives applicant shock in all groups (=20%) at T=3
(2) Differential quotas apply as in experiments A and B.
(3) Funding is on a planned long-term basis - ramp function 2% per year flat.
(4) Resource distribution policy is matched to the funding - i.e. external goal determined accordingto a planned ramp increase in enrolments. However this policy is modified by a weighting thattakes account of student demand which may deviate from the externally set goal. The weightinghere is 0.3 for the goal and 0.7 for demand. (Another run with proportions reversed exhibited similarbehaviour).
(5) Adjustment policy is on the basis of enrolments.
113
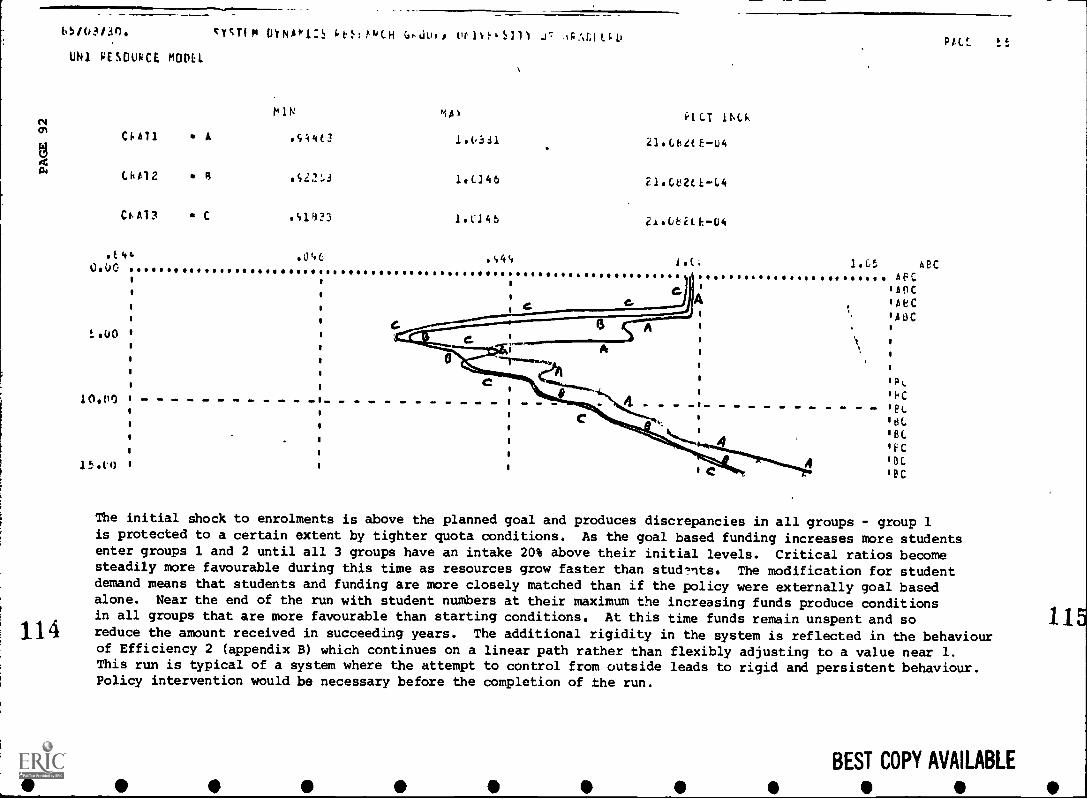
65/03/304 tYST1M WINAPI:S ;q:ttuCH Ge.kluir Utlt-h:1/11 ARAL10.11
UN1 PESCUPCE MODEL
114
MIN MAI PELT It Ck
CFAll A .5;4E3 21.(44(E--U4
ChE12 1.0146 21.0321.1G4
0413 C .S1923 1.0146 21oGE21h-04
4E44 .0460oUr.
.S4S 1.t:
S
1.c AECAFC
'AOC'AEC'AOCo
o
o
opt,
1hC4 . .11 ........
IBC
Sc E
IBC
'EC
PAU
The initial shock to enrolments is above the planned goal and produces discrepancies in all groups - group 1is protected to a certain extent by tighter quota conditions. As the goal based funding increases more studentsenter groups 1 and 2 until all 3 groups have an intake 20% above their initial levels. Critical ratios becomesteadily more favourable during this time as resources grow faster than students. The modification for studentdemand means that students and funding are more closely matched than if the policy were externally goal basedalone. Near the end of the run with student numbers at their maximum the increasing funds produce conditionsin all groups that are more favourable than starting conditions. At this time funds remain unspent and soreduce the amount received in succeeding years. The additional rigidity in the system is reflected in the behaviourof Efficiency 2 (appendix B) which continues on a linear path rather than flexibly adjusting to a value near 1.This run is typical of a system where the attempt to control from outside leads to rigid and persistent behaviour.Policy intervention would be necessary before the completion of the run.
BEST COPY AVAILABLE
115
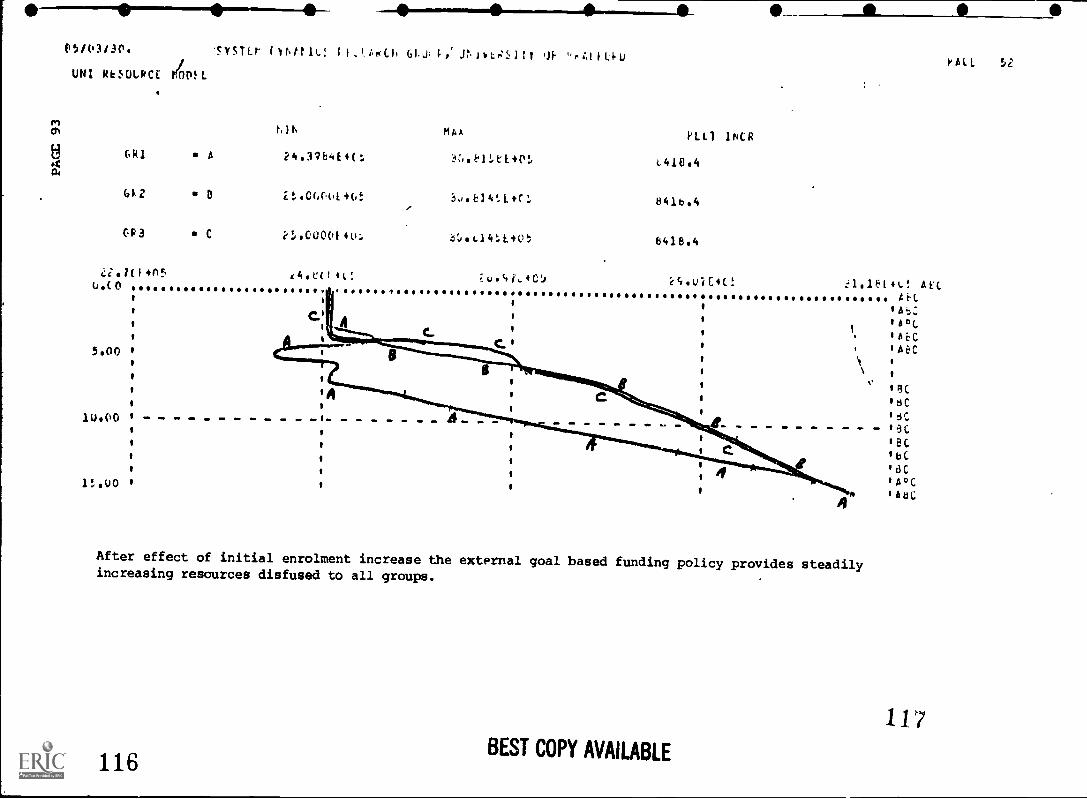
05/03/30. 'SYSTEr (Nhtt1L! 11.1A,sCh GL,J: t.; mAtILI.1.)
UNI REIkULPCI MODS L
hlh MAx
GR1 Aft
24.3/b' 4C 3.E.P...a+N,Coo
612
CP3
all 1NCR
0 2t.C600E+G! 3.b24:1.+(s. 841b.4
C il.0000/40: B:I.L14:140: 6418.4
zi./t14(15 t4.e0 4c.uo(0 iCsulEiCt
I
21.1b14.! AECArt.
liac
1AE,C
'ABC
IR(
1dC16ClacIBCIBC18C112C1AtiL
C.' o
5.00 1
o
1U.00 0
15.00 1, I 1
After effect of initial enrolment increase the external goal based funding policy provides steadilyincreasing resources disfused to all groups.
116BEST COPY AVAILABLE
117
11
PAIL 52
rn (D) EXPONENTIAL GROWTH IN ENROLMENTS
[1.3
4GROUP 1 : rl = 2% p.a.
GROUP 2 : r2 = 0% p.a. (NO CHANGE)
GROUP 3 : r3 - 4% p.a.
DISTRIBUTION POLICY : HISTORICAL DISTRIBUTION MODIFIED FOR AVERAGE ENROLMENTS
118
O

Ait5/C4/1. :1!11:, :,1;,A01.. ,,',c,.....0 P:AP, LI:11i.:.111 Jr OiAJil,ki VICE 2C
UN! RESCURCE MAR (Man. kNFIA% (IRON)
t D. rA'A PLO 1NCR
0(1 A I 3C.1.Q00140: voLIACE405 (320).0
GQ2 n1 I4.719G1.43=, itoUlt:E4V5 4111.2
R3 C ) 20.0000E405 2s,..,1.,6L.W., 9J41,.6
3o.tioLio 32,0!,14(! .4.10.4 ;.1.1:14L/9 Jr.20i405 424.4,1sni: 4:$40/140d cts!...0140:d ilft31.4(5 2t./(I+(-5 9 120.00-40t <1.34 401. cS.04.407 i7.01.#0.. 29.391 40:4 C 1O.U0 '
AC
% '4CA e o
o 'AC1 o
e
stAl 1 o oo Y 'AC
o)
So S e
S oo o e
ee
o e; 1
It1.i.0 1 oo
1
s8 I
11
1 1f
15.00 I1 t
1
Steady growth in resources as steadily increasing enrolments stimulate increased resources. Group 2 benefitsfrom the historical component of the distribution policy that allots a certain proportion of increasing fundsalthough the enrolment is stable.
119BEST COPY AVM' i 311
120
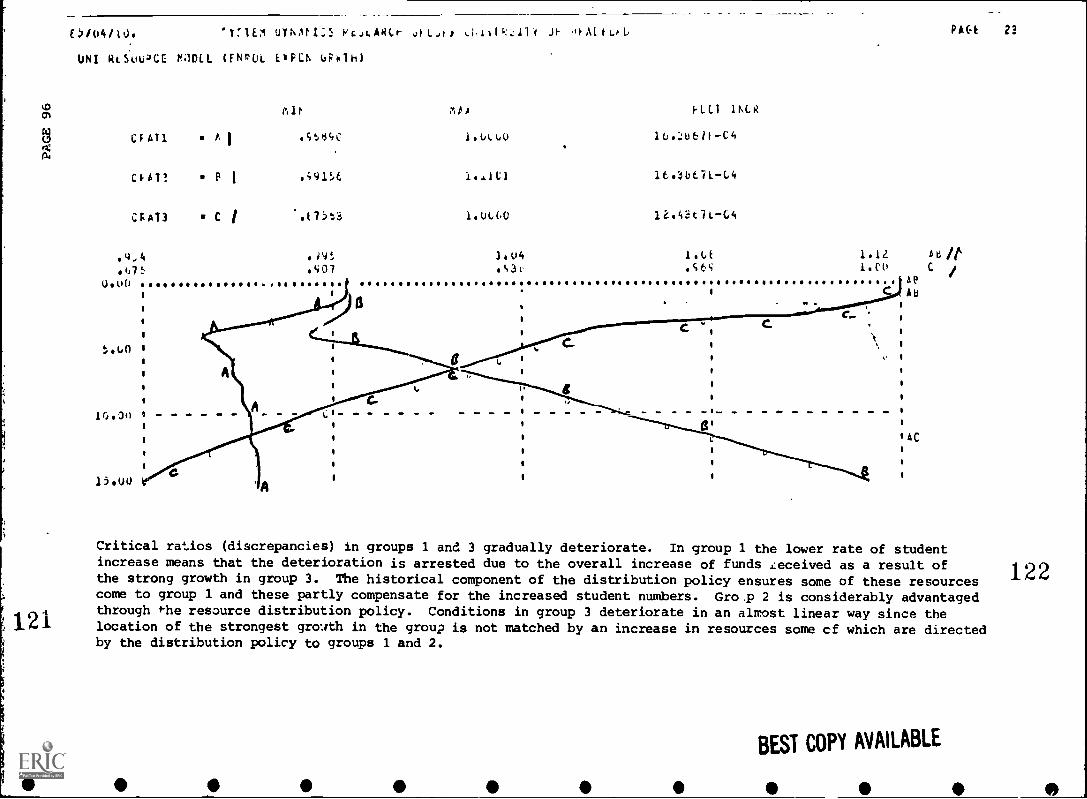
0/o4/0). .1:1Em PcJLARtr yfL,t, 0MIL.L,
UN1 RLSuLOCE MODLL (FNPUL E$PCIN 001h)
0
6 001 I
e.11,
.4td340
00? P
CJA13 C / .17513,
.4,41171,
uu0.407
-
1
1
1
1
:U0 $1
1
10.011 1 ------1
1
3 vit
.C3(
PIL1 1NLR
1 OA,S6c
15UU
8
....... 1- - - - -
1
PACE 23
1.12 eti /t
1.01 C /Ap
C AU
1t1
I
AC
Critical ratios (discrepancies) in groups 1 and 3 gradually deteriorate. In group 1 the lower rate of studentincrease means that the deterioration is arrested due to the overall increase of funds .,:eceived as a result ofthe strong growth in group 3. The historical component of the distribution policy ensures some of these resourcescome to group 1 and these partly compensate for the increased student numbers. Gro.p 2 is considerably advantagedthrough the resource distribution policy. Conditions in group 3 deteriorate in an almost linear way since thelocation of the strongest gro../th in the group is not matched by an increase in resources some cf which are directedby the distribution policy to groups 1 and 2.
BEST COPY AVAILABLE
122
DISTRIBUTION POLICY BASED ON PROJECTED ENROLMENTS
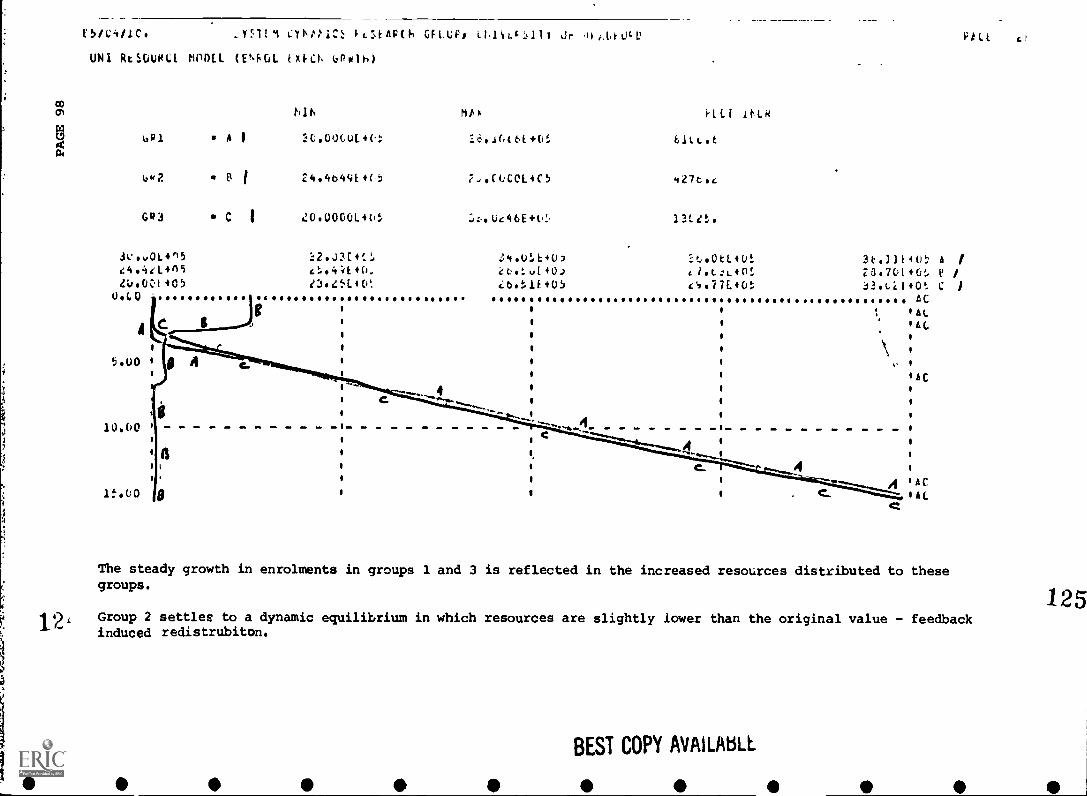
FS /C4 /1C. CYI,PHC: ;L:kaP(h GFLUF, Li..0e0Alt Jr '0..1.,t0C
UNI RtSUURCE MODEL (ENFGL FOCI` Otilh)
WM MI6 Milt
6 bpi A I 2C.00CUL4C: 16.16t6i+ULa
bk2 (I f 24.4b4IiE4C: 7d.CUCCIL4C5
GII3 C I C0.0000LJU: Lz...Ue46E+l,:'
12'
3L..v0L4n544.4114D52;.;.0:1405
UsLO
:2.J3E4E'dc:.44E4(1./3845Et(e!
A
5.00 I 0 A 1
1
10.00
1
1
1!...uo 9 1
FICf itqk
.1.L.OkL4W.
cltt.:L40:gtv.I7E4Ot
FILL ct
3F01140:: A /
23.7W+00, p /
B3.Lit+0! CAL
1 I A L
IAL
;
1 lAc1
1
;
1
,
A IAC°AL
The steady growth in enrolments in groups 1 and 3 is reflected in the increased resources distributed to thesegroups.
Group 2 settles to a dynamic equilibrium in which resources are slightly lower than the original value - feedbackinduced redistrubiton.
BEST COPY AVAILAUL
125
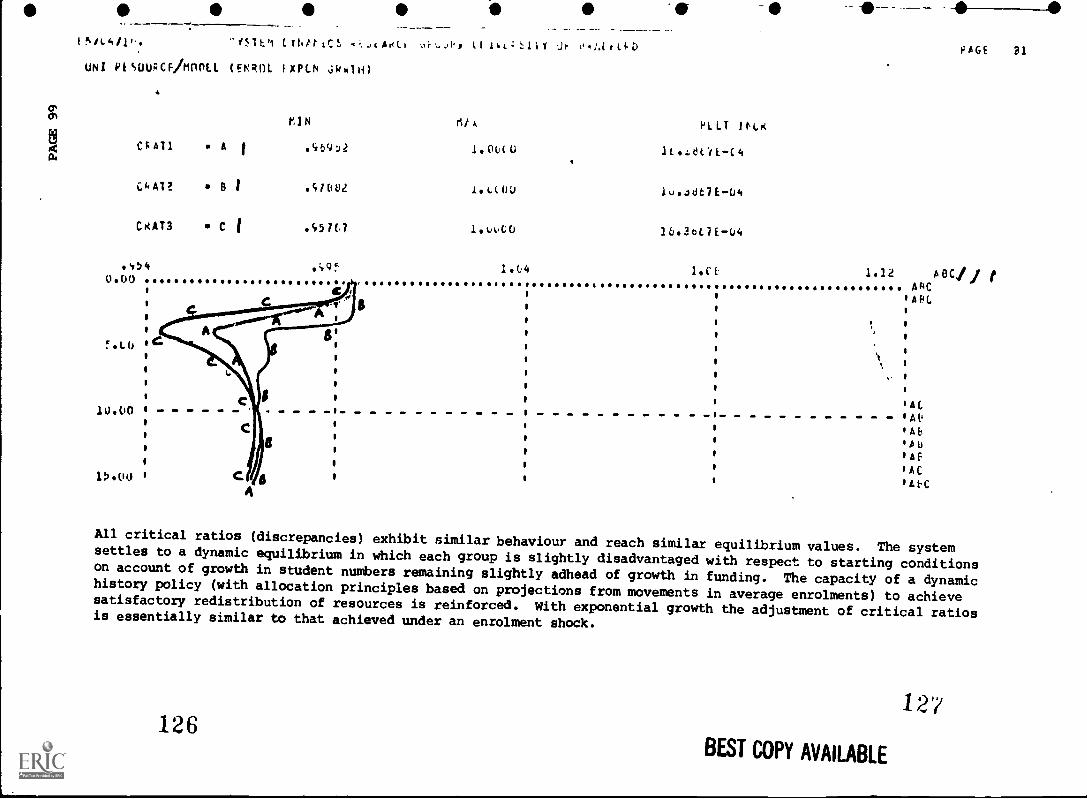
5io,/ 1
10 ID
'151to1 EtkAtICS %;.ocAoll tt 161.=;;1(t Jr omttlp
UNI lotsutpcqmnoLi (ENROL fAPCN
KIN 61A PL LT ) ,04
OM A eti692 1.0(;(0 lt.z.NOL(4
C4A1? B 1 .SIBB2 ifit,(OU lu,stit7EO4
CRAT3 C .S51C7 1.CO 1b313L1EfJ4
0.00
!.L0
0
1
10.00 II
1
1
1
100A
1(..4 I.Ct
PAGE 31
1.12 AK/AkC
o o IABLo o o
s I ,
o o o
o os
o ot%
t
o o , o
1 0
I1 SAC
1i OAP
s0 sAb
1 1'All
11 1AB
o o 0ACo o
Itt.0
All critical ratios (discrepancies) exhibit similar behaviour and reach similar equilibrium values. The systemsettles to a dynamic equilibrium in which each group is slightly disadvantaged with respect to starting conditionson account of growth in student numbers remaining slightly adhead of growth in funding. The capacity of a dynamichistory policy (with allocation principles based on projections from movements in average enrolments) to achievesatisfactory redistribution of resources is reinforced. With exponential growth the adjustment of critical ratiosis essentially similar to that achieved under an enrolment shock.
126BEST COPY AVAILABLE
12'?

O(F) ENROLMENT DOUBLE SHOCKr-t
4a, GROUP 1 : =20% at T=3 then +10% (additional) from T=9
GROUP 2 : UNIFORM RATE (no change)
GROUP 3 : -20% at T=3 then -10% (additional) from T=9
HISTORY POLICY WEIGHTED BY AVERAGE ENROLMENTS
128
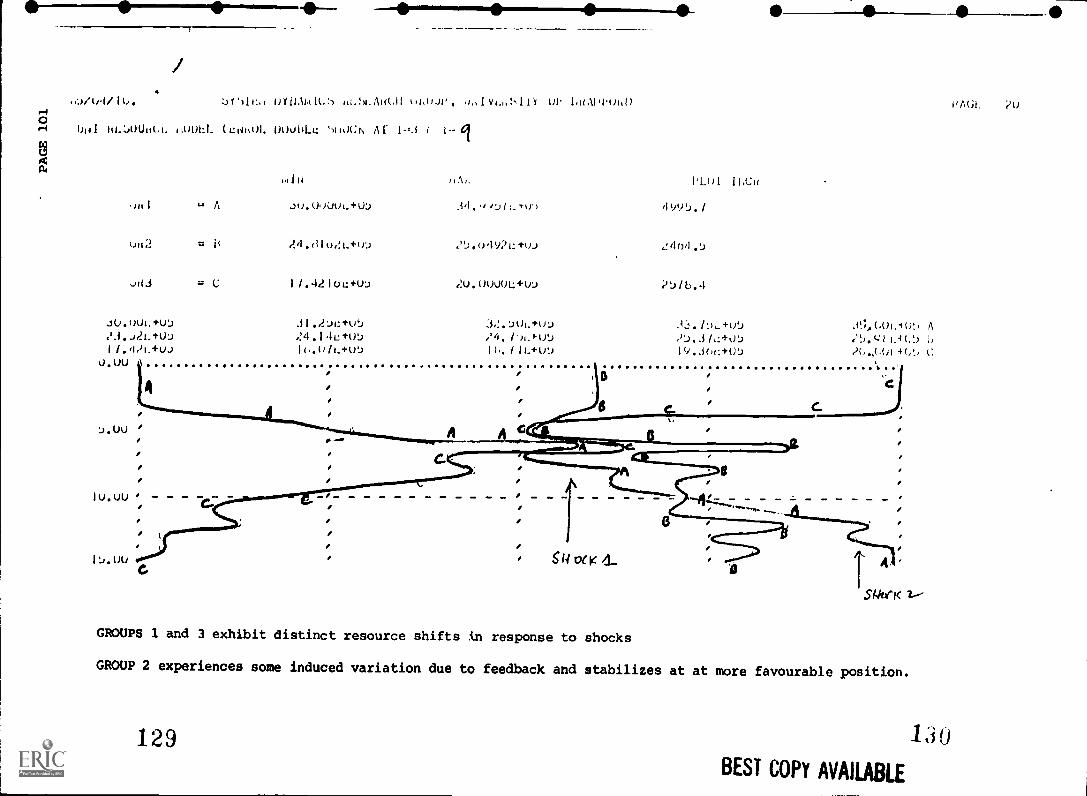
o/o4/IU. lf1,(1J1' v,..,,!,10 01. 1,,?,H.oht)
0rI 1/141 1,0UL (cpahOl. UOUIILL: '1H)Ct. 1- al
a1,111J HA/.
A Ju.UoUui.+01) m.,»D/1.-Tky)
= 2.4.01(WL+w 25.o4921:+ui
= U 11.4210c+U..) 2U.OUUUL+UJ
PLul 11.Ca
Ju.uuL+uu 31.1)1:+ut) 3,!.:)0L+u7 ,4.11.1!),.+W.) A(A)Liw, A2.3..)2L+01) 24.1412.+Ut) ,'4./')LfUti d'..).3/1:+0..) ,'5 t.:11.4Lt.) ;,
1/.,12L+ui 16.0/L+ut) 11,. /11.4.ul, 19..i/q:+01) 2C,C01+(.1) CU.UU 1 '...
. .
. . .
a .
I
J.UU
614 vele 2SWIf
GROUPS 1 and 3 exhibit distinct resource shifts in response to shocks
GROUP 2 experiences some induced variation due to feedback and stabilizes at at more favourable position.
129 130
BEST COPY AVAILABLE
PA61. 2u
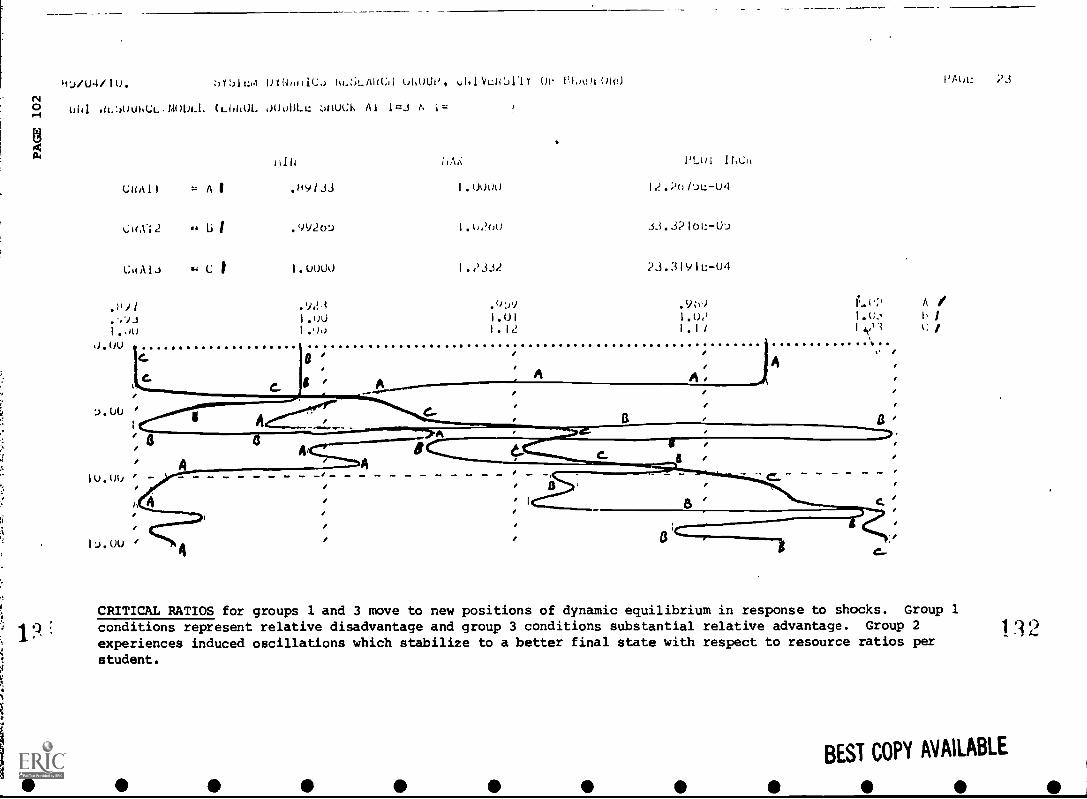
Ha /U4/1U. :).(:)11:,4 OrIumIC.) lu.;;LAkCii choV, Q141VLW.)11Y Or nAoiolill
N0 uhI au:AW4CL.M0OL1. (L6hOL o0o1iLL wioCI. Al 1=J N i=H
4a
lah hAX PL 01 IhCa
CuAl 1 =AI diyi3J 1.0000 12.2ohL-O4
Cle,112 t' li 1 .YV2o:J I.udoo 33.32lo1.:-U1)
CitAIJ ,., C I 1.0100 i.d3J2 23.319ft-04
9
..).(A,
IU.OU
PAOL :3
CRITICAL RATIOS for groups 1 and 3 move to new positions of dynamic equilibrium in response to shocks. Group 1
conditions represent relative disadvantage and group 3 conditions substantial relative advantage. Group 2
experiences induced oscillations which stabilize to a better final state with respect to resource ratios per
student.
1.3 2
BEST COPY AVAILABLE
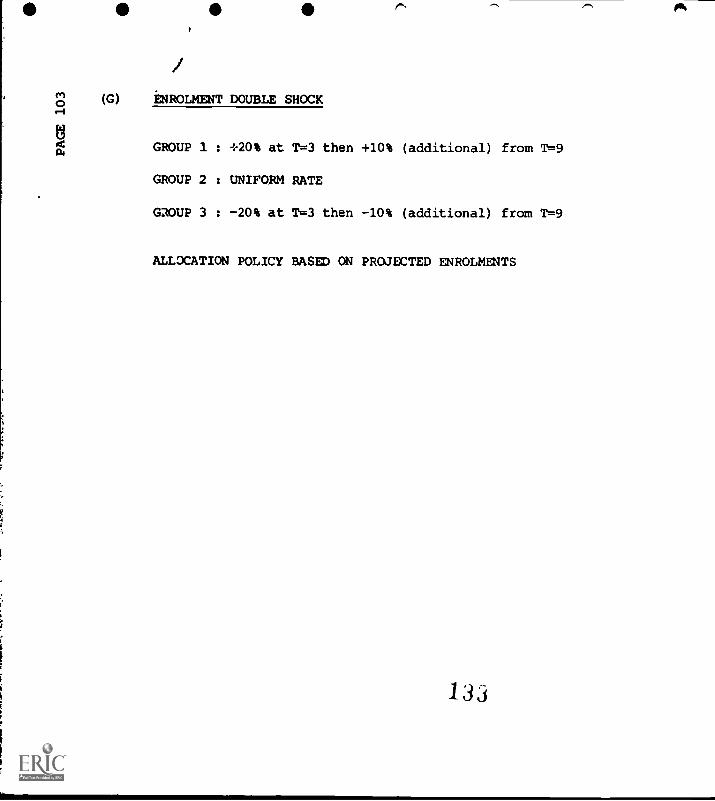
/m0u-i
U4al
(G) ENROLMENT DOUBLE SHOCK
GROUP 1
GROUP 2
GROUP 3
: +20% at T=3 then +10%
: UNIFORM RATE
: -20% at T=3 then -10%
E
(additional) from T=9
(additional) from T=9
ALLOCATION POLICY BASED ON PROJECTED ENROLMENTS
133
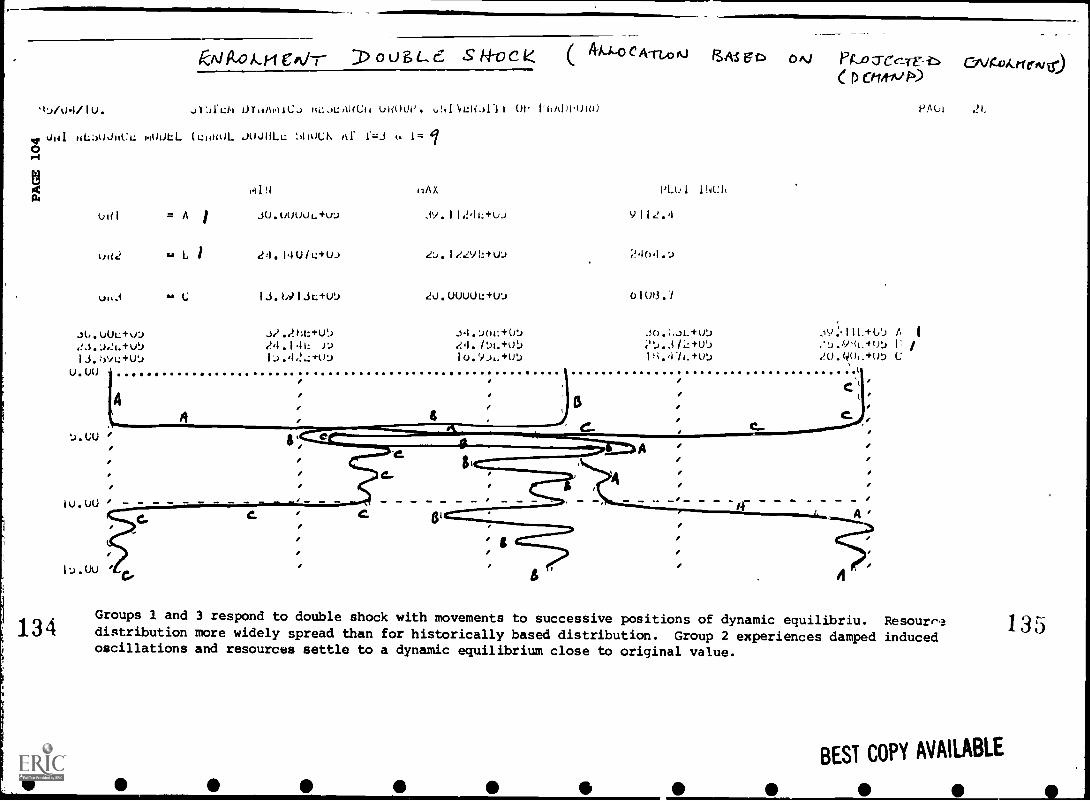
kAilLOkti CAA 3) 01)6 L c S H-OC 4A-A-0CA-n,om
..)11401 01111A0AUJ WOO. ti!,.1ukJ1.11 01 VicAla.ua0
OA ta. :)0JACL: m0I/L fu111i01.01
[121
a
134
ual = A /
ua2 s. L 1
as L;
ISAs eN OAU PA-0 0-Cc-Tr .1. OVAthkrtrivtr)Cti41,10
.
J0J1ILL N100, Al 1=3 (w I= /
MIN NAX
JO.uuuuLl.u...) 39.11.!41:+w
24.140/u+w 2:J.1911-fu..,
14.69140.0'i 2U.UUUUu+VJ
1.141: 1)
114:11
Y112.4
0109.7
P1.4 7L+05
oV:.111.-1-6'i A I
r /20.N0,+m, c
Groups 1 and 3 respond to double shock with movements to successive positions of dynamic equilibriu. Resourredistribution more widely spread than for historically based distribution. Group 2 experiences damped inducedoscillations and resources settle to a dynamic equilibrium close to original value.
BEST COPY AVAILABLE
135
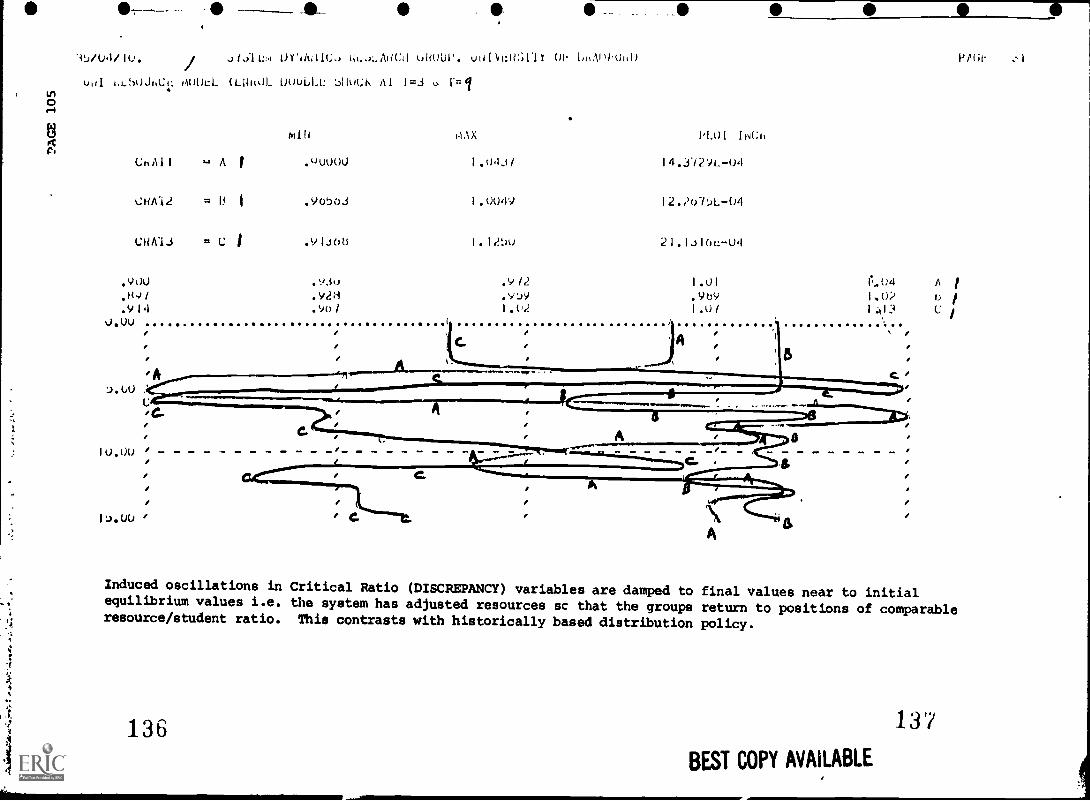
to0r-4
CI
TJ/U4/10. JijIL 01"4Ai11(;., 0UOUP. uNI41:1?:;11Y 01 14,110.0h0
1.1.!)0JhCI: ,101.l. (L101)1. DOuLLL 0110Gi. Al 1=3 u f=/
CnAll
L:t/Al2
CHA4.3
PM1-
OAX PLO! INCh
w A 1 ."u000 1.043i 14.3./291.-04
= 13 i .90o3 1.0049 12.do7JL-04
= c I .91306 1.12tm 21.1iloa-U4
.93o .9/2 1.01 11..04 A I
.Y28 .9.39 9bY 1,02
.90/ 1.02 1.0/ :03 C
C.
C.
C
8
A
Induced oscillations in Critical Ratio (DISCREPANCY) variables are damped to final values near to initialequilibrium values i.e. the system has adjusted resources sc that the groups return to positions of comparableresource/student ratio. This contrasts with historically based distribution policy.
136BEST COPY AVAILABLE
137
0(H) EAT = 1 : ADJUSTING TOO QUICKLY TO ENROLMENT CHANGE
Enrolment averaging time = 1 year : Model is unstable for this value of EAT.
1:38
Parameter Sensitivity
Note: Test with EAT = 5 resulted in extremely stable behaviour as might have been expected fromthe satisfactory results obtained from EAT = 3.
1
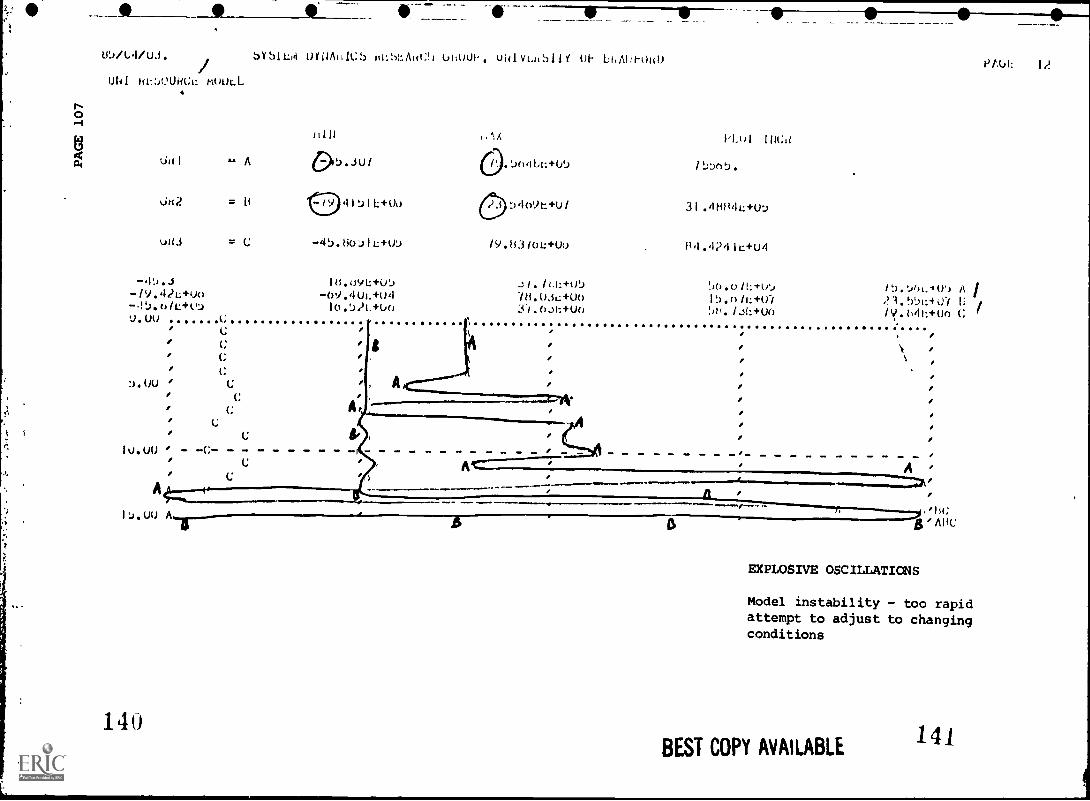
titilt,4 /U.i. SYSILoi MN/1111C!) tti....:1LAC!I ui4 vt.1,;,i le bh ;1-01(0
ttL:WWICL muULL
0
Oid 1, A 6>J.JU/ (%).:,o,lbu+1/2
in2 = ti 41:)1 -00 (>409t+U/
udi = C -4!).801,10-W /9.83/0t:+Uo
-...L).J 10.09L+LPJ-/V.42L+Uo -09.4U1. +U4-.V.I.o/v....c:) 10.:)21.+Uo
PtUI: 12
Phut InCa
/t)Drp.
31.4H84L+UD
84.4?4IL+U4
.1/./LL+Ut) !,0.011:4-W.) iti.7ML4tY) A /18.0..ic,+Uo 15.0/L+t0 '!3.!)1:+kfi hXi.o...11:+Uo !.di./.51:+UO N.h4h+Un C
U. Ulf C ,.. o
II
.
CC . g
.1
AI
,,,
,,t, .
,
,
, c ,
c , , , ,
_L.*C . . .I c
C d ,
1 u . uu ; . ,
14o
A . - ...,EXPLOSIVE OSCILLATIONS
Model instability - too rapidattempt to adjust to changingconditions
BEST COPY AVAILABLE141
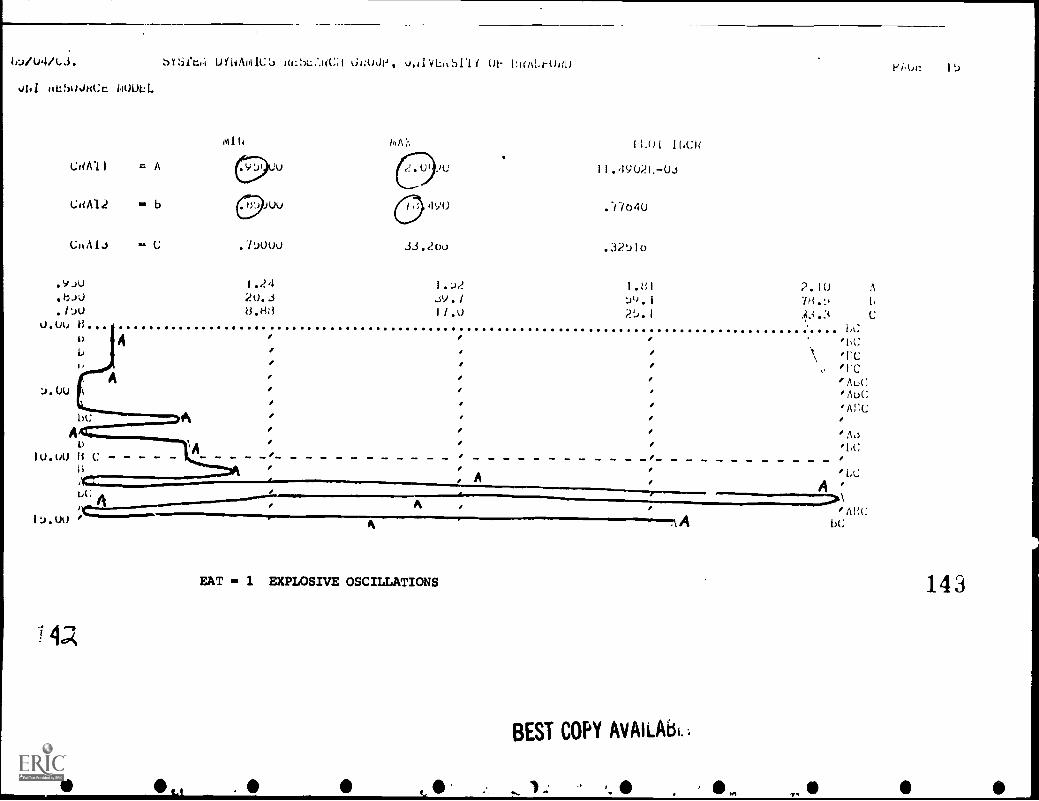
1o/U4/1.3. bYSfc14 UfNAMICb 16::Ch 61;0JP, u,4IVLnbIli 01 1:1(ALrUich
ubI tiLSOJHCt WOO.
CdAl = A
CtiAl2 b
C
'.UU rt
MAX
JUU ilY0
.3.3.2oo
1.24 1.u220...1 J(1.1
8.143 1/.0
. .
. .
. .
. .
.
I'L 11.CH
11.4902L-U3
. '0O40
. 32)10
1.81 2.10...)Q.1 I
21).1 113.3
A
1,
CI,C
. t, 'FC.
'I'C,.
'ALA:'AuC'Arc
is\A
.'I,(:
1U.U0 Ii C _ , , . ,
h . . .'IA;
I 11
A
A .A
A , , ....0"AltcA bc
EAT us 1 EXPLOSIVE OSCILLATIONS
BEST COPY AvAiLAbi..
Pi,61: it)
143
71
PAGE 109
SUMMARY
1. Parameter Sensitivit
A series of tests have found the model behaviour to be
insensitive to variations in the costs/WSU within the groups and to
changes in the magnitude of enrolment intakes.
The only parameter which proved to be sensitive was the enrolment
averaging time (EAT). This is an important parameter, representing
the time over which average enrolments are adjusted in terms of
changing intake rates. When EAT was assigned the value 1 the model
went into uncontrolled oscillation and the system became unstable when
disturbed by enrolment shocks. However for values of EAT .) 3 the
model behaviour was stable and controllable. This implies that for
enrolment averaging times of 3 years the model provides stable and
consistent output across a variety of policy alternatives. The
unstable value of EAT=1 corresponds to attempts to adjust average
enrolments almost instantaneously to new intakes and indicates that
such a practice will lead to instability. The stable behaviour that
characterizes the model when the enrolment averaging time is of the
order of a triennium suggests that 3 years is a reasonable choice for
a time period over which to adjust enrolment rates for planning
purposes.
144
PAGE 110
2. Policy Analysis
The basic allocaton policies considered represented various
weightings of mechanisms based on historical distributions, on
projected enrolments calculated from perceived movements in average
enrolments, on current values of average enrolments, and on externally
set enrolment growth goals.
(1) Policies based upon fixed (static) historical distributions were
unsatisfactory even when weighted for shifts in enrolments from
traditional patterns. Changes induced in student/resource ratios
persist and in some instances worsen. The weighting for
enrolment change serves only to alleviate a situation that would
otherwise be worse. Such a policy may be likened to a rubber
band fixed at one end (historical position) and stretched by
varying amounts (new enrolment patterns). A weighting policy
locates resource distribution formulae at some point along the
stretched band. Consequently the allocation is always inadequate
to meet the needs appropriate to the stretched end. As the band
stretches with time the consistent choice of an intermediate
position means that the relative position becomes increasingly
disadvantaged since the differences between needs and allocations
are accumulated (integrated) over time- One can take the analogy
of the rubber band further by saying that too much stretching
will inevitably lead to the band snapping. The university
resource allocation system would also collapse if overstretched.
145
PAGE 111
(2) Policies based on enrolment projections calculated from movements
in average enrolments stabilized over an averaging time have the
effect of releasing the fixed end of the rubber band. Such
policies are based on a concept of dynamic history and it is
suggested by the model that we should move to adopt such a
policy. Model output is stable for such policies and resource
distribution is achieved smoothly and in such a way that
student/resource ratios return to equilibrium values through the
operation of internal adjustment (feedback) processes.
(3) Policies based solely on externally set targets suffer from a
rigidity that prevents information from system feedback from
assisting to adjust allocations in line with deviations from the
target. In reality adjustments would be made post-hoc when it is
realised that targets in particular areas are not being met.
Model runs suggest that a useful procedure is to use current
values of average enrolments as a weighting factor to amend
discrepancies between goals and actual enrolments. It can be
noted that when a group is such that its goal (quota) is always
filled then a goal policy is numerically equivalent to the
dynamic history, .policy. It is when goals are nc.:: met, and in
particular, when their fulfilment is subject to variation from
year to year that the rigidity of a goal based policy is most
harmful.
(4) The stability of the model to cost shock indicates that
fundamental behaviour generated by particular allocation policies
146
PAGE 112
is not upset by movements in the "normal" cost/WSU that might
occur through e.g. changes in teaching technology. This does
not mean that a redistr"mtion of resources will not occur (it
will) but it indicates that the occurrence of cost changes is
irrelevant as far as the resilience of an allocation policy is
concerned. Similarly the insensitivity of model behaviour to the
relative costs within different groups indicates that the
allocation policies are general and their appropriateness is not
a function of specific group cost measures.
Adjustment Allocations
The concept of an adjustment to group funding made after the
basic allocation is an interesting option. While such an initiative
will be mandatory when funds received are less than those planned for,
or when an additional allocation is receivAd, the possibility of
including such a process as an essential part of the allocation
mechanism presents itself. For example by withholding a small
percentage of total funds from the basic allocation. There then
arises the possibility of alternative crit,..la as for ,-xample the
model use of group enrolments and group disadvantage as alternative
bases to define adjustments to basic allocations.
While a proportional policy is in some sense a natural and
obvious mechanism, the model sheds insight on why proportional
policies are relatively ineffective in achieving substantial
redistributions. This is evident from the numerical da4-1 of the model
147
PAGE 113
output but is clarified by the feedback diagrams in Figure 3 and 4.
In adopting any proportior,A policy, two opposing feedback loops are
active. For example if it is proposed to distribute additional funds
in proportion to average enrolments, the loop generating the increase
in enrolments working in favour of group 1 say, is undermined by the
loop that adds the same increase to tne total enrolment. This total
enrolment forms the denominator in the calculation of the proportional
adjustment. A similar circumstance prevails if the SIZE of group
discrepancy is used as a basis fo:* the adjustment. Hence while some
redistribution in the intended direction will be achieved it will not
be as effective as perhaps hoped for.
A similar argument holds when a reduction in total resources
means that groups are required to share cuts to their basic
allocations. Other possibilities exist that might be considered as
alternatives to proportional policies. One example would be to
replace a proportional discrepancy based policy by one based on a
notion of criticality. That is a condition that might be agreed under
which the situation of a group(s) would be regarded as critical. All
adjustment resources might then be diverted to that (those) groups.
This policy has the effect, of deactivating one of the opposing
feedback loops so enabling a more decisive change in resource
relativities to occur.
146
.10
APPENDIX A
PAGE 114
INTERVIEW SCHEDULES AND HEAD OF DEPARTMENT QUESTIONNAIRE
149
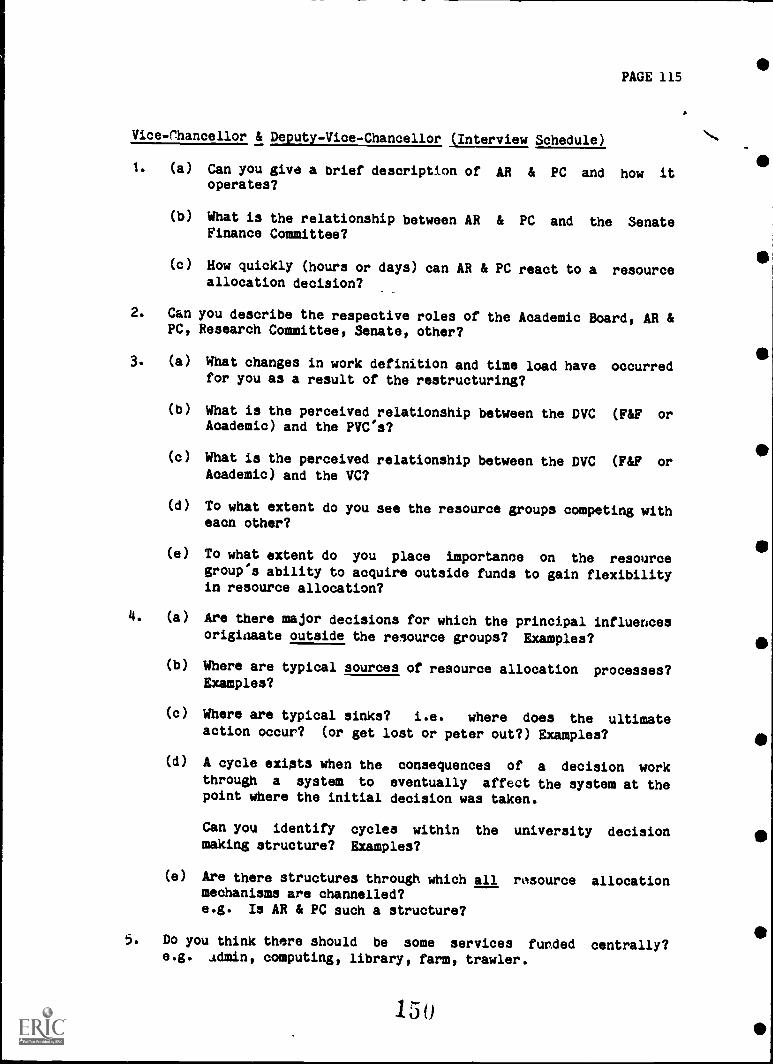
PAGE 115
Vice-Chancellor & Deputy-Vice-Chancellor (Interview Schedule)
1. (a) Can you give a brief description of AR & PC and how itoperates?
(b) What is the relationship between AR & PC and the SenateFinance Committee?
(0) How quickly (hours or days) can AR & PC react to a resourceallocation decision?
2. Can you describe the respective roles of the Academic Board, AR &PC, Research Committee, Senate, other?
3. (a) What changes in work definition and time load have occurredfor you as a result of the restructuring?
(b) What is the perceived relationship between the DVC (F&F orAcademic) and the PVC's?
(c) What is the perceived relationship between the DVC (F&F orAcademic) and the VC?
(d) To what extent do you see the resource groups competing witheaon other?
(e) To what extent do you place importance on the resourcegroup's ability to acquire outside funds to gain flexibilityin resource allocation?
4. (a) Are there major decisions for which the principal influencesorigiaaate outside the resource groups? Examples?
(b) Where are typical sources of resource allocation processes?Examples?
(c) Where are typical sinks? i.e. where does the ultimateaction occur? (or get lost or peter out?) Examples?
(d) A cycle exists when the consequences of a decision workthrough a system to eventually affect the system at thepoint where the initial decision was taken.
Can you identify cycles within the university decisionmaking structure? Examples?
(e) Are there structures through which all resource allocationmechanisms are channelled?e.g. Is AR & PC such a structure?
5. Do you think there should be some services funded centrally?e.g. Admin, computing, library, farm, trawler.
150
I
PAGE 116
Why should they be funded centrally? If they are fundedcentrally who should control them?
6. What are the key indicators of a successfully operatinguniversity?
PAGE 117
Interview Schedule - Pro-Vice-Chancellors
1. Can you give a brief description of AR & PC and how it, operates?
2. What do you see as your own role as a VC/PVC? What changes in workdefer and time load have occurred since restructuring.
3. What is the relationship between AR & PCand the Senate FinanceCommittee? Role of VC, Academic Board, Research Committee, ResourceGroups?
4. How quickly (hours or days) can AR &PC react to a resource allocationdecision?
Relationship of the PVC to his Group.
1. What is the Group Council Structure?
2. Can you comment on its mode of operation?
a) Collegiate - cooperativeb) Hierarchical with the PVC determining order of business, etc.
for ratification.0) Explore the case history of a particular decision.d) Are there some decisions that don't have to be ratified by AR &
PC or the VC's?i) If so, what are they?ii) If not, why not?
3. What is the perceived relationship between the PVC and his Deans?
4. What is the perceived relationship between the H.O.D.'s and the PVC?
5. Description of the Group resource allocation mechanism.
i) Is it one of confrontation between departments where they have tojustify their requests before the whole group; or
ii) Does the PVC act in a clearinghouse role of collating andconsolidating departmental reques:s and forward them to? (Someother person or, group for a daoision).
6. To what extent do you see the Resource groups competing with eachother?
7. To what extent do you place importance on the group's ability toacquire outside funds to gain flexibility in resource allocation?
8. Do you think that there should be some services funded centrally?i.e. administration, computing, library, research, equipment otherthan computing, other facilities, i.e. farm, trawler, ....
Why should they be funded centrally? and if they are fundedcentrally, who controls them?
152
0
PAGE 118
9 What are the key indicators of a successfully operating resourcegroup?
153

PAGE 119
Interview Schedule - Head of Department
1. How do you perceive the Group Council Structure?
2. Can you comment on its mode of operation?
(a) Collegiate - cooperative(b) Hierarchical with the PVC determining order of business etc for
ratification
3. What is the perceived relationship between the HOD's and the PVC?
4. Description of the Group resource allocation mechanism
(i) Is it one of confrontation between departments where they mustjustify and fight for requests before tho whole group; or
(ii) Does the PVC act in a clearinghouse role of collating andconsolidating departmental requests for action at a higher level.
5. How would you compare the present arrangement with the situationbefore the creation of the resource groups.
(a) Positive factors?(b) Negative factors?
6. Has the autonomy of departments been affected by the re-organization?How?
7. Have you any suggestions for improving the functioning of the presentsystem?
8. What are the key indicators of a successfully operating department?
9. What are the key indicators of a successfully operating university?
10. Can the group council be bypassed by departments in any major decisionarea?
154
PAGE 120
Heads of Departments (Information on restructuring of university)(Questionnaire)
1. How has the operation of your resource group and itsPro-Vice-Chancellor affected the work of your department and therelations between departments in your Lroup?
Positive factors!
Negative factors!
Other!
2. How has the creation of the resource groups contributed to thefunctioning of the University?
Positive factors!
Negative factors!
Other!
3. What would be your preference for decision making structures inaddition to or instead of the present arrangement?
4. What areas of decision making (if any) remain a matter of concern toyour department?
5. Other.
" Please include the name of your resource group on any reply.
155

PAGE 121
Interview Schedule - Deans
1. Would you like to comment on restructuring as it has affected thefaculty?
2. What is the present relationship of Deans with Head of Departments?
3. How would you improve the decision making structures of theUniversity? (In particular the relationships between faculties andresource groups)
4. Do you, as a Dean contribute to the Group's da...ision making in a waywhich goes beyond the immediate departments you are responsible for?
5. Have you other points you would like to raise?
156
41 PAGE 122
0
Appendix B
Model Eguations
Equation 1 (Group 1 resources ) GR!
This equation defines the amount of resources (Syr) allocatedto group 1. The figure output at T=N represents theresources for the next year T=N+1. Resources are allocatedon a cost-weighted basis in terms of a COST/WSU that isregarded as the cost for a student in that particular group.
COST/WSU can vary fro group to group, to model the realitythat costs of education vary across groups. The method ofdetermining COST/WSU have not been addressed in the model.
The model traces implications of variations in thesecosts however defined.
Equation 2 (RALG1)
This equation defines the rate of resource allocation togroup 1 according to the particular allocation policy beingapplied. Parameters H1, N1, P1, 01 are switching constantsin linking them with alternative policies only non-zerovalues are cited. All parameters not cited have zero valueswithin the particular option.
H1=1: policy based on historical allocai-iondistribution
141=1. N1=1: policy based on historical principles modifiedby recent data on average enrolments.
P1=1: policy based on dynamic demand variables -details provided in later discussion.
P1=1, 01=1: policy based on dynamic demand variables withoutside funds also available to group.
The above policies apply to the basic allocation procedure.The incorporation of adjustments to the allocation aredetailed at a later Stage and are switched in through :heswitching parameters defined with the Adjustment (AIM')formulation.
Equation 3 (HIST1)
This equation incorporates both the purely historical andthe modified historical all' ation policy. When N1=0 thepurely historical policy continues to allot resources inproportion to the original group distributions that appliedat the initialization of the model. When N1>0 a weighting isadded in terms of shifts in student load (average enrolment)that have occurred since the initi,41 state of the model. Themodification is achieved by adding a cost weighted enrolment
1 57
PAGE 123
factor. The parameter N1 can be given any positive valve to N...
represent the magnitude of the modification. In the limit asN1-0 the links with history are severed and the basis ofallocation is entirely in terms of average enrolments. Atypical set of figures (N1=1) for which the historical(initial) proportion of resources allocated to group 1 was0.4 and which sets current average enrolment in the group at0.46 of the total leads to an allocation proportion of 0.43i.e. the modified history policy with N1=1 has redistributedresources by about half the difference between the historicalratio and the present value based on average enrolments.
Equation 4 (CST1)
Provides a variety of cost change options for the modeller.The cost/student in a given group can be varied with(a) step input (C11=1)(b) exponentially (C12=1)(c) according to any input table function (C13=1)
Equation 5 (OUT1)
This equation writes in the condition that each year groupresources are depleted to zero.
Equation 6 - 15
Analogous equations for groups 2 and 3.
Equation 16 (ENR1)
The enrolment (entry) rate is expressed as the minimum of theapplication rate and the maximum number of students that canbe coped with. The model is initialized in equilibrium wherecost/student has an accepted "normal" value for theparticular group. In this formulation of the model thesevalues are arbitrarily assigned. For example C1=500 meansthat $500 per year is regarded as the "normal" cost ofeducating a student. If the average amount of money expendedper student is less than this it means that the enrolment ishigher than "normal".relative to available resources. As theaverage cost/student decreases it means that availableresources are being spread increasingly thinly which will beassociated with a reduction in the quality of education and arise in staff work loads. (For this purpose all resourcesare 'ggregated). A critical value of cost/WSU exists(CCR1) which provides an absolute quality cut off. If thisvalue is reached there will be a bar to further enrolmentsunless the resource position is improved. Under normalapplicant pressure (except in courses with rigidly enforcedquotas) students are enrolled and the average cost/WSU ratioallowed to drift downwards. This would be indicated by arise in student/staff ratios. When the critical value isreached an enrolment limit is imposed unless further
158
PAGE 124
resources become available In a situation of declimngenrolments all applicants are accepted and in some cases thecost/student ratio will be more favourable than the "normal"value. These conditions will make the group relativelyfavoured and render it vulnerable to resource transfer. Thechoice of parameters defining CCR1 determine how muchelasticity in the valuation of student/resource ratios isallowed for.
Eguation 17 (APRI)
The application rate is defined in terms of the pool ofqualified applicants aspiring to university places. Theintention is to subject the system to various inputconditions including enrolment shocks. Consequently avariety of options are provided for in this exogenousinfluence.(a) steady intake and/or shock(b) exponential growth(c) periodic (sinusoidal) variation(d) generalised table input
An arbitrary equilibrium value of 5000 applicants per groupis chosen to initialise the model. This figure may be takento include those already in the system from previous year.
Equations 18 and 19 (Critical ratios groups)
These equations define the critical value of cost/WSU forgroup 1. The choice of 0.75 for CR1 allows the cost/studentto drift down to 3/4 of its "normal" or adequate value beforecriticality occurs. A value of CR1 close to 1 represents atight quota policy which keeps a close check on ti.aresource/student balance. The model mechanism enables switchchanges to be made to the parameter values that can be used tmodel a tightening or a relaxing of quotas during the courseof a run. It is felt however that a major aim is to findpolicies and mechanisms that control much variablesendogenously. Legislative actions such as quota impositionsare essentially restrictive in the constraints that theyplace upon the systerh. They are also a source of intertia ifquotas are not filled and slact, ex3sts elsewhere. Hence anaim is to provide the structural freedom for the system tomove to unfavourable balances should appropriate conditionsoccur but to try to control its operation so that this doesnot in fact occur.
Eguations 20-27 Parallel equations for groups 2 and 3
Eguation 28-30 (Average Enrolment Rates)
The averaged (smoothed) enrolment rate calculated with anaveraging time of 3 years. This is the observable stableindicator of enrolment size. Changes in the average enrolment
159
PAGE 125 41
.
rate signify changes in the group composition and substantialchanges signal the need for reallocation of resources. Themoving exponential average is updated yearly in terms of eachnew intake.
Eguation 31 (Planned enrolment rate)
This equation expresses the planned enrolment rate for group1 in terms of the rate based on past demand (DPENR1) togetherwith a term representing planned developments in the group(PD1). Further discussion on these variables follows later(equation 73).
Eguations 32-40
These equations describe the planning mechanism for group 1with respect to projected enrolments. Essentially theyproject enrolments for year T+1 in terms of known data up toyear T-1 and projected growth rates. For example it isassumed that the resources for 1987 students become availableby the end of 1986 and that submissions supporting thisresource claim are made in 1985. The projection mechanism(which involves projecting enrolment rates including changesin them) is overidden in the case of quotas in which numbersare pre-set by formula. The delay (DLFIPE) functions in theformulation reflect that resources eventually made availableare a dele,ed manifestation of system conditions predicted atthe time of submission.
Eguation 41-60 (Parallel eguations for groups 2 and 3)
Eguation 61 (DISCI)
This equation defines the group 1 "discrepancy" or relativedisadvantage/advantage of group 1. Initially with the systemin equilibrium DISC1=1. If now the average enrolment ingroup 1 increases while the quantity of resources remainsfixed then the resources are spread mor,e thinly and DISC1<1represents a condition of disadvantage. Similarly DISC11represents a condition of relative advantage with respect to"normal" conditions..
Eguation 62 and 63 (garallel eguations for groups 2 and 3)
Eguation 64 (RESL)
RESL defines the resources left after allocation of resourcesto groups from the available central (controlling) fund.
Eguation 65 (SUMD)
This variable is the sum of the discrepancies of the groups.The variables CRAT1 etc are particular values of thediscrepancy variables as discussed under equation 85.
1 6 o
N..
PAGE 126
Eguation 66 (SPENR)
This variable is the cost weighted sum of planned enrolmentrates across all groups.
Eguation 67 (SPENR)
Sum of the reciprocals of the respective terms in equation66.
Eguation 68 (SAVENR)
Weighted sum of average enrolments g cost/WSU taken acrossall groups.
Eguation 69 (SRDISC)
Sum of the reciprocals of the discrepancies in the respectivegroups.
Eguation 70 (ADJ1)
Phis equation needs to be considered together with equation73.
This equation contains 3 options or the application of anadjustment allocation that follows the basic allocation togroups. As indicated elsewhere adjustments can be regardedas essential when it becomes necessary for share cuts infunding or when there is suriolementation to distribute.
There is however opportunity to make adjustments part of thenormal procedure by withholding a percentage of totalresources at the basic allocation stage. In the presentformulation the latter option has not been included and theadjustment mechanism applies when the basic allocation oveallocates the available resources, or when resources remainafter the basic allocation. A question remans as to howadjustments are to be apportioned. Possibilities include
(a) pro-rata adjustments this really does not involve anyadditional policy but an original formula applied to adifferent amount. It is still in one sense equivalentto a single allocation.
(b) adjustments based on enrolments but not pro-rata(c) adjustments based on discrepancies in which an attempt
is made to equalise advantage or disadvantage withingroups.
The three adjustment policies modelled are activated by theswitches PIA, P1B,P1C.
(a) Enrolment based adjustment (P1A=1)
161
PAGE 127
.
If the central controlling resources have been eNceeded lnthe basic allocation (REOL'0) then reduce each group'sresources in proportion to their cost weignted contributionto planned enrolments. This is effectively a pro-ratareduction.
If controlling resources remain after the basic allocation(or supplements arrive) then distribute in proportion tocost / weighted average enrolments.
(b) Discrepancy based adjustment (P1B=1)
If central ,:ontrolling resources have been exceeded in hebasic allocation (RESL<O) then reduce each group's resources',I proportion to the group discrepancy (CRAJ) so that thosegroups with a lower discrepancy (more disadvantage) loserelatively l:ss. If RESL>0 then distribute additional fundsin proportion to (1 /CRAT) so that disadvantaged groupsreceive rela;:i.,,ely more.
(c) Enrolment based adjustment reverse feedback (Pla=1)
If RESLes0 then reduce in proportion to the inverse of costweighted planned enrolments on the grounds that those withthe greatest planned commitment should take the lowest cu..rather than the highest cut as occurs in pro-rataadjustments.
Combinations of policies are possible e.g. combining adiscrepancy and an enrolment formula together as in
P1A=P1B=1/2, P1 /C=0
Other possibilities would be to give all additional resourcesto those group(s) with particularly bad discrepancies or toprotect such groups from shared cut sharing. This policyeffectively replaces a proportional policy with one based oncriticality groups deemed critical receiving treatment moresubstantial than a shared proportional basis would allow.
Eguations 71 and 72
Adjustment mechanisms for groups 2 and 3.
Equation 73 (PD1) - planned develggment
This equation should be considered together with equation 31of which it forms part. Writing out equation 31 to includeequation 73 as a component gives
FL-NP1.1,=(AVENR1.P-DPENR1.1) *PEWT11+(GOAL1J-DPENR1.i)*PEWT12+ (DPENR1.F)*PEWT13.
This equation is central to the model as it defines the
162
I
PAGE 128
method of basic allocation F resources to group 1. Theoperation of various policies is achieved via the switchingconstant:. (planned enrolment weights) PEWT11 etc. To definea policy all weights other than those r_:ited are set +110 zero.
(a) PEWT13=1:
(b) P.T4717=PEWT12=1
(c) PEWT13=PEWT11=1
planned enrolment is entirely onthe basis cif student demand asdescribed in egui..tions 32 to 40
planned enrolment is entirely on thebasis of an external numbers policydefined by GOAL and has no directlink with past enrolment.
planned enrolment is on the basisof the most recently available"stable" information which is theconstantly updated value of averageenrolment. The latest changes inaverage enrolments would be used inallocating group budgets in anygiven year.
(d) PEWT11=PEWT12=1/2 planned enrolment is weighted 50%to an external goal and 50% byaverage enrolments for the purposeof resource allocation. Systemconditions are used to modifydifferences between goals andenrolmentsAn infinite variety of combinationsare possiblP but all are essentiallycomposi aes of the fundamentalaltEwnatives of(i) planned enrolments as
projections based on pastgrowth and change patterns
(11) planned enrolments z.s averagevalues of enrolment rates.
(iji)planned enrolments as definedby external growth targets.
Eguations 74 and 75 (Parallel eguations for groups 2 and 3)
Eguation 7b (Goal 1)
A pre-set ramp function that prescribes an external growthtarget for group 1:- linear growth of 2% per year for 12years from T=.
Eguations 77-78 (parallel equations for groups 2 and 3).
Eguations 79-84These equations define the central controlli,g resource
1.63
PAGE 129
available as the source of group funds. The resources (CR)4
arrive in consequence of a funding rate (FUND) and the
outrate (SPEND) clears the resources each calendar year. The
formulation of FUND indicates that the centralresources are
increased through the amount of external funds made available
(EXT) and are reduced if funds remain unspent (RESID). The
variable EXT includes a variety of funding options that4
incorporate both endogenous and exogenous incluences.
(a) base allocation + step input of funds
(b) exponentialgrowth of funds
(c) ramp growth of funds
(d) free table input to define funding rate
(e) demand generated funding rate representing feedbact.
from planned developments
NOTE: The step function option enables tne inclusion of
effects such as 10% cut in projectedfunds or a sudden boost
in funds.
Together with applicationrates and cost components the
exogenous funding components represent the exogenous inp,..its
to the system.
Equation 83-84 (RESIL)
RESID provides an "average"estimate of total funds unsp3.-1t.
The additionalvariable RED is the particular value of PESID
appropriate to the end of each year
Equation 85 (CRAT1)
This important indicator variable defines the value of c
group 1 discrepancy at the instant that the university
resources are received, and consequently measures relative
group advantage (disadvantage)at year T for conditions in
year T. The, nature of the simulation process means that the
discrepancy variables (such as DISCI) are updated in suc:"1 a
way that sometimes they include a partial distribution of
future resources.In particular
the value of DISCI printed
out at the end of year T will be in terms of resources for
year T+1 but applied to enrolmentconditions in year T. The
variable CRAT1 gives a time measure of the group discrepancy
for year T.
Eguations 86-87
Parallel equations for groups 2 and 341
164Eguations 88-9$
These are non-essential internal variables.They have been
set up to check the functioning of the model equations by
PAGE 130
providing data on calculations at intermediate time periods.
Eguation 97 (EFFICI)
This variable defines an arbitrary efficiency criterion, andprovides a measure of the extent to which the externalresources have been allocated. A value of 1 indicates thatallocation has matched income. Values (e,:1) indicate an(under/over) allocation of resources.
Eguation 94 (EFFIC2)
This second efficiency ,easure is a softer index in that itis based upon average enrolments and as such is an estimaterather than a measure EFFIC2 estimates the extend to whichtarget objectives are met with respect to average enrolments.A value of 1 indicates that resources have been exactlymatched to funding requiremerts based on average enrolments.This need not always coincide with EFFIC1=1. Since that canbe achieved providing all resources are disbursed and henceif for example substantial resources are assigned to a groupwith small numbers. Values of EFFIC2 estimate how closelypoljcies manag= to meet target numbers based on the "averagecost' per WSU according to group.
Eguation 95 An optional measure indicating on a cumulative
basis the differences between expenditure and funding.
Eguation 1 n2 (ALLRT1)
This allocation ratio for group 1 measures the magnitude ofthe adjustment allocation to group 1 in relation to the basicallocation during the same year. The variable is non-essential to model interpretation.
Egu,,Ations 103-104
Equations parallel to 102 for groups 2 and 3.
1650
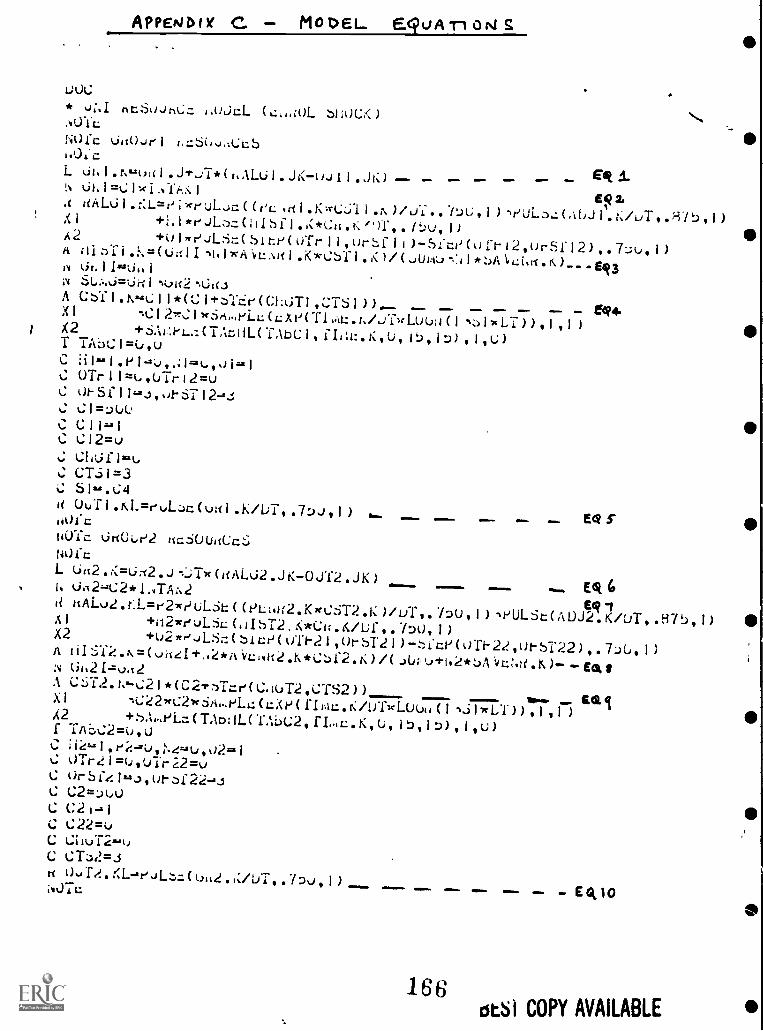
APPENDIV C. - MODEL EeQuAri or.i S
.UUC* Q;.I ntSoJhC= liojc.L. (c.,,,;OL bhO(:K).,.1.M.:
NOfc OstO.Jel r-,=56,J,ICtS1.0:c
eit 1Ldlii.r....i.d.J*.:1-4(hALul.JK-wii.JK)-- - - - - _
N Ohi=-%;iwiAlil pa.t
aAl..61.:,L=L'iweLA...Jc((eL4d1.KIrl;j1i.t.)/0Y...1)11(,11..i1.K/uT,.;-i-hv1)Xi +:.1*NJI..:)=(i1bf1 .t:*Cct.t./.)11.0.)U,1)A2+01weJLSm(Site(UTrii,UrSfil)SisLY(Orl-12,UrSf12),.7::U0)H
;11:-.Ti.i.,=(Ogil'11117ch.VtAlli.K*CTI.O/(.JUNi*:)A10L:ki1.t0....gio1,4 kit.11$20,%1
N SU:4j=Uel-,u112...Gai
A CbIl.K...C11*(Cl+Tcie(CLGT1,CTS1))-- - me+X1 -4.:
12.,:.:116,A,,eLLI(cAV(T1,1L.N/JY%cLuw(1.1xL7)),1,1)i X2
+6Ac.i-L.:(TA,..-AiL(TAbci,iLlt:.K,u,it),it)),1,0T TkoCI=U,uC ii1==1,1.113..i,.:1,01..1C OTrIl=k,.(iTr12=uC 01-5111.-..5,o1-5712-.4
C C1=JUL,C ClIzalC C12=uC CWil...t,C CT.i1=3C Sl....C4
a OuTl.r0.=ruLJc(ual.K/117,.7.J.),1)h.-
Ece CliOic
Wic 6110Lr'2 ttc6OULICc6tOicL
tja2.c:=Ua2..i.....;Tw(aAL62.JK-OJT2.JK)..... E.02, LI U.12,-.C2*10TA&2
k RALJ2.r.L=e2wiJuLit((r)L1w2.Kx.C6T2.K)/uT,s7Du,l),PULSt(ADJE.1/UT,.87b,1)xl
+ii2weuLsLtillbT2,*cu.iuuf"YDu,1)X2+u2*.J.JLS::(bicrqufe21,urST21)-:-...ict)(0TF22,0t-ST22),.7._)().1)A
ii1:312.N=(v411+.42*A.licNi12.K*Ct)c2.1..)/(JUPQ+112*:).10.--/m,N 61,21-=va2
A C::12.t,...-C21*(C2+;)-f=r(CduT2,CTS2)) -- in.... ,.... ValX1ni.:22wC2vr.ia..el...:(:.:XP( rImu.K/tfuLOul (I ,j1/cl.T))
I , I )A2 +:1:ei..7.:( TADIILCIAL)C2 g rL11: e K, tj, 15, I :)) I tkj )f TAbC2=U.0C ire.-10-,:e.,;..e.u,02,..1C OTrl=u,u1r22=vC Orbf1=-2.,,oef22-,..1C C2=...A.0
C c21-.1C C22=tdC CliuT2,...0
C CD.12=.3
a 0,,T.KL-seJL.:,z(ua4.t:/1)7,.7Du,l) - - A! mon Eck10iJ7L.:
0
166601 COPY AVAILABLE
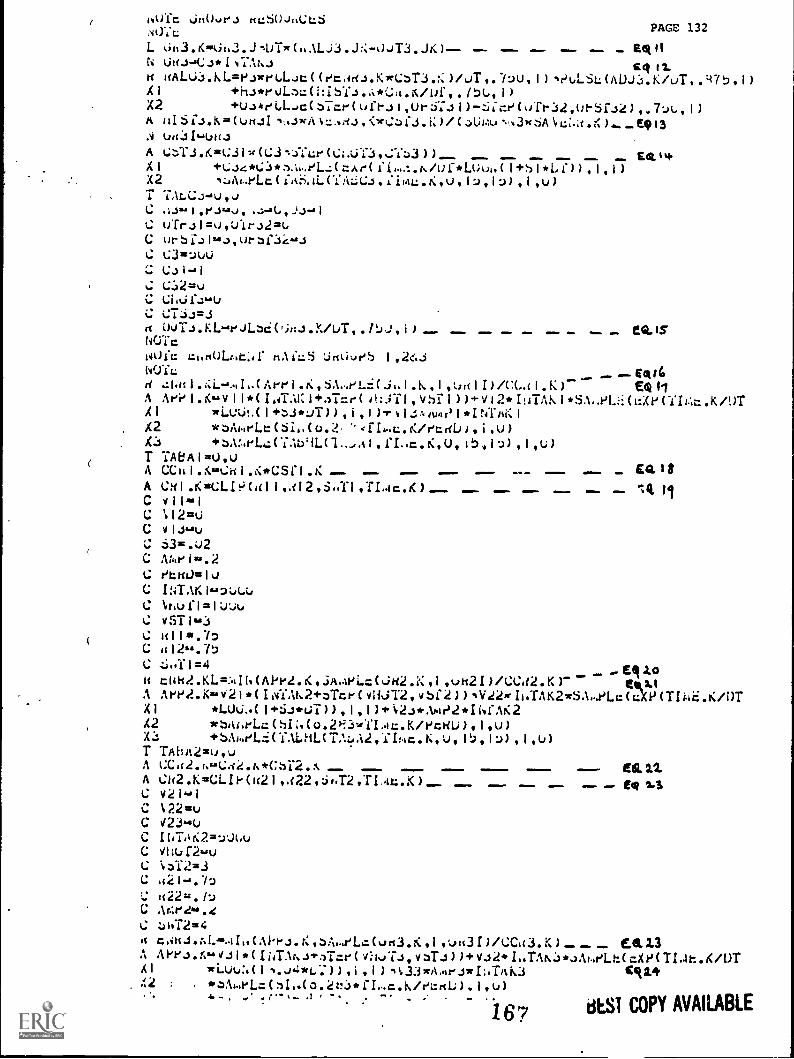
vaffc ..in0..rs ricSO-htCSNOYa PAGE 132
L 6h3.K=U1,2.J,UT7c(nALj3.-0JT3.JK)-- - EQ11N Ua.,-.C.)*1%7AN., C q 12.a aALU3.10.=?sweuLat((ecdas.KieCT3.K)/oT,.7-Jo,1),PuLSL(ADJ3.1</uT,.'q.1)Al +hi*ruL:la(i:IST.).:0*K/01,./W..,I)X2 +oJheLl....c(Tar(ufrii3OrS:J1)-:;:a?CoTr.32,(11-51.)2),.7..d(.,l)A tl1SiJ.K=(l,KJ111.3wAI.U.vilig<wfi.i.)/(JUIA3m6A).E4113A liall1UUJA Ct..T.I.K=Cilw(e.3,Y;Le(C;.UT3,CY:.13))__ -- _ EQ.14Al +C.)4*CeL.:(r...Ar(fi..!..N/uf*L(iol.(1+:11*Lf)).1,1)X2 ,:JA,..t,Lc(f11ii.a.C.CALLCJ.LimL.1l,u,IL),1:)),I,u)T TALCJ-iv.,JC .1.)=.i,es....),....,J.)--,1
C ufril=o,Uirs2=uC urbr.)1=...),uriC C3=...AJO
:.: Cil-,1
C C:)2=yC Cia.if.v..O
C C1-.i.J=.1
r% OUT.3.F.L.'-'e JG(' it:. 3 .X/UT , . P.J, J , i 1 - . - - . . - - . ... . . . . ea. IsNOTaNOfc cl.aOL.r.,t:dr aAA:S jativeS 1,26iNOM --Egg,r( z1.1% I .;i:-...,I..(Arel.tc,S.t...rq.:.:(ji.I.K. I 9:3111 DA:Li I .1 )- E @11A AidiJI.K=sv11*(LJAKI+a7=e(ik.) TI,V:11.1))-4-V12*LITAKI*SA-PIXF(TU,t.K/UTAl wi...o:jt.(1+:-..i*Lir)) , i , i )r 1.!...iti,kr, I *1 t4TAK IX2 *w.a.a-Lt(SL.(0.2. ',11.L.K/etalii,i,u)A:., +zA:..eLaCTAb9L(1-,al,f1..c.K,U,Ib.1-.)),I,u)T YAeA1=00JA CChl.&mat;h1.*CSfl.K -- .. ,-- --- EQ.18...Wm. 4011 Am
A CHI .K=CLIt101,.t12,S.;11,11..tc.K) -- -__ to IfC v11...IC \12 =uC vli.Au
C 6.3=.u2C A1itei,...2
C ftuJJ=IoC INTAKI=.3:A.id
C laa,f1=1:AiuC vrals.:s
C all=.7nC al 2.4.7t)
C .:;..TI=4 _-E11.1.0a coll1..la=:.,16(APv1.K,JA.4e1.:(jH2.K.1,utt21)/CCd2.K)- Efka.IA Aet440.V21*(INYAN2+Tcr(vliJ12,vbf2)),V2KII.TAK2,6A,..PLc(aP(TIAC.K/OTXI *LUU.,.(1+6.3*07)),1,1).Q.J*A14?2*INfAK2X2 ve ra.4.-.:( 11N(o.2)-:31e1'IA=.K/ecKU),I,u)X.:: +SApaJLiCIALHUTAL,A2,YINc.K,u,0.),1:0,1,o)T TAbA2=u,...)A GCa2.k...Ca2.&*Cb12.& &L11A Ca2.102CLII-(a21,a22,jf.T2.TIa.K)-- --C V21l
-- ... Ed/ 1.3.a
C 1.22=uC V23.41)
C INTikra=-JOLuC yht.,f2.-gu
C .12=..iC a21-,.71,
'..: a22=. /L)C Age4iu.C zaaT2184
a coati.rd."1(Alri.r: ,:*u.adL,..:(va3.K .1 ,ua.31)/CCa.3.K) _ Efa.2.3A APvi.6...,01*(INTAh.veaT=1-(4:1,,TiozT.))+v.i2+1,,TAn;)*JAke'Lt(mAP(TI.4ft.K/UTAl wi.uuN(1,...)4,1C.")).i,1),433mAmeiwLiTAK3 OW1.2 : . tyoUrLa(,1(o.2v3*fl-a.k/eL:aL),I,u)... .I..., ,. If w . 1 .. . '' . .6
167 iitS1 COPY AVAILABLE
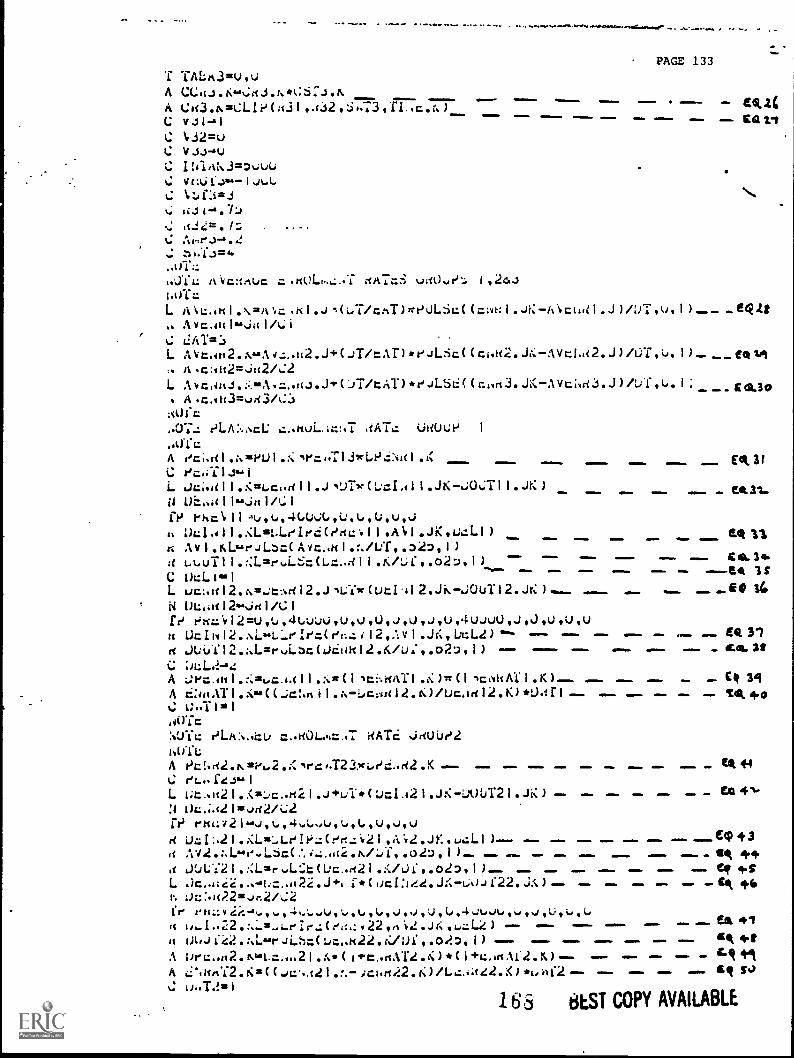
PAGE 133
T TALA3 =u0.;
A CCai.K...Ca.i.N*C6r.).11/4A Ca -.3.N=CLIP(a.:11,4i2,73,T1..c.r,) - -C rr
C %.32=uC Vis-AUC 1:ilAk.3=DJuuCC1/4.;
aJc:=.1:
,taL:
tOdcgALm :(A7aS v110,,?..;1.0T::
L -EQAt
L Atit,m2.mmAdz..a.J+(.IT/cAT),,eJLSc((ci.H2..g-Avti,a2.J)/OT,u.1)-__eca."
L Avc,01.1.::),=A.z.orti.J+CJT/tATikeJLSEC(cw13.JK-Avti,d3.J)/UT0..1; £01.30A.c.143=v.i3A:.)
NUfcuauue I
A foci.al.N2eUl.::,e=TI.31cLPhiNal.i:
LC
iP eum1.11,y0..4(..U.L.,U,u0JWQ1.411..:L=L.Leleci(r)uc:11.Ad.JK,U.:LI)
.111.. MOM. eqnN AvI.M.s.geJL.7..(Avc,111.%/UT..02D,I)a L.Luill.a.=,-...L.:;=(i.m-H1l./lift.02:),1) - AMMO.
--tt 14CL wc:.12.c.=,:t-Ad12.J,UT,r(utl.412.JK-jOUT12.JK)...- - ...E0 3(.N O,;a12.mja1 /CIr?
rr Uclii12.AL...LeIer.(enzi12,.;v1.J4,1x14)°".. EQ31d JU61.12.%L=rvi.c(OCIih12.K/U:,.02L),1) =1... - m11114. .M1m. A. Cm. 3tCA L;PcAul.:24-Aall.::m(1,tuATI.,:)71.(13cNkAYI.10-- - CR34A i:4/1.1T1.((..;c:.flil.;,-Licoa12.t0/Ucaul2.K)*U.Irl.._
Ni )'fc
'AWL: r,LA:..tAd .7....HOLT HAM jr0JUI.J2
Ian;A Pttr2.n=th..2.K - - MINIM IM - 41 ett flC rL.. ft... 1
L L;t,a21..0u.,c..112 I..)+LJT*(U=1.421.JK-LJUUT21.JK) Alm OM. .1. al 4%.:4 thz.;.c211e.m2/C2
rui:121,4.J0.,4.L.Arod,L,u,.JoiM Mo ecr) +3
Av2.:,1.....e.LS=(.% i.;..2.1./:.,1..o2:), 1 - - al - 49.a JC)LY21.::Lagr.L:;t(Uc..e21.1f./jig.02D.1)-- e,L -CA 46L. JL:.a22:4m2/2Cra 1..1.,22.:..=-1.eir.:(e41.:22,,64...)4...2)it uuJi42.:Luir.ii.h.l(Ldm..1122.t:/0i,.ol.D,I)
A 1Jec.m2..NALc...21.:,*(11.c..aA14.K)*(1 +u.iaAl2.K)-- - =.A i..11A.L2.Km((.c..121.:,-;:rs,:2.K)/Lz.iiG2.K)*L.N-2 ONO. - aM1.11. P.)
U.11.4!si16:5 BEST COPY AVAILABLE
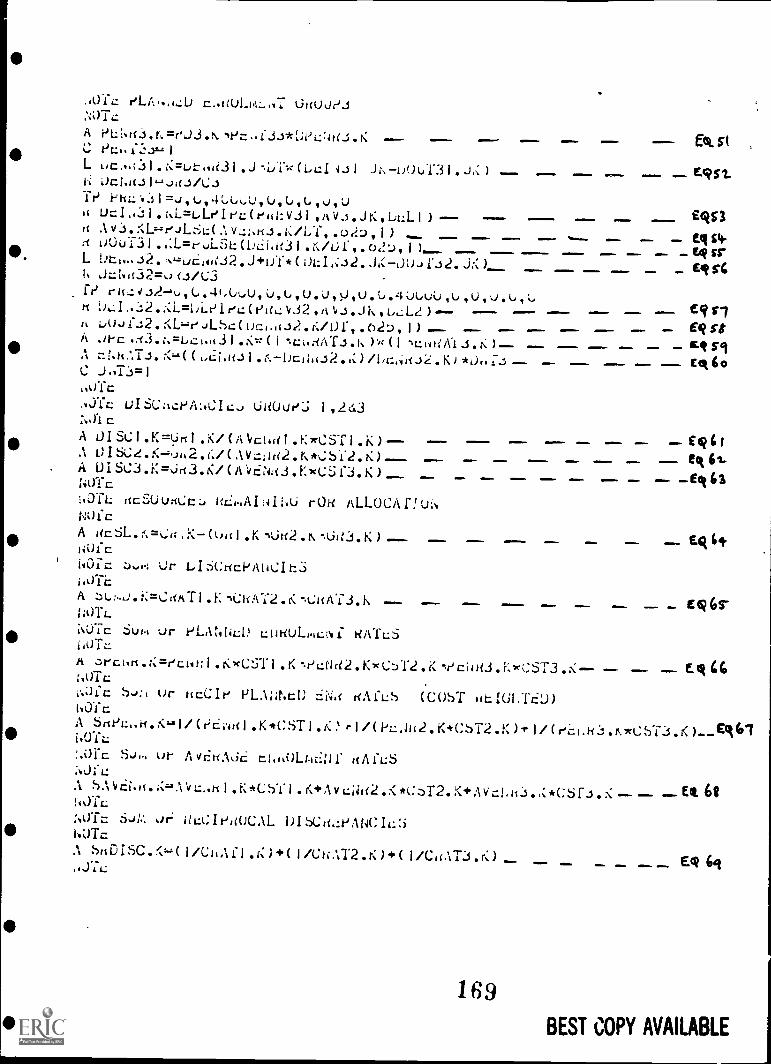
,Orc
A PLi.aJ.N=eJ3.K.,Pr...f3J.J.KCL JI\VOUT31.) 11
T?
uclo:;1.1.L=LLelec(eat:v31,AV.J.JK,LL:L1) INN 10 =MEM.
,( Av3.KL.-reJLSL(Av:::.a.s.K/LT,.o2:-.),1)=1=mb am .d imon
on ft srIP.L Oti.-52.ALJE,0i.J2.J+oT*(OLA0;i2.J,:-JoJf32.j:;) al eqs1I. J=t,a32=o3 /e3f,)
EC; VS;
tt ihA,:12.::L=IJLelec(riaLv32,A',J.JK,uL:L2)...- ONI L.10)f./2.e.A.hi.:(()=14AtJ2.i./011.02D,I) - M
Moft SA .)t-c .KT; -.LL.dATJ .1% )w ( I -IL:ilk/VI J. t:)A Llt.h.',T.S. ) *01,17..) - c 6oC j.T:5=1,,dfc
u1SCazt3A:,Clcu cjaOuldJ 1,243
A OISCI.K=.ial.K/(Aloc!ial.K.*CSTI.K)-- E IA oIs:K--...ii,2.(./(Avz.:;1/(2.1:*;$1.2.K) Mk61-
E,43A UISC3.K=Ua3.K/(A'vENa3.K.*CSf3.K)li0Tc
1,0TL ac5UumCt:, acip,AIAL; rOU ALLOCAPoi%NOfcA acSL.;,=La,K-(o(l.K ajtf2.N -61t3.K) Eqlot1:Uic
kOic Ur 1, I6ClicPAtit:It3
i.OTE
A su:..J.K=CaATI.K1CRAT2.1:-.CaAT3.K Eq6s-;MTLMfic Sum or PLAtikLIO LoHoLmcoil HATL:ShoTc.A secka.K=?Ltit-J.10(CST1.K%ecNd2.K-*CsT2.KYci4a3.K.*CST3.-- IR 4.6
SJ:: or hcCI? PLA1if.c1) LiNa aAfLS (COST atIOLTEJ)hafcA Sa?c,.a.1 :41/(?al.K*CSTI.Kr1/(PL:Ja2.K*(.
ST2.K)1.1/(eei.H:I.N-*CST3.K)-_ER611,01L:
Arc SJI.1 AVIEtlAjE aAiLS
A SA)i.a.;:=AVI:..al.K*CSII. v L;i1C2 *C3T2.K+Avz1,a3.:*(.5f3.K)YL.1:af= 6.r :. or i4:CI?a0CAL OISCaLleANCIL::iNOMA SaDISC.(1/ChAfl .r:)+( I/Cu.',12.K)+C 1/Ca,173.0 _
Me Eq 6QJ7L:p
169
BEST COPY AVAILABLE
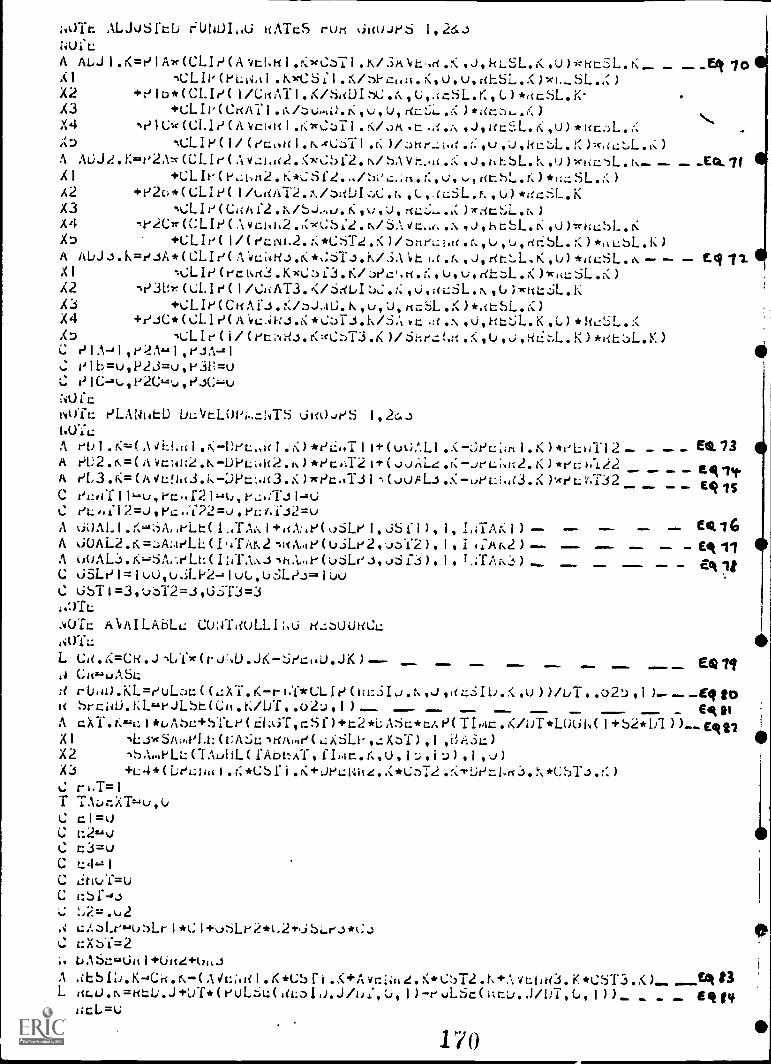
i+kar. ALJuSftU htATcS rut< kitcoJeS 26.3
A ALJ I .r(=P Aw (CLI ( A .N/3AVL..ri .K ,J,kLSL.K ,U)*Ftc3L.r:__ _EA 70SL.,, )
A At.)..)2.1:=412,\w(CLIr ( n/ SA Vt-..it ,J,tLbL.',.,,,J)-Ktic-)L.I.X I +CLIe(P,Livr12.1.:*CSf2.-/sidc_;i1.1".0),..,r(chL.K)*11,cSL.;,)X2 +1-)20*( CLI r)( luitAT2.:../31;DI .r,X3 LCLIr' (C,iii )
-.P2Cvr (CLIt) ( vcivt,2 .J ,1-1051..t ,Liltrt;L:S1...KXD +CL le( I /( etiNt.2.::*CST2.:( )/stieLL!.ic )*,,LSL.K )A Ali..13.1\=e-iA*( CLIr vci4t-?..5 ,u)*,tuSL.I -XI ( t\d3 u, u, )",-,ccSL )
X2 .)31 :>: U.:L.1e( /C,tAT3.</6.-(1.JI I( r U)
X4 +?../C* ( 1/4.11 t)( A 'vL.:Ai-c-1.K*.::31-_i.f./6,', vc .:( ,U,t-ttSL.KX-3 -ICL I ( (et is.H..5.1<;ct::->T3.K ) *t;t:3L )C , 1
C h., 1 b=u,P2,3=u , e311=u
NUicvatift: t' LA NI 4t1) ik:,VtLi)1);.c.lvTS kitIL),,r)S I ,60ILA 1-'1)1 ,ii:l.tt I .K-I)ec,,Ic .t:) -kr)C,,T I+ ( ..K --;)Pc:411 . )*1-'1:4-c 1 2 - -A r)L2 ,&=( A vc141;2 -L)PL;.1c2 .1. ) *t)ce:I2 ( 1:%L of Li.t12. 1,-1.22A riL3.K=( 1t/Ltlgt3.1.LiPL.:.1(3.::),rPc.T.31,(wAL..i.;<,eLi.a3.1<)weLkT32
XIX2X3X4;:.)
.CLIP(PLiv,t1.1\wC611.t,/s1-cit.K,UvuorthSLv)-xkl-r.)*( CLIrq 1/C11AT . K/S,(DI , ) *acbL.+CLIP(CHATI.e,/,:u.,O.K,u,u,rtc:;L.K)*ar.,(,)
YlCw(CL1?(AVcivitl.KwCz)71.!:/ortvc.,J,I(ct:.L.K,u)-CLIP(1/(eco.t(1.N.cCSTI.K)/3xe..,u,u,kc:-JL.
C
A
A
C
C
ec,,f2ec,,f12=,),Pc"T22=o,eL;AT.32=u
ki()AL2 --zz.:A:41JLC ( u..iLe 2 ..,),-;12 ) ,ouAL3.K.-.SA,-.eLt:( I i4TAN.../ J vS 13)651.?1=1uU,u.A.1-2-aluu,uSLI).51uuUST1=3,uST2=3,U;;T3=3
,,JTL
io,AILAbLL cu;4-raoLLI H.:bUtittlAL
oicricL
CW4LJASL:
1 , 1,47AK 1 )
1 g 4,A )
I g A )
MEM.. MIIIMia
d r U140 .KL=IJUL:A: ( i .K-r 14*UL le ( hc3I .N g.) 'az::: Ili.
tc brcii1.).KL...esiLbt(C11.K/DT,.02:),1)-- -- --A c XT.K.,L: I iruAsc+STLe( CLGT,17:Sf )+t2*i; ASc*tA P( TIpicXI
X2 (TALJHL( fikiw:AY, (,,U, 1 i ) i )
X3 +L4*(tAaL;;.1.K*Cb1 i.K+JeLNit.,(*C:)T2.1,r hT= 1
T TALJr.XT.4u,UC cl=uC t:2==oC t3=uC t:== I
CC 1:bf
uA31.0-80:3Lr I *C I +,,SLI-2*L2+...ibLe.5*C3cX.:T=2LoA5=ag1iill+line+UitJ
A .ibbi;;.K.-.Cil.&-(AVci.al.K*Ct.111.,<+Avcd.K*C!,T2.K+Avchr(3.K.*CST3.K4....--413L i(Lu.n=litL...),Iff*(euL6L;(aL:Dio...)/1);,::0)-evLSc(izr.LJ.J/1)70.,,i))_ 641,4t. cL=t;
-- ,1S_ e416
- EA
.111
EA 11
E6)
_ EA eiK/OT*Ltitif,( 1 +b2*1.)1 ) ).._ vitt?
170
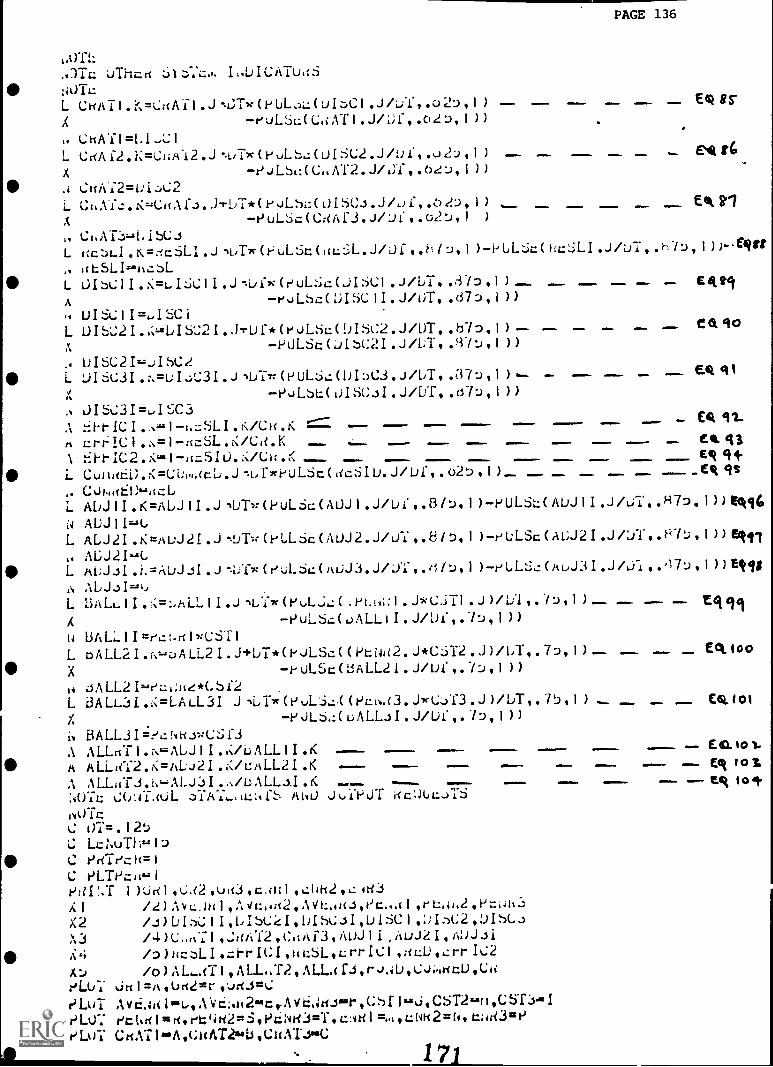
PAGE 136
07ra uThizrt I 01) I CATu,t6:4)Tc.L CHAT I. K=CgAl I J -.4,Tx(PUL-)1.: ( ZiC I .02D I ) £4 85"
t'ULSL:( AT I J/ iii , .02 )
ChAT I 1
L 2:) ) t4-4"JI.S4:(C0AT2.J/L)T, ))
r Ctliti2=IJC2L Ch.112..K.-;CriAfJ.J.t.DT*(FoL!,;.:(0ISC..1.J/of,.02-J,i) ektiA -PuLSc(Cr?Af3.J/Ji,.02:),I )
ChAT:),..LibCiL 1;c:JLI.tc=:IcSLI.J,L.T*(4=LL.3t(m.:::L.J/Dig.h/D,1)-1-ULSt(i:c:iLI.J/DT,.hPj,1))-Cqrt
g(CSLI=-=4%cbLL Eqt,A -eoLSc(OISCII.J/OT,.d7D,1))
UISCII=LISCi
x PULSt Li I bt:2 J /LT .87 I ) )
Cet 90L I 5',:2 I . g:,26 I S;;2 I ..1.1.1)f* frul..5c( DI SC2 . J/DT, .b7D, 1 ) - =1N. Mom ans.
I 5C2 I2.4j1 SC2L jI6C3I.;.=LI.:C3I.J,U77:(HULLiL:(bI:)C3.J/LT.4a7D41),- - - "q1A -PoLbt-.:( oISCJI .J/LT, .07D, I ) )
A JISC3I=LI SC3A IC I I -4, c.SL I . t:/C K
- £4 it.aPr IC 1 - Etg3
1 :::1-1-IC2.1-wc510.;:/Clt.Ki. -.L.T*1-)J1..6t (ficSIU.J/Uf,.02, I )_.4 Cui.01E1J8=itcl.L AWII.K=ALJII.J,DTw(PuL6c(AUJI.J/Uf,.8/:),1)-PULSL(AUJII.J/oi.H7D.1))0414i4 AUJ I 1.-q,L ALJ2I.K=AuJ21.J-JTIr(PLL6c(AUJ2.J/JY,.81)-4JULSc(AUJ2I.Jf.JT,.PPJ,1))411
AUJ2I--,L uL6c( mjJ3.J/jr I )-eLLS,:( AbJ3 I .J , ,I ISA .11.J..q==1,L BALL I I .7:=:,i,LL I I ,L1-*(PLL,;,:( I . J*C.i71 .J )/L.d.1 71) ) EdictiA -PuLbc.( 0ALL I . J/L)f , , I ))i 4 BALI I =ec ;.rt I wUST IL DALL2I.NDALL2I.J+1/1*(PJLtic((Pc1)a2.J*CT2.J)/I.T,.7D.1).-X -i-OLSc(LtALL21.J/Di 7D I ) )
JALL2I.-.ec.,;412*Cbf2L aALL3I.K=LALL3I J,L7*(HuLi...1.((Pc3.J*C:JI3.J)/LT,.75,1) C4.101X -k-'JLS,;( J/Uf ,. 7D, ) )
it BALIJI= :'1-.NHJwCjf3A ALLIT I . I I ALL I I .K iotA ALLaY2,K=ALJ2I.K/vALL2I.K =1= 1E/ 0 1A ALLitTi.NALJ3I.,/LALLAI.K001-c CGAYAUL MIL) JultijT ilcIAJLJTS140fcL.: . 1 2'..)
C Lc Null 1
C PeTeck=iC PLTPcso-:iPt?I!,T I );ir I ,C.C2 ,u113 c.d; 1 ,4.:141211.: 4t13
X1 /2)1vLAhl,AVc,w2,AVL,4tc.10)10-2,P=0h3X2X3 /4 ) C ,0;1tA13 AW I Al-)J2 I,Xi ial.:DIL.:rP IC2
/0) AL,...(T , ALL.T2 ALLA r.i,r.J.4U,L;J;oltU,C,4eLvi' Litil=A,um2=r,..)41.3=L:
r'LuT AvE,44i InsLIAVCAti2zac,,AV6,441.18ar,Cf I...i,CST2=*tt,CST.3. Ir'Lt.)7 I4ri I = rigehriti2=3,PC.14K3rai, cAtt 1 =.0 0.:14H2=14, t013=t)I.' LOT CtIAT 1 a'A ,CHAT2"Li 'CHAT-PBC
Eet loo
171
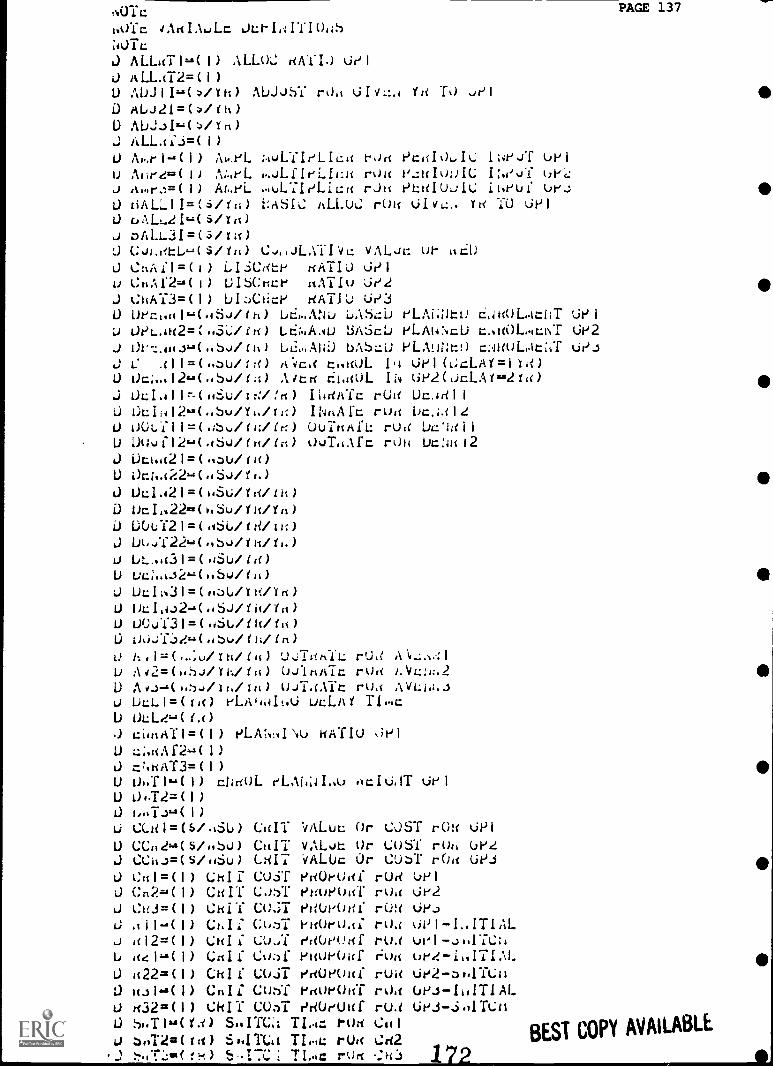
AUTa PAGE 137
L.Oit 4AaIAaLc atrIATI0,4S;40-1L:
J ALLa71,.(I) ALLOC (MI) delU ALLaT2=(l)U AUJII/Ya) ADJJST rda LifyL:,4 Ya T0 ,t'l 11
0 Aid.J21=/ta)D ADJJI.-=(:)/Ya)J ALLaii=(I)U Ap.rl-.(l) ApiaL :04.1ITLIL:a rua rcaI0,,,I 1.4eJT UPIu Ali-2..,(i) A;.seL 1,JLileLli:a roic T.:aIuoIC I:.coi ol'',:J Apst-J=(1) At..ri. ,a4LTIeLica raa rtaIuuIC ihruf or..: 11
0 6ALLI1=(6/ta) t:ASIC ALLU.,: rOit kikvi.:.. Yti TO del0 DALL.21,-,(5/Ya)J nALL3I=(5/1a)0 CJI.etL,-,(5/Ya) C4,JLATIvL1 vALJc ur aLU0 CnAr1=(i) LI6Ciitv slitilj jr'l
u CriAf2-..(i) 01SC:raze aATIu jr"2 fiaJ CaA13=(I) DlaCace HATJU CW30 Dec:14[0.,(.oSJ/th) laC,..AND 0ASaD eLAi;Ntu E.4a0L.4=i1T delJ OPL.4u2=(/iii) LE;AAU tift:icLi PLAI4NcU c.,a()I....cAT de2..) 01-:Aiii(..S.J/th) LL:....AND bASL:Li PL.VINtO =UOLtia 01).1..; C Al=(../ta) W4ca t..aOL I,. Url(L;cLAY=lla)U Oc;...12...(..5o/r.1) Aittl rihs(01. Iiv 6P2(jcLAY2.82nt)
lbJ OLI.411r-(Fdu/tr:/frt) IidriAic rUit UcAdllU ucii412-(..su/YN/r.0 INaAcc raft Ocal2U OULY11=1/4,/ia/irl) UtirmAa: rUd bc'lailU Ouoil2..,(.46o/ia/la) OuTaAfc rOa Dc:Ja12J ULka21=(,,au/ta)U Oci.a22-(..S.J/fN)
0 UcI.421=(6.6-il/Ya/ta)
0 ucI..22.=(t,Su/Ya/Ya)0 DOuY21=(.16L/fa/111)J UL4T22.-,(J/Ya/Y,.)U bt....a31=(,6U/la)U uL:to23-(uSu/111) 10
J ULLN31=(113U//ii/Yrt)U lA:1,4J2-2(.SJ/i11/1)U IJOJT31=( +60/1k/ta)0 61:)r!u/i1;/(n)0 hil=(,..;a1h/lit) U.JThit; rfJ, A.v.:0,4I
L A+2=(t,:).J/Yh/ta) 0J-iadic rua LVL:14:.2 11
U AvJ-..(4/1h/la) uJYaAit rkLc AVLitiJ DcLI=(ra) vLAIN,IIi.O ucLAY TI...cU OLLT.-(ta).) cimAT1=(1) rI..t.:,I`vo HATIu JP I
U 1.1;.a.,1f2-(1)
0 c:.HAT3=(1) 11U OhTl..(1) cl.a0I. ri.Ahia,.o .1cIOJT orlU ONT2=(I)O 1,,CEJ.-8(1)
0 CCal=($/aSU) CaIT VALLA: Or CdST rOa UPIU CCa2=(5/abu) CulT VAL.& Or COST rOt% (,PGJ CCit..)=(S/,Su) (.47 vALUc Or CULT rOa UPJ 00 Cal=(1) CHIT CUT PaUroaf rua orl0 Cn2-.(1) Can: CdaT eaueUaT rua tjt'2J CH3=(1) Chi -I CO.37 PaUcOaf 1-0:( Orj0 .1i1-(1) CNI: Cu:37 raorual rua kiiii-I,ITIALa alt =(I) Calf CU.,Y Pt Ueoaf rw ul,1-Jhra2;,U adi,..(l) Calf Coal' raurOaf rua ue,!-ii,ITIAL IIU 1122=( ) Chli cUji eaUroaf rua or2-ITuil0 ail-11( ) Crai CUT Pr(OVOta rOa Uei-liATIAL0 a32=( ) Ckli COT eaUeUaf rOa Ori-.i.vITL:nU :3NT1.4(ia) SaITC:1 TI..= tqht it
0 flT2=(1.1) SITC4i TI,. t: rUa Cd2% SIT:;.( : ) t.,..T.7.: i TI.oc rua ..7ii:, 172,
BEST COPY AVAILABLE
A.
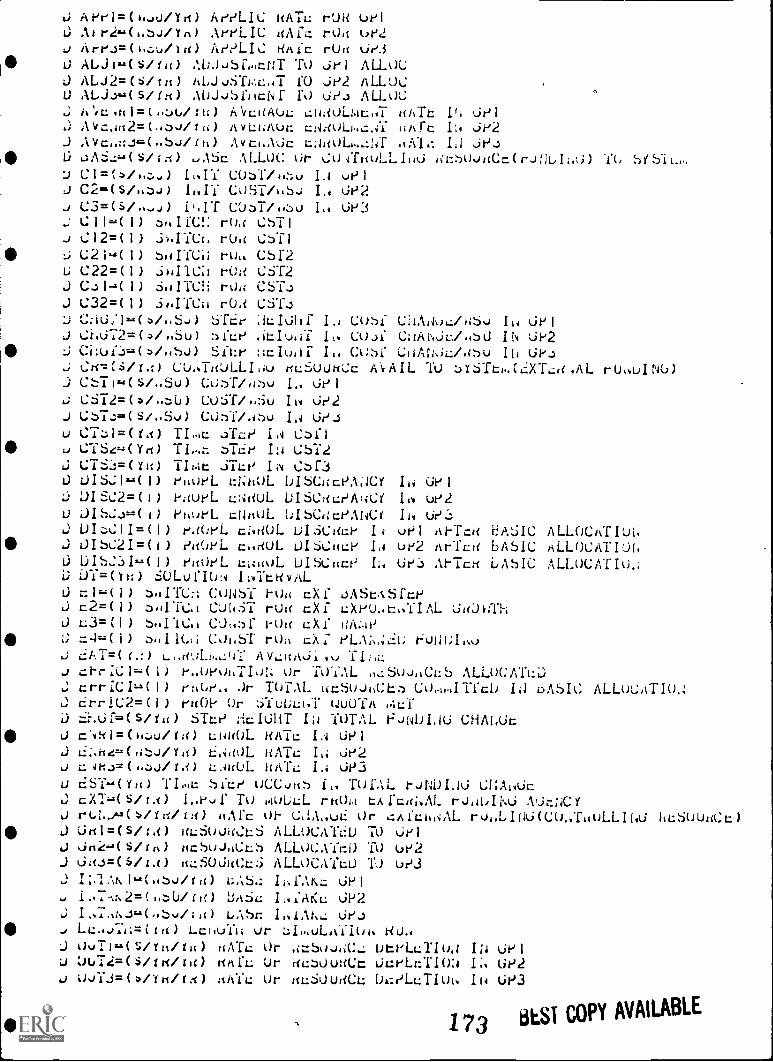
J APe1 =(,0%)/Y) APPLIC HAM0 Atr2-.(asJ/Yn) AeeLIC aiNic0 Are3=(a,-,u/la) APPLIC khicU ALJI.-.(s/ra) ,'.1A05 foltfIT TO
J ALJ2=($/tn) AL.I0STI4cJi f0U ALJJ..4(5/1K) A1)J0SflicNI
rUit uelrda uP2rUlt 61,3
jel ALLOCjP2 ALLUC61J3 ALLOC
A'.c.tcI=tauu/l) AlicaAuc ahTt jr jPIJ AvcJit2=(..su/ra) AvLiiAtir. =Aa0Lh,-.:AT NATc IN Je2J Avca(aSu/ra) Avci.AUc cJa0L1:JT Ij Jeit) ,1,11/46.:=-=(s/t?.) uAtic ALLOC or U04ThoLLIJO fcc:-)Our(Cc(rJ:ILIJW TOJ CUsT/a;:0 IA 01) 1J C2=(5 /1,JJ) 11.' COST/h5J I. OP2
LJJ
C3=($/0J) iNIT CUsT/asu I,. UP3CII(1) CSTIC12=(1) jhITCr, rUa CsTIU21.4(1) rua CSI2C22=(I) CST2C31-.(1) SaITCH rOJ CSTiC32=(I) r(),i C617.5
6Tdr IJ CoSf CilA010ilii6u IJ uei;i,u72=(4/.su) :)11:e I CoJf C:1A6jc/sd IN jP2Chu13.../a50) Sae Ia (a)S1 CfiANjc/asu 111 UPJ
0 Ch=f4/ra) CU0TWJLLIau rIc6Uuhc i-O,AIL TO sY6-11,,(CXTca,AL rUauINO)j CSTI.,(S/aSu) CusT1,1:-)0 lo JPI
CST2=(*/asU) Cu.3T1.3u IN OP2J CST.:(S/,,SJ) ConT/a:-)u IA UP3u CTsI=(iA) TIkc sTc? IA Csil
CTS2-,(Ya) TI siCe IA CST2CT63=(Y11) TIIt jilt' IN Csr3UIS01..:(1) eitueL cl;hoL U1SCacPA;ICY IN ueiDisc2=(i) eaueL cNiiUL DISCticPANCi IN uP2JI503,-.(1) PhueL cNrsOL IJISCJcPANCt IJ U?:;
ra0eL cNa0L uISCHcP I: uPI ArTca HASIC ALLOCATIOkOlbC2I=(I) eitUeL cJriOL IJI6CmcP IA uP2 ArTLH bASIC ALLOCATIJf,UIS.:3IiC I) ettOPL Li;icoL Ul!-k:ItcP ue3 ArTctt LAIC ALL0CATI0,1UT=(tr:) SOLucION INTtioAL
S.1ITC;-; CONS 1-Ulf cXf JASCASEcPc2=(I) CL)(46T rua cXf cXeUataTIAL Jicjircht.:3 =(I) sanC,1 CJN:)f rOH- 44..(1) CohbT rOa cX: ruNuIa0CLT=(i.:) AvL:ItAji.0
P.OP01,TIoN or TOIAL ,w.S0JjGcb ALLOCATc3rats'.. Jr TOTAL iicSOuliCh:, IJ oASIG ALLOCATIOj
ErrIC2=(I) ertOP Or :iTuOchT QuOTA i4cTi) thAjf=(S/iic) STc? IJ TOTAL t'uJUIjd CHANUcJ c.v:11=(.:40/Td) LNROL HAT: IA UPIJ Li;,HG=(,i;;J/Ysi) ti,;a0L HATL IJ 6P2J coli=(.sata) cmtOL IoiTc IA 6P3U Sei-,4(YN) TI,qc Sice uCCJris i TufAL ruOIJd CflANUcL) cX1,-,-.(s/r) laP01. Tu AuULL rt1014 tAfcai,ALJ Arc Or U,IAJuti Or c:AfchJAL ruaLINU(COaTauLLINO htSoUCt)J Jr(I=(S/:) acSUuCcS ALLOCATLiJ TO 61II
J jr12'..(S/in) ttCSuJ,cCt,S ALLOCATI:D T) (..n
J Uai=(S/La) ticSOditCt:i ALLOCAMO T u?..3
J II,1AN1==(.'Sulia) i:AS4 IiNfANc UPIioT,N2=(,,s1J/1H) IJ:AKc dP2
j L.7..J2-1(,150/;1() LASc kieJLL..07,:=( ) ur HUN
J OuTlia(VCR/its) ttATL: Or ,i=b0JX,.; UtPLLTIO.4 UPIJ UUT=CS/id/IN) tlArt.: Ur acsOuUec jceLcT10:4 la Ut'2J WJY-i=(*/111/1A) AAIL Ur to.:souacl: 1).7.1)LcTIOlv 114 UP3
173 dal COPY AVAILABLE
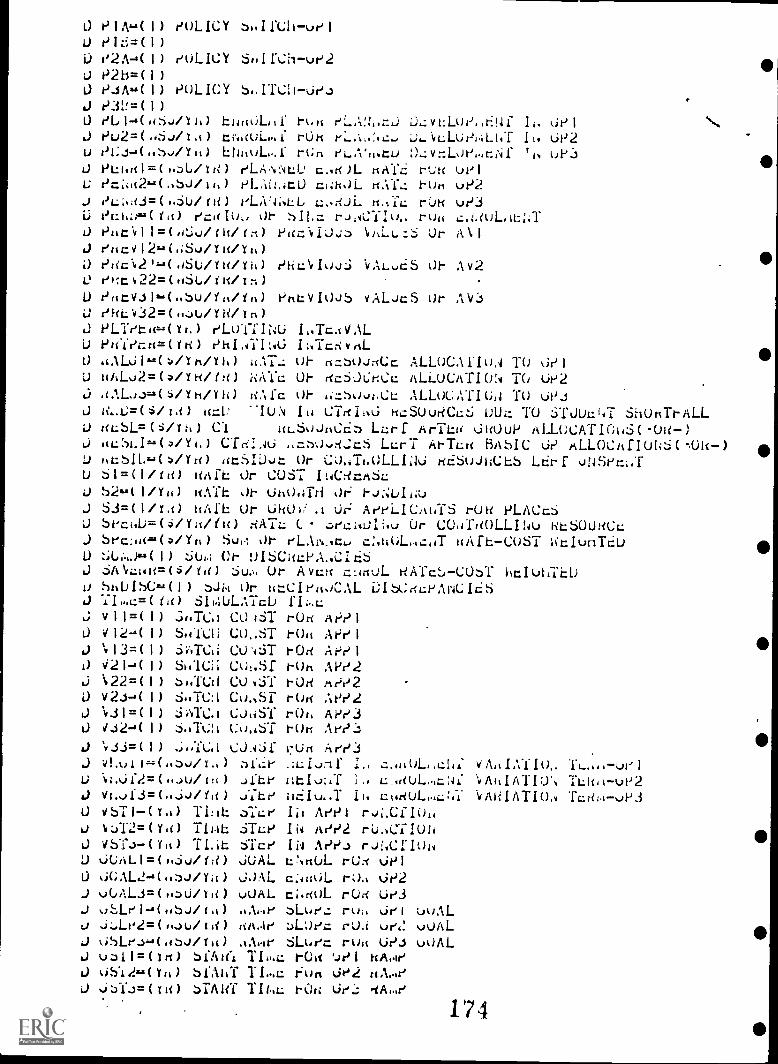
0 PIA(1) tJOLICY sk.Irch-u?1J P16=(1)U e2A-.(1) rULICY SuI1'Ch-ur2J P2b=(I)O eJA-(1) eoLln s.ITCli-JeJJ P31!=(1)0 eq.1-4(iiSJ/Yh) him6L4 1-krt eLANcj O,:vt:Lui-J1- II. 61-'1 N..
J Pu2=(.+6,d1,1) tNicoL.f rUn 1-,. L;,.vLLutiJ4LtIT It. UP2U ei:j-,(..:),./Yit) ENnuL-f rGn eiV,I.to 1)4v=Lut),,itfa Th LJP:3
J PLI.1(1=Lild) eLA,vNLU c,d)L dAlci rut( IJelU er.;i,(2.,-.(.,bu/11,) PLAi:.4tO ci:nOL nAY,: run uP2J d).3=(..6u/rk) vLA:4;,.LL L:.;;Ji. t1.: rOtt or)3U Oc:1,.(iu) e=t(I0L, or :AI.= r.),i::YIu- ruu ,:1.aiL1t:::TO PtM=(ii:;ailt/ttl) Picz:.viJJ;) \d/CLL:::: Or A11
J euEv12...t.i5../iu/YulO Plic1,2'(.4SO/tH/Yit) tific:0,Jj .v,I,LuS Ut- Av2O ef:t1.22=(6(,/itl/r:1)
U tifttvil(,,Su/Y,Win) PtAVIOJS vAL.JcS Ur ;ViJ effL'vj2=(.,:,1. /YH/tn)
J PL.TeEre-(ili) eLoTTIO Ii.TE.IVALU Pr(Yer:n=(iti) P111,4Y1:4C, 1;,TcrivAL
O .tALUI.../Yhilk) uAT.: or u=s0Jr(CE ALLOCfloA TO 6e1U nALQ2=(/in/ln) ;(AIL: Ut- daSt)r.t;L: ALLOCATIW4 TO Ue2J ,O,La..1,-.=(s/ih/Y1i) aAfc Or ,izsoQnCE ALLoCATIO,J TO UPJJ a-U=($11,t) t(: l' -IUN IL4 Cidimi HLISUuRCL:6 Mk. TO 5TLJUL:147 ShOnTrALLU rtubt.=(s/rh) C.1 I(LSoJiICE) LL:rf ArTbi jifOuP ALLUCATIG146(-0H-)j itc::)1.1--,.(/Y1,) CTr:I.46 =:10...n.;cS LL:ri ArTua BASIC Jr ALLOCAfI0k6(-Ok-)U ntSil,==(/Ya) atSIDJt Or CJ,iTt.OLLIi,ki nEbuJiiCLb LErf 014SeEijU 61=H/fa) kAil Or COST It4C:iLIA6c.J 52..6.(1/Yu) LIATE dr uu0,4Tri Jr: r.);4/Ii:u
J Sir.-(1/rA hAfE Ur Utah/ .1 Jr AerLICAhTS rOn PLACc6J beci.1)=(4/Yi(/fic) nATL: C. z,pai*J1i.v Ur C0,4-ftiOLLINL, HLSOUHCE:J Sec:41/Yn) Su,: Jr eLAiv.,,E, ;:::.uOl.z,dT uAfE-COST iEIunTEuO ZA,;..)..(1) zili Cr VISCEPA,CIESJ 6A\q:14u=($/ta) :Li.,. Ur Avutv clinoL tiiiic:)-UOT ktIuLTEDO StailbC=.(1) .11L Jr utCIruoCAL DISL:giLeANCIESJ TI.a=(tu) SII4ULATED I'L,E.:J v11=(1) 3i.TC.1 COIST rOn ArYIO V12-.(1) S.fTLAi CO,ST rOu APelJ 'v13=(1) S'AlVii Cosi:3T rOd APIJIO 1121-,(1) SllUi co,sr rOh APe2J Q2-4(1) 5t.TCLI Covji rOd ArY2O V2J-g(1) 6.,TCA Co,Si rOn ArY2J 1,31=-(1) jATCA Uu6ST r0f, Al-Y3J Vj2-8(1) 6.TU:t Uu,dST run. Ae?...1
J 'v..$3=(1) ..;..TU,i L;JAjf cUn Are3J vLuil,-.(..J/r.,) z)fiir .A.:Lxif I., ,:..01.,,ah; vA,t1ATIO" TL.,.. -velU ,I.6f2=(..Ju/tn) Jfte i:L10:.T IA L.,aoL,c141. 'vARIATIO TLilii-ue2J vi...)1.3=(..j.J/Yal .;:te ilthltA.T ii. cidduL.;;;.1 i,AHIATIOA Tcr64-vP3U vbil-(Y.1) TI:11: aTL:e Ii, AePI r.);.C110U 1,:;12=(Y,() ilbiL 3The Iii APP2 rUACTIoNO vbTJ-(Y) TLit 6Tce IN APP..) rJ!,c11014
.
U JUALI=('sjaiq) JoAL t.:.nUL rUn OP1O 6GAL2-4(.,:WY;i) jOAL c:+nOL ra% 01.'2J vUAL.3=U/Ta) QUAL ti.nOL rUn ue3J oUel-A(.4bJ/(40 ,,,u sLue.: ru,, ..Jel LAJALJ j:,Le2=(f,Ju/iii) aAAr :)LueE rU.i yr.: vuALJ 6SLeJ-a(ussi/ru) AAie SLue= ruu Ur)..1 uUALJ u,11=-(1d) i'itt(i TI,..a rOt .Jel IIA,1-,
J 05"L2...(Yi) siAkT TI...= run JP2 riA,eJ ..i:)1.3=-(tit) STA la Tlta: I-0a Ur; qilko,e
174

0U
0J
UU
UUU
PEilf11.-:( ) HLAhNED =kaoL tclUHT rOh UPI
Ptf12.-.( ) PLAi4At0 L:sHOL halUlir ruts UPI
Pci,f13=( ) HLAtsAtl; ciddA. AcluHT rOtc UPIPtill2I,---( ) PLA,c4c1) L-J4tioL uLlohl rou upePciT22=( ) PLAi.,,LIJ L:tlaUL 1.L:160Y ruh uP2PLaif2.5--:( ) P1.AA.4t1; r_hhOL IL:IjAT roh uP2Pthi31=( ) pLAi.,tL; LI.:4EOL %LiJta rOi. utdi
Pak. C.12.. ) PLAk41.:13 c,,hoL ifi.iloLf r:h; UPJPL;.13s=( ) el..ALO cA1-(OL cafuiLl rUlf UPJ
D r_XSLP,-,(S/Yh) dA.P SLR) eL rui, EXTL.(0AL 1-Ji4A,A6
UDU
000
U
L)
0000
Uo
U0Li
UUUD
U
L.)
U
JDU
0JUU
0D
0
00
DU
UJJU
Li
JT
t.:XST=(Ya) 61AtCf TI.,:: rUa t-Jt4IJI ,u . (A4)
TADAI=(,,SJ/th) TADLL AeHLI.: dAlL th, UrITALM2.-.(,..iu/ru) TALL,: ArtiLL: retfL: ruu UP2
YAbA:!=(6J/tH) f/VOIL APPLIC riArc rUa ue3TALci-(s/"sJ) TADLt COST t(ATr. rOa UPITAdC2=($/i'60) fAbLi: CUY ItAlc rUa uP2Y/WC.,..:($/%S.J) TAL,La COST aAT,--. ru,, UPJTAbl:AT=(5/Ya) TAAL: rtikoIAj dATL:l'kT.-...(I) ruNJINu ut:C.JCTIO,; uz:It.i.21
.i15T1=(I) IkIT Pd0P ALLJC 1.0 liviAIJI-2-2(i) " H 6 " UP2.lit,T3=(I) " n I, " Oe...i
b..J140($/Yr() 0J,1 ur 31-10Je HL:b0uiccaS (IAT)
.11=(I) z,nI TCd mit( III6fUai euLICt Oel
11
11
" efl:,iblAT
11It
'IIl
11
11
AUJ ,tlitt
II
OJT6ILL11
"
oTril-(s/yv) sTzte chA,Aic(1ri2=(/yu) "
.
uT1-2I..-/Ya)OTr22,-(Vla)uTr3i=(s/Yu) "
t)Tr..52( Si Yh ) "
OrJTII=(Y) ziTaiOr5112.,-.(y.c) "
It
IIIt
It
11
rd,40ii
11
:ie2
uesUPIOP2OrsUelUP2Lies
ri-LC-f11
II
uelUP 1
uH:iI:4 OJTSIDa ru.iob
11
$1
11
II
TII16 rod sift:P ru,1CY UPI11 to 11 II
II II It61-,
11
11
II
It
It
41 II II
u II IS
01'361 ft to
Ihif vAL.JL:. UrII II II
11
IJIC=(I) ..k"..C, rOil
t. Y.( -,( I) "as
d3C=(I) "si
Shr..:(th/) SJ.
14
/W.)
It
JelJe2JeJ
euLILA ul)!,, ure
(ie..3
or ,(r.Cie PLAh",:o
11
II
uLSOJaCE:)$1
.4
UPI11
01)2II
L$P311
LlihJI. ahrr..:(CJ:-)T uLAui,TL,)
175 BEST COPY AV/mita'.